Embed Size (px)
Citation preview
1
Organic tracers of fine aerosol particles in central Alaska: 1
summertime composition and sources 2
Dhananjay Kumar Deshmukh1, Mozammel Haque1,2, Yongwon Kim3, Kimitaka Kawamura1* 3
1 Chubu Institute for Advanced Studies, Chubu University, Kasugai 487-8501, Japan 42 Yale-NUIST Center on Atmospheric Environment, Department of Applied Meteorology, Nanjing 5
University of Information Science and Technology, Nanjing 210044, China 63 International Arctic Research Center, University of Alaska Fairbanks, Fairbanks 99775, USA 7
*Corresponding author: Kimitaka Kawamura 8E-mail address: [email protected] 9Tel.: +81-568-51-9330 10
Atmos. Chem. Phys. Discuss., https://doi.org/10.5194/acp-2019-293Manuscript under review for journal Atmos. Chem. Phys.Discussion started: 21 May 2019c© Author(s) 2019. CC BY 4.0 License.
2
Abstract 11
PM2.5 aerosols were collected at Fairbanks (64.51°N and 147.51°W) in central 12
Alaska during the summer of 2009 and analyzed for organic tracer compounds using gas 13
chromatograph-mass spectrometer. The organic compounds were grouped into fourteen 14
classes based on their functional groups and sources. Concentrations of total organics 15
measured ranged from 113 to 1664 ng m-3 (ave. 535 ng m-3). Anhydrosugars (ave. 186 ng m-3) 16
and n-alkanoic acids (ave. 185 ng m-3) were two major classes among the 14 compound 17
classes. The similar temporal trends and strong positive correlations among anhydrosugars 18
and n-alkanoic acids demonstrated that biomass burning (BB) is the major source of organic 19
aerosols (OAs) in central Alaska. The dominance of higher molecular weight n-alkanoic acids 20
over lower molecular weight homologues and their carbon preference index (5.6-9.8) 21
confirmed that they were mostly emitted from plant waxes during BB in central Alaska. The 22
mass concentration ratios of levoglucosan to mannosan denoted that softwood is the main 23
biomass burned. The rainfall event distinctly enhanced the levels of mannitol and arabitol due 24
to the growth of fungi and active discharge of fungal spores in the subarctic region. Molecular 25
compositions of biogenic secondary organic aerosol (BSOA) tracers inferred that isoprene is a 26
crucial precursor of BSOA over central Alaska. Our results suggest forest fires and plant 27
emissions to be the crucial factors controlling the levels and molecular composition of OAs in 28
central Alaska. We presume that the high abundance of BB-derived OAs in central Alaska 29
may have a serious impact on the Arctic climate. 30
Keywords: Primary organic aerosol, Secondary organic aerosol, Molecular composition, 31
Biomass burning, Temporal trends, Central Alaska. 32
Atmos. Chem. Phys. Discuss., https://doi.org/10.5194/acp-2019-293Manuscript under review for journal Atmos. Chem. Phys.Discussion started: 21 May 2019c© Author(s) 2019. CC BY 4.0 License.
3
1 Introduction 33
Atmospheric aerosols can absorb and scatter solar radiation and alter the radiative forcing of 34
the atmosphere (Seinfeld and Pandis, 1998; Wilkening et al., 2000). Fine aerosol particles 35
have a diameter size close to the wavelengths of visible lights and thus are expected to have a 36
stronger climatic impact than coarse particles (Kanakidou et al., 2005). They can also be 37
transported far away from the source regions and thus their climatic and environmental effects 38
are delocalized compared to the emission areas. Aerosol particles that are hydrophilic can act 39
as cloud condensation nuclei (CCN) and have an indirect climatic effect through modification 40
of cloud properties (Novakov and Penner, 1993; Novakov and Corrigan, 1996). 41
Organic aerosols (OAs) that are comprised of thousands of organic compounds 42
contribute about 20 to 50% of total mass of fine particles in the continental mid-latitudinal 43
atmosphere (Saxena and Hildemann, 1996) whereas it is around 90% in tropical forest areas 44
(Crutzen and Andreae, 1990; Andreae and Rosenfeld, 2008). They are derived from 45
anthropogenic and natural sources. They can alter the physical and chemical properties of 46
atmospheric particles depending on the meteorological conditions. OAs are highlighted for 47
the past decade because they are related to the changes of global and regional climate and 48
chemical composition of the atmosphere as well as public health. Primary organic aerosols 49
(POA) are directly emitted as particulate forms whereas secondary organic aerosols (SOA) 50
refer to particulate organic matters that are transformed to aerosol-phase via gas-phase 51
oxidation of organic precursors. Emissions of POA particles and SOA precursors can be 52
released from numerous sources near the ground surface and subsequently mixed in the 53
boundary layer and to a lesser extent in the free troposphere. The dry depositional removal of 54
OAs mainly depends on the sizes of the aerosol particles. 55
The molecular composition of OAs can be used as tracers to better understand the 56
sources and formation pathways. Advances were made during the last decade to better 57
understand the formation of OAs and their precursors in the atmosphere. On a global scale, 58
the emission of biogenic volatile organic compounds (VOCs) is one order of magnitude 59
higher than that of anthropogenic VOCs (Seinfeld and Pandis, 1998). It is notable that 60
biogenic VOCs are comprised of unsaturated hydrocarbons with double bonds and are more 61
reactive towards the atmospheric oxidants such as hydroxyl (OH) radical and ozone (O3) than 62
anthropogenic VOCs that are largely comprised of aromatic hydrocarbons. This specific 63
feature of biogenic VOCs further enhances their significance as a conceivable supplier to the 64
global burden of OAs in the atmosphere. Laboratory and chamber experiments have also 65
Atmos. Chem. Phys. Discuss., https://doi.org/10.5194/acp-2019-293Manuscript under review for journal Atmos. Chem. Phys.Discussion started: 21 May 2019c© Author(s) 2019. CC BY 4.0 License.
4
documented that biogenic VOCs are the potential precursor for SOA formation in the 66
atmosphere (Kavouras et al., 1998; Jaoui et al., 2007). 67
The arctic atmosphere is considered as a unique natural laboratory for photochemical 68
reactions and transformations during the polar sunrise (Kawamura et al., 1996). Arctic 69
atmosphere is influenced by marine-derived OAs from the Arctic Ocean as well as 70
continentally derived OAs and their precursors from mid-latitudes in Eurasia or North 71
America (Stohl et al., 2006; Law and Stohl, 2007). Previous analyses have reported a 72
substantial contribution of summertime boreal forest fires to the chemical composition of 73
aerosol over the Arctic (Iziomon et al., 2006; Kaplan and New, 2006). Kim et al. (2005) 74
proposed that black carbon is rapidly transported over the Arctic Ocean from central Alaska. 75
It is therefore needed to better understand the chemical compositions and sources of OAs in 76
the Arctic because climate change is generally proceeding fastest in the high latitudes 77
(Serreze et al., 2000; Hinzman et al., 2005). 78
We have collected PM2.5 samples during the summer of 2009 at Fairbanks in central 79
Alaska. The samples were analyzed for several organic tracer compounds to characterize OAs 80
in the North American subarctic region. This paper discusses the molecular compositions of 81
various organic compound classes and the factors controlling temporal changes in their 82
concentrations in central Alaska. We also discuss the sources of organic compounds detected 83
and the secondary formation processes as well as atmospheric implications for the burden of 84
OAs in the arctic and subarctic atmosphere. 85
2 Methodology 86
2.1 Description of sampling area 87
Alaska is located in a subarctic zone. Fairbanks is the largest city in central Alaska. It is 88
situated in the central Tanana Valley connecting the Chena River near the Tanana River. The 89
location of the sampling site in Fairbanks (64.51°N and 147.51°W) and its surroundings are 90
shown in Figure 1. The altitude of the sampling location is 136 m above sea level. A total area 91
of Fairbanks is nearly 85 km2 with a population of 31,500. The sampling site is located at the 92
downside of Fairbanks where a forest is very close to the campus of the University of Alaska 93
Fairbanks. The highest levels of atmospheric aerosol burden in the United States have been 94
recorded in Fairbanks (Ward et al., 2012). The National Emission Inventory database pointed 95
out that forest fires and combustion of fossil fuels are the two critical sources of air pollution 96
in Fairbanks (Shakya and Peltier, 2013; Ware et al., 2013). 97
2.2 Sample collection 98
Atmos. Chem. Phys. Discuss., https://doi.org/10.5194/acp-2019-293Manuscript under review for journal Atmos. Chem. Phys.Discussion started: 21 May 2019c© Author(s) 2019. CC BY 4.0 License.
5
Atmospheric particle samples of sizes less than 2.5 µm in diameter (PM2.5) were collected on 99
the rooftop of the International Arctic Research Center building of the University of Alaska 100
Fairbanks during the summer season from June 5 to September 21 in 2009 when a forest fire 101
was active in the region. The collection of samples was performed using a low-volume air 102
sampler model URG-2000-39EH (USA) with a flow rate of 16.7 L min-1. PM2.5 particles were 103
retained on a quartz fiber filter of 47 mm in diameter that was pre-combusted at 450 °C for 6 104
hours. The sampler was operated for three to several days to get enough aerosol particles on 105
the filter to detect trace organic species with very low concentrations. We collected 13 106
samples (Alaska 01 to 13) during the campaign. The samples and field blank filters were 107
individually placed in a pre-heated glass vial with a Teflon-lined screw cap. We stored the 108
aerosol samples in a dark room at -20 °C to prevent the samples from microbial degradation 109
and loss of semivolatile organic compounds. 110
2.3 Analysis of organic tracers 111
We analyzed the samples for organic compounds using a gas chromatograph-mass 112
spectrometer (GC-MS) system: Hewlett-Packard (HP) model 6890 GC coupled to HP model 113
5973 mass-selective detector. A 5.0 cm2 filter area of each aerosol sample was extracted with 114
a 10 ml dichloromethane (CH2Cl2) and methanol (CH3OH) mixture (2:1) through 115
ultrasonication (10 min × 3). The solvent extracts were filtered through a Pasteur pipet packed 116
with pre-combusted (450 °C for 6 hours) quartz wool to remove particles and filter debris. 117
The extracts were concentrated by a rotary evaporator and then dried under a stream of pure 118
nitrogen gas. The hydroxyl (OH) and carboxyl (COOH) groups of organic compounds in the 119
extracts were derivatized to trimethylsilyl ethers and esters, respectively, by the reaction with 120
50 µl N,O-bis(trimethylsilyl)trifluoroacetamide including 1% trimethylsilyl chloride and 10 121
µl pyridine at 70 °C for 3 hours (Schauer et al., 1996; Simoneit et al., 2004a). n-Hexane 122
containing 1.43 ng µl-1 of a C13 n-alkane internal standard (40 µl) was added into the 123
derivatives before injection of the sample into a GC-MS. 124
The separation of compounds was performed on a 30 m long DB-5MS fused silica 125
capillary column (0.25 mm inner diameter and 0.25 µm film thickness). Helium was used as a 126
carrier gas at a flow rate of 1.0 ml min-1. The GC oven temperature was programmed from 50 127
°C for 2 min to 120 °C at 30 °C min-1 and then 300 °C at 6 °C min-1 with a final isotherm hold 128
at 300 °C for 16 min. The sample was injected on a splitless mode with the injector 129
temperature of 280 °C. The mass detection was conducted at 70 eV on an electron ionization 130
mode with a scan range of 50 to 650 Daltons. The organic compounds were determined by the 131
Atmos. Chem. Phys. Discuss., https://doi.org/10.5194/acp-2019-293Manuscript under review for journal Atmos. Chem. Phys.Discussion started: 21 May 2019c© Author(s) 2019. CC BY 4.0 License.
6
comparison of the GC retention times and mass fragmentation patterns of a sample with those 132
of authentic standards and National Institute of Standards and Technology library data. The 133
mass spectral data were acquired and processed using HP Chemstation software. GC-MS 134
relative response factor of each compound was calculated using authentic standards or 135
surrogate compounds. The recoveries of authentic standards or surrogates were above 80% 136
for target compounds. The relative standard deviation of the measurements based on duplicate 137
analyses was within 10%. The field blank filters were analyzed by the procedure described 138
above. The target compounds were not detected in the blank filters. 139
2.4 Meteorology and air mass trajectories 140
Figure 2 shows temporal changes of daily average meteorological parameters at the campaign 141
site. The daily mean temperature was in a range of 2.0 to 33 °C with an average of 13.9 °C 142
whereas the daily average relative humidity ranged from 19 to 99 % with a mean of 63 %. 143
The mean wind speed was 5.2 km h-1 and the total rainfall was 122 mm during the sampling 144
period. The 5-days air mass backward trajectories at the height of 500 m above the ground 145
level were computed from Hybrid Single Particle Lagrangian Integrated Trajectory model 146
(Draxler and Rolph, 2013). The air mass backward trajectories arriving over the observation 147
site during the collection of aerosol samples is presented in Figure 3. 148
3 Results and discussion 149
3.1 Overview of the molecular composition of organic aerosols 150
A total of 96 organic compounds were detected in PM2.5 samples collected at Fairbanks 151
during the sampling period. We grouped them into fourteen compound classes as listed in 152
Table 1 together with the mean concentrations and ranges. Figure 4 shows the chemical 153
compositions of OAs in individual samples (Alaska 01 to 13). The levels of all the quantified 154
organic compounds in Alaskan samples ranged from 113 to 1664 (ave. 535 ng m-3) with the 155
predominance of anhydrosugars (ave. 186 ng m-3) and n-alkanoic acids (ave. 185 ng m-3). 156
Anhydrosugars are produced by pyrolysis of cellulose and hemicellulose followed by the 157
subsequent emission to the atmosphere and are widely used as specific tracers of biomass 158
burning (BB) (Simoneit et al., 1999; Sang et al., 2013). n-Alkanoic acids are derived directly 159
from the surface of plant leaves and marine phytoplankton as well as BB and meat cooking 160
(Kawamura and Gagosian, 1987; Rogge et al., 1993; Fine e al., 2001). Sugar alcohols were 161
detected in ample amount in three samples collected during the end of the campaign. We also 162
Atmos. Chem. Phys. Discuss., https://doi.org/10.5194/acp-2019-293Manuscript under review for journal Atmos. Chem. Phys.Discussion started: 21 May 2019c© Author(s) 2019. CC BY 4.0 License.
7
detected a substantial amount of isoprene-derived SOA tracers and n-alkanols in Alaskan 163
samples while the concentrations of other compound classes are relatively low. 164
3.2 Anhydrosugars and lignin and resin products: tracers of biomass burning 165
The combustion of biopolymers including cellulose and hemicellulose as well as lignin and 166
suberin produces several organic molecules that have been recognized as important source 167
tracers of OAs. Anhydrosugars and lignin and resin acids are specific tracers of BB among 168
the pyrolysis products of biopolymers (Simoneit et al., 1999). The pyrolysis of cellulose and 169
hemicellulose produces anhydrosugars such as levoglucosan and its isomers mannosan and 170
galactosan (Simoneit et al., 1999; Engling et al., 2009). Figure 5a presents molecular 171
distributions of anhydrosugars in Alaskan PM2.5 samples. Levoglucosan is the dominant 172
anhydrosugar followed by mannosan and galactosan in Alaskan samples. Their concentrations 173
ranged from 23 to 463 ng m-3 (ave. 125 ng m-3), 4.1 to 180 ng m-3 (ave. 36 ng m-3) and 3.5 to 174
106 ng m-3 (ave. 26 ng m-3), respectively. 175
Because 90% of levoglucosan exist in the atmospheric particles with aerodynamic 176
diameter less than 2 µm (Giannoni et al., 2012), it is reasonable to compare the levoglucosan 177
concentrations of Alaskan PM2.5 samples with those reported in PM10 and TSP during 178
summer or BB season. We found that the concentration levels of levoglucosan in central 179
Alaska are substantially higher than those from the Bering Sea (10 ng m-3) and Arctic Ocean 180
(5.2 ng m-3) (Hu et al., 2013), Chichijima (0.24 ng m-3) and Okinawa (0.57 ng m-3) Islands in 181
the western North Pacific (Verma et al., 2015; Zhu et al., 2015), Northern Japan (7.8 ng m-3) 182
(Agarwal et al., 2010), Mt. Everest (47.2 ng m-3) (Cong et al., 2015). They are comparable to 183
those reported at urban site Chennai in India (ave. 111 ng m-3) (Fu et al., 2010) but lower than 184
those reported at rural site Lumbini in Nepal (ave. 771 ng m-3) (Wan et al., 2017) and forest 185
site Rondonia in Brazil (ave. 1180 ng m-3) (Graham et al., 2002). 186
The emission strength of BB products and their long-range atmospheric transport 187
influence the atmospheric levels of anhydrosugars. The backward trajectories reveal that air 188
masses mostly came from the ocean during the campaign (Fig. 3). This result shows that 189
anhydrosugars present in the Alaskan aerosols were mainly associated with the local and 190
regional BB during the campaign. The higher level of levoglucosan in Fairbanks than other 191
sites in the Arctic implies a possible effect of BB on the air quality and climate in the arctic 192
region. Stocks et al. (2000) and Grell et al. (2011) proposed that the frequency of boreal forest 193
fires recently increased in summer due to global warming. Figure 6a-c show the temporal 194
trends of anhydrosugars in the Alaskan aerosols. The levels of anhydrosugars expressively 195
alter during the campaign period. The lower levoglucosan levels were found at the beginning 196
Atmos. Chem. Phys. Discuss., https://doi.org/10.5194/acp-2019-293Manuscript under review for journal Atmos. Chem. Phys.Discussion started: 21 May 2019c© Author(s) 2019. CC BY 4.0 License.
8
of the campaign whereas they became very high (241 to 463 ng m-3) in 4-23 July (Fig. 6a). 197
Another peak of levoglucosan was found in 30 July to 4 August (169 ng m-3). The 198
concentrations of levoglucosan decreased towards the end of the campaign (23 to 50 ng m-3). 199
Forest fires smokes were seen during 4-23 July and 30 July to 4 August over central Alaska. 200
This observation demonstrates that levoglucosan levels became high due to the local forest 201
fire in central Alaska. Mannosan and galactosan presented similar temporal variations with 202
levoglucosan (Fig. 6b and c). The low concentrations of anhydrosugars during the beginning 203
and end of the campaign might be caused by the decreased emission rate of BB tracers due to 204
lower BB activities in the source region. We observed rainfall especially in 5 June to 3 July 205
and 6 August to 17 September in Fairbanks (Fig. 2). A wet deposition may another cause to 206
lower the level of anhydrosugars in aerosol samples. Although the concentrations of 207
mannosan and galactosan are much lower than levoglucosan (Fig. 5a), we observed strong 208
positive correlations (r = 0.94-0.97) among these tracers (Table 2). This result indicates that 209
they might have originated from similar types of biomass via the burning in central Alaska. 210
Levoglucosan (L) is largely produced by thermal decomposition of cellulose while 211
mannosan (M) is mainly a pyrolysis product of hemicellulose (Simoneit et al., 1999). Klemm 212
et al. (2005) investigated that hardwood contains almost 55 to 65 % of cellulose and 20 to 30 213
% of hemicellulose. Accordingly, higher L/M ratios reveal hardwood burning whereas lower 214
ratios are characteristics of softwood burning (Schmidl et al., 2008; Engling et al., 2009). It is 215
worth to use the L/M ratio to identify the relative contribution of biomass types: hardwood vs. 216
softwood in central Alaska. L/M ratios in Alaskan samples ranged from 2.2 to 6.8 (ave. 4.6), 217
which is similar to those of softwood burning (3 to 5) but much lower than those found for 218
hardwood burning (10 to 15) (Schmidl et al., 2008; Engling et al., 2009) as well as burning of 219
rice (41.6), cereal (55.7) and wheat straw (40 to 60) (Sheesley et al., 2003; Zhang et al., 2007; 220
Fu et al., 2008; Thepnuan et al., 2019). These results imply that softwood is more likely 221
biomass burned in central Alaska. 222
Burning of lignin produces phenolic compounds such as 4-hydroxybenzoic (4-HBA), 223
vanillic and syringic acids whereas dehydroabietic acid (DHAA) is a specific pyrolysis 224
product of resin present in the bark surface and needle leaves and woody tissues of conifers 225
(Simoneit et al., 1993). We detected 4-HBA and DHAA in the Alaskan aerosols although 226
their concentrations were much lower than BB tracers produced from cellulose and 227
hemicellulose burning (Fig. 5). The concentrations of 4-HBA and vanillic acid ranged from 228
0.4 to 6.4 ng m-3 (ave. 1.7 ng m-3) and 0.1 to 8.6 (ave. 1.8 ng m-3), respectively whereas those 229
of syringic acid ranged from 0.02 to 1.1 ng m-3 (ave. 0.2 ng m-3). Shakya et al. (2011) and 230
Atmos. Chem. Phys. Discuss., https://doi.org/10.5194/acp-2019-293Manuscript under review for journal Atmos. Chem. Phys.Discussion started: 21 May 2019c© Author(s) 2019. CC BY 4.0 License.
9
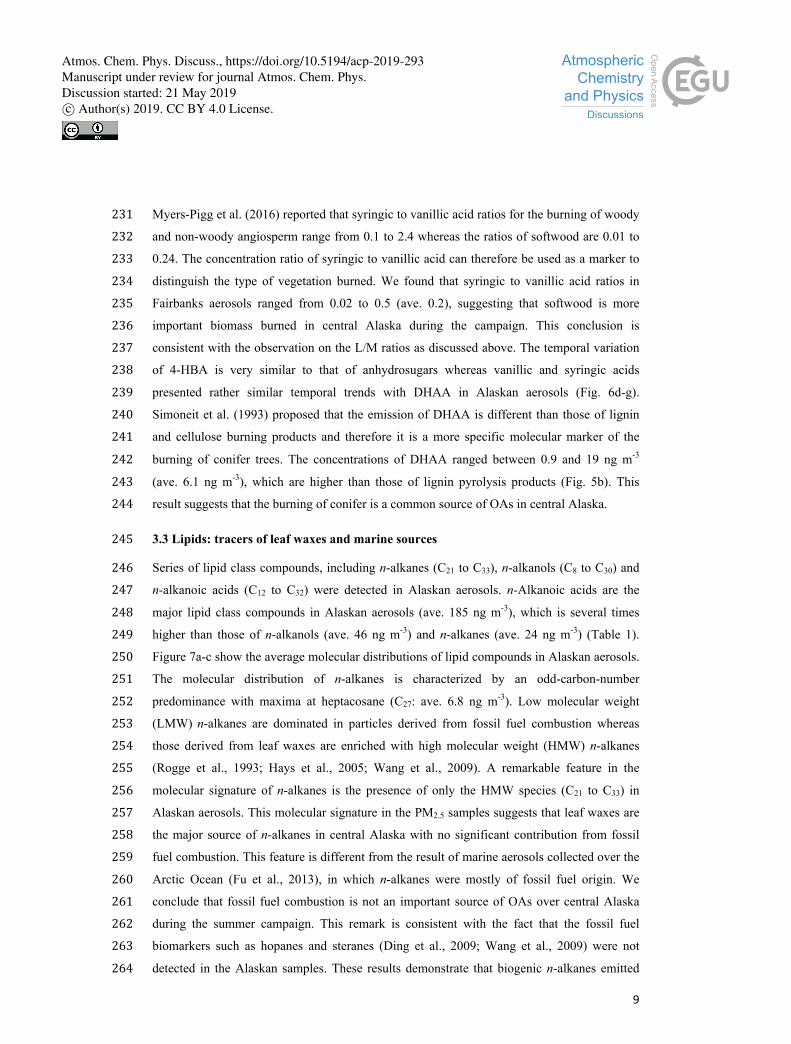
Myers-Pigg et al. (2016) reported that syringic to vanillic acid ratios for the burning of woody 231
and non-woody angiosperm range from 0.1 to 2.4 whereas the ratios of softwood are 0.01 to 232
0.24. The concentration ratio of syringic to vanillic acid can therefore be used as a marker to 233
distinguish the type of vegetation burned. We found that syringic to vanillic acid ratios in 234
Fairbanks aerosols ranged from 0.02 to 0.5 (ave. 0.2), suggesting that softwood is more 235
important biomass burned in central Alaska during the campaign. This conclusion is 236
consistent with the observation on the L/M ratios as discussed above. The temporal variation 237
of 4-HBA is very similar to that of anhydrosugars whereas vanillic and syringic acids 238
presented rather similar temporal trends with DHAA in Alaskan aerosols (Fig. 6d-g). 239
Simoneit et al. (1993) proposed that the emission of DHAA is different than those of lignin 240
and cellulose burning products and therefore it is a more specific molecular marker of the 241
burning of conifer trees. The concentrations of DHAA ranged between 0.9 and 19 ng m-3 242
(ave. 6.1 ng m-3), which are higher than those of lignin pyrolysis products (Fig. 5b). This 243
result suggests that the burning of conifer is a common source of OAs in central Alaska. 244
3.3 Lipids: tracers of leaf waxes and marine sources 245
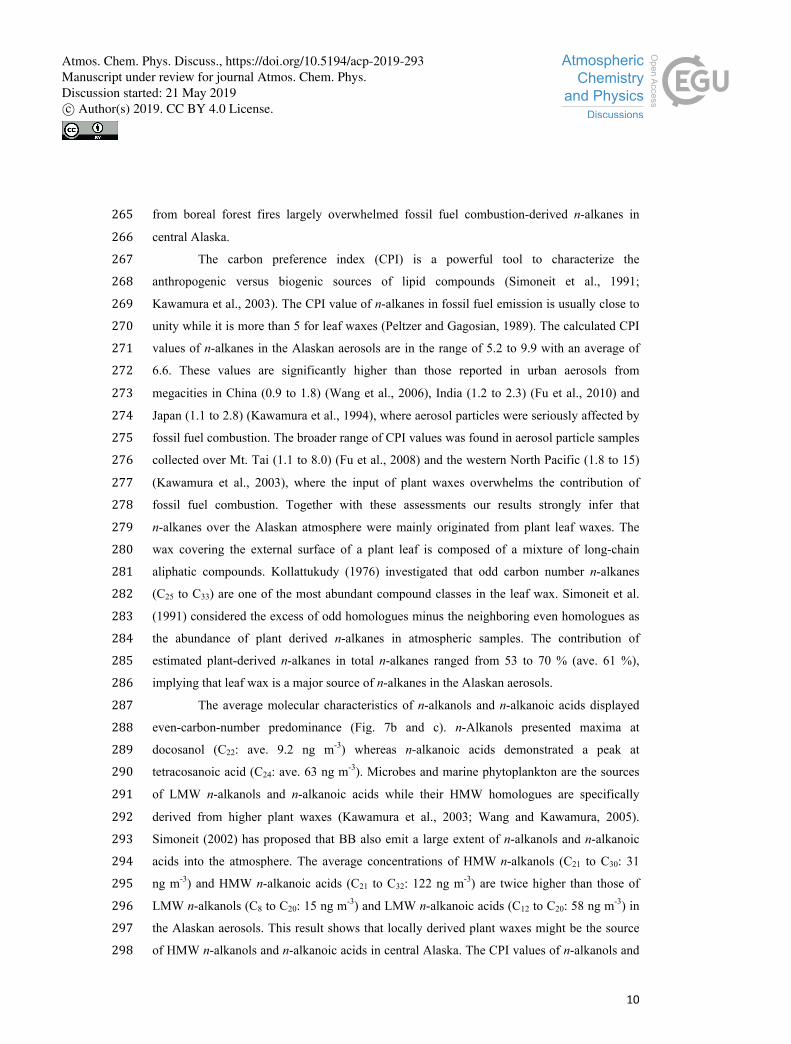
Series of lipid class compounds, including n-alkanes (C21 to C33), n-alkanols (C8 to C30) and 246
n-alkanoic acids (C12 to C32) were detected in Alaskan aerosols. n-Alkanoic acids are the 247
major lipid class compounds in Alaskan aerosols (ave. 185 ng m-3), which is several times 248
higher than those of n-alkanols (ave. 46 ng m-3) and n-alkanes (ave. 24 ng m-3) (Table 1). 249
Figure 7a-c show the average molecular distributions of lipid compounds in Alaskan aerosols. 250
The molecular distribution of n-alkanes is characterized by an odd-carbon-number 251
predominance with maxima at heptacosane (C27: ave. 6.8 ng m-3). Low molecular weight 252
(LMW) n-alkanes are dominated in particles derived from fossil fuel combustion whereas 253
those derived from leaf waxes are enriched with high molecular weight (HMW) n-alkanes 254
(Rogge et al., 1993; Hays et al., 2005; Wang et al., 2009). A remarkable feature in the 255
molecular signature of n-alkanes is the presence of only the HMW species (C21 to C33) in 256
Alaskan aerosols. This molecular signature in the PM2.5 samples suggests that leaf waxes are 257
the major source of n-alkanes in central Alaska with no significant contribution from fossil 258
fuel combustion. This feature is different from the result of marine aerosols collected over the 259
Arctic Ocean (Fu et al., 2013), in which n-alkanes were mostly of fossil fuel origin. We 260
conclude that fossil fuel combustion is not an important source of OAs over central Alaska 261
during the summer campaign. This remark is consistent with the fact that the fossil fuel 262
biomarkers such as hopanes and steranes (Ding et al., 2009; Wang et al., 2009) were not 263
detected in the Alaskan samples. These results demonstrate that biogenic n-alkanes emitted 264
Atmos. Chem. Phys. Discuss., https://doi.org/10.5194/acp-2019-293Manuscript under review for journal Atmos. Chem. Phys.Discussion started: 21 May 2019c© Author(s) 2019. CC BY 4.0 License.
10
from boreal forest fires largely overwhelmed fossil fuel combustion-derived n-alkanes in 265
central Alaska. 266
The carbon preference index (CPI) is a powerful tool to characterize the 267
anthropogenic versus biogenic sources of lipid compounds (Simoneit et al., 1991; 268
Kawamura et al., 2003). The CPI value of n-alkanes in fossil fuel emission is usually close to 269
unity while it is more than 5 for leaf waxes (Peltzer and Gagosian, 1989). The calculated CPI 270
values of n-alkanes in the Alaskan aerosols are in the range of 5.2 to 9.9 with an average of 271
6.6. These values are significantly higher than those reported in urban aerosols from 272
megacities in China (0.9 to 1.8) (Wang et al., 2006), India (1.2 to 2.3) (Fu et al., 2010) and 273
Japan (1.1 to 2.8) (Kawamura et al., 1994), where aerosol particles were seriously affected by 274
fossil fuel combustion. The broader range of CPI values was found in aerosol particle samples 275
collected over Mt. Tai (1.1 to 8.0) (Fu et al., 2008) and the western North Pacific (1.8 to 15) 276
(Kawamura et al., 2003), where the input of plant waxes overwhelms the contribution of 277
fossil fuel combustion. Together with these assessments our results strongly infer that 278
n-alkanes over the Alaskan atmosphere were mainly originated from plant leaf waxes. The 279
wax covering the external surface of a plant leaf is composed of a mixture of long-chain 280
aliphatic compounds. Kollattukudy (1976) investigated that odd carbon number n-alkanes 281
(C25 to C33) are one of the most abundant compound classes in the leaf wax. Simoneit et al. 282
(1991) considered the excess of odd homologues minus the neighboring even homologues as 283
the abundance of plant derived n-alkanes in atmospheric samples. The contribution of 284
estimated plant-derived n-alkanes in total n-alkanes ranged from 53 to 70 % (ave. 61 %), 285
implying that leaf wax is a major source of n-alkanes in the Alaskan aerosols. 286
The average molecular characteristics of n-alkanols and n-alkanoic acids displayed 287
even-carbon-number predominance (Fig. 7b and c). n-Alkanols presented maxima at 288
docosanol (C22: ave. 9.2 ng m-3) whereas n-alkanoic acids demonstrated a peak at 289
tetracosanoic acid (C24: ave. 63 ng m-3). Microbes and marine phytoplankton are the sources 290
of LMW n-alkanols and n-alkanoic acids while their HMW homologues are specifically 291
derived from higher plant waxes (Kawamura et al., 2003; Wang and Kawamura, 2005). 292
Simoneit (2002) has proposed that BB also emit a large extent of n-alkanols and n-alkanoic 293
acids into the atmosphere. The average concentrations of HMW n-alkanols (C21 to C30: 31 294
ng m-3) and HMW n-alkanoic acids (C21 to C32: 122 ng m-3) are twice higher than those of 295
LMW n-alkanols (C8 to C20: 15 ng m-3) and LMW n-alkanoic acids (C12 to C20: 58 ng m-3) in 296
the Alaskan aerosols. This result shows that locally derived plant waxes might be the source 297
of HMW n-alkanols and n-alkanoic acids in central Alaska. The CPI values of n-alkanols and 298
Atmos. Chem. Phys. Discuss., https://doi.org/10.5194/acp-2019-293Manuscript under review for journal Atmos. Chem. Phys.Discussion started: 21 May 2019c© Author(s) 2019. CC BY 4.0 License.
11
n-alkanoic acids are in the range of 3.0 to 10 (ave. 6.2) and 5.6 to 9.8 (ave. 7.9), respectively, 299
suggesting a large contribution of plant waxes to lipid class compounds in central Alaskan 300
aerosols. 301
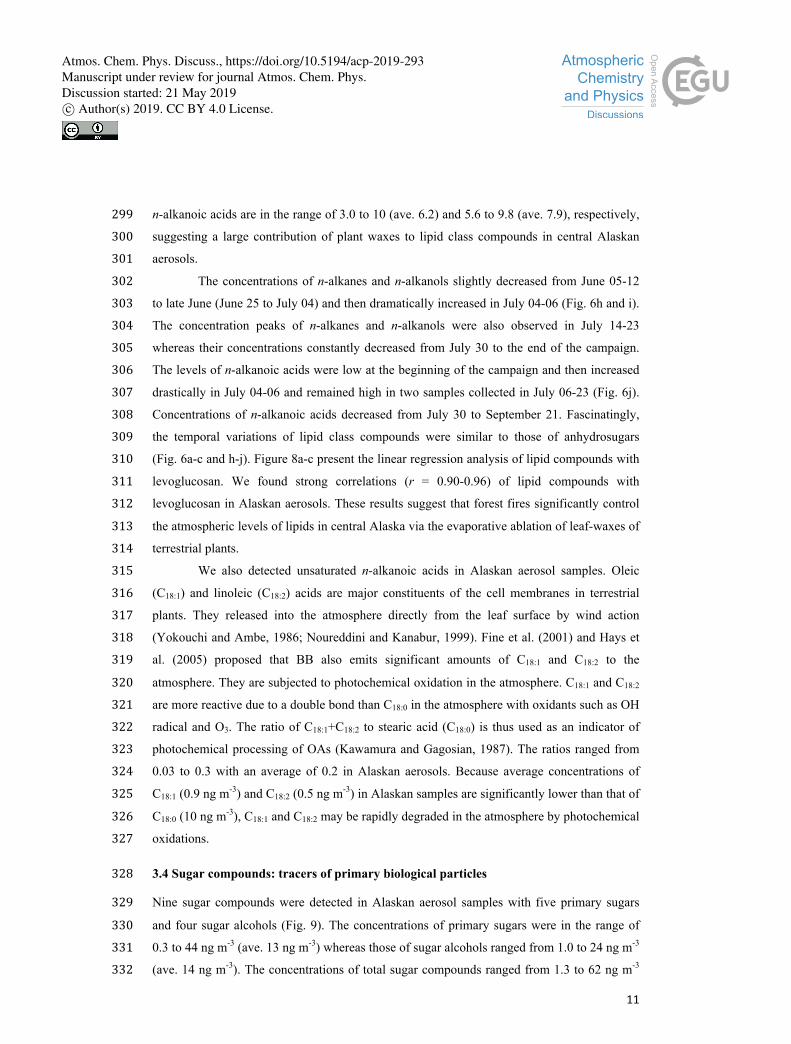
The concentrations of n-alkanes and n-alkanols slightly decreased from June 05-12 302
to late June (June 25 to July 04) and then dramatically increased in July 04-06 (Fig. 6h and i). 303
The concentration peaks of n-alkanes and n-alkanols were also observed in July 14-23 304
whereas their concentrations constantly decreased from July 30 to the end of the campaign. 305
The levels of n-alkanoic acids were low at the beginning of the campaign and then increased 306
drastically in July 04-06 and remained high in two samples collected in July 06-23 (Fig. 6j). 307
Concentrations of n-alkanoic acids decreased from July 30 to September 21. Fascinatingly, 308
the temporal variations of lipid class compounds were similar to those of anhydrosugars 309
(Fig. 6a-c and h-j). Figure 8a-c present the linear regression analysis of lipid compounds with 310
levoglucosan. We found strong correlations (r = 0.90-0.96) of lipid compounds with 311
levoglucosan in Alaskan aerosols. These results suggest that forest fires significantly control 312
the atmospheric levels of lipids in central Alaska via the evaporative ablation of leaf-waxes of 313
terrestrial plants. 314
We also detected unsaturated n-alkanoic acids in Alaskan aerosol samples. Oleic 315
(C18:1) and linoleic (C18:2) acids are major constituents of the cell membranes in terrestrial 316
plants. They released into the atmosphere directly from the leaf surface by wind action 317
(Yokouchi and Ambe, 1986; Noureddini and Kanabur, 1999). Fine et al. (2001) and Hays et 318
al. (2005) proposed that BB also emits significant amounts of C18:1 and C18:2 to the 319
atmosphere. They are subjected to photochemical oxidation in the atmosphere. C18:1 and C18:2 320
are more reactive due to a double bond than C18:0 in the atmosphere with oxidants such as OH 321
radical and O3. The ratio of C18:1+C18:2 to stearic acid (C18:0) is thus used as an indicator of 322
photochemical processing of OAs (Kawamura and Gagosian, 1987). The ratios ranged from 323
0.03 to 0.3 with an average of 0.2 in Alaskan aerosols. Because average concentrations of 324
C18:1 (0.9 ng m-3) and C18:2 (0.5 ng m-3) in Alaskan samples are significantly lower than that of 325
C18:0 (10 ng m-3), C18:1 and C18:2 may be rapidly degraded in the atmosphere by photochemical 326
oxidations. 327
3.4 Sugar compounds: tracers of primary biological particles 328
Nine sugar compounds were detected in Alaskan aerosol samples with five primary sugars 329
and four sugar alcohols (Fig. 9). The concentrations of primary sugars were in the range of 330
0.3 to 44 ng m-3 (ave. 13 ng m-3) whereas those of sugar alcohols ranged from 1.0 to 24 ng m-3 331
(ave. 14 ng m-3). The concentrations of total sugar compounds ranged from 1.3 to 62 ng m-3 332
Atmos. Chem. Phys. Discuss., https://doi.org/10.5194/acp-2019-293Manuscript under review for journal Atmos. Chem. Phys.Discussion started: 21 May 2019c© Author(s) 2019. CC BY 4.0 License.
12
(27 ng m-3), in which sugar alcohols comprised more fractions of total sugars (ave. 54.2 %) 333
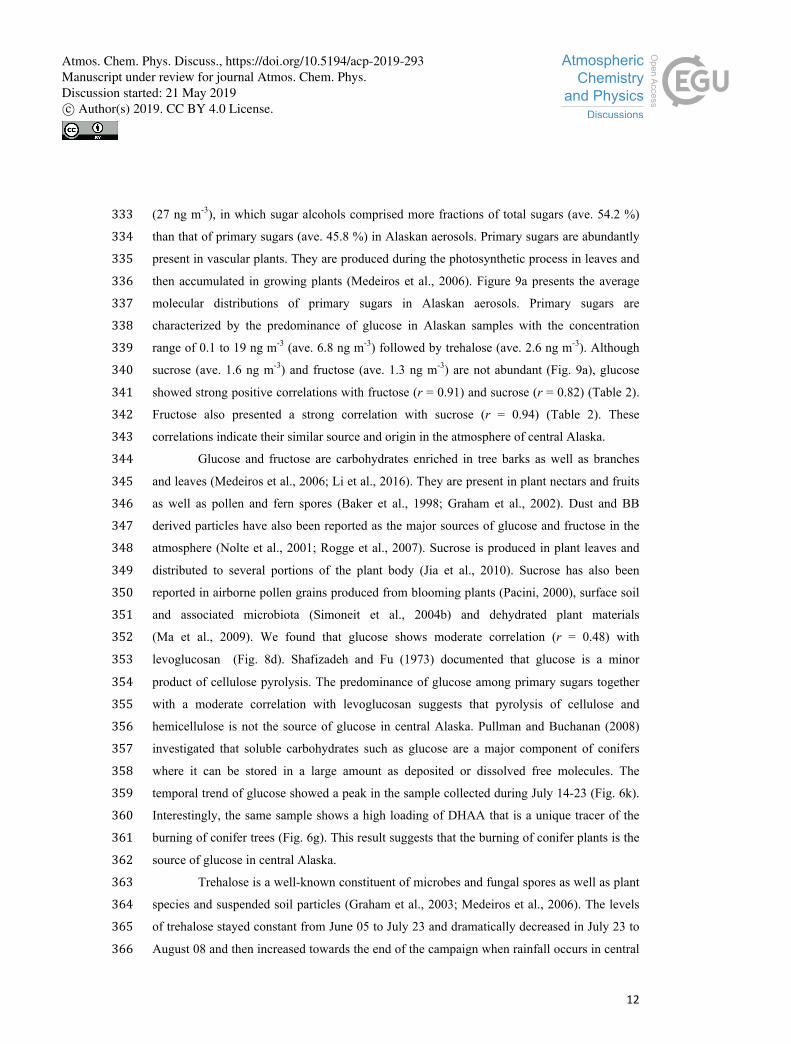
than that of primary sugars (ave. 45.8 %) in Alaskan aerosols. Primary sugars are abundantly 334
present in vascular plants. They are produced during the photosynthetic process in leaves and 335
then accumulated in growing plants (Medeiros et al., 2006). Figure 9a presents the average 336
molecular distributions of primary sugars in Alaskan aerosols. Primary sugars are 337
characterized by the predominance of glucose in Alaskan samples with the concentration 338
range of 0.1 to 19 ng m-3 (ave. 6.8 ng m-3) followed by trehalose (ave. 2.6 ng m-3). Although 339
sucrose (ave. 1.6 ng m-3) and fructose (ave. 1.3 ng m-3) are not abundant (Fig. 9a), glucose 340
showed strong positive correlations with fructose (r = 0.91) and sucrose (r = 0.82) (Table 2). 341
Fructose also presented a strong correlation with sucrose (r = 0.94) (Table 2). These 342
correlations indicate their similar source and origin in the atmosphere of central Alaska. 343
Glucose and fructose are carbohydrates enriched in tree barks as well as branches 344
and leaves (Medeiros et al., 2006; Li et al., 2016). They are present in plant nectars and fruits 345
as well as pollen and fern spores (Baker et al., 1998; Graham et al., 2002). Dust and BB 346
derived particles have also been reported as the major sources of glucose and fructose in the 347
atmosphere (Nolte et al., 2001; Rogge et al., 2007). Sucrose is produced in plant leaves and 348
distributed to several portions of the plant body (Jia et al., 2010). Sucrose has also been 349
reported in airborne pollen grains produced from blooming plants (Pacini, 2000), surface soil 350
and associated microbiota (Simoneit et al., 2004b) and dehydrated plant materials 351
(Ma et al., 2009). We found that glucose shows moderate correlation (r = 0.48) with 352
levoglucosan (Fig. 8d). Shafizadeh and Fu (1973) documented that glucose is a minor 353
product of cellulose pyrolysis. The predominance of glucose among primary sugars together 354
with a moderate correlation with levoglucosan suggests that pyrolysis of cellulose and 355
hemicellulose is not the source of glucose in central Alaska. Pullman and Buchanan (2008) 356
investigated that soluble carbohydrates such as glucose are a major component of conifers 357
where it can be stored in a large amount as deposited or dissolved free molecules. The 358
temporal trend of glucose showed a peak in the sample collected during July 14-23 (Fig. 6k). 359
Interestingly, the same sample shows a high loading of DHAA that is a unique tracer of the 360
burning of conifer trees (Fig. 6g). This result suggests that the burning of conifer plants is the 361
source of glucose in central Alaska. 362
Trehalose is a well-known constituent of microbes and fungal spores as well as plant 363
species and suspended soil particles (Graham et al., 2003; Medeiros et al., 2006). The levels 364
of trehalose stayed constant from June 05 to July 23 and dramatically decreased in July 23 to 365
August 08 and then increased towards the end of the campaign when rainfall occurs in central 366
Atmos. Chem. Phys. Discuss., https://doi.org/10.5194/acp-2019-293Manuscript under review for journal Atmos. Chem. Phys.Discussion started: 21 May 2019c© Author(s) 2019. CC BY 4.0 License.
13
Alaska (Fig. 2 and Fig. 6m). This result shows that the major source of trehalose might be the 367
fungi in the surface soil of central Alaska that was emitted after the rainfall event. Terrestrial 368
plants and marine phytoplankton as well as soil dust particles and associated microorganisms 369
release xylose into the atmosphere (Cowie and Hedges, 1984). Although xylose is a minor 370
primary sugar in Alaskan aerosols (ave. 1.1 ng m-3), its temporal trend is very similar to that 371
of anhydrosugars (Fig. 6a-c and n). This result together with a strong positive correlation of 372
xylose with levoglucosan (r = 0.92) implies its BB origin in central Alaska (Fig. 8g). This 373
implication is similar to that of Sullivan et al. (2011), who documented that atmospheric 374
levels of xylose in the Midwestern United States were attributed to BB emission. 375
Sugar alcohols presented the predominance of arabitol (ave. 6.6 ng m-3) and mannitol 376
(ave. 6.2 ng m-3) (Fig. 9b). The concentration levels of erythritol (ave. 1.0 ng m-3) and inositol 377
(ave. 0.3 ng m-3) are much lower than those of arabitol and mannitol in Alaskan aerosols. 378
Arabitol and mannitol concentrations were high during the beginning and end of the 379
campaign than those during the middle of the campaign (Fig. 6o and p). We found that 380
arabitol and mannitol are strongly correlated (r = 0.95), implying their similar source in the 381
Alaskan aerosols (Table 2). The major sources of arabitol and mannitol are airborne fungal 382
spores (Pashynska et al., 2002; Bauer et al., 2008). Debris from mature leaves has also been 383
proposed as a source of arabitol and mannitol in the forest areas (Pashynska et al., 2002; 384
Zhang et al., 2010). Guasco et al. (2013) and Prather et al. (2013) proposed that bubble 385
bursting of seawater contribute bacteria and dissolve organic species along with sea-salts to 386
aerosol particles. We presume a negligible input of marine sources to sugar alcohols in 387
Alaskan fine aerosol samples. Arabitol and mannitol were also detected in aerosol particles 388
derived from BB (Fu et al., 2012; Yang et al., 2012; Nirmalkar et al., 2015). We found 389
insignificant correlations of arabitol (r = 0.16) and mannitol (r = 0.27) with levoglucosan 390
(Fig. 8h and i). This result suggests that BB is not an important source of arabitol and 391
mannitol in the Alaskan aerosols. 392
The source of arabitol and mannitol might be fungi in the surface soil of Fairbanks 393
whose activities were high during the campaign. Elbert et al. (2007) suggested that the active 394
ejection of fungal spores demands water from the nearby atmosphere and release through 395
osmotic pressure and surface tension effects. As shown in Figure 2 and Figures 6o and 6p, 396
arabitol and mannitol concentrations in Alaskan samples are well connected with the rainfall 397
event. We found that the levels of arabitol and mannitol are high during and after the rainfall. 398
The rainfall increases the moisture contents in surface soil and thus fungal and microbial 399
activities are enhanced in central Alaska. This study implies that the precipitation stimulates 400
Atmos. Chem. Phys. Discuss., https://doi.org/10.5194/acp-2019-293Manuscript under review for journal Atmos. Chem. Phys.Discussion started: 21 May 2019c© Author(s) 2019. CC BY 4.0 License.
14
the release of fungal spores to increase the arabitol and mannitol levels in Alaskan samples. 401
Gottwald et al. (1997), and Burch and Levetin (2002) reported that passive discharge of 402
spores is enhanced under windy conditions. This consideration further implying that fungal 403
spores are actively ejected in the atmosphere of central Alaska. Our finding is consistent with 404
the result of Elbert et al. (2007) from Amazonia rainforest where the ambient fungal spores 405
were controlled by the active discharge. It is noteworthy that primary sugar trehalose 406
presented significant positive correlations with arabitol (r = 0.85) and mannitol (r = 0.74) 407
(Table 2), documenting that trehalose is also be produced from surface soil under wet 408
conditions in central Alaska. 409
3.5 Phthalate esters: tracers of plastic burning 410
Phthalates are widely used as a plasticizer in synthetic polymers and as a softener in 411
polyvinylchloride (Thuren and Larsson, 1990; Wang et al., 2006). They can be emitted into 412
the atmosphere by evaporation from polymers because they are not chemically bonded 413
(Staples et al., 1997). The compositions of phthalate esters are the subject of scientific 414
discussion and public concern due to their potential carcinogenic and endocrine disrupting 415
properties (Sidhu et al., 2005; Swan et al., 2005). We detected four phthalate esters in 416
Alaskan aerosols, including diethyl phthalate (DEP), dibutyl phthalate (DBP), diisobutyl 417
phthalate (DiBP) and diethylhexyl phthalate (DEHP). 418
The ambient concentrations of total phthalate esters ranged from 0.4 to 6.6 ng m-3 419
(ave. 1.7 ng m-3), which are slightly higher than those from the North Sea to the high Arctic 420
(0.4 to 1.0 ng m-3) (Xie et al., 2007), comparable to or slightly lower than those observed in 421
the North Pacific (0.72 to 4.48 ng m-3) (Atlas and Giam, 1981), Great Lakes (0.1 to 10 ng m-3) 422
(Eisenreich et al., 1981), Canadian High Arctic (0.28 to 11 ng m-3) (Fu et al., 2009), but much 423
lower than those reported in Sweden (0.5 to 127 ng m-3) (Thuren and Larsson, 1990), 424
mountainous aerosols (9.6 to 985 ng m-3) (Fu et al., 2008) and urban aerosols from megacities 425
in India and China (62 to 2200 ng m-3) (Wang et al., 2006; Fu et al., 2010). Figure 10a shows 426
the average molecular distributions of phthalate esters in Alaskan aerosols. We found DEP 427
(ave. 0.8 ng m-3) as a dominant phthalate followed by DBP and DEHP (ave. 0.4 ng m-3), 428
whereas DiBP was less abundant (ave. 0.2 ng m-3). The predominance of DEP among 429
phthalate esters in Alaskan aerosol is different than those found in marine aerosol from the 430
Arctic Ocean (Xie et al., 2007; Fu et al., 2013) and urban aerosols from India and China 431
(Wang et al., 2006; Fu et al., 2010), where DEHP was the dominant species. We found 432
similar temporal variations with significant positive correlations among detected phthalate 433
Atmos. Chem. Phys. Discuss., https://doi.org/10.5194/acp-2019-293Manuscript under review for journal Atmos. Chem. Phys.Discussion started: 21 May 2019c© Author(s) 2019. CC BY 4.0 License.
15
esters (r = 0.71-0.88) (Fig. 11a-d and Table 2), suggesting that they have similar sources in 434
central Alaska. 435
3.6 Tracers of biogenic SOA 436
Significant progress has been made in the last decade to better understand SOA formation 437
from BVOCs such as isoprene, monoterpenes and sesquiterpenes (Carlton et al., 2009; 438
Ding et al., 2014; Jathar et al., 2014; Sarkar et al., 2017). SOA is a crucial component of 439
the atmosphere that has an impact on the radiation budget directly by scattering sunlight and 440
indirectly by acting as CCN (Kanakidou et al., 2005; Carlton et al., 2009). Isoprene has 441
conjugated double bonds and thus it is more reactive towards oxidants such as O3 and NOx to 442
result in various intermediates and stable products via a series of oxidative reactions in the 443
atmosphere. We detected six organic compounds including 2-methylglyceric acid (2-MGA), 444
three C5-alkene triols and two 2-methyltetrols (2-MTLs) as isoprene-SOA tracers in the 445
Alaskan aerosols. Their total concentrations ranged from 2.0 to 142 ng m-3 (ave. 41 ng m-3), 446
which are significantly higher than those reported over the North Pacific (0.11 to 0.48 ng m-3) 447
(Fu et al., 2011), Canadian High Arctic (ave. 0.30 ng m-3) (Fu et al., 2009), North Pacific to 448
Arctic (ave. 0.62 ng m-3) (Ding et al., 2013), western North Pacific (0.05 to 7.22 ng m-3) 449
(Zhu et al., 2016), forest site in western Germany (ave. 20.5 ng m-3) (Kourtchev et al., 2008a), 450
and Mumbai in India (ave. 1.1 ng m-3) (Fu et al., 2016) but lower than those in Mt. Changbai 451
(22 to 280 ng m-3) (Wang et al., 2008) and Mt. Fuji (ave. 69 ng m-3) (Fu et al., 2014), 452
Research Triangle Park in USA (19.9 to 384 ng m-3) (Lewandowski et al., 2007) and several 453
sites in China (8.65 to 554 ng m-3) (Ding et al., 2014). 454
Molecular compositions of isoprene-SOA tracers are characterized by the 455
predominance of C5-alkene triols (ave. 20 ng m-3) and 2-MTLs (ave. 19 ng m-3) in Alaskan 456
aerosols (Fig. 12). Surratt et al. (2010) proposed that C5-alkene triols and 2-MTLs are higher 457
generation products from the photooxidation of epoxydiols of isoprene under low-NOx 458
conditions. C5-Alkene triols were strongly corrected with 2-MTLs (r = 0.97) in the Alaskan 459
aerosols (Table 2). The abundant co-presence of C5-alkene triols and 2-MTLs suggest their 460
similar sources and formation pathways in central Alaska. 2-Methylerythritol (ave. 13 ng m-3) 461
is twice more abundant than 2-methylthreitol (ave. 5.9 ng m-3), being similar to previous 462
studies (Ion et al., 2005; Cahill et al., 2006). The concentration of 2-MGA is significantly 463
lower (ave. 2.2 ng m-3) than C5-alkene triols and 2-MTLs (Fig. 12). Surratt et al. (2006) 464
suggested that 2-MGA is produced by the oxidation of methacrolein and methacrylic acid and 465
has been detected as an important gas-phase intermediate in the SOA formation from isoprene 466
under high-NOx conditions. Temporal variations of isoprene-SOA tracers were very similar to 467
Atmos. Chem. Phys. Discuss., https://doi.org/10.5194/acp-2019-293Manuscript under review for journal Atmos. Chem. Phys.Discussion started: 21 May 2019c© Author(s) 2019. CC BY 4.0 License.
16
each other in Alaskan aerosols (Fig. 11e-g). Their concentrations increased in the sample of 468
June 12-25 to July 06-14 and decreased in July 14-23 and July 23-30. They increased 469
significantly in July 30 to August 04 and quickly reduced in August 04-08 and then remain 470
comparable at the end of the campaign. 471
Four organic acids were identified as monoterpenes-SOA tracers in Alaskan 472
aerosols. They include 3-hydroxyglutaric acid (3-HGA), pinonic acid (PNA), pinic acid (PA) 473
and 3-methyl-1,2,3-butanetricarboxylic acid (3-MBTCA). Hallquist et al. (2009) suggested 474
that these acids are produced by the oxidation of pinenes through reactions with OH radical 475
and O3. Their total concentrations ranged from 1.0 to 36 ng m-3 (ave. 9.2 ng m-3), which are 476
higher than those reported in the North Pacific (0.02 to 0.22 ng m-3) (Fu et al., 2011), 477
Canadian High Arctic (ave. 1.6 ng m-3) (Fu et al., 2009), North Pacific to Arctic (ave. 0.05 478
ng m-3) (Ding et al., 2013), western North Pacific (0.04 to 10.8 ng m-3) (Zhu et al., 2016), and 479
comparable to those reported at several sites in China (3.09 to 33.8) (Ding et al., 2014) but 480
lower than those reported at Mt. Fuji in Japan (ave. 39 ng m-3) (Fu et al., 2014), forest site in 481
Germany (ave. 25.6 ng m-3) (Kourtchev et al., 2008a) and Finland (11.1 to 217 ng m-3) 482
(Kourtchev et al., 2008b). PA is most abundant (ave. 3.4 ng m-3) among monoterpene-SOA 483
tracers followed by PNA (ave. 2.3 ng m-3) (Fig. 12). The dominance of PA over PNA in 484
summertime can be explained by the much lower vapor pressure of PA than that of PNA. 485
However, this pattern is different from those found in summertime aerosols at the summit of 486
Mt. Tai in China (Fu et al., 2008) and other sites in Europe (Kavouras and Stephanou, 2002) 487
and North America (Cahill et al., 2006), in which PNA is more abundant than PA. 488
PA and PNA are the initial photooxidation products of monoterpenes that can further 489
photooxidized to 3-MBTCA in the atmosphere (Gomez-Gonzalez et al., 2012). The 490
concentration ratio (3-MBTCA to PA+PNA) can therefore be used to differentiate the fresh 491
and photochemically processed monoterpene-SOA tracers in the atmosphere. We found the 492
ratios to be 0.1 to 1.4 (ave. 0.5), demonstrating that monoterpene-SOA are mostly fresh in 493
central Alaska. The ratios of 3-HGA to 3-MBTCA are mostly lower when they are produced 494
from α-pinene as compared to β-pinene. Lewandowski et al. (2013) documented a major 495
contribution of α-pinene to monoterpene-SOA tracers based on the lower 3-HGA/3-MBTCA 496
ratio (ca. 1) in the southeastern United States than those observed in California (1.8 to 3.8). 497
Ding et al. (2014) also suggested α-pinene as the major precursor in China based on the low 498
ratios in Hefei (1.16) and Qianyanzhou (0.75). We found the ratios ranging from 0.5 to 2.0 in 499
Alaskan aerosols (ave. 1.0), indicating that α-pinene mainly contributes to monoterpene-SOA 500
tracers. 3-HGA and 3-MBTCA displayed somewhat similar temporal variations although the 501
Atmos. Chem. Phys. Discuss., https://doi.org/10.5194/acp-2019-293Manuscript under review for journal Atmos. Chem. Phys.Discussion started: 21 May 2019c© Author(s) 2019. CC BY 4.0 License.
17
patterns are different from PA and PNA (Fig. 11h-k), which showed very similar variations in 502
Alaskan aerosols. 503
Sesquiterpenes are BVOCs with high reactivity and relatively low vapor pressure 504
(Duhl et al., 2008). β-Caryophyllene is dominant sesquiterpene. The ozonolysis or 505
photooxidation of β-caryophyllene produces β-caryophyllinic acid in the atmosphere 506
(Jaoui et al., 2007). Concentrations of β-caryophyllinic acid in Alaskan aerosols ranged from 507
0.1 to 3.4 ng m-3 (ave. 0.9 ng m-3), which are higher than those from the Canadian High Arctic 508
(ave. 0.12 ng m-3) and Arctic Ocean (ave. 0.017 ng m-3) (Fu et al., 2009; Fu et al., 2013) but 509
lower than those reported in several sites in China (0.17 to 17.4 ng m-3) (Ding et al., 2014) 510
and Research Triangle Park in USA (5.9 to 25 ng m-3) (Lewandowski et al., 2007). The 511
temporal variation of β-caryophyllinic acid is very different than those of isoprene and 512
monoterpene-SOA tracers detected in Alaskan aerosols (Fig. 11l). Akagi et al. (2011) 513
reported that biogenic VOCs could also be emitted from biomass burning. Our result showed 514
a high level of β-caryophyllinic acid in the samples that were affected by BB in central 515
Alaska. Ciccioli et al. (2014) proposed that sesquiterpenes could be accumulated in leaves and 516
wood because of low volatility and then abundantly emitted upon heating. The temporal trend 517
variation of β-caryophyllinic acid is similar to those of anhydrosugars (Fig. 6a-c and 11l). 518
Interestingly, we found a strong correlation (r = 0.98) of β-caryophyllinic acid with 519
levoglucosan (Fig. 8j), again indicating that forest fire largely contributes to the formation of 520
β-caryophyllinic acid in central Alaska. 521
3.7 Aromatic and polyacids: tracers of SOA 522
We detected benzoic acid in the Alaskan aerosol with the concentration range of 0.1 to 0.9 523
(ave. 0.3 ng m-3). Benzoic acid is produced from several anthropogenic sources. It is a 524
primary pollutant in the automobile emission and smokes derived from burning of biomass 525
and biofuels (Rogge et al., 1993; Kawamura et al., 2000). It is also a secondary product of 526
photochemical degradation of toluene emitted from anthropogenic sources (Suh et al., 2003). 527
It can play an important role to enhance the new particle formation in the atmosphere 528
(Zhang et al., 2004). The temporal variation of benzoic acid is similar to anhydrosugars 529
detected in Alaskan samples (Fig. 6a-c and 11m). We also found a strong positive correlation 530
(r = 0.95) of benzoic acid with levoglucosan (Fig. 8k), demonstrating that BB is the source of 531
benzoic acid in central Alaska. 532
Polyacids are also the secondary photooxidation products of atmospheric organic 533
precursors (Wang et al., 2007; Fu et al., 2012). Concentrations of total polyacids ranged from 534
1.2 to 10 ng m-3 (ave. 3.3 ng m-3), among which glyceric acid (ave. 1.6 ng m-3) was dominant 535
Atmos. Chem. Phys. Discuss., https://doi.org/10.5194/acp-2019-293Manuscript under review for journal Atmos. Chem. Phys.Discussion started: 21 May 2019c© Author(s) 2019. CC BY 4.0 License.
18
(Fig. 13). Significant positive correlations were found among all polyacids (r = 0.67-0.87) in 536
Alaskan aerosols (Table 2). These results imply that polyacids may have similar sources or 537
formation pathways in central Alaska. We found that polyacids showed no significant 538
correlations with benzoic acid (r = 0.17-0.53), which is mostly of BB origin in Alaskan 539
samples as discussed above (Table 2). These correlations and different temporal trends of 540
benzoic acid and polyacids suggest that forest fires are not the main source of polyacids in the 541
Alaskan samples (Fig. 11m-p). This remark is further supported by the insignificant 542
correlations of polyacids with levoglucosan (r = 0.29-0.47) (Fig. 8l-n). Claeys et al. (2004) 543
suggested that SOA tracer such as tartaric acid is produced by the photochemical oxidation of 544
isoprene. Interestingly, significant positive correlations (r = 0.67-0.78) of polyacids were 545
found with total isoprene-SOA tracers detected in Alaskan samples (Table 2), suggesting that 546
they may be produced by photooxidation of isoprene in the Alaskan atmosphere. 547
4 Summary and conclusions 548
We identified 96 organic compounds in PM2.5 samples collected at Fairbanks in central 549
Alaska during the summer campaign in 2009. Concentrations of total organic compounds 550
ranged from 113 to 1664 (ave. 535 ng m-3). The most abundant compound classes in the 551
Alaskan aerosol are anhydrosugars (ave. 186 ng m-3) and n-alkanoic acids (ave. 185 ng m-3). 552
The temporal variations of anhydrosugars dramatically changed during the campaign, 553
showing peaks during BB events. The similar temporal trends of lipids and strong correlations 554
with levoglucosan demonstrated that local forest fires likely control the atmospheric levels of 555
OAs in central Alaska. The concentration ratios of levoglucosan to mannosan (2.2 to 6.8) and 556
syringic to vanillic acid (0.02 to 0.5) suggest that burning of softwood is common sources of 557
OAs. The higher levels of HMW n-alkanoic acids and n-alkanols than their LMW 558
homologues together with high CPI values of n-alkanes (5.2 to 9.9), n-alkanols (3.0 to 10) and 559
n-alkanoic acids (5.6 to 9.8) further suggest that they were emitted by the thermal ablation of 560
plant waxes during forest fire in central Alaska. 561
The temporal patterns of mannitol and arabitol suggested that the rainfall play an 562
important role to enhance their levels in central Alaska. The molecular compositions of 563
phthalate esters displayed that diethyl phthalate is commonly used plasticizer in central 564
Alaska. The molecular composition of biogenic SOA tracers with a predominance of 565
isoprene-SOA tracers (ave. 41 ng m-3) suggested that isoprene is a crucial precursor of SOA 566
over central Alaska. Our results provide valuable information to better understand the 567
compositions OAs and their sources and formation pathways in the subarctic atmosphere. 568
Arctic is a critical region on the Earth with a significant warming trend and high sensitivity to 569
Atmos. Chem. Phys. Discuss., https://doi.org/10.5194/acp-2019-293Manuscript under review for journal Atmos. Chem. Phys.Discussion started: 21 May 2019c© Author(s) 2019. CC BY 4.0 License.
19
climate forcing due to a strong effect on an albedo-sea ice feedback system. BB episodes in 570
warmer season enhanced the atmospheric levels of OAs in central Alaska. These organic 571
aerosols can be eventually transported to the Arctic region and may affect the air quality and 572
climate of the Arctic. 573
Data availability. The data set of this paper is available upon request to the corresponding 574
author. 575
Author contributions. KK designed the research. YK collected the aerosol samples. MMH 576
analyzed the samples for organic tracer compounds. DKD evaluated the data and wrote the 577
paper under the supervision of KK. All authors contributed to discussing results and 578
commenting on the paper. 579
Competing interests. The authors declare that they have no conflict of interest. 580
Acknowledgements. We acknowledge financial support from the Japan Society for the 581
Promotion of Science (JSPS) through grant-in-aid No. 24221001. This work was partially 582
conducted under the Japan Agency for Marine-Earth Science and Technology - International 583
Arctic Research Center (JAMSTEC-IARC) collaboration project with funding by the 584
JAMSTEC. We appreciate the financial support of a JSPS fellowship to D.K. Deshmukh 585
(PU17907) and the Special Grant Program for International Students (SGPIS) of Hokkaido 586
University, Sapporo, Japan for the financial support to M.M. Haque. We thank Bang-Yong 587
Lee for his support during the sample collection. 588
Atmos. Chem. Phys. Discuss., https://doi.org/10.5194/acp-2019-293Manuscript under review for journal Atmos. Chem. Phys.Discussion started: 21 May 2019c© Author(s) 2019. CC BY 4.0 License.
20
References 589
Agarwal, S., Aggarwal, S. G., Okuzawa, K., and Kawamura, K.: Size distributions of 590dicarboxylic acids, ketoacids, α-dicarbonyls, sugars, WSOC, OC, EC and inorganic ions 591in atmospheric particles over Northern Japan: implication for long-range transport of 592Siberian biomass burning and East Asian polluted aerosols, Atmos. Chem. Phys., 10, 5935839-5858, 2010. 594
Akagi, S. K., Yokelson, R. J., Wiedinmyer, C., Alvarado, M. J., Reid, J. S., Karl, T., Crounse, 595J. D., and Wennberg, P. O.: Emission factors for open and domestic biomass burning 596for use in atmospheric models, Atmos. Chem. Phys., 11, 4039-4072, 2011. 597
Andreae, M. O. and Rosenfeld, D.: Aerosol-cloud-precipitations Part 1: the nature and 598sources of cloud-active aerosols, Earth-Sci. Rev., 89, 13-41, 2008. 599
Atlas, E. and Giam, C. S.: Global transport of organic ambient concentrations in remote 600marine atmosphere, Science, 211, 163-165, 1981. 601
Baker, H. G., Baker, I., and Hodges, S. A.: Sugar composition of nectars and fruits consumed 602by birds and bats in the tropics and subtropics, Biotropica, 30, 559-586, 1998. 603
Bauer, H., Claeys, M., Vermeylen, R., Schueller, E., Weinke, G., Berger, A., and Puxbaum, 604H.: Arabitol and mannitol as tracers for the quantification of airborne fungal spores, 605Atmos. Environ., 42, 588-593, 2008. 606
Burch, M. and Levetin, E.: Effects of meteorological conditions on spore plumes, Int. J. 607Biometeorol., 46, 107-117, 2002. 608
Cahill, T. M., Seaman, V. Y., Charles, M. J., Holzinger, R., and Goldstein, A. H.: Secondary 609organic aerosols formed from oxidation of biogenic volatile organic compounds in the 610Sierra Nevada Mountains of California, J. Geophys. Res., 111, D16312, 611doi:10.1029/2006JD007178, 2006. 612
Carlton, A. G., Wiedinmyer, C., and Kroll, J. H.: A review of secondary organic aerosol 613(SOA) formation from isoprene, Atmos. Chem. Phys., 9, 4987-5005, 2009. 614
Ciccioli, P., Centritto, M., and Loreto, F.: Biogenic volatile organic compound emissions 615from vegetation fires, Plant Cell Environ., 37, 1810-1825, 2014. 616
Cong, Z., Kawamura, K., Kang, S., and Fu, P.: Penetration of biomass-burning emissions 617from South-Asia through the Himalayas: new insights from atmospheric organic acids. 618Scientific Report, 5, 9580, doi:10.1038/srep09580, 2015. 619
Cowie, G. L. and Hedges, J. I.: Carbohydrate sources in a coastal marine-environment. 620Geochim. Cosmochim. Acta, 48, 2075-2087, 1984. 621
Crutzen, P. J. and Andreae, M. O.: Biomass burning in the tropics: impact on atmospheric 622chemistry and biogeochemical cycles, Science, 250, 1669-1678, 1990. 623
Claeys, M. et al.: Formation of secondary organic aerosols through photooxidation of 624isoprene, Science, 303, 1173-1176. 625
Ding, L. C., Fu, K., Wang, D. K. W., Dann, T., and Austin, C. C.: A new direct thermal 626desorption-GC/MS method: organic speciation of ambient particulate matter collected 627in Golden, BC, Atmos. Environ., 43, 4894-4902, 2009. 628
Ding, X., He, Q. F., Shen, R. Q., Yu, Q. Q., and Wang, X. M.: Spatial distributions of 629secondary organic aerosols from isoprene, monoterpenes, β-caryophyllene, and 630aromatics over China during summer, J. Geophys. Res., 119, 11877-11891, 2014. 631
Ding, X., Wang, X. M., Xie, Z. Q., Zhang, Z., and Sun, L. G.: Impacts of Siberian biomass 632burning on organic aerosols over the North Pacific Ocean and the Arctic: primary and 633secondary organic tracers, Environ. Sci. Technol., 47, 3149-3157, 2013. 634
Draxler, R. R. and Rolph, G. D.: Hybrid Single-Particle Lagrangian Integrated Trajectory 635Model access via website http://www.arl.noaa.gov/HYSPLIT.php, Last access: 20 636October 2018, 2013. 637
Atmos. Chem. Phys. Discuss., https://doi.org/10.5194/acp-2019-293Manuscript under review for journal Atmos. Chem. Phys.Discussion started: 21 May 2019c© Author(s) 2019. CC BY 4.0 License.
21
Duhl, T. R., Helmig, D., and Guenther, A.: Sesquiterpene emissions from vegetation: a 638review, Biogeosciences, 5, 761-777, 2008. 639
Eisenreich, S. J., Looney, B. B., and David, J. B.: Airborne organic contaminants in the Great 640Lakes ecosystem, Environ. Sci. Technol., 15, 30-38, 1981. 641
Elbert, W., Taylor, P., Andreae, M., and Poschl, U.: Contribution of fungi to primary biogenic 642aerosols in the atmosphere: wet and dry discharged spores, carbohydrates, and inorganic 643ions, Atmos. Chem. Phys., 7, 4569-4588, 2007. 644
Engling, G., Lee, J. J., Tsai, Y. W., Lung, S. C. C., Chou, C. C. K., and Chan, C. Y.: Size-645resolved anhydrosugar composition in smoke aerosol from controlled field burning of 646rice straw, Aerosol Sci. Technol., 43, 662-672, 2009. 647
Fine, P. M., Cass, G. R., and Simoneit, B. R. T.: Chemical characterization of fine particle 648emissions from fireplace combustion of wood grown in the northeastern United States, 649Environ. Sci. Technol., 35, 2665-2675, 2001. 650
Fu, P., Aggarwal, S. G., Chen, J., Li, J., Sun, Y., Wang, Z., Chen, H., Liao, H., Ding, A., 651Umarji, G. S., Patil, R. S., Chen. Q., and Kawamura, K.: Molecular markers of 652secondary organic aerosol in Mumbai, India, Environ. Sci. Technol., 50, 4659-4667, 6532016. 654
Fu, P., Kawamura, K., Okuzawa, K., Aggarwal, S. G., Wang, G., Kanaya, Y., and Wang, Z.: 655Organic molecular compositions and temporal variations of summertime mountain 656aerosols over Mt. Tai, North China Plain, J. Geophys. Res., 113, D19107, 657doi:10.1029/2008JD009900, 2008. 658
Fu, P. Q., Kawamura, K., and Barrie, L. A.: Photochemical and other sources of organic 659compounds in the Canadian high Arctic aerosol pollution during winter-spring, Environ. 660Sci. Technol., 43, 286-292, 2009. 661
Fu, P. Q., Kawamura, K., Chen, J., Charriere, B., and Sempere, R.: Organic molecular 662composition of marine aerosols over the Arctic Ocean in summer: contributions of 663primary emission and secondary aerosol formation, Biogeosciences, 10, 653-667, 2013. 664
Fu, P. Q., Kawamura, K., Chen, J., Li, J., Su, Y. L., Liu, Y., Tachibana, E., Aggarwal, S. G., 665Okuzawa, K., Tanimoto, H., Kanaya, Y., and Wang, Z. F.: Diurnal variations of organic 666molecular tracers and stable carbon isotopic composition in atmospheric aerosols over 667Mt. Tai in the North China Plain: an influence of biomass burning, Atmos. Chem. 668Phys., 12, 8359-8375, 2012. 669
Fu, P. Q., Kawamura, K., Chen, J., and Miyazaki, Y.: Secondary production of organic 670aerosols from biogenic VOCs over Mt. Fuji, Japan, Environ. Sci. Technol., 48, 8491-6718497, 2014. 672
Fu, P. Q., Kawamura, K., and Miura, K.: Molecular characterization of marine organic 673aerosols collected during a round-the-world cruise, J. Geophys. Res., 116, D13302, 674doi:10.1029/2011JD015604, 2011. 675
Fu, P. Q., Kawamura, K., Pavuluri, C. M., Swaminathan, T., and Chen, J.: Molecular 676characterization of urban organic aerosol in tropical India: contributions of primary 677emissions and secondary photooxidation, Atmos. Chem. Phys., 2663-2689, 2010. 678
Giannoni, M., Martellini, T., Bubba, M. D., Gambaro, A., Zangrando, R., Chiari, M., Lepri, 679L., and Cincinelli, A.: The use of levoglucosan for tracing biomass burning in PM2.5 680samples in Tuscany (Italy), Environ. Poll., 167, 7-15, 2012. 681
Gomez-Gonzalez, Y., Wang, W., Vermeylen, R., Chi, X., Neirynck, J., Janssens, I. A., 682Maenhaut, W., and Claeys, M.: Chemical characterisation of atmospheric aerosols 683during a 2007 summer field campaign at Brasschaat, Belgium: sources and source 684processes of biogenic secondary organic aerosol, Atmos. Chem. Phys., 12, 125-138, 6852012. 686
Gottwald, T. R., Trocine, T. M., and Timmer, L. W.: A computer controlled environmental 687chamber for the study of aerial fungal spore release, Phytopathology, 87, 1078-1084, 6881997. 689
Atmos. Chem. Phys. Discuss., https://doi.org/10.5194/acp-2019-293Manuscript under review for journal Atmos. Chem. Phys.Discussion started: 21 May 2019c© Author(s) 2019. CC BY 4.0 License.
22
Graham, B., Guyon, P., Taylor, P. E., Artaxo, P., Maenhaut, W., Glovsky, M. M., Flagan, R. 690C., and Andreae, M. O.: Organic compounds present in the natural Amazonian aerosol: 691characterization by gas chromatography-mass spectrometry, J. Geophys. Res., 108, No. 692D24, 4766, doi:10.1029/2003JD003990, 2003. 693
Graham, B., Mayol-Bracero, O. L., Guyon, P., Roberts, G. C., Decesari, S., Facchini, M. C., 694Artaxo, P., Maenhaut, W., Koll, P., and Andreae, M. O.: Water-soluble organic 695compounds in biomass burning aerosols over Amazonia 1: characterization by NMR 696and GC-MS., J. Geophys. Res., 107, No. D20, 8047, doi:10.1029/2001JD000336, 2002. 697
Grell, G., Freitas, S. R., Stuefer, M., and Fast, J.: Inclusion of biomass burning in WRF-698Chem: impact of wildfires on weather forecasts, Atmos. Chem. Phys., 11, 5289-5303, 6992011. 700
Guasco, T. L. et al.: Transition metal associations with primary biological particles in sea 701spray aerosol generated in a wave channel, Environ. Sci. Technol., 48, 1324-1333, 7022013. 703
Hallquist, M. et al.: The formation, properties and impact of secondary organic aerosol: 704current and emerging issues, Atmos. Chem. Phys., 9, 5155-5236, 2009. 705
Hays, M. D., Fine, P. M., Geron, C. D., Kleeman, M. J., and Gullett, B. K.: Open burning of 706agricultural biomass: physical and chemical properties of particle-phase emissions, 707Atmos. Environ., 39, 6747-6764, 2005. 708
Hinzman, L. D. et al.: Evidence and implications of recent climate change in northern Alaska 709and other arctic regions, Climate Change, 72, 251-298, 2005. 710
Hu, Q. H., Xie, Z. Q., Wang, X. M., Kang, H., and Zhang, P. F.: Levoglucosan indicates high 711levels of biomass burning aerosols over oceans from the Arctic to Antarctic, Sci. 712Report, 3, 3119, doi:10.1038/Srep03119, 2013. 713
Ion, A. C., Vermeylen, R., Kourtchev, I., Cafmeyer, J., Chi, X., Gelencser, A., Maenhaut, W., 714and Claeys, M.: Polar organic compounds in rural PM2.5 aerosols from K-puszta, 715Hungary, during a 2003 summer field campaign: sources and diel variations, Atmos. 716Chem. Phys., 5, 1805-1814, 2005. 717
Iziomon, M. G., Lohmann, U., and Quinn, P. K.: Summertime pollution events in the Arctic 718and potential implications, J. Geophys. Res., 111, D12206, doi:10.1029/2005JD006223, 7192006. 720
Jathar, S. H., Gordon, T. D., Hennigan, C. J., Pye, H. O. T., Pouliot, G., Adams, P. J., 721Donahue, N. M., and Robinson, A. L.: Unspeciated organic emissions from combustion 722sources and their influence on the secondary organic aerosol budget in the United 723States, Proc. Natl. Acad. Sci. USA, 111, 10473-10478, 2014. 724
Jaoui, M., Lewandowski, M., Kleindienst, T. E., Offenberg, J. H., and Edney, E. O.: β-725Caryophyllinic acid: an atmospheric tracer for β-caryophyllene secondary organic 726aerosol, Geophys. Res. Lett., 34, L05816, doi:10.1029/2006GL028827, 2007. 727
Jia, Y. L., Clements, A. L., and Fraser, M. P.: Saccharide composition in atmospheric 728particulate matter in the southwest US and estimates of source contributions, J. Aerosol 729Sci., 41, 62-73, 2010. 730
Kanakidou, M. et al.: Organic aerosol and global climate modelling: a review, Atmos. Chem. 731Phys., 5, 1053-1123, 2005. 732
Kaplan, J. O. and New, M.: Arctic climate change with a 2°C global warming: timing, climate 733patterns and vegetation change, Climate Change, 79, 213-241, 2006. 734
Kavouras, I. G., Mihalopoulos, N., and Stephanou, E. G.: Formation of atmospheric particles 735from organic acids produced by forests, Nature, 395, 683-686, 1998. 736
Kavouras, I. G. and Stephanou, E. G.: Particle size distribution of organic primary and 737secondary aerosol constituents in urban, background marine, and forest atmosphere, J. 738Geophys. Res., 107, No. D8, 4069, doi:10.1029/2000JD000278, 2002. 739
Atmos. Chem. Phys. Discuss., https://doi.org/10.5194/acp-2019-293Manuscript under review for journal Atmos. Chem. Phys.Discussion started: 21 May 2019c© Author(s) 2019. CC BY 4.0 License.
23
Kawamura, K. and Gagosian, R.: Implications of ω-oxocarboxylic acids in the remote marine 740atmosphere for photooxidation of unsaturated fatty acids, Nature, 325, 330-332, 1987. 741
Kawamura, K., Kasukabe, H., and Barrie, L. A.: Sources and reaction pathways of 742dicarboxylic acids, ketoacids and dicarbonyls in Arctic aerosols: one year of 743observations, Atmos. Environ., 30, 1709-1722, 1996. 744
Kawamura, K., Ishimura, Y., and Yamazaki, K.: Four years observations of terrestrial lipid 745class compounds in marine aerosols from the western North Pacific, Glob. Biogeochem. 746Cycles, 17, No. 1, 1003, doi:10.1029/2001GB001810, 2003. 747
Kawamura, K., Kosaka, M., and Sempere, R.: Distributions and seasonal changes of 748hydrocarbons in urban aerosols and rainwaters, Chikyukagaku (Geochemistry), 28, 1-74915, 1994. 750
Kawamura, K., Steinberg, S., and Kaplan, I. R.: Homologous series of C1-C10 751monocarboxylic acids and C1-C6 carbonyls in Los Angeles air and motor vehicle 752exhausts, Atmos. Environ., 34, 4175-4191, 2002. 753
Kim, Y., Hatsushika, H., Muskett, R. R., and Yamazaki, K.: Possible effect of boreal wildfire 754soot on Arctic sea ice and Alaska glaciers, Atmos. Environ., 39, 3513-3520, 2005. 755
Klemm, D., Heublein, B., Fink, H. P., and Bohn, A.: Cellulose: fascinating biopolymer and 756sustainable raw material. Angew. Chem. Int. Ed. Engl., 44, 3358-3393, 2005. 757
Kolattukudy, P.E.: Chemistry and biochemistry of natural waxes, Elsevier, New York, 1976. 758Kourtchev, I., Warnke, J., Maenhaut, W., Hoffmann, T., and Claeys, M.: Polar organic 759
marker compounds in PM2.5 aerosol from a mixed forest site in western Germany, 760Chemosphere, 73, 1308-1314, 2008a. 761
Kourtchev, I., Ruuskanen, T. M., Keronen, P., Sogacheva, L., Dal Maso, M., Reissell, A., 762Chi, X., Vermeylen, R., Kulmala, M., Maenhaut, W., and Claeys, M.: Determination of 763isoprene and α-/β-pinene oxidation products in boreal forest aerosols from Hyytiala, 764Finland: diel variations and possible link with particle formation events, Plant Biol., 10, 765138-149, 2008b. 766
Law, K. S. and Stohl, A.: Arctic air pollution: origins and impacts, Science, 315, 1537-1540, 7672007. 768
Lewandowski, M., Jaoui, M., Kleindienst, T. E., Offenberg, J. H., and Edney, E. O.: 769Composition of PM2.5 during the summer of 2003 in Research Triangle Park, North 770Carolina, Atmos. Environ., 41, 4073-4083, 2007. 771
Lewandowski, M., Piletic, I. R., Kleindienst, T. E., Offenberg, J. H., Beaver, M. R., Jaoui, M., 772Docherty, K. S., and Edney, E. O.: Secondary organic aerosol characterisation at field 773sites across the United States during the spring-summer period, Int. J. Environ. Anal. 774Chem., 93, 1084-1103, 2013. 775
Li, X., Jiang, L., Hoa, L. P., Lyu, Y., Xu, T., Yang, X., Iinuma, Y., Chen, J., and Herrmann, 776H.: Size distribution of particle-phase sugar and nitrophenol tracers during severe urban 777haze episodes in Shanghai, Atmos. Environ., 145, 115-127, 2016. 778
Ma, S. X., Wang, Z. Z., Bi, X. H., Sheng, G. Y., and Fu, J. M.: Composition and source of 779saccharides in aerosols in Guangzhou, China, Chinese Sci. Bull., 54, 4500-4506, 2009. 780
Medeiros, P. M., Conte, M. H., Weber, J. C., and Simoneit, B. R. T.: Sugars as source 781indicators of biogenic organic carbon in aerosols collected above the Howland 782Experimental Forest, Maine, Atmos. Environ., 40, 1694-1705, 2006. 783
Myers-Pigg, A. N., Griffin, R. J., Louchouarn, P., Norwood, M. J., Sterne, A., and Cevik, B. 784K.: Signatures of biomass burning aerosols in the plume of a saltmarsh wildfire in South 785Texas, Environ. Sci. Technol., 50, 9308-9314, 2016. 786
Nirmalkar, J., Deshmukh, D. K., Deb, M. K., Tsai, Y. I., and Sopajaree, K.: Mass loading and 787episodic variation of molecular markers in PM2.5 aerosols over a rural area in eastern 788central India, Atmos. Environ., 117, 41-50, 2015. 789
Atmos. Chem. Phys. Discuss., https://doi.org/10.5194/acp-2019-293Manuscript under review for journal Atmos. Chem. Phys.Discussion started: 21 May 2019c© Author(s) 2019. CC BY 4.0 License.
24
Nolte, C. G., Schauer, J. J., Cass, G. R., and Simoneit, B. R. T.: Highly polar organic 790compounds present in wood smoke and in the ambient atmosphere, Environ. Sci. 791Technol., 35, 1912-1919, 2001. 792
Noureddini, H. and Kanabur, M.: Liquid-phase catalytic oxidation of unsaturated fatty acids, 793J. Amer. Oil Chem. Soc., 73, 305-312, 1999. 794
Novakov, T. and Corrigan, C. E.: Cloud condensation nucleus activity of the organic 795component of biomass smoke particles, Geophys. Res. Lett., 23, 2141-2144, 1996. 796
Novakov, T. and Penner, J. E.: Large contribution of organic aerosol to cloud-condensation-797nuclei concentrations. Nature, 365, 823-826, 1993. 798
Pacini, E.: From anther and pollen ripening to pollen presentation, Plant Syst. Evol., 222, 19-79943, 2000. 800
Pashynska, V., Vermeylen, R., Vas, G., Maenhaut, W., and Claeys, M.: Development of a gas 801chromatographic/ion trap mass spectrometric method for the determination of 802levoglucosan and saccharidic compounds in atmospheric aerosols: application to urban 803aerosols, J. Mass Spectrom., 37, 1249-1257, 2002. 804
Peltzer, E. T. and Gagosian, R. B.: Organic geochemistry of aerosols over the Pacific Ocean, 805Chemical Oceanography, Academic Press, London, Vol. 10, 281-338, 1989. 806
Prather, K. A. et al.: Bringing the ocean into the laboratory to probe the chemical complexity 807of sea spray aerosol, Proc. Natl. Acad. Sci. U.S.A., 110, 7550-7555, 2013. 808
Pullman, G. S. and Buchanan, M.: Identification and quantitative analysis of stage-specific 809carbohydrates in loblolly pine (Pinus taeda) zygotic embryo and female gametophyte 810tissues, Tree Physiol., 28, 985-996, 2008. 811
Rogge, W. F., Hildemann, L. M., Mazurek, M. A., Cass, G. R., and Simoneit, B. R. T.: 812Sources of fine organic aerosol 4: particulate abrasion products from leaf surfaces of 813urban plants, Environ. Sci. Technol., 27, 2700-2711, 1993. 814
Rogge, W. F., Medeiros, P. M., and Simoneit, B. R. T.: Organic marker compounds in surface 815soils of crop fields from the San Joaquin Valley fugitive dust characterization study, 816Atmos. Environ., 41, 8183-8204, 2007. 817
Sang, X., Zhang, Z., Chan, C., and Engling, G.: Source categories and contribution of 818biomass smoke to organic aerosol over the southeastern Tibetan Plateau, Atmos. 819Environ., 78, 113-123, 2013. 820
Sarkar, C., Sinha, V., Sinha, B., Panday, A. K., Rupakheti, M., and Lawrence M. G.: Source 821apportionment of NMVOCs in the Kathmandu Valley during the SusKat-ABC 822international field campaign using positive matrix factorization, Atmos. Chem. Phys., 82317, 8129-8156, 2017. 824
Saxena, P. and Hildemann, L. M.: Water-soluble organics in atmospheric particles: a critical 825review of the literature and application of thermodynamics to identify candidate 826compounds, J. Atmos. Chem., 24, 57-109, 1996. 827
Schauer, J. J., Rogge, W. F., Hildemann, L. M., Mazurek, M. A., Cass, G. R., and Simoneit, 828B. R. T.: Source apportionment of airborne particulate matter using organic compounds 829as tracers, Atmos. Environ., 30, 3837-3855, 1996. 830
Serreze, M. C., Walsh, J. E., Chapin, F. S., Osterkamp, T., Dyurgerov, M., Romanovsky, V., 831Oechel, W. C., Morison, J., Zhang, T., and Barry, R. G.: Observational evidence of 832recent change in the northern high latitude environment, Clim. Change, 46, 159-207. 833
Shakya, K. M. and Peltier, R. E.: Investigating missing sources of sulfur at Fairbanks, Alaska, 834Environ. Sci. Technol., 47, 9332-9338, 2013. 835
Schmidl, C., Marr, I. L., Caseiro, A., Kotianova, P., Berner, A., Bauer, H., Kasper-Giebl, A., 836and Puxbaum, H.: Chemical characterisation of fine particle emissions from wood stove 837combustion of common woods growing in mid-European Alpine regions, Atmos. 838Environ., 42, 126-141, 2008. 839
Atmos. Chem. Phys. Discuss., https://doi.org/10.5194/acp-2019-293Manuscript under review for journal Atmos. Chem. Phys.Discussion started: 21 May 2019c© Author(s) 2019. CC BY 4.0 License.
25
Seinfeld, J. H. and Pandis, S. N.: Atmospheric Chemistry and Physics, John Wiley & Sons, 840New York, 1998. 841
Shafizadeh, F. and Fu, Y.: Pyrolysis of cellulose, Carbohydrate Research, 29, 113-122, 1973. 842Shakya, K. M., Louchouarn, P., and Griffin, R. J.: Lignin derived phenols in Houston 843
aerosols: implications for natural background sources, Environ. Sci. Technol., 45, 8268-8448275, 2011. 845
Sheesley, R. J., Schauer, J. J., Chowdhury, Z., Cass, G. R., and Simoneit, B. R. T.: 846Characterization of organic aerosols emitted from the combustion of biomass 847indigenous to South Asia, J. Geophys. Res., 108, No. D9, 4285, 848doi:10.1029/2002JD002981, 2003. 849
Sidhu, S., Gullett, B., Striebich, R., Klosterman, J., Contreras, J., and DeVito, M.: Endocrine 850disrupting chemical emissions from combustion sources: diesel particulate emissions 851and domestic waste open burn emissions, Atmos. Environ., 39, 801-811, 2005. 852
Simoneit, B. R. T.: Biomass burning - a review of organic tracers for smoke from incomplete 853combustion, Appl. Geochem., 17, 129-162, 2002. 854
Simoneit, B. R. T., Kobayashi, M., Mochida, M., Kawamura, K., Lee, M., Lim, H. J., Turpin, 855B. J., and Komazaki, Y.: Composition and major source of organic compounds of 856aerosol particulate matter sample during the ACE-Asia campaign, J. Geophys. Res., 857109, D19S10, doi:10.1029/2004JD004598, 2004a. 858
Simoneit, B. R. T., Elias, V. O., Kobayashi, M., Kawamura, K., Rushdi, A. I., Medeiros, P. 859M., Rogge, W. F., and Didyk, B. M.: Sugars-dominant water-soluble organic 860compounds in soils and characterization as tracers in atmospheric particulate matter, 861Environ. Sci. Technol., 38, 5939-5949, 2004b. 862
Simoneit, B. R. T., Rogge, W. F., Mazurek, M. A., Standley, L. J., Hildemann, L. M., and 863Cass, G. R.: Lignin pyrolysis products, lignans and resin acids as specific tracers of 864plant classes in emissions from biomass combustion, Environ. Sci. Technol., 27, 2533-8652541, 1993. 866
Simoneit, B. R. T., Schauer, J. J., Nolte, C. G., Oros, D. R., Elias, V. O., Fraser, M. P., Rogge, 867W. F., and Cass, G. R.: Levoglucosan, a tracer for cellulose in biomass burning and 868atmospheric particles, Atmos. Environ., 33, 173-182, 1999. 869
Simoneit, B. R. T., Sheng, G. Y., Chen, X. J., Fu, J. M., Zhang, J. and Xu, Y. P.: Molecular 870marker study of extractable organic-matter in aerosols from urban areas of China, 871Atmos. Environ., 25, 2111-2129, 1991. 872
Staples, C. A., Peterson, D. R., Parkerton, T. F., and Adams, W. J.: The environmental fate of 873phthalate esters: a literature review, Chemosphere, 35, 667-749, 1997. 874
Stocks, B. J., Fosberg, M. A., Wotton, B. M., Lynham, T. J., and Ryan, K. C.: Climate change 875and forest fire activity in North American boreal forests, Ecol. Studies, 138, 368-376, 8762000. 877
Stohl, A. et al.: Pan-Arctic enhancements of light absorbing aerosol concentrations due to 878North American boreal forest fires during summer 2004, J. Geophys. Res, 111, D22214, 879doi:10.1029/2006JD007216, 2006. 880
Suh, I., Zhang, R., Molina, L. T., and Molina, M. J.: Oxidation mechanism of aromatic 881peroxy and bicyclic radicals from OH-toluene reactions, J. American Chem. Soc., 125, 88212655-12665, 2003. 883
Sullivan, A. P., Frank, N., Kenski, D. M., and Collett, J. L.: Application of high-performance 884anion-exchange chromatography-pulsed amperometric detection for measuring 885carbohydrates in routine daily filter samples collected by a national network 2: 886examination of sugar alcohols/polyols, sugars, and anhydro-sugars in the upper 887Midwest, J. Geophys. Res., 116, D08303, doi:10.1029/2010JD014169, 2011. 888
Surratt, J. D., Chan, A. W. H., Eddingsaas, N. C., Chan, M. N., Loza, C. L., Kwan, A. J., 889Hersey, S. P., Flagan, R. C., Wennberg, P. O., and Seinfeld, J. H.: Reactive 890
Atmos. Chem. Phys. Discuss., https://doi.org/10.5194/acp-2019-293Manuscript under review for journal Atmos. Chem. Phys.Discussion started: 21 May 2019c© Author(s) 2019. CC BY 4.0 License.
26
intermediates revealed in secondary organic aerosol formation from isoprene, Proc. 891Natl. Acad. Sci. U.S.A., 107, 6640-6645, 2010. 892
Surratt, J. D., Murphy, S. M., Kroll, J. H., Ng, N. L., Hildebrandt, L., Sorooshian, A., 893Szmigielski, R., Vermeylen, R., Maenhaut, W., Claeys, M., Flagan, R. C., and Seinfeld, 894J. H.: Chemical composition of secondary organic aerosol formed from the 895photooxidation of isoprene, J. Phys. Chem. A, 110, 9665-9690, 2006. 896
Swan, S. H., Main, K. M., Liu, F., Stewart, S. L., Kruse, R. L., Calafat, A. M., Mao, C. S., 897Redmon, J. B., Ternand, C. L., Sullivan, S., and Teague, J. L.: Decrease in anogenital 898distance among male infants with prenatal phthalate exposure, Environ. Health 899Perspect, 113, 1056-1061, 2005. 900
Thepnuan, D., Chantara, S., Lee, C. T., Lin, N. H., and Tsai, Y. I.: Molecular markers for 901biomass burning associated with the characterization of PM2.5 and component sources 902during dry season haze episodes in Upper South East Asia, Sci. Total Environ., 658, 903708-722, 2019. 904
Thuren, A. and Larsson, P.: Phthalate esters in the Swedish atmosphere, Environ. Sci. 905Technol., 24, 554-559, 1990. 906
Verma, S. K., Kawamura, K., Chen, J., Fu, P., and Zhu, C.: Thirteen years of observations on 907biomass burning organic tracers over Chichijima Island in the western North Pacific: an 908outflow region of Asian aerosols, J. Geophys. Res., 120, 4155-4168, 2015. 909
Wan, X. et al.: Organic molecular tracers in the atmospheric aerosols from Lumbini, Nepal, in 910the northern Indo-Gangetic Plain: influence of biomass burning, Atmos. Chem. Phys., 91117, 8867-8885, 2017. 912
Wang, G. and Kawamura, K.: Molecular characteristics of urban organic aerosols from 913Nanjing: a case study of a mega-city in China, Environ. Sci. Technol., 39, 7430-7438, 9142005. 915
Wang, G., Kawamura, K., Lee, S., Ho, K. F., and Cao, J. J.: Molecular, seasonal, and spatial 916distributions of organic aerosols from fourteen Chinese cities, Environ. Sci. Technol., 91740, 4619-4625, 2006. 918
Wang, G., Kawamura, K., Xie, M., Hu, S., Gao, S., Cao, J., An, Z., and Wang, Z.: Size- 919distributions of n-alkanes, PAHs and hopanes and their sources in the urban, mountain 920and marine atmospheres over East Asia, Atmos. Chem. Phys., 9, 8869-8882, 2009. 921
Wang, G. H., Kawamura, K., Zhao, X., Li, Q. G., Dai, Z. X., and Niu, H. Y.: Identification, 922abundance and seasonal variation of anthropogenic organic aerosols from a mega-city 923in China, Atmos. Environ., 41, 407-416, 2007. 924
Wang, W., Wu, M. H., Li, L., Zhang, T., Liu, X. D., Feng, J. L., Li, H. J., Wang, Y. J., Sheng, 925G. Y., Claeys, M., and Fu, J. M.: Polar organic tracers in PM2.5 aerosols from forests in 926eastern China, Atmos. Chem. Phys., 8, 7507-7518, 2008. 927
Ward, T., Trost, B., Conner, J., Flanagan, J., and Jayanty, R. K. M.: Source apportionment of 928PM2.5 in a subarctic airshed - Fairbanks, Alaska, Aerosol Air Qual. Res., 12, 536-543, 9292012. 930
Ware, D., Lewis, J., Hopkins, S., Boyer, B., Noonan, C., and Ward, T.: Sources and 931perceptions of indoor and ambient air pollution in rural Alaska, J. Comm. Health, 38, 932773-780, 2013. 933
Wilkening, K. E., Barrie, L. A., and Engle, M.: Atmospheric science: trans-Pacific air 934pollution, Science, 290, 65-67, 2000. 935
Xie, Z., Ebinghaus, R., Temme, C., Lohmann, R., Caba, A., and Ruck, W.: Occurrence and 936air-sea exchange of phthalates in the Arctic, Environ. Sci. Technol., 41, 4555-4560, 9372007. 938
Yang, Y., Chan, C. Y., Tao, J., Lin, M., Engling, G., Zhang, Z., Zhang, T., and Su, L.: 939Observation of elevated fungal tracers due to biomass burning in the Sichuan Basin at 940Chengdu City, China, Sci. Total Environ., 431, 68-77, 2012. 941
Atmos. Chem. Phys. Discuss., https://doi.org/10.5194/acp-2019-293Manuscript under review for journal Atmos. Chem. Phys.Discussion started: 21 May 2019c© Author(s) 2019. CC BY 4.0 License.
27
Yokouchi, Y. and Ambe, Y.: Characterization of polar organics in airborne particulate matter, 942Atmos. Environ., 20, 1727-1734, 1986. 943
Zhang, R. Y., Suh, I., Zhao, J., Zhang, D., Fortner, E. C., Tie, X. X., Molina, L. T., and 944Molina, M. J.: Atmospheric new particle formation enhanced by organic acids, Science, 945304, 1487-1490, 2004. 946
Zhang, T., Engling, G., Chan, C. Y., Zhang, Y. N., Zhang, Z. S., Lin, M., Sang, X. F., Li, Y. 947D., and Li, Y. S.: Contribution of fungal spores to particulate matter in a tropical 948rainforest, Environ. Res. Lett., 5, doi:10.1088/1748- 9326/5/2/024010, 2010. 949
Zhang, Y. X., Shao, M., Zhang, Y. H., Zeng, L. M., He, L. Y., Zhu, B., Wei, Y. J., and Zhu, 950X. L.: Source profiles of particulate organic matters emitted from cereal straw burnings, 951J. Environ. Sci., 19, 167-175, 2007. 952
Zhu, C., Kawamura, K., and Fu, P.: Seasonal variations of biogenic secondary organic aerosol 953tracers in Cape Hedo, Okinawa, Atmos. Environ., 130, 113-119, 2016. 954
Zhu, C., Kawamura, K., and Kunwar, B.: Effect of biomass burning over the western North 955Pacific Rim: wintertime maxima of anhydrosugars in ambient aerosols from Okinawa, 956Atmos. Chem. Phys., 15, 1959-1973, 2015. 957
Atmos. Chem. Phys. Discuss., https://doi.org/10.5194/acp-2019-293Manuscript under review for journal Atmos. Chem. Phys.Discussion started: 21 May 2019c© Author(s) 2019. CC BY 4.0 License.
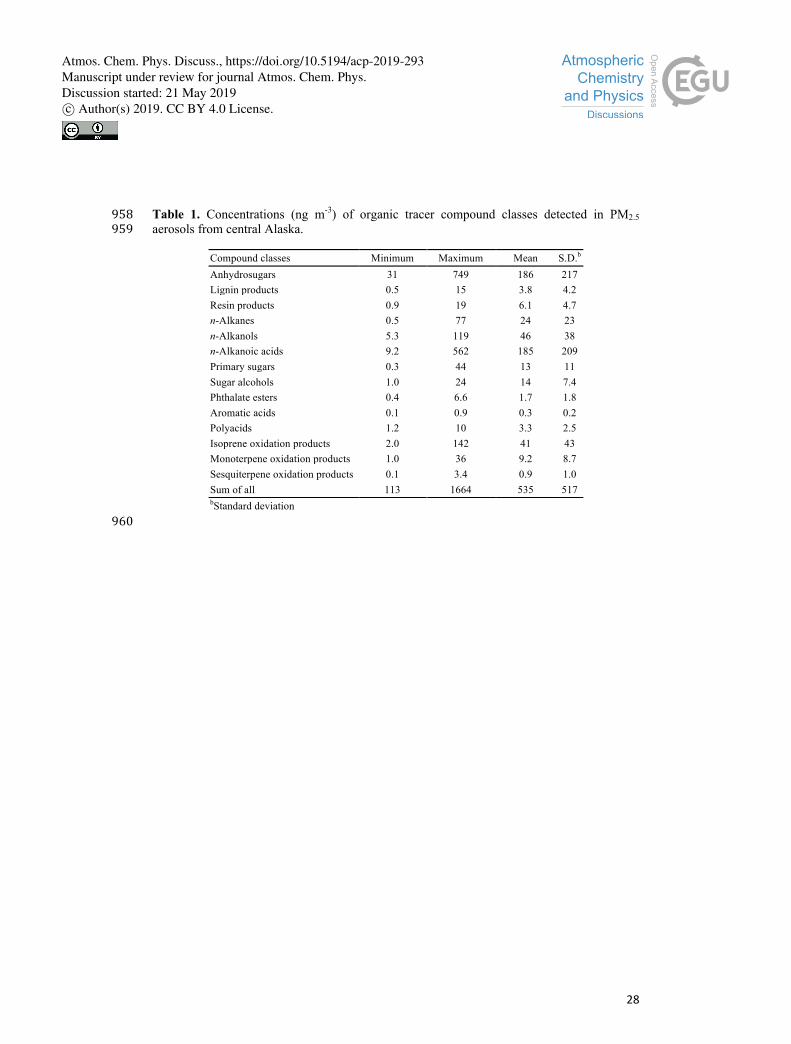
28
Table 1. Concentrations (ng m-3) of organic tracer compound classes detected in PM2.5 958aerosols from central Alaska. 959
Compound classes Minimum Maximum Mean S.D.b Anhydrosugars 31 749 186 217 Lignin products 0.5 15 3.8 4.2 Resin products 0.9 19 6.1 4.7 n-Alkanes 0.5 77 24 23 n-Alkanols 5.3 119 46 38 n-Alkanoic acids 9.2 562 185 209 Primary sugars 0.3 44 13 11 Sugar alcohols 1.0 24 14 7.4 Phthalate esters 0.4 6.6 1.7 1.8 Aromatic acids 0.1 0.9 0.3 0.2 Polyacids 1.2 10 3.3 2.5 Isoprene oxidation products 2.0 142 41 43 Monoterpene oxidation products 1.0 36 9.2 8.7 Sesquiterpene oxidation products 0.1 3.4 0.9 1.0 Sum of all 113 1664 535 517 bStandard deviation
960
Atmos. Chem. Phys. Discuss., https://doi.org/10.5194/acp-2019-293Manuscript under review for journal Atmos. Chem. Phys.Discussion started: 21 May 2019c© Author(s) 2019. CC BY 4.0 License.
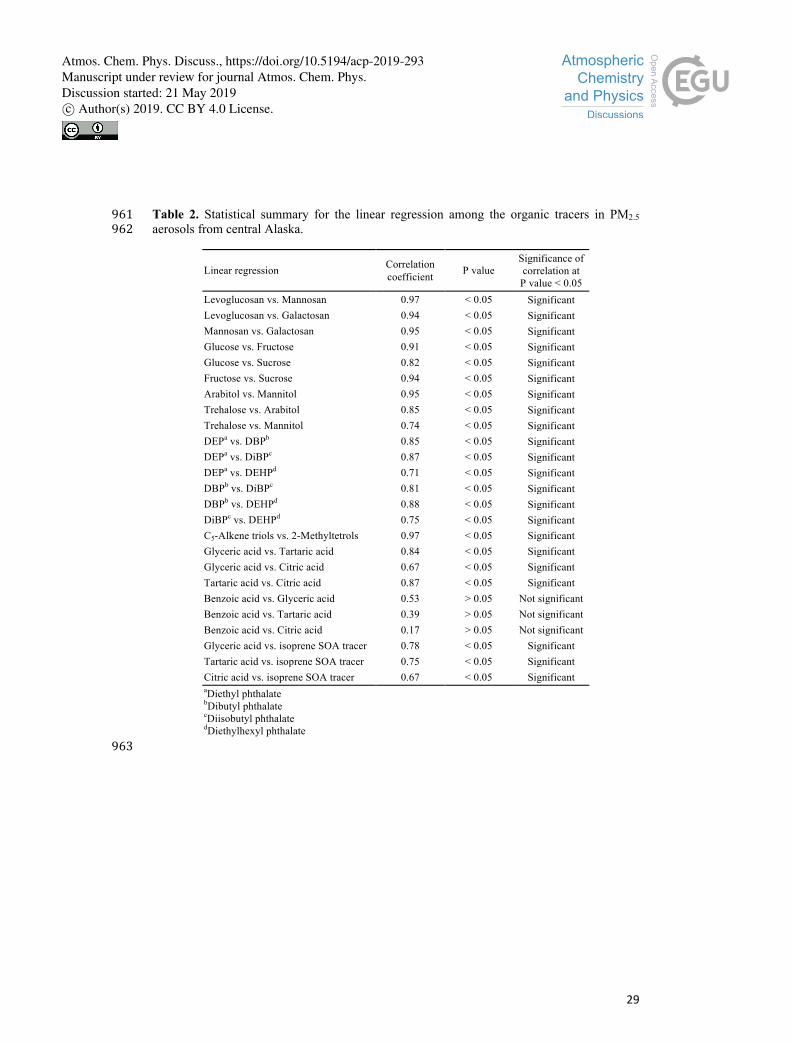
29
Table 2. Statistical summary for the linear regression among the organic tracers in PM2.5 961aerosols from central Alaska. 962
Linear regression Correlation coefficient P value
Significance of correlation at P value < 0.05
Levoglucosan vs. Mannosan 0.97 < 0.05 Significant Levoglucosan vs. Galactosan 0.94 < 0.05 Significant Mannosan vs. Galactosan 0.95 < 0.05 Significant Glucose vs. Fructose 0.91 < 0.05 Significant Glucose vs. Sucrose 0.82 < 0.05 Significant Fructose vs. Sucrose 0.94 < 0.05 Significant Arabitol vs. Mannitol 0.95 < 0.05 Significant Trehalose vs. Arabitol 0.85 < 0.05 Significant Trehalose vs. Mannitol 0.74 < 0.05 Significant DEPa vs. DBPb 0.85 < 0.05 Significant DEPa vs. DiBPc 0.87 < 0.05 Significant DEPa vs. DEHPd 0.71 < 0.05 Significant DBPb vs. DiBPc 0.81 < 0.05 Significant DBPb vs. DEHPd 0.88 < 0.05 Significant DiBPc vs. DEHPd 0.75 < 0.05 Significant C5-Alkene triols vs. 2-Methyltetrols 0.97 < 0.05 Significant Glyceric acid vs. Tartaric acid 0.84 < 0.05 Significant Glyceric acid vs. Citric acid 0.67 < 0.05 Significant Tartaric acid vs. Citric acid 0.87 < 0.05 Significant Benzoic acid vs. Glyceric acid 0.53 > 0.05 Not significant Benzoic acid vs. Tartaric acid 0.39 > 0.05 Not significant Benzoic acid vs. Citric acid 0.17 > 0.05 Not significant Glyceric acid vs. isoprene SOA tracer 0.78 < 0.05 Significant Tartaric acid vs. isoprene SOA tracer 0.75 < 0.05 Significant Citric acid vs. isoprene SOA tracer 0.67 < 0.05 Significant aDiethyl phthalate bDibutyl phthalate cDiisobutyl phthalate dDiethylhexyl phthalate
963
Atmos. Chem. Phys. Discuss., https://doi.org/10.5194/acp-2019-293Manuscript under review for journal Atmos. Chem. Phys.Discussion started: 21 May 2019c© Author(s) 2019. CC BY 4.0 License.
30
Figure captions 964
Figure 1. The location of the sampling site at Fairbanks in central Alaska (64.51°N and 965
147.51°W) and its surrounding regions. 966
Figure 2. The daily average variations of meteorological parameters from 5 June to 21 967
September 2009 at observation site in central Alaska. 968
Figure 3. The air mass backward trajectories over the observation site during the collection of 969
aerosol samples. The color scale shows the height of the air parcel. 970
Figure 4. Chemical compositions of organic compounds in atmospheric aerosols from central 971
Alaska. 972
Figure 5. Molecular distributions of anhydrosugars and lignin and resin products in PM2.5 973
aerosols collected in central Alaska. 974
Figure 6. Temporal changes in the concentrations of biomass burning tracers and other 975
organic compounds in the Alaskan aerosols. 976
Figure 7. Molecular distributions of lipid compounds in PM2.5 aerosols collected in central 977
Alaska. See Figure 5 for the description of the box-and-whisker diagram. 978
Figure 8. Correlations of organic compounds with a biomass burning tracer levoglucosan in 979
the Alaskan aerosol samples. 980
Figure 9. Molecular distributions of primary sugars and sugar alcohols in PM2.5 aerosols 981
collected in central Alaska. See Figure 5 for the description of the box-and-whisker diagram. 982
Figure 10. Molecular distributions of phthalate esters in PM2.5 aerosols collected in central 983
Alaska. See Figure 5 for the description of the box-and-whisker diagram. 984
Figure 11. Temporal changes in the concentrations of phthalate esters and other organic 985
compounds detected in the Alaskan aerosols. 986
Figure 12. Molecular distributions of biogenic secondary organic aerosol tracers in PM2.5 987
aerosols collected in central Alaska. See Figure 5 for the description of the box-and-whisker 988
diagram. 989
Figure 13. Molecular distributions of aromatic and polyacids in PM2.5 aerosols collected in 990
central Alaska. See Figure 5 for the description of the box-and-whisker diagram. 991
Atmos. Chem. Phys. Discuss., https://doi.org/10.5194/acp-2019-293Manuscript under review for journal Atmos. Chem. Phys.Discussion started: 21 May 2019c© Author(s) 2019. CC BY 4.0 License.
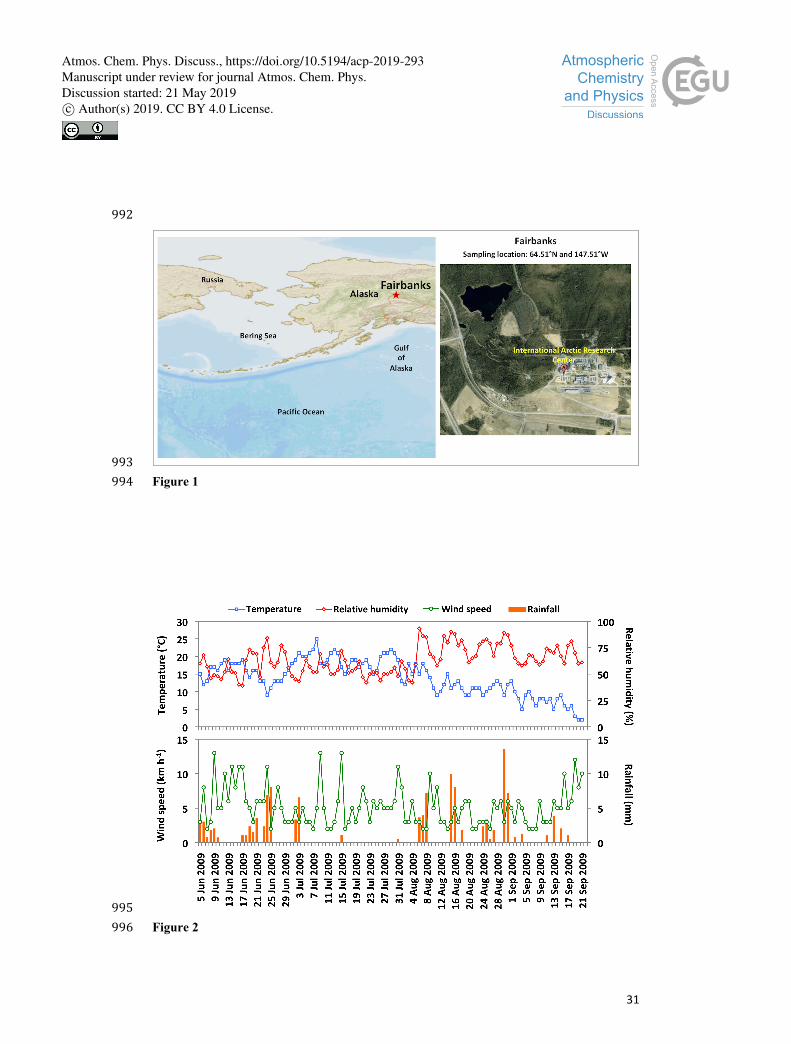
31
992
993Figure 1 994
995Figure 2 996
Atmos. Chem. Phys. Discuss., https://doi.org/10.5194/acp-2019-293Manuscript under review for journal Atmos. Chem. Phys.Discussion started: 21 May 2019c© Author(s) 2019. CC BY 4.0 License.
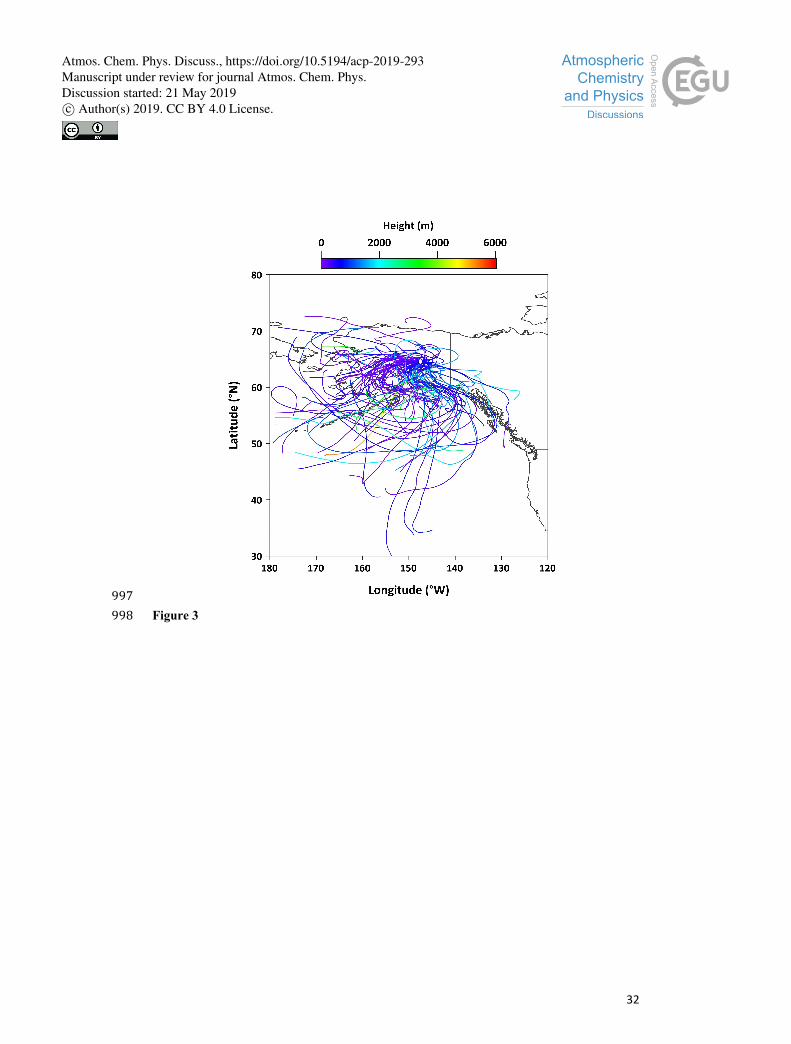
32
997Figure 3 998
Atmos. Chem. Phys. Discuss., https://doi.org/10.5194/acp-2019-293Manuscript under review for journal Atmos. Chem. Phys.Discussion started: 21 May 2019c© Author(s) 2019. CC BY 4.0 License.
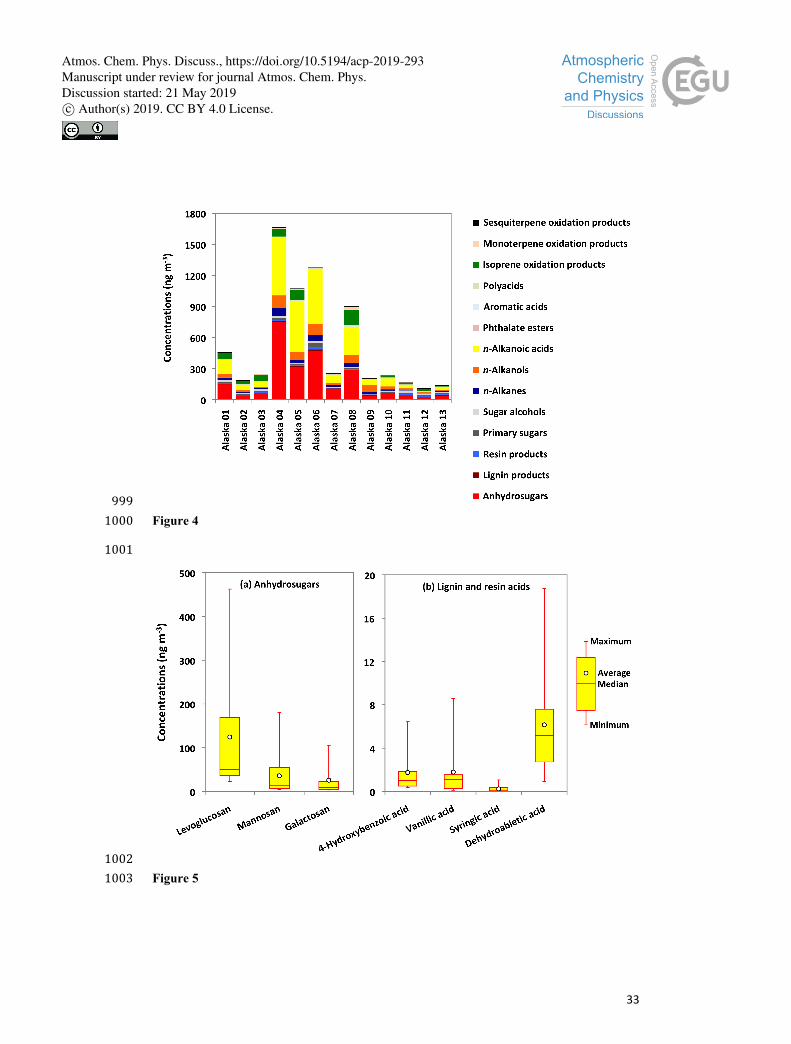
33
999Figure 4 1000
1001
1002Figure 5 1003
Atmos. Chem. Phys. Discuss., https://doi.org/10.5194/acp-2019-293Manuscript under review for journal Atmos. Chem. Phys.Discussion started: 21 May 2019c© Author(s) 2019. CC BY 4.0 License.
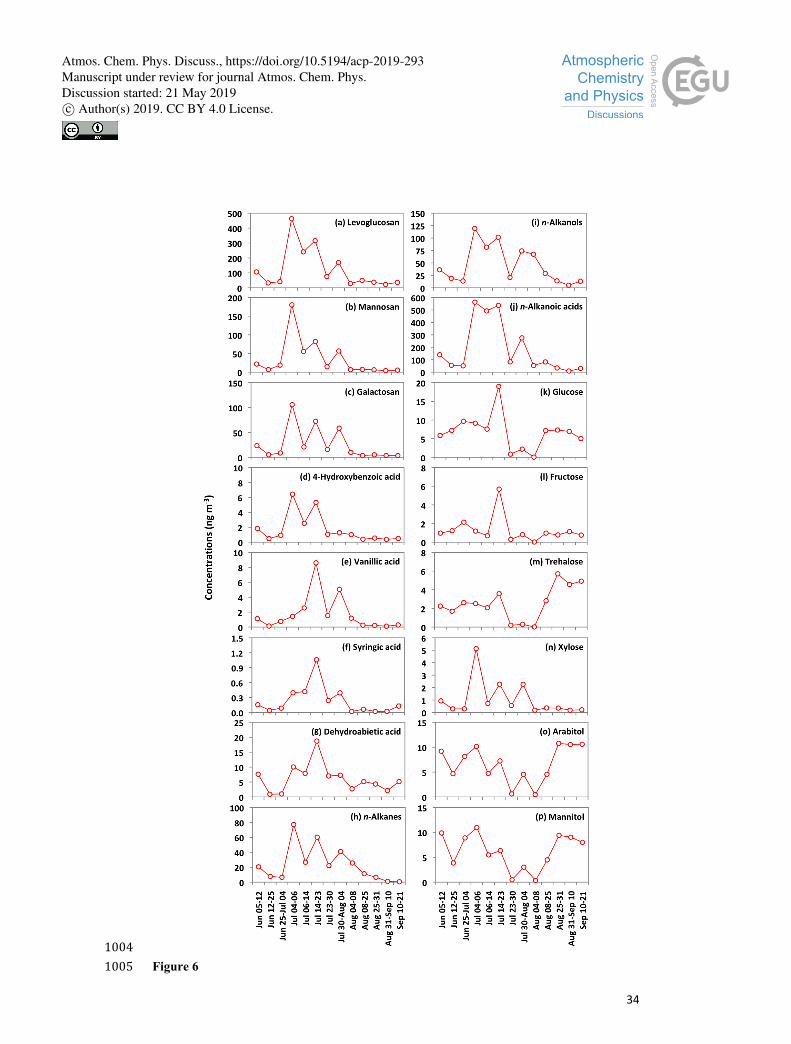
34
1004Figure 6 1005
Atmos. Chem. Phys. Discuss., https://doi.org/10.5194/acp-2019-293Manuscript under review for journal Atmos. Chem. Phys.Discussion started: 21 May 2019c© Author(s) 2019. CC BY 4.0 License.
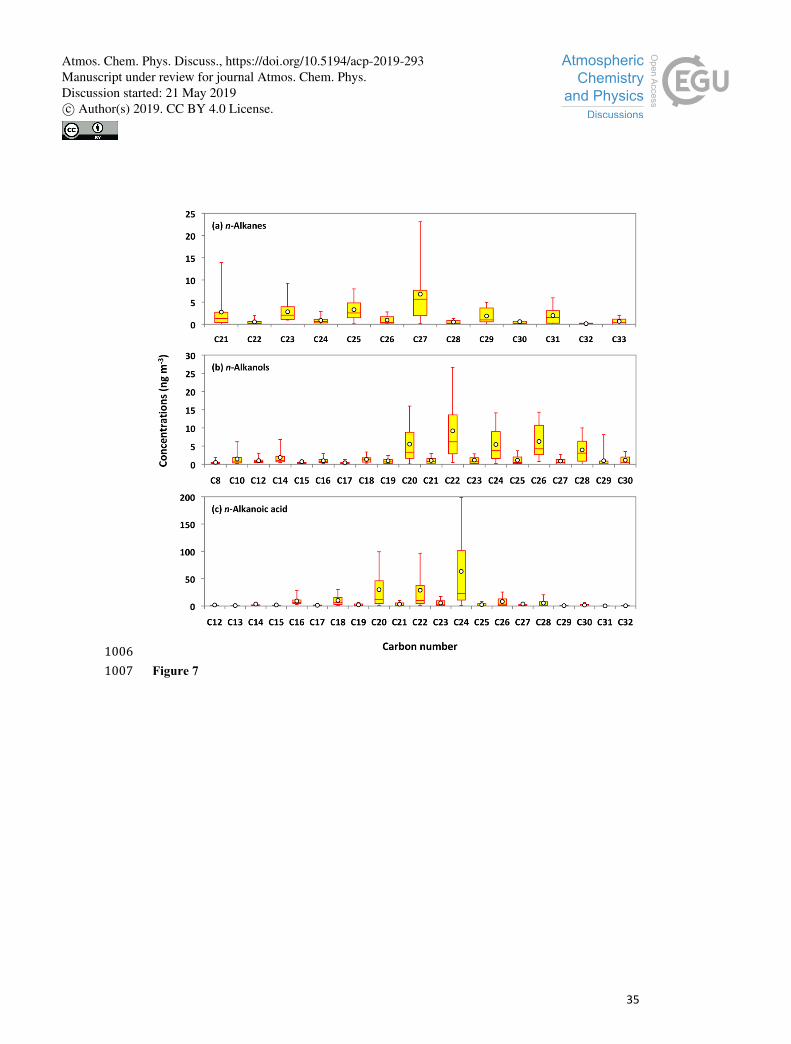
35
1006Figure 7 1007
Atmos. Chem. Phys. Discuss., https://doi.org/10.5194/acp-2019-293Manuscript under review for journal Atmos. Chem. Phys.Discussion started: 21 May 2019c© Author(s) 2019. CC BY 4.0 License.
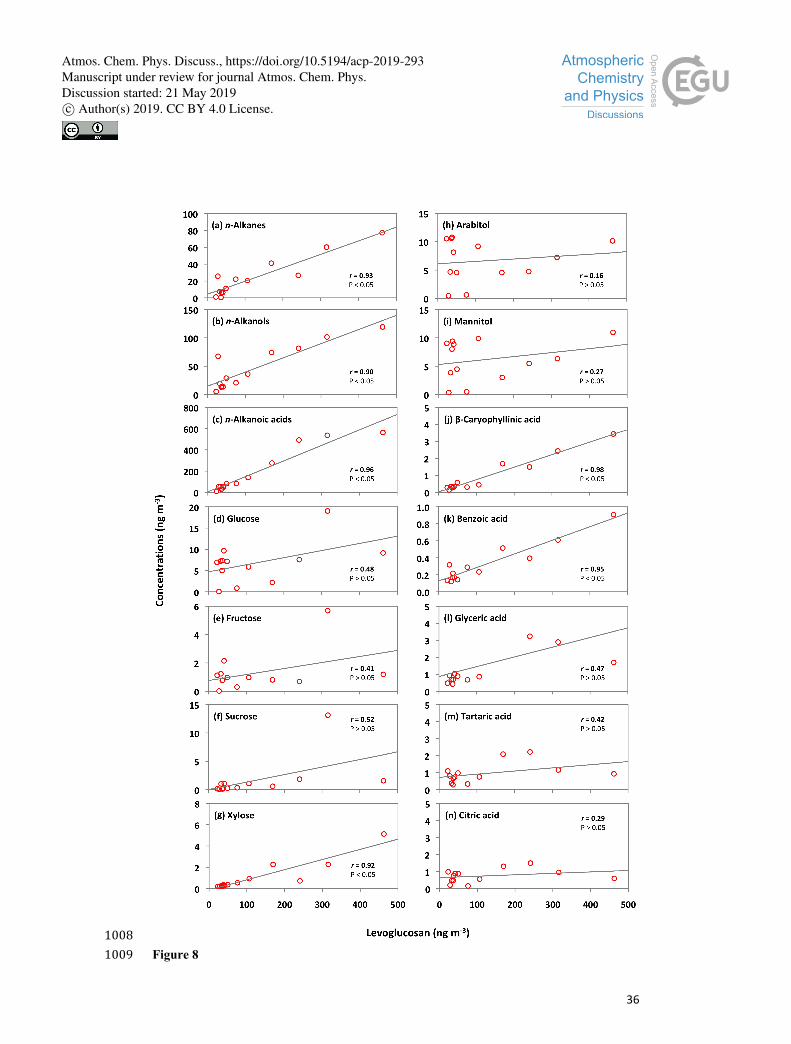
36
1008Figure 8 1009
Atmos. Chem. Phys. Discuss., https://doi.org/10.5194/acp-2019-293Manuscript under review for journal Atmos. Chem. Phys.Discussion started: 21 May 2019c© Author(s) 2019. CC BY 4.0 License.
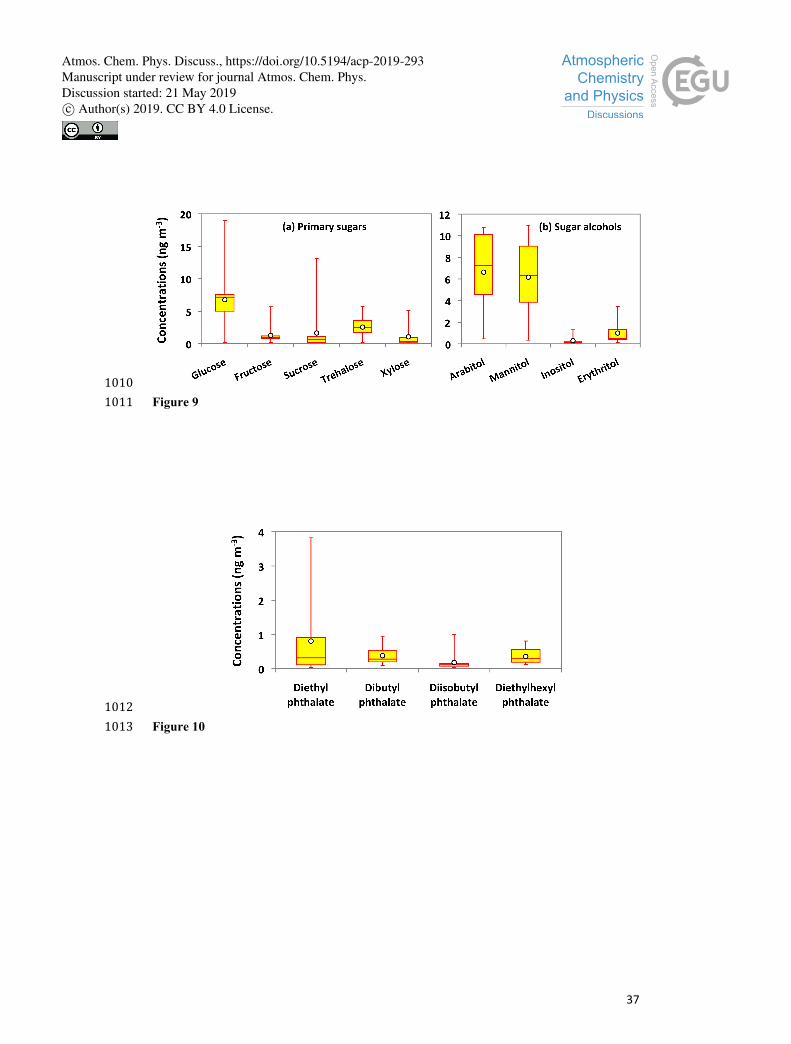
37
1010Figure 9 1011
1012Figure 10 1013
Atmos. Chem. Phys. Discuss., https://doi.org/10.5194/acp-2019-293Manuscript under review for journal Atmos. Chem. Phys.Discussion started: 21 May 2019c© Author(s) 2019. CC BY 4.0 License.
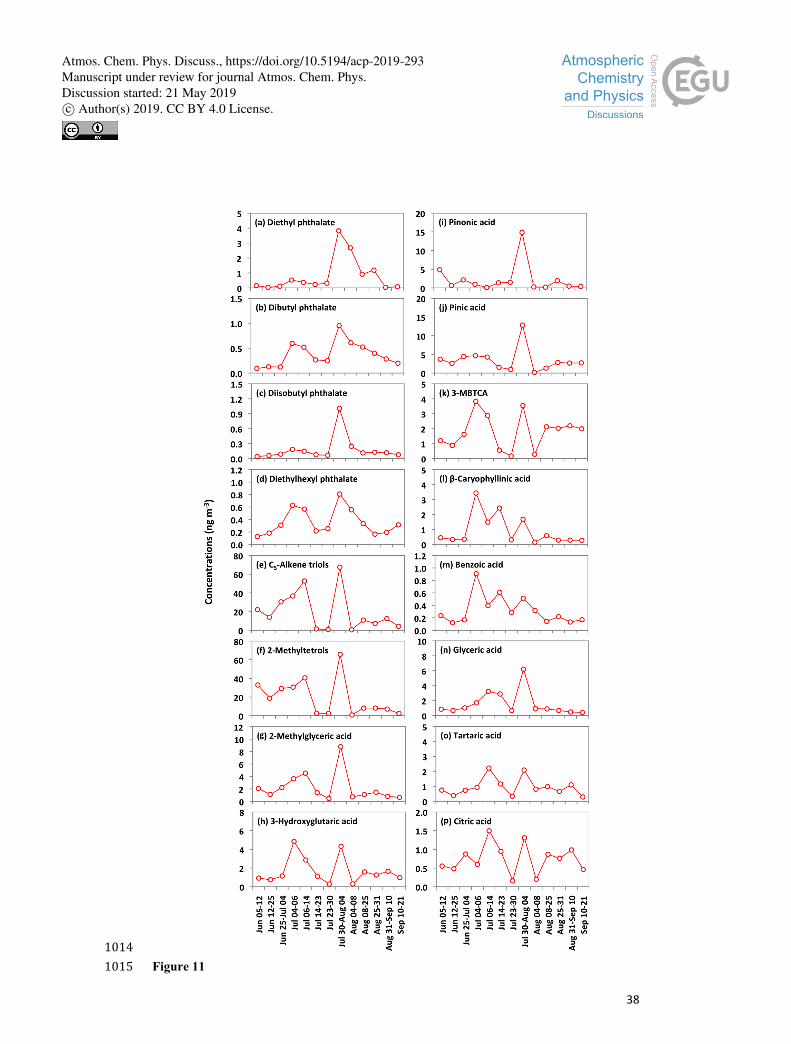
38
1014Figure 11 1015
Atmos. Chem. Phys. Discuss., https://doi.org/10.5194/acp-2019-293Manuscript under review for journal Atmos. Chem. Phys.Discussion started: 21 May 2019c© Author(s) 2019. CC BY 4.0 License.
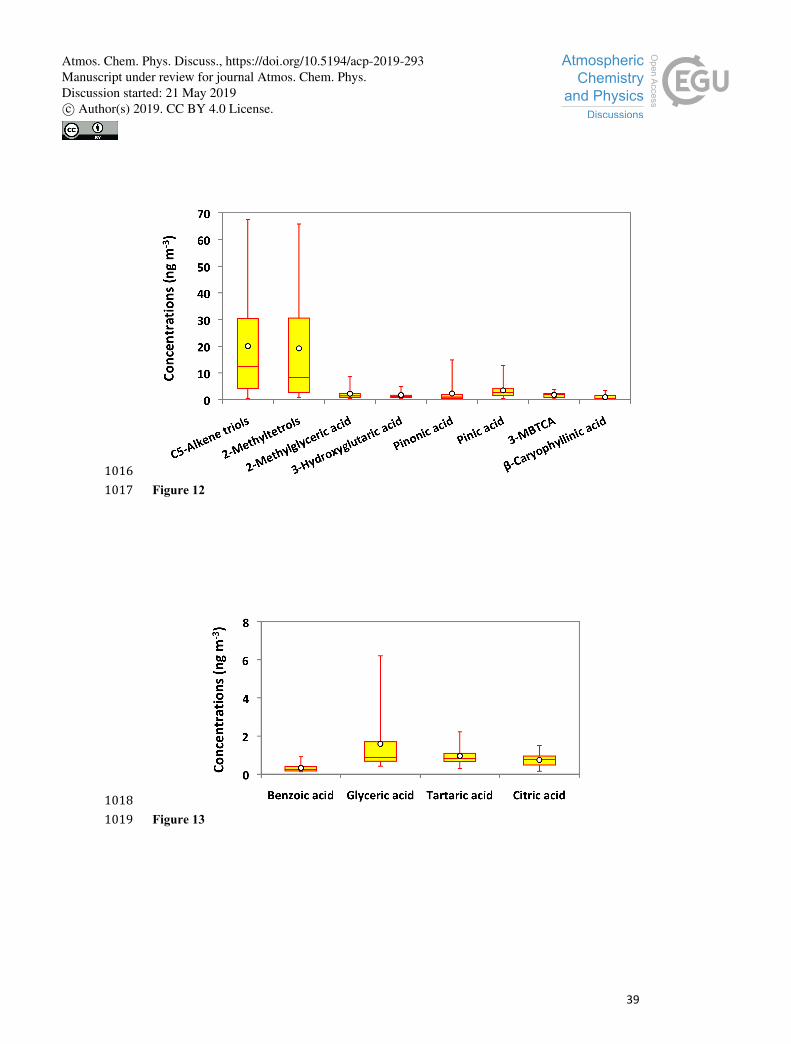
39
1016Figure 12 1017
1018Figure 13 1019
Atmos. Chem. Phys. Discuss., https://doi.org/10.5194/acp-2019-293Manuscript under review for journal Atmos. Chem. Phys.Discussion started: 21 May 2019c© Author(s) 2019. CC BY 4.0 License.


