Embed Size (px)
Citation preview
1
HEC MONTRÉAL
Internationalization Speed: Strategies in the Low-Carriers (LCCs) Industry par
Othman NAMLI
Sciences de la gestion (Option International Business)
Mémoire présenté en vue de l’obtention du grade de maîtrise ès sciences en gestion
(M. Sc.)
July 2020 © Othman NAMLI, 2020
2
2
Table of contents
CHAPTER 1: INTRODUCTION ................................................................................................... 13
LITERATURE GAP AND RESEARCH QUESTIONS ....................................................................................... 14 RESEARCH CONTEXT ............................................................................................................................. 15
Definition and growth ...................................................................................................................... 16 LCC internationalization uniqueness .............................................................................................. 17 Source of learning for airlines ......................................................................................................... 17 Conclusion ....................................................................................................................................... 17
METHODOLOGY OVERVIEW .................................................................................................................. 17 STRUCTURE OF THE THESIS ................................................................................................................... 18
CHAPTER 2: LITERATURE REVIEW ........................................................................................ 20
INTERNATIONALIZATION PROCESS THEORIES: ...................................................................................... 20 Uppsala model ................................................................................................................................. 21 Network Model ................................................................................................................................. 23 Born Global ..................................................................................................................................... 25
INTERNATIONALIZATION IN THE LCCS INDUSTRY. ................................................................................ 27 SPEED OF INTERNATIONALIZATION ....................................................................................................... 28
Definition of Internationalization’s Speed ....................................................................................... 28 Measurement of internationalization speed ..................................................................................... 29
FACTORS INFLUENCING SPEED OF INTERNATIONALIZATION ................................................................. 31 Technology ....................................................................................................................................... 33 Competition ...................................................................................................................................... 34 Management and Knowledge Learning ........................................................................................... 34 Business Networks ........................................................................................................................... 35 Firm’s Strategy ................................................................................................................................ 36 Firm’s Resources and Capabilities .................................................................................................. 36 Innovation ........................................................................................................................................ 37 Opportunity development ................................................................................................................. 37 Institutional Environment ................................................................................................................ 38
CHAPTER 3: METHODOLOGY .................................................................................................. 40
THEORETICAL FRAMEWORK .................................................................................................................. 40 RESEARCH DESIGN ................................................................................................................................ 47 STEP 1: DATA COLLECTION ................................................................................................................... 49
3
3
STEP 2: EVENT HISTORY DATABASE ..................................................................................................... 50 STEP 3: CASES PRESENTATION .............................................................................................................. 51 STEP 4: INTERNATIONALIZATION SPEED MEASUREMENT. ..................................................................... 51 STEP 5: CROSS ANALYSIS OF DIFFERENCES AND PATTERNS ................................................................. 53
CHAPTER 4: CASES PRESENTATION ....................................................................................... 55
AIR CANADA ROUGE ............................................................................................................................. 55 Internationalization Journey ............................................................................................................ 55 Technology ....................................................................................................................................... 56 Competition ...................................................................................................................................... 57 Management ..................................................................................................................................... 58 Business Network and Knowledge ................................................................................................... 59 Firm’s Resources ............................................................................................................................. 61 Strategy ............................................................................................................................................ 63 Innovation ........................................................................................................................................ 64 Opportunity Development ................................................................................................................ 65 Domestic Commitment ..................................................................................................................... 66 Regulatory Environment and Institutional Theory .......................................................................... 67
RYANAIR ............................................................................................................................................... 68 Internationalization Journey ............................................................................................................ 69 Technology ....................................................................................................................................... 69 Competition ...................................................................................................................................... 71 Management and Knowledge ........................................................................................................... 72 Business Network and Knowledge ................................................................................................... 73 Firm’s Resources ............................................................................................................................. 74 Strategy ............................................................................................................................................ 76 Innovation ........................................................................................................................................ 77 Opportunity Development ................................................................................................................ 78 Domestic Commitment ..................................................................................................................... 79 Institutional environment ................................................................................................................. 79
EASYJET ................................................................................................................................................ 81 Internationalization Journey ............................................................................................................ 81 Technology ....................................................................................................................................... 82 Competition ...................................................................................................................................... 84 Management ..................................................................................................................................... 84 Business Network and Knowledge ................................................................................................... 86 Firm’s Resources ............................................................................................................................. 87
4
4
Strategy ............................................................................................................................................ 89 Innovation ........................................................................................................................................ 89 Opportunity Development ................................................................................................................ 90 Domestic Commitment ..................................................................................................................... 90 Regulatory Environment and Institutional Theory .......................................................................... 91
JETBLUE ................................................................................................................................................ 91 Internationalization Journey ............................................................................................................ 91 Technology ....................................................................................................................................... 92 Competition ...................................................................................................................................... 95 Management and Knowledge ........................................................................................................... 96 Business Network ............................................................................................................................. 98 Firm’s Resources ........................................................................................................................... 100 Strategy .......................................................................................................................................... 102 Innovation ...................................................................................................................................... 103 Opportunity Development .............................................................................................................. 104 Domestic Commitment ................................................................................................................... 104 Regulatory Environment and Institutional Theory ........................................................................ 105
SOUTHWEST AIRLINES ......................................................................................................................... 106 Internationalization Journey .......................................................................................................... 106 Technology ..................................................................................................................................... 107 Competition .................................................................................................................................... 112 Management ................................................................................................................................... 114 Business Networks ......................................................................................................................... 118 Firm’s Resources ........................................................................................................................... 120 Strategy .......................................................................................................................................... 125 Innovation ...................................................................................................................................... 125 Opportunity Development .............................................................................................................. 126 Domestic Commitment ................................................................................................................... 127 Regulatory Environment and Institutional Theory ........................................................................ 128
CHAPTER 5: INTERNATIONALIZATION’S SPEED MEASUREMENTS OF LCCS ............. 132
MULTIDIMENSIONAL MEASUREMENT ................................................................................................. 134 Air Canada Rouge: ........................................................................................................................ 134 Ryanair ........................................................................................................................................... 138 EasyJet ........................................................................................................................................... 141 JetBlue ............................................................................................................................................ 144 Southwest Airlines .......................................................................................................................... 147
5
5
UNIDIMENSIONAL MEASUREMENT: ..................................................................................................... 149 Pre-Entry Measurement ................................................................................................................. 149 Post Entry measurement ................................................................................................................ 150
INTERNATIONALIZATION’S SPEED COMPARISON ................................................................................. 155 Multidimensional Analysis ............................................................................................................. 155 Unidimensional Analysis ............................................................................................................... 158 Conclusion ..................................................................................................................................... 159
CHAPTER 6: ANALYSIS AND DISCUSSION ............................................................................ 160
SUPRA-ORGANIZATION LEVEL ............................................................................................................ 161 Institutional Environment .............................................................................................................. 162 Competition .................................................................................................................................... 165 Business Networks ......................................................................................................................... 168
ORGANIZATIONAL LEVEL .................................................................................................................... 171 Technology ..................................................................................................................................... 172 Resources ....................................................................................................................................... 187 Firm’s Strategy .............................................................................................................................. 190 Innovation ...................................................................................................................................... 192 Opportunity Development .............................................................................................................. 194
INDIVIDUAL LEVEL .............................................................................................................................. 196 Management and Knowledge ......................................................................................................... 197
CHAPTER 7: CONCLUSION ...................................................................................................... 202
ACADEMIC CONTRIBUTION ................................................................................................................. 203 PRACTICAL CONTRIBUTIONS ............................................................................................................... 204 LIMITATION AND FURTHER RESEARCH ................................................................................................ 205
6
6
List of Figures
Figure 1: Customer as a focal point in a business network of relationship ................................... 25
Figure 2: Levels of analysis that impact the speed of internationalization .................................... 41
Figure 3: Levels and factors that impact the speed of internationalization ................................... 44
Figure 4: Theoretical framework that assesses factors that influence firms’ speed of
internationalization ........................................................................................................................ 46
Figure 5: Major LCCs at the worldwide market by revenue in 2018 (in Billion USD) ................ 47
Figure 6: The fleet size and mix development during 2011-2019 ................................................. 88
Figure 7: Southwest Airlines fleet growth -Boeing 737- during 1971-2019 ............................... 122
Figure 8: Fleet size of the major worldwide airlines in 2019 ...................................................... 123
Figure 10: Air Canada Rouge network of international destination by 2018. ............................. 135
Figure 11: EasyJet international destinations .............................................................................. 141
Figure 12: Theoretical framework that assesses factors that influence firms’ speed of
internationalization ...................................................................................................................... 161
Figure 13: Supra-organization level of analysis on internationalization speed of LCCs ............ 162
Figure 14: Timeline of capacity reduction of competitors and increased internationalization of the
fast and moderate speed LCCs ..................................................................................................... 167
Figure 15: Capacity reduction of competition and international growth of EasyJet ................... 167
Figure 16: Organizational level of analysis on internationalization speed of LCCs ................... 171
Figure 17: RMS Role in influencing internationalization speed ................................................. 173
7
7
Figure 18: RMS positioning in the LCCs value chain activities. ................................................ 175
Figure 19: Air Canada Rouge RMS development vs internationalization activities ................... 178
Figure 20: Ryanair RMS development vs internationalization activities. ................................... 179
Figure 21: EasyJet RMS development vs internationalization activities ..................................... 180
Figure 22: JetBlue RMS development vs internationalization .................................................... 181
Figure 23: Southwest Airline RMS development vs internationalization activities .................... 182
Figure 24: Individual level of analysis on internationalization speed of LCCs ........................... 196
8
8
List of Tables
Table 1: Summary of factors influencing internationalization speed ............................................ 32
Table 2: The total number of documents ....................................................................................... 49
Table 3: Summary table of key findings of internationalization speed measurements of LCCs . 133
Table 4: CAGE Distance for Air Canada Rouge between host countries and Canada (Continued)
...................................................................................................................................................... 136
Table 5: CAGE Distances for Ryanair between host countries and Ireland ................................ 139
Table 7: Table of the CAGE distance of EasyJet host countries and UK .................................... 142
Table 9: CAGE Distances for JetBlue Airways between host countries and the US .................. 146
Table 11: CAGE Distances for Southwest Airlines between host countries and US .................. 148
Table 12: Multidimensional Summary Table Calculation ........................................................... 157
Table 13: Unidimensional Speed Measurement Summary .......................................................... 158
Table 14: Key findings of competition faced by each studied LCC ............................................ 165
Table 16: Key findings of LCCs business network ..................................................................... 168
Table 18: Key findings of online sales of LCCs .......................................................................... 186
Table 19: Key findings of Resources of the studied LCCs in relation to internationalization speed
...................................................................................................................................................... 187
Table 21: Strategies implemented by the studied LCCs .............................................................. 190
Table 22: Innovations of the different studied LCCs ................................................................... 192

9
9
Table 23: Key findings of opportunity identification and development of LCCs in regard to
internationalization. ..................................................................................................................... 194
Table 24: Key findings emerging from each case’s management role in influencing
internationalization. ..................................................................................................................... 197
10
10
Abstract
Objective: The thesis studies the speed of internationalization in the LCCs industry. The first objective is to measure different internationalization speeds of LCCs through multidimensional and unidimensional methods. These measurements enable differentiating between LCCs based on speed and examine the forces influencing a high or slow speed of internationalization. Understanding these forces facilitates the management of the internationalization speed of LCCs.
Methodology: The thesis studies major LCCs that are Air Canada Rouge, Ryanair, EasyJet, JetBlue, and Southwest Airlines. After collecting data in an event history database (Edwards, 2013), case presentations were developed based on the narrative strategy (Langley, 1999). Data analysis adopted cross pattern analysis (Eisenhardt, 1989) with the aid of sensemaking strategies (Langley, 1999). The data collection relied on archival documents in the form of annual reports, letters to shareholders, conference calls, and LCCs press releases for the period of study 2000-2018. Data collection generated more than 1000 documents over more than 15,000 pages. Also, complementary data was used from public televised interviews of executives, public LinkedIn profiles, and industry reports.
Results: The internationalization speed of LCCs is influenced by three levels of factors that are supra-organizational, organizational, and individual. For organizational level, technology, strategy, resources, and opportunity development represent a source of rapid internationalization. However, innovation is not equally important to internationalization speed as the other forces at the supra-organizational level. The supra-organizational and individual levels are a source of strong influence on internationalization speed components and lead to different speeds. While management experience and risk-taking traits lead to rapid internationalization, the institutional environment and competition are external forces that control the speed of internationalization of LCCs. As a result, a three-level analysis framework is proposed to understand the reason behind LCCs internationalizing at different speeds.
Limitations: The thesis limitation starts with the reliance on secondary data and the bias of researchers emerging from case study methods. Also, the transferability of results is another source of limitation resulting from the methods.
Contributions: The thesis examined the link of influence on internationalization speed through international commercial intensity, market breadth, and commitment of foreign resources (Casillas & Acedo, 2013). The theoretical framework was based on the research of different forces influencing internationalization speed that were grouped in a three-level analysis (supra-organizational, organizational, and individual). Also, the thesis measured internationalization speed of LCCs through multidimensional methods (Lin, 2012; Chang & Rhee, 2011; Chetty et al.,
11
11
2014; Casillas & Acedo, 2013) and unidimensional methods (Ramos et al., 2011; Musteen et al., 2010; Chetty et al., 2014.; Zhou, 2007).
Originality: A limited application of internationalization speed measurement in different industries was suggested by Chetty et al. (2014). The study acknowledges the different definition of internationalization speed that was rarely captured by research in the field (Autio et al., 2000). Lastly, the thesis answers the call of Oviatt and McDougall (2005) by merging international business and international entrepreneurship research in studying internationalization speed. This answer also contributes to a further understanding of the sources of influence on internationalization speed in the LCC industry (Prashantham & Young, 2011).
Keywords: Low-cost carriers, internationalization speed, internationalization speed measurements, force of influence, multiple case study.

12
12
Acknowledgements
First, I would like to bow down to my family who didn’t only blindly believed in me but also
supported me along the way. I believe in no self-made person as the journey to fulfillment is filled
with great people who, each in his/her own turn, show you the way.
I am forever indebted to the generous and continuous support I was bestowed with by Dr.
Gwyneth Edwards. Dr. Gwyneth was always there to instantaneously guide me in unpuzzling my
challenges.
Thank you HEC Montreal and to all faculty and staff who taught me or enlightened my
journey with continuous support. Thank you to my hidden support group who took turn in making
my Msc journey as fun and enriching as possible by, reminding me to breathe and persevere in the
face of adversity.
I bow down to my mum, Grandma (Oumi), Grandpa (Abi), Amal, Najat, Souad who taught
me what unconditional support is in its truest form. Thanks to my father and to all the family for
shaping who I become.
The current endeavor represents only a steppingstone among others in my personal
development journey and will remain a triggering point of a long journey of continuous result-
driven curiosity.
Let the journey begin!

13
13
Chapter 1: Introduction
Internationalization speed is a concept that has been defined by various scholars and
researchers in the international business (Chetty et al., 2014) and international entrepreneurship
fields (Oviatt & McDougall, 2005; Rialp et al., 2005). For internationalization, academics agree on
a common definition. It is commonly defined as the dynamic process where firms increase their
level of involvement in foreign markets (Casillas, & Moreno-Menéndez, 2014) throughout a series
of methods such as the discovery, enactment, evaluation, as well as the exploitation of new cross-
border markets (Langseth et al., 2016). But concerning the speed of internationalization, the
definition is ambiguous. For some authors, it refers to the forces that impact the timing of the speed
of entry, which refers to the period between the firm’s foundation and its initial international
operation (Casilla, & Moreno-Menéndez, 2014). For other authors, the speed of
internationalization refers to the post-entry expansion pace (Prashantham & Young, 2011).
In addition to the “why,” “where,” and “how” in international business, internationalization
speed answers the “when” question for internationalization research (Casillas & Acedo, 2013;
Eden, 2009; George & Jones, 2000). For internationalization, speed needs to be considered in
parallel to market selection and mode of entry (Eden, 2009; Casillas & Acedo, 2013). However,
internationalization speed remains an “under-investigated” concept (Casillas & Acedo, 2013,
p.15), which was rarely studied by combining both streams of research: international business and
entrepreneurship (Oviatt & McDougall, 2005). Oviatt and McDougall (2005) have further
indicated that there is an urge to define the speed of internationalization while combining the
international business and international entrepreneurship fields.
Initially, in research on internationalization, researchers focused mainly on two main
dimensions: entry modes and choice of markets (Casillas & Acedo, 2013). However, during the
last decade, the focus has been transitioning towards including the speed not only as a dependent
variable, but as the focus of internationalization research (Casillas & Acedo, 2013; Humerinta-
Peltomäki, 2003). More recent contributions within the international entrepreneurship field
emphasized speed as a third important dimension, in addition to location and entry mode (Casillas
& Moreno-Menendez, 2014; Zahra & George, 2002).
14
14
In the contribution of Chetty et al. (2014), the authors indicate that global firms challenged
earlier limited research on speed emerging from the traditional Uppsala model, which refers to
firms entering nearby markets with incremental commitments. The challenge was represented by
the short time to internationalization. For Eden (2009), the limited research on the speed of
internationalization emerging from traditional models. This rarity is explained by the limited
number of researches that focused on time and speed as objectives of research (Eden, 2009). The
accelerated internationalization of firms raised the necessity to develop internationalization speed
research (Zahra et al., 2004).
Existing literature that defines the speed of internationalization still debates its differences,
commonalities, as well as the different factors that impact it. For instance, Chetty et al. (2014) and
Casillas and Moreno-Menendez (2014) both considered learning and experiential learning as part
of the speed construct, while Chetty et al., (2014) further added commitment to the construct.
Casillas & Acedo (2013), however, defined internationalization speed based on the variation of the
commitment of foreign resources, breadth of international markets, and international commercial
intensity.
This thesis contributes to the literature by assessing factors and forces that determine the
speed of internationalization in the low-cost carriers (LCCs) industry. While this topic adds value
to the existing literature related to the speed of internationalization, it is also essential for decision-
makers, to avoid the overstretching of firms’ resources while pursuing international opportunities
(Chetty et al., 2014). Understanding the forces that influence the speed of internationalization
within the LCC industry will allow managers to make efficient resource' allocation decisions
(Chetty et al., 2014), avoid sources of growth disruptions, and positively impact firm performance
(Musteen et al., 2010; Vermeulen & Barkema, 2002; Wagner, 2004).
Literature gap and research questions
Casillas and Acedo (2013) indicate that the existing literature largely discusses the
internationalization process but, until the last decade, failed to capture speed as a core component
to that process (Casillas & Acedo, 2013). Even today, few papers focus on the speed of
internationalization as the phenomenon of the research. According to Chetty et al. (2014), there are
no clear discussions about the nature of the speed of the internationalization concept. For instance,
15
15
Autio et al. (2000) indicate that several studies do not distinguish between internationalization
speed and time to internationalize. Also, Prashantham and Young (2011) suggest that there is a
lack of knowledge related to the factors that impact the speed of internationalization. This is mainly
due to the limited number of comparative studies investigating the source of impact on
internationalization speed and why some firms fail to move faster than others (Prashantham and
Young, 2011)
The current contribution adds value to the literature by discussing the measurements as well
as the influencing factors of the internationalization speed of LCCs. Thus, the thesis pursues the
following research questions:
• How can internationalization speed be measured in the LCC industry?
• Why do LCCs internationalize at different speeds?
In answering the research questions, the current contribution combines factors as well as
forces that impact the speed of internationalization from international business and international
entrepreneurship fields. Merging factors that influence the speed of internationalization from these
latter fields is not common in the existing literature (Oviatt & McDougall, 2005), as few articles
were able to combine them (Prashantham & Young, 2011).
Research Context
Consistent with the internationalization speed research domain, speed is a central
characteristic of the research context: airlines. Speed impacts the pace of travel and movement of
goods across the world, in part, through the active role of airlines. Yet, it is essential to note that
the airline industry is composed, among others, of full-service airlines and LCCs (Belobaba et al.,
2015). This latter sub-category is the main focus of this thesis. Within the LCC industry, the speed
of internationalization intuitively seems to have an impact on the increase of passenger circulation
within and across countries. The airline industry, in general, is considered to be one of the critical
industries for many economies in the world, where it is considered a significant economic force in
some countries (ATAG, 2005; Belobaba et al., 2015). The airline industry also contributes to the
world economy with revenues that account for $838 billion as of 2019 (IATA, 2019, December
11).
16
16
The emergence and growth of the LCC model date back to 1978 with Southwest Airlines
and the Airlines Deregulation Act of 1978 (IATA, 2019, December 11; de Wit, & Zuidberg, 2012).
Before this act, the US Airline market was controlled by the Civil Aeronautics Board (CAB). The
CAB controlled fares, routes, and market entry (Douglas & Miller, 1974). The Airlines
Deregulation Act of 1978 came to liberalize the US market from the control of CAB and enabled
market competition (Belobaba et al., 2015). This led to increased flight numbers and decreasing
fares (Azadian & Vasigh, 2019; de Wit, & Zuidberg, 2012). The same trend occurred in Europe as
the deregulation of European skies was introduced in the 1990s (Belobaba et al., 2015).
Definition and Growth
Compared to the full-service airlines, LCCs have a unique business model that has led to
significant growth within the industry. This model is characterized by a cost-leadership with no-
frill service, point-to-point, fleet densifications, and a high tendency for the short-haul market (de
Wit, & Zuidberg, 2012). Worldwide, LCCs have grown and captured gradually more market share
from full-service airlines by more than doubling capacities during 2003-2013 (Rozenberg et al.,
2014). With 1.5 times the growth of the total passengers carried globally, LCCs carried 11.4%
more passengers between 2016 and 2017, serving 30% of the world’s market by 2017 (ICAO, n.d).
In Europe, LCCs experienced an increase of 3200 flights per day during 2007-2016, which
represents 61% growth (EUROCONTROL, 2017; AIRLIVE, 2017). In contrast, the full-service
airlines experienced a drop of 10% in total flights market share 2007-2016 (EUROCONTROL,
2017). Plus, Anna Aero (2018) expects LCCs to capture more than half of the European market
share by 2027 (Anna Aero, 2018).
According to Sabre Air Solution (2010), LCCs have a significant potential growth in the
long-haul segments, which refers to flights exceeding four hours per trip (Binggeli & Weber, 2013).
Also, CAPA (2013) indicates that the long-haul market is underserved by LCCs. For Binggeli and
Weber (2013), the long-haul airline market represents a growth opportunity for LCCs, as they have
shown promising results for companies such as Air Asia and Jetstar Airways that have previously
entered the market. For this, Vermeulen and Barkema (2002) indicate that LCCs need to adapt and
adjust their business model to be hybrid and introduce some full-service airline processes such as
selling throughout Global Distribution Systems.
17
17
LCC Internationalization Uniqueness
For internationalization processes, LCCs use different strategies compared to full-service
airlines. For instance, LCCs engage less in alliances and focus more on foreign direct investment
(FDIs), with preference to maintain control over operations (Ramón-Rodríguez et al., 2011). While
some studies have explored the internationalization of airlines (Ramón-Rodríguez et al., 2011;
Albers et al., 2010; Al-Kwifi et al., 2019), a lack of contributions addressing the speed of
internationalization of LCCs was observed. Given the actual significant growth of this industry as
well as its potential growth, LCCs represent a productive avenue of research for the speed of
internationalization.
Source of Learning for Airlines
Given the strong margins structure (Klophaus, 2005), LCCs are a source of learning for the
global airline industry. Sabre Air Solution (2010) emphasized the strength of the strategies and
models of LCCs and suggested that some of the processes used within these companies could be
duplicated for the full-service airline industry. In the same paper, examples of LCC processes that
have been adopted by the full-service airlines that demonstrated a positive and effective impact are,
but not limited to, fare reduction and ticket restructuring.
LCCs’ ancillary revenues demonstrate the know-how that can be used by full-service
carriers to increase revenues (CAPA, 2018). Examples include aircraft densification management
and operational efficiency (Air Canada, 2017).
Conclusion
All in all, LCCs represent a relevant context for internationalization speed research for the
following reasons: 1) potential global expansion (Rozenberg et al., 2014), 2) a promising context
for academic contribution, and 3) a knowledge pipeline for the commercial airlines’ industry.
Methodology Overview
The following qualitative thesis uses multiple case studies with embedded unit of analyses
to investigate the research questions. Each case study represents an LCC company. The selection
process of LCC companies was based on market performance and geographical diversity. The
18
18
selected companies are: Air Canada Rouge, EasyJet, JetBlue Airways, Ryanair, and Southwest
Airlines.
To assess the factors influencing the speed of internationalization, the thesis starts by
differentiating between the speed of different LCCs. Among other approaches, the thesis measures
internationalization speed as the total of cultural, administrative, geographical, and economical
(CAGE) distances of each LCC, as proposed by Ghemawat (2001), times the average international
destinations per host country, divided by the internationalization period. This measurement process
enables quantifying the internationalization speed for each LCC company, which allows for cross
case comparison and analysis. This method is developed in chapter three.
After creating an event history database (Edwards, 2013), case presentations were
developed through a narrative strategy (Langley, 1999). Data analysis used visual mapping
(Langley, 1999) and cross-case patterns (Eisenhardt, 1989).
Although speed measurement is quantitative, the thesis is a qualitative study. Data
collection and analysis consisted of extensive archival documents. These documents account for
more than 15,000 pages and more than 1000 historical documents. The historical documents
include annual reports (Form-20, letter to shareholders, management discussions), analyst
conference calls, media interviews, media articles, and LCC press releases. Moreover,
complementary data was used, including televised interviews of top management, LinkedIn
(verification of executives) and industry reports. The period of the study focuses on 2000-2018, as
this period reflects the “fast growth [of LCCs] after 1999” (Alderighi et al., 2012, p. 224), and the
disruptive competition of LCCs during 2000-2010 (Fiig et al., 2015).
Structure of the Thesis
While the first chapter was an introductory one, the rest of the thesis is structured as follow:
chapter two presents the literature review of different internationalization models, the definition
and the measurement of the internationalization speed, factors that influence the speed of
internationalization, and the internationalization process of LCCs. This is followed by the third
chapter that discusses the theoretical framework as well as the research model. Chapter four
discusses the internationalization speed measurement of the studied LCCs, while chapter five

19
19
presents the cases of each of the LCC companies. Chapter six presents and discusses the findings,
while Chapter seven concludes.
20
20
Chapter 2: Literature review
The following chapter presents the literature review related to this thesis research question,
that is, why do LCCs internationalize at different speeds? The current chapter is divided into three
main sections. The first section reviews the internationalization process models and theories that
account for the traditional stage model, the network model, and the born-global model. The
literature excludes the eclectic paradigm internationalization model, as it has a limited direct link
to the speed component. This is to provide a clear understanding related to the current
internationalization models that account for speed before discussing the speed of
internationalization in depth. The speed of internationalization is the core of the second section of
the literature review, as it is the focus of the thesis. The second section will discuss the different
definitions, measurement approaches, and factors influencing the internationalization speed.
Finally, the third section of this chapter will present the different internationalization strategies
currently adopted by LCCs.
Internationalization Process Theories
The international environment has become in the most recent decades a complex
environment, which serves not only big firms and corporations, but also small and medium-sized
companies. It is important to note that internationalization strategies are used by all type of firms
with the intention to rapidly serve different markets across the globe (Ribau et al., 2015). The
interest of scholars in firms’ internationalization has led to changing and adapting its different
frameworks, assumptions, models, and theories (e.g. Ietto-Gillies, 2012; Moreira, 2009; Bayfield
et al., 2009).
By definition, the internationalization process displays the path adopted by firms in
expanding and adapting to different host environments (Kuivalainen et al., 2012). For this, some
of the international business literature has proposed three internationalization process theories. But
for contributions, they have proposed four main conventional theories of internationalization
(Ribau et al., 2015). This difference between theories roots back to the differences in the definition
of the internationalization concept. For Porter (1990), the author argued that the development of
foreign business activities comes after a period of domestic maturation. This school of thought
21
21
proposes that companies internationalize in distinct stages with an increase in commitment over
time (Johanson & Vahlne, 1977; Aharoni, 1966). But concerning Johanson and Mattson (1988),
the authors argue that firms internationalize through a network of business relationships. But with
regards to Chetty and Campbell-Hunt (2004) the authors suggest that internationalization
development led to the emergence of a born global firm that internationalize since inception. These
latter authors indicate that “domestic maturation” is less important. For this matter, the following
section will discuss and review the four existing internationalization process theories.
Uppsala Model
The internationalization process has been analyzed by many researchers as a process that
takes place over time, and after companies understand the market they perform in (Ribau et al.,
2015). This idea had a large impact on firms’ international marketing strategies (Moen and Servais,
2002), and has been enriched by many scholars (e.g. Prange & Verdier, 2011). Also, the idea has
led Johanson and Vahlne (1977) to develop one of the first internationalization theories that is
referred to as the “Uppsala model”.
The Uppsala model is considered as a stage model, which suggests that firms
internationalize incrementally and gradually through different stages by building business activities
and developing commitment over time (Johanson & Vahlne, 1977). This model assumes that the
internationalization of firms is the result of “uncertainty and bounded rationality” (Johanson &
Vahlne, 2009, p.1412), and of the lack of understanding of foreign markets (Prange and Verdier,
2011). In order to illustrate this, and while proposing the Uppsala model, Johanson and Vahlne
(2009) have analyzed the internationalization of Swedish firms and proposed that firms
internationalize incrementally by first exporting, second having middlemen who facilitate the
business in the host country, third opening a sales subsidiary that takes upon the role of
intermediary, and finally creating a production facility unit or establishing a formal presence in the
host country.
This internationalization model has contributed massively to researches related to firms’
internationalization and was largely cited in the international management field (Ahokangas, 1998;
Bjorkman & Forsgren, 2000; Catherine & Matthyssens, 2001). Nonetheless, the model was
criticized by many researchers who did not agree with the risk aversion assumption (Hadjikhani,
22
22
1997). These latter types of authors indicate that the different contributions, which assess firms’
internationalization through this model, did not use the main constructs, and tested the process
using an “indirect empirical verification” (Papadopoulos & Martín, 2010).
This model has been perceived by many scholars as static, and limits predicting the patters
of the internationalization processes (Oviatt & McDougall, 1999). Researchers also argue that the
traditional model assumes that firms are not looking primarily for internationalization
opportunities, which makes it not respond to the “how”, and mostly “when” firms should start
internationalizing (Leonidou & Katsikeas, 1996; Autio et al., 2000). For this, Andersen (1993)
urges the need of further researching and expanding the Uppsala model in terms of longitudinal
line, explanatory power, and other parameters, which will further enable explaining the
internationalization concept and needs.
In the revised Uppsala Model, Johanson and Vahlne (2009) showed the importance of
business networks, opportunity development, and knowledge learning in the internationalization
process. These elements are reappearing and discussed in the internationalization speed research.
Concerning the business network element, Johanson and Vahlne (2009) argue that it shapes the
entry mode and the direction of internationalization. The lack of a business network position, in a
foreign country, puts the entering firm in the outsider shoe that increases with it the liability of
foreignness and the difficulty to enter the market (Johanson & Vahlne, 2009). In post-entry, Chetty
and Campbell-Hunt (2004) have proposed that traditional model firms rely gradually less on
business networks and more on established resources. This observation was the result of
incremental engagements, where firms build their capabilities in the host country. Also, markets
are organized and interact in a complex manner and create an invisible network (Johanson &
Vahlne, 2009). Hence, business networks have an important role in facilitating internationalization
by reducing market entry difficulties and uncertainties (Johanson & Vahlne, 2009).
Internationalization is also driven by the opportunities presented in targeted countries.
Perceived opportunities need to be developed through discovery and creation (Johanson & Vahlne,
2009). For this, the level of knowledge and the capacity of knowledge development are critical to
internationalization (Johanson & Vahlne, 2009). It is important to note that prior experiences and
international knowledge of the management reduce the uncertainty of internationalization and
23
23
facilitates the entry, as “they are the carriers of (tacit) knowledge, trust, commitment, and network
relations.” (Johanson & Vahlne, 2009, p.1423).
The authors further developed the Uppsala model from the risk perspective management as
well as its corresponding implications on the different stages of internationalization. Results
indicate that the level of commitment and uncertainty changes contributes to the level of risk
aversion of firms. This model can be used by small to medium-sized companies and large
multinationals (Johanson & Vahlne, 2009).
Network Model
Internationalization through network model was advanced in the 1980s by Johanson &
Mattson (1988). It was built on the assumption that the market is organized as a network of business
relationships (Blankenburg & Johanson, 1992). At the international level, interconnecting networks
emerge and influence international business (Blankenburg & Johanson, 1992). It is of prime
importance to note that the network model quickly gained popularity (Törnroos, 2000), mainly
after the contribution conducted by the “Industrial Marketing and Purchasing” group (Brito &
Silva, 2009). This contribution indicates that the network model focuses on three main
determinants to analyze as well as understand firms’ systems. These variables are: actors –that refer
to firms-, their corresponding activities, and their resources (Ribau et al., 2015).
The interdependence between firms at the international level promotes increased mutual
value creation (Johanson & Mattson, 2015). This value creation is translated into an increased
presence in different foreign markets. Moreover, business partners are key to entering foreign
markets (Holm, Eriksson, & Johanson, 1999). The network model accepts two dimensions for
internationalization that are related to the firm and targeted markets (Johanson & Mattson,
2015). These two dimensions are the degree of market internationalization and the level of the
company’s internationalization (Johanson & Mattsom, 1988; 2015).
Based on industrial firms, Johanson and Mattson (2015) propose the network model as an
alternative to the Uppsala model by highlighting two important dimensions that are “experiential
learning and gradual commitments.” The network model is different from the Uppsala model such
as it resides in the incremental and progressive internationalization through successive steps
24
24
(Johanson & Vahlne, 2009). On the contrary, the network model emphasizes the understanding of
internationalization through the business network and the varying effects of business relationships
on internationalization (Johanson & Mattson, 2015).
The current and previous relationship of a company with external business actors is
reflected in the firm’s position within the network (Johanson & Mattsson 1988). For example,
Mitgwe (2006) has presented the case of high-tech firms that internationalize through business
networks. This internationalization is facilitated by the experience and resources provided by the
business network (Mitgewe, 2006). Thus, external organization and business actors in the network
are sources of internationalization influence (Johanson & Mattson, 2015). Furthermore, Johanson
and Mattson (2015) argued that the internationalization of the firm is influenced by its degree of
relationship with foreign network and external business actors. The degree of influence is based on
the firm’s position, level of integration, and type of relationship bonds established with external
business actors (Johanson & Mattson, 1988; 2015).
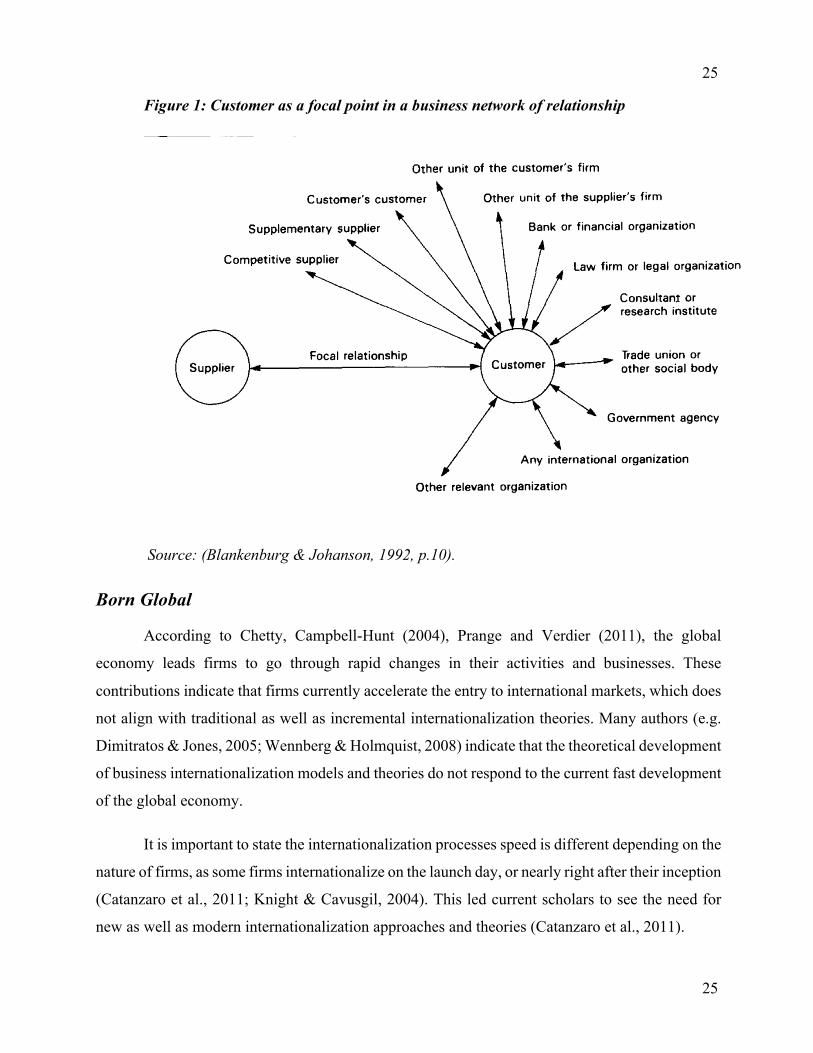
Blankenburg & Johanson (1992) indicate that business relationships are established through
customer rather than the supplier. Customer is seen as a focal point (Figure 1) that interacts with
various business actors such as banks, customer’s customer, and competitive supplier
(Blankenburg & Johanson, 1992). For instance, a firm may be asked or pressured to follow its
client in a foreign market, which makes the customer represents one of the internationalization
drivers in the business network. Business network mutuality is important to value creation through
increased commitment in the web network of business relationships (Holm et al., 1999). However,
the higher the control of business relationships across the border, the higher the cost incurred
(Blankenburg & Johanson, 1992). A strongly connected business relationship across borders may
result in reduced business freedom (Blankenburg & Johanson, 1992). Finally, the network model
of internationalization consists of firms engaging, establishing, and developing a network of
business relationships in the home and host countries (Johanson & Mattson, 1988; 2015). The
motives of internationalization through the network model are international extension, penetration,
or integration (Johanson & Mattson, 1988). In brief, business arrangement lessens bumps during
internationalization and consequently influences the speed of internationalization positively.
25
25
Figure 1: Customer as a focal point in a business network of relationship
Source: (Blankenburg & Johanson, 1992, p.10).
Born Global
According to Chetty, Campbell-Hunt (2004), Prange and Verdier (2011), the global
economy leads firms to go through rapid changes in their activities and businesses. These
contributions indicate that firms currently accelerate the entry to international markets, which does
not align with traditional as well as incremental internationalization theories. Many authors (e.g.
Dimitratos & Jones, 2005; Wennberg & Holmquist, 2008) indicate that the theoretical development
of business internationalization models and theories do not respond to the current fast development
of the global economy.
It is important to state the internationalization processes speed is different depending on the
nature of firms, as some firms internationalize on the launch day, or nearly right after their inception
(Catanzaro et al., 2011; Knight & Cavusgil, 2004). This led current scholars to see the need for
new as well as modern internationalization approaches and theories (Catanzaro et al., 2011).
26
26
Existing literature suggested analyzing the speed in terms of the period that separates the
firm’s inception and the first foreign business development. In other terms, it is the shorter time
between inception and first international entry that gave birth to international new ventures or born
global firms (Olejnik and Swoboda, 2012; Cerrato and Fernhaber, 2018). Subsequently, the current
literature has been interested in the internationalization of firms since inception or few years after
birth. This interest has produced many definitions that converge on the nature of rapid entries in
multiple markets since inception (Oviatt & McDougall, 1997).
Definitions for born global firms diverge on the portion of international sales required to
qualify for born global definition as well as the time to internationalize since inception. Not only
firms that internationalize since inceptions are regarded as born global, but also those that
internationalize a few years after inception (Chetty & Campbell-Hunt, 2004; Knight & Cavusgil,
2004; Rennie, 1993). For example, Chetty and Campbell-Hunt (2004) and Rennie (1993) argue
that born global firms internationalize on average two years after foundation, whereas Knight and
Cavusgil (2004) propose three years on average.
The portion of the international sales is also a key variable in framing born global definition.
Knight & Cavusgil (2004) argue that at least 25% of transactions need to result from the
international market to qualify for born global status. Rennie (1993) stressed that the portion of
international sales needs to exceed 76% of sales to qualify for born global definition, whereas
Chetty and Campbell-Hunt (2004) argue for 80% of sales.
On the other hand, born global firms place less importance on the firm’s home market as
they move rapidly across borders for various reasons (Chetty & Campbell-Hunt, 2004).
Alternatively, psychic distances are less considered by born global firms during internationalization
(Chetty & Campbell-Hunt, 2004). Hence, the disruptiveness of born global firms surpasses all the
limiting factors that are linked to the home market and psychic distance as they enter rapidly
different geographical markets. Finally, born global firms rely on prior knowledge, communication
technology, and business network for rapid internationalization (Chetty & Campbell-Hunt, 2004).
27
27
Internationalization in the LCCs industry.
It is important before diving into internationalization speed research, the literature also
present the internationalization of LCCs. This discussion is to confront the internationalization
concepts and the internationalization of LCCs. The internationalization of airline industry is
complex since aircraft are designed by nature to connect two points that are located very far from
each other and falls, sometimes, within different countries and different jurisdictions.
The internationalization of airlines seems natural as the fact of serving a host country from
a home country airport is considered an export of service (Ramón-Rodríguez et al., 2011). In this
line of reasoning, the internationalization of airline industry seems evident, but the complexity
arises as the LCCs target dense primary and secondary airport while maintaining operational cost
leadership (Graham, 2013; Ramón-Rodríguez et al., 2011). While some LCCs internationalize
rapidly after inception, others remain operating only in their domestic market despite financial
strength and governmental support. For instance, since its inception in the 70s, Southwest Airline
did not fly outside of the US continental until in 2013 (Diaconu, 2012).
In understanding the internationalization process of LCCs, the academic literature has
discussed different modes of internationalization and LCCs foreign market entry. For example,
Klein et al. (2015) argue that LCC’s leadership and choice of airports represent an important factor
for foreign bases establishment. Also, Klein et al (2015) have proposed three factors that influence
the decision of LCCs to establish foreign base and these factors are: “Managerial, organizational,
and environmental” (p.17). Besides, Albers et al (2010) propose that entry modes of LCCs are
influenced by the ownership and capital structure as well as the timing of the strategic decision. On
the other hand, business network, cost of labor, and flight operations have little impact on the
decision to create foreign base (Klein et al., 2015).
Ramon-Rodriguez et al. (2011) propose that LCCs opt for different internationalization
strategies than traditional airline. In fact, LCCs opt for an FDI rather than internationalization
through alliances and joint venture to gain market entries (Ramon-Rodriguez et al., 2011). LCCs’
internationalization strategies are either through export, cooperation, or FDIs. As explained by
Albers et al. (2010), the export is in the form of serving international flight without establishing a
foreign base in the host country. The cooperation mode takes the form of marketing alliance, code-
28
28
sharing, and interlining agreements (Albers, et al., 2010). FDI mode can be translated into joint
venture, minority equity participation, full acquisition, creation of subsidiary, or the establishment
of a base (Albers et al., 2010).
Speed of Internationalization
The speed of internationalization is considered to be one of the major issues facing
researchers, and mainly managers that are about to enter or expand to new markets (Chetty et al.,
2014). For Chetty et al. (2014), it is necessary for firms to measure the speed of internationalization
to be able to balance between firms’ resources with regards to international opportunities. In the
contribution of Chetty and Campbell-Hunt (2003), findings indicate that the lack of speed
measurement, mainly in a rapid international growth environment, might lead to firms
destabilization. Thus, the speed of internationalization impacts directly firms’ international
performances (Vermeulen & Barkema, 2002; Wagner, 2004). According to Casillas and Acedo
(2013), the concept of speed within the internationalization is still under-researched. These authors
indicate that scholars did not provide clear guidance and established theoretical frameworks that
enable managing as well as measuring the speed of internationalization. For this matter, the
following section will be divided into three main parts that relate to the definition of speed of
internationalization according to the existing literature. This will be followed by a presentation of
the research of internationalization speed measurement and the factors influencing
internationalization speed.
Definition of Internationalization’s Speed
The contribution of Chetty et al. (2014) indicate that the definition of this concept is not
clear. This is mainly because the different contributions within the field that did not focus on
discussing the nature of the concept. First, many authors simply refer to the speed as the “time to
internationalize”, which is not consistent for new ventures and newborn companies that go
international at the inception (Acedo & Jones, 2007; Weerawardena et al., 2007). Second, existing
contributions define speed either using a single dimension or multi-dimension method.
29
29
In the contribution of Casillas and Moreno-Menendez (2014), the terms speed of entry and
internationalization speed are used interchangeably, and refers to the link between the process of
internationalization and time. But for Casillas and Acedo (2013), the speed is defined in a way to
show the period of time needed for a company to its international events. These definitions are
different from the one of Chang and Rhee (2011). This latter author defines speed as the firms’
number of foreign direct investments per year since its first one. Concerning Prashantham and
Young (2011), the internationalization speed is used interchangeably with post-entry speed, and it
refers to a firm’s pace of international expansion.
The construction of speed also takes into account different dimensions. For instance,
Casillas and Acedo (2013) deconstructed the speed of internationalization into three dimensions
that are the speed of change in the commitment of foreign resources, speed of change in
international commercial intensity, and the speed of change in the breadth of international markets.
Alternatively, Prashantam and Young (2011) have constructed the speed on the basis of “the
country scope speed and international commitment speed”. Last but not least, the speed of
internationalization should be taken differently than the acceleration, which is a variation of speed
in time (Chetty et al., 2014).
As mentioned earlier, time is a core component of speed. Casillas and Acedo (2013) have
advanced that the temporal dimension needs to be seen through timescale (Short vs long term) and
nature of change (Continuous vs discontinuous). Also, the views have diverged whether to account
for the time period since firm’s inception or only since first internationalization. Prashantham and
Young (2011) have considered speed in the post-entry of the internationalization, whereas Casillas
and Moreno-Menendez (2014) have proposed that speed is not limited to separate period of
internationalization but stretches from inception and covers post-entry period.
Measurement of internationalization speed
The speed is an explanatory variable that is measured differently by international business
researchers. As the construct of speed differed between scholars, the literature proposed
measurement either in the form of single unit, which is time (e.g. Ramos et al., 2011; Musteen et
al., 2010), or in the form of quotient that takes time as the denominator (e.g. Casillas & Acedo,
30
30
2013). Hereafter a discussion of the literature on multidimensional and unidimensional
measurements is presented.
Multidimensional speed measurement
Some studies proposed internationalization speed as a multidimensional measurement, in
the form of quotient (Lin, 2012; Chang & Rhee, 2011; Chetty et al., 2014; Casillas & Acedo, 2013)
and a “formative construct” (Casillas & Acedo, 2013, p.26). More importantly, the
multidimensional measurement accepts at its denominator the time’s unit as an anchor for
internationalization speed (Lin, 2012; Chang & Rhee, 2011; Chetty et al., 2014; Casillas & Acedo,
2013). For the nominator, the existing literature has proposed different components of
internationalization speed and internationalization markers (e.g., Lin, 2012; Chang & Rhee, 2011;
Chetty et al., 2014; Casillas & Acedo, 2013).
Casillas and Acedo (2013) proposed that speed’s nominator needs to account for the change
in the firm’s international business activity and behavior. Chang and Rhee (2011) measured speed
in the form of "average number of FDIs in new countries per year since the first FDI" (as cited in
Chetty et al., 2014, p.636). In parallel, Lin (2012) studies the internationalization pace and measure
it as “the average number of foreign manufacturing subsidiaries divided by the number of years
since the firm’s first foreign expansion” (as cited in Chetty et al., 2014, p.636). Internationalization
speed also needs to consider commercial intensity and increased market commitment in the host
country (Casillas & Acedo, 2013).
Commonly, the important component of speed is distance. As speed takes into
consideration the distance between home and host countries, the CAGE distance can prove as
descriptive for the speed of internationalization (Aygoren & Kadakal, 2018). CAGE distance is a
construct that account for different elements that are involved in international commercial
transactions. Ghemawat (2001) constructed CAGE distance bases on cultural, administrative,
geographical, and economical distances.
The cultural distances increase with different social norms and different languages
(Ghemawat, 2001). Administrative distance is prevalent through either political synergies or
differences, and the difference in regulatory environment (Ghemawat, 2001). Ghemawat (2001)
31
31
argues that economic distance can be seen through infrastructure, consumption, income level, and
GDP.
The speed of gaining internationalization knowledge and learning are also key components
of internationalization speed (Chetty et al., 2014). Learning through repetition and diversity of
internationalization activities are important in measuring internationalization speed (Chetty et al.,
2014). The internationalization generates experience that nurtures the company’s knowledge of the
international market and influences the subsequent internationalizations (Chetty et al., 2014).
While internationalization speed measurement needs to account for its denominator time’s
unit, the nominator needs to account for different international business activities, market
commitment (Casillas & Acedo, 2013), CAGE distance (Aygoren & Kadakal, 2018), and
knowledge learning (Chetty et al., 2014),
Unidimensional speed measurement
For unidimensional measurement, the literature has accounted for pre-internationalization
and post internationalization. For pre-internationalization, the speed is measured as the time that
separates foundation and first internationalization (Ramos et al., 2011; Musteen et al., 2010). On
the other hand, Chen and Yeh (2012) proposed internationalization speed measurement as the time
span between two consecutive foreign business activities. Also, Casillas and Moreno-Menendez
(2014) have measured internationalization’s speed as the number of days that separates between
two consecutive international operations. With regards to the contribution of Oviatt and McDougall
(2005), they measured speed as the time that separates the opportunity discovery and market entry.
Zhou (2007) adds market commitment to the speed measurement. Zhou (2007) accounts for
internationalization speed in the form of international sales portion as it surpasses 20%.
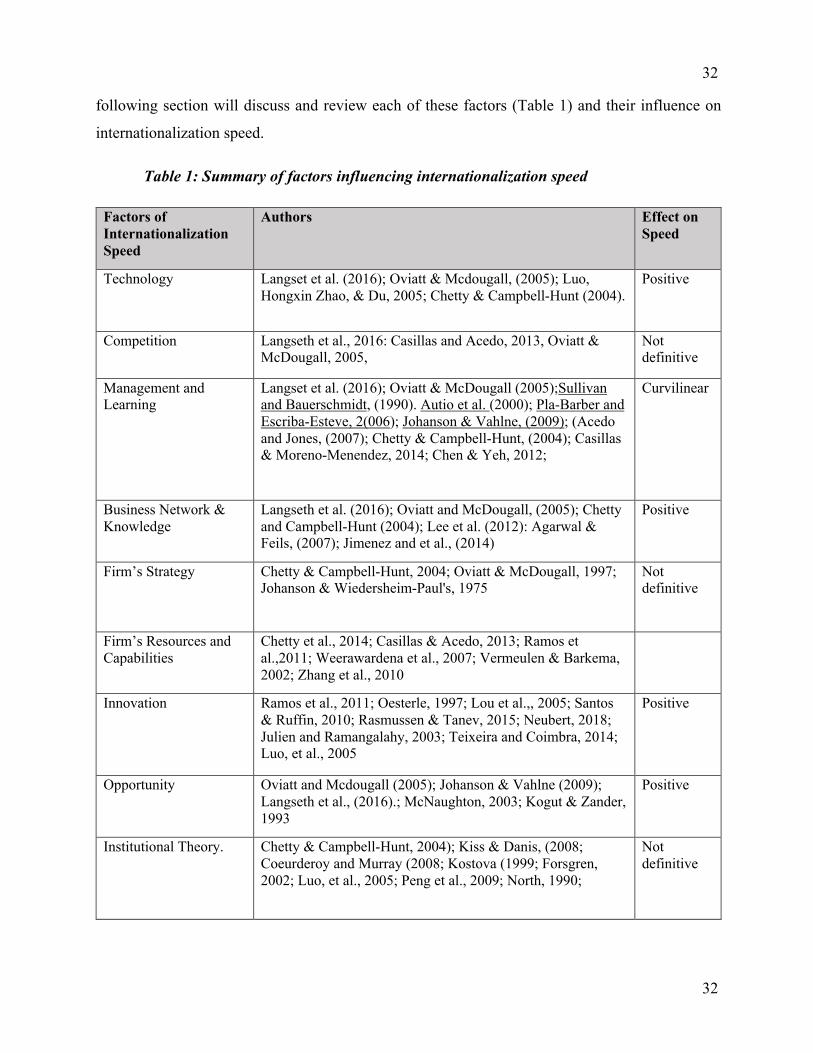
Factors Influencing Speed of Internationalization
The literature review has revealed multiple factors influencing internationalization speed.
These factors are as follow: technology, competition, management and knowledge learning,
business network, firm’s Strategy and resources, innovation, and institutional environment. The
32
32
following section will discuss and review each of these factors (Table 1) and their influence on
internationalization speed.
Table 1: Summary of factors influencing internationalization speed
Factors of Internationalization Speed
Authors Effect on Speed
Technology Langset et al. (2016); Oviatt & Mcdougall, (2005); Luo, Hongxin Zhao, & Du, 2005; Chetty & Campbell-Hunt (2004).
Positive
Competition Langseth et al., 2016: Casillas and Acedo, 2013, Oviatt & McDougall, 2005,
Not definitive
Management and Learning
Langset et al. (2016); Oviatt & McDougall (2005);Sullivan and Bauerschmidt, (1990). Autio et al. (2000); Pla-Barber and Escriba-Esteve, 2(006); Johanson & Vahlne, (2009); (Acedo and Jones, (2007); Chetty & Campbell-Hunt, (2004); Casillas & Moreno-Menendez, 2014; Chen & Yeh, 2012;
Curvilinear
Business Network & Knowledge
Langseth et al. (2016); Oviatt and McDougall, (2005); Chetty and Campbell-Hunt (2004); Lee et al. (2012): Agarwal & Feils, (2007); Jimenez and et al., (2014)
Positive
Firm’s Strategy Chetty & Campbell-Hunt, 2004; Oviatt & McDougall, 1997; Johanson & Wiedersheim-Paul's, 1975
Not definitive
Firm’s Resources and Capabilities
Chetty et al., 2014; Casillas & Acedo, 2013; Ramos et al.,2011; Weerawardena et al., 2007; Vermeulen & Barkema, 2002; Zhang et al., 2010
Innovation Ramos et al., 2011; Oesterle, 1997; Lou et al.,, 2005; Santos & Ruffin, 2010; Rasmussen & Tanev, 2015; Neubert, 2018; Julien and Ramangalahy, 2003; Teixeira and Coimbra, 2014; Luo, et al., 2005
Positive
Opportunity Oviatt and Mcdougall (2005); Johanson & Vahlne (2009); Langseth et al., (2016).; McNaughton, 2003; Kogut & Zander, 1993
Positive
Institutional Theory. Chetty & Campbell-Hunt, 2004); Kiss & Danis, (2008; Coeurderoy and Murray (2008; Kostova (1999; Forsgren, 2002; Luo, et al., 2005; Peng et al., 2009; North, 1990;
Not definitive
33
33
Technology
Langset et al. (2016) presented “communication and digital technology” (2016, p.125)
among the forces influencing the speed of internationalization. Across the globe, the organization
of business activities has been facilitated by communication technologies that offer instant
communication (Oviatt & McDougall, 2005). Also, technology reduces transactional costs and,
hence, the distance between countries (Oviatt & McDougall, 2005). The direct access to customers
across borders has been facilitated by technology and contributes to rapid internationalization
(Chetty & Campbell-Hunt, 2004; Oviatt & McDougall, 2005). Moreover, the development of
technological infrastructure in the host country positively influences the speed of entry (Luo et al.
2005; Oviatt & McDougall, 2005). Luo et al. (2005) argued that technological advancement needs
to focus on two areas “physical (technology supportiveness and internet use) and regulatory (legal
protection and government transparency)” (p.705). Finally, firms obtaining external technological
resources experience rapid internationalization (Ramos et al., 2011).
For internationalization, the born global model and traditional model have a diverging view
on the use of ICT (Chetty & Campbell-Hunt, 2004, p.66). The born global firms consider ICT to
be important to learning and internationalization, whereas the traditional model view it as “not
central to internationalization” (Chetty & Campbell-Hunt, 2004, p.66). Nonetheless, Chetty &
Campbell-Hunet (2004) acknowledge the support role of ICT in internationalization but consider
the “use of ICT is neither a necessary nor a sufficient condition for the rapid internationalization
required by born-global firms.” (p.74). However, digitalization contributes to increased efficiency
of decision making that translates into a rapid internationalization (Neubert, 2018).
While, Langselt et al. (2016) and Ramos et al. (2011) confirmed the direct influence of
communication and digital technology on small and medium enterprises rapid
internationalizations, Chetty and Campbell-Hunt (2004) argued that communication technology is
supportive rather than directly influencing internationalization speed when applied to New Zealand
firms. Besides, online sales channels positively influence internationalization speed (Arenius et al.,
2005). “When properly applied the Internet can provide a way to decrease the effects of liability of
foreignness and resource scarcity, and herewith contribute to an increased speed of
internationalization” (Arenius et al., 2005, p.279). Hence, internet sales capabilities are becoming
important to internationalization speed.
34
34
Competition
Langseth et al. (2016) introduced competition as a motivating force that influences the
speed of internationalization. Motivating forces are driven by market attraction or forces of
competition that push for a rapid internationalization to secure market and decrease exposure to
competitor’s retaliation (Langseth et al., 2016). Casillas and Acedo (2013) argued that the degree
of competition and rivalry influences positively internationalization speed of the firm. Also, Oviatt
and McDougall (2005) presented that the level of competition, in a specified industry, represents a
source of influence on internationalization speed. For example, in a competitive industry and after
a successful introduction of a product in home country, a slow internationalization will allow
competitions to increase barriers to entry in foreign market (Oviatt & McDougall, 2005). Hence,
an entrepreneur needs to internationalize rapidly in a competitive industry to secure market. In
other words, competition has a direct influence on internationalization speed depending on the
industry competitiveness and degree of exposure to competition (Oviatt & McDougall, 2005).
Management and Knowledge Learning
Langseth et al. (2016) advanced that managements and their knowledge represented
mediating forces that influence internationalization speed. The position and knowledge of the
decision maker influence the internationalization decision (Sullivan & Bauerschmidt, 1990). Also,
Autio et al. (2000) indicate that internationalization speed is influenced by the founding members
and their knowledge intensity. The proactive attitude of the management has a positive effect on
speed (Pla-Barber & Escriba-Esteve, 2006).
The prior international exposure and knowledge of management influence the
internationalization process as they nurture trust and possess a network of international relations
(Johanson & Vahlne, 2009). The international knowledge facilitates the internationalization as it
reduces the uncertainty of the entry and the psychic distance (Johanson & Vahlne, 2009). The
degree of international experience of the decision maker in the firm has an inverted curvilinear (U
form) on the speed of internationalization (Casillas & Moreno-Menendez, 2014). Also, Chen and
Yeh (2012) argue that an accumulation of FDIs experiences increase internationalization speed
(Chen & Yeh, 2012). Nonetheless, the management’s level of risk perception and their level of
tolerance to business ambiguity affect internationalization speed (Acedo & Jones, 2007).
35
35
The traditional model and born global model stress on the importance of knowledge and
management for the internationalization journey (Chetty & Campbell-hunt, 2004). In the revised
Uppsala Model, Johanson and Vahlne (2009) highlighted the importance of knowledge learning in
the internationalization process. The capacity of knowledge development is as important as the
prior knowledge for internationalization process. The knowledge learning and management are
critical to the internationalization process for born global firms (Chetty & Campbell-Hunt, 2004).
Hence, learning capacity of management and their international exposure influence the
internationalization speed.
Business Networks
Langseth et al. (2016) have introduced business networks as a moderating force that
influence the speed of internationalization. The level of involvement in a business network
influences the internationalization speed (Langeth et al., 2016; Oviatt & Mcdougall, 2005; Casillas
& Acedo, 2013). Lee et al. (2012) have argued that as business arrangement affects business
commitment, it also affects the internationalization’s speed.
Furthermore, business network reduces uncertainty and psychic distances allowing for a
less challenging entry (Johanson & Vahlne, 2009). A less challenging entry translates into an
increased internationalization speed. Among the challenges for an international entry is the political
risk in the host country (Agarwal & Feils, 2007). However, the political risk can be mitigated by
non-market strategies of the firm and the development of capabilities through business networks
that facilitate business navigation in high political risk countries (Jimenez and et al., 2014).
Chetty and Campbell-Hunt (2004) argued that the business network is as important to the
born global firms as it is to the traditional model firms. However, in the post entry, the traditional
model decreases its reliance on business network and replaces it by establishing its own capabilities
and resource in the host country (Chetty & Campbell-Hunt, 2004). Nonetheless, in the revised
Uppsala model, Johanson and Vahlne (2009) highlighted the importance of business network in
the internationalization process.
36
36
Firm’s Strategy
Concerning firm’s strategy, it also influences the speed of internationalization (Chetty &
Campbell-Hunt, 2004; Oviatt & McDougall, 1997). Strategic decisions of companies shape and
direct the speed of firms’ internationalization (Johanson & Wiedersheim-Paul's, 1975). For
example, Dunning (2000) argues that firms pursue internationalization for various strategic
objective such as seeking market or acquiring strategic assets. In today’s globalized world, the
strategies developed in acquiring knowledge have a direct influence on internationalization speed
(Chetty & Campbell-Hunt, 2004)
For the internationalization journey, firms adopt a set of strategies that can be grounded
either in traditional or born global model (Chetty & Campbell-Hunt, 2004). Born global makes
global growth as a detrimental element in the strategy making (Chetty & Campbell-Hunt, 2004).
However, Chetty and Campbell-Hunt (2004) noticed that traditional model firms adapt their
strategies to born global model to increase rapidly global reach. Although the traditional model
places less importance on firm’s strategy for internationalization, across border business activities
are the results of a combination of strategic thinking and processes (Johanson & Vahlne, 1990).
Firm’s Resources and Capabilities
Firm’s resources and capabilities highly influence internationalization speed (Chetty et al.,
2014; Casillas & Acedo, 2013). For example, prior year’s revenues and firm’s human resources
have a positive effect on internationalization speed (Ramos et al.,2011). Financial strength and
profitability allow for comfortable market expansion, assuming all other factors unchanged. Also,
firm’s marketing capabilities in communicating about products in different markets represent a
source of influence on speed (Weerawardena et al., 2007). In parallel, Vermeulen and Barkema
(2002) have proposed that the firm’s level of knowledge absorption positively correlates with
speed. Zhang et al. (2010) note that firm’s adaptability in foreign markets and to new changes
contribute to internationalization speed. The capacity to adapt resources and capabilities is key to
internationalization speed.
On the other hand, managers need to balance the speed of internationalization in accordance
with the firm’s capabilities (Chetty et al., 2014). This balance is necessary to avoid excess strain
on firm’s resources and mitigate the risk of disruption (Chetty et al., 2014).
37
37
Innovation
Innovation represents a factor that positively influences internationalization speed (Ramos
et al., 2011). Oesterle (1997) has stressed on the quality of innovation as a force that shapes
internationalization decisions and influences the speed of expansion. For example, the strength of
innovation processes and firm’s innovativeness directly affects internationalization speed (Luo et
al. 2005; Santos & Ruffin, 2010). As innovative technologies contribute to creating new market
niches, they contribute to the company’s expansion and an increase in internationalization speed
(Rasmussen & Tanev, 2015). Julien and Ramangalahy (2003) note the positive correlation between
leveraging innovative capabilities and internationalization speed. Development of innovative
internal processes promotes faster internationalization of firms (Teixeira and Coimbra, 2014). All
in all, innovation isn’t limited to technological development but also is a marketing engine for ideas
that increase internationalization speed (e.g. Luo, et al., 2005; Weerawardena et al., 2007; Ramos
et al., 2011; Langseth et al., 2016).
Opportunity development
The opportunity discovery is a triggering point in accounting for speed of
internationalization and it has been established as a reference point to calculate the speed of
internationalization by Oviatt and McDougall (2005). Opportunity discovery is one of the
influencing factors of internationalization speed (Oviatt & McDougall, 2005). As managers are
eager to take advantage of the presented opportunity, the attractiveness of the opportunity
influences the speed of internationalization (Oviatt & McDougall, 2005). Moreover, Johanson and
Vahlne (2009) have revised the Uppsala model to include opportunity development as an important
element influencing the internationalization process. Market exploration and opportunity creation
encourage rapid internationalizations to secure markets and decrease the exposure to competitor’s
retaliation (Langseth et al., 2016). McNaughton (2003) notes that the presented opportunity
encourages firms to internationalize rapidly to gain first mover advantage. Also, the development
of an opportunity may necessitate the mobilization of different sets of competencies from other
geographical locations and subsequently increase the internationalization speed (Chetty et al.,
2014; Kogut & Zander, 1993).
38
38
Institutional Environment
In addition to the forces cited above, the institutional environment also influences the speed
of internationalization. For Coeurderoy and Murray (2008), the authors suggested that the speed of
internationalization is influenced by the regulatory environment of the host country. The more
developed and less risker the regulatory environment of the host country, the faster is the
internationalization of the firm (Coeurderoy & Murray, 2008). The regulative and institutional
distance element has been proposed by Kostova (1999) to explain the regulatory and institutional
differences between countries.
The institutional development of the host country has a moderating effect on the speed of
internationalization (Kiss & Danis, 2008). Moreover, institutional development affects the speed
of internationalization depending on the network ties that the firm possesses in the host country
(Kiss & Danis, 2008). The higherr the institutional development in the host country, the less
important is the strength of business network ties (Kiss and Danis, 2008).
The institutional theory has been advanced by many scholars to reduce the uncertainty of
firms entering foreign market (Forsgren, 2002). The legal protection and transparency of the host
country affect positively the speed of internationalization (Luo, et al., 2005). Peng, Sun, Pinkham,
and Chen (2009) stressed the importance of the institutional environment as a third leg in defining
a firm’s strategy. Peng et al. (2009) defended that institutional factor shouldn’t be treated as a
background but rather as an interacting variable with organization in formulating the strategy. It is
considered by many researchers as the element that orchestrates “the rules of the game”. North
(1990) has proposed that institutions need to be framed into two dimensions as formal and informal
institutions. The formal institution relies on the regulatory environment that takes laws, regulations,
and rules as the foundations. The informal institution relies on norms, cultures, and ethics that
govern a territory or set of regions. Peng et al. (2009) argue that the analysis of institutions should
rely on one of the two propositions that drive the business interaction. Concerning the first
proposition relies on the rationality of the business actors who chose to opt for markets where
uncertainty is reduced by the governing institution and assumes that rationality enables a less risky
pursuit of interest (Peng et al., 2009). Bur for the second proposition, it stresses on the importance
of the informal institution in remedying the uncertainties when the formal institutions fail to fulfill
their duties (Peng et al., 2009). Hence, the institutional environment is not only important to the

39
39
business strategy and to the internationalization strategy, but also detrimental to
internationalization speed (Peng et al., 2009).
40
40
Chapter 3: Methodology
The current chapter of the thesis introduces the theoretical framework, drawn from the
literature, which drives the research methodology. The framework is followed by the research
design, data collection methods and event analysis description. The chapter concludes by
introducing the method used to measure the speed of internationalization, as well as the analytical
methods used to answer the research questions.
Theoretical framework
Number of studies addressed assessing the concept of firms’ speed internationalization (e.g.
Chen & Yeh, 2012; Khavul et al., 2011). Among the different contributions in this field, many of
them considers the speed of firm’s internationalization as a dependent variable (e.g. Ramos et al.,
2011; Musteen et al., 2010; Morgan-Thomas & Jones, 2009), while only few contributions
considers this variable as independent (e.g. Khavul et al., 2010; Chang & Rhee, 2011).
It is of prime importance to note that the aim of this thesis is to analyze the speed of firm’s
internationalization by assessing the significance of the forces or factors that contribute to the
increase or decrease of the speed of internationalization. The proposed theoretical framework
builds upon and synthesizes models built by other authors. While this theoretical framework can
be adapted in many industries, the aim of this contribution is to apply it to the LCC industry.
The following contribution assumes that the different factors or forces that impact the speed
of firms’ internationalization can be categorized under three main levels: “Supra-Organizational”,
“Organizational”, and “Individual”. This aligns with the contribution of Casillas et al. (2010),
which states that…
The supra-organizational level is considered as one of the main factors that impact firms
internationalization (Etemad & Lee, 2003), and it suggests that the speed of internationalization
can be heavily influenced by learning from the foreign business environment through direct contact
(Johanson & Vahlne, 2006; Lindsay et al., 2003). Casillas et al. (2010) further state that the
international experiences of competitors, suppliers, customers, and other stakeholders is reflected
in the internationalization of the business and leads to a mimetic behavior (DiMaggio & Powell,
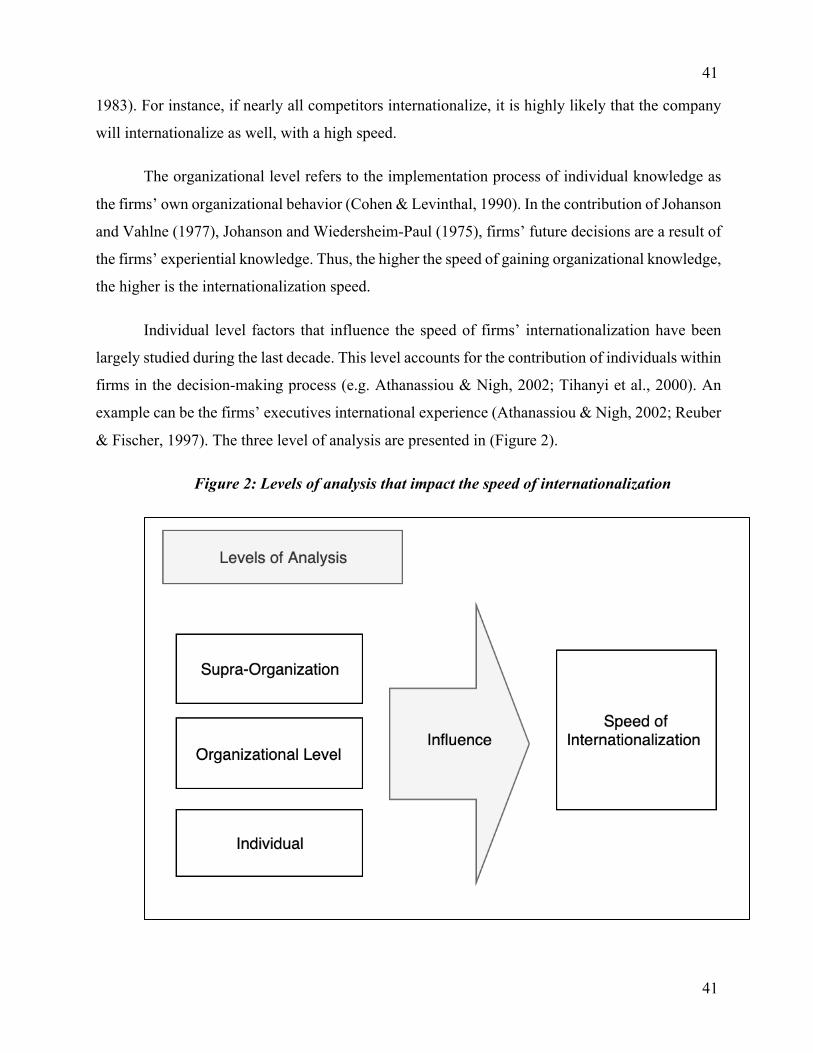
41
41
1983). For instance, if nearly all competitors internationalize, it is highly likely that the company
will internationalize as well, with a high speed.
The organizational level refers to the implementation process of individual knowledge as
the firms’ own organizational behavior (Cohen & Levinthal, 1990). In the contribution of Johanson
and Vahlne (1977), Johanson and Wiedersheim-Paul (1975), firms’ future decisions are a result of
the firms’ experiential knowledge. Thus, the higher the speed of gaining organizational knowledge,
the higher is the internationalization speed.
Individual level factors that influence the speed of firms’ internationalization have been
largely studied during the last decade. This level accounts for the contribution of individuals within
firms in the decision-making process (e.g. Athanassiou & Nigh, 2002; Tihanyi et al., 2000). An
example can be the firms’ executives international experience (Athanassiou & Nigh, 2002; Reuber
& Fischer, 1997). The three level of analysis are presented in (Figure 2).
Figure 2: Levels of analysis that impact the speed of internationalization
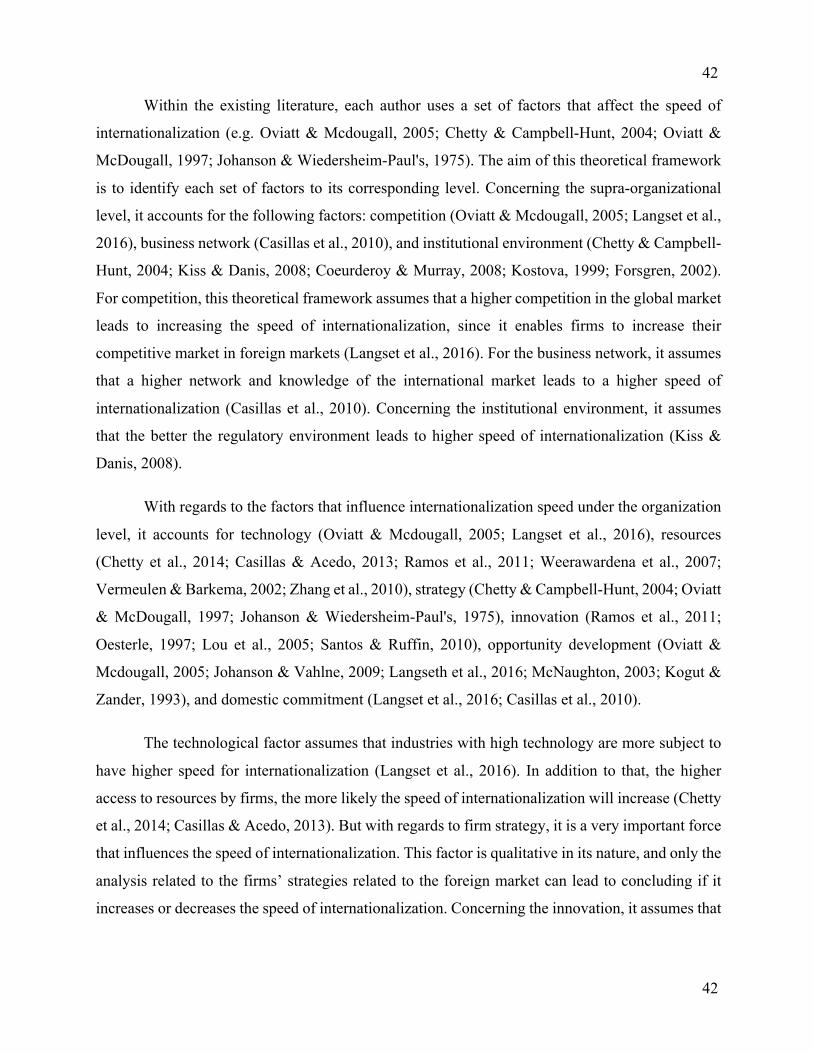
42
42
Within the existing literature, each author uses a set of factors that affect the speed of
internationalization (e.g. Oviatt & Mcdougall, 2005; Chetty & Campbell-Hunt, 2004; Oviatt &
McDougall, 1997; Johanson & Wiedersheim-Paul's, 1975). The aim of this theoretical framework
is to identify each set of factors to its corresponding level. Concerning the supra-organizational
level, it accounts for the following factors: competition (Oviatt & Mcdougall, 2005; Langset et al.,
2016), business network (Casillas et al., 2010), and institutional environment (Chetty & Campbell-
Hunt, 2004; Kiss & Danis, 2008; Coeurderoy & Murray, 2008; Kostova, 1999; Forsgren, 2002).
For competition, this theoretical framework assumes that a higher competition in the global market
leads to increasing the speed of internationalization, since it enables firms to increase their
competitive market in foreign markets (Langset et al., 2016). For the business network, it assumes
that a higher network and knowledge of the international market leads to a higher speed of
internationalization (Casillas et al., 2010). Concerning the institutional environment, it assumes
that the better the regulatory environment leads to higher speed of internationalization (Kiss &
Danis, 2008).
With regards to the factors that influence internationalization speed under the organization
level, it accounts for technology (Oviatt & Mcdougall, 2005; Langset et al., 2016), resources
(Chetty et al., 2014; Casillas & Acedo, 2013; Ramos et al., 2011; Weerawardena et al., 2007;
Vermeulen & Barkema, 2002; Zhang et al., 2010), strategy (Chetty & Campbell-Hunt, 2004; Oviatt
& McDougall, 1997; Johanson & Wiedersheim-Paul's, 1975), innovation (Ramos et al., 2011;
Oesterle, 1997; Lou et al., 2005; Santos & Ruffin, 2010), opportunity development (Oviatt &
Mcdougall, 2005; Johanson & Vahlne, 2009; Langseth et al., 2016; McNaughton, 2003; Kogut &
Zander, 1993), and domestic commitment (Langset et al., 2016; Casillas et al., 2010).
The technological factor assumes that industries with high technology are more subject to
have higher speed for internationalization (Langset et al., 2016). In addition to that, the higher
access to resources by firms, the more likely the speed of internationalization will increase (Chetty
et al., 2014; Casillas & Acedo, 2013). But with regards to firm strategy, it is a very important force
that influences the speed of internationalization. This factor is qualitative in its nature, and only the
analysis related to the firms’ strategies related to the foreign market can lead to concluding if it
increases or decreases the speed of internationalization. Concerning the innovation, it assumes that
43
43
a higher level of innovation leads to a higher speed of internationalization, while higher
opportunities in foreign markets lead to the same results (Ramos et al., 2011).
Finally, and concerning the factors that influence internationalization speed under the
individual level, it only accounts for the management and knowledge learning (Casillas et al.,
2010). Thus, the higher is the management knowledge learning and experience in international
markets, the higher will be the speed of internationalization.
At this stage, the theoretical framework can be summarized such as (Figure 3):
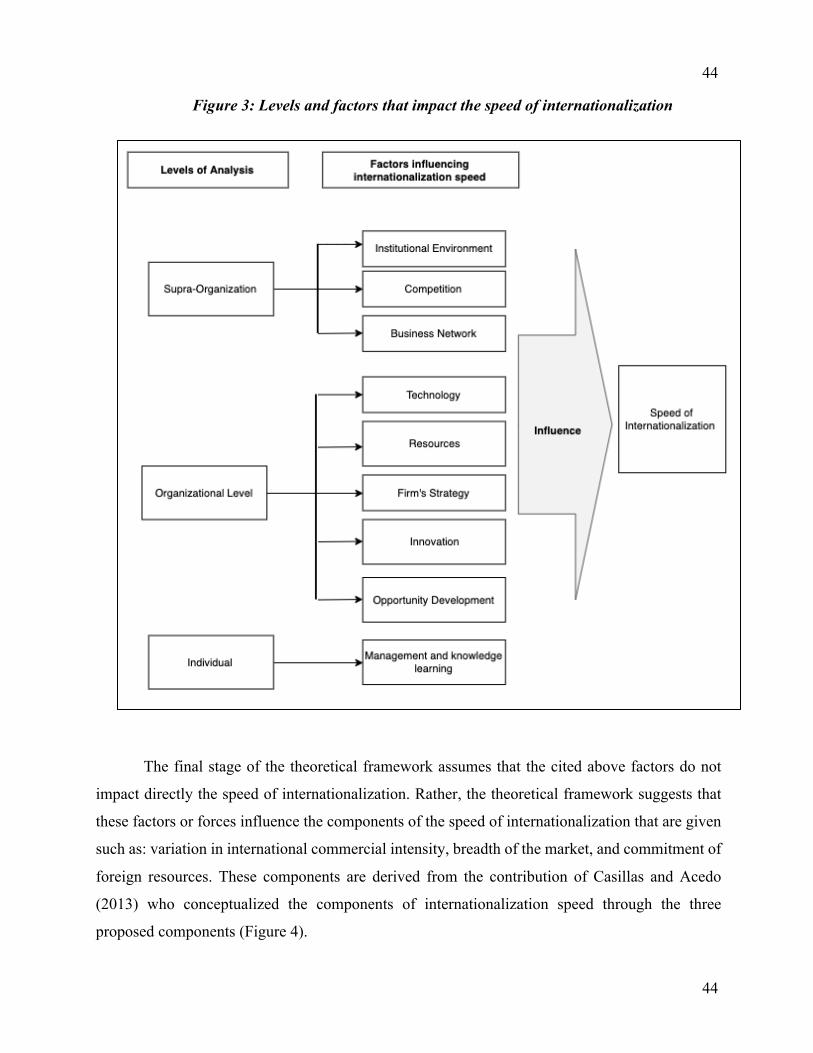
44
44
Figure 3: Levels and factors that impact the speed of internationalization
The final stage of the theoretical framework assumes that the cited above factors do not
impact directly the speed of internationalization. Rather, the theoretical framework suggests that
these factors or forces influence the components of the speed of internationalization that are given
such as: variation in international commercial intensity, breadth of the market, and commitment of
foreign resources. These components are derived from the contribution of Casillas and Acedo
(2013) who conceptualized the components of internationalization speed through the three
proposed components (Figure 4).
45
45
International commercial intensity refers to the growth of firms’ sales derived from foreign
markets (Casillas & Acedo, 2013). Breadth of the market refers to the growth of the variety as well
as the distance between the domestic countries of firms and the foreign countries where it operates
(Asmussen et al. 2009; Jones & Coviello, 2005; Zahra & George 2002). Finally, the commitment
of foreign resources refers to the extent at which firms deploy assets to host markets (Sullivan,
1994).
In sum, the theoretical framework suggests that the speed of internationalization is
influenced by the supra-organization, organization, and individual levels. Each of these levels of
analysis accounts for a number of forces or factors. These factors are considered to impact at least
one component of the speed of internationalization, including: international commercial intensity,
breadth of market, and commitment of foreign resources, as shown in Figure 4.
):
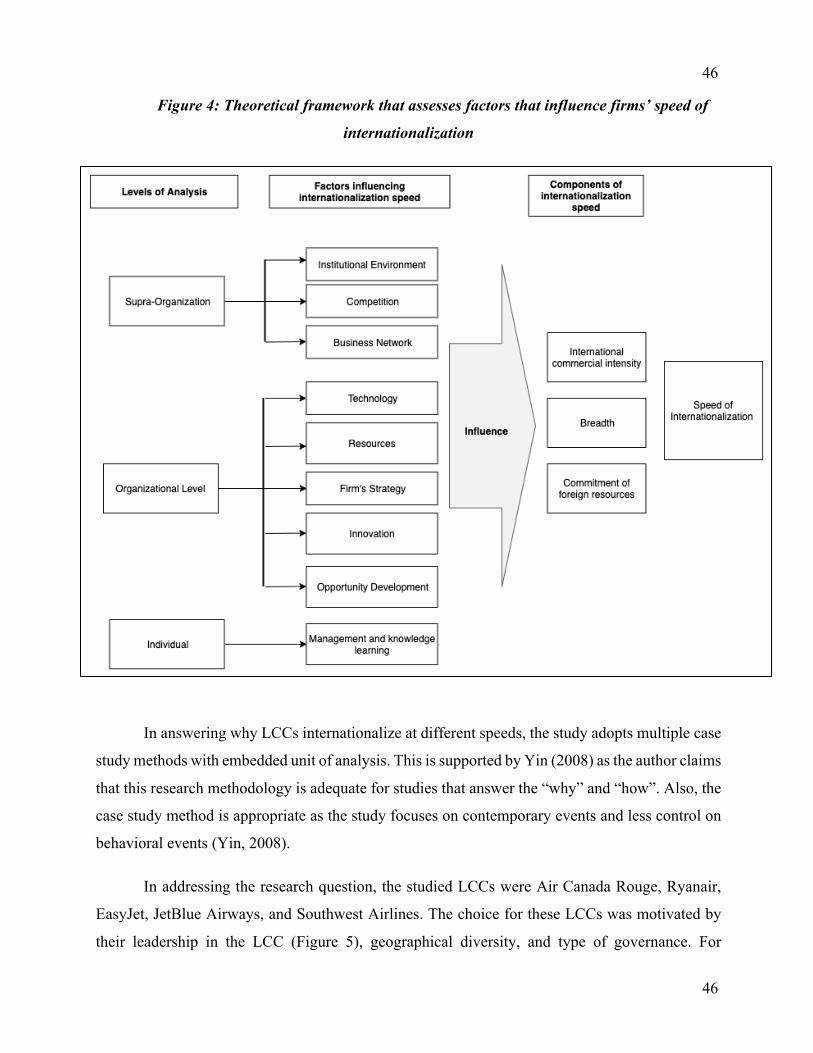
46
46
Figure 4: Theoretical framework that assesses factors that influence firms’ speed of
internationalization
In answering why LCCs internationalize at different speeds, the study adopts multiple case
study methods with embedded unit of analysis. This is supported by Yin (2008) as the author claims
that this research methodology is adequate for studies that answer the “why” and “how”. Also, the
case study method is appropriate as the study focuses on contemporary events and less control on
behavioral events (Yin, 2008).
In addressing the research question, the studied LCCs were Air Canada Rouge, Ryanair,
EasyJet, JetBlue Airways, and Southwest Airlines. The choice for these LCCs was motivated by
their leadership in the LCC (Figure 5), geographical diversity, and type of governance. For
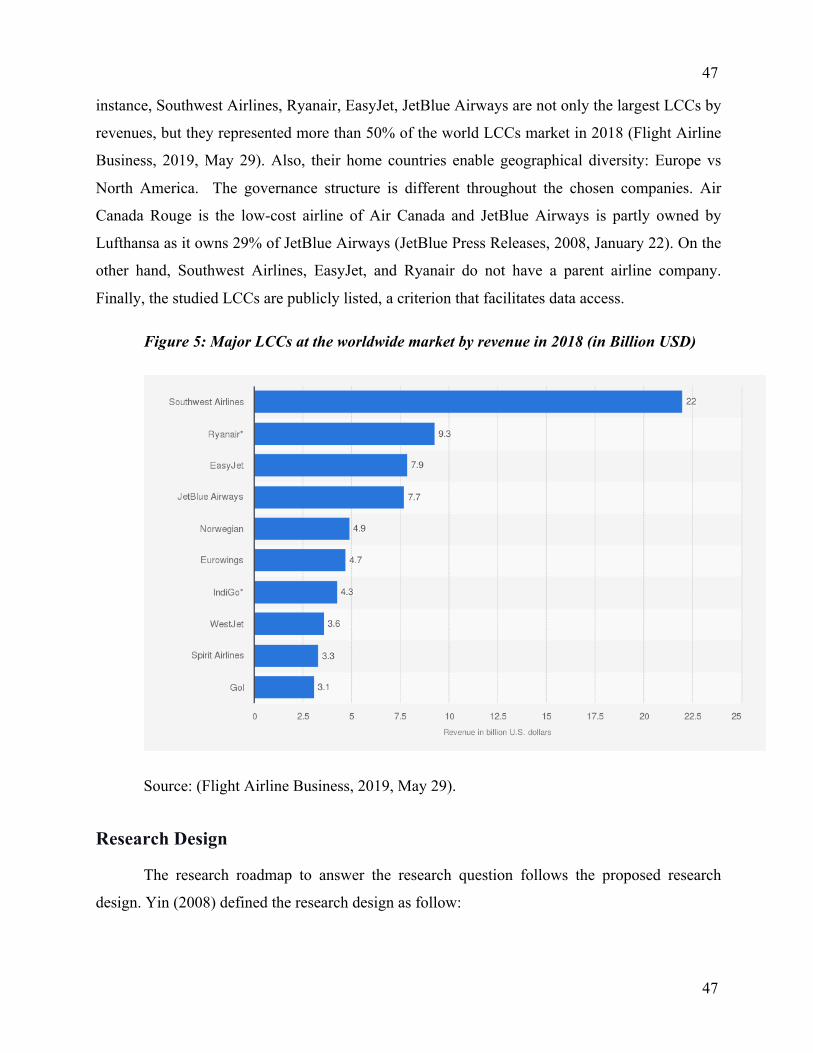
47
47
instance, Southwest Airlines, Ryanair, EasyJet, JetBlue Airways are not only the largest LCCs by
revenues, but they represented more than 50% of the world LCCs market in 2018 (Flight Airline
Business, 2019, May 29). Also, their home countries enable geographical diversity: Europe vs
North America. The governance structure is different throughout the chosen companies. Air
Canada Rouge is the low-cost airline of Air Canada and JetBlue Airways is partly owned by
Lufthansa as it owns 29% of JetBlue Airways (JetBlue Press Releases, 2008, January 22). On the
other hand, Southwest Airlines, EasyJet, and Ryanair do not have a parent airline company.
Finally, the studied LCCs are publicly listed, a criterion that facilitates data access.
Figure 5: Major LCCs at the worldwide market by revenue in 2018 (in Billion USD)
Source: (Flight Airline Business, 2019, May 29).
Research Design
The research roadmap to answer the research question follows the proposed research
design. Yin (2008) defined the research design as follow:
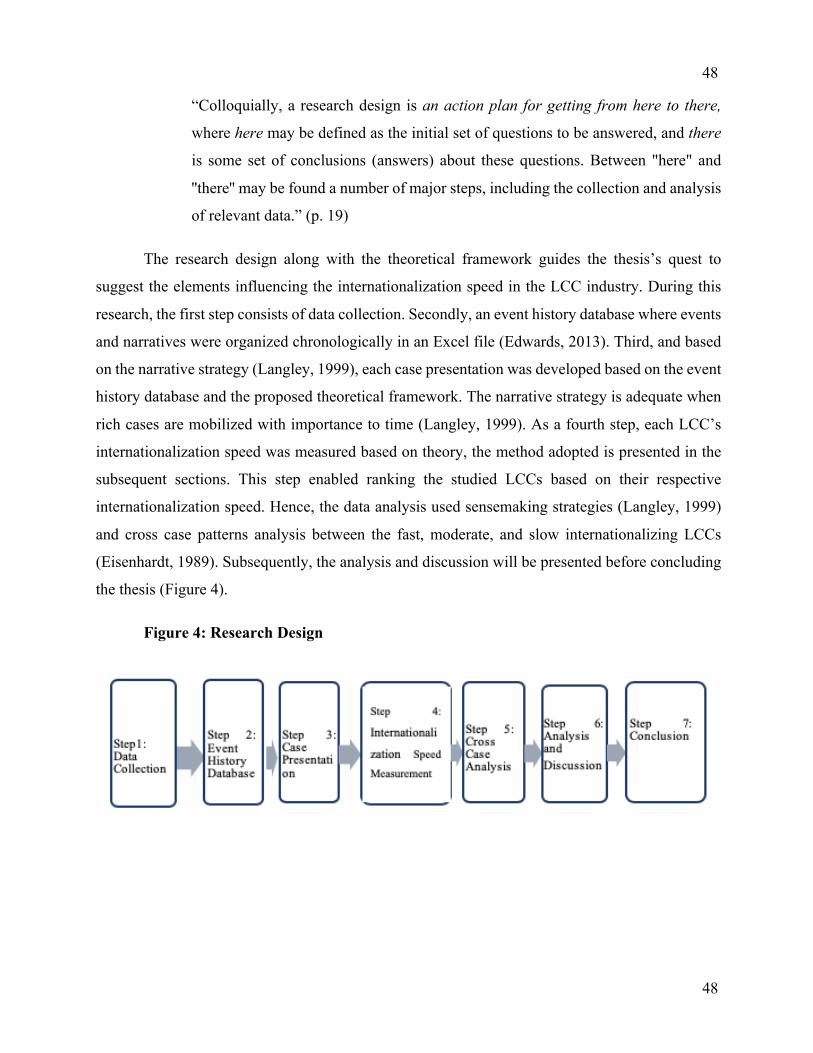
48
48
“Colloquially, a research design is an action plan for getting from here to there,
where here may be defined as the initial set of questions to be answered, and there
is some set of conclusions (answers) about these questions. Between "here" and
''there'' may be found a number of major steps, including the collection and analysis
of relevant data.” (p. 19)
The research design along with the theoretical framework guides the thesis’s quest to
suggest the elements influencing the internationalization speed in the LCC industry. During this
research, the first step consists of data collection. Secondly, an event history database where events
and narratives were organized chronologically in an Excel file (Edwards, 2013). Third, and based
on the narrative strategy (Langley, 1999), each case presentation was developed based on the event
history database and the proposed theoretical framework. The narrative strategy is adequate when
rich cases are mobilized with importance to time (Langley, 1999). As a fourth step, each LCC’s
internationalization speed was measured based on theory, the method adopted is presented in the
subsequent sections. This step enabled ranking the studied LCCs based on their respective
internationalization speed. Hence, the data analysis used sensemaking strategies (Langley, 1999)
and cross case patterns analysis between the fast, moderate, and slow internationalizing LCCs
(Eisenhardt, 1989). Subsequently, the analysis and discussion will be presented before concluding
the thesis (Figure 4).
Figure 4: Research Design
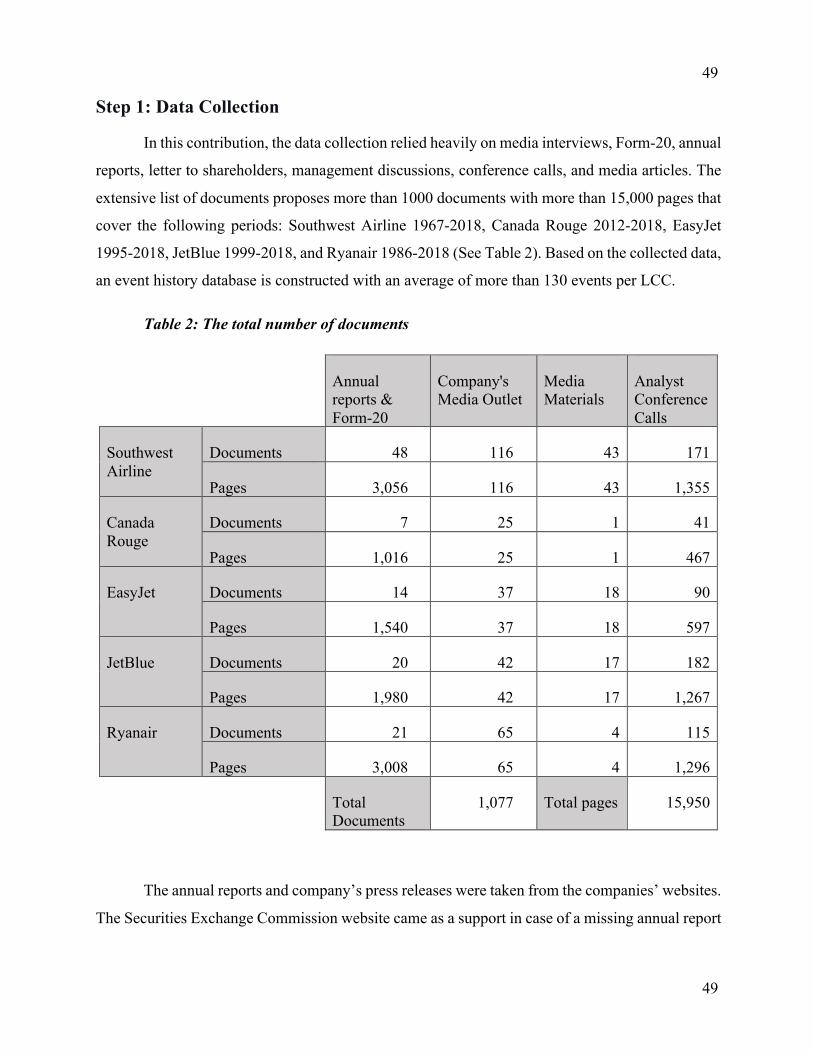
49
49
Step 1: Data Collection
In this contribution, the data collection relied heavily on media interviews, Form-20, annual
reports, letter to shareholders, management discussions, conference calls, and media articles. The
extensive list of documents proposes more than 1000 documents with more than 15,000 pages that
cover the following periods: Southwest Airline 1967-2018, Canada Rouge 2012-2018, EasyJet
1995-2018, JetBlue 1999-2018, and Ryanair 1986-2018 (See Table 2). Based on the collected data,
an event history database is constructed with an average of more than 130 events per LCC.
Table 2: The total number of documents
Annual reports & Form-20
Company's Media Outlet
Media Materials
Analyst Conference Calls
Southwest Airline
Documents 48 116 43 171
Pages 3,056 116 43 1,355
Canada Rouge
Documents 7 25 1 41
Pages 1,016 25 1 467
EasyJet Documents 14 37 18 90
Pages 1,540 37 18 597
JetBlue Documents 20 42 17 182
Pages 1,980 42 17 1,267
Ryanair Documents 21 65 4 115
Pages 3,008 65 4 1,296
Total Documents
1,077 Total pages 15,950
The annual reports and company’s press releases were taken from the companies’ websites.
The Securities Exchange Commission website came as a support in case of a missing annual report
50
50
as well as for the retrieval of Form-20. Concerning the newspaper articles, the thesis relied on
credible and industry media through http://news.google.com/ and Factiva Database.
For conference calls, the study used the FACTIVA database where keywords search were
the LCCs’ name plus conference call for the period between 1/1/2000-31/12/2018. This period was
limited because the database only accounts for the years after 2000. Conference calls represent a
“significant material events” (Edwards, 2013, p.68). That is consistent with our processual study
that investigates events and narratives of top management. Conference calls represents a research
source of document (e.g Larcker & Zakolyukina, 2012; Mayew, 2008; Bowen, Davis &
Matsumoto, 2002; Edwards, 2013) with importance deriving from disclosing information not
contained in annual reports (Larcker & Zakolyukina, 2012).
Conference calls provide disclosures of business direction as well as transcribed discussion
between analyst and LCCs top management. Also, they represent an opportunity for publicly listed
companies to make public disclosure, a regulation introduced by the Securities and Exchange
Commission (SEC) in 2000. It is necessary to note that conference calls represent a substitute to
the limitation of not conducting interviews with LCCs top managements who were involved in
strategic decision making. The challenge to conducting interviews is the time consuming and
difficulties accessing the top management of the studied LCCs.
Finally, complementary data were mobilized to reinforce cases presentations that were
established through narrative strategy (Langley, 1999). These other sources of data are industry
reports, LinkedIn public profiles, and public televised media interviews. For example, BBC and
AlJazeera English televised interviews were used to reinforce or close data gaps. Also, LinkedIn
was used for top managements’ previous experience and expertise.
Step 2: Event History Database
Following the research nature, an Event History Database (Edwards, 2013) was created in
Excel that groups historical events and narrative of LCCs. The excel file was created and accounts
for different sheets, where each one of them represents an event history table for each studied
LCCs. Each table contained the year of the event or narratives, the type of the event or narratives,
followed by the source of the data used. The categorization of the events and narrative were
51
51
conducted in a deductive approach. The type of event and narratives were categorized in
accordance with the theoretical framework. For example, an order for a new type of aircraft was
categorized as “resource” and a governmental application to fly to a new destination as
“institutional”.
The procedures adopted in data retrieval were as follow:
1- First reading of one type of document.
2- Second reading to highlight and locate the important data.
3- Importing the located data into the event history database.
The event and narratives were retrieved and organized in a chronological order to satisfy
the process research method data advanced by Langley (1999). Finally, the event history database
represents the source of case presentation construction.
Step 3: Cases Presentation
Based on the event history table, the cases presentation chapter develops the history of each
studied LCC during their operational period with a focus on the period between 2000 and 2018. In
each case presentation, each dimension of the theoretical framework is presented through narrative
strategy (Langley, 1999). The narrative strategy allows for the transformation of raw data into a
process-based and organized presentation accordingly with each dimension of the theoretical
framework (Langley, 1999). As the context is important to analyze the internationalization speed
measurement, the cases are constructed in a chronological order.
Step 4: Internationalization Speed measurement.
Different unidimensional and multidimensional measurements were carried on the studied
LCCs to compare between their speeds of internationalization. Based on the literature, the
internationalization speed measurement is carried through unidimensional measurements methods
(Musteen, et al., 2010; Oviatt & McDougall, 2005; Casillas & Moreno-Menendez, 2014; Chen &
Yeh, 2012; Zhou, 2007) and multidimensional measurement methods (Chang & Rhee, 2011;
Casillas & Acedo, 2013). Concerning the unidimensional measurement, it measures the time to
internationalize (Musteen, et al., 2010; Oviatt & McDougall, 2005), the frequency of international
52
52
business activities (Chen & Yeh, 2012: Casillas & Moreno-Menendez, 2014), and the portion of
the international revenues (Zhou, 2007).
On the other hand, the multidimensional speed measurement is constructed through the
presented literature review of internationalization speed measurement. Researchers agree on the
ratio or quotient nature of multidimensional speed measurement (Lin, 2012; Chang & Rhee, 2011;
Chetty et al., 2014; Casillas & Acedo, 2013). While the studied contributions agree on the
internationalization period as a denominator (Lin, 2012; Chang & Rhee, 2011; Chetty et al., 2014;
Casillas & Acedo, 2013), the nominator has been different from a study to another. For the purpose
of this study, and in order to be able to cross-compare between the internationalization speed of
LCCs on common indicators, three main variables are used to measure the speed of
internationalization. These variables are commitment, commercial intensity (Casillas & Acedo,
2013), and CAGE distance (Aygoren & Kadakal, 2018).
To measure commitment, the average number of international destinations per foreign
country is used as a proxy. This assumes that an increased number of destinations within a target
country represent a proxy for LCCs commitment and commercial intensity in the same country.
The validity of these comparisons remains explanatory and does not account for outliers. For
example, an outlier LCC will be with a high number of international destinations in a single host
country with limited breadth.
Concerning the distance variable, it is considered an important dimension for speed
measurements in different fields such as physics. To cover the internationalization’s speed from
different angles, the CAGE distance is included to account for distance between host and home
country. For the purpose of the study, the total CAGE Distance is used as the sum of total distances
between home and different host countries.
Ghemawat (n.d.) developed a CAGE comparator analysis that quantifies the CAGE
distance on the following website https://ghemawat.com/cage. The CAGE comparator quantifies
distances between host and home through cultural, administrative, geographical, and economical
distance between home and host countries (Ghemawat, n.d.). Also, the comparator corrects the
distance based on the nature of trade or service as well as the direction of business flow. A free
subscription, in Ghemawat portal, allows for a number of requests that meet the need of the study.
53
53
For this study, the type of trade is selected by service in transportation for an export trade flow.
This selection enables more accuracy in the context of our study. For instance, after selecting the
previous options, the Ghemawat comparator quantifies the CAGE distance between Canada and
Air Canada’s rouge destinations’ countries. Nonetheless, 20 out of 151 countries were missing
from the Ghemawat comparator. In order to remedy the data gap, this conducted an evaluation of
the existence of any colonial ties of the host country to a pre-existing country in the data. If no
colonial ties exist, the average of CAGE distance of the surrounding countries is considered.
Therefore, CAGE distance provides a representation of distances that accounts for cultural,
administrate, geographical, and economical destinations between the LCC’s home and host
country, with 87% of accuracy.
Because the sum of CAGE distances represents also a count of the different host countries
and to avoid double accounting of the number of host countries, the commitment variable only took
the average of flown destinations per host country by LCCs. Thus, to account for market
commitment and distance, a multiplication between the two variables, while implicitly accounting
for the breadth of markets. The commitment is represented by the average number of international
destinations per host country multiplied while the breadth and distance by the total CAGE Distance
travelled. The final formula (Equation 1) is the result of the multiplication of these two variables
divided by the period of internationalization. This formula (see Formula 1) produces an explanatory
variable that represents how far -in term of CAGE distance- and committed to host countries are
LCCs over the internationalization period.
Equation 1: Adapted calculation for internationalization speed measurements
!"#$%"&#'("&)'*&#'(",-$$. = "#$%&'$($)*+,&*+-,).$%/-)*0-1,*%2×4-*&50"67(+)*&,8$9$%+-:-;<,*$%,&*+-,&5+=&*+-,
Step 5: Cross Analysis of Differences and Patterns
With regards to the cross-analysis of differences and patterns, the same methodology in the
contribution of Eisenhardt (1989) is used and consists of two parts. First, a table that shows the
way each LCC is impacted by the suggested dimensions of speed is created and organized. This
54
54
method enables to have more visibility by grouping cases of the same dimension, which enables a
better understanding of the studies cases (Eisenhardt, 1989). At this stage, the categories or
dimensions represented in the theoretical framework are known. Thus, the within-group similarities
are coupled with inter-group differences (Eisenhardt, 1989). For instance, within the organization
level, more specifically, within the technological dimension, a new pattern that relates to using a
revenue management system is noticed to be emerging within LCCs.
In order to make the analysis more readable, sensemaking strategies through visual
mapping will be incorporated to process data that involves events ordering (Langley, 1999). This
is relevant to the study as it investigates the forces influencing the speed of internationalization in
the LCC industry over time. The influence can be seen through a visual timeline that tracks the
development of a dimension in parallel to the internationalization of the LCC.
55
55
Chapter 4: Cases Presentation
Air Canada Rouge
Air Canada Rouge was founded in late 2012 as Air Canada’s LCC that will provide the
parent company with competitive margins (Air Canada, 2013, February). With the launch of Air
Canada Rouge, Air Canada is aiming at broadening customer reach, proposing affordable travel,
and increasing destinations reach (Air Canada, 2013). Air Canada Rouge is a cornerstone in the
international growth of the parent company (Air Canada. 2013, February). Nonetheless, the launch
was only possible through labor agreement with employees that allow for flexibility in reaching
the company’s strategic intent (Air Canada, 2013).
Air Canada Rouge started with a fleet of 2 Boeing 767 that support long range flights and
2 Airbus 319 that support economical flight in North America (Air Canada, 2013). Air Canada
continuously support its LCC’s fleet by incrementally transferring Airbus 319 and Boeing 767 with
the intention of reaching a fleet mix of 50 Aircrafts by 2014 (Air Canada, 2013). By 2018, Air
Canada rouge reached a fleet mix of 53 Aircrafts composed of Airbus 321, Airbus 319, and Boeing
767 (Air Canada. 2019). Besides, Air Canada rouge portfolio was not limited to the American
continent but served international destination in Europe, North Africa, and Asia (Air Canada,
2019). The cases presentation will present the internationalization journey of Air Canada Rouge as
well as the different elements proposed by the literature.
Internationalization Journey
Air Canada Rouge internationalization follows the born global model. Not only did it
internationalize since inception, but it operated its own metal into farther destination during
inauguration. Air Canada Rouge internationalization started with flying to Edinburgh and Venice
(Air Canada, 2013). According to CAGE Distance Comparator by Ghemawat (n.d.), Italy is far
from Canada by 11,317 on a scale range between 813 and 16,678 for Air Canada Rouge
international reach. This shows that not only the internationalization was the first action of Air
Canada Rouge, but it didn’t choose nearby destinations. This trend continued with a mix of
international destinations that weren’t limited to the Caribbean destinations but reached North
Africa such as Morocco (Air Canada Media Room, 2015, September) and Algeria (Air Canada
56
56
Media Room. 2016, September). The network was expanded to include multiple destinations in
Europe both Western, Central Europe, and Eastern Europe (Air Canada Media Room, 2016, May)
as well as in Asia through Nagoya and Osaka in Japan (Air Canada Media Room, 2014, September;
2017, August).
Technology
Digital technologies facilitate a rapid internationalization journey (Oviatt & McDougall,
2005). Air Canada Rouge and Air Canada deployed continuous effort to provide adequate
technological platform to support its international strategy. Prior to Air Canada Rouge launch, Air
Canada invested in a new control center with advanced technologies that supports international
operations with efficiency and labeled it as the “global nerve center” of the group’s operation (Air
Canada Media Room, 2013, August). To support its international growth in 2017, the group Air
Canada entered a partnership with Amadeus to support its technological development such as
reservation systems (Air Canada Media Room, 2017, October). The partnership with Amadeus will
allow an enhanced customer experience, strengthening its distribution efforts, and facilitating
ticketing and reservation (Air Canada Media Room, 2017, October; Air Canada, 2017, September).
All these efforts led to the introduction a new updated reservation system that supports the
efficiency of the internationalization strategy (Air Canada, 2019).
On the other hand, the focus on technological investment did not only target the support of
internationalization operation but also the enhancement of customer experience. The group
introduced not only a phone application but also an Apple Watch app that allows customer a faster
check-in and reduced boarding time (Air Canada Media Room, 2015, March). Air Canada rouge
started gradually introducing high speed internet on its Airbus 319 fleet (Air Canada Media Room,
2017, May) to be fully integrated into the narrow body fleet of by the end of 2018 (Air Canada
Media Room, 2018, June). The full integration of WIFI into Air Canada Rouge fleet will be
completed in the second half of 2019 (Air Canada Media Room, 2018, June). Also, Air Canada
group became flexible in its payment accepting methods by supporting the FinTech development
through an agreement with Adyen to accept alternative payments (Air Canada Media Room, 2017,
November). Last but not least, the group appointed a new Chief Information Officer that will
support the company’s vision to pursue innovation in its IT development (Air Canada Media Room,
57
57
2018, September). The new CIO Catherine Dyer has a rich experience in distribution, sales, and
supporting IT transformation in various industries (Air Canada Media Room, 2018, September).
Competition
Competitive pressures force companies to pursue international market quickly to establish
presence and remain competitive (Oviatt & McDougall, 2005). Hence, the competition is an
influencing factor that pressures companies to pursue internationalization to remain viable in a very
competitive market. In fact, the launch of Air Canada Rouge came as a result of competitive
pressure on the parent company on its international routes, especially the international leisure
routes. For example, Air Canada has seen its revenue decreases by 0.7% equivalent of CAD 2
million on its routes for Australia, and Central and South America (Air Canada, 2013, February).
Hence, Air Canada rouge is expected to remedy to the competition experienced in the leisure
market (Air Canada, 2013, February). Also, Rouge offered the opportunity for Air Canada to return
to operate old routes effectively and efficiently during the peak season of each leisure market (Air
Canada, 2013, May). In its 2012 letter to shareholders, Air Canada CEO expressed that different
actions aiming to ameliorate the group’s efficiency in response to competition (Air Canada, 2013).
Moreover, the launch of air Canada rouge “will leverage the strengths of Air Canada’s extensive
network … and will allow the airline to compete more effectively in the leisure market, …, and
strengthening its competitive position” (Air Canada, 2013). The deployment of Air Canada rouge
will target not only international leisure destination but also wherever the group face LCCs’
competition, including home market (Air Canada, 2019).
The booking demand for Air Canada rouge showed its strength shortly after the
announcement of the launch (Air Canada, 2013, May). In fact, the launch of Air Canada Rouge
met expectation on both operational and financial level (Air Canada, 2014, February). Air Canada
Rouge demonstrated its cost effectiveness on transborder flights (Air Canada, 2013, May).
Additionally, it reinforced its competitiveness through the lowest price guaranteed strategy (Air
Canada Media Room, 2013, February).
58
58
The competitiveness of the subsidiary is also due to the support of the parent company. Air
Canada Rouge benefit from its position in the group of Air Canada that gathers not only airlines
but also a vacation agency Air Canada Vacation that supports the competitiveness of Air Canada
rouge (Air Canada, 2017, May). Also, it benefits from the brand name of the parent company as
well as the introduction of premium seating in its narrow body fleet of A319 with larger overhead
baggage carry (Air Canada, 2016, February)
The competitive pressure of the group, especially with the launch of Air Canada Rouge,
has pressured the domestic competition to terminate their contract with their booking partner for a
more stronger booking platform (Air Canada, 2014, February). In less than a year, Air Canada
reached high load factor in the near 90% with 30% cost efficiency on its 767 compared to the 767
in the parent airline fleet (Air Canada, 2014, November). The high attraction of Air Canada rouge
is explained in part by the innovative travel packaging that is supported by Air Canada Vacation.
Plus, Rouge has been awarded at the Budapest Annual Awards as "the best new long-haul airline"
(Air Canada, 2017, May). Also, Air Canada rouge maintained strong booking and gained strong
presence on Canadian-US leisure routes (Air Canada, 2017, August). Moreover, the competition
of the ULCC in the domestic market has urged the parent company to enter new agreement with
pilots that enables Air Canada rouge to be deployed with high flexibility in the domestic market
(Air Canada, 2018, April). Lastly, Rouge competes effectively during the winter season for the sun
destination and has the flexibility to move capacities during summer season and enter successfully
Asia and Europe leisure destinations (Air Canada, 2017, September).
Management
The third forces of the Oviatt and McDougall (2005) model consists of the management of
the firm and their entrepreneurial and experiences level. The managements are the decision makers
on the presented opportunities, which explain their detrimental influence on the internationalization
speed (Oviatt & McDougall, 2005).
Air Canada appointed Michael Friisdahl as the president of Air Canada Rouge to oversee
its launch in 2012 (Air Canada Media Room, 2013, July). According to Calin Rovinescu CEO of
Air Canada, the new president of Air Canada Rouge Michael Friisdahl has “experience in the
international travel and leisure business” (Air Canada Media Room, 2012, October). Hence, the
59
59
international scope is present with the appointment of Friisdahl and Alan Read who combined the
global connectiveness, international perspective, and leisure travel. Mr. Alan Read who occupied
various position in Air Canada was responsible and has the experience in facilitating the
connectiveness of passenger on a global scale (Air Canada Media Room, 2018, March).
Friisdahl was followed by Craig Landry in 2015 to lead Air Canada Rouge (Air Canada
Media Room, 2015, December). Prior to his appointment, Craig Landry was the Chief Marketing
Officer of Air Canada (Air Canada Media Room, 2015, December). Craig Landry led the
successful implementation of new product development, digital communication, and e-commerce
that contributed to the group’s international expansion (Air Canada Media Room, 2015,
December).
Besides, Benjamin Smith who became the CEO of Air France in 2018 (Air Canada Media
Room, 2018, August) was a key figure in the continuous success of Air Canada Rouge (Air Canada,
2018, September). Benjamin Smith was responsible for negotiations with pilots and other
employees to ensure the continuous flexibility and growth of Air Canada Rouge (Air Canada, 2018,
September). On the other hand, Air Canada encourages the entrepreneurial spirit of Rouge
personnel with a focus on international market that is part of the global strategy of the firm (Air
Canada, 2015, August).
Finally, Air Canada Rouge was bestowed with different type of profiles who possess
international experience and entrepreneurial traits. The international vision competencies of the
company’s top management were complemented by Benjamin Smith’s negotiation competency.
The negotiation competency ensured smooth labor negotiation that contributed to increased
flexibility of the fleet management and airlines’ crew.
Business Network and Knowledge
After the opportunity discovery by the management, the internationalization execution is
influenced by the know-how and the international business relations of the company’s management
(Oviatt & McDougall, 2005). In this regards, Air Canada rouge benefits from different business
network and possess the internationalization know-how.
60
60
Air Canada Rouge was founded as part of the leisure segment of Air Canada group where
it has the full support and extensive knowledge of Air Canada Vacation (Air Canada Media Room,
2013, July). Air Canada Vacation provides Air Canada rouge with its distribution and leisure travel
expertise to offer and market affordable flights to international leisure destinations (Air Canada
Media Room, 2013, July).
Air Canada Rouge benefits from the purchasing and negotiation power of the group that it
developed special contracts with aircraft manufacturers (Air Canada, 2014, November). These
contracts offered Air Canada Rouge the flexibility to manipulate aircraft densification with
flexibility and low-cost (Air Canada, 2014, November).
Air Canada Rouge benefits from the partnership with Amadeus that supports its
technological development to further develop its international growth (Air Canada Media Room,
2017, October). The technological business network also included partnership that are evolving in
parallel with the development of FinTech. For example, the group concluded an agreement with
Adyen to accept alternative payments (Air Canada Media Room, 2017, November). The alternative
payments offer Air Canada rouge access to different customer segment as well as facilitate the
payment customer experience worldwide.
Rouge benefits from the extensive partnership that Air Canada posses with different major
flag carriers (Air Canada, 2016, September). These different commercial partnerships offer rouge
the opportunity to connect its customer through various methods to a larger route network (Air
Canada, 2016, September). For example, Air Canada rouge has access to Star Alliance that groups
the major airlines and offers a network of more than 1250 Airports worldwide (Air Canada Media
Room, 2013, July). In fact, Air Canada is a founding member of Star Alliance. Moreover, Air
Canada Rouge customer benefit from the transferability of their reward and flyer programs under
the star alliance or Air Canada program (Air Canada Media Room, 2013, July).
The knowledge of Air Canada rouge that influence its internationalization speed comes
from the knowledge of its management as well as the extensive knowledge of the parent company.
The management of Air Canada Rouge consists of previous executive of the parent company as
well as new key figures. For example, Air Canada Rouge VP of operation Alan Read has extensive
knowledge of global connectiveness and aircraft operations (Air Canada Media Room, 2018,
61
61
March). Also, Craig Landry, who become Air Canada Rouge CEO in 2015, has extensive
knowledge of international commercialization as well as developing global digital communication
(Air Canada Media Room, 2015, December). Plus, Craig Landry has extensive knowledge to
leverage e-commerce and global distribution (Air Canada Media Room, 2015, December).
On the other hand, Air Canada Rouge did not rely only on the parent company executive
but also recruited Michael Friisdahl as the first CEO of Air Canada Rouge (Air Canada Media
Room, 2012, October). Friisdahl has a proven record of international travel and extensive
experience in the leisure and entertainment sector (Air Canada Media Room, 2012, October).
Hence, the common trait of the top management of Air Canada Rouge is their international
exposure, commercialization, operational efficiency, and leisure knowledge.
On the other hand, Air Canada Rouge benefits from the knowledge of the executive
management of the group that continuously supports the low-cost subsidiary. Also, Air Canada
Rouge profits from the extensive international knowledge passed on by the parent company Air
Canada (Air Canada, 2013, August). The extensive international knowledge of Air Canada was
built over more than 87 years of experiences with an international network of more than 150
international destinations (Air Canada Corporate Profile, n.d.). Hence, Air Canada Rouge benefits
from the knowledge of all the routes where Air Canada developed a presence (Air Canada, 2013,
August).
Finally, Air Canada Rogue developed its own knowledge of operational efficiency. In fact,
it become a knowledge catalyst for the parent company in Aircraft densification and operational
efficiency (Air Canada, 2017, May). For example, the cost reduction in the model Boeing 777 has
been transferred to the parent company (Air Canada, 2017, May).
Firm’s Resources
For Air Canada rouge, resources can be seen through fleet management and capacity as
well as its administrative and human capital. Air Canada Rouge started with a fleet of 2 Boeing
767 that supported long range flights and 2 Airbus 319 that supported economical flight in North
America (Air Canada, 2013). However, Rouge has a fleet flexibility provided by the full support
of the parent company by transferring fleet into its subsidiary when needed, while restricted by
62
62
labor negotiations limits of 50 aircrafts (Air Canada, 2013 February). Rouge will benefit from the
fleet of 767 that is being replaced by productive 787 brought in by the parent company Air Canada
(Air Canada, 2016, November).
Rouge enjoys a fleet flexibility and access to the mainline fleet as well as to existing leisure
routes for its expansion (Air Canada, 2014, May). During its launch years, Air Canada equipped
Air Canada Rouge with a fleet of 8 Airbus A319 and 2 Boeing 767-300 with an intention to grow
the fleet mix to 50 aircraft by 2014 (Air Canada, 2013). Plus, the LCC’s fleet will be supplemented
during 2013 with 6 high density Boeing with the intention to reach a fleet of 45 aircraft by 2016
(Air Canada, 2014, February). Subsequently, Air Canada rouge reached a fleet mix of 45 aircraft
combining 25 Airbus and 20 Boeing in 2017 (Air Canada, 2018).
Also, the vision of the group is to equip the LCC with more Wide Body airplane for their
efficiency (Air Canada, 2013, February). For example, the wide body 767 helped rouge reach
international market efficiently (Air Canada, 2013, May). Also, the wide body Boeing 777 benefits
rouge with increased seating and long-haul reach that facilitate the international expansions (Air
Canada, 2014, February). For example. Rouge received the dense 777 with 458 seats and delivered
20% efficiency compared to B777 on the mainline’s fleet (Air Canada, 2014, November). This
represented an increase of 100 seats on the Boeing 777 (Air Canada, 2015, May). Besides, the 767
Boeing helped Rouge to have a 30% fuel efficiency and has high competitiveness when moving to
serve European leisure market (Air Canada, 2015, August). Air Canada Rouge will not focus solely
on wide body aircraft but also on narrow-body aircraft such as the A319 (Air Canada, 2014,
February). Air Canada Rouge enjoys a diversified fleet composed widebody and narrow body
aircrafts (Air Canada, 2015, December). However, the fleet transfer from mainline to Air Canada
Rouge depended also on the reception of the Dreamliner order for the mainline (Air Canada, 2014).
Moreover, the LCC will not offer only economical seating, but it will also introduce Rouge
Premium seating with more legroom and enhanced service (Air Canada Media Room, 2013, April).
Administrative and human capabilities are key to the airline’s growth due to their
detrimental support role and cost structure. Air Canada Rouge was launched by Air Canada with
its own "separate brand, differentiated product and separate in-flight crews" and has the full support
of the parent company (Air Canada, 2017, May). It benefits from Air Canada Vacation, which is
63
63
the group leisure travel agency (Air Canada, 2019). It profits also from total support of the parent
company for the transport operating certificate, training human capital, providing routes and
encouraging the launch of new routes by Rouge (Air Canada, 2013, May). Moreover, Air Canada
Rouge enjoys the support of the mainline in its international endeavor through the established route
network, brand name, and operational expertise and knowledge (Air Canada, 2015, September).
On the other hand, the human capital of the airline is important and detrimental in every
decision undertaken by the top management. For example, the aircraft seating changes are always
in negotiation with pilots and is protected by different labor agreements (Air Canada, 2017,
February). Hence, labor stability and union agreements enable the LCC to operate more flights and
to maintain its competitiveness (Air Canada, 2018). Lastly, Air Canada Rouge encourages the
entrepreneurial spirit of the company’s member with an international orientation (Air Canada,
2015, August).
Air Canada rouge resources have resulted in possessing a capacity to carry 2 million
passengers within the first 2 years of operations (Air Canada, 2014, August). Also, it allowed in
2014 for a faster expansion to popular leisure markets in different continents such as Italy (Air
Canada, 2015). In parallel, the LCC enabled the parent company to see 25% cost saving in
comparison to the mainline with a fleet size of 53 aircrafts (Air Canada, 2018, May). Lastly, the
high density of the wide body Boeing 767 & 777 has contributed to the success of the across pacific
and Atlantic expansion (Air Canada, 2018, July)
Strategy
The strategy of the firm plays an important factor in determining the internationalization
speed (Chetty et al., 2014). In addition to founding Air Canada rouge to serve leisure destinations
in partnership with Air Canada Vacation, the low-cost subsidiary “will leverage the strengths of
Air Canada's extensive network, operational expertise and frequent flyer reward program in order
to offer Canadians great value for their vacation travel.” (Air Canada Media Room, 2012,
December). The parent company CEO Calin Rovinescu set the starting mission for “Rouge
international expansion [to] will rely more on the existing routes of the mainline” (Air Canada,
2013, August). Additionally, the parent company has developed a set of priorities for its business
and it started with internationalization, low cost leadership and increased revenues, enhanced
64
64
customer engagement, and the promotion of entrepreneurial mindset in the company (Air Canada,
2015, September). Furthermore, the parent company has a strategy to have 90% of their capacity
expansion in international market and Air Canada Rouge represented a cornerstone of the stated
strategy (Air Canada, 2015, May). Subsequently, the group’s management argued that one of
Rouge priorities is international market at the Credit Suisse Industrials Conference (Air Canada,
2015, December). Besides, CFO Mike Rousseau claimed that "we [Air Canada] are growing
internationally and primarily through Rouge" (Air Canada, 2016, February). In fact, Air Canada
rouge is a pillar in the international growth strategy of the parent company (Air Canada, 2016). For
example, Air Canada Rouge and Air Canada entered 15 new international destinations that helped
fuel their international growth in 2016 (Air Canada, 2017).
On the other hand, Air Canada Rouge allows the parent company to reach destinations that
were no longer feasible through the mainline cost structure and operational model (Air Canada,
2013, May). Besides, Air Canada Rouge proved powerful and benefitted from the aid of mainline
company to expand its network. Consequently, Air Canada rouge improved margin on leisure
destination for the parent company (Air Canada, 2015
).
The expansion strategy of Rouge also relies on the fleet mix’s strategy. The widebody
aircraft are destined to the busy routes as well as long-haul market (Air Canada, 2014, February).
For example, Air Canada CEO claimed that Rouge’s expansion business is helped through its fleet
composition of the 777 and 787 in the Q1 2015 Air Canada Earnings Call (Air Canada, 2015, May).
Lastly, the expansion strategy of Air Canada Rouge is considered to be successfully implemented
and exceeded expectation in pursuing international markets (Air Canada, 2018).
Innovation
As presented in the literature review, innovation doesn’t stop at digitalization and
technological capabilities but extends to marketing innovative ideas. In fact, innovation touches on
all the activities carried by an airline.
Air Canada Rouge proposed during the first year of operations an innovative premium
seating in its narrow body fleet by modifying the front 3x3 rows into 2x2 premium seating with
65
65
legroom and enlarged overhead baggage storage (Air Canada, 2015, August). This was preceded
by innovative seats that offered modern and stylish seating with inflight entertainment on its A319
fleets (Air Canada Media Room, 2013, April). Plus, Rouge in-flight entertainment system is
equipped with new generation player that allows customer to wirelessly stream content from their
electronic devices (Air Canada Media Room, 2014, July). This innovation has attracted customer
and enhanced in-flight experience (Air Canada Media Room, 2014, July). Also, Air Canada Rouge
premium customers have been offered access to the premium Lounge of the parent company (Air
Canada Media Room, 2016, January).
By the third birthday of Air Canada rouge, Benjamin Smith, an executive of Air Canada,
acknowledged the innovative business model of Air Canada rouge that enabled the group to enter
new international markets. (Air Canada Media Room, 2016, June). For a faster check-in and
reduced boarding time, the company didn’t stop at the development of a mobile app but extended
its innovation capabilities by offering an Apple Watch app that allowed customer a faster check-in
and reduced boarding time (Air Canada Media Room, 2015, March). On the other hand, Air Canada
rouge gradually introduced high speed internet on its Airbus 319 fleet (Air Canada Media Room,
2017, May). Air Canada Rouge became the first LCC and airline to offer high Speed Wifi in North
America in 2017 (Air Canada Media Room, 2017, May).
To attract new customers and enlarge its global reach, Air Canada rouge engaged in the
rapid development of innovative FinTech by entering an agreement with Adyen to accept the
alternative payments (Air Canada Media Room, 2017, November). The focus on innovative
capabilities has extended by recruiting a new Chief Information Officer with a focus on innovation
in its internal and external IT development (Air Canada Media Room, 2018, September). Lastly,
Air Canada rouge has not been innovative only in its operational and technological capacities, but
also in its marketing ideas by offering the retail strategy of the lowest price guaranteed during its
early years of internationalization (Air Canada Media Room, 2013, February).
Opportunity Development
Air Canada rouge represented a rapid and competitive internationalization strategy for the
group. It developed its own opportunity identification for internationalization. Nonetheless, Air
Canada rouge development was also limited by certain opportunities’ constraint.
66
66
The market demand for affordable leisure destination represented an opportunity for the
group to transfer and modify existing mainline fleet into Rouge fleet (Air Canada Media Room,
2014, July). Rouge offers the opportunity for the group to operate previously flown routes
effectively and efficiently due to the cost structure of operation with high flexibility (Air Canada,
2013, May). For example, Air Canada rouge allowed for the only nonstop flight from Canada to
Osaka, which was stopped previously by Air Canada (Air Canada Media Room, 2014, September).
This has allowed the LCC to develop its intention to intensify its presence in the Asian market
through Japan, China and Korea as they represent a growing opportunity (Air Canada, 2016, April).
Moreover, Air Canada rouge’s expansion represent an opportunity for the group to remedy to the
low third quarter in 2018 by using wide body aircraft in South & Central American destinations
(Air Canada, 2018, October). In fact, Air Canada rouge has reduced the cost structure on leisure
market by 25% in comparison to the parent company cost structure (Air Canada, 2016).
The parent executive argued that larger narrow-bodied aircraft represent a higher
performance opportunity for Rouge (Air Canada, 2014, November). The opportunity is driven by
the fact the it can accommodate more passengers with its downside of mobilizing more ground
members with high turn-over times. Also, the low-cost structure represents an opportunity for
reinvestment to increase capacity and enhance operations (Air Canada, 2014, February). The
growing popularity for international leisure destinations worldwide presented an opportunity for
entry such as Barcelona and Athens for summer 2015 (Air Canada Media Room, 2014, September).
On the other hand, Air Canada rouge has the opportunity to not be committed to year-round service
and operates its flights around the world in accordance with leisure’s destinations seasonality (Air
Canada, 2014, February). Therefore, Air Canada Rouge develop and take advantage of different
opportunities that contributed to its rapid international growth.
Domestic Commitment
Through the analysis of Air Canada Rouge internationalization, less attention was devoted
to its domestic market. The reason for less focus on domestic market comes from the existence of
Air Canada Express that is a regional airline of the parent company that serves domestic markets
in addition to the mainline domestic operations. However, Air Canada rouge launched domestic
flight from Toronto to Nanaimo and Kamloops and also from Montreal to Victoria, BC (Air Canada
Media Room, 2017, December). In fact, Rouge has the flexibility and the network to develop
67
67
domestically without cannibalizing other brands such as Air Canada express (Air Canada, 2017,
May). In this regard, Air Canada continued to develop Air Canada rouge domestic leisure network
by launching flight that connects Toronto and Kamloops and Nanaimo, and between Montreal and
Victoria (Air Canada Media Room, 2018, June). With the raise of Ultra Low-Cost Carriers within
the Canadian market, Air Canada Rouge being deployed domestically through narrow body
airplanes to protect the Canadian position against all form of competition (Air Canada, 2018,
April). Lastly, the domestic development of Rouge network will consist of service Canadian leisure
destination during the peak season from the 3 main Air Canada hubs that are Montreal, Toronto,
and Vancouver (Air Canada, 2018, July).
Regulatory Environment and Institutional Theory
In its quest of internationalization, Air Canada rouge deals with both internal and external
institutions. The internal institutions can be represented by the labor body and different unions
whereas external institution represents government agencies and regulative bodies. However, Air
Canada Rouge benefits from the administrative support and experience of the parent company
when requesting aviation transport certificate and undertaking administrative action to operate
international routes (Air Canada, 2013, May).
Air Canada Rouge faces institutional pressure for Aircraft densification. For example, the
densification of Aircrafts is legally limited in a form of a ratio of cabin crew by passenger. The
Canadian Aviation institution has granted Air Canada rouge the right in form of an exception to
have a ratio of 1 cabin crew per 50 passengers (Air Canada, 2013, May). In fact, the Canadian
Aviation Regulation enforces a ratio of 1 flight attendant for every 40 passengers, a ratio that is set
for higher safety standard and is argued politically by the conservative party (Canadian Union of
Public Employees, 2017). Prior to amending the law in 2017, the ratio of 1 flight attendant to 40
was enforced with exception to few Airlines that satisfies certain evacuation requirements (Dery,
2016).
Also, the institutional distances between countries represent a facilitator for higher
internationalization speed. For example, the Canadian visa program for Mexican national
represented a strong opportunity growth for rouge in the Mexican market (Air Canada, 2017, May).
68
68
At the Investor Day 2017 Conference, Air Canada has declared a new agreement without
providing details with pilots that enables Air Canada rouge to boost its growth and efficiency (Air
Canada, 2017, September; 2017, October). Also, the agreement with pilots allowed Air Canada
Rouge to have the flexibility to grow domestically (Air Canada, 2017, September). In later
conference calls new details have been provided on the agreement with pilots. In the Q4 2017
conference call, Air Canada has declared that change have been applied on the previous agreement
with pilots that limited the fleet size of the narrow body models as well as the flexibility of Rouge
to be deployed domestically (Air Canada, 2018, February). The new agreement with pilots’ granted
Rouge the flexibility and possibility to be deployed in a timely manner in the domestic market as
well as increasing the number of the narrow body aircrafts (Air Canada, 2018, April).
Lastly, countries from around the world have signed the international Civil Aciation that
provides countries with control over each country’s Airspace (Government of Canada Transport
Canada, 2019). The mutual agreement between countries that permits flying are negotiated under
Air Transportation Agreements (ATA). Canada has introduced in 2006 the Blue-Sky policy that
guides all ATAs with different countries that grants the right for Canadian Airlines to fly to
countries with whom open skies are signed (Government of Canada Transport Canada, 2019).
Despite the open skies’ agreement, Airlines needs to file an institutional approval to operate a
specific route. For example, Air Canada rouge requested an institutional approval to fly to Lima in
Peru (Air Canada Media Room, 2017, May), a country with whom an ATA was signed in May
2013 (Government of Canada Transport Canada, 2019). The Blue-Sky policy is focused on a
liberalized agreement that enable competition and allow for Canadian airlines to grow successfully
with accordance with safety regulation and healthy economic growth (Government of Canada
Transport Canada, 2017). All in all, Air Canada rouge benefits from The Blue-Sky Policy that is
signed with 107 countries, 70% of which are open skies (Government of Canada Transport Canada,
2019).
Ryanair
Ryanair was founded in 1985 with a Bandeirante aircraft of 15 seats that operated the route
of Waterford to London (Ryanair Corporate History, n.d.). Since 1985, the company grew into a
69
69
network of 82 bases operating throughout 40 countries with more than 2000 daily flights by the
end of 2018 (Ryanair Corporate History, n.d.). (Worldwide positioning)
According to Business Overview of Ryanair 2018, the company was leader in introducing
low cost model in the European region (Ryanair, 2019). During the period between 1992 and 2018,
Ryanair grew its total passenger carried from 1 million to 130 million passengers in 2018 with total
revenue of 5 billion Euros equivalent to $7 billion (Ryanair, 2019).
Internationalization Journey
Ryanair crossed the Irish border to serve London since its inception in 1985 by operating a
small aircraft with 15 seats capacity (Ryanair Corporate History, n.d.). However, it entered the
most sought route of Dublin-London that was dominated by British Airways and Aer Lingus
(Ryanair Corporate History, n.d.). During the three first years of its operations, Ryanair expanded
its network reach in UK and Europe by flying to Munich in Germany and Brussels in Belgium
(Ryanair Corporate History, n.d.). Ryanair continued its trend of targeting regional and secondary
airports throughout Europe and other nearby continents. Ryanair reached by the end of 2018 a
network of 40 countries with more than 2000 daily flights (Ryanair Corporate History, n.d.).
Besides, Ryanair does not only operate across border flights, but it also develops strong domestic
network in host countries with probable base establishment. Ryanair has established 36 bases
outsides of its home country Ireland (Ryanair, 2019).
Furthermore, Ryanair has been active in acquiring airlines for routes expansion and
resources. For example, Ryanair acquired Buzz in 2003 that enabled further access to the French
market by accessing 11 secondary Airports (Ryanair Corporate History, n.d.). Plus, it acquired
majority stake in Laudamotion Airline that enabled access to the Austrian market (Ryanair
Corporate History, n.d.). Therefore, Ryanair internationalization model follows the born global
internationalization model due to the rapid internationalization since inception.
Technology
Ryanair employs technology to improve customer experience and resources, and to increase
its efficiency. However, it pays little attention to inflight customer entertainment. Ryanair
encourages the use of personal electronic devices as it doesn’t provide inflight entertainment
70
70
(Ryanair Inflight Experience, n.d.). Hereafter, a narrative of the technological development of
Ryanair to improve customer experience, online sales, and investing in technology as part of
Ryanair’s efficiency quest.
Ryanair counts on technology to enhance the customer experience in the Airport and
through the booking portal (Ryanair, 2006a, February). Ryanair introduced by the end of 2007 an
online check-in feature for clients through the website (Ryanair Corporate History, n.d.; Ryanair,
2008b, November). In the Q4 2019 Analyst Briefing, Ryanair CEO recognized that the web check-
in contributed to a reduction in boarding time and enhancing Airport’s customer experience
(Ryanair, 2009, June). Ryanair expanded the online check in to its newly launched app by 2015
(Ryanair, 2014, November 3). It also engaged in a monthly update of the app to ensure a bug-free
and smooth online customer experience (Ryanair, 2015, September 9). Consequently, Ryanair App
has become in 2016 the 8th most used app in the UK, a consequence of continuous effort and
investment in Ryanair technology (Ryanair, 2016c, November 7) and became the most downloaded
the airline industry by 2017 (Ryanair Corporate History, n.d.). In 2018, the app reached 23 million
downloads (Ryanair, 2018a, July).
Ryanair continuously optimizes and modernizes its online booking (Ryanair, 2006a,
February). Since 2001, Ryanair has been enjoying the leadership in traffic attracted by its online
booking in comparison to other airlines (Ryanair Corporate History, n.d.). In its letter to
shareholders of 2017, Ryanair's CEO advanced that the website has been continuously improved
to facilitate the online booking journey and allowed the airline to enjoy market leadership (Ryanair,
2018). In 2005, Ryanair disclosed that 98% of its booking is generated by its online portal (Ryanair
Corporate History, n.d.).
Ryanair pursues operational efficiency through technology. For example, the website
enhancement, as well as its new fleet of Boeing 737 800 with winglet technology, contributed to a
reduction of its unit cost by 6% (Ryanair, 2006a, February). Moreover, Ryanair reduced the
outsourcing of technology handling and invested in Ryanair Lab (Ryanair, 2017, May 30). The
continuous investment in technology enabled the company to reach 130 million passengers
(Ryanair, 2017, May 30) and reducing distribution costs (Ryanair, 2017b, February 6).
71
71
Ryanair focuses on recruiting more IT talents to keep developing the website and its online
booking, among other technological endeavors (Ryanair, 2015). While realizing the importance of
technology, Ryanair's lab enabled the company to diversify and access a new pool of talents
(Ryanair, 2017, May 30). For example, Ryanair realized that Bratislava and Madrid enjoyed large
IT talented personnel with competitive costs compared to Dublin (Ryanair, 2018b, July). Moreover,
Ryanair Labs contributes to lowering distribution costs and increasing ancillary revenues (Ryanair,
2017b, February 6). Hence, the technology employee structure proved to be competitive in the
profit formula and internationalization commitment of Ryanair.
Ryanair was active in the development of reservation management system through external
partnerships. Beginning 2000, it changed its older RMS, the British Airways Booking System, for
an FlightSpeed RMS from Accenture Open Skies (Ryanair, 2003). The contract with Accenture
Open Skies was a 10-year contract with a focus on security and on increasing the reservation
capacity (Ryanair, 2006). By increasing the reservation capacity to 100 million passengers, Ryanair
introduced the New Skies reservation systems (Ryanair, 2007, November; 2008, June). The
introduction of the New Skies also came after Ryanair suffered a momentarily shut down of its
previous RMS, which reached its capacity limits (Ryanair, 2008, June). In 2017, Ryanair
acknowledged the challenge of connecting RMS between companies. However, Ryanair, Aer
Lingus, and Norwegian dedicate their technological department to ensure connectivity between the
airlines (Ryanair, 2017b, February 6).
Competition
In the Chief’s Executive Message 2000, he expressed the intense competition in the intra-
European market that is coupled with spikes in interest rate and fuel prices. During these times,
major European airlines announced losses while Ryanair strived during the tense competitive
market of 2000 (Ryanair, 2001). Also, Ryanair CEO argued that different state aids to airlines
render Ryanair to double its low-cost effort to maintain its competitiveness (Ryanair, 2013, July).
For example, in the Q1 conference call of 2014, Michael O’Leary complained about the state aid
to Air France that are in the form of Public Service Obligation. Also, Michael O’Leary explained
about “Lufthansa have a quasi-monopoly in Munich, which is publicly funded airport, which us
another hidden subsidy to the likes of Lufthansa” in (Ryanair, 2014, February). These different
72
72
protections that are awarded from the primary airport to the flag carrier of the country makes
Ryanair less competitive in targeting or serving primary airport (Ryanair, 2014, February).
On the other hand, Ryanair is competitive in the European market and claimed that the cost
structure of the airline is a competitive differentiator in European Airline competition (Ryanair,
2017, b, February). The financial strength of Ryanair enabled the airline to remain profitable and
competitive during different economic tense situations (Ryanair, 2004b, November). This trend
has continued in 2010 as Ryanair continued to strive financially during a time when the financial
crisis has phased out a many airline (Ryanair, 2011). Plus, the fuel price increase of 37% during
2010 and 2011 increased the cost of fuel consumption to 40% of Ryanair cost structure (Ryanair,
2012). This has increased in 2012 to represent 43% of Ryanair total cost (Ryanair, 2013).
Ryanair average fare is the lowest in the European airline industry (Ryanair, 2002,
November). In fact, Ryanair reduced its fares by 5% in 2004 when other airlines were recording
losses (Ryanair, 2004a, November). In 2008, Ryanair offered its fare on an average of 43 euros
that is the half of what EasyJet proposed (Ryanair, 2008a, November). Michael O’ Leary advanced
in the Q2 2004 conference call that Ryanair enjoyed the highest margin in the industry (Ryanair,
2004a, November). Subsequently, Ryanair announced its leadership in the European low-cost
carrier market in multiple years such as in 2004 (Ryanair, 2005) or in 2007 (Ryanair, 2007b, June
5).
Management and Knowledge
Throughout Ryanair operation and by analyzing conference calls, Michael O Leary is a key
figure and decision maker of Ryanair. Ryanair CEO, Michael O’Leary, is a key figure not only for
Ryanair but also for the Low-Cost industry and an influential figure (Shuk-Ching Poon & Waring,
2010). In fact, he is a charismatic leader known for his extensive media and publicity use (Shuk-
Ching Poon & Waring, 2010)
After Ryanair incurred a loss in 1990, the Ryan family appointed their financial Advisor
Michael O’Leary to CEO position of Ryanair (Thomas, 2015). Prior to that, Michael O’Leary was
sent to benefit from Southwest Airlines experience and knowledge of the low cost model (Thomas,
2015). Michael O’Leary adopted the low cost processes and strategy of Southwest Airlines and
73
73
made Ryanair profitable in 1991, a year marked by the gulf war and spike of oil prices (Thomas,
2015). He cultivated throughout its long year of tenure since 1991 an extensive knowledge of the
rapid evolving low-cost industry. As Michael O’Leary was developing the low cost processes for
Ryanair, the European airline industry went into Open Skies Deregulation of 1996 (O’Gorman &
Curran, 2017). Over the year, Michael O’Leary developed an “opportunistic company” that grew
its network to 40 countries (Ryanair, 2011a, July; Ryanair Corporate History, n.d.). On the other
hand, Ryanair places high importance of the international experience. For example, it specified in
its Director’s report of 2010 that the international exposure and experience are necessary assets of
its directors (Ryanair, 2011). These traits are key in leading Ryanair’s growth (Ryanair, 2011). For
example, by the end of 2017, Ryanair recruited the CEO of Malaysia Airline as the Chief Operating
Officer of Ryanair (Ryanair, 2017, October 31).
Ryanair stressed in the director report the importance of international experience and
knowledge of its directors (Ryanair, 2011). Besides, Ryanair developed a specific low-cost
business model at secondary airport that it has been successfully duplicated throughout the
European expansion (Ryanair, 2006, June 6). Furthermore, Ryanair includes in different
partnership that training for its employees. For example, it concluded a contract with CAE that
provided 6 new simulators to facilitate Ryanair pilots’ training (Ryanair, 2018, February).
Business Network and Knowledge
Ryanair has developed a business network that includes airports, airplane manufacturer,
support contractor, and technological partner. The Airport selection is detrimental to Ryanair
operational efficiency and cost structure as Michael O Leary expressed in the Q4 2004 Earnings
Conference Call. Hence, Ryanair engages in continuous discussion with different Airport
throughout Europe (Ryanair, 2002, August). In other words, Ryanair consider its relationship with
Airport as partnership as it brings customers to the airport and airport provides adequate offering
for Ryanair operation at the airports. For example, secondary airports contribute strongly to 20%
margin of Ryanair (Ryanair, 2003a, January). Although Scandinavian Airport are fully owned
and protected by government through increases cost for foreign airlines (Ryanair, 2011, May 23;
74
74
2012b, May 21), they have approached and opened negotiation with Ryanair on multiple occasion
(Ryanair, 2012b, May 21; 2018, May 21).
In parallel, Ryanair does not limit itself to Boeing for its fleet by it has opened discussion
with Airbus in 2011 (Ryanair, 2011, May 23). Furthermore, Michael O Leary also considered
COMAC, Chinese Aircraft manufacturer, for a narrow body 200 seats aircrafts (Ryanair, 2011a,
July). Plus, Ryanair organized a series of meeting with the Chinese aircraft maker including top
management meeting (Ryanair, 2011a, July)
Ryanair partners with different technological entities for its Revenue Management System
and for the Global Distribution System (GDS). For example, it has partnered with Travelport for
GDS in 2014 (Ryanair, 2014, May 19). Ryanair extended its portfolio of GDS by adding Amadeus
to Travelport that will give a gateway for 95% of European business booking that granted access
to 95% of the European booking (Ryanair, 2014, November 3).
Ryanair partnered with General Electric for engine maintenance that will support cost
efficiency (Ryanair, 2004b, January). The maintenance agreement with GE remedied to
maintenance cost amortization issue (Ryanair, 2004b, January). For the maintenance of its new
generation of Boeing 737, Ryanair partnered with CFM (Ryanair, 2018, February). Plus, Ryanair
entered a business partnership with CAE to modernize its simulator and leverage its pilot’s
trainings (Ryanair, 2018, February). Lastly, the airline partnered with Erasmus Student Network
for fare discounts to increase its customer rich and diversify its revenue mix (Ryanair Corporate
History, n.d.).
Firm’s Resources
Ryanair enjoys a fleet that started with 15-seater Aircraft in 1985 to a fleet size of 470
aircraft by the end of 2018 composed mainly of the narrow body Boeing 737-800, 737-200 Max
(Ryanair Corporate History, n.d.). The introduction of the fleet of 737-800 contributed to a
reduction of 6% of the unit cost (Ryanair, 2006a, February). Moreover, Ryanair is actively and
continuously modernizing its fleet that it reached an average fleet age of 2 years in 2005, which is
the youngest in the industry (Ryanair Corporate History, n.d.). This age has been reached through
75
75
the phasing out of its old fleet of 737-200 and the introduction of the 737-800 (Ryanair Corporate
History, n.d.). However, Ryanair fleet enjoyed by the end of 2018 an average age of 6.5 years
(Ryanair Fleet, n.d.). Ryanair average a daily fleet utilization of 9 hours (Ryanair, 2019) with more
than 2000 daily flights (Ryanair Corporate History, n.d.).
Ryanair composes its fleet that it can reach its 25 minutes turn around and any increased
seating beyond 198 seats will puts pressure on operational efficiency (Ryanair, 2011a, July).
Furthermore, regulation requires 1 cabin crew per 50 passenger which discourage Ryanair to
increase its seating beyond 198 seats aircraft for only extra 10~15 passenger (Ryanair, 2011a, July).
The discussions are ongoing with Boeing to optimize the densification through the removal of the
rear toilet cabin as well as seeing the 737-900 offering (Ryanair, 2011a, July). In parallel, Ryanair
engaged with discussion with COMAC and Airbus to evaluate the best offer for a 200 seats aircraft
(Ryanair, 2012, November). Michael O’Leary advance that the fleet is limited to narrow body
aircraft as the wide body aircraft represent a challenge for the airline (Ryanair, 2006, August 8).
The wide body aircraft can mobilize more than one gate and pressure turnaround times (Ryanair,
2006, August 8). The expansion of Ryanair with new fleet that is composed of the 737-800
contributed to an increase of 6% of its stage length (Ryanair, 2012, November).
On the other hand, the human capital represents an important resource for the LCC. In 2018,
Ryanair advanced the importance of human capital to accommodate the company’s growth
(Ryanair, 2018, May 21). Hence, it is investing heavily in its human capital (Ryanair, 2018, May
21). After Ryanair withdrew its bid for Alitalia, it focused on training its pilots through a new
program with focus on long-haul operation (Ryanair, 2017, October 31). Also, it appointed a new
Human Resource Director as Chief People Office who will ensure continuous discussion with pilot
(Ryanair, 2017, October 31). The latter development came after tense discussion and blockage
from pilot unions. For example, in 2004, Ryanair countered pilot unionization by an open day
recruitment of pilots (Ryanair, 2004b January). Hence, Ryanair reached consensus with its pilots
throughout Europe with exception to the home base pilots at Dublin (Ryanair, 2006, June 6). Also,
the Danish pilots reiterated their demands that closed strong opposition to Ryanair (Ryanair, 2016,
July). Consequently, Ryanair closed its Danish base (Ryanair, 2016, July). In parallel, Ryanair
76
76
continued its open discussion with different pilots throughout Europe in regard to pay increase and
job contract (Ryanair, 2017, October 31). These efforts were conclusive in all bases with exception
to the Dublin base (Ryanair, 2018, February). Finally, Ryanair Lab enabled the company to access
a new pool of talents that will accommodate the company’s growth (Ryanair, 2017, May 30).
As Ryanair were replacing its 737-200 by 7373-800, it launched training program for its
pilots for the new fleet, but the cost of the training remained a subject of union discussion with
Ryanair (Ryanair, 2005b, August). Besides, more than half of Ryanair operational human capital
became Ryanair contractor (Ryanair, 2010a, November 1). The new form of contract with its
operational human capital granted Ryanair flexibility during the tense economic situations such as
spikes in oil prices (Ryanair, 2012a, July).
Strategy
In the director’s report of 2000, Ryanair stated that “the group operates an international
airline business and plans to continue to develop this activity by replicating its successful low fares
formula on new and existing routes" (Ryanair, 2001). In fact, its price offering is almost half of
what is offered by major airlines (Ryanair, 2008).
In offering the lowest fare while maintaining cost leadership, Ryanair employed different
strategies in regard to Airports. First, Ryanair evaluates the airport in delivering an efficient
turnaround time for its aircrafts (Ryanair, 2004a, June). Secondly, Ryanair evaluates the secondary
airport in offering convenience for customer as well as the offering competitive offer for Ryanair
where airport charges are reduced (Ryanair, 2003a, January; 2013, May 20). Hence, the secondary
airport offers Ryanair a strong margin of 20% (Ryanair, 2003a, January).
By 2014, Ryanair started serving increasingly primary airports in primary cities which is
an important turn in airport strategy, according to Chief’s executive report of 2014 (Ryanair, 2015).
By 2017, Ryanair became increasingly attractive for primary airport that the majority of its recent
opening were in primary airports (Ryanair, 2016d, November 7). Hence, Ryanair started to focus
77
77
on its effectiveness and efficiency at primary airport as the mix has yielded more primary airport
than secondary for Ryanair airports portfolio (Ryanair, 2016b, November 7).
Ryanair developed a competitive entry strategy and called it as Vacuum Strategy (Ryanair,
2012b, May 21). The strategy is based on heavily entering a market through high frequency and
lowest fare while balancing in reaching high load factors (Ryanair, 2012b, May 21). Besides,
Ryanair’s growth is dependent on new routes opening and new bases (Ryanair, 2004). The strength
of network commitment in different host countries coupled with bases establishment offered
Ryanair flexibility in moving capacity throughout Europe (Ryanair, 2014, February). For example,
the development of a strong network of bases in Europe contributed to a reduction of 9% in costs
(Ryanair, 2011).
On the other hand, Ryanair focus on short haul operations that enable volume and scale
(Ryanair, 2014, November 3). Nonetheless, in the absence of good deals on long haul aircrafts,
Ryanair will remain less interested in long haul flights (Ryanair, 2008, February).
Innovation
Ryanair considers innovation as a growth engine (Ryanair, 2014, November 3). For
example, Ryanair created Ryanair Lab that will employ artificial intelligence and analytics under
supervision of Chief Technology Officer (Ryanair, 2014, November 3). Consequently, the airline
invested heavily in its Ryanair lab and the digital space as they are innovation engine (Ryanair,
2016d, November 7). The investment in Labs will be translated into opening new development
center or labs in other countries in addition to Spain (2017, May 30). In 2018, Ryanair employed
600 personnel in its tech Labs (Ryanair, 2018, May 21). In Parallel, the company created a
warehouse e database that will make use of analytics to innovate in enhancing customer experience
and contributing to the airline’s efficiency (Ryanair, 2015, May 26).
On the other hand, Ryanair invested in Always Getting Better program that aims at
improving customer experience (Ryanair, 2015, May 26). The Always Getting Better program
opened an interaction with customer to improve and develop the process of Ryanair (Ryanair
Always Getting Better, n.d.). The program contributed to launching different innovative strategies
78
78
such as refund if cheaper fare was found, modernized app and website, and improve ground transfer
(Ryanair Always Getting Better, n.d.). Also, Ryanair focused on mobile technology as a direct way
of communication with customers (Ryanair, 2017, b, February).
Opportunity Development
In answering an analyst question during the Q1 2020 Conference Call, Ryanair CEO
advanced that Ryanair is “an opportunistic company”. The reduction of capacities by competitors
represent an opportunity for the airline. In fact, Opportunities arise as competitor are cutting
capacity in key European market as German, Italy, Spain, and Scandinavian countries (Ryanair,
2014, July). Also, the failing of Malev, Hungarian Airlines, represented an opportunity for Ryanair
where it moved immediately to Hungarian market and within its first quarter of operation reached
80% load factor (Ryanair, 2012b, May 21). Besides, the bankruptcy of Alitalia bases and its
capacity reduction represented an opportunity for Ryanair (Ryanair, 2004a, June). By 2011, the
Scandinavian market represent an opportunity for Ryanair as SAS and Lufthansa cut capacity in
these market (Ryanair, 2011, May 23). Furthermore, the restructuring of different airlines also
represented an opportunity for Ryanair such as the restructuring of Air Berlin (Ryanair, 2017, a,
February).
The tense economic situation represented an opportunity for Ryanair. For example, during
the oil price spike in 2003, major competing airlines-imposed surcharge fuel fare on customer that
benefitted Ryanair lowest market fare with no surcharge policy (Ryanair, 2004b, June). In pursuing
cost leadership, Ryanair sees the Airport reduced charges and incentives as an opportunity to serve
the corresponding market. During Q1 2012 Conference Call, Michael O Leary, Ryanair CEO,
explained that the company “move wherever the airport deals encourage us to move”.
Lastly, the size of the market and its pricing environment represent a key opportunity for
Ryanair. For example, Ryanair deployed 2 routes in Poland but is heavily intensifying its present
in Span and Italy because of the market size, high efficiency for short haul flights, and market
growth (Ryanair, 2018b, July).
79
79
Domestic Commitment
Ryanair enjoys a heavy international presence outside of Ireland. Ryanair developed a
network of 39 countries outside of Ireland (Ryanair Corporate History, n.d.). Besides, it
internationalized since its beginning by flying into UK from Ireland and in few years after
foundation it served Belgium and Germany by 1988 (Ryanair Corporate History, n.d.). Moreover,
Ryanair developed 82 bases including only 3 in Ireland that are Cork, Dublin, and Shannon
(Ryanair Corporate History, n.d.; Ryanair, 2019). However, according to Q3 FY18 Results
Presentation of Ryanair, the airline possess leadership in its domestic market through 48% of the
Irish commercial airline market followed by Aer Lingus and British Airlines. Therefore, despite
the strong presence of Ryanair in the Irish market, it dedicated more capacity and focus to its
international market.
Institutional environment
Ryanair faced legal challenges from regulatory bodies that impeded its expansion and
operating cost but also received support from different regulatory bodies. By 1997, the European
Union completed the open skies deregulation (Ryanair Corporate History, n.d.). The open skies
deregulation allowed Ryanair to compete freely throughout Europe (Ryanair Corporate History,
n.d.). However, the open skies deregulation is threatened by the Brexit as it raised ambiguity over
future operation in the region (Ryanair, 2017b, February). The company operates 40% of its
capacity on UK-EU routes, which increased its exposure to Brexit (Ryanair, 2018a, July).
Therefore, Ryanair requested an Air Operation Certificate from UK to protect and hedge for its UK
operations against a strict Brexit (Ryanair, 2018, February)
At its home base in Dublin, Ryanair received institutional support in 2002 for building a
low-cost terminal in Dublin Airport to allow for a competitive environment with legacy airlines
(Ryanair, 2002, August). After Ryanair was pressure by Irish Airport Monopoly, the Irish
government ordered for breaking the airport monopoly of the 4 Irish airports (Ryanair, 2003a,
August). The breaking of airport monopoly enabled for competition between airport that was
translated into cost reduction for LCCs (Ryanair, 2003a, August). Nonetheless, Ryanair was faced
with high charges in Irish Airports and therefore filed legal action in 2005 (Ryanair, 2005a, August)
80
80
and continued its legal battle in 2008 (Ryanair, 2008b, November). In fact, Ryanair incue higher
cost in its Irish home base than elsewhere (Ryanair, 2005b, November). By 2012, Irish Airport
Monopoly increased charges on Ryanair by a figure of 40% (Ryanair, 2012, January). The charges
were imposed despite the decision of the court of appeal in UK for breaking the monopoly at the
Irish Airports (Ryanair, 2010a, November 1). Besides, Ryanair continue its legal battle and
lobbying within the European commission to break the airports monopoly (Ryanair, 2012a, July).
Furthermore, Ryanair was prevented from serving Russia from Ireland due to Irish regulations
(Ryanair, 2013, November).
On the other hand, Public owned airports represent a challenge for Ryanair European
expansion (Ryanair, 2003a, January). In fact, Ryanair has been faced with different legal challenges
and taxes that impeded its European operations. In the Chief Executive Report of 2007, Ryanair
expected regulatory challenges in Europe that intends to protect the major airlines (Ryanair, 2008).
For example, Ryanair has filed institutional request to allow for the Aer Lingus acquisition in 2007
(Ryanair, 2007b, June 5). However, the European Commission refuted Ryanair request to acquire
the Irish LCC Aer Lingus (Ryanair, 2013, May 20). In parallel, the Belgian administrative court
asked Ryanair to cease its operation out of Strasbourg and Charleroi for aggressive pricing reasons
(Ryanair, 2003a, August). Also, the company was pressured by taxes from the French government
in 2008 following its base opening in Marseille (Ryanair, 2008, June). The same case was repeated
by the Spanish government through in the government owned airport that pressured its cost of
operation (Ryanair, 2014). In brief, different European governments represent a source of
ambiguity and uncertainty for Ryanair in terms of tax charges continuous modification (Ryanair,
2013, November).
The legal framework ambiguity does not only stop in Europe but also extends to other
nearby regions. For example, Ryanair saw its ground contractor being changed by the Moroccan
government for a high charging contractor in 2013 (Ryanair, 2013, July). The host legal framework
enabled them to change the contractor for a state approved contracted, a decision that contributed
to high charges and capacity reduction (Ryanair, 2013, July)
However, Ryanair benefits from institutional support in different occasion. After the legal
battle in Belgian market following the administrative court decision, Ryanair won its legal battle
81
81
to stay at Charleroi and operate its routes in 2009 (Ryanair Corporate History, n.d.). Also, the
Spanish government offered 100% rebates on charges for Ryanair operation by 2010 (Ryanair,
2010, June 1). The 100% rebates on charges was tied to the extent of value created by the airline
in the Spanish market (Ryanair, 2010, June 1). Also, the Spanish government incentivized Ryanair
to operate in and out of the Canary Island (Ryanair, 2010, February).
EasyJet
EasyJet was founded by a young entrepreneur, Stelios Hajji-Ioann aged only 28 in 1995
(BBC Interview, 2013, June 19). Stelios explained in an interview that he secured around $8 million
loan from his father to launch EasyJet (Al Jazeera English, 2008, February 2). It started as a British
low-cost airline that targeted primary airports and offered low fare to customer (BBC Interview,
2013, June 19). By the end of 2018, EasyJet had multiple entities throughout Europe with 29 bases
in its portfolio (EasyJet, 2019) and connecting more than 35 countries (EasyJet Route Map, n.d.)
Internationalization Journey
EasyJet internationalization can be categorized as born global. EasyJet has internationalized
since inception by operating the Glasgow-Edinburgh flight in 1995 (EasyJet Our Journey, n.d.).
Since then and encouraged by the deregulation of skies in Europe, EasyJet developed its European
network outside of the UK by serving in 1996 Amsterdam, Brussels, and Munich (EasyJet Our
Journey, n.d.). First, it developed its UK presence through the establishment of bases such as its
second base at Liverpool in 1997 and fifth UK bases at London Gatwick in 2001 (EasyJet Our
Journey, n.d.). The development of an international network reached 29 bases (EasyJet, 2019) and
more than 130 international destinations in 39 countries (EasyJet Route Map, n.d.).
Moreover, EasyJet entered foreign markets through acquisition. It acquired in 1998 a swiss
charter through 40% ownership and named it EasyJet Switzerland (EasyJet Our Journey, n.d.). This
acquisition granted a rapid entry for EasyJet in the Swiss air zone (EasyJet Our Journey, n.d.). Also,
it acquired in 2002 Stansted, a British Airlines Low-Cost Subsidiary (EasyJet Our Journey, n.d.).
82
82
Stansted's acquisition added European routes to EasyJet Network (EasyJet Our Journey, n.d.). In
2007, EasyJet acquired another British low-cost airline named GB Airways that focused on North
African and Southern European routes (EasyJet Our Journey, n.d.). Furthermore, it strengthened
its position at Gatwick Airport through the acquisition of FlyBe airport slots after competing with
Ryanair's bid (EasyJet, 2013, November 19). Lastly, EasyJet engaged in partly acquiring Air Berlin
that strengthened EasyJet's position in Germany as well as on-site assets in the form of facilities
and aircraft (Chee, 2017, December 12; EasyJet, 2019).
EasyJet's internationalization journey was also marked by the launch of an airline alliance.
The alliance named as Worldwide by EasyJet gathered major airlines. Worldwide by EasyJet
expanded the destination reach to include the Middle East through Emirates and North America
through Norwegian Air and WestJet (Bryan & Smout, 2017, September 13; Reid, 2018, November
20).
Finally, EasyJet follows a born global model with its internationalization since its inception
and creating a large international network. Also, the expansion journey of EasyJet relied on
engaging in airline partnerships and creating Worldwide by EasyJet by the end of 2017. Therefore,
EasyJet followed strongly the born global firm model supplemented by the network model at a
later stage of internationalization.
Technology
Soon after the birth of EasyJet in 1995, the airlines launched its website in 1997 (EasyJet
Our Journey, n.d.) and made its first online sale in 1997 (EasyJet, 2008). Also, the introduction of
the mobile app enabled online booking in 2011 (EasyJet Our Journey, n.d.). The mobile app
contributed to 29% of the online sale by 2018 (EasyJet, 2019). Also, the airline was the first LCC
to access the corporate world through the Global Distribution System, which increased EasyJet’s
customer reach in 2007 (EasyJet Our Journey, n.d.). EasyJet partnered with Google and Facebook
to diversify its e-commerce channels (EasyJet, 2016, November 15). During the launch of EasyJet
in 1996, the airline partnered with Navitaire to use the Open Skies RMS (Navitaire Inc v. EasyJet
Airlines Co & BulletProof Technologies Inc, 2004). However, EasyJet changed its RMS supplier
in 2001 by choosing Bulletproof for a new RMS called eRes (BulletProof Technologies, n.d.).
Following this change, Navitaire filed a copyright infringement against EasyJet and Bulletproof
83
83
(EasyJet, 2006). In 2017 and after 15 years of using Bulletproof RMS, EasyJet introduced a new
RMS called the Hybris platform (EasyJet, 2017, September 27). This platform includes retailing
features that will contribute to ancillary revenues (EasyJet, 2017, May 16). EasyJet also uses
technology for customer experience, efficiency, and promoting innovation.
EasyJet enhanced its customer experience by introducing electronic machines in Airports
for a faster boarding in 2006 (EasyJet Our Journey, n.d.). Besides, EasyJet incorporated mobile
boarding pass in its mobile app and Apple Watch app that reduced customer journey time in airports
by the end of 2015 (EasyJet Our Journey, n.d.). Plus. The company introduced a self-service bag
drop at Gatwick Airport that EasyJet claimed to be the largest in the airline industry (EasyJet Our
Journey, n.d.). By the end of 2018, customers can book EasyJet’s flight through Instagram pictures
(Coffey, 2018, October 17). Also, EasyJet incorporated analytics and used customer data to design
a competitive product and improved demand forecast (EasyJet, 2019).
To increase its efficiency, EasyJet invested and used advanced technologies. For example,
it employs the latest technology for its fleet for fuel efficiency (EasyJet, 2008). EasyJet claimed it
used and introduced the latest technologies or its Airbus fleet of A319 and A320 to increase
efficiency and reduce delays (EasyJet Our Journey, n.d.). The company entered a partnership with
Coptercrat and Bristol Robotics Laboratory to develop and deploy drones to inspect its fleet in
2014 (EasyJet Our Journey, n.d.). Also, EasyJet partnered with Epson and Vuzix to developed
augmented 3D reality glasses that will connect pilots and ground engineers with the specialized
engineering team to provide adequate solutions and remedy instantly to minor issues in 2015
(EasyJet Our Journey, n.d.). Also, EasyJet introduced Panasonic Toughpads for pilots to go
paperless and also to facilitate communication in 2014 (EasyJet Our Journey, n.d.).
Moreover, EasyJet emphasizes the use of technology also in selecting its ground contractor.
For example, it partnered for ground operations with Swissport and Menzies that prioritize the use
of technology and innovation as key factors in cost management (EasyJet, 2014, September 18).
Finally, EasyJet invested in data science by creating a new department dedicated to data handling
with 22 new scientists (EasyJet, 2019).
84
84
Competition
EasyJet endured competitive pressure in its internationalization endeavors but constructed
a strong European LCC. EasyJet differentiated itself from its LCC competition by targeting primary
airport over secondary airports (EasyJet, 2011). A decision that reduced its exposure to competitive
pressure from peer LCCs such as Ryanair and supported the company’s European expansion
(EasyJet, 2011). The European short haul market represented an opportunity for the flag carrier
during tough economic times (EasyJet, 2014). The flag carriers are adapting their business model
or empowering their low-cost subsidiary in the short haul European market (EasyJet, 2014). The
short haul market is growing by an 8% but EasyJet built a strong low-cost structure to endure flag
carrier’s competitiveness (EasyJet, 2017). The increased competition in Europe have pressured fare
price in 2017 (Powley, 2017, July 20).
In 12 years of operations, EasyJet became the 4th largest airline in Europe by 2007 (EasyJet,
2008) and 5th largest by 2017 carrying 74 million passengers (AirportsinEurope, 2018, February
1). EasyJet focus on top European routes as well as top European major airports. In this regard,
EasyJet operated 41 routes out of the top 100 European routes and was present in 37 Airport out of
the major top 50 airports in Europe (EasyJet, 2009). Also, EasyJet entered the most European
competitive routes that are Milan-Linate and Rome-Fiumicino (EasyJet Our Journey, n.d.). The
airline has built a market share of 8% in Europe by the end of 2012 (EasyJet, 2013), a figure that
decreased to 6.3% by the end of 2018 making it the 5th largest airline in Europe (CAPA, 2019,
February 1).
Management
EasyJet was founded by risk taker entrepreneur who was eager to cease the deregulation of
European skies in mid 90s and also enjoyed the leadership of various CEO with extensive
international exposure and various expertise.
EasyJet was founded by Stelios Haji-Ioannou, a young entrepreneur of 28 years old with
fresh previous experience in the shipping industry (BBC Interview, 2013, June 19). Also, he had
launched a shipping line company 3 years before EasyJet launch (BBC Interview, 2013, June 19).
The operation team are in charge of developing new international routes (BBC Interview, 2013,
June 19). However, Stelios and top management team decide on new routes based on the required
85
85
capital expenditure for new planes if needed and the profitability of the route (BBC Interview,
2013, June 19). At the same time, Stelios vision for the airline was influenced by the liberalization
of European skies that opened competition for Airline in the mid 90s and also by the risk-taking
nature of the founder (Al Jazeera English, 2008, February 2). Consequently, Stelios took EasyJet
to fly into Europe soon after its founding 1995 by serving Amsterdam and other European
destination outside of UK (EasyJet, 2008).
Soon after launching EasyJet, Stelios have recruited Ray Webster as the managing director
and then CEO of the company until 2005 (Done, 2005, May 18). In his Financial Times Article,
Done (2005, May 18) claimed that the aggressive risk taking of Stelios was complemented by the
extensive aviation experience of Ray Webster contributed to the growth of the company (Done,
2005, May 18). Prior to joining EasyJet, Ray Webster had 27 years of experience with Air New
Zealand (Done, 2005, May 18). Also, Ray Webster tried to launch low cost airline in his homeland
New Zealand but was blocked by regulatory bodies (Done, 2005, May 18).
After Ray Webster departure in 2005, EasyJet named Andrew Harrison as its CEO (EasyJet
Our Journey, n.d.). Prior to joining EasyJet, Harrison enjoyed experience in transforming
companies into consumer interactive companies (EasyJet, 2006). At the same time, the company
recruited a new CFO with experience in highly competitive markets (EasyJet, 2006). In 2010,
Carolyn McCall replaced Andy Harrison at CEO position (EasyJet Our Journey, n.d.). Carolyn
McCall held multiple executive position in advertising and media related companies (EasyJet,
2011). In 2017, EasyJet named the Swedish businessman Johan Lundgren (EasyJet, 2018). Johan
Lundgren focused on developing EasyJet Holidays and the use of data (EasyJet Airline
Management Board, n.d.). Johan Lundgren has extensive experience in the travel industry in
various companies at different managerial layers (EasyJet Airline Management Board, n.d.).
EasyJet also empowers country’s director and appoints country’s director with knowledge
of the subsidiary’s country. For example, EasyJet named a new director of French operation with
experience in French Tourism Sector by 2008 (EasyJet, 2009).
86
86
At the same time, the board members enjoyed international leadership experience. For
example, Sir Michael Rake was named to the board of directors in 2009 who is acting as chairman
in a number of multinational corporations (EasyJet, 2010)
Business Network and Knowledge
EasyJet engaged in different form of business network that contributed to increase its sales,
efficiency, network reach, and knowledge. For in-flight support of catering services, EasyJet
reviewed its partnership with Alpha Airport Service in 2007 to introduce technology and reduce
packing and logistical cost (EasyJet, 2007, May 9). However, it ceased its partnership with Alpha
and engaged with Gate Gourmet, a partnership that increased b 18% its catering supply
performance (EasyJet, 2008, November 18). Also, EasyJet entered partnership with SRT and
Lufthansa Technik for its aircraft maintenance (EasyJet, 2009, November 17). Whereas for its
ground operation, EasyJet partnered with Swissport and Menzies with a focus on innovation and
the use of technology (EasyJet, 2014, September 18). Besides, EasyJet partnered with innovative
technological entities such as Coptercart and Bristol Robotics for fleet inspection through drones
(EasyJet Our Journey, n.d.). Also, it partnered with Epson and Vuzix to develop augmented reality
glasses for pilots and engineers to provide a timely manner response to different technical issues
(EasyJet Our Journey, n.d.). Besides, it partnered with Wright Electric to develop and produce
electric aircrafts (Monaghan, 2017, September 27).
EasyJet places high importance to engaged local responses. In that sense, it partnered with
different brand marketer to promote EasyJet in each market (EasyJet, 2011, May 10). For example,
they partnered with VisitBritain that target European mainland customer as well as Nectar that
provide marketing boost (EasyJet, 2011, May 10). Also, it reinforced its local position through
partnership with local Travel Management Companies (TMC) in 2012 (EasyJet, 2012, May 9).
However, it reviewed its contract with different TMCs that led to closing 124 contracts and keeping
only 70 TMCs (EasyJet, 2013, May 15).
On the other hand, EasyJet entered the Global Distribution System (GDS) to reach global
booking platform and access the corporate booking world (EasyJet, 2007b, November 20). In 2011,
87
87
it reinforced its GDS by partnering with Amadeus (EasyJet, 2011, November 15). Moreover, it
partnered with strong European travel brand to facilitate customer travel journey through
partnership with Europcar and Booking.com (EasyJet, 2014, May 13).
To extend its network reach, EasyJet started by partnering with WestJet and Norwegian Air
Shuttle to connect its European network with North America (Bryan & Smout, 2017, September
13). This was followed by creation of Worldwide Alliance by EasyJet that connected EasyJet to
long-haul routes through 7 Airports (EasyJet, 2018, May 15). The Worldwide Alliance by EasyJet
gathered major legacy airlines such as Norwegian Air, WestJet, Singapore Airline, and Emirates
(Reid, 2018, November 20).
On the other hand, EasyJet partnered with different academic institution to finance studies
related to aviation. For example, it engaged with International Civil Aviation Organization to study
fatigue in partnership with Imperial College London and City University London (EasyJet, 2010).
Besides, it created the EasyJet Academy in Luton where it provides continuous training to pilots
and all employees (EasyJet, 2007)
Firm’s Resources
According to Figure 6, EasyJet decreased its number of narrow body A319 and increased
its A320 fleet. The rapid development of the A320 fleet is marked by the fuel efficiency and
increased capacity in comparison to A319. Also, the A320 fleet provide 186 seats compared to 156
at A319 (EasyJet, 2017, September 27). Furthermore, the A320 offer 15% fuel efficiency compared
to A320 (EasyJet, 2019), Furthermore, the A320 provides “the longest-range single aisle aircraft”
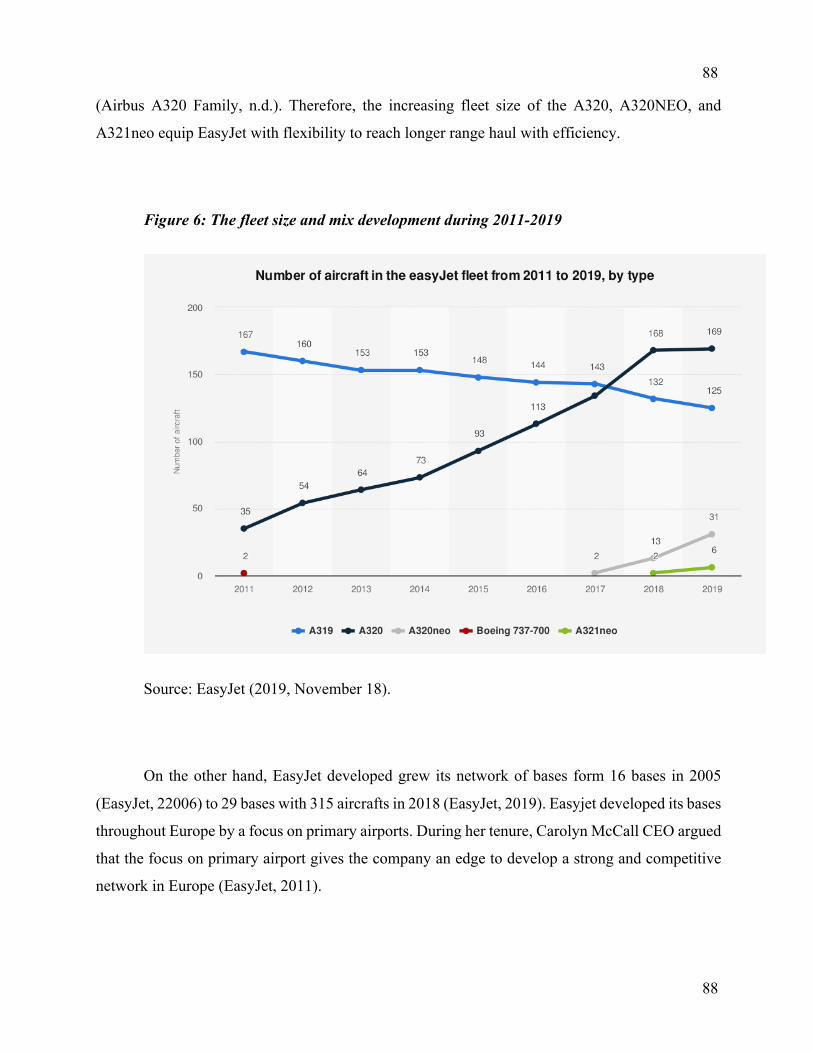
88
88
(Airbus A320 Family, n.d.). Therefore, the increasing fleet size of the A320, A320NEO, and
A321neo equip EasyJet with flexibility to reach longer range haul with efficiency.
Figure 6: The fleet size and mix development during 2011-2019
Source: EasyJet (2019, November 18).
On the other hand, EasyJet developed grew its network of bases form 16 bases in 2005
(EasyJet, 22006) to 29 bases with 315 aircrafts in 2018 (EasyJet, 2019). Easyjet developed its bases
throughout Europe by a focus on primary airports. During her tenure, Carolyn McCall CEO argued
that the focus on primary airport gives the company an edge to develop a strong and competitive
network in Europe (EasyJet, 2011).
89
89
Strategy
Since its beginning, EasyJet remained loyal to its strategy to focus on primary airport with
efficient and low-cost structure while offering the lowest fare for customers (EasyJet, 2015).
Attracting customer at major airport provide convenience and competitive landscape vis-à-vis
traditional airlines with high fare (EasyJet, 2014). Besides, the airline aims at becoming the leader
in the European market (EasyJet, 2009).
On the other hand, EasyJet launched EasyJet Europe and requested a UK Air Operating
Certificate to protect its operation in the case of a hard Brexit (BBC News, 2017, July 14). In
addition to the extensive reliance and use of the latest technologies (EasyJet, 2008), EasyJet
partnered with Wright Electric for a potential electric aircraft by the end of 2020s (Monaghan,
2017, September 27).
Since 2017, Johan Lundgren developed a strategic initiative that is axed on five priorities
that will deliver EasyJet’s growth (EasyJet, 2019). The five priorities for EasyJet are as follow:
gaining leadership position in primary airports, cultivating customer’s loyalty, efficiency, investing
in its human capital, and focus on data and innovative digitalization of the airline (EasyJet, 2019).
Innovation
In Chief Executive’s Review of 2015, Carolyn McCall stressed on innovation a key engine
for its customer’s offering as well as the company’s digital leadership (EasyJet, 2016). Moreover,
developing innovative digital capabilities are competitive advantage for EasyJet (EasyJet, 2016).
In fact, innovation enhances customer experience and operational efficiency (EasyJet, 2018). For
example, it developed drones in partnership with Coptercrat and Bristol Robotics Laboratory for
fleet inspection in 2014 (EasyJet Our Journey, n.d.). By 2017, EasyJet joined Wright Electric to
build and develop an elective aircraft (Calder, 2017, March 23; Monaghan, 2017, September 27).
Furthermore, EasyJet entered the Instagram trend and enabled customer to book flight through
Instagram pictures (Coffey, 2018, October 17). Also, EasyJet invested in augmented reality 3D
glasses for its pilots and ground engineer to connect with specialized team and provide timely
solutions (EasyJet Our Journey, n.d.). The innovation continued to represent a detrimental element
90
90
in the growth of EasyJet that the new CEO Johan Lundgren included digital innovation a
cornerstone in the airline strategy (EasyJet, 2019).
Opportunity Development
The opportunity identification and development manifest in different form for EasyJet.
Despite the heavy focus on the European market, EasyJet identified the growing opportunity of
serving Morocco with its different leisure destination as well as for Visiting Friend and Relatives
nature (EasyJet, 2007). Besides, the rapid growth of the short haul European market represented
an opportunity for the company (EasyJet, 2011). The continuous focus of EasyJet on short-haul
market was accomplished by being voted as “the Best Value Short-Haul Airline by Skyscanner”
(EasyJet, 2019, p. 13).
On the other hand, the opportunity identification of destination needs to be done in part by
evaluating the density and the wealth of the region through GDP growth (EasyJet, 2016). Stelios
in an interview with BBC has explained that the Operation Team is responsible for identifying and
developing new routes (BBC Interview, 2013, June 19). However, the opportunity development
needs to balance the capital expenditure on the new routes and its expected return on capital (BBC
Interview, 2013, June 19).
Domestic Commitment
EasyJet has internationalized since inception by operating Glasgow-Edinburgh flight
(EasyJet Our Journey, n.d.). Since then and encouraged by the deregulation of skies in Europe,
EasyJet developed its European network outside of UK. By 2018, EasyJet had less than 10% of
its capacity deployed in UK and around 35% of its capacity is on UK-EU routes (EasyJet, 2019).
Also, EasyJet possess 9 of its 29 baes in UK and have strong presence in 8 countries where it
developed at least one base (EasyJet, 2019, p.5-13). Nonetheless, UK remains a core market for
EasyJet that derives more than 40% of its capacity deployed (EasyJet, 2019). The strong presence
of EasyJet in UK is manifested by having 20% of UK market share and becoming the largest short
haul airline in UK (EasyJet, 2016, November 15).
91
91
Regulatory Environment and Institutional Theory
EasyJet was granted institutional approval to operate flights to Moscow from Manchester
by 2012 (EasyJet, 2014; EasyJet Our Journey, n.d.). Also, EasyJet was granted approval to fly to
Israel (EasyJet, 2014). Shortly after Brexit referendum in 2016, EasyJet declared loyalty to UK as
its main domestic market and its home of operations (EasyJet, 2017, Letter to shareholder).
Following the EU referendum, EasyJet filed for Air Operator Certificate for UK and for Europe
while playing an active role in lobbying for the maintaining an open sky between UK and Europe
(EasyJet, 2017). EasyJet created EasyJet group with three separate entities that are in UK,
Switzerland, and Austria (EasyJet, 2019, p. 20). The Europe regulation required airlines to have its
capital or majority owned by EU nationals, a requirement that is gradually met by having 47% of
its capital owned by EU nationals (EasyJet, 2019). Furthermore, EasyJet made its Austrian
subsidiary as its main entity in Europe and named it EasyJet Europe that will request the Air
Operator Certificate (EasyJet, 2018).
JetBlue
JetBlue started operation in February 2000 after being founded at JFK in New York in 1999
(JetBlue Airways, 2019) (JetBlue Airways, 2002). The airline operated more than 1000 daily flights
with 22,000 crewmembers (JetBlue Fact Sheet, n.d.). JetBlue has carrier by 2018 more than 40
million passengers and served 105 destination including 21 countries outside continental US
(JetBlue Airways, 2019). JetBlue grew a fleet mix of 253 aircraft that combines the Airbus 321,
Airbus 320, and Embraer 190 (JetBlue Airways, 2019). It generated $7.7 in revenues in 2018
(JetBlue Airways, 2019). A figure that placed JetBlue as the 4th in terms of revenue, coming after
Southwest Airlines, Ryanair, and EasyJet that generated only $7.9 million in 2018 (Flight Airline
Business, 2019, May 29). JetBlue has 5% of the domestic market in 2018 (JetBlue Airways, 2019).
Internationalization Journey
JetBlue combines Network Model with Uppdala Model. In other words, JetBlue engages
heavily in airlines partnerships while growing its international presence incrementally. JetBlue has
accumulated 49 airlines commercial partnership by the end of 2018 (JetBlue Airways, 2019). For
example, the code share agreement with Lufthansa opens the opportunity of 400 international
destinations for JetBlue (JetBlue Press Releases, 2009, November 11). These partnerships have
92
92
offered international exposure for JetBlue as well as $120 million in revenues (JetBlue Airways,
2014, January).
On the other hand, JetBlue operated its own metal by flying, first, outside the continental
US to San Juan in Puerto Rico in 2002 (JetBlue Press Releases, 2012, March). by investing in a
large facility, JetBlue established a home base in San Juan that support its expansion plan in the
near international (JetBlue Airways, 2012, April). JetBlue developed since 2002 a near
international network of 21 countries by 2018 (JetBlue Airways, 2019). The internationalization
journey provides 28% of JetBlue revenue by the end of 2017 (JetBlue Airways, 2018).
Technology
JetBlue expressed the importance of technology for efficiency and supporting international
growth (JetBlue Airways, 2019). Technology and automated systems are vital to JetBlue's growth
(JetBlue Airways, 2005, April). For example, the airline engages in high-level investment to
leverage the revenue management system (JetBlue Airways, 2006, December). JetBlue engages in
technological development to build operational and internationalization capabilities, enhance
customer experience, and create a pipeline of technological innovation.
JetBlue has built its technological capabilities to accommodate its growth. It invested in
technological capabilities to accommodate code sharing and other commercial agreements with
different airlines. In that sense, JetBlue Airways built Co-Chair Lite technology to accommodate
code sharing and enable customers to have an international reach through the JetBlue Airways
reservation system (JetBlue Airways, 2006, December). The developed technology is flexible and
scalable to accommodate different airline partnerships, such as the agreement with Aer Lingus or
Lufthansa in 2008 (JetBlue Airways, 2008, September 10).
Also, the airline continuously invests in the revenue management system and RMS to
accommodate market development (JetBlue Airways, 2009, December). For example, the growth
of JetBlue in 2005-2007 showed the limitation of the used version of Sabre System JetBlue
Airways, 2007a, February 22). JetBlue reduced its engagement with Sabre for its GDS and shifted
its focus to Galileo and Amadeus for the revenue system and booking (JetBlue Press Releases,
2005, November 3; July 19). However, by 2009, JetBlue increased engagement with Sabre and
93
93
moved from Open Skies, which is a revenue and booking system provided by Navitaire (JetBlue
Airways, 2009, April). Consequently, a new implementation of Sabre Technology was undertaken
in 2010 to accommodate the international expansion of JetBlue (JetBlue Airways, 2011). The move
to the new reservation system Sabre increased the profitability and the load factor of JetBlue with
higher flexibility (JetBlue Airways, 2010, June). Due to the importance of Data in the airline
industry, JetBlue recruited a data scientist as a Vice President to oversee the revenue management
system (JetBlue Airways, 2006, April).
JetBlue also invested in technology to increase its sales and gain an international presence.
For example, it created Company Blue, which is a booking portal for the corporate world in 2004
(JetBlue Press Release, 2014, June 28). Company Blue provides an internet platform for businesses
and corporations to manage their business travel directly and efficiently with JetBlue (JetBlue
Airways, 2004, February).
The online booking for JetBlue through its website represented 61.3% of its revenue in
2002 (JetBlue Airways, 2002, July). Consequently, JetBlue introduced JetBlue Gateways in its
website that offers complete vacation packages for Customer (JetBlue Press Releases, 2005,
November 3; July 19). Also, JetBlue focused on the conversion rate for its online booking by
introducing cross-sales and employing e-commerce tactics (JetBlue Airways, 2008, September
10).
Moreover, JetBlue Airways expressed its reliance on technology to increase efficiency and
rationalize its spending by reviewing all technological contracts with different partners (JetBlue
Airways, 2017, July). The year of 2017 was marked by the reorganization of the airline (JetBlue
Airways, 2017, April), the appointment of new Vice President of Sales & Revenue Management
(JetBlue Press Releases, 2017, February 1) and a new Vice President of Technology & Integration
(JetBlue Press Releases, 2017, February 6). Also, JetBlue introduced a self-tagging technology to
support employee's increase in efficiency (JetBlue Airways, 2018, January).
In building capabilities to increase productivity, JetBlue engaged with the Federal Aviation
Administration (FAA) to develop and test a new technology named as Automatic Dependent
Surveillance-Broadcast Out (JetBlue Airways, 2012, March). The technology will support the near
international routes in the Caribbean (JetBlue Airways, 2012, March). Also, JetBlue is engaged
94
94
with JFK airport authorities for the development of new technologies that will facilitate the
organization of the landing fleet and improve ground radars (JetBlue Airways, 2008, September
10).
JetBlue also invested in technology to enhance the customer experience. It partnered in
2018 with Gladly, a customer service platform, to consolidate customer information and improve
its customer support (JetBlue Airways, 2018, July). Also, JetBlue focused on customer airport
journey. Hence, it developed in 2008 a technology to design a smooth customer flow in the airport
(JetBlue Airways, 2008, September 10). The technology facilitated customer security check-in and
reduced customer boarding in international gates (JetBlue Airways, 2008, September 10). The
international gates are characterized by increased security and customs controls, which represented
an opportunity for customer enhancement (JetBlue Airways, 2008, September 10). For example, it
optimized the security checkpoint customer journey at Logan Airport to support its international
growth from Boston (JetBlue Airways, 2011, May). Plus, JetBlue engaged in the paperless trends
and invested in Mobile Boarding Passes that enhanced customer experience (JetBlue Press Release,
2012, February 6). In 2015, the airline introduced an automatic Check-in technology that facilitates
boarding (Geller, 2015, November 16). The latest development was characterized by the
development of biometrics recognition in international flying with facial recognition (JetBlue
Airways, December 13; JetBlue Press Releases, 2018, November 15); a technology with 97%
success rate (JetBlue Airways, December 13; JetBlue Press Releases, 2018, November 15).
The enhancement of customer experience didn't stop only at the airport journey but was
extended to facilitate the online booking. For example, JetBlue Airways partnered with Datalex,
Sabre, and IBM to modernize and speed customer booking (JetBlue Airways, 2013, March). The
partnership with Datalex focuses on the online merchandising experience (JetBlue Airways,
November 19). Plus, the IBM partnership provided Airport KIOS that delivered self-service check-
in for customers (JetBlue Airways, November 19).
Furthermore, the inflight journey saw technological investment from JetBlue to enhance
the customer experience. JetBlue introduced in 2004 TV entertainment (JetBlue Press Releases,
2004, January 7; June 28) and free-wifi (Fly-Fi) on board for its customer in 2017 (Singleton, 2017,
95
95
January 11). Also, it started accepting alternative payment by introducing apple pay onboard
(Tweedie, 2015, February 10).
Lastly, JetBlue remains open to technological innovations by staying close to
technologically innovative clusters. In 2018, JetBlue created a Venture Fund and positioned the
fund in Silicon Valley at the forefront of the disturbing technologies realm (JetBlue Airways, May
17). The venture fund in Silicon Valley is part of the philosophy of JetBlue to stay agile and open
to technological change and also to the art of doing things at the company (JetBlue Airways, May
22). The venture fund positioned in Silicon Valley has brought to JetBlue 2 startups, Gladly, that
helped consolidate the channel for customer support, and the second Startup is ClimaCell that
developed a technologically filled cell that has high accuracy in determining weather forecast
(JetBlue Airways, December 13). Moreover, JetBlue invests in machining learning and artificial
intelligence to optimize demand forecasts and routes (JetBlue Airways, December 13). Finally,
JetBlue partnered with Boeing in investing in an elective Jet Startup (Schlangenstein and Johnsson,
2017, April 5).
Competition
Competition represents an engine for the internationalization speed (Oviatt & McDougall,
2005). Competitions were exerting competitive pressure on JetBlue for the near international
market that led JetBlue to offer more legroom as differentiation in 2008 (JetBlue Airways, 2008,
September 10). It offered 36-inch seats, which gives more legroom compared to competition
(JetBlue Airways, 2007, January). Despite, the lack of sizeable resources for JetBlue in near
international market, JetBlue managed to fly to sunny Caribbean destinations (JetBlue Airways,
2011, May). Consequently, JetBlue exceeded its competition on revenue basis in the Caribbean
market (JetBlue Airways, September 3). For instance, JetBlue’s revenue in Caribbean is the double
of Southwest’s revenue in the region (JetBlue Airways, November 19).
JetBlue differentiated itself from competition by a set of strategic moves. For example, it
introduced the mint product, which is a premium class, whereas low-cost competitions do not offer
premium class (JetBlue Airways, 2015, October). The premium seating is move to the nearby
international routes that endure aggressive competition (JetBlue Airways, 2016, April). Also,
JetBlue offers unlimited free snack, LiveTv, and radio that provide a unique customer experience
96
96
(JetBlue Airways, December 13). JetBlue focus and invest in customer experience rather than in
fleet densification (JetBlue Airways, March). For example, JetBlue invested to place its domestic
gates near international arrivals to enhance connectivity and gain markets through its different
airlines’ commercial agreements (JetBlue Airways, 2008, September 10). Nonetheless, JetBlue is
less competitive on fares as its price offering is 19% more than AirTran’s prices and 37% more
than Southwest’s prices (JetBlue Airways, 2004, April). Also, it is less competitive in term of its
fare structure as it charges for baggage (Carey, 2015, June 30). Finally, JetBlue has a balanced
revenue mix that combines business and leisure traveler (JetBlue Airways, 2002, July) but
competes aggressively for leisure customer at main JetBlue gateways (JetBlue Airways, 2012).
Management and Knowledge
The management experience and knowledge represent a force that influence
internationalization speed (Oviatt & McDougall, 2005). JetBlue places high importance on the
experience and knowledge of its executive management team (JetBlue Airways, 2003).
Subsequently, JetBlue started with an executive team with various extensive airlines’ knowledge
over 20 years (JetBlue Airways, 2003). For example, David Neeleman is a serial airline
entrepreneur. David Neeleman has founded Morris Air that was acquired by Southwest Airlines in
1993 and also occupied executive management positions at Southwest Airlines (JetBlue Airways,
2002). In Addition to founding Morris Air and JetBlue (JetBlue Airways, 2003), David Neeleman
founded Azul, a Brazilian LCC, and was part of the founding member of WestJet Canada (Reed,
2020, February 10). His entrepreneurial quest didn’t stop at founding Airlines, but he also founded
Open Skies that is a reservation system acquired by HP (Reed, 2020, February 10). Furthermore,
David Neeleman founded in the beginning of 2020 an LCC called Breeze with an Embraer 190
fleet that targets small airport cities (Reed, 2020, February 10).
The board have asked David Neeleman to occupy nonexecutive chairman position in 2007
and nominated David Barger as CEO of the airline (Reiter, 2007, May 10; JetBlue Press Releases,
2007, May 10: JetBlue Airways, 2008). David Barger has extensive and long experience through
various managerial position with Continental Airline from 1988 until joining JetBlue by the end of
1998 (JetBlue Airways, 2008). Due to his long presence in New York, David Barger developed
strong ties and knowledge of the Port Authority at New York and New Jersey (JetBlue Airways,
2003). The company went into wide management change following the change of top management
97
97
in 2007 (JetBlue Airways, 2007, April). To accommodate its internationalization as well as the
growing data, JetBlue recruited a data scientist to reinforce its revenue management system
(JetBlue Airways, 2006, April).
In 2013, JetBlue named Robin Hayes as CEO of JetBlue Airways (JetBlue Airways, 2014;
JetBlue Press Releases, 2013, December 12). Robin Hayes operated as Chief Commercial Officer
prior to his nomination to President and CEO of JetBlue (JetBlue Press Releases, 2013, December
12). Robin Hayes has extensive experience in the international airlines industry through his various
managerial position at British Airways and The Americans (JetBlue Press Releases, 2013,
December 12). Barger advanced that Robin Hayes previous global experience will support the
growth of the company (JetBlue Press Releases, 2013, December 12). Besides, JetBlue underwent
reorganization of the company in 2017 and reduced by 10% senior manager position (JetBlue
Airways, 2017, April).
Joanna Geraghty was nominated to the position of president of JetBlue as well as Chief
Operating Officer in 2018 (JetBlue Airways, 2019). Joanna Geraghty joined JetBlue since 2005
and has gravitated different managerial position that targets human resource of regulatory affairs
of the airline (JetBlue Airways, 2019). She had accumulated extensive experience in litigation and
regulatory affairs of the airline industry (JetBlue Press Releases, 2010, September 16). Also,
Joanna Geraghty hold a Master in International Relation from Syracuse University (JetBlue Press
Releases, 2010, September 16).
On the other hand, Joel Peterson was named to Chairman position of JetBlue since 2008
(JetBlue Press Releases, 2008, May 21). Joel Peterson is engaged in teaching different business
classes related to entrepreneurship at Stanford University and serves at the board of a number of
companies from different industries as well as the management of an investment management firm
called Peterson Partners (‘Joel C. Peterson’, n.d.)
JetBlue developed its knowledge through training, experiences, partnership, and proximity
to innovations platforms. In fact, JetBlue focus in training personnel by focusing on “3P: People,
Performance, and Prosperity” (JetBlue Airways, 2004, February). It established JetBlue University
in Orlando that will train and foster its crew with the necessary knowledge (JetBlue Airways, 2003,
October). In fact, the Orlando location represent a point of international expansion for JetBlue.
98
98
(JetBlue Airways, 2008, January). Furthermore, JetBlue invested in 2005 and in 2015 to expand
and modernize its training facility in Orlando (JetBlue Press Releases, 2005, June 6; 2015, March
2). Besides, JetBlue created an agile and flexible to change employees by focusing on continuous
training for employees (JetBlue Airways, 2007b, February 22). JetBlue employees are asked for 3
hours per month dedicated for training and software changes (JetBlue Airways, 2007b, February
22).
Also, the expansion in Caribbean provided the airline with internationalization experiences
that helped building internationalization capabilities (JetBlue Airways, 2008, January). For
example, the prior experience in Mexican market facilitated the Cancun routes (JetBlue Airways,
2016, April). Alternatively, the Lufthansa partnership will not only contribute by maintenance and
commercial agreement but also through by the company’s global expertise that serves JetBlue
international long-term programs (JetBlue Airways, 2010, March).
To nurture JetBlue’s innovation and knowledge capabilities, the company created a venture
fund in Silicon Valley to benefit from disturbing innovation ideas and technologies (JetBlue
Airways, May 22). In fact, this has led to a start-up creation ClimaCell that optimizes routes based
on high accurate weather forecast (JetBlue Airways, December 13).
Business Network
JetBlue Airways participates in different form of business networks that engage
technological partnership, Airline’s commercial agreements, and manufacturer’s partnerships.
JetBlue engaged with technological partnership with the goal to increase its customer reach and
enhance customer experience. For example, it partnered with IBM to develop self-service kiosk
that facilitated boarding and check-in (JetBlue Airways, 2004, February). Also, it partnered with
different provide of Global Distribution Systems that facilitate the booking journey for customer
and enlarge the airlines’ market. For example, JetBlue has partnered with Sabre, Galilo, and
Amadeus (JetBlue Airways, 2006b, December). Plus, it partnered with Amazon to offer on-board
video streaming service for amazon’s customers for free (Luckerson, 2015, May 5).
JetBlue entered in business partnership with Aircrafts manufacturers and support
companies. For example, it has partnered with Airbus for Winglet Technology program in 2010
99
99
(JetBlue Airways, 2010, March) and also for the development of a technologically advanced A220
with higher efficiency (JetBlue Airways, July 11). Also, Boeing and JetBlue formed a partnership
to invest in an electric Jet Startup (Schlangenstein and Johnsson, 2017, April 5).
On the other hand, JetBlue engages in different commercial agreement with Airlines in the
form of interlining agreement, code share, or allowing a major legacy airline to be an important
shareholder. JetBlue benefits from its local hub at JFK Airport that is an international entry point
for international career (JetBlue Airways, 2010, October). This offers JetBlue the opportunity to
benefit from its commercial agreement with other airline to extend its international network and
customer connectivity (JetBlue Airways, 2010, October). JetBlue expressed in the Q3 2010
conference call its preference for interlining agreement with other carrier that simplifies the
commercial ties (JetBlue Airways, 2010, October). Also, JetBlue benefits from its position in the
US to offer inner line for international legacy carrier (JetBlue Airways, 2010, October). JetBlue
has reached 22 airlines partnerships in 2012 (JetBlue Airways, 2013) 38 airline partnerships in
2014 (JetBlue Airways, 2015), and 49 airlines partnership by the end of 2018 (JetBlue Airways,
2019). JetBlue has code share agreement with Airlines from different continent such Japan Airways
in Asia (JetBlue Press Release, 2012, April 17), Royal Air Maroc in Africa (JetBlue Press Releases,
2012, October 4; 2015, March 2), and Qatar Airways and El Al in the Middle East (JetBlue Press
Releases, 2011, June 30; 2013, March 2013). JetBlue starts with interlining agreement before
converting into code share. For example, JetBlue and Qatar Airways entered an interlining
agreement in June 2011 and concluded a codeshare agreement in March 2013 (JetBlue Press
Releases, 2011, June 30; 2013, March 2013). The different Airlines partnerships have generated
for JetBlue $120 million in revenue with high international exposure (JetBlue Airways, September
3).
In parallel, JetBlue was the subject of partial acquisition by Lufthansa in 2008 by acquiring
29% of JetBlue in 2008 (JetBlue Press Releases, 2008, January 22). This partial acquisition came
after Lufthansa has presented a minority investment for Jetblue in 2007 (JetBlue Airways, 2007b,
February 22), an investment of $300 million (JetBlue Airways, 2008). Besides, Lufthansa
investment provides also international knowledge and experience to JetBlue (JetBlue Airways,
2008, September 10). Also, the partial ownership of Lufthansa provided JetBlue with visibility of
100
100
international network (JetBlue Airways, 2008, September 10). These commercial tractions have
been supplemented in 2009 to formalize a code share agreement (JetBlue Airways, 2010, January).
Furthermore, JetBlue partnered with Airport authority of JFK for developing and building
a security and customer border check point that facilitates and speeds JetBlue’s customer boarding
(JetBlue Airways, 2011, May 26). Also, JetBlue received tax breaks from the City of New York
that contributed to building new HQ for the company in Long Island (Lisberg, 2010, March 23).
Firm’s Resources
JetBlue fleet management is marked by a varied fleet mix and incremental growing size.
JetBlue fleet strategy focus solely on narrow body aircraft and is engaged on developing facilities
that accommodate only narrow body body aircrafts (JetBlue Airways, 2008, September, 10).
According to JetBlue, narrow body aircraft incur less ground expenses and mobilization than the
wide body aircrafts (JetBlue Airways, 2008, September 10).
Due to the load factor at the beginning of operations, JetBlue opted for the Embraer 190
that provides flexibility and efficiency (JetBlue Airways, 2003, June). However, the A320 fleet is
economically sound for JetBlue when engaging medium and long-haul flights (JetBlue Airways,
2003, June). Despite the high fuel consumption of the E190 compared to the A320, the Embraer
benefits from 30% taxes reduction than the A320 as well as it provides 40% less seats (JetBlue
Airways, 2004, October). However, due to tax reform and the increased efficiency of the new A320
NEO, JetBlue has decreased its Embraer fleet by 25% in 2011 (JetBlue Airways, 2011, June 21).
The fleet composition allowed for JetBlue to remain competitive on both short haul with the E190
and on the medium-long haul with the A320 (JetBlue Airways, 2006, April). The utilization is split
between the Airbus aircraft and Embraer where A320 flies around 13 hours and the E190 around
9hrs (JetBlue Airways, 2006, July). In fact, JetBlue aimed in 2002 to reach 13 hours of fleet
utilization with long-haul traits across the US (JetBlue Airways, 2002, July). Besides, the long
range of JetBlue has reached 2600 miles over 50% of its deployed capacity (JetBlue Airways, 2006,
June). The long-haul portion increased to occupy 62% of the capacity deployed in 2006 (JetBlue
Airways, 2006, October). Finally, JetBlue CEO expressed that the long-range Airbus that will be
delivered by 2019 support the company’s vision of increase haul flight and reaching the European
market (JetBlue Airways, 2017, March). Also, the conversion of the A320 into long range aircraft
101
101
requires only 2 years notice for Airbus to undertake the necessary changes (JetBlue Airways, 2018,
April). Finally, JetBlue has the adequate resources in Boston Logan Airport and JFK Airport to
accommodate the operations of the Long-Range fleet and its vision to fly to Europe (JetBlue
Airways, 2018, March).
The fleet of JetBlue was a mix of Airbus and Embraer airplanes. For example, it has a fleet
mix of 85 Airbus 320 and only 7 Embraer 190 in 2005 (JetBlue Airways, 2006, January). However,
by 2018, JetBlue decided to replace its fleet of Embraer by the Airbus 220 and ended 2018 with a
fleet size of 253 Aircrafts composed of Airbus 321 and 320 (JetBlue Airways, 2019).
The fleet efficiency was reached through the installation of winglet that contributed to 128
million gallons saved in 2011 (JetBlue Airways, 2011, February). Also, the new Airbus A320 with
NEO engine helped JetBlue to reach 16% fuel saving compared to its old airbus fleet (JetBlue
Airways, September 3). JetBlue varied its fleet densification throughout its times of operations. On
the Airbus 320, it has decreased its seat densification from 162 to 150 in 2014 (JetBlue Airways,
2014, April), before returning to A320 with 162 seats in 2017 (JetBlue Airways, 2017, October).
Also, JetBlue varied the densification on the A320 NEO to 190 seats (JetBlue Airways, 2014,
January) and A321 with 200 seats (JetBlue Airways, 2018, January).
Gates and International Facilities. JetBlue engaged in developing international gates and
facilities to enable its internationalization plans. For example, JetBlue focused on 3 main hubs that
are JFK Airport, Logan Airport, and FT-Lauderdale Airport in Florida.
In partnership with JFK Authorities, JetBlue developed and opened a new international
terminal to support its international expansion and possessed 26 gates by 2008 (JetBlue Airways,
2009). Plus, it prepared a construction plan to expand its international terminal at JFK to
accommodate its growing portfolio of Airlines’ partnerships and its growing number of
international travelers (JetBlue Airways, 2012, April; October). Also, JetBlue developed a security
and border check in partnership with the authorities to increase its connectiveness to other
international carriers (JetBlue Airways, 2011, May 26).
In parallel, JetBlue focused on growing international flying from Boston Logan Airport by
operating in Terminal C that accommodate international flying (JetBlue Airways, 2011, February).
102
102
In fact, its continuous investment in Boston Logan Airport fits its strategy to increase
connectiveness with its international Airlines partners and also to accommodate its international
travel (JetBlue Airways, 2014, July). Plus, JetBlue also contributed to the expansion of
international terminal at Fort Lauderdale Hollywood in Florida that enabled JetBlue to have a
competitive position and cost structure for its near-international flying (JetBlue Airways, 2014,
January). Besides, the focus on Lauderdale-Hollywood International Airport led to the expansion
of the international terminal and reinforced the company position as it represents 25% of the Airport
traffic (JetBlue Airways, 2017). Finally, JetBlue established a home base in San Juan, Puerto Rico
that further its Caribbean expansion and reinforce its position in Central America (JetBlue Press
Release, 2012, March 14).
Strategy
The internationalization strategy of JetBlue is influenced by the risk factor of the host
country as well as whether the international destination meets the cost structure of the company
(JetBlue Airways, 2009). Also, JetBlue relies on investing in customer experience rather than
continuous fleet densification (JetBlue Airways, 2016, March).
The network strategy of JetBlue is by developing core focus cities in its network (JetBlue
Airways, 2009, July). In this regard, JetBlue has developed different focus cities such as San Juan
as focus city in addition to JFK, Boston and Orlando (JetBlue Airways, 2012, April). The company
developed six focus cities that are in other terms bases for the airline (JetBlue Airways, November
19).
The sales strategy of JetBlue was modified in 2017 by backing from selling through online
travel agent and increasing its focus on its online website sales (Josephs, 2017, October 19). Also,
to remedy to the seasonality of some leisure destination, JetBlue focus on Visiting Friends (JetBlue
Airways, 2010, January) and Relatives market as well as attracting business travelers (JetBlue
Airways, 2012). Plus, it introduced the Mint Premium class to the high-end leisure destination to
attract upper class customer and increase margins (JetBlue Airways, 2016, January).
103
103
Innovation
JetBlue was innovative in enhancing customer experience, investing in external innovations
and knowledge pipelines, and its sales schemes. As JetBlue places high importance on customer
experience, it innovated in addressing their concerns. Hence, JetBlue developed a proactive plan
that will accommodate clients during time of delays or crisis that will ameliorate customer
satisfaction (JetBlue Airways, 2007, February 20). It was followed by introducing The Passenger
Bill of Right will help the company be resilient and maintain high performance during time of crisis
(JetBlue Airways, 2007b, February 22). Besides, the company created a special team that tracks
and identify dissatisfied customer through social media and address their concern (JetBlue
Airways, 2011, May 26). Moreover, JetBlue introduced and empowered its inflight LiveTv
subsidiary that was approached for a contract by Continental Airlines (JetBlue Airways, 2008,
April).
To facilitate and increase the speed of customer boarding, JetBlue has employed innovative
techniques and strategies. It has introduced baggage online check in by 2005 (JetBlue Press
Releases, 2005, November 22). Also, it enabled customer to check-in online 24 hours before his/her
flight (JetBlue Airways, September 3). Plus, JetBlue Tech Venture introduced advance biometrics
recognition that enabled customer to board through facial recognition (JetBlue Airways, 2018,
April). In parallel, JetBlue introduced expedited security lanes that facilitated airport journey for
international boarding (JetBlue Airways, 2012, January). The success of the expedited security
lanes was translated into expanding its introduction in various airports (JetBlue Airways, 2012,
April; 2013, January).
JetBlue placed high importance to innovation as engine for growth. Hence, it has invested
in electric Jet Startup (Schlangenstein and Johnsson, 2017, April 5) as well as created a venture
fund in Silicon Valley that positioned JetBlue at the forefront of innovation (JetBlue Airways,
2018, May 17).
JetBlue has reduced its exposure to the seasonality of its international leisure destinations
by attracting business traveler as well as Visiting Friends and Relatives program (JetBlue Airways,
2012, January).
104
104
Opportunity Development
The opportunities for internationalization manifests in different forms. The risk factor of
the host country combined with meeting the cost structure of the company represented an entry
opportunity for the LCC (JetBlue Airways, 2009). Also, the capacity reduction by competitors
represents an opportunity for JetBlue. For example, capacity reduction by competition in the
Caribbean market represented a growth opportunity for JetBlue from Boston, New York, Orlando,
and Fort Lauderdale Airport (JetBlue Airways, 2010, October). Moreover, the Caribbean growth
met the low-cost structure of JetBlue and allowed for competitive offers to be placed (JetBlue
Airways, 2010, March). As a result, JetBlue placed flexible order with Airbus and Embraer that is
intended to accommodate any growth opportunity (JetBlue Airways, 2008, April).
The long stage length of the European market provides high return due to the long length
utilization of fleet and the opportunity to include high premium fares (JetBlue Airways, 2017,
March).
Domestic Commitment
The domestic operation of JetBlue remains the area of focus for JetBlue. JetBlue enters
different airline partnership to provide for them an inner connecting airline for their customers. It
provides for the international legacy airlines a connecting career with entry point in JFK and Boston
Logan Airport (JetBlue Airways, 2008, September 10) (JetBlue Airways, 2019). In this regard,
JetBlue devotes 70% of its capacity in its domestic market (JetBlue Airways, September 3). Despite
its internationalization effort, JetBlue generated more than 70% of its revenue from domestic
market (JetBlue Airways, 2018).
Also, JetBlue maintains its focus to growing its domestic market from its main three focus
Airports that are JFK, Boston Logan, FT-Lauderdale (JetBlue Airways, 2019). Also, JetBlue
developed 6 focus cities that are Boston, Los Angeles, New York, Fort Lauderdale/Hollywood,
Orlando, and San Juan (JetBlue Airways, 2019). Besides, JetBlue advanced its leadership position
in term of number of flights and capacity at Boston Logan Airport and Fort Lauderdale-Hollywood
105
105
(JetBlue Airways, 2019). In addition to focus cities, JetBlue developed a program of BlueCities
which totaled in 2018 to 105 BlueCities (JetBlue Airways, 2019).
During its beginning, JetBlue focused on reinforcing and growing the domestic network
(JetBlue Airways, 2004, October). In reinforcing its domestic network, JetBlue establish
connecting flights between the served cities (JetBlue Airways, 2008). Also, JetBlue focus on high
density region
Regulatory Environment and Institutional Theory
As JetBlue is a New York based airline, it is subject to regulation and approvals from
different regulatory bodies based on the routes network (JetBlue Airways, 2019). For example,
JetBlue operations are regulated by the Department of Transportation (DOT), Federal Aviation
Administration (FAA), Transportation Security Administration (TSA), U.S. Customs and Border
Protection (CBP), Local and Airport authorities, and Foreign agencies for international operations
(JetBlue Airways, 2019). For example, international flying is subject to DOT approval, host
country agencies approval, and also to any bilateral treaty between host and home country for air
travel such us open skies. Following the restoration of diplomatic relation and the consensus
between Cuba and US, JetBlue applied for the Cuban route with the DOT and Cuban agencies
(JetBlue Airways, 2016, January). However, the international air regulation is heavily regulated
and continuously changing (JetBlue Airways, 2019). Also, the different airlines partnerships are
subject to review by the DOT for economic and competition matters (JetBlue Airways, 2013, July).
For example, the code sharing with Emirates was subject to review by the DOT in 2013 (JetBlue
Airways, 2013, July).
On the other hand, building airport capabilities are also subject to approval by local
authorities as well as FAA for different matters including safety reasons (JetBlue Airways, 2019).
For example, JetBlue was faced by local authorities’ opposition for the construction of international
facility in Long Beach in California, which was intended for international operations (JetBlue
Airways, 2017, January). Besides, JetBlue was granted exclusivity by New York Port authorities
to have exclusivity right on Terminal 6 (JetBlue Airways, 2017, July). Also, TSA and CBP were
part of the expedited security lanes development by JetBlue (JetBlue Airways, 2012, January).
Finally, JetBlue is engaged in continuous discussion with different US aviation authorities at the
106
106
national level and local for their different operations (JetBlue Airways, 2018, January). The
opportunity of the open skies agreement between the US and Europe represent an transatlantic
opportunity for JetBlue (Reiter, 2007, May 10)
Southwest Airlines
Southwest Airlines was founded in 1967 by Herb Kelleher and Rolling King (Kelley, 2019).
The foundation of Southwest Airline emerged from the concept of a low-cost airline that links
Dallas, Houston, and San Antonio (Southwest Airlines, 1972). The first network was drawn on a
napkin in a hotel in San Antonio, Texas (Kelley, 2019). Due to the full control of federal
government that was limiting competition, Southwest was faced with numerous legal challenges
that halted its until 1971 (Southwest Airlines, 1972). Southwest Airlines was relieved for a true
competition by the Airline Deregulation Act signed in 1978 by President Carter (Kelley, 2019).
However, Southwest Airlines was limited by the Wright Amendment that limits interstate flight
from Dallas Love Airport from its introduction in until 2006 (Southwest Airlines, 2006, July).
It grew a network of almost 100 destinations including 10 countries with more than 4000
departures per week by the end of 2018, which started with a network that connects 3 cities in
Texas (Southwest Airlines, 2019). Also, it started with a fleet of 3 Boeing 737 (Southwest Airlines,
1972). Its fleet of 3 Boeing 737 grew into a fleet of 750 Boeing 737 that include the new 31 aircrafts
of 737 the new model of 737 Max 8 (
Southwest Airlines, 2019).
Internationalization Journey
Southwest Airline follows an Uppsala model in their internationalization as well as network
model to support the subsequent international business. Southwest Airlines internationalized, first,
through code sharing and then moved to operate its fleet on nearby international destinations. Gary
Kelly expressed its internationalization strategy as a step by step internationalization by targeting
near international destination (Southwest Airlines, 2008, July).
Prior to 2003, Southwest Airlines has never expressed its interest in international market.
The first time Southwest Airlines discussed international market was in 2003 when its newly
appointed CEO Gary Kelley expressed a future interest in international market, which was not of
107
107
the short-term agenda of the firm (Southwest Airlines, 2003, October). Starting 2005 and 2006,
Southwest Airlines started expressing its interest in code sharing as a form of commercial
partnership with other airlines that represent less commitment for Southwest Airlines (Southwest
Airlines, 2006, January). In fact, the simplicity of code sharing reduces the risk of increased cost
and the company lack of international experience (Southwest Airlines, 2007, June). Also, the code
sharing agreement relieved Southwest Airlines from operating its own fleet for cross border
business (Southwest Airlines, 2007, October).
Gary Kelley expressed its commitment to enter code sharing with ATA that will offer
Southwest Airline access to near international destinations by 2009 (Southwest Airlines, 2006,
April). Southwest Airlines also entered discussion with WestJet for the Canadian market and with
Volaris for the Mexican market (Southwest Airlines, 2008, December). Although Southwest
Airlines requested an approval from the Department of Transportation to operate in Canada and
Mexico, the discussions with WestJet Canada were not conclusive (Southwest Airline Media, n.d.)
The code sharing with ATA was a challenge to launch for multiple reasons, but Southwest Airlines
remained open to other code share opportunities in the region (Southwest Airlines, 2008, April).
Despite the different effort for internationalization through code sharing since 2006,
Southwest Airlines was only expected to enter international market through cooperation
agreements in 2011 (Southwest Airlines, 2009, June). Also, the acquisition of AirTran allowed for
an additional near international reach in 2011 (Southwest Airlines, 2011, December). This was
followed by the first near international flight with its own metal in 2012 by flying to San Juan
(Southwest Airlines Media, n.d.). Thereafter, Southwest Airlines grew a near international network
over the period of 2012-2018 of 15 international destination in 20 nearby countries (Southwest
Airlines, 2019). Lastly, Southwest Airlines remains a domestic LCC with strong domestic network
of more than 100 Origin and Departure points in the US (Southwest Airlines, 2017, June).
Technology
Southwest Airlines endured a long journey of technological development that started in
1973 by consolidating all of its reservations in a center in Dallas (Southwest Airlines Media, n.d.).
The technological development of Southwest Airlines has focused on developing supportive
108
108
technological platforms for domestic and international operations, enhancing customer experience,
increasing sales, and making technology a cornerstone of the firm's strategy.
Technology in Support of Domestic and International Operations. Reservation systems are the
backbone of an Airline in managing its complex networks and ticketing (Nysveen and Lexhagen,
2001; Mitev, 2000). The reservation system configuration dates back to 1973 by consolidating the
reservation systems in the Dallas center (Southwest Airlines Media, n.d.). A system that was
reinforced by opening the second center in San Antonio in 1981 (Southwest Airline Media, n.d.).
Southwest Airlines renovated its system by introducing a new reservation system that
accommodates the company's accelerated growth in 1986 (Southwest Airlines, 1987). However,
the implementation of the new reservation system proved difficult and exceeded its expected time
to accommodate operation (Southwest Airlines, 1988). Southwest Airlines overcame the
implementation difficulties and enabled the company to double its processing capacity (Southwest
Airlines Media, n.d.).
After expressing a future interest in internationalization by Southwest Airlines CEO in 2003
(Southwest Airlines, 2003, October), the top management announced in 2004 its investment in
technology to accommodate the code-sharing operation with ATA (Southwest Airlines, 2005b,
January). The airline acknowledges the need for technological enhancement to support
connectedness with other airlines and the development of a potential international network
(Southwest Airlines, 2006, January). The international development required technological
enhancement that supports transborder currencies, taxes, and complex schedule planning
(Southwest Airlines, 2006, April). The introduced technological capacity is flexible and can
accommodate the different code-sharing agreements, such as the one with Volaris or with WestJet
(Southwest Airlines, 2010, April). However, the development of the new reservation system
technology represents a challenge to overcome for Southwest Airlines to accommodate code
sharing and internationalization operations (Southwest Airlines, 2010, September). Laura Right
acknowledges that the current technological development requires further assistance to be
operational (Southwest Airlines, 2010, June). By the end of 2011, Southwest Airlines succeeded
in replacing the old reservation system with the new system that can accommodate international
destinations (Southwest Airlines, 2012). The new system replaced a system that had operated for
the previous 40 years (Southwest Airlines, 2011, March).
109
109
Nonetheless, the new reservation system is still in the adaptation phase and requires
extensive work (Southwest Airlines, 2011, May). As the deployment of the new reservation system
proved challenging for Southwest Airline, it entered in a joint contract with Amadeus IT group to
manage the international operation of the new reservation system by 2012 (Southwest Airlines
Media, n.d.). As technological development is important to the internationalization of Southwest,
it has transferred the international part of the new reservation system to Amadeus with the prospect
of also transferring the domestic part at another stage (Southwest Airlines, 2012b, April). Although
Southwest Airlines saw its technological capacities to be fully operational in 2014 to accommodate
international flights, the information synergy and connectivity with AirTran will be fully
operational in the first quarter of 2013 (Southwest Airlines, 2012b, July). Besides, the technological
development to accommodate the transformation of Southwest to accommodate international
operation has cost the company more than half-billion dollars, a figure that is subject to increase
(Southwest Airlines, 2012, October). However, the capital expenditure for technology is subject to
drop by 2018 as the constructed capabilities are entering the maintenance phase with a mature IT
department (Southwest Airlines, 2018, January). Through a partnership with Amadeus in mid-
2014, Southwest is developing a new RMS to support international operations (Southwest Airlines,
2014b, July). The partnership with Amadeus also included consolidating both domestic and
international reservation systems by 2017 (Southwest Airlines, 2015, March). A task that was
completed in 2017 by having Amadeus Altea IT group to officially manage the complete
reservation system of Southwest Airlines for both international and domestic service (Southwest
Airlines Media, n.d.). The new reservation system provides competitive cost, schedule flexibility,
tax and foreign currency management, and also revenue management (Southwest Airlines, 2017,
June). More importantly, the new reservation system has made the customer experience seamless
(Southwest Airlines, 2017, June). Not only did the new reservation system help manage the
complex network and inventory (Southwest Airlines, 2018b, July), but it also contributed to $200
million in pre-tax profit (Southwest Airlines, 2019).
On the other hand, technological development focus on efficiency and maintaining cost
leadership for Southwest Airlines. In the fourth-quarter conference call of 2016, Southwest CEO
expressed the importance of technology in pursuing a cost leadership position as well as flexibility
for the airline (Southwest Airlines, 2007b, January). Besides, Southwest equipped its fleet of
Boeing 737-700 with blended winglets that enhance performance and efficiency in 2003
110
110
(Southwest Airline Media, n.d.). Also, technology helped Southwest reducing network complexity
at a time of strategy transformation (Southwest Airlines, 2007, April). In parallel, Southwest
Airlines also introduced a new Enterprise Resource Planning (ERP) system, named as SWALife,
to enhance productivity and improve work flexibility for employees in 2004 (Southwest Airlines
Media, n.d.). The new ERP granted employees to access the company's data remotely (Southwest
Airlines Media, n.d.).
Within five years period (2013-2017), the technology department saw successive
nominations in key positions. This period was marked by the internationalization of Southwest
Airlines as well as the deployment of the new reservation system that supports international
activities. This successive management appointment started with appointing Craig Maccubbin in
the position of Chief Technology Officer and Vice President of Technology Operation (Southwest
Airlines Media, n.d.). (PR Newswire, 2013). Crag Maccubbin's mission will focus on mobile
technology development as well as services (PR Newswire, 2013). In 2014, Southwest appointed
Joe Migis as the Vice President of Product Solutions Technology (Southwest Airlines Media, n.d.)
(Journal of Transportation, 2014). Joe Migis was an in-house promotion who has extensive
knowledge of software development and the aviation industry.
To accompany the building of a strong technological department, Southwest benefitted
from its Chief Information Technology, Randy Sloan, to run the technology department (Southwest
Airlines, 2015, December). Randy Sloan was replaced by Kathleen who ensures the strategic
department initiative as well as hiring Stan Alexander as Chief Technology Architect to integrate
the different technological systems of the company starting 2017 (Dow Jones Institutional News,
2017)
Enhancing Customer Experience. An axis of technological development relies on enhancing
Southwest's customer experience. The focus on enhancing customer experience through
technology dates back to 1979 when Southwest introduced ticketing machines (Southwest Airline
Media, n.d.). In 2002, Southwest invested in the automated kiosk that delivers boarding pass, hence
reducing the time spent by customers in Airport before boarding (Southwest Airlines, 2003,
January; Southwest Airlines Media, n.d.). The efforts continued by investing in its e-commerce
and facilitating online booking as well as increasing the number of automated costs (Southwest
111
111
Airlines, 2004, January). Plus, it has enabled the option for the online check-in during the same
year (Southwest Airlines, n.d.). These efforts didn't only improve customer experience but also
contributed to the cost-efficiency of Southwest (Southwest Airlines, 2004, January). By 2005,
Southwest Airlines has created a customer portal that allows customers to create personal profiles,
which was named as MySouthwest (Southwest Airlines Media, n.d.). In order to facilitate the
customer airport journey, the airline has introduced not only electronic boarding but also an
automated baggage check-in (Southwest Airlines, 2008, January).
On the other hand, Southwest Airlines supplemented its traditional mode of payment by
adding PayPal payments in 2007 (Southwest Airlines Media, n.d.). Also, it introduced mobile
boarding passes for a fast boarding by 2014 (Southwest Airlines Media, n.d.). In parallel, the new
reservation system has made the customer experience seamless for multiple flights reservation on
an international itinerary in 2017 (Southwest Airlines, 2017, June)
Sales through Technology. Southwest Airlines relies on technology to derive and increase
its revenues. It has announced that its online booking contributes to 45% of its revenue by 2001
(Southwest Airlines, 2002, January). A figure that increased to 63% of the total revenue by 2005
(Southwest Airlines, 2005b, April). Southwest is engaged in continuous efforts to enhance its
online sales (Southwest Airlines, 2010, December). For example, it launched in 2003, an online
portal that design and create complete vacation packages for customers (Southwest Airlines Media,
n.d.). Plus, it has conducted a major refreshing of the website in 2007 (Southwest Airlines, 2008)
and in 2009 (Southwest Airlines, 2009, July). The different website refreshments have the goal to
offer a seamless booking experience, increase the online revenues, and optimize conversion rates
(Southwest Airlines, 2009, July).
To diversify its distribution channels, Southwest entered partnerships with different Global
Distribution System distributors to access other niche markets, such as the corporate booking niche
through Galileo in 2007 (Southwest Airlines, 2007, October) and Worldspan in 2009 (Southwest
Airlines, 2009, June).
The technological strategy of Southwest Airlines. Gary Kelley recognized that the major
endeavor since 2000 was building technological capabilities as well as adapting to new security
measures (Southwest Airlines, 2009, June). Gary Kelley's statement highlights the importance of
112
112
technology in the growth of the airline. The technological strategy has been run in different phases
(Southwest Airlines, 2014, September). The first phase was market by introducing a new
reservation system that supports international activities (Southwest Airlines, 2014, September).
The second phase consists of replacing the old domestic reservation system with yearly updates
and maintenance (Southwest Airlines, 2014, September). The third phase of the technology
strategy is the sale phase, where the technology is engaged in driving up conversion rates as well
as maximizing the online revenues (Southwest Airlines, 2017a, February). Finally, the final phase
consisted of a maintenance phase with an IT department with new resources and mission
(Southwest Airlines, 2018, January). The technological infrastructure and its resources enable
Southwest to flexibly deploy capacity in the near international (Southwest Airlines, 2015, March).
Competition
Since its foundation, Southwest Airlines has endured different type of competitive pressure
in its domestic market. However, Southwest Airlines has not only grew resilient to the competition,
but it become the largest carrier in the US (Southwest Airlines, 2007, March). Gary Kelly has
expressed that Southwest Airlines become the largest carrier in the US due to its large deployed
capacity as well as the number of its passengers (PR Newswire, 2007, May 11).
Southwest Airlines endured competitive pressure in its domestic market in different forms.
The competitive pressures on Southwest Airlines were exerted either through legal or political
channels, recruiting its top management, and price wars.
Legal and Political Pressures. The traditional airlines were exerting legal and political
pressure to prevent Southwest Airline from operating due to its competitive low-cost structure
(Southwest Airlines, n.d.). For example, since its foundation in 1967, Southwest was faced with
legal battle initiated by other carrier that kept Southwest from Air Certification to operate interstate
flights, which was declined by the Supreme court by the end of 1970 allowing Southwest to fly by
June 1971 (Southwest Airlines, 1972). The pre-operation legal struggle has cost the company more
than half million dollars (Southwest Airlines, 1972). The pressure to prevent Southwest to grow
has repapered in 1979 through the Wright Amendment or the International Air Transporation Act
of 1979 (Farris and Pohlen, 2006). The Wright Amendment has made it illegal for Southwest to
operate interstate flights from its base Love Field or even advertise for any connecting flights
113
113
(Farris and Pohlen, 2006). An act that was modified in 2006 by allowing Southwest to operate from
it Love Field Airport into selected states (Southwest Airlines, 2006a, July) and was completely
repealed in 2014 (Southwest Airlines, 2014b, July). Despite the strong corporate culture of
Southwest Airlines (Smith, 2004), competition has deployed efforts to recruits its top talents. After
Brannif was fined $100,000 in a case of using illegal tactics to drive Southwest Airlines out of the
market in 1978, Brannig Airways was successful in 1981 in recruiting Southwest’s President
Mr.Putnam, Southwest CFO, and The Bloom Agency, which is the marketing agency of Southwest
Airlines (Southwest Airlines Media, n.d.). However, Brannif ceased all its flights and declared
bankruptcy in May 1982 (Salpukas, 1982, May 13).
In fact, the competition with Brannif that was also based in Texas has started long before
in the beginning of 1973 when Southwest Airlines was still a small Interstate Airline operating
only 3 Boeing 737 and had just started flying after long 4 years of legal battle (The New York
Times, 1973, February 11, P234). Brannif had halved its flight fare on Dallas-San Antonio to 13$,
a price that resulted in great losses for Southwest Airlines (The New York Times, 1973, February
11, P234). However, Southwest Airlines had innovated a counter strategy by offering customers
either to pay the competition price or the full price and receiving fifth gallon of premium Whisky
(The New York Times, 1973, February 11, P234). The strategy had made Southwest Airlines the
biggest Whisky distributor in Texas and turning its losses into profit (The New York Times, 1973,
February 11, p.234).
Southwest Airlines competitiveness. Southwest Airlines has grown into a resilient
enterprise throughout its years of operations by enduring all forms of competitive pressures as well
as disruptive events in the US airlines markets (Gittel, Cameron, Lim, and Rivas, 2006). The
resilience of Southwest Airlines is also apparent through reaching its 46th consecutive year of
profitability by the end of 2018, a record figure in the airline industry (Southwest Investor
Relations, 2019, January 24).
In an era marked by deregulation and aggressive competition to Southwest, it reached $1
billion in revenues in 1989 that placed it as a major airline (Southwest Airlines, 1990). In fact, it
maintained record performance in cost management by possessing the lowest operating cost per
unit during time of increased fuel price (Southwest Airlines, 1991). Furthermore, Southwest
114
114
Airlines remained the only profitable airline in the US market despite the spike in fuel prices and
economic recession (Southwest Airlines, 1992). Besides, Gary Kelly expressed that Southwest has
the lowest cost model in the industry (Southwest Airlines, 2002, July). Plus, as a retaliation to
competition who charge for baggage, Southwest has aggressively advertised that bag fly for free
on its flights (Southwest Airlines, 2010). By 2012, Southwest has detained 25% of the commercial
US market (Southwest Airlines, 2012, May)
Based on the above, Southwest Airlines has focused throughout its years of operations on
increasing its market presence in the US. The competitive pressure exerted on Southwest in its
home market pressured Southwest to develop a large US network to a point of saturating the US
low fare market (Trefis Team, 2015, April 7).
Management
Southwest Airlines values its human capital as a detrimental part of its success and relies
on selective attributes that are warrior’s spirit, servant’s heart, and a fun-loving attitude (Weber,
2015, December 2). These traits are valued for promotion to managerial position (Weber, 2015,
December 2). Moreover, Southwest Airlines derives its competitive advantage, in part, from its
employee’s satisfaction (Hallowell, 1996, Winter). However, Oviatt and McDougall (2005) argued
that the entrepreneurial and past experience of the management influence the speed of
internationalization.
Since its foundation in 1967, Southwest has only internationalized in 2013 (Southwest
Airlines, 2014). The management of Southwest Airlines has seen a pivotal change with the tenure
of Gary Kelley as CEO during the period 2004-2017 (Southwest Airlines Media Gary Kelly, n.d.).
Prior to Gary Kelley tenure, Southwest Airlines was piloted by Herb Kelleher from 1967-2004 and
remained the company’s Chairman until his death in 2019 (Financial Times, 2019, January 5). Herb
Kelleher is a pioneer in the Low-Cost Airlines and considered as “the father of low-cost airlines”
(BBC News, 2019, January 4). Herb Keller practiced successfully law in Texas and supported
Southwest Airlines during its legal challenges since its foundation (Financial Times, 2019, January
5).
115
115
Southwest relies on internal promotion and promotes a Southwest citizenship that instills
core values and the company’s culture (Southwest Careers, n.d.). Therefore, most of top
management positions are filled with employees who has more than 15 years of Southwest
experience (Thomson, 2018, December 18). Nevertheless, a common trait of some top management
was their accountant background. For example, the list of certified accountants in management
positions has been changing throughout times. Gary Kelly CEO of Southwest Airlines (2004-2017)
is a certified accountant (Southwest Airlines Media Gary Kelly, n.d.). He joined Southwest after
graduating with a bachelor’s degree from University of Texas System in Accounting (Southwest
Airlines Media Gary Kelly, n.d.). He gravitated position in the finance department since 1986, until
he became an executive VP and CFO by 2001 (Southwest Airlines Media Gary Kelly, n.d.). In
2004, he was promoted to pilot the company as a CEO (Southwest Airlines Media Gary Kelly,
n.d.). Besides, Nan Berry Managing Director of Southwest Executive Office joined Southwest
since 1988 as accountant (PR Newswire, 2012, March 13). Also, Michael Van de Ven, who is the
Chief Operating Officer, has joined the company in 1993 with a financial audit experience and is
Certified Public Accountant (Dow Jones Institutional News, 2016, September 28).
However, Southwest Airlines was marked by a shift in management change during Gary
Kelley tenure of Southwest Airlines. Although Gary Kelley has started its tenure by prioritizing
cutting cost (Koenig, 2004, August 5), he expressed the company’s for future near
internationalization (Southwest Airlines, 2003, October). Hence, the optics have changed for the
management. This was accompanied by wide management change in executive positions and in
the board of directors since 2006 and in different years such us in 2014 and 2018 (Southwest Airline
Media, n.d.).
The change was through appointing board directors that will support the international
expansion of Southwest. For example, Southwest named a new board member Dr. Dr.Gilligan in
2015 (Airline Industry Information, 2015, September 25). Southwest maintained the nomination
on its board of Dr.Gilligan for multiple reasons and especially due to his “extensive knowledge of
political and international affairs, which is valuable to the board as the Company explores
additional international opportunities” (News Bites Finance, 2018, November 25). Plus, Grace
D.Lieblein was appointed in 2016 as a Director to support the international vision of Southwest
Airlines due to his extensive engineering skills, quality control capacity, and more importantly his
116
116
“global leadership experience … in connection with the company’s international operations”
(News Bites Finance, 2019, February, 2) (Acquisdata Inc, 2016, June 3). Besides, Southwest named
to its board Mr.Brooks, who held CEO position for US multinationals companies, in 2010 (Dow
Jones & Company, Inc, 2010, February 3). Southwest considers Mr.Brooks is a valuable asset to
the company’s strategy “in connection with the Company's international operations and its
exploration of additional international opportunities” (Acquisdata Inc, 2016, June 3).
From the operational perspective, Bob Jordan and Mike Van de Ven have developed the
research capabilities of the international market in term of market capacity and market prices
(Southwest Airlines, 2012b, July). Bob Jordan occupied during these times the Executive Vice
President and Chief Commercial Officer between 2011 and 2017, before being promoted from the
position of Executive Vice President of Strategy and Planning (Jordan, n.d.). Plus, he was
responsible for closing the acquisition deal of $3.4 billion of AirTran that opened the door for
international market (Jordan, n.d.). He was later promoted in 2017 to head over the SWAUniversity
as well as occupying the Executive Vice President Corporate Services (Jordan, n.d.). Furthermore,
Gary Kelly acknowledged the added value of Bob Jordan and Mike Van de Ven for facilitating the
internationalization vision of Southwest (Southwest Airlines, 2007, June).
Andrew Watterson has joined Southwest as Vice President of Network Planning and
Performance in 2013 and was part of the internationalization team (Watterson, n.d.). Prior to
joining Southwest, Andrew Watterson was part of Hawaiian Airlines and led negotiation of
different code sharing with international perspective (Watterson, n.d.). Also, has an extensive
experience in supply chain and consulting with a focus on global transportation practice
(Watterson, n.d.). Gary Kelley has valued the work of Andrew Watterson and his team in
developing the international portfolio in coordination with Michael G. Van de Ven and his planning
team (Southwest Airlines, 2017b, October). Due to Watterson development of network background
and Michael G. Van de Ven cost management background, the combination of these backgrounds
develops and pursues international opportunities while considering revenues and profitability in
accordance with the set of route guidelines developed by Southwest Airlines.
117
117
Knowledge learning. In an Analyst meeting conference call in 2007, Southwest CEO has
acknowledged the lack of international expertise and knowledge of the top management, but they
are developing this axis. (Southwest Airlines, 2007, June).
The complexity remains in the novelty of the long-haul flight to Southwest. For example,
Southwest advanced that its network scheduling gets challenging as the company goes for longer
range routes (Southwest Airlines, 2002, January). Plus, Gary Kelly has expressed his concern of
negative effect of the long-haul flights (Southwest Airlines, 2003, October). Southwest Airlines is
known by its frequent short haul low cost flights and also its fleet of 737 that is designed more for
the short haul flights. However, Southwest Airlines developed its knowledge of the long-haul
flight. Nonetheless, by 2015, the longer-range flights and international market have driven the
yearly growth in capacity increase of 7% while gaining slowly market share in the long-term market
(Southwest Airlines, 2015, October).
Southwest has recognized that it reached a saturation phase back in 2010 in its domestic
market and it was necessary for the company to grow through acquisition and investing in
capabilities (Southwest Airlines, 2014, December). Prior to this announcement, Gary Kelley
expressed the willing of the airline to learn and invest in technology as well as they are expanding
through code sharing (Southwest Airlines, 2005b, January). In fact, the codeshare with ATA has
helped SA open up for opportunities to connect with other carriers (Southwest Airlines, 2006,
January). In fact, the internationalization represents not only a source of revenue growth for
Southwest but also a learning experience (Southwest Airlines, 2010, September)
On the other hand, Southwest Airlines was firm on assuring a full training of its personnel
before moving international with their own metal (Southwest Airlines, 2012b, July). In fact, it had
launched back in 2004 "Go Where We're Growing" that aimed at providing training and increasing
personnel productivity. (Southwest Airlines, 2004, October). Plus, the first baby steps in
internationalization has equipped Southwest management with better optics and experience to plan
for its future internationalization (Southwest Airlines, 2015, April). Furthermore, Southwest has
provided in 2016 training on new technology to 20,000 employees (Southwest Airlines, 2016a,
October).
118
118
Also, different industry events that exerted pressures on Airlines in the US market
represented a learning experience for Southwest to lessen its exposure by diversifying its markets.
For example, the 9/11 pressured Southwest to develop their flexibility and diversify its pool of
opportunities (Southwest Airlines, 2007, May). Hence, capabilities have been built to support
Southwest internationalization (Southwest Airlines, 2007, May).
Last but not least, Southwest Airlines has its proper university named as SWA University
that train future employees through offering training path as associate business analyst, associate
software engineer, and also college internships (Southwest Careers Campus Reach, n.d.)
Business Networks
Southwest Airlines has entered throughout its years of operations in different forms of
business networks. it has developed partnerships with other airlines, multinational technological
firms, and marketing agencies.
Southwest Airlines has engaged in different commercial agreement with other airlines.
These commercial agreements didn’t always result in business gain but also in failures. These
failures are limited to acquiring Muse Air and code share negotiation with WestJet Canada. For
example, after acquiring Muse Air in 1985 and renaming it as Transtart, Southwest was pressured
to shut it down due its lack of profitability in 1987 (Southwest Airlines, 1988). On the other hand,
Southwest Airlines reached an understanding for code share with WestJet that will enable access
to Canadian market in 2008 (Southwest Airlines, 2008, December). The code sharing with WestJet
was not conclusive, which led Southwest to pull back from the agreement with WestJet in 2010
(Southwest Airline Media, n.d.).
Nonetheless, Southwest Airlines was successful in other commercial agreements. For
example, it acquired Morris Air’s in 1993 in a $130 million deal as well as naming Morris Air’s
Chairman to Southwest’s board (Southwest Airlines, 1994). The Morris Air acquisition granted
Southwest a larger capacity and market share in the west coast (Brooks and Sanchez, 1993,
December 14). This acquisition has increased Southwest capacity by 30% (Southwest Airlines,
1995). Plus, Southwest was also successful in its code share understanding with Volaris for the
119
119
Mexican market in 2008 (Southwest Airlines, 2008, December). The understanding translated into
launching connecting flights in 2010 (Southwest Airlines, 2011).
In Parallel, the commercial tractions with ATA were the most important to Southwest for
its internationalization Journey. Southwest Airlines concluded a code share agreement with ATA
airlines in 2004 (Southwest Airlines, 2005). The code sharing started by connecting Southwest
Customer through Chicago in February 2005 (Southwest Investor Relations, 2005, June 28).
Besides, Southwest expected to derive $50 million in revenue from its code share with ATA
(Southwest Investor Relations, 2005, June 28) (Southwest Airlines, 2005a, April). However, ATA
has entered bankruptcy protection, but Southwest is committed to support ATA until it emerges
from bankruptcy (Southwest Airlines, 2005b, July). Nonetheless, the bankruptcy has caused
restructuring of ATA as well as decreasing the destinations number by 3 (Southwest Airlines, 2005,
October). In the meantime, a decrease in capacity deployed by ATA represent a growth opportunity
for Southwest in the west coast of the US (Southwest Airlines, 2005, October).
In the effort to support ATA to bounce from bankruptcy, Southwest structured a deal for
ATA that include a loan of $40 million to ATA that will allow acquisition of ATA gates at Chicago
Airport, which grants Southwest control of a total of 25 gates out of 43 (Southwest Airlines, 2006,
January) (Koenig, 2004, December 10) . The engagement of Southwest has contributed in part to
help ATA emerge from Bankruptcy in 2006 (Southwest Airlines, 2006, May) (Meher, 2006,
February 27). At Bear, Stearns & Co. 2006 Global Transportation Conference, Southwest
expressed that the code share agreement offered the opportunity for Southwest to envision future
near international service (2006, May). Gary Kelly detailed that ATA code share will support
international routes by 2009 (Southwest Airlines, 2006, April). Consequently, Southwest acquired
AirTran for a deal $1.4 billion that will not only increase Southwest Capacity through the new fleet
but also by offering the first international destinations in the Mexico and Caribbean (Mouawad,
2010, September 27). In fact, the ATA acquisition will deliver 8 new international destinations for
Southwest (Southwest Airlines, 2011, May).
In brief, code sharing offers flexibility for Southwest to partner with different local and
leader carrier to provide connectivity on routes (Southwest Airlines, 2007, October). It gives
120
120
immediate access to different routes and destinations, which increase the company flexibility reach
(Southwest Airlines, 2007, October). Nevertheless, Southwest considers that major alliances do
not represent a fir for Southwest Business model, according to Southwest CEO in the Q1 2008
Conference call (2018, April). More importantly, Southwest remains open for discussion with
different carrier for code share opportunities for near international destinations (Southwest
Airlines, 2008, April).
Technological partnerships. The business network for Southwest is not limited to Airlines
but also to different technology actors. For example, Southwest partnered with IBM in 2002 to
offer fast self-service check-in points in its different terminals and in 2005 with Movielink to
enhance in-flight entertainment (Southwest Airline Media, n.d.). However, the partnership with
Amadeus IT group remains the critical one as it contributed to launch a new reservation system for
Southwest to support its internationalization (Southwest Airlines, 2012b, April). Amadeus operates
with multiple airlines and carries operations that cover more than 190 countries (Southwest
Investor Relations, 2012, April 19).
Also, Southwest Airlines relies on partnering with marketing agencies to support its
customer reach. In 2009, Southwest partnered with Wunderman, which has presence in more than
70 countries, to take in charge the company’s communication (PR Newswire, 2009, February 3).
Also, Southwest has been active in marketing business network by partnering with the
multinational Spark Foundry to take in charge its media communication (Coffee, 2017, September
27). Southwest Airlines business network also reached media through a partnership with A&E
Network to produce a real-life series of the life at Southwest starting 2003 (Southwest Airline
Media, n.d.).
On the other hand, Southwest entered the sport realm by sponsoring major events in the
US. For example, it become the official airline of National Basketball Association (NBA), National
Hockey League (NHL), and Major League Baseball (MLB) (Southwest Airline Media, n.d.).
Firm’s Resources
Southwest Airlines resources can be seen through its fleet, human capital, and gates. These
elements, in addition to technology that is developed at the beginning of the case, represent the
121
121
capabilities for firm’s internationalization. For example, Gary Kelly argued that Southwest focus
in its international expansion is on airport international facilities, commercial and technological
infrastructure, and fleet efficiency to expands its domestic operational excellences to international
undertakings (Southwest Airlines, 2015, October)
Fleet management. Southwest has started with a fleet of 3 Boeing 737 in 1971 (Southwest
Airlines, 1972) and relied throughout its years of operation on the 737 model from different
generations. Based on Figure 7, the fleet size development has saw an increase as the fleet size has
moved 312 in 1999 to 548 in 2010, an increase of 236 Aircrafts of the same Boeing model. This
increase of fleet size in 10 years is comparable to the fleet size of its US competitor JetBlue by
2019 (Figure 8). A second phase that saw an exponential increase in fleet size is between 2010-
2019, which saw the fleet size go from 548 to 750 aircrafts in 2018 (Figure 7). This increase was
in part influenced by ATA acquisition that supplemented a fleet of 140 aircrafts in 2011 (Southwest
Airlines, 2012). By 2019, southwest had the 4th largest fleet of 719 Aircraft coming after American
Airlines, Delta Air Lines, and United Airlines (Blue Swan Daily, 2019, April 18)
Southwest Airlines limits its fleet increase to its productivity and adequate training of its
human capital to accommodate any added capacity (Southwest Airlines, 2003, October). Also, the
company has diversified its 737 Model by adding 737-700 and 737-800 to its fleet mix that provide
flexibility and the increase of stage length (Southwest Airlines, 2013, March). However, Extended
Operation (ETOPS) certification is required for its 737-800 fleet to have the flexibility to operate
cross border and long-range flights (Southwest Airlines, 2012, May). Subsequently, Southwest is
expecting to have 28 of the 737-800s to be ETOPS certified (Southwest Airlines, 2012, May). Gary
Kelly expressed the fit of the Boeing 800 for long haul flight and serves the mission to serve
international market (Southwest Airlines, 2011, March). Southwest Airlines is capable to serve
near international destination in 2014 by its own fleet (Southwest Airlines, 2014b, July). Southwest
Airlines has kept modernizing its fleet through the reception of the 737 Max (Southwest Airlines,
2018b, October). The first operation of the 737 Max 8 started in the Q4 2017 while ensuring an
average age of 11 years for its fleet (Southwest Corporate Fact Sheet, n.d.).
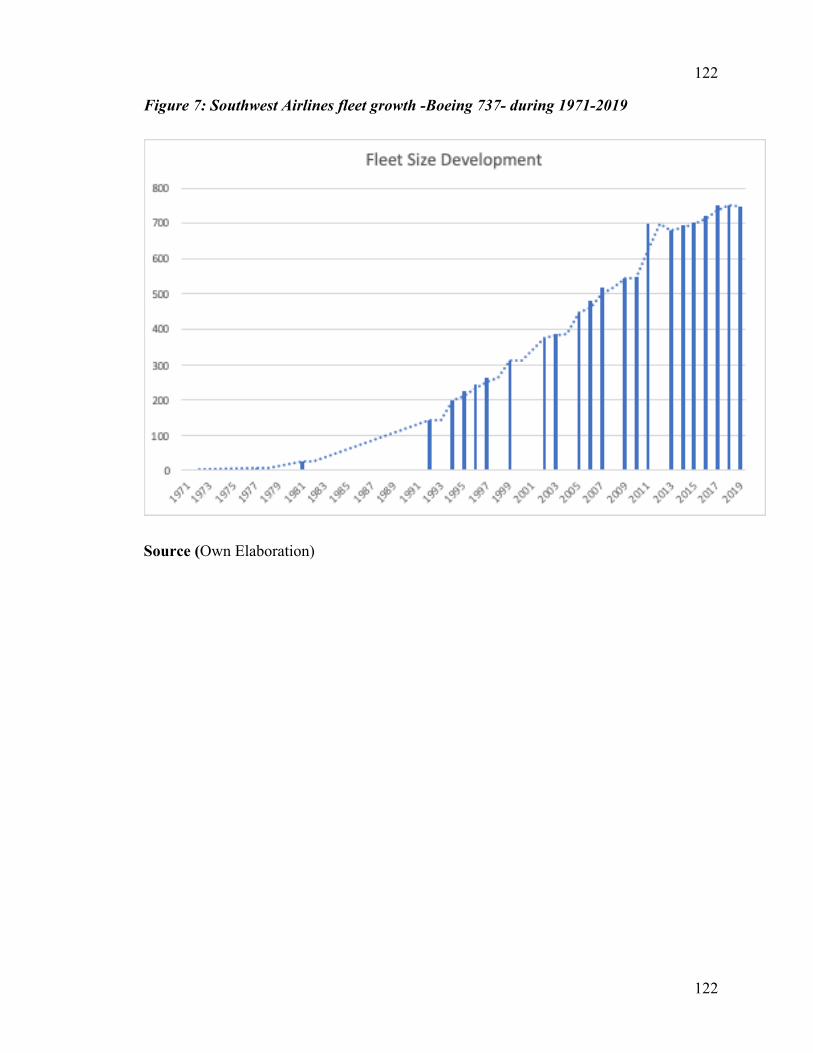
122
122
Figure 7: Southwest Airlines fleet growth -Boeing 737- during 1971-2019
Source (Own Elaboration)
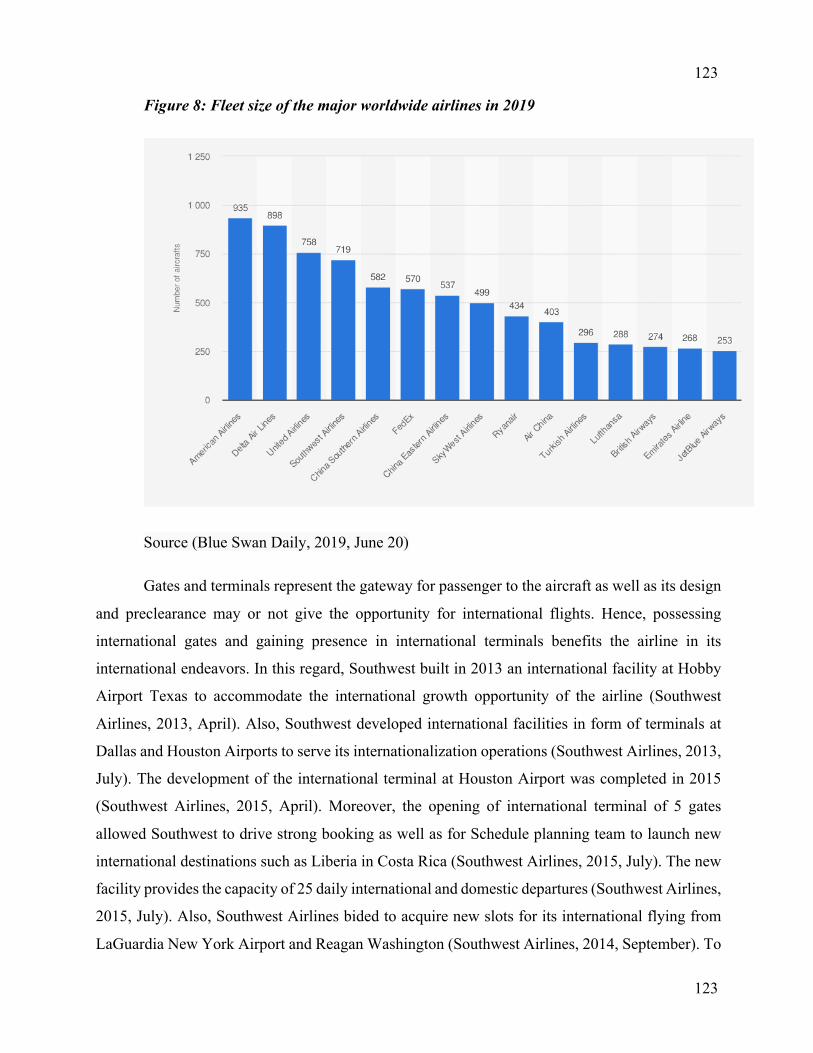
123
123
Figure 8: Fleet size of the major worldwide airlines in 2019
Source (Blue Swan Daily, 2019, June 20)
Gates and terminals represent the gateway for passenger to the aircraft as well as its design
and preclearance may or not give the opportunity for international flights. Hence, possessing
international gates and gaining presence in international terminals benefits the airline in its
international endeavors. In this regard, Southwest built in 2013 an international facility at Hobby
Airport Texas to accommodate the international growth opportunity of the airline (Southwest
Airlines, 2013, April). Also, Southwest developed international facilities in form of terminals at
Dallas and Houston Airports to serve its internationalization operations (Southwest Airlines, 2013,
July). The development of the international terminal at Houston Airport was completed in 2015
(Southwest Airlines, 2015, April). Moreover, the opening of international terminal of 5 gates
allowed Southwest to drive strong booking as well as for Schedule planning team to launch new
international destinations such as Liberia in Costa Rica (Southwest Airlines, 2015, July). The new
facility provides the capacity of 25 daily international and domestic departures (Southwest Airlines,
2015, July). Also, Southwest Airlines bided to acquire new slots for its international flying from
LaGuardia New York Airport and Reagan Washington (Southwest Airlines, 2014, September). To
124
124
strengthen its international departure from the east coast, Southwest built an international facility
in Fort Lauderdale in Florida to accommodate its internationalization to Caribbean and Central
America (Southwest Airlines, 2015, October). The Fort Lauderdale international facility is
expected to be operational by 2017 (Southwest Airlines, 2016b, October). Furthermore, Gary
Kelley considered the international terminal construction in Ft.Lauderdale as a strategic move for
the company’s internationalization plan (Southwest Airlines, 2016a, October). Gary Kelly has
acknowledged the importance of Airport international facilities in terms of terminals and gates in
2015 (Southwest Airlines, 2015, October), but the focus has shifted to the fleet mix management
and modernization by introducing and launching the new 737 Max 8 in 2017 (Southwest Airlines,
2017a, October). The investment in new gates and slots contributes to increased growth of
Southwest domestically and internationally (Southwest Airlines, 2015, March).
Human capital. Since its beginning, Southwest has acknowledged the importance of the
human capital. In fact, the more than 2/3 of the cost structure is dominated by labor and oil
(Southwest Airlines Media, n.d.). Therefore, Southwest puts in place rigorous selection that value
the personality more than the attributes or skills of the interviewee (Southwest Airlines, 2005,
February). Moreover, the expansion of Southwest for near international rely on success of
negotiation and consent from pilots due the different nature of the flight haul (Southwest Airlines,
2007, June). In brief, Southwest is people-oriented company that value its employees while giving
them stability. This is apparent through its mission statement:
We are committed to provide our Employees a stable work environment with equal
opportunity for learning and personal growth. Creativity and innovation are encouraged for
improving the effectiveness of Southwest Airlines. Above all, Employees will be provided the
same concern, respect, and caring attitude within the organization that they are expected to share
externally with every Southwest Customer. (“The Mission of Southwest Airlines”, 1998, January)
As Southwest founder Herb Kelleher had argued “if employees are treated right, they treat
the outside world right, the outside world used the company’s product again, and that makes
shareholders happy.” (as cited in Hyken, 2017, May 27). Besides, Gary Kelly Southwest CEO
advanced that the strength and company’s long-term competitive advantage rely in its people (“The
125
125
Mission of Southwest Airlines”, 1998, January). Finally, adequate human capital is necessary to
accommodate the added capacity (Southwest Airlines, 2003, October).
Strategy
Southwest Airlines started as domestic low-cost airline that service three cities in Texas
with only 3 Boeing 737 (Southwest Airlines, 1972). It focused on convenient Airport (Southwest
Airlines, 1975). Their fleet strategy focused on maximizing the use of aircraft while reaching record
turnover at gates (Southwest Airlines, 1979). The company strategy focused on simplicity, high
productivity, business travelers, and short-haul market (Southwest Airlines, 1981). Hence, they
framed their initial vision as “low fare, lots of flights, with loads of fun” (Southwest Airlines, 1989).
However, the company has changed their market vision with Gary Kelly tenure as CEO in 2004.
He has expressed the openness of the airline to serve near international destinations at Raymond
Airline Conference (Southwest Airlines, 2006, January). In 2011, Southwest launched a strategic
5 years plan that aims at ensuring full AirTran integration, Rapid Rewards frequents flyer program,
fleet modernization, incorporating Boeing 737-800 into Southwest operations, implementation the
new reservation system, and building international capabilities (Southwest Airlines, 2012). The
strategic initiative of modernizing the fleet through the new 737-800 enable the company to
increase its flight stage length (Southwest Airlines, 2012). By 2015, Southwest announced strong
result of its strategic 5-year plan with 32.7 ROIC (Southwest Airlines, 2016). However, the
company argued that it will undergo “slow and measure pace” internationalization (Southwest
Airlines, 2015, April). Finally, the strength of domestic presence of Southwest combined with its
internationalization serve its new vision to be "the world's most loved, most flown and most
profitable airline" (Southwest Airlines, 2015, March)
Innovation
Southwest Airlines has been innovative in undergoing price wars and defying competition.
During its beginning and after coming out of long legal battles, Southwest was faced with
aggressive competition from Brannif Airlines in 1973 (The New York Times, 1973, February 11,
126
126
P234). Brannif had cut the price in half, which was a loss-making fare (The New York Times,
1973, February 11, P234). Southwest has responded by giving the customer the choice to either
pay the competition price or pay the full fare and receive a premium Whisky (The New York Times,
1973, February 11, P234). This innovative response has stopped loss making for Southwest and
made it profit from the price war to $40,000 profit (The New York Times, 1973, February 11,
P234).
Southwest also employed innovative action to enhance customer experience either in
Airport (Southwest Airlines, 2004, July) or in-flight. Southwest invested in innovative check-in
technologies that reduce lead time to board the aircraft for customers (Southwest Airlines, 2003,
January). Also, Southwest Wifi-enabled aircraft offers customer the possibility since 2013 to use
personal electronic devices through Wifi to benefit from free movies, music, and live TV
(“Southwest Corporate Fact Sheet”, n.d.).
The innovation also contributes to increase aircraft efficiency through the use of Blended
winglet that is mounted on 90 of Southwest aircrafts since 2006 (Southwest Airlines, 2006b,
October). The winglet innovation has been replaced in 2017 by the new Split Scimitar Winglets
that increase the fleet’s fuel efficiency (“Southwest Corporate Fact Sheet”, n.d.).
Innovation is important to Southwest Airlines that it is joined to the Strategy department
under directorship of Tom Nealon who was named as the executive Vice President of Strategy and
Innovation in 2015 (Carey and Steele, 2017, January 10) (Southwest Airline Media, n.d.). Tom
Nealon was later promoted to president of Southwest Airlines (Carey and Steele, 2017, January
10).
Opportunity Development
By 2017, Southwest realized the benefit of internationalization by remedying to seasonality
of the industry (Southwest Airlines, 2018, January). In 2009, Gary Kelly saw the opportunity for
Southwest to take enormous growth through its near international market as well as the improving
economy that will provide a strong demand (Southwest Airlines, 2009, October). However, the
majority of opportunities are within the domestic market (Southwest Airlines, 2006, April).
127
127
The international operational opportunity identification is carried by the Schedule and
Planning Department in 2003 (Southwest Airlines, 2004, January). The pursuit of identified
opportunities is undertaken by the Network Planning Team under Andrew Watterson management
and Operational team under Mike Van de Ven management (Southwest Airlines, 2014b, July). The
network team developed a list of 50 potential opportunities of near international destinations
(Southwest Airlines, 2014b, July). Besides, Gary Kelly has expressed the opportunities that are
offered by code share agreement and acquisition at the Southwest Airlines 2007 Analyst Meeting
(2007, June). Consequently, the code share generated $40 million in revenue for Southwest with
the opportunity to reach near international market (Southwest Airlines, 2007, July). In parallel,
Southwest engaged in launching international marketing campaign to act on the international
opportunity (Southwest Airlines, 2010). Moreover, Southwest enjoys a strong domestic network
that offer strong positioning for Southwest to act on the near international opportunity with multiple
departure origins (Southwest Airlines, 2014, September). For example, Southwest enjoyed
international gates at 3 main airports that are Hobby Airport (Southwest Airlines, 2014, April), Ft.
Lauderdale (Southwest Airlines, 2016a, October) Washington Reagan Airport (Southwest Airlines,
2015, July). Also, Southwest identified the growing market of the medium stage length flights,
marked by high load factors and low frequencies (Southwest Airlines, 2006b, July). Besides, the
reduction in capacity by competition represents an opportunity for Southwest (Southwest Airlines,
2004, January).
On the other hand, international opportunity identification is limited by the market capacity
and the market price (Southwest Airlines, 2012b, July). Also, Southwest Airlines developed a list
of requirements to act on any international route opportunity. For example, in addition to adequate
capacities, Southwest requires 15% of ROIC on the new launched routes (Southwest Airlines,
2014b, July).
Domestic Commitment
Gary Kelly considers Southwest as an "all domestic carrier" (Southwest Airlines, 2003,
January). Plus, Gary Kelly considers that the majority of opportunities for the airlines exists in the
US Market (Southwest Airlines, 2006, April). In 2018, Southwest dominated the US market by
carrying more passengers than any other US airlines in the US market in 2018 (United States
Department of Transportation, 2019, March 21). Southwest deployed its capacity in the US market
128
128
as follow “"northeast 15%, Southeast, 15%, Southwest 13%, Midwest 19% And 38% for West”
(Southwest Airlines, 2006a, October). As we can see, the west coast represents the focus market
for Southwest Airlines in the US. Moreover, Southwest enjoys leadership position in more than
90% of its top 100 markets in the US (Southwest Airlines, 2007, February). Nonetheless, Southwest
is agile in managing and restructuring its routes network by cancelling low performing routes. For
example, in 2008 during the economic crisis, Southwest cancelled 56 of its low performing routes
while at the same time introducing new 40 flights (Southwest Airline Media, n.d.). The domestic
network of Southwest Airlines has covered 85 destinations by 2012 (Southwest Airline Media,
n.d.). The domestic US market represented 95% of available Seat per Miles despite the
internationalization in the near market (Southwest Airlines, 2019). The strong domestic presence
has provided Southwest with 23 port from the US to the international market (Southwest Airlines,
2019).
Regulatory Environment and Institutional Theory
After its foundation in 1967, Southwest endured legal battle that prevented the airline from
flying until a ruling in the US supreme court in 1971 (Southwest Airlines, 1972). The legal battles
incurred the airline $530,000 (Southwest Airlines, 1972). At that time, federal government and the
Civil Aeronautics Board (CAB) were controlling the market through strict monitoring of fare
prices, routes, and the airlines market entry (Douglas & Miller, 1974). The strict control had
delayed the expansion of Southwest from its original 3 cities network (Southwest Airlines, 1975).
The airline market was liberated by the Airline Deregulation Act in 1978 signed by
President of the United States Carter (Brown, 1987). The Airlines Deregulation Act in 1978
represented the starting point for the Low-Cost Carrier industry (Azadian & Vasigh, 2019). This
act has liberated the airline market from the control of the Federal Government (Brown, 1987).
Prior to this act, the Airline market was subject to the control of the Federal Government (Brown,
1987). The Federal government used to control the routes, fares, and also limiting market entry of
new airlines (Brown, 1987).
The deregulation had enabled Southwest to pursue growth by flying interstate from its base
of Love Field, which threatened the competitiveness of Dallas Forth Airport (Grantham, 2007).
Hence, Texas politician lobbied the passing of an amendment, later called Wright Amendment of
129
129
1979, that prevented airlines to fly intra-state out of Love Field Airport to the neighboring states
(Grantham, 2007). The Wright Amendment of 1979 continued to restrain Southwest from serving
adjacent state of Texas even in 2005 (Southwest Airlines, 2005, November). A situation that has
been partially corrected by a reform law allowing Southwest to fly from Dallas Love Field to
adjacent states as well as offering connecting services in 2006 (Southwest Airlines, 2007). A final
repeal of the Wright amendment that completely liberated Southwest at its Dallas Love Field has
been enacted in 2014 (Southwest Airlines, 2014b, July).
In 2007, the United States and Europe entered an open skies agreement that will be effective
in 2008 (Southwest Airlines, 2007, June). This open the airlines European market for the US
careers. In fact, politics and diplomatic relations shape the global airlines market. Before the United
States and Cuba formally restored their diplomatic relations in 2015 (Trotta and Wroughton, 2015,
July 1), Southwest expressed its interest in the Cuban market following US-Cuba discussions
(Southwest Airlines, 2015, March). Hence, Southwest was approved to serve Havannah, Cuba from
Florida in 2016 after requesting an approval from the US Department of Transportation (Southwest
Airline Media, n.d.).
Also, Ron Ricks, Regulatory officer at Southwest, expressed the company’s interest in the
continuous discussion between US-Mexico to liberalize the bilateral agreement (Southwest
Airlines, 2014b, July). In 2017, the United States and Mexico reached a bilateral agreement that
liberalized the skies between the two countries allowing for increased capacity and frequency for
Southwest Airlines during its internationalization times (Southwest Airlines, 2017, May). Prior to
this agreement, Southwest Airlines submitted institution request to allow AirTran to fly to Mexico
in 2011, which was approved in 2012 (Southwest Airline Media, n.d.). Also, Southwest Applied
with the Department of Transportation for the route of Denver International Airport and Lic.
Gustavo Diaz Ordaz International Airport in Puerto Vallarta, Mexico (Southwest Airline Media,
n.d.).
In parallel, long range and cross border operation requires special certified aircrafts.
Southwest Airlines was limited in its fleet in 2006 by not having the Extended Operations
Certificate for its aircrafts to undertake long range trans-border flights (Southwest Airlines, 2006,
April). ETOPS certification is required for Southwest to fly its own metal cross border (Southwest
130
130
Airlines, 2014b, July). This was resolved by purchasing 28 Boeing 737-800 that are ETOPS
certified in 2012 (Southwest Airlines, 2014b, July). Also, Southwest Airlines continued working
with Federal Aviation Administration (FAA) for the ETOPS certification of the long-range fleet
(Southwest Airlines, 2017a, October).
The institutional approvals are also present in different capabilities construction. For
example, in 2012, Southwest Airlines has reached consent with institutional stakeholder to build
its 5 internationals gates terminal at William P.Hobby Airport in Houston (Southwest Airline
Media, n.d.). Also, Southwest received full support from the City Council of Houston for building
the mentioned facility at Hobby Airport (Southwest Airlines, 2012b, July). After 3 years,
Southwest was granted approval to open its international terminal of 5 gates at William P.Hobby
Airport in Houston by 2015 (Southwest Airline Media, n.d.). Furthermore, Southwest airlines
received the green light for the use of ATA assets that resulted from the acquisition (Southwest
Airline Media, n.d.).
On another note, the different labor union are forms of internal institution that influences
the company’s operations. Southwest Airlines is known by its open communication with all
employees as well as its labor unions as well as being the only Airline that makes the top 10 best
companies to work for (Hallowell, 1996). Southwest endures frequent pressure from its labor
unions for pay increase, but it has less exposure to pay increase because of its competitive low-cost
structure (Southwest Airlines, 2002, January). Also, in 2007, Southwest Airlines enterred
negotiation with Pilots to receive their consent for the company’s internationalization (Southwest
Airlines, 2007, June). The consent of Pilots is necessary due to the change and extension of flights’
haul and geography (Southwest Airlines, 2007, June)

131
131
132
132
Chapter 5: Measurement of LCCs’ Internationalization Speed
To answer the core of our research question, why LCCs internationalize at different speed,
the thesis needed to determine a speed comparison basis. A basis that is not commonly observed
in the LCC research. To differentiate between the LCCs, the literature proposed different
measurements and conceptualization of internationalization speed. The different measurements
allowed for different approaches to measure and conceptualize internationalization’s speed either
with multidimensional methods (Lin, 2012; Chang & Rhee, 2011; Casillas & Acedo, 2013) or
unidimensional methods (Casillas & Moreno-Menendez, 2014) with different periods of focus that
are pre-entry (Musteen, et al., 2010; Oviatt & McDougall, 2005) and post-entry (Zhou, 2007).
The study hereafter will apply different measurements on the studied LCCs and yield a
summary (Table 3). The summary allows to differentiate and compare between LCCs’
internationalization speed. The section will start with key findings, followed by the
multidimensional measurement of each LCC, then unidimensional measurements, and concluding
with results.
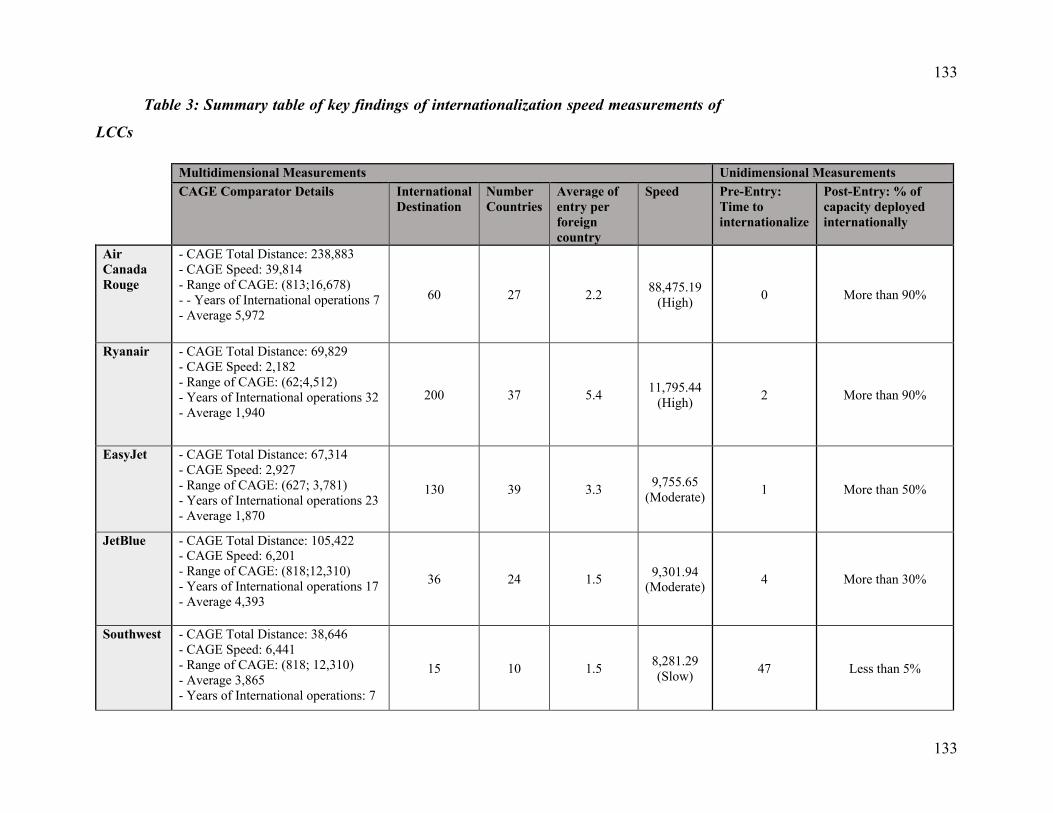
133
133
Table 3: Summary table of key findings of internationalization speed measurements of
LCCs
Multidimensional Measurements Unidimensional Measurements CAGE Comparator Details International
Destination Number Countries
Average of entry per foreign country
Speed Pre-Entry: Time to internationalize
Post-Entry: % of capacity deployed internationally
Air Canada Rouge
- CAGE Total Distance: 238,883 - CAGE Speed: 39,814 - Range of CAGE: (813;16,678) - - Years of International operations 7 - Average 5,972
60 27 2.2 88,475.19
(High) 0 More than 90%
Ryanair - CAGE Total Distance: 69,829 - CAGE Speed: 2,182 - Range of CAGE: (62;4,512) - Years of International operations 32 - Average 1,940
200 37 5.4 11,795.44
(High) 2 More than 90%
EasyJet - CAGE Total Distance: 67,314 - CAGE Speed: 2,927 - Range of CAGE: (627; 3,781) - Years of International operations 23 - Average 1,870
130 39 3.3 9,755.65
(Moderate) 1 More than 50%
JetBlue - CAGE Total Distance: 105,422 - CAGE Speed: 6,201 - Range of CAGE: (818;12,310) - Years of International operations 17 - Average 4,393
36 24 1.5 9,301.94 (Moderate)
4 More than 30%
Southwest - CAGE Total Distance: 38,646 - CAGE Speed: 6,441 - Range of CAGE: (818; 12,310) - Average 3,865 - Years of International operations: 7
15 10 1.5 8,281.29 (Slow)
47 Less than 5%
134
134
Multidimensional Measurement
The objective of this section is to present a series of multidimensional measurements of the
internationalization speed of LCCs. As presented in the methodology chapter, the proposed formula
(see Error! Reference source not found.) of internationalization speed suggests a combination of
factors. For example, reaching a farther point, in term of CAGE Distance, with high commitment
per year expresses a fast internationalizing LCC in comparison to the others. We present the current
state of internationalization of each LCC by measuring the average of international destinations
per foreign country, followed by an analysis and calculation of the CAGE distance (Aygoren &
Kadakal, 2018; Ghemawat, 2001).
Air Canada Rouge:
Air Canada Rouge was founded by its parent company Air Canada as a strategy to enhance
the group’s efficiency and grow its international presence (Air Canada, 2013). For example, Air
Canada CEO Mike Rousseau has said “we are growing internationally and primarily through
Rouge" in Q4 2015 Air Canada Earnings Call (Air Canada, 2016, February).
Internationalization and commitment calculation. Air Canada Rouge has developed 60
international destinations in 27 countries (Figure 9). Based on the proposed formula presented in
the methodology, the measurement takes the number of international destinations while ensuring
the importance of entering different countries. The average destination per foreign country has
yielded a number of 2.2 that takes into account the number of international destinations (60
international destinations) that are in the Rouge portfolio over the number of different countries
(27 countries). Hence, Air Canada Rouge has an average of 2.2 entries per foreign country over six
years of internationalization.
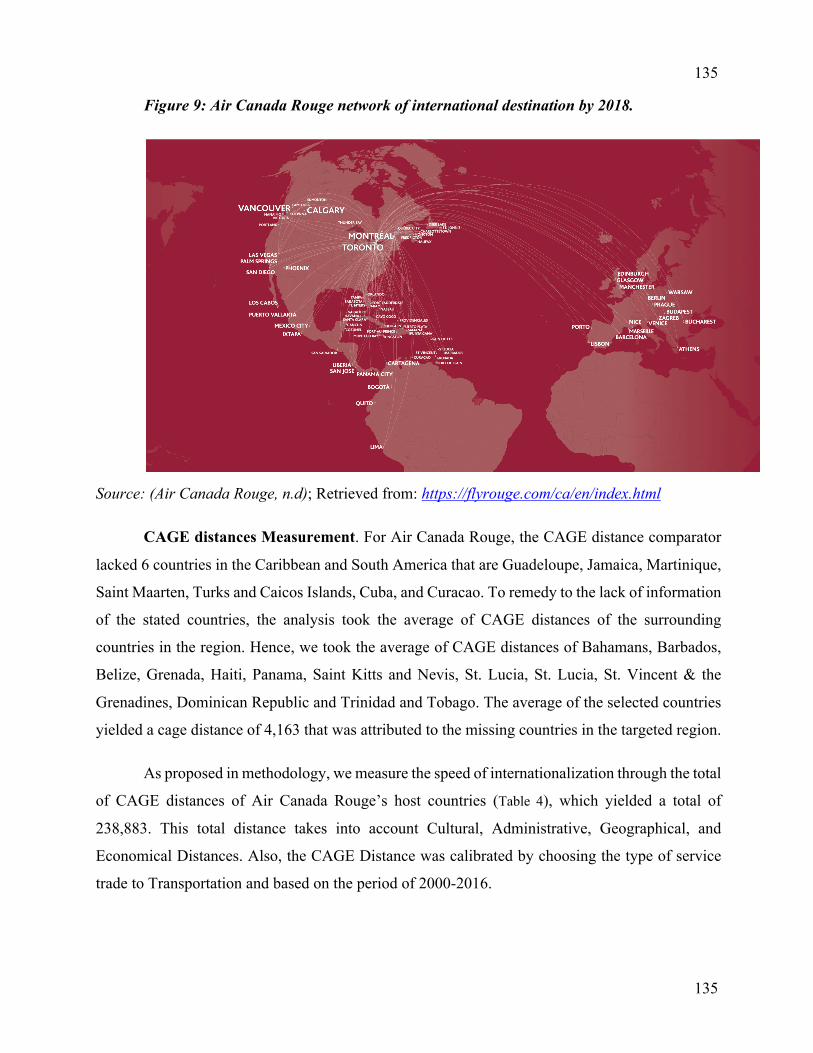
135
135
Figure 9: Air Canada Rouge network of international destination by 2018.
Source: (Air Canada Rouge, n.d); Retrieved from: https://flyrouge.com/ca/en/index.html
CAGE distances Measurement. For Air Canada Rouge, the CAGE distance comparator
lacked 6 countries in the Caribbean and South America that are Guadeloupe, Jamaica, Martinique,
Saint Maarten, Turks and Caicos Islands, Cuba, and Curacao. To remedy to the lack of information
of the stated countries, the analysis took the average of CAGE distances of the surrounding
countries in the region. Hence, we took the average of CAGE distances of Bahamans, Barbados,
Belize, Grenada, Haiti, Panama, Saint Kitts and Nevis, St. Lucia, St. Lucia, St. Vincent & the
Grenadines, Dominican Republic and Trinidad and Tobago. The average of the selected countries
yielded a cage distance of 4,163 that was attributed to the missing countries in the targeted region.
As proposed in methodology, we measure the speed of internationalization through the total
of CAGE distances of Air Canada Rouge’s host countries (Table 4), which yielded a total of
238,883. This total distance takes into account Cultural, Administrative, Geographical, and
Economical Distances. Also, the CAGE Distance was calibrated by choosing the type of service
trade to Transportation and based on the period of 2000-2016.
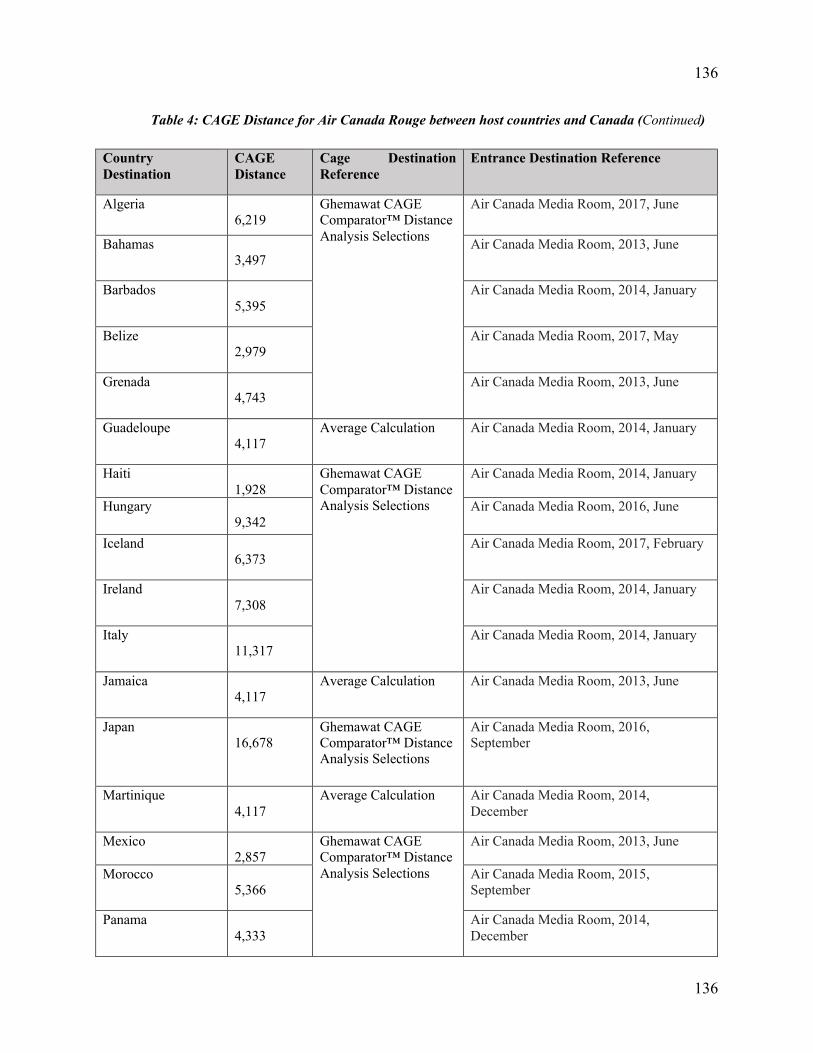
136
136
Table 4: CAGE Distance for Air Canada Rouge between host countries and Canada (Continued)
Country Destination
CAGE Distance
Cage Destination Reference
Entrance Destination Reference
Algeria 6,219
Ghemawat CAGE Comparator™ Distance Analysis Selections
Air Canada Media Room, 2017, June
Bahamas 3,497
Air Canada Media Room, 2013, June
Barbados 5,395
Air Canada Media Room, 2014, January
Belize 2,979
Air Canada Media Room, 2017, May
Grenada 4,743
Air Canada Media Room, 2013, June
Guadeloupe 4,117
Average Calculation Air Canada Media Room, 2014, January
Haiti 1,928
Ghemawat CAGE Comparator™ Distance Analysis Selections
Air Canada Media Room, 2014, January
Hungary 9,342
Air Canada Media Room, 2016, June
Iceland 6,373
Air Canada Media Room, 2017, February
Ireland 7,308
Air Canada Media Room, 2014, January
Italy 11,317
Air Canada Media Room, 2014, January
Jamaica 4,117
Average Calculation Air Canada Media Room, 2013, June
Japan 16,678
Ghemawat CAGE Comparator™ Distance Analysis Selections
Air Canada Media Room, 2016, September
Martinique 4,117
Average Calculation Air Canada Media Room, 2014, December
Mexico 2,857
Ghemawat CAGE Comparator™ Distance Analysis Selections
Air Canada Media Room, 2013, June
Morocco 5,366
Air Canada Media Room, 2015, September
Panama 4,333
Air Canada Media Room, 2014, December
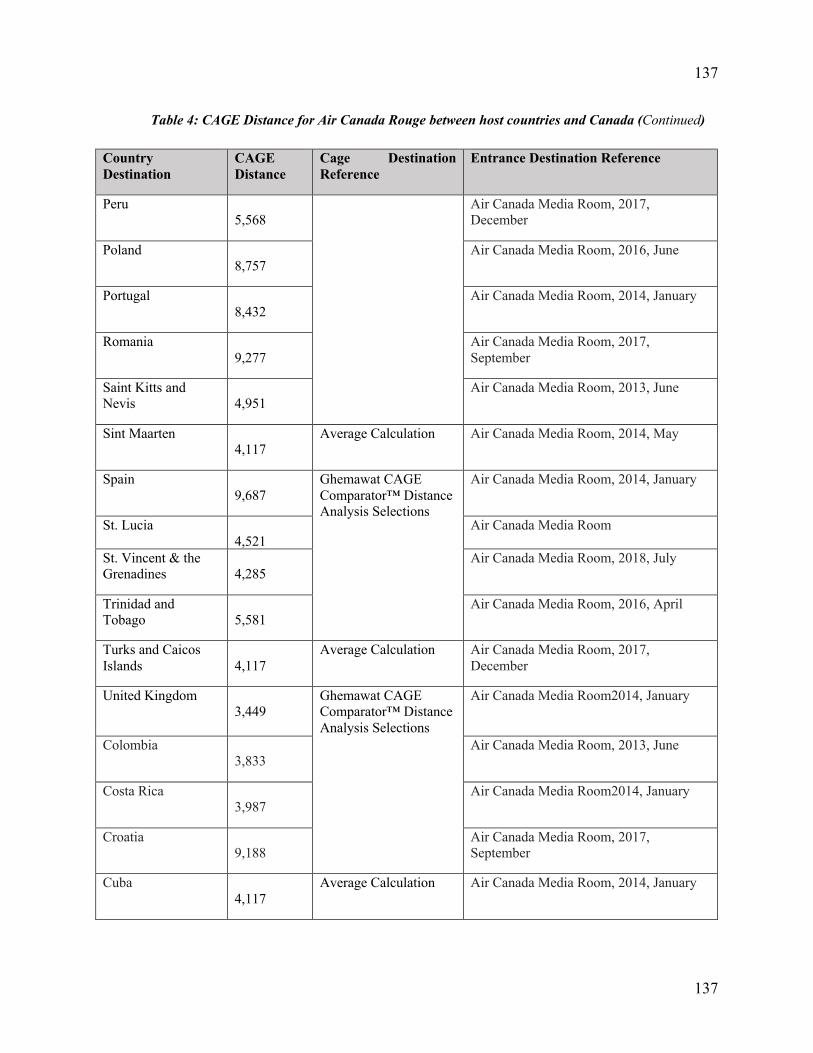
137
137
Table 4: CAGE Distance for Air Canada Rouge between host countries and Canada (Continued)
Country Destination
CAGE Distance
Cage Destination Reference
Entrance Destination Reference
Peru 5,568
Air Canada Media Room, 2017, December
Poland 8,757
Air Canada Media Room, 2016, June
Portugal 8,432
Air Canada Media Room, 2014, January
Romania 9,277
Air Canada Media Room, 2017, September
Saint Kitts and Nevis
4,951
Air Canada Media Room, 2013, June
Sint Maarten 4,117
Average Calculation Air Canada Media Room, 2014, May
Spain 9,687
Ghemawat CAGE Comparator™ Distance Analysis Selections
Air Canada Media Room, 2014, January
St. Lucia 4,521
Air Canada Media Room
St. Vincent & the Grenadines
4,285
Air Canada Media Room, 2018, July
Trinidad and Tobago
5,581
Air Canada Media Room, 2016, April
Turks and Caicos Islands
4,117
Average Calculation Air Canada Media Room, 2017, December
United Kingdom 3,449
Ghemawat CAGE Comparator™ Distance Analysis Selections
Air Canada Media Room2014, January
Colombia 3,833
Air Canada Media Room, 2013, June
Costa Rica 3,987
Air Canada Media Room2014, January
Croatia 9,188
Air Canada Media Room, 2017, September
Cuba 4,117
Average Calculation Air Canada Media Room, 2014, January
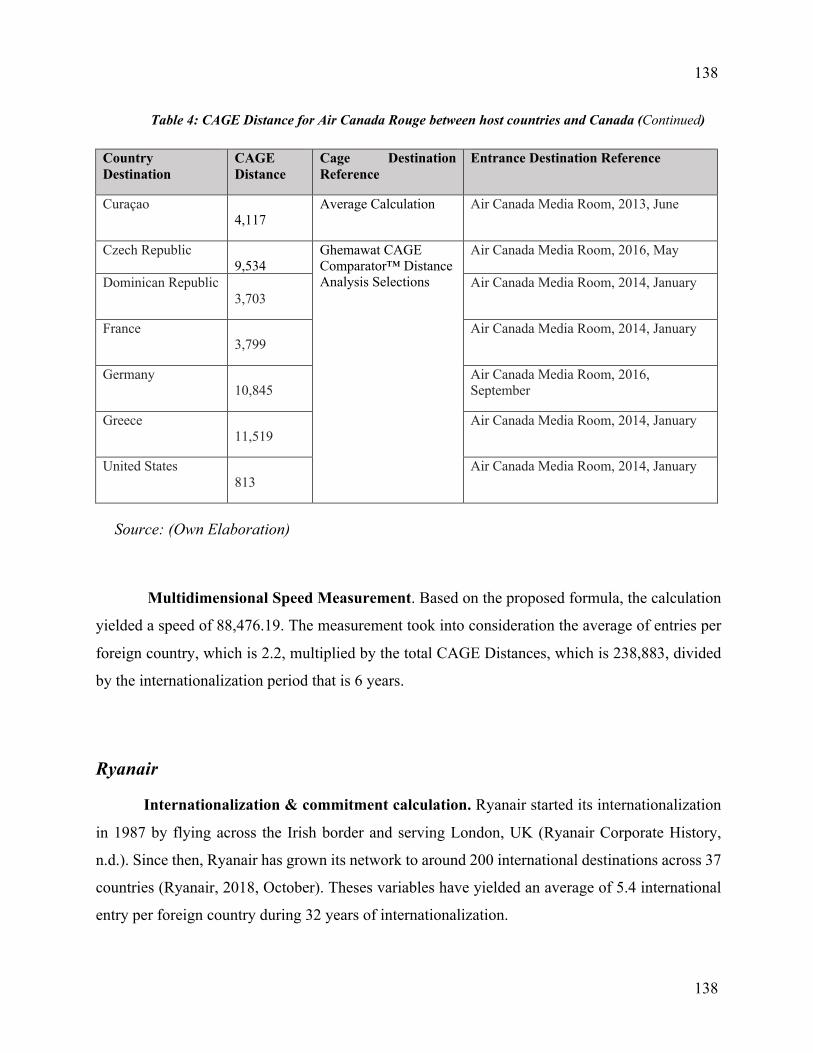
138
138
Table 4: CAGE Distance for Air Canada Rouge between host countries and Canada (Continued)
Country Destination
CAGE Distance
Cage Destination Reference
Entrance Destination Reference
Curaçao 4,117
Average Calculation Air Canada Media Room, 2013, June
Czech Republic 9,534
Ghemawat CAGE Comparator™ Distance Analysis Selections
Air Canada Media Room, 2016, May
Dominican Republic 3,703
Air Canada Media Room, 2014, January
France 3,799
Air Canada Media Room, 2014, January
Germany 10,845
Air Canada Media Room, 2016, September
Greece 11,519
Air Canada Media Room, 2014, January
United States 813
Air Canada Media Room, 2014, January
Source: (Own Elaboration)
Multidimensional Speed Measurement. Based on the proposed formula, the calculation
yielded a speed of 88,476.19. The measurement took into consideration the average of entries per
foreign country, which is 2.2, multiplied by the total CAGE Distances, which is 238,883, divided
by the internationalization period that is 6 years.
Ryanair
Internationalization & commitment calculation. Ryanair started its internationalization
in 1987 by flying across the Irish border and serving London, UK (Ryanair Corporate History,
n.d.). Since then, Ryanair has grown its network to around 200 international destinations across 37
countries (Ryanair, 2018, October). Theses variables have yielded an average of 5.4 international
entry per foreign country during 32 years of internationalization.
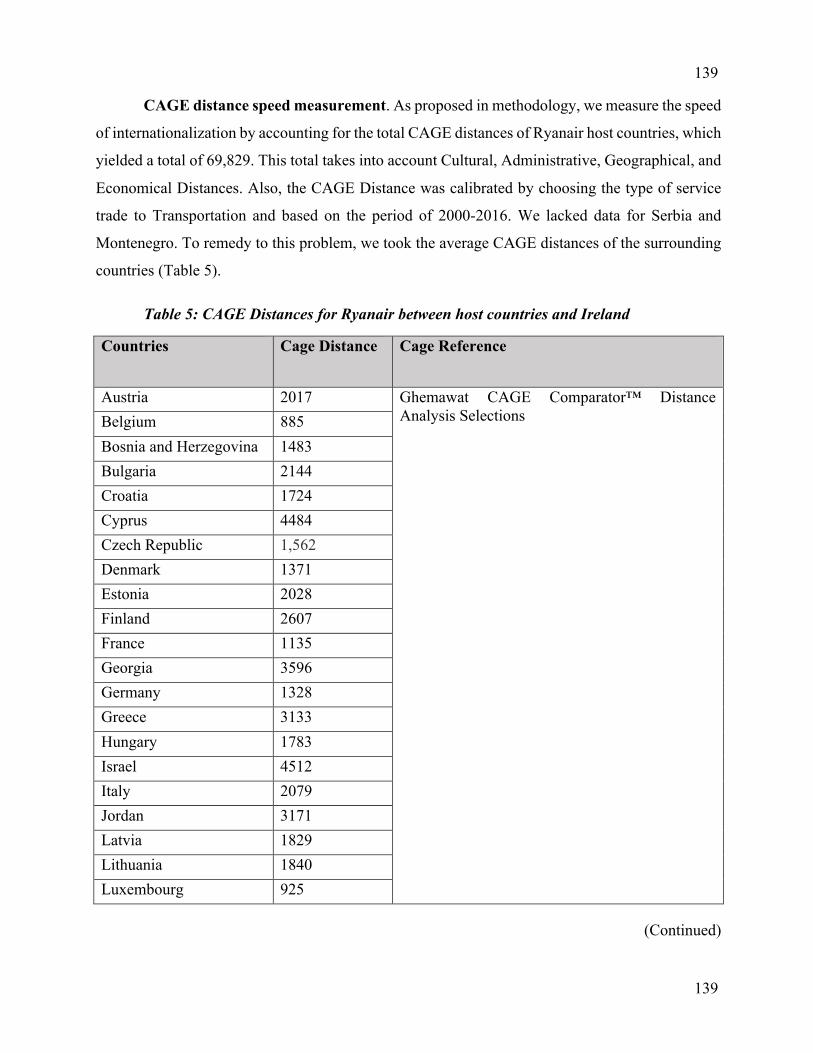
139
139
CAGE distance speed measurement. As proposed in methodology, we measure the speed
of internationalization by accounting for the total CAGE distances of Ryanair host countries, which
yielded a total of 69,829. This total takes into account Cultural, Administrative, Geographical, and
Economical Distances. Also, the CAGE Distance was calibrated by choosing the type of service
trade to Transportation and based on the period of 2000-2016. We lacked data for Serbia and
Montenegro. To remedy to this problem, we took the average CAGE distances of the surrounding
countries (Table 5).
Table 5: CAGE Distances for Ryanair between host countries and Ireland
Countries Cage Distance Cage Reference
Austria 2017 Ghemawat CAGE Comparator™ Distance Analysis Selections Belgium 885
Bosnia and Herzegovina 1483
Bulgaria 2144
Croatia 1724
Cyprus 4484
Czech Republic 1,562
Denmark 1371
Estonia 2028
Finland 2607
France 1135
Georgia 3596
Germany 1328
Greece 3133
Hungary 1783
Israel 4512
Italy 2079
Jordan 3171
Latvia 1829
Lithuania 1840
Luxembourg 925
(Continued)
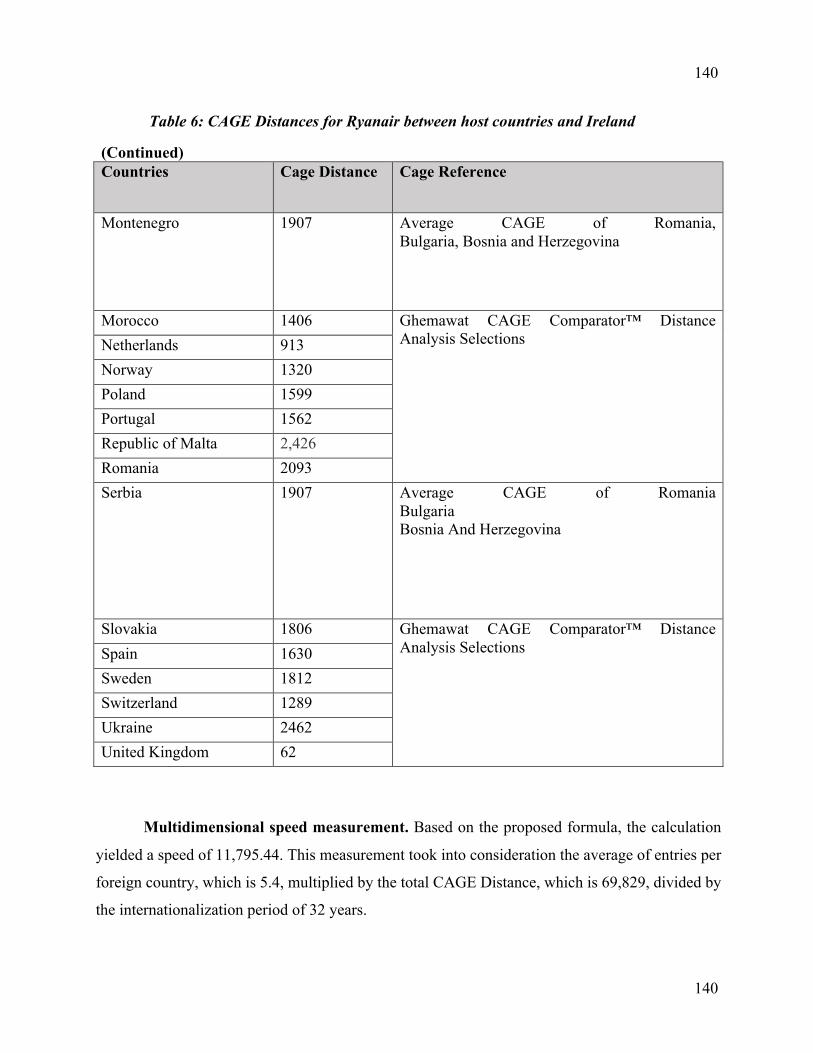
140
140
Table 6: CAGE Distances for Ryanair between host countries and Ireland
(Continued) Countries Cage Distance Cage Reference
Montenegro 1907 Average CAGE of Romania, Bulgaria, Bosnia and Herzegovina
Morocco 1406 Ghemawat CAGE Comparator™ Distance Analysis Selections Netherlands 913
Norway 1320
Poland 1599
Portugal 1562
Republic of Malta 2,426
Romania 2093
Serbia 1907 Average CAGE of Romania Bulgaria Bosnia And Herzegovina
Slovakia 1806 Ghemawat CAGE Comparator™ Distance Analysis Selections Spain 1630
Sweden 1812
Switzerland 1289
Ukraine 2462
United Kingdom 62
Multidimensional speed measurement. Based on the proposed formula, the calculation
yielded a speed of 11,795.44. This measurement took into consideration the average of entries per
foreign country, which is 5.4, multiplied by the total CAGE Distance, which is 69,829, divided by
the internationalization period of 32 years.
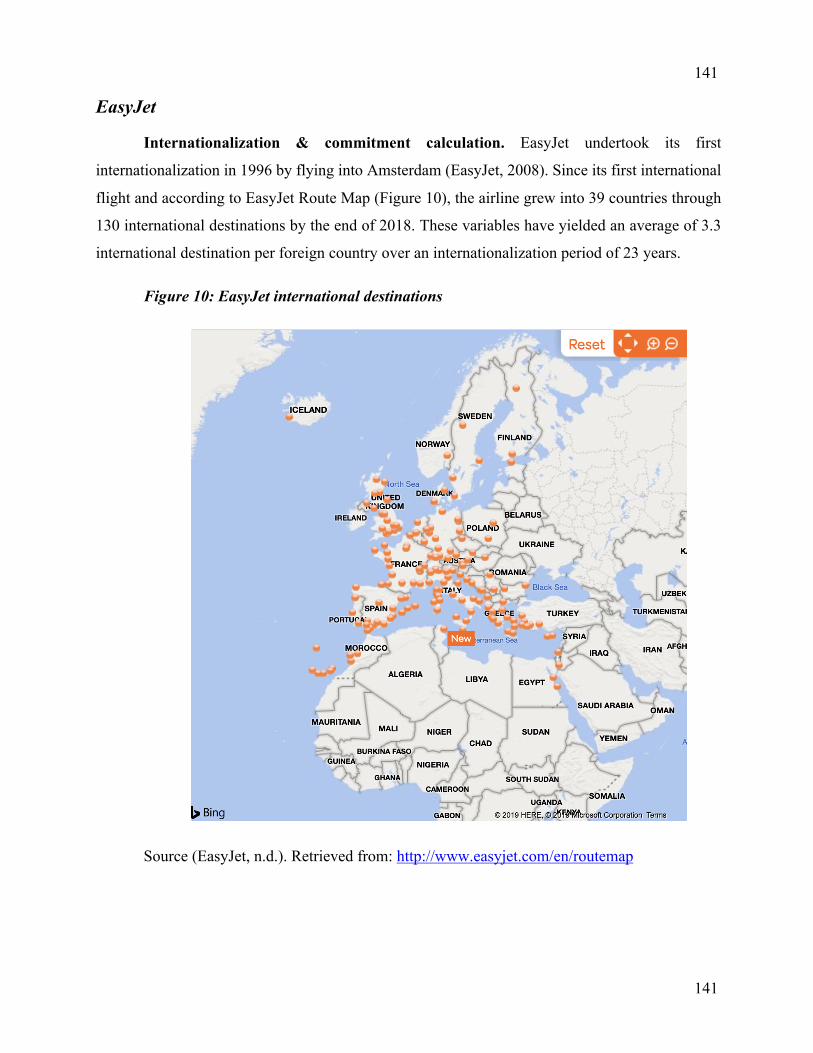
141
141
EasyJet
Internationalization & commitment calculation. EasyJet undertook its first
internationalization in 1996 by flying into Amsterdam (EasyJet, 2008). Since its first international
flight and according to EasyJet Route Map (Figure 10), the airline grew into 39 countries through
130 international destinations by the end of 2018. These variables have yielded an average of 3.3
international destination per foreign country over an internationalization period of 23 years.
Figure 10: EasyJet international destinations
Source (EasyJet, n.d.). Retrieved from: http://www.easyjet.com/en/routemap
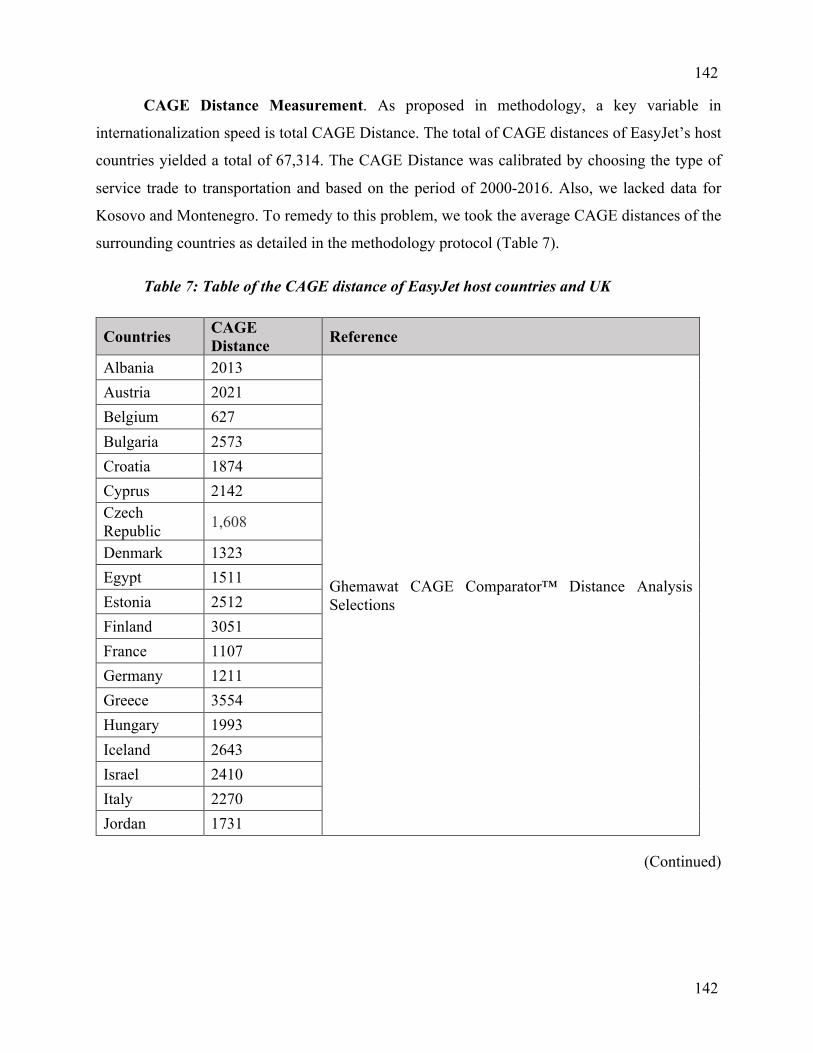
142
142
CAGE Distance Measurement. As proposed in methodology, a key variable in
internationalization speed is total CAGE Distance. The total of CAGE distances of EasyJet’s host
countries yielded a total of 67,314. The CAGE Distance was calibrated by choosing the type of
service trade to transportation and based on the period of 2000-2016. Also, we lacked data for
Kosovo and Montenegro. To remedy to this problem, we took the average CAGE distances of the
surrounding countries as detailed in the methodology protocol (Table 7).
Table 7: Table of the CAGE distance of EasyJet host countries and UK
Countries CAGE Distance Reference
Albania 2013
Ghemawat CAGE Comparator™ Distance Analysis Selections
Austria 2021
Belgium 627
Bulgaria 2573
Croatia 1874
Cyprus 2142 Czech Republic
1,608
Denmark 1323
Egypt 1511
Estonia 2512
Finland 3051
France 1107
Germany 1211
Greece 3554
Hungary 1993
Iceland 2643
Israel 2410
Italy 2270
Jordan 1731
(Continued)
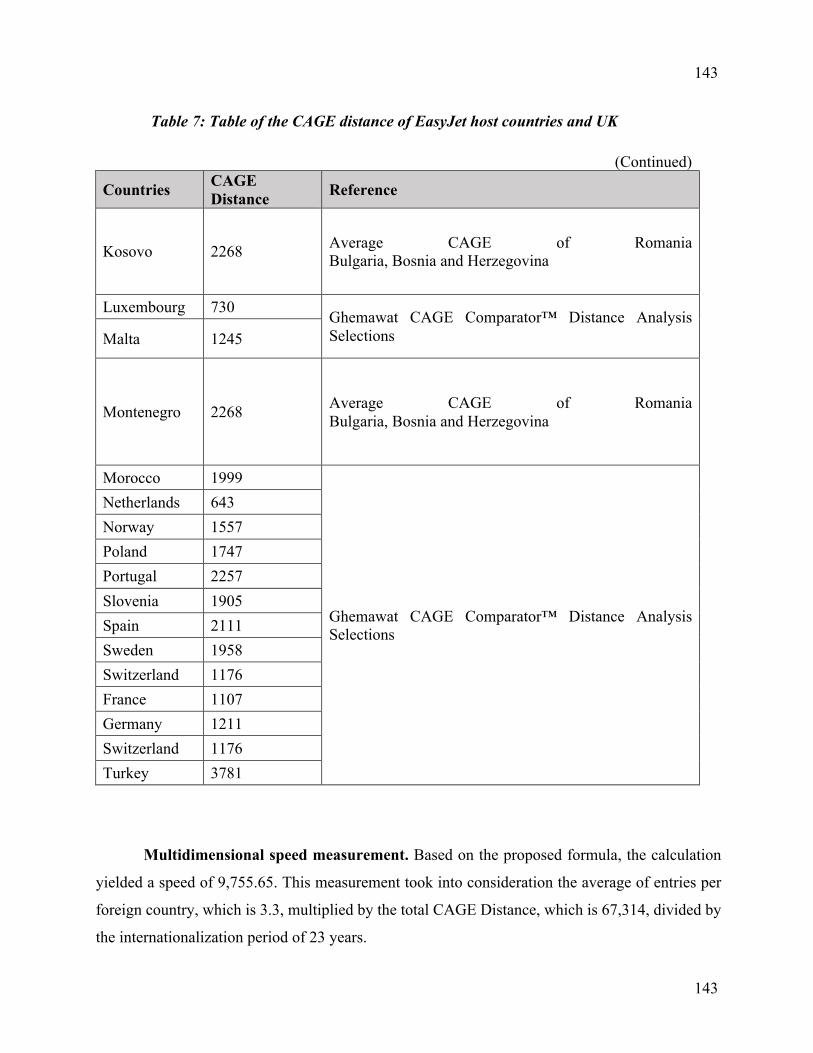
143
143
Table 7: Table of the CAGE distance of EasyJet host countries and UK
(Continued)
Countries CAGE Distance Reference
Kosovo 2268 Average CAGE of Romania Bulgaria, Bosnia and Herzegovina
Luxembourg 730 Ghemawat CAGE Comparator™ Distance Analysis Selections Malta 1245
Montenegro 2268 Average CAGE of Romania Bulgaria, Bosnia and Herzegovina
Morocco 1999
Ghemawat CAGE Comparator™ Distance Analysis Selections
Netherlands 643
Norway 1557
Poland 1747
Portugal 2257
Slovenia 1905
Spain 2111
Sweden 1958
Switzerland 1176
France 1107
Germany 1211
Switzerland 1176
Turkey 3781
Multidimensional speed measurement. Based on the proposed formula, the calculation
yielded a speed of 9,755.65. This measurement took into consideration the average of entries per
foreign country, which is 3.3, multiplied by the total CAGE Distance, which is 67,314, divided by
the internationalization period of 23 years.
144
144
JetBlue
Internationalization & commitment calculation. JetBlue has developed a network
portfolio of 24 countries with 36 international destinations (JetBlue Airways, 2019). On the other
hand, JetBlue undertook its first internationalization in 2002 to San Juan in Puerto Rico (JetBlue
Media Room, 2012, March). These variables have yielded an average of 1.5 entry per foreign
country during 17 years of internationalization.
CAGE Distance measurements. As proposed in methodology, we measure the speed of internationalization through the total of CAGE distances of JetBlue’s host countries, which yielded a total of 105,422. The CAGE Distance was calibrated by choosing the type of service trade to Transportation and based on the period of 2000-2018. We lacked data for some JetBlue’s host countries. We remedied to the lack of data through the protocol detailed in methodology. The lack of data was corrected by either taking the CAGE Distance of the countries with whom there is colonial ties or the average CAGE Distances of the surrounding countries such as for the case of Cuba and Curacao (

145
145
Table 8).
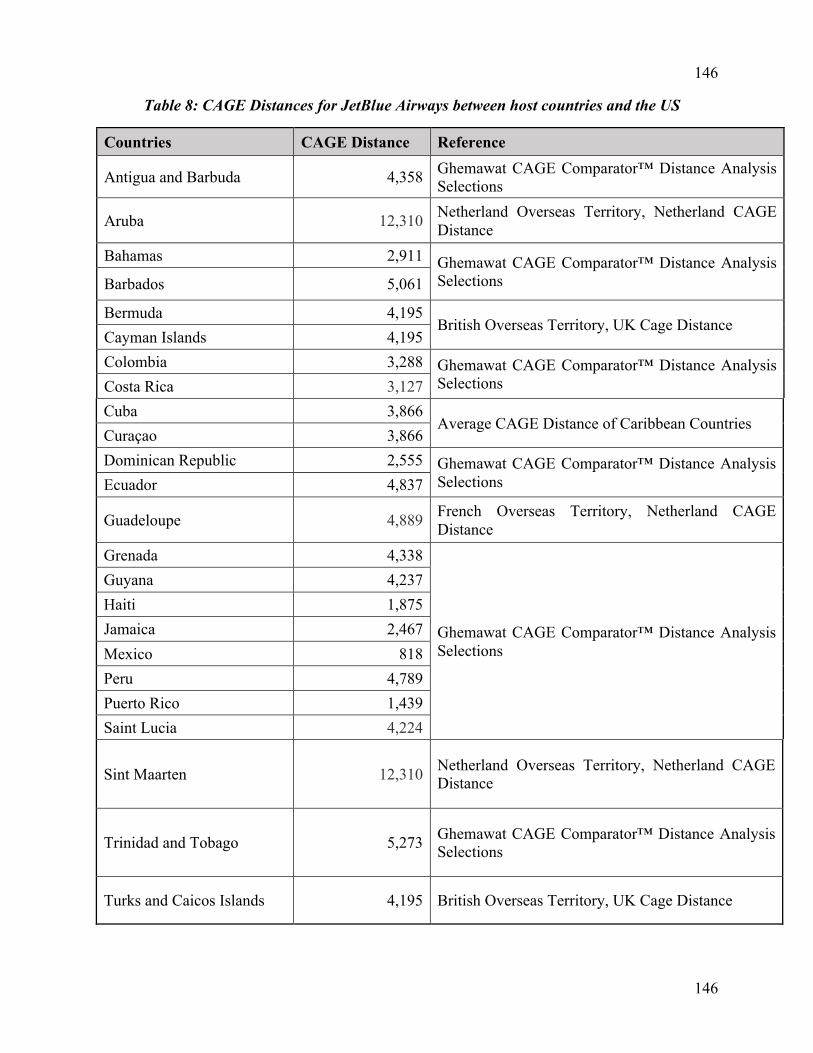
146
146
Table 8: CAGE Distances for JetBlue Airways between host countries and the US
Countries CAGE Distance Reference
Antigua and Barbuda 4,358 Ghemawat CAGE Comparator™ Distance Analysis Selections
Aruba 12,310 Netherland Overseas Territory, Netherland CAGE Distance
Bahamas 2,911 Ghemawat CAGE Comparator™ Distance Analysis Selections Barbados 5,061
Bermuda 4,195 British Overseas Territory, UK Cage Distance
Cayman Islands 4,195
Colombia 3,288 Ghemawat CAGE Comparator™ Distance Analysis Selections Costa Rica 3,127
Cuba 3,866 Average CAGE Distance of Caribbean Countries
Curaçao 3,866
Dominican Republic 2,555 Ghemawat CAGE Comparator™ Distance Analysis Selections Ecuador 4,837
Guadeloupe 4,889 French Overseas Territory, Netherland CAGE Distance
Grenada 4,338
Ghemawat CAGE Comparator™ Distance Analysis Selections
Guyana 4,237
Haiti 1,875
Jamaica 2,467
Mexico 818
Peru 4,789
Puerto Rico 1,439
Saint Lucia 4,224
Sint Maarten 12,310 Netherland Overseas Territory, Netherland CAGE Distance
Trinidad and Tobago 5,273 Ghemawat CAGE Comparator™ Distance Analysis Selections
Turks and Caicos Islands 4,195 British Overseas Territory, UK Cage Distance
147
147
Multidimensional speed measurement. Based on the proposed formula, the calculation
yielded a speed of 9,301.94. This measurement took into consideration the average of entries per
foreign country, which is 1.5, multiplied by the total CAGE Distance, which is 105,422, divided
by the internationalization period of 17 years.
Southwest Airlines
Internationalization & commitment calculation. Southwest Airline inaugurated its first
international flight by flying to San Juan in April 2013 (Southwest Airline, 2014) after requesting
an institutional approval in 2012 (Southwest Airline, 2013). Hence, Southwest Airline has
undertaken its first internationalization in 2013 to reach a total of 15 international destination in 10
countries by 2018 (Southwest Airline, 2019). This has yielded an average of 1.5 international entry
per foreign country.
CAGE distance measurement. As proposed in methodology, CAGE Distance is a key
component in speed’s measurement. The total CAGE distances of Southwest Airlines’ host
countries have totaled 38,646. The CAGE Distance was calibrated by choosing the type of service
trade to transportation and based on the period of 2000-2016. However, the data lacked
measurements of Aruba, the Cayman Islands, and Turks and Caicos. As described in the table
(Table 9) and due to being part of overseas territories of other countries, we took the number of
their sovereign countries.
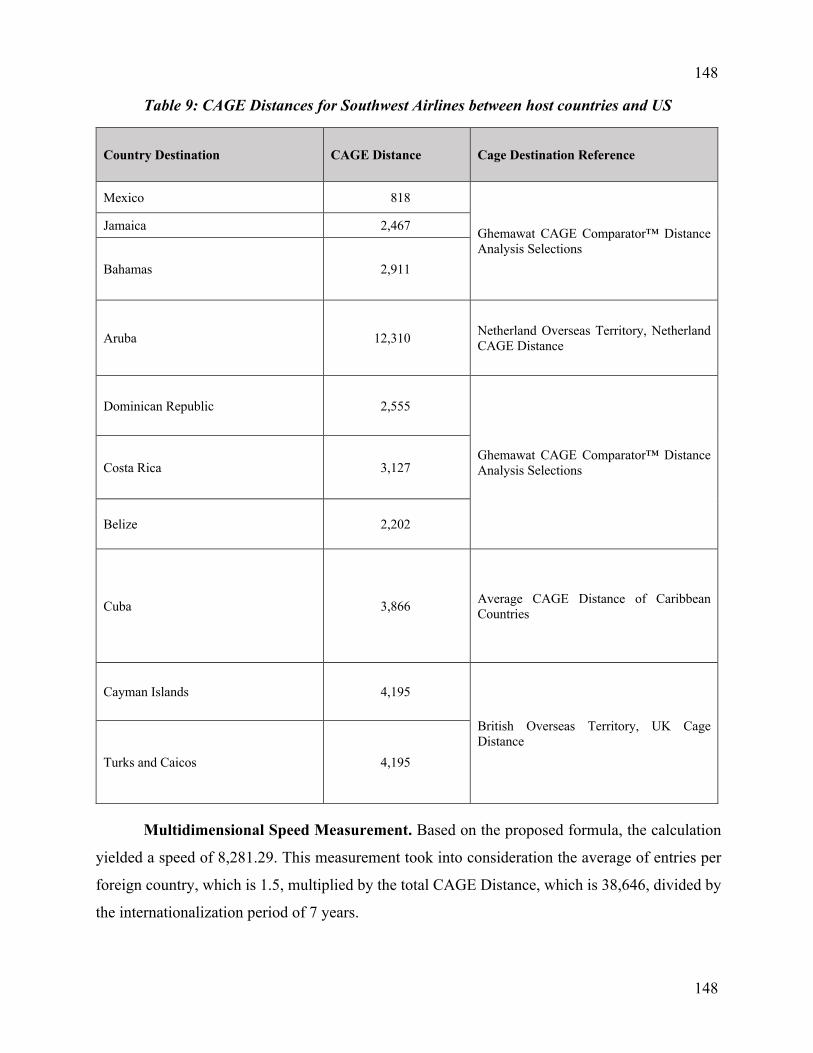
148
148
Table 9: CAGE Distances for Southwest Airlines between host countries and US
Country Destination CAGE Distance Cage Destination Reference
Mexico 818
Ghemawat CAGE Comparator™ Distance Analysis Selections
Jamaica 2,467
Bahamas 2,911
Aruba 12,310 Netherland Overseas Territory, Netherland CAGE Distance
Dominican Republic 2,555
Ghemawat CAGE Comparator™ Distance Analysis Selections Costa Rica 3,127
Belize 2,202
Cuba 3,866 Average CAGE Distance of Caribbean Countries
Cayman Islands 4,195
British Overseas Territory, UK Cage Distance
Turks and Caicos 4,195
Multidimensional Speed Measurement. Based on the proposed formula, the calculation
yielded a speed of 8,281.29. This measurement took into consideration the average of entries per
foreign country, which is 1.5, multiplied by the total CAGE Distance, which is 38,646, divided by
the internationalization period of 7 years.
149
149
Unidimensional Measurement:
The unidimensional measurements have been split into two streams. Some scholar
conceptualizes the internationalization’s speed based on pre-entry (Musteen, et al., 2010; Oviatt &
McDougall, 2005) whereas others are interested in the post-entry (Casillas and Moreno-Menendez,
2014; Chen & Yeh, 2012; Zhou, 2007). The following sections will propose unidimensional
measurement of each studied LCCs through pre-entry and post-entry measurements.
Pre-Entry Measurement
As we studied the time to internationalize in accordance to Musteen et al. (2010) definition,
we projected the calculation on studied LCCs.
Air Canada Rouge. Air Canada Rouge internationalized during its first year of operation
by launching its first flight as an international flight to Venice and Edinburgh in July 2013 (Air
Canada, 2013, February). The foundation of the airline was in December 2012 (Air Canada Media
Room, 2012, December). Therefore, Air Canada Rouge took less than 8 months to internationalize.
Ryanair was founded in 1985 and carried its first international flight in 1987, taking
Ryanair 2 years to internationalize.
EasyJet. As we studied the time to internationalize in accordance to Musteen et al. (2010)
measurement, we projected the calculation on EasyJet. Hence, EasyJet was founded in 1995
(EasyJet Corporate, n.d) and undertook its first international flight in 1996 to Amsterdam (EasyJet,
2008), taking only 1 year to internationalize.
JetBlue. JetBlue. JetBlue was founded in 1999 (‘JetBlue Our Company’, n.d.) and
undertook its 1st internationalization in 2002 (JetBlue Media Room, 2012, March). Hence, it took
JetBlue only 4 years to internationalize.
Southwest Airline was founded in 1967 and flown its own metal by 2013 to San Juan. In
fact, Southwest Airline had expressed no interest in international market prior to 2002 and Gary
Kelley advanced that Southwest Airline is an “all domestic carrier” (Southwest Airline, 2003,
January). The early internationalization’s move by southwest airline was in the form of code
sharing with other airlines such as AirTran (Southwest Airline, 2005), Volaris, and WestJet
150
150
(Southwest Airlines, 2008, December). This has represented a learning ground for southwest to
build adequate capabilities to support its internationalization in 2013. This date was reached after
many postponements due to technological development. All in all, Southwest Airline took 45 years
to internationalize. Southwest Airline has the longest pre-entry time to internationalize.
Post Entry measurement
For the post Entry measurement, Casillas and Moreno-Menendez (2014) have measured the
internationalization’s speed as the period in days between international operation since the first
internationalization. In parallel, Chen and Yeh (2012) have proposed as a measure “the time span
between two successive investments”. Based on these measurements, the following will present
each LCC with its unidimensional measurement that separate the firm’s international behavior in
form of different FDIs since its first internationalization activity. The measurement will focus on
the post entry period of LCC in their internationalization journey. However, due to the nature of
the heavy capital investment of the industry and due to the internationalization frequency of LCCs,
which takes more than couple of days or months to complete, the following measurement will be
based on the yearly activity of the firm.
Air Canada Rouge. Since its first internationalization in 2012 (Air Canada, 2013,
February), Air Canada Rouge internationalized through either year-round international flight or
seasonal international flight. Air Canada CEO Calin Rovinescu argued that Air Canada Rouge is
the competitive arm on international leisure market (Air Canada, 2013, August). This has been
translated into an aggressive internationalization of Air Canada rouge since its first international
flight and developed an international network on a yearly basis as shown in the event data table.
For instance, and in addition to 2012 and 2013, Rouge has requested an institutional
approval to fly to Peru on a year-round service (Air Canada media room, 2014, September) as well
expanding the original point of flight for Rouge not only from Montreal and Toronto but also from
Vancouver and Calgary (Air Canada, 2014, May). In 2015, it introduced 11 new international
flights that served Europe, Mexico, and North Africa through Casablanca, Morocco (Air Canada
Media Room, 2015, September). Rouge has continued to launch new service flight on a yearly
basis as seen in the event table under the internationalization type of events.
151
151
To satisfy Zhou (2007) criteria of accounting for internationalization’s speed only when
foreign sales exceed 20%, the study analyzed the case for Air Canada Rouge. Air Canada Rouge
does not communicate its international sales as the parent company provide aggregate sales figures
of all of its subsidiaries. However, Air Canada Rouge has more than 50% of its destinations outside
of Canada. For example, Air Canada CEO advanced that rouge supported their internationalization
strategy of having 90% of capacity deployed internationally (Air Canada, 2015, May). As advanced
in Air Canada Credit Suisse Industrials Conference, International market is a priority for Air
Canada Rouge (2015, December). Therefore, the study assumes that Air Canada Rouge foreign
activities exceeds Zhou’s (2007) criterion for accounting for internationalization’s speed.
Ryanair. The following will try to understand the time that separates international behavior
of Ryanair since its first internationalization. Ryanair engaged in different form of international
behavior. The international behavior of Ryanair can be categorized in term of acquisition, launch
of new international routes, bases and subsidiary establishments.
Ryanair submitted a bid to acquire either partly or completely other Airlines since its
foundation in 1986 (Ryanair Corporate History, n.d.). Ryanair acquisition journey started by
acquiring Buzz, British low-cost airline of KLM in 2004 (Ryanair Corporate History, n.d.). In 2006
and after 2 years of the previous acquisition of Buzz, Ryanair presented a bid to acquire Aer Lingus
in 2006, which was blocked by the Irish government (Ryanair, 2006, November).
On the other hand, Ryanair placed a bid to acquire FlyBe slots at Gatwick in 2013 (Ryanair,
2013, May), but these slots were acquired by EasyJet in the same year thanks to a competitive bid
(EasyJet, 2013, November). Michael O’leary has expressed Ryanair’s reluctance to acquire these
slots at high prices (Ryanair, 2014, May).
The acquisition activity of Ryanair returned in 2018 after the failing bid for FlyBe slots by
bidding for Alitalia in 2017 that was nonconclusive (Ryanair, 2017, September). During the same
year, Ryanair acquired 25% of the Austrian airline Laudamotion (Ryanair, 2018, May). The
acquisition activity of Ryanair can be seen as discontinuous and depends on the nature of the market
and the presented opportunity.
152
152
On the other hand, Ryanair engaged actively and on a yearly basis in bases establishments
since 1998 (see event history data table). Ryanair network of bases have reached 45 bases by Q1
2012 (Ryanair, 2012, July) a number that doubled in 6 years by reaching 82 bases in 2018 (Ryanair
Corporate History, n.d.). All in all, Ryanair has averaged an opening of 3 bases per year since its
first foreign base establishment in London Stansted Airport in Essex in 1991 (Ryanair Corporate
History, n.d.). The bases development and strategic commitment are developed in the company’s
case presentation.
Ryanair has a total of 82 bases including the 3 bases in Ireland (Ryanair, 2018, October).
We can see that more than 95% of its bases are in foreign countries. The heavy international
presence is apparent through more than 200 international destination across 82 bases outside of
Ireland, and a presence in 37 countries (Ryanair, 2018, October). Moreover, Ryanair carried more
than 11 million international customers, making it the first airline to have this important
international customer base in 2017 (Ryanair, 2017, November). Due to the heavy presence of
Ryanair outside of Ireland, the study can assume that Ryanair generates more than 20% of its
revenue from international sector. Hence, it satisfies Zhou’s (2007) criterion of exceeding 20% to
be accounted for internationalization’s speed.
EasyJet. Easyjet has served international market in 1996 by flying to Amsterdam (EasyJet,
2008). The year of 1996 has seen the launch of 3 international flights (EasyJet Our Journey, n.d.).
Besides, it took only 2 years for EasyJet to acquire 40% of a swiss charter and renaming it as
EasyJet Switzerland, a move that marked EasyJet entry into the swiss market by 1998 (EasyJet Our
Journey, n.d.). The same operation was run after 4 years by acquiring Stansted that is the British
Airline Low Cost Subsidiary by 2002 (EasyJet Our Journey, n.d.). The acquisition activity was
reactivated after 5 years by acquiring a London Base low-cost airline named as GB Airways
(EasyJet Our Journey, n.d.). The acquisition of GB airways grants access to Southern European
and North African destinations starting 2007 (EasyJet Our Journey, n.d.). The acquisition activity
of EasyJet will only be relaunched after 6 years in 2013 by placing a bid to acquire FlyBe slots at
Gatwick Airport to increase its presence in the Scottish market (EasyJet, 2013, November). After
a competing bid from Ryanair for FlyBe Slots at Gatwick Airport, Easyjet won the acquisition of
the slots marking a 40% capacity increase in Easyjet overall capacity increase of 3.5% (EasyJet,
2013, November). After the Flybe slots’ acquisition in 2014, EasyJet engage in partial acquisition
153
153
of Air Berlin assets in 2017 (Chee, 2017) to be finalized in 2018 (EasyJet, 2019). As described
above, the acquisition activity that aims at increasing the international behavior of EasyJet is run
every 4-7 years.
On the other hand, EasyJet engages in bases establishments as a reinforcing activity of its
internationalization endeavors. Based on the event data table, EasyJet is active on a yearly basis in
bases establishments. For example, EasyJet established its 5th base in London Gatwick in 2001
(EasyJet Corporate, n.d) and its 17th base in Madrid by 2007 (EasyJet Our Journey, n.d.). Hence,
EasyJet established 13 bases within 7 years. In 2008, EasyJet made its Paris Charles De Gaulle
base as its new European base (EasyJet Our Journey, n.d.). Plus, EasyJet is engaged in bases
establishments throughout Europe, with a focus on adding new bases to its existing markets such
as Hamburg 2nd base in Germany by 2014 and 3 new bases in France (Lyon 2008, Nice and
Toulouse in 2011) (EasyJet Our Journey, n.d.). The bases efforts translated into a network of 29
bases throughout Europe where EasyJet enjoyed leadership position in 24 of these bases, according
to its CEO (EasyJet, 2018, November). Also, Johan Lundgren EasyJet CEO (2018) argued that the
investment in bases network drove 20% contribution in revenues (EasyJet, 2018, November).
Taking into consideration the calculation of average FDIs per new year, we can see that for 29
bases across Europe within 23 years of operations expresses the yearly efforts in bases
establishments as a core strategy to expand its European presence.
Last but not least, EasyJet satisfied Zhou’s (2007) condition of exceeding 20% of total
revenue from international stream. In fact, EasyJet has expressed that non-UK passengers take up
more than 50% of revenue in 2009 (EasyJet, 2009, May).
JetBlue. JetBlue and Southwest Airline share the same first international destination that
is San Juan, Puerto Rico, but JetBlue has been first to fly to San Juan in 2002 (JetBlue Media
Room, 2012, March). Since 2002, JetBlue has increased its stage length to accommodate and gain
expertise in the long-haul flights (JetBlue Airways, 2004, January). Based on the event table for
the event type of internationalization, JetBlue has been engaged in a yearly effort to increase its
international activities and revenues. For example, the growth of stage length will equip the
company to consider long haul flights (JetBlue Airways, 2004, October). This was followed by
increasing its deployed Caribbean capacity from 6% (JetBlue Airways, 2006, February) to 8% in
154
154
less than a year (JetBlue Airways, 2006, April). In 2007, JetBlue was not only present in the
American continent but also in mid-Atlantic (JetBlue, 2007, March). In fact, the Caribbean region
represented 11.5% of the JetBlue capacity with a yearly growth of 36% through new routes to
Mexico and multiplying its origin cities that fly to Puerto Rico and Dominican Republic (JetBlue
Airways, 2007, October). On the other hand, JetBlue has engaged in different forms of alliances
with Lufthansa in the form of acquisition (JetBlue Airways, 2010, March). These efforts have been
run on a yearly basis since 2008 with frequent introduction of new routes and destinations as well
as new interlining agreement. These efforts manifested into 23 commercial agreement with
international airlines (JetBlue Airways, 2013, April). For example, JetBlue entered commercial
agreement with Icelandair in 2011 (JetBlue Airways, 2011, July) and Royal Air Maroc in 2012
(JetBlue Airways, 2012, October). To show the yearly engagement in international market, JetBlue
estimated that they are growing in nearby international market at 30% on a yearly basis (JetBlue
Airways, 2014, July).
In 2008, JetBlue has derived more than 10% of revenues from international markets
(JetBlue Airways, 2009). The international revenue was supported by a 30% of JetBlue capacity
that is deployed for international activity (JetBlue Airways, 2013, January). The different
partnership and the company international presence contributed by $120 million in 2014 to $515
million total revenues (JetBlue Airways, 2014, September). Accounting for the international
revenue based on its own operation and the international revenue generated through commercial
agreement with other airline yield a ratio of a little north of 20%. A number that was reached by
JetBlue in 2016 and 2017 by reaching 28% of revenue from international markets (JetBlue
Airways, 2017; 2018). The international revenue portion surpassed 20% making JetBlue eligible
for Internationalization’s speed measurement according to Zhou (2007).
Southwest Airline was founded in 1967 and only expressed its international openness for
the nearby international market in 2003, according to its CEO Gary Kelly (Southwest Airlines,
2003, October). However, its first internationalization through its own metal was inaugurated in
2013 by flying to San Juan according to its CEO in its letter to shareholders (Southwest Airlines,
2014). In the meantime, Southwest Airlines placed a bid to acquire ATA Airlines that had a nearby
international presence under its activities (Southwest Airline Media, n.d). By 2012, Gary Kelly,
Southwest Airline CEO, advanced that AirTran acquisition is "a unique opportunity to grow
155
155
Southwest Airlines' presence in key markets we don't yet serve and takes a significant step towards
positioning us for future growth.” (Southwest Airline Media, n.d.). The period that run between
2006 and 2013 was marked by code sharing discussion with different airlines such as Volaris,
Mexico and WestJet Canada (Southwest Airlines, 2008, December). During the period that
precedes Southwest Airline internationalization, the company was learning international expansion
through code sharing and through AirTran acquisition in 2014 (Southwest Airlines, 2015,
December). Despite the different efforts, the internationalization of Southwest Airlines through its
own metal has only reached 10 countries by 2018 (Southwest Airline, 2019). This network was
developed due in part to the acquisition of AirTran (Southwest Airlines, 2015). Also, the
international development was in part limited by the set of requirements such as 15% of ROIC of
the potential international routes during the first quarters of operations (Southwest Airline, 2014,
July).
Southwest Airlines saw its portion of international revenue to grow from 1% to 3% of the
total revenue within the period of 2014-2016 (Southwest Airlines, 2017, January). Gary Kelley has
expressed that Southwest Airlines has 4% of its capacity deployed internationally that supported
14 near international destination (Southwest Airlines, 2018, May). This signals that according to
Zhou (2007) definition, Southwest Airline is not eligible to be accounted for internationalization’s
speed as it didn’t exceed 20% of total sales.
Internationalization’s Speed Comparison
Multidimensional Analysis
Based on different measurements that are rooted in the international business scholarship,
the following discusses and ranks the studied LCCs from the fastest to the slowest
internationalizing LCC.
As presented in table below (Table 10), Air Canada Rouge ranked as the fasted LCC in its
internationalization journey, followed by Ryanair and EasyJet, then JetBlue by having a moderate
internationalization speed, and finally Southwest Airlines comes as having the lowest
internationalizing speed.
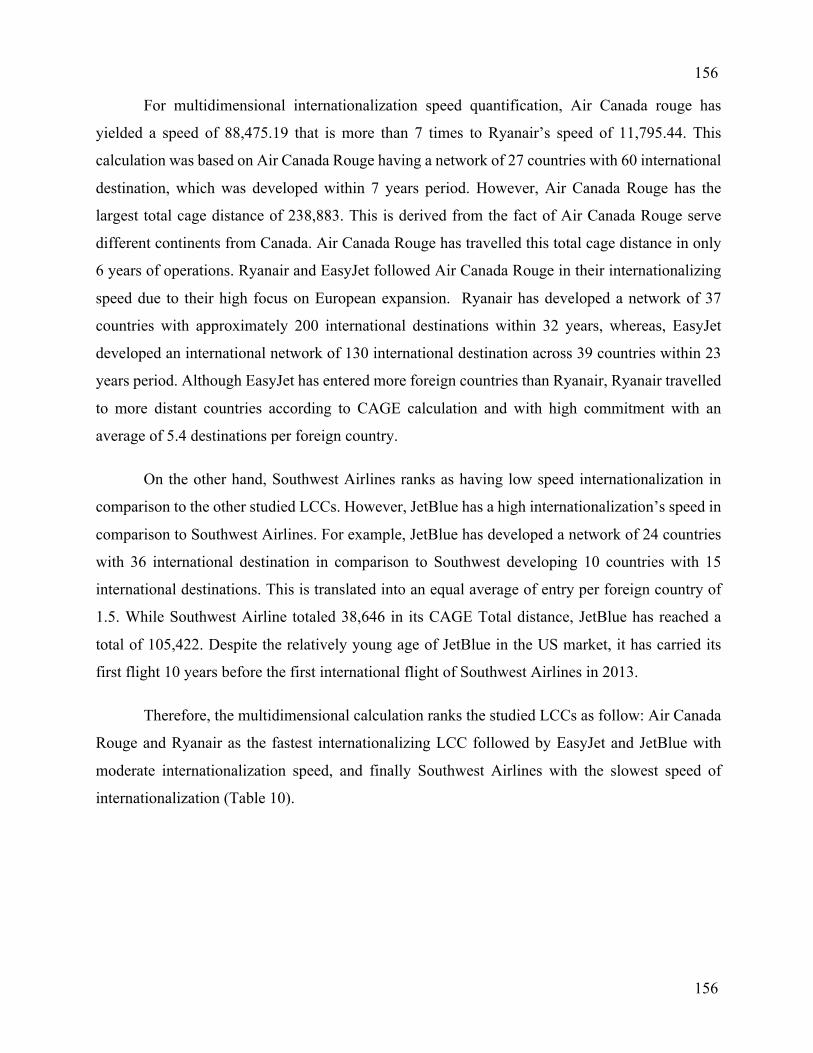
156
156
For multidimensional internationalization speed quantification, Air Canada rouge has
yielded a speed of 88,475.19 that is more than 7 times to Ryanair’s speed of 11,795.44. This
calculation was based on Air Canada Rouge having a network of 27 countries with 60 international
destination, which was developed within 7 years period. However, Air Canada Rouge has the
largest total cage distance of 238,883. This is derived from the fact of Air Canada Rouge serve
different continents from Canada. Air Canada Rouge has travelled this total cage distance in only
6 years of operations. Ryanair and EasyJet followed Air Canada Rouge in their internationalizing
speed due to their high focus on European expansion. Ryanair has developed a network of 37
countries with approximately 200 international destinations within 32 years, whereas, EasyJet
developed an international network of 130 international destination across 39 countries within 23
years period. Although EasyJet has entered more foreign countries than Ryanair, Ryanair travelled
to more distant countries according to CAGE calculation and with high commitment with an
average of 5.4 destinations per foreign country.
On the other hand, Southwest Airlines ranks as having low speed internationalization in
comparison to the other studied LCCs. However, JetBlue has a high internationalization’s speed in
comparison to Southwest Airlines. For example, JetBlue has developed a network of 24 countries
with 36 international destination in comparison to Southwest developing 10 countries with 15
international destinations. This is translated into an equal average of entry per foreign country of
1.5. While Southwest Airline totaled 38,646 in its CAGE Total distance, JetBlue has reached a
total of 105,422. Despite the relatively young age of JetBlue in the US market, it has carried its
first flight 10 years before the first international flight of Southwest Airlines in 2013.
Therefore, the multidimensional calculation ranks the studied LCCs as follow: Air Canada
Rouge and Ryanair as the fastest internationalizing LCC followed by EasyJet and JetBlue with
moderate internationalization speed, and finally Southwest Airlines with the slowest speed of
internationalization (Table 10).
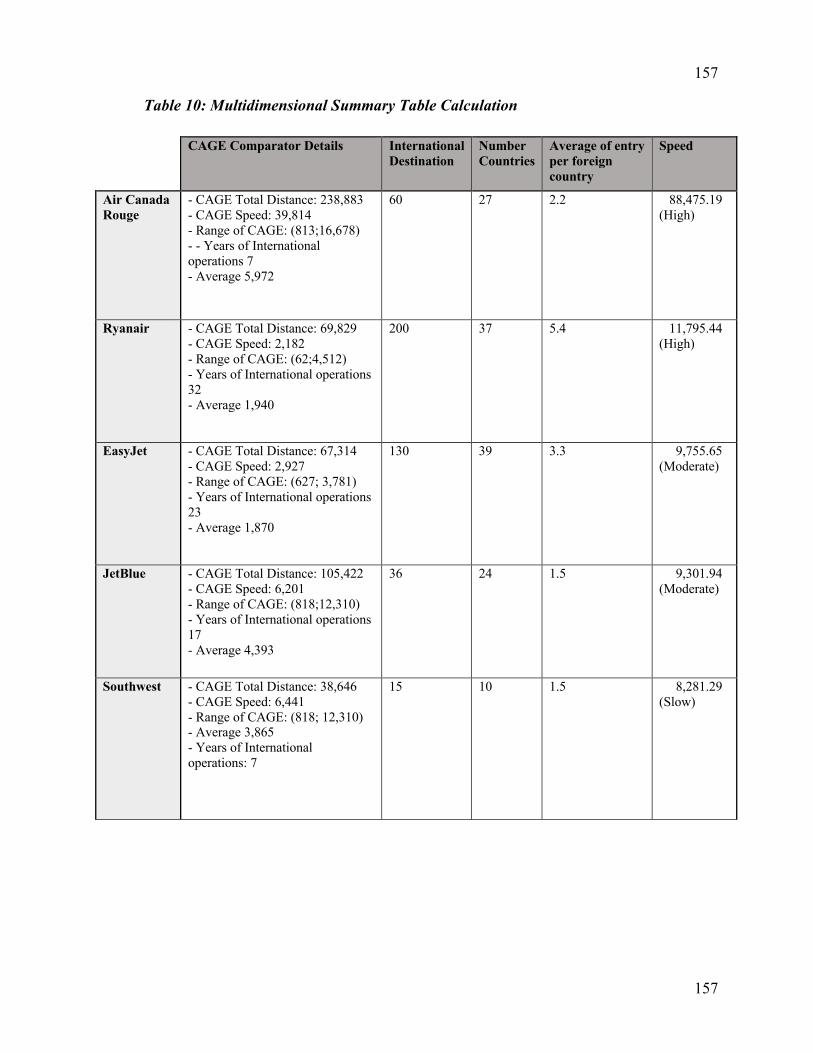
157
157
Table 10: Multidimensional Summary Table Calculation
CAGE Comparator Details International
Destination Number Countries
Average of entry per foreign country
Speed
Air Canada Rouge
- CAGE Total Distance: 238,883 - CAGE Speed: 39,814 - Range of CAGE: (813;16,678) - - Years of International operations 7 - Average 5,972
60 27 2.2 88,475.19 (High)
Ryanair - CAGE Total Distance: 69,829 - CAGE Speed: 2,182 - Range of CAGE: (62;4,512) - Years of International operations 32 - Average 1,940
200 37 5.4 11,795.44 (High)
EasyJet - CAGE Total Distance: 67,314 - CAGE Speed: 2,927 - Range of CAGE: (627; 3,781) - Years of International operations 23 - Average 1,870
130 39 3.3 9,755.65 (Moderate)
JetBlue - CAGE Total Distance: 105,422 - CAGE Speed: 6,201 - Range of CAGE: (818;12,310) - Years of International operations 17 - Average 4,393
36 24 1.5 9,301.94 (Moderate)
Southwest - CAGE Total Distance: 38,646 - CAGE Speed: 6,441 - Range of CAGE: (818; 12,310) - Average 3,865 - Years of International operations: 7
15 10 1.5 8,281.29 (Slow)
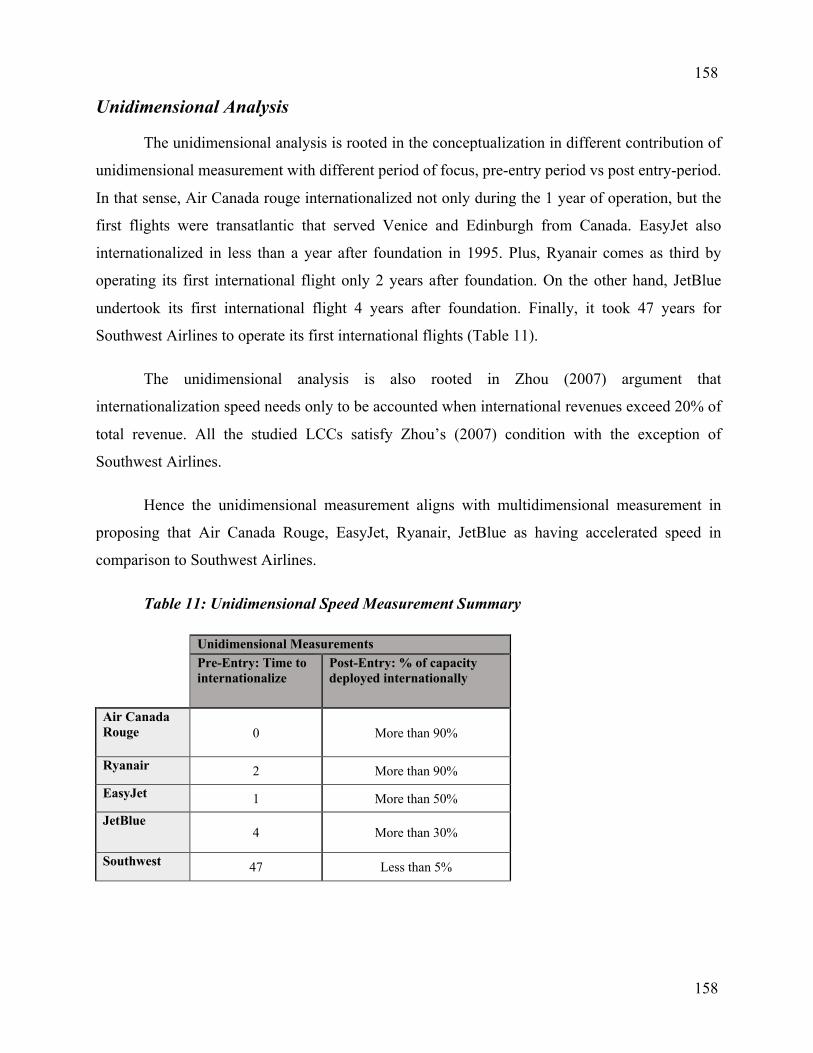
158
158
Unidimensional Analysis
The unidimensional analysis is rooted in the conceptualization in different contribution of
unidimensional measurement with different period of focus, pre-entry period vs post entry-period.
In that sense, Air Canada rouge internationalized not only during the 1 year of operation, but the
first flights were transatlantic that served Venice and Edinburgh from Canada. EasyJet also
internationalized in less than a year after foundation in 1995. Plus, Ryanair comes as third by
operating its first international flight only 2 years after foundation. On the other hand, JetBlue
undertook its first international flight 4 years after foundation. Finally, it took 47 years for
Southwest Airlines to operate its first international flights (Table 11).
The unidimensional analysis is also rooted in Zhou (2007) argument that
internationalization speed needs only to be accounted when international revenues exceed 20% of
total revenue. All the studied LCCs satisfy Zhou’s (2007) condition with the exception of
Southwest Airlines.
Hence the unidimensional measurement aligns with multidimensional measurement in
proposing that Air Canada Rouge, EasyJet, Ryanair, JetBlue as having accelerated speed in
comparison to Southwest Airlines.
Table 11: Unidimensional Speed Measurement Summary
Unidimensional Measurements Pre-Entry: Time to internationalize
Post-Entry: % of capacity deployed internationally
Air Canada Rouge 0 More than 90%
Ryanair 2 More than 90%
EasyJet 1 More than 50%
JetBlue 4 More than 30%
Southwest 47 Less than 5%
159
159
Conclusion
Based on different analysis that are multidimensional and unidimensional, they all converge
that Air Canada Rouge, Ryanair, and EasyJet as having high speed of internationalization. In
contrast, JetBlue has a moderate speed of internationalization and Southwest Airlines yields low
speed of internationalization. All in all, Air Canada rouge is the fasted studied LCC, followed by
Ryanair, EasyJet, JetBlue, and finally Southwest Airlines.
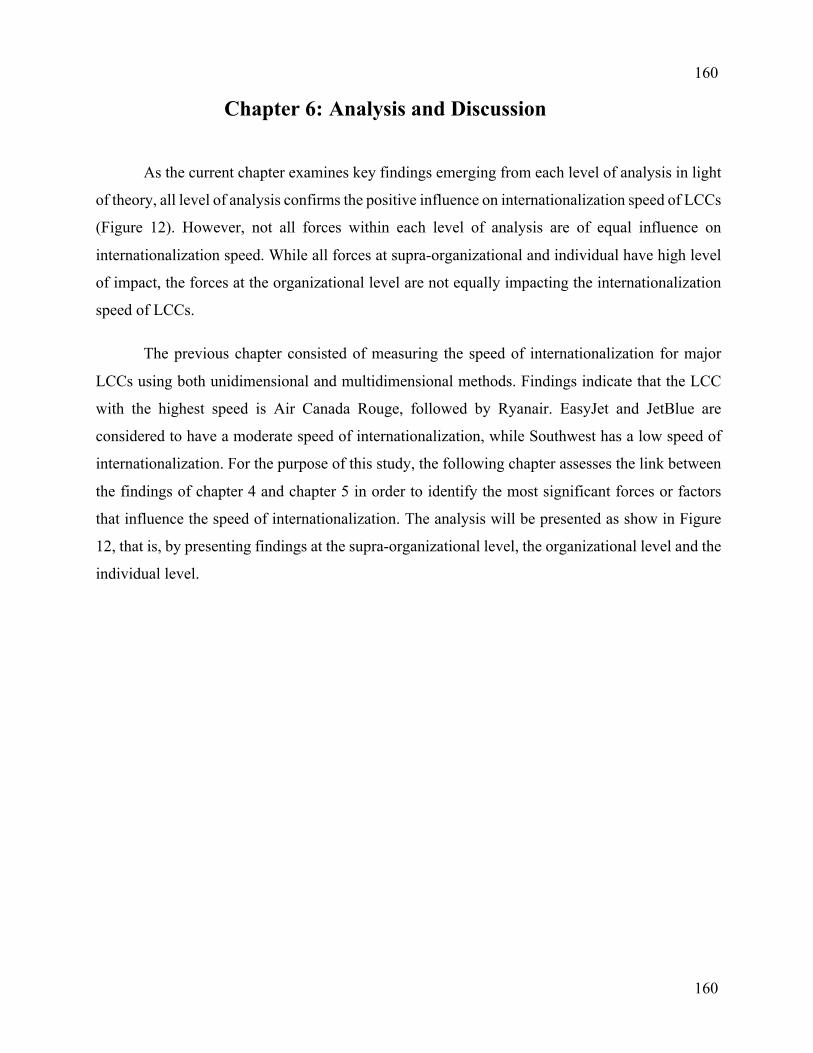
160
160
Chapter 6: Analysis and Discussion
As the current chapter examines key findings emerging from each level of analysis in light
of theory, all level of analysis confirms the positive influence on internationalization speed of LCCs
(Figure 12). However, not all forces within each level of analysis are of equal influence on
internationalization speed. While all forces at supra-organizational and individual have high level
of impact, the forces at the organizational level are not equally impacting the internationalization
speed of LCCs.
The previous chapter consisted of measuring the speed of internationalization for major
LCCs using both unidimensional and multidimensional methods. Findings indicate that the LCC
with the highest speed is Air Canada Rouge, followed by Ryanair. EasyJet and JetBlue are
considered to have a moderate speed of internationalization, while Southwest has a low speed of
internationalization. For the purpose of this study, the following chapter assesses the link between
the findings of chapter 4 and chapter 5 in order to identify the most significant forces or factors
that influence the speed of internationalization. The analysis will be presented as show in Figure
12, that is, by presenting findings at the supra-organizational level, the organizational level and the
individual level.
161
161
Figure 11: Theoretical framework that assesses factors that influence firms’ speed of
internationalization
Supra-Organization level
The supra-organization level is composed of the influencing factors outside of the LCC.
This level of analysis is composed of institutional environment, competition, and business network
in studying the influence on internationalization speed of LCCs (Figure 13).
162
162
Institutional Environment
Based on the cases presentation, the most significant and recurring elements within the
institutional environment are the home institutional environment, the host institutional
environment, and labor unions.
The home institutional environment represents a source of influence on the
internationalization speed. According to the cases presented, it became obvious that the higher the
number of open skies agreements a country has with foreign countries, the higher is the flexibility
of the airline to have opportunities to internationalize. The deregulation of skies proven to be the
main factor that enabled fast internationalization to new countries. It is also important to note that
the home institutional environment plays an important role in applying taxes, having control over
airports and charges, and facilitating flights connections for a domestic company that willing to
enter international market. Also, being part of a regional agreement, such as European Union offers
the advantage for LCCs to access a high number of countries and to have access to a larger foreign
market. However, subsidies to other carrier represent a challenge to established LCCs.
Figure 12: Supra-organization level of analysis on internationalization speed of LCCs
163
163
The Visa program leniency also represents an opportunity for internationalization as
observed among the fast internationalizing LCCs. In the US, JetBlue internationalized faster than
Southwest, and contrary to Southwest, it endured the support of regulatory authorities of New York
in the form of international slots and gates, among other incentives. Also, an understanding
between governments might facilitate the international entry for domestic LCCs to foreign
countries. Examples can be the openness in the Cuban-US diplomatic relationships and the
openness in the US-Canada relationship that has more than 107 blue sky programs including 75
open skies agreements.
The home institutional environment factor is proven in this research to have a significant
impact on the speed of internationalization. That is, if a given LCC have a favorable home
institutional environment, it increases the international commercial intensity, the breadth of market,
and the commitment in foreign resources.
Concerning the case of the host institutional environment, it also represents a source of
influence on internationalization speed. Incentives such as lowered airport charges and taxes
represent an opportunity for LCCs, such as the case of the Scandinavian and Canary Islands
institutions vis-à-vis Ryanair. However, it was noticeable through the cases analysis that the Brexit
and changes in the macro-economic environment can represent a threat for LCCs that might include
increased transactional costs and taxes as well as a reduction of capacity.
This leads to concluding that a favorable host institutional environment also leads to
impacting the three components of speed significantly. However, in the case of unfavorable host
institutional environment, LCCs might incur significant losses that lead to a significant low speed
of internationalization. This is through significantly decreasing the commitment in foreign
resources, decreasing the breadth of market, and decreasing the international commercial intensity.
Finally, and with regards to the human capital factor within the institutional environment,
it represents an important part of LCCs. In the case of Air Canada Rouge, the company could not
have the expansions of fleets, network, and flexibility of moving capacities without a successful
negotiation with labors. But at the same time, Ryanair employed another tactic that relies mainly
on job contractor and benefits from the European status. However, Southwest places high
importance on negotiation with labor union in regard to the company’s direction. The
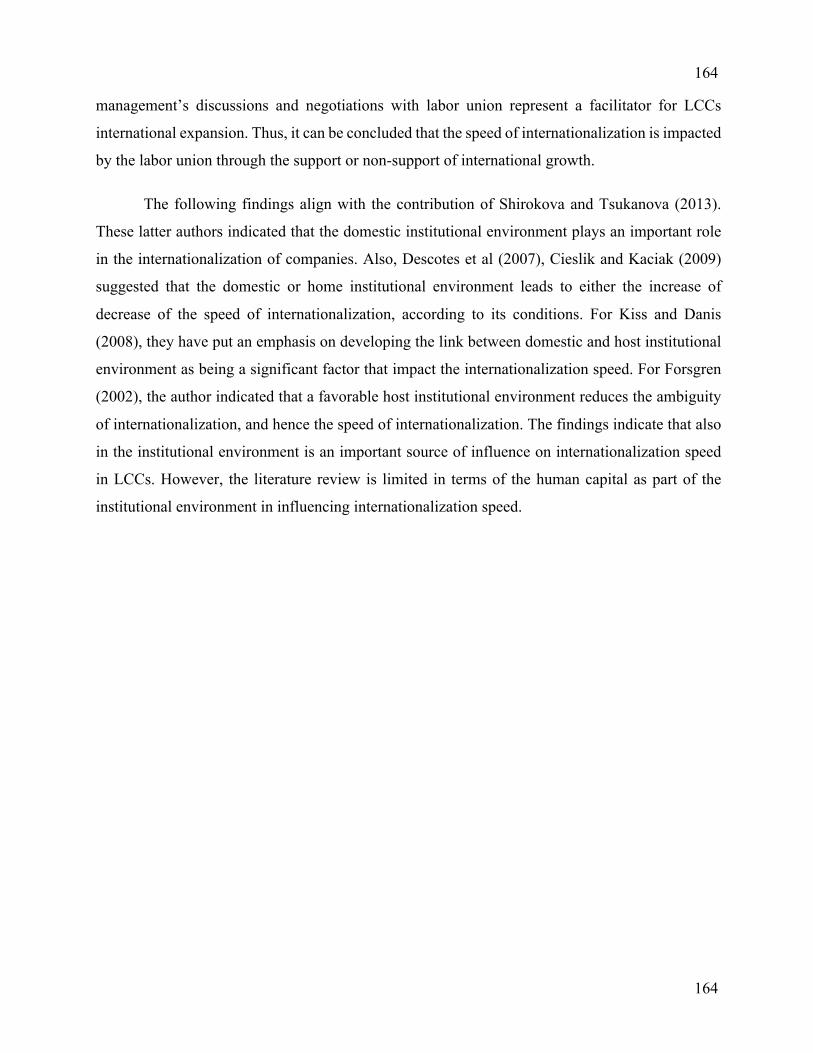
164
164
management’s discussions and negotiations with labor union represent a facilitator for LCCs
international expansion. Thus, it can be concluded that the speed of internationalization is impacted
by the labor union through the support or non-support of international growth.
The following findings align with the contribution of Shirokova and Tsukanova (2013).
These latter authors indicated that the domestic institutional environment plays an important role
in the internationalization of companies. Also, Descotes et al (2007), Cieslik and Kaciak (2009)
suggested that the domestic or home institutional environment leads to either the increase of
decrease of the speed of internationalization, according to its conditions. For Kiss and Danis
(2008), they have put an emphasis on developing the link between domestic and host institutional
environment as being a significant factor that impact the internationalization speed. For Forsgren
(2002), the author indicated that a favorable host institutional environment reduces the ambiguity
of internationalization, and hence the speed of internationalization. The findings indicate that also
in the institutional environment is an important source of influence on internationalization speed
in LCCs. However, the literature review is limited in terms of the human capital as part of the
institutional environment in influencing internationalization speed.
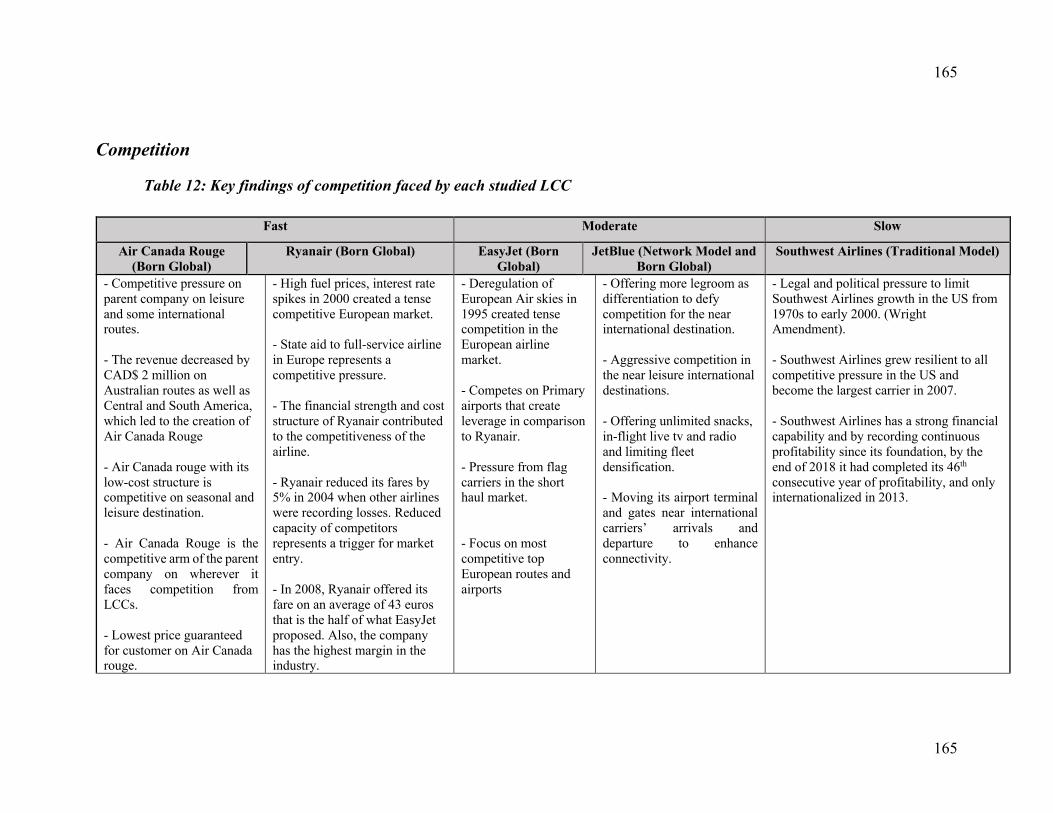
165
165
Competition
Table 12: Key findings of competition faced by each studied LCC
Fast Moderate Slow
Air Canada Rouge (Born Global)
Ryanair (Born Global) EasyJet (Born Global)
JetBlue (Network Model and Born Global)
Southwest Airlines (Traditional Model)
- Competitive pressure on parent company on leisure and some international routes. - The revenue decreased by CAD$ 2 million on Australian routes as well as Central and South America, which led to the creation of Air Canada Rouge - Air Canada rouge with its low-cost structure is competitive on seasonal and leisure destination. - Air Canada Rouge is the competitive arm of the parent company on wherever it faces competition from LCCs. - Lowest price guaranteed for customer on Air Canada rouge.
- High fuel prices, interest rate spikes in 2000 created a tense competitive European market. - State aid to full-service airline in Europe represents a competitive pressure. - The financial strength and cost structure of Ryanair contributed to the competitiveness of the airline. - Ryanair reduced its fares by 5% in 2004 when other airlines were recording losses. Reduced capacity of competitors represents a trigger for market entry. - In 2008, Ryanair offered its fare on an average of 43 euros that is the half of what EasyJet proposed. Also, the company has the highest margin in the industry.
- Deregulation of European Air skies in 1995 created tense competition in the European airline market. - Competes on Primary airports that create leverage in comparison to Ryanair. - Pressure from flag carriers in the short haul market. - Focus on most competitive top European routes and airports
- Offering more legroom as differentiation to defy competition for the near international destination. - Aggressive competition in the near leisure international destinations. - Offering unlimited snacks, in-flight live tv and radio and limiting fleet densification. - Moving its airport terminal and gates near international carriers’ arrivals and departure to enhance connectivity.
- Legal and political pressure to limit Southwest Airlines growth in the US from 1970s to early 2000. (Wright Amendment). - Southwest Airlines grew resilient to all competitive pressure in the US and become the largest carrier in 2007. - Southwest Airlines has a strong financial capability and by recording continuous profitability since its foundation, by the end of 2018 it had completed its 46th consecutive year of profitability, and only internationalized in 2013.
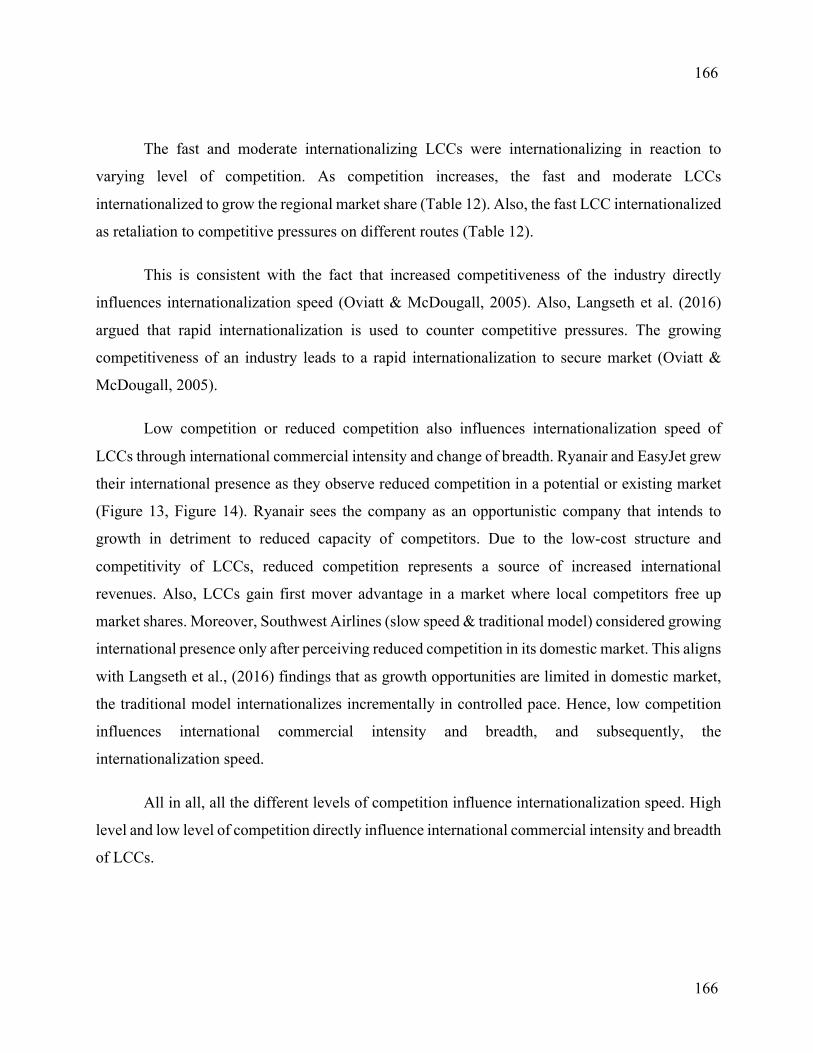
166
166
The fast and moderate internationalizing LCCs were internationalizing in reaction to
varying level of competition. As competition increases, the fast and moderate LCCs
internationalized to grow the regional market share (Table 12). Also, the fast LCC internationalized
as retaliation to competitive pressures on different routes (Table 12).
This is consistent with the fact that increased competitiveness of the industry directly
influences internationalization speed (Oviatt & McDougall, 2005). Also, Langseth et al. (2016)
argued that rapid internationalization is used to counter competitive pressures. The growing
competitiveness of an industry leads to a rapid internationalization to secure market (Oviatt &
McDougall, 2005).
Low competition or reduced competition also influences internationalization speed of
LCCs through international commercial intensity and change of breadth. Ryanair and EasyJet grew
their international presence as they observe reduced competition in a potential or existing market
(Figure 13, Figure 14). Ryanair sees the company as an opportunistic company that intends to
growth in detriment to reduced capacity of competitors. Due to the low-cost structure and
competitivity of LCCs, reduced competition represents a source of increased international
revenues. Also, LCCs gain first mover advantage in a market where local competitors free up
market shares. Moreover, Southwest Airlines (slow speed & traditional model) considered growing
international presence only after perceiving reduced competition in its domestic market. This aligns
with Langseth et al., (2016) findings that as growth opportunities are limited in domestic market,
the traditional model internationalizes incrementally in controlled pace. Hence, low competition
influences international commercial intensity and breadth, and subsequently, the
internationalization speed.
All in all, all the different levels of competition influence internationalization speed. High
level and low level of competition directly influence international commercial intensity and breadth
of LCCs.
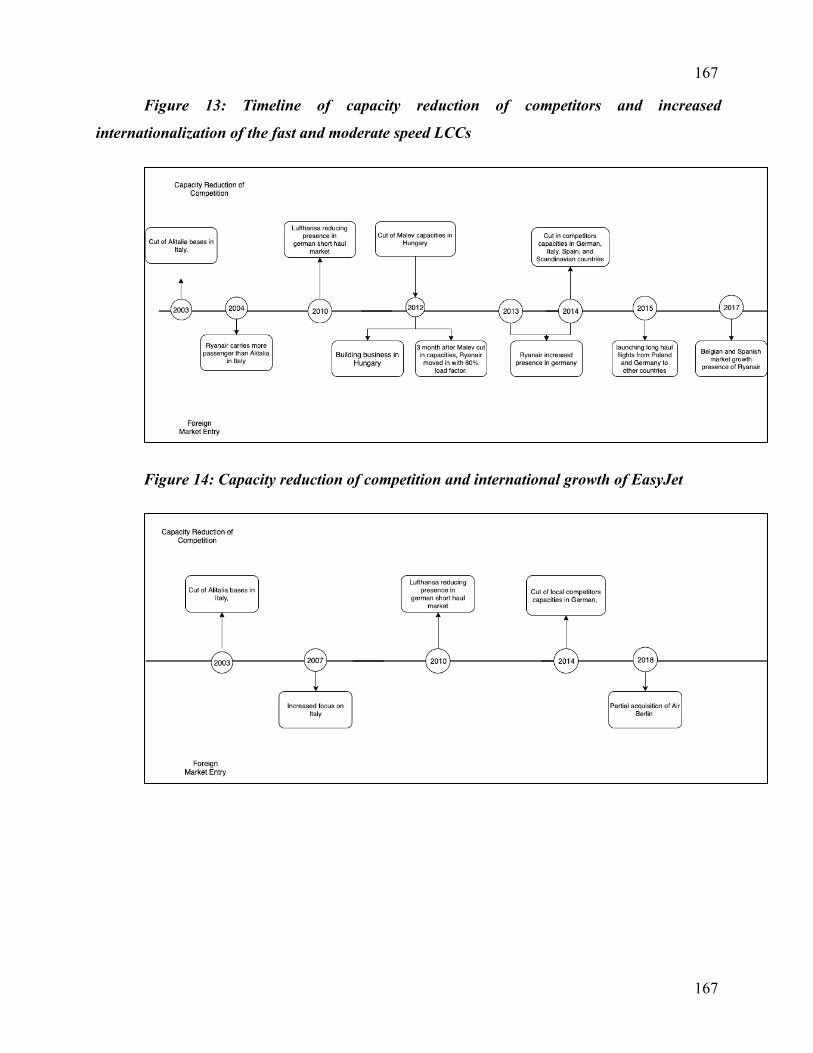
167
167
Figure 13: Timeline of capacity reduction of competitors and increased
internationalization of the fast and moderate speed LCCs
Figure 14: Capacity reduction of competition and international growth of EasyJet
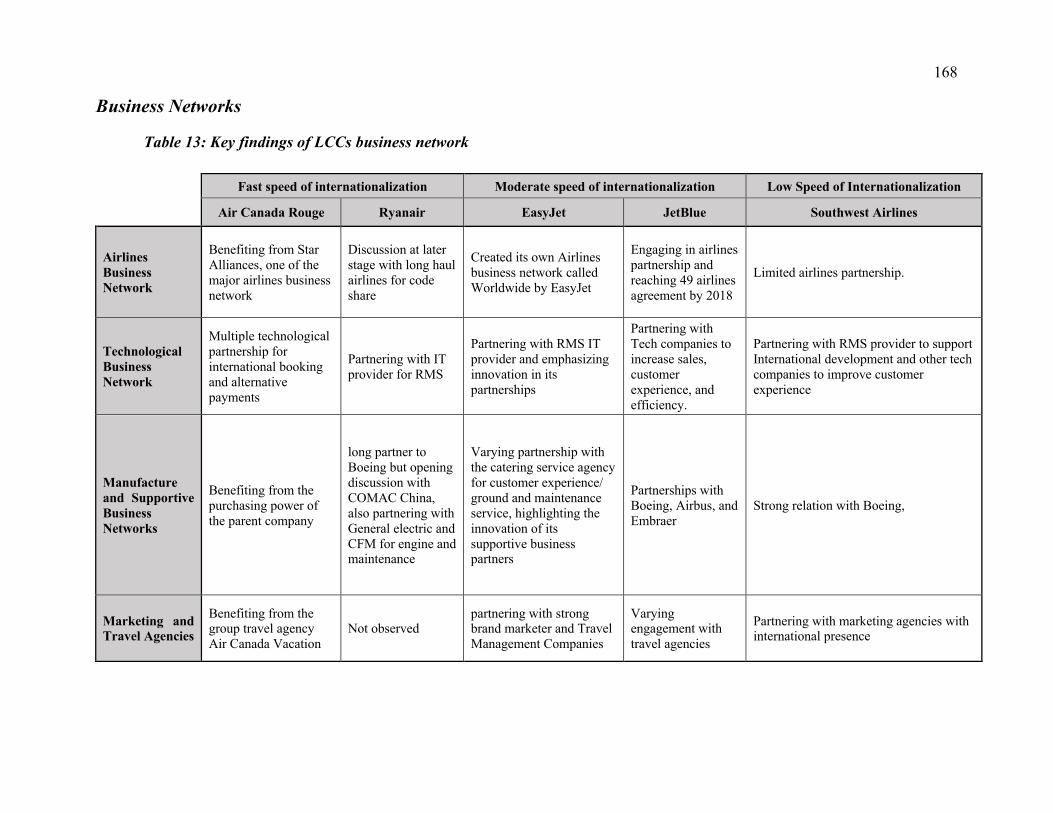
168
Business Networks
Table 13: Key findings of LCCs business network
Fast speed of internationalization Moderate speed of internationalization Low Speed of Internationalization
Air Canada Rouge Ryanair EasyJet JetBlue Southwest Airlines
Airlines Business Network
Benefiting from Star
Alliances, one of the
major airlines business
network
Discussion at later
stage with long haul
airlines for code
share
Created its own Airlines
business network called
Worldwide by EasyJet
Engaging in airlines
partnership and
reaching 49 airlines
agreement by 2018
Limited airlines partnership.
Technological Business Network
Multiple technological
partnership for
international booking
and alternative
payments
Partnering with IT
provider for RMS
Partnering with RMS IT
provider and emphasizing
innovation in its
partnerships
Partnering with
Tech companies to
increase sales,
customer
experience, and
efficiency.
Partnering with RMS provider to support
International development and other tech
companies to improve customer
experience
Manufacture and Supportive Business Networks
Benefiting from the
purchasing power of
the parent company
long partner to
Boeing but opening
discussion with
COMAC China,
also partnering with
General electric and
CFM for engine and
maintenance
Varying partnership with
the catering service agency
for customer experience/
ground and maintenance
service, highlighting the
innovation of its
supportive business
partners
Partnerships with
Boeing, Airbus, and
Embraer
Strong relation with Boeing,
Marketing and Travel Agencies
Benefiting from the
group travel agency
Air Canada Vacation
Not observed
partnering with strong
brand marketer and Travel
Management Companies
Varying
engagement with
travel agencies
Partnering with marketing agencies with
international presence
169
Through cross-case analysis of the business networks of LCCs, different types of business
relationships were observed that are airlines partnerships, manufacturers and support business
network, and technological business network.
Airlines partnership business networks:
By focusing on international business cooperation between airlines, it is noticeable that fast
and moderate speed internationalizing LCCs have engaged differently in airlines business network
compared to the slow speed LCCs. While Air Canada Rouge and EasyJet engaged in alliances and
code share, Ryanair engaged in code share at a later stage of rapid internationalization.
Nonetheless, Ryanair envision that airlines partnership offers the LCC long haul reach. In contrary,
JetBlue engaged since inception in enlarging its airlines business network that grew to 49 airlines
agreements by 2018, mostly outside of the US. For the slow internationalizing LCCs, Southwest
engaged in airlines partnership only after expressing international interest in 2004 as a way to
internationalize and grow international market rapidly.
The airlines business network contributes to increased international reach and exposure.
These partnerships provide airlines not only with reduced ambiguity and low barriers to new routes,
but also with increased international revenue. Thus, this factor is proven to impact all the three
components of the internationalization speed.
This aligns with Johanson and Vahlne (2009) in relating the role of business network to
reducing internationalization ambiguity. The absence of these partnerships would translate into
reduced reach and revenues. The higher the engagement in the network leads to increased
international revenue. This aligns with Casillas and Acedo (2013) in advancing the level of
commitment to business network affect internationalization speed. As a result, these business
networks contribute to increased international commercial intensity and market breadth, and hence,
the internationalization speed of LCCs.
170
Technological business network
According to chapter 5, LCCs are observed to engage in technological partnerships with international exposure and experience. While technology is a source of influence on internationalization speed, LCCs have engaged in different technological business relationships. The commonality is that these partnerships have provided the fast and moderate LCCs with RMS, market internationally, and innovative technologies that improve efficiency (Business Networks
Table 13) international expansion. For the slow internationalizing LCC, technological
partnership has helped reduce technological challenges to support international operations (Table
13). Having developed technological business networks lead LCCs to increase their international
market intensity.
Support business network
The support business network for LCCs is composed, in part, of aircraft manufacturer and
maintenance contractors. While the fast and moderate internationalizing LCCs are open to all
aircraft makers, Southwest Airlines have been operating a single type model of Boeing, which is
the 737 model. Ryanair is adopting the southwest model in using a single type of aircraft, but later
on changed their stance on this strategy. Ryanair is not only open to the European aircraft
manufacturers but engaged in discussion with Chinese aircraft manufacturer COMAC. While
developing manufacturers and support networks is important for LCCs, there is no obvious
relationship between them and the speed of internationalization.
To sum up, while airlines and technological business networks appeared to directly
influence internationalization speed, the support and manufacturers business networks have no
direct impact on internationalization speed. More importantly, business networks offer to LCCs
the support for international operations as well as international exposure and reach. By studying
LCCs, the thesis aligns with Langseth et al. (2016) and Oviatt and McDougall (2005) who argued
the role of business network in influencing internationalization speed
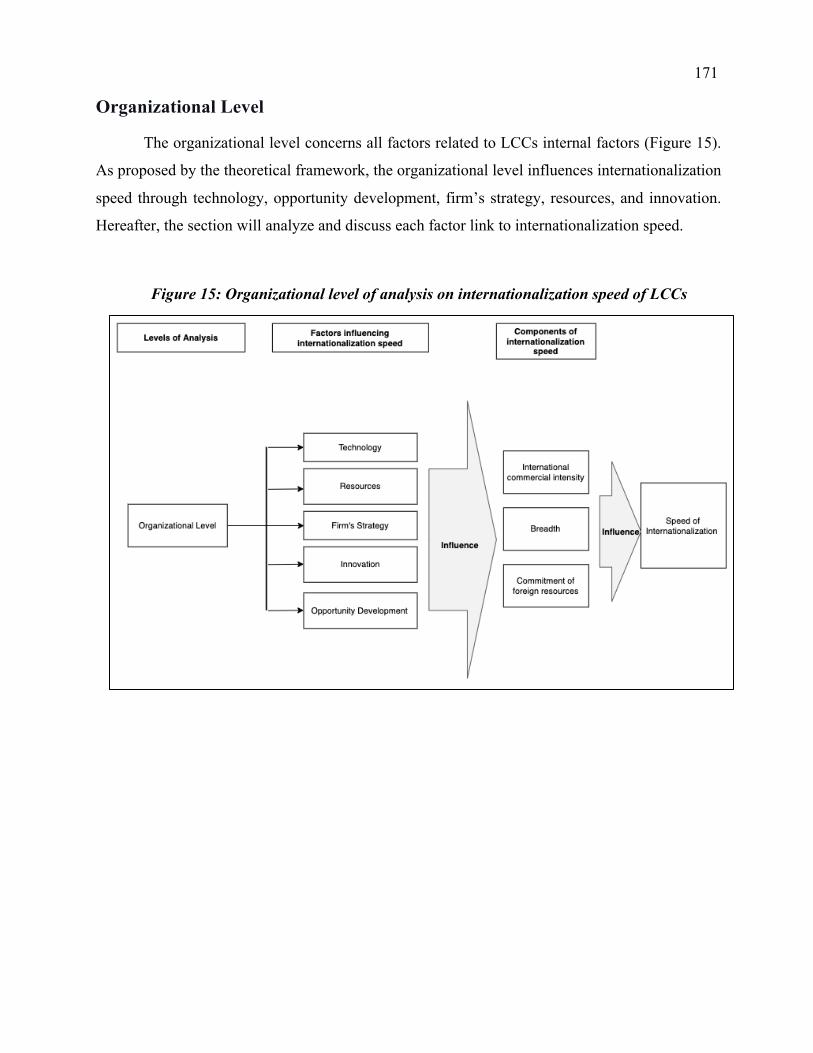
171
Organizational Level
The organizational level concerns all factors related to LCCs internal factors (Figure 15).
As proposed by the theoretical framework, the organizational level influences internationalization
speed through technology, opportunity development, firm’s strategy, resources, and innovation.
Hereafter, the section will analyze and discuss each factor link to internationalization speed.
Figure 15: Organizational level of analysis on internationalization speed of LCCs
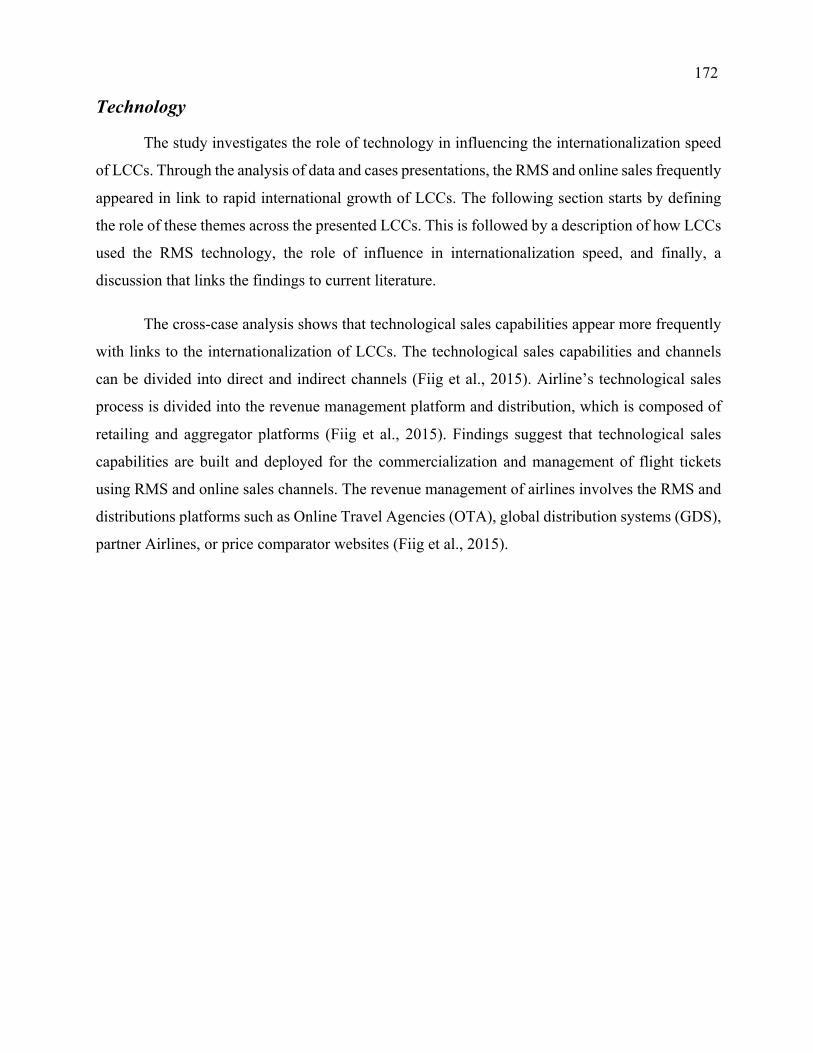
172
Technology
The study investigates the role of technology in influencing the internationalization speed
of LCCs. Through the analysis of data and cases presentations, the RMS and online sales frequently
appeared in link to rapid international growth of LCCs. The following section starts by defining
the role of these themes across the presented LCCs. This is followed by a description of how LCCs
used the RMS technology, the role of influence in internationalization speed, and finally, a
discussion that links the findings to current literature.
The cross-case analysis shows that technological sales capabilities appear more frequently
with links to the internationalization of LCCs. The technological sales capabilities and channels
can be divided into direct and indirect channels (Fiig et al., 2015). Airline’s technological sales
process is divided into the revenue management platform and distribution, which is composed of
retailing and aggregator platforms (Fiig et al., 2015). Findings suggest that technological sales
capabilities are built and deployed for the commercialization and management of flight tickets
using RMS and online sales channels. The revenue management of airlines involves the RMS and
distributions platforms such as Online Travel Agencies (OTA), global distribution systems (GDS),
partner Airlines, or price comparator websites (Fiig et al., 2015).
173
Reservation Management Systems
Figure 16: RMS Role in influencing internationalization speed
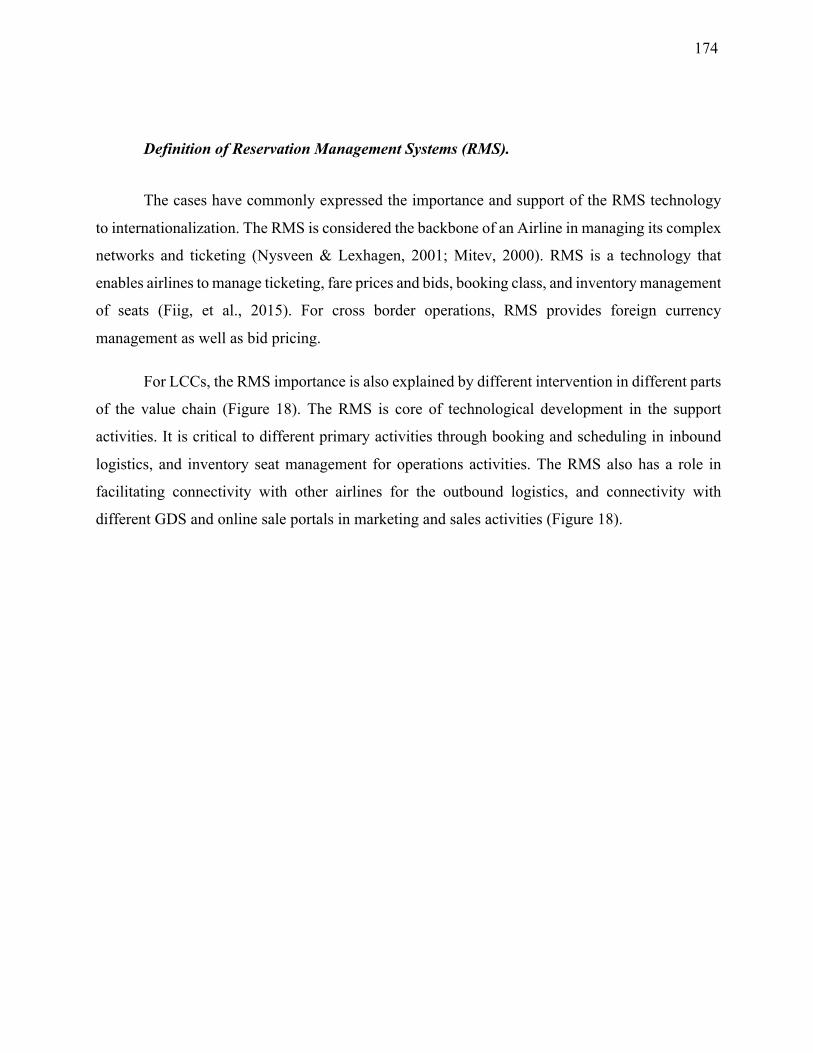
174
Definition of Reservation Management Systems (RMS).
The cases have commonly expressed the importance and support of the RMS technology
to internationalization. The RMS is considered the backbone of an Airline in managing its complex
networks and ticketing (Nysveen & Lexhagen, 2001; Mitev, 2000). RMS is a technology that
enables airlines to manage ticketing, fare prices and bids, booking class, and inventory management
of seats (Fiig, et al., 2015). For cross border operations, RMS provides foreign currency
management as well as bid pricing.
For LCCs, the RMS importance is also explained by different intervention in different parts
of the value chain (Figure 18). The RMS is core of technological development in the support
activities. It is critical to different primary activities through booking and scheduling in inbound
logistics, and inventory seat management for operations activities. The RMS also has a role in
facilitating connectivity with other airlines for the outbound logistics, and connectivity with
different GDS and online sale portals in marketing and sales activities (Figure 18).
175
Connectivity to partner airlines
Figure 17: RMS positioning in the LCCs value chain activities.
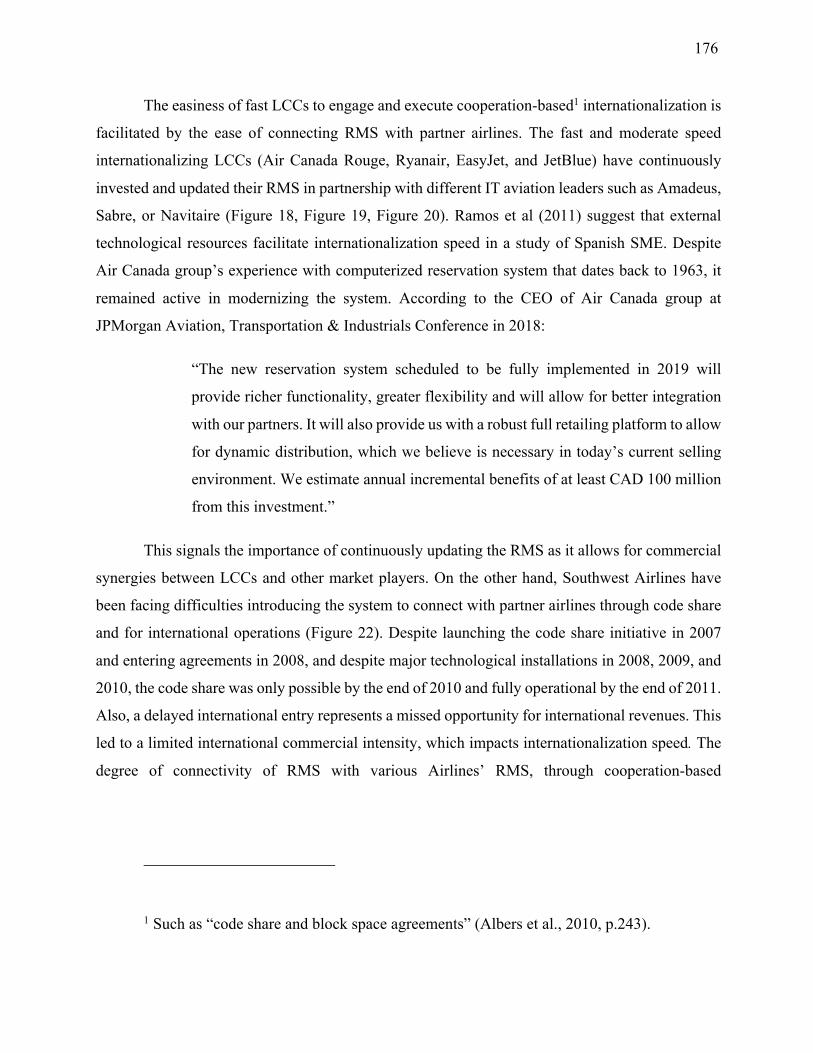
176
The easiness of fast LCCs to engage and execute cooperation-based1 internationalization is
facilitated by the ease of connecting RMS with partner airlines. The fast and moderate speed
internationalizing LCCs (Air Canada Rouge, Ryanair, EasyJet, and JetBlue) have continuously
invested and updated their RMS in partnership with different IT aviation leaders such as Amadeus,
Sabre, or Navitaire (Figure 18, Figure 19, Figure 20). Ramos et al (2011) suggest that external
technological resources facilitate internationalization speed in a study of Spanish SME. Despite
Air Canada group’s experience with computerized reservation system that dates back to 1963, it
remained active in modernizing the system. According to the CEO of Air Canada group at
JPMorgan Aviation, Transportation & Industrials Conference in 2018:
“The new reservation system scheduled to be fully implemented in 2019 will
provide richer functionality, greater flexibility and will allow for better integration
with our partners. It will also provide us with a robust full retailing platform to allow
for dynamic distribution, which we believe is necessary in today’s current selling
environment. We estimate annual incremental benefits of at least CAD 100 million
from this investment.”
This signals the importance of continuously updating the RMS as it allows for commercial
synergies between LCCs and other market players. On the other hand, Southwest Airlines have
been facing difficulties introducing the system to connect with partner airlines through code share
and for international operations (Figure 22). Despite launching the code share initiative in 2007
and entering agreements in 2008, and despite major technological installations in 2008, 2009, and
2010, the code share was only possible by the end of 2010 and fully operational by the end of 2011.
Also, a delayed international entry represents a missed opportunity for international revenues. This
led to a limited international commercial intensity, which impacts internationalization speed. The
degree of connectivity of RMS with various Airlines’ RMS, through cooperation-based
1 Such as “code share and block space agreements” (Albers et al., 2010, p.243).
177
internationalization, provides LCCs with the advantage of executing code share and interlining
partnership rapidly.
The level of RMS connectivity, for cooperation-based internationalization, influences
internationalization speed. The code share partnership offers the engaged airlines either extended
network or the chance to collectively commercialize a shared route (Du, McMullen, & Kerkvliet,
2008). When the network extension or the shared route falls beyond home country, it contributes to increased international commercial intensity and breadth. The failure of
connecting the RMS platform between airlines results in challenges to commercializing tickets
through Airlines partnerships. The full benefit of code share agreement can be reached through
smooth connectivity and sales of tickets through airlines partnerships. For example, JetBlue
engaged in more than 40 cooperation-based internationalization without experiencing
technological challenges. These partnerships contributed to an increase of $120 million
international revenues in 2014 for JetBlue. Hence, the connectivity of RMS to other airlines contributes to increased international commercial intensity and breadth of market, which is
experienced by fast LCCs. According to Casillas and Acedo (2013), international commercial
intensity and change in market breadth are components of internationalization speed. As RMS
connectivity influences these components, the RMS connectivity influences internationalization
speed. This is consistent with the findings of Oviatt and McDougall (2005) that have indicated that
technology facilitates the organization of the business internationally and influences the
internationalization speed. A smooth connectivity allows for a direct access to customers to the
extent allowed or limited by the RMS connectivity. The direct access to customer across border is
a source of influence for internationalization speed (Chetty & Campbell-Hunt, 2004; Oviatt &
McDougall, 2005). Also, Luo et al. (2005) suggest that network connectivity influence
internationalization speed of e-commerce companies.
178
Figure 18: Air Canada Rouge RMS development vs internationalization activities
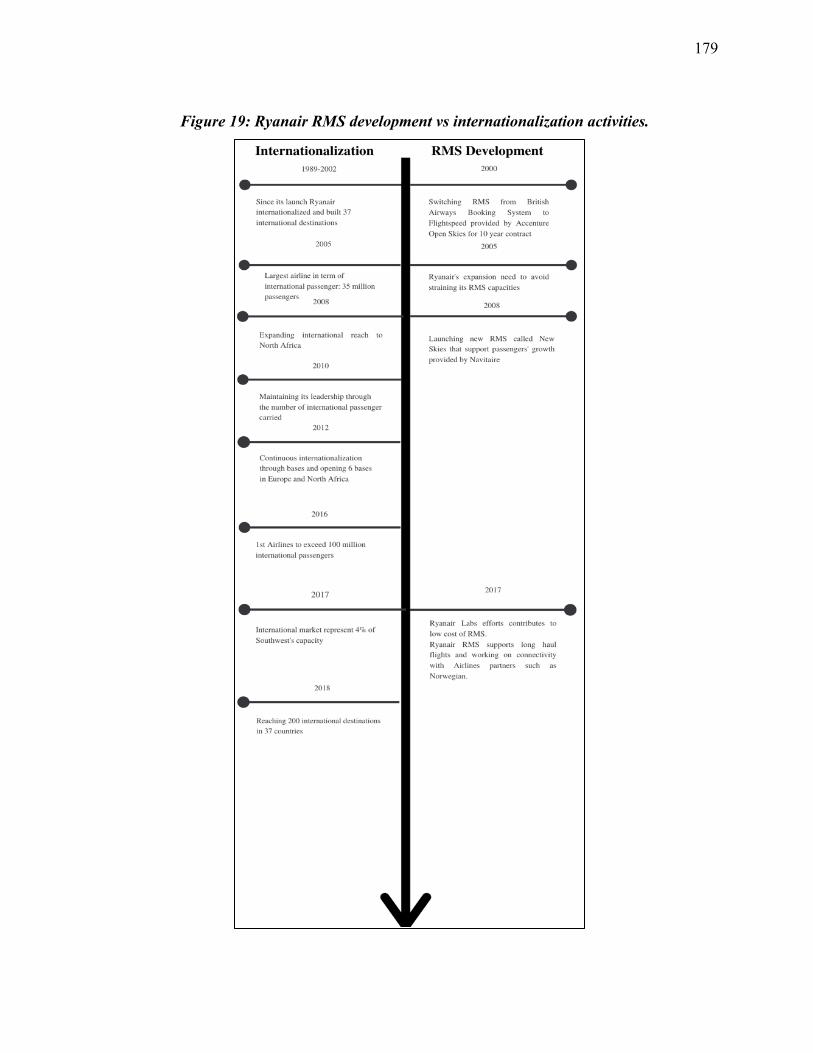
179
Figure 19: Ryanair RMS development vs internationalization activities.
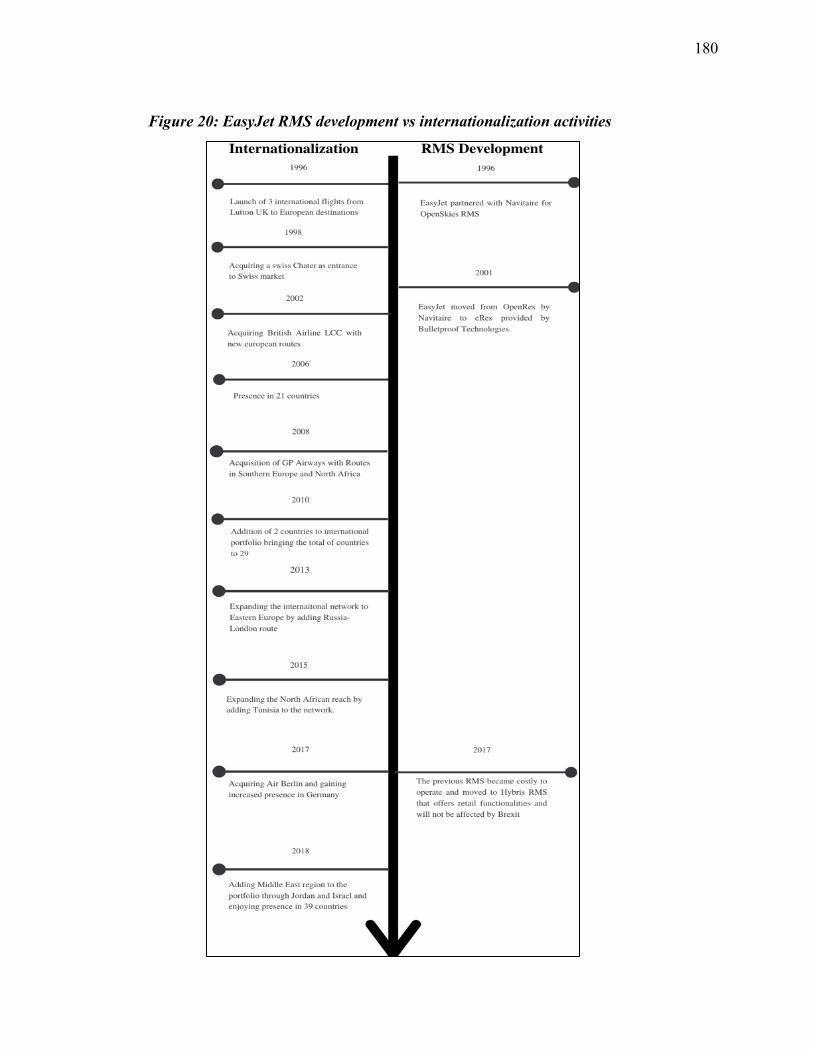
180
Figure 20: EasyJet RMS development vs internationalization activities
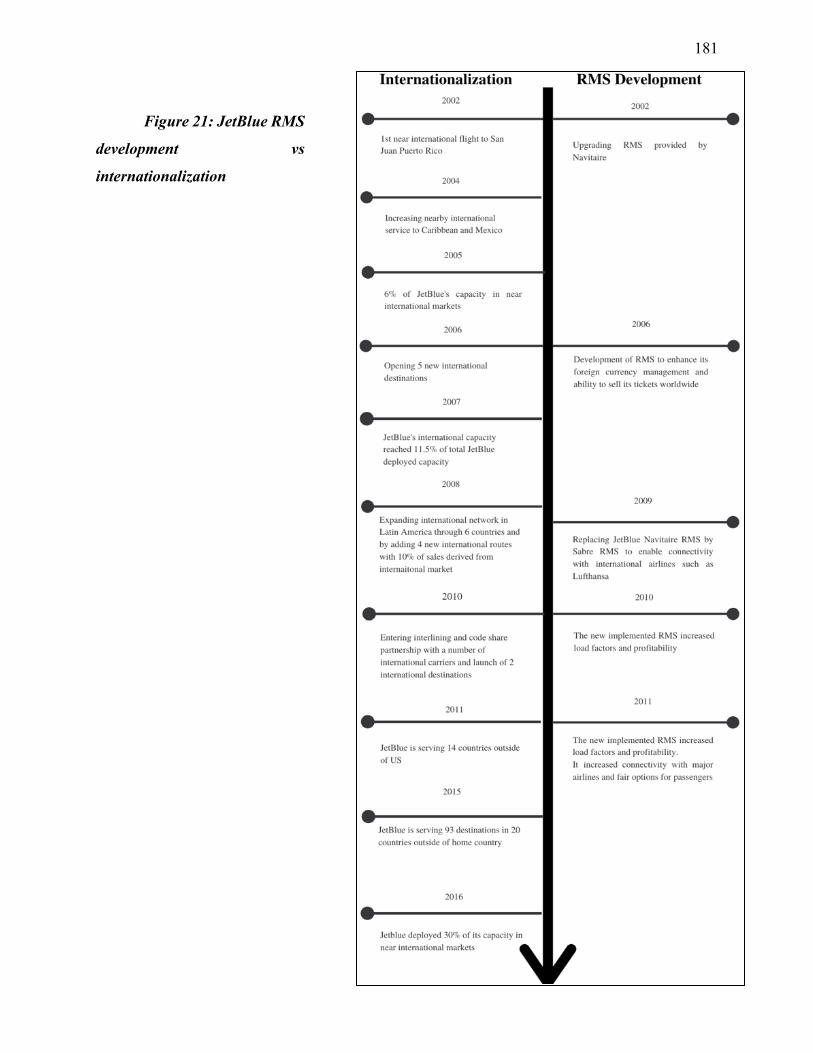
181
Figure 21: JetBlue RMS
development vs
internationalization
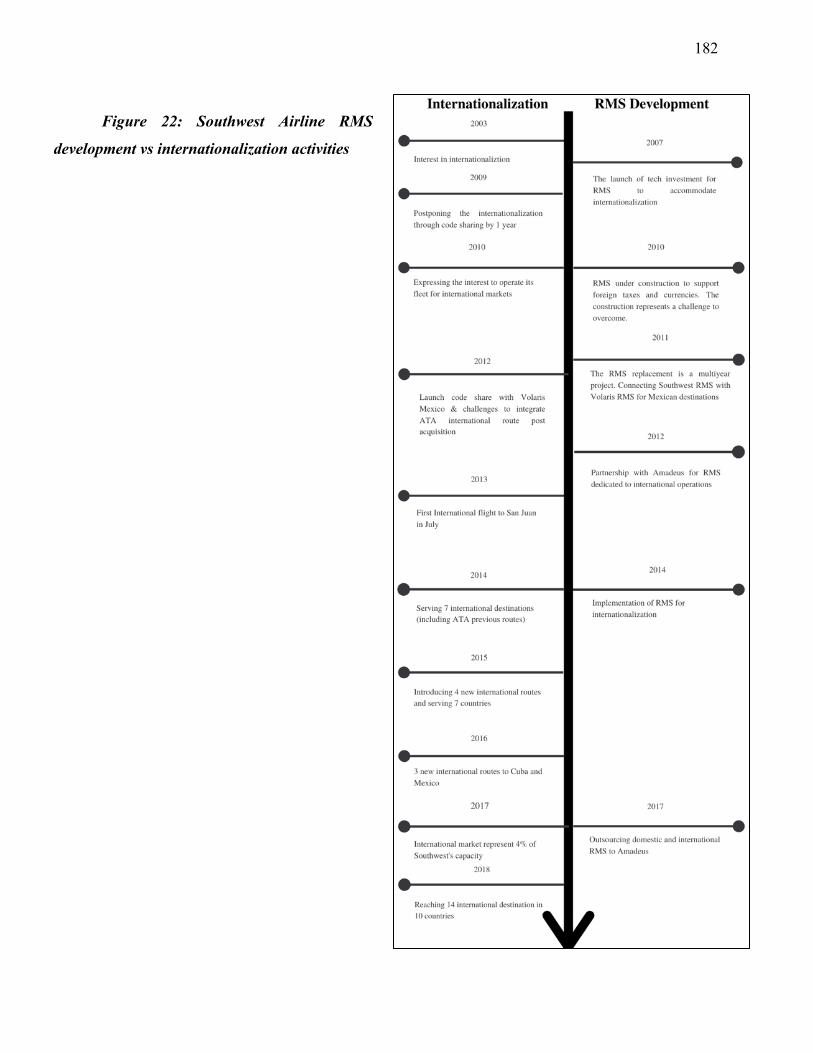
182
Figure 22: Southwest Airline RMS
development vs internationalization activities
183
Connectivity to online distribution and retailing platforms
The connectivity of RMS to online distribution and retailing platforms has an impact on the
internationalization speed of LCCs. Despite the expensive cost, LCC were observed to be
increasingly entering the GDS platforms (Fiig et al., 2015; Sabre Air Solution, 2010). In the case
of this study, fast internationalizing LCCs have enjoyed presence in GDS. While Southwest
Airlines entered GDS only in 2008 and 2009 in partnership with Galileo and Worldspan. EasyJet
extends its channels to travel management agencies that also requires an ease of booking from the
travel agencies on EasyJet RMS. Ryanair connected its RMS to GDS of Travelport in 2014 and
Amadeus in 2015 that offered 95% of European corporate booking. Ryanair evaluated the ability
of GDS connectivity to facilitate connection between Ryanair network and other long-haul flights.
Online distribution and retailing platforms offer Airlines direct access to customers (Fiig et
al., 2015). The less connectivity of an RMS to the online distribution and retailing platforms
translates into limited LCCs’ customer reach. These platforms have international exposure and
market reach. The RMS ease of connectivity to these platforms offer LCCs a rapid access to
customer in the different markets served or subject to entry. Fiig et al., (2015) conceptualized the
“RMS as solving the business functions and executing (control) the [Revenue Management]
strategy, while distribution solves the business functions of retailing and content aggregation”
(p.132).
The connectivity between the RMS and online channels is key to international growth and
facilitates the sales in different host countries. The interdependency of these platforms provides
large pool of customer with price, information, and instant booking (Fiig et al., 2015). Modern
technologies increased the importance of this connectivity as passenger easily can buy “tickets
either via the direct channel (an airline’s website) or online travel agencies (OTAs)” (Fiig et al.,
2015, p.130).
As the level of RMS connectivity to online distribution and retailing platforms are
important to reach customer across borders, the connectivity contributes to the companies’
international commercial intensity. The international commercial intensity is derived from the
184
ability to have increased international sales through performing online platforms. The international
reach of these online retailing and distribution platforms contribute to increased internationali
commercial intensity. The direct access to customer across border has been facilitated by
technology and contribute to rapid internationalization (Chetty & Campbell-Hunt, 2004; Oviatt &
McDougall, 2005). Moreover, the online sales channels positively influence the
internationalization speed (Arenius et al., 2005). Hence, the literature and findings agree on the
ability of direct customer access and online sales to influence internationalization speed.
Supporting International Operations
The RMS also influences internationalization speed of LCCs by supporting international
operations and LCCs international growth. The difference between the fast and slow
internationalizing LCCs is the RMS ability in managing across border transactions. Despite the
interest in internationalization in 2004, Southwest Airlines launched major RMS transformation to
accommodate international network complexities, taxes, and foreign currency management. In the
letter to shareholders of 2010, Gary Kelly expressed the “decision to replace our reservations
system that, among other benefits, will allow us to serve international destinations”. Air Canada
Rouge, Ryanair, and EasyJet have grown and internationalized with limited challenges from RMS.
Among the challenges expressed was the capacity limit of the Ryanair’s RMS. This capacity limit
caused Ryanair booking system to be disturbed in 2008 due to Ryanair’s growth. Hence, Ryanair
launched a new reservation system, called New Skies in 2008 to accommodate growth (Figure 19).
However, Ryanair, as a fast LCC, changed and remedied to the problem in less than year. On the
other hand, Southwest faced challenges implementing a new international RMS for more than 3
years. This has an impact on the level of international commercial intensity.
The international commercial intensity of LCCs is facilitated by the RMS in its ability to
reduce transactional cost emerging from the complexity of international network, foreign currency
management, foreign local taxes, and the ability to support online point of sales at the international
level. Also, it represents a commitment of resources to international opportunities. The fast and
moderate speed LCCs have high level of commitment of resources to foreign market in comparison
to LCC with slow speed of internationalization. As a result, the fast and moderate commit their
185
technological development to facilitate foreign market growth, and hence internationalization
speed.
The level of international transaction management of RMS contributes to LCCs having an
increased breadth. As the international commercial intensity, foreign resources commitment, and
breadth of market are components of internationalization speed, the RMS capacity in managing
and supporting across border transaction and LCCs international growth represent a source of
influence on internationalization speed of LCC
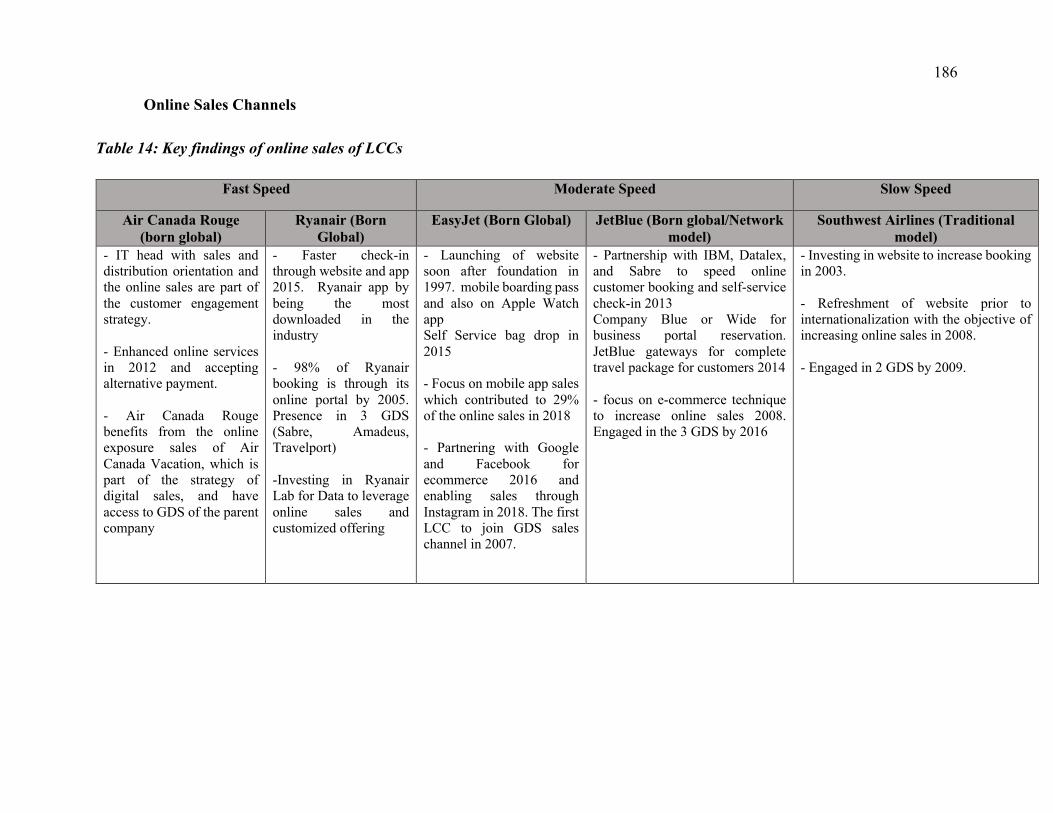
186
Online Sales Channels
Table 14: Key findings of online sales of LCCs
Fast Speed Moderate Speed Slow Speed
Air Canada Rouge (born global)
Ryanair (Born Global)
EasyJet (Born Global) JetBlue (Born global/Network model)
Southwest Airlines (Traditional model)
- IT head with sales and distribution orientation and the online sales are part of the customer engagement strategy. - Enhanced online services in 2012 and accepting alternative payment. - Air Canada Rouge benefits from the online exposure sales of Air Canada Vacation, which is part of the strategy of digital sales, and have access to GDS of the parent company
- Faster check-in through website and app 2015. Ryanair app by being the most downloaded in the industry - 98% of Ryanair booking is through its online portal by 2005. Presence in 3 GDS (Sabre, Amadeus, Travelport) -Investing in Ryanair Lab for Data to leverage online sales and customized offering
- Launching of website soon after foundation in 1997. mobile boarding pass and also on Apple Watch app Self Service bag drop in 2015 - Focus on mobile app sales which contributed to 29% of the online sales in 2018 - Partnering with Google and Facebook for ecommerce 2016 and enabling sales through Instagram in 2018. The first LCC to join GDS sales channel in 2007.
- Partnership with IBM, Datalex, and Sabre to speed online customer booking and self-service check-in 2013 Company Blue or Wide for business portal reservation. JetBlue gateways for complete travel package for customers 2014
- focus on e-commerce technique to increase online sales 2008. Engaged in the 3 GDS by 2016
- Investing in website to increase booking in 2003. - Refreshment of website prior to internationalization with the objective of increasing online sales in 2008. - Engaged in 2 GDS by 2009.
187
The fast internationalizing LCCs were active in developing the online sales not only
through website but also through LCCs Apps. This has led Ryanair app to be the most downloaded
in the industry and for EasyJet to derive 29% of online sales through the app. Moreover, the efforts
for online sales were also in recruiting IT talents with online sales and distribution skills. As
Ryanair recruited in mass IT personnel for Ryanair lab, Air Canada Rouge recruited an IT executive
with sales and distribution expertise. For EasyJet, it has engaged in social media sales through
Facebook and Google in 2016 and allowing customer a faster booking through leisure destinations
pictures on Instagram. The online and digital sales represent a priority for the fast LCCs.
The online sales channels can be seen as through Google, Facebook, Instagram, fare flight
comparator, online travel agencies, and GDS. The fast internationalizing LCCs have high presence
in GDS (Table 14) in spite of the high cost. Despite the relative young age of JetBlue to Southwest
Airlines, JetBlue engaged innovative practices to increase online presence. In this regard, JetBlue
engaged in online sales through the focus on e-commerce and partnering with tech companies to
ameliorate the booking speed and conversion rate on websites. Southwest also refreshed its website
with the aim of increasing online presence in 2009, prior to internationalization. The online sales
represent a source of influence on internationalization speed of LCCs. On one hand, deploying
online sales for foreign markets represent an increased commitment of resource for foreign
countries. On another hand, it contributes to both increased international commercial intensity and
enables market breadths.
The contributions of online sales to the above components of internationalization speed are
numerous. The online sales channels facilitate the direct access to customer domestically or
internationally. It reduces over time the distance between countries (OECD, 2019) and promotes
faster access to customers (Arenius et al., 2005). Also, it represents an efficient medium for
establishing with flexibility a point of sale in foreign markets. This is in line with Chetty and
Campbell-Hunt (2004), and Oviatt and McDougall (2005) who argued the influencing role of
technology and direct access to customer on internationalization speed.
188
A limited focus and development of online sales increase the barriers to learning and
growing international commercial intensity. Subsequently, the international commercial intensity
is influenced by the level of engagement in online sales. Benefitting from the growth of the online
sales and the growing importance of online platforms in the consumers habits for travel tickets
(Agag & El-Masry, 2017), these platforms represents an effective channel to market fare tickets in
multiple markets with less difficulties.
The e-commerce social channels growth such as Facebook, Instagram, and Google do not
only represent a sales channel, but its added value derives from the importance of customer
interaction and the data emerging from these interactions. These data enable the airlines to know
which niche market to approach and adapt accordingly the product offering. Part of EasyJet
customer’s engagement is providing the ability for customer to purchase flight ticket through
Instagram posts. The other fast internationalizing LCC, Air Canada Rouge, places high importance
on digital channels as a pillar of customer engagements. Hence, benefitting from the growth
importance of these platform contributed to increased international commercial intensity and an
effective way to learn about different market and sell accordingly (Market Breadth). Hence, the
growth of the online sales in the travel industry represents a source of influence on
internationalization speed.
In addition to online sales through websites, other channels are involved in the LCCs online
channel such as online travel agencies, GDS, and fare flights online comparators (Fiig et al., 2015).
The engagement in GDS allows LCCs to access different niche market with geographical diversity.
Also, the LCCs content in GDS enables an effective way to market fare tickets to passengers. The
ability of marketing low fare tickets through GDS represents a viable online channel for LCCs to
increased international commercial intensity.
The above analysis and discussion suggest the role of online sales channel in influencing
internationalization speed as proposed by (Arenius et al., 2005). Neubert (2018) argued that thehigh
digitalization facilitates decision making and lead to a rapid internationalization.
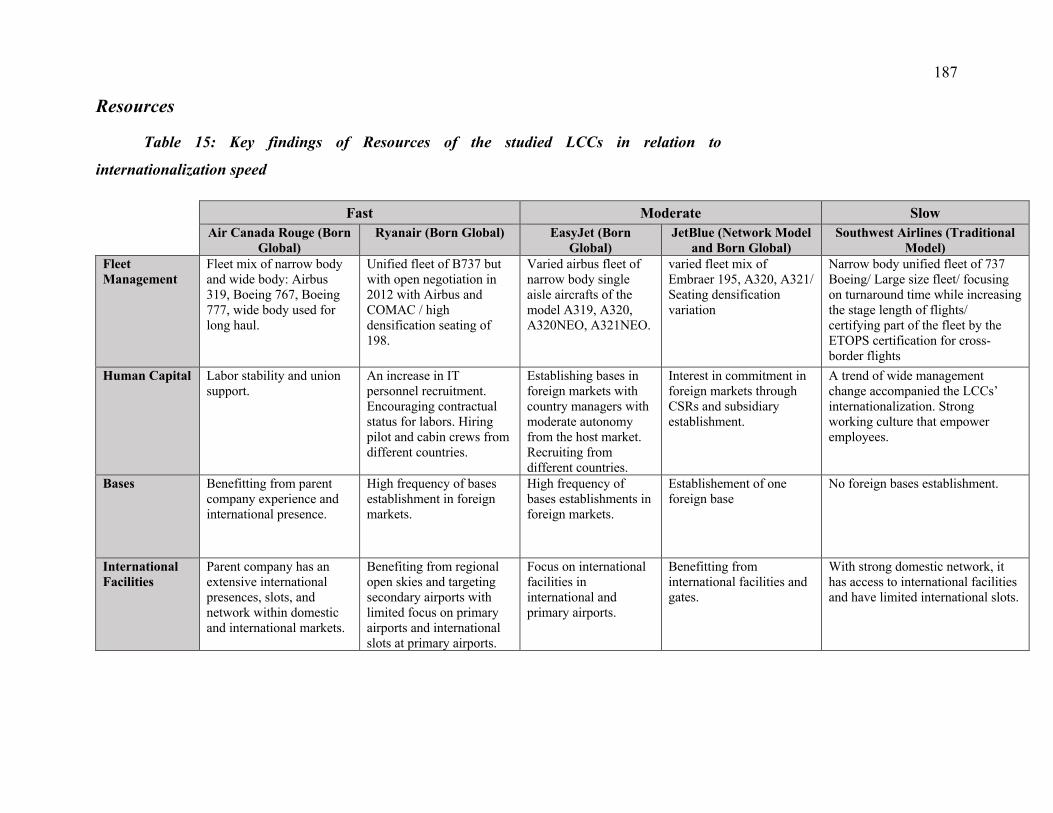
187
Resources
Table 15: Key findings of Resources of the studied LCCs in relation to
internationalization speed
Fast Moderate Slow Air Canada Rouge (Born
Global) Ryanair (Born Global) EasyJet (Born
Global) JetBlue (Network Model
and Born Global) Southwest Airlines (Traditional
Model) Fleet Management
Fleet mix of narrow body and wide body: Airbus 319, Boeing 767, Boeing 777, wide body used for long haul.
Unified fleet of B737 but with open negotiation in 2012 with Airbus and COMAC / high densification seating of 198.
Varied airbus fleet of narrow body single aisle aircrafts of the model A319, A320, A320NEO, A321NEO.
varied fleet mix of Embraer 195, A320, A321/ Seating densification variation
Narrow body unified fleet of 737 Boeing/ Large size fleet/ focusing on turnaround time while increasing the stage length of flights/ certifying part of the fleet by the ETOPS certification for cross-border flights
Human Capital Labor stability and union support.
An increase in IT personnel recruitment. Encouraging contractual status for labors. Hiring pilot and cabin crews from different countries.
Establishing bases in foreign markets with country managers with moderate autonomy from the host market. Recruiting from different countries.
Interest in commitment in foreign markets through CSRs and subsidiary establishment.
A trend of wide management change accompanied the LCCs’ internationalization. Strong working culture that empower employees.
Bases Benefitting from parent company experience and international presence.
High frequency of bases establishment in foreign markets.
High frequency of bases establishments in foreign markets.
Establishement of one foreign base
No foreign bases establishment.
International Facilities
Parent company has an extensive international presences, slots, and network within domestic and international markets.
Benefiting from regional open skies and targeting secondary airports with limited focus on primary airports and international slots at primary airports.
Focus on international facilities in international and primary airports.
Benefitting from international facilities and gates.
With strong domestic network, it has access to international facilities and have limited international slots.
188
During the analysis, the most recurring resources among all LCCs can be categorized such
as: fleet, human capital, and foreign bases and international facilities. With regards to the fleet
management, it influences both the revenues and reach of LCCs. While fleet densification enables
increased revenues, a mix of long and short haul aircrafts enables increased reach for LCCs. It is
noticeable that fast LCCs have a fleet composition of narrow body and wide body aircrafts that can
be deployed internationally with flexibility. However, LCC with slow speed needed to have the
ETOPS certification for their fleet to operate cross-border and long-haul flights. Having a fleet
with international reach facilitates the international growth in distant countries, which contributes
to changing LCCs breadth.
According to chapter 4, fast and slow LCCs opted for unified fleet models such as the case
of Ryanair and Southwest Airlines. However, some LCCs have a diversified fleet mix such as
JetBlue, Air Canada Rouge, and EasyJet. A fleet mix of narrow body and wide body aircraft
contributes to increased revenues and market reach for LCCs. As a result, fleet management is
proven to have a strong impact on both the breadth of market and the international commercial
intensity, and hence, on the internationalization speed.
Concerning human capital, they represent an important component of the cost structure of
LCCs and operational excellence. Through the analysis, human resources of LCCs support the
incremental international revenue through flexibility and efficiency. While Air Canada Rouge
counts on and consent with employees to increase fleet size and international growth, Ryanair
engages in efficient contract with employees from different markets. Moreover, the human
resources of LCCs are not only limited to cabin crew and pilots but extends to realize the
importance of IT personnel. In parallel to the online sales growth, IT personnel represent a source
of optimization for online sales, which translated into increased international commercial intensity.
With regards to the international facilities and foreign bases, they allow for flexible
international reach for LCCs. International facilities of LCCs enables securing international gates
and slots from airports. However, high charges and barriers to entry to these resources limit
189
internationalization growth of LCCs. International facilities and bases allow strengthening the
network by establishing a point of origin in different host countries to new international markets.
This was experienced by the fast and moderate speed LCCs (Table 15).
Consequently, LCCs that have access to international facilities and foreign bases positively
impact the international commercial intensity, increase the breadth of the market, and positively
increase the commitment of resources to foreign markets. Thus, the speed of internationalization
is influenced by LCCs resources (Fleet, human capital, and international facilities). This is
consistent with the contributions of Chetty et al. (2014) and Zhang et al. (2010) that indicate that
adapting resource to international growth represent a direct source of influence on the speed of
internationalization.
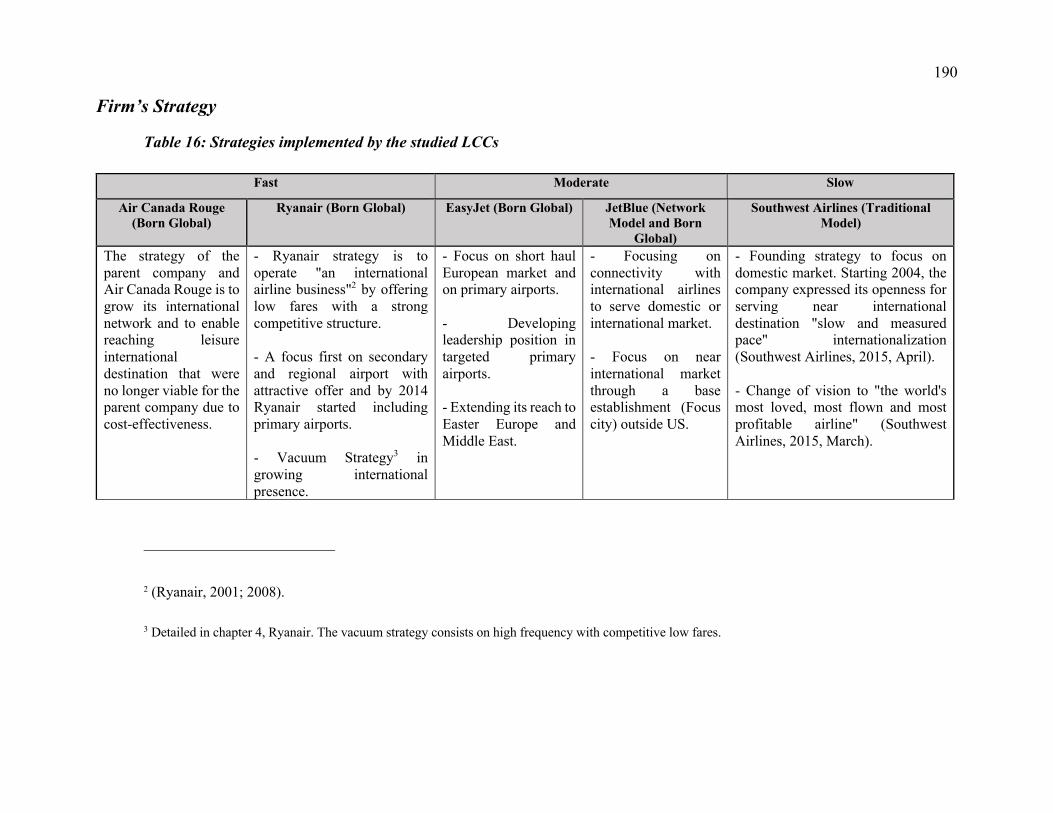
190
Firm’s Strategy
Table 16: Strategies implemented by the studied LCCs
Fast Moderate Slow
Air Canada Rouge (Born Global)
Ryanair (Born Global) EasyJet (Born Global) JetBlue (Network Model and Born
Global)
Southwest Airlines (Traditional Model)
The strategy of the parent company and Air Canada Rouge is to grow its international network and to enable reaching leisure international destination that were no longer viable for the parent company due to cost-effectiveness.
- Ryanair strategy is to operate "an international airline business"2 by offering low fares with a strong competitive structure. - A focus first on secondary and regional airport with attractive offer and by 2014 Ryanair started including primary airports. - Vacuum Strategy3 in growing international presence.
- Focus on short haul European market and on primary airports. - Developing leadership position in targeted primary airports. - Extending its reach to Easter Europe and Middle East.
- Focusing on connectivity with international airlines to serve domestic or international market. - Focus on near international market through a base establishment (Focus city) outside US.
- Founding strategy to focus on domestic market. Starting 2004, the company expressed its openness for serving near international destination "slow and measured pace" internationalization (Southwest Airlines, 2015, April). - Change of vision to "the world's most loved, most flown and most profitable airline" (Southwest Airlines, 2015, March).
2 (Ryanair, 2001; 2008).
3 Detailed in chapter 4, Ryanair. The vacuum strategy consists on high frequency with competitive low fares.
191
Through data analysis, it is noticeable that the LCCs’ strategies impacted the direction of
their internationalization speed. For the LCC with the lowest internationalization speed –
Southwest-, the company was not considering internationalization until early 2000s. However,
LCCs with rapid speed of internationalization considered internationalization as part of their
strategy. While Air Canada Rouge targeted new customer segments and long-haul flights,
Southwest have still focused on domestic market.
Thus, strategies that include internationalization as part of the mission lead to an increased
international commercial intensity, and higher market breadth. Yet, no evidence is found related to
the impact on the commitment of foreign resources. This aligns with Chetty and Campbell-Hunt
(2004) who also argued the influence of firm’s strategy on internationalization speed.
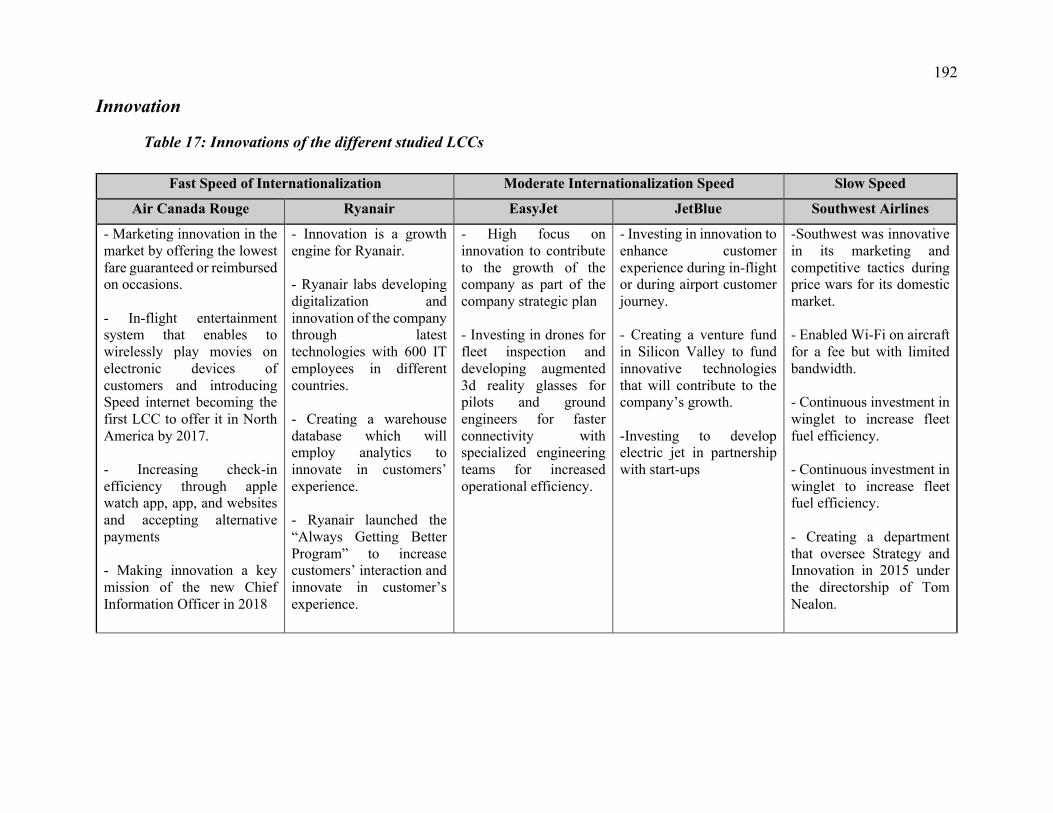
192
Innovation
Table 17: Innovations of the different studied LCCs
Fast Speed of Internationalization Moderate Internationalization Speed Slow Speed Air Canada Rouge Ryanair EasyJet JetBlue Southwest Airlines
- Marketing innovation in the market by offering the lowest fare guaranteed or reimbursed on occasions. - In-flight entertainment system that enables to wirelessly play movies on electronic devices of customers and introducing Speed internet becoming the first LCC to offer it in North America by 2017. - Increasing check-in efficiency through apple watch app, app, and websites and accepting alternative payments - Making innovation a key mission of the new Chief Information Officer in 2018
- Innovation is a growth engine for Ryanair. - Ryanair labs developing digitalization and innovation of the company through latest technologies with 600 IT employees in different countries. - Creating a warehouse database which will employ analytics to innovate in customers’ experience. - Ryanair launched the “Always Getting Better Program” to increase customers’ interaction and innovate in customer’s experience.
- High focus on innovation to contribute to the growth of the company as part of the company strategic plan - Investing in drones for fleet inspection and developing augmented 3d reality glasses for pilots and ground engineers for faster connectivity with specialized engineering teams for increased operational efficiency.
- Investing in innovation to enhance customer experience during in-flight or during airport customer journey. - Creating a venture fund in Silicon Valley to fund innovative technologies that will contribute to the company’s growth. -Investing to develop electric jet in partnership with start-ups
-Southwest was innovative in its marketing and competitive tactics during price wars for its domestic market. - Enabled Wi-Fi on aircraft for a fee but with limited bandwidth. - Continuous investment in winglet to increase fleet fuel efficiency. - Continuous investment in winglet to increase fleet fuel efficiency. - Creating a department that oversee Strategy and Innovation in 2015 under the directorship of Tom Nealon.
193
Air Canada Rouge and Southwest Airlines have used innovative marketing tactics to gain
market share. Through cases presentation, innovation was perceived as a core engine for LCCs
growth. This can be illustrated by the case of Southwest that focused on innovation by creating a
department with innovation as a mission in parallel to internationalization. For LCCs, Innovation
contributes to the simplification of process, increasing the efficiency, and offering competitive
products (Table 17).
Despite the role of innovation in internationalization speed as presented in theory, findings
indicate that the impact of innovation on the speed of internationalization is not as important as
the other factors. Innovative marketing campaign and operational efficiency represented a
facilitator for increased revenues. However, no strong evidence or findings indicated the direct
influence of innovation on any of the internationalization speed components. While innovation
contributes to increased efficiency and product offering, data analysis suggests no direct impact
on internationalization speed in comparison to other factors.
In Contrary, the existing literature indicates that innovation influence the
internationalization speed of firms (e.g. Luo, et al., 2005; Weerawardena et al., 2007; Ramos et
al., 2011; Langseth et al., 2016). Some authors confirmed that leveraging innovative technologies
or establishing innovative processes increase internationalization speed (Julien & Ramangalahy,
2003; Teixeira & Coimbra, 2014). However, this contribution did not observe a direct impact.
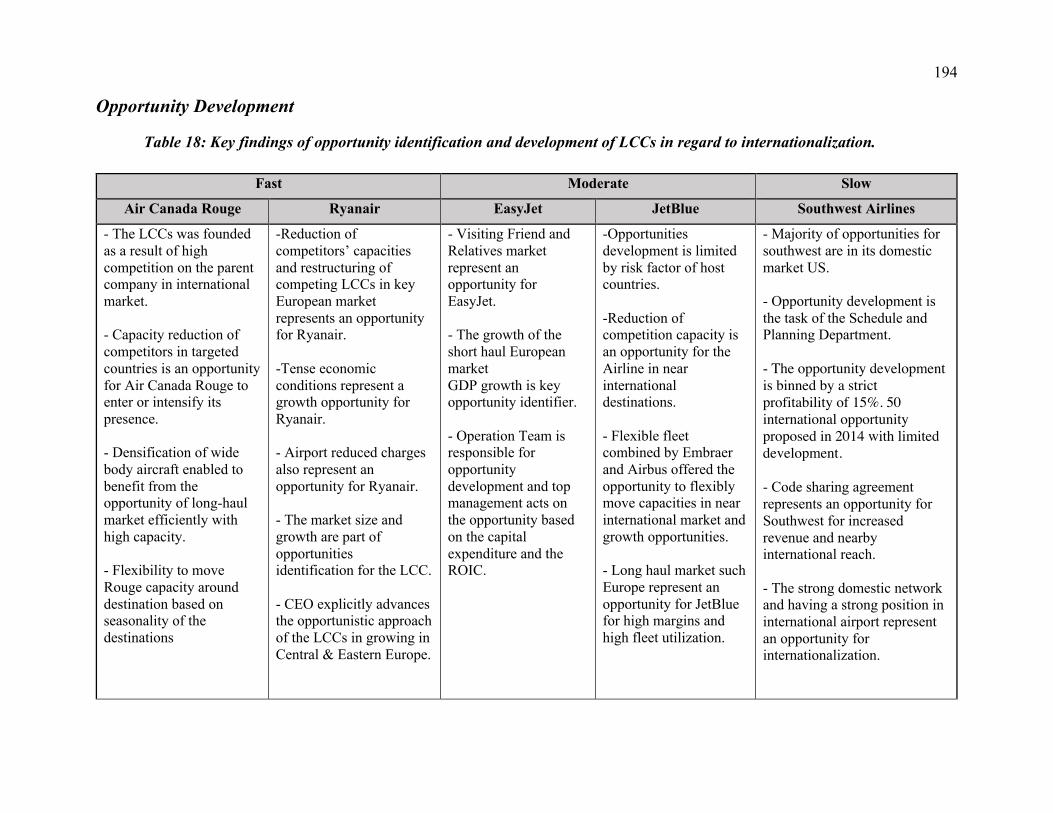
194
Opportunity Development
Table 18: Key findings of opportunity identification and development of LCCs in regard to internationalization.
Fast Moderate Slow Air Canada Rouge Ryanair EasyJet JetBlue Southwest Airlines
- The LCCs was founded as a result of high competition on the parent company in international market. - Capacity reduction of competitors in targeted countries is an opportunity for Air Canada Rouge to enter or intensify its presence. - Densification of wide body aircraft enabled to benefit from the opportunity of long-haul market efficiently with high capacity. - Flexibility to move Rouge capacity around destination based on seasonality of the destinations
-Reduction of competitors’ capacities and restructuring of competing LCCs in key European market represents an opportunity for Ryanair. -Tense economic conditions represent a growth opportunity for Ryanair. - Airport reduced charges also represent an opportunity for Ryanair. - The market size and growth are part of opportunities identification for the LCC. - CEO explicitly advances the opportunistic approach of the LCCs in growing in Central & Eastern Europe.
- Visiting Friend and Relatives market represent an opportunity for EasyJet. - The growth of the short haul European market GDP growth is key opportunity identifier. - Operation Team is responsible for opportunity development and top management acts on the opportunity based on the capital expenditure and the ROIC.
-Opportunities development is limited by risk factor of host countries. -Reduction of competition capacity is an opportunity for the Airline in near international destinations. - Flexible fleet combined by Embraer and Airbus offered the opportunity to flexibly move capacities in near international market and growth opportunities. - Long haul market such Europe represent an opportunity for JetBlue for high margins and high fleet utilization.
- Majority of opportunities for southwest are in its domestic market US. - Opportunity development is the task of the Schedule and Planning Department. - The opportunity development is binned by a strict profitability of 15%. 50 international opportunity proposed in 2014 with limited development. - Code sharing agreement represents an opportunity for Southwest for increased revenue and nearby international reach. - The strong domestic network and having a strong position in international airport represent an opportunity for internationalization.
195
It was noticeable that all LCCs identify continuously opportunities to increase their
international reach. These opportunities are identified based on the market conditions, competitors’
financial health, and institutional changes (Table 18). According to the findings of chapter 4, the
difference between LCCs with slow speed and high speed of internationalization remains in the
willingness to undertake risk. While all LCCs are active in opportunities identification, the
opportunity development is what differentiate between an increased or slow speed of
internationalization.
This leads to proposing that the higher the risk tolerance –that is demonstrated through high
and complex key performance criteria to identify opportunities- leads to increased international
commercial intensity and market breadth. While LCCs with fast and moderate speed were engaging
in active development of international opportunities with lenient profitability requirement on first
quarters, Southwest -with slow speed- have strict profitability criterion for opportunities
development.
As Table 18 proposes, the more complex are the criteria to select opportunities, the lower
is the LCC’s speed of internationalization. Oviatt and McDougall (2005), and Langseth et al.
(2016) suggested in their contributions the role of opportunity development in driving
internationalization speed. Also, our findings align with the contribution of McNaughton (2003).
This author indicated that the source of a rapid internationalization is explained by the ability to
take risk, and to be the first mover on an opportunity.
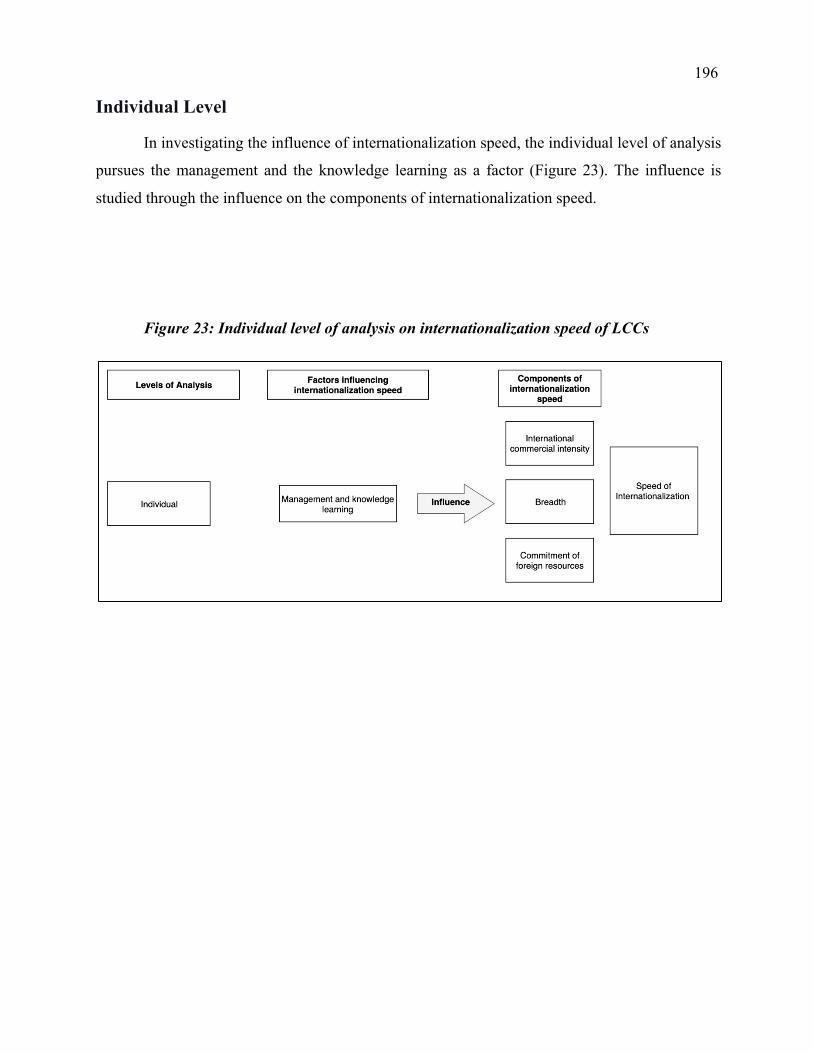
196
Individual Level
In investigating the influence of internationalization speed, the individual level of analysis
pursues the management and the knowledge learning as a factor (Figure 23). The influence is
studied through the influence on the components of internationalization speed.
Figure 23: Individual level of analysis on internationalization speed of LCCs
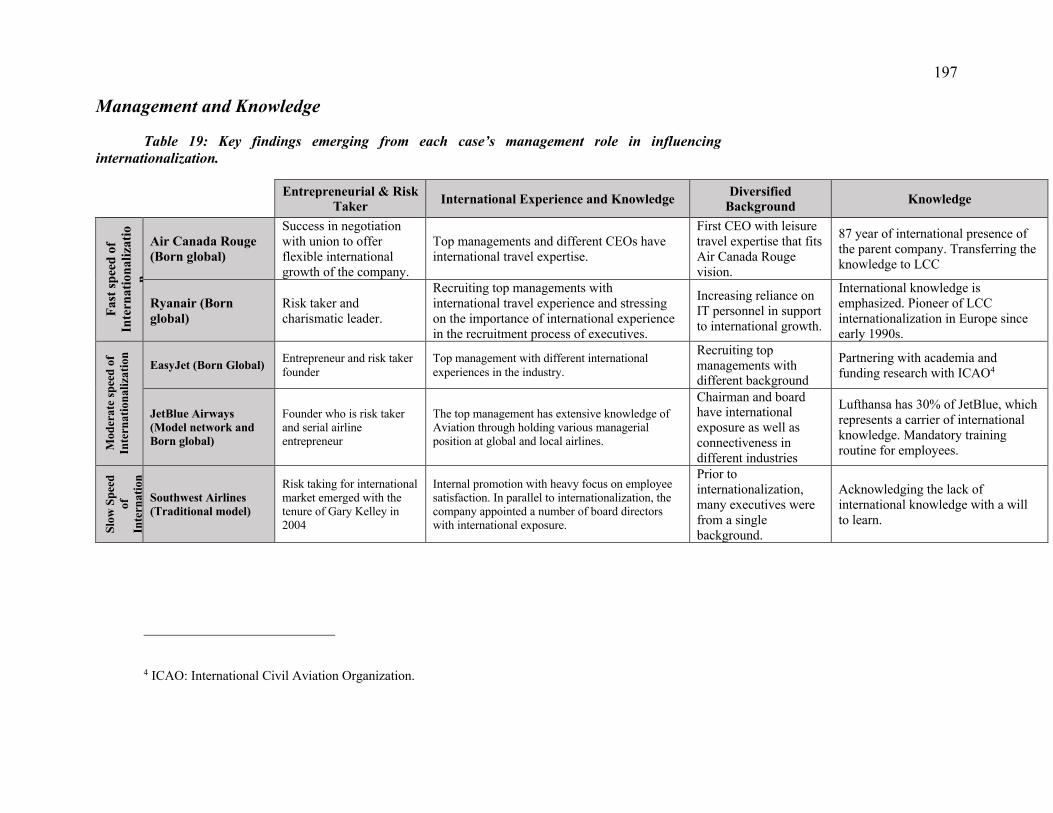
197
Management and Knowledge
Table 19: Key findings emerging from each case’s management role in influencing internationalization.
4 ICAO: International Civil Aviation Organization.
Entrepreneurial & Risk Taker International Experience and Knowledge Diversified
Background Knowledge
Fast
spee
d of
In
tern
atio
naliz
atio
n
Air Canada Rouge (Born global)
Success in negotiation with union to offer flexible international growth of the company.
Top managements and different CEOs have international travel expertise.
First CEO with leisure travel expertise that fits Air Canada Rouge vision.
87 year of international presence of the parent company. Transferring the knowledge to LCC
Ryanair (Born global)
Risk taker and charismatic leader.
Recruiting top managements with international travel experience and stressing on the importance of international experience in the recruitment process of executives.
Increasing reliance on IT personnel in support to international growth.
International knowledge is emphasized. Pioneer of LCC internationalization in Europe since early 1990s.
Mod
erat
e spe
ed o
f In
tern
atio
naliz
atio
n
EasyJet (Born Global) Entrepreneur and risk taker founder
Top management with different international experiences in the industry.
Recruiting top managements with different background
Partnering with academia and funding research with ICAO4
JetBlue Airways (Model network and Born global)
Founder who is risk taker and serial airline entrepreneur
The top management has extensive knowledge of Aviation through holding various managerial position at global and local airlines.
Chairman and board have international exposure as well as connectiveness in different industries
Lufthansa has 30% of JetBlue, which represents a carrier of international knowledge. Mandatory training routine for employees.
Slow
Spe
ed
of
Inte
rnat
ion
aliz
atio
n
Southwest Airlines (Traditional model)
Risk taking for international market emerged with the tenure of Gary Kelley in 2004
Internal promotion with heavy focus on employee satisfaction. In parallel to internationalization, the company appointed a number of board directors with international exposure.
Prior to internationalization, many executives were from a single background.
Acknowledging the lack of international knowledge with a will to learn.
198
Four sub-themes of management and learning have emerged while analyzing the cases.
These four recurring sub-themes are entrepreneurial and risk taking of the management,
international experience and knowledge of the management, diversified background of the
management, and knowledge learning capacities. Hereafter, key findings of each sub themes will
be presented and explained according to their relevance to the research. Finally, a discussion based
on the existing literature review is provided.
Entrepreneurial and Risk Taker
The entrepreneurial and risk-taking traits of management were present in regard to internationalization process of LCCs (Management and Knowledge
Table 19). By cross case analyzing the LCCs management, differences and patterns
emerged across fast and slow LCCs. Even though the leadership of all LCCs exhibited risk taking
and entrepreneurial traits, the direction of focus of these traits affects internationalization speed.
The focus direction of leadership in regard to internationalization and the level of risk tolerance
influence the internationalization speed (Langseth et al., 2016; Ruzzier et al., 2006). For the
context of this study, these traits have contributed to rapid international commercial intensity soon
after inception for fast and moderate speed LCCs.
In contrast to the other LCCs, Southwest leadership has directed their risk-taking efforts to
domestic market for more than 30 years. As soon as Southwest management included near
international in their focus, they engaged in major initiative that were the first in size of the airlines’
history. These traits have direct impact on the internationalization speed because of the influencing
position of the top management (Sullivan & Bauerschmidt, 1990). This aligns with the thesis as
these traits influence internationalization speed through increased international commercial
intensity.
The Link to Internationalization Speed. The risk taker and entrepreneurial top
management reduce the time of entry and develops subsequent international activities. For
example, the fast internationalizing LCCs have internationalized on average 2 years after
foundation. Since inception, the fast internationalizing LCCs developed a growing network of
international destinations across different countries. The findings confirm that risk taker
199
entrepreneur have high tolerance for business ambiguities, which influence the speed of
internationalization (Acedo & Jones, 2007). Entrepreneurial and risk-taking traits are also apparent
through the proactivity of the fast LCCs management. They are proactive in identifying
international opportunities and engaging in airlines cooperation and commercial agreements that
increase international exposure. This is in line with Pla-Barber and Escriba-Esteve, (2006) in
arguing the positive effect of proactivity of management on internationalization speed.
Thus, the management risk taking, and entrepreneurial traits lead to a significant positive
impact on the market breadth and international commercial intensity. At some extent, this factor
can also have a slight impact on the commitment to foreign resources.
International experience and knowledge of the management
The international experience and knowledge learning of the management are sources of influence on the internationalization speed of LCCs (Management and Knowledge
Table 19). A clear pattern emerged among LCCs in regard to international experience of
the management and internationalization speed. As the slow LCC appointed new directors with
international expertise to support international expansion, the fast internationalizing LCC were
stressing the importance of international experience in supporting international growth.
Since inception, the management of fast internationalizing LCCs possesses international
experience and knowledge, which is not the case of the slow internationalized LCCs. Upon
international interest, Southwest Airlines realized the need for managements with international
expertise and carried wide management change in parallel to internationalization. Prior to
internationalization, Southwest focused on strong internal promotion to key positions.
In parallel, the capacity of developing internationalization learning is important to
internationalization speed. All LCCs presented the importance of learning in influencing
internationalization speed. Part of learning international markets, Southwest engaged in code share
as an important step to acquire the international market knowledge before increasing commitment
(Du et al., 2008). The international expertise facilitates the internationalization of LCCs to
200
different countries with less ambiguity. This translates into increased international commercial
intensity, which directly influences internationalization speed.
Therefore, this study concludes that the higher is the international management experience
and knowledge, the greater is the impact on the international market intensity, the greater is the
impact on the breadth of the market, and the greater is the impact on the commitment in foreign
countries.
Diversified background of the management
The diverse background of the management emerged as a difference among the management of LCCs. While the slow internationalizing LCCs relied on strong internal promotions with common background, the fast internationalizing LCCs have recruited top executives with diversified backgrounds to win the international expansion (Management and Knowledge
Table 19). The fast and moderate speed LCCs recruited top management with
competencies, which are rare in the industry, that will help the company (e.g. branding, online
distribution, marketing, data scientist).
These backgrounds contribute to adapting the strategic vision of firms in focusing on
increasing the international revenues. Thus, this factor impacts significantly all the three components of the speed of internationalization.

201
202
Chapter 7: Conclusion
Internationalization speed has been a topic of interest to different scholars in various
industries (Oviatt & McDougall, 2005; Rialp et al., 2005). This concept is defined differently
among scholars since some of them define it as the time to internationalize (Casillas & Moreno-
Menéndez, 2014). But for other authors, the speed of internationalization accounts for different
components in relation to time (Chetty et al., 2014; Casillas & Acedo, 2013; Prashantham and
Young, 2011).
LCCs have been considered as a unique model in the airline industry that demonstrated
solid growth. Still, different researches and reports identified more opportunities for growth,
mostly in the long-haul segment (CAPA, 2018, May 31; HOFMANN, 2019; Binggeli & Weber,
2013, June). While the growth is very likely in this industry, the following contribution assesses
the factors that are more likely to increase the speed of internationalization. In other words, the
thesis identifies the main forces that lead to either a fast, moderate or slow speed of
internationalization. The contribution equips management teams in the industry with a framework
that proposes factors contributing to increased internationalization speed, and thus, gaining a
competitive advantage. For this, the following contribution considers five main companies that
are: Air Canada Rouge, Ryanair, EasyJet, JetBlue, and Southwest Airlines.
In order to assess the factors that impact the speed of internationalization, the following
contribution built a unique theoretical framework that has multiple layers. Initially, the framework
identifies the levels of factors that impact the speed of internationalization. These factors are
divided into three main levels that are: organizational level, supra-organizational level, and
individual level (Casillas et al., 2010). Each of these levels accounts for different factors.
In order to conduct the analysis, chapter IV and V use two different methodologies.
Concerning the first method used, it accounts for a narrative process that analyzes each company
as a unique case study. In addition to that, this method uses historical data –such as annual reports,
conference calls, media interviews, and others- to analyze the different elements within each factor
that leads to either a higher, moderate or slow speed of internationalization. But for the second
method, it accounts for the measurement of the speed of internationalization using unidimensional
203
and multidimensional methods. The second method enables calculating the speed of
internationalization for each company. Empirical findings indicate that for Air Canada Rouge and
Ryanair, they ranked as LCCs with a fast speed of internationalization while EasyJet and JetBlue
yielded a moderate speed of internationalization. But for Southwest Airlines, slow speed of
internationalization resulted.
The two methods are considered as complementary, as the analysis and discussion chapter
draw the link between the results of the narrative process of each case company, and links it with
the measured speed of internationalization for each company.
Concerning the organizational level, it represents a source of influence on the
internationalization speed of LCCs. The organizational level is composed of the following factors:
technology, resources, strategy, innovation, and opportunity development. The factors are not
equally influencing the internationalization speed of LCCs. While technology, resources, strategy,
and opportunity development are the strongest factors influencing internationalization speed
through its components, innovation is of less influence than the latter factors.
For the supra-organizational level, it represents a source of influence on
internationalization speed through competition, institutional environment, and business networks.
While business networks and competition contribute to the internationalization speed of LCCs, the
institutional environment represents an important factor that strongly influences the speed of
internationalization. This includes both the institutional environment of the host and home
countries that are noticed to intervene as limiters or attractions to a lower or higher
internationalization speed of LCCs.
Balanced management of these factors at different levels contribute to increased
internationalization speed. All the studied LCCs remained in strong financial health despite
economic downturns and subsequent aggressive international growth.
Academic Contribution
The theoretical framework represents a contribution to internationalization speed research.
This contribution adds to the existing research by combining factors from the internationalization
business research and the international entrepreneurship fields to study the internationalization
204
speed. This aligns with the call of Oviatt and McDougall (2005). The thesis organized the factors
in three mutually exclusive levels that are supra-organizational, organization, and individual
(Casillas et al., 2010).
Moreover, the thesis merges different internationalization speed measurement methods that
account for a multidimensional method (Lin, 2012; Chang & Rhee, 2011; Chetty et al., 2014;
Casillas & Acedo, 2013) and unidimensional methods (Ramos et al., 2011; Musteen et al., 2010;
Chetty et al., 2014; Zhou, 2007). By conducting internationalization speed measurement on LCCs,
the thesis enriches the literature where a limited application of these measurements was suggested
(Chetty et al., 2014). For example, the study uses the distance concept in internationalization speed
measurement, which is needed for internationalization speed research (Chetty et al., 2014)
Also, this contribution shows the link of influence on internationalization speed in a
qualitative study through the components of internationalization speed. The use of this link is rare
in internationalization speed research (Casillas & Acedo, 2013). Finally, the current research
targets analyzing the speed of internationalization within the LCC industry, which is very critical
and very lacking in the current literature.
Practical Contributions
CAPA (2018, May 31) advanced the expected significant growth of LCCs across the
Atlantic. Despite the challenges of the long-haul market, Willie Walsh (CEO, International
Airlines Group) believes that the long-haul market is an underserved opportunity by LCCs
(HOFMANN, 2019) and claims that the long-haul market can be low-cost (CAPA, 2013, April
17). Many researchers expect LCCs to pursue growth within this segment, and mainly the 4hrs-
7hrs stage length. This has proven success stories in Asia, such as the case of AirAsia X and Jetstar
Airways (Binggeli & Weber, 2013, June).
The recent development of world economics due to COVID19 has caused the paralysis of
the commercial airline market. More than ever, the commercial airline industry will see disruptive
trends emerging post COVID19 crisis. The upcoming global airline economy will need healthy
margins, successful international re-entries, and rapid new foreign market entries.
205
The theoretical framework can work for LCC businesses as a consulting medium. It is
important to note that the recovery phase in the post COVID19 period is important, especially with
the increased sensitivity of the regulatory environment in different markets. An analysis of the
factors that are the source of rapid internationalization can contribute to a rebirth of different LCCs.
While each factor influences the speed of internationalization for LCCs, it will be beneficial to
combine all these factors to offer a holistic analysis that will enable balancing between them and
reaching a balanced rapid internationalization speed. For LCCs consulting business sector and
strategist, the framework represents a tool of analysis with mutually exclusive levels of factors.
Limitation and further research
To augment the quality of data, the use of Natural Language Processing (NLP) was
attempted. However, an important portion of documents wasn't usable for the proposed techniques.
In reinforcing the use of public archival documents in research, the full digitization of archival
data is needed to enable the use of NLP.
Despite the extensive public data used, the study had the limitation of not using primary
sources such as on-site observations and interviews. However, the use of conference calls reduced
the limitation of interviews by having access to transcribed interviews between expert and analyst,
and the top management. The methodology adopted is prone to researcher bias in data analysis. In
reducing the limitation, different data sources were used, and a systematic process of data
collection and analysis was followed.
The thesis provides a fertile platform to study different angles of the internationalization
speed of LCCs. The study suggestion for further research are:
1) The significance of each factor is an avenue of research for LCCs internationalization
speed. This can be used by combining qualitative and quantitative methods. Increasing the
number of LCCs studied and verifying and validating these factors through a quantitative
study.
2) Another stream of research is the internationalization performance vis-à-vis the different
internationalization speed of full-service airlines and LCCs. This stream helps understand
206
what forces that not only influence internationalization speed but also LCCs international
performance.
3) While the proposed theoretical framework is valid, still, future research needs to update it
with other emerging significant factors that influence the speed of internationalization.
4) More converging conceptualization of internationalization speed measurement and
definitions.
5) In-depth focus on internationalization processes of LCCs and their contribution to
internationalization speed.
6) A generalization of the framework can be reached by validating the framework in other
industries.
207
References
Acedo, F. J., & Jones, M. V. (2007). Speed of internationalization and entrepreneurial cognition: Insights and a comparison between international new ventures, exporters and domestic firms. Journal of world Business, 42(3), 236-252.
Agag, G. M., & El-Masry, A. A. (2017). Why do consumers trust online travel websites? drivers and outcomes of consumer trust toward online travel websites. Journal of Travel Research, 56(3), 347-369. doi:10.1177/0047287516643185
Aharoni, Y. (1966). The foreign investment decision process (Vol. 403). Boston: Division of Research, Graduate School of Business Administration, Harvard University.
Ahokangas, A. (1998) Internationalization and Resources: An Analysis of Process in Nordic SMEs, Acta Wasaensia, No. 64, Universitas Wasaensis, Wasa.
Air Canada Media Room (2018, June). Air Canada Begins Offering Satellite Connectivity on International Flights. Air Canada Media Room
Air Canada Media Room (2018, March). Air Canada Appoints Robert Alan Read Vice-President, Airports, for North America. Aircanada media room
Air Canada Media Room. (2012, Decemeber). Air Canada rouge™: Introducing Canada's New Leisure Airline. Air Canada Media Room. https://aircanada.mediaroom.com/index.php?s=22103&item=136328
Air Canada. (2013, February). Q4 2012 Air Canada Inc Earnings Conference Call - Final Factiva Database
Air Canada. (2013, May). Q1 2013 Air Canada Inc Earnings Conference Call - Final. Factiva Database
Air Canada. (2013). Annual report 2012. https://www.aircanada.com/ca/en/aco/home/about/investor-relations.html
Air Canada. (2014, May). Q1 2014 Air Canada Inc Earnings Conference Call - Final Factiva Database
Air Canada. (2014, August). Q2 2014 Air Canada Earnings Call - Final Factiva Database
Air Canada. (2014, February). Q4 2013 Air Canada Inc Earnings Conference Call - Final. Factiva Database
Air Canada. (2014, February). Q4 2014 Air Canada Earnings Call - Final. Factiva Database
Air Canada. (2014, May). Q1 2014 Air Canada Inc Earnings Conference Call - Final. Factiva Database
Air Canada. (2014, November). Q3 2014 Air Canada Inc Earnings Conference Call - Final. Factiva Database
208
Air Canada. (2015, August). Q2 2015 Air Canada Earnings Call - Final. Factiva Database
Air Canada. (2015, December). Air Canada at Credit Suisse Industrials Conference - Final. Factiva Database
Air Canada. (2015, May). Q1 2015 Air Canada Earnings Call - Final. Factiva Database
Air Canada. (2015, September). Air Canada at Cowen Global Transportation Conference - Final. Factiva Database
Air Canada. (2016, April). Q1 2016 Air Canada Earnings Call - Final. Factiva Database
Air Canada. (2016, February). Q4 2015 Air Canada Earnings Call - Final. Factiva Database
Air Canada. (2016, November). Q3 2016 Air Canada Earnings Call - Final. Factiva Database
Air Canada. (2016, September). Air Canada at CIBC Eastern Institutional Investor Conference - Final. Factiva Database
Air Canada. (2017, August). Q2 2017 Air Canada Earnings Call - Final. Factiva Database
Air Canada. (2017, February). Q4 2016 AIR Canada Earnings Call - Final. Factiva Database
Air Canada. (2017, October). Q3 2017 Air Canada Earnings Call - Final. Factiva Database
Air Canada. (2017, September). AIR Canada 2017 Investor Day - Final. Factiva Database
Air Canada. (2017a, May). Q1 2017 Air Canada Earnings Call - Final. Factiva Database
Air Canada. (2017b, May). AIR Canada Annual Shareholders Meeting - Final. Factiva Database
Air Canada Media Room. (2017, December 1). Air Canada Rouge to Launch Non-Stop Montreal-Victoria Flights for Summer 2018. Aircanada media room. https://aircanada.mediaroom.com/2017-12-01-Air-Canada-Rouge-to-Launch-Non-Stop-Montreal-Victoria-Flights-for-Summer-2018
Air Canada Media Room. (2017, December 17). Air Canada Launches Montreal-Lima Service; First Year-Round Non-Stop South American Flights from Montreal. Aircanada media room. https://aircanada.mediaroom.com/2017-12-17-Air-Canada-Launches-Montreal-Lima-Service-First-Year-Round-Non-Stop-South-American-Flights-from-Montreal
Air Canada Media Room. (2017, November).Air Canada Expands Acceptance of Alternative Payments for International Transactions to Support Global Growth Strategy. Air Canada Media Room
Air Canada Media Room. (2017, October). Air Canada partners with Amadeus to support international network and improvements to customer experience. Air Canada Media Room,
Air Canada Media Room. (2018, September). Title .Air Canada Media Room, 2018, September
209
Air Canada. (2018, April). Air Canada Annual Shareholders Meeting - Final. Factiva Database
Air Canada. (2018, April). Q1 2018 Air Canada Earnings Call - Final. Factiva Database
Air Canada. (2018, February). Q4 2017 Air Canada Earnings Call - Final. Factiva Database
Air Canada. (2018, July). Q2 2018 Air Canada Earnings Call - Final. Factiva Database
Air Canada. (2018, March). Air Canada at JPMorgan Aviation, Transportation & Industrials Conference - Final. Factiva Database
Air Canada. (2018, May). Air Canada at Bank of America Merrill Lynch Transportation Conference - Final. Factiva Database
Air Canada. (2018, October). Q3 2018 Air Canada Earnings Call - Final. Factiva Database
Air Canada. (2018, September). Air Canada at Cowen Global Transportation Conference - Final. Factiva Database
Air Canada. (2018). Annual report 2017. https://www.aircanada.com/ca/en/aco/home/about/investor-relations.html
Air Canada. (2019). Annual report 2018. https://www.aircanada.com/ca/en/aco/home/about/investor-relations.html
Air Canada. (2019). Letter to shareholder 2018
Aircanada media room (2017, May). Air Canada To Offer High-Speed Internet on Air Canada Rouge. Air Canada Media Room. https://aircanada.mediaroom.com/2017-05-12-Air-Canada-To-Offer-High-Speed-Internet-on-Air-Canada-Rouge
Aircanada Media Room. (2017, June 1). Air Canada is getting its summer off to an early start with 11 New International Services. Aircanada media room. https://aircanada.mediaroom.com/2017-06-01-Air-Canada-is-getting-its-summer-off-to-an-early-start-with-11-New-International-Services
AIRLIVE. (2017). The rapid rise of low-cost carriers in Europe. Retrieved from: https://www.airlive.net/news-the-rapid-rise-of-low-cost-carriers-in-europe/
Al-Kwifi, O. S., Frankwick, G. L., & Ahmed, Z. U. (2019). Achieving rapid internationalization of sub-Saharan African firms: Ethiopian Airlines' operations under challenging conditions. Journal of Business Research.
Albers, S., Heuermann, C., & Koch, B. (2010). Internationalization strategies of EU and Asia–Pacific low fare airlines. Journal of Air Transport Management, 16(5), 244-250. doi:10.1016/j.jairtraman.2009.12.001
210
Alderighi, M., Cento, A., Nijkamp, P., & Rietveld, P. (2012). Competition in the European aviation market: the entry of low-cost airlines. Journal of Transport Geography, 24, 223-233.
Andersen, O. (1993). On the internationalization process of firms: A critical analysis. Journal of international business studies, 24(2), 209-231.
Anna Aero (2018). LCC capacity in Europe set for half a billion seats in 2018; nine nations already at 50% market share; European share forecast for 50% in 2027. Anna Aero Airline Network News and Analysis. Retrieved from: https://www.anna.aero/2018/07/18/lcc-capacity-in-europe-set-for-half-a-billion-seats-in-2018/
ANNA AERO. (2018). Low-cost airline capacity in Europe set for half a billion seats in 2018. Retrieved from https://www.anna.aero/2018/07/18/lcc-capacity-in-europe-set-for-half-a-billion-seats-in-2018/
Arenius, P., Sasi, V., & Gabrielsson, M. (2005). Rapid internationalisation enabled by the Internet: The case of a knowledge intensive company. Journal of International Entrepreneurship, 3(4), 279-290.
Asmussen, C.G., Benito, G.R.G. and Petersen, B. (2009). Organizing foreign market activities: from entry mode choice to configuration decisions. International Business Review, 18, pp. 145–155.
ATAG (2005). The economic & social benefits of air transport. Retrieved from: https://www.icao.int/meetings/wrdss2011/documents/jointworkshop2005/atag_socialbenefitsairtransport.pdf
Athanassiou, N., & Nigh, D. (2002). The impact of the top management teams international business experience on the firms internationalization: Social networks at work. Management International Review, 4(2), 157–181.
Autio, E. and Sapienza, H. (2000) ‘Comparing process and born global perspectives in the international growth of technology-based new company’, in Bygrave, W.D., Brush, C.G., Davidsson, P., Fiet, J., Green, P., Harrison, R., Lerner, M., Meyer, G. Sohl, J. and Zacharachis, A. (Eds.): Frontiers of Entrepreneurship Research, pp.413–424, Center for Entrepreneurial Studies, Babson College.
Autio, E., Sapienza, H.J. and Almeida, J.G. (2000). Effects of age at entry, knowledge intensity, and imitability on international growth. Academy of Management Journal, 43, 909–924.
Autio, E., Sapienza, H.J. and Almeida, J.G. (2000). Effects of age at entry, knowledge intensity, and imitability on international growth. Academy of Management Journal, 43, pp. 909–924.
Aygoren, O., & Kadakal, C. A. (2018). A Novel Measurement of Speed in Early Internationalization of New Ventures. International Journal of Marketing Studies, 10(3), 1.
Azadian, F., & Vasigh, B. (2019). The blurring lines between full-service network carriers and low-cost carriers: A financial perspective on business model convergence. Transport Policy, 75, 19-26.
211
Bayfield, R., Dana, L.P. and Stewart, S. (2009) ‘Firm characteristics and internationalization strategies: an empirical investigation of New Zealand exporters’, International Journal of Globalisation and Small Business, Vol. 3, No. 3, pp.275–287.
BBC News. (2017, July 14). EasyJet picks Austrian base for post-Brexit plan - BBC News. https://www.bbc.com/news/business-40604375
Belobaba, P., Odoni, A., & Barnhart, C. (2015). The global airline industry. John Wiley & Sons.
Binggeli, U., & Weber, M. (2013). A short life in long haul for low-cost carriers. McKinsey & Company.
Bjorkman, I. and Forsgren, M. (2000) ‘Nordic international business research’, International Studies of Management and Organization, Vol. 30 , No. 1, pp.6–25.
Blankenburg, D., & Johanson, J. (1992). Managing network connections in international business. Scandinavian International Business Review, 1(1), 5-19. doi:10.1016/0962-9262(92)90033-3
Blue Swan Daily. (June 20, 2019). Top global airlines in 2019, by fleet size* [Graph]. In Statista. https://proxy2.hec.ca:2554/statistics/1013159/airlines-worldwide-fleet-size/
Bowen, R. M., Davis, A. K., & Matsumoto, D. A. (2002). Do conference calls affect analysts’ forecasts? Accounting Review, 77(2), 285–316.
Brito, C. and Costa e Silva, S. (2009) ‘When trust becomes the fourth ‘C’ of cooperation’, The Marketing Review, Vol. 9, No. 4, pp.289–299.
CAPA (2013). Airlines in Transition part 3: How full service airlines are reshaping models to be more competitive. Retrieved from: https://centreforaviation.com/analysis/reports/airlines-in-transition-part-3-how-full-service-airlines-are-reshaping-models-to-be-more-competitive-105757
CAPA (2018). LCCs continue to provoke change in airline models. Retrieved from: https://centreforaviation.com/analysis/airline-leader/lccs-continue-to-provoke-change-in-airline-models-418852
Casillas, J. C., & Acedo, F. J. (2013). Speed in the internationalization process of the firm. International Journal of Management Reviews, 15(1), 15-29.
Casillas, J. C., & Acedo, F. J. (2013). Speed in the Internationalization Process of the Firm. International Journal of Management Reviews, 15(1), 15–29. doi:10.1111/j.1468-2370.2012.00331.x
Casillas, J. C., & Moreno-Menendez, A. M. (2014). Speed of the internationalization process: The role of diversity and depth in experiential learning. Journal of International Business Studies, 45: 85–101.
Casillas, J. C., Acedo, F. J., & Barbero, J. L. (2010). Learning, unlearning and internationalisation: Evidence from the pre-export phase. International Journal of Information Management, 30(2), 162–173. doi:10.1016/j.ijinfomgt.2009.07.005
212
Catanzaro, A., Messeghem, K. and Sammut, S. (2011) ‘Towards a typology of born again international SMEs’, World Conference Proceedings, Washington: International Council for Small Business (ICSB).
Catherine, N.A. and Matthyssens, P. (2001) ‘Reframing internationalization theory: an introduction – reassessing the internationalization of the firm’, Volume Advances in International Marketing, Vol. 11, pp.3–11.
Cerrato, D., & Fernhaber, S. A. (2018). Depth versus breadth: Exploring variation and performance differences among internationalising new ventures. International Small Business Journal: Researching Entrepreneurship, 36(7), 758-779. doi:10.1177/0266242618783309
Chang, S.-J., & Rhee, J. H. (2011). Rapid FDI expansion and firm performance. Journal of International Business Studies, 42(8): 979–994.
Chen, C. I., & Yeh, C. H. (2012). Re-examining location antecedents and pace of foreign direct investment: Evidence from Taiwanese investments in China. Journal of Business Research, 65(8): 1171–1178.
Chetty, S., & Campbell-Hunt, C. (2004). A strategic approach to internationalization: a traditional versus a “born-global” approach. Journal of International marketing, 12(1), 57-81.
Chetty, S., Johanson, M., & Martín Martín, O. (2014). Speed of internationalization: Conceptualization, measurement and validation. Journal of World Business, 49(4), 633–650. doi:10.1016/j.jwb.2013.12.014
Chetty, S., Johanson, M., Martín, O., (2014). Speed of internationalization: Conceptualization, measurement and validation. Journal of World Business, 49(4), 633.
Coeurderoy, R., & Murray, G. (2008). Regulatory environments and location decisions: evidence from the early foreign market entries of new-technology-based firms. Journal of International Business Studies, 39(4), 670–687
Coeurderoy, R., & Murray, G. (2008). Regulatory environments and the location decision: evidence from the early foreign market entries of new-technology-based firms. Journal of International Business Studies, 39(4), 670–687.
de Wit, J. G., & Zuidberg, J. (2012). The growth limits of the low cost carrier model. Journal of Air Transport Management, 21, 17-23.
Diaconu, L. (2012). The development of the low-cost carriers’ business models. Southwest Airlines case study. Analele Ştiinţifice ale Universităţii» Alexandru Ioan Cuza «din Iaşi. Ştiinţe economice, 59(1), 231-239.
DiMaggio, P., & Powell, W. W. (1983). The iron cage revisited: Institutional isomorphism and collective rationality in organizational fields. American Sociological Review, 48(2), 147–160.
213
Dimitratos, P. and Jones, M.V. (2005) ‘Future directions for international entrepreneurship research’, International Business Review, Vol. 14, No. 2, pp.119–128.
Douglas, G., & Miller III, J. A. M. E. S. (1974). Economic regulation of domestic air transport. theory and practice.
Du, Y., McMullen, B. S., & Kerkvliet, J. R. (2008). The economic impact of the ATA/Southwest airlines code-share agreement. Research in Transportation Economics, 24(1), 51-60. doi:10.1016/j.retrec.2009.01.005
Dunning, J. H. (2000). The eclectic paradigm as an envelope for economic and business theories of MNE activity. International business review, 9(2), 163-190.
EasyJet (2007, November 20). Preliminary 2007 Easyjet plc Earnings Presentation - Final. Factiva Database
EasyJet (2008, November 18). Preliminary 2008 Easyjet plc Earnings Presentation - Final. Factiva Database
EasyJet (2011, May 10)Interim 2011 Easyjet PLC Earnings Presentation - Final. Factiva Database
EasyJet (2011, November 15).Preliminary 2011 Easyjet PLC Earnings Presentation - Final. Factiva Database
EasyJet (2012, May 9)Interim 2012 Easyjet plc Earnings Presentation - Final. Factiva Database
EasyJet (2013, May 15)Interim 2013 Easyjet PLC Earnings Conference Call (Listen only) - Final. Factiva Database
EasyJet (2013, November 19).Preliminary 2013 Easyjet plc Earnings Conference Call - Final. Factiva Database
EasyJet (2014, May 13)Interim 2014 Easyjet Plc Earnings Conference Call - Final. Factiva Database
EasyJet (2016, November 15).Full Year 2016 easyJet plc Earnings Call - Final. Factiva Database
EasyJet (2017, May 16)Half Year 2017 easyJet plc Earnings Call - Final. Factiva Database
EasyJet (2018, May 15)Half Year 2018 easyJet plc Earnings Call - Final. Factiva Database
EasyJet (2018, November 20). Full Year 2018 EasyJet PLC Earnings Call - Final. Factiva Database
EasyJet (n.d.). Route Map. http://www.easyjet.com/en/routemap
easyJet plc Capital Markets Day - Final. Factiva Database
EasyJet, (2007, May 9)Interim 2007 Easyjet plc Earnings Presentation - Final. Factiva Database
214
EasyJet, (2009, May 6)Interim 2009 Easyjet plc Earnings Presentation - Final. Factiva Database
EasyJet. (2006). Annual report 2005. https://corporate.easyjet.com/investors/reports-and-presentations/
EasyJet. (2007). Annual report 2006. https://corporate.easyjet.com/investors/reports-and-presentations/
EasyJet. (2008). Annual report 2007. https://corporate.easyjet.com/investors/reports-and-presentations/
EasyJet. (2009, November 17)Preliminary 2009 Easyjet plc Earnings Presentation - Final. Factiva Database
EasyJet. (2009). Annual report 2008. https://corporate.easyjet.com/investors/reports-and-presentations/
EasyJet. (2010). Annual report 2009. https://corporate.easyjet.com/investors/reports-and-presentations/
EasyJet. (2013). Annual report 2012. https://corporate.easyjet.com/investors/reports-and-presentations/
EasyJet. (2014). Annual report 2013. https://corporate.easyjet.com/investors/reports-and-presentations/
EasyJet. (2015). Annual report 2014. https://corporate.easyjet.com/investors/reports-and-presentations/
EasyJet. (2016). Annual report 2015. https://corporate.easyjet.com/investors/reports-and-presentations/
EasyJet. (2017). Annual report 2016. https://corporate.easyjet.com/investors/reports-and-presentations/
EasyJet. (2018). Annual report 2017. https://corporate.easyjet.com/investors/reports-and-presentations/
EasyJet. (2019). Annual report 2018. https://corporate.easyjet.com/investors/reports-and-presentations/
Eden, L. (2009). Letter from the Editor-in-Chief: Time in international business. Journal Of International Business Studies, 40(4), 535-538. doi: 10.1057/jibs.2009.5
Edwards, G. (2013). The influence of ceo narratives in organizational path dependence (dissertation). Concordia University.
Eisenhardt, K. M. (1989). Building theories from case study research. Academy of Management.the Academy of Management Review,14(4), 532. Retrieved from http://proxy2.hec.ca/login?url=https://search.proquest.com/docview/210938650?accountid=11357
Etemad, H., & Lee, Y. (2003). The knowledge network of international entrepreneurship: Theory and evidence. Small Business Economics, 20(1), 5–23.
EUROCONTROL. (2017). The rapid rise of low-cost carriers. Retrieved from: https://www.eurocontrol.int/news/rapid-rise-low-cost-carriers
Fiig, T., Cholak, U., Gauchet, M., & Cany, B. (2015). What is the role of distribution in revenue management? –Past and future. Journal of Revenue and Pricing Management, 14(2), 127-133.
215
Flight Airline Business. (2019). Leading low cost airlines worldwide in 2017, based on revenue (in billion U.S. dollars). In Statista - The Statistics Portal. Retrieved April 2, 2019, from https://www.statista.com/statistics/601700/revenue-of-low-cost-carriers-worldwide/.
Forsgren, M. (2002). The concept of learning in the Uppsala internationalization process model: a critical review. International business review, 11(3), 257-277.
George, J.M. and Jones, G.R. (2000). The role of time in theory and theory building. Journal of Management, 26, pp. 657–684.
Ghemawat, P. (2001). Distance still matters. the hard reality of global expansion. Harvard Business Review, 79(8), 137–40.
Ghemawat, P. (n.d.). CAGE Comparator™ Distance Analysis Selections. https://ghemawat.com/cage.
Graham, A. (2013). Understanding the low cost carrier and airport relationship: A critical analysis of the salient issues. Tourism Management, 36, 66-76.
Hadjikhani, A. (1997) ‘A Note on the criticisms against the internationalization process model’, Management International Review, Vol. 37, No. 2, pp.43–66.
Hilmersson, M., & Johanson, M. (2015). Speed of SME Internationalization and Performance. Management International Review, 56(1), 67–94. doi:10.1007/s11575-015-0257-4
HOFMANN, K. (2019). in for the LONG HAUL. Air Transport World, 56(3), 44.
Holm, D. B., Eriksson, K., & Johanson, J. (1999). Creating value through mutual commitment to business network relationships. Strategic management journal, 20(5), 467-486.
Humerinta-Peltomäki, L. (2003). Time and internationalisation theoretical challenges set by rapid internationalisation. Journal of International Entrepreneurship, 1, 217–236.
IATA. (2019). Revenue of commercial airlines worldwide from 2003 to 2020 (in billion U.S. dollars). Statista. Retrieved from https://proxy2.hec.ca:2554/statistics/278372/revenue-of-commercial-airlines-worldwide/
ICAO (2017a). The World of Air Transport in 2017. ICAO Annual Report 2017. Retrieved from: https://www.icao.int/annual-report-2017/Pages/the-world-of-air-transport-in-2017.aspx
ICAO (n.d.). The World of Air Transport in 2017. ICAO Annyal Report 2017. Retrieved from: https://www.icao.int/annual-report-2017/Pages/the-world-of-air-transport-in-2017.aspx
Ietto-Gillies, G. (2012) Transnational Corporations: Fragmentation amidst Integration, Routeldge, London.
JetBlue Airways. (2002, July). Q2 2002 Jetblue Airways Corp Earnings Conference Call - Final. Factiva Database
216
JetBlue Airways. (2003, June). JetBlue Company Announcement Conference Call - Final. Factiva Database
JetBlue Airways. (2003, October). Q3 2003 JetBlue Airways Earnings Conference Call - Final. Factiva Database
JetBlue Airways. (2004, February). JetBlue Airways at Deutsche Bank Securities Transportation Conference - Final. Factiva Database
JetBlue Airways. (2004, January). Q4 2003 JetBlue Airways Earnings Conference Call - Final. Factiva Database
JetBlue Airways. (2005, April). Q1 2005 JetBlue Airways Earnings Conference Call - Final. Factiva Database
JetBlue Airways. (2005, January ). Event Brief of Q4 2004 JetBlue Airways Earnings Conference Call - Final. Factiva Database
JetBlue Airways. (2005, July). Event Brief of Q2 2005 JetBlue Airways Earnings Conference Call - Final. Factiva Database
JetBlue Airways. (2006, December). JetBlue Analyst Day - Final. Factiva Database
JetBlue Airways. (2006, January). Q4 2005 JetBlue Airways Earnings Conference Call - Final. Factiva Database
JetBlue Airways. (2007, October). Q3 2007 JetBlue Airways Earnings Conference Call - Final. Factiva Database
JetBlue Airways. (2007b, February, 22). Event Brief of JetBlue Investor Conference Call - Final. Factiva Database
JetBlue Airways. (2008, April). Q1 2008 JetBlue Airways Earnings Conference Call - Final. Factiva Database
JetBlue Airways. (2008, January). Q4 2007 JetBlue Airways Earnings Conference Call - Final. Factiva Database
JetBlue Airways. (2008, September, 10). JetBlue Airways Analyst Day - Final. Factiva Database
JetBlue Airways. (2008). Annual Report 2007. JetBlue. http://blueir.investproductions.com/investor-relations/financial-information/reports/annual-reports.
JetBlue Airways. (2009, April). Q1 2009 JetBlue Airways Earnings Conference Call - Final. Factiva Database
JetBlue Airways. (2009, December). JetBlue Airways at Next Generation Equity Research Airlines Conference - Final. Factiva Database
217
JetBlue Airways. (2009, July). Event Brief of Q2 2009 JetBlue Airways Earnings Conference Call - Final. Factiva Database
JetBlue Airways. (2009). Annual Report 2008. JetBlue. http://blueir.investproductions.com/investor-relations/financial-information/reports/annual-reports.
JetBlue Airways. (2010, January). Q4 2009 JetBlue Airways Earnings Conference Call - Final. Factiva Database
JetBlue Airways. (2010, June). JetBlue Airways at Bank of America Merrill Lynch Global Transportation Conference - Final. Factiva Database
JetBlue Airways. (2010, March). JetBlue Airways at JPMorgan Aviation, Transportation & Defense Conference - Final. Factiva Database
JetBlue Airways. (2010, October). Q3 2010 JetBlue Airways Earnings Conference Call - Final Factiva Database
JetBlue Airways. (2011, July). Q2 2011 Jetblue Airways Corp Earnings Conference Call - Final. Factiva Database
JetBlue Airways. (2011, June, 21). Event Brief of Jetblue Airways Corp Announces a Network-driven Revision and Extension of its A320 Delivery Schedule Conference Call - Final. Factiva Database
JetBlue Airways. (2011, May, 26). Jetblue Airways 2011 Annual Shareholders Meeting - Final. Factiva Database
JetBlue Airways. (2011, May). Jetblue Airways Corp at Bank of America Merrill Lynch Global Transportation Conference - Final. Factiva Database
JetBlue Airways. (2011). Annual Report 2010. JetBlue. http://blueir.investproductions.com/investor-relations/financial-information/reports/annual-reports.
JetBlue Airways. (2012, April). Event Brief of Q1 2012 JetBlue Airways Earnings Conference Call - Final. Factiva Database
JetBlue Airways. (2012, January). Event Brief of Q4 2011 JetBlue Airways Earnings Conference Call - Final. Factiva Database
JetBlue Airways. (2012, March). JetBlue Airways at JPMorgan Aviation, Transportation and Defense Conference - Final. Factiva Database
JetBlue Airways. (2012, October). Q3 2012 JetBlue Airways Earnings Conference Call - Final. Factiva Database
JetBlue Airways. (2012). Annual Report 2011. JetBlue. http://blueir.investproductions.com/investor-relations/financial-information/reports/annual-reports.
218
JetBlue Airways. (2013, April). Q1 2013 JetBlue Airways Earnings Conference Call - Final. Factiva Database
JetBlue Airways. (2013, January). Q4 2012 JetBlue Airways Earnings Conference Call - Final. Factiva Database
JetBlue Airways. (2013, July). Q2 2013 JetBlue Airways Earnings Conference Call - Final. Factiva Database
JetBlue Airways. (2013). Annual Report 2012. JetBlue. http://blueir.investproductions.com/investor-relations/financial-information/reports/annual-reports.
JetBlue Airways. (2014, April). Q1 2014 JetBlue Airways Earnings Conference Call - Final. Factiva Database
JetBlue Airways. (2014, January). Q4 2013 JetBlue Airways Earnings Conference Call - Final. Factiva Database
JetBlue Airways. (2014, July). Q2 2014 JetBlue Airways Corp Earnings Call - Final. Factiva Database
JetBlue Airways. (2014). Annual Report 2013. JetBlue. http://blueir.investproductions.com/investor-relations/financial-information/reports/annual-reports.
JetBlue Airways. (2015, October). Event Brief of Q3 2015 JetBlue Airways Corp Earnings Call - Final. Factiva Database
JetBlue Airways. (2015). Annual Report 2014. JetBlue. http://blueir.investproductions.com/investor-relations/financial-information/reports/annual-reports.
JetBlue Airways. (2016, April). Q1 2016 JetBlue Airways Corp Earnings Call - Final. Factiva Database
JetBlue Airways. (2016, January). Event Brief of Q4 2015 JetBlue Airways Corp Earnings Call - Final. Factiva Database
JetBlue Airways. (2017, April). Q1 2017 JetBlue Airways Corp Earnings Call - Final. Factiva Database
JetBlue Airways. (2017, January). Q4 2016 JetBlue Airways Corp Earnings Call - Final. Factiva Database
JetBlue Airways. (2017, July). Q2 2017 JetBlue Airways Corp Earnings Call - Final. Factiva Database
JetBlue Airways. (2017, October). Q3 2017 JetBlue Airways Corp Earnings Call - Final. Factiva Database
JetBlue Airways. (2017). Annual Report 2016. JetBlue. http://blueir.investproductions.com/investor-relations/financial-information/reports/annual-reports.
JetBlue Airways. (2018, April). Q1 2018 JetBlue Airways Corp Earnings Call - Final. Factiva Database
219
JetBlue Airways. (2018, January). Q4 2017 JetBlue Airways Corp Earnings Call - Final. Factiva Database
JetBlue Airways. (2018). Annual Report 2017. JetBlue. http://blueir.investproductions.com/investor-relations/financial-information/reports/annual-reports.
JetBlue Airways. (2019). Annual Report 2018. JetBlue. http://blueir.investproductions.com/investor-relations/financial-information/reports/annual-reports.
JetBlue Airways. (March). JetBlue Airways at JPMorgan Aviation Transportation and Industrials Conference - Final. Factiva Database
JetBlue Airways. (March). JetBlue Airways Corp at JPMorgan Aviation, Transportation & Industrials Conference - Final Factiva Database
JetBlue Airways. (May, 17). JetBlue Airways Corp Annual Shareholders Meeting - Final. Factiva Database
JetBlue Press Release. (2012, April 17). JetBlue | JetBlue Announces Codeshare with Japan Airlines (JAL). JetBlue. http://blueir.investproductions.com/investor-relations/press-releases/2012/04-17-2012-014742420/ ; ;
JetBlue Press Release. (2012, April 18). JetBlue | JetBlue Announces Codeshare with Emirates. JetBlue. http://blueir.investproductions.com/investor-relations/press-releases/2012/04-18-2012-014742311/ ; ;
JetBlue Press Release. (2012, February 28). JetBlue | JetBlue and Korean Air Announce New Interline Agreement to Connect Customers Between Asia and North America. JetBlue. http://blueir.investproductions.com/investor-relations/press-releases/2012/02-28-2012-014744280/; JetBlue Press Release. (2012, February 14). JetBlue | JetBlue and Japan Airlines Begin Interline Agreement to Offer More Convenience to Travellers Between North America and Asia. JetBlue. http://blueir.investproductions.com/investor-relations/press-releases/2012/02-14-2012-015028605/
JetBlue Press Release. (2012, February 6). JetBlue | JetBlue Smartly Redesigns Jetblue.com and Launches New iPhone Application. JetBlue. http://blueir.investproductions.com/investor-relations/press-releases/2012/02-06-2012-015029480/
JetBlue Press Release. (2013, April 3). JetBlue | JetBlue Announces its 80th City: Worcester, Massachusetts!. JetBlue. http://blueir.investproductions.com/investor-relations/press-releases/2013/04-03-2013-014728061/ ; ;
JetBlue Press Release. (2013, August 15). JetBlue | JetBlue and British Airways Connect Networks. JetBlue. http://blueir.investproductions.com/investor-relations/press-releases/2013/08-15-2013-015026730/ ; ;
220
JetBlue Press Release. (2013, February 21). JetBlue | JetBlue and Aer Lingus Announce Codeshare Agreement. JetBlue. http://blueir.investproductions.com/investor-relations/press-releases/2013/02-21-2013-014729592/ ; ;
JetBlue Press Release. (2013, November 12). JetBlue | JetBlue to Fly to 25 Caribbean Destinations This Winter and Expand Interline Partnerships to Even More Islands. JetBlue. http://blueir.investproductions.com/investor-relations/press-releases/2013/11-12-2013-015022136/
JetBlue Press Release. (2014, February 24). JetBlue | JetBlue Increases Its Caribbean Presence, Adds Port of Spain, Trinidad and Tobago to Its Growing Network. JetBlue. http://blueir.investproductions.com/investor-relations/press-releases/2014/02-24-2014-015018965/
JetBlue Press Release. (2014, May 12). JetBlue | JetBlue and Turkish Airlines Launch Codeshare Operations. JetBlue. http://blueir.investproductions.com/investor-relations/press-releases/2014/05-12-2014-015015683/
JetBlue Press Release. (2014, May 29). JetBlue | JetBlue and Singapore Airlines to Launch Codeshare Operations. JetBlue. http://blueir.investproductions.com/investor-relations/press-releases/2014/05-29-2014-015014699/
JetBlue Press Release. (2014, September 18). JetBlue | JetBlue Announces CEO Succession. JetBlue. http://blueir.investproductions.com/investor-relations/press-releases/2014/09-18-2014-015011387/
JetBlue Press Releases. (2002, April 11). JetBlue Announces Initial Public Offering of Its Common Stock. JetBlue. http://mediaroom.jetblue.com/investor-relations/press-releases/2002/04-11-2002-015159104; JetBlue Press Releases. (2002, April 30). ADVISORY/JetBlue Adds Twice-daily Nonstop Service Between Long Beach and Washington, DC -Dulles-; Low-Fare Airline on Track to Have 27 Departures by May, 2003.JetBlue . http://mediaroom.jetblue.com/investor-relations/press-releases/2002/04-30-2002-015158666
JetBlue Press Releases. (2002, April 30). ADVISORY/JetBlue Adds Twice-daily Nonstop Service Between Long Beach and Washington, DC -Dulles-; Low-Fare Airline on Track to Have 27 Departures by May, 2003.JetBlue . http://mediaroom.jetblue.com/investor-relations/press-releases/2002/04-30-2002-015158666
JetBlue Press Releases. (2002, May 31). JetBlue | Multimedia Available/JetBlue Debuts New Puerto Rico Service. JetBlue. http://blueir.investproductions.com/investor-relations/press-releases/2002/05-31-2002-015157354/ ; ;
JetBlue Press Releases. (2005, June 6). JetBlue | JetBlue Airways Opens Its Doors to a State-of-the-Art Training and Support Campus at the Orlando International Airport: Low-Fare Carrier Also Plans to Build and Operate a Corporate Lodge Adjacent to Its New Support Campus. JetBlue. http://blueir.investproductions.com/investor-relations/press-releases/2005/06-06-2005-014820951/ ; ;
221
JetBlue Press Releases. (2007, February 20). JetBlue | JetBlue Announces the JetBlue Customer Bill of Rights. JetBlue. http://blueir.investproductions.com/investor-relations/press-releases/2007/02-20-2007-015119917/ ; ;
JetBlue Press Releases. (2007, May 10). JetBlue | JetBlue Airways Names Dave Barger President and Chief Executive Officer; Founder David Neeleman Will Continue to Serve as Chairman of the Board. JetBlue. http://blueir.investproductions.com/investor-relations/press-releases/2007/05-10-2007-015116307/ ; ;
JetBlue Press Releases. (2007, November 14). JetBlue | JetBlue Announces Nonstop Service Between Orlando and Santo Domingo, Dominican Republic. JetBlue. http://blueir.investproductions.com/investor-relations/press-releases/2007/11-14-2007-015109964/ ; ;
JetBlue Press Releases. (2007, November 28). JetBlue | Pack Your Shorts: JetBlue Boosts Service to the Caribbean This Winter. JetBlue. http://blueir.investproductions.com/investor-relations/press-releases/2007/11-28-2007-015109417/ ; ;
JetBlue Press Releases. (2008, January 22). JetBlue | Lufthansa and JetBlue Complete Stock Purchase Transaction. JetBlue. http://blueir.investproductions.com/investor-relations/press-releases/2008/01-22-2008-015106636/ ; ;
JetBlue Press Releases. (2008, October 15). JetBlue | Sabor latino! JetBlue Airways Expands to South America with Daily Service to Bogota, Colombia. JetBlue. http://blueir.investproductions.com/investor-relations/press-releases/2008/10-15-2008-014800326/ ; JetBlue Press Releases. (2008, December 10). JetBlue | JetBlue Airways Spreads Its Wings in Latin America with New Daily Nonstop Service from Orlando to San Jose, Costa Rica. JetBlue. http://blueir.investproductions.com/investor-relations/press-releases/2008/12-10-2008-014758576; . JetBlue.
JetBlue Press Releases. (2009, April 16). JetBlue | JetBlue Names Rob Maruster Chief Operating Officer. JetBlue. http://blueir.investproductions.com/investor-relations/press-releases/2009/04-16-2009-014753498/ ; ;
JetBlue Press Releases. (2009, November 11). JetBlue | JetBlue and Lufthansa Begin Codeshare Operations. JetBlue. http://blueir.investproductions.com/investor-relations/press-releases/2009/11-11-2009-014745295/ ; ;
JetBlue Press Releases. (2010, March 31). JetBlue | American Airlines and JetBlue Airways Sign Agreement to Collaborate at Key East Coast Gateways. JetBlue. http://blueir.investproductions.com/investor-relations/press-releases/2010/03-31-2010-015055152/
222
JetBlue Press Releases. (2010, May 7). JetBlue | JetBlue Airways and EL AL Israel Airlines Announce Interline Agreement to Connect Customers Between U.S. and Israel. JetBlue. http://blueir.investproductions.com/investor-relations/press-releases/2010/07-22-2010-015051433/ ; ;
JetBlue Press Releases. (2010, September 8). JetBlue | JetBlue Announces New Service to Providenciales, Turks & Caicos Islands from New York and Boston. JetBlue. http://blueir.investproductions.com/investor-relations/press-releases/2010/09-08-2010-015050230/ ; ;
JetBlue Press Releases. (2011, March 8). JetBlue | JetBlue and LAN Partner to Offer New Interline Connections Between the Americas. JetBlue.http://blueir.investproductions.com/investor-relations/press-releases/2011/03-08-2011-015041995/
JetBlue Press Releases. (2011, September 19). JetBlue | JetBlue Just Can't Wait! Puerto Rico's Largest Carrier Launches Inaugural Service From San Juan to St. Thomas and St. Croix Three Days Early. JetBlue. http://blueir.investproductions.com/investor-relations/press-releases/2011/09-19-2011-015034558/ ; ;
JetBlue Press Releases. (2012, April 30). JetBlue | Fly JetBlue to Jamrock: Now Offering Twice Daily Service from Fort Lauderdale to Kingston, Jamaica. JetBlue. http://blueir.investproductions.com/investor-relations/press-releases/2012/04-30-2012-014741764;
JetBlue Press Releases. (2012, May 14). JetBlue | JetBlue Gets a New Home in San Juan!. JetBlue. http://blueir.investproductions.com/investor-relations/press-releases/2012/03-14-2012-014743514/ ; ;
JetBlue Press Releases. (2012, May 17). JetBlue | JetBlue Airways Announces Seasonal Jet Service From Boston to Nantucket. JetBlue. http://blueir.investproductions.com/investor-relations/press-releases/2012/02-13-2012-015028714/;
JetBlue Press Releases. (2012, October 4). JetBlue and Royal Air Maroc Partner to Bring More Access to Africa .http://mediaroom.jetblue.com/investor-relations/press-releases/2012/10-04-2012-014734655
JetBlue Press Releases. (2015, March 2). JetBlue and Royal Air Maroc to Become Codeshare Partners. JetBlue. http://mediaroom.jetblue.com/investor-relations/press-releases/2015/03-02-2015-015003793;
Jiménez, A., Luis-Rico, I., & Benito-Osorio, D. (2014). The influence of political risk on the scope of internationalization of regulated companies: Insights from a Spanish sample. Journal of World Business, 49(3), 301-311.
223
Johanson, J. and Vahlne, J-E. (1977) ‘The internationalization process of the firm: a model of knowledge development and increasing foreign markets commitments’, Journal of International Business, Vol. 8, No. 1, pp.23–32.
Johanson, J. and Vahlne, J-E. (2009) ‘The Uppsala internationalization process model revisited: from liability of foreignness to liability of outsidership’, Journal of International Business Studies, Vol. 40, No. 9, pp.1411–1431.
Johanson, J., & Mattsson, L. G. (2015). Internationalisation in industrial systems—a network approach. In Knowledge, networks and power (pp. 111-132). Palgrave Macmillan, London.
Johanson, J., & Mattsson, L.G. (1988). Internationalization in industrial systems: A network approach In: Hood, N., Vahlne, J-E., (eds), Strategies in global competition. Croom Helm, London, 194-213.
Johanson, J., & Vahlne, J. E. (1977). The internationalization process of the firm—A model of knowledge development and increasing foreign market commitment. Journal of International Business Studies, 8(1), 23–32.
Johanson, J., & Vahlne, J. E. (1990). The mechanism of internationalisation. International marketing review.
Johanson, J., & Vahlne, J. E. (2006). Commitment and opportunity development in the internationalization process: A note on the Uppsala Internationalization Process model. Management International Review, 46(2), 165– 178.
Johanson, J., & Vahlne, J. E. (2009). The Uppsala internationalization process model revisited: From liability of foreignness to liability of outsidership. Journal of international business studies, 40(9), 1411-1431.
Johanson, J., & Wiedersheim-Paul, F. (1975). The internationalization of the firm—Four Swedish cases. The Journal of Management Studies, 12(3), 305–322.
Jones, M. and Coviello, N.E. (2005). Internationalisation: conceptualising an entrepreneurial process of behaviour in time. Journal of International Business Studies, 36, pp. 284–303.
Julien, P. A., & Ramangalahy, C. (2003). Competitive strategy and performance of exporting SMEs: An empirical investigation of the impact of their export information search and competencies. Entrepreneurship Theory and Practice, 27(3), 227-245.
Khavul, S., Perez-Nordtvedt, L., & Wood, E. (2010). Organizational entrainment and the internationalization of new ventures from emerging markets. Journal of Business Venturing, 25(1): 104–119.
Kiss, A., & Danis, W. M. (2008). Country institutional context, social networks and new venture internationalization speed. European Management Journal, 26(6): 388–399.
224
Klein, K., Albers, S., Allroggen, F., & Malina, R. (2015). Serving vs. settling: What drives the establishment of low-cost carriers’ foreign bases?. Transportation Research Part A: Policy and Practice, 79, 17-30.
Klophaus, R. (2005). Frequent flyer programs for European low-cost airlines: Prospects, risks and implementation guidelines. Journal of Air Transport Management, 11(5), 348-353.
Knight, G.A. and Cavusgil, S. (2004) ‘Innovation, organizational capabilities and the born-global firm’, Journal of International Business Studies, Vol. 35, No. 2, pp.124–141.
Kogut, B., & Zander, U. (1993). Knowledge of the firm and the evolutionary theory of the multinational corporation. Journal of International Business Studies, 24(4): 625–645.
Kostova, T. (1999). Transnational transfer of strategic organizational practices: A contextual perspective. Academy of Management Review, 24(2), 308–324.
Kostova, T. 1999. Transnational transfer of strategic organizational practices: A contextual perspective. Academy of Management Review, 24(2): 308–324.
Kuivalainen, O., Sundqvist, S., Saarenketo, S., & McNaughton, R. (2012). Internationalization patterns of small and medium‐sized enterprises. International Marketing Review
Langley, A. (1999). Strategies for theorizing from process data. Academy of Management Review, 24(4), 691–710.
Langseth, H., O'Dwyer, M., & Arpa, C. (2016). Forces influencing the speed of internationalisation: An exploratory norwegian and irish study. Journal of Small Business and Enterprise Development, 23(1), 122-148. doi:10.1108/JSBED-10-2013-0155
Larcker, D. F., & Zakolyukina, A. A. (2012). Detecting deceptive discussions in conference calls. Journal of Accounting Research, 50(2), 495–540.
Lee, J. W., Abosag, I., & Kwak, J. (2012). The role of networking and commitment in foreign market entry process: Multinational corporations in the Chinese automobile industry. International Business Review, 21(1), 27-39.
Leonidou, L.C. and Katsikeas, C. (1996) ‘The export development process: an integrative review of empirical models’, Journal of International Business Studies, Vol. 27, No. 3, pp.517–551
Lin, W. (2012). Family ownership and internationalization processes: Internationalization pace, internationalization scope, and internationalization rhythm. European Management Journal, 30(1), 47-56. doi:10.1016/j.emj.2011.10.003
Lindsay, V., Chadee, D., Mattsson, J., Johnston, R., & Mollet, B. (2003). Relationships, the role of individuals and knowledge flows in the internationalization of service firms. International Journal of Service, 14(1), 7–35.
225
Luo, Y., Hongxin Zhao, J., & Du, J. (2005). The internationalization speed of e-commerce companies: An empirical analysis. International Marketing Review, 22(6), 693-709. doi:10.1108/02651330510630294
Mayew, W. J. (2008). Evidence of management discrimination among analysts during earnings conference calls. Journal of Accounting Research, 46(3), 627–659.
McNaughton, R. (2003). The number of export markets that a firm serves: Process models versus the born-global phenomenon. Journal of International Entrepreneurship, 1(3): 297–311.
Mitev, N. (2000). Toward social constructivist understandings of IS success and failure: introducing a new computerized reservation system. In Proceedings of the twenty first international conference on Information systems (pp. 84-93). Association for Information Systems.
Moen, Ø. and Servais, P. (2002) ‘Born global or gradual global? Examining the export behavior of small and medium-sized enterprises’, Journal of International Marketing, Vol. 10, No. 3, pp.49–72.
Moreira, A.C. (2009) ‘The evolution of internationalisation: towards a new theory?’, Global Economics and Management Review, Vol. 14, No. 1, pp.41–59.
Morgan-Thomas, A., & Jones, M. V. (2009). Post-entry dynamics: Differences between SMEs in the development speed of their international sales. International Small Business Journal, 27(1): 71–97
Mtigwe, B. (2006). Theoretical milestones in international business: The journey to international entrepreneurship theory. Journal of International Entrepreneurship, 4(1), 5-25.
Musteen, M., Francis, J., & Datta, D. K. (2010). The influence of international networks on internationalization speed and performance: A study of Czech SMEs. Journal of World Business, 45(3), 197-205.
Neubert, M. (2018). The impact of digitalization on the speed of internationalization of lean global startups. Technology Innovation Management Review, 8(5).
Nysveen, H., & Lexhagen, M. (2001). Swedish and Norwegian tourism websites: The importance of reservation services and value-added services. Scandinavian Journal of Hospitality and Tourism, 1(1), 38-53.
Oesterle, M. J. (1997). Time-span until internationalization: Foreign market entry as a built-in-mechanism of innovations. MIR: Management International Review, 125-149.
Olejnik, E., & Swoboda, B. (2012). SMEs' internationalisation patterns: Descriptives, dynamics and determinants. International Marketing Review, 29(5), 466-495.
Oviatt, B. and McDougall, P.P. (1999) ‘Accelerated internationalisation: why are new and small ventures internationalizing in greater numbers and with increasing speed?’, in Wright, R. (Ed.): Research in Global Strategic Management, pp.23–40, JAI Press, Stamford, CT.
226
Oviatt, B. M., & McDougall, P. P. (1997). Challenges for internationalization process theory: The case of international new ventures. MIR: Management International Review, 85-99.
Oviatt, B. M., & McDougall, P. P. (2005). Toward a theory of international new ventures. Journal of International Business Studies, 36(1), 29-41. doi:10.1057/palgrave.jibs.8400128
Papadopoulos, N. and Martín, O.M. (2010) ‘Toward a model of the relationship between internationalisation and export performance’, International Business Review, Vol. 19, No. 4, pp.388–406.
Peng, M. W., Sun, S. L., Pinkham, B., & Chen, H. (2009). The institution-based view as a third leg for a strategy tripod. Academy of Management Perspectives, 23(3), 63-81.
Pla‐Barber, J. and Escribá‐Esteve, A. (2006), "Accelerated internationalisation: evidence from a late investor country", International Marketing Review, Vol. 23 No. 3, pp. 255-278. https://doi.org/10.1108/02651330610670442
Porter, M. E. (1990). The competitive advantage of nations. Harvard business review, 68(2), 73-93.
PR Newswire. (2009, February 3). Southwest Airlines Selects Wunderman as Agency of Record for Rapid Rewards Program. PR Newswire Association, Inc. Retrieved on February 3, 2020, from Factiva Database.
Prange, C. and Verdier, S. (2011) ‘Dynamic capabilities, internationalisation processes and performance’, Journal of World Business, Vol. 46, No. 1, pp.126–133.
Prashantham, S. and Young, S. (2011). Post-entry speed of international new ventures. Entrepreneurship Theory and Practice, 35, 275–292.
Prashantham, S., & Young, S. (2011). Post-entry speed of international new ventures. Entrepreneurship Theory and Practice, 35(2): 275–292.
Ramón-Rodríguez, A. B., Moreno-Izquierdo, L., & Perles-Ribes, J. F. (2011). Growth and internationalisation strategies in the airline industry. Journal of Air Transport Management, 17(2), 110-115. doi:10.1016/j.jairtraman.2010.11.002
Ramón-Rodríguez, A. B., Moreno-Izquierdo, L., & Perles-Ribes, J. F. (2011). Growth and internationalisation strategies in the airline industry. Journal of Air Transport Management, 17(2), 110–115. doi:10.1016/j.jairtraman.2010.11.002
Ramos, E., Acedo, F. J., & Gonzalez, M. R. (2011). Internationalisation speed and technological patterns: A panel data study on Spanish SMEs. Technovation, 31(10–11): 560–572.
Rasmussen, E. S., & Tanev, S. 2015. The Emergence of the Lean Global Startup as a New Type of Firm. Technology Innovation Management Review, 5(11): 5-12. https://timreview.ca/article/941
Rennie, M. W. (1993). Born global. The McKinsey Quarterly, (4), 45-53.
227
Reuber, A. R., & Fischer, E. (1997). The influence of the management team’s international experience on the internationalization behavior of SMEs. Journal of International Business Studies, 28(4), 807–825.
Rialp, A., Rialp, J., & Knight, G.A. (2005). The phenomenon of early internationalizing firms: What do we know after a decade (1993–2003) of scientific inquiry? International Business Review, 14(2), 147–166.
Ribau, C. P., Moreira, A. C., & Raposo, M. (2015). Internationalisation of the firm theories: a schematic synthesis. International Journal of Business and Globalisation, 15(4), 528. doi:10.1504/ijbg.2015.
Rozenberg, R., Szabo, S., & Šebeščáková, I. (2014). Comparison of FSC and LCC and their market share in aviation. International Review of Aerospace Engineering (IREASE), 7(5), 149-154.
Ruzzier, M., Hisrich, R.D. and Antoncic, B. (2006), “SME internationalization research: past, present, and future”, Journal of Small Business and Enterprise Development, Vol. 13 No. 4, pp. 476-497.
Ryanair Corporate History. (n.d.). Event brief of full year 2017 Ryanair Holdings PLC earnings pre-recorded presentation - Final. Factiva Database
Ryanair Corporate History. (n.d.). History of Ryanair. Ryanair.https://corporate.ryanair.com/about-us/history-of-ryanair/
Ryanair, 2014, May 19). Q1 2009 Ryanair Holdings Earnings Conference Call - Final. Factiva Database
Ryanair, 2015, May 26 Annual report 2009. https://investor.ryanair.com/
Ryanair. (2002, August). Q1 2002 Ryanair Holdings Earnings Conference Call - Final. Factiva Database
Ryanair. (2002, November). Q2 2002 Ryanair Holdings Earnings Conference Call - Final. Factiva Database
Ryanair. (2002). Annual report 2001. https://investor.ryanair.com/
Ryanair. (2003). Form-20 Information of the Company
Ryanair. (2003). Form-20 Information of the Company 2002
Ryanair. (2003a, August). Q1 2003 Ryanair Holdings Earnings Conference Call - Final. Factiva Database
Ryanair. (2003a, January). Q3 2003 Ryanair Holdings Earnings Conference Call - Final. Factiva Database
Ryanair. (2003a, June). Q4 2002 Ryanair Holdings Earnings Conference Call - Final. Factiva Database
Ryanair. (2003b, August). Event Brief of Q1 2003 Ryanair Holdings Earnings Conference Call - Final. Factiva Database
228
Ryanair. (2003b, January). Event Brief of Q3 2003 Ryanair Holdings Earnings Conference Call - Final. Factiva Database
Ryanair. (2003b, June). Event Brief of Q4 2002 Ryanair Holdings Earnings Conference Call - Final. Factiva Database
Ryanair. (2004). Annual Report 2003. https://investor.ryanair.com/
Ryanair. (2004a, June). Q4 2003 Ryanair Holdings Earnings Conference Call - Final. Factiva Database
Ryanair. (2004a, November). Q2 2004 Ryanair Holdings Earnings Conference Call - Final. Factiva Database
Ryanair. (2004b, January). Event Brief of Q3 2004 Ryanair Holdings Earnings Conference Call - Final. Factiva Database
Ryanair. (2004b, January). Q3 2004 Ryanair Holdings Earnings Conference Call - Final. Factiva Database
Ryanair. (2004b, June). Event Brief of Q4 2003 Ryanair Holdings Earnings Conference Call - Final. Factiva Database
Ryanair. (2004b, November). Event Brief of Q2 2004 Ryanair Holdings Earnings Conference Call - Final. Factiva Database
Ryanair. (2005, May). Full Year Ryanair Holdings Earnings Conference Call - Final. Factiva Database
Ryanair. (2005). Annual Report 2004. https://investor.ryanair.com/
Ryanair. (2005a, August). Q1 2005 Ryanair Holdings Earnings Conference Call - Final. Factiva Database
Ryanair. (2005a, November). Interim 2005 Ryanair Holdings Earnings Conference Call - Final. Factiva Database
Ryanair. (2005b, August). Event Brief of Q1 2005 Ryanair Holdings Earnings Conference Call - Final. Factiva Database
Ryanair. (2005b, November). Event Brief of Interim 2005 Ryanair Holdings Earnings Conference Call - Final. Factiva Database
Ryanair. (2006, June, 6). Full Year 2005/06 Ryanair Holdings Earnings Conference Call - Final. Factiva Database
Ryanair. (2006, November, 6). Half Year 2006/07 Ryanair Holdings Earnings Conference Call - Final. Factiva Database
Ryanair. (2006). Annual report 2005. https://investor.ryanair.com/
229
Ryanair. (2006). Form-20 Company Information 2005
Ryanair. (2006a, February). Q3 2005/06 Ryanair Holdings Earnings Conference Call - Final. Factiva Database
Ryanair. (2006August, 8). Q2 2006 Fraport AG Earnings Conference Call - Final. Factiva Database
Ryanair. (2006August). Q1 2006 Ryanair Holdings Earnings Conference Call - Final. Factiva Database
Ryanair. (2006b, February). Event Brief of Q3 2005/06 Ryanair Holdings Earnings Conference Call - Final. Factiva Database
Ryanair. (2007, November 5). Event Brief of Q2 2008 Ryanair Holdings Earnings Presentation - Final. Factiva Database
Ryanair. (2007). Form-20 Company information 2006
Ryanair. (2007a, February). Q3 2007 Ryanair Holdings Earnings Conference Call - Final. Factiva Database
Ryanair. (2007a, June, 5). Full Year 2007 Ryanair Holdings Earnings Presentation - Final. Factiva Database
Ryanair. (2007b, February). Event Brief of Q3 2007 Ryanair Holdings Earnings Conference Call - Final. Factiva Database
Ryanair. (2007b, June, 5). Event Brief of Full Year 2007 Ryanair Holdings Earnings Presentation - Final. Factiva Database
Ryanair. (2008, February). Q3 2008 Ryanair Holdings Earnings Conference Call - Final. Factiva Database
Ryanair. (2008, June). Q4 2008 Ryanair Holdings Earnings Presentation - Final. Factiva Database
Ryanair. (2008, November, 3). Ryanair Holdings Earnings Half Year Results Analyst Briefing - Final. Factiva Database
Ryanair. (2008). Annual Report 2007. https://investor.ryanair.com/
Ryanair. (2008a, July). Q1 2008 Ryanair Holdings Earnings Conference Call - Final. Factiva Database
Ryanair. (2008a, November). Q2 2008 Ryanair Holdings Earnings Conference Call - Final. Factiva Database
Ryanair. (2008a, November). Q2 2008 Ryanair Holdings Earnings Presentation - Final. Factiva Database
Ryanair. (2008b, July). Event Brief of Q1 2008 Ryanair Holdings Earnings Conference Call - Final. Factiva Database
230
Ryanair. (2008b, November). Event Brief of Q2 2008 Ryanair Holdings Earnings Conference Call - Final. Factiva Database
Ryanair. (2009, February). Event Brief of Q3 2009 Ryanair Holdings Earnings Conference Call - Final. Factiva Database
Ryanair. (2009, June). Q4 2009 Ryanair Holdings Earnings Analyst Briefing - Final. Factiva Database
Ryanair. (2009). Form-20 2008 Information on the company
Ryanair. (2009July). Q1 2009 Ryanair Holdings Earnings Conference Call - Final. Factiva Database
Ryanair. (2010, February). Q3 2010 Ryanair Holdings Earnings Conference Call - Final. Factiva Database
Ryanair. (2010, June, 1). Full Year 2010 Ryanair Holdings Earnings Presentation(morning) - Final. Factiva Database
Ryanair. (2010, November). Q2 2010 Ryanair Holdings Earnings Conference Call - Final. Factiva Database
Ryanair. (2010). Annual report 2009. https://investor.ryanair.com/
Ryanair. (2010a, November 1). Half Year 2011 Ryanair Holdings Earnings Conference Call - Final. Factiva Database
Ryanair. (2010a, November 1). Half Year 2011 Ryanair Holdings Earnings Presentation - Final. Factiva Database
Ryanair. (2010b, November 1). Event Brief of Half Year 2011 Ryanair Holdings Earnings Conference Call - Final. Factiva Database
Ryanair. (2010July). Q1 2010 Ryanair Holdings Earnings Conference Call - Final. Factiva Database
Ryanair. (2011, January). Q3 2011 Ryanair Holdings Earnings Conference Call - Final. Factiva Database
Ryanair. (2011, July 25). Q1 2012 Ryanair Holdings Earnings Conference Call - Final. Factiva Database
Ryanair. (2011, May 23). Event Brief of Full Year 2011 Ryanair Holdings PLC Earnings Presentation (morning) - Final. Factiva Database
Ryanair. (2011). Annual report 2010. https://investor.ryanair.com/
Ryanair. (2011a, July). Q1 2012 Ryanair Holdings Earnings Conference Call - Final. Factiva Database
Ryanair. (2011July). Q1 2011 Ryanair Holdings Earnings Conference Call - Final. Factiva Database
Ryanair. (2012, January). Event Brief of Q3 2012 Ryanair Holdings PLC Earnings Conference Call - Final. Factiva Database
231
Ryanair. (2012, July). Event Brief of Q1 2013 Ryanair Holdings PLC Earnings Conference Call - Final. Factiva Database
Ryanair. (2012, November). Event Brief of Q2 2012 Ryanair Holdings Earnings Presentation - Final. Factiva Database
Ryanair. (2012). Annual report 2011. https://investor.ryanair.com/
Ryanair. (2012a, May 21). Full Year 2012 Ryanair Holdings PLC Earnings Conference Call - Final. Factiva Database
Ryanair. (2012b, July). Event Brief of Q1 2012 Ryanair Holdings Earnings Conference Call - Final. Factiva Database
Ryanair. (2012b, May 21). Event Brief of Full Year 2012 Ryanair Holdings Earnings Analyst Briefing - Final. Factiva Database
Ryanair. (2012b, May 21). Event Brief of Full Year 2012 Ryanair Holdings PLC Earnings Conference Call - Final. Factiva Database
Ryanair. (2013, January). Event Brief of Q3 2013 Ryanair Holdings PLC Earnings Conference Call - Final. Factiva Database
Ryanair. (2013, March, 19). Ryanair Holdings to Order 175 Aircrafts from Boeing Co Conference Call - Final. Factiva Database
Ryanair. (2013, May, 20). Event Brief of Full Year 2013 Ryanair Holdings Earnings Conference Call - Final. Factiva Database
Ryanair. (2013, November, 4). H1 2013/2014 Ryanair Holdings PLC Earnings Conference Call (Afternoon) - Final. Factiva Database
Ryanair. (2013, November). Q2 2013 Ryanair Holdings PLC Earnings Conference Call - Final. Factiva Database
Ryanair. (2013). Annual report 2012. https://investor.ryanair.com/
Ryanair. (2014, February). Event Brief of Q3 2014 Ryanair Holdings PLC Earnings Conference Call - Final. Factiva Database
Ryanair. (2014, May 19). Full Year 2014 Ryanair Holdings Earnings Conference Call - Final. Factiva Database
Ryanair. (2014, November, 3). H1 2015 Ryanair Holdings PLC Earnings Call - Final. Factiva Database
Ryanair. (2014). Annual report 2013. https://investor.ryanair.com/
232
Ryanair. (2014July). Q1 2014 Ryanair Holdings Earnings Conference Call - Final. Factiva Database
Ryanair. (2015, May 26). Full Year 2015 Ryanair Holdings PLC Earnings Call - Final. Factiva Database
Ryanair. (2015, May 26). Full Year 2015 Ryanair Holdings PLC Earnings Prerecorded Presentation - Final. Factiva Database
Ryanair. (2015, November, 2). Full Year 2016 Ryanair Holdings PLC Earnings Prerecorded Presentation - Final. Factiva Database
Ryanair. (2015, November, 2). Half Year 2016 Ryanair Holdings PLC Earnings Prerecorded Presentation - Final. Factiva Database
Ryanair. (2015, September, 9). Event Brief of Full Year 2016 Ryanair Holdings PLC Trading Statement Call - Final. Factiva Database
Ryanair. (2015). Annual report 2014. https://investor.ryanair.com/
Ryanair. (2015July). Q1 2015 Ryanair Holdings PLC Earnings Call - Final. Factiva Database
Ryanair. (2016, February). Q3 2016 Ryanair Holdings PLC Prerecorded Earnings Presentation - Final. Factiva Database
Ryanair. (2016). Annual report 2015. https://investor.ryanair.com/
Ryanair. (2016a, November, 7). Half Year 2017 Ryanair Holdings PLC Earnings Call - Final. Factiva Database
Ryanair. (2016b, November, 7). Event Brief of Half Year 2017 Ryanair Holdings PLC Earnings Call - Final. Factiva Database
Ryanair. (2016c, November, 7). Half Year 2017 Ryanair Holdings PLC Earnings PreRecorded Presentation - Final. Factiva Database
Ryanair. (2016d, November, 7). Event Brief of Half Year 2017 Ryanair Holdings PLC Earnings Pre-Recorded Presentation - Final. Factiva Database
Ryanair. (2016July). Q1 2016 Ryanair Holdings PLC Earnings Prerecorded Presentation - Final. Factiva Database
Ryanair. (2017, a, February). Q3 2017 Ryanair Holdings PLC Earnings Call - Final. Factiva Database
Ryanair. (2017, a, February). Q3 2017 Ryanair Holdings PLC Earnings PreRecorded Presentation - Final. Factiva Database
Ryanair. (2017, b, February). Event Brief of Q3 2017 Ryanair Holdings PLC Earnings Call - Final. Factiva Database
233
Ryanair. (2017, May 30). Event Brief of Full Year 2017 Ryanair Holdings PLC Earnings Pre-recorded Presentation - Final. Factiva Database
Ryanair. (2017, May 30). Full Year 2017 Ryanair Holdings PLC Earnings Call - Final. Factiva Database
Ryanair. (2017, May 30). Full Year 2017 Ryanair Holdings PLC Earnings Prerecorded Presentation - Final. Factiva Database
Ryanair. (2017, October, 31). Event Brief of Half Year 2018 Ryanair Holdings PLC Earnings Call - Final. Factiva Database
Ryanair. (2017, October, 31). Event Brief of Half Year 2018 Ryanair Holdings PLC Earnings Pre-recorded Presentation - Final. Factiva Database
Ryanair. (2017, October, 31). Half Year 2018 Ryanair Holdings PLC Earnings Call - Final. Factiva Database
Ryanair. (2017, October, 31). Half Year 2018 Ryanair Holdings PLC Earnings Prerecorded Presentation - Final. Factiva Database
Ryanair. (2017). Annual report 2016. https://investor.ryanair.com/
Ryanair. (2017a February 6). Q3 2017 Ryanair Holdings PLC Earnings PreRecorded Presentation - Final. Factiva Database
Ryanair. (2017a, September 18). Ryanair Holdings PLC to Cancel Less Than 2% of Flights Over Next 6 Weeks to Improve Punctuality Call - Final. Factiva Database
Ryanair. (2017b, February 6). Event Brief of Q3 2017 Ryanair Holdings PLC Earnings Pre-Recorded Presentation - Final. Factiva Database
Ryanair. (2018, February). Q3 2018 Ryanair Holdings PLC Earnings Call - Final. Factiva Database
Ryanair. (2018, February). Q3 2018 Ryanair Holdings PLC Earnings Prerecorded Presentation - Final. Factiva Database
Ryanair. (2018, May, 21). Event Brief of Full Year 2018 Ryanair Holdings PLC Earnings Call - Final. Factiva Database
Ryanair. (2018, May, 21). Event Brief of Full Year 2018 Ryanair Holdings PLC Earnings Pre-recorded Presentation - Final. Factiva Database
Ryanair. (2018, May, 21). Full Year 2018 Ryanair Holdings PLC Earnings Call - Final. Factiva Database
Ryanair. (2018, May, 21). Full Year 2018 Ryanair Holdings PLC Earnings Prerecorded Presentation - Final. Factiva Database
234
Ryanair. (2018, October 22). Half Year 2019 Ryanair Holdings PLC Earnings PreRecorded Presentation - Final. Factiva Database
Ryanair. (2018). Annual report 2017. https://investor.ryanair.com/
Ryanair. (2018a, July). Q1 2018 Ryanair Holdings PLC Earnings Call - Final. Factiva Database
Ryanair. (2018a, July). Q1 2018 Ryanair Holdings PLC Earnings Prerecorded Presentation - Final. Factiva Database
Ryanair. (2018b, July). Event Brief of Q1 2018 Ryanair Holdings PLC Earnings Call - Final. Factiva Database
Ryanair. (2018b, July). Event Brief of Q1 2018 Ryanair Holdings PLC Earnings Pre-recorded Presentation - Final. Factiva Database
Ryanair. (2019). Annual report 2018. https://investor.ryanair.com/
Sabre Air Solution and Sabre Travel Network. (2010.) The Evolution of The Airline Business Model. Retrieved from: https://www.sabreairlinesolutions.com/images/uploads/Hybrid_Model_Brochure.pdf
SABRE. (2010). The Evolution of The Airline Business Model. Retrieved from: https://www.sabreairlinesolutions.com/images/uploads/Hybrid_Model_Brochure.pdf
Santos, MR, & Ruffin, C. (2010). Global village vs. small town: Understanding networks at the Base of the Pyramid. International Business Review, 19(2), 126–139.
Shirokova, G., & Tsukanova, T. (2013). Impact of the domestic institutional environment on the degree of internationalization of SMEs in transition economies. The International Journal of Entrepreneurship and Innovation, 14(3), 193-204.
Southwest Airline Media. (n.d.). Event brief of Q2 2014 Southwest Airlines earnings conference call - Final. Factiva Database
Southwest Airlines. (1975). Annual report 1974. Southwest Airlines. http://investors.southwest.com/financials/company-reports/annual-reports
Southwest Airlines. (1979). Annual report 1978. Southwest Airlines. http://investors.southwest.com/financials/company-reports/annual-reports
Southwest Airlines. (1981). Annual report 1980. Southwest Airlines. http://investors.southwest.com/financials/company-reports/annual-reports
Southwest Airlines. (1989). Annual report 1988. Southwest Airlines. http://investors.southwest.com/financials/company-reports/annual-reports
235
Southwest Airlines. (1991). Annual report 1990. Southwest Airlines. http://investors.southwest.com/financials/company-reports/annual-reports
Southwest Airlines. (1992). Annual report 1991. Southwest Airlines. http://investors.southwest.com/financials/company-reports/annual-reports
Southwest Airlines. (1995). Annual report 1994. Southwest Airlines. http://investors.southwest.com/financials/company-reports/annual-reports
Southwest Airlines. (2002, January). Abstract of Q4 2001 Southwest Airlines Earnings Conference Call - Final. Factiva Database
Southwest Airlines. (2002, July). Abstract of Q2 2002 Southwest Airlines Earnings Conference Call - Final. Factiva Database
Southwest Airlines. (2003, January). Q4 2002 Southwest Airlines Earnings Conference Call - Final. Factiva Database
Southwest Airlines. (2003, October). Q1 2006 Southwest Airlines Earnings Conference Call - Final. Factiva Database
Southwest Airlines. (2004, January). Q4 2003 Southwest Airlines Earnings Conference Call - Final. Factiva Database
Southwest Airlines. (2004, July). Q2 2004 Southwest Airlines Earnings Conference Call - Final. Factiva Database
Southwest Airlines. (2004, October). Q3 2004 Southwest Airlines Earnings Conference Call - Final. Factiva Database
Southwest Airlines. (2005, February). Event Brief of Q2 2005 Watson Wyatt & Company Holdings Earnings Conference Call - Final. Factiva Database
Southwest Airlines. (2005, November). Southwest Airlines at Citigroup 20th Annual Transportation Conference - Final. Factiva Database
Southwest Airlines. (2005, October). Q3 2005 Southwest Airlines Earnings Conference Call - Final. Factiva Database
Southwest Airlines. (2005). Annual report 2004. Southwest Airlines. http://investors.southwest.com/financials/company-reports/annual-reports
Southwest Airlines. (2005a, April). Q1 2005 Southwest Airlines Earnings Conference Call - Final. Factiva Database
Southwest Airlines. (2005b, April). Event Brief of Q1 2005 Southwest Airlines Earnings Conference Call - Final. Factiva Database
236
Southwest Airlines. (2005b, January). Event Brief of Q4 2004 Southwest Airlines Earnings Conference Call - Final. Factiva Database
Southwest Airlines. (2005b, July). Event Brief of Q2 2005 Southwest Airlines Earnings Conference Call - Final. Factiva Database
Southwest Airlines. (2006, January). Q4 2005 Southwest Airlines Earnings Conference Call - Final. Factiva Database
Southwest Airlines. (2006, May). Southwest Airlines at Bear, Stearns & Co. 2006 Global Transportation Conference - Final. Factiva Database
Southwest Airlines. (2006a, July). Q2 2006 Southwest Airlines Earnings Conference Call - Final. Factiva Database
Southwest Airlines. (2006a, October). Q3 2006 Southwest Airlines Earnings Conference Call - Final. Factiva Database
Southwest Airlines. (2006b, July). Event Brief of Q2 2006 Southwest Airlines Earnings Conference Call - Final. Factiva Database
Southwest Airlines. (2006b, October). Event Brief of Q3 2006 Southwest Airlines Earnings Conference Call - Final. Factiva Database
Southwest Airlines. (2007, February). Southwest Airlines at Raymond James Growth Airline Conference - Final. Factiva Database
Southwest Airlines. (2007, July). Event Brief of Q2 2007 Southwest Airlines Earnings Conference Call - Final. Factiva Database
Southwest Airlines. (2007, June). Southwest Airlines 2007 Analyst Meeting - Final. Factiva Database
Southwest Airlines. (2007, March). Southwest Airlines at JPMorgan Aviation & Transportation Conference - Final. Factiva Database
Southwest Airlines. (2007, May). Southwest Airlines at Bear, Stearns Global Transportation Conference - Final. Factiva Database
Southwest Airlines. (2007, October). Q3 2007 Southwest Airlines Earnings Conference Call - Final. Factiva Database
Southwest Airlines. (2007). Annual report 2006. Southwest Airlines. http://investors.southwest.com/financials/company-reports/annual-reports
Southwest Airlines. (2007b, January). Event Brief of Q4 2006 Southwest Airlines Earnings Conference Call - Final. Factiva Database
237
Southwest Airlines. (2008, April). Q1 2008 Southwest Airlines Financial Results Conference Call - Final. Factiva Database
Southwest Airlines. (2008, December). Southwest Airlines at Credit Suisse Group Global Airline Conference - Final. Factiva Database
Southwest Airlines. (2008, January). Q4 2007 Southwest Airlines Earnings Conference Call - Final. Factiva Database
Southwest Airlines. (2008, July). Q2 2008 Southwest Airlines Financial Results Conference Call - Final. Factiva Database
Southwest Airlines. (2009, July). Q2 2009 Southwest Airlines Financial Results Conference Call - Final. Factiva Database
Southwest Airlines. (2009, June). Event Brief of Q1 2013 Southwest Airlines Earnings Conference Call - Final. Factiva Database
Southwest Airlines. (2009, October). Q3 2009 Southwest Airlines Financial Results Conference Call - Final. Factiva Database
Southwest Airlines. (2010, April). Q1 2010 Southwest Airlines Financial Results Conference Call - Final. Factiva Database
Southwest Airlines. (2010, December). Southwest Airlines at 2010 Hudson Securities Airline Conference - Final. Factiva Database
Southwest Airlines. (2010, June). Southwest Airlines at Bank of America Merrill Lynch Global Transportation Conference - Final. Factiva Database
Southwest Airlines. (2010, September). Southwest AirlinesConference Call to Discuss its Agreement to Acquire AirTran - Final. Factiva Database
Southwest Airlines. (2010). Annual report 2009. Southwest Airlines. http://investors.southwest.com/financials/company-reports/annual-reports
Southwest Airlines. (2011, December). Southwest Airlines Co at Rodman & Renshaw LLC Airline Conference - Final. Factiva Database
Southwest Airlines. (2011, March). Southwest Airlines Co at JPMorgan Aviation, Transportation & Defense Conference - Final. Factiva Database
Southwest Airlines. (2011, May). Event Brief of Q2 2014 Southwest Airlines Earnings Conference Call - Final. Factiva Database
Southwest Airlines. (2011). Annual report 2010. Southwest Airlines. http://investors.southwest.com/financials/company-reports/annual-reports
238
Southwest Airlines. (2012, May). Southwest Airlines at Bank of AmericaMerrill Lynch Global Transportation Conference - Final. Factiva Database
Southwest Airlines. (2012, October). Q3 2012 Southwest Airlines Earnings Conference Call - Final. Factiva Database
Southwest Airlines. (2012). Annual report 2011. Southwest Airlines. http://investors.southwest.com/financials/company-reports/annual-reports
Southwest Airlines. (2012b, April). Event Brief of Q1 2012 Southwest Airlines Earnings Conference Call - Final. Factiva Database
Southwest Airlines. (2012b, July). Event Brief of Q2 2012 Southwest Airlines Earnings Conference Call - Final. Factiva Database
Southwest Airlines. (2013, April). Event Brief of Q1 2013 Southwest Airlines Earnings Conference Call - Final. Factiva Database
Southwest Airlines. (2013, July). Event Brief of Q2 2013 Southwest Airlines Earnings Conference Call - Final. Factiva Database
Southwest Airlines. (2013, March). Event Brief of Q3 2007 Southwest Airlines Earnings Conference Call - Final. Factiva Database
Southwest Airlines. (2014, April). Event Brief of Q2 2012 Southwest Airlines Earnings Conference Call - Final. Factiva Database
Southwest Airlines. (2014, December). Event Brief of Q1 2014 Southwest Airlines Earnings Conference Call - Final. Factiva Database
Southwest Airlines. (2014, September). Southwest Airlines Co at Morgan Stanley Laguna Conference - Final. Factiva Database
Southwest Airlines. (2014). Annual report 2013. Southwest Airlines. http://investors.southwest.com/financials/company-reports/annual-reports
Southwest Airlines. (2014b, July). Event Brief of Q2 2014 Southwest Airlines Earnings Conference Call - Final. Factiva Database
Southwest Airlines. (2015, April). Event Brief of Q1 2015 Southwest Airlines Co Earnings Call - Final. Factiva Database
Southwest Airlines. (2015, December). Event Brief of Q1 2015 Southwest Airlines Co Earnings Call - Final. Factiva Database
Southwest Airlines. (2015, July). Q2 2015 Southwest Airlines Co Earnings Call - Final. Factiva Database
239
Southwest Airlines. (2015, March). Event Brief of Q3 2014 Southwest Airlines Co Earnings Conference Call - Final. Factiva Database
Southwest Airlines. (2015, October). Event Brief of Q1 2015 Southwest Airlines Co Earnings Call - Final. Factiva Database
Southwest Airlines. (2015). Annual report 2014. Southwest Airlines. http://investors.southwest.com/financials/company-reports/annual-reports
Southwest Airlines. (2016). Annual report 2015. Southwest Airlines. http://investors.southwest.com/financials/company-reports/annual-reports
Southwest Airlines. (2016a, October). Q3 2016 Southwest Airlines Co Earnings Call - Final. Factiva Database
Southwest Airlines. (2016b, October). Event Brief of Q3 2015 Southwest Airlines Co Earnings Call - Final. Factiva Database
Southwest Airlines. (2017, January). Event Brief of Q3 2015 Southwest Airlines Co Earnings Call - Final. Factiva Database
Southwest Airlines. (2017, June). Southwest Airlines Co at Deutsche Bank Global Industrials and Materials Summit - Final. Factiva Database
Southwest Airlines. (2017, May). Southwest Airlines Co Annual Shareholders Meeting - Final. Factiva Database
Southwest Airlines. (2017a, February). Southwest Airlines Co at Stifel Transportation & Logistics Conference - Final. Factiva Database
Southwest Airlines. (2017a, October). Q3 2017 Southwest Airlines Co Earnings Call - Final. Factiva Database
Southwest Airlines. (2017b, October). Event Brief of Q3 2017 Southwest Airlines Co Earnings Call - Final. Factiva Database
Southwest Airlines. (2018, January). Q4 2017 Southwest Airlines Co Earnings Call - Final. Factiva Database
Southwest Airlines. (2018b, July). Event Brief of Q2 2018 Southwest Airlines Co Earnings Call - Final. Factiva Database
Southwest Airlines. (2019). Annual report 2018. Southwest Airlines. http://investors.southwest.com/financials/company-reports/annual-reports
Southwest Airlines(1987). Annual report 1986. Southwest Airlines. http://investors.southwest.com/financials/company-reports/annual-reports
240
Southwest Airlines(1988). Annual report 1987. Southwest Airlines. http://investors.southwest.com/financials/company-reports/annual-reports
Southwest Airlines(1990). Annual report 1989. Southwest Airlines. http://investors.southwest.com/financials/company-reports/annual-reports
Sullivan, D. (1994). Measuring the degree of internationalization of a firm. Journal of International Business Studies, 25, pp. 325–342.
Sullivan, D., & Bauerschmidt, A. (1990). Incremental Internationalization: A Test of Johanson and Vahlne's Thesis. MIR: Management International Review, 30(1), 19-30. Retrieved from http://www.jstor.org/stable/40228003
Teixeira, A. A., & Coimbra, C. (2014). The determinants of the internationalization speed of Portuguese university spin-offs: An empirical investigation. Journal of International Entrepreneurship, 12(3), 270-308.
Tihanyi, L., Ellstrand, A. E., Daily, C. M., & Dalton, D. R. (2000). Composition of the top management team and firm diversification. Journal of Management, 26(6), 1157–1177.
Törnroos, J-Å. (2000) ‘Challenging internationalisation theory: some new trends forming the international and global business’, IMP Conference in Bath [online] http://www.impgroup.org/ (accessed 2 January 2015).
Vermeulen, F. & Barkema, H.G. (2002). Pace, rhythm, and scope: Process dependence in building a profitable multinational corporation. Strategic Management Journal, 23, 637–653.
Wagner, H. (2004). Internationalization speed and cost efficiency: Evidence from Germany. International Business Review, 13(4), 447-463.
Weerawardena, J., Mort, G. S., Liesch, P. W., & Knight, G. (2007). Conceptualizing accelerated internationalization in the born global firm: A dynamic capabilities perspective. Journal of World Business, 42(3): 294–306.
Wennberg, K. and Holmquist, C. (2008) ‘Problemistic search and international entrepreneurship’, European Management Journal, Vol. 26, No. 6, pp.441–454.
Yin, Robert K. (2008) Case Study Research, Design and Methods, Sage, London.
Zahra, S.A. and George, G. (2002). International entrepreneurship: the current status of the field and future research agenda. In Hitt, M.A., Ireland, R.D., Camp, S.M. and Sexton, D.L. (eds), Strategic Entrepreneurship: Creating a New Mindset. Oxford: Blackwell, pp. 255–288.
Zahra, S.A., Hayton, J.C. and Salvato, C. (2004 ). Emerging research issues in international entrepreneurship.Handbook of Research on International Entrepreneurship , 1st ed., Edward Elgar Pub., Cheltenham, 243 - 257 .

241
Zhang, Y., Li, H. and Zhou, L. (2010). FDI spillovers in an emerging market: the role of foreign firms’ country origin diversity and domestic firms’ absorptive capacity. Strategic Management Journal, 31, pp. 969–989.
Zhou, L. (2007). The effects of entrepreneurial proclivity and foreign market knowledge on early internationalization. Journal of World Business, 42(3): 281–293.


