Embed Size (px)
Citation preview
AD-A218 604 WHOI-89-27OTI FLE Cp y
Woods Hole Oceanographic InstitutionMassachusetts Institute of Technology
in ,CA.CH~sJoint ProgramiOceanography
ando.9Oceanographic Engineering
1930 O t
DOCTORAL DISSERTATION
The Trace Metal Geochemnistry ofSuspended Oceanic Particulate Matter
by
Robert M. SherrellAugust 1989 DTIC
MARO 2199O0
Appruved kr pubI~c rvh,"JDutxbui*& Un~a~ed
9003 01 226
WHOI-89-27
The Trace Metal Geochemistry ofSuspended Oceanic Particulate Matter
by
Robert M. Sherrell
Woods Hole Oceanographic Institution
Woods Hole, Massachusetts 02543
and
The Massachusetts Institute of TechnologyCambridge, Massachusetts 02139
August 1989
Doctoral Dissertation
Funding was provided by the Office of Naval Research andthe National Science Foundation through the
Massachusetts Institute of Technology.
Reproduction in whole or in part is permitted for any purpose of theUnited States Government. This thesis should be cited as:
Robert M. Sherrell, 1989. The Trace Metal Geochemistry ofSuspended Oceanic Particulate Matter. Ph.D. Thesis. MIT/WHOI, WHOI-89-8.
Approved for publication; distribution unlimited.
Approved for Distribution:
Frederick L. Sayles, Ql~raDepartment of Chemistry
AcigDean of Graduate Studies
The Trace Metal Geochemistry ofSuspended Oceanic Particulate Matter
by
Robert M. Sherrell
B.A. Chemistry, Oberlin College
(1979)
SUBMITTED IN PARTIAL FULFILLMENTOF THE REQUIREMENTS FOR THE DEGREE OF
DOCTOR OF PHILOSOPHY
at the
MASSACHUSETIS INSTITUTE OF TECHNOLOGYand the
WOODS HOLE OCEANOGRAPHIC INSTITUTION
June, 1989
© Massachusetts Institute of Technology 1989
Signature of Autlhor 0 ,: ' -Department of Earth, Atmospheric and Planetary Sciences,Massachusetts Institute of Technology and the Joint Program inOceanography, Massachusetts Institute of Technology/Woods HoleOceanographic Institution, June, 1989
Certified by W .-. 4Edward A. Boyle, ThesK SupervisoP'
Accepted by , 2• K-Philip M. Gsc-"wend,/Chairman, Joint Committee for ChemicalOceanography, Massachusetts Institute of Technology/Woods HoleOceanographic Institution
3
THE TRACE METAL GEOCHEMISTRY OFSUSPENDED OCEANIC PARTICULATE MATTER
by
Robert Mb Sherrell
Submitted to the Department of Earth, Atmospheric and Planetary Scienceson May 5th, 1989 in partial fulfillment of the requirements for
the Degree of Doctor of Philosophy in Oceanography
ABSTRACT
'Vertical profiles of suspended particulate trace metals weremeasured in thc Sagaiazc Sz car Bermuda and in the Calif.7;r:a C..:rer' ,northwest Pacific. Using a new in situ pump, sufficiently large samplesof particulate matter (order 10mg) were collected to allow measurement ofa suite of trace metals as well as major component elements, using
several different leaching techniques on separate subsamples.Concentrations of particulate Cu, Zn, Co, Cd, Ni, and Pb near
Bermuda were determined to be substantially lower than estimates based onf ., previously published work. Concentrations of the more abundant elements
Al, Fe, and Mn were similar to previous estimates.Vertical profiles of Mn, Co, Pb, Zn, Cu, and Ni (mol/l) at Bermuda
displayed similar features: a relative depletion in surface waters, a
relative maximum in the upper thermocline, and relatively constant deepwater concentrations. The similarity in the vertical variations ofdissolved/particulate fractionation for these metals may be caused by
interaction of dissolved metals with authigenic Mn phases; thefractionation is anti-correlated with other major particle components
(organic carbon, calcium carbonate, opal, and aluminosilicate). Thevertical profile of particulate Cd displayed a different form: enrichment
at the surface and decreasing concentrations through the thermocline toconstant deep water values.
These measurements were incorpor-t'I into a steady-state two-box
flux model for the Bermuda station. st'ates of the residence time ofsmall suspended particles suggest that als associated with these
particles contribute less than half of tne total flux observed in deeocean sediment traps. This result held for metals displaying a widevariety of behaviors in their dissolved profiles, and suggests that
proce *ses occurring in the upper ocean are more important determinants of
metal removal from the open ocean environment than dissolved/particulate
interactions in the deep ocean.The interactions between suspended particulate and dissolved Pb were
investigated further by an analysis of the isotopic composition of Pb ineach pool. Profiles of particulate pb/2 10 pb and 2 06 pb/207 pb were
4
virtually identical to contemporaneous seawater profiles for the sametracer ratios in the upper 2000m at Bermuda, indicating isotopicequilibration on a time scale which is rapid relative to the residencetime of suspended particles in the water column (a few years), and to thetime rate of change of the non-steady state dissolved profiles(years-decades). Analysis of the relative contribution of deep suspendedparticles to the total deep ocean downward flux suggests that the Pbisotopic composition of material deiivered to the sediments willincreasingly resemble that of deep ocean suspended matter as theanthropogenic input of Pb to the surface decreases over the next fewyears-decades. These results support a relatively rapid and reversibleexchange of Pb between solution and particles.
The particulate metal distributions in the Sargasso Sea werecompared with those observed at a station in the California Current,characterized by higher productivity, closer proximity to continental andhydrothermal particle sources, and the distinct dissolved metaldistributions of the northwest Pacific. This provided an opportunity toobserve the effect of bulk particle composition and dissolved metalconcentration on dissolved/particulate metal fractionation. Althoughconcentrations of non-aluminosilicate particulate metals were of the sameorder (generally within a factor of two) at the two stations, thedifferences are significant and are not generally proportional todifferences in the dissolved distributions. Particulate contents of Mn,Co, and Cu are lower by a factor of 2-3 in mid-waters at the Pacificsite, despite similar dissolved concentrations. In contrast, particulateconcentrations of Lhe nutrient-type elements Zn, Ni, and Cd were lessthan 50% greater at the Pacific station, although dissolved metalconcentrations are several times higheL. Of Whe metals investigated,only Pb showed similar dissolved/particulite fractionation at bothstations. The evidence indicates that metal partitioning in the openocean water column varies in response to factors which are outside thepredictive capability of simple chemical exchange models.
i I5
ACKNOWLEDGMENTS
I As I emerge from this thesis, and recover from what at times seemed
like a solitary and arduous preoccupation, I feel especially grateful forthe friends and family who saw me through it and lent support andguidance in more ways than I will be able to express here.
I thank Ed Boyle for being a demanding and caring teacher andadvisor. After trying to follow his example for the last five (allright, six) years, I am finally getting an inkling as to how to be a goodscientist. Thanks also to my committee members, Mike Bacon, Jim Bishop,Francois Morel, and Ed Sholkovitz for their interest and insight,
eseially in the final writing stages of this thesis. Mike made space
for me to do the radiochemical analyses in his lab, where reside aparticularly friendly and helpful crowd.
Thanks to everyone around the lab whose friendship and good cheermade up for the lack of windows. They are the real reason for coming inevery day. Many helped as well in building and going to sea with thepumps, under conditions ranging from laborious to impossible. GaryKlinkhamner, John Trefry, Chris German, Erik Brown, Scott Doney, Phil
~Newton and Vernon Ross all gave invaluable assistance and good company at
sea. Jim Bishop taught me everything I know about pumps, gave m somegood design sense, and provided the impetus for starting this whoitbusiness. Mike Rhodes and Tony Sherriff were a great help on every tripto Bermuda, and finally, after about a dozen tries, found some niceweather to work in. John Edmond and Bill Simpson were very generous toinvit me on their cruises and provide more than my share of deck time at
sea.Lex van Geen and I were office mates for most of this time, and kept
each other company through the difficult periods. I've been impressed byhis unique combination of motivation and joy, and enjoyed this time withhim tremendously.
I thank my parents and my brothers for their support and confidencethroughout this period. It was with my family that I learned therudiments of oceanographic sampling, raking Irish moss in Cape Cod forthree cents a pound (an hourly wage to which I aspire twenty yearslater).
The last year or so was brightened by the arrival of Maggie, whoturns out to be a sporadic and inattentive semtinar participant, but alovely companion nevertheless.
Finally, I am forever grateful to Judy Storch, who stood by me withenthusiastic support and the warmest love during times which called onlyfor toleration. She helped a great deal, as well, with the nitty-grittyof getting done, and with preserving a sense of fun which I think I can For istill match. I cherish the tinme we are together, and trust that there -will now be more of it.
This work was made possible by the Office of Naval Research d [(Grant # NOOOI4-86-K-0325) and the National Science Foundation ton
(Grant * OCE-87l0328).
Distr'ibution/ _
* Av~Alability Codes
-, Dist Spectial
Dedicated to
J. A. S.
and to my parents
7
TABLE OF CONTENTS
A b s tr a c t ............................................................. 3Acknowlegments ........................................................... 5Table of Contents ........................................................ 7
List of Figures .......................................................... 9
List of Tables .......................................................... 11
CHAPTER 1. INTRODUCTION ............................................... 13
CHAPTER 2. METHODS: COLLECTION OF SUSPENDED OCEANIC PARTICULATEMATTER FOR TRACE METAL ANALYSIS USING A NEW IN SITU PUMP
2.1. Introduction ................................................ 212.2. Instrumentation ............................................ 242.3. Sample handling and analysis ............................... 362.4. Summary ..................................................... 44
CHAPTER 3. TRACE ELEMENT COMPOSITION OF SUSPENDED PARTICULATES IN THENORTHWEST ATLANTIC OCEAN
3.1. Introduction ................................................ 483.2. Sampling and analysis ...................................... 503.3. Suspended particle composition ............................. 54
3.3.1. Susrended mass ...................................... 543.3.2. Biogenic components: CaCO3, opaline silica,
organic matter, and phosphorus .................... 573.3.3. Lithogenic components: Al and Fe ................... 603.3.4. Trace metal composition ............................. 65
3.4. Control of particulate trace metal distributions:the role of manganese ....................................... 73
3.5. The role of suspended particles in determiningmetal flux through the deep ocean .......................... 87
3.6. Sources of particulate trace metals in the deep ocean .... 933.6.1. Internal scavenging of dissolved metals ........... 933.6.2. Disaggregation of sinking particles ................ 943.6.3. Horizontal advection of particles .................. 97
3.7. Conclusions ................................................. 9
CHAPTER 4. ISOTOPIC EOUILIBRATION BETWEEN DISSOLVED AND SUSPENDEDPARTICULATE LEAD IN THE ATLANTIC OCEAN
4.1. Introduction ............................................... 1074.2. Sampling and Analysis ...................................... 1084 .3 . R e su lts .... ....... .. ......... ...... .... .... ... .... ..... .. 1 1 04.4. Disscussion ................................................ 116
I I II I i , ,8
CHAPTER 5. PARTITIONING OF TRACE METALS ON OCEANIC PARTICULATE MATTER:EVIDENCE FROM THE SARGASSO SEA AND THE NORTHEAST PACIFIC
5.1. Introduction............................................... 1235.2. Sampling and analysis...................................... 127
5.3. Results.................................................... 130
5.4. Discussion................................................. 136
5.4.1. Sources of sub-surface and near-bottom particulatemetal maxima at the northeast Pacific station ...... 136
5.4.2. Controls on metal partitioning in intermediate waterin the northeast Pacific and the Sargasso Sea ...... 142
5.4.3. Metal partitioning in the upper water column:influence of biological processes.................. 155
5.5. Conclusions................................................ 159
CHAPTER 6. FURTHER INVESTIGATION OF SUSPENDED PARTICULATE TRACE METALS:
PRELIMINARY RESULTS
6.1. Introduction............................................... 165
6.2. A transect of stations from North American shelf
to Bermuda................................................. 1686.3. Particulate metal distributions in a dispersed hydrothermal
plume at the TAG site, Mid-Atlantic Ridge ..................175
6.4. Conclusions................................................ 183
CHAPTER 7. GENERAL SUMMARY............................................ 185
Appendix A. Northwest Atlantic suspended particulate data .............191
Appendix B. Northeast Pacific station: suspended particulate andhydrographic data......................................... 201
Appendix C. Analyses of filter rinsing solutinns (Zn and Cd):Bermuda and Northeast Pacific stations................... 207
Appendix D. TAG hydrothermal area: particulate data ...................210
.IST OF FIGURES
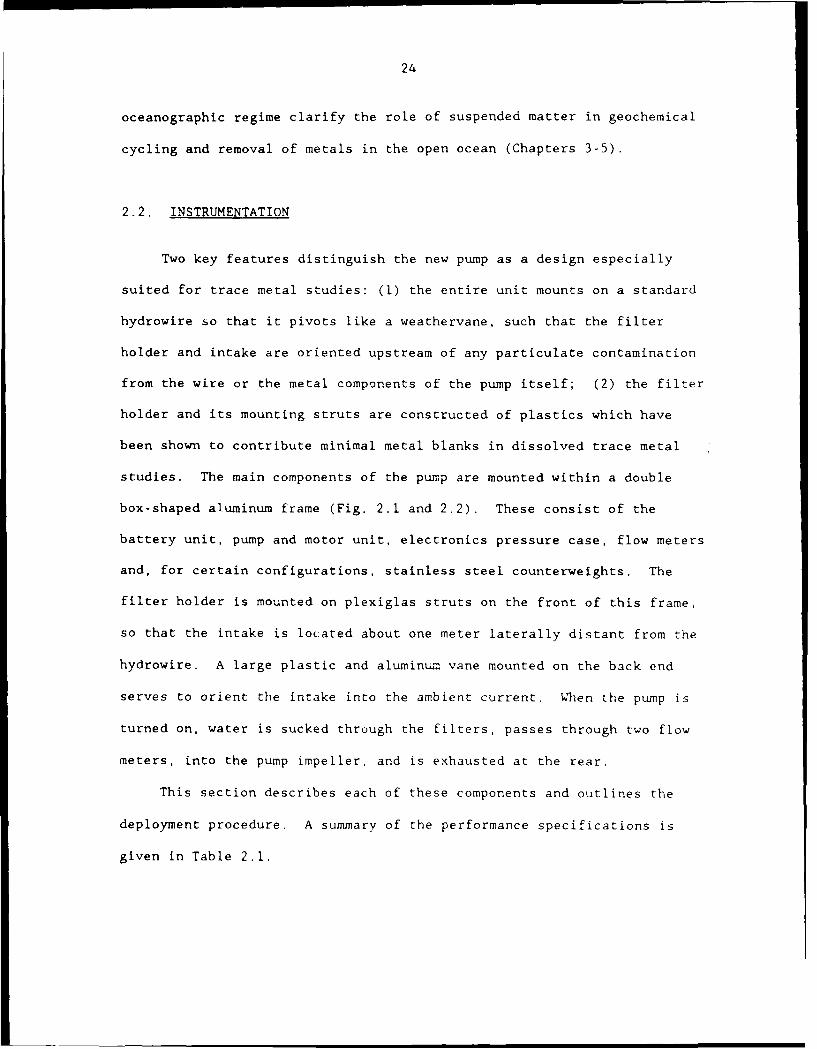
Figure 2.1. Photograph of RAPPID (in situ pump) mounted on hydrowire.
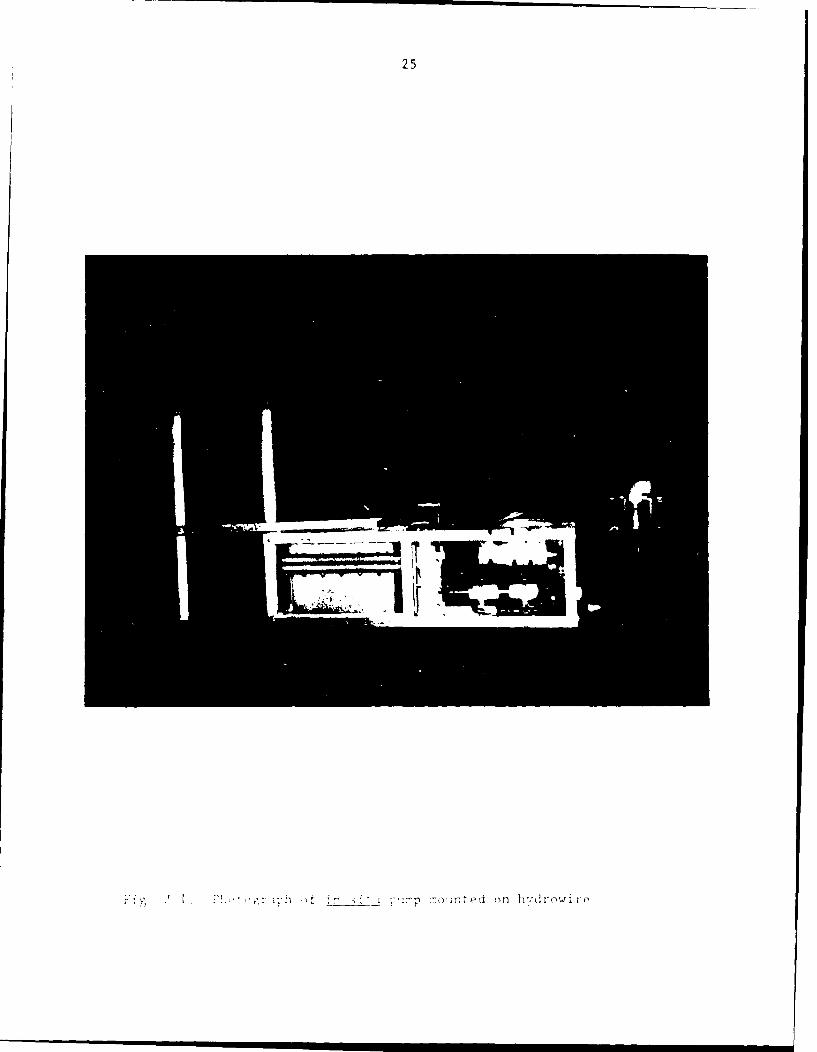
Figure 2.2. Schematic of pump construction and principle components.
Figure 2.3. Flow rate versus time curves for several Sargasso Seasamples.
Figure 2.4. Schematic of filter holder design.
Figure 3.1. Sargasso Sea: Profiles of suspended particulate mass andmajor constituent elements.
Figure 3.2. Sargasso Sea: Bulk particle composition, major constituentphases, upper 2000m.
Figure 3.3. Sargasso Sea: Particulate Al, Fe, and Fe/Al ratio.
Figure 3.4. Sargasso Sea: Particulate trace metal profiles.
Figure 3.5. Smoothed particulate metal profiles, showing similarity in
profile shape.
Figure 3.6. Metal to manganese regressions, Bermuda, upper 2000m.
Figure 3.7 Metal/Mn molar ratios in suspended particles (Bermuda,
>200m) and Pacific ferromanganese nodules.
Figure 3.8. Steady-state two-box metal flux model.
Figure 4.1. Sargasso Sea: Dissolved and suspended particulate Pb andPb-210 profiles.
Figure 4.2. Sargasso Sea: pb/ 2 10 Pb and 2 0 6 Pb/ 20 7 pb ratios in seawater
and suspended particles.
Figure 5.1. Location of northeast Pacific station in southern EscanabaTrough.
Figur 5.2 Pacfic: P~:uflts of total suspended mass concentration and
major particulate constituent elements.
Figure 5.3. Pacific: Relative bulk composition of suspended particulate
matter.
Figure 5.4. Pacific: Particulate organic carbon, ph~osphorc~:, -rndorganic C/P ratio.
Figure 5.5. Pacific: Profiles of suspended jpart iculate trace metals.
10
Figure 5.6. Pacific: Profiles of suspended particulate metals (per gramdry weight suspended material), compared to Sargasso Sea
profiles.
Figure 5.7. Profiles of North Atlantic and North Pacific dissolved trace
metals.
Figure .8. Hydrographic data for Pacific station.
Figure 5.9. Sargasso Sea and Pacific: Calculated distribution
coefficients.
Figure 5.10. Sargasso Sea and Pacific: Log Kd for trace elements,compared to equilibrium distribution coefficients fromlaboratory experiments.
Figure 5.11. Sargasso Sea and Pacific: Dissolved and particulate Cd, P.and Cd/P ratio.
Figure 6.1. Oceanus 197 transect station locations (northwest Atlantic).
Figure 6.2. Temperature profiles for transect stations 2-4.
Figure 6.3. Profiles of <53 pm suspended particulate mass and metal
concentrations (per liter seawater), transect stations 1-4.
Figure 6.4. Profiles of <53 m suspended particulate mass and metalconcentrations (per gram dry particulate matter), transect
stations 1-4.
Fiugre b.5. TAG hydrothermal area and detail of approximate RAPPID pumpsample locations.
Figure 6.6. TAG hydrothermal area: Regressions of particulate metals
versus particulate Fe.
Figure 6.,. TAG hydrothermal area: Metal/Fe ratio versus reciprocal of
particulate Fe concentration.
LIST OF TABLES
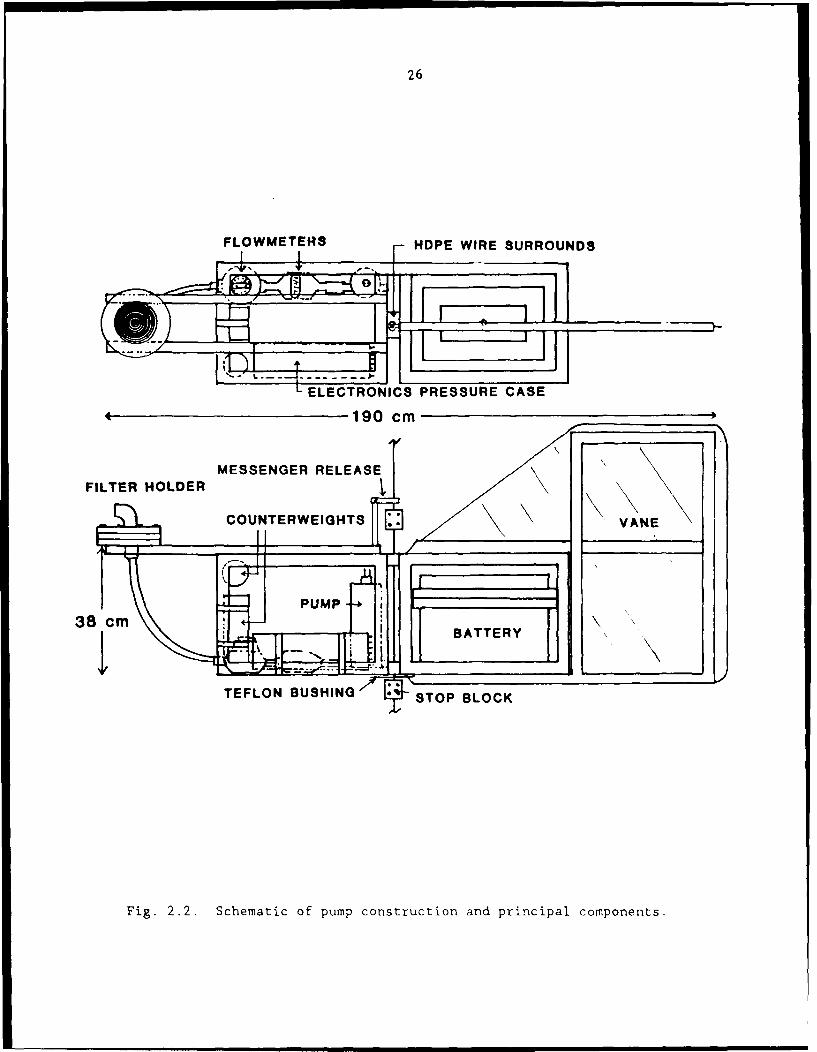
Table 2.1. RAPPID (in situ pump) performance specifications.
Table 2.2. Filter blanks, reagent blanks and analytical precision.
Table 3.1. Sargasso Sea (Bermuda) pump sampling stations, dates, and
cruises.
Table 3.2. Suspended particulate metal concentrations: Intermediate anddeep water means compared to previous studies.
Table 3.3. Metal to aluminum ratios in average crustal material and innepheloid layer particles, Sargasso Sea.
Table 3.4. Suspended particulate trace metals in Atlantic surfacewaters, :ompared to previous studies.
Table 3.5. Estimated percentage of total particulate metal carried inmineral lattice of major component phases.
Table 3.6. Bermuda: Log Kd and percent total metal for suspendedparticles in surface water and upper thermocline.
Table 3.7. Sargasso Sea two-box model flux calculations.
Table 3.8. Deep ocean scavenging residence times for several tracemetals.
Table 3.9. Sargasso Sea: Bulk composition of deep sinking, deep
suspended, and surface suspended particles.
Table 4.1. Sargasso Sea: Model-calculated small particle flux versusmeasured total fluxes of Pb and 2 10 Pb.
Table 5.1 Elemental composition of deep (2872m) 3uspended particles
compared with local surface sediments.
Table 5.2. Ratios of North Pacific to North Atlantic dissolved andparticulate trace metals (500-1500m means).
Table 5.3. Calculat'on of distribution coefficients at the northeast
Pacific and Sargasso Sea stations.
Table 6.1. Northwest Atlantic transect stations, Oceanus 197.
Table A.l. Sargasso Sea: Particulate elemental composition, 1986-1987(per volume seawater).
12
Table A.2. Sargasso Sea: Particulate elemental composition, 1986-1987(per gram dry particles).
Table A.3. Sargasso Sea: Particulate elemental composition, 1988 (pervolume seawater).
Table A.4. Sargasso Sea: Particulate elemental composition, 1988 (pergram dry particles).
Table A.5. Particulate 2 10Pb and 20 6Pb/ 20 7Pb, Bermuda, 1987-88.
Table B.1. Particulate elemental composition, Pacific, June 1988,(per volume seawater)
Table B.2. Particulate elemental composition, Pacific, June 1988,(per gram dry particles)
Table B.3. Pacific hydrographic data (plus dissolved Cd).
Table C.l. Zn and Cd in filter rinse solutions, Bermuda.
Table C.2. Zn and Cd in filter rinse solutions, Northeast Pacific.
Table D.l. Particulate elemental composition, TAG hydrothermal plumeand off-axis samples.
13
CHAPTER I
INTRODUCTION
The influence of particles on the distribution of dissolved trace
metals in the ocean was recognized many years before the true
concentrations and the details of the distribution were known (Goldberg,
1954; Krauskopf, 1956). The concentrations of many minor elemenus were
known well enough at that time to determine that their concentrations
were lower than would be predicted based solely on the solubility of
their least soluble minerals. It was therefore proposed that interaction
with a constant rain of particulate matter through the oceanic water
column maintained the low concentrations by removing metals to the
sediments.
In the past 15 years, progress in determining accurate
concentrations of dissolved trace metals in the ocean has been rapid
(Bruland, 1983, and references therein). We now have a general knowledge
of the distribution of many trace metals between the surface and deep
waters, and between the major ocean basins (Wong et al., 1983). Broad
categories of elemental behavior have begun to emerge, all of which are
tied to interactions with oceanic particulate matter. Elements such as
Cd and Zn appear from their dissolved distributions to be strongly
influenced by processes which control the distributions of the major
nutrients (Boyle et al., 1976; Bruland et al., 1978; Bruland, 1980).
These "nutrient-type" metals are taken up by phytoplankton in surface
waters and cie regenerated into solution at greater depths, where the
sinking biological material is decomposed. Other metals, such as Cu,
14
demonstrate strong interactions with particles at mid-depth, but are
apparently returned to solution at the bottom. This causes the vertical
profile of dissolved Cu to be concave upward in regions which are
uncomplicated by additional sources introduced by horizontal advection
(Boyle et al., 1977). A third group of metals are highly
particle-reactive, and have residence times substantially shorter than
the oceanic mixing time. Dissolved profiles of metals in this group,
which includes Mn, Co, and Pb, do not display the bottom source evident
for Cu, and are therefore thought to be removed on sinking particulate
matter without substantial regeneration (Martin and Knauer, 1980; Knauer
et al., 1982; Shaule and Patterson, 1981).
The major component phase composition and major element chemistry of
the particles responsible for these behaviors is reasonably well known.
Particulate matter in the open ocean is composed primarily of the organic
and inorganic remains of surface-dwelling organisms, with a smaller
lithogenic mineral component, and a very minor contribution from
cosmogenic and anthropognic particles (Lal, 1977; Bishop et al., 1980).
Major elements are thus Ca (as CaCO3), Si (as opaline silica and
lithogenic ordered silicates), and C (as organic compounds and
carbonate). The minor element composition is not as well known. Accurate
data exists on the particulate concentration and vertical flux of minor
elements which are relatively abundant in oceanic particles, such as Al,
Fe, Mn, and Ba (Orians and Bruland, 1986; Landing and Bruland, 1987;
Bishop and Fleischer, 1987; Collier and Edmond, 1984; Bishop, 1988).
However, very little is known about the concentration and distribution of
less abundant trace metals on oceanic particulate matter. Measurements
15
of trace elements in surface plankton have been made in a few locations
(Martin and Knauer, 1973; Knauer and Martin, 1981; Collier and Edmond,
1984), and on sinking particles caught in sediment traps (Jickells et
al., 1984; Dymond and Collier, 1987; Martin and Knauer, 1986). However,
the trace element composition of suspended particles which comprise most
of the suspended mass and available surface area, and therefore might be
expected to dominate interactions with dissolved metals, is largely
unknown. A few studies have described the particulate distribution of
specific elements (e.g. V, Collier, 1984). One study, published ten
years ago, presented average intermediate and deep water particulate
metal concentrations, but no details of the distributions were reported
(Buat-Menard and Chesselet, 1979).
Much of what we know about interactions between dissolved and
particulate trace elements comes from studies of the partitioning of the
natural radionuclides 2 10Pb, 2 10 po, and the Th isotopes (Thomson and
Turekian, 1976; Bacon et al., 1978; Cochran et al., 1983; Bacon et al.,
1985). The distribution of dissolved and particulate Th, for example, is
consistent with a reversible exchange model where dissolved Th is
repeatedly taken up and released by suspended particles as the particles
are carried toward the sediments by large, fast-sinking aggregates (Bacon
and Anderson, 1982; Bacon et al., 1985). The extent to which Th serves
as an analog for the behavior of other trace metals is not clear from
available evidence. The mechanism by which dissolved/particulate
exchange occurs is also not well understood. While many investigators
have considered dissolved/particulate interactions to be surface chemical
processes (adsorption/desorption)(Balistrieri et al., 1981; Honeyman et
16
al., 1988), other types of interactions, such as ion exchange,
(co-)precipitation, incorporation into insoluble mineral phases, and
active biological uptake, may be equally important.
The goal of this research was to investigate dissolved/particulate
interactions of trace metals by accurately determining suspended
particulate trace metal distributions in distinct oceanic environments.
Five broad questions form a framework for this research.
(1) What is the concentration and vertical distribution of suspended
particulate trace metals in the open ocean?
(2) What controls the partitioning of trace metals between dissolved and
suspended phases?
(3) What is the quantitative relationship between suspended particulate
trace metals in the deep ocean and the total flux of metals observed
in deep water sediment traps?
(4) How rapidly does exchange between dissolved and suspended
particulate trace metals occur, relative to the residence time of
the particles?
(5) How does trace metal partitioning vary with oceanographic regime?
To address these questions, I present detailed profiles of suspended
particulate Al, Fe, Mn, Co, Zn, Cu, Ni, Cd, and Pb for stations in the
Sargasso Sea and in the northeast Pacific. These studies required the
development of a new particle sampling device, which is described in
Chapter 2, along with the methods of analysis. The results of five
occupations of station near Bermuda in the Sargasso Sea are presented in
Chapter 3. This section defines the first accurate profiles of
17
particulate concentrations of many of these elements, and suggests
mechanisms by which the vertical particulate metal profile is maintained.
Particulate metal distributions are considered in light of known fluxes
of metals in deep water at this site in order to investigate particle
interactions in the deep ocean and the source of metals which are
transported to the bottom on fast-sinking particles. Chapter 4 reports
the dissolved and particulate distributions of stable Pb isotopes and the
ratio of Pb to 2 10Pb at the Bermuda station. The results demonstrate
rapid isotopic equilibration between dissolved and suspended particulate
Pb. In Chapter 5, the Sargasso Sea results are compared to particulate
metal distributions measured at a station in the northeast Pacific in
order to understand factors which control the partitioning of trace
metals in these two distinct oceanographic regimes. Preliminary
investigation of suspended particulate trace metals in a transect of
stations extending from the contintental shelf to Bermuda, and in a
dispersed hydrothermal plume on the mid-Atlantic Ridge are presented in
Chapter 6. A brief concluding chapter summarizes the findings and
presents the implications of this work for the continuing investigation
of oceanic scavenging mechanisms.
18
REFERENCES
Bacon, M.P., Spencer, D.W. and Brewer, P.G. (1978) Lead-210 andpolonium-210 as marine geochemical tracers: Review and discussion ofresults from the Labrador Sea. In: Natural Radiation Environment III(T.F. Gesell and W.F. Lowder, eds.), Vol. 1, pp. 473-501, U.S. Dept.Energy Report CONF-780422.
Bacon, M.P., Anderson, R.F., (1982) Distribution of thorium isotopesbetween dissolved and particulate forms in the deep sea, J. ofGeophys. Res. 87, 2045-2056.
Bacon, M.P., Huh, C.-A., Fleer, A.P., Deuser, W.G. (1985) Seasonality inthe flux of natural radionuclides and plutonium in the deep SargassoSea, Deep-Sea Res. 32, 273-286.
Balistrieri, L., Brewer, P.G., Murray, J.W., (1981) Scavenging residencetimes of trace metals and surface chemistry of sinking particles inthe deep ocean, Deep-Sea Res. 28A, 101-121.
Bishop, J.K.B., Collier, R.W., Ketten, D.R., and Edmond, J.M. (1980) Thechemistry, biology, and vertical flux of particulate matter from theupper 1500m of the Panama Basin, Deep-Sea Res. 27A, 615-640.
Bishop, J.K.B. and Fleisher, M.Q. (1987) Particulate manganese dynamicsin gulf stream warm-core rings and surrounding waters of the N.W.Atlantic. Geochim. Cosmochim. Acta 51, 2807-2827.
19
Collier, R.W. (1984) Particulate and dissolved vanadium in the NorthPacific Ocean. Nature 309, 441-444.
Collier, R. and Edmond, J. (1984) The trace element geochemistry ofmarine biogenic particulate matter. Prog. Oceanog. 13, 113-199.
Cochran, J.K., Bacon, M.P., Krishnaswami, S. and Turekian, K.K. (1983)Po-210 and Pb-210 distributions in the central and eastern IndianOcean. Earth Planet. Sci. Lett. 65, 433-452.
Dymond, J. and Collier, R. (1987) Nares Abyssal Plain sediment fluxstudies. In: Subseabed disposal project annual reporL, physicaloceanography and water column studies, S.L. Kupferman, ed., SandiaNational Laboratories, Livermore CA pp BI-B24.
Goldberg, E.D. (1954) Marine geochemistry 1. Chemical scavengers of thesea. J. Geol. 62, 249-265.
Honeyman, B.D., Balistrieri, L.S., Murray, J.W., (1988) Oceanic tracemetal scavenging: the importance of particle concentration, Deep-SeaRes. 35, 227-246.
Jickells, T.D., Deuser, W.G. and Knap, A.H. (1984) The sedimentationrates of trace elements in the Sargasso Sea measured by sedimenttrap. Deep-Sea Res. 31, 1169-1178.
Knauer, G.A.and Martin, J.H. (1981) Phosphorus-cadmium cycling innortheast Pacific waters. J. Mar. Res. 39, 65-78.
Knauer, G.A., Martin, J.H. and Gordon, R.M. (1982) Cobalt in north-eastPacific waters. Nature 297, 49-51.
Krauskopf, K.B., Factors controlling the concentration of thirteen raremetals in sea water, Geochim. Cosmochim. Acta 9, 1-32, 1956.
Lal, D. (1977) The oceanic microcosm of particles. Science 198,997-1009.
Landing, W.M. and Bruland, K.W. (1987) The contrasting biogeochemistry ofiron and manganese in the Pacific Ocean. Geochim. Cosmochim. Acta,51, 29-43.
Martin, J.H. and Knauer, G.A. (1973) The elemental composition ofplankton. Geochim. Cosmochim. Acta 37, 1639-1653.
Martin, J.H. and Knauer, G.A. (1980) Manganese cycling in northeastPacific waters. Earth Planet. Sci. Lett. 51, 266-274.
Martin, J.H. and Knauer, G.A. (1986) VERTEX: Distributions and fluxes ofAg, Al, Ba, Cd, Co, Cr, Cu, Fe, Mn, Mo, Ni, Pb, V, and Zn insub-oxic waters off Mexico. Earth Planet. Sci. Lett. unpublishedmanuscript.
20
Orians, K.J. and K.W. Bruland (1986) The biogeochemistry of aluminum inthe Pacific Ocean. Earth Planet. Sci. lett. 78, 397-410.
Schaule, B.K. and Patterson, C.C. (1981) Lead concentrations in theNortheast Pacific: evidence for global anthropogenic perturbations.Earth Planet. Sci. Lett. 54, 97-116.
Wong, C.S., Boyle, E., Bruland, K.W., Burton, J.D. and Goldberg, E.D.(1983) Trace Metals in Sea Water, NATO Conference Series, PlenumPress, New York.
21
CHAPTER 2
METHODS: COLLECTION OF SUSPENDED OCEANIC PARTICULATE MATTER
FOR TRACE METAL ANALYSIS USING A NEW IN SITU PUMP
2.1. INTRODUCTION
The interaction between dissolved chemical constituents and fine
particles suspended in the ocean is an important control on the minor
element composition of seawater. In order to understand this
interaction, it is necessary to accurately sample and analyze both
seawater and suspended particles. Techniques for collection and analysis-
of seawater samples for trace elements have advanced rapidly in the last
15 years, ii,. we now have a basic knowledge of the concentration and
distribution of many trace metals dissolved in the world's oceans
(Bruland, 1983). The distribution of particulate trace metals, which
generally comprise a small fraction of the dissolved concentration, is
not as well known (Buat-Menard and Chesselet, 1979). Accurate knowledge
of the partitioning of trace metals between dissolved and particulate
forms at several representative oceanic stations would lead to a better
understanding of transformations between these two phases, and the
processes which result in vertical flux of metals out of the oceanic
system (Jickells et al., 1984; Dymond and Collier, 1987). This paper
describes a new device for collecting relatively large uncontaminated
samples of suspended oceanic particulate matter, and a procedure for
analysis of the particles for major constituent elements and trace
metals.
22
One of the difficulties to be overcome in collection of open ocean
suspended matter for chemical analysis is the low mass concentration and
consequent need to sample large volumes of seawater. The most commonly
used technique is ship-board filtration of a few to a few tens of liters
of water collected with conventional Niskin bottles (Brewer et al.,
1976). When clean room-type precautions and Go-Flo bottles are used in
sample handling, this procedure has been shown to work very well for
analysis of relatively abundant metals such as Al, Fe, and Mn (Landing
and Bruland, 1987; Orians and Bruland; 1986) and for some more
contamination-prone metals such as Zn (Bruland, pers. comm. 1989). The
disadvantage of this technique is that sample sizes are limited to a few
hundred micrograms at typical deep ocean particle concentrations,
restricting the number of different analyses or dissolution procedures
that can be carried out on each sample. In addition, bottle artifacts
(such as incomplete sampling due to rapid settling of particles in the
samplers, Gardner, 1977; Calvert and McCartney, 1979) can be minimized
(bottle inversion, re-orientation of sampling orifice) but are difficult
to evaluate. The rationale behind the design of the current sampler was
to increase sample size by 1-2 orders of magnitude over the bottle
technique, and to avoid ship-board contamination sources and possible
bottle artifacts by filtering the particles in situ with a submersible
pump.
The use of pumps as oceanographic sampling devices is not new.
Deck-mounted pumps have been used for some time for sampling particles in
the upper water column by sucking water through various lengths of tubing
(Beers et al., 1967; Lisitzin, 1972; Lenz, 1972; Jeffrey et al., 1973).
23
In situ pumps capable of collecting particles in the deep ocean have also
been used to study the biological, mineralogical, chemical and
radiochemical composition of suspended matter (Laird et al., 1967;
Spencer and Sachs, 1970; Beer et al., 1974; Bacon and Anderson, 1982;
Winget et al., 1982). Some of these devices are powered from the surface
by means of an electro-mechanical cable and are capable of filtering up
to 25,000 liters of seawater (Bishop and Edmond, 1976; Bishop et al.,
1985). Another instrument couples battery-powered filtration with
sensors which relay temperature, depth, light transmission and particle
size fractionation data to the ship as the instrument is deployed
(Simpson et al., 1987). The current design was conceived as a relatively
simple sampling device which could be used on any vessel equipped with a
standard hydrographic winch, incorporating design elements intended to
minimize trace met 1l contamination of the particulate sample.
Here I present a detailed description of the new pump, called the
Rotating Automatic Pump for Particulate Inorganics Determination
(RAPPID), and a procedure for analysis of oceanic particulate matter for
major elements (Ca, Al, Fe), phosphorus, opaline silica, the trace metals
Mn, Co, Cu, Zn, Ni, Cd, and Pb, and the radionuclides 2 10Pb and 210po.
Three of these devices have been constructed and used successfully on
seven oceanographic cruises to collect over 50 samples of particulate
matter from volumes of 200-1500 liters to depths of 4000m. Results of
the chemical analyses indicate that concentrations of particulate metals
are, for several elements, much lower than previously estimated (see
Chapter 3). Moreover, the observed variations with depth and
24
oceanographic regime clarify the role of suspended matter in geochemical
cycling and removal of metals in the open ocean (Chapters 3-5).
2.2. INSTRUMENTATION
Two key features distinguish the new pump as a design especially
suited for trace metal studies: (1) the entire unit mounts on a standard
hydrowire so that it pivots like a weathervane, such that the filter
holder and intake are oriented upstream of any particulate contamination
from the wire or the metal components of the pump itself; (2) the filter
holder and its mounting struts are constructed of plastics which have
been shown to contribute minimal metal blanks in dissolved trace metal
studies. The main components of the pump are mounted within a double
box-shaped aluminum frame (Fig. 2.1 and 2.2). These consist of the
battery unit, pump and motor unit, electronics pressure case, flow meters
and, for certain configurations, stainless steel counterweights. The
filter holder is mounted on plexiglas struts on the front of this frame,
so that the intake is located about one meter laterally distant from the
hydrowire. A large plastic and aluminum vane mounted on the back end
serves to orient the intake into the ambient current. Vhen the pump is
turned on, water is sucked through the filters, passes through two flow
meters, into the pump impeller, and is exhausted at the rear.
This section describes each of these components and outlines the
deployment procedure. A summary of the performance specifications is
given in Table 2.1.
25
2 . 51 7p..o..li eA onl h ro41, re
26
FLIOWMETERS HDPE WIRE SURROUNDS
ID-
ELECTRNICS PRESSURE CASE
190 cm
MESSENGER RELEASEF IL T E R H O L D E R C TI
C R TVANE
i PUMP.
BATEY_
TEFLON BUSHING *" STOP BLOCK
Fig. 2.2. Schematic of pump construction and principal components,
27
Table 2.1. RAPPID performance specifications.
Weight: 80kg in air
Filter: 142mm, 127mm effective diameter
Maximum flow rate: -7.5 1/min
Maximum face velocity: 1.0 cm/sec
Battery: 12V, 76AH or 24V, 38AH-6 hrs pumping per charge cycle3 year battery life span
Maximum deployment depth: 6500m (limited by pressure housing)
Winch speed: 50 m/min
28
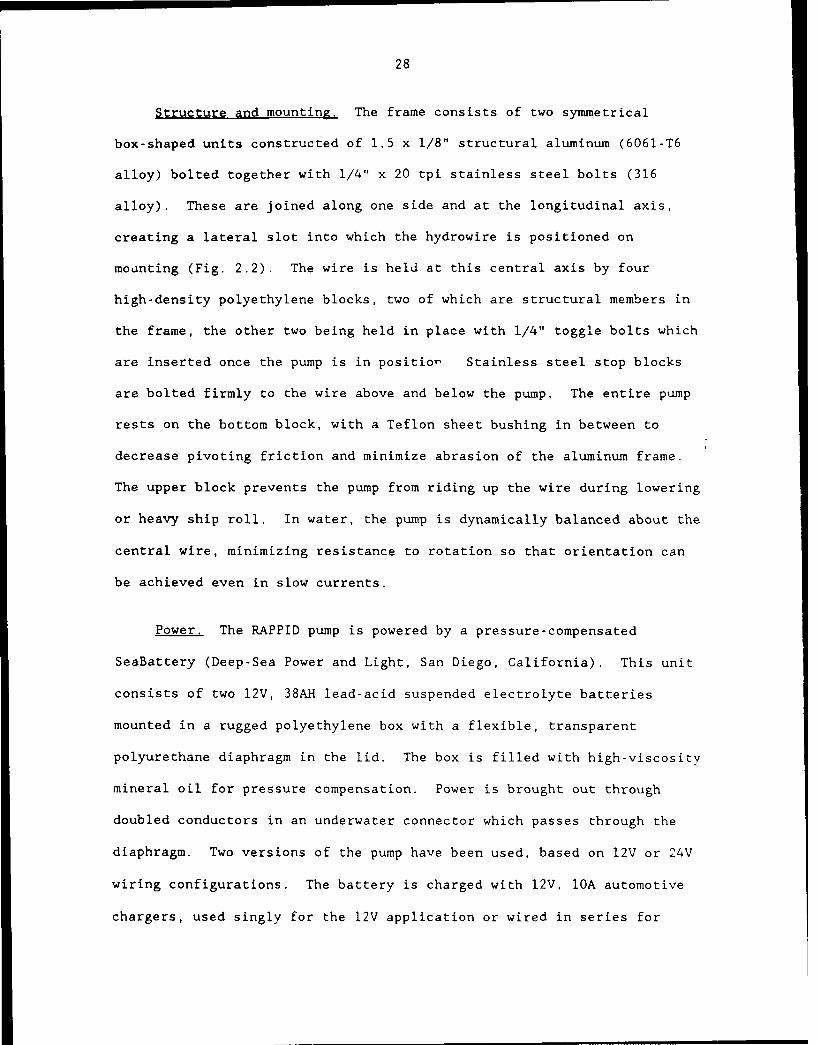
Structure and mounting The frame consists of two symmetrical
box-shaped units constructed of 1.5 x 1/8" structural aluminum (6061-T6
alloy) bolted together with 1/4" x 20 tpi stainless steel bolts (316
alloy). These are joined along one side and at the longitudinal axis,
creating a lateral slot into which the hydrowire is positioned on
mounting (Fig. 2.2). The wire is held at this central axis by four
high-density polyethylene blocks, two of which are structural members in
the frame, the other two being held in place with 1/4" toggle bolts which
are inserted once the pump is in positio Stainless steel stop blocks
are bolted firmly to the wire above and below the pump. The entire pump
rests on the bottom block, with a Teflon sheet bushing in between to
decrease pivoting friction and minimize abrasion of the aluminum frame.
The upper block prevents the pump from riding up the wire during lowering
or heavy ship roll. In water, the pump is dynamically balanced about the
central wire, minimizing resistance to rotation so that orientation can
be achieved even in slow currents.
Power. The RAPPID pump is powered by a pressure-compensated
SeaBattery (Deep-Sea Power and Light, San Diego, California). This unit
consists of two 12V, 38AH lead-acid suspended electrolyte batteries
mounted in a rugged polyethylene box with a flexible, transparent
polyurethane diaphragm in the lid. The box is filled with high-viscosity
mineral oil for pressure compensation. Power is brought out through
doubled conductors in an underwater connector which passes through the
diaphragm. Two versions of the pump have been used, based on 12V or 24V
wiring configurations. The battery is charged with 12V. 10A automotive
chargers, used singly for the 12V application or wired in series for
29
charging the batteries in the 24V configuration. Line voltage to the
chargers is controlled with a Variac transformer, allowing the charging
amperage to be manually adjusted during the charge cycle. Charging is
stopped when current falls below l.OA, or when gas is observed emanating
from the cells. A typical charging cycle took eight hours (for near full
discharge), and was sufficient for 2-3 pump deployments.
Pump/Motor Unit, Two different pump/motor combinations have been
used. The first is a 12V unit which runs in Bray oil and is fitted with
a Jabsco flexible vane pump head (Pelagic Electronics, Falmouth, MA). A
more recent version uses a 24V motor, pressure compensated with
aviation-type hydraulic oil, mated to a rotating-disk positive
displacement adjustable flow-rate pump head (Flotec) by means of an
anodized aluminum housing with ceramic shaft seal (Oceanic Industries,
Monument Beach, MA). These pumps have similar flow rate versus pressure
differential characteristics, but the latter has proved somewhat more
efficient (55VA vs. 75VA at full load) and more durable. Stainless steel
counterweights are hose-clamped to the pump frame when the lighter 12V
pump/motor is used, in order to maintain the fore/aft balance of the
entire unit.
Flow meters. Two flow meters mounted in series downstream of the
filter holder record total volume sampled and flow rate versus time data.
The first (Kent Meters, model C-700, Ocala, FL) was modified to send
electrical pulses to the electronics unit by mounting a small magnet on
the rotating central spindle of the index, and fixing a matching reed
switch to the index face (T. Hammar, pers. comm.). Flow through the
30
meter caused the switch to make and break a circuit to the control unit.
These pulses are recorded by the computer at the rate of 200 state
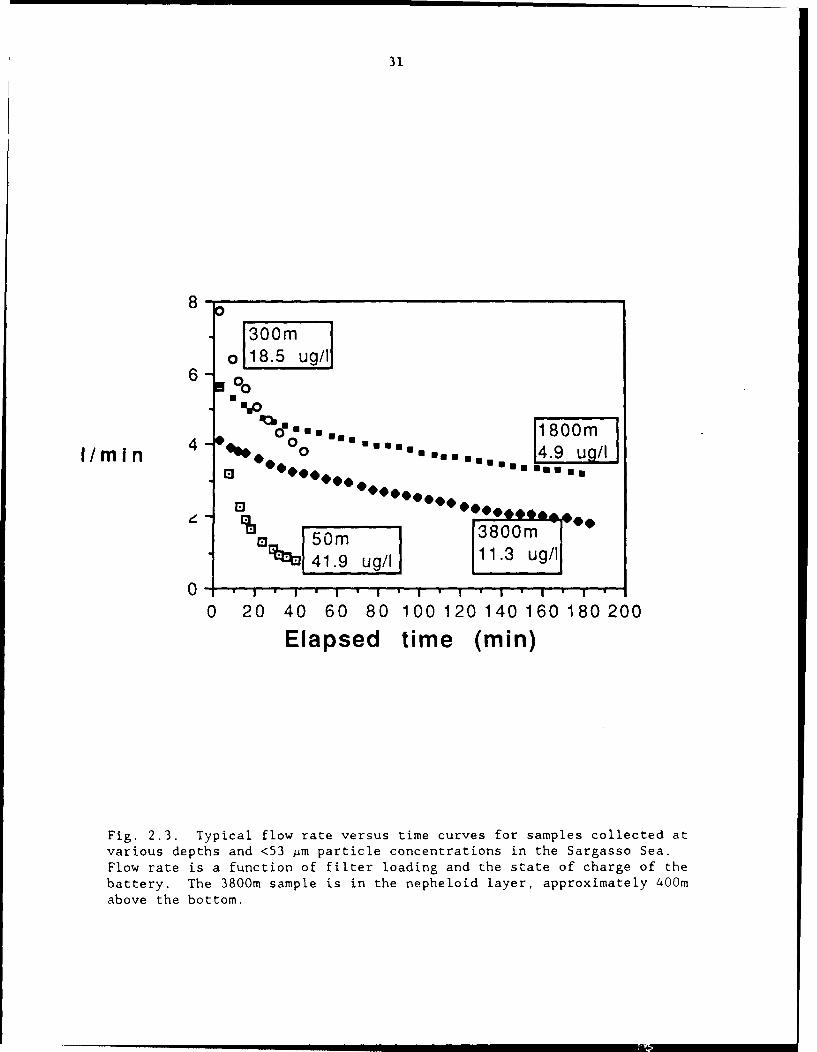
changes per gallon (52.8/liter). Flow rate decreases quasi-exponentially
with time due to filter loading (Fig. 2.3). The record of flow rate
evolution provides an indication of pump performance during the
deployment, serves as a diagnostic tool for locating pump failures, and
guides subsequent sampling so that the pump interval can be set to
optimize sample volume within ship time constraints.
The second flow meter was a different design (Kent Meters, model PSM
190, Ocala, FL) which was not readily adapted for telemetering but had
the advantage of a lower stall rate (1/8 gal/min vs. 1/4 gal/min). The
two meters provided replicate measurements of sample volume, and gave
equivalent results within the manufacturer's stated precision (±1.5%, at
flow rates exceeding stated stall rate). Discrepancies between the two
were noted only when flow rate fell below I 1/min. In these cases,
volume indicated by the PSM 190 was assumed correct.
Electronic control. The pumping interval is controlled by an
independently powered Hewlett-Packard 41CX handheld computer mated to a
small input/output/control unit (CMT-200 Data Acquisition and Control
Unit, Corvallis Microtechnology, Corvallis, OR). The computer is pre-set
for on/off times by programming control alarms actuated by the built-in
time function in the HP 41CX. After some experience, the time required
for deployment can be estimated to within 20 minutes, so that little ship
time is lost. To save battery power, the computer is on only during the
pump interval, using a "wake-up" function actuated by the control alarm.
The control unit powers a relay, also contained within the pressure
31
8-
30018.5mug/I
6 00
ao goo 180MImin 4 0, oo "-eans= 4.9 ug/I
50m 3800m .
0-3 419'/ 13u/0- .I. " I'I. I ' I ' I - I I
0 20 40 60 80 100 120 140 160 180 200
Elapsed time (min)
Fig. 2.3. Typical flow rate versus time curves for samples collected at
various depths and <53 gm particle concentrations in the Sargasso Sea.
Flow rate is a function of filter loading and the state of charge of thebattery. The 3800m sample is in the nepheloid layer, approximately 400m
above the bottom.
32
vessel, which carries primary current from the battery. An input channel
on the control unit is connected to the flow meter circuit, and pulses
are sub-totaled after a specified time interval (-5 min for a typical
deployment) and recorded in data storage registers in the computer (Fig.
2.3). All of these functions are controlled by an operation program
stored in computer memory. Upon retrieval of the pump, the pressure case
is opened, and a data reduction program transfers recorded data (flow
counts for each time interval, total counts, time on, time off) to a
compatible thermal printer (Hewlett-Packard model 22143A).
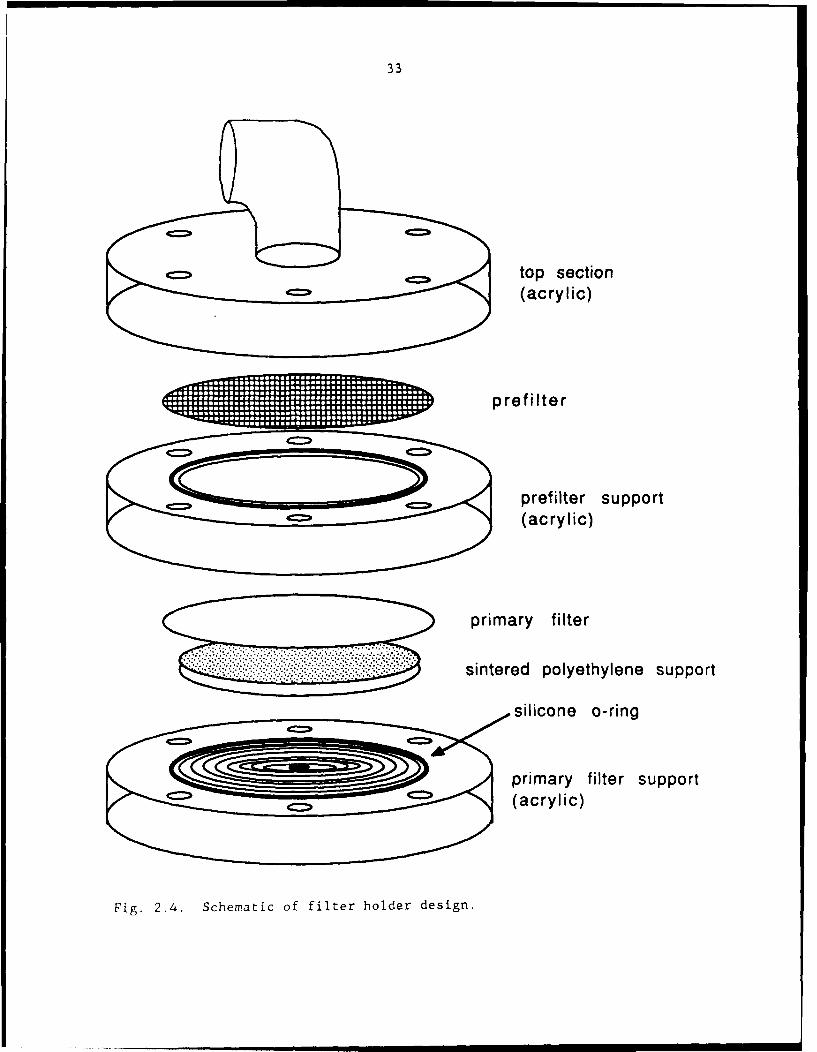
Filter Holder, The RAPPID system is designed to be used with 142mm
diameter filters, which were judged to be large enough to collect
sufficient sample in a reasonable length of time while avoiding the
handling difficulties of a larger standard size filter (e.g. 293mm). The
filter holder is custom designed to optimize effective filter area and to
minimize use of potentially contaminating materials. The two-stage
holder consists of three acrylic plastic sections (Fig. 2.4). The base
supports the primary filter on a 35 Am pore-size sintered polyethylene
disk insert (Bel-Art). The middle section is simply an open ring which
supports a prefilter, held only by tension around its perimeter. The top
section incorporates a flow expansion chamber and a PVC intake elbow,
with a 15.2 cm2 orifice facing horizontally so that the pump does not act
as a trap for rapidly sinking particles.
Silicone o-rings sit in glands machined in the upper faces of the
bottom two pieces, such that they project 0.25 mm above the face of the
holder. All three pieces are bolted together with six 1/2" Nylon bolts,
and tightened with custom-made Lexan polycarbonate wrenches so that all
33
top section(acrylic)
~prefilter
prefilter support(acrylic)
primary filter
sintered polyethylene support
silicone o-ring
primary filter support
Fig. 2.4. Schematic of filter holder design.
34
faces contact firmly. This establishes a crisp edge to the sample area,
so that subsamples can later be cut as accurate fractions of the total
sample. Tightening also compresses the o-rings slightly, and water
leakage is prevented by the o-ring's position on the low-pressure side of
the primary filter. Effective filter area is 126.7 cm2 (80% of total
filter area). The assembled filter holder is connected to the flow
meters by 1/2" polyethylene tubing and polypropylene compression fittings
(Jaco).
In preparation for use, all parts of the filter holders are
carefully washed, thoroughly rinsed, soaked in dilute HC1 at 35'C for
several days, and rinsed in distilled, deionized water. During use at
sea, filter holders are rinsed between deployments with distilled,
deionized water in a polyethylene squeeze bottle, using polyethylene
gloves for all stages of handling .
Deployment procedure, The RAPPID is designed to be used in
multiple-pump casts, so that several-depth profiles can be obtained in
one cast. Up to three pumps have been deployed simultaneously in seas up
to 6m high without undue difficulty. In calmer weather, it is expected
that several more pumps could be deployed on a single cast, increasing
sampling efficiency.
In preparation for a cast, filter holders are loaded with clean
filters in a laminar flow clean bench, bolted together, sealed with a
clean polyethylene plug inserted in the intake, and stored temporarily in
clean zip-lock polyethylene bags. Computers are set for pump interval
and sealed inside the pressure cases, which are purged with compressed
Freon to prevent condensation of water vapor on the electronic
35
components. Pressure cases are attached to the pump frames, initial flow
meter readings are recorded, and the bottom stop block is affixed to the
hydrowire. When the pump is ready for deployment, the filter holder is
removed from its storage bag, attached to the struts with acid-cleaned
Nylon wing-bolts, connected to the pump plumbing, and re-covered with a
larger polyethylene bag. The weight of the pump (over 50% of which is
due to the battery) requires it to be lifted into position on the wire
using a block and tackle. The wire is captured in position by fixing the
removable plastic blocks in place, and the lifting tackle is removed.
The top stop block is bolted to the wire, and a messenger is attached to
a release mechanism on the pump frame (Fig. 2.2).
To minimize the possibility of airborne contamination reaching the
filters, the protective plastic bag and intake plug are removed only
moments before the pump is submersed. Winch speed is limited to 50 m/min
to avoid kiting, although faster speeds have occasionally been used
without mishap.
The pumping interval varies from 40 minutes to 3 hours, depending on
anticipated particle concentration and filter clogging rate. Sampling
depth is estimated by use of reversing thermometers attached to Niskin
bottles which are mounted 10m above or below the pumps. These are
tripped by dropping a messenger at the mid-point of the pumping interval.
Additional bottles have been mounted at other depths to combine water and
particle collection in a single cast. Upon retrieval, the plastic intake
plugs are replaced immediately as the pumps emerge from the water, and
the pumps are removed from the wire. Filter holders are immediately
removed for disassembly in a laminar flow clean bench, the flow meter
36
indexes are read, the pressure cases are removed and opened, and
computers are withdrawn for data retrieval.
2.3. SAMPLE HANDLING AND ANALYSIS
Filter cleaning. drying and weighing. The filters used in this work
are chosen for an optimum combination of low metal blank, low water
absorption (for precise mass determination), and reasonably high flow
rate. The standard filters used are a 1.0 pm pore size 142mm diameter
Nuclepore polycarbonate primary filter, and a 53 pm mesh size square
weave polyester prefilter cut from bulk material (Pecap, #7-53/2, Tetko,
Briarcliffe Manor, NY). Control of trace metal blank levels requires
that they be carefully cleaned and handled only with acid-cleaned Teflon
forceps and polyethylene gloves in a laminar flow clean bench.
Filters are cleaned in batches of 25 by placing them in I liter
polyethylene bottles, filling with -1 N HC1 (reagent gr.'de, in distilled
deionized water), and heating in an oven at 60°C overnight. The acid is
then decanted to waste, and the bottles filled with distilled deionized
water and allowed to sit for -1 hour. This solution is then decanted to
waste, and the filters are rinsed five times in the bottles with
distilled deionized water, swirling and inverting the bottles each time.
The filters are then removed to a large, clean polyethylene beaker in a
laminar flow clean bench and allowed to sit in additional distilled
deionized water. They are then removed, drip-dried, and transferred one
at a time to acid-cleaned 150mm diameter polystyrene Petri dishes. The
lids are placed loosely ajar on the dishes and the filters are allowed to
dry overnight at room temperature in the laminar flow clean bench.
37
Dried filters are weighed to constant weight (±0.1mg) using an
analytical balance (Mettler H31), controlling electrostatic interactions
with two a-source anti-static strips positioned in the weighing cabinet.
Filters are prevented from contacting the stainless steel weighing pan by
placing a 152mm diameter acid-cleaned Teflon mesh di'k on the pan.
Typical mass for primary and prefilter is 180 and 640 mg, respectively.
Filters are returned to the labeled Petri dishes, which are then sealed
individually in zip-lock polyethylene bags, and in batches in larger bags
for tranporting to sea.
Shipboard procedures, At sea, filters are carefully mounted in the
filter holders immediately before use. Upon recovery, filter holders are
rid of excess seawater using a vacuum line attached to a clean length of
polyethylene tubing. Within three hours of recovery, the holders are
disassembled and the filters rinsed to remove residual seawater. For the
primary filters, this is accomplished by attaching the filter holder
base, with the filter left in position, directly onto a vacuum rinsing
apparatus by means of a short piece of clean polyethylene tubing. The
filter is rinsed with -125mi of pH 8.3 distilled water (adjusted with
pre-cleaned NaOH), which is gently dripped through the filter in a
repeating spiral fashion under moderate vacuum, so that the entire
surface is uniformly rinsed. The rinse solutions run into acid-cleaned
250mi polyethylene bottles mounted within -,,- _i ,ratus. These
solutions are then acidified with 0.5 ml 3x Vycor-distilled 6 N HCI, and
treated as dissolved trace element samples. Any loss of metal from the
particulate matter during rinsing can be determined by analysis of these
"rinsates" (Appendix C).
38
The prefilters are then placed on the same holder base and rinsed in
the same manner, still within the laminar flow bench. Both filters are
then returned to their original Petri dishes and allowed to dry for
several hours in the laminar flow bench before being sealed as before.
During transport back to the laboratory, samples are kept level to
prevent dislodging of particulate material from the filter surface.
Laboratory filter handling, Upon return to the laboratory, the
filters are re-dried for several days in a desiccator. Filters are
rapidly transferred from the desiccator (placed in a laminar flow bench)
to the balance, and sample weights are determined by re-weighing the
filters as before (this time in a desiccated weighing cabinet). Blank
filters are carried through the entire operation, and average differences
between pre- and post-sampling weights for these filters were used to
correct final weights for changes in the mass of the filter material
itself due to water absorption. This correction was less than +0.2 mg
for Nuclepore filters, but was larger (±l.0mg) for the more absorbent
pre-filters. This method was used instead of equilibration with ambient
room air to prevent erroneously high sample dry weights due to water
absorption by the particles or by residual seasalt. Within each weighing
batch, several filters are re-weighed to determine reproducibility.
Corrections for the mass of residual seasalt were made by analyzing
filter sub-samples for Na (see below), and assuming seawater major ion
composition. Salt corrections are generally less than 5% of particle
mass and are often negligible (<1%). Typical sample masses were 4.0 -
18.0 + 0.2 mg of <53,m material, and 0.5-2.0 + 0.5 mg of >53pm material.
39
These studies are concerned with the composition of small, slowly
sinking particles rather than the larger, rarer, fast-sinking particles,
represented by the >53 Mm prefilter fraction. Therefore the purpose of
the prefilter in this study was to separate the larger fraction from the
smaller particles which were the primary interest. Only the <53 ;m
fraction, which comprised 75-94% of total particulate mass, was prepa:ed
for chemical analysis. Analysis of the >53pm fraction would enable a
better understanding of exchange of metals among particle size classes,
but blank levels are too high to allow accurate analysis of any but the
most abundant elements (e.g. Al and Fe), unless a method of
quantitatively removing the particles from the filter could be devised
(Table 2.2). The primary filter was subsampled by using a small
polystyrene template and a stainless steel scalpel to cut known-area
squares for various treatments. One contribution to the total
uncertainty of the analyses is therefore associated with the homogeneity
of particle distribution across the face of the filter. Sub-sampling
repoducibility was estimated at +10%, based on analyses of replicate
sub-samples, subtracting the analytical error determined by replicate
analyses of single sub-sample digest solutions. Occasionally, visible
redistribution of the particles occurred during pump retrieval, and
replicates on these samples gave ±25% subsampling reproducibility.
Analytical procedures. Filter sub-samples were prepared for
chemical analysis using several different dissolution procedures. For
trace metals, Ca, Al, Fe, 2 10Pb, and 2 10Po analyses, two subsamples (8.3%
of total filter area, cut from radially opposed positions on the filter
face) were placed in a 7 ml flat-bottom screw-cap Teflon PFA vial
40
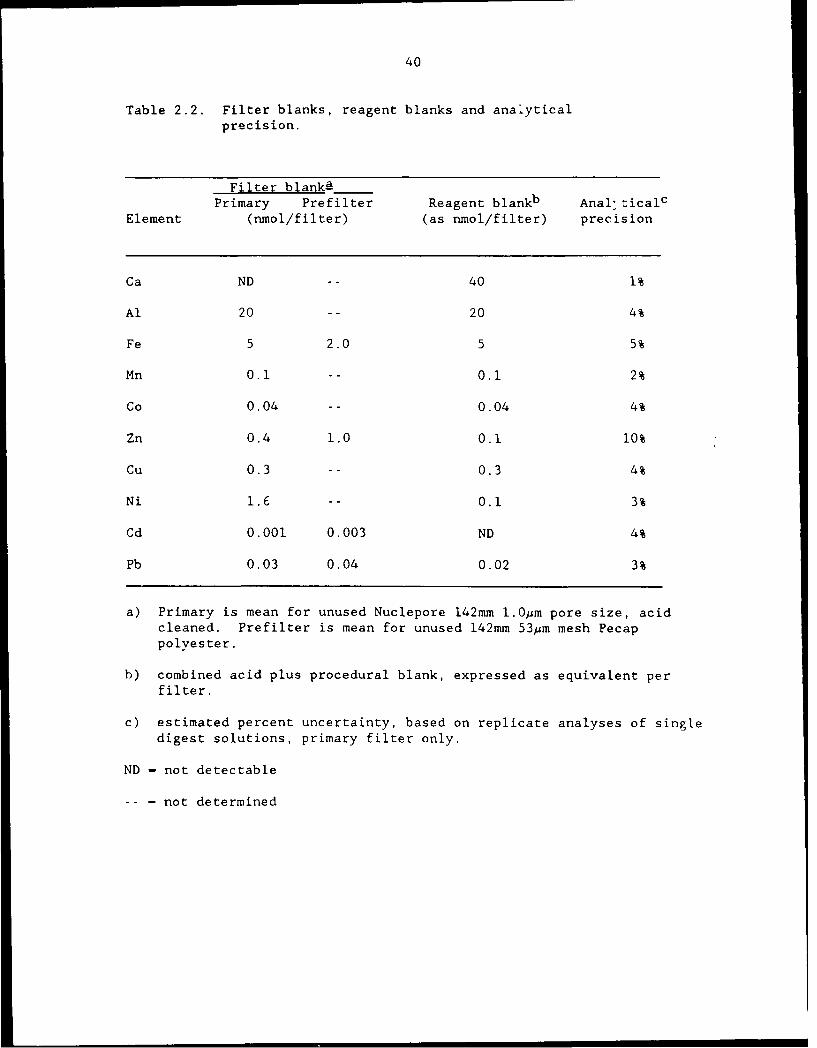
Table 2.2. Filter blanks, reagent blanks and analyticalprecision.
Filter blankaPrimary Prefilter Reagent blankb Anal-rticalc
Element (nmol/filter) (as nmol/filter) precision
Ca ND -- 40 1%
Al 20 -- 20 4%
Fe 5 2.0 5 5%
Mn 0.1 -- 0.1 2%
Co 0.04 -- 0.04 4%
Zn 0.4 1.0 0.1 10%
Cu 0.3 -- 0.3 4%
Ni 1.6 -- 0.1 3%
Cd 0.001 0.003 ND 4%
Pb 0.03 0.04 0.02 3%
a) Primary is mean for unused Nuclepore 142mm L.0sm pore size, acidcleaned. Prefilter is mean for unused 142mm 53pm mesh Pecap
polyester.
b) combined acid plus procedural blank, expressed as equivalent per
filter.
c) estimated percent uncertainty, based on replicate analyses of singledigest solutions, primary filter only.
ND - not detectable
-- - not determined
41
(Savillex). Acid-cleaned Teflon forceps were used to maneuver the filter
squares within the vial such that they adhered by electrostatic
attraction to opposite walls of the vial, particle side inward. With the
filter pieces so positioned, 0.5ml of 3x Vycor-distilled concentrated
HNO 3 was added in 100 pl aliquots, dripping these down the faces of the
filter to initiate dissolution and further adhere the filters to the
wall. To assure complete dissolution of refractory mineral phases, 20 Al
of sub-boiling distilled concentrated HF was then added. The vials were
tightly capped, weighed, and placed on a hotplate to fume/reflux for 4
hours. With proper temperature regulation, refluxing down the faces of
the filter pieces did not lead to total destruction of the polycarbonate
matrix, simplifying subsequent handling. After cooling, vials were
re-weighed to correct for loss of acid (generally <0.5%), and were
diluted with 2.0 ml of distilled, deionized water.
The dilution step was adopted after the discovery of a precipitate
phase apparently present in some undiluted digest solutions. The
precipitate was never visible, but its presence was suspected when poor
reproducibility was noticed during analysis of replicate aliquots for Al.
To test this possibility, digest solutions were transferred to an
acid-cleaned 1.5 ml microcentrifuge tube and spun for a few minutes.
Small aliquots (IOAi) were then removed from the solution surface and
from the conical bottom of the tube, where a pellet would be located if
one were visible. These were analyzed for Al again. Al concentrations
in the pellet aliquot were >10 times higher than the supernatant aliquot,
which had an Al concentrations roughly equivalent to that of a dipped
blank. Subsequent aliquots pipetted from the bottom of the same tube
42
gave lower concentrations, appoaching that of the supernatant. Analysis
of calcium in the "pellet" aliquots indicated Ca/Al ratios of -3.5
mol/mol, more than an order of magnitude higher than the ratio for
aluminosilicates. This suggested that the solid phase was not the result
of incomplete dissolution of refractory mineral particles. It was
concluded that Al was probably adsorbing to a fine precipitate, most
likely CaF2. Dilution by a factor of five apparently caused a sufficient
decrease in the solubility product to redissolve the solid. The
centrifuge test on diluted solutions gave equal aluminum concentrations
for "pellet" aad "supernatant" aliquots.
Diluted digest solutions were analyzed for Na, Al, Fe, Mn, Co, Cu,
Zn, Ni, Cd and Pb by graphite furnace atomic absorption spectroscopy,
using additional dilutions as necessary and standardizing by the method
of standard additions. Most analyses were carried out on a Perkin-Elmer
5000 equipped with with continuum source background correction, HGA 400
furnace controller, and AS-40 autosampler. A Perkin-Elmer Zeeman/5000
with HGA 500 furnace controller was used for Co and some Zn
determinations because furnace blanks were lower for these elements on
this particular instrument (not because Zeeman effect background
correction was necessary). Ca was determined by diluting 100i of digest
solution to 5.Oml in dilute HC1/HNO 3 (La added as an ionization
suppressant), and analyzing against matrix-matched standard solutions
using flame atomic absorption spectrophotometry (Perkin-Elmer 403).
Long-term secondary standards were maintained throughout this work.
Analytical precision was determined by replicate analyses of single
solutions. Blanks were determined on unused filters and on "dipped"
43
blanks, filters which were treated identically to a normal sample,
including submergence on a pump, but had not had water drawn through
them. On two occasions, additional "dipped" blanks were inadvertantly
collected as a result of an electrical failure in the pump. A summary of
analytical precision and blank values is given in Table 2.2.
For 2 1 0Po and 2 1 0Pb determination, portions of digest solutions from
three separate subsample pairs, equivalent to 20% of the total sample,
were pooled, spiked with -10 dpm 20 9 po yield monitor and 4.0 ml 70%
HCIO and heated to near dryness in a Teflon beaker. After
redissolution in 2.OM HC1, 2 10Po and 2 0 9 po were autoplated on silver
disks following the method of Fleer and Bacon (1984). Alpha counting of
the plated Po isotopes was performed on an alpha spectrometer fitted with
low-background detectors. 2 10Pb was determined after 6-12 months
ingrowth by measuring the ingrown daughter 2 10 po. Because 2 10Po activity
on oceanic particulate matter is generally several times greater than
2 1 0Pb activity (Bacon et al., 1978), counting times of 1-2 days were
sufficient to accumulate >500 counts on the first plating. For the
ingrown 210po determination, however, 3-5 days counting time was required
to obtain adequate counting statistics. Uncertainty due to counting
statistics was <5%, except for a few low-Pb surface samples. Stable Pb
was determined on each digest solution before pooling, so that accurate
Pb/ 2 1OPb ratios could be determined.
Particulate phosphorus and opaline silica were determined on
separate, smaller pairs of subsamples (2.4% of total sample). Phosphorus
was liberated as inorganic phosphate by wet oxidation in perchloric acid
using a micro adaptation of the procedure of Strickland and Parsons
44
(1968). Amorphous silica was selectively dissolved by leaching in 0.7M
Na 2CO 3 at 90°C for four hours (Eggimann et al., 1980). This treatment
should leave ordered silicates largely undissolved. Leachates were
neutralized and analyzed colorimetrically in a narrow I cm cell, using a
micro adaptation of the standard seawater method (Strickland and Parsons,
1968).
2.4. SUMMARY
A new in situ pump has been designed which filters trace metal-clean
particulate samples from volumes of the order of 1000 liters. It is
reliable and simple to use, requiring ordinary oceanographic deck
hardware, and can be deployed to full ocean depth. Three such RAPPID
pumps have been built, and have been used to collect >50 particulate
samples from the North Atlantic and North Pacific oceans.
These samples have been analyzed for a suite of trace metals, as
well as major constituent elements, using wet digestion techniques
combined with atomic absorption and UV/VIS spectrometry. This new
technique has enabled the first accurate determination of the suspended
particulate concentrations of several trace metals in the open ocean.
The results and implications of this work are presented in the following
chapters.
45
REFERENCES
Bacon, M.P., D.W. Spencer, and P.G. Brewer (1978) Lead-210 andpolonium-210 as marine geochemical tracers: Review and discussion of
results from the Labrador Sea. In: Natural Radiation Environment III(T.F. Gesell and W.F. Lowder, eds.), Vol. 1, pp. 473-501, U.S. Dept.Energy Report CONF-780422.
Bacon, M.P.and R.F. Anderson (1982) Distribution of thorium isotopesbetween dissolved and particulate forms in the deep sea. J. Geophys.
Res. 87, 2045-2056.
Beer, R.M., J.P. Dauphin and T.S. Sholes (1974) A deep-sea in sitususpended sediment sampling system. Marine Geol., 17, M35-M44.
Beers, J.R., G.L. Stewart and J.D.H. Strickland (1967) A pumping systemfor sampling small plankton. J. Fish. Res. Bd. Canada, 24,1811-1818.
Bishop, J.K.B. and J.M. Edmond (1976) A new large volume filtrationsystem for the sampling of oceanic particulate matter. J. MarineRes. 34, 181-198.
Bishop, J.K.B., D. Schupack, R.M. Sherrell and M.H. Conte (1985) Amultiple unit large volume in-situ filtration system (MULVFS) forsampling oceanic particulate matter in mesoscale environments. In:Mapping Strategies in Chemical Oceanography, A. Zirino, ed.,Advances in Chemistry Series, American Chemical Society, Vol. 29,
pp. 155-175.
Brewer, P.C., D.W. Spencer, P.E. Biscaye, A. Hanley, P.L. Sachs, C.L.Smith, S. Kadar and J. Fredricks (1976) The distribution ofparticulate matter in the Atlantic Ocean. Earth Planet. Sci Lett.32, 393-402.
Bruland, K.W. (1983) Trace elements in sea-water, in ChemicalOceanography Vol. 8, J.P. Riley, R. Chester, eds., Academic Press,
pp.158-220.
Buat-Menard, P., R. Chesselet (1979) Variable influence of theatmospheric flux on the trace metal chemistry of oceanic suspendedmatter. Earth Planet. Sci. Lett. 42, 399-411.
Calvert, S.E. and M.J. McCartney (1979) The effect of incomplete recoveryof large particles from water samplers on the chemical compositionof oceanic particulate matter. Limnol. Oceanogr. 24, 532-536.
Cochran, J.K., H.D. Livingston, D.J. Hirschberg, L.D. Surprenant (1987)Natural and anthropogenic radionuclide distributions in thenorthwest Atlantic Ocean. Earth Planet. Sci. Lett. 84, 135-152.
46
Dymond, J. and R. Collier (1987) Nares Abyssal Plain sediment fluxstudies. In: Subseabed disposal project annual report, physicaloceanography and water column studies, S.L. Kupferman, ed., SandiaNational Laboratories, Livermore CA pp BI-B24.
Eggimann, D.W., F.T. Manheim and P.R. Betzer (1980) Dissolution andanalysis of amorphous silica in marine sediments. J. Sediment.Petrol. 50, 215-225.
Fleer, A.P. and M.P. Bacon (1984) Determination of Pb-210 and Po-210 inseawater and marine particulate matter. Nuc. Instrum. Meth. Phys.Res. 223, 243-249.
Folsom, T.R., N. Hansen, T.J. Tatum and V.F. Hodge (1975) Recentimprovements in methods for concentrating and analyzing radiocesiumin seawater. J. Radiation Res., 16, 19-27.
Gardner, W.D. (1977) Incomplete extraction of rapidly settling particlesfrom water samples. Limnol. Oceanog. 22, 764-768.
Hess, F.R. (1977) Stream powered, large volume deep ocean sampler. WoodsHole Oceanogr. Inst. Invention Disclosure 214-ERDA Docket S-47, 453.
Jeffrey, L.M., A.D. Fredericks and E. Hillier (1973) An inexpensivedeep-sea pumping system. Limnol. Oceanog. 18, 336-340.
Jickells, T.D., W.G. Deuser, A.H. Knap (1984) The sedimentation rates oftrace elements in the Sargasso Sea measured by sediment trap.Deep-Sea Res. 31, 1169-1178.
Laird, J.C., D.P. Jones and C.S. Yentsch (1967) A submersible batchfiltering unit. Deep-Sea Res., 14, 251-252.
Landing, W.M.and K.W. Bruland (1987) The contrasting biogeochemistry ofiron and manganese in the Pacific Ocean. Geochim. Cosmochim. Acta,51, 29-43.
Lenz, J. (1972) A new type of plankton pump on the vacuum principle.Deep-Sea Res., 19, 453-461.
Lisitzin, A.P. (1972) Sedimentation in the world oceans. S.E.P.M. Spec.Publ. 17, 218pp.
Orians, K.J.and K.W. Bruland (1986) The biogeochemistry of aluminum inthe Pacific Ocean. Earth Planet. Sci. lett. 78, 397-410.
Simpson, W.R., T.J.P. Gwilliam, V.A. Lawford, M.J.R. Fasham and A.R.Lewis (1987) In situ deep water particle sampler and real-timesensor package with data from the Madeira Abyssal Plain. Deep-SeaRes., 34, 1477-1497.
47
Spencer, D.W. and P.L. Sachs (1970) Some aspects of the distribution,chemistry, and mineralogy of suspended matter in the Gulf of Maine.Marine Geol. 9, 117-136.
Strickland, J.D.H. and T.R. Parsons (1968) A Practical Handbook ofSeawater Analysis, Bull. 167, Fisheries Research Board of Canada,Ottowa.
Winget, C.L., J.C. Burke, D.L. Schneider and D.R. Mann (1982) Aself-powered pumping system for in situ extraction of particulateand dissolved materials from large volumes of seawater. Woods HoleOceanog. Inst. Technical Report WHOI 82-8, Woods Hole, Mass., l6pp.
48
CHAPTER 3
TRACE ELEMENT COMPOSITION OF SUSPENDED PARTICULATES IN THE NORTHWEST
ATLANTIC OCEAN
3.1 Introduction
The i-terartion cf dissolved trace metals with particles suspendcd
in seawater, and removal of these particles into sediments, exerts a
major control on the concentration and distribution of metals in the
world's oceans [1-4]. Vertical and horizontal variations in dissolved
trace metal concentrations result from the interaction of particle
formation, decomposition, and transport with physical processes of mixing
and advection. A predictive understanding of metal behavior under
different oceanographic regimes therefore requires detailed quantitative
understanding of dissolved/particulate fractionation and movement of
particles through the water column. Unfortunately, few open ocean
measurements of trace element concentrations on suspended particles have
been made.
Advances in sampling and analysis of trace metals in the past 10-15
years have provided a fundamental understanding of the distribution of
many dissolved trace metals in the major ocean basins [5]. More
recently, measurements of metals in particulate matter collected with
sediment traps have enabled quantification of vertical fluxes of metals
under certain oceanographic conditions [6-11]. The reservoir of fine
particles which sink very slowly (and therefore comprise the bulk of
suspended matter) is a critical link between dissolved and sinking
49
particulate metals. Because of the abundance of these particles and
their large available surface area, it has been suggested that they
control exchange with the dissolved reservoir. Several studies have
described the distribution of metals which are relatively abundant in
suspended particulate matter (e.g. Mn [12,13], Al [14,15), Fe [13]), and
the metal content of large and small particles collected from the surface
ocean has been reported [16-191. Other workers have presented average
particulate concentrations for a large group of elements in North
Atlantic intermediate and deep waters [20], but whole water column
suspended particulate profiles in well characterized open ocean regions
are not available.
The dearth of particulate metal data results in part from the
difficulty in obtaining these measurements by conventional sampling
techniques. Typically, water samples of the order of ten liters are
filtered from sampling bottles on board ship. At particle concentrations
found in the open ocean, this limits sample sizes to about 100 pg.
Filter and handling blanks and possible bottle artifacts [21,22] make
accurate metal determinations difficult. Small sample sizes also limit
the number of other analyses which can be carried out to characterize the
sample and provide geochemical context. In the present study, I
endeavored to minimize these limitations by collecting much larger
samples by in situ filtration.
The principal goals of this work are (I) to determine accurate full
water column profiles of suspended particulate trace metals in an open
ocean regime, (2) to identify factors controlling particulate metal
content, e.g. bulk particle composition, dissolved metal distribution,
50
and water column hydrography, and (3) to understand the role of fine,
slowly sinking particles in determining the flux of metals through the
deep ocean.
Here I present suspended particulate concentrations of Al, Fe, Mn,
Co, Zn, Cu, Ni, Cd and Pb at a Sargasso Sea station near Bermuda. The
data demonstrate that for most of these metals, concentrations are
substantially lower than previous estimates, and that sinking of fine
particle; below the thermocline is a minor contributor to the total deep
ocean flux for these elements.
32. Sampling and Analysi6
Samples were collected from depths of 10 to 4000m on five occasions
at a cluster of stations centered near Station "S", -50km southwest of
Bermuda in the Sargasso Sea (Table 3.1). Particles were filtered from
seawater using an in situ pump developed for the project and described in
detail elsewhere (Chapter 2). Briefly, this device is a self-contained
battery-powered unit which attaches to a normal hydrowire in such a way
that it is free to pivot. A vane on one end orients the intake upstream
in the ambient current, away from particulate contamination associated
with the hydrowire or the metal components of the pump itself. A small
computer controls the pre-set pumping period (typically 2-3 hours), and
provides a record of flow rate and total volume sampled. A single pump
was deployed repeatedly to obtain the samples on the earlier two cruises.
In the later work, three pumps were deployed simultaneously in a single
cast.
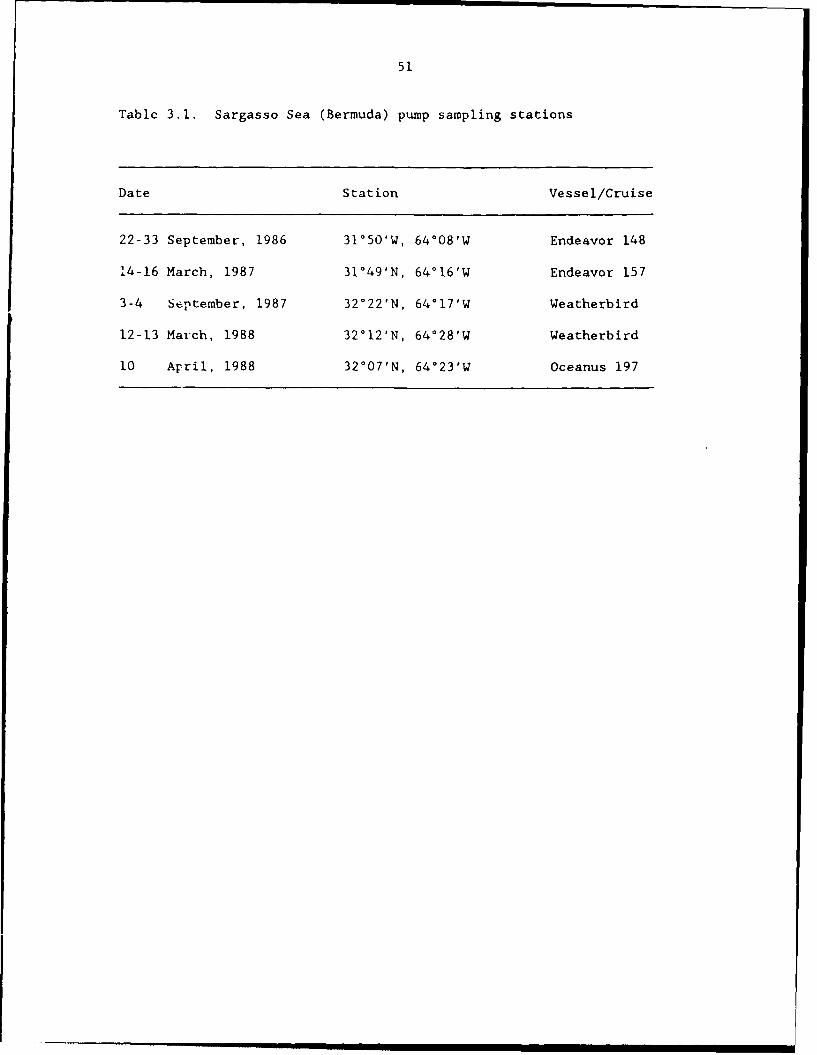
51
Table 3.1. Sargasso Sea (Bermuda) pumip sampling stations
Date Station Vessel/Cruise
22-33 September, 1986 31'50'W, 64-08-W Endeavor 148
14-16 March, 1987 31-49'N, 64-16'W Endeavor 157
3-4 September. 1987 32-22'N, 64-17'W Weatherbird
12-13 March, 1988 32012'N, 64028'W Weatherbird
10 April, 1988 32007'N, 64023'W Oceanus 197
52
Particles were collected on a 142mm diameter 53 pm mesh size
polyester (PeCap, Tetko, Inc., Briarcliffe Manor, N.Y.) prefilter and a
142mm diameter, 1.0 pm pore size Nuclepore polycarbonate primary fiiter.
Both filters were acid-cleaned, dried, and pre-weighed before mounting in
a similarly cleaned custom-made filter holder made of acrylic, silicone
rubber and sintered polyethylene. No prefilter was used for the
September, 1986 and March, 1987 samples. A 0.4 pm Nuclepore filter was
substituted for the standard primary filter on one occasion as a test of
recovery efficiency using the larger pore-sized filter. Sampled volumes
ranged from 120 to 1530 liters, depending on pumping time and filter
clogging rate, yielding 3.1 to 10.6 mg total dry weight of particulate
matter.
Within 2 hours of recovery, excess seasalt was rinsed from the
samples by dripping pH adjusted distilled deionized water (pH 8.3 by
addition of trace element clean NaOH) through each filter under mild
vacuum in a laminar flow clean bench. Filtrates were saved to evaluate
the possible loss of material during rinsing (Appendix C). Filters were
transferred to acid-cleaned 150mm Petri dishes and dried for several
hours under class 100 conditions in a clean bench. Petri dishes were
then closed, sealed within several layers of polyethylene bags, and
transported upright to the laboratory. The filters were then re-dried in
a desiccator and re-weighed to +0.1 mg on an analytical balance.
Precision of the sample mass, determined from replicate weighings, was
+4% for the <53 pm fraction, but -20% for the >53 um fraction due to
uncertainties in sample loss during rinsing and to the hygroscopicity of
the filter material.
53
Subsamples for various analyses were cut from the primary filters
using a polystyrene template and a stainless steel scalpel on an
acid-cleaned acrylic cutting board. For metal analysis, subsamples (8%
of total) were digested for 4 hours at -100°C in 0.5ml concentrated
nitric acid and 1.2M hydrofluoric acid, effecting a complete dissolution
of the particulate material. This was done by adhering the filter pieces
to the inside walls of a tightly closed 7 ml Teflon FEP screw-cap vial
(Savillex) which was placed on a hot plate, allowing the acid to fume and
reflux down the sample face of the filter. Digest solutions were cooled,
weighed to check for evaporative loss, and diluted to 2.5 ml with
distilled deionized water. These solutions were analyzed for Al, Fe, Mn,
Co, Zn, Cu, Ni, Cd, Pb and Na by graphite furnace atomic absorption
spectrometry (Perkin-Elmer 5000 with continuum or Zeeman background
correction) using the method of standard additions. Sodium
concentrations were used to estimate residual seasalt as a correction to
the mass and particulate calcium determinations. Calcium was determined
using flame atomic absorption (Perkin-Elmer 403) and matrix-matched
standards.
Reproducibility of the analyses of replicate subsamples depends on
(1) homogeneity of particle distribution across the face of the filter
and (2) analytical procedures. In general, these factors contributed
about equally, for an overall precision of +15% or better. Blanks were
determined on both unused filters and process blanks which were treated
identically to samples, including submersion on a non-operating pump.
Blanks were generally less than 10% of sample signals, often on the order
of 1%, but occasionally exceeded 50% for Zn, Cu and Ni in near-surface
54
samples. Rinsing losses were 0-10% for Zn and 15-50% for Cd (very high
values were rejected as contamination suspects, Appendix C). Rinse
solutions were not analyzed for other elements, and all values disscussed
in the text are uncorrected for losses. Prefilters caught a small
fraction of total suspended matter, and were analyzed for mass only.
Separate subsamples (2.4% of total) were subjected to a wet
oxidation in perchloric and nitric acid and analyzed for P
spectrophotometrically in a modification of the procedure of Strickland
and Parsons [23]. Other subsamples (2.4% of total) were leached in 0.7M
sodium carbonate at 900 for four hours to selectively dissolve amorphous
silica, leaving ordered silicates largely undissolved [24]. Leachates
were neutralized and analyzed for silicate by a micro adaptation of the
standard seawater technique [23]. Organic carbon content could not be
determined directly, but was estimated by difference between total weight
and summed inorganic components, assuming carbon is 50% of the total
residual weight'
3.3. SUSPEENDED PARTICLE COMPOSITION
3.3.1. Suspended mass
The composite suspended mass profile (Fig. 3.1) is similar to those
observed in other open ocean sites. Relatively high values (26-42 pg/l)
are observed in the near-surface layer of highest biological production
concentrations decrease rapidly through the thermocline to low and nearly
constant values of -6 pg/l in the intermediate and deep water column. A
small increase to -Il pg/l in the deepest samples (-200-400m above the
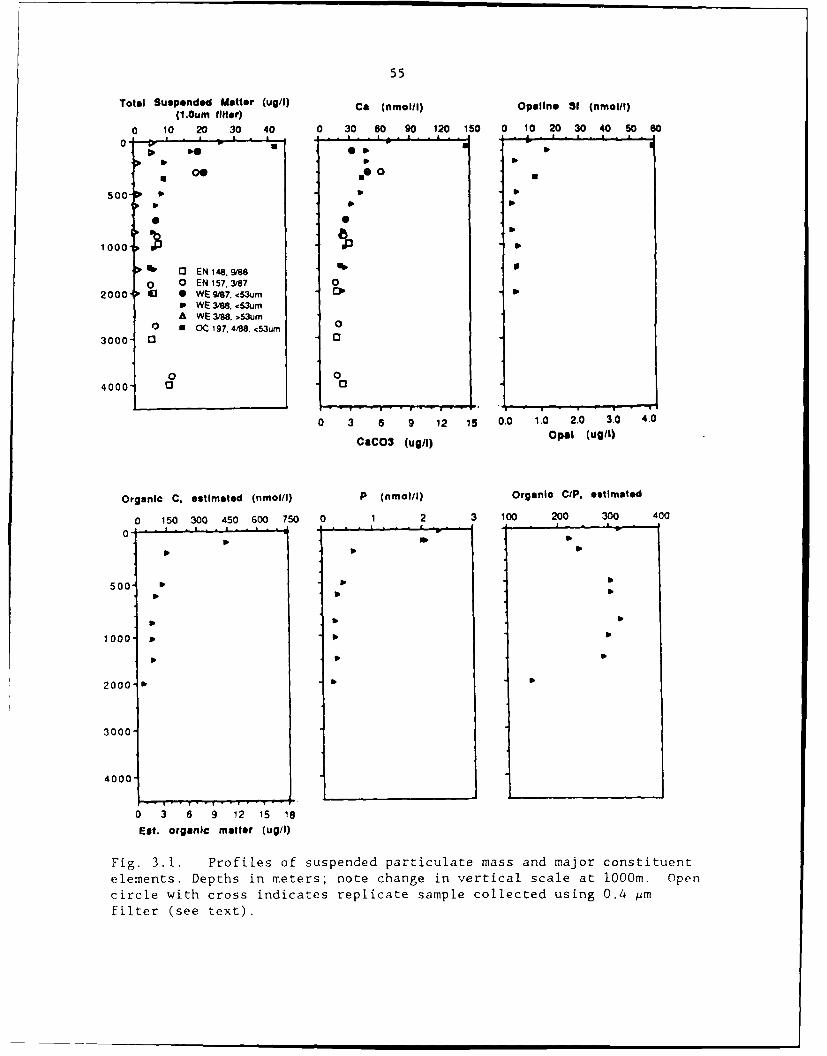
55
Total Suspended Matter (ug/1) Ca (nmol/I) Opallno Si (nmol/i)(1.0um filter)
0 10 20 30 40 0 30 60 90 120 150 010 20 30 40 50 60
0 .--w , , e , - , - - . -•.-1,a . 6
a 00 .00
500" 0 S •
00
1000 Iap
> 0 EN 14a. g/se WO 0 EN 157,3t87 0
2000 43 0 WE 9/87. <53um 01P WE 3/. 53umA WE 3/88, >53um
O 6 OC 197.488 <53um 0
3000 0 0
0 04000 0 0
0 3 6 9 12 15 0.0 1.0 2.0 3.0 4.0
CaCO3 (ug) opal (ug/)
Organic C. estimated (nmol/I) P (nmol/i) Organic C/P, estimated
0 150 300 450 600 750 0 1 2 3 100 200 300 400
500'S S,
1000 •
2000-b
3000-
4000
0 3 6 9 12 15 18
Eat. organic matter (ug/I)
Fig. 3.1. Profiles of suspended particulate mass and major constituent
elements. Depths in meters; note change in vertical scale at O00m. Open
circle with cross indicates replicate sample collected using 0.4 pm
filter (see text).
56
sediment surface) is caused by sediment resuspension, as discussed below.
The >53 jm fraction comprises 6-25% of total suspended mass, the highest
percentage being at the base of the euphotic zone (100m). Previous
measurements of suspended mass in the Sargasso Sea have produced somewhat
higher and more variable results than were determined here. Brewer et
al. [27] reported a range of approximately 2-20 Ag/l for the depth
interval 500-3000m, with a mean of approximately 10 pg/l and a standard
deviation of 5 pg/l (based on replicate samples) at GEOSECS Station 120
(33-15'N, 560 34'W). Similar results were obtained at Parflux Station S
(31-31'N, 55-03'W) by Spencer et al. [8], who reported 5.5-14.4 Ag/l
(9.0±2.2 pg/l, la, n-13) for the same depth interval. These previous
studies were based on filtration of 4-30 liter Niskin bottle samples
through 0.4 or 0.6 pm Nuclepore filters. My in situ pump results for
500-3000m at Station S range from 4.7 to 7.3 ug/l (6.1±0.9, la, n-13).
While natural oceanographic variability may account for the 30%
discrepancy in mean mass concentration between this and the Parflux
findings, failure to adequately correct for residual seasalt, or even the
hydroscopicity of the particulate matter itself may have given results
which were too high in the previous study. Differences in filter pore
size may also contribute to the discrepancy, but a single experiment
comparing mass concentrations obtained on 0.4 pm vs. 1.0 um Nuclepore
filters in consecutive pump samples at 300m (EN 157) indicated only 12±5%
more mass retained on the 0.4 pm filter. This suggests that
undersampling of the smallest particles is unlikely to be a major source
of error. However, Bishop and Fleisher [12] observed that particulate Mn
values increased 40% with a 3-fold increase in pumped sample volume in
57
the upper water column of a 1982 Warm Core Ring. They interpreted this
result as an effect of filter loading on the efficiency with which
particles near the nominal pore size are sampled by quartz fiber filters.
No comparable effect was observed for the single comparison just
described, but it should be kept in mind that particulate concentrations
are operationally defined. The contributions of the <1.0 um size
fraction to the individual elemental distributions (as distinct from
suspended mass) has not been rigorously quantified.
No temporal variability in mass concentration was discernable for
samples below 200m (- the top of the main thermocline) with the exception
of the 300m sample in March, 1987. Suspended mass for this sample was
about twice the values at bracketing depths in March and April, 1988.
Hydrographic data indicates an unusually deep convective mixed layer in
early Spring, 1987 [26], which probably mixed surface-produced particles
into the upper thermocline.
3.3.2. Biogenic components: CaCO3. opaline silica, organic matter. and
phosphorus
In order to determine whether trace metal content correlates with
any aspect of bulk composition, I analyzed suspended particles for the
dominant components. These results are interesting in their own right,
because although these components are relatively easy to analyze compared
to the trace metals, very little comparable data exists for open ocean
Atlantic waters. This is due, in part, to sample size limitations when
<30 liters are filtered. Because different dissolution procedures are
required for various major component determinations, previous
58
investigators have been obliged to limit analyses to a chosen subset.
The current study was not limited by sample size, although direct
determination of organic carbon was sacrificed for the low metal blank
obtainable with polycarbonate filters.
The vertical distribution of suspended particulate Ca resembles the
total mass profile (Fig. 3.1). Concentrations are maximum in
near-surface waters. The 50m value in April 1988 is more than twice the
particulate Ca concentration at 10 or 100m one month earlier (146 vs.
47-71 nxol/l), suggesting substantial vertical or temporal variability
during the period of the spring phytoplankton bloom. Below the surface
layer, concentrations decrease with constant slope through the
thermocline, decrease more gradually from 1000-2000m, and are
approximately constant at 20+5 nmol/l in deep water. These values are
within the range reported for other open ocean environments. For
example, Jickells [27] reported a four-year average suspended Ca in the
upper 100m at Station S to be 75 nmol/l. Mean particulate Ca for the
0-100m depth range near Bermuda were seasonally variable in the range
15-150 nmol/l, with highest concentrations corresponding to early spring
productivity maxima [28]. Bishop and Fleischer [12) found values of
30-40 nmol/l in the upper 700m of a station in the northwest Sargasso
Sea, approximately equal to values in the upper 400m of the eastern
equatorial Atlantic [29]. Sub-thermocline values in the current study
closely matched those observed in the eastern Sargasso Sea (GEOSECS Sta.
29 [30]) and in the Panama Basin [31]. These are apparently several
times higher than deep water values in the tropical northwest Atlantic
(GEOSECS Sta. 31 [30]).
59
Calcium carbonate accounts for >90% of particulate Ca through most
of the water column. The remainder is associated with refractory
lithogenous material (estimated from suspended Al and average crustal
Ca/Al ratios of Taylor [32]; see discussion below) and there may be a
small contribution from non-skeletal cellular Ca in near-surface waters
[291. In the nepheloid layer samples, lithogenous Ca contributes -40% of
the total. The decrease in particulate Ca with depth in the upper water
column is caused by the interaction of CaCO 3 production in near-surface
water, and the incorporation of suspended Ca into sinking particles
occurring throughout the upper 2000m.
Like calcium carbonate, opaline silica is relatively high and
variable in surface waters, but decreases to low and constant values
within the upper thermocline (Fig. 3.1). This may reflect rapid removal
and substantial dissolution just below the seasonal mixed layer [33].
Opal was greatly enriched at 50m in April 1988, indicating that siliceous
as well as calcareous plankton species were abundant. Below 500m, opal
concentrations are 3-7 nmol/l. These values are much lower than in the
Panama basin (40-700 nmol/l, upper 1500m, [31]), the upper 400m of the
equatorial east Atlantic (15-30 nmol/l, [29]), or the midwaters of the
Antarctic circumpolar current (35-110 nmol/l, [34]). At the Bermuda
station the refractory mineral Si, estimated from particulate Al and
average Si/Al in crustal materials [32], exceeds measured opaline Si by a
factor of three in sub-thermocline waters. Thus dissolution of a
fraction of the refractory Si could lead to over-estimates of biogenic
silica. To avoid this problem, rigorous dissolution techniques
(concentrated NaOH, Na 2CO 3 fusion) were avoided, and the relatively mild
----... immmmm mm23 mm
60
leaching treatment of Eggiman et al. [241 was employed. Honjo et al.
[35], using a similar dissolution procedure, determined opal content for
sinking particles in the Sohm Abyssal Plain (31°33'N, 55°55'W) which were
comparable to my values for suspended matter.
Particulate organic carbon (estimated by difference) and particulate
phosphorus (measured) decrease by about an order of magnitude from
relatively high values in surface waters (POC - 750nmol/l, PP - 2.3
nmol/l) to very low concentrations (POC - 71 nmol/l, PP - 0.26 nmol/l) in
thermocline and deep waters (Fig. 3.1). Values throughout the
sub-surface water column are lower than have been observed in the
equatorial and tropical eastern North Atlantic [29,36] but are of similar
magnitude to values observed in the northwest Sargasso Sea [121. The
estimated C/P molar ratio exceeds the Redfield ratio (106:1 [37]) by a
factor of 2-3, as has been observed previously in oligotrophic waters
[29,36]. An increase with depth is observed in the upper thermocline
(100-500m), consistent with rapid remobilization of P relative to C [161.
The C/P ratio is then constant at 300 mol/mol from 500-1500m. The reason
for the relatively high surface value (320 at lOm) or the decrease from
300 to 150 mol/mol between 1500 and 2000m is not known.
3.3.3. Lithozenic components: Al and Fe
Profiles of particulate aluminum and iron parallel each other
throughout the water column, suggesting that both elements are contained
largely in the same phases (Fig. 3.2). Aluminum concentrations increase
linearly from -1 nmol/l in the upper 200m, to 3.5 nmol/l at l000-3000m.
Iron concentrations increase from 0.25 to 1.2 nmol/l in the same depth
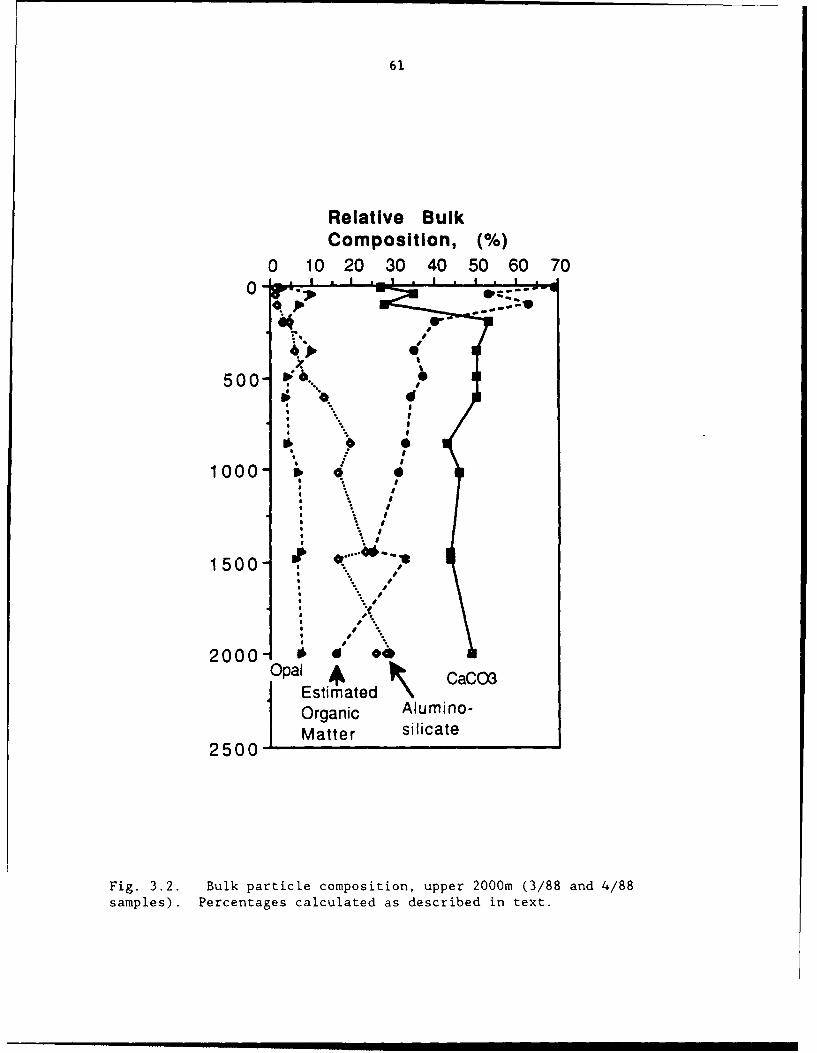
61
Relative BulkComposition, (%)
0 10 20 30 40 50 60 70
0 - -*
500-
• # I
1000 -•
I
500-3~
I
* II I
04 000 %
2000 00
S Estimated \ CaCnO3| Organic siluiate
2500 | Matter siict
Fig. 3.2. Bulk particle composition, upper 2000m (3/88 and 4/88
samples). Percentages calculated as described in text.
. ... . ----=--- == .= . , - == == nn nu nm ~ mm ~ m n I
62
range. Both elements are greatly enriched in the near-bottom samples,
where sediments enriched in detrital phases are resuspended to at least
several hundred meters above the bottom. The presence of a benthic
nepheloid layer is expected in this region because of its proximity to
high-energy western boundary currents [38]. Particle mass and aluminum
concentrations over an order of magnitude larger than those observed here
have been reported for bottom waters at other locations in the northwest
Atlantic [39].
Aluminum concentrations below lO00m are similar to previously
reported values for North Atlantic intermediate and deep values [20,30].
Low surface concentrations and a linear increase through the thermocline
have not been previously described. The surface concentrations are
several times lower than published mean particulate Al concentrations for
North Atlantic surface waters [18,20] and are approximately equal to the
lowest values observed by Krishnaswami and Sarin [17] (Table 3.2).
Molar Fe/Al ratios throughout the water column (Fig. 3.2) cluster
within 40% of the average crustal ratio of 0.33 [32]. Ratios in
atmosphti: aercrols collected near Bermuda [40] and across the N.
Atlantic [41] also fall, on average, within 30% of the crustal value.
Similar ratios have been observed for suspended particles in the North
and South Pacific as well [13,15,42]. Other workers have found North
Atlantic suspended particulate Fe/Al averaging 1.0-1.3 mol/mol (mean N.W.
Atlantic, 3°N-42°N and mean N.E. Atlantic, 150N-40=N), approaching the
crustal ratio only in nepheloid layers <500m above bottom where
aluminosilicates constituted more than 50% of total particulate mass
[20,39]. Enrichment over crustal values suggested that
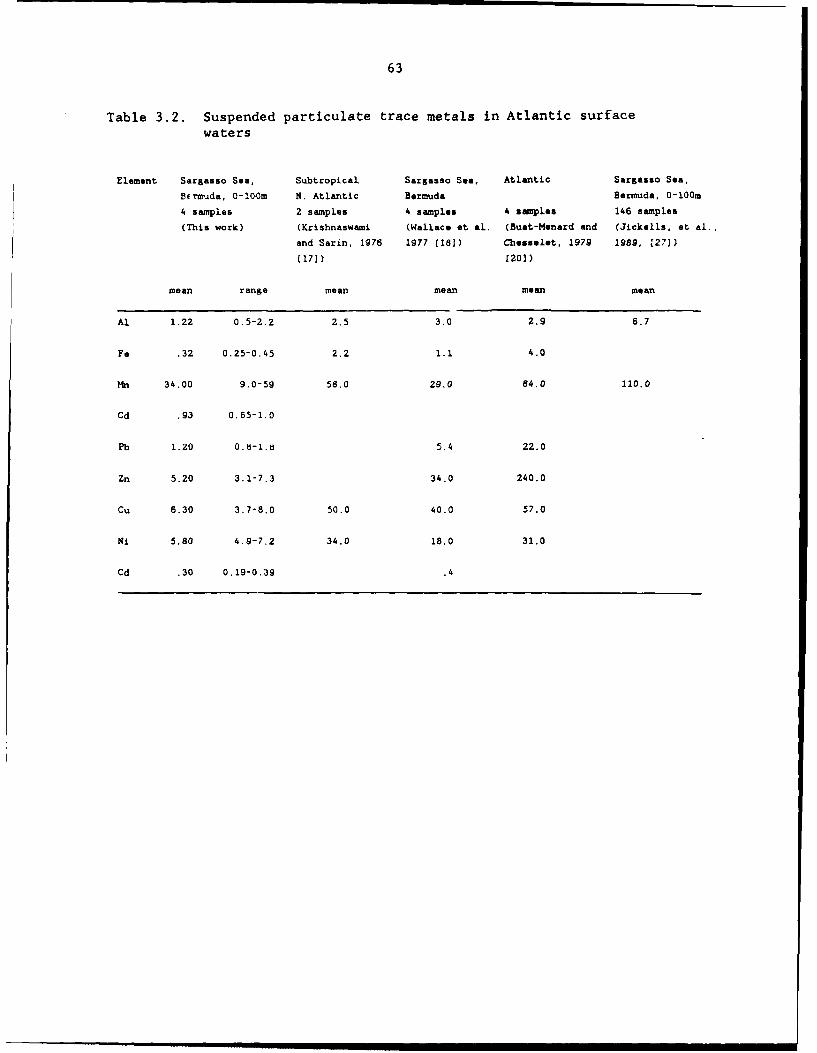
63
Table 3.2. Suspended particulate trace metals in Atlantic surfacewaters
Element Sargasso Sea, Subtropical Sargasso Sea, Atlantic Sargasso Sea,
Bermuda, 0-10-Om N. Atlantic Bermuda Bermuda, 0-100m
4 samples 2 samples 4 samples 4 samples 146 samples
(This work) (Krishnaswami (Wallace at al. (Buat-Menard and (Jickells, t al..
and Sarin, 1976 1977 (18j) Cheselt, 1979 1989, [271)
(17]) [203)
mean range mean mean mean mean
Al 1.22 0.5-2.2 2.5 3.0 2.9 6.7
Fe .32 0.25-0.45 2.2 1.1 4.0
Mn 34.00 9.0-59 58.0 29.0 84.0 110.0
Cd .93 0.65-1.0
Pb 1.20 0.6-1.8 5.4 22.0
Zn 5.20 3.1-7.3 34.0 240.0
Cu 6.30 3.7-8.0 50.0 40.0 57.0
Ni 5.80 4.9-7.2 34.0 18.0 31.0
Cd .30 0.19-0.39 .4
64
non-aluminosilicate phases constitute a substantial fraction of total
particulate Fe, although the identity of these phases was unclear [43].
In contrast, my data suggest that particulate Fe is dominated by detrital
minerals at all depths, in agreement with the Sargasso Sea surface
particulate data of Wallace et al., [18]. Observation of nanomolar
quantities of particulate Fe liberated by weak acid leaching in the upper
water column of the equatorial Atlantic [29] suggest that authigenic Fe
phases may be important under some conditions and may be subject to the
sampling efficiency for the smallest particles, as discussed above.
Additional data on the particulate distribution of Fe would augment our
poor understanding of Fe cycling in the water column, and set limits on
estimates of non-refractory particulate Fe reservoirs (oxides,
hydroxides, organics, or adsorbed) which may be important host phases for
some trace metals [19,44,45].
The bulk composition of suspended particles near Bermuda (WE 3/88
nd OC 197, 'arch-April, 1988) is presented in Figure 3.3. Mass
fractions for calcium carbonate, opaline silica, aluminosilicates, and
organic matter were calculated from elemental concentrations using the
following equations:
%CaC03 - lOOg/40g x [Ca - (Ca/Al) x Al] x lO0/(wt) (1)crust
% Opal - 70g/28g x Si x 100/(wt) (2)
% Aluminosilicate - 10 x Al x lO0/(wt) (3)
% Organic matter - 100 - (%CaC03 + %opal + % aluminosilicate) (4)
65
where (wt) is total dry weight and all elemental quantities are expressed
as ug per sample. Estimate of aluminosilicate-bound Ca is based on
average Ca/Al for shales, rather than average crust, as the crustal value
includes a carbonate rock contribution [79](Table 3.3). Conversion
factors used in equations (2) and (3) assume that opaline silica contains
some hydration water not removed during drying [46], and that
aluminosilicates comprise 10% Al (by mass), somewhat higher than the
crustal average [32] but consistent with the relatively Al-enriched clays
found in low-latitude nepheloid layers in the Atlantic (Ref. [43] and
references therein).
At this station, calcium carbonate dominates suspended particle
mass, comprising -50% of the total mass except in surface waters, where
organic matter dominates. Organic matter content decreases rapidly as
remineralization occurs in the upper water column, while terrigenous
material increases from less than 1% in surface waters to -25% at 2000m.
Opaline silica is a minor phase comprising <10% of suspended mass
throughout the water column.
3.3.4. Trace metal composition
Concentrations of particulate trace metals vary smoothly with depth
and, except for Cd, have similar profile shapes (Fig. 3.4). Particulate
Mn, Co, Pb, Zn, Cu and Ni are depleted to varying degrees in surface
water, increase to relative maxima at -500m and, except for Cu, decrease
to relatively constant values in the 1000-3000m depth range. Cu is
relatively constant from 500-4000m compared with the other metals. The
distribution of particulate Cd is distinct from the other metals and
66
Fig. 3.3. Particulate Al, Fe, and Fe/Al ratio. Symbols as per Fig.3.1. Replicate symbols at a single depth represent replicate analyses ofseparate subsamples of a single filter. Note change of scale on bothaxes.
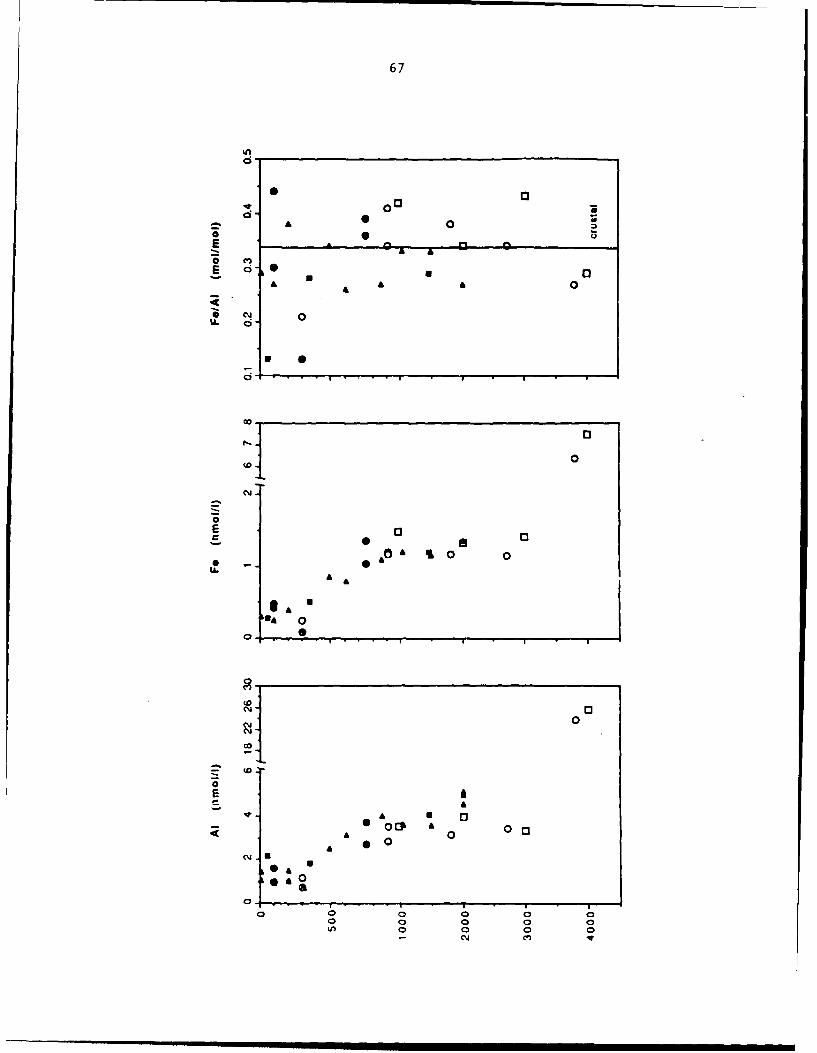
67
'to00A 00
£i 0
a 0
8 co
2 W 0@U
04 I
0 EF A
a £ 103* m.
&.
6~ c
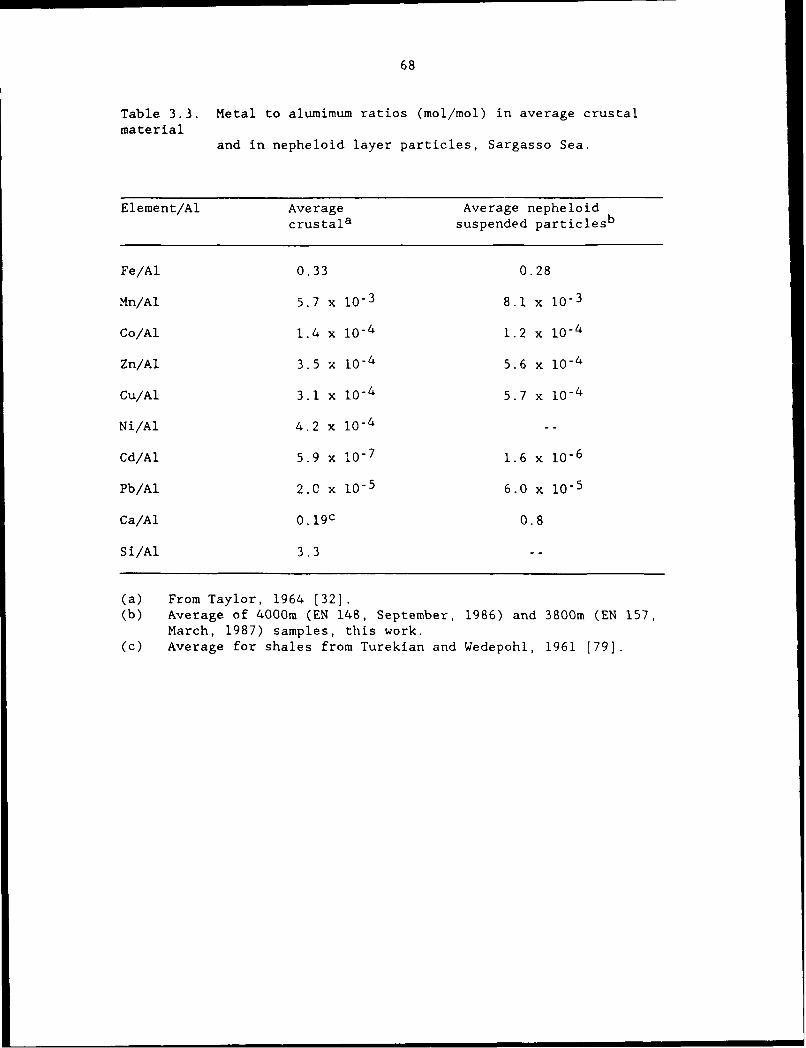
68
Table 3.3. Metal to alumimum ratios (mol/mol) in average crustalmaterial
and in nepheloid layer particles, Sargasso Sea.
Element/Al Average Average nepheloidcrustala suspended particlesb
Fe/Al 0.33 0.28
Mn/Al 5.7 x 10- 3 8.1 x 10- 3
Co/Al 1.4 x 10- 4 1.2 x 10- 4
Zn/Al 3.5 x 10- 4 5.6 x 10- 4
Cu/Al 3.1 x 10⁻⁴ 5.7 x 10- 4
Ni/Al 4.2 x 10- 4 --
Cd/Al 5.9 x 10- 7 1.6 x 10⁻⁶
Pb/Al 2.0 x 10- 5 6.0 x 10- 5
Ca/Al 0.19 c 0.8
Si/Al 3.3
(a) From Taylor, 1964 [32].(b) Average of 4000m (EN 148, September, 1986) and 3800m (EN 157,
March, 1987) samples, this work.(c) Average for shales from Turekian and Wedepohl, 1961 (79].
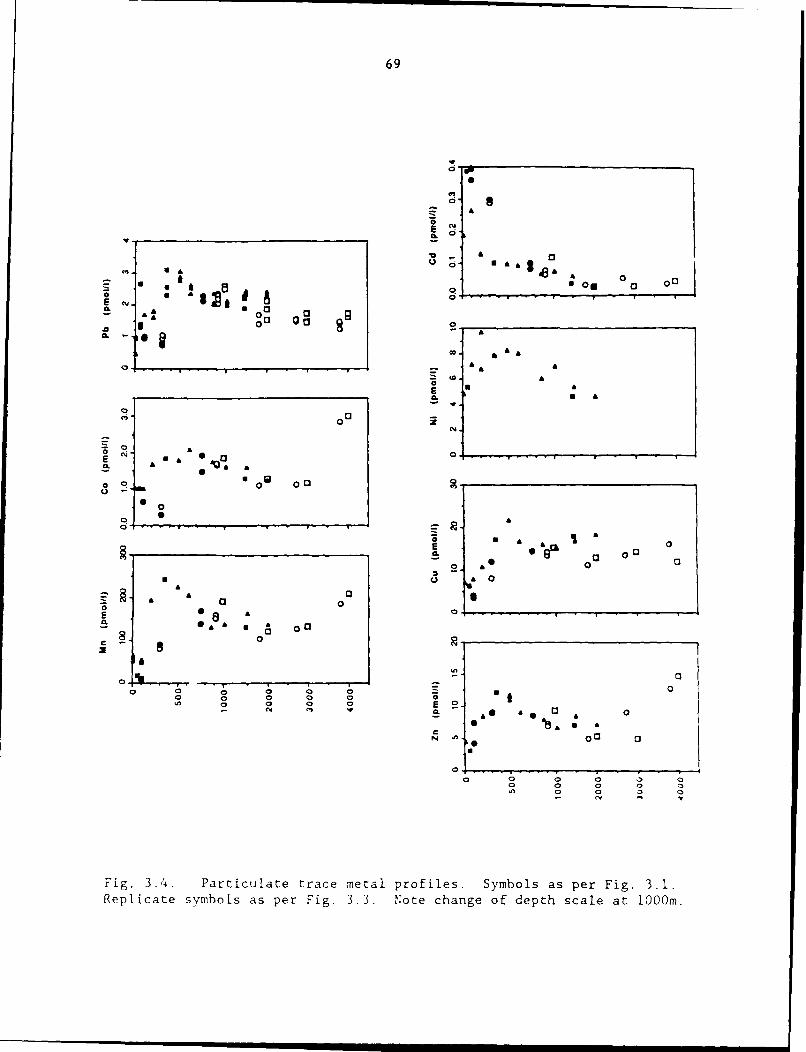
69
E N
00
- ' &
"" • 00 au ona.
00
*'. a• 0a 0
:-.'o0ENN- A&
E A
CL q 0 0 ),
aoa
0
EN
0
0 00
. . . a tmt s l a
& . . .-. . A° o o oAo o A"
£ 00 0
'00
0 - o
F 0g 0.4 Pa tc 0t trc 0ea rfie . Sm ol spr-i .3Replcat syb0 a0 pe 0ig 0.. Nt hneo et cl l0m
U, a 0 0 0 2N ~ I 0 0 0
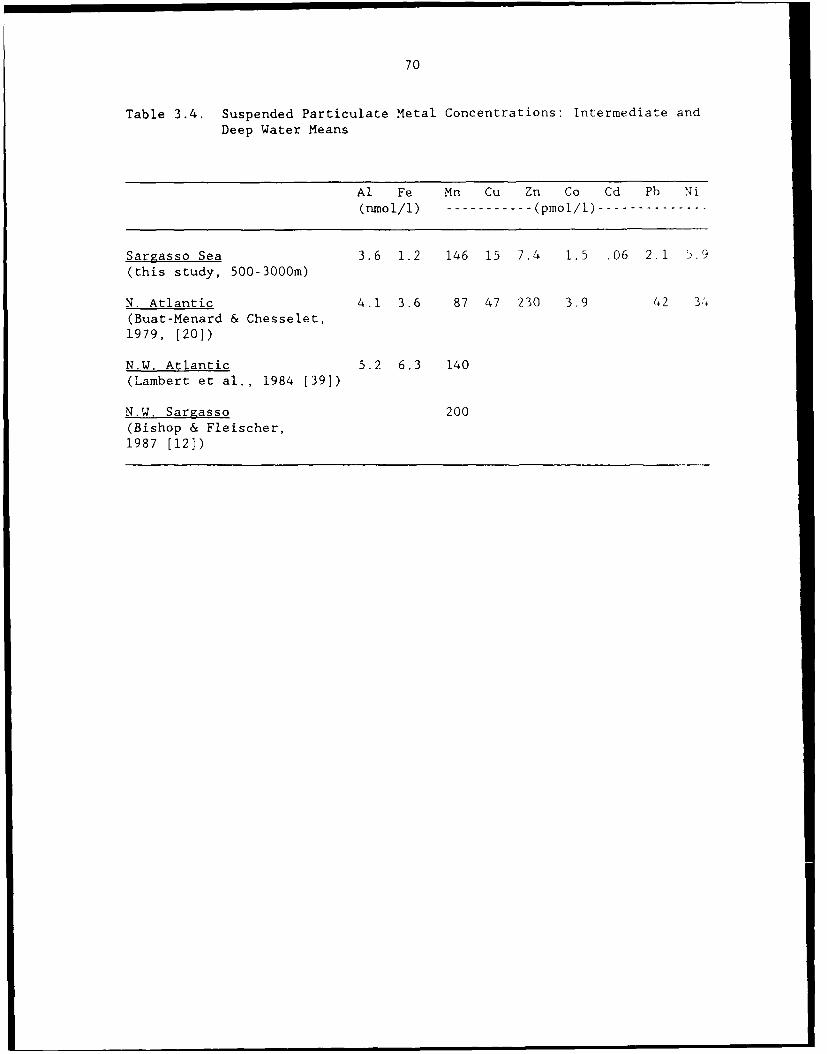
70
Table 3.4. Suspended Particulate Metal Concentrations: Intermediate andDeep Water Means
Al Fe Mn Cu Zn Co Cd Pb Ni(nmol/1) ----------- (pmol/l) --------------
Sargasso Sea 3.6 1.2 146 15 7.4 1.5 .06 2.1 5.9(this study, 500-3000m)
N. Atlantic 4.1 3.6 87 47 230 3.9 42 3'(Buat-Menard & Chesselet,1979, [20])
N.W. Atlantic 5.2 6.3 140(Lambert et al., 1984 [39])
N.W. Sargasso 200(Bishop & Fleischer,1987 [121)
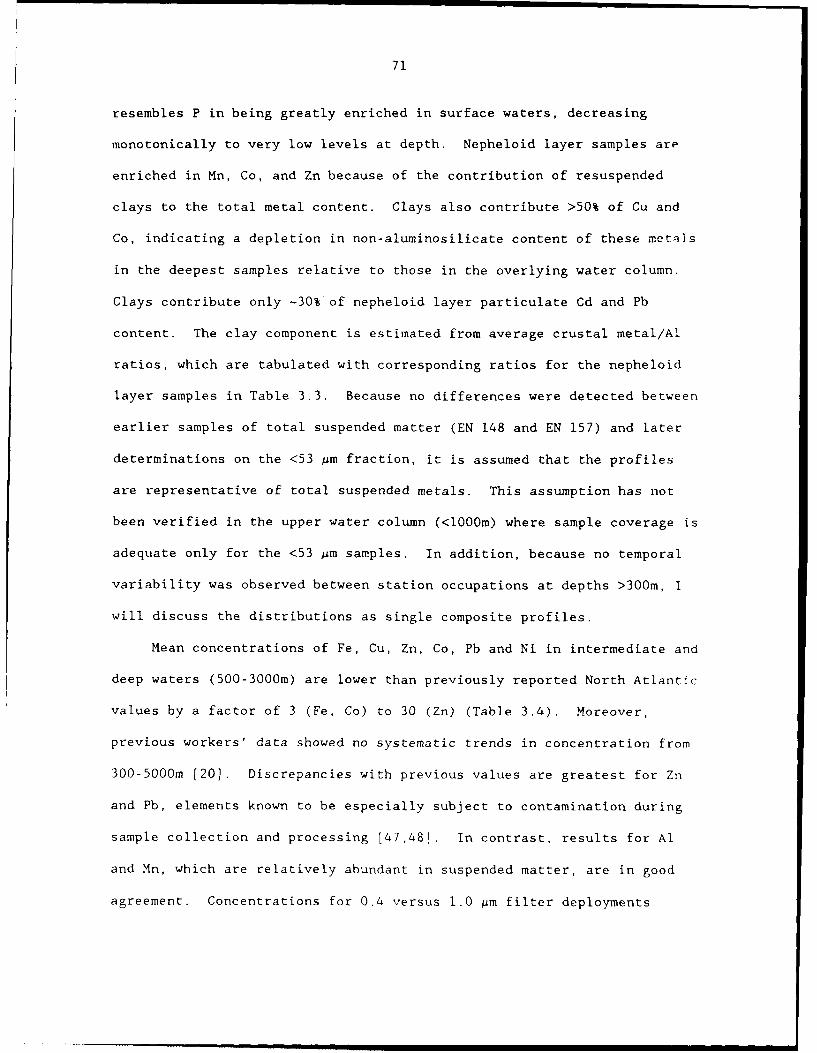
71
resembles P in being greatly enriched in surface waters, decreasing
monotonically to very low levels at depth. Nepheloid layer samples are
enriched in Mn, Co, and Zn because of the contribution of resuspended
clays to the total metal content. Clays also contribute >50% of Cu and
Co, indicating a depletion in non-aluminosilicate content of these metals
in the deepest samples relative to those in the overlying water column.
Clays contribute only -30% of nepheloid layer particulate Cd and Pb
content. The clay component is estimated from average crustal metal/Al
ratios, which are tabulated with corresponding ratios for the nepheloid
layer samples in Table 3.3. Because no differences were detected between
earlier samples of total suspended matter (EN 148 and EN 157) and later
determinations on the <53 pm fraction, it is assumed that the profiles
are representative of total suspended metals. This assumption has not
been verified in the upper water column (<1000m) where sample coverage is
adequate only for the <53 um samples. In addition, because no temporal
variability was observed between station occupations at depths >300m, I
will discuss the distributions as single composite profiles.
Mean concentrations of Fe, Cu, Zn, Co, Pb and Ni in intermediate and
deep waters (500-3000m) are lower than previously reported North Atlantic
values by a factor of 3 (Fe, Co) to 30 (Zn) (Table 3.4), Moreover,
previous workers' data showed no systematic trends in concentration from
300-5000m [20]. Discrepancies with previous values are greatest for Zn
and Pb, elements known to be especially subject to contamination during
sample collection and processing [47,48). In contrast, results for Al
and Mn, which are relatively abundant in suspended matter, are in good
agreement. Concentrations for 0.4 versus 1.0 pm filter deployments
72
described above were equal within measurement precision (Fig. 3.4).
Therefore, the use of 1.0 pm filters in this study is unlikely to produce
substantial underestimates of particulate metal concentrations. These
observations suggest that earlier values werz subject to contamination
artifacts and that the present results represent real particulate metal
distributions.
In near-surface waters, particulate metal concentrations vary
between station occupations, but even the highest values are considerably
lower than previously reported surface values, except for Al, Mn, and Cd,
which are in reasonable agreement (Table 3.2). Decreasing atmospheric
input of anthropogenic Pb since the earlier studies [49] may explain the
factor of 4.5 difference between my Pb results and those determined on
1974 samples by Wallace [18]. Temporal variability in particulate mass
and composition in surface waters is caused by seasonal variations in
biological productivity, intermittent inputs of atmospheric aerosols,
changes in mixed layer depth, and passage of inhomogeneous water masses
[49]. It is unlikely, however, that the near-surface sampling dates
(September, 1987, March, 1988, April, 1988) all fell during periods of
anomalously low particulate metal concentration. Exclusion of the >53 jLm
fraction from the pump samples may contribute to differences, but metal
contents in >44 pm Pacific plankton samples collected in waters with
dissolved metal and nutrient concentrations similar to the Bermuda
station were substantially greater only for Zn and Cd (Pb and Co not
analyzed [16]). These two metals were enriched by about an order of
magnitude (mol/g dry weight) over my <53 pm particles. Thus it is
possible that the excluded size fraction, although contributing <25% of
73
total mass, might contain a substantial fraction of total particulate Cd
and Zn. Therefore, upper water column values for these elements must be
considered as representative only of the <53 j&m fraction. Discrepancies
between this work and previous workers' values for surface particulate
Fe, Cu, and Ni are difficult to reconcile on the basis of large particle
exclusion, and may be contamination artifacts in the earlier studies.
This comparison of the present results with existing data suggests
that concentrations obtained using the in situ pump are, in general, at
least several-fold lower than results obtained previously by filtration
of isolated water samples. When combined with the earlier sediment trap
measurements of Jickells, et al. [6], the profiles presented here
therefore enable the first realistic assessment of the role of suspended
particles in controlling the distribution and removal of metals in the
North Atlantic.
3.4. CONTROL OF PARTICULATE TRACE ELEMENT DISTRIBUTIONS: THE ROLE OF
MANGANESE
The vertical distribution of trace metals in suspended particulate
matter is the net result of several processes, including (1) variations
in the concentration of individual mineral phases, in which metals are
incorporated by solid solution or by occlusion within the mineral
lattice, (2) re-distribution of the total suspended particle population
or some fraction thereof by association with rapidly-sinking but
numerically rare large particles, and (3) exchange of metals between
particulate and dissolved forms, controlled by chemical sorption or
precipitation on particle surfaces or by active biological uptake or
74
efflux of metals within living cells. Through some combination of these
three processes, metals are scavenged from the water column and
eventually delivered to the sediments. Some understanding of the
relative importance of each of these contributing factors can be gained
by consideration of particulate metal distribution in its geochemical
context. In addition to the suspended mass and major element composition
data described here, existing knowledge of dissolved metal distributions
can be considered [5]. In the following discussion, I argue that some of
these processes are of minor importance, and that the data suggests that
the major determinants of the overall profile shapes (except Cd) are
enhanced metal uptake on inorganic Mn phases and decreasing particulate
mass concentration with depth.
The most striking aspect of the particulate metal distributions
shown in Figure 3.4 is that profiles for Mn, Co, Pb, Zn, Cu, and Ni all
have the same general shape, in contrast to the varying profile shapes of
the dissolved metals (Fig 5.7). The similarity of the profile shapes is
demonstrated more clearly when plotted on the same scale in smoothed
"cartoon" form (Fig. 3.5). Surface values are generally depleted
relative to deep, and all show a relative maximum in the upper
thermocline. The similarity of distributions suggests control by a
common phase or process, but examination of the vertical variations in
major components reveals no similar pattern. Al and Fe profiles,
representative of refractory terrigenous material, increase through the
thermocline with no apparent anomalous feature at the metal maximum.
Elements associated with biogenic inorganic phases (CaCO3, opaline
silica) and organic matter (organic carbon, phosphorus) all decrease
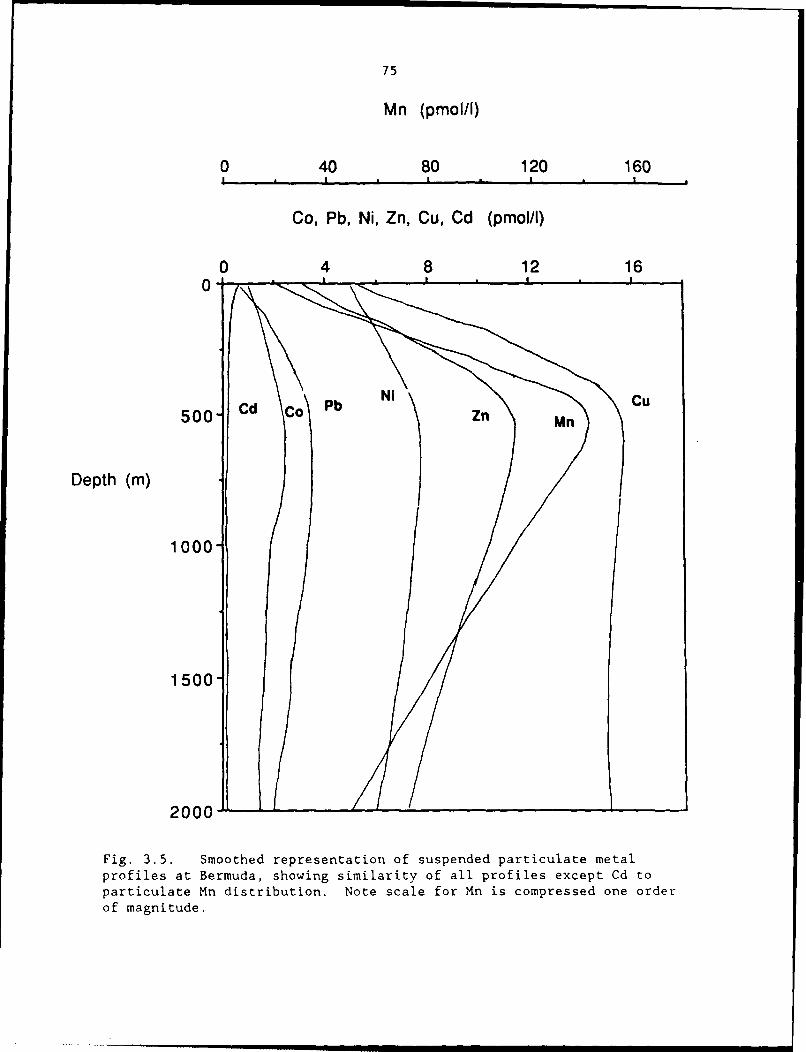
75
Mn (pmol/l)
0 40 80 120 160I, * I i I , i I
Co, Pb, Ni, Zn, Cu, Cd (pmol/I)
0 4 8 12 16
0I Cu 1 -
500- Cd Co Pb NIZn Mn C
Depth (m)
1000-
1 500-
2000-
Fig. 3.5. Smoothed representation of suspended particulate metalprofiles at Bermuda, showing similarity of all profiles except Cd toparticulate Mn distribution. Note scale for Mn is compressed one orderof magnitude.
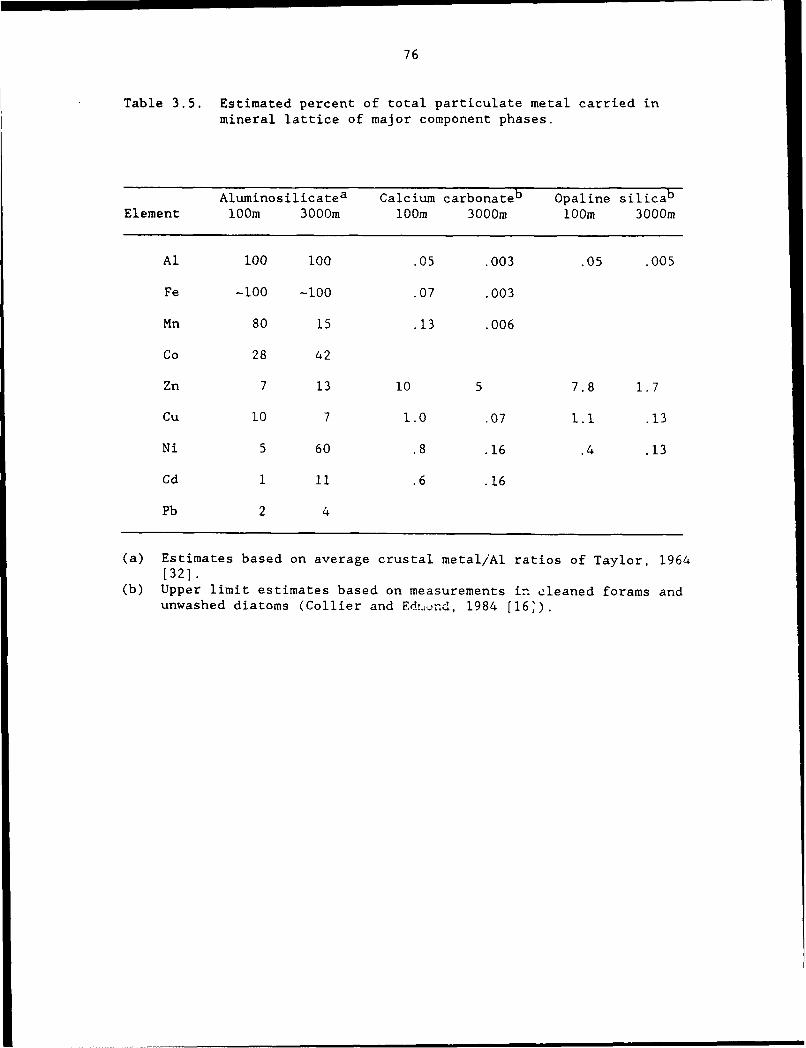
76
Table 3.5. Estimated percent of total particulate metal carried inmineral lattice of major component phases.
Aluminosilicatea Calcium carbonateb Opaline silicabElement loom 3000m loom 3000m loom 3000m
Al 100 100 .05 .003 .05 .005
Fe -100 -100 .07 .003
Mn 80 15 .13 .006
Co 28 42
Zn 7 13 10 5 7.8 1.7
Cu 10 7 1.0 .07 1.1 .13
Ni 5 60 .8 .16 .4 .13
Cd 1 11 .6 .16
Pb 2 4
(a) Estimates based on average crustal metal/Al ratios of Taylor, 1964[32].
(b) Upper limit estimates based on measurements in cleaned forams andunwashed diatoms (Collier and Ed..nd, 1984 [16]).
77
regularly through the upper water column. The lack of correlation with
the metal distributions suggests these phases are not directly
responsible for the observed profiles. Estimates of the contributions of
lattice-bound metals in aluminosilicates, CaCO and opal corroborate
this result (Table 3.5). Only the aluminosilicate contribution to Co and
Ni (and Mn at lO0m) constitutes more than 15% of total particulate
metals. This indicates that in general, either organic matter or a
relatively minor inorganic phase are the most likely host phases for the
group of metals considered here.
If a minor particle type were enriched in trace metals, a
particulate metal maximum could be generated simply by the vertical
distribution of this phase. If the phase were sufficiently metal-rich,
one could hypothesize that aggregation/sinking/disaggregation processes
might accumulate such a phase in a particular depth zone without
substantially altering the suspended mass profile. Such a hypothesis
would require a source of such particles to the surface ocean.
Atmospheric aerosols, the major exogenous particle source to Sargasso Sea
surface waters, are the most obvious candidate. However, the water
column distribution of aluminosilicate materials, the major component of
atmospheric dust, does not match that of the particulate trace metals.
It is difficult to imagine another metal-rich particle type sufficiently
resistant to dissolution to maintain its metal content after vertical
transport from the surface. Lack of an obvious candidate suggests that
particle transport processes acting on discrete phases are unlikely to he
the cause of the particulate metal maxima.
78
The explanations considered thus far have focused on the
distribution of particular phases with reasonably well known and
presumably stable metal composition, ignoring any dependence on dissolved
metal distributions. Interaction of suspended particles with the much
larger reservoir of trace metals dissolved in seawater will now be
considered. Control of particulate metal contents by exchange with
dissolved metals implies that particle surfaces, the composition of which
might not be represented by the bulk composition, are the important
variable.
Metal scavenging has been considered by many authors to be a
surface-chemical process [50-52], but the nature of oceanic particulate
surfaces is not well understood [53]. Balistrieri et al. [54] modeled
metal scavenging as a surface-complexation process, and suggested that
organic coatings on suspended particles control sorptive removal of
metals from seawater. Others have suggested control by inorganic
surfaces such as Mn oxyhydroxides [55]. The sorptive behavior of Mn
oxides has been demonstrated in laboratory studies using single minerals
[56] and natural sediments [57]. In the open ocean, Mn may form as oxide
coatings on carbonate particles [58] or in association with encapsulated
bacteria [59]. Little is known about its effect on trace metal
distributions in natural suspended matter.
In Bermuda waters, particulate Mn contents are 1-2 orders of
magnitude greater than for other metals, presenting substantial sorptive
surface if present in the form of a fine-grained authigenic mineral. The
observed correlation of trace metal concentrations with Mn (Fig. 3.6),
and lack of correlation with organic carbon (Figs. 3.1 and 3.4, and as
79
Fig. 3.6. Metal to manganese regressions, Bermuda upper 2000m. Datafrom March, 1988 (open symbols) and April, 1988 (closed symbols). Totalmetal concentrations (no correction for aluminosilicate fraction) areplotted.
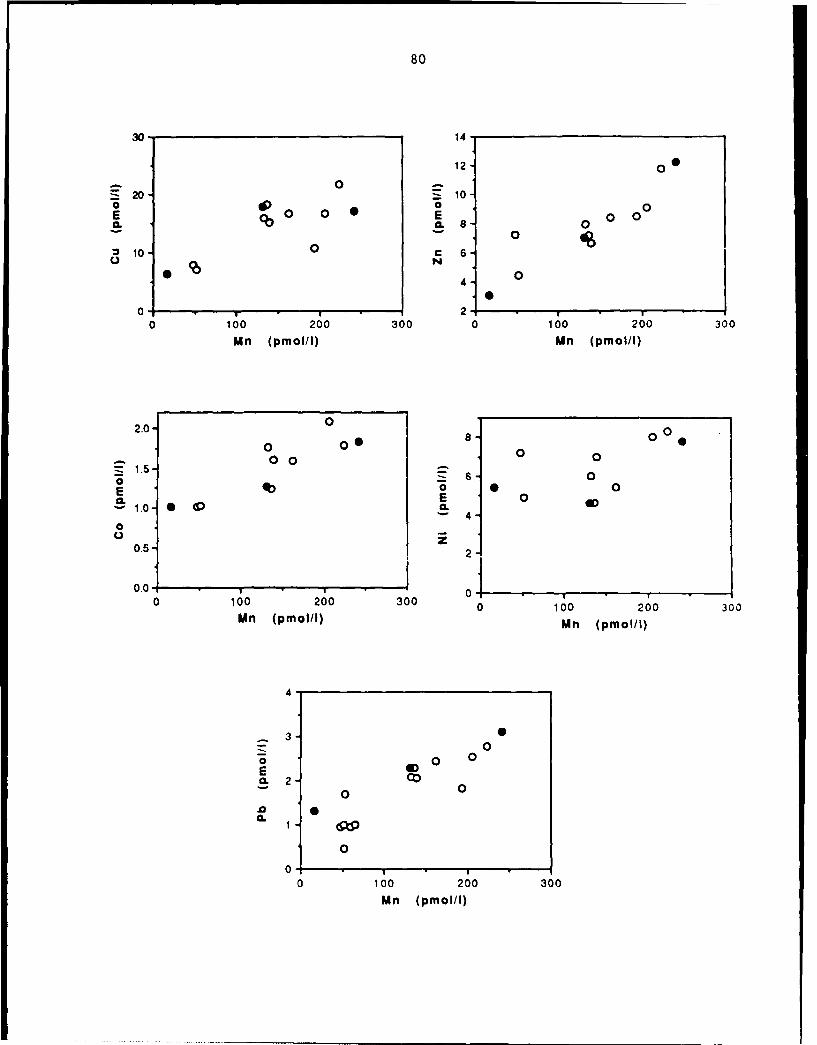
80
30 14
12 0
10E 0 0 0a. ~1a. 8 0
CL 0bC a
" 10 0 c 6-U N
00
21 T I
0 100 200 300 0 100 200 300Mn (pmol/I) Mn (pmol/I)
2.0- 0 0
0 0 O0o
0 0 0 0-- 1.5 -"-a Z 6- 0E 4b o 9 0
C. E 0v1.0. 0 G3 aE 0-" 4
0
0.5- 2
0.0' 0,_-__0 100 200 300 0 100 200 300
Mn (pmol/I) Mn (pmol/I)
4
3 -
o 0
a.2 *0v0 0
.0 0.
0
000 100 200 300
Mn (pmol/I)
81
noted by Bishop and Fleisher, 1987 for Mn [12]), suggests that sorptive
uptake of dissolved metals onto recently oxidized Mn solids may be an
important control on particulate metal contents. Understanding processes
which control the formation and distribution of particulate Mn in the
upper water column may thus shed light on the distribution of other
metals as well. Fortunately, there exists sufficient data on dissolved
and particulate Mn in the northwest Atlantic to test several hypotheses
of Mn distribution near Bermuda. In particular, it should be possible to
propose a reasonable explanation for the particulate Mn maximum at
300-500m.
The observation of an upper thermocline particulate Mn maximum in
the Atlantic is consistent with the upper 700m profile of Bishop and
Fleisher [12] from the northwest Sargassso, and may by a ubiqitous
feature of Sargasso Sea waters at temperate latitudes. Subsurface
authigenic particulate Mn maxima have been observed previously in the
Pacific [10,13] but these have generally been associated with oxygen
minima (<l00umol/kg) and coincident dissolved Mn maxima. The Sargasso
Sea Mn maximum is not associat.ed with an oxygen minimum and appears to
occur lO0-200m deeper than the base of the Mn-enriched near-surface
waters (0-200m) observed throughout the Sargasso Sea [60-63] (Fig. 5.7).
The particulte Mn maximum occurs in the depth range of the
subtropical mode water (18' water, centered about 300m). Because water
at this depth is ventilated by winter convective mixing events [64] or
mixing along isopycnals which outcrop at higher latitudes [65], high Mn
surface waters could provide a source for in situ oxidation to
particulate Mn. Ventilation along outcropping isopycnals has been shown
82
to be an important source of dissolved Pb in the thermocline at this
station [49]. However, Sargasso Sea Mn profiles demonstrate that
dissolved Mn at 500m is not appreciably higher than deep water
concentrations [62,63] (Fig. 5.7). This suggests that oxidation of
surface-derived dissolved Mn to particulate Mn has occurred very rapidly.
The Mn residence time at the depth of the maximum can be estimated by
assuming no dilution of the surface Mn during convection, Mn
concentration equal to 2 nmol/kg in surface water and 0.5 nmol/kg at
500m, and a ventilation time for water at this depth of 10 years [05].
This calculation yields a first-order half-removal time of 5 years,
considerably shorter than reported estimates of scavenging residence
times for Mn in the deep ocean (25-75y, [13,66]). This source of
dissolved Mn to the upper thermocline depends upon elevated
dissolved/particulate Mn ratios in surface waters. Such ratios are
maintained, apparently throughout the western North Atlantic [61], by a
mostly dissolved atmcspheric input i et deposition > dry derosition
[67]), by low active uptake of Mn by plankton [16,19], and by
photo-chemically mediated Mn(IV) reduction [68].
Horizontal advection must also be considered as a potential source
of Mn to the particulate maximum. Horizontal advection from ocean
margins has been invoked as a major influence on dissolved Mn mayima
observed in the thermocline near Hawaii [10,13]. It has been suggested
that the source of this Mn coald be near-shore Mn enrichments observed
along the west coast of the United States and presumed to occur along
other North Pacific continental margins. However, concentrations of
dissolved Mn in sub-surface waters are low an( uniform throughout the
83
sub-tropical North Atlantic [62,63]; no gradient of decreasing
concentration with distance from the continents is observed. Horizontal
particulate Mn transport is also possible. Bishop and Fleisher (12]
reported 1-53 pm suspended hn pcofiles in Gulf Stream and adjacent
Sargasso Sea stations with concentrations in upper thermocline waters
(200-500m) of about 200 pmol/kg, very similar to Bermuda susP=iiUd ii f
the same depth range. The similarity of the profiles suggests that
particulate Mn distribution in the western Sargasso may be influenced by
advection from the Gulf Stream/slope water system, perhaps in association
with mesoscale eddies. However, the apparent lack of a particulate Mn
gradient suggests that lateral transport is unlikely to occur by eddy
diffusion alone, unless the horizontal eddy diffusion rate is
sufficiently large to eliminate an observable gradient.
Although the cause of the particulate Mn maximum cannot be proven
with the current data set, given the evidence at hand, it seems likely
that physical transport of dissolved Mn-enriched surface waters into the
upper thermocline, followed by in situ oxidation to particulate Mn, is a
major influence on the particulate Mn distribution near Bermuda. Below
the maximum, the Mn content (per mass particles) LeniditizL approximately
constant, but particulate Mn (per volume seawater) decreases with
decreasing mass concentration, thereby inducing the upper thermocline
concentration maximum.
The influence of particulate Mn on the particulate content of Co,
Pb, Zn, Cu, and Ni is illustrated by comparing the partitioning of metals
between particulate and dissolved forms. Empirically defined metal
distribution coefficients (K d ) for surface watei and upper thrrmocline
..... =- ====== maann mam lld
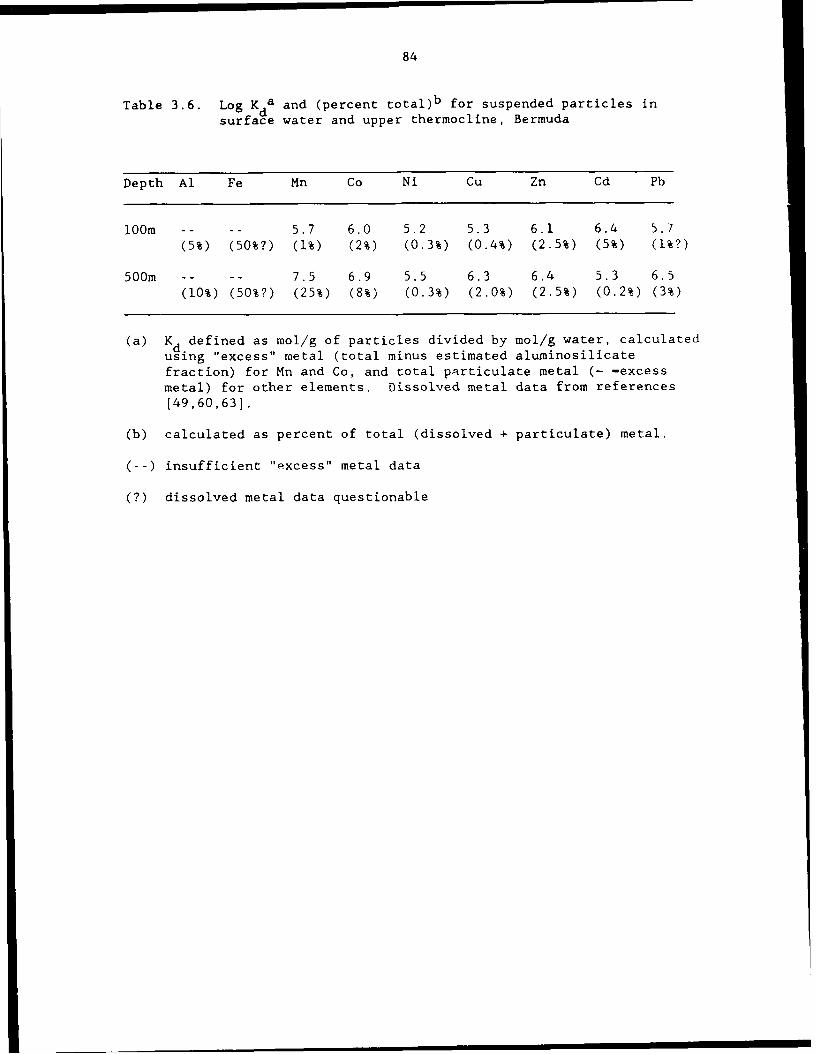
84
Table 3.6. Log K da and (percent total)b for suspended particles insurface water and upper thermocline, Bermuda
Depth Al Fe Mn Co Ni Cu Zn Cd Pb
loom .. .. 5.7 6.0 5.2 5.3 6.1 6.4 5.7
(5%) (50%?) (1%) (2%) (0.3%) (0.4%) (2.5%) (5%) (1%?)
500m .. .. 7.5 6.9 5.5 6.3 6.4 5.3 6.5
(10%) (50%?) (25%) (8%) (0.3%) (2.0%) (2.5%) (0.2%) (3%)
(a) Kd.defined as mol/g of particles divided by mol/g water, calculatedusing "excess" metal (total minus estimated aluminosilicatefraction) for Mn and Co, and total particulate metal (- -excessmetal) for other elements. Dissolved metal data from references[49,60,63].
(b) calculated as percent of total (dissolved + particulate) metal.
(--) insufficient "excess" metal data
(?) dissolved metal data questionable
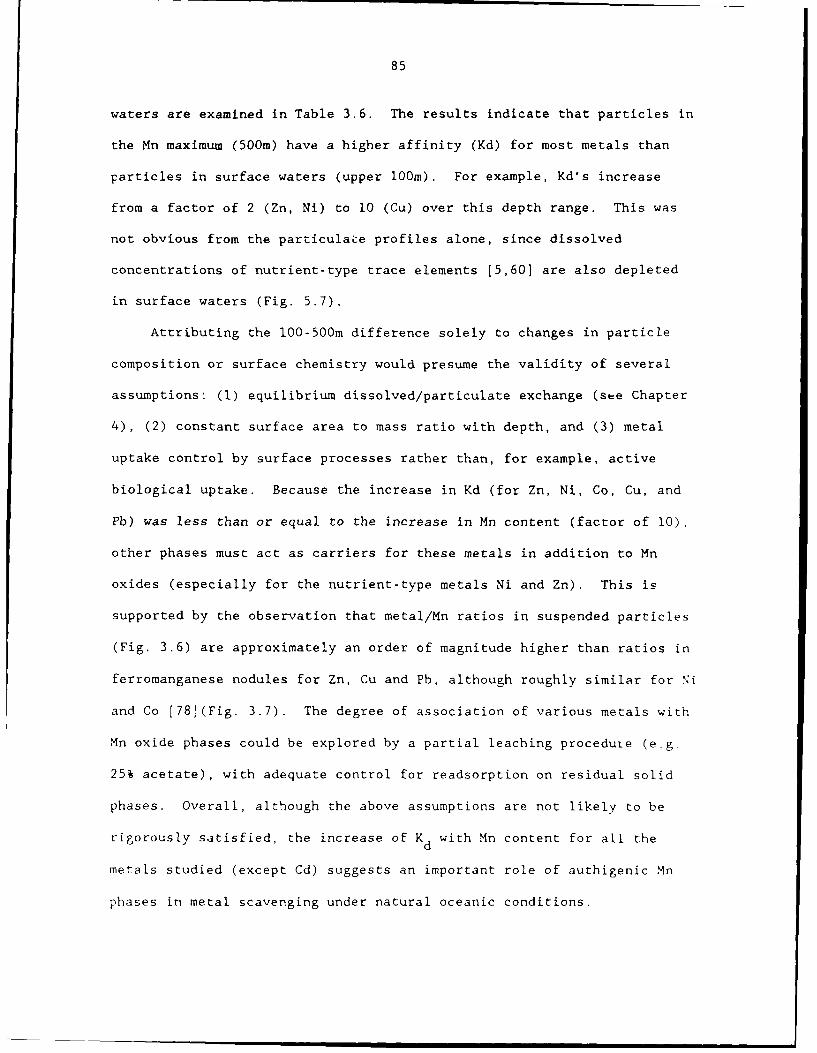
85
waters are examined in Table 3.6. The results indicate that particles in
the Mn maximum (500m) have a higher affinity (Kd) for most metals than
particles in surface waters (upper lO0m). For example, Kd's increase
from a factor of 2 (Zn, Ni) to 10 (Cu) over this depth range. This was
not obvious from the particulate profiles alone, since dissolved
concentrations of nutrient-type trace elements [5,60] are also depleted
in surface waters (Fig. 5.7).
Attributing the 100-500m difference solely to changes in particle
composition or surface chemistry would presume the validity of several
assumptions: (1) equilibrium dissolved/particulate exchange (see Chapter
4), (2) constant surface area to mass ratio with depth, and (3) metal
uptake control by surface processes rather than, for example, active
biological uptake. Because the increase in Kd (for Zn, Ni, Co, Cu, and
Pb) was less than or equal to the increase in Mn content (factor of 10),
other phases must act as carriers for these metals in addition to Mn
oxides (especially for the nutrient-type metals Ni and Zn). This is
supported by the observation that metal/Mn ratios in suspended particles
(Fig. 3.6) are approximately an order of magnitude higher than ratios in
ferromanganese nodules for Zn, Cu and Pb, although roughly similar for Ni
and Co [78](Fig. 3.7). The degree of association of various metals with
Mn oxide phases could be explored by a partial leaching procedule (e.g.
25% acetate), with adequate control for readsorption on residual solid
phases. Overall, although the above assumptions are not likely to be
rigorously satisfied, the increase of Kd with Mn content for all the
metals studied (except Cd) suggests an important role of authigenic Mn
phases in metal scavenging under natural oceanic conditions.
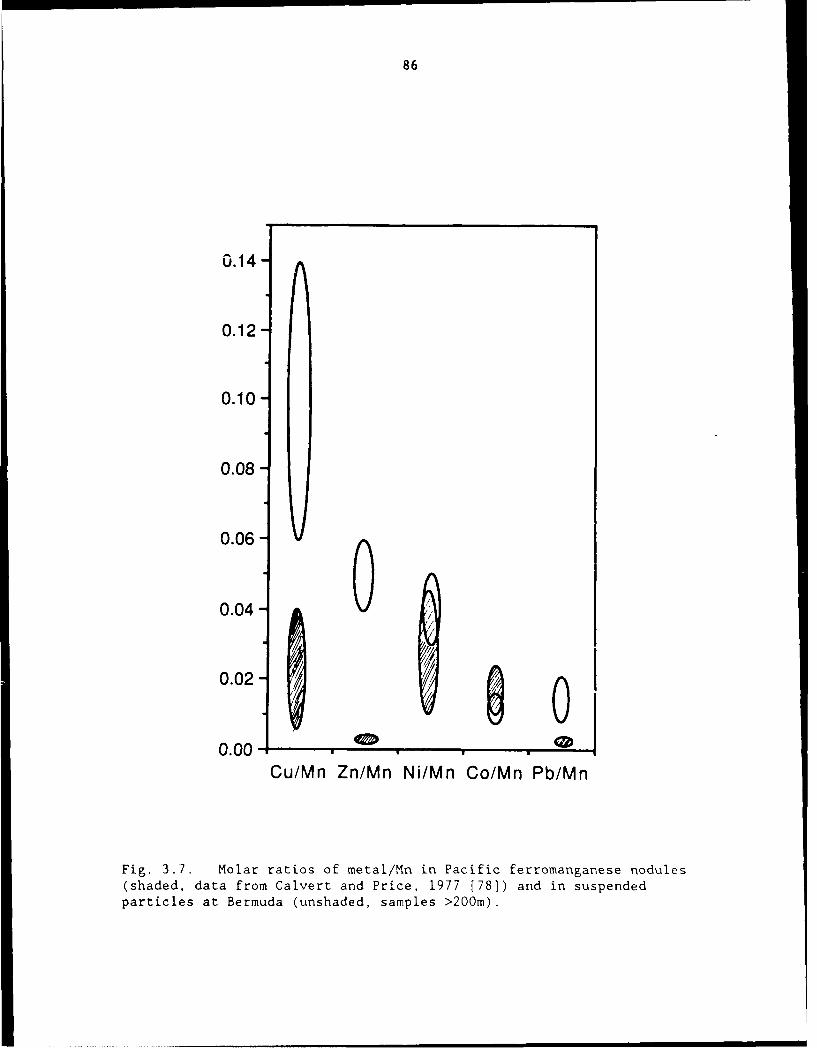
86
0.14
0.12
0.10
0.08
0.06
0.04 -
z
0.02-0
0.00
Cu/Mn Zn/Mn Ni/Mn Co/Mn Pb/Mn
Fig. 3.7. Molar ratios of metal/Mn in Pacific ferromanganese nodules(shaded, data from Calvert and Price, 1977 [78]) and in suspendedparticles at Bermuda (unshaded, samples >200m).
87
Particulate Cd, which is strongly enriched in surface waters, stands
out as an exception throughout this discussion. Its distribution mirrors
that of dissolved Cd, and suggests that Cd is dominated by association
with organic matter in surface waters, is recycled almost entirely within
the upper water column [11,69], and has very low particle affinity in
deep waters. The relationship of Cd to P in in particulate and dissolied
forms is discussed further in Chapter 5.
3.5. THE ROLE OF SUSPENDED PARTICLES IN DETERMINING METAL FLUX THROUCH
THE DEEP OCEAN
Fast-sinking particles produced by biological activity in surface
waters interact with slowly-sinking suspended particles in the deep
ocean, increasing the removal rate of the smaller particles over that
predicted by passive settling [70]. Although details of this interaction
are not well understood, removal can be considered as the sum of two
processes: (1) incorporation into particles in surface waters forming
large aggregates which sink rapidly to the deep ocean, and (2)
association with deep suspended particles which are removed by
incorporation into the surface-derived flux. Although measurements of
total fluxes of trace metals have been mdde in a few locations [711),
resolution of the relative magnitude of surface-derived versus deep
removal of trace metals has not beon possible without accurate suspended
metal distributions for the same locations. Using the new suspended
particulate metal data, we can now estimate the relative contribution of
the removal of these particles to the total deep ocean flux for these
metals.
88
To perform this calculation, I adopt a simple steady-state two-box
flux model for the Sargasso Sea (Fig. 3.8). Metal scavenging and
particle interactions are represented by a model which recognizes two
classes of particles into which the natural spectrum of particulate
matter is divided [73,73]. Large, fast-sinking particles, which dominate
the flux but contribute negligibly to the suspended mass, are assumed to
be produced by biological activity in the surface box or by aggregation
of deep suspended particles. Small suspended particles, which comprise
the bulk of the suspended mass, are assumed to sink only by association
with large particles. The large particle flux thus regulates the removal
of suspended particles, but only suspended particles, by virtue of their
greater concentration, surface area, and residence time, exchange metals
with the dissolved pool.
The flux associated with removal of suspended particulate metals,
the "repackaging" flux (FR' nmol/cm 2-yr), is calculated from:
FR - (Me p*D)/tp
where Me is the average deep ocean (500-3000m) suspended metalP
concentration (pmol/l), D is the depth of the deep box (m), and t is thep
estimated suspended particle residence time (yr). Total metal flux (FT.
nmol/cm 2-yr) is assumed equal to means determined from eleven two-month
deployments of a sediment trap at 3200m near Bermuda [6]. The
repackaging and total flux of several trace metals, as well as 2 3 0Th and
228Th, are compared in Table 3.7. Each of the parameters in the above
equation has an associated uncertainty which contributes to the
uncertainty in the estimate for F The uncertainty in Me is generallyP
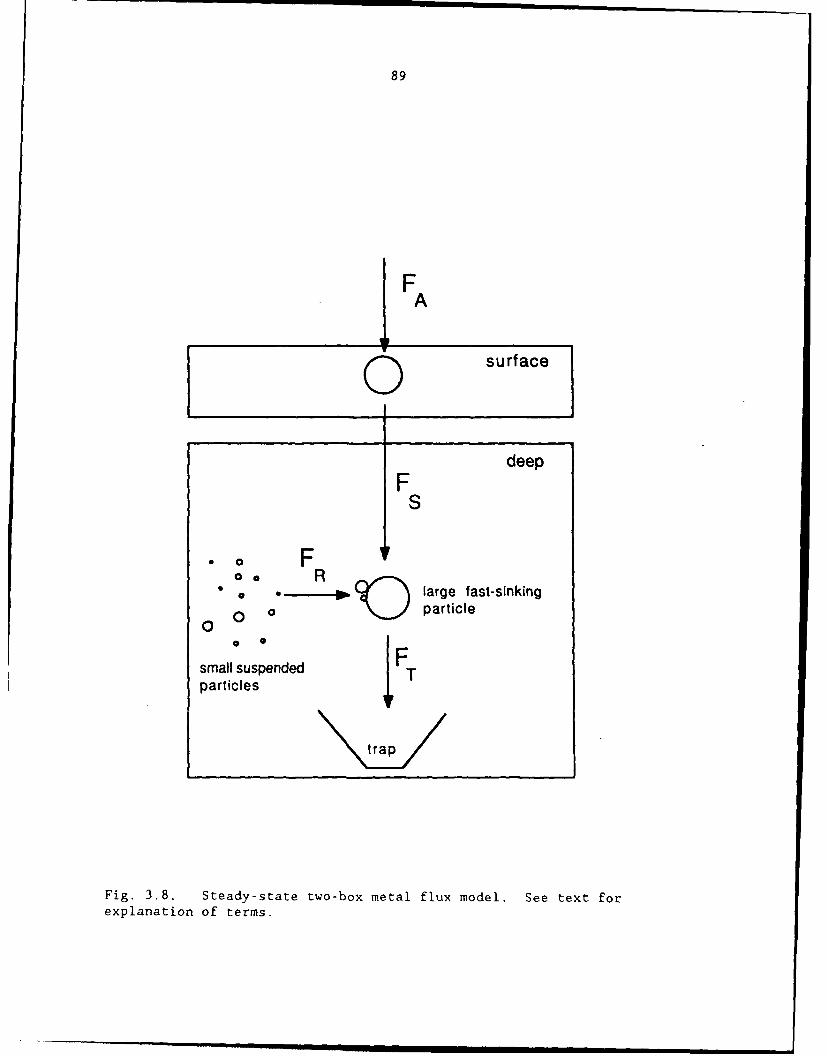
89
IF0 surface
deep
0 F
0 0 Ro , large fast-sinking
00 o particle
0 0
small suspendedFparticles T
\.trap/
Fig. 3.8. Steady-state two-box metal flux model. See text forexplanation of terms.
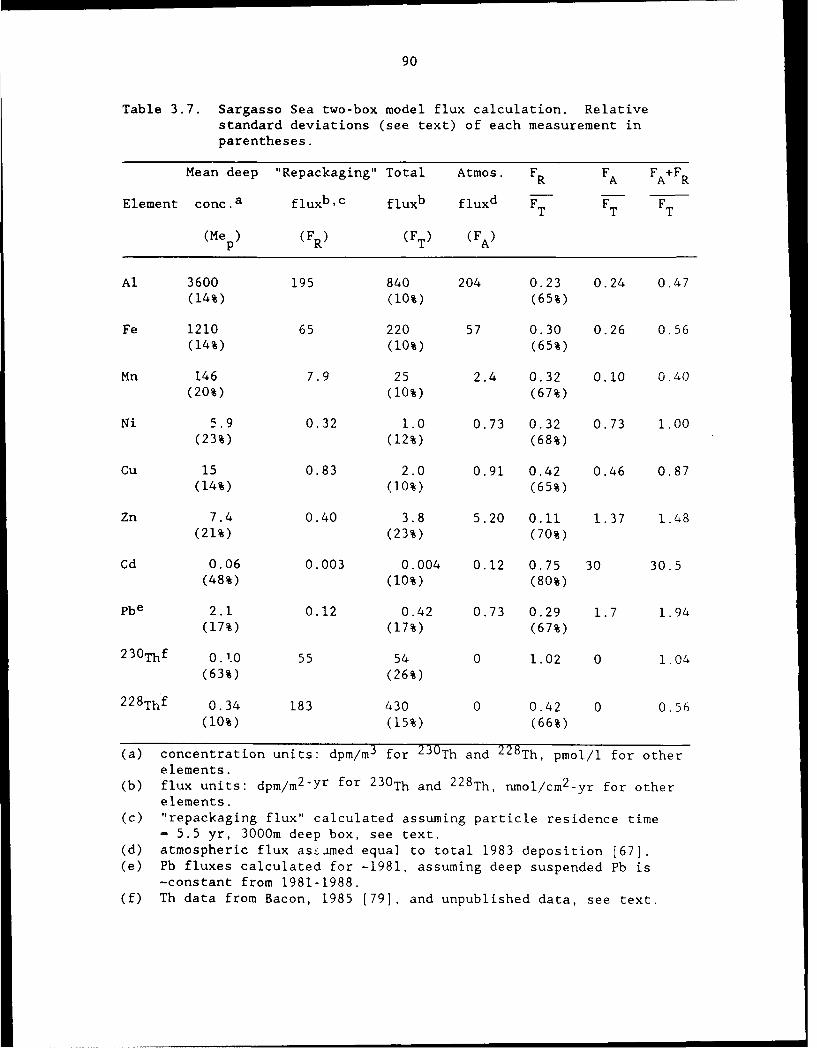
90
Table 3.7. Sargasso Sea two-box model flux calculation. Relativestandard deviations (see text) of each measurement inparentheses.
Mean deep "Repackaging" Total Atmos. FR FA F A+FR
Element conc.a fluxb,c fluxb fluxd FT FT FT
(Mep (FR) (FT) (FA)
Al 3600 195 840 204 0.23 0.24 0.47(14%) (10%) (65%)
Fe 1210 65 220 57 0.30 0.26 0.56(14%) (10%) (65%)
Mn 146 7.9 25 2.4 0.32 0.10 0.40(20%) (10%) (67%)
Ni 5.9 0.32 1.0 0.73 0.32 0.73 1.00(23%) (12%) (68%)
Cu 15 0.83 2.0 0.91 0.42 0.46 0.87(14%) (10%) (65%)
Zn 7.4 0.40 3.8 5.20 0.11 1.37 1.48(21%) (23%) (70%)
Cd 0.06 0.003 0.004 0.12 0.75 30 30.5(48%) (10%) (80%)
Pbe 2.1 0.12 0.42 0.73 0.29 1.7 1.94(17%) (17%) (67%)
230Thf 0.1.0 55 54 0 1.02 0 1.04
(63%) (26%)
2 2 8Thf 0.34 183 430 0 0.42 0 0.56
(10%) (15%) (66%)
(a) concentration units: dpm/m 3 for 2 30Th and 2 2 8Th, pmol/l for otherelements.
(b) flux units: dpm/m2 -Yr for 2 30Th and 2 2 8Th, nmol/cm 2 -yr for otherelements.
(c) "repackaging flux" calculated assuming particle residence time- 5.5 yr, 3000m deep box, see text.
(d) atmospheric flux ashamed equal to total 1983 deposition [67].(e) Pb fluxes calculated for -1981, assuming deep suspended Pb is
-constant from 1981-1988.(f) Th data from Bacon, 1985 [79], and unpublished data, see text.
91
<20% (except for Cd and 2 30Th, see Table 3.7) and D is taken as a model
assumption which therefore has no uncertainty. The uncertainty in FT is
taken as the range of the means for each integrated year of trap
deployment, divided by the mean for the entire 2-year period [6], or the
reported analytical uncertainty, whichever is larger. The resultant
uncertainty is <12% for all elements except Zn, Pb, and 2 2 8Th. The
largest uncertainty by far is in the estimate of t . This is calculatedP
from suspended particulate 2 3 0Th (single profile in March, 1985) and
trapped flux measurements of 2 3 0Th (10 observations of -2 months'
duration from May, 1984 to June, 1986) near Bermuda, assuming that the
flux of 2 3 0Th, which has no independent surface source, is totally
determined by removal of suspended particles (M. Bacon, personal
communication). The estimate obtained is 5.5+3.5 years, within the range
of estimates based on similar modeling of Th distributions in other ocean
basins [74]. This 63% uncertainty in the suspended particle residence
time accounts for almost all of the propagated uncertainty in the
estimate of FR.
The flux calculations demonstrate that for all trace metals
examined, the repackaging flux provides less than half of the total flux
in the deep ocean (Table 3.7). The fraction (FR/FT) is 30±20% or less
for all metals except Cu (42±27%), Cd (75±60%), and 2 28Th (42±28%). In
contrast to 2 30Th, the total flux of most trace metals appears to be
controlled largely by processes occurring in the surface ocean. This
conclusion rests on the assumption that published measurements of trapped
metals are accurate. Because the traps were unpoisoned, some loss of
metals by dissolution may have occurred during the 2-month deployments.
92
However, this would tend to strengthen the argument by further reducing
FR/FT for these metals. The consistency of the FR/FT values for Al, Fe,
Mn, Ni, Cu, and Cd suggests that a common particle interaction process
controls surface-derived versus deep scavenged flux components for all of
these metals. Zinc appears to be an exception, with the repackaging flux
contributing only 11±8% of the total flux (note, however that Zn is very
subject to contamination and that while the sample-to-sample variability
in the trap measurements was not much larger than for the other elements,
at least one of the 11 samples was obviously contaminated).
Calculated repackaging fractions reflect the net effect of several
processes with different intensities for each element: (1) magnitude of
surface ocean sources relative to deep sources, (2) affinity for surface
particles, (3) depth and extent of remineralization from sinking
particles, and (4) scavenging from the dissolved phase in the deep ocean.
While it is difficult to ascertain the relative contributions of each
process for each element, and thereby formulate a quantitative
justification for the results, the general conclusion of the flux
calculation is clear: the vertical transport of deep ocean saspended
particles and their associated metals is a relatively minor component of
total metal removal in the Sargasso Sea. If this result can be
extrapolated to central gyre c.onditions in general, it suggests that
although dissolved/particulate interactions influence metal distributions
throughout the deep ocean, deep particle removal in the open ocean cannot
be the primary determinant of metal removal from the oceanic system.
This control must exist at the oceans boundaries.
93
3.6. SOURCES OF PARTICULATE TRACE METALS IN THE DEEP OCEAN
The model result is simply a comparison of fluxes which does not
rest on an assumption of how the standing stock of deep suspended
particles is maintained, or how these particles acquire trace metals. In
one hypothetical extreme, particles might acquire all of their metals by
in situ scavenging from the dissolved pool, implying a source of
metal-free particles transported from elsewhere or created de novo. In
the other extreme, suspended particles might be delivered to the deep
ocean with a "pre-formed" metal content and undergo no subsequent
exchange with the dissolved phase. The balance between these two
extremes is difficult to determine from steady-state distributions. Some
progress can be made, however, by examining other lines of evidence in
the context of the present model. The following sections discuss the
roles of (1) scavenging of dissolved metals in the deep ocean, (2)
disaggregation from sinking particles, and (3) horizontal particle
advection.
3.6.1. Internal scavenging of dissolved metals
If we adopt the first extreme hypothesis, we can calculate deep
ocean scavenging residence times by dividing the deep ocean dissolved
metal inventory by the "repackaging" flux. For Mn, Cu and Pb, the
results (Table 3.8) are in very good agreement with residence times
calculated on the basis of advection/diffusion modeling of dissolved
profiles (Mn, Cu) or radioactive disequilibrium (Pb). Longer residence
times calculated for the other elements (except Co) suggest that other
94
sources ("pre-formed" particulate metals) may be important, but no
independent estimates of deep scavenging rates exist for comparison.
Although this analysis must be considered a first approximation, it
appears that in situ scavenging of dissolved trace metals in the deep
water column could explain the entire suspended particulate content of
reactive metals (Mn, Cu, Pb) except those with significant refractory
particulate components (Al, Fe, and perhaps Co).
3.6.2. Disaggregation of sinking particles
An alternative source is the disaggregation of sinking particles.
Previous authors have suggested that a quasi-continuous exchange between
sinking and suspended particles maintains the suspended pool at a
constant concentration [2,72]. If no other mechanisms influenced the
composition of suspended particles, we would expect their metal
composition to resemble that of sinking particles. Because as we have
seen, the fraction of repackaging flux is not constant (Table 3.7), we
know that the inter-element ratios differ between the two classes of
particles. The absolute composition (mol/g dry weight) is rather
similar, however (Table 3.9).
Suspended particles are enriched by 10-90+25% in Fe, Mn, Cit and
perhaps Pb relative to sinking particles (Table 3.9). These enrichments
suggest that some degree of deep water scavenging contributes to the
suspended concentrations for these elements [5], and that exchange
between the two particle classes is not complete. Thus total
disaggregation and re-aggregation of the surface-derived particles does
not occur in the deep ocean. If it did, we would expect the repackaging
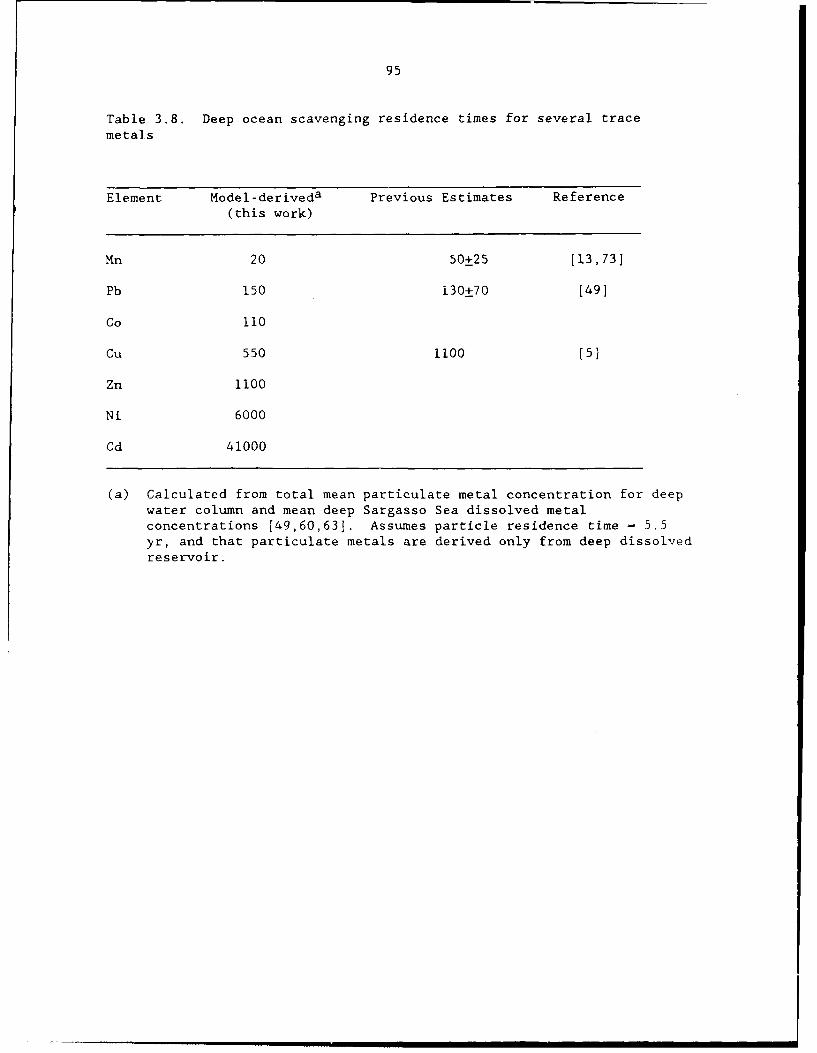
95
Table 3.8. Deep ocean scavenging residence times for several tracemetals
Element Model-deriveda Previous Estimates Reference(this work)
Mn 20 50+25 [13,73J
Pb 150 130+70 [49]
Co 110
Cu 550 1100 [5]
Zn 1100
Ni 6000
Cd 41000
(a) Calculated from total mean particulate metal concentration for deepwater column and mean deep Sargasso Sea dissolved metalconcentrations (49,60,631. Assumes particle residence time - 5.5yr, and that particulate metals are derived only from deep dissolvedreservoir.
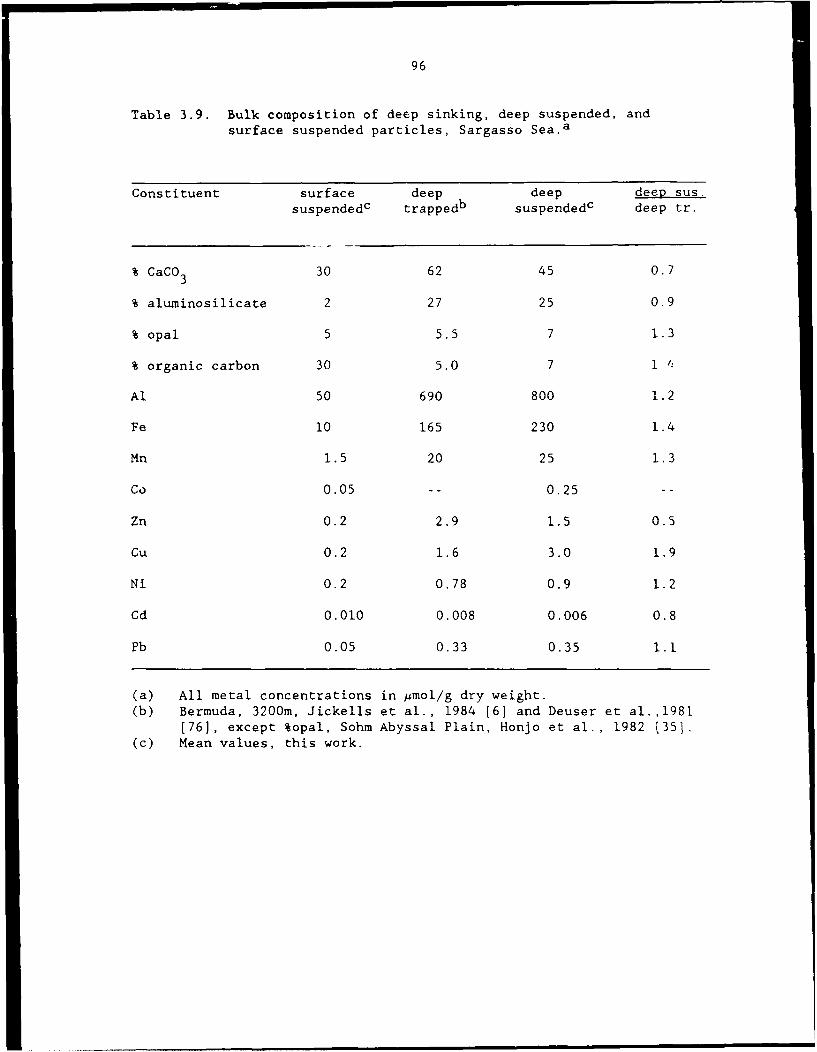
96
Table 3.9. Bulk composition of deep sinking, deep suspended, andsurface suspended particles, Sargasso Sea.a
Constituent surface deep deep deep sus.suspendedc trappedb suspendedc deep tr.
% CaCO 3 30 62 45 0.7
% aluminosilicate 2 27 25 0.9
% opal 5 5.5 7 1.3
% organic carbon 30 5.0 7 1 i:
Al 50 690 800 1.2
Fe 10 165 230 1.4
Mn 1.5 20 25 1.3
Co 0.05 -- 0.25 --
Zn 0.2 2.9 1.5 0.5
Cu 0.2 1.6 3.0 1.9
Ni 0.2 0.78 0.9 1.2
Cd 0.010 0.008 0.006 0.8
Pb 0.05 0.33 0.35 1.1
(a) All metal concentrations in umol/g dry weight.(b) Bermuda, 3200m, Jickells et al., 1984 [6] and Deuser et al.,1981
[76], except %opal, Sohm Abyssal Plain, Honjo et al., 1982 (351.(c) Mean values, this work.
97
flux to equal the total flux. Since this is not observed, this scenario
suggests that a minor portion of the large particle flux is involved in
"sweeping out" and then restocking suspended particles through
aggregation/disaggregation processes, and the major portion sinks rapidly
with little alteration. It should be noted, however, that trapped
particles are significantly different in composition from surface
particles (Table 3.9), so the large particles have been substantially
modified at some point during their descent. The flux comparison
indicates that this does not happen in the deep ocean, but occurs during
particle transformations in the dynamic and poorly understood upper
thermocline (0-500m).
The rate of exchange with suspended particles might depend on the
seasonally variable large particle flux [72]. If so, the composition of
sinking and suspended particle; "-culd be mcre similar duriig -owa period-
than others. Apparently, however, sinking particle composition is more
constant than the flux: relative standard deviations of mean metal
contents were generally less than 25% compared to 55% for total mass flux
over the same period [6]. The conclusion is that the trace metal
composition of sinking and suspended particles appear to be linked
through particle interactions over a large range of flux conditions.
3.6.3. Horizontal advection of particles
A third possible source for deep suspended metals is horizontal
particulate transport from other regions. This source may be important
for metals with longer scavenging residence times or a significant
detrital component. Jickells et al. (1987) [751 argued that the flux due
98
to vertical removal of particulate Al which is transported horizontally
from outside the region could be estimated as the difference, FT - FA '
between the deep flux and total atmospheric input (wet plus dry
deposition) (Table 3.7). If this is true, horizontal advection supplies
about 70% of total deep Al flux. Observations of increasing sediment
trap Al fluxes in the Sargasso Sea [7,9] led other workers to similar
conclusions. However, the model results (Table 3.7) indica-e that
removal of deep suspended Al, including suspended Al horizontally
transported from other regions, can only supply 30% of FT - FA '
This is a significant discrepancy which is unlikely to be caused by
uncertainties in the flux measurempnts or model assumptions. For
example, deep flux measurements for 1980-82 are within 20% of mean fluxes
for the period 1978-84, based on the correlation between fluxes of Al and
organic carbon, and average organic carbon fluxes for this period [6,761.
Calculated repackaging flux, which depends on assumed particle residence
time, cannot be more than 60% off without unreasonably violating the
230Th constraint. Although the atmospheric input is based on total
annual deposition only for the year 1983, the value lies within 30% of
previous estimates of atmospheric Al flux at Bermuda or the North
Atlantic as a whole [40,7-/]. These uncertainties are unlikely to cause
the factor of three discrepancy between our results and the previous
conclusion. The model results suggest that the atmospheric and
repackaging fluxes are of similar magnitude, and that horizontal
advection is not the major contributor to total Al flux.
The horizontally advected component of the total flux for other
metals is also probably small. It is clear that the discrepancy for Al
99
does not exist for Ni, Cu, Zn, Cd and Pb, for which (FA+FR)/FT 21.0. For
these elements, the atmospheric input is more than enough to provide the
difference between FT and F indicating that some fraction of the
atmospheric input is removed outside the study area. (It is important to
remember, however, that the atmospheric flux is based on measurements for
a single year, and is uncertain due to probable interanual variability in
wet and dry deposition.) In addition, transect data indicate that deep
water gradients of particulate Zn, Cu, and Cd between the Gulf Stream and
Bermuda are small (see Chapter 6), although sample coverage is inadequate
for a rigorous comparison of concentrations along isopycnal surfaces.
Values suggested by Jickells et al. [75], calculated by multiplying FT
FA for aluminum by the metal/Al ratio in pelagic clays, are certainly
overestimates, since they exceed the total repackaging flux calculated
here (except for Cd).
In summary, the evidence is consistent with a significant deep
scavenging source for particulate Mn, Cu, and Pb, and with sinking
particle disaggregation being a generally dominant control on suspended
particle trace metal composition. Horizontal particle advection is
probably not the major contributor to suspended particulate metal
distributions, and is certainly a minor component of the total deep metal
flux.
3.7. Conclusions
The measurements presented here constitute the first accurate
open-ocean profiles of suspended particulate concentrations for several
100
trace elements. This has enabled a better understanding of the factors
which might control particulate metal contents in the sub-surface ocean.
In particular, vertical variations in the dissolved/particulate
partitioning for many of these elements appear to be related to the
distribution of particulate Mn, and are anti-correlated with other major
components (organic carbon, calcium carbonate, opal, aluminosilicates).
Reasonable estimates for the residence time of suspended particles in the
deep water column imply metal fluxes due to their removal which are less
than half the fluxes actually measured in the deep ocean. This indicates
that processes occurring in the surface ocean are more important
determinants of metal removal from the open ocean environment than uptake
on small particles in the deep ocean. This result is consistent with
large particle disaggregation as a source which maintains the suspended
particle reservoir, but suggests that the extent
of this process exerts a minor control on the total metal flux.
101
REFERENCES
1. E.D. Goldberg, Marine geochemistry 1. Chemical scavengers of thesea, J. Geol. 62, 249-265, 1954.
2. D. Lal, The oceanic microcosm of particles, 198, 997-1009, 1977.
3. K.K. Turekian, The fate of metals in the ocean, Geochim. Cosmochim
Acta 41, 1139-1144, 1977.
4. M. Whitfield, and D.R. Turner, The role of particles in regulatingthe composition of seawater, in Aquatic Surface Chemistry, W. Stumm,ed., Wiley Interscience, pp. 457-493, 1987.
5. K.W. Bruland, Trace elements in sea-water, in Chemical OceanographyVol. 8, J.P. Riley, R. Chester, eds., Academic Press, pp.158 -2 2 0,1983.
6. T.D. Jickells, W.G. Deuser and A.H. Knap, The sedimentation rates oftrace elements in the Sargasso Sea measured by sediment trap,
Deep-Sea Res. 31, 1169-1178, 1984.
7. J. Dymond and R. Collier, Nares Abyssal Plain sediment flux studies,
in: Subseabed disposal project annual report, physical oceanographyand water column studies, S.L. Kupferman, ed., pp. BI-B24, Sandia
National Laboratories, Livermore CA, 1987.
8. D.W. Spencer, P.G. Brewer, A. Fleer, S. Honjo, S. Krishnaswami and
Y. Nozaki, Chemical fluxes from a sediment trap experiment in thedeep Sargasso Sea, J. Marine Res. 36, 493-523, 1978.
9. P.G. Brewer, Y. Nozaki, D.W. Spencer and A.P. Fleer, Sediment trapexperiments in the deep North Atlantic: isotopic and elementalfluxes, J. Mar. Res. 38, 703-728, 1980.
10. J.H. Martin, G.A. Knauer and W.W. Broenkow, VERTEX: the lateraltransport of manganese in the northeast Pacific, Deep-Sea Res. 32,
1405-1427, 1985.
11. K.W. Bruland, R.P. Franks, W.M. Landing and A. Soutar, SouthernCalifornia inner basin sediment trap calibration, Earth Planet. Sci.
Lett. 53, 400-408, 1981.
12. J.K.B. Bishop, and M.Q. Fleisher, Particulate manganese dynamics ingulf stream warm-core rings and surrounding waters of the N.W.
Atlantic, Geochim. Cosmochim. Acta 51, 2807-2827, 1987.
13. W.M. Landing and K.W. Bruland, The contrasting biogeochemistry ofiron and manganese in the Pacific Ocean, Geochim. Cosmochim. Acta,51, 29-43, 1987.
102
14. D.K. Spencer, Aluminum concentrations and fluxes in the ocean, in:
GOFS, Global Ocean Flux Study, Procedings of a Workshop, pp.206-220, National Academy Press, Washington, D.C., 1984.
15. K.J. Orians and K.W. Bruland, The biogeochemistry of aluminum in thePacific Ocean, Earth Planet. Sci. lett. 78, 397-410, 1986.
16. R. Collier and J. Edmond, The trace element geochemistry of marinebiogenic particulate matter, Prog. Oceanog. 13, 113-199, 1984.
17. S. Krishnaswami and M.M. Sarin, Atlantic surface particulates:Composition, settling rates and dissolution in the deep sea, EarthPlanet. Sci. Lett. 32, 430-440, 1976.
18. G.T. Wallace, G.L. Hoffman and R.A. Duce, The influence of organicmatter and atmospheric deposition on the particulate trace metalconcentrations of northwest Atlantic surface seawater, Marine Chem.5, 143-170, 1977.
19. J.14. Martin ind G.A. Knauer, The elemental composition of plankton,Geochim. Cosmochim. Acta, 37, 1639-1653, 1973.
20. P. Buat-Menard and R. Chesselet, Variable influence of theatmospheric flux on the trace metal chemistry of oceanic suspendedmatter, Earth Planet. Sci. Lett. 42, 399-411, 1979
21. W.D. Gardner, Incomplete extraction of rapidly settling particlesfrom water samples, Limnol. Oceanogr. 22, 764-768, 1977.
22. S.E. Calvert and M.J. McCarthy, The effect of incomplete recovery oflarge particles on the chemical composition of oceanic particulatematter, Limnol. Oceanogr. 24, 532-536, 1979.
23. J.D.H. Strickland and T.R. Parsons, A Practical Manual of SeawaterAnalysis, Fisheries Research Board of Canada, Ottawa, 1968.
24. D.W. Eggimann, F.T. Manheim and P.R. Betzer, Dissolution andanalysis of amorphous silica in marine sediments, J. Sediment.Petrol. 50, 215-225, 1980.
25. P.G. Brewer, D.W. Spencer, P.E. Biscaye, A. Hanley, P.L. Sachs, C.L.Smith, S. Kadar and J. Fredericks, The distribution of particulatematter in the Atlantic Ocean, Earth Planet. Sci. Lett. 32, 393-402,1976.
26. Station S Hydographic data, Bermuda Biological Station, 1988.
27. T. D. Jickells, W.G. Deuser, and R.A. Belastock, Temporal variationsin the concentrations of some particulate elements in the surfacewaters of the Sargasso Sea and their relationship to deep seafluxes, Marine Chem., in press, 1989.
103
28. D.W. Menzel and J.H. Ryther, The annual cycle of primary productionin the Sargasso Sea off Bermuda, Deep-Sea Res. 6, 351-367, 1960.
29. J.K.B. Bishop, J.M. Edmond, D.R. Ketten, M.P. Bacon and W.B. Silker,The chemistry, biology, and vertical flux of particulate matter fromthe upper 400 m of the equatorial Atlantic Ocean, Deep-Sea Res. 24,511-548, 1977.
30. P.G. Brewer, GEOSECS Atlantic particle analyses, unpublished data,1988.
31. J.K.B. Bishop, R.W. Collier, D.R. Ketten and J.M. Edrrond, Thechemistry, biology, and vertical flux of particulate matter from theupper 1500 m of the Panama Basin, Deep-Sea Res. 27A, 615-640, 1980.
32. S.R. Taylor, Abundance of chemical elements in the continentalcrust: a new table, Geochim. Cosmochim. Acta 28, 1273-1285, 1964.
33. D.M. Nelson and J.J. Goering, Near-surface silica dissolution in theupwelling region off northwest Africa, Deep-Sea Res. 24, 65-74,1977.
34. D.M. Nelson and L.I. Gordon, Production and pelagic dissolution ofbiogenic silica in the Southern Ocean, Geochim. Cosmochim. Acta, 46,491-501, 1982.
35. S. Honjo, S.J. Manganini and J.J. Cole, Sedimentation of biogenicmatter in the deep ocean, Deep-Sea Res. 5A, 609-625, 1982.
36. C. Copin-Montegut and G. Copin-Montegut, Stoichiometry of carbon,nitrogen, and phosphorous in marine particulate matter, Deep-SeaRes. 30, 31-46, 1983.
37. A.C. Redfield, B.H. Ketchum and F.A. Richards, The influence oforganisms on the composition of sea water. In: The Sea: Vol. 2, M.N.Hill, ed., Wiley, 1963.
38. P.E. Biscaye and S.L. Eittreim, Suspended particulate loads andtransports in the nepheloid layer of the abyssal Atlantic Ocean,Marine Geol. 23, 155-172, 1977.
39. C.E. Lambert, J.K.B. Bishop, P.E. Biscaye and R. Chesselet,Particulate aluminum, iron and manganese chemistry at the deepAtlantic boundary layer, Earth Planet. Sci. Lett. 70, 237-248, 1984.
40. R.A. Duce, B.J. Ray, G.L. Hoffman and P.R. Walsh, Trace metalconcentration as a function of particle size in marine aerosols fromBermuda, Geophys. Res. Lett. 3, 339-342, 1976.
41. R. Chester, The marine mineral aerosol, in: The Role of Air-SeaExchange in Geochemical Cycling, P. Buat-Menard, ed., pp 443-476,NATO ASI Series, Reidel, Holland, 1986.
104
42. R.M. Gordon, J.H. Martin and G.A. Knauer, Iron 'n north-east Pacificwaters, Nature 299, 611-612, 1982.
43. J.K.B. Bishop and P.E. Biscaye, Chemical characterization ofindividual particles from the nepheloid layer in the Atlantic ocean,Earth and Planet. Sci. Lett. 58, 265-275, 1982.
44. M.M. Benjamin and J.O. Leckie, Multiple-site adsorption of Cd, Cu,Zn, and Pb on amorphous iron oxyhydroxide, J. Coll. Interf. Sci. 79,209-221, 1981.
45. K.K. Turekian, A. Katz and L. Chan, Trace element trapping inpteropod tests. Limnol. Oceanogr. 18, 240-249, 1973.
46. T.C. Moore, Radiolaria: change in skeletal weight and resistance tosolution, Geol. Soc. Am. Bull. 80, 2103-2108, 1969.
47. K.W. Bruland, R.P. Franks, G.A. Knauer and J.H. Martin, Sampling andanalytical methods for the determination of copper, cadmium, zinc,and nickel at the nanogram per liter level in sea water, Anal. Chim.Acta 105, 233-245, 1979.
48. B.K. Schaule and C.C. Patterson, Lead concentrations in theNortheast Pacific: evidence for global anthropogenic perturbations,Earth Planet. Sci. Lett. 54, 97-116, 1981.
49. E.A. Boyle, S.D. Chapnick ard G.T. Shen, Temporal variability oflead in the western North Atlantic, J. Geophys. Res. 91:8573-8593,1986.
50. K.B. Krauskopf, Factors controlling the concentration of thirteenrare metals in sea water, Geochim. Cosmochim. Acta 9, 1-32, 1956.
51. P.W. Schindler, Removal of trace metals from the oceans: a zeroorder model, Thalassia jugoslavica 11, 101-111, 1975.
52. P.G. Brewer and W.M. Hao, Oceanic Elemental Scavenging, in: ChemicalModeling in Aqueous Systems, E.A. Jenne, ed., ACS Symposium SeriesNo. 93, pp. 261-274, Am. Chem. Soc., 1979.
53. B.D. Honeyman and P.H. Santschi, Metals in aquatic systems, Enviro.Sci. Tech. 22,862-871, 1988.
54. L. Balistrieri, P.G. Brewer and J.W. Murray, Scavenging residencetimes of trace metals and surface chemistry of sinking particles inthe deep ocean, Deep-Sea Res. 28A, 101-121, 1981.
55. N. Takematsu, Ultimate removal of trace elements from seawater andadsorption, J. Earth Sci. 35, 227-248, 1987.
105
56. J.W. Murray, The i -raction of metal ions at the manganesedioxide-solution rface, Geochim. Cosmochim. Acta 39, 505-519,1975.
57. U.P. Nyffeler, Y.H. Li and P.H. Santschi, A kinetic approach todesribe trace-element distribution between particles and solution innatural aquatic systems, Geochim. Cosmochim. Acta 48, 1513-1522,1984.
58. J.H. Martin and G.A. Knauer, VERTEX: Manganese transport with CaCO 3,Deep-Sea Res. 30, 411-425, 1983.
59. J.P. Cowen and K.W. Bruland, Metal deposits associated withbacteria: implications for Fe and Mn marine biogeochemistry,Deep-Sea Res. 32, 253-272, 1985.
60. K.W. Bruland and R.P. Frar.ks, Mn, Ni, Cu, Zn, and Cd in the westernNorth Atlantic, in Trace Metals in Sea Water, C.S. Wong, E.Boyle,K.W. Bruland , T.D. Burton, E.D. Goldberg, eds., Nato Conf. Series,Plenum Press, pp. 395-414, 1983.
61. P.A. Yeats and J.M. Bewers, Manganese in the western North AtlanticOcean, Marine Chem. 17, 255-263, 1985.
62. P.J. Statham and J.D. Burton, Dissolved manganese in the NorthAtlantic Ocean, 0-35 N, Earth Planet. Sci. Lett. 79, 55-65, 1986.
63. T.D. Jickells and J.D. Burton, Cobalt, copper, manganese and nickelin the sargasso sea, Marine Chem. 23, 131-144, 1988.
64. M.S. McCartney, The subtropical circulation of mode waters, J. Mar.Res. 40 (Suppl.), 427-464, 1982.
65. W.J. Jenkins, Tritium and He-3 in the Sargasso Sea, J. Mar. Res. 38,533-569, 1980.
66. R.F. Weiss, Hydrothermal manganese in the deep sea: scavengingresidence time and Mn/H-3 relationships, Earth Planet. Sci. Lett.37, 257-262, 1977.
67. T.D. Jickells and A.H. Knap, Trace metals in Bermuda rainwater, J.Geophys. Res. 89, 1423-1428, 1984.
68. W.G. Sunda and S.A. Huntsman, Effect of sunlight on redox cycles ofmanganese in the southwestern Sargasso Sea, Deep-Sea Res. 35,1297-1317, 1988.
69. G.A. Knauer and J.H. Martin, Phosphorus-cadmium cycling in northeastPacific waters, J. Mar. Res. 39, 65-78, 1981.
70. I.N. McCave, Vertical flux of particles in the ocean, Deep-Sea Res.22, 491-502, 1975.
106
71. J.H. Martin and G.A. Knauer, VERTEX I trap studies, unpublished
manuscript.
72. M.P. Bacon, C.-A. Huh, A.P. Fleer and W.G. Deuser, Seasonality inthe flux of natural radionuclides and plutonium in the deep SargassoSea, Deep-Sea Res. 32, 273-286, 1985.
73. Y. Nozaki, H.-S. Yang and M. Yamada, Scavenging of thorium in theocean, J. Geophys. Res. 92, 772-228, 1987.
74. M.P. Bacon, Radionuclide fluxes in the ocean interior, in: GOFS,Global Ocean Flux Study, Procedings of a Workshop, pp. 180-205,
National Academy Press, Washington, D.C., 1984.
75. T.D. Jickells, T.M. Church and W.G. Deuser, A comparison ofatmospheric inputs and deep-ocean particle fluxes for the SargassoSea, Global Biogeochem. Cycles 1, 117-130, 1987.
76. W.G. Deuser, E.H. Ross and R.F. Anderson, Seasonality in the supplyof sediment to the deep Sargasso Sea and implications for the rapidtransfer of matter to the deep ocean, Deep-Sea Res. 28, 495-505,1981.
77. J.M. Prospero, Eolian transport to the world ocean, in The Sea, V9l.7. The Oceanic Lithosphere, C. Emiliani, ed., Wiley-Interscience,
New York, 1981.
78. S.E. Calvert and N.B. Price, Geochmical variation in ferromanganesenodules and associated sediments from the Pacific Ocean, MarineChem. 5, 43-74, 1977.
79. K.K. Turekian and K.H. Wedepohl, Distribution of the elements insome major units of the earth's crust, Geol. Soc. Am. Bull. 72,175-192, 1961.
107
CHAPTER 4
ISOTOPIC EQUILIBRATION BETWEEN DISSOLVED AND SUSPENDED PARTICULATE LEAD
IN THE ATLANTIC OCEAN
4.1. INTRODUCTION
Suspended particles in the Sargasso Sea near Bermuda have been
analyzed for total Pb, 2 10 Pb and stable lead isotopic composition to
determine Thether particles exhibit similar depth variations to those
observed for Pb dissolved in seawater. This constitutes a test of a
central question in oceanic trace metal scavenging how rapidly do metals
exchange between solution and suspended particles? The distribut')n of
230Th and 2 34 Th, highly particle-reactive radionuclides with a uniform
source throughout the ocean, has been shown to be consistent with a
reversible uptake mechanism with exchange times which are rapid (months)
relative to the residence time of suspended particles (years)1 ,2 " The
implied state of approximate exchange equilibrium has not been
demonstrated for less reactive trace metals, which are introduced at the
ocean's boundaries rather than in its interior. Lead, in particular, is
somewhat less reactive than Th and has a deep ocean scavenging residence
time of a century or two 3 "6 , as compared with a few decades for Th8 ,9
Anthropogenic input during the last century has completely altered
the natural distribution of lead in the Sargasso Sea. Downwind from
North American industrial and automotive sources, the Pb distribution in
this region is no longer in steady-state. Since 1970, when the us- of
alkyl leaded gasolines began to be curta led in the U.S., atmospheric
108
input of lead to the Sargasso Sea has been decreasing. The concentration
of lead in the upper ocean near Bermuda, recorded in the skeletons of
corals, has been decreasing since the early 1970's I0 . Gasoline additive
lead was mined from unusually radiogenic ores during approximately
1965-1975, and from less radiogenic sources since then. Thus the
concentration decrease has been accompanied by a decrease in 20 6Pb/ 2 0 7Pb
to near the pre-alkyl lead ratio by 198511.
2 10 Pb is produced in the atmosphere by a constant decay of
continentally-derived Rn-222. It enters the surface of the western North
Atlantic via atmospheric pathways similar to those followed by
anthropogenic Pb1 2. 2 10 Pb is also generated in the ocean interior by
decay of dissolved Ra-226. The oceaiiic distribution of 2 10 Pb, in
contrast to that of stable Pb, is in approximate steady-state 3 -6. As a
result, both the 2 0 6 Pb/ 2 0 7Pb ratio and the total Pb/ 2 1 OPb ratio show
substantial changes in the upper ocean over the last decade1 1 ,1 3. The
20 6Pb/ 2 0 7Pb ratio of Bermuda surface water decreased from about 1.203 in
1980-8411 to 1.192 in 198714, and the Pb/ 2 10 Pb ratio fell from 1250
pmol/dpm in 1979 to 690 pmol/dpm in 198413 and to -300 pmol/dpm by 1987
(Boyle, pers. comm.). The vertical propagation of these changing surface
signals into the ocean interior has produced isotopic depth distributions
which are evolving on a yearly to decadal time scale11 .
4.2. SAMPLING AND ANALYSIS
Suspended particulate matter was filtered in situ from 200-1200
liters of seawater on five separate occasions from September, 1986 to
April, 1988, -50 km southwest of Bermuda (32°00'N, 64°I0'W). Sample
109
contamination is an acute concern in obtaining accurate Pb concentrations
in natural waters1 6 , so specially designed battery-powered pumps were
used to collect the samples in situ. Details of the sampling and
analytical procedures will be presented elsewhere. Briefly, 4-11 mg of
suspended matter was collect:d can 1.0 pm pore size Nuclepore
polycarbonate filters from depths of 10 to 4000m (4200m bottom depth).
In an effort to obtain samples more representative of small suspended
particles which are expected to dominate exchange with dissolved Pb, a 53
pm polyester prefilter was used on some deployments to exclude larger,
fast-sinking particles. The >53 pm fraction comprised 6-25% of the total
mass. No compositional differences between the <53 um samples and total
particulate matter samples could be discerned in any property examined
here. Samples were rinsed with distilled water (adjusted to pH 8.3 with
NaOH), dried, weighed, and subsampled.
Subsamples of the filters were completely dissolved in 3-x
Vycor-distilled concentrated HNO 3 and sub-boiling distilled HF.
Resulting solutions were analyzed for total Pb by graphite furnace atomic
absorption spectroscopy, and for 2 1 0Pb (9/87 and 3/88 samples only) by
alpha spectrometric determination of the activity of ingrown daughter
Po-2101 7 . Separate subsamples (3/87 and 3/88 samples only) were
dissolved in 0.5M HBr and analyzed for Pb content stable Pb isotope
ratios using thermal ionization mass spectrometry with Faraday cup and
Daly dettction (these analyses carried out by Bruno Hamelin,
Lamont-Doherty Geological Observatory). Reported ratios are for the
Faraday cup; Daly detector results were equivalent within counting error.
The particulate Pb contents determined by the mass spectrometric method
110
were equivalent to the atomic absorption analyses, within subsampling
uncertainty (m.s./a.a. - 0.87 + 0.17 (lal for 14 samples). It is
therefore reasonable to conclude that both leaching procedures dissolved
essentially all of the particulate Pb, and that the isotopic ratios are
representative of total particulate Pb.
4.3. RESULTS
Suspended particulate Pb concentrations resemble but do not exactly
parallel dissolved Pb profiles (Figure 4.1). Concentrations increase
from about 1 pmol/kg in near-surface waters to a maximum of almost 3
pmol/kg at about 500m, then decrease to approximately constant deep water
values of 1.6 pmol/kg. The results indicate that particulate Pb varies
from 1% (surface) to 4% (deep water) of total Pb. I believe this is the
first accurate measurement of suspended particulate Pb in the open ocean.
Previous investigators analyzed particulate Pb filtered from Niskin
bottles (0.4 Am filter), and obtained an average deep water concentration
of 42 pmol/kg for the North Atlantic in 1974-7518. Because dissolved Pb
in surface waters has changed by only a factor of -4 during 1979-198715.
and deeper waters by much less, such a high value is unlikely to be the
result of historical input variations and is more likely due to sample
contamination. Based on average crustal Pb/A1 1 9 , less than 5% of
particulate Pb is associated with refractory alumino-silicate particles.
Most of the parti,,llate Pb must therefore be acquired from solution.
consistent with the observation that almost all atmospheric Pb is
introduced dissolved in rain 20 .
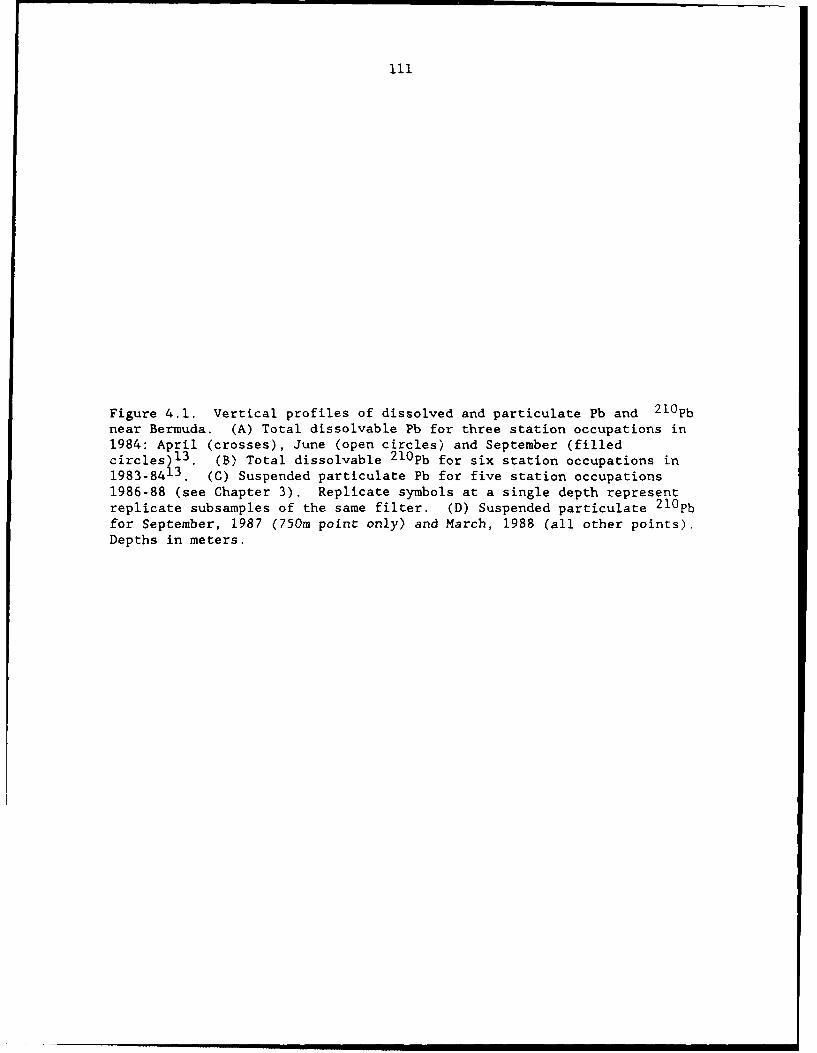
111
Figure 4.1. Vertical profiles of dissolved and particulate Pb and 2 1 OPbnear Bermuda. (A) Total dissolvable Pb for three station occupations in1984: April (crosses), June (open circles) and September (filledcircles) 1 3 . (B) Total dissolvable 2 10 Pb for six station occupations in1983-8413. (C) Suspended particulate Pb for five station occupations
1986-88 (see Chapter 3). Replicate symbols at a single depth representreplicate subsamples of the same filter. (D) Suspended particulate 2 10 Pbfor September, 1987 (750m point only) and March, 1988 (all other points).Depths in meters.
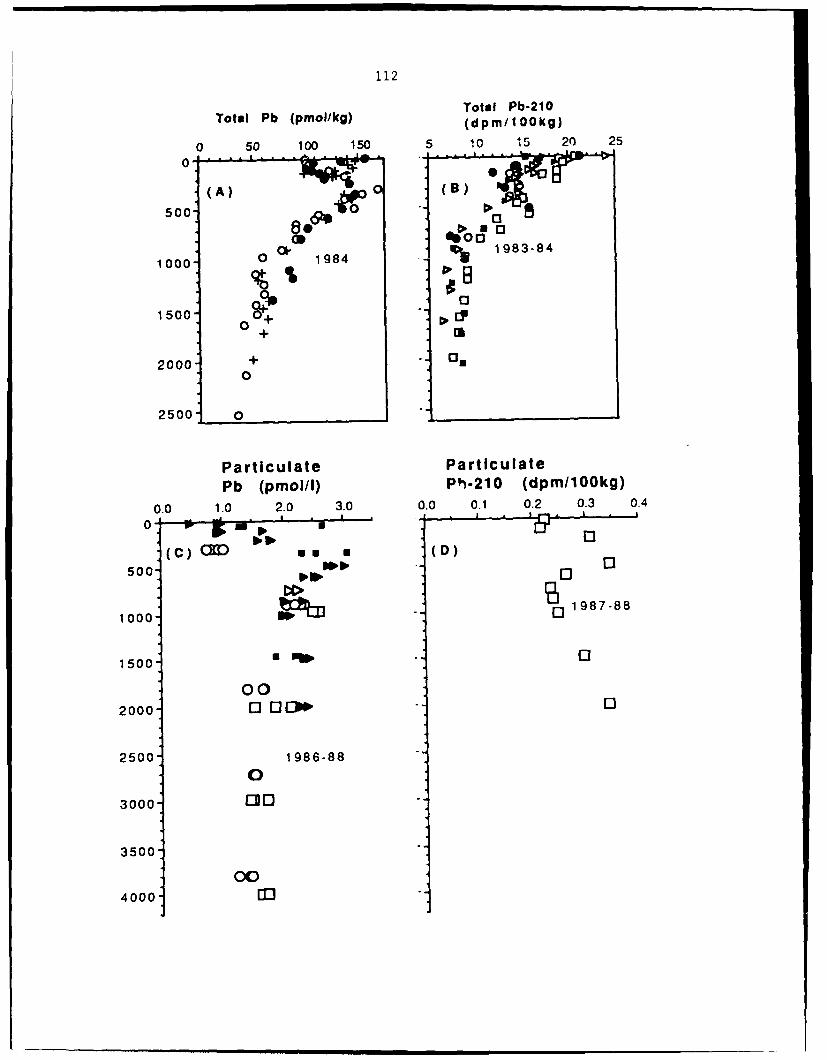
112
Total Pb-210Total Pb (pmollkg) (dpm/100kg)
0 50 100 150 5 10 15 20 25
(A) B) 0
500-
cD ~0o100 0 1- 984% r 1983-84
0+2000 + 1 1
2500 O
Particulate ParticulatePb (pmol/l) Ph-210 (dpm/lOOkg)
0.0 1.0 2.0 3.0 0.0 01 0.2 0.3 0.4
06 13F
(C) ur, - (D)
500 Ip w 0
1000 "1987-88
1500 0
002000 0 1 0
2500 1986-880
3000 IDO
3500
004000 MO
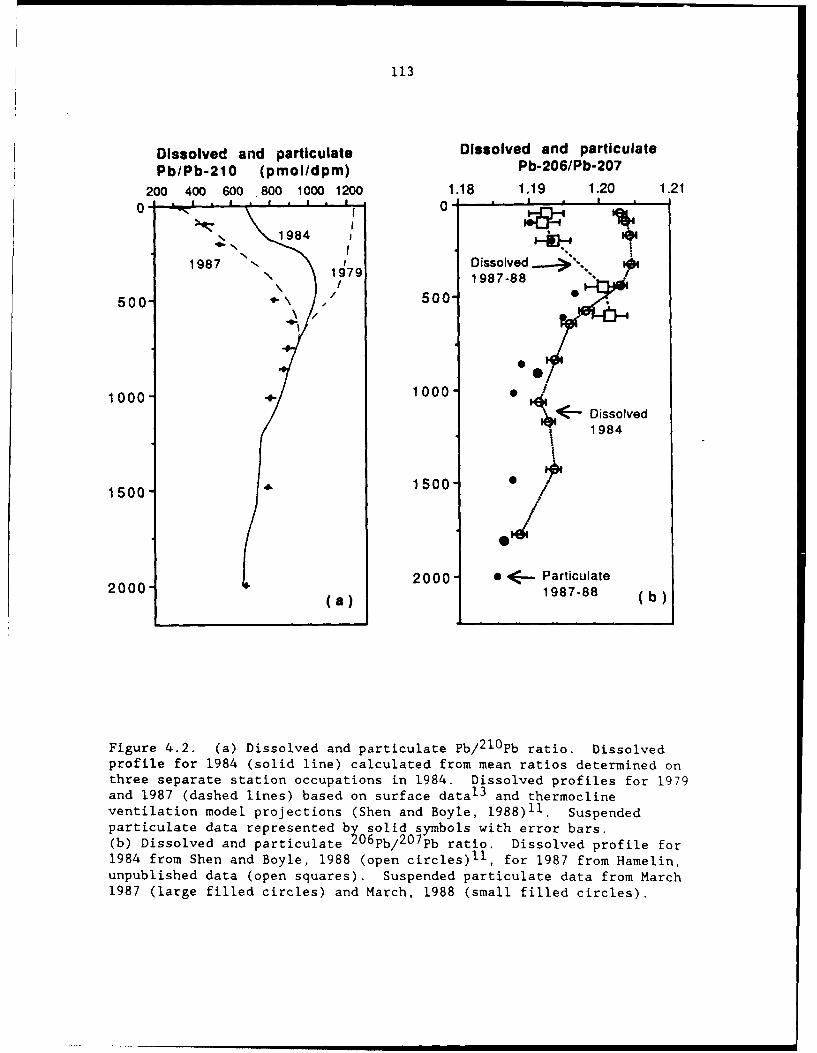
113
Dissolved and particulate Dissolved and particulatePb/Pb-210 (pmol/dpm) Pb-206/Pb-207
200 400 600 800 1000 1200 1.18 1.19 1.20 1.21• I•I•I wowl •
1987 Dissolved181979 1987-88
500 -, 500"
1000 1000- 0
DissolvedI 1984
1500 1500,
2000 e <- Particulate2000 (a) 1987-88 (b)
Figure 4.2. (a) Dissolved and particulate Pb/ 2 1OPb ratio. Dissolved
profile for 1984 (solid line) calculated from mean ratios determined onthree separate station occupations in 1984. Dissolved profiles for 1979
and 1987 (dashed lines) based on surface data 1 3 and thermoclineventilation model projections (Shen and Boyle, 1988)11. Suspended
particulate data represented by solid symbols with error bars.(b) Dissolved and particulate 206 Pb/ 20 7Pb ratio. Dissolved profile for
1984 from Shen and Boyle, 1988 (open circles)11 , for 1987 from Hamelin,unpublished data (open squares). Suspended particulate data from March
1987 (large filled circles) and March, 1988 (small filled circles).
... .......... =~mmm lmi l Modl
114
An upper thermoc - ine maximum is also observed for suspended
particulate 2 1 0 Pb, alti ough no sub-surface maximum is seen in the
dissolved 2 10 Pb profile (Figure 4.1). Between 800m and 2000m,
particulate 2 10 Pb concentration increases by -40% while particulate Pb
appears to decrease slightly.
Profiles of lead isotopic composition (2 0 6 Pb/ 2 0 7Pb values reported
here) and Pb/ 2 1 OPb in the suspended particles were very similar to
contemporaneous seawater profiles throughout the upper 2000m (Figure
4.2). In the upper 500m, particulate and dissolved ratios in 1987-88
were distinctly lower than dissolved ratios in both 1984 and 1979,
consistent with the relatively rapid renewal of Pb in the upper
thermocline1 3 . Below this depth, 1987-88 values for both ratios converge
with the 1984 dissolved profiles, indicating a relatively longer Pb
residence time in deeper waters.
In surface waters, living or recently living forms dominate the
suspended load; exogenous particles are a relatively minor fraction of
the total mass (see Chapter 3). Because these particles are created de
novo, they must have acquired their Pb directly from surface waters.
Therefore, a good match between particulate and dissolved Pb composition
is not surprising in the euphotic zone (upper 100m). Deeper in the water
column, particle sources are more complex; some may be formed in situ,
but most are likely to have settled vertically or been horizontally
transported to their sampling location. Particles thus transported from
other water masses with distinct Pb isotopic composition must exchange Pb
with ambient seawater to acquire a matching isotopic signature. The
agreement between the particulate and dissolved profiles suggests that
115
suspended particles undergo complete isotopic exchange of Pb with the
surrounding seawater before they are removed from the water column. If,
however, suspended particles at all depths are supplied by the
disaggregation of surface-derived aggregates, then an alternative
scenario is possible. Since surface particles have low Pb contents (per
gram particles), suspended particles of recent surface origin would
approach isotopic equilibrium with ambient seawater by an essentially
unidirectional uptake. A better understanding of particle size-class
interactions and the origin of suspended particles is necessary to
discriminate the complete exchange versus one-way uptake scenarios.
The result is strengthened by the combined use of 20 6Pb/ 2 0 7Pb and
Pb/ 2 10Pb ratios. The Pb/ 2 10Pb ratio displays a larger surface/deep
signal, relative to measurement precision, than the 2 0 6Pb/ 2 0 7Pb. On the
basis of the 20 6Pb/ 2 0 7Pb ratio alone, it would not be possible to prove
that particles at 1000m were isotopically distinct from surface
particles. In addition, while the 2 0 6Pb/ 2 0 7Pb values observed in the
water column are very similar to the "background" pre-anthropogenic
values observed in bottom sediments1 4 , the water column Pb/ 2 10Pb ratios
are indicative of Pb which was introduced to the surface ocean within the
last few decades1 1 . Because surface 2 0 6Pb/ 2 0 7Pb is unlikely to fall below
the pre-gasoline Pb value of -1.185, while Pb/ 2 10Pb may continue to
decrease, this utility of the combined tracers for investigating water
column exchange processes is likely to continue for at least the next few
years.
116
4.4. DISCUSSION
Observations of recent anthropogenic Pb in surface sediments of the
deep ocean have demonstrated that Pb can be transported rapidly from
surface sources to the bottom 21 ,22, probably in the form of large,
rapidly-sinking aggregates 2 3. This result suggests that
large-particulate Pb does not equilibrate with dissolved Pb during its
descent. Using the present data and a simple model of particle
interactions in the water column, it is possible to predict the
composition of rapidly sinking Pb in the present and in the near future.
I adopt a model of particle interactions which arbitrarily divides
the particle size continuum into two size classes: small particles with
negligible sinking rates which dominate exchange with the dissolved pool
by virtue of their abundance and surface area, and large rapidly-sinking
aggregates originating in surface water which remove and regenerate the
small particle population through aggregation/disaggregation processes
occurring at all depths2 ,2 4 (see Chapter 3). The degree to which the Pb
isotopic composition of rapidly-sinking particles is modified from the
surface value depends on the rate of small particle removal and the
magnitude of the surface-derived Pb flux. Knowing the Pb content of
small suspended particles, it is possible to calculate the contribution
of their removal (the "repackaging flux") to the total Pb flux by
assuming a reasonable residence time for these particles, and comparing
the resultant calculated flux with the actual total flux measured with
deep ocean sediment traps.
The results of such a calculation for Pb and for 2 10 Pb are presented
in Table 4.1. Small particle residence time is calculated using
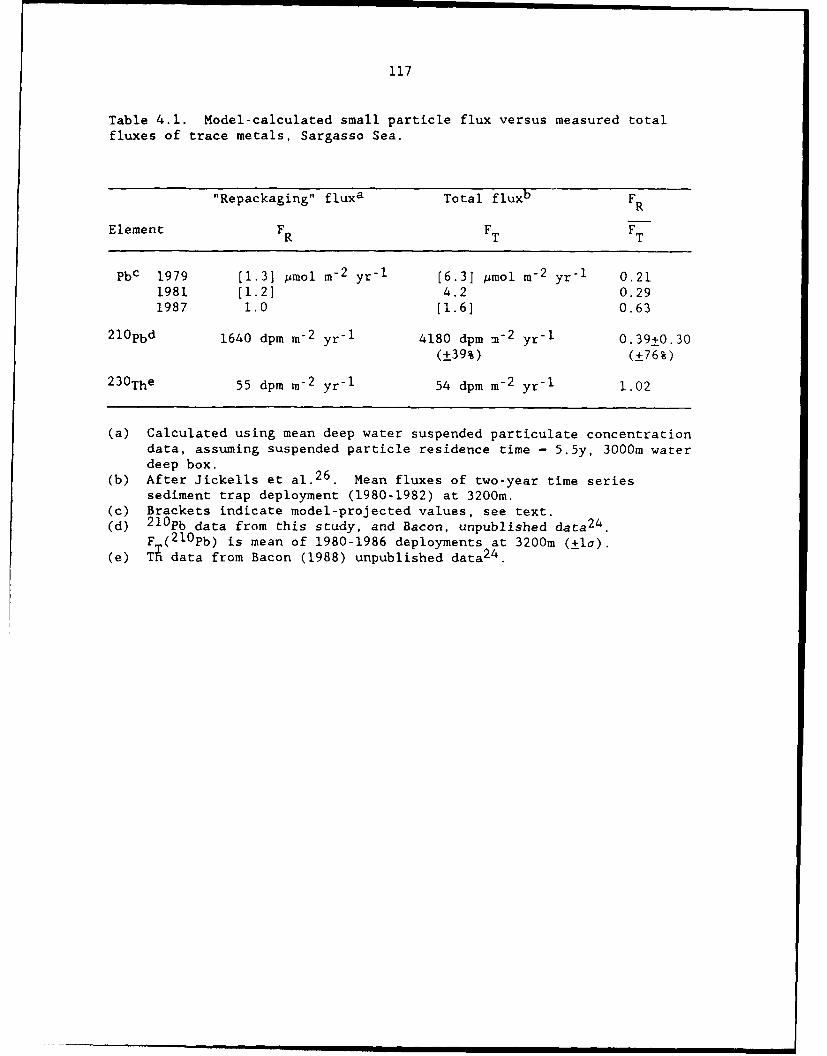
117
Table 4.1. Model-calculated small particle flux versus measured totalfluxes of trace metals, Sargasso Sea.
"Repackaging" fluxa Total fluxb FR
Element FR FT FT
Pbc 1979 [1.31 pmol m-2 yr "I [6.3] pmol m-2 yr "1 0.211981 [1.21 4.2 0.291987 1.0 [1.6] 0.63
21Opbd 1640 dpm m-2 yr "I 4180 dpm -n-2 yr'1 0.39+0.30
(±39%) (±76%)
2 30The 55 dpm m -2 yr -1 54 dpm m-2 yr -1 1.02
(a) Calculated using mean deep water suspended particulate concentrationdata, assuming suspended particle residence time - 5.5y, 3000m waterdeep box.
(b) After Jickells et al. 2 6 . Mean fluxes of two-year time seriessediment trap deployment (1980-1982) at 3200m.
(c) Brackets indicate model-projected values, see text.(d) 2 1 0Pb data from this study, and Bacon, unpublished data2 4 .
F (2 1 0Pb) is mean of 1980-1986 deployments at 3200m (±ia).(e) A data from Bacon (1988) unpublished data 24 .
118
suspended and trapped 2 3 0Th data for the same region. It is assumed that
the flux of 2 3 0Th, which has no independent surface source, is totally
controlled by removal of the suspended particles. Results indicate that
small particle "repackaging" processes which account for 100% of 2 30 Th
removal only contribute 30+20% of the Pb (in 1981) and 39+34% of the
2 1 0Pb sinking through the deep water. Thus most of the Pb and 2 10 Pb in
rapidly-sinking particles must originate at the surface, and the isotopic
composition of this material cannot be greatly shifted from the surface
value; certainly it cannot equal the deep suspended particulate value.
The history of Pb inputs to Bermuda waters suggests that sinking
particulate Pb isotopic composition has been cominated by surface input
ratios for at least the last 30 years I0 .
Because of the continuing reduction in anthropogenic Pb input since
the trap measurements were made, surface-derived Pb may cease to dominate
the deep ocean Pb flux in the near future. If yearly average
surface-derived Pb flux is dependent on the dissolved Pb concentration in
surface waters (normalized to 2 10 Pb to eliminate short-term source
strength variability), then we expect a decrease of 50% from 1979 to
198413, and half again by 198715. The repackaging flux has probably been
much less variable; if it is proportional to the total sub-surface Pb
inventory, then this component of the total flux has probably decreased
by <30% over the same period1 3. Thus the ratio of surface- versus
deep-derived Pb flux ([FT-FRI/FR) may have diminished from -4 in 1979 to
0.6 in 1987 (Table 4.1). If surface concentrations continue to decrease
as use of leaded gasoline ceases in the U.S., Pb derived from surface
waters may become a minor portion of total deep ocean flux until the deep
119
water Pb inventory has diminished to a new steady-state. During this
period, lead isotopic composition of sinking particles would be expected
to resemble values observed in deep water suspended (and dissolved) Pb.
Recently obtained 2 10Pb flux data from deep waters near Bermuda
display substantial variability on sub-annual and interannual time
scales, but are in reasonable agreement with the model overall.
Time-series sediment trap measurements in mid- and deep-water (trap
deployments by W. Deuser, 2 10Pb analyses by M. Bacon) indicate that 210Pb
flux at 1500m averaged 63±18%(Ia) of 3200m flux over the period May, 1984
to July, 1986 (n-9, two anomalously high ratios rejected), even though
average mass flux was equal at the two depths2 5 . Assuming this gradient
to be constant with depth, and extrapolating the flux difference to a
3000m-deep water column, suggests that the flux increase due to deep
ocean scavenging processes accounts for 65% ([100%-63%] x [3000m/1700m)
of the total 2 1 0Pb flux at 3200m. This is in the upper range of (FR/FT)
predicted by the model. In light of the large variability in 3200m 2 10Pb
flux from 1980-1986 (RSD of yearly means of FT - 39%, Table 4.1), it is
unclear whether the 1984-1986 1500m/3200m flux ratio can be considered a
long-term mean for the Bermuda station.
The variability of sinking particle composition is further
illustrated by combined Pb and 2 10Pb measurements. The Pb/ 2 1OPb ratio
in trapped particles at 3200m varied between values higher than 1979
surface water and lower than 1984 deep water (2000m) over the period
1980-82, with no apparent dependence on mass flux (mean-970±560 [Ia]
pmol/dpm2 4 ,2 5 ,26 ). The degree of interaction of the large-particle flux
with the standing stock of suspended particles may thus be highly
120
variable on seasonal or shorter time scales. This result indicates that
long-term observations of sinking particle composition might be required
to significantly test the model prediction that sinking particle Pb
isotopic composition should approch deep suspended composition over the
next few years to decades.
121
REFERENCES
1. Bacon, M.P. & Andersor, R.F. J. Geophys. Res. 87, 2045-2056 (1982).
2. Nozaki, Y., Yang, H.S. & Yamada, M. J. Geophys. Res. 92, 772-778
(1987).
3. Rama, Koide, M. and Goldberg, E.D. Science 134, 98 (1961).
4. Craig, H., Krishnaswami, S. and Somayajulu, B.L.K. Earth Planet
Sci. Lett. 17, 295-305 (1973).
5. Bacon, M.P., Spencer, D.W. & Brewer, P.G. Earth Planet. Sci. Lett.
32, 277-296 (1976).
6. Nozaki, Y., Thomson, J. & Turekian, K.K. Earth Planet. Sci. Lett. 32,
304-312 (1976).
7. Nozaki, Y., Turekian, K.K. & von Damm, K. Earth Planet. Sci. Lett.
49, 393-400 (1980).
8. Moore, W.S. & Sackett, W.M. J. Geophys. Res. 69, 5401-5405 (1964).
9. Anderson, R.F., Bacon, M.P. & Brewer, P.G. Earth Planet. Sci. Lett.
62, 7-23 (1983).
10. Shen, G.T. & Boyle, E.A. Earth Planet Sci. Lett. 82, 289-304 (1987).
11. Shen, G.T. & Boyle, E.A. J. Geophys. Res. 93, 15, 715-15,732 (1988).
12. Settle, D.M., & Patterson, C.C. J. Geophys. Res. 87, 8857-8869(1982).
13. Boyle, E.A., Chapnick, S.D. & Shen, G.T. J. Geophys. Res. 91,8573-8593, (1986).
14. Hamelin, B., Grousset, F. & Sholkovitz, E.R., Geochim. Cosmochim.
Acta, submitted (1989).
15. Boyle, E.A. Unpublished data (1989).
16. Schaule, B.K. and Patterson, C.C. Earth Planet. Sci. Lett. 54, 97-116
(1981).
17. Fleer, A.P. & Bacon, M.P. Nuclear Instr. Meth. Phys. Res. 223,
243-249 (1984).
18. Buat-Menard, P. & Chesselet, R. Earth Planet Sci. Lett. 42, 399-411
(1979).
19. Taylor, S.R. Geochim. Cosmochim. Acta 28, 1273-1285 (1964).
122
20. Jickells, T.D.. Church, T.M. & Deuser, W.G. Global Biogeochem. Cycles1, 117-130 (1987).
21. Hamlin, B., Shen, G.T. & Sholkovitz, E.R. EOS, 68, 1319 (1987).
22. Veron, A., Lambert, C.E., Isley, A. Linet, P. & Grousset, F. Nature326, 278-280 (1987).
23. Fowler, S.W. & Knauer, G.A. Prog. Oceanog. 16, 147-194, (1986).
23. Bacon, M.P., Huh, C.A., Fleer, A.P. & Deuser, W.G. Deep-Sea Res. 32,273-286 (1985).
25. Bacon, M.P. & Deuser, W.C. person. comm. (1989).
26. Jickells, T.D. Deuser, W.G. & Knap, A.H. Deep-Sea Res. 31, 1169-1178,(1984).
123
CHAPTER 5
PARTITIONING OF TRACE METALS ON OCEANIC SUSPENDED MATTER: EVIDENCE FROM
THE SARGASSO SEA AND THE NORTHEAST PACIFIC
5.1. INTRODUCTION
Oceanic scavenging of trace metals depends on two fundamental
variables: partitioning of metals between particles and solution, and the
removal rate of the particles. Neither of these processes is easily
quantified in the open ocean water column. Sediment traps can be used to
estimate the vertical flux of material at any depth, but the origin of
this material is difficult to determine. Near-bottom particle fluxes may
be more closely related to variable productivity in surface waters than
to the removal rate of suspended particles in the sub-surface water
column (Deuser et al., 1981; Deuser, 1986; Billet, et al., 1983).
Partitioning of metals between dissolved and suspended phases is also
difficult to determine: particulate metal concentrations in the open
ocean are low, making sample collection difficult and
contamination-prone. Determining the controls on the magnitude of these
two processes is central to understanding how particles influence metal
concentration and distribution in the ocean. The purpose of this study
was to investigate the latter problem, the magnitude and variability of
seawater/particle partitioning of metals in the open ocean. Here I
present vertical profiles of suspended particulate trace metals at two
oceanographically distinct locations, the northeast Pacific and the
Sargasso Sea.
124
Many investigators have suggested that the major process by which
metals become associated with oceanic particles is by adsorption on
particle surfaces (Goldberg, 1954; Craig, 1974; Lal, 1977; Turekian,
1977; Whitfield and Turner, 1987). Aquatic surface chemists have
endeavored to attain a predictive understanding of metal partitioning
based on the fundamental chemical properties of each individual element
and on a knowledge of the imlortant functional groups on the particle
surface. To this end, scavenging behavior is modeled as a surface
complexation process, and correlations are sought between observed
partition coefficients and an intrinsic chemical property, such as the
first hydrolysis constant of the free cation (Schindler, 1975;
Balistrieri et al., 1981). The partition coefficients used in these
studies have, in most cases, been determined in laboratory uptake
experiments on simple pure phase surfaces, mostly mineral oxides (Murray,
1975; Benjamin and Leckie, 1980). The relationship between the partition
coefficient and the intrinsic chemical property can be compared to
observations in natural systems to characterize the surfaces of natural
particles with respect to their metal affinity. On this basis, several
authors have suggested that ubiquitous organic coatings may dominate the
surface chemistry of suspended particles, and that mineral oxides, for
example, are less important adsorbers (Balistrieri et al., 1981; Hunter,
1983). In general, however, the use of surface complexation models and
data from pure phase adsorption experiments to distinguish between
possible suefaces responsible for oceanic scavenging has produced
equivocal results (Whitfield and Turnfr, 1987).
125
Recently, marine geochemists have studied metal uptake by measuring
uptake of radiotracers onto several natural particle types, in an effort
to relate adsorption behavior on heterogeneous particles to that observed
on well-defined surfaces (Li et al., 1984; Nyffeler et al., 1984). These
experiments allow "equilibrium" distribution coefficients to be
determined for the sediment types investigated, and enable the kinetics
of adsorption and desorption to be modeled. The validity of
extrapolating the magnitude and mechanism of uptake measured in the
laboratory to real oceanic environments remains open to question,
however. Among the reasons for this are (1) the particle types used,
usually sediment trap or bottom sediments (Li et al., 1984; Nyffeler et
al., 1984), may not be the particles responsible for exchange with
dissolved metals in the real system, (2) the particle concentrations used
are frequently several orders of magnitude higher than exist in the deep
ocean, and (3) time scales of reaction are shorter in laboratory
experiments than those in the open ocean. Some of these concerns are now
beginning to be addressed (Jannasch et al., 1988).
In order to understand metal scavenging in natural systems, it is
necessary to determine whether processes which appear to control metal
partitioning under artificial conditions could explain the magnitude and
variability of partition coefficients observed in the field.
The link between experiment, theory, and observation would be
strengthened by a greater understanding of metal association with oceanic
suspended matter. This material, in contrast to the rapidly-sinking
material collected in a sediment trap, comprises the bulk of the standing
stock of mass and surface area, and is therefore most likely to dominate
126
interaction with dissolved metals. While some information exists on the
dissolved/particulate partitioning of Th isotopes (Bacon and Anderson,
1982), Pu, (Cochran et al., 1987), and relatively major constituent
metals in marine particles (e.g. Fe, Mn; Landing and Bruland, 1987,
Bishop and Fleisher, 1987; Ba, Collier and Edmond, 1984), current
knowledge of trace metal distribution coefficients in the oceanic water
column is limited. Measurements of filtered and unfiltered water samples
provide estimates of dissolved versus "total dissolvable" metals, and
indicate that suspended particulate metals (0.4 pm filter) generally
comprise <10% of dissolved metal. However, a much more accurate
measurement of both particulate metal concentration and particle mass
concentration is necessary for accurate determination of partition
coefficients. Little is known, therefore, of how dissolved/particulate
partitioning varies with depth, particle concentration, bulk particle
composition, dissolved metal concentration, or oceanographic regime.
Moreover, the importance of processes other than adsorption (e.g ion
exchange, (co-)precipitation, incorporation in refractory mineral phases,
or active biological uptake) in determining observed distribution
coefficients is not well understood.
To begin to address this problem, I present a depth profile of
suspended particulate Mn, Co, Cu, Zn, Ni, Cd and Pb in the northeast
Pacific, and compare these results with particulate metal distributions
observed previously in the Sargasso Sea (Chapter 3). The particulate
metal concentrations are of similar magnitude at the two stations, and
the relative partitioning of these metals onto marine particles is
consistent in a broad sense with the results of laboratory sorption
127
experiments and surface chemical scavenging models. However, the
absolute magnitude of the particulate metal concentrations, and the
differences (< I order of magnitude) in partitioning between the two
stations are difficult to reconcile with simple surface chemical models.
The results suggest that bulk particle composition and/or biological
activity may be important in determining metal partitioning both in
surface and sub-rurface waters.
5.2. SAMPLING AND ANALYSIS
Samples were collected in the Sargasso Sea near Bermuda, and in the
northeast Pacific. Collection and analysis of the Sargasso Sea samples,
obtained during five station occupations from September, 1986 to April,
1988, has been described previously (Chapter 3). The northeast Pacific
samples were collected by in situ pumping over the period June 4-12, 1988
at 41000'N, 127 030'W, on Atlantis II/ALVIN cruise 118/35. The station is
located over the southern Escanaba Trough, a portion of the Gorda Ridge
system, about 300km off the northern California coast (Fig. 5.1).
Samples of <53um suspended particulate matter were collected and
analyzed for Al, Fe, Mn, Co, Cu, Zn, Ni, Cd, Pb and P by techniques
described previously (Chapters 2 and 3). Profiles of in situ temperature
were determined using reversing thermometers, and salinity. nhosphate,
silicate and dissolved oxygen were determined by standard techniques.
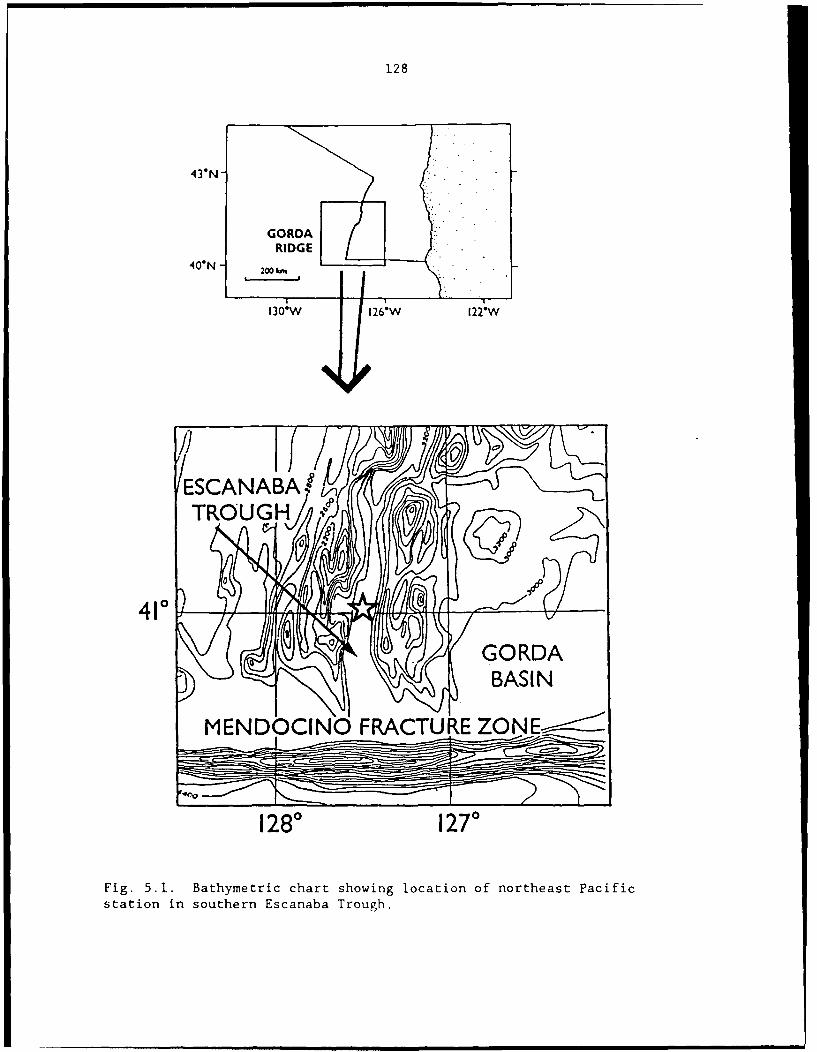
128
434N
GORDARIDGE
40*N - 20 m
130*W 126.W 122*W
/ESCANABATROUGHJ
410
MENDOCINO FRACTURE ZONE~
1280 127 0
Fig. 5.1. Bathymetric chart showing location of northeast Pacificstation in southern Escanaba Trough.
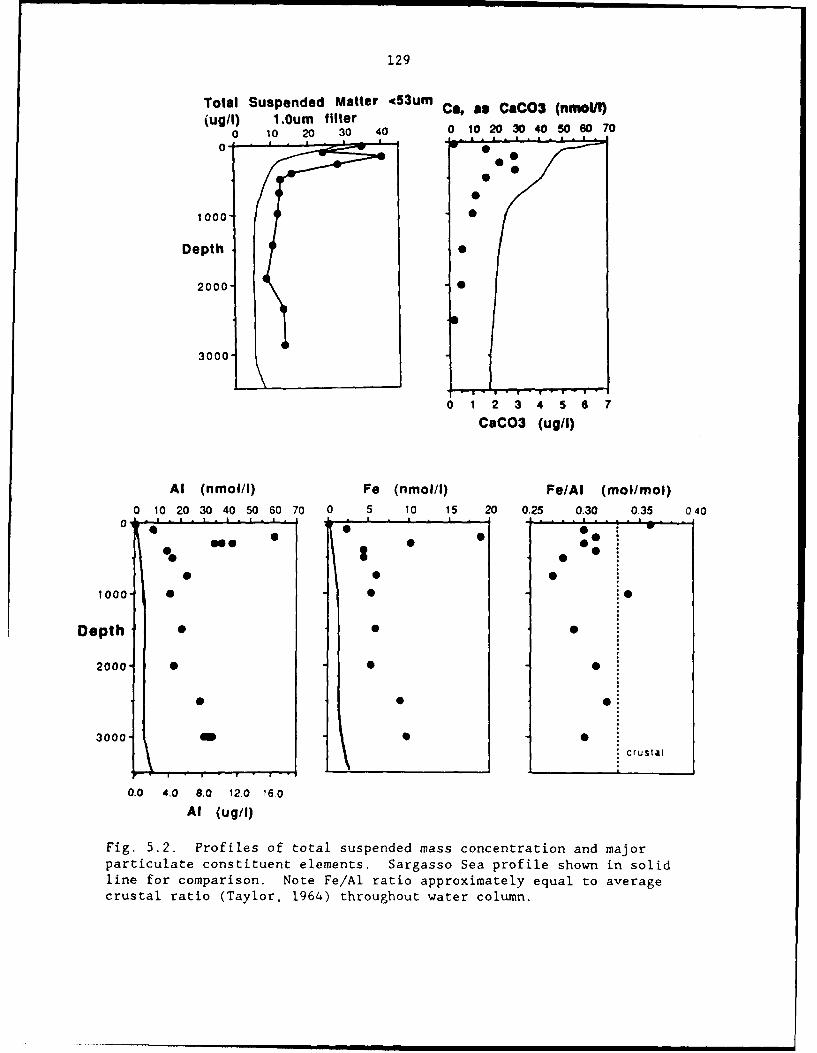
129
Total Suspended Matter .53urn Ca, as COC03 (nmol/)(ug/) 1.Oum filter
0 10 20 30 40 0 10 20 30 40 50 60 70
a-
10000
Depth -
2000 -
3000j
0 1 2 3 4 5 6 7
CaCO3 (ug/I)
Al (nmol/I) Fe (nmol/I) Fe/Al (mol/mol)
0 10 20 30 40 50 60 70 0 5 10 15 20 0.25 0.30 0.35 040. . .. 0' . . 0 ' , . . . .1. . .
0 80
0 @0
1000- 0 0
Depth 0 0
2000" 0 0
3000 m S St erosti,
0.0 4.0 8.0 12.0 16.0
Al (ug/1)
Fig. 5.2. Profiles of total suspended mass concentration and majorparticulate constituent elements. Sargasso Sea profile shown in solidline for comparison. Note Fe/Al ratio approximately equal to averagecrustal ratio (Taylor, 1964) throughout water column.
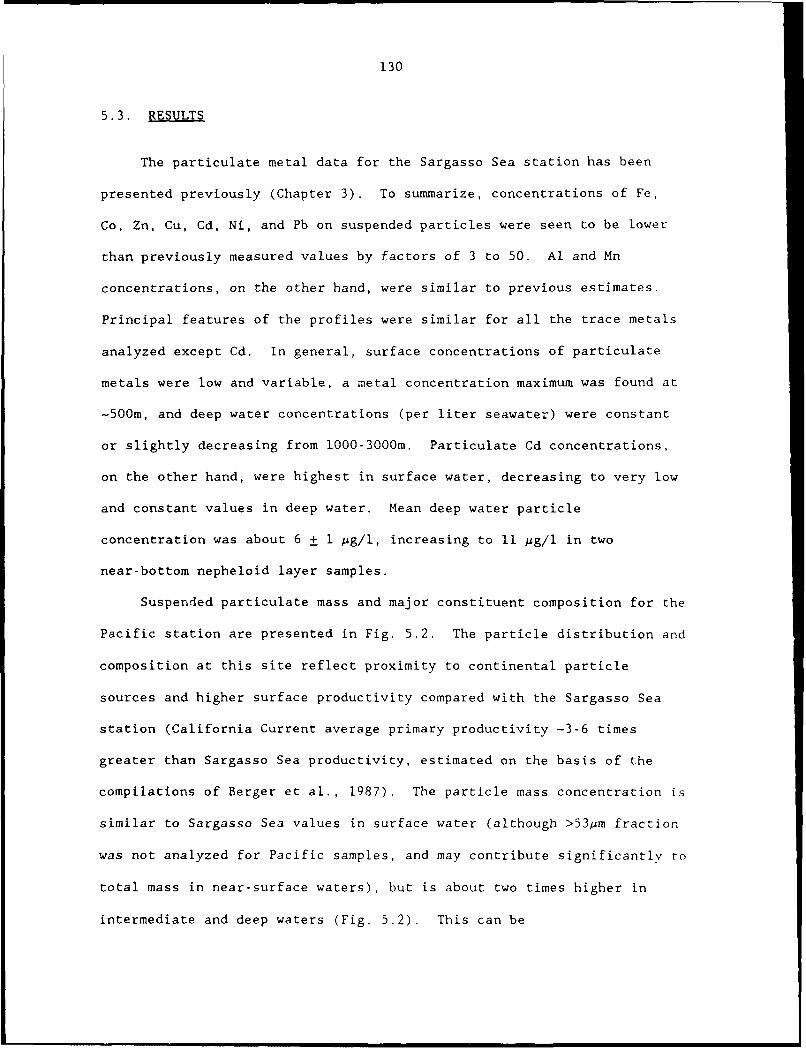
130
5.3. RESULTS
The particulate metal data for the Sargasso Sea station has been
presented previously (Chapter 3). To summarize, concentrations of Fe,
Co, Zn, Cu, Cd, Ni, and Pb on suspended particles were seen to be lower
than previously measured values by factors of 3 to 50. Al and Mn
concentrations, on the other hand, were similar to previous estimates.
Principal features of the profiles were similar for all the trace metals
analyzed except Cd. In general, surface concentrations of particulate
metals were low and variable, a metal concentration maximum was found at
-500m, and deep water concentrations (per liter seawater) were constant
or slightly decreasing from 1000-3000m. Particulate Cd concentrations,
on the other hand, were highest in surface water, decreasing to very low
and constant values in deep water. Mean deep water particle
concentration was about 6 + i pg/l, increasing to 11 Mg/l in two
near-bottom nepheloid layer samples.
Suspended particulate mass and major constituent composition for the
Pacific station are presented in Fig. 5.2. The particle distribution and
composition at this site reflect proximity to continental particle
sources and higher surface productivity compared with the Sargasso Sea
station (California Current average primary productivity -3-6 times
greater than Sargasso Sea productivity, estimated on the basis of the
compilations of Berger et al., 1987). The particle mass concentration is
similar to Sargasso Sea values in surface water (although >53pm fraction
was not analyzed for Pacific samples, and may contribute significantly to
total mass in near-surface waters), but is about two times higher in
intermediate and deep waters (Fig. 5.2). This can be
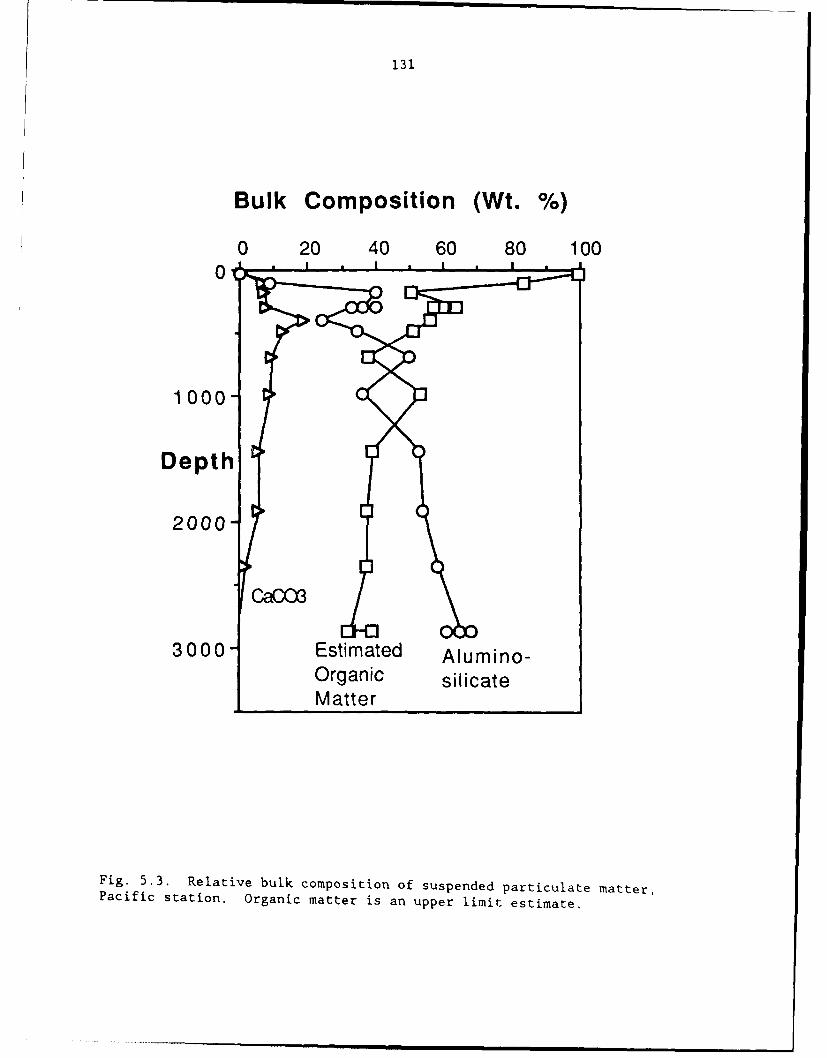
131
Bulk Composition (Wt. %)
0 20 40 60 80 1000%
1000-
2000-
0a003
3000- Estimated Alumino-Organic silicateMatter
Fig. 5.3. Relative bulk composition of suspended particulate matter,Pacific station. Organic matter is an upper limit estimate.
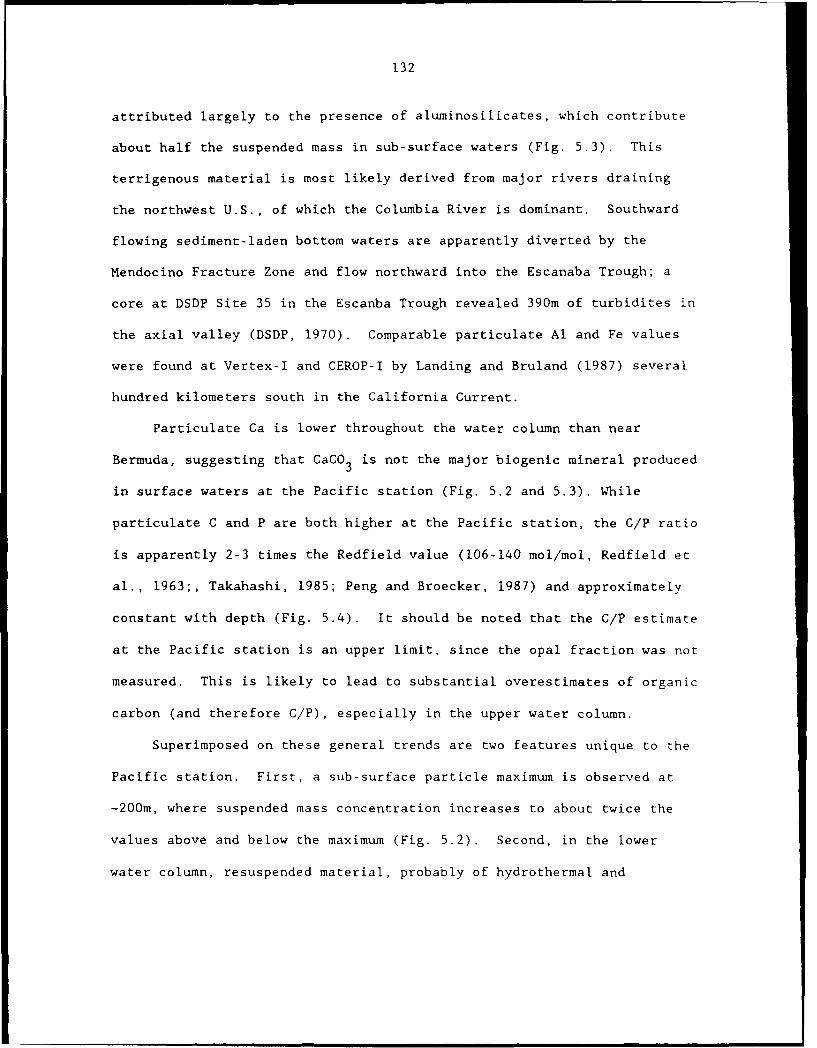
132
attributed largely to the presence of aluminosilicates, which contribute
about half the suspended mass in sub-surface waters (Fig. 5.3). This
terrigenous material is most likely derived from major rivers draining
the northwest U.S., of which the Columbia River is dominant. Southward
flowing sediment-laden bottom waters are apparently diverted by the
Mendocino Fracture Zone and flow northward into the Escanaba Trough; a
core at DSDP Site 35 in the Escanba Trough revealed 390m of turbidites in
the axial valley (DSDP, 1970). Comparable particulate Al and Fe values
were found at Vertex-I and CEROP-I by Landing and Bruland (1987) several
hundred kilometers south in the California Current.
Particulate Ca is lower throughout the water column than near
Bermuda, suggesting that CaCO 3 is not the major biogenic mineral produced
in surface waters at the Pacific station (Fig. 5.2 and 5.3). While
particulate C and P are both higher at the Pacific station, the C/P ratio
is apparently 2-3 times the Redfield value (106-140 mol/mol, Redfield et
al., 1963;, Takahashi, 1985; Peng and Broecker, 1987) and approximately
constant with depth (Fig. 5.4). It should be noted that the C/P estimate
at the Pacific station is an upper limit, since the opal fraction was not
measured. This is likely to lead to substantial overestimates of organic
carbon (and therefore C/P), especially in the upper water column.
Superimposed on these general trends are two features unique to the
Pacific station. First, a sub-surface particle maximum is observed at
-200m, where suspended mass concentration increases to about twice the
values above and below the maximum (Fig. 5.2). Second, in the lower
water column, resuspended material, probably of hydrothermal and
133
Est. organic C (nmol/l) P (nmol/l)
0 500 1000 1500 0 1 2 3 4
0 - -...t A I * #-- # I
O 0 0
*01000 0 0
Depth * 0
2000-1* 0
* 0
3000
. I
0 6 12 18 24 30 36
Est. organic matter (ugI)
Est. organic C/P
0 100 200 300 400 500
0 L
0.
1000
Depth -
2000
3000
Fig. 5.4. Particulate organic carbon (estimated), phosphorus (measured),
and organic C/P ratio (upper limit estimate).
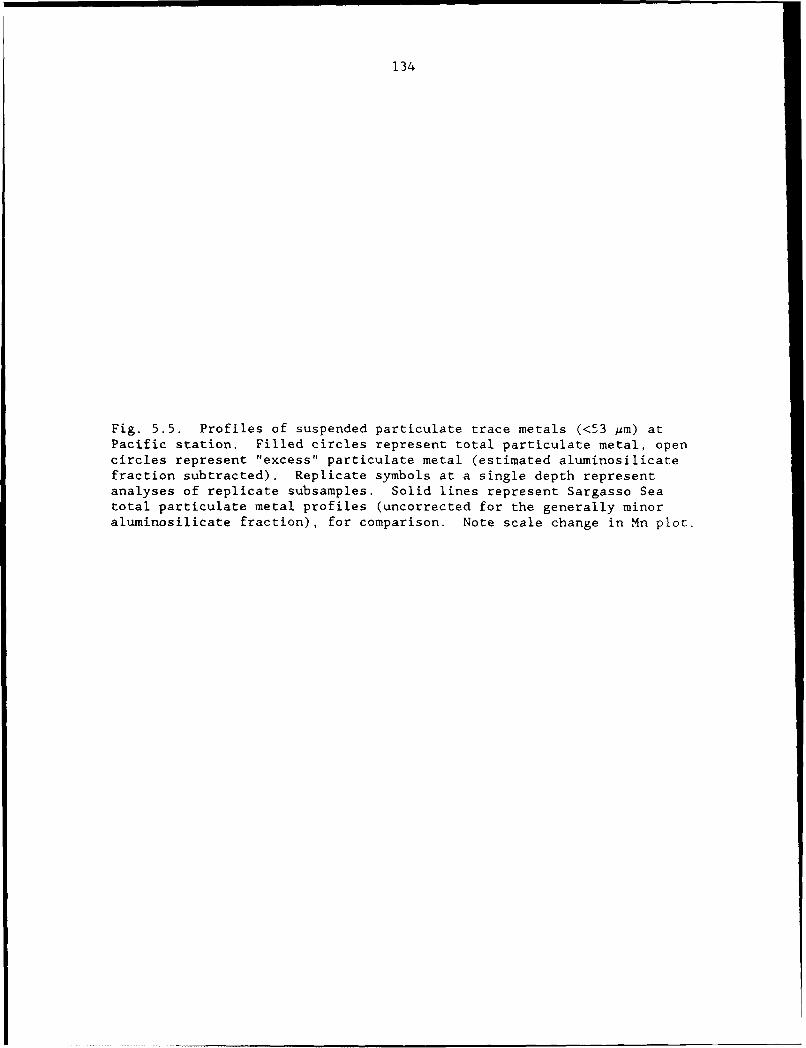
134
Fig. 5.5. Profiles of suspended particulate trace metals (<53 pm) atPacific station. Filled circles represent total particulate metal, opencircles represent "excess" particulate metal (estimated aluninosilicatefraction subtracted). Replicate symbols at a single depth representanalyses of replicate subsamples. Solid lines represent Sargasso Seatotal particulate metal profiles (uncorrected for the generally minoraluminosilicate fraction), for comparison. Note scale change in Mn plot.
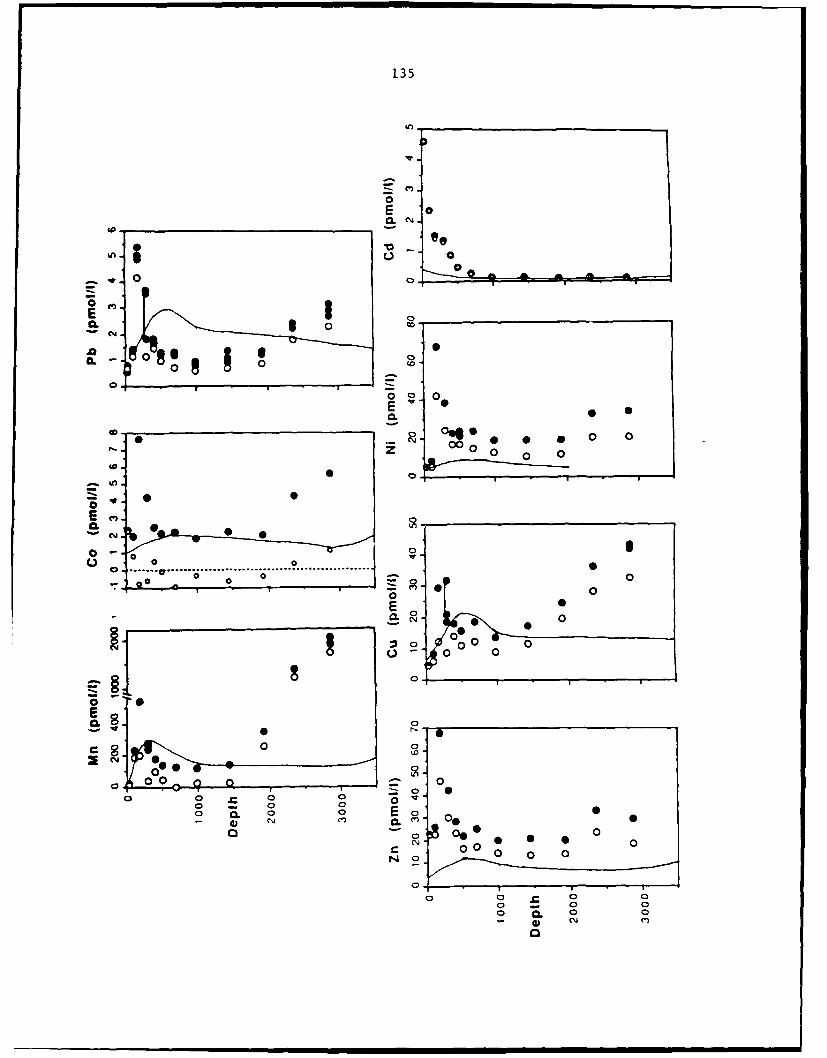
135
0CL a
00
(00
so 0
0.0
0 ____ ___e
CL
C, 71 0 00. 0
C.)0 0
0~0 0
0
c.00 0
C.0 0
o 0
o Y 00
000
o 0*0 00 0 0
o0 0
0.0
o - 0
0
136
continental origin, influences particulate metal distributions below
1500m.
Depth profiles for particulate Mn, Co, Cu, Zn, Ni, Cd and Pb are
shown in Fig. 5.5, with Sargasso Sea profiles represented by solid lines
for comparison. In general, concentrations are similar at the two
stations. Intermediate water values (1500m) generally differ by a factor
of two or less, the total particulate metal concentration being higher in
the Pacific station for Cu, Zn, and Ni, about the same for Cd and Co, and
lower for Mn and Pb. Surface waters at the two stations have similar
suspended mass concentrations, and similar concentrations of particulate
Mn, Cu, Ni and Pb. Surface concentrations of particulate Zn and Cd are
higher at the Pacific site by factors of 5 and 10, respectively.
In the following discussion, I will briefly address the possible
sources of the sub-surface particle maximum and the lower water column
increases in metal concentration observed at the Pacific station. Next,
I will focus cn particulate metal concentrations in intermediate waters
at the Atlantic and Pacific stations and their relation to dissolved
metal distributions. Finally, biological control of particulate metal
concentrations in surface waters at the two stations will be addressed.
The overall conclusion is that metal partitioning in the open ocean
varies from one location to another in response to variables which are
outside the predictive capability of simple surface chemical models.
5.4. DISCUSSION
5.4.1. Sources of sub-surface and near-bottom particulate metal
maxima at the northeast Pacific station.
137
The sub-surface particle maximum at the Pacific station is evident
in all metal profiles except Cd (Fig. 5.5). Normalizing the metal
concentration to particle mass, however, reveals that for most of these
elements the metal content of particles in the maximum does not fall
significantly off the trend defined by samples above ard below the
maximum (Fig. 5.6). Exceptions are the Al and Fe contcnt, which are
about 2 times higher in the maximum than expected from the trend (not
plotted), and Cd, which falls low of the trend defined by the shallowest
samples and the >400m samples bracketing the particle maximum.
These observations do not immediately point to a source for the
particle maximum. Lerman et al. (1974) have suggested a mechanism
whereby particle maxima can be caused by a rapid decrease in average
particle sinking speed as particles disaggregate and dissolve.
Subsequent elimination of particles below the maximum is hypothesized to
occur when particles re-aggregate, possibly through the activities of
zooplankton. Such variations in particle dynamics are difficult to
observe, however, and this hypothesis has not been verified. It is more
likely that the sub-surface particle maximum is the result of horizontal
advection of resuspended matter from the shelf/slope region.
Transmissometer studies have demonstrated the presence of nepheloid
layers created at the shelf/slope break off the coast of Washington,
which are laterally advected as much as 100km offshore (Pak et al.,
1980). These features have not been observed as far from the coast as
our station. However, recent satellite observations of large filaments or
jets of coastal water extending hundreds of kilometers into the
California Current suggest a mechanism by which particles of coastal
138
Fig. 5.6. Profiles of suspended particulate metals (total, <53 Am),expressed per gram dry weight of suspended material for Pacific station
(filled circles) and Sargasso Sea station (open circles).
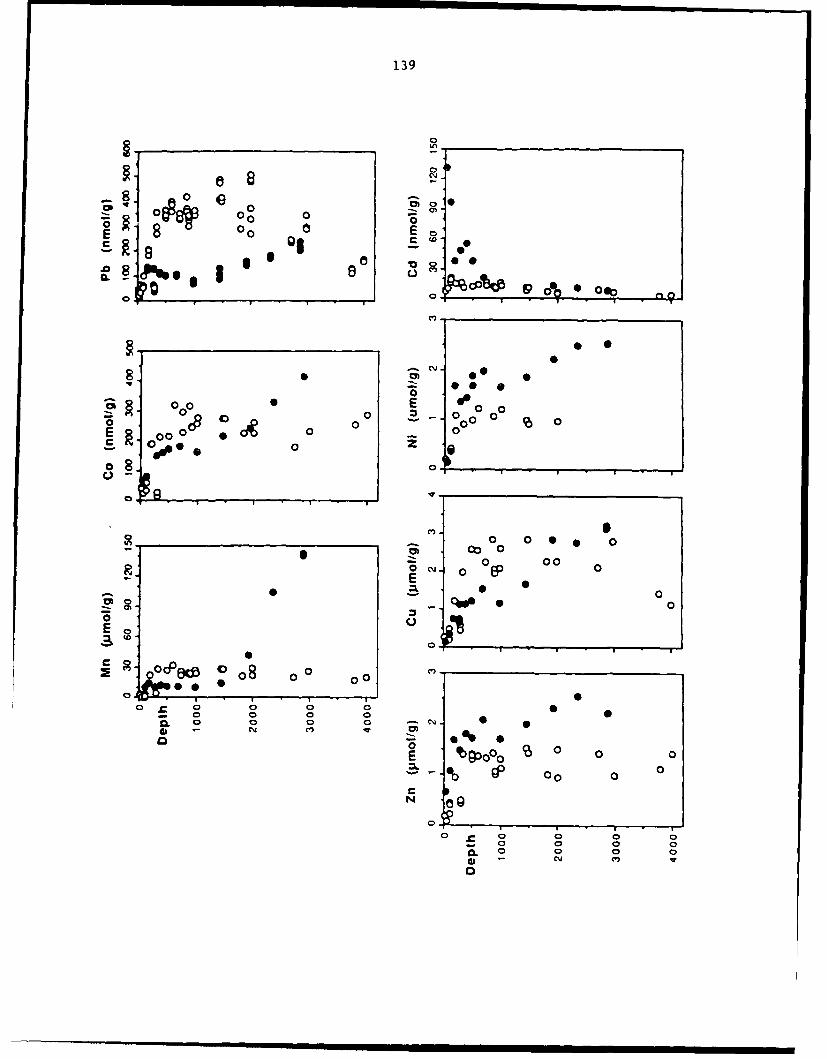
139
0 000
0 0 0~
q 0 o o8 0
E 0 0
0 D8 0O00 0 ooo0 0 0 0Q 0 0 0 0
o0 0 C 0 0
00 0
0 00 000o og
"- 0 O S0
0 0E 3 0 oo____0,_0 °
_ZS
• S' o o o
0 **• 0
M-- % Gp 0 0 0
N CLoC
0
-- m0l 0 0l nlu l mn 0I I 0
140
origin could be transported over this distance (Mooers and Robinson,
1984; Flament et al., 1985). The enrichment in detrital minerals
(evidenced by increased Al and Fe) at the particle maximum is consistent
with this explanation. A transect of stations demonstrating continuity
of the feature from the shelf to our station would be necessary to prove
this hypothesis.
In the lower water column, concentrations of particulate Mn, Co, Cu
and Pb increase with depth, and parti-alate Zn and Ni increase slightly,
while particulate mass increases only -50% in the bottom two samples
(Fig. 5.5). This feature is most evident in the Mn profile, where total
Mn content increases by an order of magnitude from 1500m to 3000m, to a
maximum of about 0.8 wt.% Mn. Evidence of past and present hydrothermal
activity within the axial valley at this location were observed by ALVIN
personnel on this cruise (Campbell et al., 1988). The metal enrichments
probably do not reflect the presence of hydrothermal plume particles of
recent origin because, (1) previously observed hydrothermal plumes (e.g.
TAG, Mid-Atlantic Ridge, 26°N, Nelson et al., 1986; Chapter 6) rise to
discrete depth zones of neutral buoyancy and spread horizonally; limited
vertical mixing confines the plume to a vertical thickness of a few
hundred meters within tens of kilometers of the source (Klinkhammer et
al., 1986; Trocine and Trefry, 1988), and (2) vent fluids observed in
this section of the southern Escanaba Trough were in fact depleted in Mn
relative to previously sampled hydrothermal fluids, and no "black
smokers" were observed (Campbell et al., 1988). Although this does not
rule out active plume sources from elsewhere on the ridge system (Baker
et al., 1987) it is more likely that the increase in particulate Mn is
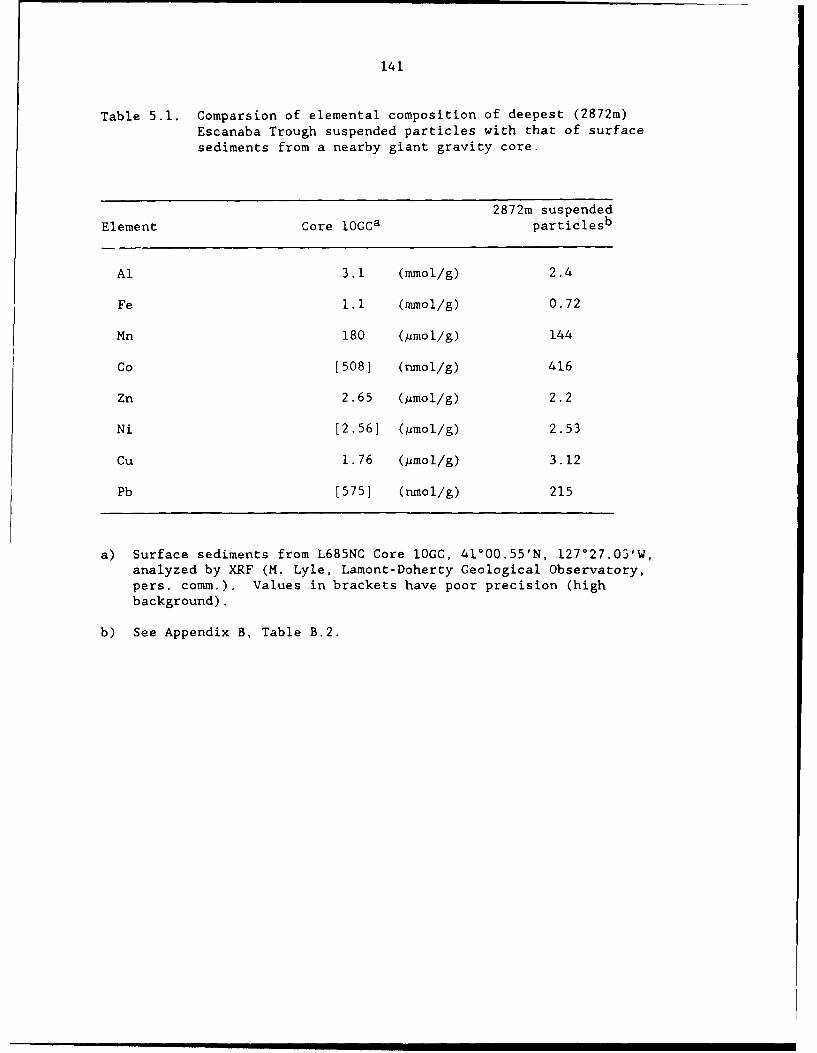
141
Table 5.1. Comparsion of elemental composition of deepest (2872m)
Escanaba Trough suspended particles with that of surfacesediments from a nearby giant gravity core.
2872m suspendedElement Core 1OGCa particlesb
Al 3.1 (mmol/g) 2.4
Fe 1.1 (mmol/g) 0.72
Mn 180 (pmol/g) 144
Co [508] (nnmol/g) 416
Zn 2.65 (pmol/g) 2.2
Ni [2.56] (gmol/g) 2.53
Cu 1.76 (wmol/g) 3.12
Pb [575] (nmol/g) 215
a) Surface sediments from L685NC Core 10GC, 41000.55'N, 127 027.03'W,analyzed by XRF (M. Lyle, Lamont-Doherty Geological Observatory,pers. comm.). Values in brackets have poor precision (highbackground).
b) See Appendix B, Table B.2.
142
caused by resuspension of sediments on the valley floor and on its walls,
which rise to a depth of -2300m about 10 km on either side of the
sampling station (Fig. 5.1). This is further demonstrated by a
comparison of the elemental composition of the deepest (2872m) suspended
particle sample with that of surface sediment from a nearby giant gravity
core (Table 5.1). Note that the suspended/surface sediment ratio is
0.75+0.10 for Al, Fe, Mn, Co and Zn. Ni concentrations are also of
similar magnitude, although the sediment value is imprecise (high
background on XRF). The Cu content of the suspended particles is
anomalous (75% higher than surface sediments), suggesting an additional
deep-scavenging source.
The degree of metal enrichment in the lower water column most likely
reflects the composition of hydrothermal sediments relative to that of
ambient deep water suspended particles (although metal contents of
surface sediments at this site are not well known) and, below 2000m, the
contribution from increased concentrations of aluminosilicate particles
(Fig. 5.2 and 5.3). In addition, there may be some contribution from
metals which are scavenged from the water column by the high-Mn
resuspended material (Trocine and Trefry, 1988).
5.4.2. Controls on metal partitioning in intermediate water in the
northeast Pacific and the Sargasso Sea
By comparing suspended particulate metal distributions in
intermediate waters at the Sargasso Sea and northeast Pacific stations we
can perform a simple test of the hypothesis that metal partitioning in
the ocean is controlled by adsorption on a single ubiquitous surface
143
type. If such a simple model were appropriate, we would expect to find
proportionality between the metal contents of particles and the
concentration of metals dissolved in the water in which the particles are
suspended. If no such relationship were found, other controls on oceanic
metal partitioning would be implied. Intermediate waters (500-1500m) are
chosen for this comparison because particles in this depth interval are
below the surface layer where it is expected that biological processes
dominate physio-chemical interactions, and above the influence of
resuspended material at the Pacific site.
Profiles of the metal content of suspended particles (expressed as
mol/g dry weight of <53 Am particulate matter) at the Pacific and
Atlantic stations are plotted in Fig. 5.6. It can be seen that the
concentrations of Zn, Ni, and Cd in the 500-1500m depth range are
approximately equal or slightly higher at the Pacific station. For each
of these metals, about half of the difference is due to the higher
concentration of aluminosilicates at the Pacific station. If we subtract
this portion (estimated from average crustal ratios [Taylor, 1964]) from
the total metal content on the assumption that the refractory mineral
fraction is not involved in interactions with the dissolved phase, the
Pacific/Atlantic ratios of particulate metal content become: Zn, 1.2; Ni,
1.4; Cd, 1.1. These differences are considerably smaller than the
corresponding ratios for dissolved metals: Zn, 5; Ni, 2; Cd, 3 (Bruland,
1980; Bruland and Franks, 1983)(Table 5.2 and Fig. 5.7). Thus the
particulate content of these three metals is remarkably constant at two
oceanographically distinct locations with large differences in dissolved
concentration. This suggests that processes other than surface
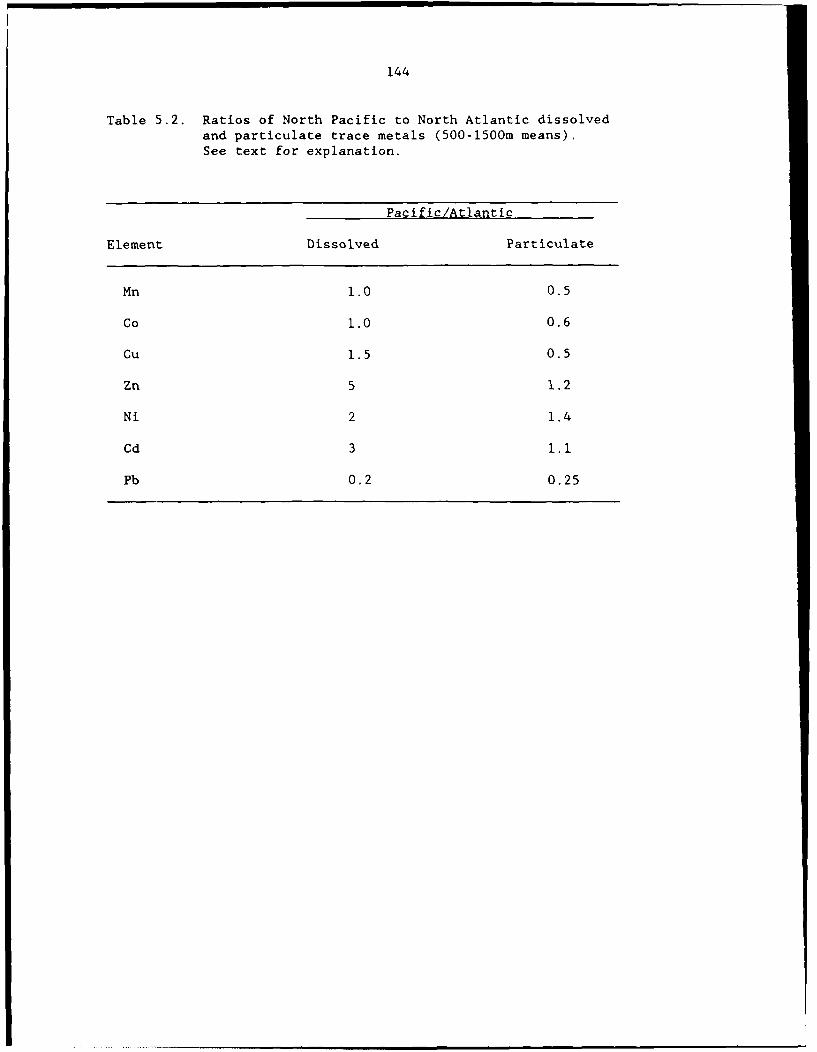
144
Table 5.2. Ratios of North Pacific to North Atlantic dissolvedand particulate trace metals (500-1500m means).See text for explanation.
Pacific/Atlantic
Element Dissolved Particulate
Mn 1.0 0.5
Co 1.0 0.6
Cu 1.5 0.5
Zn 5 1.2
Ni 2 1.4
Cd 3 1.1
Pb 0.2 0.25
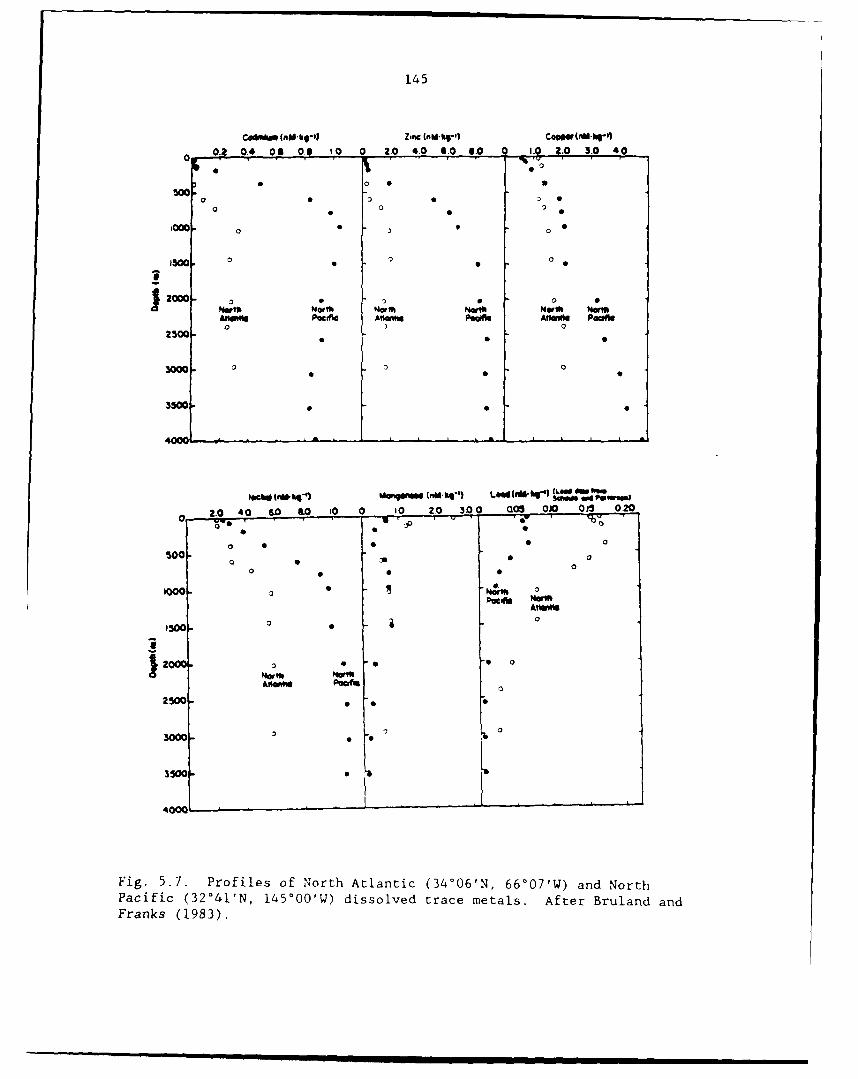
145
C~~ (nM-hq-' Zinc (rnm ,o CoW(nilbi-)
0.2 0.4 06 0.6 0 0 2.0 4.0 9.0 6.0 a 1.0 2.0 3.0 4.0
500 0 3 0 ,0
NrhNot Nort Nort North Nor
o 0 3* S0
4MOI.., 1.a Gm.e .L~ ..... .....
IM.cwtfl' l Mm ( '"MAIII LOW. 10-"W (LO d f',
0 2.0 40 &.0 &0 0 1 0 .0 30 0 0.( OJO 015 0.20
0.3 0
0 0 0 0 0
500 0 0
3 0 0 0
000 3 00• 0 0
Afte=
15OO 6.•
NMI"
sow - ,
400
Fig. 5.7. Profiles of North Atlantic (3406'N, 66°07'W) and NorthPacific (32°41'N, 145°00'W) dissolved trace metals. After Bruland and
Franks (1983).
' , m II I I I n ILl II i humi i i
146
adsorption control the dissolved/particulate partitioning for these
elements. The correlation of dissolved profiles of these elements with
those of major nutrient elements (Bruland, 1983) indicates that
biological processes might be more important. These results suggest that
the metal content of intermediate depth suspended particles is relatively
insensitive to rather different biological provenances in surface water.
In contrast to the above nutrient-type elements, the total
particulate content of Mn, Co, Cu, and Pb at 500-1500m is lower at the
Pacific station by factors of 2.0, 1.6, 2.0, and 4.0, respectively (Fig.
5.6, Table 5.2). The corrections for refractory fractions of particulate
Mn and Co at the Pacific station are large and are probably unreliable
overestimates (see negative "excess" Co values calulated using average
crustal ratios of Taylor, [1964), Fig. 5.5). A conservative correction
for refractory ratios (estimating 25% refractory Mn and Co) increases the
ratios to 3.0 for Mn and Co, 2.7 for Cu and 5.5 for Pb. The dissolved
concentrations of Mn, Co, and Cu are likely to be about the same, or even
somewhat higher in the Pacific (Fig. 5.7). It is known that the
Pacific/Atlantic ratio for dissolved Cu is approximately 1.5 in this
depth range (Bruland, 1980; Bruland and Franks, 1983). This inter-basin
comparison is more difficult to make for Mn and Co, however, because
dissolved profiles from the same Pacific station are not available and
must be estimated from other California Current stations. Such
extrapolations are uncertain because Mn and Co are short residence time
elements whose concentrations are strongly dependent on local sources.
The nearby stations of Martin, et al. (1985) and Knauer, et al., (1982)
suggest that dissolved Mn and Co concentrations are about 0.5 nmol/kg and
147
30 pmol/kg in intermediate waters of the Pacific station, about the same
as concentrations at the Sargasso Sea station (Jickells and Burton,
1988).
Thus the suspended particulate metal content of Mn, Co, and Cu is
several times lower at the Pacific site, despite similar or somewhat
higher dissolved concentrations (Table 5.2). The partitioning of these
metals therefore appears not to be controlled simply by proportionality
to dissolved concentrations. Of the metals considered here, only
particulate Pb displays a rough correlation to its dissolved
concentration at each station. This is consistent with the isotopic
equilibration of Pb observed at the Sargasso Sea station (Chapter 4). It
is important to note that this is based on 1984 dissolved Pb profiles in
the Sargasso Sea (Boyle et al., 1986) and at a more southerly California
Current Station (Vertex V, Martin et al., 1985). Concentrations in the
Sargasso Sea have probably decreased in the 3-4 years between these
measurements and the particulate metal profiles, because of the
continuing decrease in North American aerosol Pb input (Boyle et al.,
1986; Shen and Boyle, 1988). Pb concentrations at the Pacific station
may be influenced by Japanese sources, and temporal concentration trends
are not well established for this area.
The reason for the relatively low particulate Mn, Co, and Cu content
of the Pacific particles is not known. However, sufficient information
exists regarding the particulate distribution of Mn at other stations to
propose several hypotheses for this element. (I) Sources of dissolved Mn
to subsurface waters may be small, limiting the supply for oxidation to
particulate Mn. It was suggested in Chapter 3 that ventilation of the
148
thermocline with high-Mn surface water might provide a source of elevated
particulate Mn in intermediate waters. It is not known whether
ventilation sources are smaller at the Pacific site. (2) Particulate Mn
may be strongly influenced by the activity of Mn-oxidizing bacteria
(Cowen and Bruland, 1985). Although it has been suggested that metal
deposits associated with bacteria are a ubiquitous open ocean phenomenon
(Cowen and Silver, 1984), the abundance of these organisms at these two
stations is not known. (3) Mn oxidation may be hindered at low
dissolved oxygen levels. Landing and Bruland (1987) observed lower
ratios of weak acid-soluble to refractory Mn in the oxygen minimum zone
at Vertex-I (500-1500m) in the northeast Pacific, and suggested that
reduction of particulate Mn to soluble Mn(II) occurred in this interval.
This process may also be responsible for the observed low particulate Mn
at the California Current station, where dissolved 02 is less than 60 pM
throughout the intermediate waters (Fig. 5.8), compared to >150 pM at
Sargasso Sea 02 minimum. The relative importance of these mechanisms is
not known, nor can other possibilities be ruled out (for instance,
enhanced competition of dissolved ligands with particle surface for
dissolved metals; Davis and Leckie, 1978; Coale, 1988).
Despite the difficulty in reconciling this evidence with a simple
adsorption model, we can calculate distribution coefficients (Kd' mol
metal per gram particles/mol metal per gram seawater) for these seven
metals at the two stations in order to determine whether the absolute or
relative magnitude of partitioning in the ocean is related to
observations in laboratory experiments. This is demonstrated for four
different depths at each station: surface, thermocline [500m], mid-water
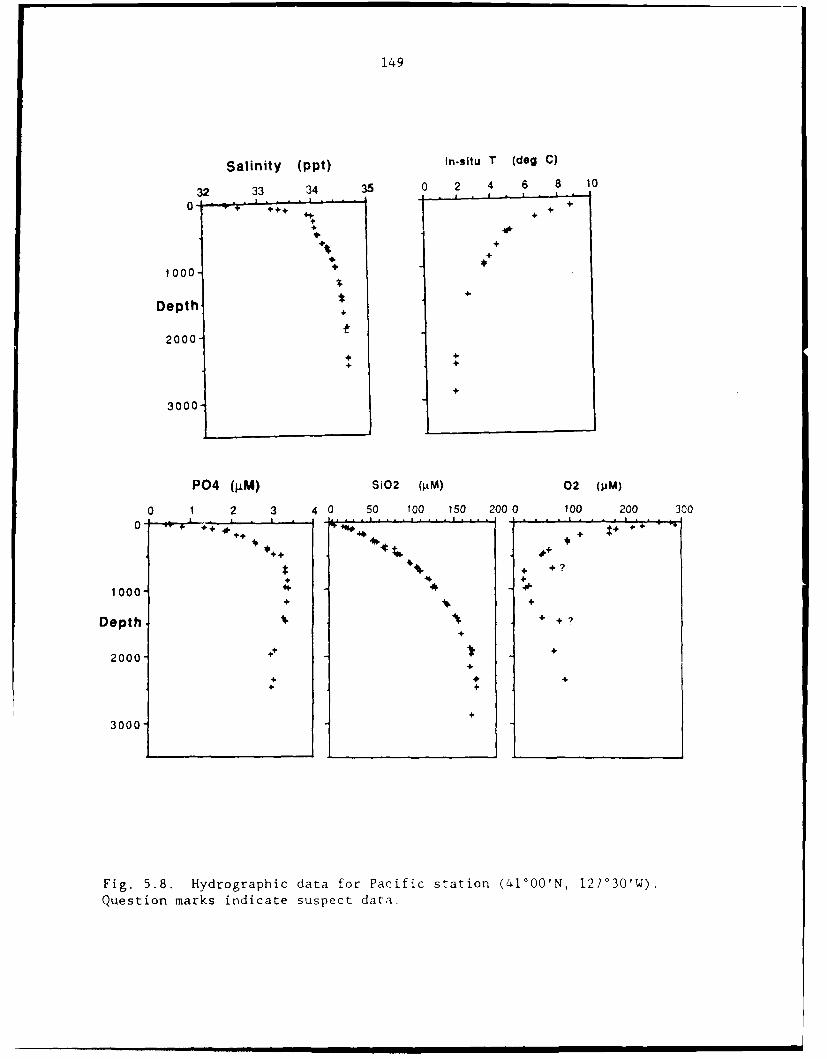
149
Salinity (ppt) In-situ T (deg C)
32 33 34 35 0 2 4 6 8 10
0 +++ + + +
4
N +,
1000 +
Depth +
2000
3000
P04 (iM) Si02 (gIM) 02 (p M)
0 1 2 3 4 0 50 100 150 2000 100 200 300
*4+ 4 4-j +t + + -+ 46. 4
1000 "
Depth + + ?
2000 4.4+
4. 4.
3000
Fig. 5.8. Hydrographic data for Pacific station (41°0O'N, 127'30'W).Question marks indicate suspect data.
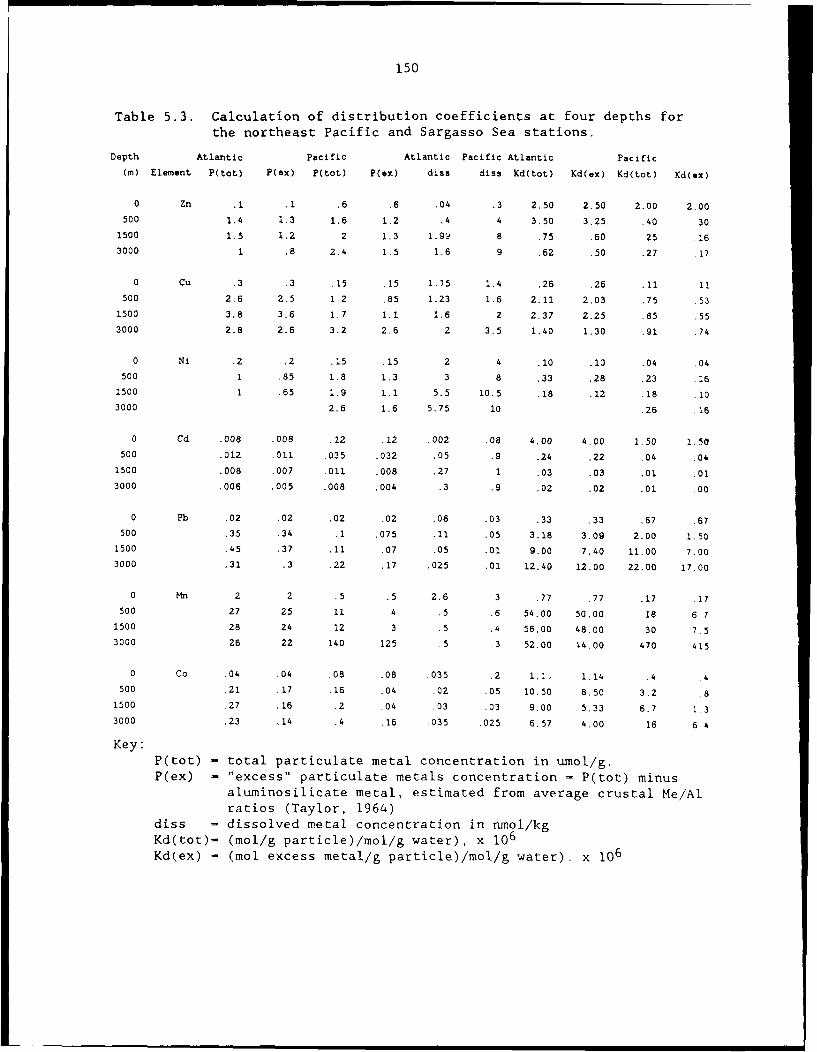
150
Table 5.3. Calculation of distribution coefficients at four depths forthe northeast Pacific and Sargasso Sea stations.
Depth Atlantic Pacific Atlantic Pacific Atlantic Pacific
(W) Element P(tot) P(ex) P(tot) P(ex) diss diss Kd(tot) Kd(ex) Kd(tot) Kd(ox)
0 Zn .1 .1 .6 .6 .04 .3 2.50 2.50 2.00 2.00
500 1.4 1.3 1.6 1.2 .4 4 3.50 3.25 .40 .30
1500 1.5 1.2 2 1.3 1.91 8 .75 .60 .25 .16
3000 1 .8 2.4 1.5 1,6 9 .62 .50 .27 .17
0 Cu .3 .3 .15 .15 1.15 1.4 .26 .26 .11 11500 2.6 2.5 1.2 .85 1.23 1.6 2.11 2.03 .75 .53
1500 3.8 3.6 1.7 1.1 1.6 2 2.37 2.25 .85 .55
3000 2.8 2.6 3.2 2.6 2 3.5 1.40 1.30 .91 .74
0 Ni .2 .2 .15 .15 2 4 .10 .10 .04 .04500 1 .85 1.8 1.3 3 8 .33 .28 .23 .16
1500 1 .65 1.9 1.1 5.5 10.5 .18 .12 .18 .103000 2.6 1.6 5.75 10 .26 .16
0 Cd .008 .008 .12 .12 .002 .08 4.00 4.00 1.50 1.50
500 .012 .011 .035 .032 .05 .9 .24 .22 .04 .04
1500 .008 .007 .011 .008 .27 1 .03 .03 .01 .01
3000 .006 .005 .008 .004 .3 .9 .02 .02 .01 .00
0 Pb .02 .02 .02 .02 .06 .03 .33 .33 .67 .67500 .35 .34 .1 .075 .11 .05 3.18 3.09 2.00 1.50
1500 .45 .37 .11 .07 .05 .01 9.00 7.40 11.00 7.00
3000 .31 .3 .22 .17 .025 .01 12.40 12,00 22.00 17.00
0 Mn 2 2 .5 .5 2.6 3 .77 .77 .17 .17
500 27 25 11 4 .5 .6 54.00 50.00 18 6,7
1500 28 24 12 3 .5 .4 56.00 48.00 30 7.5
3000 26 22 140 125 .5 .3 52.00 '4.00 470 415
0 Co .04 .04 .08 .08 .035 .2 i.i, 1.14 .4 4
500 .21 .17 .16 .04 .02 .05 10.50 8.50 3.2 81500 .27 .16 .2 .04 .03 .03 9.00 5.33 6,7 1.3
3000 .23 .14 .4 .16 .035 .025 6.57 4.00 16 6,4
Key:P(tot) - total particulate metal concentration in umol/g.P(ex) - "excess" particulate metals concentration = P(tot) minus
aluminosilicate metal, estimated from average crustal Me/Alratios (Taylor, 1964)
diss - dissolved metal concentration in nmol/kgKd(tot)= (mol/g particle)/mol/g water), x 106Kd(ex) - (mol excess metal/g particle)/mol/g water). x 106
151
Fig. 5.9. Calculated distribution coefficients (Kd, x 106) for four
depths at Atlantic (circles) and Pacific (squares) stations. Values arecalculated using total particulate metal content (filled symbols) and"excess" metal content (open symbols). Note that aluminosilicatecorrection for Mn and Co is not will constrained, so "excess" plots forthese metals have large uncertainties (see text). Note scale change inCd plot.
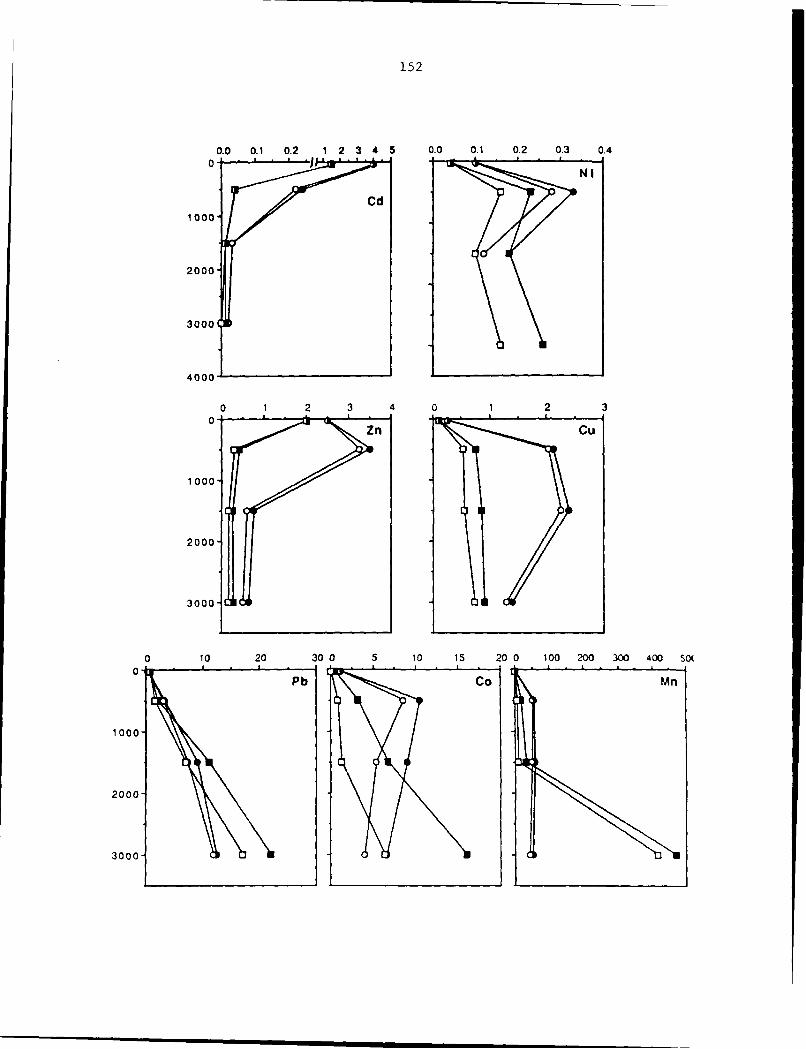
152
0.0 0.1 0.2 1 2 3 4 5 0.0 0.1 0.2 0.3 0.40 1
N I
Cd1000,
2000
31000
4000
0 1 2 3 4 0 1 2 30-
Zn Cu
1 000.
2000-
3000-
0 10 20 30 0 5 10 15 20 0 100 200 300 400 5(
0-P b C o M n
1000-
2000-
3000-
153
[1500m] and deep-water [3000m] (Table 5.3 and Fig. 5.9). The results
show a trend of increasing Kd with depth, and generally lower K d's at the
Pacific station. However, as we have seen, the Atlantic/Pacific
difference suggests that controls on metal partitioning, with the
possible exception of Pb, have little to do with equilibrium constants
for specific heterogeneous reactions. If we ignore the differences
between the stations (< a factor of 5), the order of apparent particle
affinity in the mid-water column (1500m) is Mn > Pb > Co > Cu > Zn > Ni >
Cd. This trend is very similar to that observed in laboratory adsorption
studies (Li et al., 1984; Nyffeler et al., 1984), and suggests that, in
an overall sense, the order of affinity and the relative magnitude of the
Kd differences for each element suggest that adsorptive tendencies of the
individual elements are related to the degree of particle association in
the ocean.
The magnitude of the laboratory-determined K d's, however, are
generally 1-3 orders of lower than observed in the ocean (Fig. 5.10).
Reasons for this discrepancy are not known, but may be related to the
"particle concentration effect", i.e. that apparent equilibrium K d's
determined in the laboratory are often found to be anti-correlated with
the mass concentration of the adsorbent used (Honeyman et al., 1988;
Santaschi, 1984). It is interesting to note that the radiotracer
experiments which have given results closest to the natural K d's found
here used pure Mn oxide as the adsorbent/coprecipitant (Takematsu, 1987)
or Mn-rich bottom sediments from MANOP site H (Nyffeler, 1984). However,
because authigenic Mn comprises less than 1% of total suspended matter at
our sites, the implied affinity of Mn oxides still falls short of
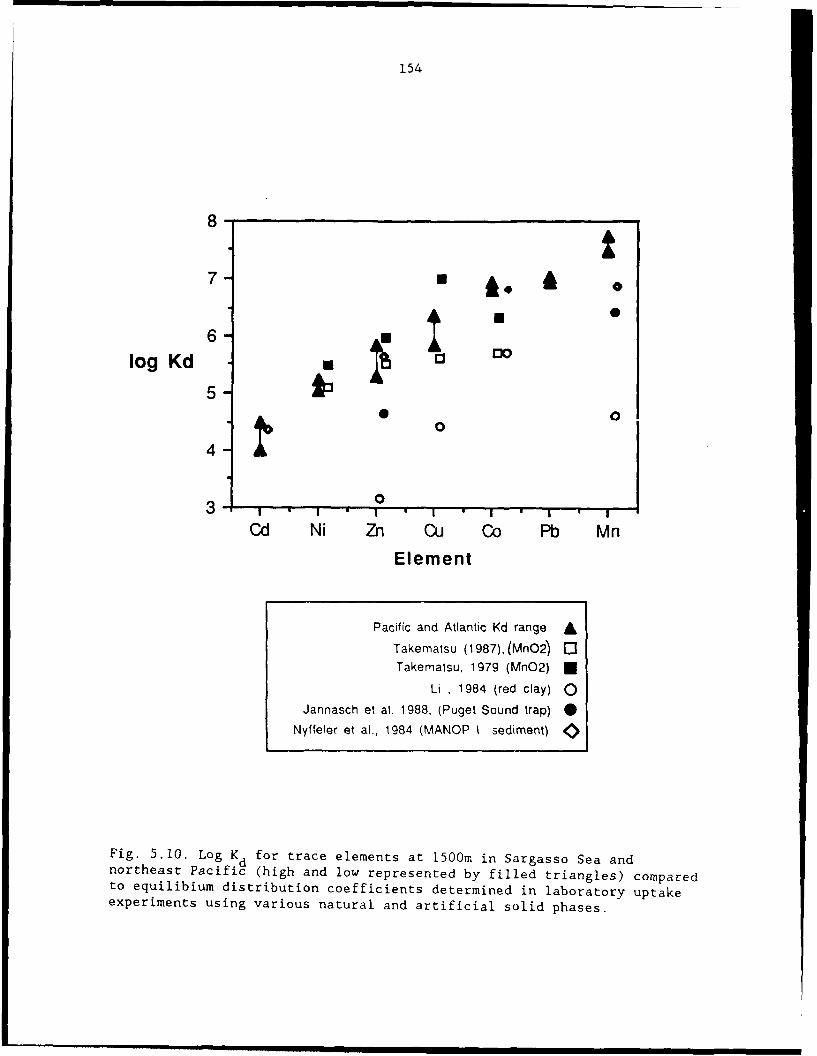
154
8 ±
log KdE
5-30 0
3 - I I I * I " ICd Ni Zn Cu Co Pb Mn
Element
Pacific and Atlantic Kd range ATakematsu (1987),(MnO2) 0Takematsu, 1979 (MnO2) *
Li , 1984 (red clay) O
Jannasch et al. 1988, (Puget Sound trap) *Nyffeler et al-, 1984 (MANOP i sediment)
Fig. 5.10. Log Kd for trace elements at 1500m in Sargasso Sea andnortheast Pacific (high and low represented by filled triangles) comparedto equilibium distribution coefficients determined in laboratory uptakeexperiments using various natural and artificial solid phases.
155
explaining the observed K d's by at least two orders of magnitude. This
demonstrates the difficulty in ascribing the metal content of natural
particles to a single carrier phase (Morel and Hudson, 1985).
It is clear that laboratory tracer experiments and current surface
chemical models are not adequate to quantitatively predict metal
partitioning or removal rates under natural oceanic conditions (Honeyman
and Santschi, 1988). Variability in metal partitioning on the scale of
one order of magnitude or less must be explained by mechanisms which do
not appear to be accounted for by simple surface adsorption models.
5.4.3. Metal partitioning in the upper water column: influence of
biological processes.
Particulate metal concentrations in surface waters (upper 100m) at
the Atlantic and Pacific station are similar, except for Zn and Cd (Fig.
5.5). These two metals are enriched in surface water of the Pacific
station by a factor of 5 for Zn (20 versus 4 pmol/l) and a factor of 10
for Cd (4.5 versus 0.4 pmol/l). Zn and Cd are the only metals of those
examined which are not depleted in surface particles (although Zn content
is depleted on a mol/g basis, see Fig. 5.6). This suggests a strong
association with near-surface biological activity, as is indicated by
their extremely depleted surface dissolved concentrations (Boyle, 1981;
Bruland, 1980)(Fig. 5.7). A comparison of Cd and phosphorus
distributions at the two stations demonstrates the influence of the biota
on the particle/water partitioning in surface waters.
Profiles of dissolved and particulate Cd and P, and the Cd/P ratio
for the two locations are shown in Fig. 5.11. The dissolved
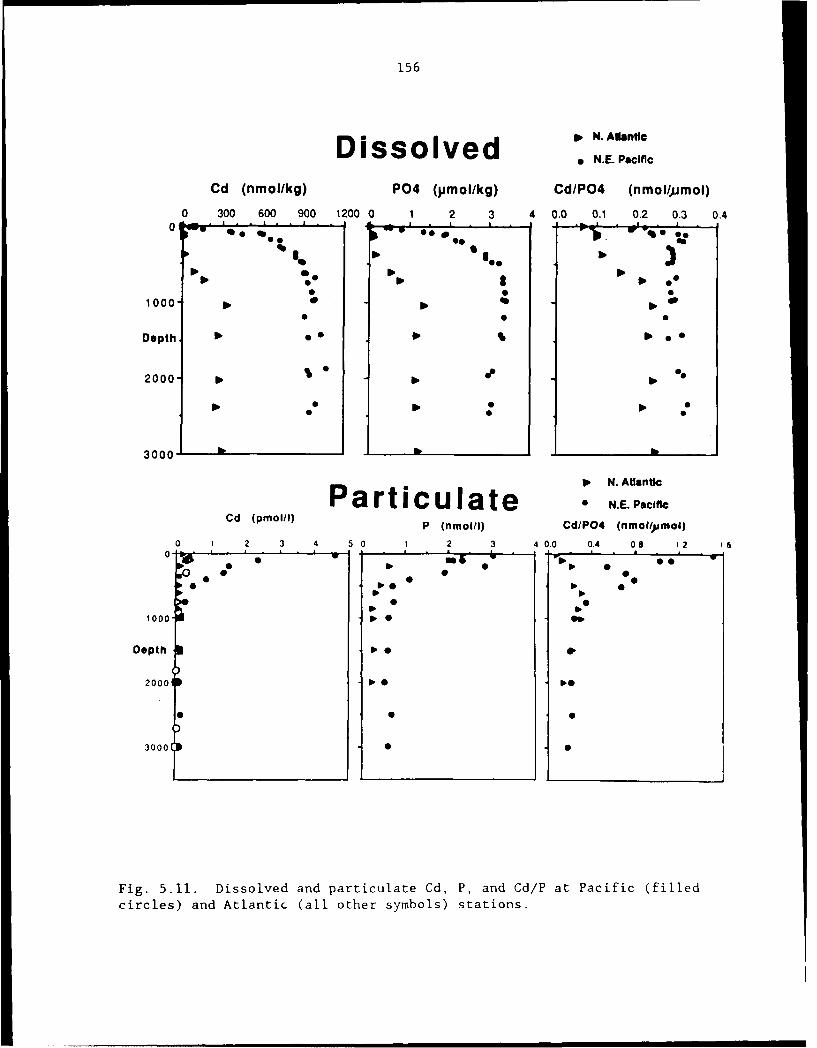
156
w N. AtlanticDissolved * N.E. Pacif
Cd (nmol/kg) P04 (Vmol/kg) Cd/PO4 (nmol/)umol)
0 300 600 900 1200 0 1 2 3 4 0.0 0.1 0.2 0.3 0.4
O ' - ° p-
go 10P% 0
IP O
1000'
Depth
2000- Ow• e
3000 D O
•N. AtlanticParticulate • ..
C po/)P (nmol/I) Cd/PO4 (nmoli)pmol)0 1 2 3 4 1 2 3 0.0 0.4 0,8 12 6
* no0 2o3o- 50 1 • 00 04 0 2
Depth 10 a • •2000 S •0-0
0000
Fig. 5.11. Dissolved and particulate Cd, P, and Cd/P at Pacific (filled
circles) and Atlantic (all other symbols) stations.
157
distributions reflect progressive enrichment of nutrients and
nutrient-type trace metals in the deep Pacific relative to the deep
Atlantic. Surface water at the Pacific site is enriched in nutrients and
Cd by more than an order of magnitude relative to the very depleted
central gyre surface water of the Sargasso Sea (Boyle et al., 1981;
Bruland and Franks, 1983). The dissolved Cd/P ratio is at a minimum in
surface waters of both stations, although the ratio for the Pacific
surface water is about twice that in the Sargasso Sea (-0.2 x 10- 3 versus
0.1 x 10⁻³). Deep water Cd/P is somewhat higher in the Pacific, as has
been noted previously (Boyle, 1988). Particulate P is only about 25%
higher in surface waters at the Pacific site, but the Cd/P ratio in
Pacific surface particles is more than an order of magnitude higher than
the Atlantic ratio (1.5 versus -0.1 x 10⁻³). (This calculation assumes
that loss of particulate P due to filter rinsing was of similar magnitude
to that measured for Cd [-30%, see Appendix C]. This is not considered a
major source of uncertainty in the order of magnitude Atlantic/Pacific
difference seen here.)
How does such a large difference in the apparent uptake ratio of P
and its analog Cd come about? Published Cd/P ratios for plankton
demonstrate that planktonic Cd/P is not simply related to surface
dissolved Cd concentration or to nutrient supply. Reported Cd/P ratios
for plankton collected in surface waters with P and Cd concentrations
both higher and lower than at the Pacific site, vary from 0.2 to 0.9 x
10- 3 with no systematic ratio to either dissolved constituent (Martin et
al., 1976; Knauer and Martin, 1981; Collier and Edmond, 1984).
158
The degree of fractionation of Cd and P between the particles and
the surface water is more likely the net result of the growth state of
the phytoplankton and the activity of zooplankton, bacteria, or other
hetertrophs. Boyle et al. (1981) and Collier and Edmond (1984)
parameterized metal fractionation relative to nutrients as a two-step
process. According to this model a fractionation relative to seawater
composition occurs when primary producers take up nutrients and metals
during growth, and a second fractionation occurs when consumers recycle
this material, leaving a residual which is removed as sinking biological
debris. In the upper 100m of the Sargasso Sea station, particulate Cd/P
is equal to the dissolved ratio, suggesting that these two process are in
approximate balance, and no net dissolved/particulate fractionation
occurs. In contrast, high particulate Cd/P in Pacific surface waters is
likely caused by a higher ratio of live organic matter to dead biological
debris.
The elevated particulate Cd/P ratio in the Pacific surface waters is
apparently carried into the thermocline as particles sink. Both Cd and P
are regenerated from particulate matter in the thermocline, and their
particulate concentrations decrease rapidly through this zone. At 200m,
the depth of the sub-surface particle maximum, particulate Cd/P exhibits
a minimum; conversely, the dissolved ratio indicates a slight maximum,
suggesting preferential regeneration of Cd in the particle maximum.
(This may indicate an advective influence on the Cd/P profile, at least
in the upper 200m, which cannot be assessed in this discussion of simple
vertical particulate transformation processes.) The particulate Cd/P
ratio only decreases to the dissolved ratio at 1000m. In light of the
159
striking surface Cd/P difference, it is surprising that the Pacific
particulate ratio matches the Atlantic ratio at depths greater than
1000m, suggesting control which is independent of surface productivity
(Fig. 5.11). Propagation of surface water particulate metal/nutrient
ratios deep into the thermocline has not been observed previously. The
Pacific data therefore suggests that dissolved Cd/P may be altered by
dissolution of high Cd/P particles throughout the thermocline. This is a
strictly one-dimensional interpretation; horizontal advection of water
masses with Cd/P ratios unrelated to local particle flux are also likely.
Nevertheless, it would be useful to know how widespread this phenomenon
is, and whether advection of high Cd/P thermocline waters from similar
high productivity regions to the central gyre could be related to the
increased slope of the dissolved Cd/P regression in the deep Pacific
versus the deep Atlantic (Bruland and Franks, 1983; Boyle, 1988).
5.5. CONCLUSION
Atlantic and Pacific particulate metal profiles provide a
preliminary illustration that dissolved/particulate fractionation of some
trace elements is determined by biological and chemical processes which
cannot be understood in terms of simple surface chemical models.
In intermediate water, the particulate content of the nutrient-type
metals Zn, Ni, and Cd is remarkably constant between these two regions of
quite different surface productivity. Higher dissolved concentrations
for these elements in the Pacific appear to have little effect on
particulate distributions. The particulate content of Mn, Co, and Cu at
the Pacific site is lower than observed in the Sargasso Sea, despite
160
similar dissolved concentrations. Of the metals studied, only Pb shows a
dissolved/particulate fractionation which is similar at the two stations,
even though absolute Pb concentrations differ by a factor of five.
Additional studies of metal partitioning in other representative
oceanographic regimes (for instance productive equatorial Pacific versus
North Pacific central gyre) would be a valuable complement to this work.
161
REFERENCES
Bacon, M.P., Anderson, R.F. (1982) Distribution of thorium isotopesbetween dissolved and particulate forms in the deep sea, J. ofGeophys. Res. 87, 2045-2056.
Balistrieri, L., Brewer, P.G. and Murray, J.W. (1981) Scavengingresidence times of trace metals and surface chemistry of sinking
particles in the deep ocean, Deep-Sea Res. 28A, 101-121.
Benjamin, M.M. and J.O. Leckie (1980) Multiple-site adsorption of Cd, Cu,
Zn, snd Pb on amorphous iron oxydroxide, J. Colloid Interface Sci.79, 209-221.
Berger, W.H., Fischer, K., Lai, C. and Wu, G. (1987) Ocean productivityand organic carbon flux, Part I: Overview and maps of primaryproduction and export production. SIO Reference Series 87-30.University of California, Scripps Institution of Oceanography, La
Jolla, California.
Billett, D.S.M., Lampitt, R.S., Rice, A.L., and Mantoura, R.F.C. (1983)Seasonal sedimentation of phytoplankton to the deep-sea benthos,Nature 302, 520-522.
Bishop, J.K.B.and M.Q. Fleisher (1987) Particulate manganese dynamics ingulf stream warm-core rings and surrounding waters of the N.W.
Atlantic, Geochim. Cosmochim. Acta 51, 2807-2827.
Boyle, E.A., Huested, S.S. and Jones, S.P. (1981) On the distribution ofcopper, nickel, and cadmium in the surface waters of the North
Atlantic and North Pacific Ocean. J. Geophys. Res. 86, 8048-8066.
Boyle, E.A., Chapnick, S.D., and Shen, G.T. (1986) Temporal variabilityof lead in the western North Atlantic, J. Geophys. Res. 91,8573-8593.
Boyle, E.A. (1988) Cadmium: Chemical tracer of deepwaterpaleoceanography, Paleocean. 3, 471-489.
Bruland, K.W., (1980) Oceanographic distributions of cadmium, zinc,nickel, and copper in the North Pacific, Earth Planet. Sci. Lett.47,176-198.
Bruland, K.W., and Franks, R.P. (1983) Mn, Ni, Cu, Zn, and Cd in thewestern North Atlantic, in Trace Metals in Sea Water, C.S. Wong,
E.Boyle, K.W. Bruland , T.D. Burton, E.D. Goldberg, eds., Nato Conf.Series, Plenum Press, pp. 395-414.
Bruland, K.W. (1983) Trace elements in sea-water, in Chemical
Oceanography Vol. 8, J.P. Riley, R. Chester, eds., Academic Press,pp.158-220.
162
Campbell, A.C., German, C., Palmer, M.R., and Edmond, J.M. (1988)Preliminary report on the chemistry of hydrothermal fluids from theEscanaba Trough. EOS, Trans. Am. Geophys. Union 69, 1271.
Coale, K. and Bruland, K.W. (in press).
Cochran, J.K., Livingston, H.D., Hirschberg, D.J. and Surprenant, L.D.(1987) Natural and anthropogenic radionuclide distributions in thenorthwest Atlantic Ocean, Earth Planet. Sci. Lett. 84, 135-152.
Collier, R. and Edmond, J. (1984) The trace element geochemistry ofmarine biogenic particulate matter, Prog. Oceanog. 13, 113-199.
Cowen, J.P. and Silver, M.W. (1984) The association of iron and manganesewith bacteria on marine macroparticulate material, Science 224,1340-1342.
Cowen, J.P. and Bruland, K.W. (1985) Metal deposits associated withbacteria: implications for Fe and Mn marine biogeochemistry,Deep-Sea Res. 32, 253-272.
Craig, H. (1974) A scavenging model for trace elements in the deep sea,Earth Planet. Sci. Lett. 23, 149-159.
Davis, J.A. and Leckie, J.O. (1978) Effect of adsorbed complexing ligandson trace metal uptake by hydrous oxides. Environ. Sci. Tech. 12,1309-1315.
Deuser, W.G., Ross, E.H. and Anderson, R.F. (1981) Seasonality in thesupply of sediment to the Deep Sargasso Sea and implications for therapid transfer of matter to the deep ocean, Deep-Sea Res. 28,495-505.
Deuser, W.G., (1986) Seasonal and interannual variations in deep-waterparticle fluxes in the Sargasso Sea and their relation to surfacehydrography, Deep-Sea Res. 33, 225-246.
DSDP (1970) Initial Reports of the Deep Sea Drilling Project, Volume V.Washington (U.S. Government Printing Office), pp. 165-202.
Flament, P., Armi, L. and Washburn, L. (1985) The evolving structure ofan upwelling filament, J. Geophys. Res. 90, 11765-11778.
Goldberg, E.D., (1954) Marine geochemistry 1. chemical scavengers of thesea, J. Geol. 62, 249-265.
Honeyman, B.D., Balistrieri, L.S. and Murray, J.W. (1988) Oceanic tracemetal scavenging: the importance of particle concentration, Deep-SeaRes. 35, 227-246.
Honeyman B.D. and Santschi, P.H. (1988) Metals in aquatic systems,Environ. Sci. Tech. 22, 862-871.
163
Hunter, K.A. (1983) The adsorptive properties of sinking particles in thedeep ocean, Deep-Sea Res. 30, 669-675.
Jannasch, H.W., Honeyman, B.D., Balistrieri, L.S. and Murray, J.W. (1988)Kinetics of trace element uptake by marine particles, Geochim.Cosmochim. 52, 567-577.
Jickells, T.D. and J.D. Burton (1988) Cobalt, copper, manganese andnickel in the sargasso sea, Marine Chem. 23, 131-144.
Knauer, G.A., and Martin, J.H. (1981) Phosphorus-cadmium cycling innortheast Pacific waters, J. Mar. Res. 39, 65-78.
Knauer, G.A., Martin, J.H. and Gordon, R.M. (1982) Cobalt in north-eastPacific waters. Nature 297, 49-51.
Lal, D. (1977) The oceanic microcosm of particles, 198, 997-1009.
Landing, W.M. and Bruland, K.W. (1987) The contrasting biogeochemistry ofiron and manganese in the Pacific Ocean, Geochim. Cosmochim. Acta51, 29-43.
Lerman, A., Lal, D. and Dacey, M.F. (1974) Stokes settling and chemicalreactivity of suspended particulates in natural waters. InSuspended Solids in Water (ed. R.J. Gibbs), pp. 17-47. Plenum Press,New York.
Li, Yuan-Hui, Burkhardt, L., Buchholtz, M. O'Hara, P. and Santschi, P.H.(1984) Partition of radiotracers between suspended particles andseawater, Geochim. Cosmochim. Acta 48, 2011-2019.
Martin, J.H., Bruland, K.W. and Broenkow, W.W. (1976) Cadmium transportin the California Current. In Marine Pollutant Transfer (eds. H.Windom and R.A. Duce), pp. 159-184. Lexington Books, LexingtonMass.
Martin, J.H., Knauer, G.A., and Broenkow, '.W. (1985) VERTEX: the lateraltransport of manganese in the northeast Pacific, Deep-Sea Res. 32,1405-1427.
Mooers, C.N.K. and Robinson, A.R. (1984) Turbulent jets and eddies in theCalifornia Current and inferred cross-shore transports, Science 223,51-53.
Morel, G.M.M. and Hudson, R.J.M. (1984) The geobiological cycle of traceelements in aquatic systems: Redfield revisited, in Chemic"'Processes is Lakes, W. Stumm, ed., Wiley-Interscience, New York, pp.251-281.
Murray, J.W. (1975) The interaction of metal ions at the manganesedioxide-solution interface, Geochim. Cosmochim. Acta 39, 505-519.
164
Nelson, T.A., Klinkhammer, G.P., Trefry, J.H. and Trocine, R.P. (1986)Real-time observation of dispersed hydrothermal plumes usingnephelometry: Examples from the Mid-Atlantic Ridge. Earth Planet.Sci. Lett. 81, 245-252.
Nyffeler, U.P., Li, Y.H., and Santschi, P.H. (1984) A kinetic approach todesribe trace-element distribution between particles and solution innatural aquatic systems, Geochim. Cosmochim. Acta 48, 1513-1522.
Oakley, S.M., Nelson, P.O. and Williamson, K.J. (1981) Model oftrace-metal partitioning in marine sediments, Environ. Sci. Technol.15, 474-480.
Peng, T.-H. and Broecker, W.S. (1987) C/P ratios in marine detritus,Global Biochem. Cycles 1, 155-161.
Redfield, A.C., Ketchum, B.H. and Richards, F.A. (1963) The influence oforganisms on the composition of sea water. In: The Sea: Vol. 2, M.N.Hill, ed., Wiley Interscience, New York.
Santschi, P.H. (1984) Particle flux and trace metal residence time innatural waters, Limnol. Oceanogr. 29, 1100-1108.
Schindler, P.W. (1975) Removal of trace metals from the oceans: a zeroorder model, Thalassia Jogoslavica 11, 101-111.
Shen, G.T. and Boyle, E.A. (1988) Thermocline ventilation ofanthropogenic lead in the Western North Atlantic, J. Geophys. Res.93, 15715-15732.
Takahashi, T., Broecker, W.S., and Langer, S. (1985) Redfield ratio basedon chemical data from isopycnal surfaces. J. Geophys. Res. 90,6907-6924.
Takematsu, N. (1987) Ultimate removal of trace elements from seawater andadsorption. J. Earth Sci. 35, 227-248.
Taylor, S.R., (1964) Abundance of chemical elements in the continentalcrust: a new table, Geochim. Cosmochim. Acta 28, 1273-1285.
Trocine, R.P. and Trefry, J.H. (1988) Distribution and chemistry ofsuspended particles from an active hydrothermal vent site on theMid-Atlantic Ridge at 26°N. Earth Planet. Sci. Lett. 88, 1-?.
Turekian, K.K. (1977) The fate of metals in the ocean, Geochim.Cosmochim. Acta 41, 1139-1144.
Whitfield, M.and Turner, D.R. (1987) The role of particles in regulatingthe composition of seawater, Aquatic Surf. Chem. 457-493.
165
CHAPTER 6
FURTHER INVESTIGATION OF PARTICULATE TRACE METALS:
PRELIMINARY RESULTS
6.1. INTRODUCTION
Two additional studies were carried out which are to some degree
complementary to the main objectives of the thesis research. A short
cruise from Woods Hole, Massacusetts to Bermuda (Oceanus 197) enabled
four stations to be sampled for suspended particulate matter. One cast
of 2-3 pumps was made at each station. The objective of the study was to
determine trends in particle composition from shelf water, across the
Gulf Stream, and into the Sargasso Sea, and to broadly quantify the
horizontal variability in particulate metal distributions at a few depths
within the Sargasso Sea. This would allow some assessment of whether the
Bermuda station was representative of distributions in the Sargasso Sea
in general.
The second study involved sampling of a dispersed hydrothermal
particulate plume at the Trans-Atlantic Geotraverse (TAG) hydrothermal
field on the mid-Atlantic ridge. The objict was to identify
compositional changes in the metal content of plume particulate material
with increasing distance and mixing from the source of the venting
hydrothermal fluid from which the particles precipitated. It was hoped
that interactions between fresh hydrothermal precipitates and dissolved
metals in seawater could be distinguished from the trends of metal
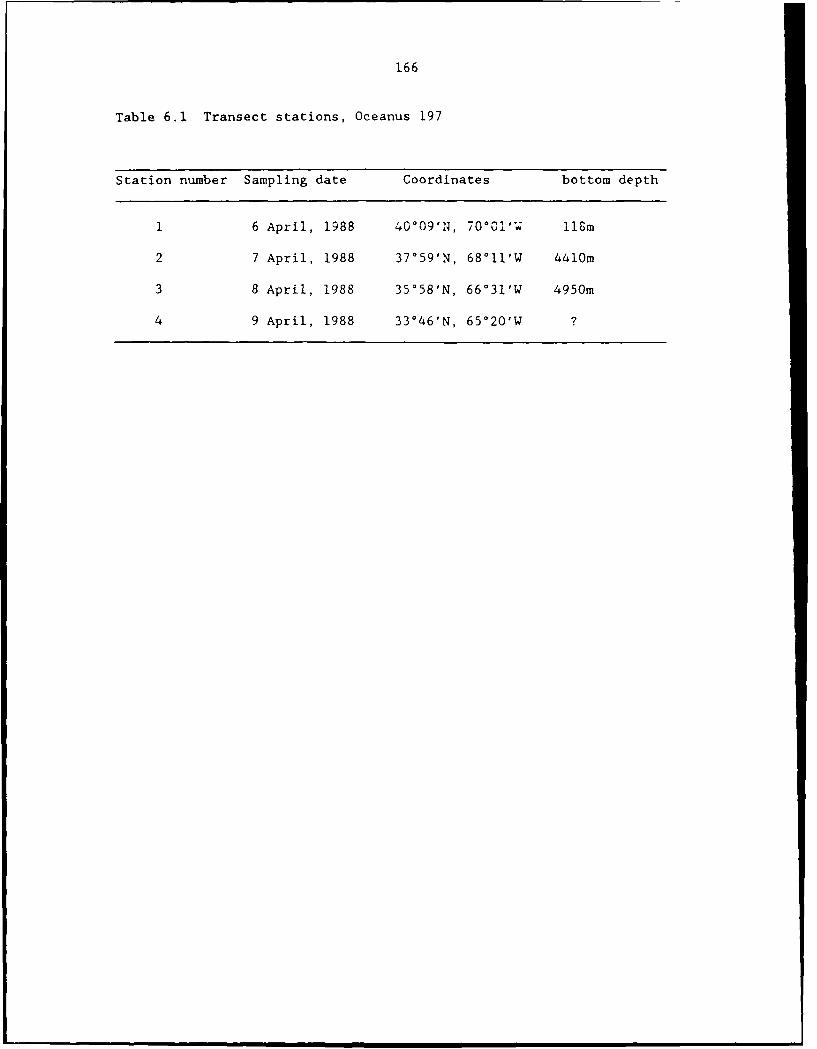
166
Table 6.1 Transect stations, Oceanus 197
Station number Sampling date Coordinates bottom depth
1 6 April, 1988 40-09-N, 70°00'W llgm
2 7 April, 1988 37°59'N, 68°11'W 4410m
3 8 April, 1988 35°58'N, 66031'W 4950m
4 9 April, 1988 33-46'N, 65°20'W ?
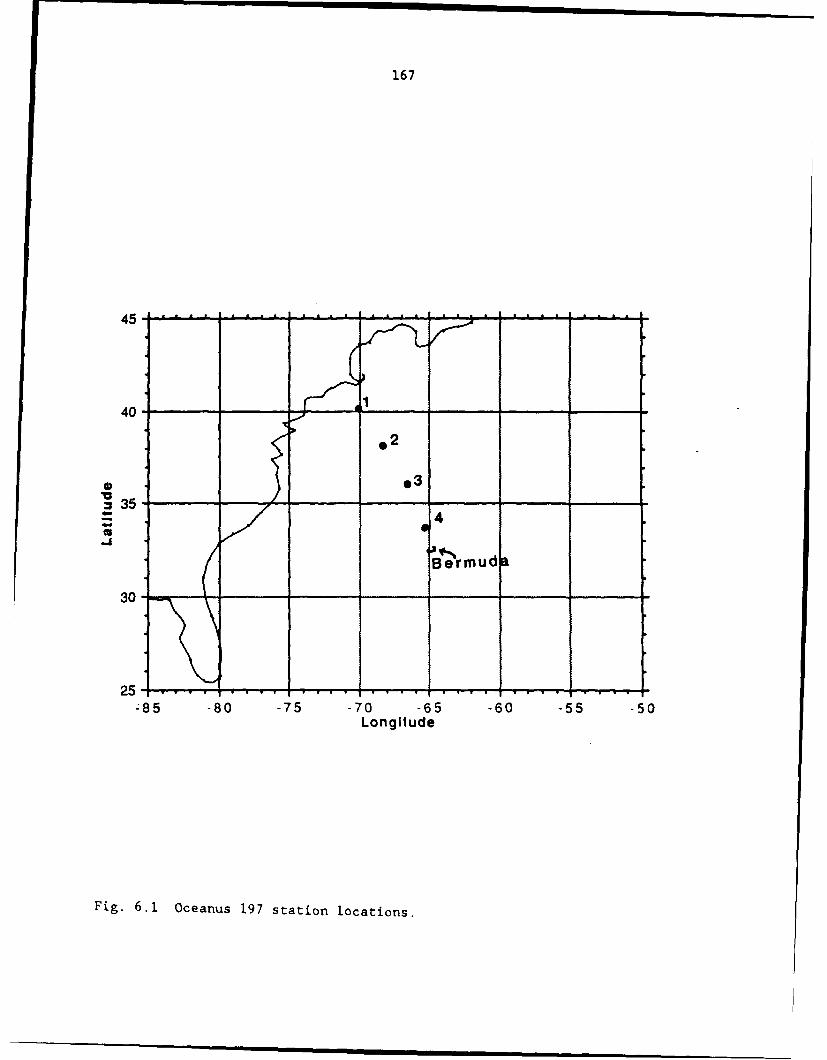
167
4O
85 -8 -
Lortud
30
25 - • - . . . . . . . --85. -80 . 7 .7 -6 6 5 -50
Longitude
Fig. 6.1 Oceanus 197 station locations.
168
composition with increasing age and dilution of the fresh hydrothermal
precipitates.
Each of these studies is briefly described in this chapter. While
low sampling density only allows broadly stated and preliminary
interpretations to be made, the results are useful guides for future
investigations.
6.2. A transect of stations from the North American Shelf to Bermuda
Four stations approximately evenly spaced between Cape Cod,
Massachusetts and Bermuda were occupied over a three-day period in April,
1988 (Table 6.1, Fig. 6.1). Station 1 was located in shelf water,
station 2 in the Gulf Stream, and 3 and 4 in the Sargasso Sea. For each
station, <53 um suspended mass, Al, Zn, Cu, Cd, and Pb were determined,
using methods outlined in Chapter 2. The uniformity of the temperature
structure in the upper water column at station 3, station 4, and an
occupation of the Bermuda station at the end of the transect (see Chapter
3) is evident from XBT profiles (Fig. 6.2). The temperature profile at
the Gulf Stream station is clearly distinguishable from the Sargasso Sea
profiles (Fig. 6.2). Figures 6.3 and 6.4 present the vertical
particulate metal profiles for each station, with the metal
concentrations expressed per volume of seawater and per dry weight of
particulate matter, respectively.
The most important finding is that, in general, stations within the
Sargasso Sea have suspended particulate metal distributions virtually
indistinguishable from the Bermuda profile. Small differences in
suspended mass concentration between station 3 and 4 (17% at 50m, 40% at
169
Fig. 6.2 Temperature profiles for Stations 2-4, plus 5 (Bermuda station)from expendable bathythermographs. Replicate XBT's were fired atStations 2-4.
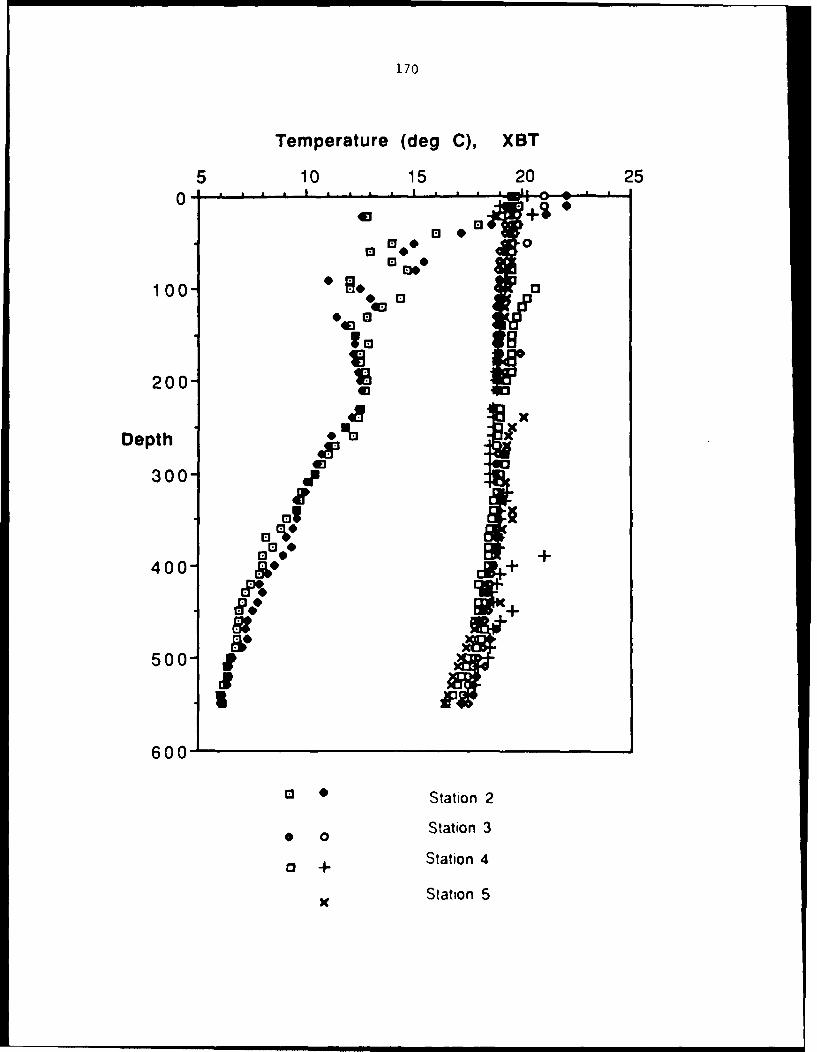
170
Temperature (deg C), XBT
5 10 15 20 250 , , 0.
100.000 0
2 00
00
100 - 0
400- c4W
200-
Depth :
300"
400 c'"
600-
= •Station 2
0 Station 3
+ Station 4
Station 5
171
Fig. 6.3 Profiles of <53,um suspended particulate mass and metalconcentrations, expressed per liter seawater, for stations 1-4.
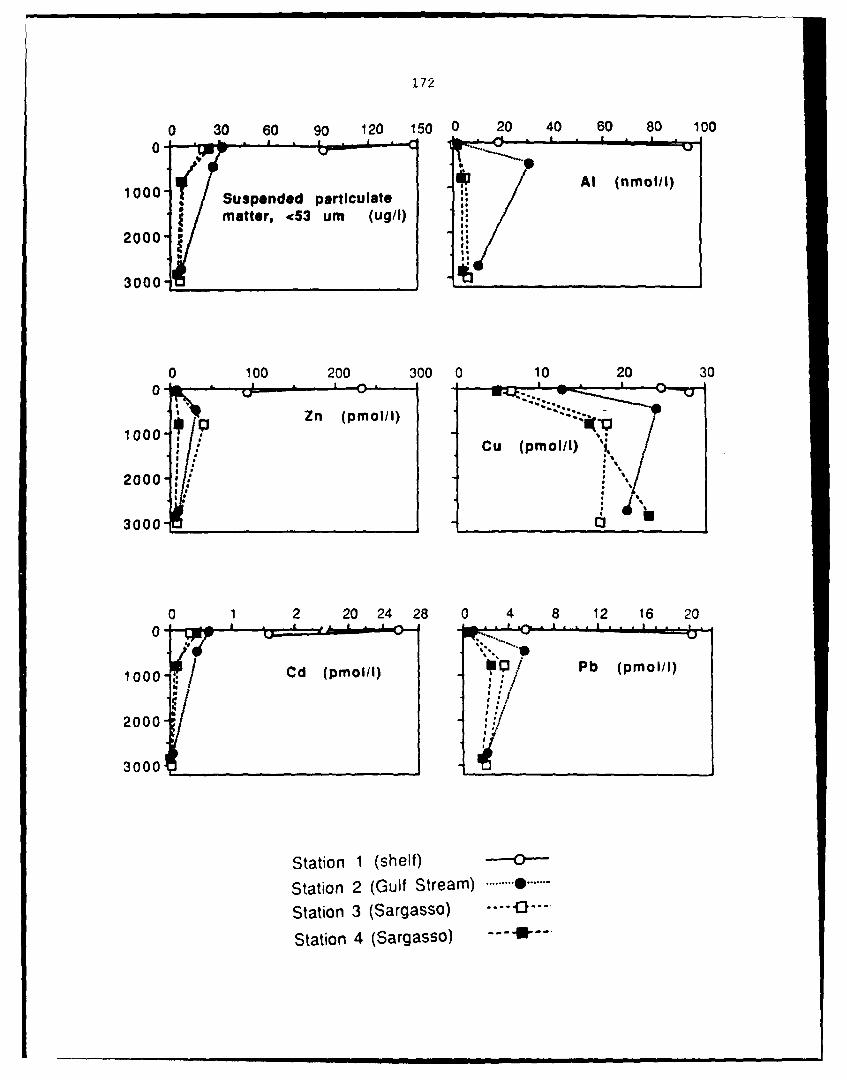
172
0 30 60 90 120 150 0 20 40 60 80 1000...... -c t . I - -
1000-I All (nmol/1)
1000 Suspended particulate l(mlsmatter, <53 urn Nug)
2000
3000 1 __ _ _ _ _ _ __ _ _ _ _ _ _
0 100 200 300 0 10 20 30
1000 Cu (pmZl/) tu
2000 :,e
3000 -
0 1 2 20 24 28 0 4 8 12 16 20
0 0
/d olPb (pmol/l)1000 d(ml)
2000
3000f________________
Station 1 (shelf)
Station 2 (Gulf Stream) ......... 0 .......Station 3 (Sargasso) .... 0 ..
Station 4 (Sargasso) ---- U---
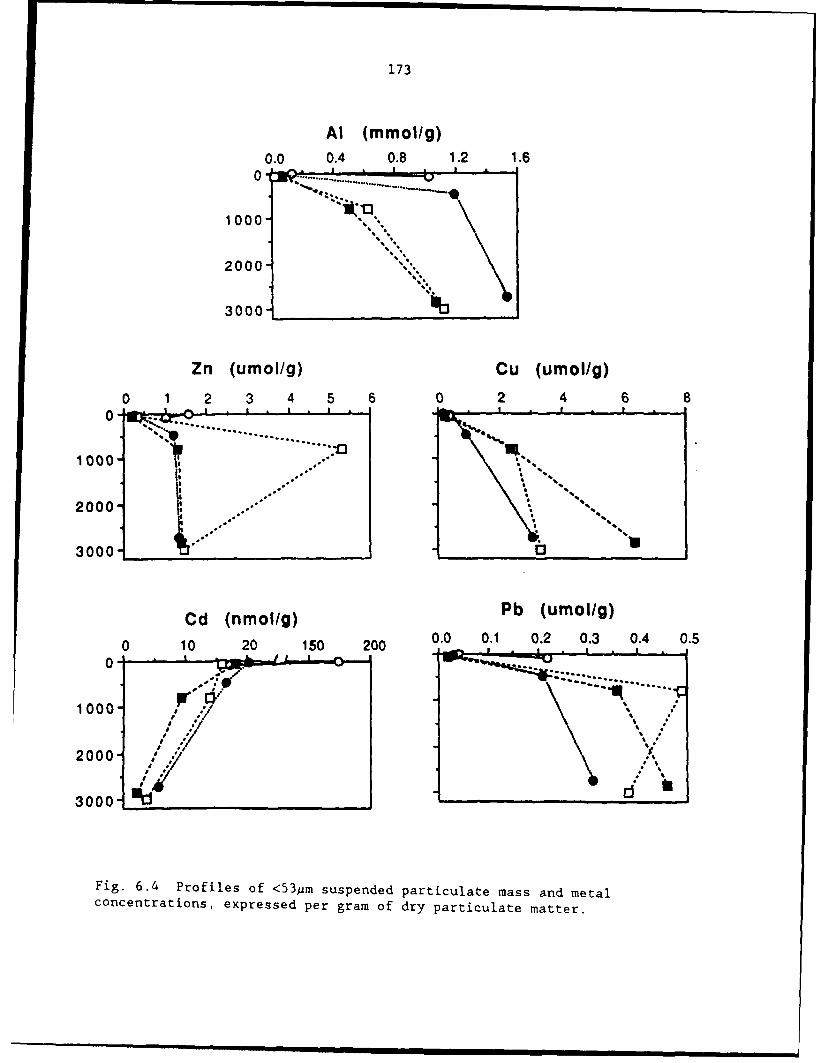
173
At (mmol/g)0.0 0.4 0.8 1.2 1.60 .. .............. ......
1000-'.
2000
3000 _
Zn (umol/g) Cu (umol/g)
0 1 2 3 4 5 6 0 2 4 6 8~~~I . S *0 --'"' "............. .. ............ ,. .,., ,
1000-
2000" I" . .. ,S
3000 L_________
Cd (nmol/g) Pb (umol/g)
0 10 20 150 200 0.0 0.1 0.2 0.3 0.4 0.5
100
Io o ..;./
2000 "5*: ,.
3000- d
Fig. 6.4 Profiles of <53pm suspended particulate mass and metalconcentrations, expressed per gram of dry particulate matter.
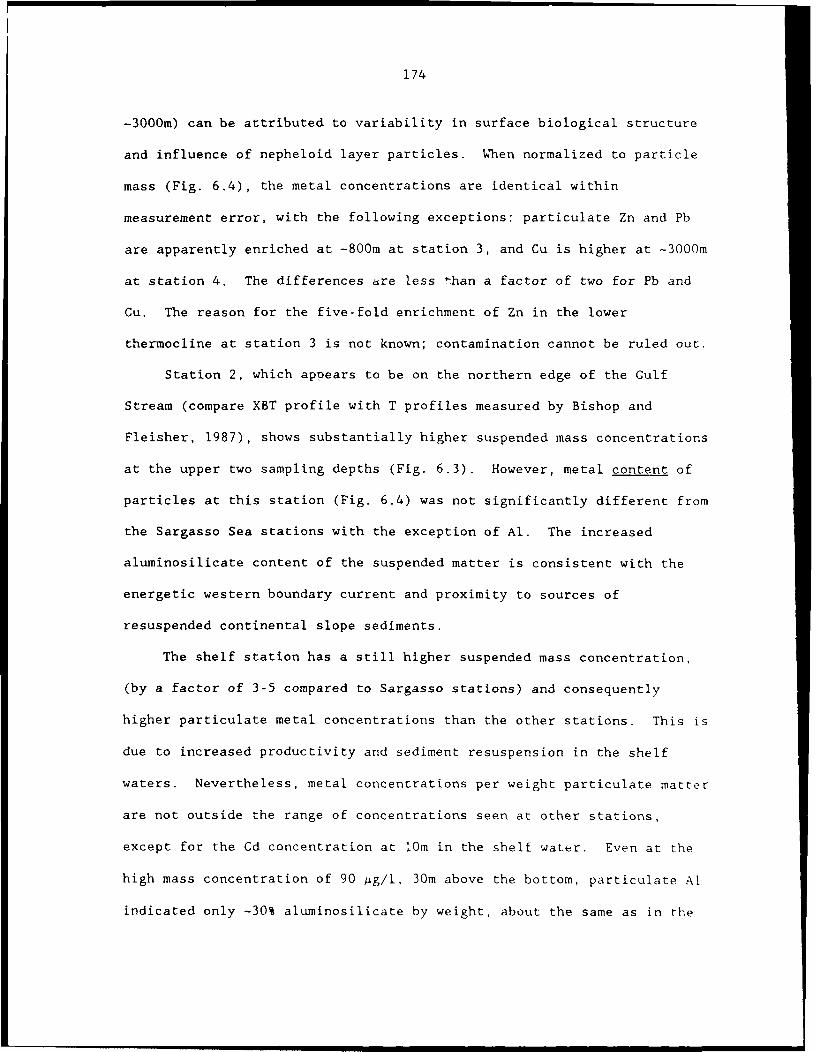
174
-3000m) can be attributed to variability in surface biological structure
and influence of nepheloid layer particles. When normalized to particle
mass (Fig. 6.4), the metal concentrations are identical within
measurement error, with the following exceptions: particulate Zn and Pb
are apparently enriched at -800m at station 3, and Cu is higher at -3000m
at station 4. The differences are less than a factor of two for Pb and
Cu. The reason for the five-fold enrichment of Zn in the lower
thermocline at station 3 is not known; contamination cannot be ruled out.
Station 2, which appears to be on the northern edge of the Gulf
Stream (compare XBT profile with T profiles measured by Bishop and
Fleisher, 1987), shows substantially higher suspended mass concentrations
at the upper two sampling depths (Fig. 6.3). However, metal content of
particles at this station (Fig. 6.4) was not significantly different from
the Sargasso Sea stations with the exception of Al. The increased
aluminosilicate content of the suspended matter is consistent with the
energetic western boundary current and proximity to sources of
resuspended continental slope sediments.
The shelf station has a still higher suspended mass concentration,
(by a factor of 3-5 compared to Sargasso stations) and consequently
higher particulate metal concentrations than the other stations. This is
due to increased productivity and sediment resuspension in the shelf
waters. Nevertheless, metal concentrations per weight particulate matter
are not outside the range of concentrations seen at other stations,
except for the Cd concentration at 10m in the shelf water. Even at the
high mass concentration of 90 Ag/l, 30m above the bottom, particulate Al
indicated only -30% aluminosilicate by weight, about the same as in the
175
deep Sargasso samples. Station I particles at 10m depth were enriched in
Zn and Cd by factors of 5 and 10, respectively, relative to near-surface
samples at the open ocean stations. This is about the same degree of
enrichment seen in surface particles at the California Current station
(Chapter 5).
Overall, the results indicate very little variability in particulate
metal concentration in the northwest section of the Sargasso Sea, and a
relatively small range (< order of magnitude) of particulate metal
content (per particle mass) from a boundary region to the open ocean. A
quantification of particulate metal transport across the Gulf Stream
would require more extensive sampling and better control on hydrographic
parameters at the sampling stations. Particulate trace metal
distributions at the Bermuda station appear to be representative of a
large region of the oligotrophic central gyre.
6.3. Particulate metal distributions in a dispersed hydrothermal plume
at the TAG site, Mid-Atlantic Ridge
Samples of suspended particulate matter were collected from within
and nearby a buoyant hydrothermal plume at the TAG site, Mid-Atlantic
Ridge. A single RAPPID pump was deployed 50-100m above or below a CTD
package or a larger filtration/real-time sensing device (Simpson et al.,
1987). Positioning of the pump and other equipment packages was
generally guided by real-time transmissometer readings, and by a partial
transponder navigation net. Attempts were made to sample as closely as
possible to the suspected plume source, a hydrothermal mound located
approximately at 26° 08'N, 44*49'W. However, navigational problems
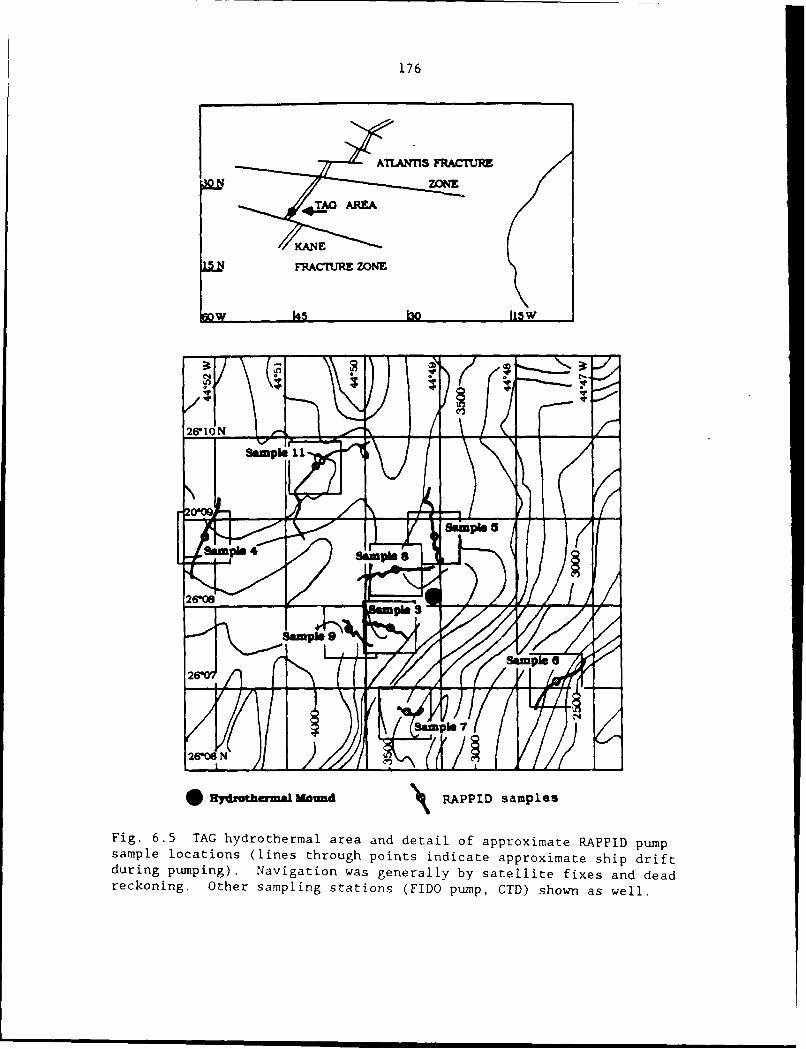
176
LUFRACT~JR ZONE
s yZ~tample 11APD ape
2.-
~~sample oain4liehog pint iniaeapoiaesiarf
dpawrs f s
reckonin. OtherSampln sttos(IOpm, T)sona el
26-0oN / I
0~~~~~~al $ymhra OdRPI ape
Fig. 6.5 TAG hydrothermal area and detail of approximate RAPPID pumpsample locations (lines through points indicate approximate ship driftduring pumping). Navigation was generally by satellite fixes and deadreckoning. Other sampling stations (FIDO pump, CTD) shown as well.
177
generally limited positioning to within - 2 km of intended sampling
locations (Fig. 6.5). Thus the samples were collected from the
relatively far-field, laterally-spreading portion of the plume, centered
at about 3300m depth, -300-400m above the median valley floor. Eleven
samples were collected, three from stations located -100km east and west
of the ridge (as ambient background controls), and eight from within the
valley walls.
Suspended mass concentration varied from 7-30 pg/l for background to
most concentrated plume sample. The small range indicates that plume
samples were all relatively dilute. Particulate Fe was taken as an
indication of the fraction of hydrothermally-derived particles in each
sample. While this was not necessarily directly related to proximity to
the plume source, (since ship drift frequently caused the pump to
integrate particulate matter from more and less intense portions of the
plume within one sample), samples up to 35 wt% Fe were collected.
Analysis of trace metal content (per g dry particulate matter) versus Fe
content indicate that Fe-enriched samples were also enriched (relative to
ambient background particles) in Zn, Cu, Cd, and Co by factors up to 40,
100, 50, and 8, respectively (Fig. 6.6). In contrast, particulate
content of Mn, Ca, and Al varied by only a factor of 2, in no systematic
relation to Fe content (Fig. 6.6). It was concluded that Ca and Al were
predominantly associated with ambient particulate matter (CaCO 3 and
aluminosilicates). Mn is highly enriched in vent fluid, but apparently
is oxidized only very slowly. No appreciable precipitation of Mn oxide
was apparent in the plume particles. Zn, Cu, Cd, and Co are associated
with the hydrothermal source.
178
Fig. 6.6 Regressions of particulate metals versus particulate Fe insamples from in and near TAG hydrothermal plume.
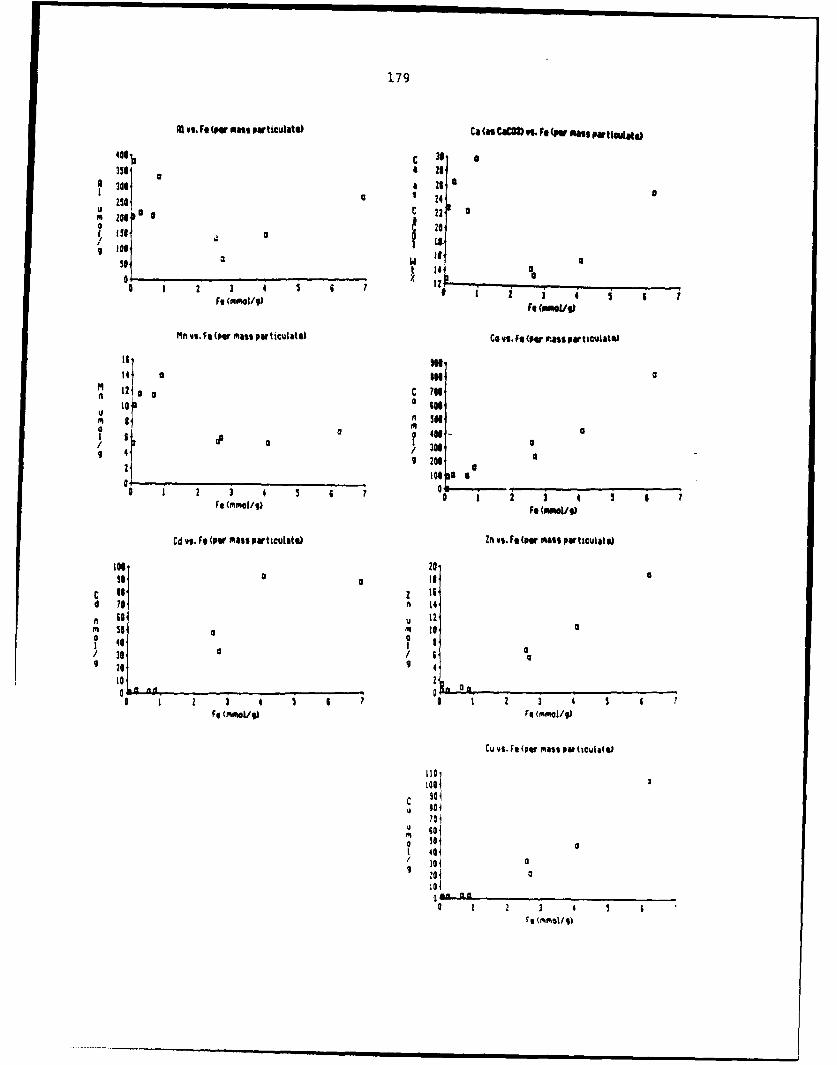
179
Al vs. Fe (w mat particulate) Ca (A MCOS) s. Fe (P mass Par tla ate)
*oI 3c 31 aSa 23 04~ a 21 a
2504 a 24au o t: 22
,20,
s i n1 I t .
t 1 ao 2 3" * 5" 7. z i"3 5 S "
Ft (MtA0l/) Ie (Meol/gI
Mn vs. Fe (par mass Par ticulatel C vs. Ft (par Pas particulate)
16 lot14 SO
MI 12 oo¢ ?of,
a a
IL a 401 -/ a+ 4300/ 30
2 2016 a
6 2 2 3 4 5 4 7 0 . ,4 (mmoil, 1 2 2 4 3 6Fe (meool/q)
Cd vs. Fe (pW Mass Particulitl) Zn vs. Fe (pat mass particulits)
106 20so a is3
C is 2 16d 70 M 14
M 60 u 2M so a If ai
"' 0 a " 6 %3 0 o/ i, aS 20 4'
10 2Cn O
0 1 2 3 4 0 6 7 02 3 4 5Fe (mftL/) Fq (mmal/l)
Cu vs. Fe (per mass par ticlate)
U 8040to
O 507 t {3i9 0
so
0 1 2 3 4 5
' ~ ~ ~ ~ ~ ~ F ,,, Mlll%*lJlIl lili
180
Fig. 6.7 Plots of metal/Fe ratio versus reciprocal of particulate Feconcentration. Straight line indicates conservative behavior withrespect to particulate Fe. Note concave up lines for Cd, Zn, and Cu.
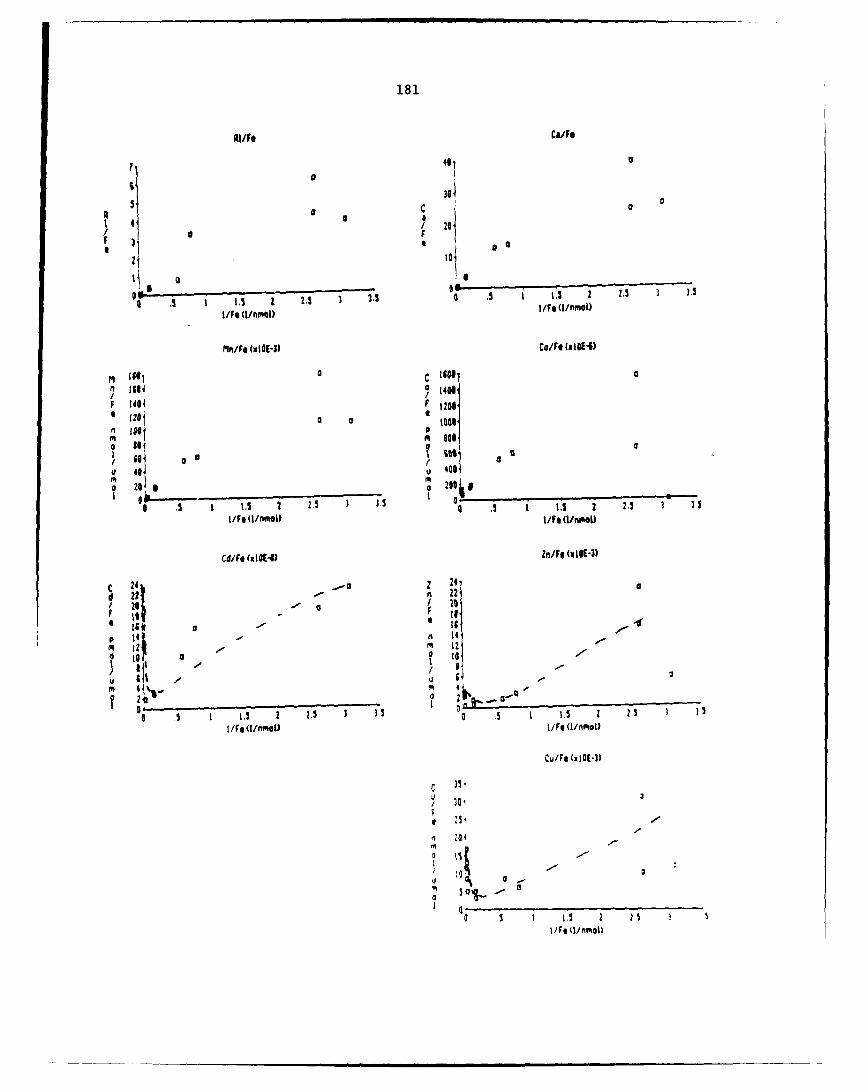
181
RUNF Ca/Fe
40 a
4 a4C
F
I's z . 2.5 3 2.5 1 5 1.5 2 25 3 35
I/Fe 11/nfalC/Fe (glnol)
MO aIEJ CO WE
F 1414 F 1200'
3G0
1 601 a ISI a a
U 40 u 400i
0 . 3 1. 2 2.5 3 .5 s. 1.5 2 2.5 $ 3I/Fe (I/nm"aI) IF 1n
Cd/Fe Ngl t41 Zn/Fe (m I101-3)
d 2 22'
F F to20
to a F o,
1 143 -. Z' 3
It I2s al"W I32 1/ ml
ouF W WI)~
-v21,J
ft U 6~ti
182
In a previous study of particle chemistry at the TAG site (Trocine
and Trefry, 1988), particulate Fe was seen to vary linearly with total
suspended matter and dissolved Mn, suggesting conservative mixing with
little loss to dissolution or settling. Defining behavior for the other
metals relative to Fe therefore provides an estimate of the degree and
direction of non-conservative behavior within the plume. In order to
identify processes other than mixing which alter metal content of plume
particles, the data was modeled as a two-component mixing process, with
particulate Fe as the independent variable. The results of this model
are most graphically obvious in plots of metal/Fe ratio plotted against
the reciprocal of the particulate Fe concentration (Fig. 6.7).
Conservative behavior relative to particulate Fe is indicated by
linearity of this regression. The results (Fig. 6.7) indicate a loss of
Cd and, to a lesser extent, Zn and Cu, relative to Fe within this portion
of the plume. In contrast, plots for Co, Mn, Ca, and Al appear
approximately linear.
The observation that the Cd/Fe, Cu/Fe and Zn/Fe ratios all display
minima at Fe concentrations equivalent to -5 wt% Fe indicates that phases
rich in these metals are somehow being lost during mixing. This could
occur through dissolution, differential settling, loss to solution during
oxidation of metal sulfides, or desorption of metals adsorbed to Fe
oxides during very early stages of plume mixing. Particulate Co, in
contrast, appears to remain tightly associated with Fe during mixing in
this portion of the plume. If scavenging of seawater metals is occurring
within the plume, any particulate metal contribution from this source is
obscured by loss processes within this far-field regime. The results
183
complement the near-field work of Trocine and Trefry (1988) and suggest
that transformations of metal composition within the plume are occurring
not only immediately upon mixing in the upward flowing portion of the
plume, but on time scales of hours-days and distance scales of kilometers
in the more dispersed portion of the plume.
6.4. Conclusions
These results serve to illustrate the range of particulate metal
environments in the North Atlantic. Hydrothermal precipitates can be
viewed as an extreme exogenous source of particles to the deep water
column. Distant from such perturbations, the particulate metal
concentration in deep waters of the North Atlantic appears to be
relatively constant.
184
REFERENCES
Bishop, J.K.B. and M.Q. Fleisher (1987) Particulate manganese dynamics inGulf Stream warm-core rings and surrounding waters of the N.W.
Atlantic. Geochim. Cosmochim. Acta, 51, 2807-2825.
Simpson, W.R., T.J.P. Gwilliam, V.A. Lawford, M.J.R. Fasham and A.R.Lewis (1987) In situ deep water particle sampler and real-timesensor package with data from the Madeira Abyssal Plain. Deep-SeaRes., 34, 1477-1497.
Trocine, R.P. and Trefry, J.H. (1988) Distribution and chemistry ofsuspended particles from an active hydrothermal vent site on theMid-Atlantic Ridge at 26°N. Earth Planet. Sci. Lett. 88, 1-15.
185
CHAPTER 7
GENERAL CONCLUSION
In this research, samples of suspended particulate matter were
collected for trace metal analysis from the full water column of an
oligotrophic central-gyre station in the Sargasso Sea and a second
station in the California Current, northeast Pacific. To collect
relatively large samples, and to ensure freedom from metal contamination,
a new in situ filtration method was devised. The samples were analyzed
for major constituent elements and the trace metals Mn, Co, Pb, Zn, Cu,
Ni, and Cd in order to investigate the role of suspended particulate
matter in the marine geochemistry of these trace elements. Sampling in
two distinct oceanographic regimes provided an opportunity to test the
effect of particle composition and dissolved metal distributions on
dissolved/particulate trace metal partitioning.
The first finding of this study was that particulate concentrations
of most of the trace metals investigated were at least several times
lower than previous estimates for intermediate and deep waters in the
North Atlantic. The smooth profile shapes and consistency of the results
from one station occupation to another lend confidence to the validity of
the measurements. At the Bermuda station, concentrations of particulate
metals generally increase with depth in the upper water column to values
which are less than 5% of the total (dissolved plus particulate)
concentrations for Cu, Zn, and Pb, and less than 1% for Ni and Cd. Deep
water particulate concentrations of Al, Fe, Mn, and Co are -10-50% of
total. The measurements demonstrated at the outset of this research that
186
the new sampling and analytical method allowed the first realistic
assessment of the role of fine, slowly-sinking particles in the marine
geochemistry of these trace elements.
The analysis of a number of different trace elements, as well as
major elements comprising the principal bulk phase components, provided
the opportunity to investigate element associations which might suggest
processes that control the trace metal content of marine particles. The
Sargasso Sea results indicate a surprising correlation between profile
shapes for particulate Co, Pb, Zn, Cu, and Ni and the shape of the
particulate Mn profile. All showed surface depletion and a relative
maximum at -500m. This result suggests an important role for the
formation of authigenic Mn in determining the particulate concentrations
of other trace metals in open ocean sub-surface waters. The importance
of other phases, such as organic particle coatings or authigenic Fe
phases, in regulating particulate metal content cannot be ruled out, but
bulk particle composition data revealed no evidence to support such
control.
The mean concentrations of non-refractory particulate Mn, Co, and CI
at intermediate depths at the Pacific station were 3-5 times lower than
observed in mid-waters at the Sargasso Sea station. This correlation
further supported a role for Mn phases in determining the uptake of Co
and Cu onto suspended particles. The reasons for the difference in
particulate Mn concentration at the two stations were not unequivocally
determined, but likely possibilities appear to be (i) low oxygen
concentrations at the Pacific station may be maintaining the net
production of oxidized Mn at low levels, and/or (2) an advective source
187
of dissolved Mn via ventilation of thermocline waters with higher
latitude surface water may provide a source for Mn oxidation in the
Sargasso Sea main thermocline.
In addition to this apparent association of some metals with
inorganic particulate components, the importance of biological processes
in controlling particulate metal content was evident for Cd and Zn. Both
metals were enriched in surface particulate matter at the relatively more
productive Pacific site. This was probably the result of a less
"reworked" biogenic particle population at the Pacific site, i.e. a
larger fraction of living particles producing metal partitioning more
representative of uptake fractionation during organism growth than of net
growth/recyling processes. The effect of surface biological processes
was evident throughout the upper water column at the Pacific station; the
Cd/P ratio in the surface suspended particles, which was an order of
magnitude higher than at the Sargasso station, decreased with depth, but
remained elevated relative to the Sargasso profile, and relative to the
dissolved Cd/P ratio, to about lO00m. In the deeper water column, the
particulate Cd/P ratio, and the particulate Cd, Ni, and Zn content were
remarkably similar at the two stations, despite the differences in
surface productivity and in dissolved concentrations of these metals.
This suggested a behavior different from Mn, Co or Cu. Therefore, at
these two stations, the deep particulate content of the "nutrient-type"
metals appears to be relatively independent of differences in bulk
particle composition, and of biological activity in overlying surface
waters.
188
To investigate the relationship between trace metals associated with
fine suspended particles and the total vertical flux of metals observed
in the deep ocean, a simple particle interaction/flux model was
constructed for the Sargasso Sea station. The complexities of oceanic
particle interactions were simplified by classifying particulate matter
into only two size classes: small suspended particles represented by the
samples collected by in situ filtration, and large fast-sinking
particles/aggregates which dominate the sinking flux and are sampled with
sediment traps. The flux due to the removal of suspended particulate
trace metals was calculated from the particulate metal concentrations
measured in this study, and the small particle residence time estimated
by comparing deep suspended and sinking particulate 2 3 0Th. A comparison
of this calculated flux to the total sediment trap flux measured in deep
water at this station reveals that interactions between suspended and
sinking particles contribute less than 30% of the total observed flux for
all of the metals examined here, with the exception of Cu (40%) and :d
(50%). This result suggests that, while suspended particles may be
removed largely by aggregation onto faster-sinking large particles, these
large particles carry a complement of metals from surface waters which i,
greater than the contribution via deep ocean suspended particles. To -'e
extent that the Sargasso station can be considered representative of the
oligotrophic central gyre ocean, the implication is that metal removal in
the oceans is controlled largely by processes occurring at the ocean
boundaries (e.g surface waters, in this case), and may be only
secondarily dependent on the degree or mechanism of metal/particle
interactions in the ocean interior.
189
An assumption inherent in this model is that small suspended
particles, rather than large aggregates, dominate interactions with
dissolved metals because of their abundance and available surface area.
If this is true, it would be instructive to know how rapidly
dissolved/particulate exchange occurs relative to the residence time of
the suspended particles. This question was investigated by measuring
stable Pb isotope ratios and the ratio of total Pb to 2 10Pb in suspended
particles and in seawater at the Sargasso Sea station. Vertical
variations in the isotopic composition of the dissolved Pb pool were
almost perfectly matched throughout the upper 2000m by the composition of
Pb in suspended particles, suggesting that isotopic equilibration occurs
faster than the particles are removed. This indicates that the
partitioning of Pb between dissolved and suspended particulate phases in
the open ocean is not controlled by particle residence time, but must
instead be determined by the Pb binding capacity of the particles. It is
not known whether rapid exchange occurs for other metals as well. The
comparison of particulate and dissolved metal distributions at the two
stations revealed that Pb was the only element of those investigated
which showed similar dissolved/particulate fractionation at different
dissolved concentration. Thus Pb behavior may resemble that of Th, but
may be a poor analog for dissolved/particulate exchange processes for
other trace elements.
Further investigation of scavenging processes by caieful collection
and analysis of suspended particulate matter would be fruitful. For
example, analysis of rare earth elements in similarly collected samples
would clarify the role of in situ scavenging in establishing the relative
190
concentrations of this coherent group of elements in the ocean. The
results of the Pb isotope study could be tested for other elements with
appropriate isotopic systematics. For instance, with sufficient
analytical sensitivity, a similar study could be carried out with
neodymium isotopes to determine whether equilibration occurs for elements
which are less particle-reactive than Pb. A natural extension of this
work is to sample a central-gyre station in the North or South Pacific,
where particle composition might be similar to that found at the Sargasso
station, but dissolved metal distribution would resemble the California
Current station.
191
APPENDIX A
Northwest Atlantic suspended particulate data
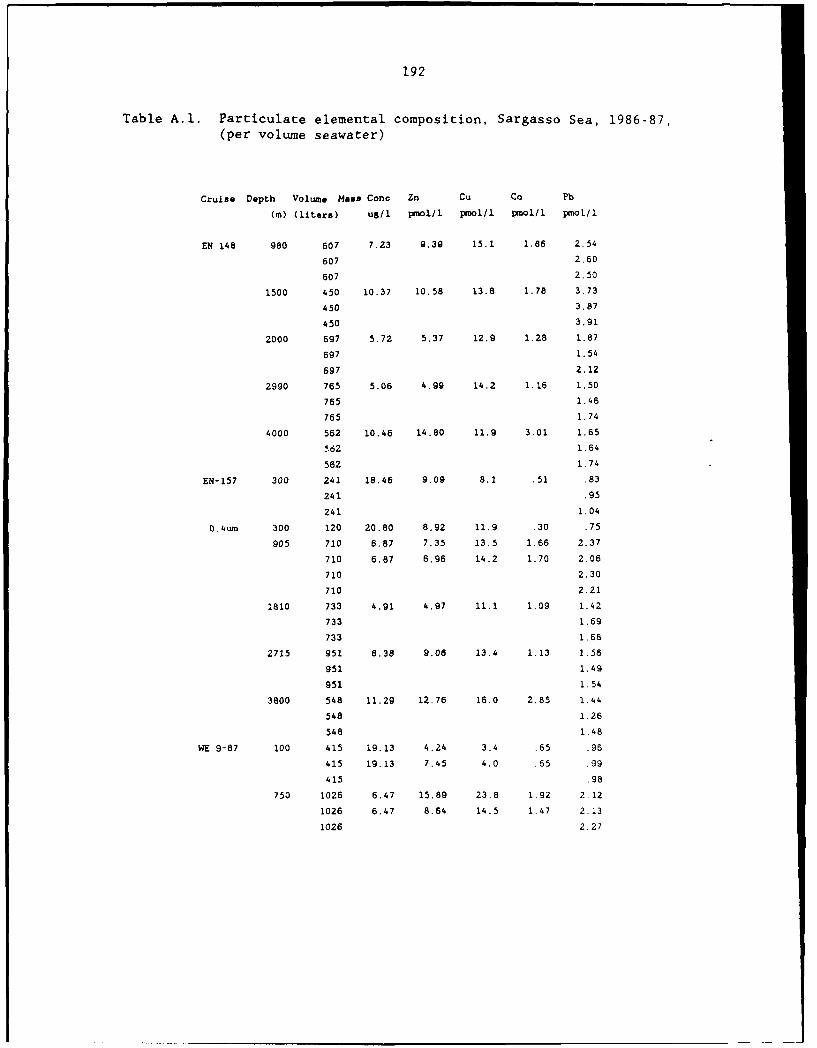
192
Table A.I. Particulate elemental composition, Sargasso Sea, 1986-87,(per volume seawater)
Cruise Depth Volume mass Conc Zn Cu Co Pb
(W) (liters) ug/l pmrol p mol/1 soll Pnot/1
EN 148 980 607 7.23 9.39 15.1 1.86 2.54
607 2.60
607 2.50
1500 450 10.37 10.58 13.8 1.78 3.73
450 3.87
450 3.91
2000 697 5.72 5.37 12.9 1.28 1.87
697 1.54
697 2.12
2990 765 5.06 4.99 14.2 1.16 1.50
765 1.46
765 1.74
4000 562 10.46 14.80 11.9 3.01 1.65
562 1.64
562 1.74
EN-157 300 241 18.46 9.09 8.1 .51 .83
241 .95
241 1.04
0.4um 300 120 20.80 8.92 11.9 .30 .75
905 710 6.87 7.35 13.5 1.66 2.37
710 6.87 6.96 14.2 1.70 2.06
710 2.30
710 2.21
1810 733 4.91 4.97 11.1 1.09 1.42
733 1.69
733 1.68
2715 951 6.38 9.08 13.4 1.13 1.56
951 1.49
951 1.54
3800 548 11.29 12.76 16.0 2.85 1.44
548 1.26
548 1.48
WE 9-87 100 415 19.13 4.24 3.4 .65 .96
415 19.13 7.45 4.0 .65 .99
415 .98
750 1026 6.47 15.89 23.8 1.92 2.12
1026 6.47 8.64 14.5 1.47 2.13
1026 2.27
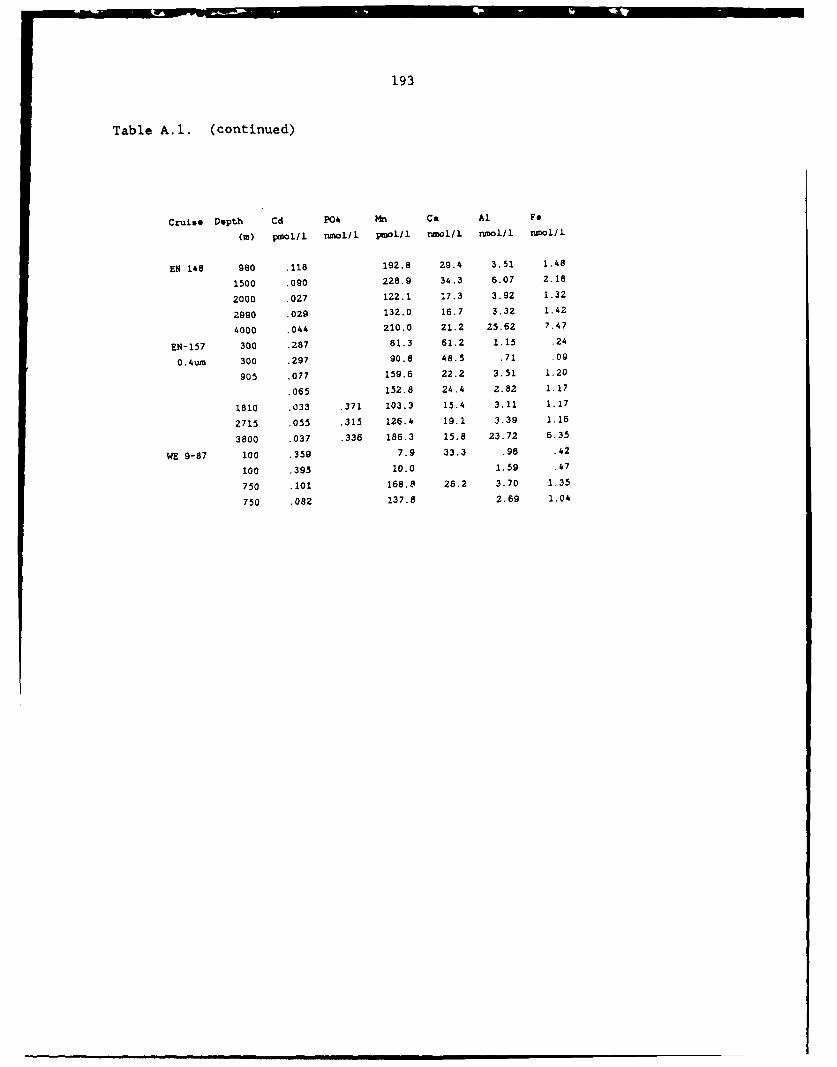
193
Table A.I. (continued)
CruisO Depth Cd P04 Ca Al Fe
(W) pmol/I nmoL/1 pmol/ nmol/l nmol/l nmol/l
EN 148 980 .118 192.8 29.4 3.51 1.48
1500 .090 228.9 34.3 6.07 2.18
2000 .027 122.1 17.3 3.92 1.32
2990 .029 132.0 16.7 3.32 1.42
4000 .044 210.0 21.2 25.62 7.47
EN-157 300 .287 81.3 61.2 1.15 .24
0.4um 300 .297 90.8 48.5 .71 .09
905 .077 159.6 22.2 3.51 1.20
.065 152.8 24.4 2.82 1.17
1810 .033 .371 103.3 15.4 3.11 1.17
2715 .055 .315 126.4 19.1 3.39 1.16
3800 .037 .336 186.3 15.8 23.72 6.35
WE 9-87 100 .359 7.9 33.3 .96 .42
100 .395 10.0 1.59 .47
750 .101 168.8 26.2 3.70 1.35
750 .082 137.6 2.69 1.04
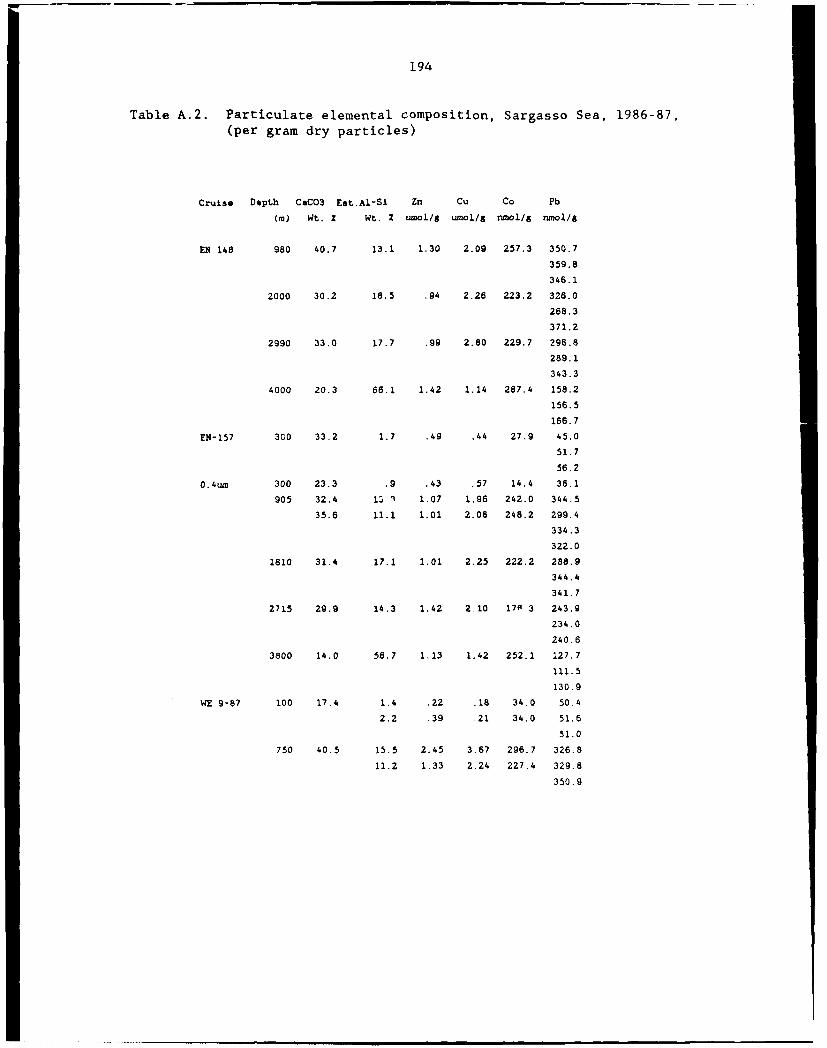
194
Table A.2. Particulate elemental composition, Sargasso Sea, 1986-87,(per gram dry particles)
Cruise Depth CaCO3 Est.AI-Si Zn Cu Co Pb
(m) Wt. 2 Wt. Z umoll umol/g nmoll/ nmol/l
EN 148 980 40.7 13.1 1.30 2.09 257.3 350.7
359.8
346.1
2000 30.2 18.5 .94 2.26 223.2 326.0
268.3
371.2
2990 33.0 17.7 .99 2.80 229.7 296.8
289.1
343.3
4000 20.3 66.1 1.42 1.14 287.4 158.2
156.5
166.7
EN-157 300 33.2 1.7 .49 .44 27.9 45.0
51.7
56.2
0.4um 300 23.3 .9 .43 .57 14.4 36.1
905 32.4 13 ' 1.07 1.96 242.0 344.5
35.6 11.1 1.01 2.06 248.2 299.4
334.3
322.0
1810 31.4 17.1 1.01 2.25 222.2 288.9
344.4
341.7
2715 29.9 14.3 1.42 2.10 179 3 243.9
234.0
240.6
3800 14.0 56.7 1.13 1.42 252.1 127.7
111.5
130.9
WE 9-87 100 17.4 1.4 .22 .18 34.0 50.4
2.2 .39 .21 34.0 51.6
51.0
750 40.5 15.5 2.45 3.67 296.7 326.8
11.2 1.33 2.24 227.4 329.8
350.9
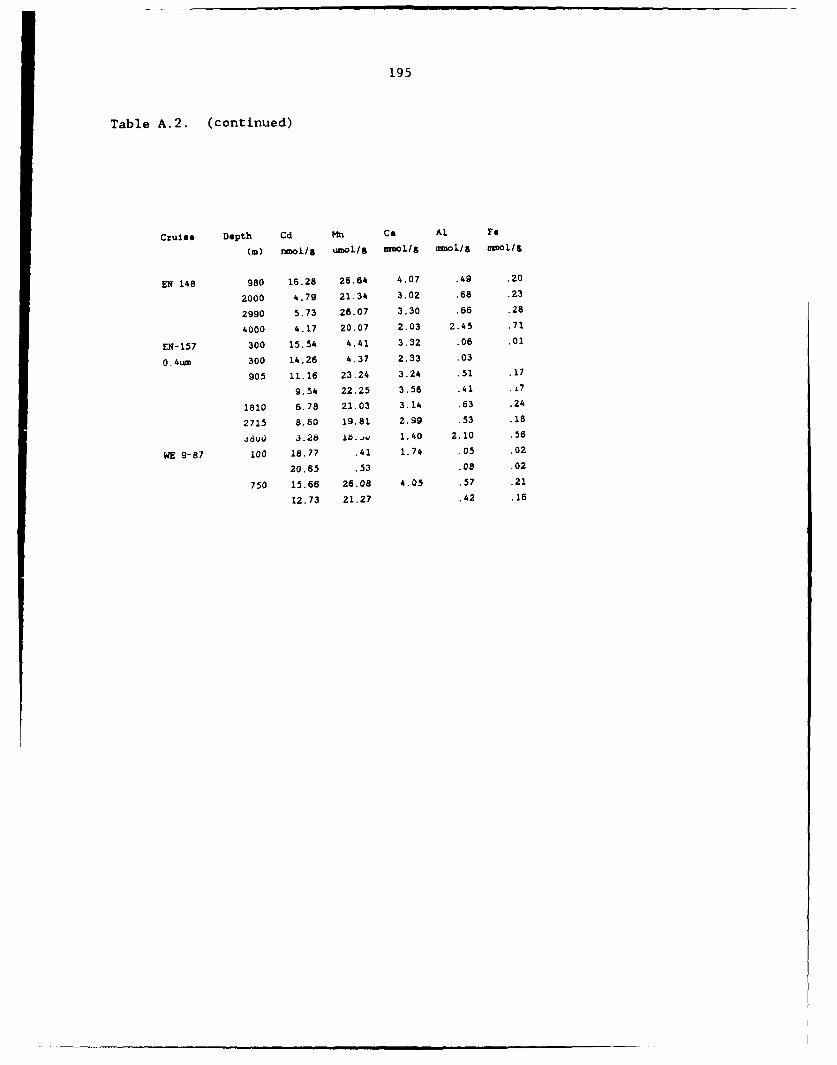
195
Table A.2. (continued)
Cruise Depth Cd tbn Ca Al Fe
(W) nmol/g umo1/o nuo/a Mnal/6 MMoL/S
EN 148 980 16.28 26.64 4.07 .49 .20
2000 4.79 21.34 3.02 .68 .23
2990 5.73 26.07 3.30 .66 .28
4000 4.17 20.07 2.03 2.45 .71
EN-157 300 15.54 4.41 3.32 .06 .01
0.4um 300 14.26 4,37 2.33 .03
905 11.16 23.24 3.24 .51 .17
9.54 22.25 3.56 .41 .47
1810 6.78 21.03 3.14 .63 .24
2715 8.60 19.81 2.99 .53 .18
JauJ 3.26 1b.. 1.40 2.10 .56
WE 9-87 100 18.77 .41 1.74 .05 .02
20.65 .53 .08 .02
750 15.66 26.08 4.05 .57 .21
12.73 21.27 .42 .16
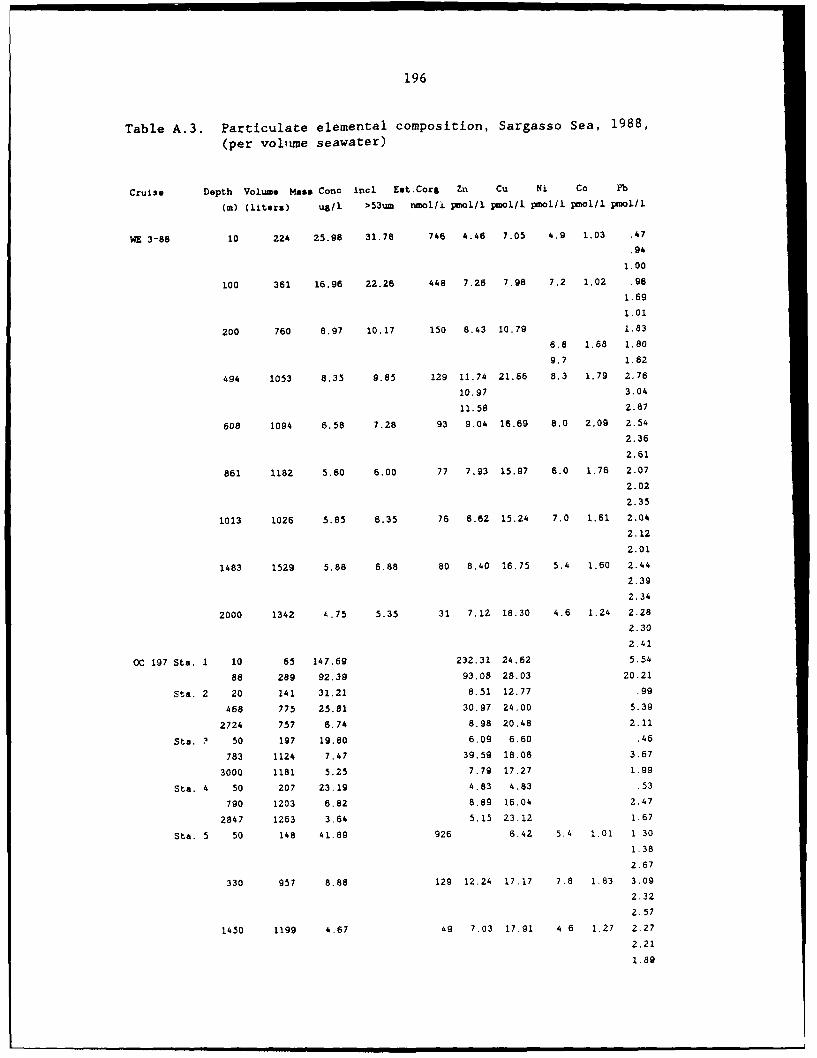
196
Table A.3. Particulate elemental composition, Sargasso Sea, 1988,
(per voliuve seawater)
Cruise Depth Volume Mass Conc incl Est.Cors Zn Cu Ni Co Pb
m) (liters) usl. >53um nMol/I pmolI pmo/I pmol l pmol/ pmolI
WE 3-88 10 224 25.98 31.78 746 4.46 7.05 4.9 1.03 .47.94
1.00
100 361 16.96 22.26 448 7.26 7.98 7.2 1.02 .96
1.69
1.01
200 760 8.97 10.17 150 8.43 10.79 1.83
6.8 1.68 1.80
9.7 1.62
494 1053 8.35 9.85 129 11.74 21.66 8.3 1.79 2.76
10.97 3.04
11.58 2.87
608 1094 6.58 7.28 93 9.04 16.69 8.0 2.09 2.54
2.36
2.61
861 1182 5.60 6.00 77 7.93 15.97 6.0 1.76 2.07
2.02
2.35
1013 1026 5.85 6.35 76 6.62 15.24 7.0 1.61 2.04
2.12
2.01
1483 1529 5.88 6.88 80 8.40 16.75 5.4 1.60 2.44
2.39
2.34
2000 1342 4.75 5.35 31 7.12 18.30 4.6 1.24 2.28
2.30
2.41
OC 197 Sta. 1 10 65 147.69 232.31 24.62 5.54
88 289 92.39 93.08 28.03 20.21
Sta. 2 20 141 31.21 8.51 12.77 .99
468 775 25.81 30.97 24,00 5.39
2724 757 6.74 8.98 20.48 2.11
Sta. ? 50 197 19.80 6.09 6.60 .46
783 1124 7.47 39.59 18.06 3.67
3000 1181 5.25 7.79 17.27 1.99
Ste. 4 50 207 23.19 4.83 4.83 .53
790 1203 6.82 8.89 16.04 2.47
2847 1263 3.64 5.15 23.12 1.67
Sta. 5 50 148 41.89 926 6.42 5.4 1.01 1,30
1.38
2.67
330 957 8.88 129 12.24 17.17 7.8 1.83 3.09
2.32
2.57
1450 1199 4.67 49 7.03 17.91 4.6 1.27 2.27
2.21
1.89
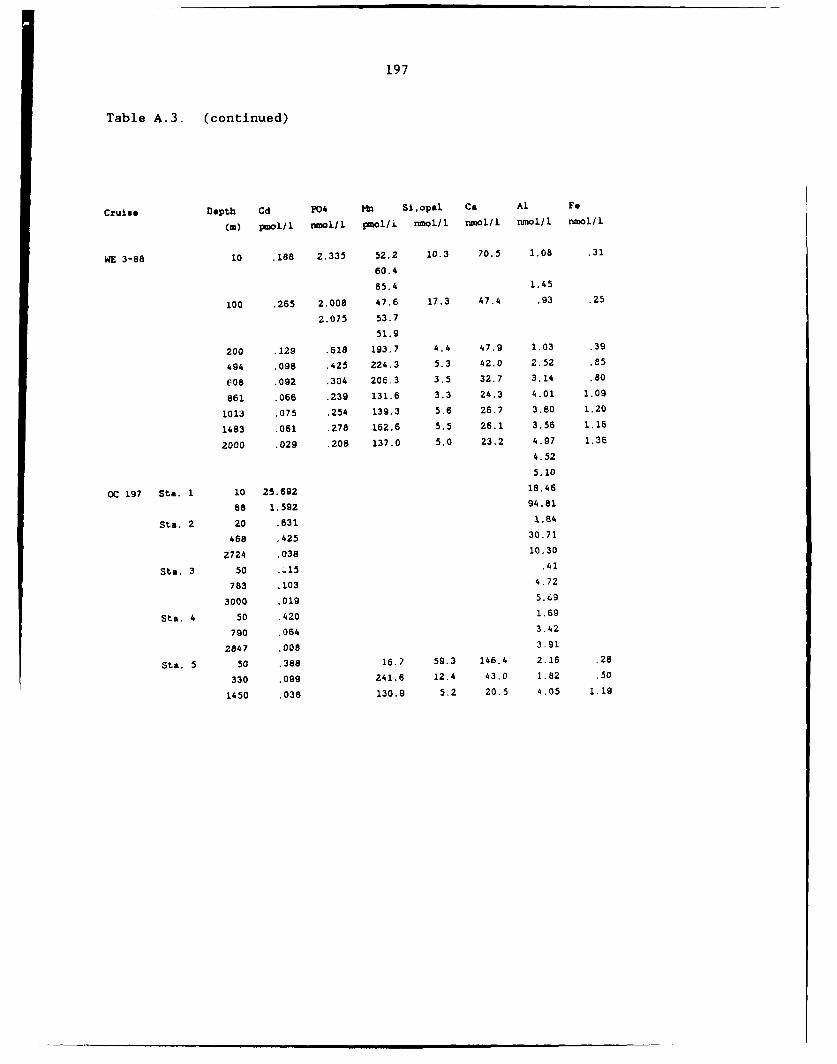
197
Table A.3. (continued)
Cruise Depth Cd P04 mn SLopal Ca Al Fe
W(m) I pm l m ol/l i li o11 1 nmo111 nmolll r u rnol/l
WE 3-88 10 .188 2.335 52.2 10.3 70.5 1.08 .31
60.4
65.4 1.45
100 .265 2.008 47.6 17.3 47.4 .93 .25
2.075 53.7
51.9
200 .129 .518 193.7 4.4 47.9 1.03 .39
494 .098 .425 224.3 5.3 42.0 2.52 .85
C08 .092 .304 206.3 3.5 32.7 3.14 .80
861 .066 .239 131.6 3.3 24.3 4.01 1.09
1013 .075 .254 139.3 5.6 26.7 3.60 1.20
1483 .061 .278 162.6 5.5 26.1 3.56 1.16
2000 .029 .208 137.0 5.0 23.2 4.97 1.36
4.52
5.10
OC 197 Sta. 1 10 25.692 18.46
88 1.592 94.81
Sta. 2 20 .631 1.84
468 .425 30.71
2724 .038 10.30
Sta. 3 50 .-15 .41
783 .103 4.72
3000 .019 5.69
Sta. 4 50 .420 1.69
790 .064 3.42
2847 .008 3.91
Sta. 5 50 .388 16.7 59.3 146.4 2.16 .28
330 .099 241.6 12.4 43.0 1.82 .50
1450 .038 130.9 5.2 20.5 4.05 1.19
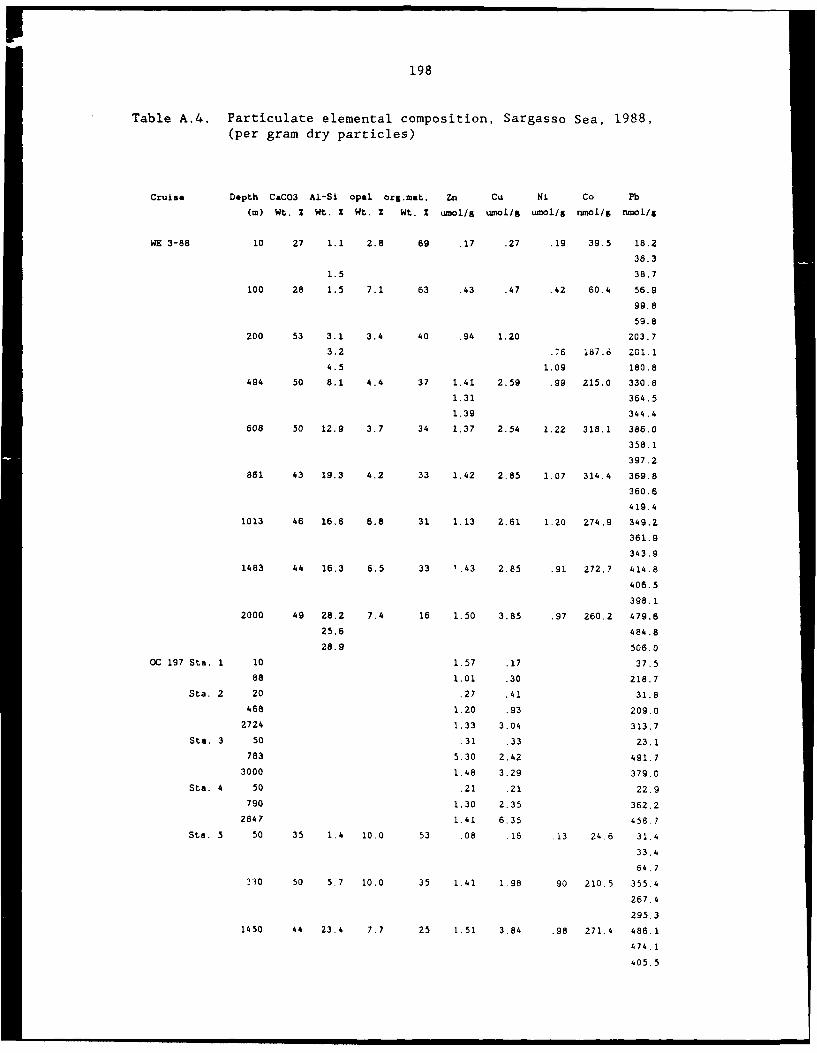
198
Table A.4. Particulate elemental composition, Sargasso Sea, 1988,(per gram dry particles)
Cruise Depth CaCO3 Al-Si opal org.mat. Zn Cu Ni Co Pb
(m) Wt. 2 Wt. z Wt. X Wt. X umollg umoll/ umol/8 rmol/g nznol/6
WE 3-88 10 27 1.1 2.8 69 .17 .27 .19 39.5 18.2
36.3
1.5 38.7
100 28 1.5 7.1 63 .43 .47 .42 60.4 56.9
99.8
59.8
200 53 3.1 3.4 40 .94 1.20 203.73.2 .76 187.6 Z01.1
4.5 1.09 180.8
494 50 8.1 4.4 37 1.41 2.59 .99 215.0 330.8
1.31 364.5
1.39 344.4
608 50 12.9 3.7 34 1.37 2.54 1.22 318.1 386.0
358.1
397.2
861 43 19.3 4.2 33 1.42 2.85 1.07 314.4 369.8
360.6
419.4
1013 46 16.6 6.8 31 1.13 2.61 1.20 274.9 349.2
361.9
343.9
1483 44 16.3 6.5 33 1.43 2.85 .91 272.7 414.8
406.5
398.1
2000 49 28.2 7.4 16 1.50 3.85 .97 260.2 479.6
25.6 484.8
28.9 506.0
OC 197 Sta. 1 10 1.57 .17 37.5
88 1.01 .30 218.7
Sta. 2 20 .27 .41 31.8
468 1.20 .93 209.0
2724 1.33 3.04 313.7
Sta. 3 50 .31 .33 23,1
783 5.30 2.42 491.7
3000 1.48 3.29 379.0
Sta. 4 50 .21 .21 22.9
790 1.30 2.35 362.2
2847 1.41 6.35 458.7
Sta. 5 50 35 1.4 10.0 53 .08 .16 .13 24.6 31.4
33. 4
64.7330 50 5.7 10.0 35 1.41 1.98 90 210.5 355.4
267.4
295.3
1450 44 23.4 7.7 25 1.51 3.84 .98 271.4 486.1
474.1
405.5
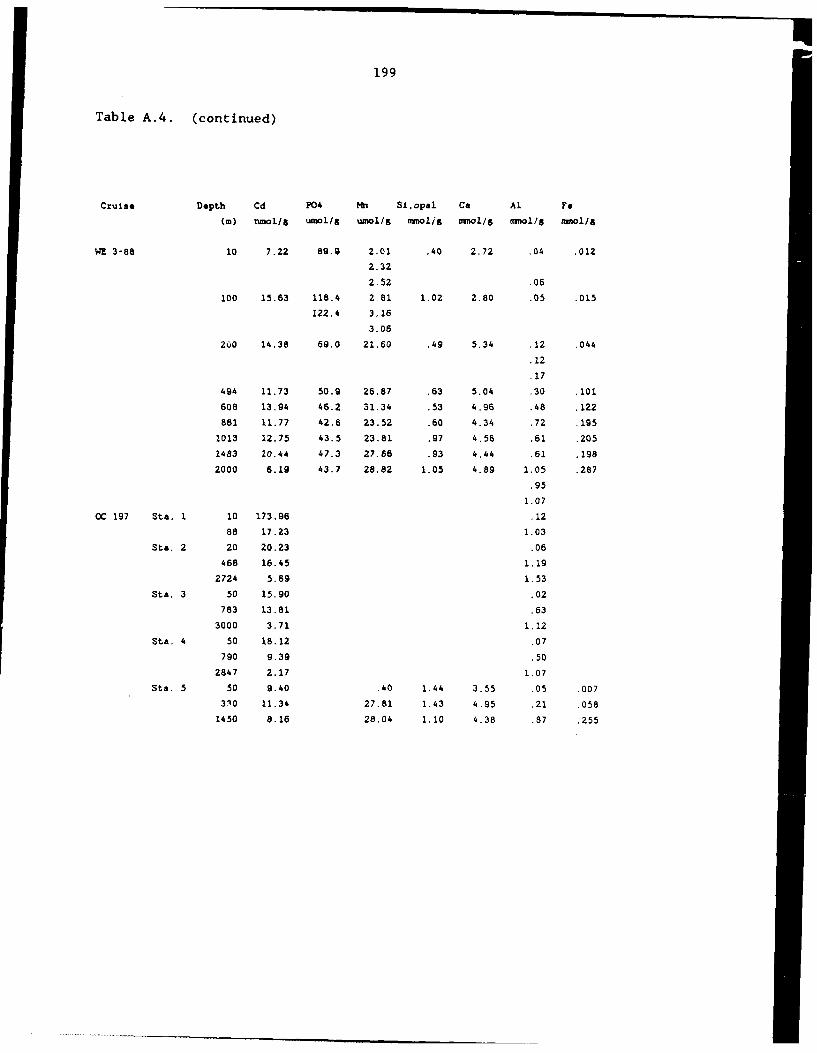
199
Table A.4. (continued)
Cruise Depth Cd P04 mIt Siopal Ca Al Fe
(W) rnol/ umolI/ umo1/5 molis mmoL/S rmuoll/ nhnoll/
WE 3-88 10 7.22 89.9 2.01 .40 2.72 .04 .012
2.32
2.52 .06
100 15.63 118.4 2.81 1.02 2.80 .05 .015
122.4 3.16
3.08
200 14.38 69.0 21.60 .49 5,34 .12 .044
.12
.17
494 11.73 50.9 26.87 .63 5.04 .30 .101
608 13.94 46.2 31.34 .53 4.96 .48 .122
861 11.77 42.6 23.52 .60 4.34 .72 .195
1013 12.75 43.5 23.81 .97 4.56 .61 .205
1483 10.44 47.3 27.66 .93 4.44 .61 .198
2000 6.19 43.7 28.82 1.05 4.89 1.05 .287
.95
1.07
OC 197 Sta. 1 10 173.96 .12
88 17.23 1.03
Sta. 2 20 20.23 .06
468 16.45 1.19
2724 5.69 1.53
Sta. 3 50 15.90 .02
783 13.81 .63
3000 3.71 1.12
Sta. 4 50 18.12 .07
790 9.39 .50
2847 2.17 1.07
Sta. 5 50 9.40 .40 1.44 3.55 .05 .007
330 11.34 27.81 1.43 4.95 .21 .058
1450 8.16 28.04 1.10 4.38 .87 .255
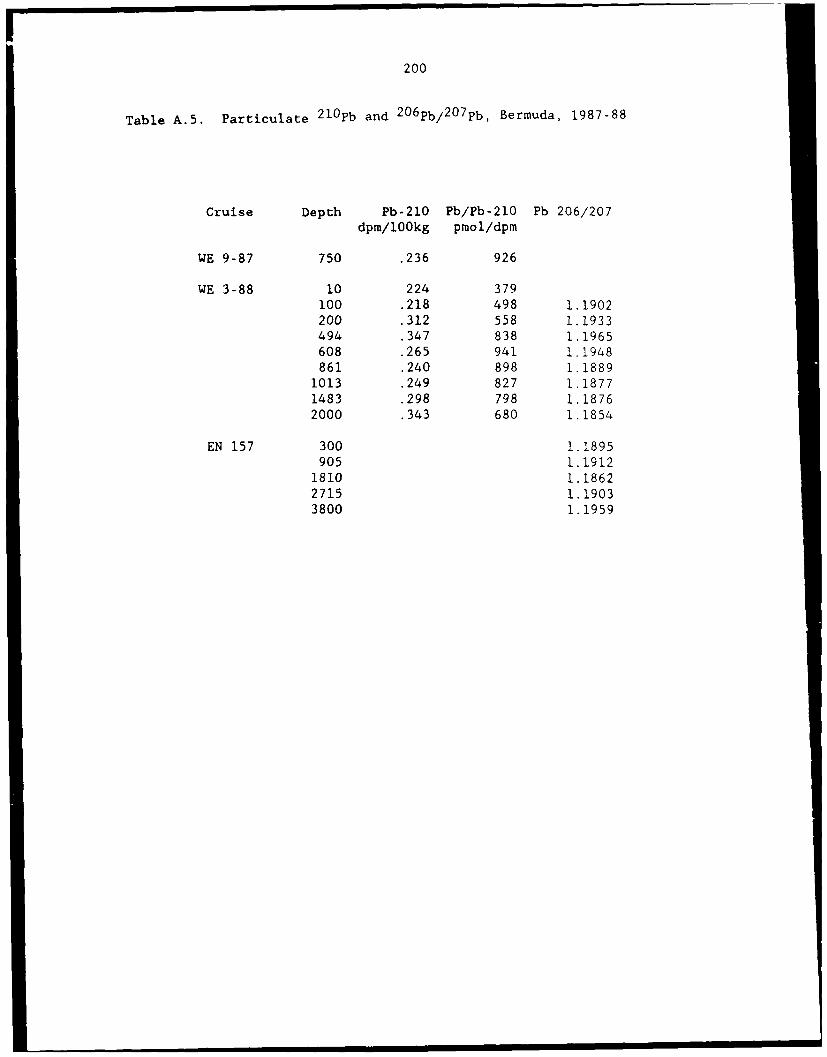
200
Table A.5. Particulate 2 10 Pb and 20 6Pb/ 20 7pb, Bermuda, 1987-88
Cruise Depth Pb-210 Pb/Pb-210 Pb 206/207dpm/lOOkg pmol/dpm
WE 9-87 750 .236 926
WE 3-88 10 224 379
100 .218 498 1.1902
200 .312 558 1.1933494 .347 838 1.1965
608 .265 941 1.1948
861 .240 898 1.18891013 .249 827 1.1877
1483 .298 798 1.1876
2000 .343 680 1.1854
EN 157 300 1.1895905 1.1912
1810 1.1862
2715 1.19033800 1.1959
201
APPENDIX B
Northeast Pacific station: suspended particulate
and hydrographic data
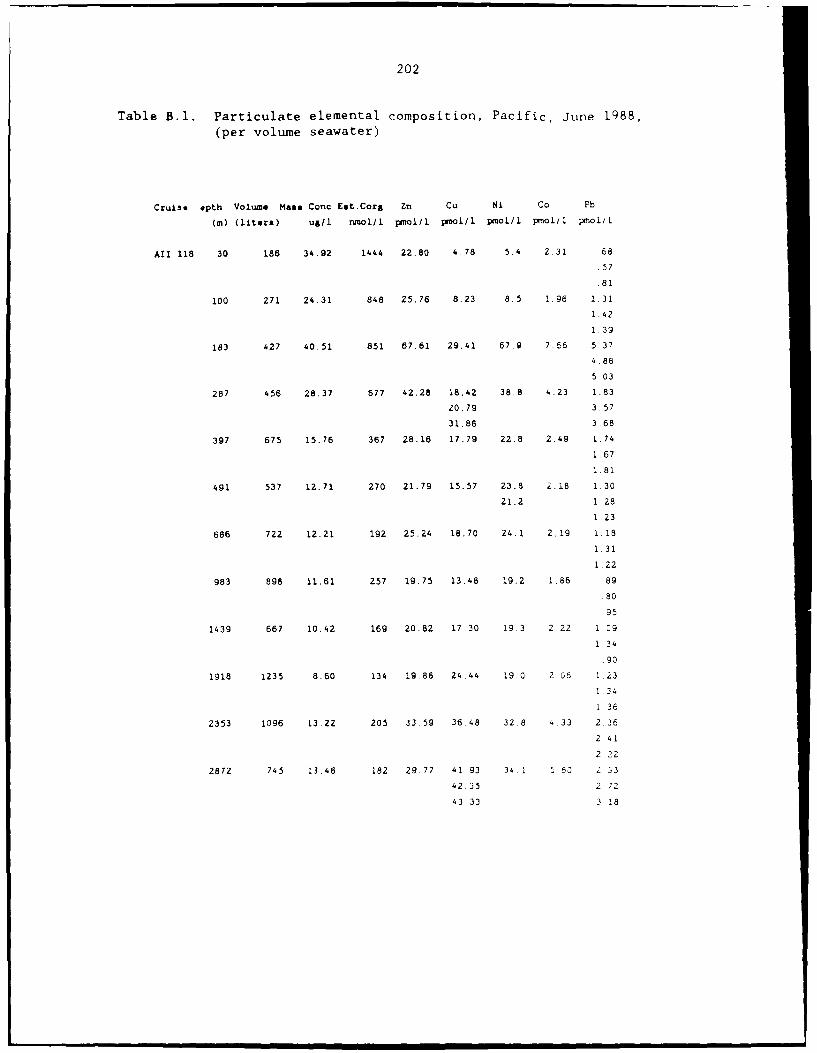
202
Table B.1. Particulate elemental composition, Pacific, June 1988,
(per volume seawater)
Cruise epth Volume Mass Conc Est.Cors Zn Cu Ni Co Pb
(W) (liters) uS/g nmol/l pmal/ pmol/1 o1/I pmol/I pmoili
AII 118 30 186 34.92 1444 22.80 4.78 5.4 2.31 68
.57
.81
100 271 24.31 848 25.76 8.23 8.5 1.96 1.31
1.42
1,39
183 427 40.51 851 67.61 29.41 67.9 7.66 5 37
4.88
5 03
287 456 28.37 677 42.28 18.42 38.8 4.23 1.83
20.79 3.57
31.86 3.68
397 675 15.76 367 28.16 17.79 22.8 2,49 1.74
1,67
1.81
491 537 12.71 270 21.79 15.57 23.8 ;.18 1.30
21.2 1.28
1.23
686 722 12.21 192 25.24 18.70 24.1 2.19 1.18
1.31
1.22
983 896 11.61 257 19.75 13.46 19.2 1.86 89
80
95
1439 667 10.42 169 20.82 17.30 19 3 2 22 1.09
1,34
.90
1918 1235 8.60 134 19.86 24.44 19.0 2 06 1.23
1.34
1 36
2353 1096 13.22 205 33.59 36.48 32.6 4 33 2 36
2 41
2 22
2872 745 13.46 182 29.77 41 93 34.1 5 60 2 j3
42.35 2 72
43.33 3 18
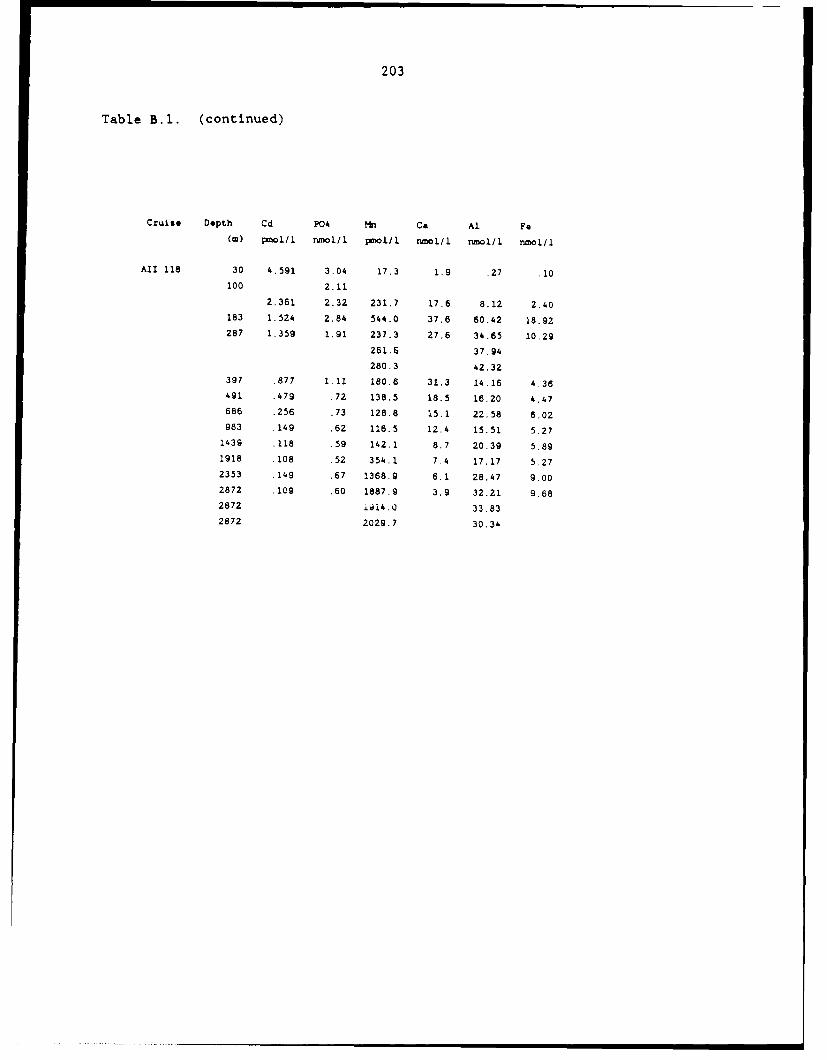
203
Table B.l. (continued)
Cruise Depth Cd P04 mn Ca Al Fem) pDo.Ii nmol/1 PMo/31 nmol/1 nmoll/. nmol/l
All 118 30 4.591 3.04 17.3 1.9 .27 .10
100 2.11
2.361 2.32 231.7 17.6 8.12 2.40183 1.524 2.84 544.0 37.6 60.42 18.92
287 1.359 1.91 237.3 27.6 34.65 10.29
261.6 37.94
280.3 42.32397 .877 1.11 180.6 31.3 14.16 4.36491 .479 .72 138.5 18.5 16.20 4.47
686 .256 .73 128.8 15.1 22.58 6.02983 .149 .62 116.5 12.4 15.51 5.27
1439 .118 .59 142.1 8.7 20.39 5.89
1918 .108 .52 354.1 7.4 17.17 5.272353 .149 .67 1368.9 6.1 28.47 9.00
2872 .109 .60 1887.9 3.9 32.21 9.682872 ±i!4.0 33.83
2872 2029.7 30.3'

204
Table B.2. Particulate elemental composition, Pacific, June 1988,(per gram dry particles)
Cruise Depth CaCO3 Est.AI-Si Est. Orgm Zn Cu Ni Co Pb
(M) Wt. 2 Wt. I Wt. Z mol1/g umol/g umoll/ nmol/& nxollg
All 118 30 .5 .2 99.3 .65 .14 .15 66.2 19.6
16.3
23.2100 7.3 9.0 83.7 1.06 .34 .35 80.5 53.7
58.5
57.4183 9.3 40.3 50.4 1.67 .73 1.68 189.1 132.6
120.5
124. 1
287 9.7 33.0 57.3 1.49 .65 1.37 149.2 64.6
36.1 63.9 .73 125.940.3 59.7 1.12 129.7
397 19.9 24.3 55.9 1.79 1.13 1.45 157.9 110.6
105.6
115.0
491 14.6 34.4 51.0 1.71 1.22 1.87 171.4 102.1
1.67 100.8
97.1686 12.3 49.9 37.7 2.07 1.53 1.97 179.3 96.8
107.5
100.1983 10.7 36.1 53.2 1.70 1.16 1.65 160.6 76.8
69.0
81.81439 8.3 52.8 38.8 2.00 1.66 1.86 212.9 105.0
128.7
86.31918 8.7 53.9 37.4 2.31 2.84 2.21 239.2 143.4
155.6
158.0
2353 4.7 58.1 37.2 2.54 2.76 2.48 327.8 178.5
182. 4
167.9
2872 2.9 64.6 32.4 2.21 3.12 2.53 416.0 217.5
67.9 32.1 3.15 202.0
60.9 39.1 3.22 236.6
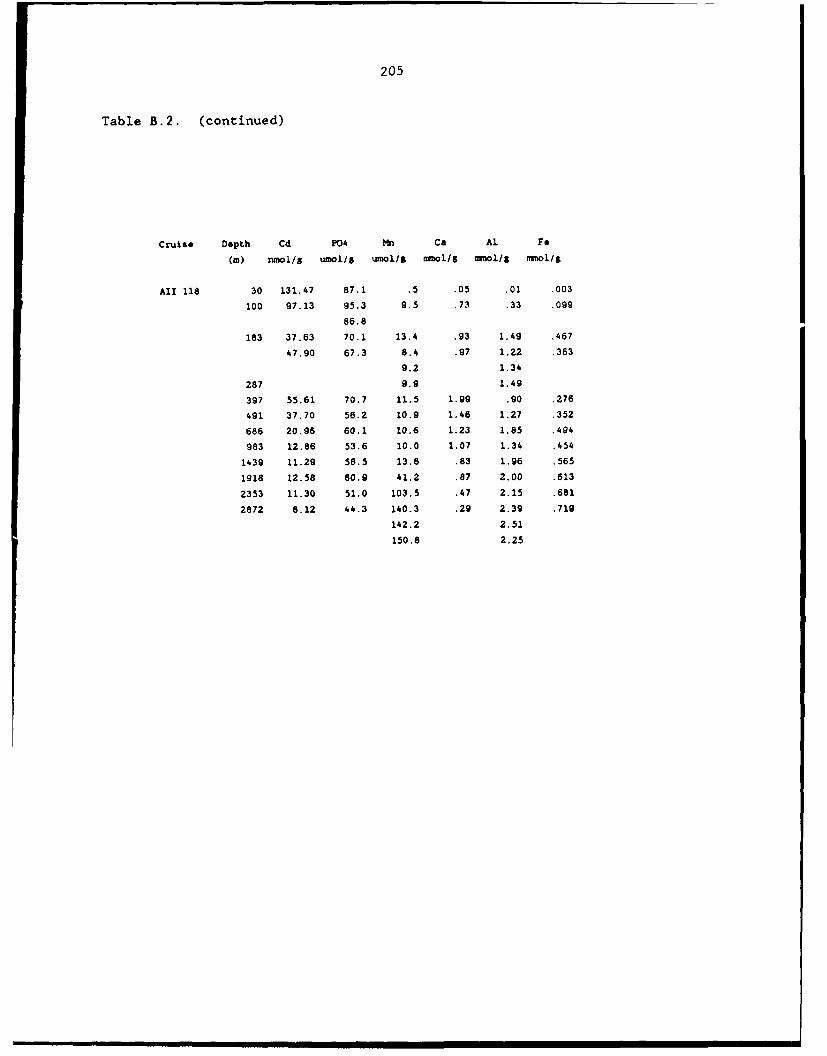
205
Table B.2. (continued)
Cruise Depth Cd P04 n Ca Al Fe
(M) nmol/S UMol/3 , l/5 awol/& mmoI/S mmoI/8
AII 118 30 131.47 87.1 .5 .05 .01 .003
100 97.13 95.3 9.5 .73 .33 .099
86.8
183 37.63 70.1 13.4 .93 1.49 .467
47.90 67.3 8.4 .97 1.22 .363
9.2 1.34
287 9.9 1.49
397 55.61 70.7 11.5 1.99 .90 .276
491 37.70 58.2 10.9 1.46 1.27 .352
686 20.96 60.1 10.6 1.23 1.85 .494
983 12.86 53.6 10.0 1.07 1.34 .454
1439 11.29 56.5 13.6 .83 1.96 .565
1918 12.58 60.9 41.2 .87 2.00 .613
2353 11.30 51.0 103.5 .47 2.15 .681
2872 8.12 44.3 140.3 .29 2.39 .719
142.2 2.51
150.8 2.25
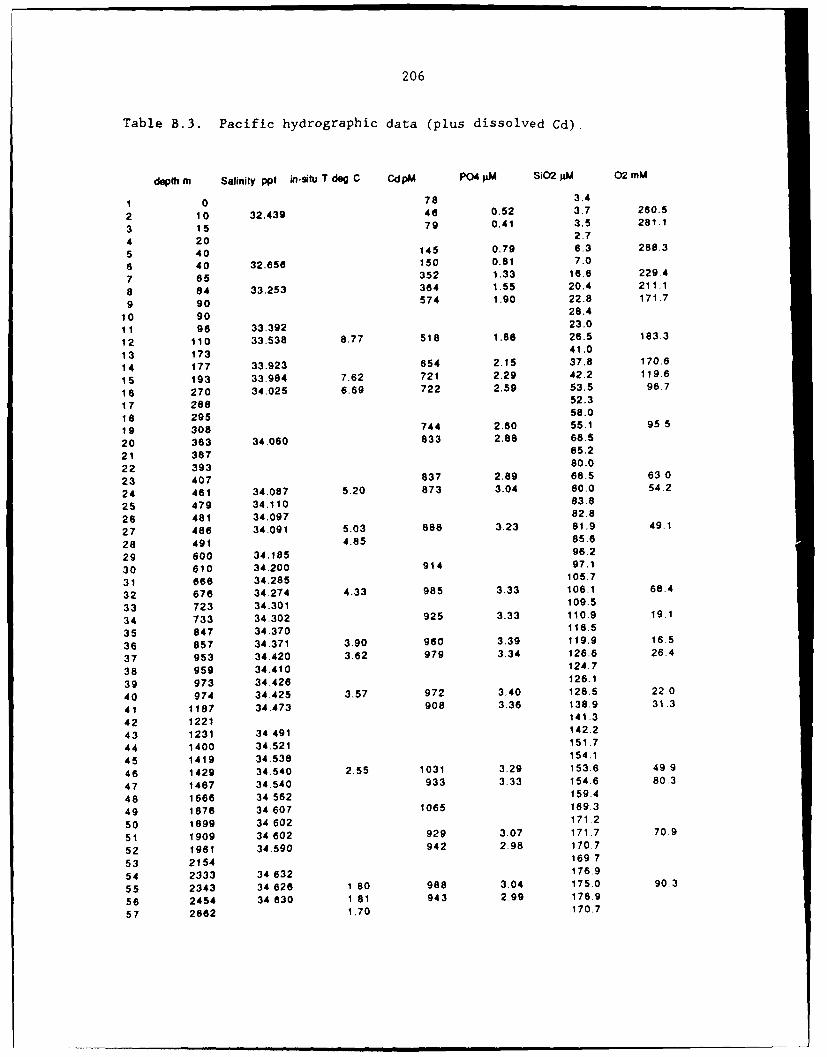
206
Table B.3. Pacific hydrographic data (plus dissolved Cd).
depth m Salinity ppt in-stu T deg C CdpM P04 jM SiO2 jIM 02 mM
1 0 78 3.4
2 10 32.439 46 0.52 3.7 260.5
3 15 79 0.41 3.5 281.1
4 20 2.7
5 40 145 0.79 6.3 288.3
6 40 32.656 150 0.81 7.0
7 65 352 1.33 16.6 229.4
8 84 33.253 364 1.55 20.4 211.1
9 90 574 1.90 22.8 171.7
10 90 28.4
11 96 33.392 23.0
12 110 33.538 8.77 518 1.86 26.5 183.3
13 173 41.0
14 177 33.923 654 2.15 37.8 170.6
15 193 33.984 7.62 721 2.29 42.2 119.6
16 270 34.025 6.69 722 2.59 53.5 96.7
17 288 52.3
18 295 58.0
19 308 744 2.60 55.1 95.5
20 363 34.060 833 2.88 68.5
21 387 65.2
22 393 80.0
23 407 837 2.89 68.5 63.0
24 461 34.087 5.20 873 3.04 80.0 54.2
25 479 34.110 83.8
26 481 34.097 82.8
27 486 34.091 5.03 888 3.23 81.9 49.1
28 491 4.85 85.6
29 600 34.185 96.2
30 610 34.200 914 97.1
31 666 34.285 105.7
32 676 34.274 4.33 985 3.33 106.1 68.4
33 723 34.301 109.5
34 733 34.302 925 3.33 110.9 19.1
35 847 34.370 118.5
36 857 34.371 3.90 960 3.39 119.9 16.5
37 953 34.420 3.62 979 3.34 126.6 26.4
38 959 34.410 124.7
39 973 34.426 126.1
40 974 34.425 3.57 972 3.40 128.5 22.0
41 1187 34.473 908 3.36 138.9 31.3
42 1221 141.3
43 1231 34.491 142.2
44 1400 34.521 151.7
45 1419 34.538 154.1
46 1429 34.540 2.55 1031 3.29 153.6 49 9
47 1467 34.540 933 3.33 154.6 80.3
48 1666 34.562 159.4
49 1876 34 607 1065 169.3
50 1899 34 602 171.2
51 1909 34,602 929 3.07 171,7 70.9
52 1961 34,590 942 2.98 170.7
53 2154 169.7
54 2333 34 632 176.9
55 2343 34 626 1 80 988 3.04 175.0 90.3
56 2454 34.630 1 81 943 2.99 176.9
57 2862 1.70 170.7
207
APPENDIX C
Analyses of filter rinsing solutions (Zn and Cd): Bermuda and NortheastPacific stations
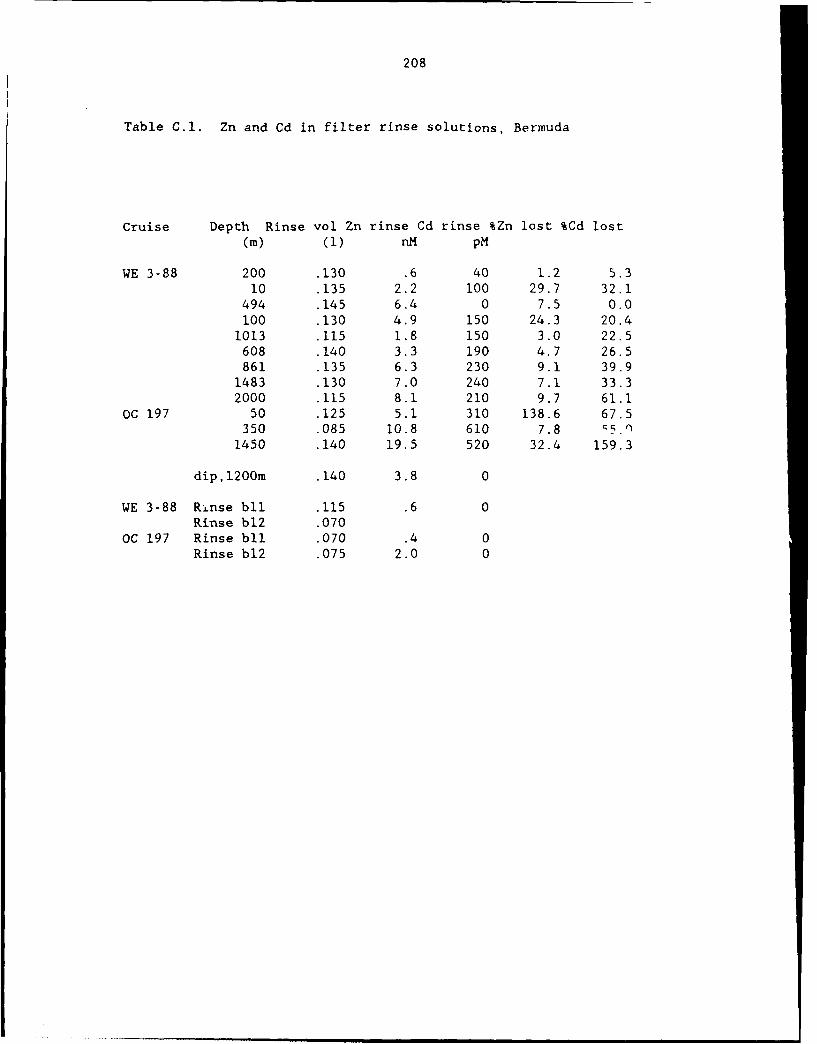
208
Table C.l. Zn and Cd in filter rinse solutions, Bermuda
Cruise Depth Rinse vol Zn rinse Cd rinse %Zn lost %Cd lost(m) (1) nM pM
WE 3-88 200 .130 .6 40 1.2 5.310 .135 2.2 100 29.7 32.1
494 .145 6.4 0 7.5 0.0100 .130 4.9 150 24.3 20.4
1013 .115 1.8 150 3.0 22.5608 .140 3.3 190 4.7 26.5861 .135 6.3 230 9.1 39.9
1483 .130 7.0 240 7.1 33.32000 .115 8.1 210 9.7 61.1
OC 197 50 .125 5.1 310 138.6 67.5350 .085 10.8 610 7.8 5.
1450 .140 19.5 520 32.4 159.3
dip,1200m .140 3.8 0
WE 3-88 Rinse bll .115 .6 0Rinse b12 .070
OC 197 Rinse bll .070 .4 0Rinse b12 .075 2.0 0
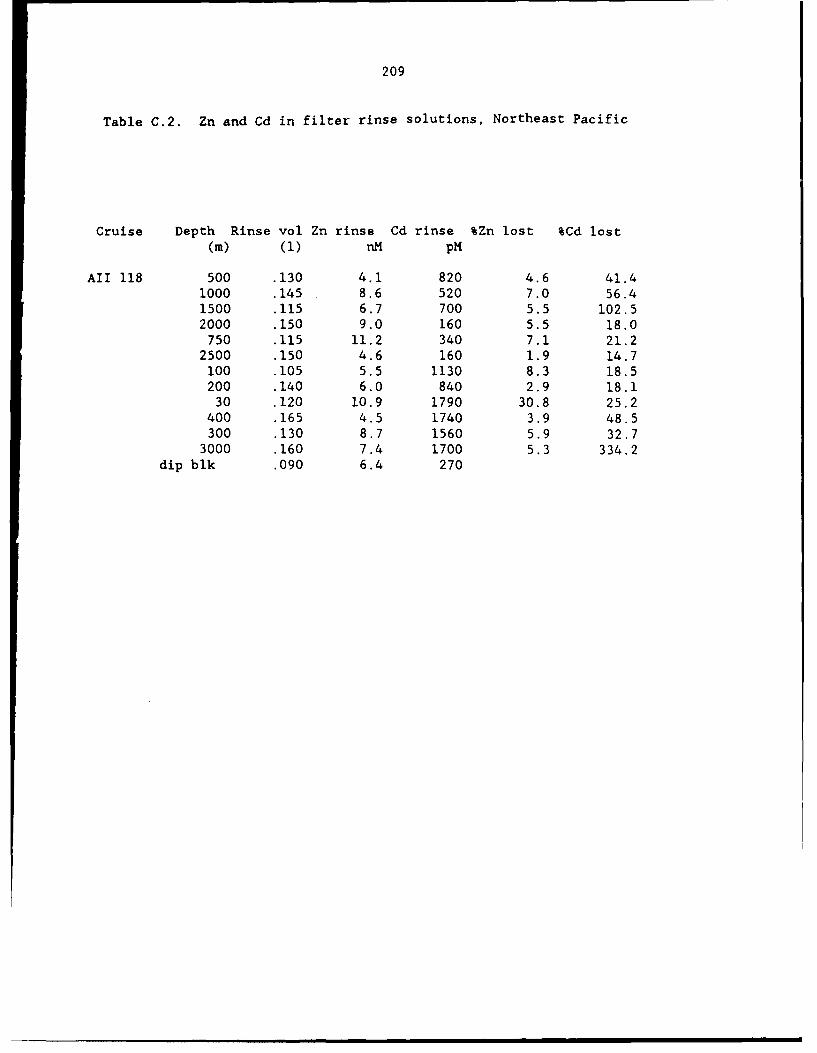
209
Table C.2. Zn and Cd in filter rinse solutions, Northeast Pacific
Cruise Depth Rinse vol Zn rinse Cd rinse %Zn lost %Cd lost(M) (1) nM pM
AII 118 500 .130 4.1 820 4.6 41.41000 .145 8.6 520 7.0 56.41500 .115 6.7 700 5.5 102.52000 .150 9.0 160 5.5 18.0750 .115 11.2 340 7.1 21.2
2500 .150 4.6 160 1.9 14.7100 .105 5.5 1130 8.3 18.5200 .140 6.0 840 2.9 18.130 .120 10.9 1790 30.8 25.2
400 .165 4.5 1740 3.9 48.5300 .130 8.7 1560 5.9 32.7
3000 .160 7.4 1700 5.3 334.2dip blk .090 6.4 270
210
APPENDIX D
TAG hydrothermal aiea: particulate data
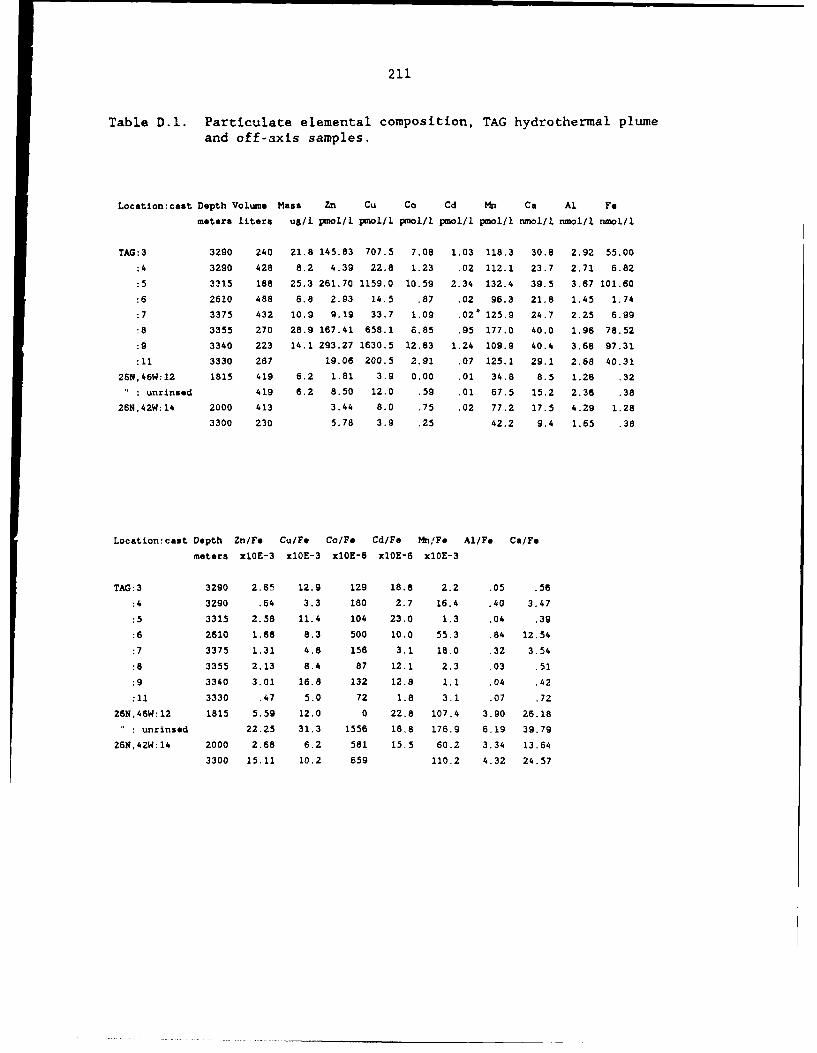
211
Table D.l. Particulate elemental composition, TAG hydrothermal plumeand off-axis samples.
Location:cast Depth Volume Mass Zn Cu Co Cd Mn Ca Al Fe
motors liters ug/l pmol/l pmol/l pmol/1 pmol/l moll/l nrmol/ nmol/l nrol/l
TAG:3 3290 240 21.8 145.83 707.5 7.08 1.03 118.3 30.8 2.92 55.00
:4 3290 428 8.2 4.39 22.8 1.23 .02 112.1 23.7 2.71 6.82
:5 3Z15 188 25.3 261.70 1159.0 10.59 2.34 132.4 39.5 3.67 101.60
:6 2610 488 6.8 2.93 14.5 .87 .02 96.3 21.8 1.45 1.74
:7 3375 432 10.9 9.19 33.7 1.09 .02' 125.9 24.7 2.25 6.99
:8 3355 270 28.9 167.41 658.1 6.85 .95 177.0 40.0 1.96 78.52
:9 3340 223 14.1 293.27 1630.5 12.83 1.24 109.9 40.4 3.68 97.31
:11 3330 287 19.06 200.5 2.91 .07 125.1 29.1 2.68 40.31
26N,46W:12 1815 419 6.2 1.81 3.9 0.00 .01 34.8 8.5 1.26 .32unrinsed 419 6.2 8.50 12.0 .59 .01 67.5 15.2 2.35 .38
26N,42W:14 2000 413 3.44 8.0 .75 .02 77.2 17.5 4.29 1.28
3300 230 5.78 3.9 .25 42.2 9.4 1.65 .38
Location:cast Depth Zn/Fe Cu/Fe Co/Fe Cd/Fe Mn/Fo Al/Fe Ca/Fe
meters xlOE-3 xlOE-3 xlOE-6 xlOE-6 xlOE-3
TAG:3 3290 2.65 12.9 129 18.8 2.2 .05 .56
:4 3290 .64 3.3 180 2.7 16.4 .40 3.47
:5 3315 2.58 11.4 104 23.0 1.3 .04 .39
:6 2610 1.68 8.3 500 10.0 55.3 .84 12.54
:7 3375 1.31 4.8 156 3.1 18.0 .32 3.54
:8 3355 2.13 8.4 87 12.1 2.3 .03 .51
:9 3340 3.01 16.8 132 12.8 1.1 .04 .42
:11 3330 .47 5.0 72 1.8 3.1 .07 .72
26N,46W:12 1815 5.59 12.0 0 22.8 107.4 3.90 26.18
: unrinsed 22.25 31.3 1556 18.8 176.9 6.19 39.79
26N,42W:14 2000 2.68 6.2 581 15.5 60.2 3.34 13.64
3300 15.11 10.2 659 110.2 4.32 24.57
DOCU ENT LIBRARYJuly 5, 1989
Distribution List for Technical Report Exchange
Attn: Stella Sanchez-Wade Director, Ralph M. Parsons LaboratoryDocuments Section Room 48-311Scripps Institution of Oceanography MITLibrary, Mail Code C-075C Cambridge, MA 02139La Jolla, CA 92093 Marine Resources Information Center
Hancock Library of Biology & Building E38-320Oceanography MIT
Alan Hancock Laboratory Cambridge, MA 02139University of Southern California LibraryUniversity Park Lamont-Doherty GeologicalLos Angeles, CA 90089-0371 O toryObservatory
Gifts & Exchanges Colombia UniversityLibrary Palisades, NY 10964Bedford Institute of Oceanography LibraryP.O. Box 1006 LiaryDartmouth, NS, B2Y 4A2, CANADA Serials DepartmentOregon State University
Office of the International Corvallis, OR 97331Ice Patrol
co Coast Guard R & D Center Pell Marine Scienee LibraryAvery Point University of Rhode Island
Groton, CT 06340 Narragansett Bay CampusNarragansett, RI 02882
Library Working CollectionPhysical Oceanographic Laboratory Texas A&M UniversityNova University Dept. of Unography8000 N. Ocean Drive Dept. of OceanographyDania, FL 33304 College Station, TX 77843
NOAA/NESDIS Miami Library Center Library4301 Rickenbacker Causeway Virginia Institute of Marine ScienceMiami, FL 33149 Gloucester Point, VA 23062
Library Fisheries-Oceanography LibrarySkidaway Institute of Oceanography 151 Oceanographytoeaching Bldg.P.O. Box 13687 University of WashingtonSavannah, GA 31416 Seattle, WA 98195
Institute of Geophysics LibraryUniversity of Hawaii R.S.M.A.S.
Library Room 252 Universi of Miami2525 Correa Road 4600 Rickenbacker CausewayHonolulu, III 96822 Miami, FL 33149
Library Maury Oceanographic LibraryChesapeake Bay Institute Naval Oceanographic Office4800 Atwell Road Stennis Space CenterShady Side, MD 20876 NSTL, MS 39522-5001
MIT Libraries Marine Sciences CollectionSerial Journal Room 14E-210 Mayaguez Campus LibraryCambridge, MA 02139 University of Puerto Rico
Mayagues, Puerto Rico 00708
Mac 88- 116 16B;
50272-101
REPORT DOCUMENTATION 1. REPORT NO. 2. 3. Recipiarna Acceason No.
PAGE WHOI-89-27
4. Title and Subtitle 5. Report Date
The Trace Metal Geochemistry of Suspended Oceanic Particulate Matter August 19886.
7. Author(s) 8. Performing O'ganization Rapt. No.
Robert M. .. rrell WHOi-89-27
9. Performing Organization Name and Address 10. ProjecIakWor Unit No.
The Woods Hole Oceanographic Irt stitution 10.
Woods Hole, Massachusetts 02543, and 11- Cordracl(C) o Gramnt(G) No.
The Massachusetts Institute of Technology (C)/V0032- 6 -,r - 0 3 SZ
Cambridge, Massachusetts 02139 (G)
12. Sponsoring Organtzation Name and Address 13. Type of Report & Period Covered
The Office of Naval Research; and The National Ph.D. ThesisScience Foundation through The MassachusettsInstitute of Technology 14.
15. Supplementary Notes
This thesis should be cited as: Robert M. Sherrell, 1989. The Trace Metal Geochemistry of Suspended Oceanic ParticulateMatter. Ph.D. Thesis, MIT/WHOI, WHOI-89-27.
16. Abstract (Limit: 200 words)
Vertical profiles of suspended particulate trace metals were measured in the Sargasso Sea near Bermuda and in theCalifornia Current, northwest Pacific, using a new in situ pump. Vertical profiles of Mn, Co, Pb, Zn, Cu, and Ni (mol/l) atBermuda displayed -;,uldr features: a relative depletion in surface waters, maximum in the upper thermocline, and constantdeep water concentrations. The similarity in the vertical variations of dissolved/particulate fractionation for these metalsmay be caused by interaction of dissolved metals with authigenic Mn phases. Results of a steady-state two-box flux modelsuggests that metals associated with small particles in the deep ocean contribute less than half of the total flux observed indeep ocean sediment traps, indicating that-upper ocean processes are more important determinants of open ocean metalremoval than dissolved/partficulate interactions in the deep ocean.
Profiles of particulate Pb/ 210pb and Ipb/ 'Pb were very similar to contemporaneous seawater profiles for the sametracer ratios in the upper 2000m at Bermuda, indicating rapid isotopic equilibration relative to the residence time ofsuspended particles. Particulate metal distributions in the California Current were of the same order of magnitude as thosein the Sargasso Sea but, except for Pb, showed little relation to dissolved metal concentrations. Metal partitioning in the openocean water column varies in response to factors which are outside the predictive capability of simple chemical exchangemodels. -
17. Document hAualysid a. Deecriptors
1. metals2. particles3. adsorption -
b. Identifier/Open-Ended Terms
c. COSATI Fleld/Group
16. Availability Statement 19. Security Class (ThIs Report) 21. No. of PagesUNCLASSIFIED 211
Approved for publication; distribution unlimited. 20. Security Clas (This Page) 22. Price
(See ANSI-Z39.18) See istuctions on Reverse OPTIONAL FORM 272 (4-77)(Form "ry NTIS-35)Department of commerce


