Embed Size (px)
Citation preview
Out-of-School Immigrant Youth• • •Laura E. HillJoseph M. Hayes
Out-of-School Im
migrant Youth
Hill, H
ayesPPIC
Public Policy Institute of California
Largely hidden from public view, a subset of California’s population is also one of its most vulnerable: immigrant youth, mainly from Mexico, who have very low levels of education, some of whom never enroll in U.S. schools. These young people have few prospects for a better life even though many work hard and support families, because their English language skills are poor and they have high rates of poverty and low rates of health insurance coverage. Their situation could have reverberations for the wider California population into the future.
In Out-of-School Immigrant Youth, Laura E. Hill and Joseph M. Hayes paint a detailed portrait of this group and examine the workings of the federal Migrant Education Program (MEP), using data both from the program and from the census. The authors find that despite their many disadvantages, many out-of-school immigrant youth want to increase their English skills and levels of education. However, few educational services available to help these young out-of-school immigrants appear to actually reach them. Some youth are not eligible: The authors estimate that only 30 percent meet the MEP criteria. Of those who are eligible, MEP is able to provide services to only a fraction, and MEP is not yet able to measure its effectiveness in helping those it does serve.
Efforts are under way to improve out-of-school youth data collection, which could ultimately lead to improvements in MEP. In the long term, the authors suggest that to improve the futures of these youth, policymakers will likely need to look beyond MEP and consider both the responsibilities of schools to educate those of high school age and the ways we might better connect these young people with other educational opportunities.
Out-of-School Immigrant Youth• • •Laura E. HillJoseph M. Hayes
2007
Supported by The James Irvine Foundation
Library of Congress Cataloging-in-Publication Data Hill, Laura E., 1970– Out-of-school immigrant youth / Laura E. Hill, Joseph M. Hayes. p. cm. “Supported by the James Irvine Foundation.” Includes bibliographical references. ISBN 978-1-58213-124-5 1. Teenage immigrants—Education—California. 2. Teenage immigrants—California—Social conditions. 3. Hispanic American youth—Education—California. 4. Hispanic American youth— California—Social conditions. 5. School attendance—California. 6. Alternative education—California. I. Hayes, Joseph M. (Joseph Michael), 1969– II. James Irvine Foundation. III. Public Policy Institute of California. IV. Title. LC3732.C2H55 2007 371.826'912—dc22 2007011803
Research publications reflect the views of the authors and do not necessarily reflect the views of the staff, officers, or Board of Directors of the Public Policy Institute of California.
Copyright © 2007 by Public Policy Institute of CaliforniaAll rights reserved San Francisco, CA
Short sections of text, not to exceed three paragraphs, may be quoted without written permission provided that full attribution is given to the source and the above copyright notice is included.
PPIC does not take or support positions on any ballot measure or on any local, state, or federal legislation, nor does it endorse, support, or oppose any political parties or candidates for public office.
iii
Summary
Immigrant youth who do not attend schools in the United States fare poorly on many standard measures of well-being, such as educational attainment, English language ability, earnings, health insurance coverage, and poverty status. Most federal and state dollars spent on youth do not reach these young people because the dollars go through educational institutions they do not attend. If policymakers wish to improve the well-being of this very vulnerable young immigrant population, traditional school systems are not likely to be a place to reach them. A federal program, the Migrant Education Program (MEP), aims to serve out-of-school immigrant youth as a part of its mission, as do a few local and state programs.
This report describes the population of out-of-school immigrant youth in California and the subset of this group served by MEP. The report uses census data to describe this population and then turns to program data from two regions of California’s Migrant Education Program. These data not only help us understand educational backgrounds, socioeconomic needs, and academic goals more thoroughly than do the census data, but they also help us understand how the populations in the two regions may differ. Analyses of these data also lead us to suggest some changes to MEP for out-of-school immigrant youth, such as ways to target services, improve future data collection, and enhance program organization.
Out-of-School Immigrant Youth: Census ProfileCalifornia has nearly 265,000 out-of-school immigrant youth—young
people born abroad who are currently ages 13 to 22, who are not in school, and who have not earned either a high school diploma or general equivalency degree (GED). Over 90 percent of these young people were born in Mexico or Central America. These immigrant youth who are not in school are at a serious disadvantage relative to other foreign-born youth who are either enrolled in school or have already earned a high school diploma (or equivalent). For example, 62 percent of out-of-school immigrant youth report not being able to speak English “well” or “very
iv
well,” but the same is true for only 15 percent of in-school immigrant youth.
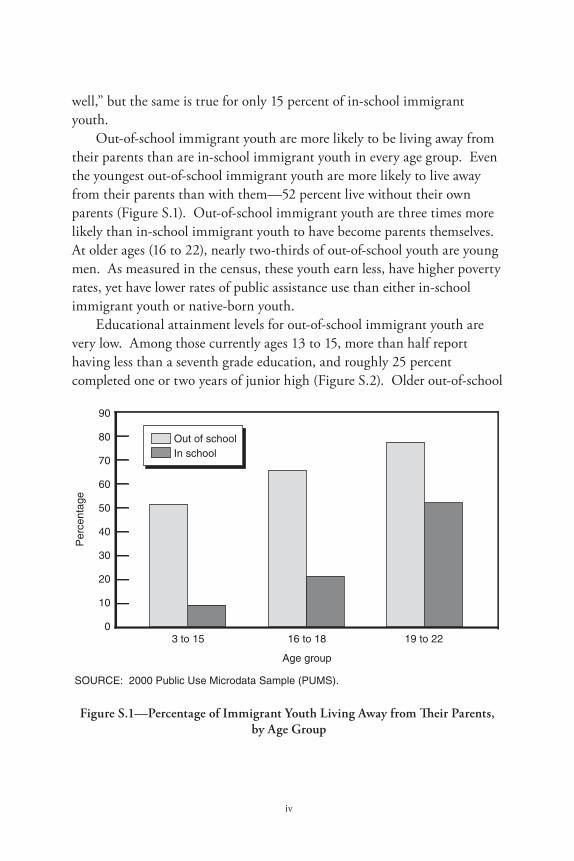
Out-of-school immigrant youth are more likely to be living away from their parents than are in-school immigrant youth in every age group. Even the youngest out-of-school immigrant youth are more likely to live away from their parents than with them—52 percent live without their own parents (Figure S.1). Out-of-school immigrant youth are three times more likely than in-school immigrant youth to have become parents themselves. At older ages (16 to 22), nearly two-thirds of out-of-school youth are young men. As measured in the census, these youth earn less, have higher poverty rates, yet have lower rates of public assistance use than either in-school immigrant youth or native-born youth.
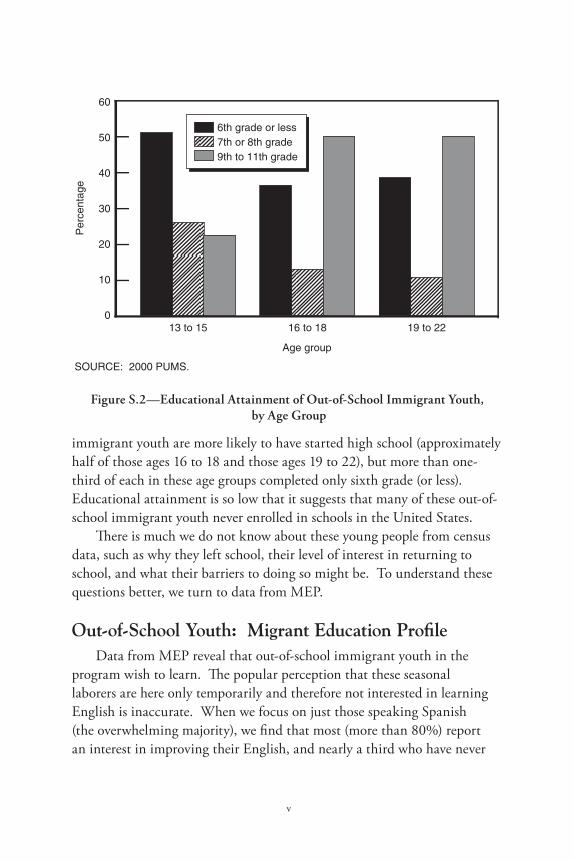
Educational attainment levels for out-of-school immigrant youth are very low. Among those currently ages 13 to 15, more than half report having less than a seventh grade education, and roughly 25 percent completed one or two years of junior high (Figure S.2). Older out-of-school
Figure S.1—Percentage of Immigrant Youth Living Away from Their Parents, by Age Group
v
Figure S.2—Educational Attainment of Out-of-School Immigrant Youth, by Age Group
immigrant youth are more likely to have started high school (approximately half of those ages 16 to 18 and those ages 19 to 22), but more than one-third of each in these age groups completed only sixth grade (or less). Educational attainment is so low that it suggests that many of these out-of-school immigrant youth never enrolled in schools in the United States.
There is much we do not know about these young people from census data, such as why they left school, their level of interest in returning to school, and what their barriers to doing so might be. To understand these questions better, we turn to data from MEP.
Out-of-School Youth: Migrant Education Profile Data from MEP reveal that out-of-school immigrant youth in the
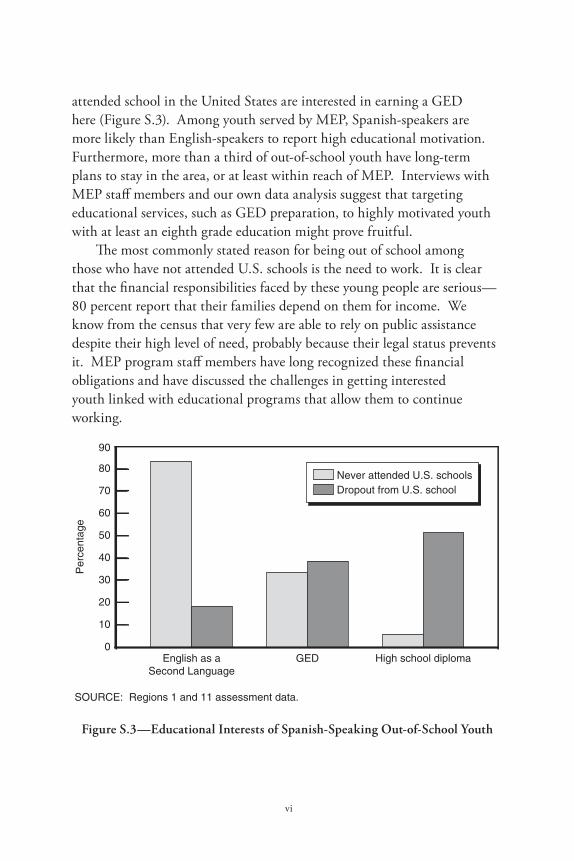
program wish to learn. The popular perception that these seasonal laborers are here only temporarily and therefore not interested in learning English is inaccurate. When we focus on just those speaking Spanish (the overwhelming majority), we find that most (more than 80%) report an interest in improving their English, and nearly a third who have never
vi
attended school in the United States are interested in earning a GED here (Figure S.3). Among youth served by MEP, Spanish-speakers are more likely than English-speakers to report high educational motivation. Furthermore, more than a third of out-of-school youth have long-term plans to stay in the area, or at least within reach of MEP. Interviews with MEP staff members and our own data analysis suggest that targeting educational services, such as GED preparation, to highly motivated youth with at least an eighth grade education might prove fruitful.
The most commonly stated reason for being out of school among those who have not attended U.S. schools is the need to work. It is clear that the financial responsibilities faced by these young people are serious—80 percent report that their families depend on them for income. We know from the census that very few are able to rely on public assistance despite their high level of need, probably because their legal status prevents it. MEP program staff members have long recognized these financial obligations and have discussed the challenges in getting interested youth linked with educational programs that allow them to continue working.
Figure S.3—Educational Interests of Spanish-Speaking Out-of-School Youth
vii
In addition, MEP staff members report that out-of-school youth have health needs that may interfere with school attendance. Indeed, many out-of-school youth recruited by two Bay Area regions report having medical, dental, and vision needs, and those who have never attended U.S. schools are more likely than dropouts from U.S. schools (hereafter referred to as dropouts) to report them. For example, nearly twice as many of those who have not attended U.S. schools report having vision needs than do dropouts. Health insurance levels are low—fewer than 15 percent of those who have not attended U.S. schools have medical insurance and slightly more than 50 percent of dropouts do. Other socioeconomic needs were assessed, and more than one-third of out-of-school youth reported needing assistance with transportation, child care, clothing, counseling, and drug and alcohol interventions.
Policy Recommendations for Serving Out-of-School Immigrant Youth
Merely increasing MEP funding would not help all of California’s out-of-school immigrant youth. The census counts about 265,000 in the state, and they are considered eligible for MEP if they or their parent(s) moved in the previous 36 months to seek seasonal or temporary work in agriculture, fishing, or logging. Very rough estimates suggest that only about 80,000 of the total out of school immigrant youth population meet these criteria. Thus, even if funding for MEP were dramatically increased, many immigrant young people—about 185,000—could not be served by the program. So the state should consider ways to expand outreach to this important group of ineligible young people, for instance, involving them in English as a Second Language (ESL) courses or in Spanish and English GED programs and strengthening their relationships to the ten Mexican consulates in the state, some of which offer education programs for expatriates. Previous research suggests that many of these young people will remain in the country for the long term, so providing opportunities for them and their children to improve their socioeconomic outcomes will benefit California.
Lack of funding is an issue in serving two groups of out-of-school immigrant youth: those eligible for the program but not currently recruited
into it and those recruited into the program but receiving either no or very low levels of service. We estimate that there are roughly 40,000 in this first group, half the total number eligible. Of the other half, the 40,000 MEP has currently recruited, the program has provided services to only half of them, about 20,000. Program staff members attribute this gap between recruitment and service provision to difficulties in locating the youth after initial contact, to lack of sufficient resources, and to waning interest in education on the part of the youth. Providing services to all recruited youth and increasing the intensity of service provision to those youth MEP does serve may result in improved outcomes for youth already in the program.
The program’s funding structure encourages the recruitment of out-of-school youth but not necessarily the provision of services to them. California’s MEP funds are allocated to the regional programs on a student-based funding formula. MEP provides more dollars per person for an out-of-school youth than it does for a K–12 student. However, regions are not required to demonstrate that they are using this funding to serve out-of-school youth. Some migrant education staff members note that this means that out-of-school youth are effectively subsidizing services to K–12 youth. Aligning spending with revenue generation could dramatically improve services to those out-of-school youth MEP has already recruited, but doing so would effectively divert funding from K–12 students in many regions.
Demonstrating program effectiveness will be central to increasing funding, but at this time, measurement of program effectiveness is challenging. Not all regions in California’s Migrant Education Program are able to reliably measure the needs, services, or outcomes for out-of-school youth. Although regions have made great strides in expanding and standardizing their data collection efforts, there is currently tremendous variation among regions. One reason is that federal reporting requirements are few; another is that the governance structure of MEP is decentralized. The latter allows regions to choose appropriate priorities and services for their own populations, but it can also lead to a lack of accountability. Further, many regions lack sufficient resources to expand their data collection capacity. Perhaps in the longer range, as the state’s regions are able to demonstrate the need to serve out-of-school youth and to determine which services lead to educational success, funding for out-of-school youth will increase and do so not at the expense of K–12 MEP students.
viii
Contents
ix
Summary . . . . . . . . . . . . . . . . . . . . . . . . . . . . . . . . . . . . . . . . . . . . . . . . . . . . . . . . . . . . . . . . . . . . . . . . . iiiFigures . . . . . . . . . . . . . . . . . . . . . . . . . . . . . . . . . . . . . . . . . . . . . . . . . . . . . . . . . . . . . . . . . . . . . . . . . . . . xiTables . . . . . . . . . . . . . . . . . . . . . . . . . . . . . . . . . . . . . . . . . . . . . . . . . . . . . . . . . . . . . . . . . . . . . . . . . . . . . xiiiAcknowledgments . . . . . . . . . . . . . . . . . . . . . . . . . . . . . . . . . . . . . . . . . . . . . . . . . . . . . . . . . . . . . . . xvAcronyms and Glossary . . . . . . . . . . . . . . . . . . . . . . . . . . . . . . . . . . . . . . . . . . . . . . . . . . . . . . . . xvii
1. INTrODUCTION . . . . . . . . . . . . . . . . . . . . . . . . . . . . . . . . . . . . . . . . . . . . . . . . . . . . . . . 1
2. CALIFOrNIA’S OUT-OF-SCHOOL IMMIGrANT YOUTH . . 5The Out-of-School Immigrant Youth Population in California . . . . . 5Geographic Distribution . . . . . . . . . . . . . . . . . . . . . . . . . . . . . . . . . . . . . . . . . . . . . . . . . . 6Characteristics of the Out-of-School Immigrant Youth
Population . . . . . . . . . . . . . . . . . . . . . . . . . . . . . . . . . . . . . . . . . . . . . . . . . . . . . . . . . . . . 9 Households, Families, and Living Arrangements . . . . . . . . . . . . . . . . . . . . . . 12 Measures of Well-Being . . . . . . . . . . . . . . . . . . . . . . . . . . . . . . . . . . . . . . . . . . . . . . . . . . . 16 School and Work . . . . . . . . . . . . . . . . . . . . . . . . . . . . . . . . . . . . . . . . . . . . . . . . . . . . . . . . . . 18
3. WHO DOES MEP SErVE? . . . . . . . . . . . . . . . . . . . . . . . . . . . . . . . . . . . . . . . . . . . . . 23The Migrant Education Program . . . . . . . . . . . . . . . . . . . . . . . . . . . . . . . . . . . . . . . 23 California’s Migrant Education Program . . . . . . . . . . . . . . . . . . . . . . . . . . . . . . 26 Out-of-School Youth in California’s MEP . . . . . . . . . . . . . . . . . . . . . . . . . . . . . 28
region 1: Santa Clara County Office of Education . . . . . . . . . . . . . . 29 region 11: Pajaro Unified School District . . . . . . . . . . . . . . . . . . . . . . . . . 30
The Data: Needs Assessments . . . . . . . . . . . . . . . . . . . . . . . . . . . . . . . . . . . . . . . . . . . 32Demographic Characteristics . . . . . . . . . . . . . . . . . . . . . . . . . . . . . . . . . . . . . . . . . . . . 33
4. SOCIOECONOMIC NEEDS OF OUT-OF-SCHOOL YOUTH . . . . . . . . . . . . . . . . . . . . . . . . . . . . . . . . . . . . . . . . . . . . . . . . . . . . . . . . . . . . . . . . . . . . . 37Family Formation . . . . . . . . . . . . . . . . . . . . . . . . . . . . . . . . . . . . . . . . . . . . . . . . . . . . . . . . . 37Health and Socioeconomic Needs . . . . . . . . . . . . . . . . . . . . . . . . . . . . . . . . . . . . . . . 40
Medical Conditions and Health Insurance Needs . . . . . . . . . . . . . . . . . 40Socioeconomic Conditions and Needs . . . . . . . . . . . . . . . . . . . . . . . . . . . . . . 42
Mobility . . . . . . . . . . . . . . . . . . . . . . . . . . . . . . . . . . . . . . . . . . . . . . . . . . . . . . . . . . . . . . . . . . . . 45Services related to Socioeconomic and Health Needs . . . . . . . . . . . . . . . . 47Data Collection . . . . . . . . . . . . . . . . . . . . . . . . . . . . . . . . . . . . . . . . . . . . . . . . . . . . . . . . . . . . 48
x
5. SCHOOLING, LANGUAGE, AND ACADEMIC GOALS OF OUT-OF-SCHOOL YOUTH . . . . . . . . . . . . . . . . . . . . . . . . . . . . . . . . . . . . . . . . . . . 51Level of Schooling Attained . . . . . . . . . . . . . . . . . . . . . . . . . . . . . . . . . . . . . . . . . . . . . . 51 Language . . . . . . . . . . . . . . . . . . . . . . . . . . . . . . . . . . . . . . . . . . . . . . . . . . . . . . . . . . . . . . . . . . . 53 Goals . . . . . . . . . . . . . . . . . . . . . . . . . . . . . . . . . . . . . . . . . . . . . . . . . . . . . . . . . . . . . . . . . . . . . . . . 56
Educational Motivation . . . . . . . . . . . . . . . . . . . . . . . . . . . . . . . . . . . . . . . . . . . . . . . 56 Academic Interests . . . . . . . . . . . . . . . . . . . . . . . . . . . . . . . . . . . . . . . . . . . . . . . . . . . . 57
Academic Services . . . . . . . . . . . . . . . . . . . . . . . . . . . . . . . . . . . . . . . . . . . . . . . . . . . . . . . . 62 Migrant Education Academic Services . . . . . . . . . . . . . . . . . . . . . . . . . . . . . . . . . 63
6. FINDINGS AND POLICY IMPLICATIONS . . . . . . . . . . . . . . . . . . . . . . . 67Serving Out-of-School Immigrant Youth in the Migrant
Education Program . . . . . . . . . . . . . . . . . . . . . . . . . . . . . . . . . . . . . . . . . . . . . . . . . 67Targeting Services . . . . . . . . . . . . . . . . . . . . . . . . . . . . . . . . . . . . . . . . . . . . . . . . . . . . . . 68 Measurement Issues in the Migrant Education Program . . . . . . . . 69 Organizational Structure of Migrant Education Within
California . . . . . . . . . . . . . . . . . . . . . . . . . . . . . . . . . . . . . . . . . . . . . . . . . . . . . . . . . . . 71Other Policies Presenting Challenges and Opportunities in
Serving Out-of-School Immigrant Youth . . . . . . . . . . . . . . . . . . . . . . . 73 Further research . . . . . . . . . . . . . . . . . . . . . . . . . . . . . . . . . . . . . . . . . . . . . . . . . . . . . . . . . . . 74
AppendixA. Out-of-School Immigrant Youth Counted in Census 2000 . . . . . . . . 77 B. What Share of the Potentially Eligible Are Served by the
Migrant Education Program? . . . . . . . . . . . . . . . . . . . . . . . . . . . . . . . . . . . . . . . . . . . 91 C. Out-of-School Youth Needs Assessment . . . . . . . . . . . . . . . . . . . . . . . . . . . . . . 99D. Interviews of regional and Out-of-School Youth Program
Directors . . . . . . . . . . . . . . . . . . . . . . . . . . . . . . . . . . . . . . . . . . . . . . . . . . . . . . . . . . . . . . . . . . 105E. Chapter 5 Detailed Model results . . . . . . . . . . . . . . . . . . . . . . . . . . . . . . . . . . . . . 109
references . . . . . . . . . . . . . . . . . . . . . . . . . . . . . . . . . . . . . . . . . . . . . . . . . . . . . . . . . . . . . . . . . . . . . . . 111
About the Authors . . . . . . . . . . . . . . . . . . . . . . . . . . . . . . . . . . . . . . . . . . . . . . . . . . . . . . . . . . . . . . 113
related PPIC Publications . . . . . . . . . . . . . . . . . . . . . . . . . . . . . . . . . . . . . . . . . . . . . . . . . . . . 115
Figures
xi
S.1. Percentage of Immigrant Youth Living Away from Their Parents, by Age Group . . . . . . . . . . . . . . . . . . . . . . . . . . . . . . . . . . . . . . . . . . . . . . . iv
S.2. Educational Attainment of Out-of-School Immigrant Youth, by Age Group . . . . . . . . . . . . . . . . . . . . . . . . . . . . . . . . . . . . . . . . . . . . . . . . . . . . . . . . . v
S.3. Educational Interests of Spanish-Speaking Out-of-School Youth . . . . . . . . . . . . . . . . . . . . . . . . . . . . . . . . . . . . . . . . . . . . . . . . . . . . . . . . . . . . . . . . . . vi
2.1. Population of Out-of-School Immigrant Youth, by Public Use Microdata Area . . . . . . . . . . . . . . . . . . . . . . . . . . . . . . . . . . . . . . . . . . . . . . . . . . 10
2.2. Age Distribution of Out-of-School Immigrant Youth . . . . . . . . . . . 112.3. English Language Skills of Immigrant Youth . . . . . . . . . . . . . . . . . . . . 17 2.4. Educational Attainment of Youth, by Age Group, Nativity,
and Educational Status . . . . . . . . . . . . . . . . . . . . . . . . . . . . . . . . . . . . . . . . . . . . . 18 3.1. California’s Migrant Education Program regions . . . . . . . . . . . . . . . 26 3.2. Youth Attendance at U.S. Schools, by Gender . . . . . . . . . . . . . . . . . . . 34 3.3. Age Distribution of Out-of-School Youth, by Gender
and U.S. School Attendance . . . . . . . . . . . . . . . . . . . . . . . . . . . . . . . . . . . . . . . . 35 4.1. Presence of Children, by Marital Status of Young Men and
Young Women . . . . . . . . . . . . . . . . . . . . . . . . . . . . . . . . . . . . . . . . . . . . . . . . . . . . . . . 39 4.2. Type of Health Insurance, by U.S. School Attendance . . . . . . . . . . 42 4.3. Self-reported Socioeconomic Needs of Out-of-School Youth . . 43 4.4. Percentage of Youth Whose Families Depend on Them for
Income, by U.S. School Attendance . . . . . . . . . . . . . . . . . . . . . . . . . . . . . . . 44 4.5. Planned Length of Stay in the Area for Out-of-School Youth,
by U.S. School Attendance . . . . . . . . . . . . . . . . . . . . . . . . . . . . . . . . . . . . . . . . . 46 5.1. Level of Schooling reached, by U.S. School Attendance . . . . . . . 52 5.2. reason for Leaving School, by U.S. School Attendance . . . . . . . . 53 5.3. Primary or Home Language Spoken, by U.S. School
Attendance . . . . . . . . . . . . . . . . . . . . . . . . . . . . . . . . . . . . . . . . . . . . . . . . . . . . . . . . . . . . 54 5.4. Ability in Spoken English, by Language Spoken and U.S.
School Attendance . . . . . . . . . . . . . . . . . . . . . . . . . . . . . . . . . . . . . . . . . . . . . . . . . . . 55 5.5. Percentage of “High” Levels of Educational Motivation, by
Language Spoken and U.S. School Attendance . . . . . . . . . . . . . . . . . . 56 5.6. Educational Interests, by Last Grade Attended . . . . . . . . . . . . . . . . . . . 60
5.7. Educational Interests, by Educational Motivation and U.S. School Attendance . . . . . . . . . . . . . . . . . . . . . . . . . . . . . . . . . . . . . . . . . . . . . . . . . . . 61
5.8. Educational Interests of Spanish-Speaking Out-of-School Youth, by U.S. School Attendance . . . . . . . . . . . . . . . . . . . . . . . . . . . . . . . . . 62
A.1. Population of Out-of-School Immigrant Youth with Less Than a Ninth Grade Education, by Public Use Microdata Area . . . . . . . . . . . . . . . . . . . . . . . . . . . . . . . . . . . . . . . . . . . . . . . . . . . . . . . . . . . . . . . . . . . . 88
A.2. Population of Out-of-School Immigrant Youth with at Least Some High School (But No Diploma or GED), by Public Use Microdata Area . . . . . . . . . . . . . . . . . . . . . . . . . . . . . . . . . . . . . . . . . 89
xii
Tables
xiii
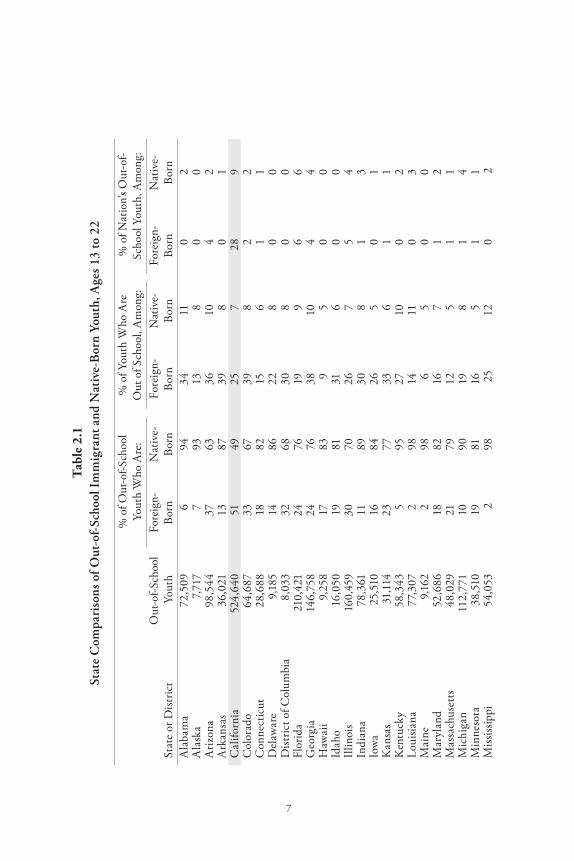
2.1. State Comparisons of Out-of-School Immigrant and Native- Born Youth, Ages 13 to 22 . . . . . . . . . . . . . . . . . . . . . . . . . . . . . . . . . . . . . . . . 7
2.2. Mean Age at Arrival of Immigrant Youth, by Age Group and Educational Status . . . . . . . . . . . . . . . . . . . . . . . . . . . . . . . . . . . . . . . . . . . . . 11
2.3. Percentage of Youth Currently Married, by Age Group, Gender, Nativity, and Educational Status . . . . . . . . . . . . . . . . . . . . . . . 13
2.4. Living Arrangements of Youth, by Age Group, Nativity, and Educational Status . . . . . . . . . . . . . . . . . . . . . . . . . . . . . . . . . . . . . . . . . . . . . . . . . . 15
2.5. Poverty rates and Public Assistance Use of Youth, by Nativity and Educational Status . . . . . . . . . . . . . . . . . . . . . . . . . . . . . . . . . . 16
2.6. Labor Force Participation of Youth, by Gender, Age Group, Nativity, and Educational Status. . . . . . . . . . . . . . . . . . . . . . . . . . . . . . . . . . 19
2.7. Mean Wages of Youth Working Full Time, by Gender, Age Group, Nativity, and Educational Status . . . . . . . . . . . . . . . . . . . 20
3.1. Demographic Characteristics of Out-of-School Youth in regions 1 and 11 . . . . . . . . . . . . . . . . . . . . . . . . . . . . . . . . . . . . . . . . . . . . . . . . . . . . 33
4.1. Living Arrangements and Family Formation of Out-of- School Youth . . . . . . . . . . . . . . . . . . . . . . . . . . . . . . . . . . . . . . . . . . . . . . . . . . . . . . . . 38
4.2. Health Needs of Out-of-School Youth . . . . . . . . . . . . . . . . . . . . . . . . . . . 40 4.3. Number of Health Needs of Out-of-School Youth . . . . . . . . . . . . . 41 5.1. Educational Interests of Out-of-School Youth . . . . . . . . . . . . . . . . . . 58 5.2. School Attendance Among Those Expressing Interest, by
Type of Institution . . . . . . . . . . . . . . . . . . . . . . . . . . . . . . . . . . . . . . . . . . . . . . . . . 65 A.1. Unweighted Sample Sizes of Youth, by Age Group, Gender,
and Educational Status . . . . . . . . . . . . . . . . . . . . . . . . . . . . . . . . . . . . . . . . . . . . 77 A.2a. Number of Youth Ages 13 to 22, by Nativity and County . . . . 78 A.2b. Number of Youth Ages 13 to 22 Out of School, by Nativity
and County . . . . . . . . . . . . . . . . . . . . . . . . . . . . . . . . . . . . . . . . . . . . . . . . . . . . . . . . . 80 A.2c. Number of Youth Ages 13 to 22 in School, by Nativity and
County . . . . . . . . . . . . . . . . . . . . . . . . . . . . . . . . . . . . . . . . . . . . . . . . . . . . . . . . . . . . . . . 82 A.3a. Number of Immigrant Youth, by Age Group, Educational
Status, and County . . . . . . . . . . . . . . . . . . . . . . . . . . . . . . . . . . . . . . . . . . . . . . . . . 84 A.3b. Mean Age at Arrival of Immigrant Youth, by Age Group,
Educational Status, and County . . . . . . . . . . . . . . . . . . . . . . . . . . . . . . . . . . 86
xiv
B.1. Population of Out-of-School Youth Measured in the 2000 Census with Increasingly restrictive Migrant Education Program Eligibility Criteria . . . . . . . . . . . . . . . . . . . . . . . . . . . . . . . . . . . . . . 92
B.2a. Number of Youth Ages 13 to 22, by Nativity and MEP region Group . . . . . . . . . . . . . . . . . . . . . . . . . . . . . . . . . . . . . . . . . . . . . . . . . . . . . . 94
B.2b. Number of Youth Ages 13 to 22 Out of School, by Nativity and MEP region Group . . . . . . . . . . . . . . . . . . . . . . . . . . . . . . . . . . . . . . . . . . 95
B.2c. Number of Youth Ages 13 to 22 in School, by Nativity and MEP region Group . . . . . . . . . . . . . . . . . . . . . . . . . . . . . . . . . . . . . . . . . . . . . . . 96
B.3a. Number of Immigrant Youth, by Age Group, Educational Status, and MEP region Group . . . . . . . . . . . . . . . . . . . . . . . . . . . . . . . . . 97
B.3b. Mean Age at Arrival of Immigrant Youth, by Age Group, Educational Status, and MEP region Group . . . . . . . . . . . . . . . . . . 98
E.1. Estimates from Logistic regression Model for Attendance in Academic Programs . . . . . . . . . . . . . . . . . . . . . . . . . . . . . . . . . . . . . . . . . . . . 110
xv
Acknowledgments
We wish to thank The James Irvine Foundation for its generous support of this research project and Anne Stanton for her ongoing enthusiasm and assistance. We also thank Jorge ruiz-de-Velasco for his many helpful suggestions in the development of this project and the planned research projects to follow. We also appreciate the many helpful suggestions of Marcia Quiñones of the Walter S. Johnson Foundation. We are grateful to Brad Doyel for his early interest in our research on immigrant youth at PPIC and for providing his region’s Out of School Youth data. We are also grateful to Faris Sabbah for data from his region and to Oscar Lamas and rosa Coronado who worked with us tirelessly to help us create the database from their two regions’ data. Tammie Shea provided excellent assistance in the actual development of the database used for this report, and Jessica Yamasaki furnished valuable help with entering assessment form data into the database. We very much appreciate Lisa Cole’s expertise in grant writing. The Out of School Youth Network provided both motivation and feedback for this research, and we are grateful to those involved in that network for their continued interest. Deborah reed contributed valuable comments on an earlier draft, as did Helen Lee, Chris Paige, Michael Fix, Margie McHugh, and Edward Kissam. Lynette Ubois, Gary Bjork, and richard Greene made essential contributions to improving the report’s clarity and exposition. We are also thankful for conversations with colleagues Hans Johnson, Christopher Jepsen, Andrés Jiménez, and Edward Kissam. The methods and content of this report were determined solely by the authors.

Acronyms
xvii
Acronyms and Glossary
Dropout: Out-of-school youth served through MEP who have dropped out of U.S. schools. They may be working.
ESL: English as a Second Language.
GED: general equivalency degree.
HEP: High School Equivalency Program. HEP provides instruction in Spanish or English to help MEP students earn their GEDs (and the pro-gram pays the testing fee).
Here to work: Out-of-school youth served through MEP who have not attended school in the United States. They may be working.
INEA: Instituto Nacional de Educación para Adultos. INEA is an adult education curriculum in Spanish provided through the Mexican Consulate.
MEP: Migrant Education Program.
NCLB: No Child Left Behind.
OSY: Out-of-school youth, a specific program term for young people ages 21 and younger who qualify for services from MEP but who are not in school pursuing a high school diploma.
PASS: Portable Assisted Study Sequence. PASS is a workbook-based pro-gram by which MEP students can earn high school credits (some of which meet the University of California’s A–G requirements), without attending traditional high schools.
PUMA: Public Use Microdata Area.
PUMS: Public Use Microdata Sample of the decennial census.

�
1.Introduction
In California, about 265,000 immigrants ages �3 to 22 are not enrolled in school, and over 90 percent of these are Latino (2000 census). Immigrants make up half of the state’s out-of-school youth despite being only 25 percent of the state’s population. Many out-of-school immigrant youth never attend U.S. schools, arriving here only to work. School enrollment declines with age at arrival—immigrants who arrive in their later teen years are less likely to be enrolled in schools in the United States. It appears that a substantial number of young immigrants who do not attend school here remain in California—40 percent of Mexican immigrants who arrived in the United States between ages �3 and �8 and who are currently ages 25 to 29 have less than a ninth grade education. Previous research suggests that young immigrants who come to the United States at older ages (and who are less likely to attend school) have poor outcomes relative to immigrant youth who attend school (Hill, 2004). When compared to other youth, these young people have low levels of educational attainment, poor English language abilities, high poverty rates, and low rates of health insurance, despite their high rates of employment. Many of these young immigrants also have very young U.S.-born children, who start their lives at a significant disadvantage relative to other native-born children.
Low levels of educational attainment are linked to low wages and are thus a concern for the future well-being of these immigrants and their children. Low educational attainment is also a major challenge to the strength of our state’s economy. Recent projections suggest that by 2020, the economy’s demand for workers without a high school diploma will only be �� percent, whereas 22 percent of California residents of working age will not have graduated from high school (Neumark, 2005). Furthermore, although we can expect the children of these out-of-school immigrant youth to make more progress than their own parents, few of them can be expected to continue their education beyond high school (Reed et al., 2005). Given the relative deprivation of these young people and the likelihood of their passing on poor prospects to their citizen children, it is
2
important for California to understand and address their needs, especially those most closely related to education and health.
Young people not in school have access to few federal and state resources. In some cases, they are barred from attending schools. For example, youth who would not be able to complete enough credits to graduate by ages �8 or �9 are not permitted to attend traditional high schools and might also be too young to attend Adult Education classes. However, the federal Migrant Education Program (MEP), serves out-of-school youth ages �6 to 2� as a part of its mission.� Currently, federal funding for this program totals nearly $400 million, and California gets nearly one-third of that. In California, out-of-school immigrant youth are an important component of MEP but they receive a smaller proportion of services than their population would dictate. The vast majority of funds are earmarked for the in-school population of migrant farm workers and their children. Federal and state reporting requirements for MEP are few. As a result, little is known about which program services are most beneficial to out-of-school immigrant youth.
This is PPIC’s first research devoted to understanding the out-of-school immigrant youth population. Our study first provides a profile of out-of-school immigrant youth in California, using data from the 2000 census. From these data, we estimate that there are approximately 265,000 out-of-school immigrant youth between ages �3 and 22 in California.2 We provide an overview of the location and concentration of these youth throughout the state and then explore details of their national origins, family and living arrangements, languages spoken, educational attainment, labor force activity, income, and other resources. We highlight some comparisons between this group and in-school immigrant youth, and the native-born population in the same age group, and find large disparities between in-school and out-of-school immigrant youth.
However, census and survey data are limited in their ability to describe this population. For example, we cannot learn why these immigrant youth
� In fact, youth ages �3 to 22 may be served. Chapter 3 discusses program eligibility criteria.
2 Weighting from census counts of �3,233 out-of-school immigrant youth ages �3 to 22 in the state.
3
left school, whether they ever attended school in the United States, or what prevents them from improving their English skills or enrolling in school. Nor do these data help us decide what we might do to encourage these youth to return to school or how effective efforts are to induce them to do so. Furthermore, these young people are among those most likely to be undercounted by the census and surveys; they are often in households and dwellings that these data collections fail to find, especially those working and living in agricultural areas. Therefore, those who are enumerated or surveyed may not be representative.
Thus, we turn to program data from MEP in California to understand this at-risk and hard-to-find population. The program is administered in California through 23 regional programs that differ in size and organizational structure. In this report, we use data from two regions in the San Francisco Bay Area. Program directors in both regions were interested in getting help to understand their population of out-of-school youth and had devised data collection efforts well suited for demographic analysis. These two regions represent both urban and rural areas and serve a diverse population. For example, some out-of-school youth have been recruited to the program through their former high schools, and others who have never attended U.S. high schools have been recruited from the fields where they work picking strawberries. Their reasons for leaving school are diverse as well and range from being unmotivated, to living too far away from a school in their community in Mexico, to having a dire financial need to work.
When out-of-school immigrant youth are recruited into the Migrant Education Program, they fill out a needs assessment form. Data from these forms for approximately �,200 youth have been entered into a database. This report analyzes these data for the first time. We also incorporate the results of our semi-structured interviews with regional directors (or those most knowledgeable about services to out-of-school youth) from most of the state’s regional programs. Our analysis has resulted in a number of suggestions for ways to improve the program for out-of-school immigrant youth: better targeting of services, better data collection, and changes to program organization, among others. However, neither program data nor program objectives are sufficiently defined to conduct a program evaluation per se. This research lays the groundwork for what we hope will be a more
4
extensive set of future analyses of the link between needs, services, and outcomes for out-of-school youth.
Chapter 2 uses data from the 2000 census to show the large disparities between in-school and out-of-school immigrant groups. The remaining chapters turn to MEP data. In these chapters, we aim to present a more comprehensive profile of these youth, their needs, and their goals. Chapter 3 describes MEP in California and provides basic demographic data for out-of-school youth served by two of California’s regional programs. Chapter 4 describes the socioeconomic needs of out-of-school immigrant youth recruited by MEP and Chapter 5 explores their academic backgrounds, English language abilities, and goals. In Chapter 6, we describe our main findings and discuss policy implications, including some suggestions of areas for improvement in MEP and plans for future research.
�
2.California’sOut-of-SchoolImmigrantYouth
Most research addressing the well-being of immigrant young people focuses on their successes and challenges in school. However, this chapter will show that many of California’s out-of-school immigrant youth left school at relatively young ages, suggesting that many of them never attended school in the United States. Perhaps as a direct consequence, many of these young people have very poor circumstances compared to immigrant youth who are enrolled in school or native-born youth. Using data from the 2000 census, this chapter finds that out-of-school immigrant youth have relatively low levels of spoken English ability.� Approximately 60 percent of those ages �3 to 22 do not speak English “well” or “very well.” Census data show further that immigrants who left school before earning a high school diploma or GED are poor despite their relatively high work effort. Most live apart from their parents, many are married, many are parenting (especially young women), but few receive any form of public assistance.
TheOut-of-SchoolImmigrantYouthPopulationinCalifornia
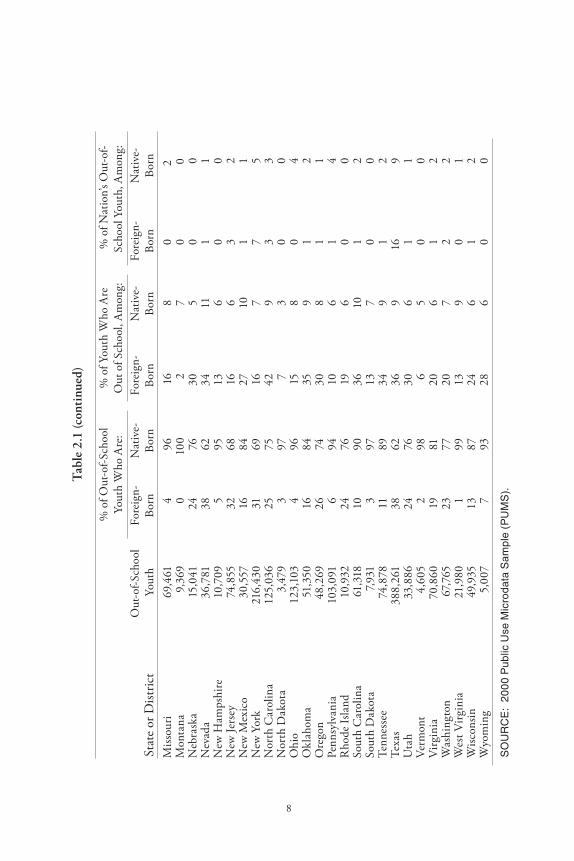
High school completion rates are a problem nationwide. In California, more than �00,000 young people ages �3 to 22 left school before earning a high school diploma or GED (Table 2.�). Half of those young people are foreign-born (a higher share than is found in any other state). Although a sizable number of out-of-school youth are native-born, a much lower percentage of native-born youth than of foreign-born youth are out of school (7% compared to 2�%). Some of the newer immigrant destination
� In this chapter, out-of-school youth are defined as young people ages �3 to 22 who are not enrolled in school and have not earned either a high school diploma or general equivalency degree (GED). In-school youth are defined as those either enrolled in school or having earned a diploma or GED. Later chapters focus on the population of foreign-born out-of-school youth served by MEP, who can range in age from �3 to 22.
6
states have far higher percentages of foreign-born youth out of school—for example, North Carolina (42%), Arkansas (39%), and Georgia (38%). California has 28 percent of the nation’s total out-of-school immigrant youth (Table 2.�), perhaps not surprising given that California is the nation’s most populous state and has the largest percentage of foreign-born residents. Texas, New York, and Florida—other states with large migrant labor populations—follow, with �6, 7, and 6 percent, respectively, of the national total.
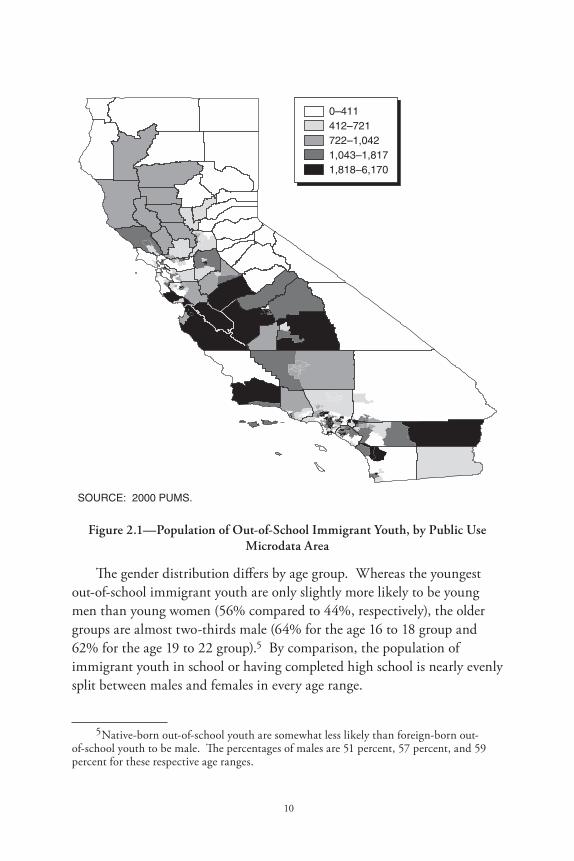
Geographic DistributionFigure 2.� shows the number of out-of-school immigrant youth
residing in each of the state’s Public Use Microdata Areas (PUMAs).2 Out-of-school immigrant youth in California are found in particularly high concentrations in certain rural, agricultural areas—especially the Central Valley and the Central Coast—as well as in some urban centers, notably in parts of Los Angeles, Stockton, and Fresno. Eastern parts of the state, including the Sierras, desert regions, and foothills, have very low concentrations of out-of-school immigrant youth. The one exception to this is the eastern portion of Riverside County, which includes the agricultural Coachella Valley and has one of the highest concentrations in the state. In Appendix A, we divide the out-of-school immigrant youth population into those with an eighth grade education or less (those very unlikely to have ever attended school in the United States) and those with some high school. Their distributions throughout the state are similar to those in Figure 2.�.
Out-of-school immigrant youth are distributed throughout the state in roughly the same proportions as foreign-born youth in general. Over �03,000, or 39 percent, of California’s out-of-school immigrant youth live in Los Angeles County. Orange and San Diego Counties are home to �0 percent and 6 percent, respectively, of the state’s out-of-school immigrant youth, and Santa Clara, San Bernardino, and Riverside Counties each have 4 percent of the total, or about �0,000 (see Appendix Table A.2b).
2 PUMAs are regions constructed by the Census Bureau to represent approximately �00,000 people. They are typically coterminous with county boundaries. Larger PUMAs denote more sparsely populated areas, and smaller PUMAs denote high population density.
7
Tabl
e 2.
1St
ate
Com
pari
sons
of O
ut-o
f-Sc
hool
Im
mig
rant
and
Nat
ive-
Bor
n Yo
uth,
Age
s 13
to 2
2
Stat
e or
Dist
rict
Out
-of-S
choo
l Y
outh
% o
f Out
-of-S
choo
l Yo
uth
Who
Are
:%
of Y
outh
Who
Are
O
ut o
f Sch
ool,
Am
ong:
% o
f Nat
ion’
s Out
-of-
Scho
ol Y
outh
, Am
ong:
Fore
ign-
Born
Nat
ive-
Born
Fore
ign-
Born
Nat
ive-
Born
Fore
ign-
Born
Nat
ive-
Born
Ala
bam
a72
,�09
694
34��
02
Ala
ska
7,7�
77
93�3
80
0A
rizon
a98
,�44
3763
36�0
42
Ark
ansa
s36
,02�
�387
398
0�
Cal
iforn
ia�2
4,64
0��
492�
728
9C
olor
ado
64,6
8733
6739
82
2C
onne
ctic
ut28
,688
�882
��6
��
Del
awar
e9,
�8�
�486
228
00
Dist
rict o
f Col
umbi
a8,
033
3268
308
00
Flor
ida
2�0,
42�
2476
�99
66
Geo
rgia
�46,
7�8
2476
38�0
44
Haw
aii
9,2�
8�7
839
�0
0Id
aho
�6,0
�0�9
8�3�
60
0Ill
inoi
s�6
0,4�
930
7026
7�
4In
dian
a78
,36�
��89
308
�3
Iow
a2�
,��0
�684
26�
0�
Kan
sas
3�,�
�423
7733
6�
�K
entu
cky
�8,3
43�
9�27
�00
2Lo
uisia
na77
,307
298
�4��
03
Mai
ne9,
�62
298
6�
00
Mar
ylan
d�2
,686
�882
�67
�2
Mas
sach
uset
ts48
,029
2�79
�2�
��
Mic
higa
n��
2,77
��0
90�9
8�
4M
inne
sota
38,�
�0�9
8��6
��
�M
ississ
ippi
�4,0
�32
982�
�20
2
8
Stat
e or
Dist
rict
Out
-of-S
choo
l Y
outh
% o
f Out
-of-S
choo
l Yo
uth
Who
Are
:%
of Y
outh
Who
Are
O
ut o
f Sch
ool,
Am
ong:
% o
f Nat
ion’
s Out
-of-
Scho
ol Y
outh
, Am
ong:
Fore
ign-
Born
Nat
ive-
Born
Fore
ign-
Born
Nat
ive-
Born
Fore
ign-
Born
Nat
ive-
Born
Miss
ouri
69,4
6�4
96�6
80
2M
onta
na9,
369
0�0
02
70
0N
ebra
ska
��,0
4�24
7630
�0
0N
evad
a36
,78�
3862
34��
��
New
Ham
pshi
re�0
,709
�9�
�36
00
New
Jers
ey74
,8��
3268
�66
32
New
Mex
ico
30,�
�7�6
8427
�0�
�N
ew Y
ork
2�6,
430
3�69
�67
7�
Nor
th C
arol
ina
�2�,
036
2�7�
429
33
Nor
th D
akot
a3,
479
397
73
00
Ohi
o�2
3,�0
34
96��
80
4O
klah
oma
��,3
�0�6
843�
9�
2O
rego
n48
,269
2674
308
��
Penn
sylv
ania
�03,
09�
694
�06
�4
Rho
de Is
land
�0,9
3224
76�9
60
0So
uth
Car
olin
a6�
,3�8
�090
36�0
�2
Sout
h D
akot
a7,
93�
397
�37
00
Tenn
esse
e74
,878
��89
349
�2
Texa
s38
8,26
�38
6236
9�6
9U
tah
33,8
8624
7630
6�
�Ve
rmon
t4,
60�
298
6�
00
Virg
inia
70,8
60�9
8�20
6�
2W
ashi
ngto
n67
,76�
2377
207
22
Wes
t Virg
inia
2�,9
80�
99�3
90
�W
iscon
sin49
,93�
�387
246
�2
Wyo
min
g�,
007
793
286
00
SO
UR
CE
: 20
00
Pub
lic U
se M
icro
data
Sam
ple
(PU
MS
).
Tab
le 2
.1 (c
onti
nued
)
9
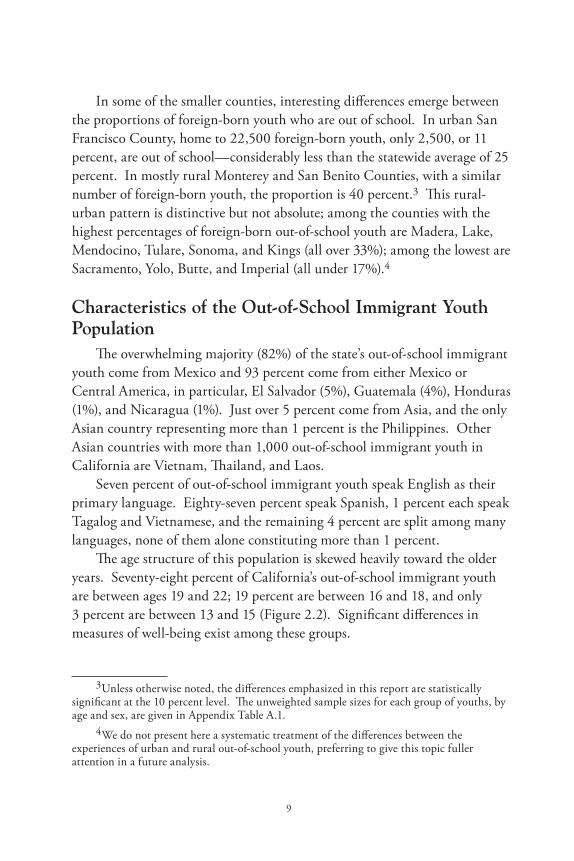
In some of the smaller counties, interesting differences emerge between the proportions of foreign-born youth who are out of school. In urban San Francisco County, home to 22,�00 foreign-born youth, only 2,�00, or �� percent, are out of school—considerably less than the statewide average of 2� percent. In mostly rural Monterey and San Benito Counties, with a similar number of foreign-born youth, the proportion is 40 percent.3 This rural-urban pattern is distinctive but not absolute; among the counties with the highest percentages of foreign-born out-of-school youth are Madera, Lake, Mendocino, Tulare, Sonoma, and Kings (all over 33%); among the lowest are Sacramento, Yolo, Butte, and Imperial (all under �7%).4
CharacteristicsoftheOut-of-SchoolImmigrantYouthPopulation
The overwhelming majority (82%) of the state’s out-of-school immigrant youth come from Mexico and 93 percent come from either Mexico or Central America, in particular, El Salvador (�%), Guatemala (4%), Honduras (�%), and Nicaragua (�%). Just over � percent come from Asia, and the only Asian country representing more than � percent is the Philippines. Other Asian countries with more than �,000 out-of-school immigrant youth in California are Vietnam, Thailand, and Laos.
Seven percent of out-of-school immigrant youth speak English as their primary language. Eighty-seven percent speak Spanish, � percent each speak Tagalog and Vietnamese, and the remaining 4 percent are split among many languages, none of them alone constituting more than � percent.
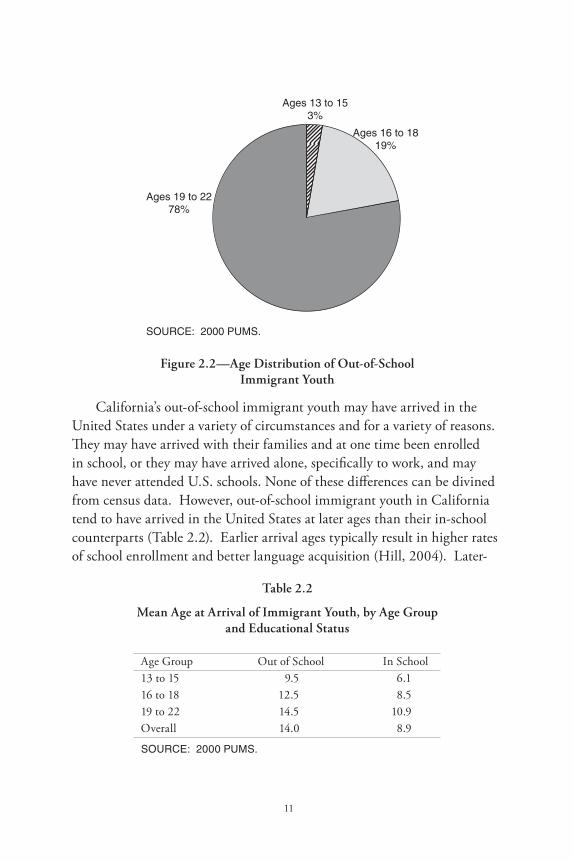
The age structure of this population is skewed heavily toward the older years. Seventy-eight percent of California’s out-of-school immigrant youth are between ages �9 and 22; �9 percent are between �6 and �8, and only 3 percent are between �3 and �� (Figure 2.2). Significant differences in measures of well-being exist among these groups.
3 Unless otherwise noted, the differences emphasized in this report are statistically significant at the �0 percent level. The unweighted sample sizes for each group of youths, by age and sex, are given in Appendix Table A.�.
4 We do not present here a systematic treatment of the differences between the experiences of urban and rural out-of-school youth, preferring to give this topic fuller attention in a future analysis.
�0
Figure 2.1—Population of Out-of-School Immigrant Youth, by Public Use Microdata Area
The gender distribution differs by age group. Whereas the youngest out-of-school immigrant youth are only slightly more likely to be young men than young women (�6% compared to 44%, respectively), the older groups are almost two-thirds male (64% for the age �6 to �8 group and 62% for the age �9 to 22 group).� By comparison, the population of immigrant youth in school or having completed high school is nearly evenly split between males and females in every age range.
� Native-born out-of-school youth are somewhat less likely than foreign-born out-of-school youth to be male. The percentages of males are �� percent, �7 percent, and �9 percent for these respective age ranges.
��
Figure 2.2—Age Distribution of Out-of-School Immigrant Youth
California’s out-of-school immigrant youth may have arrived in the United States under a variety of circumstances and for a variety of reasons. They may have arrived with their families and at one time been enrolled in school, or they may have arrived alone, specifically to work, and may have never attended U.S. schools. None of these differences can be divined from census data. However, out-of-school immigrant youth in California tend to have arrived in the United States at later ages than their in-school counterparts (Table 2.2). Earlier arrival ages typically result in higher rates of school enrollment and better language acquisition (Hill, 2004). Later-
Table 2.2
Mean Age at Arrival of Immigrant Youth, by Age Group and Educational Status
Age Group Out of School In School13 to 15 9.5 6.116 to 18 12.5 8.519 to 22 14.5 10.9Overall 14.0 8.9
SOURCE: 2000 PUMS.
�2
arriving youth may never intend to enroll (and work instead) or may find success in school too difficult. Mean age at arrival for out-of-school immigrant youth is 9.� years for the �3 to �� age group, �2.� years for ages �6 to �8, and �4.� years for ages �9 to 22; in-school youths’ mean ages at arrival range between three and a half to four years younger.
Households, Families, and Living ArrangementsThe home environment of out-of-school immigrant youth can
affect their lives in important ways. Financial responsibilities, access to information, and sources of emergency assistance or emotional support all differ according to youths’ marital status, the size and composition of youths’ households, and whether they live with their parents or are themselves caring for children. In this section, we consider these elements of the home environment of out-of-school immigrant youth and compare them to those of in-school immigrant youth and the native-born.6
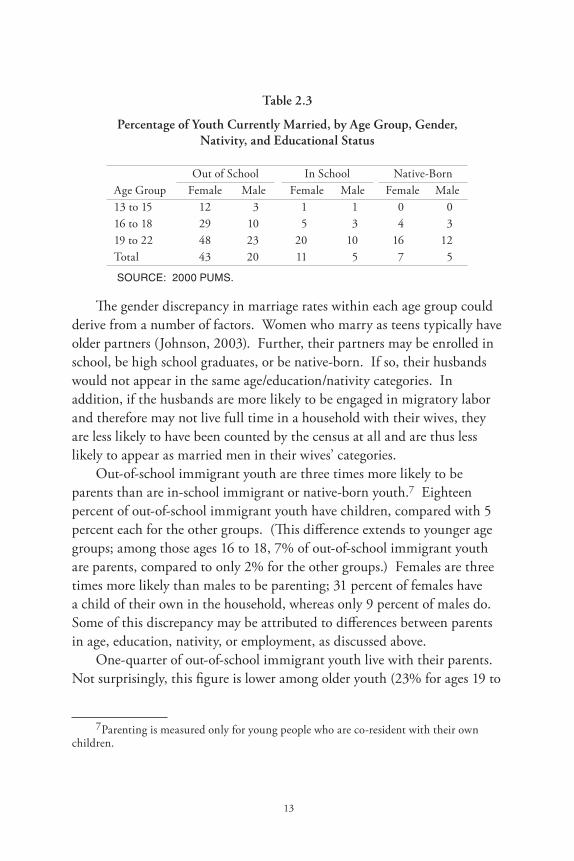
Out-of-school immigrant youth are twice as likely to be married as are in-school immigrant youth—32 percent versus �� percent—and this distinction is amplified when examined by gender and age (Table 2.3). Forty-three percent of out-of-school immigrant young women are married, compared to �� percent of their in-school counterparts. Among young men, the comparable figures are 20 percent and � percent. Older immigrant youth are more likely to be married than are younger ones, but even in the youngest out-of-school group, marriage rates are much higher than among the in-school group. Nearly half (48%) of women ages �9 to 22 are married, as are almost a third (29%) of those ages �6 to �8 and one in eight (�2%) girls ages �3 to ��. These rates are all far higher than both the rates for in-school female immigrant youth in the same age groups and the rates for out-of-school immigrant males.
6 Only 7 percent of California’s 3.8 million native-born youth are out of school (as we define them here). Because the focus of this report is immigrant youth who are out of school, we do not disaggregate the native-born into in-school and out-of-school youth. However, we note here that foreign-born out-of-school youth typically have the worst socioeconomic outcomes, followed by native-born out-of-school youth. Foreign-born in-school youth fare somewhat better, and native-born in-school youth have the best outcomes in this age range.
�3
Table 2.3
Percentage of Youth Currently Married, by Age Group, Gender, Nativity, and Educational Status
Out of School In School Native-BornAge Group Female Male Female Male Female Male�3 to �� �2 3 � � 0 0�6 to �8 29 �0 � 3 4 3�9 to 22 48 23 20 �0 �6 �2Total 43 20 �� � 7 �
SOURCE: 2000 PUMS.
The gender discrepancy in marriage rates within each age group could derive from a number of factors. Women who marry as teens typically have older partners (Johnson, 2003). Further, their partners may be enrolled in school, be high school graduates, or be native-born. If so, their husbands would not appear in the same age/education/nativity categories. In addition, if the husbands are more likely to be engaged in migratory labor and therefore may not live full time in a household with their wives, they are less likely to have been counted by the census at all and are thus less likely to appear as married men in their wives’ categories.
Out-of-school immigrant youth are three times more likely to be parents than are in-school immigrant or native-born youth.7 Eighteen percent of out-of-school immigrant youth have children, compared with � percent each for the other groups. (This difference extends to younger age groups; among those ages �6 to �8, 7% of out-of-school immigrant youth are parents, compared to only 2% for the other groups.) Females are three times more likely than males to be parenting; 3� percent of females have a child of their own in the household, whereas only 9 percent of males do. Some of this discrepancy may be attributed to differences between parents in age, education, nativity, or employment, as discussed above.
One-quarter of out-of-school immigrant youth live with their parents. Not surprisingly, this figure is lower among older youth (23% for ages �9 to
7 Parenting is measured only for young people who are co-resident with their own children.
�4
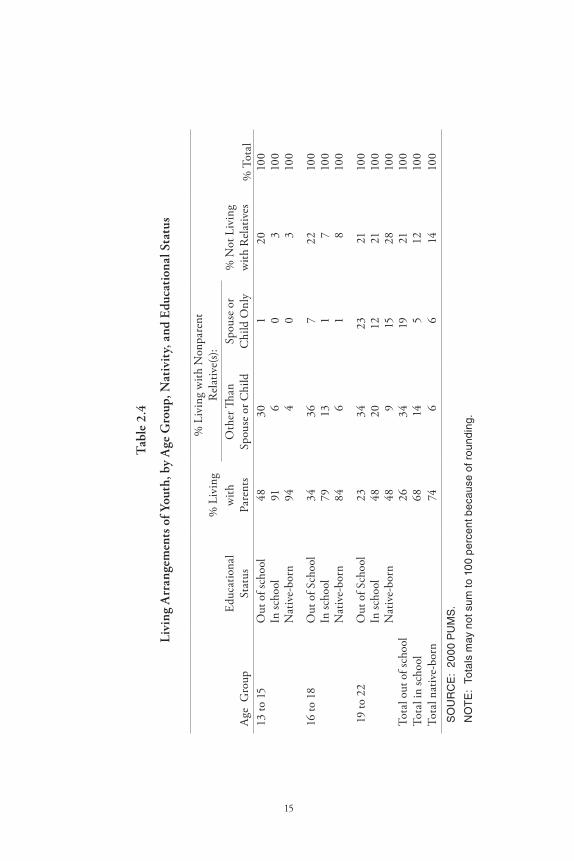
22), but even at younger ages, fewer than half share a household with their parents (34% for ages �6 to �8 and 48% for ages �3 to ��). Recent popular pieces (Nazario, 2006; Kotlowitz, 2006) have described young people in their early to late teens coming to the United States alone—some to reunite with mothers or fathers who came to the United States years earlier and some entirely on their own. Among in-school immigrants as well as native-born youth, living with one’s parents is much more common; more than two-thirds overall live with their parents and among the youngest group, more than 90 percent do (Table 2.4). Differences between males and females are negligible.
About a third of out-of-school immigrant youth in each age group live with relatives other than their parents (not including their own spouses or children). By contrast, this arrangement accounts for only �4 percent of in-school and 6 percent of native-born youth, among whom it is much less common at younger ages.
Another �9 percent live with their spouses or children as their only relatives, compared with � percent and 6 percent of in-school immigrant and native-born youth, respectively. Not surprisingly, this arrangement is more common among older youth across the board.
Twenty-one percent of out-of-school immigrant youth live with no relatives at all—nearly twice the rate for their in-school or native-born counterparts (�2% and �4%, respectively). Strikingly, this figure does not differ much by age for out-of-school youth—at least one-fifth of youth ages �3 to �� and �6 to �8 have such living arrangements—whereas younger in-school or native-born youth are much less likely to live in households without any relatives.
Large households are the rule among out-of-school immigrant youth, whose average household size is 6.5 persons. In-school immigrant youth and native-born youth live in households whose average size is 5.6 and 4.4 persons, respectively. A similar pattern holds for family size; out-of-school immigrant youth live in families with an average of 5.4 persons, larger families than those of their in-school and native-born counterparts (5.1 and 3.9 persons, respectively).
��
Tab
le 2
.4
Livi
ng A
rran
gem
ents
of Y
outh
, by
Age
Gro
up, N
ativ
ity,
and
Edu
cati
onal
Sta
tus
% L
ivin
g %
Liv
ing
with
Non
pare
nt
Rel
ativ
e(s):
% N
ot L
ivin
g w
ith R
elat
ives
% T
otal
Age
Gro
upEd
ucat
iona
l St
atus
with
Pa
rent
sO
ther
Than
Sp
ouse
or C
hild
Spou
se o
r C
hild
Onl
y�3
to �
�O
ut o
f sch
ool
4830
�20
�00
In sc
hool
9�6
03
�00
N
ativ
e-bo
rn94
40
3�0
0
�6 to
�8
Out
of S
choo
l34
367
22�0
0In
scho
ol79
�3�
7�0
0
Nat
ive-
born
846
�8
�00
�9
to 2
2O
ut o
f Sch
ool
2334
232�
�00
In sc
hool
4820
�22�
�00
N
ativ
e-bo
rn48
9��
28�0
0To
tal o
ut o
f sch
ool
Tota
l in
scho
olTo
tal n
ativ
e-bo
rn
2634
�92�
�00
68�4
��2
�00
746
6�4
�00
SO
UR
CE
: 20
00
PU
MS
.
NO
TE
: To
tals
may
not
sum
to 1
00
perc
ent b
ecau
se o
f rou
ndin
g.
�6
MeasuresofWell-BeingResources are often pooled within families. Because so many out-
of-school youth live away from their parents and families, it is especially important to measure their socioeconomic well-being. Here, we consider poverty, public assistance, household crowding, and linguistic isolation among out-of-school immigrant youth and their households and families.
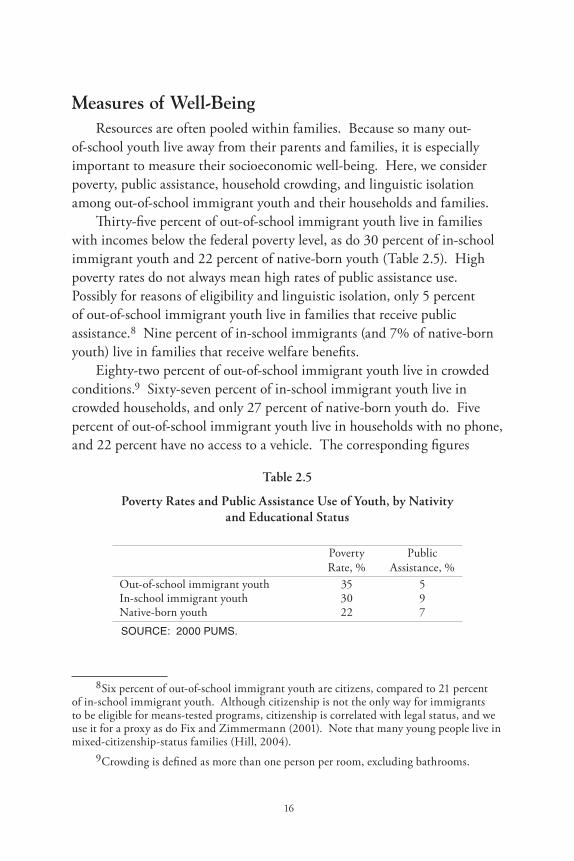
Thirty-five percent of out-of-school immigrant youth live in families with incomes below the federal poverty level, as do 30 percent of in-school immigrant youth and 22 percent of native-born youth (Table 2.�). High poverty rates do not always mean high rates of public assistance use. Possibly for reasons of eligibility and linguistic isolation, only � percent of out-of-school immigrant youth live in families that receive public assistance.8 Nine percent of in-school immigrants (and 7% of native-born youth) live in families that receive welfare benefits.
Eighty-two percent of out-of-school immigrant youth live in crowded conditions.9 Sixty-seven percent of in-school immigrant youth live in crowded households, and only 27 percent of native-born youth do. Five percent of out-of-school immigrant youth live in households with no phone, and 22 percent have no access to a vehicle. The corresponding figures
Table 2.5
Poverty Rates and Public Assistance Use of Youth, by Nativity and Educational Status
Poverty Rate, %
Public Assistance, %
Out-of-school immigrant youth 3� �In-school immigrant youth 30 9Native-born youth 22 7SOURCE: 2000 PUMS.
8 Six percent of out-of-school immigrant youth are citizens, compared to 2� percent of in-school immigrant youth. Although citizenship is not the only way for immigrants to be eligible for means-tested programs, citizenship is correlated with legal status, and we use it for a proxy as do Fix and Zimmermann (200�). Note that many young people live in mixed-citizenship-status families (Hill, 2004).
9 Crowding is defined as more than one person per room, excluding bathrooms.
�7
for in-school immigrant youth households are 2 percent and �2 percent, respectively.
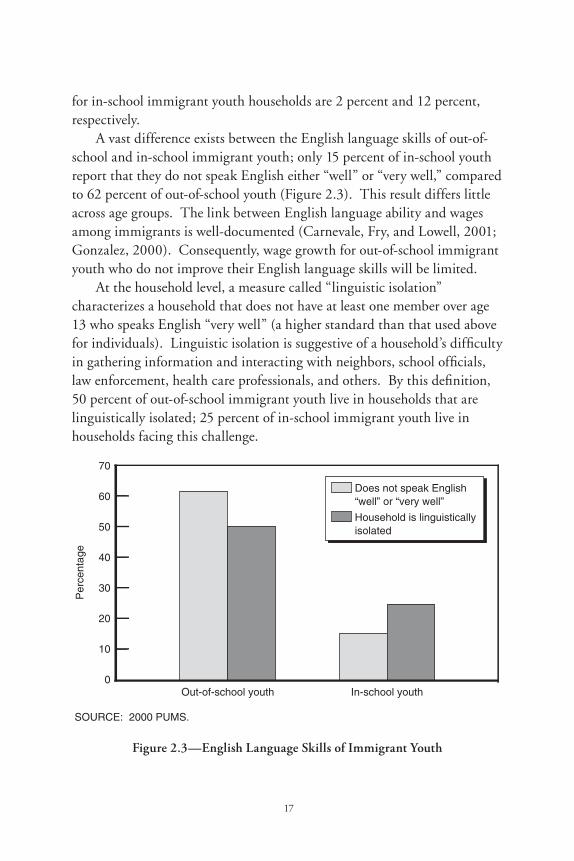
A vast difference exists between the English language skills of out-of-school and in-school immigrant youth; only 15 percent of in-school youth report that they do not speak English either “well” or “very well,” compared to 62 percent of out-of-school youth (Figure 2.3). This result differs little across age groups. The link between English language ability and wages among immigrants is well-documented (Carnevale, Fry, and Lowell, 2001; Gonzalez, 2000). Consequently, wage growth for out-of-school immigrant youth who do not improve their English language skills will be limited.
At the household level, a measure called “linguistic isolation” characterizes a household that does not have at least one member over age 13 who speaks English “very well” (a higher standard than that used above for individuals). Linguistic isolation is suggestive of a household’s difficulty in gathering information and interacting with neighbors, school officials, law enforcement, health care professionals, and others. By this definition, 50 percent of out-of-school immigrant youth live in households that are linguistically isolated; 25 percent of in-school immigrant youth live in households facing this challenge.
Figure 2.3—English Language Skills of Immigrant Youth
�8
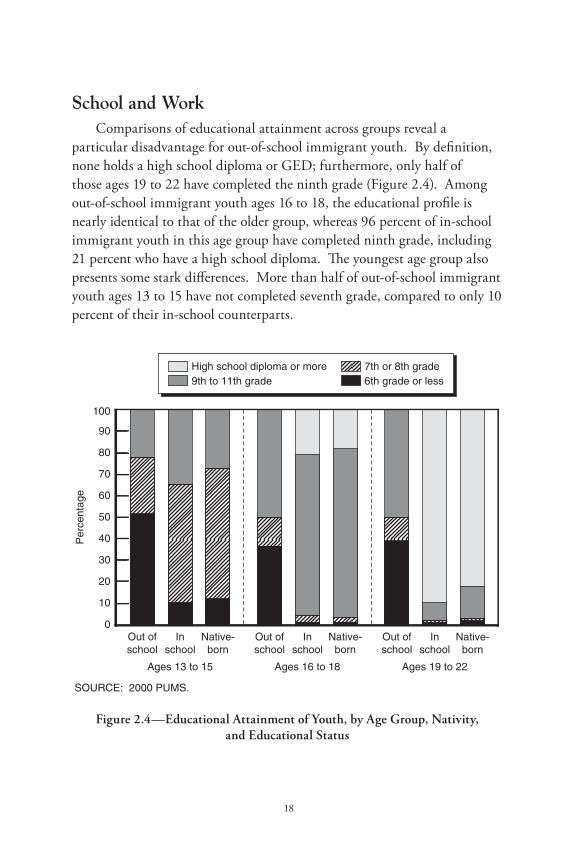
SchoolandWorkComparisons of educational attainment across groups reveal a
particular disadvantage for out-of-school immigrant youth. By definition, none holds a high school diploma or GED; furthermore, only half of those ages �9 to 22 have completed the ninth grade (Figure 2.4). Among out-of-school immigrant youth ages �6 to �8, the educational profile is nearly identical to that of the older group, whereas 96 percent of in-school immigrant youth in this age group have completed ninth grade, including 2� percent who have a high school diploma. The youngest age group also presents some stark differences. More than half of out-of-school immigrant youth ages �3 to �� have not completed seventh grade, compared to only �0 percent of their in-school counterparts.
Figure 2.4—Educational Attainment of Youth, by Age Group, Nativity, and Educational Status
�9
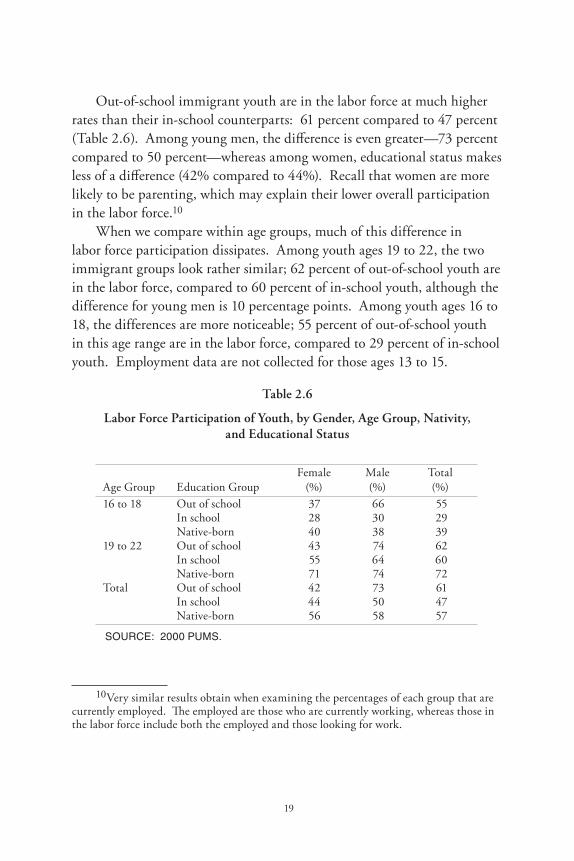
Out-of-school immigrant youth are in the labor force at much higher rates than their in-school counterparts: 6� percent compared to 47 percent (Table 2.6). Among young men, the difference is even greater—73 percentcompared to �0 percent—whereas among women, educational status makes less of a difference (42% compared to 44%). Recall that women are more likely to be parenting, which may explain their lower overall participation in the labor force.�0
When we compare within age groups, much of this difference in labor force participation dissipates. Among youth ages 19 to 22, the two immigrant groups look rather similar; 62 percent of out-of-school youth are in the labor force, compared to 60 percent of in-school youth, although the difference for young men is 10 percentage points. Among youth ages 16 to 18, the differences are more noticeable; 55 percent of out-of-school youth in this age range are in the labor force, compared to 29 percent of in-school youth. Employment data are not collected for those ages 13 to 15.
Table 2.6
Labor Force Participation of Youth, by Gender, Age Group, Nativity, and Educational Status
Age Group Education GroupFemale
(%)Male (%)
Total (%)
�6 to �8 Out of school 37 66 ��In school 28 30 29Native-born 40 38 39
�9 to 22 Out of school 43 74 62In school �� 64 60Native-born 7� 74 72
Total Out of school 42 73 6�In school 44 �0 47Native-born �6 �8 �7
SOURCE: 2000 PUMS.
�0 Very similar results obtain when examining the percentages of each group that are currently employed. The employed are those who are currently working, whereas those in the labor force include both the employed and those looking for work.
20
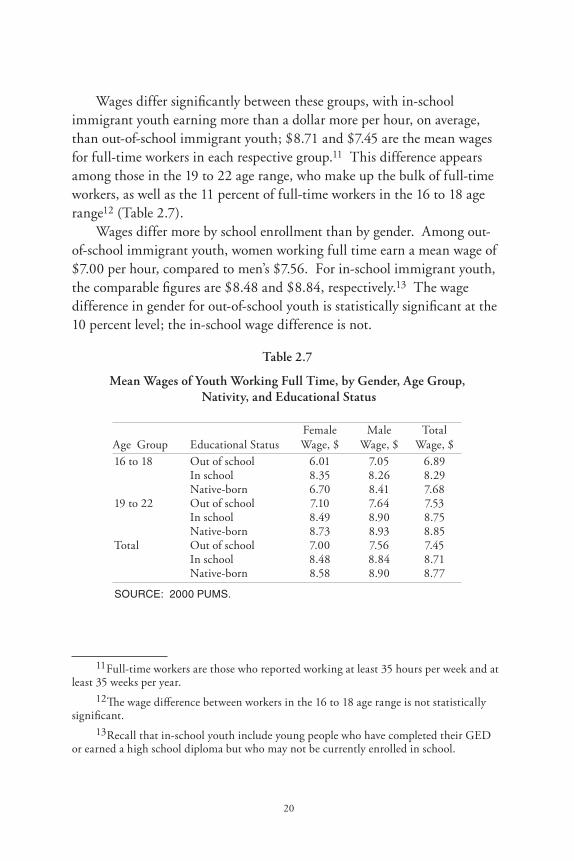
Wages differ significantly between these groups, with in-school immigrant youth earning more than a dollar more per hour, on average, than out-of-school immigrant youth; $8.71 and $7.45 are the mean wages for full-time workers in each respective group.�� This difference appears among those in the 19 to 22 age range, who make up the bulk of full-time workers, as well as the 11 percent of full-time workers in the 16 to 18 age range�2 (Table 2.7).
Wages differ more by school enrollment than by gender. Among out-of-school immigrant youth, women working full time earn a mean wage of $7.00 per hour, compared to men’s $7.56. For in-school immigrant youth, the comparable figures are $8.48 and $8.84, respectively.�3 The wage difference in gender for out-of-school youth is statistically significant at the 10 percent level; the in-school wage difference is not.
Table 2.7
Mean Wages of Youth Working Full Time, by Gender, Age Group, Nativity, and Educational Status
Age Group Educational StatusFemale Wage, $
Male Wage, $
Total Wage, $
�6 to �8 Out of school 6.0� 7.0� 6.89In school 8.3� 8.26 8.29Native-born 6.70 8.4� 7.68
�9 to 22 Out of school 7.�0 7.64 7.�3In school 8.49 8.90 8.7�Native-born 8.73 8.93 8.8�
Total Out of school 7.00 7.�6 7.4�In school 8.48 8.84 8.7�Native-born 8.�8 8.90 8.77
SOURCE: 2000 PUMS.
�� Full-time workers are those who reported working at least 3� hours per week and at least 3� weeks per year.
�2 The wage difference between workers in the �6 to �8 age range is not statistically significant.
�3 Recall that in-school youth include young people who have completed their GED or earned a high school diploma but who may not be currently enrolled in school.
2�
Annual earned incomes are very low among immigrant youth, even those who work full time. Those not attending school or lacking diplomas earn roughly $2,500 less per year than their in-school or high school graduate counterparts. At $15,353 and $17,848, respectively, both immigrant groups’ yearly earned income falls below that of their native-born cohorts: $18,251.�4
To sum up, census data show that for a number of fundamental measures, out-of-school immigrant youth in California face significant challenges. In particular, they experience lower levels of English proficiency, educational attainment, and earning power than do in-school immigrant youth, who are themselves worse off than their native-born counterparts.
This picture is incomplete, however, because census data are limited in their ability to describe out-of-school immigrant youth. Further, the census may undercount this recently arrived and highly mobile population, many of whom may be undocumented or work in the informal economy. Those enumerated in the census may not adequately represent the population as a whole.
The census undercount may introduce bias in a number of ways. As detailed in Gabbard, Kissam, and Martin (1993), entire households may go uncounted, especially if they have no official address, live in illegal rental housing, or are hidden or otherwise inconspicuous. This may frequently be the case among undocumented workers or those living in unlicensed migrant camps. If this occurs, the resulting census count may understate the numbers of migrants living in small families or on their own in substandard housing conditions. Alternatively, individuals within a household may be missed by the census, particularly if they are unrelated to the household head, recently arrived, or undocumented. This type of omission, likewise, would result in a census sample that overstates the socioeconomic well-being of the migrant population in these dimensions. Since the census aims to count all those in the United States on April �st, it will miss migrants who are out of the country on that date but reside in the United States for much of the rest of the year. The resulting census count
�4 The difference in yearly incomes between in-school immigrant youth and native-born youth is not statistically significant.
22
will overstate the proportion of migrants who are permanently settled and stably employed in the country.
A General Accounting Office (now the Government Accountability Office) report assessing the efforts of the Census Bureau to correct these problems in the 2000 census indicates that progress has been made in attempts to identify hidden dwellings such as illegal rental units and inconspicuous labor camps in which many migrant workers may live, but that other barriers such as language unfamiliarity and suspicion of census workers remain serious problems (U.S. Government Accountability Office, 2003).
Furthermore, the census does not elicit information about respondents’ motivations for immigrating or for leaving school, and thus it provides few clues about how this population might best be served. For this insight, subsequent chapters turn to youth assessment data from two regions of California’s MEP.
23
3.WhoDoesMEPServe?
Out-of-school immigrant youth are a large population in California—approximately 265,000 were counted in the 2000 census. Some have dropped out of schools in the United States, but many have never attended. Those young people who have not attended school in the United States are among the most disadvantaged youth. They miss out on the primary opportunities young people have to advance their educations not only because they are not in school but also because they work in jobs where they are unlikely to improve their English language skills. Because they are not in school, few of the resources that the federal and state governments direct toward youth reach this population. This chapter describes the Migrant Education Program and the population characteristics of out-of-school youth served by MEP in two regions of California.
TheMigrantEducationProgramThe Migrant Education Program began approximately 40 years ago
to provide supplemental services to families and children employed in migratory farm and agricultural work. Because migrant families moved often to follow crop cycles, many children had gaps in their education as they moved repeatedly across school district boundaries, counties, states, and even the Mexico-U.S. border. To minimize the effect of these moves on the education of the migrant workers’ children (those in kindergarten through 12th grade) and to allow them to benefit equally from the public education system, MEP was written into the federal Title I program in 1965. In 2002, it was wrapped into Title I of the No Child Left Behind Act (NCLB).
To qualify for MEP as a “migrant child,” a young person must have a parent, spouse, or guardian who has moved across school district boundaries within the last 36 months to seek temporary or seasonal employment in agriculture, fishing, or logging (hereafter we will
24
refer to this eligibility requirement as seeking work in agriculture).1 Employment in these industries must be a principal means of livelihood (U.S. Department of Education, 2003). A young person meeting these employment and mobility criteria himself or herself also qualifies for services through MEP. There is no requirement that the young person be foreign-born.
Over time, MEP expanded its program to incorporate preschool-age children and youth as old as 21 who are not enrolled in school (and are without a high school diploma or GED). Young people not enrolled in school are termed out-of-school youth (OSY) by the Migrant Education Program and can range in age from 13 to 22.2 Neither OSY nor preschoolers are considered a “priority for service” in the language of NCLB. Children and young people who do fit this definition are those “(1) who are failing, or most at risk of failing, to meet the State’s challenging State academic content standards and challenging State student academic achievement standards, and (2) whose education has been interrupted during the regular school year” (U.S. Department of Education, 2003). Because out-of-school youth are not enrolled, they are neither at risk for having a gap in their education nor at risk of failing. However, the federal program does allow states a fair amount of flexibility in how MEP can provide services to them, as long as the population of enrolled K–12 students receives priority.
In California, as we have seen in the previous chapter, the potential size of the population of out-of-school immigrant youth is quite large. Given that there must have been a qualifying move within the previous three years and that the move must have been for employment in agriculture, not all out-of-school immigrant youth will qualify for services from the program. However, if we estimate one criterion, movement, it does not dramatically diminish the size of the population that might be eligible. Census data suggest that 81 percent of the 265,000 out-of-school immigrant youth ages
1 There is some degree of uncertainty about what constitutes a “move” for the purposes of qualifying for MEP.
2 MEP aims to serve just those ages 16 to 21 in its OSY program, hoping to return those younger than age 16 to traditional high schools. In practice, MEP does serve some youth ages 13 to 15. In addition, OSY who reach age 22 during the school year can remain in the program through the school year’s end.
25
13 to 22 counted in 2000 had moved within the last five years (44% lived outside the United States five years before the census).
Despite flexibility in providing services to those who are not a priority under NCLB guidelines, the program’s funding constraints make it impossible to identify and serve all potentially qualifying out-of-school youth. California’s Department of Education receives about $130 million annually for the state MEP, and the vast majority of these dollars are targeted to providing supplemental services for the in-school K–12 population of migrant families. Relatively few dollars appear to be available for supplemental services for OSY.
Most young people served by MEP are K–12 students currently enrolled in school. MEP dollars fund supplemental services such as summer programs or pay for extra staffing at their schools for K–12 students. For OSY, who are not in any school at the time of enrollment in the OSY program, the supplemental services provided by MEP are often the only public service those young people receive.
The funding allocation for OSY is often not known at the regional level. Few regions can estimate the percentage of the budget spent on OSY. Most services provided to OSY come in the form of staff time (e.g., intake, referrals, case management) rather than direct instruction or services (e.g., health services).
To date, reporting requirements for federal funding have consisted of counts of students recruited and counts of services administered. Although MEP is required to conduct a needs assessment for MEP students and families recruited, the content of that assessment is not uniform across states (or regions within states), nor is the content of these assessments reported to the U.S. Department of Education. In most cases, data have not been collected in a way that would allow regions or the state to evaluate MEP effectiveness in helping children maintain educational progress. In the case of out-of-school youth, this insufficiency prevents an evaluation of effectiveness in facilitating the acquisition of a high school diploma or GED, in improving English language skills, or in attaining other measurable goals. California and the other states providing MEP have been encouraged by the U.S. Department of Education to conduct a comprehensive needs assessment for each state’s program. California’s
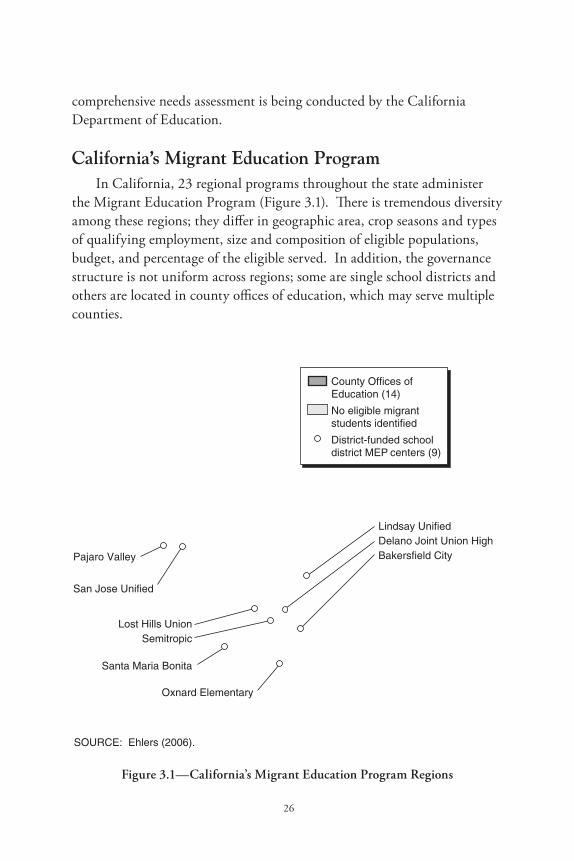
26
comprehensive needs assessment is being conducted by the California Department of Education.
California’sMigrantEducationProgramIn California, 23 regional programs throughout the state administer
the Migrant Education Program (Figure 3.1). There is tremendous diversity among these regions; they differ in geographic area, crop seasons and types of qualifying employment, size and composition of eligible populations, budget, and percentage of the eligible served. In addition, the governance structure is not uniform across regions; some are single school districts and others are located in county offices of education, which may serve multiple counties.
Figure 3.1—California’s Migrant Education Program Regions
27
For example, Region 2, the Northern California region, is run out of the Butte County Office of Education (Figure 3.1) and serves 36,000 MEP students in 22 counties with an annual budget of $12.9 million. At the other end of the spectrum, Region 20 in Kern County serves just one school district and has an annual budget of $35,000. Regions that are directly funded school districts operate quite differently from those where the county office of education receives the budget and then passes some of the funding on to the school districts within the regions. For a more detailed overview of the organizational structure of MEP in California, see a recent Legislative Analyst’s Office report (Ehlers, 2006).
Of the $130 million in federal funds allocated to the state’s MEP, approximately 85 percent is distributed to the state’s regional programs. This amount is based on a formula that ties extra funding to different categories of high-risk MEP students (such as OSY). For the 2006–2007 school year, the extra allocation for each California region’s out-of-school youth population is expected to be 5.5 percent. The funding schedule can differ from year to year but the basic structure has remained the same over time. Money is allocated to regions on the basis of overall population and the composition of MEP students identified and recruited in the previous year, but not on the services provided or on achieving measurable outcomes. Regions compete with each other for their share of the state’s MEP allocation from the federal government.
The organizational structure of regions, whether school district or county office of education, can particularly affect the OSY population served. For example, regions based in school districts recruit families, children, and OSY through their schools. OSY identified in these regions are typically dropouts of the district schools or are the older siblings of enrolled children. OSY identified by regions served by county offices of education are more likely to be recruited at employer sites and by community canvassing. As a result, OSY served by regions operated through county offices of education are more likely than those recruited through school-district–based regions to be young people who have never attended schools in the United States.
Given the program eligibility constraints of MEP, we might not expect regional programs to have recruited all of the out-of-school immigrant youth in their regions. However, the funding structure gives regions every
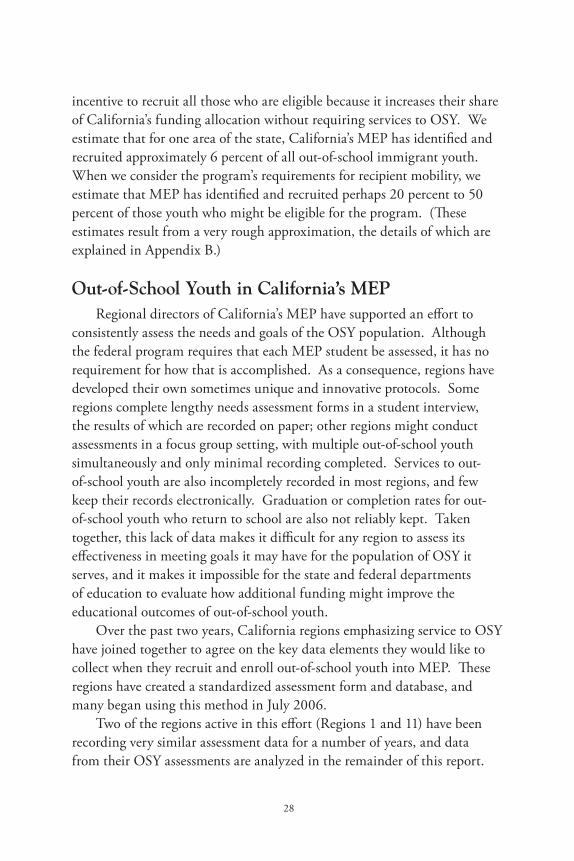
28
incentive to recruit all those who are eligible because it increases their share of California’s funding allocation without requiring services to OSY. We estimate that for one area of the state, California’s MEP has identified and recruited approximately 6 percent of all out-of-school immigrant youth. When we consider the program’s requirements for recipient mobility, we estimate that MEP has identified and recruited perhaps 20 percent to 50 percent of those youth who might be eligible for the program. (These estimates result from a very rough approximation, the details of which are explained in Appendix B.)
Out-of-SchoolYouthinCalifornia’sMEPRegional directors of California’s MEP have supported an effort to
consistently assess the needs and goals of the OSY population. Although the federal program requires that each MEP student be assessed, it has no requirement for how that is accomplished. As a consequence, regions have developed their own sometimes unique and innovative protocols. Some regions complete lengthy needs assessment forms in a student interview, the results of which are recorded on paper; other regions might conduct assessments in a focus group setting, with multiple out-of-school youth simultaneously and only minimal recording completed. Services to out-of-school youth are also incompletely recorded in most regions, and few keep their records electronically. Graduation or completion rates for out-of-school youth who return to school are also not reliably kept. Taken together, this lack of data makes it difficult for any region to assess its effectiveness in meeting goals it may have for the population of OSY it serves, and it makes it impossible for the state and federal departments of education to evaluate how additional funding might improve the educational outcomes of out-of-school youth.
Over the past two years, California regions emphasizing service to OSY have joined together to agree on the key data elements they would like to collect when they recruit and enroll out-of-school youth into MEP. These regions have created a standardized assessment form and database, and many began using this method in July 2006.
Two of the regions active in this effort (Regions 1 and 11) have been recording very similar assessment data for a number of years, and data from their OSY assessments are analyzed in the remainder of this report.
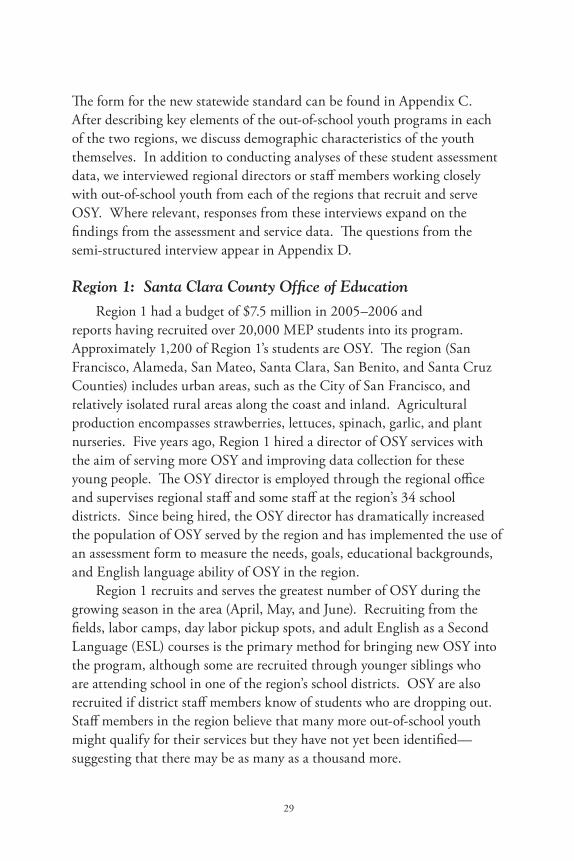
29
The form for the new statewide standard can be found in Appendix C. After describing key elements of the out-of-school youth programs in each of the two regions, we discuss demographic characteristics of the youth themselves. In addition to conducting analyses of these student assessment data, we interviewed regional directors or staff members working closely with out-of-school youth from each of the regions that recruit and serve OSY. Where relevant, responses from these interviews expand on the findings from the assessment and service data. The questions from the semi-structured interview appear in Appendix D.
Region 1: Santa Clara County Office of Education Region 1 had a budget of $7.5 million in 2005–2006 and
reports having recruited over 20,000 MEP students into its program. Approximately 1,200 of Region 1’s students are OSY. The region (San Francisco, Alameda, San Mateo, Santa Clara, San Benito, and Santa Cruz Counties) includes urban areas, such as the City of San Francisco, and relatively isolated rural areas along the coast and inland. Agricultural production encompasses strawberries, lettuces, spinach, garlic, and plant nurseries. Five years ago, Region 1 hired a director of OSY services with the aim of serving more OSY and improving data collection for these young people. The OSY director is employed through the regional office and supervises regional staff and some staff at the region’s 34 school districts. Since being hired, the OSY director has dramatically increased the population of OSY served by the region and has implemented the use of an assessment form to measure the needs, goals, educational backgrounds, and English language ability of OSY in the region.
Region 1 recruits and serves the greatest number of OSY during the growing season in the area (April, May, and June). Recruiting from the fields, labor camps, day labor pickup spots, and adult English as a Second Language (ESL) courses is the primary method for bringing new OSY into the program, although some are recruited through younger siblings who are attending school in one of the region’s school districts. OSY are also recruited if district staff members know of students who are dropping out. Staff members in the region believe that many more out-of-school youth might qualify for their services but they have not yet been identified—suggesting that there may be as many as a thousand more.
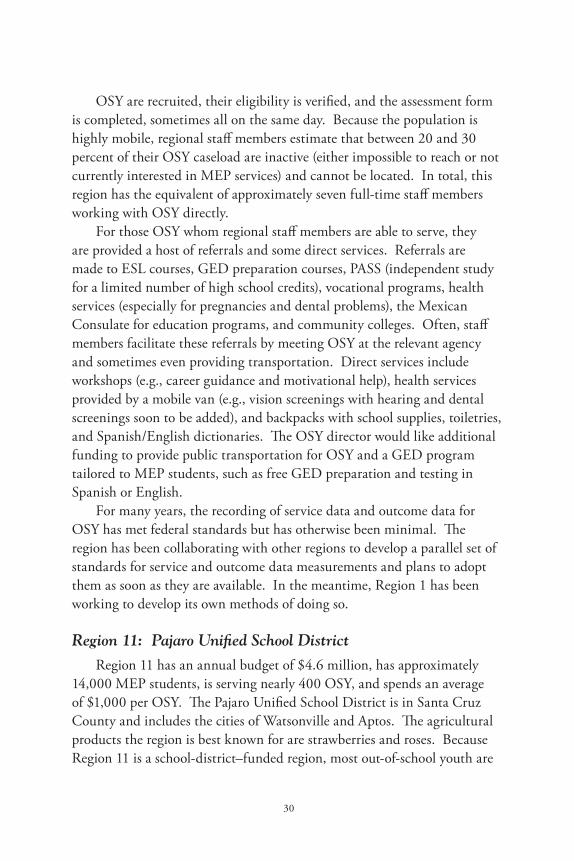
30
OSY are recruited, their eligibility is verified, and the assessment form is completed, sometimes all on the same day. Because the population is highly mobile, regional staff members estimate that between 20 and 30 percent of their OSY caseload are inactive (either impossible to reach or not currently interested in MEP services) and cannot be located. In total, this region has the equivalent of approximately seven full-time staff members working with OSY directly.
For those OSY whom regional staff members are able to serve, they are provided a host of referrals and some direct services. Referrals are made to ESL courses, GED preparation courses, PASS (independent study for a limited number of high school credits), vocational programs, health services (especially for pregnancies and dental problems), the Mexican Consulate for education programs, and community colleges. Often, staff members facilitate these referrals by meeting OSY at the relevant agency and sometimes even providing transportation. Direct services include workshops (e.g., career guidance and motivational help), health services provided by a mobile van (e.g., vision screenings with hearing and dental screenings soon to be added), and backpacks with school supplies, toiletries, and Spanish/English dictionaries. The OSY director would like additional funding to provide public transportation for OSY and a GED program tailored to MEP students, such as free GED preparation and testing in Spanish or English.
For many years, the recording of service data and outcome data for OSY has met federal standards but has otherwise been minimal. The region has been collaborating with other regions to develop a parallel set of standards for service and outcome data measurements and plans to adopt them as soon as they are available. In the meantime, Region 1 has been working to develop its own methods of doing so.
Region 11: Pajaro Unified School District Region 11 has an annual budget of $4.6 million, has approximately
14,000 MEP students, is serving nearly 400 OSY, and spends an average of $1,000 per OSY. The Pajaro Unified School District is in Santa Cruz County and includes the cities of Watsonville and Aptos. The agricultural products the region is best known for are strawberries and roses. Because Region 11 is a school-district–funded region, most out-of-school youth are
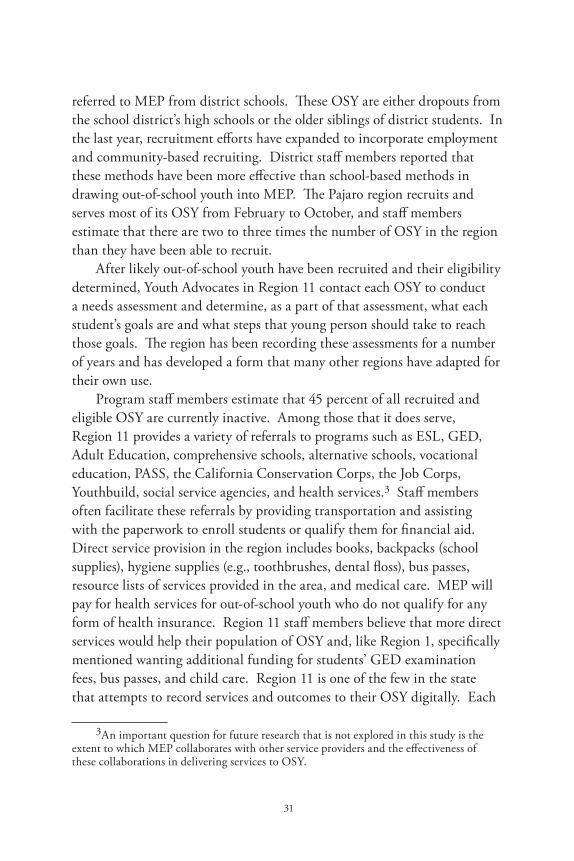
31
referred to MEP from district schools. These OSY are either dropouts from the school district’s high schools or the older siblings of district students. In the last year, recruitment efforts have expanded to incorporate employment and community-based recruiting. District staff members reported that these methods have been more effective than school-based methods in drawing out-of-school youth into MEP. The Pajaro region recruits and serves most of its OSY from February to October, and staff members estimate that there are two to three times the number of OSY in the region than they have been able to recruit.
After likely out-of-school youth have been recruited and their eligibility determined, Youth Advocates in Region 11 contact each OSY to conduct a needs assessment and determine, as a part of that assessment, what each student’s goals are and what steps that young person should take to reach those goals. The region has been recording these assessments for a number of years and has developed a form that many other regions have adapted for their own use.
Program staff members estimate that 45 percent of all recruited and eligible OSY are currently inactive. Among those that it does serve, Region 11 provides a variety of referrals to programs such as ESL, GED, Adult Education, comprehensive schools, alternative schools, vocational education, PASS, the California Conservation Corps, the Job Corps, Youthbuild, social service agencies, and health services.3 Staff members often facilitate these referrals by providing transportation and assisting with the paperwork to enroll students or qualify them for financial aid. Direct service provision in the region includes books, backpacks (school supplies), hygiene supplies (e.g., toothbrushes, dental floss), bus passes, resource lists of services provided in the area, and medical care. MEP will pay for health services for out-of-school youth who do not qualify for any form of health insurance. Region 11 staff members believe that more direct services would help their population of OSY and, like Region 1, specifically mentioned wanting additional funding for students’ GED examination fees, bus passes, and child care. Region 11 is one of the few in the state that attempts to record services and outcomes to their OSY digitally. Each
3 An important question for future research that is not explored in this study is the extent to which MEP collaborates with other service providers and the effectiveness of these collaborations in delivering services to OSY.
32
contact or attempted contact with OSY is recorded in a database and includes the date, the type of contact, the goal of the student, the program or service the student is being contacted about, and whether that student has enrolled in, attended, or completed that program.
TheData:NeedsAssessmentsIn each of these two regions, very similar needs assessment data
have been gathered for OSY for a number of years. The new assessment form nearly all regions began using in July 2006 is quite similar to those previously in use by Regions 1 and 11 and can be found in Appendix C. To collect the data on these forms, Youth Advocates meet with OSY to determine their educational backgrounds, English language abilities, family situations, socioeconomic needs, and educational and vocational goals. In Region 1 interviews, Youth Advocates stressed that although they may wish to direct OSY to a particular goal or may feel that an OSY has a particular need (e.g., drug counseling), they will not indicate that on the needs assessment form unless the OSY concurs. In Region 11, Youth Advocates will indicate any barriers that they feel are relevant for the youth, whether or not the youth concurs.4 For ease of exposition, we describe these needs as if they have been self-reported by the youth.
It is important to note that not all OSY who are identified by MEP in Regions 1 and 11 will be recruited into the program. This may be because they do not meet the specific program eligibility requirements or because they are not interested in the program despite their eligibility. Youth Advocates report that those not interested can be among the most and the least needy. In some cases, OSY are apprehensive about government-provided services, as many may be undocumented. However, many young people are effectively recruited from the fields where they work or the camps where they sleep. Youth Advocates note that having an established relationship with a grower or with other OSY can make possible recruitment of even the most reluctant. Thus, although we cannot be certain of the degree to which these data are representative of all OSY or even of all MEP-eligible OSY, they are representative of those served
4 Thus, reports of socioeconomic needs and barriers are probably best interpreted as underrepresentative of actual need.
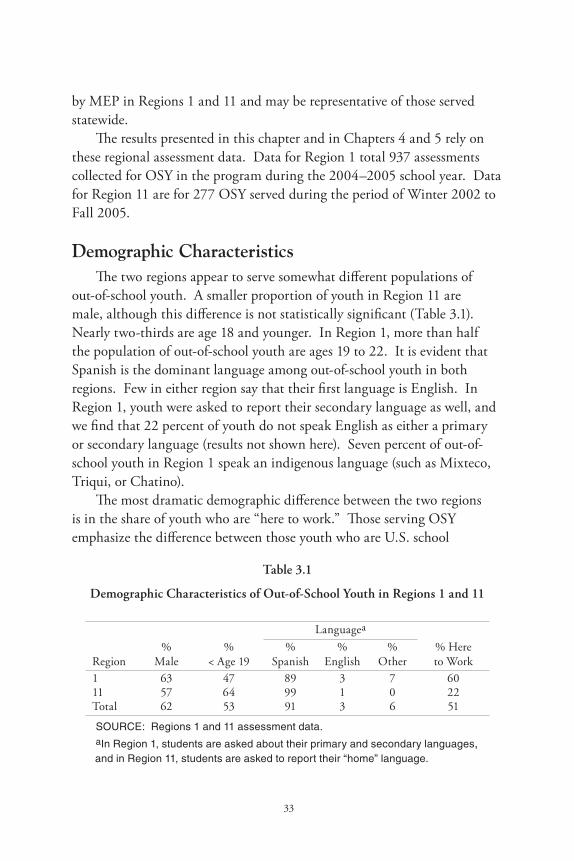
33
by MEP in Regions 1 and 11 and may be representative of those served statewide.
The results presented in this chapter and in Chapters 4 and 5 rely on these regional assessment data. Data for Region 1 total 937 assessments collected for OSY in the program during the 2004–2005 school year. Data for Region 11 are for 277 OSY served during the period of Winter 2002 to Fall 2005.
DemographicCharacteristicsThe two regions appear to serve somewhat different populations of
out-of-school youth. A smaller proportion of youth in Region 11 are male, although this difference is not statistically significant (Table 3.1). Nearly two-thirds are age 18 and younger. In Region 1, more than half the population of out-of-school youth are ages 19 to 22. It is evident that Spanish is the dominant language among out-of-school youth in both regions. Few in either region say that their first language is English. In Region 1, youth were asked to report their secondary language as well, and we find that 22 percent of youth do not speak English as either a primary or secondary language (results not shown here). Seven percent of out-of-school youth in Region 1 speak an indigenous language (such as Mixteco, Triqui, or Chatino).
The most dramatic demographic difference between the two regions is in the share of youth who are “here to work.” Those serving OSY emphasize the difference between those youth who are U.S. school
Table 3.1
Demographic Characteristics of Out-of-School Youth in Regions 1 and 11
Languagea
Region%
Male%
< Age 19 %
Spanish%
English%
Other% Here to Work
1 63 47 89 3 7 6011 57 64 99 1 0 22Total 62 53 91 3 6 51
SOURCE: Regions 1 and 11 assessment data.aIn Region 1, students are asked about their primary and secondary languages,
and in Region 11, students are asked to report their “home” language.
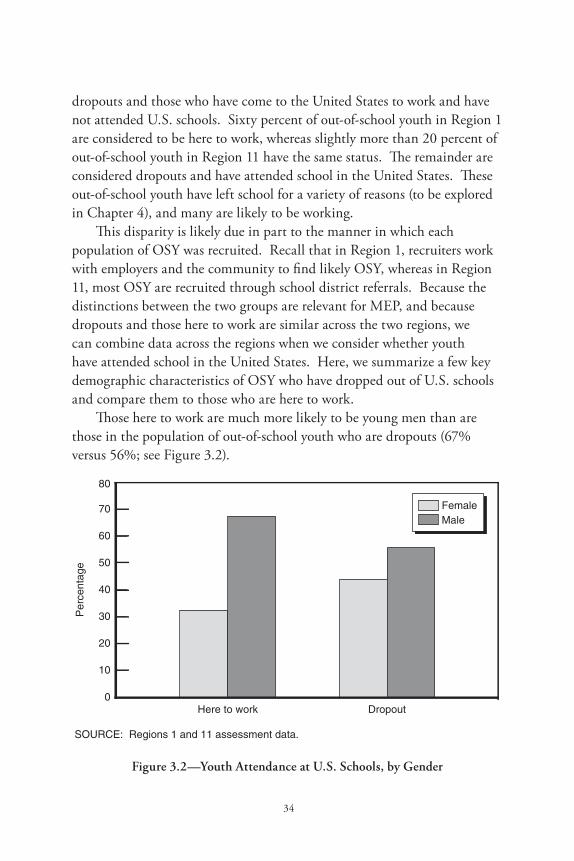
34
dropouts and those who have come to the United States to work and have not attended U.S. schools. Sixty percent of out-of-school youth in Region 1 are considered to be here to work, whereas slightly more than 20 percent of out-of-school youth in Region 11 have the same status. The remainder are considered dropouts and have attended school in the United States. These out-of-school youth have left school for a variety of reasons (to be explored in Chapter 4), and many are likely to be working.
This disparity is likely due in part to the manner in which each population of OSY was recruited. Recall that in Region 1, recruiters work with employers and the community to find likely OSY, whereas in Region 11, most OSY are recruited through school district referrals. Because the distinctions between the two groups are relevant for MEP, and because dropouts and those here to work are similar across the two regions, we can combine data across the regions when we consider whether youth have attended school in the United States. Here, we summarize a few key demographic characteristics of OSY who have dropped out of U.S. schools and compare them to those who are here to work.
Those here to work are much more likely to be young men than are those in the population of out-of-school youth who are dropouts (67% versus 56%; see Figure 3.2).
Figure 3.2—Youth Attendance at U.S. Schools, by Gender
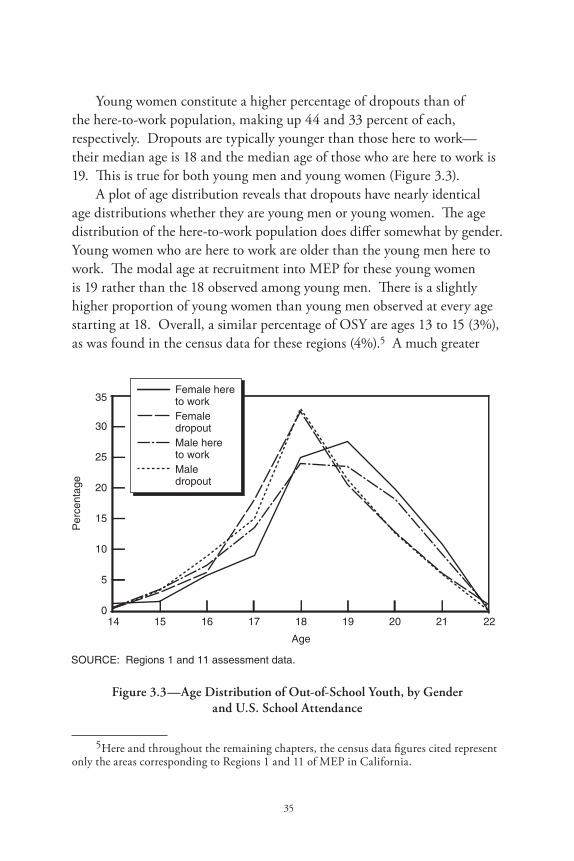
35
Young women constitute a higher percentage of dropouts than of the here-to-work population, making up 44 and 33 percent of each, respectively. Dropouts are typically younger than those here to work—their median age is 18 and the median age of those who are here to work is 19. This is true for both young men and young women (Figure 3.3).
A plot of age distribution reveals that dropouts have nearly identical age distributions whether they are young men or young women. The age distribution of the here-to-work population does differ somewhat by gender. Young women who are here to work are older than the young men here to work. The modal age at recruitment into MEP for these young women is 19 rather than the 18 observed among young men. There is a slightly higher proportion of young women than young men observed at every age starting at 18. Overall, a similar percentage of OSY are ages 13 to 15 (3%), as was found in the census data for these regions (4%).5 A much greater
Figure 3.3—Age Distribution of Out-of-School Youth, by Gender and U.S. School Attendance
5 Here and throughout the remaining chapters, the census data figures cited represent only the areas corresponding to Regions 1 and 11 of MEP in California.
36
proportion in Regions 1 and 11 are ages 16 to 18 (50%) than was observed in the census (19%). Only 47 percent of OSY in Regions 1 and 11 are ages 19 to 22, whereas the census out-of-school immigrant youth were mostly ages 19 to 22 (77%). The difference in the age distribution of out-of-school youth between the two data sources may be due to undercounting—the census may be less successful at finding these younger-age agricultural workers than is the MEP, or the MEP may be less successful at finding the older youth. For a discussion of census undercounts, see Chapter 2.
Although MEP does not require that participants be foreign-born, the vast majority are. In Region 11, 100 percent of those who are here to work are foreign-born and nearly 60 percent of those who dropped out of U.S.-schools are foreign-born. All of those born abroad were born in Mexico. So, although the program does not explicitly exclude the native-born, the majority of dropouts were born abroad, as were all of those here to work. We do not know the place of birth of OSY in Region 1. As noted above, these regions contain both rural agricultural areas and urban areas. Characteristics of OSY (as well as services available to OSY) may differ along this urban/rural dimension but this research question will be left until we have data from additional regions.
The next two chapters look in greater detail at assessment and service data for OSY. In Chapter 4, we examine how home life, socioeconomic resources, and socioeconomic needs might differ between those out-of-school youth who are here to work and those who have dropped out of U.S. schools. In Chapter 5, we probe how language abilities, schooling, and academic interests differ between dropouts and those here to work, and we take a preliminary look at academic services to OSY and predictors of school attendance among OSY.
37
4.SocioeconomicNeedsofOut-of-SchoolYouth
We know from census data that immigrant youth who lack a high school diploma or GED tend to be poor, are likely to live away from their parents, and are much more likely than other young people to be parents. This chapter gives a more complete picture than the census can provide about the well-being of out-of-school youth, including their medical needs, health insurance coverage, and whether their families depend on them for income. We also examine how services provided by MEP in two regions relate to their needs.
FamilyFormationIn Chapter 2, we found that out-of-school immigrant youth were more
likely than in-school immigrant youth to be living away from their parents and were more likely to be married and to have children. With Regions 1 and 11 assessment data, we are able to examine living conditions and family formation (i.e., marriage and parenting) of out-of-school youth who have not attended U.S. schools (those we call here to work) and those who have attended but are no longer in school (dropouts). As we established in Chapter 3, OSY served through MEP are just a subset of the state’s out-of-school immigrant youth population.
Out-of-school youth who are here to work are more likely than dropouts to live away from their parents (Table 4.1). This is true for both young men and young women, but the gap between those here to work and dropouts is greatest among young men; nearly three-quarters of young men who are here to work live away from their parents, but only 17 percent of male dropouts do. The percentage of young men here to work who are living away from their parents is similar to the percentage of out-of-school youth living away from their parents observed in the census data for these regions (76%). Overall, young women are less likely to live away from their parents than are young men (32% compared to 48%).
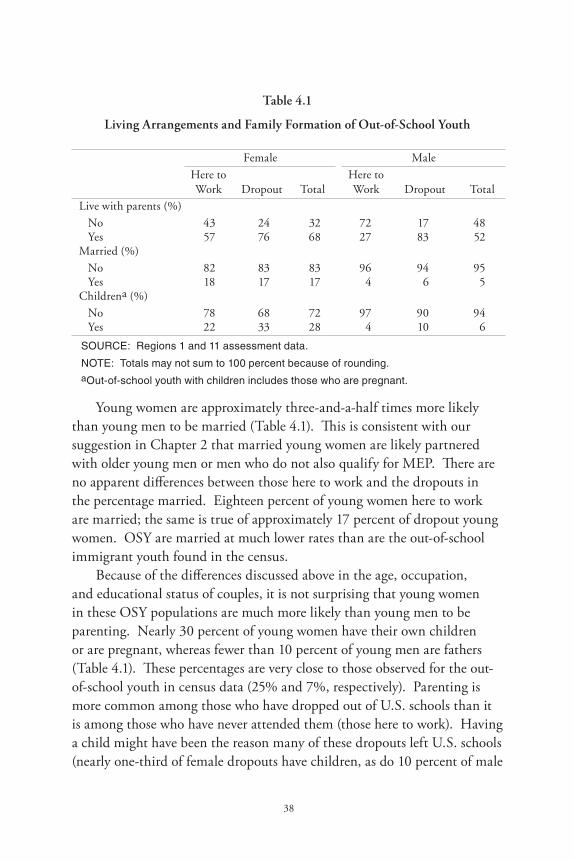
38
Table 4.1
Living Arrangements and Family Formation of Out-of-School Youth
Female Male
Here to Work Dropout Total
Here to Work Dropout Total
Live with parents (%)
No 43 24 32 72 17 48 Yes 57 76 68 27 83 52Married (%)
No 82 83 83 96 94 95 Yes 18 17 17 4 6 5Childrena (%)
No 78 68 72 97 90 94 Yes 22 33 28 4 10 6
SOURCE: Regions 1 and 11 assessment data.
NOTE: Totals may not sum to 100 percent because of rounding.aOut-of-school youth with children includes those who are pregnant.
Young women are approximately three-and-a-half times more likely than young men to be married (Table 4.1). This is consistent with our suggestion in Chapter 2 that married young women are likely partnered with older young men or men who do not also qualify for MEP. There are no apparent differences between those here to work and the dropouts in the percentage married. Eighteen percent of young women here to work are married; the same is true of approximately 17 percent of dropout young women. OSY are married at much lower rates than are the out-of-school immigrant youth found in the census.
Because of the differences discussed above in the age, occupation, and educational status of couples, it is not surprising that young women in these OSY populations are much more likely than young men to be parenting. Nearly 30 percent of young women have their own children or are pregnant, whereas fewer than 10 percent of young men are fathers (Table 4.1). These percentages are very close to those observed for the out-of-school youth in census data (25% and 7%, respectively). Parenting is more common among those who have dropped out of U.S. schools than it is among those who have never attended them (those here to work). Having a child might have been the reason many of these dropouts left U.S. schools (nearly one-third of female dropouts have children, as do 10 percent of male
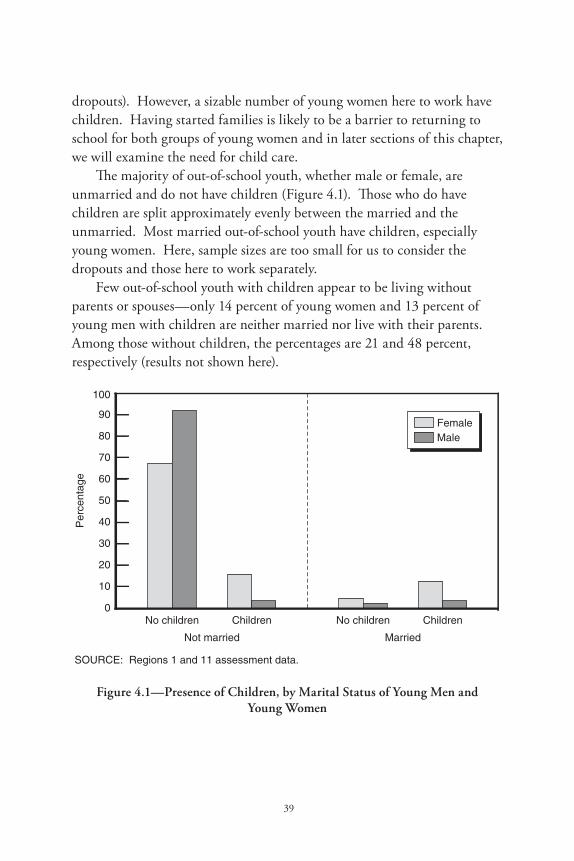
39
dropouts). However, a sizable number of young women here to work have children. Having started families is likely to be a barrier to returning to school for both groups of young women and in later sections of this chapter, we will examine the need for child care.
The majority of out-of-school youth, whether male or female, are unmarried and do not have children (Figure 4.1). Those who do have children are split approximately evenly between the married and the unmarried. Most married out-of-school youth have children, especially young women. Here, sample sizes are too small for us to consider the dropouts and those here to work separately.
Few out-of-school youth with children appear to be living without parents or spouses—only 14 percent of young women and 13 percent of young men with children are neither married nor live with their parents. Among those without children, the percentages are 21 and 48 percent, respectively (results not shown here).
Figure 4.1—Presence of Children, by Marital Status of Young Men and Young Women
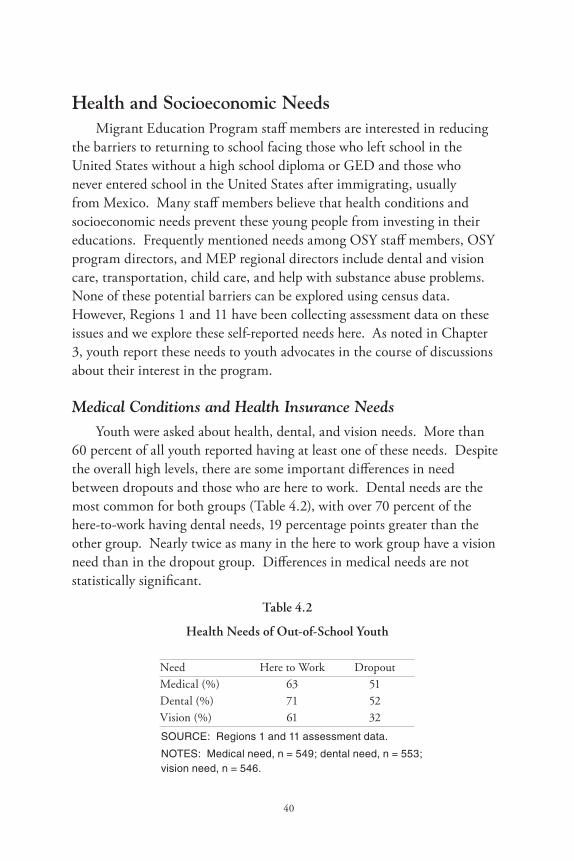
40
HealthandSocioeconomicNeedsMigrant Education Program staff members are interested in reducing
the barriers to returning to school facing those who left school in the United States without a high school diploma or GED and those who never entered school in the United States after immigrating, usually from Mexico. Many staff members believe that health conditions and socioeconomic needs prevent these young people from investing in their educations. Frequently mentioned needs among OSY staff members, OSY program directors, and MEP regional directors include dental and vision care, transportation, child care, and help with substance abuse problems. None of these potential barriers can be explored using census data. However, Regions 1 and 11 have been collecting assessment data on these issues and we explore these self-reported needs here. As noted in Chapter 3, youth report these needs to youth advocates in the course of discussions about their interest in the program.
Medical Conditions and Health Insurance NeedsYouth were asked about health, dental, and vision needs. More than
60 percent of all youth reported having at least one of these needs. Despite the overall high levels, there are some important differences in need between dropouts and those who are here to work. Dental needs are the most common for both groups (Table 4.2), with over 70 percent of the here-to-work having dental needs, 19 percentage points greater than the other group. Nearly twice as many in the here to work group have a vision need than in the dropout group. Differences in medical needs are not statistically significant.
Table 4.2
Health Needs of Out-of-School Youth
Need Here to Work DropoutMedical (%) 63 51Dental (%) 71 52Vision (%) 61 32
SOURCE: Regions 1 and 11 assessment data.
NOTES: Medical need, n = 549; dental need, n = 553;vision need, n = 546.
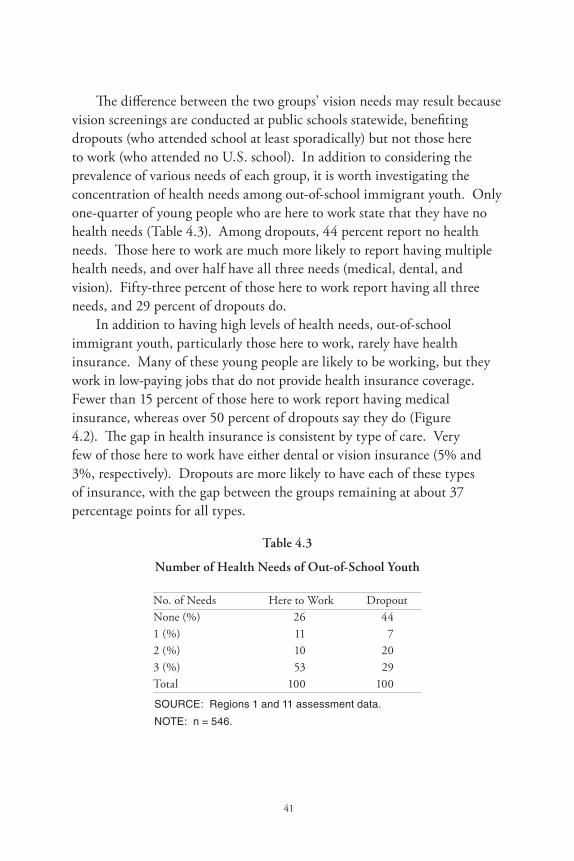
41
The difference between the two groups’ vision needs may result because vision screenings are conducted at public schools statewide, benefiting dropouts (who attended school at least sporadically) but not those here to work (who attended no U.S. school). In addition to considering the prevalence of various needs of each group, it is worth investigating the concentration of health needs among out-of-school immigrant youth. Only one-quarter of young people who are here to work state that they have no health needs (Table 4.3). Among dropouts, 44 percent report no health needs. Those here to work are much more likely to report having multiple health needs, and over half have all three needs (medical, dental, and vision). Fifty-three percent of those here to work report having all three needs, and 29 percent of dropouts do.
In addition to having high levels of health needs, out-of-school immigrant youth, particularly those here to work, rarely have health insurance. Many of these young people are likely to be working, but they work in low-paying jobs that do not provide health insurance coverage. Fewer than 15 percent of those here to work report having medical insurance, whereas over 50 percent of dropouts say they do (Figure 4.2). The gap in health insurance is consistent by type of care. Very few of those here to work have either dental or vision insurance (5% and 3%, respectively). Dropouts are more likely to have each of these types of insurance, with the gap between the groups remaining at about 37 percentage points for all types.
Table 4.3
Number of Health Needs of Out-of-School Youth
No. of Needs Here to Work DropoutNone (%) 26 441 (%) 11 72 (%) 10 203 (%) 53 29Total 100 100
SOURCE: Regions 1 and 11 assessment data.
NOTE: n = 546.
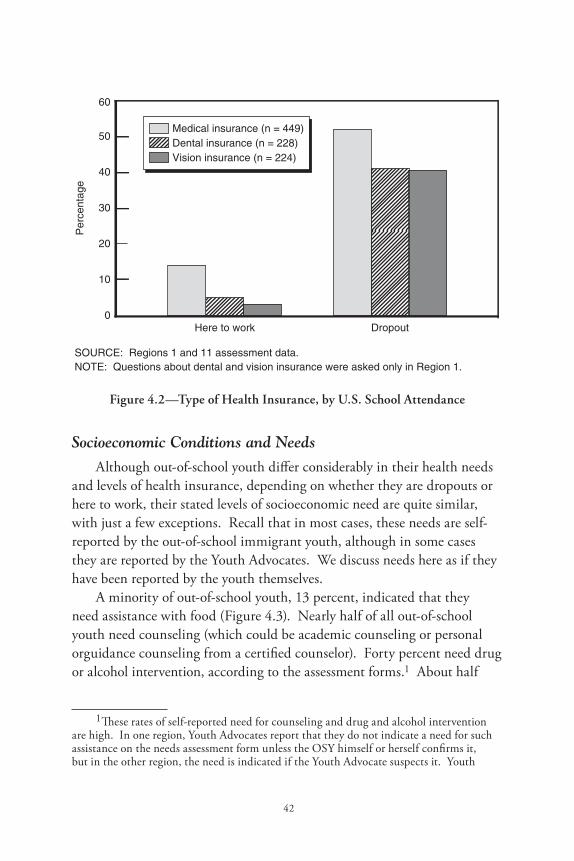
42
Figure 4.2—Type of Health Insurance, by U.S. School Attendance
Socioeconomic Conditions and NeedsAlthough out-of-school youth differ considerably in their health needs
and levels of health insurance, depending on whether they are dropouts or here to work, their stated levels of socioeconomic need are quite similar, with just a few exceptions. Recall that in most cases, these needs are self-reported by the out-of-school immigrant youth, although in some cases they are reported by the Youth Advocates. We discuss needs here as if they have been reported by the youth themselves.
A minority of out-of-school youth, 13 percent, indicated that they need assistance with food (Figure 4.3). Nearly half of all out-of-school youth need counseling (which could be academic counseling or personal orguidance counseling from a certified counselor). Forty percent need drug or alcohol intervention, according to the assessment forms.1 About half
1 These rates of self-reported need for counseling and drug and alcohol intervention are high. In one region, Youth Advocates report that they do not indicate a need for such assistance on the needs assessment form unless the OSY himself or herself confirms it, but in the other region, the need is indicated if the Youth Advocate suspects it. Youth
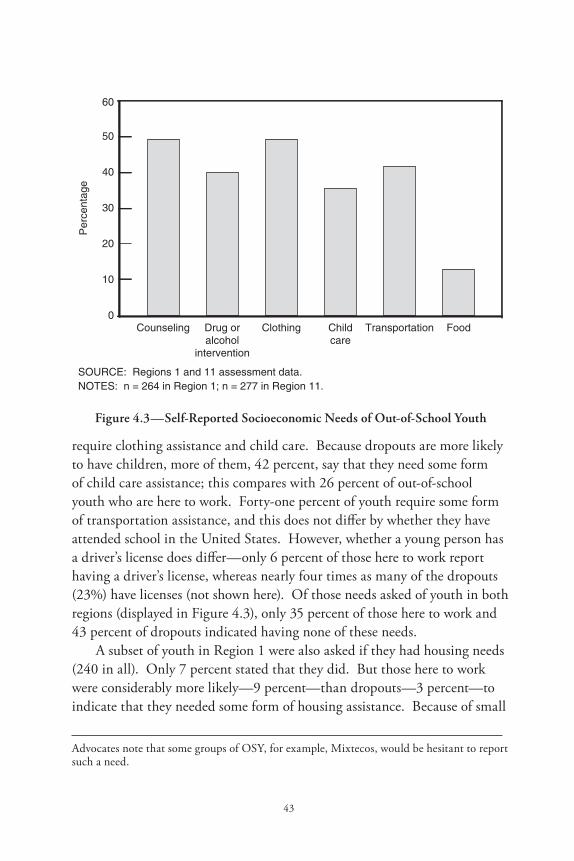
43
Figure 4.3—Self-Reported Socioeconomic Needs of Out-of-School Youth
require clothing assistance and child care. Because dropouts are more likely to have children, more of them, 42 percent, say that they need some form of child care assistance; this compares with 26 percent of out-of-school youth who are here to work. Forty-one percent of youth require some form of transportation assistance, and this does not differ by whether they have attended school in the United States. However, whether a young person has a driver’s license does differ—only 6 percent of those here to work report having a driver’s license, whereas nearly four times as many of the dropouts (23%) have licenses (not shown here). Of those needs asked of youth in both regions (displayed in Figure 4.3), only 35 percent of those here to work and 43 percent of dropouts indicated having none of these needs.
A subset of youth in Region 1 were also asked if they had housing needs (240 in all). Only 7 percent stated that they did. But those here to work were considerably more likely—9 percent—than dropouts—3 percent—to indicate that they needed some form of housing assistance. Because of small
Advocates note that some groups of OSY, for example, Mixtecos, would be hesitant to report such a need.
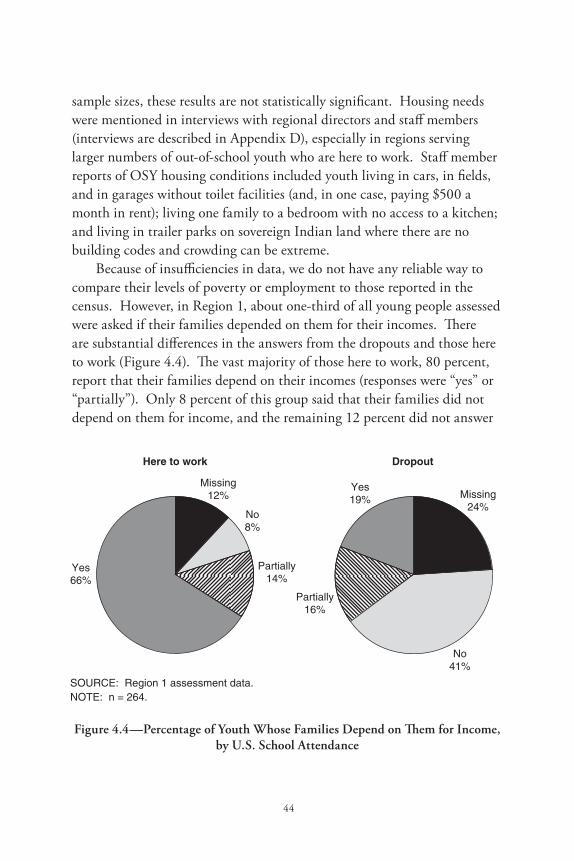
44
sample sizes, these results are not statistically significant. Housing needs were mentioned in interviews with regional directors and staff members (interviews are described in Appendix D), especially in regions serving larger numbers of out-of-school youth who are here to work. Staff member reports of OSY housing conditions included youth living in cars, in fields, and in garages without toilet facilities (and, in one case, paying $500 a month in rent); living one family to a bedroom with no access to a kitchen; and living in trailer parks on sovereign Indian land where there are no building codes and crowding can be extreme.
Because of insufficiencies in data, we do not have any reliable way to compare their levels of poverty or employment to those reported in the census. However, in Region 1, about one-third of all young people assessed were asked if their families depended on them for their incomes. There are substantial differences in the answers from the dropouts and those here to work (Figure 4.4). The vast majority of those here to work, 80 percent, report that their families depend on their incomes (responses were “yes” or “partially”). Only 8 percent of this group said that their families did not depend on them for income, and the remaining 12 percent did not answer
Figure 4.4—Percentage of Youth Whose Families Depend on Them for Income, by U.S. School Attendance
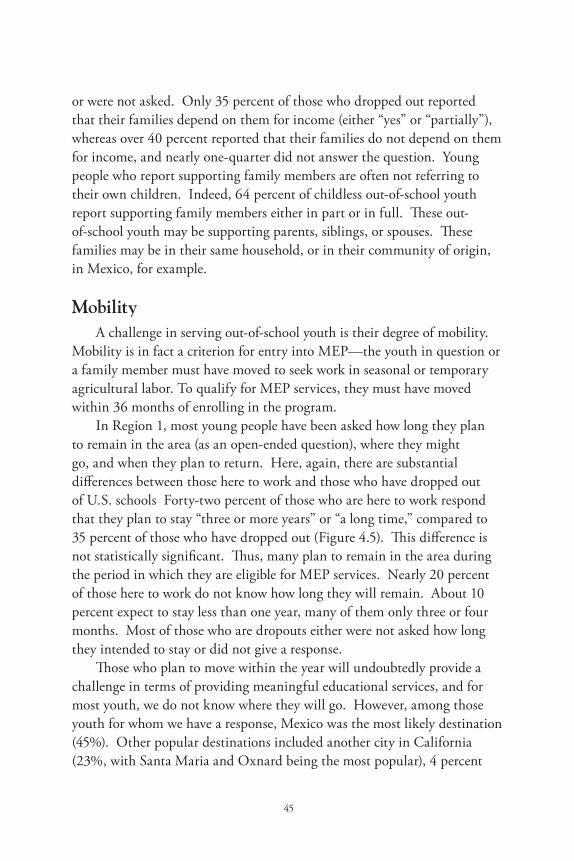
45
or were not asked. Only 35 percent of those who dropped out reported that their families depend on them for income (either “yes” or “partially”), whereas over 40 percent reported that their families do not depend on them for income, and nearly one-quarter did not answer the question. Young people who report supporting family members are often not referring to their own children. Indeed, 64 percent of childless out-of-school youth report supporting family members either in part or in full. These out-of-school youth may be supporting parents, siblings, or spouses. These families may be in their same household, or in their community of origin, in Mexico, for example.
MobilityA challenge in serving out-of-school youth is their degree of mobility.
Mobility is in fact a criterion for entry into MEP—the youth in question or a family member must have moved to seek work in seasonal or temporary agricultural labor. To qualify for MEP services, they must have moved within 36 months of enrolling in the program.
In Region 1, most young people have been asked how long they plan to remain in the area (as an open-ended question), where they might go, and when they plan to return. Here, again, there are substantial differences between those here to work and those who have dropped out of U.S. schools Forty-two percent of those who are here to work respond that they plan to stay “three or more years” or “a long time,” compared to 35 percent of those who have dropped out (Figure 4.5). This difference is not statistically significant. Thus, many plan to remain in the area during the period in which they are eligible for MEP services. Nearly 20 percent of those here to work do not know how long they will remain. About 10 percent expect to stay less than one year, many of them only three or four months. Most of those who are dropouts either were not asked how long they intended to stay or did not give a response.
Those who plan to move within the year will undoubtedly provide a challenge in terms of providing meaningful educational services, and for most youth, we do not know where they will go. However, among those youth for whom we have a response, Mexico was the most likely destination (45%). Other popular destinations included another city in California (23%, with Santa Maria and Oxnard being the most popular), 4 percent
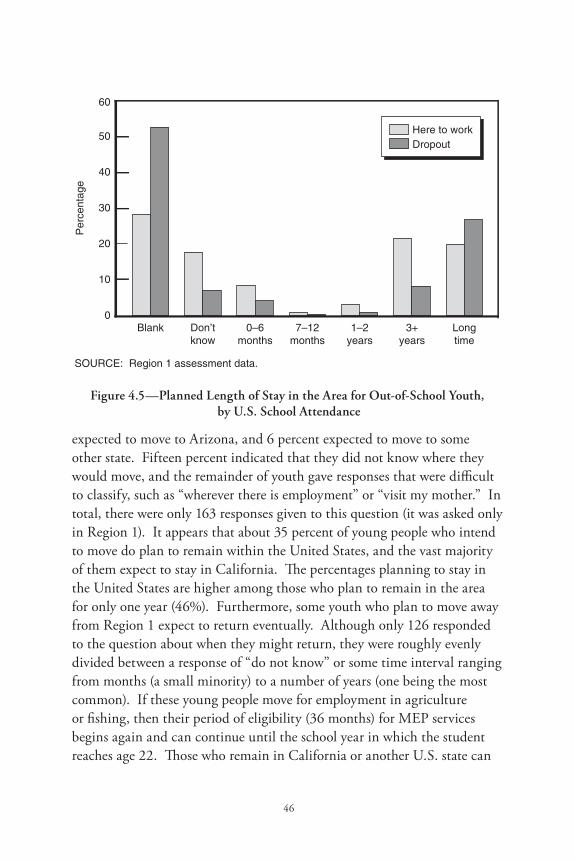
46
Figure 4.5—Planned Length of Stay in the Area for Out-of-School Youth, by U.S. School Attendance
expected to move to Arizona, and 6 percent expected to move to some other state. Fifteen percent indicated that they did not know where they would move, and the remainder of youth gave responses that were difficult to classify, such as “wherever there is employment” or “visit my mother.” In total, there were only 163 responses given to this question (it was asked only in Region 1). It appears that about 35 percent of young people who intend to move do plan to remain within the United States, and the vast majority of them expect to stay in California. The percentages planning to stay in the United States are higher among those who plan to remain in the area for only one year (46%). Furthermore, some youth who plan to move away from Region 1 expect to return eventually. Although only 126 responded to the question about when they might return, they were roughly evenly divided between a response of “do not know” or some time interval ranging from months (a small minority) to a number of years (one being the most common). If these young people move for employment in agriculture or fishing, then their period of eligibility (36 months) for MEP services begins again and can continue until the school year in which the student reaches age 22. Those who remain in California or another U.S. state can
47
be served by MEP in their new location. Many MEP regions throughout California report giving their out-of-school youth MEP Hotline cards with a number they can call that will put them in touch with services in their new location.
It may not be easy to find those who do plan to remain in the area—many MEP staff members report difficulty in finding out-of-school youth after enrollment in the program. Addresses and phone numbers change frequently even when youth stay in the region.
ServicesRelatedtoSocioeconomicandHealthNeedsRegions 1 and 11 describe providing a variety of services, referrals,
and facilitative activities related to OSY health and socioeconomic needs. Out-of-school youth in Regions 1 and 11 receive school supplies such as Spanish/English dictionaries, paper, pens, and personal hygiene supplies such as toothpaste, toothbrushes, and shampoo. Staff members will provide rides for those without transportation and will sometimes provide bus passes as well. Both regions conduct workshops periodically where a variety of topics may be addressed including nutrition, life skills, educational empowerment, job-seeking skills, and parenting. These types of workshops are relatively common throughout all of the regions. Assistance and information about the identification card issued through the Mexican Consulate were forms of services mentioned by more than one region.2
In Region 1, a mobile van provides vision screenings, and other medical services will be provided in the coming year. In Region 11, MEP will pay the Medi-Cal rate when no other insurance source can be used to pay for necessary medical services. Other regions provide similar services—at one, its mobile van staff members serve OSY as their first priority because OSY so rarely have other options for obtaining health services. Another region pointed out that OSY over age 18 often still need childhood immunizations, but because of their age, they no longer qualify for free immunizations. Many regional staff members also mentioned depression
2 Consulate cards are an accepted form of identification for opening bank accounts, for example.
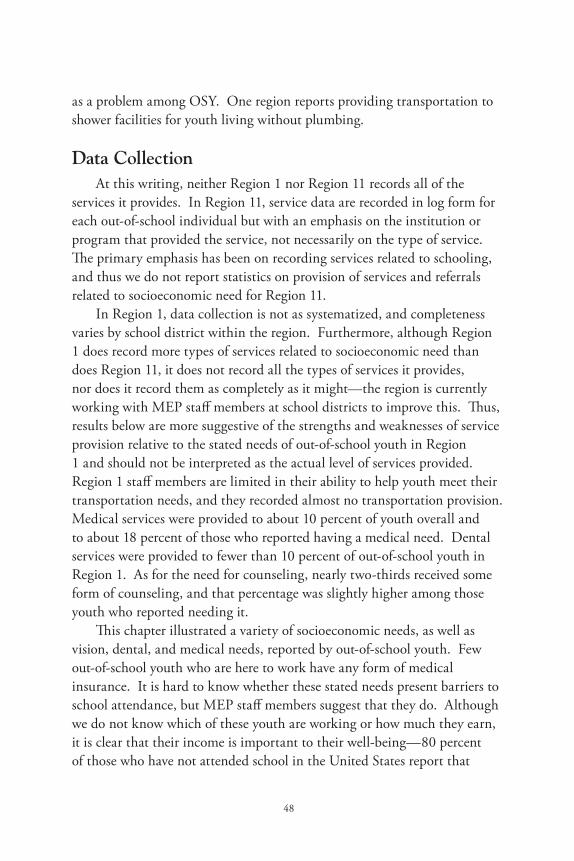
48
as a problem among OSY. One region reports providing transportation to shower facilities for youth living without plumbing.
DataCollectionAt this writing, neither Region 1 nor Region 11 records all of the
services it provides. In Region 11, service data are recorded in log form for each out-of-school individual but with an emphasis on the institution or program that provided the service, not necessarily on the type of service. The primary emphasis has been on recording services related to schooling, and thus we do not report statistics on provision of services and referrals related to socioeconomic need for Region 11.
In Region 1, data collection is not as systematized, and completeness varies by school district within the region. Furthermore, although Region 1 does record more types of services related to socioeconomic need than does Region 11, it does not record all the types of services it provides, nor does it record them as completely as it might—the region is currently working with MEP staff members at school districts to improve this. Thus, results below are more suggestive of the strengths and weaknesses of service provision relative to the stated needs of out-of-school youth in Region 1 and should not be interpreted as the actual level of services provided. Region 1 staff members are limited in their ability to help youth meet their transportation needs, and they recorded almost no transportation provision. Medical services were provided to about 10 percent of youth overall and to about 18 percent of those who reported having a medical need. Dental services were provided to fewer than 10 percent of out-of-school youth in Region 1. As for the need for counseling, nearly two-thirds received some form of counseling, and that percentage was slightly higher among those youth who reported needing it.
This chapter illustrated a variety of socioeconomic needs, as well as vision, dental, and medical needs, reported by out-of-school youth. Few out-of-school youth who are here to work have any form of medical insurance. It is hard to know whether these stated needs present barriers to school attendance, but MEP staff members suggest that they do. Although we do not know which of these youth are working or how much they earn, it is clear that their income is important to their well-being—80 percent of those who have not attended school in the United States report that

49
their families depend on them for income. The need to work is likely to be quite serious—nearly 30 percent of young women have children, and many out-of-school youth do not live with their own parents. Record-keeping for service provision lags that for needs assessments, and at this point it is difficult to know which services are provided. Thus, we cannot yet discuss how addressing socioeconomic and medical needs might improve school attendance or English language learning for out-of-school youth.

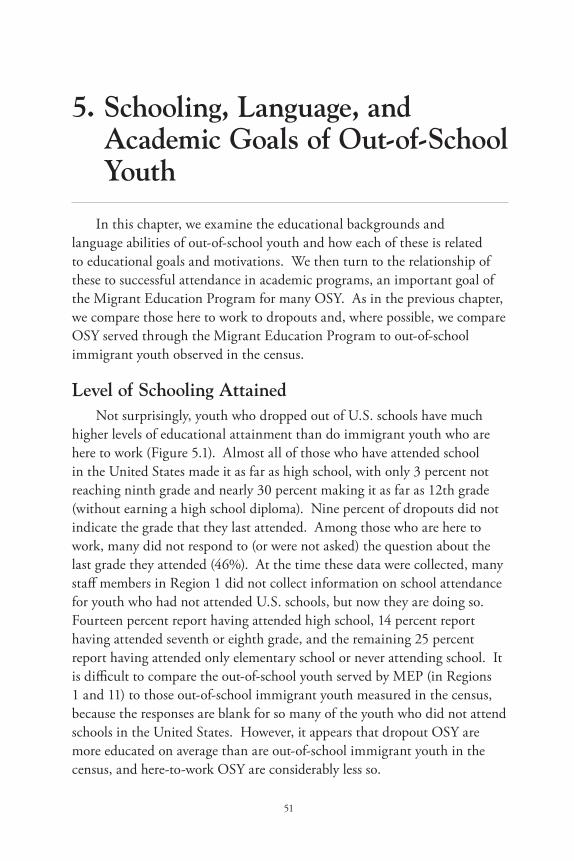
51
5.Schooling,Language,andAcademicGoalsofOut-of-SchoolYouth
In this chapter, we examine the educational backgrounds and language abilities of out-of-school youth and how each of these is related to educational goals and motivations. We then turn to the relationship of these to successful attendance in academic programs, an important goal of the Migrant Education Program for many OSY. As in the previous chapter, we compare those here to work to dropouts and, where possible, we compare OSY served through the Migrant Education Program to out-of-school immigrant youth observed in the census.
LevelofSchoolingAttainedNot surprisingly, youth who dropped out of U.S. schools have much
higher levels of educational attainment than do immigrant youth who are here to work (Figure 5.1). Almost all of those who have attended school in the United States made it as far as high school, with only 3 percent not reaching ninth grade and nearly 30 percent making it as far as 12th grade (without earning a high school diploma). Nine percent of dropouts did not indicate the grade that they last attended. Among those who are here to work, many did not respond to (or were not asked) the question about the last grade they attended (46%). At the time these data were collected, many staff members in Region 1 did not collect information on school attendance for youth who had not attended U.S. schools, but now they are doing so. Fourteen percent report having attended high school, 14 percent report having attended seventh or eighth grade, and the remaining 25 percent report having attended only elementary school or never attending school. It is difficult to compare the out-of-school youth served by MEP (in Regions 1 and 11) to those out-of-school immigrant youth measured in the census, because the responses are blank for so many of the youth who did not attend schools in the United States. However, it appears that dropout OSY are more educated on average than are out-of-school immigrant youth in the census, and here-to-work OSY are considerably less so.
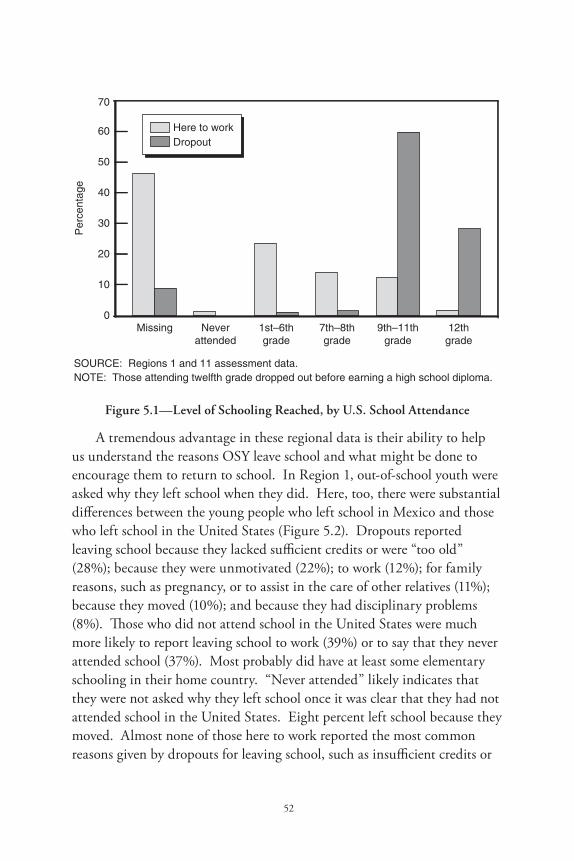
52
Figure 5.1—Level of Schooling Reached, by U.S. School Attendance
A tremendous advantage in these regional data is their ability to help us understand the reasons OSY leave school and what might be done to encourage them to return to school. In Region 1, out-of-school youth were asked why they left school when they did. Here, too, there were substantial differences between the young people who left school in Mexico and those who left school in the United States (Figure 5.2). Dropouts reported leaving school because they lacked sufficient credits or were “too old” (28%); because they were unmotivated (22%); to work (12%); for family reasons, such as pregnancy, or to assist in the care of other relatives (11%); because they moved (10%); and because they had disciplinary problems (8%). Those who did not attend school in the United States were much more likely to report leaving school to work (39%) or to say that they never attended school (37%). Most probably did have at least some elementary schooling in their home country. “Never attended” likely indicates that they were not asked why they left school once it was clear that they had not attended school in the United States. Eight percent left school because they moved. Almost none of those here to work reported the most common reasons given by dropouts for leaving school, such as insufficient credits or
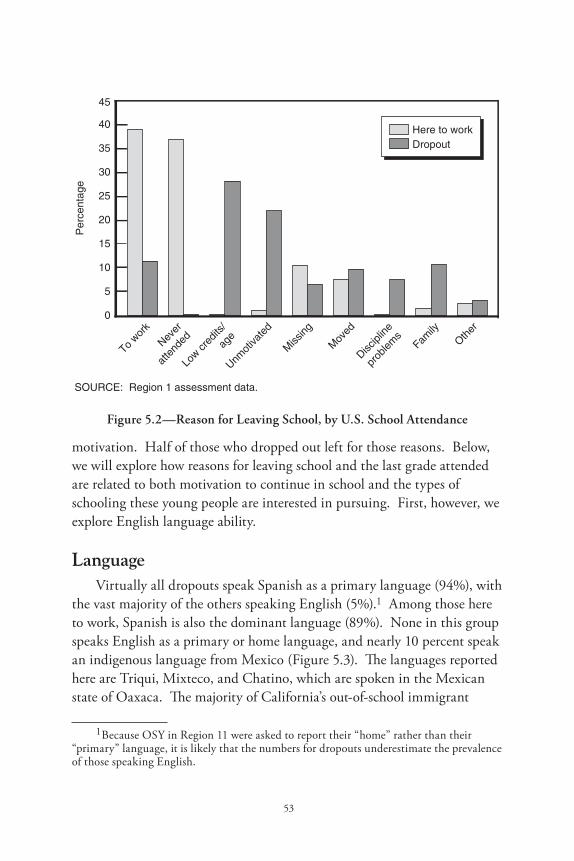
53
Figure 5.2—Reason for Leaving School, by U.S. School Attendance
motivation. Half of those who dropped out left for those reasons. Below, we will explore how reasons for leaving school and the last grade attended are related to both motivation to continue in school and the types of schooling these young people are interested in pursuing. First, however, we explore English language ability.
LanguageVirtually all dropouts speak Spanish as a primary language (94%), with
the vast majority of the others speaking English (5%).1 Among those here to work, Spanish is also the dominant language (89%). None in this group speaks English as a primary or home language, and nearly 10 percent speak an indigenous language from Mexico (Figure 5.3). The languages reported here are Triqui, Mixteco, and Chatino, which are spoken in the Mexican state of Oaxaca. The majority of California’s out-of-school immigrant
1 Because OSY in Region 11 were asked to report their “home” rather than their “primary” language, it is likely that the numbers for dropouts underestimate the prevalence of those speaking English.
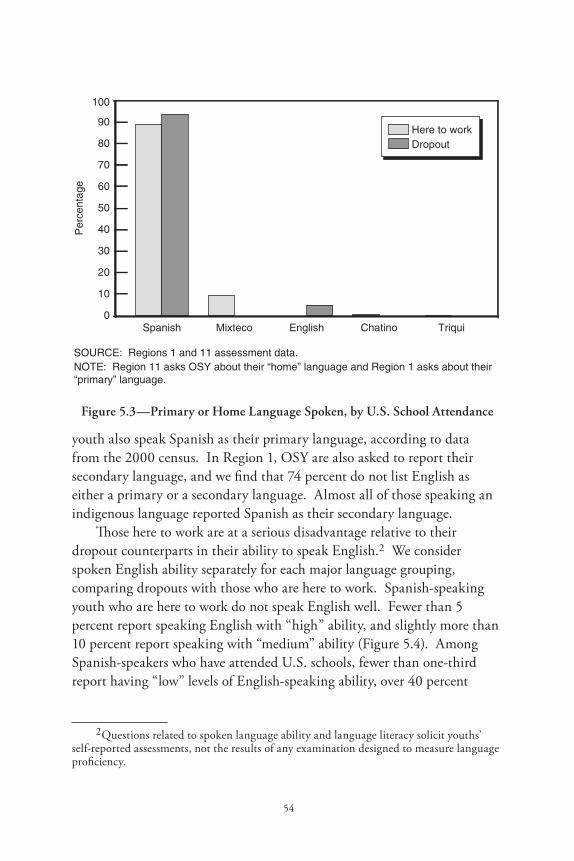
54
Figure 5.3—Primary or Home Language Spoken, by U.S. School Attendance
youth also speak Spanish as their primary language, according to data from the 2000 census. In Region 1, OSY are also asked to report their secondary language, and we find that 74 percent do not list English as either a primary or a secondary language. Almost all of those speaking an indigenous language reported Spanish as their secondary language.
Those here to work are at a serious disadvantage relative to their dropout counterparts in their ability to speak English.2 We consider spoken English ability separately for each major language grouping, comparing dropouts with those who are here to work. Spanish-speaking youth who are here to work do not speak English well. Fewer than 5 percent report speaking English with “high” ability, and slightly more than 10 percent report speaking with “medium” ability (Figure 5.4). Among Spanish-speakers who have attended U.S. schools, fewer than one-third report having “low” levels of English-speaking ability, over 40 percent
2 Questions related to spoken language ability and language literacy solicit youths’ self-reported assessments, not the results of any examination designed to measure language proficiency.
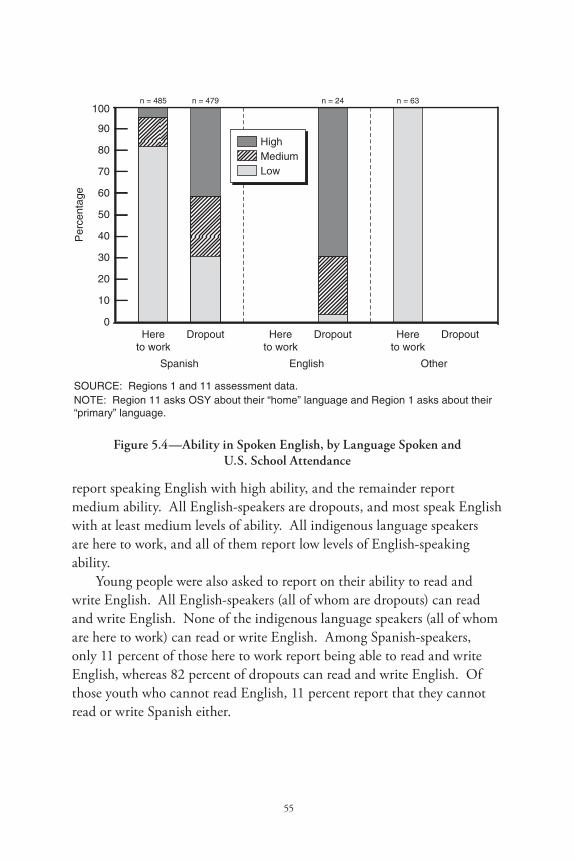
55
Figure 5.4—Ability in Spoken English, by Language Spoken and U.S. School Attendance
report speaking English with high ability, and the remainder report medium ability. All English-speakers are dropouts, and most speak English with at least medium levels of ability. All indigenous language speakers are here to work, and all of them report low levels of English-speaking ability.
Young people were also asked to report on their ability to read and write English. All English-speakers (all of whom are dropouts) can read and write English. None of the indigenous language speakers (all of whom are here to work) can read or write English. Among Spanish-speakers, only 11 percent of those here to work report being able to read and write English, whereas 82 percent of dropouts can read and write English. Of those youth who cannot read English, 11 percent report that they cannot read or write Spanish either.
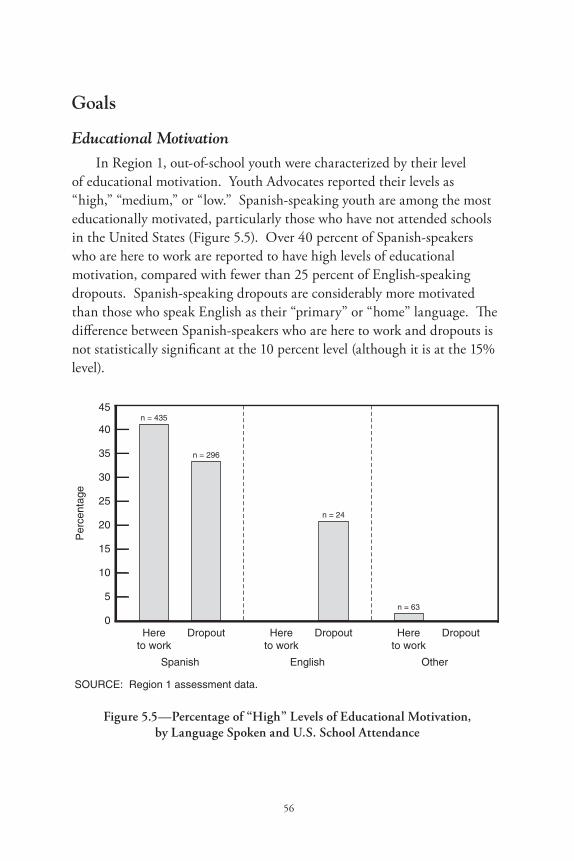
56
Goals
Educational MotivationIn Region 1, out-of-school youth were characterized by their level
of educational motivation. Youth Advocates reported their levels as “high,” “medium,” or “low.” Spanish-speaking youth are among the most educationally motivated, particularly those who have not attended schools in the United States (Figure 5.5). Over 40 percent of Spanish-speakers who are here to work are reported to have high levels of educational motivation, compared with fewer than 25 percent of English-speaking dropouts. Spanish-speaking dropouts are considerably more motivated than those who speak English as their “primary” or “home” language. The difference between Spanish-speakers who are here to work and dropouts is not statistically significant at the 10 percent level (although it is at the 15% level).
Figure 5.5—Percentage of “High” Levels of Educational Motivation, by Language Spoken and U.S. School Attendance
57
Staff members working with MEP out-of-school youth said that they were not surprised to learn that dropouts are less motivated than those who have never attended U.S. schools. They suggested that many of the dropouts had had very negative experiences with the school system and were thus discouraged and not motivated to return. Other research has suggested that with longer residence in the United States, children of immigrants have worse school performance and lower levels of academic ambition (Portes and Rumbaut, 2001).
When we examine level of educational motivation by last grade completed, we find a bimodal distribution: Those who had either never attended school or who did not give a response are almost equally likely as those who had attended 12th grade to have high levels of educational motivation (48% and 44%, respectively). Those who dropped out of school before 12th grade have lower levels of motivation, with only 20 to 30 percent reporting high levels of motivation. In the next section, we explore how levels of educational motivation are related to particular interests in schooling.
Academic Interests Although an important goal of the Migrant Education Program is to
return out-of-school youth to a school setting to earn either a GED or a high school diploma, young people are also asked about a variety of broader educational and instructional interests. Regions differ in how they ask out-of-school youth about these interests. In both Regions 1 and 11, out-of-school youth are asked if they are interested in ESL courses, the GED, a high school diploma, or community college and vocational training.
In addition, Region 1 asks about a few related programs such as PASS, the High School Equivalency Program (HEP), Instituto Nacional de Educación para Adultos (INEA), and Adult Education. PASS is a workbook-based program through which MEP students can earn high school credits (some of which meet the University of California’s A–G requirements) without attending traditional high schools. HEP provides instruction in Spanish or English to help MEP students earn their GEDs (and the program pays the testing fee). INEA is an adult education curriculum in Spanish provided through the Mexican Consulate, but it requires teaching staff, so it is not available everywhere, and probably
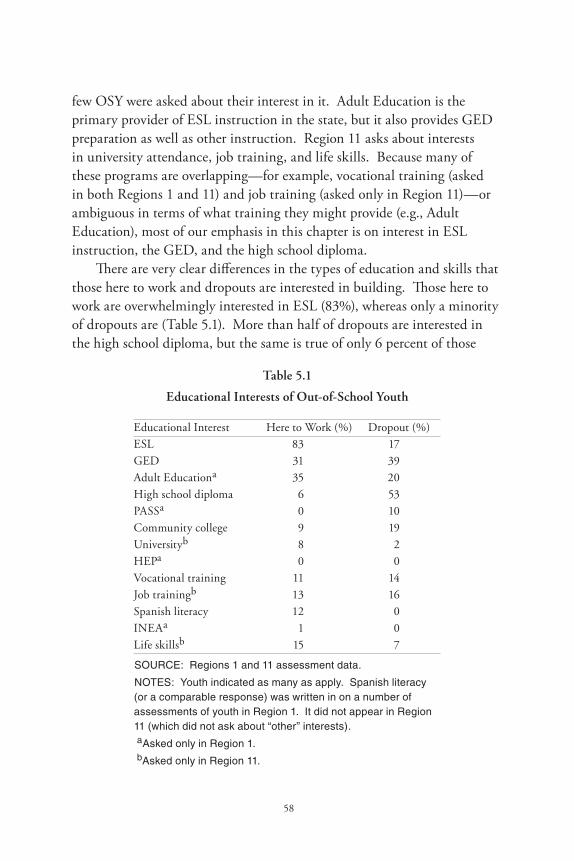
58
few OSY were asked about their interest in it. Adult Education is the primary provider of ESL instruction in the state, but it also provides GED preparation as well as other instruction. Region 11 asks about interests in university attendance, job training, and life skills. Because many of these programs are overlapping—for example, vocational training (asked in both Regions 1 and 11) and job training (asked only in Region 11)—or ambiguous in terms of what training they might provide (e.g., Adult Education), most of our emphasis in this chapter is on interest in ESL instruction, the GED, and the high school diploma.
There are very clear differences in the types of education and skills that those here to work and dropouts are interested in building. Those here to work are overwhelmingly interested in ESL (83%), whereas only a minority of dropouts are (Table 5.1). More than half of dropouts are interested in the high school diploma, but the same is true of only 6 percent of those
Table 5.1
Educational Interests of Out-of-School Youth
Educational Interest Here to Work (%) Dropout (%)ESL 83 17GED 31 39Adult Educationa 35 20High school diploma 6 53PASSa 0 10Community college 9 19Universityb 8 2HEPa 0 0Vocational training 11 14Job trainingb 13 16Spanish literacy 12 0INEAa 1 0Life skillsb 15 7
SOURCE: Regions 1 and 11 assessment data.
NOTES: Youth indicated as many as apply. Spanish literacy (or a comparable response) was written in on a number of assessments of youth in Region 1. It did not appear in Region 11 (which did not ask about “other” interests).
aAsked only in Region 1. bAsked only in Region 11.
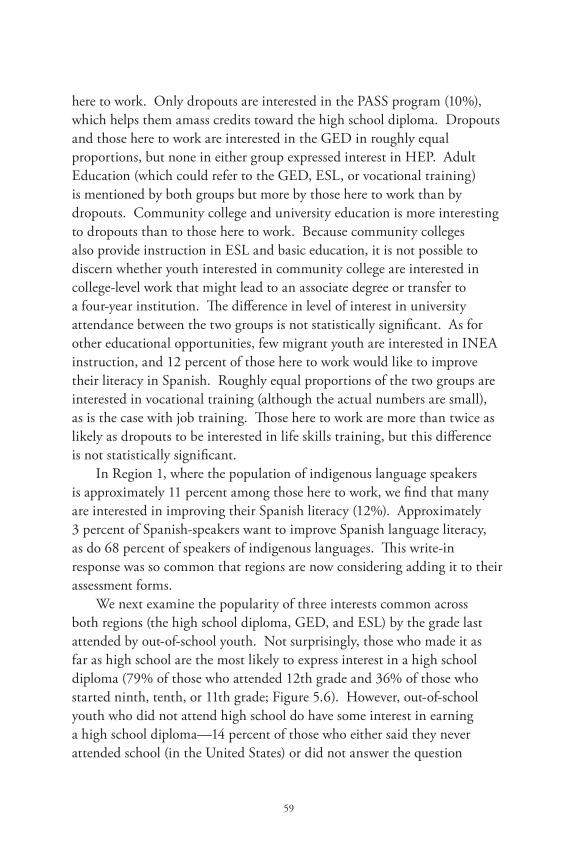
59
here to work. Only dropouts are interested in the PASS program (10%), which helps them amass credits toward the high school diploma. Dropouts and those here to work are interested in the GED in roughly equal proportions, but none in either group expressed interest in HEP. Adult Education (which could refer to the GED, ESL, or vocational training) is mentioned by both groups but more by those here to work than by dropouts. Community college and university education is more interesting to dropouts than to those here to work. Because community colleges also provide instruction in ESL and basic education, it is not possible to discern whether youth interested in community college are interested in college-level work that might lead to an associate degree or transfer to a four-year institution. The difference in level of interest in university attendance between the two groups is not statistically significant. As for other educational opportunities, few migrant youth are interested in INEA instruction, and 12 percent of those here to work would like to improve their literacy in Spanish. Roughly equal proportions of the two groups are interested in vocational training (although the actual numbers are small), as is the case with job training. Those here to work are more than twice as likely as dropouts to be interested in life skills training, but this difference is not statistically significant.
In Region 1, where the population of indigenous language speakers is approximately 11 percent among those here to work, we find that many are interested in improving their Spanish literacy (12%). Approximately 3 percent of Spanish-speakers want to improve Spanish language literacy, as do 68 percent of speakers of indigenous languages. This write-in response was so common that regions are now considering adding it to their assessment forms.
We next examine the popularity of three interests common across both regions (the high school diploma, GED, and ESL) by the grade last attended by out-of-school youth. Not surprisingly, those who made it as far as high school are the most likely to express interest in a high school diploma (79% of those who attended 12th grade and 36% of those who started ninth, tenth, or 11th grade; Figure 5.6). However, out-of-school youth who did not attend high school do have some interest in earning a high school diploma—14 percent of those who either said they never attended school (in the United States) or did not answer the question
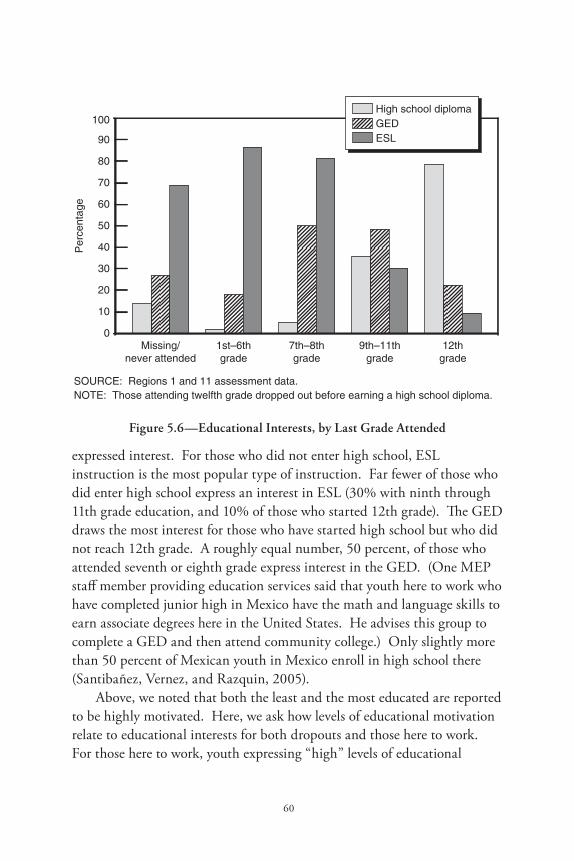
60
Figure 5.6—Educational Interests, by Last Grade Attended
expressed interest. For those who did not enter high school, ESL instruction is the most popular type of instruction. Far fewer of those who did enter high school express an interest in ESL (30% with ninth through 11th grade education, and 10% of those who started 12th grade). The GED draws the most interest for those who have started high school but who did not reach 12th grade. A roughly equal number, 50 percent, of those who attended seventh or eighth grade express interest in the GED. (One MEP staff member providing education services said that youth here to work who have completed junior high in Mexico have the math and language skills to earn associate degrees here in the United States. He advises this group to complete a GED and then attend community college.) Only slightly more than 50 percent of Mexican youth in Mexico enroll in high school there (Santibañez, Vernez, and Razquin, 2005).
Above, we noted that both the least and the most educated are reported to be highly motivated. Here, we ask how levels of educational motivation relate to educational interests for both dropouts and those here to work. For those here to work, youth expressing “high” levels of educational
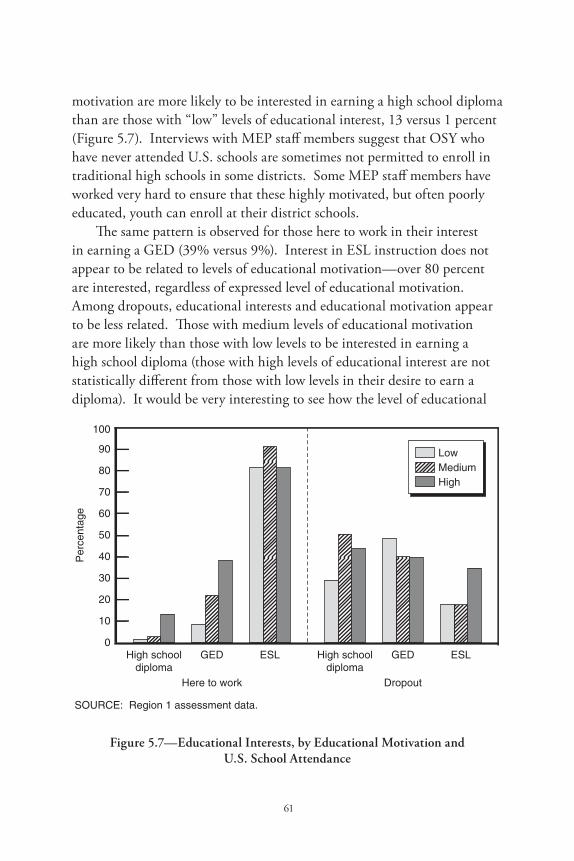
61
motivation are more likely to be interested in earning a high school diploma than are those with “low” levels of educational interest, 13 versus 1 percent (Figure 5.7). Interviews with MEP staff members suggest that OSY who have never attended U.S. schools are sometimes not permitted to enroll in traditional high schools in some districts. Some MEP staff members have worked very hard to ensure that these highly motivated, but often poorly educated, youth can enroll at their district schools.
The same pattern is observed for those here to work in their interest in earning a GED (39% versus 9%). Interest in ESL instruction does not appear to be related to levels of educational motivation—over 80 percent are interested, regardless of expressed level of educational motivation. Among dropouts, educational interests and educational motivation appear to be less related. Those with medium levels of educational motivation are more likely than those with low levels to be interested in earning a high school diploma (those with high levels of educational interest are not statistically different from those with low levels in their desire to earn a diploma). It would be very interesting to see how the level of educational
Figure 5.7—Educational Interests, by Educational Motivation and U.S. School Attendance
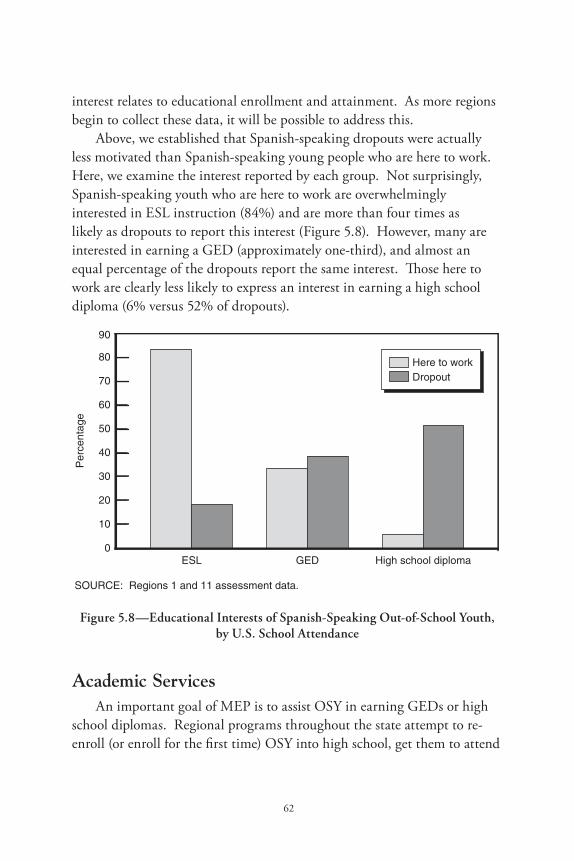
62
interest relates to educational enrollment and attainment. As more regions begin to collect these data, it will be possible to address this.
Above, we established that Spanish-speaking dropouts were actually less motivated than Spanish-speaking young people who are here to work. Here, we examine the interest reported by each group. Not surprisingly, Spanish-speaking youth who are here to work are overwhelmingly interested in ESL instruction (84%) and are more than four times as likely as dropouts to report this interest (Figure 5.8). However, many are interested in earning a GED (approximately one-third), and almost an equal percentage of the dropouts report the same interest. Those here to work are clearly less likely to express an interest in earning a high school diploma (6% versus 52% of dropouts).
Figure 5.8—Educational Interests of Spanish-Speaking Out-of-School Youth, by U.S. School Attendance
AcademicServicesAn important goal of MEP is to assist OSY in earning GEDs or high
school diplomas. Regional programs throughout the state attempt to re-enroll (or enroll for the first time) OSY into high school, get them to attend
63
GED programs, and improve their English language skills by enrolling them in ESL courses. Each region has different community resources available to it; the strength of the program’s relationship with local school districts differs also. Nearly all regions reported working with Adult Education and community colleges to link their OSY with basic skills training, GED preparation, and English language courses. A few regions reported relatively novel approaches, such as residential summer programs for OSY (either HEP or others), ESL courses broadcast on public television early in the morning (with accompanying workbooks), or classes in the early evening for OSY to complete their diplomas or GEDs, paid for by MEP.
In addition to being able to provide more services, MEP staff members want more staff time to devote to follow-up with OSY. Many mentioned the difficulty of helping OSY stay on track and motivated, given the many obstacles they face. Many would like to be able to spend more time with each individual and provide more services, such as meeting OSY at the adult school to help them register or driving them to a community health clinic. A few mentioned a lack of ESL courses as a reason for low enrollment rates in ESL courses, although many work hard to facilitate the provision of ESL courses that OSY can attend. Gonzalez (2007) suggests that demand for ESL classes may be constrained by the supply (at least among ESL classes provided by Adult Education) in many school districts in the state.
MigrantEducationAcademicServicesNow we explore academic services either provided directly or facilitated
by the Migrant Education Program in Regions 1 and 11 and how they relate to OSY interests and backgrounds. Services are considered separately for each region because the recording methods they use are not comparable.
As noted in Chapter 4, in Region 1 not all types of services are recorded, and completeness for those that are recorded differs by school district in the region. Although there is generally low interest in the PASS program (earning high school credits through independent study) in Region 1, 30 percent of those who were interested received PASS services. These were more likely provided to dropouts than to those here to work
64
because one must have enrolled in a high school in California to use PASS. Approximately 60 percent of all youth expressed an interest in ESL instruction. Of those who expressed interest in ESL instruction, only 13 percent received it. Fewer than 10 percent of those interested in vocational training were recorded as having received it and fewer still recorded receiving GED instruction. However, as noted above, Region 1 staff members believe that their ability to report services lags behind their ability to provide them. Although it appears that the program is not meeting most needs of those it serves, it is hard to tell for certain because the program does not yet track data in a way that would make this clear.
In Region 11, where 80 percent of out-of-school youth are dropouts, more than 60 percent expressed an interest in earning a high school diploma. Region 11 records providers of services rather than the type of service or referral provided. In many cases, that makes it difficult to evaluate what type of goal a student might be working toward when he or she is involved with a particular program. For example, students attending courses through Adult Education may be attempting to earn a GED or may be taking ESL classes. Thus, we consider three categories of youth program attendance: (1) those who are attending an institution that grants high school diplomas but no other degrees, (2) those who are attending an institution that grants high school diplomas or GEDs but no other degrees, and (3) those who are attending an institution that grants high school diplomas and GEDs and provides some other instruction or service. When we consider institutions or programs that grant high school diplomas and GEDs and provide other programs or services, nearly two-thirds of out-of-school youth in Region 11 expressing an interest in such a program attended one (Table 5.2). When we use more restrictive definitions, we find that about one-quarter of youth who are interested in either a high school diploma or GED attend institutions that grant them.
Expressing interest in a particular program does not appear to be closely linked to attendance in it. In fact, in many cases, having expressed an interest in a program of study makes the youth no more likely to attend than if no interest was indicated. Only those interested in the high school diploma seemed to have a higher likelihood of attending a program that grants the degree. Among out-of-school youth who did not express an interest in earning a high school diploma, 6 percent attended an institution
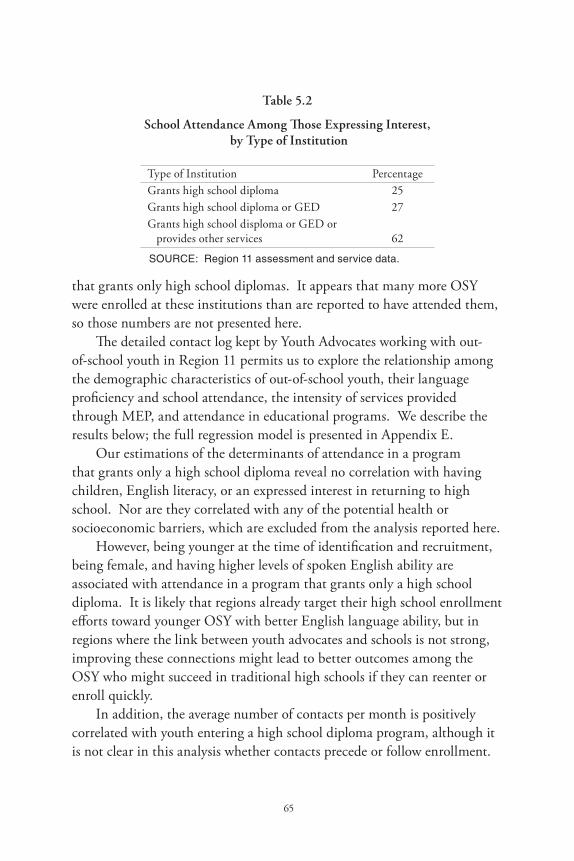
65
Table 5.2
School Attendance Among Those Expressing Interest, by Type of Institution
Type of Institution PercentageGrants high school diploma 25Grants high school diploma or GED 27Grants high school disploma or GED or provides other services 62
SOURCE: Region 11 assessment and service data.
that grants only high school diplomas. It appears that many more OSY were enrolled at these institutions than are reported to have attended them, so those numbers are not presented here.
The detailed contact log kept by Youth Advocates working with out-of-school youth in Region 11 permits us to explore the relationship among the demographic characteristics of out-of-school youth, their language proficiency and school attendance, the intensity of services provided through MEP, and attendance in educational programs. We describe the results below; the full regression model is presented in Appendix E.
Our estimations of the determinants of attendance in a program that grants only a high school diploma reveal no correlation with having children, English literacy, or an expressed interest in returning to high school. Nor are they correlated with any of the potential health or socioeconomic barriers, which are excluded from the analysis reported here.
However, being younger at the time of identification and recruitment, being female, and having higher levels of spoken English ability are associated with attendance in a program that grants only a high school diploma. It is likely that regions already target their high school enrollment efforts toward younger OSY with better English language ability, but in regions where the link between youth advocates and schools is not strong, improving these connections might lead to better outcomes among the OSY who might succeed in traditional high schools if they can reenter or enroll quickly.
In addition, the average number of contacts per month is positively correlated with youth entering a high school diploma program, although it is not clear in this analysis whether contacts precede or follow enrollment.
66
For high school attendance, the type of contact is also relevant—out-of-school youth with higher percentages of office visits or teacher contacts are more likely than youth with higher percentages of other types of contacts, such as phone calls and written letters, to be attending a high-school-diploma-granting program. Office visits and teacher contacts are face-to-face contacts. Phone calls and letters include unsuccessful contacts as well as successful ones (e.g., a phone call made but not answered or a letter mailed but not received). Thus, the correlation between the percentage of office visits and teacher contacts and high school diploma programs may tell more about whether a student can be successfully contacted, rather than about the value of type of contact. Collecting the data so that successful and unsuccessful contacts can be distinguished will be important in the future.
We repeated these regressions for programs that grant high school diplomas and GEDs only and for programs that offered other certificates in addition and obtained similar results. See Appendix E for the full regression results.
Out-of-school youth who have attended school in the United States are more likely to have the language ability necessary to earn a high school diploma—and the interest in doing so—than are young people who have never attended U.S. schools. Those who have not attended U.S. schools have low levels of spoken English and English literacy. These young people often do wish to improve their English, and many would even like to earn a GED if not an actual high school diploma. For those who have had educational success in Mexico, these may be attainable goals, according to MEP staff members.
Finally, each of these preliminary explorations of the services delivered (or facilitated) by MEP are a long way from helping policymakers understand which programs or services increase educational attainment and improve English language skills for out-of-school immigrant youth. Not until regional programs increase their data collection efforts and record the types of programs students are enrolling in and attending—instead of just recording the providers of the services—will we be able to begin to understand how we can improve attendance in educational programs. Data collection on outcomes (such as graduation, program completion, and improved English skill) is also necessary before we can evaluate which MEP efforts improve outcomes for young people.
67
6.FindingsandPolicyImplications
Out-of-school immigrant youth are among the most disadvantaged young people in the state, and without increased educational attainment or improved English language skills, they will remain poor and isolated from the larger society and economy. Because they are not in school—many of them never have attended school in the United States—they are not likely to see their lives improve without some intervention. Because many of them have young children, inattention to this group’s needs is already having generational consequences. Out-of-school immigrant youth are served by MEP, but this program cannot serve them all because it has limited resources and because only a small number of this group meets the program’s eligibility criteria. In addition, because MEP is really intended to supplement services received in school, only a low level of support can be provided by the program to any individual. Furthermore, at this time, the program cannot measure the effectiveness of the limited services it does provide. MEP is attempting to improve its data collection and use, and here we discuss ways that regional programs might improve data collection and how these data might be used to target services to the OSY they recruit. Next, we offer some thoughts on the organizational structure of MEP in California and how it might be adapted to improve services to out-of-school youth in the state. Finally, we note a number of federal and state policies that may provide both challenges and opportunities for serving out-of-school youth in the near future and suggest directions for our future research.
ServingOut-of-SchoolImmigrantYouthintheMigrantEducationProgram
This report does not aim to be a program evaluation, but our analysis of OSY served by two regions of California’s Migrant Education Program leads us to recommend ways to improve services. We feel that it is important to note here that the vast majority of California’s out-of-school immigrant youth are not served by MEP. Even if MEP funding were increased sufficiently to recruit and serve all those out-of-school immigrant
68
youth eligible for the program, nearly 185,000 (approximately two-thirds) of the state’s out-of-school immigrant youth could not be served because of eligibility constraints.
Using rough criteria for MEP eligibility, we find that those eligible for program services are much more likely to report not speaking English well and are also more likely to report being linguistically isolated than are ineligible out-of-school immigrant youth. Differences in levels of educational attainment are relatively small, as are differences in poverty. Those eligible for MEP services are substantially more likely than those who are ineligible to live apart from their parents. Thus, if MEP were able to increase the numbers of eligible OSY it could recruit and serve, it would be able to help some of the most needy out-of-school youth in the state. As we have demonstrated here, and as program administrators are well aware, MEP “supplemental” services to OSY are few and often the only services OSY receive.
Traditional high school is the right place for some of these young people, if the many barriers to enrollment can be overcome. Some of these barriers are socioeconomic. Others have to do with the ability of traditional schools to enroll them. Currently, schools struggling to meet their Adequate Yearly Progress targets under No Child Left Behind may not have an incentive to enroll OSY. Many OSY would lower a school’s Academic Performance Index scores because of their low levels of English proficiency.
Targeting ServicesSpanish-speaking youth who are here to work are the most highly
motivated to further their education of all OSY served. This relates primarily to ESL instruction, but their desire for a GED, and in some cases, even a high school diploma, should not be discounted. For many, improving their low levels of English-speaking ability and English literacy to the level required for an English language GED is not feasible given the limited time and resources the MEP has to serve them. However, OSY staff members in one region suggested that any young person who had completed the eighth grade in Mexico has the academic skills to earn a GED and progress to the community college system. For those who are
69
less educated (or less motivated), a Spanish language GED or ESL course may meet their needs.
Staff members in all regions lament the struggle they face in providing meaningful services to this highly transient population of young people. In the region where we can measure planned mobility of OSY, we find that many expect to remain in the region during the period in which they are eligible for services (three years). For those youth who do intend to stay for longer periods of time, regional programs can develop plans that span multiple years (or multiple summers).
Many OSY do plan to leave the region but often moving only to other parts of California, and many plan to return to the region. Thus, it is important for regional programs to communicate with each other about students moving around the state. Some regions developed their out-of-school youth needs assessment form with triplicate copies precisely because they want students to be able to take their copies of the form with them when they move. However, if digital copies of this form and the related service form could be shared among the regions, the continuity of services would be improved, as would the efficiency of the program’s delivery. This is not a new issue, nor are we the first to raise it. However, data systems have been lagging behind the program’s intentions.
Measurement Issues in the Migrant Education Program Assessment Data
Regions are required to conduct needs assessments for young people whom they have recruited into MEP. However, assessments differ in content, length, and format. Most regions work with youth to fill out a needs assessment form, which is then kept in the OSY’s file. A few regions have digitized these data but most have not. Further, one region reported being so overwhelmed with the need to provide some form of service to young people here to work that its “needs assessment” is a focus group. Staff members work with young people in a group setting to help them identify their own goals, barriers to these goals, and ways to reach the goals. Many regional directors and staff are excited that regions have agreed to use a new database and needs assessment form, but most are waiting to see if they will have the resources to make these changes happen. A few think the form and database are more complex than they will find useful.
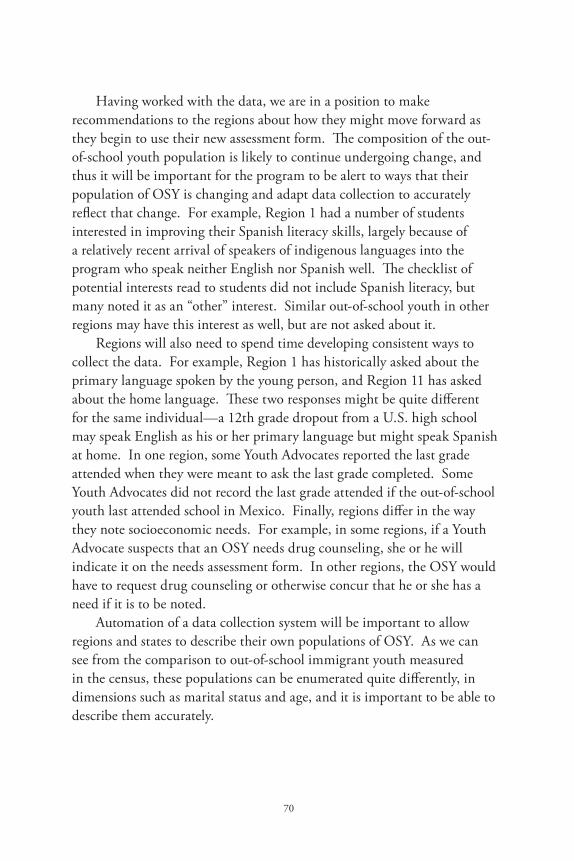
70
Having worked with the data, we are in a position to make recommendations to the regions about how they might move forward as they begin to use their new assessment form. The composition of the out-of-school youth population is likely to continue undergoing change, and thus it will be important for the program to be alert to ways that their population of OSY is changing and adapt data collection to accurately reflect that change. For example, Region 1 had a number of students interested in improving their Spanish literacy skills, largely because of a relatively recent arrival of speakers of indigenous languages into the program who speak neither English nor Spanish well. The checklist of potential interests read to students did not include Spanish literacy, but many noted it as an “other” interest. Similar out-of-school youth in other regions may have this interest as well, but are not asked about it.
Regions will also need to spend time developing consistent ways to collect the data. For example, Region 1 has historically asked about the primary language spoken by the young person, and Region 11 has asked about the home language. These two responses might be quite different for the same individual—a 12th grade dropout from a U.S. high school may speak English as his or her primary language but might speak Spanish at home. In one region, some Youth Advocates reported the last grade attended when they were meant to ask the last grade completed. Some Youth Advocates did not record the last grade attended if the out-of-school youth last attended school in Mexico. Finally, regions differ in the way they note socioeconomic needs. For example, in some regions, if a Youth Advocate suspects that an OSY needs drug counseling, she or he will indicate it on the needs assessment form. In other regions, the OSY would have to request drug counseling or otherwise concur that he or she has a need if it is to be noted.
Automation of a data collection system will be important to allow regions and states to describe their own populations of OSY. As we can see from the comparison to out-of-school immigrant youth measured in the census, these populations can be enumerated quite differently, in dimensions such as marital status and age, and it is important to be able to describe them accurately.
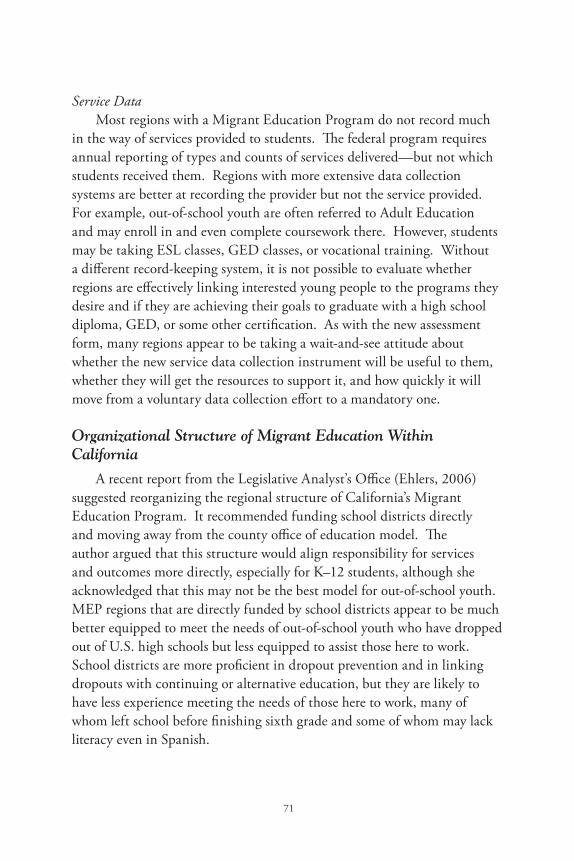
71
Service Data Most regions with a Migrant Education Program do not record much
in the way of services provided to students. The federal program requires annual reporting of types and counts of services delivered—but not which students received them. Regions with more extensive data collection systems are better at recording the provider but not the service provided. For example, out-of-school youth are often referred to Adult Education and may enroll in and even complete coursework there. However, students may be taking ESL classes, GED classes, or vocational training. Without a different record-keeping system, it is not possible to evaluate whether regions are effectively linking interested young people to the programs they desire and if they are achieving their goals to graduate with a high school diploma, GED, or some other certification. As with the new assessment form, many regions appear to be taking a wait-and-see attitude about whether the new service data collection instrument will be useful to them, whether they will get the resources to support it, and how quickly it will move from a voluntary data collection effort to a mandatory one.
Organizational Structure of Migrant Education Within California
A recent report from the Legislative Analyst’s Office (Ehlers, 2006) suggested reorganizing the regional structure of California’s Migrant Education Program. It recommended funding school districts directly and moving away from the county office of education model. The author argued that this structure would align responsibility for services and outcomes more directly, especially for K–12 students, although she acknowledged that this may not be the best model for out-of-school youth. MEP regions that are directly funded by school districts appear to be much better equipped to meet the needs of out-of-school youth who have dropped out of U.S. high schools but less equipped to assist those here to work. School districts are more proficient in dropout prevention and in linking dropouts with continuing or alternative education, but they are likely to have less experience meeting the needs of those here to work, many of whom left school before finishing sixth grade and some of whom may lack literacy even in Spanish.
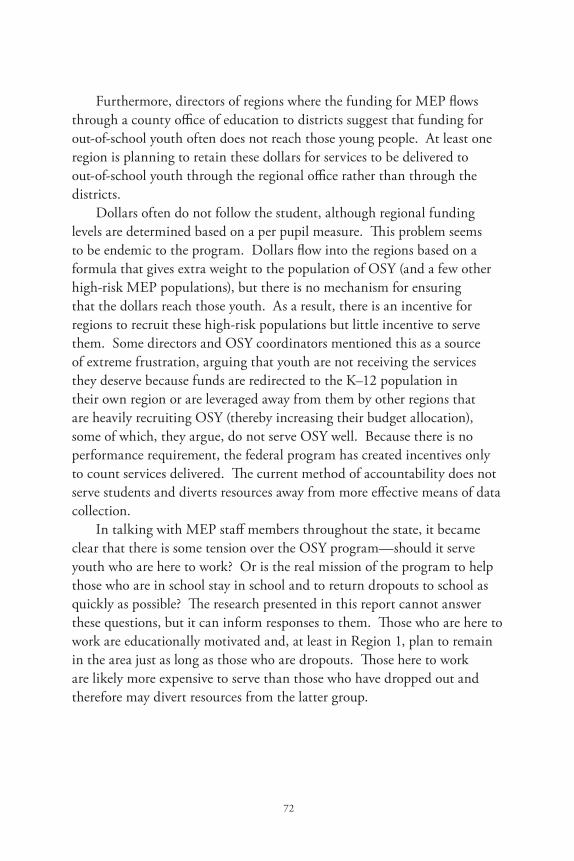
72
Furthermore, directors of regions where the funding for MEP flows through a county office of education to districts suggest that funding for out-of-school youth often does not reach those young people. At least one region is planning to retain these dollars for services to be delivered to out-of-school youth through the regional office rather than through the districts.
Dollars often do not follow the student, although regional funding levels are determined based on a per pupil measure. This problem seems to be endemic to the program. Dollars flow into the regions based on a formula that gives extra weight to the population of OSY (and a few other high-risk MEP populations), but there is no mechanism for ensuring that the dollars reach those youth. As a result, there is an incentive for regions to recruit these high-risk populations but little incentive to serve them. Some directors and OSY coordinators mentioned this as a source of extreme frustration, arguing that youth are not receiving the services they deserve because funds are redirected to the K–12 population in their own region or are leveraged away from them by other regions that are heavily recruiting OSY (thereby increasing their budget allocation), some of which, they argue, do not serve OSY well. Because there is no performance requirement, the federal program has created incentives only to count services delivered. The current method of accountability does not serve students and diverts resources away from more effective means of data collection.
In talking with MEP staff members throughout the state, it became clear that there is some tension over the OSY program—should it serve youth who are here to work? Or is the real mission of the program to help those who are in school stay in school and to return dropouts to school as quickly as possible? The research presented in this report cannot answer these questions, but it can inform responses to them. Those who are here to work are educationally motivated and, at least in Region 1, plan to remain in the area just as long as those who are dropouts. Those here to work are likely more expensive to serve than those who have dropped out and therefore may divert resources from the latter group.
73
OtherPoliciesPresentingChallengesandOpportunitiesinServingOut-of-SchoolImmigrantYouth
Discussions with OSY staff and regional directors pointed to one federal and two state policies that already have or may soon have an effect on OSY in California. The first is the new high school exit exam in California, the second is California’s AB540 (allowing the undocumented to pay in-state tuition at the state’s colleges and universities), and the third is a federal guestworker proposal.
Some regions noted that they expect their counts of out-of-school youth to rise when some of their K–12 MEP students fail the California High School Exit Exam (CAHSEE). These young people will technically be qualified for the out-of-school youth program despite having completed their high school coursework. Until they can pass the CAHSEE, they will have only a certificate of completion and not a high school diploma. Some MEP staff members expect this number to be large and fear that many of their students will not work to pass the exam after failing it. Others suggest that although many will fail initially, the state is directing substantial resources toward ensuring that those who do eventually pass the test, whether or not they are part of MEP, and thus this population should not be large. Any K–12 students who are reclassified as OSY students may cause a shift in funding allocation and a shift within each region’s mix of those here to work and dropout OSY.
Under AB540, undocumented students who have graduated from a California high school and have attended a California school for at least three years may pay in-state tuition at the University of California, California State University, or the California Community College System, if they promise to gain legal status by graduation. Some OSY who complete high school in California could benefit from these provisions of AB540, although they are not eligible for any form of state or federal financial aid. Recently, Senator Gil Cedillo introduced legislation to permit undocumented students to qualify for all financial aid administered by each of the three college systems in the state, including Board of Governors fee waivers at the community colleges, which would further lessen the
74
financial burden faced by these students. However, AB540 may have had unintended consequences for undocumented immigrants who have not graduated from a California high school or cannot demonstrate having attended California schools for at least three years. These young people may now face more scrutiny of their documentation status than in the past. This may particularly affect out-of-school youth who attempt to enroll in ESL courses at community colleges.
Should the federal government succeed in passing some form of guestworker program (such as AgJobs) or extend amnesty to the undocumented, such legislation will undoubtedly have repercussions for the out-of-school immigrant youth population in California. Many of these young people are undocumented and working in jobs without official authorization to do so. Some regional programs are already recommending to their clients that they keep track of their pay stubs and any other documentation that might help them establish residency.
FurtherResearchMuch more work needs to be done to link assessment and service
data to understand correlates of successful enrollment and completion of programs for OSY. California’s MEP regions are currently assembling the building blocks for doing so. Starting in summer 2006, more of the regions began using the standard OSY needs assessment form (Appendix C). Once there are sufficient data to do so, we will report a more representative portrait of the needs, educational backgrounds, and educational aspirations of OSY statewide using data from a number of regions in different parts of the state.
Many of the regions would like to be able to assess how they are doing in serving OSY and have taken the first steps toward doing so by stating their desired outcomes for this hard-to-serve population. Regions are also currently working to improve their ability to track services to OSY and outcomes for OSY. These data will likely lag behind the available needs assessment data. PPIC plans to further develop the preliminary analyses of academic program attendance presented here to study program completion, high school diploma and GED rates, and progress with English language learning, as well as other important milestones in OSY success. These analyses will be both quantitative and qualitative. This research

75
would include policy analysis of regional MEP data, case studies of the organizational structure of the participating MEP regions, and perhaps in-depth interviews or focus groups with the immigrant youth themselves.

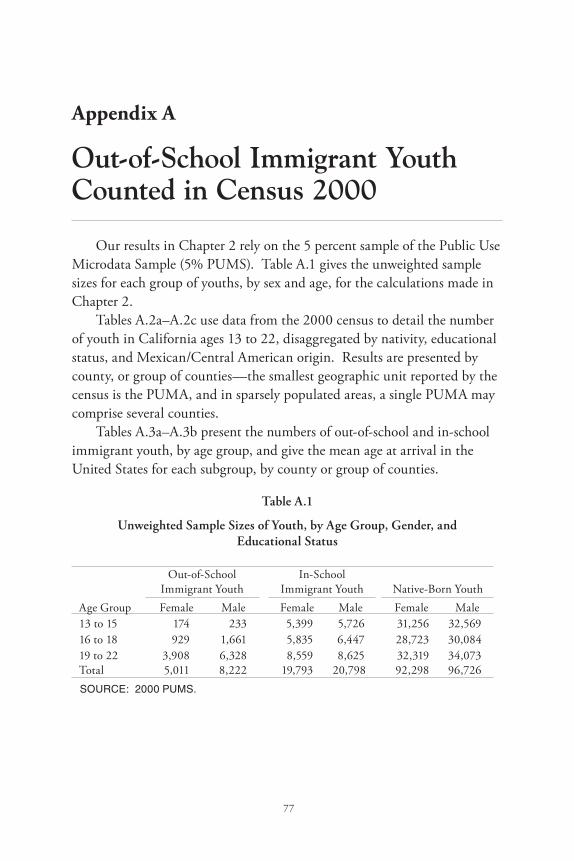
77
Appendix A
Out-of-School Immigrant Youth Counted in Census 2000
Our results in Chapter 2 rely on the 5 percent sample of the Public Use Microdata Sample (5% PUMS). Table A.1 gives the unweighted sample sizes for each group of youths, by sex and age, for the calculations made in Chapter 2.
Tables A.2a–A.2c use data from the 2000 census to detail the number of youth in California ages 13 to 22, disaggregated by nativity, educational status, and Mexican/Central American origin. Results are presented by county, or group of counties—the smallest geographic unit reported by the census is the PUMA, and in sparsely populated areas, a single PUMA may comprise several counties.
Tables A.3a–A.3b present the numbers of out-of-school and in-school immigrant youth, by age group, and give the mean age at arrival in the United States for each subgroup, by county or group of counties.
Table A.1
Unweighted Sample Sizes of Youth, by Age Group, Gender, and Educational Status
Out-of-School Immigrant Youth
In-School Immigrant Youth Native-Born Youth
Age Group Female Male Female Male Female Male13 to 15 174 233 5,399 5,726 31,256 32,56916 to 18 929 1,661 5,835 6,447 28,723 30,08419 to 22 3,908 6,328 8,559 8,625 32,319 34,073Total 5,011 8,222 19,793 20,798 92,298 96,726SOURCE: 2000 PUMS.
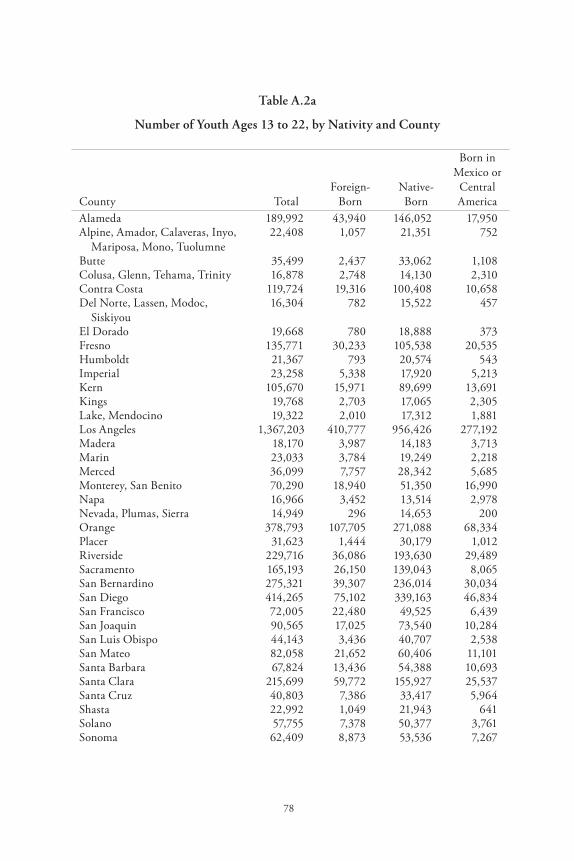
78
Table A.2a
Number of Youth Ages 13 to 22, by Nativity and County
County TotalForeign-
BornNative-Born
Born in Mexico or
Central America
Alameda 189,992 43,940 146,052 17,950Alpine, Amador, Calaveras, Inyo, Mariposa, Mono, Tuolumne
22,408 1,057 21,351 752
Butte 35,499 2,437 33,062 1,108Colusa, Glenn, Tehama, Trinity 16,878 2,748 14,130 2,310Contra Costa 119,724 19,316 100,408 10,658Del Norte, Lassen, Modoc, Siskiyou
16,304 782 15,522 457
El Dorado 19,668 780 18,888 373Fresno 135,771 30,233 105,538 20,535Humboldt 21,367 793 20,574 543Imperial 23,258 5,338 17,920 5,213Kern 105,670 15,971 89,699 13,691Kings 19,768 2,703 17,065 2,305Lake, Mendocino 19,322 2,010 17,312 1,881Los Angeles 1,367,203 410,777 956,426 277,192Madera 18,170 3,987 14,183 3,713Marin 23,033 3,784 19,249 2,218Merced 36,099 7,757 28,342 5,685Monterey, San Benito 70,290 18,940 51,350 16,990Napa 16,966 3,452 13,514 2,978Nevada, Plumas, Sierra 14,949 296 14,653 200Orange 378,793 107,705 271,088 68,334Placer 31,623 1,444 30,179 1,012Riverside 229,716 36,086 193,630 29,489Sacramento 165,193 26,150 139,043 8,065San Bernardino 275,321 39,307 236,014 30,034San Diego 414,265 75,102 339,163 46,834San Francisco 72,005 22,480 49,525 6,439San Joaquin 90,565 17,025 73,540 10,284San Luis Obispo 44,143 3,436 40,707 2,538San Mateo 82,058 21,652 60,406 11,101Santa Barbara 67,824 13,436 54,388 10,693Santa Clara 215,699 59,772 155,927 25,537Santa Cruz 40,803 7,386 33,417 5,964Shasta 22,992 1,049 21,943 641Solano 57,755 7,378 50,377 3,761Sonoma 62,409 8,873 53,536 7,267
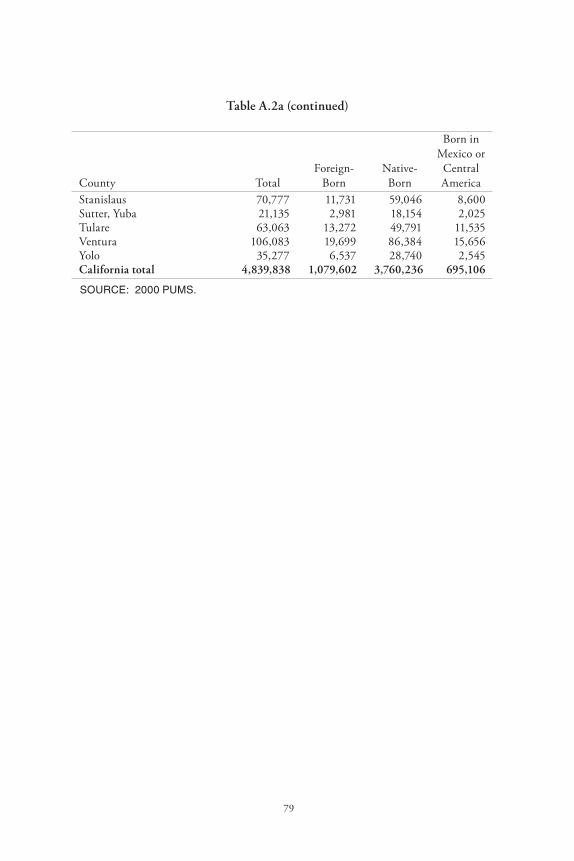
79
Table A.2a (continued)
County TotalForeign-
BornNative-Born
Born in Mexico or
Central America
Stanislaus 70,777 11,731 59,046 8,600Sutter, Yuba 21,135 2,981 18,154 2,025Tulare 63,063 13,272 49,791 11,535Ventura 106,083 19,699 86,384 15,656Yolo 35,277 6,537 28,740 2,545California total 4,839,838 1,079,602 3,760,236 695,106
SOURCE: 2000 PUMS.
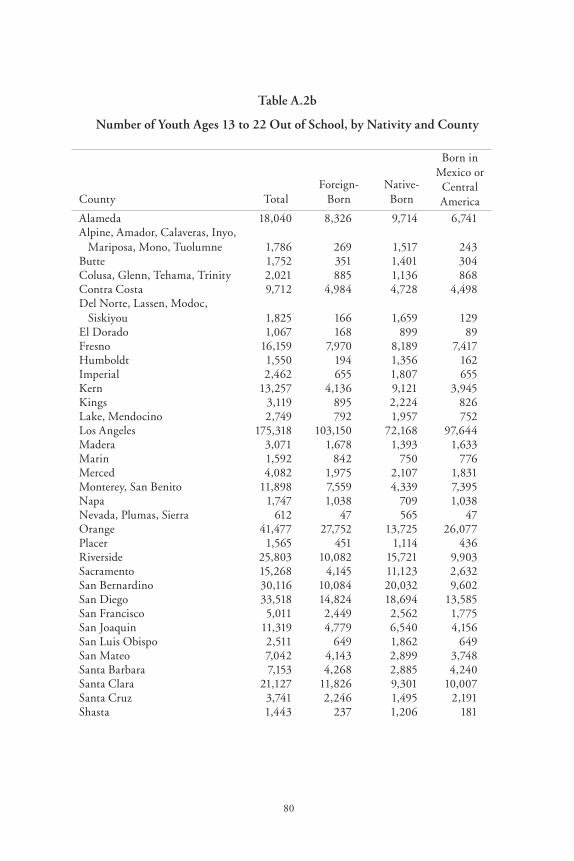
80
Table A.2b
Number of Youth Ages 13 to 22 Out of School, by Nativity and County
County TotalForeign-
BornNative-Born
Born in Mexico or
Central America
Alameda 18,040 8,326 9,714 6,741Alpine, Amador, Calaveras, Inyo, Mariposa, Mono, Tuolumne 1,786 269 1,517 243Butte 1,752 351 1,401 304Colusa, Glenn, Tehama, Trinity 2,021 885 1,136 868Contra Costa 9,712 4,984 4,728 4,498Del Norte, Lassen, Modoc, Siskiyou 1,825 166 1,659 129El Dorado 1,067 168 899 89Fresno 16,159 7,970 8,189 7,417Humboldt 1,550 194 1,356 162Imperial 2,462 655 1,807 655Kern 13,257 4,136 9,121 3,945Kings 3,119 895 2,224 826Lake, Mendocino 2,749 792 1,957 752Los Angeles 175,318 103,150 72,168 97,644Madera 3,071 1,678 1,393 1,633Marin 1,592 842 750 776Merced 4,082 1,975 2,107 1,831Monterey, San Benito 11,898 7,559 4,339 7,395Napa 1,747 1,038 709 1,038Nevada, Plumas, Sierra 612 47 565 47Orange 41,477 27,752 13,725 26,077Placer 1,565 451 1,114 436Riverside 25,803 10,082 15,721 9,903Sacramento 15,268 4,145 11,123 2,632San Bernardino 30,116 10,084 20,032 9,602San Diego 33,518 14,824 18,694 13,585San Francisco 5,011 2,449 2,562 1,775San Joaquin 11,319 4,779 6,540 4,156San Luis Obispo 2,511 649 1,862 649San Mateo 7,042 4,143 2,899 3,748Santa Barbara 7,153 4,268 2,885 4,240Santa Clara 21,127 11,826 9,301 10,007Santa Cruz 3,741 2,246 1,495 2,191Shasta 1,443 237 1,206 181
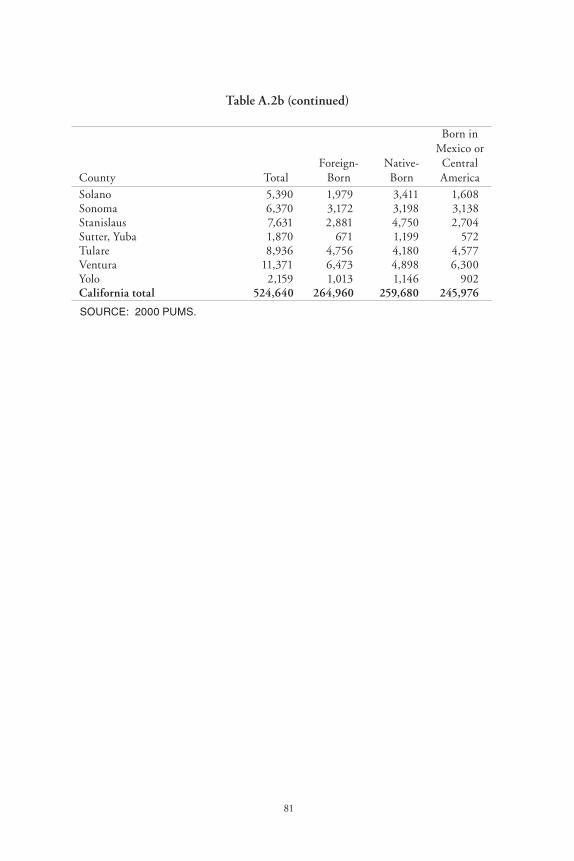
81
Table A.2b (continued)
County TotalForeign-
BornNative-Born
Born in Mexico or
Central America
Solano 5,390 1,979 3,411 1,608Sonoma 6,370 3,172 3,198 3,138Stanislaus 7,631 2,881 4,750 2,704Sutter, Yuba 1,870 671 1,199 572Tulare 8,936 4,756 4,180 4,577Ventura 11,371 6,473 4,898 6,300Yolo 2,159 1,013 1,146 902California total 524,640 264,960 259,680 245,976
SOURCE: 2000 PUMS.
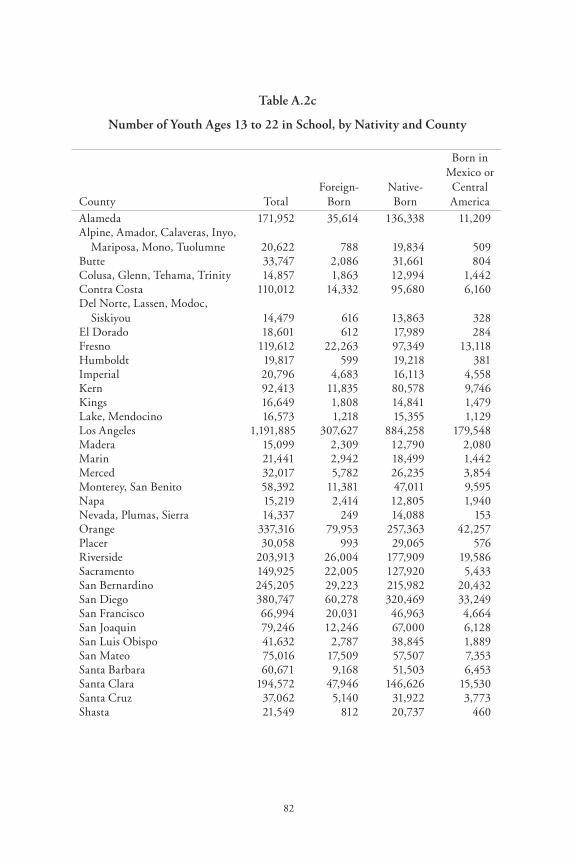
82
Table A.2c
Number of Youth Ages 13 to 22 in School, by Nativity and County
County TotalForeign-
BornNative-Born
Born in Mexico or
Central America
Alameda 171,952 35,614 136,338 11,209Alpine, Amador, Calaveras, Inyo, Mariposa, Mono, Tuolumne 20,622 788 19,834 509Butte 33,747 2,086 31,661 804Colusa, Glenn, Tehama, Trinity 14,857 1,863 12,994 1,442Contra Costa 110,012 14,332 95,680 6,160Del Norte, Lassen, Modoc, Siskiyou 14,479 616 13,863 328El Dorado 18,601 612 17,989 284Fresno 119,612 22,263 97,349 13,118Humboldt 19,817 599 19,218 381Imperial 20,796 4,683 16,113 4,558Kern 92,413 11,835 80,578 9,746Kings 16,649 1,808 14,841 1,479Lake, Mendocino 16,573 1,218 15,355 1,129Los Angeles 1,191,885 307,627 884,258 179,548Madera 15,099 2,309 12,790 2,080Marin 21,441 2,942 18,499 1,442Merced 32,017 5,782 26,235 3,854Monterey, San Benito 58,392 11,381 47,011 9,595Napa 15,219 2,414 12,805 1,940Nevada, Plumas, Sierra 14,337 249 14,088 153Orange 337,316 79,953 257,363 42,257Placer 30,058 993 29,065 576Riverside 203,913 26,004 177,909 19,586Sacramento 149,925 22,005 127,920 5,433San Bernardino 245,205 29,223 215,982 20,432San Diego 380,747 60,278 320,469 33,249San Francisco 66,994 20,031 46,963 4,664San Joaquin 79,246 12,246 67,000 6,128San Luis Obispo 41,632 2,787 38,845 1,889San Mateo 75,016 17,509 57,507 7,353Santa Barbara 60,671 9,168 51,503 6,453Santa Clara 194,572 47,946 146,626 15,530Santa Cruz 37,062 5,140 31,922 3,773Shasta 21,549 812 20,737 460
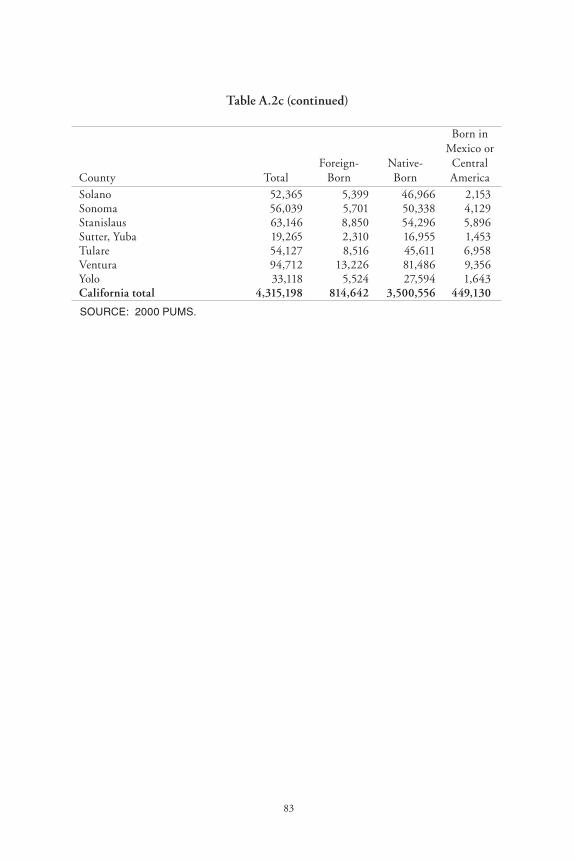
83
Table A.2c (continued)
County TotalForeign-
BornNative-Born
Born in Mexico or
Central America
Solano 52,365 5,399 46,966 2,153Sonoma 56,039 5,701 50,338 4,129Stanislaus 63,146 8,850 54,296 5,896Sutter, Yuba 19,265 2,310 16,955 1,453Tulare 54,127 8,516 45,611 6,958Ventura 94,712 13,226 81,486 9,356Yolo 33,118 5,524 27,594 1,643California total 4,315,198 814,642 3,500,556 449,130
SOURCE: 2000 PUMS.
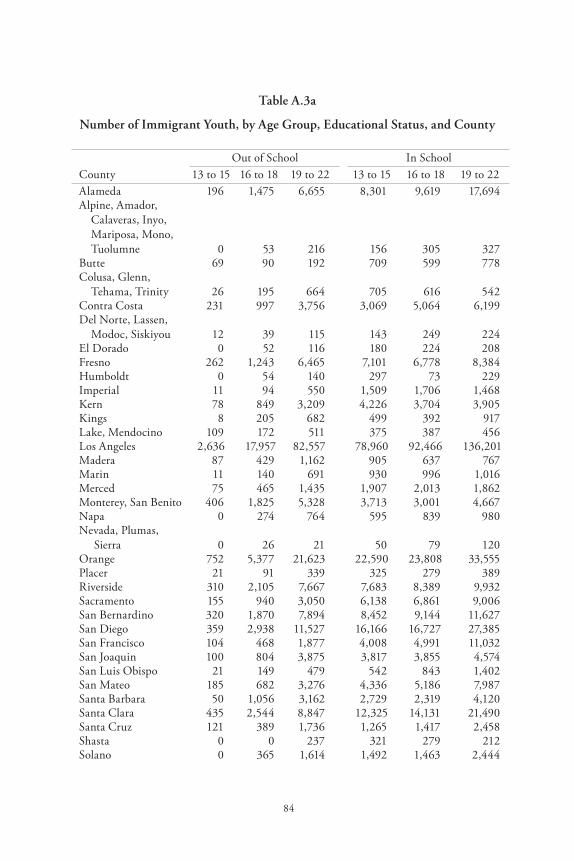
84
Table A.3a
Number of Immigrant Youth, by Age Group, Educational Status, and County
Out of School In SchoolCounty 13 to 15 16 to 18 19 to 22 13 to 15 16 to 18 19 to 22Alameda 196 1,475 6,655 8,301 9,619 17,694Alpine, Amador, Calaveras, Inyo, Mariposa, Mono, Tuolumne 0 53 216 156 305 327Butte 69 90 192 709 599 778Colusa, Glenn, Tehama, Trinity 26 195 664 705 616 542Contra Costa 231 997 3,756 3,069 5,064 6,199Del Norte, Lassen, Modoc, Siskiyou 12 39 115 143 249 224El Dorado 0 52 116 180 224 208Fresno 262 1,243 6,465 7,101 6,778 8,384Humboldt 0 54 140 297 73 229Imperial 11 94 550 1,509 1,706 1,468Kern 78 849 3,209 4,226 3,704 3,905Kings 8 205 682 499 392 917Lake, Mendocino 109 172 511 375 387 456Los Angeles 2,636 17,957 82,557 78,960 92,466 136,201Madera 87 429 1,162 905 637 767Marin 11 140 691 930 996 1,016Merced 75 465 1,435 1,907 2,013 1,862Monterey, San Benito 406 1,825 5,328 3,713 3,001 4,667Napa 0 274 764 595 839 980Nevada, Plumas, Sierra 0 26 21 50 79 120Orange 752 5,377 21,623 22,590 23,808 33,555Placer 21 91 339 325 279 389Riverside 310 2,105 7,667 7,683 8,389 9,932Sacramento 155 940 3,050 6,138 6,861 9,006San Bernardino 320 1,870 7,894 8,452 9,144 11,627San Diego 359 2,938 11,527 16,166 16,727 27,385San Francisco 104 468 1,877 4,008 4,991 11,032San Joaquin 100 804 3,875 3,817 3,855 4,574San Luis Obispo 21 149 479 542 843 1,402San Mateo 185 682 3,276 4,336 5,186 7,987Santa Barbara 50 1,056 3,162 2,729 2,319 4,120Santa Clara 435 2,544 8,847 12,325 14,131 21,490Santa Cruz 121 389 1,736 1,265 1,417 2,458Shasta 0 0 237 321 279 212Solano 0 365 1,614 1,492 1,463 2,444
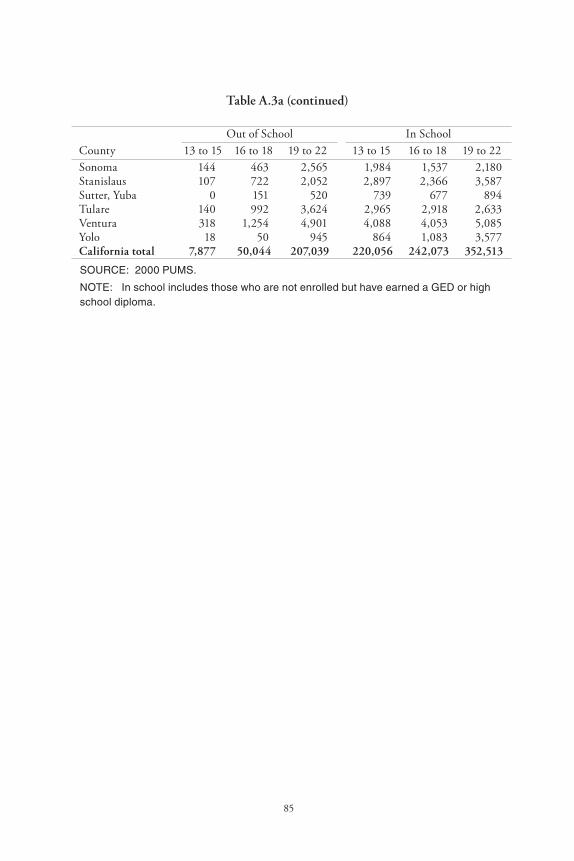
85
Table A.3a (continued)
Out of School In SchoolCounty 13 to 15 16 to 18 19 to 22 13 to 15 16 to 18 19 to 22Sonoma 144 463 2,565 1,984 1,537 2,180Stanislaus 107 722 2,052 2,897 2,366 3,587Sutter, Yuba 0 151 520 739 677 894Tulare 140 992 3,624 2,965 2,918 2,633Ventura 318 1,254 4,901 4,088 4,053 5,085Yolo 18 50 945 864 1,083 3,577California total 7,877 50,044 207,039 220,056 242,073 352,513
SOURCE: 2000 PUMS.
NOTE: In school includes those who are not enrolled but have earned a GED or highschool diploma.
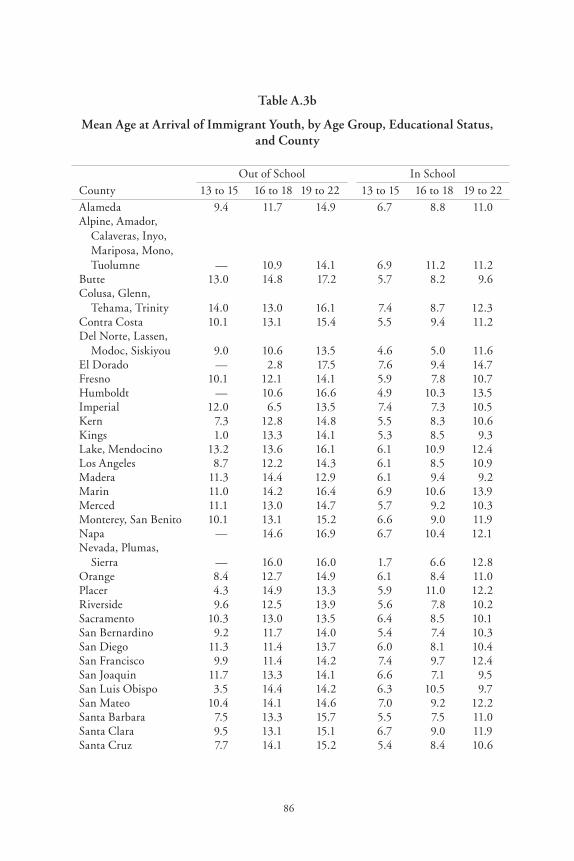
86
Table A.3b
Mean Age at Arrival of Immigrant Youth, by Age Group, Educational Status, and County
Out of School In SchoolCounty 13 to 15 16 to 18 19 to 22 13 to 15 16 to 18 19 to 22Alameda 9.4 11.7 14.9 6.7 8.8 11.0 Alpine, Amador, Calaveras, Inyo, Mariposa, Mono, Tuolumne — 10.9 14.1 6.9 11.2 11.2 Butte 13.0 14.8 17.2 5.7 8.2 9.6 Colusa, Glenn, Tehama, Trinity 14.0 13.0 16.1 7.4 8.7 12.3 Contra Costa 10.1 13.1 15.4 5.5 9.4 11.2 Del Norte, Lassen, Modoc, Siskiyou 9.0 10.6 13.5 4.6 5.0 11.6 El Dorado — 2.8 17.5 7.6 9.4 14.7 Fresno 10.1 12.1 14.1 5.9 7.8 10.7 Humboldt — 10.6 16.6 4.9 10.3 13.5 Imperial 12.0 6.5 13.5 7.4 7.3 10.5 Kern 7.3 12.8 14.8 5.5 8.3 10.6 Kings 1.0 13.3 14.1 5.3 8.5 9.3 Lake, Mendocino 13.2 13.6 16.1 6.1 10.9 12.4 Los Angeles 8.7 12.2 14.3 6.1 8.5 10.9 Madera 11.3 14.4 12.9 6.1 9.4 9.2 Marin 11.0 14.2 16.4 6.9 10.6 13.9 Merced 11.1 13.0 14.7 5.7 9.2 10.3 Monterey, San Benito 10.1 13.1 15.2 6.6 9.0 11.9 Napa — 14.6 16.9 6.7 10.4 12.1 Nevada, Plumas, Sierra — 16.0 16.0 1.7 6.6 12.8 Orange 8.4 12.7 14.9 6.1 8.4 11.0 Placer 4.3 14.9 13.3 5.9 11.0 12.2 Riverside 9.6 12.5 13.9 5.6 7.8 10.2 Sacramento 10.3 13.0 13.5 6.4 8.5 10.1 San Bernardino 9.2 11.7 14.0 5.4 7.4 10.3 San Diego 11.3 11.4 13.7 6.0 8.1 10.4 San Francisco 9.9 11.4 14.2 7.4 9.7 12.4 San Joaquin 11.7 13.3 14.1 6.6 7.1 9.5 San Luis Obispo 3.5 14.4 14.2 6.3 10.5 9.7 San Mateo 10.4 14.1 14.6 7.0 9.2 12.2 Santa Barbara 7.5 13.3 15.7 5.5 7.5 11.0 Santa Clara 9.5 13.1 15.1 6.7 9.0 11.9 Santa Cruz 7.7 14.1 15.2 5.4 8.4 10.6
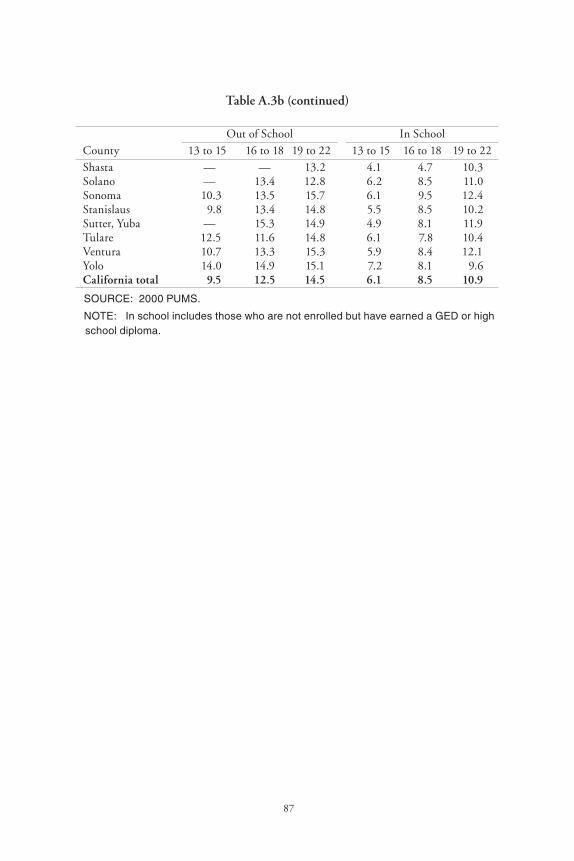
87
Table A.3b (continued)
Out of School In SchoolCounty 13 to 15 16 to 18 19 to 22 13 to 15 16 to 18 19 to 22Shasta — — 13.2 4.1 4.7 10.3 Solano — 13.4 12.8 6.2 8.5 11.0 Sonoma 10.3 13.5 15.7 6.1 9.5 12.4 Stanislaus 9.8 13.4 14.8 5.5 8.5 10.2 Sutter, Yuba — 15.3 14.9 4.9 8.1 11.9 Tulare 12.5 11.6 14.8 6.1 7.8 10.4 Ventura 10.7 13.3 15.3 5.9 8.4 12.1 Yolo 14.0 14.9 15.1 7.2 8.1 9.6 California total 9.5 12.5 14.5 6.1 8.5 10.9
SOURCE: 2000 PUMS.
NOTE: In school includes those who are not enrolled but have earned a GED or high school diploma.
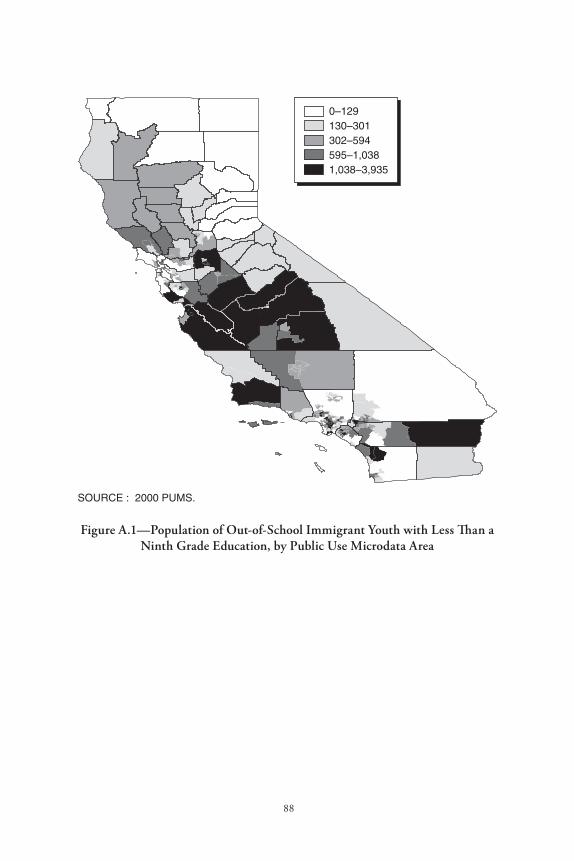
88
Figure A.1—Population of Out-of-School Immigrant Youth with Less Than a Ninth Grade Education, by Public Use Microdata Area
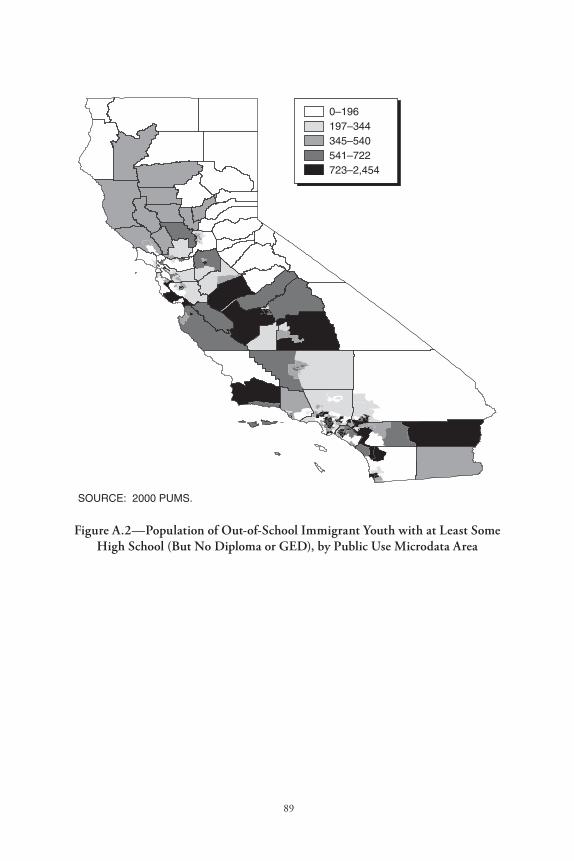
89
Figure A.2—Population of Out-of-School Immigrant Youth with at Least Some High School (But No Diploma or GED), by Public Use Microdata Area

91
Appendix B
What Share of the Potentially Eligible Are Served by the Migrant Education Program?
The Migrant Education Program serves out-of-school youth who have neither a high school diploma nor a GED, who are age 21 or younger (or who did not turn 22 during the current school year), who (or their qualifying adult) work in the agricultural, fishing, or forestry industries, and who moved across school district boundaries in the last 36 months to seek employment in these industries. We know that the program cannot serve all immigrant youth who lack a GED or diploma. Here we attempt to assess MEP’s ability to identify and recruit the out-of-school youth most likely to meet the program’s eligibility criteria.
To do so, we use the PUMS from the 2000 census to restrict the population characteristics of out-of-school youth found in the census to more closely match those characteristics targeted by MEP. However, because the boundaries of MEP regions in California are not necessarily based on counties, we must exclude those youth served by Region 1 in Santa Cruz and San Benito Counties (and thus exclude Santa Cruz and San Benito Counties from our census estimates as well). Santa Cruz County is served by two MEP regions, and San Benito County cannot be disaggregated from the PUMS data. We also include those youth served by Region 13 (San Jose Unified School District), which is part of Santa Clara County (see Figure 3.1), because we could not restrict the PUMS data to exclude the area served by Region 13. Region 13 estimates having identified and recruited 45 out-of-school youth, and Region 1 estimates having identified and recruited 1,200 out-of-school youth.
Although not a requirement of the program, out-of-school youth served through MEP are either first- or second-generation foreign-born. Thus, we begin by considering all first- and second-generation youth ages 15 to 22 who are not in school and do not have either a high school diploma
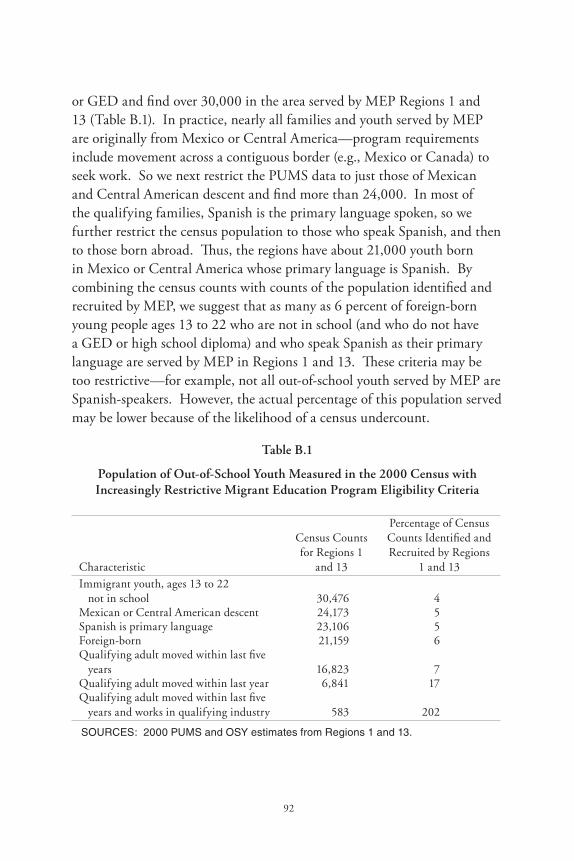
92
or GED and find over 30,000 in the area served by MEP Regions 1 and 13 (Table B.1). In practice, nearly all families and youth served by MEP are originally from Mexico or Central America—program requirements include movement across a contiguous border (e.g., Mexico or Canada) to seek work. So we next restrict the PUMS data to just those of Mexican and Central American descent and find more than 24,000. In most of the qualifying families, Spanish is the primary language spoken, so we further restrict the census population to those who speak Spanish, and then to those born abroad. Thus, the regions have about 21,000 youth born in Mexico or Central America whose primary language is Spanish. By combining the census counts with counts of the population identified and recruited by MEP, we suggest that as many as 6 percent of foreign-born young people ages 13 to 22 who are not in school (and who do not have a GED or high school diploma) and who speak Spanish as their primary language are served by MEP in Regions 1 and 13. These criteria may be too restrictive—for example, not all out-of-school youth served by MEP are Spanish-speakers. However, the actual percentage of this population served may be lower because of the likelihood of a census undercount.
Table B.1
Population of Out-of-School Youth Measured in the 2000 Census with Increasingly Restrictive Migrant Education Program Eligibility Criteria
Characteristic
Census Counts for Regions 1
and 13
Percentage of Census Counts Identified and Recruited by Regions
1 and 13 Immigrant youth, ages 13 to 22 not in school 30,476 4Mexican or Central American descent 24,173 5Spanish is primary language 23,106 5Foreign-born 21,159 6Qualifying adult moved within last five years 16,823 7Qualifying adult moved within last year 6,841 17Qualifying adult moved within last five years and works in qualifying industry 583 202
SOURCES: 2000 PUMS and OSY estimates from Regions 1 and 13.
93
Next, we attempt to incorporate the program’s requirements about migration across school district boundaries in the last 36 months. To do so, we consider whether the qualifying adult (either the out-of-school youth or his or her parent) moved within the last five years. There is no census question for an interval of 0 to 36 months. We next restrict our criteria to movement within the last year, which is clearly much more restrictive than that required by MEP, and find that as many as 17 percent of this population might be being served. However, even these movement definitions do not map perfectly to the population that is eligible for service in MEP, where the requirement is crossing school district boundaries, not moving into a different home. Finally, we restrict our census counts of youth to only those who work in agriculture or fishing (or who have a parent or spouse who does so), and who moved within the last five years; we find that MEP serves many more than we count in the census. This last restriction is likely too stringent, because it overlooks those who moved to look for work in either of these two industries. Seeking qualifying employment is sufficient to qualify for the MEP program—one must not actually find that type of work to qualify for services. Thus, we conclude that, as those serving out-of-school youth themselves have suggested, there are likely a few thousand more out-of-school youth who might qualify for MEP services in Regions 1 and 13, but the exact numbers are difficult to pinpoint.
In the tables that follow, we consider the counts of out-of-school and in-school immigrant youth by approximate MEP region using data from the 2000 census. Tables B.2a–B.2c detail the youth in California ages 13 to 22, both native-born and foreign-born, classifying them as either in school (or who have earned a GED or high school diploma) or out of school. Tables B.3a–B.3c present the numbers and mean age at arrival of out-of-school and in-school immigrant youth population by age group and by region of the Migrant Education Program.
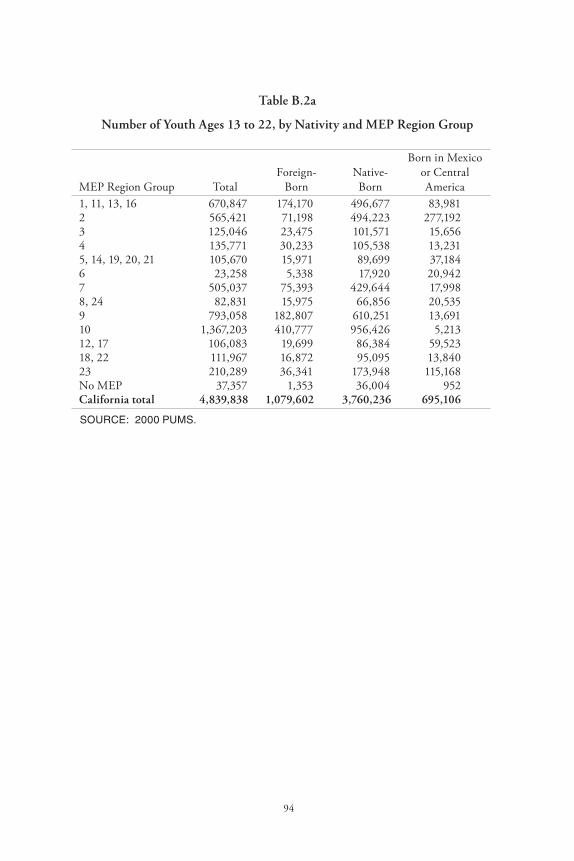
94
Table B.2a
Number of Youth Ages 13 to 22, by Nativity and MEP Region Group
MEP Region Group TotalForeign-
BornNative-Born
Born in Mexico or Central America
1, 11, 13, 16 670,847 174,170 496,677 83,9812 565,421 71,198 494,223 277,1923 125,046 23,475 101,571 15,6564 135,771 30,233 105,538 13,2315, 14, 19, 20, 21 105,670 15,971 89,699 37,1846 23,258 5,338 17,920 20,9427 505,037 75,393 429,644 17,9988, 24 82,831 15,975 66,856 20,5359 793,058 182,807 610,251 13,69110 1,367,203 410,777 956,426 5,21312, 17 106,083 19,699 86,384 59,52318, 22 111,967 16,872 95,095 13,84023 210,289 36,341 173,948 115,168No MEP 37,357 1,353 36,004 952California total 4,839,838 1,079,602 3,760,236 695,106
SOURCE: 2000 PUMS.
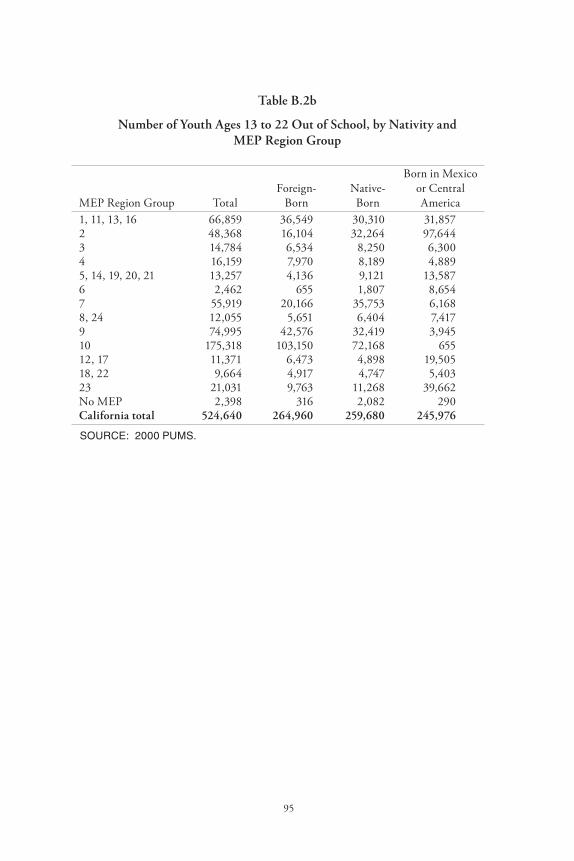
95
Table B.2b
Number of Youth Ages 13 to 22 Out of School, by Nativity and MEP Region Group
MEP Region Group TotalForeign-
BornNative-Born
Born in Mexico or Central America
1, 11, 13, 16 66,859 36,549 30,310 31,8572 48,368 16,104 32,264 97,6443 14,784 6,534 8,250 6,3004 16,159 7,970 8,189 4,8895, 14, 19, 20, 21 13,257 4,136 9,121 13,5876 2,462 655 1,807 8,6547 55,919 20,166 35,753 6,1688, 24 12,055 5,651 6,404 7,4179 74,995 42,576 32,419 3,94510 175,318 103,150 72,168 65512, 17 11,371 6,473 4,898 19,50518, 22 9,664 4,917 4,747 5,40323 21,031 9,763 11,268 39,662No MEP 2,398 316 2,082 290California total 524,640 264,960 259,680 245,976
SOURCE: 2000 PUMS.
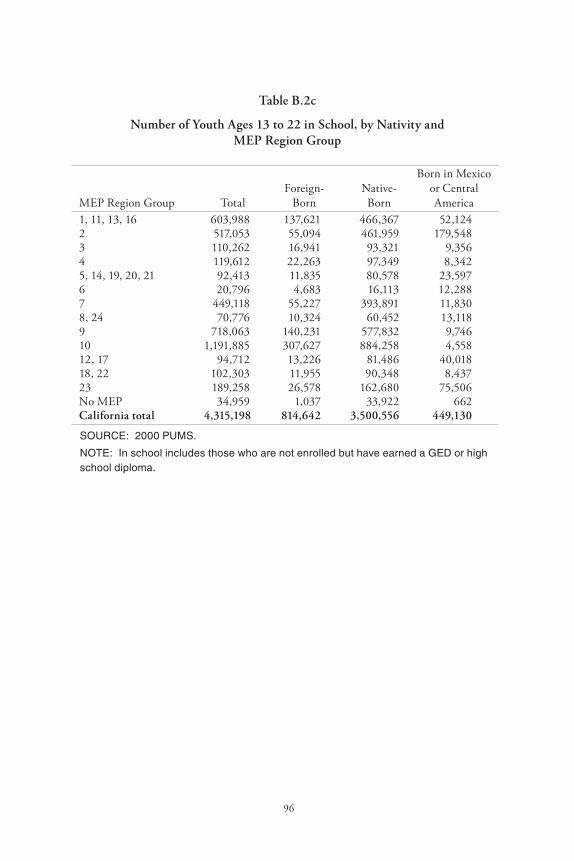
96
Table B.2c
Number of Youth Ages 13 to 22 in School, by Nativity and MEP Region Group
MEP Region Group TotalForeign-
BornNative-Born
Born in Mexico or Central America
1, 11, 13, 16 603,988 137,621 466,367 52,1242 517,053 55,094 461,959 179,5483 110,262 16,941 93,321 9,3564 119,612 22,263 97,349 8,3425, 14, 19, 20, 21 92,413 11,835 80,578 23,5976 20,796 4,683 16,113 12,2887 449,118 55,227 393,891 11,8308, 24 70,776 10,324 60,452 13,1189 718,063 140,231 577,832 9,74610 1,191,885 307,627 884,258 4,55812, 17 94,712 13,226 81,486 40,01818, 22 102,303 11,955 90,348 8,43723 189,258 26,578 162,680 75,506No MEP 34,959 1,037 33,922 662California total 4,315,198 814,642 3,500,556 449,130
SOURCE: 2000 PUMS.
NOTE: In school includes those who are not enrolled but have earned a GED or high school diploma.
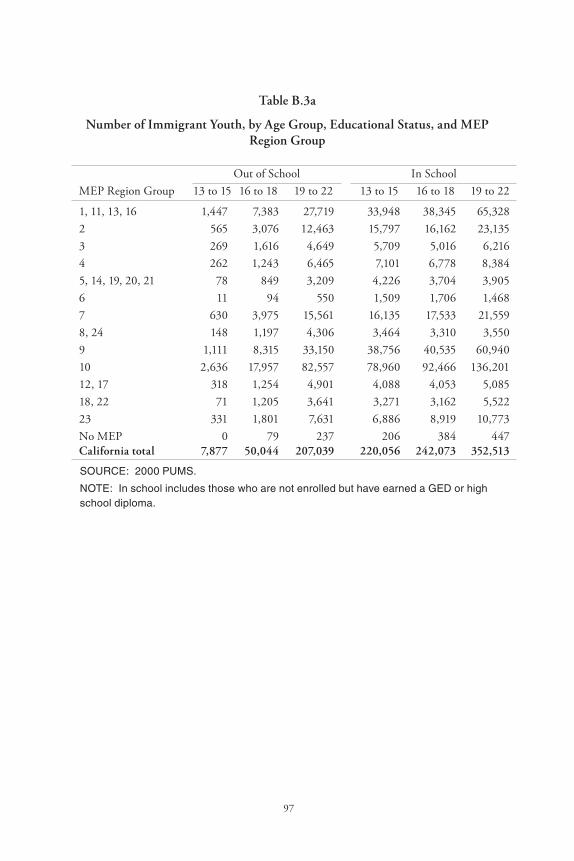
97
Table B.3a
Number of Immigrant Youth, by Age Group, Educational Status, and MEP Region Group
Out of School In SchoolMEP Region Group 13 to 15 16 to 18 19 to 22 13 to 15 16 to 18 19 to 22
1, 11, 13, 16 1,447 7,383 27,719 33,948 38,345 65,3282 565 3,076 12,463 15,797 16,162 23,1353 269 1,616 4,649 5,709 5,016 6,2164 262 1,243 6,465 7,101 6,778 8,3845, 14, 19, 20, 21 78 849 3,209 4,226 3,704 3,9056 11 94 550 1,509 1,706 1,4687 630 3,975 15,561 16,135 17,533 21,5598, 24 148 1,197 4,306 3,464 3,310 3,5509 1,111 8,315 33,150 38,756 40,535 60,94010 2,636 17,957 82,557 78,960 92,466 136,20112, 17 318 1,254 4,901 4,088 4,053 5,08518, 22 71 1,205 3,641 3,271 3,162 5,52223 331 1,801 7,631 6,886 8,919 10,773No MEP 0 79 237 206 384 447California total 7,877 50,044 207,039 220,056 242,073 352,513
SOURCE: 2000 PUMS.
NOTE: In school includes those who are not enrolled but have earned a GED or high school diploma.
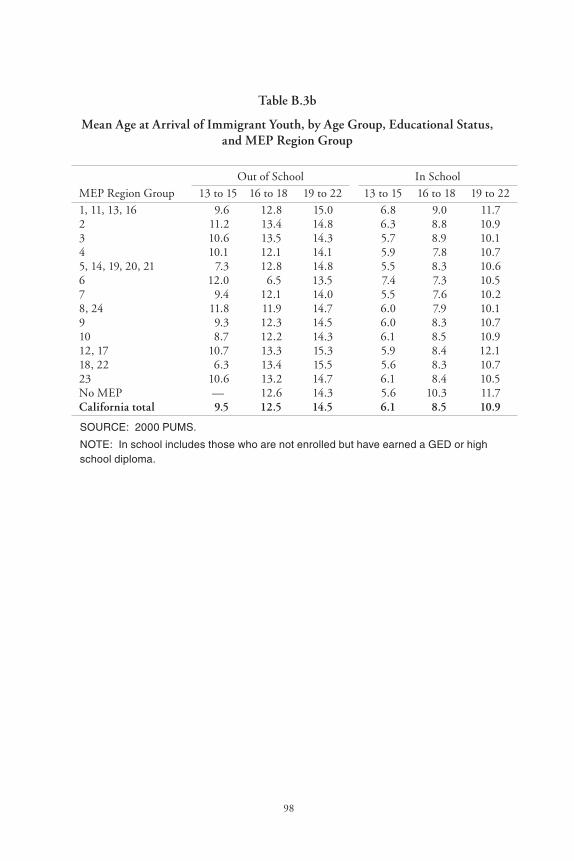
98
Table B.3b
Mean Age at Arrival of Immigrant Youth, by Age Group, Educational Status, and MEP Region Group
Out of School In SchoolMEP Region Group 13 to 15 16 to 18 19 to 22 13 to 15 16 to 18 19 to 221, 11, 13, 16 9.6 12.8 15.0 6.8 9.0 11.72 11.2 13.4 14.8 6.3 8.8 10.93 10.6 13.5 14.3 5.7 8.9 10.14 10.1 12.1 14.1 5.9 7.8 10.75, 14, 19, 20, 21 7.3 12.8 14.8 5.5 8.3 10.66 12.0 6.5 13.5 7.4 7.3 10.57 9.4 12.1 14.0 5.5 7.6 10.28, 24 11.8 11.9 14.7 6.0 7.9 10.19 9.3 12.3 14.5 6.0 8.3 10.710 8.7 12.2 14.3 6.1 8.5 10.912, 17 10.7 13.3 15.3 5.9 8.4 12.118, 22 6.3 13.4 15.5 5.6 8.3 10.723 10.6 13.2 14.7 6.1 8.4 10.5No MEP — 12.6 14.3 5.6 10.3 11.7California total 9.5 12.5 14.5 6.1 8.5 10.9
SOURCE: 2000 PUMS.
NOTE: In school includes those who are not enrolled but have earned a GED or high school diploma.
99
Appendix C
Out-of-School Youth Needs Assessment
Chapters 3, 4, and 5 rely on data from needs assessments administered to out-of-school youth from two regions of California’s Migrant Education Program. These data are confidential. PPIC has access to them by special agreement, and every precaution has been taken to protect the identities of the out-of-school youth in the data.
There are slight differences in the data collected by Regions 1 and 11. Starting in July, those two regions, as well as a number of others, began to use a new form in conducting OSY assessments, and that form is included below.
In preparing the data for use in this report, data from Regions 1 and 11 had to be recoded somewhat to make the results generalizable across the regions. For example, OSY in Region 1 indicate whether they can “Read/Write” in English, but OSY in Region 11 are asked about their reading and writing ability in English separately. Only those in Region 11 who could read and write in English were recoded as being able to “Read/Write” in English. Only ten OSY were able to read but not write or write but not read in English. The remainder could either both read and write, neither read nor write, or had missing values.

100
Standard Assessment Form
Migrant Education
OSY Individual Needs Assessment
Region:______________________
District: _____________________
Student Information
Name: __________________________________________________________________________
Address: _________________________________________________________________________
City: ______________________________ Zip Code: ____________________________________
Phone: __________________________ DOB: _____________________£ MALE £ FEMALE
Living w/ Parent/Guardian: £ YES £ NO
Parent/Guardian Name: ___________________________ Phone: (__) ______________________
Youth is £ Here to Work £ Dropout
How long before your next move? _____ Reason for leaving: ________________________________
Emergency Contact: __________________________ Phone: (__) __________________________
Place of Birth: ___________________________________________ Married: £ YES £ NO
Children: £ YES £ NO How many? __________________________________
Employer: ___________________________________________ Phone: _____________________
Work Hours: _____________________________________________________________________
Valid CA DL: £ YES £ NO Transportation: £ YES £ NO
Type: _______________________________ If no explain: _______________________________

101
Educational Needs
Last School Attended: _______________________________________________________________
School District: _____________________________ Student ID#: __________________________
Last Date Attended: ____________________ Last Grade Completed: _______________________
Total Credits Earned: ______________________________________________________________
Attempted to enroll at a local high school: £ YES £ NO
School Name: __________________________________ Date of attempt: ___________________
Reason student did not enroll: _______________________________________________________
Do you have a disability (learning or physical)? £ YES £ NO
Explain: _________________________________________________________________________
Do you have a(n) £ IEP £ 504 Plan
Have you ever attended special education classes? £ YES £ NO
£ RSP (Resource) £ SDC (Special Day Class)
Favorite Subject: ______________________________ Total Years of schooling: _______________
Reason for Leaving School: __________________________________________________________
Do you like: £ Reading £ Writing £ Math
Days available: £ Mon £ Tue £ Wed £ Thu £ Fri £ Sat £ Sun
Time available: £ Morning £ Afternoon £ Evening

102
Language Needs
Primary Language: _________________________________________________________________
Secondary Language: _______________________________________________________________
English Language Oral Proficiency: £ High £ Medium £ Low £ None
Read English: £ YES £ NO
Write English: £ YES £ NO
Read Spanish: £ YES £ NO
Write Spanish: £ YES £ NO
Other Language: ___________________________________________________________________
Read Other Language: £ YES £ NO
Write Other Language: £ YES £ NO
English Assessment Used: ____________________________________________________________
Spanish Assessment Used: ____________________________________________________________
Social/Economic Needs
£ Food £ Dental £ Medical £ Vision £ Transportation £ Childcare
£ Counseling £ Clothing
£ Prenatal Care—Due Date: ________________________________________________________
£ Family Planning Services £ Taking Medication
£ Intervention Counseling £ Other needs: ___________________________________________
_________________________________________________________________________________
Medical Insurance £ YES £ NO

103
Dental Insurance £ YES £ NO
Vision Insurance £ YES £ NO
Do you work? £ YES £ NO
Does your family rely on your income? £ YES £ NO
Do you have a health condition(s) you would like to share? __________________________________
_________________________________________________________________________________
Educational/Vocational Goals
£ High School Diploma £ GED £ Outside Work Experience
£ Employment: ___________________________________________________________________
£ English Proficiency/English as a Second Language
£ Community College
£ Job/vocational Training: __________________________________________________________
Additional Comments
Comments: ______________________________________________________________________
_________________________________________________________________________________
_________________________________________________________________________________
Interviewer: ______________________________________________________________________
Intake Date: ______________________________________________________________________
Received materials: £ YES £ NO
Educationally Motivated: £ YES £ NO

105
Appendix D
Interviews of Regional and Out-of-School Youth Program Directors
Regional programs throughout the state have a fair amount of flexibility regarding whether and how they establish programs for out-of-school youth. That fact, in conjunction with the tremendous diversity in the regions themselves (see Chapter 3) leads to wide variation in regional approaches to serving OSY. In addition, many regions do not know how other regions recruit, assess, and serve out-of-school youth. To understand some of this variation across the state, we conducted interviews with either regional directors, out-of-school youth directors, or primary providers of out-of-school youth services in each of the state’s 23 regions. At the time of this writing, interviews had been conducted with 21 of the state’s 23 regions.
Phone interviews lasted between 30 and 60 minutes and covered topics ranging from OSY budgets (dollars and staffing); OSY population size; methods for recruiting OSY; assessing, serving, and documenting services to OSY; and governance structure of the regions. The semi-structured survey instrument is included below.
Survey of Migrant Education Regions’ Out of School Youth ProgramsRegion ____
Funding• What is your region’s budget for Migrant Education (FY ’05–’06)?• What share is spent on OSY?• Do you have other sources of funding your region uses in serving
OSY? (dollars, source?)
OSY Program• What age ranges do you serve in your OSY program?• What proportion is under the age of 19?
106
• How many OSY do you estimate that you have recruited/ identified?
• Of those, what share (or number) are o Active?o Inactive?o Graduated/completed?
• What proportion of your OSY do you estimate are dropouts vs. here to work?
Staffing• Who directly serves OSY in your region?• What are their titles?• What are their roles? • How many full-time equivalent (FTE) staff members do you
estimate your region devotes to OSY?
OSY Recruitment• How do you recruit your OSY?• Which recruitment methods are most successful?• When do you recruit and serve your greatest number of OSY? (e.g.,
seasons or months)?• How many FTE staff members are devoted to recruiting OSY?• How many more OSY do you estimate are in your region but who
you have not been able to identify/recruit?
OSY Services and Activities• Please describe the process you use for administering a needs
assessment for OSY.• Services
o Please describe the types of referrals you provide for OSY, if any.
o Please describe the types of facilitation you provide for OSY, if any. (By facilitation, we mean more active connecting OSY with a service, for example, providing transportation, meeting OSY at a clinic, etc.)

107
o Please describe the types of direct services you provide/pay for on behalf of OSY, if any.
• Are your referrals, facilitations, direct services, recorded in any way? How?
• Are there other services and referrals you would like to provide your OSY which you are currently unable to provide? If so, please describe them.
Regional and School District Interaction• Is the OSY program mostly a part of the regional office, or more a
part of the districts? • Who do you work with in the school districts?• Do you interact with other regions?


109
Appendix E
Chapter 5 Detailed Model Results
Table E.1 provides coefficient estimates from logistic regressions for attendance at an institution that (1) grants high school diplomas but no other degrees, (2) grants high school diplomas or GEDs but no other certification, or (3) grants both and provides some other instruction or service.
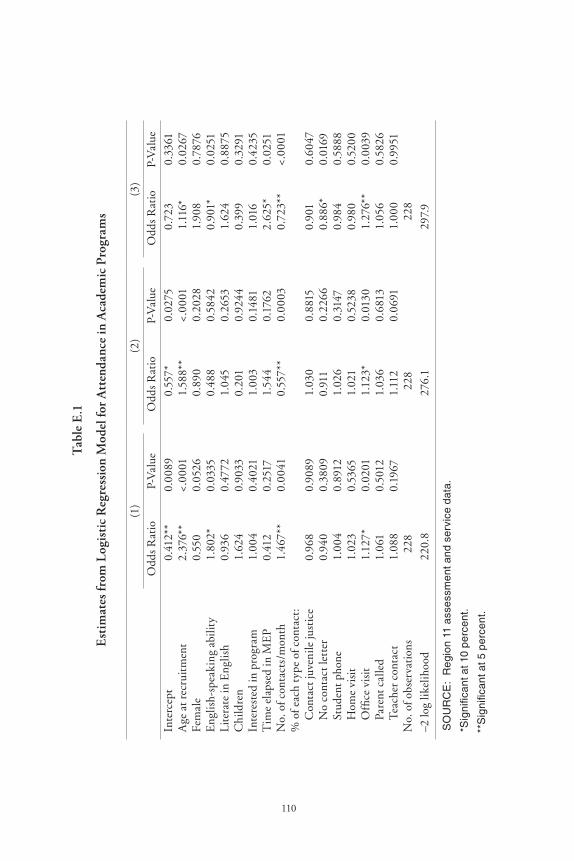
110
Tab
le E
.1
Est
imat
es fr
om L
ogis
tic
Reg
ress
ion
Mod
el fo
r A
tten
danc
e in
Aca
dem
ic P
rogr
ams
(1)
(2)
(3)
Odd
s R
atio
P-V
alue
Odd
s R
atio
P-V
alue
Odd
s R
atio
P-V
alue
Inte
rcep
t 0.
412*
*0.
0089
0.55
7*0.
0275
0.72
30.
3361
Age
at r
ecru
itm
ent
2.37
6**
<.00
011.
588*
*<.
0001
1.11
6*0.
0267
Fem
ale
0.55
00.
0526
0.89
00.
2028
1.90
80.
7876
Eng
lish-
spea
king
abi
lity
1.80
2*0.
0335
0.48
80.
5842
0.90
1*0.
0251
Lite
rate
in E
nglis
h0.
936
0.47
721.
045
0.26
531.
624
0.88
75C
hild
ren
1.62
40.
9033
0.20
10.
9244
0.39
90.
3291
Inte
rest
ed in
pro
gram
1.00
40.
4021
1.00
30.
1481
1.01
60.
4235
Tim
e el
apse
d in
ME
P0.
412
0.25
171.
544
0.17
622.
625*
0.02
51N
o. o
f con
tact
s/m
onth
1.46
7**
0.00
410.
557*
*0.
0003
0.72
3**
<.00
01%
of e
ach
type
of c
onta
ct:
C
onta
ct ju
veni
le ju
stic
e0.
968
0.90
891.
030
0.88
150.
901
0.60
47
No
cont
act l
ette
r0.
940
0.38
090.
911
0.22
660.
886*
0.01
69
Stu
dent
pho
ne1.
004
0.89
121.
026
0.31
470.
984
0.58
88
Hom
e vi
sit
1.02
30.
5365
1.02
10.
5238
0.98
00.
5200
O
ffice
vis
it1.
127*
0.02
011.
123*
0.01
301.
276*
*0.
0039
P
aren
t cal
led
1.06
10.
5012
1.03
60.
6813
1.05
60.
5826
T
each
er c
onta
ct1.
088
0.19
671.
112
0.06
911.
000
0.99
51N
o. o
f obs
erva
tion
s22
8
228
2
28
–2 lo
g lik
elih
ood
220
.8
2
76.1
297
.9
SO
UR
CE
: R
egio
n 11
ass
essm
ent a
nd s
ervi
ce d
ata.
*Sig
nific
ant a
t 10
perc
ent.
**S
igni
fican
t at 5
per
cent
.
111
References
Carnevale, Anthony P., Richard A. Fry, and B. Lindsay Lowell, “Understanding, Speaking, Reading, Writing, and Earnings in the Immigrant Labor Market,” AEA Papers and Proceedings, Vol. 91, No. 2, 2001.
Ehlers, Rachel, Improving Services for Migrant Students, California Legislative Analyst’s Office, Sacramento, California, February 2006.
Fix, Michael, and Wendy Zimmermann, “All Under One Roof: Mixed Status Families in an Era of Reform,” International Migration Review, Vol. 35, No. 2, 2001.
Gabbard, Susan, Edward Kissam, Philip L. Martin, “The Impact of Migrant Travel Patterns on the Undercount of Hispanic Farm Workers,” Research Conference on Undercounted Ethnic Populations, Proceedings, Bureau of the Census, Richmond, Virginia, 1993.
Gonzalez, Arturo, California’s Commitment to Adult English Learners: Caught Between Funding and Need, Public Policy Institute of California, San Francisco, California, 2007.
Gonzalez, Arturo, “The Acquisition and Labor Market Value of Four English Skills: New Evidence from NALS,” Contemporary Economic Policy, Vol. 18, No. 3, 2000.
Hill, Laura E., The Socioeconomic Well-Being of California’s Immigrant Youth, Public Policy Institute of California, San Francisco, California, 2004.
Johnson, Hans P., “Maternity Before Maturity: Teen Birth Rates in California, California Counts, Vol. 4, No. 3, Public Policy Institute of California, San Francisco, California, February 2003.
Kotlowitz, Alex, “The Smugglers’ Due,” The New York Times Magazine, June 11, 2006.
Nazario, Sonia, Enrique’s Journey: The Story of a Boy’s Dangerous Odyssey to Reunite with His Mother, Random House, New York, 2006.
Neumark, David, “California’s Economic Future and Infrastructure Challenges,” in Ellen Hanak and Mark Baldassare, eds., California 2025: Taking on the Future, Public Policy Institute of California, San Francisco, California, 2005, pp. 51–82.
112
Portes, Alejandro, and Rubén G. Rumbaut, Legacies: The Story of the Immigrant Second Generation, The University of California Press, Berkeley, California, 2001.
Reed, Deborah, Laura E. Hill, Christopher Jepsen, and Hans P. Johnson, Educational Progress Across Immigrant Generations in California, Public Policy Institute of California, San Francisco, California, 2005.
Santibañez, Lucrecia, Georges Vernez, and Paula Razquin, Education in Mexico: Challenges and Opportunities, the RAND Corporation, Santa Monica, California, 2005.
U.S. Census Bureau, Census 2000, Public Use Microdata Sample (PUMS), United States, 2003.
U.S. Department of Education, No Child Left Behind. Title I, Part C. Education of Migratory Children. Draft Non-Regulatory Guidance, 2003, available at www.ed.gov/programs/mep/mepguidance2003.doc.
U.S. Government Accountability Office, Decennial Census: Lessons Learned for Locating and Counting Migrant and Seasonal Farm Workers, Washington, D.C., 2003.
113
About the Authors
LAURA E. HILL
Laura E. Hill is a research fellow at the Public Policy Institute of California, where she researches immigrants, immigration, race and ethnicity, and youth. Before joining PPIC, she was a research associate at The SPHERE Institute and a National Institute of Aging postdoctoral fellow. She has a Ph.D. in demography from the University of California, Berkeley.
JOSEPH M. HAYES
Joseph M. Hayes, a research associate at the Public Policy Institute of California, studies migration and population change throughout the state. Previous projects have focused on movements of people into and out of the Central Valley and the Inland Empire, and on the families of newly arrived immigrants to California. A recent publication profiles the state’s prison population. He holds an M.S. in agricultural economics from the University of Wisconsin, Madison.

115
Related PPIC Publications
California’s Commitment to Adult English Learners: Caught Between Funding and Need (2007) Arturo Gonzalez
Educational Progress Across Immigrant Generations in California (2005) Deborah Reed, Laura E. Hill, Christopher Jepsen, Hans P. Johnson
English Learners in California Schools (2005) Christopher Jepsen, Shelley de Alth
The Socioeconomic Well-Being of California’s Immigrant Youth (2004) Laura E. Hill
PPIC publications may be ordered by phone or from our website (800) 232-5343 (mainland U.S.)
(415) 291-4400 (outside mainland U.S.) www.ppic.org