Embed Size (px)
Citation preview
OUTCOMEBUDGET2017-18
DELHI
Ushering Transparency and
Accountability in Public Spending
INDEX
309
311
317
319
326
332
335
337
338
339
340
343
345
349
350
MANISH SISODIA
I
euh"k fllksfn;k
mi eq[;ea=h] fnYyh ljdkj
ubZ fnYyh
ekpZ 30] 2017II
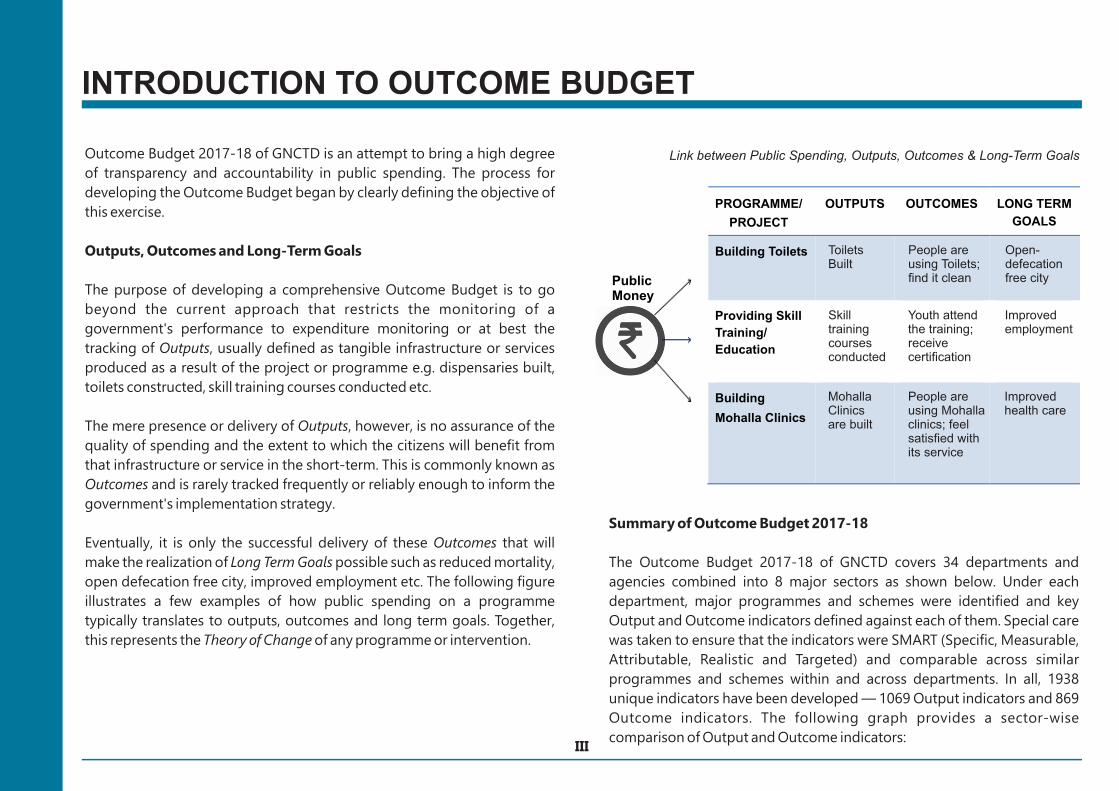
INTRODUCTION TO OUTCOME BUDGET
III
Link between Public Spending, Outputs, Outcomes & Long-Term Goals
PROGRAMME/
PROJECT
OUTPUTS OUTCOMES LONG TERM
GOALS
Building Toilets
Providing Skill
Training/
Education
Building
Mohalla Clinics
Toilets Built
Open-defecation free city
Skill training courses conducted
Improved employment
Mohalla Clinics are built
Improved health care
PublicMoney
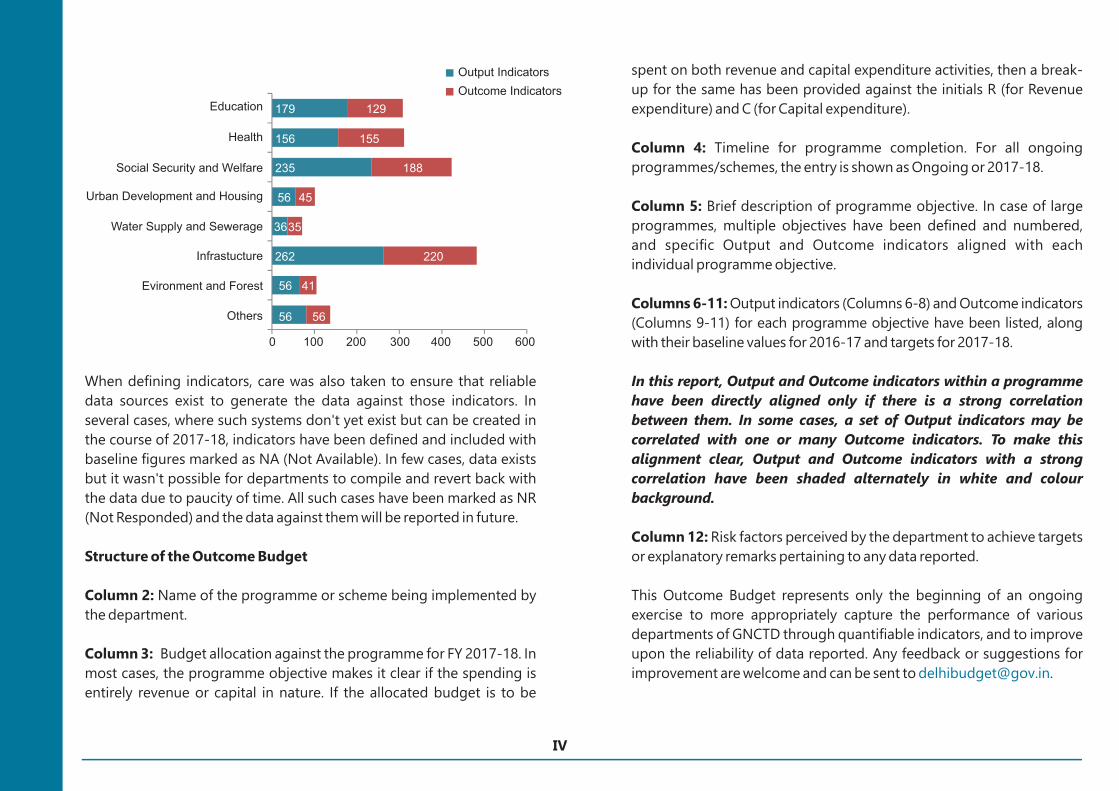
179 129
155
188
156
235
56 45
3635
262 220
56
56 56
41
0 100 200 300 400 500 600
Education
Health
Social Security and Welfare
Urban Development and Housing
Water Supply and Sewerage
Infrastucture
Evironment and Forest
Others
Output Indicators
Outcome Indicators
IV
EDUCATIONEDUCATIO
N

EDUCATIO
N
EDUCATION
Indicator Baseline
2016-17
Target
2017-18Indicator
Baseline
2016-17
Target
2017-18
1 2 3 4 5 6 7 8 9 10 11 12
Total number of schools
under Directorate of
Education (DoE) offering
Nursery / KG classes
400 550
Total seats available for
Nursery / KG classes in DoE
schools
30,200 36,440
Total posts for nursery
teachers sanctioned
499 1,350
PTR in nursery classes NA 20:1
Totals posts for Aayas
sanctioned
304 956
% of sanctioned posts for
Aayas that are filled
24% 100%
Average attendance of
students enrolled in Nursery /
KG classes
NA 60%
Retention Rate
(% of students continuing
their studies in next class)
NA NA
Number of Out of School
children newly enrolled at
STCs
8,100 NA
Number of children
mainstreamed to schools
5,000 NA
DIRECTORATE OF EDUCATION
100%
a) Universalisation of
Elementary Education
Number of Special Training
Centres (STCs) set up for
mainstreaming of Out of
School children
To provide integrated
educational facility to
the children from
Nursery to Class XII
and provide quality
early childhood
education
2
1. Nursery/Prep class
rooms to be
upgraded through
PWD. Speed of
implementation of
classrooms by PWD
will be a risk factor.
2. Availability of
infrastructure
3. The entire IT
attendance system
for students will have
to be redesigned. It
will be major project
and will take at least
06 months to
implement. Thus
attendance for 2017-
18 may be available
for only 06 months.
Sarva Shiksha
Abhiyan (CSS)
1. Delay in receipt of
funds from MHRD
18950Introduction of
primary classes in
the existing
government
schools
April -
September
2017
2017-18Rev-12000
Cap-3000
80%
214
% of seats filled in nursery
classes
300
71%
% of sanctioned posts for
nursery teachers that are
filled
OUTPUTS
Pupil Teacher Ratio (PTR) in
KG classes
40:1 20:1
OUTCOMESRisk Factors /
Remarks
Sr.
No
Name of the
Scheme
/ Programme
Budget
Allocation
(Rs. Lakhs)
Timelines Objectives
1
NA
Directorate of Education 1NA : Not Available
NR : Not Responded
EDUCATION
Indicator Baseline
2016-17
Target
2017-18Indicator
Baseline
2016-17
Target
2017-18
1 2 3 4 5 6 7 8 9 10 11 12
OUTPUTS OUTCOMESRisk Factors /
Remarks
Sr.
No
Name of the
Scheme
/ Programme
Budget
Allocation
(Rs. Lakhs)
Timelines Objectives
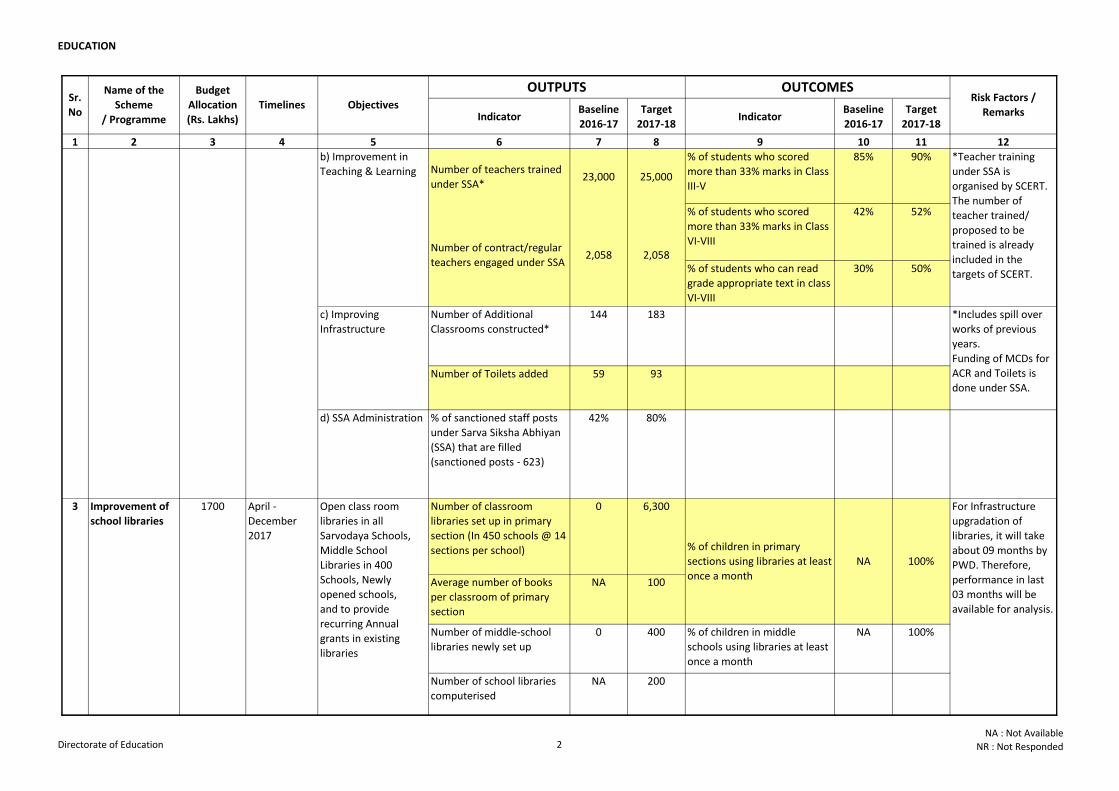
Number of teachers trained
under SSA*23,000 25,000
% of students who scored
more than 33% marks in Class
III-V
85% 90%
% of students who scored
more than 33% marks in Class
VI-VIII
42% 52%
% of students who can read
grade appropriate text in class
VI-VIII
30% 50%
Number of Additional
Classrooms constructed*
144 183
Number of Toilets added 59 93
d) SSA Administration % of sanctioned staff posts
under Sarva Siksha Abhiyan
(SSA) that are filled
(sanctioned posts - 623)
42% 80%
Number of classroom
libraries set up in primary
section (In 450 schools @ 14
sections per school)
0 6,300
Average number of books
per classroom of primary
section
NA 100
Number of middle-school
libraries newly set up
0 400 % of children in middle
schools using libraries at least
once a month
NA 100%
Number of school libraries
computerised
NA 200
1700
2,058
b) Improvement in
Teaching & Learning
2 Sarva Shiksha
Abhiyan (CSS)
2017-18
Number of contract/regular
teachers engaged under SSA
Rev-12000
Cap-3000
c) Improving
Infrastructure
Open class room
libraries in all
Sarvodaya Schools,
Middle School
Libraries in 400
Schools, Newly
opened schools,
and to provide
recurring Annual
grants in existing
libraries
100%
3 Improvement of
school libraries
April -
December
2017
2,058
For Infrastructure
upgradation of
libraries, it will take
about 09 months by
PWD. Therefore,
performance in last
03 months will be
available for analysis.
% of children in primary
sections using libraries at least
once a month
NA
*Includes spill over
works of previous
years.
Funding of MCDs for
ACR and Toilets is
done under SSA.
*Teacher training
under SSA is
organised by SCERT.
The number of
teacher trained/
proposed to be
trained is already
included in the
targets of SCERT.
Directorate of Education 2NA : Not Available
NR : Not Responded
EDUCATION
Indicator Baseline
2016-17
Target
2017-18Indicator
Baseline
2016-17
Target
2017-18
1 2 3 4 5 6 7 8 9 10 11 12
OUTPUTS OUTCOMESRisk Factors /
Remarks
Sr.
No
Name of the
Scheme
/ Programme
Budget
Allocation
(Rs. Lakhs)
Timelines Objectives
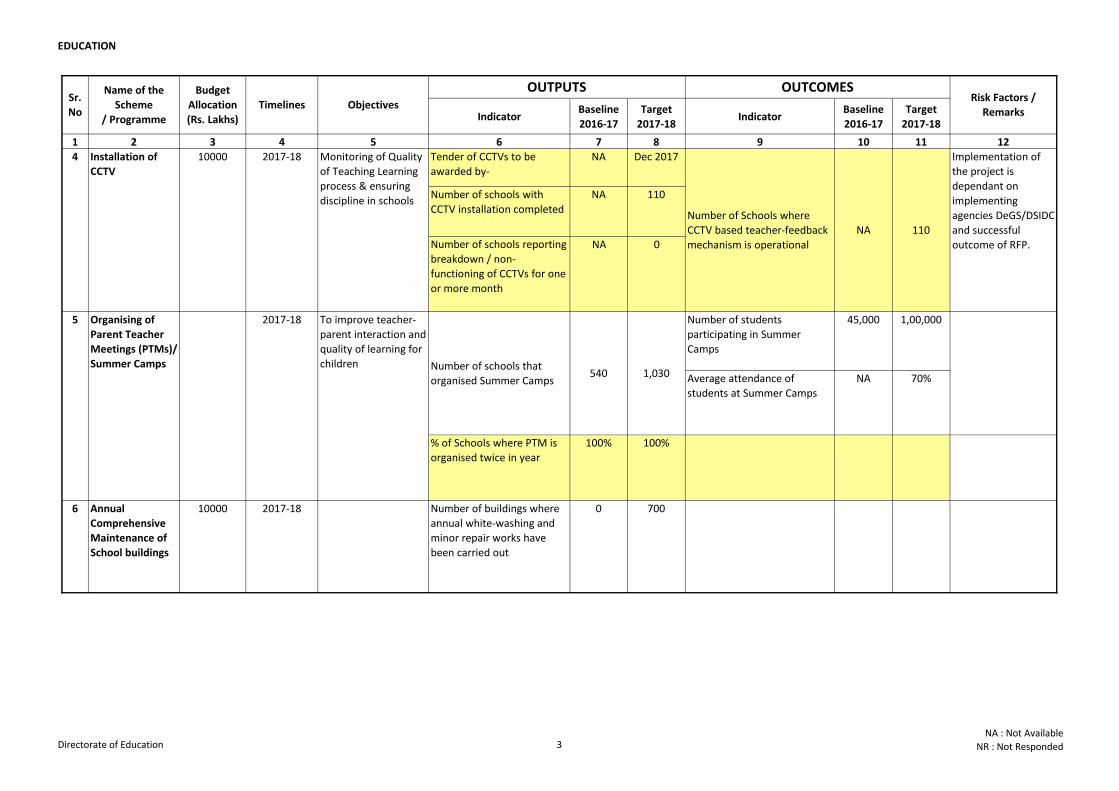
Tender of CCTVs to be
awarded by-
NA Dec 2017
Number of schools with
CCTV installation completed
NA 110
Number of schools reporting
breakdown / non-
functioning of CCTVs for one
or more month
NA 0
Number of students
participating in Summer
Camps
45,000 1,00,000
Average attendance of
students at Summer Camps
NA 70%
% of Schools where PTM is
organised twice in year
100% 100%
6 Annual
Comprehensive
Maintenance of
School buildings
10000 2017-18 Number of buildings where
annual white-washing and
minor repair works have
been carried out
0 700
2017-18
5 Organising of
Parent Teacher
Meetings (PTMs)/
Summer Camps Number of schools that
organised Summer Camps
2017-18
4 Installation of
CCTV
10000 Monitoring of Quality
of Teaching Learning
process & ensuring
discipline in schools
540 1,030
To improve teacher-
parent interaction and
quality of learning for
children
Implementation of
the project is
dependant on
implementing
agencies DeGS/DSIDC
and successful
outcome of RFP.
Number of Schools where
CCTV based teacher-feedback
mechanism is operational
NA 110
Directorate of Education 3NA : Not Available
NR : Not Responded
EDUCATION
Indicator Baseline
2016-17
Target
2017-18Indicator
Baseline
2016-17
Target
2017-18
1 2 3 4 5 6 7 8 9 10 11 12
OUTPUTS OUTCOMESRisk Factors /
Remarks
Sr.
No
Name of the
Scheme
/ Programme
Budget
Allocation
(Rs. Lakhs)
Timelines Objectives
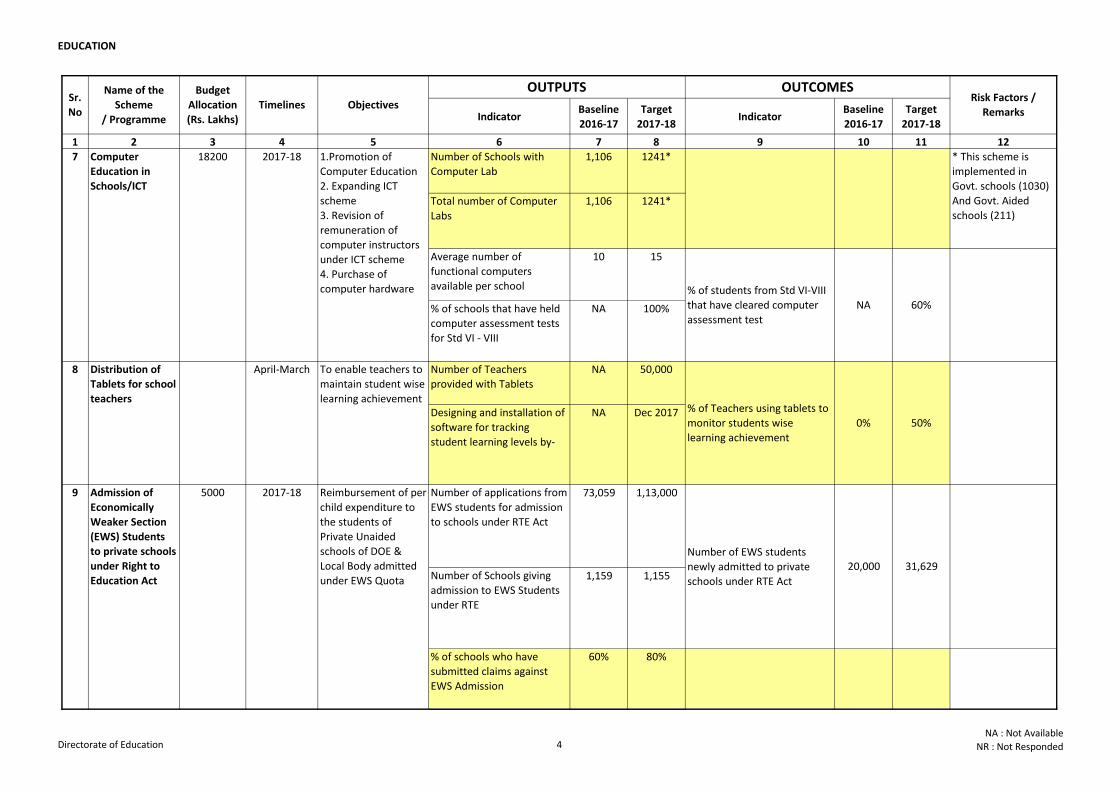
Number of Schools with
Computer Lab
1,106 1241*
Total number of Computer
Labs
1,106 1241*
Average number of
functional computers
available per school
10 15
% of schools that have held
computer assessment tests
for Std VI - VIII
NA 100%
Number of Teachers
provided with Tablets
NA 50,000
Designing and installation of
software for tracking
student learning levels by-
NA Dec 2017
Number of applications from
EWS students for admission
to schools under RTE Act
73,059 1,13,000
Number of Schools giving
admission to EWS Students
under RTE
1,159 1,155
% of schools who have
submitted claims against
EWS Admission
60% 80%
31,629
To enable teachers to
maintain student wise
learning achievement
1.Promotion of
Computer Education
2. Expanding ICT
scheme
3. Revision of
remuneration of
computer instructors
under ICT scheme
4. Purchase of
computer hardware
Reimbursement of per
child expenditure to
the students of
Private Unaided
schools of DOE &
Local Body admitted
under EWS Quota
Number of EWS students
newly admitted to private
schools under RTE Act
20,000
% of Teachers using tablets to
monitor students wise
learning achievement
0% 50%
NA 60%
% of students from Std VI-VIII
that have cleared computer
assessment test
2017-187 18200Computer
Education in
Schools/ICT
5000
Distribution of
Tablets for school
teachers
Admission of
Economically
Weaker Section
(EWS) Students
to private schools
under Right to
Education Act
8
9
April-March
2017-18
* This scheme is
implemented in
Govt. schools (1030)
And Govt. Aided
schools (211)
Directorate of Education 4NA : Not Available
NR : Not Responded
EDUCATION
Indicator Baseline
2016-17
Target
2017-18Indicator
Baseline
2016-17
Target
2017-18
1 2 3 4 5 6 7 8 9 10 11 12
OUTPUTS OUTCOMESRisk Factors /
Remarks
Sr.
No
Name of the
Scheme
/ Programme
Budget
Allocation
(Rs. Lakhs)
Timelines Objectives
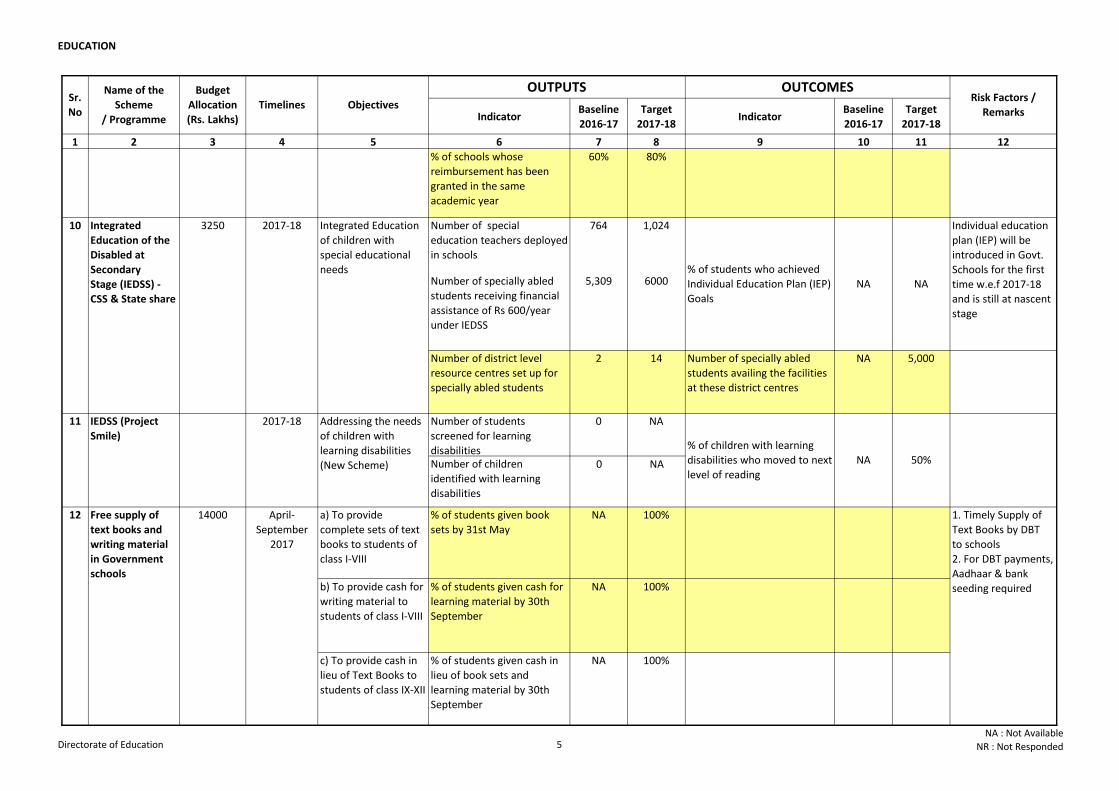
% of schools whose
reimbursement has been
granted in the same
academic year
60% 80%
Number of special
education teachers deployed
in schools
764 1,024
Number of specially abled
students receiving financial
assistance of Rs 600/year
under IEDSS
5,309 6000
Number of district level
resource centres set up for
specially abled students
2 14 Number of specially abled
students availing the facilities
at these district centres
NA 5,000
Number of students
screened for learning
disabilities
0 NA
Number of children
identified with learning
disabilities
0 NA
a) To provide
complete sets of text
books to students of
class I-VIII
% of students given book
sets by 31st May
NA 100%
b) To provide cash for
writing material to
students of class I-VIII
% of students given cash for
learning material by 30th
September
NA 100%
c) To provide cash in
lieu of Text Books to
students of class IX-XII
% of students given cash in
lieu of book sets and
learning material by 30th
September
NA 100%
% of students who achieved
Individual Education Plan (IEP)
Goals
NA NA
Individual education
plan (IEP) will be
introduced in Govt.
Schools for the first
time w.e.f 2017-18
and is still at nascent
stage
1. Timely Supply of
Text Books by DBT
to schools
2. For DBT payments,
Aadhaar & bank
seeding required
50%
Addressing the needs
of children with
learning disabilities
(New Scheme)
Reimbursement of per
child expenditure to
the students of
Private Unaided
schools of DOE &
Local Body admitted
under EWS Quota
Integrated Education
of children with
special educational
needs
NA
% of children with learning
disabilities who moved to next
level of reading
10
5000
Integrated
Education of the
Disabled at
Secondary
Stage (IEDSS) -
CSS & State share
3250
Admission of
Economically
Weaker Section
(EWS) Students
to private schools
under Right to
Education Act
9
2017-18
12 14000
2017-18
2017-18
IEDSS (Project
Smile)
11
Free supply of
text books and
writing material
in Government
schools
April-
September
2017
Directorate of Education 5NA : Not Available
NR : Not Responded
EDUCATION
Indicator Baseline
2016-17
Target
2017-18Indicator
Baseline
2016-17
Target
2017-18
1 2 3 4 5 6 7 8 9 10 11 12
OUTPUTS OUTCOMESRisk Factors /
Remarks
Sr.
No
Name of the
Scheme
/ Programme
Budget
Allocation
(Rs. Lakhs)
Timelines Objectives
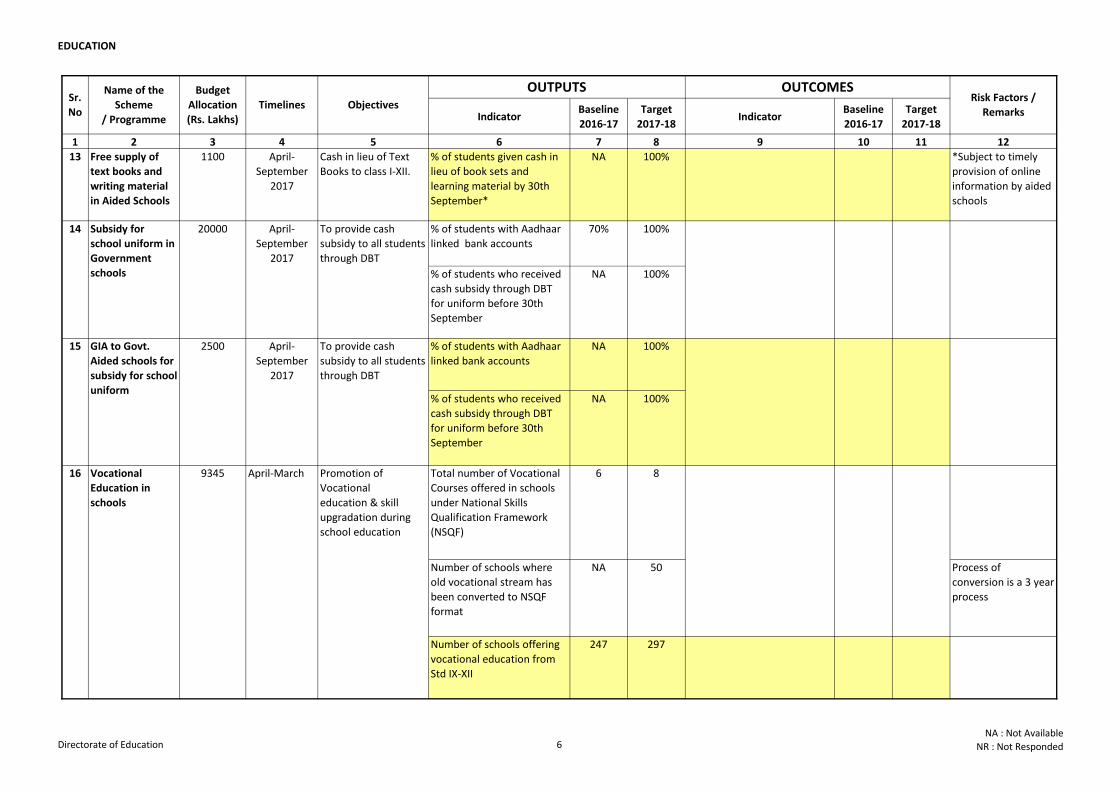
13 Free supply of
text books and
writing material
in Aided Schools
1100 April-
September
2017
Cash in lieu of Text
Books to class I-XII.
% of students given cash in
lieu of book sets and
learning material by 30th
September*
NA 100% *Subject to timely
provision of online
information by aided
schools
% of students with Aadhaar
linked bank accounts
70% 100%
% of students who received
cash subsidy through DBT
for uniform before 30th
September
NA 100%
% of students with Aadhaar
linked bank accounts
NA 100%
% of students who received
cash subsidy through DBT
for uniform before 30th
September
NA 100%
Total number of Vocational
Courses offered in schools
under National Skills
Qualification Framework
(NSQF)
6 8
Number of schools where
old vocational stream has
been converted to NSQF
format
NA 50 Process of
conversion is a 3 year
process
Number of schools offering
vocational education from
Std IX-XII
247 297
Promotion of
Vocational
education & skill
upgradation during
school education
To provide cash
subsidy to all students
through DBT
To provide cash
subsidy to all students
through DBT
14
15 April-
September
2017
Subsidy for
school uniform in
Government
schools
20000 April-
September
2017
GIA to Govt.
Aided schools for
subsidy for school
uniform
2500
16 Vocational
Education in
schools
9345 April-March
Number of students enrolled
in Vocational Courses73,017 80,000
Directorate of Education 6NA : Not Available
NR : Not Responded
EDUCATION
Indicator Baseline
2016-17
Target
2017-18Indicator
Baseline
2016-17
Target
2017-18
1 2 3 4 5 6 7 8 9 10 11 12
OUTPUTS OUTCOMESRisk Factors /
Remarks
Sr.
No
Name of the
Scheme
/ Programme
Budget
Allocation
(Rs. Lakhs)
Timelines Objectives
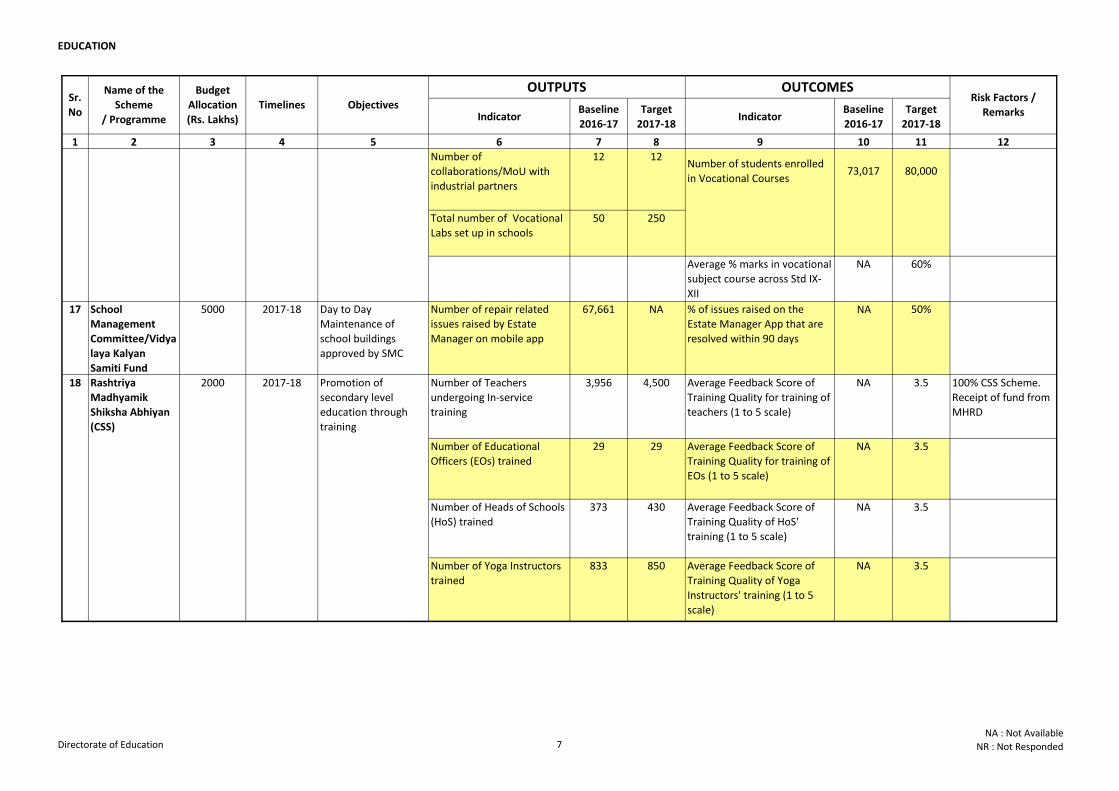
Number of
collaborations/MoU with
industrial partners
12 12
Total number of Vocational
Labs set up in schools
50 250
Average % marks in vocational
subject course across Std IX-
XII
NA 60%
17 School
Management
Committee/Vidya
laya Kalyan
Samiti Fund
5000 2017-18 Day to Day
Maintenance of
school buildings
approved by SMC
Number of repair related
issues raised by Estate
Manager on mobile app
67,661 NA % of issues raised on the
Estate Manager App that are
resolved within 90 days
NA 50%
Number of Teachers
undergoing In-service
training
3,956 4,500 Average Feedback Score of
Training Quality for training of
teachers (1 to 5 scale)
NA 3.5 100% CSS Scheme.
Receipt of fund from
MHRD
Number of Educational
Officers (EOs) trained
29 29 Average Feedback Score of
Training Quality for training of
EOs (1 to 5 scale)
NA 3.5
Number of Heads of Schools
(HoS) trained
373 430 Average Feedback Score of
Training Quality of HoS'
training (1 to 5 scale)
NA 3.5
Number of Yoga Instructors
trained
833 850 Average Feedback Score of
Training Quality of Yoga
Instructors' training (1 to 5
scale)
NA 3.5
Promotion of
Vocational
education & skill
upgradation during
school education
Promotion of
secondary level
education through
training
18 Rashtriya
Madhyamik
Shiksha Abhiyan
(CSS)
2000
16 Vocational
Education in
schools
9345 April-March
2017-18
Number of students enrolled
in Vocational Courses73,017 80,000
Directorate of Education 7NA : Not Available
NR : Not Responded
EDUCATION
Indicator Baseline
2016-17
Target
2017-18Indicator
Baseline
2016-17
Target
2017-18
1 2 3 4 5 6 7 8 9 10 11 12
OUTPUTS OUTCOMESRisk Factors /
Remarks
Sr.
No
Name of the
Scheme
/ Programme
Budget
Allocation
(Rs. Lakhs)
Timelines Objectives
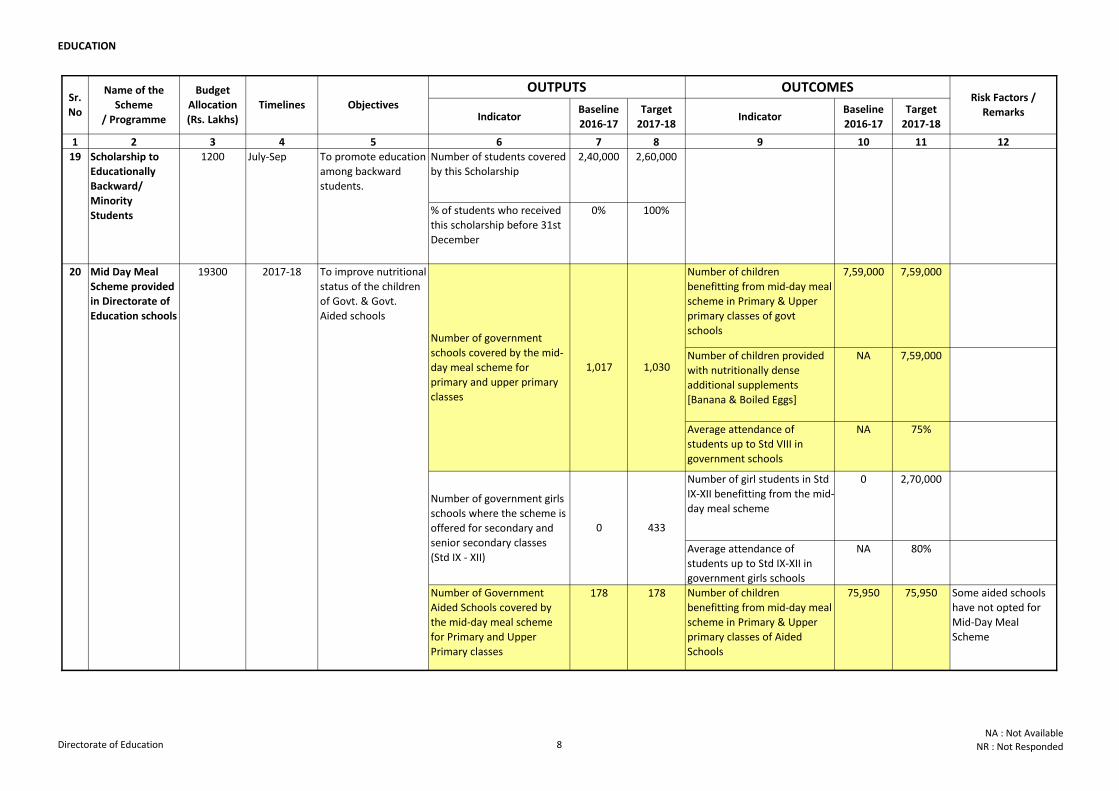
Number of students covered
by this Scholarship
2,40,000 2,60,000
% of students who received
this scholarship before 31st
December
0% 100%
Number of children
benefitting from mid-day meal
scheme in Primary & Upper
primary classes of govt
schools
7,59,000 7,59,000
Number of children provided
with nutritionally dense
additional supplements
[Banana & Boiled Eggs]
NA 7,59,000
Average attendance of
students up to Std VIII in
government schools
NA 75%
Number of girl students in Std
IX-XII benefitting from the mid-
day meal scheme
0 2,70,000
Average attendance of
students up to Std IX-XII in
government girls schools
NA 80%
Number of Government
Aided Schools covered by
the mid-day meal scheme
for Primary and Upper
Primary classes
178 178 Number of children
benefitting from mid-day meal
scheme in Primary & Upper
primary classes of Aided
Schools
75,950 75,950 Some aided schools
have not opted for
Mid-Day Meal
Scheme
July-Sep
1,030
19
To improve nutritional
status of the children
of Govt. & Govt.
Aided schools
Number of government girls
schools where the scheme is
offered for secondary and
senior secondary classes
(Std IX - XII)
0 433
Number of government
schools covered by the mid-
day meal scheme for
primary and upper primary
classes
1,017
20 Mid Day Meal
Scheme provided
in Directorate of
Education schools
19300 2017-18
Scholarship to
Educationally
Backward/
Minority
Students
1200 To promote education
among backward
students.
Directorate of Education 8NA : Not Available
NR : Not Responded
EDUCATION
Indicator Baseline
2016-17
Target
2017-18Indicator
Baseline
2016-17
Target
2017-18
1 2 3 4 5 6 7 8 9 10 11 12
OUTPUTS OUTCOMESRisk Factors /
Remarks
Sr.
No
Name of the
Scheme
/ Programme
Budget
Allocation
(Rs. Lakhs)
Timelines Objectives
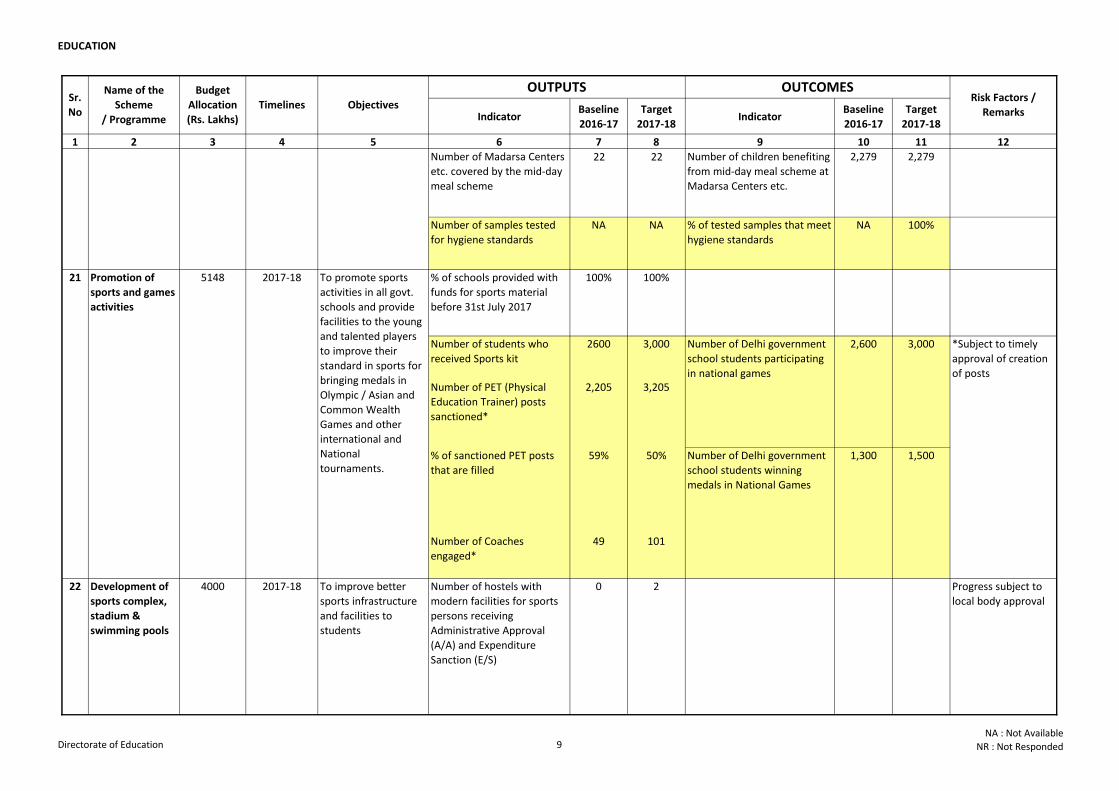
Number of Madarsa Centers
etc. covered by the mid-day
meal scheme
22 22 Number of children benefiting
from mid-day meal scheme at
Madarsa Centers etc.
2,279 2,279
Number of samples tested
for hygiene standards
NA NA % of tested samples that meet
hygiene standards
NA 100%
% of schools provided with
funds for sports material
before 31st July 2017
100% 100%
Number of students who
received Sports kit
2600 3,000
Number of PET (Physical
Education Trainer) posts
sanctioned*
2,205 3,205
% of sanctioned PET posts
that are filled
59% 50%
Number of Coaches
engaged*
49 101
Number of hostels with
modern facilities for sports
persons receiving
Administrative Approval
(A/A) and Expenditure
Sanction (E/S)
0 2 Progress subject to
local body approval
To promote sports
activities in all govt.
schools and provide
facilities to the young
and talented players
to improve their
standard in sports for
bringing medals in
Olympic / Asian and
Common Wealth
Games and other
international and
National
tournaments.
To improve nutritional
status of the children
of Govt. & Govt.
Aided schools
21 Promotion of
sports and games
activities
5148 2017-18
20 Mid Day Meal
Scheme provided
in Directorate of
Education schools
19300 2017-18
22 4000 2017-18 To improve better
sports infrastructure
and facilities to
students
Development of
sports complex,
stadium &
swimming pools
1,500
*Subject to timely
approval of creation
of posts
Number of Delhi government
school students participating
in national games
2,600 3,000
Number of Delhi government
school students winning
medals in National Games
1,300
Directorate of Education 9NA : Not Available
NR : Not Responded
EDUCATION
Indicator Baseline
2016-17
Target
2017-18Indicator
Baseline
2016-17
Target
2017-18
1 2 3 4 5 6 7 8 9 10 11 12
OUTPUTS OUTCOMESRisk Factors /
Remarks
Sr.
No
Name of the
Scheme
/ Programme
Budget
Allocation
(Rs. Lakhs)
Timelines Objectives
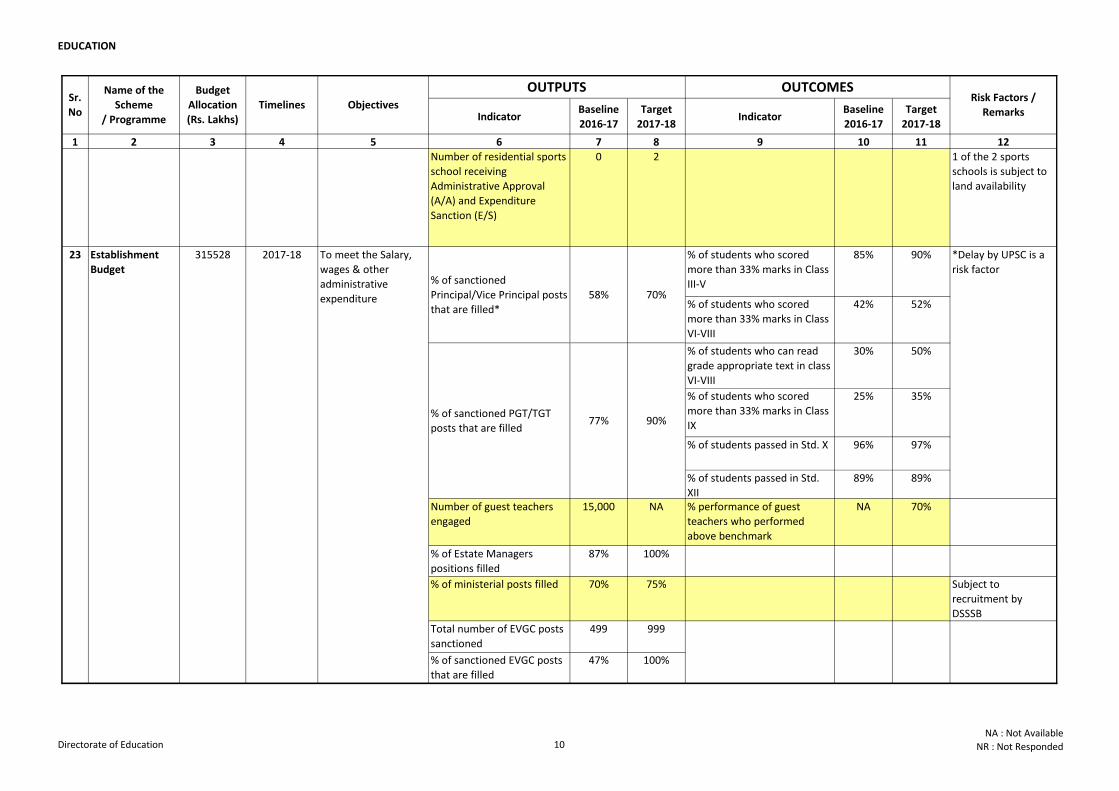
Number of residential sports
school receiving
Administrative Approval
(A/A) and Expenditure
Sanction (E/S)
0 2 1 of the 2 sports
schools is subject to
land availability
% of students who scored
more than 33% marks in Class
III-V
85% 90%
% of students who scored
more than 33% marks in Class
VI-VIII
42% 52%
% of students who can read
grade appropriate text in class
VI-VIII
30% 50%
% of students who scored
more than 33% marks in Class
IX
25% 35%
% of students passed in Std. X 96% 97%
% of students passed in Std.
XII
89% 89%
Number of guest teachers
engaged
15,000 NA % performance of guest
teachers who performed
above benchmark
NA 70%
% of Estate Managers
positions filled
87% 100%
% of ministerial posts filled 70% 75% Subject to
recruitment by
DSSSB
Total number of EVGC posts
sanctioned
499 999
% of sanctioned EVGC posts
that are filled
47% 100%
% of sanctioned
Principal/Vice Principal posts
that are filled*
58% 70%
% of sanctioned PGT/TGT
posts that are filled77% 90%
23 To meet the Salary,
wages & other
administrative
expenditure
22 4000 2017-18 To improve better
sports infrastructure
and facilities to
students
Development of
sports complex,
stadium &
swimming pools
2017-18315528Establishment
Budget
*Delay by UPSC is a
risk factor
Directorate of Education 10NA : Not Available
NR : Not Responded
EDUCATION
Indicator Baseline
2016-17
Target
2017-18Indicator
Baseline
2016-17
Target
2017-18
1 2 3 4 5 6 7 8 9 10 11 12
OUTPUTS OUTCOMESRisk Factors /
Remarks
Sr.
No
Name of the
Scheme
/ Programme
Budget
Allocation
(Rs. Lakhs)
Timelines Objectives
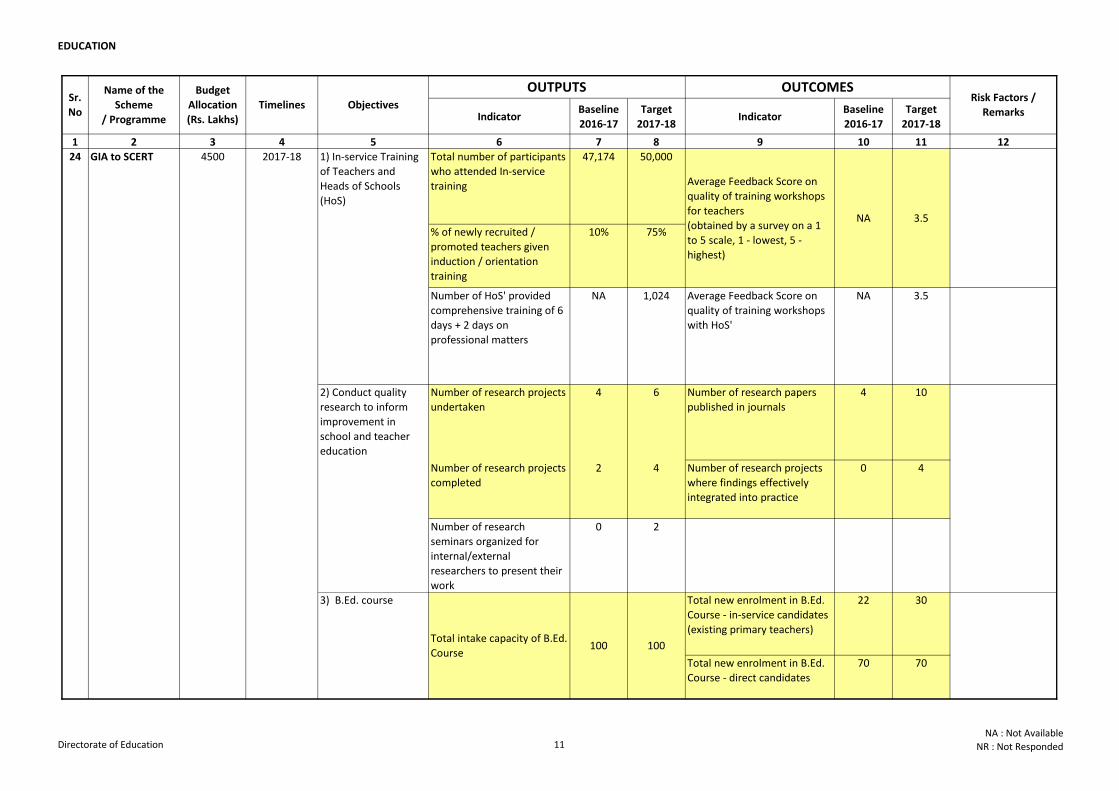
Total number of participants
who attended In-service
training
47,174 50,000
% of newly recruited /
promoted teachers given
induction / orientation
training
10% 75%
Number of HoS' provided
comprehensive training of 6
days + 2 days on
professional matters
NA 1,024 Average Feedback Score on
quality of training workshops
with HoS'
NA 3.5
Number of research projects
undertaken
4 6 Number of research papers
published in journals
4 10
Number of research projects
completed
2 4 Number of research projects
where findings effectively
integrated into practice
0 4
Number of research
seminars organized for
internal/external
researchers to present their
work
0 2
Total new enrolment in B.Ed.
Course - in-service candidates
(existing primary teachers)
22 30
Total new enrolment in B.Ed.
Course - direct candidates
70 70
1) In-service Training
of Teachers and
Heads of Schools
(HoS)
24 GIA to SCERT 4500 2017-18
2) Conduct quality
research to inform
improvement in
school and teacher
education
3) B.Ed. course
Total intake capacity of B.Ed.
Course100 100
NA 3.5
Average Feedback Score on
quality of training workshops
for teachers
(obtained by a survey on a 1
to 5 scale, 1 - lowest, 5 -
highest)
Directorate of Education 11NA : Not Available
NR : Not Responded
EDUCATION
Indicator Baseline
2016-17
Target
2017-18Indicator
Baseline
2016-17
Target
2017-18
1 2 3 4 5 6 7 8 9 10 11 12
OUTPUTS OUTCOMESRisk Factors /
Remarks
Sr.
No
Name of the
Scheme
/ Programme
Budget
Allocation
(Rs. Lakhs)
Timelines Objectives
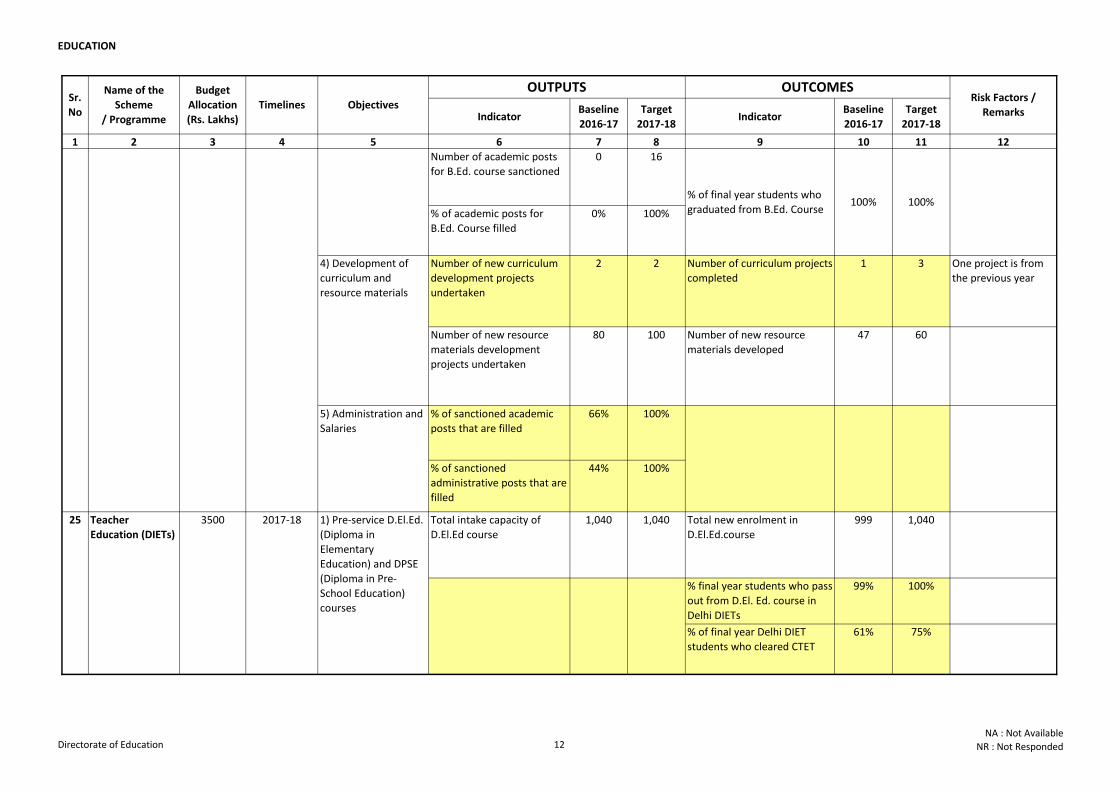
Number of academic posts
for B.Ed. course sanctioned
0 16
% of academic posts for
B.Ed. Course filled
0% 100%
Number of new curriculum
development projects
undertaken
2 2 Number of curriculum projects
completed
1 3 One project is from
the previous year
Number of new resource
materials development
projects undertaken
80 100 Number of new resource
materials developed
47 60
% of sanctioned academic
posts that are filled
66% 100%
% of sanctioned
administrative posts that are
filled
44% 100%
Total intake capacity of
D.El.Ed course
1,040 1,040 Total new enrolment in
D.El.Ed.course
999 1,040
% final year students who pass
out from D.El. Ed. course in
Delhi DIETs
99% 100%
% of final year Delhi DIET
students who cleared CTET
61% 75%
4) Development of
curriculum and
resource materials
5) Administration and
Salaries
25 Teacher
Education (DIETs)
3500 2017-18 1) Pre-service D.El.Ed.
(Diploma in
Elementary
Education) and DPSE
(Diploma in Pre-
School Education)
courses
24 GIA to SCERT 4500 2017-18
3) B.Ed. course
100%% of final year students who
graduated from B.Ed. Course100%
Directorate of Education 12NA : Not Available
NR : Not Responded
EDUCATION
Indicator Baseline
2016-17
Target
2017-18Indicator
Baseline
2016-17
Target
2017-18
1 2 3 4 5 6 7 8 9 10 11 12
OUTPUTS OUTCOMESRisk Factors /
Remarks
Sr.
No
Name of the
Scheme
/ Programme
Budget
Allocation
(Rs. Lakhs)
Timelines Objectives
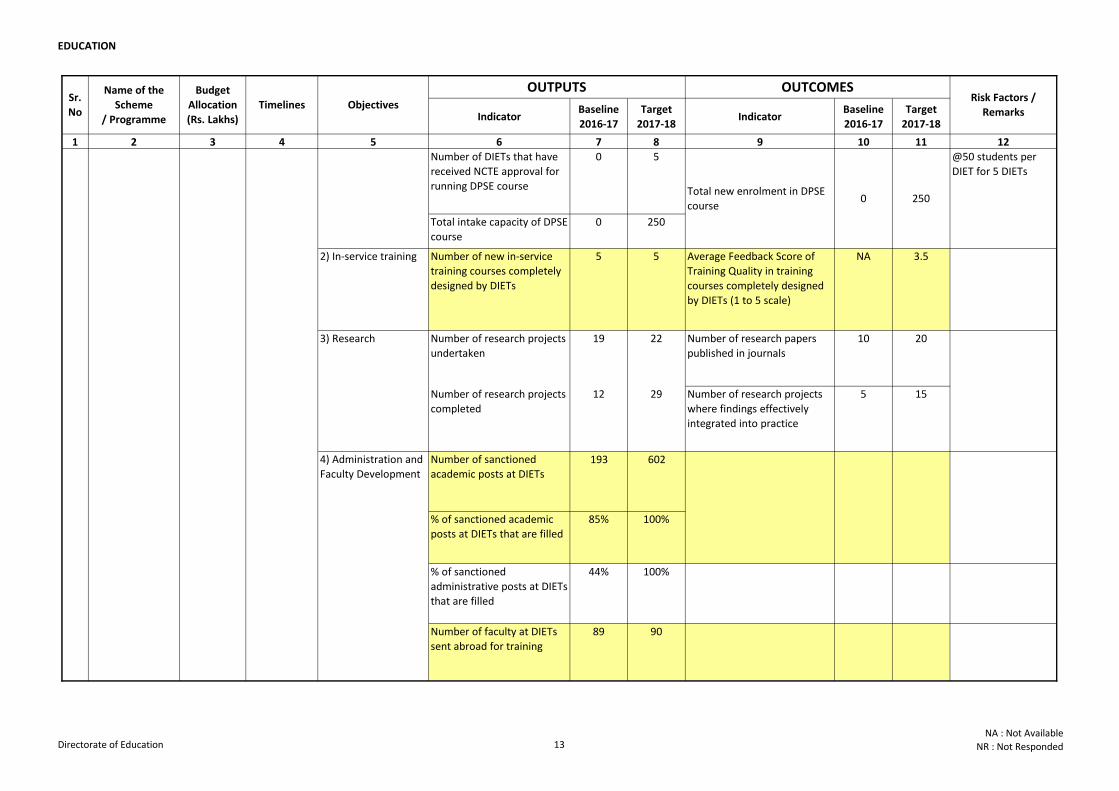
Number of DIETs that have
received NCTE approval for
running DPSE course
0 5
Total intake capacity of DPSE
course
0 250
2) In-service training Number of new in-service
training courses completely
designed by DIETs
5 5 Average Feedback Score of
Training Quality in training
courses completely designed
by DIETs (1 to 5 scale)
NA 3.5
Number of research projects
undertaken
19 22 Number of research papers
published in journals
10 20
Number of research projects
completed
12 29 Number of research projects
where findings effectively
integrated into practice
5 15
Number of sanctioned
academic posts at DIETs193 602
% of sanctioned academic
posts at DIETs that are filled
85% 100%
% of sanctioned
administrative posts at DIETs
that are filled
44% 100%
Number of faculty at DIETs
sent abroad for training
89 90
0 250
@50 students per
DIET for 5 DIETs
Total new enrolment in DPSE
course
3) Research
25 Teacher
Education (DIETs)
3500 2017-18 1) Pre-service D.El.Ed.
(Diploma in
Elementary
Education) and DPSE
(Diploma in Pre-
School Education)
courses
4) Administration and
Faculty Development
Directorate of Education 13NA : Not Available
NR : Not Responded
EDUCATION
Indicator Baseline
2016-17
Target
2017-18Indicator
Baseline
2016-17
Target
2017-18
1 2 3 4 5 6 7 8 9 10 11 12
OUTPUTS OUTCOMESRisk Factors /
Remarks
Sr.
No
Name of the
Scheme
/ Programme
Budget
Allocation
(Rs. Lakhs)
Timelines Objectives
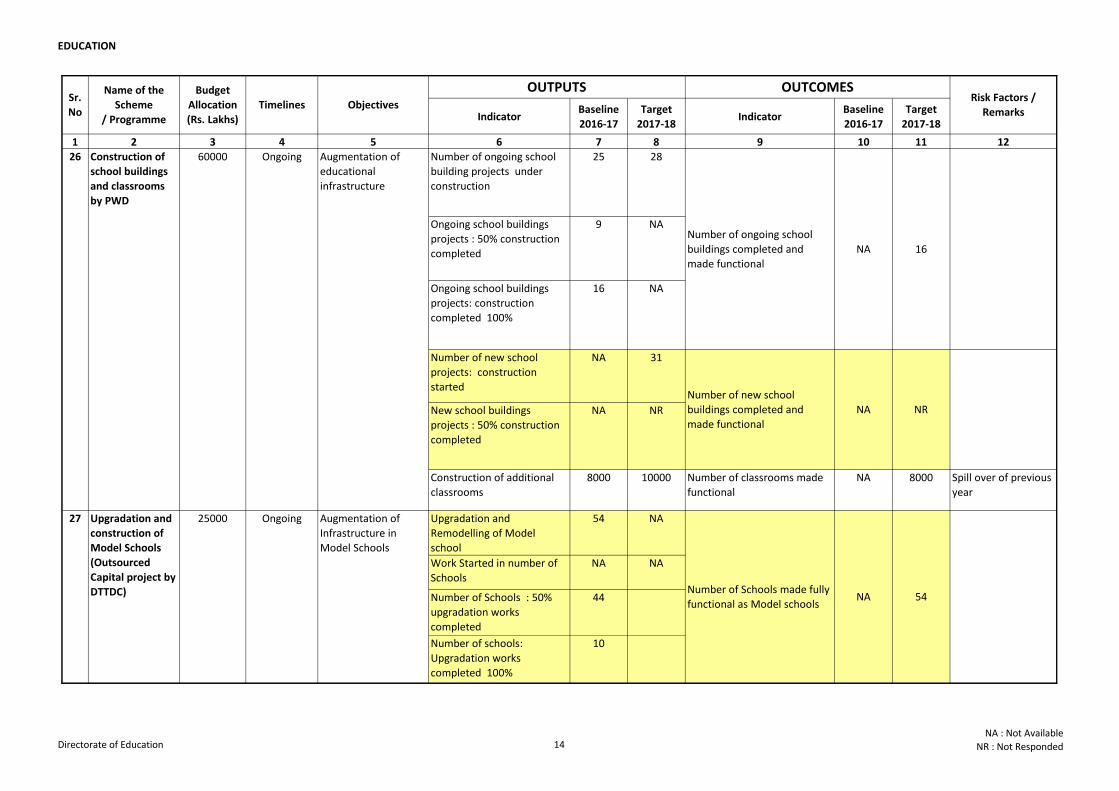
Number of ongoing school
building projects under
construction
25 28
Ongoing school buildings
projects : 50% construction
completed
9 NA
Ongoing school buildings
projects: construction
completed 100%
16 NA
Number of new school
projects: construction
started
NA 31
New school buildings
projects : 50% construction
completed
NA NR
Construction of additional
classrooms
8000 10000 Number of classrooms made
functional
NA 8000 Spill over of previous
year
Upgradation and
Remodelling of Model
school
54 NA
Work Started in number of
Schools
NA NA
Number of Schools : 50%
upgradation works
completed
44
Number of schools:
Upgradation works
completed 100%
10
27 Upgradation and
construction of
Model Schools
(Outsourced
Capital project by
DTTDC)
25000 Ongoing Augmentation of
Infrastructure in
Model Schools
60000 Augmentation of
educational
infrastructure
26 Construction of
school buildings
and classrooms
by PWD
Ongoing
Number of Schools made fully
functional as Model schools NA 54
NR
Number of ongoing school
buildings completed and
made functional
NA 16
Number of new school
buildings completed and
made functional
NA
Directorate of Education 14NA : Not Available
NR : Not Responded

EDUCATIO
N
EDUCATION
Indicator Baseline
2016-17
Target
2017-18Indicator
Baseline
2016-17
Target
2017-18
1 2 3 4 5 6 7 8 9 10 11 12
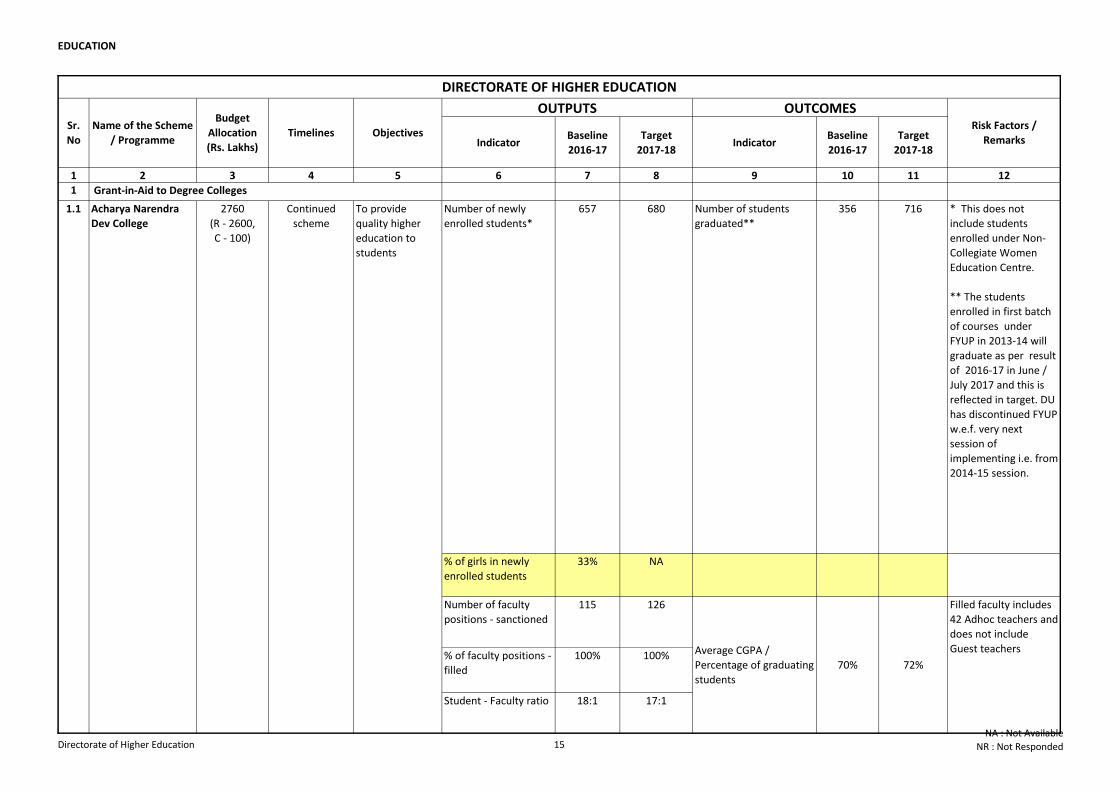
1 Grant-in-Aid to Degree Colleges
% of girls in newly
enrolled students
33% NA
Number of faculty
positions - sanctioned
115 126
% of faculty positions -
filled
100% 100%
Student - Faculty ratio 18:1 17:1
To provide
quality higher
education to
students
Number of newly
enrolled students*
657 680
Risk Factors /
Remarks
* This does not
include students
enrolled under Non-
Collegiate Women
Education Centre.
** The students
enrolled in first batch
of courses under
FYUP in 2013-14 will
graduate as per result
of 2016-17 in June /
July 2017 and this is
reflected in target. DU
has discontinued FYUP
w.e.f. very next
session of
implementing i.e. from
2014-15 session.
Number of students
graduated**
356 716
Filled faculty includes
42 Adhoc teachers and
does not include
Guest teachersAverage CGPA /
Percentage of graduating
students
70% 72%
Sr.
No
Name of the Scheme
/ Programme
Budget
Allocation
(Rs. Lakhs)
Timelines Objectives
OUTPUTS OUTCOMES
Continued
scheme
2760
(R - 2600,
C - 100)
Acharya Narendra
Dev College
1.1
DIRECTORATE OF HIGHER EDUCATION
Directorate of Higher Education 15NA : Not Available
NR : Not Responded
EDUCATION
Indicator Baseline
2016-17
Target
2017-18Indicator
Baseline
2016-17
Target
2017-18
1 2 3 4 5 6 7 8 9 10 11 12
Risk Factors /
Remarks
Sr.
No
Name of the Scheme
/ Programme
Budget
Allocation
(Rs. Lakhs)
Timelines Objectives
OUTPUTS OUTCOMES
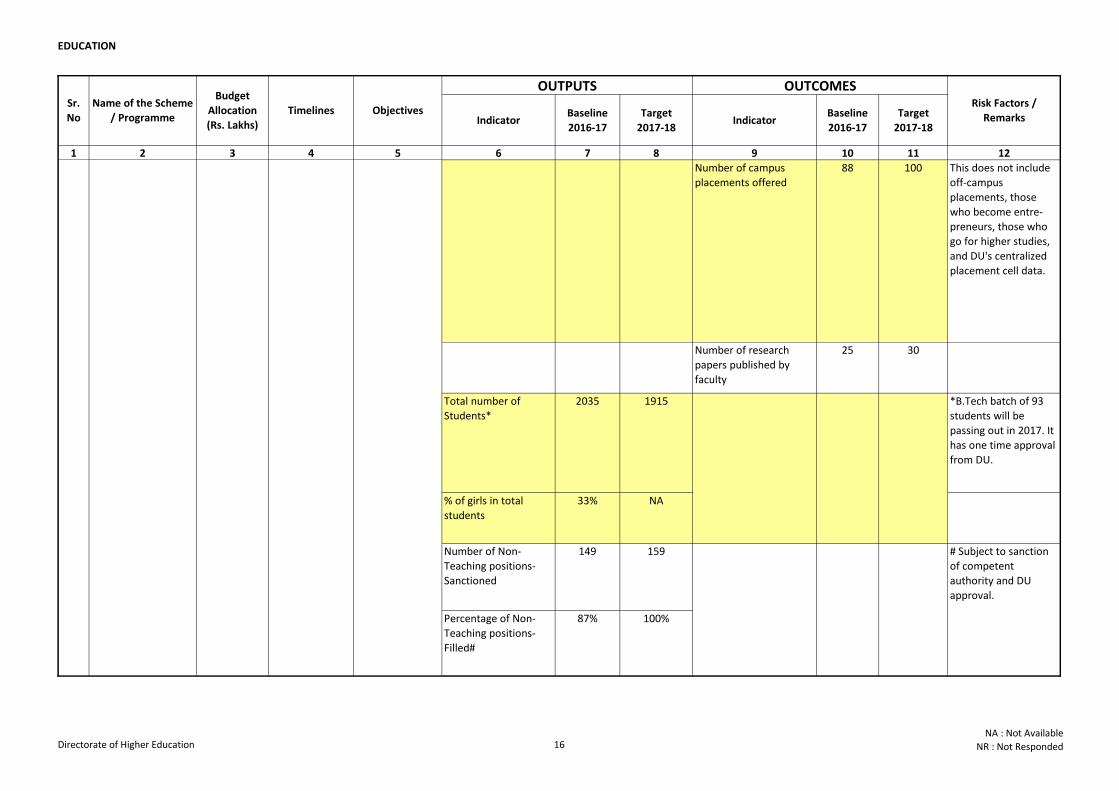
Number of campus
placements offered
88 100 This does not include
off-campus
placements, those
who become entre-
preneurs, those who
go for higher studies,
and DU's centralized
placement cell data.
Number of research
papers published by
faculty
25 30
Total number of
Students*
2035 1915 *B.Tech batch of 93
students will be
passing out in 2017. It
has one time approval
from DU.
% of girls in total
students
33% NA
Number of Non-
Teaching positions-
Sanctioned
149 159
Percentage of Non-
Teaching positions-
Filled#
87% 100%
To provide
quality higher
education to
students
# Subject to sanction
of competent
authority and DU
approval.
Continued
scheme
2760
(R - 2600,
C - 100)
Acharya Narendra
Dev College
1.1
Directorate of Higher Education 16NA : Not Available
NR : Not Responded
EDUCATION
Indicator Baseline
2016-17
Target
2017-18Indicator
Baseline
2016-17
Target
2017-18
1 2 3 4 5 6 7 8 9 10 11 12
Risk Factors /
Remarks
Sr.
No
Name of the Scheme
/ Programme
Budget
Allocation
(Rs. Lakhs)
Timelines Objectives
OUTPUTS OUTCOMES
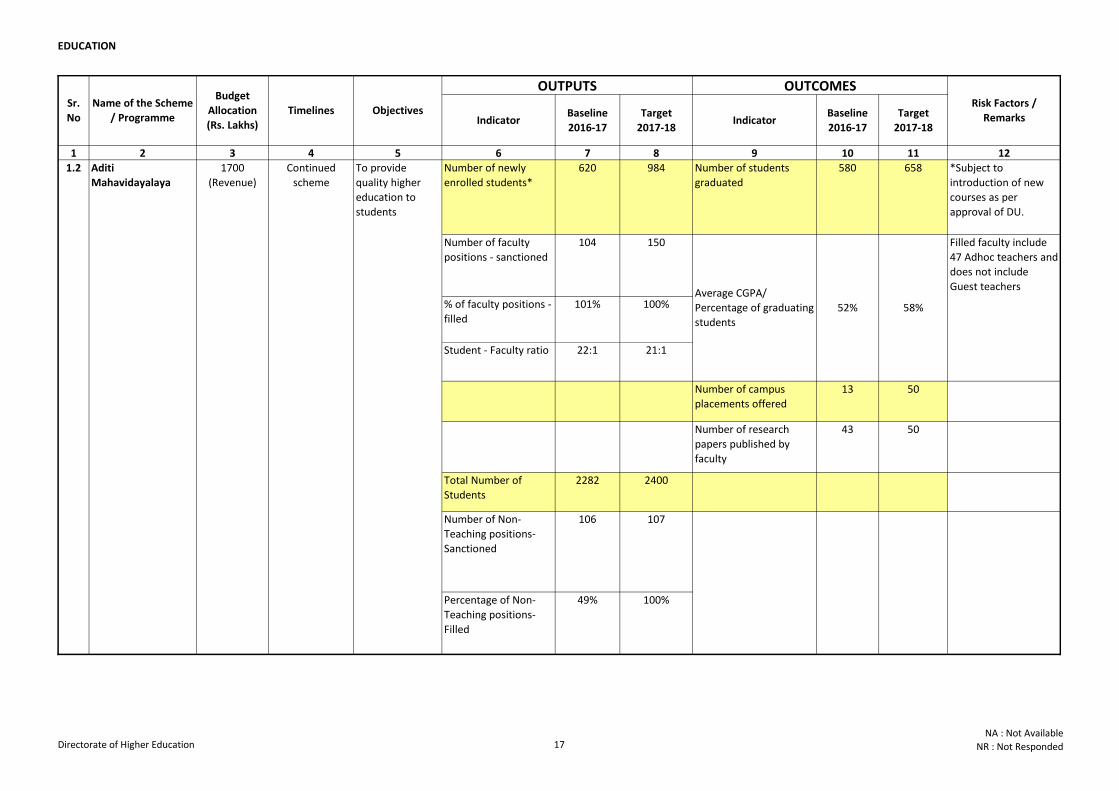
Number of newly
enrolled students*
620 984 Number of students
graduated
580 658 *Subject to
introduction of new
courses as per
approval of DU.
Number of faculty
positions - sanctioned
104 150
% of faculty positions -
filled
101% 100%
Student - Faculty ratio 22:1 21:1
Number of campus
placements offered
13 50
Number of research
papers published by
faculty
43 50
Total Number of
Students
2282 2400
Number of Non-
Teaching positions-
Sanctioned
106 107
Percentage of Non-
Teaching positions-
Filled
49% 100%
Filled faculty include
47 Adhoc teachers and
does not include
Guest teachers
Continued
scheme
52% 58%
Average CGPA/
Percentage of graduating
students
Aditi
Mahavidayalaya
1700
(Revenue)
To provide
quality higher
education to
students
1.2
Directorate of Higher Education 17NA : Not Available
NR : Not Responded
EDUCATION
Indicator Baseline
2016-17
Target
2017-18Indicator
Baseline
2016-17
Target
2017-18
1 2 3 4 5 6 7 8 9 10 11 12
Risk Factors /
Remarks
Sr.
No
Name of the Scheme
/ Programme
Budget
Allocation
(Rs. Lakhs)
Timelines Objectives
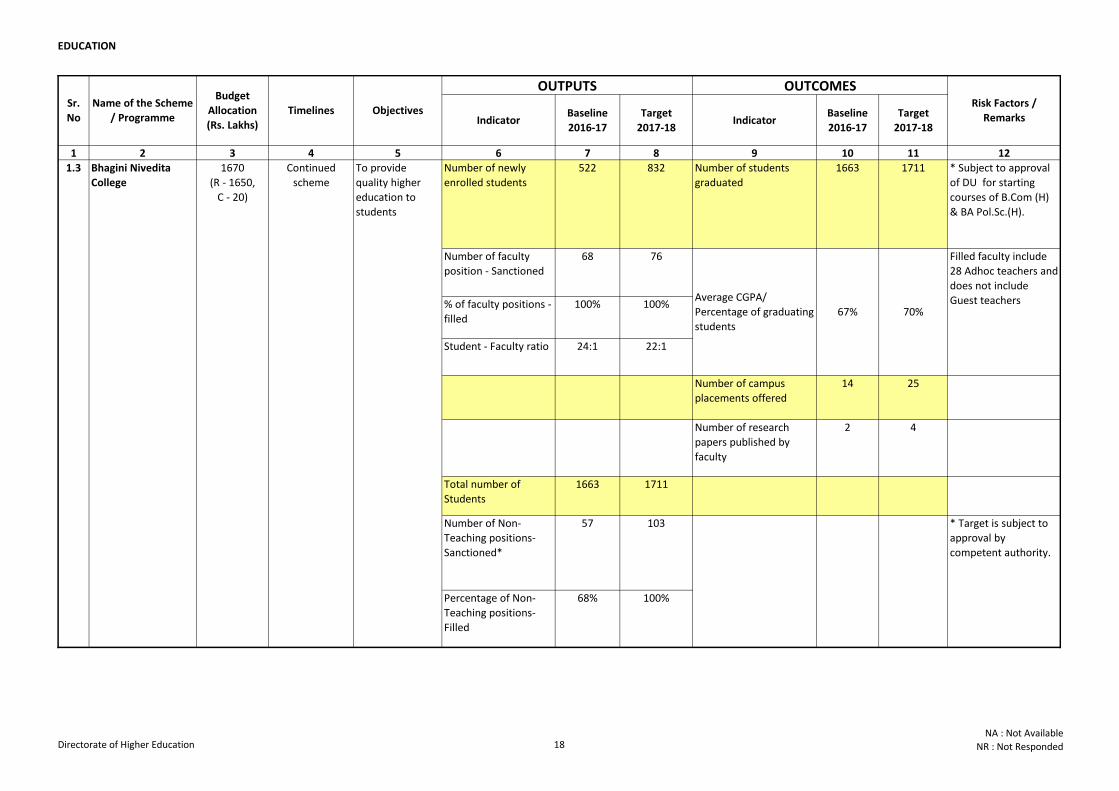
OUTPUTS OUTCOMES
Number of newly
enrolled students
522 832 Number of students
graduated
1663 1711 * Subject to approval
of DU for starting
courses of B.Com (H)
& BA Pol.Sc.(H).
Number of faculty
position - Sanctioned
68 76
% of faculty positions -
filled
100% 100%
Student - Faculty ratio 24:1 22:1
Number of campus
placements offered
14 25
Number of research
papers published by
faculty
2 4
Total number of
Students
1663 1711
Number of Non-
Teaching positions-
Sanctioned*
57 103
Percentage of Non-
Teaching positions-
Filled
68% 100%
Filled faculty include
28 Adhoc teachers and
does not include
Guest teachers70%
Continued
scheme
67%
Average CGPA/
Percentage of graduating
students
1.3 Bhagini Nivedita
College
1670
(R - 1650,
C - 20)
To provide
quality higher
education to
students
* Target is subject to
approval by
competent authority.
Directorate of Higher Education 18NA : Not Available
NR : Not Responded
EDUCATION
Indicator Baseline
2016-17
Target
2017-18Indicator
Baseline
2016-17
Target
2017-18
1 2 3 4 5 6 7 8 9 10 11 12
Risk Factors /
Remarks
Sr.
No
Name of the Scheme
/ Programme
Budget
Allocation
(Rs. Lakhs)
Timelines Objectives
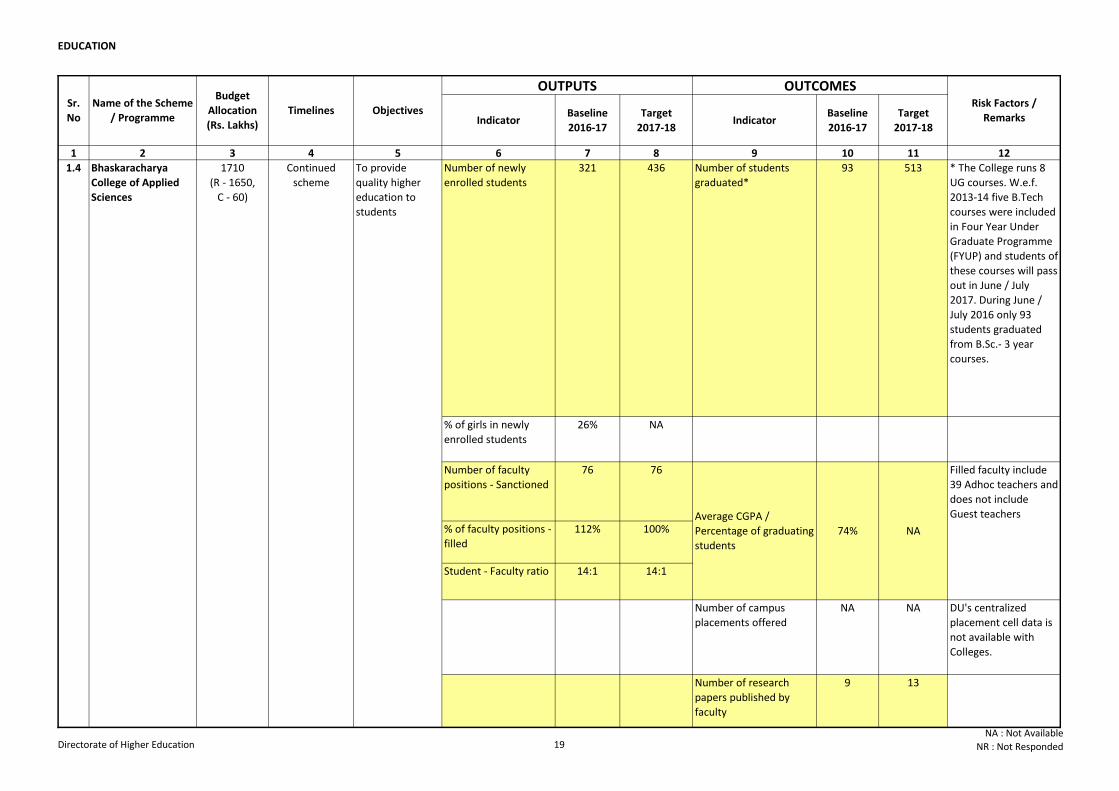
OUTPUTS OUTCOMES
% of girls in newly
enrolled students
26% NA
Number of faculty
positions - Sanctioned
76 76
% of faculty positions -
filled
112% 100%
Student - Faculty ratio 14:1 14:1
Number of campus
placements offered
NA NA DU's centralized
placement cell data is
not available with
Colleges.
Number of research
papers published by
faculty
9 13
436
Filled faculty include
39 Adhoc teachers and
does not include
Guest teachers
1.4 Bhaskaracharya
College of Applied
Sciences
1710
(R - 1650,
C - 60)
* The College runs 8
UG courses. W.e.f.
2013-14 five B.Tech
courses were included
in Four Year Under
Graduate Programme
(FYUP) and students of
these courses will pass
out in June / July
2017. During June /
July 2016 only 93
students graduated
from B.Sc.- 3 year
courses.
Number of students
graduated*
93 513Continued
scheme
Average CGPA /
Percentage of graduating
students
74% NA
To provide
quality higher
education to
students
Number of newly
enrolled students
321
Directorate of Higher Education 19NA : Not Available
NR : Not Responded
EDUCATION
Indicator Baseline
2016-17
Target
2017-18Indicator
Baseline
2016-17
Target
2017-18
1 2 3 4 5 6 7 8 9 10 11 12
Risk Factors /
Remarks
Sr.
No
Name of the Scheme
/ Programme
Budget
Allocation
(Rs. Lakhs)
Timelines Objectives
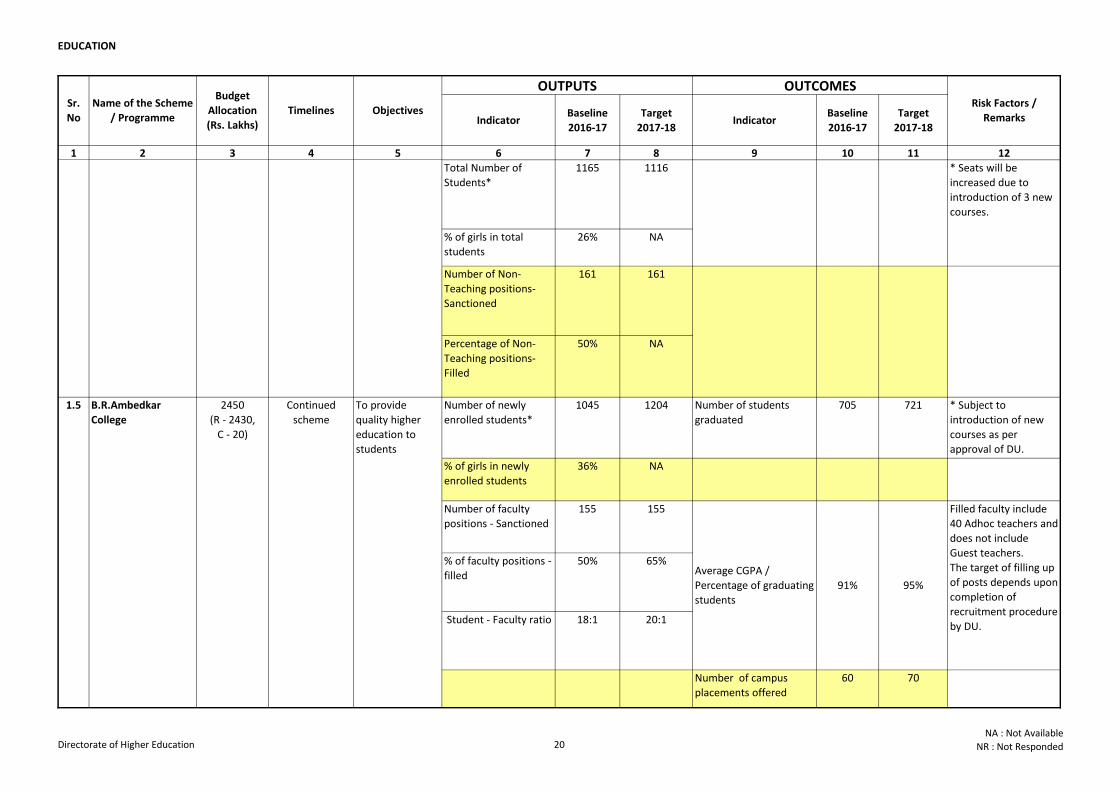
OUTPUTS OUTCOMES
Total Number of
Students*
1165 1116
% of girls in total
students
26% NA
Number of Non-
Teaching positions-
Sanctioned
161 161
Percentage of Non-
Teaching positions-
Filled
50% NA
Number of newly
enrolled students*
1045 1204 Number of students
graduated
705 721 * Subject to
introduction of new
courses as per
approval of DU.
% of girls in newly
enrolled students
36% NA
Number of faculty
positions - Sanctioned
155 155
% of faculty positions -
filled
50% 65%
Student - Faculty ratio 18:1 20:1
Number of campus
placements offered
60 70
1.5 B.R.Ambedkar
College
Filled faculty include
40 Adhoc teachers and
does not include
Guest teachers.
The target of filling up
of posts depends upon
completion of
recruitment procedure
by DU.
Average CGPA /
Percentage of graduating
students
91% 95%
2450
(R - 2430,
C - 20)
Continued
scheme
To provide
quality higher
education to
students
1.4 Bhaskaracharya
College of Applied
Sciences
1710
(R - 1650,
C - 60)
Continued
scheme
To provide
quality higher
education to
students
* Seats will be
increased due to
introduction of 3 new
courses.
Directorate of Higher Education 20NA : Not Available
NR : Not Responded
EDUCATION
Indicator Baseline
2016-17
Target
2017-18Indicator
Baseline
2016-17
Target
2017-18
1 2 3 4 5 6 7 8 9 10 11 12
Risk Factors /
Remarks
Sr.
No
Name of the Scheme
/ Programme
Budget
Allocation
(Rs. Lakhs)
Timelines Objectives
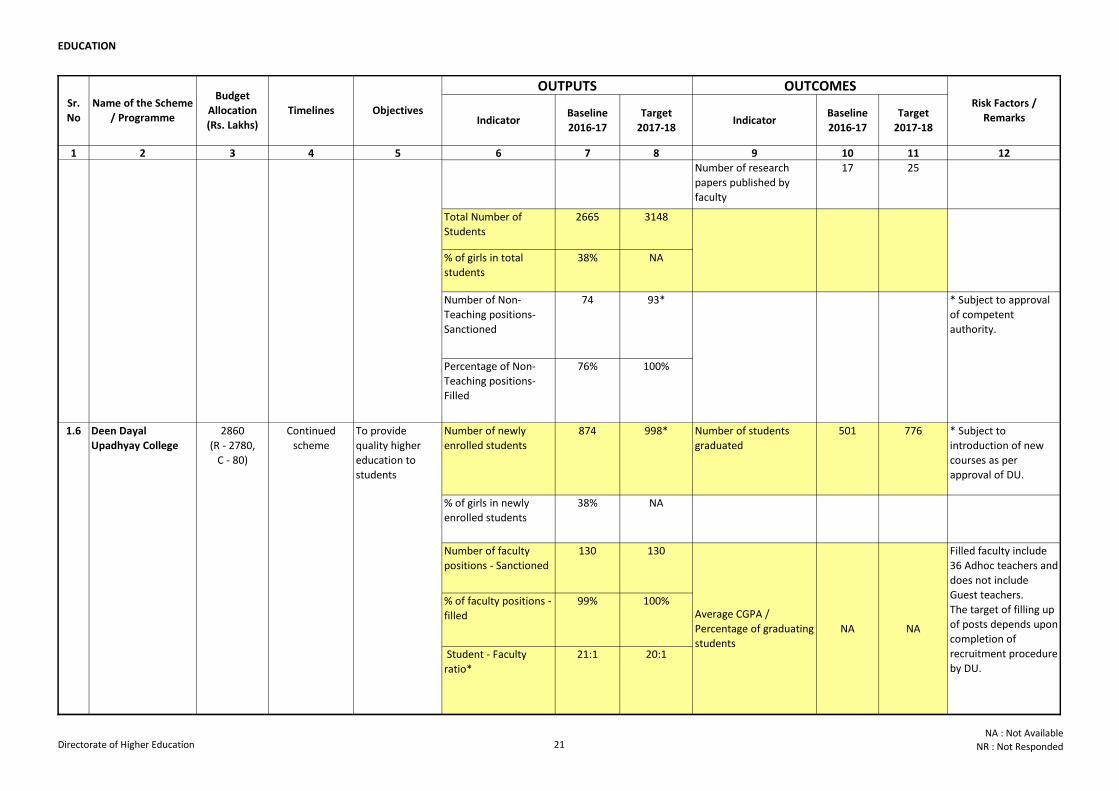
OUTPUTS OUTCOMES
Number of research
papers published by
faculty
17 25
Total Number of
Students
2665 3148
% of girls in total
students
38% NA
Number of Non-
Teaching positions-
Sanctioned
74 93*
Percentage of Non-
Teaching positions-
Filled
76% 100%
Number of newly
enrolled students
874 998* Number of students
graduated
501 776 * Subject to
introduction of new
courses as per
approval of DU.
% of girls in newly
enrolled students
38% NA
Number of faculty
positions - Sanctioned
130 130
% of faculty positions -
filled
99% 100%
Student - Faculty
ratio*
21:1 20:1
1.5 B.R.Ambedkar
College
2450
(R - 2430,
C - 20)
Continued
scheme
To provide
quality higher
education to
students
Continued
scheme
1.6 2860
(R - 2780,
C - 80)
To provide
quality higher
education to
students
Deen Dayal
Upadhyay College
NA
Average CGPA /
Percentage of graduating
students
NA
Filled faculty include
36 Adhoc teachers and
does not include
Guest teachers.
The target of filling up
of posts depends upon
completion of
recruitment procedure
by DU.
* Subject to approval
of competent
authority.
Directorate of Higher Education 21NA : Not Available
NR : Not Responded
EDUCATION
Indicator Baseline
2016-17
Target
2017-18Indicator
Baseline
2016-17
Target
2017-18
1 2 3 4 5 6 7 8 9 10 11 12
Risk Factors /
Remarks
Sr.
No
Name of the Scheme
/ Programme
Budget
Allocation
(Rs. Lakhs)
Timelines Objectives
OUTPUTS OUTCOMES
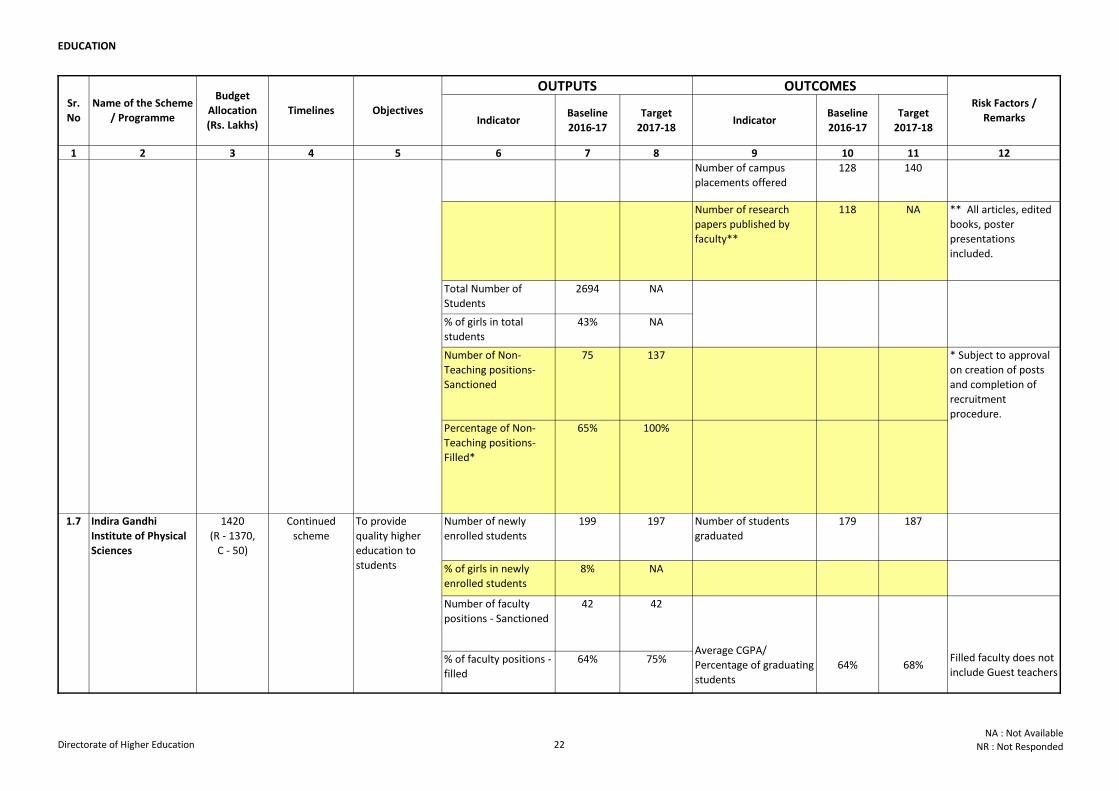
Number of campus
placements offered
128 140
Number of research
papers published by
faculty**
118 NA ** All articles, edited
books, poster
presentations
included.
Total Number of
Students
2694 NA
% of girls in total
students
43% NA
Number of Non-
Teaching positions-
Sanctioned
75 137
Percentage of Non-
Teaching positions-
Filled*
65% 100%
Number of newly
enrolled students
199 197 Number of students
graduated
179 187
% of girls in newly
enrolled students
8% NA
Number of faculty
positions - Sanctioned
42 42
% of faculty positions -
filled
64% 75%
Continued
scheme
Continued
scheme
1.6 2860
(R - 2780,
C - 80)
To provide
quality higher
education to
students
To provide
quality higher
education to
students
1420
(R - 1370,
C - 50)
Deen Dayal
Upadhyay College
Indira Gandhi
Institute of Physical
Sciences
Average CGPA/
Percentage of graduating
students
64% 68%
1.7
Filled faculty does not
include Guest teachers
* Subject to approval
on creation of posts
and completion of
recruitment
procedure.
Directorate of Higher Education 22NA : Not Available
NR : Not Responded
EDUCATION
Indicator Baseline
2016-17
Target
2017-18Indicator
Baseline
2016-17
Target
2017-18
1 2 3 4 5 6 7 8 9 10 11 12
Risk Factors /
Remarks
Sr.
No
Name of the Scheme
/ Programme
Budget
Allocation
(Rs. Lakhs)
Timelines Objectives
OUTPUTS OUTCOMES
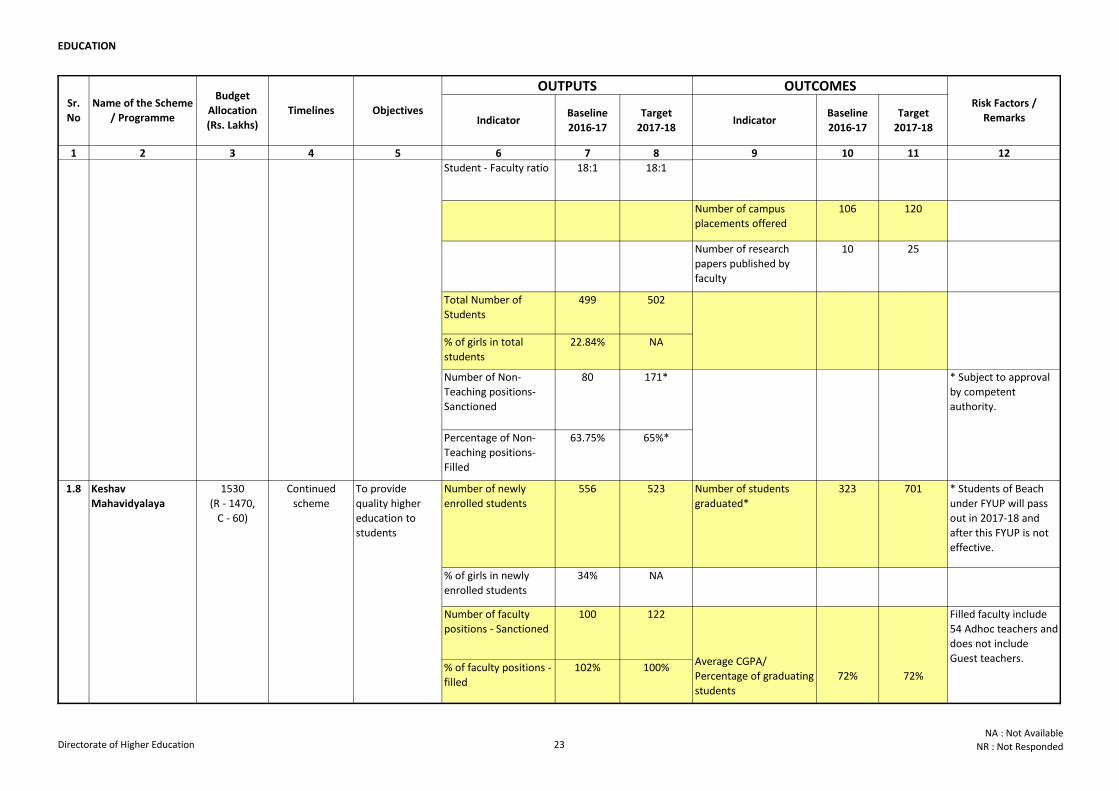
Student - Faculty ratio 18:1 18:1
Number of campus
placements offered
106 120
Number of research
papers published by
faculty
10 25
Total Number of
Students
499 502
% of girls in total
students
22.84% NA
Number of Non-
Teaching positions-
Sanctioned
80 171*
Percentage of Non-
Teaching positions-
Filled
63.75% 65%*
Number of newly
enrolled students
556 523 Number of students
graduated*
323 701 * Students of Beach
under FYUP will pass
out in 2017-18 and
after this FYUP is not
effective.
% of girls in newly
enrolled students
34% NA
Number of faculty
positions - Sanctioned
100 122
% of faculty positions -
filled
102% 100%
Continued
scheme
1.8
To provide
quality higher
education to
students
1420
(R - 1370,
C - 50)
1530
(R - 1470,
C - 60)
To provide
quality higher
education to
students
Indira Gandhi
Institute of Physical
Sciences
Keshav
Mahavidyalaya
Average CGPA/
Percentage of graduating
students
64% 68%
Continued
scheme
Average CGPA/
Percentage of graduating
students
72% 72%
Filled faculty include
54 Adhoc teachers and
does not include
Guest teachers.
1.7
Filled faculty does not
include Guest teachers
* Subject to approval
by competent
authority.
Directorate of Higher Education 23NA : Not Available
NR : Not Responded
EDUCATION
Indicator Baseline
2016-17
Target
2017-18Indicator
Baseline
2016-17
Target
2017-18
1 2 3 4 5 6 7 8 9 10 11 12
Risk Factors /
Remarks
Sr.
No
Name of the Scheme
/ Programme
Budget
Allocation
(Rs. Lakhs)
Timelines Objectives
OUTPUTS OUTCOMES
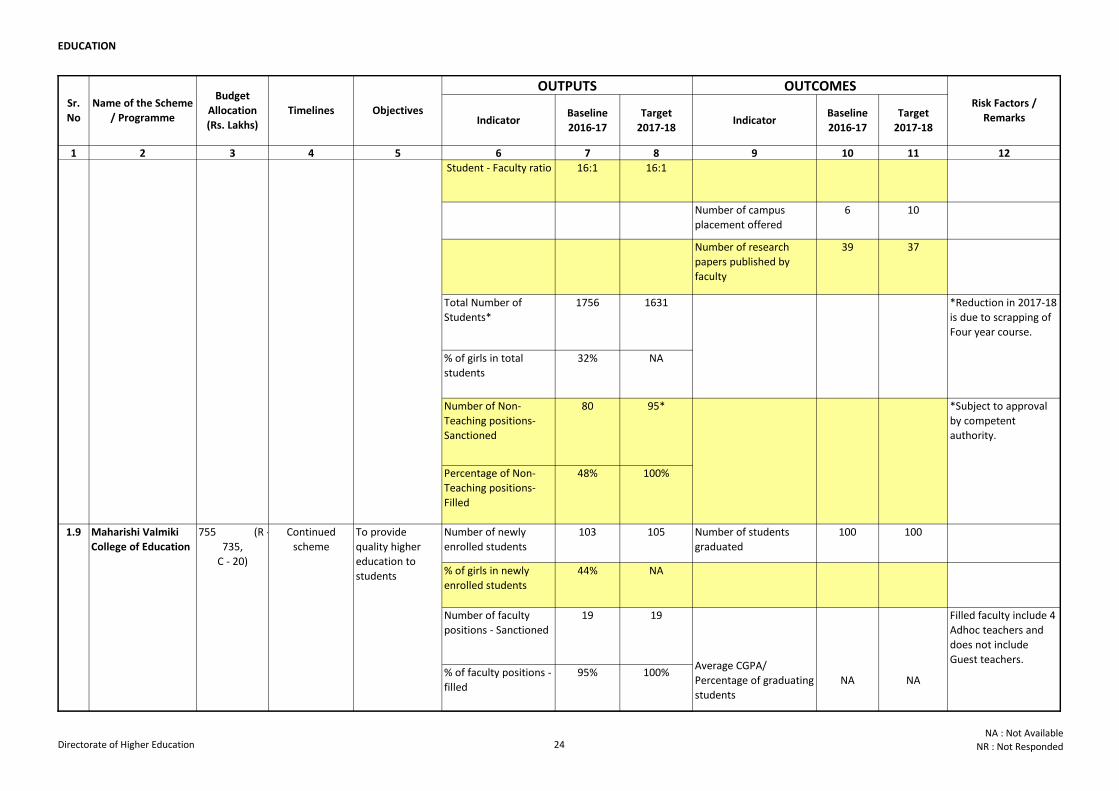
Student - Faculty ratio 16:1 16:1
Number of campus
placement offered
6 10
Number of research
papers published by
faculty
39 37
Total Number of
Students*
1756 1631
% of girls in total
students
32% NA
Number of Non-
Teaching positions-
Sanctioned
80 95*
Percentage of Non-
Teaching positions-
Filled
48% 100%
Number of newly
enrolled students
103 105 Number of students
graduated
100 100
% of girls in newly
enrolled students
44% NA
Number of faculty
positions - Sanctioned
19 19
% of faculty positions -
filled
95% 100%
1.9 755 (R -
735,
C - 20)
To provide
quality higher
education to
students
1.8 1530
(R - 1470,
C - 60)
To provide
quality higher
education to
students
Keshav
Mahavidyalaya
Maharishi Valmiki
College of Education
Continued
scheme
Continued
scheme
Average CGPA/
Percentage of graduating
students
72% 72%
Average CGPA/
Percentage of graduating
students
NA NA
Filled faculty include 4
Adhoc teachers and
does not include
Guest teachers.
Filled faculty include
54 Adhoc teachers and
does not include
Guest teachers.
*Reduction in 2017-18
is due to scrapping of
Four year course.
*Subject to approval
by competent
authority.
Directorate of Higher Education 24NA : Not Available
NR : Not Responded
EDUCATION
Indicator Baseline
2016-17
Target
2017-18Indicator
Baseline
2016-17
Target
2017-18
1 2 3 4 5 6 7 8 9 10 11 12
Risk Factors /
Remarks
Sr.
No
Name of the Scheme
/ Programme
Budget
Allocation
(Rs. Lakhs)
Timelines Objectives
OUTPUTS OUTCOMES
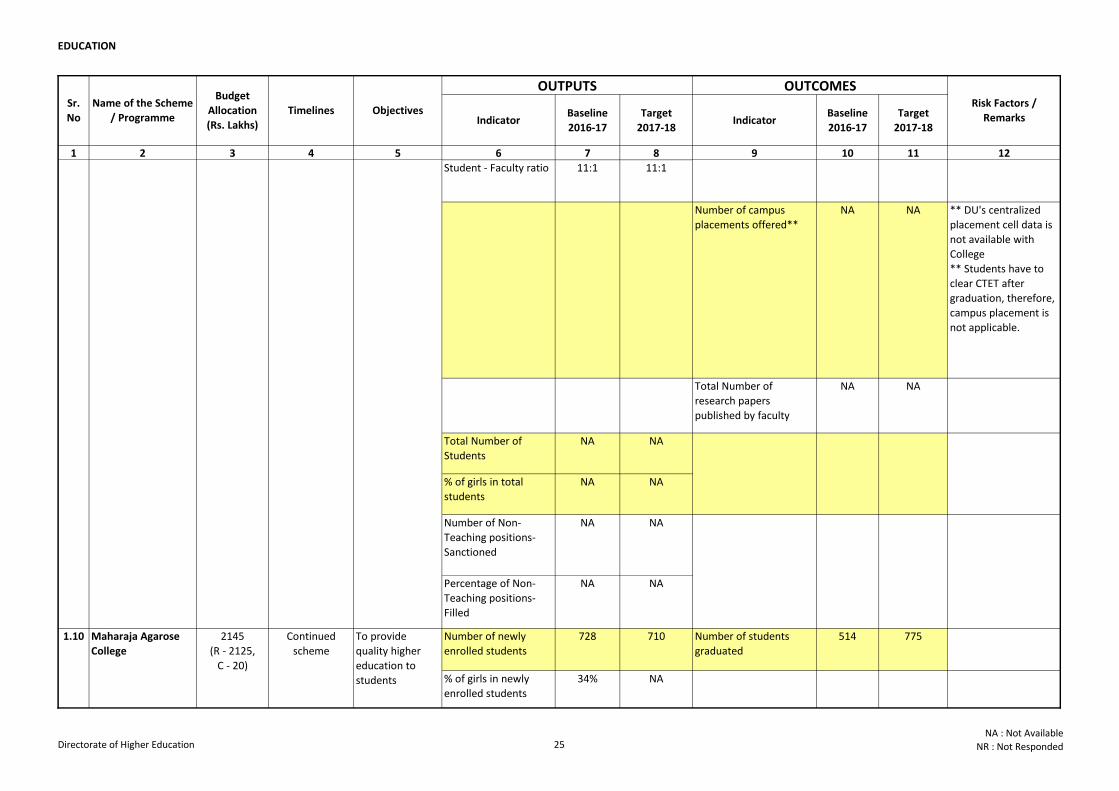
Student - Faculty ratio 11:1 11:1
Number of campus
placements offered**
NA NA ** DU's centralized
placement cell data is
not available with
College
** Students have to
clear CTET after
graduation, therefore,
campus placement is
not applicable.
Total Number of
research papers
published by faculty
NA NA
Total Number of
Students
NA NA
% of girls in total
students
NA NA
Number of Non-
Teaching positions-
Sanctioned
NA NA
Percentage of Non-
Teaching positions-
Filled
NA NA
Number of newly
enrolled students
728 710 Number of students
graduated
514 775
% of girls in newly
enrolled students
34% NA
1.9 755 (R -
735,
C - 20)
To provide
quality higher
education to
students
Maharishi Valmiki
College of Education
Maharaja Agarose
College
2145
(R - 2125,
C - 20)
To provide
quality higher
education to
students
Continued
scheme
Continued
scheme
Average CGPA/
Percentage of graduating
students
NA NA
Filled faculty include 4
Adhoc teachers and
does not include
Guest teachers.
1.10
Directorate of Higher Education 25NA : Not Available
NR : Not Responded
EDUCATION
Indicator Baseline
2016-17
Target
2017-18Indicator
Baseline
2016-17
Target
2017-18
1 2 3 4 5 6 7 8 9 10 11 12
Risk Factors /
Remarks
Sr.
No
Name of the Scheme
/ Programme
Budget
Allocation
(Rs. Lakhs)
Timelines Objectives
OUTPUTS OUTCOMES
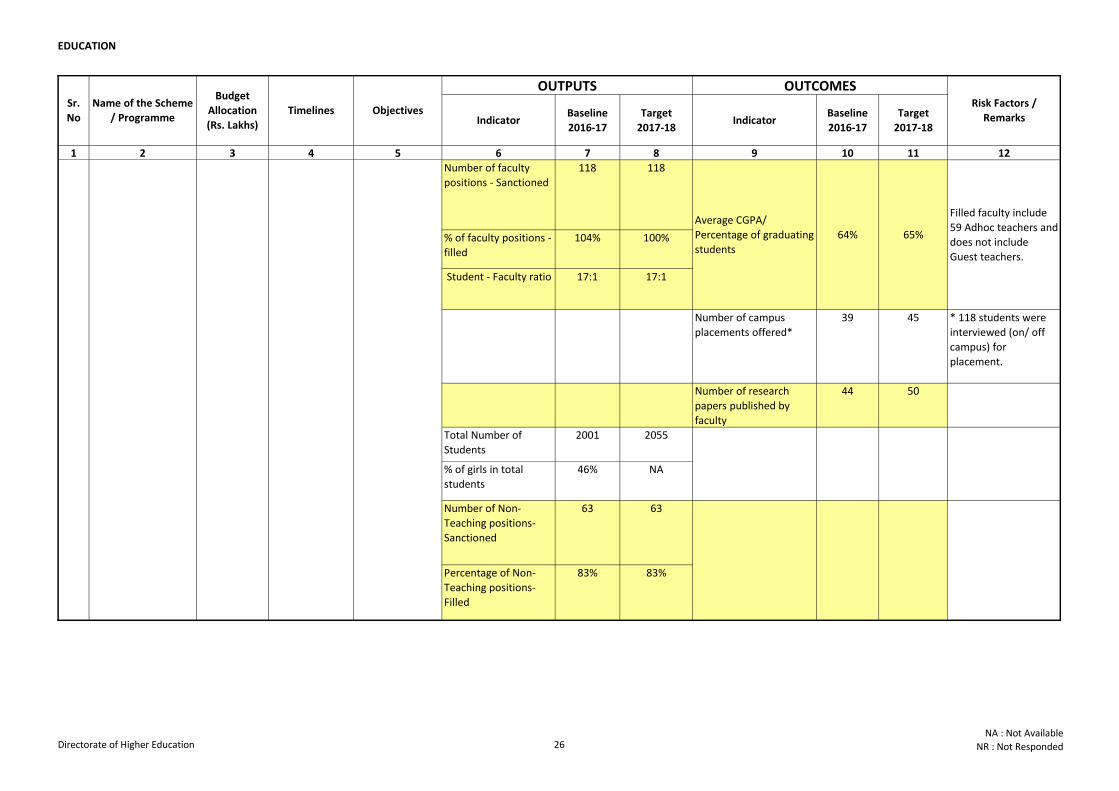
Number of faculty
positions - Sanctioned
118 118
% of faculty positions -
filled
104% 100%
Student - Faculty ratio 17:1 17:1
Number of campus
placements offered*
39 45 * 118 students were
interviewed (on/ off
campus) for
placement.
Number of research
papers published by
faculty
44 50
Total Number of
Students
2001 2055
% of girls in total
students
46% NA
Number of Non-
Teaching positions-
Sanctioned
63 63
Percentage of Non-
Teaching positions-
Filled
83% 83%
Maharaja Agarose
College
2145
(R - 2125,
C - 20)
To provide
quality higher
education to
students
Continued
scheme
1.10
Filled faculty include
59 Adhoc teachers and
does not include
Guest teachers.
Average CGPA/
Percentage of graduating
students
64% 65%
Directorate of Higher Education 26NA : Not Available
NR : Not Responded
EDUCATION
Indicator Baseline
2016-17
Target
2017-18Indicator
Baseline
2016-17
Target
2017-18
1 2 3 4 5 6 7 8 9 10 11 12
Risk Factors /
Remarks
Sr.
No
Name of the Scheme
/ Programme
Budget
Allocation
(Rs. Lakhs)
Timelines Objectives
OUTPUTS OUTCOMES
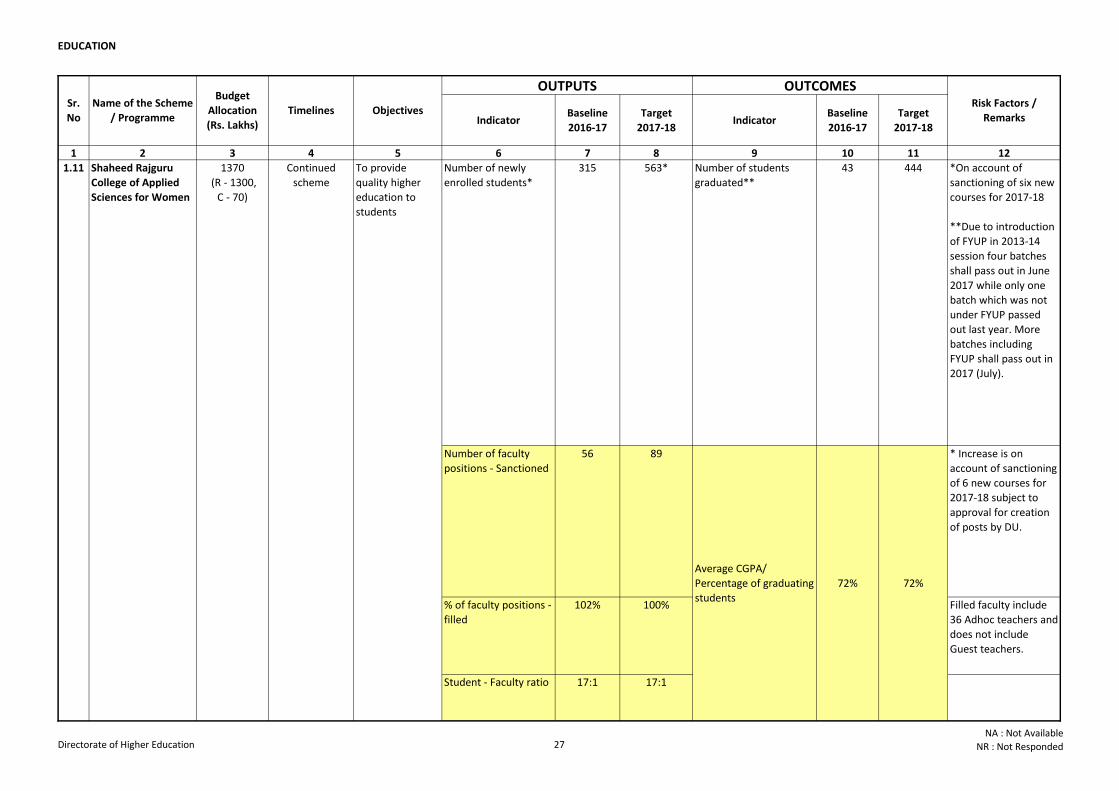
Number of faculty
positions - Sanctioned
56 89 * Increase is on
account of sanctioning
of 6 new courses for
2017-18 subject to
approval for creation
of posts by DU.
% of faculty positions -
filled
102% 100% Filled faculty include
36 Adhoc teachers and
does not include
Guest teachers.
Student - Faculty ratio 17:1 17:1
Average CGPA/
Percentage of graduating
students
72% 72%
*On account of
sanctioning of six new
courses for 2017-18
**Due to introduction
of FYUP in 2013-14
session four batches
shall pass out in June
2017 while only one
batch which was not
under FYUP passed
out last year. More
batches including
FYUP shall pass out in
2017 (July).
43 4441370
(R - 1300,
C - 70)
To provide
quality higher
education to
students
1.11 Shaheed Rajguru
College of Applied
Sciences for Women
Continued
scheme
Number of newly
enrolled students*
315 563* Number of students
graduated**
Directorate of Higher Education 27NA : Not Available
NR : Not Responded
EDUCATION
Indicator Baseline
2016-17
Target
2017-18Indicator
Baseline
2016-17
Target
2017-18
1 2 3 4 5 6 7 8 9 10 11 12
Risk Factors /
Remarks
Sr.
No
Name of the Scheme
/ Programme
Budget
Allocation
(Rs. Lakhs)
Timelines Objectives
OUTPUTS OUTCOMES
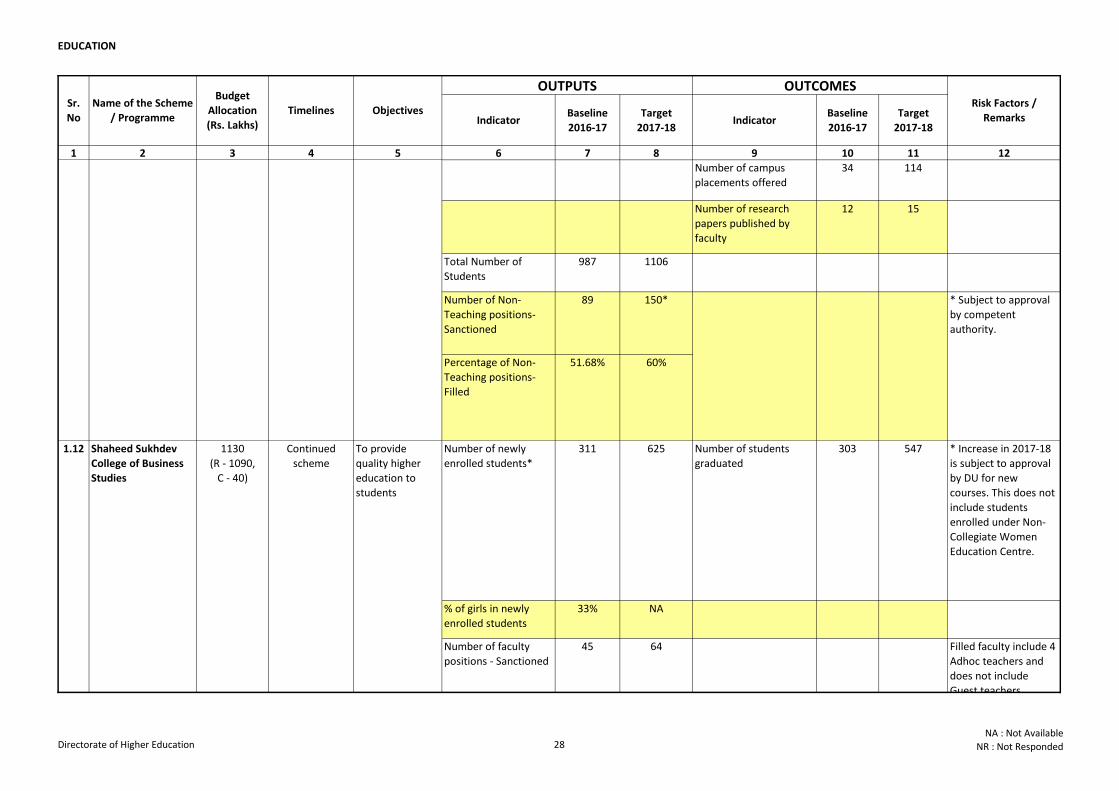
Number of campus
placements offered
34 114
Number of research
papers published by
faculty
12 15
Total Number of
Students
987 1106
Number of Non-
Teaching positions-
Sanctioned
89 150*
Percentage of Non-
Teaching positions-
Filled
51.68% 60%
Number of newly
enrolled students*
311 625 Number of students
graduated
303 547 * Increase in 2017-18
is subject to approval
by DU for new
courses. This does not
include students
enrolled under Non-
Collegiate Women
Education Centre.
% of girls in newly
enrolled students
33% NA
Number of faculty
positions - Sanctioned
45 64
* Subject to approval
by competent
authority.
Filled faculty include 4
Adhoc teachers and
does not include
Guest teachers. Average CGPA/
Percentage of graduating
students
98% 98%
1370
(R - 1300,
C - 70)
To provide
quality higher
education to
students
1130
(R - 1090,
C - 40)
To provide
quality higher
education to
students
1.11
1.12 Shaheed Sukhdev
College of Business
Studies
Shaheed Rajguru
College of Applied
Sciences for Women
Continued
scheme
Continued
scheme
Directorate of Higher Education 28NA : Not Available
NR : Not Responded
EDUCATION
Indicator Baseline
2016-17
Target
2017-18Indicator
Baseline
2016-17
Target
2017-18
1 2 3 4 5 6 7 8 9 10 11 12
Risk Factors /
Remarks
Sr.
No
Name of the Scheme
/ Programme
Budget
Allocation
(Rs. Lakhs)
Timelines Objectives
OUTPUTS OUTCOMES
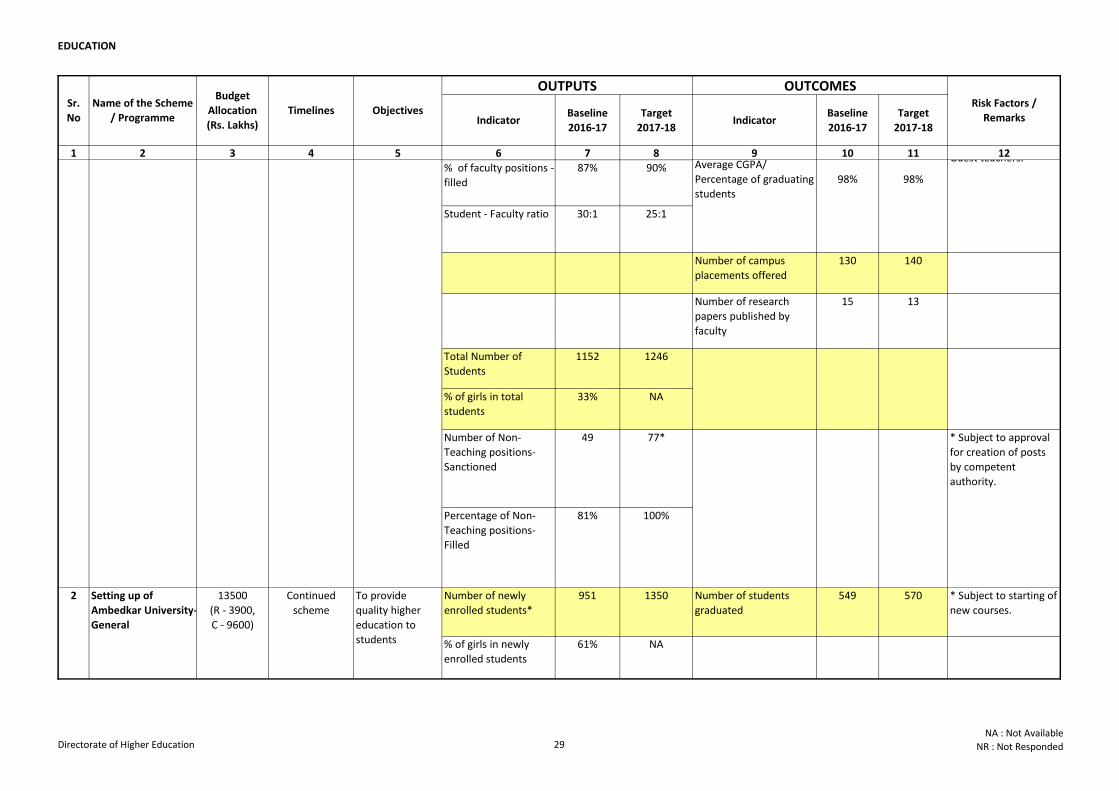
% of faculty positions -
filled
87% 90%
Student - Faculty ratio 30:1 25:1
Number of campus
placements offered
130 140
Number of research
papers published by
faculty
15 13
Total Number of
Students
1152 1246
% of girls in total
students
33% NA
Number of Non-
Teaching positions-
Sanctioned
49 77*
Percentage of Non-
Teaching positions-
Filled
81% 100%
Number of newly
enrolled students*
951 1350 Number of students
graduated
549 570 * Subject to starting of
new courses.
% of girls in newly
enrolled students
61% NA
Setting up of
Ambedkar University-
General
To provide
quality higher
education to
students
13500
(R - 3900,
C - 9600)
Filled faculty include 4
Adhoc teachers and
does not include
Guest teachers. Average CGPA/
Percentage of graduating
students
98% 98%
1130
(R - 1090,
C - 40)
To provide
quality higher
education to
students
2
1.12 Shaheed Sukhdev
College of Business
Studies
Continued
scheme
Continued
scheme
* Subject to approval
for creation of posts
by competent
authority.
Directorate of Higher Education 29NA : Not Available
NR : Not Responded
EDUCATION
Indicator Baseline
2016-17
Target
2017-18Indicator
Baseline
2016-17
Target
2017-18
1 2 3 4 5 6 7 8 9 10 11 12
Risk Factors /
Remarks
Sr.
No
Name of the Scheme
/ Programme
Budget
Allocation
(Rs. Lakhs)
Timelines Objectives
OUTPUTS OUTCOMES
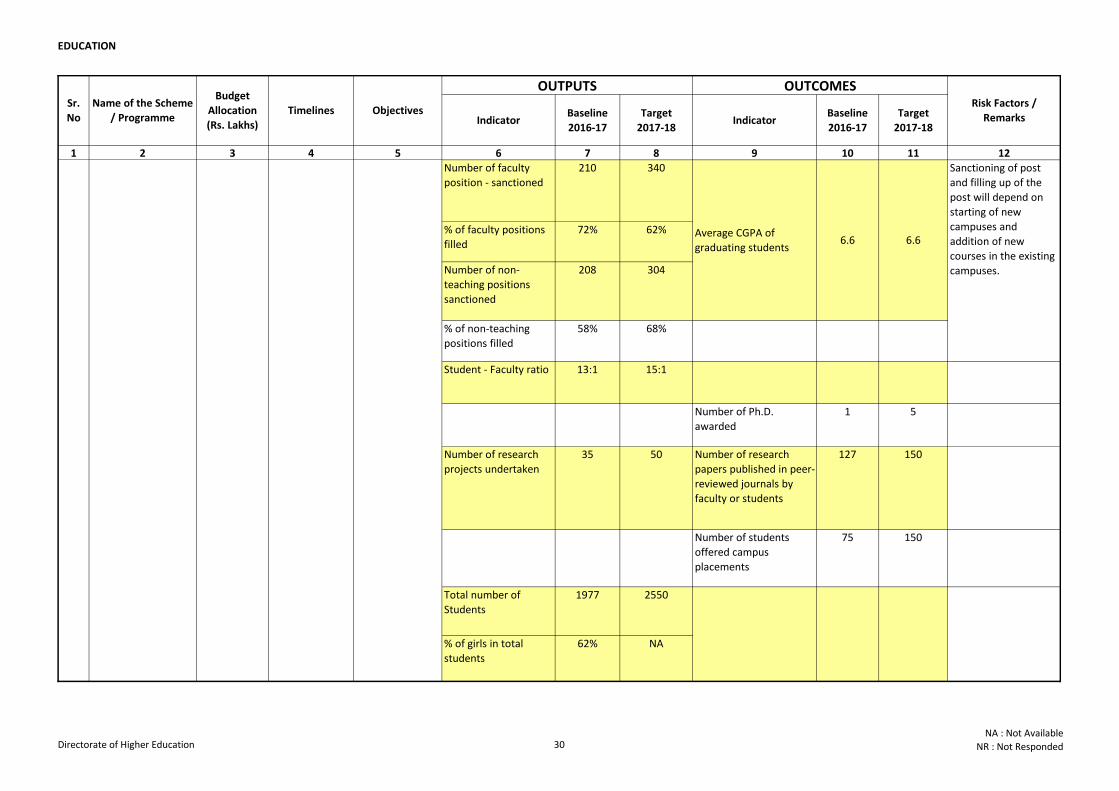
Number of faculty
position - sanctioned
210 340
% of faculty positions
filled
72% 62%
Number of non-
teaching positions
sanctioned
208 304
% of non-teaching
positions filled
58% 68%
Student - Faculty ratio 13:1 15:1
Number of Ph.D.
awarded
1 5
Number of research
projects undertaken
35 50 Number of research
papers published in peer-
reviewed journals by
faculty or students
127 150
Number of students
offered campus
placements
75 150
Total number of
Students
1977 2550
% of girls in total
students
62% NA
Setting up of
Ambedkar University-
General
To provide
quality higher
education to
students
13500
(R - 3900,
C - 9600)
2 Continued
scheme
Sanctioning of post
and filling up of the
post will depend on
starting of new
campuses and
addition of new
courses in the existing
campuses.
Average CGPA of
graduating students6.6 6.6
Directorate of Higher Education 30NA : Not Available
NR : Not Responded
EDUCATION
Indicator Baseline
2016-17
Target
2017-18Indicator
Baseline
2016-17
Target
2017-18
1 2 3 4 5 6 7 8 9 10 11 12
Risk Factors /
Remarks
Sr.
No
Name of the Scheme
/ Programme
Budget
Allocation
(Rs. Lakhs)
Timelines Objectives
OUTPUTS OUTCOMES
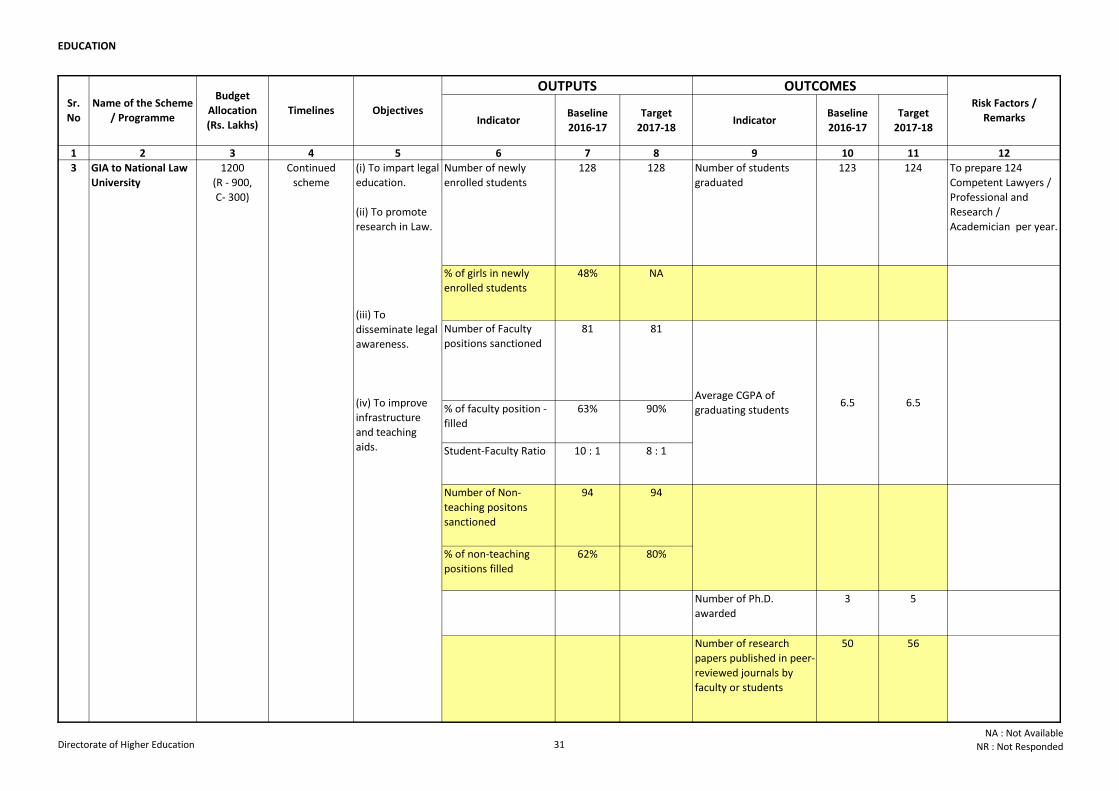
Number of newly
enrolled students
128 128 Number of students
graduated
123 124 To prepare 124
Competent Lawyers /
Professional and
Research /
Academician per year.
% of girls in newly
enrolled students
48% NA
Number of Faculty
positions sanctioned
81 81
% of faculty position -
filled
63% 90%
Student-Faculty Ratio 10 : 1 8 : 1
Number of Non-
teaching positons
sanctioned
94 94
% of non-teaching
positions filled
62% 80%
Number of Ph.D.
awarded
3 5
Number of research
papers published in peer-
reviewed journals by
faculty or students
50 56
6.5 6.5
3 GIA to National Law
University
1200
(R - 900,
C- 300)
(i) To impart legal
education.
(ii) To promote
research in Law.
(iii) To
disseminate legal
awareness.
(iv) To improve
infrastructure
and teaching
aids.
Continued
scheme
Average CGPA of
graduating students
Directorate of Higher Education 31NA : Not Available
NR : Not Responded
EDUCATION
Indicator Baseline
2016-17
Target
2017-18Indicator
Baseline
2016-17
Target
2017-18
1 2 3 4 5 6 7 8 9 10 11 12
Risk Factors /
Remarks
Sr.
No
Name of the Scheme
/ Programme
Budget
Allocation
(Rs. Lakhs)
Timelines Objectives
OUTPUTS OUTCOMES
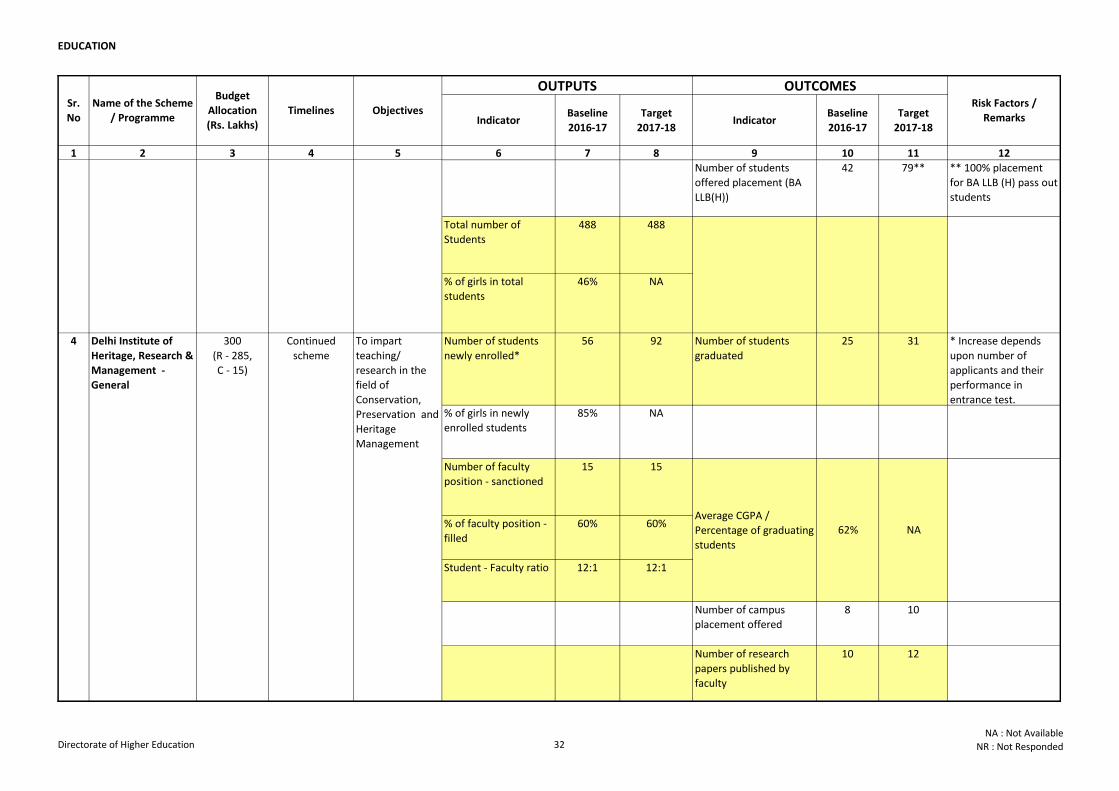
Number of students
offered placement (BA
LLB(H))
42 79** ** 100% placement
for BA LLB (H) pass out
students
Total number of
Students
488 488
% of girls in total
students
46% NA
Number of students
newly enrolled*
56 92 Number of students
graduated
25 31 * Increase depends
upon number of
applicants and their
performance in
entrance test.% of girls in newly
enrolled students
85% NA
Number of faculty
position - sanctioned
15 15
% of faculty position -
filled
60% 60%
Student - Faculty ratio 12:1 12:1
Number of campus
placement offered
8 10
Number of research
papers published by
faculty
10 12
4 300
(R - 285,
C - 15)
Delhi Institute of
Heritage, Research &
Management -
General
To impart
teaching/
research in the
field of
Conservation,
Preservation and
Heritage
Management
Continued
scheme
3 GIA to National Law
University
1200
(R - 900,
C- 300)
(i) To impart legal
education.
(ii) To promote
research in Law.
(iii) To
disseminate legal
awareness.
(iv) To improve
infrastructure
and teaching
aids.
Continued
scheme
Average CGPA /
Percentage of graduating
students
62% NA
Directorate of Higher Education 32NA : Not Available
NR : Not Responded
EDUCATION
Indicator Baseline
2016-17
Target
2017-18Indicator
Baseline
2016-17
Target
2017-18
1 2 3 4 5 6 7 8 9 10 11 12
Risk Factors /
Remarks
Sr.
No
Name of the Scheme
/ Programme
Budget
Allocation
(Rs. Lakhs)
Timelines Objectives
OUTPUTS OUTCOMES
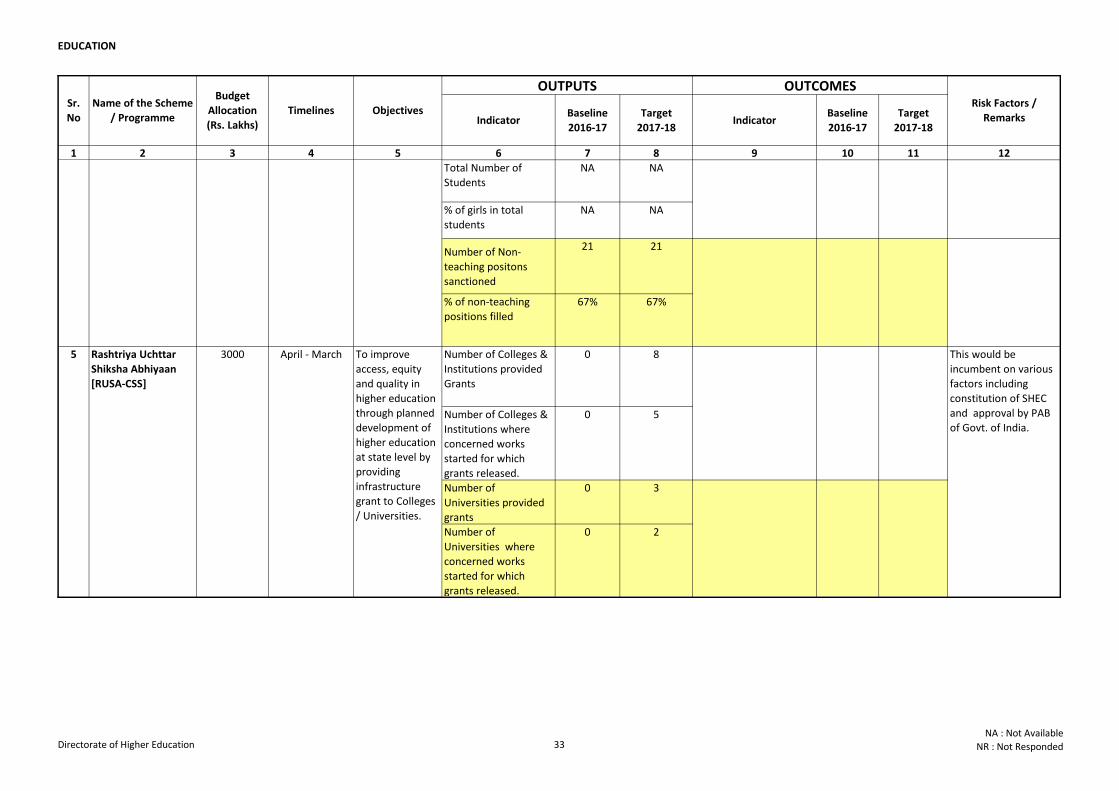
Total Number of
Students
NA NA
% of girls in total
students
NA NA
Number of Non-
teaching positons
sanctioned
21 21
% of non-teaching
positions filled
67% 67%
Number of Colleges &
Institutions provided
Grants
0 8
Number of Colleges &
Institutions where
concerned works
started for which
grants released.
0 5
Number of
Universities provided
grants
0 3
Number of
Universities where
concerned works
started for which
grants released.
0 2
4 300
(R - 285,
C - 15)
Rashtriya Uchttar
Shiksha Abhiyaan
[RUSA-CSS]
3000 To improve
access, equity
and quality in
higher education
through planned
development of
higher education
at state level by
providing
infrastructure
grant to Colleges
/ Universities.
Delhi Institute of
Heritage, Research &
Management -
General
5
To impart
teaching/
research in the
field of
Conservation,
Preservation and
Heritage
Management
Continued
scheme
April - March This would be
incumbent on various
factors including
constitution of SHEC
and approval by PAB
of Govt. of India.
Directorate of Higher Education 33NA : Not Available
NR : Not Responded
EDUCATION
Indicator Baseline
2016-17
Target
2017-18Indicator
Baseline
2016-17
Target
2017-18
1 2 3 4 5 6 7 8 9 10 11 12
Risk Factors /
Remarks
Sr.
No
Name of the Scheme
/ Programme
Budget
Allocation
(Rs. Lakhs)
Timelines Objectives
OUTPUTS OUTCOMES
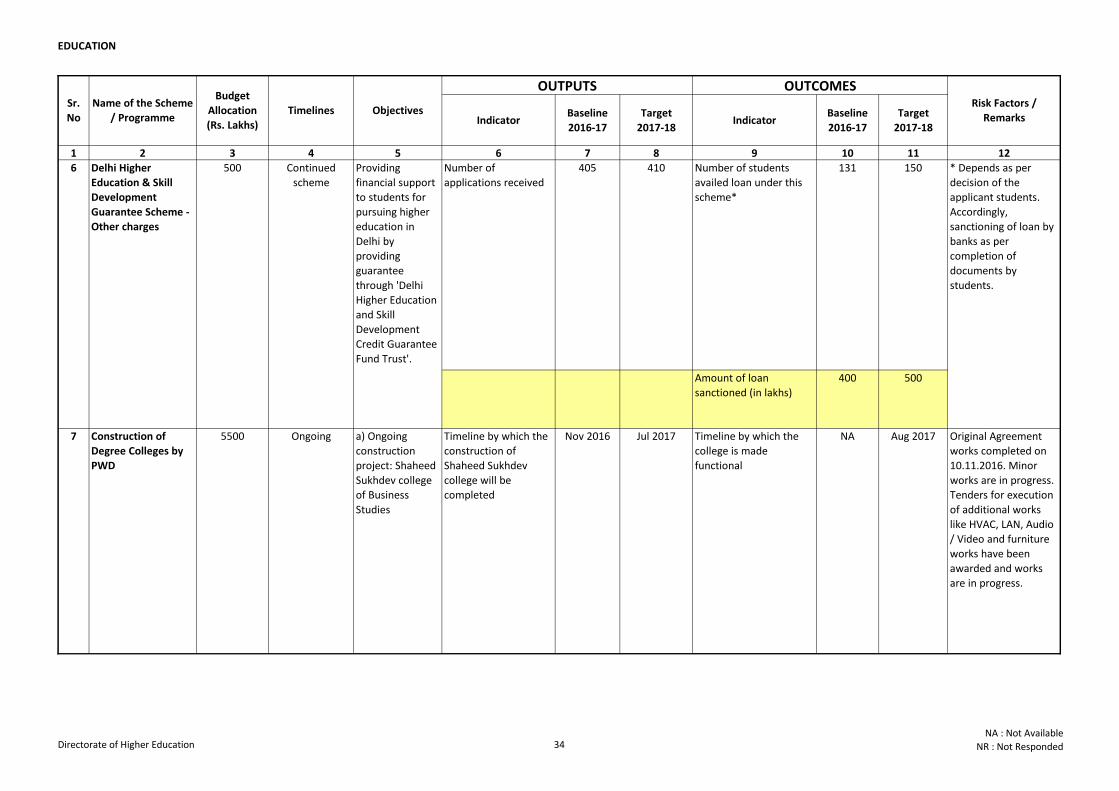
Number of
applications received
405 410 Number of students
availed loan under this
scheme*
131 150
Amount of loan
sanctioned (in lakhs)
400 500
6 500 Providing
financial support
to students for
pursuing higher
education in
Delhi by
providing
guarantee
through 'Delhi
Higher Education
and Skill
Development
Credit Guarantee
Fund Trust'.
Delhi Higher
Education & Skill
Development
Guarantee Scheme -
Other charges
Continued
scheme
Ongoing 5500
* Depends as per
decision of the
applicant students.
Accordingly,
sanctioning of loan by
banks as per
completion of
documents by
students.
Original Agreement
works completed on
10.11.2016. Minor
works are in progress.
Tenders for execution
of additional works
like HVAC, LAN, Audio
/ Video and furniture
works have been
awarded and works
are in progress.
Aug 2017NATimeline by which the
college is made
functional
Jul 2017Nov 2016Timeline by which the
construction of
Shaheed Sukhdev
college will be
completed
a) Ongoing
construction
project: Shaheed
Sukhdev college
of Business
Studies
Construction of
Degree Colleges by
PWD
7
Directorate of Higher Education 34NA : Not Available
NR : Not Responded
EDUCATION
Indicator Baseline
2016-17
Target
2017-18Indicator
Baseline
2016-17
Target
2017-18
1 2 3 4 5 6 7 8 9 10 11 12
Risk Factors /
Remarks
Sr.
No
Name of the Scheme
/ Programme
Budget
Allocation
(Rs. Lakhs)
Timelines Objectives
OUTPUTS OUTCOMES
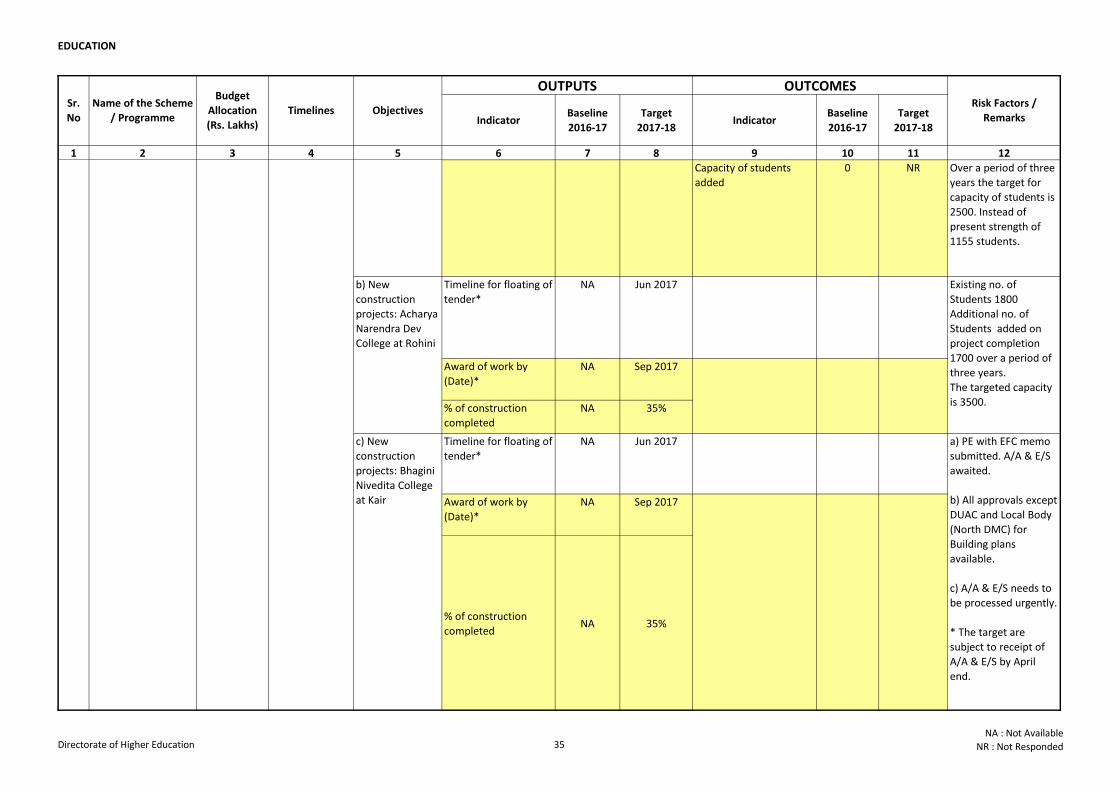
Capacity of students
added
0 NR Over a period of three
years the target for
capacity of students is
2500. Instead of
present strength of
1155 students.
Timeline for floating of
tender*
NA Jun 2017
Award of work by
(Date)*
NA Sep 2017
% of construction
completed
NA 35%
Timeline for floating of
tender*
NA Jun 2017
Award of work by
(Date)*
NA Sep 2017
% of construction
completed NA 35%
Ongoing 5500
Existing no. of
Students 1800
Additional no. of
Students added on
project completion
1700 over a period of
three years.
The targeted capacity
is 3500.
a) PE with EFC memo
submitted. A/A & E/S
awaited.
b) All approvals except
DUAC and Local Body
(North DMC) for
Building plans
available.
c) A/A & E/S needs to
be processed urgently.
* The target are
subject to receipt of
A/A & E/S by April
end.
b) New
construction
projects: Acharya
Narendra Dev
College at Rohini
a) Ongoing
construction
project: Shaheed
Sukhdev college
of Business
Studies
c) New
construction
projects: Bhagini
Nivedita College
at Kair
Construction of
Degree Colleges by
PWD
7
Directorate of Higher Education 35NA : Not Available
NR : Not Responded
EDUCATION
Indicator Baseline
2016-17
Target
2017-18Indicator
Baseline
2016-17
Target
2017-18
1 2 3 4 5 6 7 8 9 10 11 12
Risk Factors /
Remarks
Sr.
No
Name of the Scheme
/ Programme
Budget
Allocation
(Rs. Lakhs)
Timelines Objectives
OUTPUTS OUTCOMES
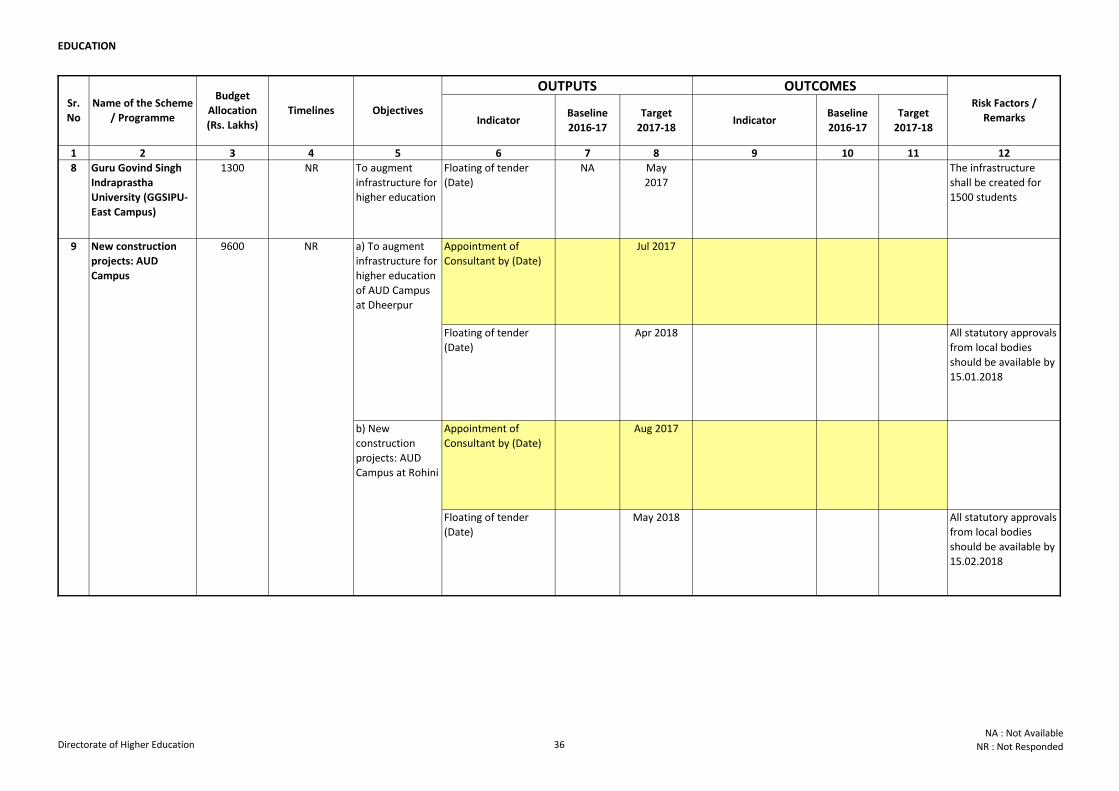
8 Guru Govind Singh
Indraprastha
University (GGSIPU-
East Campus)
1300 NR To augment
infrastructure for
higher education
Floating of tender
(Date)
NA May
2017
The infrastructure
shall be created for
1500 students
Appointment of
Consultant by (Date)
Jul 2017
Floating of tender
(Date)
Apr 2018 All statutory approvals
from local bodies
should be available by
15.01.2018
Appointment of
Consultant by (Date)
Aug 2017
Floating of tender
(Date)
May 2018 All statutory approvals
from local bodies
should be available by
15.02.2018
9 9600 a) To augment
infrastructure for
higher education
of AUD Campus
at Dheerpur
b) New
construction
projects: AUD
Campus at Rohini
NRNew construction
projects: AUD
Campus
Directorate of Higher Education 36NA : Not Available
NR : Not Responded
EDUCATIO
N
EDUCATION
Indicator Baseline
2016-17
Target
2017-18Indicator
Baseline
2016-17
Target
2017-18
1 2 3 4 5 6 7 8 9 10 11 12
Risk Factors /
Remarks
Sr.
No
Name of the Scheme
/ Programme
Budget
Allocation
(Rs. Lakhs)
Timelines Objectives
OUTPUTS OUTCOMES
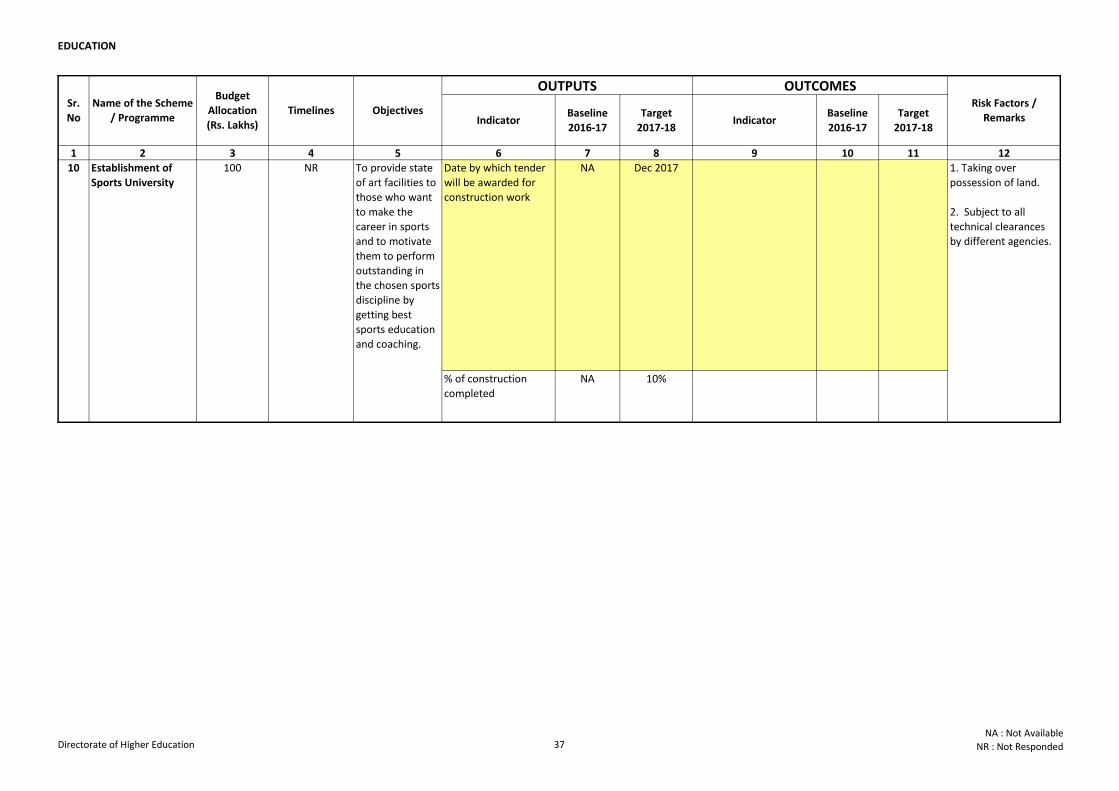
Date by which tender
will be awarded for
construction work
NA Dec 2017
% of construction
completed
NA 10%
1. Taking over
possession of land.
2. Subject to all
technical clearances
by different agencies.
10 Establishment of
Sports University
100 NR To provide state
of art facilities to
those who want
to make the
career in sports
and to motivate
them to perform
outstanding in
the chosen sports
discipline by
getting best
sports education
and coaching.
Directorate of Higher Education 37NA : Not Available
NR : Not Responded
EDUCATION
Indicator Baseline
2016-17
Target
2017-18Indicator
Baseline
2016-17
Target
2017-18
1 2 3 4 5 6 7 8 9 10 11 12
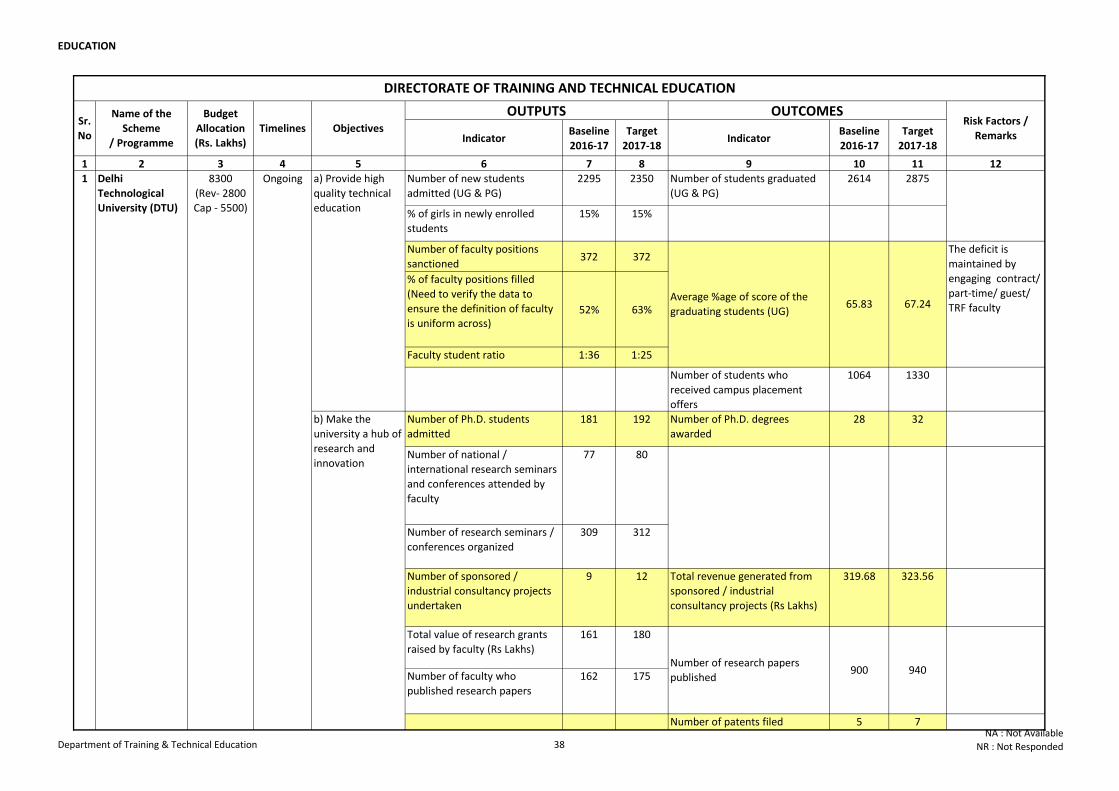
Number of new students
admitted (UG & PG)
2295 2350 Number of students graduated
(UG & PG)
2614 2875
% of girls in newly enrolled
students
15% 15%
Number of faculty positions
sanctioned372 372
% of faculty positions filled
(Need to verify the data to
ensure the definition of faculty
is uniform across)52% 63%
Faculty student ratio 1:36 1:25
Number of students who
received campus placement
offers
1064 1330
Number of Ph.D. students
admitted
181 192 Number of Ph.D. degrees
awarded
28 32
Number of national /
international research seminars
and conferences attended by
faculty
77 80
Number of research seminars /
conferences organized
309 312
Number of sponsored /
industrial consultancy projects
undertaken
9 12 Total revenue generated from
sponsored / industrial
consultancy projects (Rs Lakhs)
319.68 323.56
Total value of research grants
raised by faculty (Rs Lakhs)
161 180
Number of faculty who
published research papers
162 175
Number of patents filed 5 7
Average %age of score of the
graduating students (UG)
DIRECTORATE OF TRAINING AND TECHNICAL EDUCATION
OUTPUTS OUTCOMESSr.
No
Name of the
Scheme
/ Programme
Budget
Allocation
(Rs. Lakhs)
Timelines Objectives Risk Factors /
Remarks
65.83 67.24
The deficit is
maintained by
engaging contract/
part-time/ guest/
TRF faculty
b) Make the
university a hub of
research and
innovation
Number of research papers
published900 940
1 Delhi
Technological
University (DTU)
8300
(Rev- 2800
Cap - 5500)
Ongoing a) Provide high
quality technical
education
Department of Training & Technical Education 38NA : Not Available
NR : Not Responded
EDUCATION
Indicator Baseline
2016-17
Target
2017-18Indicator
Baseline
2016-17
Target
2017-18
1 2 3 4 5 6 7 8 9 10 11 12
OUTPUTS OUTCOMESSr.
No
Name of the
Scheme
/ Programme
Budget
Allocation
(Rs. Lakhs)
Timelines Objectives Risk Factors /
Remarks
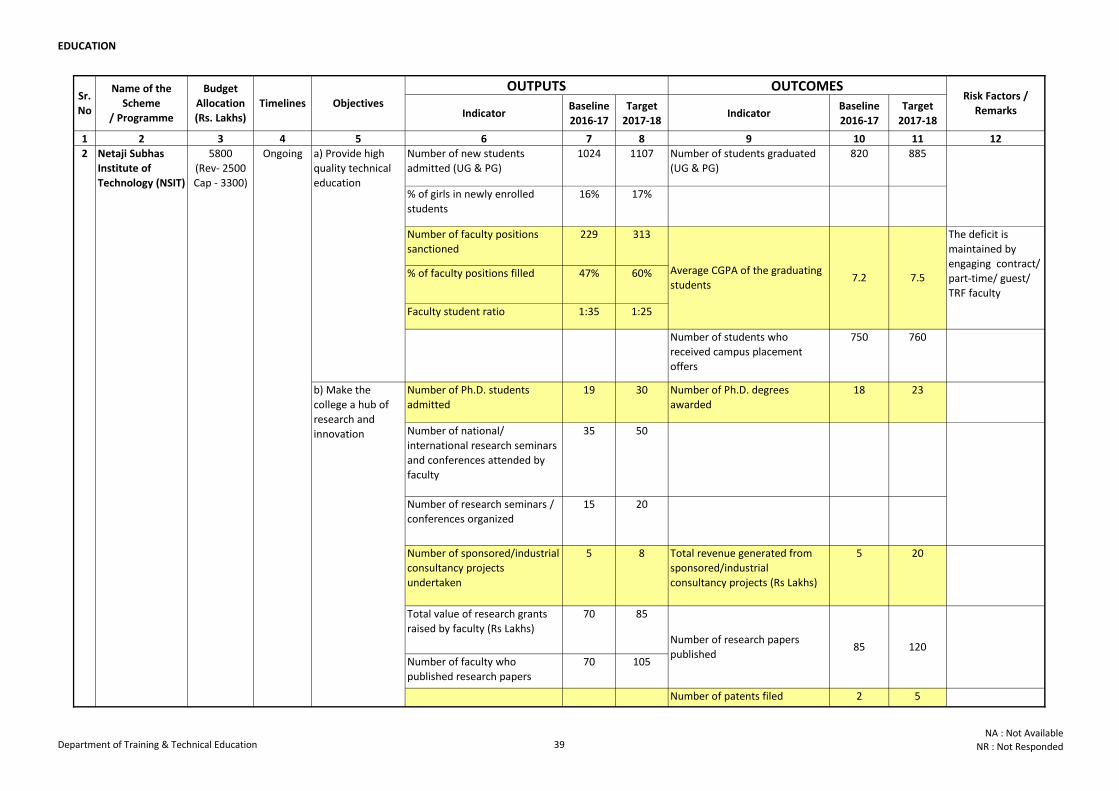
Number of new students
admitted (UG & PG)
1024 1107 Number of students graduated
(UG & PG)
820 885
% of girls in newly enrolled
students
16% 17%
Number of faculty positions
sanctioned
229 313
% of faculty positions filled 47% 60%
Faculty student ratio 1:35 1:25
Number of students who
received campus placement
offers
750 760
Number of Ph.D. students
admitted
19 30 Number of Ph.D. degrees
awarded
18 23
Number of national/
international research seminars
and conferences attended by
faculty
35 50
Number of research seminars /
conferences organized
15 20
Number of sponsored/industrial
consultancy projects
undertaken
5 8 Total revenue generated from
sponsored/industrial
consultancy projects (Rs Lakhs)
5 20
Total value of research grants
raised by faculty (Rs Lakhs)
70 85
Number of faculty who
published research papers
70 105
Number of patents filed 2 5
2 Netaji Subhas
Institute of
Technology (NSIT)
5800
(Rev- 2500
Cap - 3300)
Ongoing a) Provide high
quality technical
education
Average CGPA of the graduating
students7.2 7.5
The deficit is
maintained by
engaging contract/
part-time/ guest/
TRF faculty
b) Make the
college a hub of
research and
innovation
Number of research papers
published85 120
Department of Training & Technical Education 39NA : Not Available
NR : Not Responded
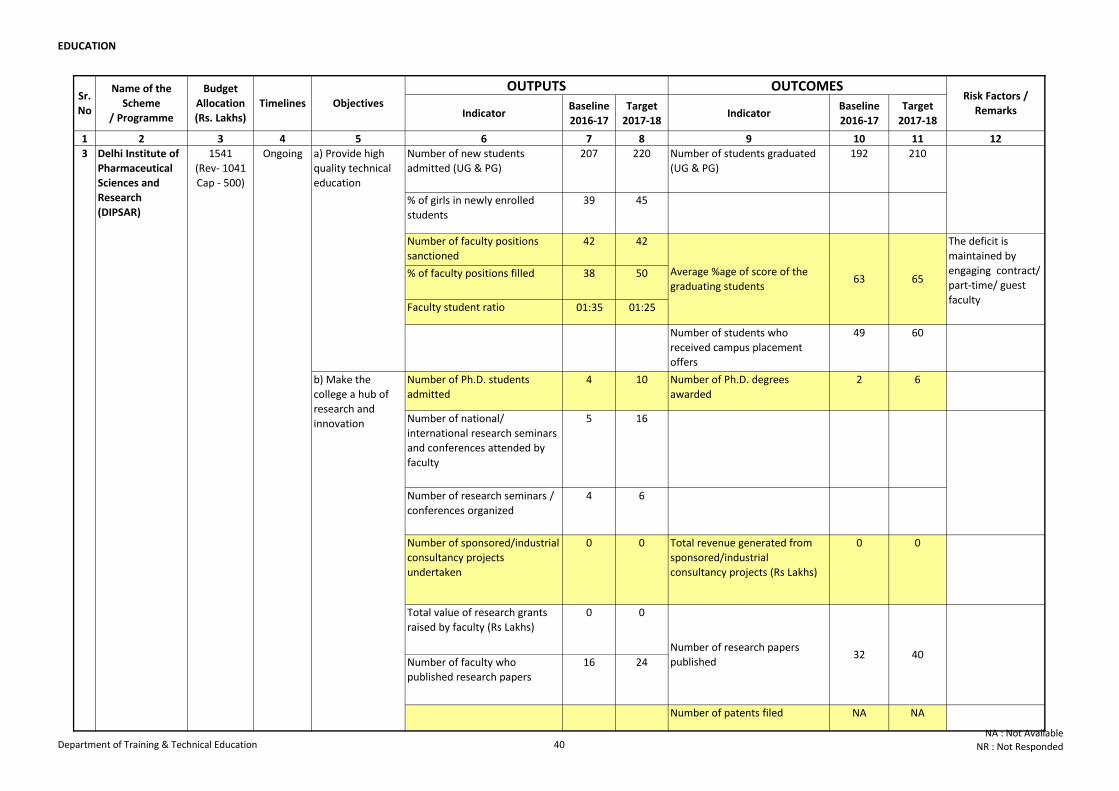
EDUCATION
Indicator Baseline
2016-17
Target
2017-18Indicator
Baseline
2016-17
Target
2017-18
1 2 3 4 5 6 7 8 9 10 11 12
OUTPUTS OUTCOMESSr.
No
Name of the
Scheme
/ Programme
Budget
Allocation
(Rs. Lakhs)
Timelines Objectives Risk Factors /
Remarks
Number of new students
admitted (UG & PG)
207 220 Number of students graduated
(UG & PG)
192 210
% of girls in newly enrolled
students
39 45
Number of faculty positions
sanctioned
42 42
% of faculty positions filled 38 50
Faculty student ratio 01:35 01:25
Number of students who
received campus placement
offers
49 60
Number of Ph.D. students
admitted
4 10 Number of Ph.D. degrees
awarded
2 6
Number of national/
international research seminars
and conferences attended by
faculty
5 16
Number of research seminars /
conferences organized
4 6
Number of sponsored/industrial
consultancy projects
undertaken
0 0 Total revenue generated from
sponsored/industrial
consultancy projects (Rs Lakhs)
0 0
Total value of research grants
raised by faculty (Rs Lakhs)
0 0
Number of faculty who
published research papers
16 24
Number of patents filed NA NA
b) Make the
college a hub of
research and
innovation
Number of research papers
published32 40
3 Delhi Institute of
Pharmaceutical
Sciences and
Research
(DIPSAR)
1541
(Rev- 1041
Cap - 500)
Ongoing a) Provide high
quality technical
education
Average %age of score of the
graduating students63 65
The deficit is
maintained by
engaging contract/
part-time/ guest
faculty
Department of Training & Technical Education 40NA : Not Available
NR : Not Responded
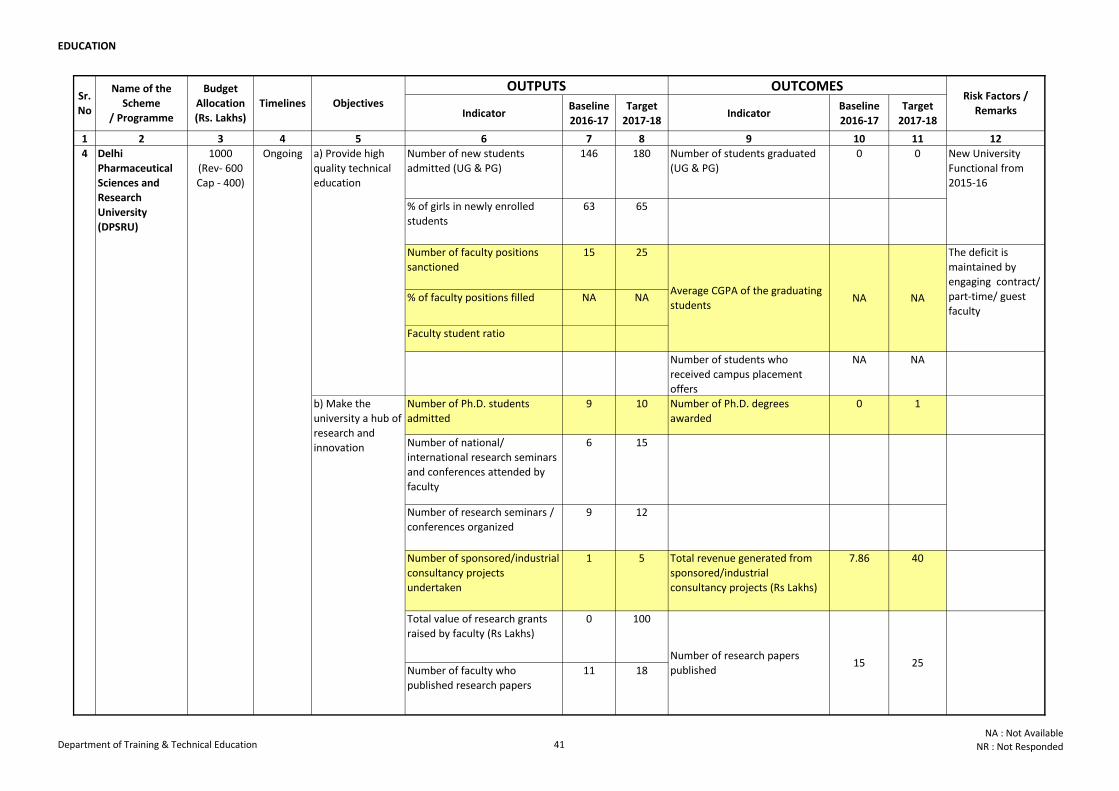
EDUCATION
Indicator Baseline
2016-17
Target
2017-18Indicator
Baseline
2016-17
Target
2017-18
1 2 3 4 5 6 7 8 9 10 11 12
OUTPUTS OUTCOMESSr.
No
Name of the
Scheme
/ Programme
Budget
Allocation
(Rs. Lakhs)
Timelines Objectives Risk Factors /
Remarks
Number of new students
admitted (UG & PG)
146 180 Number of students graduated
(UG & PG)
0 0
% of girls in newly enrolled
students
63 65
Number of faculty positions
sanctioned
15 25
% of faculty positions filled NA NA
Faculty student ratio
Number of students who
received campus placement
offers
NA NA
Number of Ph.D. students
admitted
9 10 Number of Ph.D. degrees
awarded
0 1
Number of national/
international research seminars
and conferences attended by
faculty
6 15
Number of research seminars /
conferences organized
9 12
Number of sponsored/industrial
consultancy projects
undertaken
1 5 Total revenue generated from
sponsored/industrial
consultancy projects (Rs Lakhs)
7.86 40
Total value of research grants
raised by faculty (Rs Lakhs)
0 100
Number of faculty who
published research papers
11 18
NA NA
The deficit is
maintained by
engaging contract/
part-time/ guest
faculty
b) Make the
university a hub of
research and
innovation
Number of research papers
published15 25
4 Delhi
Pharmaceutical
Sciences and
Research
University
(DPSRU)
1000
(Rev- 600
Cap - 400)
Ongoing a) Provide high
quality technical
education
Average CGPA of the graduating
students
New University
Functional from
2015-16
Department of Training & Technical Education 41NA : Not Available
NR : Not Responded
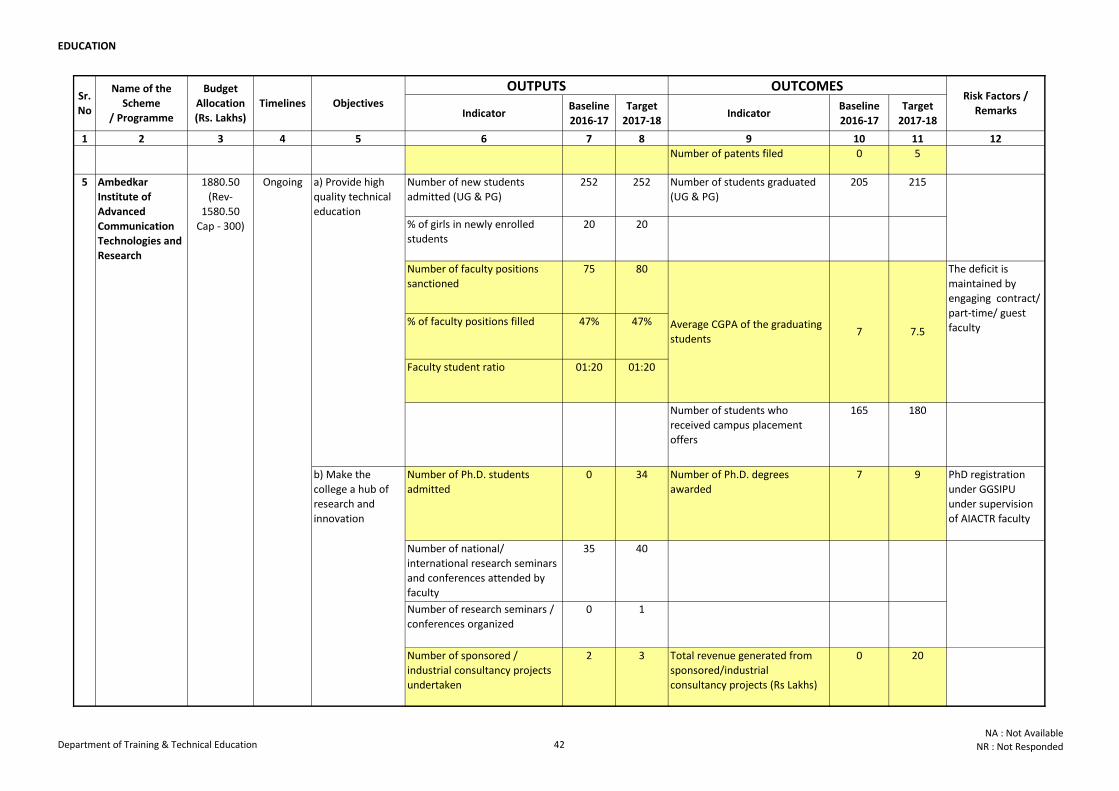
EDUCATION
Indicator Baseline
2016-17
Target
2017-18Indicator
Baseline
2016-17
Target
2017-18
1 2 3 4 5 6 7 8 9 10 11 12
OUTPUTS OUTCOMESSr.
No
Name of the
Scheme
/ Programme
Budget
Allocation
(Rs. Lakhs)
Timelines Objectives Risk Factors /
Remarks
Number of patents filed 0 5
Number of new students
admitted (UG & PG)
252 252 Number of students graduated
(UG & PG)
205 215
% of girls in newly enrolled
students
20 20
Number of faculty positions
sanctioned
75 80
% of faculty positions filled 47% 47%
Faculty student ratio 01:20 01:20
Number of students who
received campus placement
offers
165 180
Number of Ph.D. students
admitted
0 34 Number of Ph.D. degrees
awarded
7 9 PhD registration
under GGSIPU
under supervision
of AIACTR faculty
Number of national/
international research seminars
and conferences attended by
faculty
35 40
Number of research seminars /
conferences organized
0 1
Number of sponsored /
industrial consultancy projects
undertaken
2 3 Total revenue generated from
sponsored/industrial
consultancy projects (Rs Lakhs)
0 20
7 7.5
The deficit is
maintained by
engaging contract/
part-time/ guest
faculty
b) Make the
college a hub of
research and
innovation
5 Ambedkar
Institute of
Advanced
Communication
Technologies and
Research
1880.50
(Rev-
1580.50
Cap - 300)
Ongoing a) Provide high
quality technical
education
Average CGPA of the graduating
students
b) Make the
university a hub of
research and
innovation
4 Delhi
Pharmaceutical
Sciences and
Research
University
(DPSRU)
1000
(Rev- 600
Cap - 400)
Ongoing
Department of Training & Technical Education 42NA : Not Available
NR : Not Responded
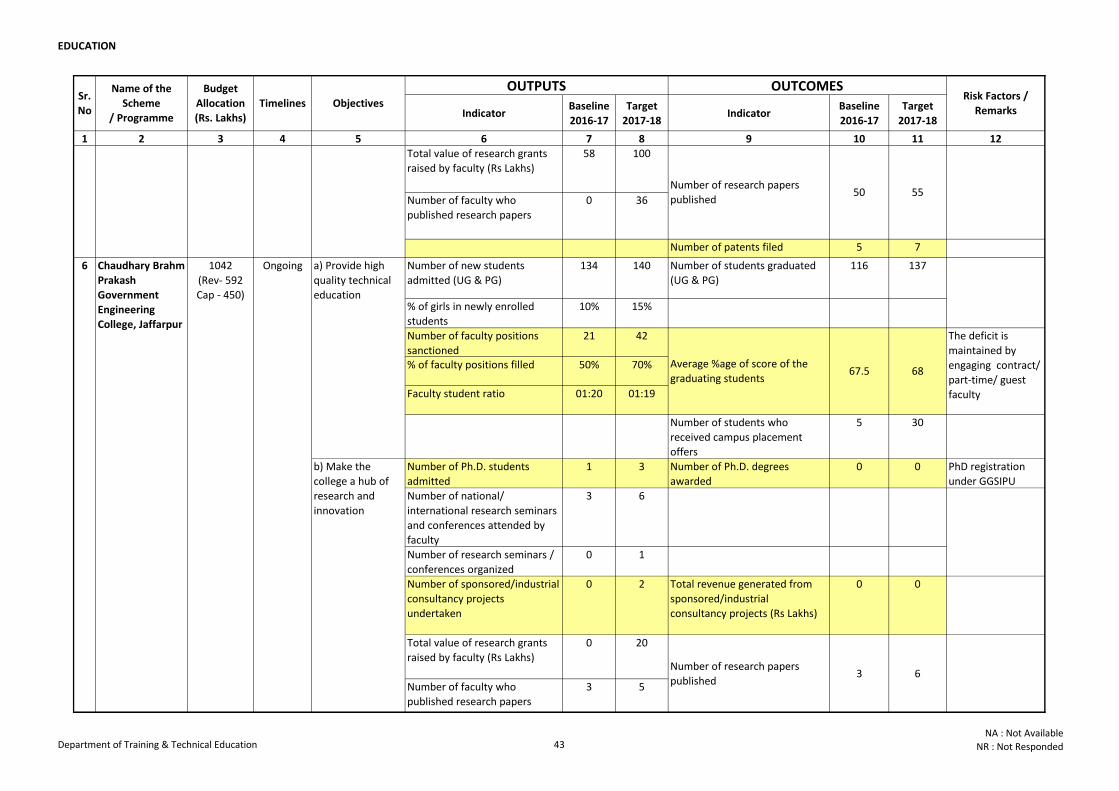
EDUCATION
Indicator Baseline
2016-17
Target
2017-18Indicator
Baseline
2016-17
Target
2017-18
1 2 3 4 5 6 7 8 9 10 11 12
OUTPUTS OUTCOMESSr.
No
Name of the
Scheme
/ Programme
Budget
Allocation
(Rs. Lakhs)
Timelines Objectives Risk Factors /
Remarks
Total value of research grants
raised by faculty (Rs Lakhs)
58 100
Number of faculty who
published research papers
0 36
Number of patents filed 5 7
Number of new students
admitted (UG & PG)
134 140 Number of students graduated
(UG & PG)
116 137
% of girls in newly enrolled
students
10% 15%
Number of faculty positions
sanctioned
21 42
% of faculty positions filled 50% 70%
Faculty student ratio 01:20 01:19
Number of students who
received campus placement
offers
5 30
Number of Ph.D. students
admitted
1 3 Number of Ph.D. degrees
awarded
0 0 PhD registration
under GGSIPU
under supervision Number of national/
international research seminars
and conferences attended by
faculty
3 6
Number of research seminars /
conferences organized
0 1
Number of sponsored/industrial
consultancy projects
undertaken
0 2 Total revenue generated from
sponsored/industrial
consultancy projects (Rs Lakhs)
0 0
Total value of research grants
raised by faculty (Rs Lakhs)
0 20
Number of faculty who
published research papers
3 5
67.5 68
The deficit is
maintained by
engaging contract/
part-time/ guest
faculty
b) Make the
college a hub of
research and
innovation
Number of research papers
published3 6
6 Chaudhary Brahm
Prakash
Government
Engineering
College, Jaffarpur
1042
(Rev- 592
Cap - 450)
Ongoing a) Provide high
quality technical
education
Average %age of score of the
graduating students
b) Make the
college a hub of
research and
innovation
Number of research papers
published50 55
5 Ambedkar
Institute of
Advanced
Communication
Technologies and
Research
1880.50
(Rev-
1580.50
Cap - 300)
Ongoing
Department of Training & Technical Education 43NA : Not Available
NR : Not Responded
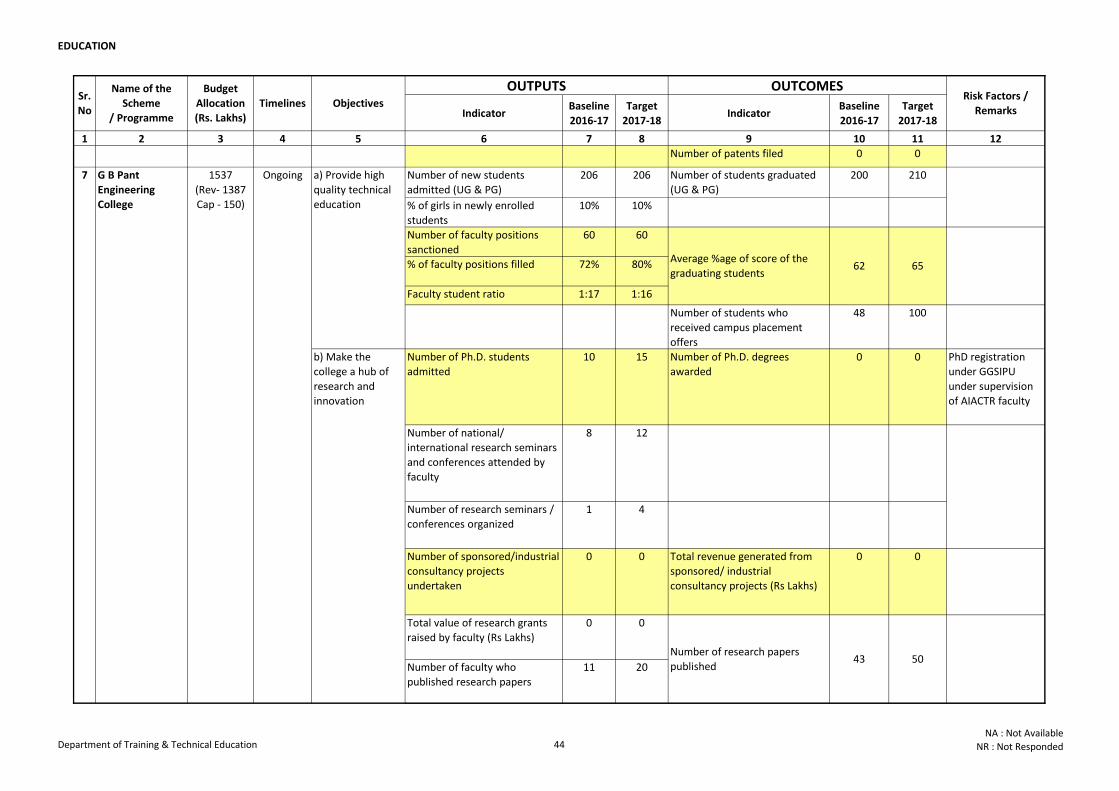
EDUCATION
Indicator Baseline
2016-17
Target
2017-18Indicator
Baseline
2016-17
Target
2017-18
1 2 3 4 5 6 7 8 9 10 11 12
OUTPUTS OUTCOMESSr.
No
Name of the
Scheme
/ Programme
Budget
Allocation
(Rs. Lakhs)
Timelines Objectives Risk Factors /
Remarks
Number of patents filed 0 0
Number of new students
admitted (UG & PG)
206 206 Number of students graduated
(UG & PG)
200 210
% of girls in newly enrolled
students
10% 10%
Number of faculty positions
sanctioned
60 60
% of faculty positions filled 72% 80%
Faculty student ratio 1:17 1:16
Number of students who
received campus placement
offers
48 100
Number of Ph.D. students
admitted
10 15 Number of Ph.D. degrees
awarded
0 0 PhD registration
under GGSIPU
under supervision
of AIACTR faculty
Number of national/
international research seminars
and conferences attended by
faculty
8 12
Number of research seminars /
conferences organized
1 4
Number of sponsored/industrial
consultancy projects
undertaken
0 0 Total revenue generated from
sponsored/ industrial
consultancy projects (Rs Lakhs)
0 0
Total value of research grants
raised by faculty (Rs Lakhs)
0 0
Number of faculty who
published research papers
11 20
62 65
b) Make the
college a hub of
research and
innovation
Number of research papers
published43 50
7 G B Pant
Engineering
College
1537
(Rev- 1387
Cap - 150)
Ongoing a) Provide high
quality technical
education
Average %age of score of the
graduating students
b) Make the
college a hub of
research and
innovation
6 Chaudhary Brahm
Prakash
Government
Engineering
College, Jaffarpur
1042
(Rev- 592
Cap - 450)
Ongoing
Department of Training & Technical Education 44NA : Not Available
NR : Not Responded
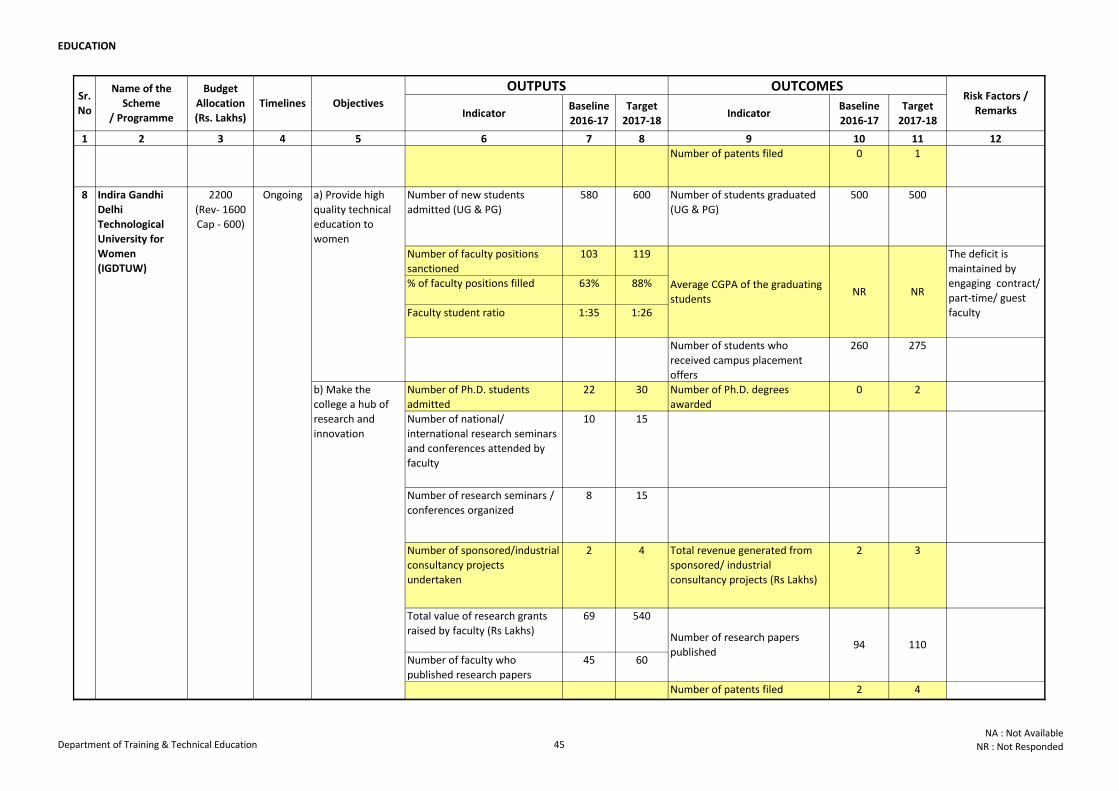
EDUCATION
Indicator Baseline
2016-17
Target
2017-18Indicator
Baseline
2016-17
Target
2017-18
1 2 3 4 5 6 7 8 9 10 11 12
OUTPUTS OUTCOMESSr.
No
Name of the
Scheme
/ Programme
Budget
Allocation
(Rs. Lakhs)
Timelines Objectives Risk Factors /
Remarks
Number of patents filed 0 1
Number of new students
admitted (UG & PG)
580 600 Number of students graduated
(UG & PG)
500 500
Number of faculty positions
sanctioned
103 119
% of faculty positions filled 63% 88%
Faculty student ratio 1:35 1:26
Number of students who
received campus placement
offers
260 275
Number of Ph.D. students
admitted
22 30 Number of Ph.D. degrees
awarded
0 2
Number of national/
international research seminars
and conferences attended by
faculty
10 15
Number of research seminars /
conferences organized
8 15
Number of sponsored/industrial
consultancy projects
undertaken
2 4 Total revenue generated from
sponsored/ industrial
consultancy projects (Rs Lakhs)
2 3
Total value of research grants
raised by faculty (Rs Lakhs)
69 540
Number of faculty who
published research papers
45 60
Number of patents filed 2 4
NR NR
b) Make the
college a hub of
research and
innovation
Number of research papers
published94 110
8 Indira Gandhi
Delhi
Technological
University for
Women
(IGDTUW)
2200
(Rev- 1600
Cap - 600)
Ongoing a) Provide high
quality technical
education to
women
Average CGPA of the graduating
students
b) Make the
college a hub of
research and
innovation
7 G B Pant
Engineering
College
1537
(Rev- 1387
Cap - 150)
Ongoing
The deficit is
maintained by
engaging contract/
part-time/ guest
faculty
Department of Training & Technical Education 45NA : Not Available
NR : Not Responded
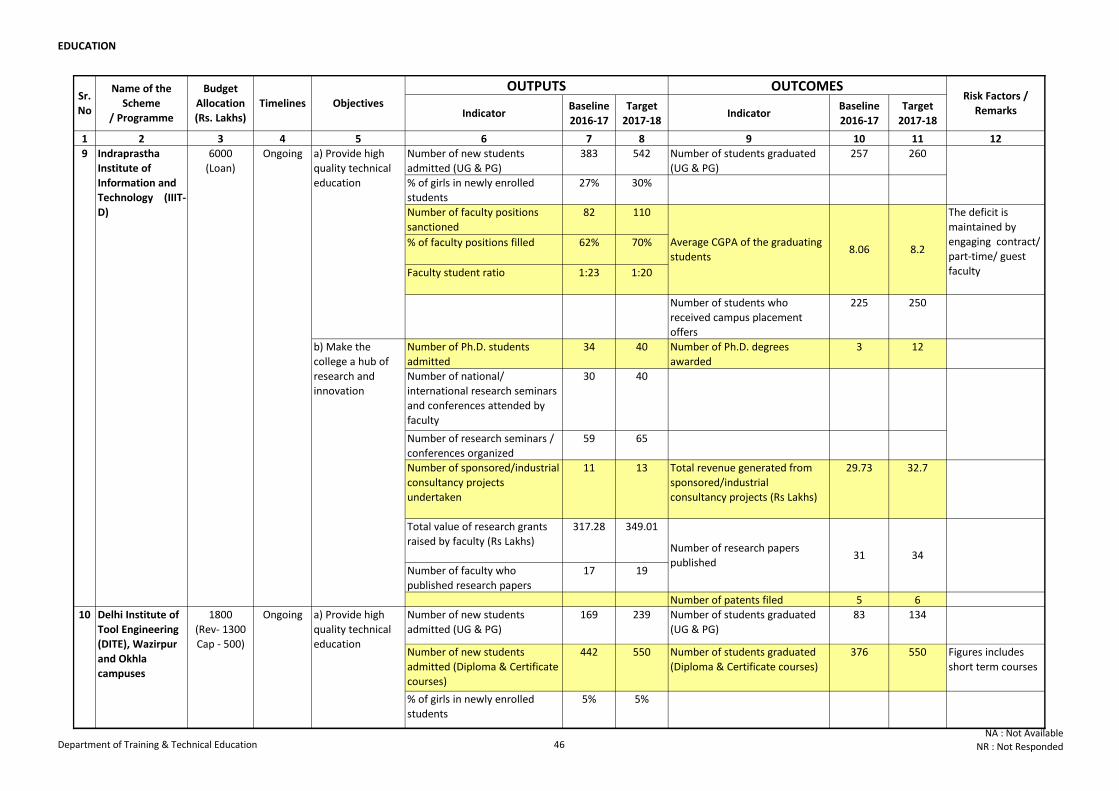
EDUCATION
Indicator Baseline
2016-17
Target
2017-18Indicator
Baseline
2016-17
Target
2017-18
1 2 3 4 5 6 7 8 9 10 11 12
OUTPUTS OUTCOMESSr.
No
Name of the
Scheme
/ Programme
Budget
Allocation
(Rs. Lakhs)
Timelines Objectives Risk Factors /
Remarks
Number of new students
admitted (UG & PG)
383 542 Number of students graduated
(UG & PG)
257 260
% of girls in newly enrolled
students
27% 30%
Number of faculty positions
sanctioned
82 110
% of faculty positions filled 62% 70%
Faculty student ratio 1:23 1:20
Number of students who
received campus placement
offers
225 250
Number of Ph.D. students
admitted
34 40 Number of Ph.D. degrees
awarded
3 12
Number of national/
international research seminars
and conferences attended by
faculty
30 40
Number of research seminars /
conferences organized
59 65
Number of sponsored/industrial
consultancy projects
undertaken
11 13 Total revenue generated from
sponsored/industrial
consultancy projects (Rs Lakhs)
29.73 32.7
Total value of research grants
raised by faculty (Rs Lakhs)
317.28 349.01
Number of faculty who
published research papers
17 19
Number of patents filed 5 6
Number of new students
admitted (UG & PG)
169 239 Number of students graduated
(UG & PG)
83 134
Number of new students
admitted (Diploma & Certificate
courses)
442 550 Number of students graduated
(Diploma & Certificate courses)
376 550 Figures includes
short term courses
% of girls in newly enrolled
students
5% 5%
10 Delhi Institute of
Tool Engineering
(DITE), Wazirpur
and Okhla
campuses
1800
(Rev- 1300
Cap - 500)
Ongoing a) Provide high
quality technical
education
8.06 8.2
b) Make the
college a hub of
research and
innovation
Number of research papers
published31 34
9 Indraprastha
Institute of
Information and
Technology (IIIT-
D)
6000
(Loan)
Ongoing a) Provide high
quality technical
education
Average CGPA of the graduating
students
The deficit is
maintained by
engaging contract/
part-time/ guest
faculty
Department of Training & Technical Education 46NA : Not Available
NR : Not Responded
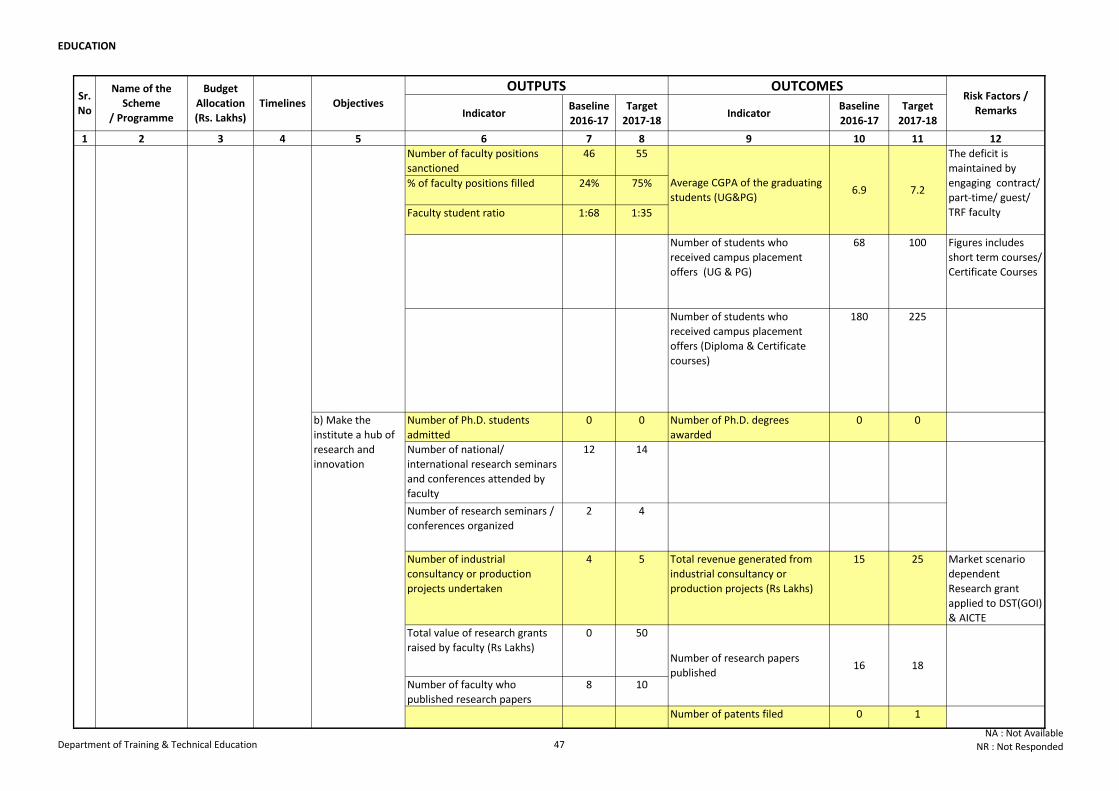
EDUCATION
Indicator Baseline
2016-17
Target
2017-18Indicator
Baseline
2016-17
Target
2017-18
1 2 3 4 5 6 7 8 9 10 11 12
OUTPUTS OUTCOMESSr.
No
Name of the
Scheme
/ Programme
Budget
Allocation
(Rs. Lakhs)
Timelines Objectives Risk Factors /
Remarks
Number of faculty positions
sanctioned
46 55
% of faculty positions filled 24% 75%
Faculty student ratio 1:68 1:35
Number of students who
received campus placement
offers (UG & PG)
68 100 Figures includes
short term courses/
Certificate Courses
Number of students who
received campus placement
offers (Diploma & Certificate
courses)
180 225
Number of Ph.D. students
admitted
0 0 Number of Ph.D. degrees
awarded
0 0
Number of national/
international research seminars
and conferences attended by
faculty
12 14
Number of research seminars /
conferences organized
2 4
Number of industrial
consultancy or production
projects undertaken
4 5 Total revenue generated from
industrial consultancy or
production projects (Rs Lakhs)
15 25 Market scenario
dependent
Research grant
applied to DST(GOI)
& AICTE
Total value of research grants
raised by faculty (Rs Lakhs)
0 50
Number of faculty who
published research papers
8 10
Number of patents filed 0 1
6.9 7.2
The deficit is
maintained by
engaging contract/
part-time/ guest/
TRF faculty
b) Make the
institute a hub of
research and
innovation
Number of research papers
published16 18
10 Delhi Institute of
Tool Engineering
(DITE), Wazirpur
and Okhla
campuses
1800
(Rev- 1300
Cap - 500)
Ongoing a) Provide high
quality technical
education
Average CGPA of the graduating
students (UG&PG)
Department of Training & Technical Education 47NA : Not Available
NR : Not Responded
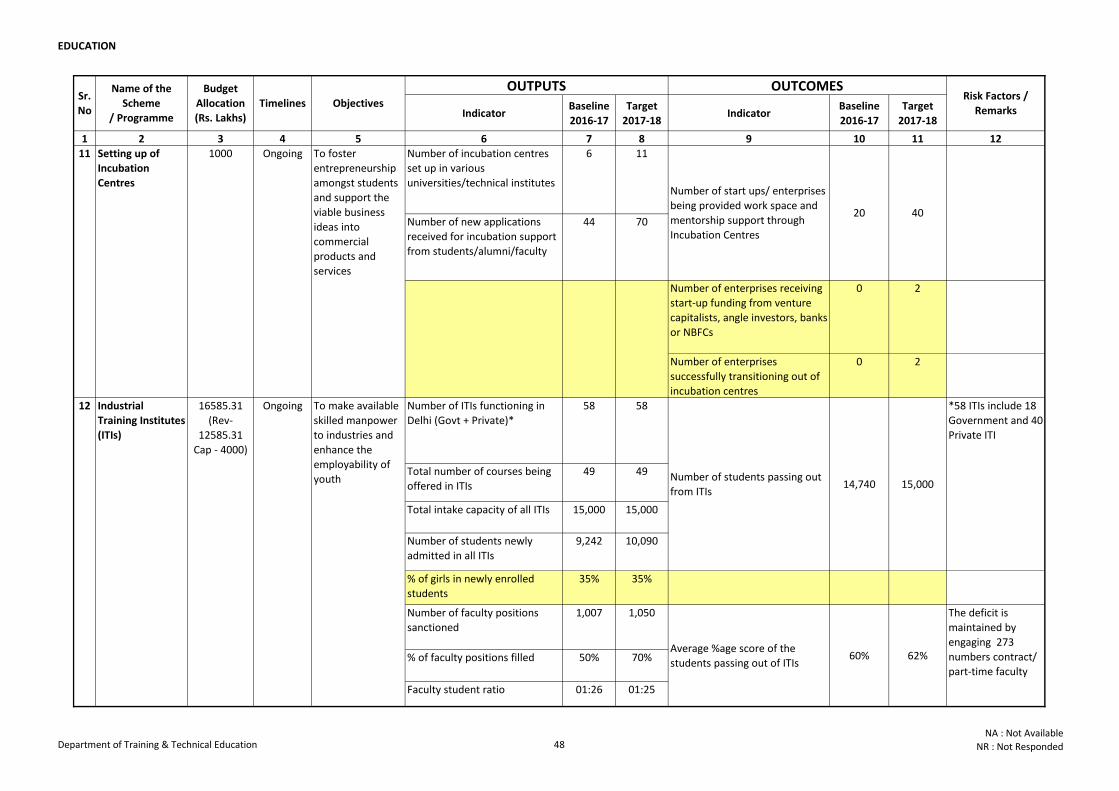
EDUCATION
Indicator Baseline
2016-17
Target
2017-18Indicator
Baseline
2016-17
Target
2017-18
1 2 3 4 5 6 7 8 9 10 11 12
OUTPUTS OUTCOMESSr.
No
Name of the
Scheme
/ Programme
Budget
Allocation
(Rs. Lakhs)
Timelines Objectives Risk Factors /
Remarks
Number of incubation centres
set up in various
universities/technical institutes
6 11
Number of new applications
received for incubation support
from students/alumni/faculty
44 70
Number of enterprises receiving
start-up funding from venture
capitalists, angle investors, banks
or NBFCs
0 2
Number of enterprises
successfully transitioning out of
incubation centres
0 2
Number of ITIs functioning in
Delhi (Govt + Private)*
58 58
Total number of courses being
offered in ITIs
49 49
Total intake capacity of all ITIs 15,000 15,000
Number of students newly
admitted in all ITIs
9,242 10,090
% of girls in newly enrolled
students
35% 35%
Number of faculty positions
sanctioned
1,007 1,050
% of faculty positions filled 50% 70%
Faculty student ratio 01:26 01:25
14,740 15,000
*58 ITIs include 18
Government and 40
Private ITI
Average %age score of the
students passing out of ITIs 60% 62%
The deficit is
maintained by
engaging 273
numbers contract/
part-time faculty
12 Industrial
Training Institutes
(ITIs)
16585.31
(Rev-
12585.31
Cap - 4000)
Ongoing To make available
skilled manpower
to industries and
enhance the
employability of
youth Number of students passing out
from ITIs
20 40
11 Setting up of
Incubation
Centres
1000 Ongoing To foster
entrepreneurship
amongst students
and support the
viable business
ideas into
commercial
products and
services
Number of start ups/ enterprises
being provided work space and
mentorship support through
Incubation Centres
Department of Training & Technical Education 48NA : Not Available
NR : Not Responded
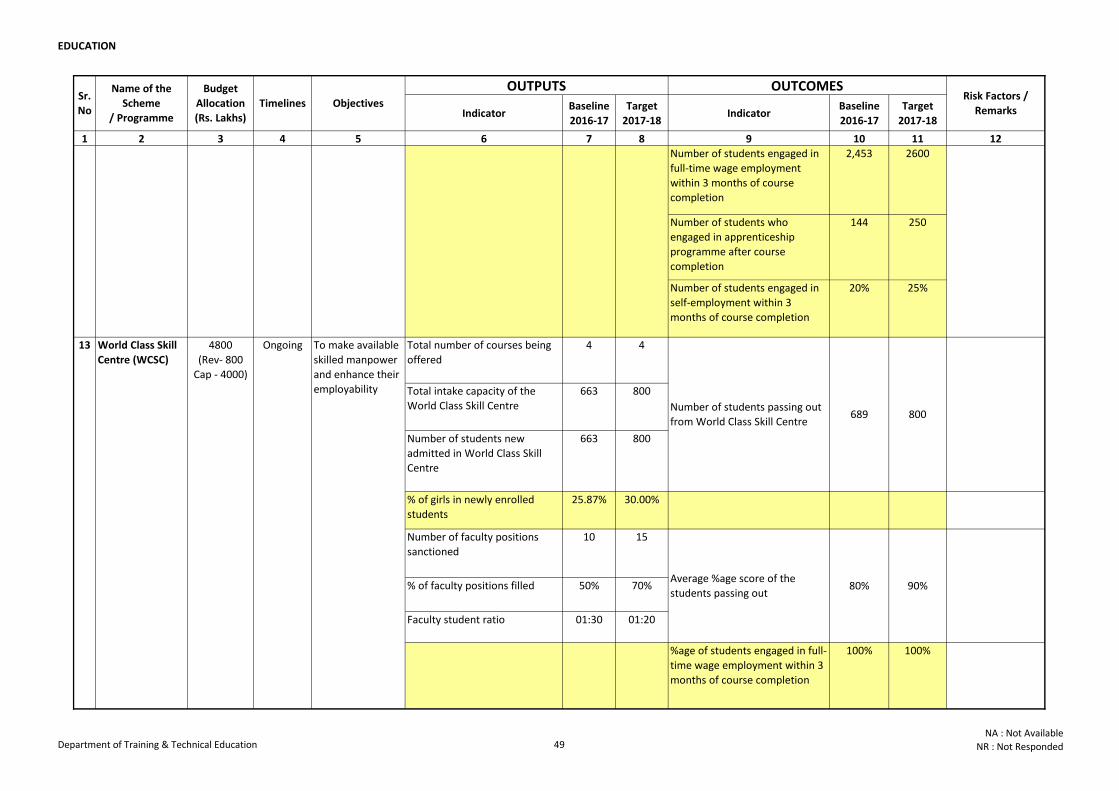
EDUCATION
Indicator Baseline
2016-17
Target
2017-18Indicator
Baseline
2016-17
Target
2017-18
1 2 3 4 5 6 7 8 9 10 11 12
OUTPUTS OUTCOMESSr.
No
Name of the
Scheme
/ Programme
Budget
Allocation
(Rs. Lakhs)
Timelines Objectives Risk Factors /
Remarks
Number of students engaged in
full-time wage employment
within 3 months of course
completion
2,453 2600
Number of students who
engaged in apprenticeship
programme after course
completion
144 250
Number of students engaged in
self-employment within 3
months of course completion
20% 25%
Total number of courses being
offered
4 4
Total intake capacity of the
World Class Skill Centre
663 800
Number of students new
admitted in World Class Skill
Centre
663 800
% of girls in newly enrolled
students
25.87% 30.00%
Number of faculty positions
sanctioned
10 15
% of faculty positions filled 50% 70%
Faculty student ratio 01:30 01:20
%age of students engaged in full-
time wage employment within 3
months of course completion
100% 100%
689 800
Average %age score of the
students passing out80% 90%
13 World Class Skill
Centre (WCSC)
4800
(Rev- 800
Cap - 4000)
Ongoing To make available
skilled manpower
and enhance their
employability
Number of students passing out
from World Class Skill Centre
12 Industrial
Training Institutes
(ITIs)
16585.31
(Rev-
12585.31
Cap - 4000)
Ongoing To make available
skilled manpower
to industries and
enhance the
employability of
youth
Department of Training & Technical Education 49NA : Not Available
NR : Not Responded
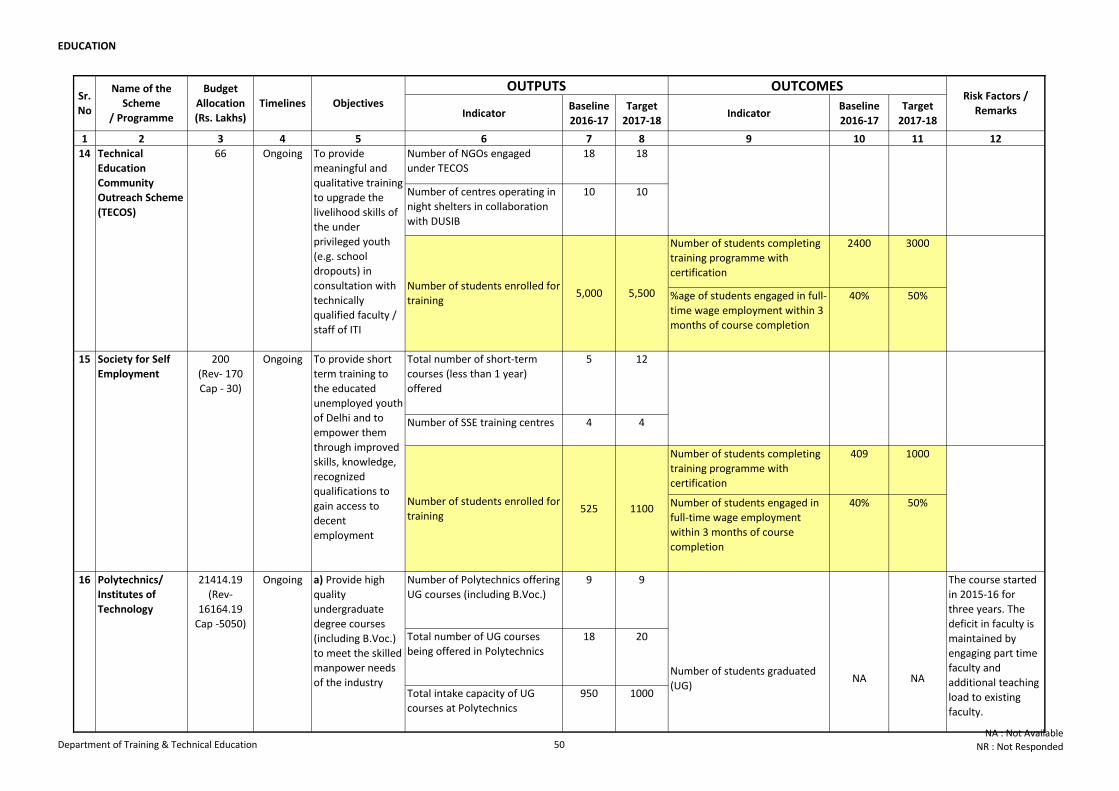
EDUCATION
Indicator Baseline
2016-17
Target
2017-18Indicator
Baseline
2016-17
Target
2017-18
1 2 3 4 5 6 7 8 9 10 11 12
OUTPUTS OUTCOMESSr.
No
Name of the
Scheme
/ Programme
Budget
Allocation
(Rs. Lakhs)
Timelines Objectives Risk Factors /
Remarks
Number of NGOs engaged
under TECOS
18 18
Number of centres operating in
night shelters in collaboration
with DUSIB
10 10
Number of students completing
training programme with
certification
2400 3000
%age of students engaged in full-
time wage employment within 3
months of course completion
40% 50%
Total number of short-term
courses (less than 1 year)
offered
5 12
Number of SSE training centres 4 4
Number of students completing
training programme with
certification
409 1000
Number of students engaged in
full-time wage employment
within 3 months of course
completion
40% 50%
Number of Polytechnics offering
UG courses (including B.Voc.)
9 9
Total number of UG courses
being offered in Polytechnics
18 20
Total intake capacity of UG
courses at Polytechnics
950 1000
The course started
in 2015-16 for
three years. The
deficit in faculty is
maintained by
engaging part time
faculty and
additional teaching
load to existing
faculty.
16 Polytechnics/
Institutes of
Technology
21414.19
(Rev-
16164.19
Cap -5050)
Ongoing a) Provide high
quality
undergraduate
degree courses
(including B.Voc.)
to meet the skilled
manpower needs
of the industryNumber of students graduated
(UG)NA NA
5,000 5,500
15 Society for Self
Employment
200
(Rev- 170
Cap - 30)
Ongoing To provide short
term training to
the educated
unemployed youth
of Delhi and to
empower them
through improved
skills, knowledge,
recognized
qualifications to
gain access to
decent
employment
Number of students enrolled for
training525
14 Technical
Education
Community
Outreach Scheme
(TECOS)
66 Ongoing To provide
meaningful and
qualitative training
to upgrade the
livelihood skills of
the under
privileged youth
(e.g. school
dropouts) in
consultation with
technically
qualified faculty /
staff of ITI
Number of students enrolled for
training
1100
Department of Training & Technical Education 50NA : Not Available
NR : Not Responded
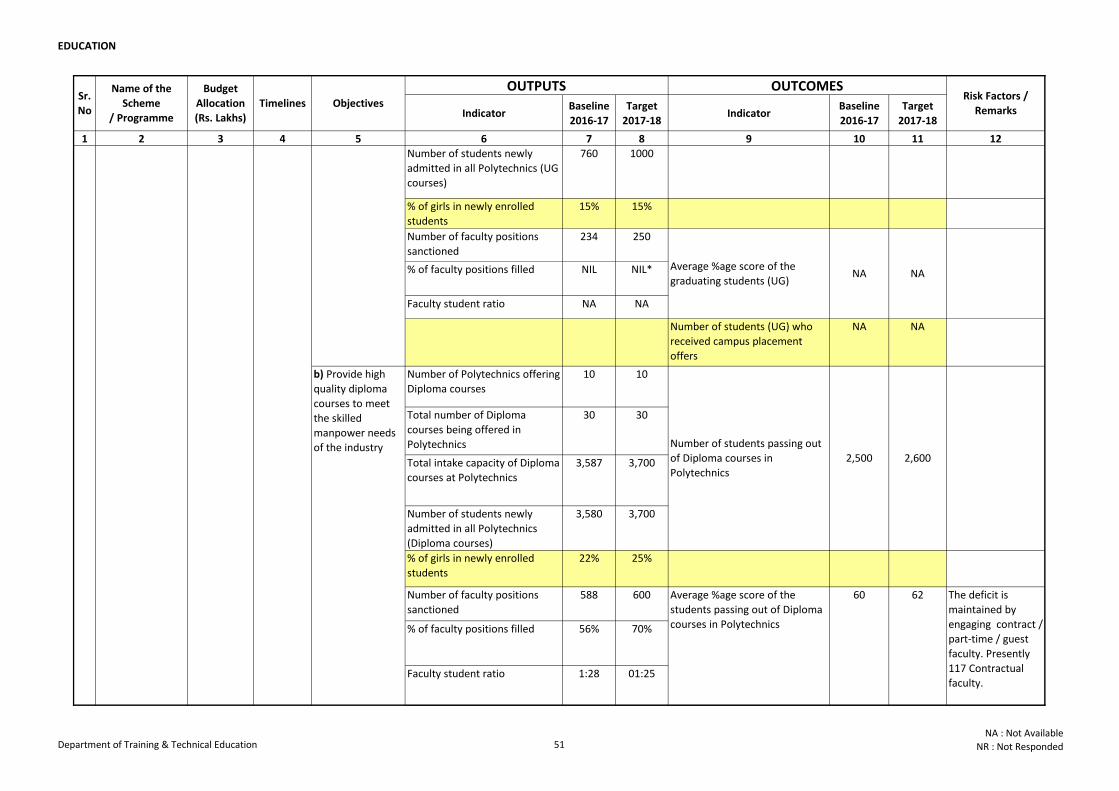
EDUCATION
Indicator Baseline
2016-17
Target
2017-18Indicator
Baseline
2016-17
Target
2017-18
1 2 3 4 5 6 7 8 9 10 11 12
OUTPUTS OUTCOMESSr.
No
Name of the
Scheme
/ Programme
Budget
Allocation
(Rs. Lakhs)
Timelines Objectives Risk Factors /
Remarks
Number of students newly
admitted in all Polytechnics (UG
courses)
760 1000
% of girls in newly enrolled
students
15% 15%
Number of faculty positions
sanctioned
234 250
% of faculty positions filled NIL NIL*
Faculty student ratio NA NA
Number of students (UG) who
received campus placement
offers
NA NA
Number of Polytechnics offering
Diploma courses
10 10
Total number of Diploma
courses being offered in
Polytechnics
30 30
Total intake capacity of Diploma
courses at Polytechnics
3,587 3,700
Number of students newly
admitted in all Polytechnics
(Diploma courses)
3,580 3,700
% of girls in newly enrolled
students
22% 25%
Number of faculty positions
sanctioned
588 600
% of faculty positions filled 56% 70%
Faculty student ratio 1:28 01:25
The deficit is
maintained by
engaging contract /
part-time / guest
faculty. Presently
117 Contractual
faculty.
The course started
in 2015-16 for
three years. The
deficit in faculty is
maintained by
engaging part time
faculty and
additional teaching
load to existing
faculty.
Average %age score of the
graduating students (UG)NA NA
b) Provide high
quality diploma
courses to meet
the skilled
manpower needs
of the industry
16 Polytechnics/
Institutes of
Technology
21414.19
(Rev-
16164.19
Cap -5050)
Ongoing a) Provide high
quality
undergraduate
degree courses
(including B.Voc.)
to meet the skilled
manpower needs
of the industryNumber of students graduated
(UG)NA NA
60 62
Number of students passing out
of Diploma courses in
Polytechnics
2,500 2,600
Average %age score of the
students passing out of Diploma
courses in Polytechnics
Department of Training & Technical Education 51NA : Not Available
NR : Not Responded
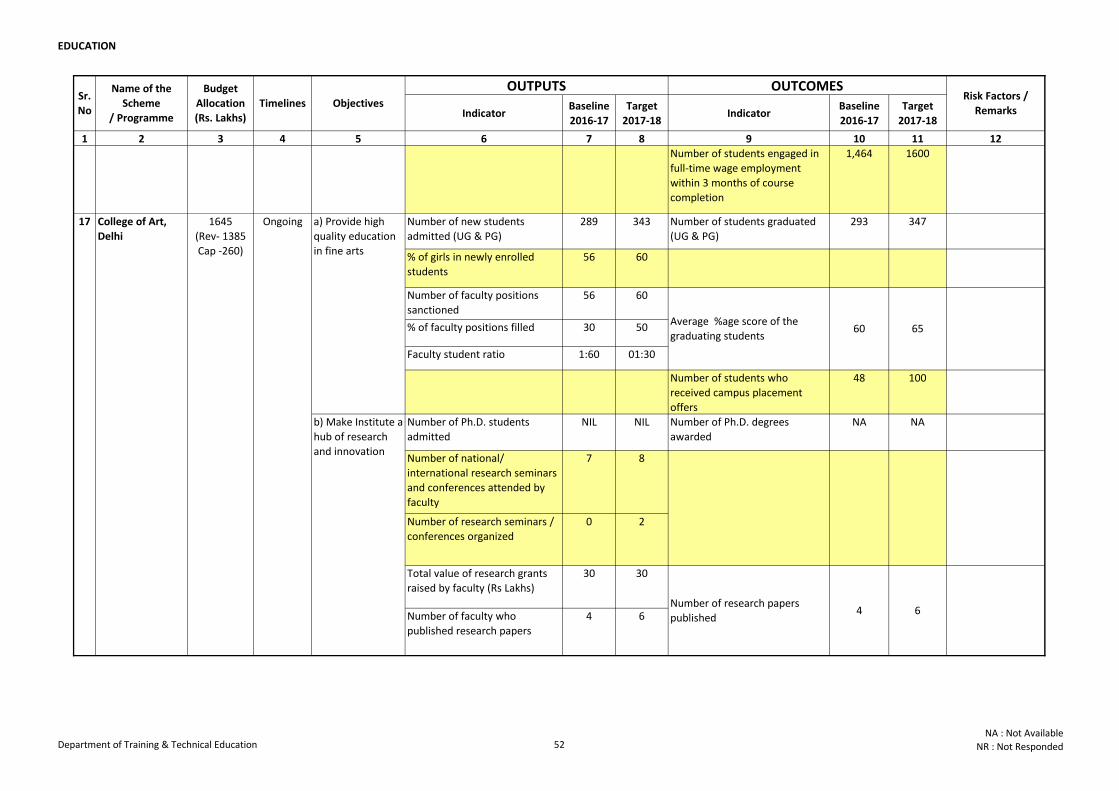
EDUCATION
Indicator Baseline
2016-17
Target
2017-18Indicator
Baseline
2016-17
Target
2017-18
1 2 3 4 5 6 7 8 9 10 11 12
OUTPUTS OUTCOMESSr.
No
Name of the
Scheme
/ Programme
Budget
Allocation
(Rs. Lakhs)
Timelines Objectives Risk Factors /
Remarks
Number of students engaged in
full-time wage employment
within 3 months of course
completion
1,464 1600
Number of new students
admitted (UG & PG)
289 343 Number of students graduated
(UG & PG)
293 347
% of girls in newly enrolled
students
56 60
Number of faculty positions
sanctioned
56 60
% of faculty positions filled 30 50
Faculty student ratio 1:60 01:30
Number of students who
received campus placement
offers
48 100
Number of Ph.D. students
admitted
NIL NIL Number of Ph.D. degrees
awarded
NA NA
Number of national/
international research seminars
and conferences attended by
faculty
7 8
Number of research seminars /
conferences organized
0 2
Total value of research grants
raised by faculty (Rs Lakhs)
30 30
Number of faculty who
published research papers
4 6
17 College of Art,
Delhi
1645
(Rev- 1385
Cap -260)
Ongoing a) Provide high
quality education
in fine arts
Average %age score of the
graduating students60 65
b) Make Institute a
hub of research
and innovation
Number of research papers
published4 6
b) Provide high
quality diploma
courses to meet
the skilled
manpower needs
of the industry
16 Polytechnics/
Institutes of
Technology
21414.19
(Rev-
16164.19
Cap -5050)
Ongoing
Department of Training & Technical Education 52NA : Not Available
NR : Not Responded
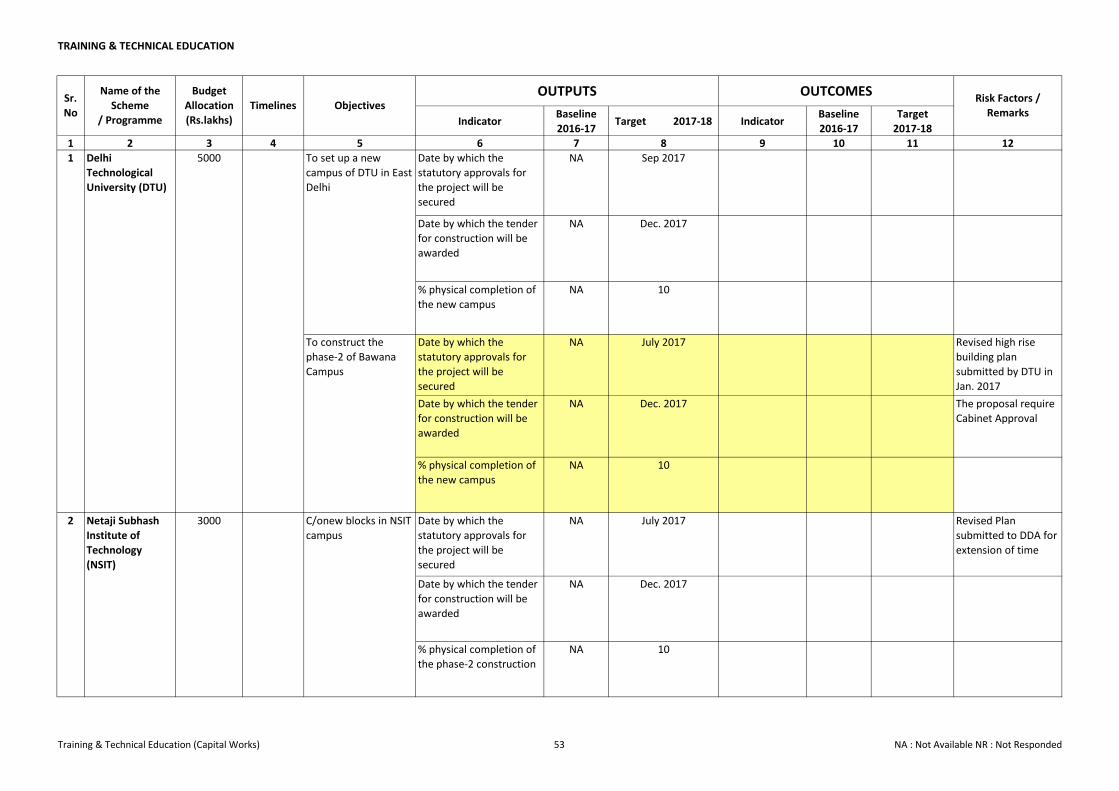
TRAINING & TECHNICAL EDUCATION
Indicator Baseline
2016-17Target 2017-18 Indicator
Baseline
2016-17
Target
2017-18
1 2 3 4 5 6 7 8 9 10 11 12
Date by which the
statutory approvals for
the project will be
secured
NA Sep 2017
Date by which the tender
for construction will be
awarded
NA Dec. 2017
% physical completion of
the new campus
NA 10
Date by which the
statutory approvals for
the project will be
secured
NA July 2017 Revised high rise
building plan
submitted by DTU in
Jan. 2017
Date by which the tender
for construction will be
awarded
NA Dec. 2017 The proposal require
Cabinet Approval
% physical completion of
the new campus
NA 10
Date by which the
statutory approvals for
the project will be
secured
NA July 2017 Revised Plan
submitted to DDA for
extension of time
Date by which the tender
for construction will be
awarded
NA Dec. 2017
% physical completion of
the phase-2 construction
NA 10
OUTPUTS OUTCOMESSr.
No
Name of the
Scheme
/ Programme
Budget
Allocation
(Rs.lakhs)
Timelines Objectives
1 Delhi
Technological
University (DTU)
5000 To set up a new
campus of DTU in East
Delhi
To construct the
phase-2 of Bawana
Campus
2 Netaji Subhash
Institute of
Technology
(NSIT)
3000 C/onew blocks in NSIT
campus
Risk Factors /
Remarks
Training & Technical Education (Capital Works) 53 NA : Not Available NR : Not Responded
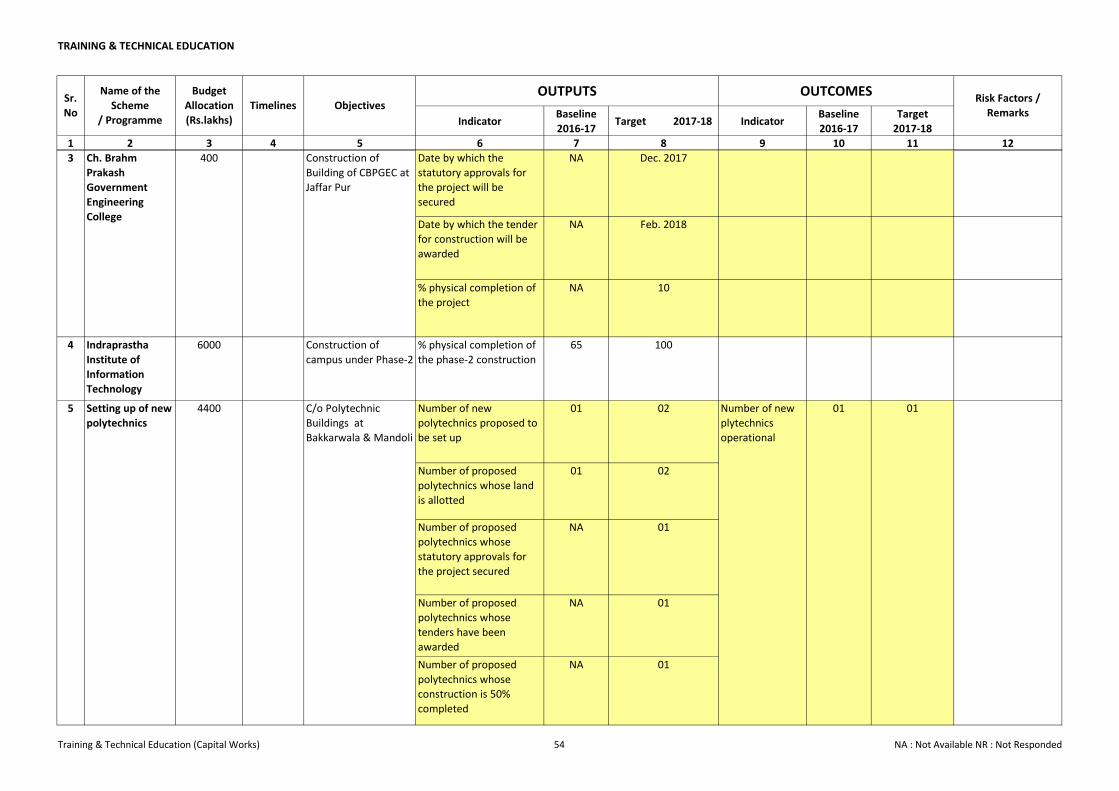
TRAINING & TECHNICAL EDUCATION
Indicator Baseline
2016-17Target 2017-18 Indicator
Baseline
2016-17
Target
2017-18
1 2 3 4 5 6 7 8 9 10 11 12
OUTPUTS OUTCOMESSr.
No
Name of the
Scheme
/ Programme
Budget
Allocation
(Rs.lakhs)
Timelines Objectives Risk Factors /
Remarks
Date by which the
statutory approvals for
the project will be
secured
NA Dec. 2017
Date by which the tender
for construction will be
awarded
NA Feb. 2018
% physical completion of
the project
NA 10
4 Indraprastha
Institute of
Information
Technology
6000 Construction of
campus under Phase-2
% physical completion of
the phase-2 construction
65 100
Number of new
polytechnics proposed to
be set up
01 02
Number of proposed
polytechnics whose land
is allotted
01 02
Number of proposed
polytechnics whose
statutory approvals for
the project secured
NA 01
Number of proposed
polytechnics whose
tenders have been
awarded
NA 01
Number of proposed
polytechnics whose
construction is 50%
completed
NA 01
3 Ch. Brahm
Prakash
Government
Engineering
College
400 Construction of
Building of CBPGEC at
Jaffar Pur
5 Setting up of new
polytechnics
4400 C/o Polytechnic
Buildings at
Bakkarwala & Mandoli
Number of new
plytechnics
operational
01 01
Training & Technical Education (Capital Works) 54 NA : Not Available NR : Not Responded
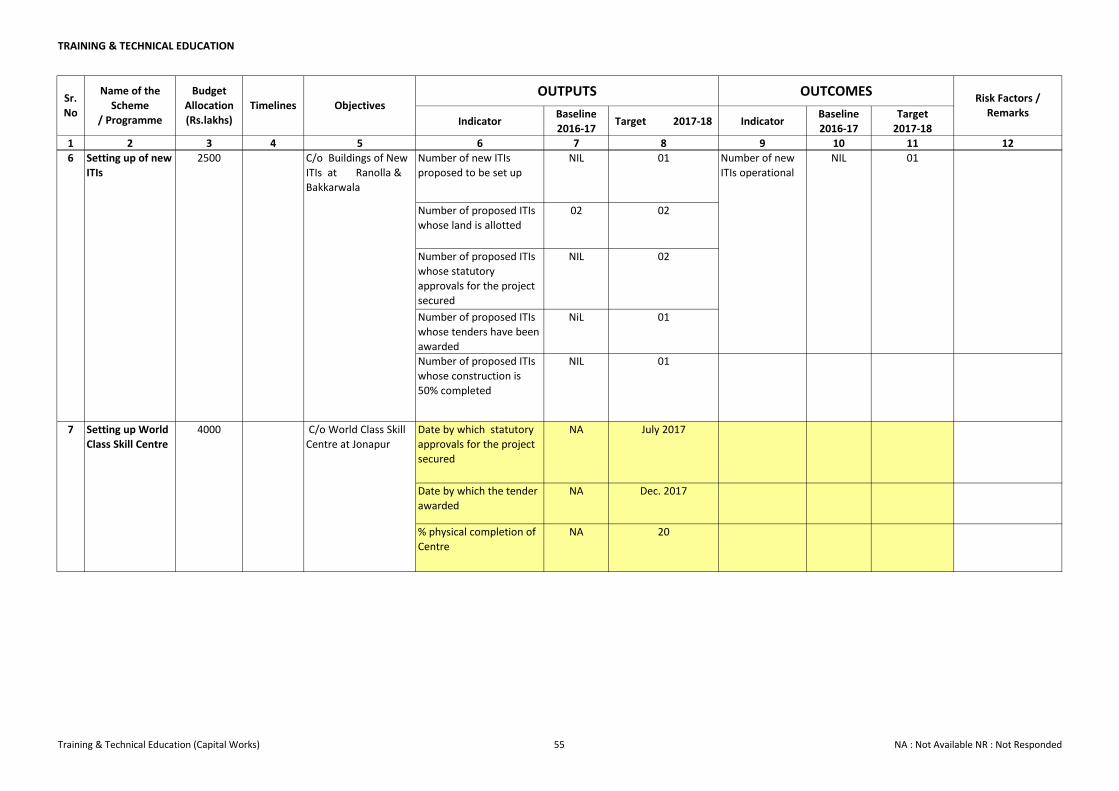
TRAINING & TECHNICAL EDUCATION
Indicator Baseline
2016-17Target 2017-18 Indicator
Baseline
2016-17
Target
2017-18
1 2 3 4 5 6 7 8 9 10 11 12
OUTPUTS OUTCOMESSr.
No
Name of the
Scheme
/ Programme
Budget
Allocation
(Rs.lakhs)
Timelines Objectives Risk Factors /
Remarks
Number of new ITIs
proposed to be set up
NIL 01
Number of proposed ITIs
whose land is allotted
02 02
Number of proposed ITIs
whose statutory
approvals for the project
secured
NIL 02
Number of proposed ITIs
whose tenders have been
awarded
NiL 01
Number of proposed ITIs
whose construction is
50% completed
NIL 01
Date by which statutory
approvals for the project
secured
NA July 2017
Date by which the tender
awarded
NA Dec. 2017
% physical completion of
Centre
NA 20
Number of new
ITIs operational
NIL 01
7 Setting up World
Class Skill Centre
4000 C/o World Class Skill
Centre at Jonapur
6 Setting up of new
ITIs
2500 C/o Buildings of New
ITIs at Ranolla &
Bakkarwala
Training & Technical Education (Capital Works) 55 NA : Not Available NR : Not Responded

EDUCATIO
N
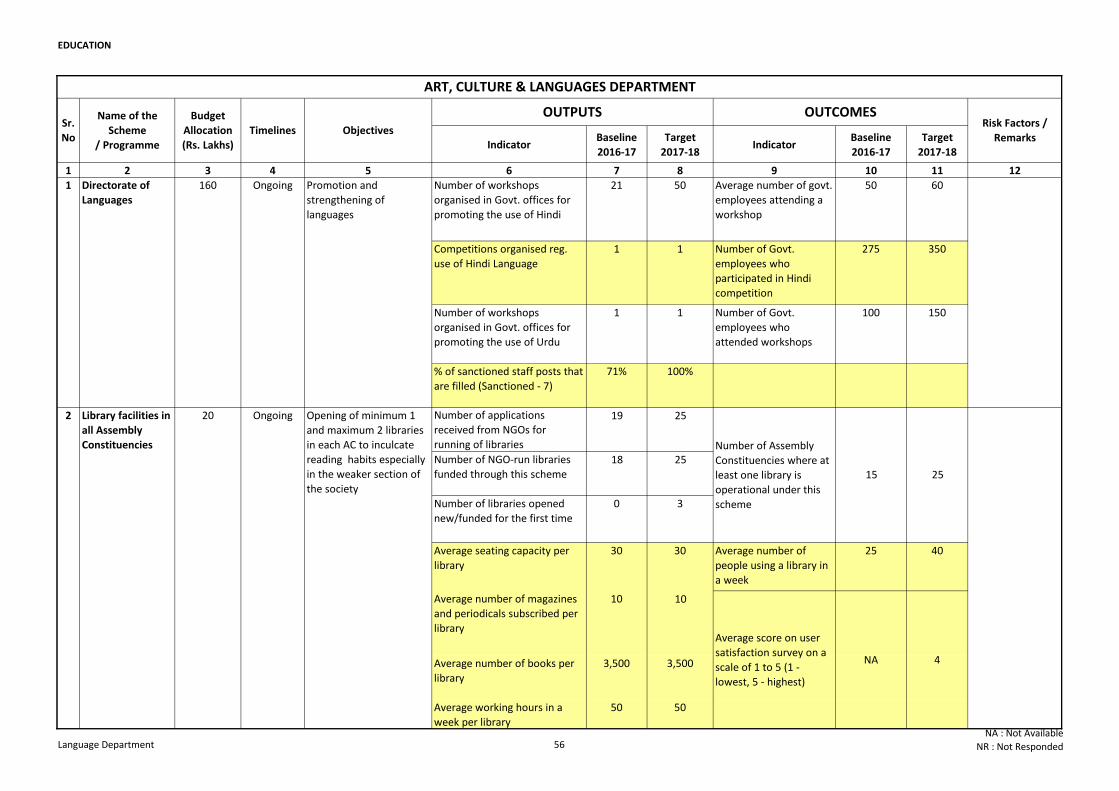
EDUCATION
Indicator Baseline
2016-17
Target
2017-18Indicator
Baseline
2016-17
Target
2017-18
1 2 3 4 5 6 7 8 9 10 11 12
Number of workshops
organised in Govt. offices for
promoting the use of Hindi
21 50 Average number of govt.
employees attending a
workshop
50 60
Competitions organised reg.
use of Hindi Language
1 1 Number of Govt.
employees who
participated in Hindi
competition
275 350
Number of workshops
organised in Govt. offices for
promoting the use of Urdu
1 1 Number of Govt.
employees who
attended workshops
100 150
% of sanctioned staff posts that
are filled (Sanctioned - 7)
71% 100%
Number of applications
received from NGOs for
running of libraries
19 25
Number of NGO-run libraries
funded through this scheme18 25
Number of libraries opened
new/funded for the first time
0 3
Average seating capacity per
library
30 30 Average number of
people using a library in
a week
25 40
Average number of magazines
and periodicals subscribed per
library
10 10
Average number of books per
library
3,500 3,500
Average working hours in a
week per library
50 50
ART, CULTURE & LANGUAGES DEPARTMENT
Risk Factors /
Remarks
OUTPUTS OUTCOMES
1 Directorate of
Languages
160 Ongoing Promotion and
strengthening of
languages
Sr.
No
Name of the
Scheme
/ Programme
Budget
Allocation
(Rs. Lakhs)
Timelines Objectives
2 Library facilities in
all Assembly
Constituencies
20 Ongoing Opening of minimum 1
and maximum 2 libraries
in each AC to inculcate
reading habits especially
in the weaker section of
the society
Number of Assembly
Constituencies where at
least one library is
operational under this
scheme
15 25
Average score on user
satisfaction survey on a
scale of 1 to 5 (1 -
lowest, 5 - highest)
NA 4
Language Department 56NA : Not Available
NR : Not Responded
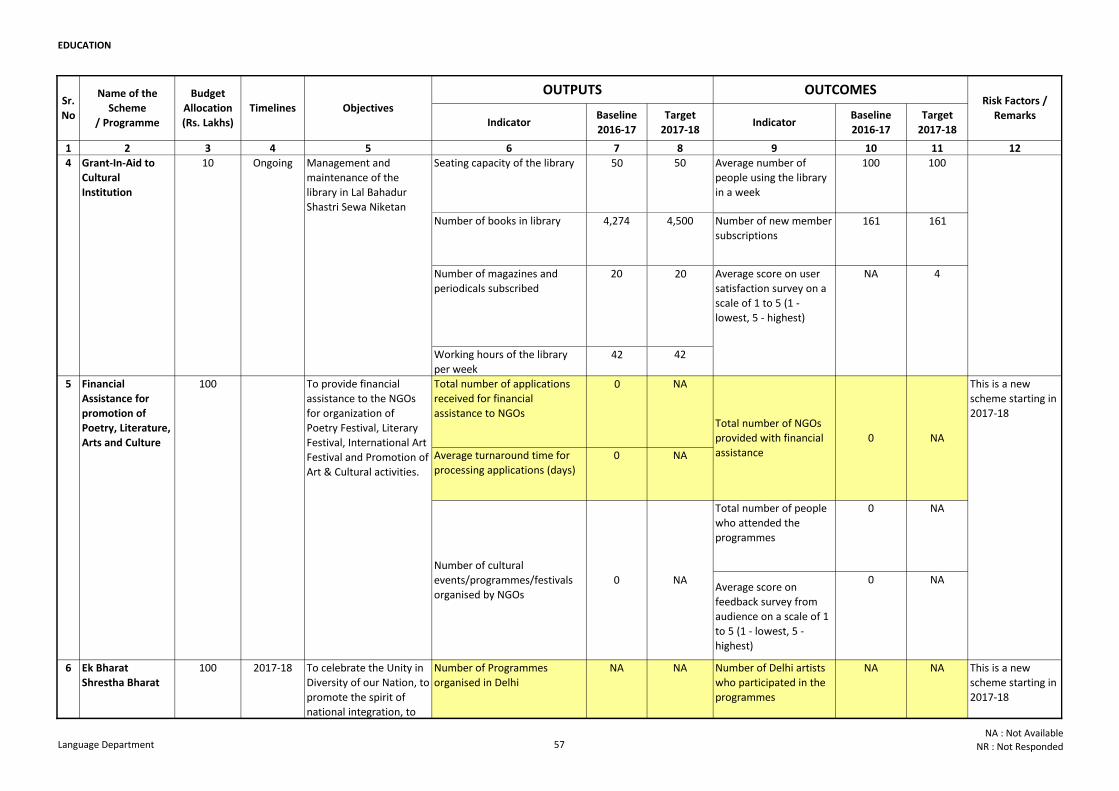
EDUCATION
Indicator Baseline
2016-17
Target
2017-18Indicator
Baseline
2016-17
Target
2017-18
1 2 3 4 5 6 7 8 9 10 11 12
Risk Factors /
Remarks
OUTPUTS OUTCOMESSr.
No
Name of the
Scheme
/ Programme
Budget
Allocation
(Rs. Lakhs)
Timelines Objectives
Seating capacity of the library 50 50 Average number of
people using the library
in a week
100 100
Number of books in library 4,274 4,500 Number of new member
subscriptions161 161
Number of magazines and
periodicals subscribed
20 20
Working hours of the library
per week42 42
Total number of applications
received for financial
assistance to NGOs
0 NA
Average turnaround time for
processing applications (days)
0 NA
Total number of people
who attended the
programmes
0 NA
Average score on
feedback survey from
audience on a scale of 1
to 5 (1 - lowest, 5 -
highest)
0 NA
Number of Programmes
organised in Delhi
NA NA Number of Delhi artists
who participated in the
programmes
NA NA
Ongoing Management and
maintenance of the
library in Lal Bahadur
Shastri Sewa Niketan
Average score on user
satisfaction survey on a
scale of 1 to 5 (1 -
lowest, 5 - highest)
NA 4
5 Financial
Assistance for
promotion of
Poetry, Literature,
Arts and Culture
100 To provide financial
assistance to the NGOs
for organization of
Poetry Festival, Literary
Festival, International Art
Festival and Promotion of
Art & Cultural activities.
Total number of NGOs
provided with financial
assistance
0 NA
This is a new
scheme starting in
2017-18
Number of cultural
events/programmes/festivals
organised by NGOs
0 NA
4 Grant-In-Aid to
Cultural
Institution
10
This is a new
scheme starting in
2017-18
6 Ek Bharat
Shrestha Bharat
100 2017-18 To celebrate the Unity in
Diversity of our Nation, to
promote the spirit of
national integration, to
showcase the rich
heritage, culture, customs
& traditions to establish
long- term engagement
between states.
Language Department 57NA : Not Available
NR : Not Responded
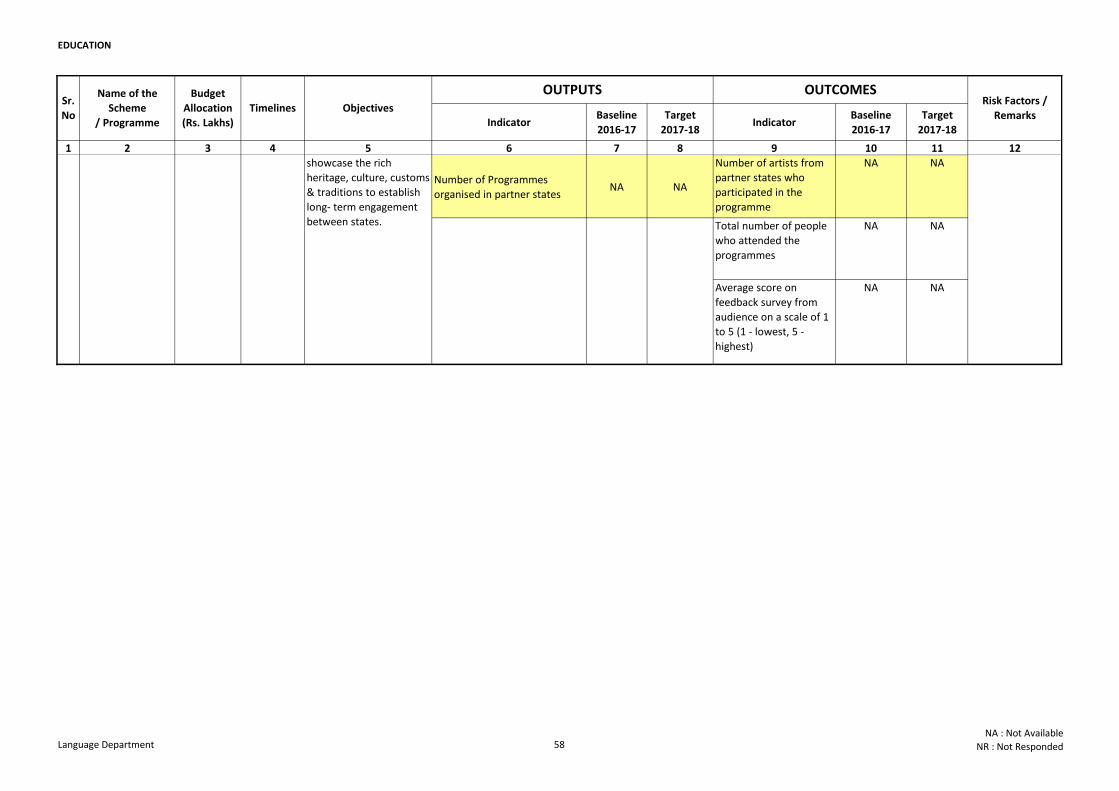
EDUCATION
Indicator Baseline
2016-17
Target
2017-18Indicator
Baseline
2016-17
Target
2017-18
1 2 3 4 5 6 7 8 9 10 11 12
Risk Factors /
Remarks
OUTPUTS OUTCOMESSr.
No
Name of the
Scheme
/ Programme
Budget
Allocation
(Rs. Lakhs)
Timelines Objectives
Number of Programmes
organised in partner statesNA NA
Number of artists from
partner states who
participated in the
programme
NA NA
Total number of people
who attended the
programmes
NA NA
Average score on
feedback survey from
audience on a scale of 1
to 5 (1 - lowest, 5 -
highest)
NA NA
This is a new
scheme starting in
2017-18
6 Ek Bharat
Shrestha Bharat
100 2017-18 To celebrate the Unity in
Diversity of our Nation, to
promote the spirit of
national integration, to
showcase the rich
heritage, culture, customs
& traditions to establish
long- term engagement
between states.
Language Department 58NA : Not Available
NR : Not Responded
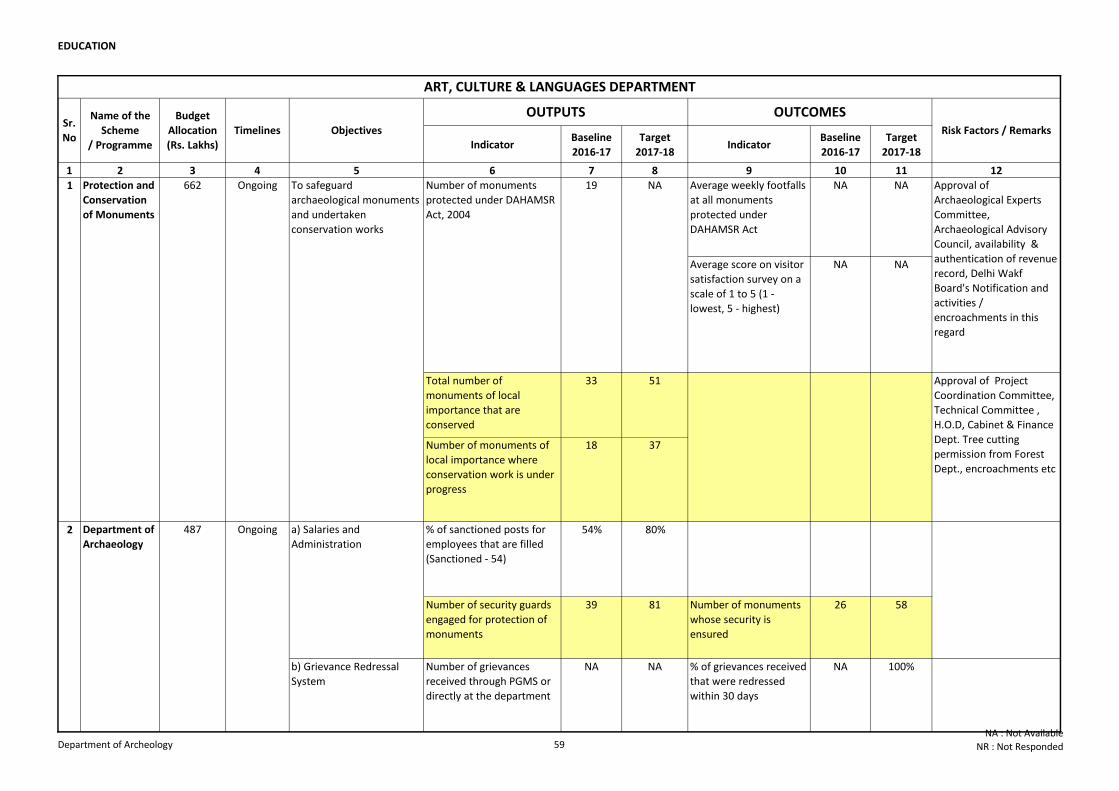
EDUCATION
Indicator Baseline
2016-17
Target
2017-18Indicator
Baseline
2016-17
Target
2017-18
1 2 3 4 5 6 7 8 9 10 11 12
Average weekly footfalls
at all monuments
protected under
DAHAMSR Act
NA NA
Average score on visitor
satisfaction survey on a
scale of 1 to 5 (1 -
lowest, 5 - highest)
NA NA
Total number of
monuments of local
importance that are
conserved
33 51
Number of monuments of
local importance where
conservation work is under
progress
18 37
% of sanctioned posts for
employees that are filled
(Sanctioned - 54)
54% 80%
Number of security guards
engaged for protection of
monuments
39 81 Number of monuments
whose security is
ensured
26 58
b) Grievance Redressal
System
Number of grievances
received through PGMS or
directly at the department
NA NA % of grievances received
that were redressed
within 30 days
NA 100%
1 Protection and
Conservation
of Monuments
662 Ongoing To safeguard
archaeological monuments
and undertaken
conservation works
Number of monuments
protected under DAHAMSR
Act, 2004
19 NA
2 Department of
Archaeology
487 Ongoing a) Salaries and
Administration
ART, CULTURE & LANGUAGES DEPARTMENT
Approval of
Archaeological Experts
Committee,
Archaeological Advisory
Council, availability &
authentication of revenue
record, Delhi Wakf
Board's Notification and
activities /
encroachments in this
regard
Approval of Project
Coordination Committee,
Technical Committee ,
H.O.D, Cabinet & Finance
Dept. Tree cutting
permission from Forest
Dept., encroachments etc
OUTPUTS OUTCOMESRisk Factors / Remarks
Sr.
No
Name of the
Scheme
/ Programme
Budget
Allocation
(Rs. Lakhs)
Timelines Objectives
Department of Archeology 59NA : Not Available
NR : Not Responded
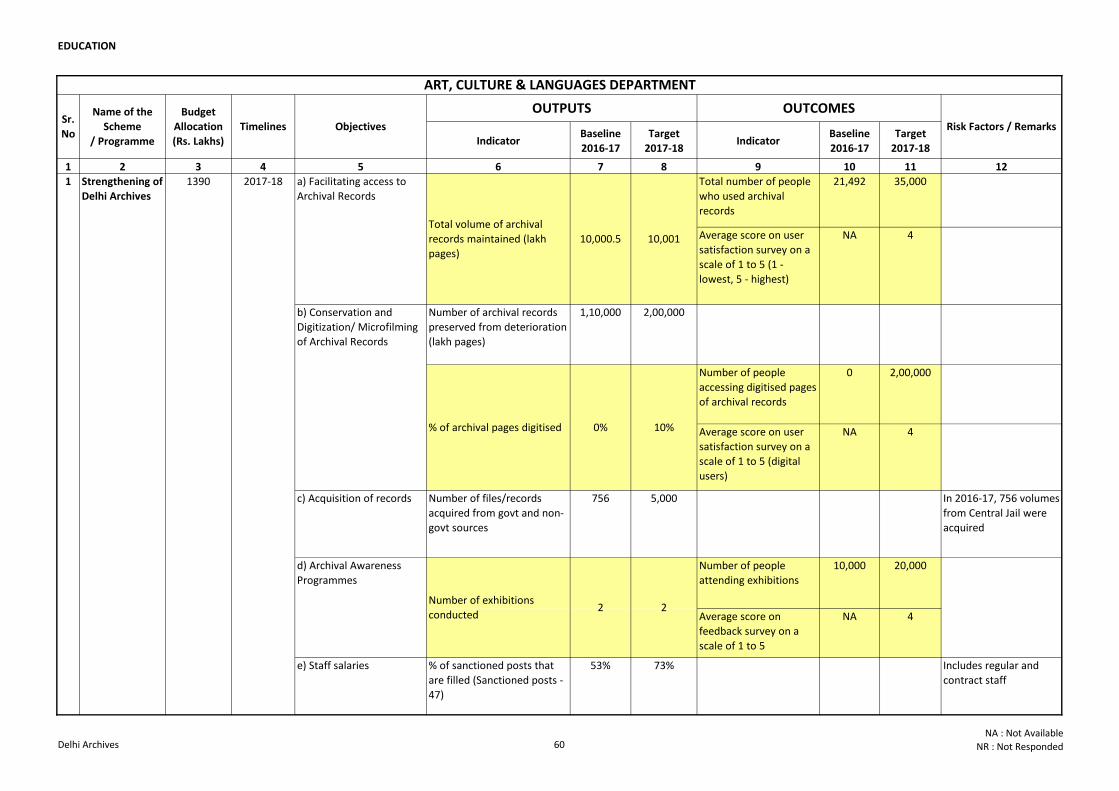
EDUCATION
Indicator Baseline
2016-17
Target
2017-18Indicator
Baseline
2016-17
Target
2017-18
1 2 3 4 5 6 7 8 9 10 11 12
Total number of people
who used archival
records
21,492 35,000
Average score on user
satisfaction survey on a
scale of 1 to 5 (1 -
lowest, 5 - highest)
NA 4
Number of archival records
preserved from deterioration
(lakh pages)
1,10,000 2,00,000
Number of people
accessing digitised pages
of archival records
0 2,00,000
Average score on user
satisfaction survey on a
scale of 1 to 5 (digital
users)
NA 4
c) Acquisition of records Number of files/records
acquired from govt and non-
govt sources
756 5,000 In 2016-17, 756 volumes
from Central Jail were
acquired
Number of people
attending exhibitions
10,000 20,000
Average score on
feedback survey on a
scale of 1 to 5
NA 4
e) Staff salaries % of sanctioned posts that
are filled (Sanctioned posts -
47)
53% 73% Includes regular and
contract staff
ART, CULTURE & LANGUAGES DEPARTMENT
Number of exhibitions
conducted
OUTCOMESRisk Factors / Remarks
2
OUTPUTS
2
10,001
b) Conservation and
Digitization/ Microfilming
of Archival Records
% of archival pages digitised 10%
Sr.
No
Name of the
Scheme
/ Programme
Budget
Allocation
(Rs. Lakhs)
Timelines Objectives
0%
d) Archival Awareness
Programmes
10,000.5
1 Strengthening of
Delhi Archives
1390 2017-18 a) Facilitating access to
Archival Records
Total volume of archival
records maintained (lakh
pages)
Delhi Archives 60NA : Not Available
NR : Not Responded
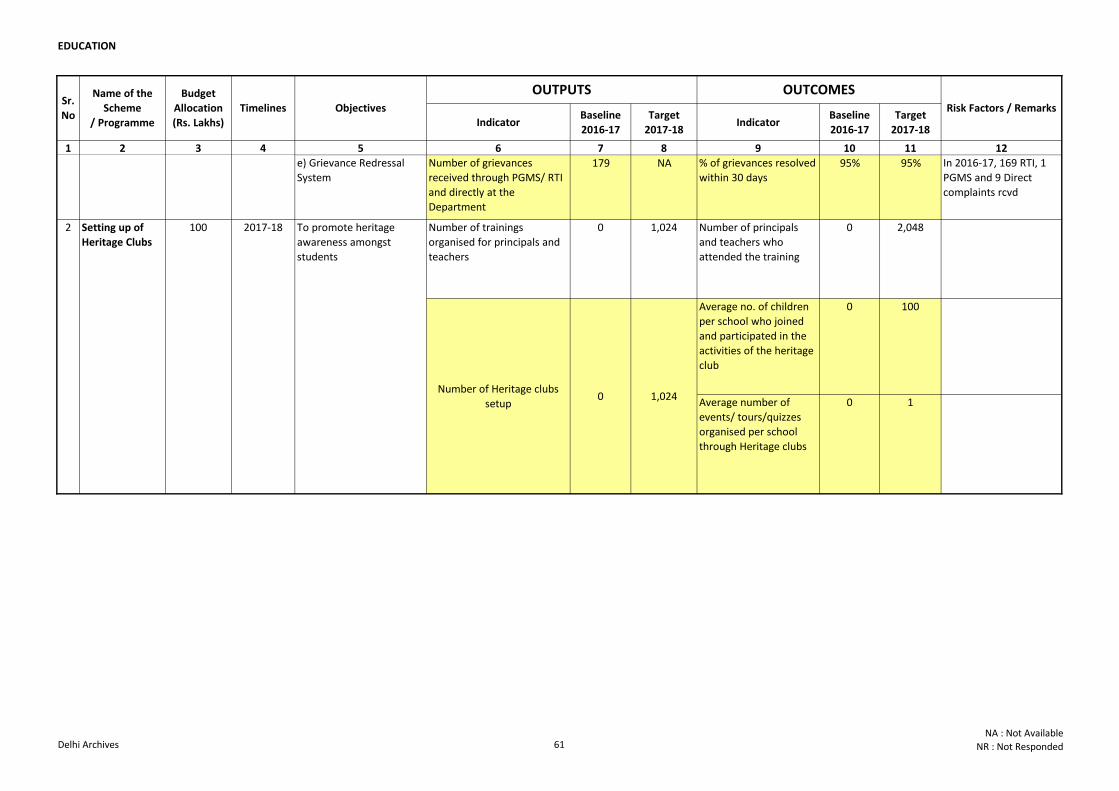
EDUCATION
Indicator Baseline
2016-17
Target
2017-18Indicator
Baseline
2016-17
Target
2017-18
1 2 3 4 5 6 7 8 9 10 11 12
OUTCOMESRisk Factors / Remarks
OUTPUTSSr.
No
Name of the
Scheme
/ Programme
Budget
Allocation
(Rs. Lakhs)
Timelines Objectives
e) Grievance Redressal
System
Number of grievances
received through PGMS/ RTI
and directly at the
Department
179 NA % of grievances resolved
within 30 days95% 95% In 2016-17, 169 RTI, 1
PGMS and 9 Direct
complaints rcvd
Number of trainings
organised for principals and
teachers
0 1,024 Number of principals
and teachers who
attended the training
0 2,048
Average no. of children
per school who joined
and participated in the
activities of the heritage
club
0 100
Average number of
events/ tours/quizzes
organised per school
through Heritage clubs
0 10 1,024
1 Strengthening of
Delhi Archives
1390 2017-18
Number of Heritage clubs
setup
2 Setting up of
Heritage Clubs
100 2017-18 To promote heritage
awareness amongst
students
Delhi Archives 61NA : Not Available
NR : Not Responded
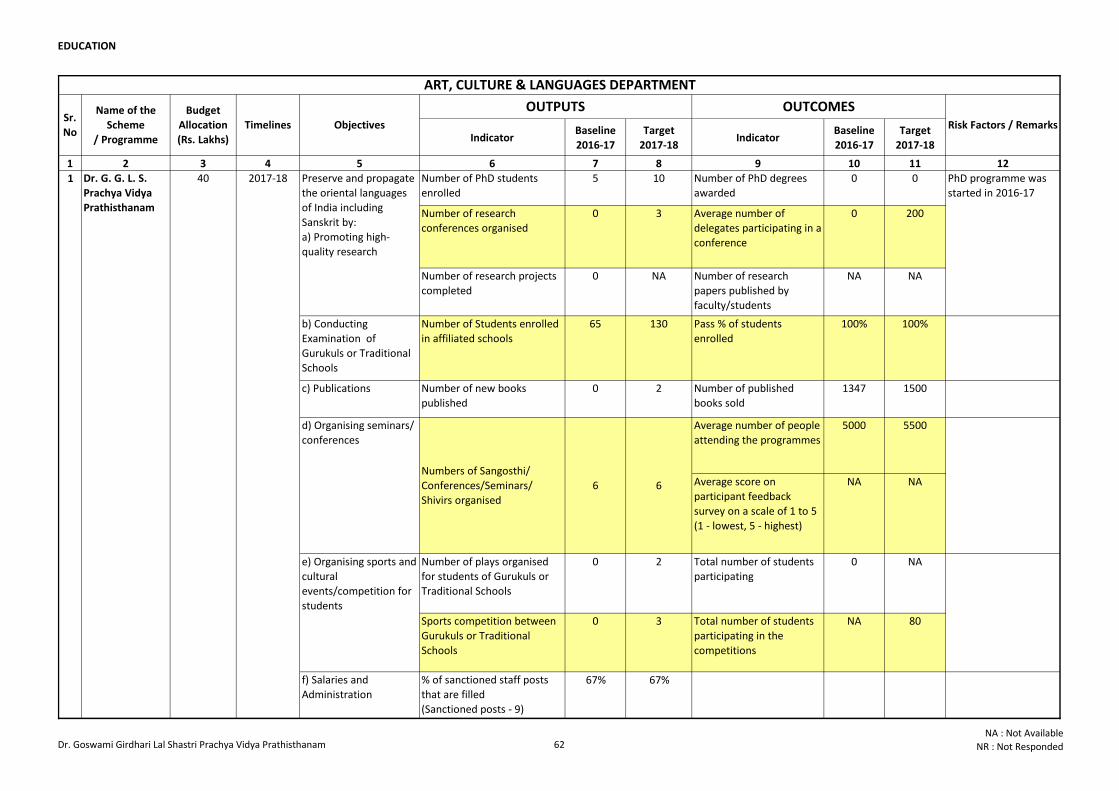
EDUCATION
Indicator Baseline
2016-17
Target
2017-18Indicator
Baseline
2016-17
Target
2017-18
1 2 3 4 5 6 7 8 9 10 11 12
Number of PhD students
enrolled
5 10 Number of PhD degrees
awarded
0 0
Number of research
conferences organised
0 3 Average number of
delegates participating in a
conference
0 200
Number of research projects
completed
0 NA Number of research
papers published by
faculty/students
NA NA
b) Conducting
Examination of
Gurukuls or Traditional
Schools
Number of Students enrolled
in affiliated schools
65 130 Pass % of students
enrolled
100% 100%
c) Publications Number of new books
published
0 2 Number of published
books sold
1347 1500
Average number of people
attending the programmes
5000 5500
Average score on
participant feedback
survey on a scale of 1 to 5
(1 - lowest, 5 - highest)
NA NA
Number of plays organised
for students of Gurukuls or
Traditional Schools
0 2 Total number of students
participating
0 NA
Sports competition between
Gurukuls or Traditional
Schools
0 3 Total number of students
participating in the
competitions
NA 80
f) Salaries and
Administration
% of sanctioned staff posts
that are filled
(Sanctioned posts - 9)
67% 67%
Risk Factors / RemarksSr.
No
Name of the
Scheme
/ Programme
Budget
Allocation
(Rs. Lakhs)
Timelines Objectives
ART, CULTURE & LANGUAGES DEPARTMENT
PhD programme was
started in 2016-17
d) Organising seminars/
conferences
Numbers of Sangosthi/
Conferences/Seminars/
Shivirs organised
6 6
1 Dr. G. G. L. S.
Prachya Vidya
Prathisthanam
40 2017-18 Preserve and propagate
the oriental languages
of India including
Sanskrit by:
a) Promoting high-
quality research
e) Organising sports and
cultural
events/competition for
students
OUTPUTS OUTCOMES
Dr. Goswami Girdhari Lal Shastri Prachya Vidya Prathisthanam 62NA : Not Available
NR : Not Responded
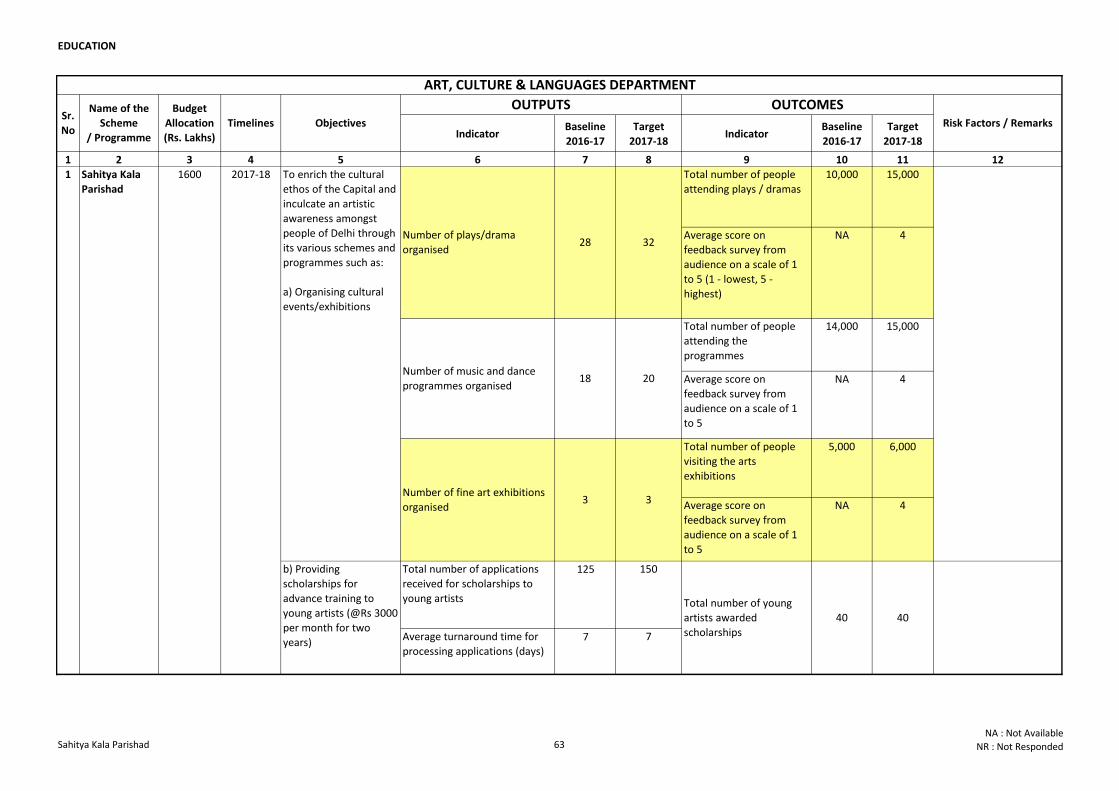
EDUCATION
Indicator Baseline
2016-17
Target
2017-18Indicator
Baseline
2016-17
Target
2017-18
1 2 3 4 5 6 7 8 9 10 11 12
Total number of people
attending plays / dramas
10,000 15,000
Average score on
feedback survey from
audience on a scale of 1
to 5 (1 - lowest, 5 -
highest)
NA 4
Total number of people
attending the
programmes
14,000 15,000
Average score on
feedback survey from
audience on a scale of 1
to 5
NA 4
Total number of people
visiting the arts
exhibitions
5,000 6,000
Average score on
feedback survey from
audience on a scale of 1
to 5
NA 4
Total number of applications
received for scholarships to
young artists
125 150
Average turnaround time for
processing applications (days)7 7
3
b) Providing
scholarships for
advance training to
young artists (@Rs 3000
per month for two
years)
Number of music and dance
programmes organised18
Number of fine art exhibitions
organised
Name of the
Scheme
/ Programme
Budget
Allocation
(Rs. Lakhs)
1600
Timelines Objectives
OUTPUTS OUTCOMESRisk Factors / Remarks
2017-18 To enrich the cultural
ethos of the Capital and
inculcate an artistic
awareness amongst
people of Delhi through
its various schemes and
programmes such as:
a) Organising cultural
events/exhibitions
Number of plays/drama
organised28
ART, CULTURE & LANGUAGES DEPARTMENT
3
Total number of young
artists awarded
scholarships
40 40
32
20
1 Sahitya Kala
Parishad
Sr.
No
Sahitya Kala Parishad 63NA : Not Available
NR : Not Responded
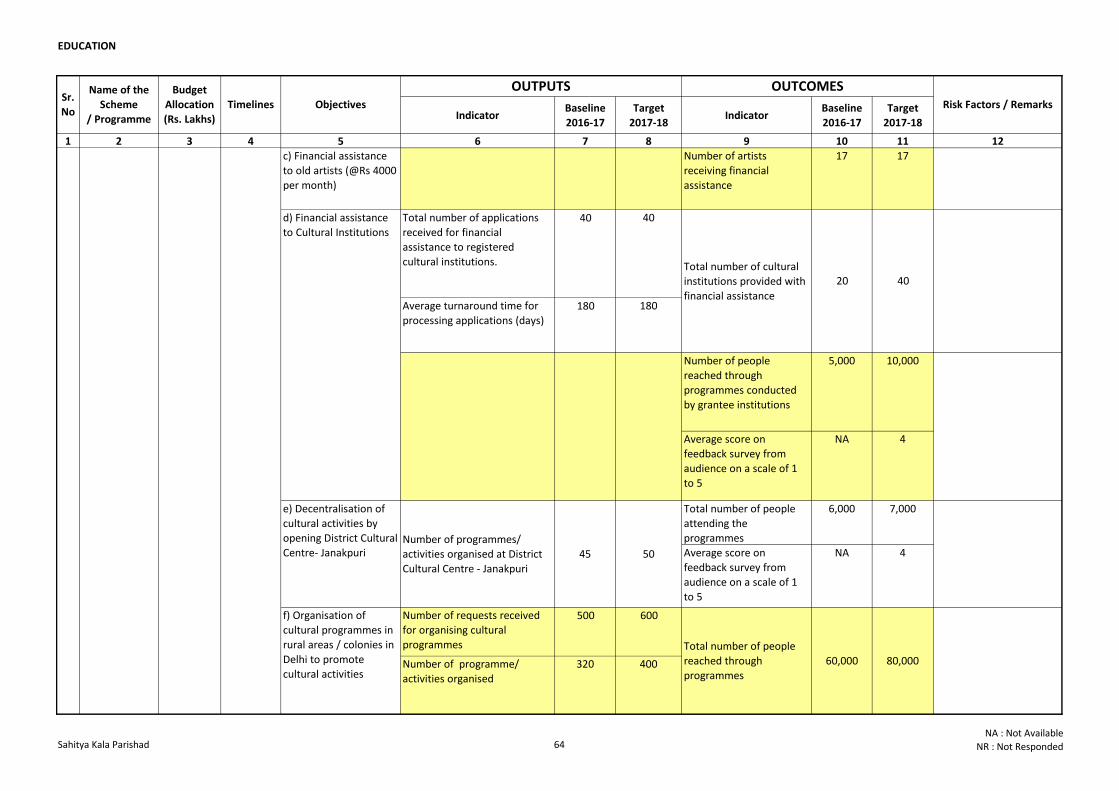
EDUCATION
Indicator Baseline
2016-17
Target
2017-18Indicator
Baseline
2016-17
Target
2017-18
1 2 3 4 5 6 7 8 9 10 11 12
Name of the
Scheme
/ Programme
Budget
Allocation
(Rs. Lakhs)
Timelines Objectives
OUTPUTS OUTCOMESRisk Factors / Remarks
Sr.
No
c) Financial assistance
to old artists (@Rs 4000
per month)
Number of artists
receiving financial
assistance
17 17
Total number of applications
received for financial
assistance to registered
cultural institutions.
40 40
Average turnaround time for
processing applications (days)180 180
Number of people
reached through
programmes conducted
by grantee institutions
5,000 10,000
Average score on
feedback survey from
audience on a scale of 1
to 5
NA 4
Total number of people
attending the
programmes
6,000 7,000
Average score on
feedback survey from
audience on a scale of 1
to 5
NA 4
Number of requests received
for organising cultural
programmes
500 600
Number of programme/
activities organised
320 400
1600 2017-18
d) Financial assistance
to Cultural Institutions
Total number of people
reached through
programmes
60,000 80,000
e) Decentralisation of
cultural activities by
opening District Cultural
Centre- Janakpuri
f) Organisation of
cultural programmes in
rural areas / colonies in
Delhi to promote
cultural activities
50
Number of programmes/
activities organised at District
Cultural Centre - Janakpuri
45
Total number of cultural
institutions provided with
financial assistance
20 40
1 Sahitya Kala
Parishad
Sahitya Kala Parishad 64NA : Not Available
NR : Not Responded
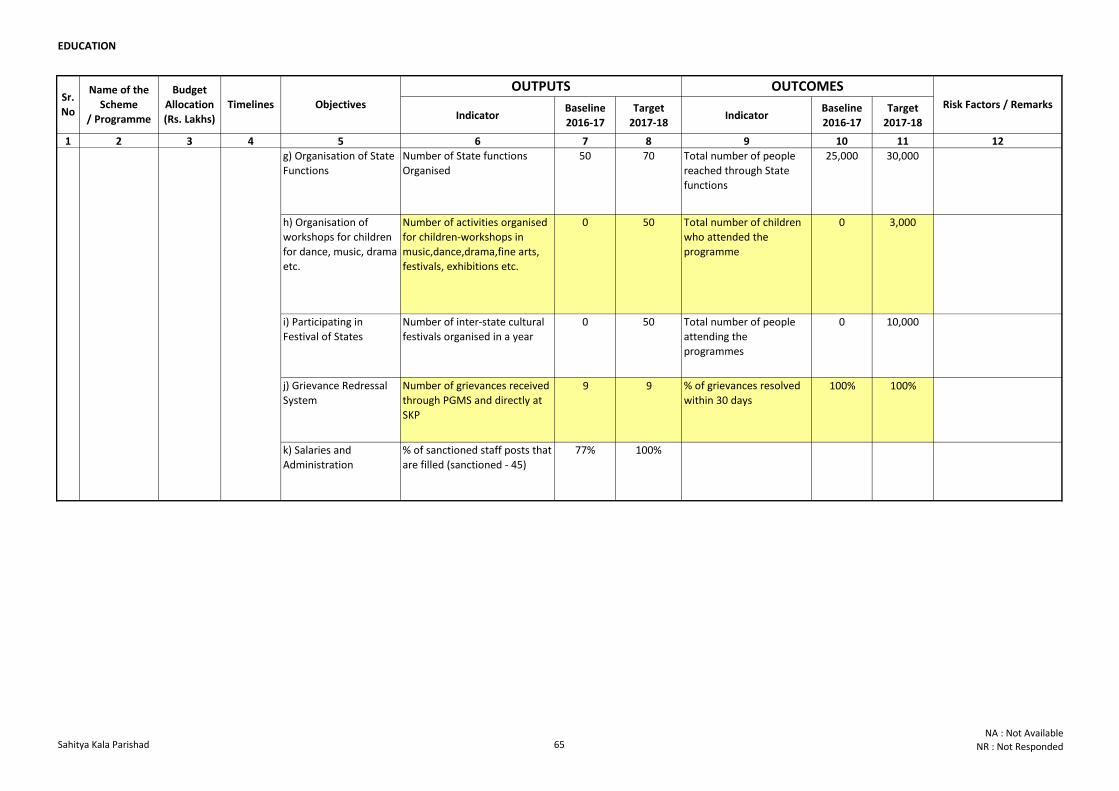
EDUCATION
Indicator Baseline
2016-17
Target
2017-18Indicator
Baseline
2016-17
Target
2017-18
1 2 3 4 5 6 7 8 9 10 11 12
Name of the
Scheme
/ Programme
Budget
Allocation
(Rs. Lakhs)
Timelines Objectives
OUTPUTS OUTCOMESRisk Factors / Remarks
Sr.
No
g) Organisation of State
Functions
Number of State functions
Organised
50 70 Total number of people
reached through State
functions
25,000 30,000
h) Organisation of
workshops for children
for dance, music, drama
etc.
Number of activities organised
for children-workshops in
music,dance,drama,fine arts,
festivals, exhibitions etc.
0 50 Total number of children
who attended the
programme
0 3,000
i) Participating in
Festival of States
Number of inter-state cultural
festivals organised in a year
0 50 Total number of people
attending the
programmes
0 10,000
j) Grievance Redressal
System
Number of grievances received
through PGMS and directly at
SKP
9 9 % of grievances resolved
within 30 days100% 100%
k) Salaries and
Administration
% of sanctioned staff posts that
are filled (sanctioned - 45)
77% 100%
1600 2017-181 Sahitya Kala
Parishad
Sahitya Kala Parishad 65NA : Not Available
NR : Not Responded
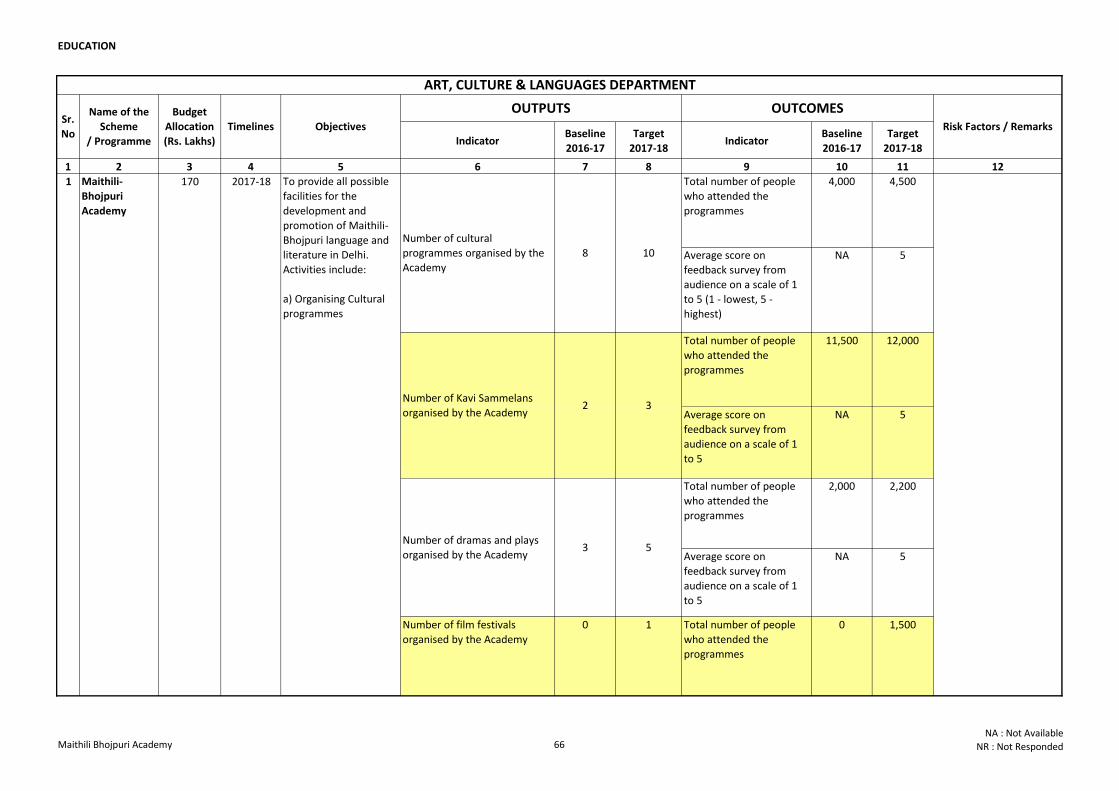
EDUCATION
Indicator Baseline
2016-17
Target
2017-18Indicator
Baseline
2016-17
Target
2017-18
1 2 3 4 5 6 7 8 9 10 11 12
Total number of people
who attended the
programmes
4,000 4,500
Average score on
feedback survey from
audience on a scale of 1
to 5 (1 - lowest, 5 -
highest)
NA 5
Total number of people
who attended the
programmes
11,500 12,000
Average score on
feedback survey from
audience on a scale of 1
to 5
NA 5
Total number of people
who attended the
programmes
2,000 2,200
Average score on
feedback survey from
audience on a scale of 1
to 5
NA 5
Number of film festivals
organised by the Academy
0 1 Total number of people
who attended the
programmes
0 1,500
OUTPUTS OUTCOMESRisk Factors / Remarks
Sr.
No
Name of the
Scheme
/ Programme
Budget
Allocation
(Rs. Lakhs)
Timelines Objectives
10
Number of Kavi Sammelans
organised by the Academy
Number of dramas and plays
organised by the Academy3 5
2 3
Number of cultural
programmes organised by the
Academy
8
ART, CULTURE & LANGUAGES DEPARTMENT
1 Maithili-
Bhojpuri
Academy
170 2017-18 To provide all possible
facilities for the
development and
promotion of Maithili-
Bhojpuri language and
literature in Delhi.
Activities include:
a) Organising Cultural
programmes
Maithili Bhojpuri Academy 66NA : Not Available
NR : Not Responded
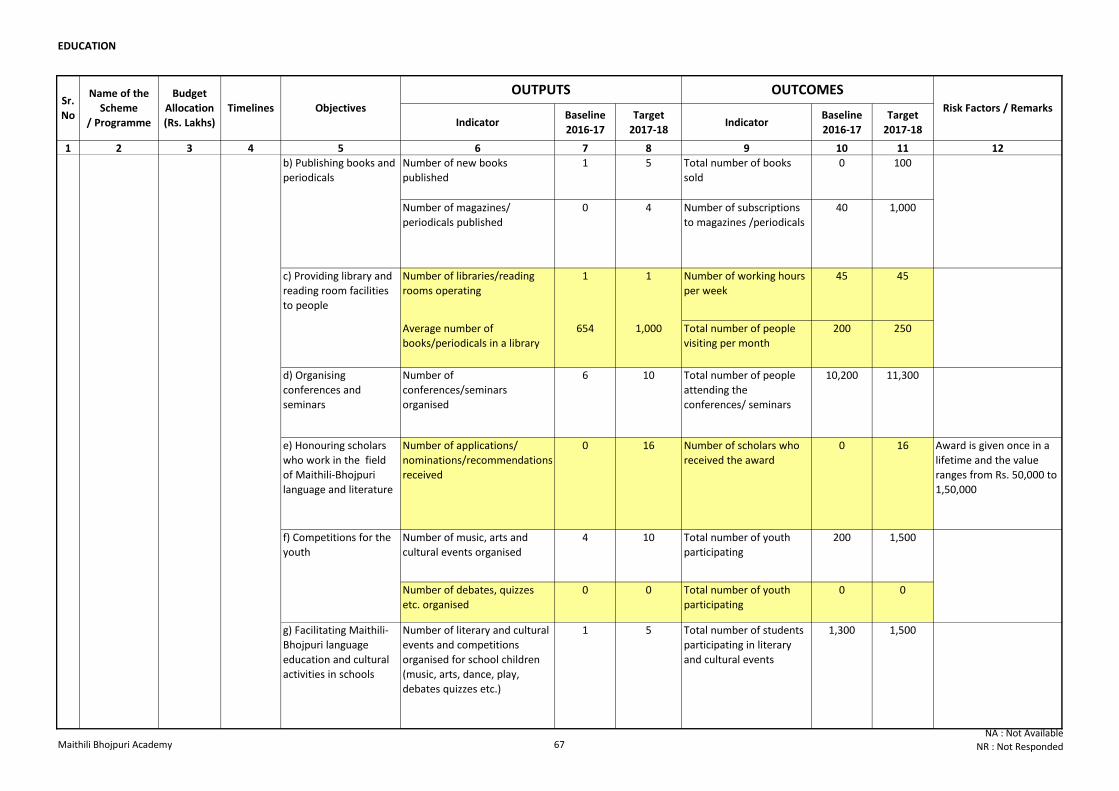
EDUCATION
Indicator Baseline
2016-17
Target
2017-18Indicator
Baseline
2016-17
Target
2017-18
1 2 3 4 5 6 7 8 9 10 11 12
OUTPUTS OUTCOMESRisk Factors / Remarks
Sr.
No
Name of the
Scheme
/ Programme
Budget
Allocation
(Rs. Lakhs)
Timelines Objectives
Number of new books
published
1 5 Total number of books
sold
0 100
Number of magazines/
periodicals published
0 4 Number of subscriptions
to magazines /periodicals
40 1,000
Number of libraries/reading
rooms operating
1 1 Number of working hours
per week
45 45
Average number of
books/periodicals in a library
654 1,000 Total number of people
visiting per month
200 250
d) Organising
conferences and
seminars
Number of
conferences/seminars
organised
6 10 Total number of people
attending the
conferences/ seminars
10,200 11,300
e) Honouring scholars
who work in the field
of Maithili-Bhojpuri
language and literature
Number of applications/
nominations/recommendations
received
0 16 Number of scholars who
received the award
0 16 Award is given once in a
lifetime and the value
ranges from Rs. 50,000 to
1,50,000
Number of music, arts and
cultural events organised
4 10 Total number of youth
participating
200 1,500
Number of debates, quizzes
etc. organised
0 0 Total number of youth
participating
0 0
Number of literary and cultural
events and competitions
organised for school children
(music, arts, dance, play,
debates quizzes etc.)
1 5 Total number of students
participating in literary
and cultural events
1,300 1,500
1 Maithili-
Bhojpuri
Academy
170 2017-18
g) Facilitating Maithili-
Bhojpuri language
education and cultural
activities in schools
b) Publishing books and
periodicals
c) Providing library and
reading room facilities
to people
f) Competitions for the
youth
Maithili Bhojpuri Academy 67NA : Not Available
NR : Not Responded
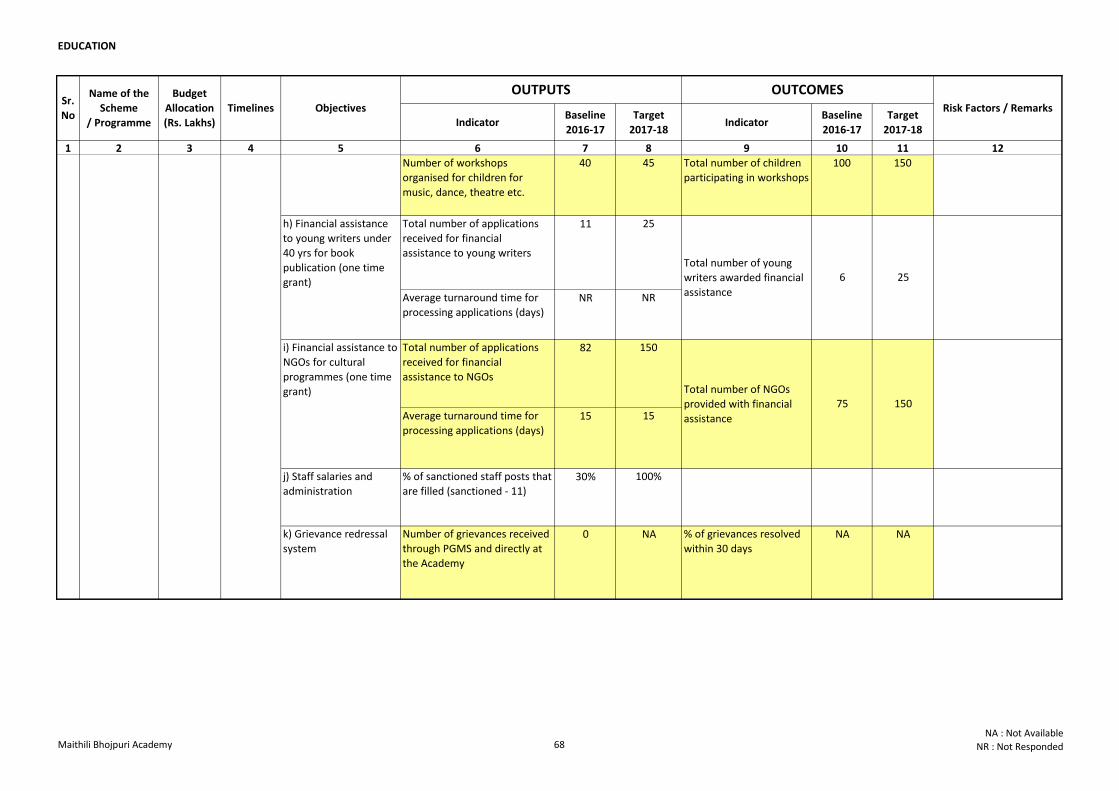
EDUCATION
Indicator Baseline
2016-17
Target
2017-18Indicator
Baseline
2016-17
Target
2017-18
1 2 3 4 5 6 7 8 9 10 11 12
OUTPUTS OUTCOMESRisk Factors / Remarks
Sr.
No
Name of the
Scheme
/ Programme
Budget
Allocation
(Rs. Lakhs)
Timelines Objectives
Number of workshops
organised for children for
music, dance, theatre etc.
40 45 Total number of children
participating in workshops
100 150
Total number of applications
received for financial
assistance to young writers
11 25
Average turnaround time for
processing applications (days)NR NR
Total number of applications
received for financial
assistance to NGOs
82 150
Average turnaround time for
processing applications (days)15 15
j) Staff salaries and
administration
% of sanctioned staff posts that
are filled (sanctioned - 11)30% 100%
k) Grievance redressal
system
Number of grievances received
through PGMS and directly at
the Academy
0 NA % of grievances resolved
within 30 daysNA NA
6 25
i) Financial assistance to
NGOs for cultural
programmes (one time
grant)
1 Maithili-
Bhojpuri
Academy
170 2017-18
g) Facilitating Maithili-
Bhojpuri language
education and cultural
activities in schools
Total number of NGOs
provided with financial
assistance
75 150
h) Financial assistance
to young writers under
40 yrs for book
publication (one time
grant)
Total number of young
writers awarded financial
assistance
Maithili Bhojpuri Academy 68NA : Not Available
NR : Not Responded
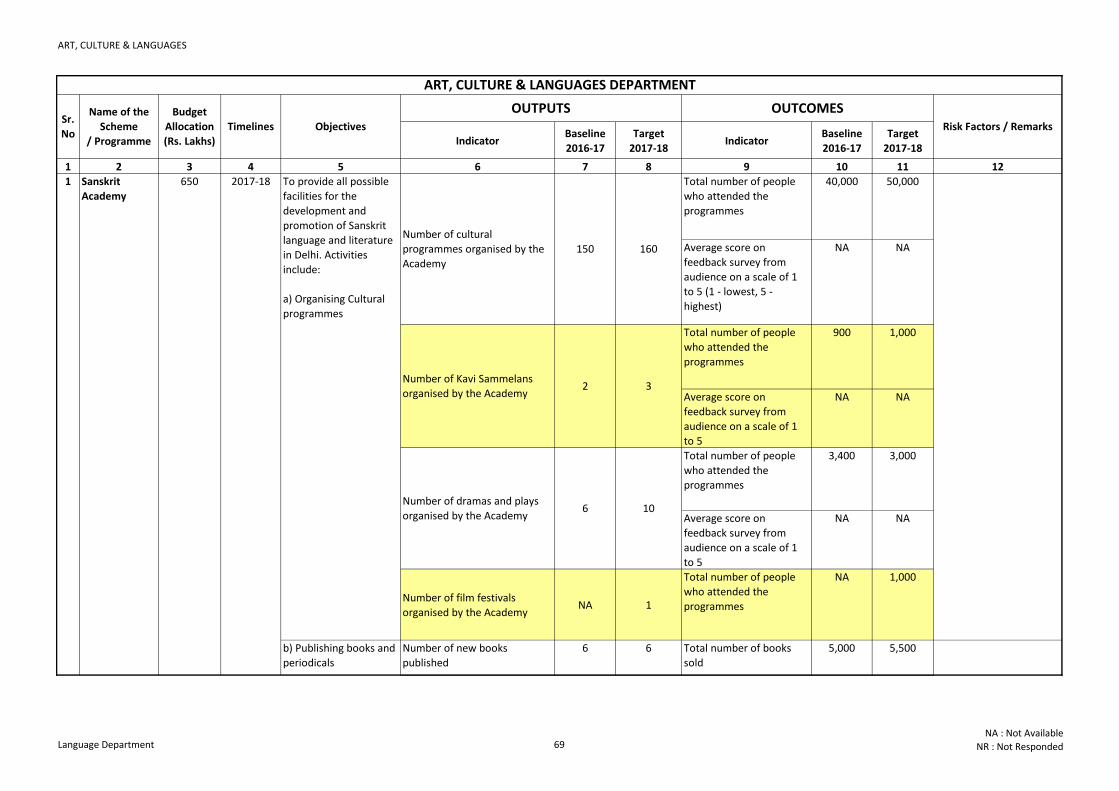
ART, CULTURE & LANGUAGES
Indicator Baseline
2016-17
Target
2017-18Indicator
Baseline
2016-17
Target
2017-18
1 2 3 4 5 6 7 8 9 10 11 12
Total number of people
who attended the
programmes
40,000 50,000
Average score on
feedback survey from
audience on a scale of 1
to 5 (1 - lowest, 5 -
highest)
NA NA
Total number of people
who attended the
programmes
900 1,000
Average score on
feedback survey from
audience on a scale of 1
to 5
NA NA
Total number of people
who attended the
programmes
3,400 3,000
Average score on
feedback survey from
audience on a scale of 1
to 5
NA NA
Number of film festivals
organised by the AcademyNA 1
Total number of people
who attended the
programmes
NA 1,000
Number of new books
published
6 6 Total number of books
sold
5,000 5,500
ART, CULTURE & LANGUAGES DEPARTMENT
OUTPUTS OUTCOMESRisk Factors / Remarks
Sr.
No
Name of the
Scheme
/ Programme
Budget
Allocation
(Rs. Lakhs)
Timelines Objectives
150 160
Number of Kavi Sammelans
organised by the Academy2 3
Number of dramas and plays
organised by the Academy6 10
Number of cultural
programmes organised by the
Academy
b) Publishing books and
periodicals
1 Sanskrit
Academy
650 2017-18 To provide all possible
facilities for the
development and
promotion of Sanskrit
language and literature
in Delhi. Activities
include:
a) Organising Cultural
programmes
Language Department 69NA : Not Available
NR : Not Responded
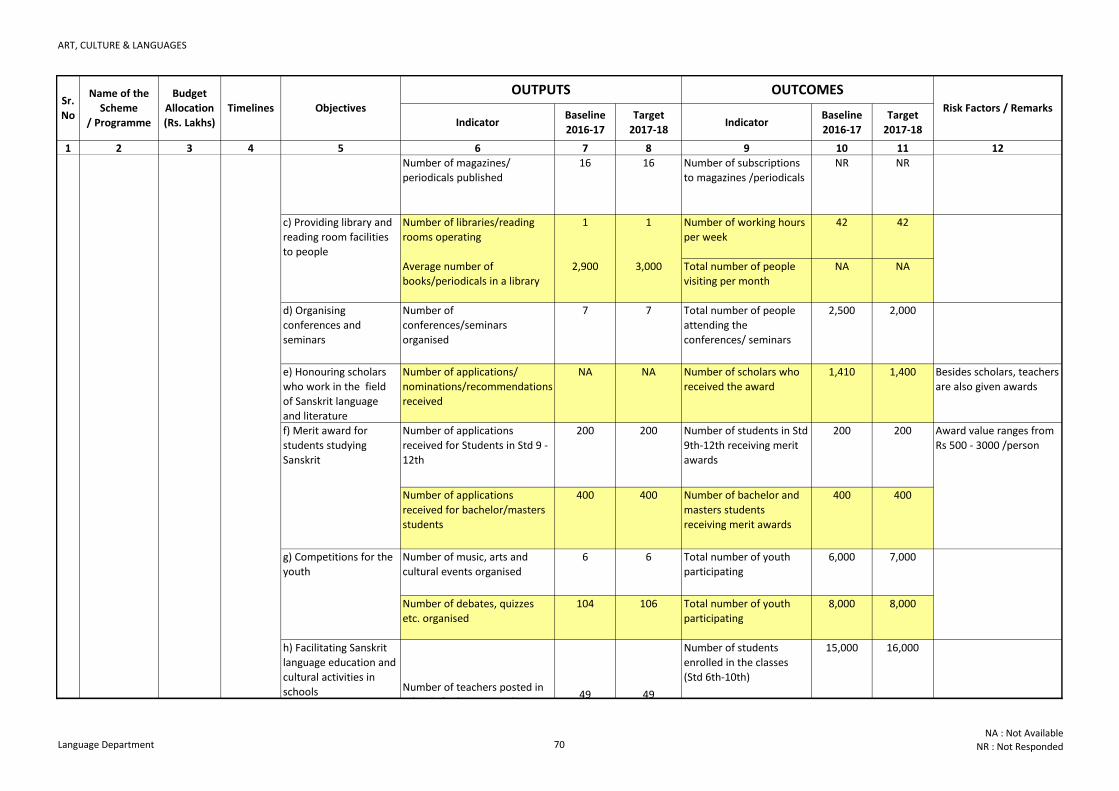
ART, CULTURE & LANGUAGES
Indicator Baseline
2016-17
Target
2017-18Indicator
Baseline
2016-17
Target
2017-18
1 2 3 4 5 6 7 8 9 10 11 12
OUTPUTS OUTCOMESRisk Factors / Remarks
Sr.
No
Name of the
Scheme
/ Programme
Budget
Allocation
(Rs. Lakhs)
Timelines Objectives
Number of magazines/
periodicals published
16 16 Number of subscriptions
to magazines /periodicals
NR NR
Number of libraries/reading
rooms operating
1 1 Number of working hours
per week
42 42
Average number of
books/periodicals in a library
2,900 3,000 Total number of people
visiting per month
NA NA
d) Organising
conferences and
seminars
Number of
conferences/seminars
organised
7 7 Total number of people
attending the
conferences/ seminars
2,500 2,000
e) Honouring scholars
who work in the field
of Sanskrit language
and literature
Number of applications/
nominations/recommendations
received
NA NA Number of scholars who
received the award
1,410 1,400 Besides scholars, teachers
are also given awards
Number of applications
received for Students in Std 9 -
12th
200 200 Number of students in Std
9th-12th receiving merit
awards
200 200
Number of applications
received for bachelor/masters
students
400 400 Number of bachelor and
masters students
receiving merit awards
400 400
Number of music, arts and
cultural events organised
6 6 Total number of youth
participating
6,000 7,000
Number of debates, quizzes
etc. organised
104 106 Total number of youth
participating
8,000 8,000
Number of students
enrolled in the classes
(Std 6th-10th)
15,000 16,000
f) Merit award for
students studying
Sanskrit
Award value ranges from
Rs 500 - 3000 /person
b) Publishing books and
periodicals
1 Sanskrit
Academy
650 2017-18
g) Competitions for the
youth
c) Providing library and
reading room facilities
to people
h) Facilitating Sanskrit
language education and
cultural activities in
schools Number of teachers posted in
schools for language education49 49
Language Department 70NA : Not Available
NR : Not Responded
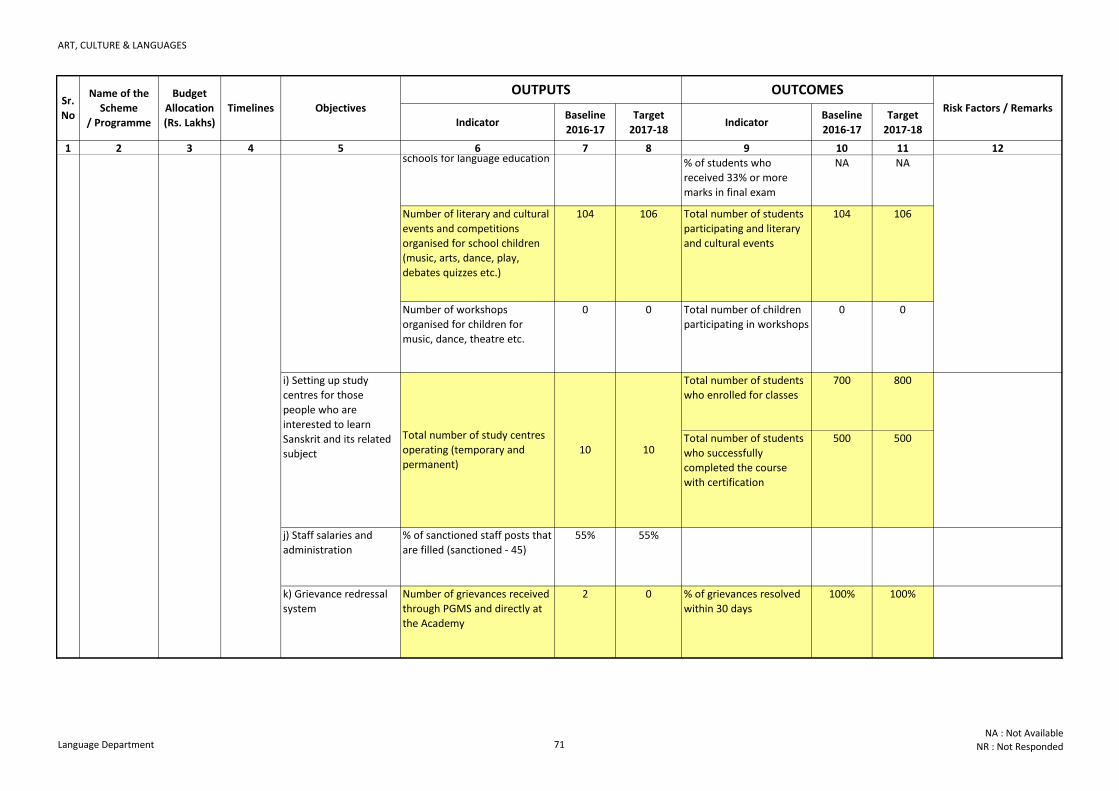
ART, CULTURE & LANGUAGES
Indicator Baseline
2016-17
Target
2017-18Indicator
Baseline
2016-17
Target
2017-18
1 2 3 4 5 6 7 8 9 10 11 12
OUTPUTS OUTCOMESRisk Factors / Remarks
Sr.
No
Name of the
Scheme
/ Programme
Budget
Allocation
(Rs. Lakhs)
Timelines Objectives
% of students who
received 33% or more
marks in final exam
NA NA
Number of literary and cultural
events and competitions
organised for school children
(music, arts, dance, play,
debates quizzes etc.)
104 106 Total number of students
participating and literary
and cultural events
104 106
Number of workshops
organised for children for
music, dance, theatre etc.
0 0 Total number of children
participating in workshops
0 0
Total number of students
who enrolled for classes
700 800
Total number of students
who successfully
completed the course
with certification
500 500
j) Staff salaries and
administration
% of sanctioned staff posts that
are filled (sanctioned - 45)
55% 55%
k) Grievance redressal
system
Number of grievances received
through PGMS and directly at
the Academy
2 0 % of grievances resolved
within 30 days
100% 100%
1 Sanskrit
Academy
650 2017-18
i) Setting up study
centres for those
people who are
interested to learn
Sanskrit and its related
subject
h) Facilitating Sanskrit
language education and
cultural activities in
schools Number of teachers posted in
schools for language education49 49
Total number of study centres
operating (temporary and
permanent)
10 10
Language Department 71NA : Not Available
NR : Not Responded
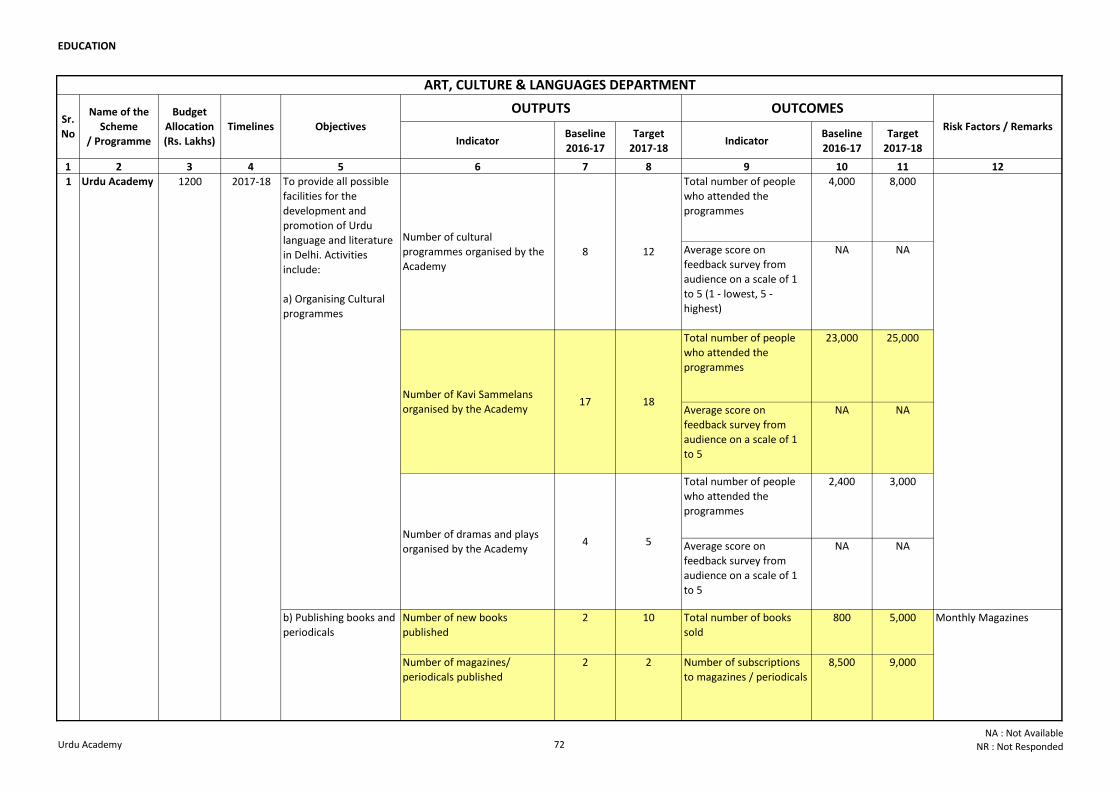
EDUCATION
Indicator Baseline
2016-17
Target
2017-18Indicator
Baseline
2016-17
Target
2017-18
1 2 3 4 5 6 7 8 9 10 11 12
Total number of people
who attended the
programmes
4,000 8,000
Average score on
feedback survey from
audience on a scale of 1
to 5 (1 - lowest, 5 -
highest)
NA NA
Total number of people
who attended the
programmes
23,000 25,000
Average score on
feedback survey from
audience on a scale of 1
to 5
NA NA
Total number of people
who attended the
programmes
2,400 3,000
Average score on
feedback survey from
audience on a scale of 1
to 5
NA NA
Number of new books
published
2 10 Total number of books
sold
800 5,000
Number of magazines/
periodicals published
2 2 Number of subscriptions
to magazines / periodicals
8,500 9,000
ART, CULTURE & LANGUAGES DEPARTMENT
OUTPUTS OUTCOMESRisk Factors / Remarks
Sr.
No
Name of the
Scheme
/ Programme
Budget
Allocation
(Rs. Lakhs)
Timelines Objectives
b) Publishing books and
periodicals
Monthly Magazines
8 12
Number of Kavi Sammelans
organised by the Academy17 18
Number of dramas and plays
organised by the Academy4 5
Number of cultural
programmes organised by the
Academy
1 Urdu Academy 1200 2017-18 To provide all possible
facilities for the
development and
promotion of Urdu
language and literature
in Delhi. Activities
include:
a) Organising Cultural
programmes
Urdu Academy 72NA : Not Available
NR : Not Responded
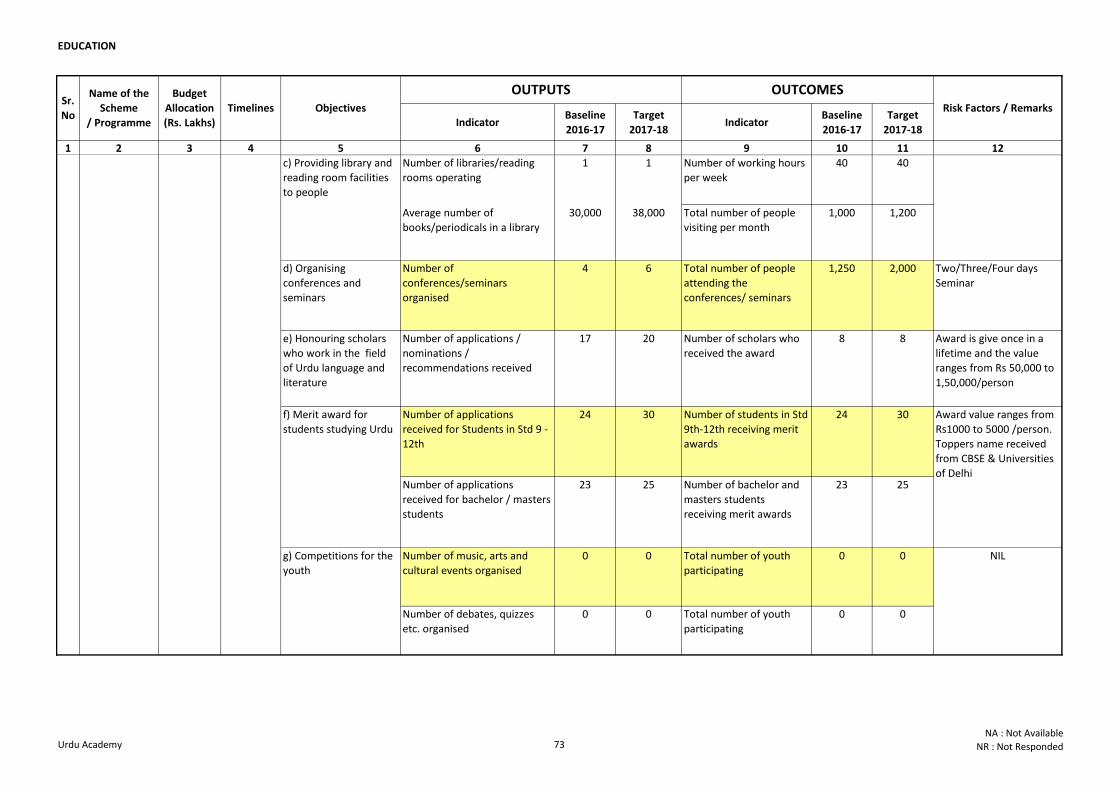
EDUCATION
Indicator Baseline
2016-17
Target
2017-18Indicator
Baseline
2016-17
Target
2017-18
1 2 3 4 5 6 7 8 9 10 11 12
OUTPUTS OUTCOMESRisk Factors / Remarks
Sr.
No
Name of the
Scheme
/ Programme
Budget
Allocation
(Rs. Lakhs)
Timelines Objectives
Number of libraries/reading
rooms operating
1 1 Number of working hours
per week
40 40
Average number of
books/periodicals in a library
30,000 38,000 Total number of people
visiting per month
1,000 1,200
d) Organising
conferences and
seminars
Number of
conferences/seminars
organised
4 6 Total number of people
attending the
conferences/ seminars
1,250 2,000 Two/Three/Four days
Seminar
e) Honouring scholars
who work in the field
of Urdu language and
literature
Number of applications /
nominations /
recommendations received
17 20 Number of scholars who
received the award
8 8 Award is give once in a
lifetime and the value
ranges from Rs 50,000 to
1,50,000/person
Number of applications
received for Students in Std 9 -
12th
24 30 Number of students in Std
9th-12th receiving merit
awards
24 30
Number of applications
received for bachelor / masters
students
23 25 Number of bachelor and
masters students
receiving merit awards
23 25
Number of music, arts and
cultural events organised
0 0 Total number of youth
participating
0 0
Number of debates, quizzes
etc. organised
0 0 Total number of youth
participating
0 0
Award value ranges from
Rs1000 to 5000 /person.
Toppers name received
from CBSE & Universities
of Delhi
NIL
1 Urdu Academy 1200 2017-18
c) Providing library and
reading room facilities
to people
f) Merit award for
students studying Urdu
g) Competitions for the
youth
Urdu Academy 73NA : Not Available
NR : Not Responded
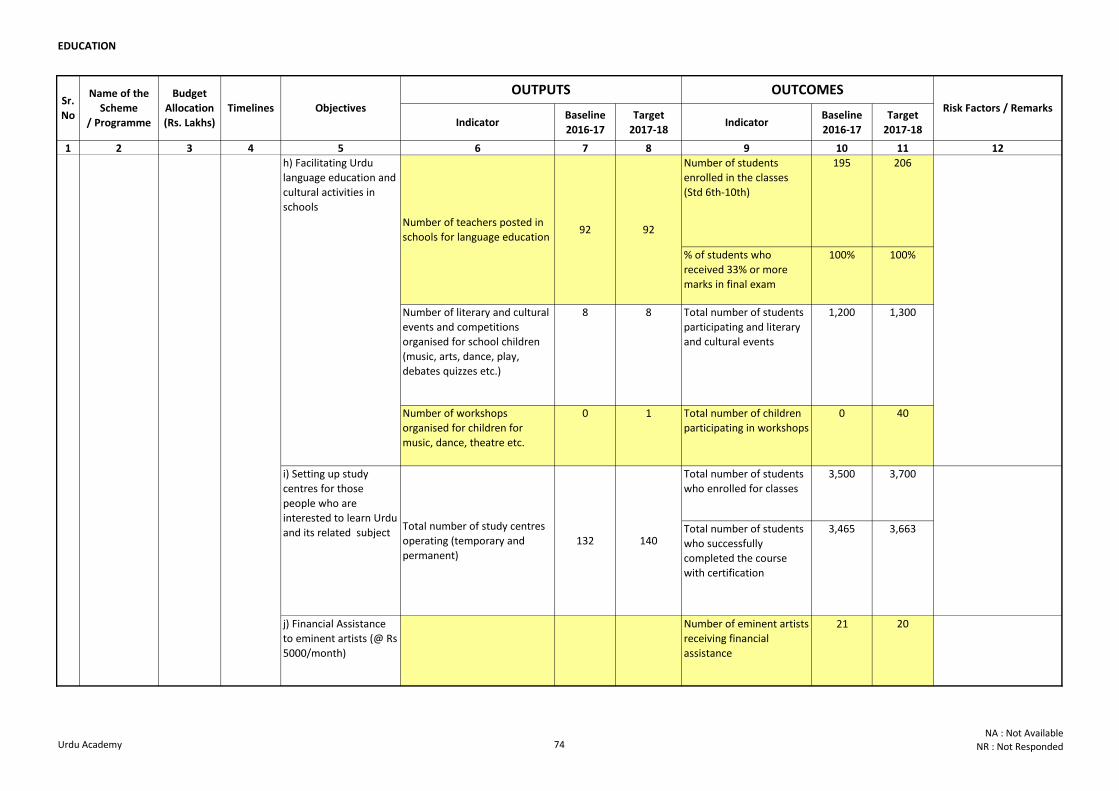
EDUCATION
Indicator Baseline
2016-17
Target
2017-18Indicator
Baseline
2016-17
Target
2017-18
1 2 3 4 5 6 7 8 9 10 11 12
OUTPUTS OUTCOMESRisk Factors / Remarks
Sr.
No
Name of the
Scheme
/ Programme
Budget
Allocation
(Rs. Lakhs)
Timelines Objectives
Number of students
enrolled in the classes
(Std 6th-10th)
195 206
% of students who
received 33% or more
marks in final exam
100% 100%
Number of literary and cultural
events and competitions
organised for school children
(music, arts, dance, play,
debates quizzes etc.)
8 8 Total number of students
participating and literary
and cultural events
1,200 1,300
Number of workshops
organised for children for
music, dance, theatre etc.
0 1 Total number of children
participating in workshops
0 40
Total number of students
who enrolled for classes
3,500 3,700
Total number of students
who successfully
completed the course
with certification
3,465 3,663
j) Financial Assistance
to eminent artists (@ Rs
5000/month)
Number of eminent artists
receiving financial
assistance
21 20
1 Urdu Academy 1200 2017-18
i) Setting up study
centres for those
people who are
interested to learn Urdu
and its related subject
h) Facilitating Urdu
language education and
cultural activities in
schools
Number of teachers posted in
schools for language education92 92
Total number of study centres
operating (temporary and
permanent)
132 140
Urdu Academy 74NA : Not Available
NR : Not Responded
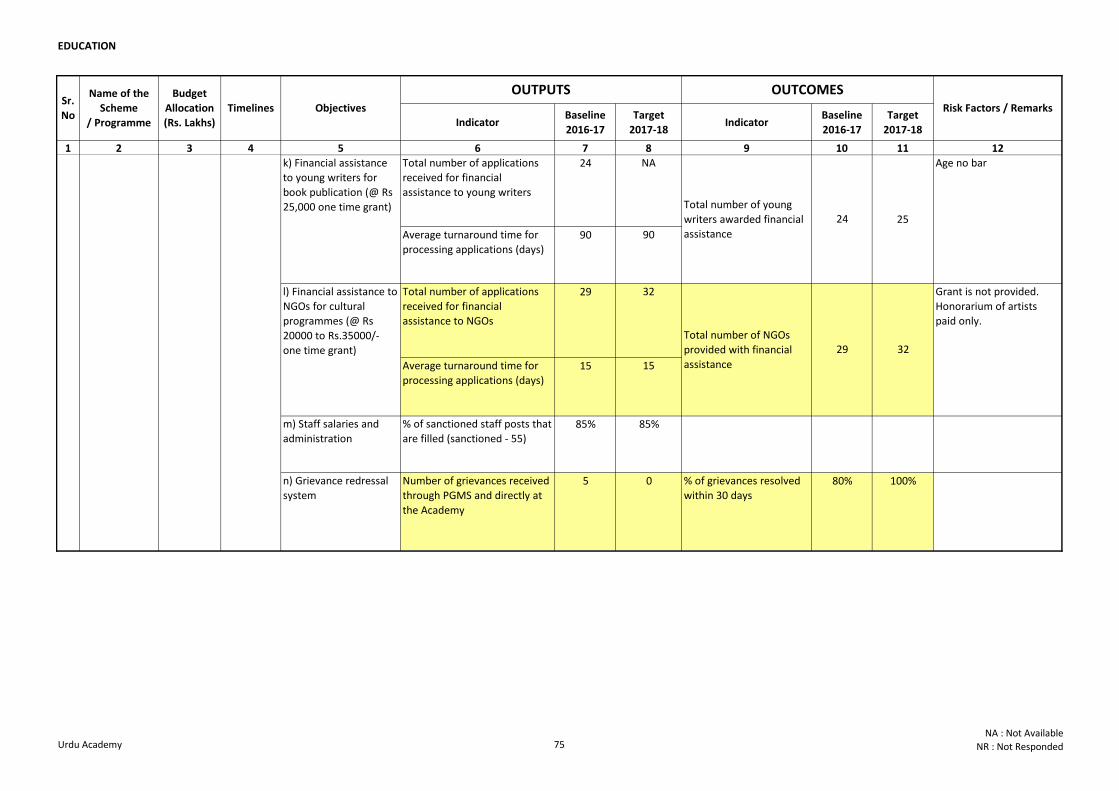
EDUCATION
Indicator Baseline
2016-17
Target
2017-18Indicator
Baseline
2016-17
Target
2017-18
1 2 3 4 5 6 7 8 9 10 11 12
OUTPUTS OUTCOMESRisk Factors / Remarks
Sr.
No
Name of the
Scheme
/ Programme
Budget
Allocation
(Rs. Lakhs)
Timelines Objectives
Total number of applications
received for financial
assistance to young writers
24 NA
Average turnaround time for
processing applications (days)90 90
Total number of applications
received for financial
assistance to NGOs
29 32
Average turnaround time for
processing applications (days)15 15
m) Staff salaries and
administration
% of sanctioned staff posts that
are filled (sanctioned - 55)85% 85%
n) Grievance redressal
system
Number of grievances received
through PGMS and directly at
the Academy
5 0 % of grievances resolved
within 30 days80% 100%
1 Urdu Academy 1200 2017-18
l) Financial assistance to
NGOs for cultural
programmes (@ Rs
20000 to Rs.35000/-
one time grant)
k) Financial assistance
to young writers for
book publication (@ Rs
25,000 one time grant)
Total number of NGOs
provided with financial
assistance
29 32
Grant is not provided.
Honorarium of artists
paid only.
Total number of young
writers awarded financial
assistance
24 25
Age no bar
Urdu Academy 75NA : Not Available
NR : Not Responded
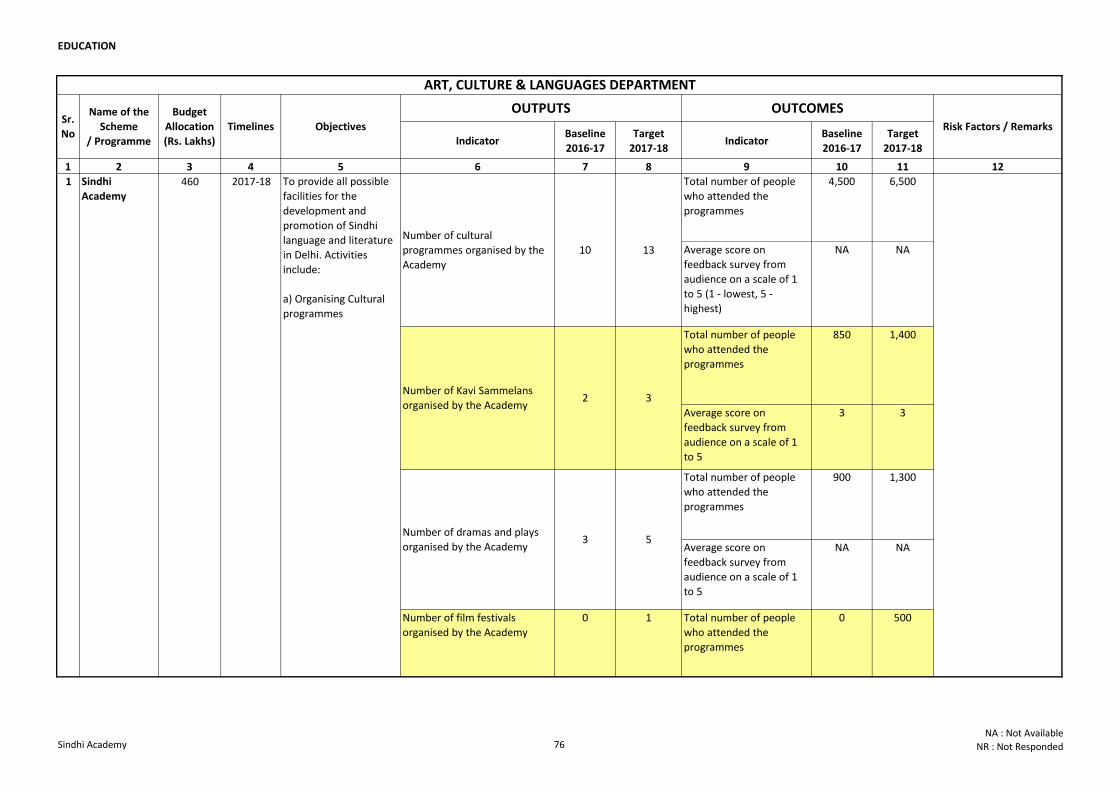
EDUCATION
Indicator Baseline
2016-17
Target
2017-18Indicator
Baseline
2016-17
Target
2017-18
1 2 3 4 5 6 7 8 9 10 11 12
Total number of people
who attended the
programmes
4,500 6,500
Average score on
feedback survey from
audience on a scale of 1
to 5 (1 - lowest, 5 -
highest)
NA NA
Total number of people
who attended the
programmes
850 1,400
Average score on
feedback survey from
audience on a scale of 1
to 5
3 3
Total number of people
who attended the
programmes
900 1,300
Average score on
feedback survey from
audience on a scale of 1
to 5
NA NA
Number of film festivals
organised by the Academy
0 1 Total number of people
who attended the
programmes
0 500
ART, CULTURE & LANGUAGES DEPARTMENT
OUTPUTS OUTCOMESRisk Factors / Remarks
Sr.
No
Name of the
Scheme
/ Programme
Budget
Allocation
(Rs. Lakhs)
Timelines Objectives
3
5
13
1
10
Number of Kavi Sammelans
organised by the Academy2
Number of dramas and plays
organised by the Academy3
Sindhi
Academy460 2017-18 To provide all possible
facilities for the
development and
promotion of Sindhi
language and literature
in Delhi. Activities
include:
a) Organising Cultural
programmes
Number of cultural
programmes organised by the
Academy
Sindhi Academy 76NA : Not Available
NR : Not Responded
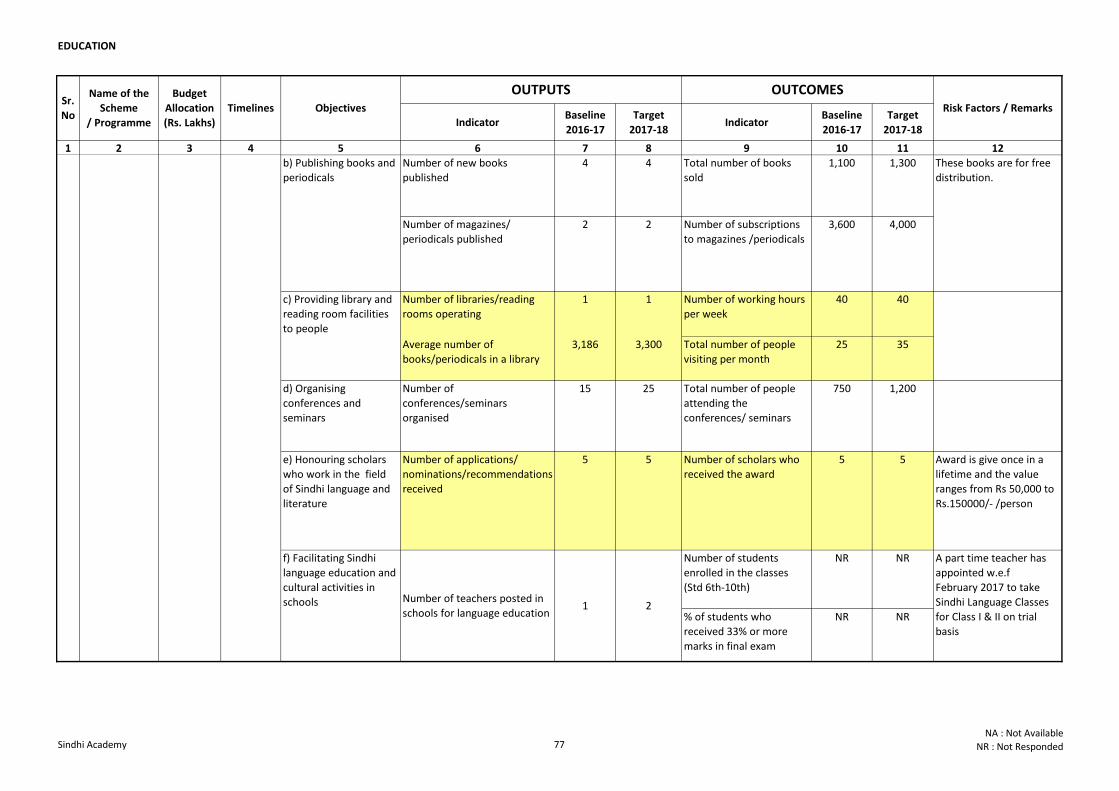
EDUCATION
Indicator Baseline
2016-17
Target
2017-18Indicator
Baseline
2016-17
Target
2017-18
1 2 3 4 5 6 7 8 9 10 11 12
OUTPUTS OUTCOMESRisk Factors / Remarks
Sr.
No
Name of the
Scheme
/ Programme
Budget
Allocation
(Rs. Lakhs)
Timelines Objectives
Number of new books
published
4 4 Total number of books
sold
1,100 1,300
Number of magazines/
periodicals published
2 2 Number of subscriptions
to magazines /periodicals
3,600 4,000
Number of libraries/reading
rooms operating
1 1 Number of working hours
per week
40 40
Average number of
books/periodicals in a library
3,186 3,300 Total number of people
visiting per month
25 35
d) Organising
conferences and
seminars
Number of
conferences/seminars
organised
15 25 Total number of people
attending the
conferences/ seminars
750 1,200
e) Honouring scholars
who work in the field
of Sindhi language and
literature
Number of applications/
nominations/recommendations
received
5 5 Number of scholars who
received the award
5 5 Award is give once in a
lifetime and the value
ranges from Rs 50,000 to
Rs.150000/- /person
Number of students
enrolled in the classes
(Std 6th-10th)
NR NR
% of students who
received 33% or more
marks in final exam
NR NR
1 Sindhi
Academy460 2017-18
b) Publishing books and
periodicals
These books are for free
distribution.
c) Providing library and
reading room facilities
to people
f) Facilitating Sindhi
language education and
cultural activities in
schools Number of teachers posted in
schools for language education1 2
A part time teacher has
appointed w.e.f
February 2017 to take
Sindhi Language Classes
for Class I & II on trial
basis
Sindhi Academy 77NA : Not Available
NR : Not Responded
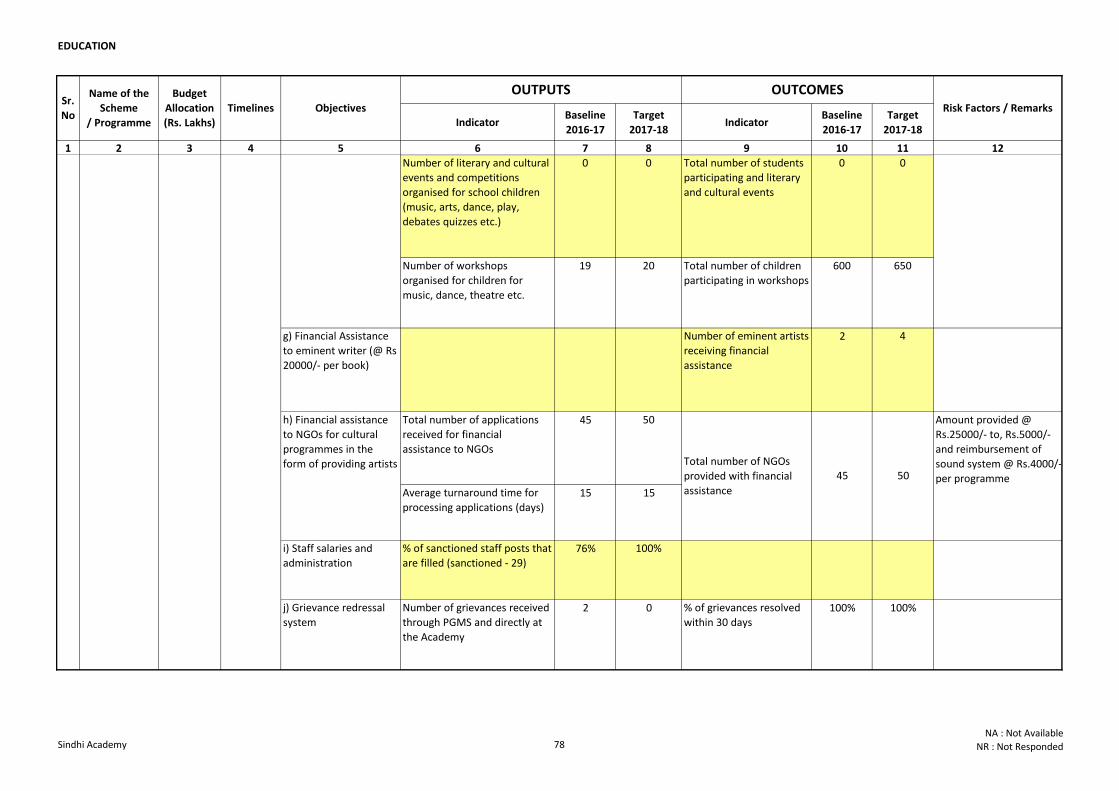
EDUCATION
Indicator Baseline
2016-17
Target
2017-18Indicator
Baseline
2016-17
Target
2017-18
1 2 3 4 5 6 7 8 9 10 11 12
OUTPUTS OUTCOMESRisk Factors / Remarks
Sr.
No
Name of the
Scheme
/ Programme
Budget
Allocation
(Rs. Lakhs)
Timelines Objectives
Number of literary and cultural
events and competitions
organised for school children
(music, arts, dance, play,
debates quizzes etc.)
0 0 Total number of students
participating and literary
and cultural events
0 0
Number of workshops
organised for children for
music, dance, theatre etc.
19 20 Total number of children
participating in workshops
600 650
g) Financial Assistance
to eminent writer (@ Rs
20000/- per book)
Number of eminent artists
receiving financial
assistance
2 4
Total number of applications
received for financial
assistance to NGOs
45 50
Average turnaround time for
processing applications (days)
15 15
i) Staff salaries and
administration
% of sanctioned staff posts that
are filled (sanctioned - 29)76% 100%
j) Grievance redressal
system
Number of grievances received
through PGMS and directly at
the Academy
2 0 % of grievances resolved
within 30 days100% 100%
1 Sindhi
Academy460 2017-18
h) Financial assistance
to NGOs for cultural
programmes in the
form of providing artists 45 50
Amount provided @
Rs.25000/- to, Rs.5000/-
and reimbursement of
sound system @ Rs.4000/-
per programme
f) Facilitating Sindhi
language education and
cultural activities in
schools
A part time teacher has
appointed w.e.f
February 2017 to take
Sindhi Language Classes
for Class I & II on trial
basis
Total number of NGOs
provided with financial
assistance
Sindhi Academy 78NA : Not Available
NR : Not Responded
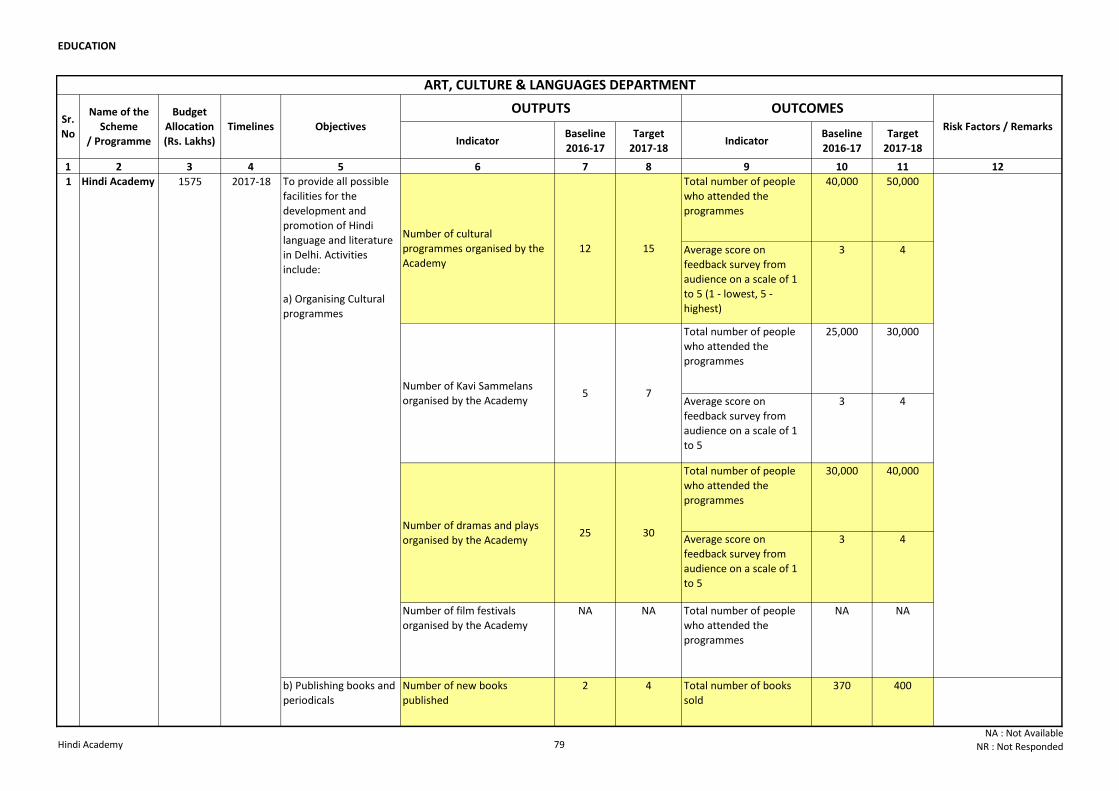
EDUCATION
Indicator Baseline
2016-17
Target
2017-18Indicator
Baseline
2016-17
Target
2017-18
1 2 3 4 5 6 7 8 9 10 11 12
Total number of people
who attended the
programmes
40,000 50,000
Average score on
feedback survey from
audience on a scale of 1
to 5 (1 - lowest, 5 -
highest)
3 4
Total number of people
who attended the
programmes
25,000 30,000
Average score on
feedback survey from
audience on a scale of 1
to 5
3 4
Total number of people
who attended the
programmes
30,000 40,000
Average score on
feedback survey from
audience on a scale of 1
to 5
3 4
Number of film festivals
organised by the Academy
NA NA Total number of people
who attended the
programmes
NA NA
Number of new books
published
2 4 Total number of books
sold
370 400b) Publishing books and
periodicals
1 Hindi Academy 1575 2017-18 To provide all possible
facilities for the
development and
promotion of Hindi
language and literature
in Delhi. Activities
include:
a) Organising Cultural
programmes
12 15
Number of Kavi Sammelans
organised by the Academy5 7
Number of dramas and plays
organised by the Academy25 30
Number of cultural
programmes organised by the
Academy
ART, CULTURE & LANGUAGES DEPARTMENT
Sr.
No
Name of the
Scheme
/ Programme
Budget
Allocation
(Rs. Lakhs)
Timelines Objectives
OUTPUTS OUTCOMESRisk Factors / Remarks
Hindi Academy 79NA : Not Available
NR : Not Responded
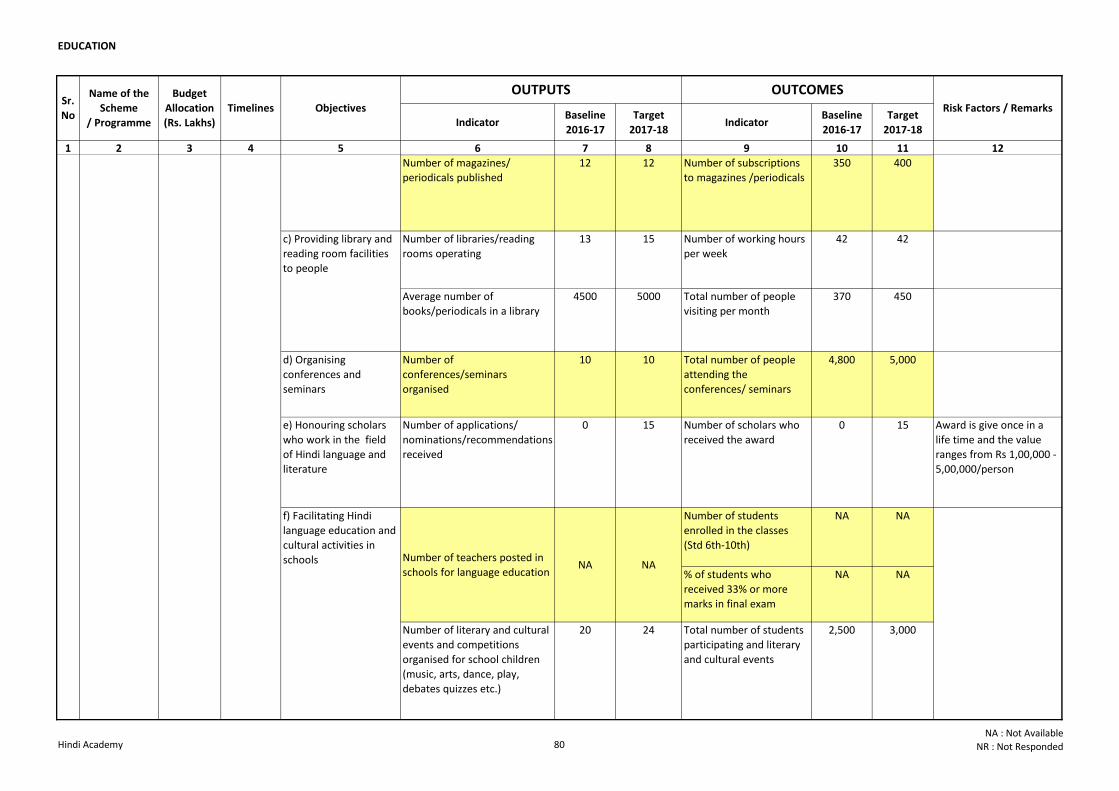
EDUCATION
Indicator Baseline
2016-17
Target
2017-18Indicator
Baseline
2016-17
Target
2017-18
1 2 3 4 5 6 7 8 9 10 11 12
Sr.
No
Name of the
Scheme
/ Programme
Budget
Allocation
(Rs. Lakhs)
Timelines Objectives
OUTPUTS OUTCOMESRisk Factors / Remarks
Number of magazines/
periodicals published
12 12 Number of subscriptions
to magazines /periodicals
350 400
Number of libraries/reading
rooms operating
13 15 Number of working hours
per week
42 42
Average number of
books/periodicals in a library
4500 5000 Total number of people
visiting per month
370 450
d) Organising
conferences and
seminars
Number of
conferences/seminars
organised
10 10 Total number of people
attending the
conferences/ seminars
4,800 5,000
e) Honouring scholars
who work in the field
of Hindi language and
literature
Number of applications/
nominations/recommendations
received
0 15 Number of scholars who
received the award
0 15 Award is give once in a
life time and the value
ranges from Rs 1,00,000 -
5,00,000/person
Number of students
enrolled in the classes
(Std 6th-10th)
NA NA
% of students who
received 33% or more
marks in final exam
NA NA
Number of literary and cultural
events and competitions
organised for school children
(music, arts, dance, play,
debates quizzes etc.)
20 24 Total number of students
participating and literary
and cultural events
2,500 3,000
c) Providing library and
reading room facilities
to people
b) Publishing books and
periodicals
1 Hindi Academy 1575 2017-18
f) Facilitating Hindi
language education and
cultural activities in
schools NA NANumber of teachers posted in
schools for language education
Hindi Academy 80NA : Not Available
NR : Not Responded
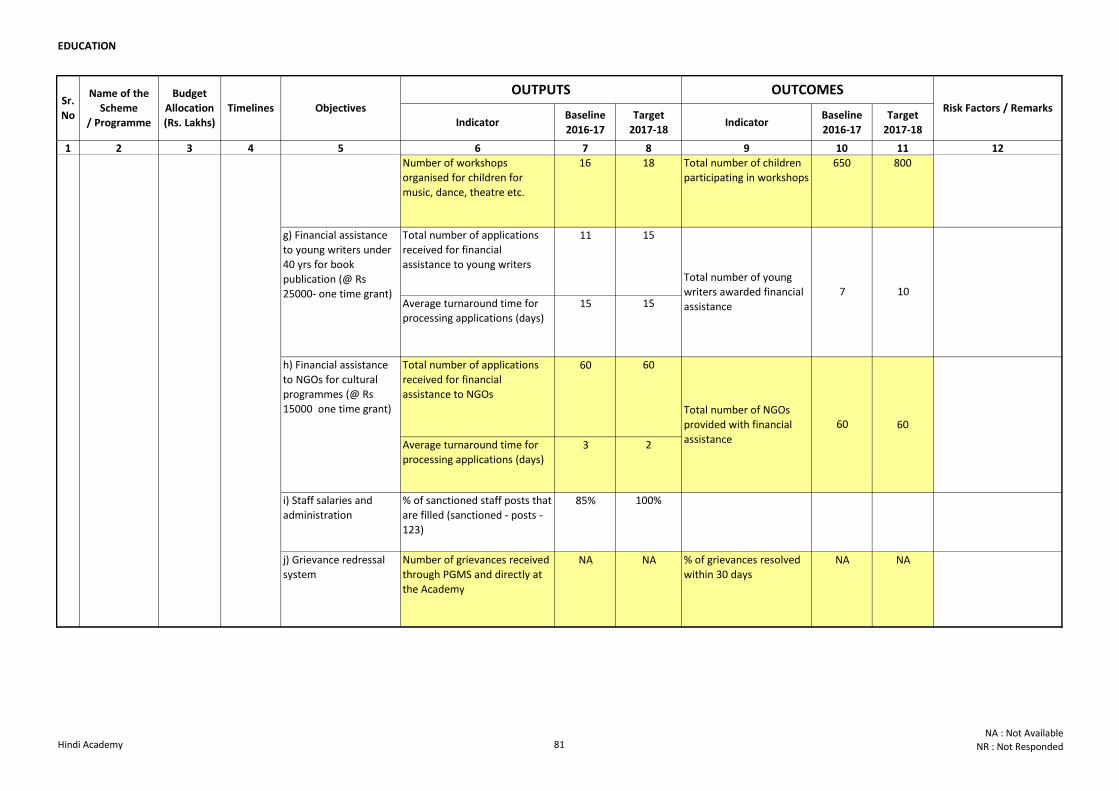
EDUCATION
Indicator Baseline
2016-17
Target
2017-18Indicator
Baseline
2016-17
Target
2017-18
1 2 3 4 5 6 7 8 9 10 11 12
Sr.
No
Name of the
Scheme
/ Programme
Budget
Allocation
(Rs. Lakhs)
Timelines Objectives
OUTPUTS OUTCOMESRisk Factors / Remarks
Number of workshops
organised for children for
music, dance, theatre etc.
16 18 Total number of children
participating in workshops
650 800
Total number of applications
received for financial
assistance to young writers
11 15
Average turnaround time for
processing applications (days)15 15
Total number of applications
received for financial
assistance to NGOs
60 60
Average turnaround time for
processing applications (days)3 2
i) Staff salaries and
administration
% of sanctioned staff posts that
are filled (sanctioned - posts -
123)
85% 100%
j) Grievance redressal
system
Number of grievances received
through PGMS and directly at
the Academy
NA NA % of grievances resolved
within 30 daysNA NA
1 Hindi Academy 1575 2017-18
f) Facilitating Hindi
language education and
cultural activities in
schools
g) Financial assistance
to young writers under
40 yrs for book
publication (@ Rs
25000- one time grant)
h) Financial assistance
to NGOs for cultural
programmes (@ Rs
15000 one time grant)
60
Total number of young
writers awarded financial
assistance
7 10
Total number of NGOs
provided with financial
assistance
60
Hindi Academy 81NA : Not Available
NR : Not Responded
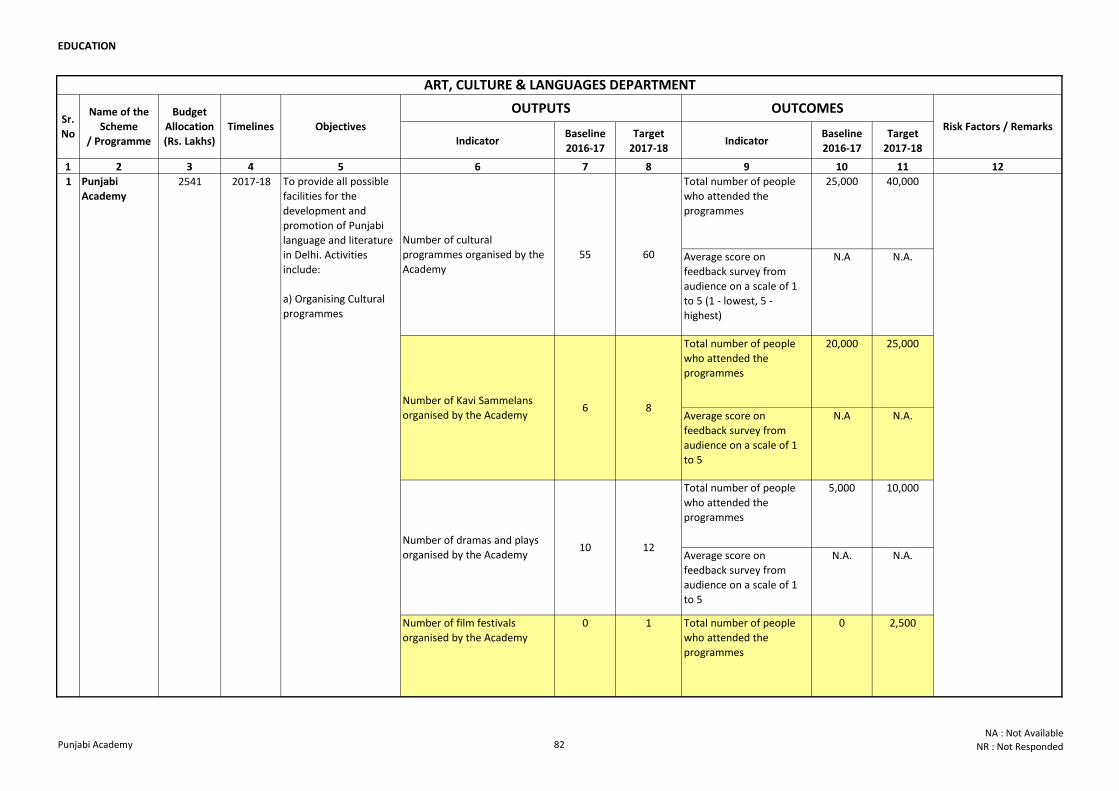
EDUCATION
Indicator Baseline
2016-17
Target
2017-18Indicator
Baseline
2016-17
Target
2017-18
1 2 3 4 5 6 7 8 9 10 11 12
Total number of people
who attended the
programmes
25,000 40,000
Average score on
feedback survey from
audience on a scale of 1
to 5 (1 - lowest, 5 -
highest)
N.A N.A.
Total number of people
who attended the
programmes
20,000 25,000
Average score on
feedback survey from
audience on a scale of 1
to 5
N.A N.A.
Total number of people
who attended the
programmes
5,000 10,000
Average score on
feedback survey from
audience on a scale of 1
to 5
N.A. N.A.
Number of film festivals
organised by the Academy
0 1 Total number of people
who attended the
programmes
0 2,500
Sr.
No
Name of the
Scheme
/ Programme
Budget
Allocation
(Rs. Lakhs)
Timelines Objectives
OUTPUTS OUTCOMES
1 Punjabi
Academy2541 2017-18 To provide all possible
facilities for the
development and
promotion of Punjabi
language and literature
in Delhi. Activities
include:
a) Organising Cultural
programmes
ART, CULTURE & LANGUAGES DEPARTMENT
Risk Factors / Remarks
55 60
Number of Kavi Sammelans
organised by the Academy6 8
Number of dramas and plays
organised by the Academy10 12
Number of cultural
programmes organised by the
Academy
Punjabi Academy 82NA : Not Available
NR : Not Responded
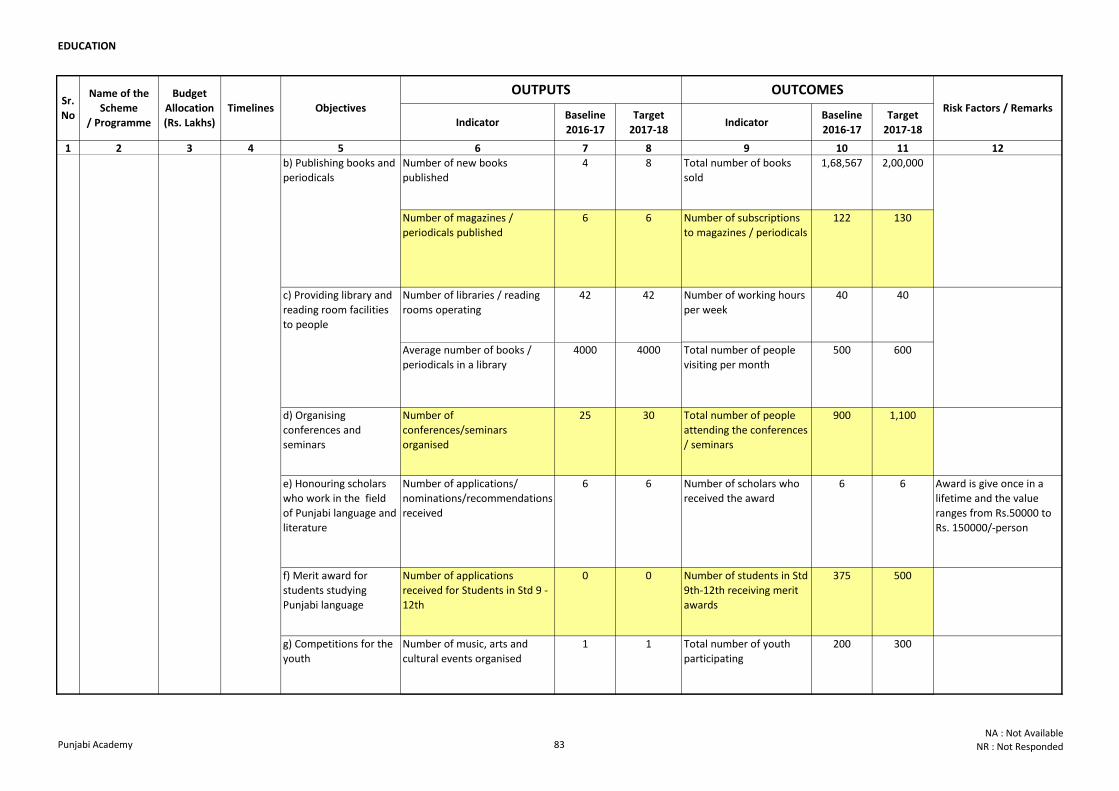
EDUCATION
Indicator Baseline
2016-17
Target
2017-18Indicator
Baseline
2016-17
Target
2017-18
1 2 3 4 5 6 7 8 9 10 11 12
Sr.
No
Name of the
Scheme
/ Programme
Budget
Allocation
(Rs. Lakhs)
Timelines Objectives
OUTPUTS OUTCOMESRisk Factors / Remarks
Number of new books
published
4 8 Total number of books
sold
1,68,567 2,00,000
Number of magazines /
periodicals published
6 6 Number of subscriptions
to magazines / periodicals
122 130
Number of libraries / reading
rooms operating
42 42 Number of working hours
per week
40 40
Average number of books /
periodicals in a library
4000 4000 Total number of people
visiting per month
500 600
d) Organising
conferences and
seminars
Number of
conferences/seminars
organised
25 30 Total number of people
attending the conferences
/ seminars
900 1,100
e) Honouring scholars
who work in the field
of Punjabi language and
literature
Number of applications/
nominations/recommendations
received
6 6 Number of scholars who
received the award
6 6 Award is give once in a
lifetime and the value
ranges from Rs.50000 to
Rs. 150000/-person
f) Merit award for
students studying
Punjabi language
Number of applications
received for Students in Std 9 -
12th
0 0 Number of students in Std
9th-12th receiving merit
awards
375 500
Number of music, arts and
cultural events organised
1 1 Total number of youth
participating
200 300
c) Providing library and
reading room facilities
to people
b) Publishing books and
periodicals
1 Punjabi
Academy2541 2017-18
g) Competitions for the
youth
Punjabi Academy 83NA : Not Available
NR : Not Responded
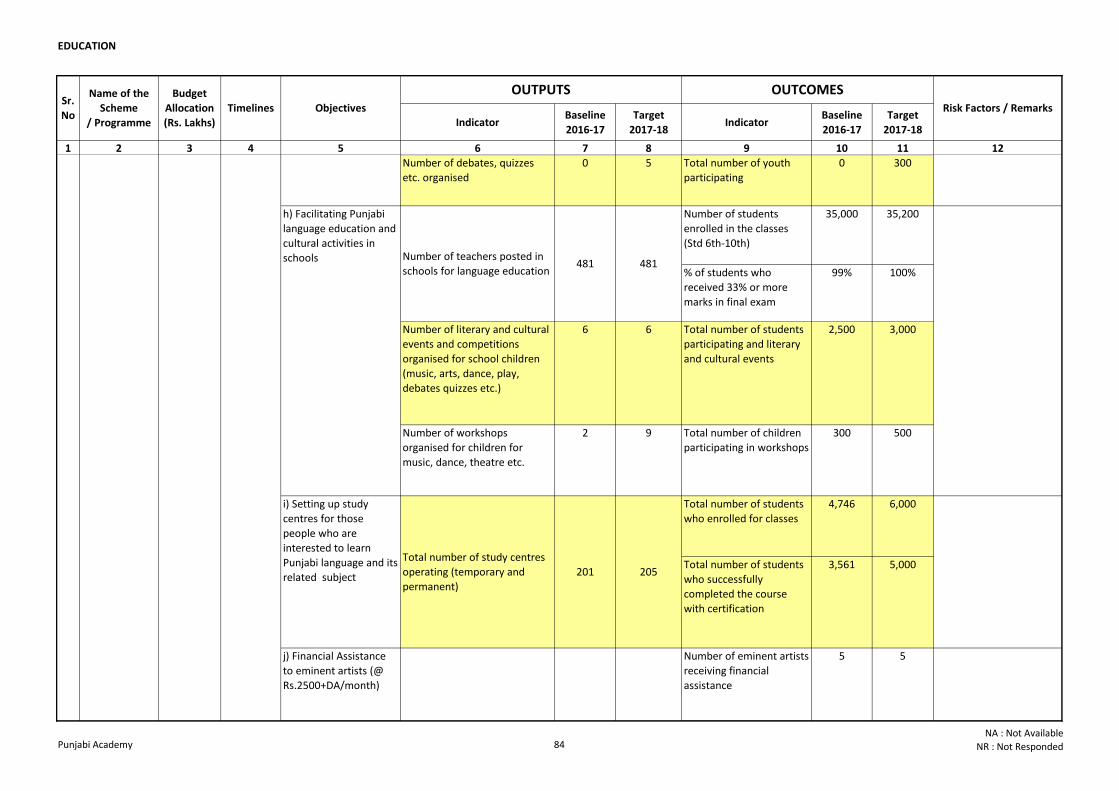
EDUCATION
Indicator Baseline
2016-17
Target
2017-18Indicator
Baseline
2016-17
Target
2017-18
1 2 3 4 5 6 7 8 9 10 11 12
Sr.
No
Name of the
Scheme
/ Programme
Budget
Allocation
(Rs. Lakhs)
Timelines Objectives
OUTPUTS OUTCOMESRisk Factors / Remarks
Number of debates, quizzes
etc. organised
0 5 Total number of youth
participating
0 300
Number of students
enrolled in the classes
(Std 6th-10th)
35,000 35,200
% of students who
received 33% or more
marks in final exam
99% 100%
Number of literary and cultural
events and competitions
organised for school children
(music, arts, dance, play,
debates quizzes etc.)
6 6 Total number of students
participating and literary
and cultural events
2,500 3,000
Number of workshops
organised for children for
music, dance, theatre etc.
2 9 Total number of children
participating in workshops
300 500
Total number of students
who enrolled for classes
4,746 6,000
Total number of students
who successfully
completed the course
with certification
3,561 5,000
j) Financial Assistance
to eminent artists (@
Rs.2500+DA/month)
Number of eminent artists
receiving financial
assistance
5 5
Number of teachers posted in
schools for language education481 481
i) Setting up study
centres for those
people who are
interested to learn
Punjabi language and its
related subject
Total number of study centres
operating (temporary and
permanent)
201 205
1 Punjabi
Academy2541 2017-18
h) Facilitating Punjabi
language education and
cultural activities in
schools
g) Competitions for the
youth
Punjabi Academy 84NA : Not Available
NR : Not Responded
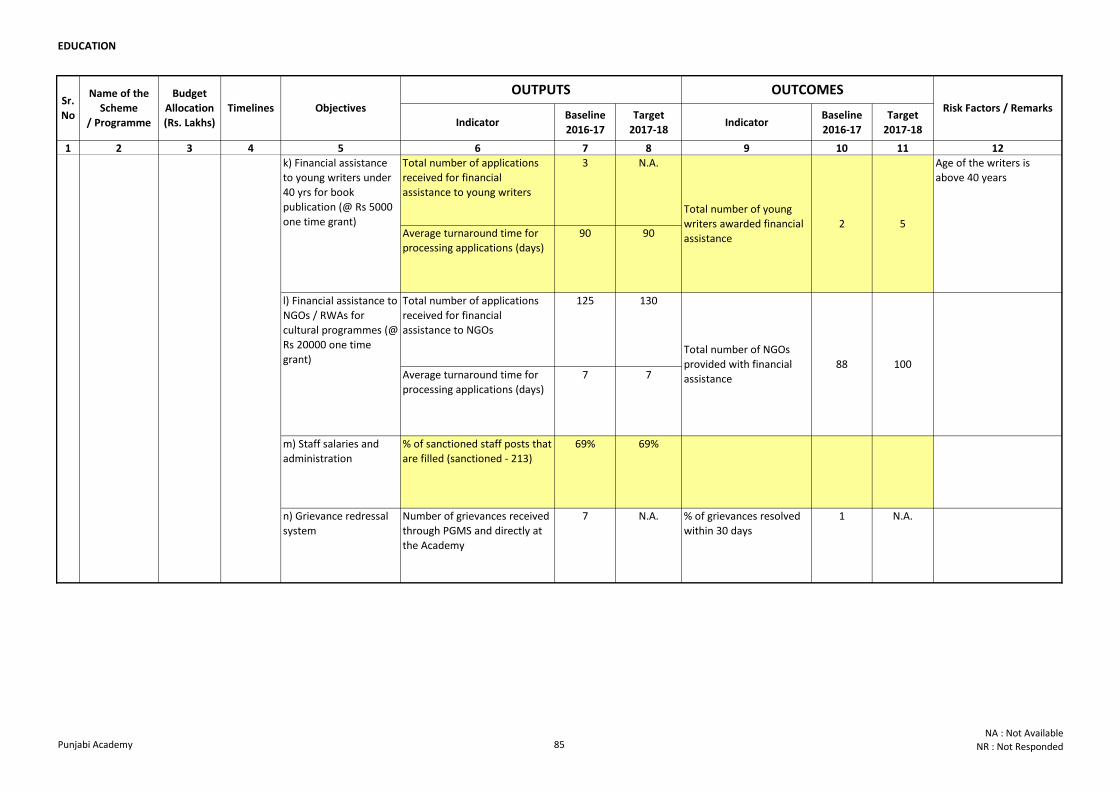
EDUCATION
Indicator Baseline
2016-17
Target
2017-18Indicator
Baseline
2016-17
Target
2017-18
1 2 3 4 5 6 7 8 9 10 11 12
Sr.
No
Name of the
Scheme
/ Programme
Budget
Allocation
(Rs. Lakhs)
Timelines Objectives
OUTPUTS OUTCOMESRisk Factors / Remarks
Total number of applications
received for financial
assistance to young writers
3 N.A.
Average turnaround time for
processing applications (days)
90 90
Total number of applications
received for financial
assistance to NGOs
125 130
Average turnaround time for
processing applications (days)
7 7
m) Staff salaries and
administration
% of sanctioned staff posts that
are filled (sanctioned - 213)
69% 69%
n) Grievance redressal
system
Number of grievances received
through PGMS and directly at
the Academy
7 N.A. % of grievances resolved
within 30 days
1 N.A.
100
Total number of young
writers awarded financial
assistance
Age of the writers is
above 40 years
l) Financial assistance to
NGOs / RWAs for
cultural programmes (@
Rs 20000 one time
grant)
2 5
1 Punjabi
Academy2541 2017-18
Total number of NGOs
provided with financial
assistance
88
k) Financial assistance
to young writers under
40 yrs for book
publication (@ Rs 5000
one time grant)
Punjabi Academy 85NA : Not Available
NR : Not Responded
HEALTHHEALTH
HEALTH
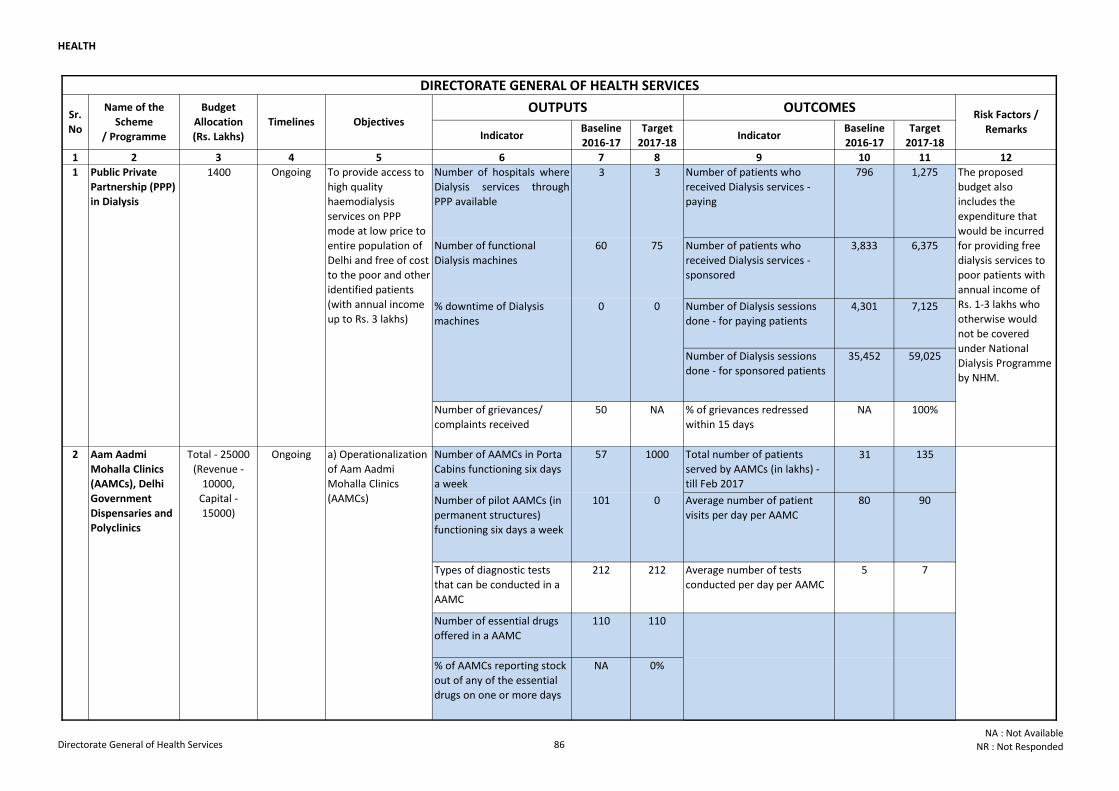
HEALTH
Indicator Baseline
2016-17
Target
2017-18Indicator
Baseline
2016-17
Target
2017-18
1 2 3 4 5 6 7 8 9 10 11 12
Number of hospitals where
Dialysis services through
PPP available
3 3 Number of patients who
received Dialysis services -
paying
796 1,275
Number of functional
Dialysis machines
60 75 Number of patients who
received Dialysis services -
sponsored
3,833 6,375
% downtime of Dialysis
machines
0 0 Number of Dialysis sessions
done - for paying patients
4,301 7,125
Number of Dialysis sessions
done - for sponsored patients
35,452 59,025
Number of grievances/
complaints received
50 NA % of grievances redressed
within 15 days
NA 100%
Number of AAMCs in Porta
Cabins functioning six days
a week
57 1000 Total number of patients
served by AAMCs (in lakhs) -
till Feb 2017
31 135
Number of pilot AAMCs (in
permanent structures)
functioning six days a week
101 0 Average number of patient
visits per day per AAMC
80 90
Types of diagnostic tests
that can be conducted in a
AAMC
212 212 Average number of tests
conducted per day per AAMC
5 7
Number of essential drugs
offered in a AAMC
110 110
% of AAMCs reporting stock
out of any of the essential
drugs on one or more days
NA 0%
DIRECTORATE GENERAL OF HEALTH SERVICES
Ongoing
Sr.
No
Name of the
Scheme
/ Programme
Budget
Allocation
(Rs. Lakhs)
Objectives Risk Factors /
Remarks
1
Timelines
Aam Aadmi
Mohalla Clinics
(AAMCs), Delhi
Government
Dispensaries and
Polyclinics
a) Operationalization
of Aam Aadmi
Mohalla Clinics
(AAMCs)
The proposed
budget also
includes the
expenditure that
would be incurred
for providing free
dialysis services to
poor patients with
annual income of
Rs. 1-3 lakhs who
otherwise would
not be covered
under National
Dialysis Programme
by NHM.
To provide access to
high quality
haemodialysis
services on PPP
mode at low price to
entire population of
Delhi and free of cost
to the poor and other
identified patients
(with annual income
up to Rs. 3 lakhs)
1400Public Private
Partnership (PPP)
in Dialysis
Ongoing
Total - 25000
(Revenue -
10000,
Capital -
15000)
OUTPUTS OUTCOMES
2
Directorate General of Health Services 86NA : Not Available
NR : Not Responded
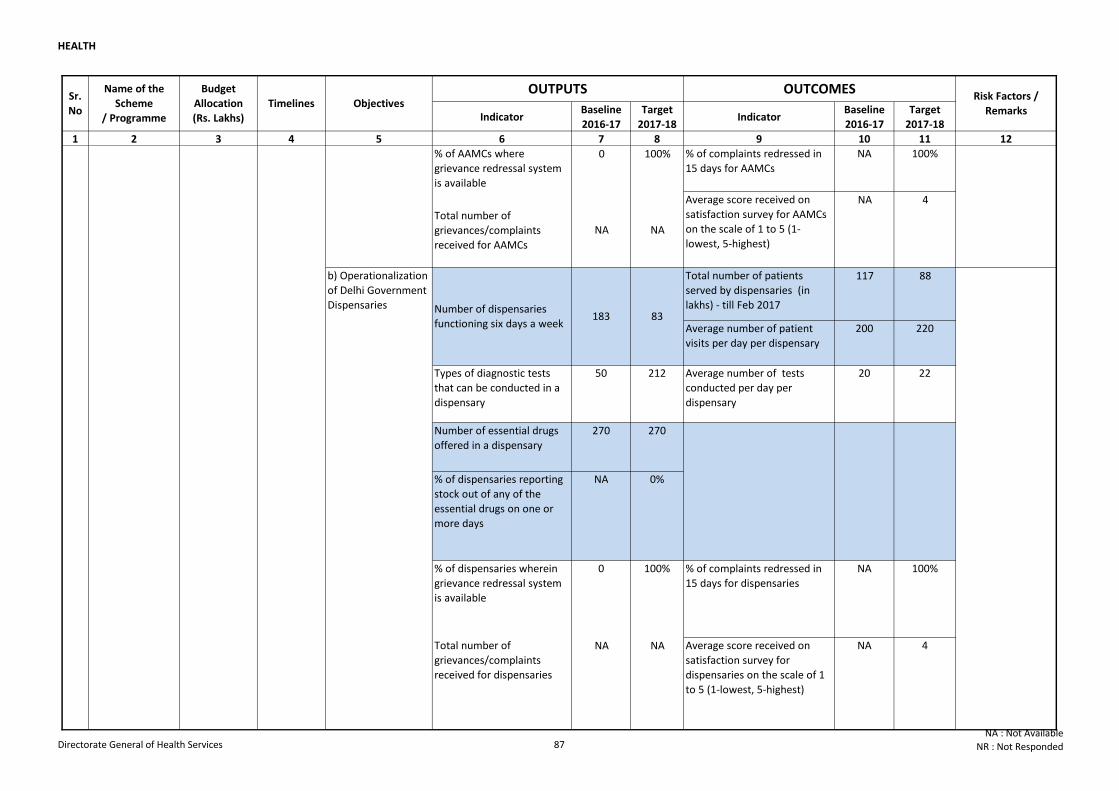
HEALTH
Indicator Baseline
2016-17
Target
2017-18Indicator
Baseline
2016-17
Target
2017-18
1 2 3 4 5 6 7 8 9 10 11 12
Sr.
No
Name of the
Scheme
/ Programme
Budget
Allocation
(Rs. Lakhs)
Objectives Risk Factors /
RemarksTimelines
OUTPUTS OUTCOMES
% of AAMCs where
grievance redressal system
is available
0 100% % of complaints redressed in
15 days for AAMCs
NA 100%
Total number of
grievances/complaints
received for AAMCs
NA NA
Average score received on
satisfaction survey for AAMCs
on the scale of 1 to 5 (1-
lowest, 5-highest)
NA 4
Total number of patients
served by dispensaries (in
lakhs) - till Feb 2017
117 88
Average number of patient
visits per day per dispensary
200 220
Types of diagnostic tests
that can be conducted in a
dispensary
50 212 Average number of tests
conducted per day per
dispensary
20 22
Number of essential drugs
offered in a dispensary
270 270
% of dispensaries reporting
stock out of any of the
essential drugs on one or
more days
NA 0%
% of dispensaries wherein
grievance redressal system
is available
0 100% % of complaints redressed in
15 days for dispensaries
NA 100%
Total number of
grievances/complaints
received for dispensaries
NA NA Average score received on
satisfaction survey for
dispensaries on the scale of 1
to 5 (1-lowest, 5-highest)
NA 4
b) Operationalization
of Delhi Government
Dispensaries
OngoingAam Aadmi
Mohalla Clinics
(AAMCs), Delhi
Government
Dispensaries and
Polyclinics
a) Operationalization
of Aam Aadmi
Mohalla Clinics
(AAMCs)
Total - 25000
(Revenue -
10000,
Capital -
15000)
Number of dispensaries
functioning six days a week183 83
2
Directorate General of Health Services 87NA : Not Available
NR : Not Responded
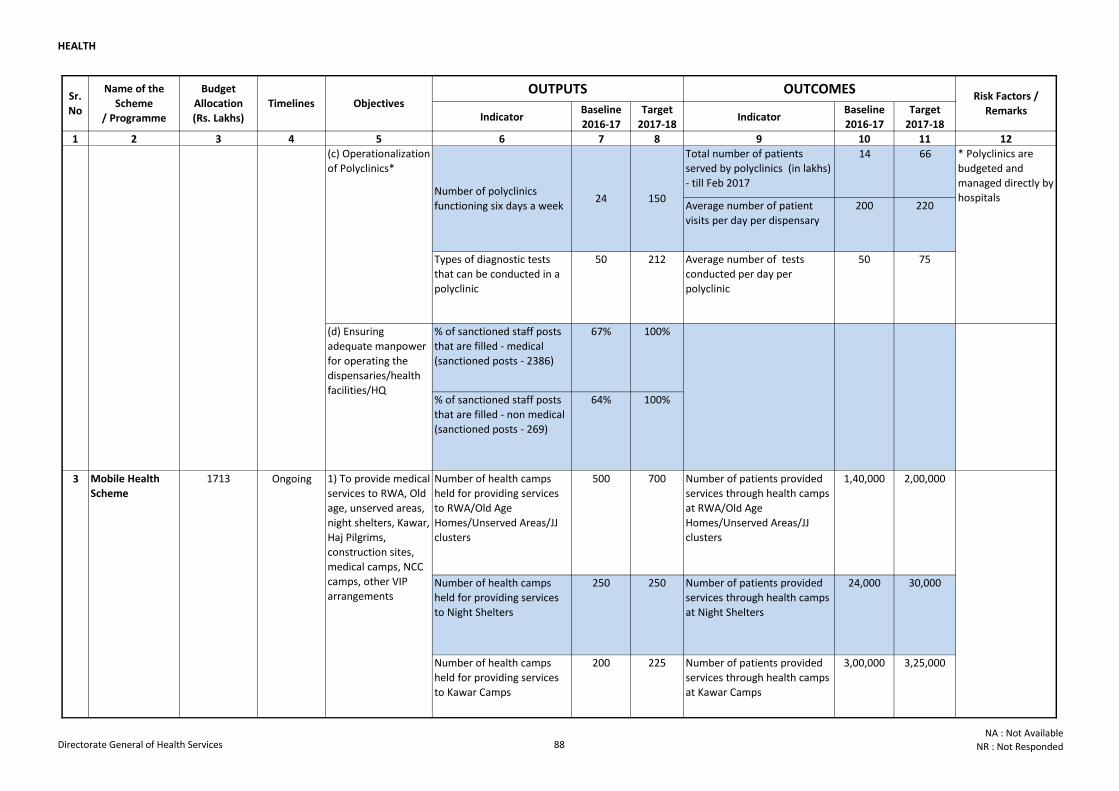
HEALTH
Indicator Baseline
2016-17
Target
2017-18Indicator
Baseline
2016-17
Target
2017-18
1 2 3 4 5 6 7 8 9 10 11 12
Sr.
No
Name of the
Scheme
/ Programme
Budget
Allocation
(Rs. Lakhs)
Objectives Risk Factors /
RemarksTimelines
OUTPUTS OUTCOMES
Total number of patients
served by polyclinics (in lakhs)
- till Feb 2017
14 66
Average number of patient
visits per day per dispensary
200 220
Types of diagnostic tests
that can be conducted in a
polyclinic
50 212 Average number of tests
conducted per day per
polyclinic
50 75
% of sanctioned staff posts
that are filled - medical
(sanctioned posts - 2386)
67% 100%
% of sanctioned staff posts
that are filled - non medical
(sanctioned posts - 269)
64% 100%
Number of health camps
held for providing services
to RWA/Old Age
Homes/Unserved Areas/JJ
clusters
500 700 Number of patients provided
services through health camps
at RWA/Old Age
Homes/Unserved Areas/JJ
clusters
1,40,000 2,00,000
Number of health camps
held for providing services
to Night Shelters
250 250 Number of patients provided
services through health camps
at Night Shelters
24,000 30,000
Number of health camps
held for providing services
to Kawar Camps
200 225 Number of patients provided
services through health camps
at Kawar Camps
3,00,000 3,25,000
150
Mobile Health
Scheme
1713 1) To provide medical
services to RWA, Old
age, unserved areas,
night shelters, Kawar,
Haj Pilgrims,
construction sites,
medical camps, NCC
camps, other VIP
arrangements
Ongoing
24
Ongoing
Aam Aadmi
Mohalla Clinics
(AAMCs), Delhi
Government
Dispensaries and
Polyclinics
* Polyclinics are
budgeted and
managed directly by
hospitals
(d) Ensuring
adequate manpower
for operating the
dispensaries/health
facilities/HQ
Total - 25000
(Revenue -
10000,
Capital -
15000)
3
(c) Operationalization
of Polyclinics*
Number of polyclinics
functioning six days a week
2
Directorate General of Health Services 88NA : Not Available
NR : Not Responded
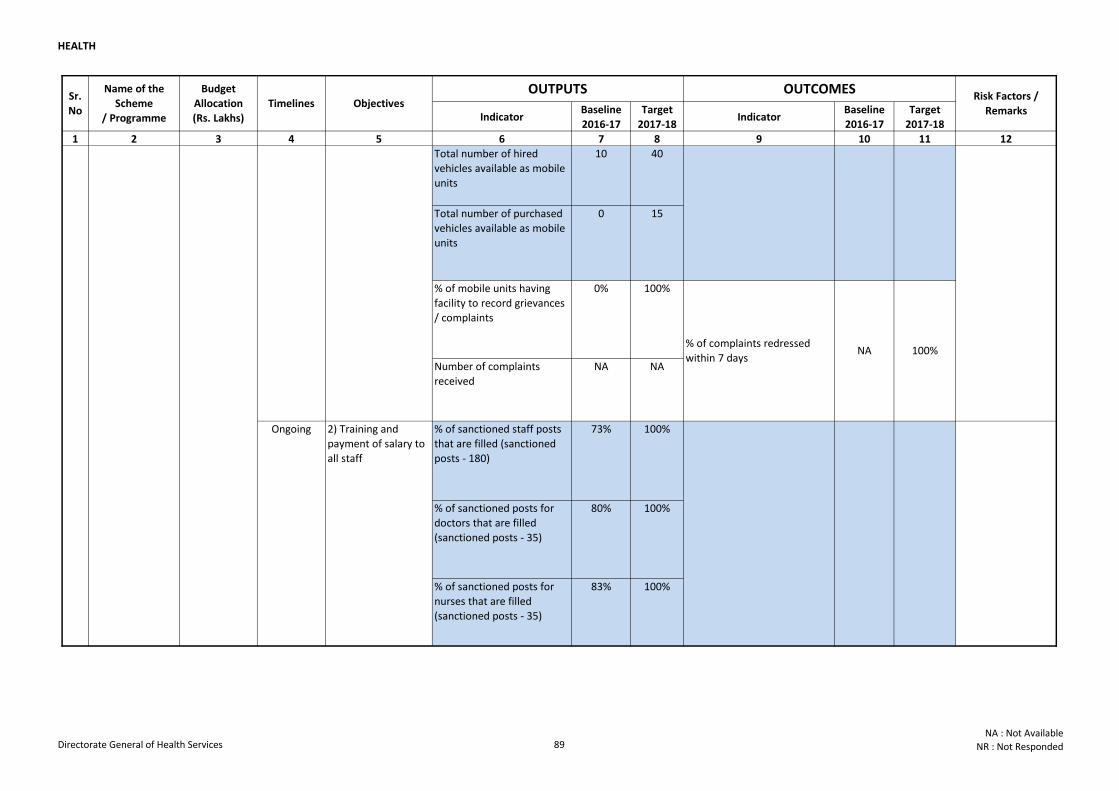
HEALTH
Indicator Baseline
2016-17
Target
2017-18Indicator
Baseline
2016-17
Target
2017-18
1 2 3 4 5 6 7 8 9 10 11 12
Sr.
No
Name of the
Scheme
/ Programme
Budget
Allocation
(Rs. Lakhs)
Objectives Risk Factors /
RemarksTimelines
OUTPUTS OUTCOMES
Total number of hired
vehicles available as mobile
units
10 40
Total number of purchased
vehicles available as mobile
units
0 15
% of mobile units having
facility to record grievances
/ complaints
0% 100%
Number of complaints
received
NA NA
% of sanctioned staff posts
that are filled (sanctioned
posts - 180)
73% 100%
% of sanctioned posts for
doctors that are filled
(sanctioned posts - 35)
80% 100%
% of sanctioned posts for
nurses that are filled
(sanctioned posts - 35)
83% 100%
Mobile Health
Scheme
1713 1) To provide medical
services to RWA, Old
age, unserved areas,
night shelters, Kawar,
Haj Pilgrims,
construction sites,
medical camps, NCC
camps, other VIP
arrangements
2) Training and
payment of salary to
all staff
100%% of complaints redressed
within 7 daysNA
Ongoing
Ongoing
3
Directorate General of Health Services 89NA : Not Available
NR : Not Responded
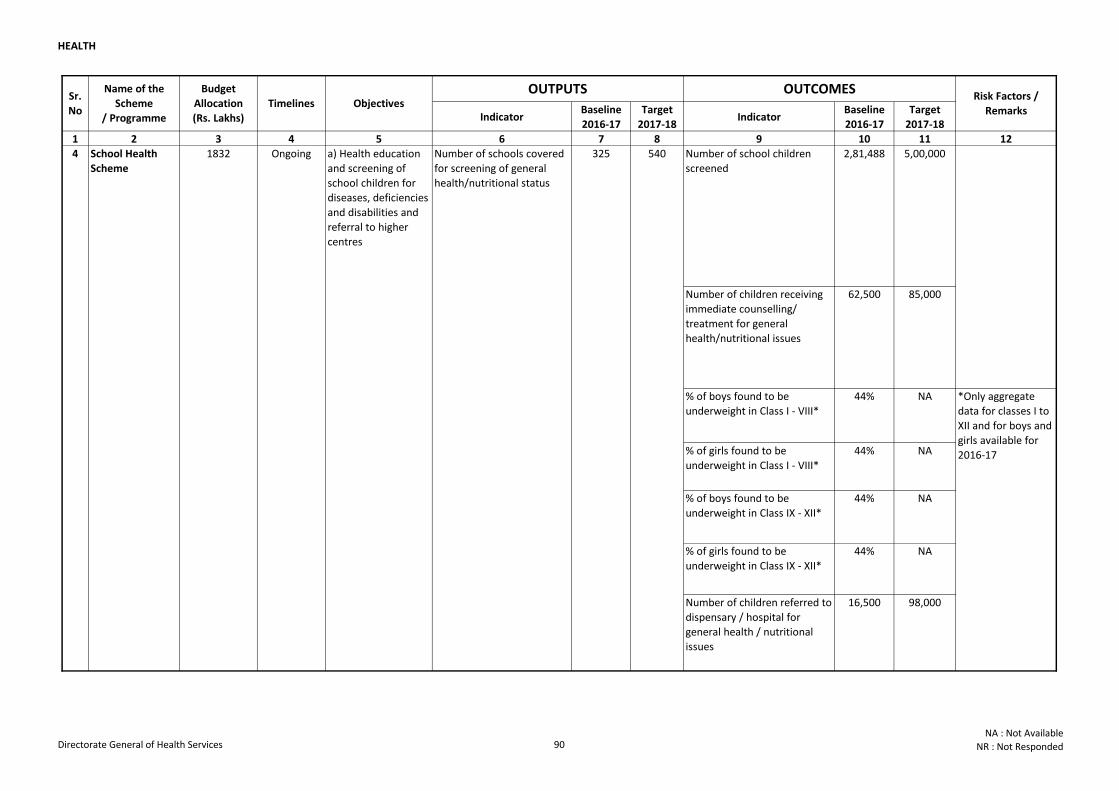
HEALTH
Indicator Baseline
2016-17
Target
2017-18Indicator
Baseline
2016-17
Target
2017-18
1 2 3 4 5 6 7 8 9 10 11 12
Sr.
No
Name of the
Scheme
/ Programme
Budget
Allocation
(Rs. Lakhs)
Objectives Risk Factors /
RemarksTimelines
OUTPUTS OUTCOMES
Number of school children
screened
2,81,488 5,00,000
Number of children receiving
immediate counselling/
treatment for general
health/nutritional issues
62,500 85,000
% of boys found to be
underweight in Class I - VIII*
44% NA
% of girls found to be
underweight in Class I - VIII*
44% NA
% of boys found to be
underweight in Class IX - XII*
44% NA
% of girls found to be
underweight in Class IX - XII*
44% NA
Number of children referred to
dispensary / hospital for
general health / nutritional
issues
16,500 98,000
540325Number of schools covered
for screening of general
health/nutritional status
School Health
Scheme
1832
*Only aggregate
data for classes I to
XII and for boys and
girls available for
2016-17
4 Ongoing a) Health education
and screening of
school children for
diseases, deficiencies
and disabilities and
referral to higher
centres
Directorate General of Health Services 90NA : Not Available
NR : Not Responded
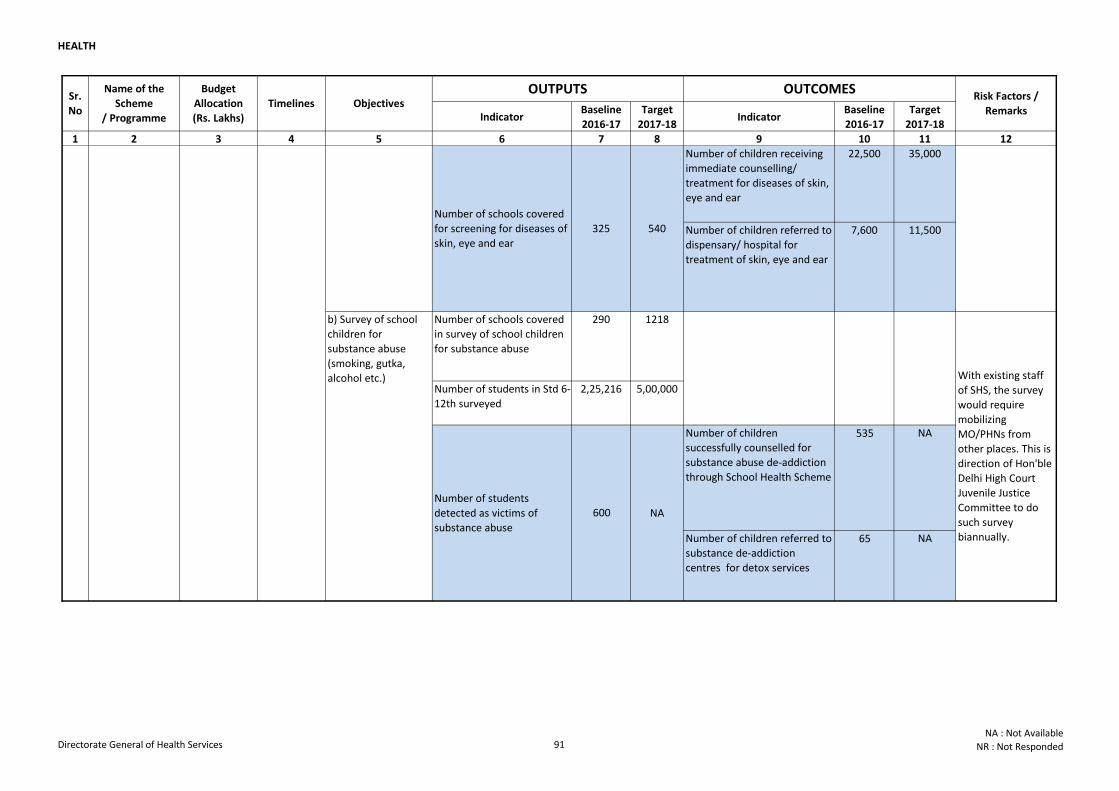
HEALTH
Indicator Baseline
2016-17
Target
2017-18Indicator
Baseline
2016-17
Target
2017-18
1 2 3 4 5 6 7 8 9 10 11 12
Sr.
No
Name of the
Scheme
/ Programme
Budget
Allocation
(Rs. Lakhs)
Objectives Risk Factors /
RemarksTimelines
OUTPUTS OUTCOMES
Number of children receiving
immediate counselling/
treatment for diseases of skin,
eye and ear
22,500 35,000
Number of children referred to
dispensary/ hospital for
treatment of skin, eye and ear
7,600 11,500
Number of schools covered
in survey of school children
for substance abuse
290 1218
Number of students in Std 6-
12th surveyed
2,25,216 5,00,000
Number of children
successfully counselled for
substance abuse de-addiction
through School Health Scheme
535 NA
Number of children referred to
substance de-addiction
centres for detox services
65 NA
Number of schools covered
for screening for diseases of
skin, eye and ear
325 540
Number of students
detected as victims of
substance abuse
600 NA
School Health
Scheme
1832
*Only aggregate
data for classes I to
XII and for boys and
girls available for
2016-17
b) Survey of school
children for
substance abuse
(smoking, gutka,
alcohol etc.) With existing staff
of SHS, the survey
would require
mobilizing
MO/PHNs from
other places. This is
direction of Hon'ble
Delhi High Court
Juvenile Justice
Committee to do
such survey
biannually.
4 Ongoing a) Health education
and screening of
school children for
diseases, deficiencies
and disabilities and
referral to higher
centres
Directorate General of Health Services 91NA : Not Available
NR : Not Responded
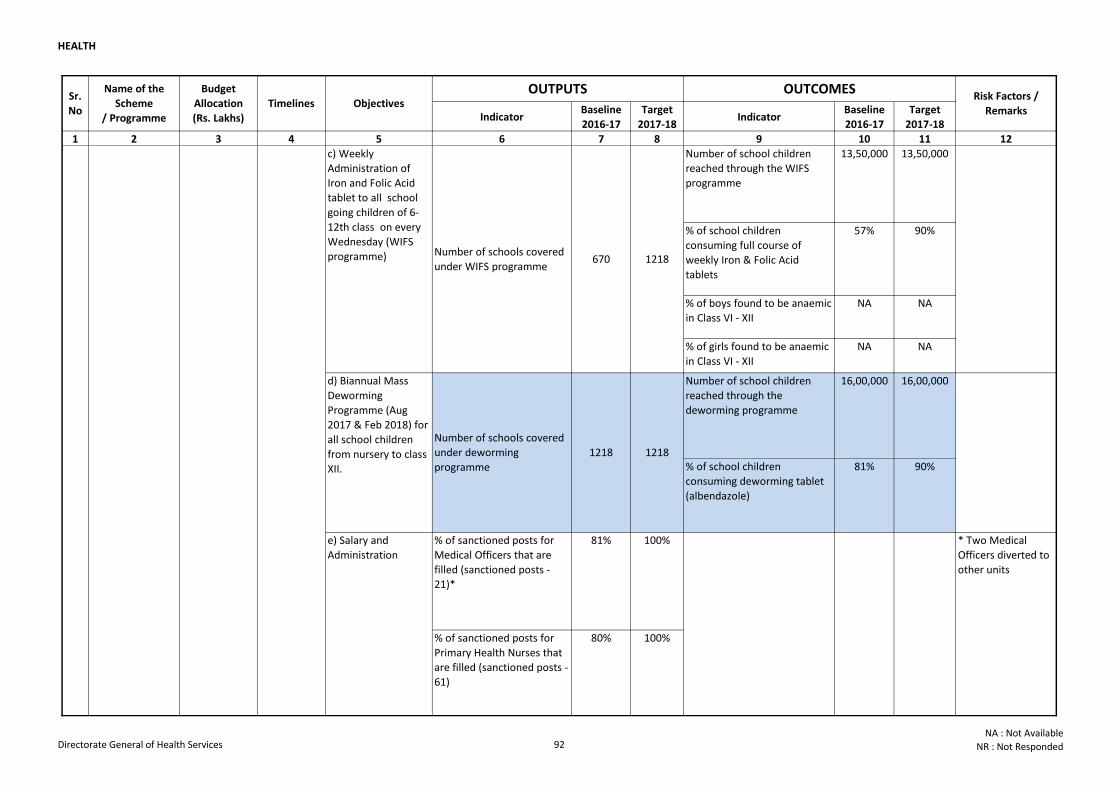
HEALTH
Indicator Baseline
2016-17
Target
2017-18Indicator
Baseline
2016-17
Target
2017-18
1 2 3 4 5 6 7 8 9 10 11 12
Sr.
No
Name of the
Scheme
/ Programme
Budget
Allocation
(Rs. Lakhs)
Objectives Risk Factors /
RemarksTimelines
OUTPUTS OUTCOMES
Number of school children
reached through the WIFS
programme
13,50,000 13,50,000
% of school children
consuming full course of
weekly Iron & Folic Acid
tablets
57% 90%
% of boys found to be anaemic
in Class VI - XII
NA NA
% of girls found to be anaemic
in Class VI - XII
NA NA
Number of school children
reached through the
deworming programme
16,00,000 16,00,000
% of school children
consuming deworming tablet
(albendazole)
81% 90%
% of sanctioned posts for
Medical Officers that are
filled (sanctioned posts -
21)*
81% 100%
% of sanctioned posts for
Primary Health Nurses that
are filled (sanctioned posts -
61)
80% 100%
1218 1218
* Two Medical
Officers diverted to
other units
School Health
Scheme
1832
e) Salary and
Administration
Number of schools covered
under deworming
programme
4 Ongoing
d) Biannual Mass
Deworming
Programme (Aug
2017 & Feb 2018) for
all school children
from nursery to class
XII.
670 1218
c) Weekly
Administration of
Iron and Folic Acid
tablet to all school
going children of 6-
12th class on every
Wednesday (WIFS
programme) Number of schools covered
under WIFS programme
Directorate General of Health Services 92NA : Not Available
NR : Not Responded
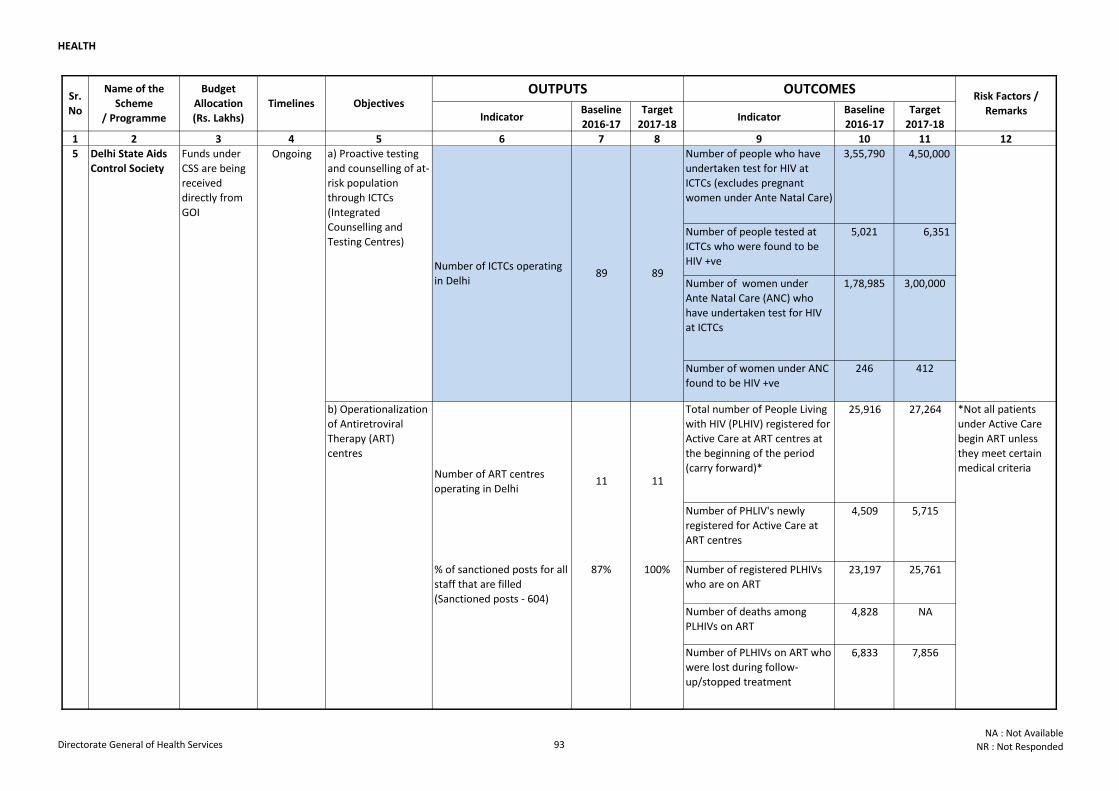
HEALTH
Indicator Baseline
2016-17
Target
2017-18Indicator
Baseline
2016-17
Target
2017-18
1 2 3 4 5 6 7 8 9 10 11 12
Sr.
No
Name of the
Scheme
/ Programme
Budget
Allocation
(Rs. Lakhs)
Objectives Risk Factors /
RemarksTimelines
OUTPUTS OUTCOMES
Number of people who have
undertaken test for HIV at
ICTCs (excludes pregnant
women under Ante Natal Care)
3,55,790 4,50,000
Number of people tested at
ICTCs who were found to be
HIV +ve
5,021 6,351
Number of women under
Ante Natal Care (ANC) who
have undertaken test for HIV
at ICTCs
1,78,985 3,00,000
Number of women under ANC
found to be HIV +ve
246 412
Total number of People Living
with HIV (PLHIV) registered for
Active Care at ART centres at
the beginning of the period
(carry forward)*
25,916 27,264
Number of PHLIV's newly
registered for Active Care at
ART centres
4,509 5,715
Number of registered PLHIVs
who are on ART23,197 25,761
Number of deaths among
PLHIVs on ART4,828 NA
Number of PLHIVs on ART who
were lost during follow-
up/stopped treatment
6,833 7,856
Funds under
CSS are being
received
directly from
GOI
Ongoing
*Not all patients
under Active Care
begin ART unless
they meet certain
medical criteria
a) Proactive testing
and counselling of at-
risk population
through ICTCs
(Integrated
Counselling and
Testing Centres)
b) Operationalization
of Antiretroviral
Therapy (ART)
centres
5
Number of ICTCs operating
in Delhi89
% of sanctioned posts for all
staff that are filled
(Sanctioned posts - 604)
87%
Number of ART centres
operating in Delhi11
Delhi State Aids
Control Society
100%
11
89
Directorate General of Health Services 93NA : Not Available
NR : Not Responded
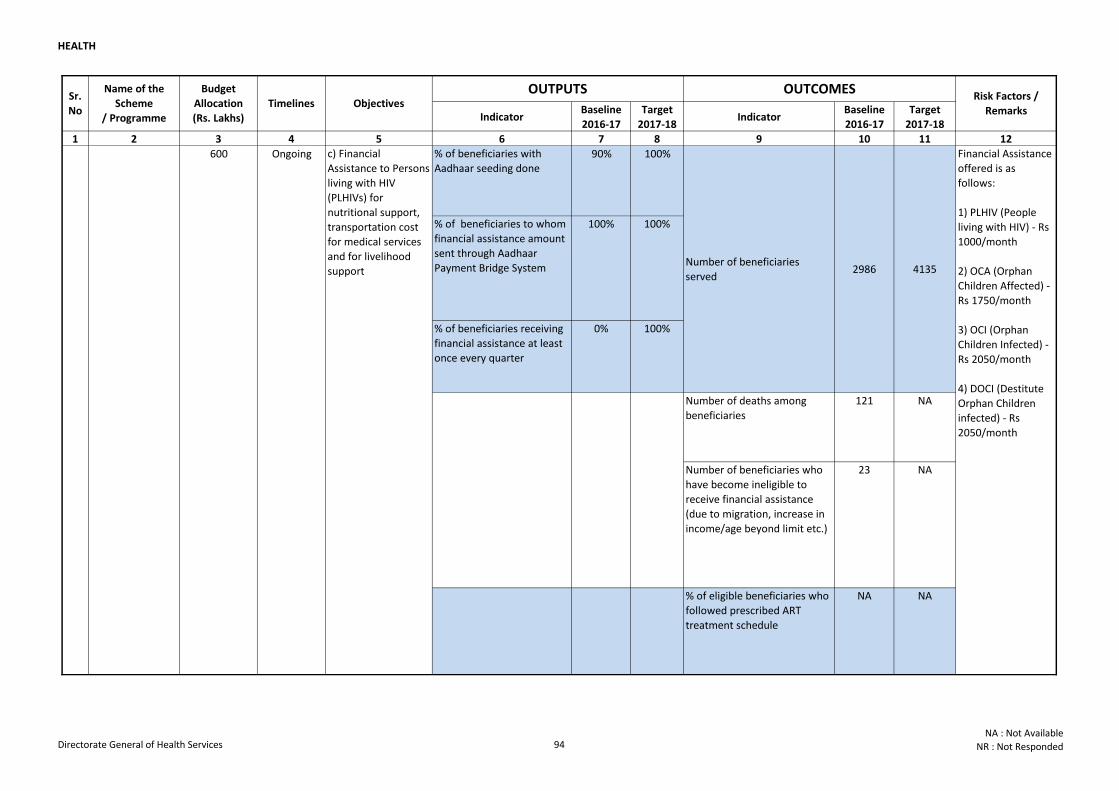
HEALTH
Indicator Baseline
2016-17
Target
2017-18Indicator
Baseline
2016-17
Target
2017-18
1 2 3 4 5 6 7 8 9 10 11 12
Sr.
No
Name of the
Scheme
/ Programme
Budget
Allocation
(Rs. Lakhs)
Objectives Risk Factors /
RemarksTimelines
OUTPUTS OUTCOMES
% of beneficiaries with
Aadhaar seeding done 90% 100%
% of beneficiaries to whom
financial assistance amount
sent through Aadhaar
Payment Bridge System
100% 100%
% of beneficiaries receiving
financial assistance at least
once every quarter
0% 100%
Number of deaths among
beneficiaries
121 NA
Number of beneficiaries who
have become ineligible to
receive financial assistance
(due to migration, increase in
income/age beyond limit etc.)
23 NA
% of eligible beneficiaries who
followed prescribed ART
treatment schedule
NA NA
Ongoing Financial Assistance
offered is as
follows:
1) PLHIV (People
living with HIV) - Rs
1000/month
2) OCA (Orphan
Children Affected) -
Rs 1750/month
3) OCI (Orphan
Children Infected) -
Rs 2050/month
4) DOCI (Destitute
Orphan Children
infected) - Rs
2050/month
5
c) Financial
Assistance to Persons
living with HIV
(PLHIVs) for
nutritional support,
transportation cost
for medical services
and for livelihood
support
600
Delhi State Aids
Control Society
Number of beneficiaries
served2986 4135
Directorate General of Health Services 94NA : Not Available
NR : Not Responded
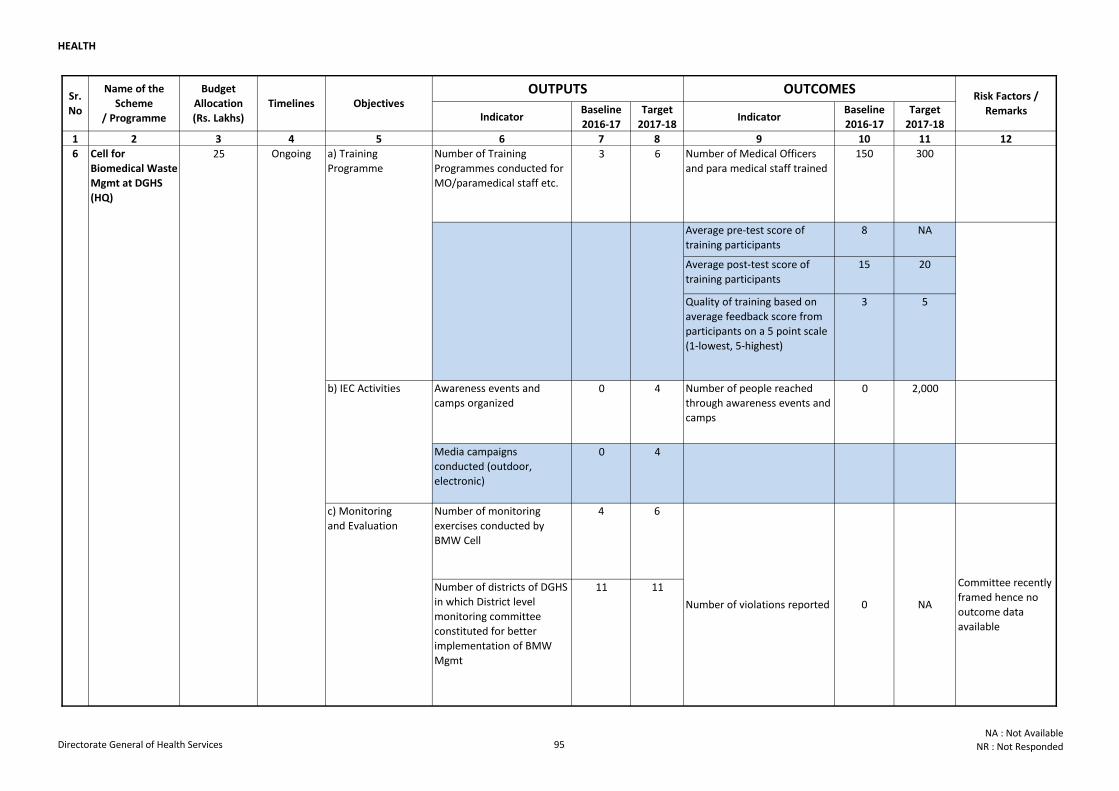
HEALTH
Indicator Baseline
2016-17
Target
2017-18Indicator
Baseline
2016-17
Target
2017-18
1 2 3 4 5 6 7 8 9 10 11 12
Sr.
No
Name of the
Scheme
/ Programme
Budget
Allocation
(Rs. Lakhs)
Objectives Risk Factors /
RemarksTimelines
OUTPUTS OUTCOMES
Number of Training
Programmes conducted for
MO/paramedical staff etc.
3 6 Number of Medical Officers
and para medical staff trained
150 300
Average pre-test score of
training participants
8 NA
Average post-test score of
training participants
15 20
Quality of training based on
average feedback score from
participants on a 5 point scale
(1-lowest, 5-highest)
3 5
Awareness events and
camps organized0 4 Number of people reached
through awareness events and
camps
0 2,000
Media campaigns
conducted (outdoor,
electronic)
0 4
Number of monitoring
exercises conducted by
BMW Cell
4 6
Number of districts of DGHS
in which District level
monitoring committee
constituted for better
implementation of BMW
Mgmt
11 11
b) IEC Activities
c) Monitoring
and Evaluation
Cell for
Biomedical Waste
Mgmt at DGHS
(HQ)
25 a) Training
Programme
6 Ongoing
Committee recently
framed hence no
outcome data
available
Number of violations reported 0 NA
Directorate General of Health Services 95NA : Not Available
NR : Not Responded
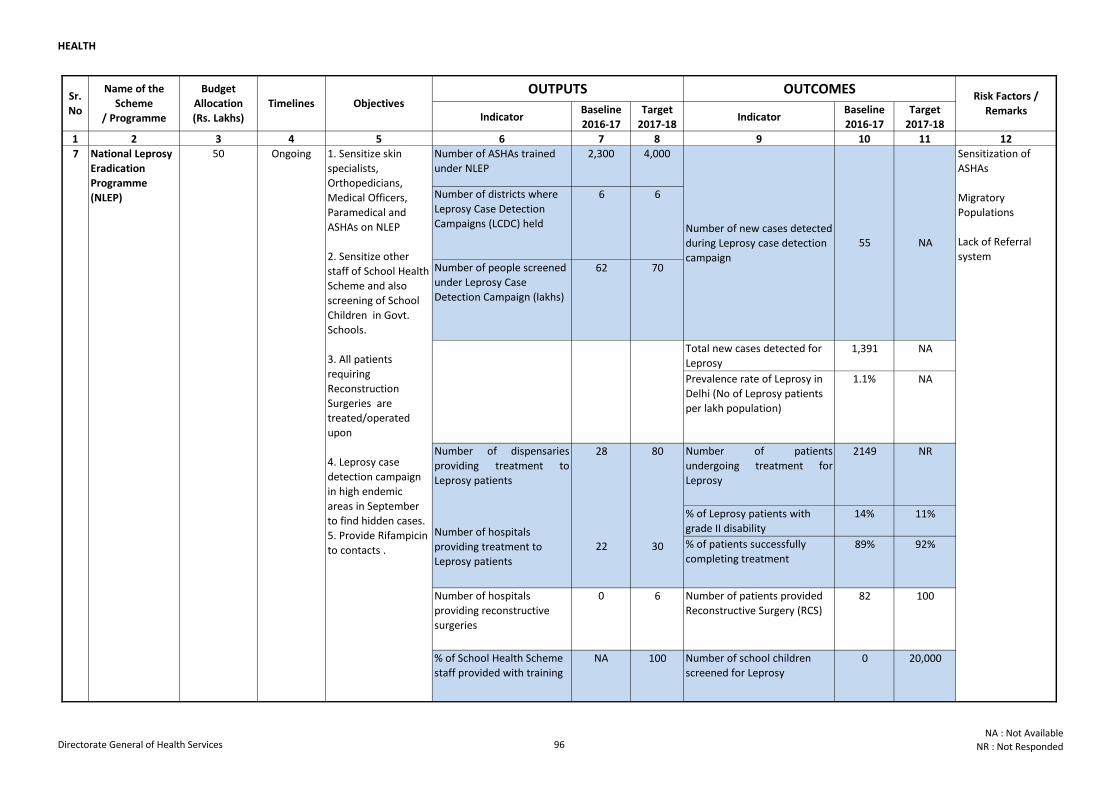
HEALTH
Indicator Baseline
2016-17
Target
2017-18Indicator
Baseline
2016-17
Target
2017-18
1 2 3 4 5 6 7 8 9 10 11 12
Sr.
No
Name of the
Scheme
/ Programme
Budget
Allocation
(Rs. Lakhs)
Objectives Risk Factors /
RemarksTimelines
OUTPUTS OUTCOMES
Number of ASHAs trained
under NLEP
2,300 4,000
Number of districts where
Leprosy Case Detection
Campaigns (LCDC) held
6 6
Number of people screened
under Leprosy Case
Detection Campaign (lakhs)
62 70
Total new cases detected for
Leprosy1,391 NA
Prevalence rate of Leprosy in
Delhi (No of Leprosy patients
per lakh population)
1.1% NA
Number of dispensaries
providing treatment to
Leprosy patients
28 80 Number of patients
undergoing treatment for
Leprosy
2149 NR
% of Leprosy patients with
grade II disability
14% 11%
% of patients successfully
completing treatment89% 92%
Number of hospitals
providing reconstructive
surgeries
0 6 Number of patients provided
Reconstructive Surgery (RCS)82 100
% of School Health Scheme
staff provided with training
NA 100 Number of school children
screened for Leprosy0 20,000
NA
Sensitization of
ASHAs
Migratory
Populations
Lack of Referral
system
1. Sensitize skin
specialists,
Orthopedicians,
Medical Officers,
Paramedical and
ASHAs on NLEP
2. Sensitize other
staff of School Health
Scheme and also
screening of School
Children in Govt.
Schools.
3. All patients
requiring
Reconstruction
Surgeries are
treated/operated
upon
4. Leprosy case
detection campaign
in high endemic
areas in September
to find hidden cases.
5. Provide Rifampicin
to contacts .
50National Leprosy
Eradication
Programme
(NLEP)
7 Ongoing
22 30Number of hospitals
providing treatment to
Leprosy patients
55Number of new cases detected
during Leprosy case detection
campaign
Directorate General of Health Services 96NA : Not Available
NR : Not Responded
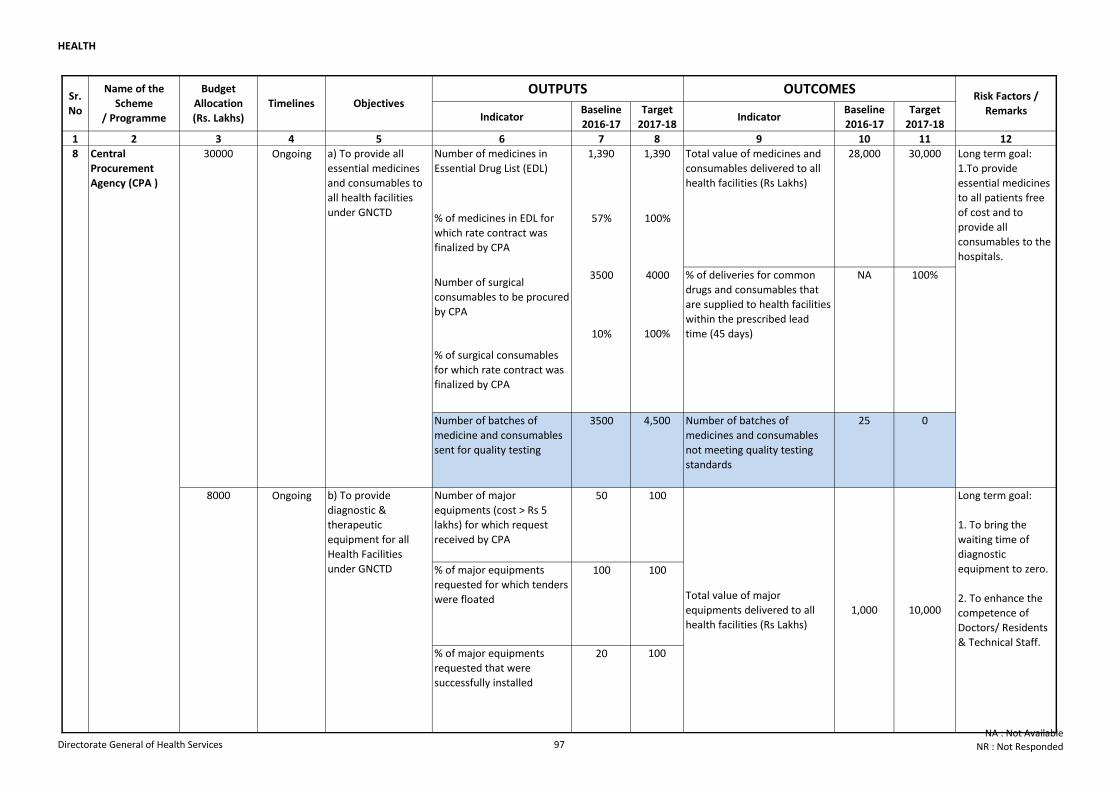
HEALTH
Indicator Baseline
2016-17
Target
2017-18Indicator
Baseline
2016-17
Target
2017-18
1 2 3 4 5 6 7 8 9 10 11 12
Sr.
No
Name of the
Scheme
/ Programme
Budget
Allocation
(Rs. Lakhs)
Objectives Risk Factors /
RemarksTimelines
OUTPUTS OUTCOMES
Number of medicines in
Essential Drug List (EDL)
1,390 1,390
% of medicines in EDL for
which rate contract was
finalized by CPA
57% 100%
Number of surgical
consumables to be procured
by CPA
3500 4000
% of surgical consumables
for which rate contract was
finalized by CPA
10% 100%
Number of batches of
medicine and consumables
sent for quality testing
3500 4,500 Number of batches of
medicines and consumables
not meeting quality testing
standards
25 0
Number of major
equipments (cost > Rs 5
lakhs) for which request
received by CPA
50 100
% of major equipments
requested for which tenders
were floated
100 100
% of major equipments
requested that were
successfully installed
20 100
a) To provide all
essential medicines
and consumables to
all health facilities
under GNCTD
b) To provide
diagnostic &
therapeutic
equipment for all
Health Facilities
under GNCTD
8 Long term goal:
1.To provide
essential medicines
to all patients free
of cost and to
provide all
consumables to the
hospitals.
Total value of medicines and
consumables delivered to all
health facilities (Rs Lakhs)
28,000 30,000
% of deliveries for common
drugs and consumables that
are supplied to health facilities
within the prescribed lead
time (45 days)
NA 100%
Long term goal:
1. To bring the
waiting time of
diagnostic
equipment to zero.
2. To enhance the
competence of
Doctors/ Residents
& Technical Staff.
Total value of major
equipments delivered to all
health facilities (Rs Lakhs)
1,000 10,000
Central
Procurement
Agency (CPA )
Ongoing
Ongoing8000
30000
Directorate General of Health Services 97NA : Not Available
NR : Not Responded
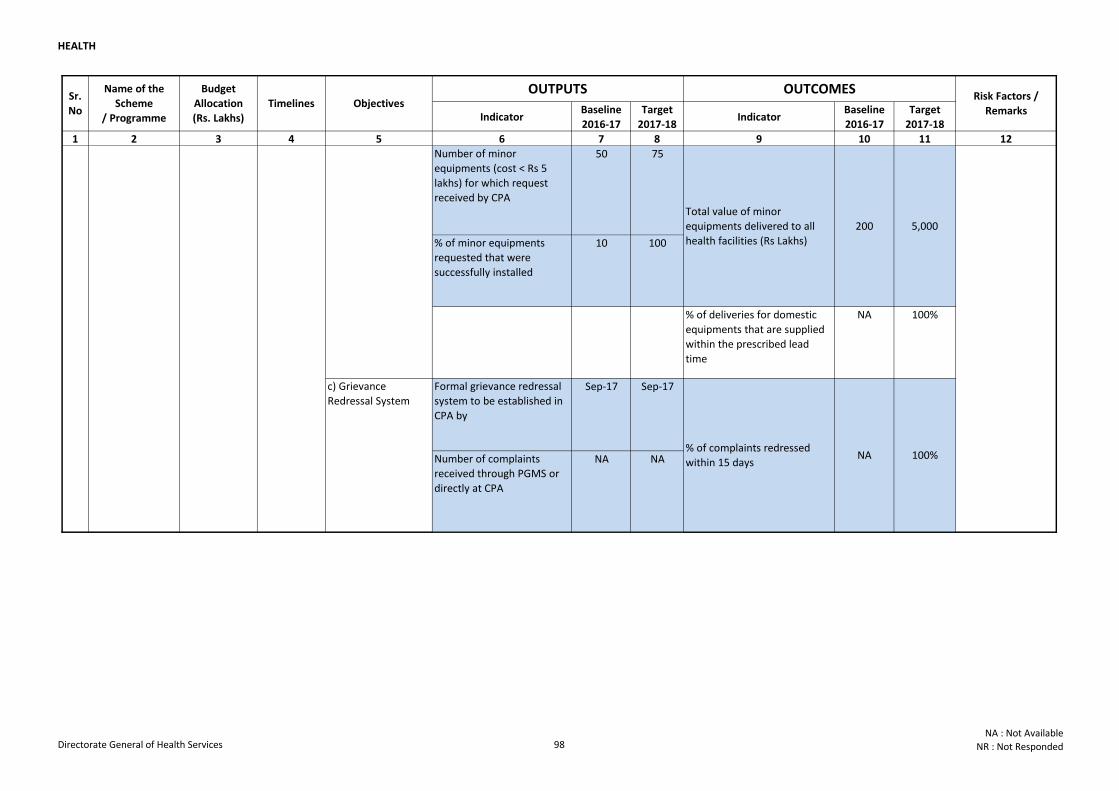
HEALTH
Indicator Baseline
2016-17
Target
2017-18Indicator
Baseline
2016-17
Target
2017-18
1 2 3 4 5 6 7 8 9 10 11 12
Sr.
No
Name of the
Scheme
/ Programme
Budget
Allocation
(Rs. Lakhs)
Objectives Risk Factors /
RemarksTimelines
OUTPUTS OUTCOMES
Number of minor
equipments (cost < Rs 5
lakhs) for which request
received by CPA
50 75
% of minor equipments
requested that were
successfully installed
10 100
% of deliveries for domestic
equipments that are supplied
within the prescribed lead
time
NA 100%
Formal grievance redressal
system to be established in
CPA by
Sep-17 Sep-17
Number of complaints
received through PGMS or
directly at CPA
NA NA
b) To provide
diagnostic &
therapeutic
equipment for all
Health Facilities
under GNCTD
c) Grievance
Redressal System
8
Long term goal:
1. To bring the
waiting time of
diagnostic
equipment to zero.
2. To enhance the
competence of
Doctors/ Residents
& Technical Staff.
Total value of minor
equipments delivered to all
health facilities (Rs Lakhs)
200 5,000
% of complaints redressed
within 15 days
Central
Procurement
Agency (CPA )
NA 100%
Ongoing8000
Directorate General of Health Services 98NA : Not Available
NR : Not Responded
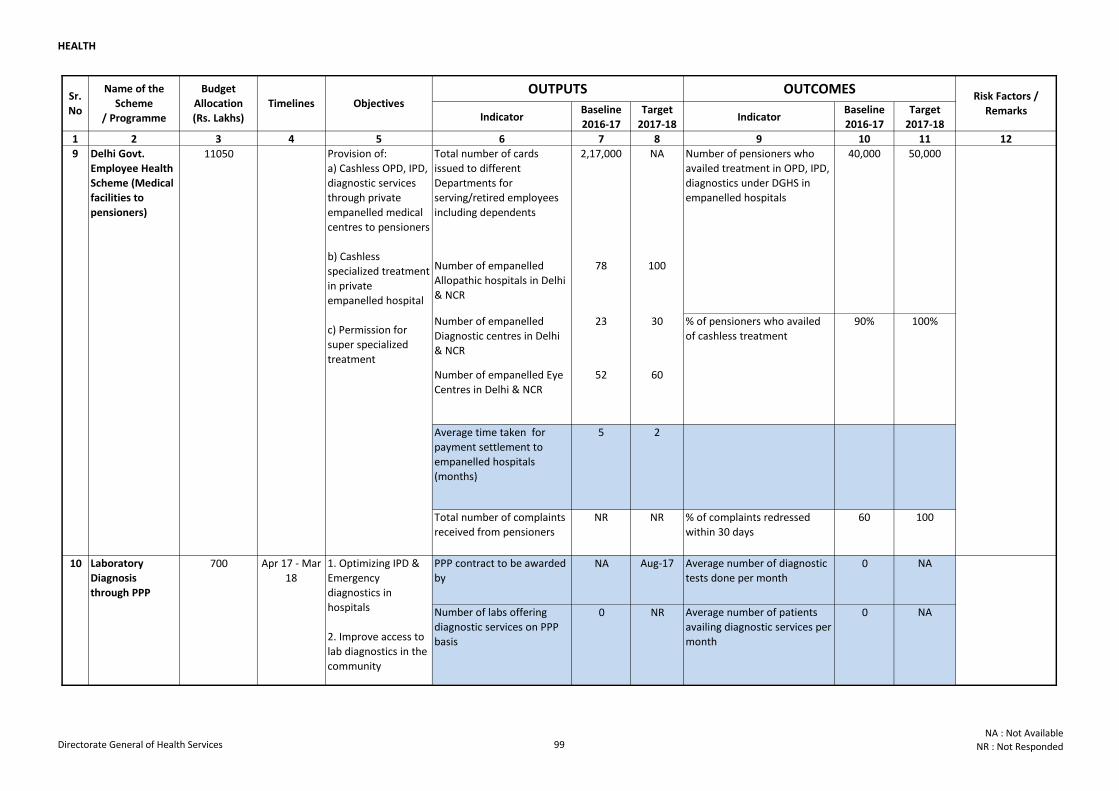
HEALTH
Indicator Baseline
2016-17
Target
2017-18Indicator
Baseline
2016-17
Target
2017-18
1 2 3 4 5 6 7 8 9 10 11 12
Sr.
No
Name of the
Scheme
/ Programme
Budget
Allocation
(Rs. Lakhs)
Objectives Risk Factors /
RemarksTimelines
OUTPUTS OUTCOMES
Total number of cards
issued to different
Departments for
serving/retired employees
including dependents
2,17,000 NA
Number of empanelled
Allopathic hospitals in Delhi
& NCR
78 100
Number of empanelled
Diagnostic centres in Delhi
& NCR
23 30
Number of empanelled Eye
Centres in Delhi & NCR
52 60
Average time taken for
payment settlement to
empanelled hospitals
(months)
5 2
Total number of complaints
received from pensioners
NR NR % of complaints redressed
within 30 days
60 100
PPP contract to be awarded
byNA Aug-17 Average number of diagnostic
tests done per month0 NA
Number of labs offering
diagnostic services on PPP
basis
0 NR Average number of patients
availing diagnostic services per
month
0 NA
Delhi Govt.
Employee Health
Scheme (Medical
facilities to
pensioners)
Provision of:
a) Cashless OPD, IPD,
diagnostic services
through private
empanelled medical
centres to pensioners
b) Cashless
specialized treatment
in private
empanelled hospital
c) Permission for
super specialized
treatment
% of pensioners who availed
of cashless treatment
90% 100%
Number of pensioners who
availed treatment in OPD, IPD,
diagnostics under DGHS in
empanelled hospitals
40,000 50,00011050
Laboratory
Diagnosis
through PPP
10 1. Optimizing IPD &
Emergency
diagnostics in
hospitals
2. Improve access to
lab diagnostics in the
community
Apr 17 - Mar
18700
9
Directorate General of Health Services 99NA : Not Available
NR : Not Responded
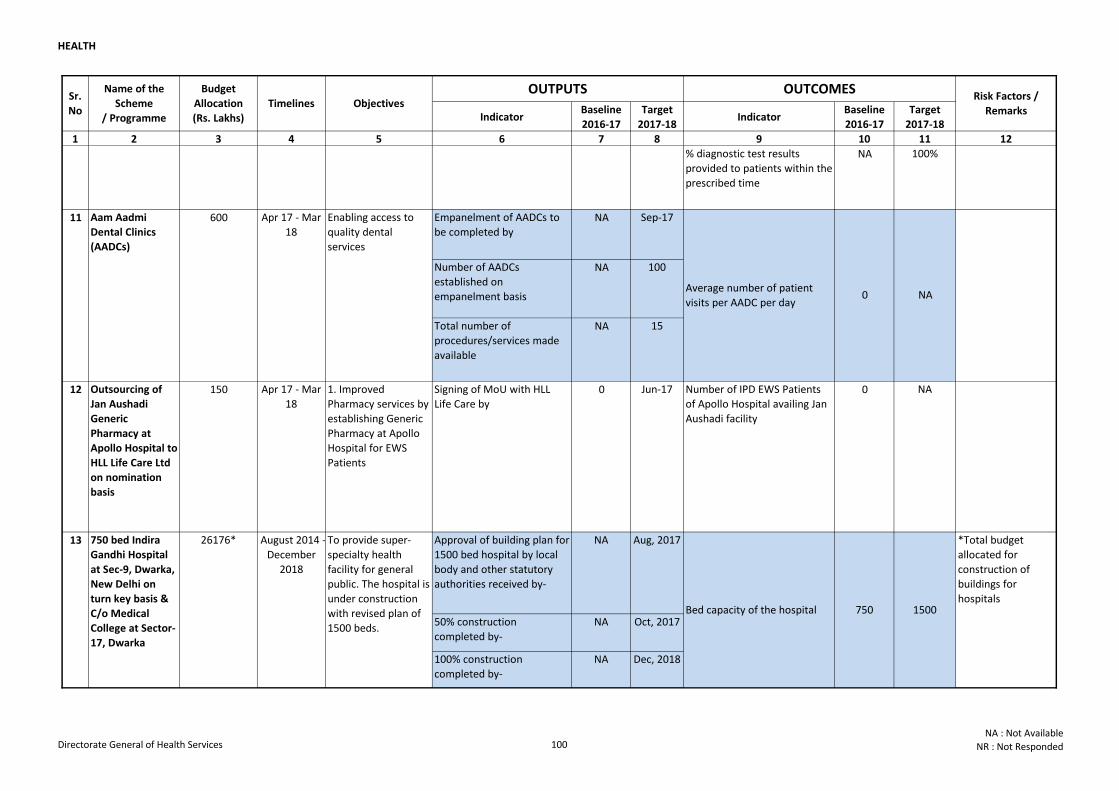
HEALTH
Indicator Baseline
2016-17
Target
2017-18Indicator
Baseline
2016-17
Target
2017-18
1 2 3 4 5 6 7 8 9 10 11 12
Sr.
No
Name of the
Scheme
/ Programme
Budget
Allocation
(Rs. Lakhs)
Objectives Risk Factors /
RemarksTimelines
OUTPUTS OUTCOMES
% diagnostic test results
provided to patients within the
prescribed time
NA 100%
Empanelment of AADCs to
be completed byNA Sep-17
Number of AADCs
established on
empanelment basis
NA 100
Total number of
procedures/services made
available
NA 15
12 Outsourcing of
Jan Aushadi
Generic
Pharmacy at
Apollo Hospital to
HLL Life Care Ltd
on nomination
basis
150 Apr 17 - Mar
18
1. Improved
Pharmacy services by
establishing Generic
Pharmacy at Apollo
Hospital for EWS
Patients
Signing of MoU with HLL
Life Care by0 Jun-17 Number of IPD EWS Patients
of Apollo Hospital availing Jan
Aushadi facility
0 NA
Approval of building plan for
1500 bed hospital by local
body and other statutory
authorities received by-
NA Aug, 2017
50% construction
completed by-
NA Oct, 2017
100% construction
completed by-
NA Dec, 2018
11 Aam Aadmi
Dental Clinics
(AADCs)
600 Apr 17 - Mar
18
Average number of patient
visits per AADC per day0 NA
Enabling access to
quality dental
services
13 750 bed Indira
Gandhi Hospital
at Sec-9, Dwarka,
New Delhi on
turn key basis &
C/o Medical
College at Sector-
17, Dwarka
August 2014 -
December
2018
To provide super-
specialty health
facility for general
public. The hospital is
under construction
with revised plan of
1500 beds.
Bed capacity of the hospital 750 1500
Laboratory
Diagnosis
through PPP
10 1. Optimizing IPD &
Emergency
diagnostics in
hospitals
2. Improve access to
lab diagnostics in the
community
Apr 17 - Mar
18700
26176* *Total budget
allocated for
construction of
buildings for
hospitals
Directorate General of Health Services 100NA : Not Available
NR : Not Responded
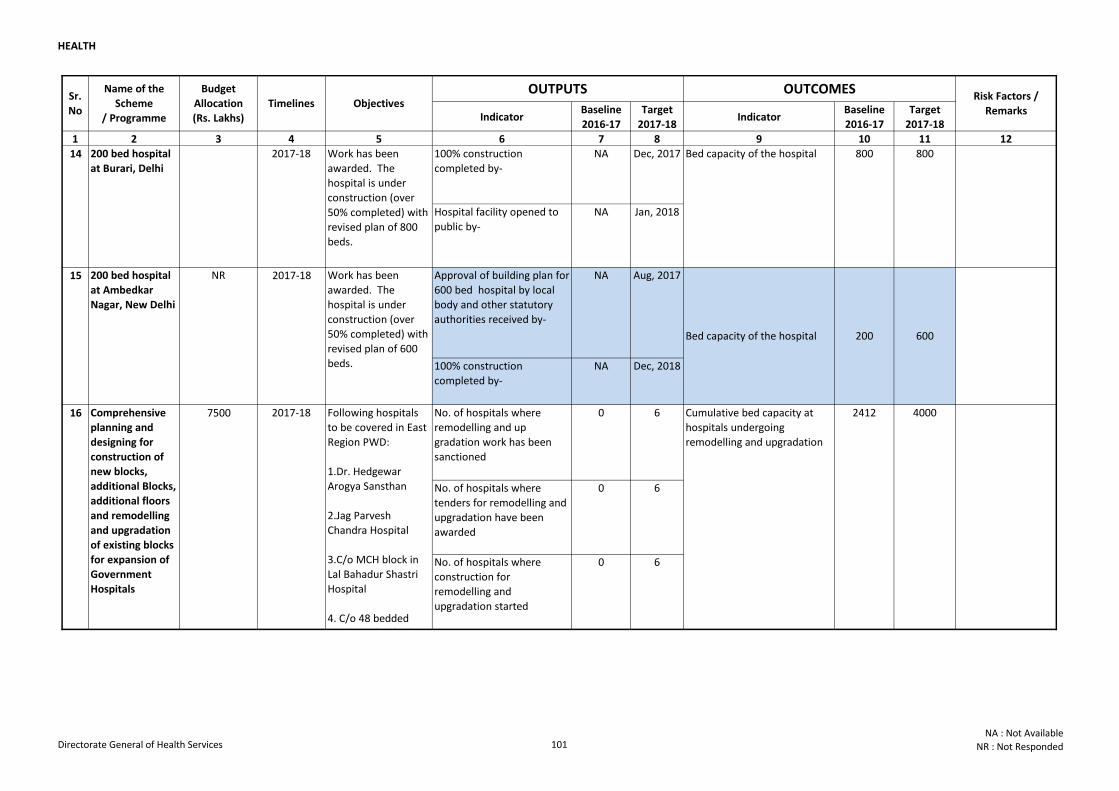
HEALTH
Indicator Baseline
2016-17
Target
2017-18Indicator
Baseline
2016-17
Target
2017-18
1 2 3 4 5 6 7 8 9 10 11 12
Sr.
No
Name of the
Scheme
/ Programme
Budget
Allocation
(Rs. Lakhs)
Objectives Risk Factors /
RemarksTimelines
OUTPUTS OUTCOMES
100% construction
completed by-
NA Dec, 2017
Hospital facility opened to
public by-
NA Jan, 2018
Approval of building plan for
600 bed hospital by local
body and other statutory
authorities received by-
NA Aug, 2017
100% construction
completed by-
NA Dec, 2018
No. of hospitals where
remodelling and up
gradation work has been
sanctioned
0 6
No. of hospitals where
tenders for remodelling and
upgradation have been
awarded
0 6
No. of hospitals where
construction for
remodelling and
upgradation started
0 6
26176*
14 200 bed hospital
at Burari, Delhi
2017-18 Work has been
awarded. The
hospital is under
construction (over
50% completed) with
revised plan of 800
beds.
Bed capacity of the hospital 800 800
15 200 bed hospital
at Ambedkar
Nagar, New Delhi
NR 2017-18 Work has been
awarded. The
hospital is under
construction (over
50% completed) with
revised plan of 600
beds.
Bed capacity of the hospital 200 600
16 7500Comprehensive
planning and
designing for
construction of
new blocks,
additional Blocks,
additional floors
and remodelling
and upgradation
of existing blocks
for expansion of
Government
Hospitals
2017-18 Following hospitals
to be covered in East
Region PWD:
1.Dr. Hedgewar
Arogya Sansthan
2.Jag Parvesh
Chandra Hospital
3.C/o MCH block in
Lal Bahadur Shastri
Hospital
4. C/o 48 bedded
ward in Lal Bahadur
Shastri Hospital
5. GTBH, Shahdara.
6.Chacha Nehru Bal
Chikitasalaya
Cumulative bed capacity at
hospitals undergoing
remodelling and upgradation
2412 4000
Directorate General of Health Services 101NA : Not Available
NR : Not Responded
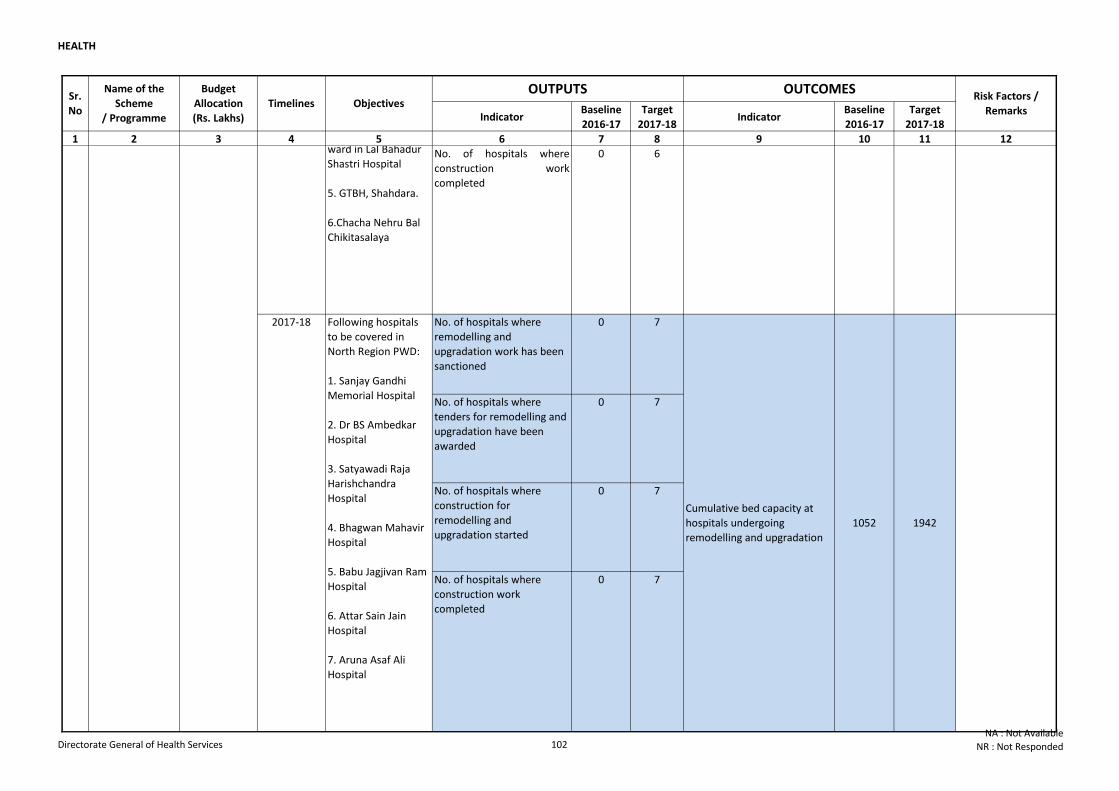
HEALTH
Indicator Baseline
2016-17
Target
2017-18Indicator
Baseline
2016-17
Target
2017-18
1 2 3 4 5 6 7 8 9 10 11 12
Sr.
No
Name of the
Scheme
/ Programme
Budget
Allocation
(Rs. Lakhs)
Objectives Risk Factors /
RemarksTimelines
OUTPUTS OUTCOMES
No. of hospitals where
construction work
completed
0 6
No. of hospitals where
remodelling and
upgradation work has been
sanctioned
0 7
No. of hospitals where
tenders for remodelling and
upgradation have been
awarded
0 7
No. of hospitals where
construction for
remodelling and
upgradation started
0 7
No. of hospitals where
construction work
completed
0 7
16 7500Comprehensive
planning and
designing for
construction of
new blocks,
additional Blocks,
additional floors
and remodelling
and upgradation
of existing blocks
for expansion of
Government
Hospitals
2017-18 Following hospitals
to be covered in East
Region PWD:
1.Dr. Hedgewar
Arogya Sansthan
2.Jag Parvesh
Chandra Hospital
3.C/o MCH block in
Lal Bahadur Shastri
Hospital
4. C/o 48 bedded
ward in Lal Bahadur
Shastri Hospital
5. GTBH, Shahdara.
6.Chacha Nehru Bal
Chikitasalaya
Cumulative bed capacity at
hospitals undergoing
remodelling and upgradation
2412 4000
2017-18 Following hospitals
to be covered in
North Region PWD:
1. Sanjay Gandhi
Memorial Hospital
2. Dr BS Ambedkar
Hospital
3. Satyawadi Raja
Harishchandra
Hospital
4. Bhagwan Mahavir
Hospital
5. Babu Jagjivan Ram
Hospital
6. Attar Sain Jain
Hospital
7. Aruna Asaf Ali
Hospital
Cumulative bed capacity at
hospitals undergoing
remodelling and upgradation
1052 1942
Directorate General of Health Services 102NA : Not Available
NR : Not Responded
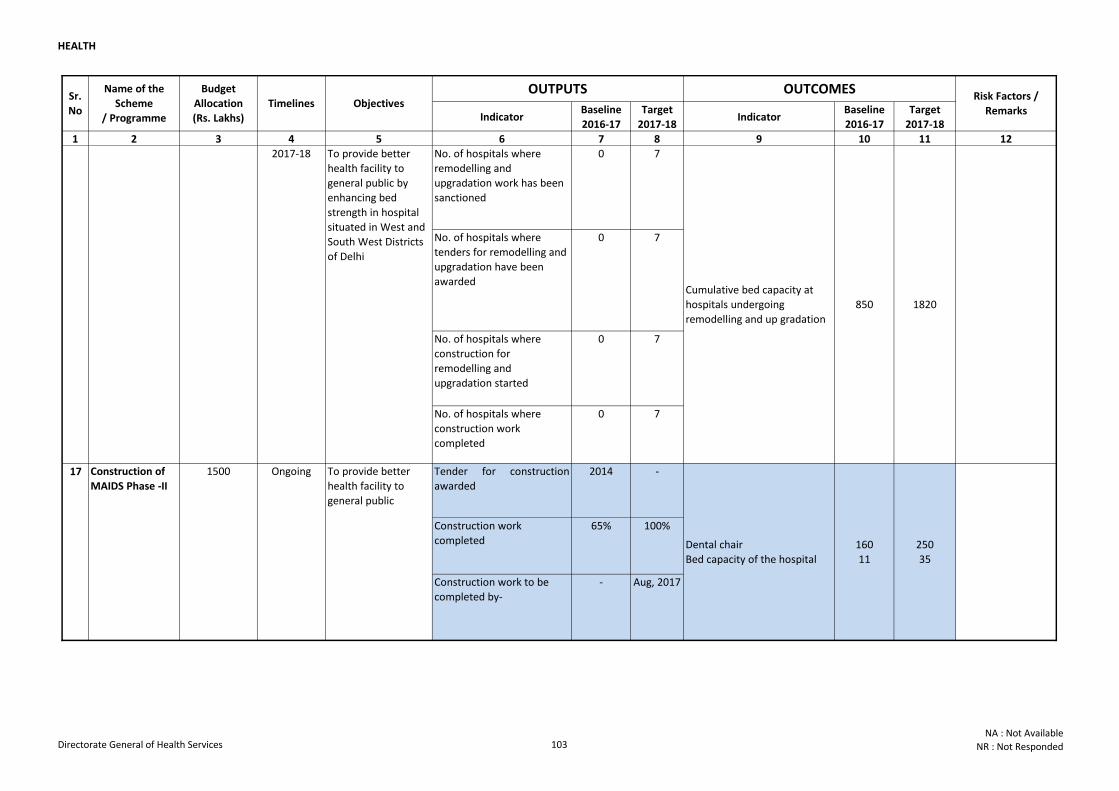
HEALTH
Indicator Baseline
2016-17
Target
2017-18Indicator
Baseline
2016-17
Target
2017-18
1 2 3 4 5 6 7 8 9 10 11 12
Sr.
No
Name of the
Scheme
/ Programme
Budget
Allocation
(Rs. Lakhs)
Objectives Risk Factors /
RemarksTimelines
OUTPUTS OUTCOMES
No. of hospitals where
remodelling and
upgradation work has been
sanctioned
0 7
No. of hospitals where
tenders for remodelling and
upgradation have been
awarded
0 7
No. of hospitals where
construction for
remodelling and
upgradation started
0 7
No. of hospitals where
construction work
completed
0 7
Tender for construction
awarded
2014 -
Construction work
completed
65% 100%
Construction work to be
completed by-
- Aug, 2017
160
11
250
35
16
2017-18 To provide better
health facility to
general public by
enhancing bed
strength in hospital
situated in West and
South West Districts
of Delhi
Cumulative bed capacity at
hospitals undergoing
remodelling and up gradation
850 1820
7500Comprehensive
planning and
designing for
construction of
new blocks,
additional Blocks,
additional floors
and remodelling
and upgradation
of existing blocks
for expansion of
Government
Hospitals
17 Construction of
MAIDS Phase -II
1500 Ongoing To provide better
health facility to
general public
Dental chair
Bed capacity of the hospital
Directorate General of Health Services 103NA : Not Available
NR : Not Responded
HEALTH
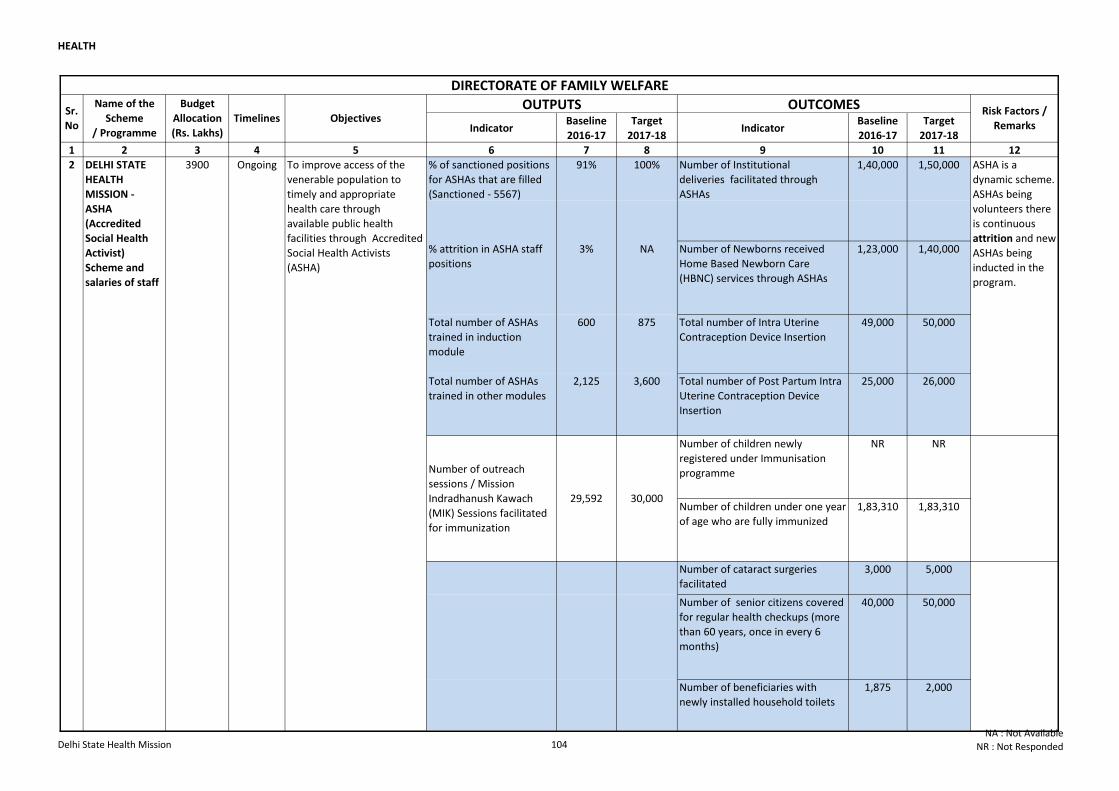
HEALTH
Indicator Baseline
2016-17
Target
2017-18Indicator
Baseline
2016-17
Target
2017-18
1 2 3 4 5 6 7 8 9 10 11 12
% attrition in ASHA staff
positions
3% NA Number of Newborns received
Home Based Newborn Care
(HBNC) services through ASHAs
1,23,000 1,40,000
Total number of ASHAs
trained in induction
module
600 875 Total number of Intra Uterine
Contraception Device Insertion
49,000 50,000
Total number of ASHAs
trained in other modules
2,125 3,600 Total number of Post Partum Intra
Uterine Contraception Device
Insertion
25,000 26,000
Number of children newly
registered under Immunisation
programme
NR NR
Number of children under one year
of age who are fully immunized
1,83,310 1,83,310
Number of cataract surgeries
facilitated
3,000 5,000
Number of senior citizens covered
for regular health checkups (more
than 60 years, once in every 6
months)
40,000 50,000
Number of beneficiaries with
newly installed household toilets
1,875 2,000
OUTPUTS OUTCOMES Risk Factors /
Remarks
1,50,000% of sanctioned positions
for ASHAs that are filled
(Sanctioned - 5567)
91% 100% Number of Institutional
deliveries facilitated through
ASHAs
1,40,000
Sr.
No
Name of the
Scheme
/ Programme
Budget
Allocation
(Rs. Lakhs)
Timelines Objectives
2 DELHI STATE
HEALTH
MISSION -
ASHA
(Accredited
Social Health
Activist)
Scheme and
salaries of staff
3900 Ongoing To improve access of the
venerable population to
timely and appropriate
health care through
available public health
facilities through Accredited
Social Health Activists
(ASHA)
DIRECTORATE OF FAMILY WELFARE
ASHA is a
dynamic scheme.
ASHAs being
volunteers there
is continuous
attrition and new
ASHAs being
inducted in the
program.
Number of outreach
sessions / Mission
Indradhanush Kawach
(MIK) Sessions facilitated
for immunization
29,592 30,000
Delhi State Health Mission 104NA : Not Available
NR : Not Responded
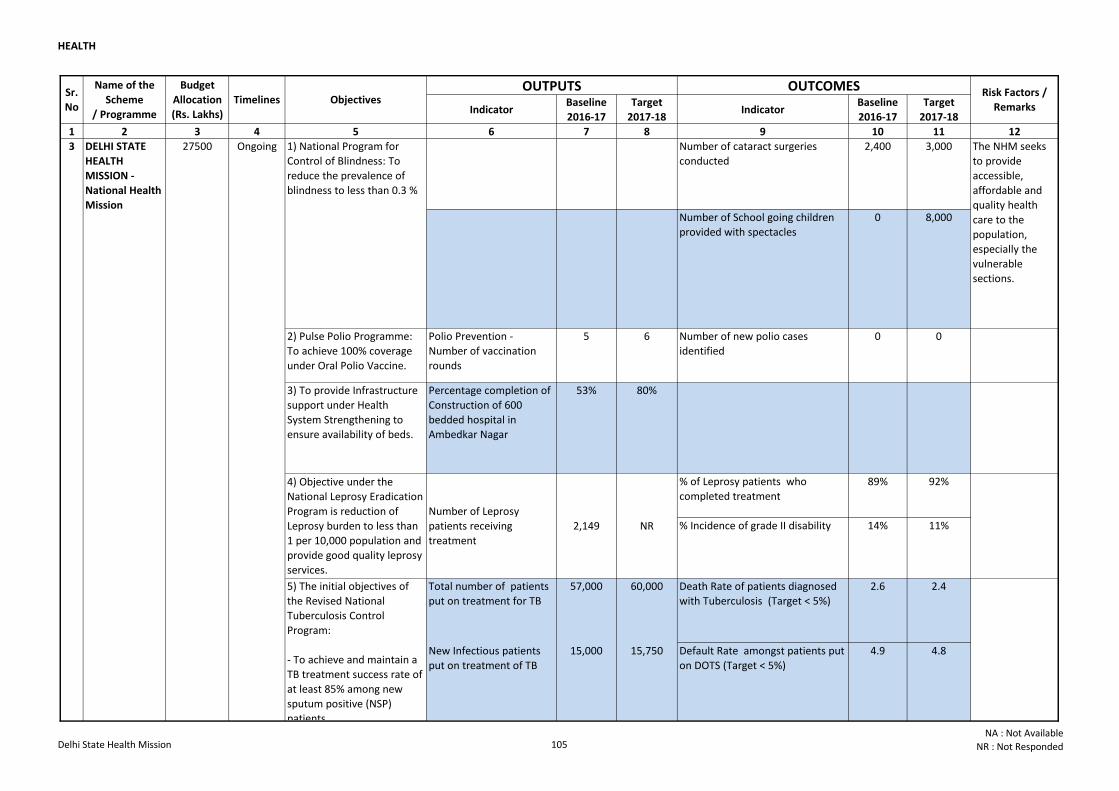
HEALTH
Indicator Baseline
2016-17
Target
2017-18Indicator
Baseline
2016-17
Target
2017-18
1 2 3 4 5 6 7 8 9 10 11 12
OUTPUTS OUTCOMES Risk Factors /
Remarks
Sr.
No
Name of the
Scheme
/ Programme
Budget
Allocation
(Rs. Lakhs)
Timelines Objectives
Number of cataract surgeries
conducted
2,400 3,000
Number of School going children
provided with spectacles
0 8,000
2) Pulse Polio Programme:
To achieve 100% coverage
under Oral Polio Vaccine.
Polio Prevention -
Number of vaccination
rounds
5 6 Number of new polio cases
identified
0 0
3) To provide Infrastructure
support under Health
System Strengthening to
ensure availability of beds.
Percentage completion of
Construction of 600
bedded hospital in
Ambedkar Nagar
53% 80%
% of Leprosy patients who
completed treatment
89% 92%
% Incidence of grade II disability 14% 11%
Total number of patients
put on treatment for TB
57,000 60,000 Death Rate of patients diagnosed
with Tuberculosis (Target < 5%)
2.6 2.4
New Infectious patients
put on treatment of TB
15,000 15,750 Default Rate amongst patients put
on DOTS (Target < 5%)
4.9 4.8
DELHI STATE
HEALTH
MISSION -
National Health
Mission
27500 Ongoing 1) National Program for
Control of Blindness: To
reduce the prevalence of
blindness to less than 0.3 %
4) Objective under the
National Leprosy Eradication
Program is reduction of
Leprosy burden to less than
1 per 10,000 population and
provide good quality leprosy
services.
5) The initial objectives of
the Revised National
Tuberculosis Control
Program:
- To achieve and maintain a
TB treatment success rate of
at least 85% among new
sputum positive (NSP)
patients
- To achieve and maintain
detection of at least 70% of
the estimated new sputum
positive people in the
community
Number of Leprosy
patients receiving
treatment
2,149 NR
The NHM seeks
to provide
accessible,
affordable and
quality health
care to the
population,
especially the
vulnerable
sections.
3
Delhi State Health Mission 105NA : Not Available
NR : Not Responded
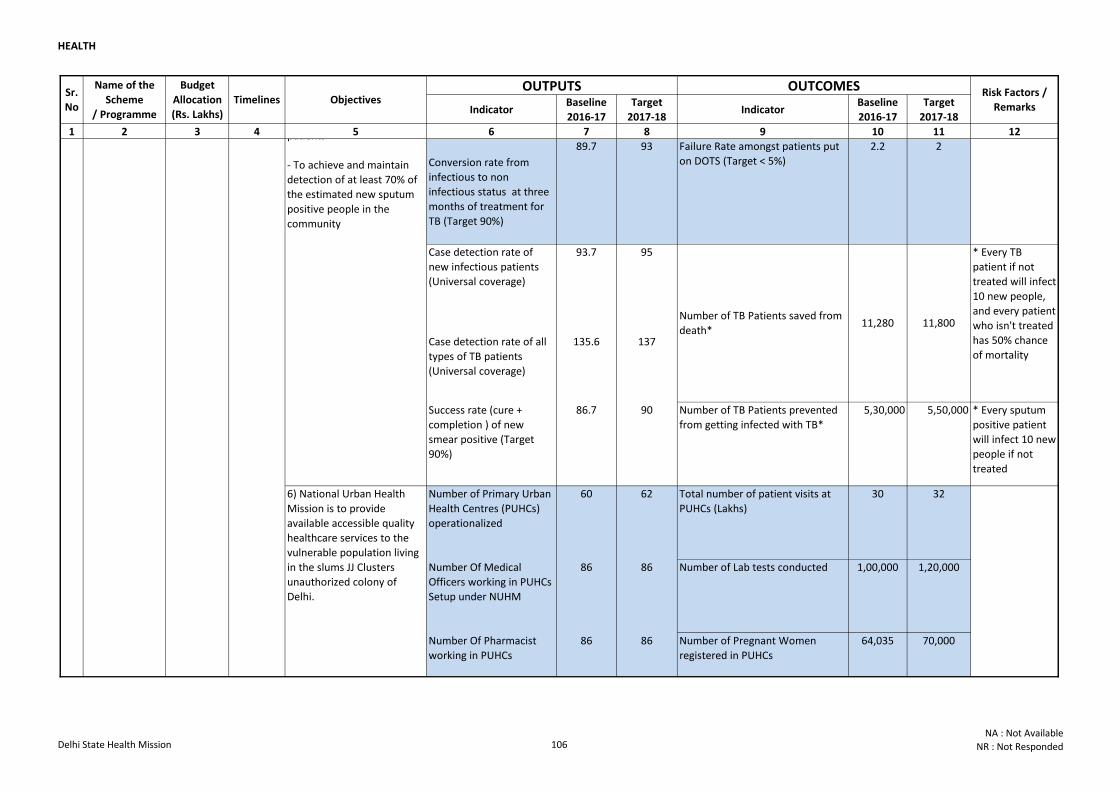
HEALTH
Indicator Baseline
2016-17
Target
2017-18Indicator
Baseline
2016-17
Target
2017-18
1 2 3 4 5 6 7 8 9 10 11 12
OUTPUTS OUTCOMES Risk Factors /
Remarks
Sr.
No
Name of the
Scheme
/ Programme
Budget
Allocation
(Rs. Lakhs)
Timelines Objectives
Conversion rate from
infectious to non
infectious status at three
months of treatment for
TB (Target 90%)
89.7 93 Failure Rate amongst patients put
on DOTS (Target < 5%)
2.2 2
Case detection rate of
new infectious patients
(Universal coverage)
93.7 95
Case detection rate of all
types of TB patients
(Universal coverage)
135.6 137
Success rate (cure +
completion ) of new
smear positive (Target
90%)
86.7 90 Number of TB Patients prevented
from getting infected with TB*
5,30,000 5,50,000 * Every sputum
positive patient
will infect 10 new
people if not
treated
Number of Primary Urban
Health Centres (PUHCs)
operationalized
60 62 Total number of patient visits at
PUHCs (Lakhs)
30 32
Number Of Medical
Officers working in PUHCs
Setup under NUHM
86 86 Number of Lab tests conducted 1,00,000 1,20,000
Number Of Pharmacist
working in PUHCs
86 86 Number of Pregnant Women
registered in PUHCs
64,035 70,000
DELHI STATE
HEALTH
MISSION -
National Health
Mission
27500 Ongoing
5) The initial objectives of
the Revised National
Tuberculosis Control
Program:
- To achieve and maintain a
TB treatment success rate of
at least 85% among new
sputum positive (NSP)
patients
- To achieve and maintain
detection of at least 70% of
the estimated new sputum
positive people in the
community
6) National Urban Health
Mission is to provide
available accessible quality
healthcare services to the
vulnerable population living
in the slums JJ Clusters
unauthorized colony of
Delhi.
Number of TB Patients saved from
death*11,280 11,800
* Every TB
patient if not
treated will infect
10 new people,
and every patient
who isn't treated
has 50% chance
of mortality
3
Delhi State Health Mission 106NA : Not Available
NR : Not Responded
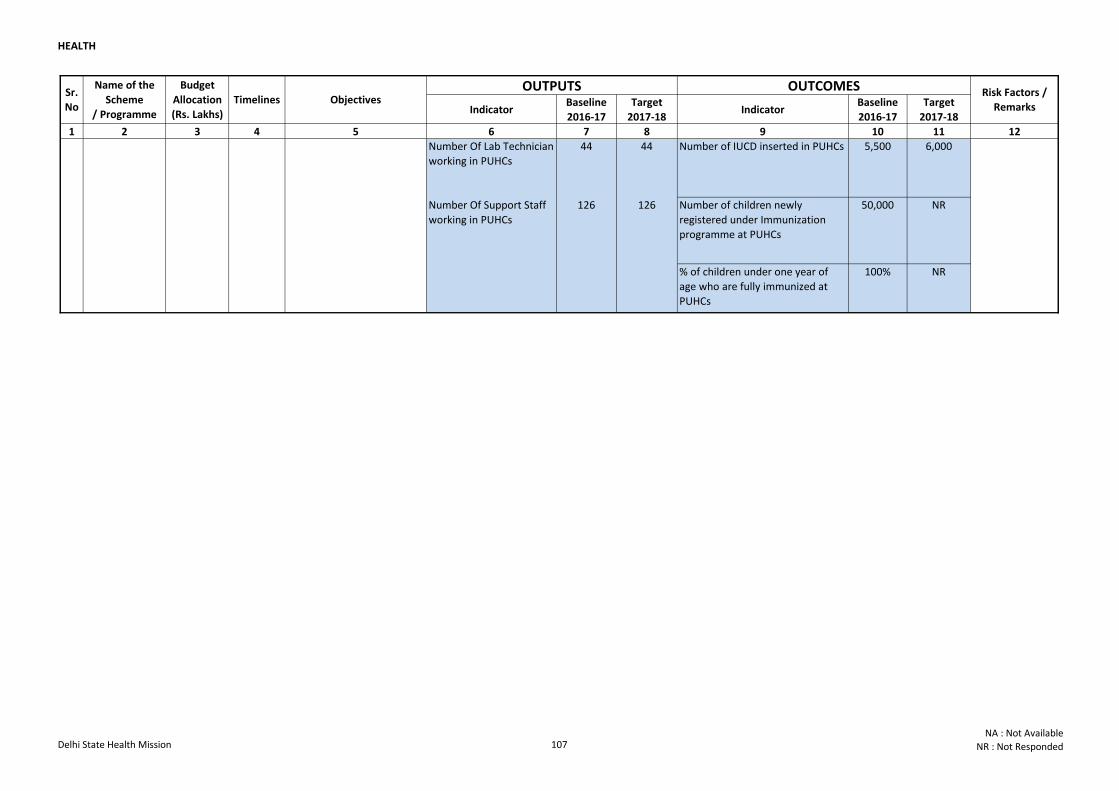
HEALTH
Indicator Baseline
2016-17
Target
2017-18Indicator
Baseline
2016-17
Target
2017-18
1 2 3 4 5 6 7 8 9 10 11 12
OUTPUTS OUTCOMES Risk Factors /
Remarks
Sr.
No
Name of the
Scheme
/ Programme
Budget
Allocation
(Rs. Lakhs)
Timelines Objectives
Number Of Lab Technician
working in PUHCs
44 44 Number of IUCD inserted in PUHCs 5,500 6,000
Number of children newly
registered under Immunization
programme at PUHCs
50,000 NR
% of children under one year of
age who are fully immunized at
PUHCs
100% NR
DELHI STATE
HEALTH
MISSION -
National Health
Mission
27500 Ongoing
6) National Urban Health
Mission is to provide
available accessible quality
healthcare services to the
vulnerable population living
in the slums JJ Clusters
unauthorized colony of
Delhi.
Number Of Support Staff
working in PUHCs
126 126
3
Delhi State Health Mission 107NA : Not Available
NR : Not Responded
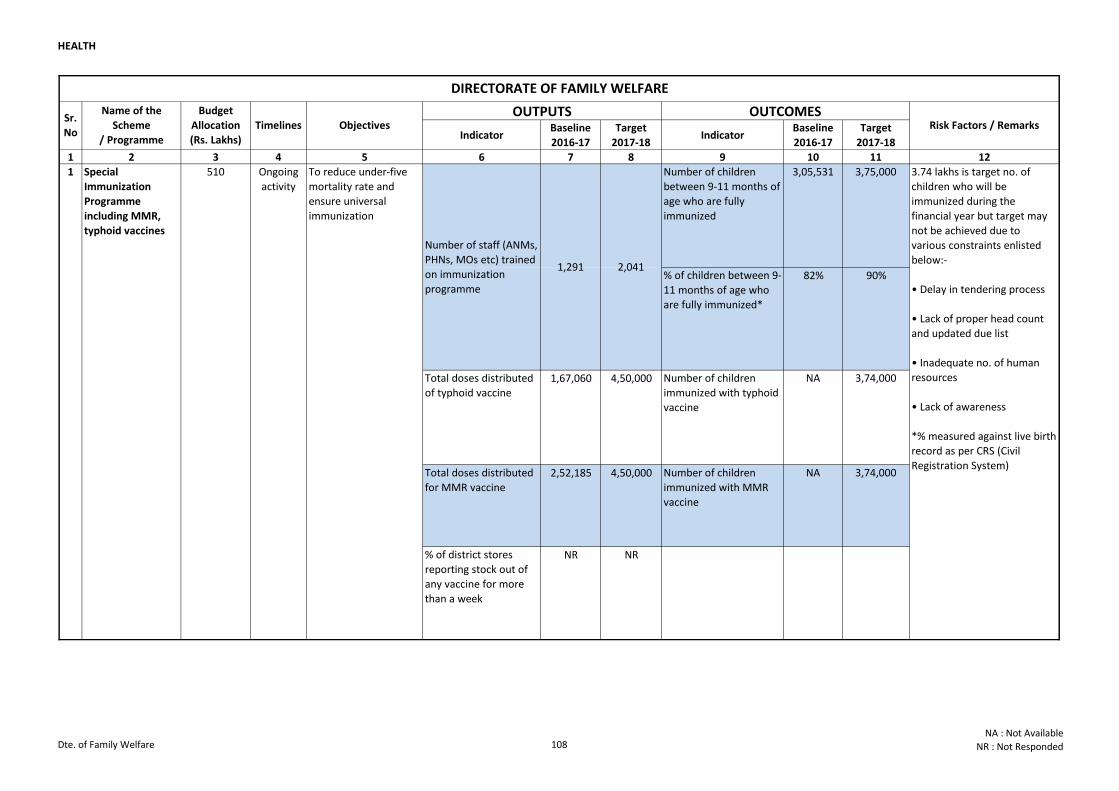
HEALTH
Indicator Baseline
2016-17
Target
2017-18Indicator
Baseline
2016-17
Target
2017-18
1 2 3 4 5 6 7 8 9 10 11 12
Number of children
between 9-11 months of
age who are fully
immunized
3,05,531 3,75,000
% of children between 9-
11 months of age who
are fully immunized*
82% 90%
Total doses distributed
of typhoid vaccine1,67,060 4,50,000 Number of children
immunized with typhoid
vaccine
NA 3,74,000
Total doses distributed
for MMR vaccine2,52,185 4,50,000 Number of children
immunized with MMR
vaccine
NA 3,74,000
% of district stores
reporting stock out of
any vaccine for more
than a week
NR NR
1 Ongoing
activity
Special
Immunization
Programme
including MMR,
typhoid vaccines
510 To reduce under-five
mortality rate and
ensure universal
immunization
DIRECTORATE OF FAMILY WELFARE
Risk Factors / RemarksSr.
No
Name of the
Scheme
/ Programme
Budget
Allocation
(Rs. Lakhs)
Objectives Timelines
1,291 2,041
3.74 lakhs is target no. of
children who will be
immunized during the
financial year but target may
not be achieved due to
various constraints enlisted
below:-
• Delay in tendering process
• Lack of proper head count
and updated due list
• Inadequate no. of human
resources
• Lack of awareness
*% measured against live birth
record as per CRS (Civil
Registration System)
OUTPUTS OUTCOMES
Number of staff (ANMs,
PHNs, MOs etc) trained
on immunization
programme
Dte. of Family Welfare 108NA : Not Available
NR : Not Responded
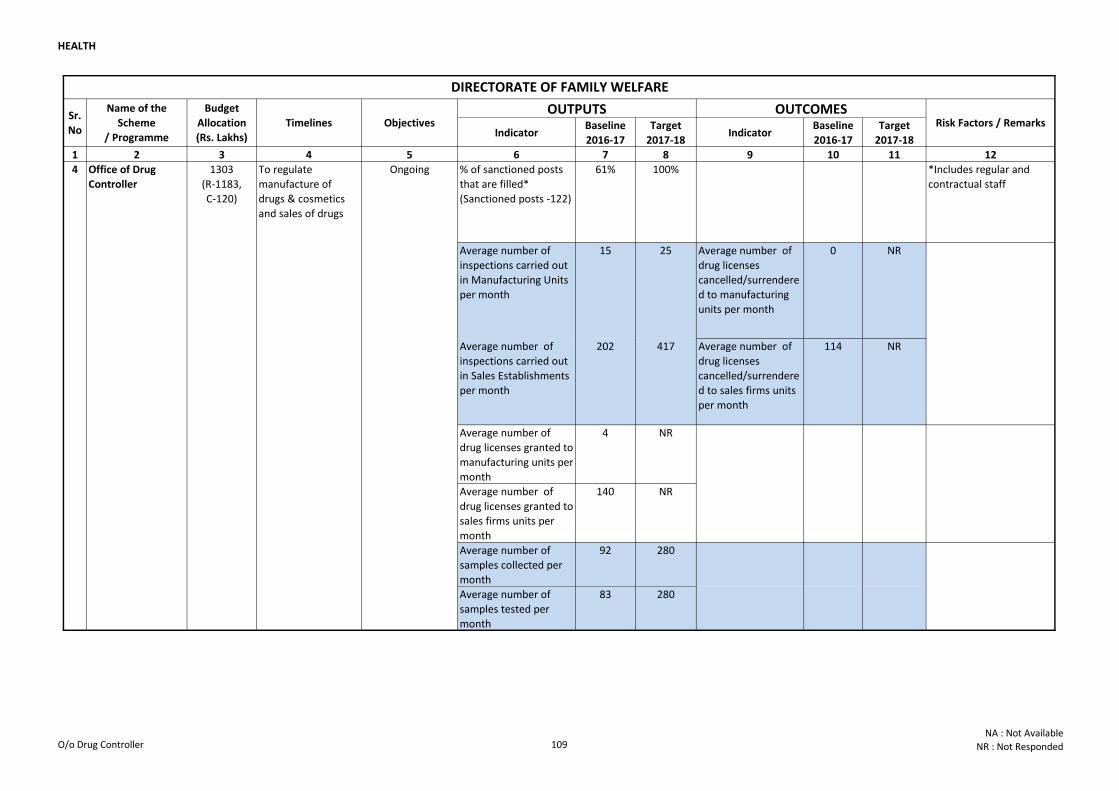
HEALTH
Indicator Baseline
2016-17
Target
2017-18Indicator
Baseline
2016-17
Target
2017-18
1 2 3 4 5 6 7 8 9 10 11 12
% of sanctioned posts
that are filled*
(Sanctioned posts -122)
61% 100% *Includes regular and
contractual staff
Average number of
inspections carried out
in Manufacturing Units
per month
15 25 Average number of
drug licenses
cancelled/surrendere
d to manufacturing
units per month
0 NR
Average number of
inspections carried out
in Sales Establishments
per month
202 417 Average number of
drug licenses
cancelled/surrendere
d to sales firms units
per month
114 NR
Average number of
drug licenses granted to
manufacturing units per
month
4 NR
Average number of
drug licenses granted to
sales firms units per
month
140 NR
Average number of
samples collected per
month
92 280
Average number of
samples tested per
month
83 280
OUTCOMESRisk Factors / Remarks
Sr.
No
Name of the
Scheme
/ Programme
Budget
Allocation
(Rs. Lakhs)
Timelines Objectives
DIRECTORATE OF FAMILY WELFARE
4 Office of Drug
Controller
1303
(R-1183,
C-120)
To regulate
manufacture of
drugs & cosmetics
and sales of drugs
Ongoing
OUTPUTS
O/o Drug Controller 109NA : Not Available
NR : Not Responded
HEALTH
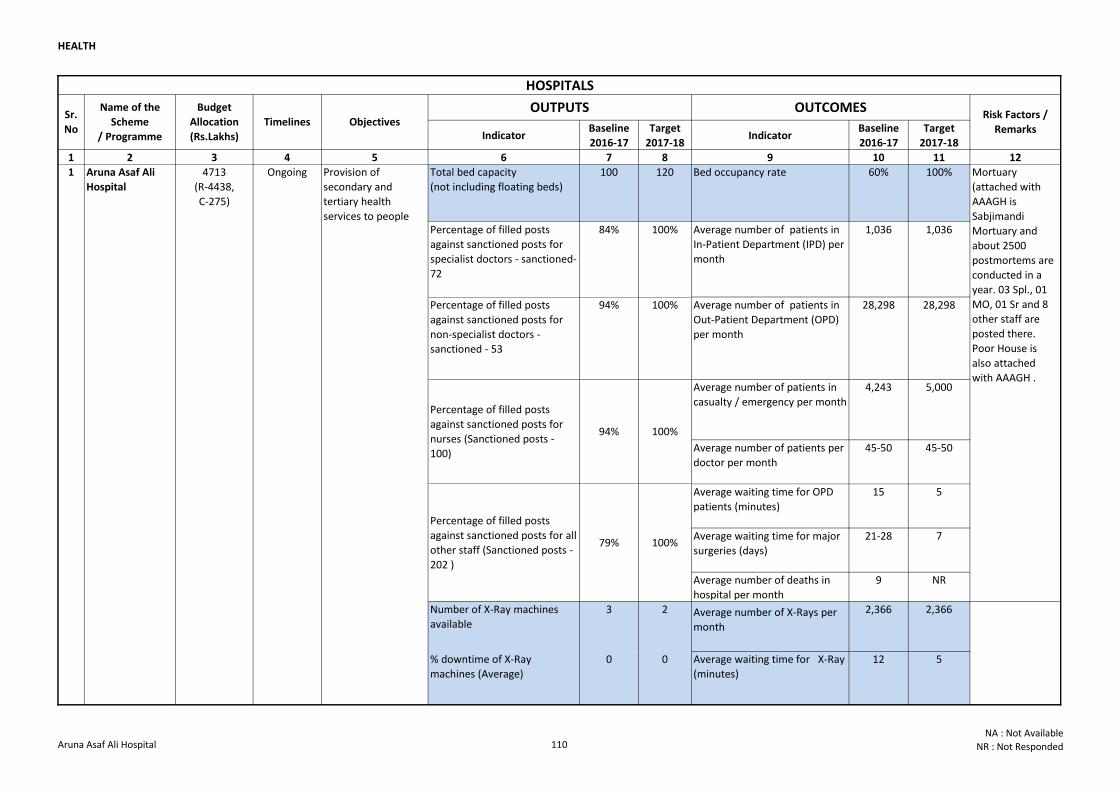
HEALTH
Indicator Baseline
2016-17
Target
2017-18Indicator
Baseline
2016-17
Target
2017-18
1 2 3 4 5 6 7 8 9 10 11 12
Total bed capacity
(not including floating beds)
100 120 Bed occupancy rate 60% 100%
Percentage of filled posts
against sanctioned posts for
specialist doctors - sanctioned-
72
84% 100% Average number of patients in
In-Patient Department (IPD) per
month
1,036 1,036
Percentage of filled posts
against sanctioned posts for
non-specialist doctors -
sanctioned - 53
94% 100% Average number of patients in
Out-Patient Department (OPD)
per month
28,298 28,298
Average number of patients in
casualty / emergency per month
4,243 5,000
Average number of patients per
doctor per month
45-50 45-50
Average waiting time for OPD
patients (minutes)
15 5
Average waiting time for major
surgeries (days)
21-28 7
Average number of deaths in
hospital per month
9 NR
Number of X-Ray machines
available
3 2 Average number of X-Rays per
month
2,366 2,366
% downtime of X-Ray
machines (Average)
0 0 Average waiting time for X-Ray
(minutes)
12 5
1 Aruna Asaf Ali
Hospital
4713
(R-4438,
C-275)
Ongoing Provision of
secondary and
tertiary health
services to people
Mortuary
(attached with
AAAGH is
Sabjimandi
Mortuary and
about 2500
postmortems are
conducted in a
year. 03 Spl., 01
MO, 01 Sr and 8
other staff are
posted there.
Poor House is
also attached
with AAAGH .
Percentage of filled posts
against sanctioned posts for
nurses (Sanctioned posts -
100)
94% 100%
Percentage of filled posts
against sanctioned posts for all
other staff (Sanctioned posts -
202 )
79% 100%
HOSPITALS
Sr.
No
Name of the
Scheme
/ Programme
Budget
Allocation
(Rs.Lakhs)
Timelines Objectives OUTPUTS OUTCOMES
Risk Factors /
Remarks
Aruna Asaf Ali Hospital 110NA : Not Available
NR : Not Responded
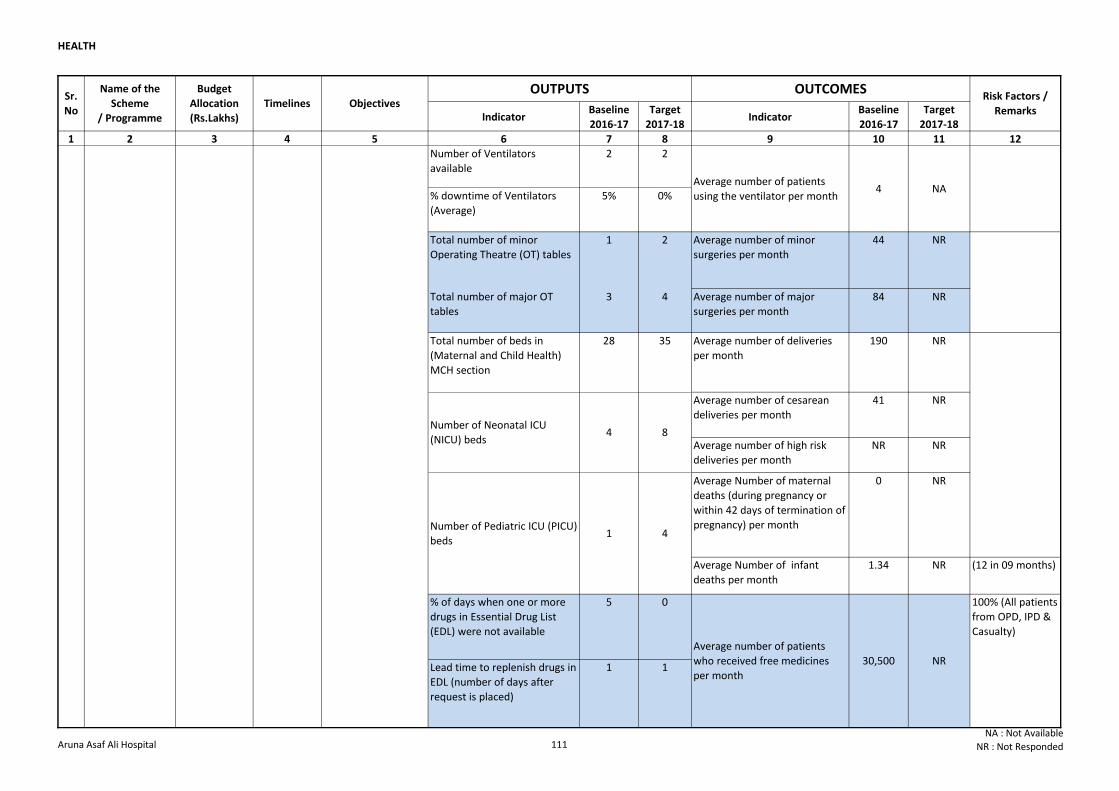
HEALTH
Indicator Baseline
2016-17
Target
2017-18Indicator
Baseline
2016-17
Target
2017-18
1 2 3 4 5 6 7 8 9 10 11 12
Sr.
No
Name of the
Scheme
/ Programme
Budget
Allocation
(Rs.Lakhs)
Timelines Objectives OUTPUTS OUTCOMES
Risk Factors /
Remarks
Number of Ventilators
available
2 2
% downtime of Ventilators
(Average)
5% 0%
Total number of minor
Operating Theatre (OT) tables
1 2 Average number of minor
surgeries per month
44 NR
Total number of major OT
tables
3 4 Average number of major
surgeries per month
84 NR
Total number of beds in
(Maternal and Child Health)
MCH section
28 35 Average number of deliveries
per month
190 NR
Average number of cesarean
deliveries per month
41 NR
Average number of high risk
deliveries per month
NR NR
Average Number of maternal
deaths (during pregnancy or
within 42 days of termination of
pregnancy) per month
0 NR
Average Number of infant
deaths per month
1.34 NR (12 in 09 months)
% of days when one or more
drugs in Essential Drug List
(EDL) were not available
5 0
Lead time to replenish drugs in
EDL (number of days after
request is placed)
1 1
4 8
Number of Pediatric ICU (PICU)
beds1 4
Number of Neonatal ICU
(NICU) beds
1 Aruna Asaf Ali
Hospital
4713
(R-4438,
C-275)
Ongoing Provision of
secondary and
tertiary health
services to people
Average number of patients
who received free medicines
per month
30,500 NR
100% (All patients
from OPD, IPD &
Casualty)
Average number of patients
using the ventilator per month4 NA
Aruna Asaf Ali Hospital 111NA : Not Available
NR : Not Responded
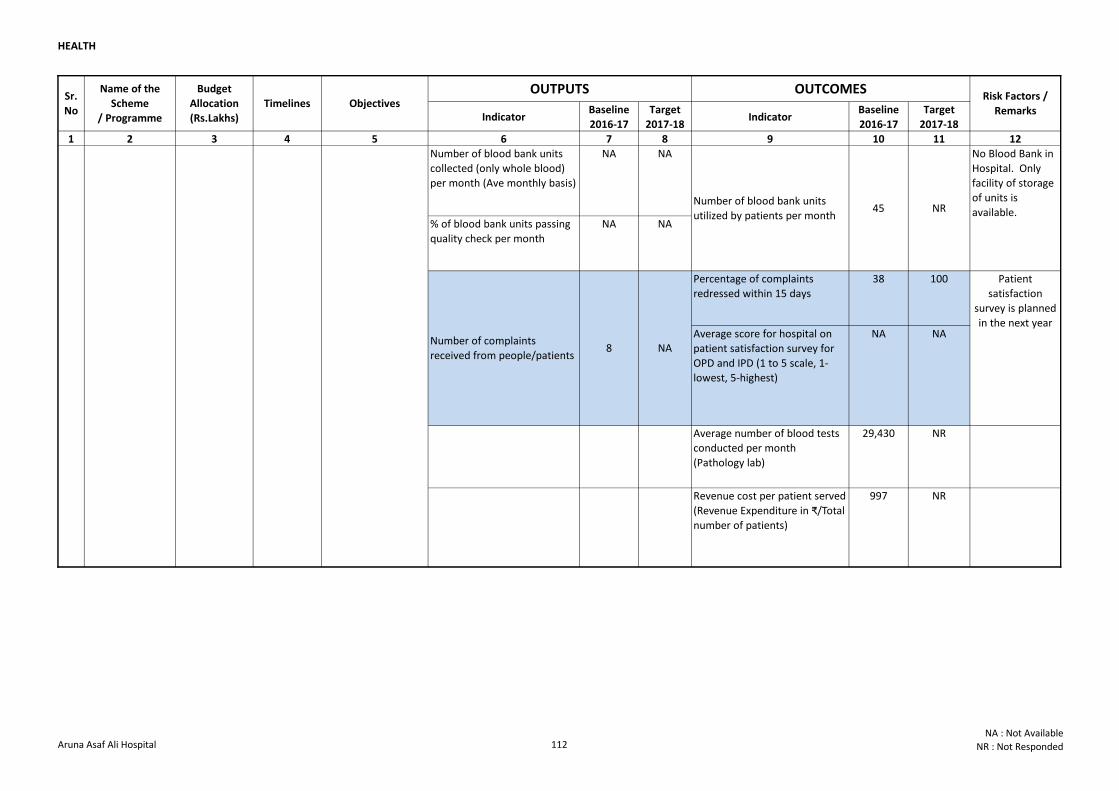
HEALTH
Indicator Baseline
2016-17
Target
2017-18Indicator
Baseline
2016-17
Target
2017-18
1 2 3 4 5 6 7 8 9 10 11 12
Sr.
No
Name of the
Scheme
/ Programme
Budget
Allocation
(Rs.Lakhs)
Timelines Objectives OUTPUTS OUTCOMES
Risk Factors /
Remarks
Number of blood bank units
collected (only whole blood)
per month (Ave monthly basis)
NA NA
% of blood bank units passing
quality check per month
NA NA
Percentage of complaints
redressed within 15 days
38 100
Average score for hospital on
patient satisfaction survey for
OPD and IPD (1 to 5 scale, 1-
lowest, 5-highest)
NA NA
Average number of blood tests
conducted per month
(Pathology lab)
29,430 NR
Revenue cost per patient served
(Revenue Expenditure in ₹/Total
number of patients)
997 NR
Patient
satisfaction
survey is planned
in the next year
Number of complaints
received from people/patients8 NA
Number of blood bank units
utilized by patients per month45 NR
No Blood Bank in
Hospital. Only
facility of storage
of units is
available.
1 Aruna Asaf Ali
Hospital
4713
(R-4438,
C-275)
Ongoing Provision of
secondary and
tertiary health
services to people
Aruna Asaf Ali Hospital 112NA : Not Available
NR : Not Responded
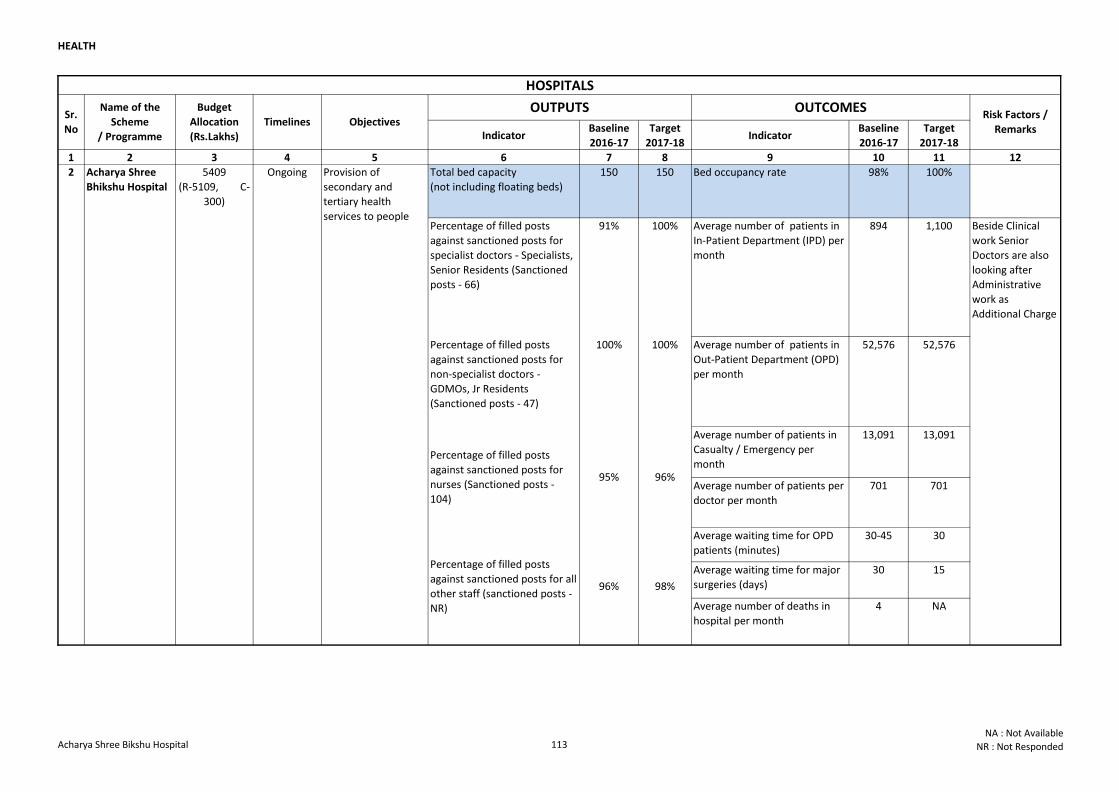
HEALTH
Indicator Baseline
2016-17
Target
2017-18Indicator
Baseline
2016-17
Target
2017-18
1 2 3 4 5 6 7 8 9 10 11 12
Total bed capacity
(not including floating beds)
150 150 Bed occupancy rate 98% 100%
Percentage of filled posts
against sanctioned posts for
specialist doctors - Specialists,
Senior Residents (Sanctioned
posts - 66)
91% 100% Average number of patients in
In-Patient Department (IPD) per
month
894 1,100
Percentage of filled posts
against sanctioned posts for
non-specialist doctors -
GDMOs, Jr Residents
(Sanctioned posts - 47)
100% 100% Average number of patients in
Out-Patient Department (OPD)
per month
52,576 52,576
Average number of patients in
Casualty / Emergency per
month
13,091 13,091
Average number of patients per
doctor per month
701 701
Average waiting time for OPD
patients (minutes)
30-45 30
Average waiting time for major
surgeries (days)
30 15
Average number of deaths in
hospital per month
4 NA
Beside Clinical
work Senior
Doctors are also
looking after
Administrative
work as
Additional Charge
Percentage of filled posts
against sanctioned posts for
nurses (Sanctioned posts -
104)
95% 96%
Percentage of filled posts
against sanctioned posts for all
other staff (sanctioned posts -
NR)
96% 98%
2 Acharya Shree
Bhikshu Hospital
5409
(R-5109, C-
300)
Ongoing Provision of
secondary and
tertiary health
services to people
HOSPITALS
Sr.
No
Name of the
Scheme
/ Programme
Budget
Allocation
(Rs.Lakhs)
Objectives Risk Factors /
RemarksTimelines
OUTPUTS OUTCOMES
Acharya Shree Bikshu Hospital 113NA : Not Available
NR : Not Responded
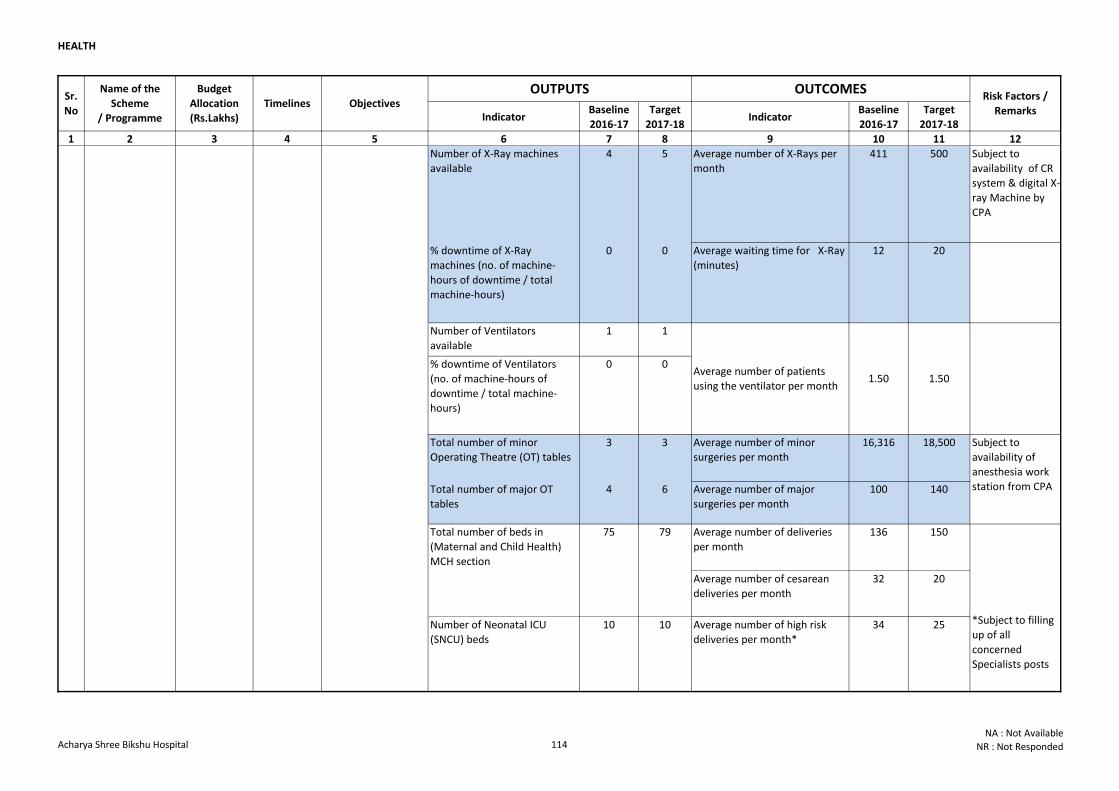
HEALTH
Indicator Baseline
2016-17
Target
2017-18Indicator
Baseline
2016-17
Target
2017-18
1 2 3 4 5 6 7 8 9 10 11 12
Sr.
No
Name of the
Scheme
/ Programme
Budget
Allocation
(Rs.Lakhs)
Objectives Risk Factors /
RemarksTimelines
OUTPUTS OUTCOMES
Number of X-Ray machines
available
4 5 Average number of X-Rays per
month
411 500 Subject to
availability of CR
system & digital X-
ray Machine by
CPA
% downtime of X-Ray
machines (no. of machine-
hours of downtime / total
machine-hours)
0 0 Average waiting time for X-Ray
(minutes)
12 20
Number of Ventilators
available
1 1
% downtime of Ventilators
(no. of machine-hours of
downtime / total machine-
hours)
0 0
Total number of minor
Operating Theatre (OT) tables
3 3 Average number of minor
surgeries per month
16,316 18,500
Total number of major OT
tables
4 6 Average number of major
surgeries per month
100 140
Average number of deliveries
per month
136 150
Average number of cesarean
deliveries per month
32 20
Number of Neonatal ICU
(SNCU) beds
10 10 Average number of high risk
deliveries per month*
34 25
1.50 1.50
Subject to
availability of
anesthesia work
station from CPA
*Subject to filling
up of all
concerned
Specialists posts
Average number of patients
using the ventilator per month
2 Acharya Shree
Bhikshu Hospital
5409
(R-5109, C-
300)
Total number of beds in
(Maternal and Child Health)
MCH section
75 79
Ongoing Provision of
secondary and
tertiary health
services to people
Acharya Shree Bikshu Hospital 114NA : Not Available
NR : Not Responded
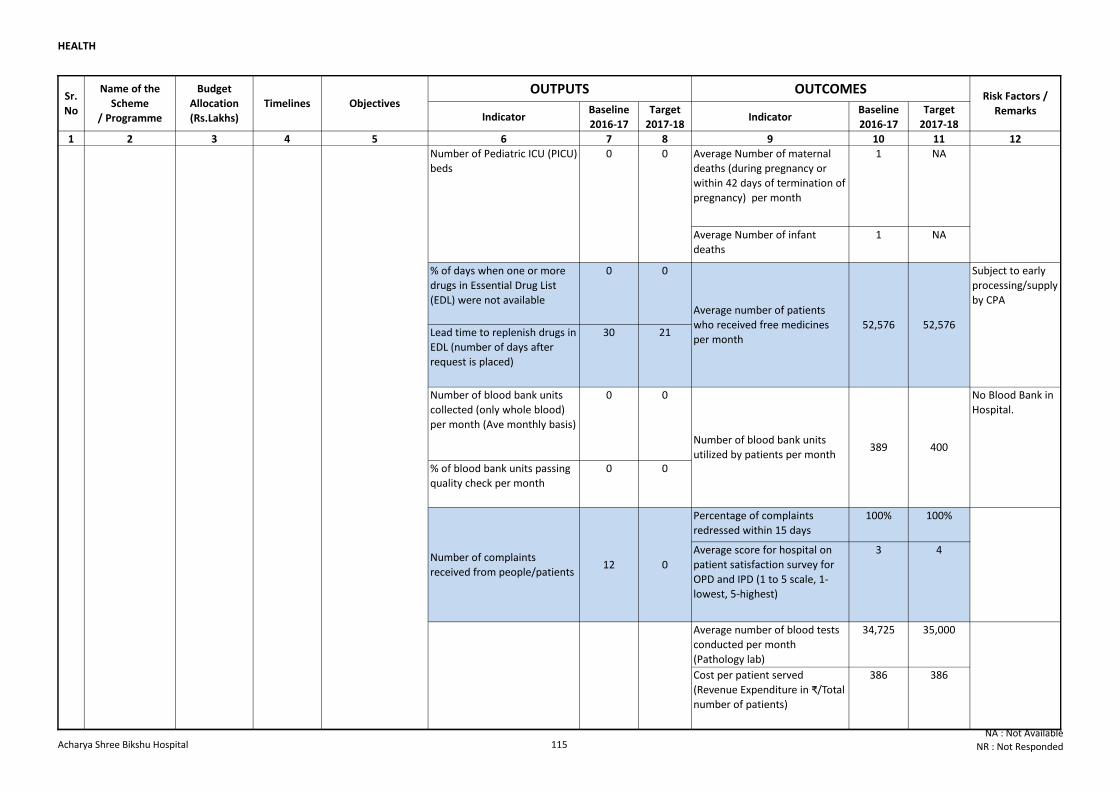
HEALTH
Indicator Baseline
2016-17
Target
2017-18Indicator
Baseline
2016-17
Target
2017-18
1 2 3 4 5 6 7 8 9 10 11 12
Sr.
No
Name of the
Scheme
/ Programme
Budget
Allocation
(Rs.Lakhs)
Objectives Risk Factors /
RemarksTimelines
OUTPUTS OUTCOMES
Average Number of maternal
deaths (during pregnancy or
within 42 days of termination of
pregnancy) per month
1 NA
Average Number of infant
deaths
1 NA
% of days when one or more
drugs in Essential Drug List
(EDL) were not available
0 0
Lead time to replenish drugs in
EDL (number of days after
request is placed)
30 21
Number of blood bank units
collected (only whole blood)
per month (Ave monthly basis)
0 0
% of blood bank units passing
quality check per month
0 0
Percentage of complaints
redressed within 15 days
100% 100%
Average score for hospital on
patient satisfaction survey for
OPD and IPD (1 to 5 scale, 1-
lowest, 5-highest)
3 4
Average number of blood tests
conducted per month
(Pathology lab)
34,725 35,000
Cost per patient served
(Revenue Expenditure in ₹/Total
number of patients)
386 386
52,576 52,576
Subject to early
processing/supply
by CPA
*Subject to filling
up of all
concerned
Specialists posts
400389
No Blood Bank in
Hospital.
Number of blood bank units
utilized by patients per month
Average number of patients
who received free medicines
per month
2 Acharya Shree
Bhikshu Hospital
5409
(R-5109, C-
300)
0
Number of Pediatric ICU (PICU)
beds
0 0
Ongoing Provision of
secondary and
tertiary health
services to people
Number of complaints
received from people/patients12
Acharya Shree Bikshu Hospital 115NA : Not Available
NR : Not Responded
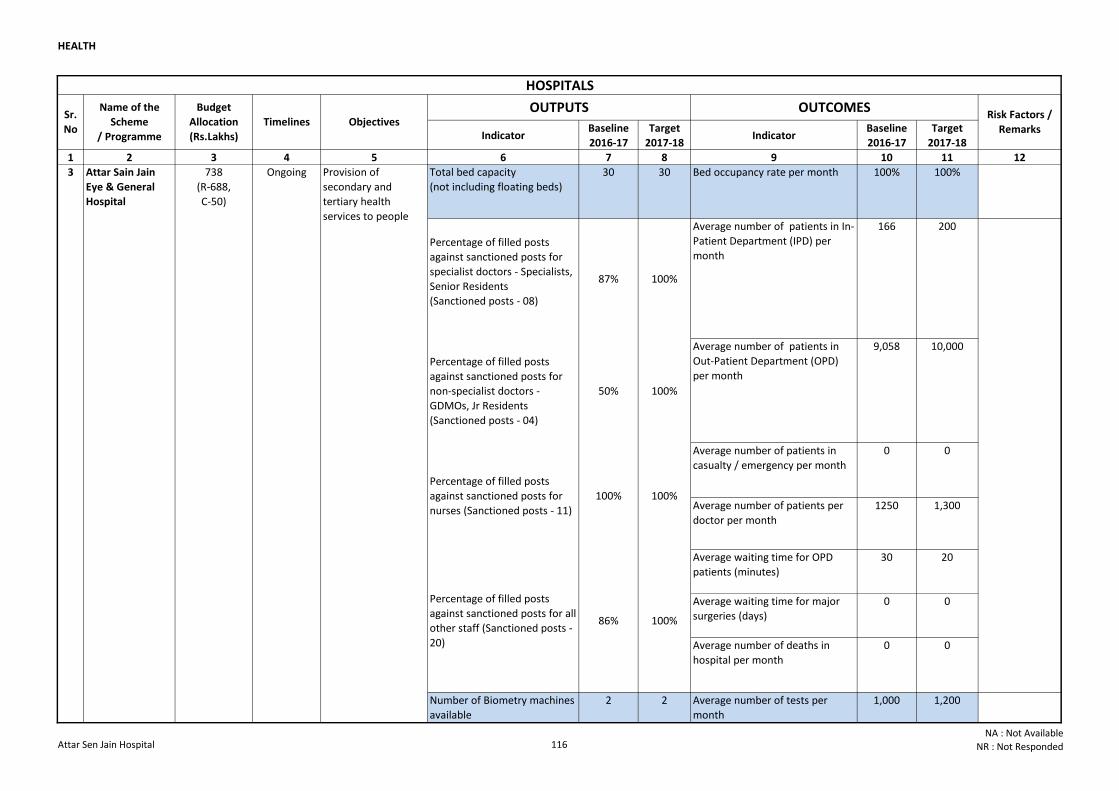
HEALTH
Indicator Baseline
2016-17
Target
2017-18Indicator
Baseline
2016-17
Target
2017-18
1 2 3 4 5 6 7 8 9 10 11 12
Total bed capacity
(not including floating beds)
30 30 Bed occupancy rate per month 100% 100%
Percentage of filled posts
against sanctioned posts for
specialist doctors - Specialists,
Senior Residents
(Sanctioned posts - 08)
87% 100%
Average number of patients in In-
Patient Department (IPD) per
month
166 200
Percentage of filled posts
against sanctioned posts for
non-specialist doctors -
GDMOs, Jr Residents
(Sanctioned posts - 04)
50% 100%
Average number of patients in
Out-Patient Department (OPD)
per month
9,058 10,000
Average number of patients in
casualty / emergency per month
0 0
Average number of patients per
doctor per month
1250 1,300
Average waiting time for OPD
patients (minutes)
30 20
Average waiting time for major
surgeries (days)
0 0
Average number of deaths in
hospital per month
0 0
Number of Biometry machines
available
2 2 Average number of tests per
month
1,000 1,200
100%
OUTPUTS OUTCOMES
Percentage of filled posts
against sanctioned posts for all
other staff (Sanctioned posts -
20)
86%
HOSPITALS
Risk Factors /
Remarks
Percentage of filled posts
against sanctioned posts for
nurses (Sanctioned posts - 11)
100% 100%
Sr.
No
Name of the
Scheme
/ Programme
Budget
Allocation
(Rs.Lakhs)
Timelines Objectives
3 Attar Sain Jain
Eye & General
Hospital
738
(R-688,
C-50)
Ongoing Provision of
secondary and
tertiary health
services to people
Attar Sen Jain Hospital 116NA : Not Available
NR : Not Responded
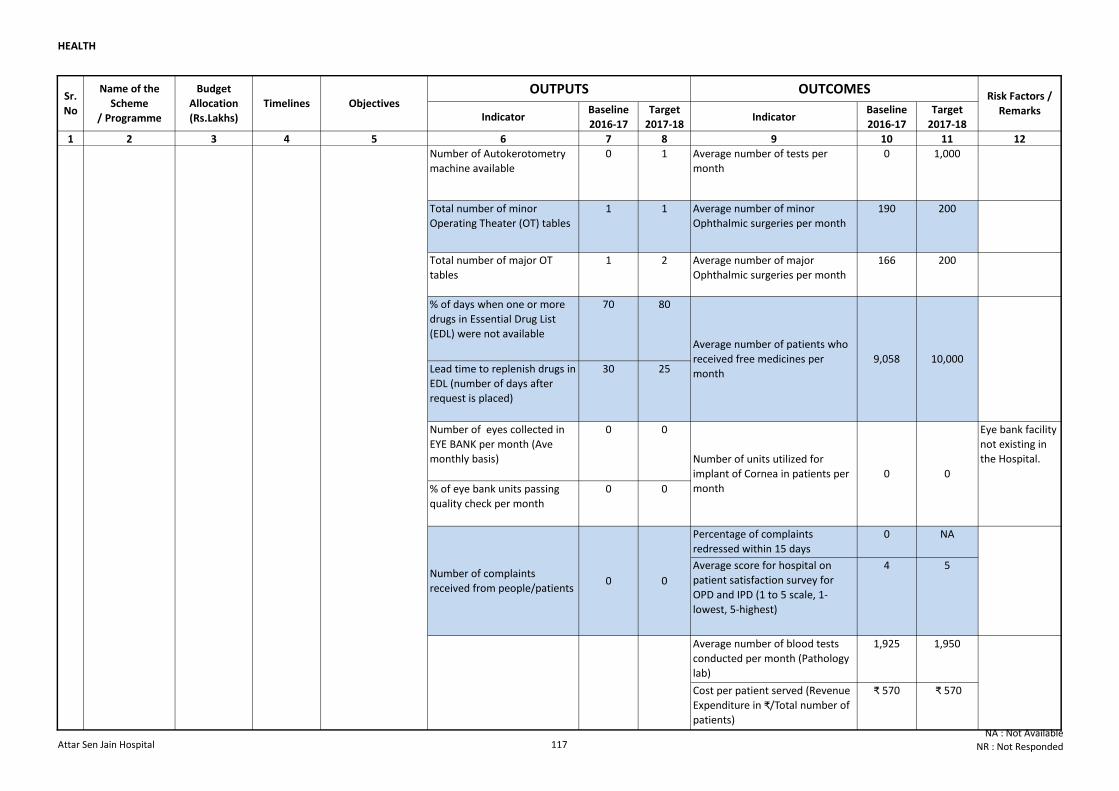
HEALTH
Indicator Baseline
2016-17
Target
2017-18Indicator
Baseline
2016-17
Target
2017-18
1 2 3 4 5 6 7 8 9 10 11 12
OUTPUTS OUTCOMESRisk Factors /
Remarks
Sr.
No
Name of the
Scheme
/ Programme
Budget
Allocation
(Rs.Lakhs)
Timelines Objectives
Number of Autokerotometry
machine available
0 1 Average number of tests per
month
0 1,000
Total number of minor
Operating Theater (OT) tables
1 1 Average number of minor
Ophthalmic surgeries per month
190 200
Total number of major OT
tables
1 2 Average number of major
Ophthalmic surgeries per month
166 200
% of days when one or more
drugs in Essential Drug List
(EDL) were not available
70 80
Lead time to replenish drugs in
EDL (number of days after
request is placed)
30 25
Number of eyes collected in
EYE BANK per month (Ave
monthly basis)
0 0
% of eye bank units passing
quality check per month
0 0
Percentage of complaints
redressed within 15 days
0 NA
Average score for hospital on
patient satisfaction survey for
OPD and IPD (1 to 5 scale, 1-
lowest, 5-highest)
4 5
Average number of blood tests
conducted per month (Pathology
lab)
1,925 1,950
Cost per patient served (Revenue
Expenditure in ₹/Total number of
patients)
₹ 570 ₹ 570
Number of units utilized for
implant of Cornea in patients per
month
0 0
Eye bank facility
not existing in
the Hospital.
Number of complaints
received from people/patients0 0
Average number of patients who
received free medicines per
month
9,058 10,000
3 Attar Sain Jain
Eye & General
Hospital
738
(R-688,
C-50)
Ongoing Provision of
secondary and
tertiary health
services to people
Attar Sen Jain Hospital 117NA : Not Available
NR : Not Responded
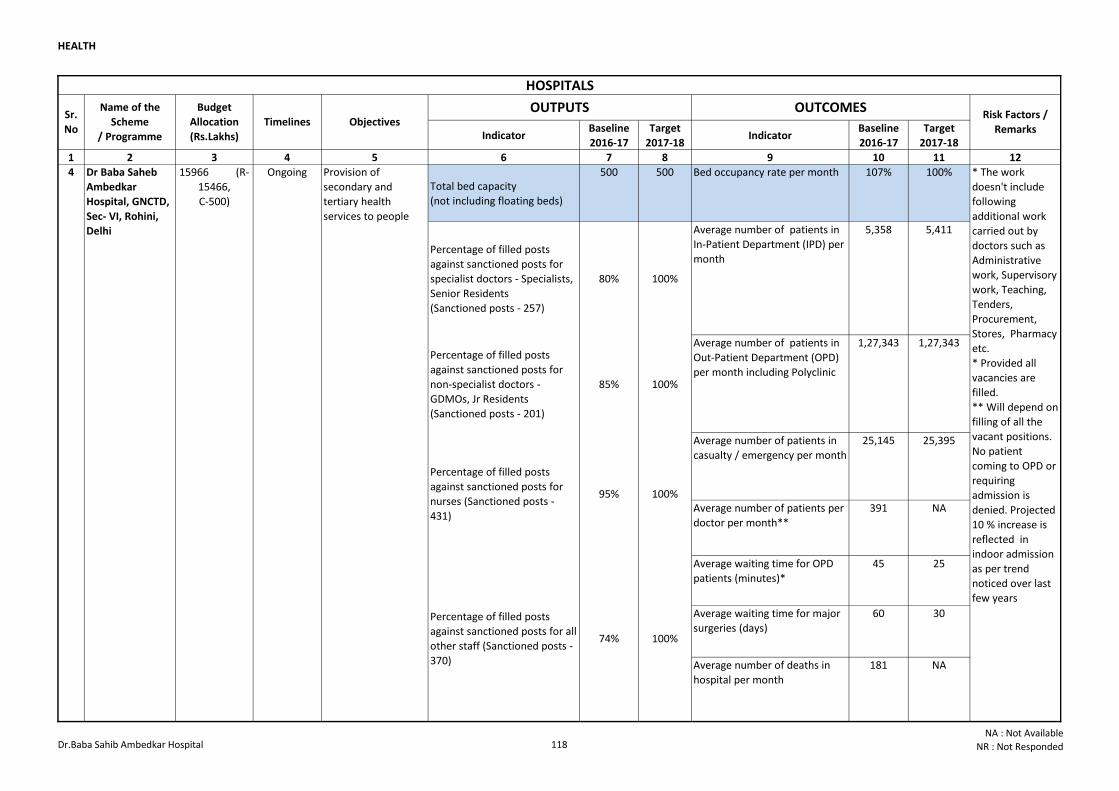
HEALTH
Indicator Baseline
2016-17
Target
2017-18Indicator
Baseline
2016-17
Target
2017-18
1 2 3 4 5 6 7 8 9 10 11 12
Total bed capacity
(not including floating beds)
500 500 Bed occupancy rate per month 107% 100%
Percentage of filled posts
against sanctioned posts for
specialist doctors - Specialists,
Senior Residents
(Sanctioned posts - 257)
80% 100%
Average number of patients in
In-Patient Department (IPD) per
month
5,358 5,411
Percentage of filled posts
against sanctioned posts for
non-specialist doctors -
GDMOs, Jr Residents
(Sanctioned posts - 201)
85% 100%
Average number of patients in
Out-Patient Department (OPD)
per month including Polyclinic
1,27,343 1,27,343
Average number of patients in
casualty / emergency per month
25,145 25,395
Average number of patients per
doctor per month**
391 NA
Average waiting time for OPD
patients (minutes)*
45 25
Average waiting time for major
surgeries (days)
60 30
Average number of deaths in
hospital per month
181 NA
74% 100%
4 Dr Baba Saheb
Ambedkar
Hospital, GNCTD,
Sec- VI, Rohini,
Delhi
15966 (R-
15466,
C-500)
Ongoing Provision of
secondary and
tertiary health
services to people
* The work
doesn't include
following
additional work
carried out by
doctors such as
Administrative
work, Supervisory
work, Teaching,
Tenders,
Procurement,
Stores, Pharmacy
etc.
* Provided all
vacancies are
filled.
** Will depend on
filling of all the
vacant positions.
No patient
coming to OPD or
requiring
admission is
denied. Projected
10 % increase is
reflected in
indoor admission
as per trend
noticed over last
few years
Percentage of filled posts
against sanctioned posts for
nurses (Sanctioned posts -
431)
HOSPITALS
Percentage of filled posts
against sanctioned posts for all
other staff (Sanctioned posts -
370)
Sr.
No
Name of the
Scheme
/ Programme
Budget
Allocation
(Rs.Lakhs)
Timelines Objectives OUTPUTS
95% 100%
OUTCOMESRisk Factors /
Remarks
Dr.Baba Sahib Ambedkar Hospital 118NA : Not Available
NR : Not Responded
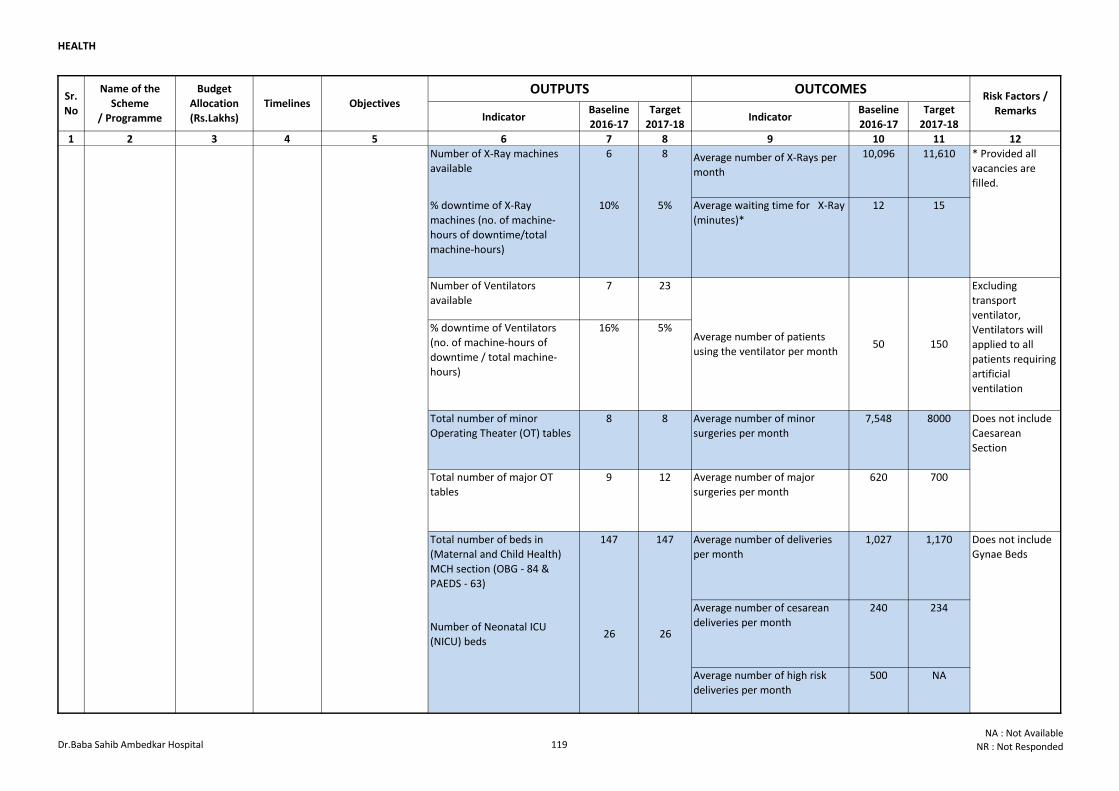
HEALTH
Indicator Baseline
2016-17
Target
2017-18Indicator
Baseline
2016-17
Target
2017-18
1 2 3 4 5 6 7 8 9 10 11 12
Sr.
No
Name of the
Scheme
/ Programme
Budget
Allocation
(Rs.Lakhs)
Timelines Objectives OUTPUTS OUTCOMES
Risk Factors /
Remarks
Number of X-Ray machines
available
6 8 Average number of X-Rays per
month
10,096 11,610
% downtime of X-Ray
machines (no. of machine-
hours of downtime/total
machine-hours)
10% 5% Average waiting time for X-Ray
(minutes)*
12 15
Number of Ventilators
available
7 23
% downtime of Ventilators
(no. of machine-hours of
downtime / total machine-
hours)
16% 5%
Total number of minor
Operating Theater (OT) tables
8 8 Average number of minor
surgeries per month
7,548 8000
Total number of major OT
tables
9 12 Average number of major
surgeries per month
620 700
Total number of beds in
(Maternal and Child Health)
MCH section (OBG - 84 &
PAEDS - 63)
147 147 Average number of deliveries
per month
1,027 1,170
Number of Neonatal ICU
(NICU) beds 26 26
Average number of cesarean
deliveries per month
240 234
Average number of high risk
deliveries per month
500 NA
0 6 (HDU)
Does not include
Gynae Beds
Number of Pediatric ICU (PICU)
beds
Does not include
Caesarean
Section
4 Dr Baba Saheb
Ambedkar
Hospital, GNCTD,
Sec- VI, Rohini,
Delhi
15966 (R-
15466,
C-500)
Ongoing Provision of
secondary and
tertiary health
services to people
* Provided all
vacancies are
filled.
Average number of patients
using the ventilator per month50 150
Excluding
transport
ventilator,
Ventilators will
applied to all
patients requiring
artificial
ventilation
Dr.Baba Sahib Ambedkar Hospital 119NA : Not Available
NR : Not Responded
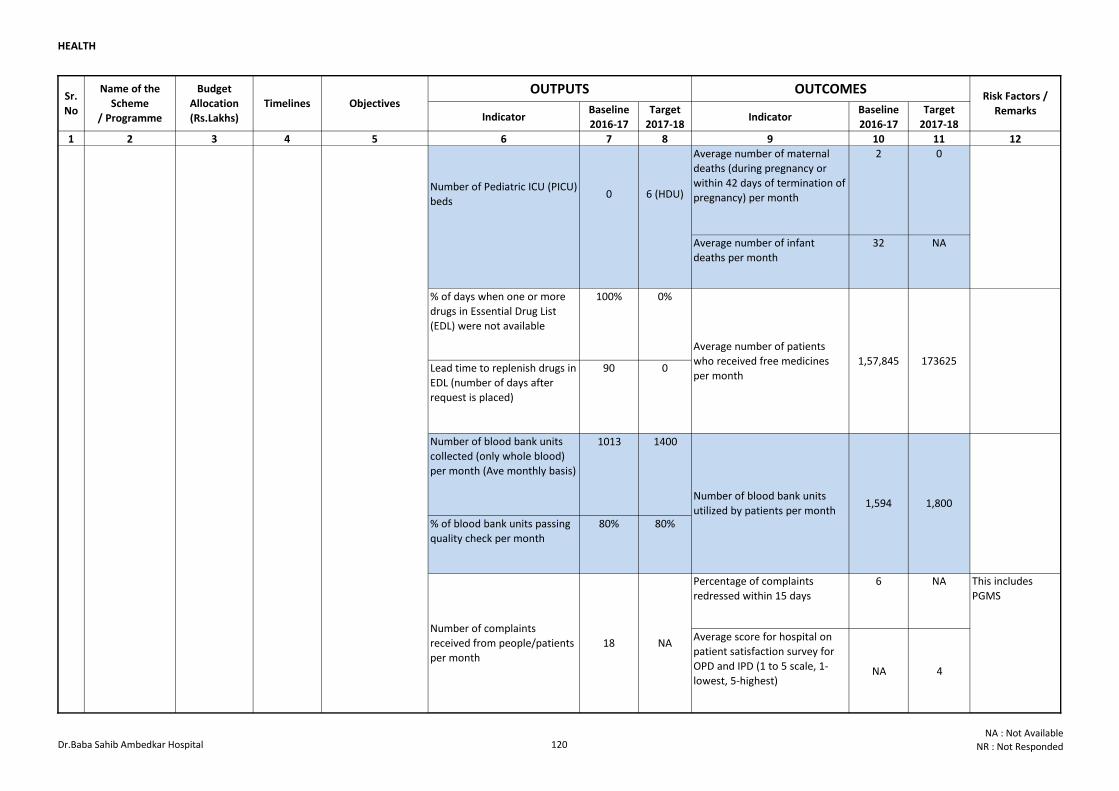
HEALTH
Indicator Baseline
2016-17
Target
2017-18Indicator
Baseline
2016-17
Target
2017-18
1 2 3 4 5 6 7 8 9 10 11 12
Sr.
No
Name of the
Scheme
/ Programme
Budget
Allocation
(Rs.Lakhs)
Timelines Objectives OUTPUTS OUTCOMES
Risk Factors /
Remarks
Average number of maternal
deaths (during pregnancy or
within 42 days of termination of
pregnancy) per month
2 0
Average number of infant
deaths per month
32 NA
% of days when one or more
drugs in Essential Drug List
(EDL) were not available
100% 0%
Lead time to replenish drugs in
EDL (number of days after
request is placed)
90 0
Number of blood bank units
collected (only whole blood)
per month (Ave monthly basis)
1013 1400
% of blood bank units passing
quality check per month
80% 80%
Percentage of complaints
redressed within 15 days
6 NA
Average score for hospital on
patient satisfaction survey for
OPD and IPD (1 to 5 scale, 1-
lowest, 5-highest)NA 4
0 6 (HDU)
Does not include
Gynae Beds
NA
This includes
PGMS
Average number of patients
who received free medicines
per month
1,57,845 173625
Number of blood bank units
utilized by patients per month1,594 1,800
Number of Pediatric ICU (PICU)
beds
4 Dr Baba Saheb
Ambedkar
Hospital, GNCTD,
Sec- VI, Rohini,
Delhi
15966 (R-
15466,
C-500)
Ongoing Provision of
secondary and
tertiary health
services to people
Number of complaints
received from people/patients
per month
18
Dr.Baba Sahib Ambedkar Hospital 120NA : Not Available
NR : Not Responded
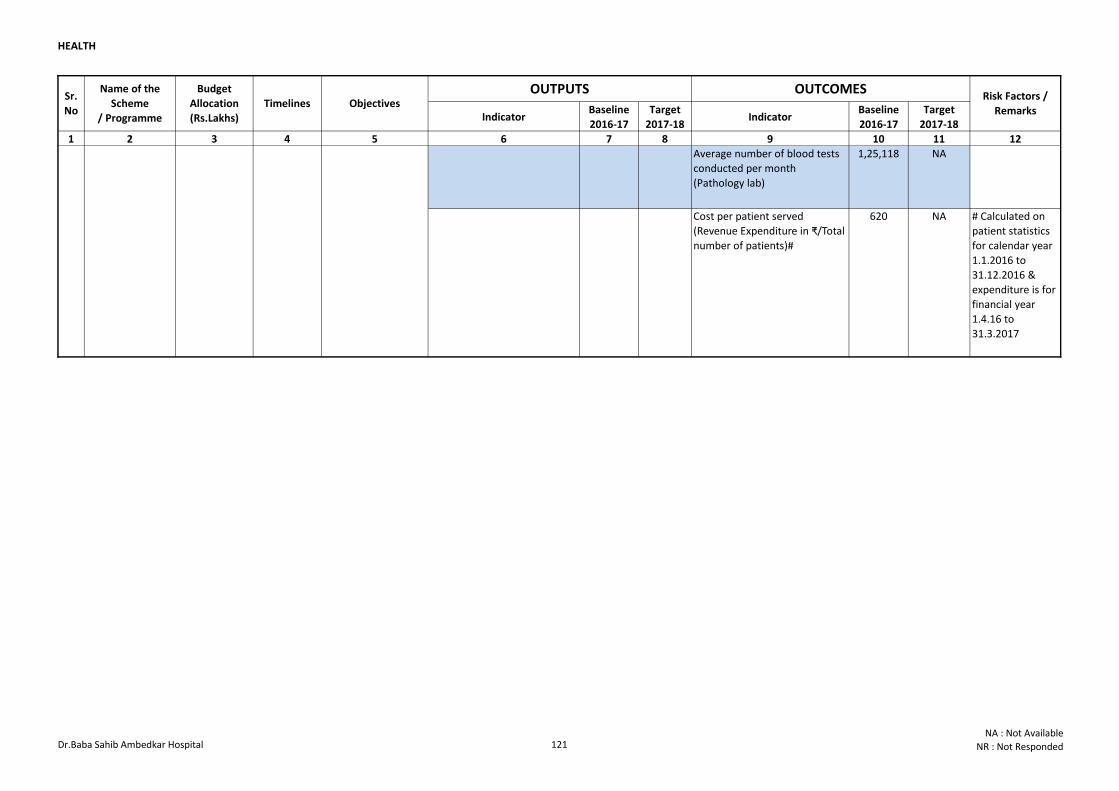
HEALTH
Indicator Baseline
2016-17
Target
2017-18Indicator
Baseline
2016-17
Target
2017-18
1 2 3 4 5 6 7 8 9 10 11 12
Sr.
No
Name of the
Scheme
/ Programme
Budget
Allocation
(Rs.Lakhs)
Timelines Objectives OUTPUTS OUTCOMES
Risk Factors /
Remarks
Average number of blood tests
conducted per month
(Pathology lab)
1,25,118 NA
Cost per patient served
(Revenue Expenditure in ₹/Total
number of patients)#
620 NA # Calculated on
patient statistics
for calendar year
1.1.2016 to
31.12.2016 &
expenditure is for
financial year
1.4.16 to
31.3.2017
4 Dr Baba Saheb
Ambedkar
Hospital, GNCTD,
Sec- VI, Rohini,
Delhi
15966 (R-
15466,
C-500)
Ongoing Provision of
secondary and
tertiary health
services to people
Dr.Baba Sahib Ambedkar Hospital 121NA : Not Available
NR : Not Responded
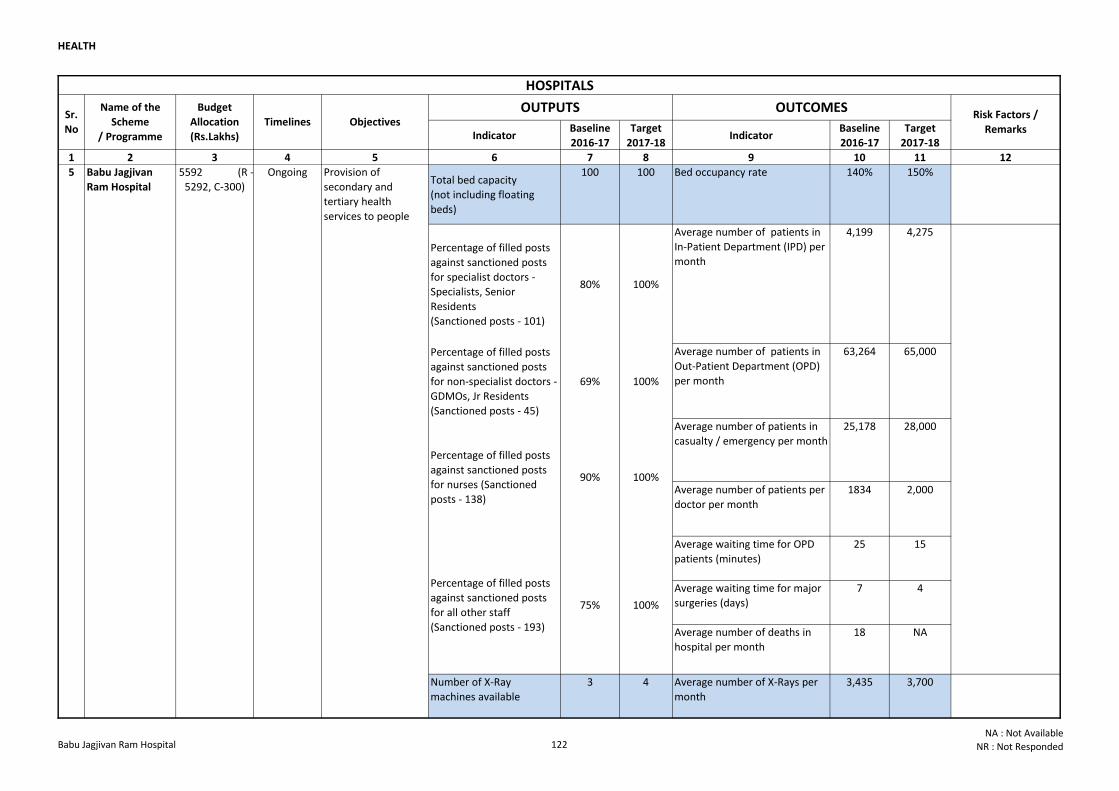
HEALTH
Indicator Baseline
2016-17
Target
2017-18Indicator
Baseline
2016-17
Target
2017-18
1 2 3 4 5 6 7 8 9 10 11 12
Total bed capacity
(not including floating
beds)
100 100 Bed occupancy rate 140% 150%
Percentage of filled posts
against sanctioned posts
for specialist doctors -
Specialists, Senior
Residents
(Sanctioned posts - 101)
80% 100%
Average number of patients in
In-Patient Department (IPD) per
month
4,199 4,275
Percentage of filled posts
against sanctioned posts
for non-specialist doctors -
GDMOs, Jr Residents
(Sanctioned posts - 45)
69% 100%
Average number of patients in
Out-Patient Department (OPD)
per month
63,264 65,000
Average number of patients in
casualty / emergency per month
25,178 28,000
Average number of patients per
doctor per month
1834 2,000
Average waiting time for OPD
patients (minutes)
25 15
Average waiting time for major
surgeries (days)
7 4
Average number of deaths in
hospital per month
18 NA
Number of X-Ray
machines available
3 4 Average number of X-Rays per
month
3,435 3,700
OUTCOMESRisk Factors /
Remarks
5 Babu Jagjivan
Ram Hospital
5592 (R -
5292, C-300)
Ongoing
Sr.
No
Name of the
Scheme
/ Programme
Budget
Allocation
(Rs.Lakhs)
Timelines Objectives OUTPUTS
Provision of
secondary and
tertiary health
services to people
Percentage of filled posts
against sanctioned posts
for nurses (Sanctioned
posts - 138)
90% 100%
Percentage of filled posts
against sanctioned posts
for all other staff
(Sanctioned posts - 193)
75% 100%
HOSPITALS
Babu Jagjivan Ram Hospital 122NA : Not Available
NR : Not Responded
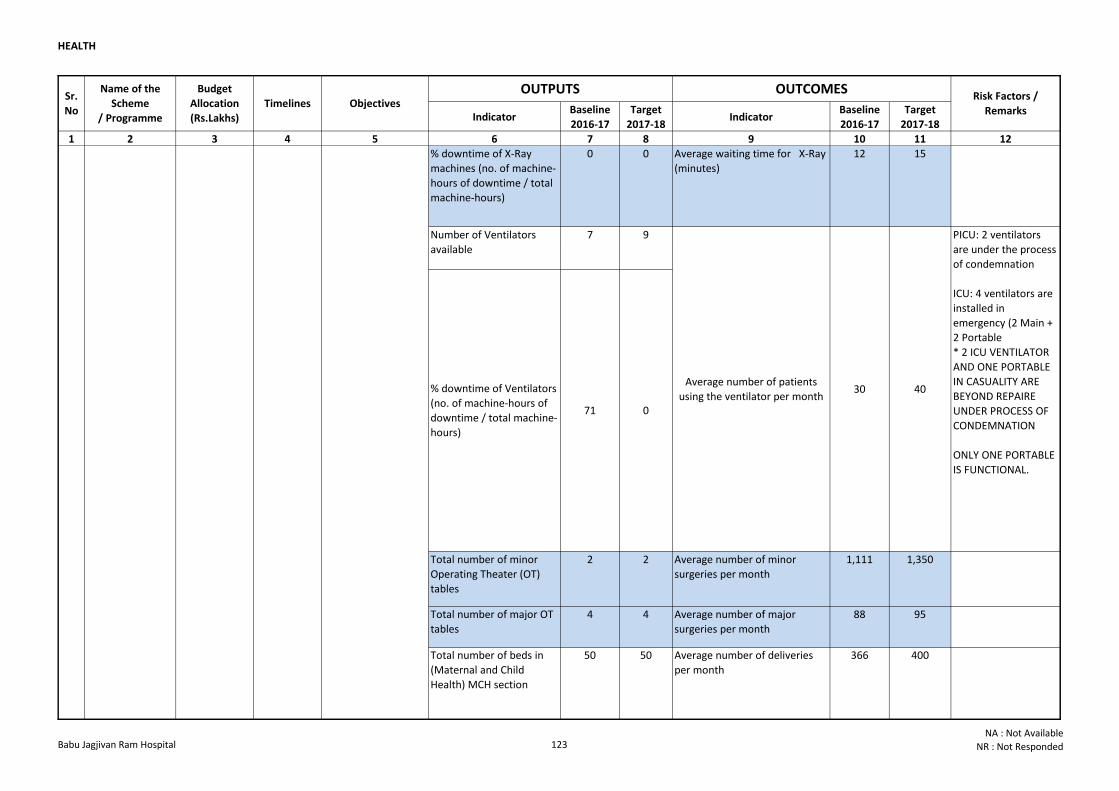
HEALTH
Indicator Baseline
2016-17
Target
2017-18Indicator
Baseline
2016-17
Target
2017-18
1 2 3 4 5 6 7 8 9 10 11 12
OUTCOMESRisk Factors /
Remarks
Sr.
No
Name of the
Scheme
/ Programme
Budget
Allocation
(Rs.Lakhs)
Timelines Objectives OUTPUTS
% downtime of X-Ray
machines (no. of machine-
hours of downtime / total
machine-hours)
0 0 Average waiting time for X-Ray
(minutes)
12 15
Number of Ventilators
available
7 9
Total number of minor
Operating Theater (OT)
tables
2 2 Average number of minor
surgeries per month
1,111 1,350
Total number of major OT
tables
4 4 Average number of major
surgeries per month
88 95
Total number of beds in
(Maternal and Child
Health) MCH section
50 50 Average number of deliveries
per month
366 400
5 Babu Jagjivan
Ram Hospital
5592 (R -
5292, C-300)
Ongoing Provision of
secondary and
tertiary health
services to people
PICU: 2 ventilators
are under the process
of condemnation
ICU: 4 ventilators are
installed in
emergency (2 Main +
2 Portable
* 2 ICU VENTILATOR
AND ONE PORTABLE
IN CASUALITY ARE
BEYOND REPAIRE
UNDER PROCESS OF
CONDEMNATION
ONLY ONE PORTABLE
IS FUNCTIONAL.
% downtime of Ventilators
(no. of machine-hours of
downtime / total machine-
hours)
71 0
30 40Average number of patients
using the ventilator per month
Babu Jagjivan Ram Hospital 123NA : Not Available
NR : Not Responded
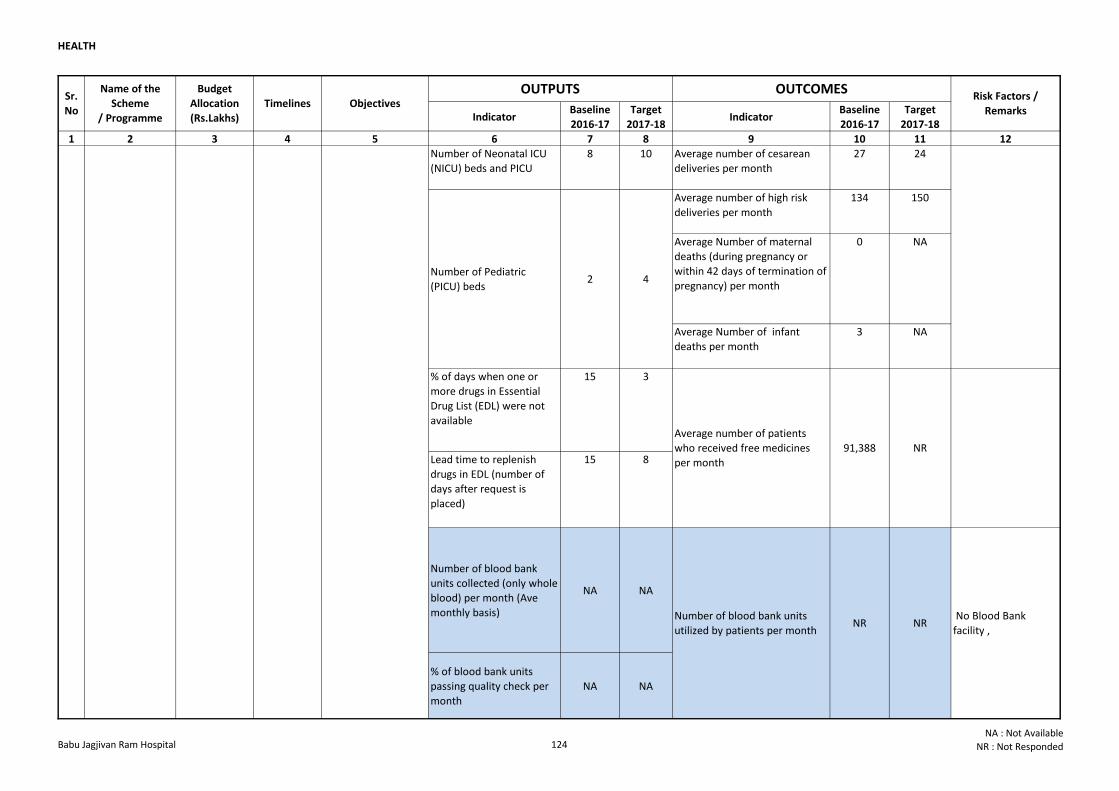
HEALTH
Indicator Baseline
2016-17
Target
2017-18Indicator
Baseline
2016-17
Target
2017-18
1 2 3 4 5 6 7 8 9 10 11 12
OUTCOMESRisk Factors /
Remarks
Sr.
No
Name of the
Scheme
/ Programme
Budget
Allocation
(Rs.Lakhs)
Timelines Objectives OUTPUTS
Number of Neonatal ICU
(NICU) beds and PICU
8 10 Average number of cesarean
deliveries per month
27 24
Average number of high risk
deliveries per month
134 150
Average Number of maternal
deaths (during pregnancy or
within 42 days of termination of
pregnancy) per month
0 NA
Average Number of infant
deaths per month
3 NA
% of days when one or
more drugs in Essential
Drug List (EDL) were not
available
15 3
Lead time to replenish
drugs in EDL (number of
days after request is
placed)
15 8
Number of blood bank
units collected (only whole
blood) per month (Ave
monthly basis)
NA NA
% of blood bank units
passing quality check per
month
NA NA
5 Babu Jagjivan
Ram Hospital
5592 (R -
5292, C-300)
Ongoing Provision of
secondary and
tertiary health
services to people
Number of Pediatric
(PICU) beds2 4
Average number of patients
who received free medicines
per month
91,388 NR
Number of blood bank units
utilized by patients per monthNR NR
No Blood Bank
facility ,
Babu Jagjivan Ram Hospital 124NA : Not Available
NR : Not Responded
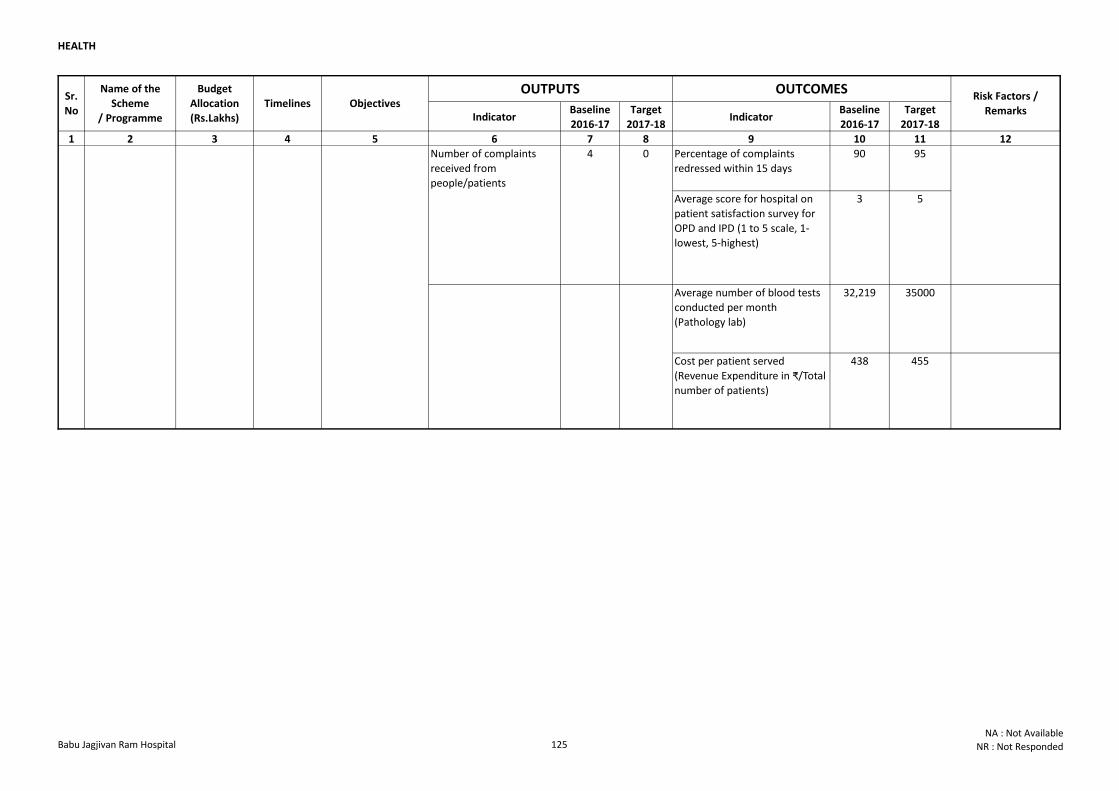
HEALTH
Indicator Baseline
2016-17
Target
2017-18Indicator
Baseline
2016-17
Target
2017-18
1 2 3 4 5 6 7 8 9 10 11 12
OUTCOMESRisk Factors /
Remarks
Sr.
No
Name of the
Scheme
/ Programme
Budget
Allocation
(Rs.Lakhs)
Timelines Objectives OUTPUTS
Percentage of complaints
redressed within 15 days
90 95
Average score for hospital on
patient satisfaction survey for
OPD and IPD (1 to 5 scale, 1-
lowest, 5-highest)
3 5
Average number of blood tests
conducted per month
(Pathology lab)
32,219 35000
Cost per patient served
(Revenue Expenditure in ₹/Total
number of patients)
438 455
5 Babu Jagjivan
Ram Hospital
5592 (R -
5292, C-300)
Ongoing Provision of
secondary and
tertiary health
services to people
Number of complaints
received from
people/patients
4 0
Babu Jagjivan Ram Hospital 125NA : Not Available
NR : Not Responded
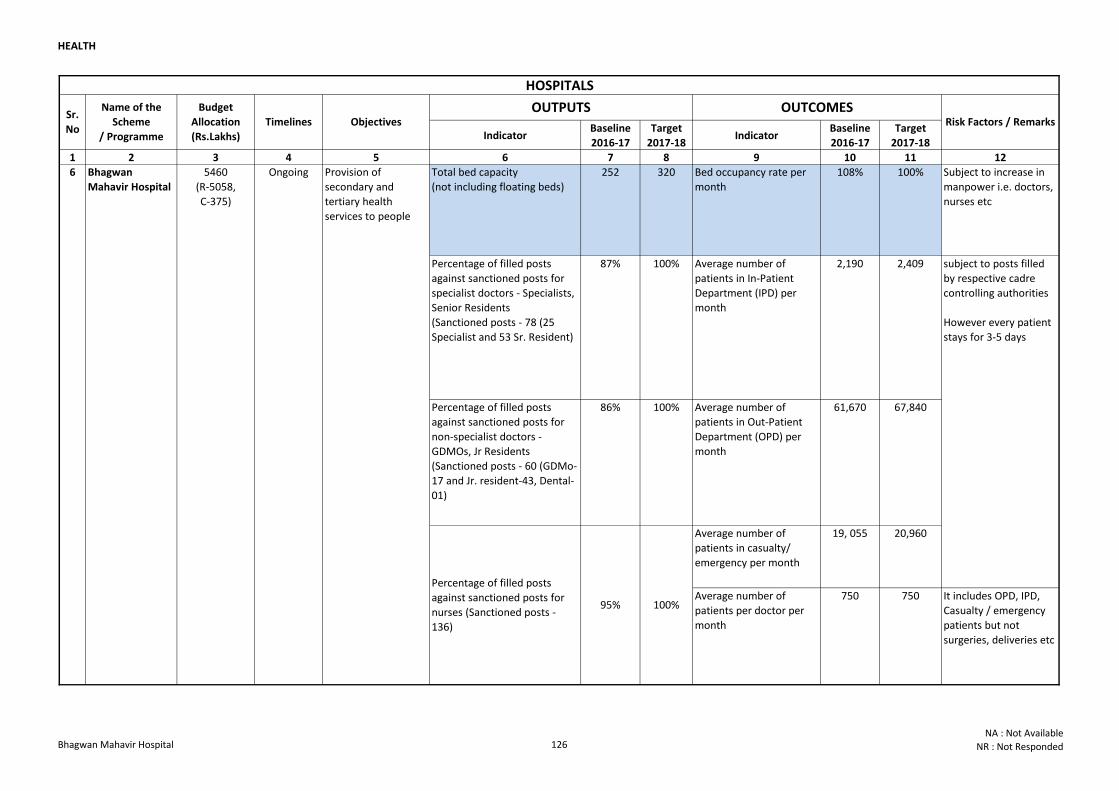
HEALTH
Indicator Baseline
2016-17
Target
2017-18Indicator
Baseline
2016-17
Target
2017-18
1 2 3 4 5 6 7 8 9 10 11 12
Total bed capacity
(not including floating beds)
252 320 Bed occupancy rate per
month
108% 100% Subject to increase in
manpower i.e. doctors,
nurses etc
Percentage of filled posts
against sanctioned posts for
specialist doctors - Specialists,
Senior Residents
(Sanctioned posts - 78 (25
Specialist and 53 Sr. Resident)
87% 100% Average number of
patients in In-Patient
Department (IPD) per
month
2,190 2,409
Percentage of filled posts
against sanctioned posts for
non-specialist doctors -
GDMOs, Jr Residents
(Sanctioned posts - 60 (GDMo-
17 and Jr. resident-43, Dental-
01)
86% 100% Average number of
patients in Out-Patient
Department (OPD) per
month
61,670 67,840
Average number of
patients in casualty/
emergency per month
19, 055 20,960
Average number of
patients per doctor per
month
750 750 It includes OPD, IPD,
Casualty / emergency
patients but not
surgeries, deliveries etc
OUTPUTS OUTCOMESRisk Factors / Remarks
Sr.
No
Name of the
Scheme
/ Programme
Budget
Allocation
(Rs.Lakhs)
Timelines Objectives
subject to posts filled
by respective cadre
controlling authorities
However every patient
stays for 3-5 days
Percentage of filled posts
against sanctioned posts for
nurses (Sanctioned posts -
136)
95% 100%
HOSPITALS
6 Bhagwan
Mahavir Hospital
5460
(R-5058,
C-375)
Ongoing Provision of
secondary and
tertiary health
services to people
Bhagwan Mahavir Hospital 126NA : Not Available
NR : Not Responded
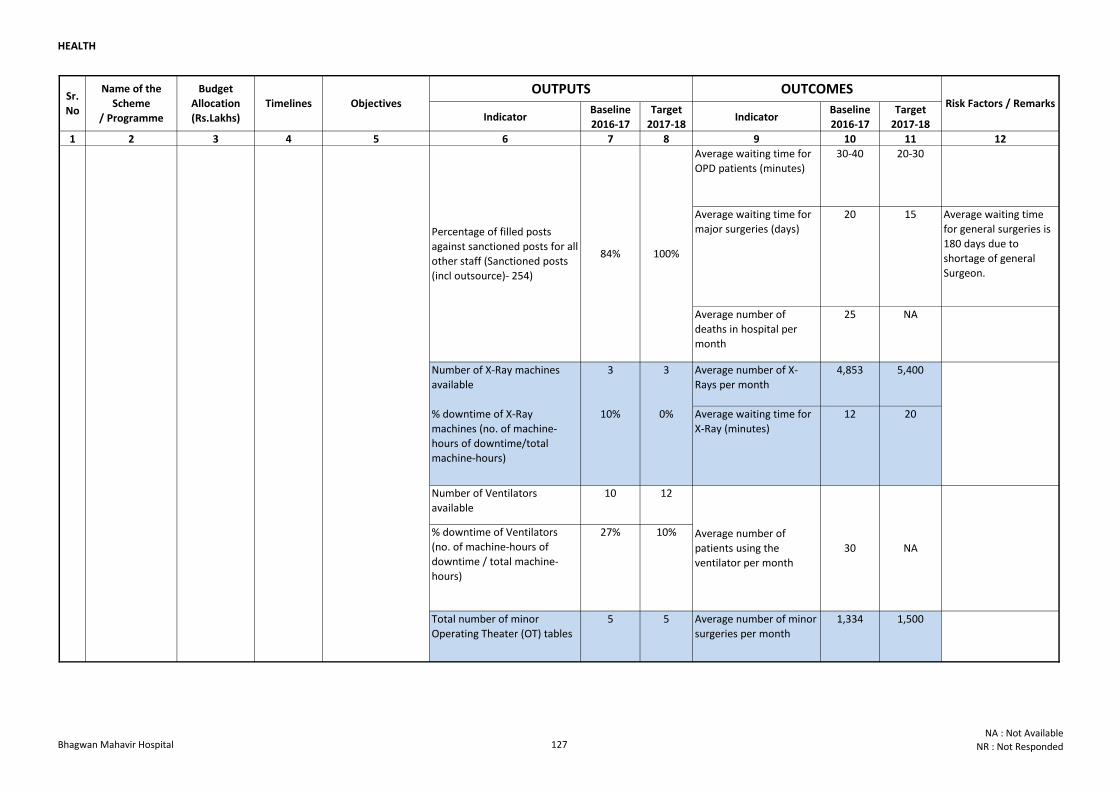
HEALTH
Indicator Baseline
2016-17
Target
2017-18Indicator
Baseline
2016-17
Target
2017-18
1 2 3 4 5 6 7 8 9 10 11 12
OUTPUTS OUTCOMESRisk Factors / Remarks
Sr.
No
Name of the
Scheme
/ Programme
Budget
Allocation
(Rs.Lakhs)
Timelines Objectives
Average waiting time for
OPD patients (minutes)
30-40 20-30
Average waiting time for
major surgeries (days)
20 15 Average waiting time
for general surgeries is
180 days due to
shortage of general
Surgeon.
Average number of
deaths in hospital per
month
25 NA
Number of X-Ray machines
available
3 3 Average number of X-
Rays per month
4,853 5,400
% downtime of X-Ray
machines (no. of machine-
hours of downtime/total
machine-hours)
10% 0% Average waiting time for
X-Ray (minutes)
12 20
Number of Ventilators
available
10 12
% downtime of Ventilators
(no. of machine-hours of
downtime / total machine-
hours)
27% 10%
Total number of minor
Operating Theater (OT) tables
5 5 Average number of minor
surgeries per month
1,334 1,500
Average number of
patients using the
ventilator per month
30 NA
Percentage of filled posts
against sanctioned posts for all
other staff (Sanctioned posts
(incl outsource)- 254)
84% 100%
6 Bhagwan
Mahavir Hospital
5460
(R-5058,
C-375)
Ongoing Provision of
secondary and
tertiary health
services to people
Bhagwan Mahavir Hospital 127NA : Not Available
NR : Not Responded
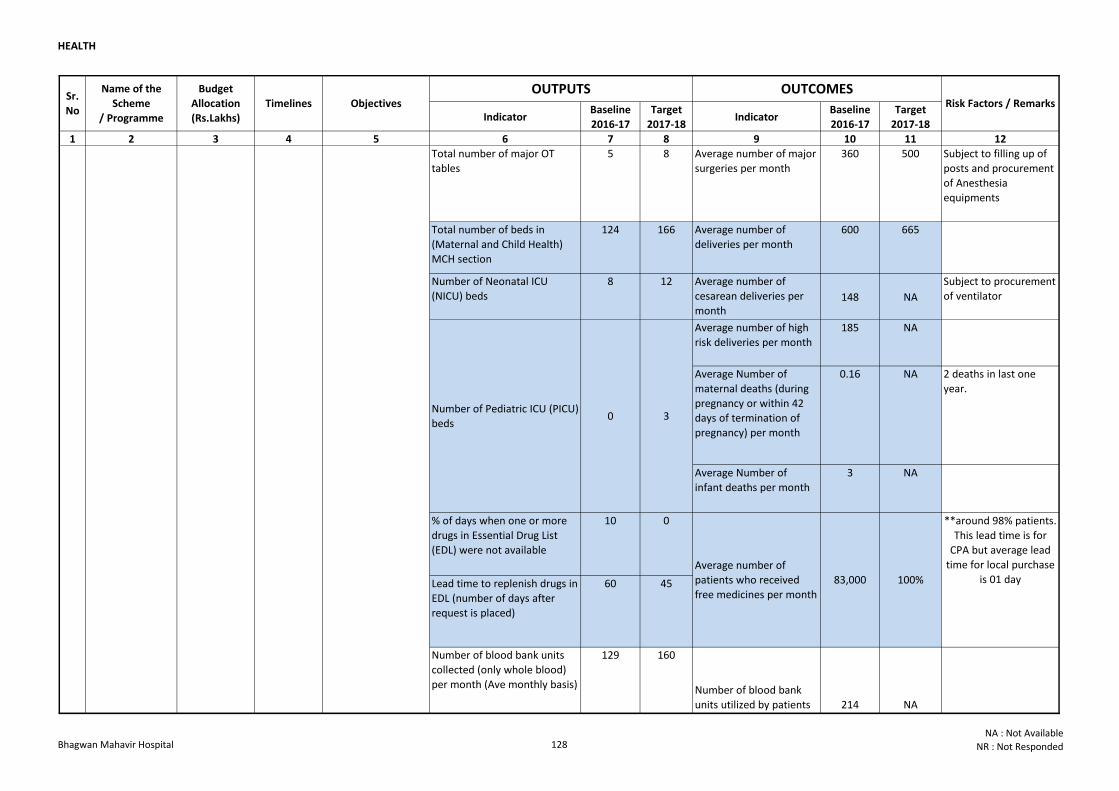
HEALTH
Indicator Baseline
2016-17
Target
2017-18Indicator
Baseline
2016-17
Target
2017-18
1 2 3 4 5 6 7 8 9 10 11 12
OUTPUTS OUTCOMESRisk Factors / Remarks
Sr.
No
Name of the
Scheme
/ Programme
Budget
Allocation
(Rs.Lakhs)
Timelines Objectives
Total number of major OT
tables
5 8 Average number of major
surgeries per month
360 500 Subject to filling up of
posts and procurement
of Anesthesia
equipments
Total number of beds in
(Maternal and Child Health)
MCH section
124 166 Average number of
deliveries per month
600 665
Number of Neonatal ICU
(NICU) beds
8 12 Average number of
cesarean deliveries per
month148 NA
Subject to procurement
of ventilator
Average number of high
risk deliveries per month
185 NA
Average Number of
maternal deaths (during
pregnancy or within 42
days of termination of
pregnancy) per month
0.16 NA 2 deaths in last one
year.
Average Number of
infant deaths per month
3 NA
% of days when one or more
drugs in Essential Drug List
(EDL) were not available
10 0
Lead time to replenish drugs in
EDL (number of days after
request is placed)
60 45
Number of blood bank units
collected (only whole blood)
per month (Ave monthly basis)
129 160
NA
Number of Pediatric ICU (PICU)
beds0 3
6 Bhagwan
Mahavir Hospital
5460
(R-5058,
C-375)
Ongoing Provision of
secondary and
tertiary health
services to people
Average number of
patients who received
free medicines per month
83,000 100%
**around 98% patients.
This lead time is for
CPA but average lead
time for local purchase
is 01 day
Number of blood bank
units utilized by patients
per month
214
Bhagwan Mahavir Hospital 128NA : Not Available
NR : Not Responded
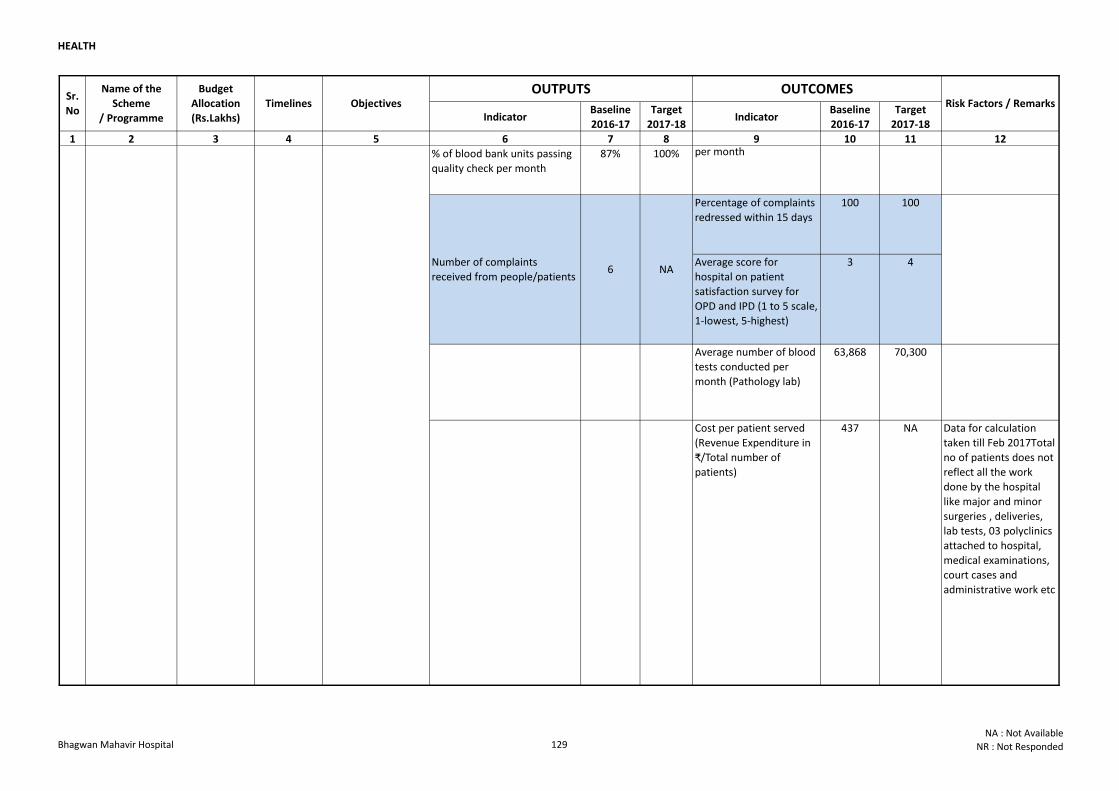
HEALTH
Indicator Baseline
2016-17
Target
2017-18Indicator
Baseline
2016-17
Target
2017-18
1 2 3 4 5 6 7 8 9 10 11 12
OUTPUTS OUTCOMESRisk Factors / Remarks
Sr.
No
Name of the
Scheme
/ Programme
Budget
Allocation
(Rs.Lakhs)
Timelines Objectives
% of blood bank units passing
quality check per month
87% 100%
Percentage of complaints
redressed within 15 days
100 100
Average score for
hospital on patient
satisfaction survey for
OPD and IPD (1 to 5 scale,
1-lowest, 5-highest)
3 4
Average number of blood
tests conducted per
month (Pathology lab)
63,868 70,300
NA
Data for calculation
taken till Feb 2017Total
no of patients does not
reflect all the work
done by the hospital
like major and minor
surgeries , deliveries,
lab tests, 03 polyclinics
attached to hospital,
medical examinations,
court cases and
administrative work etc
Cost per patient served
(Revenue Expenditure in
₹/Total number of
patients)
437 NA
Number of complaints
received from people/patients6 NA
6 Bhagwan
Mahavir Hospital
5460
(R-5058,
C-375)
Ongoing Provision of
secondary and
tertiary health
services to people
Number of blood bank
units utilized by patients
per month
214
Bhagwan Mahavir Hospital 129NA : Not Available
NR : Not Responded
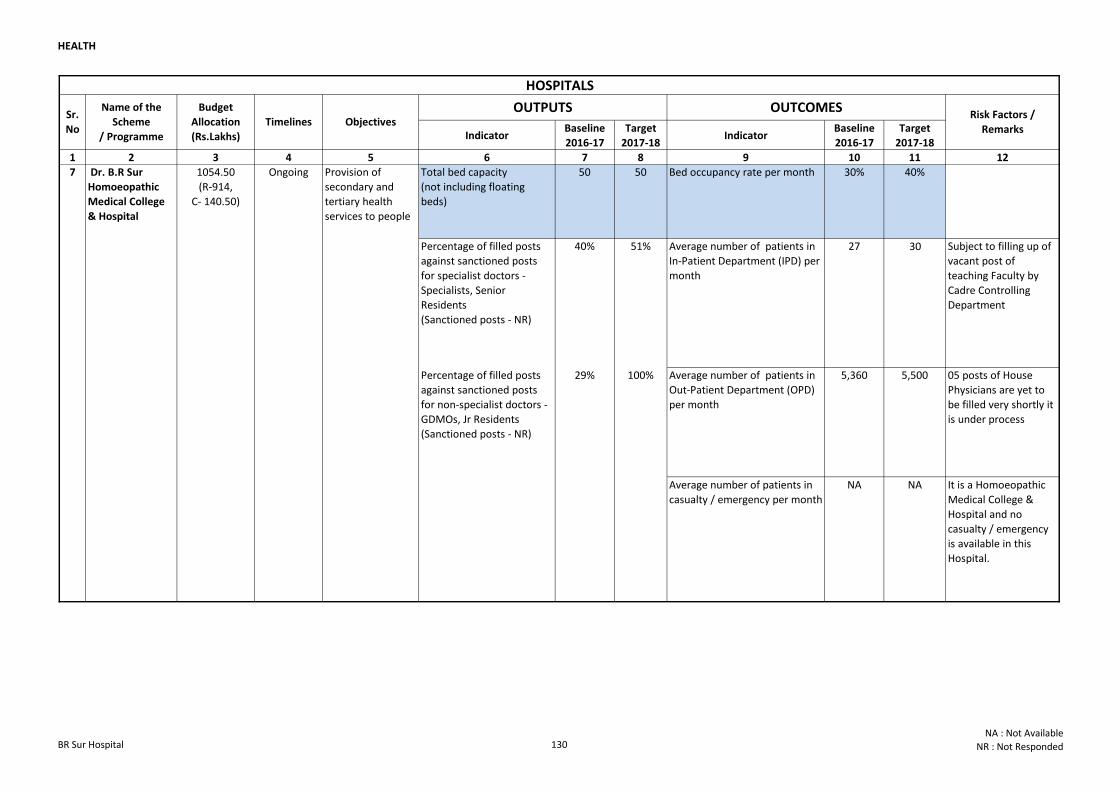
HEALTH
Indicator Baseline
2016-17
Target
2017-18Indicator
Baseline
2016-17
Target
2017-18
1 2 3 4 5 6 7 8 9 10 11 12
Total bed capacity
(not including floating
beds)
50 50 Bed occupancy rate per month 30% 40%
Percentage of filled posts
against sanctioned posts
for specialist doctors -
Specialists, Senior
Residents
(Sanctioned posts - NR)
40% 51% Average number of patients in
In-Patient Department (IPD) per
month
27 30 Subject to filling up of
vacant post of
teaching Faculty by
Cadre Controlling
Department
Percentage of filled posts
against sanctioned posts
for non-specialist doctors -
GDMOs, Jr Residents
(Sanctioned posts - NR)
29% 100% Average number of patients in
Out-Patient Department (OPD)
per month
5,360 5,500 05 posts of House
Physicians are yet to
be filled very shortly it
is under process
Average number of patients in
casualty / emergency per month
NA NA It is a Homoeopathic
Medical College &
Hospital and no
casualty / emergency
is available in this
Hospital.
100%92%
7 Dr. B.R Sur
Homoeopathic
Medical College
& Hospital
1054.50
(R-914,
C- 140.50)
Ongoing Provision of
secondary and
tertiary health
services to people
HOSPITALS
Percentage of filled posts
against sanctioned posts
for nurses (Sanctioned
posts - NR)
OUTPUTS OUTCOMESRisk Factors /
Remarks
Sr.
No
Name of the
Scheme
/ Programme
Budget
Allocation
(Rs.Lakhs)
Timelines Objectives
BR Sur Hospital 130NA : Not Available
NR : Not Responded
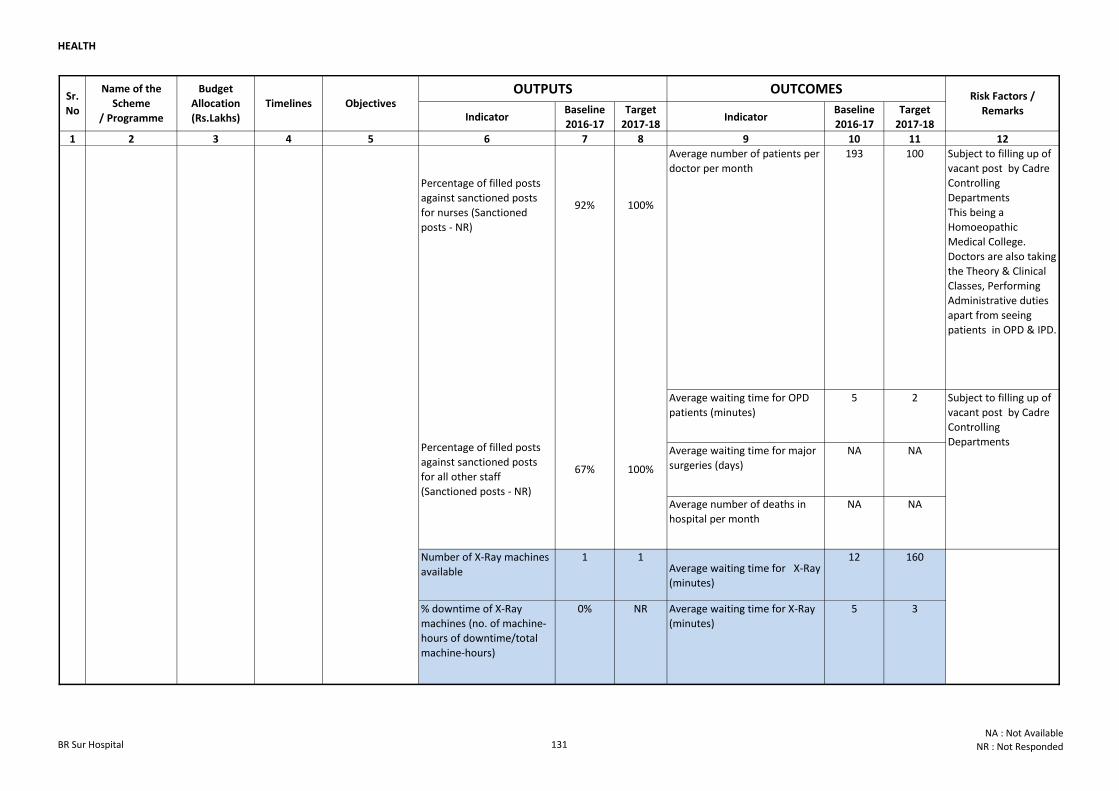
HEALTH
Indicator Baseline
2016-17
Target
2017-18Indicator
Baseline
2016-17
Target
2017-18
1 2 3 4 5 6 7 8 9 10 11 12
OUTPUTS OUTCOMESRisk Factors /
Remarks
Sr.
No
Name of the
Scheme
/ Programme
Budget
Allocation
(Rs.Lakhs)
Timelines Objectives
Average waiting time for OPD
patients (minutes)
5 2
Average waiting time for major
surgeries (days)
NA NA
Average number of deaths in
hospital per month
NA NA
Number of X-Ray machines
available
1 1Average waiting time for X-Ray
(minutes)
12 160
% downtime of X-Ray
machines (no. of machine-
hours of downtime/total
machine-hours)
0% NR Average waiting time for X-Ray
(minutes)
5 3
100%92%
7 Dr. B.R Sur
Homoeopathic
Medical College
& Hospital
1054.50
(R-914,
C- 140.50)
Ongoing Provision of
secondary and
tertiary health
services to people
100%
Percentage of filled posts
against sanctioned posts
for all other staff
(Sanctioned posts - NR)
67%
Subject to filling up of
vacant post by Cadre
Controlling
Departments
This being a
Homoeopathic
Medical College.
Doctors are also taking
the Theory & Clinical
Classes, Performing
Administrative duties
apart from seeing
patients in OPD & IPD.
Average number of patients per
doctor per month
193 100
Subject to filling up of
vacant post by Cadre
Controlling
Departments
Percentage of filled posts
against sanctioned posts
for nurses (Sanctioned
posts - NR)
BR Sur Hospital 131NA : Not Available
NR : Not Responded
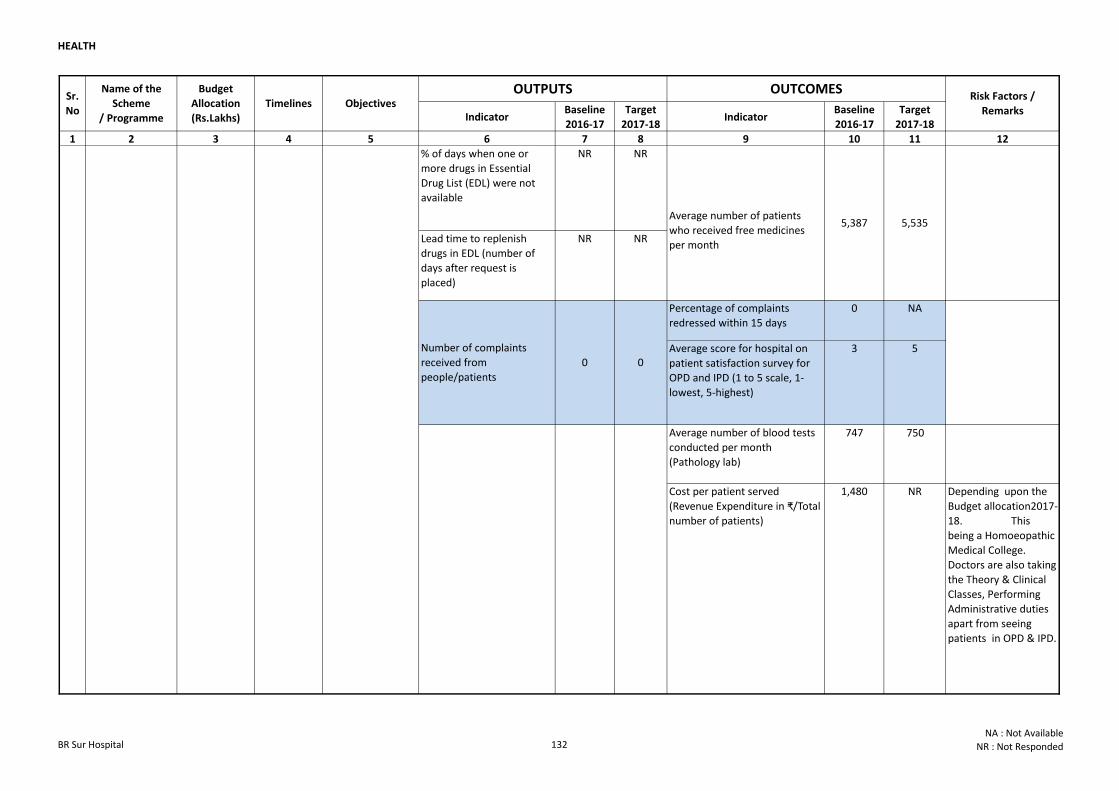
HEALTH
Indicator Baseline
2016-17
Target
2017-18Indicator
Baseline
2016-17
Target
2017-18
1 2 3 4 5 6 7 8 9 10 11 12
OUTPUTS OUTCOMESRisk Factors /
Remarks
Sr.
No
Name of the
Scheme
/ Programme
Budget
Allocation
(Rs.Lakhs)
Timelines Objectives
% of days when one or
more drugs in Essential
Drug List (EDL) were not
available
NR NR
Lead time to replenish
drugs in EDL (number of
days after request is
placed)
NR NR
Percentage of complaints
redressed within 15 days
0 NA
Average score for hospital on
patient satisfaction survey for
OPD and IPD (1 to 5 scale, 1-
lowest, 5-highest)
3 5
Average number of blood tests
conducted per month
(Pathology lab)
747 750
Cost per patient served
(Revenue Expenditure in ₹/Total
number of patients)
1,480 NR Depending upon the
Budget allocation2017-
18. This
being a Homoeopathic
Medical College.
Doctors are also taking
the Theory & Clinical
Classes, Performing
Administrative duties
apart from seeing
patients in OPD & IPD.
0
7 Dr. B.R Sur
Homoeopathic
Medical College
& Hospital
1054.50
(R-914,
C- 140.50)
Ongoing Provision of
secondary and
tertiary health
services to people
Number of complaints
received from
people/patients
0
Average number of patients
who received free medicines
per month
5,387 5,535
BR Sur Hospital 132NA : Not Available
NR : Not Responded
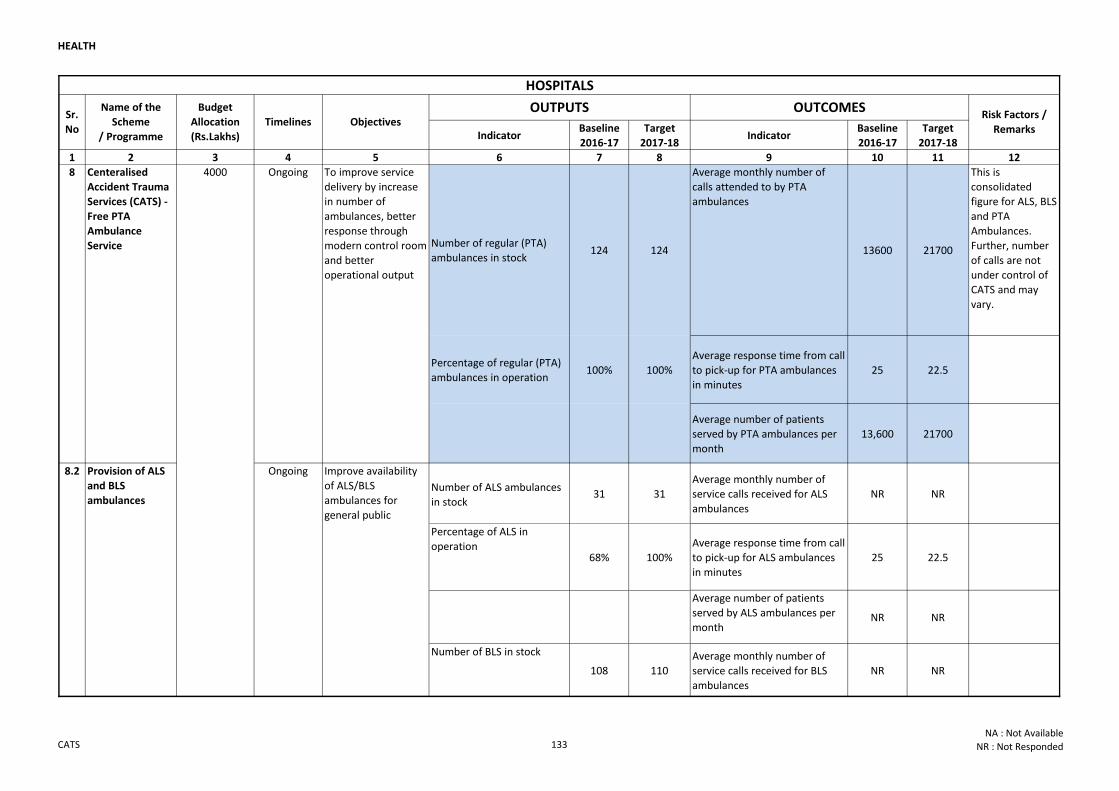
HEALTH
Indicator Baseline
2016-17
Target
2017-18Indicator
Baseline
2016-17
Target
2017-18
1 2 3 4 5 6 7 8 9 10 11 12
Number of regular (PTA)
ambulances in stock124 124
Average monthly number of
calls attended to by PTA
ambulances
13600 21700
This is
consolidated
figure for ALS, BLS
and PTA
Ambulances.
Further, number
of calls are not
under control of
CATS and may
vary.
Percentage of regular (PTA)
ambulances in operation100% 100%
Average response time from call
to pick-up for PTA ambulances
in minutes
25 22.5
Average number of patients
served by PTA ambulances per
month
13,600 21700
Number of ALS ambulances
in stock31 31
Average monthly number of
service calls received for ALS
ambulances
NR NR
Percentage of ALS in
operation 68% 100%
Average response time from call
to pick-up for ALS ambulances
in minutes
25 22.5
Average number of patients
served by ALS ambulances per
monthNR NR
Number of BLS in stock
108 110
Average monthly number of
service calls received for BLS
ambulances
NR NR
Risk Factors /
Remarks
Sr.
No
Name of the
Scheme
/ Programme
Budget
Allocation
(Rs.Lakhs)
Timelines Objectives
8.2
OUTPUTS OUTCOMES
Provision of ALS
and BLS
ambulances
Ongoing Improve availability
of ALS/BLS
ambulances for
general public
HOSPITALS
8 Centeralised
Accident Trauma
Services (CATS) -
Free PTA
Ambulance
Service
4000 Ongoing To improve service
delivery by increase
in number of
ambulances, better
response through
modern control room
and better
operational output
CATS 133NA : Not Available
NR : Not Responded
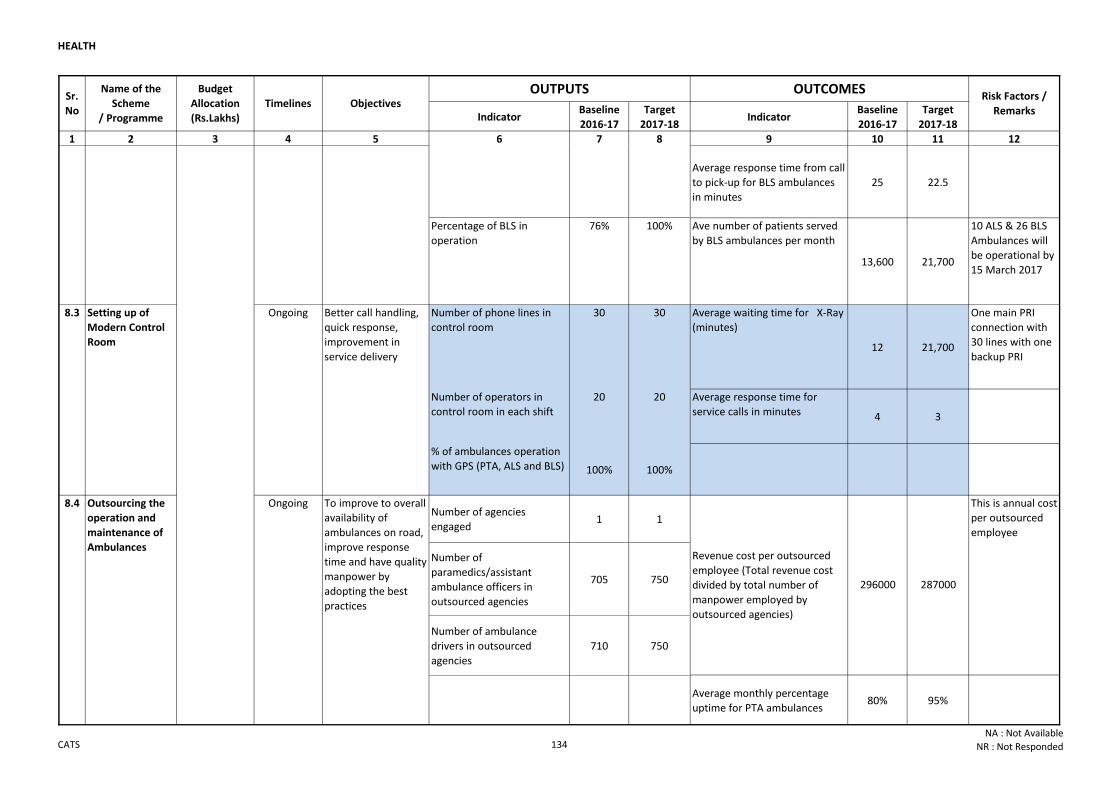
HEALTH
Indicator Baseline
2016-17
Target
2017-18Indicator
Baseline
2016-17
Target
2017-18
1 2 3 4 5 6 7 8 9 10 11 12
Risk Factors /
Remarks
Sr.
No
Name of the
Scheme
/ Programme
Budget
Allocation
(Rs.Lakhs)
Timelines Objectives OUTPUTS OUTCOMES
Average response time from call
to pick-up for BLS ambulances
in minutes
25 22.5
Percentage of BLS in
operation
76% 100% Ave number of patients served
by BLS ambulances per month
13,600 21,700
10 ALS & 26 BLS
Ambulances will
be operational by
15 March 2017
Number of phone lines in
control room
30 30 Average waiting time for X-Ray
(minutes)
12 21,700
One main PRI
connection with
30 lines with one
backup PRI
Number of operators in
control room in each shift
20 20 Average response time for
service calls in minutes 4 3
% of ambulances operation
with GPS (PTA, ALS and BLS) 100% 100%
Number of agencies
engaged1 1
Number of
paramedics/assistant
ambulance officers in
outsourced agencies
705 750
Number of ambulance
drivers in outsourced
agencies
710 750
Average monthly percentage
uptime for PTA ambulances80% 95%
8.3 Setting up of
Modern Control
Room
Ongoing
8.2
Better call handling,
quick response,
improvement in
service delivery
Outsourcing the
operation and
maintenance of
Ambulances
Provision of ALS
and BLS
ambulances
Ongoing Improve availability
of ALS/BLS
ambulances for
general public
This is annual cost
per outsourced
employee
Percentage uptime target in
SLA 95% 95%
Ongoing To improve to overall
availability of
ambulances on road,
improve response
time and have quality
manpower by
adopting the best
practices
Revenue cost per outsourced
employee (Total revenue cost
divided by total number of
manpower employed by
outsourced agencies)
296000 287000
4000
8.4
CATS 134NA : Not Available
NR : Not Responded
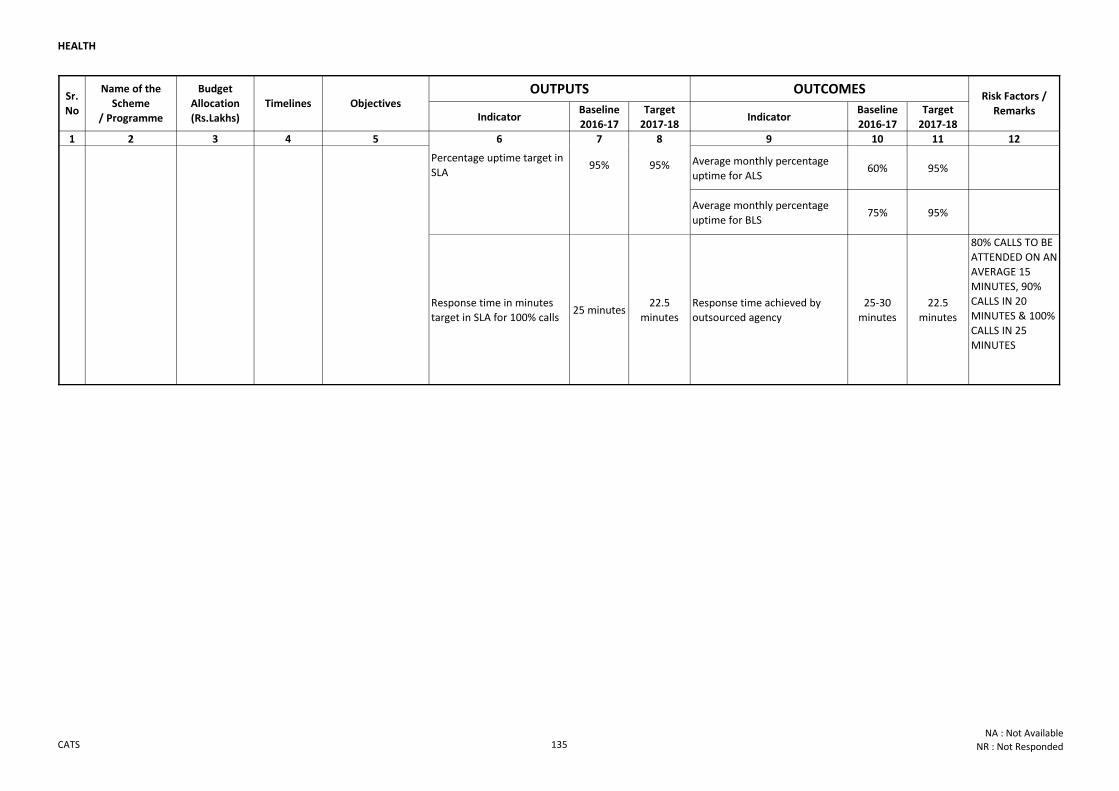
HEALTH
Indicator Baseline
2016-17
Target
2017-18Indicator
Baseline
2016-17
Target
2017-18
1 2 3 4 5 6 7 8 9 10 11 12
Risk Factors /
Remarks
Sr.
No
Name of the
Scheme
/ Programme
Budget
Allocation
(Rs.Lakhs)
Timelines Objectives OUTPUTS OUTCOMES
Average monthly percentage
uptime for ALS60% 95%
Average monthly percentage
uptime for BLS75% 95%
Response time in minutes
target in SLA for 100% calls25 minutes
22.5
minutes
Response time achieved by
outsourced agency
25-30
minutes
22.5
minutes
80% CALLS TO BE
ATTENDED ON AN
AVERAGE 15
MINUTES, 90%
CALLS IN 20
MINUTES & 100%
CALLS IN 25
MINUTES
Outsourcing the
operation and
maintenance of
Ambulances
Percentage uptime target in
SLA 95% 95%
Ongoing To improve to overall
availability of
ambulances on road,
improve response
time and have quality
manpower by
adopting the best
practices
4000
8.4
CATS 135NA : Not Available
NR : Not Responded
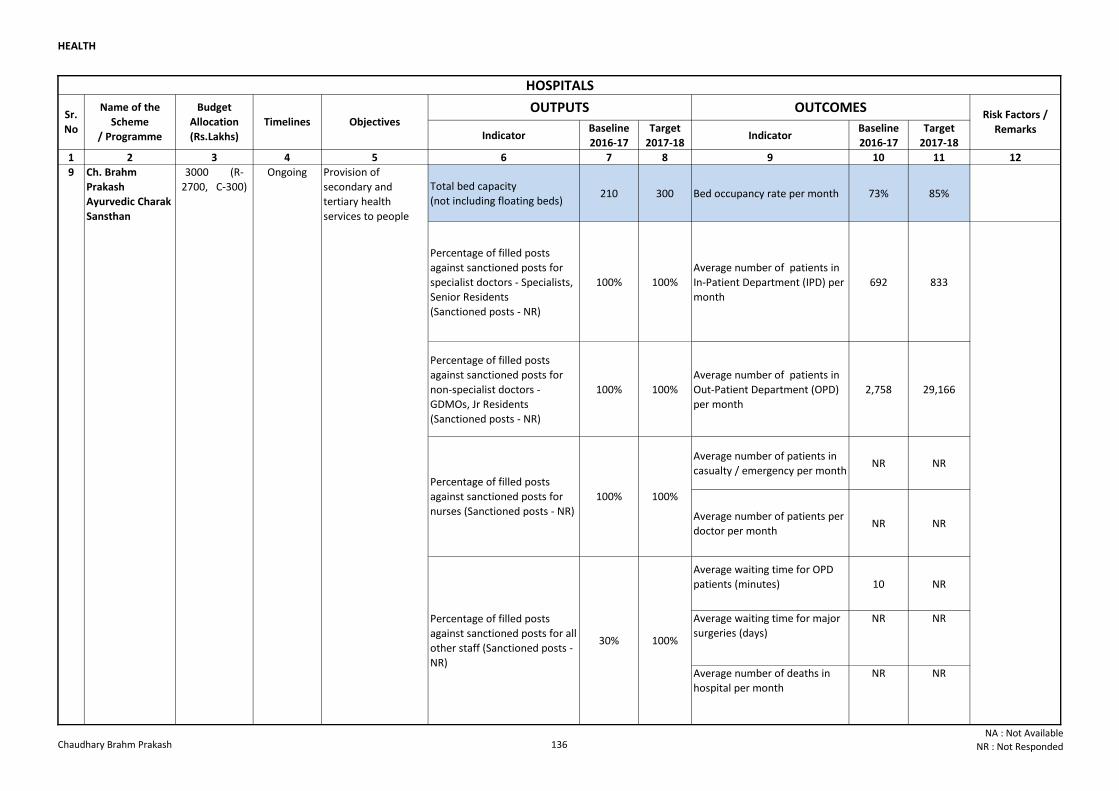
HEALTH
Indicator Baseline
2016-17
Target
2017-18Indicator
Baseline
2016-17
Target
2017-18
1 2 3 4 5 6 7 8 9 10 11 12
Total bed capacity
(not including floating beds)210 300 Bed occupancy rate per month 73% 85%
Percentage of filled posts
against sanctioned posts for
specialist doctors - Specialists,
Senior Residents
(Sanctioned posts - NR)
100% 100%
Average number of patients in
In-Patient Department (IPD) per
month
692 833
Percentage of filled posts
against sanctioned posts for
non-specialist doctors -
GDMOs, Jr Residents
(Sanctioned posts - NR)
100% 100%
Average number of patients in
Out-Patient Department (OPD)
per month
2,758 29,166
Average number of patients in
casualty / emergency per month NR NR
Average number of patients per
doctor per monthNR NR
Average waiting time for OPD
patients (minutes) 10 NR
Average waiting time for major
surgeries (days)
NR NR
Average number of deaths in
hospital per month
NR NR
OUTPUTS OUTCOMESRisk Factors /
Remarks
Sr.
No
Name of the
Scheme
/ Programme
Budget
Allocation
(Rs.Lakhs)
Timelines Objectives
9 Ch. Brahm
Prakash
Ayurvedic Charak
Sansthan
3000 (R-
2700, C-300)
Ongoing Provision of
secondary and
tertiary health
services to people
100% 100%
Percentage of filled posts
against sanctioned posts for all
other staff (Sanctioned posts -
NR)
30% 100%
HOSPITALS
Percentage of filled posts
against sanctioned posts for
nurses (Sanctioned posts - NR)
Chaudhary Brahm Prakash 136NA : Not Available
NR : Not Responded
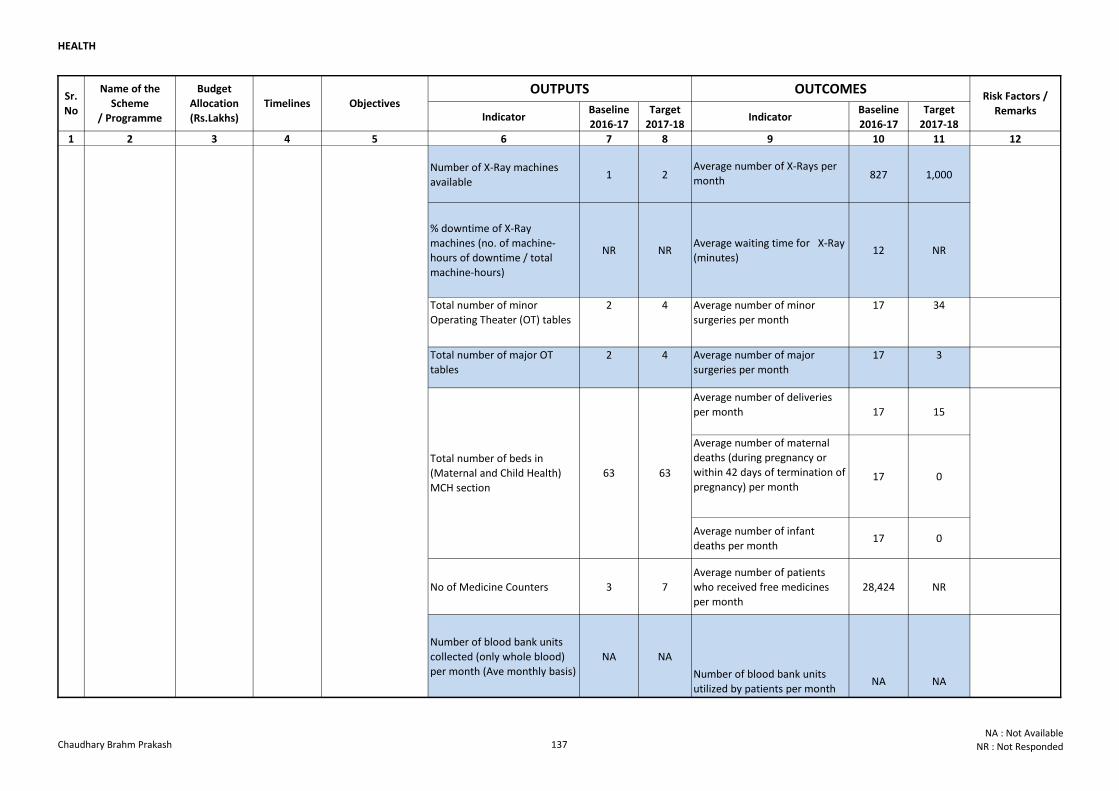
HEALTH
Indicator Baseline
2016-17
Target
2017-18Indicator
Baseline
2016-17
Target
2017-18
1 2 3 4 5 6 7 8 9 10 11 12
OUTPUTS OUTCOMESRisk Factors /
Remarks
Sr.
No
Name of the
Scheme
/ Programme
Budget
Allocation
(Rs.Lakhs)
Timelines Objectives
Number of X-Ray machines
available1 2
Average number of X-Rays per
month827 1,000
% downtime of X-Ray
machines (no. of machine-
hours of downtime / total
machine-hours)
NR NRAverage waiting time for X-Ray
(minutes)12 NR
Total number of minor
Operating Theater (OT) tables
2 4 Average number of minor
surgeries per month
17 34
Total number of major OT
tables
2 4 Average number of major
surgeries per month
17 3
Average number of deliveries
per month 17 15
Average number of maternal
deaths (during pregnancy or
within 42 days of termination of
pregnancy) per month17 0
Average number of infant
deaths per month17 0
No of Medicine Counters 3 7
Average number of patients
who received free medicines
per month
28,424 NR
Number of blood bank units
collected (only whole blood)
per month (Ave monthly basis)
NA NA
9 Ch. Brahm
Prakash
Ayurvedic Charak
Sansthan
3000 (R-
2700, C-300)
Ongoing Provision of
secondary and
tertiary health
services to people
Total number of beds in
(Maternal and Child Health)
MCH section
63 63
Number of blood bank units
utilized by patients per monthNA NA
Chaudhary Brahm Prakash 137NA : Not Available
NR : Not Responded
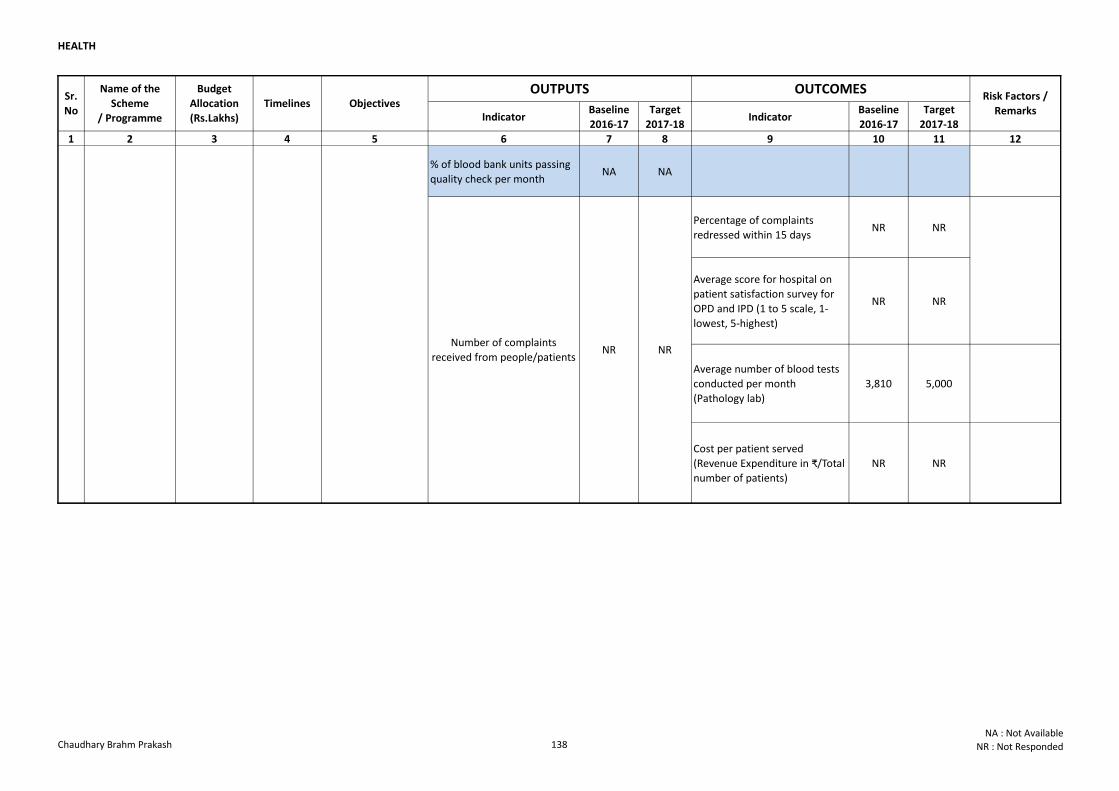
HEALTH
Indicator Baseline
2016-17
Target
2017-18Indicator
Baseline
2016-17
Target
2017-18
1 2 3 4 5 6 7 8 9 10 11 12
OUTPUTS OUTCOMESRisk Factors /
Remarks
Sr.
No
Name of the
Scheme
/ Programme
Budget
Allocation
(Rs.Lakhs)
Timelines Objectives
% of blood bank units passing
quality check per monthNA NA
Percentage of complaints
redressed within 15 daysNR NR
Average score for hospital on
patient satisfaction survey for
OPD and IPD (1 to 5 scale, 1-
lowest, 5-highest)
NR NR
Average number of blood tests
conducted per month
(Pathology lab)
3,810 5,000
Cost per patient served
(Revenue Expenditure in ₹/Total
number of patients)
NR NR
9 Ch. Brahm
Prakash
Ayurvedic Charak
Sansthan
3000 (R-
2700, C-300)
Ongoing Provision of
secondary and
tertiary health
services to people
Number of blood bank units
utilized by patients per monthNA NA
Number of complaints
received from people/patientsNR NR
Chaudhary Brahm Prakash 138NA : Not Available
NR : Not Responded
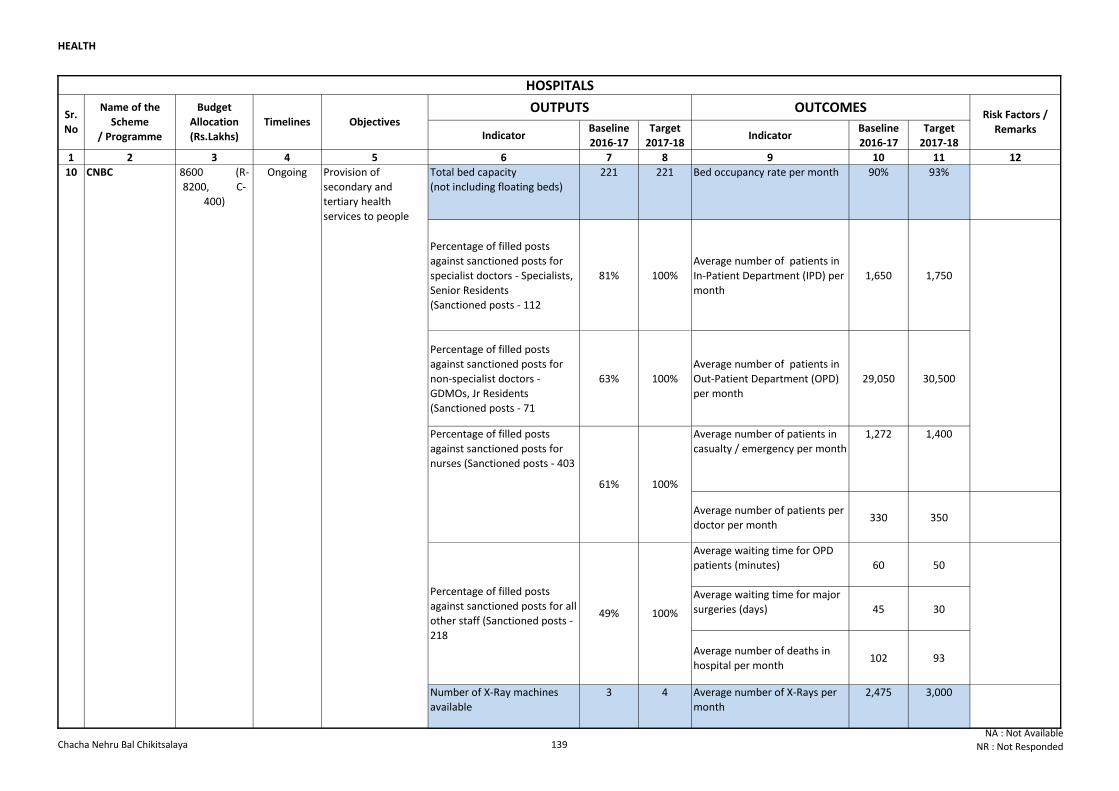
HEALTH
Indicator Baseline
2016-17
Target
2017-18Indicator
Baseline
2016-17
Target
2017-18
1 2 3 4 5 6 7 8 9 10 11 12
Total bed capacity
(not including floating beds)
221 221 Bed occupancy rate per month 90% 93%
Percentage of filled posts
against sanctioned posts for
specialist doctors - Specialists,
Senior Residents
(Sanctioned posts - 112
81% 100%
Average number of patients in
In-Patient Department (IPD) per
month
1,650 1,750
Percentage of filled posts
against sanctioned posts for
non-specialist doctors -
GDMOs, Jr Residents
(Sanctioned posts - 71
63% 100%
Average number of patients in
Out-Patient Department (OPD)
per month
29,050 30,500
Average number of patients in
casualty / emergency per month
1,272 1,400
Average number of patients per
doctor per month330 350
Average waiting time for OPD
patients (minutes) 60 50
Average waiting time for major
surgeries (days) 45 30
Average number of deaths in
hospital per month102 93
Number of X-Ray machines
available
3 4 Average number of X-Rays per
month
2,475 3,000
OUTPUTS OUTCOMESRisk Factors /
Remarks
Sr.
No
Name of the
Scheme
/ Programme
Budget
Allocation
(Rs.Lakhs)
Timelines Objectives
10 CNBC 8600 (R-
8200, C-
400)
Ongoing Provision of
secondary and
tertiary health
services to people
Percentage of filled posts
against sanctioned posts for
nurses (Sanctioned posts - 403
61% 100%
Percentage of filled posts
against sanctioned posts for all
other staff (Sanctioned posts -
218
49% 100%
HOSPITALS
Chacha Nehru Bal Chikitsalaya 139NA : Not Available
NR : Not Responded
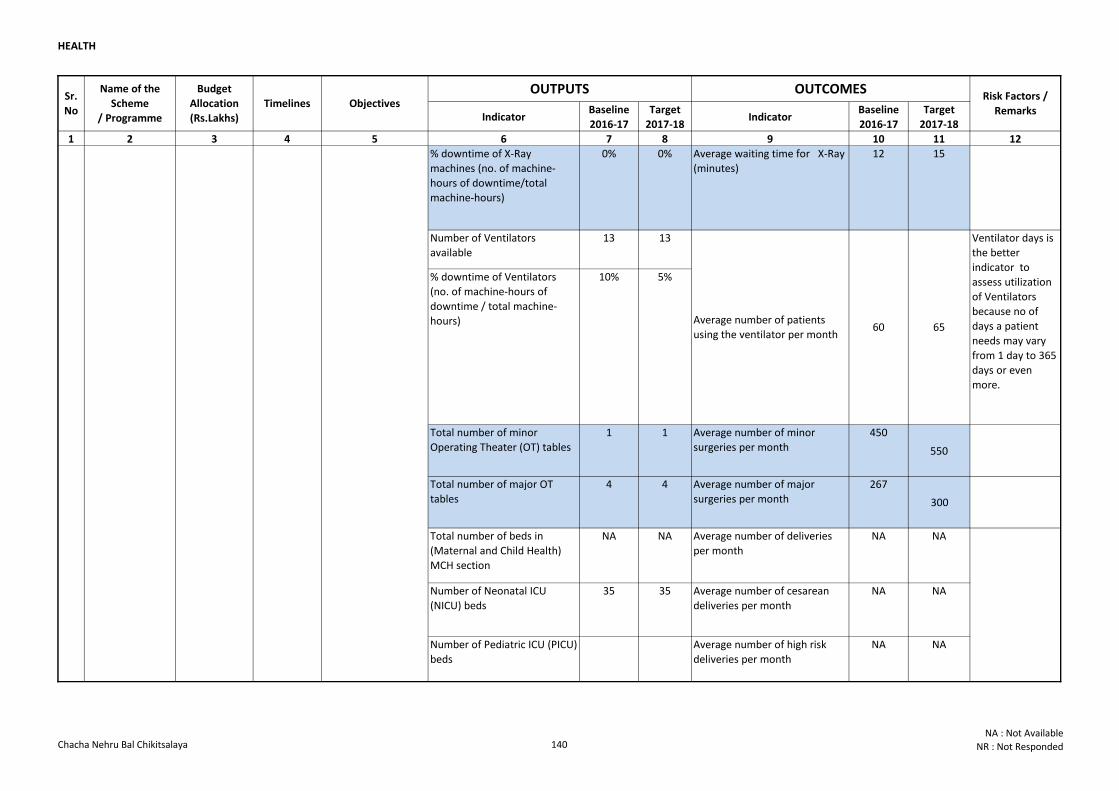
HEALTH
Indicator Baseline
2016-17
Target
2017-18Indicator
Baseline
2016-17
Target
2017-18
1 2 3 4 5 6 7 8 9 10 11 12
OUTPUTS OUTCOMESRisk Factors /
Remarks
Sr.
No
Name of the
Scheme
/ Programme
Budget
Allocation
(Rs.Lakhs)
Timelines Objectives
% downtime of X-Ray
machines (no. of machine-
hours of downtime/total
machine-hours)
0% 0% Average waiting time for X-Ray
(minutes)
12 15
Number of Ventilators
available
13 13
% downtime of Ventilators
(no. of machine-hours of
downtime / total machine-
hours)
10% 5%
Total number of minor
Operating Theater (OT) tables
1 1 Average number of minor
surgeries per month
450
550
Total number of major OT
tables
4 4 Average number of major
surgeries per month
267
300
Total number of beds in
(Maternal and Child Health)
MCH section
NA NA Average number of deliveries
per month
NA NA
Number of Neonatal ICU
(NICU) beds
35 35 Average number of cesarean
deliveries per month
NA NA
Average number of high risk
deliveries per month
NA NA
10 CNBC 8600 (R-
8200, C-
400)
Ongoing Provision of
secondary and
tertiary health
services to people
Average number of patients
using the ventilator per month60 65
Ventilator days is
the better
indicator to
assess utilization
of Ventilators
because no of
days a patient
needs may vary
from 1 day to 365
days or even
more.
Number of Pediatric ICU (PICU)
beds
12 12
Chacha Nehru Bal Chikitsalaya 140NA : Not Available
NR : Not Responded
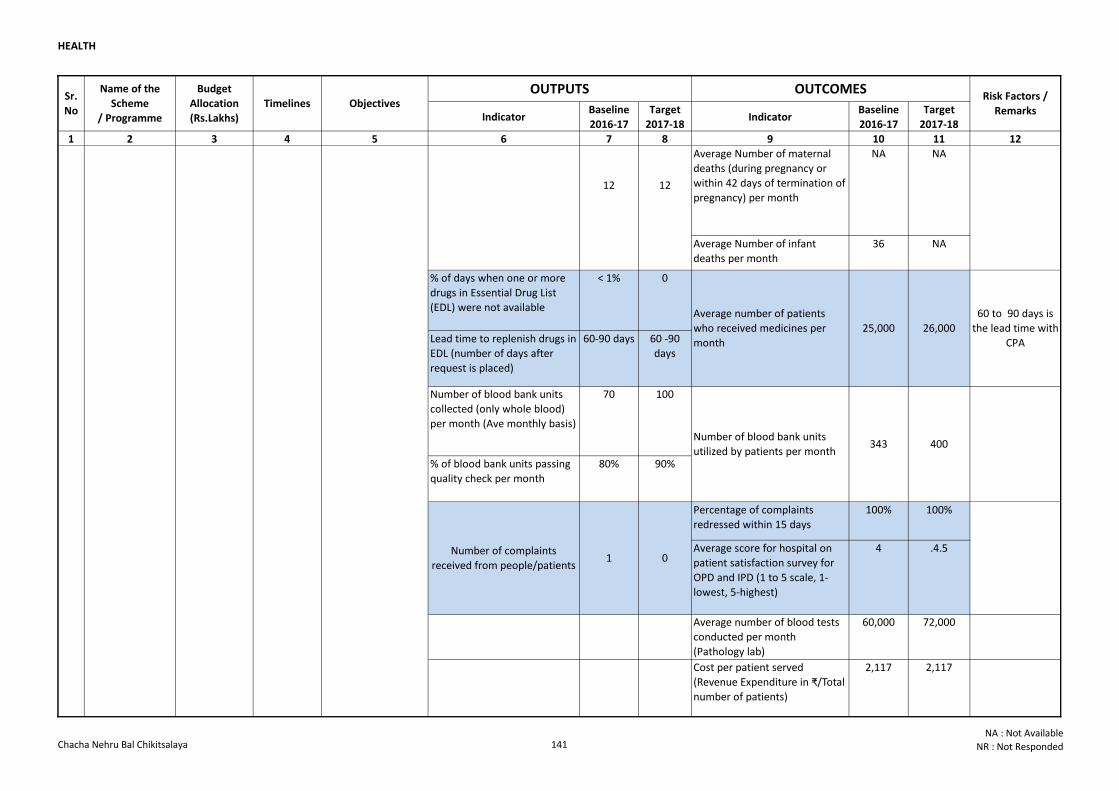
HEALTH
Indicator Baseline
2016-17
Target
2017-18Indicator
Baseline
2016-17
Target
2017-18
1 2 3 4 5 6 7 8 9 10 11 12
OUTPUTS OUTCOMESRisk Factors /
Remarks
Sr.
No
Name of the
Scheme
/ Programme
Budget
Allocation
(Rs.Lakhs)
Timelines Objectives
Average Number of maternal
deaths (during pregnancy or
within 42 days of termination of
pregnancy) per month
NA NA
Average Number of infant
deaths per month
36 NA
% of days when one or more
drugs in Essential Drug List
(EDL) were not available
< 1% 0
Lead time to replenish drugs in
EDL (number of days after
request is placed)
60-90 days 60 -90
days
Number of blood bank units
collected (only whole blood)
per month (Ave monthly basis)
70 100
% of blood bank units passing
quality check per month
80% 90%
Percentage of complaints
redressed within 15 days
100% 100%
Average score for hospital on
patient satisfaction survey for
OPD and IPD (1 to 5 scale, 1-
lowest, 5-highest)
4 .4.5
Average number of blood tests
conducted per month
(Pathology lab)
60,000 72,000
Cost per patient served
(Revenue Expenditure in ₹/Total
number of patients)
2,117 2,117
10 CNBC 8600 (R-
8200, C-
400)
Ongoing Provision of
secondary and
tertiary health
services to people
Number of complaints
received from people/patients1 0
Number of Pediatric ICU (PICU)
beds
12 12
Average number of patients
who received medicines per
month
25,000 26,000
60 to 90 days is
the lead time with
CPA
Number of blood bank units
utilized by patients per month343 400
Chacha Nehru Bal Chikitsalaya 141NA : Not Available
NR : Not Responded
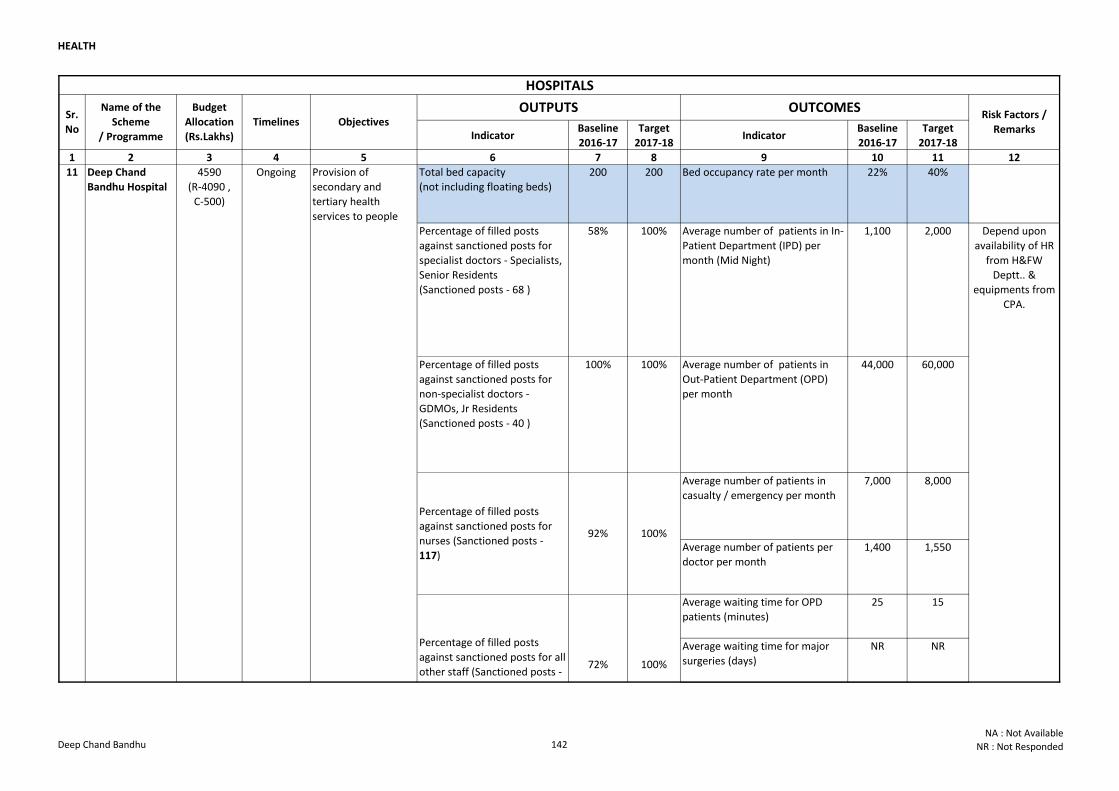
HEALTH
Indicator Baseline
2016-17
Target
2017-18Indicator
Baseline
2016-17
Target
2017-18
1 2 3 4 5 6 7 8 9 10 11 12
Total bed capacity
(not including floating beds)
200 200 Bed occupancy rate per month 22% 40%
Percentage of filled posts
against sanctioned posts for
specialist doctors - Specialists,
Senior Residents
(Sanctioned posts - 68 )
58% 100% Average number of patients in In-
Patient Department (IPD) per
month (Mid Night)
1,100 2,000
Percentage of filled posts
against sanctioned posts for
non-specialist doctors -
GDMOs, Jr Residents
(Sanctioned posts - 40 )
100% 100% Average number of patients in
Out-Patient Department (OPD)
per month
44,000 60,000
Average number of patients in
casualty / emergency per month
7,000 8,000
Average number of patients per
doctor per month
1,400 1,550
Average waiting time for OPD
patients (minutes)
25 15
Average waiting time for major
surgeries (days)
NR NR
Sr.
No
Name of the
Scheme
/ Programme
Budget
Allocation
(Rs.Lakhs)
Timelines Objectives OUTPUTS
11 Deep Chand
Bandhu Hospital
4590
(R-4090 ,
C-500)
Ongoing
Depend upon
availability of HR
from H&FW
Deptt.. &
equipments from
CPA.
Percentage of filled posts
against sanctioned posts for
nurses (Sanctioned posts -
117)
92% 100%
Percentage of filled posts
against sanctioned posts for all
other staff (Sanctioned posts -
192)
72% 100%
HOSPITALS
OUTCOMESRisk Factors /
Remarks
Provision of
secondary and
tertiary health
services to people
Deep Chand Bandhu 142NA : Not Available
NR : Not Responded
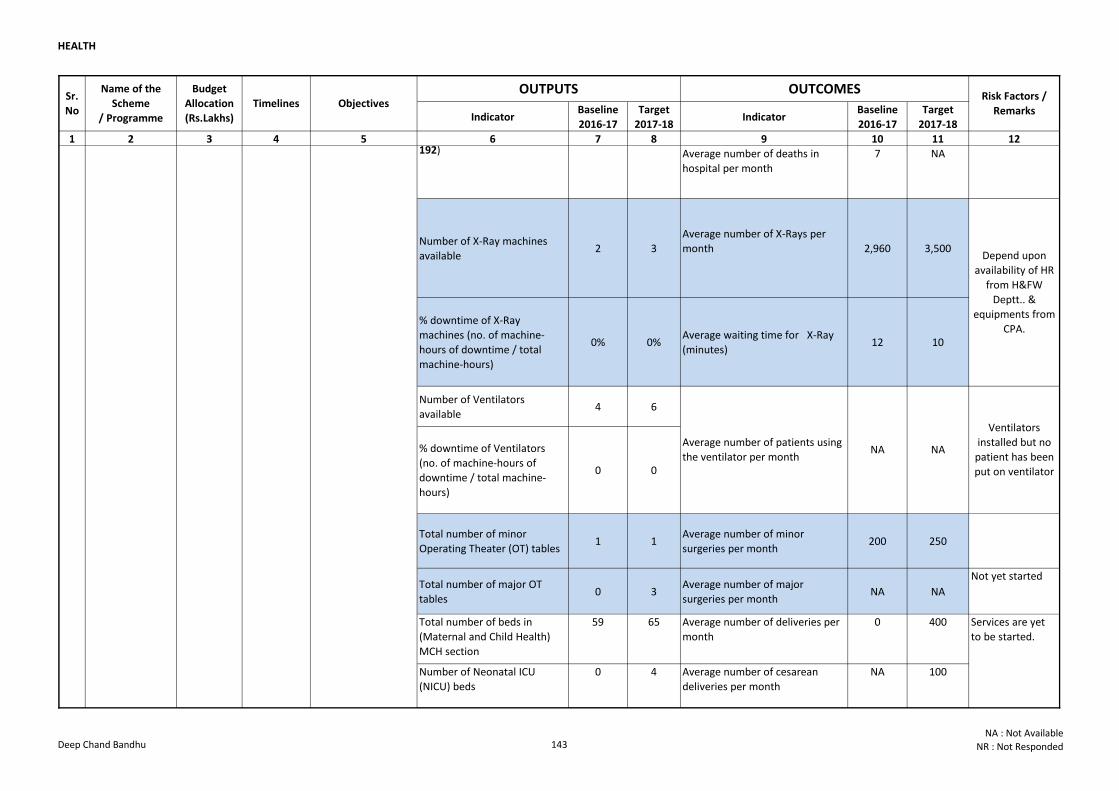
HEALTH
Indicator Baseline
2016-17
Target
2017-18Indicator
Baseline
2016-17
Target
2017-18
1 2 3 4 5 6 7 8 9 10 11 12
Sr.
No
Name of the
Scheme
/ Programme
Budget
Allocation
(Rs.Lakhs)
Timelines Objectives OUTPUTS OUTCOMES
Risk Factors /
Remarks
Average number of deaths in
hospital per month
7 NA
Number of X-Ray machines
available2 3
Average number of X-Rays per
month 2,960 3,500
% downtime of X-Ray
machines (no. of machine-
hours of downtime / total
machine-hours)
0% 0%Average waiting time for X-Ray
(minutes)12 10
Number of Ventilators
available4 6
% downtime of Ventilators
(no. of machine-hours of
downtime / total machine-
hours)
0 0
Total number of minor
Operating Theater (OT) tables1 1
Average number of minor
surgeries per month200 250
Total number of major OT
tables 0 3
Average number of major
surgeries per monthNA NA
Not yet started
Total number of beds in
(Maternal and Child Health)
MCH section
59 65 Average number of deliveries per
month
0 400
Number of Neonatal ICU
(NICU) beds
0 4 Average number of cesarean
deliveries per month
NA 100
11 Deep Chand
Bandhu Hospital
4590
(R-4090 ,
C-500)
Ongoing
Average number of patients using
the ventilator per monthNA NA
Ventilators
installed but no
patient has been
put on ventilator
Services are yet
to be started.
Depend upon
availability of HR
from H&FW
Deptt.. &
equipments from
CPA.
Percentage of filled posts
against sanctioned posts for all
other staff (Sanctioned posts -
192)
72% 100%
Depend upon
availability of HR
from H&FW
Deptt.. &
equipments from
CPA.
Provision of
secondary and
tertiary health
services to people
Deep Chand Bandhu 143NA : Not Available
NR : Not Responded
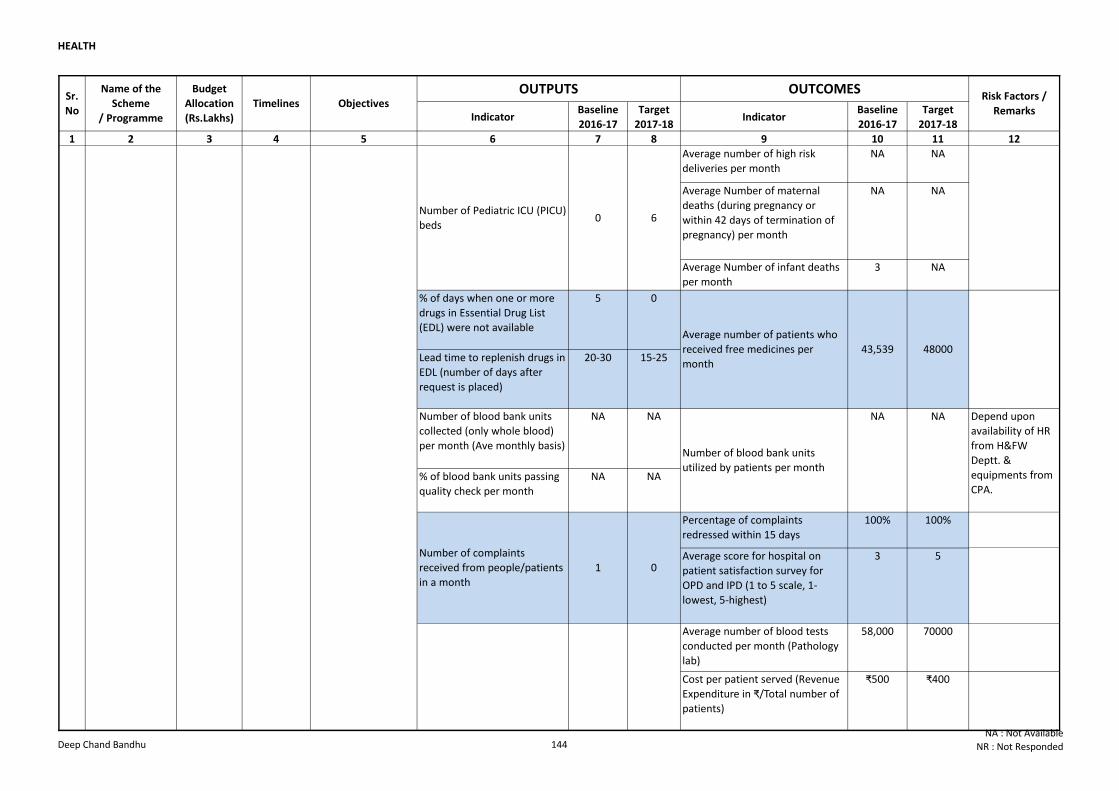
HEALTH
Indicator Baseline
2016-17
Target
2017-18Indicator
Baseline
2016-17
Target
2017-18
1 2 3 4 5 6 7 8 9 10 11 12
Sr.
No
Name of the
Scheme
/ Programme
Budget
Allocation
(Rs.Lakhs)
Timelines Objectives OUTPUTS OUTCOMES
Risk Factors /
Remarks
Average number of high risk
deliveries per month
NA NA
Average Number of maternal
deaths (during pregnancy or
within 42 days of termination of
pregnancy) per month
NA NA
Average Number of infant deaths
per month
3 NA
% of days when one or more
drugs in Essential Drug List
(EDL) were not available
5 0
Lead time to replenish drugs in
EDL (number of days after
request is placed)
20-30 15-25
Number of blood bank units
collected (only whole blood)
per month (Ave monthly basis)
NA NA
% of blood bank units passing
quality check per month
NA NA
Percentage of complaints
redressed within 15 days
100% 100%
Average score for hospital on
patient satisfaction survey for
OPD and IPD (1 to 5 scale, 1-
lowest, 5-highest)
3 5
Average number of blood tests
conducted per month (Pathology
lab)
58,000 70000
Cost per patient served (Revenue
Expenditure in ₹/Total number of
patients)
₹500 ₹400
11 Deep Chand
Bandhu Hospital
4590
(R-4090 ,
C-500)
Ongoing
Number of complaints
received from people/patients
in a month
1 0
Services are yet
to be started.
Depend upon
availability of HR
from H&FW
Deptt. &
equipments from
CPA.
48000
Number of blood bank units
utilized by patients per month
NA NA
Average number of patients who
received free medicines per
month
43,539
Number of Pediatric ICU (PICU)
beds0 6
Provision of
secondary and
tertiary health
services to people
Deep Chand Bandhu 144NA : Not Available
NR : Not Responded
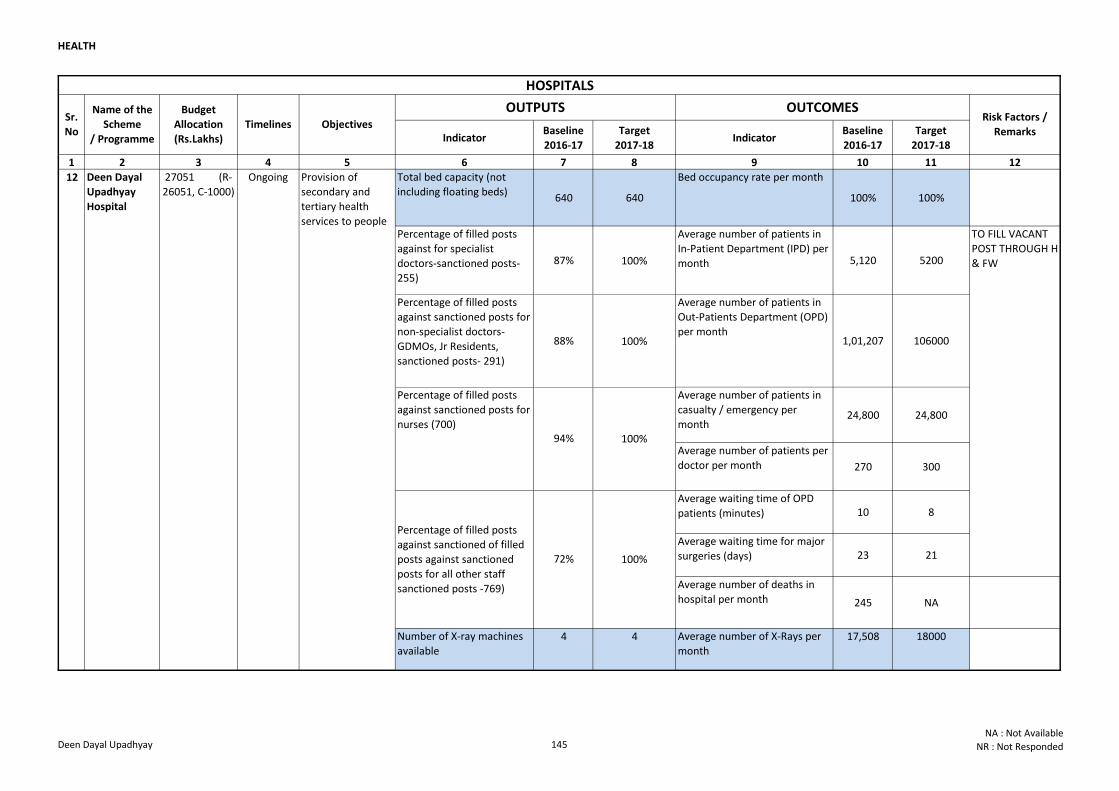
HEALTH
Indicator Baseline
2016-17
Target
2017-18Indicator
Baseline
2016-17
Target
2017-18
1 2 3 4 5 6 7 8 9 10 11 12
Total bed capacity (not
including floating beds)640 640
Bed occupancy rate per month
100% 100%
Percentage of filled posts
against for specialist
doctors-sanctioned posts-
255)
87% 100%
Average number of patients in
In-Patient Department (IPD) per
month 5,120 5200
Percentage of filled posts
against sanctioned posts for
non-specialist doctors-
GDMOs, Jr Residents,
sanctioned posts- 291)
88% 100%
Average number of patients in
Out-Patients Department (OPD)
per month1,01,207 106000
Average number of patients in
casualty / emergency per
month24,800 24,800
Average number of patients per
doctor per month 270 300
Average waiting time of OPD
patients (minutes) 10 8
Average waiting time for major
surgeries (days) 23 21
Average number of deaths in
hospital per month 245 NA
Number of X-ray machines
available4 4 Average number of X-Rays per
month17,508 18000
OUTCOMESRisk Factors /
Remarks
12 Deen Dayal
Upadhyay
Hospital
27051 (R-
26051, C-1000)
Ongoing
Sr.
No
Name of the
Scheme
/ Programme
Budget
Allocation
(Rs.Lakhs)
Timelines Objectives
OUTPUTS
Provision of
secondary and
tertiary health
services to people
94% 100%
Percentage of filled posts
against sanctioned of filled
posts against sanctioned
posts for all other staff
sanctioned posts -769)
72% 100%
HOSPITALS
TO FILL VACANT
POST THROUGH H
& FW
Percentage of filled posts
against sanctioned posts for
nurses (700)
Deen Dayal Upadhyay 145NA : Not Available
NR : Not Responded
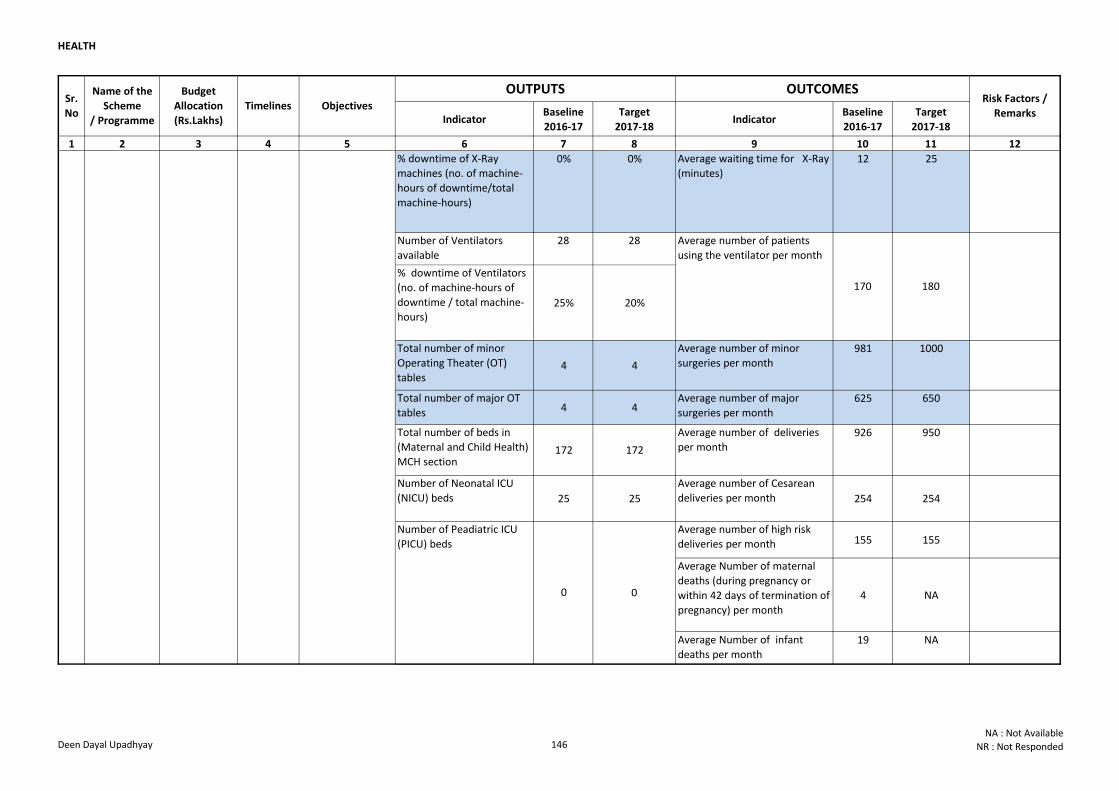
HEALTH
Indicator Baseline
2016-17
Target
2017-18Indicator
Baseline
2016-17
Target
2017-18
1 2 3 4 5 6 7 8 9 10 11 12
OUTCOMESRisk Factors /
Remarks
Sr.
No
Name of the
Scheme
/ Programme
Budget
Allocation
(Rs.Lakhs)
Timelines Objectives
OUTPUTS
% downtime of X-Ray
machines (no. of machine-
hours of downtime/total
machine-hours)
0% 0% Average waiting time for X-Ray
(minutes)12 25
Number of Ventilators
available
28 28
% downtime of Ventilators
(no. of machine-hours of
downtime / total machine-
hours)25% 20%
Total number of minor
Operating Theater (OT)
tables4 4
Average number of minor
surgeries per month981 1000
Total number of major OT
tables 4 4Average number of major
surgeries per month625 650
Total number of beds in
(Maternal and Child Health)
MCH section172 172
Average number of deliveries
per month926 950
Number of Neonatal ICU
(NICU) beds 25 25
Average number of Cesarean
deliveries per month 254 254
Average number of high risk
deliveries per month 155 155
Average Number of maternal
deaths (during pregnancy or
within 42 days of termination of
pregnancy) per month
4 NA
Average Number of infant
deaths per month 19 NA
12 Deen Dayal
Upadhyay
Hospital
27051 (R-
26051, C-1000)
Ongoing Provision of
secondary and
tertiary health
services to people
Average number of patients
using the ventilator per month
170 180
Number of Peadiatric ICU
(PICU) beds
0 0
Deen Dayal Upadhyay 146NA : Not Available
NR : Not Responded
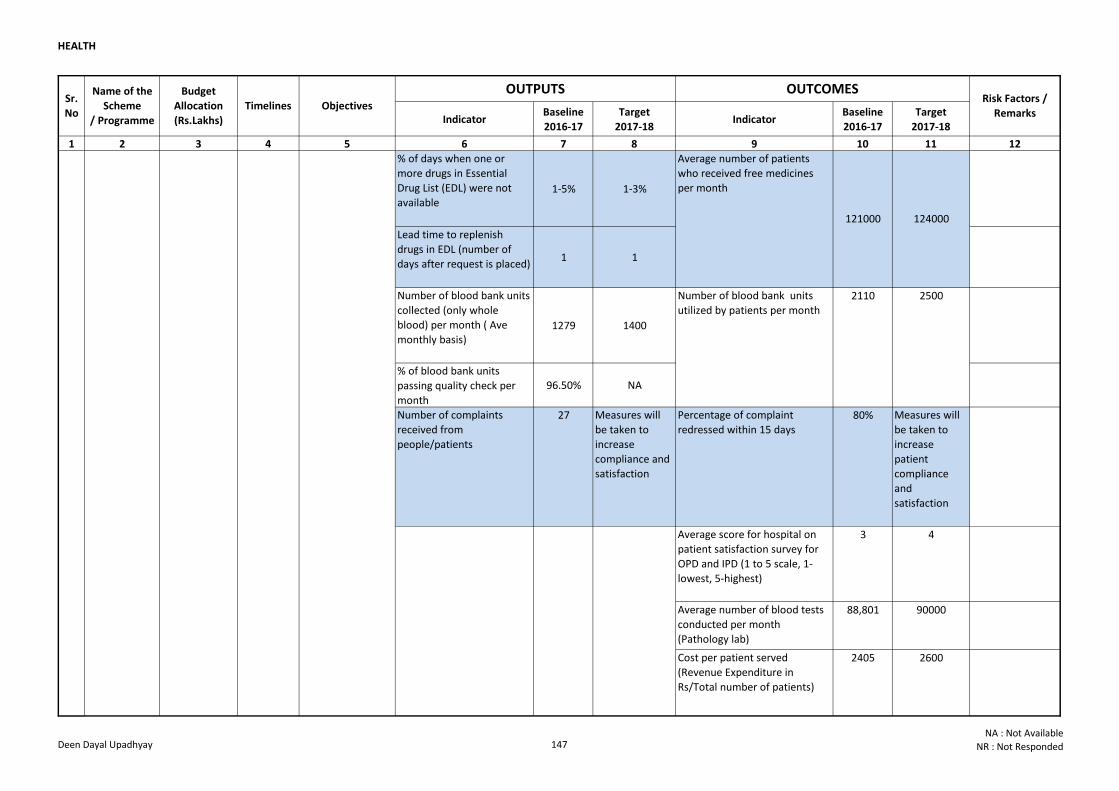
HEALTH
Indicator Baseline
2016-17
Target
2017-18Indicator
Baseline
2016-17
Target
2017-18
1 2 3 4 5 6 7 8 9 10 11 12
OUTCOMESRisk Factors /
Remarks
Sr.
No
Name of the
Scheme
/ Programme
Budget
Allocation
(Rs.Lakhs)
Timelines Objectives
OUTPUTS
% of days when one or
more drugs in Essential
Drug List (EDL) were not
available1-5% 1-3%
Lead time to replenish
drugs in EDL (number of
days after request is placed)1 1
Number of blood bank units
collected (only whole
blood) per month ( Ave
monthly basis)1279 1400
% of blood bank units
passing quality check per
month
96.50% NA
Number of complaints
received from
people/patients
27 Measures will
be taken to
increase
compliance and
satisfaction
Percentage of complaint
redressed within 15 days80% Measures will
be taken to
increase
patient
compliance
and
satisfaction
Average score for hospital on
patient satisfaction survey for
OPD and IPD (1 to 5 scale, 1-
lowest, 5-highest)
3 4
Average number of blood tests
conducted per month
(Pathology lab)
88,801 90000
Cost per patient served
(Revenue Expenditure in
Rs/Total number of patients)
2405 2600
12 Deen Dayal
Upadhyay
Hospital
27051 (R-
26051, C-1000)
Ongoing Provision of
secondary and
tertiary health
services to people
Average number of patients
who received free medicines
per month
121000 124000
Number of blood bank units
utilized by patients per month2110 2500
Deen Dayal Upadhyay 147NA : Not Available
NR : Not Responded
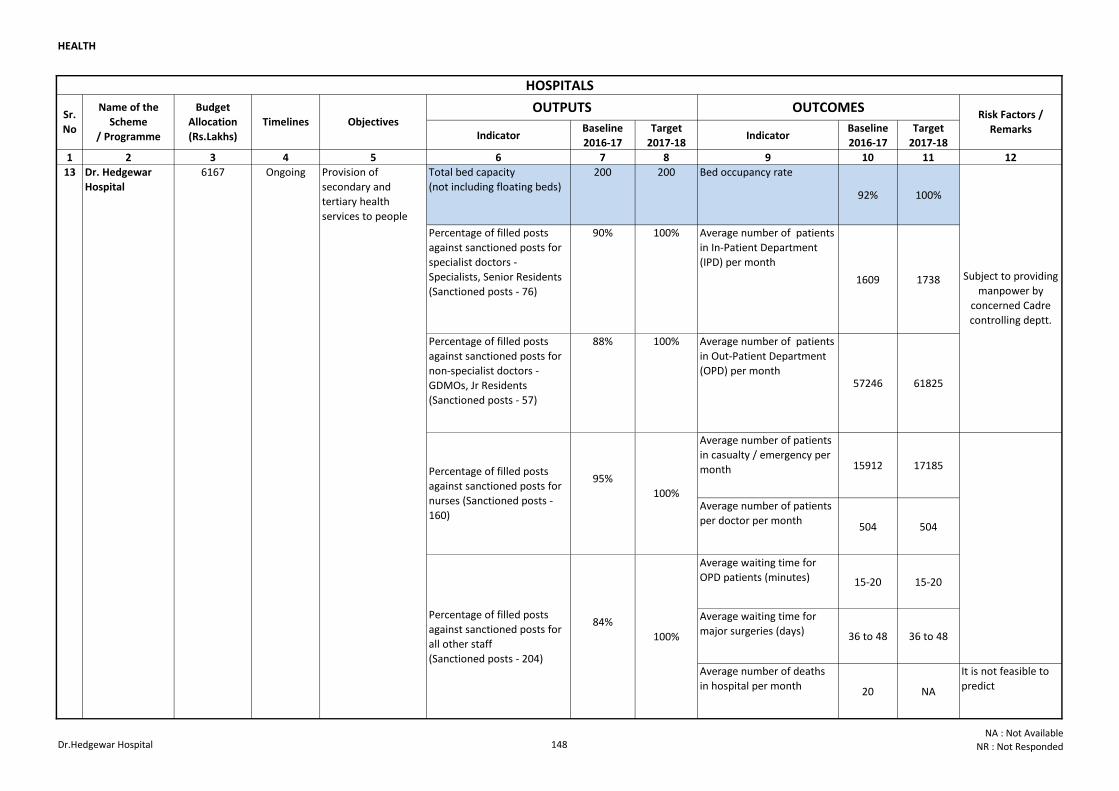
HEALTH
Indicator Baseline
2016-17
Target
2017-18Indicator
Baseline
2016-17
Target
2017-18
1 2 3 4 5 6 7 8 9 10 11 12
Total bed capacity
(not including floating beds)
200 200 Bed occupancy rate
92% 100%
Percentage of filled posts
against sanctioned posts for
specialist doctors -
Specialists, Senior Residents
(Sanctioned posts - 76)
90% 100% Average number of patients
in In-Patient Department
(IPD) per month
1609 1738
Percentage of filled posts
against sanctioned posts for
non-specialist doctors -
GDMOs, Jr Residents
(Sanctioned posts - 57)
88% 100% Average number of patients
in Out-Patient Department
(OPD) per month57246 61825
Average number of patients
in casualty / emergency per
month 15912 17185
Average number of patients
per doctor per month504 504
Average waiting time for
OPD patients (minutes) 15-20 15-20
Average waiting time for
major surgeries (days) 36 to 48 36 to 48
Average number of deaths
in hospital per month 20 NA
It is not feasible to
predict
13 Dr. Hedgewar
Hospital
6167
Risk Factors /
Remarks
Subject to providing
manpower by
concerned Cadre
controlling deptt.
Sr.
No
Name of the
Scheme
/ Programme
Budget
Allocation
(Rs.Lakhs)
Timelines Objectives OUTPUTS OUTCOMES
100%
HOSPITALS
Ongoing Provision of
secondary and
tertiary health
services to people
Percentage of filled posts
against sanctioned posts for
all other staff
(Sanctioned posts - 204)
84%
Percentage of filled posts
against sanctioned posts for
nurses (Sanctioned posts -
160)
95%
100%
Dr.Hedgewar Hospital 148NA : Not Available
NR : Not Responded
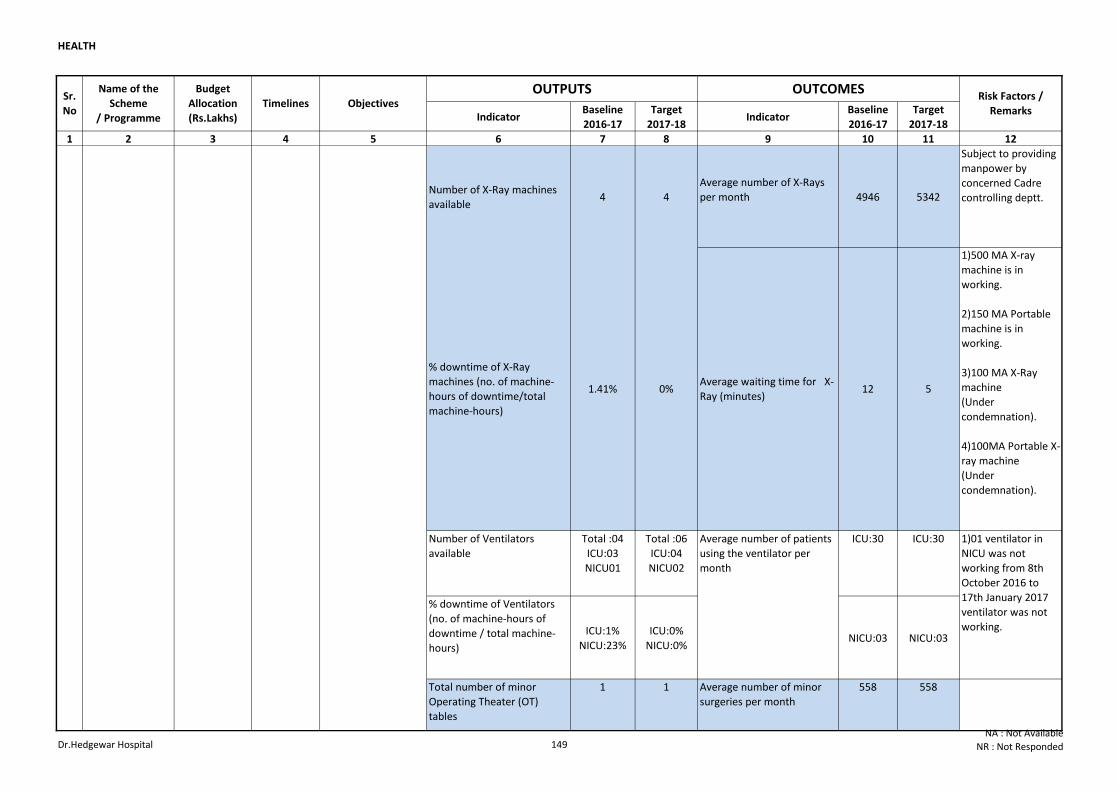
HEALTH
Indicator Baseline
2016-17
Target
2017-18Indicator
Baseline
2016-17
Target
2017-18
1 2 3 4 5 6 7 8 9 10 11 12
Risk Factors /
Remarks
Sr.
No
Name of the
Scheme
/ Programme
Budget
Allocation
(Rs.Lakhs)
Timelines Objectives OUTPUTS OUTCOMES
Number of X-Ray machines
available4 4
Average number of X-Rays
per month 4946 5342
Subject to providing
manpower by
concerned Cadre
controlling deptt.
Number of Ventilators
available
Total :04
ICU:03
NICU01
Total :06
ICU:04
NICU02
ICU:30 ICU:30
% downtime of Ventilators
(no. of machine-hours of
downtime / total machine-
hours)
ICU:1%
NICU:23%
ICU:0%
NICU:0%NICU:03 NICU:03
Total number of minor
Operating Theater (OT)
tables
1 1 Average number of minor
surgeries per month
558 558
13 Dr. Hedgewar
Hospital
6167
1)01 ventilator in
NICU was not
working from 8th
October 2016 to
17th January 2017
ventilator was not
working.
12 5
1)500 MA X-ray
machine is in
working.
2)150 MA Portable
machine is in
working.
3)100 MA X-Ray
machine
(Under
condemnation).
4)100MA Portable X-
ray machine
(Under
condemnation).
Average waiting time for X-
Ray (minutes)
Average number of patients
using the ventilator per
month
Ongoing Provision of
secondary and
tertiary health
services to people
% downtime of X-Ray
machines (no. of machine-
hours of downtime/total
machine-hours)
1.41% 0%
Dr.Hedgewar Hospital 149NA : Not Available
NR : Not Responded
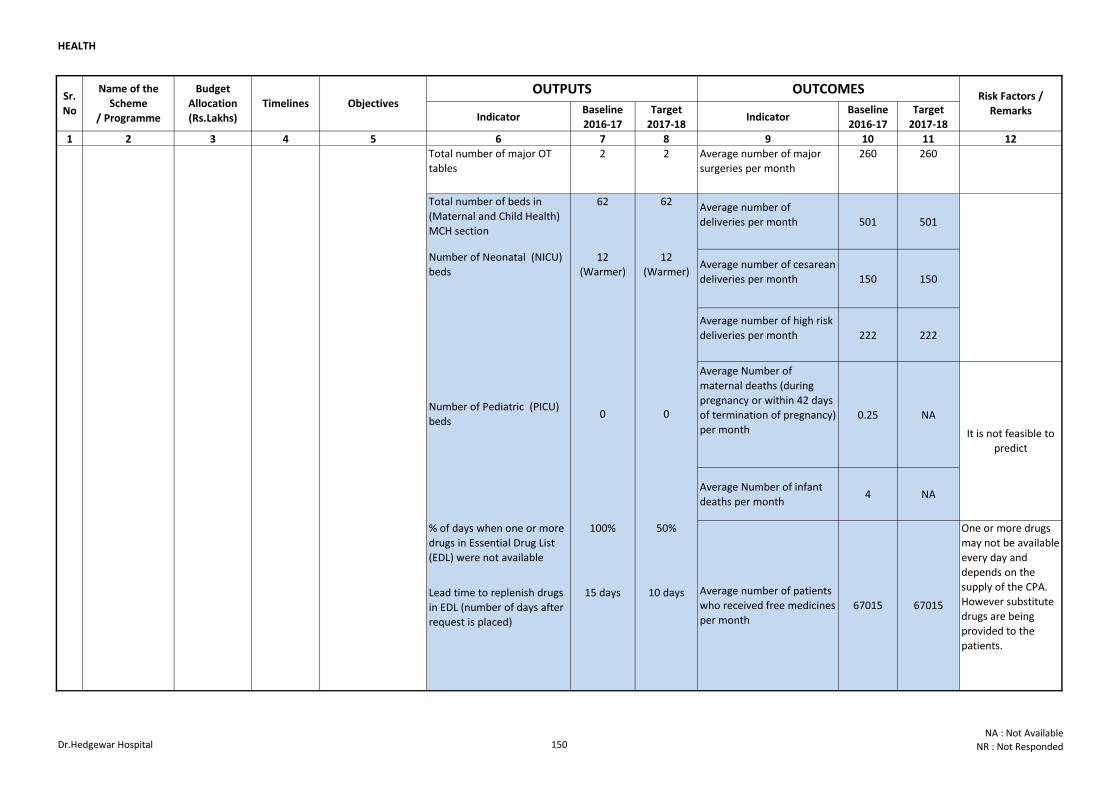
HEALTH
Indicator Baseline
2016-17
Target
2017-18Indicator
Baseline
2016-17
Target
2017-18
1 2 3 4 5 6 7 8 9 10 11 12
Risk Factors /
Remarks
Sr.
No
Name of the
Scheme
/ Programme
Budget
Allocation
(Rs.Lakhs)
Timelines Objectives OUTPUTS OUTCOMES
Total number of major OT
tables
2 2 Average number of major
surgeries per month
260 260
Total number of beds in
(Maternal and Child Health)
MCH section
62 62 Average number of
deliveries per month 501 501
Number of Neonatal (NICU)
beds
12
(Warmer)
12
(Warmer)Average number of cesarean
deliveries per month 150 150
Average number of high risk
deliveries per month 222 222
Average Number of
maternal deaths (during
pregnancy or within 42 days
of termination of pregnancy)
per month
0.25 NA
Average Number of infant
deaths per month4 NA
% of days when one or more
drugs in Essential Drug List
(EDL) were not available
100% 50%
Lead time to replenish drugs
in EDL (number of days after
request is placed)
15 days 10 days Average number of patients
who received free medicines
per month
67015
13 Dr. Hedgewar
Hospital
6167
67015
One or more drugs
may not be available
every day and
depends on the
supply of the CPA.
However substitute
drugs are being
provided to the
patients.
It is not feasible to
predict
Number of Pediatric (PICU)
beds0 0
Ongoing Provision of
secondary and
tertiary health
services to people
Dr.Hedgewar Hospital 150NA : Not Available
NR : Not Responded
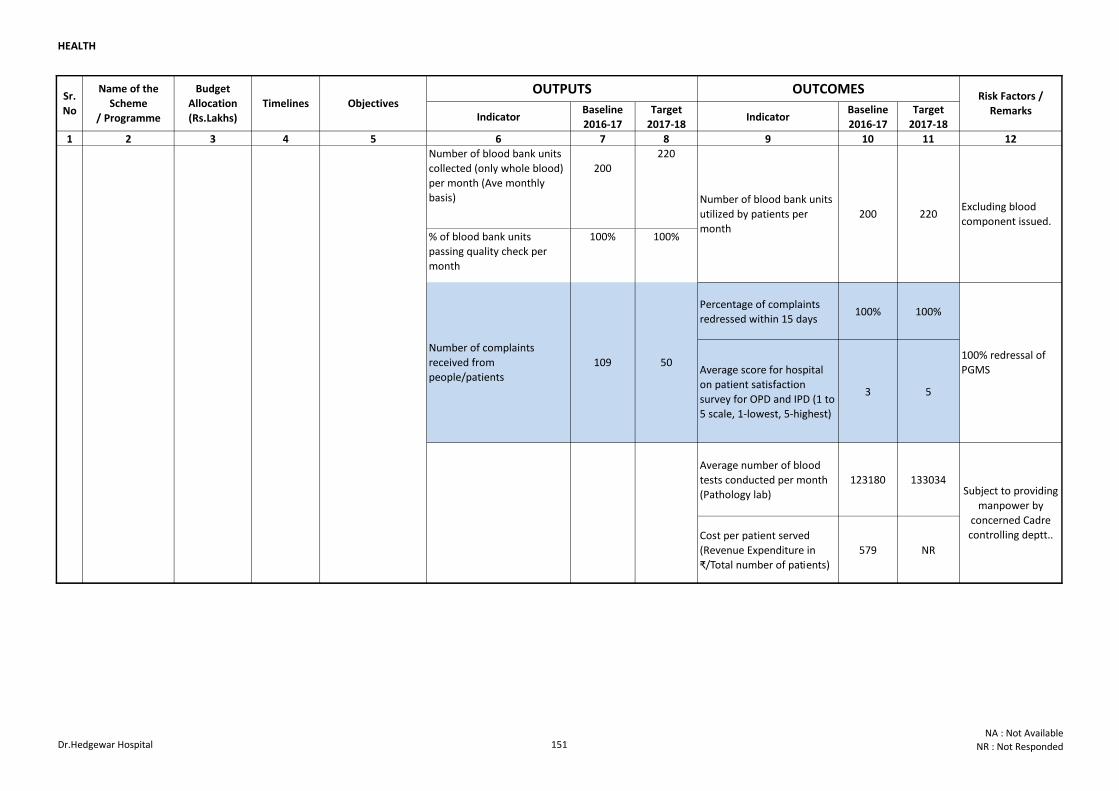
HEALTH
Indicator Baseline
2016-17
Target
2017-18Indicator
Baseline
2016-17
Target
2017-18
1 2 3 4 5 6 7 8 9 10 11 12
Risk Factors /
Remarks
Sr.
No
Name of the
Scheme
/ Programme
Budget
Allocation
(Rs.Lakhs)
Timelines Objectives OUTPUTS OUTCOMES
Number of blood bank units
collected (only whole blood)
per month (Ave monthly
basis)
200
220
% of blood bank units
passing quality check per
month
100% 100%
Percentage of complaints
redressed within 15 days100% 100%
Average score for hospital
on patient satisfaction
survey for OPD and IPD (1 to
5 scale, 1-lowest, 5-highest)
3 5
Average number of blood
tests conducted per month
(Pathology lab)
123180 133034
Cost per patient served
(Revenue Expenditure in
₹/Total number of patients)
579 NR
Excluding blood
component issued.
13 Dr. Hedgewar
Hospital
6167
Subject to providing
manpower by
concerned Cadre
controlling deptt..
100% redressal of
PGMS
220
Ongoing Provision of
secondary and
tertiary health
services to people
Number of complaints
received from
people/patients
109 50
Number of blood bank units
utilized by patients per
month
200
Dr.Hedgewar Hospital 151NA : Not Available
NR : Not Responded
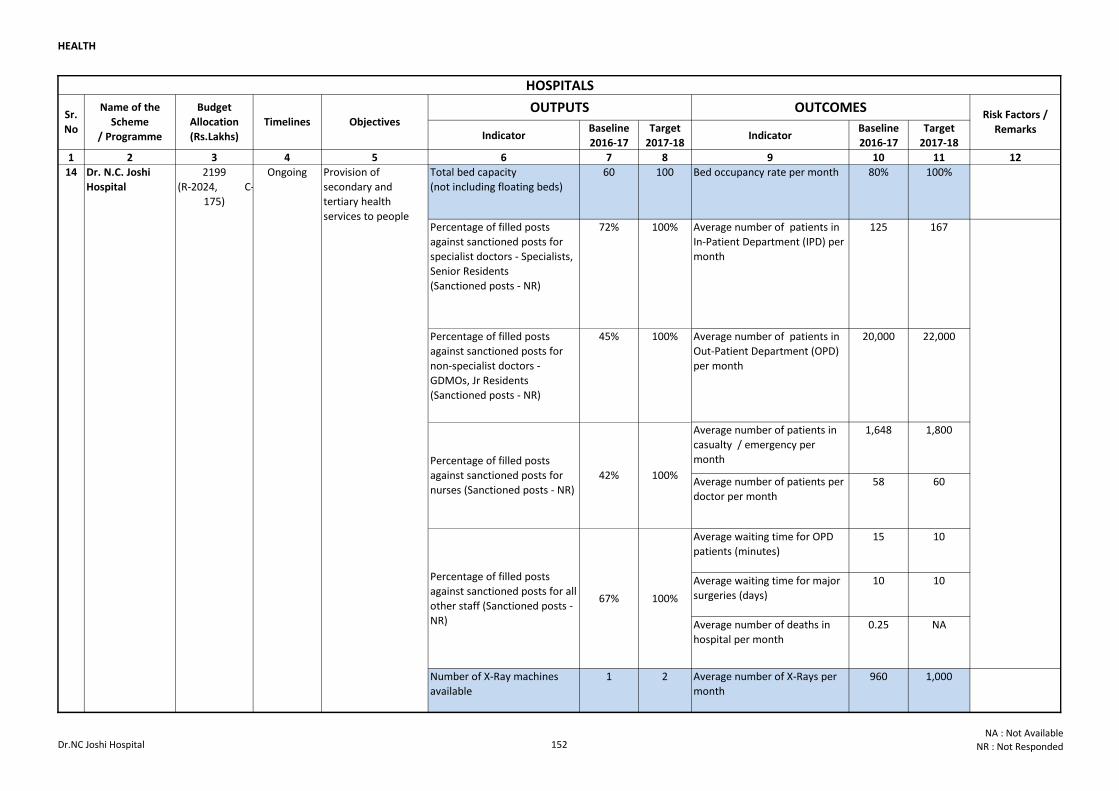
HEALTH
Indicator Baseline
2016-17
Target
2017-18Indicator
Baseline
2016-17
Target
2017-18
1 2 3 4 5 6 7 8 9 10 11 12
Total bed capacity
(not including floating beds)
60 100 Bed occupancy rate per month 80% 100%
Percentage of filled posts
against sanctioned posts for
specialist doctors - Specialists,
Senior Residents
(Sanctioned posts - NR)
72% 100% Average number of patients in
In-Patient Department (IPD) per
month
125 167
Percentage of filled posts
against sanctioned posts for
non-specialist doctors -
GDMOs, Jr Residents
(Sanctioned posts - NR)
45% 100% Average number of patients in
Out-Patient Department (OPD)
per month
20,000 22,000
Average number of patients in
casualty / emergency per
month
1,648 1,800
Average number of patients per
doctor per month
58 60
Average waiting time for OPD
patients (minutes)
15 10
Average waiting time for major
surgeries (days)
10 10
Average number of deaths in
hospital per month
0.25 NA
Number of X-Ray machines
available
1 2 Average number of X-Rays per
month
960 1,000
OUTCOMESRisk Factors /
Remarks
14 Dr. N.C. Joshi
Hospital
2199
(R-2024, C-
175)
Ongoing
Sr.
No
Name of the
Scheme
/ Programme
Budget
Allocation
(Rs.Lakhs)
Timelines Objectives OUTPUTS
Provision of
secondary and
tertiary health
services to people
Percentage of filled posts
against sanctioned posts for
nurses (Sanctioned posts - NR)
42% 100%
Percentage of filled posts
against sanctioned posts for all
other staff (Sanctioned posts -
NR)
67% 100%
HOSPITALS
Dr.NC Joshi Hospital 152NA : Not Available
NR : Not Responded
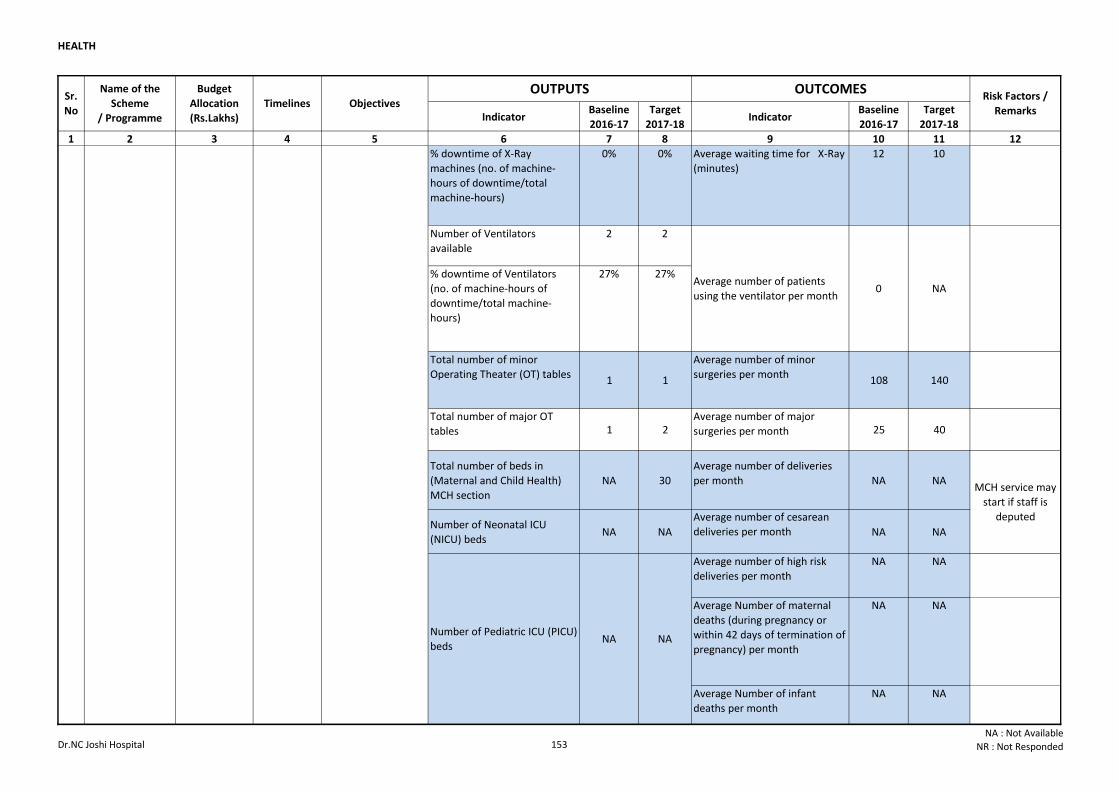
HEALTH
Indicator Baseline
2016-17
Target
2017-18Indicator
Baseline
2016-17
Target
2017-18
1 2 3 4 5 6 7 8 9 10 11 12
OUTCOMESRisk Factors /
Remarks
Sr.
No
Name of the
Scheme
/ Programme
Budget
Allocation
(Rs.Lakhs)
Timelines Objectives OUTPUTS
% downtime of X-Ray
machines (no. of machine-
hours of downtime/total
machine-hours)
0% 0% Average waiting time for X-Ray
(minutes)
12 10
Number of Ventilators
available
2 2
% downtime of Ventilators
(no. of machine-hours of
downtime/total machine-
hours)
27% 27%
Total number of minor
Operating Theater (OT) tables1 1
Average number of minor
surgeries per month108 140
Total number of major OT
tables 1 2Average number of major
surgeries per month 25 40
Total number of beds in
(Maternal and Child Health)
MCH section
NA 30
Average number of deliveries
per month NA NA
Number of Neonatal ICU
(NICU) bedsNA NA
Average number of cesarean
deliveries per month NA NA
Average number of high risk
deliveries per month
NA NA
Average Number of maternal
deaths (during pregnancy or
within 42 days of termination of
pregnancy) per month
NA NA
Average Number of infant
deaths per month
NA NA
14 Dr. N.C. Joshi
Hospital
2199
(R-2024, C-
175)
Ongoing Provision of
secondary and
tertiary health
services to people
MCH service may
start if staff is
deputed
Average number of patients
using the ventilator per month0 NA
Number of Pediatric ICU (PICU)
bedsNA NA
Dr.NC Joshi Hospital 153NA : Not Available
NR : Not Responded
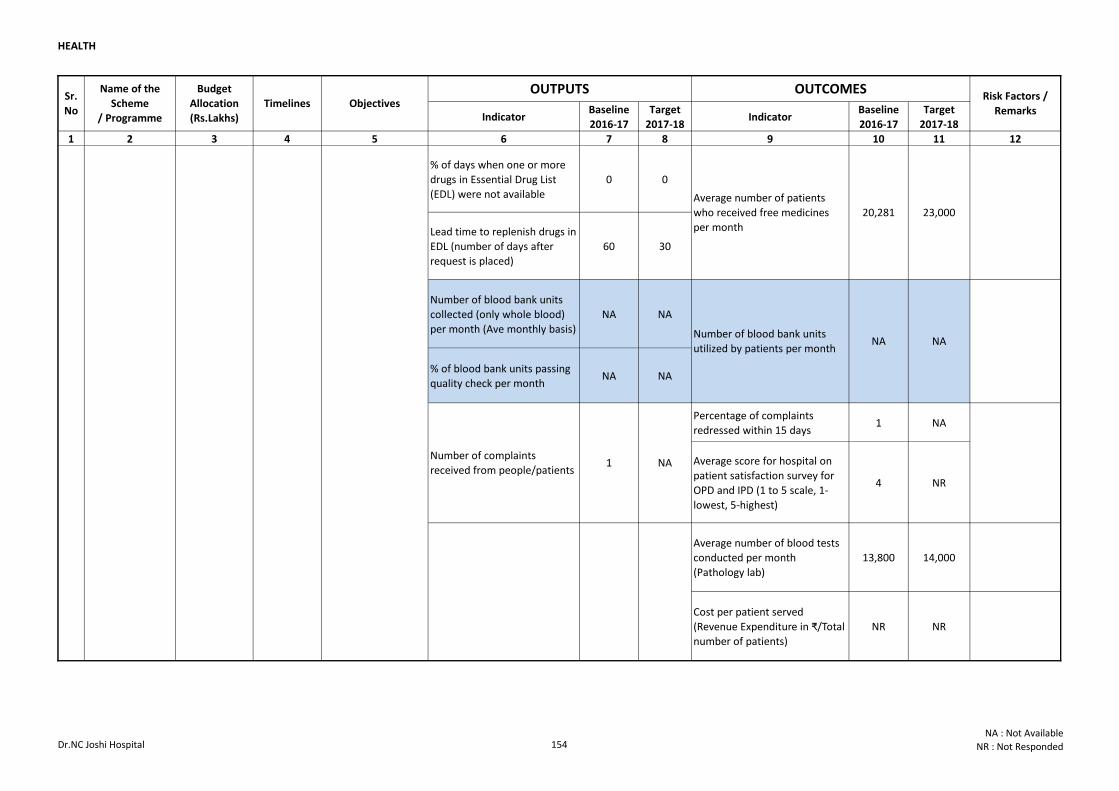
HEALTH
Indicator Baseline
2016-17
Target
2017-18Indicator
Baseline
2016-17
Target
2017-18
1 2 3 4 5 6 7 8 9 10 11 12
OUTCOMESRisk Factors /
Remarks
Sr.
No
Name of the
Scheme
/ Programme
Budget
Allocation
(Rs.Lakhs)
Timelines Objectives OUTPUTS
% of days when one or more
drugs in Essential Drug List
(EDL) were not available
0 0
Lead time to replenish drugs in
EDL (number of days after
request is placed)
60 30
Number of blood bank units
collected (only whole blood)
per month (Ave monthly basis)
NA NA
% of blood bank units passing
quality check per monthNA NA
Percentage of complaints
redressed within 15 days1 NA
Average score for hospital on
patient satisfaction survey for
OPD and IPD (1 to 5 scale, 1-
lowest, 5-highest)
4 NR
Average number of blood tests
conducted per month
(Pathology lab)
13,800 14,000
Cost per patient served
(Revenue Expenditure in ₹/Total
number of patients)
NR NR
14 Dr. N.C. Joshi
Hospital
2199
(R-2024, C-
175)
Ongoing Provision of
secondary and
tertiary health
services to people
Number of complaints
received from people/patients1 NA
Average number of patients
who received free medicines
per month
20,281 23,000
Number of blood bank units
utilized by patients per monthNA NA
Dr.NC Joshi Hospital 154NA : Not Available
NR : Not Responded
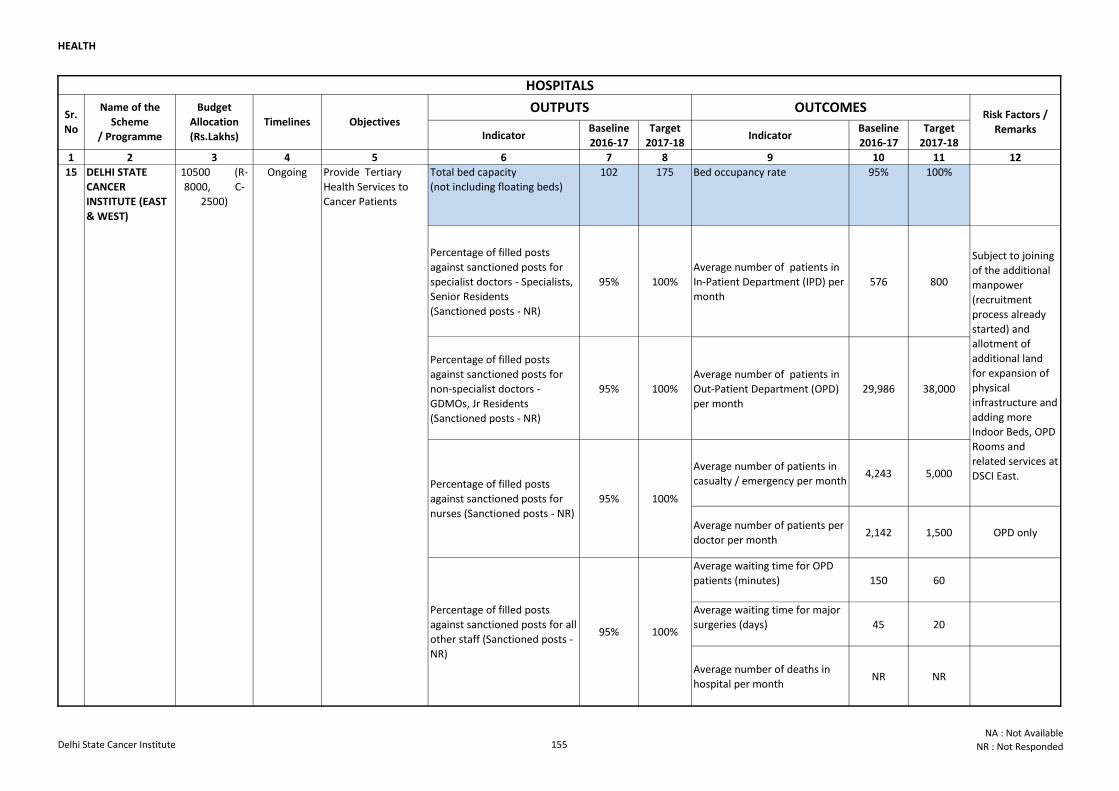
HEALTH
Indicator Baseline
2016-17
Target
2017-18Indicator
Baseline
2016-17
Target
2017-18
1 2 3 4 5 6 7 8 9 10 11 12
Total bed capacity
(not including floating beds)
102 175 Bed occupancy rate 95% 100%
Percentage of filled posts
against sanctioned posts for
specialist doctors - Specialists,
Senior Residents
(Sanctioned posts - NR)
95% 100%
Average number of patients in
In-Patient Department (IPD) per
month
576 800
Percentage of filled posts
against sanctioned posts for
non-specialist doctors -
GDMOs, Jr Residents
(Sanctioned posts - NR)
95% 100%
Average number of patients in
Out-Patient Department (OPD)
per month
29,986 38,000
Average number of patients in
casualty / emergency per month 4,243 5,000
Average number of patients per
doctor per month2,142 1,500 OPD only
Average waiting time for OPD
patients (minutes) 150 60
Average waiting time for major
surgeries (days) 45 20
Average number of deaths in
hospital per monthNR NR
OUTPUTS OUTCOMESRisk Factors /
Remarks
Sr.
No
Name of the
Scheme
/ Programme
Budget
Allocation
(Rs.Lakhs)
Timelines Objectives
15 DELHI STATE
CANCER
INSTITUTE (EAST
& WEST)
10500 (R-
8000, C-
2500)
Ongoing Provide Tertiary
Health Services to
Cancer Patients
Subject to joining
of the additional
manpower
(recruitment
process already
started) and
allotment of
additional land
for expansion of
physical
infrastructure and
adding more
Indoor Beds, OPD
Rooms and
related services at
DSCI East.Percentage of filled posts
against sanctioned posts for
nurses (Sanctioned posts - NR)
95% 100%
Percentage of filled posts
against sanctioned posts for all
other staff (Sanctioned posts -
NR)
95% 100%
HOSPITALS
Delhi State Cancer Institute 155NA : Not Available
NR : Not Responded
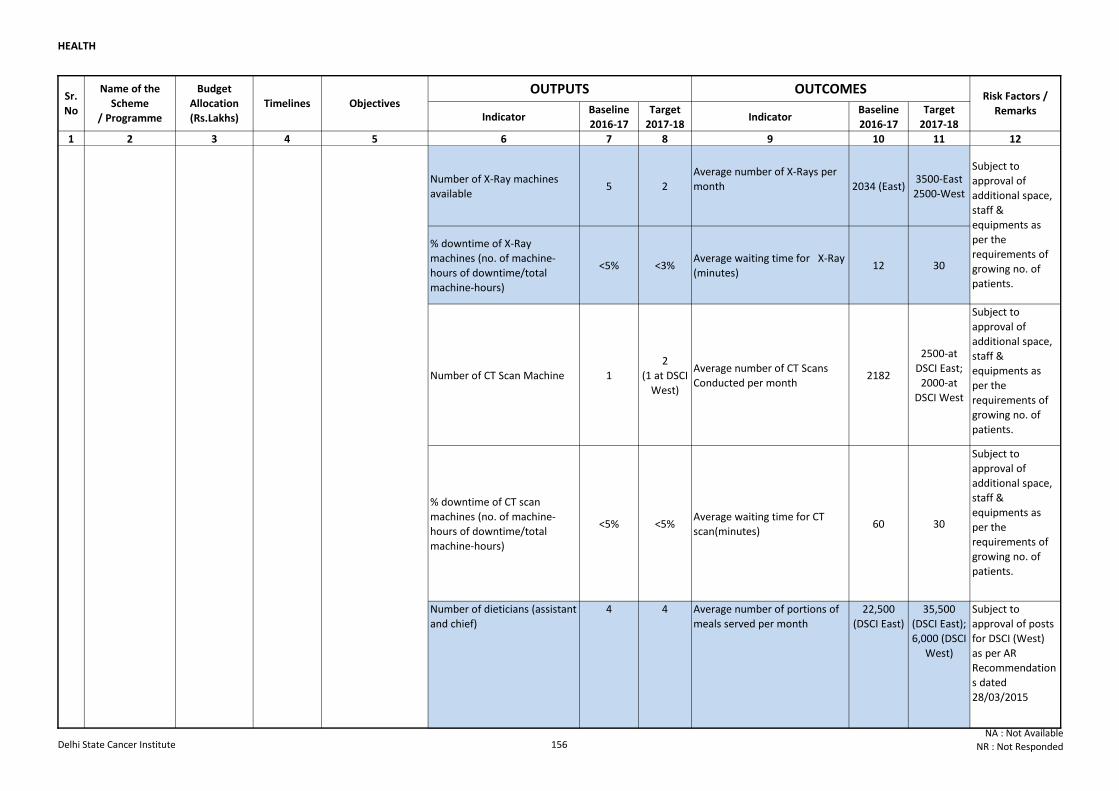
HEALTH
Indicator Baseline
2016-17
Target
2017-18Indicator
Baseline
2016-17
Target
2017-18
1 2 3 4 5 6 7 8 9 10 11 12
OUTPUTS OUTCOMESRisk Factors /
Remarks
Sr.
No
Name of the
Scheme
/ Programme
Budget
Allocation
(Rs.Lakhs)
Timelines Objectives
Number of X-Ray machines
available5 2
Average number of X-Rays per
month 2034 (East)3500-East
2500-West
% downtime of X-Ray
machines (no. of machine-
hours of downtime/total
machine-hours)
<5% <3%Average waiting time for X-Ray
(minutes)12 30
Number of CT Scan Machine 1
2
(1 at DSCI
West)
Average number of CT Scans
Conducted per month2182
2500-at
DSCI East;
2000-at
DSCI West
Subject to
approval of
additional space,
staff &
equipments as
per the
requirements of
growing no. of
patients.
% downtime of CT scan
machines (no. of machine-
hours of downtime/total
machine-hours)
<5% <5%Average waiting time for CT
scan(minutes)60 30
Subject to
approval of
additional space,
staff &
equipments as
per the
requirements of
growing no. of
patients.
Number of dieticians (assistant
and chief)
4 4 Average number of portions of
meals served per month
22,500
(DSCI East)
35,500
(DSCI East);
6,000 (DSCI
West)
Subject to
approval of posts
for DSCI (West)
as per AR
Recommendation
s dated
28/03/2015
15 DELHI STATE
CANCER
INSTITUTE (EAST
& WEST)
10500 (R-
8000, C-
2500)
Ongoing Provide Tertiary
Health Services to
Cancer Patients
Subject to
approval of
additional space,
staff &
equipments as
per the
requirements of
growing no. of
patients.
Delhi State Cancer Institute 156NA : Not Available
NR : Not Responded
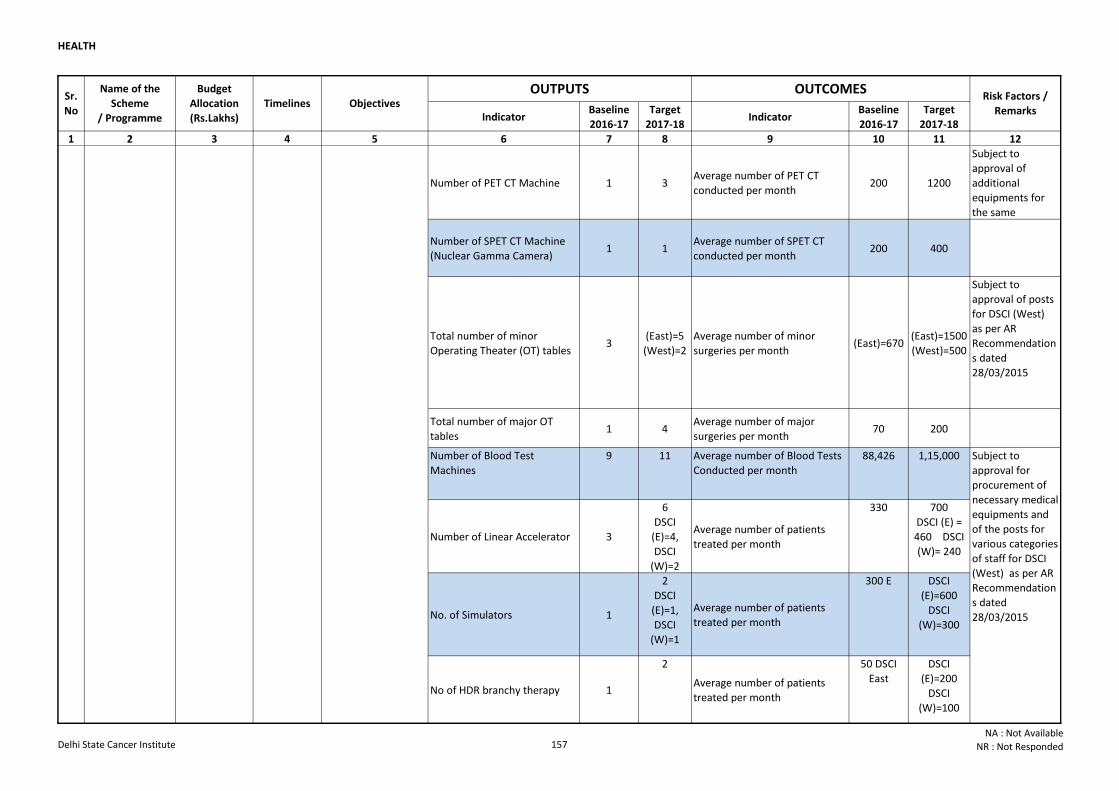
HEALTH
Indicator Baseline
2016-17
Target
2017-18Indicator
Baseline
2016-17
Target
2017-18
1 2 3 4 5 6 7 8 9 10 11 12
OUTPUTS OUTCOMESRisk Factors /
Remarks
Sr.
No
Name of the
Scheme
/ Programme
Budget
Allocation
(Rs.Lakhs)
Timelines Objectives
Number of PET CT Machine 1 3Average number of PET CT
conducted per month200 1200
Subject to
approval of
additional
equipments for
the same
Number of SPET CT Machine
(Nuclear Gamma Camera)1 1
Average number of SPET CT
conducted per month200 400
Total number of minor
Operating Theater (OT) tables3
(East)=5
(West)=2
Average number of minor
surgeries per month(East)=670
(East)=1500
(West)=500
Subject to
approval of posts
for DSCI (West)
as per AR
Recommendation
s dated
28/03/2015
Total number of major OT
tables 1 4
Average number of major
surgeries per month70 200
Number of Blood Test
Machines
9 11 Average number of Blood Tests
Conducted per month
88,426 1,15,000
Number of Linear Accelerator 3
6
DSCI
(E)=4,
DSCI
(W)=2
Average number of patients
treated per month
330 700
DSCI (E) =
460 DSCI
(W)= 240
No. of Simulators 1
2
DSCI
(E)=1,
DSCI
(W)=1
Average number of patients
treated per month
300 E DSCI
(E)=600
DSCI
(W)=300
No of HDR branchy therapy 1
2
Average number of patients
treated per month
50 DSCI
East
DSCI
(E)=200
DSCI
(W)=100
15 DELHI STATE
CANCER
INSTITUTE (EAST
& WEST)
10500 (R-
8000, C-
2500)
Ongoing Provide Tertiary
Health Services to
Cancer Patients
Subject to
approval for
procurement of
necessary medical
equipments and
of the posts for
various categories
of staff for DSCI
(West) as per AR
Recommendation
s dated
28/03/2015
Delhi State Cancer Institute 157NA : Not Available
NR : Not Responded
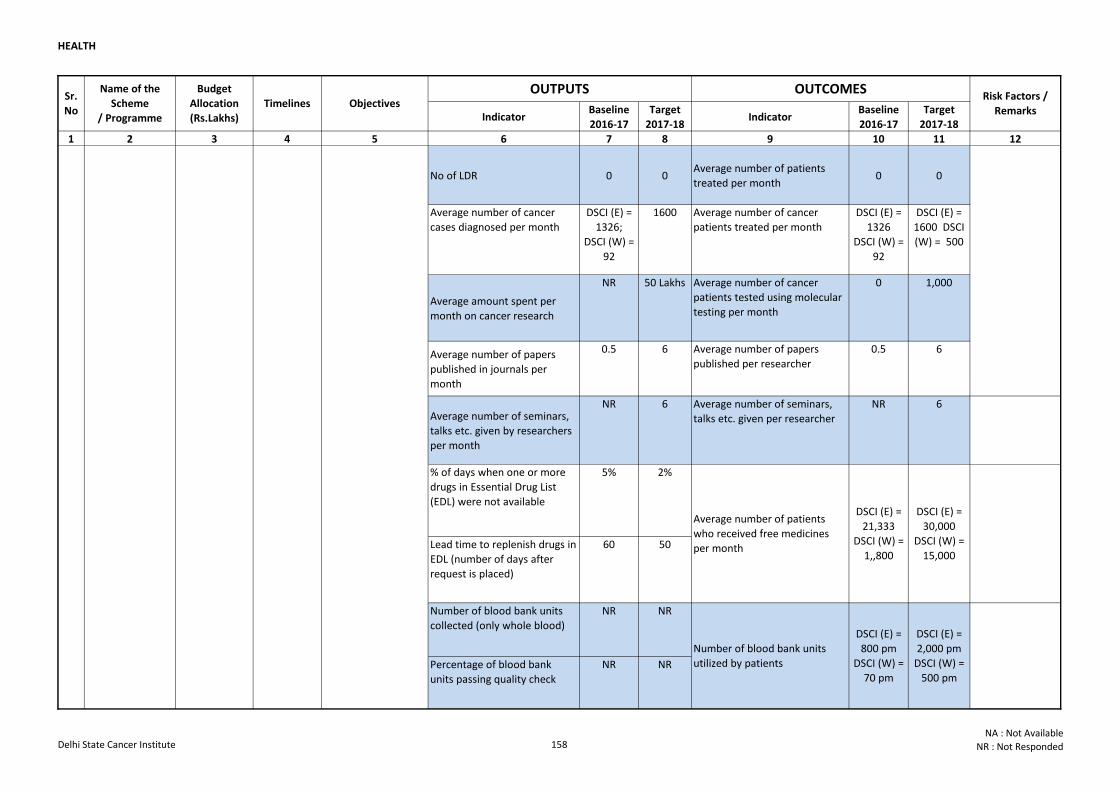
HEALTH
Indicator Baseline
2016-17
Target
2017-18Indicator
Baseline
2016-17
Target
2017-18
1 2 3 4 5 6 7 8 9 10 11 12
OUTPUTS OUTCOMESRisk Factors /
Remarks
Sr.
No
Name of the
Scheme
/ Programme
Budget
Allocation
(Rs.Lakhs)
Timelines Objectives
No of LDR 0 0Average number of patients
treated per month0 0
Average number of cancer
cases diagnosed per month
DSCI (E) =
1326;
DSCI (W) =
92
1600 Average number of cancer
patients treated per month
DSCI (E) =
1326
DSCI (W) =
92
DSCI (E) =
1600 DSCI
(W) = 500
Average amount spent per
month on cancer research
NR 50 Lakhs Average number of cancer
patients tested using molecular
testing per month
0 1,000
Average number of papers
published in journals per
month
0.5 6 Average number of papers
published per researcher
0.5 6
Average number of seminars,
talks etc. given by researchers
per month
NR 6 Average number of seminars,
talks etc. given per researcher
NR 6
% of days when one or more
drugs in Essential Drug List
(EDL) were not available
5% 2%
Lead time to replenish drugs in
EDL (number of days after
request is placed)
60 50
Number of blood bank units
collected (only whole blood)
NR NR
Percentage of blood bank
units passing quality check
NR NR
15 DELHI STATE
CANCER
INSTITUTE (EAST
& WEST)
10500 (R-
8000, C-
2500)
Ongoing Provide Tertiary
Health Services to
Cancer Patients
DSCI (E) =
30,000
DSCI (W) =
15,000
Number of blood bank units
utilized by patients
DSCI (E) =
800 pm
DSCI (W) =
70 pm
DSCI (E) =
2,000 pm
DSCI (W) =
500 pm
Subject to
approval for
procurement of
necessary medical
equipments and
of the posts for
various categories
of staff for DSCI
(West) as per AR
Recommendation
s dated
28/03/2015
Average number of patients
who received free medicines
per month
DSCI (E) =
21,333
DSCI (W) =
1,,800
Delhi State Cancer Institute 158NA : Not Available
NR : Not Responded
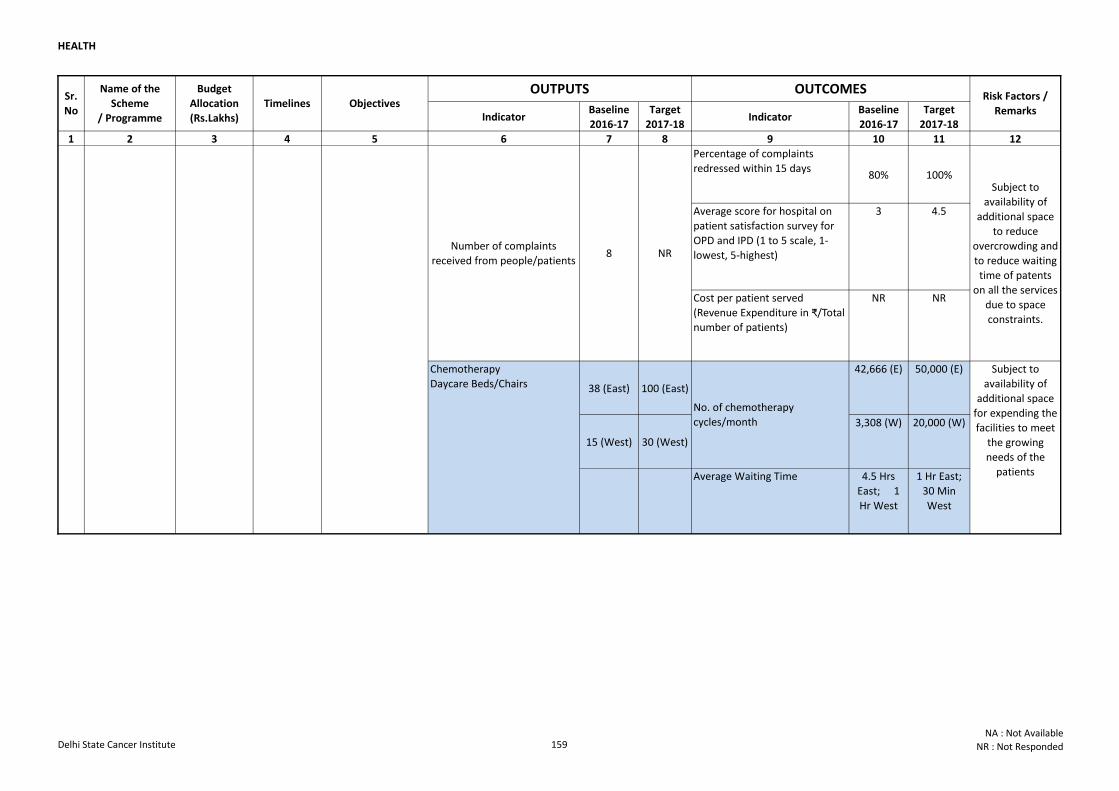
HEALTH
Indicator Baseline
2016-17
Target
2017-18Indicator
Baseline
2016-17
Target
2017-18
1 2 3 4 5 6 7 8 9 10 11 12
OUTPUTS OUTCOMESRisk Factors /
Remarks
Sr.
No
Name of the
Scheme
/ Programme
Budget
Allocation
(Rs.Lakhs)
Timelines Objectives
Percentage of complaints
redressed within 15 days80% 100%
Average score for hospital on
patient satisfaction survey for
OPD and IPD (1 to 5 scale, 1-
lowest, 5-highest)
3 4.5
Cost per patient served
(Revenue Expenditure in ₹/Total
number of patients)
NR NR
38 (East) 100 (East)
42,666 (E) 50,000 (E)
15 (West) 30 (West)
3,308 (W) 20,000 (W)
Average Waiting Time 4.5 Hrs
East; 1
Hr West
1 Hr East;
30 Min
West
15 DELHI STATE
CANCER
INSTITUTE (EAST
& WEST)
10500 (R-
8000, C-
2500)
Ongoing Provide Tertiary
Health Services to
Cancer Patients
Chemotherapy
Daycare Beds/Chairs
No. of chemotherapy
cycles/month
Subject to
availability of
additional space
for expending the
facilities to meet
the growing
needs of the
patients
Subject to
availability of
additional space
to reduce
overcrowding and
to reduce waiting
time of patents
on all the services
due to space
constraints.
Number of complaints
received from people/patients8 NR
Delhi State Cancer Institute 159NA : Not Available
NR : Not Responded
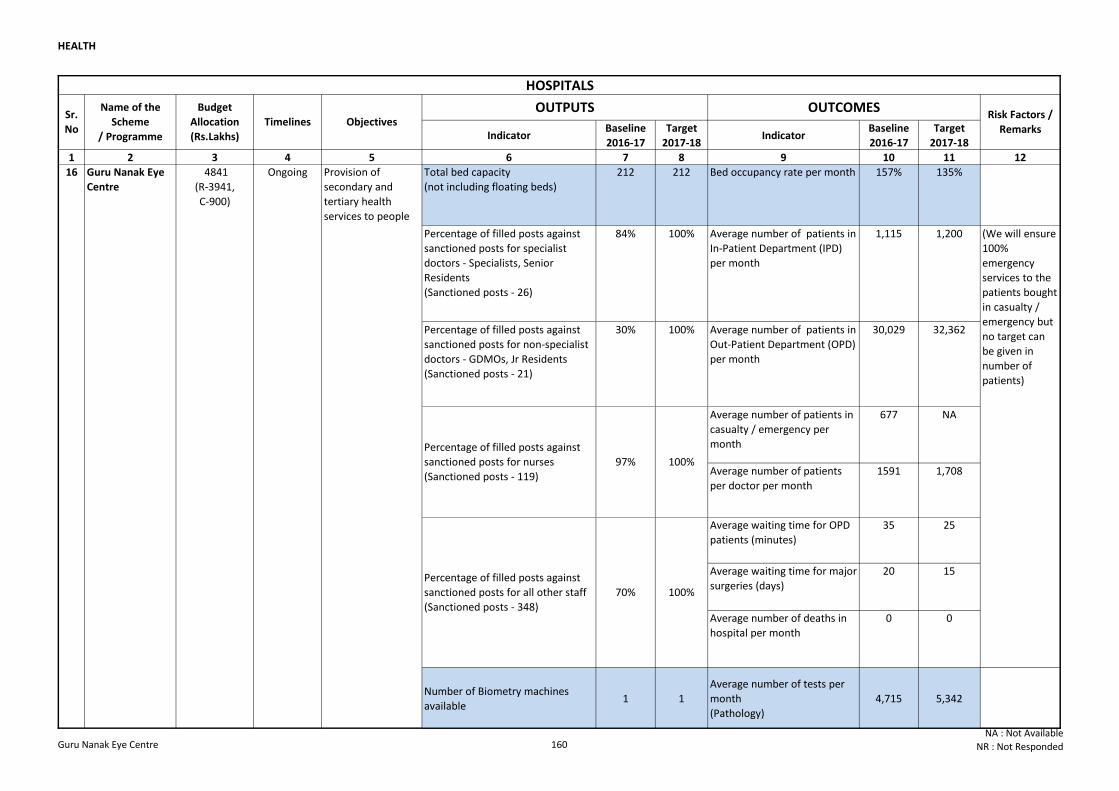
HEALTH
Indicator Baseline
2016-17
Target
2017-18Indicator
Baseline
2016-17
Target
2017-18
1 2 3 4 5 6 7 8 9 10 11 12
Total bed capacity
(not including floating beds)
212 212 Bed occupancy rate per month 157% 135%
Percentage of filled posts against
sanctioned posts for specialist
doctors - Specialists, Senior
Residents
(Sanctioned posts - 26)
84% 100% Average number of patients in
In-Patient Department (IPD)
per month
1,115 1,200
Percentage of filled posts against
sanctioned posts for non-specialist
doctors - GDMOs, Jr Residents
(Sanctioned posts - 21)
30% 100% Average number of patients in
Out-Patient Department (OPD)
per month
30,029 32,362
Average number of patients in
casualty / emergency per
month
677 NA
Average number of patients
per doctor per month
1591 1,708
Average waiting time for OPD
patients (minutes)
35 25
Average waiting time for major
surgeries (days)
20 15
Average number of deaths in
hospital per month
0 0
Number of Biometry machines
available1 1
Average number of tests per
month
(Pathology)
4,715 5,342
16 Guru Nanak Eye
Centre
4841
(R-3941,
C-900)
Ongoing Provision of
secondary and
tertiary health
services to people
(We will ensure
100%
emergency
services to the
patients bought
in casualty /
emergency but
no target can
be given in
number of
patients)
Percentage of filled posts against
sanctioned posts for nurses
(Sanctioned posts - 119)
97% 100%
Percentage of filled posts against
sanctioned posts for all other staff
(Sanctioned posts - 348)
70% 100%
HOSPITALS
Sr.
No
Name of the
Scheme
/ Programme
Budget
Allocation
(Rs.Lakhs)
Timelines Objectives OUTPUTS OUTCOMES
Risk Factors /
Remarks
Guru Nanak Eye Centre 160NA : Not Available
NR : Not Responded
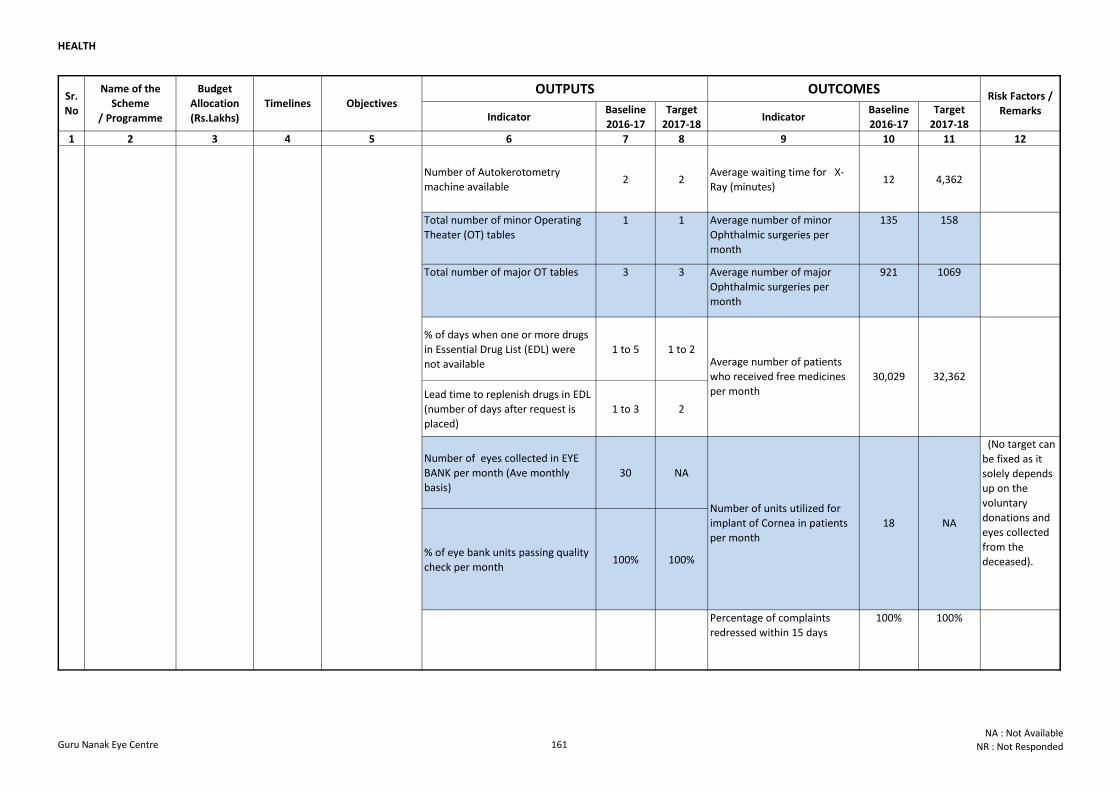
HEALTH
Indicator Baseline
2016-17
Target
2017-18Indicator
Baseline
2016-17
Target
2017-18
1 2 3 4 5 6 7 8 9 10 11 12
Sr.
No
Name of the
Scheme
/ Programme
Budget
Allocation
(Rs.Lakhs)
Timelines Objectives OUTPUTS OUTCOMES
Risk Factors /
Remarks
Number of Autokerotometry
machine available2 2
Average waiting time for X-
Ray (minutes)12 4,362
Total number of minor Operating
Theater (OT) tables
1 1 Average number of minor
Ophthalmic surgeries per
month
135 158
Total number of major OT tables 3 3 Average number of major
Ophthalmic surgeries per
month
921 1069
% of days when one or more drugs
in Essential Drug List (EDL) were
not available
1 to 5 1 to 2
Lead time to replenish drugs in EDL
(number of days after request is
placed)
1 to 3 2
Number of eyes collected in EYE
BANK per month (Ave monthly
basis)
30 NA
% of eye bank units passing quality
check per month100% 100%
Percentage of complaints
redressed within 15 days
100% 100%
Number of complaints received
from people/patients38 NA
16 Guru Nanak Eye
Centre
4841
(R-3941,
C-900)
Ongoing Provision of
secondary and
tertiary health
services to people
32,362
Number of units utilized for
implant of Cornea in patients
per month
(No target can
be fixed as it
solely depends
up on the
voluntary
donations and
eyes collected
from the
deceased).
Average number of patients
who received free medicines
per month
30,029
18 NA
Guru Nanak Eye Centre 161NA : Not Available
NR : Not Responded
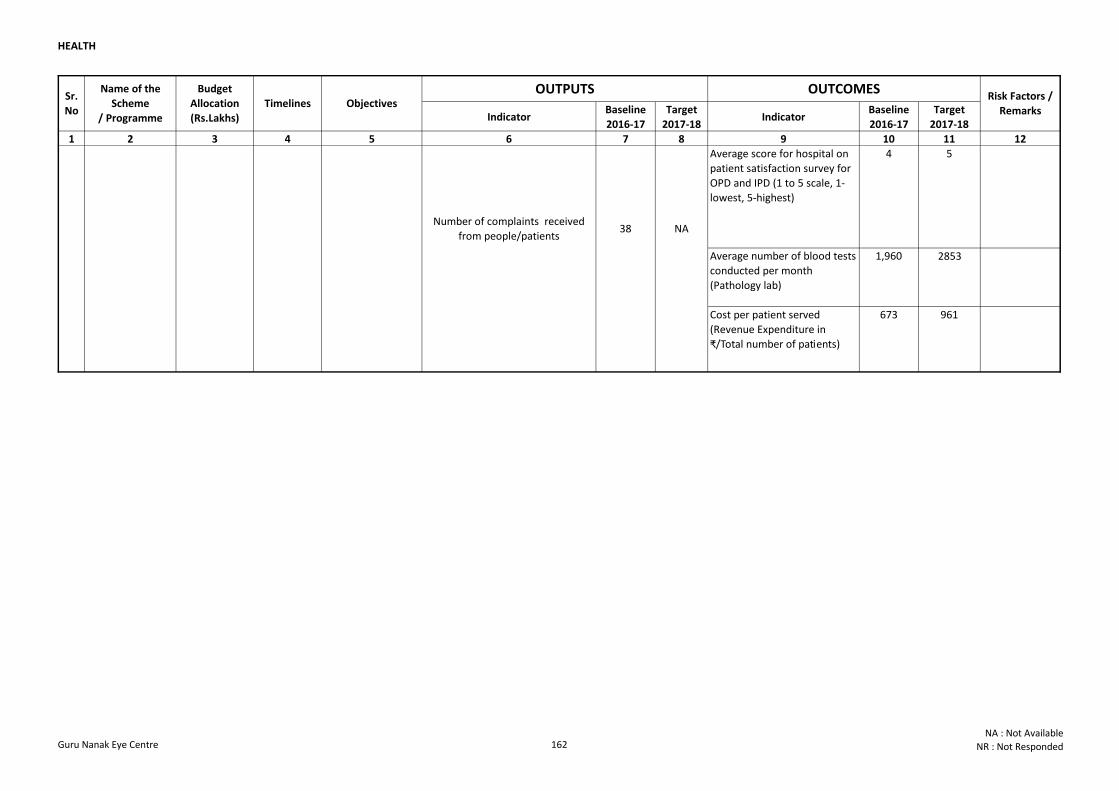
HEALTH
Indicator Baseline
2016-17
Target
2017-18Indicator
Baseline
2016-17
Target
2017-18
1 2 3 4 5 6 7 8 9 10 11 12
Sr.
No
Name of the
Scheme
/ Programme
Budget
Allocation
(Rs.Lakhs)
Timelines Objectives OUTPUTS OUTCOMES
Risk Factors /
Remarks
Average score for hospital on
patient satisfaction survey for
OPD and IPD (1 to 5 scale, 1-
lowest, 5-highest)
4 5
Average number of blood tests
conducted per month
(Pathology lab)
1,960 2853
Cost per patient served
(Revenue Expenditure in
₹/Total number of patients)
673 961
Number of complaints received
from people/patients38 NA
16 Guru Nanak Eye
Centre
4841
(R-3941,
C-900)
Ongoing Provision of
secondary and
tertiary health
services to people
Guru Nanak Eye Centre 162NA : Not Available
NR : Not Responded
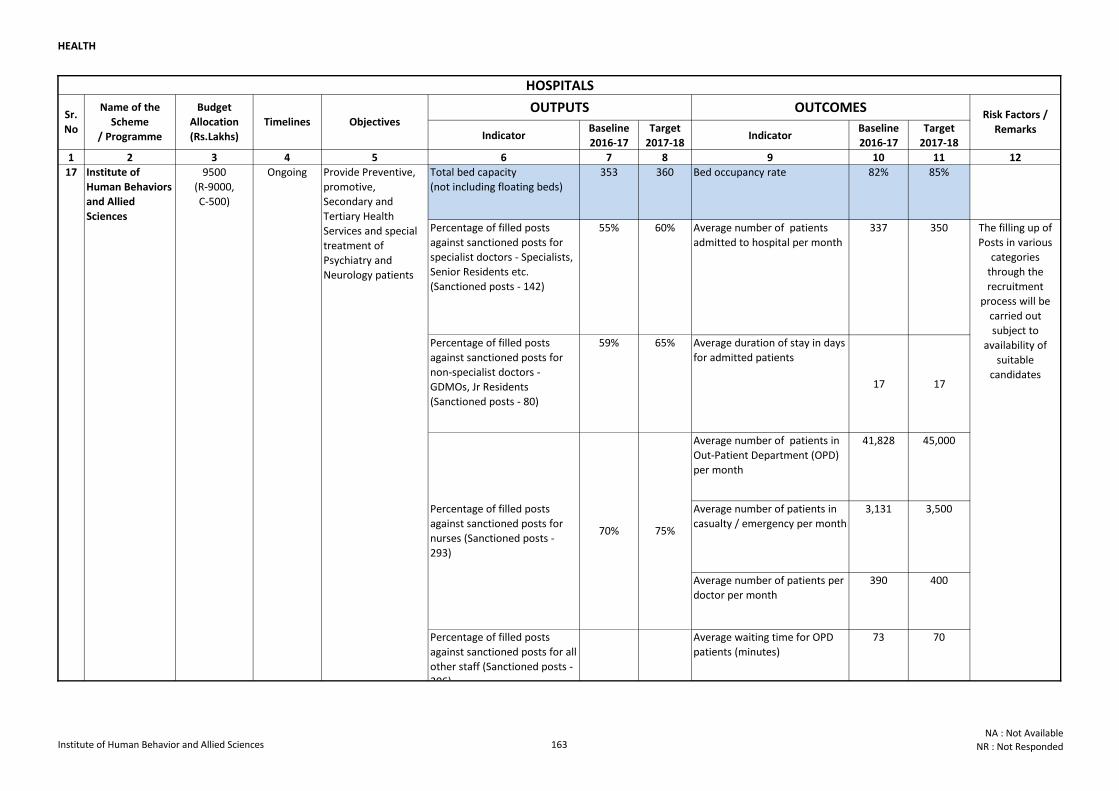
HEALTH
Indicator Baseline
2016-17
Target
2017-18Indicator
Baseline
2016-17
Target
2017-18
1 2 3 4 5 6 7 8 9 10 11 12
Total bed capacity
(not including floating beds)
353 360 Bed occupancy rate 82% 85%
Percentage of filled posts
against sanctioned posts for
specialist doctors - Specialists,
Senior Residents etc.
(Sanctioned posts - 142)
55% 60% Average number of patients
admitted to hospital per month
337 350
Percentage of filled posts
against sanctioned posts for
non-specialist doctors -
GDMOs, Jr Residents
(Sanctioned posts - 80)
59% 65% Average duration of stay in days
for admitted patients
17 17
Average number of patients in
Out-Patient Department (OPD)
per month
41,828 45,000
Average number of patients in
casualty / emergency per month
3,131 3,500
Average number of patients per
doctor per month
390 400
Average waiting time for OPD
patients (minutes)
73 70
The filling up of
Posts in various
categories
through the
recruitment
process will be
carried out
subject to
availability of
suitable
candidates
Percentage of filled posts
against sanctioned posts for
nurses (Sanctioned posts -
293)
70% 75%
Percentage of filled posts
against sanctioned posts for all
other staff (Sanctioned posts -
306)
58% 65%
17 Institute of
Human Behaviors
and Allied
Sciences
9500
(R-9000,
C-500)
Ongoing Provide Preventive,
promotive,
Secondary and
Tertiary Health
Services and special
treatment of
Psychiatry and
Neurology patients
HOSPITALS
Sr.
No
Name of the
Scheme
/ Programme
Budget
Allocation
(Rs.Lakhs)
Timelines Objectives OUTPUTS OUTCOMES
Risk Factors /
Remarks
Institute of Human Behavior and Allied Sciences 163NA : Not Available
NR : Not Responded
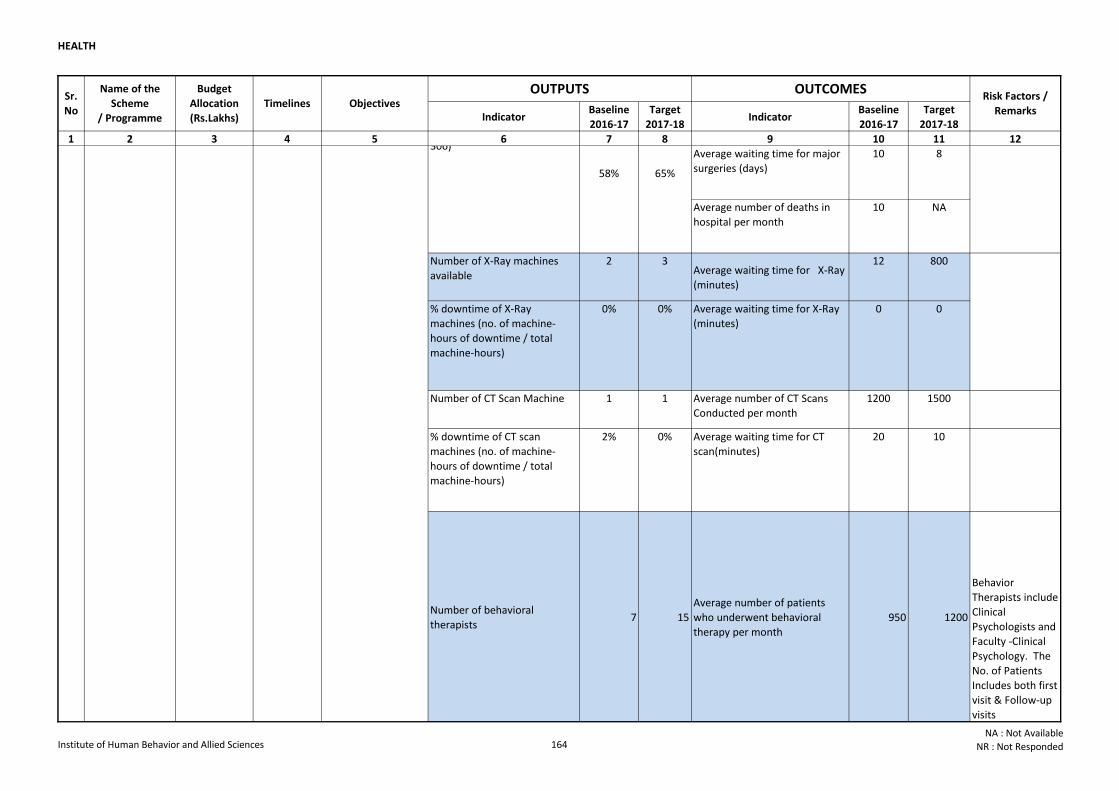
HEALTH
Indicator Baseline
2016-17
Target
2017-18Indicator
Baseline
2016-17
Target
2017-18
1 2 3 4 5 6 7 8 9 10 11 12
Sr.
No
Name of the
Scheme
/ Programme
Budget
Allocation
(Rs.Lakhs)
Timelines Objectives OUTPUTS OUTCOMES
Risk Factors /
Remarks
Average waiting time for major
surgeries (days)
10 8
Average number of deaths in
hospital per month
10 NA
Number of X-Ray machines
available
2 3Average waiting time for X-Ray
(minutes)
12 800
% downtime of X-Ray
machines (no. of machine-
hours of downtime / total
machine-hours)
0% 0% Average waiting time for X-Ray
(minutes)
0 0
Number of CT Scan Machine 1 1 Average number of CT Scans
Conducted per month
1200 1500
% downtime of CT scan
machines (no. of machine-
hours of downtime / total
machine-hours)
2% 0% Average waiting time for CT
scan(minutes)
20 10
Number of behavioral
therapists7 15
Average number of patients
who underwent behavioral
therapy per month
950 1200
Behavior
Therapists include
Clinical
Psychologists and
Faculty -Clinical
Psychology. The
No. of Patients
Includes both first
visit & Follow-up
visits
The filling up of
Posts in various
categories
through the
recruitment
process will be
carried out
subject to
availability of
suitable
candidates
Percentage of filled posts
against sanctioned posts for all
other staff (Sanctioned posts -
306)
58% 65%
17 Institute of
Human Behaviors
and Allied
Sciences
9500
(R-9000,
C-500)
Ongoing Provide Preventive,
promotive,
Secondary and
Tertiary Health
Services and special
treatment of
Psychiatry and
Neurology patients
Institute of Human Behavior and Allied Sciences 164NA : Not Available
NR : Not Responded
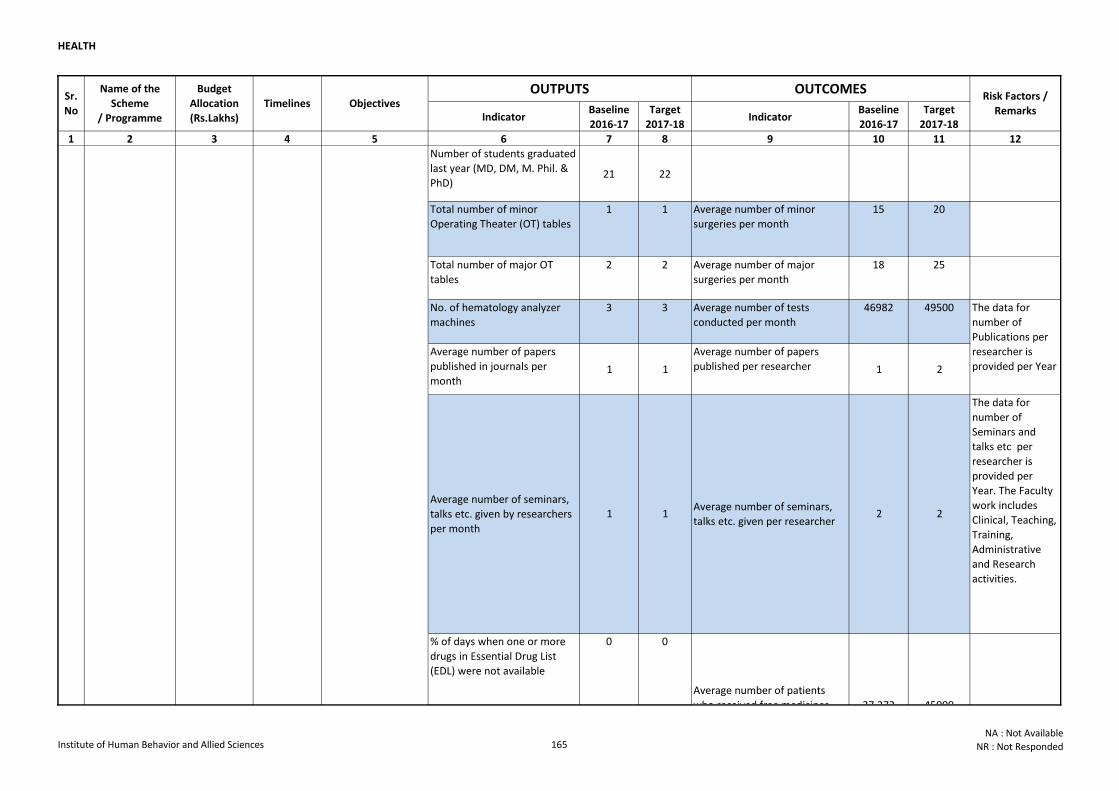
HEALTH
Indicator Baseline
2016-17
Target
2017-18Indicator
Baseline
2016-17
Target
2017-18
1 2 3 4 5 6 7 8 9 10 11 12
Sr.
No
Name of the
Scheme
/ Programme
Budget
Allocation
(Rs.Lakhs)
Timelines Objectives OUTPUTS OUTCOMES
Risk Factors /
Remarks
Number of students graduated
last year (MD, DM, M. Phil. &
PhD)21 22
Total number of minor
Operating Theater (OT) tables
1 1 Average number of minor
surgeries per month
15 20
Total number of major OT
tables
2 2 Average number of major
surgeries per month
18 25
No. of hematology analyzer
machines
3 3 Average number of tests
conducted per month
46982 49500
Average number of papers
published in journals per
month1 1
Average number of papers
published per researcher 1 2
% of days when one or more
drugs in Essential Drug List
(EDL) were not available
0 0
Average number of seminars,
talks etc. given by researchers
per month
1 1Average number of seminars,
talks etc. given per researcher2
The data for
number of
Publications per
researcher is
provided per Year
Average number of patients
who received free medicines
per month
37,272 45000
The data for
number of
Seminars and
talks etc per
researcher is
provided per
Year. The Faculty
work includes
Clinical, Teaching,
Training,
Administrative
and Research
activities.
2
17 Institute of
Human Behaviors
and Allied
Sciences
9500
(R-9000,
C-500)
Ongoing Provide Preventive,
promotive,
Secondary and
Tertiary Health
Services and special
treatment of
Psychiatry and
Neurology patients
Institute of Human Behavior and Allied Sciences 165NA : Not Available
NR : Not Responded
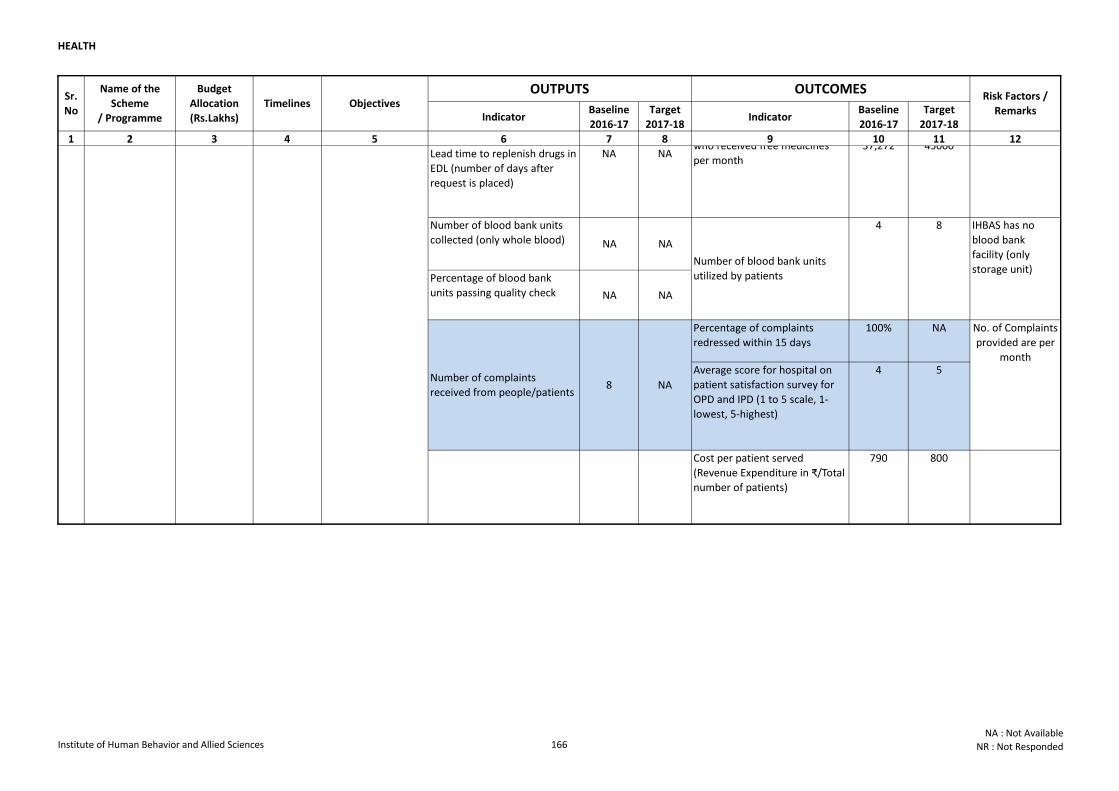
HEALTH
Indicator Baseline
2016-17
Target
2017-18Indicator
Baseline
2016-17
Target
2017-18
1 2 3 4 5 6 7 8 9 10 11 12
Sr.
No
Name of the
Scheme
/ Programme
Budget
Allocation
(Rs.Lakhs)
Timelines Objectives OUTPUTS OUTCOMES
Risk Factors /
Remarks
Lead time to replenish drugs in
EDL (number of days after
request is placed)
NA NA
Number of blood bank units
collected (only whole blood) NA NA
Percentage of blood bank
units passing quality check NA NA
Percentage of complaints
redressed within 15 days
100% NA
Average score for hospital on
patient satisfaction survey for
OPD and IPD (1 to 5 scale, 1-
lowest, 5-highest)
4 5
Cost per patient served
(Revenue Expenditure in ₹/Total
number of patients)
790 800
Number of blood bank units
utilized by patients
4 8 IHBAS has no
blood bank
facility (only
storage unit)
Number of complaints
received from people/patients8 NA
No. of Complaints
provided are per
month
Average number of patients
who received free medicines
per month
37,272 45000
17 Institute of
Human Behaviors
and Allied
Sciences
9500
(R-9000,
C-500)
Ongoing Provide Preventive,
promotive,
Secondary and
Tertiary Health
Services and special
treatment of
Psychiatry and
Neurology patients
Institute of Human Behavior and Allied Sciences 166NA : Not Available
NR : Not Responded
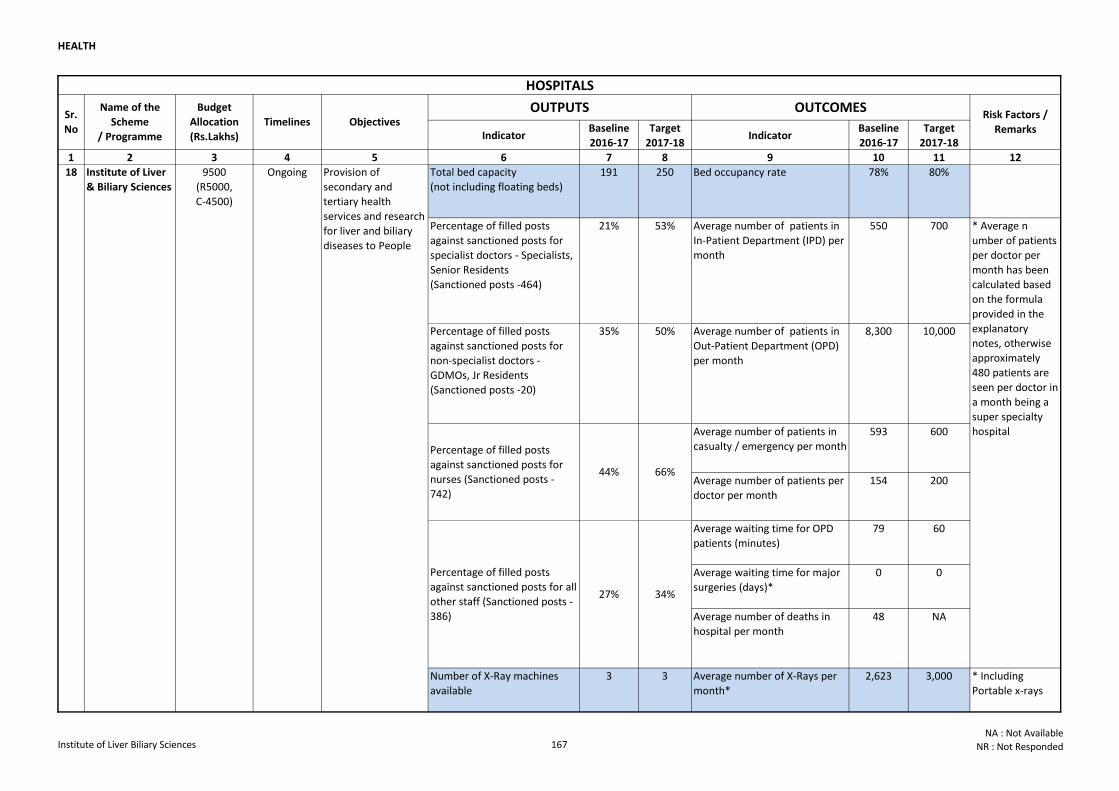
HEALTH
Indicator Baseline
2016-17
Target
2017-18Indicator
Baseline
2016-17
Target
2017-18
1 2 3 4 5 6 7 8 9 10 11 12
Total bed capacity
(not including floating beds)
191 250 Bed occupancy rate 78% 80%
Percentage of filled posts
against sanctioned posts for
specialist doctors - Specialists,
Senior Residents
(Sanctioned posts -464)
21% 53% Average number of patients in
In-Patient Department (IPD) per
month
550 700
Percentage of filled posts
against sanctioned posts for
non-specialist doctors -
GDMOs, Jr Residents
(Sanctioned posts -20)
35% 50% Average number of patients in
Out-Patient Department (OPD)
per month
8,300 10,000
Average number of patients in
casualty / emergency per month
593 600
Average number of patients per
doctor per month
154 200
Average waiting time for OPD
patients (minutes)
79 60
Average waiting time for major
surgeries (days)*
0 0
Average number of deaths in
hospital per month
48 NA
Number of X-Ray machines
available
3 3 Average number of X-Rays per
month*
2,623 3,000 * Including
Portable x-rays
* Average n
umber of patients
per doctor per
month has been
calculated based
on the formula
provided in the
explanatory
notes, otherwise
approximately
480 patients are
seen per doctor in
a month being a
super specialty
hospital
Percentage of filled posts
against sanctioned posts for
nurses (Sanctioned posts -
742)
44% 66%
Percentage of filled posts
against sanctioned posts for all
other staff (Sanctioned posts -
386)
27% 34%
18 Institute of Liver
& Biliary Sciences
9500
(R5000,
C-4500)
Ongoing Provision of
secondary and
tertiary health
services and research
for liver and biliary
diseases to People
HOSPITALS
Sr.
No
Name of the
Scheme
/ Programme
Budget
Allocation
(Rs.Lakhs)
Timelines Objectives OUTPUTS OUTCOMES
Risk Factors /
Remarks
Institute of Liver Biliary Sciences 167NA : Not Available
NR : Not Responded
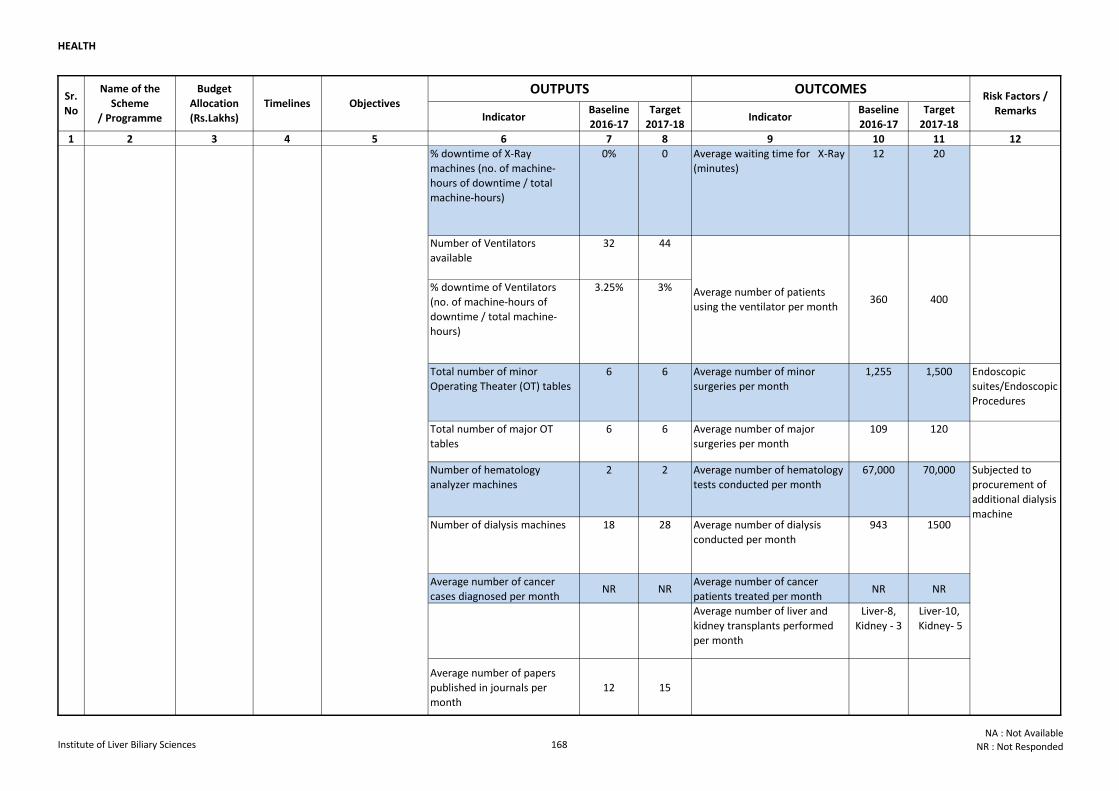
HEALTH
Indicator Baseline
2016-17
Target
2017-18Indicator
Baseline
2016-17
Target
2017-18
1 2 3 4 5 6 7 8 9 10 11 12
Sr.
No
Name of the
Scheme
/ Programme
Budget
Allocation
(Rs.Lakhs)
Timelines Objectives OUTPUTS OUTCOMES
Risk Factors /
Remarks
% downtime of X-Ray
machines (no. of machine-
hours of downtime / total
machine-hours)
0% 0 Average waiting time for X-Ray
(minutes)
12 20
Number of Ventilators
available
32 44
% downtime of Ventilators
(no. of machine-hours of
downtime / total machine-
hours)
3.25% 3%
Total number of minor
Operating Theater (OT) tables
6 6 Average number of minor
surgeries per month
1,255 1,500 Endoscopic
suites/Endoscopic
Procedures
Total number of major OT
tables
6 6 Average number of major
surgeries per month
109 120
Number of hematology
analyzer machines
2 2 Average number of hematology
tests conducted per month
67,000 70,000
Number of dialysis machines 18 28 Average number of dialysis
conducted per month
943 1500
Average number of cancer
cases diagnosed per monthNR NR
Average number of cancer
patients treated per monthNR NR
Average number of liver and
kidney transplants performed
per month
Liver-8,
Kidney - 3
Liver-10,
Kidney- 5
Average number of papers
published in journals per
month
12 15
Subjected to
procurement of
additional dialysis
machine
* Including
Portable x-rays
Average number of patients
using the ventilator per month360 400
18 Institute of Liver
& Biliary Sciences
9500
(R5000,
C-4500)
Ongoing Provision of
secondary and
tertiary health
services and research
for liver and biliary
diseases to People
Institute of Liver Biliary Sciences 168NA : Not Available
NR : Not Responded
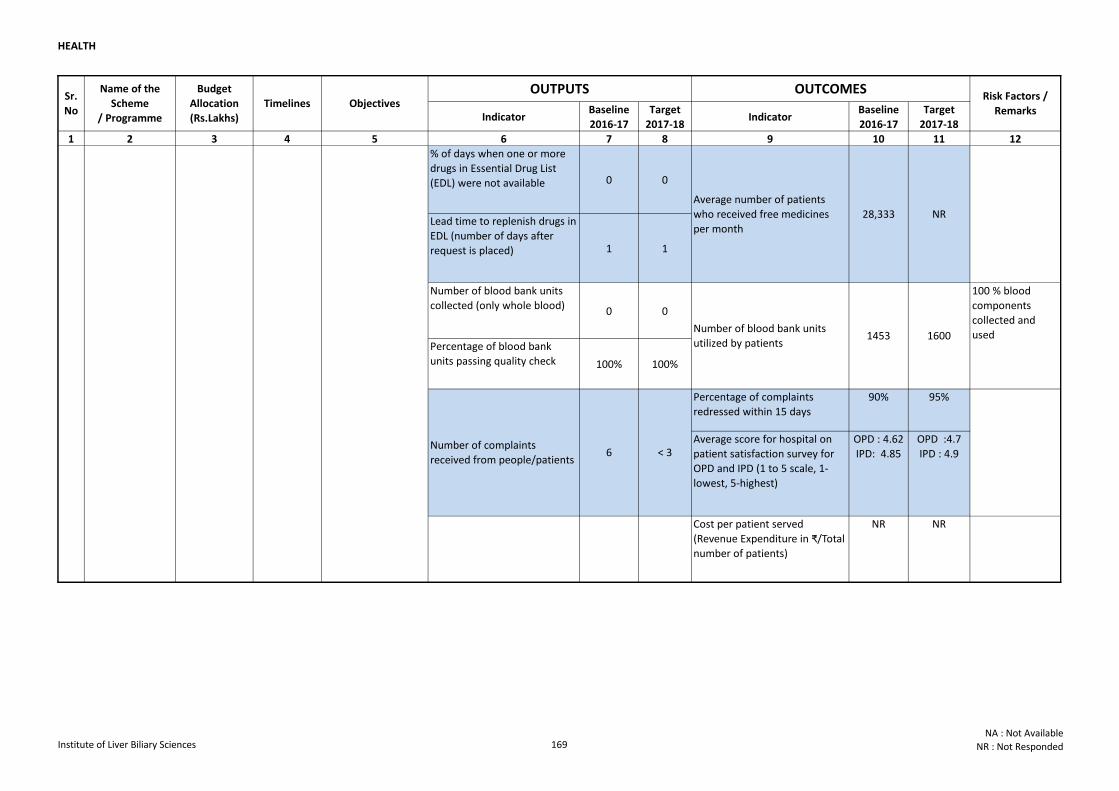
HEALTH
Indicator Baseline
2016-17
Target
2017-18Indicator
Baseline
2016-17
Target
2017-18
1 2 3 4 5 6 7 8 9 10 11 12
Sr.
No
Name of the
Scheme
/ Programme
Budget
Allocation
(Rs.Lakhs)
Timelines Objectives OUTPUTS OUTCOMES
Risk Factors /
Remarks
% of days when one or more
drugs in Essential Drug List
(EDL) were not available 0 0
Lead time to replenish drugs in
EDL (number of days after
request is placed) 1 1
Number of blood bank units
collected (only whole blood) 0 0
Percentage of blood bank
units passing quality check 100% 100%
Percentage of complaints
redressed within 15 days
90% 95%
Average score for hospital on
patient satisfaction survey for
OPD and IPD (1 to 5 scale, 1-
lowest, 5-highest)
OPD : 4.62
IPD: 4.85
OPD :4.7
IPD : 4.9
Cost per patient served
(Revenue Expenditure in ₹/Total
number of patients)
NR NR
Number of complaints
received from people/patients6 < 3
Average number of patients
who received free medicines
per month
28,333 NR
Number of blood bank units
utilized by patients1453 1600
100 % blood
components
collected and
used
18 Institute of Liver
& Biliary Sciences
9500
(R5000,
C-4500)
Ongoing Provision of
secondary and
tertiary health
services and research
for liver and biliary
diseases to People
Institute of Liver Biliary Sciences 169NA : Not Available
NR : Not Responded
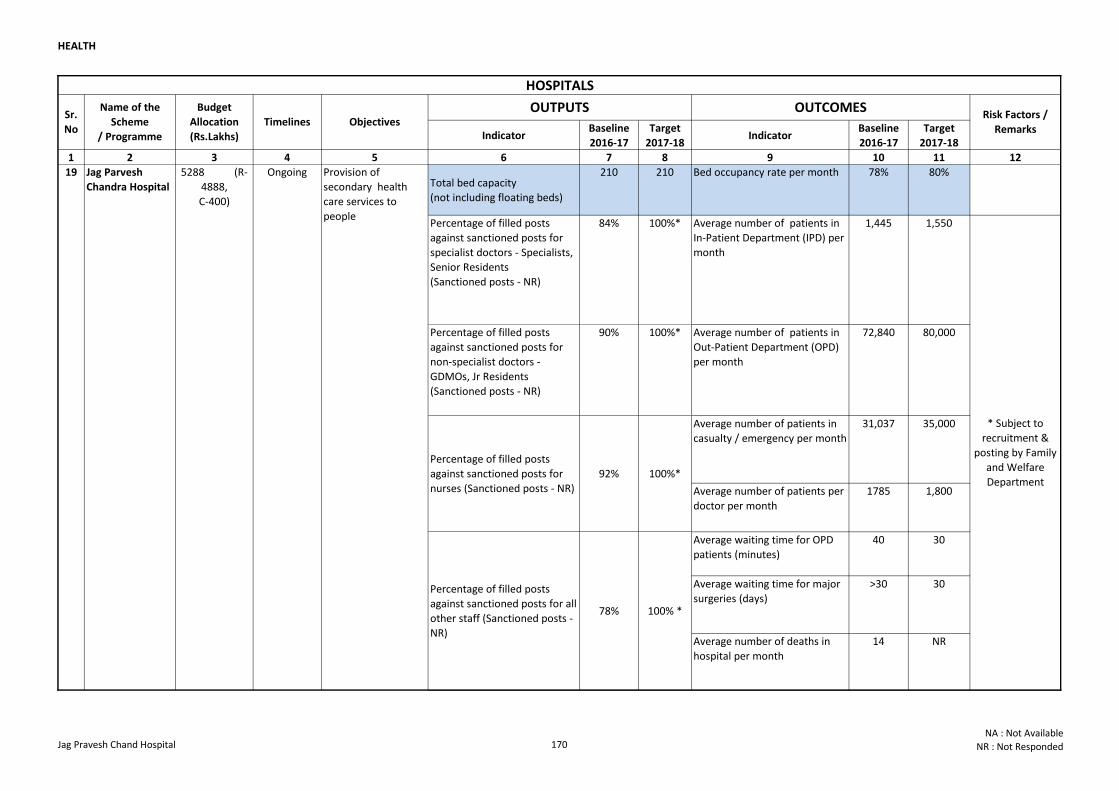
HEALTH
Indicator Baseline
2016-17
Target
2017-18Indicator
Baseline
2016-17
Target
2017-18
1 2 3 4 5 6 7 8 9 10 11 12
Total bed capacity
(not including floating beds)
210 210 Bed occupancy rate per month 78% 80%
Percentage of filled posts
against sanctioned posts for
specialist doctors - Specialists,
Senior Residents
(Sanctioned posts - NR)
84% 100%* Average number of patients in
In-Patient Department (IPD) per
month
1,445 1,550
Percentage of filled posts
against sanctioned posts for
non-specialist doctors -
GDMOs, Jr Residents
(Sanctioned posts - NR)
90% 100%* Average number of patients in
Out-Patient Department (OPD)
per month
72,840 80,000
Average number of patients in
casualty / emergency per month
31,037 35,000
Average number of patients per
doctor per month
1785 1,800
Average waiting time for OPD
patients (minutes)
40 30
Average waiting time for major
surgeries (days)
>30 30
Average number of deaths in
hospital per month
14 NR
* Subject to
recruitment &
posting by Family
and Welfare
Department
Percentage of filled posts
against sanctioned posts for
nurses (Sanctioned posts - NR)
92% 100%*
Percentage of filled posts
against sanctioned posts for all
other staff (Sanctioned posts -
NR)
78% 100% *
19 Jag Parvesh
Chandra Hospital
5288 (R-
4888,
C-400)
Ongoing Provision of
secondary health
care services to
people
HOSPITALS
Sr.
No
Name of the
Scheme
/ Programme
Budget
Allocation
(Rs.Lakhs)
Timelines Objectives OUTPUTS OUTCOMES
Risk Factors /
Remarks
Jag Pravesh Chand Hospital 170NA : Not Available
NR : Not Responded
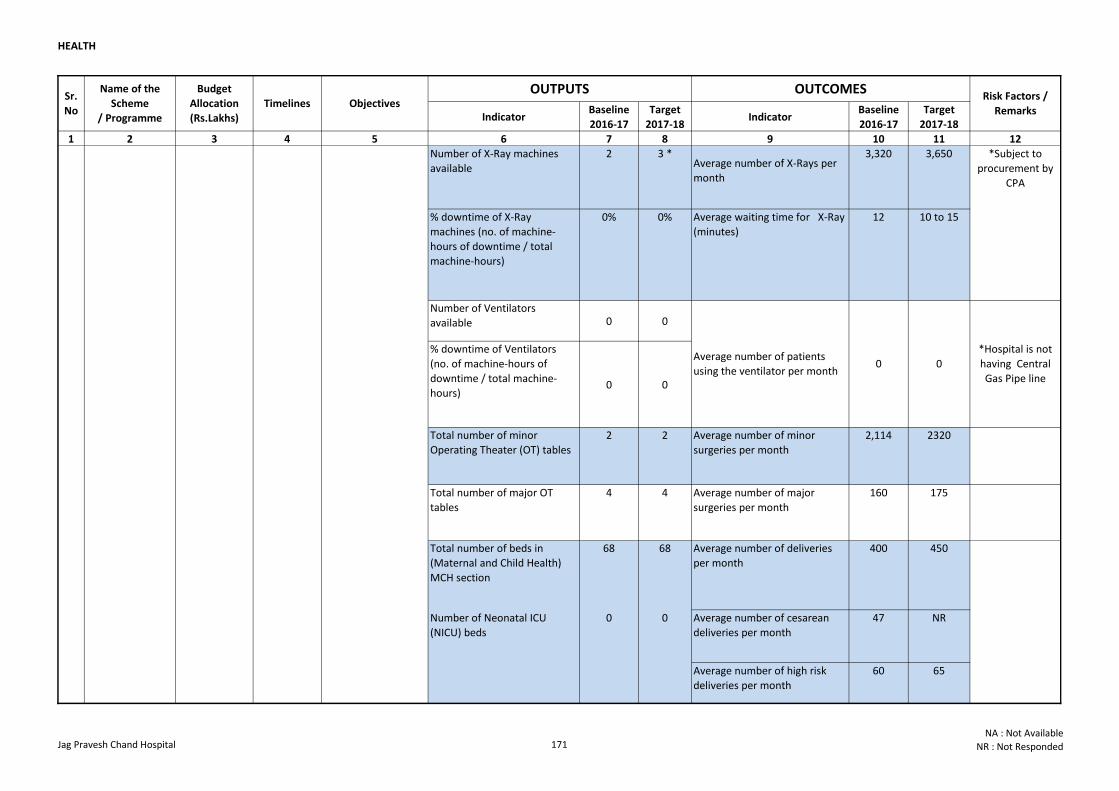
HEALTH
Indicator Baseline
2016-17
Target
2017-18Indicator
Baseline
2016-17
Target
2017-18
1 2 3 4 5 6 7 8 9 10 11 12
Sr.
No
Name of the
Scheme
/ Programme
Budget
Allocation
(Rs.Lakhs)
Timelines Objectives OUTPUTS OUTCOMES
Risk Factors /
Remarks
Number of X-Ray machines
available
2 3 *Average number of X-Rays per
month
3,320 3,650
% downtime of X-Ray
machines (no. of machine-
hours of downtime / total
machine-hours)
0% 0% Average waiting time for X-Ray
(minutes)
12 10 to 15
Number of Ventilators
available 0 0
% downtime of Ventilators
(no. of machine-hours of
downtime / total machine-
hours)0 0
Total number of minor
Operating Theater (OT) tables
2 2 Average number of minor
surgeries per month
2,114 2320
Total number of major OT
tables
4 4 Average number of major
surgeries per month
160 175
Total number of beds in
(Maternal and Child Health)
MCH section
68 68 Average number of deliveries
per month
400 450
Number of Neonatal ICU
(NICU) beds
0 0 Average number of cesarean
deliveries per month
47 NR
Average number of high risk
deliveries per month
60 65
0Number of Pediatric ICU (PICU)
beds0
Average number of patients
using the ventilator per month0
*Subject to
procurement by
CPA
0
*Hospital is not
having Central
Gas Pipe line
19 Jag Parvesh
Chandra Hospital
5288 (R-
4888,
C-400)
Ongoing Provision of
secondary health
care services to
people
Jag Pravesh Chand Hospital 171NA : Not Available
NR : Not Responded
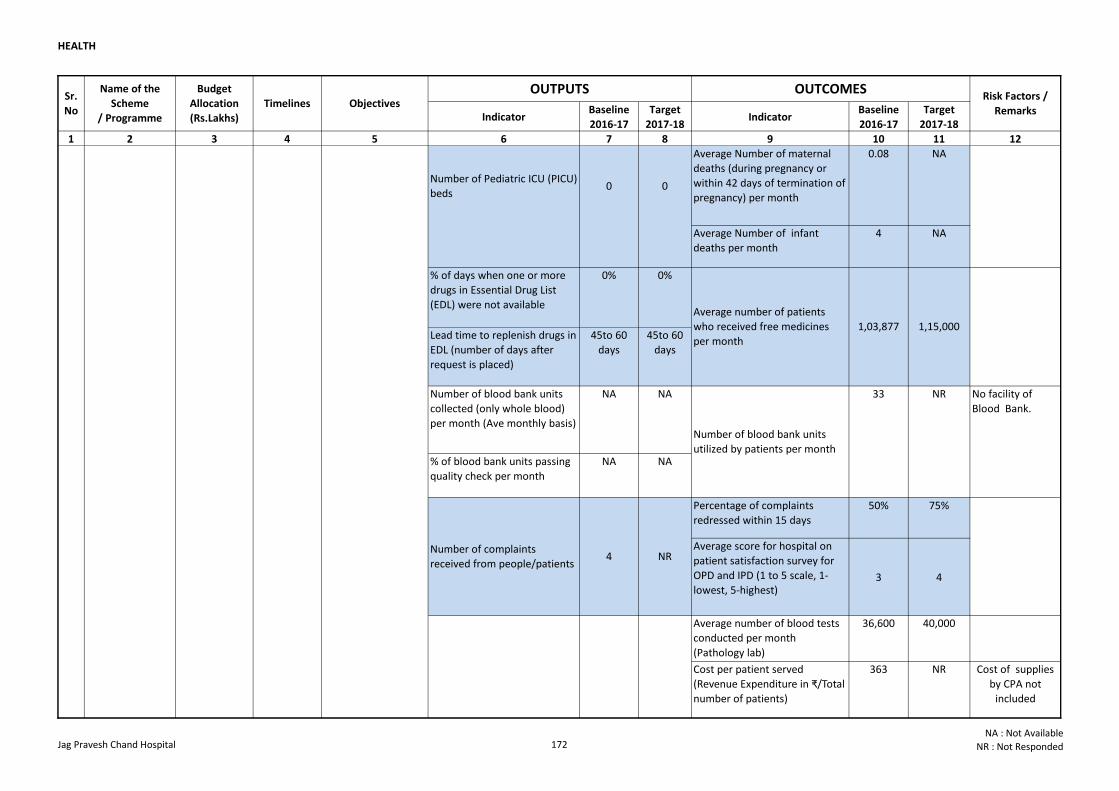
HEALTH
Indicator Baseline
2016-17
Target
2017-18Indicator
Baseline
2016-17
Target
2017-18
1 2 3 4 5 6 7 8 9 10 11 12
Sr.
No
Name of the
Scheme
/ Programme
Budget
Allocation
(Rs.Lakhs)
Timelines Objectives OUTPUTS OUTCOMES
Risk Factors /
Remarks
Average Number of maternal
deaths (during pregnancy or
within 42 days of termination of
pregnancy) per month
0.08 NA
Average Number of infant
deaths per month
4 NA
% of days when one or more
drugs in Essential Drug List
(EDL) were not available
0% 0%
Lead time to replenish drugs in
EDL (number of days after
request is placed)
45to 60
days
45to 60
days
Number of blood bank units
collected (only whole blood)
per month (Ave monthly basis)
NA NA
% of blood bank units passing
quality check per month
NA NA
Percentage of complaints
redressed within 15 days
50% 75%
Average score for hospital on
patient satisfaction survey for
OPD and IPD (1 to 5 scale, 1-
lowest, 5-highest)3 4
Average number of blood tests
conducted per month
(Pathology lab)
36,600 40,000
Cost per patient served
(Revenue Expenditure in ₹/Total
number of patients)
363 NR Cost of supplies
by CPA not
included
Number of complaints
received from people/patients4 NR
1,15,000
Number of blood bank units
utilized by patients per month
33 NR No facility of
Blood Bank.
Average number of patients
who received free medicines
per month
1,03,877
0Number of Pediatric ICU (PICU)
beds0
19 Jag Parvesh
Chandra Hospital
5288 (R-
4888,
C-400)
Ongoing Provision of
secondary health
care services to
people
Jag Pravesh Chand Hospital 172NA : Not Available
NR : Not Responded
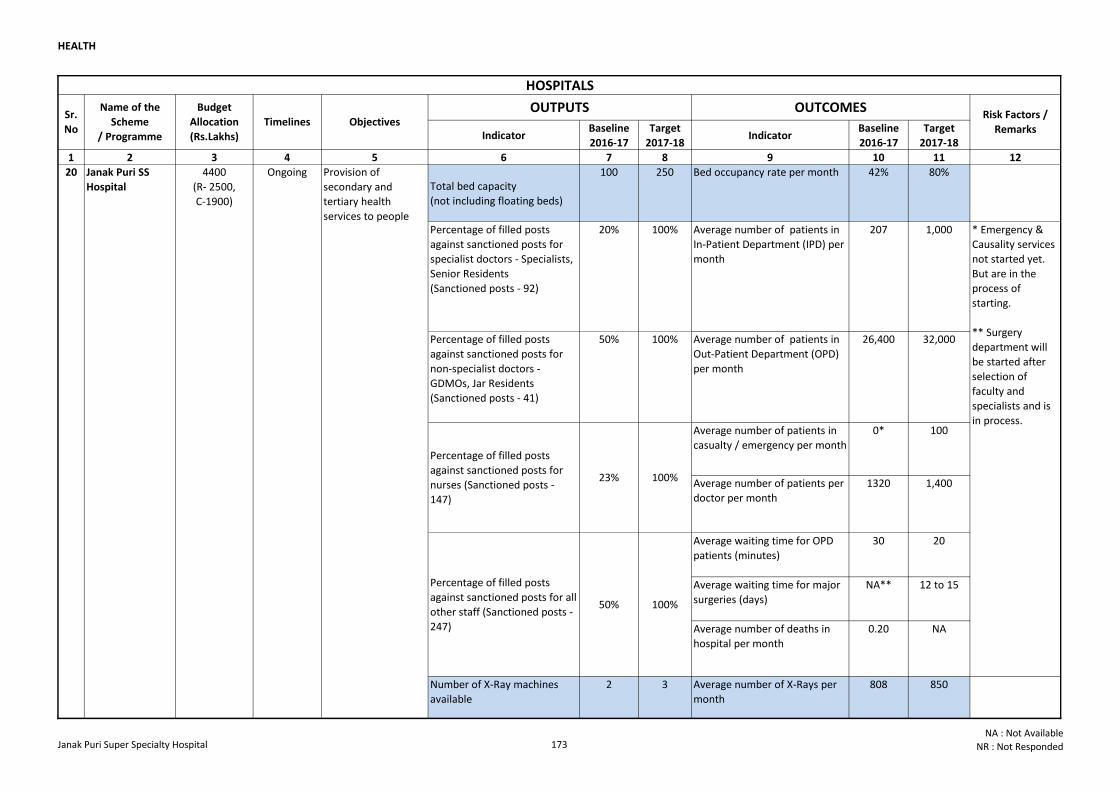
HEALTH
Indicator Baseline
2016-17
Target
2017-18Indicator
Baseline
2016-17
Target
2017-18
1 2 3 4 5 6 7 8 9 10 11 12
Total bed capacity
(not including floating beds)
100 250 Bed occupancy rate per month 42% 80%
Percentage of filled posts
against sanctioned posts for
specialist doctors - Specialists,
Senior Residents
(Sanctioned posts - 92)
20% 100% Average number of patients in
In-Patient Department (IPD) per
month
207 1,000
Percentage of filled posts
against sanctioned posts for
non-specialist doctors -
GDMOs, Jar Residents
(Sanctioned posts - 41)
50% 100% Average number of patients in
Out-Patient Department (OPD)
per month
26,400 32,000
Average number of patients in
casualty / emergency per month
0* 100
Average number of patients per
doctor per month
1320 1,400
Average waiting time for OPD
patients (minutes)
30 20
Average waiting time for major
surgeries (days)
NA** 12 to 15
Average number of deaths in
hospital per month
0.20 NA
Number of X-Ray machines
available
2 3 Average number of X-Rays per
month
808 850
* Emergency &
Causality services
not started yet.
But are in the
process of
starting.
** Surgery
department will
be started after
selection of
faculty and
specialists and is
in process.
Percentage of filled posts
against sanctioned posts for
nurses (Sanctioned posts -
147)
23% 100%
Percentage of filled posts
against sanctioned posts for all
other staff (Sanctioned posts -
247)
50% 100%
20 Janak Puri SS
Hospital
4400
(R- 2500,
C-1900)
Ongoing Provision of
secondary and
tertiary health
services to people
HOSPITALS
Sr.
No
Name of the
Scheme
/ Programme
Budget
Allocation
(Rs.Lakhs)
Timelines Objectives OUTPUTS OUTCOMES
Risk Factors /
Remarks
Janak Puri Super Specialty Hospital 173NA : Not Available
NR : Not Responded

HEALTH
Indicator Baseline
2016-17
Target
2017-18Indicator
Baseline
2016-17
Target
2017-18
1 2 3 4 5 6 7 8 9 10 11 12
Sr.
No
Name of the
Scheme
/ Programme
Budget
Allocation
(Rs.Lakhs)
Timelines Objectives OUTPUTS OUTCOMES
Risk Factors /
Remarks
% downtime of X-Ray
machines (no. of machine-
hours of downtime / total
machine-hours)
0% 0% Average waiting time for X-Ray
(minutes)
12 10
Number of Ventilators
available10 30
% downtime of Ventilators
(no. of machine-hours of
downtime / total machine-
hours)
0 0
Total number of minor
Operating Theater (OT) tables
5 5 Average number of minor
surgeries per month
0* 10
Total number of major OT
tables
7 7 Average number of major
surgeries per month
0* 15
Total number of beds in
(Maternal and Child Health)
MCH section
NA NA Average number of deliveries
per month
NA NA
Number of Neonatal ICU
(NICU) beds
NA NA Average number of cesarean
deliveries per month
NA NA
Average number of high risk
deliveries per month
NA NA
Number of maternal deaths
(during pregnancy or within 42
days of termination of
pregnancy) per month
NA NA
Number of Neo-natal infant
deaths per month
NA NA
NA:- These
services are not
available in JSSHS.
Number of Pediatric ICU (PICU)
bedsNA NA
*Services are yet
to start.
Average number of patients
using the ventilator per month2 to 3 7 to 8
20 Janak Puri SS
Hospital
4400
(R- 2500,
C-1900)
Ongoing Provision of
secondary and
tertiary health
services to people
Janak Puri Super Specialty Hospital 174NA : Not Available
NR : Not Responded
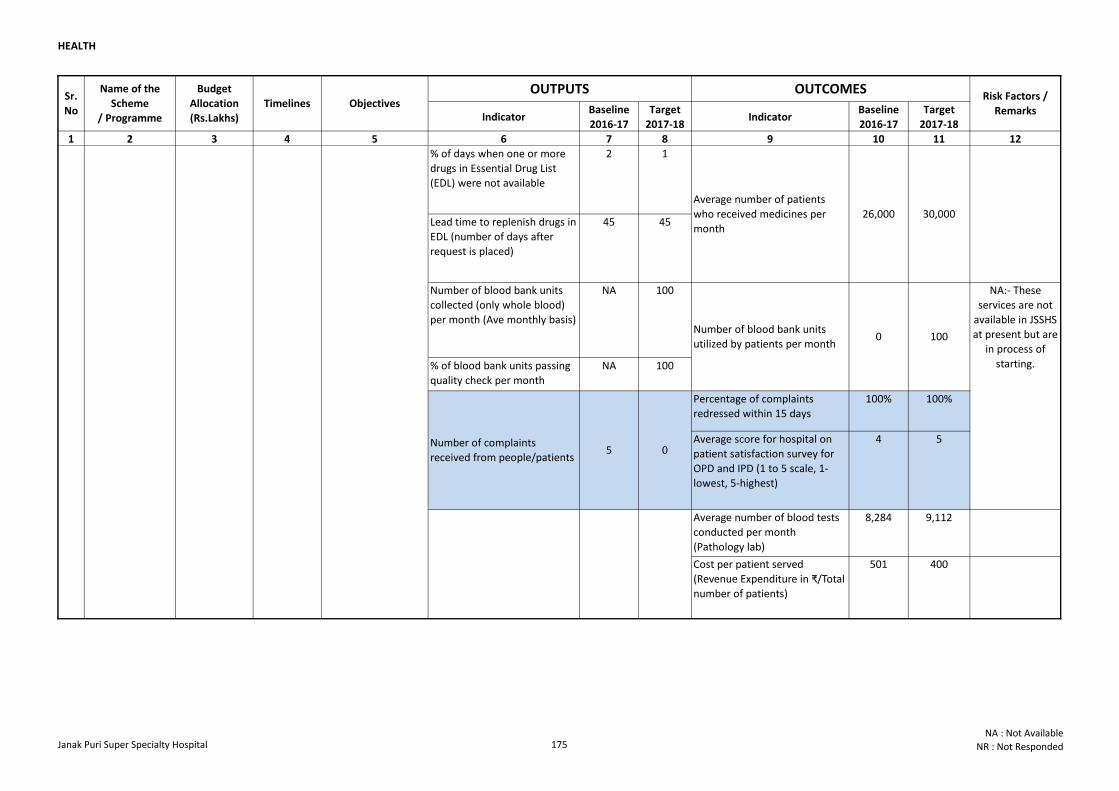
HEALTH
Indicator Baseline
2016-17
Target
2017-18Indicator
Baseline
2016-17
Target
2017-18
1 2 3 4 5 6 7 8 9 10 11 12
Sr.
No
Name of the
Scheme
/ Programme
Budget
Allocation
(Rs.Lakhs)
Timelines Objectives OUTPUTS OUTCOMES
Risk Factors /
Remarks
% of days when one or more
drugs in Essential Drug List
(EDL) were not available
2 1
Lead time to replenish drugs in
EDL (number of days after
request is placed)
45 45
Number of blood bank units
collected (only whole blood)
per month (Ave monthly basis)
NA 100
% of blood bank units passing
quality check per month
NA 100
Percentage of complaints
redressed within 15 days
100% 100%
Average score for hospital on
patient satisfaction survey for
OPD and IPD (1 to 5 scale, 1-
lowest, 5-highest)
4 5
Average number of blood tests
conducted per month
(Pathology lab)
8,284 9,112
Cost per patient served
(Revenue Expenditure in ₹/Total
number of patients)
501 400
Number of blood bank units
utilized by patients per month0 100
NA:- These
services are not
available in JSSHS
at present but are
in process of
starting.
Number of complaints
received from people/patients5 0
Average number of patients
who received medicines per
month
26,000 30,000
20 Janak Puri SS
Hospital
4400
(R- 2500,
C-1900)
Ongoing Provision of
secondary and
tertiary health
services to people
Janak Puri Super Specialty Hospital 175NA : Not Available
NR : Not Responded
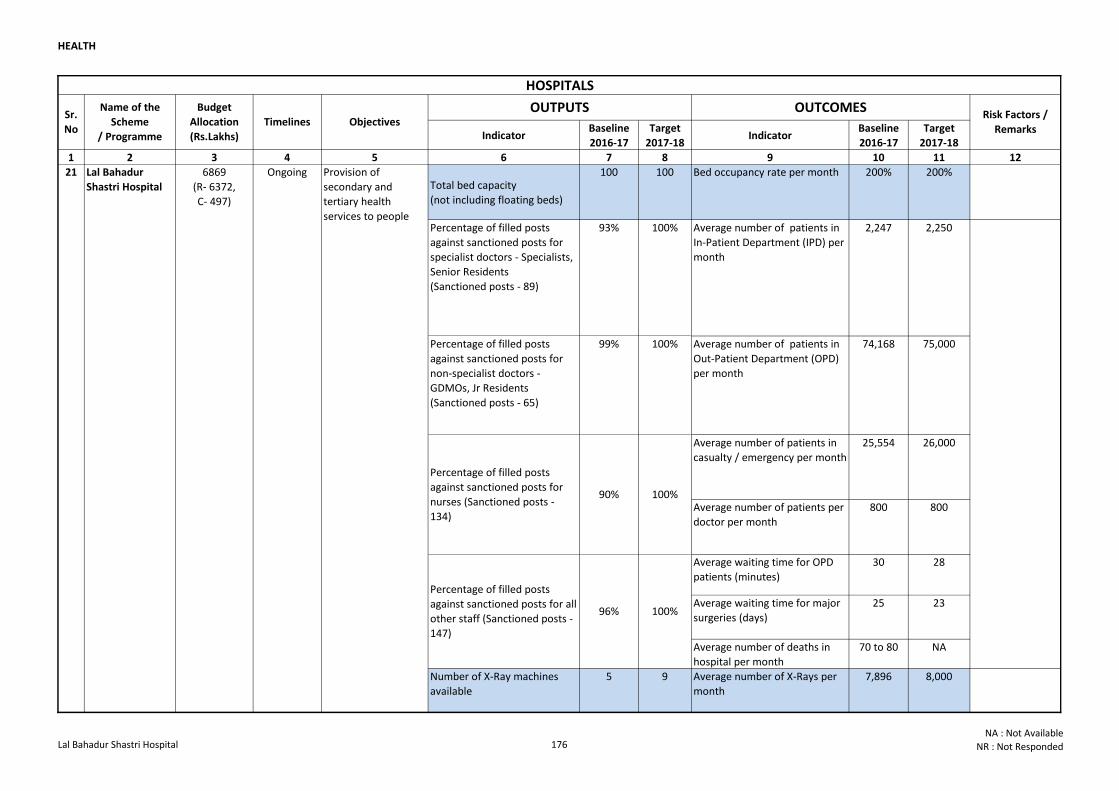
HEALTH
Indicator Baseline
2016-17
Target
2017-18Indicator
Baseline
2016-17
Target
2017-18
1 2 3 4 5 6 7 8 9 10 11 12
Total bed capacity
(not including floating beds)
100 100 Bed occupancy rate per month 200% 200%
Percentage of filled posts
against sanctioned posts for
specialist doctors - Specialists,
Senior Residents
(Sanctioned posts - 89)
93% 100% Average number of patients in
In-Patient Department (IPD) per
month
2,247 2,250
Percentage of filled posts
against sanctioned posts for
non-specialist doctors -
GDMOs, Jr Residents
(Sanctioned posts - 65)
99% 100% Average number of patients in
Out-Patient Department (OPD)
per month
74,168 75,000
Average number of patients in
casualty / emergency per month
25,554 26,000
Average number of patients per
doctor per month
800 800
Average waiting time for OPD
patients (minutes)
30 28
Average waiting time for major
surgeries (days)
25 23
Average number of deaths in
hospital per month
70 to 80 NA
Number of X-Ray machines
available
5 9 Average number of X-Rays per
month
7,896 8,000
Percentage of filled posts
against sanctioned posts for
nurses (Sanctioned posts -
134)
90% 100%
Percentage of filled posts
against sanctioned posts for all
other staff (Sanctioned posts -
147)
96% 100%
21 Lal Bahadur
Shastri Hospital
6869
(R- 6372,
C- 497)
Ongoing Provision of
secondary and
tertiary health
services to people
HOSPITALS
Sr.
No
Name of the
Scheme
/ Programme
Budget
Allocation
(Rs.Lakhs)
Timelines Objectives OUTPUTS OUTCOMES
Risk Factors /
Remarks
Lal Bahadur Shastri Hospital 176NA : Not Available
NR : Not Responded
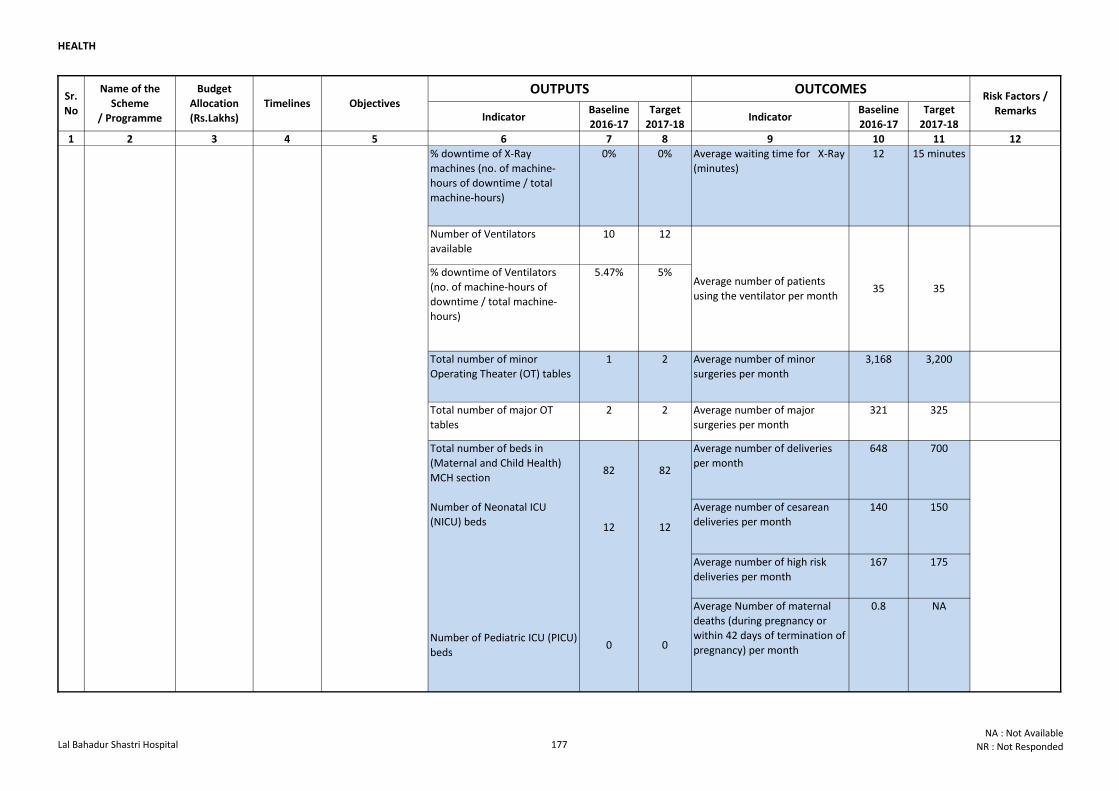
HEALTH
Indicator Baseline
2016-17
Target
2017-18Indicator
Baseline
2016-17
Target
2017-18
1 2 3 4 5 6 7 8 9 10 11 12
Sr.
No
Name of the
Scheme
/ Programme
Budget
Allocation
(Rs.Lakhs)
Timelines Objectives OUTPUTS OUTCOMES
Risk Factors /
Remarks
% downtime of X-Ray
machines (no. of machine-
hours of downtime / total
machine-hours)
0% 0% Average waiting time for X-Ray
(minutes)
12 15 minutes
Number of Ventilators
available
10 12
% downtime of Ventilators
(no. of machine-hours of
downtime / total machine-
hours)
5.47% 5%
Total number of minor
Operating Theater (OT) tables
1 2 Average number of minor
surgeries per month
3,168 3,200
Total number of major OT
tables
2 2 Average number of major
surgeries per month
321 325
Total number of beds in
(Maternal and Child Health)
MCH section82 82
Average number of deliveries
per month
648 700
Number of Neonatal ICU
(NICU) beds 12 12
Average number of cesarean
deliveries per month
140 150
Average number of high risk
deliveries per month
167 175
Average Number of maternal
deaths (during pregnancy or
within 42 days of termination of
pregnancy) per month
0.8 NA
Number of Pediatric ICU (PICU)
beds0 0
Average number of patients
using the ventilator per month35 35
21 Lal Bahadur
Shastri Hospital
6869
(R- 6372,
C- 497)
Ongoing Provision of
secondary and
tertiary health
services to people
Lal Bahadur Shastri Hospital 177NA : Not Available
NR : Not Responded
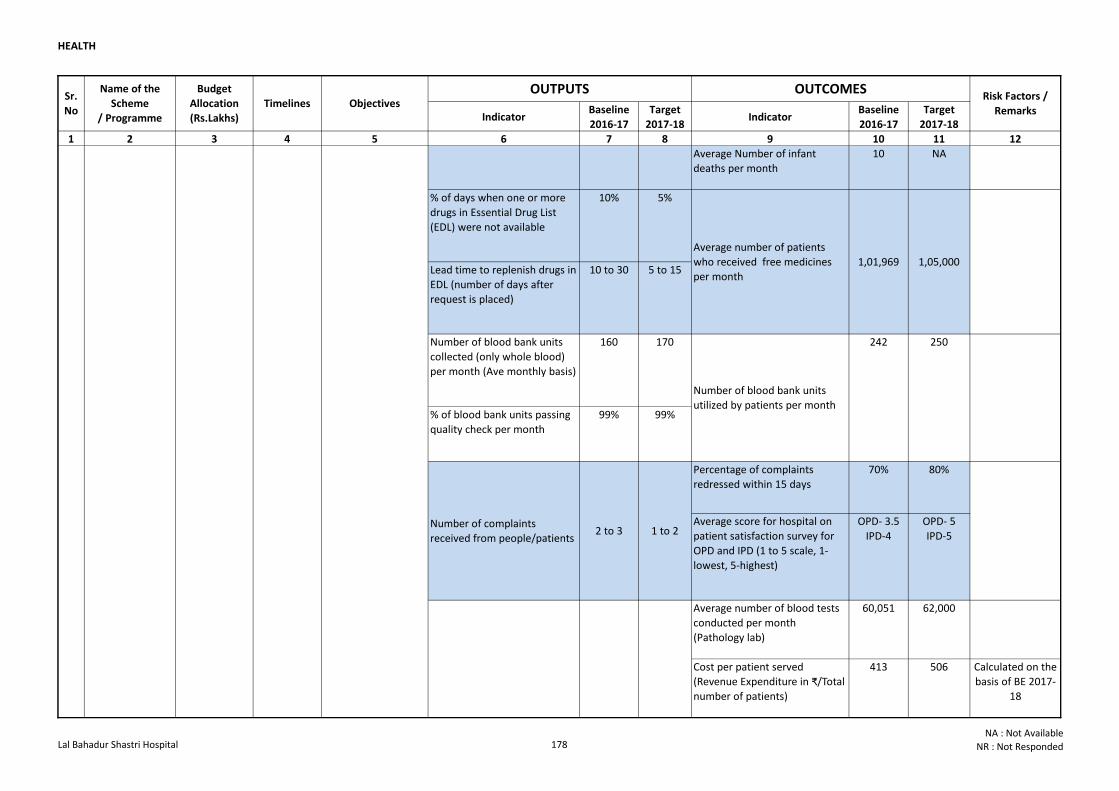
HEALTH
Indicator Baseline
2016-17
Target
2017-18Indicator
Baseline
2016-17
Target
2017-18
1 2 3 4 5 6 7 8 9 10 11 12
Sr.
No
Name of the
Scheme
/ Programme
Budget
Allocation
(Rs.Lakhs)
Timelines Objectives OUTPUTS OUTCOMES
Risk Factors /
Remarks
Average Number of infant
deaths per month
10 NA
% of days when one or more
drugs in Essential Drug List
(EDL) were not available
10% 5%
Lead time to replenish drugs in
EDL (number of days after
request is placed)
10 to 30 5 to 15
Number of blood bank units
collected (only whole blood)
per month (Ave monthly basis)
160 170
% of blood bank units passing
quality check per month
99% 99%
Percentage of complaints
redressed within 15 days
70% 80%
Average score for hospital on
patient satisfaction survey for
OPD and IPD (1 to 5 scale, 1-
lowest, 5-highest)
OPD- 3.5
IPD-4
OPD- 5
IPD-5
Average number of blood tests
conducted per month
(Pathology lab)
60,051 62,000
Cost per patient served
(Revenue Expenditure in ₹/Total
number of patients)
413 506 Calculated on the
basis of BE 2017-
18
Number of complaints
received from people/patients2 to 3 1 to 2
Number of Pediatric ICU (PICU)
beds0 0
Average number of patients
who received free medicines
per month
1,01,969 1,05,000
Number of blood bank units
utilized by patients per month
242 250
21 Lal Bahadur
Shastri Hospital
6869
(R- 6372,
C- 497)
Ongoing Provision of
secondary and
tertiary health
services to people
Lal Bahadur Shastri Hospital 178NA : Not Available
NR : Not Responded
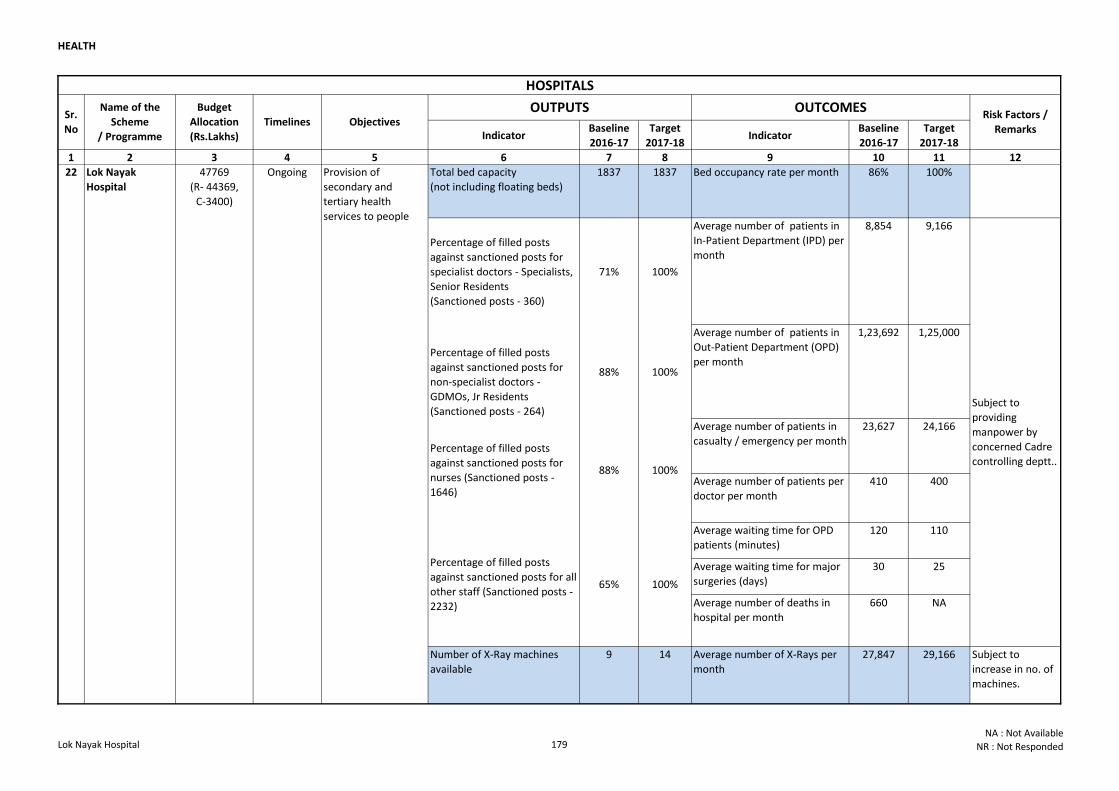
HEALTH
Indicator Baseline
2016-17
Target
2017-18Indicator
Baseline
2016-17
Target
2017-18
1 2 3 4 5 6 7 8 9 10 11 12
Total bed capacity
(not including floating beds)
1837 1837 Bed occupancy rate per month 86% 100%
Percentage of filled posts
against sanctioned posts for
specialist doctors - Specialists,
Senior Residents
(Sanctioned posts - 360)
71% 100%
Average number of patients in
In-Patient Department (IPD) per
month
8,854 9,166
Percentage of filled posts
against sanctioned posts for
non-specialist doctors -
GDMOs, Jr Residents
(Sanctioned posts - 264)
88% 100%
Average number of patients in
Out-Patient Department (OPD)
per month
1,23,692 1,25,000
Average number of patients in
casualty / emergency per month
23,627 24,166
Average number of patients per
doctor per month
410 400
Average waiting time for OPD
patients (minutes)
120 110
Average waiting time for major
surgeries (days)
30 25
Average number of deaths in
hospital per month
660 NA
Number of X-Ray machines
available
9 14 Average number of X-Rays per
month
27,847 29,166
HOSPITALS
Sr.
No
Name of the
Scheme
/ Programme
Budget
Allocation
(Rs.Lakhs)
Timelines Objectives OUTPUTS OUTCOMES
Risk Factors /
Remarks
22 Lok Nayak
Hospital
47769
(R- 44369,
C-3400)
Ongoing Provision of
secondary and
tertiary health
services to people
Subject to
providing
manpower by
concerned Cadre
controlling deptt..Percentage of filled posts
against sanctioned posts for
nurses (Sanctioned posts -
1646)
88% 100%
Percentage of filled posts
against sanctioned posts for all
other staff (Sanctioned posts -
2232)
65% 100%
Subject to
increase in no. of
machines.
Lok Nayak Hospital 179NA : Not Available
NR : Not Responded
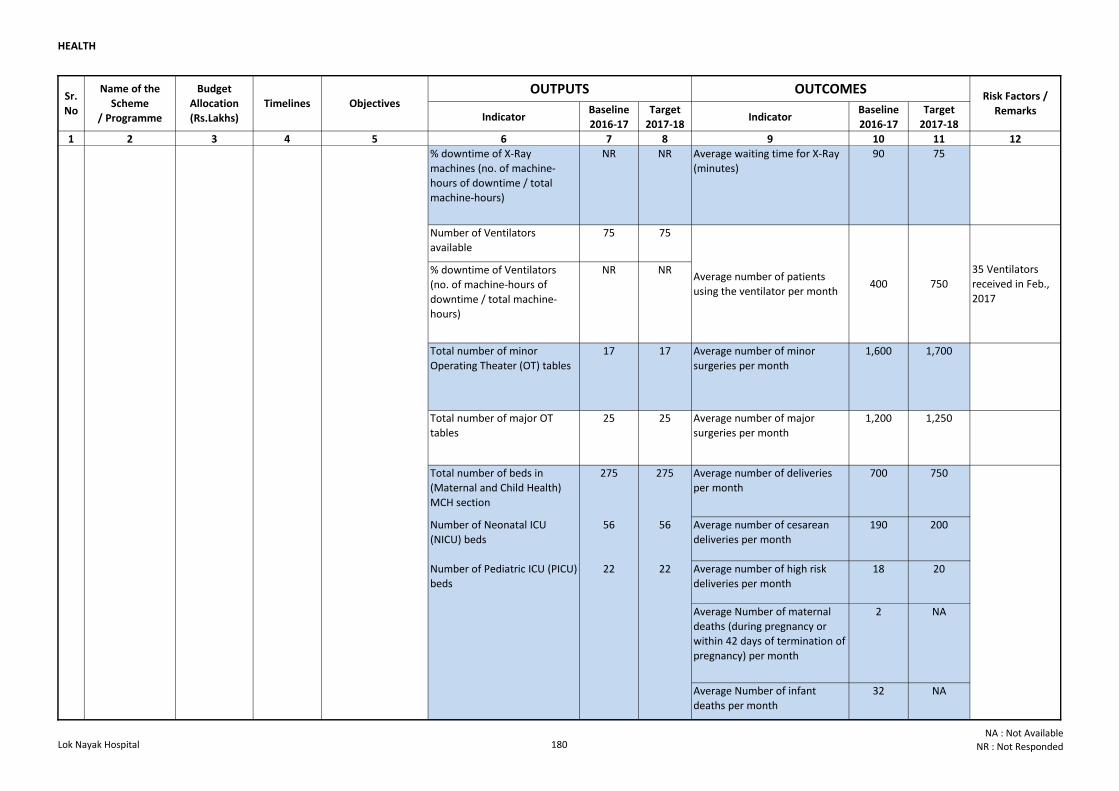
HEALTH
Indicator Baseline
2016-17
Target
2017-18Indicator
Baseline
2016-17
Target
2017-18
1 2 3 4 5 6 7 8 9 10 11 12
Sr.
No
Name of the
Scheme
/ Programme
Budget
Allocation
(Rs.Lakhs)
Timelines Objectives OUTPUTS OUTCOMES
Risk Factors /
Remarks
% downtime of X-Ray
machines (no. of machine-
hours of downtime / total
machine-hours)
NR NR Average waiting time for X-Ray
(minutes)
90 75
Number of Ventilators
available
75 75
% downtime of Ventilators
(no. of machine-hours of
downtime / total machine-
hours)
NR NR
Total number of minor
Operating Theater (OT) tables
17 17 Average number of minor
surgeries per month
1,600 1,700
Total number of major OT
tables
25 25 Average number of major
surgeries per month
1,200 1,250
Total number of beds in
(Maternal and Child Health)
MCH section
275 275 Average number of deliveries
per month
700 750
Number of Neonatal ICU
(NICU) beds
56 56 Average number of cesarean
deliveries per month
190 200
Average number of high risk
deliveries per month
18 20
Average Number of maternal
deaths (during pregnancy or
within 42 days of termination of
pregnancy) per month
2 NA
Average Number of infant
deaths per month
32 NA
22 Lok Nayak
Hospital
47769
(R- 44369,
C-3400)
Ongoing Provision of
secondary and
tertiary health
services to people
Subject to
increase in no. of
machines.
Average number of patients
using the ventilator per month400 750
35 Ventilators
received in Feb.,
2017
Number of Pediatric ICU (PICU)
beds
22 22
Lok Nayak Hospital 180NA : Not Available
NR : Not Responded
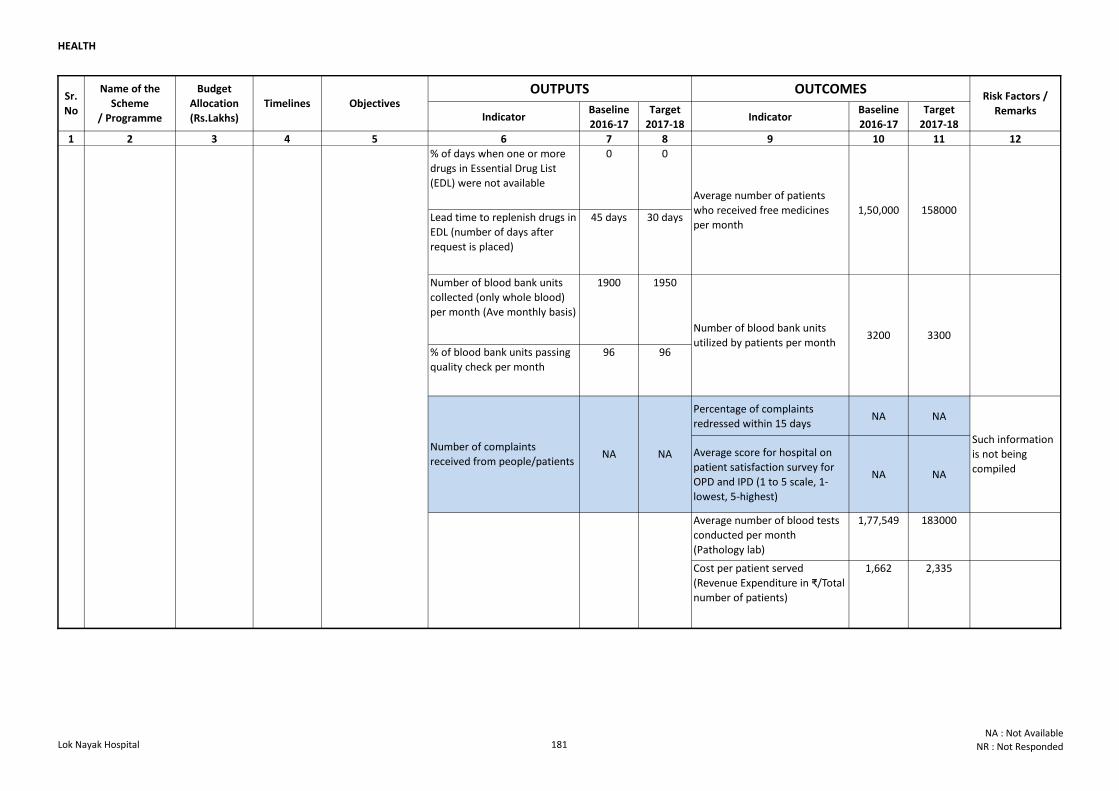
HEALTH
Indicator Baseline
2016-17
Target
2017-18Indicator
Baseline
2016-17
Target
2017-18
1 2 3 4 5 6 7 8 9 10 11 12
Sr.
No
Name of the
Scheme
/ Programme
Budget
Allocation
(Rs.Lakhs)
Timelines Objectives OUTPUTS OUTCOMES
Risk Factors /
Remarks
% of days when one or more
drugs in Essential Drug List
(EDL) were not available
0 0
Lead time to replenish drugs in
EDL (number of days after
request is placed)
45 days 30 days
Number of blood bank units
collected (only whole blood)
per month (Ave monthly basis)
1900 1950
% of blood bank units passing
quality check per month
96 96
Percentage of complaints
redressed within 15 daysNA NA
Average score for hospital on
patient satisfaction survey for
OPD and IPD (1 to 5 scale, 1-
lowest, 5-highest)
NA NA
Average number of blood tests
conducted per month
(Pathology lab)
1,77,549 183000
Cost per patient served
(Revenue Expenditure in ₹/Total
number of patients)
1,662 2,335
22 Lok Nayak
Hospital
47769
(R- 44369,
C-3400)
Ongoing Provision of
secondary and
tertiary health
services to people
Number of complaints
received from people/patientsNA NA
Such information
is not being
compiled
Average number of patients
who received free medicines
per month
1,50,000 158000
Number of blood bank units
utilized by patients per month3200 3300
Lok Nayak Hospital 181NA : Not Available
NR : Not Responded
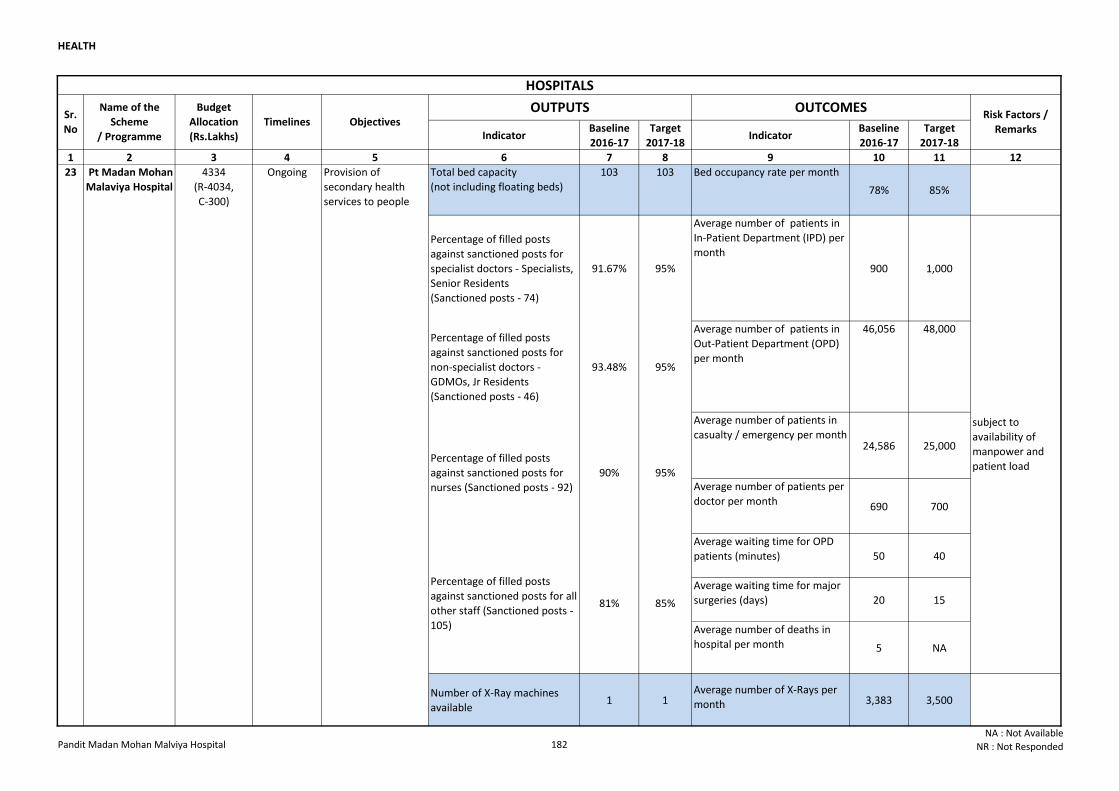
HEALTH
Indicator Baseline
2016-17
Target
2017-18Indicator
Baseline
2016-17
Target
2017-18
1 2 3 4 5 6 7 8 9 10 11 12
Total bed capacity
(not including floating beds)
103 103 Bed occupancy rate per month
78% 85%
Percentage of filled posts
against sanctioned posts for
specialist doctors - Specialists,
Senior Residents
(Sanctioned posts - 74)
91.67% 95%
Average number of patients in
In-Patient Department (IPD) per
month
900 1,000
Percentage of filled posts
against sanctioned posts for
non-specialist doctors -
GDMOs, Jr Residents
(Sanctioned posts - 46)
93.48% 95%
Average number of patients in
Out-Patient Department (OPD)
per month
46,056 48,000
Average number of patients in
casualty / emergency per month 24,586 25,000
Average number of patients per
doctor per month 690 700
Average waiting time for OPD
patients (minutes) 50 40
Average waiting time for major
surgeries (days) 20 15
Average number of deaths in
hospital per month 5 NA
Number of X-Ray machines
available1 1
Average number of X-Rays per
month 3,383 3,500
subject to
availability of
manpower and
patient loadPercentage of filled posts
against sanctioned posts for
nurses (Sanctioned posts - 92)
90% 95%
Percentage of filled posts
against sanctioned posts for all
other staff (Sanctioned posts -
105)
81% 85%
23 Pt Madan Mohan
Malaviya Hospital
4334
(R-4034,
C-300)
Ongoing Provision of
secondary health
services to people
HOSPITALS
Sr.
No
Name of the
Scheme
/ Programme
Budget
Allocation
(Rs.Lakhs)
Timelines Objectives OUTPUTS OUTCOMES
Risk Factors /
Remarks
Pandit Madan Mohan Malviya Hospital 182NA : Not Available
NR : Not Responded
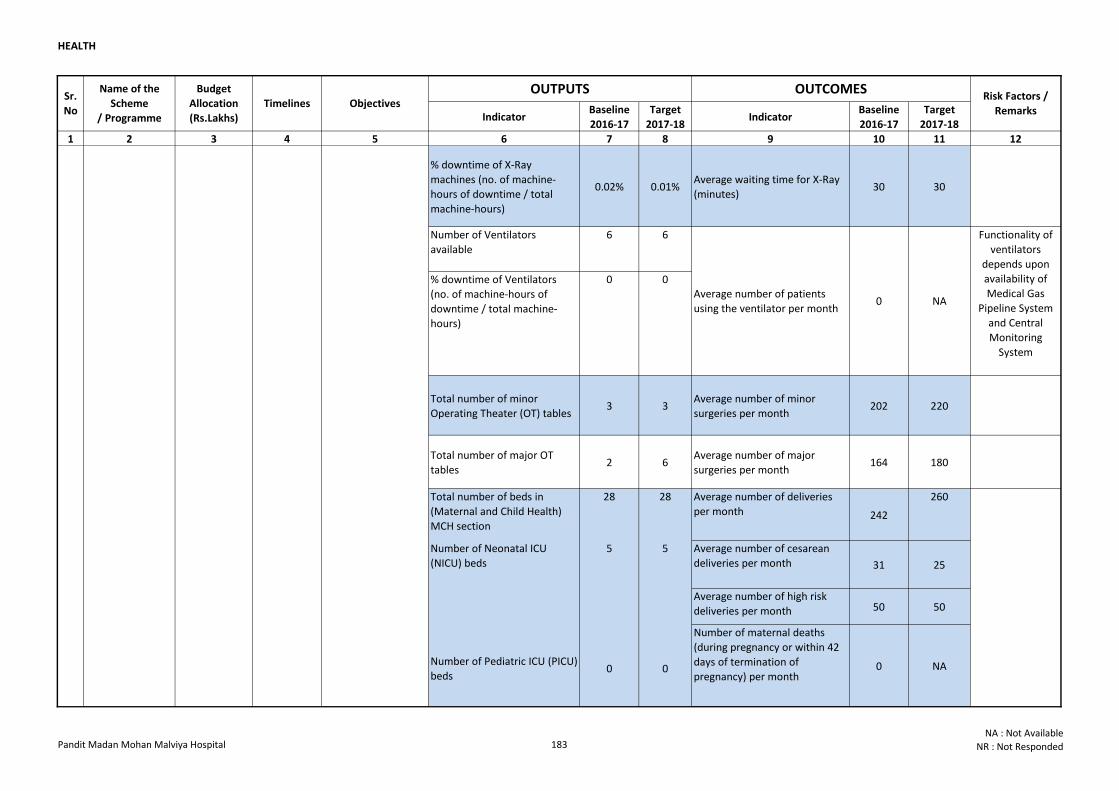
HEALTH
Indicator Baseline
2016-17
Target
2017-18Indicator
Baseline
2016-17
Target
2017-18
1 2 3 4 5 6 7 8 9 10 11 12
Sr.
No
Name of the
Scheme
/ Programme
Budget
Allocation
(Rs.Lakhs)
Timelines Objectives OUTPUTS OUTCOMES
Risk Factors /
Remarks
% downtime of X-Ray
machines (no. of machine-
hours of downtime / total
machine-hours)
0.02% 0.01%Average waiting time for X-Ray
(minutes)30 30
Number of Ventilators
available
6 6
% downtime of Ventilators
(no. of machine-hours of
downtime / total machine-
hours)
0 0
Total number of minor
Operating Theater (OT) tables3 3
Average number of minor
surgeries per month202 220
Total number of major OT
tables 2 6
Average number of major
surgeries per month164 180
Total number of beds in
(Maternal and Child Health)
MCH section
28 28 Average number of deliveries
per month 242
260
Number of Neonatal ICU
(NICU) beds
5 5 Average number of cesarean
deliveries per month 31 25
Average number of high risk
deliveries per month 50 50
Number of maternal deaths
(during pregnancy or within 42
days of termination of
pregnancy) per month0 NANumber of Pediatric ICU (PICU)
beds0 0
Average number of patients
using the ventilator per month0 NA
Functionality of
ventilators
depends upon
availability of
Medical Gas
Pipeline System
and Central
Monitoring
System
23 Pt Madan Mohan
Malaviya Hospital
4334
(R-4034,
C-300)
Ongoing Provision of
secondary health
services to people
Pandit Madan Mohan Malviya Hospital 183NA : Not Available
NR : Not Responded
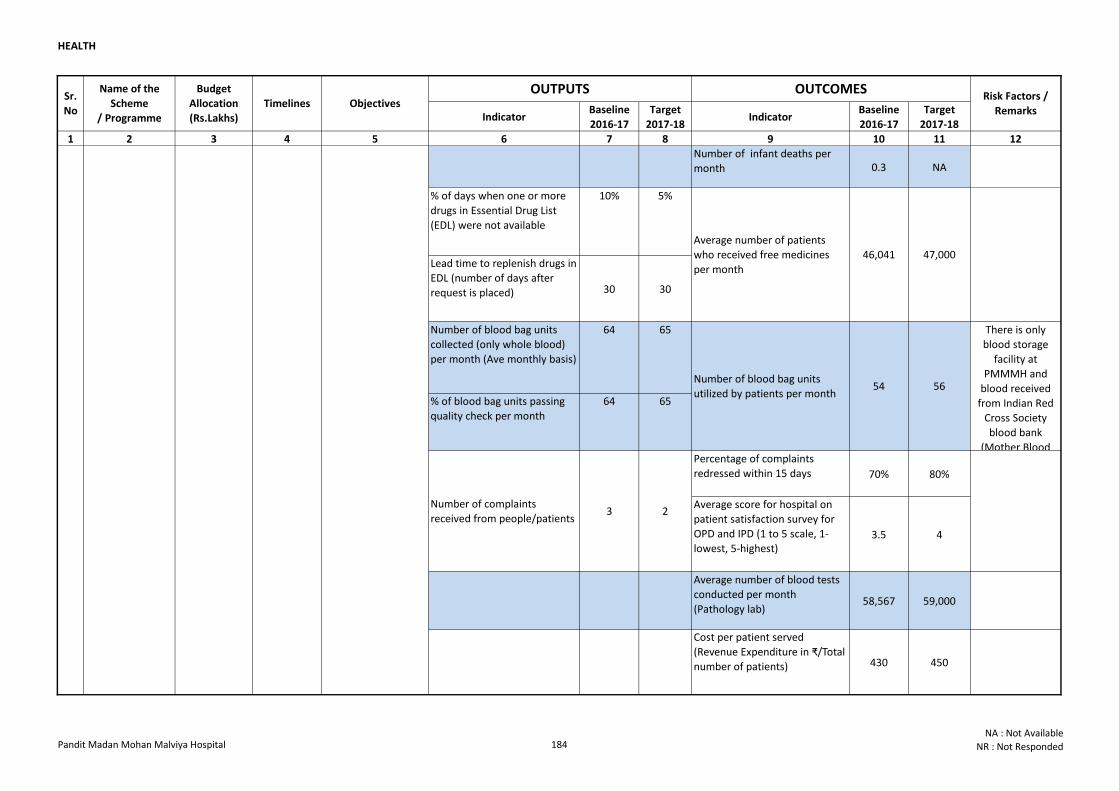
HEALTH
Indicator Baseline
2016-17
Target
2017-18Indicator
Baseline
2016-17
Target
2017-18
1 2 3 4 5 6 7 8 9 10 11 12
Sr.
No
Name of the
Scheme
/ Programme
Budget
Allocation
(Rs.Lakhs)
Timelines Objectives OUTPUTS OUTCOMES
Risk Factors /
Remarks
Number of infant deaths per
month 0.3 NA
% of days when one or more
drugs in Essential Drug List
(EDL) were not available
10% 5%
Lead time to replenish drugs in
EDL (number of days after
request is placed) 30 30
Number of blood bag units
collected (only whole blood)
per month (Ave monthly basis)
64 65
% of blood bag units passing
quality check per month
64 65
Percentage of complaints
redressed within 15 days 70% 80%
Average score for hospital on
patient satisfaction survey for
OPD and IPD (1 to 5 scale, 1-
lowest, 5-highest)3.5 4
Average number of blood tests
conducted per month
(Pathology lab)58,567 59,000
Cost per patient served
(Revenue Expenditure in ₹/Total
number of patients) 430 450
Number of blood bag units
utilized by patients per month54 56
There is only
blood storage
facility at
PMMMH and
blood received
from Indian Red
Cross Society
blood bank
(Mother Blood
Number of complaints
received from people/patients3 2
Number of Pediatric ICU (PICU)
beds0 0
Average number of patients
who received free medicines
per month
46,041 47,000
23 Pt Madan Mohan
Malaviya Hospital
4334
(R-4034,
C-300)
Ongoing Provision of
secondary health
services to people
Pandit Madan Mohan Malviya Hospital 184NA : Not Available
NR : Not Responded
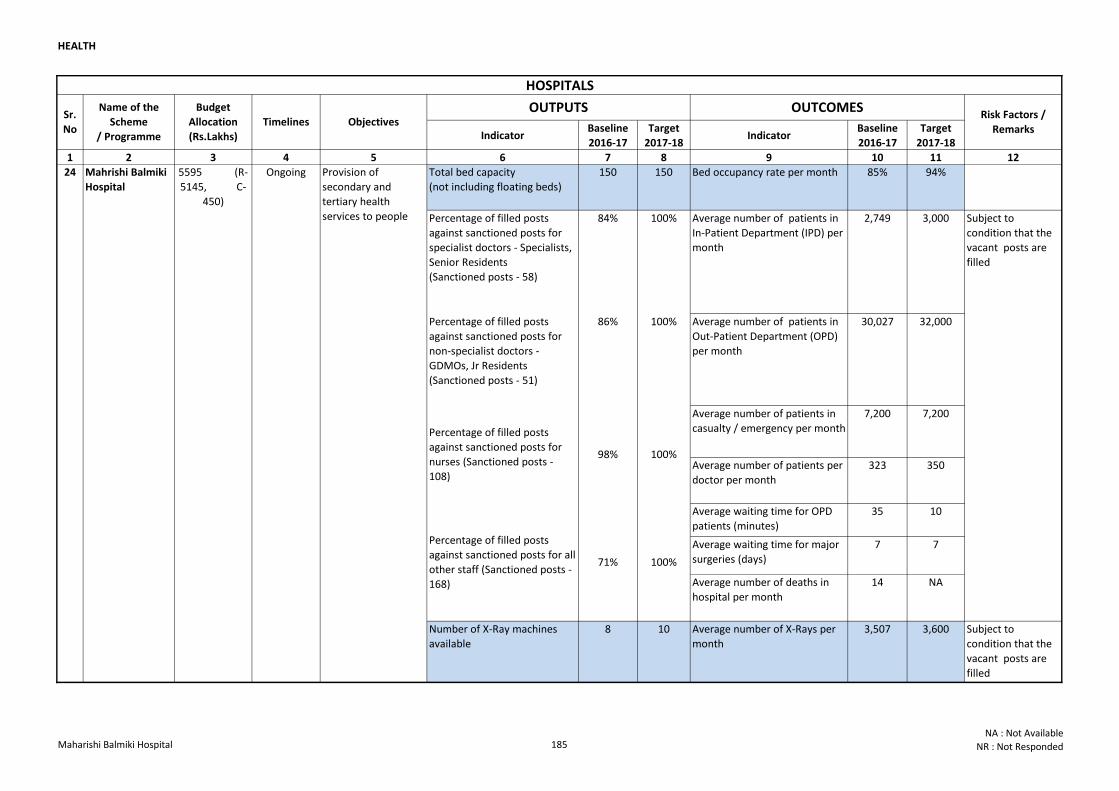
HEALTH
Indicator Baseline
2016-17
Target
2017-18Indicator
Baseline
2016-17
Target
2017-18
1 2 3 4 5 6 7 8 9 10 11 12
Total bed capacity
(not including floating beds)
150 150 Bed occupancy rate per month 85% 94%
Percentage of filled posts
against sanctioned posts for
specialist doctors - Specialists,
Senior Residents
(Sanctioned posts - 58)
84% 100% Average number of patients in
In-Patient Department (IPD) per
month
2,749 3,000
Percentage of filled posts
against sanctioned posts for
non-specialist doctors -
GDMOs, Jr Residents
(Sanctioned posts - 51)
86% 100% Average number of patients in
Out-Patient Department (OPD)
per month
30,027 32,000
Average number of patients in
casualty / emergency per month
7,200 7,200
Average number of patients per
doctor per month
323 350
Average waiting time for OPD
patients (minutes)
35 10
Average waiting time for major
surgeries (days)
7 7
Average number of deaths in
hospital per month
14 NA
Number of X-Ray machines
available
8 10 Average number of X-Rays per
month
3,507 3,600 Subject to
condition that the
vacant posts are
filled
Subject to
condition that the
vacant posts are
filled
Percentage of filled posts
against sanctioned posts for
nurses (Sanctioned posts -
108)
98% 100%
Percentage of filled posts
against sanctioned posts for all
other staff (Sanctioned posts -
168)
71% 100%
24 Mahrishi Balmiki
Hospital
5595 (R-
5145, C-
450)
Ongoing Provision of
secondary and
tertiary health
services to people
HOSPITALS
Sr.
No
Name of the
Scheme
/ Programme
Budget
Allocation
(Rs.Lakhs)
Timelines Objectives OUTPUTS OUTCOMES
Risk Factors /
Remarks
Maharishi Balmiki Hospital 185NA : Not Available
NR : Not Responded
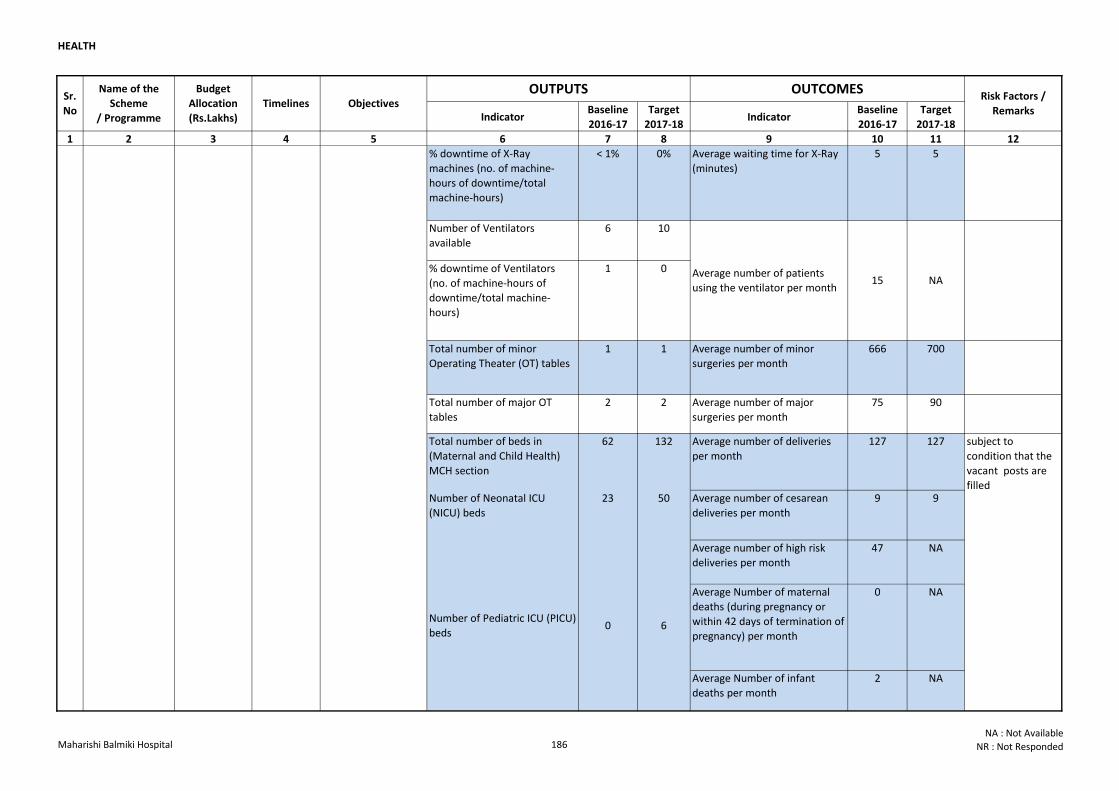
HEALTH
Indicator Baseline
2016-17
Target
2017-18Indicator
Baseline
2016-17
Target
2017-18
1 2 3 4 5 6 7 8 9 10 11 12
Sr.
No
Name of the
Scheme
/ Programme
Budget
Allocation
(Rs.Lakhs)
Timelines Objectives OUTPUTS OUTCOMES
Risk Factors /
Remarks
% downtime of X-Ray
machines (no. of machine-
hours of downtime/total
machine-hours)
< 1% 0% Average waiting time for X-Ray
(minutes)
5 5
Number of Ventilators
available
6 10
% downtime of Ventilators
(no. of machine-hours of
downtime/total machine-
hours)
1 0
Total number of minor
Operating Theater (OT) tables
1 1 Average number of minor
surgeries per month
666 700
Total number of major OT
tables
2 2 Average number of major
surgeries per month
75 90
Total number of beds in
(Maternal and Child Health)
MCH section
62 132 Average number of deliveries
per month
127 127
Number of Neonatal ICU
(NICU) beds
23 50 Average number of cesarean
deliveries per month
9 9
Average number of high risk
deliveries per month
47 NA
Average Number of maternal
deaths (during pregnancy or
within 42 days of termination of
pregnancy) per month
0 NA
Average Number of infant
deaths per month
2 NA
Number of Pediatric ICU (PICU)
beds0 6
subject to
condition that the
vacant posts are
filled
Subject to
condition that the
vacant posts are
filled
Average number of patients
using the ventilator per month15 NA
24 Mahrishi Balmiki
Hospital
5595 (R-
5145, C-
450)
Ongoing Provision of
secondary and
tertiary health
services to people
Maharishi Balmiki Hospital 186NA : Not Available
NR : Not Responded
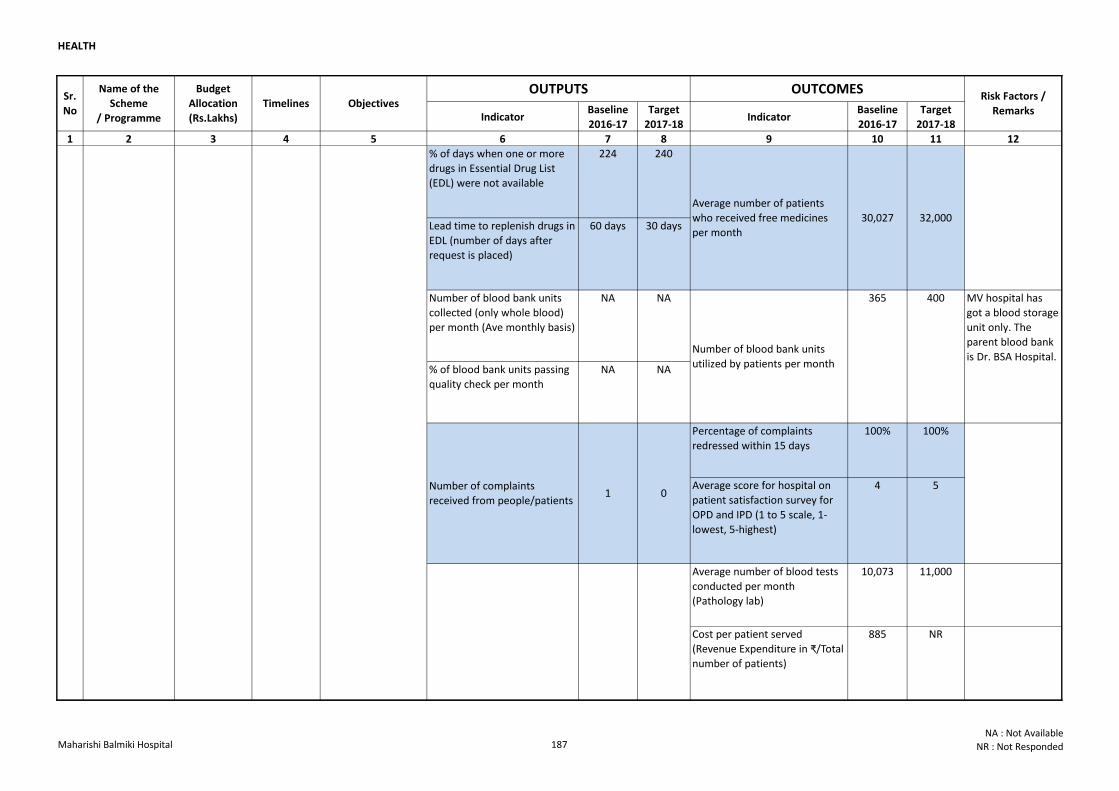
HEALTH
Indicator Baseline
2016-17
Target
2017-18Indicator
Baseline
2016-17
Target
2017-18
1 2 3 4 5 6 7 8 9 10 11 12
Sr.
No
Name of the
Scheme
/ Programme
Budget
Allocation
(Rs.Lakhs)
Timelines Objectives OUTPUTS OUTCOMES
Risk Factors /
Remarks
% of days when one or more
drugs in Essential Drug List
(EDL) were not available
224 240
Lead time to replenish drugs in
EDL (number of days after
request is placed)
60 days 30 days
Number of blood bank units
collected (only whole blood)
per month (Ave monthly basis)
NA NA
% of blood bank units passing
quality check per month
NA NA
Percentage of complaints
redressed within 15 days
100% 100%
Average score for hospital on
patient satisfaction survey for
OPD and IPD (1 to 5 scale, 1-
lowest, 5-highest)
4 5
Average number of blood tests
conducted per month
(Pathology lab)
10,073 11,000
Cost per patient served
(Revenue Expenditure in ₹/Total
number of patients)
885 NR
Number of complaints
received from people/patients1 0
Average number of patients
who received free medicines
per month
30,027 32,000
Number of blood bank units
utilized by patients per month
365 400 MV hospital has
got a blood storage
unit only. The
parent blood bank
is Dr. BSA Hospital.
24 Mahrishi Balmiki
Hospital
5595 (R-
5145, C-
450)
Ongoing Provision of
secondary and
tertiary health
services to people
Maharishi Balmiki Hospital 187NA : Not Available
NR : Not Responded
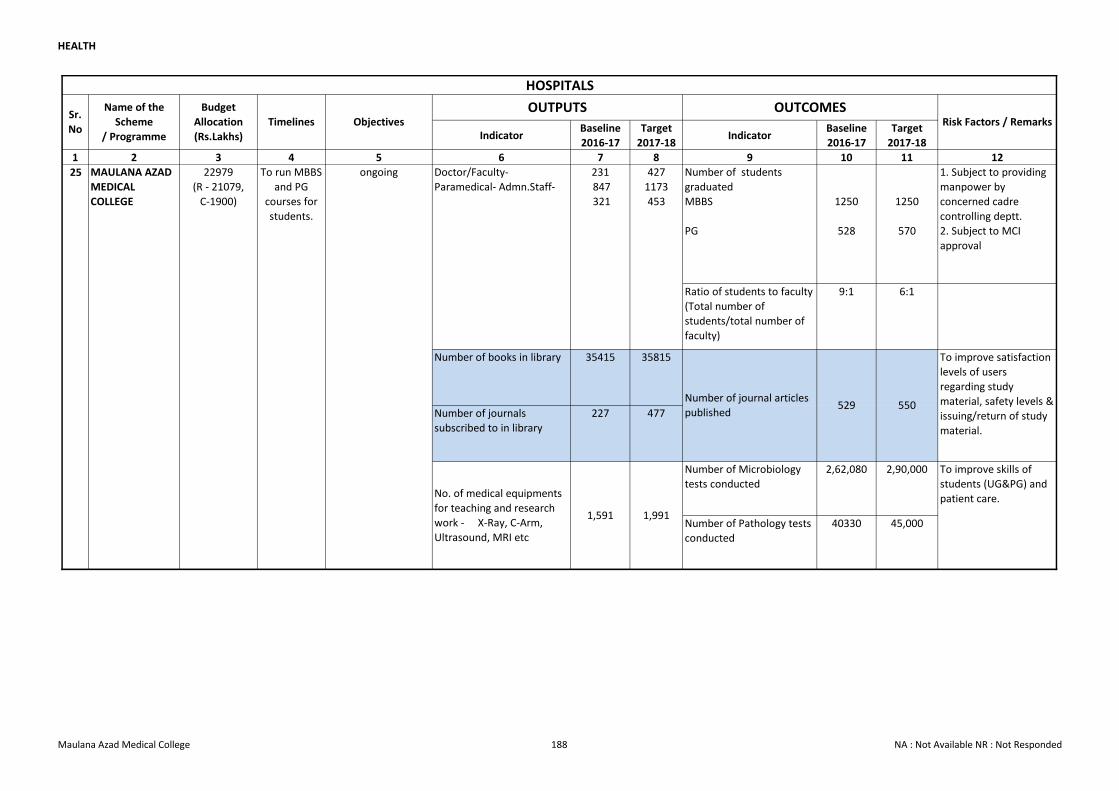
HEALTH
Indicator Baseline
2016-17
Target
2017-18Indicator
Baseline
2016-17
Target
2017-18
1 2 3 4 5 6 7 8 9 10 11 12
Number of students
graduated
MBBS
PG
1250
528
1250
570
1. Subject to providing
manpower by
concerned cadre
controlling deptt.
2. Subject to MCI
approval
Ratio of students to faculty
(Total number of
students/total number of
faculty)
9:1 6:1
Number of books in library 35415 35815
Number of journals
subscribed to in library
227 477
Number of Microbiology
tests conducted
2,62,080 2,90,000
Number of Pathology tests
conducted
40330 45,000
550
To improve satisfaction
levels of users
regarding study
material, safety levels &
issuing/return of study
material.
No. of medical equipments
for teaching and research
work - X-Ray, C-Arm,
Ultrasound, MRI etc
1,9911,591
To improve skills of
students (UG&PG) and
patient care.
25 Doctor/Faculty-
Paramedical- Admn.Staff-
MAULANA AZAD
MEDICAL
COLLEGE
22979
(R - 21079,
C-1900)
To run MBBS
and PG
courses for
students.
ongoing
HOSPITALS
Sr.
No
Name of the
Scheme
/ Programme
Budget
Allocation
(Rs.Lakhs)
Timelines Objectives OUTPUTS OUTCOMES
Risk Factors / Remarks
231
847
321
427
1173
453
Number of journal articles
published529
Maulana Azad Medical College 188 NA : Not Available NR : Not Responded
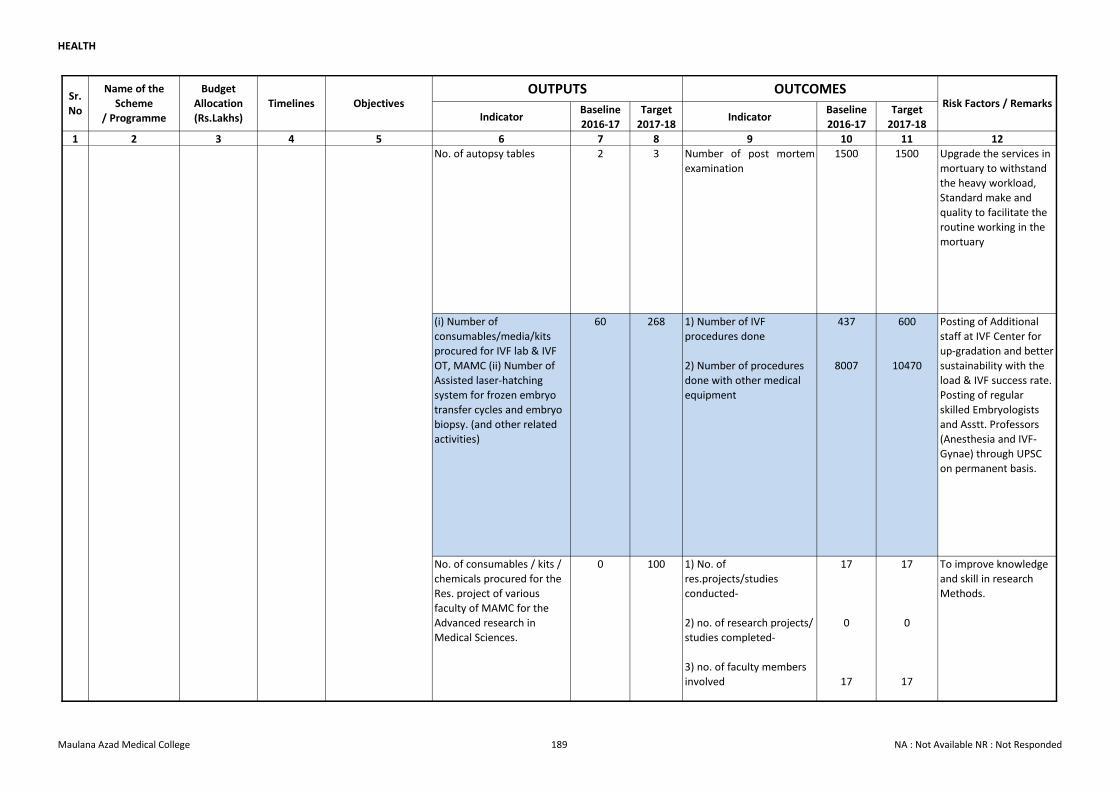
HEALTH
Indicator Baseline
2016-17
Target
2017-18Indicator
Baseline
2016-17
Target
2017-18
1 2 3 4 5 6 7 8 9 10 11 12
Sr.
No
Name of the
Scheme
/ Programme
Budget
Allocation
(Rs.Lakhs)
Timelines Objectives OUTPUTS OUTCOMES
Risk Factors / Remarks
No. of autopsy tables 2 3 Number of post mortem
examination
1500 1500 Upgrade the services in
mortuary to withstand
the heavy workload,
Standard make and
quality to facilitate the
routine working in the
mortuary
No. of consumables / kits /
chemicals procured for the
Res. project of various
faculty of MAMC for the
Advanced research in
Medical Sciences.
0 100 1) No. of
res.projects/studies
conducted-
2) no. of research projects/
studies completed-
3) no. of faculty members
involved
17
0
17
17
0
17
To improve knowledge
and skill in research
Methods.
437
8007
1) Number of IVF
procedures done
2) Number of procedures
done with other medical
equipment
Posting of Additional
staff at IVF Center for
up-gradation and better
sustainability with the
load & IVF success rate.
Posting of regular
skilled Embryologists
and Asstt. Professors
(Anesthesia and IVF-
Gynae) through UPSC
on permanent basis.
600
10470
25 MAULANA AZAD
MEDICAL
COLLEGE
22979
(R - 21079,
C-1900)
To run MBBS
and PG
courses for
students.
ongoing
(i) Number of
consumables/media/kits
procured for IVF lab & IVF
OT, MAMC (ii) Number of
Assisted laser-hatching
system for frozen embryo
transfer cycles and embryo
biopsy. (and other related
activities)
60 268
Maulana Azad Medical College 189 NA : Not Available NR : Not Responded
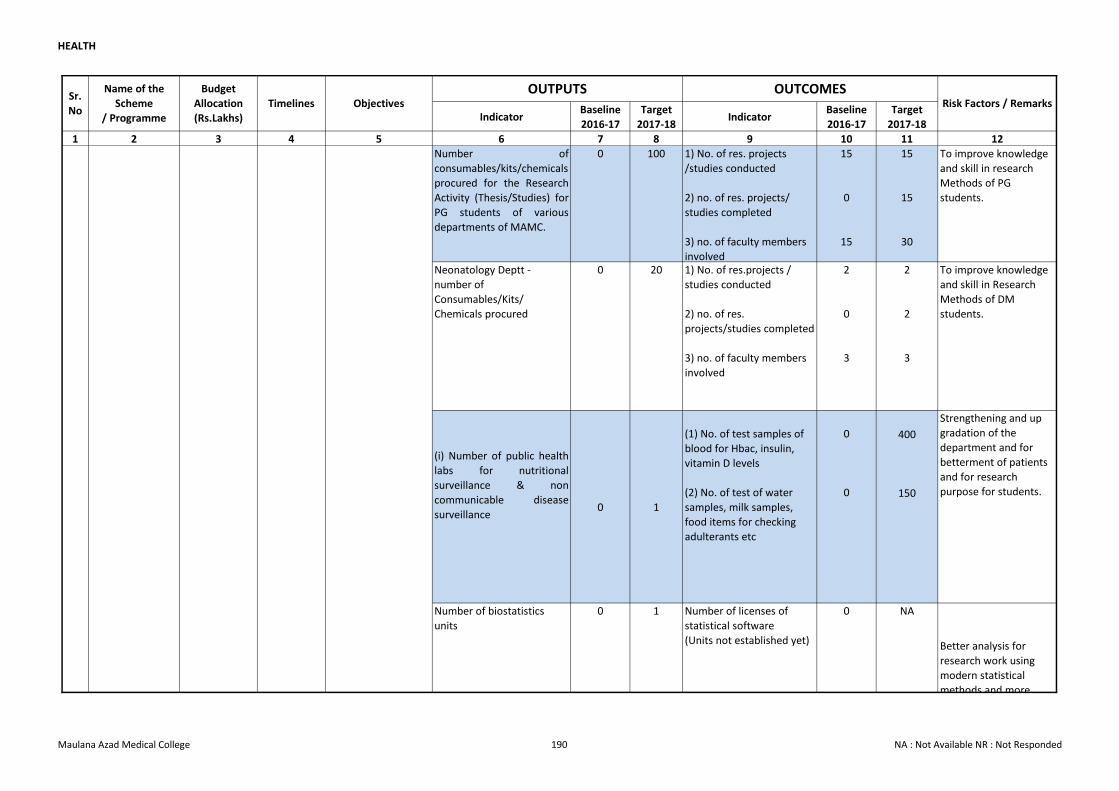
HEALTH
Indicator Baseline
2016-17
Target
2017-18Indicator
Baseline
2016-17
Target
2017-18
1 2 3 4 5 6 7 8 9 10 11 12
Sr.
No
Name of the
Scheme
/ Programme
Budget
Allocation
(Rs.Lakhs)
Timelines Objectives OUTPUTS OUTCOMES
Risk Factors / Remarks
Number of
consumables/kits/chemicals
procured for the Research
Activity (Thesis/Studies) for
PG students of various
departments of MAMC.
0 100 1) No. of res. projects
/studies conducted
2) no. of res. projects/
studies completed
3) no. of faculty members
involved
15
0
15
15
15
30
To improve knowledge
and skill in research
Methods of PG
students.
Neonatology Deptt -
number of
Consumables/Kits/
Chemicals procured
0 20 1) No. of res.projects /
studies conducted
2) no. of res.
projects/studies completed
3) no. of faculty members
involved
2
0
3
2
2
3
To improve knowledge
and skill in Research
Methods of DM
students.
(i) Number of public health
labs for nutritional
surveillance & non
communicable disease
surveillance0 1
(1) No. of test samples of
blood for Hbac, insulin,
vitamin D levels
(2) No. of test of water
samples, milk samples,
food items for checking
adulterants etc
0
0
400
150
Strengthening and up
gradation of the
department and for
betterment of patients
and for research
purpose for students.
Number of biostatistics
units
0 1 Number of licenses of
statistical software
(Units not established yet)
0 NA
25 MAULANA AZAD
MEDICAL
COLLEGE
22979
(R - 21079,
C-1900)
To run MBBS
and PG
courses for
students.
ongoing
Better analysis for
research work using
modern statistical
methods and more
scientific publications
and up gradation of
knowledge of UG,PG &
PhD students.Maulana Azad Medical College 190 NA : Not Available NR : Not Responded
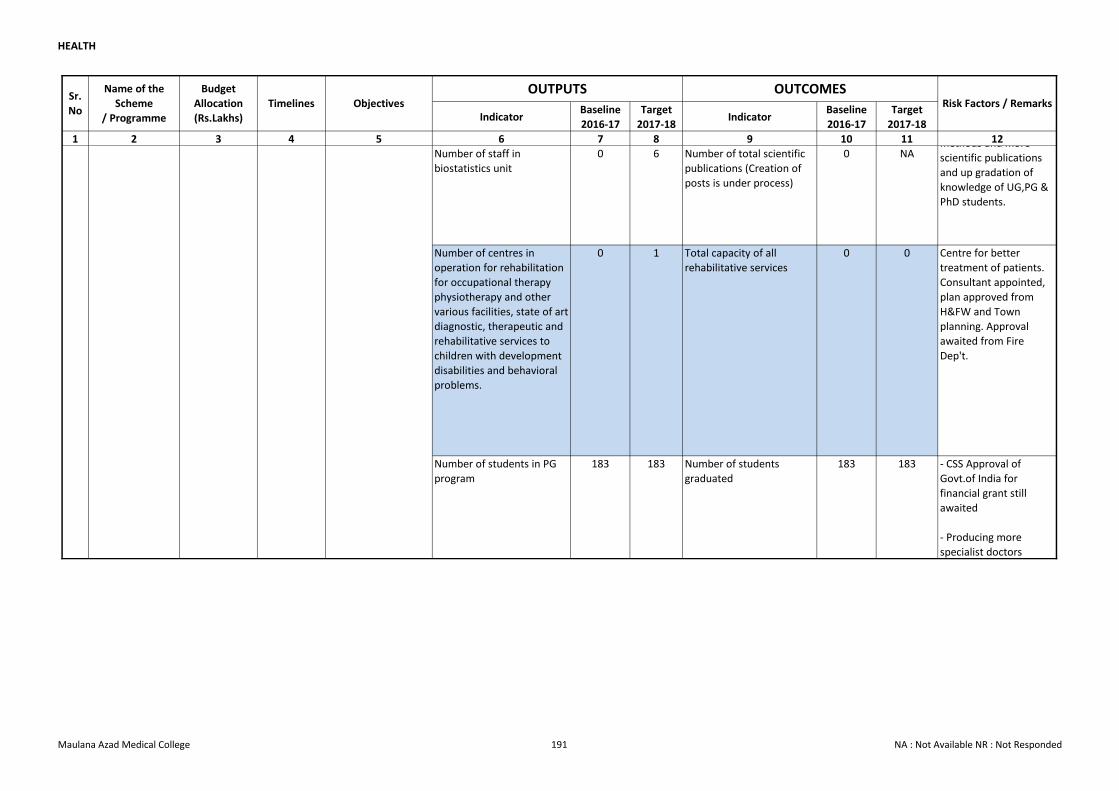
HEALTH
Indicator Baseline
2016-17
Target
2017-18Indicator
Baseline
2016-17
Target
2017-18
1 2 3 4 5 6 7 8 9 10 11 12
Sr.
No
Name of the
Scheme
/ Programme
Budget
Allocation
(Rs.Lakhs)
Timelines Objectives OUTPUTS OUTCOMES
Risk Factors / Remarks
Number of staff in
biostatistics unit
0 6 Number of total scientific
publications (Creation of
posts is under process)
0 NA
Number of centres in
operation for rehabilitation
for occupational therapy
physiotherapy and other
various facilities, state of art
diagnostic, therapeutic and
rehabilitative services to
children with development
disabilities and behavioral
problems.
0 1 Total capacity of all
rehabilitative services
0 0 Centre for better
treatment of patients.
Consultant appointed,
plan approved from
H&FW and Town
planning. Approval
awaited from Fire
Dep't.
Number of students in PG
program
183 183 Number of students
graduated
183 183 - CSS Approval of
Govt.of India for
financial grant still
awaited
- Producing more
specialist doctors
25 MAULANA AZAD
MEDICAL
COLLEGE
22979
(R - 21079,
C-1900)
To run MBBS
and PG
courses for
students.
ongoing
Better analysis for
research work using
modern statistical
methods and more
scientific publications
and up gradation of
knowledge of UG,PG &
PhD students.
Maulana Azad Medical College 191 NA : Not Available NR : Not Responded
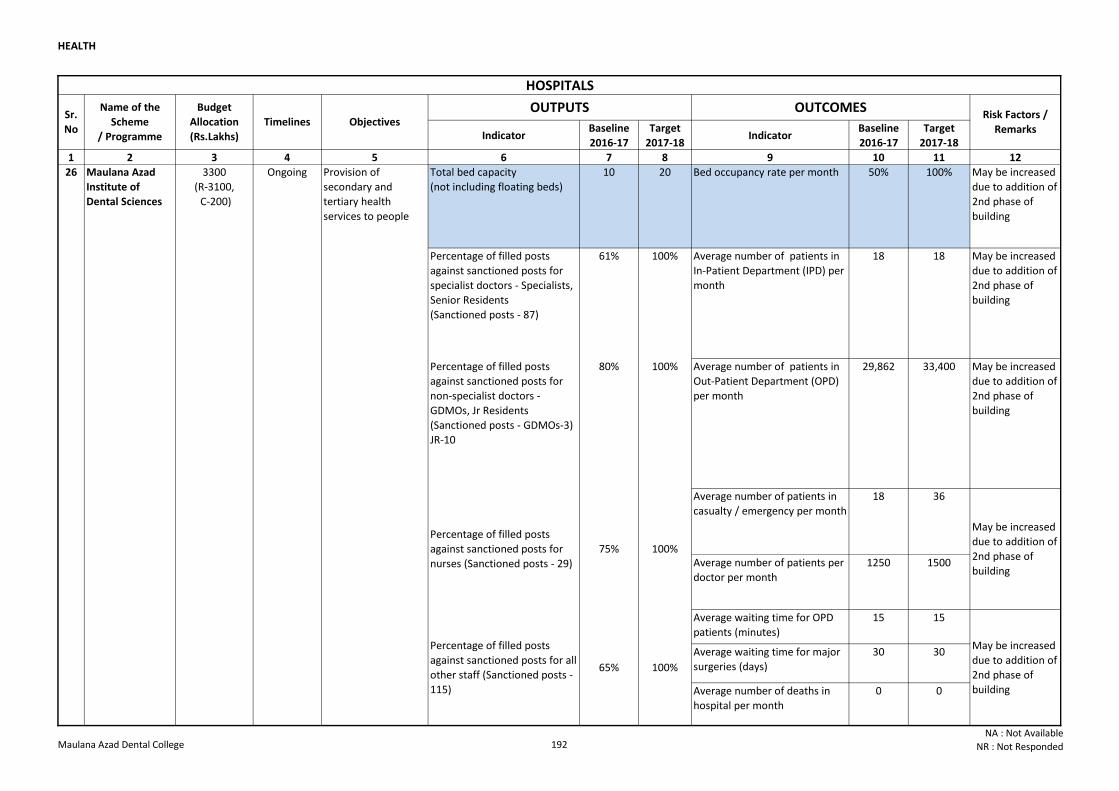
HEALTH
Indicator Baseline
2016-17
Target
2017-18Indicator
Baseline
2016-17
Target
2017-18
1 2 3 4 5 6 7 8 9 10 11 12
Total bed capacity
(not including floating beds)
10 20 Bed occupancy rate per month 50% 100% May be increased
due to addition of
2nd phase of
building
Percentage of filled posts
against sanctioned posts for
specialist doctors - Specialists,
Senior Residents
(Sanctioned posts - 87)
61% 100% Average number of patients in
In-Patient Department (IPD) per
month
18 18 May be increased
due to addition of
2nd phase of
building
Percentage of filled posts
against sanctioned posts for
non-specialist doctors -
GDMOs, Jr Residents
(Sanctioned posts - GDMOs-3)
JR-10
80% 100% Average number of patients in
Out-Patient Department (OPD)
per month
29,862 33,400 May be increased
due to addition of
2nd phase of
building
Average number of patients in
casualty / emergency per month
18 36
Average number of patients per
doctor per month
1250 1500
Average waiting time for OPD
patients (minutes)
15 15
Average waiting time for major
surgeries (days)
30 30
Average number of deaths in
hospital per month
0 0
Percentage of filled posts
against sanctioned posts for
nurses (Sanctioned posts - 29)
75% 100%
May be increased
due to addition of
2nd phase of
building
Percentage of filled posts
against sanctioned posts for all
other staff (Sanctioned posts -
115)
65% 100%
May be increased
due to addition of
2nd phase of
building
26 Maulana Azad
Institute of
Dental Sciences
3300
(R-3100,
C-200)
Ongoing Provision of
secondary and
tertiary health
services to people
HOSPITALS
Sr.
No
Name of the
Scheme
/ Programme
Budget
Allocation
(Rs.Lakhs)
Timelines Objectives OUTPUTS OUTCOMES
Risk Factors /
Remarks
Maulana Azad Dental College 192NA : Not Available
NR : Not Responded
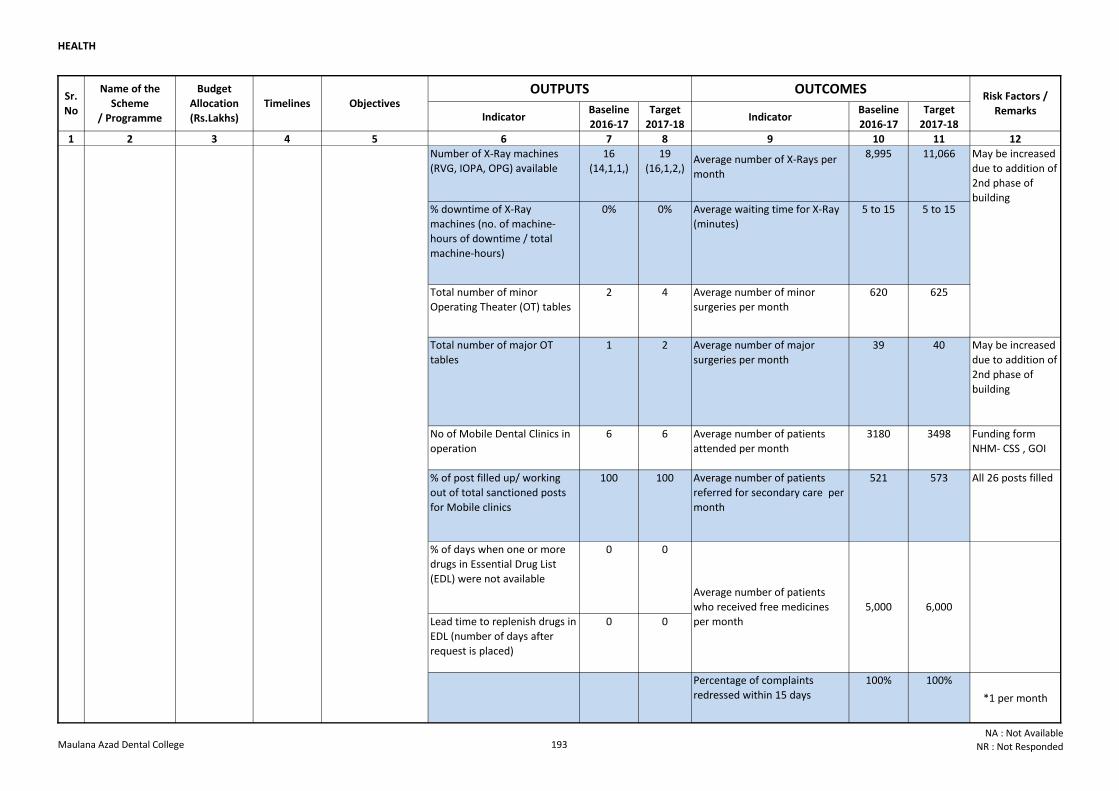
HEALTH
Indicator Baseline
2016-17
Target
2017-18Indicator
Baseline
2016-17
Target
2017-18
1 2 3 4 5 6 7 8 9 10 11 12
Sr.
No
Name of the
Scheme
/ Programme
Budget
Allocation
(Rs.Lakhs)
Timelines Objectives OUTPUTS OUTCOMES
Risk Factors /
Remarks
Number of X-Ray machines
(RVG, IOPA, OPG) available
16
(14,1,1,)
19
(16,1,2,)Average number of X-Rays per
month
8,995 11,066
% downtime of X-Ray
machines (no. of machine-
hours of downtime / total
machine-hours)
0% 0% Average waiting time for X-Ray
(minutes)
5 to 15 5 to 15
Total number of minor
Operating Theater (OT) tables
2 4 Average number of minor
surgeries per month
620 625
Total number of major OT
tables
1 2 Average number of major
surgeries per month
39 40 May be increased
due to addition of
2nd phase of
building
No of Mobile Dental Clinics in
operation
6 6 Average number of patients
attended per month
3180 3498 Funding form
NHM- CSS , GOI
% of post filled up/ working
out of total sanctioned posts
for Mobile clinics
100 100 Average number of patients
referred for secondary care per
month
521 573 All 26 posts filled
% of days when one or more
drugs in Essential Drug List
(EDL) were not available
0 0
Lead time to replenish drugs in
EDL (number of days after
request is placed)
0 0
Percentage of complaints
redressed within 15 days
100% 100%
*1 per month
May be increased
due to addition of
2nd phase of
building
Average number of patients
who received free medicines
per month
5,000 6,000
Number of complaints
received from people /
patients
1* 0
26 Maulana Azad
Institute of
Dental Sciences
3300
(R-3100,
C-200)
Ongoing Provision of
secondary and
tertiary health
services to people
Maulana Azad Dental College 193NA : Not Available
NR : Not Responded
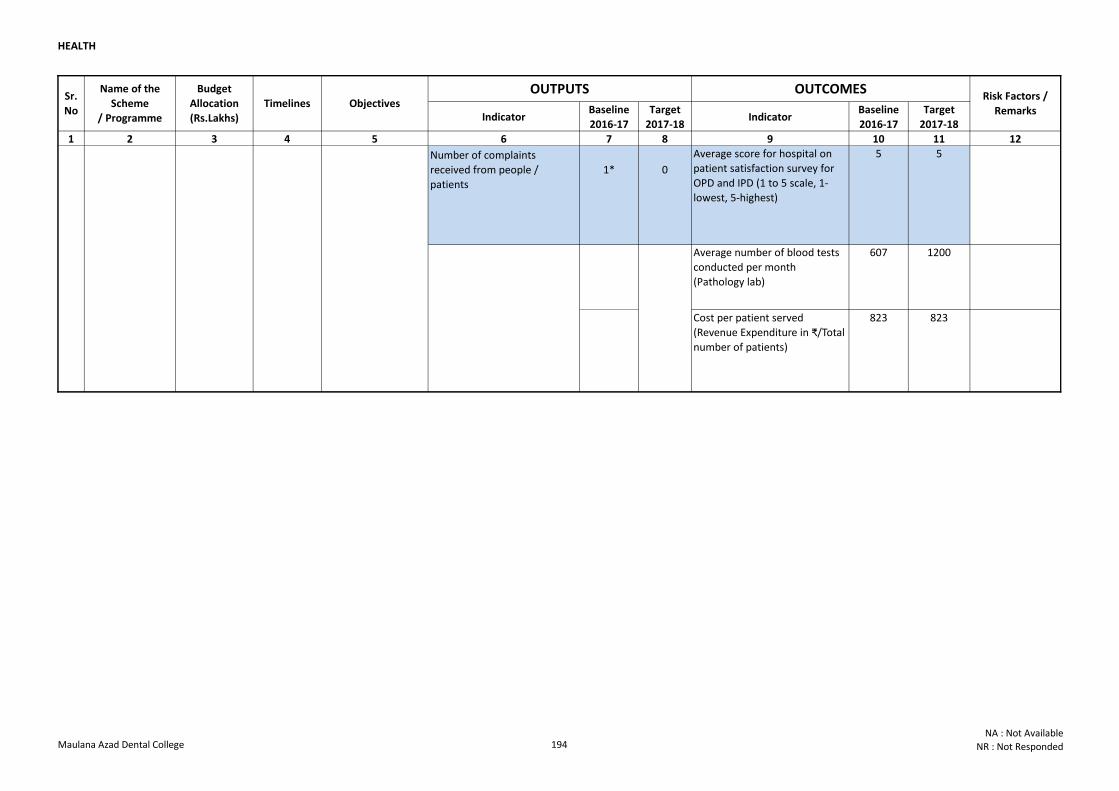
HEALTH
Indicator Baseline
2016-17
Target
2017-18Indicator
Baseline
2016-17
Target
2017-18
1 2 3 4 5 6 7 8 9 10 11 12
Sr.
No
Name of the
Scheme
/ Programme
Budget
Allocation
(Rs.Lakhs)
Timelines Objectives OUTPUTS OUTCOMES
Risk Factors /
Remarks
Average score for hospital on
patient satisfaction survey for
OPD and IPD (1 to 5 scale, 1-
lowest, 5-highest)
5 5
Average number of blood tests
conducted per month
(Pathology lab)
607 1200
Cost per patient served
(Revenue Expenditure in ₹/Total
number of patients)
823 823
Number of complaints
received from people /
patients
1* 0
26 Maulana Azad
Institute of
Dental Sciences
3300
(R-3100,
C-200)
Ongoing Provision of
secondary and
tertiary health
services to people
Maulana Azad Dental College 194NA : Not Available
NR : Not Responded
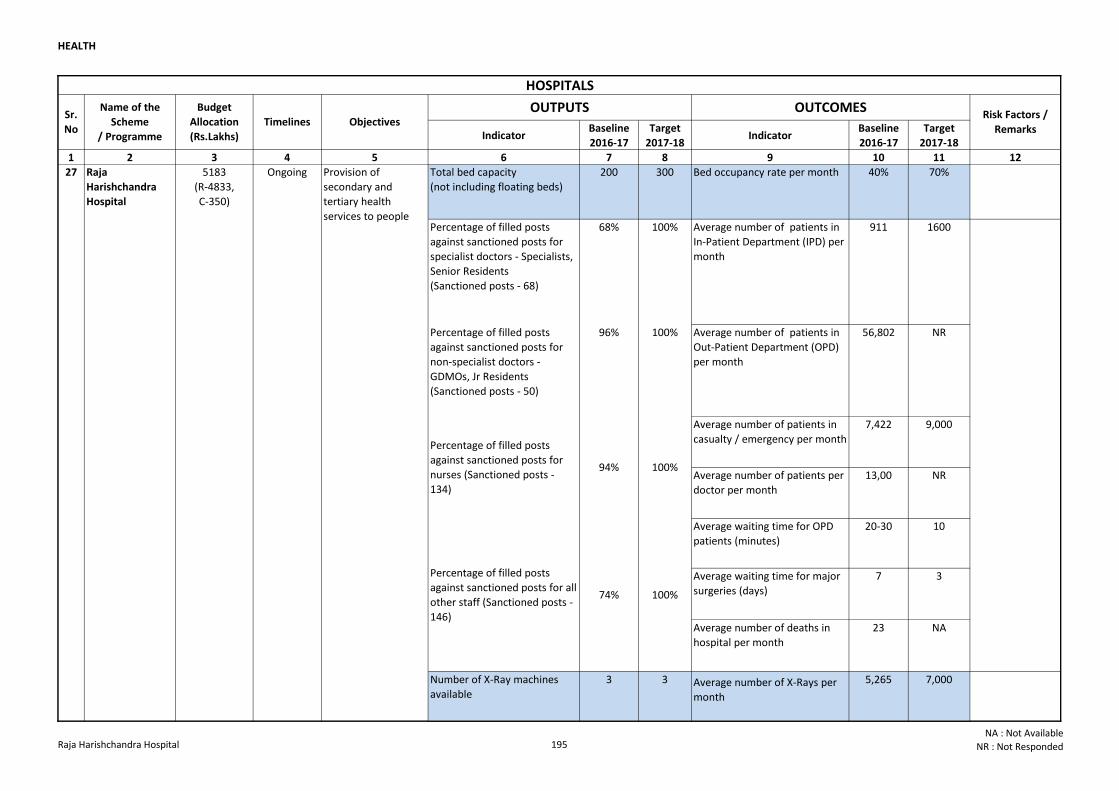
HEALTH
Indicator Baseline
2016-17
Target
2017-18Indicator
Baseline
2016-17
Target
2017-18
1 2 3 4 5 6 7 8 9 10 11 12
Total bed capacity
(not including floating beds)
200 300 Bed occupancy rate per month 40% 70%
Percentage of filled posts
against sanctioned posts for
specialist doctors - Specialists,
Senior Residents
(Sanctioned posts - 68)
68% 100% Average number of patients in
In-Patient Department (IPD) per
month
911 1600
Percentage of filled posts
against sanctioned posts for
non-specialist doctors -
GDMOs, Jr Residents
(Sanctioned posts - 50)
96% 100% Average number of patients in
Out-Patient Department (OPD)
per month
56,802 NR
Average number of patients in
casualty / emergency per month
7,422 9,000
Average number of patients per
doctor per month
13,00 NR
Average waiting time for OPD
patients (minutes)
20-30 10
Average waiting time for major
surgeries (days)
7 3
Average number of deaths in
hospital per month
23 NA
Number of X-Ray machines
available
3 3 Average number of X-Rays per
month
5,265 7,000
Percentage of filled posts
against sanctioned posts for
nurses (Sanctioned posts -
134)
94% 100%
Percentage of filled posts
against sanctioned posts for all
other staff (Sanctioned posts -
146)
74% 100%
27 Raja
Harishchandra
Hospital
5183
(R-4833,
C-350)
Ongoing Provision of
secondary and
tertiary health
services to people
HOSPITALS
Sr.
No
Name of the
Scheme
/ Programme
Budget
Allocation
(Rs.Lakhs)
Timelines Objectives OUTPUTS OUTCOMES
Risk Factors /
Remarks
Raja Harishchandra Hospital 195NA : Not Available
NR : Not Responded
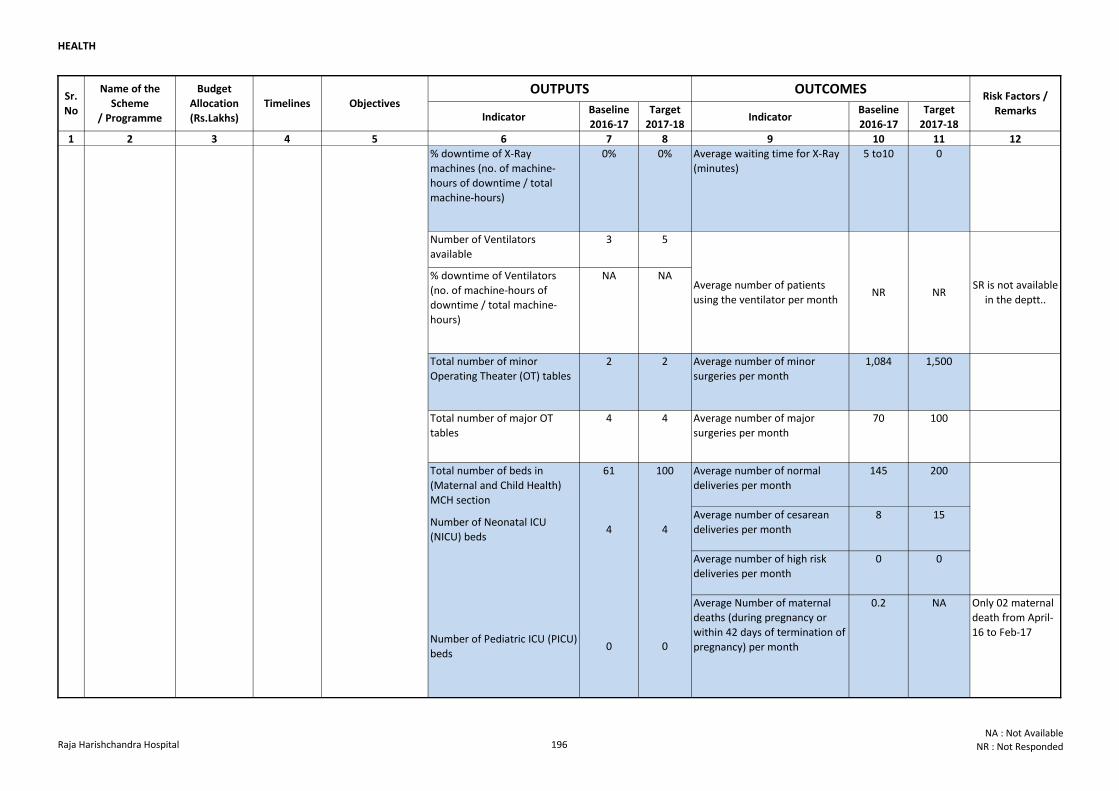
HEALTH
Indicator Baseline
2016-17
Target
2017-18Indicator
Baseline
2016-17
Target
2017-18
1 2 3 4 5 6 7 8 9 10 11 12
Sr.
No
Name of the
Scheme
/ Programme
Budget
Allocation
(Rs.Lakhs)
Timelines Objectives OUTPUTS OUTCOMES
Risk Factors /
Remarks
% downtime of X-Ray
machines (no. of machine-
hours of downtime / total
machine-hours)
0% 0% Average waiting time for X-Ray
(minutes)
5 to10 0
Number of Ventilators
available
3 5
% downtime of Ventilators
(no. of machine-hours of
downtime / total machine-
hours)
NA NA
Total number of minor
Operating Theater (OT) tables
2 2 Average number of minor
surgeries per month
1,084 1,500
Total number of major OT
tables
4 4 Average number of major
surgeries per month
70 100
Total number of beds in
(Maternal and Child Health)
MCH section
61 100 Average number of normal
deliveries per month
145 200
Number of Neonatal ICU
(NICU) beds4 4
Average number of cesarean
deliveries per month
8 15
Average number of high risk
deliveries per month
0 0
Average Number of maternal
deaths (during pregnancy or
within 42 days of termination of
pregnancy) per month
0.2 NA Only 02 maternal
death from April-
16 to Feb-17Number of Pediatric ICU (PICU)
beds0 0
Average number of patients
using the ventilator per monthNR NR
SR is not available
in the deptt..
27 Raja
Harishchandra
Hospital
5183
(R-4833,
C-350)
Ongoing Provision of
secondary and
tertiary health
services to people
Raja Harishchandra Hospital 196NA : Not Available
NR : Not Responded
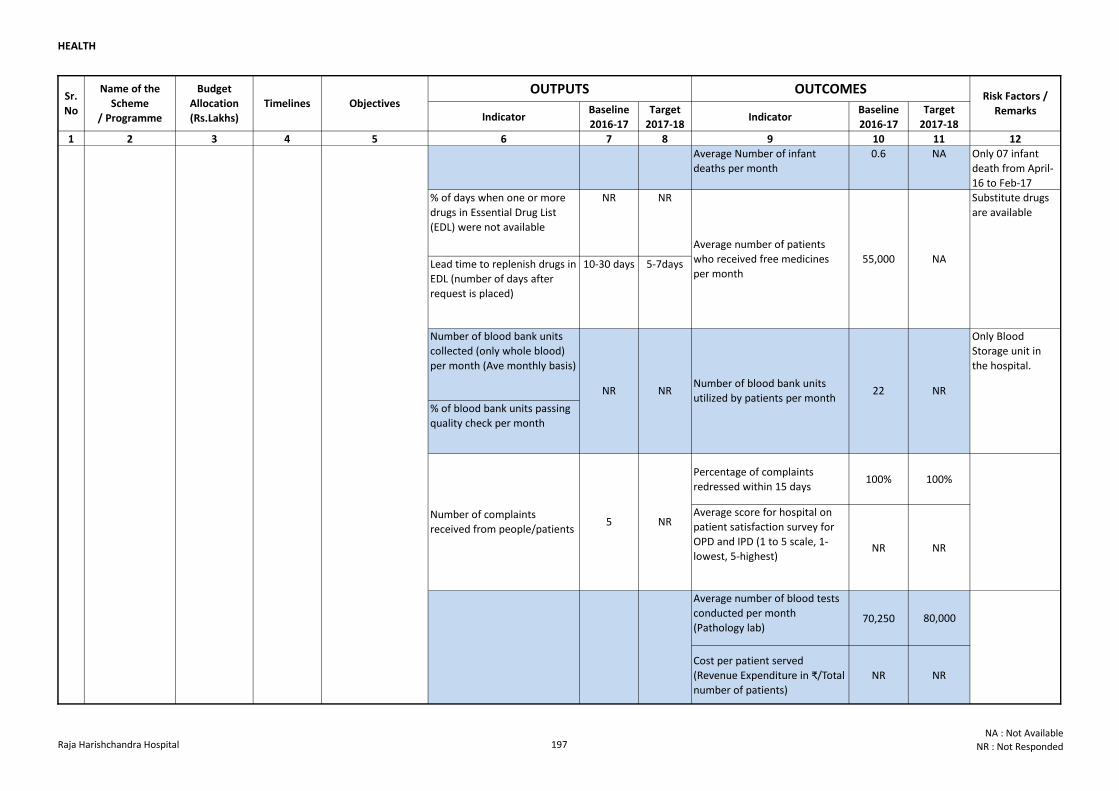
HEALTH
Indicator Baseline
2016-17
Target
2017-18Indicator
Baseline
2016-17
Target
2017-18
1 2 3 4 5 6 7 8 9 10 11 12
Sr.
No
Name of the
Scheme
/ Programme
Budget
Allocation
(Rs.Lakhs)
Timelines Objectives OUTPUTS OUTCOMES
Risk Factors /
Remarks
Average Number of infant
deaths per month
0.6 NA Only 07 infant
death from April-
16 to Feb-17
% of days when one or more
drugs in Essential Drug List
(EDL) were not available
NR NR
Lead time to replenish drugs in
EDL (number of days after
request is placed)
10-30 days 5-7days
Number of blood bank units
collected (only whole blood)
per month (Ave monthly basis)
% of blood bank units passing
quality check per month
Percentage of complaints
redressed within 15 days100% 100%
Average score for hospital on
patient satisfaction survey for
OPD and IPD (1 to 5 scale, 1-
lowest, 5-highest)NR NR
Average number of blood tests
conducted per month
(Pathology lab)70,250 80,000
Cost per patient served
(Revenue Expenditure in ₹/Total
number of patients)
NR NR
Number of complaints
received from people/patients5 NR
Average number of patients
who received free medicines
per month
55,000 NA
Substitute drugs
are available
Only Blood
Storage unit in
the hospital.
NR NRNumber of blood bank units
utilized by patients per month22 NR
Number of Pediatric ICU (PICU)
beds0 0
27 Raja
Harishchandra
Hospital
5183
(R-4833,
C-350)
Ongoing Provision of
secondary and
tertiary health
services to people
Raja Harishchandra Hospital 197NA : Not Available
NR : Not Responded
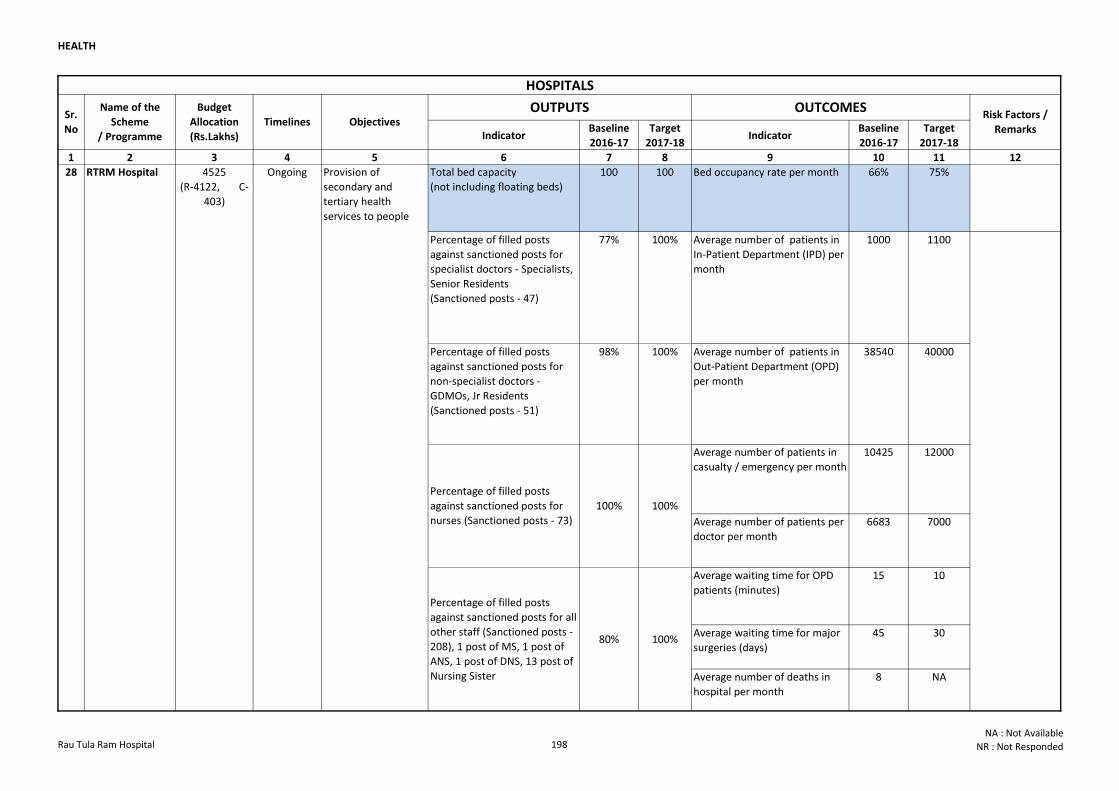
HEALTH
Indicator Baseline
2016-17
Target
2017-18Indicator
Baseline
2016-17
Target
2017-18
1 2 3 4 5 6 7 8 9 10 11 12
Total bed capacity
(not including floating beds)
100 100 Bed occupancy rate per month 66% 75%
Percentage of filled posts
against sanctioned posts for
specialist doctors - Specialists,
Senior Residents
(Sanctioned posts - 47)
77% 100% Average number of patients in
In-Patient Department (IPD) per
month
1000 1100
Percentage of filled posts
against sanctioned posts for
non-specialist doctors -
GDMOs, Jr Residents
(Sanctioned posts - 51)
98% 100% Average number of patients in
Out-Patient Department (OPD)
per month
38540 40000
Average number of patients in
casualty / emergency per month
10425 12000
Average number of patients per
doctor per month
6683 7000
Average waiting time for OPD
patients (minutes)
15 10
Average waiting time for major
surgeries (days)
45 30
Average number of deaths in
hospital per month
8 NA
Percentage of filled posts
against sanctioned posts for
nurses (Sanctioned posts - 73)
100% 100%
Percentage of filled posts
against sanctioned posts for all
other staff (Sanctioned posts -
208), 1 post of MS, 1 post of
ANS, 1 post of DNS, 13 post of
Nursing Sister
80% 100%
28 RTRM Hospital 4525
(R-4122, C-
403)
Ongoing Provision of
secondary and
tertiary health
services to people
HOSPITALS
Sr.
No
Name of the
Scheme
/ Programme
Budget
Allocation
(Rs.Lakhs)
Timelines Objectives OUTPUTS OUTCOMES
Risk Factors /
Remarks
Rau Tula Ram Hospital 198NA : Not Available
NR : Not Responded
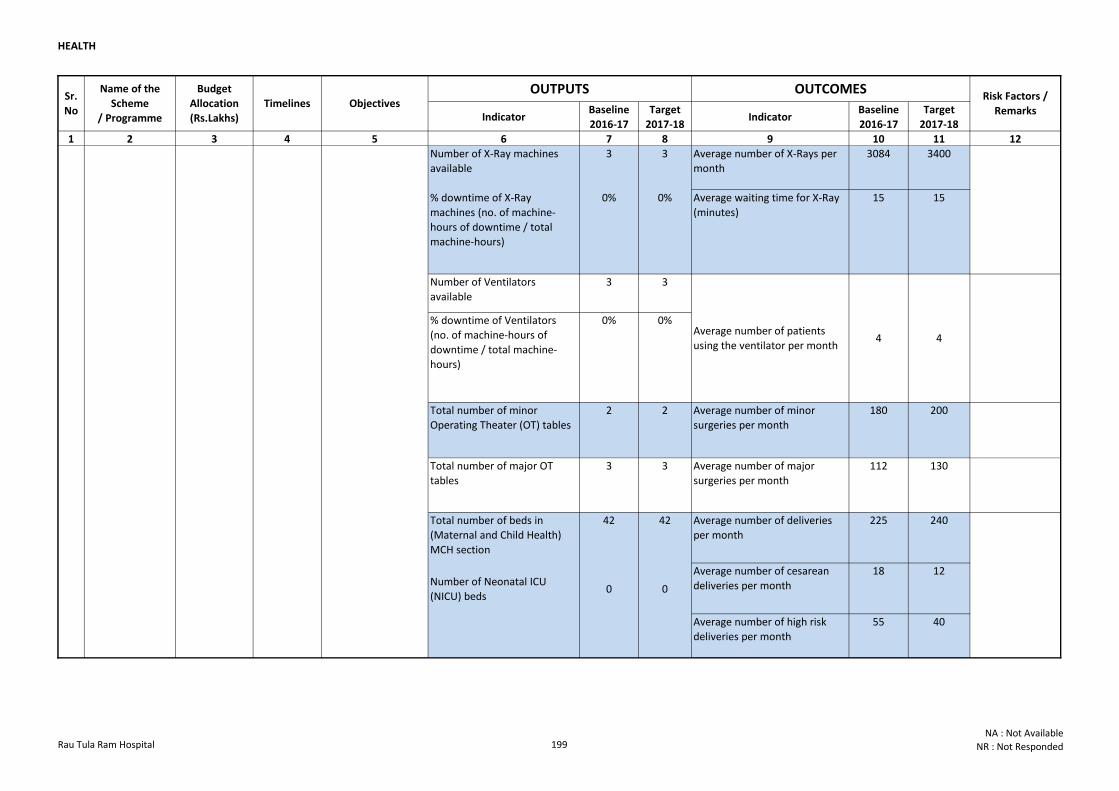
HEALTH
Indicator Baseline
2016-17
Target
2017-18Indicator
Baseline
2016-17
Target
2017-18
1 2 3 4 5 6 7 8 9 10 11 12
Sr.
No
Name of the
Scheme
/ Programme
Budget
Allocation
(Rs.Lakhs)
Timelines Objectives OUTPUTS OUTCOMES
Risk Factors /
Remarks
Number of X-Ray machines
available
3 3 Average number of X-Rays per
month
3084 3400
% downtime of X-Ray
machines (no. of machine-
hours of downtime / total
machine-hours)
0% 0% Average waiting time for X-Ray
(minutes)
15 15
Number of Ventilators
available
3 3
% downtime of Ventilators
(no. of machine-hours of
downtime / total machine-
hours)
0% 0%
Total number of minor
Operating Theater (OT) tables
2 2 Average number of minor
surgeries per month
180 200
Total number of major OT
tables
3 3 Average number of major
surgeries per month
112 130
Total number of beds in
(Maternal and Child Health)
MCH section
42 42 Average number of deliveries
per month
225 240
Number of Neonatal ICU
(NICU) beds0 0
Average number of cesarean
deliveries per month
18 12
Average number of high risk
deliveries per month
55 40
Number of Pediatric ICU (PICU)
beds0 0
Average number of patients
using the ventilator per month4 4
28 RTRM Hospital 4525
(R-4122, C-
403)
Ongoing Provision of
secondary and
tertiary health
services to people
Rau Tula Ram Hospital 199NA : Not Available
NR : Not Responded
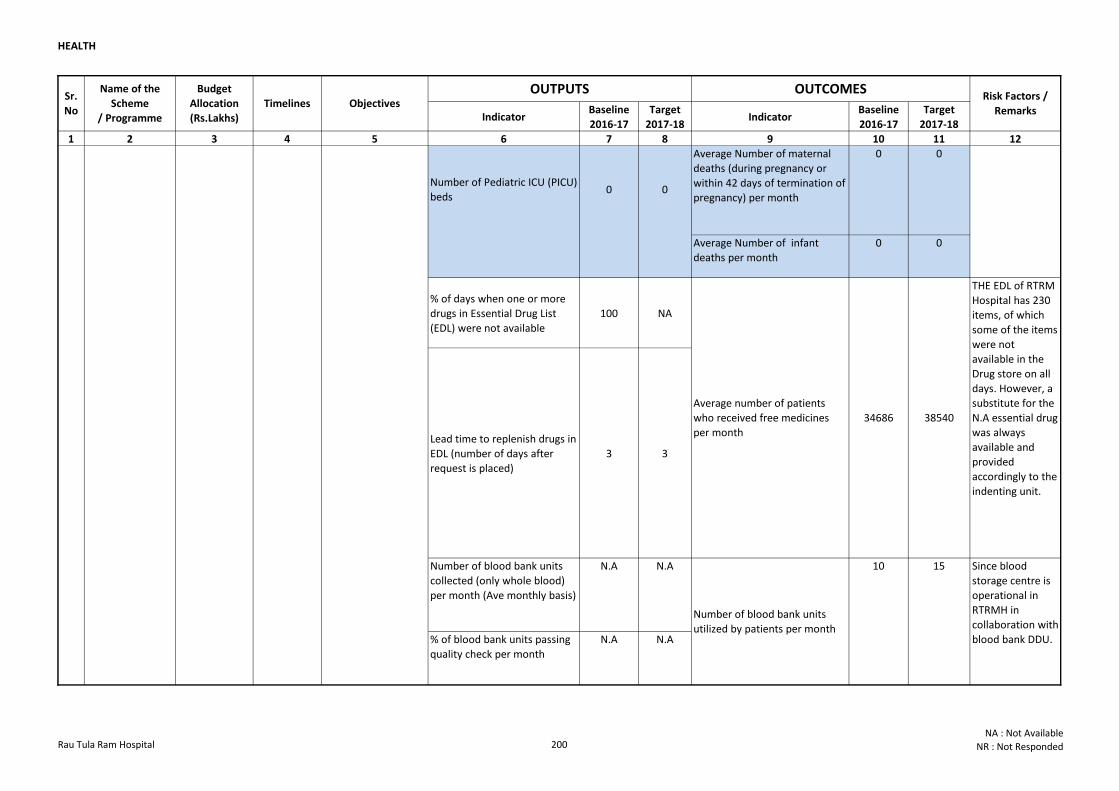
HEALTH
Indicator Baseline
2016-17
Target
2017-18Indicator
Baseline
2016-17
Target
2017-18
1 2 3 4 5 6 7 8 9 10 11 12
Sr.
No
Name of the
Scheme
/ Programme
Budget
Allocation
(Rs.Lakhs)
Timelines Objectives OUTPUTS OUTCOMES
Risk Factors /
Remarks
Average Number of maternal
deaths (during pregnancy or
within 42 days of termination of
pregnancy) per month
0 0
Average Number of infant
deaths per month
0 0
% of days when one or more
drugs in Essential Drug List
(EDL) were not available
100 NA
Lead time to replenish drugs in
EDL (number of days after
request is placed)
3 3
Number of blood bank units
collected (only whole blood)
per month (Ave monthly basis)
N.A N.A
% of blood bank units passing
quality check per month
N.A N.A
Number of blood bank units
utilized by patients per month
10 15 Since blood
storage centre is
operational in
RTRMH in
collaboration with
blood bank DDU.
Number of Pediatric ICU (PICU)
beds0 0
Average number of patients
who received free medicines
per month
34686 38540
THE EDL of RTRM
Hospital has 230
items, of which
some of the items
were not
available in the
Drug store on all
days. However, a
substitute for the
N.A essential drug
was always
available and
provided
accordingly to the
indenting unit.
28 RTRM Hospital 4525
(R-4122, C-
403)
Ongoing Provision of
secondary and
tertiary health
services to people
Rau Tula Ram Hospital 200NA : Not Available
NR : Not Responded
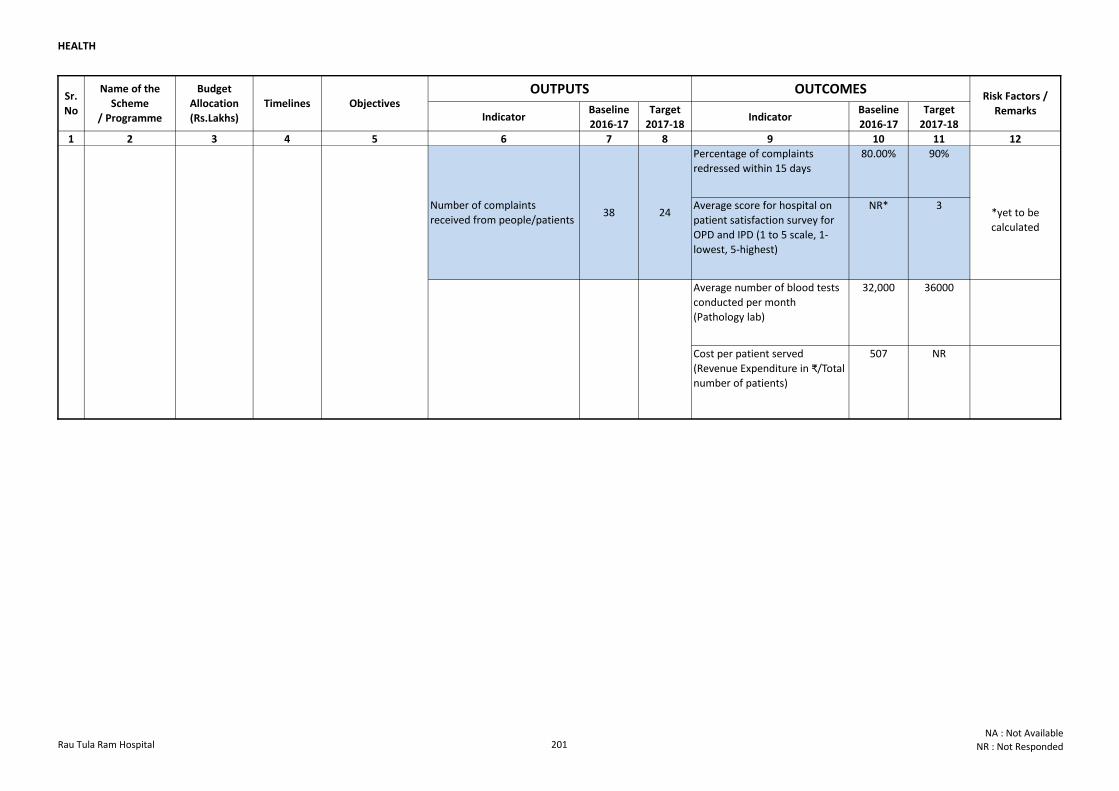
HEALTH
Indicator Baseline
2016-17
Target
2017-18Indicator
Baseline
2016-17
Target
2017-18
1 2 3 4 5 6 7 8 9 10 11 12
Sr.
No
Name of the
Scheme
/ Programme
Budget
Allocation
(Rs.Lakhs)
Timelines Objectives OUTPUTS OUTCOMES
Risk Factors /
Remarks
Percentage of complaints
redressed within 15 days
80.00% 90%
Average score for hospital on
patient satisfaction survey for
OPD and IPD (1 to 5 scale, 1-
lowest, 5-highest)
NR* 3
Average number of blood tests
conducted per month
(Pathology lab)
32,000 36000
Cost per patient served
(Revenue Expenditure in ₹/Total
number of patients)
507 NR
Number of complaints
received from people/patients38 24
*yet to be
calculated
28 RTRM Hospital 4525
(R-4122, C-
403)
Ongoing Provision of
secondary and
tertiary health
services to people
Rau Tula Ram Hospital 201NA : Not Available
NR : Not Responded
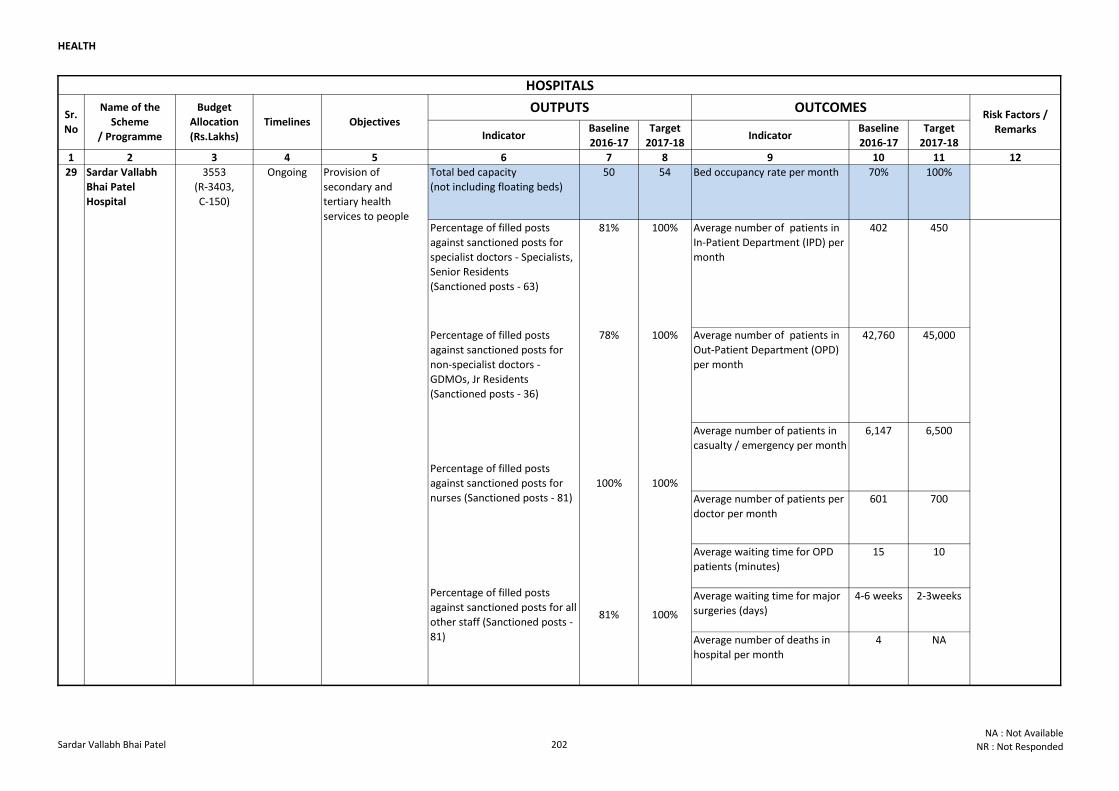
HEALTH
Indicator Baseline
2016-17
Target
2017-18Indicator
Baseline
2016-17
Target
2017-18
1 2 3 4 5 6 7 8 9 10 11 12
Total bed capacity
(not including floating beds)
50 54 Bed occupancy rate per month 70% 100%
Percentage of filled posts
against sanctioned posts for
specialist doctors - Specialists,
Senior Residents
(Sanctioned posts - 63)
81% 100% Average number of patients in
In-Patient Department (IPD) per
month
402 450
Percentage of filled posts
against sanctioned posts for
non-specialist doctors -
GDMOs, Jr Residents
(Sanctioned posts - 36)
78% 100% Average number of patients in
Out-Patient Department (OPD)
per month
42,760 45,000
Average number of patients in
casualty / emergency per month
6,147 6,500
Average number of patients per
doctor per month
601 700
Average waiting time for OPD
patients (minutes)
15 10
Average waiting time for major
surgeries (days)
4-6 weeks 2-3weeks
Average number of deaths in
hospital per month
4 NA
Percentage of filled posts
against sanctioned posts for
nurses (Sanctioned posts - 81)
100% 100%
Percentage of filled posts
against sanctioned posts for all
other staff (Sanctioned posts -
81)
81% 100%
29 Sardar Vallabh
Bhai Patel
Hospital
3553
(R-3403,
C-150)
Ongoing Provision of
secondary and
tertiary health
services to people
HOSPITALS
Sr.
No
Name of the
Scheme
/ Programme
Budget
Allocation
(Rs.Lakhs)
Timelines Objectives OUTPUTS OUTCOMES
Risk Factors /
Remarks
Sardar Vallabh Bhai Patel 202NA : Not Available
NR : Not Responded
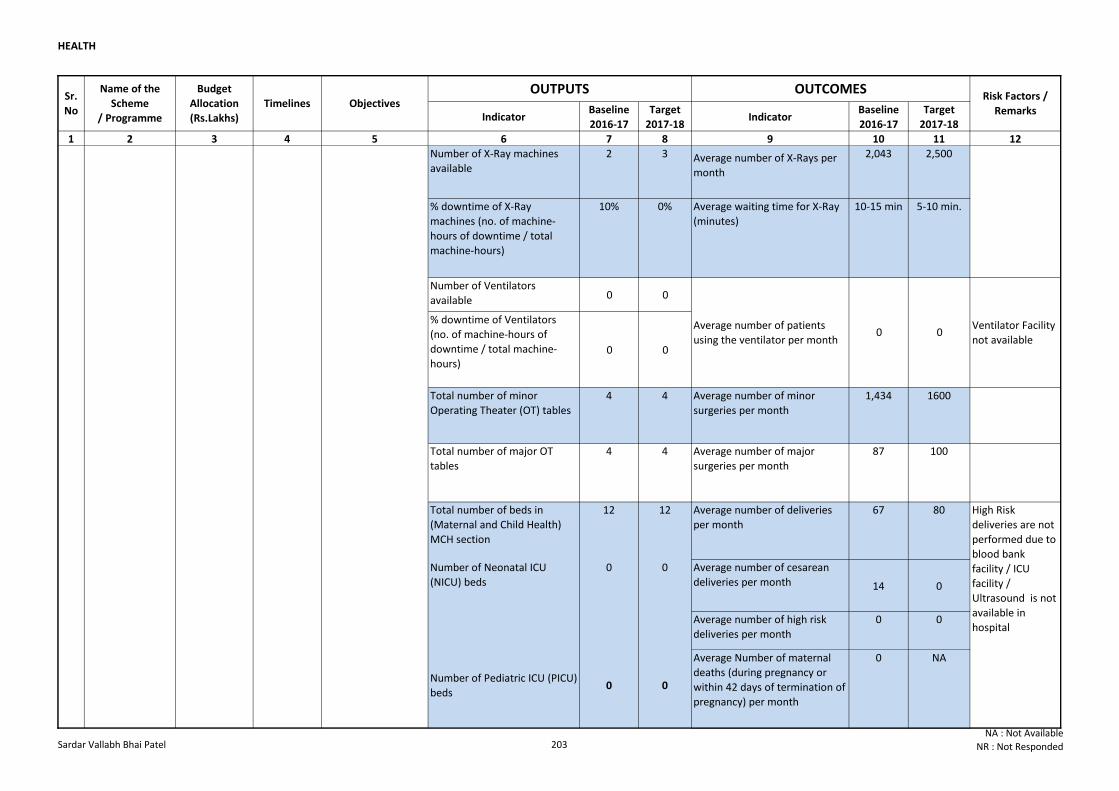
HEALTH
Indicator Baseline
2016-17
Target
2017-18Indicator
Baseline
2016-17
Target
2017-18
1 2 3 4 5 6 7 8 9 10 11 12
Sr.
No
Name of the
Scheme
/ Programme
Budget
Allocation
(Rs.Lakhs)
Timelines Objectives OUTPUTS OUTCOMES
Risk Factors /
Remarks
Number of X-Ray machines
available
2 3 Average number of X-Rays per
month
2,043 2,500
% downtime of X-Ray
machines (no. of machine-
hours of downtime / total
machine-hours)
10% 0% Average waiting time for X-Ray
(minutes)
10-15 min 5-10 min.
Number of Ventilators
available 0 0
% downtime of Ventilators
(no. of machine-hours of
downtime / total machine-
hours)0 0
Total number of minor
Operating Theater (OT) tables
4 4 Average number of minor
surgeries per month
1,434 1600
Total number of major OT
tables
4 4 Average number of major
surgeries per month
87 100
Total number of beds in
(Maternal and Child Health)
MCH section
12 12 Average number of deliveries
per month
67 80
Number of Neonatal ICU
(NICU) beds
0 0 Average number of cesarean
deliveries per month 14 0
Average number of high risk
deliveries per month
0 0
Average Number of maternal
deaths (during pregnancy or
within 42 days of termination of
pregnancy) per month
0 NA
Number of Pediatric ICU (PICU)
beds0 0
Average number of patients
using the ventilator per month0 0
Ventilator Facility
not available
High Risk
deliveries are not
performed due to
blood bank
facility / ICU
facility /
Ultrasound is not
available in
hospital
29 Sardar Vallabh
Bhai Patel
Hospital
3553
(R-3403,
C-150)
Ongoing Provision of
secondary and
tertiary health
services to people
Sardar Vallabh Bhai Patel 203NA : Not Available
NR : Not Responded
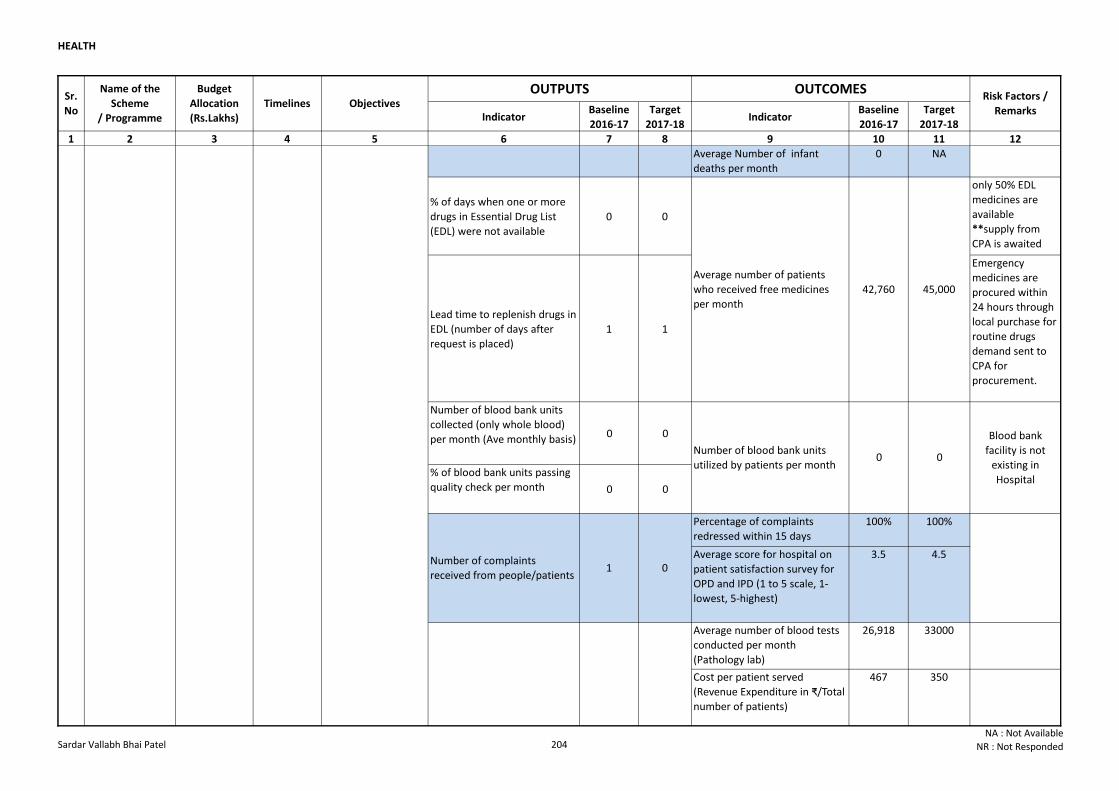
HEALTH
Indicator Baseline
2016-17
Target
2017-18Indicator
Baseline
2016-17
Target
2017-18
1 2 3 4 5 6 7 8 9 10 11 12
Sr.
No
Name of the
Scheme
/ Programme
Budget
Allocation
(Rs.Lakhs)
Timelines Objectives OUTPUTS OUTCOMES
Risk Factors /
Remarks
Average Number of infant
deaths per month
0 NA
% of days when one or more
drugs in Essential Drug List
(EDL) were not available
0 0
only 50% EDL
medicines are
available
**supply from
CPA is awaited
Lead time to replenish drugs in
EDL (number of days after
request is placed)
1 1
Emergency
medicines are
procured within
24 hours through
local purchase for
routine drugs
demand sent to
CPA for
procurement.
Number of blood bank units
collected (only whole blood)
per month (Ave monthly basis) 0 0
% of blood bank units passing
quality check per month 0 0
Percentage of complaints
redressed within 15 days
100% 100%
Average score for hospital on
patient satisfaction survey for
OPD and IPD (1 to 5 scale, 1-
lowest, 5-highest)
3.5 4.5
Average number of blood tests
conducted per month
(Pathology lab)
26,918 33000
Cost per patient served
(Revenue Expenditure in ₹/Total
number of patients)
467 350
Number of blood bank units
utilized by patients per month
Blood bank
facility is not
existing in
Hospital
Number of complaints
received from people/patients1 0
0 0
Number of Pediatric ICU (PICU)
beds0 0
Average number of patients
who received free medicines
per month
42,760 45,000
High Risk
deliveries are not
performed due to
blood bank
facility / ICU
facility /
Ultrasound is not
available in
hospital
29 Sardar Vallabh
Bhai Patel
Hospital
3553
(R-3403,
C-150)
Ongoing Provision of
secondary and
tertiary health
services to people
Sardar Vallabh Bhai Patel 204NA : Not Available
NR : Not Responded
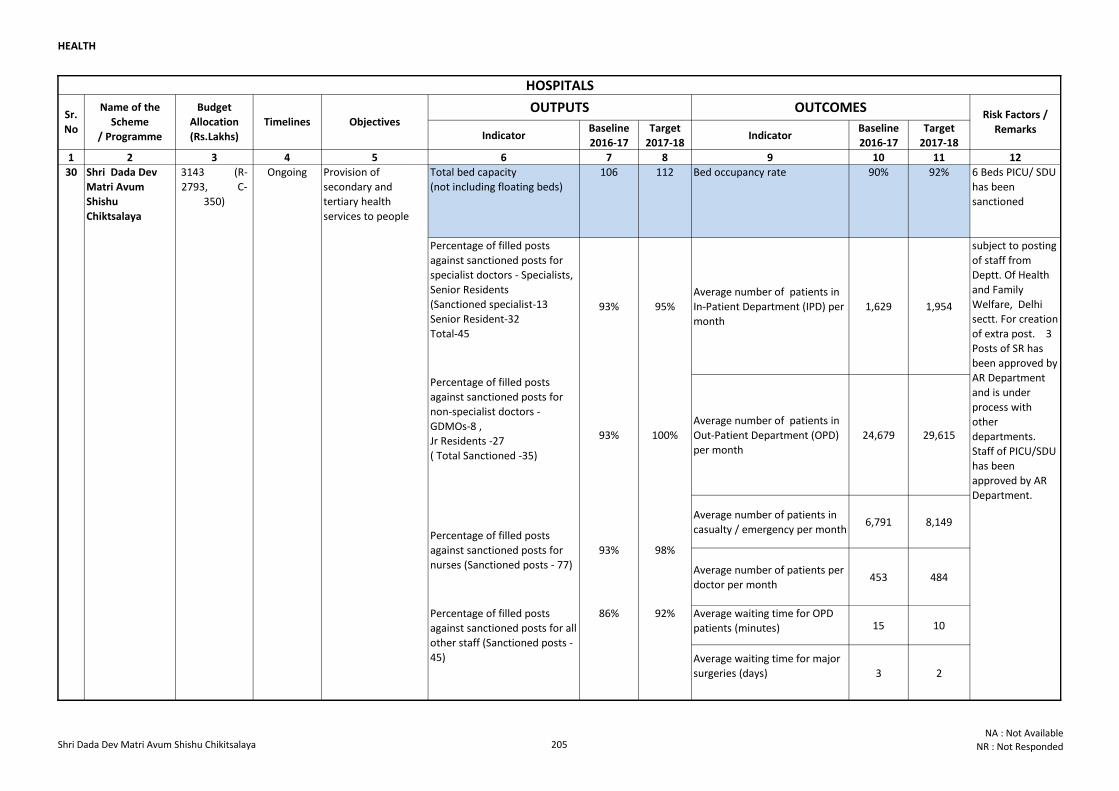
HEALTH
Indicator Baseline
2016-17
Target
2017-18Indicator
Baseline
2016-17
Target
2017-18
1 2 3 4 5 6 7 8 9 10 11 12
Total bed capacity
(not including floating beds)
106 112 Bed occupancy rate 90% 92% 6 Beds PICU/ SDU
has been
sanctioned
Percentage of filled posts
against sanctioned posts for
specialist doctors - Specialists,
Senior Residents
(Sanctioned specialist-13
Senior Resident-32
Total-45
93% 95%
Average number of patients in
In-Patient Department (IPD) per
month
1,629 1,954
Percentage of filled posts
against sanctioned posts for
non-specialist doctors -
GDMOs-8 ,
Jr Residents -27
( Total Sanctioned -35)
93% 100%
Average number of patients in
Out-Patient Department (OPD)
per month
24,679 29,615
Average number of patients in
casualty / emergency per month 6,791 8,149
Average number of patients per
doctor per month453 484
Average waiting time for OPD
patients (minutes) 15 10
Average waiting time for major
surgeries (days) 3 2
subject to posting
of staff from
Deptt. Of Health
and Family
Welfare, Delhi
sectt. For creation
of extra post. 3
Posts of SR has
been approved by
AR Department
and is under
process with
other
departments.
Staff of PICU/SDU
has been
approved by AR
Department.
Percentage of filled posts
against sanctioned posts for
nurses (Sanctioned posts - 77)
93% 98%
Percentage of filled posts
against sanctioned posts for all
other staff (Sanctioned posts -
45)
86% 92%
30 Shri Dada Dev
Matri Avum
Shishu
Chiktsalaya
3143 (R-
2793, C-
350)
Ongoing Provision of
secondary and
tertiary health
services to people
HOSPITALS
Sr.
No
Name of the
Scheme
/ Programme
Budget
Allocation
(Rs.Lakhs)
Timelines Objectives OUTPUTS OUTCOMES
Risk Factors /
Remarks
Shri Dada Dev Matri Avum Shishu Chikitsalaya 205NA : Not Available
NR : Not Responded
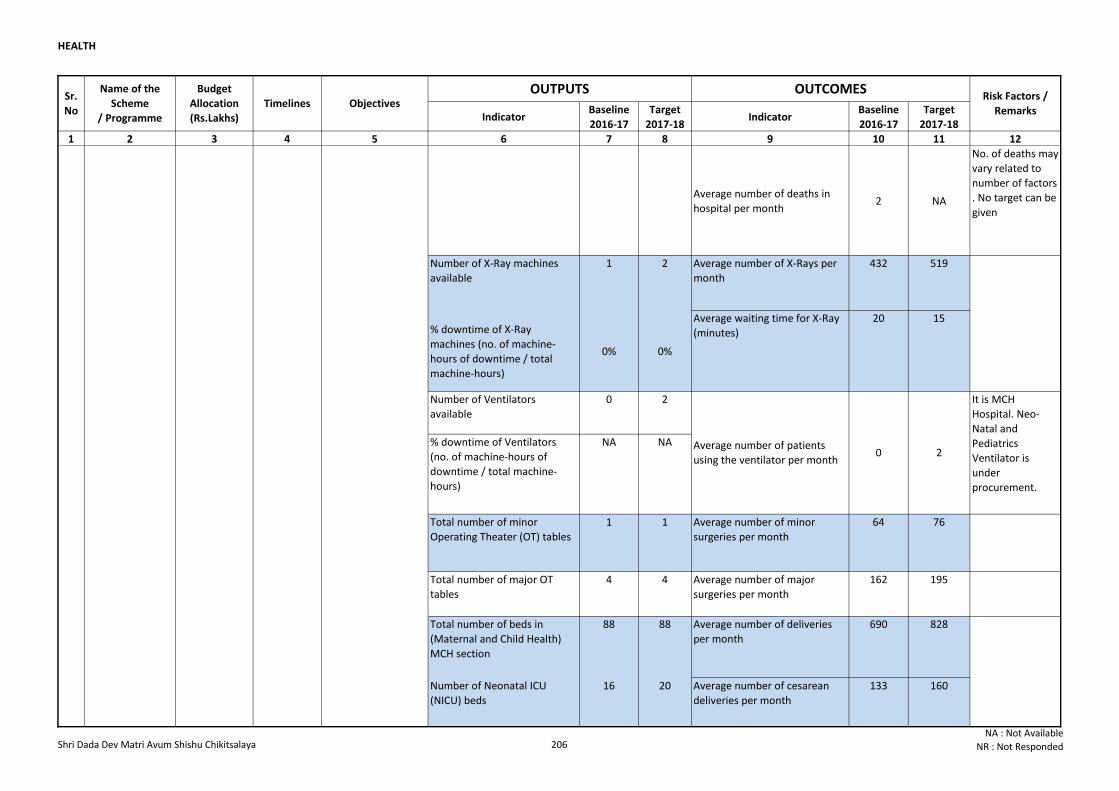
HEALTH
Indicator Baseline
2016-17
Target
2017-18Indicator
Baseline
2016-17
Target
2017-18
1 2 3 4 5 6 7 8 9 10 11 12
Sr.
No
Name of the
Scheme
/ Programme
Budget
Allocation
(Rs.Lakhs)
Timelines Objectives OUTPUTS OUTCOMES
Risk Factors /
Remarks
Average number of deaths in
hospital per month2 NA
No. of deaths may
vary related to
number of factors
. No target can be
given
Number of X-Ray machines
available
1 2 Average number of X-Rays per
month
432 519
% downtime of X-Ray
machines (no. of machine-
hours of downtime / total
machine-hours)
0% 0%
Average waiting time for X-Ray
(minutes)
20 15
Number of Ventilators
available
0 2
% downtime of Ventilators
(no. of machine-hours of
downtime / total machine-
hours)
NA NA
Total number of minor
Operating Theater (OT) tables
1 1 Average number of minor
surgeries per month
64 76
Total number of major OT
tables
4 4 Average number of major
surgeries per month
162 195
Total number of beds in
(Maternal and Child Health)
MCH section
88 88 Average number of deliveries
per month
690 828
Number of Neonatal ICU
(NICU) beds
16 20 Average number of cesarean
deliveries per month
133 160
Percentage of filled posts
against sanctioned posts for all
other staff (Sanctioned posts -
45)
86% 92%
Average number of patients
using the ventilator per month0 2
It is MCH
Hospital. Neo-
Natal and
Pediatrics
Ventilator is
under
procurement.
30 Shri Dada Dev
Matri Avum
Shishu
Chiktsalaya
3143 (R-
2793, C-
350)
Ongoing Provision of
secondary and
tertiary health
services to people
Shri Dada Dev Matri Avum Shishu Chikitsalaya 206NA : Not Available
NR : Not Responded
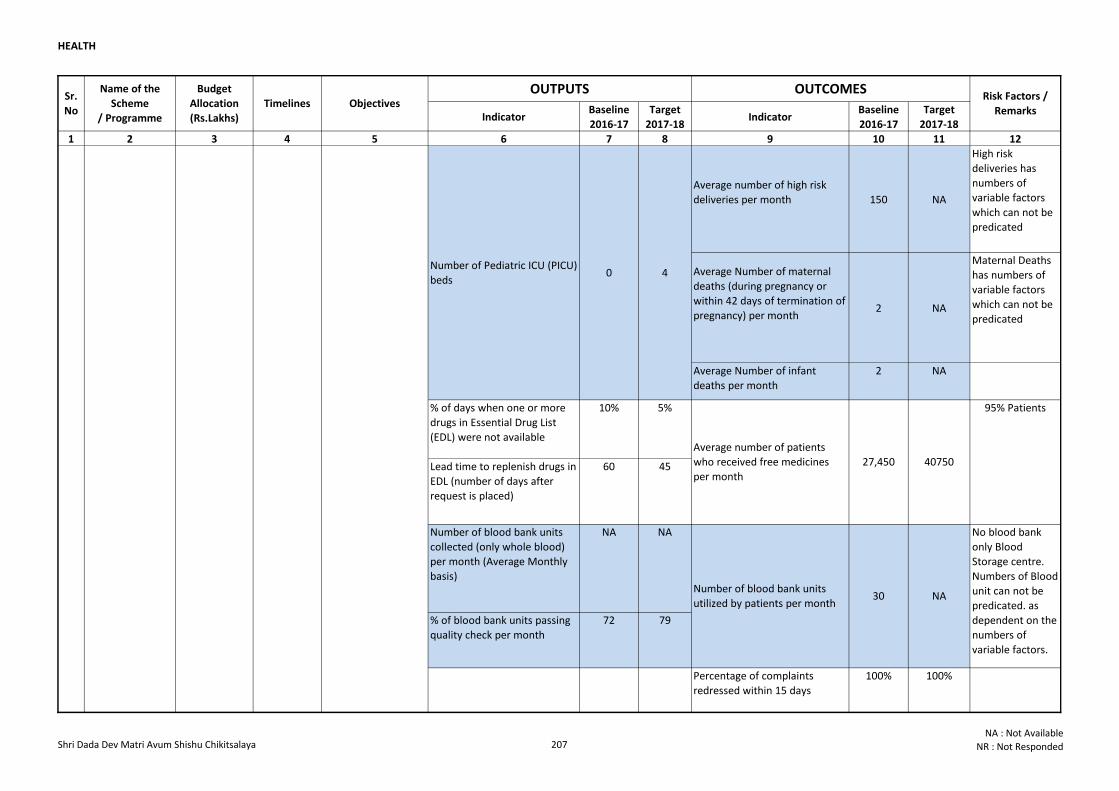
HEALTH
Indicator Baseline
2016-17
Target
2017-18Indicator
Baseline
2016-17
Target
2017-18
1 2 3 4 5 6 7 8 9 10 11 12
Sr.
No
Name of the
Scheme
/ Programme
Budget
Allocation
(Rs.Lakhs)
Timelines Objectives OUTPUTS OUTCOMES
Risk Factors /
Remarks
Average number of high risk
deliveries per month 150 NA
High risk
deliveries has
numbers of
variable factors
which can not be
predicated
Average Number of maternal
deaths (during pregnancy or
within 42 days of termination of
pregnancy) per month2 NA
Maternal Deaths
has numbers of
variable factors
which can not be
predicated
Average Number of infant
deaths per month
2 NA
% of days when one or more
drugs in Essential Drug List
(EDL) were not available
10% 5%
Lead time to replenish drugs in
EDL (number of days after
request is placed)
60 45
Number of blood bank units
collected (only whole blood)
per month (Average Monthly
basis)
NA NA
% of blood bank units passing
quality check per month
72 79
Percentage of complaints
redressed within 15 days
100% 100%
Number of complaints
received from people/patients
per month
6 NA
Average number of patients
who received free medicines
per month
27,450 40750
95% Patients
Number of blood bank units
utilized by patients per month30 NA
No blood bank
only Blood
Storage centre.
Numbers of Blood
unit can not be
predicated. as
dependent on the
numbers of
variable factors.
Number of Pediatric ICU (PICU)
beds0 4
30 Shri Dada Dev
Matri Avum
Shishu
Chiktsalaya
3143 (R-
2793, C-
350)
Ongoing Provision of
secondary and
tertiary health
services to people
Shri Dada Dev Matri Avum Shishu Chikitsalaya 207NA : Not Available
NR : Not Responded
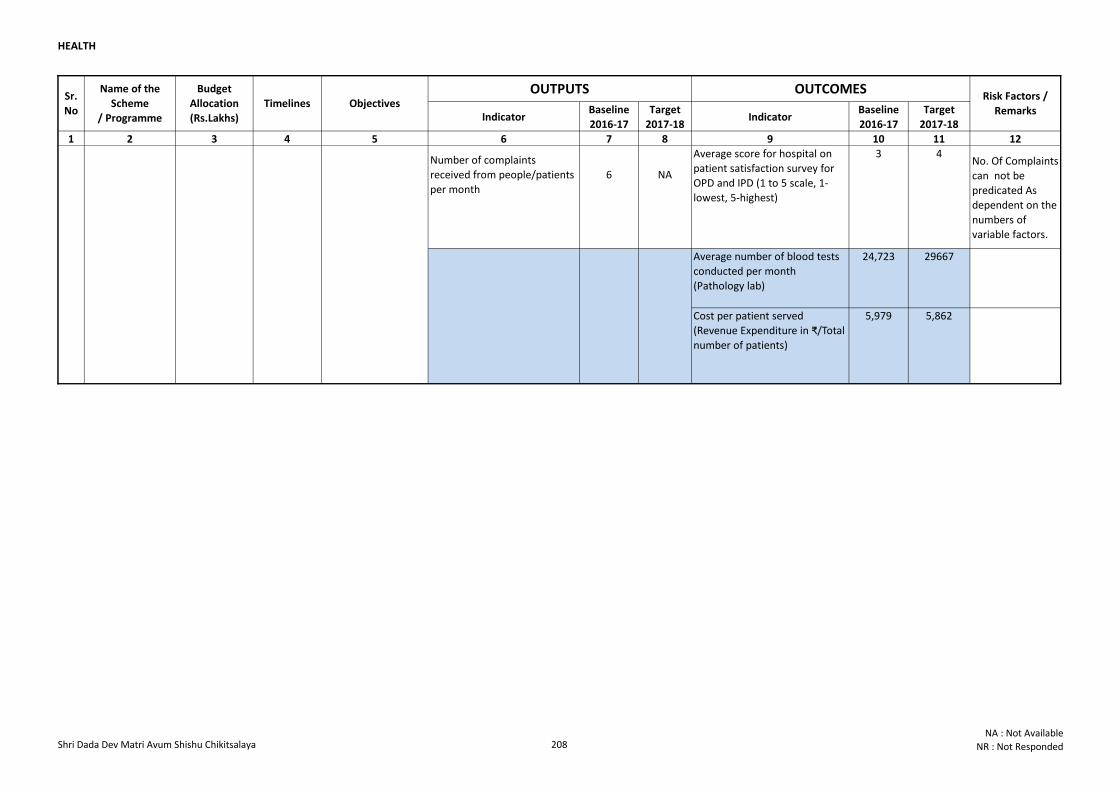
HEALTH
Indicator Baseline
2016-17
Target
2017-18Indicator
Baseline
2016-17
Target
2017-18
1 2 3 4 5 6 7 8 9 10 11 12
Sr.
No
Name of the
Scheme
/ Programme
Budget
Allocation
(Rs.Lakhs)
Timelines Objectives OUTPUTS OUTCOMES
Risk Factors /
Remarks
Average score for hospital on
patient satisfaction survey for
OPD and IPD (1 to 5 scale, 1-
lowest, 5-highest)
3 4No. Of Complaints
can not be
predicated As
dependent on the
numbers of
variable factors.
Average number of blood tests
conducted per month
(Pathology lab)
24,723 29667
Cost per patient served
(Revenue Expenditure in ₹/Total
number of patients)
5,979 5,862
Number of complaints
received from people/patients
per month
6 NA
30 Shri Dada Dev
Matri Avum
Shishu
Chiktsalaya
3143 (R-
2793, C-
350)
Ongoing Provision of
secondary and
tertiary health
services to people
Shri Dada Dev Matri Avum Shishu Chikitsalaya 208NA : Not Available
NR : Not Responded
SOCIAL SECURITY
AND WELFARE
SO
CIA
L S
EU
RIT
Y A
ND
WELFA
RE
SO
CIA
L S
EU
RIT
Y A
ND
WELFA
RE
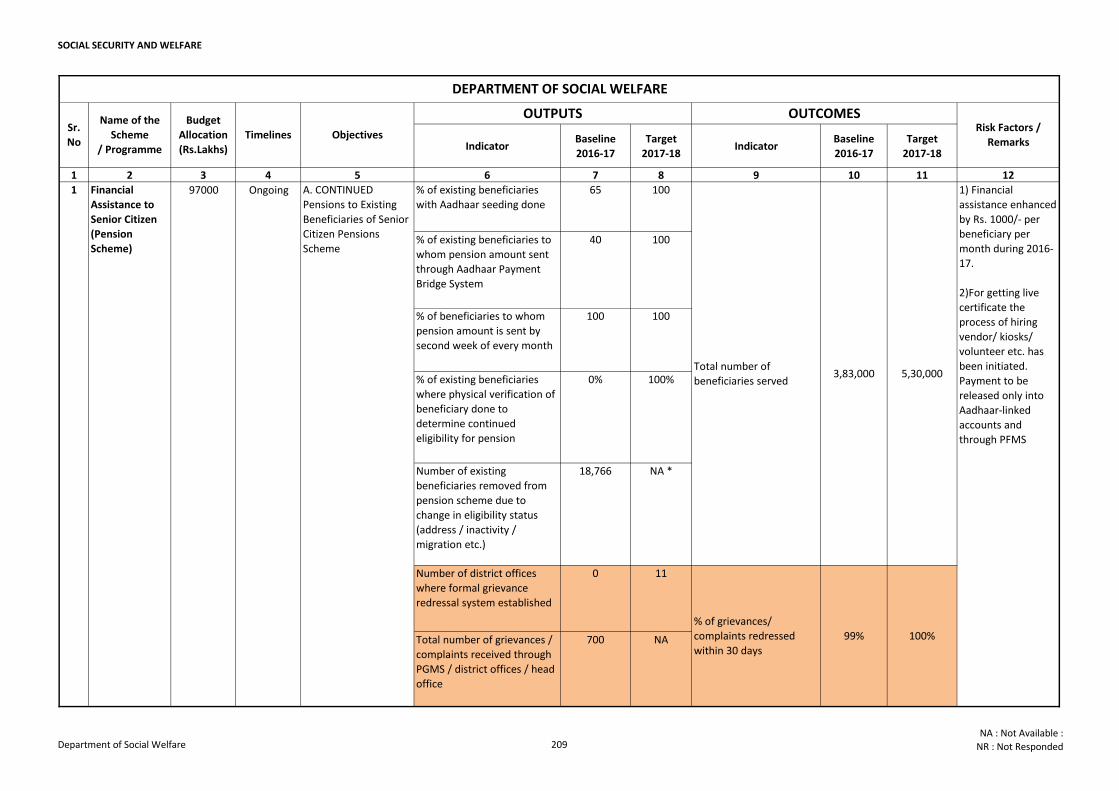
SOCIAL SECURITY AND WELFARE
Indicator Baseline
2016-17
Target
2017-18Indicator
Baseline
2016-17
Target
2017-18
1 2 3 4 5 6 7 8 9 10 11 12
% of existing beneficiaries
with Aadhaar seeding done
65 100
% of existing beneficiaries to
whom pension amount sent
through Aadhaar Payment
Bridge System
40 100
% of beneficiaries to whom
pension amount is sent by
second week of every month
100 100
% of existing beneficiaries
where physical verification of
beneficiary done to
determine continued
eligibility for pension
0% 100%
Number of existing
beneficiaries removed from
pension scheme due to
change in eligibility status
(address / inactivity /
migration etc.)
18,766 NA *
Number of district offices
where formal grievance
redressal system established
0 11
Total number of grievances /
complaints received through
PGMS / district offices / head
office
700 NA
Financial
Assistance to
Senior Citizen
(Pension
Scheme)
DEPARTMENT OF SOCIAL WELFARE
1) Financial
assistance enhanced
by Rs. 1000/- per
beneficiary per
month during 2016-
17.
2)For getting live
certificate the
process of hiring
vendor/ kiosks/
volunteer etc. has
been initiated.
Payment to be
released only into
Aadhaar-linked
accounts and
through PFMS
Timelines Objectives Risk Factors /
Remarks
1 A. CONTINUED
Pensions to Existing
Beneficiaries of Senior
Citizen Pensions
Scheme
Sr.
No
Name of the
Scheme
/ Programme
Budget
Allocation
(Rs.Lakhs)
97000 Ongoing
OUTPUTS OUTCOMES
Total number of
beneficiaries served
100%99%
% of grievances/
complaints redressed
within 30 days
3,83,000 5,30,000
Department of Social Welfare 209NA : Not Available :
NR : Not Responded
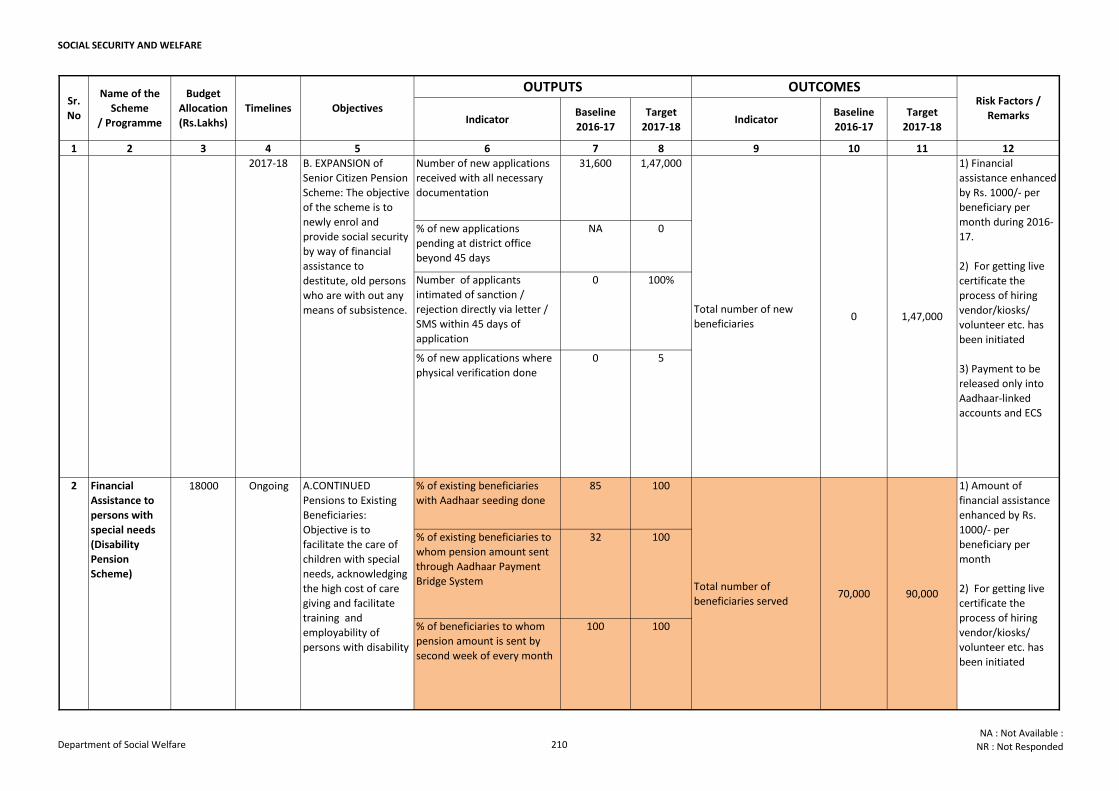
SOCIAL SECURITY AND WELFARE
Indicator Baseline
2016-17
Target
2017-18Indicator
Baseline
2016-17
Target
2017-18
1 2 3 4 5 6 7 8 9 10 11 12
Timelines Objectives Risk Factors /
Remarks
Sr.
No
Name of the
Scheme
/ Programme
Budget
Allocation
(Rs.Lakhs)
OUTPUTS OUTCOMES
Number of new applications
received with all necessary
documentation
31,600 1,47,000
% of new applications
pending at district office
beyond 45 days
NA 0
Number of applicants
intimated of sanction /
rejection directly via letter /
SMS within 45 days of
application
0 100%
% of existing beneficiaries
with Aadhaar seeding done
85 100
% of existing beneficiaries to
whom pension amount sent
through Aadhaar Payment
Bridge System
32 100
% of beneficiaries to whom
pension amount is sent by
second week of every month
100 100
5
2017-18
Financial
Assistance to
Senior Citizen
(Pension
Scheme)
B. EXPANSION of
Senior Citizen Pension
Scheme: The objective
of the scheme is to
newly enrol and
provide social security
by way of financial
assistance to
destitute, old persons
who are with out any
means of subsistence. Total number of new
beneficiaries0
1
0
1,47,000
Total number of
beneficiaries served
1) Financial
assistance enhanced
by Rs. 1000/- per
beneficiary per
month during 2016-
17.
2) For getting live
certificate the
process of hiring
vendor/kiosks/
volunteer etc. has
been initiated
3) Payment to be
released only into
Aadhaar-linked
accounts and ECS
70,000 90,000
1) Amount of
financial assistance
enhanced by Rs.
1000/- per
beneficiary per
month
2) For getting live
certificate the
process of hiring
vendor/kiosks/
volunteer etc. has
been initiated
3) To provide
pension to all
eligible resident of
Delhi through ECS
and linking it with
Aadhaar number
2 Ongoing A.CONTINUED
Pensions to Existing
Beneficiaries:
Objective is to
facilitate the care of
children with special
needs, acknowledging
the high cost of care
giving and facilitate
training and
employability of
persons with disability
97000
% of new applications where
physical verification done
18000Financial
Assistance to
persons with
special needs
(Disability
Pension
Scheme)
Department of Social Welfare 210NA : Not Available :
NR : Not Responded
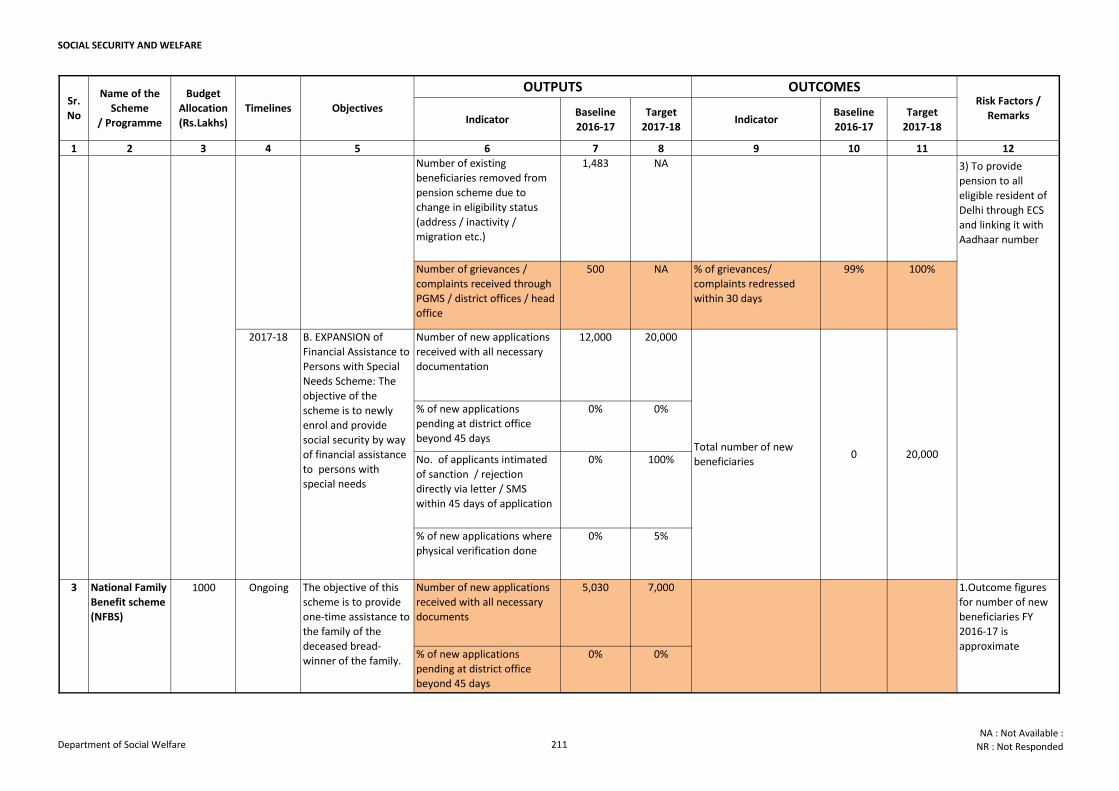
SOCIAL SECURITY AND WELFARE
Indicator Baseline
2016-17
Target
2017-18Indicator
Baseline
2016-17
Target
2017-18
1 2 3 4 5 6 7 8 9 10 11 12
Timelines Objectives Risk Factors /
Remarks
Sr.
No
Name of the
Scheme
/ Programme
Budget
Allocation
(Rs.Lakhs)
OUTPUTS OUTCOMES
Number of existing
beneficiaries removed from
pension scheme due to
change in eligibility status
(address / inactivity /
migration etc.)
1,483 NA
Number of grievances /
complaints received through
PGMS / district offices / head
office
500 NA % of grievances/
complaints redressed
within 30 days
99% 100%
Number of new applications
received with all necessary
documentation
12,000 20,000
% of new applications
pending at district office
beyond 45 days
0% 0%
No. of applicants intimated
of sanction / rejection
directly via letter / SMS
within 45 days of application
0% 100%
% of new applications where
physical verification done
0% 5%
Number of new applications
received with all necessary
documents
5,030 7,000
% of new applications
pending at district office
beyond 45 days
0% 0%
The objective of this
scheme is to provide
one-time assistance to
the family of the
deceased bread-
winner of the family.
3 1000 Ongoing
2017-18
1) Amount of
financial assistance
enhanced by Rs.
1000/- per
beneficiary per
month
2) For getting live
certificate the
process of hiring
vendor/kiosks/
volunteer etc. has
been initiated
3) To provide
pension to all
eligible resident of
Delhi through ECS
and linking it with
Aadhaar number
2
Total number of new
beneficiaries
Ongoing
B. EXPANSION of
Financial Assistance to
Persons with Special
Needs Scheme: The
objective of the
scheme is to newly
enrol and provide
social security by way
of financial assistance
to persons with
special needs
A.CONTINUED
Pensions to Existing
Beneficiaries:
Objective is to
facilitate the care of
children with special
needs, acknowledging
the high cost of care
giving and facilitate
training and
employability of
persons with disability
Total number of new
beneficiaries0 20,000
National Family
Benefit scheme
(NFBS)
7,000 7,000
1.Outcome figures
for number of new
beneficiaries FY
2016-17 is
approximate
18000Financial
Assistance to
persons with
special needs
(Disability
Pension
Scheme)
Department of Social Welfare 211NA : Not Available :
NR : Not Responded
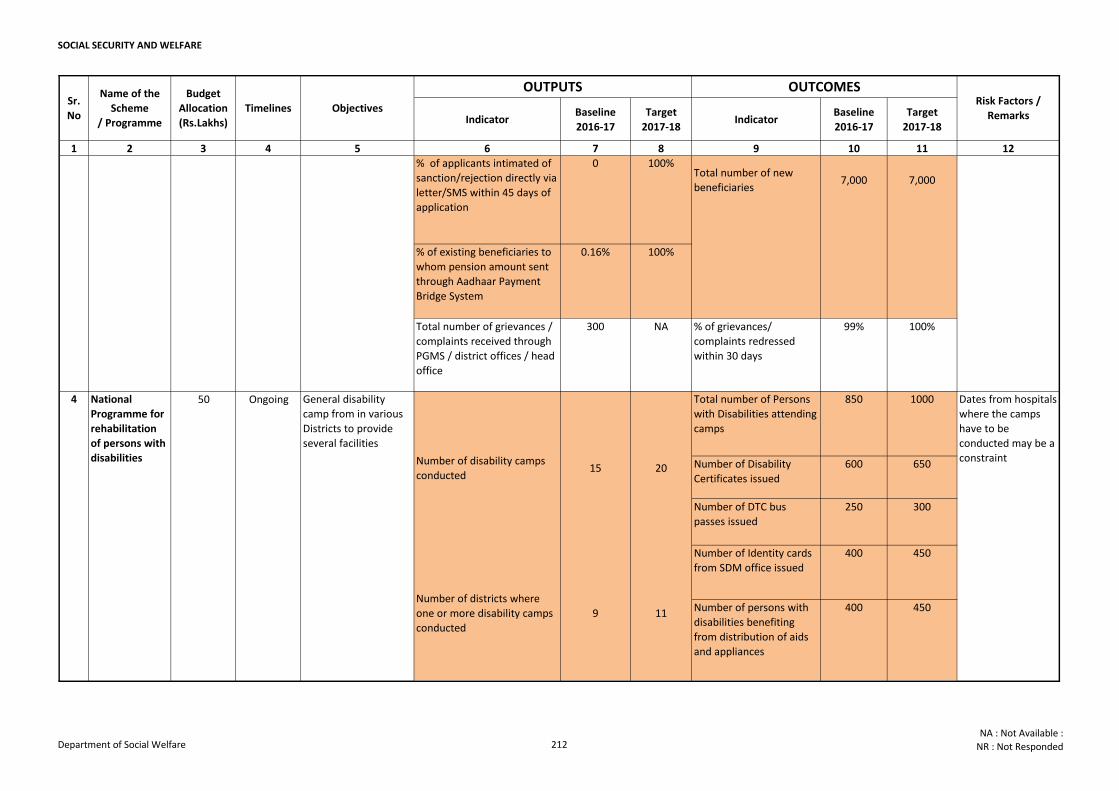
SOCIAL SECURITY AND WELFARE
Indicator Baseline
2016-17
Target
2017-18Indicator
Baseline
2016-17
Target
2017-18
1 2 3 4 5 6 7 8 9 10 11 12
Timelines Objectives Risk Factors /
Remarks
Sr.
No
Name of the
Scheme
/ Programme
Budget
Allocation
(Rs.Lakhs)
OUTPUTS OUTCOMES
% of applicants intimated of
sanction/rejection directly via
letter/SMS within 45 days of
application
0 100%
% of existing beneficiaries to
whom pension amount sent
through Aadhaar Payment
Bridge System
0.16% 100%
Total number of grievances /
complaints received through
PGMS / district offices / head
office
300 NA % of grievances/
complaints redressed
within 30 days
99% 100%
Total number of Persons
with Disabilities attending
camps
850 1000
Number of Disability
Certificates issued
600 650
Number of DTC bus
passes issued
250 300
Number of Identity cards
from SDM office issued
400 450
Number of persons with
disabilities benefiting
from distribution of aids
and appliances
400 450
50
The objective of this
scheme is to provide
one-time assistance to
the family of the
deceased bread-
winner of the family.
3 1000
National
Programme for
rehabilitation
of persons with
disabilities
4 General disability
camp from in various
Districts to provide
several facilities
Ongoing
Ongoing
Total number of new
beneficiaries
Number of disability camps
conducted15
Number of districts where
one or more disability camps
conducted
9 11
Dates from hospitals
where the camps
have to be
conducted may be a
constraint
National Family
Benefit scheme
(NFBS)
7,000 7,000
1.Outcome figures
for number of new
beneficiaries FY
2016-17 is
approximate
20
Department of Social Welfare 212NA : Not Available :
NR : Not Responded
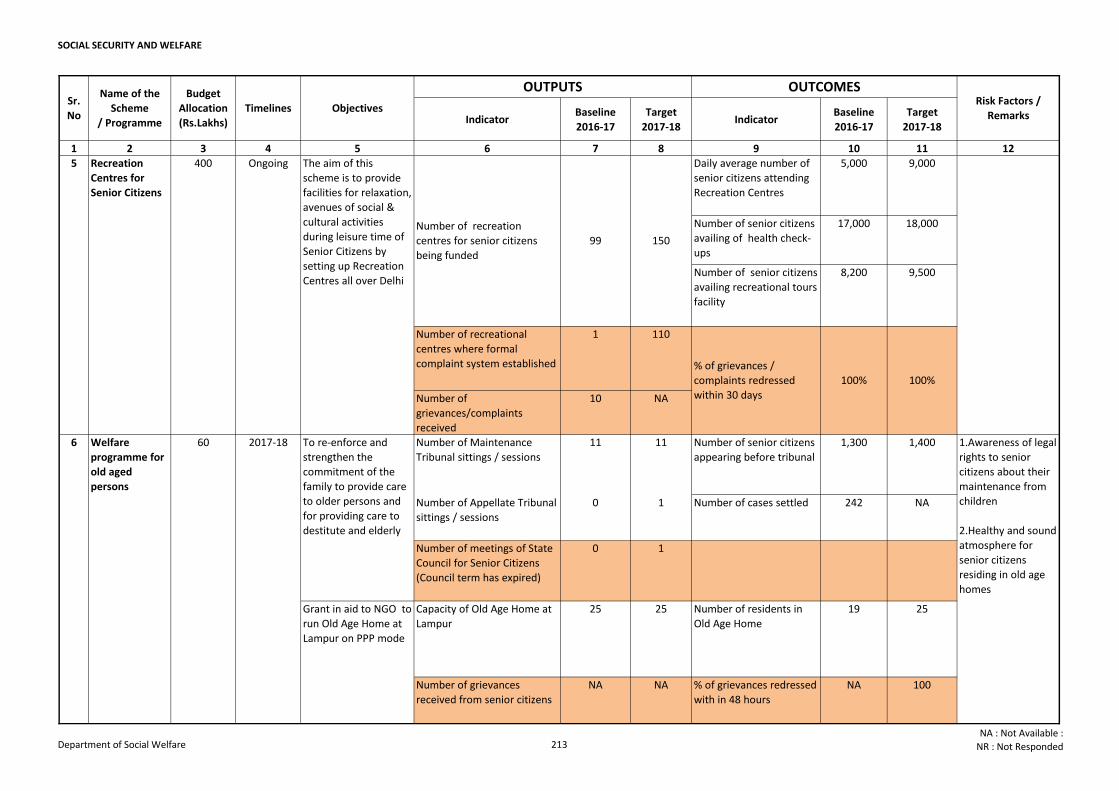
SOCIAL SECURITY AND WELFARE
Indicator Baseline
2016-17
Target
2017-18Indicator
Baseline
2016-17
Target
2017-18
1 2 3 4 5 6 7 8 9 10 11 12
Timelines Objectives Risk Factors /
Remarks
Sr.
No
Name of the
Scheme
/ Programme
Budget
Allocation
(Rs.Lakhs)
OUTPUTS OUTCOMES
Daily average number of
senior citizens attending
Recreation Centres
5,000 9,000
Number of senior citizens
availing of health check-
ups
17,000 18,000
Number of senior citizens
availing recreational tours
facility
8,200 9,500
Number of recreational
centres where formal
complaint system established
1 110
Number of
grievances/complaints
received
10 NA
Number of Maintenance
Tribunal sittings / sessions
11 11 Number of senior citizens
appearing before tribunal
1,300 1,400
Number of Appellate Tribunal
sittings / sessions
0 1 Number of cases settled 242 NA
Number of meetings of State
Council for Senior Citizens
(Council term has expired)
0 1
Capacity of Old Age Home at
Lampur
25 25 Number of residents in
Old Age Home
19 25
Number of grievances
received from senior citizens
NA NA % of grievances redressed
with in 48 hours
NA 100
Welfare
programme for
old aged
persons
6 60
% of grievances /
complaints redressed
within 30 days
100% 100%
5 Recreation
Centres for
Senior Citizens
400 Ongoing The aim of this
scheme is to provide
facilities for relaxation,
avenues of social &
cultural activities
during leisure time of
Senior Citizens by
setting up Recreation
Centres all over Delhi
Number of recreation
centres for senior citizens
being funded
2017-18 To re-enforce and
strengthen the
commitment of the
family to provide care
to older persons and
for providing care to
destitute and elderly
Grant in aid to NGO to
run Old Age Home at
Lampur on PPP mode
99 150
1.Awareness of legal
rights to senior
citizens about their
maintenance from
children
2.Healthy and sound
atmosphere for
senior citizens
residing in old age
homes
Department of Social Welfare 213NA : Not Available :
NR : Not Responded
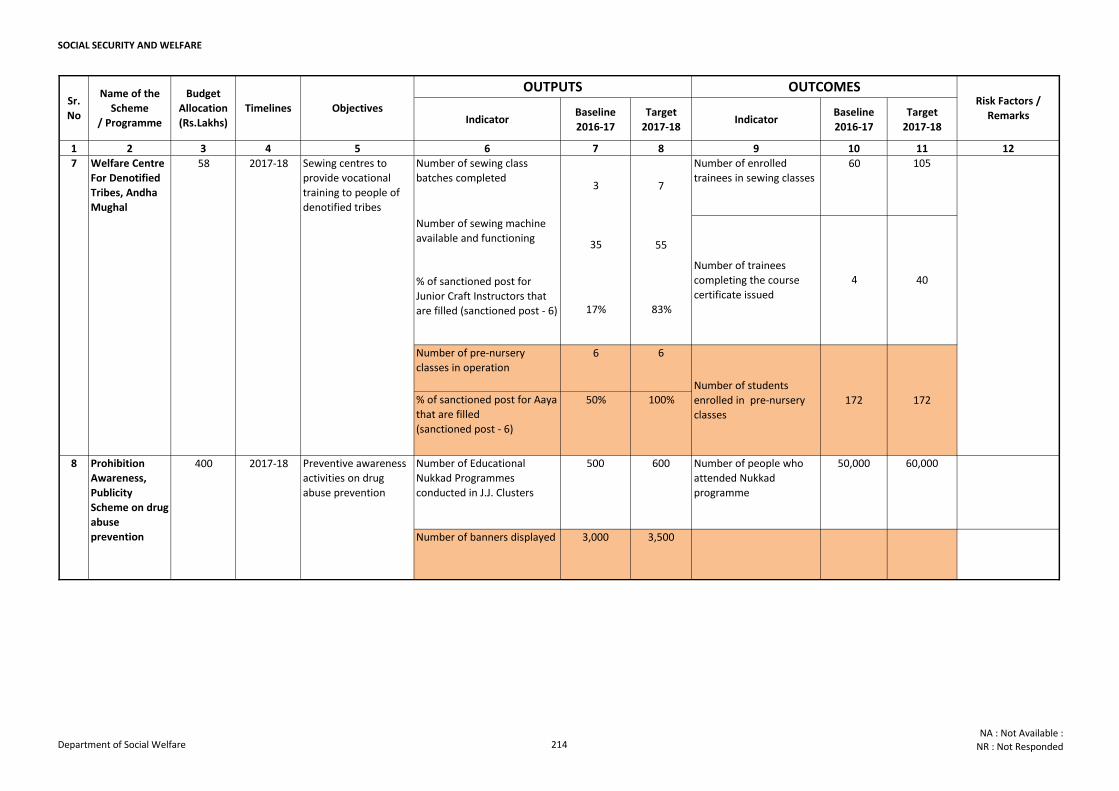
SOCIAL SECURITY AND WELFARE
Indicator Baseline
2016-17
Target
2017-18Indicator
Baseline
2016-17
Target
2017-18
1 2 3 4 5 6 7 8 9 10 11 12
Timelines Objectives Risk Factors /
Remarks
Sr.
No
Name of the
Scheme
/ Programme
Budget
Allocation
(Rs.Lakhs)
OUTPUTS OUTCOMES
Number of sewing class
batches completed3 7
Number of enrolled
trainees in sewing classes60 105
Number of sewing machine
available and functioning35 55
% of sanctioned post for
Junior Craft Instructors that
are filled (sanctioned post - 6) 17% 83%
Number of pre-nursery
classes in operation 6 6
% of sanctioned post for Aaya
that are filled
(sanctioned post - 6)
50% 100%
Number of Educational
Nukkad Programmes
conducted in J.J. Clusters
500 600 Number of people who
attended Nukkad
programme
50,000 60,000
Number of banners displayed 3,000 3,500
2017-18
7 Welfare Centre
For Denotified
Tribes, Andha
Mughal
58 2017-18
Preventive awareness
activities on drug
abuse prevention
Sewing centres to
provide vocational
training to people of
denotified tribes
Number of students
enrolled in pre-nursery
classes
172
8 Prohibition
Awareness,
Publicity
Scheme on drug
abuse
prevention
400
Number of trainees
completing the course
certificate issued
4 40
172
Department of Social Welfare 214NA : Not Available :
NR : Not Responded
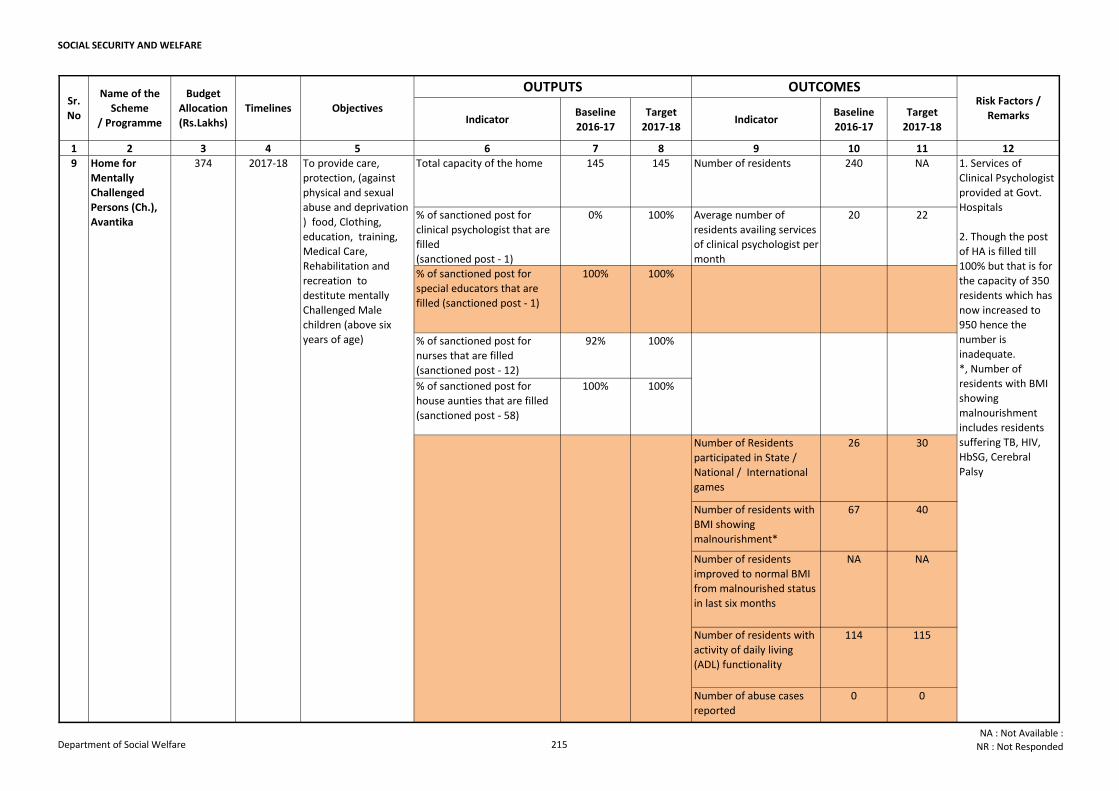
SOCIAL SECURITY AND WELFARE
Indicator Baseline
2016-17
Target
2017-18Indicator
Baseline
2016-17
Target
2017-18
1 2 3 4 5 6 7 8 9 10 11 12
Timelines Objectives Risk Factors /
Remarks
Sr.
No
Name of the
Scheme
/ Programme
Budget
Allocation
(Rs.Lakhs)
OUTPUTS OUTCOMES
Total capacity of the home 145 145 Number of residents 240 NA
% of sanctioned post for
clinical psychologist that are
filled
(sanctioned post - 1)
0% 100% Average number of
residents availing services
of clinical psychologist per
month
20 22
% of sanctioned post for
special educators that are
filled (sanctioned post - 1)
100% 100%
% of sanctioned post for
nurses that are filled
(sanctioned post - 12)
92% 100%
% of sanctioned post for
house aunties that are filled
(sanctioned post - 58)
100% 100%
Number of Residents
participated in State /
National / International
games
26 30
Number of residents with
BMI showing
malnourishment*
67 40
Number of residents
improved to normal BMI
from malnourished status
in last six months
NA NA
Number of residents with
activity of daily living
(ADL) functionality
114 115
Number of abuse cases
reported
0 0
9 To provide care,
protection, (against
physical and sexual
abuse and deprivation
) food, Clothing,
education, training,
Medical Care,
Rehabilitation and
recreation to
destitute mentally
Challenged Male
children (above six
years of age)
1. Services of
Clinical Psychologist
provided at Govt.
Hospitals
2. Though the post
of HA is filled till
100% but that is for
the capacity of 350
residents which has
now increased to
950 hence the
number is
inadequate.
*, Number of
residents with BMI
showing
malnourishment
includes residents
suffering TB, HIV,
HbSG, Cerebral
Palsy
2017-18374Home for
Mentally
Challenged
Persons (Ch.),
Avantika
Department of Social Welfare 215NA : Not Available :
NR : Not Responded
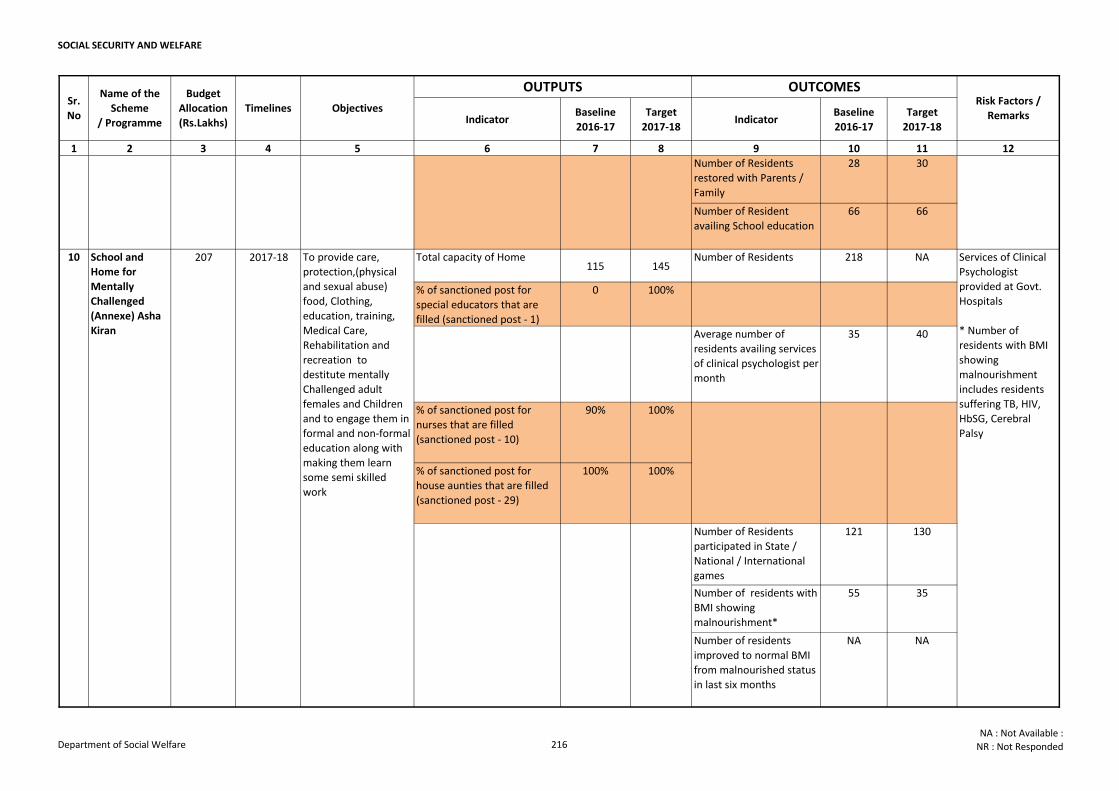
SOCIAL SECURITY AND WELFARE
Indicator Baseline
2016-17
Target
2017-18Indicator
Baseline
2016-17
Target
2017-18
1 2 3 4 5 6 7 8 9 10 11 12
Timelines Objectives Risk Factors /
Remarks
Sr.
No
Name of the
Scheme
/ Programme
Budget
Allocation
(Rs.Lakhs)
OUTPUTS OUTCOMES
Number of Residents
restored with Parents /
Family
28 30
Number of Resident
availing School education
66 66
Total capacity of Home 115 145
Number of Residents 218 NA
% of sanctioned post for
special educators that are
filled (sanctioned post - 1)
0 100%
Average number of
residents availing services
of clinical psychologist per
month
35 40
% of sanctioned post for
nurses that are filled
(sanctioned post - 10)
90% 100%
% of sanctioned post for
house aunties that are filled
(sanctioned post - 29)
100% 100%
Number of Residents
participated in State /
National / International
games
121 130
Number of residents with
BMI showing
malnourishment*
55 35
Number of residents
improved to normal BMI
from malnourished status
in last six months
NA NA
2017-18
9 To provide care,
protection, (against
physical and sexual
abuse and deprivation
) food, Clothing,
education, training,
Medical Care,
Rehabilitation and
recreation to
destitute mentally
Challenged Male
children (above six
years of age)
1. Services of
Clinical Psychologist
provided at Govt.
Hospitals
2. Though the post
of HA is filled till
100% but that is for
the capacity of 350
residents which has
now increased to
950 hence the
number is
inadequate.
*, Number of
residents with BMI
showing
malnourishment
includes residents
suffering TB, HIV,
HbSG, Cerebral
Palsy
Services of Clinical
Psychologist
provided at Govt.
Hospitals
* Number of
residents with BMI
showing
malnourishment
includes residents
suffering TB, HIV,
HbSG, Cerebral
Palsy
School and
Home for
Mentally
Challenged
(Annexe) Asha
Kiran
207 To provide care,
protection,(physical
and sexual abuse)
food, Clothing,
education, training,
Medical Care,
Rehabilitation and
recreation to
destitute mentally
Challenged adult
females and Children
and to engage them in
formal and non-formal
education along with
making them learn
some semi skilled
work
2017-18374Home for
Mentally
Challenged
Persons (Ch.),
Avantika
10
Department of Social Welfare 216NA : Not Available :
NR : Not Responded
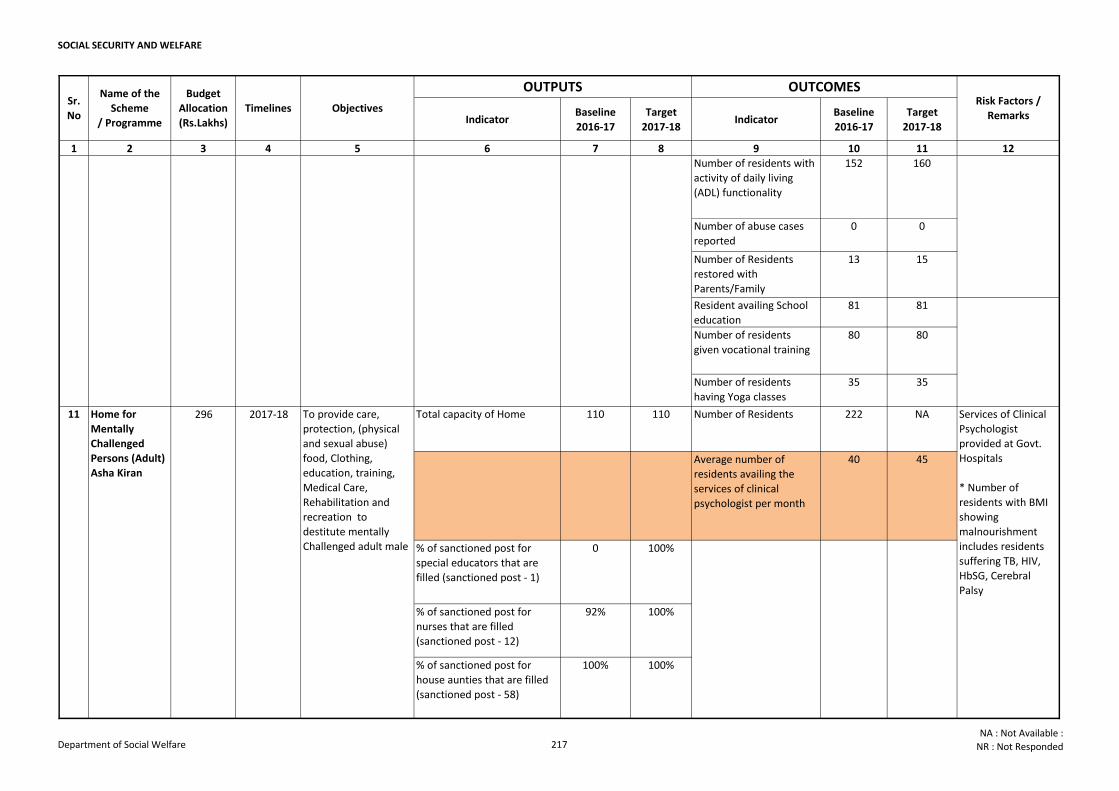
SOCIAL SECURITY AND WELFARE
Indicator Baseline
2016-17
Target
2017-18Indicator
Baseline
2016-17
Target
2017-18
1 2 3 4 5 6 7 8 9 10 11 12
Timelines Objectives Risk Factors /
Remarks
Sr.
No
Name of the
Scheme
/ Programme
Budget
Allocation
(Rs.Lakhs)
OUTPUTS OUTCOMES
Number of residents with
activity of daily living
(ADL) functionality
152 160
Number of abuse cases
reported
0 0
Number of Residents
restored with
Parents/Family
13 15
Resident availing School
education
81 81
Number of residents
given vocational training
80 80
Number of residents
having Yoga classes
35 35
Total capacity of Home 110 110 Number of Residents 222 NA
Average number of
residents availing the
services of clinical
psychologist per month
40 45
% of sanctioned post for
special educators that are
filled (sanctioned post - 1)
0 100%
% of sanctioned post for
nurses that are filled
(sanctioned post - 12)
92% 100%
% of sanctioned post for
house aunties that are filled
(sanctioned post - 58)
100% 100%
Services of Clinical
Psychologist
provided at Govt.
Hospitals
* Number of
residents with BMI
showing
malnourishment
includes residents
suffering TB, HIV,
HbSG, Cerebral
Palsy
Services of Clinical
Psychologist
provided at Govt.
Hospitals
* Number of
residents with BMI
showing
malnourishment
includes residents
suffering TB, HIV,
HbSG, Cerebral
Palsy
Home for
Mentally
Challenged
Persons (Adult)
Asha Kiran
296 2017-18 To provide care,
protection, (physical
and sexual abuse)
food, Clothing,
education, training,
Medical Care,
Rehabilitation and
recreation to
destitute mentally
Challenged adult male
10
11
Department of Social Welfare 217NA : Not Available :
NR : Not Responded
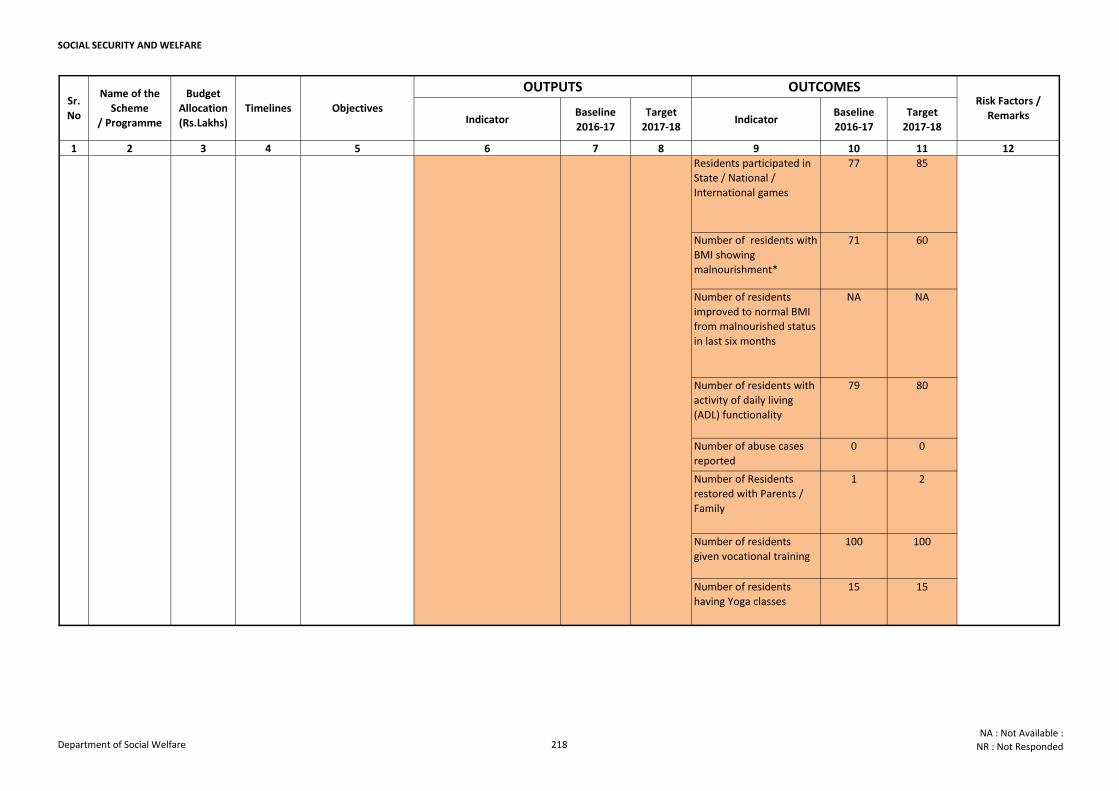
SOCIAL SECURITY AND WELFARE
Indicator Baseline
2016-17
Target
2017-18Indicator
Baseline
2016-17
Target
2017-18
1 2 3 4 5 6 7 8 9 10 11 12
Timelines Objectives Risk Factors /
Remarks
Sr.
No
Name of the
Scheme
/ Programme
Budget
Allocation
(Rs.Lakhs)
OUTPUTS OUTCOMES
Residents participated in
State / National /
International games
77 85
Number of residents with
BMI showing
malnourishment*
71 60
Number of residents
improved to normal BMI
from malnourished status
in last six months
NA NA
Number of residents with
activity of daily living
(ADL) functionality
79 80
Number of abuse cases
reported
0 0
Number of Residents
restored with Parents /
Family
1 2
Number of residents
given vocational training
100 100
Number of residents
having Yoga classes
15 15
Services of Clinical
Psychologist
provided at Govt.
Hospitals
* Number of
residents with BMI
showing
malnourishment
includes residents
suffering TB, HIV,
HbSG, Cerebral
Palsy
To provide care,
protection, (physical
and sexual abuse)
food, Clothing,
education, training,
Medical Care,
Rehabilitation and
recreation to
destitute mentally
Challenged adult male
11
Department of Social Welfare 218NA : Not Available :
NR : Not Responded
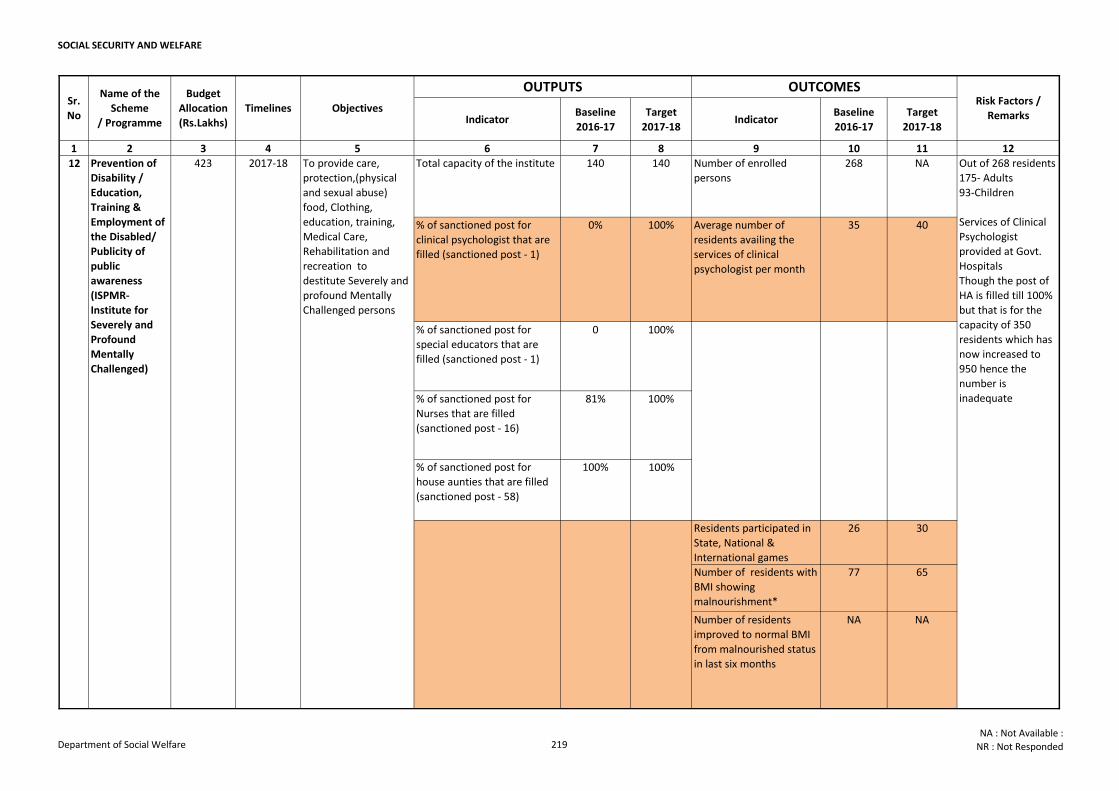
SOCIAL SECURITY AND WELFARE
Indicator Baseline
2016-17
Target
2017-18Indicator
Baseline
2016-17
Target
2017-18
1 2 3 4 5 6 7 8 9 10 11 12
Timelines Objectives Risk Factors /
Remarks
Sr.
No
Name of the
Scheme
/ Programme
Budget
Allocation
(Rs.Lakhs)
OUTPUTS OUTCOMES
Total capacity of the institute 140 140 Number of enrolled
persons
268 NA
% of sanctioned post for
clinical psychologist that are
filled (sanctioned post - 1)
0% 100% Average number of
residents availing the
services of clinical
psychologist per month
35 40
% of sanctioned post for
special educators that are
filled (sanctioned post - 1)
0 100%
% of sanctioned post for
Nurses that are filled
(sanctioned post - 16)
81% 100%
% of sanctioned post for
house aunties that are filled
(sanctioned post - 58)
100% 100%
Residents participated in
State, National &
International games
26 30
Number of residents with
BMI showing
malnourishment*
77 65
Number of residents
improved to normal BMI
from malnourished status
in last six months
NA NA
Prevention of
Disability /
Education,
Training &
Employment of
the Disabled/
Publicity of
public
awareness
(ISPMR-
Institute for
Severely and
Profound
Mentally
Challenged)
To provide care,
protection,(physical
and sexual abuse)
food, Clothing,
education, training,
Medical Care,
Rehabilitation and
recreation to
destitute Severely and
profound Mentally
Challenged persons
2017-1812 423 Out of 268 residents
175- Adults
93-Children
Services of Clinical
Psychologist
provided at Govt.
Hospitals
Though the post of
HA is filled till 100%
but that is for the
capacity of 350
residents which has
now increased to
950 hence the
number is
inadequate
Department of Social Welfare 219NA : Not Available :
NR : Not Responded
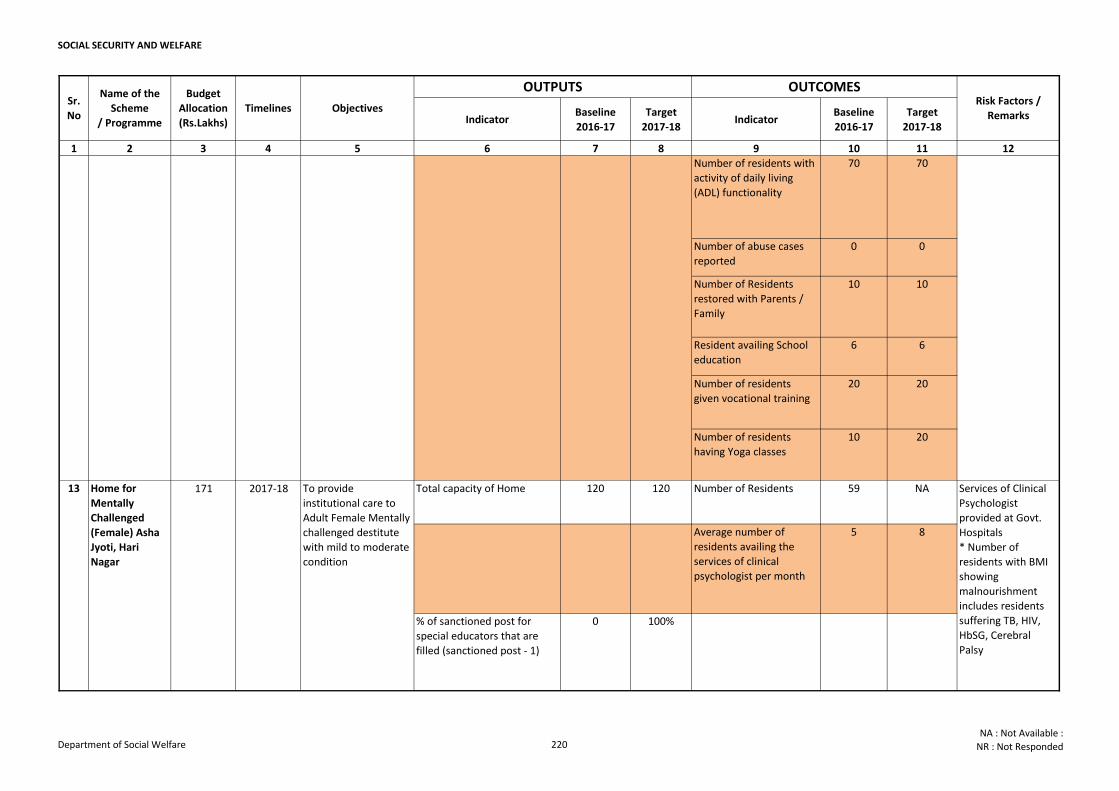
SOCIAL SECURITY AND WELFARE
Indicator Baseline
2016-17
Target
2017-18Indicator
Baseline
2016-17
Target
2017-18
1 2 3 4 5 6 7 8 9 10 11 12
Timelines Objectives Risk Factors /
Remarks
Sr.
No
Name of the
Scheme
/ Programme
Budget
Allocation
(Rs.Lakhs)
OUTPUTS OUTCOMES
Number of residents with
activity of daily living
(ADL) functionality
70 70
Number of abuse cases
reported
0 0
Number of Residents
restored with Parents /
Family
10 10
Resident availing School
education
6 6
Number of residents
given vocational training
20 20
Number of residents
having Yoga classes
10 20
Total capacity of Home 120 120 Number of Residents 59 NA
Average number of
residents availing the
services of clinical
psychologist per month
5 8
% of sanctioned post for
special educators that are
filled (sanctioned post - 1)
0 100%
Prevention of
Disability /
Education,
Training &
Employment of
the Disabled/
Publicity of
public
awareness
(ISPMR-
Institute for
Severely and
Profound
Mentally
Challenged)
To provide care,
protection,(physical
and sexual abuse)
food, Clothing,
education, training,
Medical Care,
Rehabilitation and
recreation to
destitute Severely and
profound Mentally
Challenged persons
2017-1812 423 Out of 268 residents
175- Adults
93-Children
Services of Clinical
Psychologist
provided at Govt.
Hospitals
Though the post of
HA is filled till 100%
but that is for the
capacity of 350
residents which has
now increased to
950 hence the
number is
inadequate
Services of Clinical
Psychologist
provided at Govt.
Hospitals
* Number of
residents with BMI
showing
malnourishment
includes residents
suffering TB, HIV,
HbSG, Cerebral
Palsy
Home for
Mentally
Challenged
(Female) Asha
Jyoti, Hari
Nagar
171 To provide
institutional care to
Adult Female Mentally
challenged destitute
with mild to moderate
condition
2017-1813
Department of Social Welfare 220NA : Not Available :
NR : Not Responded
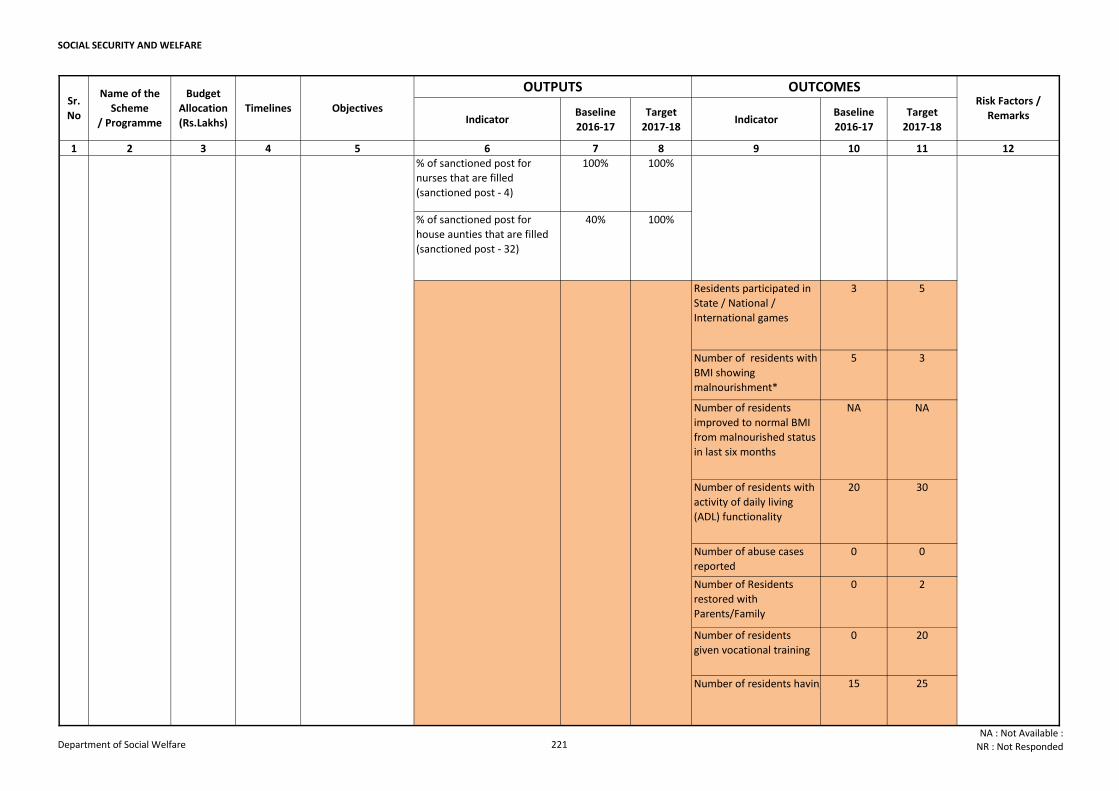
SOCIAL SECURITY AND WELFARE
Indicator Baseline
2016-17
Target
2017-18Indicator
Baseline
2016-17
Target
2017-18
1 2 3 4 5 6 7 8 9 10 11 12
Timelines Objectives Risk Factors /
Remarks
Sr.
No
Name of the
Scheme
/ Programme
Budget
Allocation
(Rs.Lakhs)
OUTPUTS OUTCOMES
% of sanctioned post for
nurses that are filled
(sanctioned post - 4)
100% 100%
% of sanctioned post for
house aunties that are filled
(sanctioned post - 32)
40% 100%
Residents participated in
State / National /
International games
3 5
Number of residents with
BMI showing
malnourishment*
5 3
Number of residents
improved to normal BMI
from malnourished status
in last six months
NA NA
Number of residents with
activity of daily living
(ADL) functionality
20 30
Number of abuse cases
reported
0 0
Number of Residents
restored with
Parents/Family
0 2
Number of residents
given vocational training
0 20
Number of residents having Yoga classes15 25
Services of Clinical
Psychologist
provided at Govt.
Hospitals
* Number of
residents with BMI
showing
malnourishment
includes residents
suffering TB, HIV,
HbSG, Cerebral
Palsy
Home for
Mentally
Challenged
(Female) Asha
Jyoti, Hari
Nagar
171 To provide
institutional care to
Adult Female Mentally
challenged destitute
with mild to moderate
condition
2017-1813
Department of Social Welfare 221NA : Not Available :
NR : Not Responded
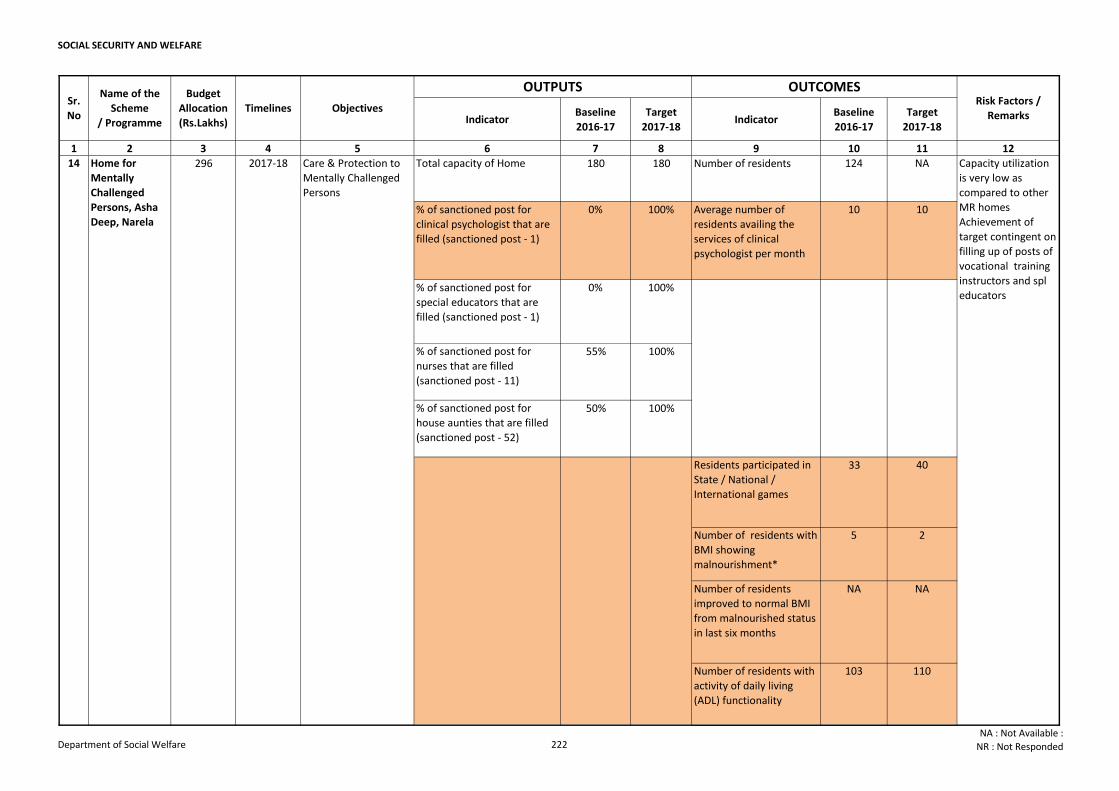
SOCIAL SECURITY AND WELFARE
Indicator Baseline
2016-17
Target
2017-18Indicator
Baseline
2016-17
Target
2017-18
1 2 3 4 5 6 7 8 9 10 11 12
Timelines Objectives Risk Factors /
Remarks
Sr.
No
Name of the
Scheme
/ Programme
Budget
Allocation
(Rs.Lakhs)
OUTPUTS OUTCOMES
Total capacity of Home 180 180 Number of residents 124 NA
% of sanctioned post for
clinical psychologist that are
filled (sanctioned post - 1)
0% 100% Average number of
residents availing the
services of clinical
psychologist per month
10 10
% of sanctioned post for
special educators that are
filled (sanctioned post - 1)
0% 100%
% of sanctioned post for
nurses that are filled
(sanctioned post - 11)
55% 100%
% of sanctioned post for
house aunties that are filled
(sanctioned post - 52)
50% 100%
Residents participated in
State / National /
International games
33 40
Number of residents with
BMI showing
malnourishment*
5 2
Number of residents
improved to normal BMI
from malnourished status
in last six months
NA NA
Number of residents with
activity of daily living
(ADL) functionality
103 110
14 Capacity utilization
is very low as
compared to other
MR homes
Achievement of
target contingent on
filling up of posts of
vocational training
instructors and spl
educators
Home for
Mentally
Challenged
Persons, Asha
Deep, Narela
296 2017-18 Care & Protection to
Mentally Challenged
Persons
Department of Social Welfare 222NA : Not Available :
NR : Not Responded
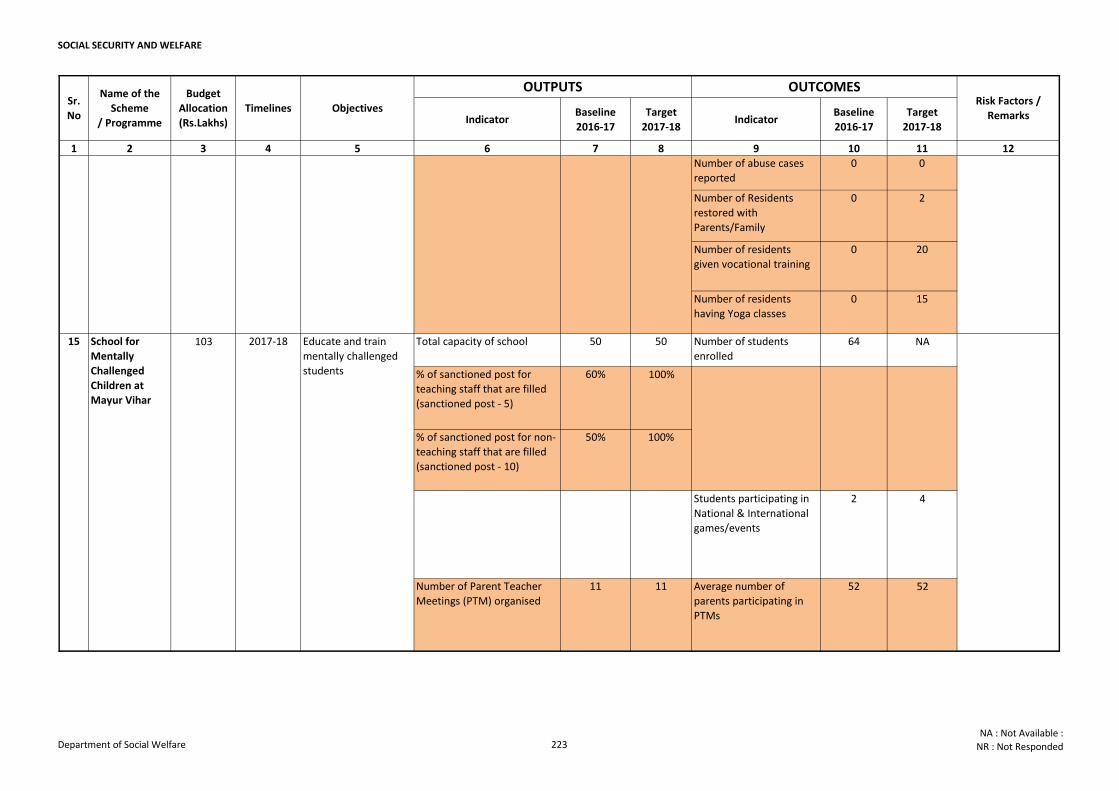
SOCIAL SECURITY AND WELFARE
Indicator Baseline
2016-17
Target
2017-18Indicator
Baseline
2016-17
Target
2017-18
1 2 3 4 5 6 7 8 9 10 11 12
Timelines Objectives Risk Factors /
Remarks
Sr.
No
Name of the
Scheme
/ Programme
Budget
Allocation
(Rs.Lakhs)
OUTPUTS OUTCOMES
Number of abuse cases
reported
0 0
Number of Residents
restored with
Parents/Family
0 2
Number of residents
given vocational training
0 20
Number of residents
having Yoga classes
0 15
Total capacity of school 50 50 Number of students
enrolled
64 NA
% of sanctioned post for
teaching staff that are filled
(sanctioned post - 5)
60% 100%
% of sanctioned post for non-
teaching staff that are filled
(sanctioned post - 10)
50% 100%
Students participating in
National & International
games/events
2 4
Number of Parent Teacher
Meetings (PTM) organised
11 11 Average number of
parents participating in
PTMs
52 52
15
14
103 2017-18School for
Mentally
Challenged
Children at
Mayur Vihar
Educate and train
mentally challenged
students
Department of Social Welfare 223NA : Not Available :
NR : Not Responded
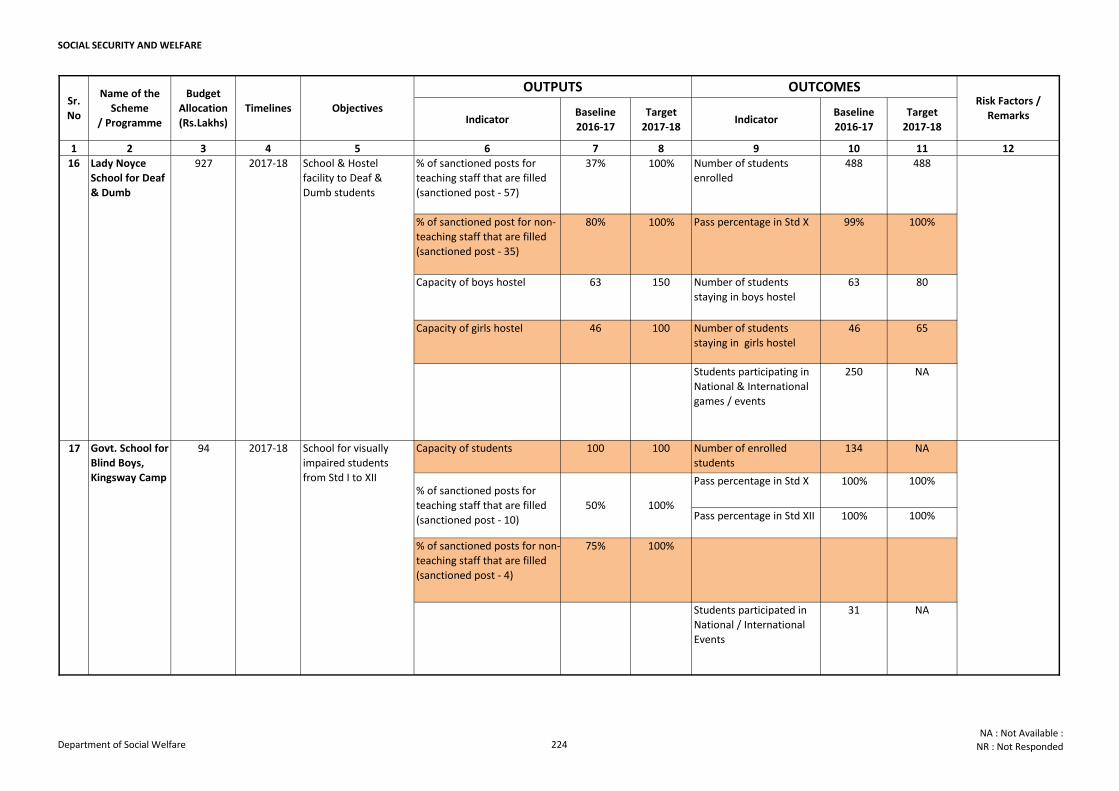
SOCIAL SECURITY AND WELFARE
Indicator Baseline
2016-17
Target
2017-18Indicator
Baseline
2016-17
Target
2017-18
1 2 3 4 5 6 7 8 9 10 11 12
Timelines Objectives Risk Factors /
Remarks
Sr.
No
Name of the
Scheme
/ Programme
Budget
Allocation
(Rs.Lakhs)
OUTPUTS OUTCOMES
% of sanctioned posts for
teaching staff that are filled
(sanctioned post - 57)
37% 100% Number of students
enrolled
488 488
% of sanctioned post for non-
teaching staff that are filled
(sanctioned post - 35)
80% 100% Pass percentage in Std X 99% 100%
Capacity of boys hostel 63 150 Number of students
staying in boys hostel
63 80
Capacity of girls hostel 46 100 Number of students
staying in girls hostel46 65
Students participating in
National & International
games / events
250 NA
Capacity of students 100 100 Number of enrolled
students
134 NA
Pass percentage in Std X 100% 100%
Pass percentage in Std XII 100% 100%
% of sanctioned posts for non-
teaching staff that are filled
(sanctioned post - 4)
75% 100%
Students participated in
National / International
Events
31 NA
17 Govt. School for
Blind Boys,
Kingsway Camp
94 2017-18 School for visually
impaired students
from Std I to XII
Lady Noyce
School for Deaf
& Dumb
% of sanctioned posts for
teaching staff that are filled
(sanctioned post - 10)
100%
927 2017-18 School & Hostel
facility to Deaf &
Dumb students
50%
16
Department of Social Welfare 224NA : Not Available :
NR : Not Responded
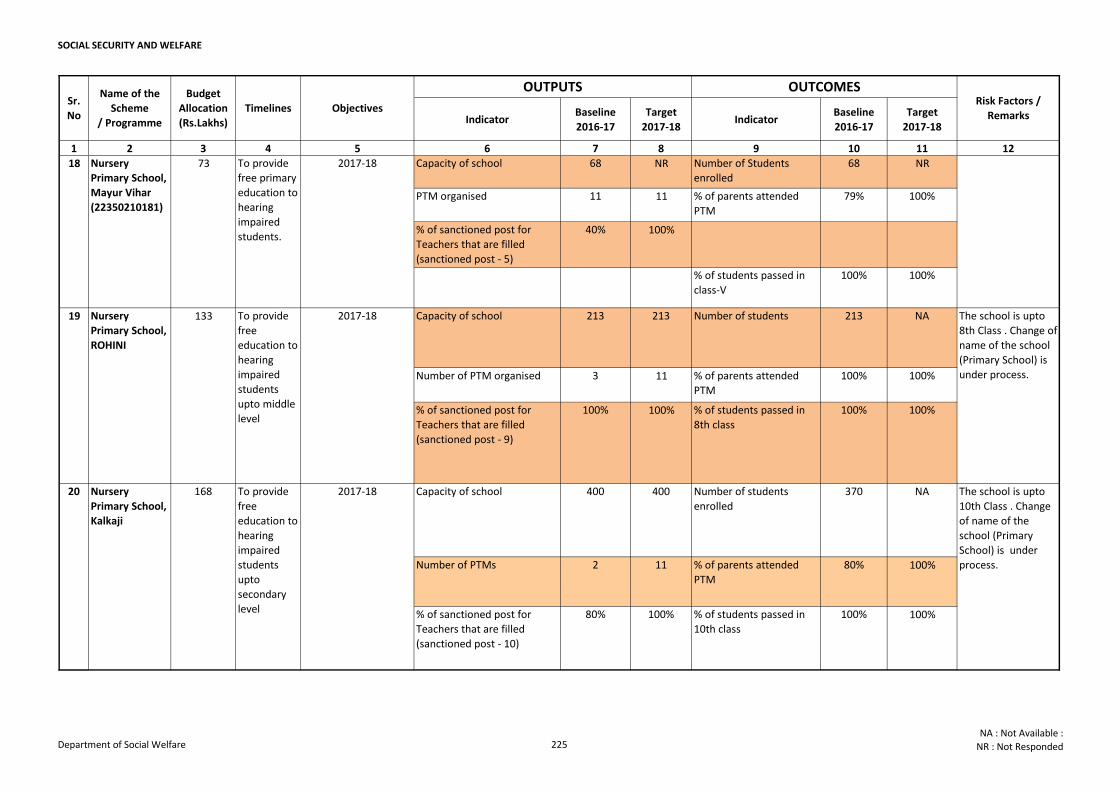
SOCIAL SECURITY AND WELFARE
Indicator Baseline
2016-17
Target
2017-18Indicator
Baseline
2016-17
Target
2017-18
1 2 3 4 5 6 7 8 9 10 11 12
Timelines Objectives Risk Factors /
Remarks
Sr.
No
Name of the
Scheme
/ Programme
Budget
Allocation
(Rs.Lakhs)
OUTPUTS OUTCOMES
Capacity of school 68 NR Number of Students
enrolled
68 NR
PTM organised 11 11 % of parents attended
PTM
79% 100%
% of sanctioned post for
Teachers that are filled
(sanctioned post - 5)
40% 100%
% of students passed in
class-V
100% 100%
Capacity of school 213 213 Number of students 213 NA
Number of PTM organised 3 11 % of parents attended
PTM
100% 100%
% of sanctioned post for
Teachers that are filled
(sanctioned post - 9)
100% 100% % of students passed in
8th class
100% 100%
Capacity of school 400 400 Number of students
enrolled
370 NA
Number of PTMs 2 11 % of parents attended
PTM
80% 100%
% of sanctioned post for
Teachers that are filled
(sanctioned post - 10)
80% 100% % of students passed in
10th class
100% 100%
The school is upto
10th Class . Change
of name of the
school (Primary
School) is under
process.
20
To provide
free primary
education to
hearing
impaired
students.
Nursery
Primary School,
Mayur Vihar
(22350210181)
2017-1873
Nursery
Primary School,
Kalkaji
To provide
free
education to
hearing
impaired
students
upto
secondary
level
168 2017-18
18
19 Nursery
Primary School,
ROHINI
133 To provide
free
education to
hearing
impaired
students
upto middle
level
2017-18 The school is upto
8th Class . Change of
name of the school
(Primary School) is
under process.
Department of Social Welfare 225NA : Not Available :
NR : Not Responded
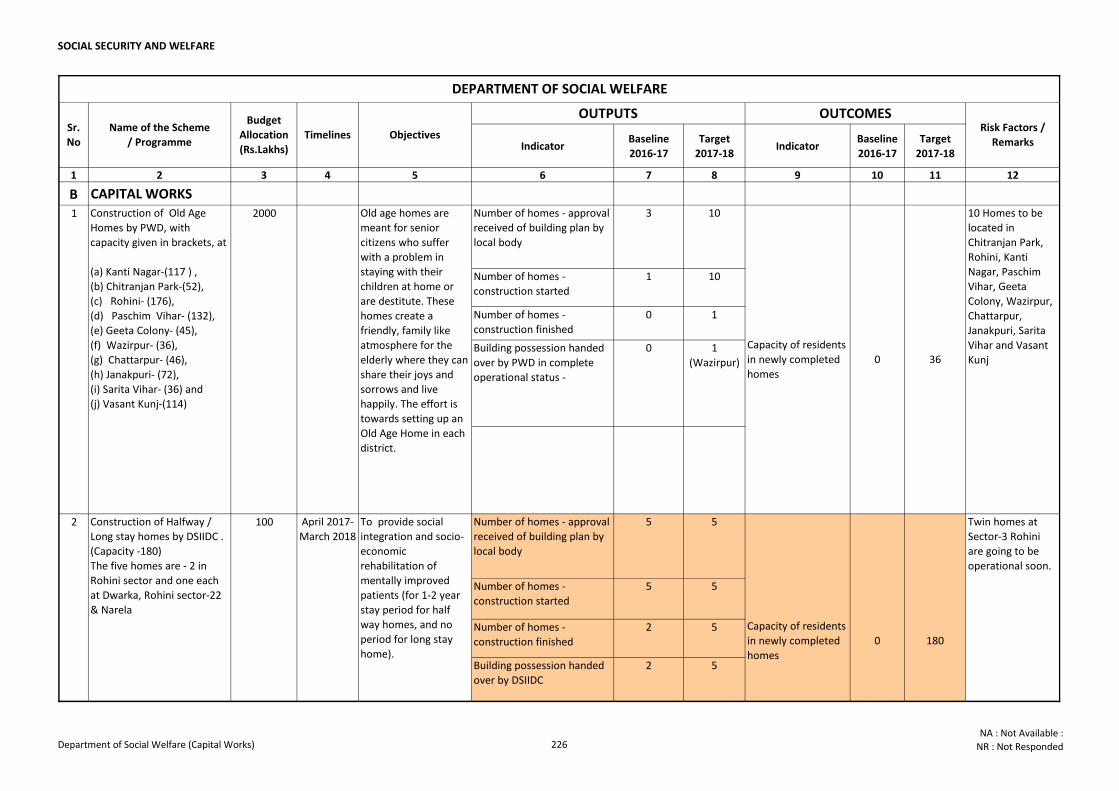
SOCIAL SECURITY AND WELFARE
Indicator Baseline
2016-17
Target
2017-18Indicator
Baseline
2016-17
Target
2017-18
1 2 3 4 5 6 7 8 9 10 11 12
B CAPITAL WORKSNumber of homes - approval
received of building plan by
local body
3 10
Number of homes -
construction started
1 10
Number of homes -
construction finished
0 1
Building possession handed
over by PWD in complete
operational status -
0 1
(Wazirpur)
Number of homes - approval
received of building plan by
local body
5 5
Number of homes -
construction started
5 5
Number of homes -
construction finished
2 5
Building possession handed
over by DSIIDC
2 5
Construction of Old Age
Homes by PWD, with
capacity given in brackets, at
(a) Kanti Nagar-(117 ) ,
(b) Chitranjan Park-(52),
(c) Rohini- (176),
(d) Paschim Vihar- (132),
(e) Geeta Colony- (45),
(f) Wazirpur- (36),
(g) Chattarpur- (46),
(h) Janakpuri- (72),
(i) Sarita Vihar- (36) and
(j) Vasant Kunj-(114)
1 2000 Old age homes are
meant for senior
citizens who suffer
with a problem in
staying with their
children at home or
are destitute. These
homes create a
friendly, family like
atmosphere for the
elderly where they can
share their joys and
sorrows and live
happily. The effort is
towards setting up an
Old Age Home in each
district.
Capacity of residents
in newly completed
homes
0 36
100 April 2017-
March 2018
To provide social
integration and socio-
economic
rehabilitation of
mentally improved
patients (for 1-2 year
stay period for half
way homes, and no
period for long stay
home). 0
10 Homes to be
located in
Chitranjan Park,
Rohini, Kanti
Nagar, Paschim
Vihar, Geeta
Colony, Wazirpur,
Chattarpur,
Janakpuri, Sarita
Vihar and Vasant
Kunj
DEPARTMENT OF SOCIAL WELFARE
Sr.
No
Name of the Scheme
/ Programme
Budget
Allocation
(Rs.Lakhs)
Timelines Objectives
OUTPUTS OUTCOMESRisk Factors /
Remarks
180
Twin homes at
Sector-3 Rohini
are going to be
operational soon.
Capacity of residents
in newly completed
homes
2 Construction of Halfway /
Long stay homes by DSIIDC .
(Capacity -180)
The five homes are - 2 in
Rohini sector and one each
at Dwarka, Rohini sector-22
& Narela
Department of Social Welfare (Capital Works) 226NA : Not Available :
NR : Not Responded
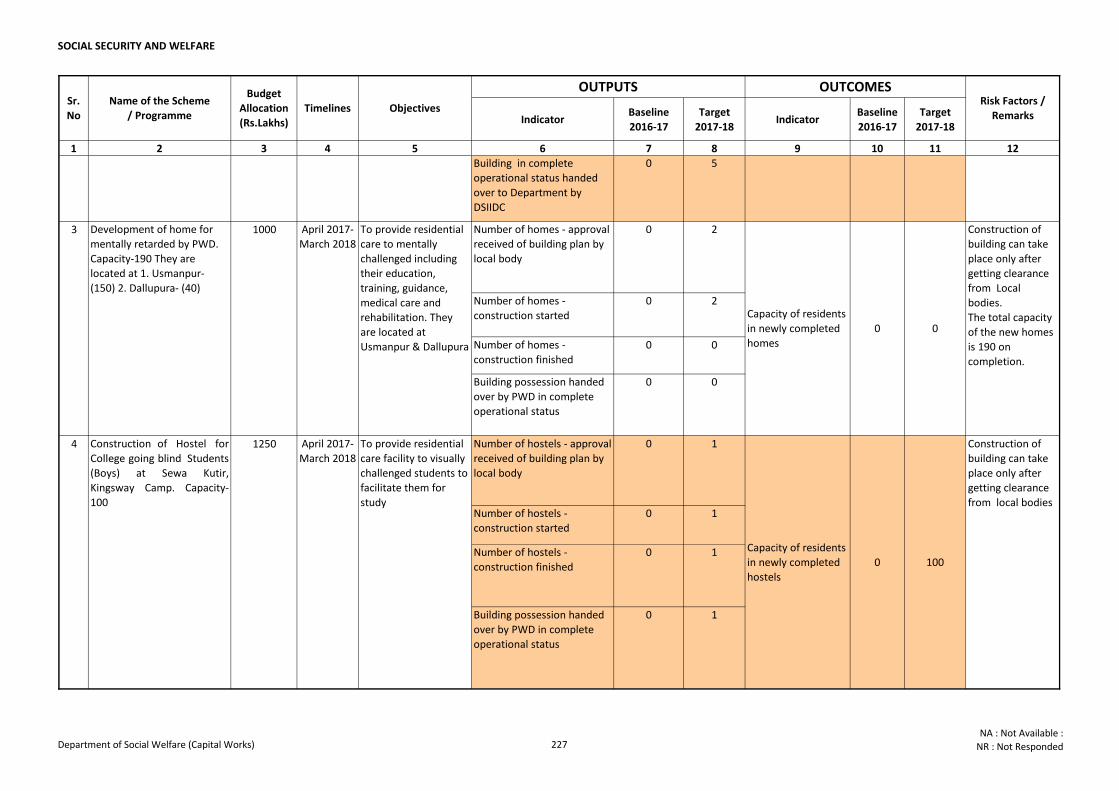
SOCIAL SECURITY AND WELFARE
Indicator Baseline
2016-17
Target
2017-18Indicator
Baseline
2016-17
Target
2017-18
1 2 3 4 5 6 7 8 9 10 11 12
Sr.
No
Name of the Scheme
/ Programme
Budget
Allocation
(Rs.Lakhs)
Timelines Objectives
OUTPUTS OUTCOMESRisk Factors /
Remarks
Building in complete
operational status handed
over to Department by
DSIIDC
0 5
Number of homes - approval
received of building plan by
local body
0 2
Number of homes -
construction started
0 2
Number of homes -
construction finished
0 0
Building possession handed
over by PWD in complete
operational status
0 0
Number of hostels - approval
received of building plan by
local body
0 1
Number of hostels -
construction started
0 1
Number of hostels -
construction finished
0 1
Building possession handed
over by PWD in complete
operational status
0 1
100 April 2017-
March 2018
To provide social
integration and socio-
economic
rehabilitation of
mentally improved
patients (for 1-2 year
stay period for half
way homes, and no
period for long stay
home).
Construction of
building can take
place only after
getting clearance
from Local
bodies.
The total capacity
of the new homes
is 190 on
completion.
4 Construction of Hostel for
College going blind Students
(Boys) at Sewa Kutir,
Kingsway Camp. Capacity-
100
1250 April 2017-
March 2018
To provide residential
care facility to visually
challenged students to
facilitate them for
study
Capacity of residents
in newly completed
hostels
0 100
Construction of
building can take
place only after
getting clearance
from local bodies
Capacity of residents
in newly completed
homes
0 0
3 Development of home for
mentally retarded by PWD.
Capacity-190 They are
located at 1. Usmanpur-
(150) 2. Dallupura- (40)
1000 April 2017-
March 2018
To provide residential
care to mentally
challenged including
their education,
training, guidance,
medical care and
rehabilitation. They
are located at
Usmanpur & Dallupura
0 180
Twin homes at
Sector-3 Rohini
are going to be
operational soon.
Capacity of residents
in newly completed
homes
2 Construction of Halfway /
Long stay homes by DSIIDC .
(Capacity -180)
The five homes are - 2 in
Rohini sector and one each
at Dwarka, Rohini sector-22
& Narela
Department of Social Welfare (Capital Works) 227NA : Not Available :
NR : Not Responded
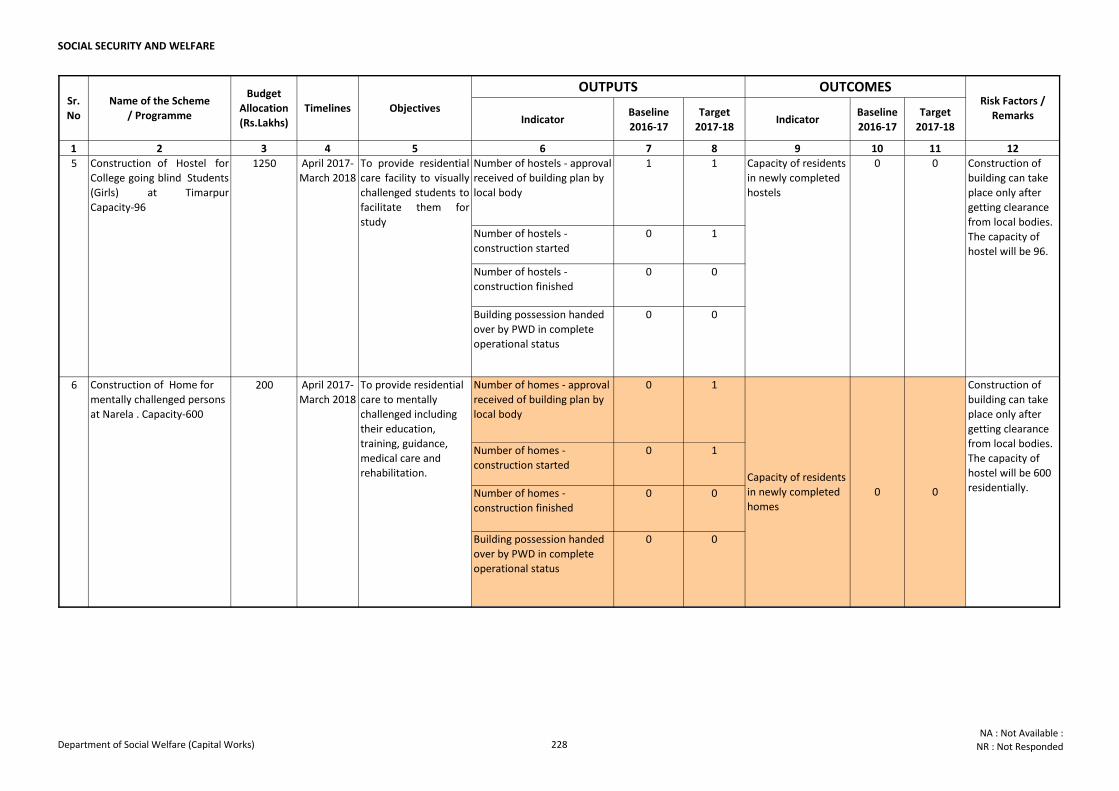
SOCIAL SECURITY AND WELFARE
Indicator Baseline
2016-17
Target
2017-18Indicator
Baseline
2016-17
Target
2017-18
1 2 3 4 5 6 7 8 9 10 11 12
Sr.
No
Name of the Scheme
/ Programme
Budget
Allocation
(Rs.Lakhs)
Timelines Objectives
OUTPUTS OUTCOMESRisk Factors /
Remarks
Number of hostels - approval
received of building plan by
local body
1 1
Number of hostels -
construction started
0 1
Number of hostels -
construction finished
0 0
Building possession handed
over by PWD in complete
operational status
0 0
Number of homes - approval
received of building plan by
local body
0 1
Number of homes -
construction started
0 1
Number of homes -
construction finished
0 0
Building possession handed
over by PWD in complete
operational status
0 0
0
Construction of
building can take
place only after
getting clearance
from local bodies.
The capacity of
hostel will be 600
residentially.
0 0 Construction of
building can take
place only after
getting clearance
from local bodies.
The capacity of
hostel will be 96.
6 Construction of Home for
mentally challenged persons
at Narela . Capacity-600
200 April 2017-
March 2018
To provide residential
care to mentally
challenged including
their education,
training, guidance,
medical care and
rehabilitation. Capacity of residents
in newly completed
homes
0
5 Construction of Hostel for
College going blind Students
(Girls) at Timarpur
Capacity-96
1250 April 2017-
March 2018
To provide residential
care facility to visually
challenged students to
facilitate them for
study
Capacity of residents
in newly completed
hostels
Department of Social Welfare (Capital Works) 228NA : Not Available :
NR : Not Responded
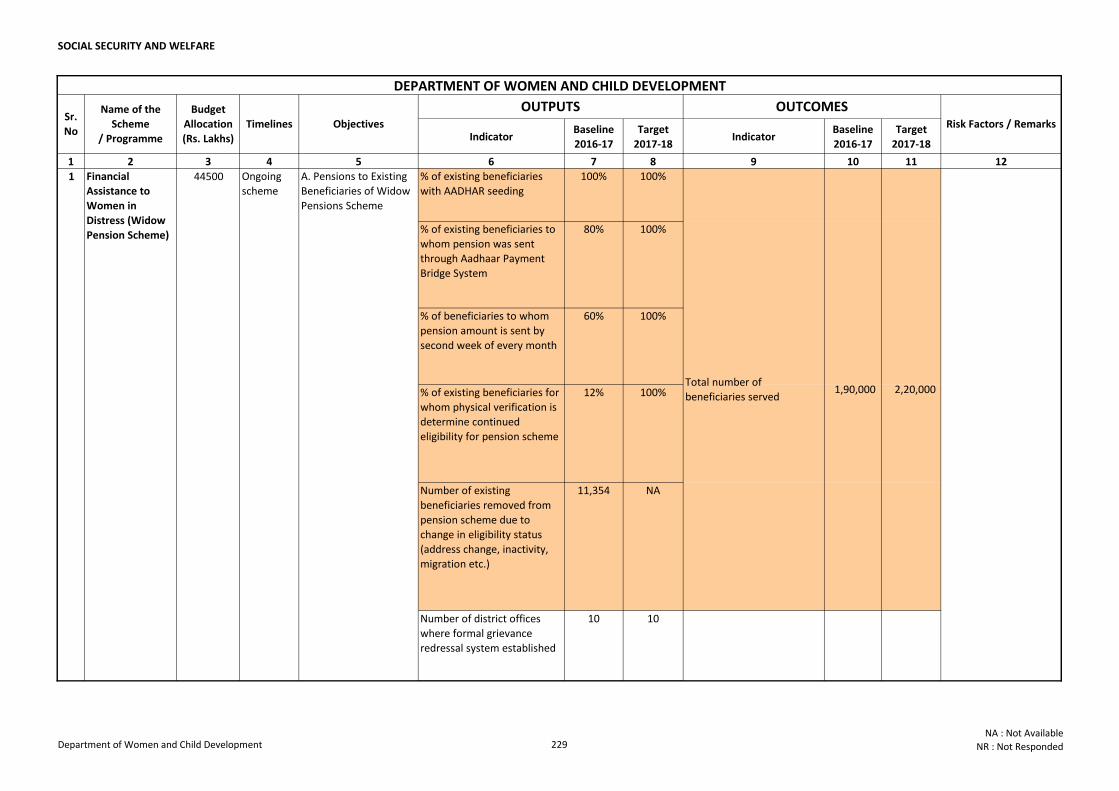
SOCIAL SECURITY AND WELFARE
Indicator Baseline
2016-17
Target
2017-18Indicator
Baseline
2016-17
Target
2017-18
1 2 3 4 5 6 7 8 9 10 11 12
% of existing beneficiaries
with AADHAR seeding
100% 100%
% of existing beneficiaries to
whom pension was sent
through Aadhaar Payment
Bridge System
80% 100%
% of beneficiaries to whom
pension amount is sent by
second week of every month
60% 100%
% of existing beneficiaries for
whom physical verification is
determine continued
eligibility for pension scheme
12% 100%
Number of existing
beneficiaries removed from
pension scheme due to
change in eligibility status
(address change, inactivity,
migration etc.)
11,354 NA
Number of district offices
where formal grievance
redressal system established
10 10
1,90,000 Total number of
beneficiaries served
100%
Ongoing
scheme
A. Pensions to Existing
Beneficiaries of Widow
Pensions Scheme
Sr.
No
Name of the
Scheme
/ Programme
Budget
Allocation
(Rs. Lakhs)
Objectives
2,20,000
% of grievances/ complaints
redressed within 30 days98%
DEPARTMENT OF WOMEN AND CHILD DEVELOPMENT
OUTPUTS OUTCOMES
1 Financial
Assistance to
Women in
Distress (Widow
Pension Scheme)
44500
Risk Factors / RemarksTimelines
Department of Women and Child Development 229NA : Not Available
NR : Not Responded
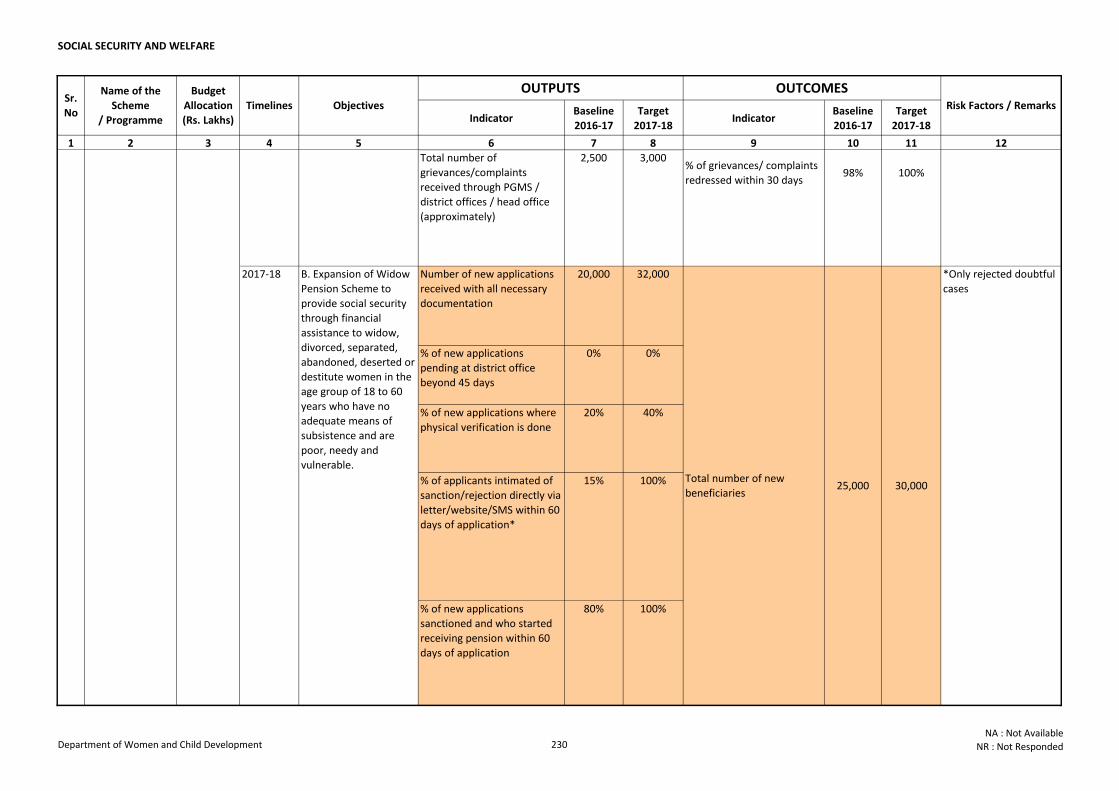
SOCIAL SECURITY AND WELFARE
Indicator Baseline
2016-17
Target
2017-18Indicator
Baseline
2016-17
Target
2017-18
1 2 3 4 5 6 7 8 9 10 11 12
Sr.
No
Name of the
Scheme
/ Programme
Budget
Allocation
(Rs. Lakhs)
Objectives
OUTPUTS OUTCOMESRisk Factors / RemarksTimelines
Total number of
grievances/complaints
received through PGMS /
district offices / head office
(approximately)
2,500 3,000
Number of new applications
received with all necessary
documentation
20,000 32,000
% of new applications
pending at district office
beyond 45 days
0% 0%
% of new applications where
physical verification is done
20% 40%
% of applicants intimated of
sanction/rejection directly via
letter/website/SMS within 60
days of application*
15% 100%
% of new applications
sanctioned and who started
receiving pension within 60
days of application
80% 100%
100%
Ongoing
scheme
B. Expansion of Widow
Pension Scheme to
provide social security
through financial
assistance to widow,
divorced, separated,
abandoned, deserted or
destitute women in the
age group of 18 to 60
years who have no
adequate means of
subsistence and are
poor, needy and
vulnerable.
2017-18
Total number of new
beneficiaries25,000 30,000
A. Pensions to Existing
Beneficiaries of Widow
Pensions Scheme
% of grievances/ complaints
redressed within 30 days98%
1 Financial
Assistance to
Women in
Distress (Widow
Pension Scheme)
44500
*Only rejected doubtful
cases
Department of Women and Child Development 230NA : Not Available
NR : Not Responded
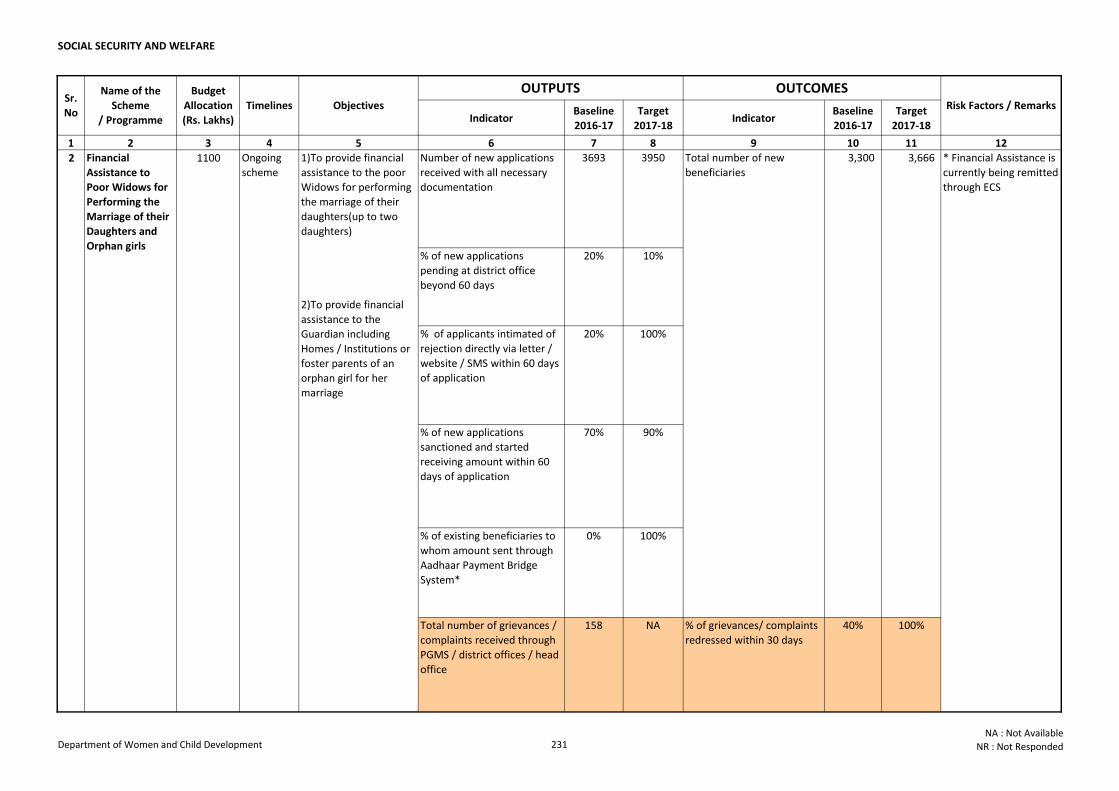
SOCIAL SECURITY AND WELFARE
Indicator Baseline
2016-17
Target
2017-18Indicator
Baseline
2016-17
Target
2017-18
1 2 3 4 5 6 7 8 9 10 11 12
Sr.
No
Name of the
Scheme
/ Programme
Budget
Allocation
(Rs. Lakhs)
Objectives
OUTPUTS OUTCOMESRisk Factors / RemarksTimelines
Number of new applications
received with all necessary
documentation
3693 3950
% of new applications
pending at district office
beyond 60 days
20% 10%
% of applicants intimated of
rejection directly via letter /
website / SMS within 60 days
of application
20% 100%
% of new applications
sanctioned and started
receiving amount within 60
days of application
70% 90%
% of existing beneficiaries to
whom amount sent through
Aadhaar Payment Bridge
System*
0% 100%
Total number of grievances /
complaints received through
PGMS / district offices / head
office
158 NA % of grievances/ complaints
redressed within 30 days
40% 100%
3,300 3,666 11002 Financial
Assistance to
Poor Widows for
Performing the
Marriage of their
Daughters and
Orphan girls
1)To provide financial
assistance to the poor
Widows for performing
the marriage of their
daughters(up to two
daughters)
2)To provide financial
assistance to the
Guardian including
Homes / Institutions or
foster parents of an
orphan girl for her
marriage
Ongoing
scheme
Total number of new
beneficiaries
* Financial Assistance is
currently being remitted
through ECS
Department of Women and Child Development 231NA : Not Available
NR : Not Responded
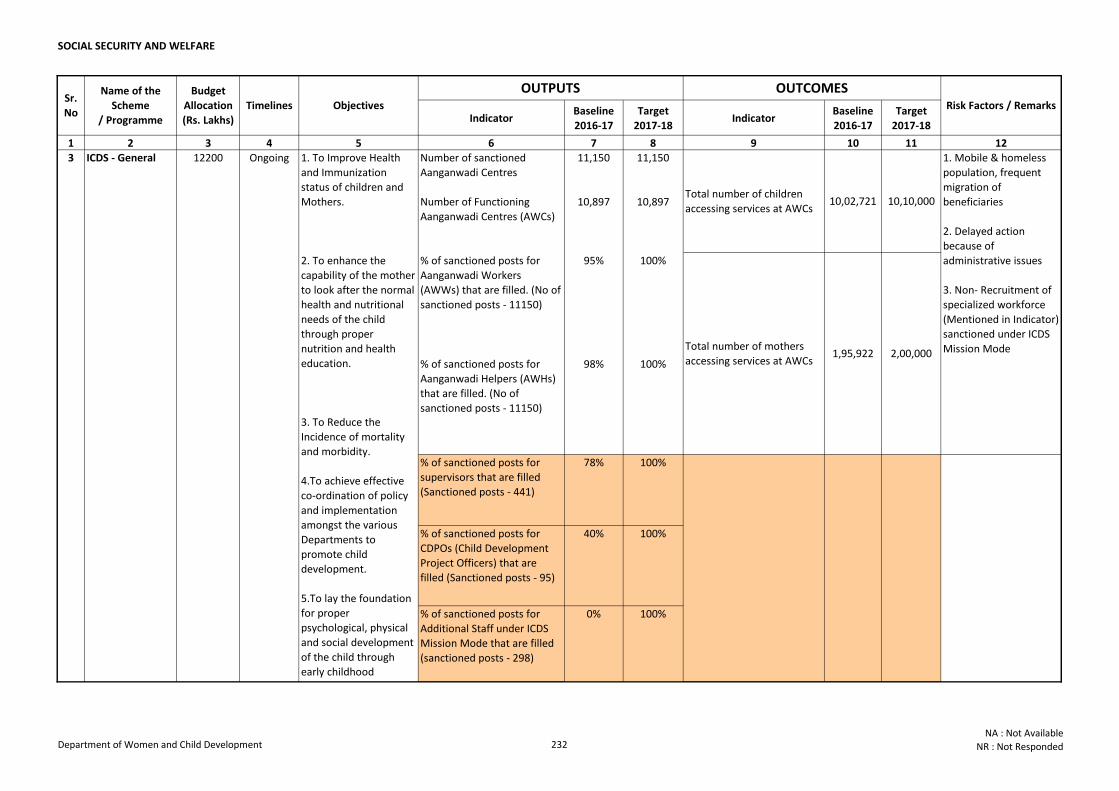
SOCIAL SECURITY AND WELFARE
Indicator Baseline
2016-17
Target
2017-18Indicator
Baseline
2016-17
Target
2017-18
1 2 3 4 5 6 7 8 9 10 11 12
Sr.
No
Name of the
Scheme
/ Programme
Budget
Allocation
(Rs. Lakhs)
Objectives
OUTPUTS OUTCOMESRisk Factors / RemarksTimelines
Number of sanctioned
Aanganwadi Centres
11,150 11,150
Number of Functioning
Aanganwadi Centres (AWCs)
10,897 10,897
% of sanctioned posts for
Aanganwadi Workers
(AWWs) that are filled. (No of
sanctioned posts - 11150)
95% 100%
% of sanctioned posts for
Aanganwadi Helpers (AWHs)
that are filled. (No of
sanctioned posts - 11150)
98% 100%
% of sanctioned posts for
supervisors that are filled
(Sanctioned posts - 441)
78% 100%
% of sanctioned posts for
CDPOs (Child Development
Project Officers) that are
filled (Sanctioned posts - 95)
40% 100%
% of sanctioned posts for
Additional Staff under ICDS
Mission Mode that are filled
(sanctioned posts - 298)
0% 100%
1. To Improve Health
and Immunization
status of children and
Mothers.
2. To enhance the
capability of the mother
to look after the normal
health and nutritional
needs of the child
through proper
nutrition and health
education.
3. To Reduce the
Incidence of mortality
and morbidity.
4.To achieve effective
co-ordination of policy
and implementation
amongst the various
Departments to
promote child
development.
5.To lay the foundation
for proper
psychological, physical
and social development
of the child through
early childhood
Ongoing
Total number of mothers
accessing services at AWCs1,95,922 2,00,000
Total number of children
accessing services at AWCs10,02,721 10,10,000
1. Mobile & homeless
population, frequent
migration of
beneficiaries
2. Delayed action
because of
administrative issues
3. Non- Recruitment of
specialized workforce
(Mentioned in Indicator)
sanctioned under ICDS
Mission Mode
12200ICDS - General 3
Department of Women and Child Development 232NA : Not Available
NR : Not Responded
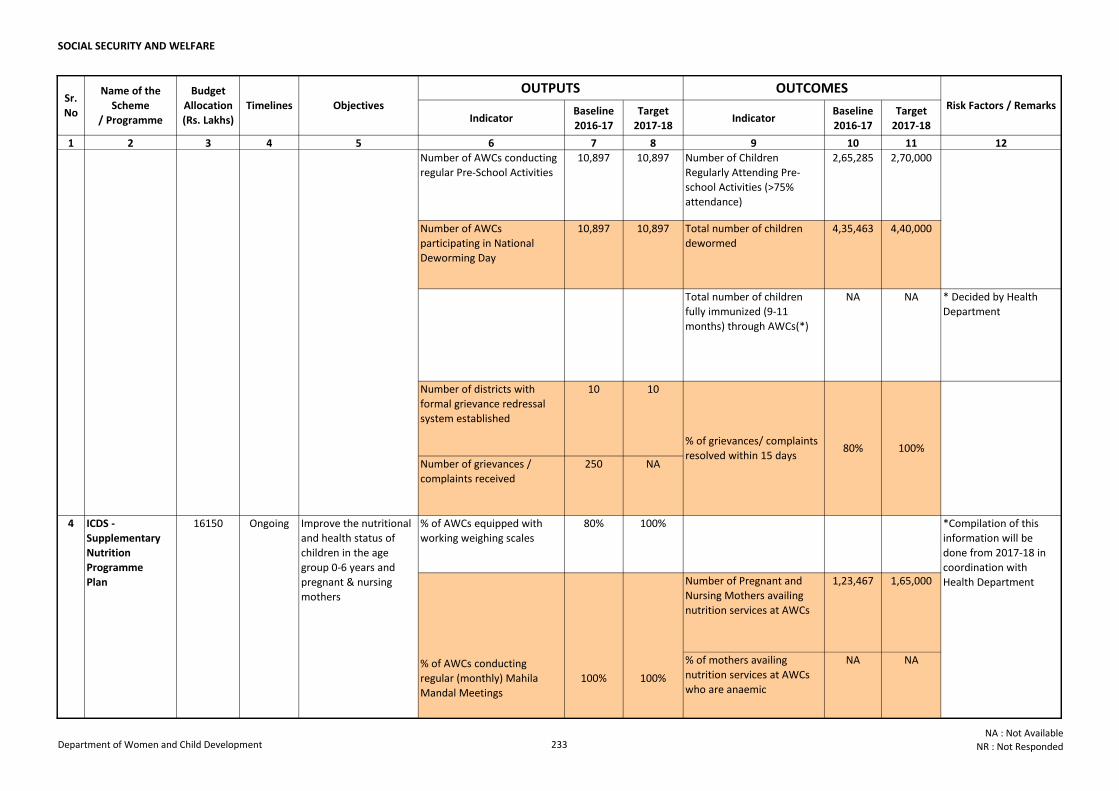
SOCIAL SECURITY AND WELFARE
Indicator Baseline
2016-17
Target
2017-18Indicator
Baseline
2016-17
Target
2017-18
1 2 3 4 5 6 7 8 9 10 11 12
Sr.
No
Name of the
Scheme
/ Programme
Budget
Allocation
(Rs. Lakhs)
Objectives
OUTPUTS OUTCOMESRisk Factors / RemarksTimelines
Number of AWCs conducting
regular Pre-School Activities
10,897 10,897 Number of Children
Regularly Attending Pre-
school Activities (>75%
attendance)
2,65,285 2,70,000
Number of AWCs
participating in National
Deworming Day
10,897 10,897 Total number of children
dewormed
4,35,463 4,40,000
Total number of children
fully immunized (9-11
months) through AWCs(*)
NA NA * Decided by Health
Department
Number of districts with
formal grievance redressal
system established
10 10
Number of grievances /
complaints received
250 NA
% of AWCs equipped with
working weighing scales
80% 100%
Number of Pregnant and
Nursing Mothers availing
nutrition services at AWCs
1,23,467 1,65,000
% of mothers availing
nutrition services at AWCs
who are anaemic
NA NA
1. To Improve Health
and Immunization
status of children and
Mothers.
2. To enhance the
capability of the mother
to look after the normal
health and nutritional
needs of the child
through proper
nutrition and health
education.
3. To Reduce the
Incidence of mortality
and morbidity.
4.To achieve effective
co-ordination of policy
and implementation
amongst the various
Departments to
promote child
development.
5.To lay the foundation
for proper
psychological, physical
and social development
of the child through
early childhood
Improve the nutritional
and health status of
children in the age
group 0-6 years and
pregnant & nursing
mothers
*Compilation of this
information will be
done from 2017-18 in
coordination with
Health Department
% of AWCs conducting
regular (monthly) Mahila
Mandal Meetings
100% 100%
Ongoing
80% 100%% of grievances/ complaints
resolved within 15 days
16150ICDS -
Supplementary
Nutrition
Programme
Plan
4
Ongoing12200ICDS - General 3
Department of Women and Child Development 233NA : Not Available
NR : Not Responded
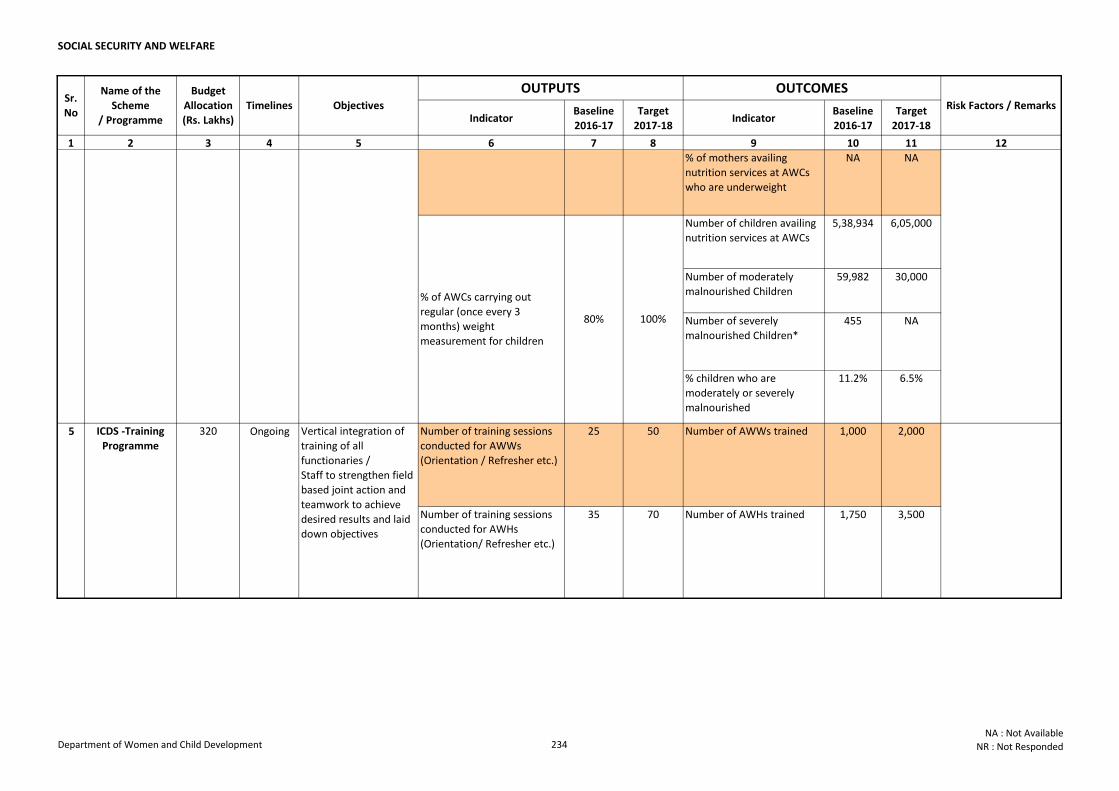
SOCIAL SECURITY AND WELFARE
Indicator Baseline
2016-17
Target
2017-18Indicator
Baseline
2016-17
Target
2017-18
1 2 3 4 5 6 7 8 9 10 11 12
Sr.
No
Name of the
Scheme
/ Programme
Budget
Allocation
(Rs. Lakhs)
Objectives
OUTPUTS OUTCOMESRisk Factors / RemarksTimelines
% of mothers availing
nutrition services at AWCs
who are underweight
NA NA
Number of children availing
nutrition services at AWCs
5,38,934 6,05,000
Number of moderately
malnourished Children
59,982 30,000
Number of severely
malnourished Children*
455 NA
% children who are
moderately or severely
malnourished
11.2% 6.5%
Number of training sessions
conducted for AWWs
(Orientation / Refresher etc.)
25 50 Number of AWWs trained 1,000 2,000
Number of training sessions
conducted for AWHs
(Orientation/ Refresher etc.)
35 70 Number of AWHs trained 1,750 3,500
320
Improve the nutritional
and health status of
children in the age
group 0-6 years and
pregnant & nursing
mothers
*Compilation of this
information will be
done from 2017-18 in
coordination with
Health Department
% of AWCs conducting
regular (monthly) Mahila
Mandal Meetings
100% 100%
% of AWCs carrying out
regular (once every 3
months) weight
measurement for children
80% 100%
Ongoing
5
16150ICDS -
Supplementary
Nutrition
Programme
Plan
4
ICDS -Training
ProgrammeOngoing Vertical integration of
training of all
functionaries /
Staff to strengthen field
based joint action and
teamwork to achieve
desired results and laid
down objectives
Department of Women and Child Development 234NA : Not Available
NR : Not Responded
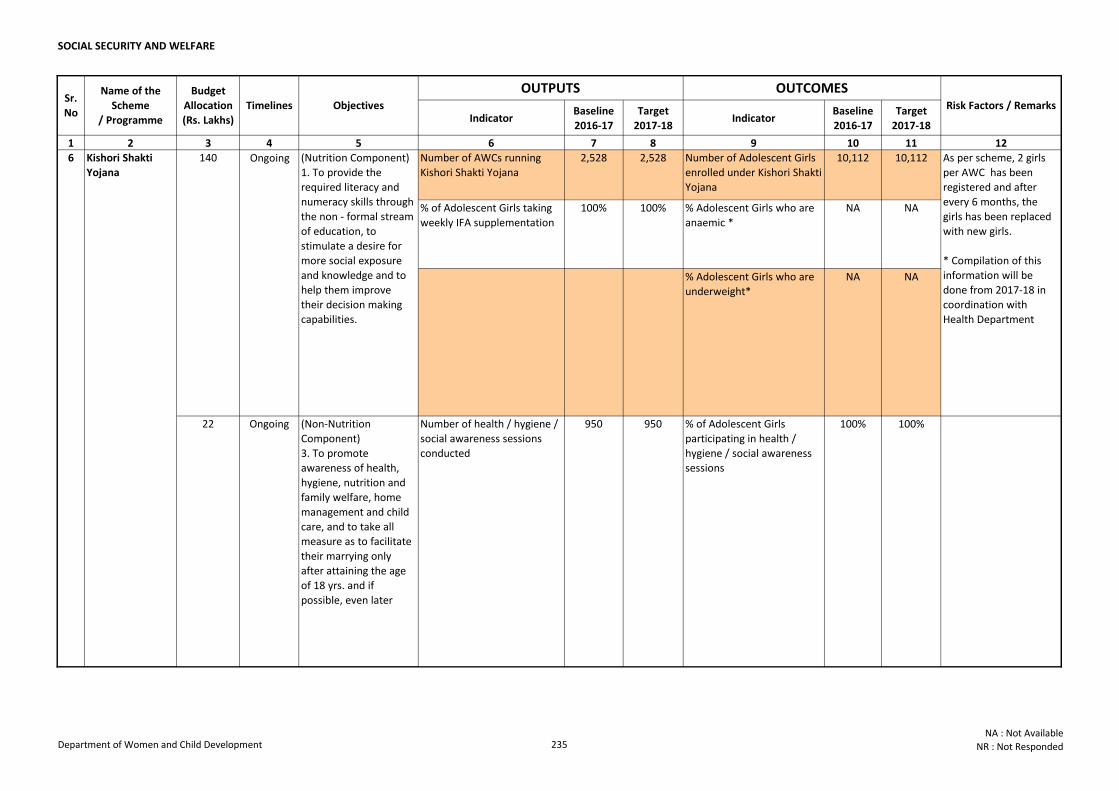
SOCIAL SECURITY AND WELFARE
Indicator Baseline
2016-17
Target
2017-18Indicator
Baseline
2016-17
Target
2017-18
1 2 3 4 5 6 7 8 9 10 11 12
Sr.
No
Name of the
Scheme
/ Programme
Budget
Allocation
(Rs. Lakhs)
Objectives
OUTPUTS OUTCOMESRisk Factors / RemarksTimelines
Number of AWCs running
Kishori Shakti Yojana
2,528 2,528 Number of Adolescent Girls
enrolled under Kishori Shakti
Yojana
10,112 10,112
% of Adolescent Girls taking
weekly IFA supplementation
100% 100% % Adolescent Girls who are
anaemic *
NA NA
% Adolescent Girls who are
underweight*
NA NA
(Nutrition Component)
1. To provide the
required literacy and
numeracy skills through
the non - formal stream
of education, to
stimulate a desire for
more social exposure
and knowledge and to
help them improve
their decision making
capabilities.
(Non-Nutrition
Component)
3. To promote
awareness of health,
hygiene, nutrition and
family welfare, home
management and child
care, and to take all
measure as to facilitate
their marrying only
after attaining the age
of 18 yrs. and if
possible, even later
6 Kishori Shakti
Yojana
22 Ongoing
Ongoing140
Number of health / hygiene /
social awareness sessions
conducted
950 950 % of Adolescent Girls
participating in health /
hygiene / social awareness
sessions
100% 100%
As per scheme, 2 girls
per AWC has been
registered and after
every 6 months, the
girls has been replaced
with new girls.
* Compilation of this
information will be
done from 2017-18 in
coordination with
Health Department
Department of Women and Child Development 235NA : Not Available
NR : Not Responded
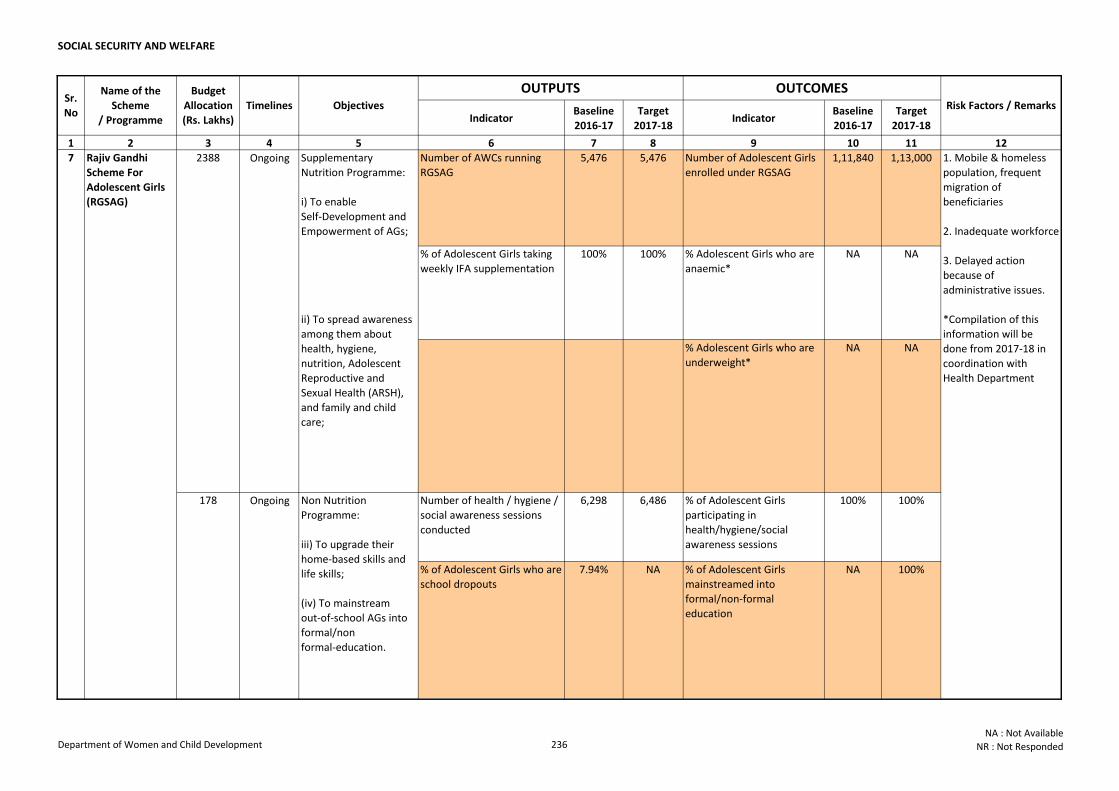
SOCIAL SECURITY AND WELFARE
Indicator Baseline
2016-17
Target
2017-18Indicator
Baseline
2016-17
Target
2017-18
1 2 3 4 5 6 7 8 9 10 11 12
Sr.
No
Name of the
Scheme
/ Programme
Budget
Allocation
(Rs. Lakhs)
Objectives
OUTPUTS OUTCOMESRisk Factors / RemarksTimelines
Number of AWCs running
RGSAG
5,476 5,476 Number of Adolescent Girls
enrolled under RGSAG
1,11,840 1,13,000
% of Adolescent Girls taking
weekly IFA supplementation
100% 100% % Adolescent Girls who are
anaemic*
NA NA
% Adolescent Girls who are
underweight*
NA NA
Number of health / hygiene /
social awareness sessions
conducted
6,298 6,486 % of Adolescent Girls
participating in
health/hygiene/social
awareness sessions
100% 100%Ongoing
7 Rajiv Gandhi
Scheme For
Adolescent Girls
(RGSAG)
1. Mobile & homeless
population, frequent
migration of
beneficiaries
2. Inadequate workforce
3. Delayed action
because of
administrative issues.
*Compilation of this
information will be
done from 2017-18 in
coordination with
Health Department
Supplementary
Nutrition Programme:
i) To enable
Self‐Development and
Empowerment of AGs;
ii) To spread awareness
among them about
health, hygiene,
nutrition, Adolescent
Reproductive and
Sexual Health (ARSH),
and family and child
care;
Non Nutrition
Programme:
iii) To upgrade their
home‐based skills and
life skills;
(iv) To mainstream
out‐of‐school AGs into
formal/non
formal‐education.
Ongoing
% of Adolescent Girls
mainstreamed into
formal/non-formal
education
% of Adolescent Girls who are
school dropouts
7.94% NA
2388
178
NA 100%
Department of Women and Child Development 236NA : Not Available
NR : Not Responded
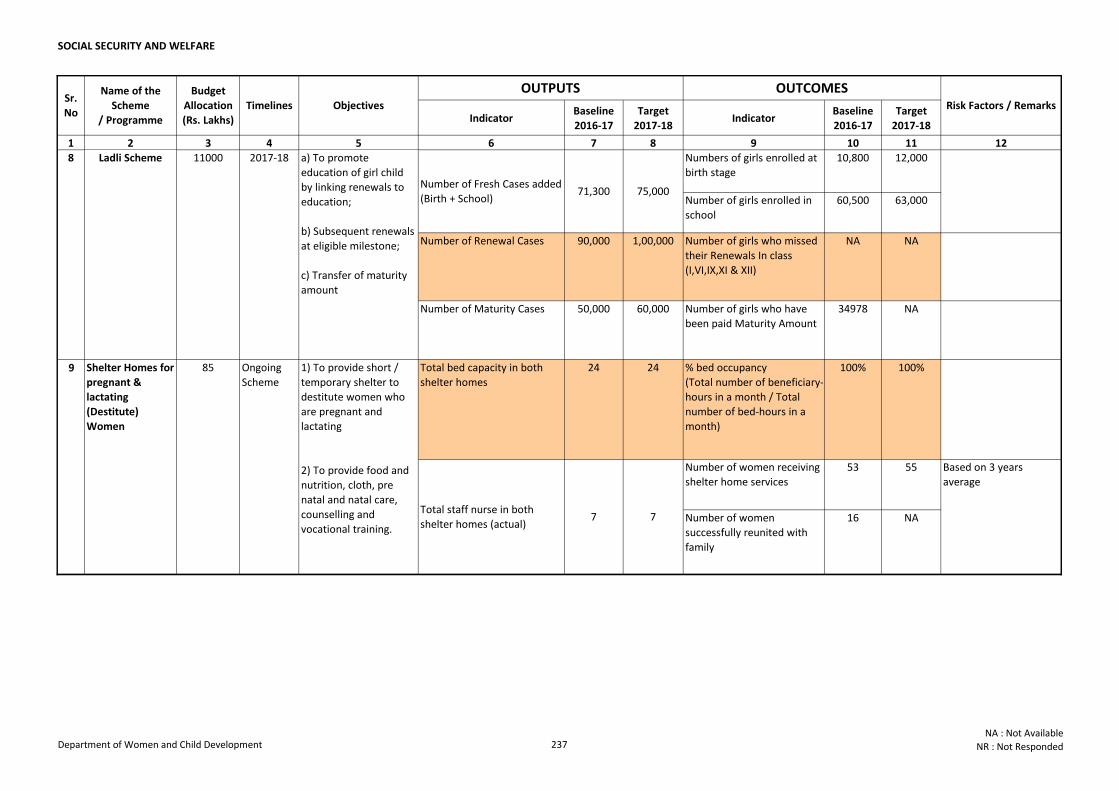
SOCIAL SECURITY AND WELFARE
Indicator Baseline
2016-17
Target
2017-18Indicator
Baseline
2016-17
Target
2017-18
1 2 3 4 5 6 7 8 9 10 11 12
Sr.
No
Name of the
Scheme
/ Programme
Budget
Allocation
(Rs. Lakhs)
Objectives
OUTPUTS OUTCOMESRisk Factors / RemarksTimelines
Numbers of girls enrolled at
birth stage
10,800 12,000
Number of girls enrolled in
school
60,500 63,000
Number of Renewal Cases 90,000 1,00,000 Number of girls who missed
their Renewals In class
(I,VI,IX,XI & XII)
NA NA
Number of Maturity Cases 50,000 60,000 Number of girls who have
been paid Maturity Amount
34978 NA
Total bed capacity in both
shelter homes
24 24 % bed occupancy
(Total number of beneficiary-
hours in a month / Total
number of bed-hours in a
month)
100% 100%
Number of women receiving
shelter home services
53 55
Number of women
successfully reunited with
family
16 NA
9 Shelter Homes for
pregnant &
lactating
(Destitute)
Women
85 Ongoing
Scheme
2017-18
Based on 3 years
average
110008 a) To promote
education of girl child
by linking renewals to
education;
b) Subsequent renewals
at eligible milestone;
c) Transfer of maturity
amount
Total staff nurse in both
shelter homes (actual)7 7
Number of Fresh Cases added
(Birth + School)71,300
1) To provide short /
temporary shelter to
destitute women who
are pregnant and
lactating
2) To provide food and
nutrition, cloth, pre
natal and natal care,
counselling and
vocational training.
Two Shelter Homes for
Pregnant and Lactating
Women are functional
since Feb. 2011 at Sarai
Rohilla and Jahangir
Puri. These Shelter
Homes have the
capacity to house 14
and 10 women
respectively.
Ladli Scheme
75,000
Department of Women and Child Development 237NA : Not Available
NR : Not Responded
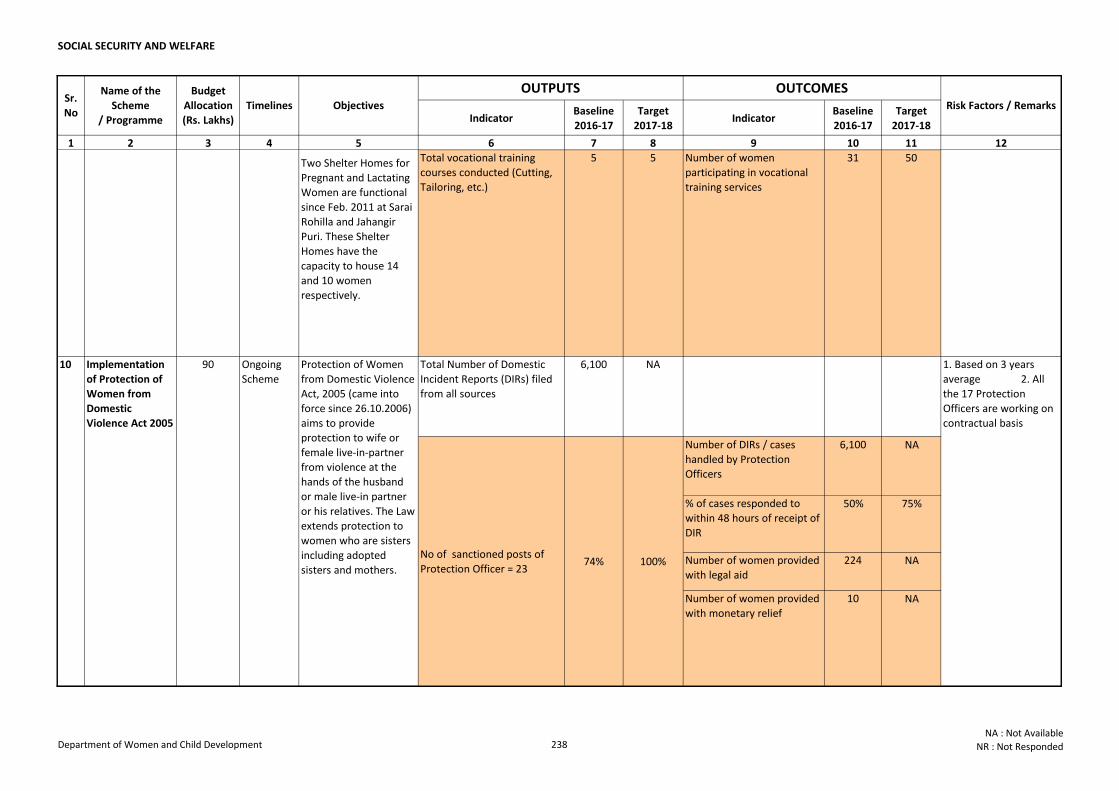
SOCIAL SECURITY AND WELFARE
Indicator Baseline
2016-17
Target
2017-18Indicator
Baseline
2016-17
Target
2017-18
1 2 3 4 5 6 7 8 9 10 11 12
Sr.
No
Name of the
Scheme
/ Programme
Budget
Allocation
(Rs. Lakhs)
Objectives
OUTPUTS OUTCOMESRisk Factors / RemarksTimelines
Total vocational training
courses conducted (Cutting,
Tailoring, etc.)
5 5 Number of women
participating in vocational
training services
31 50
Total Number of Domestic
Incident Reports (DIRs) filed
from all sources
6,100 NA
Number of DIRs / cases
handled by Protection
Officers
6,100 NA
% of cases responded to
within 48 hours of receipt of
DIR
50% 75%
Number of women provided
with legal aid
224 NA
Number of women provided
with monetary relief
10 NA
9 Shelter Homes for
pregnant &
lactating
(Destitute)
Women
85
10
Ongoing
Scheme
Implementation
of Protection of
Women from
Domestic
Violence Act 2005
90 Protection of Women
from Domestic Violence
Act, 2005 (came into
force since 26.10.2006)
aims to provide
protection to wife or
female live-in-partner
from violence at the
hands of the husband
or male live-in partner
or his relatives. The Law
extends protection to
women who are sisters
including adopted
sisters and mothers.
Based on 3 years
average
Ongoing
Scheme
1) To provide short /
temporary shelter to
destitute women who
are pregnant and
lactating
2) To provide food and
nutrition, cloth, pre
natal and natal care,
counselling and
vocational training.
Two Shelter Homes for
Pregnant and Lactating
Women are functional
since Feb. 2011 at Sarai
Rohilla and Jahangir
Puri. These Shelter
Homes have the
capacity to house 14
and 10 women
respectively.
No of sanctioned posts of
Protection Officer = 23
1. Based on 3 years
average 2. All
the 17 Protection
Officers are working on
contractual basis
74% 100%
Department of Women and Child Development 238NA : Not Available
NR : Not Responded
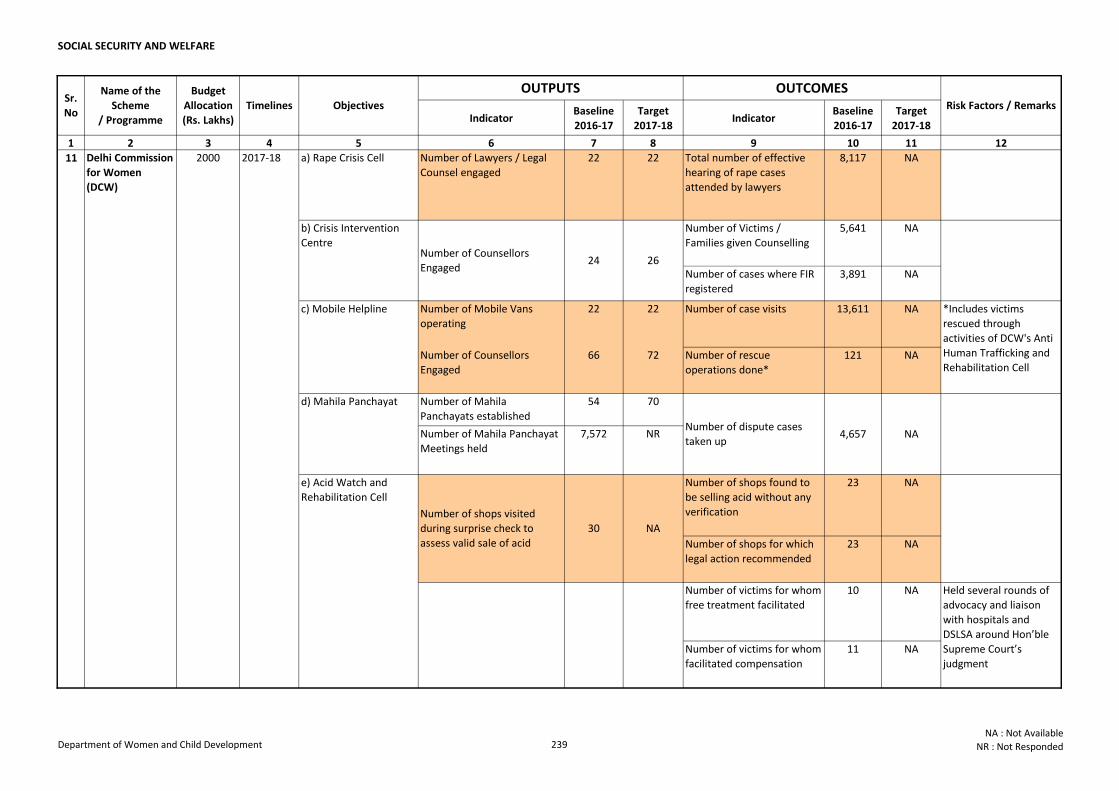
SOCIAL SECURITY AND WELFARE
Indicator Baseline
2016-17
Target
2017-18Indicator
Baseline
2016-17
Target
2017-18
1 2 3 4 5 6 7 8 9 10 11 12
Sr.
No
Name of the
Scheme
/ Programme
Budget
Allocation
(Rs. Lakhs)
Objectives
OUTPUTS OUTCOMESRisk Factors / RemarksTimelines
a) Rape Crisis Cell Number of Lawyers / Legal
Counsel engaged
22 22 Total number of effective
hearing of rape cases
attended by lawyers
8,117 NA
Number of Victims /
Families given Counselling
5,641 NA
Number of cases where FIR
registered
3,891 NA
Number of Mobile Vans
operating
22 22 Number of case visits 13,611 NA
Number of Counsellors
Engaged
66 72 Number of rescue
operations done*
121 NA
Number of Mahila
Panchayats established
54 70
Number of Mahila Panchayat
Meetings held
7,572 NR
Number of shops found to
be selling acid without any
verification
23 NA
Number of shops for which
legal action recommended
23 NA
Number of victims for whom
free treatment facilitated
10 NA
Number of victims for whom
facilitated compensation
11 NA
2017-1811 Delhi Commission
for Women
(DCW)
2000
Number of shops visited
during surprise check to
assess valid sale of acid
30
b) Crisis Intervention
Centre
c) Mobile Helpline
d) Mahila Panchayat
*Includes victims
rescued through
activities of DCW's Anti
Human Trafficking and
Rehabilitation Cell
Held several rounds of
advocacy and liaison
with hospitals and
DSLSA around Hon’ble
Supreme Court’s
judgment
4,657 NANumber of dispute cases
taken up
e) Acid Watch and
Rehabilitation Cell
NA
Number of Counsellors
Engaged24 26
Department of Women and Child Development 239NA : Not Available
NR : Not Responded
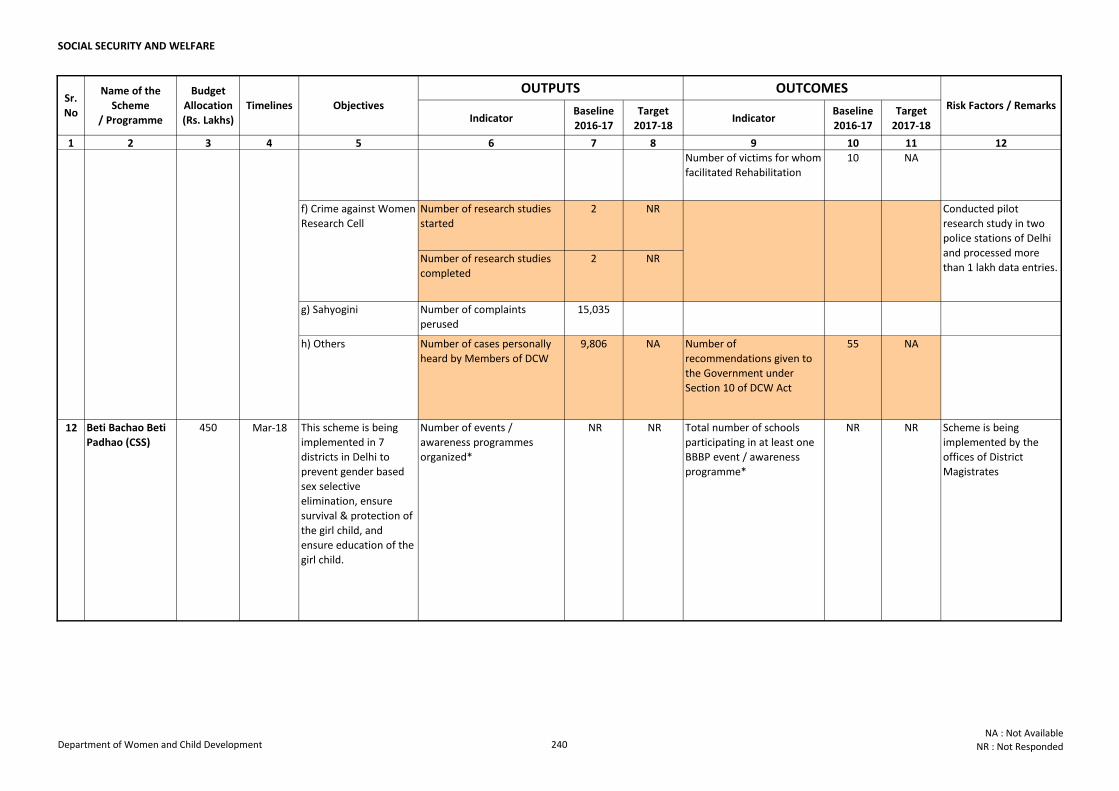
SOCIAL SECURITY AND WELFARE
Indicator Baseline
2016-17
Target
2017-18Indicator
Baseline
2016-17
Target
2017-18
1 2 3 4 5 6 7 8 9 10 11 12
Sr.
No
Name of the
Scheme
/ Programme
Budget
Allocation
(Rs. Lakhs)
Objectives
OUTPUTS OUTCOMESRisk Factors / RemarksTimelines
Number of victims for whom
facilitated Rehabilitation
10 NA
Number of research studies
started
2 NR
Number of research studies
completed
2 NR
g) Sahyogini Number of complaints
perused
15,035
h) Others Number of cases personally
heard by Members of DCW
9,806 NA Number of
recommendations given to
the Government under
Section 10 of DCW Act
55 NA
12 Beti Bachao Beti
Padhao (CSS)
450 Mar-18 This scheme is being
implemented in 7
districts in Delhi to
prevent gender based
sex selective
elimination, ensure
survival & protection of
the girl child, and
ensure education of the
girl child.
Number of events /
awareness programmes
organized*
NR NR Total number of schools
participating in at least one
BBBP event / awareness
programme*
NR NR Scheme is being
implemented by the
offices of District
Magistrates
2017-18
f) Crime against Women
Research Cell
Conducted pilot
research study in two
police stations of Delhi
and processed more
than 1 lakh data entries.
11 Delhi Commission
for Women
(DCW)
2000
Held several rounds of
advocacy and liaison
with hospitals and
DSLSA around Hon’ble
Supreme Court’s
judgment
e) Acid Watch and
Rehabilitation Cell
Department of Women and Child Development 240NA : Not Available
NR : Not Responded
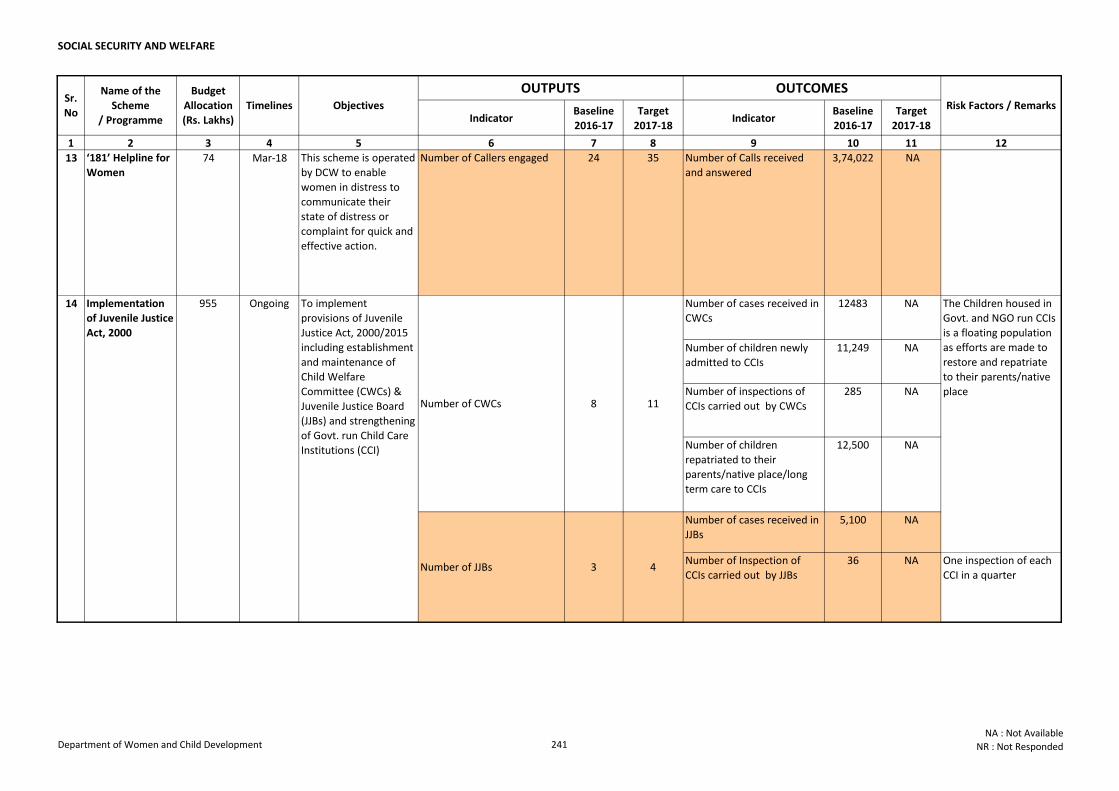
SOCIAL SECURITY AND WELFARE
Indicator Baseline
2016-17
Target
2017-18Indicator
Baseline
2016-17
Target
2017-18
1 2 3 4 5 6 7 8 9 10 11 12
Sr.
No
Name of the
Scheme
/ Programme
Budget
Allocation
(Rs. Lakhs)
Objectives
OUTPUTS OUTCOMESRisk Factors / RemarksTimelines
13 ‘181’ Helpline for
Women74 Mar-18 This scheme is operated
by DCW to enable
women in distress to
communicate their
state of distress or
complaint for quick and
effective action.
Number of Callers engaged 24 35 Number of Calls received
and answered
3,74,022 NA
Number of cases received in
CWCs
12483 NA
Number of children newly
admitted to CCIs
11,249 NA
Number of inspections of
CCIs carried out by CWCs
285 NA
Number of children
repatriated to their
parents/native place/long
term care to CCIs
12,500 NA
Number of cases received in
JJBs
5,100 NA
Number of Inspection of
CCIs carried out by JJBs
36 NA One inspection of each
CCI in a quarter
14
43Number of JJBs
Number of CWCs
Implementation
of Juvenile Justice
Act, 2000
955 Ongoing
11
The Children housed in
Govt. and NGO run CCIs
is a floating population
as efforts are made to
restore and repatriate
to their parents/native
place8
To implement
provisions of Juvenile
Justice Act, 2000/2015
including establishment
and maintenance of
Child Welfare
Committee (CWCs) &
Juvenile Justice Board
(JJBs) and strengthening
of Govt. run Child Care
Institutions (CCI)
Department of Women and Child Development 241NA : Not Available
NR : Not Responded
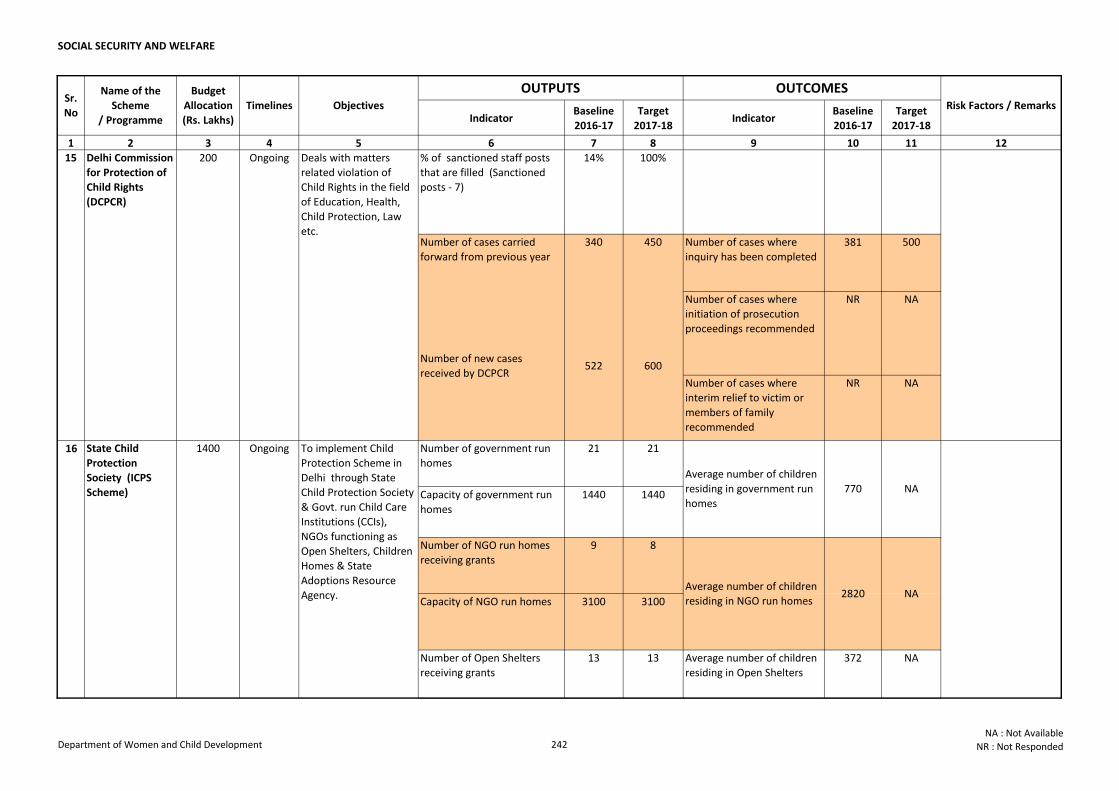
SOCIAL SECURITY AND WELFARE
Indicator Baseline
2016-17
Target
2017-18Indicator
Baseline
2016-17
Target
2017-18
1 2 3 4 5 6 7 8 9 10 11 12
Sr.
No
Name of the
Scheme
/ Programme
Budget
Allocation
(Rs. Lakhs)
Objectives
OUTPUTS OUTCOMESRisk Factors / RemarksTimelines
% of sanctioned staff posts
that are filled (Sanctioned
posts - 7)
14% 100%
Number of cases carried
forward from previous year
340 450 Number of cases where
inquiry has been completed
381 500
Number of cases where
initiation of prosecution
proceedings recommended
NR NA
Number of cases where
interim relief to victim or
members of family
recommended
NR NA
Number of government run
homes
21 21
Capacity of government run
homes
1440 1440
Number of NGO run homes
receiving grants
9 8
Capacity of NGO run homes 3100 3100
Number of Open Shelters
receiving grants
13 13 Average number of children
residing in Open Shelters
372 NA
Average number of children
residing in government run
homes
Average number of children
residing in NGO run homes
770 NA
2820 NA
16 State Child
Protection
Society (ICPS
Scheme)
1400 Ongoing To implement Child
Protection Scheme in
Delhi through State
Child Protection Society
& Govt. run Child Care
Institutions (CCIs),
NGOs functioning as
Open Shelters, Children
Homes & State
Adoptions Resource
Agency.
15 Delhi Commission
for Protection of
Child Rights
(DCPCR)
200 Ongoing Deals with matters
related violation of
Child Rights in the field
of Education, Health,
Child Protection, Law
etc.
Number of new cases
received by DCPCR 522 600
Department of Women and Child Development 242NA : Not Available
NR : Not Responded
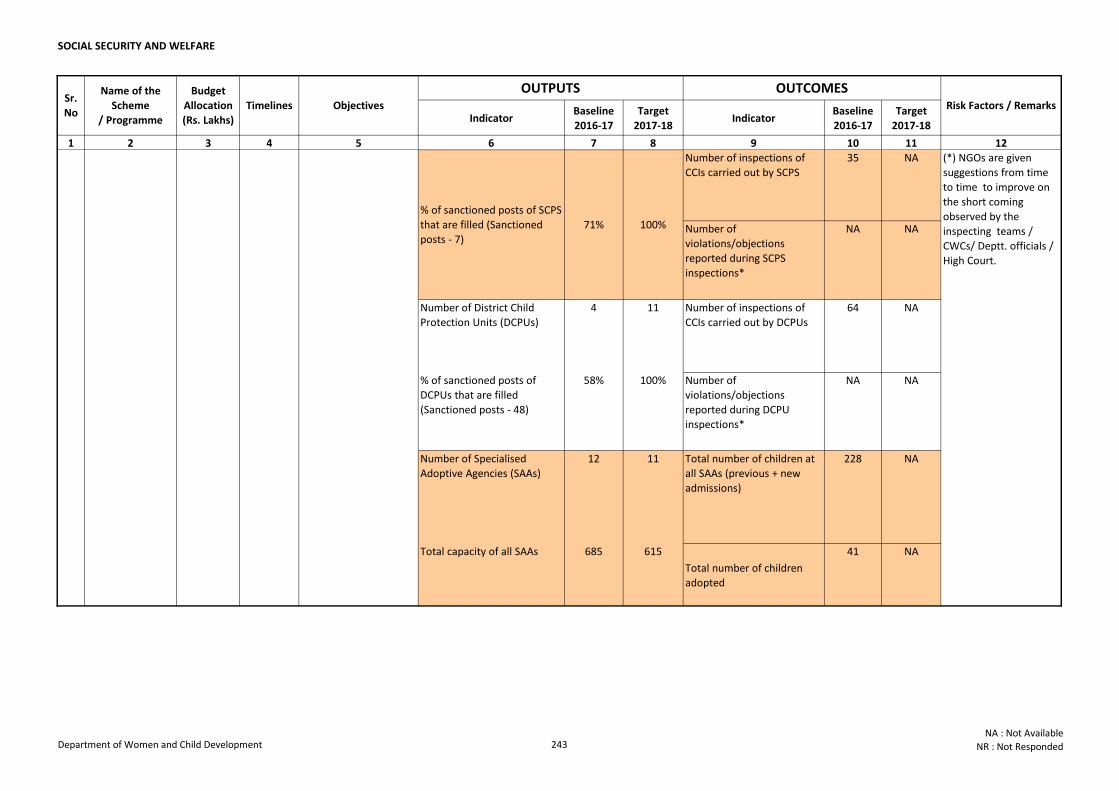
SOCIAL SECURITY AND WELFARE
Indicator Baseline
2016-17
Target
2017-18Indicator
Baseline
2016-17
Target
2017-18
1 2 3 4 5 6 7 8 9 10 11 12
Sr.
No
Name of the
Scheme
/ Programme
Budget
Allocation
(Rs. Lakhs)
Objectives
OUTPUTS OUTCOMESRisk Factors / RemarksTimelines
Number of inspections of
CCIs carried out by SCPS
35 NA
Number of
violations/objections
reported during SCPS
inspections*
NA NA
Number of District Child
Protection Units (DCPUs)
4 11 Number of inspections of
CCIs carried out by DCPUs
64 NA
% of sanctioned posts of
DCPUs that are filled
(Sanctioned posts - 48)
58% 100% Number of
violations/objections
reported during DCPU
inspections*
NA NA
Number of Specialised
Adoptive Agencies (SAAs)
12 11 Total number of children at
all SAAs (previous + new
admissions)
228 NA
Total capacity of all SAAs 685 615
Total number of children
adopted
41 NA
(*) NGOs are given
suggestions from time
to time to improve on
the short coming
observed by the
inspecting teams /
CWCs/ Deptt. officials /
High Court.
16 State Child
Protection
Society (ICPS
Scheme)
1400 Ongoing To implement Child
Protection Scheme in
Delhi through State
Child Protection Society
& Govt. run Child Care
Institutions (CCIs),
NGOs functioning as
Open Shelters, Children
Homes & State
Adoptions Resource
Agency.
% of sanctioned posts of SCPS
that are filled (Sanctioned
posts - 7)
71% 100%
Department of Women and Child Development 243NA : Not Available
NR : Not Responded
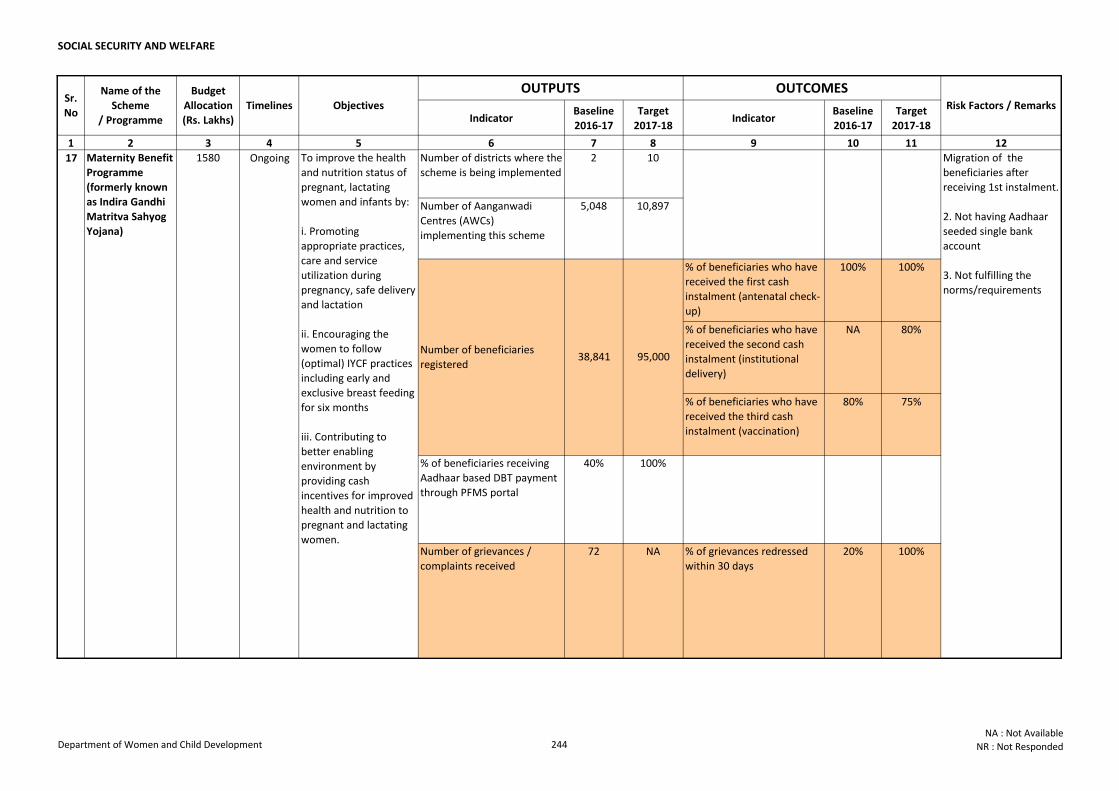
SOCIAL SECURITY AND WELFARE
Indicator Baseline
2016-17
Target
2017-18Indicator
Baseline
2016-17
Target
2017-18
1 2 3 4 5 6 7 8 9 10 11 12
Sr.
No
Name of the
Scheme
/ Programme
Budget
Allocation
(Rs. Lakhs)
Objectives
OUTPUTS OUTCOMESRisk Factors / RemarksTimelines
Number of districts where the
scheme is being implemented
2 10
Number of Aanganwadi
Centres (AWCs)
implementing this scheme
5,048 10,897
% of beneficiaries who have
received the first cash
instalment (antenatal check-
up)
100% 100%
% of beneficiaries who have
received the second cash
instalment (institutional
delivery)
NA 80%
% of beneficiaries who have
received the third cash
instalment (vaccination)
80% 75%
% of beneficiaries receiving
Aadhaar based DBT payment
through PFMS portal
40% 100%
Number of grievances /
complaints received
72 NA % of grievances redressed
within 30 days
20% 100%
Migration of the
beneficiaries after
receiving 1st instalment.
2. Not having Aadhaar
seeded single bank
account
3. Not fulfilling the
norms/requirements
Number of beneficiaries
registered
17 Maternity Benefit
Programme
(formerly known
as Indira Gandhi
Matritva Sahyog
Yojana)
1580 Ongoing
38,841
To improve the health
and nutrition status of
pregnant, lactating
women and infants by:
i. Promoting
appropriate practices,
care and service
utilization during
pregnancy, safe delivery
and lactation
ii. Encouraging the
women to follow
(optimal) IYCF practices
including early and
exclusive breast feeding
for six months
iii. Contributing to
better enabling
environment by
providing cash
incentives for improved
health and nutrition to
pregnant and lactating
women.
95,000
Department of Women and Child Development 244NA : Not Available
NR : Not Responded
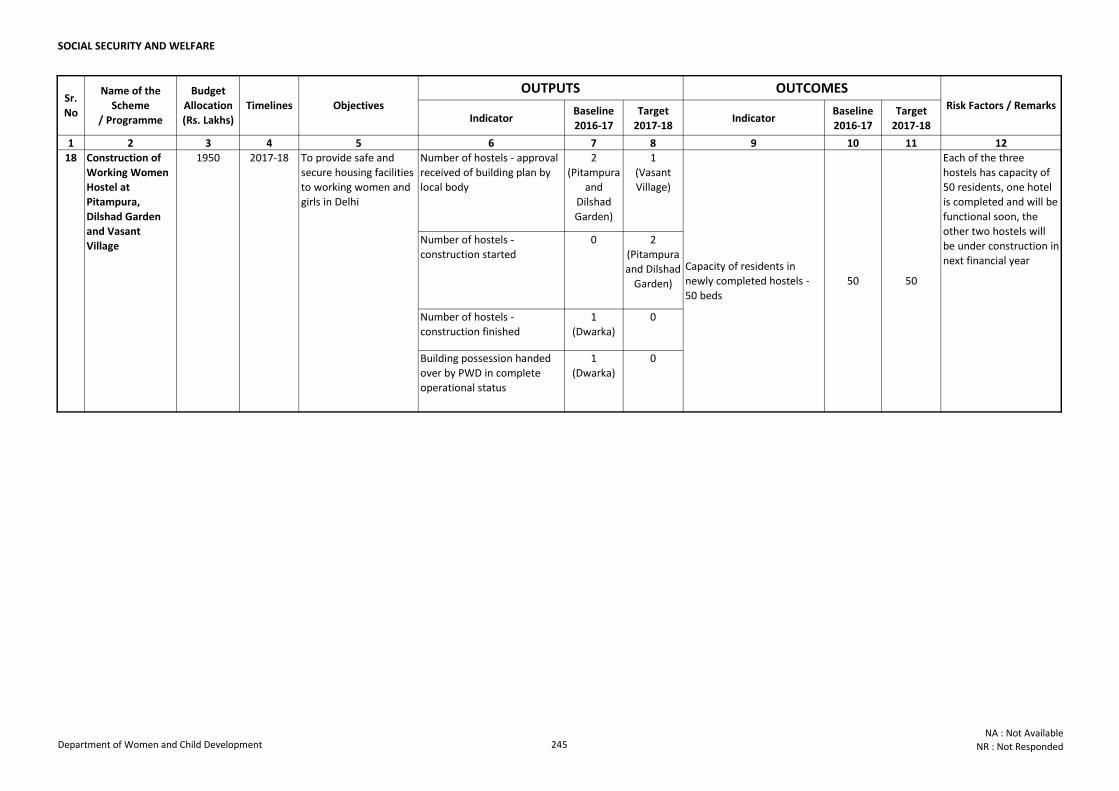
SOCIAL SECURITY AND WELFARE
Indicator Baseline
2016-17
Target
2017-18Indicator
Baseline
2016-17
Target
2017-18
1 2 3 4 5 6 7 8 9 10 11 12
Sr.
No
Name of the
Scheme
/ Programme
Budget
Allocation
(Rs. Lakhs)
Objectives
OUTPUTS OUTCOMESRisk Factors / RemarksTimelines
Number of hostels - approval
received of building plan by
local body
2
(Pitampura
and
Dilshad
Garden)
1
(Vasant
Village)
Number of hostels -
construction started
0 2
(Pitampura
and Dilshad
Garden)
Number of hostels -
construction finished
1
(Dwarka)
0
Building possession handed
over by PWD in complete
operational status
1
(Dwarka)
0
To provide safe and
secure housing facilities
to working women and
girls in Delhi
2017-181950
Capacity of residents in
newly completed hostels -
50 beds
50 50
Each of the three
hostels has capacity of
50 residents, one hotel
is completed and will be
functional soon, the
other two hostels will
be under construction in
next financial year
Construction of
Working Women
Hostel at
Pitampura,
Dilshad Garden
and Vasant
Village
18
Department of Women and Child Development 245NA : Not Available
NR : Not Responded
SO
CIA
L S
EU
RIT
Y A
ND
WELFA
RE
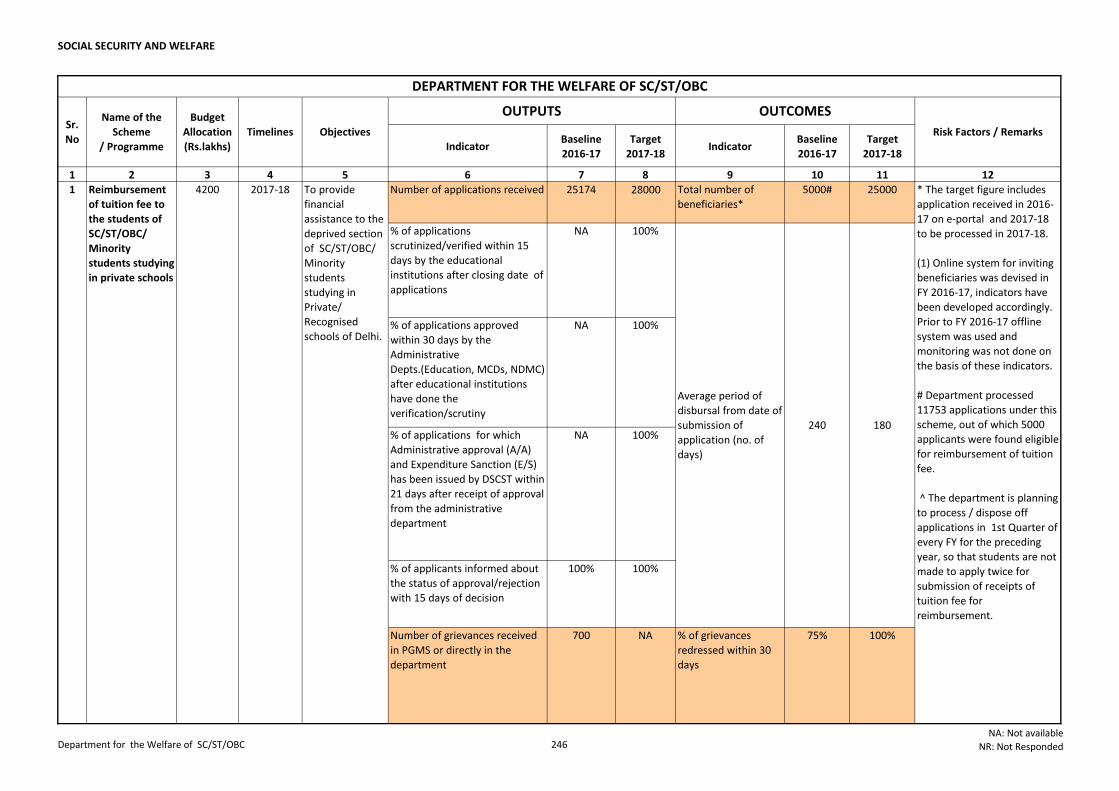
SOCIAL SECURITY AND WELFARE
Indicator Baseline
2016-17
Target
2017-18Indicator
Baseline
2016-17
Target
2017-18
1 2 3 4 5 6 7 8 9 10 11 12
Number of applications received 25174 28000 Total number of
beneficiaries*
5000# 25000
% of applications
scrutinized/verified within 15
days by the educational
institutions after closing date of
applications
NA 100%
% of applications approved
within 30 days by the
Administrative
Depts.(Education, MCDs, NDMC)
after educational institutions
have done the
verification/scrutiny
NA 100%
% of applications for which
Administrative approval (A/A)
and Expenditure Sanction (E/S)
has been issued by DSCST within
21 days after receipt of approval
from the administrative
department
NA 100%
% of applicants informed about
the status of approval/rejection
with 15 days of decision
100% 100%
Number of grievances received
in PGMS or directly in the
department
700 NA % of grievances
redressed within 30
days
75% 100%
* The target figure includes
application received in 2016-
17 on e-portal and 2017-18
to be processed in 2017-18.
(1) Online system for inviting
beneficiaries was devised in
FY 2016-17, indicators have
been developed accordingly.
Prior to FY 2016-17 offline
system was used and
monitoring was not done on
the basis of these indicators.
# Department processed
11753 applications under this
scheme, out of which 5000
applicants were found eligible
for reimbursement of tuition
fee.
^ The department is planning
to process / dispose off
applications in 1st Quarter of
every FY for the preceding
year, so that students are not
made to apply twice for
submission of receipts of
tuition fee for
reimbursement.
4200
DEPARTMENT FOR THE WELFARE OF SC/ST/OBC
Name of the
Scheme
/ Programme
OUTCOMES
To provide
financial
assistance to the
deprived section
of SC/ST/OBC/
Minority
students
studying in
Private/
Recognised
schools of Delhi.
2017-18
Risk Factors / Remarks
Average period of
disbursal from date of
submission of
application (no. of
days)
240 180
Sr.
No
1
Budget
Allocation
(Rs.lakhs)
Timelines Objectives
OUTPUTS
Reimbursement
of tuition fee to
the students of
SC/ST/OBC/
Minority
students studying
in private schools
Department for the Welfare of SC/ST/OBC 246NA: Not available
NR: Not Responded
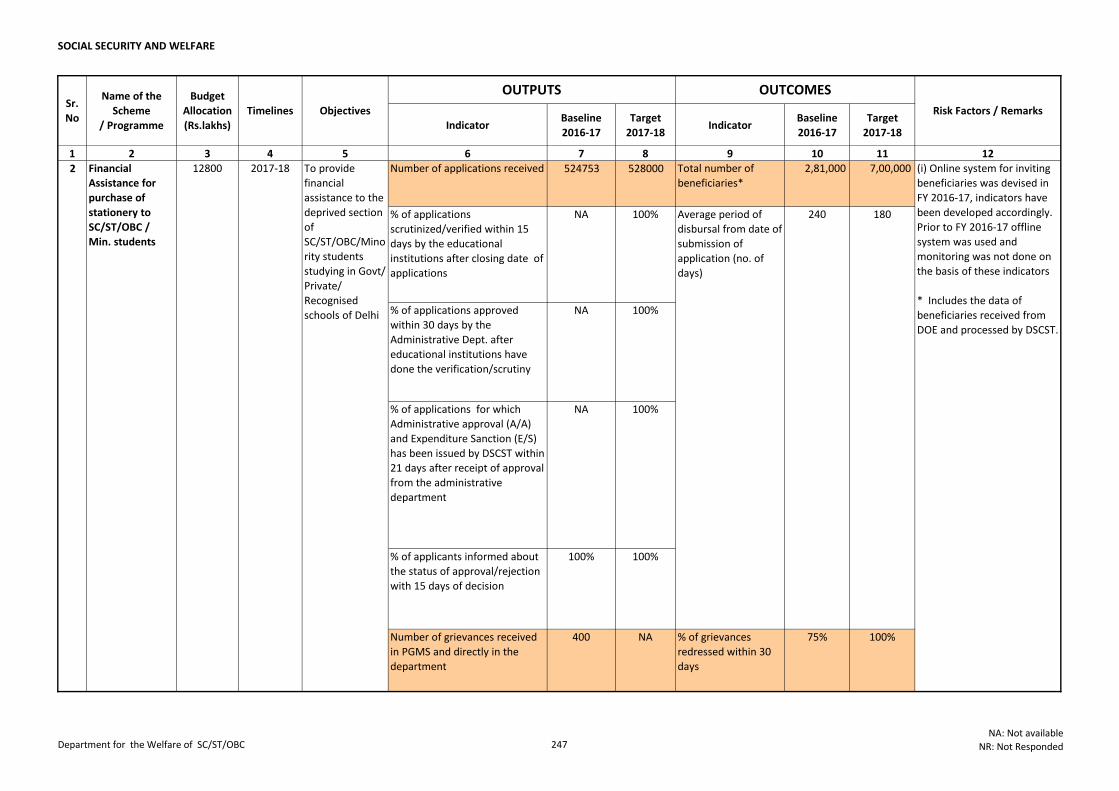
SOCIAL SECURITY AND WELFARE
Indicator Baseline
2016-17
Target
2017-18Indicator
Baseline
2016-17
Target
2017-18
1 2 3 4 5 6 7 8 9 10 11 12
Name of the
Scheme
/ Programme
OUTCOMES
Risk Factors / RemarksSr.
No
Budget
Allocation
(Rs.lakhs)
Timelines Objectives
OUTPUTS
Number of applications received 524753 528000 Total number of
beneficiaries*
2,81,000 7,00,000
% of applications
scrutinized/verified within 15
days by the educational
institutions after closing date of
applications
NA 100%
% of applications approved
within 30 days by the
Administrative Dept. after
educational institutions have
done the verification/scrutiny
NA 100%
% of applications for which
Administrative approval (A/A)
and Expenditure Sanction (E/S)
has been issued by DSCST within
21 days after receipt of approval
from the administrative
department
NA 100%
% of applicants informed about
the status of approval/rejection
with 15 days of decision
100% 100%
Number of grievances received
in PGMS and directly in the
department
400 NA % of grievances
redressed within 30
days
75% 100%
(i) Online system for inviting
beneficiaries was devised in
FY 2016-17, indicators have
been developed accordingly.
Prior to FY 2016-17 offline
system was used and
monitoring was not done on
the basis of these indicators
* Includes the data of
beneficiaries received from
DOE and processed by DSCST.
240
2017-18 To provide
financial
assistance to the
deprived section
of
SC/ST/OBC/Mino
rity students
studying in Govt/
Private/
Recognised
schools of Delhi
Average period of
disbursal from date of
submission of
application (no. of
days)
180
Financial
Assistance for
purchase of
stationery to
SC/ST/OBC /
Min. students
128002
Department for the Welfare of SC/ST/OBC 247NA: Not available
NR: Not Responded
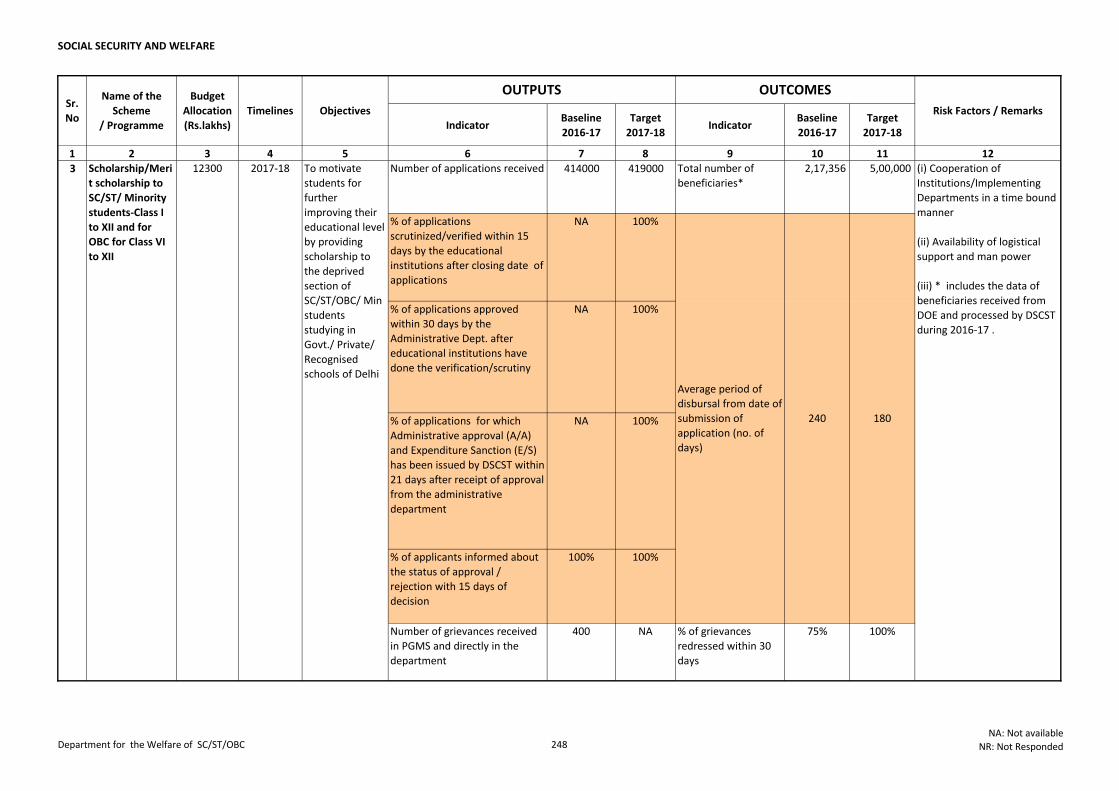
SOCIAL SECURITY AND WELFARE
Indicator Baseline
2016-17
Target
2017-18Indicator
Baseline
2016-17
Target
2017-18
1 2 3 4 5 6 7 8 9 10 11 12
Name of the
Scheme
/ Programme
OUTCOMES
Risk Factors / RemarksSr.
No
Budget
Allocation
(Rs.lakhs)
Timelines Objectives
OUTPUTS
Number of applications received 414000 419000 Total number of
beneficiaries*
2,17,356 5,00,000
% of applications
scrutinized/verified within 15
days by the educational
institutions after closing date of
applications
NA 100%
% of applications approved
within 30 days by the
Administrative Dept. after
educational institutions have
done the verification/scrutiny
NA 100%
% of applications for which
Administrative approval (A/A)
and Expenditure Sanction (E/S)
has been issued by DSCST within
21 days after receipt of approval
from the administrative
department
NA 100%
% of applicants informed about
the status of approval /
rejection with 15 days of
decision
100% 100%
Number of grievances received
in PGMS and directly in the
department
400 NA % of grievances
redressed within 30
days
75% 100%
(i) Cooperation of
Institutions/Implementing
Departments in a time bound
manner
(ii) Availability of logistical
support and man power
(iii) * includes the data of
beneficiaries received from
DOE and processed by DSCST
during 2016-17 .
Average period of
disbursal from date of
submission of
application (no. of
days)
240
12300 2017-18 To motivate
students for
further
improving their
educational level
by providing
scholarship to
the deprived
section of
SC/ST/OBC/ Min
students
studying in
Govt./ Private/
Recognised
schools of Delhi
180
3 Scholarship/Meri
t scholarship to
SC/ST/ Minority
students-Class I
to XII and for
OBC for Class VI
to XII
Department for the Welfare of SC/ST/OBC 248NA: Not available
NR: Not Responded
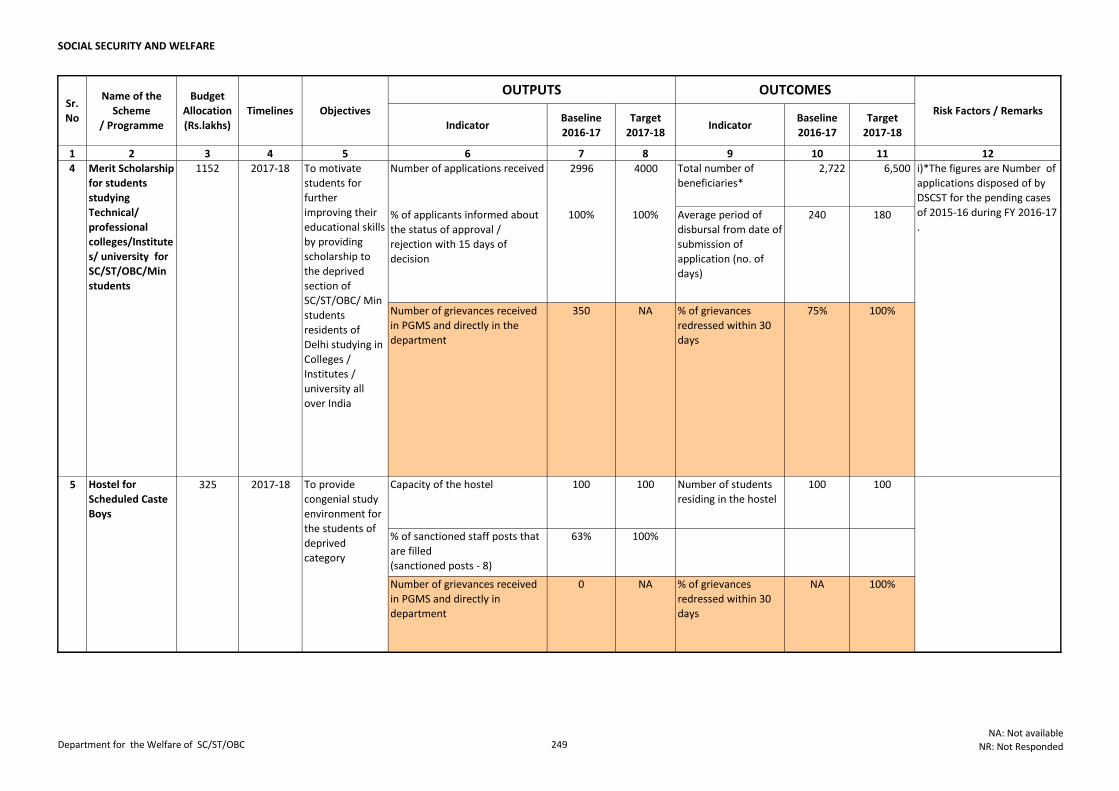
SOCIAL SECURITY AND WELFARE
Indicator Baseline
2016-17
Target
2017-18Indicator
Baseline
2016-17
Target
2017-18
1 2 3 4 5 6 7 8 9 10 11 12
Name of the
Scheme
/ Programme
OUTCOMES
Risk Factors / RemarksSr.
No
Budget
Allocation
(Rs.lakhs)
Timelines Objectives
OUTPUTS
Number of applications received 2996 4000 Total number of
beneficiaries*
2,722 6,500
% of applicants informed about
the status of approval /
rejection with 15 days of
decision
100% 100% Average period of
disbursal from date of
submission of
application (no. of
days)
240 180
Number of grievances received
in PGMS and directly in the
department
350 NA % of grievances
redressed within 30
days
75% 100%
Capacity of the hostel 100 100 Number of students
residing in the hostel
100 100
% of sanctioned staff posts that
are filled
(sanctioned posts - 8)
63% 100%
Number of grievances received
in PGMS and directly in
department
0 NA % of grievances
redressed within 30
days
NA 100%
To provide
congenial study
environment for
the students of
deprived
category
325
i)*The figures are Number of
applications disposed of by
DSCST for the pending cases
of 2015-16 during FY 2016-17
.
To motivate
students for
further
improving their
educational skills
by providing
scholarship to
the deprived
section of
SC/ST/OBC/ Min
students
residents of
Delhi studying in
Colleges /
Institutes /
university all
over India
2017-1811524 Merit Scholarship
for students
studying
Technical/
professional
colleges/Institute
s/ university for
SC/ST/OBC/Min
students
5 Hostel for
Scheduled Caste
Boys
2017-18
Department for the Welfare of SC/ST/OBC 249NA: Not available
NR: Not Responded
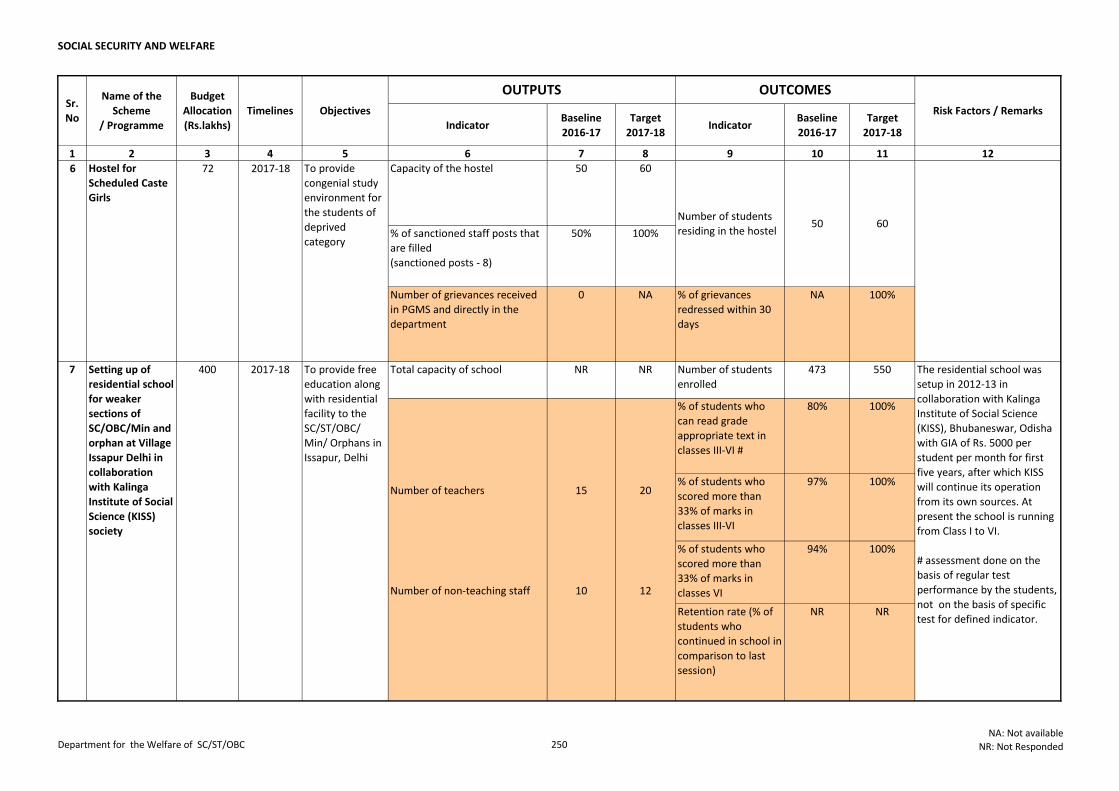
SOCIAL SECURITY AND WELFARE
Indicator Baseline
2016-17
Target
2017-18Indicator
Baseline
2016-17
Target
2017-18
1 2 3 4 5 6 7 8 9 10 11 12
Name of the
Scheme
/ Programme
OUTCOMES
Risk Factors / RemarksSr.
No
Budget
Allocation
(Rs.lakhs)
Timelines Objectives
OUTPUTS
Capacity of the hostel 50 60
% of sanctioned staff posts that
are filled
(sanctioned posts - 8)
50% 100%
Number of grievances received
in PGMS and directly in the
department
0 NA % of grievances
redressed within 30
days
NA 100%
Total capacity of school NR NR Number of students
enrolled
473 550
% of students who
can read grade
appropriate text in
classes III-VI #
80% 100%
% of students who
scored more than
33% of marks in
classes III-VI
97% 100%
Retention rate (% of
students who
continued in school in
comparison to last
session)
NR NR
Setting up of
residential school
for weaker
sections of
SC/OBC/Min and
orphan at Village
Issapur Delhi in
collaboration
with Kalinga
Institute of Social
Science (KISS)
society
7 400 2017-18 To provide free
education along
with residential
facility to the
SC/ST/OBC/
Min/ Orphans in
Issapur, Delhi
Number of teachers 15
100%
The residential school was
setup in 2012-13 in
collaboration with Kalinga
Institute of Social Science
(KISS), Bhubaneswar, Odisha
with GIA of Rs. 5000 per
student per month for first
five years, after which KISS
will continue its operation
from its own sources. At
present the school is running
from Class I to VI.
# assessment done on the
basis of regular test
performance by the students,
not on the basis of specific
test for defined indicator.
50
% of students who
scored more than
33% of marks in
classes VI
94%
Number of students
residing in the hostel
20
Number of non-teaching staff 10 12
6 Hostel for
Scheduled Caste
Girls
72 2017-18 To provide
congenial study
environment for
the students of
deprived
category
60
Department for the Welfare of SC/ST/OBC 250NA: Not available
NR: Not Responded
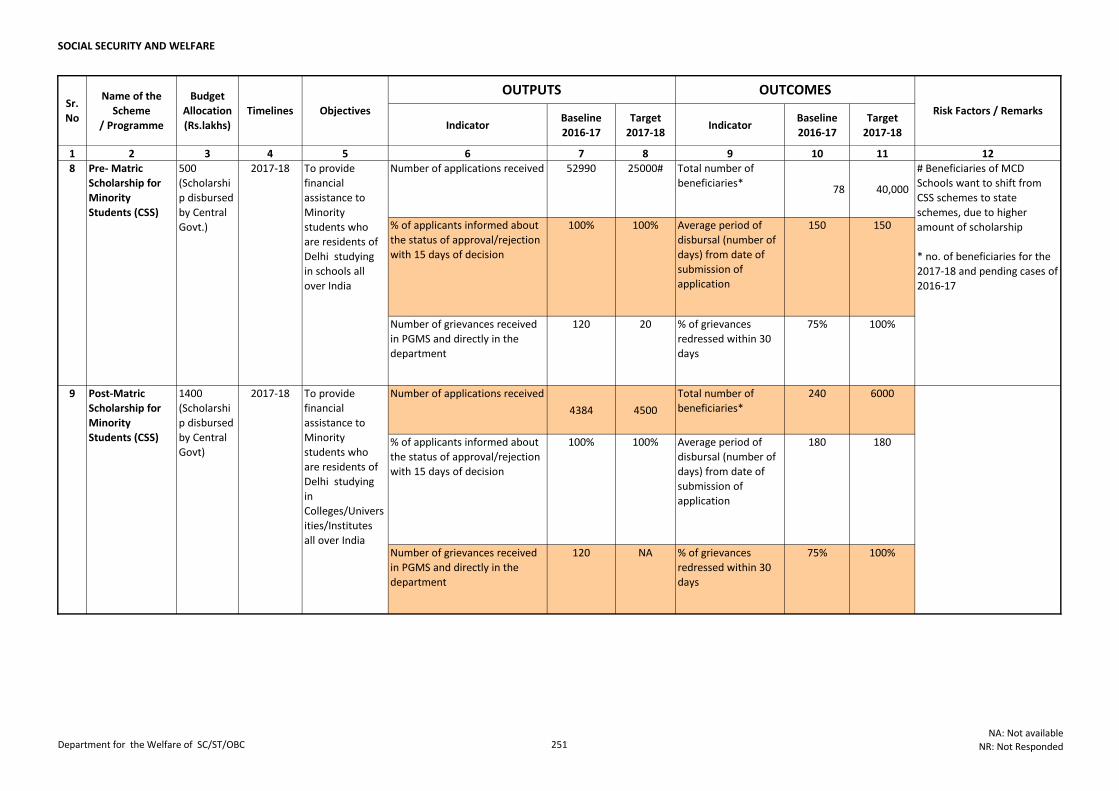
SOCIAL SECURITY AND WELFARE
Indicator Baseline
2016-17
Target
2017-18Indicator
Baseline
2016-17
Target
2017-18
1 2 3 4 5 6 7 8 9 10 11 12
Name of the
Scheme
/ Programme
OUTCOMES
Risk Factors / RemarksSr.
No
Budget
Allocation
(Rs.lakhs)
Timelines Objectives
OUTPUTS
Number of applications received 52990 25000# Total number of
beneficiaries* 78 40,000
% of applicants informed about
the status of approval/rejection
with 15 days of decision
100% 100% Average period of
disbursal (number of
days) from date of
submission of
application
150 150
Number of grievances received
in PGMS and directly in the
department
120 20 % of grievances
redressed within 30
days
75% 100%
Number of applications received
4384 4500
Total number of
beneficiaries*
240 6000
% of applicants informed about
the status of approval/rejection
with 15 days of decision
100% 100% Average period of
disbursal (number of
days) from date of
submission of
application
180 180
Number of grievances received
in PGMS and directly in the
department
120 NA % of grievances
redressed within 30
days
75% 100%
# Beneficiaries of MCD
Schools want to shift from
CSS schemes to state
schemes, due to higher
amount of scholarship
* no. of beneficiaries for the
2017-18 and pending cases of
2016-17
9 To provide
financial
assistance to
Minority
students who
are residents of
Delhi studying
in
Colleges/Univers
ities/Institutes
all over India
2017-181400
(Scholarshi
p disbursed
by Central
Govt)
Post-Matric
Scholarship for
Minority
Students (CSS)
8 Pre- Matric
Scholarship for
Minority
Students (CSS)
500
(Scholarshi
p disbursed
by Central
Govt.)
2017-18 To provide
financial
assistance to
Minority
students who
are residents of
Delhi studying
in schools all
over India
Department for the Welfare of SC/ST/OBC 251NA: Not available
NR: Not Responded
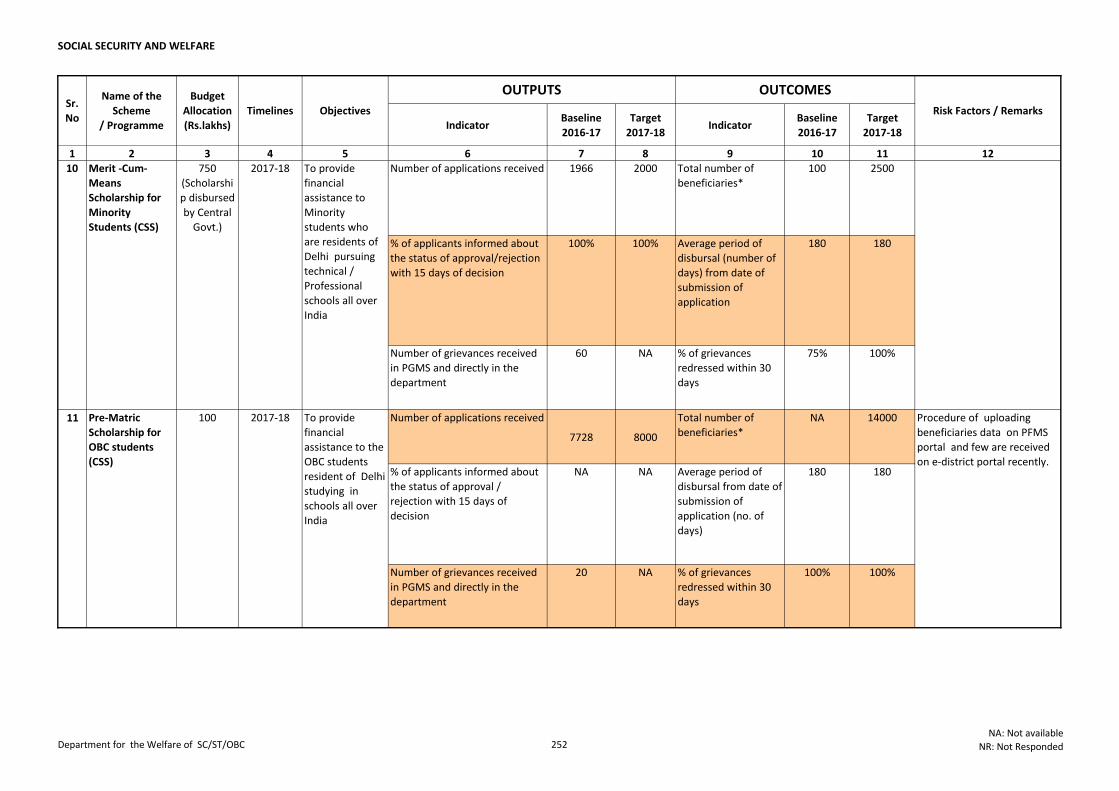
SOCIAL SECURITY AND WELFARE
Indicator Baseline
2016-17
Target
2017-18Indicator
Baseline
2016-17
Target
2017-18
1 2 3 4 5 6 7 8 9 10 11 12
Name of the
Scheme
/ Programme
OUTCOMES
Risk Factors / RemarksSr.
No
Budget
Allocation
(Rs.lakhs)
Timelines Objectives
OUTPUTS
Number of applications received 1966 2000 Total number of
beneficiaries*
100 2500
% of applicants informed about
the status of approval/rejection
with 15 days of decision
100% 100% Average period of
disbursal (number of
days) from date of
submission of
application
180 180
Number of grievances received
in PGMS and directly in the
department
60 NA % of grievances
redressed within 30
days
75% 100%
Number of applications received
7728 8000
Total number of
beneficiaries*
NA 14000
% of applicants informed about
the status of approval /
rejection with 15 days of
decision
NA NA Average period of
disbursal from date of
submission of
application (no. of
days)
180 180
Number of grievances received
in PGMS and directly in the
department
20 NA % of grievances
redressed within 30
days
100% 100%
To provide
financial
assistance to the
OBC students
resident of Delhi
studying in
schools all over
India
2017-18100
To provide
financial
assistance to
Minority
students who
are residents of
Delhi pursuing
technical /
Professional
schools all over
India
Merit -Cum-
Means
Scholarship for
Minority
Students (CSS)
Procedure of uploading
beneficiaries data on PFMS
portal and few are received
on e-district portal recently.
10 2017-18750
(Scholarshi
p disbursed
by Central
Govt.)
11 Pre-Matric
Scholarship for
OBC students
(CSS)
Department for the Welfare of SC/ST/OBC 252NA: Not available
NR: Not Responded
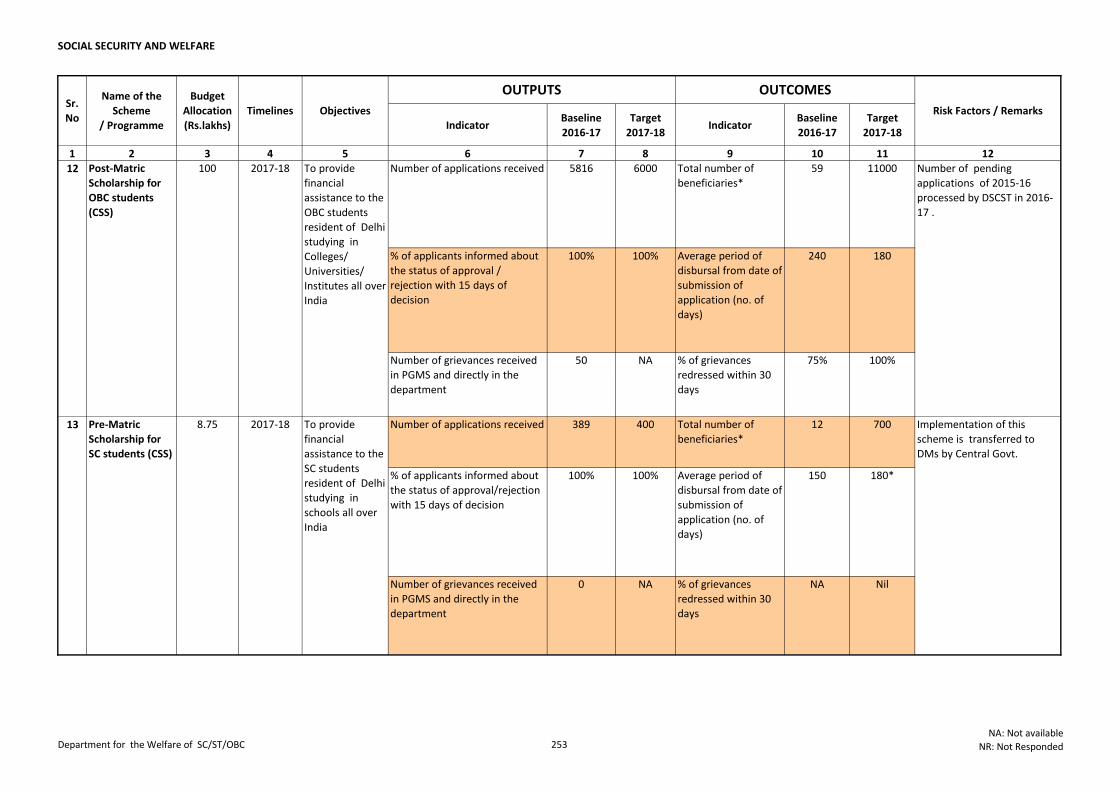
SOCIAL SECURITY AND WELFARE
Indicator Baseline
2016-17
Target
2017-18Indicator
Baseline
2016-17
Target
2017-18
1 2 3 4 5 6 7 8 9 10 11 12
Name of the
Scheme
/ Programme
OUTCOMES
Risk Factors / RemarksSr.
No
Budget
Allocation
(Rs.lakhs)
Timelines Objectives
OUTPUTS
Number of applications received 5816 6000 Total number of
beneficiaries*
59 11000
% of applicants informed about
the status of approval /
rejection with 15 days of
decision
100% 100% Average period of
disbursal from date of
submission of
application (no. of
days)
240 180
Number of grievances received
in PGMS and directly in the
department
50 NA % of grievances
redressed within 30
days
75% 100%
Number of applications received 389 400 Total number of
beneficiaries*
12 700
% of applicants informed about
the status of approval/rejection
with 15 days of decision
100% 100% Average period of
disbursal from date of
submission of
application (no. of
days)
150 180*
Number of grievances received
in PGMS and directly in the
department
0 NA % of grievances
redressed within 30
days
NA Nil
100Post-Matric
Scholarship for
OBC students
(CSS)
Implementation of this
scheme is transferred to
DMs by Central Govt.
Number of pending
applications of 2015-16
processed by DSCST in 2016-
17 .
12
To provide
financial
assistance to the
SC students
resident of Delhi
studying in
schools all over
India
2017-188.75Pre-Matric
Scholarship for
SC students (CSS)
13
To provide
financial
assistance to the
OBC students
resident of Delhi
studying in
Colleges/
Universities/
Institutes all over
India
2017-18
Department for the Welfare of SC/ST/OBC 253NA: Not available
NR: Not Responded
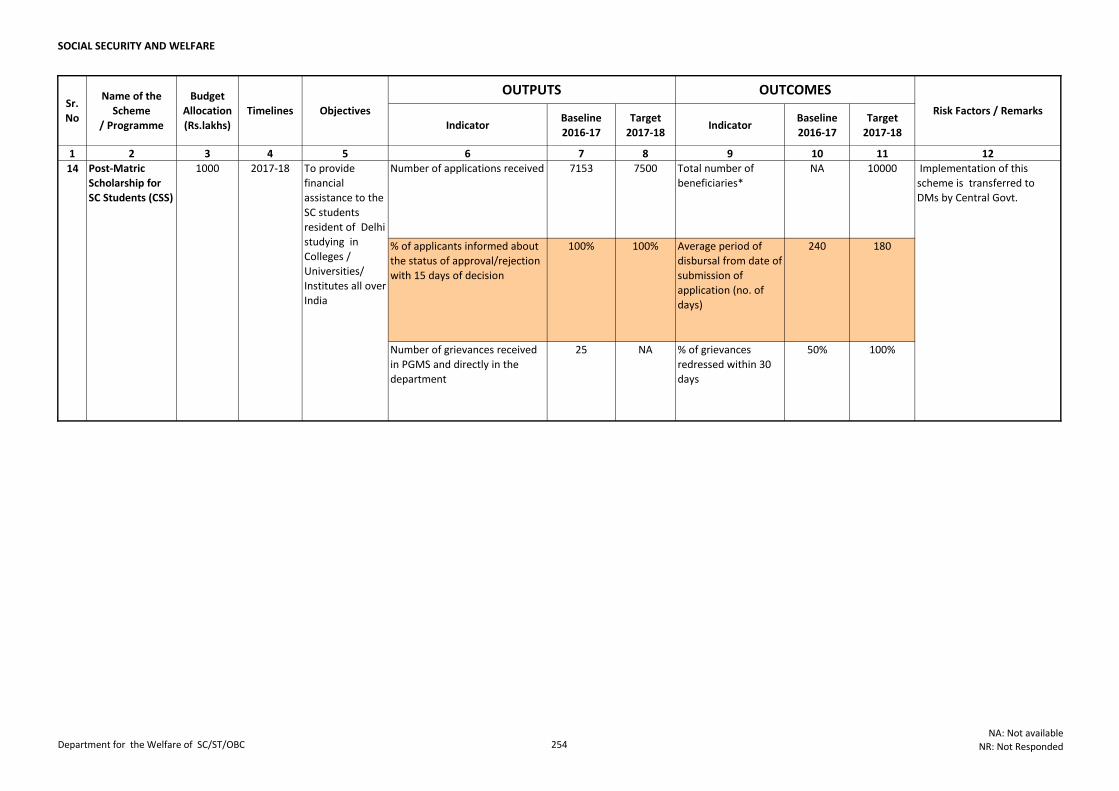
SOCIAL SECURITY AND WELFARE
Indicator Baseline
2016-17
Target
2017-18Indicator
Baseline
2016-17
Target
2017-18
1 2 3 4 5 6 7 8 9 10 11 12
Name of the
Scheme
/ Programme
OUTCOMES
Risk Factors / RemarksSr.
No
Budget
Allocation
(Rs.lakhs)
Timelines Objectives
OUTPUTS
Number of applications received 7153 7500 Total number of
beneficiaries*
NA 10000
% of applicants informed about
the status of approval/rejection
with 15 days of decision
100% 100% Average period of
disbursal from date of
submission of
application (no. of
days)
240 180
Number of grievances received
in PGMS and directly in the
department
25 NA % of grievances
redressed within 30
days
50% 100%
1000Post-Matric
Scholarship for
SC Students (CSS)
Implementation of this
scheme is transferred to
DMs by Central Govt.
To provide
financial
assistance to the
SC students
resident of Delhi
studying in
Colleges /
Universities/
Institutes all over
India
2017-1814
Department for the Welfare of SC/ST/OBC 254NA: Not available
NR: Not Responded
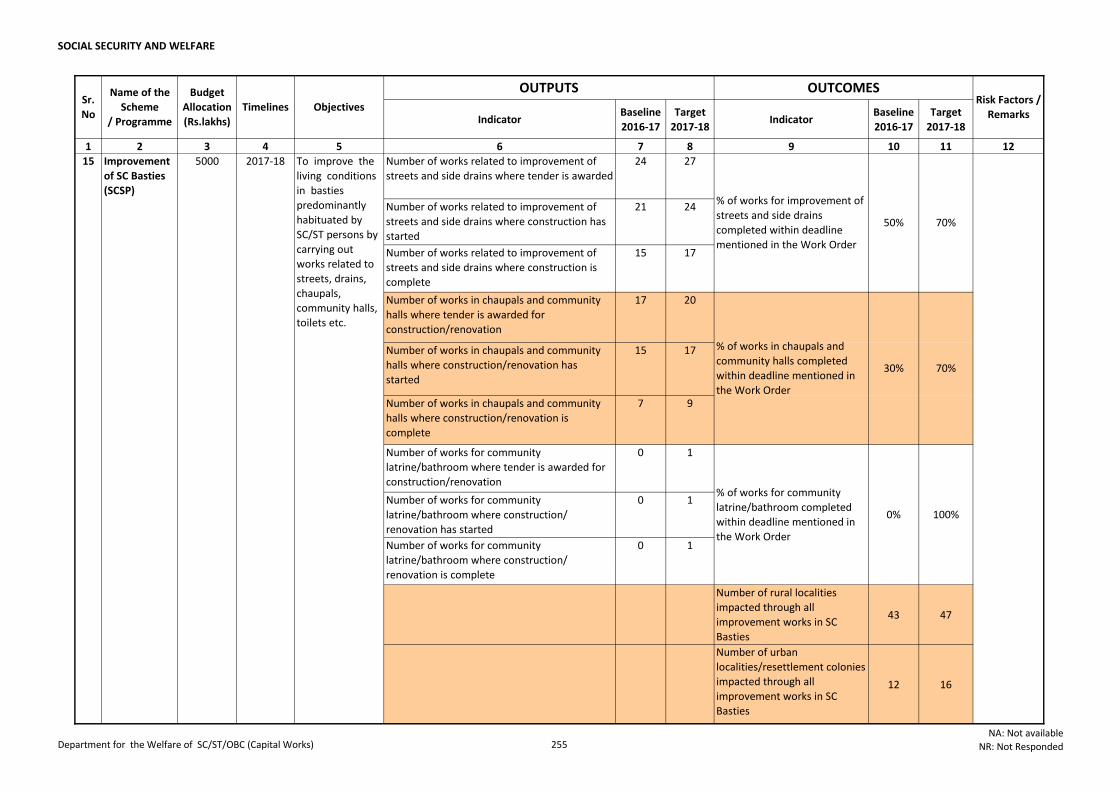
SOCIAL SECURITY AND WELFARE
Indicator Baseline
2016-17
Target
2017-18Indicator
Baseline
2016-17
Target
2017-18
1 2 3 4 5 6 7 8 9 10 11 12
Number of works related to improvement of
streets and side drains where tender is awarded
24 27
Number of works related to improvement of
streets and side drains where construction has
started
21 24
Number of works related to improvement of
streets and side drains where construction is
complete
15 17
Number of works in chaupals and community
halls where tender is awarded for
construction/renovation
17 20
Number of works in chaupals and community
halls where construction/renovation has
started
15 17
Number of works in chaupals and community
halls where construction/renovation is
complete
7 9
Number of works for community
latrine/bathroom where tender is awarded for
construction/renovation
0 1
Number of works for community
latrine/bathroom where construction/
renovation has started
0 1
Number of works for community
latrine/bathroom where construction/
renovation is complete
0 1
Number of rural localities
impacted through all
improvement works in SC
Basties
43 47
Number of urban
localities/resettlement colonies
impacted through all
improvement works in SC
Basties
12 16
% of works for community
latrine/bathroom completed
within deadline mentioned in
the Work Order
To improve the
living conditions
in basties
predominantly
habituated by
SC/ST persons by
carrying out
works related to
streets, drains,
chaupals,
community halls,
toilets etc.
100%
50% 70%
30% 70%
OUTCOMES
0%
Risk Factors /
Remarks
Sr.
No
Name of the
Scheme
/ Programme
Budget
Allocation
(Rs.lakhs)
Timelines Objectives
OUTPUTS
15 2017-185000Improvement
of SC Basties
(SCSP)% of works for improvement of
streets and side drains
completed within deadline
mentioned in the Work Order
% of works in chaupals and
community halls completed
within deadline mentioned in
the Work Order
Department for the Welfare of SC/ST/OBC (Capital Works) 255NA: Not available
NR: Not Responded
SO
CIA
L S
EU
RIT
Y A
ND
WELFA
RE
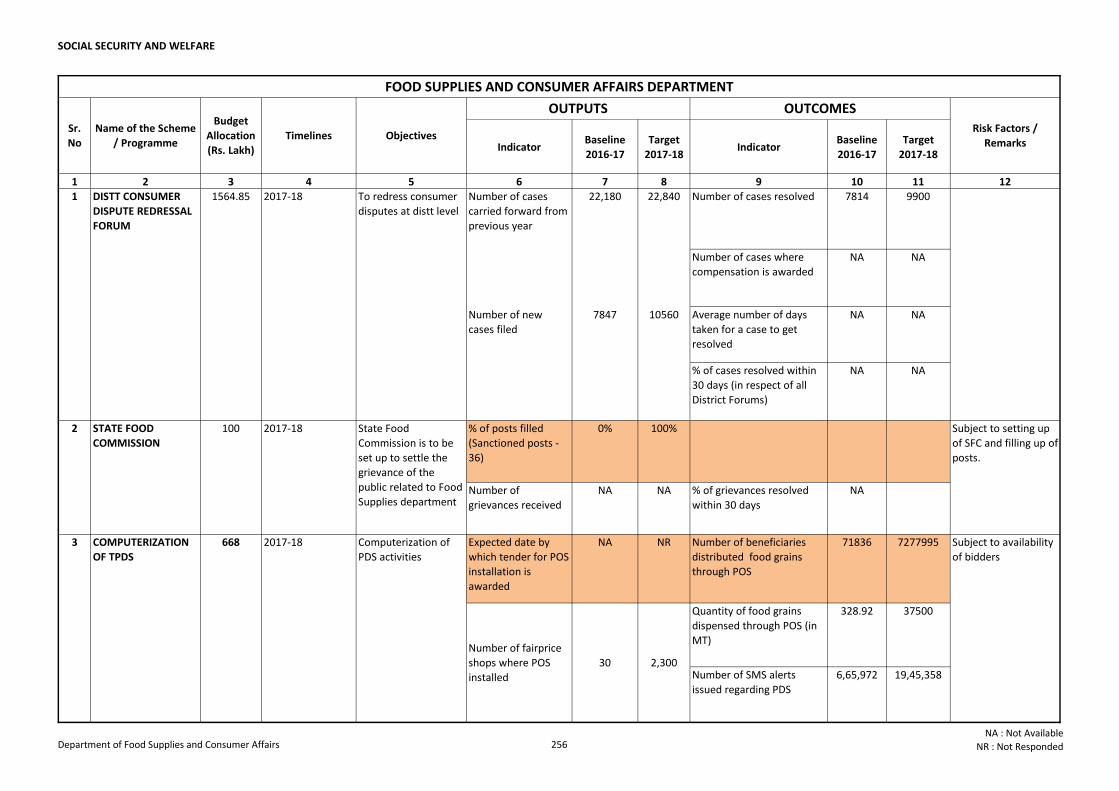
SOCIAL SECURITY AND WELFARE
Indicator Baseline
2016-17
Target
2017-18Indicator
Baseline
2016-17
Target
2017-18
1 2 3 4 5 6 7 8 9 10 11 12
Number of cases resolved 7814 9900
Number of cases where
compensation is awarded
NA NA
Average number of days
taken for a case to get
resolved
NA NA
% of cases resolved within
30 days (in respect of all
District Forums)
NA NA
% of posts filled
(Sanctioned posts -
36)
0% 100%
Number of
grievances received
NA NA % of grievances resolved
within 30 days
NA
Expected date by
which tender for POS
installation is
awarded
NA NR Number of beneficiaries
distributed food grains
through POS
71836 7277995
Quantity of food grains
dispensed through POS (in
MT)
328.92 37500
Number of SMS alerts
issued regarding PDS
6,65,972 19,45,358
STATE FOOD
COMMISSION
2
7847 10560
2017-18100
1 DISTT CONSUMER
DISPUTE REDRESSAL
FORUM
22,180 22,840
State Food
Commission is to be
set up to settle the
grievance of the
public related to Food
Supplies department
Number of cases
carried forward from
previous year
668COMPUTERIZATION
OF TPDS
Computerization of
PDS activities
3 2017-18
Number of new
cases filed
Number of fairprice
shops where POS
installed
30
Subject to availability
of bidders
2,300
Subject to setting up
of SFC and filling up of
posts.
1564.85 2017-18 To redress consumer
disputes at distt level
OUTCOMES
FOOD SUPPLIES AND CONSUMER AFFAIRS DEPARTMENT
Risk Factors /
Remarks
OUTPUTS
Objectives Sr.
No
Name of the Scheme
/ Programme
Budget
Allocation
(Rs. Lakh)
Timelines
Department of Food Supplies and Consumer Affairs 256NA : Not Available
NR : Not Responded
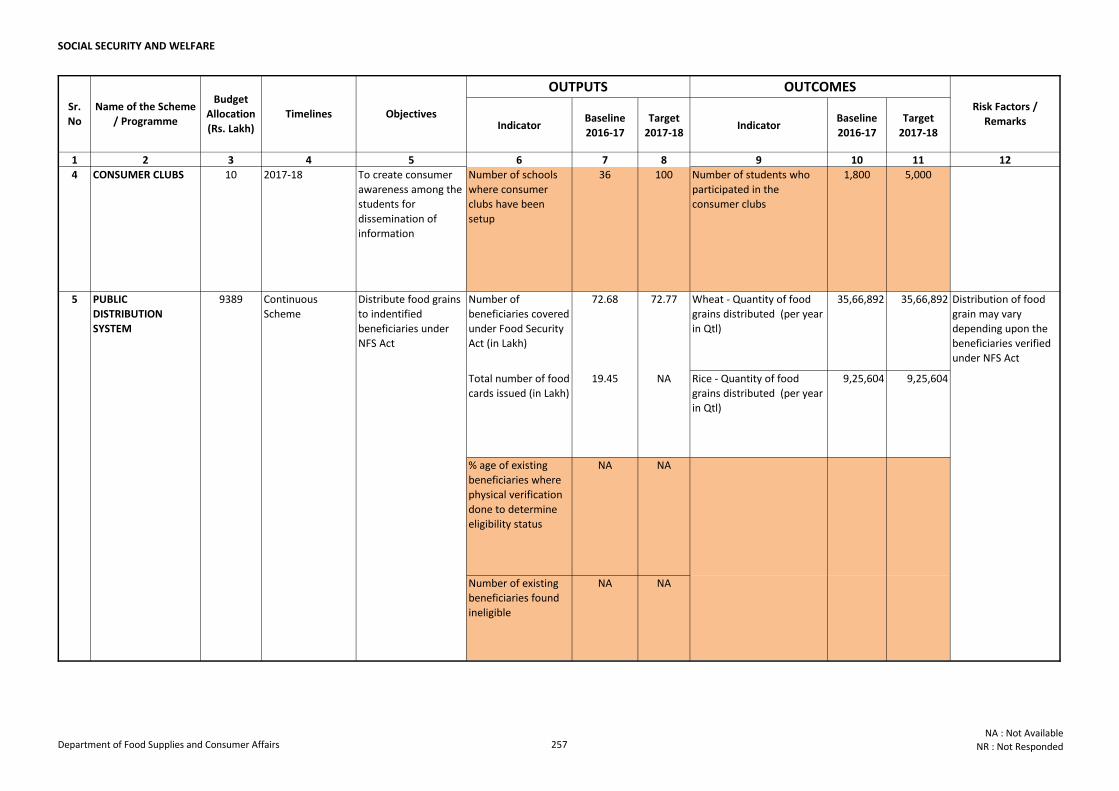
SOCIAL SECURITY AND WELFARE
Indicator Baseline
2016-17
Target
2017-18Indicator
Baseline
2016-17
Target
2017-18
1 2 3 4 5 6 7 8 9 10 11 12
OUTCOMES
Risk Factors /
Remarks
OUTPUTS
Objectives Sr.
No
Name of the Scheme
/ Programme
Budget
Allocation
(Rs. Lakh)
Timelines
4 CONSUMER CLUBS 10 2017-18 To create consumer
awareness among the
students for
dissemination of
information
Number of schools
where consumer
clubs have been
setup
36 100 Number of students who
participated in the
consumer clubs
1,800 5,000
Number of
beneficiaries covered
under Food Security
Act (in Lakh)
72.68 72.77 Wheat - Quantity of food
grains distributed (per year
in Qtl)
35,66,892 35,66,892
Total number of food
cards issued (in Lakh)
19.45 NA Rice - Quantity of food
grains distributed (per year
in Qtl)
9,25,604 9,25,604
% age of existing
beneficiaries where
physical verification
done to determine
eligibility status
NA NA
Number of existing
beneficiaries found
ineligible
NA NA
5 PUBLIC
DISTRIBUTION
SYSTEM
Continuous
Scheme
Distribute food grains
to indentified
beneficiaries under
NFS Act
9389 Distribution of food
grain may vary
depending upon the
beneficiaries verified
under NFS Act
Department of Food Supplies and Consumer Affairs 257NA : Not Available
NR : Not Responded
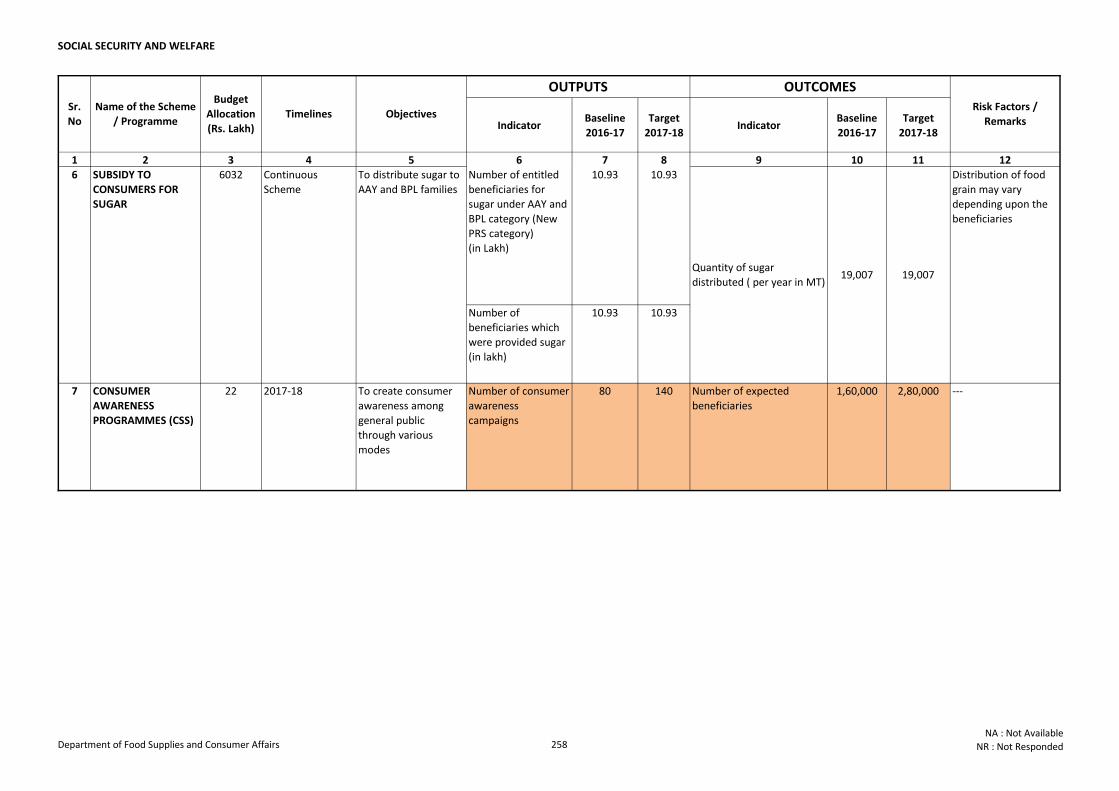
SOCIAL SECURITY AND WELFARE
Indicator Baseline
2016-17
Target
2017-18Indicator
Baseline
2016-17
Target
2017-18
1 2 3 4 5 6 7 8 9 10 11 12
OUTCOMES
Risk Factors /
Remarks
OUTPUTS
Objectives Sr.
No
Name of the Scheme
/ Programme
Budget
Allocation
(Rs. Lakh)
Timelines
Number of entitled
beneficiaries for
sugar under AAY and
BPL category (New
PRS category)
(in Lakh)
10.93 10.93
Number of
beneficiaries which
were provided sugar
(in lakh)
10.93 10.93
7 CONSUMER
AWARENESS
PROGRAMMES (CSS)
22 2017-18 To create consumer
awareness among
general public
through various
modes
Number of consumer
awareness
campaigns
80 140 Number of expected
beneficiaries
1,60,000 2,80,000 ---
To distribute sugar to
AAY and BPL families
SUBSIDY TO
CONSUMERS FOR
SUGAR
6 6032 Continuous
Scheme
19,007
Distribution of food
grain may vary
depending upon the
beneficiaries
Quantity of sugar
distributed ( per year in MT)19,007
Department of Food Supplies and Consumer Affairs 258NA : Not Available
NR : Not Responded
SO
CIA
L S
EU
RIT
Y A
ND
WELFA
RE
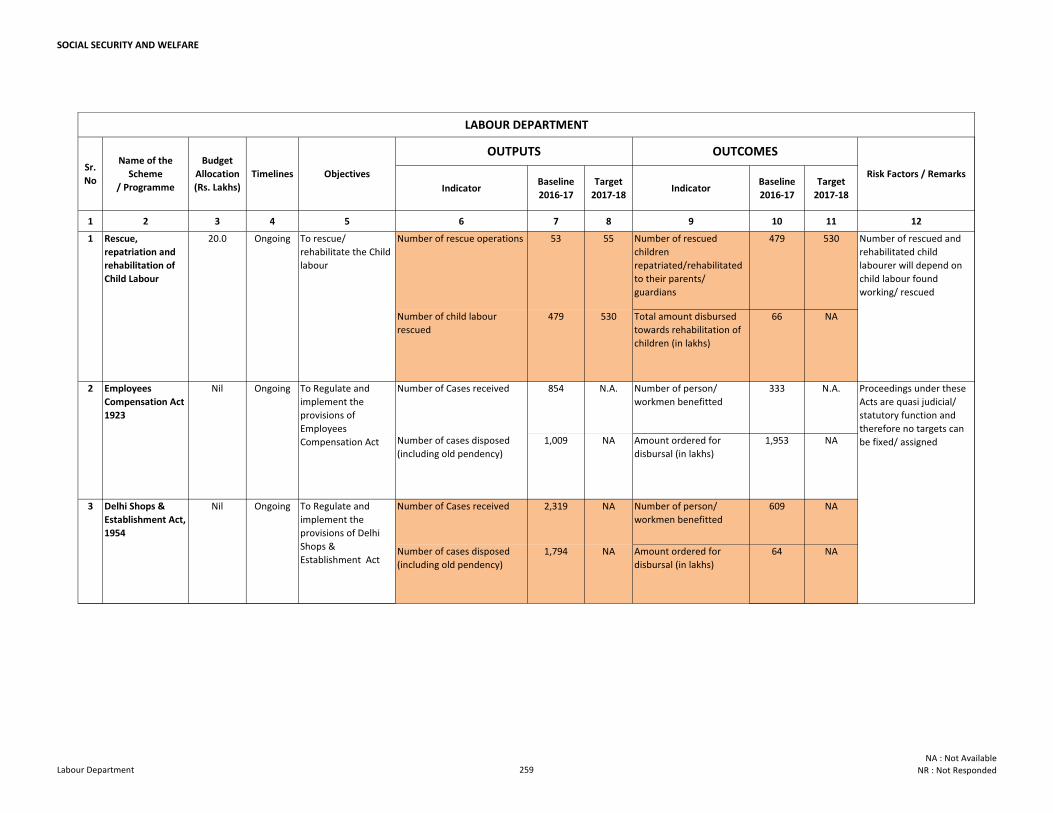
SOCIAL SECURITY AND WELFARE
Indicator Baseline
2016-17
Target
2017-18Indicator
Baseline
2016-17
Target
2017-18
1 2 3 4 5 6 7 8 9 10 11 12
Number of rescue operations 53 55 Number of rescued
children
repatriated/rehabilitated
to their parents/
guardians
479 530
Number of child labour
rescued
479 530 Total amount disbursed
towards rehabilitation of
children (in lakhs)
66 NA
Number of Cases received 854 N.A. Number of person/
workmen benefitted
333 N.A.
Number of cases disposed
(including old pendency)
1,009 NA Amount ordered for
disbursal (in lakhs)
1,953 NA
Number of Cases received 2,319 NA Number of person/
workmen benefitted
609 NA
Number of cases disposed
(including old pendency)
1,794 NA Amount ordered for
disbursal (in lakhs)
64 NA
To Regulate and
implement the
provisions of
Employees
Compensation Act
Ongoing To Regulate and
implement the
provisions of Delhi
Shops &
Establishment Act
Sr.
No
Name of the
Scheme
/ Programme
Timelines
Budget
Allocation
(Rs. Lakhs)
OUTPUTS
LABOUR DEPARTMENT
OUTCOMES
Risk Factors / RemarksObjectives
Nil
Number of rescued and
rehabilitated child
labourer will depend on
child labour found
working/ rescued
Proceedings under these
Acts are quasi judicial/
statutory function and
therefore no targets can
be fixed/ assigned
20.0 Ongoing
Ongoing
To rescue/
rehabilitate the Child
labour
Delhi Shops &
Establishment Act,
1954
3
1
2 Employees
Compensation Act
1923
Rescue,
repatriation and
rehabilitation of
Child Labour
Nil
Labour Department 259
NA : Not Available
NR : Not Responded
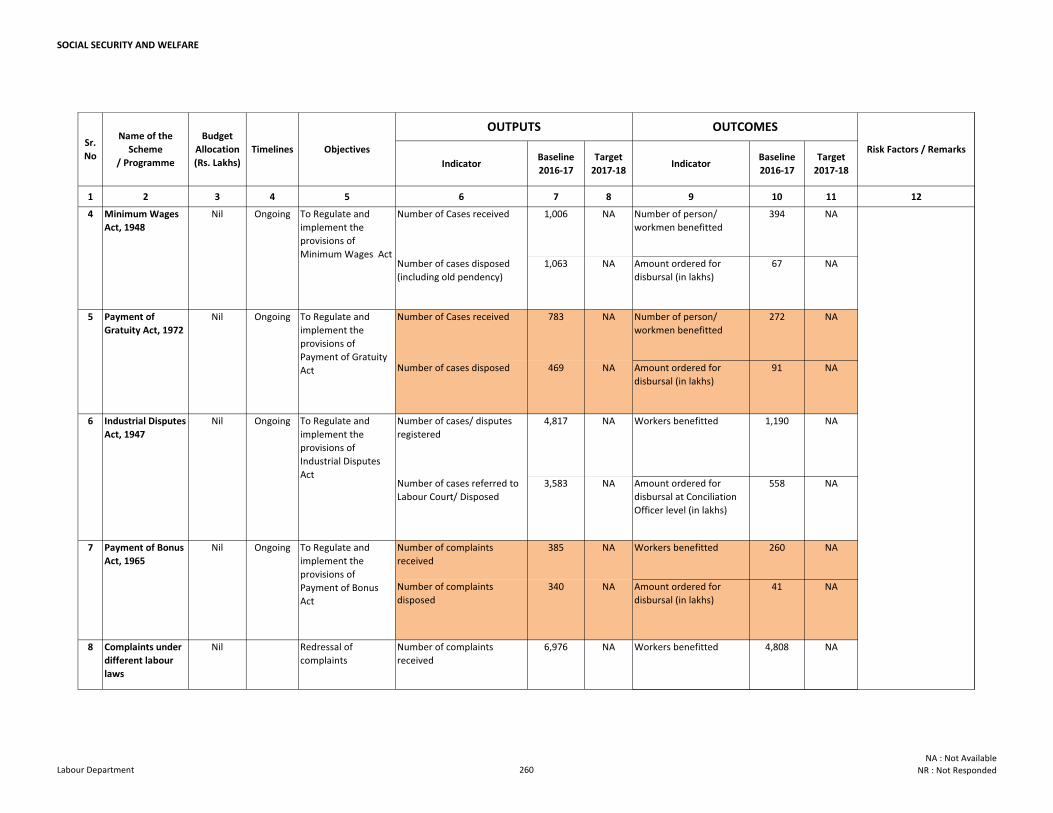
SOCIAL SECURITY AND WELFARE
Indicator Baseline
2016-17
Target
2017-18Indicator
Baseline
2016-17
Target
2017-18
1 2 3 4 5 6 7 8 9 10 11 12
Sr.
No
Name of the
Scheme
/ Programme
Timelines
Budget
Allocation
(Rs. Lakhs)
OUTPUTS OUTCOMES
Risk Factors / RemarksObjectives
Number of Cases received 1,006 NA Number of person/
workmen benefitted
394 NA
Number of cases disposed
(including old pendency)
1,063 NA Amount ordered for
disbursal (in lakhs)
67 NA
Number of Cases received 783 NA Number of person/
workmen benefitted
272 NA
Number of cases disposed 469 NA Amount ordered for
disbursal (in lakhs)
91 NA
Number of cases/ disputes
registered
4,817 NA Workers benefitted 1,190 NA
Number of cases referred to
Labour Court/ Disposed
3,583 NA Amount ordered for
disbursal at Conciliation
Officer level (in lakhs)
558 NA
Number of complaints
received
385 NA Workers benefitted 260 NA
Number of complaints
disposed
340 NA Amount ordered for
disbursal (in lakhs)
41 NA
Number of complaints
received
6,976 NA Workers benefitted 4,808 NA
To Regulate and
implement the
provisions of
Payment of Bonus
Act
To Regulate and
implement the
provisions of
Industrial Disputes
Act
Redressal of
complaints
Ongoing
Ongoing To Regulate and
implement the
provisions of
Minimum Wages Act
To Regulate and
implement the
provisions of
Payment of Gratuity
Act
Ongoing
Ongoing
5 Payment of
Gratuity Act, 1972
4
6
Payment of Bonus
Act, 1965
7
Complaints under
different labour
laws
Industrial Disputes
Act, 1947
8 Nil
Nil
Nil
Nil
Minimum Wages
Act, 1948
Nil
Labour Department 260
NA : Not Available
NR : Not Responded
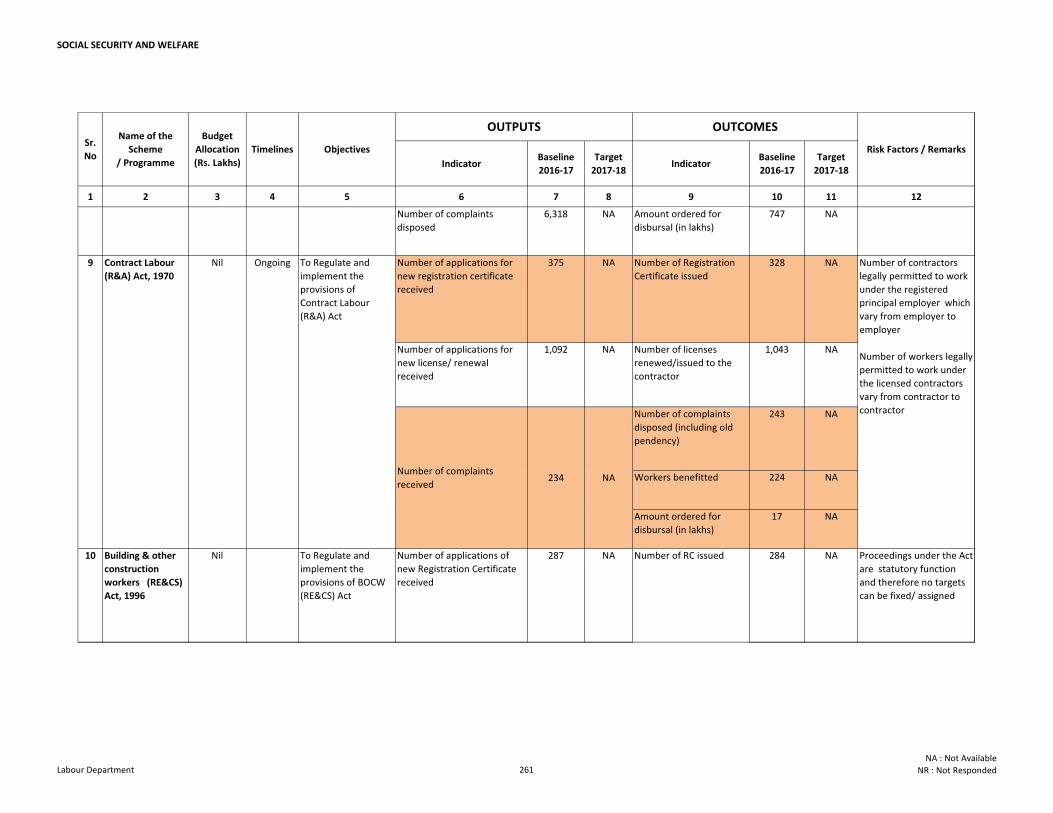
SOCIAL SECURITY AND WELFARE
Indicator Baseline
2016-17
Target
2017-18Indicator
Baseline
2016-17
Target
2017-18
1 2 3 4 5 6 7 8 9 10 11 12
Sr.
No
Name of the
Scheme
/ Programme
Timelines
Budget
Allocation
(Rs. Lakhs)
OUTPUTS OUTCOMES
Risk Factors / RemarksObjectives
Number of complaints
disposed
6,318 NA Amount ordered for
disbursal (in lakhs)
747 NA
Number of applications for
new registration certificate
received
375 NA Number of Registration
Certificate issued
328 NA
Number of applications for
new license/ renewal
received
1,092 NA Number of licenses
renewed/issued to the
contractor
1,043 NA
Number of complaints
disposed (including old
pendency)
243 NA
Workers benefitted 224 NA
Amount ordered for
disbursal (in lakhs)
17 NA
10 Building & other
construction
workers (RE&CS)
Act, 1996
Nil To Regulate and
implement the
provisions of BOCW
(RE&CS) Act
Number of applications of
new Registration Certificate
received
287 NA Number of RC issued 284 NA Proceedings under the Act
are statutory function
and therefore no targets
can be fixed/ assigned
Number of complaints
received234 NA
To Regulate and
implement the
provisions of
Contract Labour
(R&A) Act
Number of contractors
legally permitted to work
under the registered
principal employer which
vary from employer to
employer
Number of workers legally
permitted to work under
the licensed contractors
vary from contractor to
contractor
9 Contract Labour
(R&A) Act, 1970
Nil Ongoing
Labour Department 261
NA : Not Available
NR : Not Responded
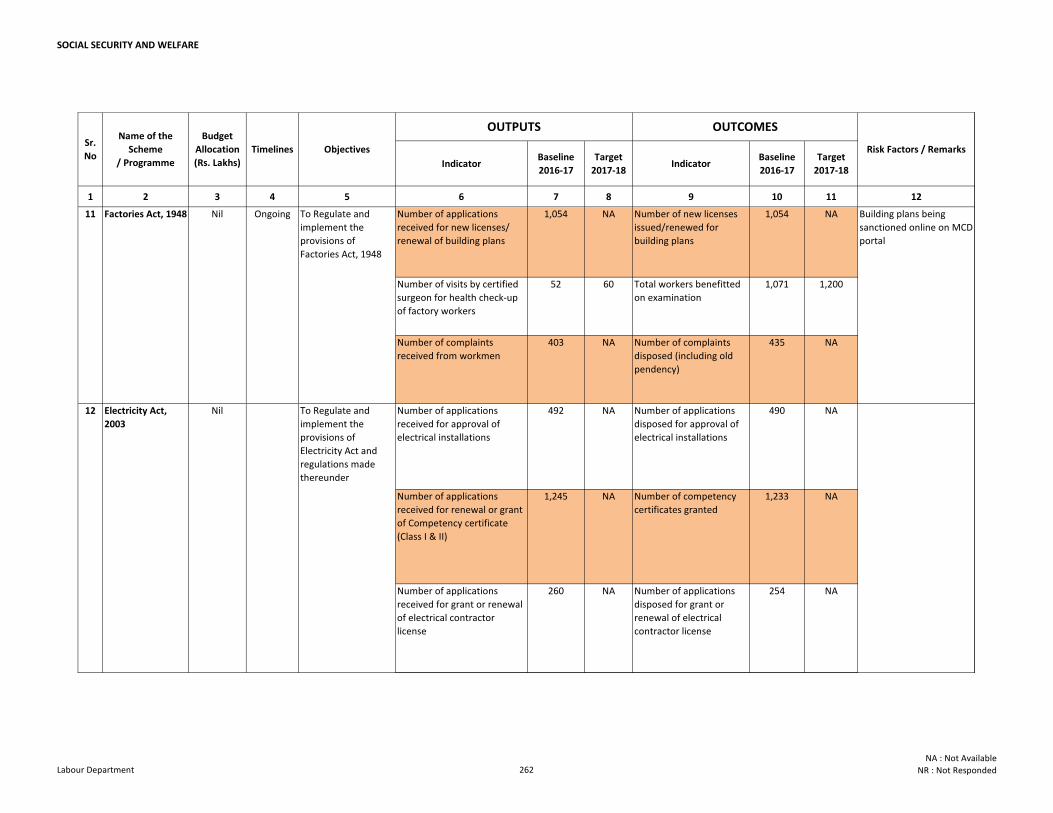
SOCIAL SECURITY AND WELFARE
Indicator Baseline
2016-17
Target
2017-18Indicator
Baseline
2016-17
Target
2017-18
1 2 3 4 5 6 7 8 9 10 11 12
Sr.
No
Name of the
Scheme
/ Programme
Timelines
Budget
Allocation
(Rs. Lakhs)
OUTPUTS OUTCOMES
Risk Factors / RemarksObjectives
Number of applications
received for new licenses/
renewal of building plans
1,054 NA Number of new licenses
issued/renewed for
building plans
1,054 NA
Number of visits by certified
surgeon for health check-up
of factory workers
52 60 Total workers benefitted
on examination
1,071 1,200
Number of complaints
received from workmen
403 NA Number of complaints
disposed (including old
pendency)
435 NA
Number of applications
received for approval of
electrical installations
492 NA Number of applications
disposed for approval of
electrical installations
490 NA
Number of applications
received for renewal or grant
of Competency certificate
(Class I & II)
1,245 NA Number of competency
certificates granted
1,233 NA
Number of applications
received for grant or renewal
of electrical contractor
license
260 NA Number of applications
disposed for grant or
renewal of electrical
contractor license
254 NA
To Regulate and
implement the
provisions of
Factories Act, 1948
To Regulate and
implement the
provisions of
Electricity Act and
regulations made
thereunder
Ongoing
Nil
Nil Building plans being
sanctioned online on MCD
portal
11
12 Electricity Act,
2003
Factories Act, 1948
Labour Department 262
NA : Not Available
NR : Not Responded
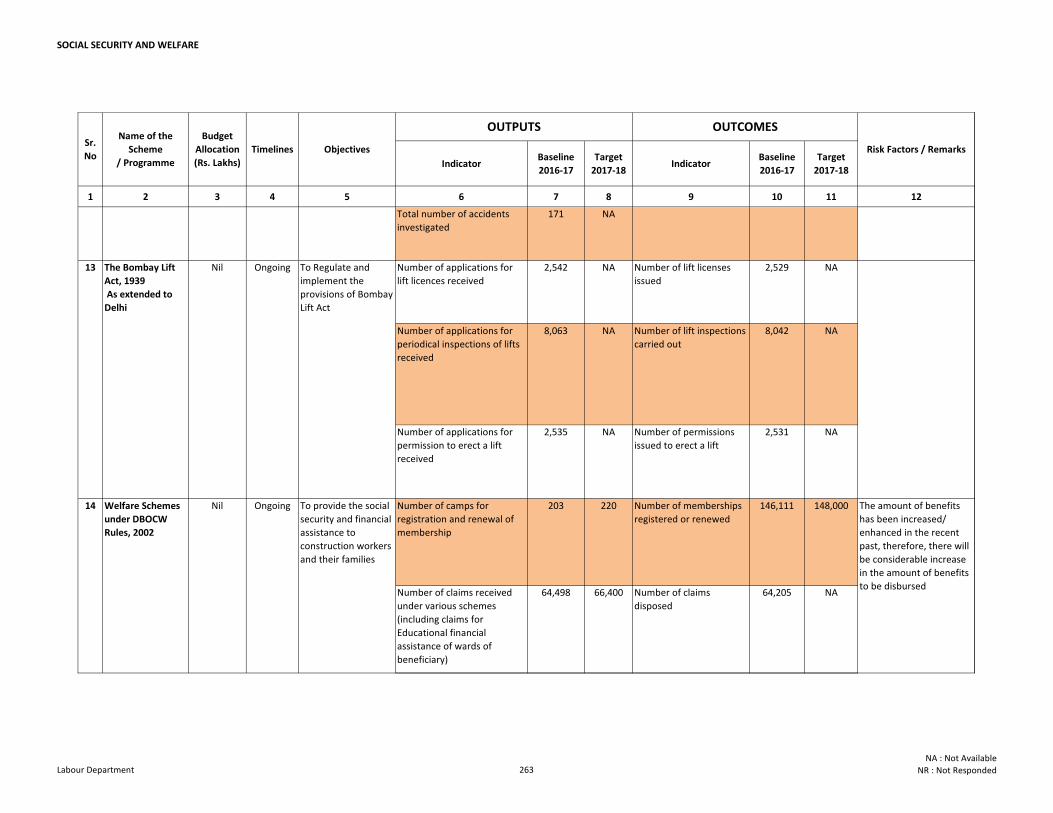
SOCIAL SECURITY AND WELFARE
Indicator Baseline
2016-17
Target
2017-18Indicator
Baseline
2016-17
Target
2017-18
1 2 3 4 5 6 7 8 9 10 11 12
Sr.
No
Name of the
Scheme
/ Programme
Timelines
Budget
Allocation
(Rs. Lakhs)
OUTPUTS OUTCOMES
Risk Factors / RemarksObjectives
Total number of accidents
investigated
171 NA
Number of applications for
lift licences received
2,542 NA Number of lift licenses
issued
2,529 NA
Number of applications for
periodical inspections of lifts
received
8,063 NA Number of lift inspections
carried out
8,042 NA
Number of applications for
permission to erect a lift
received
2,535 NA Number of permissions
issued to erect a lift
2,531 NA
Number of camps for
registration and renewal of
membership
203 220 Number of memberships
registered or renewed
146,111 148,000
Number of claims received
under various schemes
(including claims for
Educational financial
assistance of wards of
beneficiary)
64,498 66,400 Number of claims
disposed
64,205 NA
OngoingNil To provide the social
security and financial
assistance to
construction workers
and their families
OngoingNil To Regulate and
implement the
provisions of Bombay
Lift Act
The amount of benefits
has been increased/
enhanced in the recent
past, therefore, there will
be considerable increase
in the amount of benefits
to be disbursed
13
14 Welfare Schemes
under DBOCW
Rules, 2002
The Bombay Lift
Act, 1939
As extended to
Delhi
Labour Department 263
NA : Not Available
NR : Not Responded
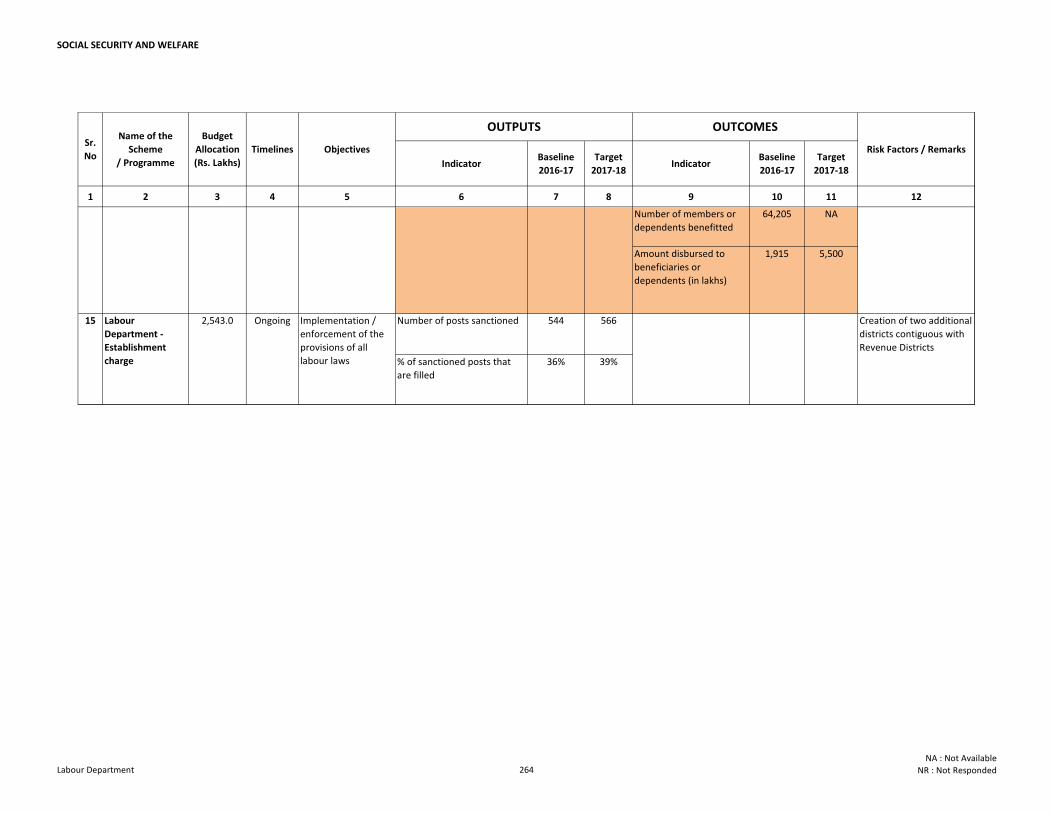
SOCIAL SECURITY AND WELFARE
Indicator Baseline
2016-17
Target
2017-18Indicator
Baseline
2016-17
Target
2017-18
1 2 3 4 5 6 7 8 9 10 11 12
Sr.
No
Name of the
Scheme
/ Programme
Timelines
Budget
Allocation
(Rs. Lakhs)
OUTPUTS OUTCOMES
Risk Factors / RemarksObjectives
Number of members or
dependents benefitted
64,205 NA
Amount disbursed to
beneficiaries or
dependents (in lakhs)
1,915 5,500
Number of posts sanctioned 544 566
% of sanctioned posts that
are filled
36% 39%
Ongoing2,543.0 Implementation /
enforcement of the
provisions of all
labour laws
Creation of two additional
districts contiguous with
Revenue Districts
15 Labour
Department -
Establishment
charge
Labour Department 264
NA : Not Available
NR : Not Responded
SO
CIA
L S
EU
RIT
Y A
ND
WELFA
RE
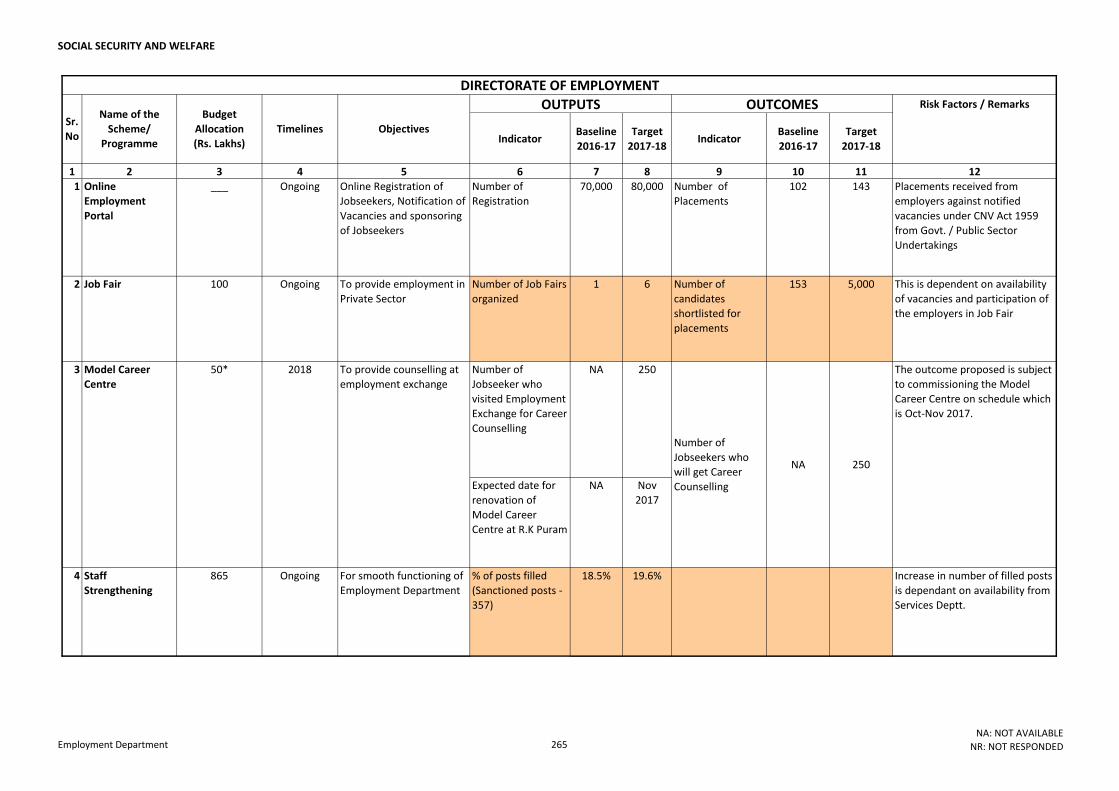
SOCIAL SECURITY AND WELFARE
Risk Factors / Remarks
Indicator Baseline
2016-17
Target
2017-18Indicator
Baseline
2016-17
Target
2017-18
1 2 3 4 5 6 7 8 9 10 11 12
1 Online
Employment
Portal
___ Ongoing Online Registration of
Jobseekers, Notification of
Vacancies and sponsoring
of Jobseekers
Number of
Registration
70,000 80,000 Number of
Placements
102 143 Placements received from
employers against notified
vacancies under CNV Act 1959
from Govt. / Public Sector
Undertakings
2 Job Fair 100 Ongoing To provide employment in
Private Sector
Number of Job Fairs
organized
1 6 Number of
candidates
shortlisted for
placements
153 5,000 This is dependent on availability
of vacancies and participation of
the employers in Job Fair
Number of
Jobseeker who
visited Employment
Exchange for Career
Counselling
NA 250
Expected date for
renovation of
Model Career
Centre at R.K Puram
NA Nov
2017
4 Staff
Strengthening
865 Ongoing For smooth functioning of
Employment Department
% of posts filled
(Sanctioned posts -
357)
18.5% 19.6% Increase in number of filled posts
is dependant on availability from
Services Deptt.
OUTCOMES
Number of
Jobseekers who
will get Career
Counselling
NA 250
DIRECTORATE OF EMPLOYMENT
2018 To provide counselling at
employment exchange
The outcome proposed is subject
to commissioning the Model
Career Centre on schedule which
is Oct-Nov 2017.
OUTPUTS
3 Model Career
Centre
Sr.
No
Name of the
Scheme/
Programme
Budget
Allocation
(Rs. Lakhs)
ObjectivesTimelines
50*
Employment Department 265NA: NOT AVAILABLE
NR: NOT RESPONDED
URBAN DEVELOPMENT
AND HOUSING
UR
BA
N D
EV
ELO
PM
EN
T A
ND
HO
US
ING
UR
BA
N D
EV
ELO
PM
EN
T A
ND
HO
US
ING
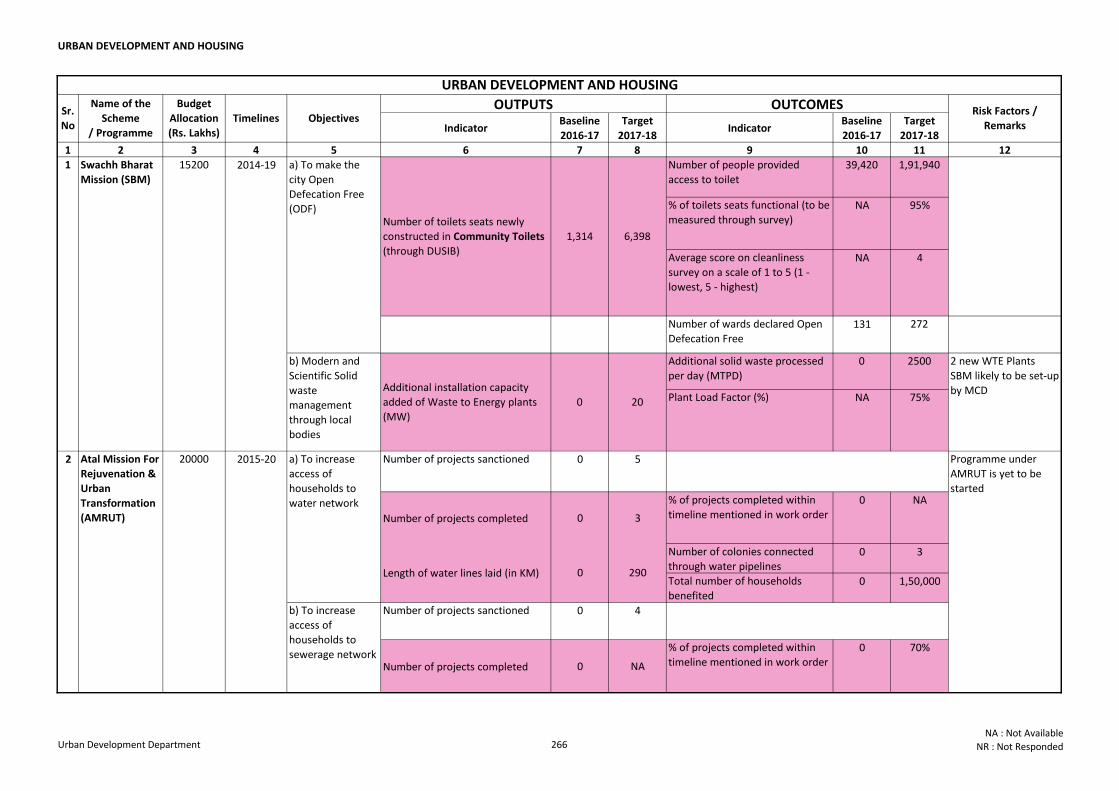
URBAN DEVELOPMENT AND HOUSING
Indicator Baseline
2016-17
Target
2017-18Indicator
Baseline
2016-17
Target
2017-18
1 2 3 4 5 6 7 8 9 10 11 12
Number of people provided
access to toilet
39,420 1,91,940
% of toilets seats functional (to be
measured through survey)NA 95%
Average score on cleanliness
survey on a scale of 1 to 5 (1 -
lowest, 5 - highest)
NA 4
Number of wards declared Open
Defecation Free131 272
Additional solid waste processed
per day (MTPD)
0 2500
Plant Load Factor (%) NA 75%
Number of projects sanctioned 0 5
Number of projects completed 0 3
% of projects completed within
timeline mentioned in work order0 NA
Number of colonies connected
through water pipelines0 3
Total number of households
benefited0 1,50,000
Number of projects sanctioned 0 4
Number of projects completed 0 NA
% of projects completed within
timeline mentioned in work order0 70%
20000 2015-202 Atal Mission For
Rejuvenation &
Urban
Transformation
(AMRUT)
a) To increase
access of
households to
water network
Programme under
AMRUT is yet to be
started
Length of water lines laid (in KM) 0 290
b) To increase
access of
households to
sewerage network
1,314 6,398
b) Modern and
Scientific Solid
waste
management
through local
bodies
Additional installation capacity
added of Waste to Energy plants
(MW)
0 20
2 new WTE Plants
SBM likely to be set-up
by MCD
1 Swachh Bharat
Mission (SBM)
15200 2014-19 a) To make the
city Open
Defecation Free
(ODF)Number of toilets seats newly
constructed in Community Toilets
(through DUSIB)
URBAN DEVELOPMENT AND HOUSING
Sr.
No
Name of the
Scheme
/ Programme
Budget
Allocation
(Rs. Lakhs)
Timelines Objectives OUTPUTS OUTCOMES Risk Factors /
Remarks
Urban Development Department 266NA : Not Available
NR : Not Responded
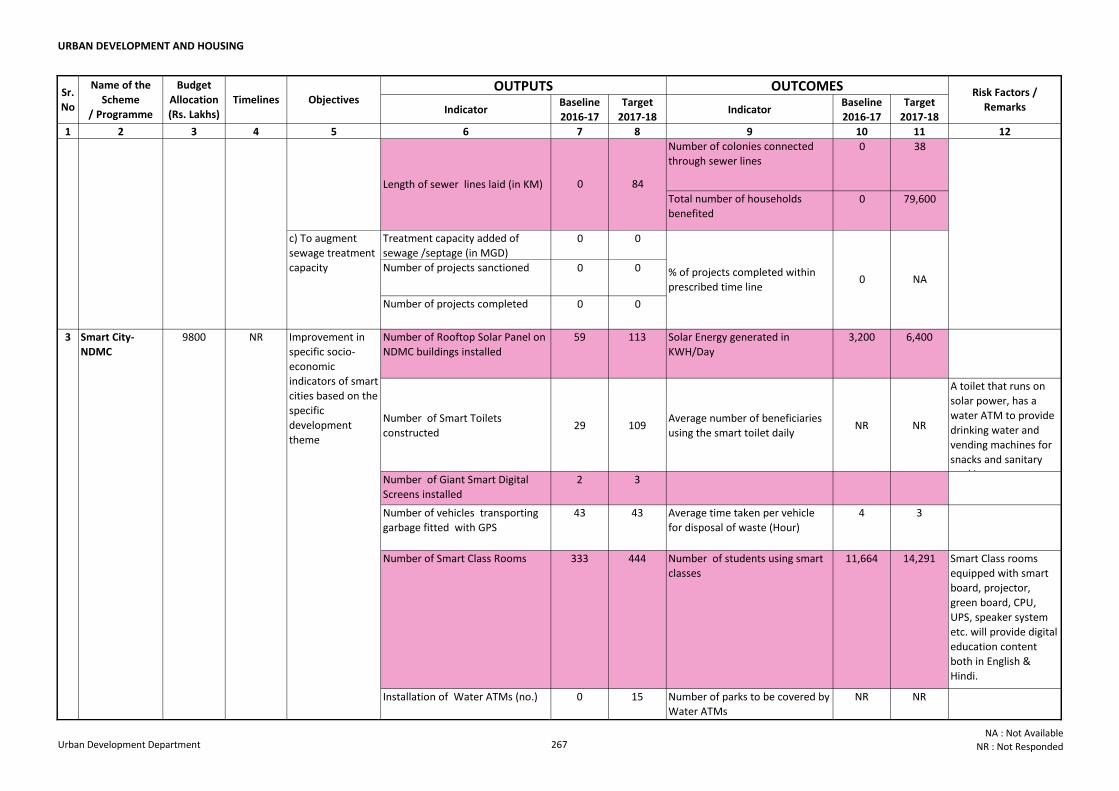
URBAN DEVELOPMENT AND HOUSING
Indicator Baseline
2016-17
Target
2017-18Indicator
Baseline
2016-17
Target
2017-18
1 2 3 4 5 6 7 8 9 10 11 12
Sr.
No
Name of the
Scheme
/ Programme
Budget
Allocation
(Rs. Lakhs)
Timelines Objectives OUTPUTS OUTCOMES Risk Factors /
Remarks
Number of colonies connected
through sewer lines0 38
Total number of households
benefited
0 79,600
Treatment capacity added of
sewage /septage (in MGD)0 0
Number of projects sanctioned 0 0
Number of projects completed 0 0
Number of Rooftop Solar Panel on
NDMC buildings installed
59 113 Solar Energy generated in
KWH/Day
3,200 6,400
Number of Smart Toilets
constructed29 109
Average number of beneficiaries
using the smart toilet dailyNR NR
A toilet that runs on
solar power, has a
water ATM to provide
drinking water and
vending machines for
snacks and sanitary
napkinsNumber of Giant Smart Digital
Screens installed
2 3
Number of vehicles transporting
garbage fitted with GPS
43 43 Average time taken per vehicle
for disposal of waste (Hour)
4 3
Number of Smart Class Rooms 333 444 Number of students using smart
classes
11,664 14,291 Smart Class rooms
equipped with smart
board, projector,
green board, CPU,
UPS, speaker system
etc. will provide digital
education content
both in English &
Hindi.
Installation of Water ATMs (no.) 0 15 Number of parks to be covered by
Water ATMs
NR NR
20000 2015-20
% of projects completed within
prescribed time line0 NA
3 Smart City-
NDMC
9800 NR Improvement in
specific socio-
economic
indicators of smart
cities based on the
specific
development
theme
2 Atal Mission For
Rejuvenation &
Urban
Transformation
(AMRUT)
Programme under
AMRUT is yet to be
started
b) To increase
access of
households to
sewerage network
Length of sewer lines laid (in KM) 0 84
c) To augment
sewage treatment
capacity
Urban Development Department 267NA : Not Available
NR : Not Responded
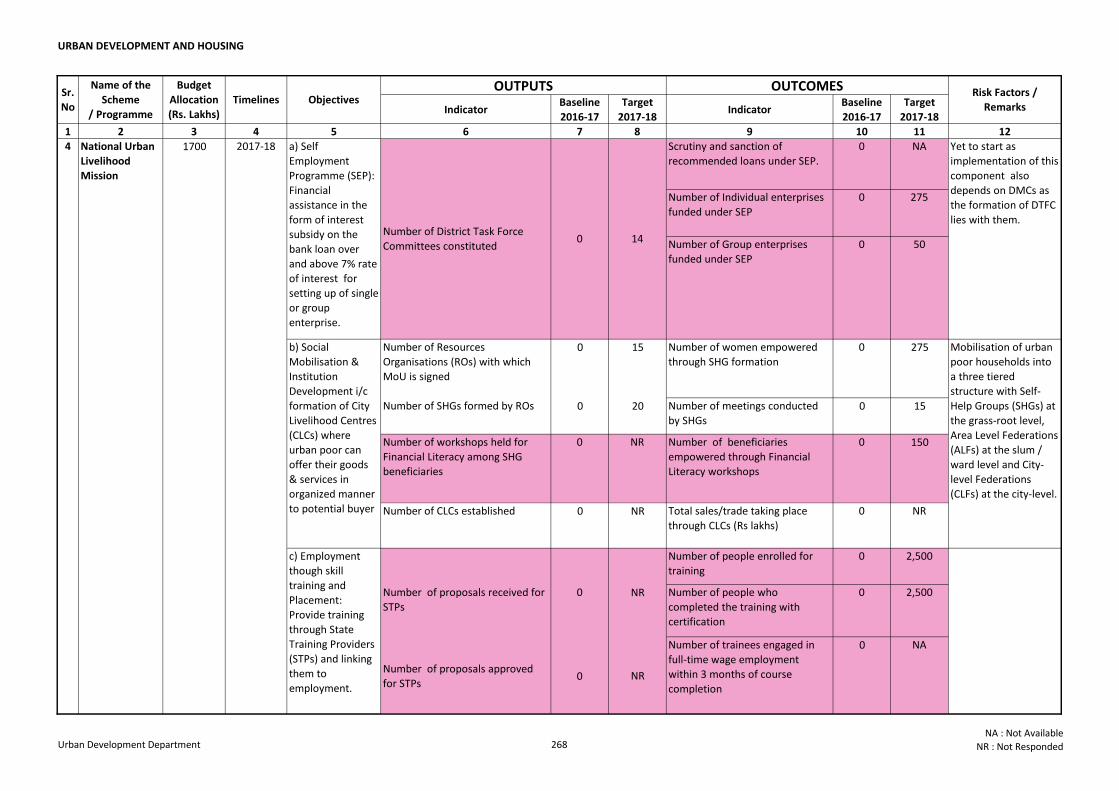
URBAN DEVELOPMENT AND HOUSING
Indicator Baseline
2016-17
Target
2017-18Indicator
Baseline
2016-17
Target
2017-18
1 2 3 4 5 6 7 8 9 10 11 12
Sr.
No
Name of the
Scheme
/ Programme
Budget
Allocation
(Rs. Lakhs)
Timelines Objectives OUTPUTS OUTCOMES Risk Factors /
Remarks
Scrutiny and sanction of
recommended loans under SEP.
0 NA
Number of Individual enterprises
funded under SEP
0 275
Number of Group enterprises
funded under SEP
0 50
Number of Resources
Organisations (ROs) with which
MoU is signed
0 15 Number of women empowered
through SHG formation
0 275
Number of SHGs formed by ROs 0 20 Number of meetings conducted
by SHGs0 15
Number of workshops held for
Financial Literacy among SHG
beneficiaries
0 NR Number of beneficiaries
empowered through Financial
Literacy workshops
0 150
Number of CLCs established 0 NR Total sales/trade taking place
through CLCs (Rs lakhs)
0 NR
Number of people enrolled for
training
0 2,500
Number of proposals received for
STPs
0 NR Number of people who
completed the training with
certification
0 2,500
Number of proposals approved
for STPs0 NR
Number of trainees engaged in
full-time wage employment
within 3 months of course
completion
0 NA
a) Self
Employment
Programme (SEP):
Financial
assistance in the
form of interest
subsidy on the
bank loan over
and above 7% rate
of interest for
setting up of single
or group
enterprise.
Number of District Task Force
Committees constituted0 14
Yet to start as
implementation of this
component also
depends on DMCs as
the formation of DTFC
lies with them.
b) Social
Mobilisation &
Institution
Development i/c
formation of City
Livelihood Centres
(CLCs) where
urban poor can
offer their goods
& services in
organized manner
to potential buyer
Mobilisation of urban
poor households into
a three tiered
structure with Self-
Help Groups (SHGs) at
the grass-root level,
Area Level Federations
(ALFs) at the slum /
ward level and City-
level Federations
(CLFs) at the city-level.
c) Employment
though skill
training and
Placement:
Provide training
through State
Training Providers
(STPs) and linking
them to
employment.
4 National Urban
Livelihood
Mission
1700 2017-18
Urban Development Department 268NA : Not Available
NR : Not Responded
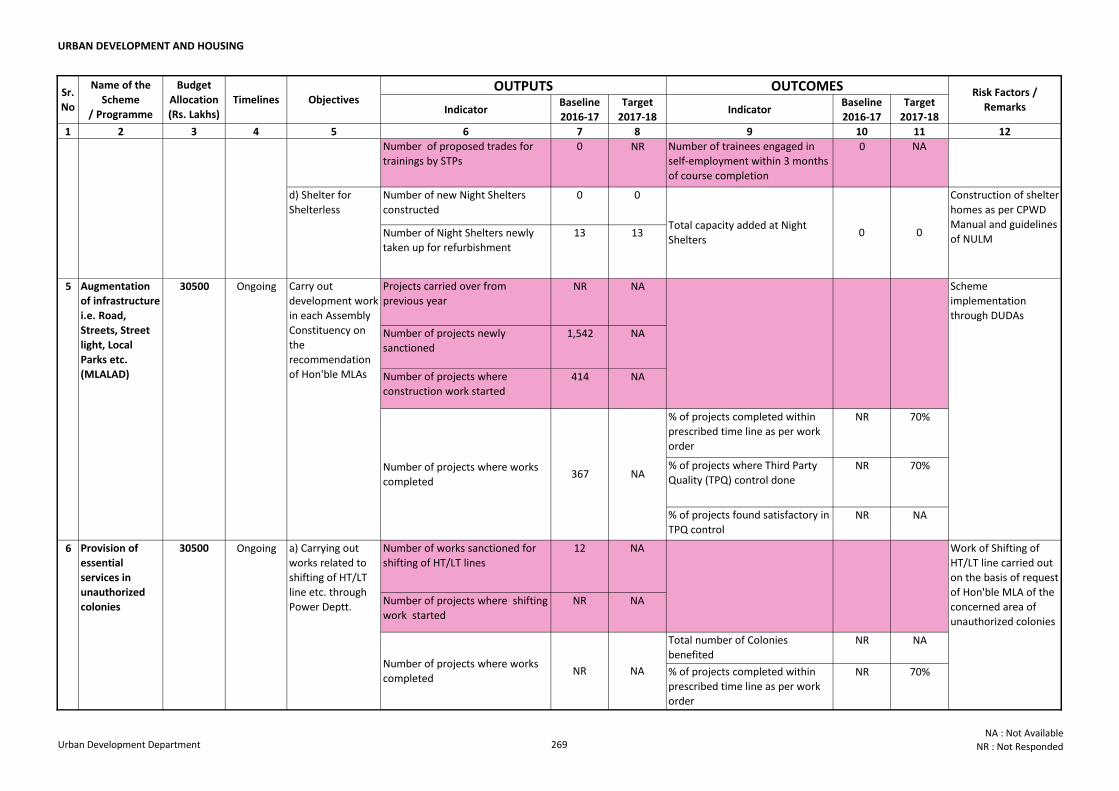
URBAN DEVELOPMENT AND HOUSING
Indicator Baseline
2016-17
Target
2017-18Indicator
Baseline
2016-17
Target
2017-18
1 2 3 4 5 6 7 8 9 10 11 12
Sr.
No
Name of the
Scheme
/ Programme
Budget
Allocation
(Rs. Lakhs)
Timelines Objectives OUTPUTS OUTCOMES Risk Factors /
Remarks
Number of proposed trades for
trainings by STPs
0 NR Number of trainees engaged in
self-employment within 3 months
of course completion
0 NA
Number of new Night Shelters
constructed
0 0
Number of Night Shelters newly
taken up for refurbishment
13 13
Projects carried over from
previous yearNR NA
Number of projects newly
sanctioned1,542 NA
Number of projects where
construction work started414 NA
% of projects completed within
prescribed time line as per work
order
NR 70%
% of projects where Third Party
Quality (TPQ) control done NR 70%
% of projects found satisfactory in
TPQ controlNR NA
Number of works sanctioned for
shifting of HT/LT lines
12 NA
Number of projects where shifting
work started
NR NA
Total number of Colonies
benefitedNR NA
% of projects completed within
prescribed time line as per work
order
NR 70%
Work of Shifting of
HT/LT line carried out
on the basis of request
of Hon'ble MLA of the
concerned area of
unauthorized colonies
Number of projects where works
completedNR NA
Number of projects where works
completed367 NA
6 Provision of
essential
services in
unauthorized
colonies
30500 Ongoing a) Carrying out
works related to
shifting of HT/LT
line etc. through
Power Deptt.
Total capacity added at Night
Shelters0 0
Construction of shelter
homes as per CPWD
Manual and guidelines
of NULM
5 Augmentation
of infrastructure
i.e. Road,
Streets, Street
light, Local
Parks etc.
(MLALAD)
30500 Ongoing Carry out
development work
in each Assembly
Constituency on
the
recommendation
of Hon'ble MLAs
Scheme
implementation
through DUDAs
d) Shelter for
Shelterless
c) Employment
though skill
training and
Placement:
Provide training
through State
Training Providers
(STPs) and linking
them to
employment.
4 National Urban
Livelihood
Mission
1700 2017-18
Urban Development Department 269NA : Not Available
NR : Not Responded
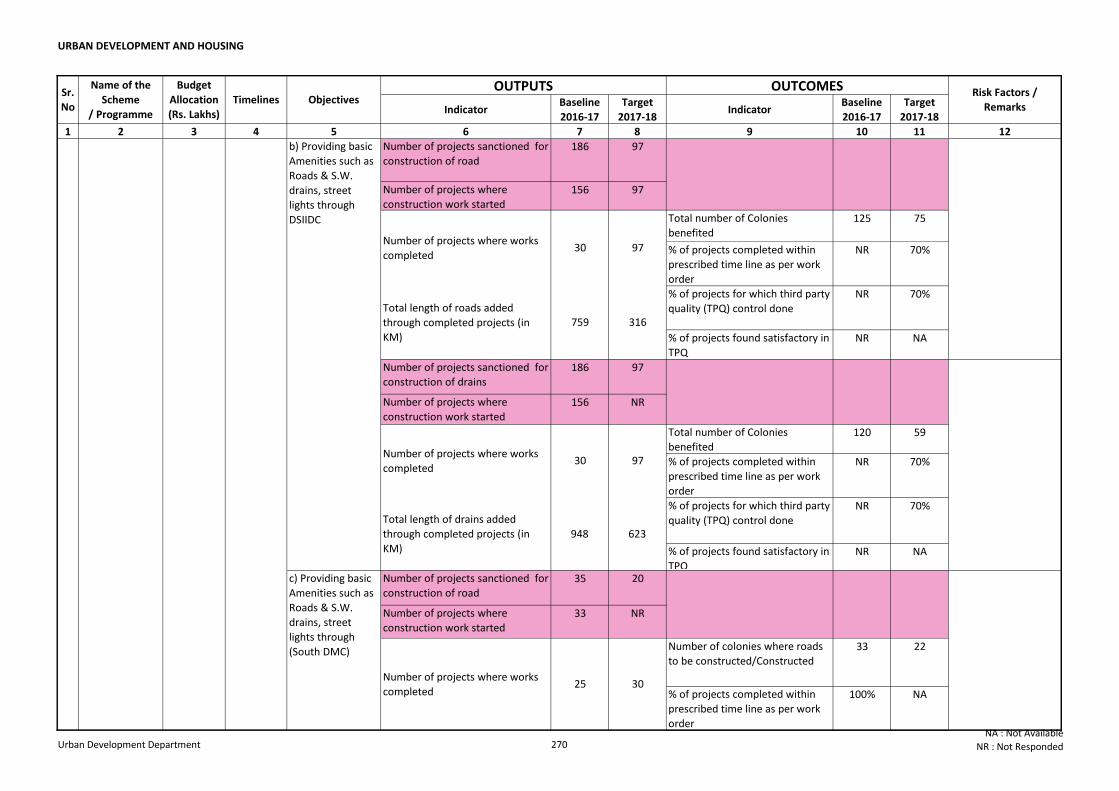
URBAN DEVELOPMENT AND HOUSING
Indicator Baseline
2016-17
Target
2017-18Indicator
Baseline
2016-17
Target
2017-18
1 2 3 4 5 6 7 8 9 10 11 12
Sr.
No
Name of the
Scheme
/ Programme
Budget
Allocation
(Rs. Lakhs)
Timelines Objectives OUTPUTS OUTCOMES Risk Factors /
Remarks
Number of projects sanctioned for
construction of road 186 97
Number of projects where
construction work started156 97
Total number of Colonies
benefited125 75
% of projects completed within
prescribed time line as per work
order
NR 70%
% of projects for which third party
quality (TPQ) control doneNR 70%
% of projects found satisfactory in
TPQNR NA
Number of projects sanctioned for
construction of drains186 97
Number of projects where
construction work started 156 NR
Total number of Colonies
benefited120 59
% of projects completed within
prescribed time line as per work
order
NR 70%
% of projects for which third party
quality (TPQ) control doneNR 70%
% of projects found satisfactory in
TPQNR NA
Number of projects sanctioned for
construction of road 35 20
Number of projects where
construction work started33 NR
Number of colonies where roads
to be constructed/Constructed33 22
% of projects completed within
prescribed time line as per work
order
100% NA
c) Providing basic
Amenities such as
Roads & S.W.
drains, street
lights through
(South DMC)
25 30Number of projects where works
completed
Number of projects where works
completed30 97
b) Providing basic
Amenities such as
Roads & S.W.
drains, street
lights through
DSIIDC
Number of projects where works
completed30 97
Total length of roads added
through completed projects (in
KM)
Total length of drains added
through completed projects (in
KM)
948 623
6 Provision of
essential
services in
unauthorized
colonies
30500 Ongoing
759 316
Urban Development Department 270NA : Not Available
NR : Not Responded
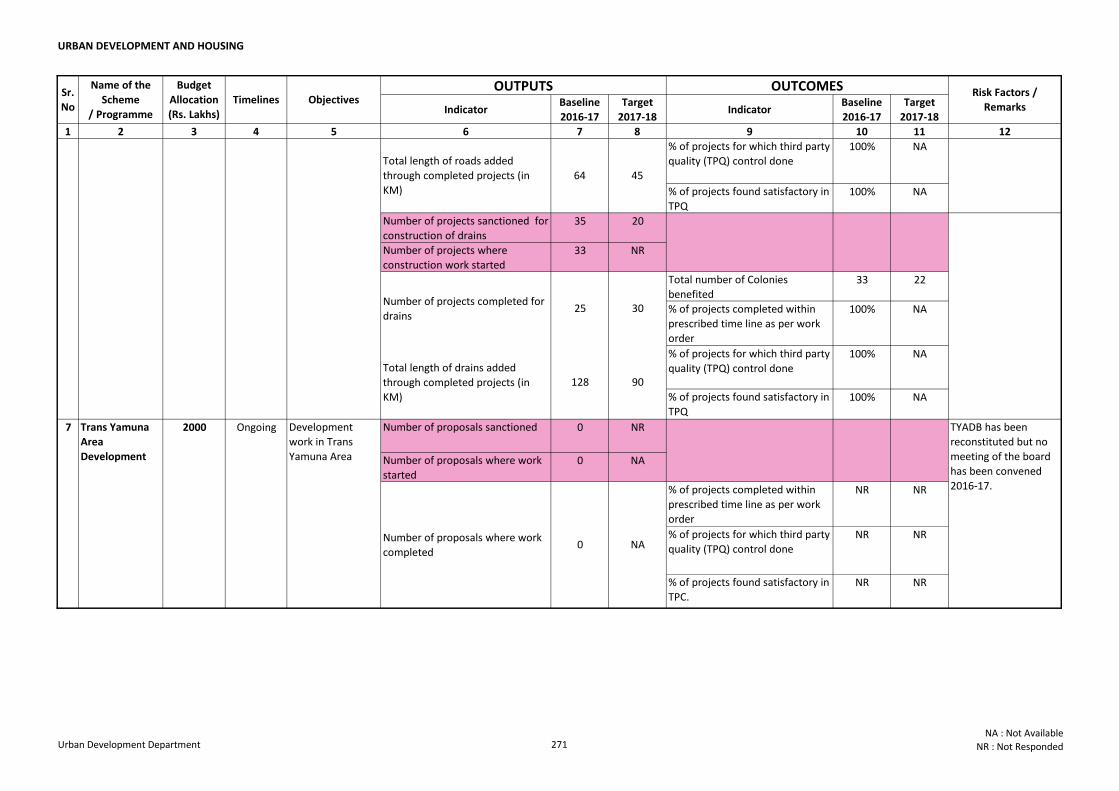
URBAN DEVELOPMENT AND HOUSING
Indicator Baseline
2016-17
Target
2017-18Indicator
Baseline
2016-17
Target
2017-18
1 2 3 4 5 6 7 8 9 10 11 12
Sr.
No
Name of the
Scheme
/ Programme
Budget
Allocation
(Rs. Lakhs)
Timelines Objectives OUTPUTS OUTCOMES Risk Factors /
Remarks
% of projects for which third party
quality (TPQ) control done100% NA
% of projects found satisfactory in
TPQ100% NA
Number of projects sanctioned for
construction of drains35 20
Number of projects where
construction work started33 NR
Total number of Colonies
benefited33 22
% of projects completed within
prescribed time line as per work
order
100% NA
% of projects for which third party
quality (TPQ) control done100% NA
% of projects found satisfactory in
TPQ100% NA
Number of proposals sanctioned 0 NR
Number of proposals where work
started0 NA
% of projects completed within
prescribed time line as per work
order
NR NR
% of projects for which third party
quality (TPQ) control doneNR NR
% of projects found satisfactory in
TPC.NR NR
c) Providing basic
Amenities such as
Roads & S.W.
drains, street
lights through
(South DMC)
TYADB has been
reconstituted but no
meeting of the board
has been convened
2016-17.
Number of proposals where work
completed0 NA
25 30
Total length of drains added
through completed projects (in
KM)
128 90
Total length of roads added
through completed projects (in
KM)
64 45
7 Trans Yamuna
Area
Development
2000 Ongoing Development
work in Trans
Yamuna Area
Number of projects completed for
drains
6 Provision of
essential
services in
unauthorized
colonies
30500 Ongoing
Urban Development Department 271NA : Not Available
NR : Not Responded
UR
BA
N D
EV
ELO
PM
EN
T A
ND
HO
US
ING
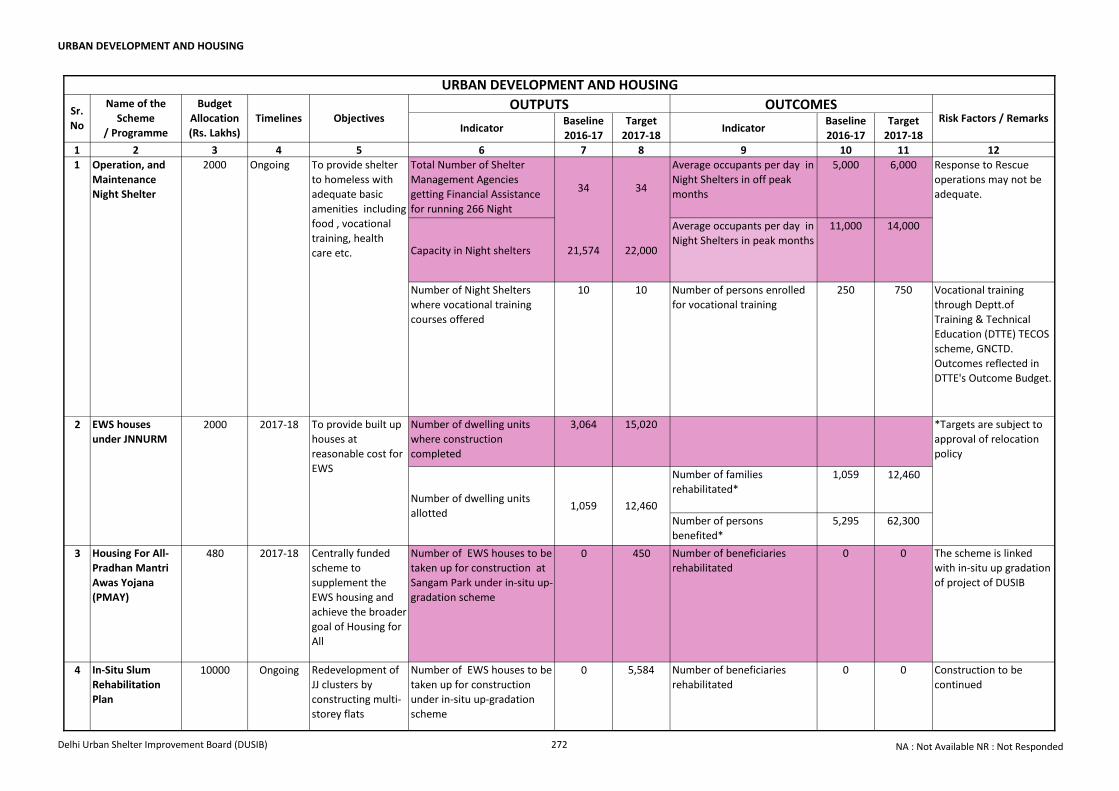
URBAN DEVELOPMENT AND HOUSING
Indicator Baseline
2016-17
Target
2017-18Indicator
Baseline
2016-17
Target
2017-18
1 2 3 4 5 6 7 8 9 10 11 12
Total Number of Shelter
Management Agencies
getting Financial Assistance
for running 266 Night
Shelters
34 34
Average occupants per day in
Night Shelters in off peak
months
5,000 6,000
Capacity in Night shelters 21,574 22,000
Average occupants per day in
Night Shelters in peak months
11,000 14,000
Number of Night Shelters
where vocational training
courses offered
10 10 Number of persons enrolled
for vocational training
250 750 Vocational training
through Deptt.of
Training & Technical
Education (DTTE) TECOS
scheme, GNCTD.
Outcomes reflected in
DTTE's Outcome Budget.
Number of dwelling units
where construction
completed
3,064 15,020
Number of families
rehabilitated*
1,059 12,460
Number of persons
benefited*
5,295 62,300
3 Housing For All-
Pradhan Mantri
Awas Yojana
(PMAY)
480 2017-18 Centrally funded
scheme to
supplement the
EWS housing and
achieve the broader
goal of Housing for
All
Number of EWS houses to be
taken up for construction at
Sangam Park under in-situ up-
gradation scheme
0 450 Number of beneficiaries
rehabilitated
0 0 The scheme is linked
with in-situ up gradation
of project of DUSIB
Number of EWS houses to be
taken up for construction
under in-situ up-gradation
scheme
0 5,584 0 0 Construction to be
continued
*Targets are subject to
approval of relocation
policy
Number of dwelling units
allotted1,059 12,460
4 In-Situ Slum
Rehabilitation
Plan
10000 Ongoing Redevelopment of
JJ clusters by
constructing multi-
storey flats
Number of beneficiaries
rehabilitated
Response to Rescue
operations may not be
adequate.
Objectives OUTPUTS OUTCOMES
Risk Factors / Remarks
2 EWS houses
under JNNURM2000 2017-18 To provide built up
houses at
reasonable cost for
EWS
1 Operation, and
Maintenance
Night Shelter
2000 Ongoing To provide shelter
to homeless with
adequate basic
amenities including
food , vocational
training, health
care etc.
URBAN DEVELOPMENT AND HOUSING
Sr.
No
Name of the
Scheme
/ Programme
Budget
Allocation
(Rs. Lakhs)
Timelines
Delhi Urban Shelter Improvement Board (DUSIB) 272 NA : Not Available NR : Not Responded
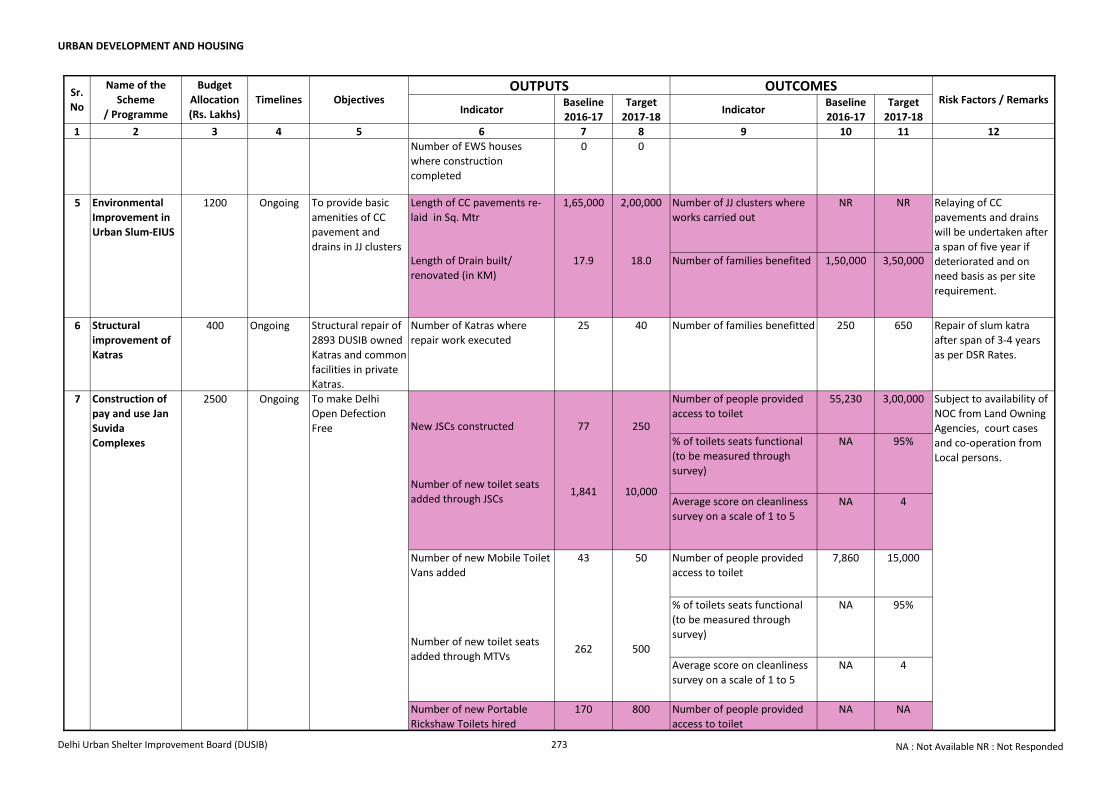
URBAN DEVELOPMENT AND HOUSING
Indicator Baseline
2016-17
Target
2017-18Indicator
Baseline
2016-17
Target
2017-18
1 2 3 4 5 6 7 8 9 10 11 12
Objectives OUTPUTS OUTCOMES
Risk Factors / RemarksSr.
No
Name of the
Scheme
/ Programme
Budget
Allocation
(Rs. Lakhs)
Timelines
Number of EWS houses
where construction
completed
0 0
Length of CC pavements re-
laid in Sq. Mtr
1,65,000 2,00,000 Number of JJ clusters where
works carried out
NR NR
Length of Drain built/
renovated (in KM)
17.9 18.0 Number of families benefited 1,50,000 3,50,000
6 Structural
improvement of
Katras
400 Ongoing Structural repair of
2893 DUSIB owned
Katras and common
facilities in private
Katras.
Number of Katras where
repair work executed
25 40 Number of families benefitted 250 650 Repair of slum katra
after span of 3-4 years
as per DSR Rates.
New JSCs constructed 77 250
Number of people provided
access to toilet
55,230 3,00,000
% of toilets seats functional
(to be measured through
survey)
NA 95%
Average score on cleanliness
survey on a scale of 1 to 5
NA 4
Number of new Mobile Toilet
Vans added
43 50 Number of people provided
access to toilet
7,860 15,000
% of toilets seats functional
(to be measured through
survey)
NA 95%
Average score on cleanliness
survey on a scale of 1 to 5
NA 4
Number of new Portable
Rickshaw Toilets hired
170 800 Number of people provided
access to toilet
NA NA
Construction of
pay and use Jan
Suvida
Complexes
7 2500 Ongoing To make Delhi
Open Defection
Free
Subject to availability of
NOC from Land Owning
Agencies, court cases
and co-operation from
Local persons.
Number of new toilet seats
added through JSCs1,841 10,000
Number of new toilet seats
added through MTVs
0 0 Construction to be
continued
262 500
5 Environmental
Improvement in
Urban Slum-EIUS
1200 Ongoing To provide basic
amenities of CC
pavement and
drains in JJ clusters
Relaying of CC
pavements and drains
will be undertaken after
a span of five year if
deteriorated and on
need basis as per site
requirement.
4 In-Situ Slum
Rehabilitation
Plan
10000 Ongoing Redevelopment of
JJ clusters by
constructing multi-
storey flats
Number of beneficiaries
rehabilitated
Delhi Urban Shelter Improvement Board (DUSIB) 273 NA : Not Available NR : Not Responded
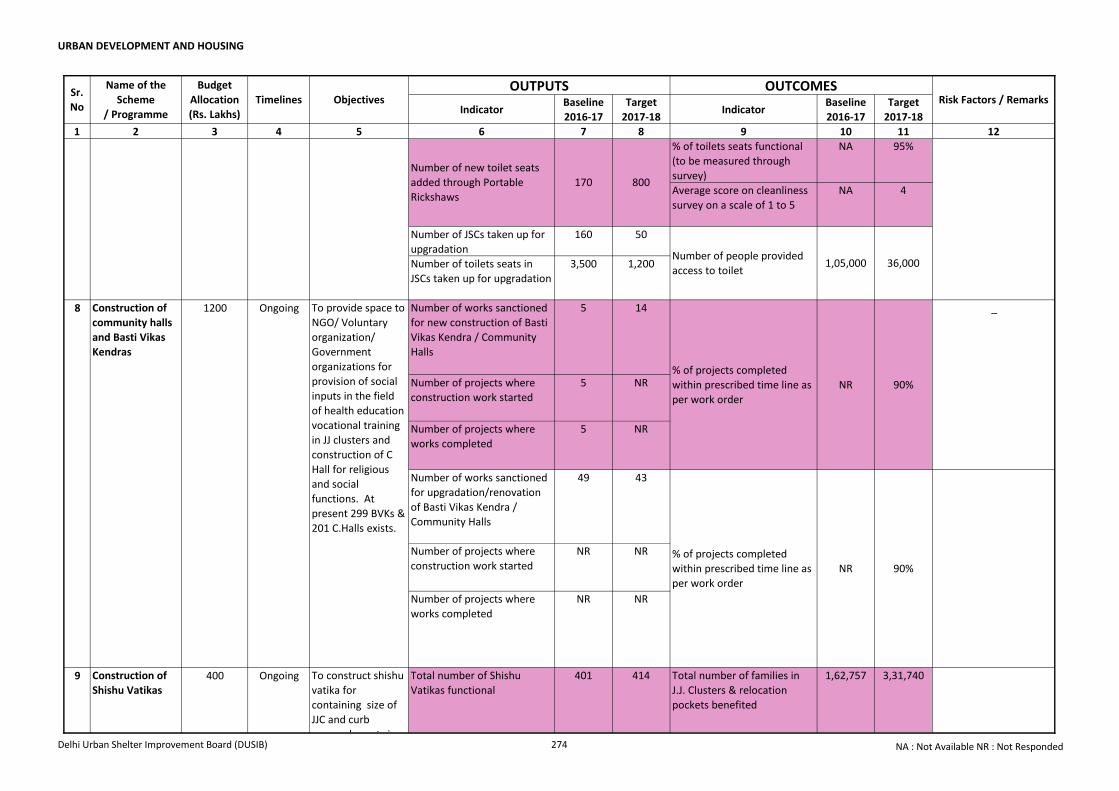
URBAN DEVELOPMENT AND HOUSING
Indicator Baseline
2016-17
Target
2017-18Indicator
Baseline
2016-17
Target
2017-18
1 2 3 4 5 6 7 8 9 10 11 12
Objectives OUTPUTS OUTCOMES
Risk Factors / RemarksSr.
No
Name of the
Scheme
/ Programme
Budget
Allocation
(Rs. Lakhs)
Timelines
% of toilets seats functional
(to be measured through
survey)
NA 95%
Average score on cleanliness
survey on a scale of 1 to 5
NA 4
Number of JSCs taken up for
upgradation
160 50
Number of toilets seats in
JSCs taken up for upgradation
3,500 1,200
Number of works sanctioned
for new construction of Basti
Vikas Kendra / Community
Halls
5 14
Number of projects where
construction work started
5 NR
Number of projects where
works completed
5 NR
Number of works sanctioned
for upgradation/renovation
of Basti Vikas Kendra /
Community Halls
49 43
Number of projects where
construction work started
NR NR
Number of projects where
works completed
NR NR
Total number of Shishu
Vatikas functional
401 414 Total number of families in
J.J. Clusters & relocation
pockets benefited
1,62,757 3,31,740
_
% of projects completed
within prescribed time line as
per work order
NR 90%
90%
Number of new toilet seats
added through Portable
Rickshaws
9 Construction of
Shishu Vatikas400 Ongoing To construct shishu
vatika for
containing size of
JJC and curb
encroachments in
JJC / relocation
pkts. /walled city.
At present 401 SVs
exists.
Construction of
pay and use Jan
Suvida
Complexes
170 800
Number of people provided
access to toilet
% of projects completed
within prescribed time line as
per work order
NR
1,05,000 36,000
8 Construction of
community halls
and Basti Vikas
Kendras
1200 Ongoing To provide space to
NGO/ Voluntary
organization/
Government
organizations for
provision of social
inputs in the field
of health education
vocational training
in JJ clusters and
construction of C
Hall for religious
and social
functions. At
present 299 BVKs &
201 C.Halls exists.
7 2500 Ongoing To make Delhi
Open Defection
Free
Subject to availability of
NOC from Land Owning
Agencies, court cases
and co-operation from
Local persons.
Delhi Urban Shelter Improvement Board (DUSIB) 274 NA : Not Available NR : Not Responded
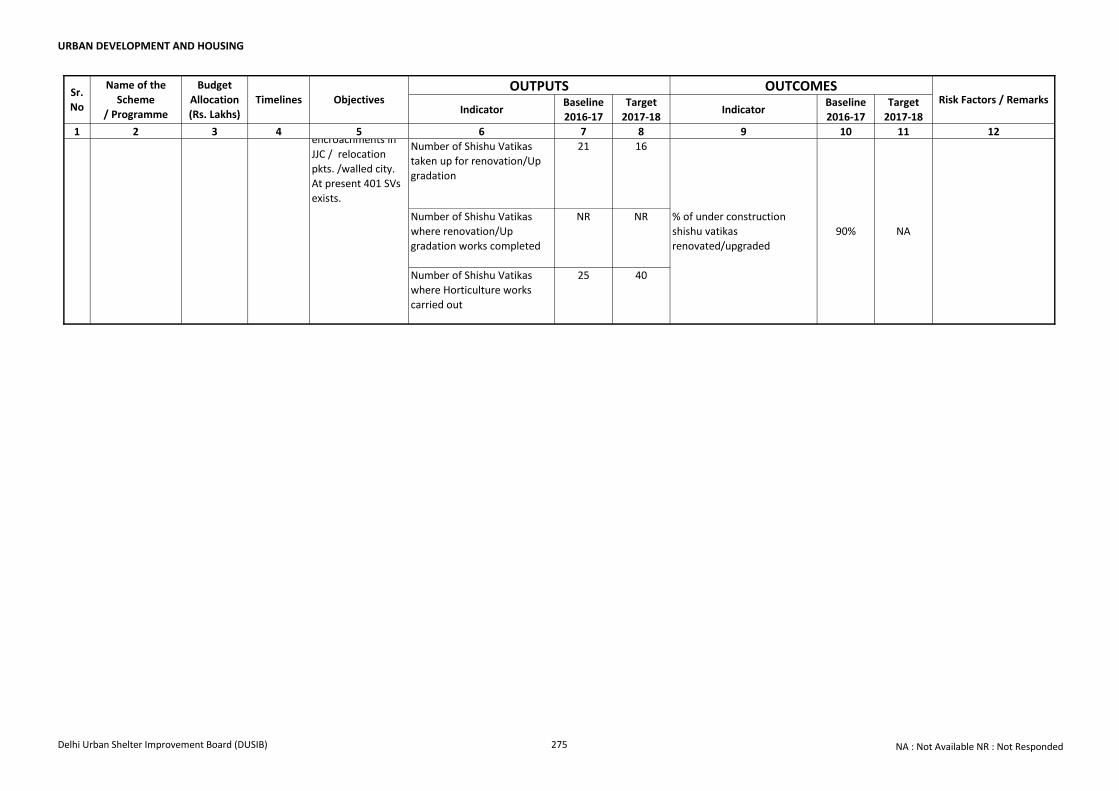
URBAN DEVELOPMENT AND HOUSING
Indicator Baseline
2016-17
Target
2017-18Indicator
Baseline
2016-17
Target
2017-18
1 2 3 4 5 6 7 8 9 10 11 12
Objectives OUTPUTS OUTCOMES
Risk Factors / RemarksSr.
No
Name of the
Scheme
/ Programme
Budget
Allocation
(Rs. Lakhs)
Timelines
Number of Shishu Vatikas
taken up for renovation/Up
gradation
21 16
Number of Shishu Vatikas
where renovation/Up
gradation works completed
NR NR
Number of Shishu Vatikas
where Horticulture works
carried out
25 40
NA
% of under construction
shishu vatikas
renovated/upgraded
90%
9 Construction of
Shishu Vatikas400 Ongoing To construct shishu
vatika for
containing size of
JJC and curb
encroachments in
JJC / relocation
pkts. /walled city.
At present 401 SVs
exists.
Delhi Urban Shelter Improvement Board (DUSIB) 275 NA : Not Available NR : Not Responded
UR
BA
N D
EV
ELO
PM
EN
T A
ND
HO
US
ING
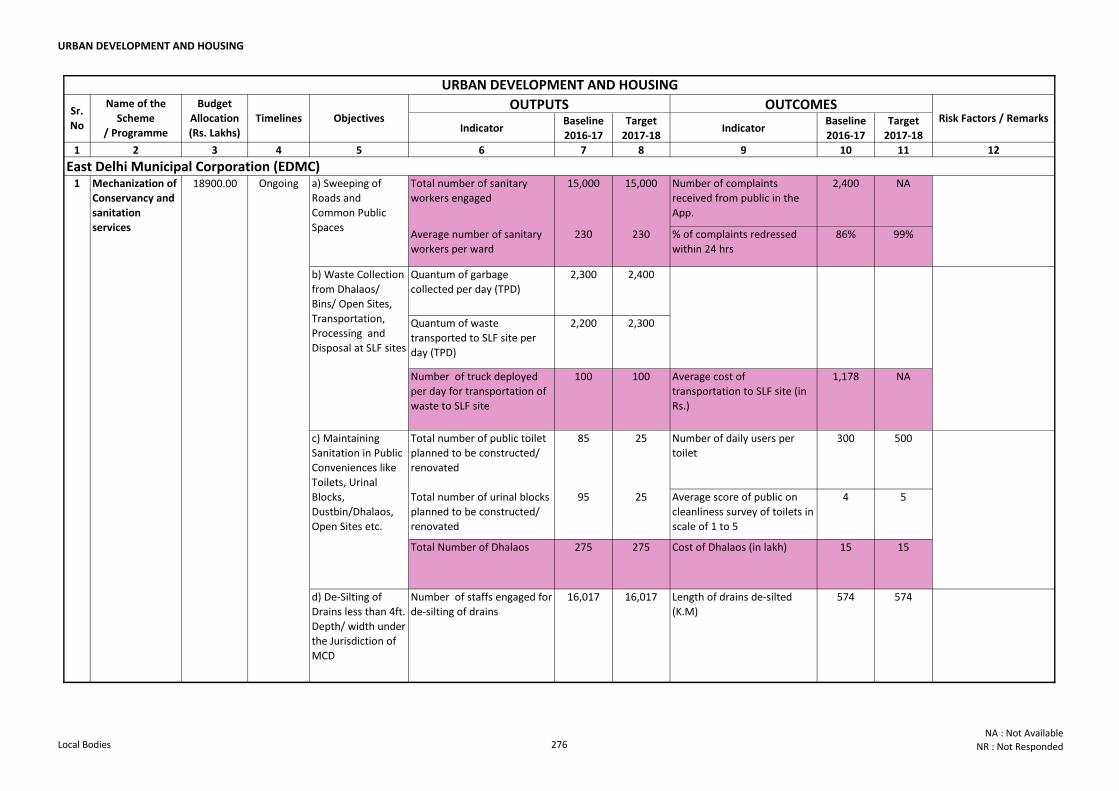
URBAN DEVELOPMENT AND HOUSING
Indicator Baseline
2016-17
Target
2017-18Indicator
Baseline
2016-17
Target
2017-18
1 2 3 4 5 6 7 8 9 10 11 12
East Delhi Municipal Corporation (EDMC)Total number of sanitary
workers engaged
15,000 15,000 Number of complaints
received from public in the
App.
2,400 NA
Average number of sanitary
workers per ward
230 230 % of complaints redressed
within 24 hrs
86% 99%
Quantum of garbage
collected per day (TPD)
2,300 2,400
Quantum of waste
transported to SLF site per
day (TPD)
2,200 2,300
Number of truck deployed
per day for transportation of
waste to SLF site
100 100 Average cost of
transportation to SLF site (in
Rs.)
1,178 NA
Total number of public toilet
planned to be constructed/
renovated
85 25 Number of daily users per
toilet
300 500
Total number of urinal blocks
planned to be constructed/
renovated
95 25 Average score of public on
cleanliness survey of toilets in
scale of 1 to 5
4 5
Total Number of Dhalaos 275 275 Cost of Dhalaos (in lakh) 15 15
d) De-Silting of
Drains less than 4ft.
Depth/ width under
the Jurisdiction of
MCD
Number of staffs engaged for
de-silting of drains
16,017 16,017 Length of drains de-silted
(K.M)
574 574
Name of the
Scheme
/ Programme
Budget
Allocation
(Rs. Lakhs)
Objectives
a) Sweeping of
Roads and
Common Public
Spaces
Mechanization of
Conservancy and
sanitation
services
b) Waste Collection
from Dhalaos/
Bins/ Open Sites,
Transportation,
Processing and
Disposal at SLF sites
18900.001
c) Maintaining
Sanitation in Public
Conveniences like
Toilets, Urinal
Blocks,
Dustbin/Dhalaos,
Open Sites etc.
Ongoing
Sr.
No
OUTPUTS OUTCOMES
URBAN DEVELOPMENT AND HOUSING
Timelines Risk Factors / Remarks
Local Bodies 276NA : Not Available
NR : Not Responded
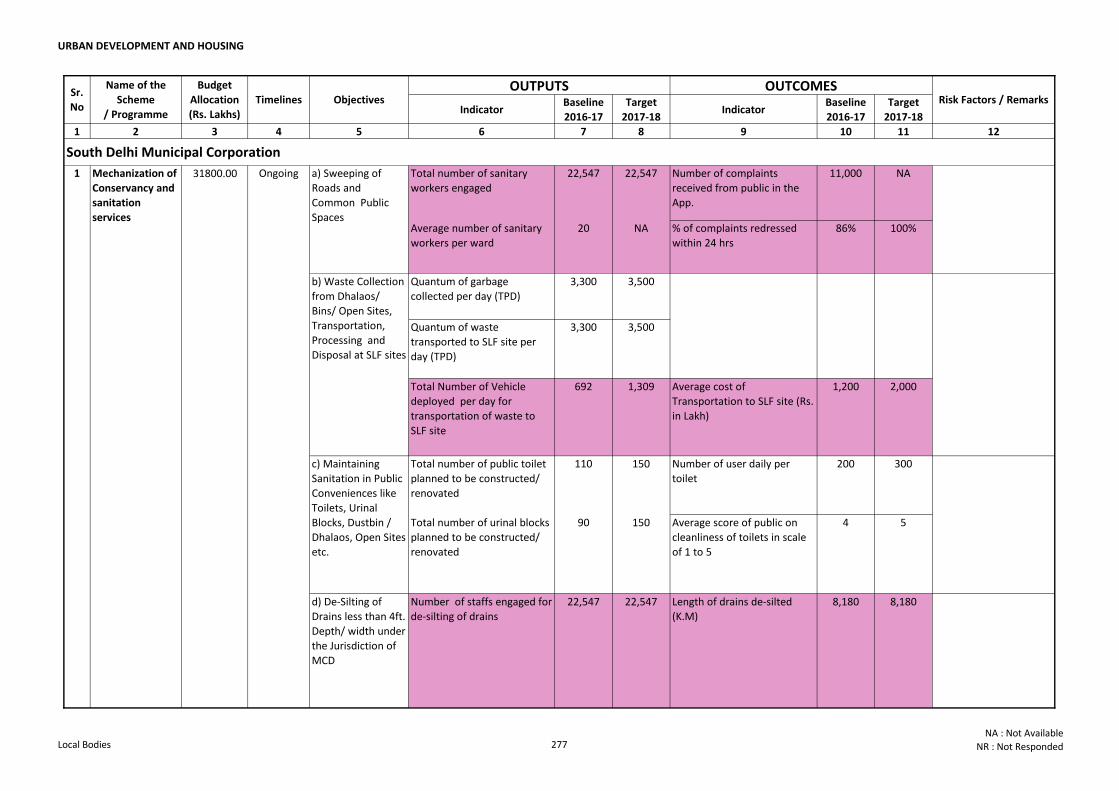
URBAN DEVELOPMENT AND HOUSING
Indicator Baseline
2016-17
Target
2017-18Indicator
Baseline
2016-17
Target
2017-18
1 2 3 4 5 6 7 8 9 10 11 12
Name of the
Scheme
/ Programme
Budget
Allocation
(Rs. Lakhs)
Objectives Sr.
No
OUTPUTS OUTCOMESTimelines Risk Factors / Remarks
South Delhi Municipal Corporation
Total number of sanitary
workers engaged
22,547 22,547 Number of complaints
received from public in the
App.
11,000 NA
Average number of sanitary
workers per ward
20 NA % of complaints redressed
within 24 hrs
86% 100%
Quantum of garbage
collected per day (TPD)
3,300 3,500
Quantum of waste
transported to SLF site per
day (TPD)
3,300 3,500
Total Number of Vehicle
deployed per day for
transportation of waste to
SLF site
692 1,309 Average cost of
Transportation to SLF site (Rs.
in Lakh)
1,200 2,000
Total number of public toilet
planned to be constructed/
renovated
110 150 Number of user daily per
toilet
200 300
Total number of urinal blocks
planned to be constructed/
renovated
90 150 Average score of public on
cleanliness of toilets in scale
of 1 to 5
4 5
d) De-Silting of
Drains less than 4ft.
Depth/ width under
the Jurisdiction of
MCD
Number of staffs engaged for
de-silting of drains
22,547 22,547 Length of drains de-silted
(K.M)
8,180 8,180
Ongoing a) Sweeping of
Roads and
Common Public
Spaces
Mechanization of
Conservancy and
sanitation
services
1 31800.00
c) Maintaining
Sanitation in Public
Conveniences like
Toilets, Urinal
Blocks, Dustbin /
Dhalaos, Open Sites
etc.
b) Waste Collection
from Dhalaos/
Bins/ Open Sites,
Transportation,
Processing and
Disposal at SLF sites
Local Bodies 277NA : Not Available
NR : Not Responded
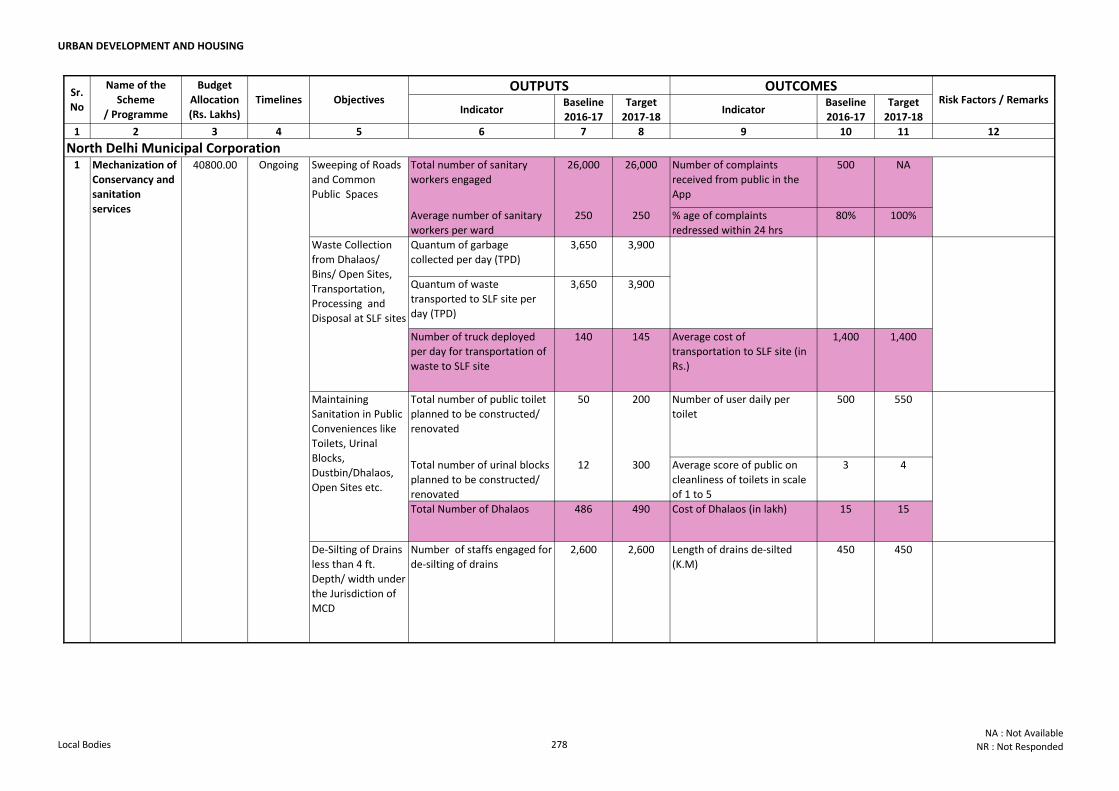
URBAN DEVELOPMENT AND HOUSING
Indicator Baseline
2016-17
Target
2017-18Indicator
Baseline
2016-17
Target
2017-18
1 2 3 4 5 6 7 8 9 10 11 12
Name of the
Scheme
/ Programme
Budget
Allocation
(Rs. Lakhs)
Objectives Sr.
No
OUTPUTS OUTCOMESTimelines Risk Factors / Remarks
North Delhi Municipal CorporationTotal number of sanitary
workers engaged
26,000 26,000 Number of complaints
received from public in the
App
500 NA
Average number of sanitary
workers per ward
250 250 % age of complaints
redressed within 24 hrs
80% 100%
Quantum of garbage
collected per day (TPD)
3,650 3,900
Quantum of waste
transported to SLF site per
day (TPD)
3,650 3,900
Number of truck deployed
per day for transportation of
waste to SLF site
140 145 Average cost of
transportation to SLF site (in
Rs.)
1,400 1,400
Total number of public toilet
planned to be constructed/
renovated
50 200 Number of user daily per
toilet
500 550
Total number of urinal blocks
planned to be constructed/
renovated
12 300 Average score of public on
cleanliness of toilets in scale
of 1 to 5
3 4
Total Number of Dhalaos 486 490 Cost of Dhalaos (in lakh) 15 15
De-Silting of Drains
less than 4 ft.
Depth/ width under
the Jurisdiction of
MCD
Number of staffs engaged for
de-silting of drains
2,600 2,600 Length of drains de-silted
(K.M)
450 450
40800.00 Ongoing
Waste Collection
from Dhalaos/
Bins/ Open Sites,
Transportation,
Processing and
Disposal at SLF sites
Maintaining
Sanitation in Public
Conveniences like
Toilets, Urinal
Blocks,
Dustbin/Dhalaos,
Open Sites etc.
Mechanization of
Conservancy and
sanitation
services
1 Sweeping of Roads
and Common
Public Spaces
Local Bodies 278NA : Not Available
NR : Not Responded
WATER SUPPLY AND
SEWERAGE
WA
TER
SU
PP
LY
AN
D S
EW
ER
AG
E

Delhi Jal Board
WA
TER
SU
PP
LY
AN
D S
EW
ER
AG
E
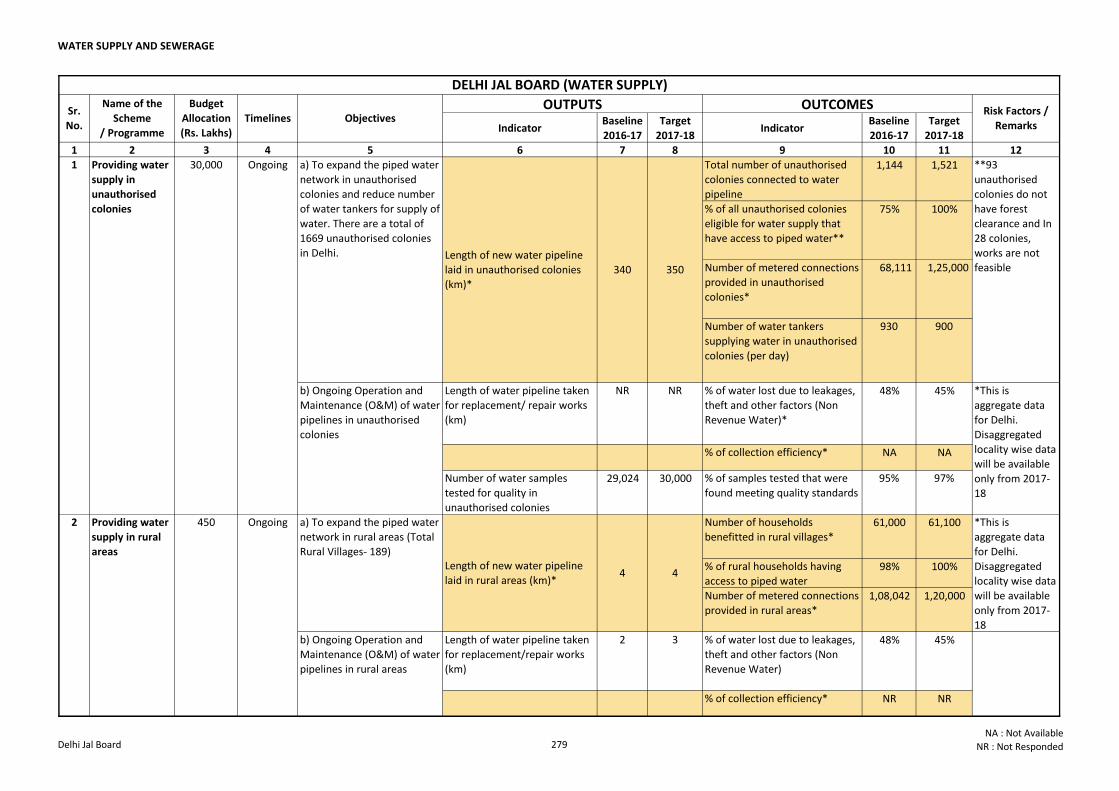
WATER SUPPLY AND SEWERAGE
Indicator Baseline
2016-17
Target
2017-18Indicator
Baseline
2016-17
Target
2017-18
1 2 3 4 5 6 7 8 9 10 11 12
Total number of unauthorised
colonies connected to water
pipeline
1,144 1,521
% of all unauthorised colonies
eligible for water supply that
have access to piped water**
75% 100%
Number of metered connections
provided in unauthorised
colonies*
68,111 1,25,000
Number of water tankers
supplying water in unauthorised
colonies (per day)
930 900
Length of water pipeline taken
for replacement/ repair works
(km)
NR NR % of water lost due to leakages,
theft and other factors (Non
Revenue Water)*
48% 45%
% of collection efficiency* NA NA
Number of water samples
tested for quality in
unauthorised colonies
29,024 30,000 % of samples tested that were
found meeting quality standards
95% 97%
Number of households
benefitted in rural villages*61,000 61,100
% of rural households having
access to piped water98% 100%
Number of metered connections
provided in rural areas*1,08,042 1,20,000
Length of water pipeline taken
for replacement/repair works
(km)
2 3 % of water lost due to leakages,
theft and other factors (Non
Revenue Water)
48% 45%
% of collection efficiency* NR NR
*This is
aggregate data
for Delhi.
Disaggregated
locality wise data
will be available
only from 2017-
18
Length of new water pipeline
laid in rural areas (km)*
Objectives
Name of the
Scheme
/ Programme
2 Providing water
supply in rural
areas
450 Ongoing
b) Ongoing Operation and
Maintenance (O&M) of water
pipelines in rural areas
a) To expand the piped water
network in rural areas (Total
Rural Villages- 189)
**93
unauthorised
colonies do not
have forest
clearance and In
28 colonies,
works are not
feasible
4
a) To expand the piped water
network in unauthorised
colonies and reduce number
of water tankers for supply of
water. There are a total of
1669 unauthorised colonies
in Delhi. Length of new water pipeline
laid in unauthorised colonies
(km)*
340
4
DELHI JAL BOARD (WATER SUPPLY)
OUTCOMESOUTPUTS Risk Factors /
Remarks
Ongoing1 Providing water
supply in
unauthorised
colonies
30,000
350
*This is
aggregate data
for Delhi.
Disaggregated
locality wise data
will be available
only from 2017-
18
b) Ongoing Operation and
Maintenance (O&M) of water
pipelines in unauthorised
colonies
Sr.
No.
Budget
Allocation
(Rs. Lakhs)
Timelines
Delhi Jal Board 279NA : Not Available
NR : Not Responded
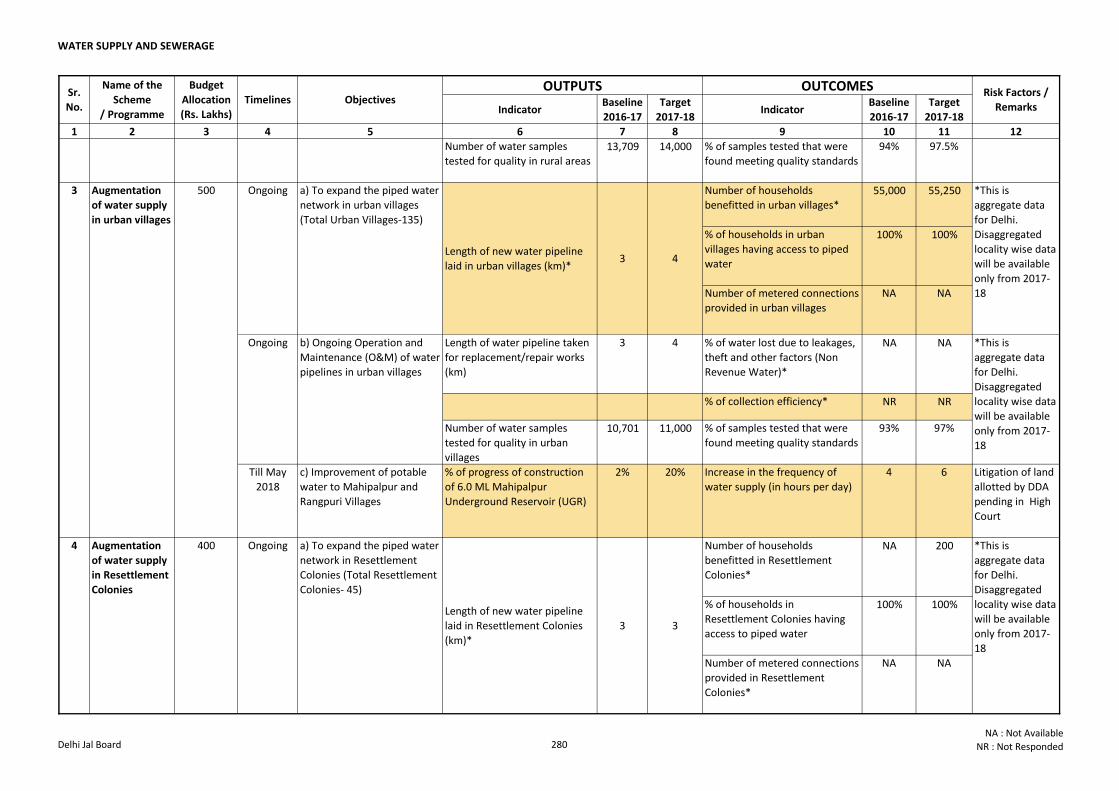
WATER SUPPLY AND SEWERAGE
Indicator Baseline
2016-17
Target
2017-18Indicator
Baseline
2016-17
Target
2017-18
1 2 3 4 5 6 7 8 9 10 11 12
Objectives
Name of the
Scheme
/ Programme
OUTCOMESOUTPUTS Risk Factors /
Remarks
Sr.
No.
Budget
Allocation
(Rs. Lakhs)
Timelines
Number of water samples
tested for quality in rural areas13,709 14,000 % of samples tested that were
found meeting quality standards
94% 97.5%
Number of households
benefitted in urban villages*55,000 55,250
% of households in urban
villages having access to piped
water
100% 100%
Number of metered connections
provided in urban villages
NA NA
b) Ongoing Operation and
Maintenance (O&M) of water
pipelines in urban villages
Length of water pipeline taken
for replacement/repair works
(km)
3 4 % of water lost due to leakages,
theft and other factors (Non
Revenue Water)*
NA NA
% of collection efficiency* NR NR
Number of water samples
tested for quality in urban
villages
10,701 11,000 % of samples tested that were
found meeting quality standards
93% 97%
Till May
2018
c) Improvement of potable
water to Mahipalpur and
Rangpuri Villages
% of progress of construction
of 6.0 ML Mahipalpur
Underground Reservoir (UGR)
2% 20% Increase in the frequency of
water supply (in hours per day)
4 6 Litigation of land
allotted by DDA
pending in High
Court
Number of households
benefitted in Resettlement
Colonies*
NA 200
% of households in
Resettlement Colonies having
access to piped water
100% 100%
Number of metered connections
provided in Resettlement
Colonies*
NA NA
*This is
aggregate data
for Delhi.
Disaggregated
locality wise data
will be available
only from 2017-
18
*This is
aggregate data
for Delhi.
Disaggregated
locality wise data
will be available
only from 2017-
18
*This is
aggregate data
for Delhi.
Disaggregated
locality wise data
will be available
only from 2017-
18
33
Length of new water pipeline
laid in Resettlement Colonies
(km)*
3 Augmentation
of water supply
in urban villages
500 a) To expand the piped water
network in urban villages
(Total Urban Villages-135)
Ongoing
Ongoing
2 Providing water
supply in rural
areas
450 Ongoing
b) Ongoing Operation and
Maintenance (O&M) of water
pipelines in rural areas
Length of new water pipeline
laid in urban villages (km)*3 4
4 Augmentation
of water supply
in Resettlement
Colonies
400 Ongoing a) To expand the piped water
network in Resettlement
Colonies (Total Resettlement
Colonies- 45)
Delhi Jal Board 280NA : Not Available
NR : Not Responded
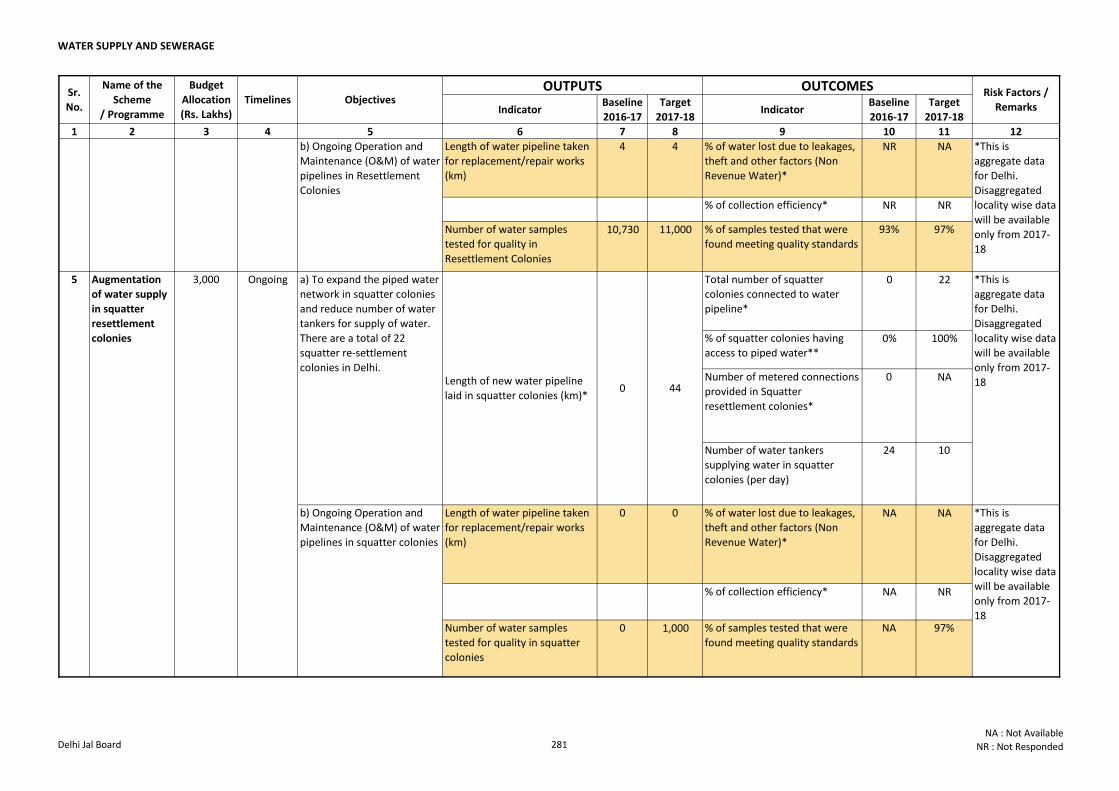
WATER SUPPLY AND SEWERAGE
Indicator Baseline
2016-17
Target
2017-18Indicator
Baseline
2016-17
Target
2017-18
1 2 3 4 5 6 7 8 9 10 11 12
Objectives
Name of the
Scheme
/ Programme
OUTCOMESOUTPUTS Risk Factors /
Remarks
Sr.
No.
Budget
Allocation
(Rs. Lakhs)
Timelines
Length of water pipeline taken
for replacement/repair works
(km)
4 4 % of water lost due to leakages,
theft and other factors (Non
Revenue Water)*
NR NA
% of collection efficiency* NR NR
Number of water samples
tested for quality in
Resettlement Colonies
10,730 11,000 % of samples tested that were
found meeting quality standards
93% 97%
Total number of squatter
colonies connected to water
pipeline*
0 22
% of squatter colonies having
access to piped water**0% 100%
Number of metered connections
provided in Squatter
resettlement colonies*
0 NA
Number of water tankers
supplying water in squatter
colonies (per day)
24 10
Length of water pipeline taken
for replacement/repair works
(km)
0 0 % of water lost due to leakages,
theft and other factors (Non
Revenue Water)*
NA NA
% of collection efficiency* NA NR
Number of water samples
tested for quality in squatter
colonies
0 1,000 % of samples tested that were
found meeting quality standards
NA 97%
3,000 Ongoing
*This is
aggregate data
for Delhi.
Disaggregated
locality wise data
will be available
only from 2017-
18
a) To expand the piped water
network in squatter colonies
and reduce number of water
tankers for supply of water.
There are a total of 22
squatter re-settlement
colonies in Delhi.
44
*This is
aggregate data
for Delhi.
Disaggregated
locality wise data
will be available
only from 2017-
18
b) Ongoing Operation and
Maintenance (O&M) of water
pipelines in squatter colonies
*This is
aggregate data
for Delhi.
Disaggregated
locality wise data
will be available
only from 2017-
18
Length of new water pipeline
laid in squatter colonies (km)*0
5 Augmentation
of water supply
in squatter
resettlement
colonies
4 Augmentation
of water supply
in Resettlement
Colonies
400 Ongoing
b) Ongoing Operation and
Maintenance (O&M) of water
pipelines in Resettlement
Colonies
Delhi Jal Board 281NA : Not Available
NR : Not Responded
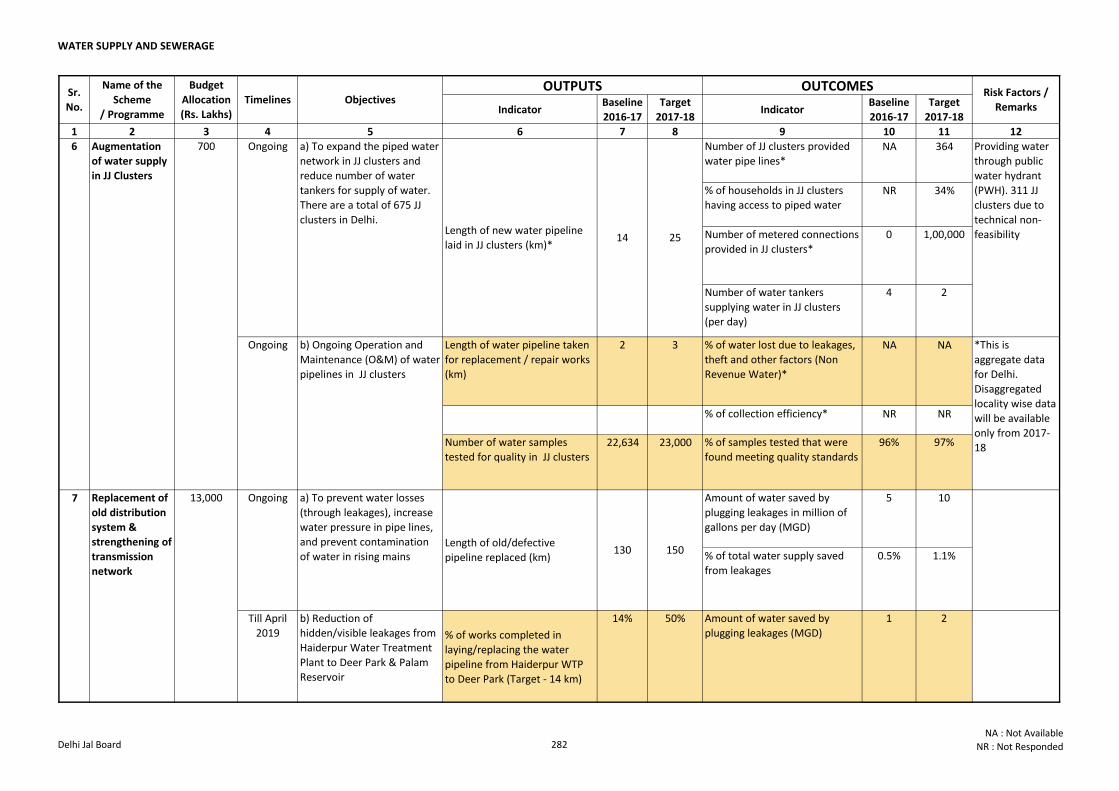
WATER SUPPLY AND SEWERAGE
Indicator Baseline
2016-17
Target
2017-18Indicator
Baseline
2016-17
Target
2017-18
1 2 3 4 5 6 7 8 9 10 11 12
Objectives
Name of the
Scheme
/ Programme
OUTCOMESOUTPUTS Risk Factors /
Remarks
Sr.
No.
Budget
Allocation
(Rs. Lakhs)
Timelines
Number of JJ clusters provided
water pipe lines*NA 364
% of households in JJ clusters
having access to piped waterNR 34%
Number of metered connections
provided in JJ clusters*
0 1,00,000
Number of water tankers
supplying water in JJ clusters
(per day)
4 2
Length of water pipeline taken
for replacement / repair works
(km)
2 3 % of water lost due to leakages,
theft and other factors (Non
Revenue Water)*
NA NA
% of collection efficiency* NR NR
Number of water samples
tested for quality in JJ clusters22,634 23,000 % of samples tested that were
found meeting quality standards
96% 97%
Amount of water saved by
plugging leakages in million of
gallons per day (MGD)
5 10
% of total water supply saved
from leakages
0.5% 1.1%
Till April
2019
b) Reduction of
hidden/visible leakages from
Haiderpur Water Treatment
Plant to Deer Park & Palam
Reservoir
% of works completed in
laying/replacing the water
pipeline from Haiderpur WTP
to Deer Park (Target - 14 km)
14% 50% Amount of water saved by
plugging leakages (MGD)
1 2
14 25
Providing water
through public
water hydrant
(PWH). 311 JJ
clusters due to
technical non-
feasibility
a) To prevent water losses
(through leakages), increase
water pressure in pipe lines,
and prevent contamination
of water in rising mains
Ongoing
150
*This is
aggregate data
for Delhi.
Disaggregated
locality wise data
will be available
only from 2017-
18
b) Ongoing Operation and
Maintenance (O&M) of water
pipelines in JJ clusters
a) To expand the piped water
network in JJ clusters and
reduce number of water
tankers for supply of water.
There are a total of 675 JJ
clusters in Delhi.Length of new water pipeline
laid in JJ clusters (km)*
6
Ongoing
Augmentation
of water supply
in JJ Clusters
700 Ongoing
Length of old/defective
pipeline replaced (km)130
7 Replacement of
old distribution
system &
strengthening of
transmission
network
13,000
Delhi Jal Board 282NA : Not Available
NR : Not Responded
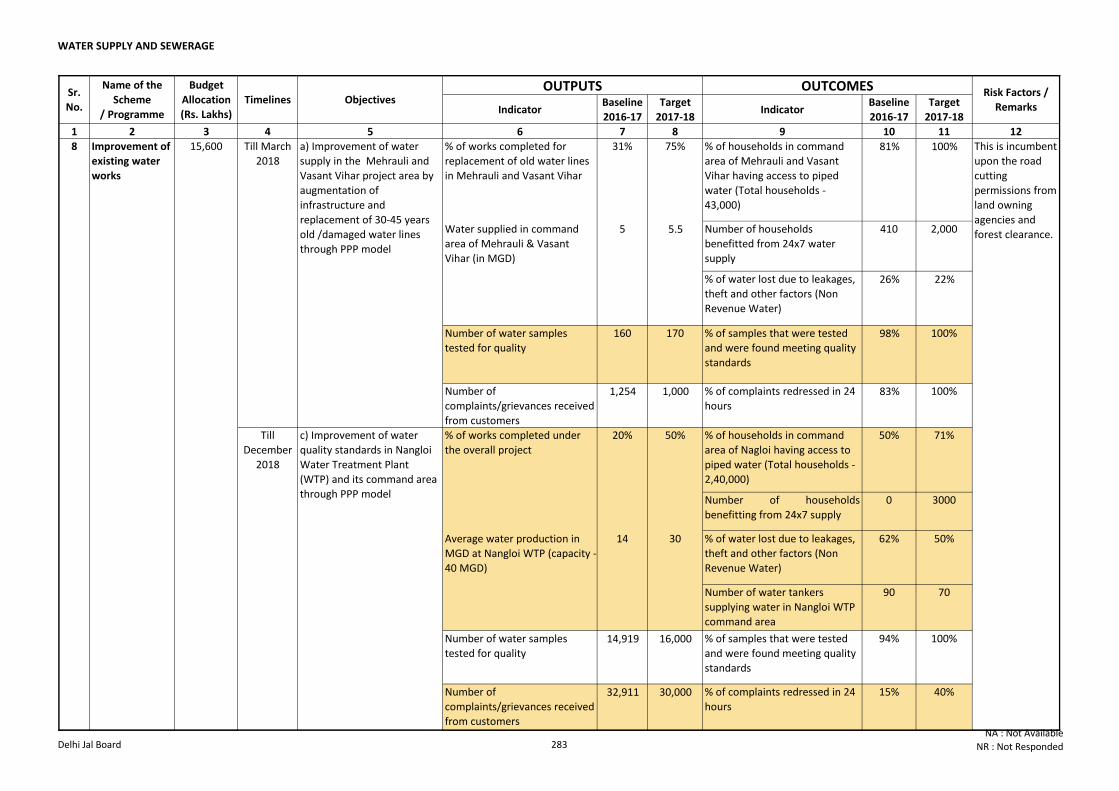
WATER SUPPLY AND SEWERAGE
Indicator Baseline
2016-17
Target
2017-18Indicator
Baseline
2016-17
Target
2017-18
1 2 3 4 5 6 7 8 9 10 11 12
Objectives
Name of the
Scheme
/ Programme
OUTCOMESOUTPUTS Risk Factors /
Remarks
Sr.
No.
Budget
Allocation
(Rs. Lakhs)
Timelines
% of works completed for
replacement of old water lines
in Mehrauli and Vasant Vihar
31% 75% % of households in command
area of Mehrauli and Vasant
Vihar having access to piped
water (Total households -
43,000)
81% 100%
Number of households
benefitted from 24x7 water
supply
410 2,000
% of water lost due to leakages,
theft and other factors (Non
Revenue Water)
26% 22%
Number of water samples
tested for quality
160 170 % of samples that were tested
and were found meeting quality
standards
98% 100%
Number of
complaints/grievances received
from customers
1,254 1,000 % of complaints redressed in 24
hours83% 100%
% of works completed under
the overall project
20% 50% % of households in command
area of Nagloi having access to
piped water (Total households -
2,40,000)
50% 71%
Number of households
benefitting from 24x7 supply
0 3000
Average water production in
MGD at Nangloi WTP (capacity -
40 MGD)
14 30 % of water lost due to leakages,
theft and other factors (Non
Revenue Water)
62% 50%
Number of water tankers
supplying water in Nangloi WTP
command area
90 70
Number of water samples
tested for quality14,919 16,000 % of samples that were tested
and were found meeting quality
standards
94% 100%
Number of
complaints/grievances received
from customers
32,911 30,000 % of complaints redressed in 24
hours
15% 40%
Improvement of
existing water
works
Till
December
2018
15,600
c) Improvement of water
quality standards in Nangloi
Water Treatment Plant
(WTP) and its command area
through PPP model
This is incumbent
upon the road
cutting
permissions from
land owning
agencies and
forest clearance.Water supplied in command
area of Mehrauli & Vasant
Vihar (in MGD)
5 5.5
8 Till March
2018
a) Improvement of water
supply in the Mehrauli and
Vasant Vihar project area by
augmentation of
infrastructure and
replacement of 30-45 years
old /damaged water lines
through PPP model
Delhi Jal Board 283NA : Not Available
NR : Not Responded
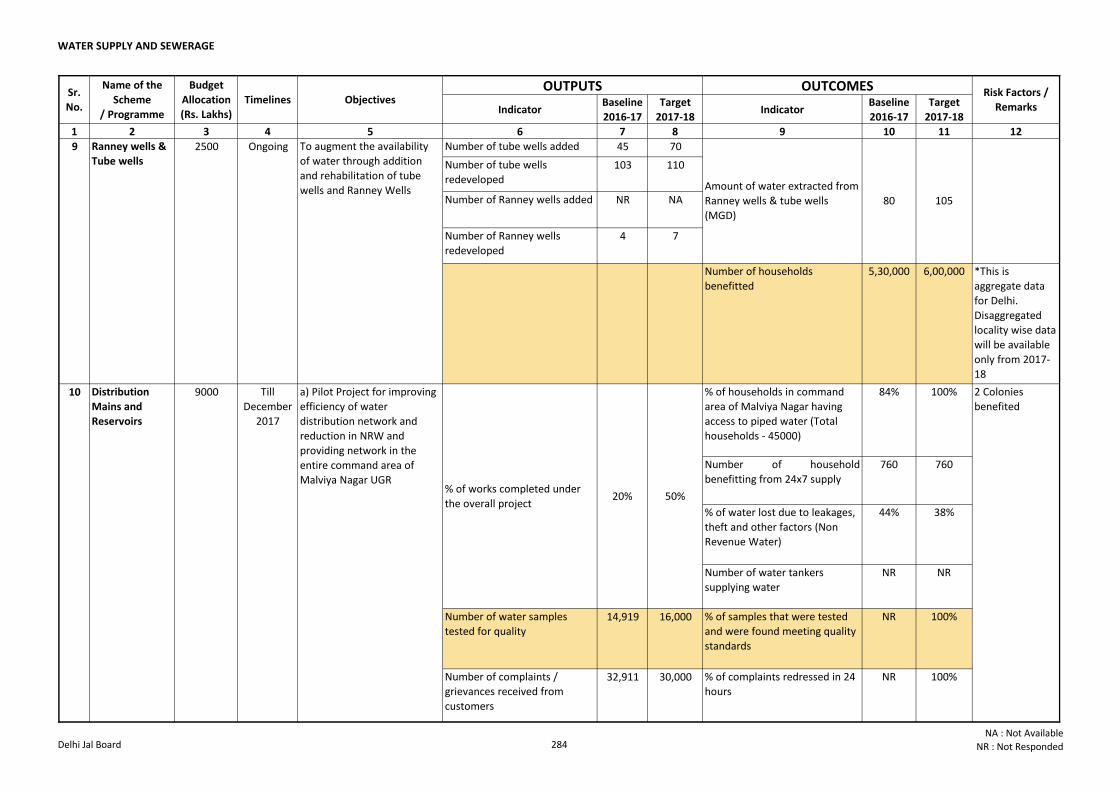
WATER SUPPLY AND SEWERAGE
Indicator Baseline
2016-17
Target
2017-18Indicator
Baseline
2016-17
Target
2017-18
1 2 3 4 5 6 7 8 9 10 11 12
Objectives
Name of the
Scheme
/ Programme
OUTCOMESOUTPUTS Risk Factors /
Remarks
Sr.
No.
Budget
Allocation
(Rs. Lakhs)
Timelines
Number of tube wells added 45 70
Number of tube wells
redeveloped103 110
Number of Ranney wells added NR NA
Number of Ranney wells
redeveloped4 7
Number of households
benefitted
5,30,000 6,00,000 *This is
aggregate data
for Delhi.
Disaggregated
locality wise data
will be available
only from 2017-
18
% of households in command
area of Malviya Nagar having
access to piped water (Total
households - 45000)
84% 100%
Number of household
benefitting from 24x7 supply
760 760
% of water lost due to leakages,
theft and other factors (Non
Revenue Water)
44% 38%
Number of water tankers
supplying water
NR NR
Number of water samples
tested for quality14,919 16,000 % of samples that were tested
and were found meeting quality
standards
NR 100%
Number of complaints /
grievances received from
customers
32,911 30,000 % of complaints redressed in 24
hours
NR 100%
10 Distribution
Mains and
Reservoirs
9000
% of works completed under
the overall project20% 50%
Till
December
2017
a) Pilot Project for improving
efficiency of water
distribution network and
reduction in NRW and
providing network in the
entire command area of
Malviya Nagar UGR
2 Colonies
benefited
80 105
9 Ranney wells &
Tube wells2500 Ongoing To augment the availability
of water through addition
and rehabilitation of tube
wells and Ranney Wells Amount of water extracted from
Ranney wells & tube wells
(MGD)
Delhi Jal Board 284NA : Not Available
NR : Not Responded
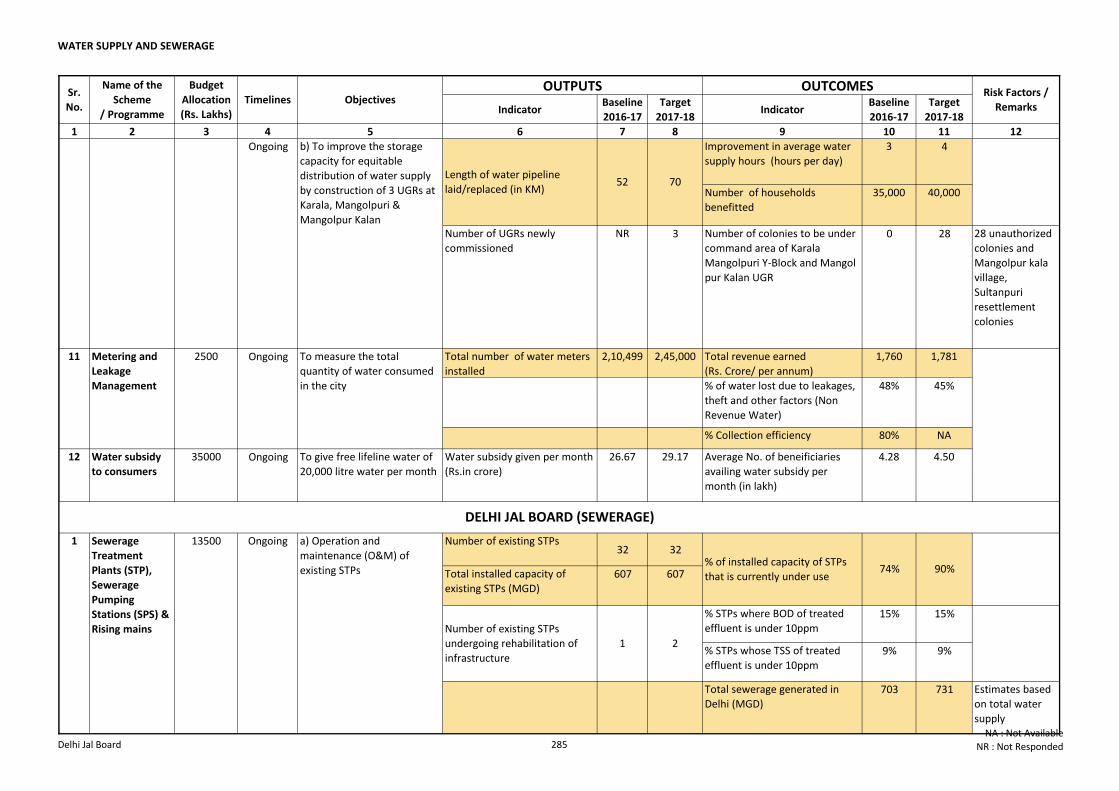
WATER SUPPLY AND SEWERAGE
Indicator Baseline
2016-17
Target
2017-18Indicator
Baseline
2016-17
Target
2017-18
1 2 3 4 5 6 7 8 9 10 11 12
Objectives
Name of the
Scheme
/ Programme
OUTCOMESOUTPUTS Risk Factors /
Remarks
Sr.
No.
Budget
Allocation
(Rs. Lakhs)
Timelines
Improvement in average water
supply hours (hours per day)
3 4
Number of households
benefitted
35,000 40,000
Number of UGRs newly
commissioned
NR 3 Number of colonies to be under
command area of Karala
Mangolpuri Y-Block and Mangol
pur Kalan UGR
0 28 28 unauthorized
colonies and
Mangolpur kala
village,
Sultanpuri
resettlement
colonies
Total number of water meters
installed
2,10,499 2,45,000 Total revenue earned
(Rs. Crore/ per annum)
1,760 1,781
% of water lost due to leakages,
theft and other factors (Non
Revenue Water)
48% 45%
% Collection efficiency 80% NA
12 Water subsidy
to consumers
35000 Ongoing To give free lifeline water of
20,000 litre water per month
Water subsidy given per month
(Rs.in crore)
26.67 29.17 Average No. of beneificiaries
availing water subsidy per
month (in lakh)
4.28 4.50
Number of existing STPs32 32
Total installed capacity of
existing STPs (MGD)607 607
% STPs where BOD of treated
effluent is under 10ppm15% 15%
% STPs whose TSS of treated
effluent is under 10ppm9% 9%
Total sewerage generated in
Delhi (MGD)703 731 Estimates based
on total water
supply
10 Distribution
Mains and
Reservoirs
9000
52 70Length of water pipeline
laid/replaced (in KM)
Ongoing b) To improve the storage
capacity for equitable
distribution of water supply
by construction of 3 UGRs at
Karala, Mangolpuri &
Mangolpur Kalan
1 Sewerage
Treatment
Plants (STP),
Sewerage
Pumping
Stations (SPS) &
Rising mains
13500 Ongoing a) Operation and
maintenance (O&M) of
existing STPs% of installed capacity of STPs
that is currently under use74% 90%
Number of existing STPs
undergoing rehabilitation of
infrastructure
1 2
Metering and
Leakage
Management
2500 Ongoing11 To measure the total
quantity of water consumed
in the city
DELHI JAL BOARD (SEWERAGE)
Delhi Jal Board 285NA : Not Available
NR : Not Responded
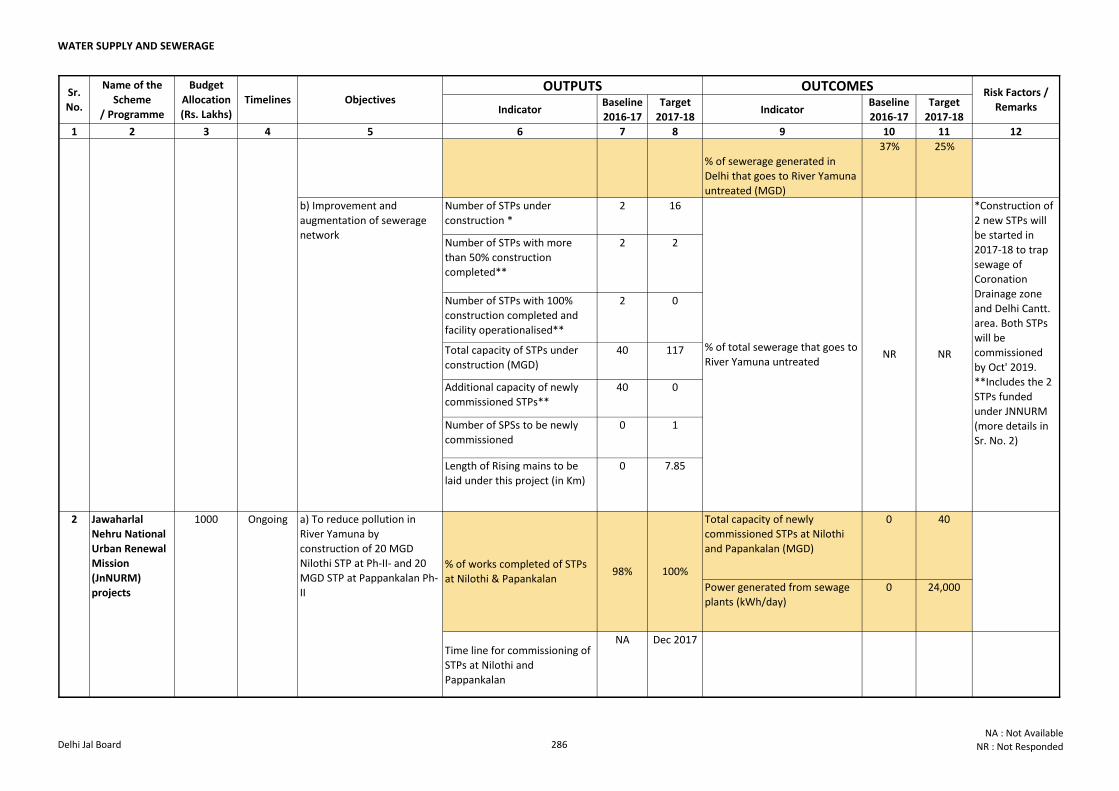
WATER SUPPLY AND SEWERAGE
Indicator Baseline
2016-17
Target
2017-18Indicator
Baseline
2016-17
Target
2017-18
1 2 3 4 5 6 7 8 9 10 11 12
Objectives
Name of the
Scheme
/ Programme
OUTCOMESOUTPUTS Risk Factors /
Remarks
Sr.
No.
Budget
Allocation
(Rs. Lakhs)
Timelines
% of sewerage generated in
Delhi that goes to River Yamuna
untreated (MGD)
37% 25%
Number of STPs under
construction *
2 16
Number of STPs with more
than 50% construction
completed**
2 2
Number of STPs with 100%
construction completed and
facility operationalised**
2 0
Total capacity of STPs under
construction (MGD)
40 117
Additional capacity of newly
commissioned STPs**
40 0
Number of SPSs to be newly
commissioned
0 1
Length of Rising mains to be
laid under this project (in Km)
0 7.85
Total capacity of newly
commissioned STPs at Nilothi
and Papankalan (MGD)
0 40
Power generated from sewage
plants (kWh/day)
0 24,000
Time line for commissioning of
STPs at Nilothi and
Pappankalan
NA Dec 2017
1 Sewerage
Treatment
Plants (STP),
Sewerage
Pumping
Stations (SPS) &
Rising mains
13500 Ongoing a) Operation and
maintenance (O&M) of
existing STPs
2 Jawaharlal
Nehru National
Urban Renewal
Mission
(JnNURM)
projects
1000 Ongoing a) To reduce pollution in
River Yamuna by
construction of 20 MGD
Nilothi STP at Ph-II- and 20
MGD STP at Pappankalan Ph-
II
% of works completed of STPs
at Nilothi & Papankalan
% of total sewerage that goes to
River Yamuna untreatedNR NR
*Construction of
2 new STPs will
be started in
2017-18 to trap
sewage of
Coronation
Drainage zone
and Delhi Cantt.
area. Both STPs
will be
commissioned
by Oct' 2019.
**Includes the 2
STPs funded
under JNNURM
(more details in
Sr. No. 2)
b) Improvement and
augmentation of sewerage
network
98% 100%
Delhi Jal Board 286NA : Not Available
NR : Not Responded
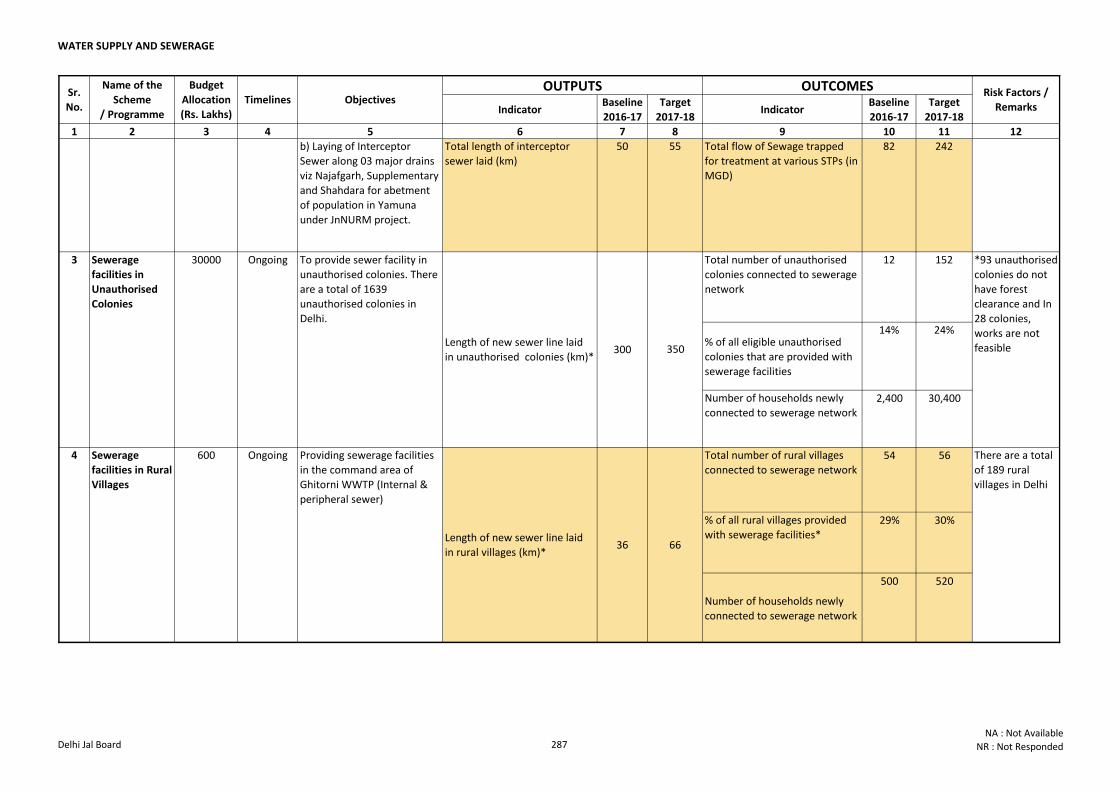
WATER SUPPLY AND SEWERAGE
Indicator Baseline
2016-17
Target
2017-18Indicator
Baseline
2016-17
Target
2017-18
1 2 3 4 5 6 7 8 9 10 11 12
Objectives
Name of the
Scheme
/ Programme
OUTCOMESOUTPUTS Risk Factors /
Remarks
Sr.
No.
Budget
Allocation
(Rs. Lakhs)
Timelines
b) Laying of Interceptor
Sewer along 03 major drains
viz Najafgarh, Supplementary
and Shahdara for abetment
of population in Yamuna
under JnNURM project.
Total length of interceptor
sewer laid (km)
50 55 Total flow of Sewage trapped
for treatment at various STPs (in
MGD)
82 242
Total number of unauthorised
colonies connected to sewerage
network
12 152
% of all eligible unauthorised
colonies that are provided with
sewerage facilities
14% 24%
Number of households newly
connected to sewerage network2,400 30,400
Total number of rural villages
connected to sewerage network54 56
% of all rural villages provided
with sewerage facilities*29% 30%
Number of households newly
connected to sewerage network
500 520
Providing sewerage facilities
in the command area of
Ghitorni WWTP (Internal &
peripheral sewer)
Length of new sewer line laid
in rural villages (km)*36
2 Jawaharlal
Nehru National
Urban Renewal
Mission
(JnNURM)
projects
1000 Ongoing
3 Sewerage
facilities in
Unauthorised
Colonies
30000 Ongoing
4 Sewerage
facilities in Rural
Villages
600 Ongoing
To provide sewer facility in
unauthorised colonies. There
are a total of 1639
unauthorised colonies in
Delhi.
Length of new sewer line laid
in unauthorised colonies (km)*300
*93 unauthorised
colonies do not
have forest
clearance and In
28 colonies,
works are not
feasible350
66
There are a total
of 189 rural
villages in Delhi
Delhi Jal Board 287NA : Not Available
NR : Not Responded
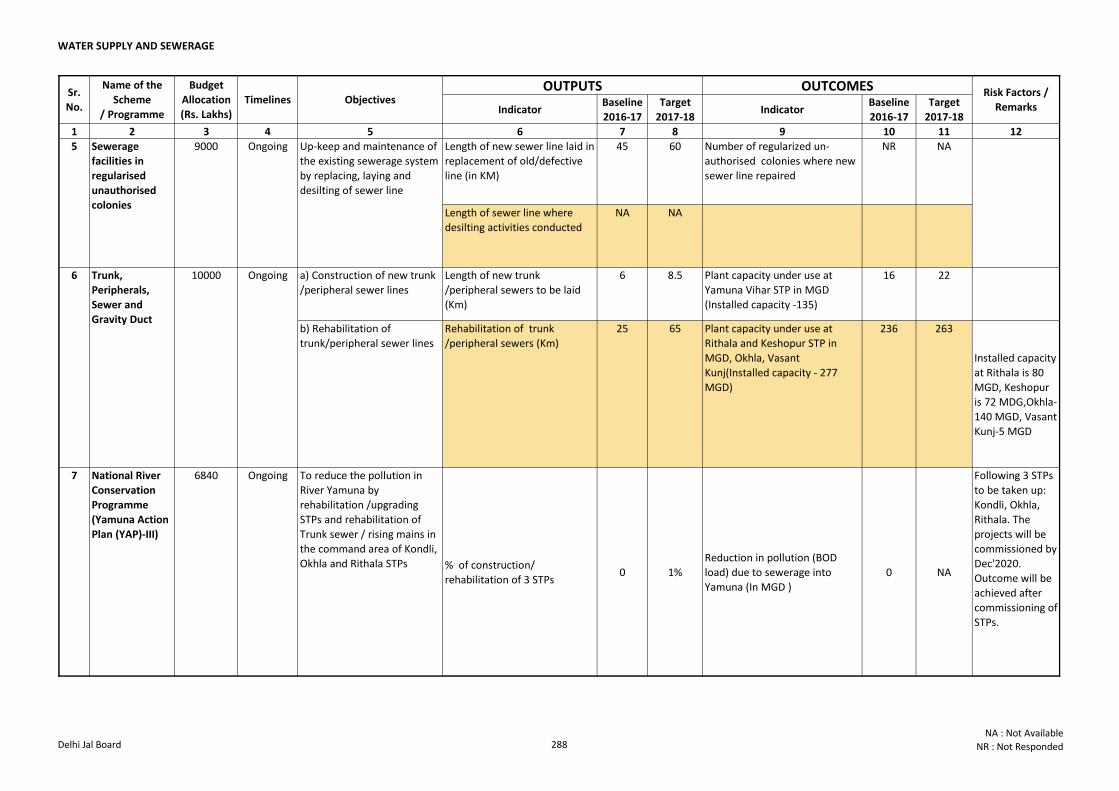
WATER SUPPLY AND SEWERAGE
Indicator Baseline
2016-17
Target
2017-18Indicator
Baseline
2016-17
Target
2017-18
1 2 3 4 5 6 7 8 9 10 11 12
Objectives
Name of the
Scheme
/ Programme
OUTCOMESOUTPUTS Risk Factors /
Remarks
Sr.
No.
Budget
Allocation
(Rs. Lakhs)
Timelines
Length of new sewer line laid in
replacement of old/defective
line (in KM)
45 60 Number of regularized un-
authorised colonies where new
sewer line repaired
NR NA
Length of sewer line where
desilting activities conducted
NA NA
a) Construction of new trunk
/peripheral sewer lines
Length of new trunk
/peripheral sewers to be laid
(Km)
6 8.5 Plant capacity under use at
Yamuna Vihar STP in MGD
(Installed capacity -135)
16 22
b) Rehabilitation of
trunk/peripheral sewer lines
Rehabilitation of trunk
/peripheral sewers (Km)
25 65 Plant capacity under use at
Rithala and Keshopur STP in
MGD, Okhla, Vasant
Kunj(Installed capacity - 277
MGD)
236 263
Installed capacity
at Rithala is 80
MGD, Keshopur
is 72 MDG,Okhla-
140 MGD, Vasant
Kunj-5 MGD
% of construction/
rehabilitation of 3 STPs 0 1%
Reduction in pollution (BOD
load) due to sewerage into
Yamuna (In MGD )
0 NA
Following 3 STPs
to be taken up:
Kondli, Okhla,
Rithala. The
projects will be
commissioned by
Dec'2020.
Outcome will be
achieved after
commissioning of
STPs.
Sewerage
facilities in
regularised
unauthorised
colonies
Up-keep and maintenance of
the existing sewerage system
by replacing, laying and
desilting of sewer line
9000 Ongoing
6 Trunk,
Peripherals,
Sewer and
Gravity Duct
10000 Ongoing
National River
Conservation
Programme
(Yamuna Action
Plan (YAP)-III)
6840 Ongoing To reduce the pollution in
River Yamuna by
rehabilitation /upgrading
STPs and rehabilitation of
Trunk sewer / rising mains in
the command area of Kondli,
Okhla and Rithala STPs
5
7
Delhi Jal Board 288NA : Not Available
NR : Not Responded
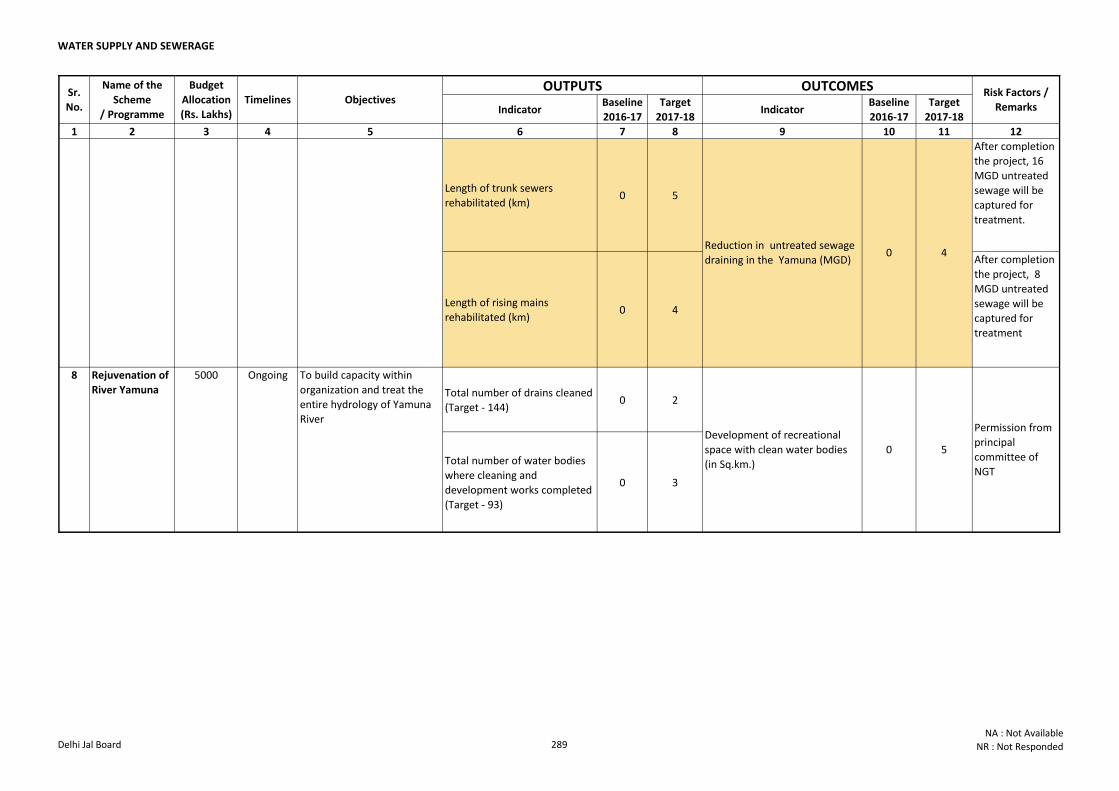
WATER SUPPLY AND SEWERAGE
Indicator Baseline
2016-17
Target
2017-18Indicator
Baseline
2016-17
Target
2017-18
1 2 3 4 5 6 7 8 9 10 11 12
Objectives
Name of the
Scheme
/ Programme
OUTCOMESOUTPUTS Risk Factors /
Remarks
Sr.
No.
Budget
Allocation
(Rs. Lakhs)
Timelines
Length of trunk sewers
rehabilitated (km)0 5
After completion
the project, 16
MGD untreated
sewage will be
captured for
treatment.
Length of rising mains
rehabilitated (km)0 4
After completion
the project, 8
MGD untreated
sewage will be
captured for
treatment
Total number of drains cleaned
(Target - 144)0 2
Total number of water bodies
where cleaning and
development works completed
(Target - 93)
0 3
Development of recreational
space with clean water bodies
(in Sq.km.)
0 5
8 To build capacity within
organization and treat the
entire hydrology of Yamuna
River
Rejuvenation of
River Yamuna
5000 Ongoing
Permission from
principal
committee of
NGT
National River
Conservation
Programme
(Yamuna Action
Plan (YAP)-III)
6840 Ongoing To reduce the pollution in
River Yamuna by
rehabilitation /upgrading
STPs and rehabilitation of
Trunk sewer / rising mains in
the command area of Kondli,
Okhla and Rithala STPs
Reduction in untreated sewage
draining in the Yamuna (MGD)0 4
7
Delhi Jal Board 289NA : Not Available
NR : Not Responded
INFRASTRUCTUREIN
FR
AS
TR
UC
TU
RE
INFR
AS
TR
UC
TU
RE
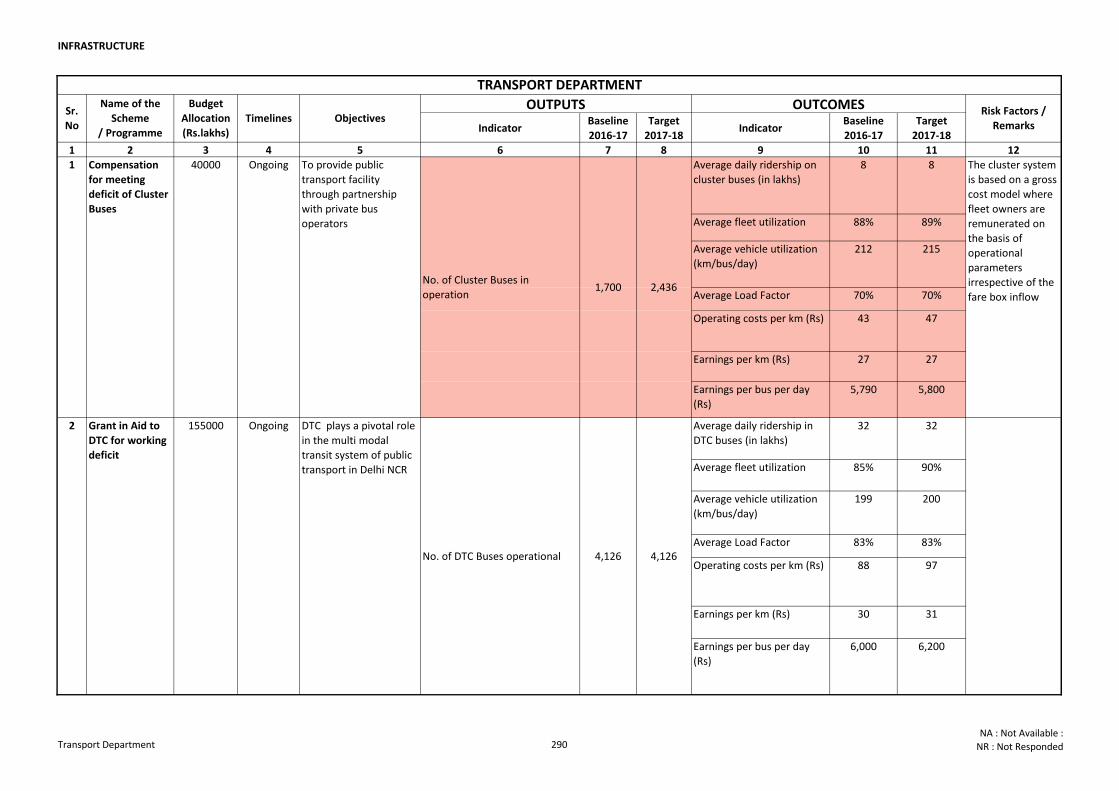
INFRASTRUCTURE
Indicator Baseline
2016-17
Target
2017-18Indicator
Baseline
2016-17
Target
2017-18
1 2 3 4 5 6 7 8 9 10 11 12
Average daily ridership on
cluster buses (in lakhs)
8 8
Average fleet utilization 88% 89%
Average vehicle utilization
(km/bus/day)
212 215
Average Load Factor 70% 70%
Operating costs per km (Rs) 43 47
Earnings per km (Rs) 27 27
Earnings per bus per day
(Rs)
5,790 5,800
Average daily ridership in
DTC buses (in lakhs)
32 32
Average fleet utilization 85% 90%
Average vehicle utilization
(km/bus/day)
199 200
Average Load Factor 83% 83%
Operating costs per km (Rs) 88 97
Earnings per km (Rs) 30 31
Earnings per bus per day
(Rs)
6,000 6,200
The cluster system
is based on a gross
cost model where
fleet owners are
remunerated on
the basis of
operational
parameters
irrespective of the
fare box inflow
Ongoing DTC plays a pivotal role
in the multi modal
transit system of public
transport in Delhi NCR
No. of DTC Buses operational 4,126 4,126
OUTPUTS OUTCOMES
TRANSPORT DEPARTMENT
Timelines Objectives Risk Factors /
Remarks
Sr.
No
Name of the
Scheme
/ Programme
Budget
Allocation
(Rs.lakhs)
1,700 2,436
To provide public
transport facility
through partnership
with private bus
operators
2 Grant in Aid to
DTC for working
deficit
155000
Ongoing1 Compensation
for meeting
deficit of Cluster
Buses
40000
No. of Cluster Buses in
operation
Transport Department 290NA : Not Available :
NR : Not Responded
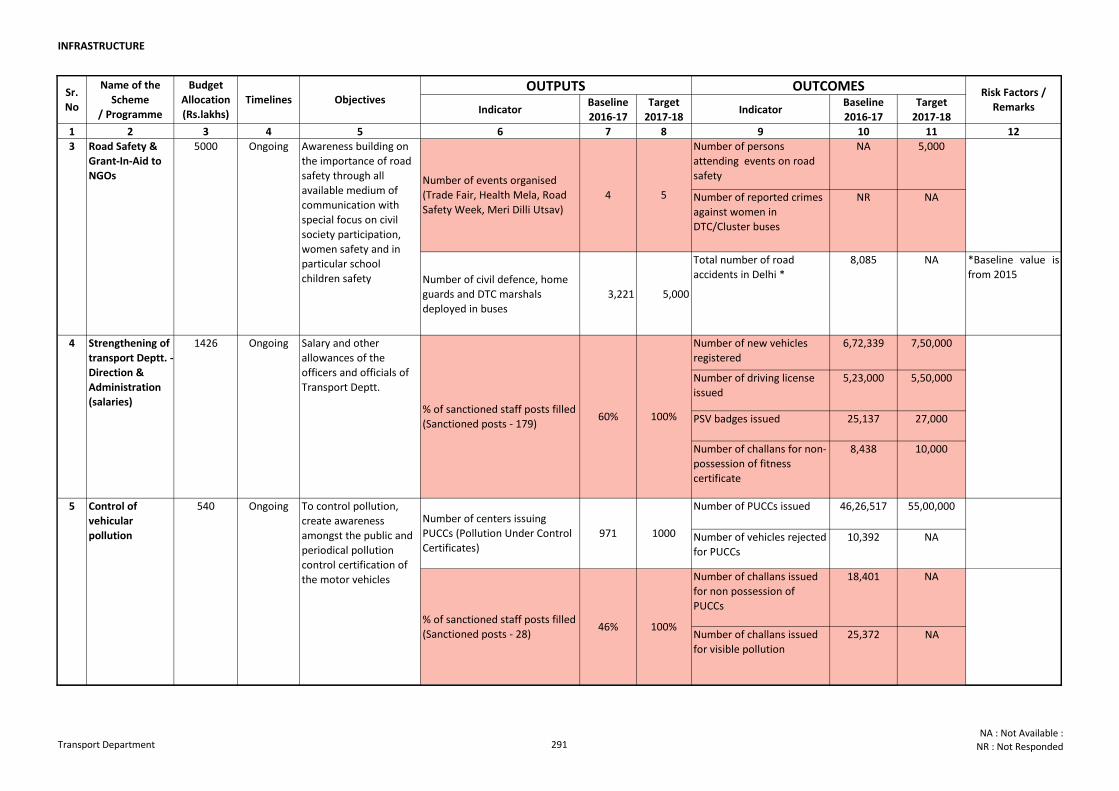
INFRASTRUCTURE
Indicator Baseline
2016-17
Target
2017-18Indicator
Baseline
2016-17
Target
2017-18
1 2 3 4 5 6 7 8 9 10 11 12
OUTPUTS OUTCOMESTimelines Objectives
Risk Factors /
Remarks
Sr.
No
Name of the
Scheme
/ Programme
Budget
Allocation
(Rs.lakhs)
Number of persons
attending events on road
safety
NA 5,000
Number of reported crimes
against women in
DTC/Cluster buses
NR NA
Number of civil defence, home
guards and DTC marshals
deployed in buses
3,221 5,000
Total number of road
accidents in Delhi *
8,085 NA *Baseline value is
from 2015
Number of new vehicles
registered
6,72,339 7,50,000
Number of driving license
issued
5,23,000 5,50,000
PSV badges issued 25,137 27,000
Number of challans for non-
possession of fitness
certificate
8,438 10,000
Number of PUCCs issued 46,26,517 55,00,000
Number of vehicles rejected
for PUCCs
10,392 NA
Number of challans issued
for non possession of
PUCCs
18,401 NA
Number of challans issued
for visible pollution
25,372 NA
Number of centers issuing
PUCCs (Pollution Under Control
Certificates)
971 1000
5 Control of
vehicular
pollution
540 Ongoing To control pollution,
create awareness
amongst the public and
periodical pollution
control certification of
the motor vehicles
Salary and other
allowances of the
officers and officials of
Transport Deptt.
% of sanctioned staff posts filled
(Sanctioned posts - 28)46% 100%
Awareness building on
the importance of road
safety through all
available medium of
communication with
special focus on civil
society participation,
women safety and in
particular school
children safety
Number of events organised
(Trade Fair, Health Mela, Road
Safety Week, Meri Dilli Utsav)
4 5
60% 100%% of sanctioned staff posts filled
(Sanctioned posts - 179)
4 Strengthening of
transport Deptt. -
Direction &
Administration
(salaries)
1426 Ongoing
Ongoing3 Road Safety &
Grant-In-Aid to
NGOs
5000
Transport Department 291NA : Not Available :
NR : Not Responded
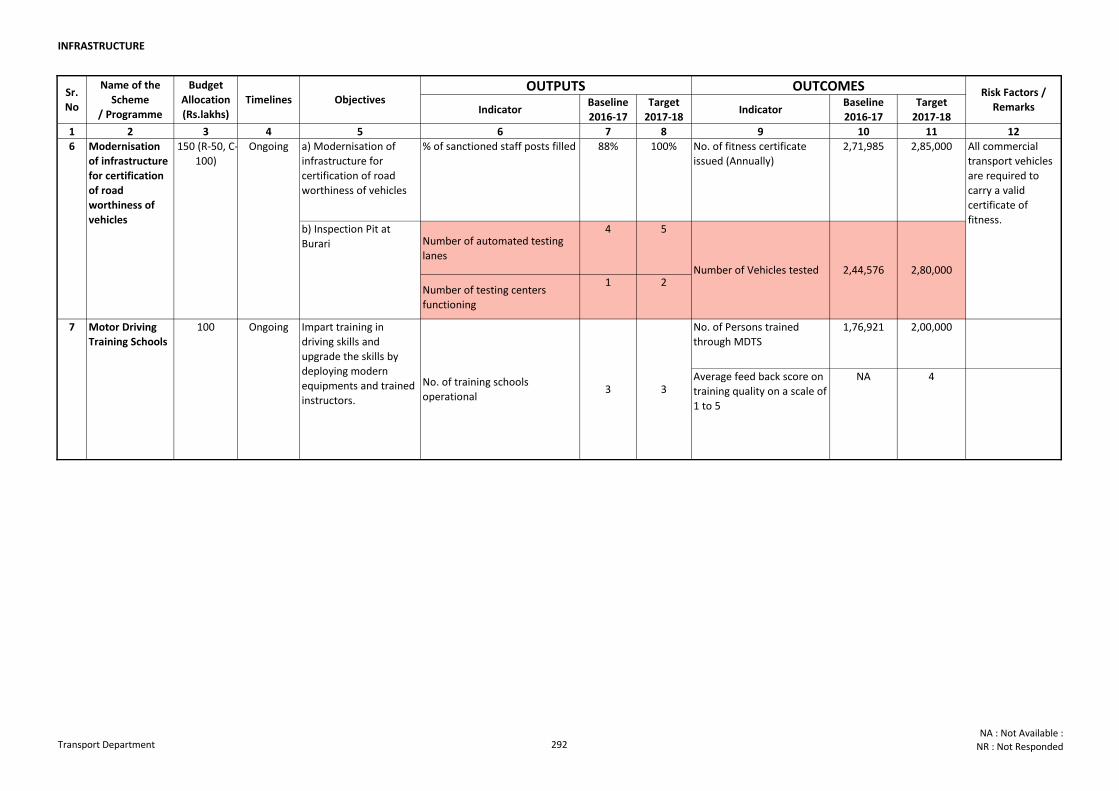
INFRASTRUCTURE
Indicator Baseline
2016-17
Target
2017-18Indicator
Baseline
2016-17
Target
2017-18
1 2 3 4 5 6 7 8 9 10 11 12
OUTPUTS OUTCOMESTimelines Objectives
Risk Factors /
Remarks
Sr.
No
Name of the
Scheme
/ Programme
Budget
Allocation
(Rs.lakhs)
a) Modernisation of
infrastructure for
certification of road
worthiness of vehicles
% of sanctioned staff posts filled 88% 100% No. of fitness certificate
issued (Annually)
2,71,985 2,85,000
Number of automated testing
lanes
4 5
Number of testing centers
functioning
1 2
No. of Persons trained
through MDTS
1,76,921 2,00,000
Average feed back score on
training quality on a scale of
1 to 5
NA 4
7 Motor Driving
Training Schools
100 Ongoing Impart training in
driving skills and
upgrade the skills by
deploying modern
equipments and trained
instructors.
No. of training schools
operational 3 3
All commercial
transport vehicles
are required to
carry a valid
certificate of
fitness.
Number of Vehicles tested 2,44,576 2,80,000
6 Modernisation
of infrastructure
for certification
of road
worthiness of
vehicles
150 (R-50, C-
100)
Ongoing
b) Inspection Pit at
Burari
Transport Department 292NA : Not Available :
NR : Not Responded
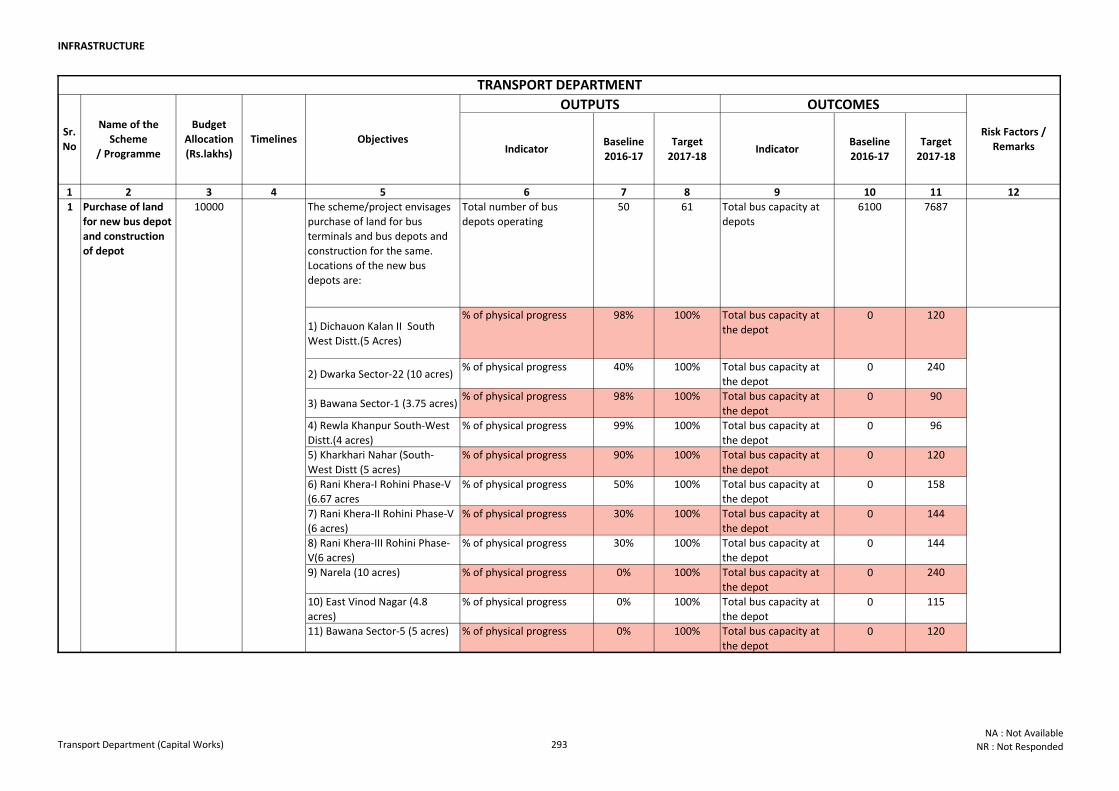
INFRASTRUCTURE
Indicator Baseline
2016-17
Target
2017-18Indicator
Baseline
2016-17
Target
2017-18
1 2 3 4 5 6 7 8 9 10 11 12
The scheme/project envisages
purchase of land for bus
terminals and bus depots and
construction for the same.
Locations of the new bus
depots are:
Total number of bus
depots operating
50 61 Total bus capacity at
depots
6100 7687
1) Dichauon Kalan II South
West Distt.(5 Acres)
% of physical progress 98% 100% Total bus capacity at
the depot 0 120
2) Dwarka Sector-22 (10 acres)% of physical progress 40% 100% Total bus capacity at
the depot 0 240
3) Bawana Sector-1 (3.75 acres)% of physical progress 98% 100% Total bus capacity at
the depot 0 90
4) Rewla Khanpur South-West
Distt.(4 acres)
% of physical progress 99% 100% Total bus capacity at
the depot 0 96
5) Kharkhari Nahar (South-
West Distt (5 acres)
% of physical progress 90% 100% Total bus capacity at
the depot 0 120
6) Rani Khera-I Rohini Phase-V
(6.67 acres
% of physical progress 50% 100% Total bus capacity at
the depot 0 158
7) Rani Khera-II Rohini Phase-V
(6 acres)
% of physical progress 30% 100% Total bus capacity at
the depot 0 144
8) Rani Khera-III Rohini Phase-
V(6 acres)
% of physical progress 30% 100% Total bus capacity at
the depot 0 144
9) Narela (10 acres) % of physical progress 0% 100% Total bus capacity at
the depot 0 240
10) East Vinod Nagar (4.8
acres)
% of physical progress 0% 100% Total bus capacity at
the depot 0 115
11) Bawana Sector-5 (5 acres) % of physical progress 0% 100% Total bus capacity at
the depot 0 120
OUTPUTS OUTCOMES
Risk Factors /
Remarks
TRANSPORT DEPARTMENT
1 Purchase of land
for new bus depot
and construction
of depot
10000
Objectives Sr.
No
Name of the
Scheme
/ Programme
Budget
Allocation
(Rs.lakhs)
Timelines
Transport Department (Capital Works) 293NA : Not Available
NR : Not Responded
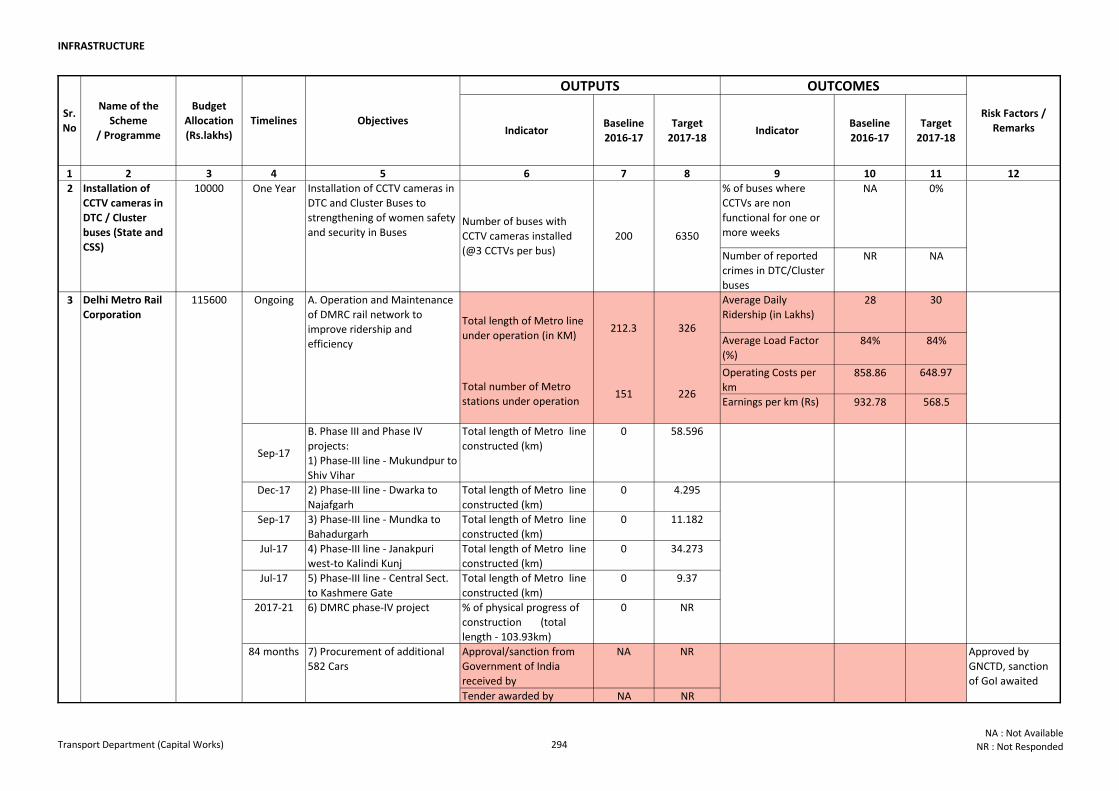
INFRASTRUCTURE
Indicator Baseline
2016-17
Target
2017-18Indicator
Baseline
2016-17
Target
2017-18
1 2 3 4 5 6 7 8 9 10 11 12
OUTPUTS OUTCOMES
Risk Factors /
RemarksObjectives
Sr.
No
Name of the
Scheme
/ Programme
Budget
Allocation
(Rs.lakhs)
Timelines
% of buses where
CCTVs are non
functional for one or
more weeks
NA 0%
Number of reported
crimes in DTC/Cluster
buses
NR NA
Average Daily
Ridership (in Lakhs)28 30
Average Load Factor
(%)84% 84%
Operating Costs per
km858.86 648.97
Sep-17
B. Phase III and Phase IV
projects:
1) Phase-III line - Mukundpur to
Shiv Vihar
Total length of Metro line
constructed (km)
0 58.596
Dec-17 2) Phase-III line - Dwarka to
Najafgarh
Total length of Metro line
constructed (km)
0 4.295
Sep-17 3) Phase-III line - Mundka to
Bahadurgarh
Total length of Metro line
constructed (km)
0 11.182
Jul-17 4) Phase-III line - Janakpuri
west-to Kalindi Kunj
Total length of Metro line
constructed (km)
0 34.273
Jul-17 5) Phase-III line - Central Sect.
to Kashmere Gate
Total length of Metro line
constructed (km)
0 9.37
2017-21 6) DMRC phase-IV project % of physical progress of
construction (total
length - 103.93km)
0 NR
Approval/sanction from
Government of India
received by
NA NR
Tender awarded by NA NR
A. Operation and Maintenance
of DMRC rail network to
improve ridership and
efficiency
Total length of Metro line
under operation (in KM)212.3 326
151 226
84 months 7) Procurement of additional
582 Cars
Earnings per km (Rs) 932.78 568.5
Total number of Metro
stations under operation
Approved by
GNCTD, sanction
of GoI awaited
2 Installation of
CCTV cameras in
DTC / Cluster
buses (State and
CSS)
10000 One Year Installation of CCTV cameras in
DTC and Cluster Buses to
strengthening of women safety
and security in BusesNumber of buses with
CCTV cameras installed
(@3 CCTVs per bus)
200 6350
3 Delhi Metro Rail
Corporation
115600 Ongoing
Transport Department (Capital Works) 294NA : Not Available
NR : Not Responded
INFR
AS
TR
UC
TU
RE
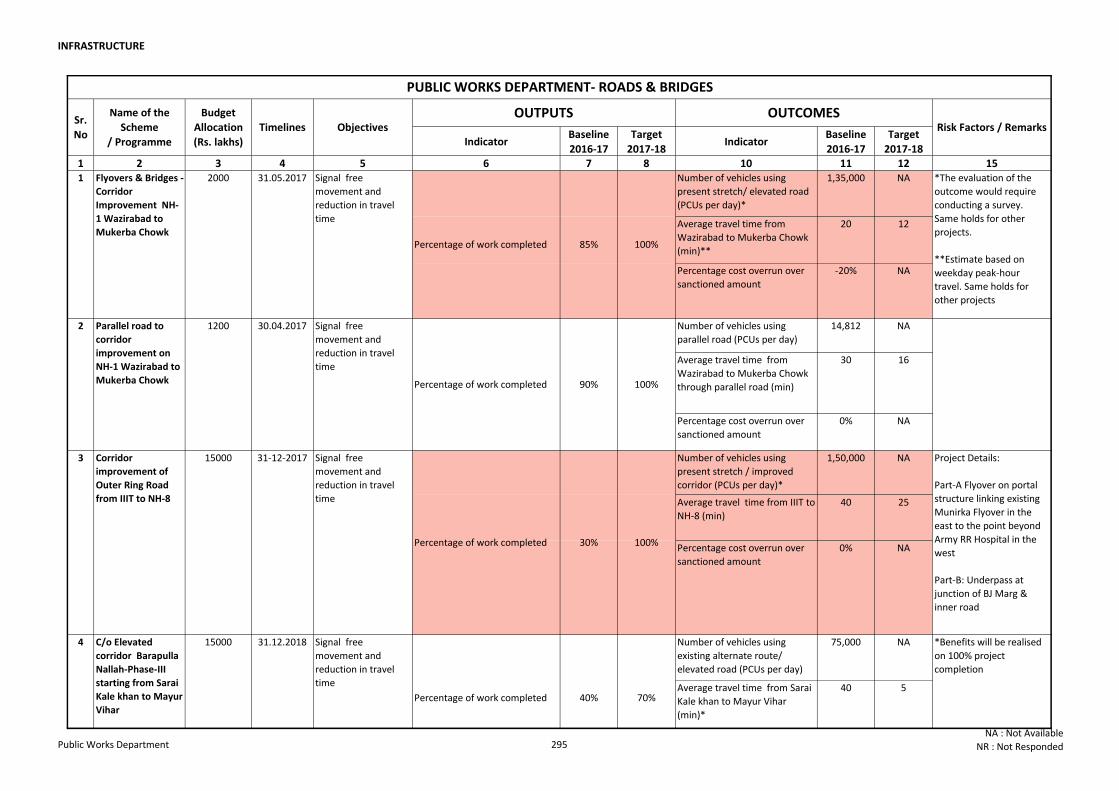
INFRASTRUCTURE
Indicator Baseline
2016-17
Target
2017-18Indicator
Baseline
2016-17
Target
2017-181 2 3 4 5 6 7 8 10 11 12 15
Number of vehicles using
present stretch/ elevated road
(PCUs per day)*
1,35,000 NA
Average travel time from
Wazirabad to Mukerba Chowk
(min)**
20 12
Percentage cost overrun over
sanctioned amount
-20% NA
Number of vehicles using
parallel road (PCUs per day)
14,812 NA
Average travel time from
Wazirabad to Mukerba Chowk
through parallel road (min)
30 16
Percentage cost overrun over
sanctioned amount
0% NA
Number of vehicles using
present stretch / improved
corridor (PCUs per day)*
1,50,000 NA
Average travel time from IIIT to
NH-8 (min)
40 25
Percentage cost overrun over
sanctioned amount
0% NA
Number of vehicles using
existing alternate route/
elevated road (PCUs per day)
75,000 NA
Average travel time from Sarai
Kale khan to Mayur Vihar
(min)*
40 5
*Benefits will be realised
on 100% project
completion
Percentage of work completed 85% 100%
Percentage of work completed 30%
31.05.2017
30.04.2017
31-12-2017
31.12.2018
2 Parallel road to
corridor
improvement on
NH-1 Wazirabad to
Mukerba Chowk
1200 Signal free
movement and
reduction in travel
time
4 Signal free
movement and
reduction in travel
time
Risk Factors / Remarks
C/o Elevated
corridor Barapulla
Nallah-Phase-III
starting from Sarai
Kale khan to Mayur
Vihar
15000
3 Corridor
improvement of
Outer Ring Road
from IIIT to NH-8
15000 Signal free
movement and
reduction in travel
time
Project Details:
Part-A Flyover on portal
structure linking existing
Munirka Flyover in the
east to the point beyond
Army RR Hospital in the
west
Part-B: Underpass at
junction of BJ Marg &
inner road
*The evaluation of the
outcome would require
conducting a survey.
Same holds for other
projects.
**Estimate based on
weekday peak-hour
travel. Same holds for
other projects
1
100%
Sr.
No
Name of the
Scheme
/ Programme
Budget
Allocation
(Rs. lakhs)
Timelines Objectives
Flyovers & Bridges -
Corridor
Improvement NH-
1 Wazirabad to
Mukerba Chowk
2000 Signal free
movement and
reduction in travel
time
Percentage of work completed
100%
Percentage of work completed 40% 70%
90%
PUBLIC WORKS DEPARTMENT- ROADS & BRIDGES
OUTPUTS OUTCOMES
Public Works Department 295NA : Not Available
NR : Not Responded
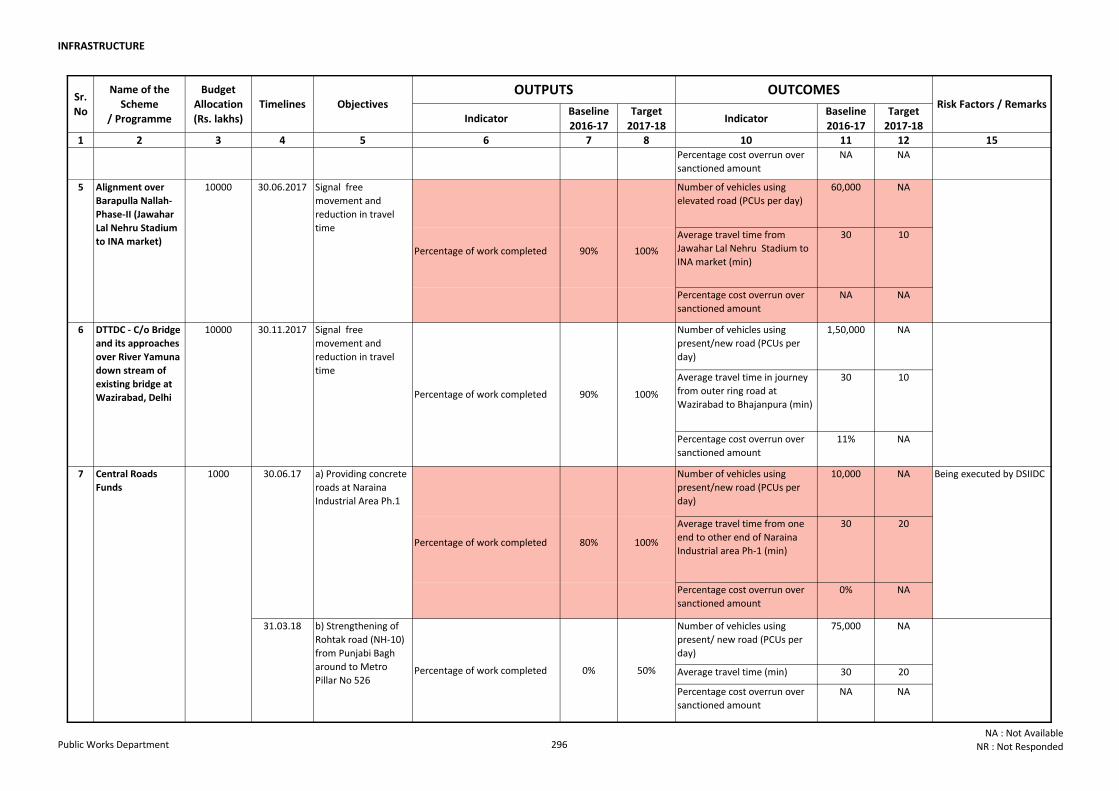
INFRASTRUCTURE
Indicator Baseline
2016-17
Target
2017-18Indicator
Baseline
2016-17
Target
2017-181 2 3 4 5 6 7 8 10 11 12 15
Risk Factors / RemarksSr.
No
Name of the
Scheme
/ Programme
Budget
Allocation
(Rs. lakhs)
Timelines Objectives OUTPUTS OUTCOMES
Percentage cost overrun over
sanctioned amount
NA NA
Number of vehicles using
elevated road (PCUs per day)
60,000 NA
Average travel time from
Jawahar Lal Nehru Stadium to
INA market (min)
30 10
Percentage cost overrun over
sanctioned amount
NA NA
Number of vehicles using
present/new road (PCUs per
day)
1,50,000 NA
Average travel time in journey
from outer ring road at
Wazirabad to Bhajanpura (min)
30 10
Percentage cost overrun over
sanctioned amount
11% NA
Number of vehicles using
present/new road (PCUs per
day)
10,000 NA
Average travel time from one
end to other end of Naraina
Industrial area Ph-1 (min)
30 20
Percentage cost overrun over
sanctioned amount
0% NA
Number of vehicles using
present/ new road (PCUs per
day)
75,000 NA
Average travel time (min) 30 20
Percentage cost overrun over
sanctioned amount
NA NA
*Benefits will be realised
on 100% project
completion
Being executed by DSIIDC
Percentage of work completed 80% 100%
Percentage of work completed 90% 100%
30.06.17 a) Providing concrete
roads at Naraina
Industrial Area Ph.1
Percentage of work completed 90% 100%
31.12.2018
30.06.2017
30.11.2017
31.03.18 b) Strengthening of
Rohtak road (NH-10)
from Punjabi Bagh
around to Metro
Pillar No 526Percentage of work completed 0% 50%
7 Central Roads
Funds
1000
6 DTTDC - C/o Bridge
and its approaches
over River Yamuna
down stream of
existing bridge at
Wazirabad, Delhi
10000
5 Alignment over
Barapulla Nallah-
Phase-II (Jawahar
Lal Nehru Stadium
to INA market)
10000 Signal free
movement and
reduction in travel
time
4 Signal free
movement and
reduction in travel
time
C/o Elevated
corridor Barapulla
Nallah-Phase-III
starting from Sarai
Kale khan to Mayur
Vihar
15000
Percentage of work completed 40% 70%
Signal free
movement and
reduction in travel
time
Public Works Department 296NA : Not Available
NR : Not Responded
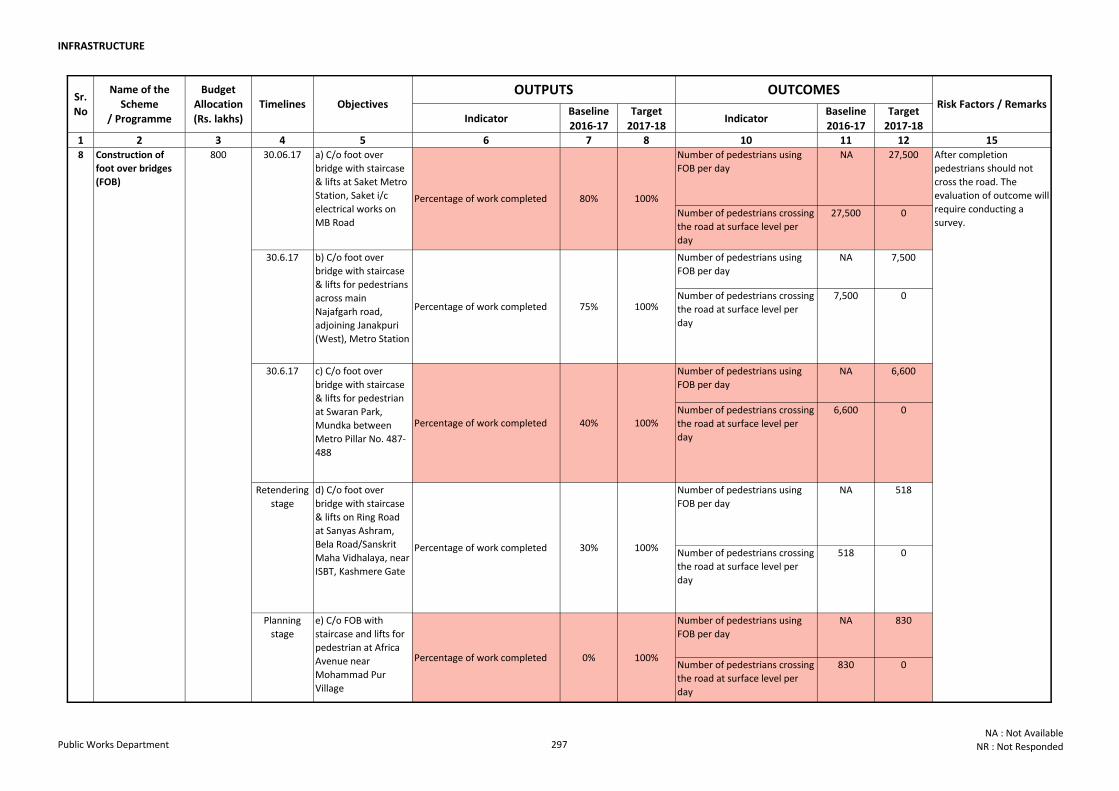
INFRASTRUCTURE
Indicator Baseline
2016-17
Target
2017-18Indicator
Baseline
2016-17
Target
2017-181 2 3 4 5 6 7 8 10 11 12 15
Risk Factors / RemarksSr.
No
Name of the
Scheme
/ Programme
Budget
Allocation
(Rs. lakhs)
Timelines Objectives OUTPUTS OUTCOMES
Number of pedestrians using
FOB per day
NA 27,500
Number of pedestrians crossing
the road at surface level per
day
27,500 0
Number of pedestrians using
FOB per day
NA 7,500
Number of pedestrians crossing
the road at surface level per
day
7,500 0
Number of pedestrians using
FOB per day
NA 6,600
Number of pedestrians crossing
the road at surface level per
day
6,600 0
Number of pedestrians using
FOB per day
NA 518
Number of pedestrians crossing
the road at surface level per
day
518 0
Number of pedestrians using
FOB per day
NA 830
Number of pedestrians crossing
the road at surface level per
day
830 0100%
After completion
pedestrians should not
cross the road. The
evaluation of outcome will
require conducting a
survey.
100%
40% 100%
Planning
stage
Percentage of work completed 0%
100%
30.6.17 b) C/o foot over
bridge with staircase
& lifts for pedestrians
across main
Najafgarh road,
adjoining Janakpuri
(West), Metro Station
100%
Percentage of work completed
a) C/o foot over
bridge with staircase
& lifts at Saket Metro
Station, Saket i/c
electrical works on
MB Road
30.06.17
Percentage of work completed 80%
75%
Retendering
stage
d) C/o foot over
bridge with staircase
& lifts on Ring Road
at Sanyas Ashram,
Bela Road/Sanskrit
Maha Vidhalaya, near
ISBT, Kashmere Gate
Percentage of work completed
c) C/o foot over
bridge with staircase
& lifts for pedestrian
at Swaran Park,
Mundka between
Metro Pillar No. 487-
488
Percentage of work completed 30%
30.6.17
e) C/o FOB with
staircase and lifts for
pedestrian at Africa
Avenue near
Mohammad Pur
Village
Construction of
foot over bridges
(FOB)
8 800
Public Works Department 297NA : Not Available
NR : Not Responded
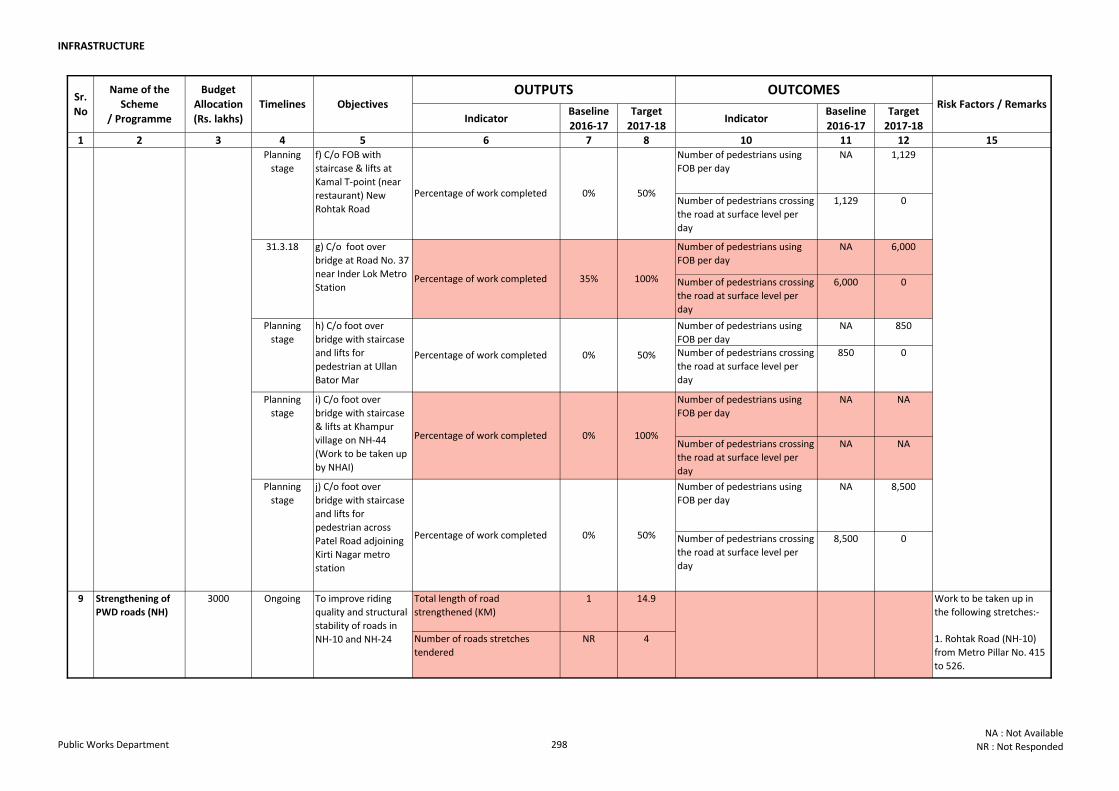
INFRASTRUCTURE
Indicator Baseline
2016-17
Target
2017-18Indicator
Baseline
2016-17
Target
2017-181 2 3 4 5 6 7 8 10 11 12 15
Risk Factors / RemarksSr.
No
Name of the
Scheme
/ Programme
Budget
Allocation
(Rs. lakhs)
Timelines Objectives OUTPUTS OUTCOMES
Number of pedestrians using
FOB per day
NA 1,129
Number of pedestrians crossing
the road at surface level per
day
1,129 0
Number of pedestrians using
FOB per day
NA 6,000
Number of pedestrians crossing
the road at surface level per
day
6,000 0
Number of pedestrians using
FOB per day
NA 850
Number of pedestrians crossing
the road at surface level per
day
850 0
Number of pedestrians using
FOB per day
NA NA
Number of pedestrians crossing
the road at surface level per
day
NA NA
Number of pedestrians using
FOB per day
NA 8,500
Number of pedestrians crossing
the road at surface level per
day
8,500 0
Total length of road
strengthened (KM)
1 14.9 Work to be taken up in
the following stretches:-
Number of roads stretches
tendered
NR 4 1. Rohtak Road (NH-10)
from Metro Pillar No. 415
to 526.
i) C/o foot over
bridge with staircase
& lifts at Khampur
village on NH-44
(Work to be taken up
by NHAI)
35% 100%
0% 50%
After completion
pedestrians should not
cross the road. The
evaluation of outcome will
require conducting a
survey.
% of road stretches where
construction completed in
deadline as per Work Order
NA 100%
100%
0% 50%
50%
0%
31.3.18
Planning
stage
Planning
stage
Planning
stage
f) C/o FOB with
staircase & lifts at
Kamal T-point (near
restaurant) New
Rohtak Road
Ongoing9
Percentage of work completed
Percentage of work completed
Percentage of work completed
Percentage of work completed
Planning
stage
j) C/o foot over
bridge with staircase
and lifts for
pedestrian across
Patel Road adjoining
Kirti Nagar metro
station
h) C/o foot over
bridge with staircase
and lifts for
pedestrian at Ullan
Bator Mar
Percentage of work completed
Strengthening of
PWD roads (NH)
3000 To improve riding
quality and structural
stability of roads in
NH-10 and NH-24
g) C/o foot over
bridge at Road No. 37
near Inder Lok Metro
Station
0%
Construction of
foot over bridges
(FOB)
8 800
Public Works Department 298NA : Not Available
NR : Not Responded
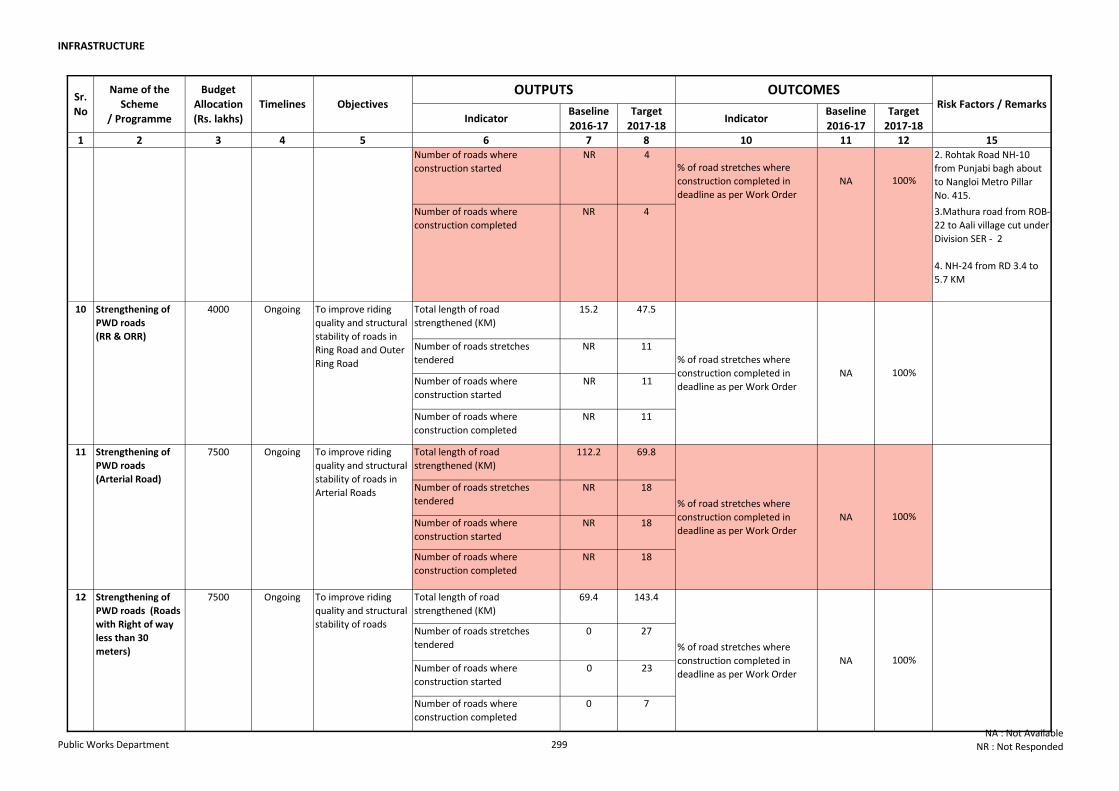
INFRASTRUCTURE
Indicator Baseline
2016-17
Target
2017-18Indicator
Baseline
2016-17
Target
2017-181 2 3 4 5 6 7 8 10 11 12 15
Risk Factors / RemarksSr.
No
Name of the
Scheme
/ Programme
Budget
Allocation
(Rs. lakhs)
Timelines Objectives OUTPUTS OUTCOMES
Number of roads where
construction started
NR 4 2. Rohtak Road NH-10
from Punjabi bagh about
to Nangloi Metro Pillar
No. 415.
Number of roads where
construction completed
NR 4 3.Mathura road from ROB-
22 to Aali village cut under
Division SER - 2
4. NH-24 from RD 3.4 to
5.7 KM
Total length of road
strengthened (KM)
15.2 47.5
Number of roads stretches
tendered
NR 11
Number of roads where
construction started
NR 11
Number of roads where
construction completed
NR 11
Total length of road
strengthened (KM)
112.2 69.8
Number of roads stretches
tendered
NR 18
Number of roads where
construction started
NR 18
Number of roads where
construction completed
NR 18
Total length of road
strengthened (KM)
69.4 143.4
Number of roads stretches
tendered
0 27
Number of roads where
construction started
0 23
Number of roads where
construction completed
0 7
% of road stretches where
construction completed in
deadline as per Work Order
NA 100%
To improve riding
quality and structural
stability of roads in
Arterial Roads
7500
% of road stretches where
construction completed in
deadline as per Work Order
NA
Ongoing
Ongoing
% of road stretches where
construction completed in
deadline as per Work Order
NA 100%
100%% of road stretches where
construction completed in
deadline as per Work Order
NA
10 Strengthening of
PWD roads
(RR & ORR)
4000 To improve riding
quality and structural
stability of roads in
Ring Road and Outer
Ring Road
Ongoing
11 Strengthening of
PWD roads
(Arterial Road)
9 Strengthening of
PWD roads (NH)
3000 To improve riding
quality and structural
stability of roads in
NH-10 and NH-24
12 Strengthening of
PWD roads (Roads
with Right of way
less than 30
meters)
7500 Ongoing
100%
To improve riding
quality and structural
stability of roads
Public Works Department 299NA : Not Available
NR : Not Responded
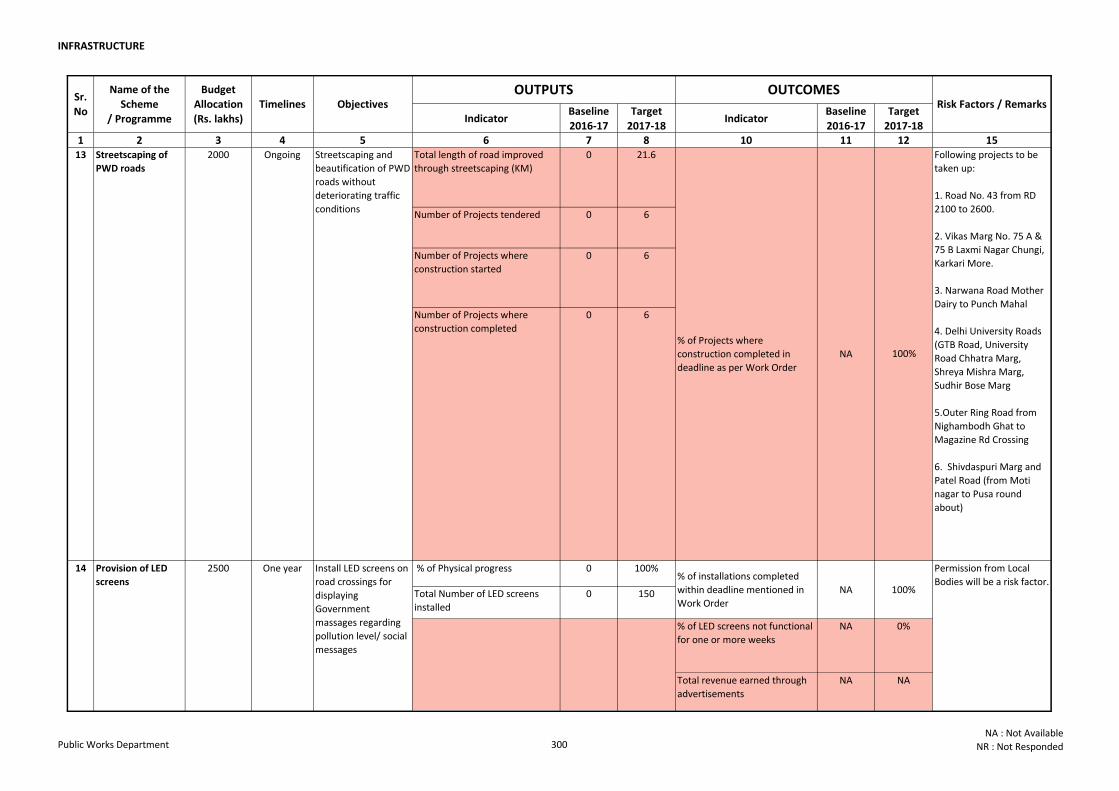
INFRASTRUCTURE
Indicator Baseline
2016-17
Target
2017-18Indicator
Baseline
2016-17
Target
2017-181 2 3 4 5 6 7 8 10 11 12 15
Risk Factors / RemarksSr.
No
Name of the
Scheme
/ Programme
Budget
Allocation
(Rs. lakhs)
Timelines Objectives OUTPUTS OUTCOMES
Total length of road improved
through streetscaping (KM)
0 21.6
Number of Projects tendered 0 6
Number of Projects where
construction started
0 6
% of Physical progress 0 100%
Total Number of LED screens
installed
0 150
% of LED screens not functional
for one or more weeks
NA 0%
Total revenue earned through
advertisements
NA NA
13 Streetscaping of
PWD roads
2000 Ongoing Streetscaping and
beautification of PWD
roads without
deteriorating traffic
conditions
Following projects to be
taken up:
1. Road No. 43 from RD
2100 to 2600.
2. Vikas Marg No. 75 A &
75 B Laxmi Nagar Chungi,
Karkari More.
3. Narwana Road Mother
Dairy to Punch Mahal
4. Delhi University Roads
(GTB Road, University
Road Chhatra Marg,
Shreya Mishra Marg,
Sudhir Bose Marg
5.Outer Ring Road from
Nighambodh Ghat to
Magazine Rd Crossing
6. Shivdaspuri Marg and
Patel Road (from Moti
nagar to Pusa round
about)
Permission from Local
Bodies will be a risk factor.
One year14 Provision of LED
screens
2500 Install LED screens on
road crossings for
displaying
Government
massages regarding
pollution level/ social
messages
NA 100%
NA 100%
Number of Projects where
construction completed
0 6
% of Projects where
construction completed in
deadline as per Work Order
% of installations completed
within deadline mentioned in
Work Order
Public Works Department 300NA : Not Available
NR : Not Responded
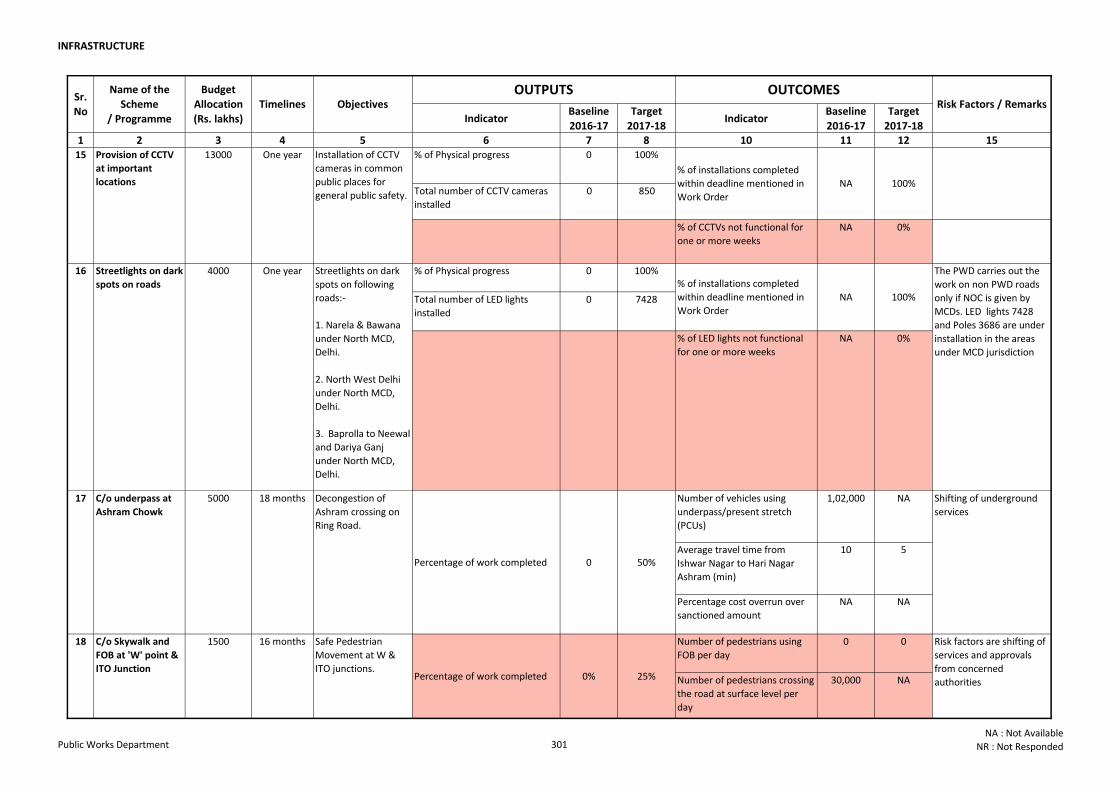
INFRASTRUCTURE
Indicator Baseline
2016-17
Target
2017-18Indicator
Baseline
2016-17
Target
2017-181 2 3 4 5 6 7 8 10 11 12 15
Risk Factors / RemarksSr.
No
Name of the
Scheme
/ Programme
Budget
Allocation
(Rs. lakhs)
Timelines Objectives OUTPUTS OUTCOMES
% of Physical progress 0 100%
Total number of CCTV cameras
installed
0 850
% of CCTVs not functional for
one or more weeks
NA 0%
% of Physical progress 0 100%
Total number of LED lights
installed
0 7428
% of LED lights not functional
for one or more weeks
NA 0%
Number of vehicles using
underpass/present stretch
(PCUs)
1,02,000 NA
Average travel time from
Ishwar Nagar to Hari Nagar
Ashram (min)
10 5
Percentage cost overrun over
sanctioned amount
NA NA
Number of pedestrians using
FOB per day
0 0
Number of pedestrians crossing
the road at surface level per
day
30,000 NA
Shifting of underground
services
Percentage of work completed 0
18 months
One year
One year
5000 Decongestion of
Ashram crossing on
Ring Road.
Risk factors are shifting of
services and approvals
from concerned
authorities
15 Provision of CCTV
at important
locations
13000 Installation of CCTV
cameras in common
public places for
general public safety.
The PWD carries out the
work on non PWD roads
only if NOC is given by
MCDs. LED lights 7428
and Poles 3686 are under
installation in the areas
under MCD jurisdiction
Streetlights on dark
spots on roads
4000 Streetlights on dark
spots on following
roads:-
1. Narela & Bawana
under North MCD,
Delhi.
2. North West Delhi
under North MCD,
Delhi.
3. Baprolla to Neewal
and Dariya Ganj
under North MCD,
Delhi.
17
16
C/o underpass at
Ashram Chowk
1500 Safe Pedestrian
Movement at W &
ITO junctions.
18 16 monthsC/o Skywalk and
FOB at 'W' point &
ITO Junction
% of installations completed
within deadline mentioned in
Work Order
NA
0%
50%
100%
% of installations completed
within deadline mentioned in
Work Order
NA 100%
25%Percentage of work completed
Public Works Department 301NA : Not Available
NR : Not Responded
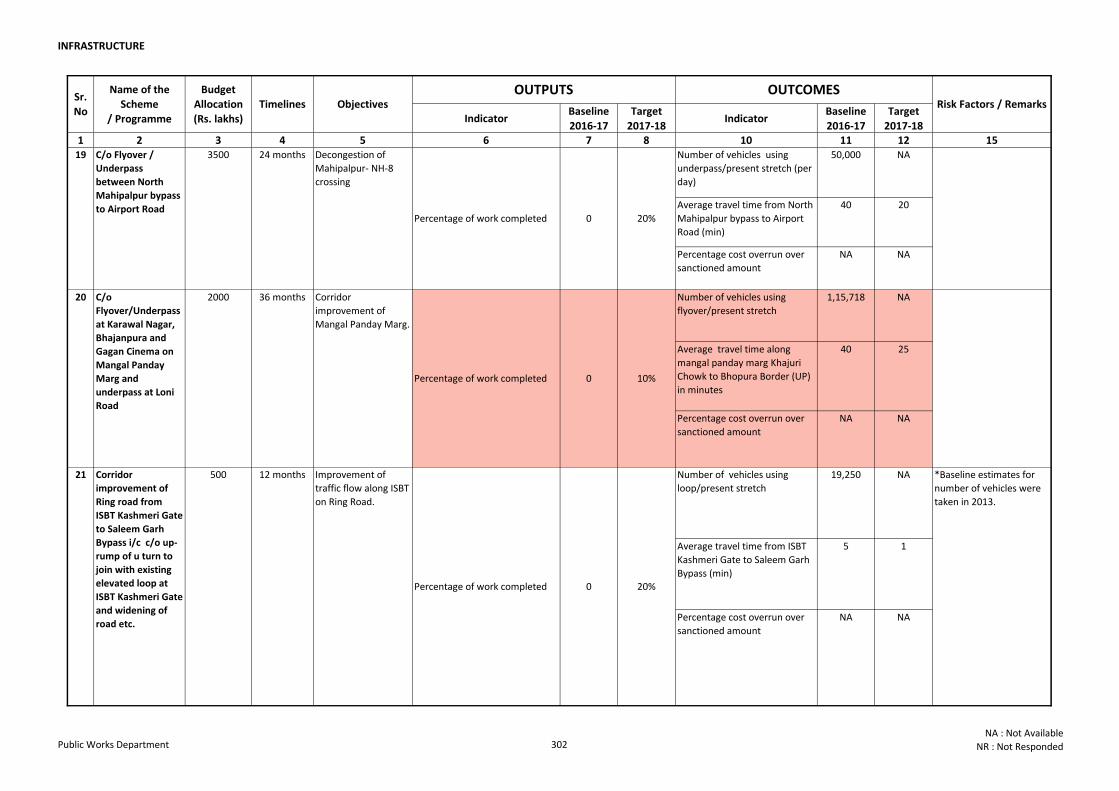
INFRASTRUCTURE
Indicator Baseline
2016-17
Target
2017-18Indicator
Baseline
2016-17
Target
2017-181 2 3 4 5 6 7 8 10 11 12 15
Risk Factors / RemarksSr.
No
Name of the
Scheme
/ Programme
Budget
Allocation
(Rs. lakhs)
Timelines Objectives OUTPUTS OUTCOMES
Number of vehicles using
underpass/present stretch (per
day)
50,000 NA
Average travel time from North
Mahipalpur bypass to Airport
Road (min)
40 20
Percentage cost overrun over
sanctioned amount
NA NA
Number of vehicles using
flyover/present stretch
1,15,718 NA
Average travel time along
mangal panday marg Khajuri
Chowk to Bhopura Border (UP)
in minutes
40 25
Percentage cost overrun over
sanctioned amount
NA NA
Number of vehicles using
loop/present stretch
19,250 NA
Average travel time from ISBT
Kashmeri Gate to Saleem Garh
Bypass (min)
5 1
Percentage cost overrun over
sanctioned amount
NA NA
36 months
12 months
2000 Corridor
improvement of
Mangal Panday Marg.
3500 Decongestion of
Mahipalpur- NH-8
crossing
21 Corridor
improvement of
Ring road from
ISBT Kashmeri Gate
to Saleem Garh
Bypass i/c c/o up-
rump of u turn to
join with existing
elevated loop at
ISBT Kashmeri Gate
and widening of
road etc.
500 Improvement of
traffic flow along ISBT
on Ring Road.
24 months
20
19
C/o
Flyover/Underpass
at Karawal Nagar,
Bhajanpura and
Gagan Cinema on
Mangal Panday
Marg and
underpass at Loni
Road
C/o Flyover /
Underpass
between North
Mahipalpur bypass
to Airport Road
Percentage of work completed 0 10%
*Baseline estimates for
number of vehicles were
taken in 2013.
Percentage of work completed 0 20%
Percentage of work completed 0 20%
Public Works Department 302NA : Not Available
NR : Not Responded
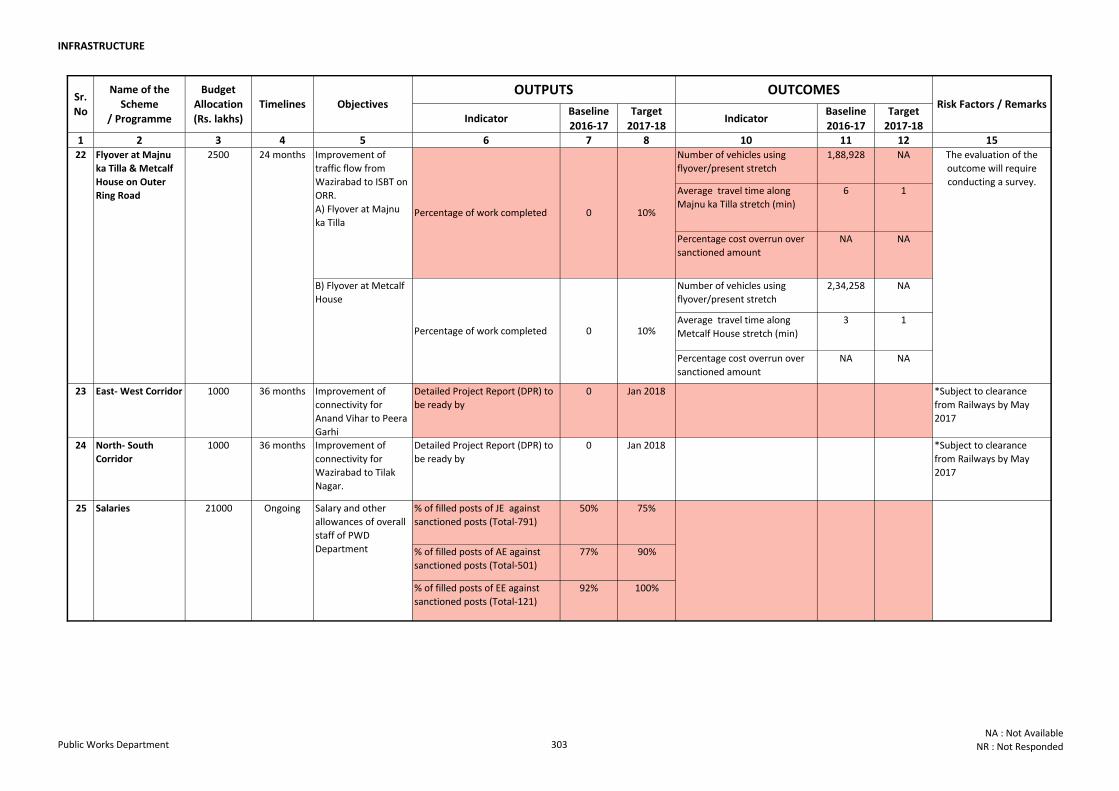
INFRASTRUCTURE
Indicator Baseline
2016-17
Target
2017-18Indicator
Baseline
2016-17
Target
2017-181 2 3 4 5 6 7 8 10 11 12 15
Risk Factors / RemarksSr.
No
Name of the
Scheme
/ Programme
Budget
Allocation
(Rs. lakhs)
Timelines Objectives OUTPUTS OUTCOMES
Number of vehicles using
flyover/present stretch
1,88,928 NA
Average travel time along
Majnu ka Tilla stretch (min)
6 1
Percentage cost overrun over
sanctioned amount
NA NA
Number of vehicles using
flyover/present stretch
2,34,258 NA
Average travel time along
Metcalf House stretch (min)
3 1
Percentage cost overrun over
sanctioned amount
NA NA
23 East- West Corridor 1000 36 months Improvement of
connectivity for
Anand Vihar to Peera
Garhi
Detailed Project Report (DPR) to
be ready by
0 Jan 2018 *Subject to clearance
from Railways by May
2017
24 North- South
Corridor
1000 36 months Improvement of
connectivity for
Wazirabad to Tilak
Nagar.
Detailed Project Report (DPR) to
be ready by
0 Jan 2018 *Subject to clearance
from Railways by May
2017
% of filled posts of JE against
sanctioned posts (Total-791)
50% 75%
% of filled posts of AE against
sanctioned posts (Total-501)
77% 90%
% of filled posts of EE against
sanctioned posts (Total-121)
92% 100%
24 months
Ongoing
22 Flyover at Majnu
ka Tilla & Metcalf
House on Outer
Ring Road
2500
B) Flyover at Metcalf
House
Salaries 21000 Salary and other
allowances of overall
staff of PWD
Department
Improvement of
traffic flow from
Wazirabad to ISBT on
ORR.
A) Flyover at Majnu
ka Tilla
25
Percentage of work completed 0 10%
Percentage of work completed 0
The evaluation of the
outcome will require
conducting a survey.
10%
Public Works Department 303NA : Not Available
NR : Not Responded
INFR
AS
TR
UC
TU
RE
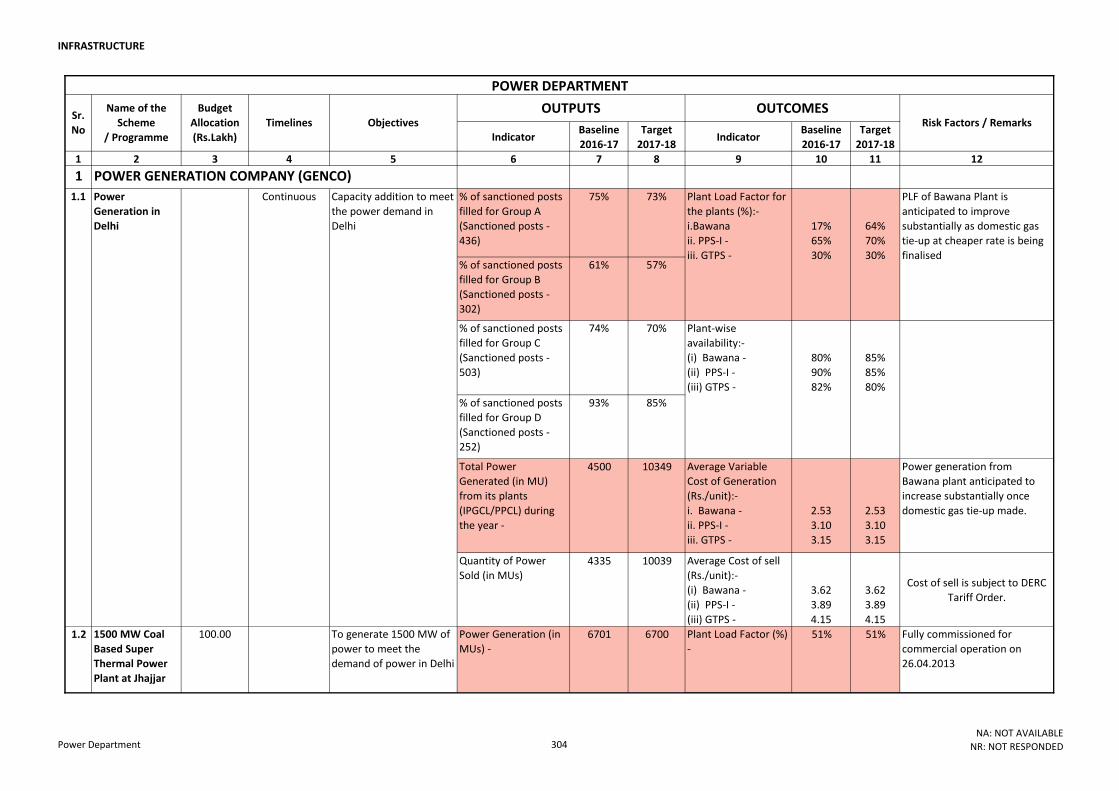
INFRASTRUCTURE
Indicator Baseline
2016-17
Target
2017-18Indicator
Baseline
2016-17
Target
2017-18
1 2 3 4 5 6 7 8 9 10 11 12
1 POWER GENERATION COMPANY (GENCO)
% of sanctioned posts
filled for Group A
(Sanctioned posts -
436)
75% 73%
% of sanctioned posts
filled for Group B
(Sanctioned posts -
302)
61% 57%
% of sanctioned posts
filled for Group C
(Sanctioned posts -
503)
74% 70%
% of sanctioned posts
filled for Group D
(Sanctioned posts -
252)
93% 85%
Total Power
Generated (in MU)
from its plants
(IPGCL/PPCL) during
the year -
4500 10349 Average Variable
Cost of Generation
(Rs./unit):-
i. Bawana -
ii. PPS-I -
iii. GTPS -
2.53
3.10
3.15
2.53
3.10
3.15
Power generation from
Bawana plant anticipated to
increase substantially once
domestic gas tie-up made.
Quantity of Power
Sold (in MUs) 4335 10039 Average Cost of sell
(Rs./unit):-
(i) Bawana -
(ii) PPS-I -
(iii) GTPS -
3.62
3.89
4.15
3.62
3.89
4.15
Cost of sell is subject to DERC
Tariff Order.
Plant Load Factor (%)
- 51% 51% Fully commissioned for
commercial operation on
26.04.2013
Objectives
Power
Generation in
Delhi
Capacity addition to meet
the power demand in
Delhi
OUTPUTS OUTCOMESRisk Factors / Remarks
POWER DEPARTMENT
Sr.
No
Name of the
Scheme
/ Programme
Budget
Allocation
(Rs.Lakh)
Timelines
1500 MW Coal
Based Super
Thermal Power
Plant at Jhajjar
100.00 Power Generation (in
MUs) -
To generate 1500 MW of
power to meet the
demand of power in Delhi
Plant Load Factor for
the plants (%):-
i.Bawana
ii. PPS-I -
iii. GTPS -
17%
65%
30%
80%
90%
82%
Plant-wise
availability:-
(i) Bawana -
(ii) PPS-I -
(iii) GTPS -
6701 67001.2
1.1 Continuous
64%
70%
30%
PLF of Bawana Plant is
anticipated to improve
substantially as domestic gas
tie-up at cheaper rate is being
finalised
85%
85%
80%
Power Department 304NA: NOT AVAILABLE
NR: NOT RESPONDED
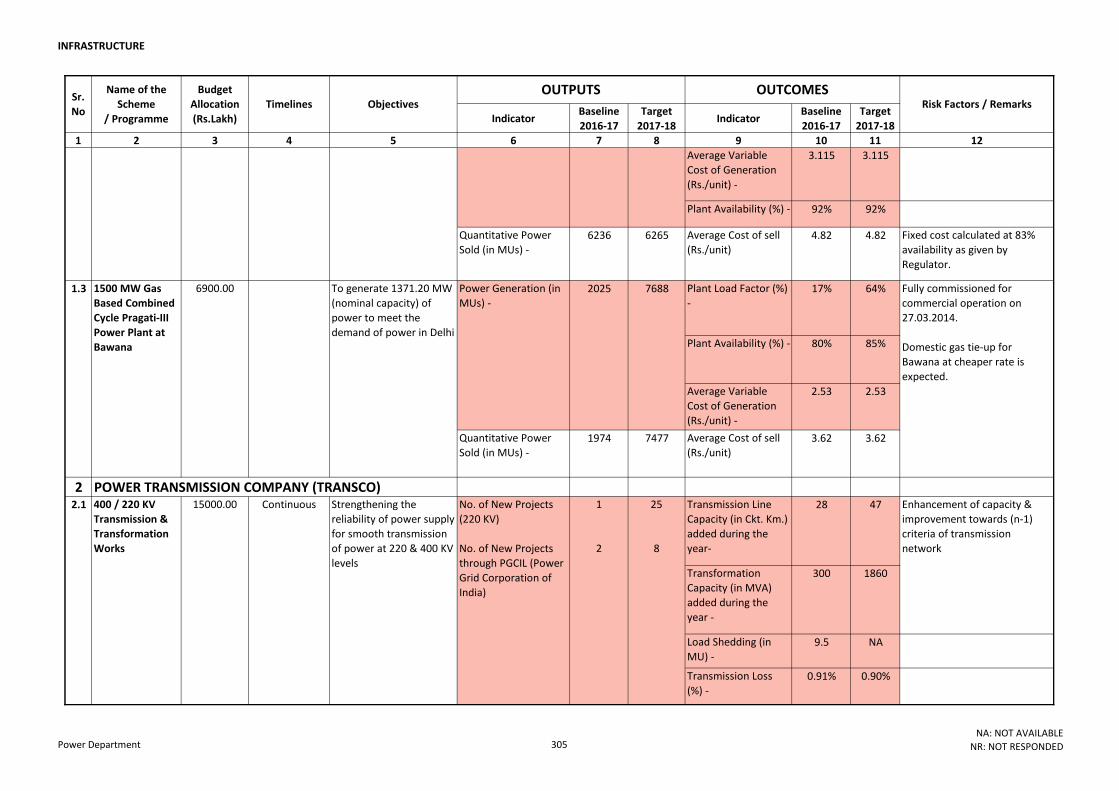
INFRASTRUCTURE
Indicator Baseline
2016-17
Target
2017-18Indicator
Baseline
2016-17
Target
2017-18
1 2 3 4 5 6 7 8 9 10 11 12
Objectives OUTPUTS OUTCOMES
Risk Factors / RemarksSr.
No
Name of the
Scheme
/ Programme
Budget
Allocation
(Rs.Lakh)
Timelines
Average Variable
Cost of Generation
(Rs./unit) -
3.115 3.115
Plant Availability (%) - 92% 92%
Quantitative Power
Sold (in MUs) - 6236 6265 Average Cost of sell
(Rs./unit)4.82 4.82 Fixed cost calculated at 83%
availability as given by
Regulator.
Plant Load Factor (%)
- 17% 64%
Plant Availability (%) - 80% 85%
Average Variable
Cost of Generation
(Rs./unit) -
2.53 2.53
Quantitative Power
Sold (in MUs) - 1974 7477 Average Cost of sell
(Rs./unit)3.62 3.62
2 POWER TRANSMISSION COMPANY (TRANSCO)Transmission Line
Capacity (in Ckt. Km.)
added during the
year-
28 47
Transformation
Capacity (in MVA)
added during the
year -
300 1860
Load Shedding (in
MU) -9.5 NA
Transmission Loss
(%) -0.91% 0.90%
No. of New Projects
(220 KV)
No. of New Projects
through PGCIL (Power
Grid Corporation of
India)
1500 MW Gas
Based Combined
Cycle Pragati-III
Power Plant at
Bawana
1.3
Strengthening the
reliability of power supply
for smooth transmission
of power at 220 & 400 KV
levels
Power Generation (in
MUs) -
2.1
7688
1
2
25
8
To generate 1371.20 MW
(nominal capacity) of
power to meet the
demand of power in Delhi
1500 MW Coal
Based Super
Thermal Power
Plant at Jhajjar
100.00 Power Generation (in
MUs) -
400 / 220 KV
Transmission &
Transformation
Works
15000.00 Continuous
To generate 1500 MW of
power to meet the
demand of power in Delhi
6900.00 2025
6701 67001.2
Fully commissioned for
commercial operation on
27.03.2014.
Domestic gas tie-up for
Bawana at cheaper rate is
expected.
Enhancement of capacity &
improvement towards (n-1)
criteria of transmission
network
Power Department 305NA: NOT AVAILABLE
NR: NOT RESPONDED
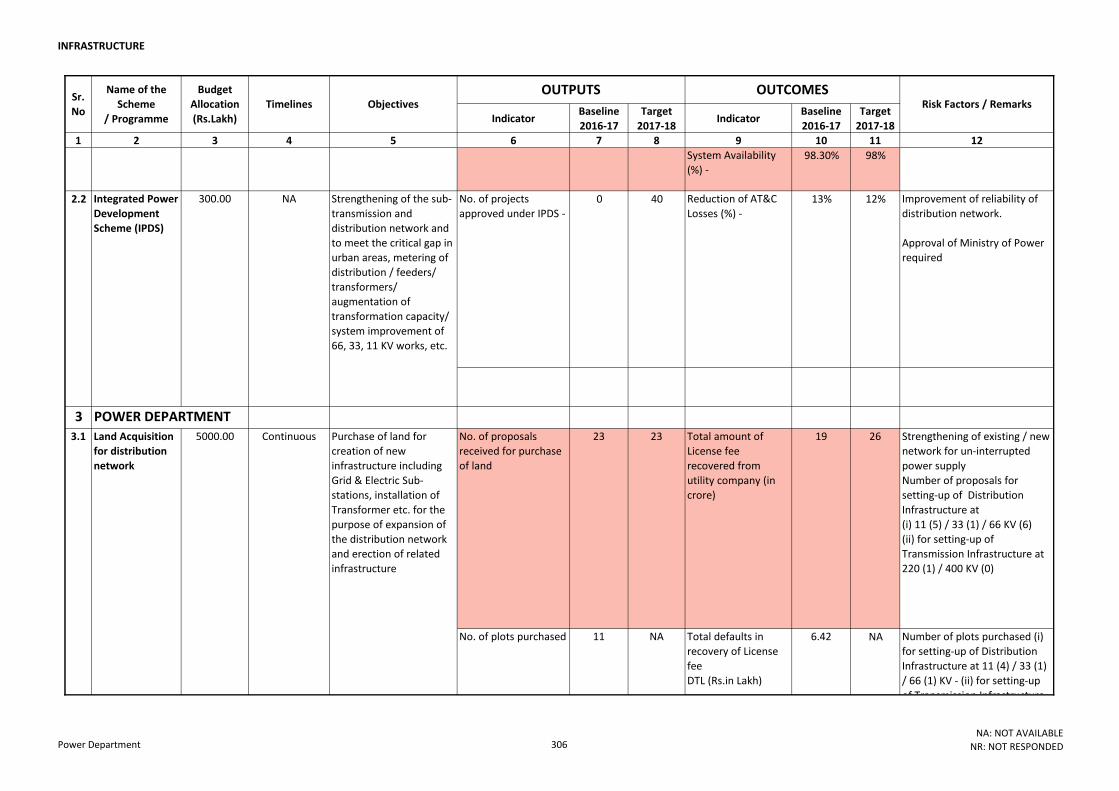
INFRASTRUCTURE
Indicator Baseline
2016-17
Target
2017-18Indicator
Baseline
2016-17
Target
2017-18
1 2 3 4 5 6 7 8 9 10 11 12
Objectives OUTPUTS OUTCOMES
Risk Factors / RemarksSr.
No
Name of the
Scheme
/ Programme
Budget
Allocation
(Rs.Lakh)
Timelines
System Availability
(%) -98.30% 98%
No. of projects
approved under IPDS -
0 40 Reduction of AT&C
Losses (%) -
13% 12% Improvement of reliability of
distribution network.
Approval of Ministry of Power
required
3 POWER DEPARTMENT
No. of proposals
received for purchase
of land
23 23 Total amount of
License fee
recovered from
utility company (in
crore)
19 26 Strengthening of existing / new
network for un-interrupted
power supply
Number of proposals for
setting-up of Distribution
Infrastructure at
(i) 11 (5) / 33 (1) / 66 KV (6)
(ii) for setting-up of
Transmission Infrastructure at
220 (1) / 400 KV (0)
Total defaults in
recovery of License
fee
DTL (Rs.in Lakh)
6.42 NA
No. of New Projects
(220 KV)
No. of New Projects
through PGCIL (Power
Grid Corporation of
India)
Strengthening the
reliability of power supply
for smooth transmission
of power at 220 & 400 KV
levels
2.1
ContinuousLand Acquisition
for distribution
network
5000.00
1
2
25
8
11 NANo. of plots purchased
Purchase of land for
creation of new
infrastructure including
Grid & Electric Sub-
stations, installation of
Transformer etc. for the
purpose of expansion of
the distribution network
and erection of related
infrastructure
Strengthening of the sub-
transmission and
distribution network and
to meet the critical gap in
urban areas, metering of
distribution / feeders/
transformers/
augmentation of
transformation capacity/
system improvement of
66, 33, 11 KV works, etc.
400 / 220 KV
Transmission &
Transformation
Works
15000.00 Continuous
NA300.00Integrated Power
Development
Scheme (IPDS)
2.2
3.1
Number of plots purchased (i)
for setting-up of Distribution
Infrastructure at 11 (4) / 33 (1)
/ 66 (1) KV - (ii) for setting-up
of Transmission Infrastructure
at 220 (2) / 400 KV (3)
Power Department 306NA: NOT AVAILABLE
NR: NOT RESPONDED
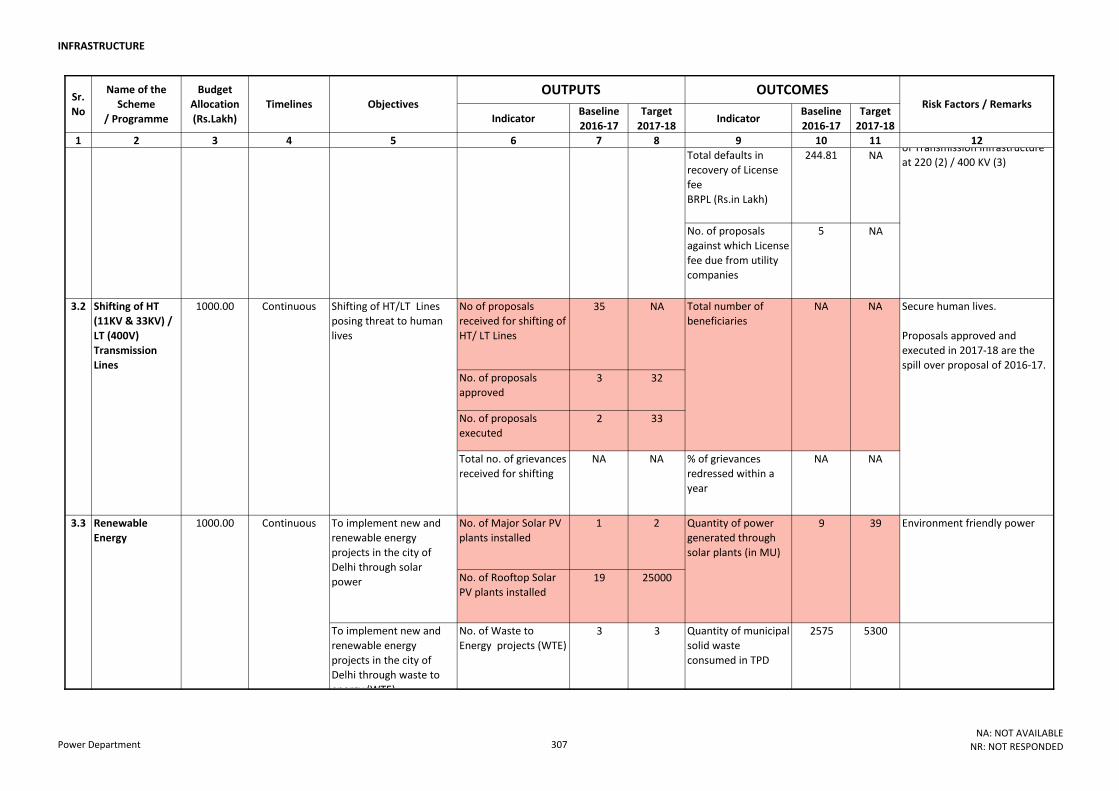
INFRASTRUCTURE
Indicator Baseline
2016-17
Target
2017-18Indicator
Baseline
2016-17
Target
2017-18
1 2 3 4 5 6 7 8 9 10 11 12
Objectives OUTPUTS OUTCOMES
Risk Factors / RemarksSr.
No
Name of the
Scheme
/ Programme
Budget
Allocation
(Rs.Lakh)
Timelines
Total defaults in
recovery of License
fee
BRPL (Rs.in Lakh)
244.81 NA
No. of proposals
against which License
fee due from utility
companies
5 NA
No of proposals
received for shifting of
HT/ LT Lines
35 NA
No. of proposals
approved3 32
No. of proposals
executed2 33
Total no. of grievances
received for shifting
NA NA % of grievances
redressed within a
year
NA NA
No. of Major Solar PV
plants installed
1 2
No. of Rooftop Solar
PV plants installed19 25000
No. of Waste to
Energy projects (WTE)3 3 Quantity of municipal
solid waste
consumed in TPD
2575 5300
3.2
Continuous1000.00Renewable
Energy
3.3
Shifting of HT
(11KV & 33KV) /
LT (400V)
Transmission
Lines
ContinuousLand Acquisition
for distribution
network
1000.00
5000.00
Continuous Shifting of HT/LT Lines
posing threat to human
lives
11 NA
To implement new and
renewable energy
projects in the city of
Delhi through waste to
energy (WTE)
No. of plots purchased
Purchase of land for
creation of new
infrastructure including
Grid & Electric Sub-
stations, installation of
Transformer etc. for the
purpose of expansion of
the distribution network
and erection of related
infrastructure
Quantity of power
generated through
solar plants (in MU)
Total number of
beneficiaries
9To implement new and
renewable energy
projects in the city of
Delhi through solar
power
3.1
39
NA
Environment friendly power
Number of plots purchased (i)
for setting-up of Distribution
Infrastructure at 11 (4) / 33 (1)
/ 66 (1) KV - (ii) for setting-up
of Transmission Infrastructure
at 220 (2) / 400 KV (3)
Secure human lives.
Proposals approved and
executed in 2017-18 are the
spill over proposal of 2016-17.
NA
Power Department 307NA: NOT AVAILABLE
NR: NOT RESPONDED
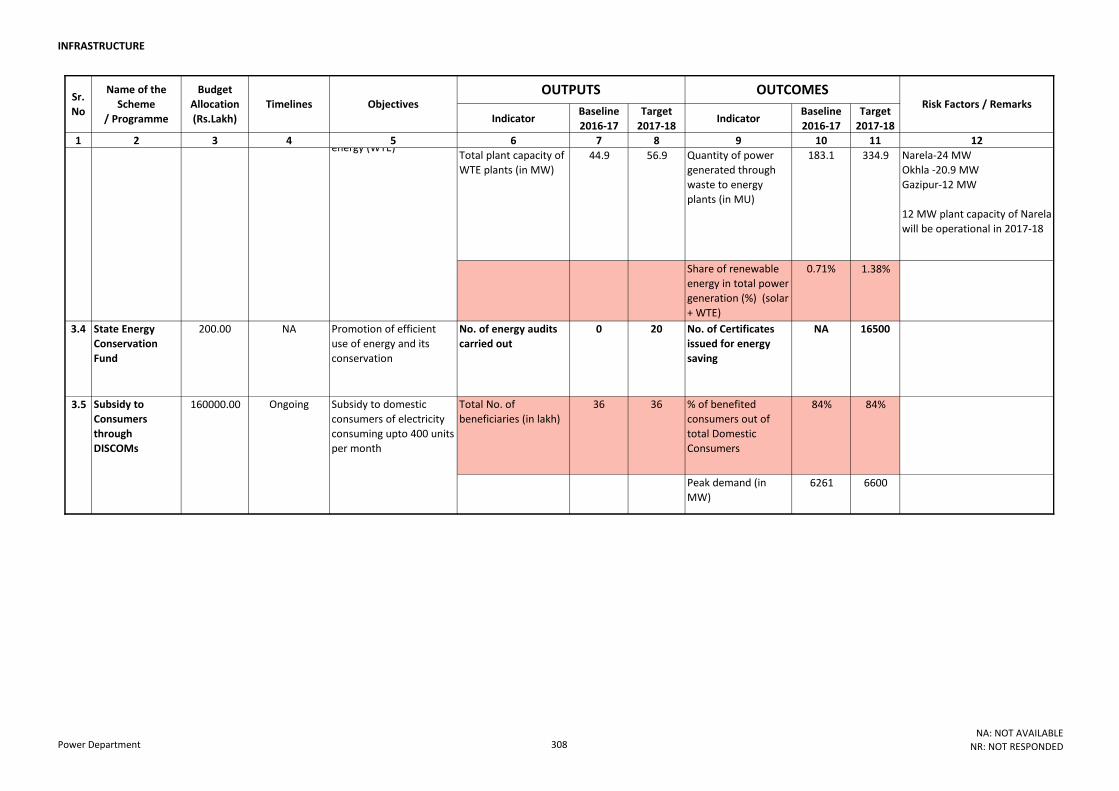
INFRASTRUCTURE
Indicator Baseline
2016-17
Target
2017-18Indicator
Baseline
2016-17
Target
2017-18
1 2 3 4 5 6 7 8 9 10 11 12
Objectives OUTPUTS OUTCOMES
Risk Factors / RemarksSr.
No
Name of the
Scheme
/ Programme
Budget
Allocation
(Rs.Lakh)
Timelines
Total plant capacity of
WTE plants (in MW)44.9 56.9 Quantity of power
generated through
waste to energy
plants (in MU)
183.1 334.9 Narela-24 MW
Okhla -20.9 MW
Gazipur-12 MW
12 MW plant capacity of Narela
will be operational in 2017-18
Share of renewable
energy in total power
generation (%) (solar
+ WTE)
0.71% 1.38%
3.4 State Energy
Conservation
Fund
200.00 NA Promotion of efficient
use of energy and its
conservation
No. of energy audits
carried out
0 20 No. of Certificates
issued for energy
saving
NA 16500
Total No. of
beneficiaries (in lakh)
36 36 % of benefited
consumers out of
total Domestic
Consumers
84% 84%
Peak demand (in
MW)6261 6600
3.5 Subsidy to
Consumers
through
DISCOMs
Continuous1000.00Renewable
Energy
3.3
Ongoing160000.00 Subsidy to domestic
consumers of electricity
consuming upto 400 units
per month
To implement new and
renewable energy
projects in the city of
Delhi through waste to
energy (WTE)
Power Department 308NA: NOT AVAILABLE
NR: NOT RESPONDED
INFR
AS
TR
UC
TU
RE
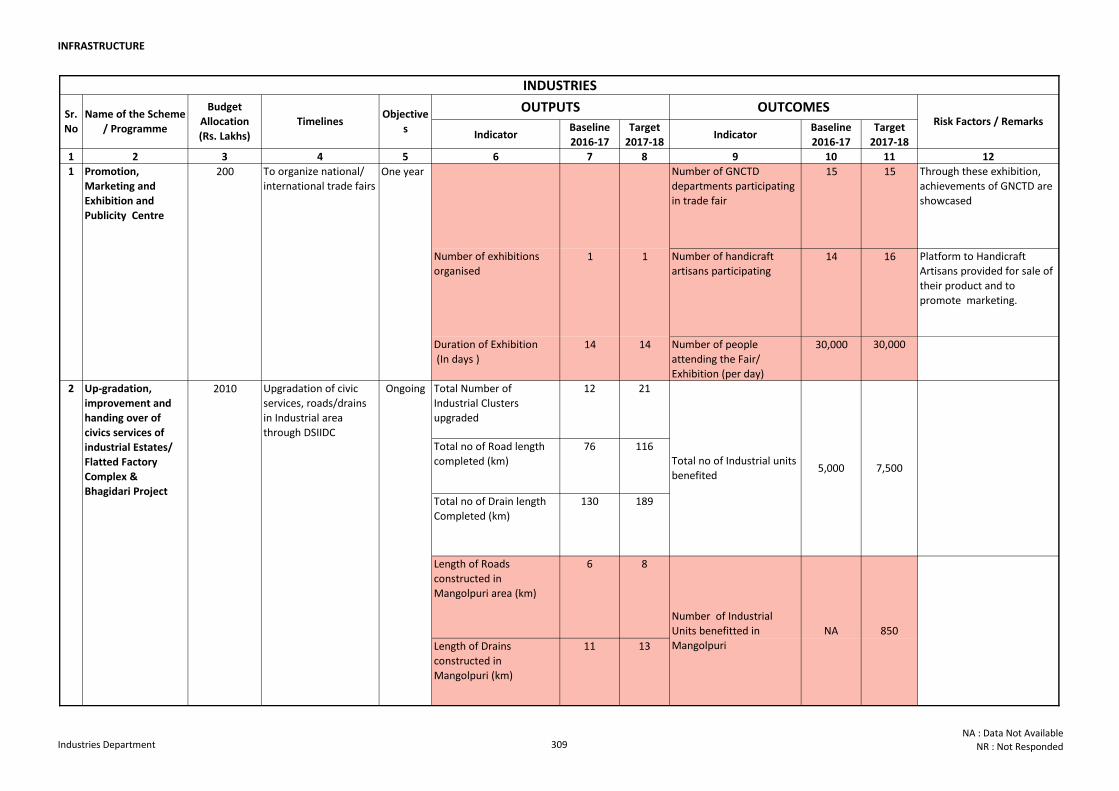
INFRASTRUCTURE
Indicator Baseline
2016-17
Target
2017-18Indicator
Baseline
2016-17
Target
2017-18
1 2 3 4 5 6 7 8 9 10 11 12
Number of GNCTD
departments participating
in trade fair
15 15 Through these exhibition,
achievements of GNCTD are
showcased
Number of exhibitions
organised1 1 Number of handicraft
artisans participating14 16 Platform to Handicraft
Artisans provided for sale of
their product and to
promote marketing.
Duration of Exhibition
(In days )14 14 Number of people
attending the Fair/
Exhibition (per day)
30,000 30,000
Total Number of
Industrial Clusters
upgraded
12 21
Total no of Road length
completed (km)
76 116
Total no of Drain length
Completed (km)
130 189
Length of Roads
constructed in
Mangolpuri area (km)
6 8
Length of Drains
constructed in
Mangolpuri (km)
11 13
7,500
OngoingUpgradation of civic
services, roads/drains
in Industrial area
through DSIIDC
2010
Total no of Industrial units
benefited5,000
Number of Industrial
Units benefitted in
Mangolpuri
NA 850
INDUSTRIES
To organize national/
international trade fairsOne year1 Promotion,
Marketing and
Exhibition and
Publicity Centre
200
Sr.
No
OUTCOMESRisk Factors / Remarks
Name of the Scheme
/ Programme
Budget
Allocation
(Rs. Lakhs)
TimelinesObjective
s
OUTPUTS
Up-gradation,
improvement and
handing over of
civics services of
industrial Estates/
Flatted Factory
Complex &
Bhagidari Project
2
Industries Department 309NA : Data Not Available
NR : Not Responded
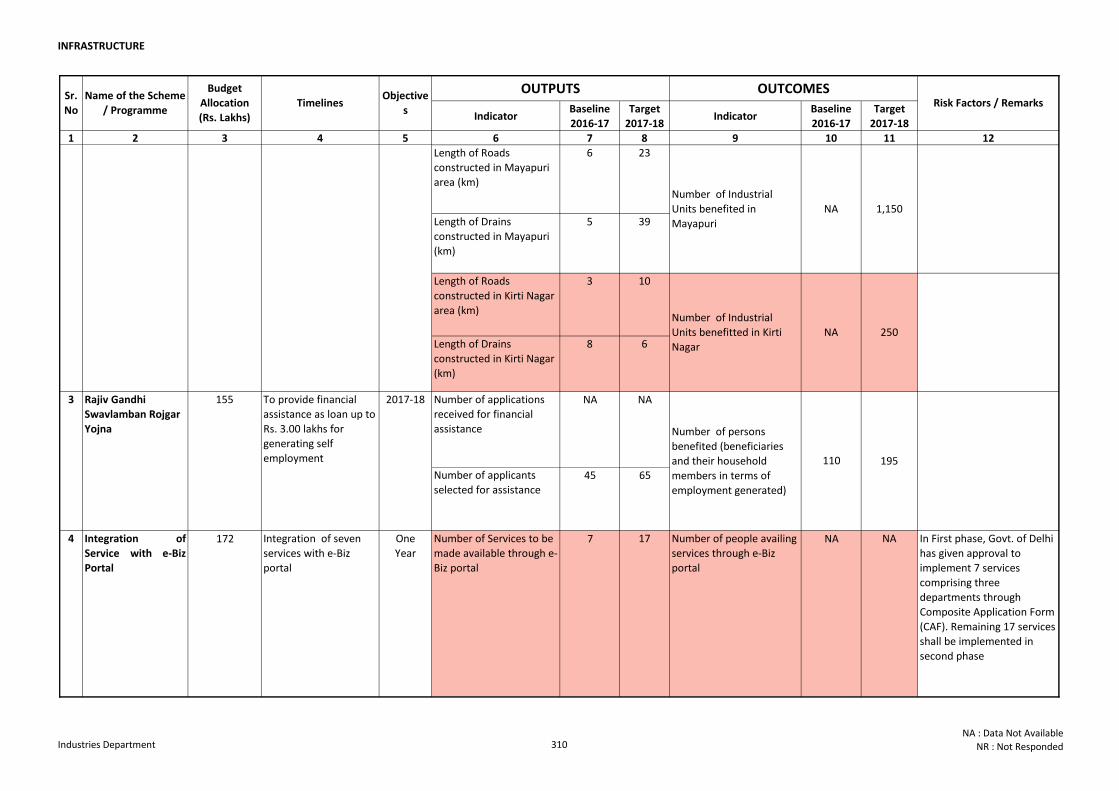
INFRASTRUCTURE
Indicator Baseline
2016-17
Target
2017-18Indicator
Baseline
2016-17
Target
2017-18
1 2 3 4 5 6 7 8 9 10 11 12
Sr.
No
OUTCOMESRisk Factors / Remarks
Name of the Scheme
/ Programme
Budget
Allocation
(Rs. Lakhs)
TimelinesObjective
s
OUTPUTS
Length of Roads
constructed in Mayapuri
area (km)
6 23
Length of Drains
constructed in Mayapuri
(km)
5 39
Length of Roads
constructed in Kirti Nagar
area (km)
3 10
Length of Drains
constructed in Kirti Nagar
(km)
8 6
Number of applications
received for financial
assistance
NA NA
Number of applicants
selected for assistance45 65
4 Integration of
Service with e-Biz
Portal
172 Integration of seven
services with e-Biz
portal
One
Year
Number of Services to be
made available through e-
Biz portal
7 17 Number of people availing
services through e-Biz
portal
NA NA In First phase, Govt. of Delhi
has given approval to
implement 7 services
comprising three
departments through
Composite Application Form
(CAF). Remaining 17 services
shall be implemented in
second phase
OngoingUpgradation of civic
services, roads/drains
in Industrial area
through DSIIDC
2010
Number of Industrial
Units benefited in
Mayapuri
NA 1,150
250
Number of persons
benefited (beneficiaries
and their household
members in terms of
employment generated)
110 195
To provide financial
assistance as loan up to
Rs. 3.00 lakhs for
generating self
employment
2017-183
Number of Industrial
Units benefitted in Kirti
Nagar
NA
Up-gradation,
improvement and
handing over of
civics services of
industrial Estates/
Flatted Factory
Complex &
Bhagidari Project
2
Rajiv Gandhi
Swavlamban Rojgar
Yojna
155
Industries Department 310NA : Data Not Available
NR : Not Responded
INFR
AS
TR
UC
TU
RE
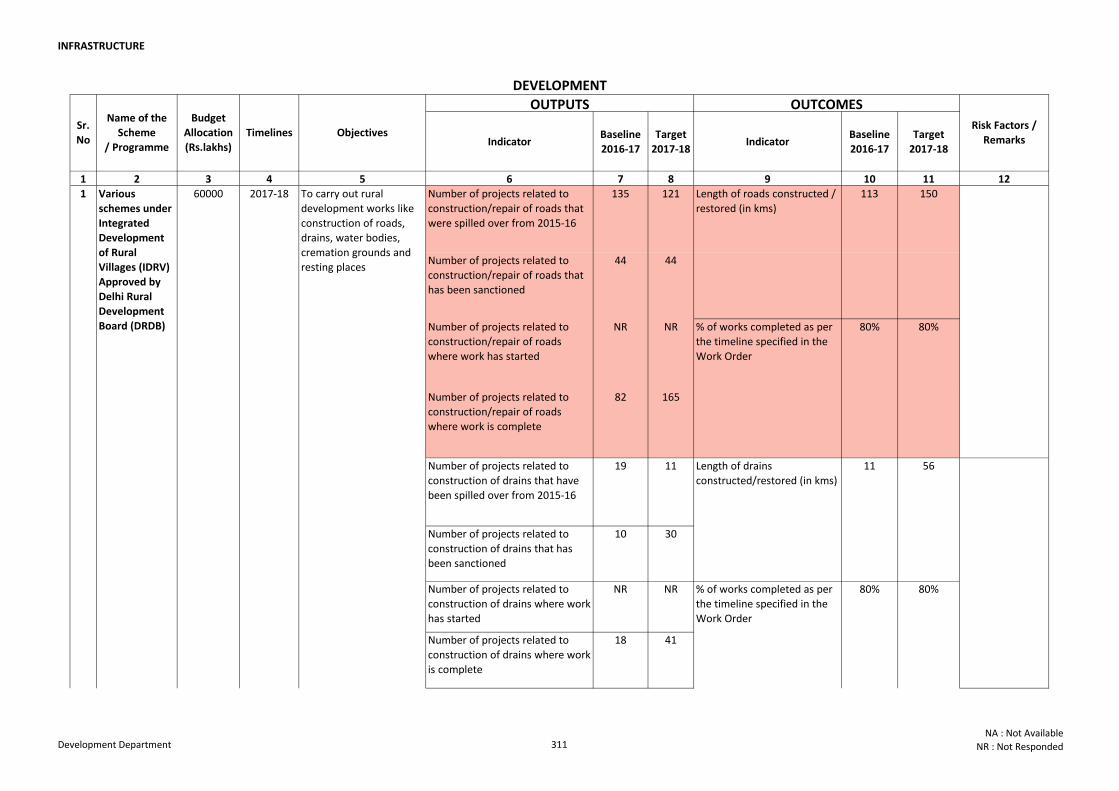
INFRASTRUCTURE
Indicator Baseline
2016-17
Target
2017-18Indicator
Baseline
2016-17
Target
2017-18
1 2 3 4 5 6 7 8 9 10 11 12
Number of projects related to
construction/repair of roads that
were spilled over from 2015-16
135 121
Number of projects related to
construction/repair of roads that
has been sanctioned
44 44
Number of projects related to
construction/repair of roads
where work has started
NR NR
Number of projects related to
construction/repair of roads
where work is complete
82 165
Number of projects related to
construction of drains that have
been spilled over from 2015-16
19 11
Number of projects related to
construction of drains that has
been sanctioned
10 30
Number of projects related to
construction of drains where work
has started
NR NR
Number of projects related to
construction of drains where work
is complete
18 41
OUTPUTS
Objectives
OUTCOMES
To carry out rural
development works like
construction of roads,
drains, water bodies,
cremation grounds and
resting places
2017-18
Length of drains
constructed/restored (in kms)
11
% of works completed as per
the timeline specified in the
Work Order
80%
80%80%
Budget
Allocation
(Rs.lakhs)
Timelines
113 150
DEVELOPMENT
Sr.
No
Risk Factors /
Remarks
Name of the
Scheme
/ Programme
1 Various
schemes under
Integrated
Development
of Rural
Villages (IDRV)
Approved by
Delhi Rural
Development
Board (DRDB)
60000
% of works completed as per
the timeline specified in the
Work Order
Length of roads constructed /
restored (in kms)
56
80%
Development Department 311NA : Not Available
NR : Not Responded
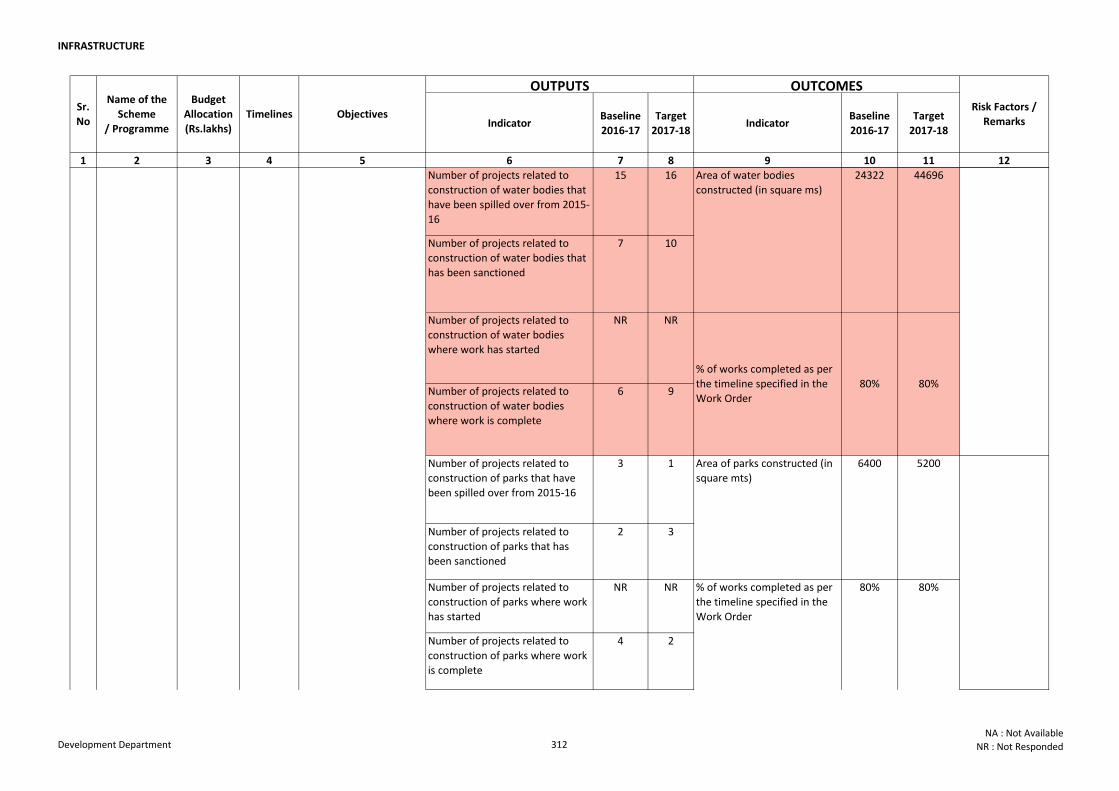
INFRASTRUCTURE
Indicator Baseline
2016-17
Target
2017-18Indicator
Baseline
2016-17
Target
2017-18
1 2 3 4 5 6 7 8 9 10 11 12
OUTPUTS
Objectives
OUTCOMESBudget
Allocation
(Rs.lakhs)
TimelinesSr.
No
Risk Factors /
Remarks
Name of the
Scheme
/ Programme
Number of projects related to
construction of water bodies that
have been spilled over from 2015-
16
15 16
Number of projects related to
construction of water bodies that
has been sanctioned
7 10
Number of projects related to
construction of water bodies
where work has started
NR NR
Number of projects related to
construction of water bodies
where work is complete
6 9
Number of projects related to
construction of parks that have
been spilled over from 2015-16
3 1
Number of projects related to
construction of parks that has
been sanctioned
2 3
Number of projects related to
construction of parks where work
has started
NR NR
Number of projects related to
construction of parks where work
is complete
4 2
To carry out rural
development works like
construction of roads,
drains, water bodies,
cremation grounds and
resting places
2017-18
80%
80%80%
Area of water bodies
constructed (in square ms)
24322
1 Various
schemes under
Integrated
Development
of Rural
Villages (IDRV)
Approved by
Delhi Rural
Development
Board (DRDB)
60000
% of works completed as per
the timeline specified in the
Work Order
52006400
% of works completed as per
the timeline specified in the
Work Order
80%
Area of parks constructed (in
square mts)
44696
Development Department 312NA : Not Available
NR : Not Responded
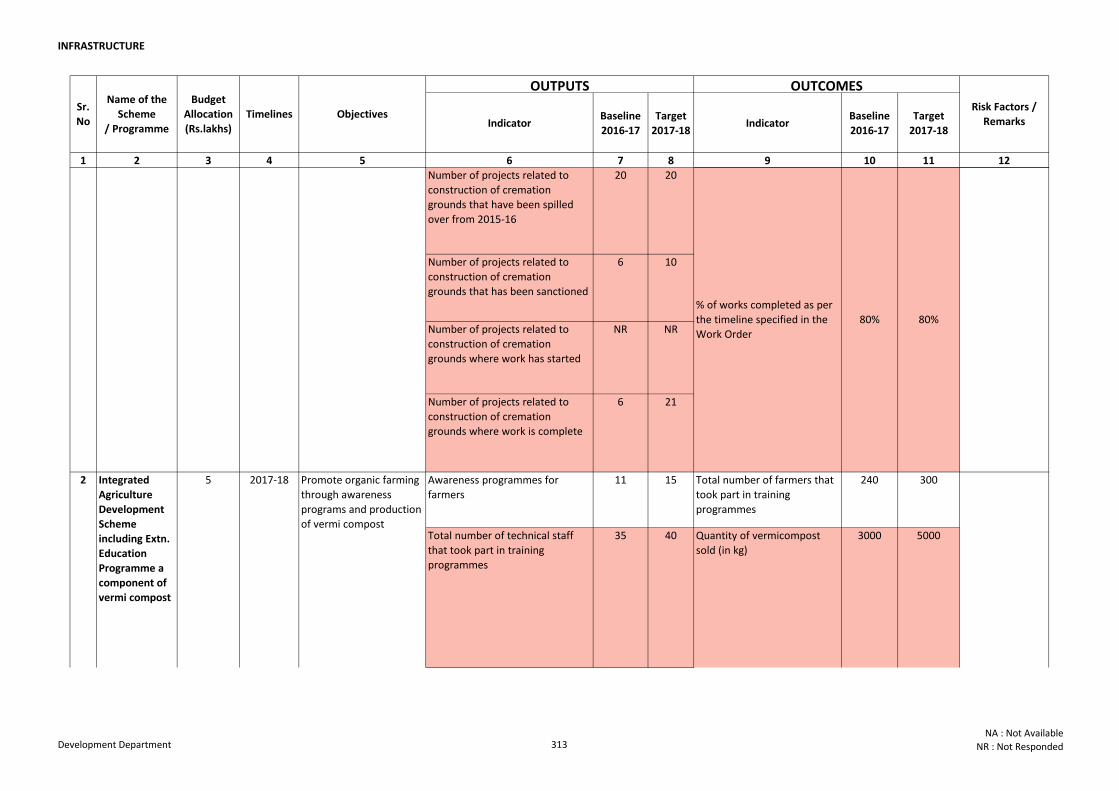
INFRASTRUCTURE
Indicator Baseline
2016-17
Target
2017-18Indicator
Baseline
2016-17
Target
2017-18
1 2 3 4 5 6 7 8 9 10 11 12
OUTPUTS
Objectives
OUTCOMESBudget
Allocation
(Rs.lakhs)
TimelinesSr.
No
Risk Factors /
Remarks
Name of the
Scheme
/ Programme
Number of projects related to
construction of cremation
grounds that have been spilled
over from 2015-16
20 20
Number of projects related to
construction of cremation
grounds that has been sanctioned
6 10
Number of projects related to
construction of cremation
grounds where work has started
NR NR
Number of projects related to
construction of cremation
grounds where work is complete
6 21
Awareness programmes for
farmers
11 15 Total number of farmers that
took part in training
programmes
240 300
Total number of technical staff
that took part in training
programmes
35 40 Quantity of vermicompost
sold (in kg)
3000 5000
5Integrated
Agriculture
Development
Scheme
including Extn.
Education
Programme a
component of
vermi compost
2
To carry out rural
development works like
construction of roads,
drains, water bodies,
cremation grounds and
resting places
2017-18
2017-18
% of works completed as per
the timeline specified in the
Work Order
Promote organic farming
through awareness
programs and production
of vermi compost
80% 80%
1 Various
schemes under
Integrated
Development
of Rural
Villages (IDRV)
Approved by
Delhi Rural
Development
Board (DRDB)
60000
Development Department 313NA : Not Available
NR : Not Responded
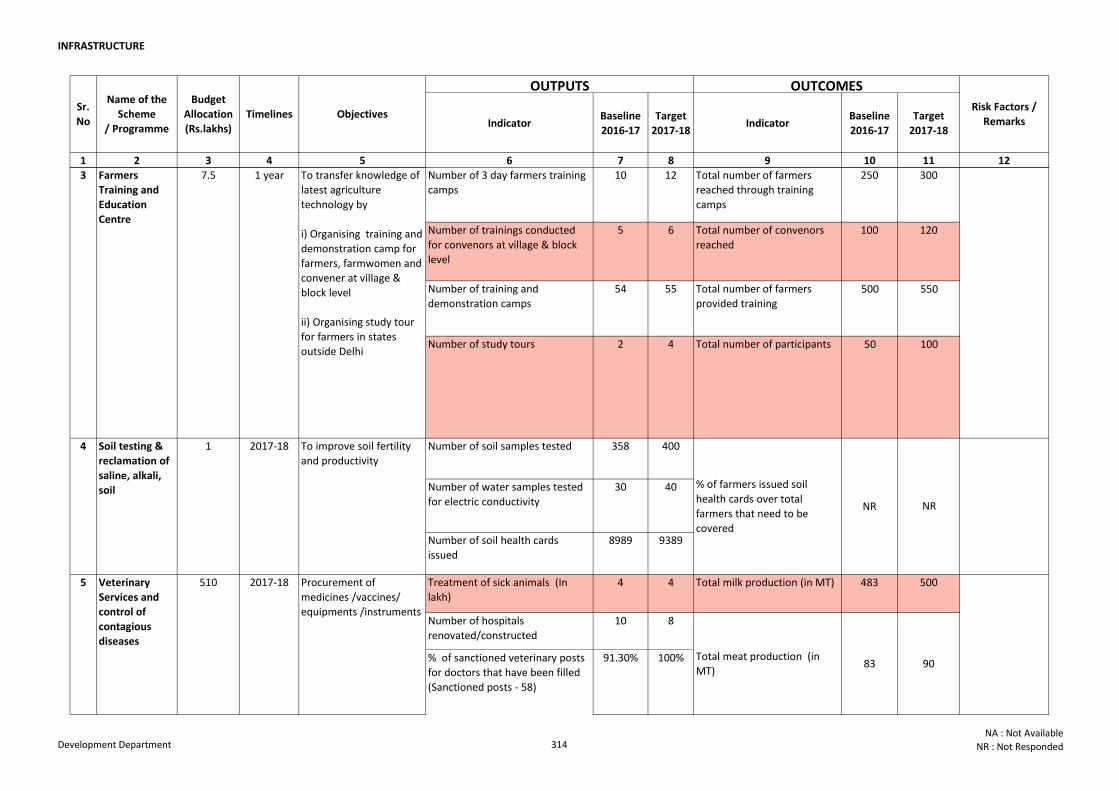
INFRASTRUCTURE
Indicator Baseline
2016-17
Target
2017-18Indicator
Baseline
2016-17
Target
2017-18
1 2 3 4 5 6 7 8 9 10 11 12
OUTPUTS
Objectives
OUTCOMESBudget
Allocation
(Rs.lakhs)
TimelinesSr.
No
Risk Factors /
Remarks
Name of the
Scheme
/ Programme
Number of 3 day farmers training
camps
10 12 Total number of farmers
reached through training
camps
250 300
Number of trainings conducted
for convenors at village & block
level
5 6 Total number of convenors
reached
100 120
Number of training and
demonstration camps
54 55 Total number of farmers
provided training 500 550
Number of study tours 2 4 Total number of participants 50 100
Number of soil samples tested 358 400
Number of water samples tested
for electric conductivity
30 40
Number of soil health cards
issued
8989 9389
Treatment of sick animals (In
lakh)
4 4 Total milk production (in MT) 483 500
Number of hospitals
renovated/constructed
10 8
% of sanctioned veterinary posts
for doctors that have been filled
(Sanctioned posts - 58)
91.30% 100%
5
Farmers
Training and
Education
Centre
7.5
4
3
1
510
To transfer knowledge of
latest agriculture
technology by
i) Organising training and
demonstration camp for
farmers, farmwomen and
convener at village &
block level
ii) Organising study tour
for farmers in states
outside Delhi
1 year
2017-18
NR
% of farmers issued soil
health cards over total
farmers that need to be
covered
Veterinary
Services and
control of
contagious
diseases
Procurement of
medicines /vaccines/
equipments /instruments
Soil testing &
reclamation of
saline, alkali,
soil
To improve soil fertility
and productivity
Total meat production (in
MT)90
2017-18
NR
83
Development Department 314NA : Not Available
NR : Not Responded
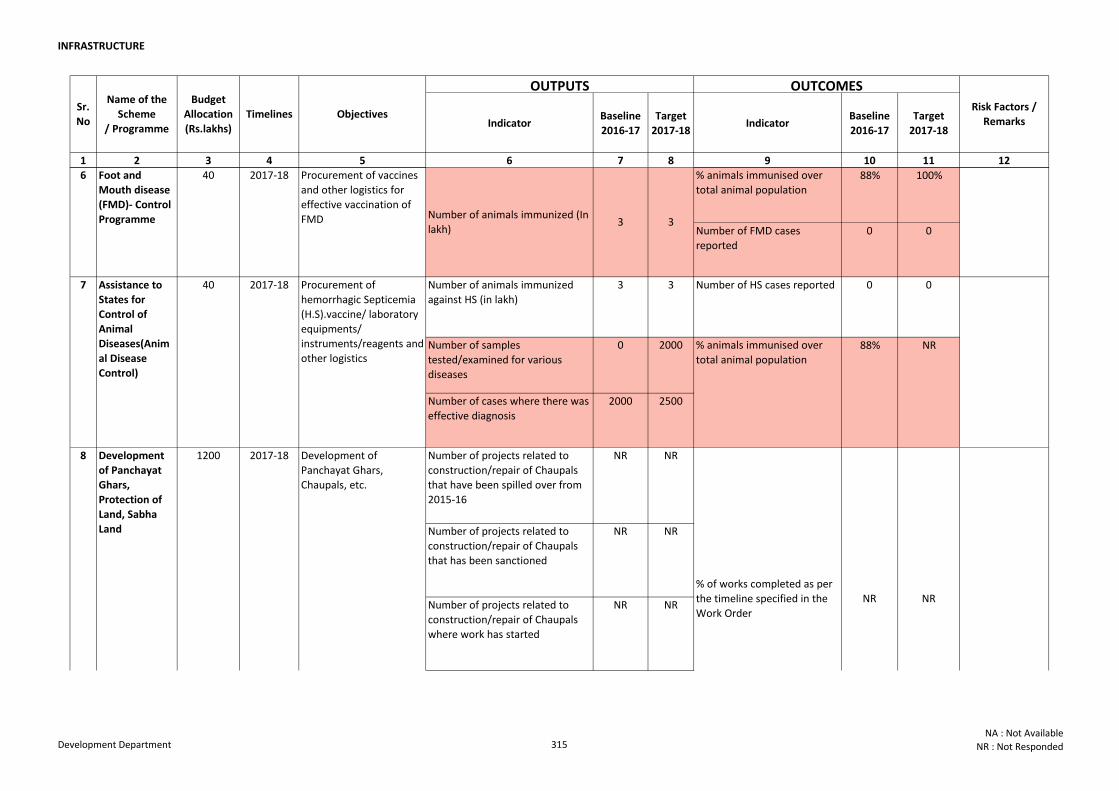
INFRASTRUCTURE
Indicator Baseline
2016-17
Target
2017-18Indicator
Baseline
2016-17
Target
2017-18
1 2 3 4 5 6 7 8 9 10 11 12
OUTPUTS
Objectives
OUTCOMESBudget
Allocation
(Rs.lakhs)
TimelinesSr.
No
Risk Factors /
Remarks
Name of the
Scheme
/ Programme
% animals immunised over
total animal population88% 100%
Number of FMD cases
reported
0 0
Number of animals immunized
against HS (in lakh)
3 3 Number of HS cases reported 0 0
Number of samples
tested/examined for various
diseases
0 2000
Number of cases where there was
effective diagnosis
2000 2500
Number of projects related to
construction/repair of Chaupals
that have been spilled over from
2015-16
NR NR
Number of projects related to
construction/repair of Chaupals
that has been sanctioned
NR NR
Number of projects related to
construction/repair of Chaupals
where work has started
NR NR
6
7
8 1200
40
Procurement of vaccines
and other logistics for
effective vaccination of
FMD
NR88%
2017-18
Development of
Panchayat Ghars,
Chaupals, etc.
Development
of Panchayat
Ghars,
Protection of
Land, Sabha
Land
Procurement of
hemorrhagic Septicemia
(H.S).vaccine/ laboratory
equipments/
instruments/reagents and
other logistics
Foot and
Mouth disease
(FMD)- Control
Programme
Assistance to
States for
Control of
Animal
Diseases(Anim
al Disease
Control)
3 3Number of animals immunized (In
lakh)
2017-18
2017-18
40
NRNR
% animals immunised over
total animal population
% of works completed as per
the timeline specified in the
Work Order
Development Department 315NA : Not Available
NR : Not Responded
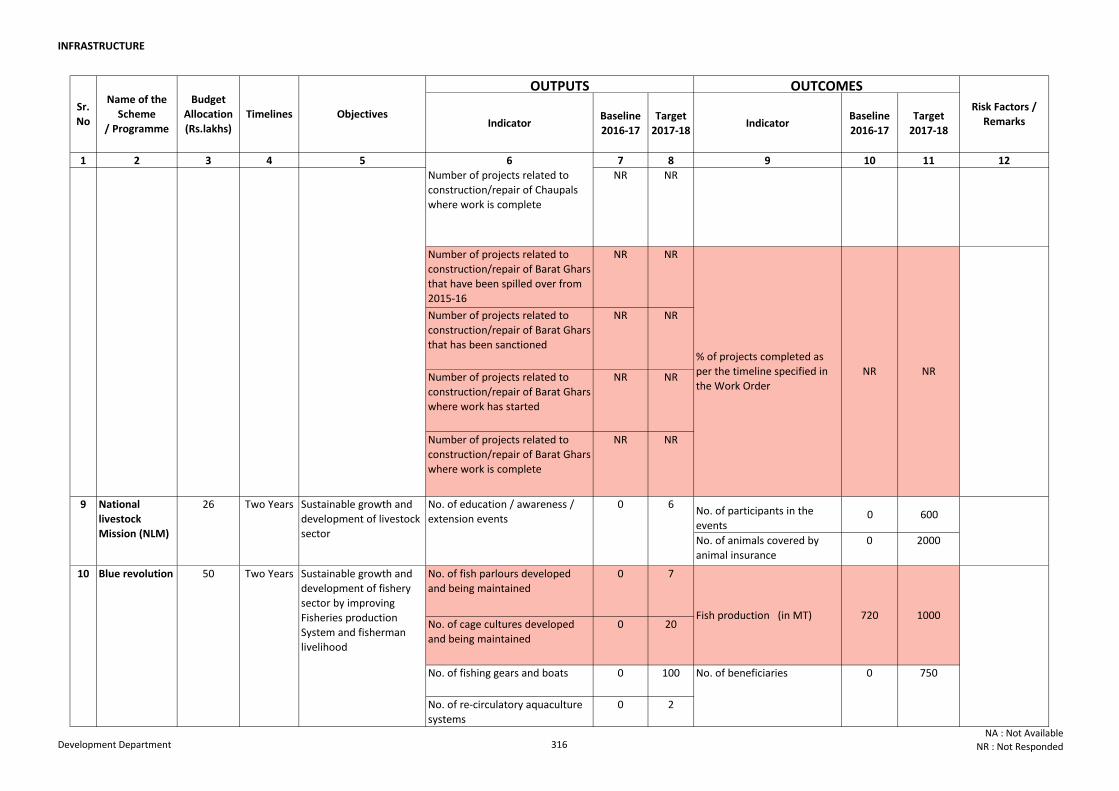
INFRASTRUCTURE
Indicator Baseline
2016-17
Target
2017-18Indicator
Baseline
2016-17
Target
2017-18
1 2 3 4 5 6 7 8 9 10 11 12
OUTPUTS
Objectives
OUTCOMESBudget
Allocation
(Rs.lakhs)
TimelinesSr.
No
Risk Factors /
Remarks
Name of the
Scheme
/ Programme
Number of projects related to
construction/repair of Chaupals
where work is complete
NR NR
Number of projects related to
construction/repair of Barat Ghars
that have been spilled over from
2015-16
NR NR
Number of projects related to
construction/repair of Barat Ghars
that has been sanctioned
NR NR
Number of projects related to
construction/repair of Barat Ghars
where work has started
NR NR
Number of projects related to
construction/repair of Barat Ghars
where work is complete
NR NR
No. of participants in the
events0 600
No. of animals covered by
animal insurance
0 2000
No. of fish parlours developed
and being maintained
0 7
No. of cage cultures developed
and being maintained
0 20
No. of fishing gears and boats 0 100
No. of re-circulatory aquaculture
systems
0 2
Blue revolution
8
10
1200
50
9 National
livestock
Mission (NLM)
26
1000
Sustainable growth and
development of fishery
sector by improving
Fisheries production
System and fisherman
livelihood
Two Years
Development of
Panchayat Ghars,
Chaupals, etc.
No. of beneficiaries 0 750
Development
of Panchayat
Ghars,
Protection of
Land, Sabha
Land
Sustainable growth and
development of livestock
sector
No. of education / awareness /
extension events
0 6
2017-18
Two Years
NRNR
Fish production (in MT) 720
% of projects completed as
per the timeline specified in
the Work Order
NR NR
% of works completed as per
the timeline specified in the
Work Order
Development Department 316NA : Not Available
NR : Not Responded
INFR
AS
TR
UC
TU
RE
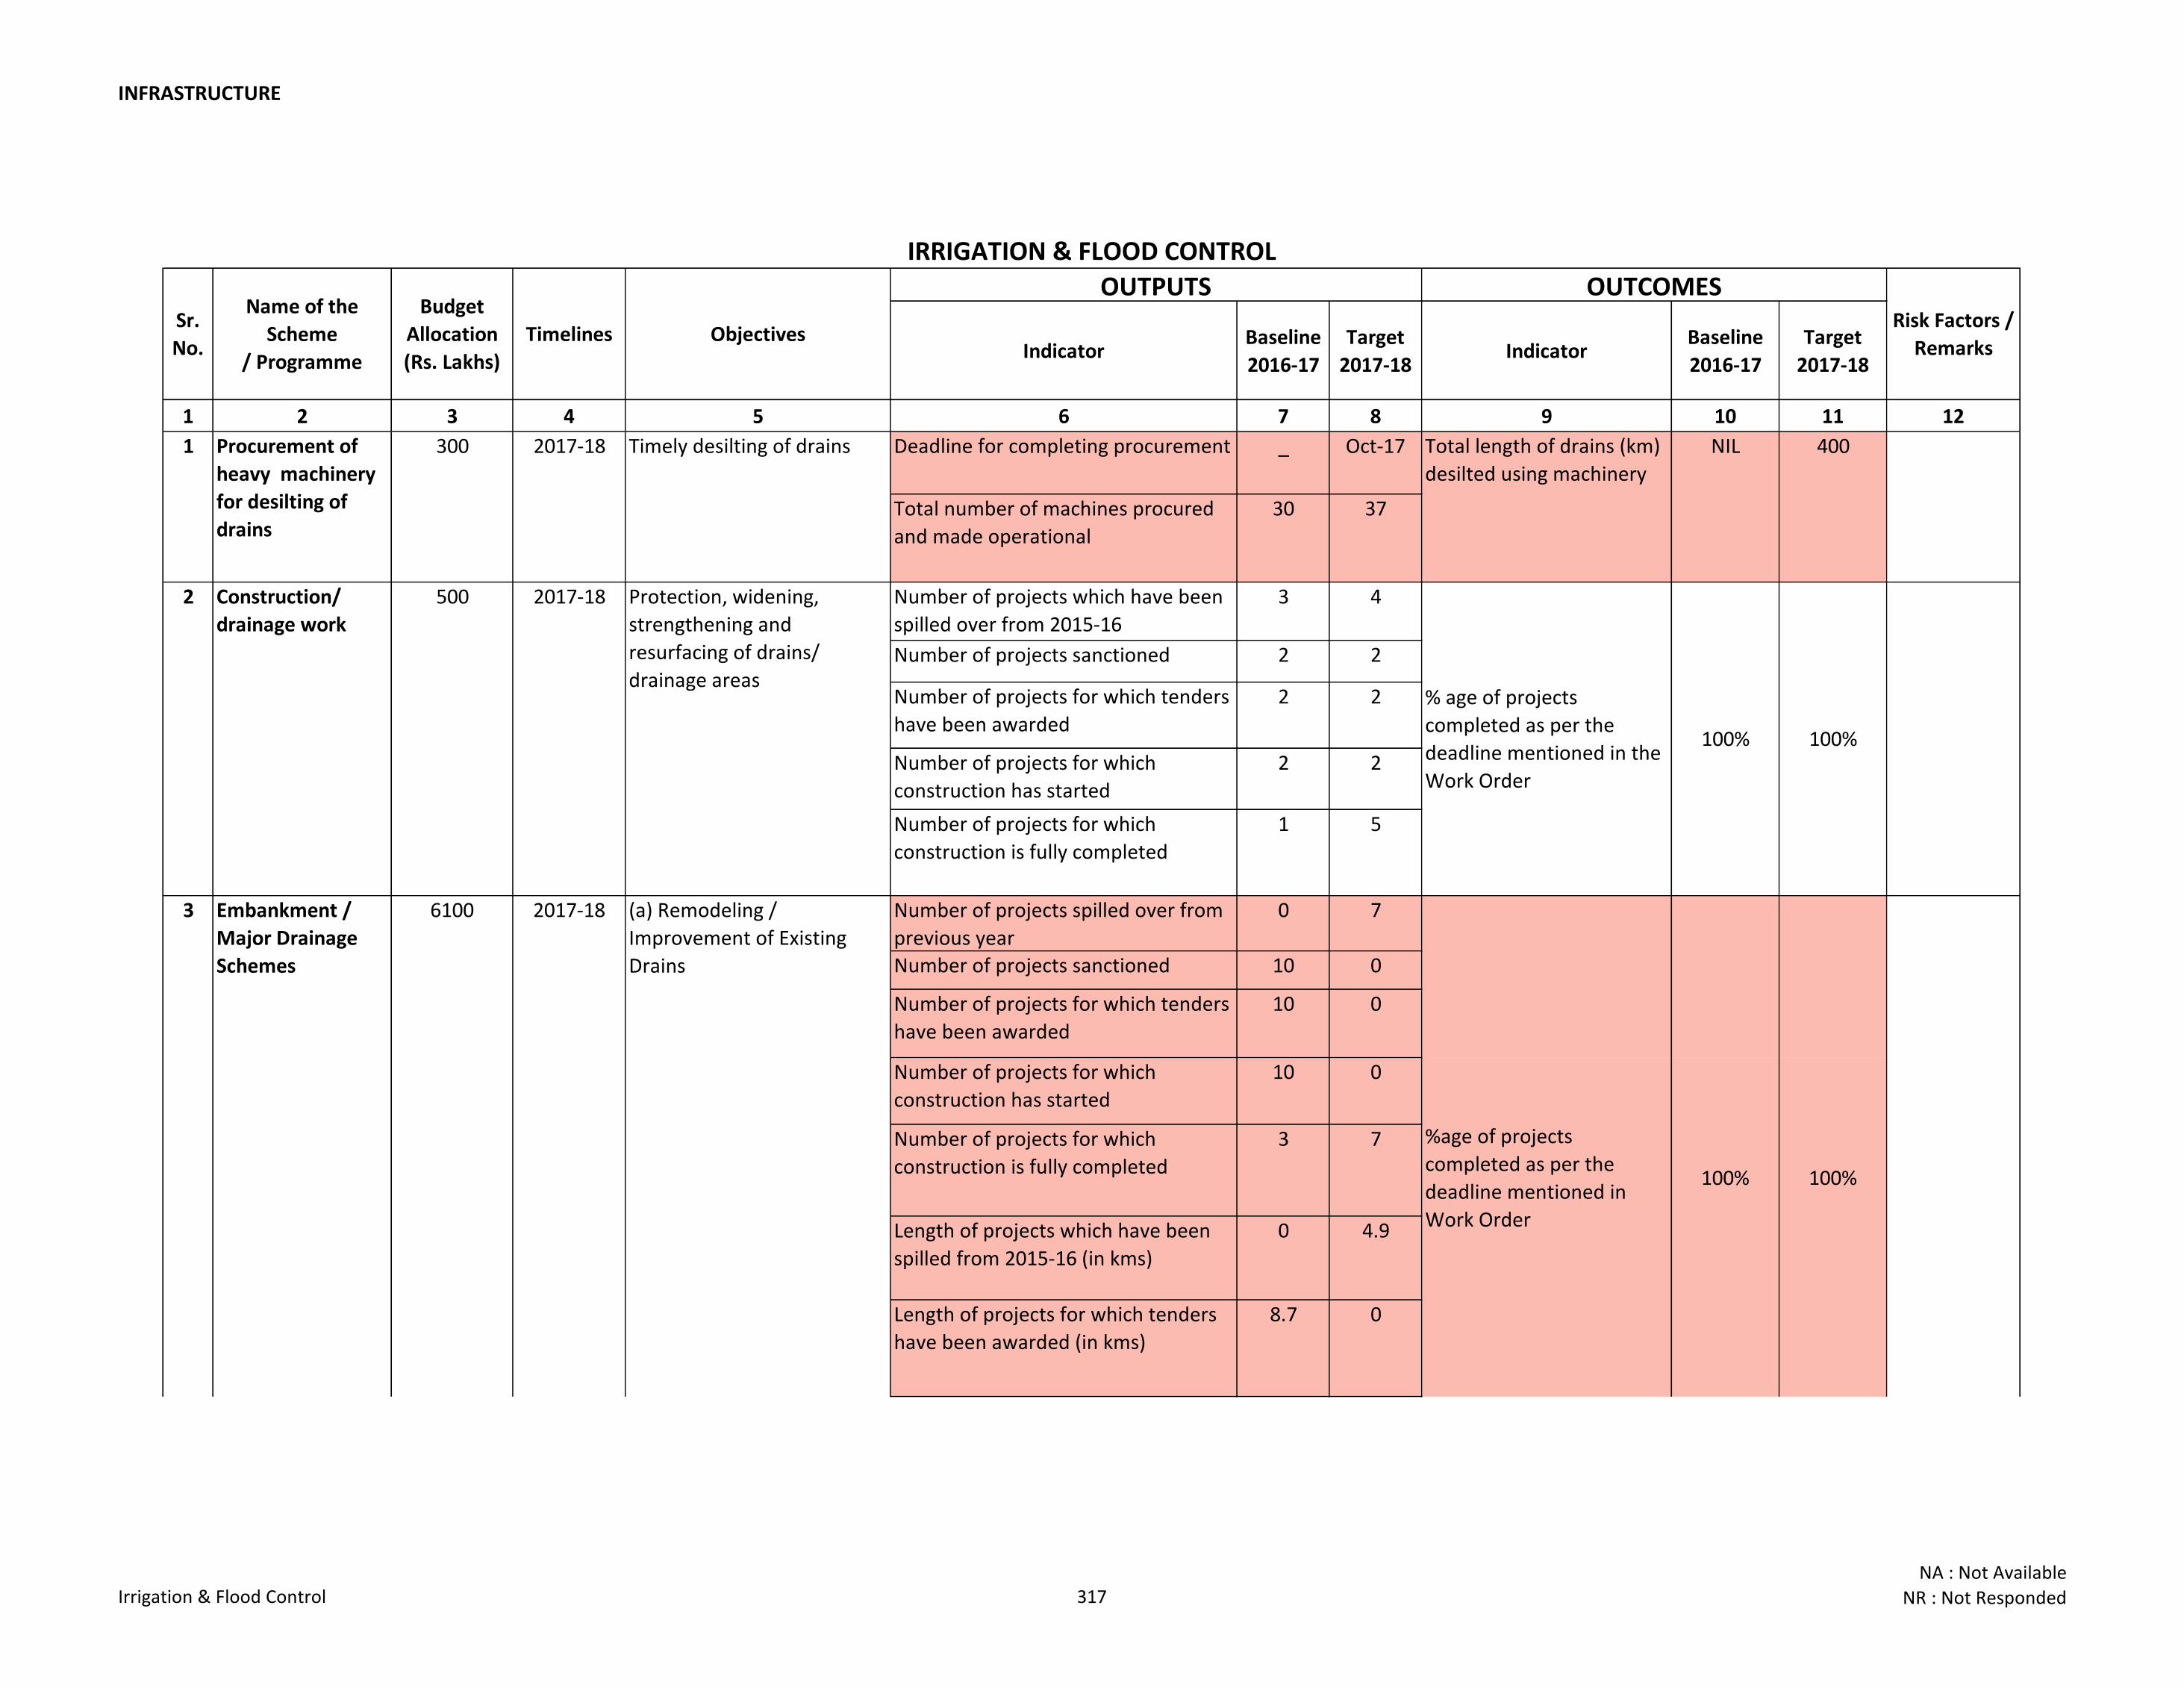
INFRASTRUCTURE
Indicator Baseline
2016-17
Target
2017-18Indicator
Baseline
2016-17
Target
2017-18
1 2 3 4 5 6 7 8 9 10 11 12
Deadline for completing procurement _ Oct-17
Total number of machines procured
and made operational
30 37
Number of projects which have been
spilled over from 2015-16
3 4
Number of projects sanctioned 2 2
Number of projects for which tenders
have been awarded
2 2
Number of projects for which
construction has started
2 2
Number of projects for which
construction is fully completed
1 5
Number of projects spilled over from
previous year
0 7
Number of projects sanctioned 10 0
Number of projects for which tenders
have been awarded
10 0
Number of projects for which
construction has started
10 0
Number of projects for which
construction is fully completed
3 7
Length of projects which have been
spilled from 2015-16 (in kms)
0 4.9
Length of projects for which tenders
have been awarded (in kms)
8.7 0
Timely desilting of drains
Sr.
No.
2 Construction/
drainage work
2017-18 Protection, widening,
strengthening and
resurfacing of drains/
drainage areas
500
400
100%
3 Embankment /
Major Drainage
Schemes
IRRIGATION & FLOOD CONTROL
OUTPUTSName of the
Scheme
/ Programme
Objectives
Budget
Allocation
(Rs. Lakhs)
Timelines
OUTCOMESRisk Factors /
Remarks
6100 2017-18
100%
1 NILTotal length of drains (km)
desilted using machinery
300 2017-18Procurement of
heavy machinery
for desilting of
drains
% age of projects
completed as per the
deadline mentioned in the
Work Order
100%
%age of projects
completed as per the
deadline mentioned in
Work Order
100%
(a) Remodeling /
Improvement of Existing
Drains
Irrigation & Flood Control 317NA : Not Available
NR : Not Responded
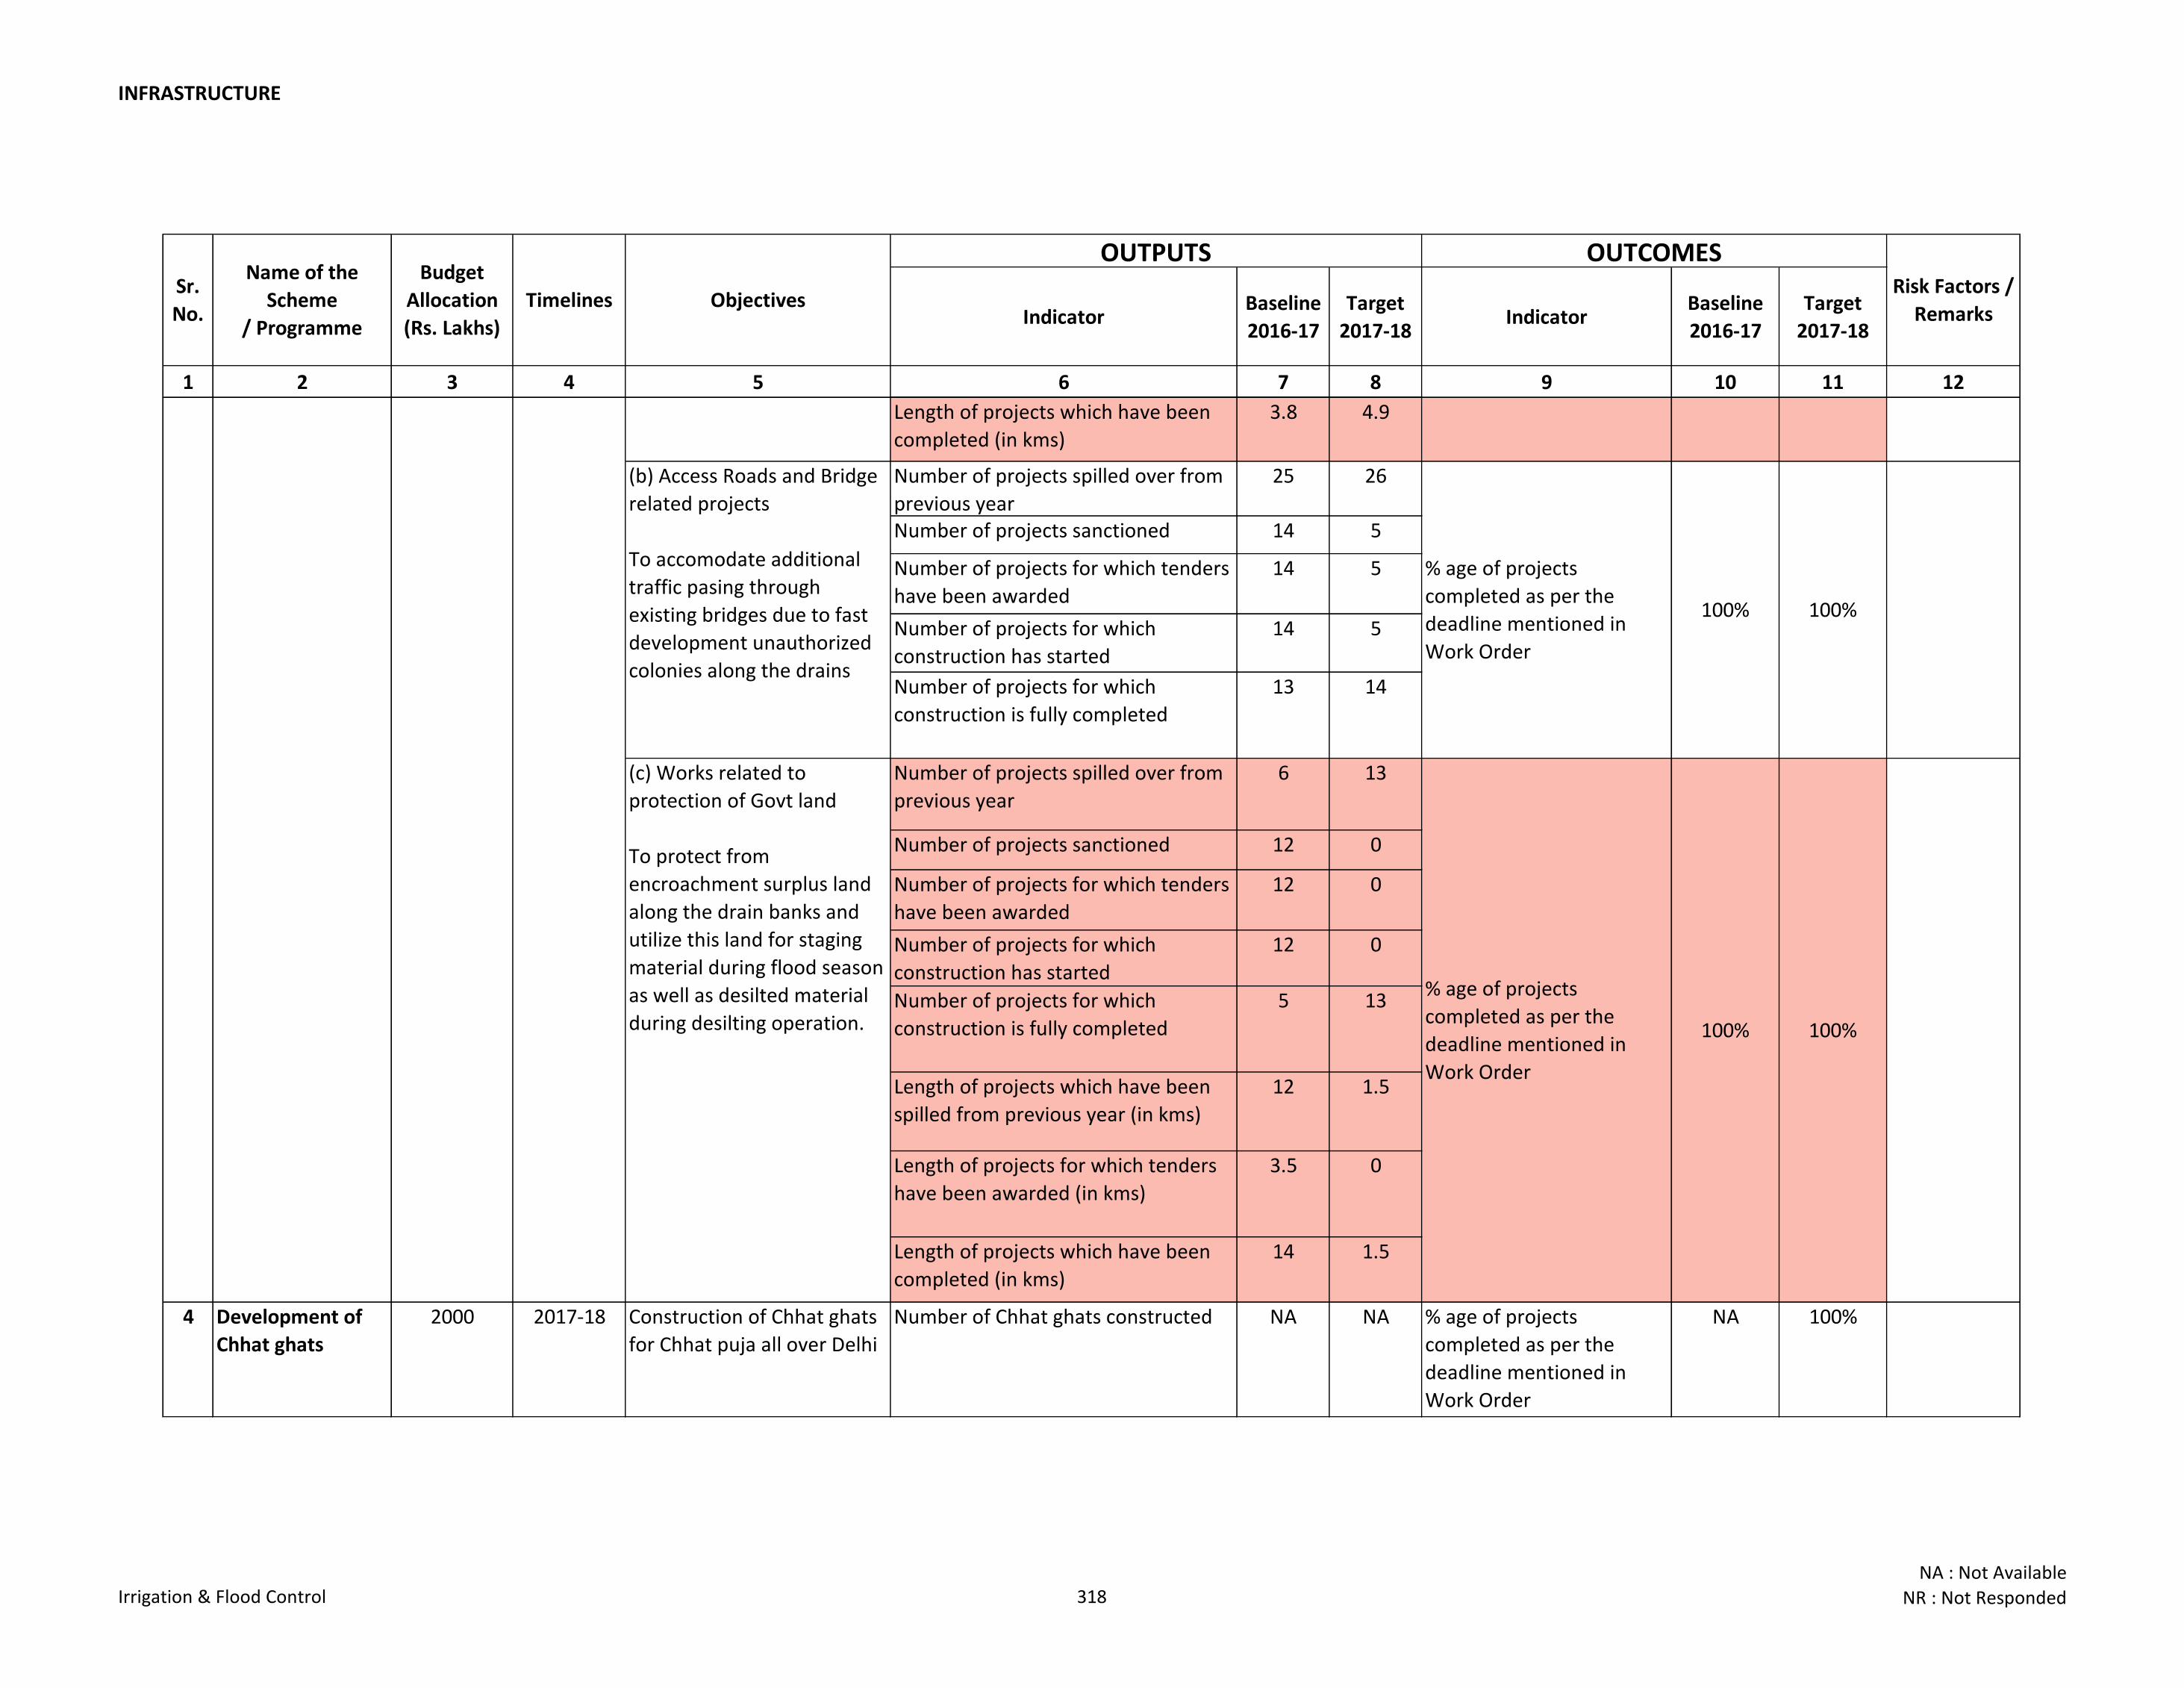
INFRASTRUCTURE
Indicator Baseline
2016-17
Target
2017-18Indicator
Baseline
2016-17
Target
2017-18
1 2 3 4 5 6 7 8 9 10 11 12
Sr.
No.
OUTPUTSName of the
Scheme
/ Programme
Objectives
Budget
Allocation
(Rs. Lakhs)
Timelines
OUTCOMESRisk Factors /
Remarks
Length of projects which have been
completed (in kms)
3.8 4.9
Number of projects spilled over from
previous year
25 26
Number of projects sanctioned 14 5
Number of projects for which tenders
have been awarded
14 5
Number of projects for which
construction has started
14 5
Number of projects for which
construction is fully completed
13 14
Number of projects spilled over from
previous year
6 13
Number of projects sanctioned 12 0
Number of projects for which tenders
have been awarded
12 0
Number of projects for which
construction has started
12 0
Number of projects for which
construction is fully completed
5 13
Length of projects which have been
spilled from previous year (in kms)
12 1.5
Length of projects for which tenders
have been awarded (in kms)
3.5 0
Length of projects which have been
completed (in kms)
14 1.5
4 Development of
Chhat ghats
2000 2017-18 Construction of Chhat ghats
for Chhat puja all over Delhi
Number of Chhat ghats constructed NA NA % age of projects
completed as per the
deadline mentioned in
Work Order
NA 100%
100%
3 Embankment /
Major Drainage
Schemes
6100 2017-18
(c) Works related to
protection of Govt land
To protect from
encroachment surplus land
along the drain banks and
utilize this land for staging
material during flood season
as well as desilted material
during desilting operation. 100% 100%
(b) Access Roads and Bridge
related projects
To accomodate additional
traffic pasing through
existing bridges due to fast
development unauthorized
colonies along the drains
100%
% age of projects
completed as per the
deadline mentioned in
Work Order
100%
100%
%age of projects
completed as per the
deadline mentioned in
Work Order
% age of projects
completed as per the
deadline mentioned in
Work Order
(a) Remodeling /
Improvement of Existing
Drains
Irrigation & Flood Control 318NA : Not Available
NR : Not Responded

INFR
AS
TR
UC
TU
RE
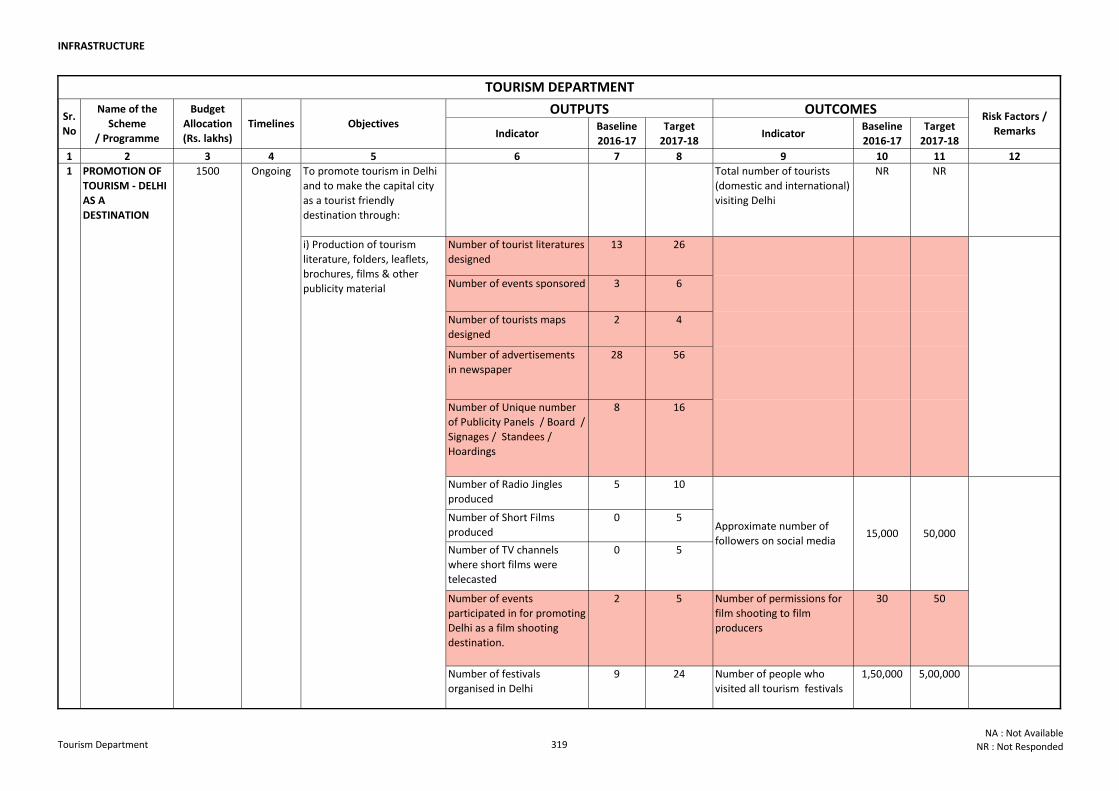
INFRASTRUCTURE
Indicator Baseline
2016-17
Target
2017-18Indicator
Baseline
2016-17
Target
2017-18
1 2 3 4 5 6 7 8 9 10 11 12
To promote tourism in Delhi
and to make the capital city
as a tourist friendly
destination through:
Total number of tourists
(domestic and international)
visiting Delhi
NR NR
Number of tourist literatures
designed
13 26
Number of events sponsored 3 6
Number of tourists maps
designed
2 4
Number of advertisements
in newspaper
28 56
Number of Unique number
of Publicity Panels / Board /
Signages / Standees /
Hoardings
8 16
Number of Radio Jingles
produced
5 10
Number of Short Films
produced
0 5
Number of TV channels
where short films were
telecasted
0 5
Number of events
participated in for promoting
Delhi as a film shooting
destination.
2 5 Number of permissions for
film shooting to film
producers
30 50
Number of festivals
organised in Delhi
9 24 Number of people who
visited all tourism festivals
1,50,000 5,00,000
i) Production of tourism
literature, folders, leaflets,
brochures, films & other
publicity material
1500PROMOTION OF
TOURISM - DELHI
AS A
DESTINATION
1
15,000 50,000
Risk Factors /
Remarks
TOURISM DEPARTMENT
Sr.
No
Name of the
Scheme
/ Programme
Budget
Allocation
(Rs. lakhs)
Timelines Objectives OUTPUTS OUTCOMES
Approximate number of
followers on social media
Ongoing
Tourism Department 319NA : Not Available
NR : Not Responded
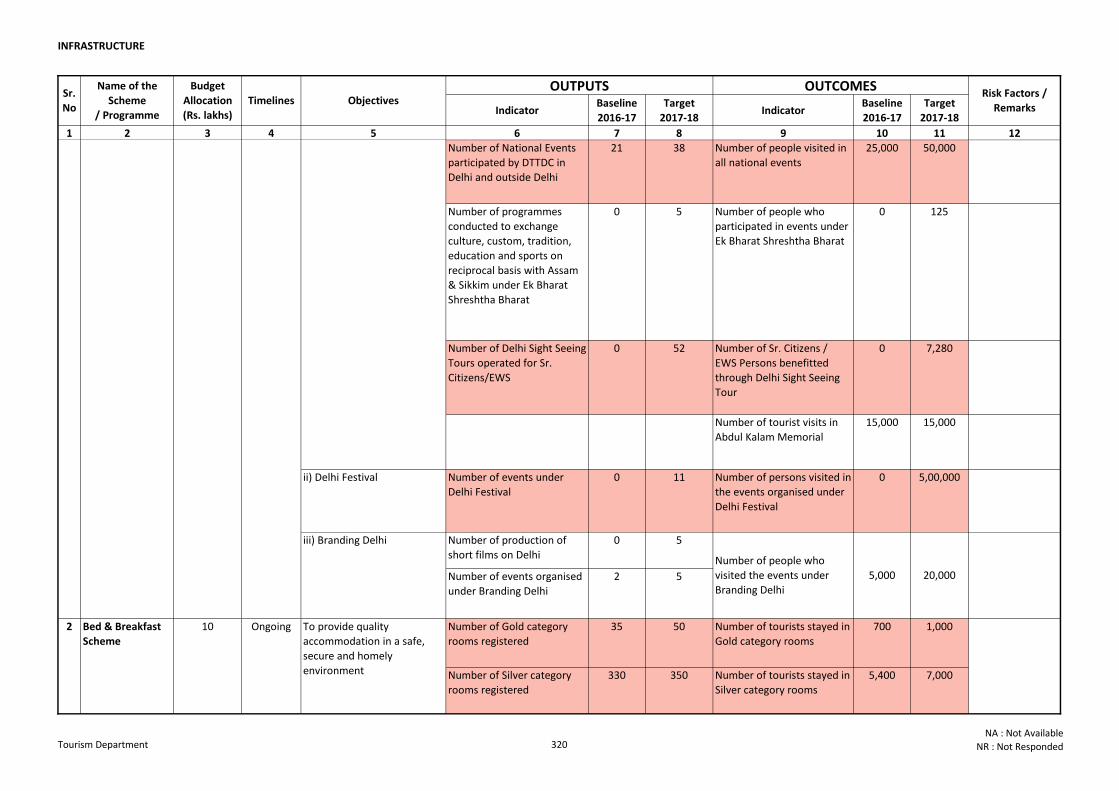
INFRASTRUCTURE
Indicator Baseline
2016-17
Target
2017-18Indicator
Baseline
2016-17
Target
2017-18
1 2 3 4 5 6 7 8 9 10 11 12
Risk Factors /
Remarks
Sr.
No
Name of the
Scheme
/ Programme
Budget
Allocation
(Rs. lakhs)
Timelines Objectives OUTPUTS OUTCOMES
Number of National Events
participated by DTTDC in
Delhi and outside Delhi
21 38 Number of people visited in
all national events
25,000 50,000
Number of programmes
conducted to exchange
culture, custom, tradition,
education and sports on
reciprocal basis with Assam
& Sikkim under Ek Bharat
Shreshtha Bharat
0 5 Number of people who
participated in events under
Ek Bharat Shreshtha Bharat
0 125
Number of Delhi Sight Seeing
Tours operated for Sr.
Citizens/EWS
0 52 Number of Sr. Citizens /
EWS Persons benefitted
through Delhi Sight Seeing
Tour
0 7,280
Number of tourist visits in
Abdul Kalam Memorial
15,000 15,000
ii) Delhi Festival Number of events under
Delhi Festival
0 11 Number of persons visited in
the events organised under
Delhi Festival
0 5,00,000
Number of production of
short films on Delhi
0 5
Number of events organised
under Branding Delhi
2 5
Number of Gold category
rooms registered
35 50 Number of tourists stayed in
Gold category rooms
700 1,000
Number of Silver category
rooms registered
330 350 Number of tourists stayed in
Silver category rooms
5,400 7,000
i) Production of tourism
literature, folders, leaflets,
brochures, films & other
publicity material
1500PROMOTION OF
TOURISM - DELHI
AS A
DESTINATION
1
Ongoing
5,000 20,000
2
Number of people who
visited the events under
Branding Delhi
To provide quality
accommodation in a safe,
secure and homely
environment
iii) Branding Delhi
10Bed & Breakfast
Scheme
Ongoing
Tourism Department 320NA : Not Available
NR : Not Responded
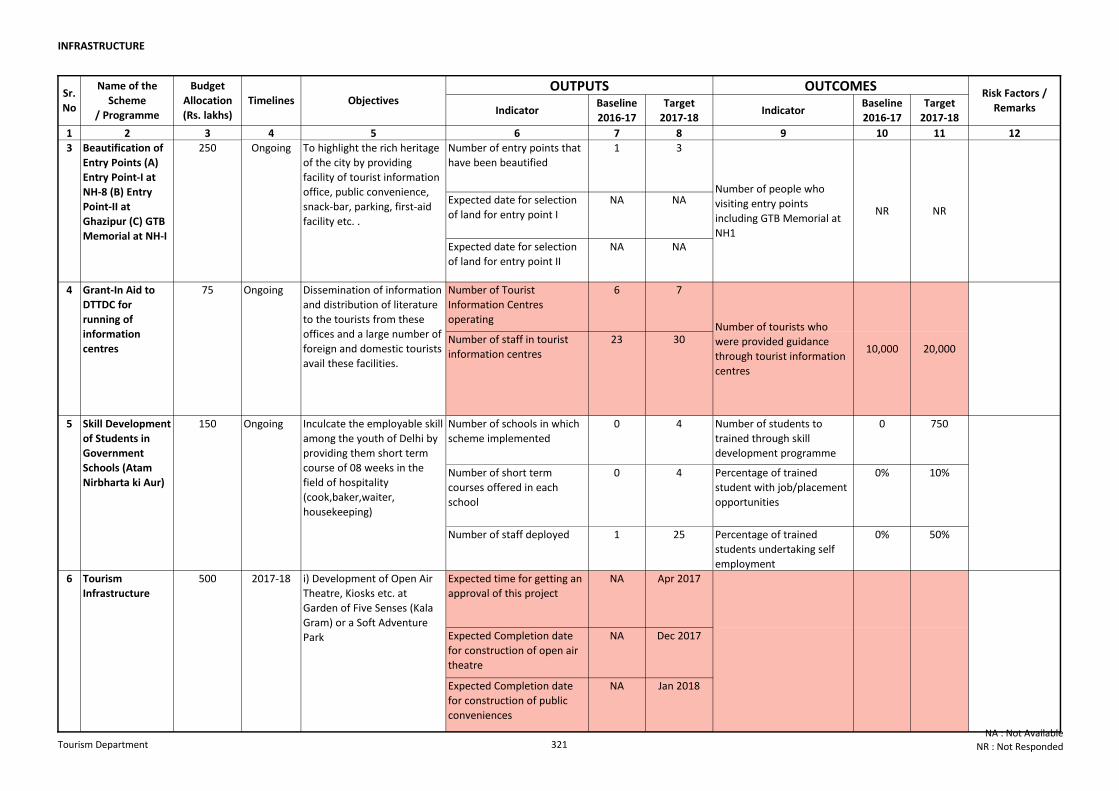
INFRASTRUCTURE
Indicator Baseline
2016-17
Target
2017-18Indicator
Baseline
2016-17
Target
2017-18
1 2 3 4 5 6 7 8 9 10 11 12
Risk Factors /
Remarks
Sr.
No
Name of the
Scheme
/ Programme
Budget
Allocation
(Rs. lakhs)
Timelines Objectives OUTPUTS OUTCOMES
Number of entry points that
have been beautified
1 3
Expected date for selection
of land for entry point I
NA NA
Expected date for selection
of land for entry point II
NA NA
Number of Tourist
Information Centres
operating
6 7
Number of staff in tourist
information centres
23 30
Number of schools in which
scheme implemented
0 4 Number of students to
trained through skill
development programme
0 750
Number of short term
courses offered in each
school
0 4 Percentage of trained
student with job/placement
opportunities
0% 10%
Number of staff deployed 1 25 Percentage of trained
students undertaking self
employment
0% 50%
Expected time for getting an
approval of this project
NA Apr 2017
Expected Completion date
for construction of open air
theatre
NA Dec 2017
Expected Completion date
for construction of public
conveniences
NA Jan 2018
6 Tourism
Infrastructure
500 2017-18
NRNR
10,000 20,000
3 Beautification of
Entry Points (A)
Entry Point-I at
NH-8 (B) Entry
Point-II at
Ghazipur (C) GTB
Memorial at NH-I
Ongoing
Number of people who
visiting entry points
including GTB Memorial at
NH1
1505 Skill Development
of Students in
Government
Schools (Atam
Nirbharta ki Aur)
4 Grant-In Aid to
DTTDC for
running of
information
centres
i) Development of Open Air
Theatre, Kiosks etc. at
Garden of Five Senses (Kala
Gram) or a Soft Adventure
Park
Ongoing
Inculcate the employable skill
among the youth of Delhi by
providing them short term
course of 08 weeks in the
field of hospitality
(cook,baker,waiter,
housekeeping)
Dissemination of information
and distribution of literature
to the tourists from these
offices and a large number of
foreign and domestic tourists
avail these facilities.
To highlight the rich heritage
of the city by providing
facility of tourist information
office, public convenience,
snack-bar, parking, first-aid
facility etc. .
75
Ongoing250
Number of tourists who
were provided guidance
through tourist information
centres
Tourism Department 321NA : Not Available
NR : Not Responded
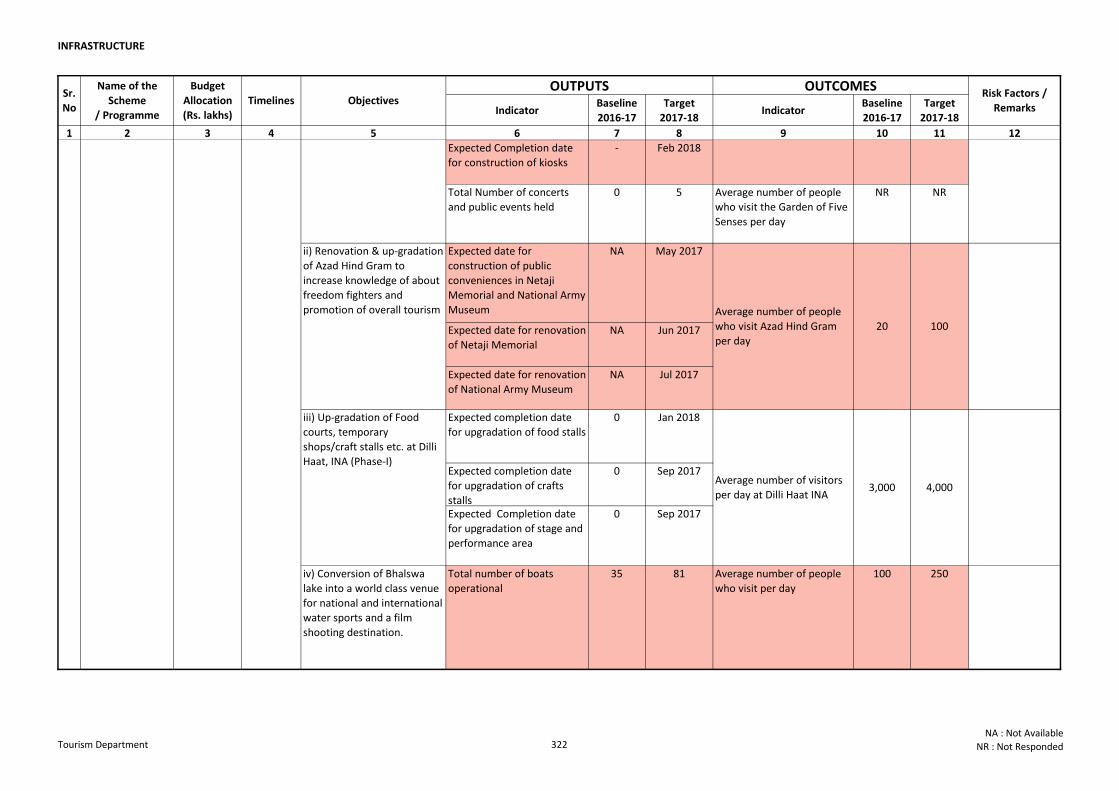
INFRASTRUCTURE
Indicator Baseline
2016-17
Target
2017-18Indicator
Baseline
2016-17
Target
2017-18
1 2 3 4 5 6 7 8 9 10 11 12
Risk Factors /
Remarks
Sr.
No
Name of the
Scheme
/ Programme
Budget
Allocation
(Rs. lakhs)
Timelines Objectives OUTPUTS OUTCOMES
Expected Completion date
for construction of kiosks
- Feb 2018
Total Number of concerts
and public events held
0 5 Average number of people
who visit the Garden of Five
Senses per day
NR NR
Expected date for
construction of public
conveniences in Netaji
Memorial and National Army
Museum
NA May 2017
Expected date for renovation
of Netaji Memorial
NA Jun 2017
Expected date for renovation
of National Army Museum
NA Jul 2017
Expected completion date
for upgradation of food stalls
0 Jan 2018
Expected completion date
for upgradation of crafts
stalls
0 Sep 2017
Expected Completion date
for upgradation of stage and
performance area
0 Sep 2017
iv) Conversion of Bhalswa
lake into a world class venue
for national and international
water sports and a film
shooting destination.
Total number of boats
operational
35 81 Average number of people
who visit per day
100 250
6 Tourism
Infrastructure
500 2017-18
20 100
3,000 4,000
ii) Renovation & up-gradation
of Azad Hind Gram to
increase knowledge of about
freedom fighters and
promotion of overall tourism Average number of people
who visit Azad Hind Gram
per day
iii) Up-gradation of Food
courts, temporary
shops/craft stalls etc. at Dilli
Haat, INA (Phase-I)
i) Development of Open Air
Theatre, Kiosks etc. at
Garden of Five Senses (Kala
Gram) or a Soft Adventure
Park
Average number of visitors
per day at Dilli Haat INA
Tourism Department 322NA : Not Available
NR : Not Responded
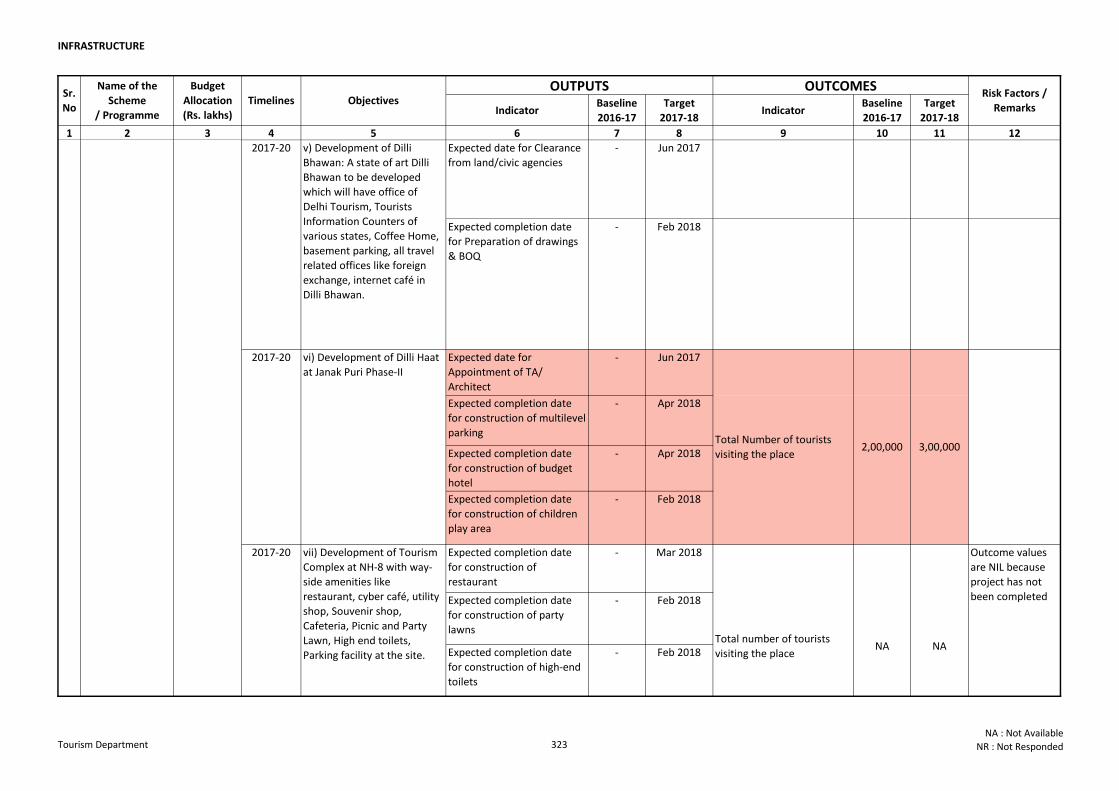
INFRASTRUCTURE
Indicator Baseline
2016-17
Target
2017-18Indicator
Baseline
2016-17
Target
2017-18
1 2 3 4 5 6 7 8 9 10 11 12
Risk Factors /
Remarks
Sr.
No
Name of the
Scheme
/ Programme
Budget
Allocation
(Rs. lakhs)
Timelines Objectives OUTPUTS OUTCOMES
Expected date for Clearance
from land/civic agencies
- Jun 2017
Expected completion date
for Preparation of drawings
& BOQ
- Feb 2018
Expected date for
Appointment of TA/
Architect
- Jun 2017
Expected completion date
for construction of multilevel
parking
- Apr 2018
Expected completion date
for construction of budget
hotel
- Apr 2018
Expected completion date
for construction of children
play area
- Feb 2018
Expected completion date
for construction of
restaurant
- Mar 2018
Expected completion date
for construction of party
lawns
- Feb 2018
Expected completion date
for construction of high-end
toilets
- Feb 2018
6 Tourism
Infrastructure
500
Total Number of tourists
visiting the place2,00,000 3,00,000
Total number of tourists
visiting the place NA NA
2017-20
vii) Development of Tourism
Complex at NH-8 with way-
side amenities like
restaurant, cyber café, utility
shop, Souvenir shop,
Cafeteria, Picnic and Party
Lawn, High end toilets,
Parking facility at the site.
2017-20
2017-20 vi) Development of Dilli Haat
at Janak Puri Phase-II
v) Development of Dilli
Bhawan: A state of art Dilli
Bhawan to be developed
which will have office of
Delhi Tourism, Tourists
Information Counters of
various states, Coffee Home,
basement parking, all travel
related offices like foreign
exchange, internet café in
Dilli Bhawan.
Outcome values
are NIL because
project has not
been completed
Tourism Department 323NA : Not Available
NR : Not Responded
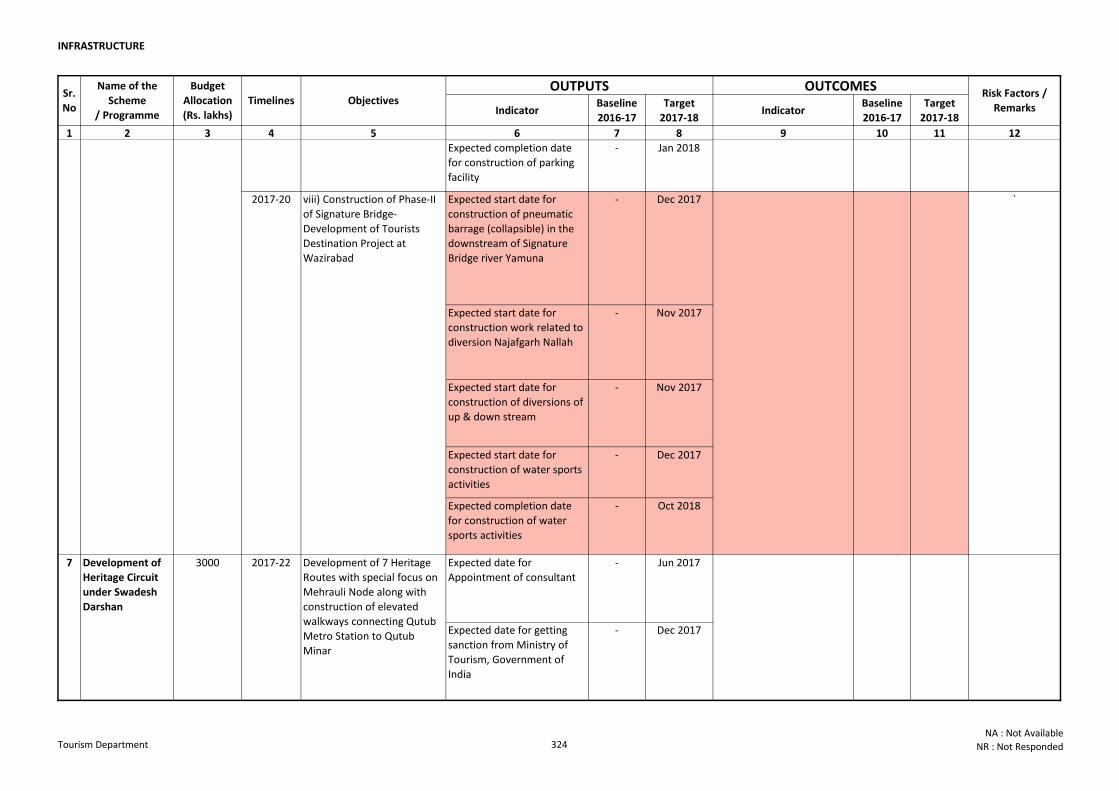
INFRASTRUCTURE
Indicator Baseline
2016-17
Target
2017-18Indicator
Baseline
2016-17
Target
2017-18
1 2 3 4 5 6 7 8 9 10 11 12
Risk Factors /
Remarks
Sr.
No
Name of the
Scheme
/ Programme
Budget
Allocation
(Rs. lakhs)
Timelines Objectives OUTPUTS OUTCOMES
Expected completion date
for construction of parking
facility
- Jan 2018
Expected start date for
construction of pneumatic
barrage (collapsible) in the
downstream of Signature
Bridge river Yamuna
- Dec 2017
Expected start date for
construction work related to
diversion Najafgarh Nallah
- Nov 2017
Expected start date for
construction of diversions of
up & down stream
- Nov 2017
Expected start date for
construction of water sports
activities
- Dec 2017
Expected completion date
for construction of water
sports activities
- Oct 2018
Expected date for
Appointment of consultant
- Jun 2017
Expected date for getting
sanction from Ministry of
Tourism, Government of
India
- Dec 2017
`
6 Tourism
Infrastructure
500
Total number of tourists
visiting the place NA NA
viii) Construction of Phase-II
of Signature Bridge-
Development of Tourists
Destination Project at
Wazirabad
7 Development of
Heritage Circuit
under Swadesh
Darshan
3000 2017-22 Development of 7 Heritage
Routes with special focus on
Mehrauli Node along with
construction of elevated
walkways connecting Qutub
Metro Station to Qutub
Minar
vii) Development of Tourism
Complex at NH-8 with way-
side amenities like
restaurant, cyber café, utility
shop, Souvenir shop,
Cafeteria, Picnic and Party
Lawn, High end toilets,
Parking facility at the site.
2017-20
2017-20
Outcome values
are NIL because
project has not
been completed
Tourism Department 324NA : Not Available
NR : Not Responded
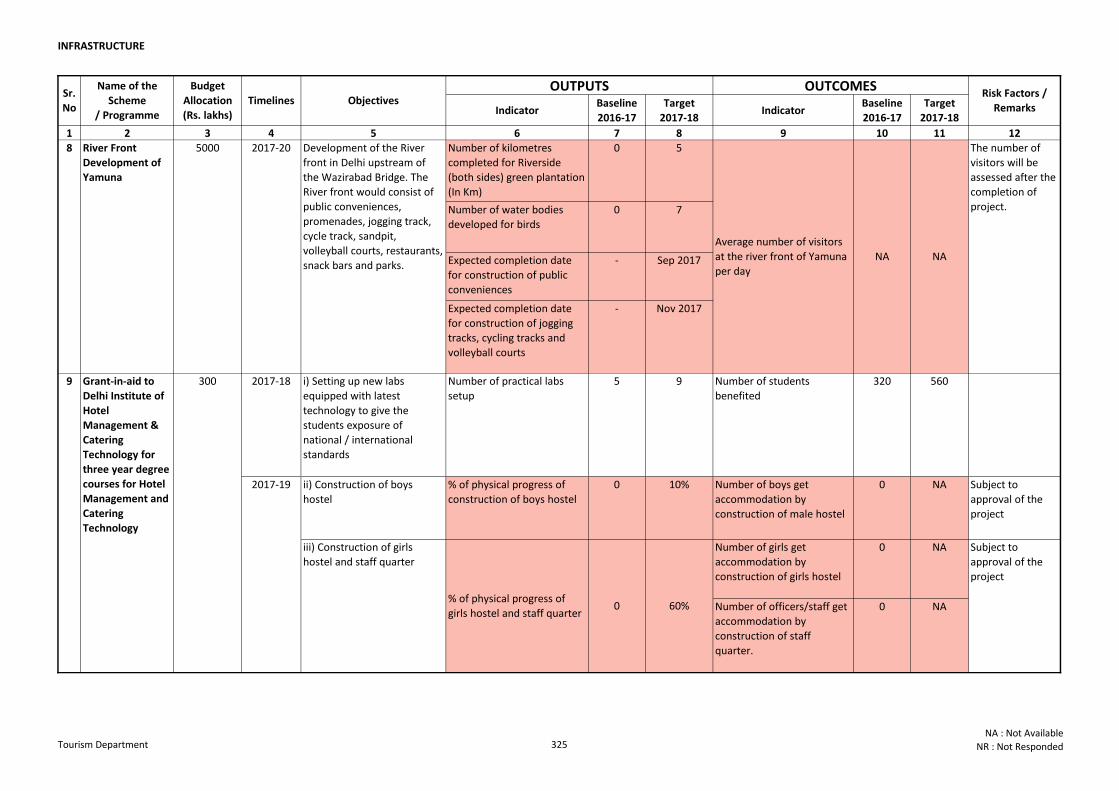
INFRASTRUCTURE
Indicator Baseline
2016-17
Target
2017-18Indicator
Baseline
2016-17
Target
2017-18
1 2 3 4 5 6 7 8 9 10 11 12
Risk Factors /
Remarks
Sr.
No
Name of the
Scheme
/ Programme
Budget
Allocation
(Rs. lakhs)
Timelines Objectives OUTPUTS OUTCOMES
Number of kilometres
completed for Riverside
(both sides) green plantation
(In Km)
0 5
Number of water bodies
developed for birds
0 7
Expected completion date
for construction of public
conveniences
- Sep 2017
Expected completion date
for construction of jogging
tracks, cycling tracks and
volleyball courts
- Nov 2017
2017-18 i) Setting up new labs
equipped with latest
technology to give the
students exposure of
national / international
standards
Number of practical labs
setup
5 9 Number of students
benefited
320 560
ii) Construction of boys
hostel
% of physical progress of
construction of boys hostel
0 10% Number of boys get
accommodation by
construction of male hostel
0 NA Subject to
approval of the
project
Number of girls get
accommodation by
construction of girls hostel
0 NA
Number of officers/staff get
accommodation by
construction of staff
quarter.
0 NA
2017-19
9 Grant-in-aid to
Delhi Institute of
Hotel
Management &
Catering
Technology for
three year degree
courses for Hotel
Management and
Catering
Technology
300
5000
Subject to
approval of the
project
60%% of physical progress of
girls hostel and staff quarter 0
iii) Construction of girls
hostel and staff quarter
NA
Average number of visitors
at the river front of Yamuna
per day
NA
2017-208 River Front
Development of
Yamuna
The number of
visitors will be
assessed after the
completion of
project.
Development of the River
front in Delhi upstream of
the Wazirabad Bridge. The
River front would consist of
public conveniences,
promenades, jogging track,
cycle track, sandpit,
volleyball courts, restaurants,
snack bars and parks.
Tourism Department 325NA : Not Available
NR : Not Responded
ENVIRONMENT
AND FOREST
EN
VIR
ON
MEN
T A
ND
FO
RES
T
EN
VIR
ON
MEN
T A
ND
FO
RES
T
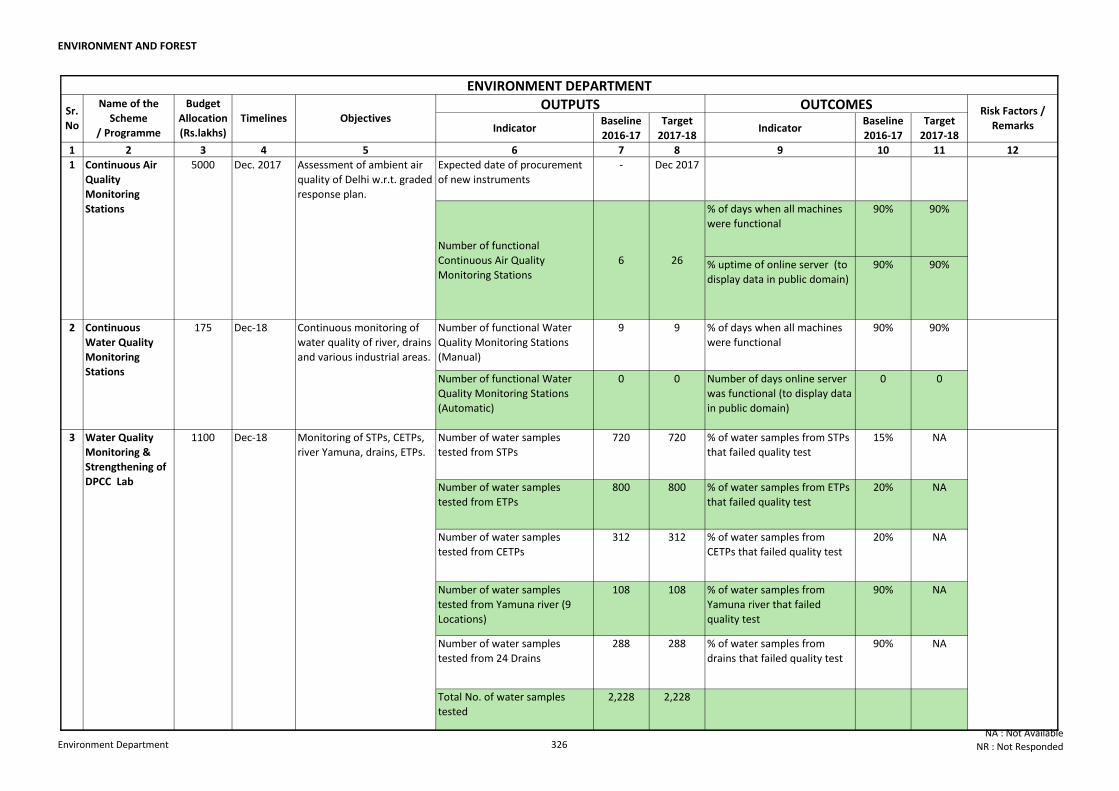
ENVIRONMENT AND FOREST
Indicator Baseline
2016-17
Target
2017-18Indicator
Baseline
2016-17
Target
2017-18
1 2 3 4 5 6 7 8 9 10 11 12
Expected date of procurement
of new instruments
- Dec 2017
% of days when all machines
were functional
90% 90%
% uptime of online server (to
display data in public domain)
90% 90%
Number of functional Water
Quality Monitoring Stations
(Manual)
9 9 % of days when all machines
were functional
90% 90%
Number of functional Water
Quality Monitoring Stations
(Automatic)
0 0 Number of days online server
was functional (to display data
in public domain)
0 0
Number of water samples
tested from STPs
720 720 % of water samples from STPs
that failed quality test
15% NA
Number of water samples
tested from ETPs
800 800 % of water samples from ETPs
that failed quality test
20% NA
Number of water samples
tested from CETPs
312 312 % of water samples from
CETPs that failed quality test
20% NA
Number of water samples
tested from Yamuna river (9
Locations)
108 108 % of water samples from
Yamuna river that failed
quality test
90% NA
Number of water samples
tested from 24 Drains
288 288 % of water samples from
drains that failed quality test
90% NA
Total No. of water samples
tested
2,228 2,228
1100
1
2
6
Number of functional
Continuous Air Quality
Monitoring Stations
26
ENVIRONMENT DEPARTMENT
Water Quality
Monitoring &
Strengthening of
DPCC Lab
Dec-18175Continuous
Water Quality
Monitoring
Stations
Continuous monitoring of
water quality of river, drains
and various industrial areas.
Continuous Air
Quality
Monitoring
Stations
Assessment of ambient air
quality of Delhi w.r.t. graded
response plan.
5000 Dec. 2017
Sr.
No
Name of the
Scheme
/ Programme
Budget
Allocation
(Rs.lakhs)
Timelines Objectives OUTPUTS OUTCOMES
Dec-18
Risk Factors /
Remarks
3 Monitoring of STPs, CETPs,
river Yamuna, drains, ETPs.
Environment Department 326NA : Not Available
NR : Not Responded
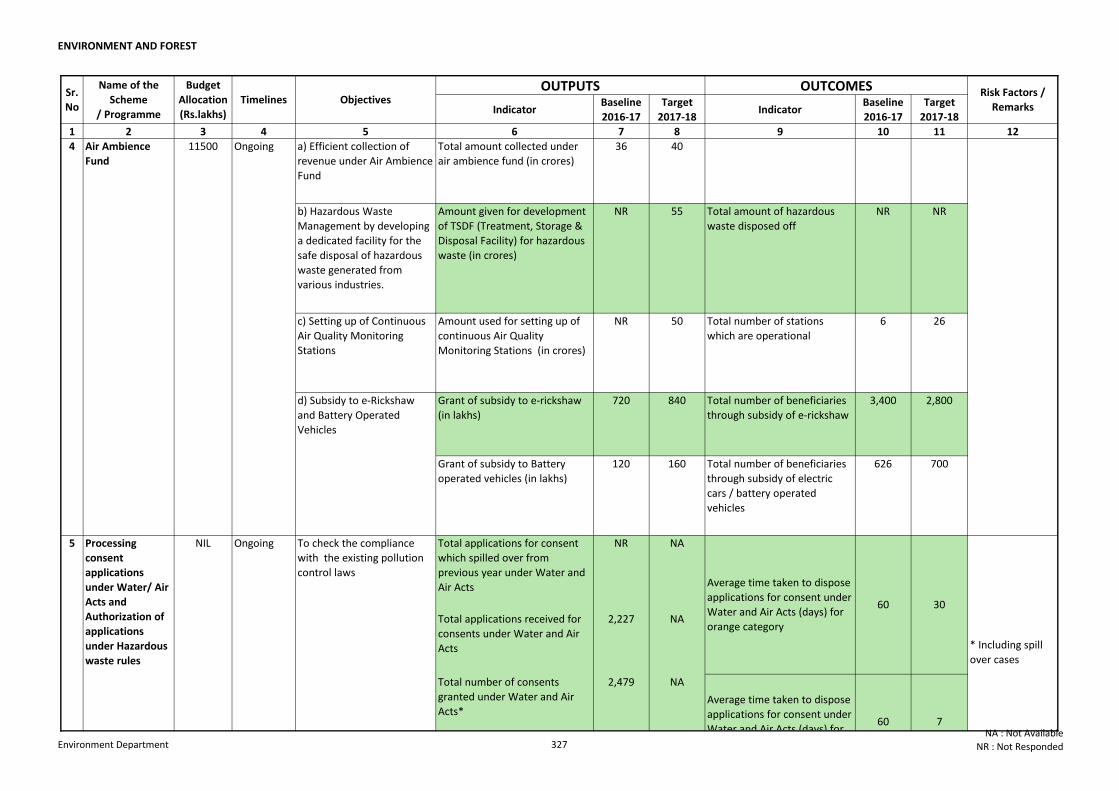
ENVIRONMENT AND FOREST
Indicator Baseline
2016-17
Target
2017-18Indicator
Baseline
2016-17
Target
2017-18
1 2 3 4 5 6 7 8 9 10 11 12
Sr.
No
Name of the
Scheme
/ Programme
Budget
Allocation
(Rs.lakhs)
Timelines Objectives OUTPUTS OUTCOMES Risk Factors /
Remarks
a) Efficient collection of
revenue under Air Ambience
Fund
Total amount collected under
air ambience fund (in crores)
36 40
b) Hazardous Waste
Management by developing
a dedicated facility for the
safe disposal of hazardous
waste generated from
various industries.
Amount given for development
of TSDF (Treatment, Storage &
Disposal Facility) for hazardous
waste (in crores)
NR 55 Total amount of hazardous
waste disposed off
NR NR
c) Setting up of Continuous
Air Quality Monitoring
Stations
Amount used for setting up of
continuous Air Quality
Monitoring Stations (in crores)
NR 50 Total number of stations
which are operational
6 26
Grant of subsidy to e-rickshaw
(in lakhs)
720 840 Total number of beneficiaries
through subsidy of e-rickshaw
3,400 2,800
Grant of subsidy to Battery
operated vehicles (in lakhs)
120 160 Total number of beneficiaries
through subsidy of electric
cars / battery operated
vehicles
626 700
Total applications for consent
which spilled over from
previous year under Water and
Air Acts
NR NA
Total applications received for
consents under Water and Air
Acts
2,227 NA
Total number of consents
granted under Water and Air
Acts*
2,479 NA
d) Subsidy to e-Rickshaw
and Battery Operated
Vehicles
Ongoing
Average time taken to dispose
applications for consent under
Water and Air Acts (days) for
orange category
60 30
60 7
To check the compliance
with the existing pollution
control laws
Ongoing
Average time taken to dispose
applications for consent under
Water and Air Acts (days) for
green category
* Including spill
over cases
5 Processing
consent
applications
under Water/ Air
Acts and
Authorization of
applications
under Hazardous
waste rules
NIL
Air Ambience
Fund
115004
Environment Department 327NA : Not Available
NR : Not Responded
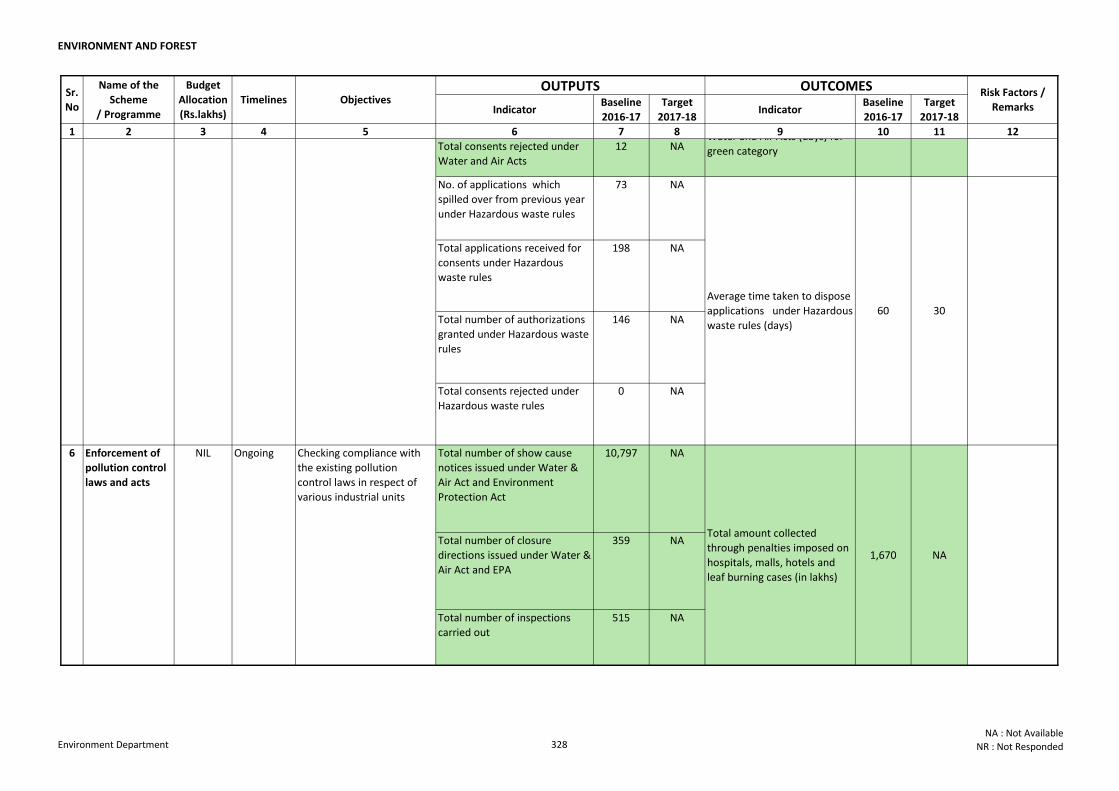
ENVIRONMENT AND FOREST
Indicator Baseline
2016-17
Target
2017-18Indicator
Baseline
2016-17
Target
2017-18
1 2 3 4 5 6 7 8 9 10 11 12
Sr.
No
Name of the
Scheme
/ Programme
Budget
Allocation
(Rs.lakhs)
Timelines Objectives OUTPUTS OUTCOMES Risk Factors /
Remarks
Total consents rejected under
Water and Air Acts
12 NA
No. of applications which
spilled over from previous year
under Hazardous waste rules
73 NA
Total applications received for
consents under Hazardous
waste rules
198 NA
Total number of authorizations
granted under Hazardous waste
rules
146 NA
Total consents rejected under
Hazardous waste rules
0 NA
Total number of show cause
notices issued under Water &
Air Act and Environment
Protection Act
10,797 NA
Total number of closure
directions issued under Water &
Air Act and EPA
359 NA
Total number of inspections
carried out
515 NA
Average time taken to dispose
applications under Hazardous
waste rules (days)
60 30
60 7
To check the compliance
with the existing pollution
control laws
Ongoing
Average time taken to dispose
applications for consent under
Water and Air Acts (days) for
green category
* Including spill
over cases
NA
6
5 Processing
consent
applications
under Water/ Air
Acts and
Authorization of
applications
under Hazardous
waste rules
1,670
Total amount collected
through penalties imposed on
hospitals, malls, hotels and
leaf burning cases (in lakhs)
Ongoing Checking compliance with
the existing pollution
control laws in respect of
various industrial units
Enforcement of
pollution control
laws and acts
NIL
NIL
Environment Department 328NA : Not Available
NR : Not Responded
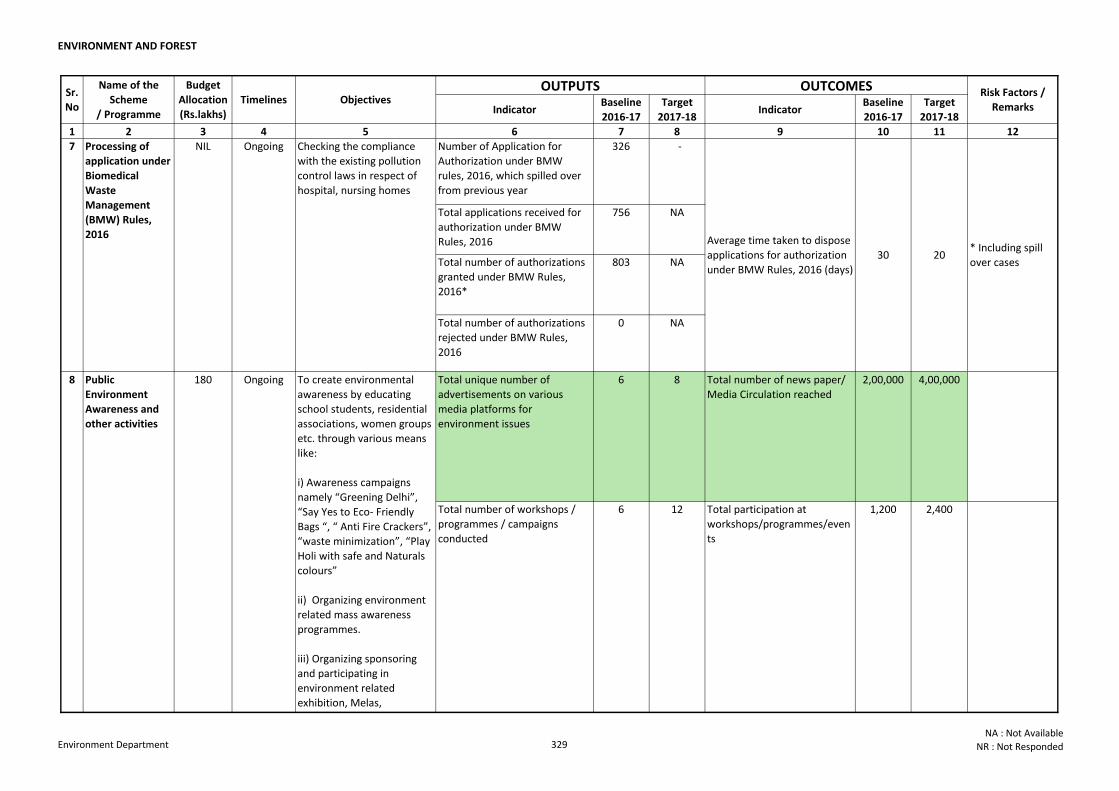
ENVIRONMENT AND FOREST
Indicator Baseline
2016-17
Target
2017-18Indicator
Baseline
2016-17
Target
2017-18
1 2 3 4 5 6 7 8 9 10 11 12
Sr.
No
Name of the
Scheme
/ Programme
Budget
Allocation
(Rs.lakhs)
Timelines Objectives OUTPUTS OUTCOMES Risk Factors /
Remarks
Number of Application for
Authorization under BMW
rules, 2016, which spilled over
from previous year
326 -
Total applications received for
authorization under BMW
Rules, 2016
756 NA
Total number of authorizations
granted under BMW Rules,
2016*
803 NA
Total number of authorizations
rejected under BMW Rules,
2016
0 NA
Total unique number of
advertisements on various
media platforms for
environment issues
6 8 Total number of news paper/
Media Circulation reached
2,00,000 4,00,0008 Public
Environment
Awareness and
other activities
180 Ongoing
7 Processing of
application under
Biomedical
Waste
Management
(BMW) Rules,
2016
NIL Ongoing Checking the compliance
with the existing pollution
control laws in respect of
hospital, nursing homes
Average time taken to dispose
applications for authorization
under BMW Rules, 2016 (days)
30 20* Including spill
over cases
Total number of workshops /
programmes / campaigns
conducted
6 12 Total participation at
workshops/programmes/even
ts
1,200 2,400
To create environmental
awareness by educating
school students, residential
associations, women groups
etc. through various means
like:
i) Awareness campaigns
namely “Greening Delhi”,
“Say Yes to Eco- Friendly
Bags “, “ Anti Fire Crackers”,
“waste minimization”, “Play
Holi with safe and Naturals
colours”
ii) Organizing environment
related mass awareness
programmes.
iii) Organizing sponsoring
and participating in
environment related
exhibition, Melas,
workshops etc.
Environment Department 329NA : Not Available
NR : Not Responded
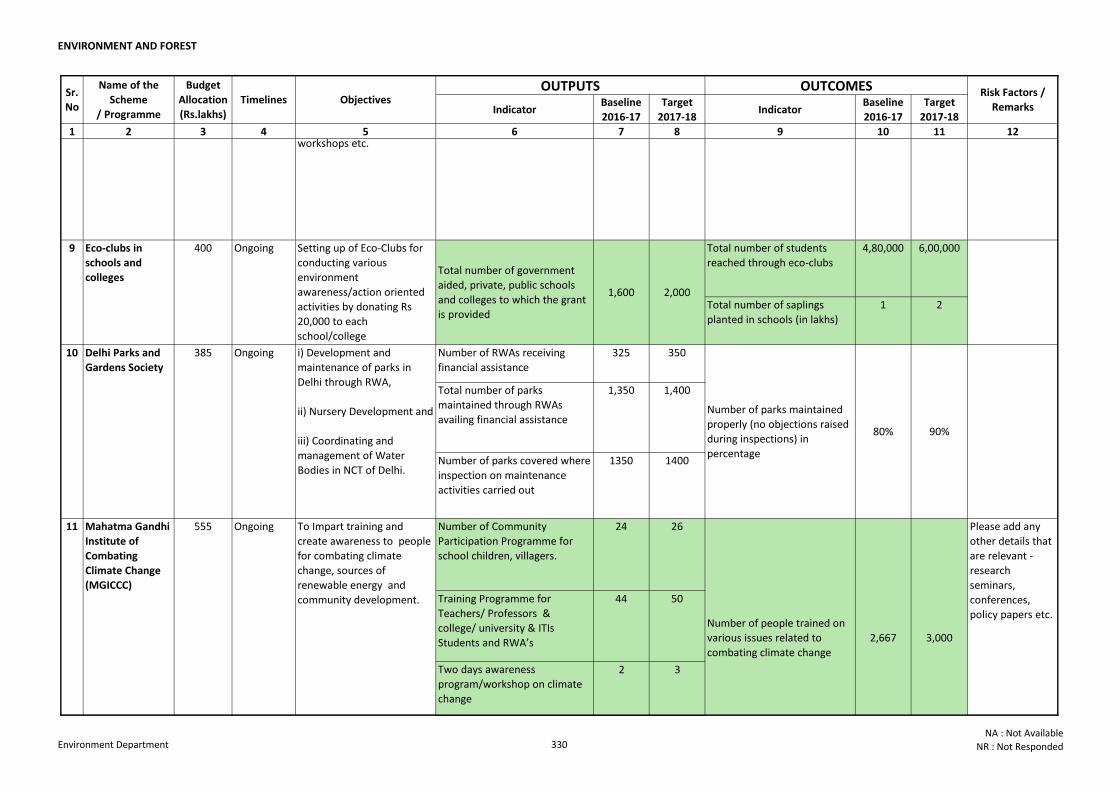
ENVIRONMENT AND FOREST
Indicator Baseline
2016-17
Target
2017-18Indicator
Baseline
2016-17
Target
2017-18
1 2 3 4 5 6 7 8 9 10 11 12
Sr.
No
Name of the
Scheme
/ Programme
Budget
Allocation
(Rs.lakhs)
Timelines Objectives OUTPUTS OUTCOMES Risk Factors /
Remarks
Total number of students
reached through eco-clubs
4,80,000 6,00,000
Total number of saplings
planted in schools (in lakhs)
1 2
Number of RWAs receiving
financial assistance
325 350
Total number of parks
maintained through RWAs
availing financial assistance
1,350 1,400
Number of parks covered where
inspection on maintenance
activities carried out
1350 1400
Number of Community
Participation Programme for
school children, villagers.
24 26
Training Programme for
Teachers/ Professors &
college/ university & ITIs
Students and RWA’s
44 50
Two days awareness
program/workshop on climate
change
2 3
10
9 Setting up of Eco-Clubs for
conducting various
environment
awareness/action oriented
activities by donating Rs
20,000 to each
school/college
400
Ongoing385 i) Development and
maintenance of parks in
Delhi through RWA,
ii) Nursery Development and
iii) Coordinating and
management of Water
Bodies in NCT of Delhi.
8 Public
Environment
Awareness and
other activities
180 Ongoing
Total number of government
aided, private, public schools
and colleges to which the grant
is provided
1,600 2,000
Total number of workshops /
programmes / campaigns
conducted
6 12 Total participation at
workshops/programmes/even
ts
1,200 2,400
Please add any
other details that
are relevant -
research
seminars,
conferences,
policy papers etc.
3,000
Number of parks maintained
properly (no objections raised
during inspections) in
percentage
80% 90%
Ongoing
Number of people trained on
various issues related to
combating climate change
2,667
To Impart training and
create awareness to people
for combating climate
change, sources of
renewable energy and
community development.
To create environmental
awareness by educating
school students, residential
associations, women groups
etc. through various means
like:
i) Awareness campaigns
namely “Greening Delhi”,
“Say Yes to Eco- Friendly
Bags “, “ Anti Fire Crackers”,
“waste minimization”, “Play
Holi with safe and Naturals
colours”
ii) Organizing environment
related mass awareness
programmes.
iii) Organizing sponsoring
and participating in
environment related
exhibition, Melas,
workshops etc.
OngoingMahatma Gandhi
Institute of
Combating
Climate Change
(MGICCC)
55511
Delhi Parks and
Gardens Society
Eco-clubs in
schools and
colleges
Environment Department 330NA : Not Available
NR : Not Responded
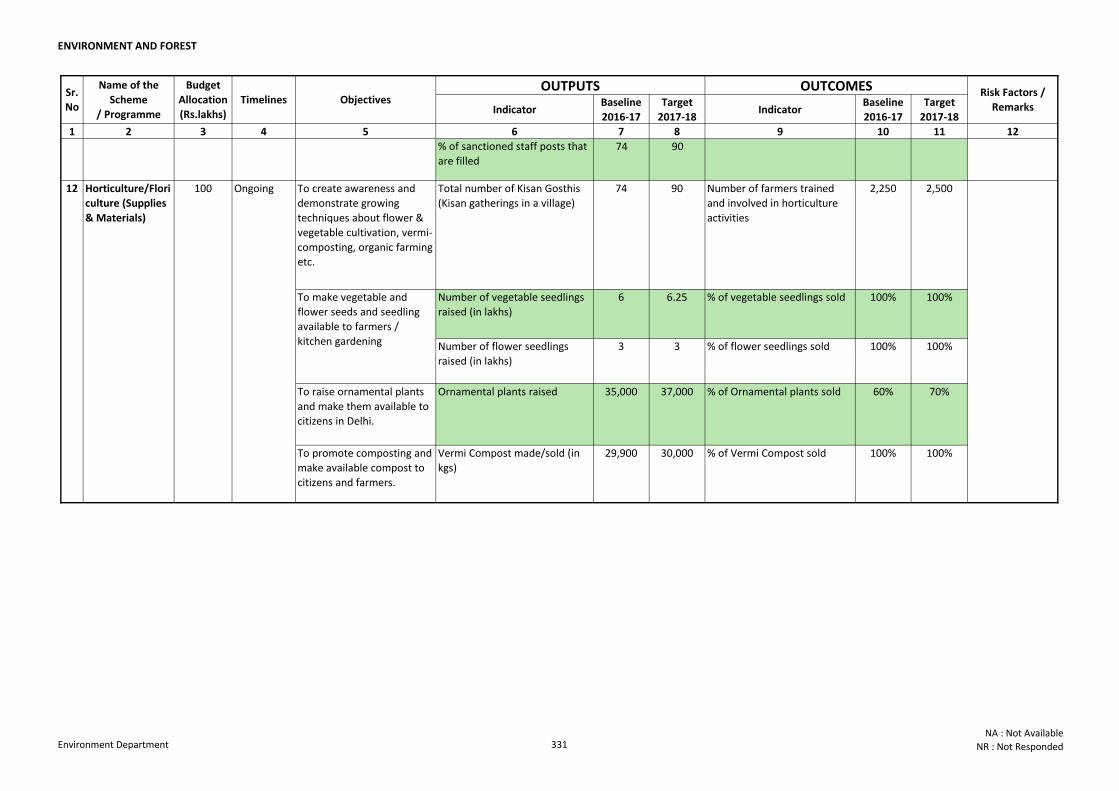
ENVIRONMENT AND FOREST
Indicator Baseline
2016-17
Target
2017-18Indicator
Baseline
2016-17
Target
2017-18
1 2 3 4 5 6 7 8 9 10 11 12
Sr.
No
Name of the
Scheme
/ Programme
Budget
Allocation
(Rs.lakhs)
Timelines Objectives OUTPUTS OUTCOMES Risk Factors /
Remarks
% of sanctioned staff posts that
are filled74 90
To create awareness and
demonstrate growing
techniques about flower &
vegetable cultivation, vermi-
composting, organic farming
etc.
Total number of Kisan Gosthis
(Kisan gatherings in a village)
74 90 Number of farmers trained
and involved in horticulture
activities
2,250 2,500
Number of vegetable seedlings
raised (in lakhs)
6 6.25 % of vegetable seedlings sold 100% 100%
Number of flower seedlings
raised (in lakhs)
3 3 % of flower seedlings sold 100% 100%
To raise ornamental plants
and make them available to
citizens in Delhi.
Ornamental plants raised 35,000 37,000 % of Ornamental plants sold 60% 70%
To promote composting and
make available compost to
citizens and farmers.
Vermi Compost made/sold (in
kgs)
29,900 30,000 % of Vermi Compost sold 100% 100%
Please add any
other details that
are relevant -
research
seminars,
conferences,
policy papers etc.
3,000
Number of people trained on
various issues related to
combating climate change
2,667
To make vegetable and
flower seeds and seedling
available to farmers /
kitchen gardening
To Impart training and
create awareness to people
for combating climate
change, sources of
renewable energy and
community development.
Ongoing
OngoingMahatma Gandhi
Institute of
Combating
Climate Change
(MGICCC)
Horticulture/Flori
culture (Supplies
& Materials)
555
100
11
12
Environment Department 331NA : Not Available
NR : Not Responded

EN
VIR
ON
MEN
T A
ND
FO
RES
T
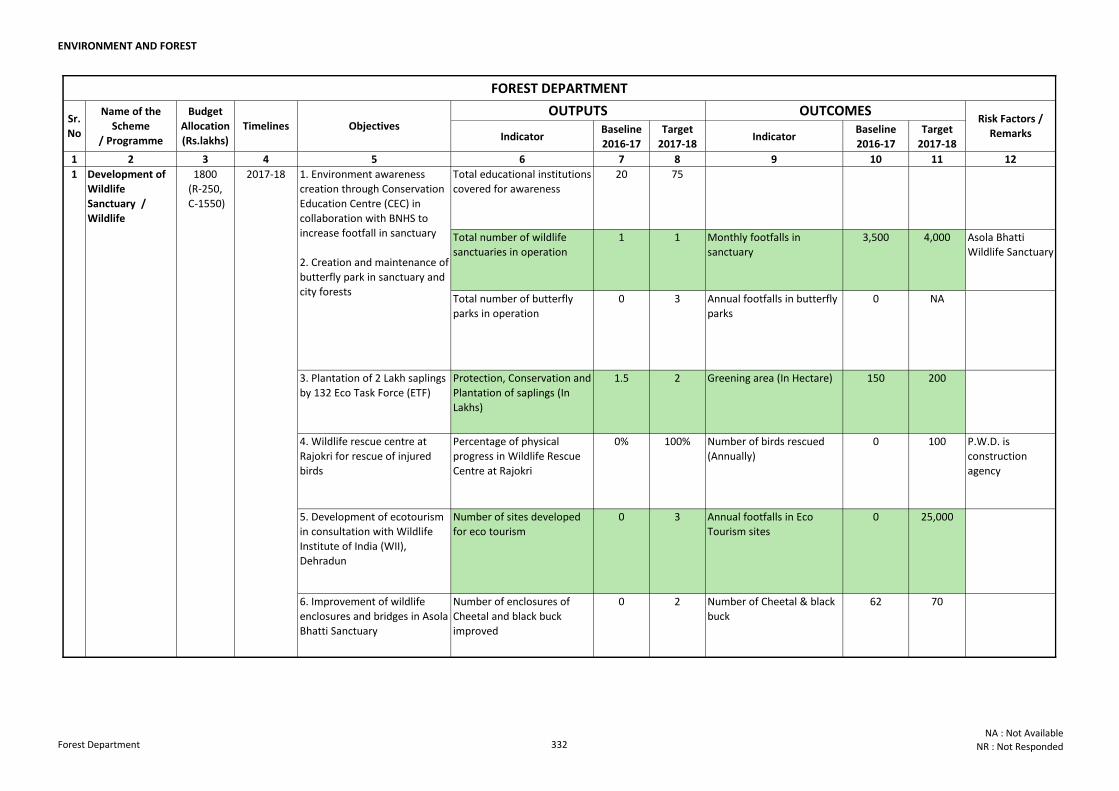
ENVIRONMENT AND FOREST
Indicator Baseline
2016-17
Target
2017-18Indicator
Baseline
2016-17
Target
2017-18
1 2 3 4 5 6 7 8 9 10 11 12
Total educational institutions
covered for awareness
20 75
Total number of wildlife
sanctuaries in operation
1 1 Monthly footfalls in
sanctuary
3,500 4,000 Asola Bhatti
Wildlife Sanctuary
Total number of butterfly
parks in operation
0 3 Annual footfalls in butterfly
parks
0 NA
3. Plantation of 2 Lakh saplings
by 132 Eco Task Force (ETF)
Protection, Conservation and
Plantation of saplings (In
Lakhs)
1.5 2 Greening area (In Hectare) 150 200
4. Wildlife rescue centre at
Rajokri for rescue of injured
birds
Percentage of physical
progress in Wildlife Rescue
Centre at Rajokri
0% 100% Number of birds rescued
(Annually)
0 100 P.W.D. is
construction
agency
5. Development of ecotourism
in consultation with Wildlife
Institute of India (WII),
Dehradun
Number of sites developed
for eco tourism
0 3 Annual footfalls in Eco
Tourism sites
0 25,000
6. Improvement of wildlife
enclosures and bridges in Asola
Bhatti Sanctuary
Number of enclosures of
Cheetal and black buck
improved
0 2 Number of Cheetal & black
buck
62 70
FOREST DEPARTMENT
1. Environment awareness
creation through Conservation
Education Centre (CEC) in
collaboration with BNHS to
increase footfall in sanctuary
2. Creation and maintenance of
butterfly park in sanctuary and
city forests
1800
(R-250,
C-1550)
Development of
Wildlife
Sanctuary /
Wildlife
1
Sr.
No
Name of the
Scheme
/ Programme
Budget
Allocation
(Rs.lakhs)
Timelines Objectives OUTPUTS OUTCOMES
Risk Factors /
Remarks
2017-18
Forest Department 332NA : Not Available
NR : Not Responded
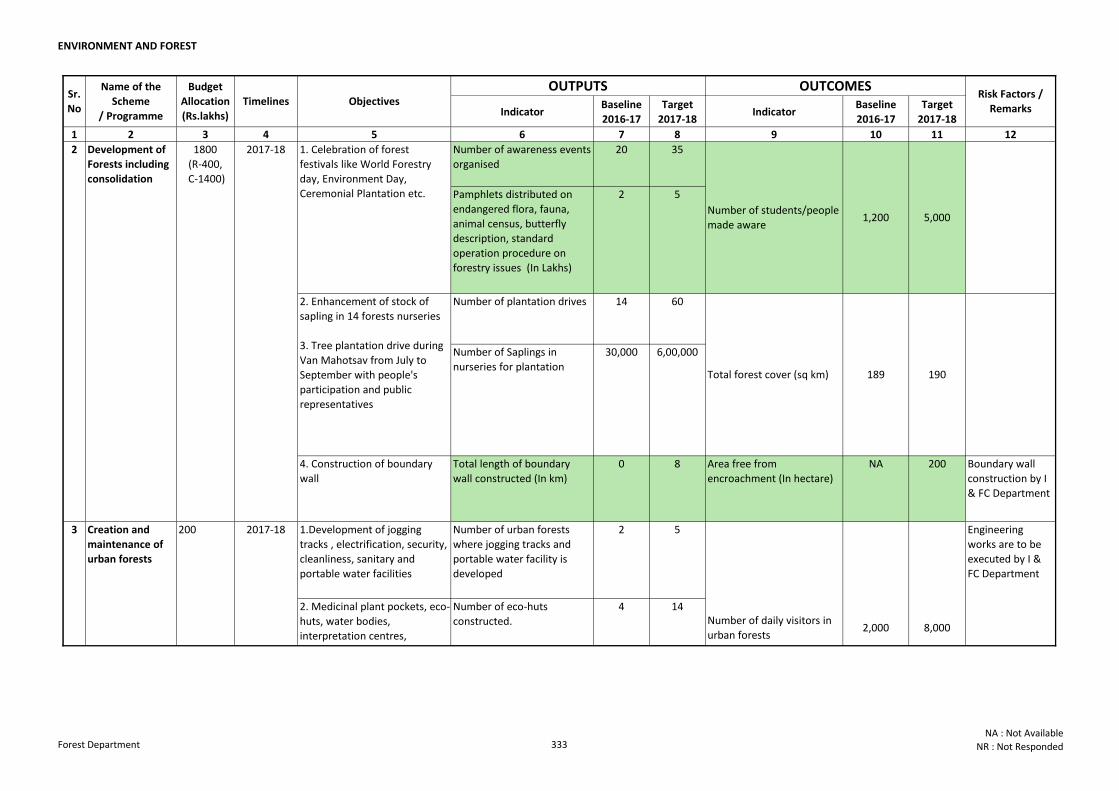
ENVIRONMENT AND FOREST
Indicator Baseline
2016-17
Target
2017-18Indicator
Baseline
2016-17
Target
2017-18
1 2 3 4 5 6 7 8 9 10 11 12
Sr.
No
Name of the
Scheme
/ Programme
Budget
Allocation
(Rs.lakhs)
Timelines Objectives OUTPUTS OUTCOMES
Risk Factors /
Remarks
Number of awareness events
organised
20 35
Pamphlets distributed on
endangered flora, fauna,
animal census, butterfly
description, standard
operation procedure on
forestry issues (In Lakhs)
2 5
Number of plantation drives 14 60
Number of Saplings in
nurseries for plantation
30,000 6,00,000
4. Construction of boundary
wall
Total length of boundary
wall constructed (In km)
0 8 Area free from
encroachment (In hectare)
NA 200 Boundary wall
construction by I
& FC Department
1.Development of jogging
tracks , electrification, security,
cleanliness, sanitary and
portable water facilities
Number of urban forests
where jogging tracks and
portable water facility is
developed
2 5
Number of eco-huts
constructed.
4 14
2
3 Creation and
maintenance of
urban forests
200
2. Medicinal plant pockets, eco-
huts, water bodies,
interpretation centres,
butterfly pockets and
plantation of nectar plants,
landscaping, strengthening of
boundaries etc. in 10 city
forests
1. Celebration of forest
festivals like World Forestry
day, Environment Day,
Ceremonial Plantation etc.
Number of daily visitors in
urban forests
Development of
Forests including
consolidation
1800
(R-400,
C-1400)
2017-18
2017-18
2. Enhancement of stock of
sapling in 14 forests nurseries
3. Tree plantation drive during
Van Mahotsav from July to
September with people's
participation and public
representatives
Total forest cover (sq km) 189 190
Number of students/people
made aware5,0001,200
Engineering
works are to be
executed by I &
FC Department
8,0002,000
Forest Department 333NA : Not Available
NR : Not Responded
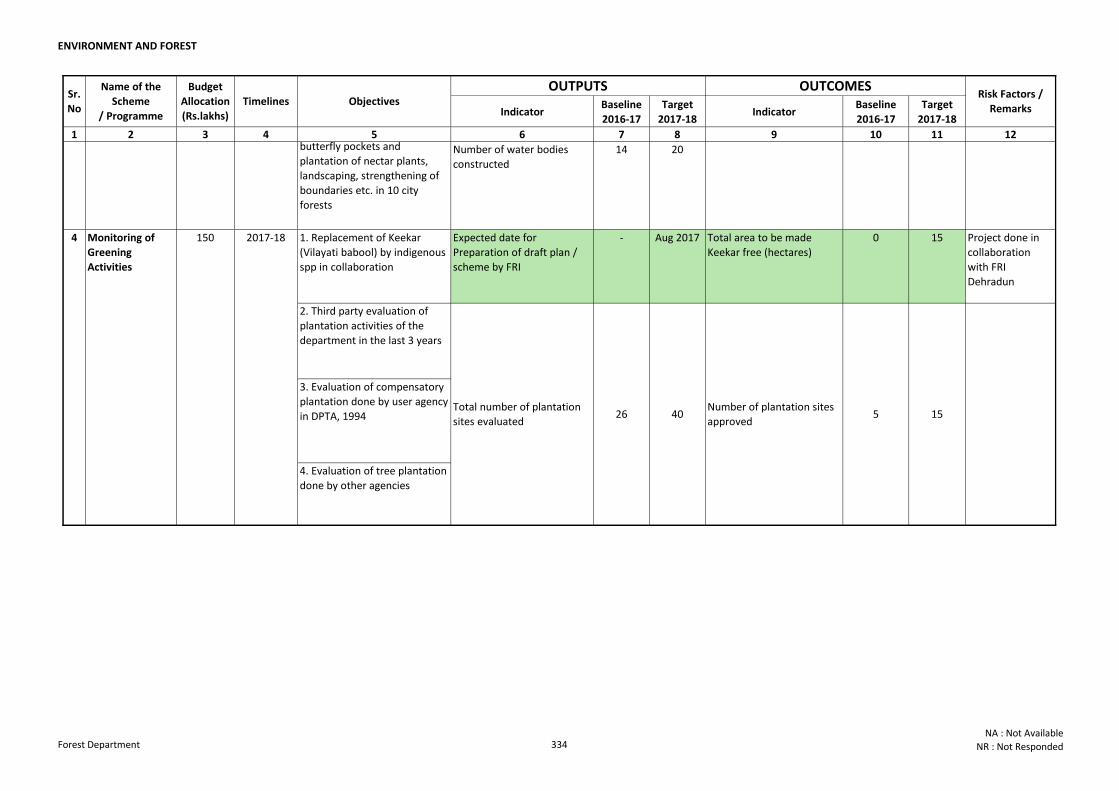
ENVIRONMENT AND FOREST
Indicator Baseline
2016-17
Target
2017-18Indicator
Baseline
2016-17
Target
2017-18
1 2 3 4 5 6 7 8 9 10 11 12
Sr.
No
Name of the
Scheme
/ Programme
Budget
Allocation
(Rs.lakhs)
Timelines Objectives OUTPUTS OUTCOMES
Risk Factors /
Remarks
Number of water bodies
constructed
14 20
1. Replacement of Keekar
(Vilayati babool) by indigenous
spp in collaboration
Expected date for
Preparation of draft plan /
scheme by FRI
- Aug 2017 Total area to be made
Keekar free (hectares)
0 15 Project done in
collaboration
with FRI
Dehradun
2. Third party evaluation of
plantation activities of the
department in the last 3 years
3. Evaluation of compensatory
plantation done by user agency
in DPTA, 1994
4. Evaluation of tree plantation
done by other agencies
4
3 Creation and
maintenance of
urban forests
200
26 40
2. Medicinal plant pockets, eco-
huts, water bodies,
interpretation centres,
butterfly pockets and
plantation of nectar plants,
landscaping, strengthening of
boundaries etc. in 10 city
forests
Number of plantation sites
approved
Number of daily visitors in
urban forests
Monitoring of
Greening
Activities
150
Total number of plantation
sites evaluated
2017-18
2017-18
Engineering
works are to be
executed by I &
FC Department
8,0002,000
5 15
Forest Department 334NA : Not Available
NR : Not Responded
OTHERSO
TH
ER
S
OT
HER
S
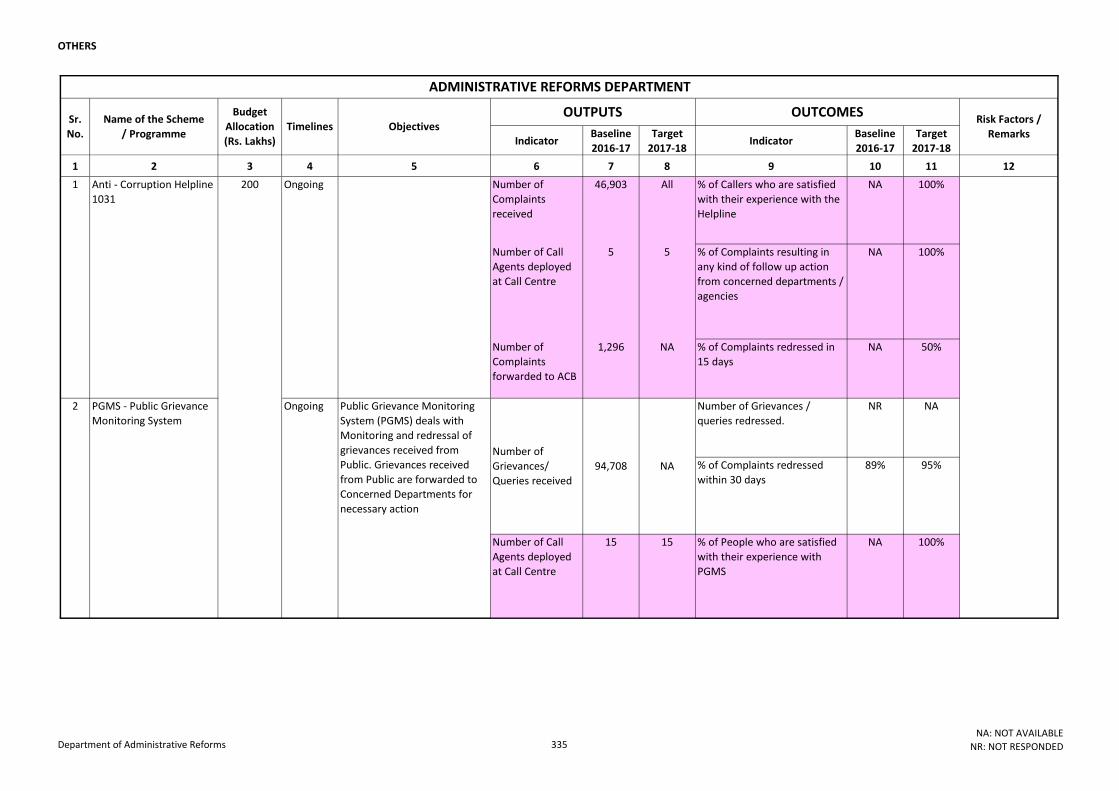
OTHERS
Indicator Baseline
2016-17
Target
2017-18Indicator
Baseline
2016-17
Target
2017-18
1 2 3 4 5 6 7 8 9 10 11 12
Number of
Complaints
received
46,903 All % of Callers who are satisfied
with their experience with the
Helpline
NA 100%
Number of Call
Agents deployed
at Call Centre
5 5 % of Complaints resulting in
any kind of follow up action
from concerned departments /
agencies
NA 100%
Number of
Complaints
forwarded to ACB
1,296 NA % of Complaints redressed in
15 days
NA 50%
Number of Grievances /
queries redressed.
NR NA
% of Complaints redressed
within 30 days
89% 95%
Number of Call
Agents deployed
at Call Centre
15 15 % of People who are satisfied
with their experience with
PGMS
NA 100%
ADMINISTRATIVE REFORMS DEPARTMENT
Sr.
No.
Name of the Scheme
/ Programme
Budget
Allocation
(Rs. Lakhs)
Timelines Objectives OUTPUTS OUTCOMES
Risk Factors /
Remarks
1 Anti - Corruption Helpline
1031
2
200 Ongoing
PGMS - Public Grievance
Monitoring System
Number of
Grievances/
Queries received
94,708 NA
Public Grievance Monitoring
System (PGMS) deals with
Monitoring and redressal of
grievances received from
Public. Grievances received
from Public are forwarded to
Concerned Departments for
necessary action
Ongoing
Department of Administrative Reforms 335NA: NOT AVAILABLE
NR: NOT RESPONDED
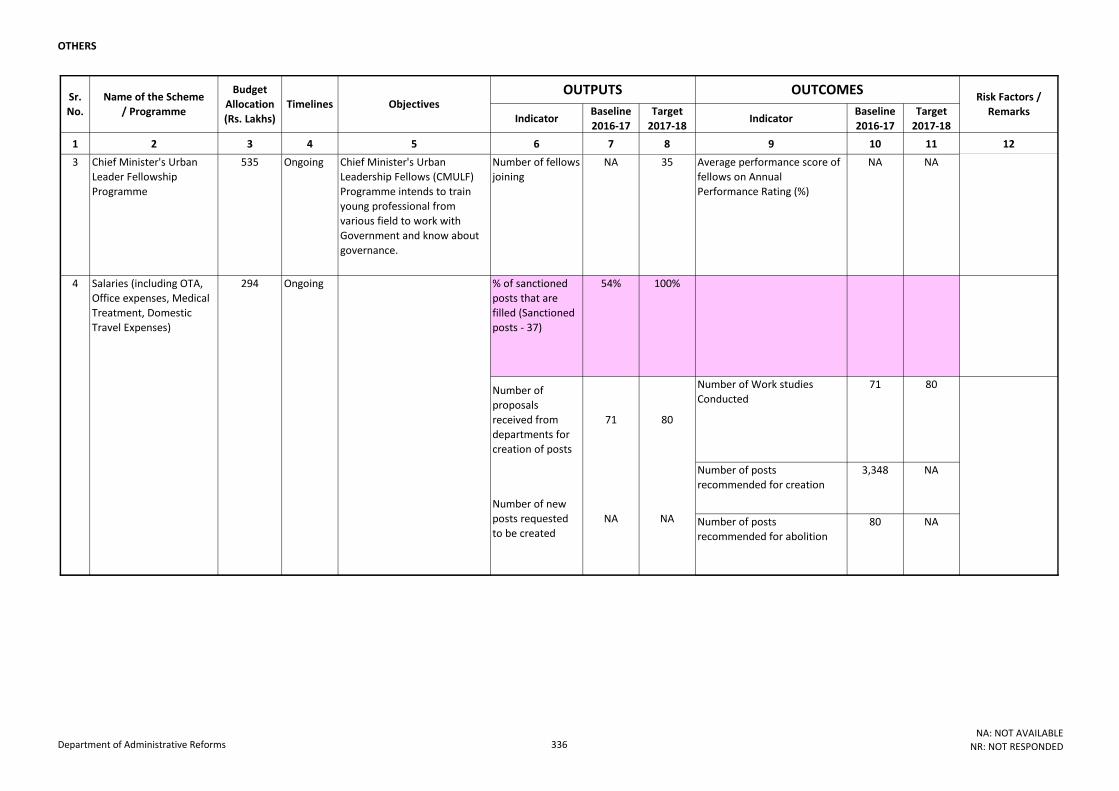
OTHERS
Indicator Baseline
2016-17
Target
2017-18Indicator
Baseline
2016-17
Target
2017-18
1 2 3 4 5 6 7 8 9 10 11 12
Sr.
No.
Name of the Scheme
/ Programme
Budget
Allocation
(Rs. Lakhs)
Timelines Objectives OUTPUTS OUTCOMES
Risk Factors /
Remarks
3 Chief Minister's Urban
Leader Fellowship
Programme
535 Ongoing Chief Minister's Urban
Leadership Fellows (CMULF)
Programme intends to train
young professional from
various field to work with
Government and know about
governance.
Number of fellows
joining
NA 35 Average performance score of
fellows on Annual
Performance Rating (%)
NA NA
% of sanctioned
posts that are
filled (Sanctioned
posts - 37)
54% 100%
Number of
proposals
received from
departments for
creation of posts
71 80
Number of Work studies
Conducted
71 80
Number of posts
recommended for creation
3,348 NA
Number of posts
recommended for abolition
80 NA
4
NA
294
Number of new
posts requested
to be created
NA
Ongoing Salaries (including OTA,
Office expenses, Medical
Treatment, Domestic
Travel Expenses)
Department of Administrative Reforms 336NA: NOT AVAILABLE
NR: NOT RESPONDED
OT
HER
S
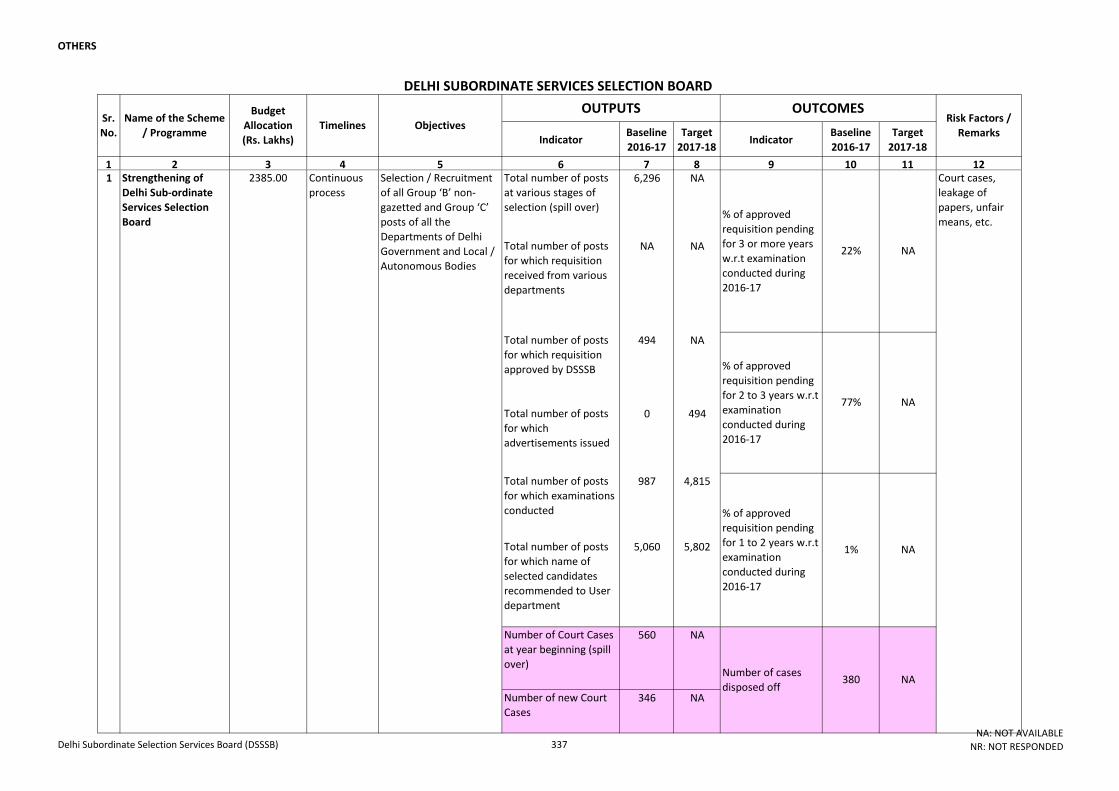
OTHERS
Indicator Baseline
2016-17
Target
2017-18Indicator
Baseline
2016-17
Target
2017-18
1 2 3 4 5 6 7 8 9 10 11 12Total number of posts
at various stages of
selection (spill over)
6,296 NA
Total number of posts
for which requisition
received from various
departments
NA NA
Total number of posts
for which requisition
approved by DSSSB
494 NA
Total number of posts
for which
advertisements issued
0 494
Total number of posts
for which examinations
conducted
987 4,815
Total number of posts
for which name of
selected candidates
recommended to User
department
5,060 5,802
Number of Court Cases
at year beginning (spill
over)
560 NA
Number of new Court
Cases 346 NA
NA
% of approved
requisition pending
for 2 to 3 years w.r.t
examination
conducted during
2016-17
77% NA
Number of cases
disposed off
DELHI SUBORDINATE SERVICES SELECTION BOARD
% of approved
requisition pending
for 3 or more years
w.r.t examination
conducted during
2016-17
22%
Risk Factors /
Remarks
Court cases,
leakage of
papers, unfair
means, etc.
Objectives
NA
Strengthening of
Delhi Sub-ordinate
Services Selection
Board
2385.00 Selection / Recruitment
of all Group ‘B’ non-
gazetted and Group ‘C’
posts of all the
Departments of Delhi
Government and Local /
Autonomous Bodies
1 Continuous
process
380 NA
% of approved
requisition pending
for 1 to 2 years w.r.t
examination
conducted during
2016-17
1%
Name of the Scheme
/ Programme
Budget
Allocation
(Rs. Lakhs)
OUTPUTS OUTCOMESSr.
No.Timelines
Delhi Subordinate Selection Services Board (DSSSB) 337NA: NOT AVAILABLE
NR: NOT RESPONDED

OT
HER
S
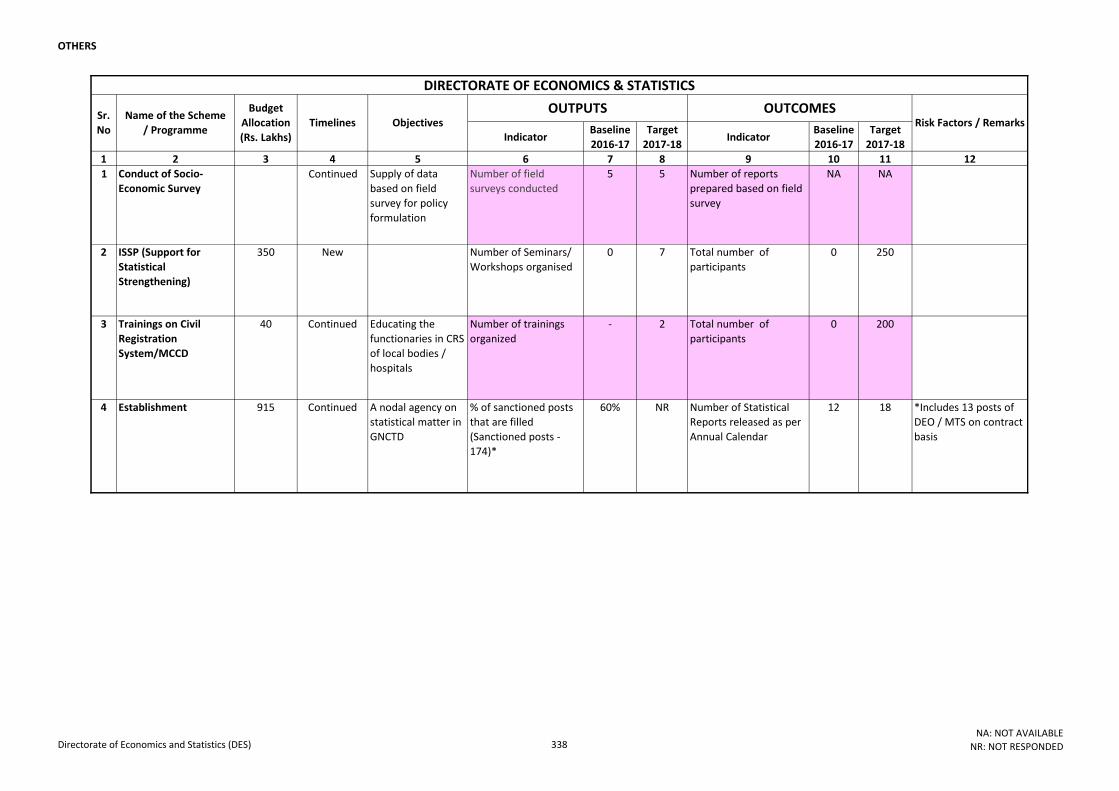
OTHERS
Indicator Baseline
2016-17
Target
2017-18Indicator
Baseline
2016-17
Target
2017-18
1 2 3 4 5 6 7 8 9 10 11 12
1 Conduct of Socio-
Economic Survey Continued Supply of data
based on field
survey for policy
formulation
Number of field
surveys conducted
5 5 Number of reports
prepared based on field
survey
NA NA
2 ISSP (Support for
Statistical
Strengthening)
350 New Number of Seminars/
Workshops organised
0 7 Total number of
participants
0 250
3 Trainings on Civil
Registration
System/MCCD
40 Continued Educating the
functionaries in CRS
of local bodies /
hospitals
Number of trainings
organized
- 2 Total number of
participants
0 200
4 Establishment 915 Continued A nodal agency on
statistical matter in
GNCTD
% of sanctioned posts
that are filled
(Sanctioned posts -
174)*
60% NR Number of Statistical
Reports released as per
Annual Calendar
12 18 *Includes 13 posts of
DEO / MTS on contract
basis
DIRECTORATE OF ECONOMICS & STATISTICS
Sr.
No
Name of the Scheme
/ Programme
Budget
Allocation
(Rs. Lakhs)
Timelines Objectives OUTPUTS OUTCOMES
Risk Factors / Remarks
Directorate of Economics and Statistics (DES) 338NA: NOT AVAILABLE
NR: NOT RESPONDED

OT
HER
S
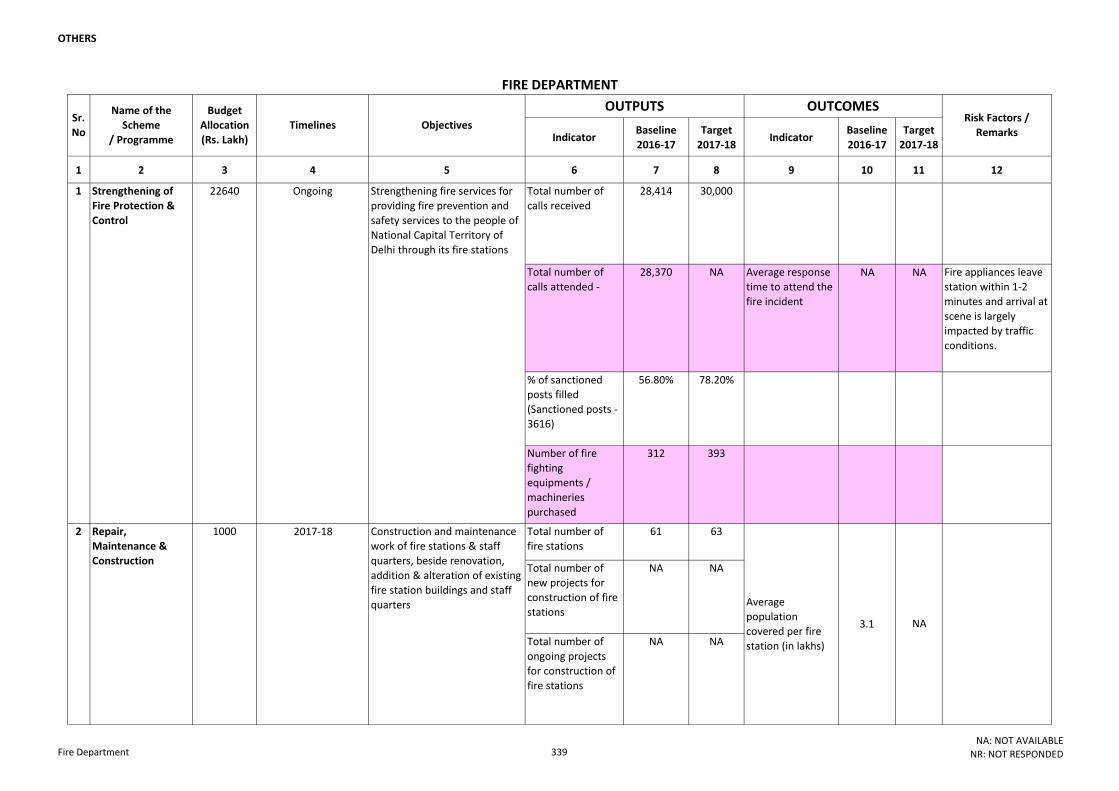
OTHERS
Indicator Baseline
2016-17
Target
2017-18Indicator
Baseline
2016-17
Target
2017-18
1 2 3 4 5 6 7 8 9 10 11 12
Total number of
calls received
28,414 30,000
Total number of
calls attended -
28,370 NA Average response
time to attend the
fire incident
NA NA Fire appliances leave
station within 1-2
minutes and arrival at
scene is largely
impacted by traffic
conditions.
% of sanctioned
posts filled
(Sanctioned posts -
3616)
56.80% 78.20%
Number of fire
fighting
equipments /
machineries
purchased
312 393
Total number of
fire stations
61 63
Total number of
new projects for
construction of fire
stations
NA NA
Total number of
ongoing projects
for construction of
fire stations
NA NA
OUTCOMESOUTPUTSSr.
No
Name of the
Scheme
/ Programme
Budget
Allocation
(Rs. Lakh)
Timelines Objectives Risk Factors /
Remarks
FIRE DEPARTMENT
Strengthening fire services for
providing fire prevention and
safety services to the people of
National Capital Territory of
Delhi through its fire stations
Repair,
Maintenance &
Construction
1
2
Strengthening of
Fire Protection &
Control
22640 Ongoing
1000 2017-18 Construction and maintenance
work of fire stations & staff
quarters, beside renovation,
addition & alteration of existing
fire station buildings and staff
quarters Average
population
covered per fire
station (in lakhs)
3.1 NA
Fire Department 339NA: NOT AVAILABLE
NR: NOT RESPONDED
OT
HER
S
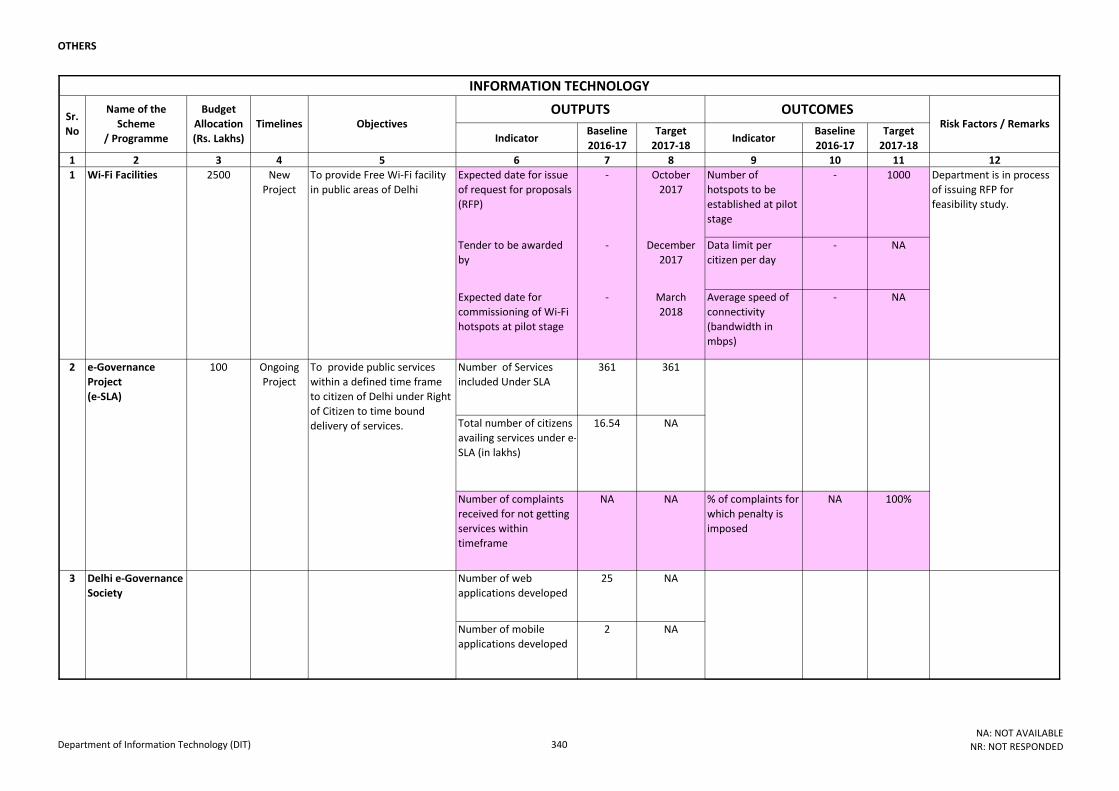
OTHERS
Indicator Baseline
2016-17
Target
2017-18Indicator
Baseline
2016-17
Target
2017-18
1 2 3 4 5 6 7 8 9 10 11 12
Expected date for issue
of request for proposals
(RFP)
- October
2017
Number of
hotspots to be
established at pilot
stage
- 1000
Tender to be awarded
by
- December
2017
Data limit per
citizen per day
- NA
Expected date for
commissioning of Wi-Fi
hotspots at pilot stage
- March
2018
Average speed of
connectivity
(bandwidth in
mbps)
- NA
Number of Services
included Under SLA
361 361
Total number of citizens
availing services under e-
SLA (in lakhs)
16.54 NA
Number of complaints
received for not getting
services within
timeframe
NA NA % of complaints for
which penalty is
imposed
NA 100%
Number of web
applications developed
25 NA
Number of mobile
applications developed
2 NA
Name of the
Scheme
/ Programme
Budget
Allocation
(Rs. Lakhs)
INFORMATION TECHNOLOGY
Department is in process
of issuing RFP for
feasibility study.
Risk Factors / RemarksOUTPUTS
2500 New
Project
Wi-Fi Facilities To provide Free Wi-Fi facility
in public areas of Delhi
OUTCOMESObjectives Timelines
1
Sr.
No
3 Delhi e-Governance
Society
Ongoing
Project
100e-Governance
Project
(e-SLA)
2 To provide public services
within a defined time frame
to citizen of Delhi under Right
of Citizen to time bound
delivery of services.
Department of Information Technology (DIT) 340NA: NOT AVAILABLE
NR: NOT RESPONDED
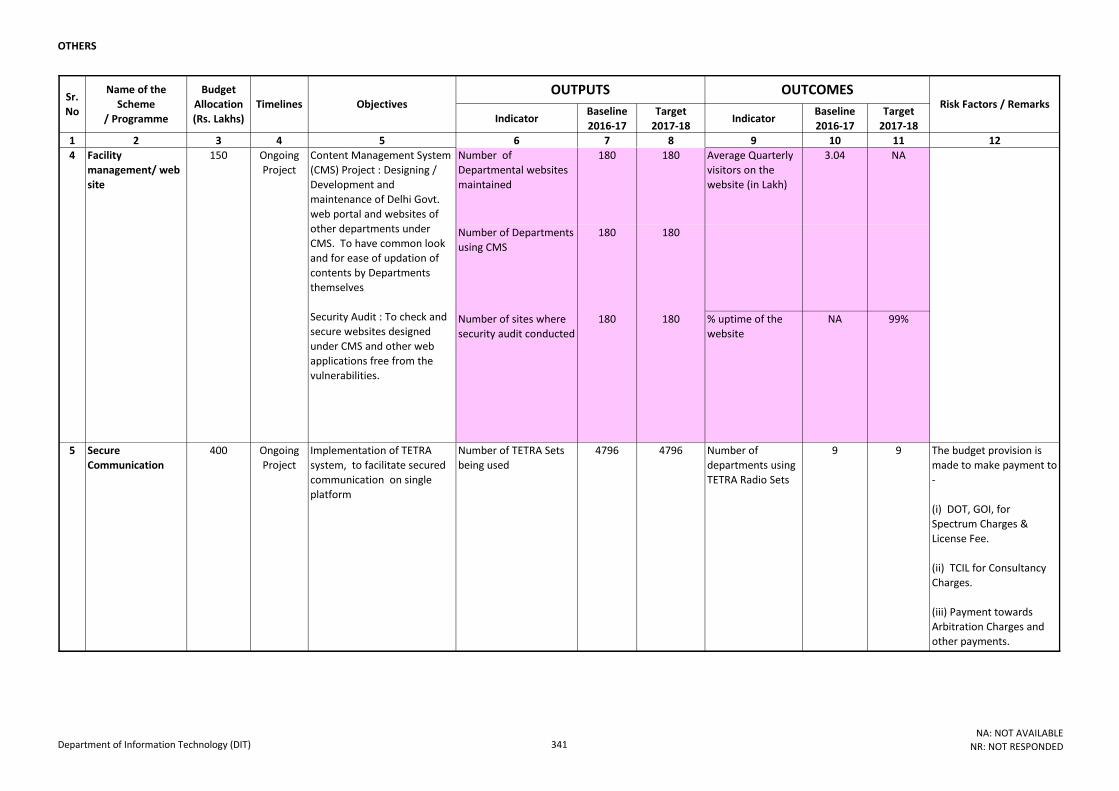
OTHERS
Indicator Baseline
2016-17
Target
2017-18Indicator
Baseline
2016-17
Target
2017-18
1 2 3 4 5 6 7 8 9 10 11 12
Name of the
Scheme
/ Programme
Budget
Allocation
(Rs. Lakhs)
Risk Factors / RemarksOUTPUTS OUTCOMES
Objectives TimelinesSr.
No
Number of
Departmental websites
maintained
180 180
Number of Departments
using CMS
180 180
Number of sites where
security audit conducted
180 180 % uptime of the
website
NA 99%
Ongoing
Project
4 Content Management System
(CMS) Project : Designing /
Development and
maintenance of Delhi Govt.
web portal and websites of
other departments under
CMS. To have common look
and for ease of updation of
contents by Departments
themselves
Security Audit : To check and
secure websites designed
under CMS and other web
applications free from the
vulnerabilities.
150Facility
management/ web
site
Average Quarterly
visitors on the
website (in Lakh)
3.04 NA
The budget provision is
made to make payment to
-
(i) DOT, GOI, for
Spectrum Charges &
License Fee.
(ii) TCIL for Consultancy
Charges.
(iii) Payment towards
Arbitration Charges and
other payments.
5 Secure
Communication
400 Ongoing
Project
Implementation of TETRA
system, to facilitate secured
communication on single
platform
Number of TETRA Sets
being used
4796 4796 Number of
departments using
TETRA Radio Sets
9 9
Department of Information Technology (DIT) 341NA: NOT AVAILABLE
NR: NOT RESPONDED
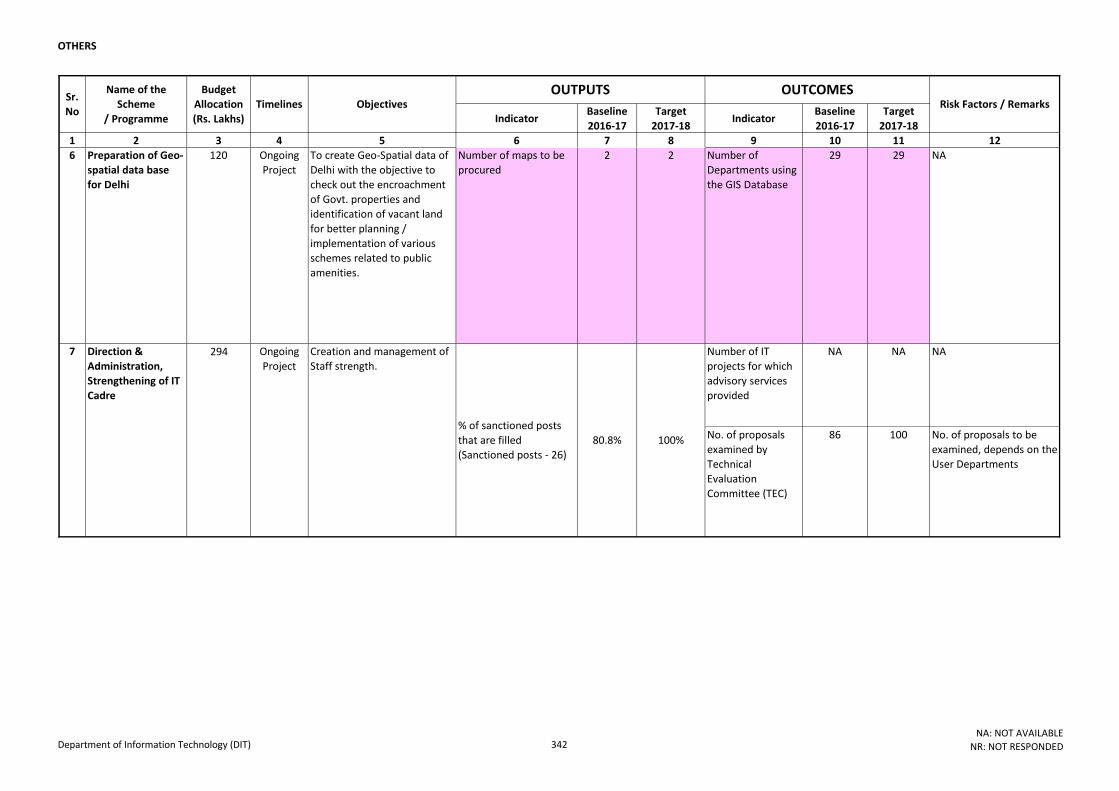
OTHERS
Indicator Baseline
2016-17
Target
2017-18Indicator
Baseline
2016-17
Target
2017-18
1 2 3 4 5 6 7 8 9 10 11 12
Name of the
Scheme
/ Programme
Budget
Allocation
(Rs. Lakhs)
Risk Factors / RemarksOUTPUTS OUTCOMES
Objectives TimelinesSr.
No
6 Preparation of Geo-
spatial data base
for Delhi
120 Ongoing
Project
To create Geo-Spatial data of
Delhi with the objective to
check out the encroachment
of Govt. properties and
identification of vacant land
for better planning /
implementation of various
schemes related to public
amenities.
Number of maps to be
procured
2 2 Number of
Departments using
the GIS Database
29 29 NA
Number of IT
projects for which
advisory services
provided
NA NA NA
No. of proposals
examined by
Technical
Evaluation
Committee (TEC)
86 100 No. of proposals to be
examined, depends on the
User Departments
% of sanctioned posts
that are filled
(Sanctioned posts - 26)
80.8% 100%
7 Direction &
Administration,
Strengthening of IT
Cadre
Ongoing
Project294 Creation and management of
Staff strength.
Department of Information Technology (DIT) 342NA: NOT AVAILABLE
NR: NOT RESPONDED

OT
HER
S
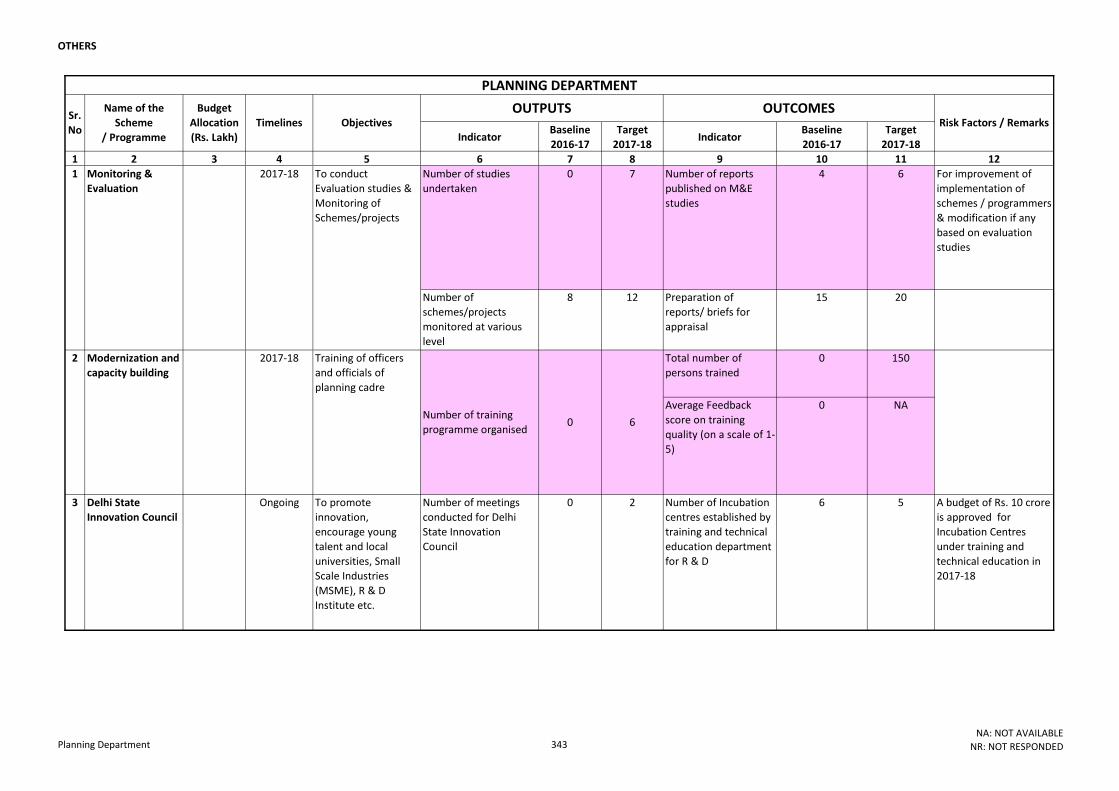
OTHERS
Indicator Baseline
2016-17
Target
2017-18Indicator
Baseline
2016-17
Target
2017-18
1 2 3 4 5 6 7 8 9 10 11 12
Number of studies
undertaken
0 7 Number of reports
published on M&E
studies
4 6 For improvement of
implementation of
schemes / programmers
& modification if any
based on evaluation
studies
Number of
schemes/projects
monitored at various
level
8 12 Preparation of
reports/ briefs for
appraisal
15 20
Total number of
persons trained
0 150
Average Feedback
score on training
quality (on a scale of 1-
5)
0 NA
3 Delhi State
Innovation Council
Ongoing To promote
innovation,
encourage young
talent and local
universities, Small
Scale Industries
(MSME), R & D
Institute etc.
Number of meetings
conducted for Delhi
State Innovation
Council
0 2 Number of Incubation
centres established by
training and technical
education department
for R & D
6 5 A budget of Rs. 10 crore
is approved for
Incubation Centres
under training and
technical education in
2017-18
Monitoring &
Evaluation
2017-18
Modernization and
capacity building
6Number of training
programme organised0
Training of officers
and officials of
planning cadre
To conduct
Evaluation studies &
Monitoring of
Schemes/projects
2017-18
PLANNING DEPARTMENT
Sr.
No
Name of the
Scheme
/ Programme
Budget
Allocation
(Rs. Lakh)
Timelines Objectives OUTPUTS OUTCOMES
Risk Factors / Remarks
1
2
Planning Department 343NA: NOT AVAILABLE
NR: NOT RESPONDED
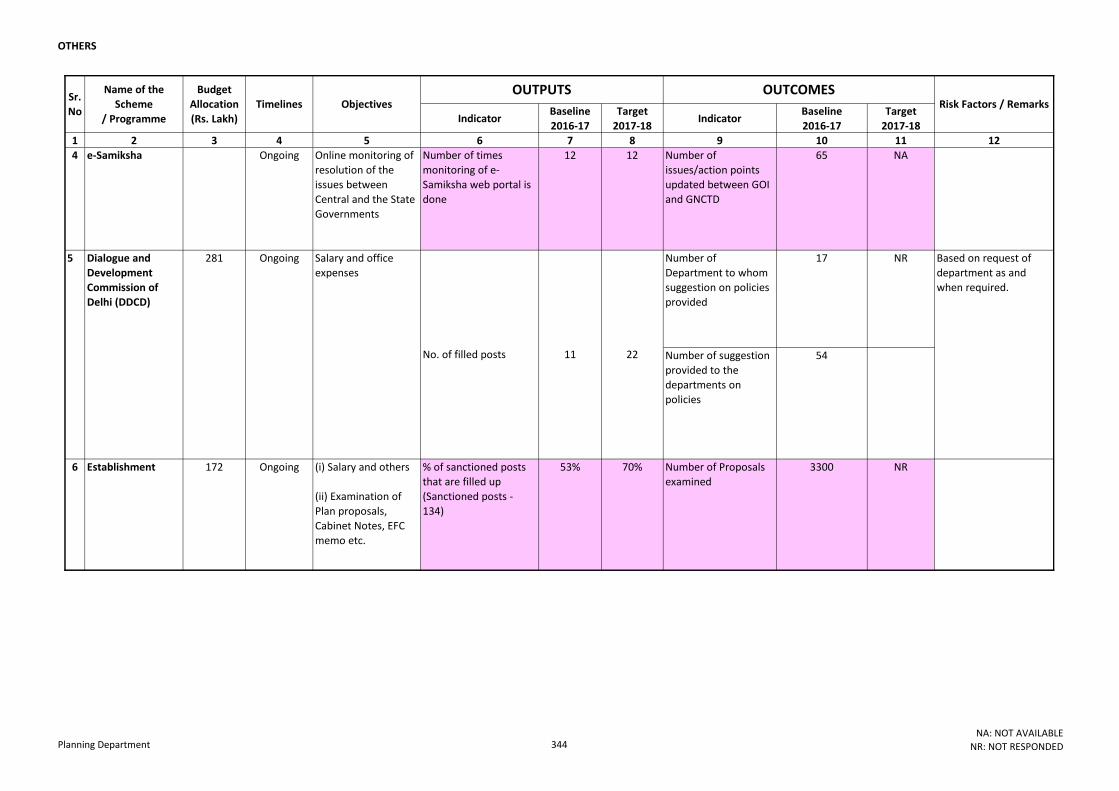
OTHERS
Indicator Baseline
2016-17
Target
2017-18Indicator
Baseline
2016-17
Target
2017-18
1 2 3 4 5 6 7 8 9 10 11 12
Sr.
No
Name of the
Scheme
/ Programme
Budget
Allocation
(Rs. Lakh)
Timelines Objectives OUTPUTS OUTCOMES
Risk Factors / Remarks
4 e-Samiksha Ongoing Online monitoring of
resolution of the
issues between
Central and the State
Governments
Number of times
monitoring of e-
Samiksha web portal is
done
12 12 Number of
issues/action points
updated between GOI
and GNCTD
65 NA
Number of suggestion
provided to the
departments on
policies
54
6 Establishment 172 Ongoing (i) Salary and others
(ii) Examination of
Plan proposals,
Cabinet Notes, EFC
memo etc.
% of sanctioned posts
that are filled up
(Sanctioned posts -
134)
53% 70% Number of Proposals
examined
3300 NR
NR
No. of filled posts
Based on request of
department as and
when required.
Number of
Department to whom
suggestion on policies
provided
17
11 22
Dialogue and
Development
Commission of
Delhi (DDCD)
5 Salary and office
expenses
Ongoing281
Planning Department 344NA: NOT AVAILABLE
NR: NOT RESPONDED
OT
HER
S
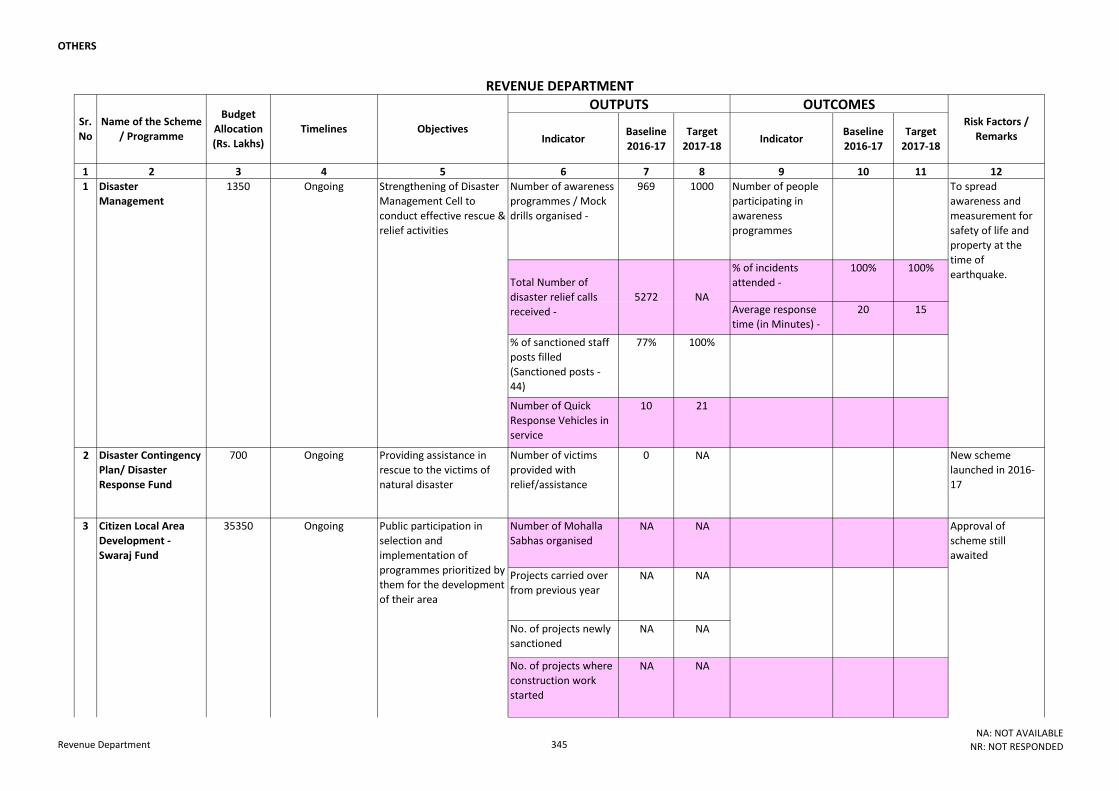
OTHERS
Indicator Baseline
2016-17
Target
2017-18Indicator
Baseline
2016-17
Target
2017-18
1 2 3 4 5 6 7 8 9 10 11 12
Number of awareness
programmes / Mock
drills organised -
969 1000 Number of people
participating in
awareness
programmes
% of incidents
attended -
100% 100%
Average response
time (in Minutes) -
20 15
% of sanctioned staff
posts filled
(Sanctioned posts -
44)
77% 100%
Number of Quick
Response Vehicles in
service
10 21
2 Disaster Contingency
Plan/ Disaster
Response Fund
700 Ongoing Providing assistance in
rescue to the victims of
natural disaster
Number of victims
provided with
relief/assistance
0 NA New scheme
launched in 2016-
17
Number of Mohalla
Sabhas organisedNA NA
Projects carried over
from previous yearNA NA
No. of projects newly
sanctionedNA NA
No. of projects where
construction work
started
NA NA
OUTCOMESRisk Factors /
Remarks
Sr.
No
Name of the Scheme
/ Programme
Budget
Allocation
(Rs. Lakhs)
Timelines Objectives
REVENUE DEPARTMENT
Ongoing
Ongoing
Total Number of
disaster relief calls
received -
Citizen Local Area
Development -
Swaraj Fund
Public participation in
selection and
implementation of
programmes prioritized by
them for the development
of their area
35350 Approval of
scheme still
awaited
1 Disaster
Management
5272
1350 Strengthening of Disaster
Management Cell to
conduct effective rescue &
relief activities
To spread
awareness and
measurement for
safety of life and
property at the
time of
earthquake.
NA
OUTPUTS
3
Revenue Department 345NA: NOT AVAILABLE
NR: NOT RESPONDED
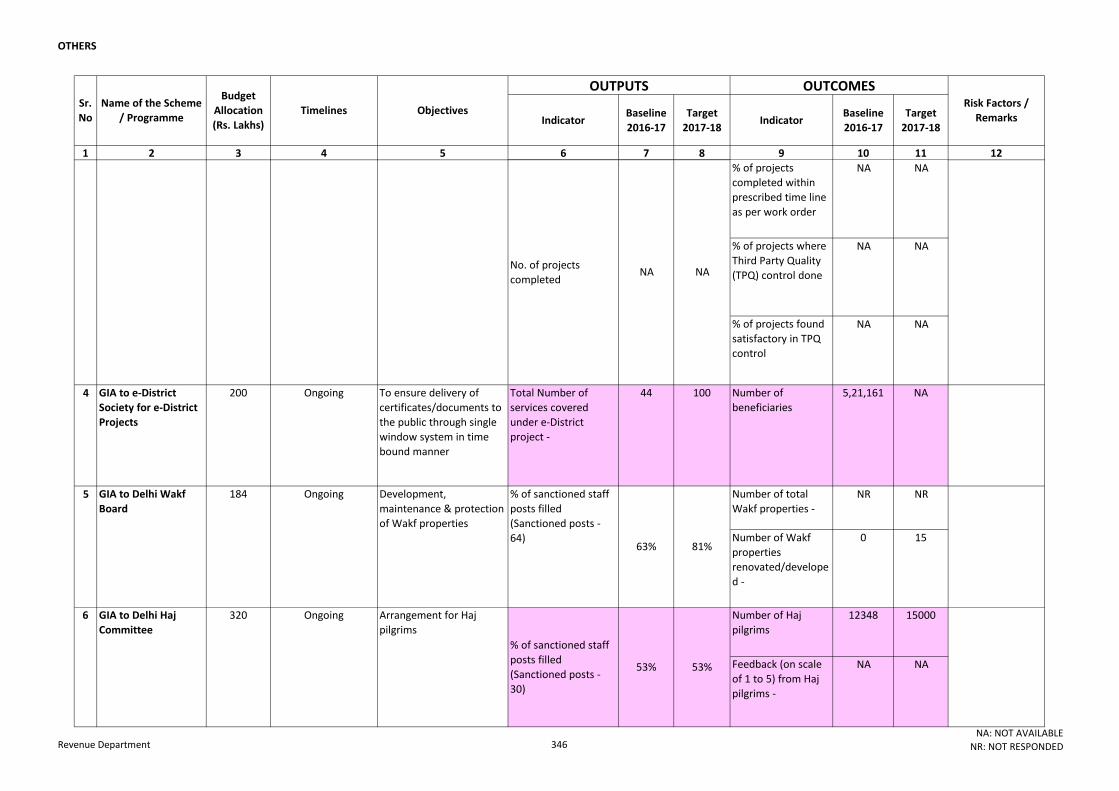
OTHERS
Indicator Baseline
2016-17
Target
2017-18Indicator
Baseline
2016-17
Target
2017-18
1 2 3 4 5 6 7 8 9 10 11 12
OUTCOMESRisk Factors /
Remarks
Sr.
No
Name of the Scheme
/ Programme
Budget
Allocation
(Rs. Lakhs)
Timelines Objectives
OUTPUTS
% of projects
completed within
prescribed time line
as per work order
NA NA
% of projects where
Third Party Quality
(TPQ) control done
NA NA
% of projects found
satisfactory in TPQ
control
NA NA
4 GIA to e-District
Society for e-District
Projects
200 Ongoing To ensure delivery of
certificates/documents to
the public through single
window system in time
bound manner
Total Number of
services covered
under e-District
project -
44 100 Number of
beneficiaries
5,21,161 NA
Number of total
Wakf properties -
NR NR
Number of Wakf
properties
renovated/develope
d -
0 15
Number of Haj
pilgrims
12348 15000
Feedback (on scale
of 1 to 5) from Haj
pilgrims -
NA NA
No. of projects
completedNA NA
OngoingCitizen Local Area
Development -
Swaraj Fund
Public participation in
selection and
implementation of
programmes prioritized by
them for the development
of their area
35350 Approval of
scheme still
awaited
81%
53%
% of sanctioned staff
posts filled
(Sanctioned posts -
30)
53%
GIA to Delhi Haj
Committee
% of sanctioned staff
posts filled
(Sanctioned posts -
64)63%
6
3
5 GIA to Delhi Wakf
Board
Development,
maintenance & protection
of Wakf properties
Ongoing184
320 Arrangement for Haj
pilgrims
Ongoing
Revenue Department 346NA: NOT AVAILABLE
NR: NOT RESPONDED
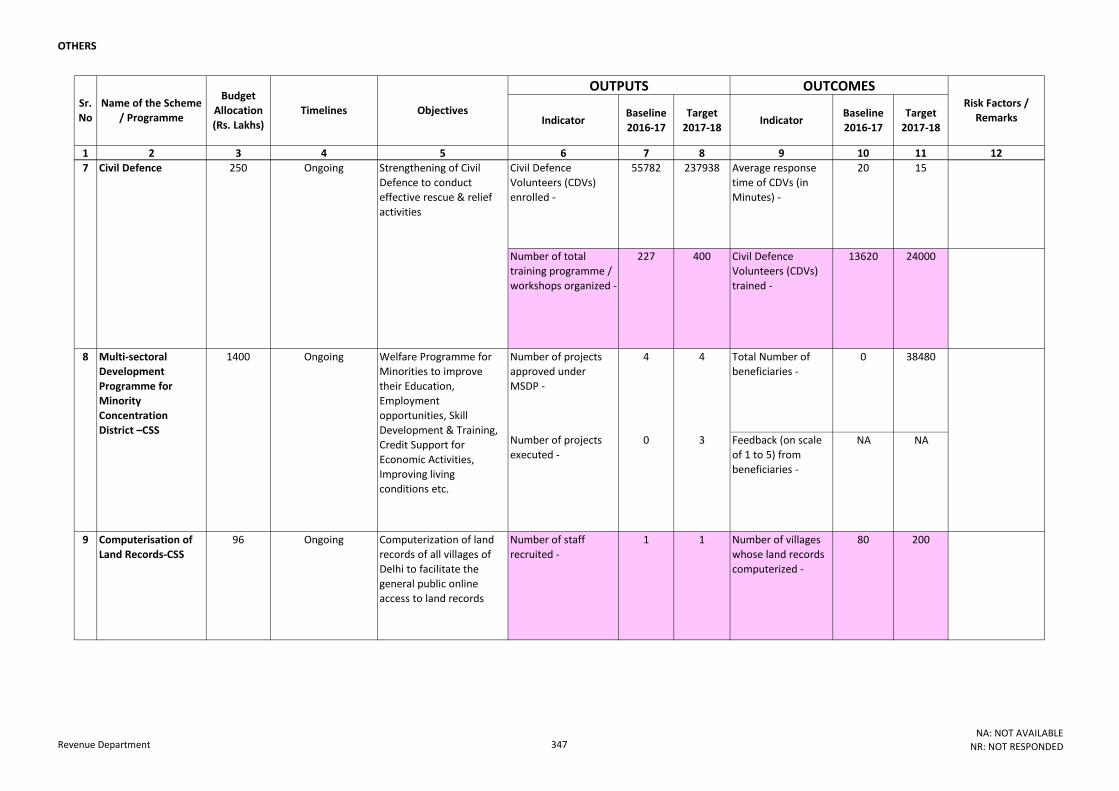
OTHERS
Indicator Baseline
2016-17
Target
2017-18Indicator
Baseline
2016-17
Target
2017-18
1 2 3 4 5 6 7 8 9 10 11 12
OUTCOMESRisk Factors /
Remarks
Sr.
No
Name of the Scheme
/ Programme
Budget
Allocation
(Rs. Lakhs)
Timelines Objectives
OUTPUTS
Civil Defence
Volunteers (CDVs)
enrolled -
55782 237938 Average response
time of CDVs (in
Minutes) -
20 15
Number of total
training programme /
workshops organized -
227 400 Civil Defence
Volunteers (CDVs)
trained -
13620 24000
Number of projects
approved under
MSDP -
4 4 Total Number of
beneficiaries -
0 38480
Number of projects
executed -
0 3 Feedback (on scale
of 1 to 5) from
beneficiaries -
NA NA
9 Computerisation of
Land Records-CSS
96 Ongoing Computerization of land
records of all villages of
Delhi to facilitate the
general public online
access to land records
Number of staff
recruited -
1 1 Number of villages
whose land records
computerized -
80 200
1400
250
Welfare Programme for
Minorities to improve
their Education,
Employment
opportunities, Skill
Development & Training,
Credit Support for
Economic Activities,
Improving living
conditions etc.
Strengthening of Civil
Defence to conduct
effective rescue & relief
activities
Ongoing
Ongoing
8
Civil Defence
Multi-sectoral
Development
Programme for
Minority
Concentration
District –CSS
7
Revenue Department 347NA: NOT AVAILABLE
NR: NOT RESPONDED
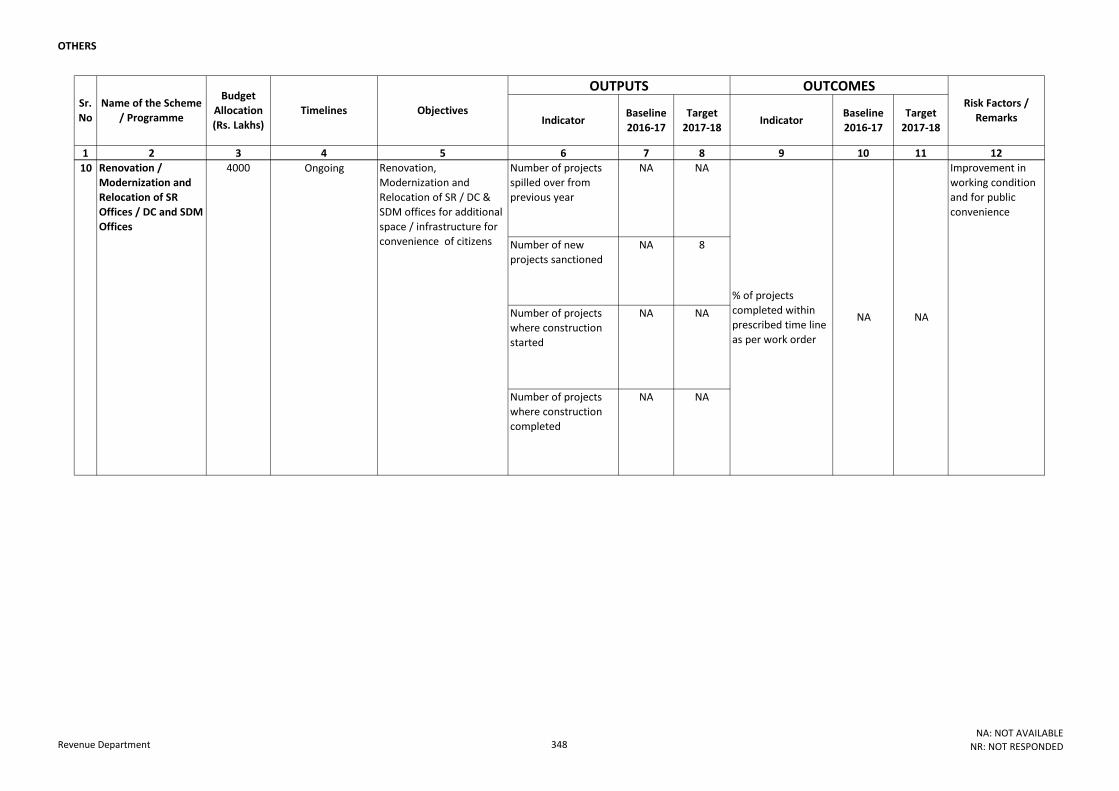
OTHERS
Indicator Baseline
2016-17
Target
2017-18Indicator
Baseline
2016-17
Target
2017-18
1 2 3 4 5 6 7 8 9 10 11 12
OUTCOMESRisk Factors /
Remarks
Sr.
No
Name of the Scheme
/ Programme
Budget
Allocation
(Rs. Lakhs)
Timelines Objectives
OUTPUTS
Number of projects
spilled over from
previous year
NA NA
Number of new
projects sanctioned
NA 8
Number of projects
where construction
started
NA NA
Number of projects
where construction
completed
NA NA
4000 Ongoing Improvement in
working condition
and for public
convenience
% of projects
completed within
prescribed time line
as per work order
NA NA
Renovation,
Modernization and
Relocation of SR / DC &
SDM offices for additional
space / infrastructure for
convenience of citizens
Renovation /
Modernization and
Relocation of SR
Offices / DC and SDM
Offices
10
Revenue Department 348NA: NOT AVAILABLE
NR: NOT RESPONDED
OT
HER
S
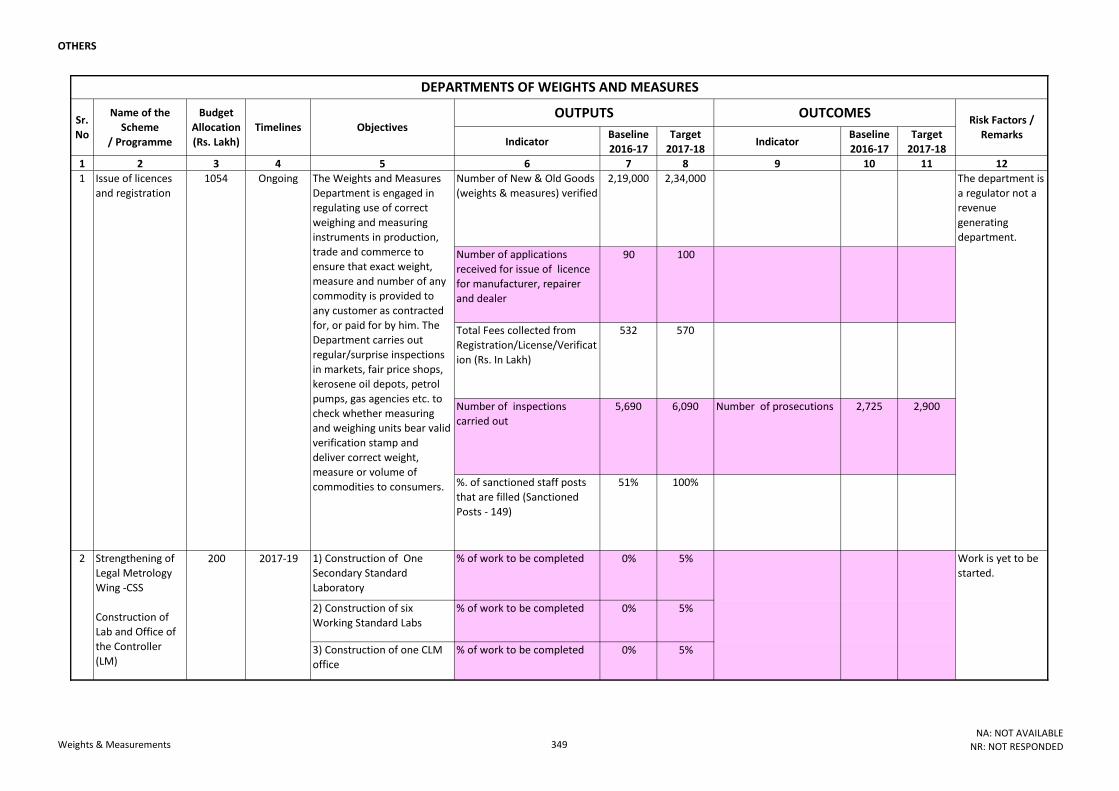
OTHERS
Indicator Baseline
2016-17
Target
2017-18Indicator
Baseline
2016-17
Target
2017-18
1 2 3 4 5 6 7 8 9 10 11 12
Number of New & Old Goods
(weights & measures) verified
2,19,000 2,34,000
Number of applications
received for issue of licence
for manufacturer, repairer
and dealer
90 100
Total Fees collected from
Registration/License/Verificat
ion (Rs. In Lakh)
532 570
Number of inspections
carried out
5,690 6,090 Number of prosecutions 2,725 2,900
%. of sanctioned staff posts
that are filled (Sanctioned
Posts - 149)
51% 100%
1) Construction of One
Secondary Standard
Laboratory
% of work to be completed 0% 5%
2) Construction of six
Working Standard Labs
% of work to be completed 0% 5%
3) Construction of one CLM
office
% of work to be completed 0% 5%
Work is yet to be
started.
The department is
a regulator not a
revenue
generating
department.
DEPARTMENTS OF WEIGHTS AND MEASURES
1054
200
Issue of licences
and registration
1
Strengthening of
Legal Metrology
Wing -CSS
Construction of
Lab and Office of
the Controller
(LM)
2
Sr.
No
2017-19
Ongoing The Weights and Measures
Department is engaged in
regulating use of correct
weighing and measuring
instruments in production,
trade and commerce to
ensure that exact weight,
measure and number of any
commodity is provided to
any customer as contracted
for, or paid for by him. The
Department carries out
regular/surprise inspections
in markets, fair price shops,
kerosene oil depots, petrol
pumps, gas agencies etc. to
check whether measuring
and weighing units bear valid
verification stamp and
deliver correct weight,
measure or volume of
commodities to consumers.
Risk Factors /
Remarks
Name of the
Scheme
/ Programme
Budget
Allocation
(Rs. Lakh)
Timelines Objectives OUTPUTS OUTCOMES
Weights & Measurements 349NA: NOT AVAILABLE
NR: NOT RESPONDED

OT
HER
S
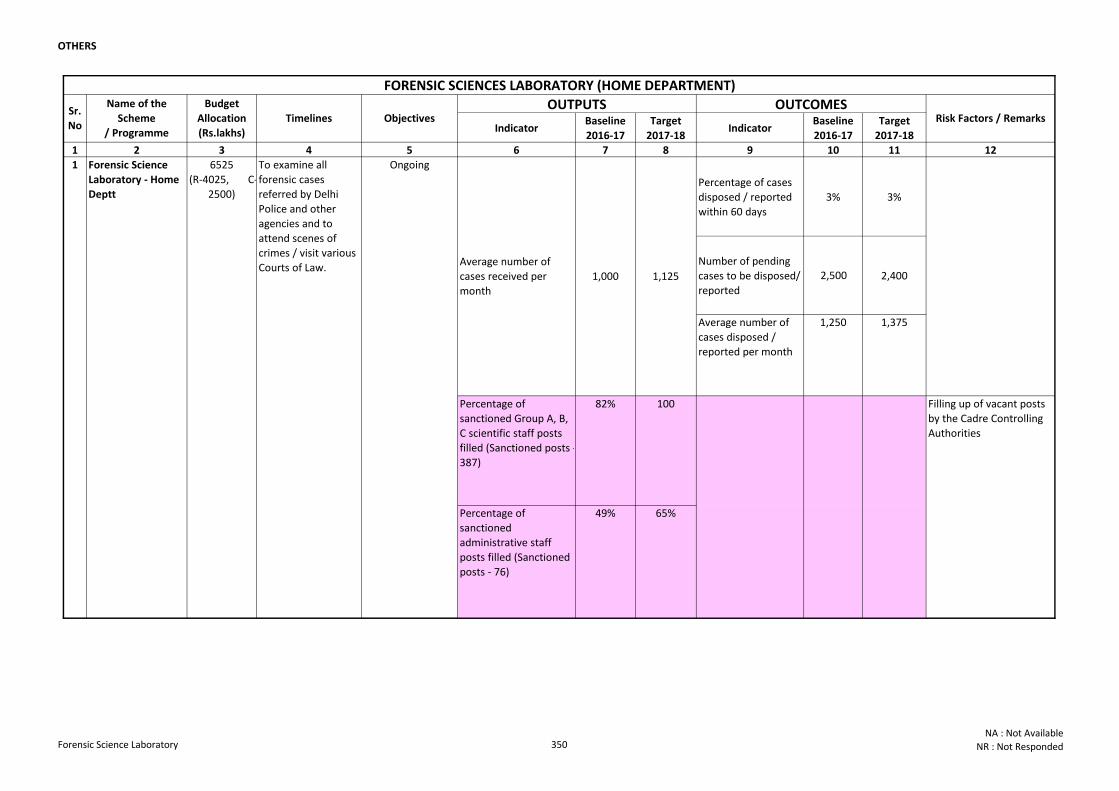
OTHERS
Indicator Baseline
2016-17
Target
2017-18Indicator
Baseline
2016-17
Target
2017-18
1 2 3 4 5 6 7 8 9 10 11 12
Percentage of cases
disposed / reported
within 60 days
3% 3%
Number of pending
cases to be disposed/
reported
2,500 2,400
Average number of
cases disposed /
reported per month
1,250 1,375
Percentage of
sanctioned Group A, B,
C scientific staff posts
filled (Sanctioned posts -
387)
82% 100
Percentage of
sanctioned
administrative staff
posts filled (Sanctioned
posts - 76)
49% 65%
FORENSIC SCIENCES LABORATORY (HOME DEPARTMENT)
1,000 1,125
1 Forensic Science
Laboratory - Home
Deptt
6525
(R-4025, C-
2500)
To examine all
forensic cases
referred by Delhi
Police and other
agencies and to
attend scenes of
crimes / visit various
Courts of Law.
Ongoing
Average number of
cases received per
month
Filling up of vacant posts
by the Cadre Controlling
Authorities
OUTPUTS OUTCOMESRisk Factors / Remarks
Sr.
No
Name of the
Scheme
/ Programme
Budget
Allocation
(Rs.lakhs)
Timelines Objectives
Forensic Science Laboratory 350NA : Not Available
NR : Not Responded


