Embed Size (px)
Citation preview

arX
iv:1
007.
0290
v1 [
astr
o-ph
.IM
] 2
Jul
201
0Draft version July 5, 2010Preprint typeset using LATEX style emulateapj v. 08/13/06
THE ATACAMA COSMOLOGY TELESCOPE: THE RECEIVER AND INSTRUMENTATION
D. S. Swetz1,2, P. A. R. Ade3, M. Amiri4, J. W. Appel5, E. S. Battistelli6,4, B. Burger4, J. Chervenak7,M. J. Devlin1, S. R. Dicker1, W. B. Doriese2, R. Dunner8, T. Essinger-Hileman5, R. P. Fisher5, J. W. Fowler5,M. Halpern4, M. Hasselfield4, G. C. Hilton2, A. D. Hincks5, K. D. Irwin2, N. Jarosik5, M. Kaul1, J. Klein1,J. M. Lau9,10,5, M. Limon11,1,5, T. A. Marriage12, D. Marsden1, K. Martocci13,5, P. Mauskopf3, H. Moseley7,C. B. Netterfield14, M. D. Niemack2,5, M. R. Nolta15, L. A. Page5, L. Parker5, S. T. Staggs5, O. Stryzak5,
E. R. Switzer13,5, R. Thornton1,16, C. Tucker3, E. Wollack7, Y. Zhao5
Draft version July 5, 2010
ABSTRACT
The Atacama Cosmology Telescope was designed to measure small-scale anisotropies in the CosmicMicrowave Background and detect galaxy clusters through the Sunyaev-Zel’dovich effect. The instru-ment is located on Cerro Toco in the Atacama Desert, at an altitude of 5190 meters. A six-meteroff-axis Gregorian telescope feeds a new type of cryogenic receiver, the Millimeter Bolometer ArrayCamera. The receiver features three 1000-element arrays of transition-edge sensor bolometers forobservations at 148GHz, 218GHz, and 277GHz. Each detector array is fed by free space mm-waveoptics. Each frequency band has a field of view of approximately 22′ × 26′. The telescope was com-missioned in 2007 and has completed its third year of operations. We discuss the major componentsof the telescope, camera, and related systems, and summarize the instrument performance.Subject headings: Microwave Telescopes, CMB Observations
1. INTRODUCTION
Measurements of the Cosmic Microwave Background(CMB) provide a wealth of information about the originand evolution of the Universe. Current measurements ofthe angular power spectrum from tenths of a degree toall sky have provided estimates of cosmological paramtersand have begun to quantify the big bang process (e.g.,Komatsu et al. (2009), Brown et al. (2009), Chiang etal. (2009), Sievers et al. (2009)). Detailed measurementsat arcminute scales are placing tighter constraints on thestandard cosmological model and probe possible devia-tions. These higher resolution measurements also reveal
1 Department of Physics and Astronomy, University of Pennsyl-vania, 209 South 33rd Street, Philadelphia, PA, USA 19104
2 NIST Quantum Devices Group, 325 Broadway Mailcode817.03, Boulder, CO, USA 80305
3 School of Physics and Astronomy, Cardiff University, The Pa-rade, Cardiff, Wales, UK CF24 3AA
4 Department of Physics and Astronomy, University of BritishColumbia, Vancouver, BC, Canada V6T 1Z4
5 Joseph Henry Laboratories of Physics, Jadwin Hall, PrincetonUniversity, Princeton, NJ, USA 08544
6 Department of Physics, University of Rome “La Sapienza”, Pi-azzale Aldo Moro 5, I-00185 Rome, Italy
7 Code 553/665, NASA/Goddard Space Flight Center, Green-belt, MD, USA 20771
8 Departamento de Astronomıa y Astrofısica, Facultad de Fısica,Pontificıa Universidad Catolica, Casilla 306, Santiago 22, Chile
9 Kavli Institute for Particle Astrophysics and Cosmology, Stan-ford University, Stanford, CA, USA 94305-4085
10 Department of Physics, Stanford University, Stanford, CA,USA 94305-4085
11 Columbia Astrophysics Laboratory, 550 W. 120th St. MailCode 5247, New York, NY USA 10027
12 Department of Astrophysical Sciences, Peyton Hall, Prince-ton University, Princeton, NJ USA 08544
13 Kavli Institute for Cosmological Physics, 5620 South EllisAve., Chicago, IL, USA 60637
14 Department of Physics, University of Toronto, 60 St. GeorgeStreet, Toronto, ON, Canada M5S 1A7
15 Canadian Institute for Theoretical Astrophysics, University ofToronto, Toronto, ON, Canada M5S 3H8
16 Department of Physics , West Chester University of Pennsyl-vania, West Chester, PA, USA 19383
secondary effects on CMB anisotropy, from, for exam-ple, the Sunyaev-Zel’dovich (SZ) effect and gravitationallensing, which are important for understanding structureformation.We have built the Atacama Cosmology Telescope
(ACT), a custom six-meter telescope, to address thesescientific questions. ACT features a cryogenic receiver,the Millimeter Bolometer Array Camera (MBAC), thatoperates at three frequencies: 148GHz, 218GHz, and277GHz. Each frequency band is imaged by a 32 × 32array of transition-edge sensor (TES) bolometers. Thetelescope was commissioned at its site in late 2007, atwhich time the 148GHz channel was installed in MBAC.The remaining two frequencies were installed in June2008. Since then the telescope and completed camerahave collected approximately twelve months of data overtwo observing seasons.This paper presents the instrument and complements a
set of ACT papers presenting the first generation of ex-perimental results. The paper is organized as follows.In Section 2 we discuss the optical design and struc-ture characteristics, site location, and telescope opera-tion. Section 3 details the design of the MBAC cryostat,cold optics, and detectors. Telescope control, data ac-quisition, merging, and related topics are discussed inSection 4. Finally, we present the image quality of thesystem in Section 5. Companion papers that detail thebeams and scientific results are Hincks et al. (2009) andFowler et al. (2010).
2. THE ATACAMA COSMOLOGY TELESCOPE
2.1. Telescope Construction and Optics
The diameter of the six-meter primary reflector was setby the requirement to obtain arcminute-resolution at theACT frequencies. The primary and two-meter secondaryare arranged in an off-axis Gregorian configuration togive an unobstructed image of the sky. The primaryfocal length was fixed at 5.2m. This results in a com-

2 D. Swetz et al.
pact arrangement between the primary and secondaryreflectors, making it easier to achieve the fast scanningspecifications of the telescope (Section 2.3). The designis described in Fowler et al. (2007). The telescope wasbuilt by Amec Dynamic Structures Ltd. (now EmpireDynamic Structures).Figure 1 shows the major components of the telescope
structure and Table 1 the important parameters. To min-imize ground pick-up during scanning, the telescope hastwo ground screens. A large, stationary outer groundscreen surrounds the telescope. A second, inner groundscreen connects the open sides of the primary reflectorto the secondary reflector, and moves with the telescopeduring scanning. A climate-controlled receiver cabin issituated underneath the primary and secondary reflec-tors. The telescope was designed to work with MBAC(Section 3), and also to be able to accommodate futurereceivers.
TABLE 1Physical properties of the telescope and optics
Telescope Properties Location
Telescope height 12 m Altitude 5190 mGround screen height 13 m Longitude 6747′15′′W
Total mass 52 t Latitude 2257′31′′SMoving structure mass 40 t · · · · · ·
Optics
f-numbera 2.5 Azimuth range ±220
FOVa 1 deg2 Max. az speed 2/sPrimary reflector Dia 6 m Max. az acc. 10/s2
No. primary panels 71 Elev range 30.5 – 60
Secondary reflector Dia 2 m Max. elev speed 0.2/sNo. secondary panels 11 · · · · · ·
aAt telescope Gregorian focus
Using the Gregorian design as a starting point, the re-flector shapes were numerically optimized to increase thefield of view over a classic Gregorian using Code V opticaldesign software.1 At the Gregorian focus before reimag-ing (Section 3.1), the telescope achieves a Strehl ratiogreater than 0.9 over a 1 square-degree field at 277GHz.Details of the numerical optimization and reflector for-mulae are given in Fowler et al. (2007). The telescopeapproaches an aplanatic system with no leading-orderspherical aberrations or coma in the focal plane. Figure2 shows a ray trace through the telescope-camera system.The fast focal ratio (F = 2.5) allows the MBAC window(Section 3.2) to be small.To minimize the beam sizes and maximize the collect-
ing area, 97% of the primary reflector diameter is illumi-nated, limited by a cold aperture stop (the “Lyot stop”).Spillover at the Lyot stop inside MBAC can load the de-tectors with radiation emitted from warm, nearby struc-tures. Calculations show that there is a maximum of0.5% spillover on the primary reflector and 2% spilloveron the secondary reflector. To reduce this spillover load-ing, the primary reflector has a 0.75m radial baffle thatreduces the primary spillover to < 0.2%. However, thespillover on the secondary reflector occurs at larger an-gles. While there is a 0.3m radial baffle around the
1 Business address: Optical Research Associates, 3280East Foothill Blvd., Pasadena, CA, 91107. Internet URL:http://www.opticalres.com/.
secondary, it does little to reduce the effective spillover.Measurements of the detectors indicate that there is asmuch as 2–3% spillover that does not get reflected to thecold sky. As a result, the secondary baffling is being re-designed to ensure that the majority of the spillover isredirected to the sky in future observations.
2.2. Site Location, Band Selection, and Logistics
The ACT site is at an altitude of 5190m near thepeak of Cerro Toco in the Atacama Desert of north-ern Chile. The telescope location provides visibility toapproximately 70% of the sky. The high elevation andlow precipitable water vapor (PWV) at this location pro-vides excellent millimeter and submillimeter atmospherictransparency and has attracted several other millimeter-wave experiments. The specific ACT site has also beenused by the TOCO (Miller et al. 2003) and MillimeterINTerferometer (Fowler et al. 2005) telescopes.The ACT bands were selected to discriminate be-
tween the SZ, CMB, and point sources. The bandswere also chosen to avoid three large emission features,an oxygen emission line at 119GHz and water emis-sion lines at 183GHz and 325GHz (e.g, Danese andPartrige (1989)). Using the National Radio AstronomyObservatory/European Southern Observatory monitor-ing data and an atmospheric modeling program devel-oped by Pardo et al. (2001), the opacity and Raleigh-Jeans (RJ) brightness temperatures are extrapolated tothe ACT bands. The level of emission in the continuumwhere the ACT bands lie is due to O2 and H2O in com-parable parts. Thus, the transmission and absorption inthe bands is a function of the PWV in the atmosphere.Seasonal changes in the weather provide sustained peri-ods with low amounts of water vapor and naturally setthe ACT observing season to April through Decemberwhen the PWV is lowest due to the colder weather.The ACT site is approximately 50 km from the town
of San Pedro de Atacama (altitude ∼ 2750m), the loca-tion of lodging and the main field office. Travel to thesite from North America takes approximately one day.The roads are clear year-round with brief periods of in-accessibility due to snow, providing site access through-out the year. Communication with the site is possiblethrough a data link consisting of a 60 cm parabolic an-tenna in San Pedro and a 1.2m parabolic antenna at thesite, and an Orthogon PTP600 transreceiver pair oper-ating at 5.8GHz.2 The overall communications rate is∼ 40Mb/s. Connection to the Internet is made in SanPedro; this connection limits the speed of communicationfrom North America and the site to 1–2Mb/s.Site electricity is alternately supplied by one of two
XJ150 John Deere (Triton Power Generation) diesel gen-erators, with sufficient on-site fuel for 60 days of au-tonomous operation at ∼ 240 liters per day. The gen-erators are rated at 150 kW (at sea level), but typicalconsumption during full operation is approximately 25–30kW.
2.3. Scan Strategy
The sky is scanned to separate the CMB signal fromdrifts in the detectors and atmosphere. Often, this
2 Orthogon is a subsidiary of Motorola. For more informationsee www.motorla.com.

ACT Instrument 3
Fig. 1.— Picture (left) and mechanical rendering (right) of ACT and its ground screens. The telescope has a low profile; the full heightis 12m. The entire upper structure (“Azimuth structure” and above) rotates as a unit. The surrounding outer ground screen shields thetelescope from ground emission. The screen also acts as a wind shield. An inner ground screen mounted on the telescope connects the sidesof the secondary and primary. The primary reflector is 6m and is surrounded by a 0.5m guard ring (Figures courtesy of AMEC DynamicStructures).
is done by moving the telescope beam on the sky ontimescales faster than the 1/f knee of the low frequencynoise but slower than the time constants of the detec-tors. For ACT, the entire 40 metric-ton upper structuretypically scans at 1.5 /s in azimuth while holding the el-evation fixed (typically at 50.5). Scans are done at twopositions, east and west of an arc between the south ce-lestial pole (SCP) and the zenith. As the sky rotates, anannulus around the SCP is mapped out.This strategy has several benefits for observations from
the ground. Changing the amount of airmass affects boththe gain of the system due to atmospheric absorbtion andthe background loading from gray body emission. Keep-ing the elevation fixed ensures the amount of atmosphericairmass is relatively constant during a scan, preventinga scan-synchronous atmospheric signal. Second, by per-forming scans both east and west along the SCP-zenitharc, the mapped annulus will be observed in two differentcross-linked orientations. Cross-linking has been shownto be important for the removal of scanning-induced sys-tematic effects such as striping when making maximumlikelihood maps (Wright 1996; Tegmark 1997) of the mil-limeter sky. Finally, by moving the entire upper structureof the telescope, including the primary, secondary, andreceiver, the detectors are constantly looking through thesame optics. This avoids any scan-synchronous signalssuch as beam shape, reflector emission, or ground pick-up that could potentially arise from changing the opticalpath.
2.4. Pointing
The typical telescope scan has an amplitude be-tween 5 and 7 degrees with constant velocity betweenturnarounds, when the telescope changes direction at theend of a scan. Rapid turnarounds at the end points ofthe scan minimize time spent not scanning, which max-imizes the sky overlap of the three separate arrays asdiscussed in Section 3.1 (see Figure 5). The telescope isdesigned to produce a maximum scan speed of 2/s witha turnaround time of less than 400ms (10/s2) while
maintaining a pointing error of 6′′ rms from the com-manded position in both azimuth and elevation. Therapid turnarounds combined with the 40 metric-ton scan-ning component of the telescope made the pointing sta-bility during scanning a considerable challenge.The telescope motion systems were designed by
KUKA, a robotics systems company.3 The KUKA robotcomprises the motor drivers, an uninterruptible powersupply, an embedded computer with a solid-state drive,and operator console. The KUKA robot monitors thetelescope position using a pair of Heidenhain absolute en-coders (27-bit, 0.0097′′ accuracy) on the azimuth and ele-vation axes. For down-stream pointing reconstruction, asecond set of identical encoders is read out synchronouslywith the ≈ 400Hz bolometer data stream. A DeviceNetnetwork relays telescope motion parameters between theKUKA robot controller and a housekeeping computer(Section 4.3).4 KUKA’s robot also produces a stream oftelescope health information (its internal encoder and re-solver readouts, motor currents and temperature) whichare broadcast via the user datagram protocol (UDP) andrecorded by the housekeeping computer at 50Hz. Incli-nometers are mounted on the telescope base and the ro-tating structure to measure tilt, and accelerometers aremounted at four positions along the center of the pri-mary reflector and one near the secondary reflector. Thereadout of these devices is synchronized to within 5µs ofthe detector data (Switzer et al. 2008). The elevation en-coder readings are well within the pointing requirementsduring the constant-velocity portion of the scan.During science observations, the scan speed is 1.5 /s.
The acceleration at turnaround is reduced so that it takes800 ms to change direction. With these parameters, thetelescope stays within 2′′ rms of the desired path theentire time, and the sky is observed through the entirescan.
2.5. Reflector Alignment
3 Internet URL: http://www.kuka.com.4 Open DeviceNet Vendors Association (ODVA; odva.org).

4 D. Swetz et al.
Ref lector
Ref lector
Fig. 2.— Ray trace of ACT’s primary and secondary reflectors. The telescope is an off-axis numerically optimized Gregorian. The raysare traced into the MBAC cryostat, mounted on the far right of the receiver cabin. The service position (position where the receiver-cabinfloor is level) is shown, corresponding to a viewing elevation of 60. The nominal observing elevation is 50.5. The rays are traced for thehighest (blue), central (green), and lowest (red) fields in both the 277GHz camera (higher in the cryostat) and the 218GHz camera (lowerin the cryostat). The Figure also shows the dimensions and location of the receiver cabin and MBAC mounting structure.
The telescope’s six-meter primary and two-meter sec-ondary reflectors are composed of individually machinedaluminum panels mounted to a back-up structure (BUS).The primary consists of 71 roughly rectangular panelslaid out in eight rows. The panels comprising each roware identical, but the curvature of the panels decreaseswith increasing height of the BUS (Figure 3). An indi-vidual panel measures ≈ 0.65× 0.85m and weighs 10 kg.The secondary reflector is assembled by arranging 10trapezoidal panels, measuring ≈ 0.35 × 0.80m, arounda ≈ 0.50 × 0.80m decagonal-shaped central panel. Thepanels, manufactured by Forcier Machine Design, wereindividually machined to their required surface shape.5
They were measured using a coordinate-measuring ma-chine (CMM) to have an rms deviation from the expectedshape of ≈ 3µm.The backside of each panel of the primary and sec-
ondary reflector is attached to the telescope structurenear the four corners of the panel, and is thus over-
5 Business address: 123 Marshall Ave, Petaluma, CA 04052,USA.
constrained. Threaded mechanisms at these attachmentpoints allows for manual coarse and fine adjustment ofthe position of each panel (Woody et al. 2008).The loss in forward gain due to panel-to-panel mis-
alignment was estimated with the Ruze formula (Ruze1966). To achieve ≈ 90% of the optimal forward gain atour highest frequency of 277GHz, a surface rms of 27µmis required assuming a Gaussian distribution of phase er-rors. The panel positions are measured using a lasertracker manufactured by Faro.6 The tracker measuresthe time of flight of a laser pulse to determine the dis-tance to a point on the reflector’s surface. Corner cubesand retroreflectors are used on every panel to measurealignment. After three years and six sets of measure-ments of the primary, the rms has consistently been inthe 25-30µm range, and 10-12µm for the secondary. Fig-ure 3 shows the alignment results obtained prior to the2009 observing season.After the individual panels have been set, the position
of the secondary can be adjusted as a unit using linear
6 Internet URL: http://www.faro.com.

ACT Instrument 5
Fig. 3.— Primary reflector layout and final reflector alignment.The primary is composed of 71 approximately rectangular panelsarranged in eight rows. The panels are attached to the telescopeBUS and are aligned using four adjustment screws on the panelback-side. Panel positions are measured using a laser tracker. Theresiduals of a fit to the reflector’s equation give the necessary ad-justments. The figure shows the residual after the final adjustmentsfor the 2008 observing season were made. The reflector was alignedto better than 30µm rms.
actuators mounted on the secondary frame. This canbe performed remotely by the telescope control software.The adjusters allow ±1 cm motion in y and z, and rota-tions of ±1 in azimuth and elevation. Optimal focus isachieved by analyzing the detector response to planetsat various positions for the secondary.
3. THE MILLIMETER BOLOMETER ARRAY CAMERA
MBAC is a cryogenic camera designed specifically tomeet the scientific goals of the ACT project. The de-sign entails three independent sets of cold reimaging op-tics, one for each frequency. Achieving the sensitivitygoals of the project requires that the detectors operateat 300mK.
3.1. Cold Reimaging Optics
The Gregorian telescope produces large field of viewsuitable for a several square degree camera. Three sets ofcold optics reimage parts of this field onto three separatefocal plane arrays (Figure 4). Due to the off-axis Grego-rian design, the optimal focal plane is not perpendicularto the optical axis. Due to the non-telentric, off-axis de-sign, the cold optics are held at compound angles insidethe cryostat. The specifications required a diffraction-limited field of view for each 22′ × 26′ array. Each setof reimaging optics has a cold aperture stop that definesthe illumination of the secondary and primary reflectors.The three optics tube design has several advantages.
Wide-band anti-reflective (AR) coatings can be difficultto produce, optimizing over a small band leads to highertransmission through the optical elements. The opticalcomponents at a given frequency are on-axis and cylin-
drically symmetric. This geometry allows the optical ele-ments to be placed in an optics tube that provides shield-ing for the arrays against stray radiation, and leads toa simpler mechanical design. Each optics tube was builtseparately, allowing for greater flexibility. Several as-pects of the camera design were based on the MUSTANGinstrument on the Green Bank Telescope (Dicker et al.2008) and on the prototype instrument for ACT, CCAM(Lau 2008; Aboobaker 2006).A disadvantage of the design is that the three arrays
do not image the same region of sky simultaneously. Theoffset between arrays is minimized by packing them asclosely together as mechanically possible. The resultingtriangular configuration places the 277GHz camera inthe plane of symmetry of the telescope due to its tighterdiffraction requirements, and the 148 and 218GHz cam-eras below and on either side of the plane of symmetry.This arrangement coupled with the ACT scan strategymaximizes the total sky coverage overlap among the dif-ferent frequencies. As the telescope scans back and forth,most of the scanned area is covered by both of the bot-tom two arrays; only in the turnaround regions, chosen tobe short in duration, are the two fields not overlapping.Sky rotation moves the lower observed region through theupper camera when observing in the east (or vice-versawhen the telescope is observing in the west).All the lenses are made out of high-purity silicon, cho-
sen for its high index of refraction (n = 3.416) (Lamb1996) and high thermal conductivity at cryogenic tem-peratures. High-purity was used to reduce absorptionloss at millimeter wavelengths. An AR layer is added toeach lens by coating it on both sides with a thin layer(≈ several hundred µm, the exact number depending onthe frequency) of machined Cirlex (n = 1.84) (Lau etal. 2006). The first lens, located just after the Grego-rian focus, forms an image of the primary mirror on thecold aperture stop. Bare arrays, such as those used inMBAC, accept radiation from all directions. Illumina-tion is controlled using a cold (1K) Lyot stop locatedafter the first lens. Since the cold stop is not a perfectimage of the primary, individual detectors geometricallyilluminate approximately 5.6m of the primary reflector.The second and third lenses refocus the sky onto the
focal plane arrays. The optics were designed to maximizethe Strehl ratio over the focal plane. The placement ofthe final lens with respect to the array has the tightesttolerance of all optical elements, ≈ 600µm.7 Hence thefinal lens and array were designed as a single mechanicalunit at 300mK. The final band-pass filter sits in front ofthe final lens and is also cooled to ≈ 300mK (Fig 4).The detectors are 1.050 × 1.050mm squares, with
a spacing of 1.050 ± 0.002mm (horizontal) by 1.22 ±
0.02mm (vertical). The horizontal error is based on fab-rication estimates and the vertical error is based on ma-chine tolerance. This results in the 32 × 32 rectangu-lar detector grid measuring approximately 33.6 ± 0.1 ×
39.0 ± 0.1mm, where the errors are estimates from as-sembly and machining tolerances. Table 2 summarizestheir physical and optical properties. The numbers forthe focal length, primary illumination, and focal ratiovary across the array. The numbers reported in Table
7 The tolerance criteria was defined as the amount a lens neededto be misplaced to produce a 1% decrease in the Strehl ratio.

6 D. Swetz et al.
Fig. 4.— Three dimensional model of the cold reimaging optics for MBAC. The optical elements for each array are separated intoindividual optics tubes. Each array has a similar set of optical elements. The 277GHz elements and temperatures are labeled. The lensesare labeled Lens 1 to 3, with Lens 1 one being closest to the 300K window. The low-pass capacitive-mesh filters are labeled LP and theband-pass filter as BP. Infrared blocking filters are labeled IR. The temperature of the components decreases moving toward the arrays toreduce the loading, with the band-pass filter, the third lens, and arrays all held at 0.3K.
2 are calculated from a model and the “uncertainties”are the maximum and minimum range. The field of viewis ≈ 22′ × 26′ for each array. In terms of angle on thesky, the detectors are spaced approximately 1/2Fλ to1.1Fλ going from the lowest to highest frequencies. Thismeans that for 148GHz, the entire field is fully sampledin a single pointing. There are no feed horns in the sys-tem. Figure 5 shows the the relative sky spacing of thedetectors for the three arrays.Calculations using optics design software predict Strehl
ratios greater than 0.97, 0.94, and 0.96 across the entirefocal plane region, with average Strehl ratios of 0.99, 0.98and 0.98 for the 148, 218, and 277GHz cameras, respec-tively.
3.2. Vacuum Windows
The vacuum window location was chosen near theGregorian focus of the telescope to minimize the win-dow size, which in turn reduces the load on the cryo-genic stages. A separate window was used for each ofthe three frequencies, each with an optimized AR coat-ing. The close spacing of the optics dictated a rectangu-lar window shape, which takes advantage of the imageshape of the array at the window. The vacuum windowsare made of 4 mm-thick Ultra High Molecular WeightPolyethylene (UHMWPE) with an index of refraction of∼ 1.53 at 160GHz (Lamb 1996). The AR coatings con-sist of bonded expanded-Teflon sheets glued to the frontand back surfaces of the UHWPE. Measurements of theMBAC windows using a Fourier transform spectrometer(FTS) show transmissions of over 96% for the 148GHz
TABLE 2Detector Array Physical and Optical Properties
Detector Physical Properties
· · · Horizontal VerticalPixel size 1.050mm 1.050mm
Pixel spacinga 1.050±0.002mm 1.22±0.02mmArray configuration 32 32
Array sizeb 33.6±0.1mm 39.0±0.1mm
Optical Properties: 148 and 218GHz Arrays
· · · Horizontal VerticalEffective focal lengthc 5.17±0.12m 5.03±0.13mPrimary illuminationc 5.60±0.21m 5.59±0.23m
Focal ratioc 0.93±0.02 0.90±0.02Detector spacing 41±4′′ 50±4′′
Optical Properties: 277GHz Array
· · · Horizontal VerticalEffective focal lengthc 5.41±0.11m 5.06±0.12mPrimary illuminationc 5.48±0.19m 5.50±0.20m
Focal ratioc 0.98±0.04 0.91±0.04Detector spacing 40±4′′ 49±4′′
aHorizontal error estimated from fabrication tolerances. Verticalerror estimated from machining tolerances.bErrors are estimated from machining and assembly tolerances.cThe number varies across the array and the “±” indicates the
maximum and minimum of the range.
and 218GHz bands and over 93% in the 277GHz band(Swetz 2009).
3.3. Filters and Bandpass Measurements
The frequency responses of the bolometric detector ar-rays for MBAC are defined by the transmission throughthe optical elements in the optical path to the detec-

ACT Instrument 7
Fig. 5.— The idealized arrangement of the ACT detectors onthe sky. This arrangement on the sky is the reverse of the viewwhen looking into MBAC (Fig. 4).
tors. The frequency transmission band is set primarilyby a series of low-pass (LP) capacitive-mesh filters and aband-defining edge (BP) filter (Ade et al. 2006). Multiplefilters are used because the LP filters have transmissionleaks at harmonics of their cut-off frequency. The useof filters with a range of cut-off frequencies allows subse-quent filters to suppress the out of band leaks from previ-ous filters. Filters are placed at each successive cryogenicstage along the optical path to limit loading on the nextstage. They are arranged from highest frequency cut-offto lowest. There are also a series of 4µm thick infrared-blocking (IR) reflective filters to reduce the optical load-ing on the cold stages (Tucker and Ade 2006). These IRblocking filters prevent the center of the poorly conduct-ing LP filters from heating up and consequently reducethe radiative loading from the windows. Each optics tubecontains 10 filter elements, including the windows. Table3 lists the nominal temperature, location, and low-passcut-off frequency for each of the filters. Figure 4 showsall the filter and lenses in free space.Each filter’s frequency response at room temperature
was measured using a FTS. A composite transmissionspectrum was created by multiplying together the indi-vidually measured filter responses. After the filters wereinstalled into MBAC, FTS measurements were made inthe lab prior to shipping to Chile with a different spec-trometer on the fully cooled system. It should be notedthat at this time there was one additional element placedin the optical chain, an anti-reflective (AR) layer, directlyin front of the detectors.Using the instrument passband (normalized by the
peak in the composite passband), we follow the methodof Page et al. (2003) for calculating the effective centralfrequency of broadband sources, including the CMB andSZ effect. The effect of these sources on the band centeris to shift it slightly. The results are given in Table 4.
TABLE 3Filter location, temperature, and cut-off frequency ofthe filters in the order they are placed in the optical
path.
Filter Type Temperature Frequency (GHz)148 218 277
Window Ambient · · · · · · · · ·IR blocker Ambient · · · · · · · · ·IR blocker 40 K · · · · · · · · ·Low-passa 40 K 360 360 540IR blocker 40 K · · · · · · · · ·IR blocker 4 K · · · · · · · · ·Low-passa 4 K 270 330 450Low-passa 1 K 210 300 390Low-passa 1 K 186 255 360Band-passb 300 mK 148 220 280
aApproximate frequency cut-off listed.bExpected band center listed.
TABLE 4Properties of the MBAC filters.
Array 148 (GHz) 218 (GHz) 277 (GHz)
Comp. Bandcentera 146.9 217.3 273.5Max. Transmissiona 0.74 0.72 0.69
Bandcenterb 149.2±3.5 219.7±3.5 277.4±3.5Bandwidthb 18.4 17.0 20.9Noise Bandwidthb 27.6 25.9 34.8Band FWHMb 27.0 22.2 30.3
Effective Bandcentersc
Synchrotronc 147.6 217.6 274.8Free-freec 147.9 218.0 275.4Rayleigh-Jeansc 149.0 219.1 276.7Dusty sourcec 149.7 219.6 277.4CMBc 148.4 218.3 274.7SZ effectc 146.9 220.2 277.2
Conversion factors
δTCMB/δTRJ 1.71±0.04 3.02±0.10 5.44±0.20δW/δTRJ (pW/K) 0.569±0.055 0.483±0.055 0.699±0.055Γ (µK/Jy) 6826±350 5824±240 4373±550aBased on a composite of room temperature measurements. The
source spectrum has been divided out. The effect of the lenses andcoupling to the detectors is not included.bMeasurements were made with all filters installed in MBACalong with the lenses and the ACT detectors. This measurementincludes neutral density filters in each band and the coupling of theFTS to MBAC. The neutral density filters are not present whenobserving the sky. Three measures of the width of the band aregiven. The uncertainties are obtained from a combination of therms of the measurements and an estimate of the systematic er-ror. The source spectrum has been divided out of the measuredresponse.cEffective band centers for synchrotron emission (α = −0.7), free-
free emission (α = −0.1), Rayleigh-Jeans emission (α = 2.0), dustysource emission (α = 3.5). These values are based on the averageof the computed composite of all filters and the measured responsein MBAC. The uncertainty on all values is 3.5 GHz. For example,for the response to the CMB we use 148 GHz, 218 GHz in AR1and AR2. Since the CMB will be difficult to detect in AR3 we usethe RJ band center of 277 GHz.
3.4. Detectors
MBAC has three 1024-element (32 × 32) detector ar-rays, one for each frequency. The focal plane is filled bya tiling of free-standing bolometric sensors with squareabsorbers. The array elements are pop-up TES bolome-ters (Benford et al. 2003; Li et al. 1999), fabricated inthe Detector Development Lab at NASA Goddard SpaceFlight Center. Each 20mΩ TES is voltage-biased with

8 D. Swetz et al.
a 1mΩ shunt resistor. Each sensor array is enclosed ina cooled enclosure and its field of view of the incidentradiation is limited by the cold stop.The bolometers are fabricated in columns of 32 el-
ements on silicon on insulator (SOI) wafers. Thesewafers have a 1.45 µm-thick silicon membrane separatedby a thin layer of oxide from the 450µm bulk silicon.Each bolometer is a superconducting MoAu bilayer withTc ≈ 500mK atop a 1.05 mm×1.05 mm square of the sil-icon membrane. The rest of the square is implanted withphosphorus ions that serve as the absorber, with a surfaceimpedance of ≈ 100Ω/2. The absorber is coupled to thebulk silicon by four 1mm-long legs etched from the sili-con membrane with widths between 5-20µm, dependingon the array. Two of the legs carry superconducting biaswiring for the TES. These legs define the thermal con-ductance G to the thermal bath, and are mechanicallycompliant enough so that each can be folded 90 so thatthe square absorbers are orthogonal to the planes of bulksilicon. The bulk silicon is then wire bonded to a siliconcircuit board with superconducting (aluminum) wiringwhich exits the circuit board on superconducting (tinplated on copper) flexible circuits via zero insertion force(ZIF) connectors. These column assemblies are stackedto form the 32× 32 array of detectors.The sensitivities of the 148GHz and 218GHz arrays
were ≈ 30µKs1/2 and 40µKs1/2, respectively in 2008,in CMB temperature units. These include atmosphericeffects. Table 5 lists some of the basic properties of theTES detectors with their measured standard deviationsfor each of the three arrays, including their thermal con-ductivities, G, their critical temperatures, Tc, their darknoise (NEP), and their time constants, τ . For a morecomplete description of the ACT detectors, see Marriageet al. (2006); Niemack et al. (2008); Zhao et al. (2008).
TABLE 5Detector Parameters
Array G Tc Dark Noise τ
(pW/K) (mK) (W /√Hz ) (ms)
148 GHz 80± 20 510 ± 20 (6± 2)× 10−17 1.9± 0.2218 GHz 120± 30 510 ± 20 (5± 1)× 10−17 2.5± 0.4277 GHz 300± 60 500 ± 30 (7± 1)× 10−17 1.6± 0.3
3.5. Detector Readout and Control
The individual bolometers are read out in a time-multiplexed fashion using Superconducting Quantum In-terference Device (SQUID) multiplexers (Chervenak etal. 1999). Prior to exiting the cryostat, the bolome-ter signals are amplified by an array of approximately100 SQUIDS in series held at 4K. The series array am-plifiers and multiplexers are controlled and read out bythe Multi-Channel Electronics (MCE) (Battistelli et al.2008).Each of the three bands has an independent MCE
which is mounted directly onto the MBAC cryostat. TheMCEs, their power supplies, and MBAC all reside in thetelescope receiver cabin. The three MCEs are connectedto three storage and control computers in the equipmentroom through multimode fiber-optic carriers. The signals
from each MCE are decoded by a PCI card from Astro-nomical Research Cameras, Inc. in each of the three dataacquisition computers.8
The base clock rate of the MCE is 50 MHz. This isdivided down to 100 clock cycles per detector row by32 detector rows plus one row of dark SQUIDs. Thus,the native read-rate of the array is 15.15kHz as it leavesthe cryostat. Nyquist inductors at 0.3K band-limit theresponse so the array can be multiplexed with mini-mal aliased noise while maintaining stability of the loop(Niemack et al. 2008; Niemack 2008). To downsample the15.15kHz multiplexing rate to 399 Hz, the MCE appliesa 4-pole Butterworth filter with a rolloff f3dB = 122 Hzto the feedback stream from each detector. This filter isefficient to implement digitally and has a flat passband.The downsampling to 399 Hz, which can be obtained bypulling every 38th sample (at 15.15kHz) from the filterstack, is synchronized by similar clock counting in thesynchronization box. Each time an MCE receives a sys-tem trigger, it packages the output of the 32×32+1×32(32 dark SQUIDs) array and sends it over a fiber optic toa PCI card on its acquisition computer in the equipementroom, where it is buffered and written to disk. Addi-tional information that fully specifies the MCE state ineach 10-minute acquisition interval is written to a text“run file.”
3.6. Magnetic Shielding
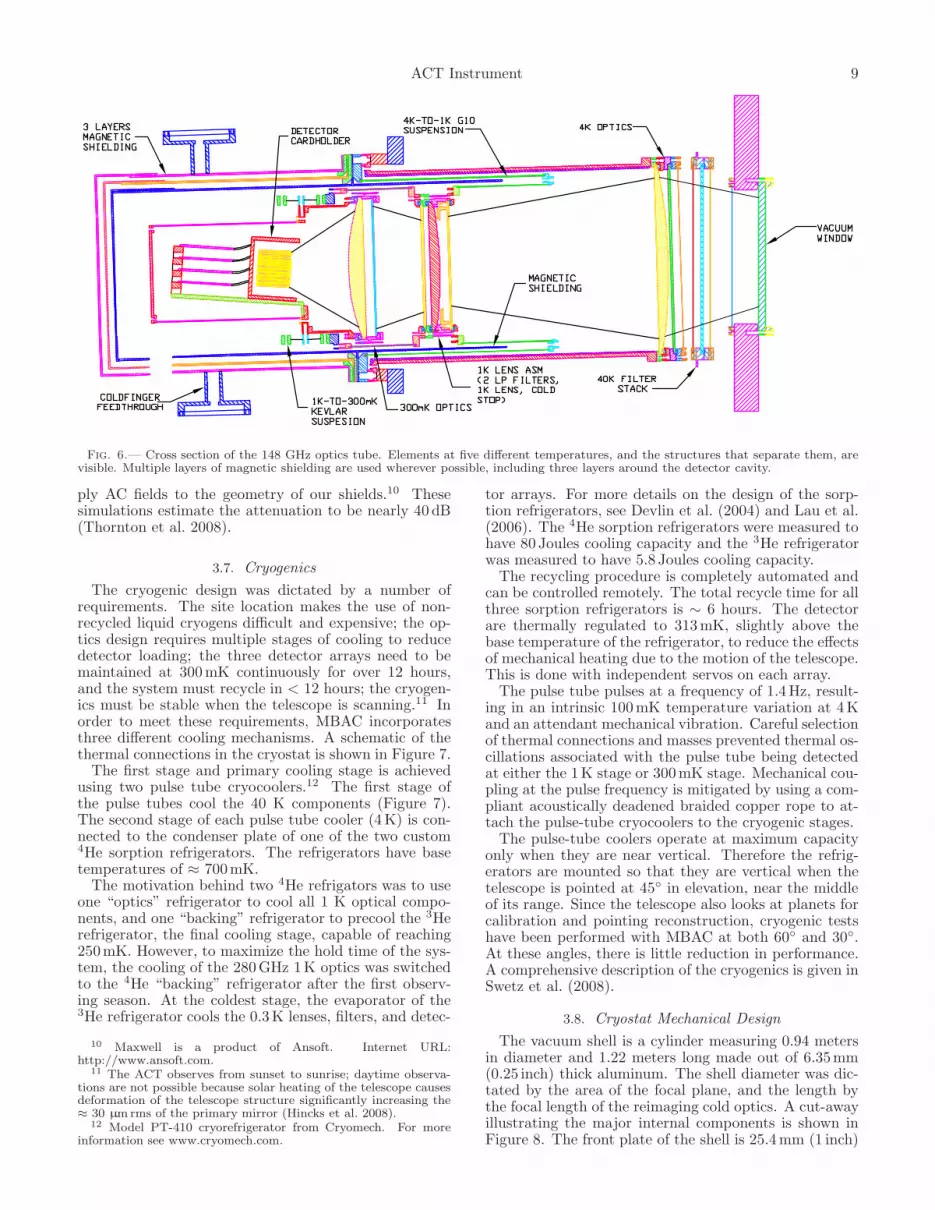
The SQUID multiplexers and amplifiers are sensitive tochanging magnetic fields. They require magnetic shield-ing from both Earth’s DC field and AC fields induced bythe telescope motion through Earth’s DC field and po-tential fields such as those generated from the telescopemotors. The series array amplifiers are located outsideof the optics tubes and are self-contained units enclosedwithin their own magnetic shielding. The SQUID multi-plexers, however, are mounted on the silicon cards thatmake up each column in the detector array holder.Because of their proximity to the array it would be dif-
ficult to provide individual magnetic shielding. The ef-fectiveness of the magnetic shielding is highly dependenton the shield geometry. Given the details of geometryof the detector arrays in the optics tube, it was foundthat the best solution was to enclose each optics tube inmagnetic shielding.Cryoperm-10 is an alloy with a high nickel concentra-
tion.9 Its composition coupled with a proprietary heattreatment give it a high magnetic permeability at cryo-genic temperatures. To achieve the maximum attenua-tion, our shielding uses the thickest available Cryoperm,1.5mm. We also use multiple layers (Figure 6) which,given sufficient spacing between them, approaches thelimit of multiplicative increases in the field attenuation.Each layer of shielding has different dimensions, ports,
and tubulations, making it difficult to calculate the mag-netic field attenuation at the SQUIDs analytically. Com-puter simulations using Maxwell were employed to ap-
8 Internet URL: http://www.astro-cam.com/.9 Cryoperm is a trademark of Vacuumschmelze GmbH in Hanau,
GermanyLocal Distributor: Amuneal Manufactoring Corporation, 4737Darrah St., Philadelphia, PA 19124, [email protected], (800)-755-9843.
ACT Instrument 9
Fig. 6.— Cross section of the 148 GHz optics tube. Elements at five different temperatures, and the structures that separate them, arevisible. Multiple layers of magnetic shielding are used wherever possible, including three layers around the detector cavity.
ply AC fields to the geometry of our shields.10 Thesesimulations estimate the attenuation to be nearly 40 dB(Thornton et al. 2008).
3.7. Cryogenics
The cryogenic design was dictated by a number ofrequirements. The site location makes the use of non-recycled liquid cryogens difficult and expensive; the op-tics design requires multiple stages of cooling to reducedetector loading; the three detector arrays need to bemaintained at 300mK continuously for over 12 hours,and the system must recycle in < 12 hours; the cryogen-ics must be stable when the telescope is scanning.11 Inorder to meet these requirements, MBAC incorporatesthree different cooling mechanisms. A schematic of thethermal connections in the cryostat is shown in Figure 7.The first stage and primary cooling stage is achieved
using two pulse tube cryocoolers.12 The first stage ofthe pulse tubes cool the 40 K components (Figure 7).The second stage of each pulse tube cooler (4K) is con-nected to the condenser plate of one of the two custom4He sorption refrigerators. The refrigerators have basetemperatures of ≈ 700mK.The motivation behind two 4He refrigators was to use
one “optics” refrigerator to cool all 1 K optical compo-nents, and one “backing” refrigerator to precool the 3Herefrigerator, the final cooling stage, capable of reaching250mK. However, to maximize the hold time of the sys-tem, the cooling of the 280GHz 1K optics was switchedto the 4He “backing” refrigerator after the first observ-ing season. At the coldest stage, the evaporator of the3He refrigerator cools the 0.3K lenses, filters, and detec-
10 Maxwell is a product of Ansoft. Internet URL:http://www.ansoft.com.
11 The ACT observes from sunset to sunrise; daytime observa-tions are not possible because solar heating of the telescope causesdeformation of the telescope structure significantly increasing the≈ 30 µmrms of the primary mirror (Hincks et al. 2008).
12 Model PT-410 cryorefrigerator from Cryomech. For moreinformation see www.cryomech.com.
tor arrays. For more details on the design of the sorp-tion refrigerators, see Devlin et al. (2004) and Lau et al.(2006). The 4He sorption refrigerators were measured tohave 80 Joules cooling capacity and the 3He refrigeratorwas measured to have 5.8 Joules cooling capacity.The recycling procedure is completely automated and
can be controlled remotely. The total recycle time for allthree sorption refrigerators is ∼ 6 hours. The detectorare thermally regulated to 313mK, slightly above thebase temperature of the refrigerator, to reduce the effectsof mechanical heating due to the motion of the telescope.This is done with independent servos on each array.The pulse tube pulses at a frequency of 1.4Hz, result-
ing in an intrinsic 100mK temperature variation at 4Kand an attendant mechanical vibration. Careful selectionof thermal connections and masses prevented thermal os-cillations associated with the pulse tube being detectedat either the 1K stage or 300mK stage. Mechanical cou-pling at the pulse frequency is mitigated by using a com-pliant acoustically deadened braided copper rope to at-tach the pulse-tube cryocoolers to the cryogenic stages.The pulse-tube coolers operate at maximum capacity
only when they are near vertical. Therefore the refrig-erators are mounted so that they are vertical when thetelescope is pointed at 45 in elevation, near the middleof its range. Since the telescope also looks at planets forcalibration and pointing reconstruction, cryogenic testshave been performed with MBAC at both 60 and 30.At these angles, there is little reduction in performance.A comprehensive description of the cryogenics is given inSwetz et al. (2008).
3.8. Cryostat Mechanical Design
The vacuum shell is a cylinder measuring 0.94 metersin diameter and 1.22 meters long made out of 6.35mm(0.25 inch) thick aluminum. The shell diameter was dic-tated by the area of the focal plane, and the length bythe focal length of the reimaging cold optics. A cut-awayillustrating the major internal components is shown inFigure 8. The front plate of the shell is 25.4mm (1 inch)

10 D. Swetz et al.
4He Backing Refrigerator
Fig. 7.— Schematic of the radiation shielding and thermal connections in MBAC. Only a single optics tube is shown, depicting the 148and 218GHz channels. The 277GHz 1K optics (not shown) are connected to and cooled by the 4He backing refrigerator.
thick and serves as the optical bench to which all of thecold optics are ultimately mounted. The front plate isalso an integral part of the mounting of MBAC to ACT.This design allows all of the cold optics to be rigidlymounted to the telescope without relying on the rigidityof the cylindrical cryostat vacuum vessel.Two additional aluminum plates are attached to the
front plate via G-10 cylinders. The first plate (“40Kplate”) is cooled to ∼ 40K. The second plate (“4Kplate”), suspended from the 40K plate by G-10, is cooledto ∼ 4K. A large radiation shield is attached to eachplate. The shields are nested so that the outer 40K shieldcompletely surrounds the inner one 4K shield. The he-lium refrigerators and optics tubes are rigidly mountedto the 4K plate and are located between the 4K plateand its corresponding radiation shield.The vacuum shell is split about 200mm back from the
front plate. Removing the back section of the cryostatdecouples and removes the pulse-tube refrigerators fromthe optics and adsorption refrigerators, allowing easy ac-cess to the cold plates, optics, and detectors. All of thecabling for the thermometry, detectors, and the detectorreadout comes in through ports in the front vacuum shellsection. These cables are heat sunk at both the 40K andat 4K plates. An advantage of this design is that it al-lows for access to all of the cabling, optics, and detectorswithout making or breaking any cable attachments.
3.9. Optical Support Structures
To minimize weight, aluminum was generally used tomount optical elements at 300K, 40K, and 4K. For the1K and 300mK assemblies, where conductivity is criti-cal and where aluminum is superconducting (resulting ingreatly reduced thermal conductivity), oxygen-free high-conductivity copper (OFHC) was generally used. An-other reason for using mostly copper below ≈ 1K is po-tential problems with trapped magnetic flux in supercon-ducting aluminum alloys.Each optics tube has a compound wedge at its 4K
base that holds it at the proper angle with respect to thetelescope beam. The tubes can be removed individually,which allowed the 148GHz optics tube to be deployed inMBAC for the 2007 season while the 218 and 277GHzoptics tubes were being constructed.The second lens and cold stop for each optics tube is
held at 1K. To reduce the load on our 4He refrigerator,we use two concentric and re-entrant G-10 (fiberglass)tubes to connect the 4K optics to the 1K optics.As mentioned in Section 3.1, the third lens/bandpass
and the detector package were designed to be a single me-chanical unit (magenta in Figure 8). This OFHC unit issuspended from the 1K optics stack via a Kevlar suspen-sion (not shown in figure). The limited cooling capacityat 300mK (∼ 5.8 J) and desired hold time of > 18 hoursmeans the total loading from all three frequencies mustbe less than 80µW, preventing G-10 from being usedhere. The 300mK assembly is enclosed in a light-tightcopper shell which shields the detector from 4K radiationfrom the surrounding magnetic shielding. The total massof the 300mK assembly for each array is approximately5 kg.
3.10. Mechanical Alignment of MBAC to ACT
MBAC is mounted to ACT at the flange that joinsthe front plate to the vacuum cylinder, providing an ex-tremely rigid plane that can be precisely aligned with theoptical axis of the telescope. This plane was used as thebase for all optical elements inside MBAC, ensuring thatthe alignment was independent of variations in the cylin-drical vacuum shell caused by pressure and temperature.Adjustments permit fine tuning MBAC’s position beforeit is bolted in place.Figure 2 shows the mating of MBAC in the receiver
cabin. The width of the receiver cabin is 3.3 meters.The MBAC enters though doors on the front of the re-ceiver cabin (left side of Figure 2), and passes throughthe MBAC mounting structure whose width is ≈ 1 me-ter, where it is then hoisted and bolted into place. Once

ACT Instrument 11
Fig. 8.— Cut away view of the MBAC cryostat showing the location of the internal components. A cut away view of the 218GHz opticstube is also shown, giving the location of its lenses, filters, and array, which is similar for all three tubes. The 277GHz optics tube mountsjust above the 148 and 218GHz optics tubes, but is removed for clarity. The connection of the first stage of the pulse tube and its radiationshielding to the 40K plate is also omitted for clarity.
the cryostat is bolted into the telescope receiver cabin,the laser tracker (Section 2.5) is used to locate the frontplate in relation to the primary mirror.
4. DATA ACQUISITION
4.1. Overview
The science data are all written to hard drives on a lo-cal acquisition computer (one for housekeeping and threefor the science cameras). On each machine, a serverbroadcasts the data to a central merger computer whichaligns and writes the science data from the three cameras,telescope and housekeeping systems to a disk at the tele-scope site. Large capacity hard drives are problematicat the ACT site due to the dusty environment and low
atmospheric pressure. Therefore all of the site drives arecontained in individually pressurized boxes with eitherESATA or USB interfaces. Because of limited storagespace at the site, these merged data are transmitted toa larger, intermediate, RAID storage node in San Pedrode Atacama with 6.5TB of available storage. The RAIDdrives located in San Pedro do not need to be pressurized.The data can also be served to clients on real-time datavisualization computers either at the site or the groundstation.13
To make the large data volume more manageable, we
13 Data are displayed in real time using kst(http://kst.kde.org/).

12 D. Swetz et al.
Interface Server Schedule Dispatcher
Database
Data Merger
42 kbps
Housekeeping DAS
x3
51 Mbps
51 Mbps
Monitor clients RAID storage
North America Operator client Operator client
Ground Station
Synchronization generatorTelescopeand encoders
Telescope
Site (Mountain)
and North A
merica
Ground station
Array DAS x3
Camera Electronics
Receiver
Cabin
Equipm
ent room
"Heartbeat"
Observing schedule
Fig. 9.— Overview of the ACT data and control systems,split into telescope (top), on-site (middle), ground station, andNorth American systems (bottom). Solid lines show data streamswhile dashed lines show commanding and file information channels.Cylinders represent data storage. We show only one of three detec-tor array acquisition systems (“Array DAS”) for simplicity. Theground station RAID array aggregates data from several machinesat the site, so we do not show it as being connected to a particularnode. To prepare a transport disk with data to ship back to NorthAmerica, an operator connects the drive to the RAID array, andthe data are automatically copied over based on information in thefile database. Operators define a schedule each night and upload itto the schedule dispatcher at the site. Here we have only shown amonitor client in the ground station, but the site also has a systemmonitor terminal.
compress the data using a fast, lossless algorithim sep-arately to each channel.14 The compression reduces atypical data file to one-third its original size. The aver-age (compressed) data rate is 80GB per night. The dataare copied from the intermediate RAID storage to exter-nal transport disks which are hand-carried on flights toNorth America. Both the housekeeping and camera datahave associated entries in a file database which is period-ically checked to automatically move data from the sitecomputers to the ground station, onto transport disks,and to confirm that the data have been properly received(using an md5 checksum) in North America before delet-ing the data from site computers. There is an associatedwebpage where operators can track the volume and typeof data acquired in real time.Observations with ACT are defined through a schedule
file that specifies an execution time for a task with givenparameters. The schedule is tailored for each observingnight and coordinates all aspects of science operation.There is no decision structure in the scheduler itself be-cause of the simplicity of the scan strategy. Figure 9 givesa schematic of the acquisition and commanding system.
4.2. Timing
Relative timing to align the camera data, housekeeingand encoders is determined by a system-wide trigger andassociated serial stamp. An identical stamp and triggerare passed to each science camera’s acquisition electron-ics through a fiber optic, and to the housekeeping com-puter (in the equipment room) through an RS485 chan-
14 The compression code slim is publicly available athttp://slimdata.sourceforge.net/.
nel in the telescope’s cable wrap. The system-wide clockrate is defined by counting down a 25MHz clock over 50cycles per detector row, over 32 rows of detectors plusone row of dark SQUIDs for the array readout, over 38array reads per sample trigger. This gives the final rateof ∼ 399 Hz. The beam-crossing time of a point sourcein the scan direction is ∼ 10 ms, while in the Earth driftdirection it is several seconds. Thus, the ∼ 399Hz fullysamples the beam. A Meinberg GPS-169 PCI card dis-ciplines the system clock of the housekeeping computer,with a precision of < 1 ms to GPS time, sufficient for as-trometry and book-keeping. Relative timing of encodersand camera data of 5 µs is achieved.The synchronization serial stamp from the RS485
channel is incorporated into the housekeeping data (in-cluding the encoders) through the following chain: 1) inthe housekeeping computer, a PCI card receives a 5MHzbiphase signal which encodes serial data stamps at 399Hzover RS485 from the synchronization box; 2) these trig-ger CPU interrupts at 399Hz; 3) a timing driver handlesthese interrupts by polling the encoders at 399Hz; 4) thePCI card clocks down the serial stamps to 99.7Hz, whichit uses to poll the housekeeping acquisition electronics; 5)the housekeeping software then assembles the housekeep-ing and encoder time streams, matching serial stamps; 6)these are written to disk in a flat file format, where for ev-ery data frame there are, for example, four times as many399Hz encoder values as there are 99.7Hz housekeepingdata frames. The camera, encoder, and housekeepingdata are synchronized and stored in the “dirfile” format,where one file represents each channel. For a completediscussion of the ACT timing see Hincks (2009).
4.3. Housekeeping readout
Housekeeping comprises all electronics and systemsother than the camera and its electronics and the tele-scope motion control. The primary systems withinhousekeeping are the cryogenic thermal readouts andcontrollers, the telescope health readouts, the telescopemotion encoders, and auxiliary monitors. The telescope’sazimuth and elevation encoder signals are read by a Hei-denhain (model IK220) PCI card in the housekeepingcomputer over RS485 from the cable wrap. Cryogenichousekeeping is read at 99.7Hz and auxiliary channels(such as the mirror temperature) are read from 1−20Hzasynchronously by a Sensoray 2600 DAQ. Weather dataare available from an on-site WeatherHawk station andfrom the APEX collaboration.15
5. BEAMS
Observations of planets were used to determine the po-sitions of detectors in the focal plane (Swetz 2009), to cal-ibrate detector response, and to measure beam profilesfor the determination of the window function (Hincks etal. 2009). Detector position and beam shape measure-ments relied especially on observations of Saturn.Observations of Saturn were made approximately every
second night during the 2008 season as the planet roseor set through the ACT observing elevation of 50.5. Theplanet observations were accomplished using the samefixed-elevation scan strategy and scan speed as the ACTsurvey data.
15 http://www.apex-telescope.org/weather/index.html.

ACT Instrument 13
The maps are shown in Figure 10. Maximum likeli-hood maps were made of each Saturn observation fol-lowing the method described in Fowler et al. (2010),but with a less sophisticated approach to the removalof low-frequency atmospheric noise. For each map, thedetector noise spectra were estimated from the data afterfitting and removing a single common mode. The solu-tion for each map was found using a conjugate gradienttechnique, with a low frequency common mode removedbetween each iteration. Only 5–10 iterations were nec-essary to provide adequate convergence. The maps aremade in tangent plane coordinates, centered at the ex-pected planet peak position, with the x-axis parallel tothe scanning direction.The beam maps in Figure 10 are the result of co-adding
23, 30, and 13 individual Saturn maps for 148GHz,218GHz, and 277GHz, respectively. (The lower yieldof high quality maps in 277GHz is due to relative gaindrifts in some detectors.) Small, variable offsets in theplanet position relative to the center of each map wereremoved prior to combining the maps.Point-spread function quality was assessed by mea-
suring the solid angle and FWHM of the beam maps ineach array. The results are summarized in Table 6 andthe solid angles are consistent with those presented inHincks et al. (2009) which used a different map-makingmethod and data subset. An elliptical Gaussian is fittedto the peak of the beam profile. The axis angle is theangle of the semi-major axis relative to the x-axis,increasing counter-clockwise.
TABLE 6Summary of Beam Parameters
148GHz 218GHz 277GHz
Solid Anglea (nsr) 217.7± 3.6 117.6± 2.8 97 ± 12Major FWHMa (′) 1.401± 0.003 1.012 ± 0.001 0.891± 0.04Minor FWHMa (′) 1.336± 0.001 0.991 ± 0.001 0.858 ± 0.005Axis Anglea () 66 ± 1 45± 2 66 ± 10
aThe error bars are effective 1-σ errors. The relatively large sizeof the 277GHz error bar is due to the systematic errors from at-mospheric modeling and is expected to improve.
The beam shapes are consistent with an Airy patternintegrated over the frequency band-width of the filtersand non-zero extent of the detectors. First side lobepeaks are apparent at approximately the −15 dB level,at radii of roughly 1.7′, 1.2′ and 1.0′. A simple model ofthe optics predicts beam FWHM of 1.38′, 1.03′ and 0.88′
for the three arrays (Niemack 2008). This model wascalculated for a single detector near the middle of thearray and assumes uniform primary illumination, a cir-cular aperture, and takes into account the non-point-likeextent of the detectors. It does not include diffractionanalysis or integration of beam variation across the ar-ray, while the planet measurements are an average acrossall detectors in each array. Despite the simplifications,the measured FWHM are consistent with the model.
The ACT project was proposed in 2000 and funded Jan
1, 2004. Many have contributed to the project since itsinception. We especially wish to thank Asad Aboobaker,Christine Allen, Dominic Benford, Paul Bode, KristenBurgess, Angelica de Oliveira-Costa, Peter Hargrave,Amber Miller, Carl Reintsema, Uros Seljak, MartinSpergel, Johannes Staghun, Carl Stahle, Max Tegmark,Masao Uehara, and Ed Wishnow. It is a pleasure to ac-knowledge Bob Margolis, ACT’s project manager. ReedPlimpton and David Jacobson worked at the telescopeduring the 2008 season, and Mike McLaren during the2009 season. ACT is on the Chajnantor Science preservewhich was made possible by the Chilean Comision Na-cional de Investigacion Cientıfica y Tecnologica. We aregrateful for the assistance we received at various timesfrom the ALMA, APEX, ASTE, CBI/QUIET, and Nan-ten groups. The PWV data come from the public APEXweather site. Field operations were based at the Don Es-teban facility run by Astro-Norte. We thank Tom Her-big who chaired our external advisory board (with AmyNewbury, Charles Alcock, Walter Gear, Cliff Jackson,and Paul Steinhardt), which helped guide the project tofruition. This work was supported by the U.S. NationalScience Foundation through awards AST-0408698 forthe ACT project, and PHY-0355328, AST-0707731 andPIRE-0507768. Funding was also provided by Prince-ton University and the University of Pennsylvania. AHreceived additional support from a Natural Science andEngineering Research Council of Canada (NSERC) PGS-D scholarship. PhD thesis based on ACT can be foundat www.physics.princeton.edu/act/papers.html.We thank AMEC/Dynamic Structures/Empire for
their work on the telescope construction, and Kuka forthe motion control system. We are very grateful for BillDix, Glen Atkinson, and the rest of the Princeton PhysicsDepartment Machine Shop, and Harold Borders at theUniversity of Pennsylvania Physics Department MachineShop. Much of our data acquisition system was based onthe BLAST experiment. This paper includes contribu-tions from a U.S. government agency, and is not subjectto copyright.

14 D. Swetz et al.
Fig. 10.— Beam maps for the 148GHz , 218GHz and 277GHz arrays (from left to right), made from 23, 30, and 13 (respectively)observations of Saturn.
REFERENCES
Asad M. Aboobaker. A new millimeter-wave camera for CMBobservations. PhD thesis, Princeton University, 2006.
P. A. R. Ade, G. Pisano, C. Tucker, and S. Weaver. A review ofmetal mesh filters. In Jonas Zmuidzinas, Wayne S. Holland,Stafford Withington, and William D. Duncan, editors, Proc.SPIE, volume 6275, page 62750T, July 2006.
E. S. Battistelli, M. Amiri, B. Burger, M. J. Devlin, S. R.Dicker, W. B. Doriese, R. Dunner, R. P. Fisher, J. W. Fowler,M. Halpern, M. Hasselfield, G. C. Hilton, A. D. Hincks, K. D.Irwin, M. Kaul, J. Klein, S. Knotek, J. M. Lau, M. Limon,T. A. Marriage, M. D. Niemack, L. Page, C. D. Reintsema,S. T. Staggs, D. S. Swetz, E. R. Switzer, R. J. Thornton, andY. Zhao. Automated SQUID tuning procedure for kilo-pixelarrays of TES bolometers on the Atacama Cosmology Telescope.In William D. Duncan, Wayne S. Holland, Stafford Withington,and Jonas Zmuidzinas, editors, Proc. SPIE, volume 7020, page702028. SPIE, 2008.
D. J. Benford, G. M. Voellmer, J. A. Chervenak, K. D. Irwin,H. S. Moseley, R. A. Shafer, J. G. Staguhn, and G. J. Stacey.Design and Fabrication of Two-Dimensional SuperconductingBolometer Arrays. In T. G. Phillips & J. Zmuidzinas, editor,Society of Photo-Optical Instrumentation Engineers (SPIE)Conference Series, volume 4855 of Society of Photo-OpticalInstrumentation Engineers (SPIE) Conference Series, pages552–562, February 2003.
M. L. Brown, P. Ade, J. Bock, M. Bowden, G. Cahill, P. G.Castro, S. Church, T. Culverhouse, R. B. Friedman, K. Ganga,W. K. Gear, S. Gupta, J. Hinderks, J. Kovac, A. E. Lange,E. Leitch, S. J. Melhuish, Y. Memari, J. A. Murphy, A. Orlando,C. O’Sullivan, L. Piccirillo, C. Pryke, N. Rajguru, B. Rusholme,R. Schwarz, A. N. Taylor, K. L. Thompson, A. H. Turner, E. Y. S.Wu, M. Zemcov, and The QUaD collaboration. ImprovedMeasurements of the Temperature and Polarization of theCosmic Microwave Background from QUaD. ApJ, 705:978–999,November 2009.
J. A. Chervenak, K. D. Irwin, E. N. Grossman, John M.Martinis, C. D. Reintsema, and M. E. Huber. Superconductingmultiplexer for arrays of transition edge sensors. Applied PhysicsLetters, 74(26):4043–4045, 1999.
H. C. Chiang, P. A. R. Ade, D. Barkats, J. O. Battle, E. M.Bierman, J. J. Bock, C. D. Dowell, L. Duband, E. F. Hivon,W. L. Holzapfel, V. V. Hristov, W. C. Jones, B. G. Keating,J. M. Kovac, C. L. Kuo, A. E. Lange, E. M. Leitch, P. V. Mason,T. Matsumura, H. T. Nguyen, N. Ponthieu, C. Pryke, S. Richter,G. Rocha, C. Sheehy, Y. D. Takahashi, J. E. Tolan, and K. W.Yoon. Measurement of CMB Polarization Power Spectra fromTwo Years of BICEP Data. arXiv:0906.1181, June 2009.
L. Danese and R.B. Partridge. Atmospheric emission models:confrontation between observational data and predictions in the2.5-300 GHz frequency range. Astrophysical Journal, 342(1):604– 15, 1989.
M.J. Devlin, S.R. Dicker, J. Klein, and M.P. Supanich. A highcapacity completely closed-cycle 250 mk 3He refrigeration systembased on a pulse tube cooler. Cryogenics, 44:611–616, 2004.
S.R. Dicker, P. M. Korngut, B. S. Mason, P. A. R. Ade, J. Aguirre,T. J. Ames, D. J. Benford, T. C. Chen, J. A. Chervenak,W. D. Cotton, M. J. Devlin, E. Figueroa-Feliciano, K. D. Irwin,S. Maher, M. Mello, S. H. Moseley, D. J. Tally, C. Tucker, andS. D. White. MUSTANG: 90 GHz science with the Green BankTelescope. In William D. Duncan, Wayne S. Holland, StaffordWithington, and Jonas Zmuidzinas, editors, Proc. SPIE, volume7020. SPIE, 2008.
J. W. Fowler, V. Acquaviva, P. A. R. Ade, P. Aguirre, M. Amiri,J. W. Appel, L. F. Barrientos, E. S. Battistelli, J. R. Bond,B. Brown, B. Burger, J. Chervenak, S. Das, M. J. Devlin, S. R.Dicker, W. B. Doriese, J. Dunkley, R. Dunner, T. Essinger-Hileman, R. P. Fisher, A. Hajian, M. Halpern, M. Hasselfield,C. Hernandez-Monteagudo, G. C. Hilton, M. Hilton, A. D.Hincks, R. Hlozek, K. M. Huffenberger, D. H. Hughes, J. P.Hughes, L. Infante, K. D. Irwin, R. Jimenez, J. B. Juin, M. Kaul,J. Klein, A. Kosowsky, J. M. Lau, M. Limon, Y. -. Lin, R. H.Lupton, T. A. Marriage, D. Marsden, K. Martocci, P. Mauskopf,F. Menanteau, K. Moodley, H. Moseley, C. B. Netterfield, M. D.Niemack, M. R. Nolta, L. A. Page, L. Parker, B. Partridge,H. Quintana, B. Reid, N. Sehgal, J. Sievers, D. N. Spergel,S. T. Staggs, D. S. Swetz, E. R. Switzer, R. Thornton, H. Trac,C. Tucker, L. Verde, R. Warne, G. Wilson, E. Wollack, andY. Zhao. The Atacama Cosmology Telescope: A Measurementof the 600 < ℓ < 8000 Cosmic Microwave Background PowerSpectrum at 148 GHz. ArXiv e-prints, January 2010.
J. W. Fowler, W. B. Doriese, T. A. Marriage, H. T. Tran, A. M.Aboobaker, C. Dumont, M. Halpern, Z. D. Kermish, Y.-S. Loh,L. A. Page, S. T. Staggs, and D. H. Wesley. Cosmic MicrowaveBackground Observations with a Compact Heterogeneous 150GHz Interferometer in Chile. ApJS, 156:1–11, January 2005.
J. W. Fowler, M. D. Niemack, S. R. Dicker, A. M. Aboobaker,P. A. R. Ade, E. S. Battistelli, M. J. Devlin, R. P. Fisher,M. Halpern, P. C. Hargrave, A. D. Hincks, M. Kaul, J. Klein,J. M. Lau, M. Limon, T. A. Marriage, P. D. Mauskopf, L. Page,S. T. Staggs, D. S. Swetz, E. R. Switzer, R. J. Thornton,and C. E. Tucker. Optical design of the Atacama CosmologyTelescope and the Millimeter Bolometric Array Camera. Appl.Opt., 46(17):3444–3454, 2007.

ACT Instrument 15
A. D. Hincks, V. Acquaviva, P. Ade, P. Aguirre, M. Amiri,J. W. Appel, L. F. Barrientos, E. S. Battistelli, J. R.Bond, B. Brown, B. Burger, J. Chervenak, S. Das, M. J.Devlin, S. Dicker, W. B. Doriese, J. Dunkley, R. Dunner,T. Essinger-Hileman, R. P. Fisher, J. W. Fowler, A. Hajian,M. Halpern, M. Hasselfield, C. Hernandez-Monteagudo, G. C.Hilton, M. Hilton, R. Hlozek, K. Huffenberger, D. Hughes, J. P.Hughes, L. Infante, K. D. Irwin, R. Jimenez, J. B. Juin, M. Kaul,J. Klein, A. Kosowsky, J. M. Lau, M. Limon, Y. -. Lin, R. H.Lupton, T. Marriage, D. Marsden, K. Martocci, P. Mauskopf,F. Menanteau, K. Moodley, H. Moseley, C. B. Netterfield, M. D.Niemack, M. R. Nolta, L. A. Page, L. Parker, B. Partridge,H. Quintana, B. Reid, N. Sehgal, J. Sievers, D. N. Spergel,S. T. Staggs, O. Stryzak, D. Swetz, E. Switzer, R. Thornton,H. Trac, C. Tucker, L. Verde, R. Warne, G. Wilson, E. Wollack,and Y. Zhao. The Atacama Cosmology Telescope (ACT): BeamProfiles and First SZ Cluster Maps. arXiv:0907:0461, July 2009.
A. D. Hincks, P. A. R. Ade, C. Allen, M. Amiri, J. W. Appel,E. S. Battistelli, B. Burger, J. A. Chervenak, A. J. Dahlen,S. Denny, M. J. Devlin, S. R. Dicker, W. B. Doriese, R. Dunner,T. Essinger-Hileman, R. P. Fisher, J. W. Fowler, M. Halpern,P. C. Hargrave, M. Hasselfield, G. C. Hilton, K. D. Irwin,N. Jarosik, M. Kaul, J. Klein, J. M. Lau, M. Limon, R. H.Lupton, T. A. Marriage, K. L. Martocci, P. Mauskopf, S. H.Moseley, C. B. Netterfield, M. D. Niemack, M. R. Nolta, L. Page,L. P. Parker, A. J. Sederberg, S. T. Staggs, O. R. Stryzak,D. S. Swetz, E. R. Switzer, R. J. Thornton, C. Tucker, E. J.Wollack, and Y. Zhao. The effects of the mechanical performanceand alignment of the Atacama Cosmology Telescope on thesensitivity of microwave observations. In William D. Duncan,Wayne S. Holland, Stafford Withington, and Jonas Zmuidzinas,editors, Proc. SPIE, volume 7020, page 70201P. SPIE, 2008.
Adam D. Hincks. Towards a Mass-Limited Catalog of GalaxyClusters from the Atacama Cosmology Telescope. PhD thesis,Princeton University, 2009.
E. Komatsu, J. Dunkley, M. R. Nolta, C. L. Bennett, B. Gold,G. Hinshaw, N. Jarosik, D. Larson, M. Limon, L. Page, D. N.Spergel, M. Halpern, R. S. Hill, A. Kogut, S. S. Meyer,G. S. Tucker, J. L. Weiland, E. Wollack, and E. L. Wright.Five-Year Wilkinson Microwave Anisotropy Probe (WMAP)Observations: Cosmological Interpretation. ApJS, 180:330–376,February 2009.
J.W. Lamb. Miscellaneous data on materials for millimetre andsubmillimetre optics. International Journal of Infrared andMillimeter Waves, 17(12):1997–2034, 1996.
J. Lau, J. Fowler, T. Marriage, L. Page, J. Leong, E. Wishnow,R. Henry, E. Wollack, M. Halpern, D. Marsden, and G. Marsden.Millimeter-wave antireflection coating for cryogenic siliconlenses. Appl. Opt., 45:3746–3751, June 2006.
Judy M. Lau. CCAM: A Novel Millimeter-Wave InstrumentUsing A Close-Packed TES Bolometer Array. PhD thesis,Princeton University, 2008.
Mary J. Li, Christine A. Allen, Scott A. Gordon, Jonathan L.Kuhn, David B. Mott, Caroline K. Stahle, and Liqin L. Wang.Fabrication of pop-up detector arrays on si wafers. volume 3874,pages 422–431. SPIE, 1999.
T. A. Marriage, J. A. Chervenak, and W. B. Doriese. Testing andassembly of the detectors for the Millimeter Bolometric ArrayCamera on ACT. Nuc Inst & Meth. in Phys Res A, 559:551–553, 2006.
A. Miller, J. Beach, S. Bradley, R. Caldwell, H. Chapman, M. J.Devlin, W. B. Dorwart, T. Herbig, D. Jones, G. Monnelly, C. B.Netterfield, M. Nolta, L. A. Page, J. Puchalla, T. Robertson,E. Torbet, H. T. Tran, and W. E. Vinje. The QMAP andMAT/TOCO Experiments for Measuring Anisotropy in theCosmic Microwave Background. ApJS, 140:115–141, June 2002.
M. D. Niemack, Y. Zhao, E. Wollack, R. Thornton, E. R. Switzer,D. S. Swetz, S. T. Staggs, L. Page, O. Stryzak, H. Moseley, T. A.Marriage, M. Limon, J. M. Lau, J. Klein, M. Kaul, N. Jarosik,K. D. Irwin, A. D. Hincks, G. C. Hilton, M. Halpern, J. W.Fowler, R. P. Fisher, R. Dunner, W. B. Doriese, S. R. Dicker,M. J. Devlin, J. Chervenak, B. Burger, E. S. Battistelli, J. Appel,M. Amiri, C. Allen, and A. M. Aboobaker. A kilopixel array ofTES bolometers for ACT: Development, testing, and first light.J. Low Temp. Phys., 151(3-4):690–696, 2008.
Michael D. Niemack. Towards Dark Energy: Design, Development,and Preliminary Data from ACT. PhD thesis, PrincetonUniversity, 2008.
L. Page, C. Jackson, C. Barnes, C. Bennett, M. Halpern,G. Hinshaw, N. Jarosik, A. Kogut, M. Limon, S. S. Meyer,D. N. Spergel, G. S. Tucker, D. T. Wilkinson, E. Wollack, andE. L. Wright. The Optical Design and Characterization of theMicrowave Anisotropy Probe. ApJ, 585:566–586, March 2003.
J. R. Pardo, J. Cernicharo, and E. Serabyn. Atmospherictransmission at microwaves (ATM): an improved model formillimeter/submillimeter applications. IEEE Transactions onAntennas and Propagation, 49:1683–1694, December 2001.
J. Ruze. Antenna tolerance theory – a review. Proc. IEEE, 54:633–640, 1966.
J. L. Sievers, B. S. Mason, L. Weintraub, C. Achermann,P. Altamirano, J. R. Bond, L. Bronfman, R. Bustos, C. Contaldi,C. Dickinson, M. E. Jones, J. May, S. T. Myers, N. Oyarce,S. Padin, T. J. Pearson, M. Pospieszalski, A. C. S. Readhead,R. Reeves, M. C. Shepherd, A. C. Taylor, and S. Torres.Cosmological Results from Five Years of 30 GHz CMBIntensity Measurements with the Cosmic Background Imager.arXiv:0901.4540, January 2009.
D. S. Swetz, P. A. R. Ade, C. Allen, M. Amiri, J. W. Appel, E. S.Battistelli, B. Burger, J. A. Chervenak, A. J. Dahlen, S. Das,S. Denny, M. J. Devlin, S. R. Dicker, W. B. Doriese, R. Dunner,T. Essinger-Hileman, R. P. Fisher, J. W. Fowler, X. Gao,A. Hajian, M. Halpern, P. C. Hargrave, M. Hasselfield, G. C.Hilton, A. D. Hincks, K. D. Irwin, N. Jarosik, M. Kaul, J. Klein,S. Knotek, J. M. Lau, M. Limon, R. H. Lupton, T. A. Marriage,K. L. Martocci, P. Mauskopf, S. H. Moseley, C. B. Netterfield,M. D. Niemack, M. R. Nolta, L. Page, L. P. Parker, B. A.Reid, C. D. Reintsema, A. J. Sederberg, N. Sehgal, J. L. Sievers,D. N. Spergel, S. T. Staggs, O. R. Stryzak, E. R. Switzer, R. J.Thornton, C. Tucker, E. J. Wollack, and Y. Zhao. Instrumentdesign and characterization of the Millimeter Bolometer ArrayCamera on the Atacama Cosmology Telescope. In William D.Duncan, Wayne S. Holland, Stafford Withington, and JonasZmuidzinas, editors, Proc. SPIE, volume 7020, page 702008.SPIE, 2008.
Daniel S. Swetz. The Atacama Cosmology Telescope. PhD thesis,The University of Pennsylvania, 2009.
E. R. Switzer, C. Allen, M. Amiri, J. W. Appel, E. S. Battistelli,B. Burger, J. A. Chervenak, A. J. Dahlen, S. Das, M. J. Devlin,S. R. Dicker, W. B. Doriese, R. Dunner, T. Essinger-Hileman,X. Gao, M. Halpern, M. Hasselfield, G. C. Hilton, A. D. Hincks,K. D. Irwin, S. Knotek, R. P. Fisher, J. W. Fowler, N. Jarosik,M. Kaul, J. Klein, J. M. Lau, M. Limon, R. H. Lupton, T. A.Marriage, K. L. Martocci, S. H. Moseley, C. B. Netterfield, M. D.Niemack, M. R. Nolta, L. Page, L. P. Parker, B. A. Reid, C. D.Reintsema, A. J. Sederberg, J. L. Sievers, D. N. Spergel, S. T.Staggs, O. R. Stryzak, D. S. Swetz, R. J. Thornton, E. J. Wollack,and Y. Zhao. Systems and control software for the atacamacosmology telescope. In Alan Bridger and Nicole M. Radziwill,editors, Proc. SPIE, volume 7019, page 70192L. SPIE, 2008.
M. Tegmark. CMB mapping experiments: a designer’s guide.Physical Review D, 56(8):4514 – 29, 1997.
R. J. Thornton, P. A. R. Ade, C. Allen, M. Amiri, J. W. Appel,E. S. Battistelli, B. Burger, J. A. Chervenak, M. J. Devlin,S. R. Dicker, W. B. Doriese, T. Essinger-Hileman, R. P. Fisher,J. W. Fowler, M. Halpern, P. C. Hargrave, M. Hasselfield,G. C. Hilton, A. D. Hincks, K. D. Irwin, N. Jarosik, M. Kaul,J. Klein, J. M. Lau, M. Limon, T. A. Marriage, K. L. Martocci,P. Mauskopf, S. H. Moseley, M. D. Niemack, L. Page, L. P.Parker, J. Reidel, C. D. Reintsema, S. T. Staggs, O. R. Stryzak,D. S. Swetz, E. R. Switzer, C. Tucker, E. J. Wollack, and Y. Zhao.Opto-mechanical design and performance of a compact three-frequency camera for the millimeter bolometer array cameraon the atacama cosmology telescope. In William D. Duncan,Wayne S. Holland, Stafford Withington, and Jonas Zmuidzinas,editors, Proc. SPIE, volume 7020, page 70201R. SPIE, 2008.
C. E. Tucker and P. A. R. Ade. Thermal filtering for large aperturecryogenic detector arrays. In Jonas Zmuidzinas, Wayne S.Holland, Stafford Withington, and William D. Duncan, editors,Proc. SPIE, volume 6275, page 62750U, July 2006.
D. Woody, D. MacDonald, M. Bradford, R. Chamberlin,M. Dragovan, P. Goldsmith, J. Lamb, S. Radford, andJ. Zmuidzinas. Panel options for large precision radio telescopes.In Society of Photo-Optical Instrumentation Engineers (SPIE)Conference Series, volume 7018 of Society of Photo-OpticalInstrumentation Engineers (SPIE) Conference Series, July2008.

16 D. Swetz et al.
E. L. Wright. Scanning and Mapping Strategies for CMBExperiments. ArXiv Astrophysics e-prints, November 1996.
Y. Zhao, C. Allen, M. Amiri, J. W. Appel, E. S. Battistelli,B. Burger, J. A. Chervenak, A. Dahlen, S. Denny, M. J. Devlin,S. R. Dicker, W. B. Doriese, R. Dunner, T. Essinger-Hileman,R. P. Fisher, J. W. Fowler, M. Halpern, G. C. Hilton, A. D.Hincks, K. D. Irwin, N. Jarosik, J. Klein, J. M. Lau, T. A.Marriage, K. Martocci, H. Moseley, M. D. Niemack, L. Page,L. P. Parker, A. Sederberg, S. T. Staggs, O. R. Stryzak,D. S.Swetz, E. R. Switzer, R. J. Thornton, and E. J. Wollack.Characterization of transition edge sensors for the millimeterbolometer array camera on the atacama cosmology telescope.In William D. Duncan, Wayne S. Holland, Stafford Withington,and Jonas Zmuidzinas, editors, Proc. SPIE, volume 7020, page70200O. SPIE, 2008.


