Embed Size (px)
Citation preview
Vol. 46, No.6November - December 2003
Physical Sciences. Pages 395-438Biological Sciences. Pages 439-472
Technology. Pages 473-477
ISSN 0030-9885 Coden: PSIRAA 46(6) 395-477 (2003)
Published bimonthly byScientific Information Centre
PAKISTAN COUNCIL OF SCIENTIFIC AND INDUSTRIAL RESEARCHKarachi
PAKISTAN JOURNALOF SCIENTIFIC AND
INDUSTRIAL RESEARCH
PAKISTAN JOURNAL OF SCIENTIFIC AND INDUSTRIAL RESEARCH
DR. ANWAR-UL-IIAQ
Chief E d i t o r
* DR. KHURSHID ZAMAN Executive Edi tor
Editorial Board
Dr:H. Akhtar Agriculttlre and Agri-Food Canada, Ontario, Canada
Prof. M. Akhtar, FRS University of Southampton, Southampton, United Kingdom
Dr. A. G. Attkins University of Reading, Reading, United Kingdom
Prof. G. Bouet Universitv of Angers, Angers, France
Dr. M. A. Khan King Abdtllaziz City for Science & Technology, Riyadh, Kingdom of Saudi Arabia
Prof. W. Linert Vienna University of Technology, Kenna, A uttria
Prof. B. Hiralal Mehta Universitv of Mu~nbai, Mumbai, India
Prof. E. Miraldi University of Siena, Siena, Italy
Dr. S. Narine University of Alberta, Edmonton,Canada
Dr. J. R. Ogren Editol; Journal of Materials Engineering and Performance, Los Angeles, USA
Prof. H. M. Ortner Technical University of Darmstadt, Darmstadt, Germany
Dr. M. J. Qureshi Ntlclear Institute for Food & Agriculttlre, Peshawal: Pakistan
Dr. Zafar Saied Saify University of Karachi, Karachi, Pakistan
Dr. F. M. Slater Cardiff University, Powys, United Kingdom
Prof. M. A. Waqar Sindh Institute of Urology & Transplantation (SIUT), Karachi, Pakistan
Dr. S. I. Zafar PCSIR Laboratories Complex, Lahore, Pakistan
Field Editors
Ghulam Qadir Shaikh Gulzar Hussain Jhatial
Shagufta Y. lqbal Shahida Begum
, Production Composing
Riazuddin Ahmed lrshad Hussain
Editorial Address
Executive Editor, Pakistan Journal o f ScientiJic and Industrial Research, PCSIR ScientiJic Information
Centre, PCSIR Laboratories. Campus, Karachi-75280, Pakistan. '
'I
Tel: 92 - 021 - 8151739,8151741 -43,Fax: 92 - 021 - 8151738, ~ r n a i l : [email protected] [email protected]
PAKISTAN JOURNAL OF SCIENTIFIC AND INDUSTRIAL RESEARCH
Vol.46, No.6 CONTENTS November - December 2003
ACKNOWLEDGEMENT i
PHYSICAL SCIENCES
Heavy metal ions concentration in wheat plant (Triticum aestivum L .) irrigated with city effluentS.Farid (Pakistan) 395
Environmental impact assesment of air pollution in different areas of KarachiD.R.Hashmi and M.I.Q.Khani (Pakistan) 399
Synthesis of hetero-bicyclic compounds Part - X. Formation of 2H, 4H, 5H 2, 2 - diphenyl - 4, 5 - dioxopyrido[4, 3 - d] 1, 3 dioxinA.Salam and A.Akhtar (Pakistan) 406
Ternary liquid equilibria of ethanol - water - oleyl alcohol and ethanol - water - oleic acid systemsM.S.Rahman, M.A.Rahman and M.N.Nabi (Bangladesh) 409
Electrocapillary and flotation studies using potassium ethylxanthate, dithiophosphate collectors and their mixtureM.Riaz, F.Khan, Mumtaz, N. Jan and N.Pirzada (Pakistan) 414
The distribution of Mn, Zn, Cu, Cr, Ni, and Pb around two major refuse dumpsites in Benin city, NigeriaE.E.Ukpebor, P.O.Oviasogie and C.A.Unuigbe (Nigeria) 418
Simulation of chloride transport based descriptive soil structureM.M.-ul-Hassan, M.S.Akhtar, S.M.Gill and G.Nabi (Pakistan) 424
Studies of the polynuclear complexes of labile ligands of vitamin B1 and Zn (II), Cd (II) and Hg (II) with Fe (III)J.O.Ojo (Nigeria) 432
SHORT COMMUNICATIONS
Synthesis of 3 - methoxy - 4'- prenyloxy - furano (2", 3":7, 8) flavoneM.A.Hossain and S.M.Salehuddin (Bangladesh) 436
BIOLOGICAL SCIENCES
Variation of heavy metal concentrations in water and freshwater fish in Niger delta waters - A case study ofBenin RiverM.O.James and P.O.Okolo (Nigeria) 439
Stability of rust resistance and yield potential of some Icarda bread wheat lines in PakistanS.J.A.Shah, A.J.Khan, F. Azam, J.I.Mirza and A. ur Rehman (Pakistan) 443
Leaf phenolics of different varieties of tropical rapeseed at various growing stagesM.A.Chaudry, N.Bibi, A.Badshah, M.Khan and Z.Ali (Pakistan) 447
Levels of cadmium, chromium and lead in dumpsites soil, earthworm (Lybrodrilus violaceous), housefly (Muscadomestica) and dragonfly (Libellula luctosa)A.A.Adeniyi, A.B.Idowu and O.O.Okedeyi (Nigeria) 452
Available and unavailable carbohydrate content of black gram (Vigna mungo) and chick - pea (Cicer arietinum) asaffected by soaking and cooking processesZ.-ur-Rehman, M.Rashid and A.M.Salariya (Pakistan) 457
Observations on Rafiqius bodenheimeri (Steiner 1936) Khan and Hussain 1998 and Discolaimus lahorensis Khan,1998 from Karachi, SindhH.A.Khan and S.A.Khan (Pakistan) 462
Microbial production of xylitol from acid treated corn cobsR. F.Allam (Egypt) 465
SHORT COMMUNICATION
Antibacterial activity of Euphorbia heterophylla Linn (Family - Euphorbiaceae)Falodun A., E.O.P.Agbakwuru and G.C.Ukoh (Nigeria) 471
TECHNOLOGY
Wrench analysis for 3 - D model used in robotic end - effectorZ.A.Soomro (Pakistan) 473
Contents of Volume 46 ii
Author Index xi
Subject Index xiv
Printed: December 2003
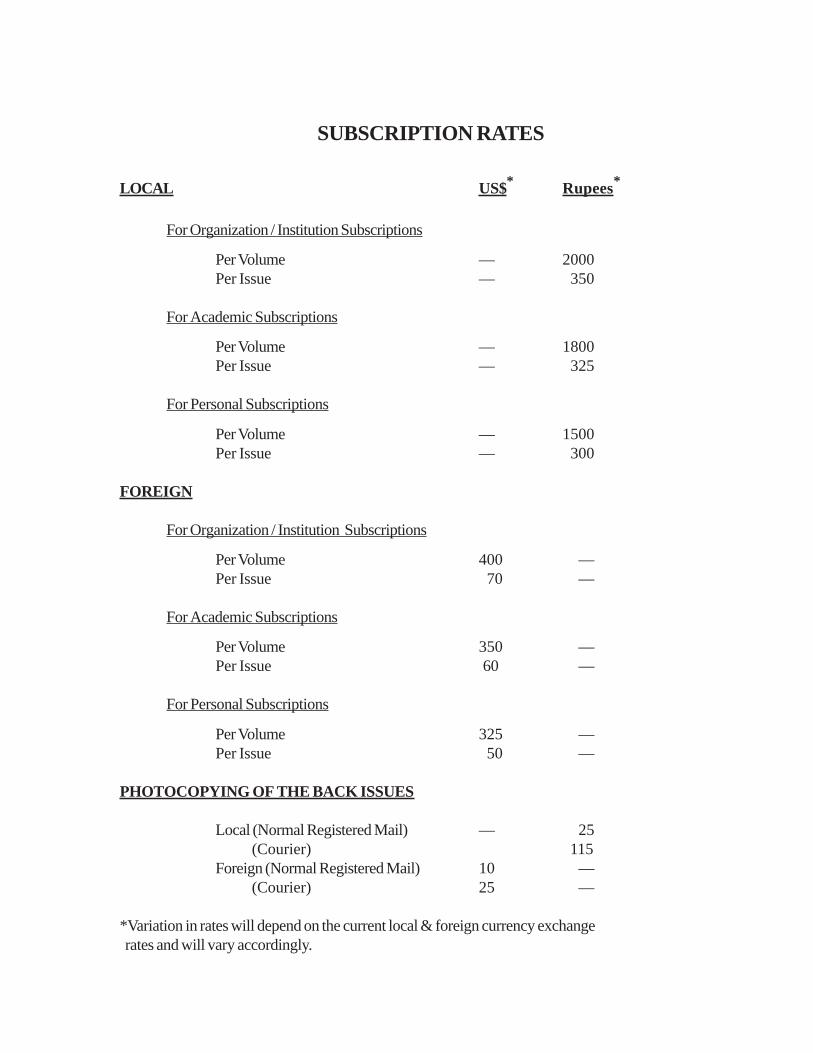
SUBSCRIPTION RATES
LOCAL US$* Rupees*
For Organization / Institution Subscriptions
Per Volume — 2000Per Issue — 350
For Academic Subscriptions
Per Volume — 1800Per Issue — 325
For Personal Subscriptions
Per Volume — 1500Per Issue — 300
FOREIGN
For Organization / Institution Subscriptions
Per Volume 400 —Per Issue 70 —
For Academic Subscriptions
Per Volume 350 —Per Issue 60 —
For Personal Subscriptions
Per Volume 325 —Per Issue 50 —
PHOTOCOPYING OF THE BACK ISSUES
Local (Normal Registered Mail) — 25 (Courier) 115Foreign (Normal Registered Mail) 10 — (Courier) 25 —
*Variation in rates will depend on the current local & foreign currency exchange rates and will vary accordingly.
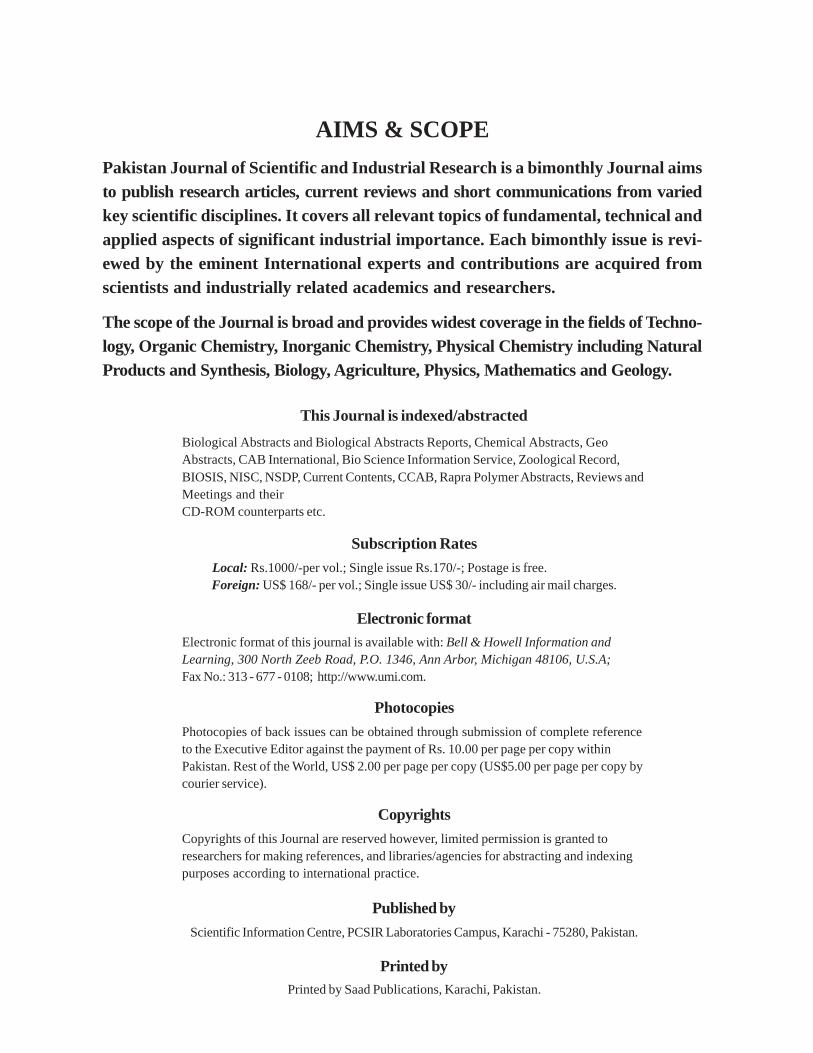
AIMS & SCOPEPakistan Journal of Scientific and Industrial Research is a bimonthly Journal aimsto publish research articles, current reviews and short communications from variedkey scientific disciplines. It covers all relevant topics of fundamental, technical andapplied aspects of significant industrial importance. Each bimonthly issue is revi-ewed by the eminent International experts and contributions are acquired fromscientists and industrially related academics and researchers.
The scope of the Journal is broad and provides widest coverage in the fields of Techno-logy, Organic Chemistry, Inorganic Chemistry, Physical Chemistry including NaturalProducts and Synthesis, Biology, Agriculture, Physics, Mathematics and Geology.
This Journal is indexed/abstractedBiological Abstracts and Biological Abstracts Reports, Chemical Abstracts, GeoAbstracts, CAB International, Bio Science Information Service, Zoological Record,BIOSIS, NISC, NSDP, Current Contents, CCAB, Rapra Polymer Abstracts, Reviews andMeetings and theirCD-ROM counterparts etc.
Subscription Rates Local: Rs.1000/-per vol.; Single issue Rs.170/-; Postage is free.
Foreign: US$ 168/- per vol.; Single issue US$ 30/- including air mail charges.
Electronic formatElectronic format of this journal is available with: Bell & Howell Information andLearning, 300 North Zeeb Road, P.O. 1346, Ann Arbor, Michigan 48106, U.S.A;Fax No.: 313 - 677 - 0108; http://www.umi.com.
PhotocopiesPhotocopies of back issues can be obtained through submission of complete referenceto the Executive Editor against the payment of Rs. 10.00 per page per copy withinPakistan. Rest of the World, US$ 2.00 per page per copy (US$5.00 per page per copy bycourier service).
CopyrightsCopyrights of this Journal are reserved however, limited permission is granted toresearchers for making references, and libraries/agencies for abstracting and indexingpurposes according to international practice.
Published byScientific Information Centre, PCSIR Laboratories Campus, Karachi - 75280, Pakistan.
Printed byPrinted by Saad Publications, Karachi, Pakistan.
Pak. J. Sci. Ind. Res. 2003 46(6)
Afroz, H. ...................................................... PakistanAkhtar, H. ......................................................CanadaAli, M. .................................................... BangladeshAngers, D. ......................................................CanadaAngus, R. ...........................................................USAClarke, J. M. ...................................................CanadaDenysenko, S. ....................................................USAEl-Marhomy, A. A. .......................................... EgyptGilani, A.-ul-H. ............................................ PakistanHaque, I. ul ............................................. BangladeshHossain, I. .................................................... PakistanIrfanullah ..................................................... PakistanJabbar, A. ..................................................... PakistanJafri, S. I. H. ................................................. PakistanKhalil, M. I. ............................................ BangladeshKhan, M. A. ................................................. PakistanLaakso, J. ...................................................... FinlandMilburn, P. H. ................................................CanadaMinhas, N. M. .............................................. PakistanMujib, B. ...................................................... PakistanNarine, S. .......................................................CanadaNasreen, Z. ................................................... PakistanQazi, I. ......................................................... PakistanQureshi, J. .................................................... PakistanRahim, T. ..................................................... PakistanRathod, S. ......................................................... IndiaSamed, A. K. M. A .......................................... EgyptSarfaraz, B. .................................................. PakistanShahzad, S. .................................................. PakistanSharkovsky, V. ............................................... RussiaSmith, F. ..................................................... AustraliaYasmin, A. ................................................... Pakistan
ACKNOWLEDGEMENT
Scientific Information Centre, Pakistan Council of Scientific and Industrial Research, Karachi,Pakistan extend utmost gratitude to the following eminent Scientists/Subject experts for their thoroughreview and valuable feedback for the articles appearing in November - December 2003 issue of PakistanJournal of Scientific and Industrial Research.
EXECUTIVE EDITOR
i
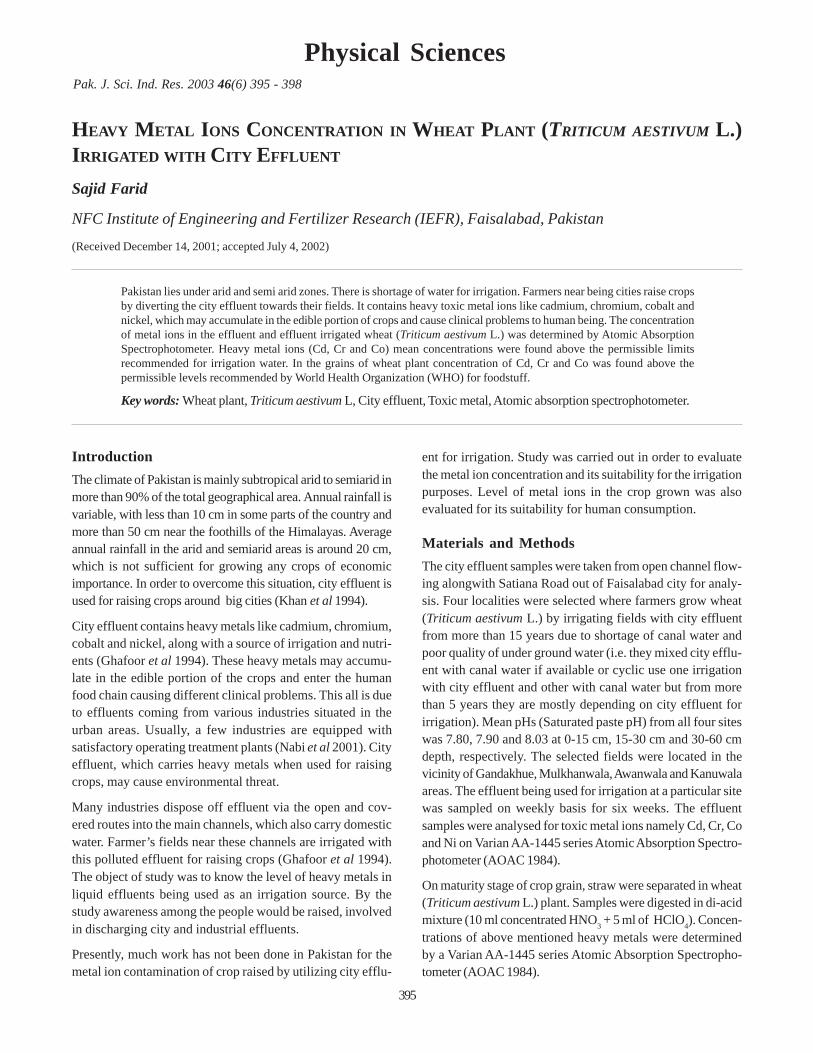
Pak. J. Sci. Ind. Res. 2003 46(6) 395 - 398
HEAVY METAL IONS CONCENTRATION IN WHEAT PLANT (TRITICUM AESTIVUM L.)IRRIGATED WITH CITY EFFLUENT
Sajid Farid
NFC Institute of Engineering and Fertilizer Research (IEFR), Faisalabad, Pakistan
(Received December 14, 2001; accepted July 4, 2002)
Pakistan lies under arid and semi arid zones. There is shortage of water for irrigation. Farmers near being cities raise cropsby diverting the city effluent towards their fields. It contains heavy toxic metal ions like cadmium, chromium, cobalt andnickel, which may accumulate in the edible portion of crops and cause clinical problems to human being. The concentrationof metal ions in the effluent and effluent irrigated wheat (Triticum aestivum L.) was determined by Atomic AbsorptionSpectrophotometer. Heavy metal ions (Cd, Cr and Co) mean concentrations were found above the permissible limitsrecommended for irrigation water. In the grains of wheat plant concentration of Cd, Cr and Co was found above thepermissible levels recommended by World Health Organization (WHO) for foodstuff.
Key words: Wheat plant, Triticum aestivum L, City effluent, Toxic metal, Atomic absorption spectrophotometer.
IntroductionThe climate of Pakistan is mainly subtropical arid to semiarid inmore than 90% of the total geographical area. Annual rainfall isvariable, with less than 10 cm in some parts of the country andmore than 50 cm near the foothills of the Himalayas. Averageannual rainfall in the arid and semiarid areas is around 20 cm,which is not sufficient for growing any crops of economicimportance. In order to overcome this situation, city effluent isused for raising crops around big cities (Khan et al 1994).
City effluent contains heavy metals like cadmium, chromium,cobalt and nickel, along with a source of irrigation and nutri-ents (Ghafoor et al 1994). These heavy metals may accumu-late in the edible portion of the crops and enter the humanfood chain causing different clinical problems. This all is dueto effluents coming from various industries situated in theurban areas. Usually, a few industries are equipped withsatisfactory operating treatment plants (Nabi et al 2001). Cityeffluent, which carries heavy metals when used for raisingcrops, may cause environmental threat.
Many industries dispose off effluent via the open and cov-ered routes into the main channels, which also carry domesticwater. Farmer’s fields near these channels are irrigated withthis polluted effluent for raising crops (Ghafoor et al 1994).The object of study was to know the level of heavy metals inliquid effluents being used as an irrigation source. By thestudy awareness among the people would be raised, involvedin discharging city and industrial effluents.
Presently, much work has not been done in Pakistan for themetal ion contamination of crop raised by utilizing city efflu-
ent for irrigation. Study was carried out in order to evaluatethe metal ion concentration and its suitability for the irrigationpurposes. Level of metal ions in the crop grown was alsoevaluated for its suitability for human consumption.
Materials and MethodsThe city effluent samples were taken from open channel flow-ing alongwith Satiana Road out of Faisalabad city for analy-sis. Four localities were selected where farmers grow wheat(Triticum aestivum L.) by irrigating fields with city effluentfrom more than 15 years due to shortage of canal water andpoor quality of under ground water (i.e. they mixed city efflu-ent with canal water if available or cyclic use one irrigationwith city effluent and other with canal water but from morethan 5 years they are mostly depending on city effluent forirrigation). Mean pHs (Saturated paste pH) from all four siteswas 7.80, 7.90 and 8.03 at 0-15 cm, 15-30 cm and 30-60 cmdepth, respectively. The selected fields were located in thevicinity of Gandakhue, Mulkhanwala, Awanwala and Kanuwalaareas. The effluent being used for irrigation at a particular sitewas sampled on weekly basis for six weeks. The effluentsamples were analysed for toxic metal ions namely Cd, Cr, Coand Ni on Varian AA-1445 series Atomic Absorption Spectro-photometer (AOAC 1984).
On maturity stage of crop grain, straw were separated in wheat(Triticum aestivum L.) plant. Samples were digested in di-acidmixture (10 ml concentrated HNO3 + 5 ml of HClO4). Concen-trations of above mentioned heavy metals were determinedby a Varian AA-1445 series Atomic Absorption Spectropho-tometer (AOAC 1984).
Physical Sciences
395
Results and DiscussionCadmium. Major sources of Cd in effluents are industriesrelated to electroplating, pigments for plastics and paints, plas-tic stabilizer and batteries (Brady 1996).
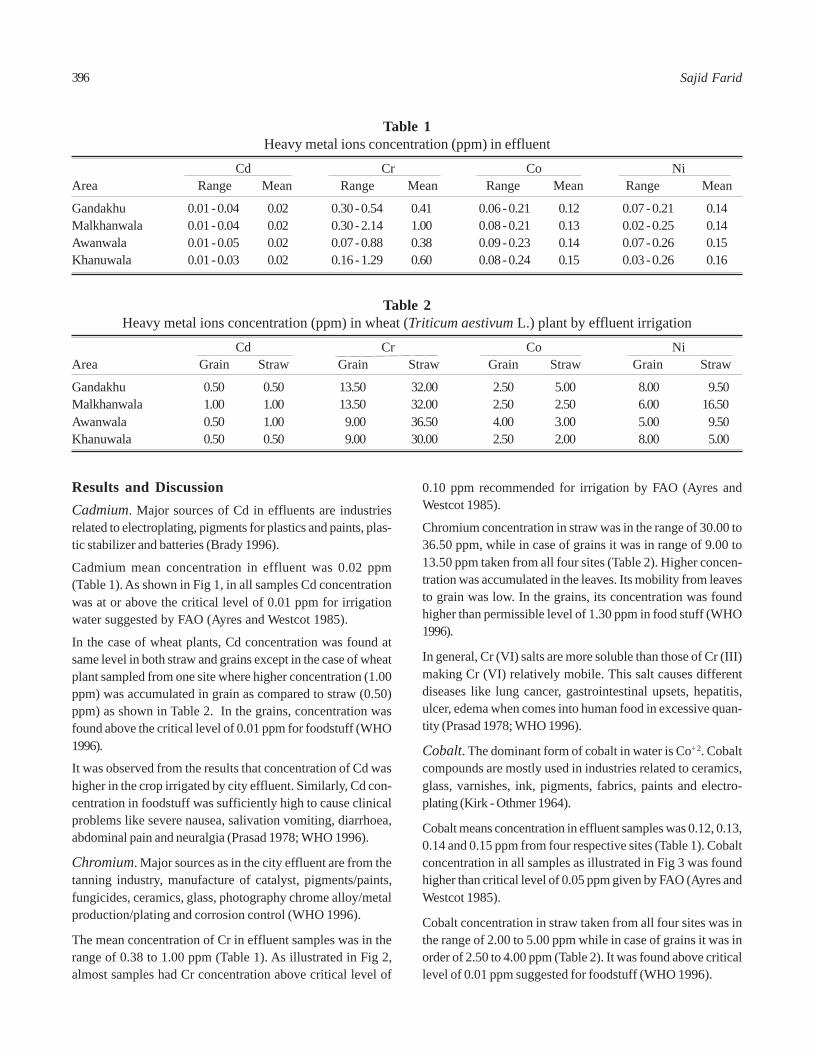
Cadmium mean concentration in effluent was 0.02 ppm(Table 1). As shown in Fig 1, in all samples Cd concentrationwas at or above the critical level of 0.01 ppm for irrigationwater suggested by FAO (Ayres and Westcot 1985).
In the case of wheat plants, Cd concentration was found atsame level in both straw and grains except in the case of wheatplant sampled from one site where higher concentration (1.00ppm) was accumulated in grain as compared to straw (0.50)ppm) as shown in Table 2. In the grains, concentration wasfound above the critical level of 0.01 ppm for foodstuff (WHO1996).
It was observed from the results that concentration of Cd washigher in the crop irrigated by city effluent. Similarly, Cd con-centration in foodstuff was sufficiently high to cause clinicalproblems like severe nausea, salivation vomiting, diarrhoea,abdominal pain and neuralgia (Prasad 1978; WHO 1996).
Chromium. Major sources as in the city effluent are from thetanning industry, manufacture of catalyst, pigments/paints,fungicides, ceramics, glass, photography chrome alloy/metalproduction/plating and corrosion control (WHO 1996).
The mean concentration of Cr in effluent samples was in therange of 0.38 to 1.00 ppm (Table 1). As illustrated in Fig 2,almost samples had Cr concentration above critical level of
0.10 ppm recommended for irrigation by FAO (Ayres andWestcot 1985).
Chromium concentration in straw was in the range of 30.00 to36.50 ppm, while in case of grains it was in range of 9.00 to13.50 ppm taken from all four sites (Table 2). Higher concen-tration was accumulated in the leaves. Its mobility from leavesto grain was low. In the grains, its concentration was foundhigher than permissible level of 1.30 ppm in food stuff (WHO1996).
In general, Cr (VI) salts are more soluble than those of Cr (III)making Cr (VI) relatively mobile. This salt causes differentdiseases like lung cancer, gastrointestinal upsets, hepatitis,ulcer, edema when comes into human food in excessive quan-tity (Prasad 1978; WHO 1996).
Cobalt. The dominant form of cobalt in water is Co+ 2. Cobaltcompounds are mostly used in industries related to ceramics,glass, varnishes, ink, pigments, fabrics, paints and electro-plating (Kirk - Othmer 1964).
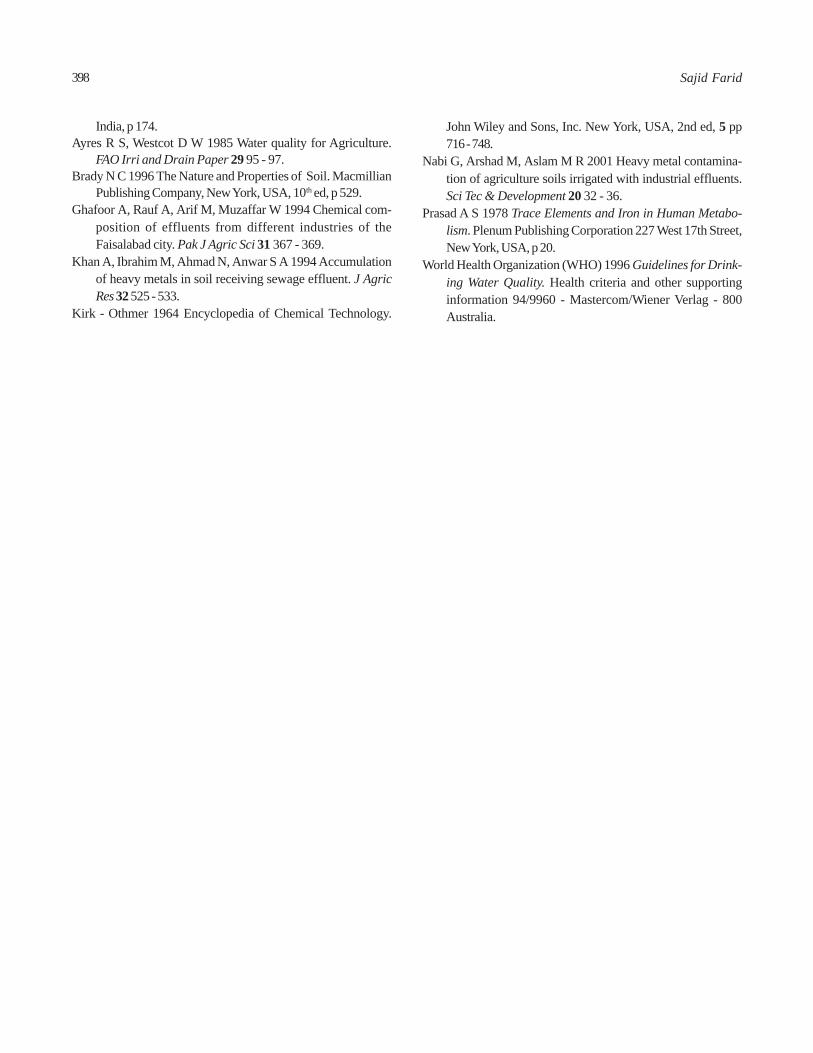
Cobalt means concentration in effluent samples was 0.12, 0.13,0.14 and 0.15 ppm from four respective sites (Table 1). Cobaltconcentration in all samples as illustrated in Fig 3 was foundhigher than critical level of 0.05 ppm given by FAO (Ayres andWestcot 1985).
Cobalt concentration in straw taken from all four sites was inthe range of 2.00 to 5.00 ppm while in case of grains it was inorder of 2.50 to 4.00 ppm (Table 2). It was found above criticallevel of 0.01 ppm suggested for foodstuff (WHO 1996).
Table 1Heavy metal ions concentration (ppm) in effluent
Cd Cr Co NiArea Range Mean Range Mean Range Mean Range Mean
Gandakhu 0.01 - 0.04 0.02 0.30 - 0.54 0.41 0.06 - 0.21 0.12 0.07 - 0.21 0.14Malkhanwala 0.01 - 0.04 0.02 0.30 - 2.14 1.00 0.08 - 0.21 0.13 0.02 - 0.25 0.14Awanwala 0.01 - 0.05 0.02 0.07 - 0.88 0.38 0.09 - 0.23 0.14 0.07 - 0.26 0.15Khanuwala 0.01 - 0.03 0.02 0.16 - 1.29 0.60 0.08 - 0.24 0.15 0.03 - 0.26 0.16
Table 2Heavy metal ions concentration (ppm) in wheat (Triticum aestivum L.) plant by effluent irrigation
Cd Cr Co NiArea Grain Straw Grain Straw Grain Straw Grain Straw
Gandakhu 0.50 0.50 13.50 32.00 2.50 5.00 8.00 9.50Malkhanwala 1.00 1.00 13.50 32.00 2.50 2.50 6.00 16.50Awanwala 0.50 1.00 9.00 36.50 4.00 3.00 5.00 9.50Khanuwala 0.50 0.50 9.00 30.00 2.50 2.00 8.00 5.00
396 Sajid Farid
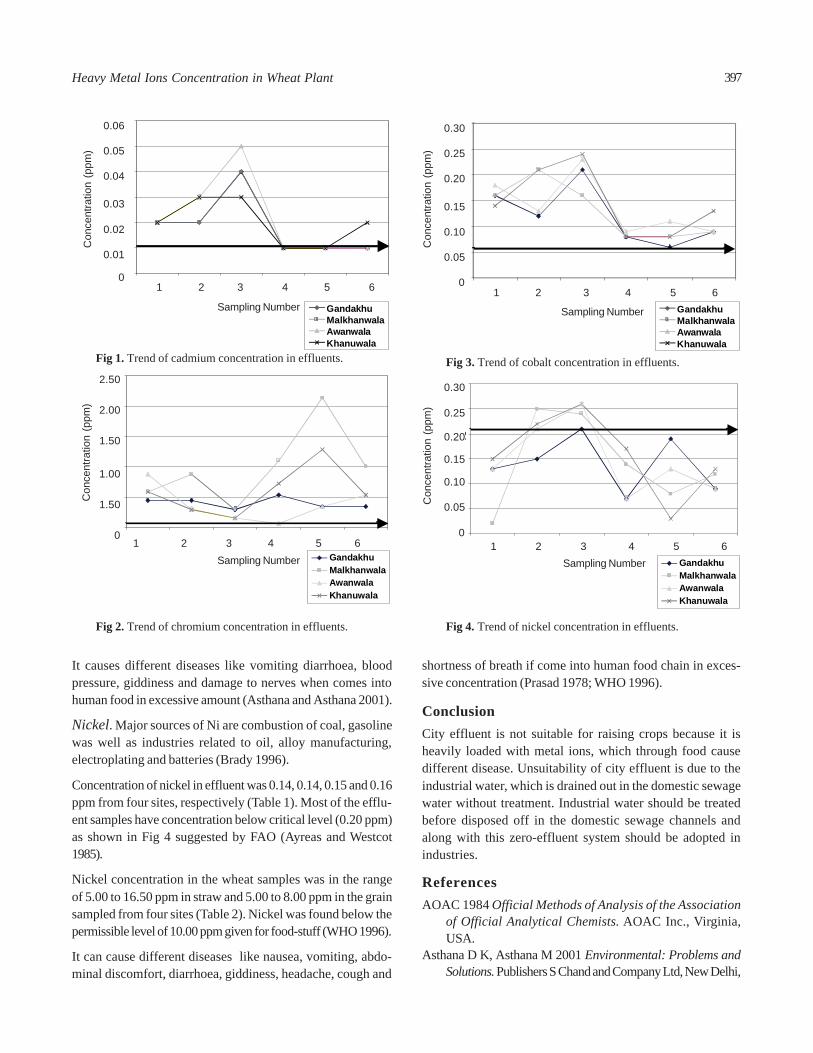
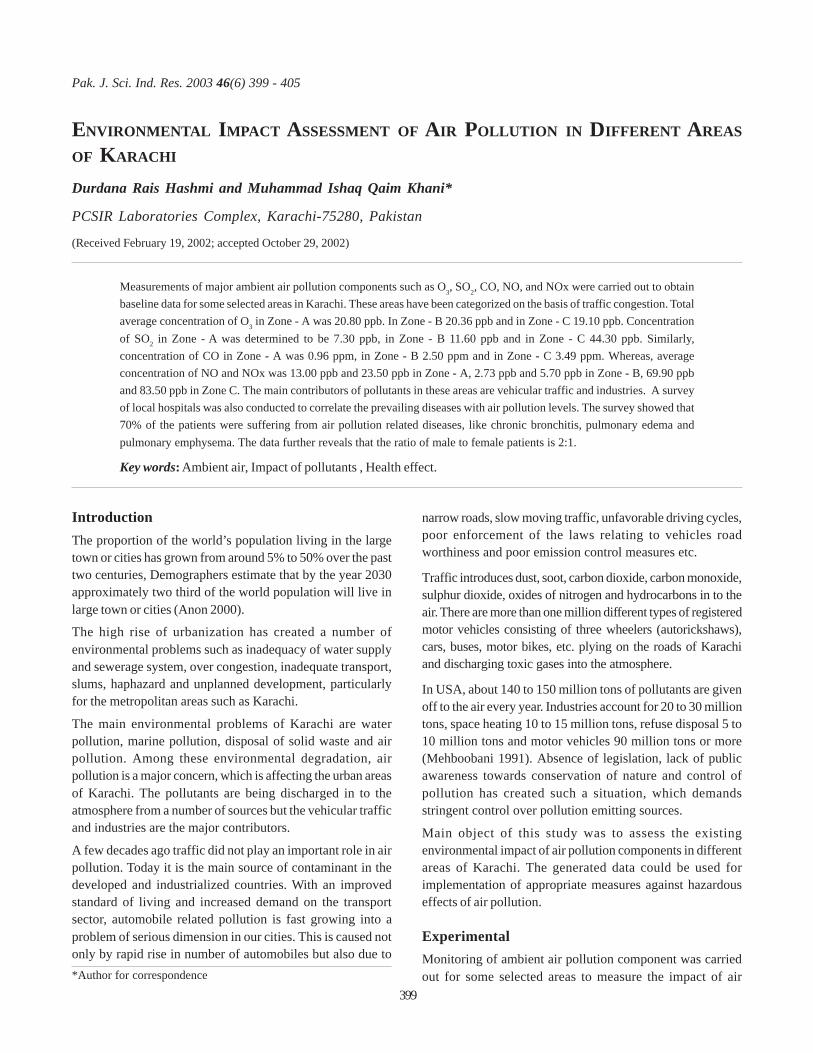
Fig 4. Trend of nickel concentration in effluents.Fig 2. Trend of chromium concentration in effluents.
It causes different diseases like vomiting diarrhoea, bloodpressure, giddiness and damage to nerves when comes intohuman food in excessive amount (Asthana and Asthana 2001).
Nickel. Major sources of Ni are combustion of coal, gasolinewas well as industries related to oil, alloy manufacturing,electroplating and batteries (Brady 1996).
Concentration of nickel in effluent was 0.14, 0.14, 0.15 and 0.16ppm from four sites, respectively (Table 1). Most of the efflu-ent samples have concentration below critical level (0.20 ppm)as shown in Fig 4 suggested by FAO (Ayreas and Westcot1985).
Nickel concentration in the wheat samples was in the rangeof 5.00 to 16.50 ppm in straw and 5.00 to 8.00 ppm in the grainsampled from four sites (Table 2). Nickel was found below thepermissible level of 10.00 ppm given for food-stuff (WHO 1996).
It can cause different diseases like nausea, vomiting, abdo-minal discomfort, diarrhoea, giddiness, headache, cough and
shortness of breath if come into human food chain in exces-sive concentration (Prasad 1978; WHO 1996).
ConclusionCity effluent is not suitable for raising crops because it isheavily loaded with metal ions, which through food causedifferent disease. Unsuitability of city effluent is due to theindustrial water, which is drained out in the domestic sewagewater without treatment. Industrial water should be treatedbefore disposed off in the domestic sewage channels andalong with this zero-effluent system should be adopted inindustries.
ReferencesAOAC 1984 Official Methods of Analysis of the Association
of Official Analytical Chemists. AOAC Inc., Virginia,USA.
Asthana D K, Asthana M 2001 Environmental: Problems andSolutions. Publishers S Chand and Company Ltd, New Delhi,
397Heavy Metal Ions Concentration in Wheat Plant
Fig 1. Trend of cadmium concentration in effluents. Fig 3. Trend of cobalt concentration in effluents.
Con
cent
ratio
n (p
pm)
Con
cent
ratio
n (p
pm)
Con
cent
ratio
n (p
pm)
Con
cent
ratio
n (p
pm)
5
5
2
5
3
GandakhuMalkhanwalaAwanwalaKhanuwala
GandakhuMalkhanwalaAwanwalaKhanuwala
Sampling Number
Sampling Number Sampling Number
Sampling Number
0.30
0.25
0.20
0.15
0.10
0.05
0
0.30
0.25
0.20
0.15
0.10
0.05
0
0.06
0.05
0.04
0.03
0.02
0.01
0
2.50
2.00
1.50
1.00
1.50
01 2 3 4 5 61 2 3 4 5 6
GandakhuMalkhanwalaAwanwalaKhanuwala
GandakhuMalkhanwalaAwanwalaKhanuwala
1 2 3 4 5 61 2 3 4 5 6
India, p 174.Ayres R S, Westcot D W 1985 Water quality for Agriculture.
FAO Irri and Drain Paper 29 95 - 97.Brady N C 1996 The Nature and Properties of Soil. Macmillian
Publishing Company, New York, USA, 10th ed, p 529.Ghafoor A, Rauf A, Arif M, Muzaffar W 1994 Chemical com-
position of effluents from different industries of theFaisalabad city. Pak J Agric Sci 31 367 - 369.
Khan A, Ibrahim M, Ahmad N, Anwar S A 1994 Accumulationof heavy metals in soil receiving sewage effluent. J AgricRes 32 525 - 533.
Kirk - Othmer 1964 Encyclopedia of Chemical Technology.
John Wiley and Sons, Inc. New York, USA, 2nd ed, 5 pp716 - 748.
Nabi G, Arshad M, Aslam M R 2001 Heavy metal contamina-tion of agriculture soils irrigated with industrial effluents.Sci Tec & Development 20 32 - 36.
Prasad A S 1978 Trace Elements and Iron in Human Metabo-lism. Plenum Publishing Corporation 227 West 17th Street,New York, USA, p 20.
World Health Organization (WHO) 1996 Guidelines for Drink-ing Water Quality. Health criteria and other supportinginformation 94/9960 - Mastercom/Wiener Verlag - 800Australia.
398 Sajid Farid
IntroductionThe proportion of the world’s population living in the largetown or cities has grown from around 5% to 50% over the pasttwo centuries, Demographers estimate that by the year 2030approximately two third of the world population will live inlarge town or cities (Anon 2000).
The high rise of urbanization has created a number ofenvironmental problems such as inadequacy of water supplyand sewerage system, over congestion, inadequate transport,slums, haphazard and unplanned development, particularlyfor the metropolitan areas such as Karachi.
The main environmental problems of Karachi are waterpollution, marine pollution, disposal of solid waste and airpollution. Among these environmental degradation, airpollution is a major concern, which is affecting the urban areasof Karachi. The pollutants are being discharged in to theatmosphere from a number of sources but the vehicular trafficand industries are the major contributors.
A few decades ago traffic did not play an important role in airpollution. Today it is the main source of contaminant in thedeveloped and industrialized countries. With an improvedstandard of living and increased demand on the transportsector, automobile related pollution is fast growing into aproblem of serious dimension in our cities. This is caused notonly by rapid rise in number of automobiles but also due to
narrow roads, slow moving traffic, unfavorable driving cycles,poor enforcement of the laws relating to vehicles roadworthiness and poor emission control measures etc.
Traffic introduces dust, soot, carbon dioxide, carbon monoxide,sulphur dioxide, oxides of nitrogen and hydrocarbons in to theair. There are more than one million different types of registeredmotor vehicles consisting of three wheelers (autorickshaws),cars, buses, motor bikes, etc. plying on the roads of Karachiand discharging toxic gases into the atmosphere.
In USA, about 140 to 150 million tons of pollutants are givenoff to the air every year. Industries account for 20 to 30 milliontons, space heating 10 to 15 million tons, refuse disposal 5 to10 million tons and motor vehicles 90 million tons or more(Mehboobani 1991). Absence of legislation, lack of publicawareness towards conservation of nature and control ofpollution has created such a situation, which demandsstringent control over pollution emitting sources.
Main object of this study was to assess the existingenvironmental impact of air pollution components in differentareas of Karachi. The generated data could be used forimplementation of appropriate measures against hazardouseffects of air pollution.
ExperimentalMonitoring of ambient air pollution component was carriedout for some selected areas to measure the impact of air
ENVIRONMENTAL IMPACT ASSESSMENT OF AIR POLLUTION IN DIFFERENT AREAS
OF KARACHI
Durdana Rais Hashmi and Muhammad Ishaq Qaim Khani*
PCSIR Laboratories Complex, Karachi-75280, Pakistan
(Received February 19, 2002; accepted October 29, 2002)
Measurements of major ambient air pollution components such as O3, SO2, CO, NO, and NOx were carried out to obtainbaseline data for some selected areas in Karachi. These areas have been categorized on the basis of traffic congestion. Totalaverage concentration of O3 in Zone - A was 20.80 ppb. In Zone - B 20.36 ppb and in Zone - C 19.10 ppb. Concentrationof SO2 in Zone - A was determined to be 7.30 ppb, in Zone - B 11.60 ppb and in Zone - C 44.30 ppb. Similarly,concentration of CO in Zone - A was 0.96 ppm, in Zone - B 2.50 ppm and in Zone - C 3.49 ppm. Whereas, averageconcentration of NO and NOx was 13.00 ppb and 23.50 ppb in Zone - A, 2.73 ppb and 5.70 ppb in Zone - B, 69.90 ppband 83.50 ppb in Zone C. The main contributors of pollutants in these areas are vehicular traffic and industries. A surveyof local hospitals was also conducted to correlate the prevailing diseases with air pollution levels. The survey showed that70% of the patients were suffering from air pollution related diseases, like chronic bronchitis, pulmonary edema andpulmonary emphysema. The data further reveals that the ratio of male to female patients is 2:1.
Key words: Ambient air, Impact of pollutants , Health effect.
Pak. J. Sci. Ind. Res. 2003 46(6) 399 - 405
*Author for correspondence
399
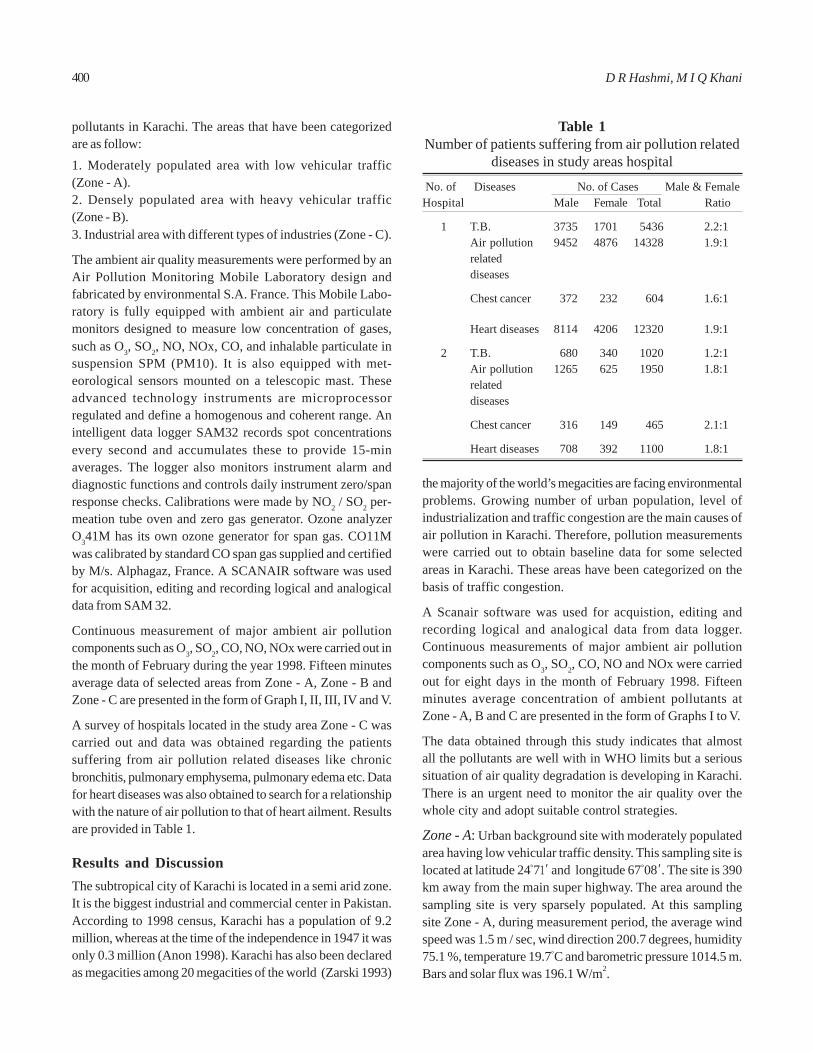
pollutants in Karachi. The areas that have been categorizedare as follow:1. Moderately populated area with low vehicular traffic(Zone - A).2. Densely populated area with heavy vehicular traffic(Zone - B).3. Industrial area with different types of industries (Zone - C).
The ambient air quality measurements were performed by anAir Pollution Monitoring Mobile Laboratory design andfabricated by environmental S.A. France. This Mobile Labo-ratory is fully equipped with ambient air and particulatemonitors designed to measure low concentration of gases,such as O3, SO2, NO, NOx, CO, and inhalable particulate insuspension SPM (PM10). It is also equipped with met-eorological sensors mounted on a telescopic mast. Theseadvanced technology instruments are microprocessorregulated and define a homogenous and coherent range. Anintelligent data logger SAM32 records spot concentrationsevery second and accumulates these to provide 15-minaverages. The logger also monitors instrument alarm anddiagnostic functions and controls daily instrument zero/spanresponse checks. Calibrations were made by NO2 / SO2 per-meation tube oven and zero gas generator. Ozone analyzerO341M has its own ozone generator for span gas. CO11Mwas calibrated by standard CO span gas supplied and certifiedby M/s. Alphagaz, France. A SCANAIR software was usedfor acquisition, editing and recording logical and analogicaldata from SAM 32.
Continuous measurement of major ambient air pollutioncomponents such as O3, SO2, CO, NO, NOx were carried out inthe month of February during the year 1998. Fifteen minutesaverage data of selected areas from Zone - A, Zone - B andZone - C are presented in the form of Graph I, II, III, IV and V.
A survey of hospitals located in the study area Zone - C wascarried out and data was obtained regarding the patientssuffering from air pollution related diseases like chronicbronchitis, pulmonary emphysema, pulmonary edema etc. Datafor heart diseases was also obtained to search for a relationshipwith the nature of air pollution to that of heart ailment. Resultsare provided in Table 1.
Results and DiscussionThe subtropical city of Karachi is located in a semi arid zone.It is the biggest industrial and commercial center in Pakistan.According to 1998 census, Karachi has a population of 9.2million, whereas at the time of the independence in 1947 it wasonly 0.3 million (Anon 1998). Karachi has also been declaredas megacities among 20 megacities of the world (Zarski 1993)
the majority of the world’s megacities are facing environmentalproblems. Growing number of urban population, level ofindustrialization and traffic congestion are the main causes ofair pollution in Karachi. Therefore, pollution measurementswere carried out to obtain baseline data for some selectedareas in Karachi. These areas have been categorized on thebasis of traffic congestion.
A Scanair software was used for acquistion, editing andrecording logical and analogical data from data logger.Continuous measurements of major ambient air pollutioncomponents such as O3, SO2, CO, NO and NOx were carriedout for eight days in the month of February 1998. Fifteenminutes average concentration of ambient pollutants atZone - A, B and C are presented in the form of Graphs I to V.
The data obtained through this study indicates that almostall the pollutants are well with in WHO limits but a serioussituation of air quality degradation is developing in Karachi.There is an urgent need to monitor the air quality over thewhole city and adopt suitable control strategies.
Zone - A: Urban background site with moderately populatedarea having low vehicular traffic density. This sampling site islocated at latitude 24°71' and longitude 67°08' . The site is 390km away from the main super highway. The area around thesampling site is very sparsely populated. At this samplingsite Zone - A, during measurement period, the average windspeed was 1.5 m / sec, wind direction 200.7 degrees, humidity75.1 %, temperature 19.7°C and barometric pressure 1014.5 m.Bars and solar flux was 196.1 W/m2.
Table 1Number of patients suffering from air pollution related
diseases in study areas hospital
No. of Diseases No. of Cases Male & FemaleHospital Male Female Total Ratio
1 T.B. 3735 1701 5436 2.2:1Air pollution 9452 4876 14328 1.9:1relateddiseases
Chest cancer 372 232 604 1.6:1
Heart diseases 8114 4206 12320 1.9:1
2 T.B. 680 340 1020 1.2:1Air pollution 1265 625 1950 1.8:1relateddiseases
Chest cancer 316 149 465 2.1:1
Heart diseases 708 392 1100 1.8:1
400 D R Hashmi, M I Q Khani
Graph - IIWeekly average concentration of photochemical oxidants in densely populated area Zone - B
NO
, NO
x an
d O
3 in
ppb
Local Time (h)
Graph - IWeekly average concentration of photochemical oxidants in urban background site Zone - A
NO
, NO
x an
d O
3 in
ppb
Local Time (h)
70
60
50
40
30
20
10
0
NOX
NO
O3
25.00
20.00
15.00
10.00
5.00
0.00
NOxNO
O3
401Ambient Air Pollution Components
Graph - IVWeekly average concentration of CO in Zone - A, B & C
Con
c. o
f CO
in p
pm
Local Time (h)
4.00
3.50
3.00
2.50
2.00
1.50
1.00
0.50
0.00
Zone-C
Zone-B
Zone-A
Graph - IIIWeekly average concentration of photochemical oxidants in industrial area Zone - C
NO
, NO
x an
d O
3 in
ppb
Local Time (h)
NOx
NO
90.00
80.00
70.00
60.00
50.00
40.00
30.00
20.00
10.00
0.00
O3
x
402 D R Hashmi, M I Q Khani
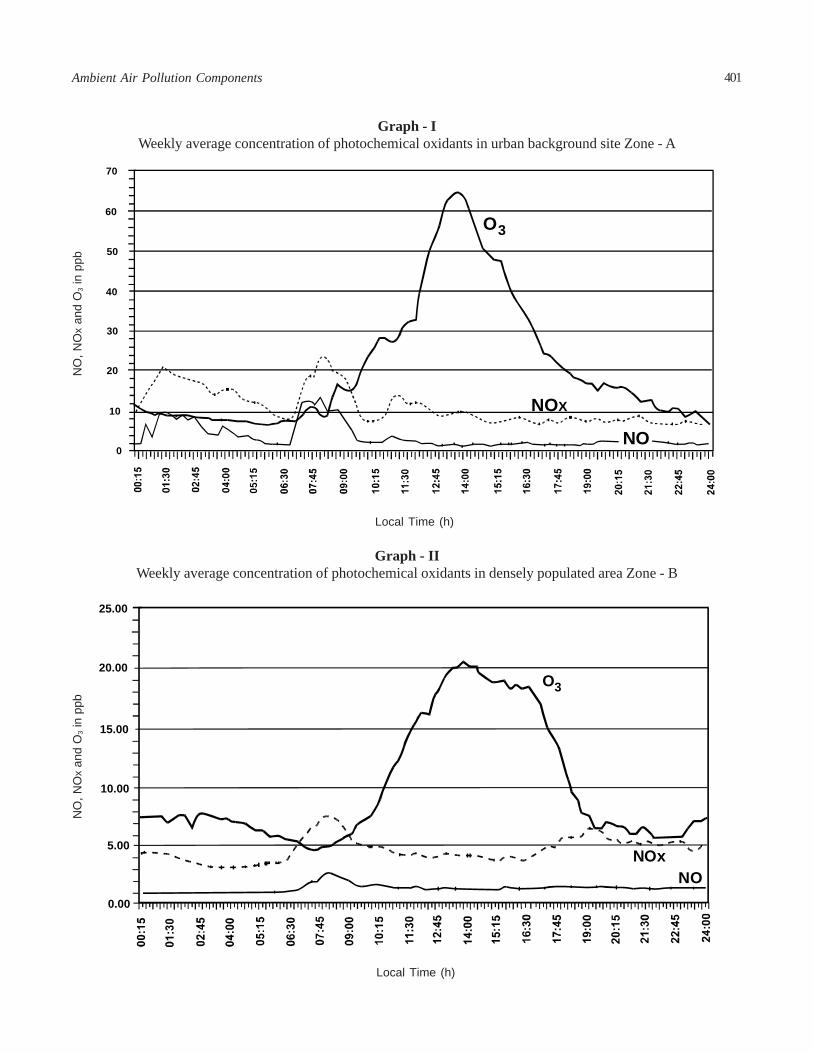
Zone - B: Sub urban site with densely populated area havinghigh traffic density. This sampling site is located at latitude24°53' and longitude 67°06' . The site is relatively open placeand is surrounded by the residential area. In 320° NW to 240°
SW there is a main university road about 1km away fromsampling site having traffic density of 323245 vehicles perday (Anon 1993). The population living around the sitebelongs to the middle and high-income group. Duringmeasurement period, in Zone - B, the average wind speed was2.75 m / sec. Wind direction 194.6 degrees, humidity 63.71%,temperature 24.1°C and barometric pressure 100.4 m. Bars andsolar flux was 228.8 W/m2.
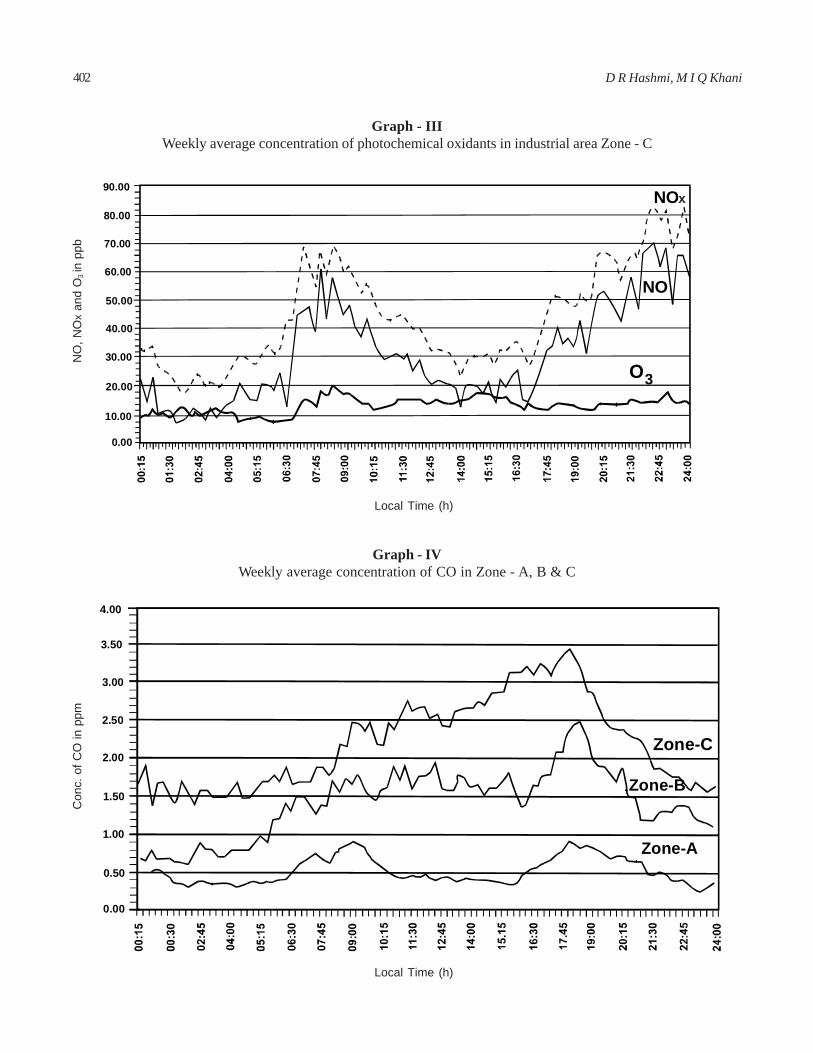
Zone - C: Industrial area having different types of indus-tries. This sampling site is located at latitude 24°54' andlongitude 67°10' in south district. The site has nearly 2000different types of industries. Approximately 60 percent ofthese industries are textile mills, while others involvepharmaceuticals, chemicals, detergents, iron and steelsulphur refining, vegetable oil, beverages and foodproducts. The daily average traffic density at this samplingsite was 39743 vehicles per day (Anon 1993). The averagewind speed in this zone during the period of measurementwas 2.2 m/sec, wind direction 169.6 degrees, humidity 45.2%, temperature 22.6°C and barometric pressure 1014.4 m.Bars and solar flux was 215.0 W/m2.
Graph-I shows the weekly average concentration of photo-chemical oxidants at urban background site (Zone - A). Maxi-mum average concentration of NO was 13.0 ppb and NOxwas 23.5 ppb was found to be at 8:15 h local time. Whereas,maximum average con-centration of O3 was found to be 64.5ppb at 13.45 h local time.
It can be seen from the Graph - I that the balance among NO,NO, and O3 is shifted in the favour of net ozone production.The formation of ozone is evident during day time and highestconcentration of ozone was found when solar radiation wasalso high. The sampling site is located 20 km down wind fromthe city center and diurnal pattern was clearly observed. Themasses were coming from the university road. The maincontributor of photochemical oxidants at this location may bedue to motor vehicles.
Graph-II shows the weekly average concentration of photo-chemical oxidants at densely populated area (Zone - B). Maxi-mum average concentration of NO 2.73 ppb and NOx 7.5 ppbwas found at 08:00 h local time. Whereas, the maximumaverage concentration of O3 was found to be 20.36 ppb at13:45 h local time. It can also be seen from the Graph - II thatthe balance between NO, NOx and ozone shift in favour ofnet ozone production due to photochemical dissociation ofNO2, resulting in the maximum concentration of ozone in themid afternoon. The main contributor of photochemical
Graph - VWeekly average concentration of SO2 in Zone - A, B & C
Con
c. o
f SO
2 in
ppb
Local Time (h)
50.00
45.00
40.00
35.00
30.00
25.00
20.00
15.00
10.00
5.00
0.00
Zone-C
Zone-BZone-A
403Ambient Air Pollution Components
oxidants at this location is also main road that has very hightraffic density. A some what photo stationary state may existat this location.
Graph-III shows the weekly average concentration ofphotochemical oxidants at industrial area Zone - C. Maximumaverage concentration of NO was found to be 69.9 ppb andNOx was 83.5 ppb at 22:15 h local time, whereas, maximumaverage concentration of O3 was found to be 19.9 ppb at 8:45h local time. It can be seen from the graph that ozoneconcentration is less than NO and NOx concentration. It hasbeen reported that at typical ambient air and NO concentration,the reaction of photochemical oxidants has a time scale of oneto a few minutes (Clark 1988). A power generation plant andboiler of pharmaceutical industry was located only 50 - 75meters away from the receptor. It shows that most of NO andNOx were coming from combustion sources. Graph-III alsoshows that in recently emitted plume, the reaction of NO withO3 is even more rapid having a time scale of only few seconds.So, the chemical reaction between two mixing species was notcompleted due to time lag and thus low concentration of ozonewas observed at this site.
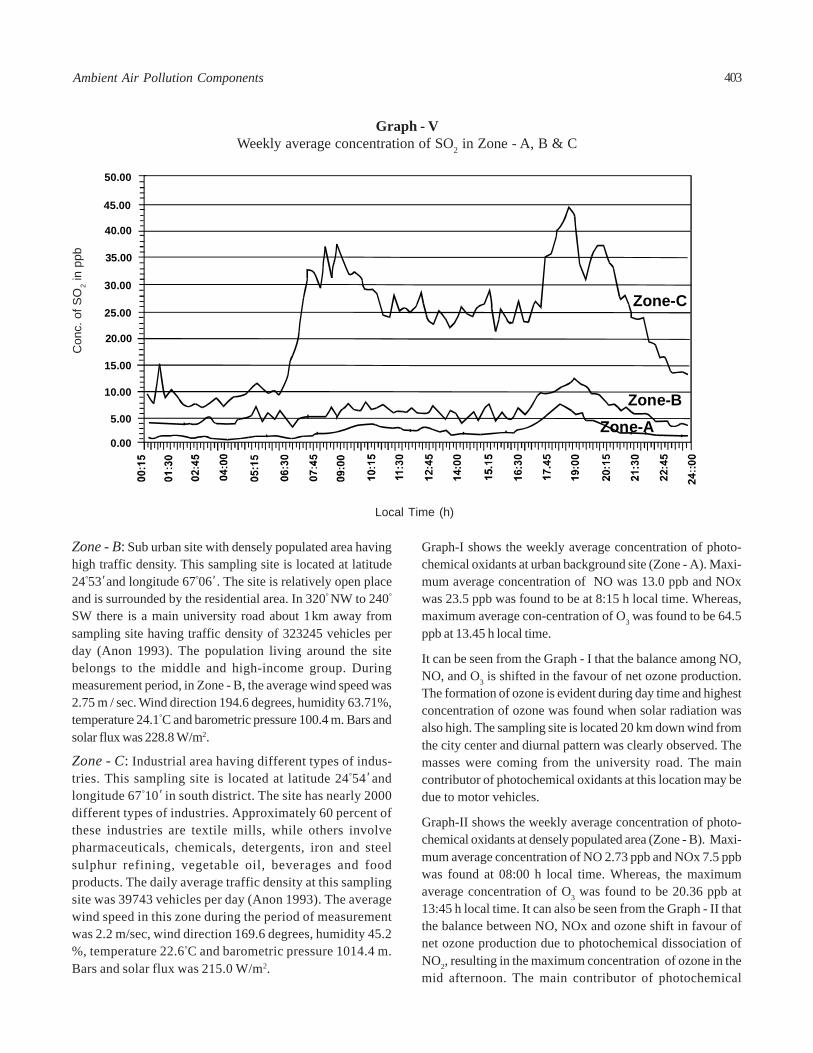
The incomplete burning of carbon containing fuels producecarbon monoxide. It is almost entirely a man made pollutant.Carbon monoxide is most hazardous to human at concentrationof 100 ppm or more if experienced over a period of severalhours (Bassow 1989). It is estimated that motor vehiclescontribute to more than 80 % man made global carbon monoxideemission, with a smaller amount resulting from othercombustion processes (Baig 1993).
Graph-IV shows the concentration of carbon monoxide in zoneA, B and C. The maximum average concentration of carbonmonoxide in Zone - A, (urban background site) was found tobe 0.96 ppm at 18.00 h local time, in Zone - B (densely back-ground site) was 2.50 ppm at 18:30 h local time whereas, inZone - C (Industrial Area) the maximum average concentrationof carbon monoxide was 3.49 ppm at 18:00 h local time. In themorning hours, the movement of traffic is towards down townand is the reverse in the evening. The variation in the concen-tration of carbon monoxide shows that the concentrationgradually increases till 9:00 h and then comes down at 13:00 hand again increase around 18:00 h, the rush hours. In Zone - Aand B the air pollution being generated by vehicular traffic.The study further shows that the level of carbon monoxide inindustrial area (Zone - C) is relatively higher than denselypopulated area Zone - B. The pollution in industrial area ismainly due to industrial processes.
Graph-V shows the concentration of SO2 in the selected zonesA, B and C. The major sources of SO2 are combustion of
fossil fuels, coke ovens, metal smelting, wood and pulpproduction, petroleum refining and brick manufacture. Theestimated background concentration of SO2 is 0.2 ppb andcalculated atmospheric residence time is 4 days (Kennethand Cecil 1976). Short term high level of SO2 may increaserespiratory diseases, lung function disturbance and mortalityin adult and children (Wieslaw 1995). The maximum averageconcentration of SO2 at urban background site (Zone - A)was found to be 7.30 ppb at 18:15 h local time, at denselypopulated area (Zone - B) was 12.60 ppb at 19:00 h local timewhile at industrial area (Zone - C) was found to be 44.3 ppb at18:45 h local time.
The variation in the concentration of SO2 indicates the samepattern as carbon monoxide concentration in Zone - A, B andC, whereas the concentration of SO2 in zone C is higher thanZone - A and B due to the combustion process in industries.The average concentration of SO2 in all the selected areas arewell with in WHO limits (40 - 60 μg / m3) (WHO 1987). The lowlevel of SO2 may be due to the fact that the use of coal inKarachi is negligible and almost 99 percent of the popula-tion and factories use natural gas (Sui gas) as a fuel, which issulphur free.
Hospital survey. A hospital survey was carried out to assessthe impact of pollution on human health (Table 1). This surveyrevealed that a total 6456 cases of tuberculosis were reportedduring last two-year, out of which 4415 were males and 2041were females.
A total number of 16078 patients were suffering from airpollution related diseases consisting of 10577 males and 5501females.
A total of chest cancer cases 1069 attributed to air pollution,out of which 688 were males and 381 were female patients. Thehospital data indicates the trend of cancer shifting from oldage group of middle age group, which is an indicator ofdeteriorating air environment.
The heart ailment cases of 13420 were reported during thesame period, 8822 were males and 4598 were females.
The degrading effects on human health can also be seen fromthe increasing number of patients in the hospitals sufferingfrom air pollution related diseases. Air pollution has become aworld wide public health problem, particularly in large cities ofthe developing countries. An estimated 130,000 prematuredeaths and 50 - 70 million incidents of respiratory illness occureach year due to episodes of urban air pollution in developingcountries, half of them in East Asia (Maddison 1997).
Air pollution increases the risk of chronic obstructivepulmonary diseases and acute respiratory infections in
404 D R Hashmi, M I Q Khani
childhood, lung and chest cancer, tuberculosis, prenatal outcomes including low birth weight and eye diseases.
Survey of hospitals show that the number of patients suffe-ring from air pollution related diseases to that of tuberculosisis about 3:1. The number of male cases as compared to femaleregarding air pollution related chest diseases, are in the ratioof 2.1:1. This may be due to an extensive exposure of males tothe polluted ambient air and professional hazards as comparedto females who are housewives and remain indoor.
Few decades ago, only tobacco smoke was considered as animportant risk for lung cancer but now a days polluted air isthe most important factor for lung cancer. People in developingcountries are commonly exposed to very high levels ofpollution for 3 - 7 h daily over many years (Engel and Hartodo1998). The number of lung cancer cases by air pollution arealso on the increase and mostly male cases due to theirexposure to air. The worst effected age group is between 50 -60 years but now this is reducing up to 45 - 60 years. This ismainly because of increasing air pollution level but some otherfactors are also involved like personal hygiene, social activity,socio-economic condition, mental worries and smoking etc.
The cases of heart diseases are also on the increase. This ismainly due to the increase of ambient air pollution. The maleand female ratio of heart diseases is approximately 2.1:1,indicating that men suffer more than women due to exposurein society. The worst effected age group of heart patients isbetween 40 - 50 years, which can be attributed to the exposure.Effect of air pollution on human health varies according toboth the intensity and duration of exposure and health statusof exposed population.
ConclusionThe baseline data for ambient air pollutants in selected areasof Karachi reveals that the average concentration of O3, SO2,CO, NO, and NOx are well with in WHO limits, But the variationindicates a rising trend due to multiple factors like growth inpopulation, motor vehicles and industries etc. The observedvalues of NO2 and NOx during the survey indicate that thesepollutants originate from the combustion of fuel in motorvehicle power generation plant and boiler of industries. It wasalso observed that O3, SO2 and CO are mainly emitted frommotor vehicles and from Industrial processes. The generated
data has the potential to lay the foundation for implementationof appropriate ambient air quality standards.
ReferencesAnon 1993 Traffic Survey Programme for DKA, Karachi.
Traffic Engineering Bureau Report No. 926. TrafficEngineering Bureau Karachi.
Anon 1998 Pakistan In Figure. Federal Bureau of Statistics,Statistical Division, Government of Pakistan.
Anon 2000 “Environment and Health”, Bulletin of WHO. 78(9)pp 1117-1126.
Baig M A A 1993 International Seminar on EnvironmentalPollution. Pak. Association of Scientist and ScientificProfession (PASSP), 29th April, 1993.
Bassow H 1989 Air Pollution Chemistry, An experimenter’ssource book. Hyden Book Company. Inc. Rochella Park,New Jersey, USA. pp 37.
Clark P A 1988 Mixing models for simulation of plume inte-raction with ambient air. “Atmospheric Environment ” 221097 - 1106.
Engel P, Hartodo E, Ruel M 1998 Smoke exposure of womenand young children in highland Guatemala, PredicationsRecall Accuracy, and Human Organization. 54 408 -417.
Kenneth W, Cecil F 1976 Air pollution, Its Origin & Control.Harper & Row Publishers. NewYork. pp 103.
Maddison D 1997 A meta analysis of air pollutionepidemiological studies. London Centre for Social andEconomic Research on the Globle Environment, UniversityCollege London.
Mehboobani A K 1991 Automobile Pollution Vehicle Emissionand Pollution Control. Ashish Publishing House, NewDehli, 110026, ASBN 81 - 7024 - 414 - 5, pp 41.
Wieslaw J 1995 Review of recent studies from Central andEastern Europe. Associating of Respiratory healtheffect with high level of exposure to traditional airpollutants. Environmental Health Perspective. 103(suppl. 2) pp 15.
WHO 1987 Global Pollution and Health. Results of HealthRelating Environmental Monitoring WHO & UNEPPublication, Global Environment Programme. Environ-mental Data Report. pp 10,17 & 24.
Zarski L 1993 Urban air pollution in megacities of the world.World Environment. 36(2) 4.
405Ambient Air Pollution Components
SYNTHESIS OF HETERO-BICYCLIC COMPOUNDS
PART-X. FORMATION OF 2H,4H,5H 2,2-DIPHENYL-4, 5-DIOXOPYRIDO [4, 3-d] 1,3DIOXIN
Abdul Salam and Ausaf Akhtar*
PCSIR Laboratories Complex, Karachi-75280, Pakistan
(Received May 24, 2002; accepted December 14, 2002)
Pak. J. Sci. Ind. Res. 2003 46(6) 406 - 408
Aminopyranodioxin derived from benzophenone isomerize to yield 6 substituted 1, 2-dihydropyridodioxins (III),whosestructures were determined by chemical conversions and spectroscopic studies.
Key words: Pyranodioxin, Pyridodioxin, Hetero-bicyclic compound.
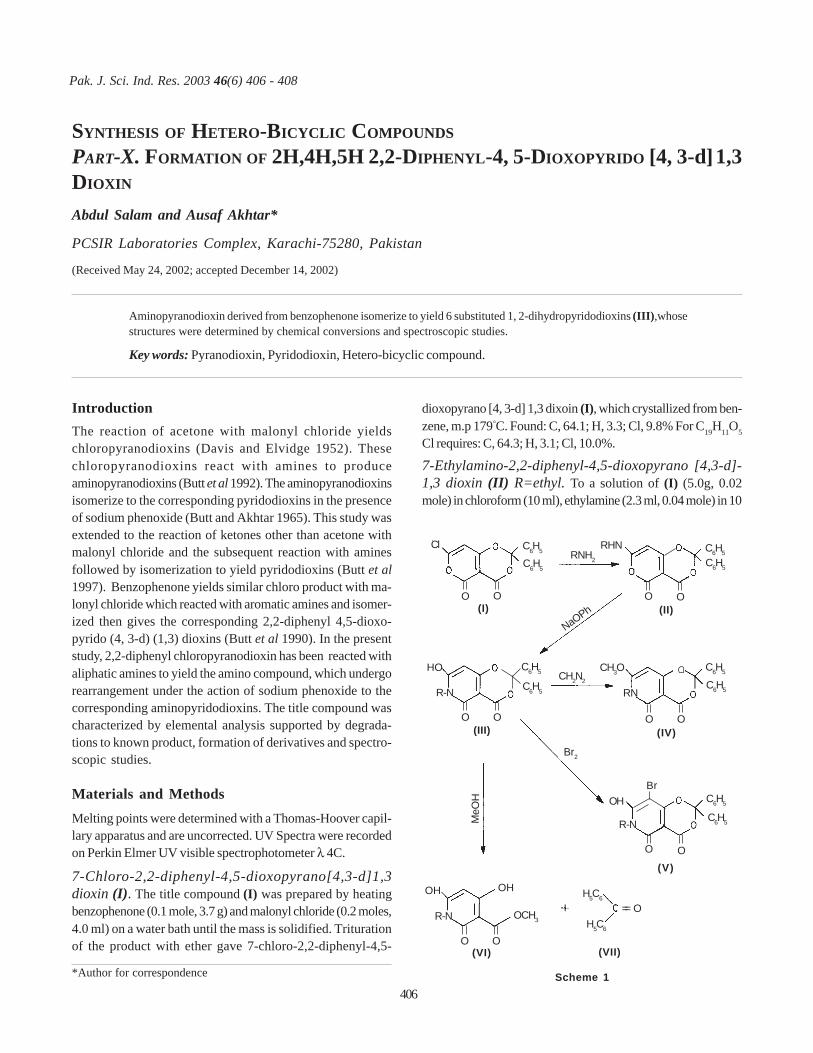
IntroductionThe reaction of acetone with malonyl chloride yieldschloropyranodioxins (Davis and Elvidge 1952). Thesechloropyranodioxins react with amines to produceaminopyranodioxins (Butt et al 1992). The aminopyranodioxinsisomerize to the corresponding pyridodioxins in the presenceof sodium phenoxide (Butt and Akhtar 1965). This study wasextended to the reaction of ketones other than acetone withmalonyl chloride and the subsequent reaction with aminesfollowed by isomerization to yield pyridodioxins (Butt et al1997). Benzophenone yields similar chloro product with ma-lonyl chloride which reacted with aromatic amines and isomer-ized then gives the corresponding 2,2-diphenyl 4,5-dioxo-pyrido (4, 3-d) (1,3) dioxins (Butt et al 1990). In the presentstudy, 2,2-diphenyl chloropyranodioxin has been reacted withaliphatic amines to yield the amino compound, which undergorearrangement under the action of sodium phenoxide to thecorresponding aminopyridodioxins. The title compound wascharacterized by elemental analysis supported by degrada-tions to known product, formation of derivatives and spectro-scopic studies.
Materials and MethodsMelting points were determined with a Thomas-Hoover capil-lary apparatus and are uncorrected. UV Spectra were recordedon Perkin Elmer UV visible spectrophotometer λ 4C.
7-Chloro-2,2-diphenyl-4,5-dioxopyrano[4,3-d]1,3dioxin (I). The title compound (I) was prepared by heatingbenzophenone (0.1 mole, 3.7 g) and malonyl chloride (0.2 moles,4.0 ml) on a water bath until the mass is solidified. Triturationof the product with ether gave 7-chloro-2,2-diphenyl-4,5-
dioxopyrano [4, 3-d] 1,3 dixoin (I), which crystallized from ben-zene, m.p 179°C. Found: C, 64.1; H, 3.3; Cl, 9.8% For C19H11O5
Cl requires: C, 64.3; H, 3.1; Cl, 10.0%.
7-Ethylamino-2,2-diphenyl-4,5-dioxopyrano [4,3-d]-1,3 dioxin (II) R=ethyl. To a solution of (I) (5.0g, 0.02mole) in chloroform (10 ml), ethylamine (2.3 ml, 0.04 mole) in 10
*Author for correspondence Scheme 1
(I) (II)
(III) (IV)
(V)
(VII)(VI)
C6H5
C6H5
C6H5
C6H5
C6H5
C6H5
C6H5
C6H5
O OOO
O O O O
O O
= OH5C6
H5C6
O O
Br2
CH3OC6H5
C6H5
CH2N2
RN
RHNRNH2
=
R-N
HO
OCH3
OHOH
R-N
R-N
NaOPh
MeO
H OHBr
Cl
406
ml chloroform was added with constant stirring. The solidproduct obtained was washed with water and dried. 7-ethylamino-2, 2-diphenyl-4, 5-dioxopyrano [4, 3-d] 1, 3-dioxin(4.2g) was crystallized from methanol, m.p. 162°C. Found: C,69.2; H, 4.4; N, 3.6; C21H17O5N requires: C, 69.4; H, 4.6; N, 3.8%.Other 7-amino 2, 2-diphenyl-4, 5-dioxopyrano [4, 3-d] 1, 3 di-oxins (II) prepared as above are listed in Table 1.Reaction of 4,5 dioxo-2,2-diphenyl 7-ethylamino[4,3-d]1,3 dioxin with sodium phenoxide in phenol.4, 5 dioxo-2, 2-diphenyl 7-ethylamino [4, 3-d] 1, 3 dioxin (2.5 g,0.01 mole) was added to a solution of sodium (0.7 g.) in phenol
(20 ml) and the mixture was heated at 120°C for two minutes.The solution was cooled, diluted with water and extractedwith ether to recover excess of phenol. The ethereal layer wasagain extracted with water and the combined aqueous extracts(150 ml) were acidified with 2N HCl. The solid product ob-tained 4, 5-dioxo-2, 2-diphenyl-6-ethyl-7-hydroxy pyrido [4, 3-d] 1, 3 dioxin (III) R = ethyl, 2.1g was crystallized from metha-nol, m.p. 198°C. It produced reddish brown colour with aq.FeCl3 and gave effervescence with aq. sodium bicarbonate.Found: C, 69.3; H, 4.6; N, 3.7% for C21H17O5N requires: C, 69.4;H, 4.6; N, 3.8%.
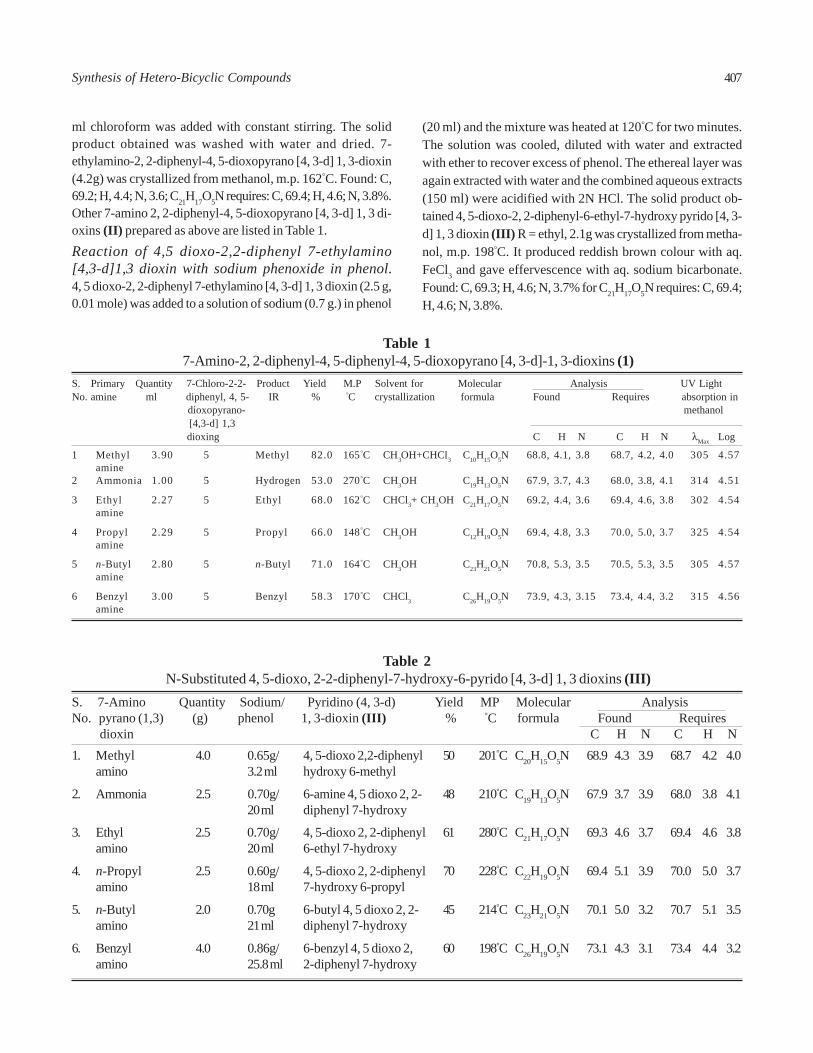
Table 1 7-Amino-2, 2-diphenyl-4, 5-diphenyl-4, 5-dioxopyrano [4, 3-d]-1, 3-dioxins (1)
S. Primary Quantity 7-Chloro-2-2- Product Yield M.P Solvent for Molecular Analysis UV LightNo. amine ml diphenyl, 4, 5- IR % °C crystallization formula Found Requires absorption in
dioxopyrano- methanol [4,3-d] 1,3 dioxing C H N C H N λMax Log
1 Methyl 3.90 5 Methyl 82.0 165°C CH3OH+CHCl3 C10H15O5N 68.8, 4.1, 3.8 68.7, 4.2, 4.0 305 4.57amine
2 Ammonia 1.00 5 Hydrogen 53.0 270°C CH3OH C19H13O5N 67.9, 3.7, 4.3 68.0, 3.8, 4.1 314 4.51
3 Ethyl 2.27 5 Ethyl 68.0 162°C CHCl3+ CH3OH C21H17O5N 69.2, 4.4, 3.6 69.4, 4.6, 3.8 302 4.54amine
4 Propyl 2.29 5 Propyl 66.0 148°C CH3OH C12H19O5N 69.4, 4.8, 3.3 70.0, 5.0, 3.7 325 4.54amine
5 n-Butyl 2.80 5 n-Butyl 71.0 164°C CH3OH C23H21O5N 70.8, 5.3, 3.5 70.5, 5.3, 3.5 305 4.57amine
6 Benzyl 3.00 5 Benzyl 58.3 170°C CHCl3 C26H19O5N 73.9, 4.3, 3.15 73.4, 4.4, 3.2 315 4.56amine
Table 2 N-Substituted 4, 5-dioxo, 2-2-diphenyl-7-hydroxy-6-pyrido [4, 3-d] 1, 3 dioxins (III)
S. 7-Amino Quantity Sodium/ Pyridino (4, 3-d) Yield MP Molecular AnalysisNo. pyrano (1,3) (g) phenol 1, 3-dioxin (III) % °C formula Found Requires dioxin C H N C H N1. Methyl 4.0 0.65g/ 4, 5-dioxo 2,2-diphenyl 50 201°C C20H15O5N 68.9 4.3 3.9 68.7 4.2 4.0
amino 3.2 ml hydroxy 6-methyl
2. Ammonia 2.5 0.70g/ 6-amine 4, 5 dioxo 2, 2- 48 210°C C19H13O5N 67.9 3.7 3.9 68.0 3.8 4.120 ml diphenyl 7-hydroxy
3. Ethyl 2.5 0.70g/ 4, 5-dioxo 2, 2-diphenyl 61 280°C C21H17O5N 69.3 4.6 3.7 69.4 4.6 3.8amino 20 ml 6-ethyl 7-hydroxy
4. n-Propyl 2.5 0.60g/ 4, 5-dioxo 2, 2-diphenyl 70 228°C C22H19O5N 69.4 5.1 3.9 70.0 5.0 3.7amino 18 ml 7-hydroxy 6-propyl
5. n-Butyl 2.0 0.70g 6-butyl 4, 5 dioxo 2, 2- 45 214°C C23H21O5N 70.1 5.0 3.2 70.7 5.1 3.5amino 21 ml diphenyl 7-hydroxy
6. Benzyl 4.0 0.86g/ 6-benzyl 4, 5 dioxo 2, 60 198°C C26H19O5N 73.1 4.3 3.1 73.4 4.4 3.2amino 25.8 ml 2-diphenyl 7-hydroxy
407Synthesis of Hetero-Bicyclic Compounds
Other alkylamino pyranodioxins (II) were reacted similarly withsodium phenoxide in phenol and the products obtained byformula (III) are listed in Table 2.
Both 4,5-dioxo-2,2-diphenyl 6-ethylamino 7-methoxypyrido [4,3-d] 1,3 dioxin (IV). To 0.5g (III) R = ethyl inether (10 ml), a solution of diazomethane in ether was added inportions until yellow colour persisted. The solution was keptovernight in a refrigerator and the excess solvent was removed.The residue upon trituration with ether yielded a neutral prod-uct, which showed no colouration with aq FeCl3 (IV) 0.3 gobtained was crystallized from methanol, m.p 183°C Found: C,69.9; H, 4.9; N, 3.8% for C22H19NO5 requires: C, 70.0; H, 5.0; N,3.7%.
8-Bromo 4,5-dioxo 2,2-diphenyl-6-ethylamino-pyrido [4,3-d]-1,3 dioxin (V) R = ethyl. The compound(III) R = ethyl (0.5 g) was dissolved in chloroform (20 ml) andbromine in chloroform was added dropwise till an orange colourpersisted. The reaction mixture was kept at room temperaturefor 1 h and subsequently, the solvent was removed. The solidbromo product (0.5 g, 75%) (V) R = ethyl was re-crystallizedfrom methanol, m.p. 189°C. Found: C, 57.0; H, 3.6; N, 3.1%requires: C, 56.8; H, 3.8; N, 3.1% for C21H16O5N Br.
Degradation of (III) with methanol. The compound (III)R = ethyl (0.05g) was refluxed with methanol (25 ml) for 6 h.The solution upon concentration in vacuum yielded (VI) 0.3 gwhich was crystallized from MeOH, m.p 221°C. Found: C, 50.5;H, 5.3; N, 6.3% requires: C, 50.7; H, 5.1; N, 6.5 %. From thefiltrate benzophenone was isolated and characterized as 2,4dinitrophenyl - hydrazone derivative for C9H11NO5.
Results and DiscussionIsomerization of 7-alkylamino 4, 5-dioxopyrano 2, 2-diphenyl[4, 3-d] 1, 3 dioxins (II) under the influence of sodium phenox-ide to the corresponding alkyl substituted pyridodioxins (III)has been studied. For instance, 7-ethylamino 4, 5 dioxo 2, 2-
diphenyl 6-ethylamino pyrano [4, 3-d] 1, 3 dioxin (II) on react-ing with phenoxide in phenol produced C21H17O5N (III) R-C2H5,m.p. 198°C (Scheme 1). This product is enolic in nature (FeCl3
test) dissolves in aq. sodium bicarbonate solution and is iso-meric with the starting material. It is moderately stable to-wards alcohol and is decomposed on boiling. The otheralkylamino pyranodioxins yield similar isomeric products upontreatment with sodium phenoxide in phenol. These products(III) absorb in the UV region 310-315 mμ. Table 3 closely re-sembling pyridodioxins.
The OH group at position 7, was methylated into the product(IV) R = ethyl, λmax 300 log ∈ 4.0 (λmax 275, log ∈ 4.2). Similarly,bromo derivative (V) R = ethyl had ( λmax 300 log ∈ 4.87).Finally, the structure (III) for these new products was con-firmed by boiling it (III) R = ethyl in methanol to form pyridinemethyl ester (VI) R = ethyl and benzophenone (VII).
ReferencesButt M A, Akhtar I A 1965 Synthesis of hetero-bicyclic com-
pound. Part-I. Synthesis of pyridino-(1-3) dioxins. Tetra-hedron 21 1917-1922.
Butt M A, Kemal R, Salam A, Akhter A 1990 Synthesis ofhetero-bicyclic compounds. Part-VII: Formation of 2,2-diphenyl-4, 5-dioxopyridino (4, 3-d)(1,3) dioxins. Pak JSci Ind Res 33 (1-2) 27-29.
Butt M A, Kemal R, Salam A, Mumtaz G 1992 Synthesis ofhetero-bicyclic compounds. Part-VIII: Formation of6-alkyl-2, 2-dimethyl, 4, 5-dioxo-7-hydroxy pyridino (4, 3-d) (1,3). Pak J Sci Ind Res 35(9) 325-327.
Butt M A, Kemal R, Salam A, Akhter A 1997 Synthesis ofhetero-bicyclic compounds. Part-IX: Formartion of 2,2-disubstuted 4, 5-dioxo-pyridino (4, 3-d) (1,3) dioxin. PakJ Sci Ind Res 40(5-12) 75-78.
Davis S J, Elvidge J A 1952 Heterocyclic synthesis with malo-nyl chloride. Part I: Pyrano-1, 3 dioxins from ketones. JChem Soc 4109-4114.
408 A Salam, A Akhtar
Pak. J. Sci. Ind. Res. 2003 46(6) 409 - 413
TERNARY LIQUID EQUILIBRIA OF ETHANOL-WATER-OLEYL ALCOHOL AND ETHA-NOL-WATER-OLEIC ACID SYSTEMS
M S Rahman*, M A Rahman and M N Nabi
Department of Applied Chemistry and Chemical Technology, University of Rajshahi, Rajshahi, Bangladesh
(Received Feburary 14, 2002; accepted January 2, 2003)
The ternary equilibrium data are presented for the ethanol -water - oleyl alcohol and ethanol- water - oleic acid systems at30°C. The binodal curves, tie lines, plait points, distribution coefficients and separation factors have been determined toextract ethanol from the aqueous solution. Hand’s method has been used to correlate tie lines and to calculate coordinatesof plait points. Tie line data were satisfactorily correlated by the Othmer - Tobias method on a mass fraction basis.
Keywords: Ternary equilibrium data, Tie line, Ethanol-water-oleyl alcohol.
IntroductionThe production of anhydrous alcohol from lower concentra-tion of aqueous solutions, requires almost complete removalof water. This operation is often complicated by the formationof azeotropes. Typically, azeotropic or extractive distillationsare used for such separations. These traditional technologyfor the separation of alcohol from aqueous solutions are en-ergy intensive and expensive because of the high reflux ratioand large number of stages required for nearly complete sepa-ration.
Liquid - liquid extraction is one of the separation process in che-mical industries and it requires a reliable knowledge of the liquid-liquid equilibria for the system to be separated. The extractionof alcohol from dilute solutions resulting from fermentationprocesses and many solvents have been tried to improve suchrecovery by means of liquid-liquid extraction (Munsan and King1984; Botto et al 1989; Letcher et al 1991; Arda and Sayar 1992;Briones et al 1994; Maeda et al 1997; Gomez Marigliano et al1998; Rahman et al 2001). For the design of an extracting device,quantitative representation is required of the liquid - liquid equi-libria of the appropriate ternaries.
The purpose of this study is to determine precise binodalcurves, tie lines and plait points for ethanol-water -oleyl alco-hol and ethanol-water-oleic acid systems at 30°C. The distri-bution coefficients and separation factors have to be evalu-ated to investigate the extracting capabilities of the selectedsolvents.
ExperimentalMaterials. Ethanol (Merck KGaA, Germany, 99-100%,d = 0.79g/cm3), oleyl alcohol (BDH, England, d = 0.83 g/cm3) and oleic
acid (BDH, England, 92%, d=0.888 g/cm3) were used withoutfurther purification. Distilled water was used throughout thiswork.
Solubility data. The solubility data for ethanol-water-oleylalcohol and ethanol-water-oleic acid systems were determinedby the titration method (Feki et al 1994). 10 cm3 of water wasmeasured into a 125cm3 closed Erlenmeyer flask and solventwas added from a burette and agitated till the solution startedto appear turbid. The amount of solvent added was recordedas the maximum solubility of the solvent in the water and gavethe first point of the binodal curve on the base line. The ap-pearance of turbidity indicated the beginning of formation ofthe second phase, the solvent layer. Therefore, further addi-tion of a small amount of solvent gave a heterogeneous mix-ture. Then ethanol was added from a burette until the firstappearance of distinct clear homogeneity. This gave anotherpoint of binodal curve on the aqueous side. Same procedurewas applied starting with an initially measured quantity ofsolvent to construct the binodal curve on the solvent side.The refractive index of each mixture indicated as a point onthe binodal curve which was measured by using an “AtagoPrecision Abbe Refractometer.”
Equilibrium data. Equilibrium data were determined forthese systems at 30°C. Aliquots of 20 cm3 each of water andsolvent were taken in five different 250 cm3 closed Erlenmeyerflask and then various amounts of ethanol were added untilthe formation of single phases were noticed. These flaskswere vigorously shaken by an electric shaker for 30 min andwere permitted to settle for 60 min. After settling, two coexist-ing phases were formed. 1-2 Drops of each equilibrated phasewere removed by pipette, and their refractive index was care-fully measured. Compositions of the phases were determinedfrom the solubility data using calibration curves for refracto-*Author for correspondence
409
metric measurements (Ananthanarayanan and Rao 1968;Hegazi and Salem 1983).
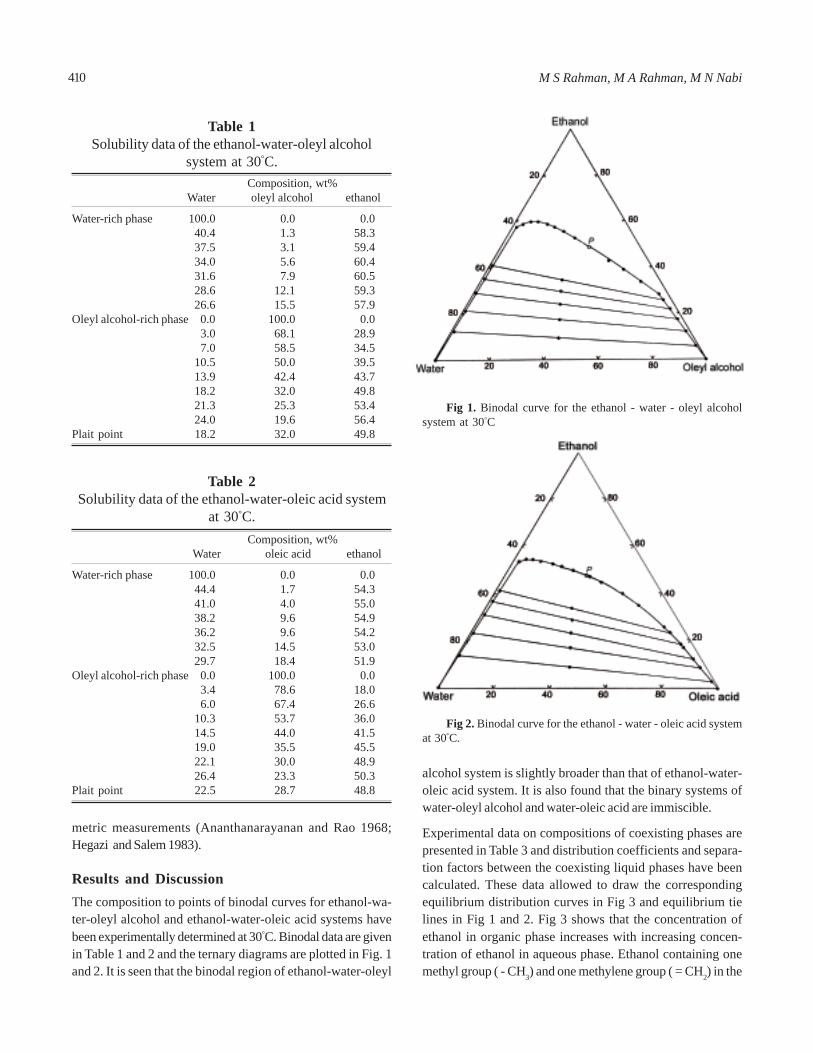
Results and DiscussionThe composition to points of binodal curves for ethanol-wa-ter-oleyl alcohol and ethanol-water-oleic acid systems havebeen experimentally determined at 30°C. Binodal data are givenin Table 1 and 2 and the ternary diagrams are plotted in Fig. 1and 2. It is seen that the binodal region of ethanol-water-oleyl
alcohol system is slightly broader than that of ethanol-water-oleic acid system. It is also found that the binary systems ofwater-oleyl alcohol and water-oleic acid are immiscible.
Experimental data on compositions of coexisting phases arepresented in Table 3 and distribution coefficients and separa-tion factors between the coexisting liquid phases have beencalculated. These data allowed to draw the correspondingequilibrium distribution curves in Fig 3 and equilibrium tielines in Fig 1 and 2. Fig 3 shows that the concentration ofethanol in organic phase increases with increasing concen-tration of ethanol in aqueous phase. Ethanol containing onemethyl group ( - CH3) and one methylene group ( = CH2) in the
Table 1Solubility data of the ethanol-water-oleyl alcohol
system at 30°C. Composition, wt%
Water oleyl alcohol ethanol
Water-rich phase 100.0 0.0 0.040.4 1.3 58.337.5 3.1 59.434.0 5.6 60.431.6 7.9 60.528.6 12.1 59.326.6 15.5 57.9
Oleyl alcohol-rich phase 0.0 100.0 0.03.0 68.1 28.97.0 58.5 34.5
10.5 50.0 39.513.9 42.4 43.718.2 32.0 49.821.3 25.3 53.424.0 19.6 56.4
Plait point 18.2 32.0 49.8
Table 2Solubility data of the ethanol-water-oleic acid system
at 30°C. Composition, wt%
Water oleic acid ethanol
Water-rich phase 100.0 0.0 0.044.4 1.7 54.341.0 4.0 55.038.2 9.6 54.936.2 9.6 54.232.5 14.5 53.029.7 18.4 51.9
Oleyl alcohol-rich phase 0.0 100.0 0.03.4 78.6 18.06.0 67.4 26.6
10.3 53.7 36.014.5 44.0 41.519.0 35.5 45.522.1 30.0 48.926.4 23.3 50.3
Plait point 22.5 28.7 48.8
Fig 2. Binodal curve for the ethanol - water - oleic acid systemat 30°C.
Fig 1. Binodal curve for the ethanol - water - oleyl alcoholsystem at 30°C
410 M S Rahman, M A Rahman, M N Nabi
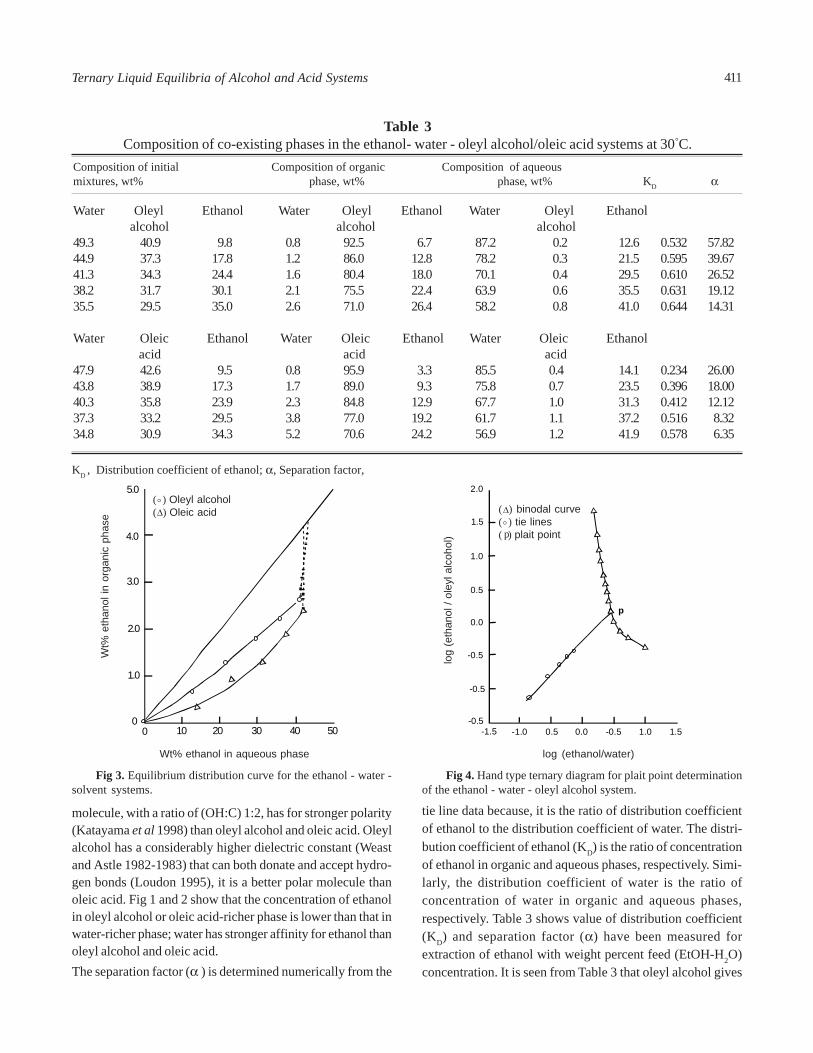
Table 3Composition of co-existing phases in the ethanol- water - oleyl alcohol/oleic acid systems at 30°C.
Composition of initial Composition of organic Composition of aqueousmixtures, wt% phase, wt% phase, wt% KD α
Water Oleyl Ethanol Water Oleyl Ethanol Water Oleyl Ethanol alcohol alcohol alcohol49.3 40.9 9.8 0.8 92.5 6.7 87.2 0.2 12.6 0.532 57.8244.9 37.3 17.8 1.2 86.0 12.8 78.2 0.3 21.5 0.595 39.6741.3 34.3 24.4 1.6 80.4 18.0 70.1 0.4 29.5 0.610 26.5238.2 31.7 30.1 2.1 75.5 22.4 63.9 0.6 35.5 0.631 19.1235.5 29.5 35.0 2.6 71.0 26.4 58.2 0.8 41.0 0.644 14.31
Water Oleic Ethanol Water Oleic Ethanol Water Oleic Ethanol acid acid acid47.9 42.6 9.5 0.8 95.9 3.3 85.5 0.4 14.1 0.234 26.0043.8 38.9 17.3 1.7 89.0 9.3 75.8 0.7 23.5 0.396 18.0040.3 35.8 23.9 2.3 84.8 12.9 67.7 1.0 31.3 0.412 12.1237.3 33.2 29.5 3.8 77.0 19.2 61.7 1.1 37.2 0.516 8.3234.8 30.9 34.3 5.2 70.6 24.2 56.9 1.2 41.9 0.578 6.35
KD , Distribution coefficient of ethanol; α, Separation factor,
Fig 3. Equilibrium distribution curve for the ethanol - water -solvent systems.
Fig 4. Hand type ternary diagram for plait point determinationof the ethanol - water - oleyl alcohol system.
molecule, with a ratio of (OH:C) 1:2, has for stronger polarity(Katayama et al 1998) than oleyl alcohol and oleic acid. Oleylalcohol has a considerably higher dielectric constant (Weastand Astle 1982-1983) that can both donate and accept hydro-gen bonds (Loudon 1995), it is a better polar molecule thanoleic acid. Fig 1 and 2 show that the concentration of ethanolin oleyl alcohol or oleic acid-richer phase is lower than that inwater-richer phase; water has stronger affinity for ethanol thanoleyl alcohol and oleic acid.The separation factor (α ) is determined numerically from the
tie line data because, it is the ratio of distribution coefficientof ethanol to the distribution coefficient of water. The distri-bution coefficient of ethanol (KD) is the ratio of concentrationof ethanol in organic and aqueous phases, respectively. Simi-larly, the distribution coefficient of water is the ratio ofconcentration of water in organic and aqueous phases,respectively. Table 3 shows value of distribution coefficient(KD) and separation factor (α) have been measured forextraction of ethanol with weight percent feed (EtOH-H2O)concentration. It is seen from Table 3 that oleyl alcohol gives
Wt% ethanol in aqueous phase log (ethanol/water)
Wt%
eth
anol
in o
rgan
ic p
hase
log
(eth
anol
/ ol
eyl a
lcoh
ol)
5.0
4.0
3.0
2.0
1.0
00 10 20 30 40 50
( ) Oleyl alcohol( ) Oleic acid°Δ
2.0
1.5
1.0
0.5
0.0
-0.5
-0.5
-0.5-1.5 -1.0 0.5 -0.50.0 1.0 1.5
p
( ) binodal curve( ) tie lines( ) plait point°Δ
p
411Ternary Liquid Equilibria of Alcohol and Acid Systems
KD values ranging from 0.5 - 0.6 and for oleic acid, it rangesfrom 0.2 - 0.6 for various ethanol concentration in feed. Theseparation factors for ethanol-water-oleyl alcohol and etha-nol-water-oleic acid systems are considerably greater than 6.Oleyl alcohol and oleic acid give the separation factors (α)ranging from 14.3 - 57.8 and 6.3 - 26.0, respectively, for variousethanol concentration in feed. This indicates that ethanol haspreferential solubility in solvents as desired in the extractionprocess.
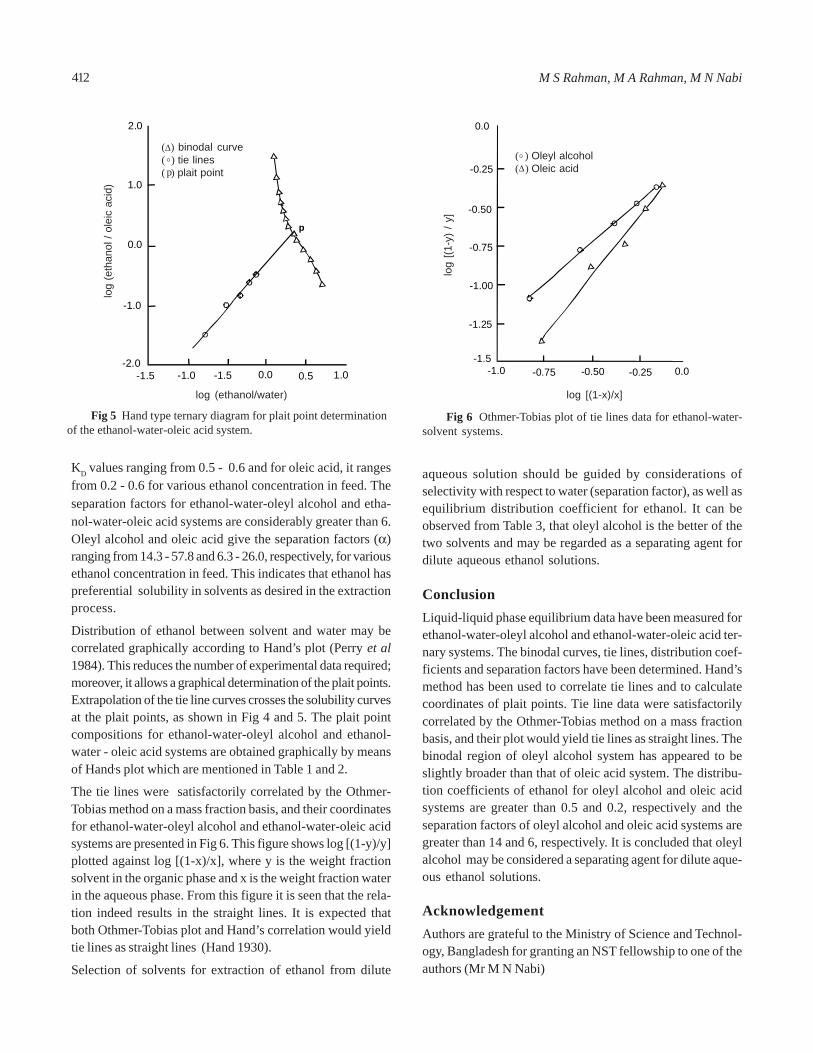
Distribution of ethanol between solvent and water may becorrelated graphically according to Hand’s plot (Perry et al1984). This reduces the number of experimental data required;moreover, it allows a graphical determination of the plait points.Extrapolation of the tie line curves crosses the solubility curvesat the plait points, as shown in Fig 4 and 5. The plait pointcompositions for ethanol-water-oleyl alcohol and ethanol-water - oleic acid systems are obtained graphically by meansof Hand,s plot which are mentioned in Table 1 and 2.
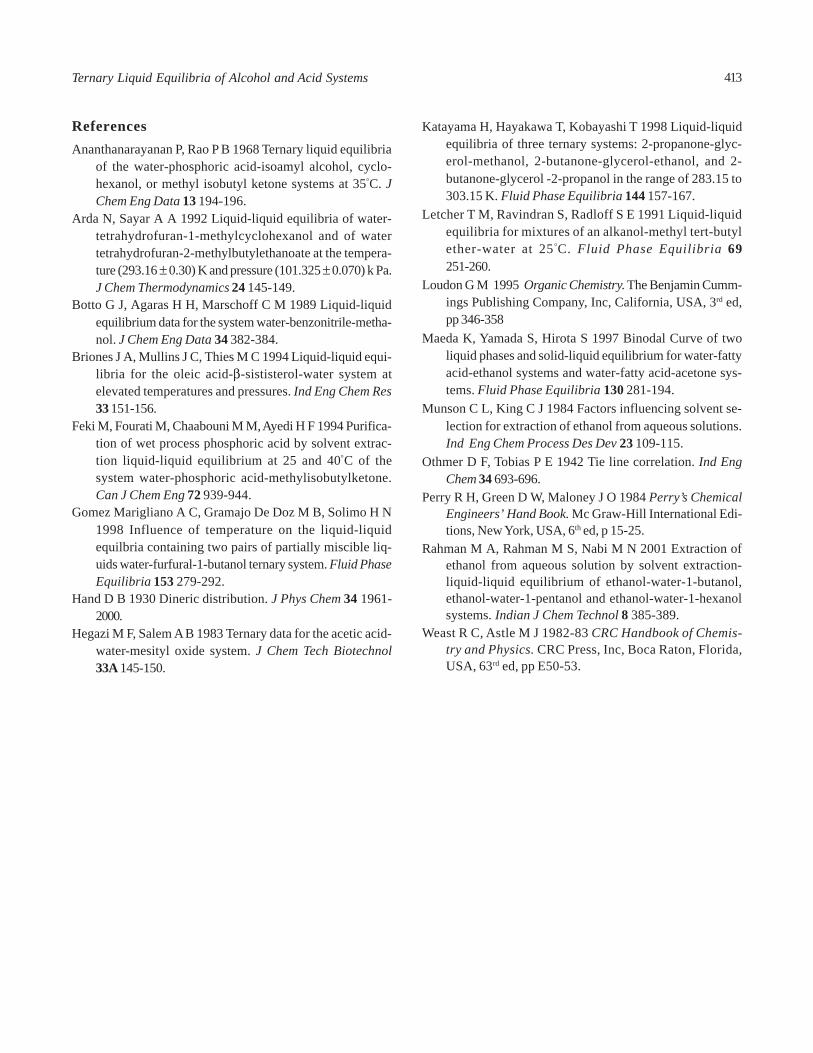
The tie lines were satisfactorily correlated by the Othmer-Tobias method on a mass fraction basis, and their coordinatesfor ethanol-water-oleyl alcohol and ethanol-water-oleic acidsystems are presented in Fig 6. This figure shows log [(1-y)/y]plotted against log [(1-x)/x], where y is the weight fractionsolvent in the organic phase and x is the weight fraction waterin the aqueous phase. From this figure it is seen that the rela-tion indeed results in the straight lines. It is expected thatboth Othmer-Tobias plot and Hand’s correlation would yieldtie lines as straight lines (Hand 1930).
Selection of solvents for extraction of ethanol from dilute
aqueous solution should be guided by considerations ofselectivity with respect to water (separation factor), as well asequilibrium distribution coefficient for ethanol. It can beobserved from Table 3, that oleyl alcohol is the better of thetwo solvents and may be regarded as a separating agent fordilute aqueous ethanol solutions.
ConclusionLiquid-liquid phase equilibrium data have been measured forethanol-water-oleyl alcohol and ethanol-water-oleic acid ter-nary systems. The binodal curves, tie lines, distribution coef-ficients and separation factors have been determined. Hand’smethod has been used to correlate tie lines and to calculatecoordinates of plait points. Tie line data were satisfactorilycorrelated by the Othmer-Tobias method on a mass fractionbasis, and their plot would yield tie lines as straight lines. Thebinodal region of oleyl alcohol system has appeared to beslightly broader than that of oleic acid system. The distribu-tion coefficients of ethanol for oleyl alcohol and oleic acidsystems are greater than 0.5 and 0.2, respectively and theseparation factors of oleyl alcohol and oleic acid systems aregreater than 14 and 6, respectively. It is concluded that oleylalcohol may be considered a separating agent for dilute aque-ous ethanol solutions.
AcknowledgementAuthors are grateful to the Ministry of Science and Technol-ogy, Bangladesh for granting an NST fellowship to one of theauthors (Mr M N Nabi)
Fig 5 Hand type ternary diagram for plait point determinationof the ethanol-water-oleic acid system.
Fig 6 Othmer-Tobias plot of tie lines data for ethanol-water-solvent systems.
log (ethanol/water) log [(1-x)/x]
log
[(1-y
) / y
]
0.0
-0.25
-0.50
-0.75
-1.00
-1.25
-1.5-1.0 -0.75 -0.50 -0.25 0.0
( ) Oleyl alcohol( ) Oleic acidΔ°
log
(eth
anol
/ ol
eic
acid
)
2.0
1.0
-1.0
0.0
-1.0-2.0
-1.5 -1.5 0.0 0.5 1.0
p
(Δ) binodal curve( ) tie lines( ) plait point°p
412 M S Rahman, M A Rahman, M N Nabi
ReferencesAnanthanarayanan P, Rao P B 1968 Ternary liquid equilibria
of the water-phosphoric acid-isoamyl alcohol, cyclo-hexanol, or methyl isobutyl ketone systems at 35°C. JChem Eng Data 13 194-196.
Arda N, Sayar A A 1992 Liquid-liquid equilibria of water-tetrahydrofuran-1-methylcyclohexanol and of watertetrahydrofuran-2-methylbutylethanoate at the tempera-ture (293.16 ± 0.30) K and pressure (101.325 ± 0.070) k Pa.J Chem Thermodynamics 24 145-149.
Botto G J, Agaras H H, Marschoff C M 1989 Liquid-liquidequilibrium data for the system water-benzonitrile-metha-nol. J Chem Eng Data 34 382-384.
Briones J A, Mullins J C, Thies M C 1994 Liquid-liquid equi-libria for the oleic acid-β-sististerol-water system atelevated temperatures and pressures. Ind Eng Chem Res33 151-156.
Feki M, Fourati M, Chaabouni M M, Ayedi H F 1994 Purifica-tion of wet process phosphoric acid by solvent extrac-tion liquid-liquid equilibrium at 25 and 40°C of thesystem water-phosphoric acid-methylisobutylketone.Can J Chem Eng 72 939-944.
Gomez Marigliano A C, Gramajo De Doz M B, Solimo H N1998 Influence of temperature on the liquid-liquidequilbria containing two pairs of partially miscible liq-uids water-furfural-1-butanol ternary system. Fluid PhaseEquilibria 153 279-292.
Hand D B 1930 Dineric distribution. J Phys Chem 34 1961-2000.
Hegazi M F, Salem A B 1983 Ternary data for the acetic acid-water-mesityl oxide system. J Chem Tech Biotechnol33A 145-150.
Katayama H, Hayakawa T, Kobayashi T 1998 Liquid-liquidequilibria of three ternary systems: 2-propanone-glyc-erol-methanol, 2-butanone-glycerol-ethanol, and 2-butanone-glycerol -2-propanol in the range of 283.15 to303.15 K. Fluid Phase Equilibria 144 157-167.
Letcher T M, Ravindran S, Radloff S E 1991 Liquid-liquidequilibria for mixtures of an alkanol-methyl tert-butylether-water at 25°C. Fluid Phase Equilibria 69251-260.
Loudon G M 1995 Organic Chemistry. The Benjamin Cumm-ings Publishing Company, Inc, California, USA, 3rd ed,pp 346-358
Maeda K, Yamada S, Hirota S 1997 Binodal Curve of twoliquid phases and solid-liquid equilibrium for water-fattyacid-ethanol systems and water-fatty acid-acetone sys-tems. Fluid Phase Equilibria 130 281-194.
Munson C L, King C J 1984 Factors influencing solvent se-lection for extraction of ethanol from aqueous solutions.Ind Eng Chem Process Des Dev 23 109-115.
Othmer D F, Tobias P E 1942 Tie line correlation. Ind EngChem 34 693-696.
Perry R H, Green D W, Maloney J O 1984 Perry’s ChemicalEngineers’ Hand Book. Mc Graw-Hill International Edi-tions, New York, USA, 6th ed, p 15-25.
Rahman M A, Rahman M S, Nabi M N 2001 Extraction ofethanol from aqueous solution by solvent extraction-liquid-liquid equilibrium of ethanol-water-1-butanol,ethanol-water-1-pentanol and ethanol-water-1-hexanolsystems. Indian J Chem Technol 8 385-389.
Weast R C, Astle M J 1982-83 CRC Handbook of Chemis-try and Physics. CRC Press, Inc, Boca Raton, Florida,USA, 63rd ed, pp E50-53.
413Ternary Liquid Equilibria of Alcohol and Acid Systems
Pak. J. Sci. Ind. Res. 2003 46(6) 414 - 417
ELECTROCAPILLARY AND FLOTATION STUDIES USING POTASSIUM ETHYLXANTHATE,DITHIOPHOSPHATE COLLECTORS AND THEIR MIXTURE.
M Riaz,* Faridullah Khan, Mumtaz, Nazir Jan and Naeem Pirzada
PCSIR Laboratories, PO Peshawar University, Jamrud Road Peshawar, Pakistan
(Received October 30, 2002; accepted January 27, 2003)
The sufrace tension measurements were carried out on dropping mercury electrode (dme) in 0.1 M sodium tetraboratebuffer solution, with potassium ethylxanthate (KEtx) and dithiophosphate (Dtp) added separately or in combinationunder comparable conditions. The electrocapillary curves determined as function of potential indicating reduction insurface tension by the addition of KEtx and Dtp. Synergistic behaviour was also studied by comparing the decrease insurface tension of individual collectors with that of their mixtures at various mole ratios and potentials. Flotation studieswere also conducted on heazlewoodite (Ni3S2) with these collectors separately and in combination to study the synergisticeffect.
Keywords: Electrocapillary, Flotation, Collectors
IntroductionSynergism may be defined as the enhanced effect obtainedfrom the use of a combinations of reagents relative to theirindividual action. In flotation, synergistic effect betweencollectors and frothers have long been recognized in plantpractices (Taggart 1945), though little attention have beenpaid to these in laboratory studies. Exception to this area, forexample, the investigation reported by Glembotskii (1958) onthe use of mixtures of collectors of same type but of differenthydrocarbon chain length or degree of branching. The workof Mingion (1984) on the use of dithiophosphates in conjunc-tion with xanthates and sodium mercaptobenzothiozole inthe flotation of platinum group metals, and the work ofPomianowski and Powlikowski - Czubak (1967), who have pre-sented the results the tensammetric measurements on mer-cury and of flotation using KEtx with dodecyltrimethyl ammo-nium bromide. The study of synergism between xanthate andcarbamate, sodium sulphide and carbamate was also carriedout (Critchely and Riaz 1991; Riaz and Critchley 1993; Riaz etal 1997; Riaz et al 2001) on dropping mercury electrodes andother metal electrodes. The study of such effects betweenKEtx and dithiophosphate (Dtp) in reaction with mercury elec-trode and flotation studies of heazlewoodite (Ni3S2) synergisedand supplied by Johnson Matthey Research, Ltd. is describedin the present contribution. Correlation was obtained betweenflotation recoveries obtained in a modified Hallimond tubeand simple measurements of surface tension carried out on adropping mercury electrode at controlled potentials (inelectrocapillary phenomenon).
ExperimentalReagents. All the chemicals used in the investigation wereof analytical grade. The KEtx and Dtp were freshly recrysta-llized for each experiment, single distilled water being usedthrough out. Unless otherwise stated, all experiments werecarried out in an electrolyte of 0.1M sodium tetraboratewhich gives a constant pH of 9.2. The pH was adjusted asnecessary by addition of NaOH or H2SO4.
Surface tension was measured by dropping mercury elec-trode by means of drop weight method. The apparatuswas calibrated against standard values for the surface ten-sion of mercury in contact with 0.1M KC1 solution. Poten-tials were measured with a saturated calomel reference elec-trode (SCE), and all potentials are given relative to thisscale. The dropping mercury electrode consisted of an extralong capillary and large mercury head to give as constantmercury flow rate as possible. The lower tip of capillarywas immersed in test solution contained in the cell. Thevolume of the cell was 100 cm3 which housed the workingelectrode connected by a side tube containing a sinteredglass frit and an agar-salt bridge to a side tube which formedthe saturated calomel reference electrode. The potentialacross the cell was controlled by general purposepolarograph E.I.I.Cambridge Model 0410 and digital mul-timeter, Thander TM 355.All potentials were measured withrespect to a saturated calomel electrode, whose potentialmay be taken as 241.2 mV with respect to the saturatedhydrogen scale of potential. The solutions were deoxy-genated using nitrogen gas that had been scrubbed invanadous chloride. A continuous nitrogen flow was main-tained though the experiments.*Author for correspondence
414
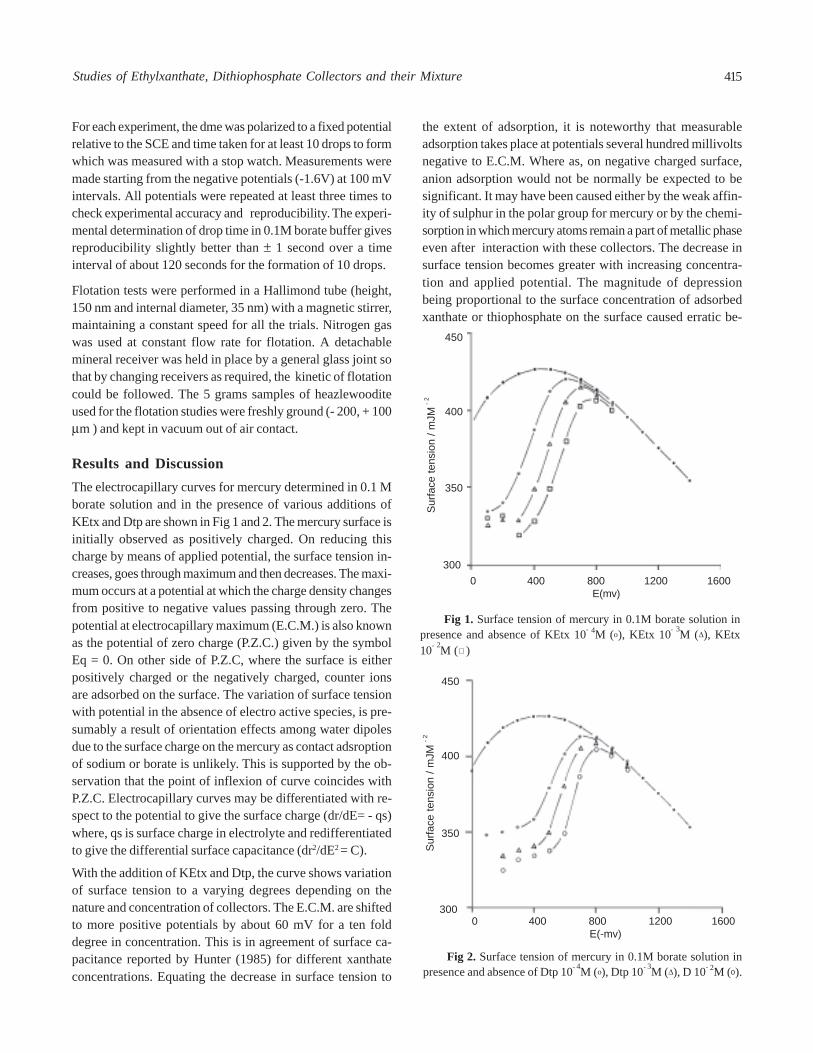
For each experiment, the dme was polarized to a fixed potentialrelative to the SCE and time taken for at least 10 drops to formwhich was measured with a stop watch. Measurements weremade starting from the negative potentials (-1.6V) at 100 mVintervals. All potentials were repeated at least three times tocheck experimental accuracy and reproducibility. The experi-mental determination of drop time in 0.1M borate buffer givesreproducibility slightly better than ± 1 second over a timeinterval of about 120 seconds for the formation of 10 drops.
Flotation tests were performed in a Hallimond tube (height,150 nm and internal diameter, 35 nm) with a magnetic stirrer,maintaining a constant speed for all the trials. Nitrogen gaswas used at constant flow rate for flotation. A detachablemineral receiver was held in place by a general glass joint sothat by changing receivers as required, the kinetic of flotationcould be followed. The 5 grams samples of heazlewooditeused for the flotation studies were freshly ground (- 200, + 100μm ) and kept in vacuum out of air contact.
Results and DiscussionThe electrocapillary curves for mercury determined in 0.1 Mborate solution and in the presence of various additions ofKEtx and Dtp are shown in Fig 1 and 2. The mercury surface isinitially observed as positively charged. On reducing thischarge by means of applied potential, the surface tension in-creases, goes through maximum and then decreases. The maxi-mum occurs at a potential at which the charge density changesfrom positive to negative values passing through zero. Thepotential at electrocapillary maximum (E.C.M.) is also knownas the potential of zero charge (P.Z.C.) given by the symbolEq = 0. On other side of P.Z.C, where the surface is eitherpositively charged or the negatively charged, counter ionsare adsorbed on the surface. The variation of surface tensionwith potential in the absence of electro active species, is pre-sumably a result of orientation effects among water dipolesdue to the surface charge on the mercury as contact adsroptionof sodium or borate is unlikely. This is supported by the ob-servation that the point of inflexion of curve coincides withP.Z.C. Electrocapillary curves may be differentiated with re-spect to the potential to give the surface charge (dr/dE= - qs)where, qs is surface charge in electrolyte and redifferentiatedto give the differential surface capacitance (dr2/dE2 = C).
With the addition of KEtx and Dtp, the curve shows variationof surface tension to a varying degrees depending on thenature and concentration of collectors. The E.C.M. are shiftedto more positive potentials by about 60 mV for a ten folddegree in concentration. This is in agreement of surface ca-pacitance reported by Hunter (1985) for different xanthateconcentrations. Equating the decrease in surface tension to
the extent of adsorption, it is noteworthy that measurableadsorption takes place at potentials several hundred millivoltsnegative to E.C.M. Where as, on negative charged surface,anion adsorption would not be normally be expected to besignificant. It may have been caused either by the weak affin-ity of sulphur in the polar group for mercury or by the chemi-sorption in which mercury atoms remain a part of metallic phaseeven after interaction with these collectors. The decrease insurface tension becomes greater with increasing concentra-tion and applied potential. The magnitude of depressionbeing proportional to the surface concentration of adsorbedxanthate or thiophosphate on the surface caused erratic be-
Fig 1. Surface tension of mercury in 0.1M borate solution inpresence and absence of KEtx 10- 4M (o), KEtx 10- 3M (Δ), KEtx10- 2M ( )
Surfa
ce te
nsio
n / m
JM - 2
0 400 800 1200 1600E(mv)
450
400
350
300
Fig 2. Surface tension of mercury in 0.1M borate solution inpresence and absence of Dtp 10- 4M (o), Dtp 10- 3M (Δ), D 10- 2M (o).
Sur
face
tens
ion
/ mJM
- 2
0 400 800 1200 1600E(-mv)
450
400
350
300
415Studies of Ethylxanthate, Dithiophosphate Collectors and their Mixture
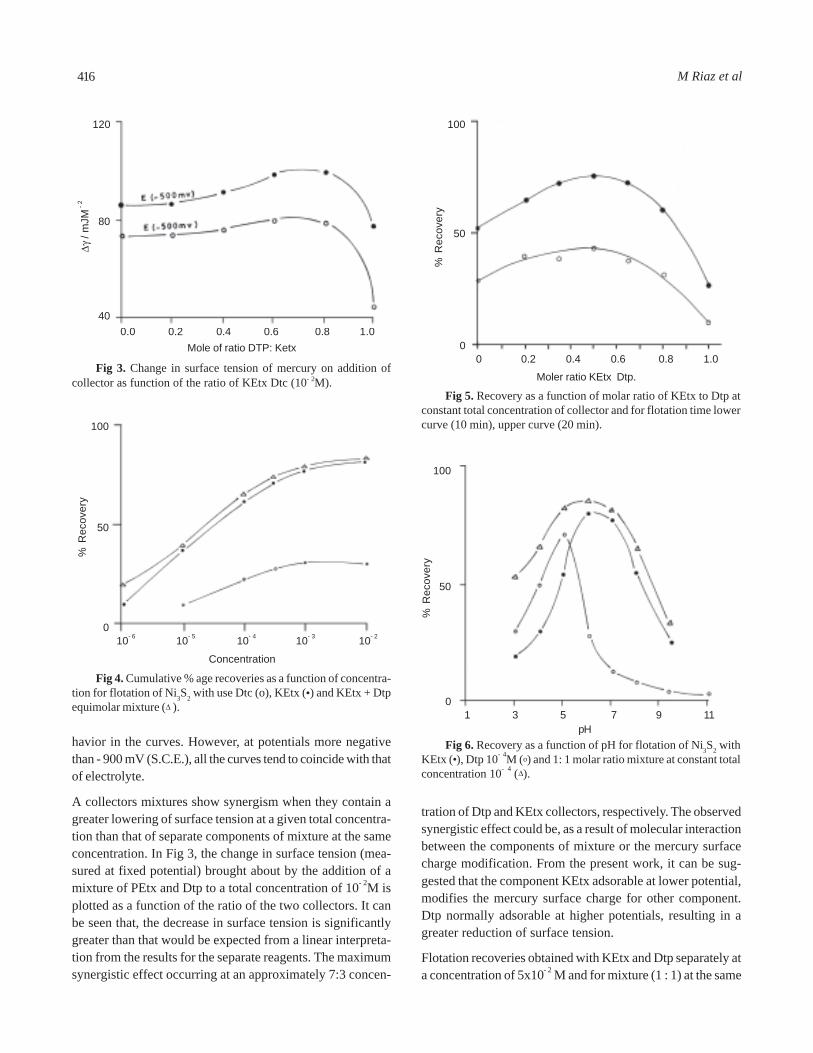
havior in the curves. However, at potentials more negativethan - 900 mV (S.C.E.), all the curves tend to coincide with thatof electrolyte.
A collectors mixtures show synergism when they contain agreater lowering of surface tension at a given total concentra-tion than that of separate components of mixture at the sameconcentration. In Fig 3, the change in surface tension (mea-sured at fixed potential) brought about by the addition of amixture of PEtx and Dtp to a total concentration of 10- 2M isplotted as a function of the ratio of the two collectors. It canbe seen that, the decrease in surface tension is significantlygreater than that would be expected from a linear interpreta-tion from the results for the separate reagents. The maximumsynergistic effect occurring at an approximately 7:3 concen-
Fig 4. Cumulative % age recoveries as a function of concentra-tion for flotation of Ni3S2 with use Dtc (o), KEtx (•) and KEtx + Dtpequimolar mixture (Δ ).
tration of Dtp and KEtx collectors, respectively. The observedsynergistic effect could be, as a result of molecular interactionbetween the components of mixture or the mercury surfacecharge modification. From the present work, it can be sug-gested that the component KEtx adsorable at lower potential,modifies the mercury surface charge for other component.Dtp normally adsorable at higher potentials, resulting in agreater reduction of surface tension.
Flotation recoveries obtained with KEtx and Dtp separately ata concentration of 5x10- 2 M and for mixture (1 : 1) at the same
Fig 3. Change in surface tension of mercury on addition ofcollector as function of the ratio of KEtx Dtc (10- 2M).
Mole of ratio DTP: Ketx
Δγ /
mJM
- 2
0.0 0.2 0.4 0.6 0.8 1.0
120
80
40
Concentration
% R
ecov
ery
10- 6 10- 5 10- 4 10- 3 10- 2
100
50
0
Fig 6. Recovery as a function of pH for flotation of Ni3S2 withKEtx (•), Dtp 10- 4M (o) and 1: 1 molar ratio mixture at constant totalconcentration 10- 4 (Δ).
% R
ecov
ery
pH1 3 5 7 9 11
100
50
0
Fig 5. Recovery as a function of molar ratio of KEtx to Dtp atconstant total concentration of collector and for flotation time lowercurve (10 min), upper curve (20 min).
% R
ecov
ery
Moler ratio KEtx Dtp.
0 0.2 0.4 0.6 0.8 1.0
100
50
0
416 M Riaz et al
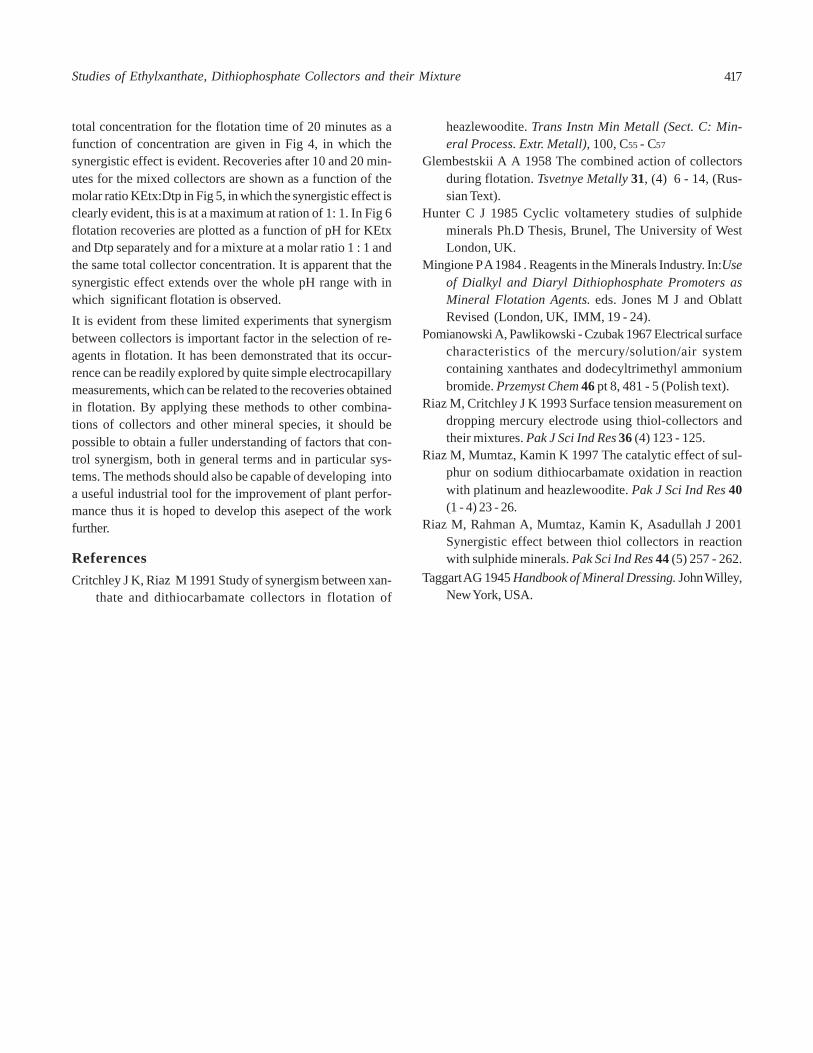
total concentration for the flotation time of 20 minutes as afunction of concentration are given in Fig 4, in which thesynergistic effect is evident. Recoveries after 10 and 20 min-utes for the mixed collectors are shown as a function of themolar ratio KEtx:Dtp in Fig 5, in which the synergistic effect isclearly evident, this is at a maximum at ration of 1: 1. In Fig 6flotation recoveries are plotted as a function of pH for KEtxand Dtp separately and for a mixture at a molar ratio 1 : 1 andthe same total collector concentration. It is apparent that thesynergistic effect extends over the whole pH range with inwhich significant flotation is observed.It is evident from these limited experiments that synergismbetween collectors is important factor in the selection of re-agents in flotation. It has been demonstrated that its occur-rence can be readily explored by quite simple electrocapillarymeasurements, which can be related to the recoveries obtainedin flotation. By applying these methods to other combina-tions of collectors and other mineral species, it should bepossible to obtain a fuller understanding of factors that con-trol synergism, both in general terms and in particular sys-tems. The methods should also be capable of developing intoa useful industrial tool for the improvement of plant perfor-mance thus it is hoped to develop this asepect of the workfurther.
ReferencesCritchley J K, Riaz M 1991 Study of synergism between xan-
thate and dithiocarbamate collectors in flotation of
heazlewoodite. Trans Instn Min Metall (Sect. C: Min-eral Process. Extr. Metall), 100, C55 - C57
Glembestskii A A 1958 The combined action of collectorsduring flotation. Tsvetnye Metally 31, (4) 6 - 14, (Rus-sian Text).
Hunter C J 1985 Cyclic voltametery studies of sulphideminerals Ph.D Thesis, Brunel, The University of WestLondon, UK.
Mingione P A 1984 . Reagents in the Minerals Industry. In:Useof Dialkyl and Diaryl Dithiophosphate Promoters asMineral Flotation Agents. eds. Jones M J and OblattRevised (London, UK, IMM, 19 - 24).
Pomianowski A, Pawlikowski - Czubak 1967 Electrical surfacecharacteristics of the mercury/solution/air systemcontaining xanthates and dodecyltrimethyl ammoniumbromide. Przemyst Chem 46 pt 8, 481 - 5 (Polish text).
Riaz M, Critchley J K 1993 Surface tension measurement ondropping mercury electrode using thiol-collectors andtheir mixtures. Pak J Sci Ind Res 36 (4) 123 - 125.
Riaz M, Mumtaz, Kamin K 1997 The catalytic effect of sul-phur on sodium dithiocarbamate oxidation in reactionwith platinum and heazlewoodite. Pak J Sci Ind Res 40(1 - 4) 23 - 26.
Riaz M, Rahman A, Mumtaz, Kamin K, Asadullah J 2001Synergistic effect between thiol collectors in reactionwith sulphide minerals. Pak Sci Ind Res 44 (5) 257 - 262.
Taggart AG 1945 Handbook of Mineral Dressing. John Willey,New York, USA.
417Studies of Ethylxanthate, Dithiophosphate Collectors and their Mixture
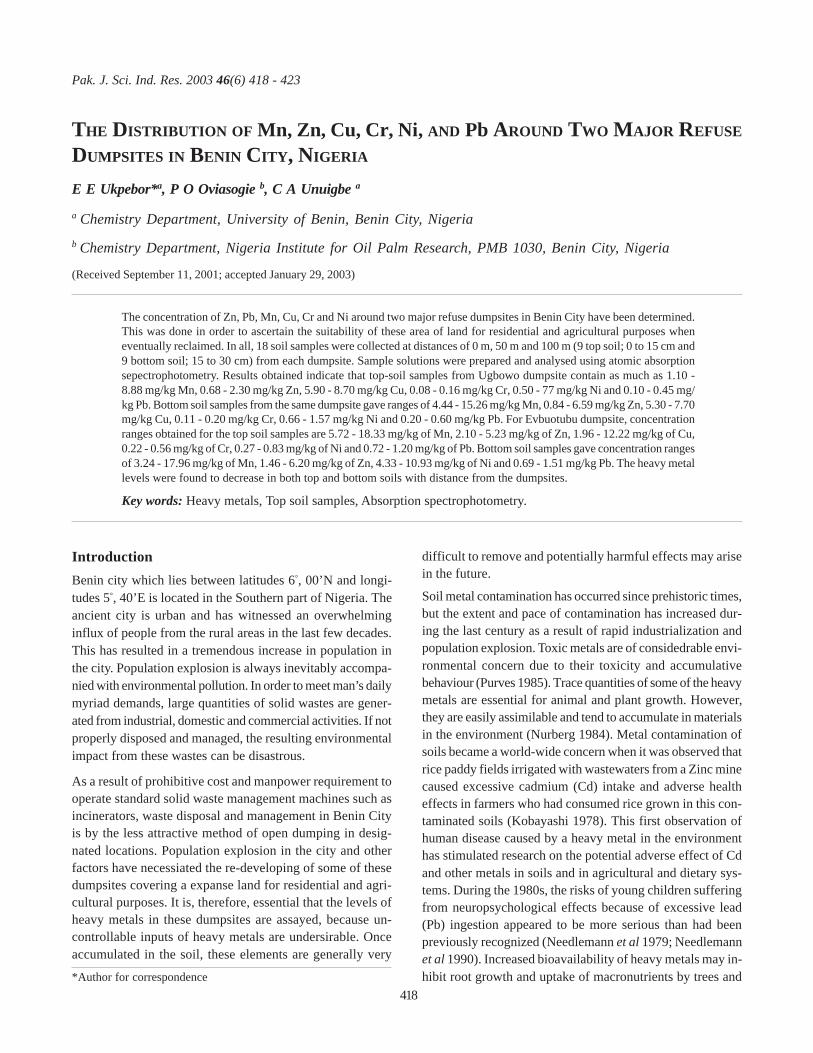
Pak. J. Sci. Ind. Res. 2003 46(6) 418 - 423
THE DISTRIBUTION OF Mn, Zn, Cu, Cr, Ni, AND Pb AROUND TWO MAJOR REFUSE
DUMPSITES IN BENIN CITY, NIGERIA
E E Ukpebor*a, P O Oviasogie b, C A Unuigbe a
a Chemistry Department, University of Benin, Benin City, Nigeriab Chemistry Department, Nigeria Institute for Oil Palm Research, PMB 1030, Benin City, Nigeria
(Received September 11, 2001; accepted January 29, 2003)
The concentration of Zn, Pb, Mn, Cu, Cr and Ni around two major refuse dumpsites in Benin City have been determined.This was done in order to ascertain the suitability of these area of land for residential and agricultural purposes wheneventually reclaimed. In all, 18 soil samples were collected at distances of 0 m, 50 m and 100 m (9 top soil; 0 to 15 cm and9 bottom soil; 15 to 30 cm) from each dumpsite. Sample solutions were prepared and analysed using atomic absorptionsepectrophotometry. Results obtained indicate that top-soil samples from Ugbowo dumpsite contain as much as 1.10 -8.88 mg/kg Mn, 0.68 - 2.30 mg/kg Zn, 5.90 - 8.70 mg/kg Cu, 0.08 - 0.16 mg/kg Cr, 0.50 - 77 mg/kg Ni and 0.10 - 0.45 mg/kg Pb. Bottom soil samples from the same dumpsite gave ranges of 4.44 - 15.26 mg/kg Mn, 0.84 - 6.59 mg/kg Zn, 5.30 - 7.70mg/kg Cu, 0.11 - 0.20 mg/kg Cr, 0.66 - 1.57 mg/kg Ni and 0.20 - 0.60 mg/kg Pb. For Evbuotubu dumpsite, concentrationranges obtained for the top soil samples are 5.72 - 18.33 mg/kg of Mn, 2.10 - 5.23 mg/kg of Zn, 1.96 - 12.22 mg/kg of Cu,0.22 - 0.56 mg/kg of Cr, 0.27 - 0.83 mg/kg of Ni and 0.72 - 1.20 mg/kg of Pb. Bottom soil samples gave concentration rangesof 3.24 - 17.96 mg/kg of Mn, 1.46 - 6.20 mg/kg of Zn, 4.33 - 10.93 mg/kg of Ni and 0.69 - 1.51 mg/kg Pb. The heavy metallevels were found to decrease in both top and bottom soils with distance from the dumpsites.
Key words: Heavy metals, Top soil samples, Absorption spectrophotometry.
IntroductionBenin city which lies between latitudes 6°, 00’N and longi-tudes 5°, 40’E is located in the Southern part of Nigeria. Theancient city is urban and has witnessed an overwhelminginflux of people from the rural areas in the last few decades.This has resulted in a tremendous increase in population inthe city. Population explosion is always inevitably accompa-nied with environmental pollution. In order to meet man’s dailymyriad demands, large quantities of solid wastes are gener-ated from industrial, domestic and commercial activities. If notproperly disposed and managed, the resulting environmentalimpact from these wastes can be disastrous.
As a result of prohibitive cost and manpower requirement tooperate standard solid waste management machines such asincinerators, waste disposal and management in Benin Cityis by the less attractive method of open dumping in desig-nated locations. Population explosion in the city and otherfactors have necessiated the re-developing of some of thesedumpsites covering a expanse land for residential and agri-cultural purposes. It is, therefore, essential that the levels ofheavy metals in these dumpsites are assayed, because un-controllable inputs of heavy metals are undersirable. Onceaccumulated in the soil, these elements are generally very
difficult to remove and potentially harmful effects may arisein the future.
Soil metal contamination has occurred since prehistoric times,but the extent and pace of contamination has increased dur-ing the last century as a result of rapid industrialization andpopulation explosion. Toxic metals are of considedrable envi-ronmental concern due to their toxicity and accumulativebehaviour (Purves 1985). Trace quantities of some of the heavymetals are essential for animal and plant growth. However,they are easily assimilable and tend to accumulate in materialsin the environment (Nurberg 1984). Metal contamination ofsoils became a world-wide concern when it was observed thatrice paddy fields irrigated with wastewaters from a Zinc minecaused excessive cadmium (Cd) intake and adverse healtheffects in farmers who had consumed rice grown in this con-taminated soils (Kobayashi 1978). This first observation ofhuman disease caused by a heavy metal in the environmenthas stimulated research on the potential adverse effect of Cdand other metals in soils and in agricultural and dietary sys-tems. During the 1980s, the risks of young children sufferingfrom neuropsychological effects because of excessive lead(Pb) ingestion appeared to be more serious than had beenpreviously recognized (Needlemann et al 1979; Needlemannet al 1990). Increased bioavailability of heavy metals may in-hibit root growth and uptake of macronutrients by trees and*Author for correspondence
418
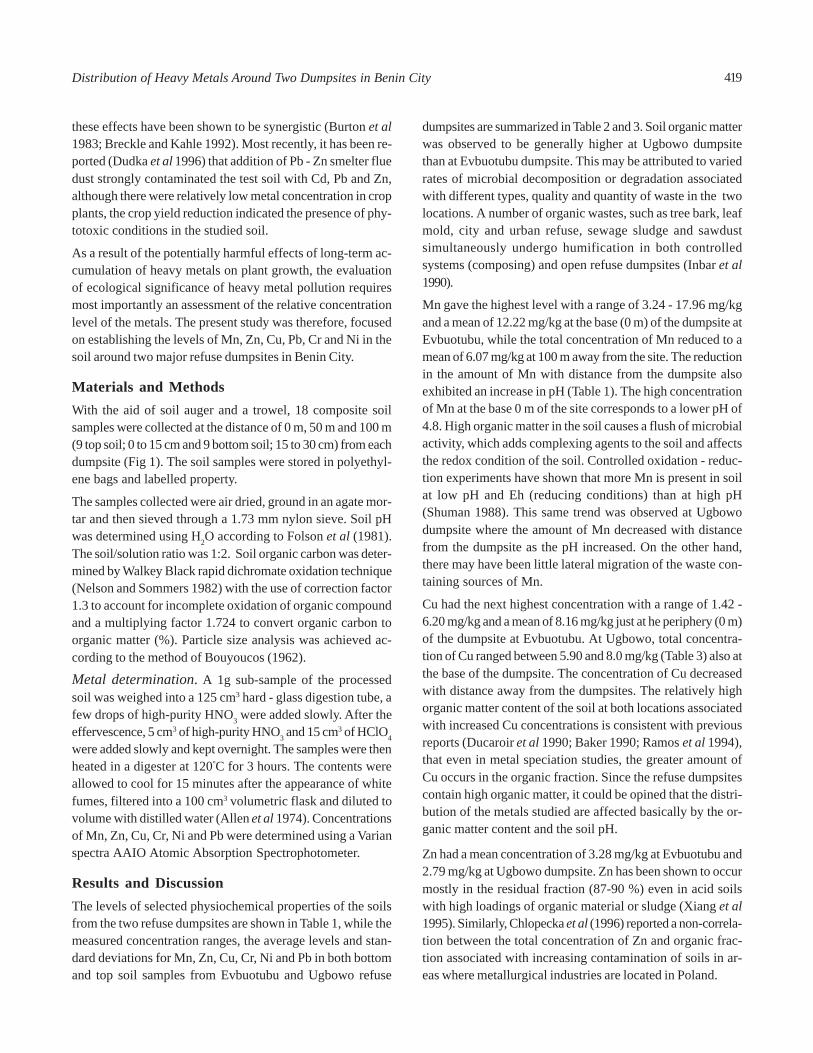
these effects have been shown to be synergistic (Burton et al1983; Breckle and Kahle 1992). Most recently, it has been re-ported (Dudka et al 1996) that addition of Pb - Zn smelter fluedust strongly contaminated the test soil with Cd, Pb and Zn,although there were relatively low metal concentration in cropplants, the crop yield reduction indicated the presence of phy-totoxic conditions in the studied soil.
As a result of the potentially harmful effects of long-term ac-cumulation of heavy metals on plant growth, the evaluationof ecological significance of heavy metal pollution requiresmost importantly an assessment of the relative concentrationlevel of the metals. The present study was therefore, focusedon establishing the levels of Mn, Zn, Cu, Pb, Cr and Ni in thesoil around two major refuse dumpsites in Benin City.
Materials and MethodsWith the aid of soil auger and a trowel, 18 composite soilsamples were collected at the distance of 0 m, 50 m and 100 m(9 top soil; 0 to 15 cm and 9 bottom soil; 15 to 30 cm) from eachdumpsite (Fig 1). The soil samples were stored in polyethyl-ene bags and labelled property.
The samples collected were air dried, ground in an agate mor-tar and then sieved through a 1.73 mm nylon sieve. Soil pHwas determined using H2O according to Folson et al (1981).The soil/solution ratio was 1:2. Soil organic carbon was deter-mined by Walkey Black rapid dichromate oxidation technique(Nelson and Sommers 1982) with the use of correction factor1.3 to account for incomplete oxidation of organic compoundand a multiplying factor 1.724 to convert organic carbon toorganic matter (%). Particle size analysis was achieved ac-cording to the method of Bouyoucos (1962).
Metal determination. A 1g sub-sample of the processedsoil was weighed into a 125 cm3 hard - glass digestion tube, afew drops of high-purity HNO3 were added slowly. After theeffervescence, 5 cm3 of high-purity HNO3 and 15 cm3 of HClO4
were added slowly and kept overnight. The samples were thenheated in a digester at 120°C for 3 hours. The contents wereallowed to cool for 15 minutes after the appearance of whitefumes, filtered into a 100 cm3 volumetric flask and diluted tovolume with distilled water (Allen et al 1974). Concentrationsof Mn, Zn, Cu, Cr, Ni and Pb were determined using a Varianspectra AAIO Atomic Absorption Spectrophotometer.
Results and DiscussionThe levels of selected physiochemical properties of the soilsfrom the two refuse dumpsites are shown in Table 1, while themeasured concentration ranges, the average levels and stan-dard deviations for Mn, Zn, Cu, Cr, Ni and Pb in both bottomand top soil samples from Evbuotubu and Ugbowo refuse
dumpsites are summarized in Table 2 and 3. Soil organic matterwas observed to be generally higher at Ugbowo dumpsitethan at Evbuotubu dumpsite. This may be attributed to variedrates of microbial decomposition or degradation associatedwith different types, quality and quantity of waste in the twolocations. A number of organic wastes, such as tree bark, leafmold, city and urban refuse, sewage sludge and sawdustsimultaneously undergo humification in both controlledsystems (composing) and open refuse dumpsites (Inbar et al1990).
Mn gave the highest level with a range of 3.24 - 17.96 mg/kgand a mean of 12.22 mg/kg at the base (0 m) of the dumpsite atEvbuotubu, while the total concentration of Mn reduced to amean of 6.07 mg/kg at 100 m away from the site. The reductionin the amount of Mn with distance from the dumpsite alsoexhibited an increase in pH (Table 1). The high concentrationof Mn at the base 0 m of the site corresponds to a lower pH of4.8. High organic matter in the soil causes a flush of microbialactivity, which adds complexing agents to the soil and affectsthe redox condition of the soil. Controlled oxidation - reduc-tion experiments have shown that more Mn is present in soilat low pH and Eh (reducing conditions) than at high pH(Shuman 1988). This same trend was observed at Ugbowodumpsite where the amount of Mn decreased with distancefrom the dumpsite as the pH increased. On the other hand,there may have been little lateral migration of the waste con-taining sources of Mn.
Cu had the next highest concentration with a range of 1.42 -6.20 mg/kg and a mean of 8.16 mg/kg just at he periphery (0 m)of the dumpsite at Evbuotubu. At Ugbowo, total concentra-tion of Cu ranged between 5.90 and 8.0 mg/kg (Table 3) also atthe base of the dumpsite. The concentration of Cu decreasedwith distance away from the dumpsites. The relatively highorganic matter content of the soil at both locations associatedwith increased Cu concentrations is consistent with previousreports (Ducaroir et al 1990; Baker 1990; Ramos et al 1994),that even in metal speciation studies, the greater amount ofCu occurs in the organic fraction. Since the refuse dumpsitescontain high organic matter, it could be opined that the distri-bution of the metals studied are affected basically by the or-ganic matter content and the soil pH.
Zn had a mean concentration of 3.28 mg/kg at Evbuotubu and2.79 mg/kg at Ugbowo dumpsite. Zn has been shown to occurmostly in the residual fraction (87-90 %) even in acid soilswith high loadings of organic material or sludge (Xiang et al1995). Similarly, Chlopecka et al (1996) reported a non-correla-tion between the total concentration of Zn and organic frac-tion associated with increasing contamination of soils in ar-eas where metallurgical industries are located in Poland.
419Distribution of Heavy Metals Around Two Dumpsites in Benin City
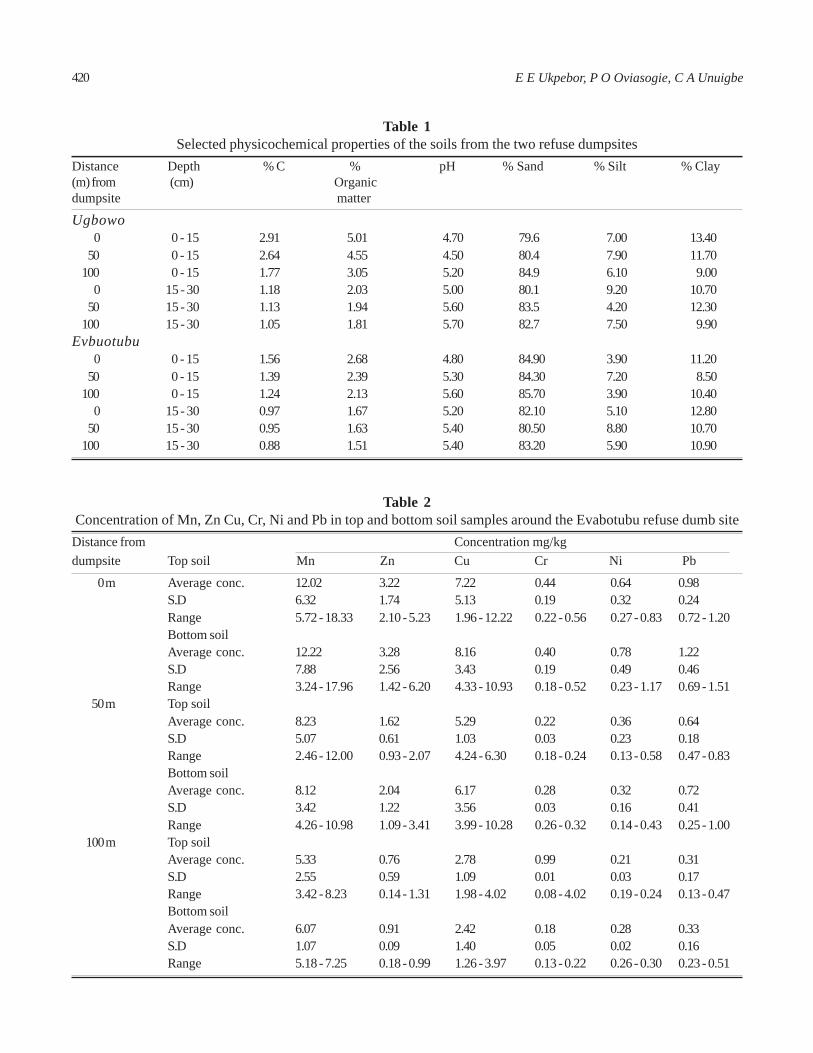
Table 1Selected physicochemical properties of the soils from the two refuse dumpsites
Distance Depth % C % pH % Sand % Silt % Clay(m) from (cm) Organicdumpsite matter
Ugbowo0 0 - 15 2.91 5.01 4.70 79.6 7.00 13.40
50 0 - 15 2.64 4.55 4.50 80.4 7.90 11.70100 0 - 15 1.77 3.05 5.20 84.9 6.10 9.00
0 15 - 30 1.18 2.03 5.00 80.1 9.20 10.7050 15 - 30 1.13 1.94 5.60 83.5 4.20 12.30
100 15 - 30 1.05 1.81 5.70 82.7 7.50 9.90Evbuotubu
0 0 - 15 1.56 2.68 4.80 84.90 3.90 11.2050 0 - 15 1.39 2.39 5.30 84.30 7.20 8.50
100 0 - 15 1.24 2.13 5.60 85.70 3.90 10.400 15 - 30 0.97 1.67 5.20 82.10 5.10 12.80
50 15 - 30 0.95 1.63 5.40 80.50 8.80 10.70100 15 - 30 0.88 1.51 5.40 83.20 5.90 10.90
Table 2Concentration of Mn, Zn Cu, Cr, Ni and Pb in top and bottom soil samples around the Evabotubu refuse dumb site
Distance from Concentration mg/kgdumpsite Top soil Mn Zn Cu Cr Ni Pb
0 m Average conc. 12.02 3.22 7.22 0.44 0.64 0.98S.D 6.32 1.74 5.13 0.19 0.32 0.24Range 5.72 - 18.33 2.10 - 5.23 1.96 - 12.22 0.22 - 0.56 0.27 - 0.83 0.72 - 1.20Bottom soilAverage conc. 12.22 3.28 8.16 0.40 0.78 1.22S.D 7.88 2.56 3.43 0.19 0.49 0.46Range 3.24 - 17.96 1.42 - 6.20 4.33 - 10.93 0.18 - 0.52 0.23 - 1.17 0.69 - 1.51
50 m Top soilAverage conc. 8.23 1.62 5.29 0.22 0.36 0.64S.D 5.07 0.61 1.03 0.03 0.23 0.18Range 2.46 - 12.00 0.93 - 2.07 4.24 - 6.30 0.18 - 0.24 0.13 - 0.58 0.47 - 0.83Bottom soilAverage conc. 8.12 2.04 6.17 0.28 0.32 0.72S.D 3.42 1.22 3.56 0.03 0.16 0.41Range 4.26 - 10.98 1.09 - 3.41 3.99 - 10.28 0.26 - 0.32 0.14 - 0.43 0.25 - 1.00
100 m Top soilAverage conc. 5.33 0.76 2.78 0.99 0.21 0.31S.D 2.55 0.59 1.09 0.01 0.03 0.17Range 3.42 - 8.23 0.14 - 1.31 1.98 - 4.02 0.08 - 4.02 0.19 - 0.24 0.13 - 0.47Bottom soilAverage conc. 6.07 0.91 2.42 0.18 0.28 0.33S.D 1.07 0.09 1.40 0.05 0.02 0.16Range 5.18 - 7.25 0.18 - 0.99 1.26 - 3.97 0.13 - 0.22 0.26 - 0.30 0.23 - 0.51
420 E E Ukpebor, P O Oviasogie, C A Unuigbe
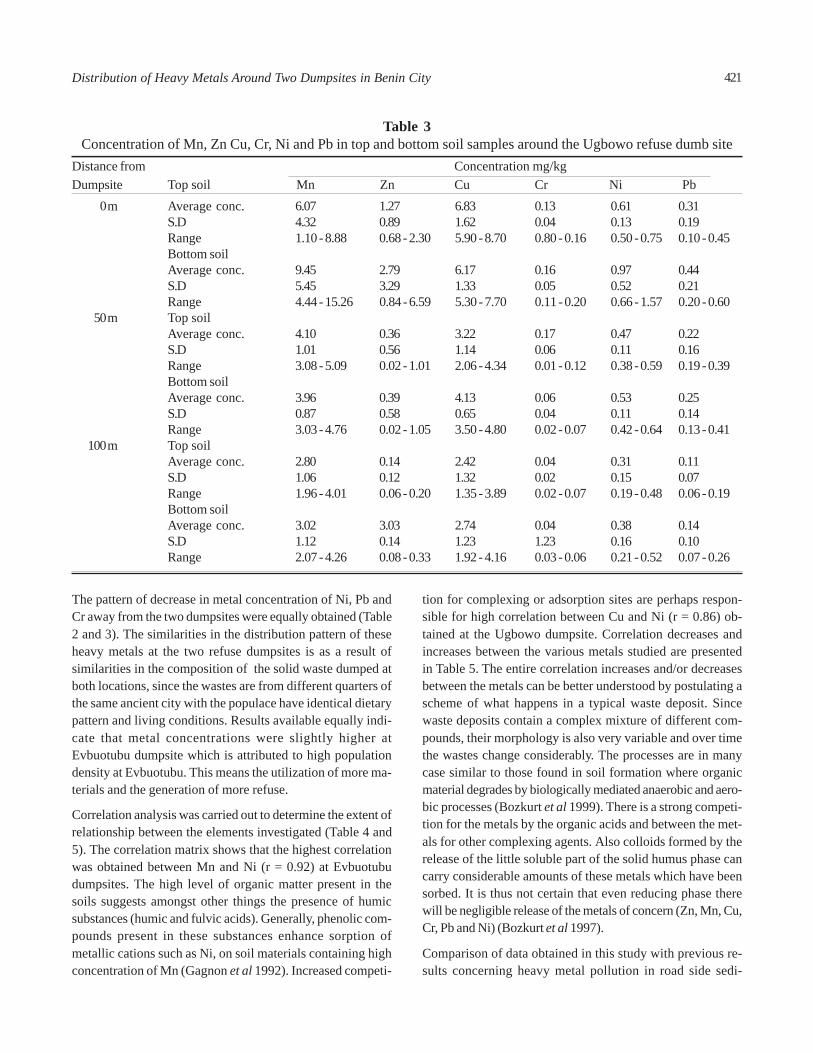
The pattern of decrease in metal concentration of Ni, Pb andCr away from the two dumpsites were equally obtained (Table2 and 3). The similarities in the distribution pattern of theseheavy metals at the two refuse dumpsites is as a result ofsimilarities in the composition of the solid waste dumped atboth locations, since the wastes are from different quarters ofthe same ancient city with the populace have identical dietarypattern and living conditions. Results available equally indi-cate that metal concentrations were slightly higher atEvbuotubu dumpsite which is attributed to high populationdensity at Evbuotubu. This means the utilization of more ma-terials and the generation of more refuse.
Correlation analysis was carried out to determine the extent ofrelationship between the elements investigated (Table 4 and5). The correlation matrix shows that the highest correlationwas obtained between Mn and Ni (r = 0.92) at Evbuotubudumpsites. The high level of organic matter present in thesoils suggests amongst other things the presence of humicsubstances (humic and fulvic acids). Generally, phenolic com-pounds present in these substances enhance sorption ofmetallic cations such as Ni, on soil materials containing highconcentration of Mn (Gagnon et al 1992). Increased competi-
tion for complexing or adsorption sites are perhaps respon-sible for high correlation between Cu and Ni (r = 0.86) ob-tained at the Ugbowo dumpsite. Correlation decreases andincreases between the various metals studied are presentedin Table 5. The entire correlation increases and/or decreasesbetween the metals can be better understood by postulating ascheme of what happens in a typical waste deposit. Sincewaste deposits contain a complex mixture of different com-pounds, their morphology is also very variable and over timethe wastes change considerably. The processes are in manycase similar to those found in soil formation where organicmaterial degrades by biologically mediated anaerobic and aero-bic processes (Bozkurt et al 1999). There is a strong competi-tion for the metals by the organic acids and between the met-als for other complexing agents. Also colloids formed by therelease of the little soluble part of the solid humus phase cancarry considerable amounts of these metals which have beensorbed. It is thus not certain that even reducing phase therewill be negligible release of the metals of concern (Zn, Mn, Cu,Cr, Pb and Ni) (Bozkurt et al 1997).
Comparison of data obtained in this study with previous re-sults concerning heavy metal pollution in road side sedi-
Table 3Concentration of Mn, Zn Cu, Cr, Ni and Pb in top and bottom soil samples around the Ugbowo refuse dumb site
Distance from Concentration mg/kgDumpsite Top soil Mn Zn Cu Cr Ni Pb
0 m Average conc. 6.07 1.27 6.83 0.13 0.61 0.31S.D 4.32 0.89 1.62 0.04 0.13 0.19Range 1.10 - 8.88 0.68 - 2.30 5.90 - 8.70 0.80 - 0.16 0.50 - 0.75 0.10 - 0.45Bottom soilAverage conc. 9.45 2.79 6.17 0.16 0.97 0.44S.D 5.45 3.29 1.33 0.05 0.52 0.21Range 4.44 - 15.26 0.84 - 6.59 5.30 - 7.70 0.11 - 0.20 0.66 - 1.57 0.20 - 0.60
50 m Top soilAverage conc. 4.10 0.36 3.22 0.17 0.47 0.22S.D 1.01 0.56 1.14 0.06 0.11 0.16Range 3.08 - 5.09 0.02 - 1.01 2.06 - 4.34 0.01 - 0.12 0.38 - 0.59 0.19 - 0.39Bottom soilAverage conc. 3.96 0.39 4.13 0.06 0.53 0.25S.D 0.87 0.58 0.65 0.04 0.11 0.14Range 3.03 - 4.76 0.02 - 1.05 3.50 - 4.80 0.02 - 0.07 0.42 - 0.64 0.13 - 0.41
100 m Top soilAverage conc. 2.80 0.14 2.42 0.04 0.31 0.11S.D 1.06 0.12 1.32 0.02 0.15 0.07Range 1.96 - 4.01 0.06 - 0.20 1.35 - 3.89 0.02 - 0.07 0.19 - 0.48 0.06 - 0.19Bottom soilAverage conc. 3.02 3.03 2.74 0.04 0.38 0.14S.D 1.12 0.14 1.23 1.23 0.16 0.10Range 2.07 - 4.26 0.08 - 0.33 1.92 - 4.16 0.03 - 0.06 0.21 - 0.52 0.07 - 0.26
421Distribution of Heavy Metals Around Two Dumpsites in Benin City
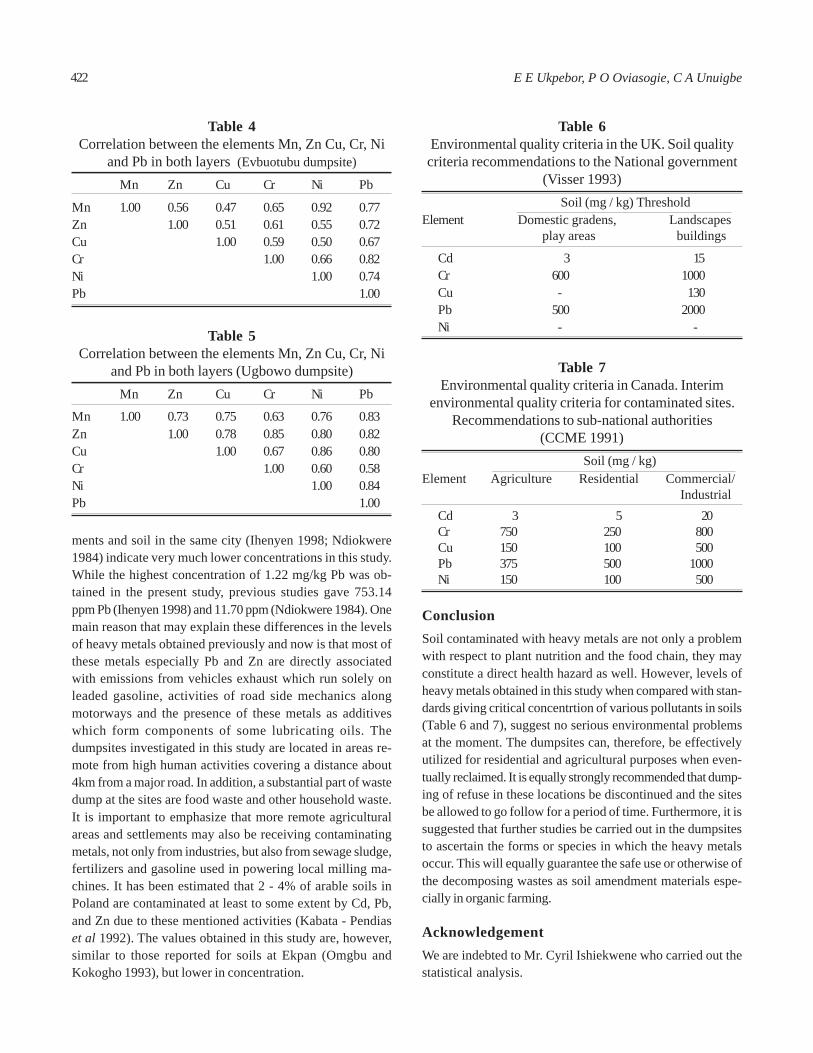
ments and soil in the same city (Ihenyen 1998; Ndiokwere1984) indicate very much lower concentrations in this study.While the highest concentration of 1.22 mg/kg Pb was ob-tained in the present study, previous studies gave 753.14ppm Pb (Ihenyen 1998) and 11.70 ppm (Ndiokwere 1984). Onemain reason that may explain these differences in the levelsof heavy metals obtained previously and now is that most ofthese metals especially Pb and Zn are directly associatedwith emissions from vehicles exhaust which run solely onleaded gasoline, activities of road side mechanics alongmotorways and the presence of these metals as additiveswhich form components of some lubricating oils. Thedumpsites investigated in this study are located in areas re-mote from high human activities covering a distance about4km from a major road. In addition, a substantial part of wastedump at the sites are food waste and other household waste.It is important to emphasize that more remote agriculturalareas and settlements may also be receiving contaminatingmetals, not only from industries, but also from sewage sludge,fertilizers and gasoline used in powering local milling ma-chines. It has been estimated that 2 - 4% of arable soils inPoland are contaminated at least to some extent by Cd, Pb,and Zn due to these mentioned activities (Kabata - Pendiaset al 1992). The values obtained in this study are, however,similar to those reported for soils at Ekpan (Omgbu andKokogho 1993), but lower in concentration.
Table 4Correlation between the elements Mn, Zn Cu, Cr, Ni
and Pb in both layers (Evbuotubu dumpsite)
Mn Zn Cu Cr Ni Pb
Mn 1.00 0.56 0.47 0.65 0.92 0.77Zn 1.00 0.51 0.61 0.55 0.72Cu 1.00 0.59 0.50 0.67Cr 1.00 0.66 0.82Ni 1.00 0.74Pb 1.00
Table 5Correlation between the elements Mn, Zn Cu, Cr, Ni
and Pb in both layers (Ugbowo dumpsite)Mn Zn Cu Cr Ni Pb
Mn 1.00 0.73 0.75 0.63 0.76 0.83Zn 1.00 0.78 0.85 0.80 0.82Cu 1.00 0.67 0.86 0.80Cr 1.00 0.60 0.58Ni 1.00 0.84Pb 1.00
ConclusionSoil contaminated with heavy metals are not only a problemwith respect to plant nutrition and the food chain, they mayconstitute a direct health hazard as well. However, levels ofheavy metals obtained in this study when compared with stan-dards giving critical concentrtion of various pollutants in soils(Table 6 and 7), suggest no serious environmental problemsat the moment. The dumpsites can, therefore, be effectivelyutilized for residential and agricultural purposes when even-tually reclaimed. It is equally strongly recommended that dump-ing of refuse in these locations be discontinued and the sitesbe allowed to go follow for a period of time. Furthermore, it issuggested that further studies be carried out in the dumpsitesto ascertain the forms or species in which the heavy metalsoccur. This will equally guarantee the safe use or otherwise ofthe decomposing wastes as soil amendment materials espe-cially in organic farming.
AcknowledgementWe are indebted to Mr. Cyril Ishiekwene who carried out thestatistical analysis.
Table 7Environmental quality criteria in Canada. Interim
environmental quality criteria for contaminated sites.Recommendations to sub-national authorities
(CCME 1991) Soil (mg / kg)
Element Agriculture Residential Commercial/ Industrial
Cd 3 5 20Cr 750 250 800Cu 150 100 500Pb 375 500 1000Ni 150 100 500
Table 6Environmental quality criteria in the UK. Soil qualitycriteria recommendations to the National government
(Visser 1993) Soil (mg / kg) Threshold
Element Domestic gradens, Landscapes play areas buildings
Cd 3 15Cr 600 1000Cu - 130Pb 500 2000Ni - -
422 E E Ukpebor, P O Oviasogie, C A Unuigbe
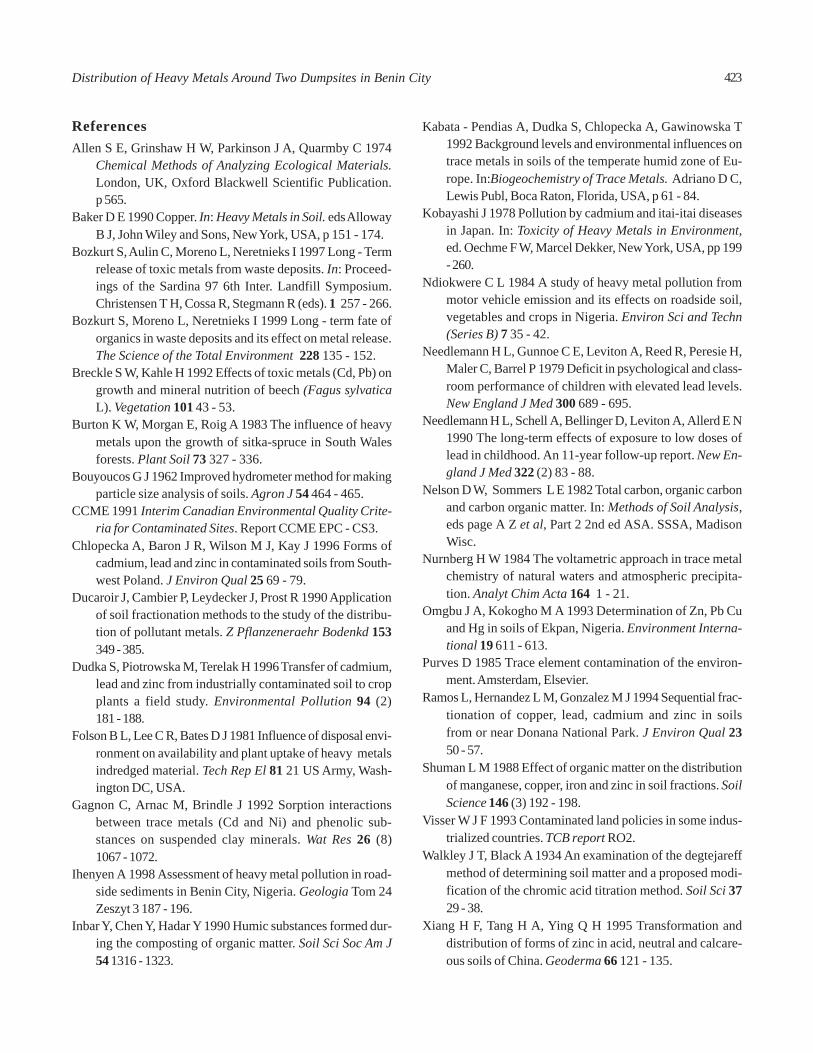
ReferencesAllen S E, Grinshaw H W, Parkinson J A, Quarmby C 1974
Chemical Methods of Analyzing Ecological Materials.London, UK, Oxford Blackwell Scientific Publication.p 565.
Baker D E 1990 Copper. In: Heavy Metals in Soil. eds AllowayB J, John Wiley and Sons, New York, USA, p 151 - 174.
Bozkurt S, Aulin C, Moreno L, Neretnieks I 1997 Long - Termrelease of toxic metals from waste deposits. In: Proceed-ings of the Sardina 97 6th Inter. Landfill Symposium.Christensen T H, Cossa R, Stegmann R (eds). 1 257 - 266.
Bozkurt S, Moreno L, Neretnieks I 1999 Long - term fate oforganics in waste deposits and its effect on metal release.The Science of the Total Environment 228 135 - 152.
Breckle S W, Kahle H 1992 Effects of toxic metals (Cd, Pb) ongrowth and mineral nutrition of beech (Fagus sylvaticaL). Vegetation 101 43 - 53.
Burton K W, Morgan E, Roig A 1983 The influence of heavymetals upon the growth of sitka-spruce in South Walesforests. Plant Soil 73 327 - 336.
Bouyoucos G J 1962 Improved hydrometer method for makingparticle size analysis of soils. Agron J 54 464 - 465.
CCME 1991 Interim Canadian Environmental Quality Crite-ria for Contaminated Sites. Report CCME EPC - CS3.
Chlopecka A, Baron J R, Wilson M J, Kay J 1996 Forms ofcadmium, lead and zinc in contaminated soils from South-west Poland. J Environ Qual 25 69 - 79.
Ducaroir J, Cambier P, Leydecker J, Prost R 1990 Applicationof soil fractionation methods to the study of the distribu-tion of pollutant metals. Z Pflanzeneraehr Bodenkd 153349 - 385.
Dudka S, Piotrowska M, Terelak H 1996 Transfer of cadmium,lead and zinc from industrially contaminated soil to cropplants a field study. Environmental Pollution 94 (2)181 - 188.
Folson B L, Lee C R, Bates D J 1981 Influence of disposal envi-ronment on availability and plant uptake of heavy metalsindredged material. Tech Rep El 81 21 US Army, Wash-ington DC, USA.
Gagnon C, Arnac M, Brindle J 1992 Sorption interactionsbetween trace metals (Cd and Ni) and phenolic sub-stances on suspended clay minerals. Wat Res 26 (8)1067 - 1072.
Ihenyen A 1998 Assessment of heavy metal pollution in road-side sediments in Benin City, Nigeria. Geologia Tom 24Zeszyt 3 187 - 196.
Inbar Y, Chen Y, Hadar Y 1990 Humic substances formed dur-ing the composting of organic matter. Soil Sci Soc Am J54 1316 - 1323.
Kabata - Pendias A, Dudka S, Chlopecka A, Gawinowska T1992 Background levels and environmental influences ontrace metals in soils of the temperate humid zone of Eu-rope. In:Biogeochemistry of Trace Metals. Adriano D C,Lewis Publ, Boca Raton, Florida, USA, p 61 - 84.
Kobayashi J 1978 Pollution by cadmium and itai-itai diseasesin Japan. In: Toxicity of Heavy Metals in Environment,ed. Oechme F W, Marcel Dekker, New York, USA, pp 199- 260.
Ndiokwere C L 1984 A study of heavy metal pollution frommotor vehicle emission and its effects on roadside soil,vegetables and crops in Nigeria. Environ Sci and Techn(Series B) 7 35 - 42.
Needlemann H L, Gunnoe C E, Leviton A, Reed R, Peresie H,Maler C, Barrel P 1979 Deficit in psychological and class-room performance of children with elevated lead levels.New England J Med 300 689 - 695.
Needlemann H L, Schell A, Bellinger D, Leviton A, Allerd E N1990 The long-term effects of exposure to low doses oflead in childhood. An 11-year follow-up report. New En-gland J Med 322 (2) 83 - 88.
Nelson D W, Sommers L E 1982 Total carbon, organic carbonand carbon organic matter. In: Methods of Soil Analysis,eds page A Z et al, Part 2 2nd ed ASA. SSSA, MadisonWisc.
Nurnberg H W 1984 The voltametric approach in trace metalchemistry of natural waters and atmospheric precipita-tion. Analyt Chim Acta 164 1 - 21.
Omgbu J A, Kokogho M A 1993 Determination of Zn, Pb Cuand Hg in soils of Ekpan, Nigeria. Environment Interna-tional 19 611 - 613.
Purves D 1985 Trace element contamination of the environ-ment. Amsterdam, Elsevier.
Ramos L, Hernandez L M, Gonzalez M J 1994 Sequential frac-tionation of copper, lead, cadmium and zinc in soilsfrom or near Donana National Park. J Environ Qual 2350 - 57.
Shuman L M 1988 Effect of organic matter on the distributionof manganese, copper, iron and zinc in soil fractions. SoilScience 146 (3) 192 - 198.
Visser W J F 1993 Contaminated land policies in some indus-trialized countries. TCB report RO2.
Walkley J T, Black A 1934 An examination of the degtejareffmethod of determining soil matter and a proposed modi-fication of the chromic acid titration method. Soil Sci 3729 - 38.
Xiang H F, Tang H A, Ying Q H 1995 Transformation anddistribution of forms of zinc in acid, neutral and calcare-ous soils of China. Geoderma 66 121 - 135.
423Distribution of Heavy Metals Around Two Dumpsites in Benin City
Pak. J. Sci. Ind. Res 2003 46(6) 424 - 431
SIMULATION OF CHLORIDE TRANSPORT BASED DESCRIPTIVE SOIL STRUCTURE
M Mahmood-ul-Hassan*, M S Akhtar, S M Gill and G Nabi
Land Resources Research Program, National Agricultural Research Centre, Islamabad-45500, Pakistan
(Received October 5, 2001; accepted March 24, 2003)
There is a need of environmental implications of rapid appearance of surface by applying chemical at depths below thevadose zone (tile line or shallow groundwater) for developing better insight into solute flow mechanism through the arablelands. Transport of chloride, a respresentative non-adsorbing solute, through a moderately structured silty clay loam soil(Gujranwala series, Typic Ustochrepts) and an un-structured sandy loam soil (Nabipur series, Typic Camborthid) wascharacterized and two existing models viz. convection dispersion equation (CDE) and preferential flow models were tested.The flux average of solute concentration in the outflow as a function of cumulative drainage was fitted to the models. TheCDE fitted, relatively, better in the non-structured soil than in the moderately structured soil. Dispersivity value deter-mined by CDE was very high for the structured soil which is physically not possible. The preferential flow model fittedwell in the Gujranwala soil, but not in the Nabipur soil. The breakthrough characteristics i.e. drainage to peak concentration(Dp), symmetry coefficient (SC), skewness, and kurtosis were compared. Chloride breakthrough was earlier than expectedbased on piston flow. It indicated preferential flow in both the soils, yet, immediate appearance of the tracer in the Gujran-wala soil demonstrated even larger magnitude of the preferential flow. Breakthrough curves’ parameters indicated a largeamount of the solute movement through the preferred pathways bypassing the soil matrix in the Gujranwala soil. The studysuggests that some soil structure parameters (size/shape and degree of aggregation) should be incorporated in the solutetransport models.
Key words: Soil structure, Solute transport, Simulation, Dispersitivity, Preferential flow.
IntroductionLoss of agricultural chemicals from agro-ecosystems and thesubsequent groundwater contamination demand better un-derstanding of water and solute movement in the root andvadose-zone. Simulation models are widely used for predict-ing water and solute movement through unsaturated soil(Steenhuis et al 1994; Hatfiel et al 1997). Discrepancies be-tween model results and the actual field measurements oftenoccur (Jury and Fluhter 1992; Steenhuis et al 1994). Manyrecent studies have depicted rapid increase in concentrationsof surface when applied agro-chemicals in tile lines or shallowgroundwater shortly after application (Mohanty et al 1998).In other studies, travel times of adsorbed and non-adsorbedchemicals have been found to be the same (Flury et al 1994;Camobreco et al 1996).
The classical convection-dispersion equation used for waterand solute movement through the porous medium is valid aslong as the porous medium is homogeneous and solute moveswith a horizontally uniform wetting front (Khan and Jury 1990;Hatfield et al 1997). However, validity of this equation for fieldapplication has been challenged in the recent past due to soiltextural and structural heterogeneity (Bouma 1991). Some ped-ological features viz. macropores, continuous inter-aggregatedvoids, earthworm burrows, decayed root channels and other
geometric anomalies, have entirely different hydraulic proper-ties than soil matrix and act as preferential flow pathways(Gupta et al 1999). The preferential pathways are small frac-tions of total porosity through which solutes travel rapidly,by passing the soil matrix (Radulovich et al 1992), causing arapid and accelerated breakthrough (Buchter et al 1995; Gaberet al 1995).
Accurate estimation of water and solute velocities in soil pro-file is essential for the prediction of sub-soil and groundwatercontamination. Solute transport can accurately be predictedonce breakthrough curves over a range of flow rates havebeen established, which is cumbersome and impractical underfield conditions. The soil structure description available inthe soil survery reports can be correlated with the magnitudeof preferentially-transported solutes and hence, possiblyforms the basis to simulate models for agricultural chemicalsloss. Objectives of the leaching study were to develop rela-tionship between soil structure and magnitude of preferentialflow and test applicability of the existing models for one-dimensional transport of non-adsorbing solute using C1
_ as
tracer.
Models. Convection dispersion equation. The well-knownconvection-dispersion model assumes that dispersion pro-cess is formally equivalent to the diffusion. Even though thedispersion is a convective transport process and solute*Author for correspondence; E.mail: [email protected]
424
samples all pore spaces with an average velocity with disper-sion around the front. The convection-dispersion equationfor one-dimensional transport of adsorbing and non-adsorbing solutes in one or two domains has been solved forseveral boundary conditions (Parker and van Genuchten 1984;Marshall et al 1996). A constant adsorption partition coeffi-cient is employed to solve the differential equation foradsorbing solutes and movement of solutes is scaled with aretardation coefficient, R. Thus, the average velocity is Rtimes slower and time of arrival is R times longer compared toa non-adsorbing solute. In the one-domain model, the wholeprofile is assumed to take part in the transport of the solutes.In the two-domain model, the liquid phase is partitioned intomobile and immobile domains and the solute exchange bet-ween the two liquid regions is modeled as a first-order pro-cess (Parker and van Genuchten 1984).
Preferential flow model. The preferential flow model assumesthat the flow through the macropores is fast and no interac-tion takes place with the soil matrix. This model is simple andrequires minimum parameters to be fitted (Steenhuis et al 1994).It is assumed that the flow in the distribution layer can bedescribed with the linear reservoir theory (Gelhar and Wilson1974) and that no interaction with the soil matrix takes placebelow the distribution layer. The cumulative loss of solutes,L, in the preferentially moving water from a soil with a distri-bution layer of thickness D, can be written as (Steenhuis et al2001).
Where,
W = Apparent water content and equals D(ρ kd + θs),Y = The cumulative amount of percolation since the
application of solute,Mo = Initial amount of solute applied.
This equation is similar in form to that used by the U.S. Envi-ronment Protection Agency (1992) in predicting the loss ofmetals from the incorporation zone of sludge. The preferentialflow model has been used to predict the loss of C1
_, pesti-
cides, blue dye and metals when the matrix flow in the vadosezone could be neglected (Steenhuis et al 1994; Steenhuis et al2001).
Materials and MethodsSite description. The soils were located at longitude 72.1°Eand latitude 34.4°N in Potohar plateau (Pakistan ) in sub-hu-mid continental climate developed in Subrecent floodplain ofKorang River (Khanzada 1976). Two soils-Nabipur, a sandyloam Typic Camborthid and Gujranwala (silty clay variant),
silty clay Typic Ustochrepts were selected for the study. TheNabipur soil is deep, well drained, moderately calcareous andloam developed on level to nearly level position of the flood-plain. It has very friable, massive and sandy loam top-soilunderlain by friable loam B horizon with weak, coarse andsub-angular blocky structure. The Gujranwala (silty clay vari-ant) is very deep, well drained and non-calcareous and thesoil is developed in nearly leveled parts of convex slopes. Thesoil has moderate and medium sub-angular blocky silty clayloam surface and moderate, coarse and medium, sub-angularblocky silty clay ‘B’ horizon. The Nabipur soil has been underrain-fed wheat-maize cropping with annual moldboard tillageoperation while the Gujranwala soil remained untilled for thelast 4 years.
Excavation and Preparation of soil columns. Six intactsoil columns, three for each soil, were extracted by hand-exca-vating and carving leaving soil pedestals in the centre of thesoil pit. The pedestals were carefully trimmed to closely fit inthe 260 mm diameter and 390 mm long PVC pipes. The space(≈ 10 mm) between the PVC pipe and the pedestals was filledwith melted paraffin wax. The columns were transported tothe laboratory. Undisturbed soil cores were also taken from30 to 80 mm, 130 to 180 mm and 230 to 280 mm depths todetermine the soil bulk density. Total porosity was calculated,assuming particle density 2.65Mg/m3. Bottom and top of thecolumns were trimmed and smoothed in the laboratory. Fur-ther, 5 to 7 mm of bottom soil was removed and 0.05 to 0.02 mmfine sand was filled and covered by the nylon gauze sheet toensure good hydraulic contact between the column andcollection chamber. Finally, a perforated aluminum sheet wasfixed at the bottom to firmly support the sand and the nylongauze sheet. The sand had 3.4 mm/s saturated hydraulicconductivity and 1.52 Mg/m3 bulk density. The nylon gauzesheet and aluminum sheet had 81 mesh openings. The columnrested on a collection chamber, sealed with silicon rubber seal-ant. Polythene drain tube was fixed to both the holes. Thecollection chamber had attached two drinage tubes, one wasused to drain leachate to sampling bottle and the other servedas a peizometer. Each column had two microtensiometers fixedat 70 and 220 mm below the soil surface to ensure constantsaturation.
Each column was slowly saturated from the bottom throughthe drain tube attached to the chamber. Saturation wasachieved in 4 days by raising the water reservoir 100 mm in aday until water appeared at the surface. Water was kept pond-ing for further 48 h to ensure complete saturation. Duringsaturation one drain tube attached to the chamber in order tobleed air. To maintain the constant ponding on the surface ofthe column, a water supply reservoir (Mariotte siphon) with
YW
L = Mo [1-exp (- )] ............... (1)
425Simulation Models and Chloride Transport
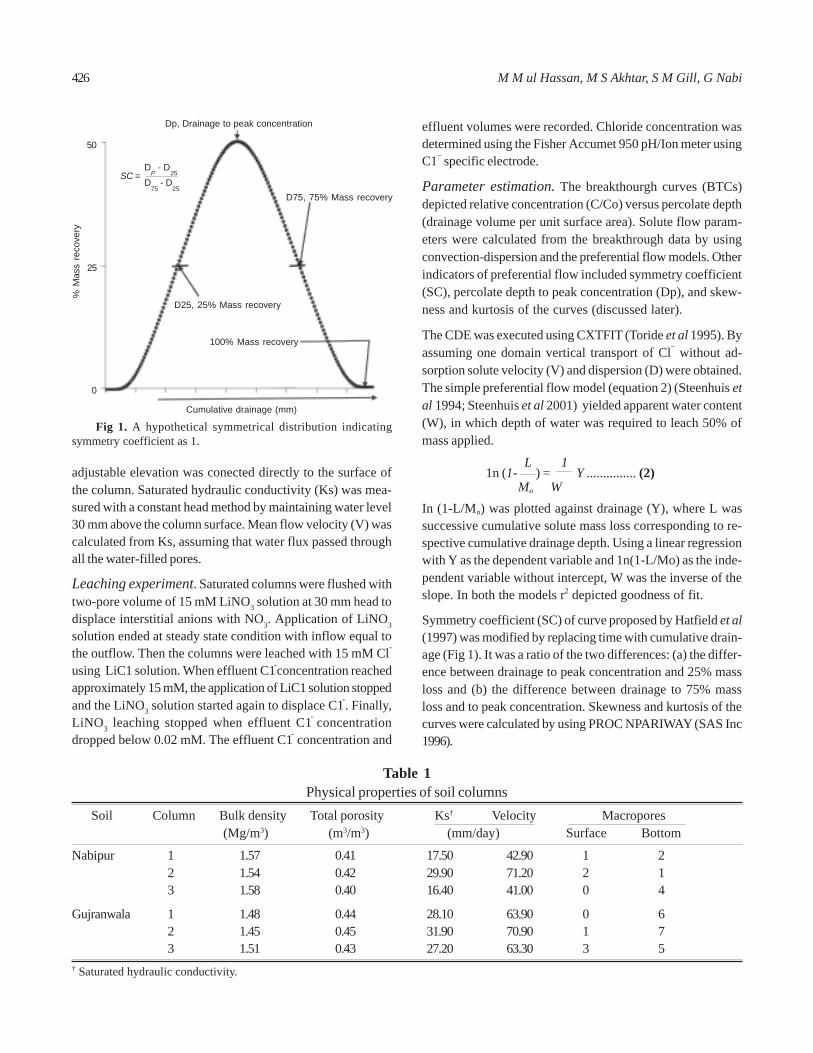
adjustable elevation was conected directly to the surface ofthe column. Saturated hydraulic conductivity (Ks) was mea-sured with a constant head method by maintaining water level30 mm above the column surface. Mean flow velocity (V) wascalculated from Ks, assuming that water flux passed throughall the water-filled pores.
Leaching experiment. Saturated columns were flushed withtwo-pore volume of 15 mM LiNO3 solution at 30 mm head todisplace interstitial anions with NO3. Application of LiNO3
solution ended at steady state condition with inflow equal tothe outflow. Then the columns were leached with 15 mM Cl-
using LiC1 solution. When effluent C1-concentration reachedapproximately 15 mM, the application of LiC1 solution stoppedand the LiNO3 solution started again to displace C1-. Finally,LiNO3 leaching stopped when effluent C1- concentrationdropped below 0.02 mM. The effluent C1- concentration and
In (1-L/Mo) was plotted against drainage (Y), where L wassuccessive cumulative solute mass loss corresponding to re-spective cumulative drainage depth. Using a linear regressionwith Y as the dependent variable and 1n(1-L/Mo) as the inde-pendent variable without intercept, W was the inverse of theslope. In both the models r2 depicted goodness of fit.
Symmetry coefficient (SC) of curve proposed by Hatfield et al(1997) was modified by replacing time with cumulative drain-age (Fig 1). It was a ratio of the two differences: (a) the differ-ence between drainage to peak concentration and 25% massloss and (b) the difference between drainage to 75% massloss and to peak concentration. Skewness and kurtosis of thecurves were calculated by using PROC NPARIWAY (SAS Inc1996).
Fig 1. A hypothetical symmetrical distribution indicatingsymmetry coefficient as 1.
Dp, Drainage to peak concentration
% M
ass
reco
very
D75, 75% Mass recovery
D25, 25% Mass recovery
100% Mass recovery
Cumulative drainage (mm)
50
25
0
effluent volumes were recorded. Chloride concentration wasdetermined using the Fisher Accumet 950 pH/Ion meter usingC1
_ specific electrode.
Parameter estimation. The breakthourgh curves (BTCs)depicted relative concentration (C/Co) versus percolate depth(drainage volume per unit surface area). Solute flow param-eters were calculated from the breakthrough data by usingconvection-dispersion and the preferential flow models. Otherindicators of preferential flow included symmetry coefficient(SC), percolate depth to peak concentration (Dp), and skew-ness and kurtosis of the curves (discussed later).
The CDE was executed using CXTFIT (Toride et al 1995). Byassuming one domain vertical transport of Cl
_ without ad-
sorption solute velocity (V) and dispersion (D) were obtained.The simple preferential flow model (equation 2) (Steenhuis etal 1994; Steenhuis et al 2001) yielded apparent water content(W), in which depth of water was required to leach 50% ofmass applied.
Table 1Physical properties of soil columns
Soil Column Bulk density Total porosity Ks† Velocity Macropores (Mg/m3) (m3/m3) (mm/day) Surface Bottom
Nabipur 1 1.57 0.41 17.50 42.90 1 22 1.54 0.42 29.90 71.20 2 13 1.58 0.40 16.40 41.00 0 4
Gujranwala 1 1.48 0.44 28.10 63.90 0 62 1.45 0.45 31.90 70.90 1 73 1.51 0.43 27.20 63.30 3 5
† Saturated hydraulic conductivity.
L 11n (1- ) = Y ............... (2) Mo W
SC =D
P - D
25
D75
- D25
426 M M ul Hassan, M S Akhtar, S M Gill, G Nabi
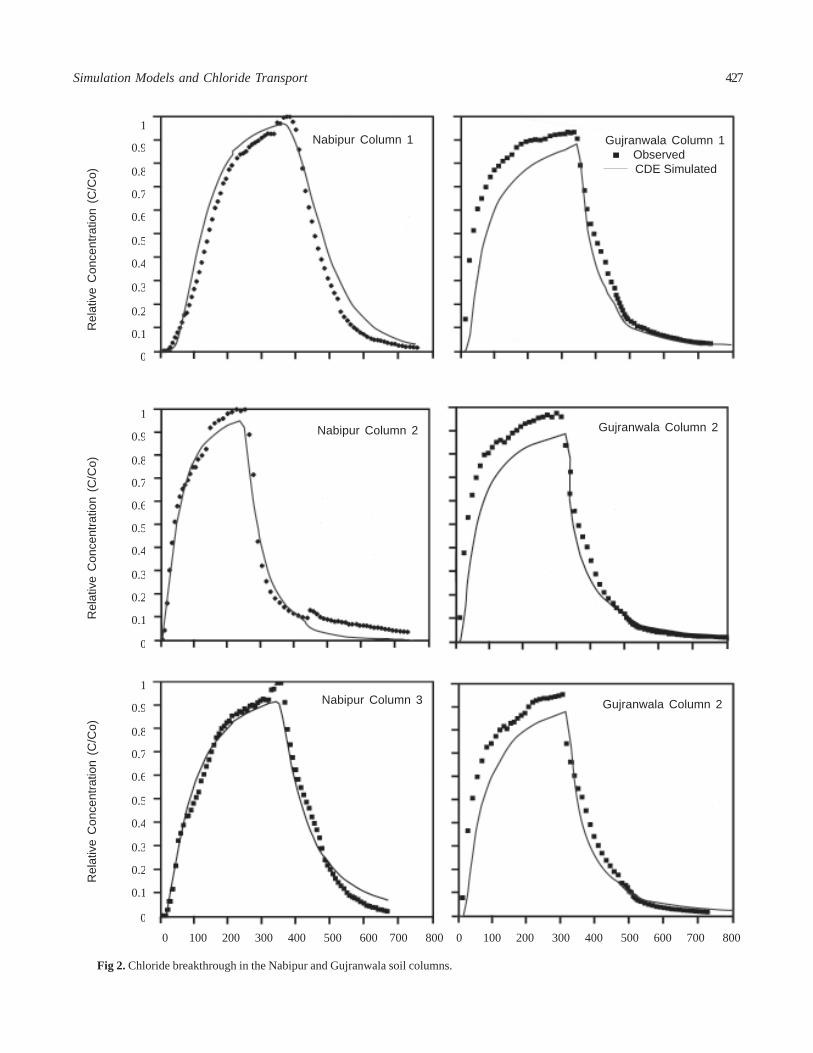
1
0.9
0.8
0.7
0.6
0.5
0.4
0.3
0.2
0.1
0
1
0.9
0.8
0.7
0.6
0.5
0.4
0.3
0.2
0.1
0
1
0.9
0.8
0.7
0.6
0.5
0.4
0.3
0.2
0.1
0
Rel
ativ
e C
once
ntra
tion
(C/C
o)R
elat
ive
Con
cent
ratio
n (C
/Co)
Rel
ativ
e C
once
ntra
tion
(C/C
o)
Fig 2. Chloride breakthrough in the Nabipur and Gujranwala soil columns.
0 100 200 300 400 500 600 700 800 0 100 200 300 400 500 600 700 800
Nabipur Column 1
Nabipur Column 2
Nabipur Column 3
Gujranwala Column 1 Observed CDE Simulated
Gujranwala Column 2
Gujranwala Column 2
427Simulation Models and Chloride Transport
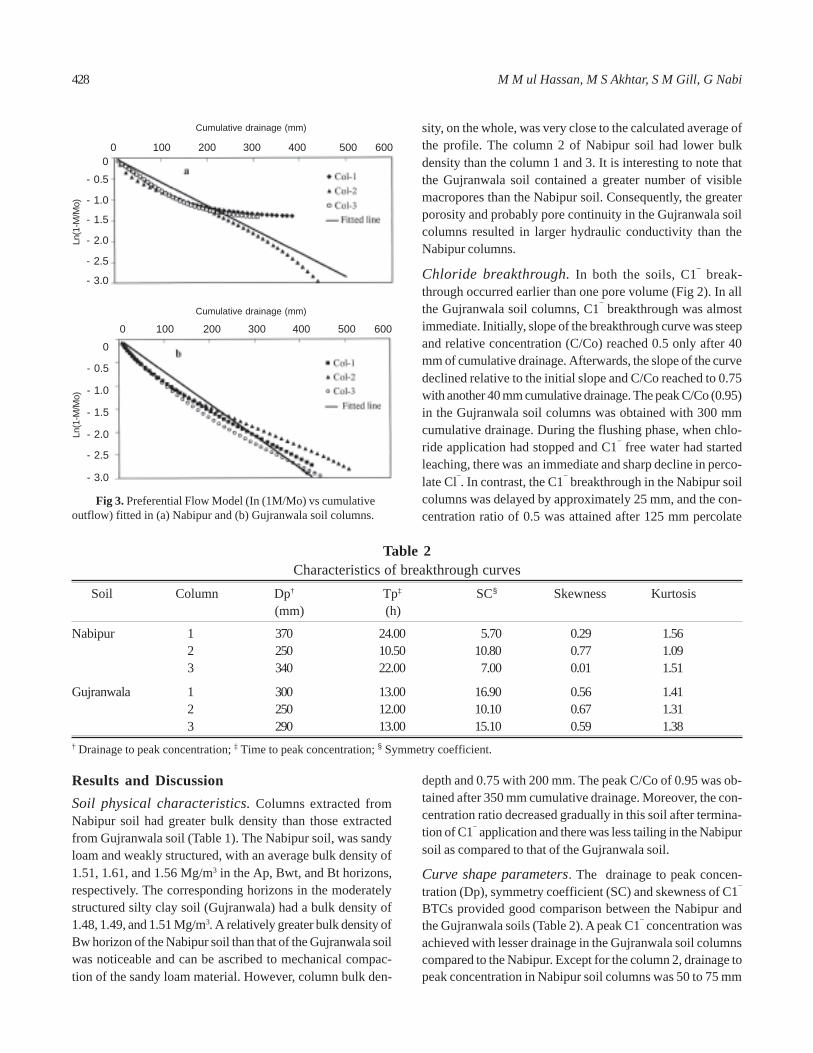
Results and DiscussionSoil physical characteristics. Columns extracted fromNabipur soil had greater bulk density than those extractedfrom Gujranwala soil (Table 1). The Nabipur soil, was sandyloam and weakly structured, with an average bulk density of1.51, 1.61, and 1.56 Mg/m3 in the Ap, Bwt, and Bt horizons,respectively. The corresponding horizons in the moderatelystructured silty clay soil (Gujranwala) had a bulk density of1.48, 1.49, and 1.51 Mg/m3. A relatively greater bulk density ofBw horizon of the Nabipur soil than that of the Gujranwala soilwas noticeable and can be ascribed to mechanical compac-tion of the sandy loam material. However, column bulk den-
depth and 0.75 with 200 mm. The peak C/Co of 0.95 was ob-tained after 350 mm cumulative drainage. Moreover, the con-centration ratio decreased gradually in this soil after termina-tion of C1
_ application and there was less tailing in the Nabipur
soil as compared to that of the Gujranwala soil.
Curve shape parameters. The drainage to peak concen-tration (Dp), symmetry coefficient (SC) and skewness of C1
_
BTCs provided good comparison between the Nabipur andthe Gujranwala soils (Table 2). A peak C1
_ concentration was
achieved with lesser drainage in the Gujranwala soil columnscompared to the Nabipur. Except for the column 2, drainage topeak concentration in Nabipur soil columns was 50 to 75 mm
Table 2Characteristics of breakthrough curves
Soil Column Dp† Tp‡ SC§ Skewness Kurtosis (mm) (h)
Nabipur 1 370 24.00 5.70 0.29 1.562 250 10.50 10.80 0.77 1.093 340 22.00 7.00 0.01 1.51
Gujranwala 1 300 13.00 16.90 0.56 1.412 250 12.00 10.10 0.67 1.313 290 13.00 15.10 0.59 1.38
† Drainage to peak concentration; ‡ Time to peak concentration; § Symmetry coefficient.
Cumulative drainage (mm) sity, on the whole, was very close to the calculated average ofthe profile. The column 2 of Nabipur soil had lower bulkdensity than the column 1 and 3. It is interesting to note thatthe Gujranwala soil contained a greater number of visiblemacropores than the Nabipur soil. Consequently, the greaterporosity and probably pore continuity in the Gujranwala soilcolumns resulted in larger hydraulic conductivity than theNabipur columns.
Chloride breakthrough. In both the soils, C1_ break-
through occurred earlier than one pore volume (Fig 2). In allthe Gujranwala soil columns, C1
_ breakthrough was almost
immediate. Initially, slope of the breakthrough curve was steepand relative concentration (C/Co) reached 0.5 only after 40mm of cumulative drainage. Afterwards, the slope of the curvedeclined relative to the initial slope and C/Co reached to 0.75with another 40 mm cumulative drainage. The peak C/Co (0.95)in the Gujranwala soil columns was obtained with 300 mmcumulative drainage. During the flushing phase, when chlo-ride application had stopped and C1
_ free water had started
leaching, there was an immediate and sharp decline in perco-late Cl
_. In contrast, the C1
_ breakthrough in the Nabipur soil
columns was delayed by approximately 25 mm, and the con-centration ratio of 0.5 was attained after 125 mm percolate
Cumulative drainage (mm)
Ln(1
-M/M
o)Ln
(1-M
/Mo)
0
- 0.5
- 1.0
- 1.5
- 2.0
- 2.5
- 3.0
0
- 0.5
- 1.0
- 1.5
- 2.0
- 2.5
- 3.0
0 100 200 300 400 500 600
0 100 200 300 400 500 600
Fig 3. Preferential Flow Model (In (1M/Mo) vs cumulativeoutflow) fitted in (a) Nabipur and (b) Gujranwala soil columns.
428 M M ul Hassan, M S Akhtar, S M Gill, G Nabi
which was greater than that of Gujranwala columns. Break-through curves from the Nabipur soil columns were relativelysymmetrical and were less skewed as compared to theGujranwala soil columns. The symmetry coefficient value inthe Nabipur soil column curves was half that of the Gujranwalacolumns. Mean kurtosis values for both the soils were similarbut the Nabipur soil took twice the time (1400 min) to achievethe crest as compared to the Gujranwala (740 min). The Nabipursoil column 2 behaved differently than the other two columnsfrom the same soil.
The solute breakthrough occurred immediately in the struc-tured (Gujranwala) soil and after 25 mm of drainage in the un-structured (Nabipur) soil (Fig 2). Further, in un-structured soil,the percolate amount was less than 0.3 pore volume whereas,under uniform flow exactly one pore volume of incoming sol-ute would have been required to replace the pre-existing sol-ute and breakthrough at outflow end by assuming zero dis-persion (van Genuchten 1981). In a homogeneous cylindricalsoil column, solute mixed completely in radial direction beforeit reached to the outflow end in the vertical direction. There-fore, the early breakthrough of the solute indicated the occur-rence of preferential flow through all the columns of both thesoils although the magnitude was greater in the structuredthan in the un-structured soil.
Preferential flow was caused by wetting front instability(DeRooij and DeVaries 1996), funnel flow in layered soils (Kung1990) and flow through macropore by-passing the soil matrix(Sollins and Radulovich 1988; Gupta et al 1999). Macro-poresflow, through non-capillary inter-pedal void spaces, was asso-ciated with pedological cracks, decayed root channels and otherstructural anomalies essentially present in intact soil columns(Sollins and Radulovich 1988). The immediate breakthrough incase of the Gujranwala soil could be due to preferential flowthrough inter-ped void spaces or macropores. These resultscorroborated with the structural conditions of the soils as
macropores resulted in greater inter-aggregate infiltrability thanintra-aggregate infiltrability (Gupta et al 1999).
Model fitting. Convection dispersion and preferential flowmodels have been compared. The Convection-Dispersionequation used one-dimensional mode by assuming zero retar-dation (R) as C1
_ is non-adsorbing. The model parameters
mean i.e. pore velocity (V), apparent dispersion coefficient(D) and r2 (indicates the fitness of the model) were determinedby using CXTFIT computer program (Toride et al 1995).Dispersivity (λ), solute dispersion to mass transfer per unittime or drainage outflow in a unit cross-sectional porous area,is D/V (Jury et al 1991). Except for one column, mean porevelocity of the un-structured soil was approximately two timesun-structured soil (Table 3), indicating larger flow throughnon-capillary porosity. Dispersion in the structured soil col-umns was larger than the un-structured soil but was highlyvariable. Surprisingly, in all the three Gujranwala soil columnsbest-fit solution (r2 > 0.96) was achieved at D > 150 cm2/h. Thislarge D value implied no mass transfer of water had occurredand the movement of C1
_ was solely due to diffusion. This
resulted in extremely high dispersivity values (21 - 37 cm) thatwere physically impossible. Dispersivity ranged from 4.5 to17.4 cm for the non-structured soil, which were within accept-able limits (Jury et al 1991). Therefore, although the CDE modelsimulated the general shapes of the BTC, except the initialbreakthrough and the peak, it predicted an erroneousdispersivity in the structured soil.
In contrast, the preferential flow model was better fit in thestructured soil than in the un-structured soil as indicated by afairly straight line in the later case (Fig 3). If the preferentialflow model is valid then the data should plot reasonably wellas a straight line. The regression results showed that the datafit the preferential flow model very well (Table 3). The r2 for thethree columns from the Gujranwala soil was 0.93 or higher andwith an exception, it was 0.83 or less for the Nabipur soil. One
Table 3Summary of CDE† and preferential flow model results
Soil Columns Convection-Dispersion equation Preferential flow model D V λ r2 W r2
(cm2/h) (cm2/h) (cm) (cm)
Nabipur 1 14.50 3.21 4.52 0.96 20.96 0.642 172.20 9.89 17.41 0.98 15.11 0.943 64.80 4.05 16.00 0.98 17.48 0.83
Gujranwala 1 255.40 6.94 36.80 0.97 14.37 0.962 230.10 8.53 26.98 0.98 16.58 0.933 156.20 7.33 21.31 0.96 13.81 0.95
† Convection-Dispersion equation.
429Simulation Models and Chloride Transport
column in Nabipur soil did fit to a straight line, which reflectseither an artifact or natural variability.
In the Gujranwala soil, the conductivity of the matrix was rela-tively low than in the Nabipur soil. Thus, no exchange ofsolutes took place between macropores and matrix for theGujranwala soil which was assumed in the preferential flowmodel (Steenhuis et al 1994). This is not true for the Nabipursoil, showing a deviation from the straight line probably be-cause of increasing concentration (Steenhuis et al 2001). Thetheory assumes that the mixing is instantaneous and that thereis no delay in travelling time from the distribution zone to thebottom of the column. In this study, we plotted part of thedata set (natural log of mass of Cl
_ remaining vs. the cumula-
tive outflow) starting immediately after the effluent Cl_ had
reached maxima as mixing was not instantaneous in this case.Therefore, the initial deviation from straight line is not de-picted in the graph.
Curve shape parameters. The curve parameters i.e. drain-age to peak concentration (Dp), symmetry coefficient (SC)and skewness provided comparison between the Nabipur andGujranwala soil columns (Table 2). Compared to the Nabipursoil, the peak Cl
_ concentration in the Gujranwala soil col-
umns was attained with less drainage due to inter-void spacesconducting greater solute compared to matrix. This phenom-enon is related to differences in soil structure. However, timeto peak concentration had greater magnitude of differencebetween the two soils compared with drainage to peak con-centration because higher flow rate in the structured soil alsoallowed more water to drain in given time. As such the Nabipursoil columns required twice the time to attain the peak Cl
_
concentration than the Gujranwala soil while the difference indrainage was not so high.
The peak concentration would coincide with loss of 50% massin a symmetrical bell-shaped curve. A symmetry coefficientclose to one indicated the symmetricl distribution and value>1 indicate preferential flow. The Gujranwala soil had abouttwo times larger SC than the Nabipur soil. The faster translo-cation of mass in the Gujranwala soil compared with theNabipur soil was obvious as the peak concentration in theGujranwala soil columns coincided with about 75% of the to-tal mass loss, which was about 60% in the Nabipur soil. Kur-tosis values of BTCs, another quantitative indicator of prefer-ential flow (Hatfield et al 1997), were slightly higher in theNabipur soil than in the Gujranwala soil. The reported resultsare contrarily to Hatfield et al (1997) to the extent that kurto-sis is a better numeric indicator of preferential flow than skew-ness and SC, whereas we found DP, skewness, and SC betternumeric indicators than kurtosis.
ConclusionComparison of calculated and observed first arrival times andBTCs indicated that perferential flow occurred in all the col-umns from both the soils. However, the magnitude of prefer-ential flow was higher in the Gujranwala soil than in the Nabipursoil. Drainage to peak concentration, symmetry coefficient,and skewness of the BTC were quantitative parameters forperferential flow and their statistical comprison has potentialfor field application. Further, the CDE described well the sol-ute transport through the un-structured soil but failed in caseof the structured soil while the reverse was true for the prefe-rential flow model. The study indicates a need for incorpora-tion of soil structure parameters (size/shape and degree ofaggregation) in the solute transport models in order to imp-rove simulation.
ReferencesBouma J 1991 Influence of soil macroporosity on environ-
mental quality. Advances in Agronomy, Academic press,San Diego, CA, USA, Vol 46 pp 1 - 37.
Buchter B, Hinz C, Flury M, Fluhler H 1995 Heterogenous flowand solute transport in an unsturated stony soil mono-lith. Soil Sci Soc Am J 59 14 - 21.
Camobreco V J, Richards B K, Steenhuis T S, Peverly J H,McBride M B 1996 Movement of heavy metals throughundisturbed and homogenized soil columns. Soil Sci 161740 - 750.
DeRooij G H, DeVaries P 1996 Solute leaching in a sandy soilwith a water repellent surface layer: A simulation.Geoderma 70 253 - 263.
Flury M, Fluhler H, Jury W A, Leuenberger J 1994 Susceptibil-ity of soils to preferential flow of water: A field study.Water Resour Res 30 1945 - 1954.
Gaber H M, Inskeep P W, Comfort S D, Mraith J M 1995 Non-equilibrium transport of atrazine through large intact soilcores. Soil Sci Soc Am J 59 60 - 67.
Gelhar L W, Wilson J L 1977 Groundwater quality modelling.Groundwater 12 399 - 408.
Gupta A, Destouni G, Jensen M B 1999 Modelling tritium andphosphorous transport by preferential flow in structuredsoil. J Contam Hydrol 35 389 - 407.
Hatfield K K, Warner G S, Guillard K 1997 Bromide and FD andC Blue No 1 dye movement through intact and packedsoil columns. Transactions ASAE 40 309 - 315.
Jury W A, Gardner W R, Gardner W H 1991 Soil Physics. JohnWiley and Sons Inc, New York, USA.
Jury W A, Fluhter H 1992 Transport of chemical through soilmechanisms, models and field application. Adv Agron 47141 - 201.
Khan A H, Jury W A 1990 A laboratory study of the disper-
430 M M ul Hassan, M S Akhtar, S M Gill, G Nabi
sion scale effect in column out-flow experiments. J ContamHydrol 5 119 - 131.
Khanzada S K 1976 Soils and Capability. National Agricul-tural Research Centre, Islamabad. Soil Survey of Paki-stan, Ministry of Food and Agriculture, Pakistan.
Kung K J S 1990 Preferential flow in a sandy vadose soil: 1 Fie-ld observation. Geoderma 46 51 - 59.
Mohanty B P, Bowman R S, Hendrickx J M H, van GenuchtenM Th 1998 Preferential transport of nitrate to a tile drainin an intermittent-flood-irrigated field: Model develop-ment and experimental evaluation. Water Resour Res 341061 - 1076.
Parker J C, van Genuchten M Th 1984 Determining transportparameters from laboratory and field trace experiments.VA Agric Exp Stn Bull 84 - 93.
Radulovich R, Sollin P, Baveye P, Solorzano E 1992 Bypasswater flow through unsaturated microaggregated tropi-cal soils. Soil Sci Soc Am J 56 721 - 726.
SAS Institute, INC 1990 Version. SAS/STAT User’s Guide, SASInstitute, Inc. Cary, NC, USA, 64th ed.
Sollins P, Radulovich R 1988 Effect of soil physical structure
on solute transport in a weathered tropical soil. Soil SciSoc Am J 52 1168 - 1173.
Steenhuis T S, Boll J, Shalit G, Selker J S, Merwin I A 1994 Asimple equation for predicting preferential flow soluteconcentrations. J Environ Qual 23 1058 - 1064.
Steenhuis T S, Kim Y J, Parlange J Y, Akhtar S M, Richards BK, Kung K J S, Gish T J, Dekker L W, Ritsema C J, AburimeS A 2001 An equation for describing solute transport infield soils with preferential flow paths. In: PreferentialFlow: Water Movement and Chemical Transport in theEnvironment. Proc ASAE 2nd Int Symp Preferential flow.Honolulu, HI, USA, Jan 3-5, 2001 pp 137 - 140.
Toride N, Leij F J, van Genuchten M Th 1995 The CXTFITCode for Estimating Transport Parameters from Labo-ratory or Field Tracer Version 2.0. Research Report No.137, US Salinity Laboratory, U S Department of Agricul-ture, California, USA.
USEPA 1992 Another Look National Survey of Pesticide inDrinking Water Wells. Phase II Report NTIS Doc PB92-120883 U S Environmental Protection. Agency, Washing-ton, DC, USA.
431Simulation Models and Chloride Transport
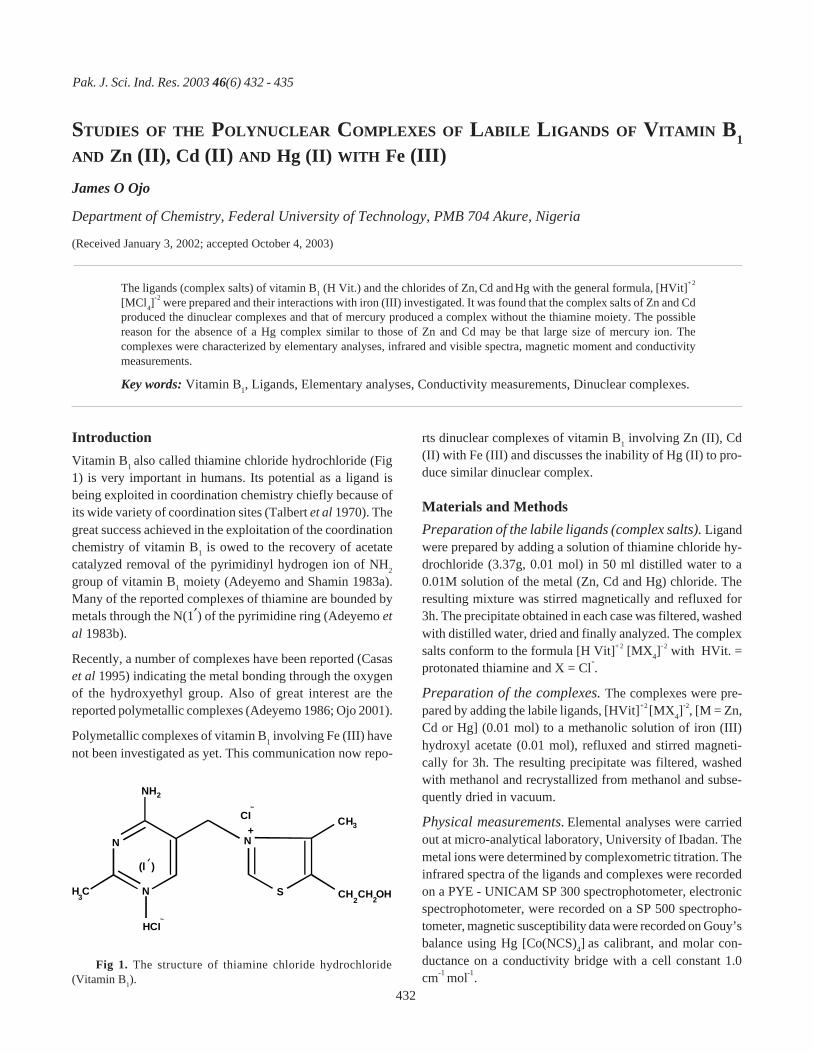
Pak. J. Sci. Ind. Res. 2003 46(6) 432 - 435
STUDIES OF THE POLYNUCLEAR COMPLEXES OF LABILE LIGANDS OF VITAMIN B1AND Zn (II), Cd (II) AND Hg (II) WITH Fe (III)James O Ojo
Department of Chemistry, Federal University of Technology, PMB 704 Akure, Nigeria
(Received January 3, 2002; accepted October 4, 2003)
The ligands (complex salts) of vitamin B1 (H Vit.) and the chlorides of Zn, Cd and Hg with the general formula, [HVit]+ 2
[MCl4]- 2 were prepared and their interactions with iron (III) investigated. It was found that the complex salts of Zn and Cd
produced the dinuclear complexes and that of mercury produced a complex without the thiamine moiety. The possiblereason for the absence of a Hg complex similar to those of Zn and Cd may be that large size of mercury ion. Thecomplexes were characterized by elementary analyses, infrared and visible spectra, magnetic moment and conductivitymeasurements.
Key words: Vitamin B1, Ligands, Elementary analyses, Conductivity measurements, Dinuclear complexes.
IntroductionVitamin B1 also called thiamine chloride hydrochloride (Fig1) is very important in humans. Its potential as a ligand isbeing exploited in coordination chemistry chiefly because ofits wide variety of coordination sites (Talbert et al 1970). Thegreat success achieved in the exploitation of the coordinationchemistry of vitamin B1 is owed to the recovery of acetatecatalyzed removal of the pyrimidinyl hydrogen ion of NH2
group of vitamin B1 moiety (Adeyemo and Shamin 1983a).Many of the reported complexes of thiamine are bounded bymetals through the N(1′) of the pyrimidine ring (Adeyemo etal 1983b).
Recently, a number of complexes have been reported (Casaset al 1995) indicating the metal bonding through the oxygenof the hydroxyethyl group. Also of great interest are thereported polymetallic complexes (Adeyemo 1986; Ojo 2001).
Polymetallic complexes of vitamin B1 involving Fe (III) havenot been investigated as yet. This communication now repo-
rts dinuclear complexes of vitamin B1 involving Zn (II), Cd(II) with Fe (III) and discusses the inability of Hg (II) to pro-duce similar dinuclear complex.
Materials and MethodsPreparation of the labile ligands (complex salts). Ligandwere prepared by adding a solution of thiamine chloride hy-drochloride (3.37g, 0.01 mol) in 50 ml distilled water to a0.01M solution of the metal (Zn, Cd and Hg) chloride. Theresulting mixture was stirred magnetically and refluxed for3h. The precipitate obtained in each case was filtered, washedwith distilled water, dried and finally analyzed. The complexsalts conform to the formula [H Vit]+ 2 [MX4]
- 2 with HVit. =protonated thiamine and X = Cl-.
Preparation of the complexes. The complexes were pre-pared by adding the labile ligands, [HVit]+ 2 [MX4]
- 2, [M = Zn,Cd or Hg] (0.01 mol) to a methanolic solution of iron (III)hydroxyl acetate (0.01 mol), refluxed and stirred magneti-cally for 3h. The resulting precipitate was filtered, washedwith methanol and recrystallized from methanol and subse-quently dried in vacuum.
Physical measurements. Elemental analyses were carriedout at micro-analytical laboratory, University of Ibadan. Themetal ions were determined by complexometric titration. Theinfrared spectra of the ligands and complexes were recordedon a PYE - UNICAM SP 300 spectrophotometer, electronicspectrophotometer, were recorded on a SP 500 spectropho-tometer, magnetic susceptibility data were recorded on Gouy’sbalance using Hg [Co(NCS)4] as calibrant, and molar con-ductance on a conductivity bridge with a cell constant 1.0cm-1 mol-1.
Fig 1. The structure of thiamine chloride hydrochloride(Vitamin B1).
HCI
NH
N
NH C3
CI+
N
S
C H3
CH2CH2OH
2
(l )
432
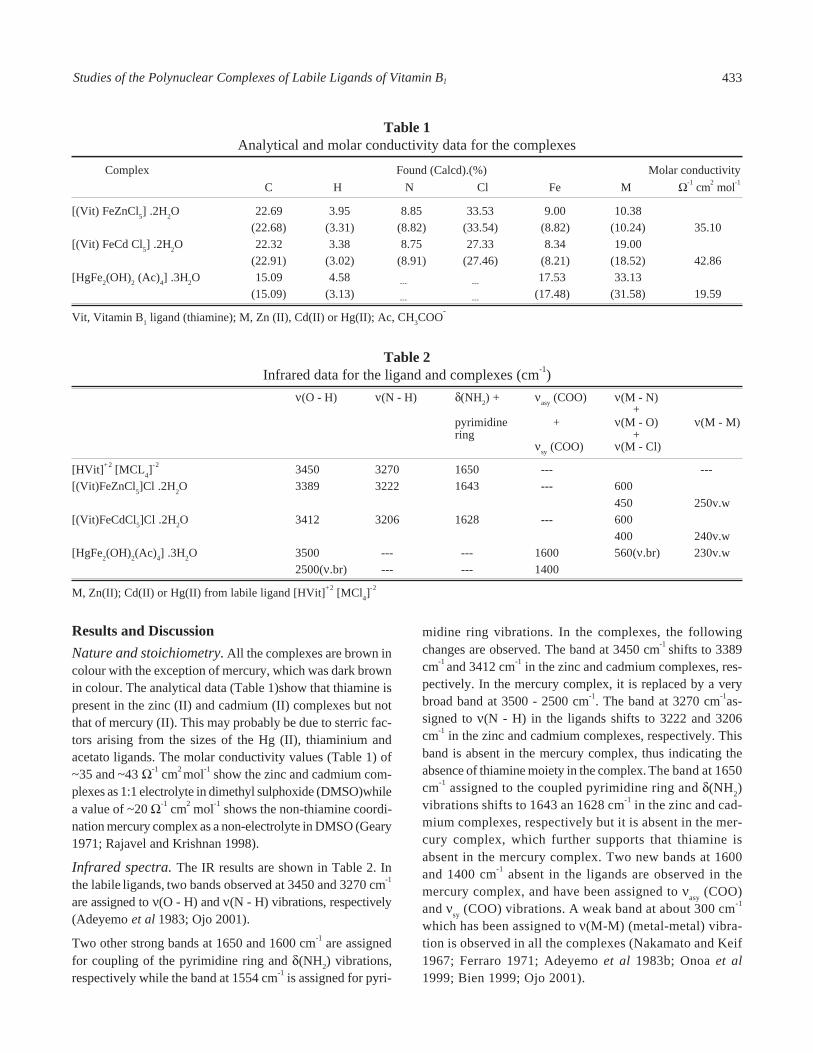
Results and DiscussionNature and stoichiometry. All the complexes are brown incolour with the exception of mercury, which was dark brownin colour. The analytical data (Table 1)show that thiamine ispresent in the zinc (II) and cadmium (II) complexes but notthat of mercury (II). This may probably be due to sterric fac-tors arising from the sizes of the Hg (II), thiaminium andacetato ligands. The molar conductivity values (Table 1) of~35 and ~43 Ω-1 cm2 mol-1 show the zinc and cadmium com-plexes as 1:1 electrolyte in dimethyl sulphoxide (DMSO)whilea value of ~20 Ω-1 cm2 mol-1 shows the non-thiamine coordi-nation mercury complex as a non-electrolyte in DMSO (Geary1971; Rajavel and Krishnan 1998).
Infrared spectra. The IR results are shown in Table 2. Inthe labile ligands, two bands observed at 3450 and 3270 cm-1
are assigned to ν(O - H) and ν(N - H) vibrations, respectively(Adeyemo et al 1983; Ojo 2001).
Two other strong bands at 1650 and 1600 cm-1 are assignedfor coupling of the pyrimidine ring and δ(NH2) vibrations,respectively while the band at 1554 cm-1 is assigned for pyri-
midine ring vibrations. In the complexes, the followingchanges are observed. The band at 3450 cm-1 shifts to 3389cm-1 and 3412 cm-1 in the zinc and cadmium complexes, res-pectively. In the mercury complex, it is replaced by a verybroad band at 3500 - 2500 cm-1. The band at 3270 cm-1as-signed to ν(N - H) in the ligands shifts to 3222 and 3206cm-1 in the zinc and cadmium complexes, respectively. Thisband is absent in the mercury complex, thus indicating theabsence of thiamine moiety in the complex. The band at 1650cm-1 assigned to the coupled pyrimidine ring and δ(NH2)vibrations shifts to 1643 an 1628 cm-1 in the zinc and cad-mium complexes, respectively but it is absent in the mer-cury complex, which further supports that thiamine isabsent in the mercury complex. Two new bands at 1600and 1400 cm-1 absent in the ligands are observed in themercury complex, and have been assigned to νasy (COO)and νsy (COO) vibrations. A weak band at about 300 cm-1
which has been assigned to ν(M-M) (metal-metal) vibra-tion is observed in all the complexes (Nakamato and Keif1967; Ferraro 1971; Adeyemo et al 1983b; Onoa et al1999; Bien 1999; Ojo 2001).
Table 1Analytical and molar conductivity data for the complexes
Complex Found (Calcd).(%) Molar conductivity C H N Cl Fe M Ω-1 cm2 mol-1
[(Vit) FeZnCl5] .2H2O 22.69 3.95 8.85 33.53 9.00 10.38(22.68) (3.31) (8.82) (33.54) (8.82) (10.24) 35.10
[(Vit) FeCd Cl5] .2H2O 22.32 3.38 8.75 27.33 8.34 19.00(22.91) (3.02) (8.91) (27.46) (8.21) (18.52) 42.86
[HgFe2(OH)2 (Ac)4] .3H2O 15.09 4.58 --- --- 17.53 33.13(15.09) (3.13) --- --- (17.48) (31.58) 19.59
Vit, Vitamin B1 ligand (thiamine); M, Zn (II), Cd(II) or Hg(II); Ac, CH3COO-
Table 2Infrared data for the ligand and complexes (cm-1)
ν(O - H) ν(N - H) δ(NH2) + νasy (COO) ν(M - N) +
pyrimidine + ν(M - O) ν(M - M)ring +
νsy (COO) ν(M - Cl)
[HVit]+ 2 [MCL4]- 2 3450 3270 1650 --- ---
[(Vit)FeZnCl5]Cl .2H2O 3389 3222 1643 --- 600450 250v.w
[(Vit)FeCdCl5]Cl .2H2O 3412 3206 1628 --- 600400 240v.w
[HgFe2(OH)2(Ac)4] .3H2O 3500 --- --- 1600 560(ν.br) 230v.w2500(ν.br) --- --- 1400
M, Zn(II); Cd(II) or Hg(II) from labile ligand [HVit]+ 2 [MCl4]- 2
433Studies of the Polynuclear Complexes of Labile Ligands of Vitamin B1
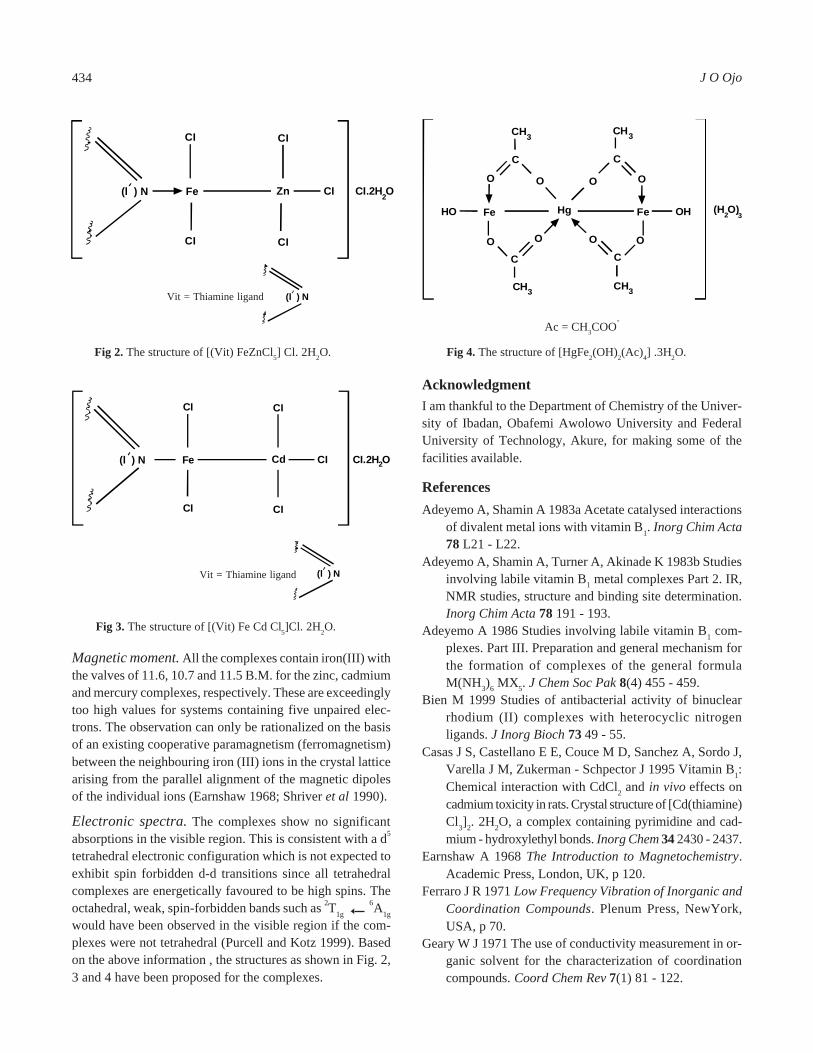
Magnetic moment. All the complexes contain iron(III) withthe valves of 11.6, 10.7 and 11.5 B.M. for the zinc, cadmiumand mercury complexes, respectively. These are exceedinglytoo high values for systems containing five unpaired elec-trons. The observation can only be rationalized on the basisof an existing cooperative paramagnetism (ferromagnetism)between the neighbouring iron (III) ions in the crystal latticearising from the parallel alignment of the magnetic dipolesof the individual ions (Earnshaw 1968; Shriver et al 1990).
Electronic spectra. The complexes show no significantabsorptions in the visible region. This is consistent with a d5
tetrahedral electronic configuration which is not expected toexhibit spin forbidden d-d transitions since all tetrahedralcomplexes are energetically favoured to be high spins. Theoctahedral, weak, spin-forbidden bands such as 2T1g
6A1g
would have been observed in the visible region if the com-plexes were not tetrahedral (Purcell and Kotz 1999). Basedon the above information , the structures as shown in Fig. 2,3 and 4 have been proposed for the complexes.
AcknowledgmentI am thankful to the Department of Chemistry of the Univer-sity of Ibadan, Obafemi Awolowo University and FederalUniversity of Technology, Akure, for making some of thefacilities available.
ReferencesAdeyemo A, Shamin A 1983a Acetate catalysed interactions
of divalent metal ions with vitamin B1. Inorg Chim Acta78 L21 - L22.
Adeyemo A, Shamin A, Turner A, Akinade K 1983b Studiesinvolving labile vitamin B1 metal complexes Part 2. IR,NMR studies, structure and binding site determination.Inorg Chim Acta 78 191 - 193.
Adeyemo A 1986 Studies involving labile vitamin B1 com-plexes. Part III. Preparation and general mechanism forthe formation of complexes of the general formulaM(NH3)6 MX5. J Chem Soc Pak 8(4) 455 - 459.
Bien M 1999 Studies of antibacterial activity of binuclearrhodium (II) complexes with heterocyclic nitrogenligands. J Inorg Bioch 73 49 - 55.
Casas J S, Castellano E E, Couce M D, Sanchez A, Sordo J,Varella J M, Zukerman - Schpector J 1995 Vitamin B1:Chemical interaction with CdCl2 and in vivo effects oncadmium toxicity in rats. Crystal structure of [Cd(thiamine)Cl3]2. 2H2O, a complex containing pyrimidine and cad-mium - hydroxylethyl bonds. Inorg Chem 34 2430 - 2437.
Earnshaw A 1968 The Introduction to Magnetochemistry.Academic Press, London, UK, p 120.
Ferraro J R 1971 Low Frequency Vibration of Inorganic andCoordination Compounds. Plenum Press, NewYork,USA, p 70.
Geary W J 1971 The use of conductivity measurement in or-ganic solvent for the characterization of coordinationcompounds. Coord Chem Rev 7(1) 81 - 122.
Fig 3. The structure of [(Vit) Fe Cd Cl5]Cl. 2H2O.
Fig 2. The structure of [(Vit) FeZnCl5] Cl. 2H2O. Fig 4. The structure of [HgFe2(OH)2(Ac)4] .3H2O.
Ac = CH3COO-
Vit = Thiamine ligand
Vit = Thiamine ligand
Fe OHHO Hg
OC
C
CH
Fe
OO
C
CH3
CH3
O
OC
O
CH3
(H O)2 3
O
O
3
(l ) N Fe
CI
CI
CI
CI
Zn CI CI.2H O2
(l ) N Fe Cd
CI
CI
CI
CI
CI CI.2H O2
(l ) N
(l ) N
434 J O Ojo
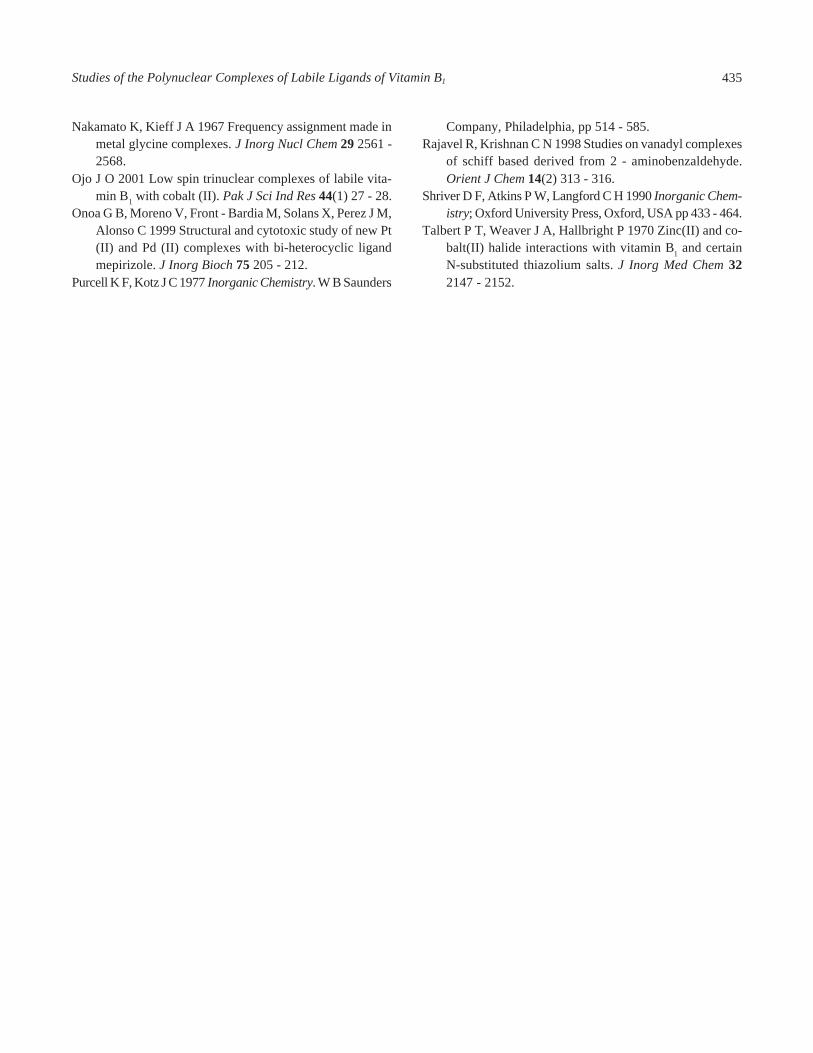
Nakamato K, Kieff J A 1967 Frequency assignment made inmetal glycine complexes. J Inorg Nucl Chem 29 2561 -2568.
Ojo J O 2001 Low spin trinuclear complexes of labile vita-min B1 with cobalt (II). Pak J Sci Ind Res 44(1) 27 - 28.
Onoa G B, Moreno V, Front - Bardia M, Solans X, Perez J M,Alonso C 1999 Structural and cytotoxic study of new Pt(II) and Pd (II) complexes with bi-heterocyclic ligandmepirizole. J Inorg Bioch 75 205 - 212.
Purcell K F, Kotz J C 1977 Inorganic Chemistry. W B Saunders
Company, Philadelphia, pp 514 - 585.Rajavel R, Krishnan C N 1998 Studies on vanadyl complexes
of schiff based derived from 2 - aminobenzaldehyde.Orient J Chem 14(2) 313 - 316.
Shriver D F, Atkins P W, Langford C H 1990 Inorganic Chem-istry; Oxford University Press, Oxford, USA pp 433 - 464.
Talbert P T, Weaver J A, Hallbright P 1970 Zinc(II) and co-balt(II) halide interactions with vitamin B1 and certainN-substituted thiazolium salts. J Inorg Med Chem 322147 - 2152.
435Studies of the Polynuclear Complexes of Labile Ligands of Vitamin B1
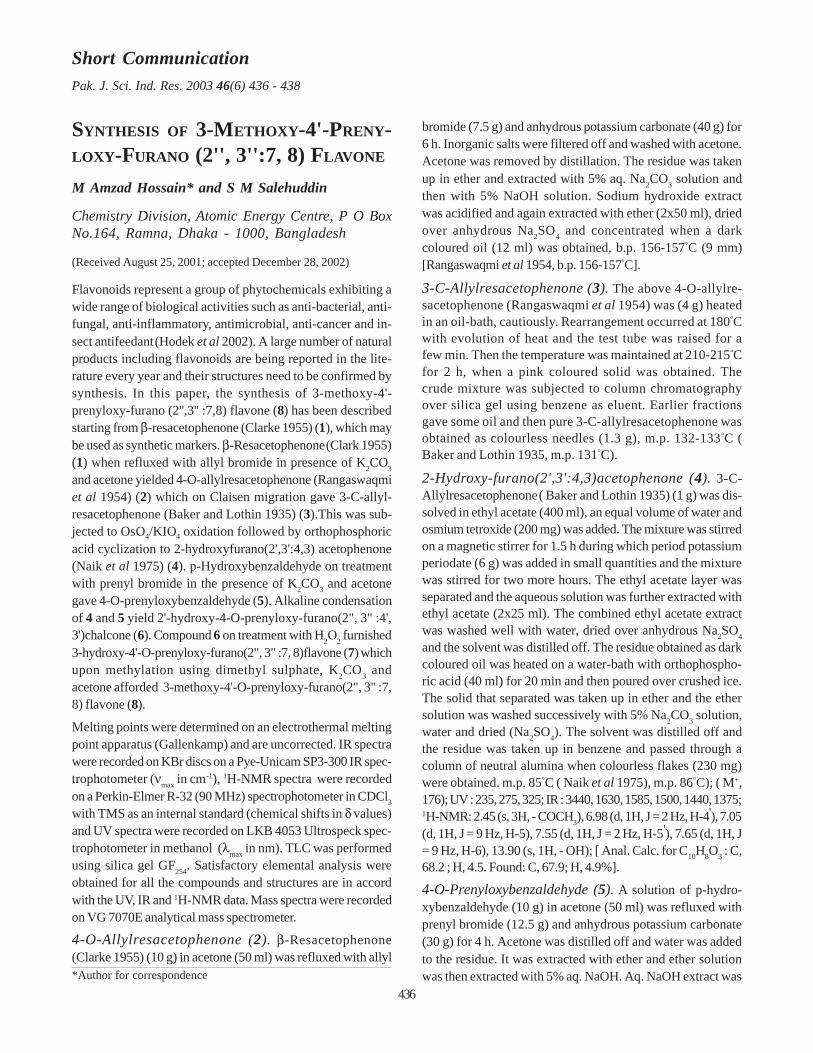
SYNTHESIS OF 3-METHOXY-4'-PRENY-LOXY-FURANO (2'', 3'':7, 8) FLAVONE
M Amzad Hossain* and S M Salehuddin
Chemistry Division, Atomic Energy Centre, P O BoxNo.164, Ramna, Dhaka - 1000, Bangladesh
(Received August 25, 2001; accepted December 28, 2002)
Flavonoids represent a group of phytochemicals exhibiting awide range of biological activities such as anti-bacterial, anti-fungal, anti-inflammatory, antimicrobial, anti-cancer and in-sect antifeedant (Hodek et al 2002). A large number of naturalproducts including flavonoids are being reported in the lite-rature every year and their structures need to be confirmed bysynthesis. In this paper, the synthesis of 3-methoxy-4'-prenyloxy-furano (2'',3'' :7,8) flavone (8) has been describedstarting from β-resacetophenone (Clarke 1955) (1), which maybe used as synthetic markers. β-Resacetophenone (Clark 1955)(1) when refluxed with allyl bromide in presence of K2CO3
and acetone yielded 4-O-allylresacetophenone (Rangaswaqmiet al 1954) (2) which on Claisen migration gave 3-C-allyl-resacetophenone (Baker and Lothin 1935) (3).This was sub-jected to OsO4/KIO4 oxidation followed by orthophosphoricacid cyclization to 2-hydroxyfurano(2',3':4,3) acetophenone(Naik et al 1975) (4). p-Hydroxybenzaldehyde on treatmentwith prenyl bromide in the presence of K2CO3 and acetonegave 4-O-prenyloxybenzaldehyde (5). Alkaline condensationof 4 and 5 yield 2'-hydroxy-4-O-prenyloxy-furano(2", 3" :4',3')chalcone (6). Compound 6 on treatment with H2O2 furnished3-hydroxy-4'-O-prenyloxy-furano(2", 3" :7, 8)flavone (7) whichupon methylation using dimethyl sulphate, K2CO3 andacetone afforded 3-methoxy-4'-O-prenyloxy-furano(2", 3" :7,8) flavone (8).
Melting points were determined on an electrothermal meltingpoint apparatus (Gallenkamp) and are uncorrected. IR spectrawere recorded on KBr discs on a Pye-Unicam SP3-300 IR spec-trophotometer (νmax in cm-1), 1H-NMR spectra were recordedon a Perkin-Elmer R-32 (90 MHz) spectrophotometer in CDCl3
with TMS as an internal standard (chemical shifts in δ values)and UV spectra were recorded on LKB 4053 Ultrospeck spec-trophotometer in methanol (λmax in nm). TLC was performedusing silica gel GF254. Satisfactory elemental analysis wereobtained for all the compounds and structures are in accordwith the UV, IR and 1H-NMR data. Mass spectra were recordedon VG 7070E analytical mass spectrometer.
4-O-Allylresacetophenone (2). β-Resacetophenone(Clarke 1955) (10 g) in acetone (50 ml) was refluxed with allyl
bromide (7.5 g) and anhydrous potassium carbonate (40 g) for6 h. Inorganic salts were filtered off and washed with acetone.Acetone was removed by distillation. The residue was takenup in ether and extracted with 5% aq. Na2CO3 solution andthen with 5% NaOH solution. Sodium hydroxide extractwas acidified and again extracted with ether (2x50 ml), driedover anhydrous Na2SO4 and concentrated when a darkcoloured oil (12 ml) was obtained, b.p. 156-157°C (9 mm)[Rangaswaqmi et al 1954, b.p. 156-157°C].
3-C-Allylresacetophenone (3). The above 4-O-allylre-sacetophenone (Rangaswaqmi et al 1954) was (4 g) heatedin an oil-bath, cautiously. Rearrangement occurred at 180°Cwith evolution of heat and the test tube was raised for afew min. Then the temperature was maintained at 210-215°Cfor 2 h, when a pink coloured solid was obtained. Thecrude mixture was subjected to column chromatographyover silica gel using benzene as eluent. Earlier fractionsgave some oil and then pure 3-C-allylresacetophenone wasobtained as colourless needles (1.3 g), m.p. 132-133°C (Baker and Lothin 1935, m.p. 131°C).
2-Hydroxy-furano(2',3':4,3)acetophenone (4). 3-C-Allylresacetophenone ( Baker and Lothin 1935) (1 g) was dis-solved in ethyl acetate (400 ml), an equal volume of water andosmium tetroxide (200 mg) was added. The mixture was stirredon a magnetic stirrer for 1.5 h during which period potassiumperiodate (6 g) was added in small quantities and the mixturewas stirred for two more hours. The ethyl acetate layer wasseparated and the aqueous solution was further extracted withethyl acetate (2x25 ml). The combined ethyl acetate extractwas washed well with water, dried over anhydrous Na2SO4and the solvent was distilled off. The residue obtained as darkcoloured oil was heated on a water-bath with orthophospho-ric acid (40 ml) for 20 min and then poured over crushed ice.The solid that separated was taken up in ether and the ethersolution was washed successively with 5% Na2CO3 solution,water and dried (Na2SO4). The solvent was distilled off andthe residue was taken up in benzene and passed through acolumn of neutral alumina when colourless flakes (230 mg)were obtained. m.p. 85°C ( Naik et al 1975), m.p. 86°C); ( M+,176); UV : 235, 275, 325; IR : 3440, 1630, 1585, 1500, 1440, 1375;1H-NMR: 2.45 (s, 3H, - COCH3), 6.98 (d, 1H, J = 2 Hz, H-4'), 7.05(d, 1H, J = 9 Hz, H-5), 7.55 (d, 1H, J = 2 Hz, H-5'), 7.65 (d, 1H, J= 9 Hz, H-6), 13.90 (s, 1H, - OH); [ Anal. Calc. for C10H8O3 : C,68.2 ; H, 4.5. Found: C, 67.9; H, 4.9%].
4-O-Prenyloxybenzaldehyde (5). A solution of p-hydro-xybenzaldehyde (10 g) in acetone (50 ml) was refluxed withprenyl bromide (12.5 g) and anhydrous potassium carbonate(30 g) for 4 h. Acetone was distilled off and water was addedto the residue. It was extracted with ether and ether solutionwas then extracted with 5% aq. NaOH. Aq. NaOH extract was
Short CommunicationPak. J. Sci. Ind. Res. 2003 46(6) 436 - 438
*Author for correspondence436
acidified and extracted with ether. Ether extract on columnchromatography with petroleum spirit gave an oily liquidwhich on cooling gave colourless needles (6 g), m.p. 61°C;(M+, 190); IR : 2980, 1640, 1500, 1375, 1330, 1250, 1190, 1130,1065, 1000, 800, 605 cm-1; 1H-NMR : 1.72 [s, 6H, C(CH3)2], 4.48(d, 2H, J = 7 Hz, -O-CH2 - CH=), 5.43 (t, 1H, -O-CH2 - CH = ), 6.73(d, 2H, J = 9 Hz, H-3 and 5), 7.55 (d, 1H, J = 9 Hz, H-2 and H-6),9.40 (s, 1H, - CHO); [Anal. Calc. for C12H14O2: C, 75.7 ; H, 7.4 .Found : C, 75.9; H, 7.5%].
2'-Hydroxy-4-prenyloxy-furano(2",3":4',3') chal-cone (6). A mixture of 2-hydroxy-furano(2',3':4,3) acetophe-
none (4, 1 g) and 4-prenyloxybenzaldehyde (5, 0.824 g) inethanolic solution of KOH (50%, 10 ml) was kept at roomtemperature for about 75 h. The reaction mixture was dilutedwith ice-cold water, acidified with cold dil. HCl and extractedwith ether. The ether layer was washed with water, dried overanhydrous Na2SO4 and evaporated to dryness. It was crys-tallized from benzene-petroleum spirit as yellow needles (400mg), m.p. 102-104°C; (M+, 348); Rf 0.64 (benzene-acetone-ethylacetate ; 4:9:1); UV: 250, 275, 320 ; IR : 3450, 1645, 1600, 1590,1470, 1420, 1375, 1325; 1H-NMR : 1.74 [s, 6H, C(CH3)2], 4.42(d, 2H, J = 7 Hz, -O - CH2-CH =), 5.51(t, 1H, - O- CH2- CH =), 6.79
--
--
HO OH CH2 CH CH2 Br O OH
O2
rearrangement
Claisan HO OH
O3
O
1
3OsO , KIO4 4
arthophosphoric acid
O
O
O
OH
OH
CHO
Prenyl bromide
acetone
4
2 3K CO ,
CHO
O
5
OH
O
O
6
H O2 2
OKOH
Alcoholic4 + 5
O
O
OCH3
(CH ) SO3 2 4O
OH
O
O7
O
O
8Scheme 1
O
K CO2 3 , acetone
2 3K CO
437Short Communication
(d, 2H, J = 9 Hz, H-3 and 5), 6.99 (d, 2H, J = 9Hz, H-5' and H-6'),7.18 ( d, 1H, J = 2 Hz, H-4"), 7.43 (d, 1H, J = 9Hz, H-α), 7.58 (d,1H, J = 9 Hz, H-2 and H - 6), 7.81 (d, 1H, J = 2Hz, H-5"), 8.03 (d,1H, J = 9 Hz, Hβ), 12.71 (s, 1H, - OH); [Anal. Calc. for C22H20O4:C, 75.8 ; H, 5.7 .Found: C, 75.9 ; H, 5.8%].
3-Hydroxy-4'-prenyloxy-furano(2",3":7,8) flavone(7). To the above hydroxychalcone (6, 1 g) in pyridine (10 ml)and NaOH (20%, in 20 ml ) kept at 60 - 70°C. H2O2 (30%, 30 ml)was added with stirring during 15 min. The reaction mixturewas acidified 20 min and the solid that separated was filtered.The solid was dissolved in benzene and crystallised frompetroleum ether as yellow needles (0.34g) , m.p. 124-127°C ;(M+, 362 ) ; Rf 0.74 (benzene-acetone-n-hexane: 4:3:1) ; UV:225, 255, 355 ; IR : 3470, 2980, 2875, 1643, 1595, 1510, 1472,1375, 1365 cm-1 ; 1H-NMR: 1.69 [s, 6H, C(CH3)2 ], 4.44 (d, 2H,J = 7 Hz, - O - CH2- CH = ), 5.54 (t, 1H, - O- CH2- CH =), 6.72 (d,2H, J = 9 Hz, H-3 and 5 ), 6.95 (d, 2H, J = 9Hz, H-5' and H-6'),7.12 (d, 1H, J = 2 Hz, H-4"), 7.58 (d, 1H, J = 9 Hz, H-2 and H-6),7.81 (d, 1H, J = 2 Hz, H-5"), 13.21 (s, 1H, - OH); [Anal. Calc. forC22H18O5: C, 72.9 ; H, 4.9 .Found: C, 72.5 ; H, 4.5%].
3-Methoxy-4'-prenyloxy-furano(2",3":7,8) flavone(8). A mixture of 7 (1.40g), dimethyl sulphate (0.228g) andanhydrous K2CO3 (10g) in acetone (25 ml ) was refluxed for 2h. Acetone was removed by distillation, water was added tothe residue and extracted with ether. The ether layer was washedwith water, dried over anhydrous Na2SO4 and evaporated todryness. The product purified by preparative TLC over silicagel GF254 using methanol-chloroform (10:1) as developingsolvent. It was crystallized from methanol to give yellow crys-tals (0.68g), m.p 147 - 149°C ; Rf 0.66 (methanol-chloroform; 10:1), (M+, 376), UV : 232, 255, 364; IR : 1645, 1605, 1590, 1470,1372, 1365, 1147 cm-1; 1HNMR : 1.71 [s, 6H, C(CH3)2], 3.98 (s,3H, - OCH3), 4.41 (d, 2H, J = 7 Hz, - O- CH2- CH =), 5.55(t, 1H, -O- CH2- CH =), 6.73 (d, 2H, J = 9 Hz, H-3 and 5), 6.93 (d, 2H, J =9Hz, H-5' and H-6'), 7.15 ( d, 1H, J = 2 Hz, H-4"), 7.59 (d, 1H, J= 9 Hz, H-2 and H-6), 7.84 ( d, 1H, J = 2Hz, H-5"). [Anal. Calc.for C23H20O5: C, 73.4; H, 5.3 .Found: C, 73.6 ; H, 5.5%].
The compounds 1 (β-resacetophenone), 2 (4-O-allylresace-tophenone), 3 (3-C-allylresacetophenone) and 4 (2-hydro-xyfurano (2', 3':4,3) have been prepared by following literatureprocedures (Clarke 1955; Rangaswaqmi et a1 1954; Baker andLothin 1935; Niak et al 1975). The formation of these productshas been confirmed by comparing their melting points withthe reported values (Clarke 1955; Rangaswaqmi et a1 1954;Baker and Lothin 1935; Niak et al 1975). p-Hydroxybenzal-
dehyde on treatment with prenyl bromide in the presence ofK2CO3 and acetone gave 4-O-prenyloxybenzaldehyde 5. Theformation of which was ascertained by spectral studies. IRspectrum of 5 showed 1640 cm-1 indicating the presence ofketo group in conjugation. The compound 4 on cross-aldolcondensation with 5 afforded the compound 6 after dehydra-tion of the initial product. The IR spectrum of compound 6showed absorption frequencies at 3450, 1645 cm-1 indicatingthe presence of a hydroxyl, a conjugated carbonyl groupsand the absorption peaks at 1600 and 1590 cm-1 .This indi-cated the presence of unsymmetric ethylenic double bondand aromatic rings respectively. The singlet for methyl pro-tons of acetyl group disappeared while two new doublets atδ7.43 and 8.03 appeared showing the presence of two vinylicprotons (α and β protons). The elemental analysis for C and Hshowed satisfactory results (within + 0.4%). The cyclizedproduct 7 was obtained by H2O2/pyridine/NaOH treatment ofits precusor 6. The formation of 7 was confirmed by compar-ing its spectral data and elemental analysis. IR spectra of com-pound 7 showed 3470 cm-1 (phenolic - OH), 1643 cm-1 ( C=O)and 1595 cm-1 (double bond/ aromatic ring). In the 1H-NMRspectrum two doublets at δ7.43 and 8.03 for vinylic protonsdisappeared. The title compound 8 was finally obtained bymethylation of its precursor.
AcknowledgementAuthors are grateful to Dr. J. Palige, Department Number-6,Institute of Nuclear Chemistry and Technology, Warsaw,Poland for 1H-NMR, mass and elemental analyses.
Key words: Synthesis, Chalcone, Flavone
ReferencesBaker W, Lothin O M 1935 Flavonoids and phenolic glyco-
side from Salvin officinalis. J Chem Soc 7 628 - 631.Clarke H T 1955 Organic Synthesis, Collective Vol.III, 761.Hodek P, Trefil P, Stiborova M 2002 Flavonoids - potent and
versatile biologically active compounds interacting withcytochromes P450 Chemmico - Biological Interactions139 1 - 21.
Naik H B, Mankiwala S C, Ankiwala, Thakor V M 1975 At-tempted synthesis of 3,3’- linked flavonoids. J IndianChem Soc, 18 52 - 54.
Rangaswaqmi S, Narayanaswami S, Sesshadri T R 1954 A newflavonoids coumarins from Murraya exotica L. J ChemSoc, 26 1871 - 1874.
--
--
--
438 Short Communication
Pak. J. Sci. Ind. Res. 2003 46(6) 439 - 442
VARIATION OF HEAVY METAL CONCENTRATIONS IN WATER AND FRESHWATER FISH
IN NIGER DELTA WATERS - A CASE STUDY OF BENIN RIVER
M Okuo James* and P O Okolo
Department of Chemistry, University of Benin, Benin City, Nigeria
(Received January 3, 2002; accepted February 25, 2003)
Levels of Cd, Cr, Fe, Pb and Zn were determined in water and fish samples from three different locations in the Beninriver. The sampling points were chosen such that Gbokoda, a village between Koko and Ogheye where a flow station(Olague flow station or crude oil well) is situated serves as a pollution point source and Koko as a baseline concentrationpoint. Three species of fish each, that are top feeder, Tilapia mariae (which is herbivorous and feeds mainly on floatingphytoplankton), middle feeder, Pseudotolithus elongatus (that is ominivorous) and bottom feeder, Chrysichthysnigrodigitatus (also ominivorous) were used for the study. The mean wet weight of the species sampled at the differentlocations ranged between 385.17 - 417.44g. The maximum concentration levels observed in water samples for Cd, Cr, Fe,Pb and Zn were 3.50 x 10- 4 g/l, 1.24 x 10- 3 g/l, 3.10 x 10- 3 g/l and 1.50 x 10- 3 g/l, respectively. The mean concentrationlevels determined for the various species of fish are: for Cd, Tilapia mariae 7.30 x 10- 5, Pseudotolitus elongatus 8.67 x10- 4 and Chrysichthys nigrodigitatus 1.581 x 10- 4, for Fe, Tilapia mariae 5.500 x 10- 3, Pseudotolithus elongatus 4.700 x10- 3 and Chrysichthys nigrodigitatus 3.9133 x 10- 3, for Pb, Tilapia mariae 4.4240 x 10- 3, Pseudotolithus elongatus3.4100 x 10- 3 and Chrysichthys nigrodigitatus 9.6730 x 10- 3 for Zn, Tilapia mariae 5.467 x 10- 3, Pseudotolithus elongatus5.067 x 10- 3 and Chrysichthys nigrodigitatus 8.833 x 10- 3. (All values are g/g of fish)
Key words: Heavy metal, Fresh water fish, Benin river, Herbivorous, Omnivorous.
IntroductionHeavy metals have water bodies in both natural and anthro-pogenic origin and they will cause long-term damage to theaquatic environment.
The levels of heavy metals on freshwater fish and aquaticorganisms reported by (Comparetto and Jester 1981; Hart1982; Luoma 1983; Ndiokwere 1983). The concentration ofthese heavy metals in an organism’s environment and its rateof ingestion and excretion. The concentration of harmful sub-stances especially hydrophobic compounds are higher in sedi-ments and biological tissues than in water itself (Florenceand Batley 1980). It is likely that some of these hydrophobiccompounds can form chelates with heavy metals.
Many aquatic organisms are able to concentrate these metalsto a high level which become hazardous to health. Prestonet al (1972), suggested that some aquatic organism may pro-vide a useful means of monitoring elemental concentrationin surface waters and their impact on the aquatic environ-ment. One objective of this study is to determine the concen-tration of some heavy metal Cd, Cr, Fe, Pb and Zn in waterand fish samples from the Benin river. A second objective isto determine the concentration of these heavy metals at dif-ferent depths using three species that are top, middle and bot-tom feeders.* Author for correspondence
The Benin river runs through an area of dense oil activitiesincluding exploration and drilling of crude oil by Chevron,Shell companies, Nigeria Limited. These heavy metals areknown to be associated with oil-drilling operations and sev-eral oil spills resulting from these activities have been re-ported in this area of study. Effluent from these activities isdischarged either directly into the river on into creeks whichdrain into the river. The Benin river finally runs into the At-lantic Ocean at Ogheye a distance of 42km from Koko, oneof the sampling station.
Through the liver of fish is known to concentrate moremetals than any other part (De Goeji et al 1974). We chose tofocus on muscle tissue which is highly consumed by man.Heavy metals are known to be deleterious to humans, there-fore, man is exposed to a health hazard when large quantitiesof contaminated fishes are consumed.
Method. Sample collection and preparation: The fish andwater samples were collected from three sampling locationson Benin river viz Ogheye, Gbokoda and Koko. The watersampling was done twice a month for a period of 6 months(Fig 1).
The water samples were collected using ‘grab samplingmethod’ (APHA 1985). The samples were stored in 2.5 litreplastic containers which were previously washed with 2%v/v HNO3 and rinsed thoroughly with distilled water. A two
439
Biological Sciences
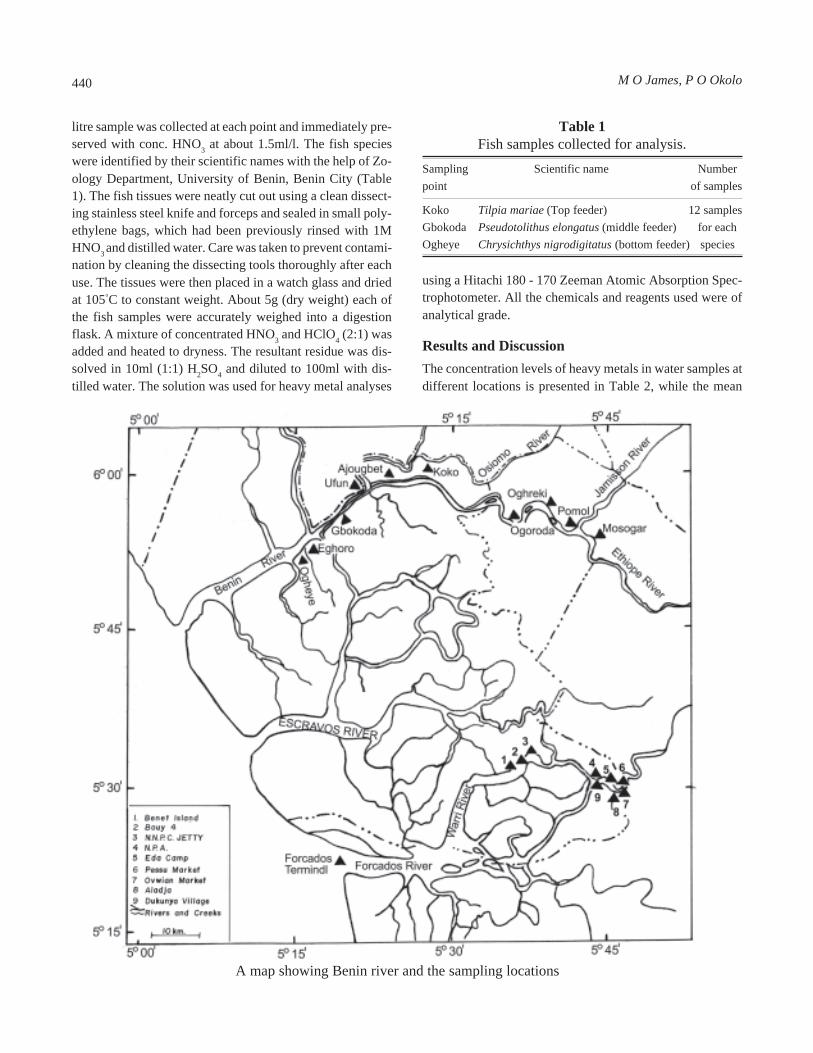
litre sample was collected at each point and immediately pre-served with conc. HNO3 at about 1.5ml/l. The fish specieswere identified by their scientific names with the help of Zo-ology Department, University of Benin, Benin City (Table1). The fish tissues were neatly cut out using a clean dissect-ing stainless steel knife and forceps and sealed in small poly-ethylene bags, which had been previously rinsed with 1MHNO3 and distilled water. Care was taken to prevent contami-nation by cleaning the dissecting tools thoroughly after eachuse. The tissues were then placed in a watch glass and driedat 105°C to constant weight. About 5g (dry weight) each ofthe fish samples were accurately weighed into a digestionflask. A mixture of concentrated HNO3 and HClO4 (2:1) wasadded and heated to dryness. The resultant residue was dis-solved in 10ml (1:1) H2SO4 and diluted to 100ml with dis-tilled water. The solution was used for heavy metal analyses
Table 1Fish samples collected for analysis.
Sampling Scientific name Numberpoint of samples
Koko Tilpia mariae (Top feeder) 12 samplesGbokoda Pseudotolithus elongatus (middle feeder) for eachOgheye Chrysichthys nigrodigitatus (bottom feeder) species
using a Hitachi 180 - 170 Zeeman Atomic Absorption Spec-trophotometer. All the chemicals and reagents used were ofanalytical grade.
Results and DiscussionThe concentration levels of heavy metals in water samples atdifferent locations is presented in Table 2, while the mean
A map showing Benin river and the sampling locations
440 M O James, P O Okolo
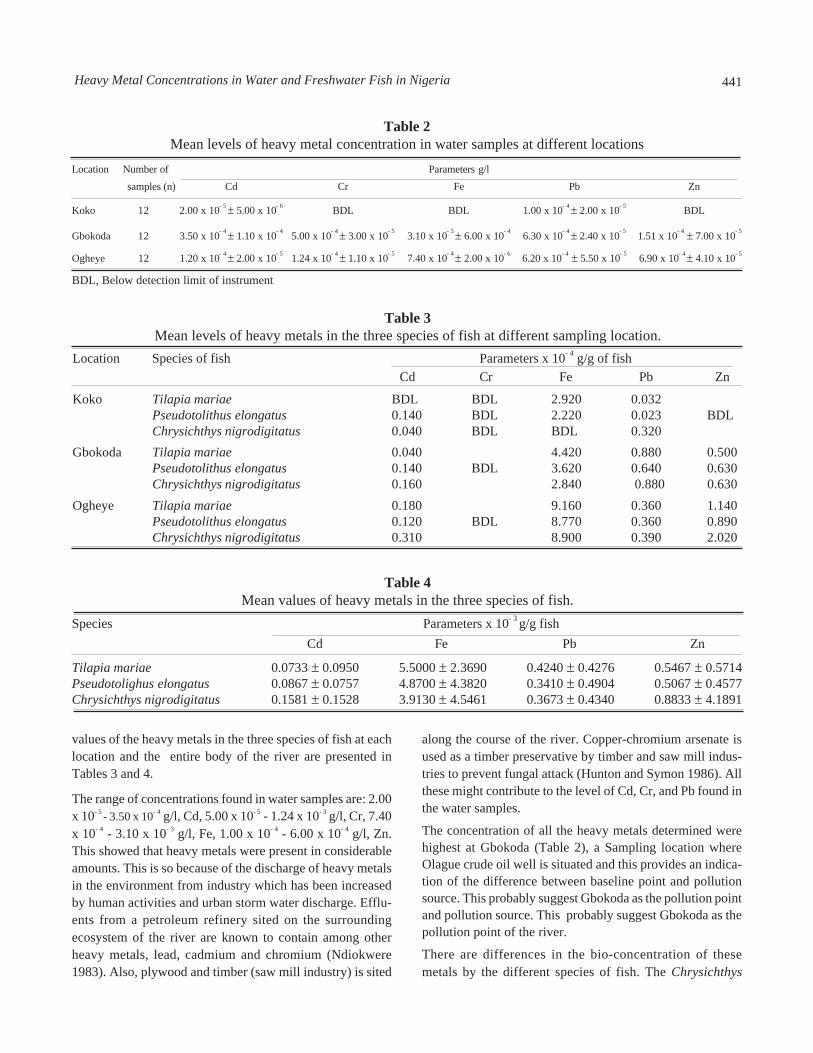
values of the heavy metals in the three species of fish at eachlocation and the entire body of the river are presented inTables 3 and 4.
The range of concentrations found in water samples are: 2.00x 10- 5 - 3.50 x 10- 4 g/l, Cd, 5.00 x 10- 5 - 1.24 x 10- 3 g/l, Cr, 7.40x 10- 4 - 3.10 x 10- 3 g/l, Fe, 1.00 x 10- 4 - 6.00 x 10- 4 g/l, Zn.This showed that heavy metals were present in considerableamounts. This is so because of the discharge of heavy metalsin the environment from industry which has been increasedby human activities and urban storm water discharge. Efflu-ents from a petroleum refinery sited on the surroundingecosystem of the river are known to contain among otherheavy metals, lead, cadmium and chromium (Ndiokwere1983). Also, plywood and timber (saw mill industry) is sited
along the course of the river. Copper-chromium arsenate isused as a timber preservative by timber and saw mill indus-tries to prevent fungal attack (Hunton and Symon 1986). Allthese might contribute to the level of Cd, Cr, and Pb found inthe water samples.
The concentration of all the heavy metals determined werehighest at Gbokoda (Table 2), a Sampling location whereOlague crude oil well is situated and this provides an indica-tion of the difference between baseline point and pollutionsource. This probably suggest Gbokoda as the pollution pointand pollution source. This probably suggest Gbokoda as thepollution point of the river.
There are differences in the bio-concentration of thesemetals by the different species of fish. The Chrysichthys
Table 3Mean levels of heavy metals in the three species of fish at different sampling location.
Location Species of fish Parameters x 10- 4 g/g of fishCd Cr Fe Pb Zn
Koko Tilapia mariae BDL BDL 2.920 0.032Pseudotolithus elongatus 0.140 BDL 2.220 0.023 BDLChrysichthys nigrodigitatus 0.040 BDL BDL 0.320
Gbokoda Tilapia mariae 0.040 4.420 0.880 0.500Pseudotolithus elongatus 0.140 BDL 3.620 0.640 0.630Chrysichthys nigrodigitatus 0.160 2.840 0.880 0.630
Ogheye Tilapia mariae 0.180 9.160 0.360 1.140Pseudotolithus elongatus 0.120 BDL 8.770 0.360 0.890Chrysichthys nigrodigitatus 0.310 8.900 0.390 2.020
Table 4Mean values of heavy metals in the three species of fish.
Species Parameters x 10- 3 g/g fishCd Fe Pb Zn
Tilapia mariae 0.0733 ± 0.0950 5.5000 ± 2.3690 0.4240 ± 0.4276 0.5467 ± 0.5714Pseudotolighus elongatus 0.0867 ± 0.0757 4.8700 ± 4.3820 0.3410 ± 0.4904 0.5067 ± 0.4577Chrysichthys nigrodigitatus 0.1581 ± 0.1528 3.9130 ± 4.5461 0.3673 ± 0.4340 0.8833 ± 4.1891
Table 2Mean levels of heavy metal concentration in water samples at different locations
Location Number of Parameters g/l samples (n) Cd Cr Fe Pb Zn
Koko 12 2.00 x 10- 5 ± 5.00 x 10- 6 BDL BDL 1.00 x 10- 4 ± 2.00 x 10- 5 BDL
Gbokoda 12 3.50 x 10- 4 ± 1.10 x 10- 4 5.00 x 10- 4 ± 3.00 x 10- 5 3.10 x 10- 5 ± 6.00 x 10- 4 6.30 x 10- 4 ± 2.40 x 10- 5 1.51 x 10- 4 ± 7.00 x 10- 5
Ogheye 12 1.20 x 10- 4 ± 2.00 x 10- 5 1.24 x 10- 4 ± 1.10 x 10- 5 7.40 x 10- 4 ± 2.00 x 10- 6 6.20 x 10- 4 ± 5.50 x 10- 5 6.90 x 10- 4 ± 4.10 x 10- 5
BDL, Below detection limit of instrument
441Heavy Metal Concentrations in Water and Freshwater Fish in Nigeria
nigrodigitatus specie, the bottom feeder tends to bio-accu-mulate more of Cd and Zn with concentrations of 1.58 x10- 4 g and 8.83 x 10- 4 g/g of fish, respectively. The highestconcentration of 5.50 x 10- 3 g/g and 4.240 x 10- 5 g/g of fishfor Fe and Pb, respectively were determined for Tilapiamariae, the top feeder. The high concentrations may be as aresult of exposure to, and feeding in contaminated freshwater sediments. Other human activities such as the washingof clothes and motor vehicles at various sites on the bank ofthis river, can possibly contribute to its pollution by heavymetals. Cr was not detected in any of the fish samples. Theconcentration of Cr in the fish samples might be below thedetection limits of 0.005 μg of the Hitachi 180 - 170 ZeemanAtomic Absorption Spectrophotometer.
The average size of the fish samples from the different loca-tions were approximately the same. The degree to which thedifferences in the fish sizes influence the bio-accumulativebehaviour of the fish species cannot be correlated with thedifference in the heavy metal concentration levels, thoughnot investigated. The high levels of heavy metals determinedin all the fish samples might be due to local contamination ofthe river.
ConclusionConclusively, the bio-concentration of heavy metals in biotasuch as fish is an indicator of the pollution of water bodies byheavy metals. This is apparent in the elevated levels of met-als observed in the fish samples than that obtained for thewater samples. The heavy metals pollutant levels in the fishsamples were in the decreasing order Fe > Zn > Pb and Cd.
AcknowledgementThe authors are grateful to the Department of Chemistry,University of Benin, Benin City, for funding this researchwork. We also acknowledge Mrs Ukwade, P.O., for puttingthis work in print.
ReferencesAPHA, AWWA, WPCF 1985 Standard Methods for the
Examination of Water and Waste Water. Published byAmerican Public Health Association, 1015, FifteenthStreet NW, Washington DC, USA, 20005, 16th ed, P 17.
Comparetto G M, Jester W A 1981 Arsenic activation, analy-sis of fresh water fish through the precipitation ofelemental arsenic. Abstract presented at The Int. Conf.On Modern Trends in Activation Analysis, 6th, Toronto,Canada, 9 - 13 June.
De-Goeji J J M, Guinn V P, Young D B, Mearns A J 1974Neutron Activation Analysis - Trace Element Studies ofDover Sole Liver and Marine Sediments. In comparativeStudies of Food and Environmental Contamination,Vienna, Austria, IAEA, SM - 275/15, pp 189 - 200.
Florence T M, Bately G E 1980 Chemical, speciation of natu-ral waters. CRC. Critical Reviews of Analytical Chemis-try 9 219 - 296.
Hart B T 1982 Australian Water Quality Criteria for HeavyMetals, Australian Water Resources Council TechnicalPaper No 79. Australian Government PublishingService.
Hutton M, Symon C 1986 The quantities of cadmium, lead,mercury and arsenic entering the U.K. environment fromhuman activities. The Science of the Total Environment57 129 - 150.
Luoma S N 1983 Bio-availability of Trace Metals to AquaticOrganism - a Review of the Science of the Total Envi-ronment. 28 1 - 22.
Ndiokwere C L 1983 Arsenic, gold and mercury concentra-tion levels in freshwater fish by neutron activation analy-sis. Environmental Pollution (Series B) 6 263 - 269.
Preston A, Jefferies D F, Dutton J W R, Harvey B R, Steele AK 1972 British Isles Coastal Waters - The concentrationsof selected heavy metals in sea water, suspended matterand biological indicators pilot survey. EnvironmentalPollution, 3 69 - 82.
442 M O James, P O Okolo
IntroductionLarge-scale cultivation of bread wheat varieties with geneticuniformity of rust resistance was one of the major causes of1994 - 1995 Yr epidemic in northern Pakistan, where losseswere up to 40% (Saari et al 1995). Inqilab-91 was swiftly spreadthroughout Pakistan after the defeat of Yellow rust resistancegene Yr 9 in Pirsabak - 85 and Pak - 81, which were extensivelygrown in the Northwest Frontier Province and barani areas ofPunjab. At present, almost 80% of the area under wheat culti-vation is occupied by this single variety, posing a high risk ofcrop loss due to change in races of Yr (Anonymous 2000).Therefore, a constant search for new and stable Yr resistancesources with high yield potential is imperative for the devel-opment of improved rust resistant cultivars. This paperreports two years results (1998 - 1999 and 1999 - 2000) ofstability of Yr resistance in some selected wheat lines fromICARDA germplasm and their yield potential at Tarnab dur-ing 1999 - 2000.
Materials and MethodsField experiments were conducted to select Yr resistantgermplasm at NIFA during 1998 - 1999 from two ICARDAbread wheat nurseries, viz, Semi Arid Wheat Screening Nurs-ery (SAWSN) and Wheat Observation Nursery for Drought(WON-D), which were composed of 174 and 91entries, re-spectively. In each nursery, every entry was planted in strips
STABILITY OF RUST RESISTANCE AND YIELD POTENTIAL OF SOME ICARDA BREAD
WHEAT LINES IN PAKISTAN
Syed Jawad Ahmad Shah a*, A J Khan a, F Azam a, J I Mirza b and Atiq ur Rehman b
aNuclear Institute for Food and Agriculture (NIFA), Tarnab, Peshawar, PakistanbCrop Diseases Research Institute (CDRI), National Agricultural Research Center, Islamabad, Pakistan
(Received January 17, 2002; accepted March 24, 2003)
Thirty bread wheat lines resistant to Yellow rust (Yr) were selected after careful screening from two ICARDA nurseriesduring 1998 - 1999, Rabi season at Nuclear Institute for Food and Agriculture (NIFA), Tarnab, Peshawar under severedisease pressure. In the following crop cycle, these selections were again field evaluated for stability and effectiveness of Yrresistance at multilocations while their yield potential was ascertained at Tarnab in two different trials with Tatara ascommercial check. Results revealed that uniformity was found in the potential behavior of 23 lines (77%) in both thecropping seasons against Yr. This included some high yielding (up to 7067 kg / ha) and low yielding lines (up to 4333 kg/ ha) when compared with the check (6089 kg / ha). Yield potential of some high yielding lines with stable Yr resistanceshould be further evaluated over sites and seasons for wide adaptability, under national uniform testing in order to select anddeploy future varieties to combat Yr for acquiring food security in Pakistan.
Key words: Yellow rust, Bread wheat, Yield potential.
of small adjacent plots having 2 rows/plot of 2.5 m length and0.3 m apart. A super susceptible wheat variety (Local White)was sown around each nursery as spreader and also to act asthe adult plant susceptible check. Nurseries and spreader wereinoculated two to three times in early March using prevailingYr races obtained from CDRI, Murree. This was done aftersunset using a turbo - air sprayer at growth stage 34 - 37(Zadoks et al 1974). Rust severity and response data wasrecorded on flag leaves after flowering was almost completeand when Local White had severity more than 50%. Severityestimates were based on the Modified Cobb Scale (Patersonet al 1948), while host response to infection was scored ac-cording to (Singh 1993) and converted to Coefficient of Infec-tion Scale developed by Stubbs et al (1986).
Stability of resistance in thirty Yr resistant sources selectedduring 1998 - 1999 were further filed and evaluated in the fol-lowing crop cycle (1999 - 2000) at Rawalpindi, Islamabad,Chackwall, Nawshara and Peshawar in the CDRI NationalWheat Disease Screening Nursery (NWDSN). Each entry wasplanted in a single 1m row, 0.3 m apart. Two rows of rust sus-ceptible spreader consisting of Local White, Moroco andSonora were planted around the nursery. In addition, a row ofsusceptible check (Local White) was also planted at the 5th
and then every 25th subsequent row. Artificial rust inoculationand Yr data was recorded in the same way as mentioned above.Thirty selected lines were also evaluated for yield potentialduring 1999 - 2000 in two different trials of 15 selections each.
Pak. J. Sci. Ind. Res. 2003 46(6) 443 - 446
*Author for correspondence
443
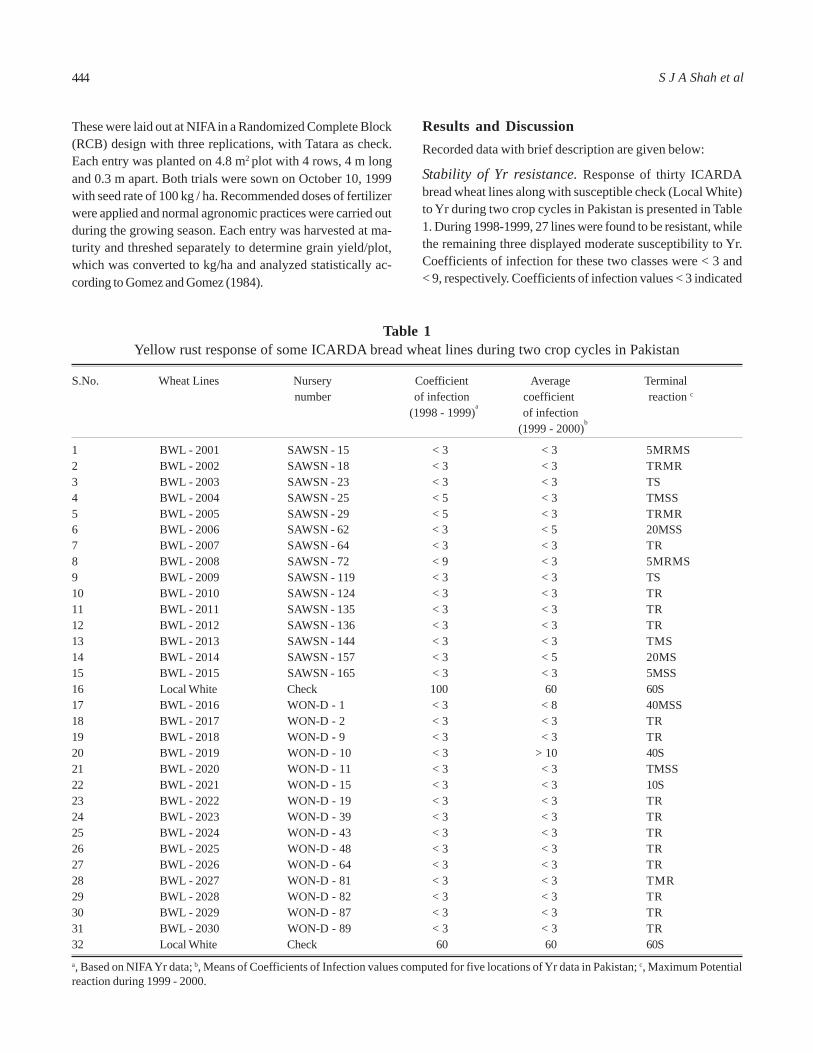
These were laid out at NIFA in a Randomized Complete Block(RCB) design with three replications, with Tatara as check.Each entry was planted on 4.8 m2 plot with 4 rows, 4 m longand 0.3 m apart. Both trials were sown on October 10, 1999with seed rate of 100 kg / ha. Recommended doses of fertilizerwere applied and normal agronomic practices were carried outduring the growing season. Each entry was harvested at ma-turity and threshed separately to determine grain yield/plot,which was converted to kg/ha and analyzed statistically ac-cording to Gomez and Gomez (1984).
Results and DiscussionRecorded data with brief description are given below:
Stability of Yr resistance. Response of thirty ICARDAbread wheat lines along with susceptible check (Local White)to Yr during two crop cycles in Pakistan is presented in Table1. During 1998-1999, 27 lines were found to be resistant, whilethe remaining three displayed moderate susceptibility to Yr.Coefficients of infection for these two classes were < 3 and< 9, respectively. Coefficients of infection values < 3 indicated
Table 1Yellow rust response of some ICARDA bread wheat lines during two crop cycles in Pakistan
S.No. Wheat Lines Nursery Coefficient Average Terminal number of infection coefficient reaction c
(1998 - 1999)a of infection
(1999 - 2000)b
1 BWL - 2001 SAWSN - 15 < 3 < 3 5MRMS2 BWL - 2002 SAWSN - 18 < 3 < 3 TRMR3 BWL - 2003 SAWSN - 23 < 3 < 3 TS4 BWL - 2004 SAWSN - 25 < 5 < 3 TMSS5 BWL - 2005 SAWSN - 29 < 5 < 3 TRMR6 BWL - 2006 SAWSN - 62 < 3 < 5 20MSS7 BWL - 2007 SAWSN - 64 < 3 < 3 TR8 BWL - 2008 SAWSN - 72 < 9 < 3 5MRMS9 BWL - 2009 SAWSN - 119 < 3 < 3 TS10 BWL - 2010 SAWSN - 124 < 3 < 3 TR11 BWL - 2011 SAWSN - 135 < 3 < 3 TR12 BWL - 2012 SAWSN - 136 < 3 < 3 TR13 BWL - 2013 SAWSN - 144 < 3 < 3 TMS14 BWL - 2014 SAWSN - 157 < 3 < 5 20MS15 BWL - 2015 SAWSN - 165 < 3 < 3 5MSS16 Local White Check 100 60 60S17 BWL - 2016 WON-D - 1 < 3 < 8 40MSS18 BWL - 2017 WON-D - 2 < 3 < 3 TR19 BWL - 2018 WON-D - 9 < 3 < 3 TR20 BWL - 2019 WON-D - 10 < 3 > 10 40S21 BWL - 2020 WON-D - 11 < 3 < 3 TMSS22 BWL - 2021 WON-D - 15 < 3 < 3 10S23 BWL - 2022 WON-D - 19 < 3 < 3 TR24 BWL - 2023 WON-D - 39 < 3 < 3 TR25 BWL - 2024 WON-D - 43 < 3 < 3 TR26 BWL - 2025 WON-D - 48 < 3 < 3 TR27 BWL - 2026 WON-D - 64 < 3 < 3 TR28 BWL - 2027 WON-D - 81 < 3 < 3 TMR29 BWL - 2028 WON-D - 82 < 3 < 3 TR30 BWL - 2029 WON-D - 87 < 3 < 3 TR31 BWL - 2030 WON-D - 89 < 3 < 3 TR32 Local White Check 60 60 60Sa, Based on NIFA Yr data; b, Means of Coefficients of Infection values computed for five locations of Yr data in Pakistan; c, Maximum Potentialreaction during 1999 - 2000.
444 S J A Shah et al
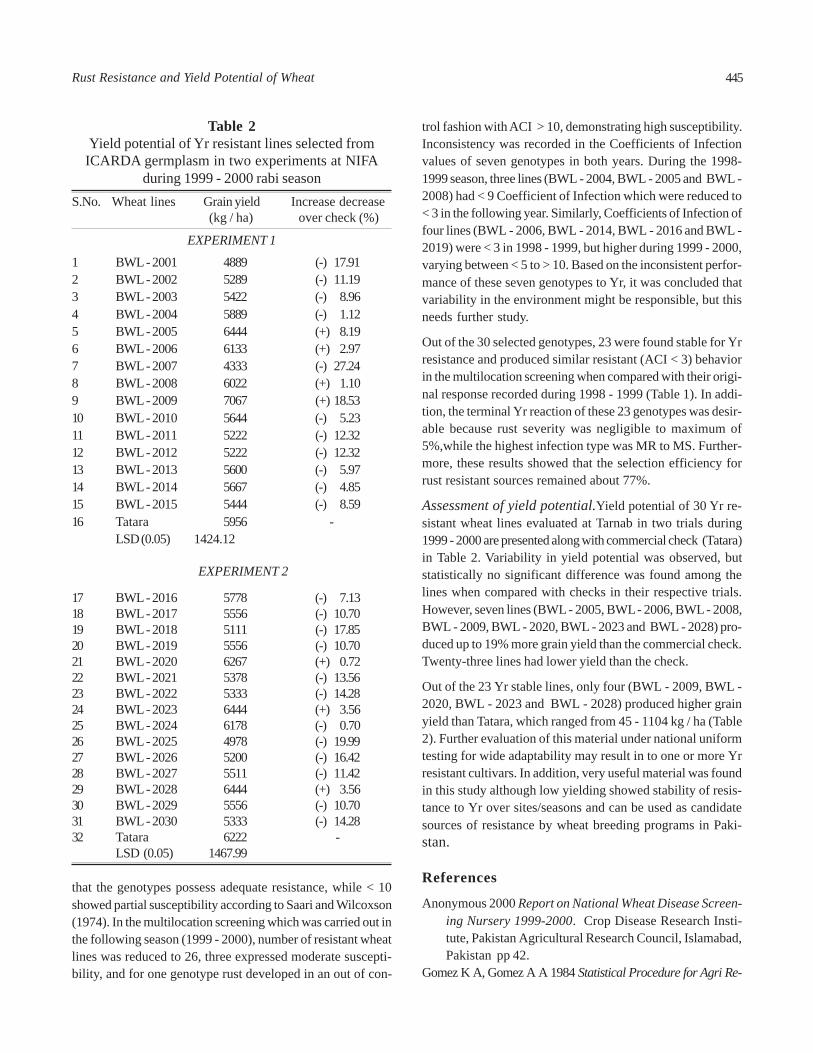
trol fashion with ACI > 10, demonstrating high susceptibility.Inconsistency was recorded in the Coefficients of Infectionvalues of seven genotypes in both years. During the 1998-1999 season, three lines (BWL - 2004, BWL - 2005 and BWL -2008) had < 9 Coefficient of Infection which were reduced to< 3 in the following year. Similarly, Coefficients of Infection offour lines (BWL - 2006, BWL - 2014, BWL - 2016 and BWL -2019) were < 3 in 1998 - 1999, but higher during 1999 - 2000,varying between < 5 to > 10. Based on the inconsistent perfor-mance of these seven genotypes to Yr, it was concluded thatvariability in the environment might be responsible, but thisneeds further study.
Out of the 30 selected genotypes, 23 were found stable for Yrresistance and produced similar resistant (ACI < 3) behaviorin the multilocation screening when compared with their origi-nal response recorded during 1998 - 1999 (Table 1). In addi-tion, the terminal Yr reaction of these 23 genotypes was desir-able because rust severity was negligible to maximum of5%,while the highest infection type was MR to MS. Further-more, these results showed that the selection efficiency forrust resistant sources remained about 77%.
Assessment of yield potential.Yield potential of 30 Yr re-sistant wheat lines evaluated at Tarnab in two trials during1999 - 2000 are presented along with commercial check (Tatara)in Table 2. Variability in yield potential was observed, butstatistically no significant difference was found among thelines when compared with checks in their respective trials.However, seven lines (BWL - 2005, BWL - 2006, BWL - 2008,BWL - 2009, BWL - 2020, BWL - 2023 and BWL - 2028) pro-duced up to 19% more grain yield than the commercial check.Twenty-three lines had lower yield than the check.
Out of the 23 Yr stable lines, only four (BWL - 2009, BWL -2020, BWL - 2023 and BWL - 2028) produced higher grainyield than Tatara, which ranged from 45 - 1104 kg / ha (Table2). Further evaluation of this material under national uniformtesting for wide adaptability may result in to one or more Yrresistant cultivars. In addition, very useful material was foundin this study although low yielding showed stability of resis-tance to Yr over sites/seasons and can be used as candidatesources of resistance by wheat breeding programs in Paki-stan.
References
Anonymous 2000 Report on National Wheat Disease Screen-ing Nursery 1999-2000. Crop Disease Research Insti-tute, Pakistan Agricultural Research Council, Islamabad,Pakistan pp 42.
Gomez K A, Gomez A A 1984 Statistical Procedure for Agri Re-
that the genotypes possess adequate resistance, while < 10showed partial susceptibility according to Saari and Wilcoxson(1974). In the multilocation screening which was carried out inthe following season (1999 - 2000), number of resistant wheatlines was reduced to 26, three expressed moderate suscepti-bility, and for one genotype rust developed in an out of con-
Table 2Yield potential of Yr resistant lines selected from
ICARDA germplasm in two experiments at NIFAduring 1999 - 2000 rabi season
S.No. Wheat lines Grain yield Increase decrease (kg / ha) over check (%)
EXPERIMENT 11 BWL - 2001 4889 (-) 17.912 BWL - 2002 5289 (-) 11.193 BWL - 2003 5422 (-) 8.964 BWL - 2004 5889 (-) 1.125 BWL - 2005 6444 (+) 8.196 BWL - 2006 6133 (+) 2.977 BWL - 2007 4333 (-) 27.248 BWL - 2008 6022 (+) 1.109 BWL - 2009 7067 (+) 18.5310 BWL - 2010 5644 (-) 5.2311 BWL - 2011 5222 (-) 12.3212 BWL - 2012 5222 (-) 12.3213 BWL - 2013 5600 (-) 5.9714 BWL - 2014 5667 (-) 4.8515 BWL - 2015 5444 (-) 8.5916 Tatara 5956 -
LSD (0.05) 1424.12
EXPERIMENT 2
17 BWL - 2016 5778 (-) 7.1318 BWL - 2017 5556 (-) 10.7019 BWL - 2018 5111 (-) 17.8520 BWL - 2019 5556 (-) 10.7021 BWL - 2020 6267 (+) 0.7222 BWL - 2021 5378 (-) 13.5623 BWL - 2022 5333 (-) 14.2824 BWL - 2023 6444 (+) 3.5625 BWL - 2024 6178 (-) 0.7026 BWL - 2025 4978 (-) 19.9927 BWL - 2026 5200 (-) 16.4228 BWL - 2027 5511 (-) 11.4229 BWL - 2028 6444 (+) 3.5630 BWL - 2029 5556 (-) 10.7031 BWL - 2030 5333 (-) 14.2832 Tatara 6222 -
LSD (0.05) 1467.99
445Rust Resistance and Yield Potential of Wheat
search 2nd ed. John Willey & Sons, Inc. USA pp 188 - 192.Peterson R E, Campbell A B, Hannah A E 1948 A diagram-
matic scale for estimating rust severity on leaves andstems of cereals. Can J Res, Sect. C. 26 496 - 500.
Saari E E, Wilcoxson R D 1974 Plant disease situation of highyielding dwarf wheat in Asia and Africa. Annual Rev. ofPhytopathology. 12 49 - 67.
Saari E E, Hashmi N I, Kisana N S 1995 Wheat and Pakistan,
an update (Yr 95 doc.) pp 3.Singh R P 1993 Resistance to leaf rust in 26 Mexican wheat
cultivars. Crop Sci 33 633 - 637.Stubbs RW, Prescott M, Saari E E, Dubin H J 1986 Cereal
Diseases Methodology Manual. Centro International deMejoramieto de Maize Y Trigo (CIMMYT). pp 46.
Zadoks J C, Chang T T, Konzak C F 1974 A decimal code forthe growth stages of cereals. Weed Res 14 415 - 421.
446 S J A Shah et al
Pak. J. Sci. Ind. Res. 2003 46(6) 447 - 451
LEAF PHENOLICS OF DIFFERENT VARIETIES OF TROPICAL RAPESEED AT VARIOUS
GROWING STAGES
M Ashraf Chaudry*, Nizakat Bibi, Amal Badshah, Misal Khan and Zahid Ali
Nuclear Institute for Food and Agriculture, Tarnab, G.T. Road Peshawar, Peshawar, Pakistan
(Received October 5, 2002; accepted May 19, 2003)
Three species of rapeseed viz RM-9-7 (Brassica napus), BM-1 (Brassica juncea) and peela raya (Brassica carinata) weregrown using normal agronomic practices. The leaves of three species were harvested after 20,40,60,80,100 and 120 daysof sowing for analysis of different polyphenols after extraction in water and methanol by spectrophotometric methods.The results revealed that maximum concentration of sinapine, total phenols, leucoanthocyanidine and procyanidine werehighest after 80 days of sowing in all species except the leucoanthocyanidine content of BM-I and peela raya specieswhere maximum concentration was recorded after 100 days of sowing. Concentrations of methanol extractable phenolicswere higher than water extractable phenolics in all species. Maximum values for methanol soluble sinapine (0.243%),total phenols (0.203%), leucoanthocyanidine (0.812 Δ A 550/g) and procyanidine (Δ A 550/g) were found in RM-9-7,BM-1 and peela raya, respectively. It may be concluded that for optimum phenolics concentration in the extract, theleaves of these species should be harvested after 80 days.
Key words: Methanol extractable phenolics, Rapeseed leaves, Growing stages, Sinapine.
IntroductionRapeseed is among world’s most important oilseed crops andis used for the production of high quality edible oil and a feedgrade meal. Rapeseed meal has reasonable amino acid butits utilization as a source of protein in human nutrition is lim-ited due to the presence of glucosinolates, phenolic com-pounds, phytates and hull (Fereidoon & Naezk 1992). Therole of these harmful compounds (anti-nutrients) as protec-tive agents against fungi and other pathogens has beenreviewed (Butler 1982). Mature grains of mold resistant sor-ghum cultivars have much higher concentration of flavan - 4- ols than mold susceptible cultivars (Jambunathan et al 1986).The concentration of flavan - 4 - ols in mature sorghum seedshould give an indication about the expected reaction of thesorghum cultivars to grain mold in field and could be a veryimportant aid in screening cultivars for grain mold resistanceor susceptibility (Jambunathan et al 1990). Studies have alsoshown the major role of phenolic compounds in defencemechanism of plant tissues in response to infections or inju-ries (Legrand 1983 & Manibhusharaura et al 1988). As cer-tain phenolics are bitter tasting and have the ability to pre-cipitate plant and animal proteins, they have been consideredas defence compounds against animal predators and microbes(Butler et al 1982). Bird resistant sorghum contains condensedtannins (proanthocyanidine, oligomers of flavanols) that arethought to account for their bird repellent properties. Theextracted tannin content and the bird repellency of the ex-tracts change considerably during the process of seed matu-
ration and reach a maximum early in the maturation process.The mature seed is usually reported to decline and the de-crease in assayable proanthocyanidine of sorghum on matu-ration has been ascribed to increase polymerization (Bullardet al 1981). The decrease in astringency/phenolics is connectedwith polymerization leading to an increased proportion ofhigher molecules in fully ripened seeds/fruits (Sattar et al1992). The objective of the present study was to determinethe exact stage of maximum synthesis of different phenolicsduring the leaf-growth of rapeseed for extract preparation tobe used as an insect repellent in future.
Materials and MethodsThree newly evolved species viz. RM-9-7 (Brassica napus),BM-1 (Brassica juncea) and peela raya (Brassica carinata)of rapeseed were sown at the experimental fields using thenormal agronomic protocol. The leaves of each cultivar wereharvested at 20, 40, 60, 80, 100 and 120 days after sowing forthe estimation of various polyphenols. The leaves werewashed to remove dust and dirt, and dried with tissue paper.For the estimation of the polyphenols (sinapine, total phenols,procyanidine and leucoanthocyanidine), the samples wereextracted in water and methanol. An aqueous extract (1:10,w/v) was prepared by boiling ground sample with water (g /10 ml) for 30 min. The extract was then filtered and the volumewas made up to the required dilution with distilled water. Formethanol extract (1:10, w/v) ground tissues were boiled withmethanol for 10 min and after decanting off the supernatantliquid, the residue was re-extracted for four successive times*Author for correspondence
447
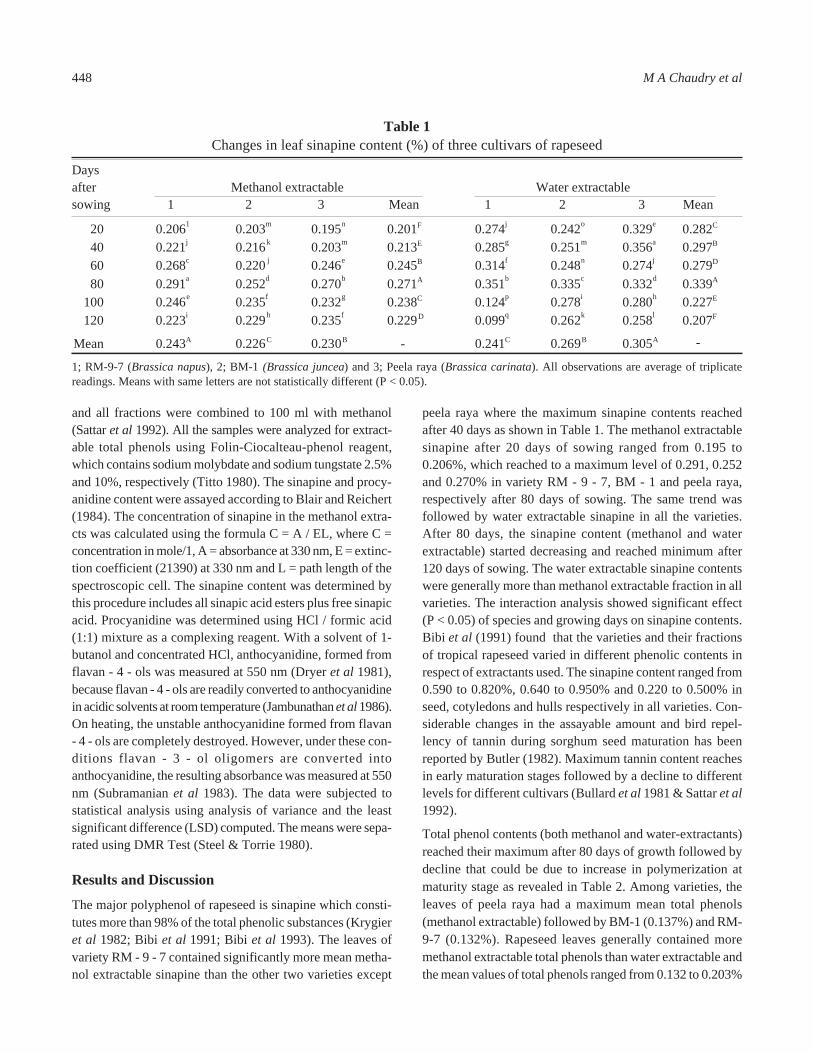
and all fractions were combined to 100 ml with methanol(Sattar et al 1992). All the samples were analyzed for extract-able total phenols using Folin-Ciocalteau-phenol reagent,which contains sodium molybdate and sodium tungstate 2.5%and 10%, respectively (Titto 1980). The sinapine and procy-anidine content were assayed according to Blair and Reichert(1984). The concentration of sinapine in the methanol extra-cts was calculated using the formula C = A / EL, where C =concentration in mole/1, A = absorbance at 330 nm, E = extinc-tion coefficient (21390) at 330 nm and L = path length of thespectroscopic cell. The sinapine content was determined bythis procedure includes all sinapic acid esters plus free sinapicacid. Procyanidine was determined using HCl / formic acid(1:1) mixture as a complexing reagent. With a solvent of 1-butanol and concentrated HCl, anthocyanidine, formed fromflavan - 4 - ols was measured at 550 nm (Dryer et al 1981),because flavan - 4 - ols are readily converted to anthocyanidinein acidic solvents at room temperature (Jambunathan et al 1986).On heating, the unstable anthocyanidine formed from flavan- 4 - ols are completely destroyed. However, under these con-ditions flavan - 3 - ol oligomers are converted intoanthocyanidine, the resulting absorbance was measured at 550nm (Subramanian et al 1983). The data were subjected tostatistical analysis using analysis of variance and the leastsignificant difference (LSD) computed. The means were sepa-rated using DMR Test (Steel & Torrie 1980).
Results and Discussion
The major polyphenol of rapeseed is sinapine which consti-tutes more than 98% of the total phenolic substances (Krygieret al 1982; Bibi et al 1991; Bibi et al 1993). The leaves ofvariety RM - 9 - 7 contained significantly more mean metha-nol extractable sinapine than the other two varieties except
peela raya where the maximum sinapine contents reachedafter 40 days as shown in Table 1. The methanol extractablesinapine after 20 days of sowing ranged from 0.195 to0.206%, which reached to a maximum level of 0.291, 0.252and 0.270% in variety RM - 9 - 7, BM - 1 and peela raya,respectively after 80 days of sowing. The same trend wasfollowed by water extractable sinapine in all the varieties.After 80 days, the sinapine content (methanol and waterextractable) started decreasing and reached minimum after120 days of sowing. The water extractable sinapine contentswere generally more than methanol extractable fraction in allvarieties. The interaction analysis showed significant effect(P < 0.05) of species and growing days on sinapine contents.Bibi et al (1991) found that the varieties and their fractionsof tropical rapeseed varied in different phenolic contents inrespect of extractants used. The sinapine content ranged from0.590 to 0.820%, 0.640 to 0.950% and 0.220 to 0.500% inseed, cotyledons and hulls respectively in all varieties. Con-siderable changes in the assayable amount and bird repel-lency of tannin during sorghum seed maturation has beenreported by Butler (1982). Maximum tannin content reachesin early maturation stages followed by a decline to differentlevels for different cultivars (Bullard et al 1981 & Sattar et al1992).
Total phenol contents (both methanol and water-extractants)reached their maximum after 80 days of growth followed bydecline that could be due to increase in polymerization atmaturity stage as revealed in Table 2. Among varieties, theleaves of peela raya had a maximum mean total phenols(methanol extractable) followed by BM-1 (0.137%) and RM-9-7 (0.132%). Rapeseed leaves generally contained moremethanol extractable total phenols than water extractable andthe mean values of total phenols ranged from 0.132 to 0.203%
Table 1Changes in leaf sinapine content (%) of three cultivars of rapeseed
Daysafter Methanol extractable Water extractablesowing 1 2 3 Mean 1 2 3 Mean
20 0.2061 0.203m 0.195n 0.201F 0.274j 0.242o 0.329e 0.282C
40 0.221j 0.216k 0.203m 0.213E 0.285g 0.251m 0.356a 0.297B
60 0.268c 0.220 j 0.246e 0.245B 0.314f 0.248n 0.274j 0.279D
80 0.291a 0.252d 0.270b 0.271A 0.351b 0.335c 0.332d 0.339A
100 0.246e 0.235f 0.232g 0.238C 0.124p 0.278i 0.280h 0.227E
120 0.223i 0.229h 0.235f 0.229D 0.099q 0.262k 0.258l 0.207F
Mean 0.243A 0.226C 0.230B - 0.241C 0.269B 0.305A -
1; RM-9-7 (Brassica napus), 2; BM-1 (Brassica juncea) and 3; Peela raya (Brassica carinata). All observations are average of triplicatereadings. Means with same letters are not statistically different (P < 0.05).
448 M A Chaudry et al
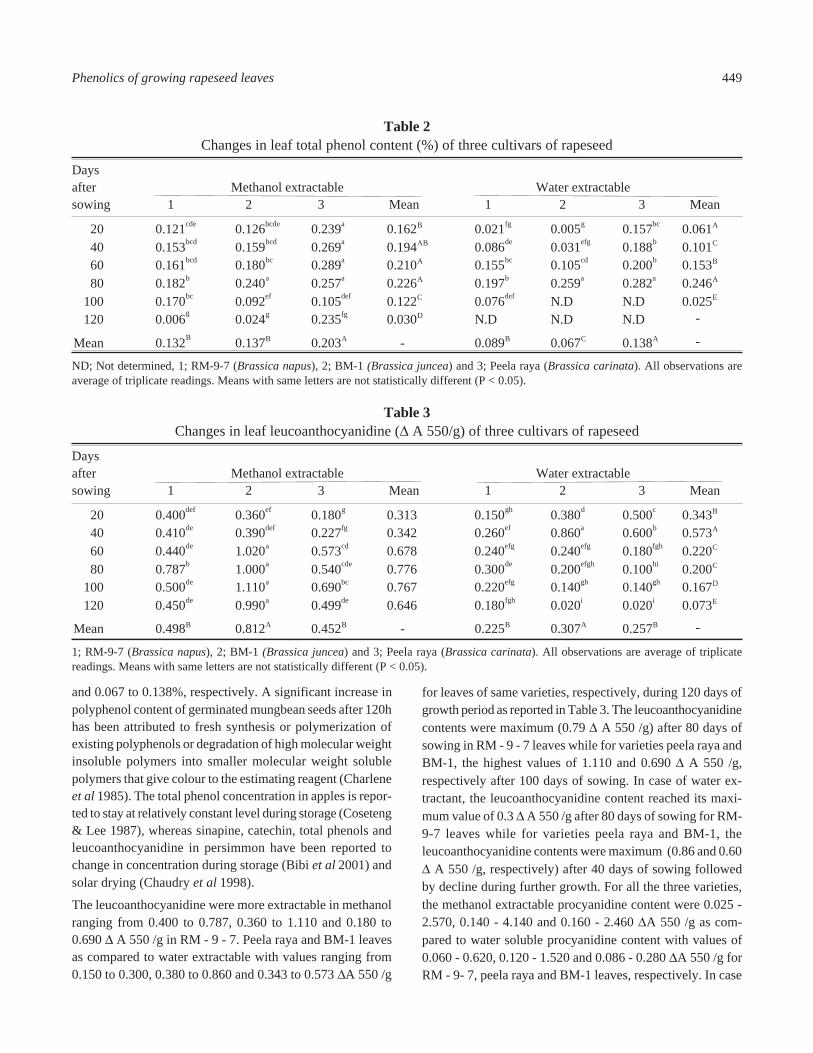
and 0.067 to 0.138%, respectively. A significant increase inpolyphenol content of germinated mungbean seeds after 120hhas been attributed to fresh synthesis or polymerization ofexisting polyphenols or degradation of high molecular weightinsoluble polymers into smaller molecular weight solublepolymers that give colour to the estimating reagent (Charleneet al 1985). The total phenol concentration in apples is repor-ted to stay at relatively constant level during storage (Coseteng& Lee 1987), whereas sinapine, catechin, total phenols andleucoanthocyanidine in persimmon have been reported tochange in concentration during storage (Bibi et al 2001) andsolar drying (Chaudry et al 1998).
The leucoanthocyanidine were more extractable in methanolranging from 0.400 to 0.787, 0.360 to 1.110 and 0.180 to0.690 Δ A 550 /g in RM - 9 - 7. Peela raya and BM-1 leavesas compared to water extractable with values ranging from0.150 to 0.300, 0.380 to 0.860 and 0.343 to 0.573 ΔA 550 /g
for leaves of same varieties, respectively, during 120 days ofgrowth period as reported in Table 3. The leucoanthocyanidinecontents were maximum (0.79 Δ A 550 /g) after 80 days ofsowing in RM - 9 - 7 leaves while for varieties peela raya andBM-1, the highest values of 1.110 and 0.690 Δ A 550 /g,respectively after 100 days of sowing. In case of water ex-tractant, the leucoanthocyanidine content reached its maxi-mum value of 0.3 Δ A 550 /g after 80 days of sowing for RM-9-7 leaves while for varieties peela raya and BM-1, theleucoanthocyanidine contents were maximum (0.86 and 0.60Δ A 550 /g, respectively) after 40 days of sowing followedby decline during further growth. For all the three varieties,the methanol extractable procyanidine content were 0.025 -2.570, 0.140 - 4.140 and 0.160 - 2.460 ΔA 550 /g as com-pared to water soluble procyanidine content with values of0.060 - 0.620, 0.120 - 1.520 and 0.086 - 0.280 ΔA 550 /g forRM - 9- 7, peela raya and BM-1 leaves, respectively. In case
Table 2Changes in leaf total phenol content (%) of three cultivars of rapeseed
Daysafter Methanol extractable Water extractablesowing 1 2 3 Mean 1 2 3 Mean
20 0.121cde 0.126bcde 0.239a 0.162B 0.021fg 0.005g 0.157bc 0.061A
40 0.153bcd 0.159bcd 0.269a 0.194AB 0.086de 0.031efg 0.188b 0.101C
60 0.161bcd 0.180bc 0.289a 0.210A 0.155bc 0.105cd 0.200b 0.153B
80 0.182b 0.240a 0.257a 0.226A 0.197b 0.259a 0.282a 0.246A
100 0.170bc 0.092ef 0.105def 0.122C 0.076def N.D N.D 0.025E
120 0.006g 0.024g 0.235fg 0.030D N.D N.D N.D -
Mean 0.132B 0.137B 0.203A - 0.089B 0.067C 0.138A -
ND; Not determined, 1; RM-9-7 (Brassica napus), 2; BM-1 (Brassica juncea) and 3; Peela raya (Brassica carinata). All observations areaverage of triplicate readings. Means with same letters are not statistically different (P < 0.05).
Table 3Changes in leaf leucoanthocyanidine (Δ A 550/g) of three cultivars of rapeseed
Daysafter Methanol extractable Water extractablesowing 1 2 3 Mean 1 2 3 Mean
20 0.400def 0.360ef 0.180g 0.313 0.150gh 0.380d 0.500c 0.343B
40 0.410de 0.390def 0.227fg 0.342 0.260ef 0.860a 0.600b 0.573A
60 0.440de 1.020a 0.573cd 0.678 0.240efg 0.240efg 0.180fgh 0.220C
80 0.787b 1.000a 0.540cde 0.776 0.300de 0.200efgh 0.100hi 0.200C
100 0.500de 1.110a 0.690bc 0.767 0.220efg 0.140gh 0.140gh 0.167D
120 0.450de 0.990a 0.499de 0.646 0.180fgh 0.020i 0.020i 0.073E
Mean 0.498B 0.812A 0.452B - 0.225B 0.307A 0.257B -
1; RM-9-7 (Brassica napus), 2; BM-1 (Brassica juncea) and 3; Peela raya (Brassica carinata). All observations are average of triplicatereadings. Means with same letters are not statistically different (P < 0.05).
449Phenolics of growing rapeseed leaves
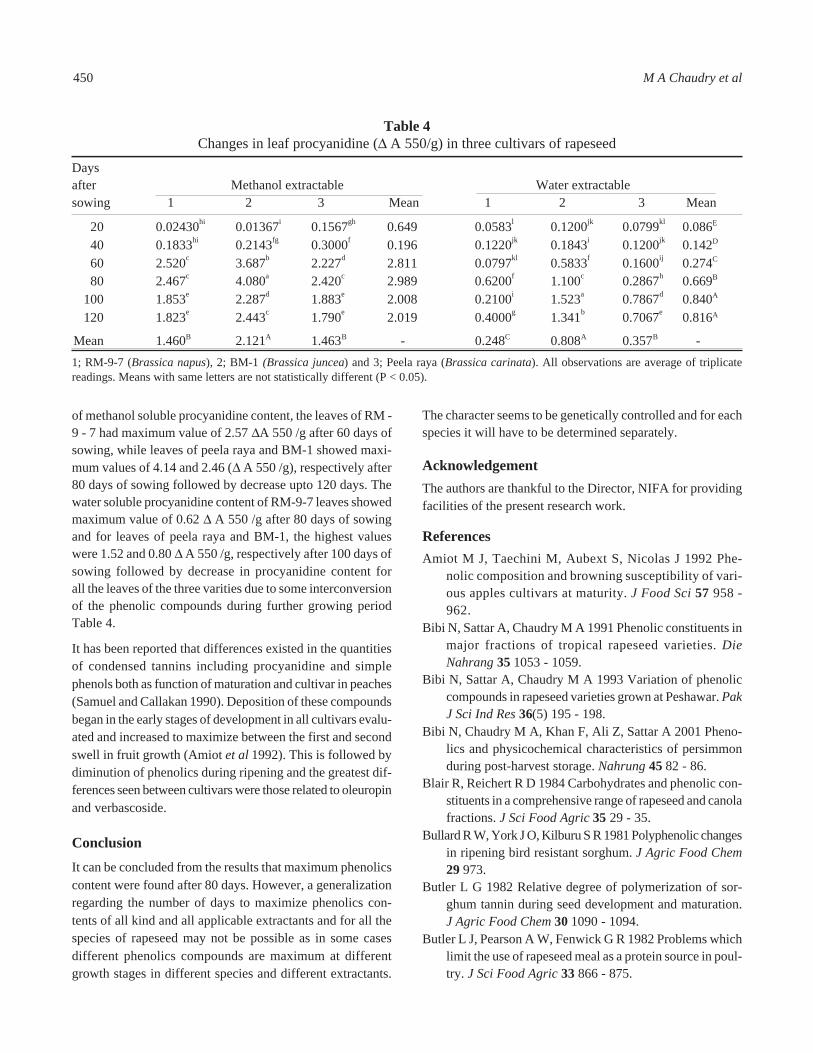
of methanol soluble procyanidine content, the leaves of RM -9 - 7 had maximum value of 2.57 ΔA 550 /g after 60 days ofsowing, while leaves of peela raya and BM-1 showed maxi-mum values of 4.14 and 2.46 (Δ A 550 /g), respectively after80 days of sowing followed by decrease upto 120 days. Thewater soluble procyanidine content of RM-9-7 leaves showedmaximum value of 0.62 Δ A 550 /g after 80 days of sowingand for leaves of peela raya and BM-1, the highest valueswere 1.52 and 0.80 Δ A 550 /g, respectively after 100 days ofsowing followed by decrease in procyanidine content forall the leaves of the three varities due to some interconversionof the phenolic compounds during further growing periodTable 4.
It has been reported that differences existed in the quantitiesof condensed tannins including procyanidine and simplephenols both as function of maturation and cultivar in peaches(Samuel and Callakan 1990). Deposition of these compoundsbegan in the early stages of development in all cultivars evalu-ated and increased to maximize between the first and secondswell in fruit growth (Amiot et al 1992). This is followed bydiminution of phenolics during ripening and the greatest dif-ferences seen between cultivars were those related to oleuropinand verbascoside.
ConclusionIt can be concluded from the results that maximum phenolicscontent were found after 80 days. However, a generalizationregarding the number of days to maximize phenolics con-tents of all kind and all applicable extractants and for all thespecies of rapeseed may not be possible as in some casesdifferent phenolics compounds are maximum at differentgrowth stages in different species and different extractants.
The character seems to be genetically controlled and for eachspecies it will have to be determined separately.
AcknowledgementThe authors are thankful to the Director, NIFA for providingfacilities of the present research work.
ReferencesAmiot M J, Taechini M, Aubext S, Nicolas J 1992 Phe-
nolic composition and browning susceptibility of vari-ous apples cultivars at maturity. J Food Sci 57 958 -962.
Bibi N, Sattar A, Chaudry M A 1991 Phenolic constituents inmajor fractions of tropical rapeseed varieties. DieNahrang 35 1053 - 1059.
Bibi N, Sattar A, Chaudry M A 1993 Variation of phenoliccompounds in rapeseed varieties grown at Peshawar. PakJ Sci Ind Res 36(5) 195 - 198.
Bibi N, Chaudry M A, Khan F, Ali Z, Sattar A 2001 Pheno-lics and physicochemical characteristics of persimmonduring post-harvest storage. Nahrung 45 82 - 86.
Blair R, Reichert R D 1984 Carbohydrates and phenolic con-stituents in a comprehensive range of rapeseed and canolafractions. J Sci Food Agric 35 29 - 35.
Bullard R W, York J O, Kilburu S R 1981 Polyphenolic changesin ripening bird resistant sorghum. J Agric Food Chem29 973.
Butler L G 1982 Relative degree of polymerization of sor-ghum tannin during seed development and maturation.J Agric Food Chem 30 1090 - 1094.
Butler L J, Pearson A W, Fenwick G R 1982 Problems whichlimit the use of rapeseed meal as a protein source in poul-try. J Sci Food Agric 33 866 - 875.
Table 4Changes in leaf procyanidine (Δ A 550/g) in three cultivars of rapeseed
Daysafter Methanol extractable Water extractablesowing 1 2 3 Mean 1 2 3 Mean
20 0.02430hi 0.01367i 0.1567gh 0.649 0.0583l 0.1200jk 0.0799kl 0.086E
40 0.1833hi 0.2143fg 0.3000f 0.196 0.1220jk 0.1843i 0.1200jk 0.142D
60 2.520c 3.687b 2.227d 2.811 0.0797kl 0.5833f 0.1600ij 0.274C
80 2.467c 4.080a 2.420c 2.989 0.6200f 1.100c 0.2867h 0.669B
100 1.853e 2.287d 1.883e 2.008 0.2100i 1.523a 0.7867d 0.840A
120 1.823e 2.443c 1.790e 2.019 0.4000g 1.341b 0.7067e 0.816A
Mean 1.460B 2.121A 1.463B - 0.248C 0.808A 0.357B -1; RM-9-7 (Brassica napus), 2; BM-1 (Brassica juncea) and 3; Peela raya (Brassica carinata). All observations are average of triplicatereadings. Means with same letters are not statistically different (P < 0.05).
450 M A Chaudry et al
Charlene F B, Antonio C L, Evelyn Mae F M 1985 Polyphe-nols in mungbean: determination and removal. J AgricFood Chem 33 1006 - 1009.
Chaudry M A, Bibi N, Khan F, Sattar A 1998 Phenolics andquality of solar cabinet dried persimmon during storage.Italian J Food Sci 10 269 - 274.
Coseteng M Y, Lee C Y 1987 Changes in polyphenol concen-tration in relation to degree of browning in apple. J FoodSci 52 985 - 989.
Dryer D L, Reese J C, Jones K C 1981 Aphid feeding deter-rents in sorghum bioassay isolation and characterization.J Chem Ecol 7 273 - 284.
Fereidoon S, Naezk M 1992 An overview of the phenolics ofcanola and rapeseed. JAOCS 69 917 - 924.
Jambunathan R, Butler L G, Bandyopalhyay R, MughoghoL K 1986 Polyphenol concentration in grain leaf and cal-lus tissues of mold suspeptible and mold resistantsorghum cultivars. J Agric Food Chem 34 425 - 429.
Jambunathan R, Milind S K, Ranajit B 1990 Flavan - 4 - olsconcentration in mold susceptible and mold resistantsorghum cultivars at different stages of grain develop-ment. Agric Food Chem 38 545 - 548.
Krygier K, Sosulki F, Hogge L 1982 Free esterified and inso-luble-bound phenolic acid extraction and purification. JAgri Food Chem 30 330 - 334.
Legrand M 1983 Biochemical Plant Pathology. Phenylpropa-noid metabolism and its regulations in disease. J A Cal-low (Ed.). John Wiley & Sons Ltd. New York, USA, pp367 - 371.
Manibhusharaura K, Zuber M, Matsuyama N 1988 Phenolmetabolism and plant disease resistance. Acta Phytopa-thologica Entomologica Hungarica 23 103 - 108.
Peterson M S, Johnson A U 1977 Tannin. In: Encyclopediaof Food Science and Technology, Academic Press,Westport, Connecticut, USA, Vol 3, pp 732 - 734.
Samuel D S, Callakan A 1990 Variability in the quantities ofcondensed tannins and other major phenol, in peach fruitduring maturation. J Food Sci 55 1585 - 1587.
Sattar A, Bibi N, Chaudry M A 1992 Phenolic compounds inpersimmon during maturation and on tree ripening. DieNahrung 36(5) 467 - 472.
Steel R G D, Torrie J H 1980 Principles and Procedures ofStatistics. Mc Graw Hill. Book Co. Inc. New York, USA,pp 137.
Subramanian, V, Butler L B, Jambunathan R, Prasada-Rao KE 1983 Some agronomic and biochemical characters ofbrown sorghum and their possible role in bird resistance.J Agric Food Chem 31 1303 - 1307.
Titto R J 1980 Methods for the analysis of certain phenolicsJ. Agric Food Chem 33 213 - 217.
451Phenolics of growing rapeseed leaves
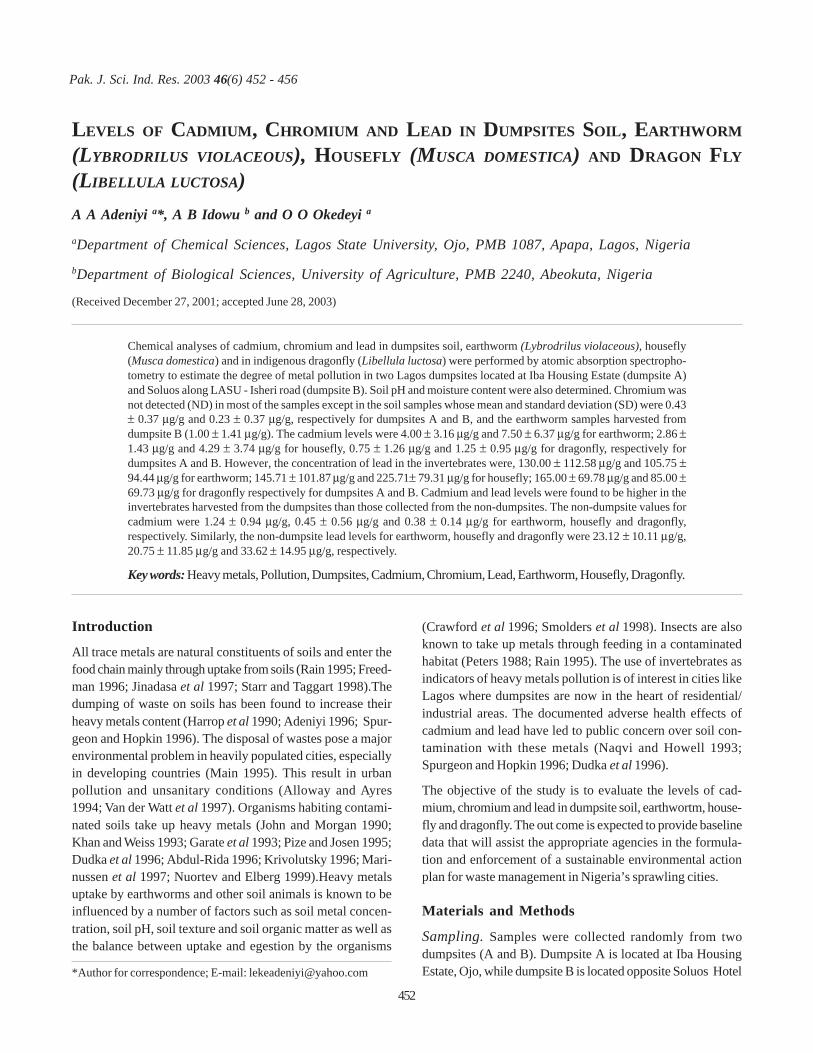
LEVELS OF CADMIUM, CHROMIUM AND LEAD IN DUMPSITES SOIL, EARTHWORM
(LYBRODRILUS VIOLACEOUS), HOUSEFLY (MUSCA DOMESTICA) AND DRAGON FLY
(LIBELLULA LUCTOSA)A A Adeniyi a*, A B Idowu b and O O Okedeyi a
aDepartment of Chemical Sciences, Lagos State University, Ojo, PMB 1087, Apapa, Lagos, NigeriabDepartment of Biological Sciences, University of Agriculture, PMB 2240, Abeokuta, Nigeria
(Received December 27, 2001; accepted June 28, 2003)
Pak. J. Sci. Ind. Res. 2003 46(6) 452 - 456
Chemical analyses of cadmium, chromium and lead in dumpsites soil, earthworm (Lybrodrilus violaceous), housefly(Musca domestica) and in indigenous dragonfly (Libellula luctosa) were performed by atomic absorption spectropho-tometry to estimate the degree of metal pollution in two Lagos dumpsites located at Iba Housing Estate (dumpsite A)and Soluos along LASU - Isheri road (dumpsite B). Soil pH and moisture content were also determined. Chromium wasnot detected (ND) in most of the samples except in the soil samples whose mean and standard deviation (SD) were 0.43± 0.37 μg/g and 0.23 ± 0.37 μg/g, respectively for dumpsites A and B, and the earthworm samples harvested fromdumpsite B (1.00 ± 1.41 μg/g). The cadmium levels were 4.00 ± 3.16 μg/g and 7.50 ± 6.37 μg/g for earthworm; 2.86 ±1.43 μg/g and 4.29 ± 3.74 μg/g for housefly, 0.75 ± 1.26 μg/g and 1.25 ± 0.95 μg/g for dragonfly, respectively fordumpsites A and B. However, the concentration of lead in the invertebrates were, 130.00 ± 112.58 μg/g and 105.75 ±94.44 μg/g for earthworm; 145.71 ± 101.87 μg/g and 225.71± 79.31 μg/g for housefly; 165.00 ± 69.78 μg/g and 85.00 ±69.73 μg/g for dragonfly respectively for dumpsites A and B. Cadmium and lead levels were found to be higher in theinvertebrates harvested from the dumpsites than those collected from the non-dumpsites. The non-dumpsite values forcadmium were 1.24 ± 0.94 μg/g, 0.45 ± 0.56 μg/g and 0.38 ± 0.14 μg/g for earthworm, housefly and dragonfly,respectively. Similarly, the non-dumpsite lead levels for earthworm, housefly and dragonfly were 23.12 ± 10.11 μg/g,20.75 ± 11.85 μg/g and 33.62 ± 14.95 μg/g, respectively.
Key words: Heavy metals, Pollution, Dumpsites, Cadmium, Chromium, Lead, Earthworm, Housefly, Dragonfly.
*Author for correspondence; E-mail: [email protected]
Introduction
All trace metals are natural constituents of soils and enter thefood chain mainly through uptake from soils (Rain 1995; Freed-man 1996; Jinadasa et al 1997; Starr and Taggart 1998).Thedumping of waste on soils has been found to increase theirheavy metals content (Harrop et al 1990; Adeniyi 1996; Spur-geon and Hopkin 1996). The disposal of wastes pose a majorenvironmental problem in heavily populated cities, especiallyin developing countries (Main 1995). This result in urbanpollution and unsanitary conditions (Alloway and Ayres1994; Van der Watt et al 1997). Organisms habiting contami-nated soils take up heavy metals (John and Morgan 1990;Khan and Weiss 1993; Garate et al 1993; Pize and Josen 1995;Dudka et al 1996; Abdul-Rida 1996; Krivolutsky 1996; Mari-nussen et al 1997; Nuortev and Elberg 1999).Heavy metalsuptake by earthworms and other soil animals is known to beinfluenced by a number of factors such as soil metal concen-tration, soil pH, soil texture and soil organic matter as well asthe balance between uptake and egestion by the organisms
(Crawford et al 1996; Smolders et al 1998). Insects are alsoknown to take up metals through feeding in a contaminatedhabitat (Peters 1988; Rain 1995). The use of invertebrates asindicators of heavy metals pollution is of interest in cities likeLagos where dumpsites are now in the heart of residential/industrial areas. The documented adverse health effects ofcadmium and lead have led to public concern over soil con-tamination with these metals (Naqvi and Howell 1993;Spurgeon and Hopkin 1996; Dudka et al 1996).
The objective of the study is to evaluate the levels of cad-mium, chromium and lead in dumpsite soil, earthwortm, house-fly and dragonfly. The out come is expected to provide baselinedata that will assist the appropriate agencies in the formula-tion and enforcement of a sustainable environmental actionplan for waste management in Nigeria’s sprawling cities.
Materials and Methods
Sampling. Samples were collected randomly from twodumpsites (A and B). Dumpsite A is located at Iba HousingEstate, Ojo, while dumpsite B is located opposite Soluos Hotel
452
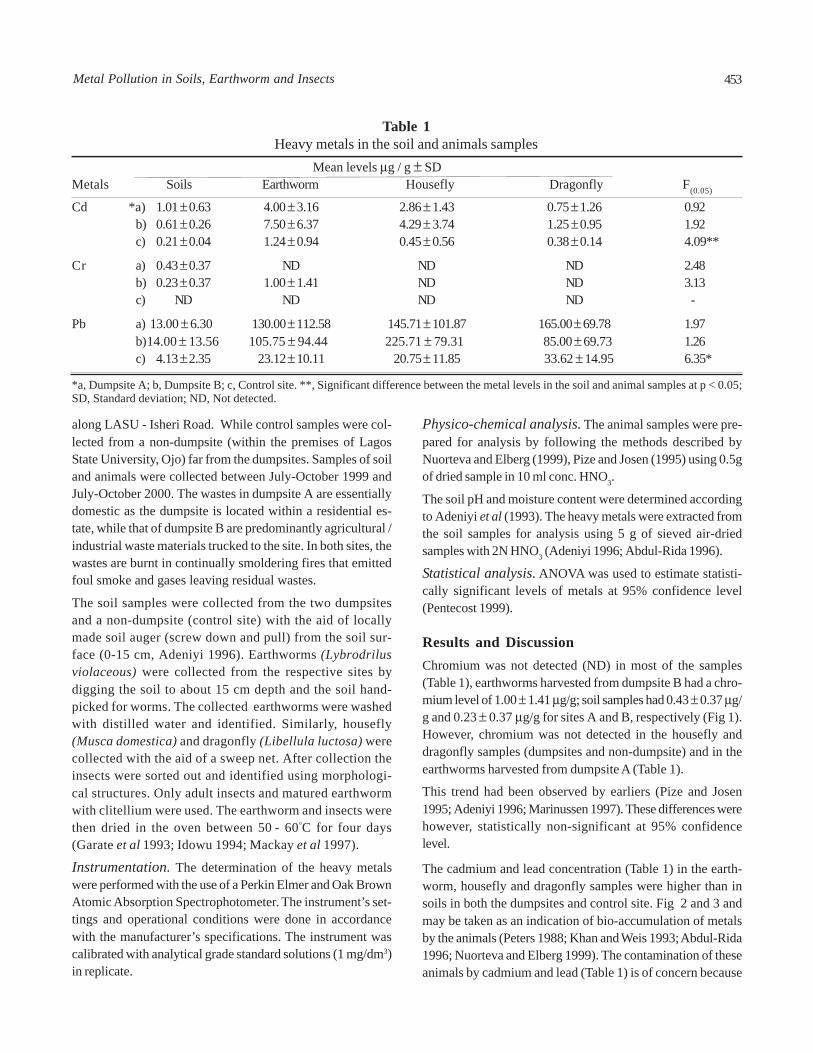
along LASU - Isheri Road. While control samples were col-lected from a non-dumpsite (within the premises of LagosState University, Ojo) far from the dumpsites. Samples of soiland animals were collected between July-October 1999 andJuly-October 2000. The wastes in dumpsite A are essentiallydomestic as the dumpsite is located within a residential es-tate, while that of dumpsite B are predominantly agricultural /industrial waste materials trucked to the site. In both sites, thewastes are burnt in continually smoldering fires that emittedfoul smoke and gases leaving residual wastes.
The soil samples were collected from the two dumpsitesand a non-dumpsite (control site) with the aid of locallymade soil auger (screw down and pull) from the soil sur-face (0-15 cm, Adeniyi 1996). Earthworms (Lybrodrilusviolaceous) were collected from the respective sites bydigging the soil to about 15 cm depth and the soil hand-picked for worms. The collected earthworms were washedwith distilled water and identified. Similarly, housefly(Musca domestica) and dragonfly (Libellula luctosa) werecollected with the aid of a sweep net. After collection theinsects were sorted out and identified using morphologi-cal structures. Only adult insects and matured earthwormwith clitellium were used. The earthworm and insects werethen dried in the oven between 50 - 60°C for four days(Garate et al 1993; Idowu 1994; Mackay et al 1997).
Instrumentation. The determination of the heavy metalswere performed with the use of a Perkin Elmer and Oak BrownAtomic Absorption Spectrophotometer. The instrument’s set-tings and operational conditions were done in accordancewith the manufacturer’s specifications. The instrument wascalibrated with analytical grade standard solutions (1 mg/dm3)in replicate.
Physico-chemical analysis. The animal samples were pre-pared for analysis by following the methods described byNuorteva and Elberg (1999), Pize and Josen (1995) using 0.5gof dried sample in 10 ml conc. HNO3.
The soil pH and moisture content were determined accordingto Adeniyi et al (1993). The heavy metals were extracted fromthe soil samples for analysis using 5 g of sieved air-driedsamples with 2N HNO3 (Adeniyi 1996; Abdul-Rida 1996).
Statistical analysis. ANOVA was used to estimate statisti-cally significant levels of metals at 95% confidence level(Pentecost 1999).
Results and DiscussionChromium was not detected (ND) in most of the samples(Table 1), earthworms harvested from dumpsite B had a chro-mium level of 1.00 ± 1.41 μg/g; soil samples had 0.43 ± 0.37 μg/g and 0.23 ± 0.37 μg/g for sites A and B, respectively (Fig 1).However, chromium was not detected in the housefly anddragonfly samples (dumpsites and non-dumpsite) and in theearthworms harvested from dumpsite A (Table 1).
This trend had been observed by earliers (Pize and Josen1995; Adeniyi 1996; Marinussen 1997). These differences werehowever, statistically non-significant at 95% confidencelevel.
The cadmium and lead concentration (Table 1) in the earth-worm, housefly and dragonfly samples were higher than insoils in both the dumpsites and control site. Fig 2 and 3 andmay be taken as an indication of bio-accumulation of metalsby the animals (Peters 1988; Khan and Weis 1993; Abdul-Rida1996; Nuorteva and Elberg 1999). The contamination of theseanimals by cadmium and lead (Table 1) is of concern because
Table 1Heavy metals in the soil and animals samples
Mean levels μg / g ± SDMetals Soils Earthworm Housefly Dragonfly F(0.05)
Cd *a) 1.01 ± 0.63 4.00 ± 3.16 2.86 ± 1.43 0.75 ± 1.26 0.92b) 0.61 ± 0.26 7.50 ± 6.37 4.29 ± 3.74 1.25 ± 0.95 1.92c) 0.21 ± 0.04 1.24 ± 0.94 0.45 ± 0.56 0.38 ± 0.14 4.09**
Cr a) 0.43 ± 0.37 ND ND ND 2.48b) 0.23 ± 0.37 1.00 ± 1.41 ND ND 3.13c) ND ND ND ND -
Pb a) 13.00 ± 6.30 130.00 ± 112.58 145.71 ± 101.87 165.00 ± 69.78 1.97b)14.00 ± 13.56 105.75 ± 94.44 225.71 ± 79.31 85.00 ± 69.73 1.26c) 4.13 ± 2.35 23.12 ± 10.11 20.75 ± 11.85 33.62 ± 14.95 6.35*
*a, Dumpsite A; b, Dumpsite B; c, Control site. **, Significant difference between the metal levels in the soil and animal samples at p < 0.05;SD, Standard deviation; ND, Not detected.
453Metal Pollution in Soils, Earthworm and Insects
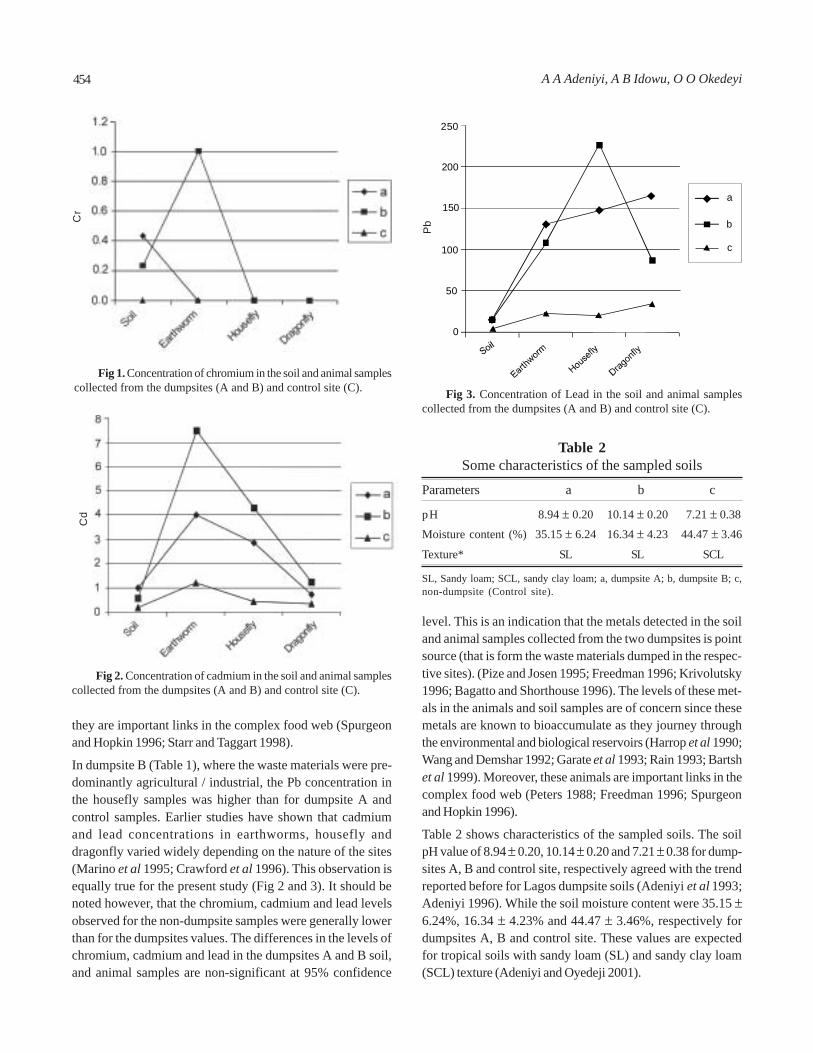
they are important links in the complex food web (Spurgeonand Hopkin 1996; Starr and Taggart 1998).
In dumpsite B (Table 1), where the waste materials were pre-dominantly agricultural / industrial, the Pb concentration inthe housefly samples was higher than for dumpsite A andcontrol samples. Earlier studies have shown that cadmiumand lead concentrations in earthworms, housefly anddragonfly varied widely depending on the nature of the sites(Marino et al 1995; Crawford et al 1996). This observation isequally true for the present study (Fig 2 and 3). It should benoted however, that the chromium, cadmium and lead levelsobserved for the non-dumpsite samples were generally lowerthan for the dumpsites values. The differences in the levels ofchromium, cadmium and lead in the dumpsites A and B soil,and animal samples are non-significant at 95% confidence
Fig 1. Concentration of chromium in the soil and animal samplescollected from the dumpsites (A and B) and control site (C). Fig 3. Concentration of Lead in the soil and animal samples
collected from the dumpsites (A and B) and control site (C).
Fig 2. Concentration of cadmium in the soil and animal samplescollected from the dumpsites (A and B) and control site (C).
level. This is an indication that the metals detected in the soiland animal samples collected from the two dumpsites is pointsource (that is form the waste materials dumped in the respec-tive sites). (Pize and Josen 1995; Freedman 1996; Krivolutsky1996; Bagatto and Shorthouse 1996). The levels of these met-als in the animals and soil samples are of concern since thesemetals are known to bioaccumulate as they journey throughthe environmental and biological reservoirs (Harrop et al 1990;Wang and Demshar 1992; Garate et al 1993; Rain 1993; Bartshet al 1999). Moreover, these animals are important links in thecomplex food web (Peters 1988; Freedman 1996; Spurgeonand Hopkin 1996).
Table 2 shows characteristics of the sampled soils. The soilpH value of 8.94 ± 0.20, 10.14 ± 0.20 and 7.21 ± 0.38 for dump-sites A, B and control site, respectively agreed with the trendreported before for Lagos dumpsite soils (Adeniyi et al 1993;Adeniyi 1996). While the soil moisture content were 35.15 ±6.24%, 16.34 ± 4.23% and 44.47 ± 3.46%, respectively fordumpsites A, B and control site. These values are expectedfor tropical soils with sandy loam (SL) and sandy clay loam(SCL) texture (Adeniyi and Oyedeji 2001).
Table 2Some characteristics of the sampled soils
Parameters a b c
pH 8.94 ± 0.20 10.14 ± 0.20 7.21 ± 0.38
Moisture content (%) 35.15 ± 6.24 16.34 ± 4.23 44.47 ± 3.46
Texture* SL SL SCL
SL, Sandy loam; SCL, sandy clay loam; a, dumpsite A; b, dumpsite B; c,non-dumpsite (Control site).
Cr
Cd
Pb
250
200
150
100
50
0
a
b
c
454 A A Adeniyi, A B Idowu, O O Okedeyi
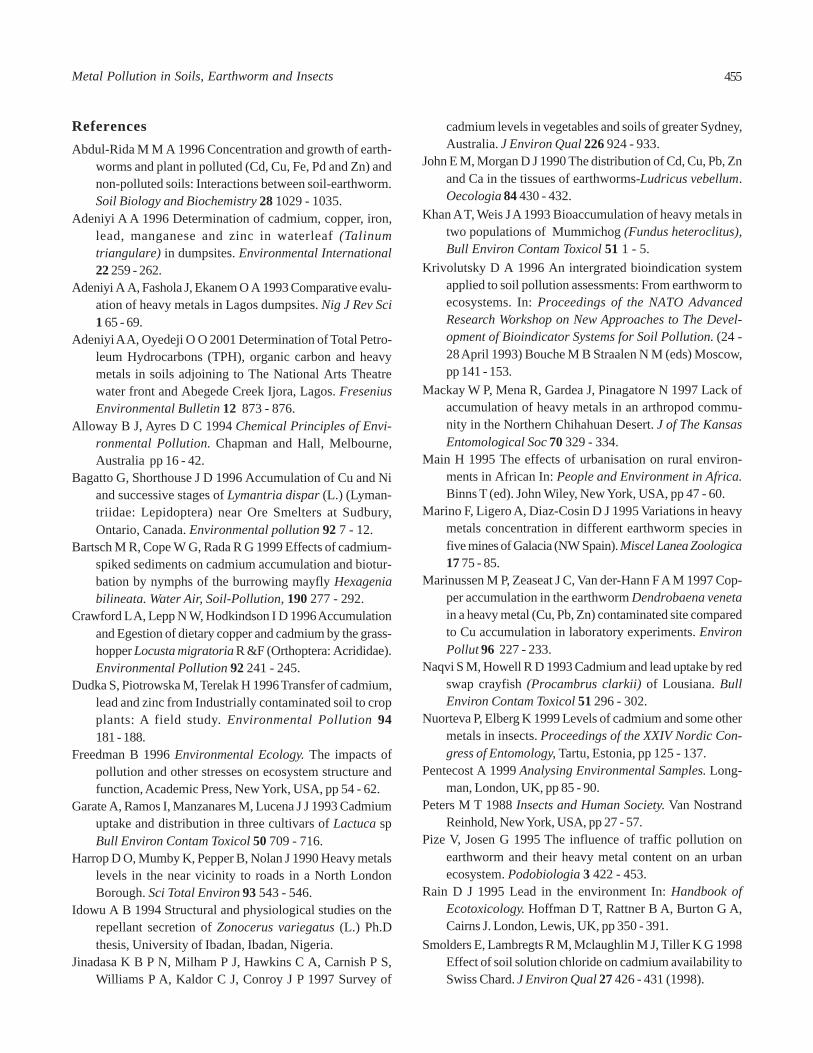
ReferencesAbdul-Rida M M A 1996 Concentration and growth of earth-
worms and plant in polluted (Cd, Cu, Fe, Pd and Zn) andnon-polluted soils: Interactions between soil-earthworm.Soil Biology and Biochemistry 28 1029 - 1035.
Adeniyi A A 1996 Determination of cadmium, copper, iron,lead, manganese and zinc in waterleaf (Talinumtriangulare) in dumpsites. Environmental International22 259 - 262.
Adeniyi A A, Fashola J, Ekanem O A 1993 Comparative evalu-ation of heavy metals in Lagos dumpsites. Nig J Rev Sci1 65 - 69.
Adeniyi A A, Oyedeji O O 2001 Determination of Total Petro-leum Hydrocarbons (TPH), organic carbon and heavymetals in soils adjoining to The National Arts Theatrewater front and Abegede Creek Ijora, Lagos. FreseniusEnvironmental Bulletin 12 873 - 876.
Alloway B J, Ayres D C 1994 Chemical Principles of Envi-ronmental Pollution. Chapman and Hall, Melbourne,Australia pp 16 - 42.
Bagatto G, Shorthouse J D 1996 Accumulation of Cu and Niand successive stages of Lymantria dispar (L.) (Lyman-triidae: Lepidoptera) near Ore Smelters at Sudbury,Ontario, Canada. Environmental pollution 92 7 - 12.
Bartsch M R, Cope W G, Rada R G 1999 Effects of cadmium-spiked sediments on cadmium accumulation and biotur-bation by nymphs of the burrowing mayfly Hexageniabilineata. Water Air, Soil-Pollution, 190 277 - 292.
Crawford L A, Lepp N W, Hodkindson I D 1996 Accumulationand Egestion of dietary copper and cadmium by the grass-hopper Locusta migratoria R &F (Orthoptera: Acrididae).Environmental Pollution 92 241 - 245.
Dudka S, Piotrowska M, Terelak H 1996 Transfer of cadmium,lead and zinc from Industrially contaminated soil to cropplants: A field study. Environmental Pollution 94181 - 188.
Freedman B 1996 Environmental Ecology. The impacts ofpollution and other stresses on ecosystem structure andfunction, Academic Press, New York, USA, pp 54 - 62.
Garate A, Ramos I, Manzanares M, Lucena J J 1993 Cadmiumuptake and distribution in three cultivars of Lactuca spBull Environ Contam Toxicol 50 709 - 716.
Harrop D O, Mumby K, Pepper B, Nolan J 1990 Heavy metalslevels in the near vicinity to roads in a North LondonBorough. Sci Total Environ 93 543 - 546.
Idowu A B 1994 Structural and physiological studies on therepellant secretion of Zonocerus variegatus (L.) Ph.Dthesis, University of Ibadan, Ibadan, Nigeria.
Jinadasa K B P N, Milham P J, Hawkins C A, Carnish P S,Williams P A, Kaldor C J, Conroy J P 1997 Survey of
cadmium levels in vegetables and soils of greater Sydney,Australia. J Environ Qual 226 924 - 933.
John E M, Morgan D J 1990 The distribution of Cd, Cu, Pb, Znand Ca in the tissues of earthworms-Ludricus vebellum.Oecologia 84 430 - 432.
Khan A T, Weis J A 1993 Bioaccumulation of heavy metals intwo populations of Mummichog (Fundus heteroclitus),Bull Environ Contam Toxicol 51 1 - 5.
Krivolutsky D A 1996 An intergrated bioindication systemapplied to soil pollution assessments: From earthworm toecosystems. In: Proceedings of the NATO AdvancedResearch Workshop on New Approaches to The Devel-opment of Bioindicator Systems for Soil Pollution. (24 -28 April 1993) Bouche M B Straalen N M (eds) Moscow,pp 141 - 153.
Mackay W P, Mena R, Gardea J, Pinagatore N 1997 Lack ofaccumulation of heavy metals in an arthropod commu-nity in the Northern Chihahuan Desert. J of The KansasEntomological Soc 70 329 - 334.
Main H 1995 The effects of urbanisation on rural environ-ments in African In: People and Environment in Africa.Binns T (ed). John Wiley, New York, USA, pp 47 - 60.
Marino F, Ligero A, Diaz-Cosin D J 1995 Variations in heavymetals concentration in different earthworm species infive mines of Galacia (NW Spain). Miscel Lanea Zoologica17 75 - 85.
Marinussen M P, Zeaseat J C, Van der-Hann F A M 1997 Cop-per accumulation in the earthworm Dendrobaena venetain a heavy metal (Cu, Pb, Zn) contaminated site comparedto Cu accumulation in laboratory experiments. EnvironPollut 96 227 - 233.
Naqvi S M, Howell R D 1993 Cadmium and lead uptake by redswap crayfish (Procambrus clarkii) of Lousiana. BullEnviron Contam Toxicol 51 296 - 302.
Nuorteva P, Elberg K 1999 Levels of cadmium and some othermetals in insects. Proceedings of the XXIV Nordic Con-gress of Entomology, Tartu, Estonia, pp 125 - 137.
Pentecost A 1999 Analysing Environmental Samples. Long-man, London, UK, pp 85 - 90.
Peters M T 1988 Insects and Human Society. Van NostrandReinhold, New York, USA, pp 27 - 57.
Pize V, Josen G 1995 The influence of traffic pollution onearthworm and their heavy metal content on an urbanecosystem. Podobiologia 3 422 - 453.
Rain D J 1995 Lead in the environment In: Handbook ofEcotoxicology. Hoffman D T, Rattner B A, Burton G A,Cairns J. London, Lewis, UK, pp 350 - 391.
Smolders E, Lambregts R M, Mclaughlin M J, Tiller K G 1998Effect of soil solution chloride on cadmium availability toSwiss Chard. J Environ Qual 27 426 - 431 (1998).
455Metal Pollution in Soils, Earthworm and Insects

Spurgeon D J, Hopkin S P 1996 Risk assessment of the threatof secondary poisoning by metal to predators of earth-worms in the vicinity of a primary smelting works. Sci-ence of the Tot Environ 187 167 - 183.
Starr C, Taggart R 1998 Biology - The Unity and Diversity ofLife. Wadsworth, London, UK, pp 882 - 889.
Van der Watt H V H, Summer M E, Canbera M L 1994 Bio-availability of copper, manganese and zinc in poultry lit-ter J Environ Qual 23 43 - 49.
Wang S T, Demshar A P 1992 Determination of lead in driedblood spot specimens by Zeeman effect background cor-rected atomic absorption. Analyst 117 959 - 961.
456 A A Adeniyi, A B Idowu, O O Okedeyi
AVAILABLE AND UNAVAILABLE CARBOHYDRATE CONTENT OF BLACK GRAM (VIGNA
MUNGO) AND CHICK-PEA (CICER ARIETINUM) AS AFFECTED BY SOAKING AND COOK-ING PROCESSES
Zia-ur-Rehman,* M Rashid and A M Salariya
Biotechnology and Food Research Centre PCSIR Laboratories Complex, Ferozepur Road, Lahore-54600Pakistan
(Received July 8, 2002; accepted July 7, 2003)
The effects of soaking (Tap water, sodium bicarbonate solution) and cooking in tap water were investigated on available andunavailable carbohydrate contents and starch digestibility of black grams and chick-peas. Available carbohydrates includingtotal soluble sugars, reducing sugars, non-reducing sugars and starch contents of these two legumes decreased to variousextents as a result of soaking and cooking. From 3.43 - 25.63% total soluble sugars and 4.26 - 22.70% starch contents werelost on soaking black grams and chick-peas in tap water and sodium bicarbonate solution. Maximum amounts of totalsoluble sugars (28.43 - 59.64%) and starch contents (29.93 - 67.40%) were lost on cooking the water and alkali soakedlegumes. However, these losses were comparatively less in case of water soaking process. Soaking and cooking processesalso brought about some changes in the profile of unavailable carbohydrates of black grams and chick-peas. Soaking insodium bicarbonate solution led to an appreciable increase of hemicellulose (42.50 - 54.31%) and NDF (28.69 - 30.68%)but not in legumes soaked in tap water. However, cooking process caused reduction in NDF (19.25 - 41.04%), ADF (5.48- 25.31%), cellulose (12.88 - 28.42%) and hemicellulose (31.86 - 59.37%). Lignin contents of these legumes increased tosome extents on cooking whereas it remained unchanged as a result of soaking . Starch digestibility of black grams and chickpeas was markedly improved after cooking. However, no appreciable improvement in starch digestibility was observedafter soaking these legumes in tap water or alkaline solution.
Key words: Black grams, Chick-peas, Soaking, Cooking, Carbohydrates, Starch.
IntroductionAvailable and unavailable carbohydrates play an importantrole in human health. Available carbohydrates serve as asource of energy for human body whereas the importance ofunavailable carbohydrates in normal and therapeutic dietshas been well acknowledged in literature ( Spiller 1986; Mor-row 1991; El-Bayoumy et al 1997). Unavailable carbohydrateswhich are commonly known as dietary fibre, mainly consist ofcellulose, hemicellulose, lignin and pectin. These unavailablecarbohydrates components exert different physiologicaleffects on human health. Unavailable carbohydrates particu-larly pectin lower serum cholesterol help to reduce the risk ofheart attack (Kelsey 1978). Presence of unavailable carbohy-drates in diets is also helpful to prevent appendicitis, coloncancer and constipation in human due to absorption of waterfrom the digestive track (Awan 1993; Hu Frank et al 2000; ). Indiabetics, legumes are reported to reduce the level of glucosein human blood due to the presence of unavailable carbohy-drates (Brand et al 1990).
Available and unavailable carbohydrates are present invarious food legumes. Food legumes are usually cooked after
soaking in water prior to consumption. Cooking process isknown to improve the nutritional quality of legumes whereasmost of the macro and micro-nutrients are lost during soakingand cooking process (De-Leon et al 1992; Addy et al 1995).However, very little information is available in literatureregarding available and unavailable carbohydrates in raw andcooked legumes. Therefore, present study was undertaken toinvestigate the effect of soaking and cooking on availableand unavailable carbohydrate in black grams (Vigna mungo)and chick-peas (Cicer arietinum). Starch digestibility ofthese legumes was also studied after soaking and cookingprocesses.
Materials and MethodsBlack grams and chick-peas were obtained from Ayub Agri-cultural Research Institute, Resalewala, Faisalabad (Pakistan).These legumes were cleaned to remove broken seeds, dustand other foreign materials and then subjected to soakingtreatments prior to cooking.
Soaking treatment. A 50g sample of legumes was soaked in250ml of tap water (pH - 7.0) and sodium bicarbonate solution(1% w/v, pH - 9.5) separately at 30°C and 100°C for 1-2h. The*Author for correpondence; E-mail: [email protected]
Pak. J. Sci. Ind. Res. 2003 46(6) 457 - 461
457
soaking solution was drained off, rinsed twice with distilledwater and then dried in a hot air oven (Horizontal Forced AirDrier, Proctor and Schwartz Inc. Philadelphia, PA) at 55°C for24h. Presoaked legumes were cooked in a pressure cooker asgiven below.
Pressure cooking. Presoaked legumes were placed in one literbeakers containing tap water (5ml/g). Tops of the beakers werecovered with aluminium foil. After cooking in a pressure cookerat 15 lbs/inch2 for 15 min, excess water was drained off andthen dried in a hot air oven at 55°C for 24h. Raw and processedlegumes were ground in a Wiley Mill to pass through a 40mesh sieve.
Chemical analysis. The total water soluble sugars were extrac-ted according to the method of Cerning & Guilbot (1973).Starch was extracted from the sugar free pellet by the methodof Clegg (1956). Quantitative determination of total solublesugars and starch was carried out according to the method ofYemm and Willis (1954). Reducing sugars were estimated bySomogyi’s modified method (Somogyi 1945), and non-redu-cing sugars were estimated by calculating the difference bet-ween total soluble sugars and reducing sugars. Unavailablecarbohydrates including neutral detergent fibre (NDF), aciddetergent fibre (ADF), cellulose, hemicellulose and lignin con-tents were estimated according to the method of Van Soest& Wine (1967) and Mc Queen & Nicholson (1979). In accor-dance with ealier researchers, a preliminary overnight incu-bation with bacterial alpha amylase was employed. This metho-dology had already been used by earlier workers for estima-tion of dietary fibre components in legumes (Vidal-Valverde &Frias 1991). In vitro starch digestibility was determined afterdigestion with pancreatic α amylase in 0.1M phosphate bufferat 37°C for 2h. (Costas 1982). All determination were carriedout in triplicate and standard deviation (SD) were calculatedaccording to the method of Steel & Torrie (1980). Duncansmultiple range test was used to determine significant diffe-rences (P < 0.05).
Results and DiscussionTable 1 summarizes the available carbohydrates contents ofraw and soaked black grams and chick-peas.Total soluble sug-ars, reducing sugars, non-reducing sugars and starch con-tents in black grams and chick peas were 9.64 and 9.83%, 0.78and 0.83%, 8.86 & 9.00% and 42.95 and 44.33% respectively.Results in Table 1 show that soaking of black grams and chick-peas decreased the quantity of availabale carbohydrates i.e.total soluble sugars, reducing sugars, non-reducing sugars.When the soaking temperature and time was increased, theextent of decrease in all these carbohydrates became morepronounced in these legumes. Sodium bicarbonate solution,
as soaking solution, the extent of loss was significantly (P <0.05) higher than that observed when these legumes weresoaked in tap water. It is apparent from Table 1 that watersoaking process caused reductions in total soluble sugarsfrom 4.46 - 19.29% from black grams and 5.90 - 21.56% fromchick-peas whereas 14.41 - 34.33% and 15.36 - 32.96% totalsoluble sugars contents were reduced from black grams andchick-peas respectively, on soaking in sodium bicarbonatesolution. Reduction in reducing and non-reducing sugarsfrom these legumes on soaking in tap water and sodium bicar-bonate solution were also observed. Starch contents of blackgrams and chick-peas were reduced from 6.86 - 14.94% and5.07-11.45% respectively, due to water soaking process. How-ever, starch contents were further reduced from 14.43 - 29.68%and 13.28 - 24.92% from black grams and chick-peas respec-tively, as a result of soaking these legumes in alkaline solutionof sodium bicarbonate. In fact, reduction in the levels of avail-able carbohydrates with these treatments occurred mainlybecause of their solubility in simple water and sodium bicar-bonate solution which has already been observed by earlierworkers in case of other dry beans (Silva and Braga 1982;Sudesh et al 1986). Generally, legume starch is composed ofsoluble and insoluble portions and the soluble portion mighthave been extracted out and consequently caused significantreduction in starch contents.
Available carbohydrates contents of black grams and chick-peas were further decreased as a result of cooking (Table 2).Cooking process caused reduction in total soluble sugars28.43 - 59.64% and starch contents 30.50 - 67.40% from blackgrams whereas, 28.88 - 55.55% total soluble sugars and 29.93- 63.40% starch contents were lost from chick-peas. It is evi-dent from these findings that when soaking in water or so-dium bicarbonate solution was combined with cooking, theextent of losses of available carbohydrates from these legumeswas significantly (P < 0.05) higher in comparison to that ofsimple soaking treatment. This is understandable again basedon the fact that, in boiling water during cooking, the solubilityof sugars will comparatively be much higher than at ordinarytemperature. Contrary to these observations, Rao & Belavady(1978) reported that cooking brought about a significant in-crease in soluble sugars. This could be explained by the factthat cooking water was not discarded in that study whereassoaking and cooking water was rejected and beans alone wereanalyzed for various carbohydrates components during thepresent study.
Table 3 summarizes the contents of unavailable carbohyd-rates contents of raw, soaked and cooked black grams andchick-peas. NDF, ADF, cellulose, hemicellulose and lignincontents in raw black grams and chick peas were 24.41 and25.58%, 11.67 and 9.44%, 9.78 and 8.29%, 12.74 and 16.14%
458 Z.-ur-Rehman, M Rashid, A M Salariya
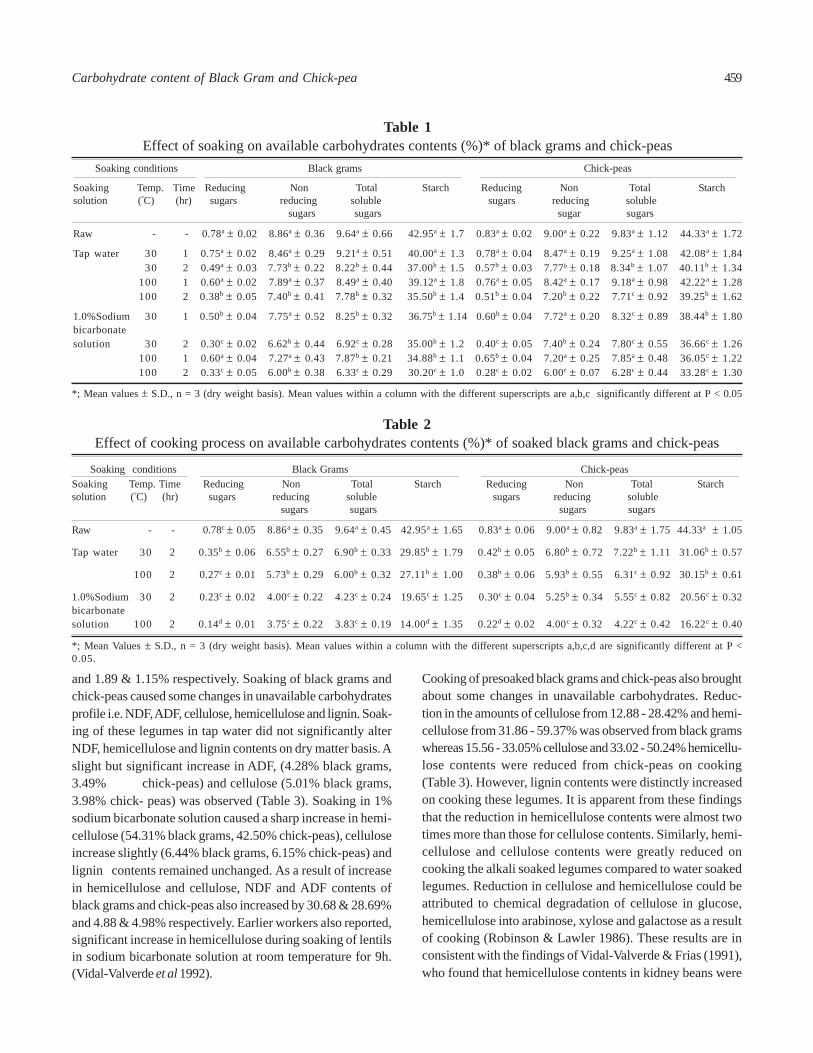
and 1.89 & 1.15% respectively. Soaking of black grams andchick-peas caused some changes in unavailable carbohydratesprofile i.e. NDF, ADF, cellulose, hemicellulose and lignin. Soak-ing of these legumes in tap water did not significantly alterNDF, hemicellulose and lignin contents on dry matter basis. Aslight but significant increase in ADF, (4.28% black grams,3.49% chick-peas) and cellulose (5.01% black grams,3.98% chick- peas) was observed (Table 3). Soaking in 1%sodium bicarbonate solution caused a sharp increase in hemi-cellulose (54.31% black grams, 42.50% chick-peas), celluloseincrease slightly (6.44% black grams, 6.15% chick-peas) andlignin contents remained unchanged. As a result of increasein hemicellulose and cellulose, NDF and ADF contents ofblack grams and chick-peas also increased by 30.68 & 28.69%and 4.88 & 4.98% respectively. Earlier workers also reported,significant increase in hemicellulose during soaking of lentilsin sodium bicarbonate solution at room temperature for 9h.(Vidal-Valverde et al 1992).
Cooking of presoaked black grams and chick-peas also broughtabout some changes in unavailable carbohydrates. Reduc-tion in the amounts of cellulose from 12.88 - 28.42% and hemi-cellulose from 31.86 - 59.37% was observed from black gramswhereas 15.56 - 33.05% cellulose and 33.02 - 50.24% hemicellu-lose contents were reduced from chick-peas on cooking(Table 3). However, lignin contents were distinctly increasedon cooking these legumes. It is apparent from these findingsthat the reduction in hemicellulose contents were almost twotimes more than those for cellulose contents. Similarly, hemi-cellulose and cellulose contents were greatly reduced oncooking the alkali soaked legumes compared to water soakedlegumes. Reduction in cellulose and hemicellulose could beattributed to chemical degradation of cellulose in glucose,hemicellulose into arabinose, xylose and galactose as a resultof cooking (Robinson & Lawler 1986). These results are inconsistent with the findings of Vidal-Valverde & Frias (1991),who found that hemicellulose contents in kidney beans were
Table 2Effect of cooking process on available carbohydrates contents (%)* of soaked black grams and chick-peas
Soaking conditions Black Grams Chick-peasSoaking Temp. Time Reducing Non Total Starch Reducing Non Total Starchsolution (°C) (hr) sugars reducing soluble sugars reducing soluble sugars sugars sugars sugars
Raw - - 0.78c ± 0.05 8.86a ± 0.35 9.64a ± 0.45 42.95a ± 1.65 0.83a ± 0.06 9.00a ± 0.82 9.83a ± 1.75 44.33a ± 1.05
Tap water 30 2 0.35b ± 0.06 6.55b ± 0.27 6.90b ± 0.33 29.85b ± 1.79 0.42b ± 0.05 6.80b ± 0.72 7.22b ± 1.11 31.06b ± 0.57
100 2 0.27c ± 0.01 5.73b ± 0.29 6.00b ± 0.32 27.11b ± 1.00 0.38b ± 0.06 5.93b ± 0.55 6.31c ± 0.92 30.15b ± 0.61
1.0%Sodium 30 2 0.23c ± 0.02 4.00c ± 0.22 4.23c ± 0.24 19.65c ± 1.25 0.30c ± 0.04 5.25b ± 0.34 5.55c ± 0.82 20.56c ± 0.32bicarbonatesolution 100 2 0.14d ± 0.01 3.75c ± 0.22 3.83c ± 0.19 14.00d ± 1.35 0.22d ± 0.02 4.00c ± 0.32 4.22c ± 0.42 16.22c ± 0.40
*; Mean Values ± S.D., n = 3 (dry weight basis). Mean values within a column with the different superscripts a,b,c,d are significantly different at P <0.05.
Table 1Effect of soaking on available carbohydrates contents (%)* of black grams and chick-peas
Soaking conditions Black grams Chick-peas
Soaking Temp. Time Reducing Non Total Starch Reducing Non Total Starchsolution (°C) (hr) sugars reducing soluble sugars reducing soluble sugars sugars sugar sugars
Raw - - 0.78a ± 0.02 8.86a ± 0.36 9.64a ± 0.66 42.95a ± 1.7 0.83a ± 0.02 9.00a ± 0.22 9.83a ± 1.12 44.33a ± 1.72
Tap water 30 1 0.75a ± 0.02 8.46a ± 0.29 9.21a ± 0.51 40.00a ± 1.3 0.78a ± 0.04 8.47a ± 0.19 9.25a ± 1.08 42.08a ± 1.8430 2 0.49a ± 0.03 7.73b ± 0.22 8.22b ± 0.44 37.00b ± 1.5 0.57b ± 0.03 7.77b ± 0.18 8.34b ± 1.07 40.11b ± 1.34
100 1 0.60a ± 0.02 7.89a ± 0.37 8.49a ± 0.40 39.12a ± 1.8 0.76a ± 0.05 8.42a ± 0.17 9.18a ± 0.98 42.22a ± 1.28100 2 0.38b ± 0.05 7.40b ± 0.41 7.78b ± 0.32 35.50b ± 1.4 0.51b ± 0.04 7.20b ± 0.22 7.71c ± 0.92 39.25b ± 1.62
1.0%Sodium 30 1 0.50b ± 0.04 7.75a ± 0.52 8.25b ± 0.32 36.75b ± 1.14 0.60b ± 0.04 7.72a ± 0.20 8.32c ± 0.89 38.44b ± 1.80bicarbonatesolution 30 2 0.30c ± 0.02 6.62b ± 0.44 6.92c ± 0.28 35.00b ± 1.2 0.40c ± 0.05 7.40b ± 0.24 7.80c ± 0.55 36.66c ± 1.26
100 1 0.60a ± 0.04 7.27a ± 0.43 7.87b ± 0.21 34.88b ± 1.1 0.65b ± 0.04 7.20a ± 0.25 7.85a ± 0.48 36.05c ± 1.22100 2 0.33c ± 0.05 6.00b ± 0.38 6.33c ± 0.29 30.20c ± 1.0 0.28c ± 0.02 6.00c ± 0.07 6.28c ± 0.44 33.28c ± 1.30
*; Mean values ± S.D., n = 3 (dry weight basis). Mean values within a column with the different superscripts are a,b,c significantly different at P < 0.05
459Carbohydrate content of Black Gram and Chick-pea
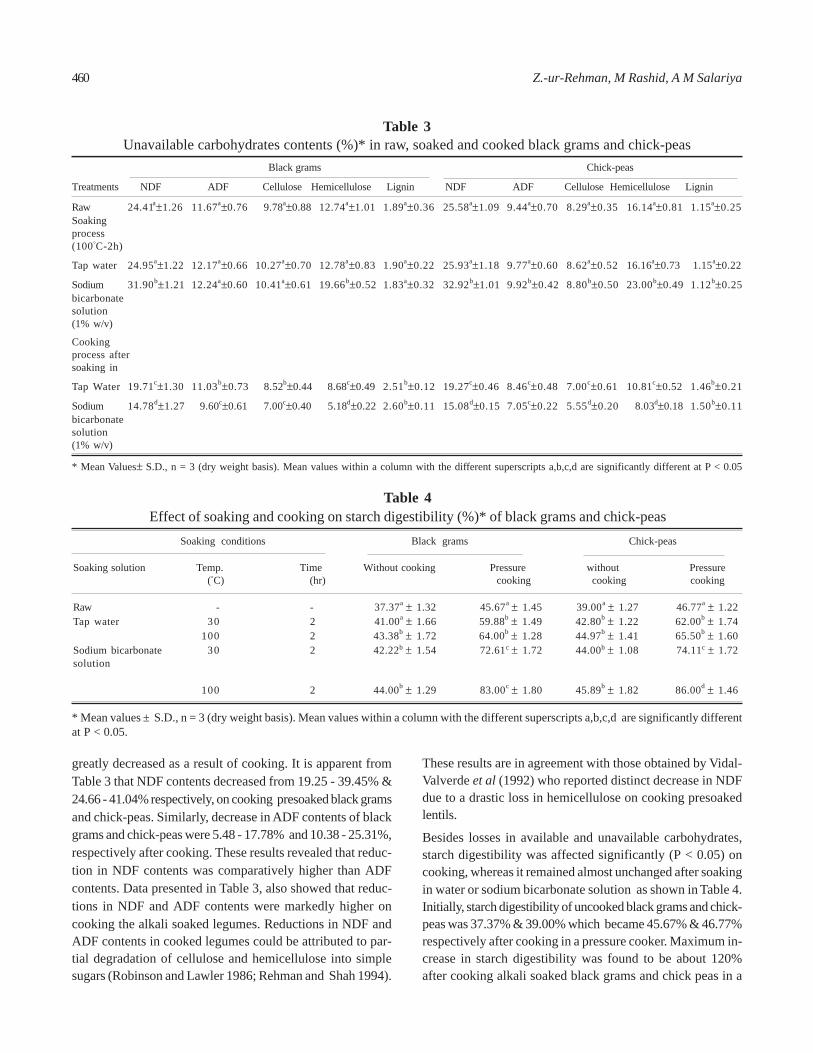
greatly decreased as a result of cooking. It is apparent fromTable 3 that NDF contents decreased from 19.25 - 39.45% &24.66 - 41.04% respectively, on cooking presoaked black gramsand chick-peas. Similarly, decrease in ADF contents of blackgrams and chick-peas were 5.48 - 17.78% and 10.38 - 25.31%,respectively after cooking. These results revealed that reduc-tion in NDF contents was comparatively higher than ADFcontents. Data presented in Table 3, also showed that reduc-tions in NDF and ADF contents were markedly higher oncooking the alkali soaked legumes. Reductions in NDF andADF contents in cooked legumes could be attributed to par-tial degradation of cellulose and hemicellulose into simplesugars (Robinson and Lawler 1986; Rehman and Shah 1994).
These results are in agreement with those obtained by Vidal-Valverde et al (1992) who reported distinct decrease in NDFdue to a drastic loss in hemicellulose on cooking presoakedlentils.
Besides losses in available and unavailable carbohydrates,starch digestibility was affected significantly (P < 0.05) oncooking, whereas it remained almost unchanged after soakingin water or sodium bicarbonate solution as shown in Table 4.Initially, starch digestibility of uncooked black grams and chick-peas was 37.37% & 39.00% which became 45.67% & 46.77%respectively after cooking in a pressure cooker. Maximum in-crease in starch digestibility was found to be about 120%after cooking alkali soaked black grams and chick peas in a
Table 4Effect of soaking and cooking on starch digestibility (%)* of black grams and chick-peas
Soaking conditions Black grams Chick-peas
Soaking solution Temp. Time Without cooking Pressure without Pressure (°C) (hr) cooking cooking cooking
Raw - - 37.37a ± 1.32 45.67a ± 1.45 39.00a ± 1.27 46.77a ± 1.22Tap water 30 2 41.00a ± 1.66 59.88b ± 1.49 42.80b ± 1.22 62.00b ± 1.74
100 2 43.38b ± 1.72 64.00b ± 1.28 44.97b ± 1.41 65.50b ± 1.60Sodium bicarbonate 30 2 42.22b ± 1.54 72.61c ± 1.72 44.00b ± 1.08 74.11c ± 1.72solution
100 2 44.00b ± 1.29 83.00c ± 1.80 45.89b ± 1.82 86.00d ± 1.46
* Mean values ± S.D., n = 3 (dry weight basis). Mean values within a column with the different superscripts a,b,c,d are significantly differentat P < 0.05.
Table 3Unavailable carbohydrates contents (%)* in raw, soaked and cooked black grams and chick-peas
Black grams Chick-peas
Treatments NDF ADF Cellulose Hemicellulose Lignin NDF ADF Cellulose Hemicellulose Lignin
Raw 24.41a±1.26 11.67a±0.76 9.78a±0.88 12.74a±1.01 1.89a±0.36 25.58a±1.09 9.44a±0.70 8.29a±0.35 16.14a±0.81 1.15a±0.25Soakingprocess(100°C-2h)
Tap water 24.95a±1.22 12.17a±0.66 10.27a±0.70 12.78a±0.83 1.90a±0.22 25.93a±1.18 9.77a±0.60 8.62a±0.52 16.16a±0.73 1.15a±0.22
Sodium 31.90b±1.21 12.24a±0.60 10.41a±0.61 19.66b±0.52 1.83a±0.32 32.92b±1.01 9.92b±0.42 8.80b±0.50 23.00b±0.49 1.12b±0.25bicarbonatesolution(1% w/v)
Cookingprocess aftersoaking in
Tap Water 19.71c±1.30 11.03b±0.73 8.52b±0.44 8.68c±0.49 2.51b±0.12 19.27c±0.46 8.46c±0.48 7.00c±0.61 10.81c±0.52 1.46b±0.21
Sodium 14.78d±1.27 9.60c±0.61 7.00c±0.40 5.18d±0.22 2.60b±0.11 15.08d±0.15 7.05c±0.22 5.55d±0.20 8.03d±0.18 1.50b±0.11bicarbonatesolution(1% w/v)
* Mean Values± S.D., n = 3 (dry weight basis). Mean values within a column with the different superscripts a,b,c,d are significantly different at P < 0.05
460 Z.-ur-Rehman, M Rashid, A M Salariya
pressure cooker whereas the increase was only 68 - 71% oncooking water soaked legumes in a pressure cooker. Improve-ment in starch digestibility after cooking could be attributeddue to complete hydrolysis of starch under the drastic condi-tions of heating under pressure. However, improvement indigestibility of starch become about two times more for alkalisoaked legumes compared to water soaked legumes on cook-ing. These results are in agreement with those obtained byMbofung et al (1999) who reported distinct improvement instarch digestibility of cow-peas after cooking. In this study,legumes were markedly resistant to pancreatic amylase attackbut cooking led to a dramatic increase in its susceptibility todigest by this enzyme. In fact, cooking improves the diges-tibility of starch through gelatinization and destruction ofanti-nutrients (Yu - Hui 1991).
ConclusionAvailable and unavailable carbohydrates contents of blackgrams and chick-peas were reduced to various extents due tosoaking and cooking processes. Soaking temperatures andtime significantly affected the rate of extraction of availableand unavailable carbohydrates. Sodium bicarbonate solutionextracted comparatively more carbohydrates compared towater soaking process. Maximum amount of available andunavailable carbohydrates were reduced as a result of cook-ing process. Besides losses in available and unavailable car-bohydrates, significant improvement in starch digestibilityof black grams and chick -peas was observed after cooking.However, no appreciable improvement in starch digestibilityof black grams and chick-peas was observed after cooking.However, no sappreciable improvement in starch digestibilitywas observed after soaking these legumes in tap water andsodium bicarbonate solution.
ReferencesAddy E O H, Salami L I, Ibocli L C, Remawa H S 1995 Effect of
Processing on Nutrient Composition and Anti-nutrientiveSubstances of African Locust Bean and Baobale Seed. PlantFoods Hum Nutri 48(2) 113 - 117.
Awan J A 1993 Elements of Food and Nutrition 1st Ed. PressStreet, Bazar, Faisalabad, Pakistan, pp 3.
Brand J C, Snow B J, Nobhan G P, Truswell A S 1990 Plasmaglucose and insulin responses to traditional Pima IndianMeals. Am J Clin Nutr 51 416 - 420.
Cerning J, Guilbot J 1973 Specific method for the determinationof Pentosans in cereals and products. Cereal Chem 50 (2)176 - 184.
Clegg K M 1956 The application of the anthrone reagent to theestimation of starch in cereals. J Sci Food Agric 7 40 - 44.
Costas G B 1982 Physical characteristics, enzymatic digestibilityand structure of chemically modified smooth pea and waxy
maize starches. J Agri Food Chem 30 925 - 930.De-Leon L F, Elias L G, Bressani R 1992 Effect of salt solutions
on the cooking time, nutritional and sensory characteristicsof common beans. Food Res Int 25 131 - 136.
El-Bayoumy K, Chung F L, Richie S J, Reddy B S, Cohen L,Weisburger J, Wynder E L 1997 Dietary control of cancer.Proc Soc Exp Biol Med 216 211 - 233.
Hu F B, Rimm E B, Stampfer M J, Ascherio A, Spiegelman D,Willett W C 2000 Prospective study of major dietary pat-terns and risk of cornary heart disease in men. Am J ClinNutr 72 912 - 921.
Kelsey J I 1978 A review of research on effect of fiber intake onman. Am J Clin Nutr 31 142 - 152.
Mbofung C M F, Rigby N, Waldron F 1999 Use of two varietiesand hard-to-cook beans (Phaseolus vulgaris) in the Pro-cessing of Koki (a Steamed Legume Product). Plant FoodHum Nutri 54 131 - 150.
McQueen R A, Nichelson J W G 1979 Modification of the neu-tral detergent fiber procedure for cereal and vegetables byusing alpha amylase. J Assoc Off Anal Chem 62 679 - 681.
Morrow B 1991 The rebirth of legumes.Food Tech 45 96 - 121.Rao P U, Belavady B 1978 Oligosaccharides in pulses; varietral
differences and effects of cooking and germination. J AgricFood Chem 26 316 - 319.
Rehman Z U, Shah W H 1994 Preparation of dietary fiber frommustard seed meal. Pak J Sci Ind Res 37 156 - 159.
Robinson C H, Lawler M R 1986 Normal and Therapeutic Nu-trition, 7th ed, Callias MacMillion Publishers, London, UK.
Silva H C, Braga C L 1982 Effect of soaking and cooking on theoligosaccharide content of dry beans (Phaseolus vulgaris,L. J Food Sci 47 924 - 925.
Somogyi M 1945 A new reagent for the determination of sugars.J Biol Chem 160 61-68.
Spiller G A 1986 Hand Book of Dietary fibre in Human Nutri-tion. CRC Press, Inc., Boca Raton FL, USA.
Steel R G D, Torrie J H 1980 Principles and Procedures of Statis-tics. McGraw Hill, London, UK.
Sudesh J, Usha M, Randhir S 1986 Effect of Processing on avail-able carbohydrates in legumes. J Agric Food Chem 34 417- 420.
Van Soest P J, Wine R H 1967 Use of detergents in the analysisof fibrous feeds determination plant cell wall constituents.J Assoc Off Anal Chem 51 417 - 420.
Vidal-Valverde C, Frias J 1991 Legumes processing effects ondietary fiber components. J Food Sci 56 1350 - 1352.
Vidal-Valverde C, Frias J, Esteben R 1992 Dietary fiber in pro-cessed lentils. J Food Sci 57 1151 - 1163.
Yemm E W, Willis A J 1954 The Estimation of carbohydrates inplant extracts by anthrone. Biochem J 57 508 - 514
Yu-Hui T 1991 Effect of the hard-to-cook defect and processingon protein and starch digestibility of Cow-peas. CerealChem 68(4) 413 - 418.
461Carbohydrate content of Black Gram and Chick-pea
Pak. J. Sci. Ind. Res. 2003 46(6) 462 - 464
OBSERVATIONS ON RAFIQIUS BODENHEIMERI (STEINER 1936) KHAN AND HUSSAIN
1998 AND DISCOLAIMUS LAHORENSIS KHAN, 1998 FROM KARACHI, SINDH
H A Khan* and S A Khan
PCSIR Laboratories Complex, Off University Road, Karachi - 75280, Pakistan
(Received May 11, 2002; accepted July 26, 2003)
Rafiqius bodenheimeri (Steiner 1936) Khan and Hussain 1998 Discolaimus lahorensis are described from Karachi,R. bodenheimeri (Steiner 1936) Khan and Hussain 1998 is different in size and shape of post vulval uterine sac which isbeing 70.2μm in length, whereas, uterine sac is collapsed in R. saeedi. Males are present, in R. bodenheimeri while malesnot found in R. saeedi. R. bodenheimeri is different from R. amurensis (Truskova 1971, Siddiqi, Deley and Khan 1992)Khan and Hussain 1998 in body length, shape of spicules and size of gubernaculum.
Key words: Soil, Nematodes, Systematics.
IntroductionDuring a survey, nematodes were isolated from soil sampleidentified as Rafiqius bodenheimeri (Steiner 1936) Khanand Hussain, 1998 and Discolaimus lahorensis. It appearedto be first record of these nematodes from Karachi anddescribed in detail.
Material and MethodsSoil samples were collected from various localities of Karachiand carried to the laboratory. All samples were sieved byCobb’s gravity method (1918) and later improved byBaermann’s method. Nematodes were collected under thestereoscopic binocular and killed by gentle heat. Nematodeswere processed by slow method to glycerine and mounted onglass slides in a drop of anhydrous glycerine according toSiddiqi (1986). Measurements were taken from preservedspecimens. Some specimens were also studied in freshlykilled conditions, specimens were deposited in CommonWealth Institute of Parasitology England and are rested inNematology Laboratory, Food and Marine Resources Rese-arch Centre PCSIR Labs. Complex, Karachi.
Genus Rafiqius Khan and Hussain 1998: Diagnosis(Emended) Acrobelinae. Body more than 0.5 mm in length;Cephalic probolae was present; axils as a deep cleft boardedby flap, like usually drawn out a set, located laterodorsallyon lateral lips. Stoma constituted on chelorhabdion and pro-rhabdion slightly swollen behind the middle. Lateral field wasprominent with five to seven incisures on mid body. Isthmusshort and broad, less in length adjacent to body; basal bulbstrongly valvate. Post vulval uterine sac was well developed,usually longer than body width. Ovary monodelphic. Female* Author for correspondence
tail was subcylindrical with rounded truncate or notchedterminus. Phasmids distinct on tail. Lateral field extendingbeyond phasmid, but in some specimens stopped at phasmids.Male rare, equal to female. Oesophagus, spicules, gubernacu-lum and tail were typically cephaloboid type.
Type species:Rafiqius saeedi (Siddiqi, Deley and Khan 1992)Syn. Acrobeloides saeedi (Siddiqi, Deley and Khan 1992)Other species: R. bodenheimeri (Steiner, 1936)Thorne 1937, Siddiqi, Deley, Khan 1992, Khan and Hussain1998 n. Comb.Syn: Acrobeloides bodenheimeri (Steiner 1936) Siddiqi, Deleyand Khan 1992. R. camberensis Khan and Hussain 1998Syn: Acrobeloides camberensis (Deley, Geraert and Coomans1990) Siddiqi, Deley and Khan 1992Syn: Cephalobus camberensis, Deley, Geraert and Coomans1990.
Rafiqius bodenheimeri n. Comb. Measurement. L =0.60 - 0.64 (0.62 ± 0.77) mm; a = 15.30 - 16.00 (15.60 ±3.70); b = 4.50 - 4.60 (4.40 ± 3.70); c = 15.70 - 17.00 (16.40± 2.70); c1 = 19.50 - 20.00 (19.70 ± 3.50); V = 66.00 - 70.00(6.80 ± 7.50). L = 0.64 - 0.71 (0.67 ± 1.10) mm; b = 4.20- 4.50 (4.30 ± 1.80); c = 23.00 - 24.60 (23.80 ± 3.10); c =19.50 - 20.00 (19.60 ± 4.40); spicules = 45.60 - 46.20 (44.90± 6.40)μm; gubernaculum = 24.60 - 25.30 (24.60 ± 4.20) μm.
Description: Body of the heat relaxed specimens clyindri-cal narrow at both ends just behind vulva tapering. Cuticleprominently annulated, 2.30 μm at mid body; lateral fielddistinct, 6.50 - 90.00 μm and have five distinct incisures. Cepha-lic region expended with six slightly separated lips making ahexagonal shape; labial probolae three, asymmetrical, roundedanteriorly slightly elevated above the head contour; cephalic
←
o
←
o
+ +o o
462
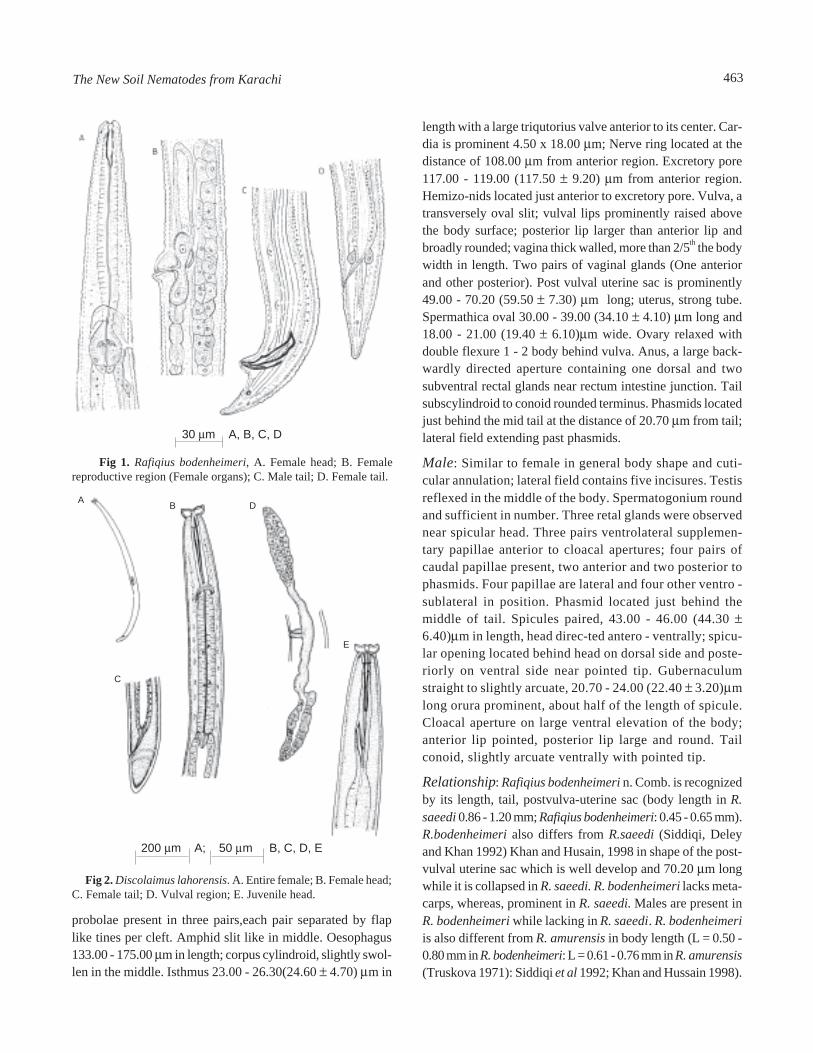
probolae present in three pairs,each pair separated by flaplike tines per cleft. Amphid slit like in middle. Oesophagus133.00 - 175.00 μm in length; corpus cylindroid, slightly swol-len in the middle. Isthmus 23.00 - 26.30(24.60 ± 4.70) μm in
length with a large triqutorius valve anterior to its center. Car-dia is prominent 4.50 x 18.00 μm; Nerve ring located at thedistance of 108.00 μm from anterior region. Excretory pore117.00 - 119.00 (117.50 ± 9.20) μm from anterior region.Hemizo-nids located just anterior to excretory pore. Vulva, atransversely oval slit; vulval lips prominently raised abovethe body surface; posterior lip larger than anterior lip andbroadly rounded; vagina thick walled, more than 2/5th the bodywidth in length. Two pairs of vaginal glands (One anteriorand other posterior). Post vulval uterine sac is prominently49.00 - 70.20 (59.50 ± 7.30) μm long; uterus, strong tube.Spermathica oval 30.00 - 39.00 (34.10 ± 4.10) μm long and18.00 - 21.00 (19.40 ± 6.10)μm wide. Ovary relaxed withdouble flexure 1 - 2 body behind vulva. Anus, a large back-wardly directed aperture containing one dorsal and twosubventral rectal glands near rectum intestine junction. Tailsubscylindroid to conoid rounded terminus. Phasmids locatedjust behind the mid tail at the distance of 20.70 μm from tail;lateral field extending past phasmids.
Male: Similar to female in general body shape and cuti-cular annulation; lateral field contains five incisures. Testisreflexed in the middle of the body. Spermatogonium roundand sufficient in number. Three retal glands were observednear spicular head. Three pairs ventrolateral supplemen-tary papillae anterior to cloacal apertures; four pairs ofcaudal papillae present, two anterior and two posterior tophasmids. Four papillae are lateral and four other ventro -sublateral in position. Phasmid located just behind themiddle of tail. Spicules paired, 43.00 - 46.00 (44.30 ±6.40)μm in length, head direc-ted antero - ventrally; spicu-lar opening located behind head on dorsal side and poste-riorly on ventral side near pointed tip. Gubernaculumstraight to slightly arcuate, 20.70 - 24.00 (22.40 ± 3.20)μmlong orura prominent, about half of the length of spicule.Cloacal aperture on large ventral elevation of the body;anterior lip pointed, posterior lip large and round. Tailconoid, slightly arcuate ventrally with pointed tip.
Relationship: Rafiqius bodenheimeri n. Comb. is recognizedby its length, tail, postvulva-uterine sac (body length in R.saeedi 0.86 - 1.20 mm; Rafiqius bodenheimeri: 0.45 - 0.65 mm).R.bodenheimeri also differs from R.saeedi (Siddiqi, Deleyand Khan 1992) Khan and Husain, 1998 in shape of the post-vulval uterine sac which is well develop and 70.20 μm longwhile it is collapsed in R. saeedi. R. bodenheimeri lacks meta-carps, whereas, prominent in R. saeedi. Males are present inR. bodenheimeri while lacking in R. saeedi. R. bodenheimeriis also different from R. amurensis in body length (L = 0.50 -0.80 mm in R. bodenheimeri: L = 0.61 - 0.76 mm in R. amurensis(Truskova 1971): Siddiqi et al 1992; Khan and Hussain 1998).
Fig 1. Rafiqius bodenheimeri, A. Female head; B. Femalereproductive region (Female organs); C. Male tail; D. Female tail.
30 μm A, B, C, D
Fig 2. Discolaimus lahorensis. A. Entire female; B. Female head;C. Female tail; D. Vulval region; E. Juvenile head.
200 μm A; 50 μm B, C, D, E
A B D
C
E
463The New Soil Nematodes from Karachi
Spicules in R.bodenheimeri is 16.00 μm and R. amurensis =32.00 μm. A detailed work on biology is necessary to solvesome critical points in this connection.
Discolaimus lahorensis Khan 1998: 1.60 - 1.80 (1.30 ±0.20) mm; a = 39.00 - 40.00 (40.10 ± 0.50); b = 3.60 - 3.90(3.70 ± 0.20); c = 36 - 44 (40.50 ± 4.50); V = 50.00 - 51.00(50.50 ± 0.70); odontostyle = 17.00 - 18.30 (17.60 ± 0.30)μm;Odon-tophore = 37.00 - 38.50 (38.00 ± 0.30)μm.
Description: Body stout and curved posteriorly after relax-ing by gentle heat. Cuticle contains transverse striationsnear head and tail. Head not separated from the body; lipstypical, somewhat angular, 56.00 μm in breadth with 16 pa-pillae. Amphids of stirrup shape, 8.00 μm in breadth.Odontostyle prominent 17.00 - 18.30 (17.30 ± 0.20)μm longwith apertur, 1/2 of its length. Odontophore 37.00 - 38.20(37.00 ± 0.82)μm in length; guiding ring single; Oesoph-ageal extension starts before the mid point. Cardia oval, 16.00μm long. Dorsal gland nucleus located more than one widthbehind the beginning of oesophageal expansion; other glandnuclei inconspicuous. Nerve ring located at 180.00 - 195.00(187.00 ± 1.00)μm. Gonads amphidelphic; Vulva transversesslit; vagina less than half of corresponding body with ova-ries paired and opposed; prerectum more than 13 times ofthe rectum length. Tail convexconoid with broadly roundedterminus.
ConclusionDiscolaimus lahorensis, Khan (1998) was originally collectedfrom Poagrass, West Regional Laboratories, Lahore. Foursamples collected from various localities of Sindh were foundpositive for Discolaimus lahorensis. There is sufficientvariation in shape of odontostyle length of oesophagus, shapeof the body and is compared to the original description.Disocolaimus lahorensis, Khan 1998 except in shape andlength of odontostyle and length of oesophagus. These
variations may be due to environmental conditions of thisprovince.
ReferencesBassu C 1991 Frilibende Nematoden aus Kuslenduch and agre-
nschden Biltopen den deutsehen und danichen Kusten.Zoologischer Anzeiger 226 114 - 148.
Cobb N A 1918 Amended characterization of nemic generaCephalobus and Acrobeles. J Parasit II, 108 pp.
DeLey P, Geraert E A, Coomans 1990 Seven Cephalobids fromSanigal (Nematoda: Rhabditida). J African Zool 10$:287 - 304.
Khan H A, Hussain S S 1998 Biosystematics of Rafiqius saeedi(Siddiqi, Deley and Khan 1992) Gen N (Nematoda:Cephalobidae with observation on its life cycle. Pak J Zool29(2) 139 - 143.
Khan H A 1998 A new species of Discolaimus (Nematoda:Discolaimidae) with the description of two other speciesfrom Pakistan. Bangladesh J Zool 26(2) 13 - 18.
Saeed M, Khan S A, Saeed V A, Khan H A 1988 Cephalobuslitoralis: Biology and tolerance to description. J Nematol20(2) 327 - 329.
Siddiqi M R 1986 Tylenchida: Parasite of Plant and Insect.Farnhamm Royal, U.K. Common Wealth Agric Bureau,Bureaux, IX 645 pp.
Siddiqi M R, DeLey P, Khan H A 1992 Acrobeloides saeedi sp.n. from Pakistan and redescription of A. bodenheimeri(Steiner) and Placodera lobata Thorne (Nematoda:Cephalobidae). Afro-Asian J Nematol 2 5 - 16.
Steiner G 1936 Opuscula miscellanea nemtologica II. ProcHelm Soci Wash 2 41 - 16.
Throne G 1937 A revision of nematode family Cephalobi-dae Chitwood and Chitwood 1934. Proc Helm Soc Wash4 1 - 16.
Truskova G M 1971 A new species of the genus Acrobeloides(Nematoda: Cephalobidae). Zoolgischekii Zhurnal 50434 - 436.
+ +o o
464 H A Khan, S A Khan
MICROBIAL PRODUCTION OF XYLITOL FROM ACID TREATED CORN COBS
R F Allam
Chemistry of Natural and Microbial Products Department, National Research Centre, Dokki, Cairo, Egypt
(Received December 12, 2001; accepted September 23, 2003)
Pak. J. Sci. Ind. Res. 2003 46(6) 465 - 470
The fermentation of xylan hydrolyzate corn cobs by different yeast species revealed the formation of different polyalcoholsugars. Both Schizosaccharomyces japonicus and Kluyveromyces bulgaricus form xylitol as sole product. Relatively highxylitol pro-duction by S. japonicus and K. bulgaricus was achieved under static fermentation, among other parameters,initial pH 9 and 8, carbon concentrations 88 - 110 g / l, ammonium chloride 1.0, 2.0 g / l and 10, 15 g / l yeast extract for S.janponicus and K. bulgricus, respectively were obtained. However, maximal xylitol yields were recorded after 4 days ofincubation for S. japonicus (18 g / l) and K. bulgaricus (16 g / l), respectively.
Key words: Corn cobs, Xylitol, Yeast.
IntroductionHemicellulose (as xylan) comprises up to 20% of the dry bio-mass of some lignocellulosic materials, such as corn cobs, withxylose as the major (about 94%) constituent sugar (Jeffries1983; Welther et al 2000; Leathers 2003). The extraction andhydrolysis of xylan component, for example with diluted mine-ral acid, can be achieved more easily than cellulose hydrolysisand can be regarded as a pretreatment step to enhance subse-quent cellulose saccharification (Watson et al 1984). The fer-mentation of D-xylose and other pentose sugars will facilitatethe exploitation of plant biomass for the production of xylitoland ethanol (Du Preez et al 1986).
Xylitol, a five carbon sugar alcohol, is used as a sweetener infoods and may apply to medical purpose as sugar substitutefor the treatment of diabetes (Kitpreechavanich et al 1984).
Many yeasts possess xylose reductase which catalyzes thereduction of D-xylose to xylitol as first step in xylose metabo-lism (Bruinenberg 1986; Kim et al 2002). This paper deals withproduction of xylitol from a cheap carbon source (corn cobs),rich in xylose and outlines some factors affecting its produc-tion.
Materials and MethodsYeast strains. The following yeast strains were examined: Can-dida albicans, C. utilis, C. lipolytica CAIM, C. lipolytica, C.tropicalis, C. kefyr, Cryptococcus laurentii Y-2536, Deba-ryomyces hansenii, Hansenula polymorpha, Kluyveromycesbulgaricus, Lipomyces lipoferus, Metschnikowia pulcherrima,Nadosenia fluvsence, Pachysolen tannophilus Y-2460,Rhodotorula rubra, Saccharomyces cerevisiae, S. cerevisiae vareulisaudans, S. diastaticus, S. lipolytica CAIM 26, S. lipolytica, S.
E-mail: [email protected]
rouxii CAIM 21, S. uvarum, Schizosaccharomyces japonicus,Schizosaccharomyces pombe, Trichosporon cutaneum.
Xylan corn cobs hydrolyzate: this was prepared according toWhislher (1963).
Medium and fermentation conditions. The organism wasroutinely maintained on yeast malt agar medium. A loopful ofcells taken from mother slant was transferred to a 250-ml Erlen-meyer flask containing 25 ml of inoculum medium of thefollowing composition (g / l): yeast extract, 5; malt extract, 5;NaCl, 1; xylose, 10; pH 5.5 and shaking at 150 rpm for 24 h at30°C.
Two ml of freshly cultured yeast suspension was inoculatedinto test tube (20 x 3 cm), each containing 20 ml of a sterilizedmedium having the following composition (g / l): NH4Cl, 1;yeast extract, 5; NaCl, 3; MgSO4.7H2O, 1; K2HPO4, 3 andhydrolyzate xylan corn cobs (containing 10 g / l xylose) at pH5.5 - 6. The tubes were incubated in inclubator at 30°C for 4days.
Analytical methods. After removal of the yeast cells bycentrifugation, the cell free fermentation broth was analyzedaccording to Somogyi’s method (1952) for reducing sugarand the method of Neish (1952) for polyalcohol contents,respectively.
Isolation and identification of xylitol. After cultivationfor 4 days, the culture medium was centrifuged at 500 rpm.The culture filtrate was deproteinized by the addition of 25%zinc sulfate, neutralized to pH 7.5 with 5N NaOH, and thencentrifuged. The supernatant was concentrated in vacuum todryness. The residue was extracted with boiling absolute etha-nol and the extract was filtered. The paper chromatographywas done to detect the presence of reducing sugars (Moore
465
et al 1960), while xylose and xylitol were analyzed by ShimadzuHPLC (C10) with refractive index detector. The sample (20μl)was injected in shim-pack CLC-NH2 (6.0 mm i.d.x15 cm) col-umn, the mobile phase acetonitrile / water (7/3) in flow rate: 1.0ml / min, at 40°C for 30 min.
Results and DiscussionScreening of yeasts for xylitol formation. The testedstrains were found to be able to hydrolyze corn cobs as car-bon source and produce xylitol and other sugar alcohols, asshown in Table 1. Among them, Candida utilis, C. lipolyticaCAIM, Cryptococcus laurentii Y-2536, Debaryomyceshansenii, Hansenula polymorpha, Kluyveromyces bulga-ricus, Pachysolen tannophilus Y-2460, Rhodotorula rubra,Saccharomyces cerevisiae, S. diastaticus, S. uvarum and Schi-zosaccharomyces japonicus produced total polyalcohols in arelatively good amount. However, Kluyveromyces bulgaricusand Schizosaccharomyces japonicus were recorded as the
Table 1Screening of some yeasts for xylitol production from hydrolyzed corn cobs
Tested yeasts Total polyalcohol Types of detected sugar alcohols content (g / l) Hexitol Xylitol Arbitol Others
Candida albicans 0.20 + + + +C. utilis 0.27 - + - ++C. lipolytica CAIM 0.26 - + + + -C. lipolytica 0.13 + + + - -C. tropicalis 0.12 - + + +C. kefyr 0.18 + + + -Cryptococcus laurentii Y-2536 0.32 + + + +Debaryomyces hansenii 0.26 + + + + -Hansenula polymorpha 0.20 - + + + + + +Kluyveromyces bulgaricus 0.54 - + + + - -Lipomyces lipoferus 0.15 + + - - + +Metschnikowia pulcherrima 0.08 + + + -Nadosenia fluvsence 0.21 - - + + +Pachysolen tannophilus Y-2460 0.30 - + + + +Rodotorula rubra 0.27 + + + -Saccharomyces cerevisiae 0.23 + + + - -S. cerevisiae var. eulisaudans 0.23 - - + +S. diastaticus 0.24 + + + + + +S. lipolytica CAIM 26 0.23 + - + + +S. lipolytica 0.24 + + + +S. rouxii CAIM 21 0.23 + + + - +S. uvarum 0.26 + + + + +Schizosaccharomyces japonicus 0.70 + + + + - -S. pombe 0.25 - + + + +Trichosporon cutaneum 0.23 + + + -
-, negative; +, small amount; + +, medium amount; + + +, large amount.
Table 2Effect of aeration condition on xylitol production
Residual sugar Consumed XylitolYeast (g / l) sugar (%) (g / l)
Static Shaked Static Shaked Static Shaked
Schizosaccharo- 16.40 1.50 51.00 95.59 16.30 4.34myces japonicusKluyveromyces 10.70 2.60 68.00 92.00 11.90 1.78bulgaricus
- Initial xylose concentration 33.5 g / l.
best xylitol producers. These two promising yeasts were there-fore, selected for further experimentation.
Effect of cultivation technique. Both static and submergedcultivation techniques were examined for xylitol productionby the promising yeasts. The data given in Table 2 revealedthe superiority of the static technique. Under this condition,relatively more amounts of xylitol were formed, in spite of the
466 R F Allam
Table 3Effect of pH regulation on xylitol production by S. japonicus and K. bulgaricus
S. japonicus K. bulgaricusInitial pH Final pH Consumed Xylitol Consumed Xylitol
Sugar (%) (g / l ) sugar (%) (g / l )
3.00 4.37 48 15.00 43 13.704.00 4.57 51 17.60 46 14.805.00 5.36 54 19.10 50 15.906.00 5.91 57 18.70 54 17.707.00 5.84 56 20.30 57 18.708.00 6.40 62 20.80 60 19.709.00 7.00 61 22.50 58 18.80
10.00 7.71 55 19.80 55 16.50
- Initial reducing sugar 44 g / l.
Table 4Effect of different nitrogen sources and concentrations on xylitol production by the tested yeasts
Consumed sugar % Xylitol (g / l)Nitrogen Nitrogen S. japonicus K. bulgaricus S. japonicus K. bulgaricussource conc. (g / l)
0.50 57 73 10.51 5.50NH4Cl 1.00 43 66 14.00 5.30
2.00 44 70 10.70 9.00
0.50 67 74 7.50 5.40Urea 1.00 54 70 7.40 5.00
2.00 66 73 6.50 4.80
0.50 47 45 12.80 10.00(NH4)2SO4 1.00 66 50 9.40 8.00
2.00 70 60 8.60 5.80
0.50 70 76 4.30 0.40NH4NO3 1.00 73 73 4.20 1.40
2.00 70 69 4.30 1.70
0.50 45 55 11.00 8.20NH4H2PO4 1.00 35 60 12.30 6.70
2.00 40 70 10.00 5.70
- NH4Cl, NH4NO3, NH4H2PO4, (NH4)2SO4 and urea were used at 88 g / l xylose.
assimilation of relatively low xylose levels. As the yeast as-similates xylitol after accumulation as a carbon source in sub-merged culture, therefore, it is safe to conclude that under thestatic culture condition, xylose was favourably metabolizedto xylitol. This may be because the yeast shows little ability toconsume xylitol under limited aeration (Jeffries 1985; Ahmed1991; Sanchez et al 1997; Zagustina et al 2001; Walthers et al2001). Our results are also in agreement with the results ofLigthelm et al (1988) who reported that xylitol, ribitol andglycerol were formed in high yields under oxygen limitation
conditions by Pachysolen tannophilus,C. shehatae and Pichiastipitis. Faria et al (2002) reported that C. guilliermondii gave0.71 g of xylitol/g xylose consumed at limited aeration. AlsoWalthers et al (2001) stated that high xylitol was produced(0.62 g/g) by Candida tropicalis ATCC 96745 under semi aero-bic conditions.
pH regulation. The optimum initial pH values for xylitolproduction by S. japonicus and K. bulgaricus were found tobe 9 and 8, respectively (Table 3). These results are in agree-ment with Kitpreechavanich et al (1984) who found that the
467Xylitol Production from Corn Cobs
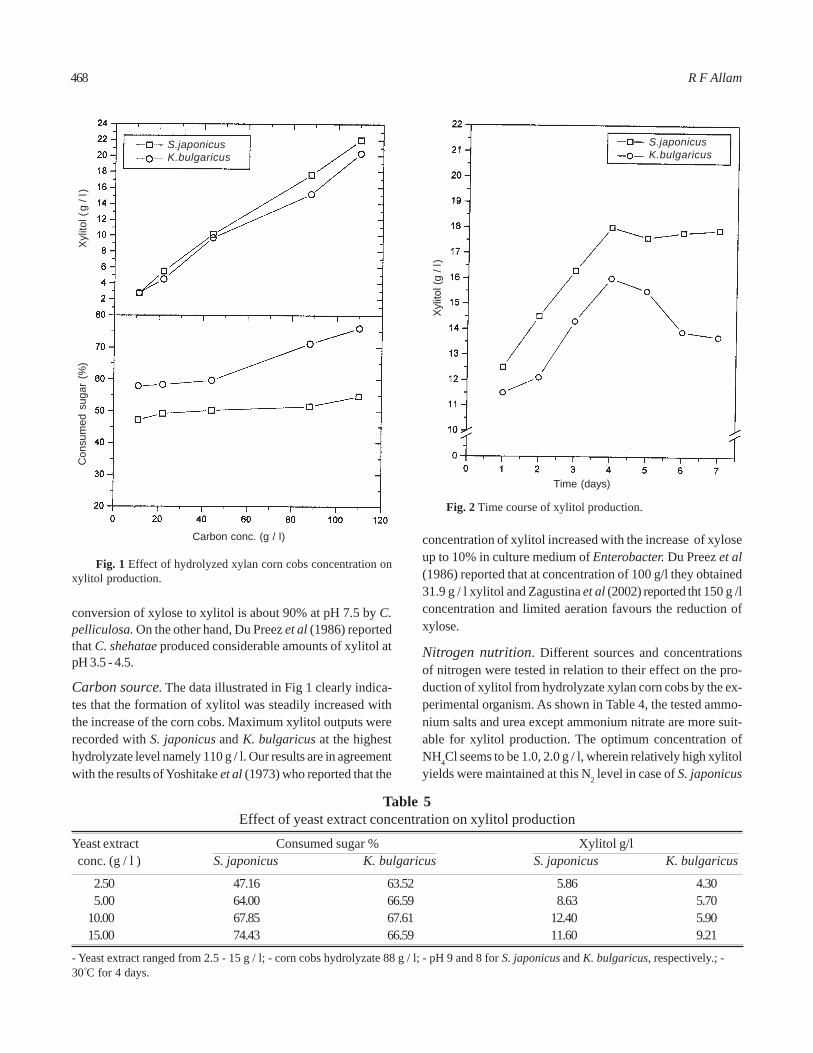
Table 5Effect of yeast extract concentration on xylitol production
Yeast extract Consumed sugar % Xylitol g/l conc. (g / l ) S. japonicus K. bulgaricus S. japonicus K. bulgaricus
2.50 47.16 63.52 5.86 4.305.00 64.00 66.59 8.63 5.70
10.00 67.85 67.61 12.40 5.9015.00 74.43 66.59 11.60 9.21
- Yeast extract ranged from 2.5 - 15 g / l; - corn cobs hydrolyzate 88 g / l; - pH 9 and 8 for S. japonicus and K. bulgaricus, respectively.; -30°C for 4 days.
conversion of xylose to xylitol is about 90% at pH 7.5 by C.pelliculosa. On the other hand, Du Preez et al (1986) reportedthat C. shehatae produced considerable amounts of xylitol atpH 3.5 - 4.5.
Carbon source. The data illustrated in Fig 1 clearly indica-tes that the formation of xylitol was steadily increased withthe increase of the corn cobs. Maximum xylitol outputs wererecorded with S. japonicus and K. bulgaricus at the highesthydrolyzate level namely 110 g / l. Our results are in agreementwith the results of Yoshitake et al (1973) who reported that the
concentration of xylitol increased with the increase of xyloseup to 10% in culture medium of Enterobacter. Du Preez et al(1986) reported that at concentration of 100 g/l they obtained31.9 g / l xylitol and Zagustina et al (2002) reported tht 150 g /lconcentration and limited aeration favours the reduction ofxylose.
Nitrogen nutrition. Different sources and concentrationsof nitrogen were tested in relation to their effect on the pro-duction of xylitol from hydrolyzate xylan corn cobs by the ex-perimental organism. As shown in Table 4, the tested ammo-nium salts and urea except ammonium nitrate are more suit-able for xylitol production. The optimum concentration ofNH4Cl seems to be 1.0, 2.0 g / l, wherein relatively high xylitolyields were maintained at this N2 level in case of S. japonicus
Fig. 1 Effect of hydrolyzed xylan corn cobs concentration onxylitol production.
Fig. 2 Time course of xylitol production.
Carbon conc. (g / l )
Time (days)
Xyl
itol (
g / l
)
Con
sum
ed s
ugar
(%
)X
ylito
l ( g
/ l )
S.japonicusK.bulgaricus
S.japonicusK.bulgaricus
468 R F Allam
and K. bulgaricus wherein (NH4)2SO4 the concentration of 0.5g / l favours xylitol production in both S. japonicus and K.bulgaricus. Holzer and Witt (1960) reported that ammoniumsalts seem to stimulate the oxidative pentose-phosphate path-way in S. cerevisiae.
Effect of organic nitrogen sources on xylitol produc-tion. The results in Table 5 reported the superiority of themedium, corn cobs hydrolyzate and containing of differentconcentrations of yeast extract for xylitol production. Where,relatively higher xylitol yields were obtained both in case ofS. japonicus and K. bulgaricus. However, maximum yieldswere obtained by S. japonicus at 10 g / l yeast extract andthat of 15 g / l for K. bulgaricus. In agreement with ourresults, Ahmed (1991) and Hottori and Suzuki (1974) describedthat 10 g/l gave the optimal concentration, of mannitol anderythritol. Contrary to these results, Hajany (1964) found thatat highest concentration, a very poor arbitol production wasobtained.
Time course of xylitol production. The time course ofxylitol production by the tested yeasts using the most favo-urable medium composed of (g / l): NH4Cl, 1; yeast extract, 5;NaCl, 3; MgSO4.7H2O, 1; KH2PO4, 3 and hydrolyzate xylancorn cobs (unpublished data) was studied (Fig 2). The xylitolproduction reached maximum after 4 days for both S. japonicus(18 g / l) and K. bulgaricus (16 g / l) at carbon source xylose (88g / l) from hydrolyzate corn cobs. In agreement with his resultsCao et al (1994) found that maximum xylitol was obtained after96 h from 260 g / l xylose.
Assessment of the presence of xylose and xylitol. Bothpaper chromatography and HPLC were used to analyze theproduct present in the alcoholic extract.
The spots were visualized on paper chromatogram by spray-ing with KIO - benzidine reagent. The spots were closely agreedwith authentic xylitol for both strains. While, xylose was detec-ted by aniline hydrogen phthalate reagent. The HPLC analy-sis assessed the presence of xylose and xylitol which wereseparated at different time intervals of 7 and 13 min, respec-tively, identical to the authentic samples.
ConclusionSchizosaccharomyces japonicus and Kluyveromyces bulga-ricus were the most potent microorganisms to produce xylitolfrom hydrolyzate xylan corn cobs using static technique atpH 9, 8 for S. japonicus and K. bulgaricus, respectively. Themaximum productivity was reached on using 110 g / l carbonsource and ammonium chloride after four days fermentation.Xylose and xylitol were identical with authentic samples whenanalyzed using HPLC.
ReferencesAhmed Y M 1991 Biochemical studies on the use of farm by-
products for the production of ketosugars and sugaralcohols by microorganisms. Ph.D. Thesis, Faculty of Agric.,Cairo University, Egypt.
Bruinenberg P 1986 The NADP(H) redox couple in yeast meta-bolism. Anto. Van Leeuwenhoek 52 411 - 429.
Cao N J, Tang R, Gong C S, Chem L F 1994 The effect of celldensity on the production of xylitol from D-xylose by-yeast. Appl Biochem Biotechnol 45 - 46 515 - 519.
Du Preez J C, Bosch M, Prior B A 1986 Xylose fermentation byCandida shehatae and Pichia stipitis: Effect of pH, tem-perature and substrate concentration. Enzyme MicrobTechnol 8 360 - 364.
Faria L F, Gimenes M A, Nobrega R, Pereira N Jr 2002 Influenceof oxygen availability on cell growth and xylitol productionby Candida guilliermondii. Appl. Biochem Biotechnol98 - 100 449 - 458.
Hajany G J 1964 D-Arabitol production by Endomyces chodati.Appl Microbiol 12 87 - 92.
Hattori K, Suzuki T 1974 Production of erythritol by n-alkalnegrown yeasts. Agric Biol Chem 38 581 - 586.
Holzer H, Witt I 1960 Bschleunigung des oxidativen pento-sephosphatcyclus in Hefezellen durch moniumsalze.Biochim Biophys Acta 38 163 - 164.
Jeffries J E 1983 Utilization of xylose by bacteria, yeasts andfungi. Adv Biochem Engin Biotechnol 27 1 - 32.
Jeffries T W 1985 Emerging technology for fermentation D-xylose. Trends Biotechnol 3 208 - 212.
Kim J H, Han K C, Koh Y N, Ryn, Y W, Sea J H 2002 Optimizationof fed batch fermentation of xylitol production by Candidatropicalis. J Ind Microbiol Biotechnol 29 16 - 19.
Kitpreechavanich V, Hayashi M, Nishio N, Nagaishi S 1984Conversion of D-xylose into xylitol by xylose reductasefrom C. pelliculose coupled with the oxidoreductase sys-tem of methanagen strain. Hu Biotechnol Lett 6 651 - 656.
Leathers T D 2003 Bioconversion of maiz residues to valueadded co-products using yeast like fungi. FEM Yeast Res3 133 - 140.
Ligthelm M E, Prior B A, Du Preez J C, Brandt V 1988 The oxy-gen requirement of yeasts for the fermentation of D-xyloseand D-glucose to ethanol. Appl Microbiol Bio-technol 2863 - 68.
Moore W E, Effland M J, Johnson D B, Daughorty M N, Sch-werdtfeger E J 1960 Chromatographic analyses of sugaralcohols and glycols. Appl Microbiol 8 169 - 173.
Neish A C 1952 Analytical Methods for Bacterial Fermenta-tion. 2nd rev. Natl. Research Council Can., Praire RegionalLab., Saskatoon, Saskatchewan N.R.C. Canada.
Ssnchez S, Bravo V, Castro E, Moya A J, Camacho F 1997 Influ-
469Xylitol Production from Corn Cobs
ence of pH and aeration rate on the fermentation of D-xy-lose by Candida shehatae. Enzyme Microb Technol 21(5)355 - 360.
Somogyi M 1952 Notes on sugar determination. J Biol Chem195 19 - 23.
Walthers T, Hensirisak P, Agblervor F A 2001 Model compoundstudies: Influence of aeration and hemicellulosic sugars onxylitol production by Candida tropicalis. Appl BiochemBiotechnol 91 - 93 423 - 435.
Watson N E, Prior B A, Lategan P M 1984 Factors in acid treated
bagasse inhibiting ethanol production from D-xylose byPachysolen tannophilus. Enzyme Microb Technol 6 451 -456.
Whislher R L 1963 Methods Carbohydrate Chem., 1 88 - 90.Yoshitake J, Ishizaki H, Shimamura M, Imai T 1973 Xylitol pro-
duction by Enterobacter sp. Agric Biol Chem 35 905 - 911.Zagustina N A, Rodonova N A, Mestechkina N M, Secher-
bukhin V D, Bezborodov A M 2001 Fermentation of xylitolin Candida guilliermondii 2581 culture. Prikl BiokimMikrobiol 37 573 - 577.
470 R F Allam
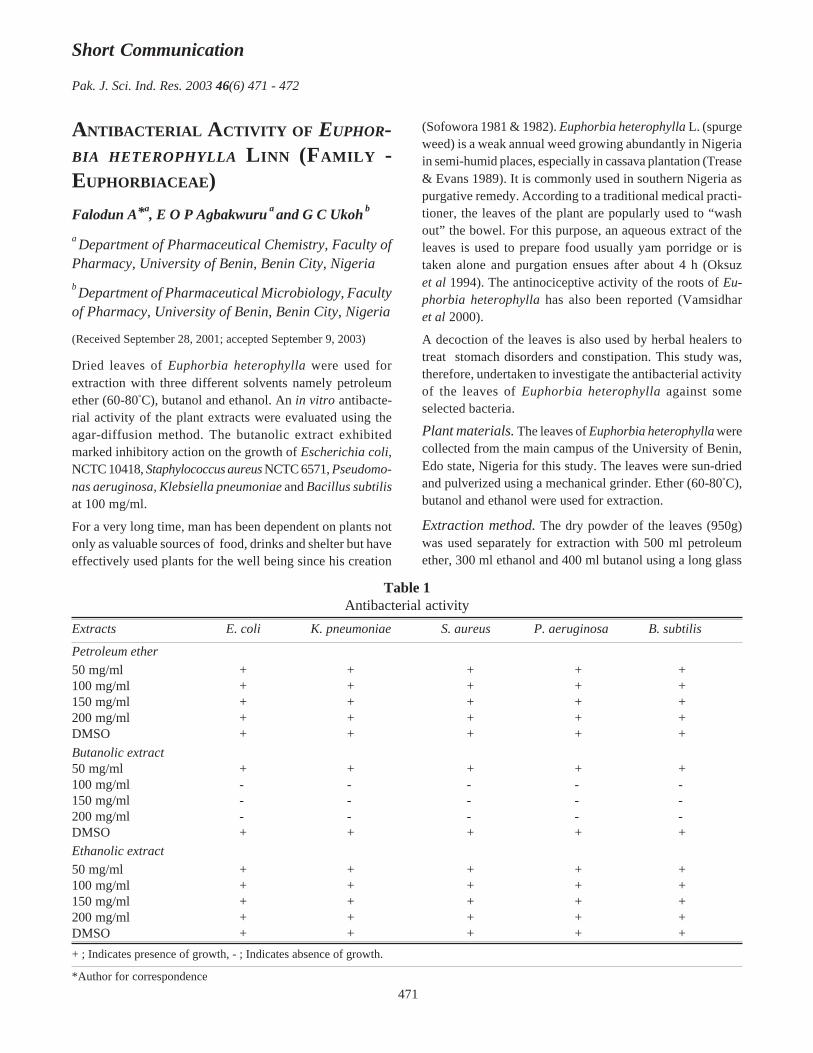
Pak. J. Sci. Ind. Res. 2003 46(6) 471 - 472
ANTIBACTERIAL ACTIVITY OF EUPHOR-BIA HETEROPHYLLA LINN (FAMILY -EUPHORBIACEAE)Falodun A*a, E O P Agbakwuru a and G C Ukoh b
a Department of Pharmaceutical Chemistry, Faculty ofPharmacy, University of Benin, Benin City, Nigeriab Department of Pharmaceutical Microbiology, Facultyof Pharmacy, University of Benin, Benin City, Nigeria
(Received September 28, 2001; accepted September 9, 2003)
Dried leaves of Euphorbia heterophylla were used forextraction with three different solvents namely petroleumether (60-80°C), butanol and ethanol. An in vitro antibacte-rial activity of the plant extracts were evaluated using theagar-diffusion method. The butanolic extract exhibitedmarked inhibitory action on the growth of Escherichia coli,NCTC 10418, Staphylococcus aureus NCTC 6571, Pseudomo-nas aeruginosa, Klebsiella pneumoniae and Bacillus subtilisat 100 mg/ml.
For a very long time, man has been dependent on plants notonly as valuable sources of food, drinks and shelter but haveeffectively used plants for the well being since his creation
Short Communication
*Author for correspondence
(Sofowora 1981 & 1982). Euphorbia heterophylla L. (spurgeweed) is a weak annual weed growing abundantly in Nigeriain semi-humid places, especially in cassava plantation (Trease& Evans 1989). It is commonly used in southern Nigeria aspurgative remedy. According to a traditional medical practi-tioner, the leaves of the plant are popularly used to “washout” the bowel. For this purpose, an aqueous extract of theleaves is used to prepare food usually yam porridge or istaken alone and purgation ensues after about 4 h (Oksuzet al 1994). The antinociceptive activity of the roots of Eu-phorbia heterophylla has also been reported (Vamsidharet al 2000).
A decoction of the leaves is also used by herbal healers totreat stomach disorders and constipation. This study was,therefore, undertaken to investigate the antibacterial activityof the leaves of Euphorbia heterophylla against someselected bacteria.
Plant materials. The leaves of Euphorbia heterophylla werecollected from the main campus of the University of Benin,Edo state, Nigeria for this study. The leaves were sun-driedand pulverized using a mechanical grinder. Ether (60-80°C),butanol and ethanol were used for extraction.
Extraction method. The dry powder of the leaves (950g)was used separately for extraction with 500 ml petroleumether, 300 ml ethanol and 400 ml butanol using a long glass
Table 1Antibacterial activity
Extracts E. coli K. pneumoniae S. aureus P. aeruginosa B. subtilis
Petroleum ether50 mg/ml + + + + +100 mg/ml + + + + +150 mg/ml + + + + +200 mg/ml + + + + +DMSO + + + + +Butanolic extract50 mg/ml + + + + +100 mg/ml - - - - -150 mg/ml - - - - -200 mg/ml - - - - -DMSO + + + + +Ethanolic extract50 mg/ml + + + + +100 mg/ml + + + + +150 mg/ml + + + + +200 mg/ml + + + + +DMSO + + + + ++ ; Indicates presence of growth, - ; Indicates absence of growth.
471
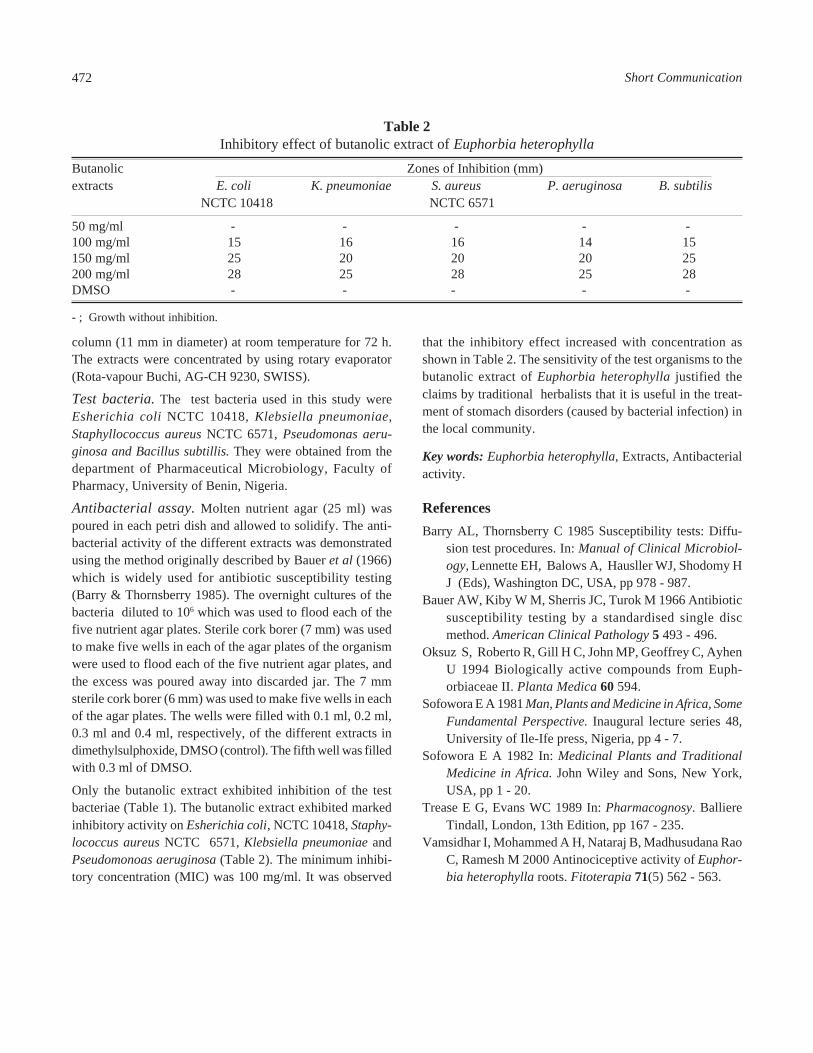
Table 2Inhibitory effect of butanolic extract of Euphorbia heterophylla
Butanolic Zones of Inhibition (mm)extracts E. coli K. pneumoniae S. aureus P. aeruginosa B. subtilis
NCTC 10418 NCTC 6571
50 mg/ml - - - - -100 mg/ml 15 16 16 14 15150 mg/ml 25 20 20 20 25200 mg/ml 28 25 28 25 28DMSO - - - - -
- ; Growth without inhibition.
column (11 mm in diameter) at room temperature for 72 h.The extracts were concentrated by using rotary evaporator(Rota-vapour Buchi, AG-CH 9230, SWISS).
Test bacteria. The test bacteria used in this study wereEsherichia coli NCTC 10418, Klebsiella pneumoniae,Staphyllococcus aureus NCTC 6571, Pseudomonas aeru-ginosa and Bacillus subtillis. They were obtained from thedepartment of Pharmaceutical Microbiology, Faculty ofPharmacy, University of Benin, Nigeria.
Antibacterial assay. Molten nutrient agar (25 ml) waspoured in each petri dish and allowed to solidify. The anti-bacterial activity of the different extracts was demonstratedusing the method originally described by Bauer et al (1966)which is widely used for antibiotic susceptibility testing(Barry & Thornsberry 1985). The overnight cultures of thebacteria diluted to 106 which was used to flood each of thefive nutrient agar plates. Sterile cork borer (7 mm) was usedto make five wells in each of the agar plates of the organismwere used to flood each of the five nutrient agar plates, andthe excess was poured away into discarded jar. The 7 mmsterile cork borer (6 mm) was used to make five wells in eachof the agar plates. The wells were filled with 0.1 ml, 0.2 ml,0.3 ml and 0.4 ml, respectively, of the different extracts indimethylsulphoxide, DMSO (control). The fifth well was filledwith 0.3 ml of DMSO.
Only the butanolic extract exhibited inhibition of the testbacteriae (Table 1). The butanolic extract exhibited markedinhibitory activity on Esherichia coli, NCTC 10418, Staphy-lococcus aureus NCTC 6571, Klebsiella pneumoniae andPseudomonoas aeruginosa (Table 2). The minimum inhibi-tory concentration (MIC) was 100 mg/ml. It was observed
that the inhibitory effect increased with concentration asshown in Table 2. The sensitivity of the test organisms to thebutanolic extract of Euphorbia heterophylla justified theclaims by traditional herbalists that it is useful in the treat-ment of stomach disorders (caused by bacterial infection) inthe local community.
Key words: Euphorbia heterophylla, Extracts, Antibacterialactivity.
ReferencesBarry AL, Thornsberry C 1985 Susceptibility tests: Diffu-
sion test procedures. In: Manual of Clinical Microbiol-ogy, Lennette EH, Balows A, Hausller WJ, Shodomy HJ (Eds), Washington DC, USA, pp 978 - 987.
Bauer AW, Kiby W M, Sherris JC, Turok M 1966 Antibioticsusceptibility testing by a standardised single discmethod. American Clinical Pathology 5 493 - 496.
Oksuz S, Roberto R, Gill H C, John MP, Geoffrey C, AyhenU 1994 Biologically active compounds from Euph-orbiaceae II. Planta Medica 60 594.
Sofowora E A 1981 Man, Plants and Medicine in Africa, SomeFundamental Perspective. Inaugural lecture series 48,University of Ile-Ife press, Nigeria, pp 4 - 7.
Sofowora E A 1982 In: Medicinal Plants and TraditionalMedicine in Africa. John Wiley and Sons, New York,USA, pp 1 - 20.
Trease E G, Evans WC 1989 In: Pharmacognosy. BalliereTindall, London, 13th Edition, pp 167 - 235.
Vamsidhar I, Mohammed A H, Nataraj B, Madhusudana RaoC, Ramesh M 2000 Antinociceptive activity of Euphor-bia heterophylla roots. Fitoterapia 71(5) 562 - 563.
472 Short Communication
Pak. J. Sci. Ind. Res. 2003 46(6) 473 - 476
WRENCH ANALYSIS FOR 3-D MODEL USED IN ROBOTIC END-EFFECTOR
Zulfiqar Ali Soomro
Mechanical Engineering Department, Quaid-e-Awam University of Engineering Sciences & Technology Nawabshah,Pakistan
(Received June 8, 2002; accepted April 18, 2003)
In this paper, wrench analysis of a new proposed 3-D robotic model is discussed and applied. The model is basically usedfor calculating applied force through known spring stiffnesses and concerned compressive displacements. The wrench iscorrelated by already determined Jacobian matrix with global displacements. Local displacements are determined practi-cally by applying load vertically in centrer. The global displacements (taken as reference) are calculated by congruencematrix through wrench analysis and shown. The theoretical relationship between global displacements and individuallocal displacements is also calculated and shown. Besides this practical determination of the wrench analysis is alsoverified by applying force on any leg of the model.
Key words. Wrench analysis, 3 - D robotic model.
IntroductionTo calculate the wrench of any manufactured 3-D model isan extreme work rather than its twist. This is the model, whichis used to determine its wrench analysis due to its turningaffect from its three directions. An important elastic relation-ship is obtained of individual contact forces with externallyapplied global wrench. The wrench equation can be used tosolve the forces in any statically indeterminate grasp pro-blem. The significance of this relationship will be empha-sized in the subsquent section ( Kerr et al 1991).
To achieve the desired in-grasp manipulation, some preloadhas to be applied along some of the contacts in order to pro-duce the effective global wrench ‘w’. The present interest isto achieve a practicable solution such that a desired manipu-lation of objects can be achieved by preloading the minimumnumber of contacts with minimum possible preloads. It shouldbe noted that the twist is in the axis coordinates that are itstranslational terms appear before rotational (Ghaffor and Kerr1992).
δW is an infinitesimal wrench in ray coordinates in the formof δf, δm, and δd that is the infinitesimal twist of the graspedobject in ray coordinates (Ghaffor et al 2000). The param-eters of external infinitesimal wrench and body infinitesimaltwist can be given by defining δf as force vector of (δfx, δFy,δFz) and δM as moment vector of (δMx, δMy, δMz) and δdas vector of translational displacements of (δ x, δy, δz).
A grasp with this stiffness matrix provides a restraint alongsix degrees of freedom when an object is subjected to anexternal wrench. The grasp arrangement does not have capa-bility to induce fine motion in full dexterity and in particular
cannot manipulate the object along z-axis. This can be vis-ualized by substituting relationship of vector of preload mag-nitude δf and δw (Ghaffor et al 2000).Any twist vector in the twist space under the mapping is alinear combination of these six twist vectors which correspondto be linearly independent. The six wrench vectors define abasis for the wrench space (Klafter et al 1989). Any wrenchvector in this wrench space under mapping is a linear combi-nation of these six wrench vectors.
Wrench analysis is investigated upon 3-D robotic model com-prising of six legs attached with two different diameter plat-forms by spherical joints (Soomroza 2001). These joints givesix degrees of freedom (three translatory and three rotationary)to calculate wrench matrix. A wrench is like torque havingdirection in x, y, z directions while wrench is the combina-tion of force and moments in x, y, z directions.
Methodology. A 3-D model is used for grasping the object.This 3-D model is used in the end-Effector of the roboticmanipulator. It possesses six legs joined by prismatic jointswith inside springs as shown in Fig 1. These legs are fittedwith two platforms giving six degrees of freedom. Thesemotions are calculated by wrench analysis through appliedforces ‘F’stiffness [K] and compressive displacements asunder.
Wrench Analysis. Since, we know that F=[K]. δd multiply-ing both sides by [J] we get:
[J].F = [J].[K]. δd
or W = [J].[K]. δd
But δd = [Jt]. δd
473
Technology
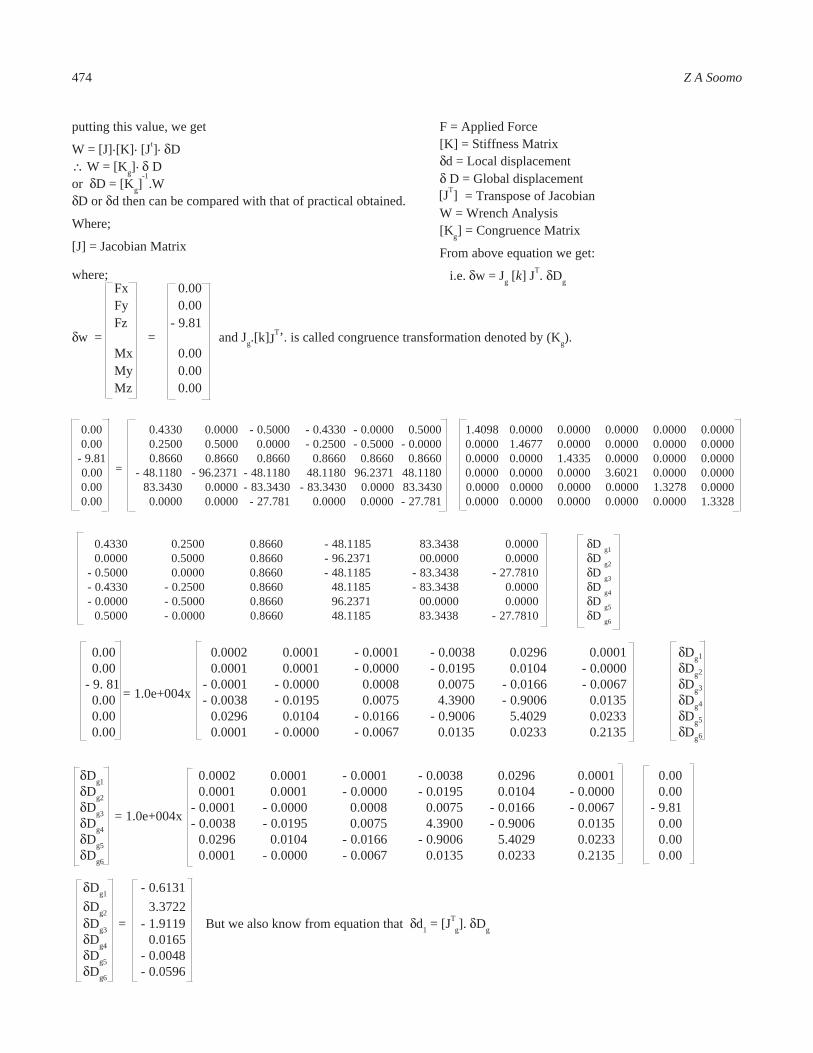
putting this value, we get
W = [J].[K]. [Jt]. δD∴ W = [Kg]. δ Dor δD = [Kg]
-1.W
δD or δd then can be compared with that of practical obtained.
Where;
[J] = Jacobian Matrix
Fx 0.00Fy 0.00Fz - 9.81
δw = = and Jg.[k]JT’. is called congruence transformation denoted by (Kg).Mx 0.00My 0.00Mz 0.00
0.00 0.4330 0.0000 - 0.5000 - 0.4330 - 0.0000 0.5000 1.4098 0.0000 0.0000 0.0000 0.0000 0.00000.00 0.2500 0.5000 0.0000 - 0.2500 - 0.5000 - 0.0000 0.0000 1.4677 0.0000 0.0000 0.0000 0.0000
- 9.81 0.8660 0.8660 0.8660 0.8660 0.8660 0.8660 0.0000 0.0000 1.4335 0.0000 0.0000 0.0000 0.00 - 48.1180 - 96.2371 - 48.1180 48.1180 96.2371 48.1180 0.0000 0.0000 0.0000 3.6021 0.0000 0.0000
0.00 83.3430 0.0000 - 83.3430 - 83.3430 0.0000 83.3430 0.0000 0.0000 0.0000 0.0000 1.3278 0.00000.00 0.0000 0.0000 - 27.781 0.0000 0.0000 - 27.781 0.0000 0.0000 0.0000 0.0000 0.0000 1.3328
0.4330 0.2500 0.8660 - 48.1185 83.3438 0.0000 δD g10.0000 0.5000 0.8660 - 96.2371 00.0000 0.0000 δD g2
- 0.5000 0.0000 0.8660 - 48.1185 - 83.3438 - 27.7810 δD g3- 0.4330 - 0.2500 0.8660 48.1185 - 83.3438 0.0000 δD g4- 0.0000 - 0.5000 0.8660 96.2371 00.0000 0.0000 δD g5
0.5000 - 0.0000 0.8660 48.1185 83.3438 - 27.7810 δD g6
0.00 0.0002 0.0001 - 0.0001 - 0.0038 0.0296 0.0001 δDg1
0.00 0.0001 0.0001 - 0.0000 - 0.0195 0.0104 - 0.0000 δDg2
- 9. 81 - 0.0001 - 0.0000 0.0008 0.0075 - 0.0166 - 0.0067 δDg3
0.00 - 0.0038 - 0.0195 0.0075 4.3900 - 0.9006 0.0135 δDg4
0.00 0.0296 0.0104 - 0.0166 - 0.9006 5.4029 0.0233 δDg5
0.00 0.0001 - 0.0000 - 0.0067 0.0135 0.0233 0.2135 δDg6
δDg1 0.0002 0.0001 - 0.0001 - 0.0038 0.0296 0.0001 0.00δDg2 0.0001 0.0001 - 0.0000 - 0.0195 0.0104 - 0.0000 0.00δDg3 - 0.0001 - 0.0000 0.0008 0.0075 - 0.0166 - 0.0067 - 9.81δDg4 - 0.0038 - 0.0195 0.0075 4.3900 - 0.9006 0.0135 0.00δDg5 0.0296 0.0104 - 0.0166 - 0.9006 5.4029 0.0233 0.00δDg6 0.0001 - 0.0000 - 0.0067 0.0135 0.0233 0.2135 0.00
= 1.0e+004x
δDg1 - 0.6131δDg2 3.3722δDg3 = - 1.9119 But we also know from equation that δd1 = [JT
g]. δDgδDg4 0.0165δDg5 - 0.0048δDg6 - 0.0596
where;
=
= 1.0e+004x
F = Applied Force[K] = Stiffness Matrixδd = Local displacementδ D = Global displacement[J T] = Transpose of JacobianW = Wrench Analysis[Kg] = Congruence Matrix
From above equation we get:
i.e. δw = Jg [k] JT. δDg
[JT]
474 Z A Soomo
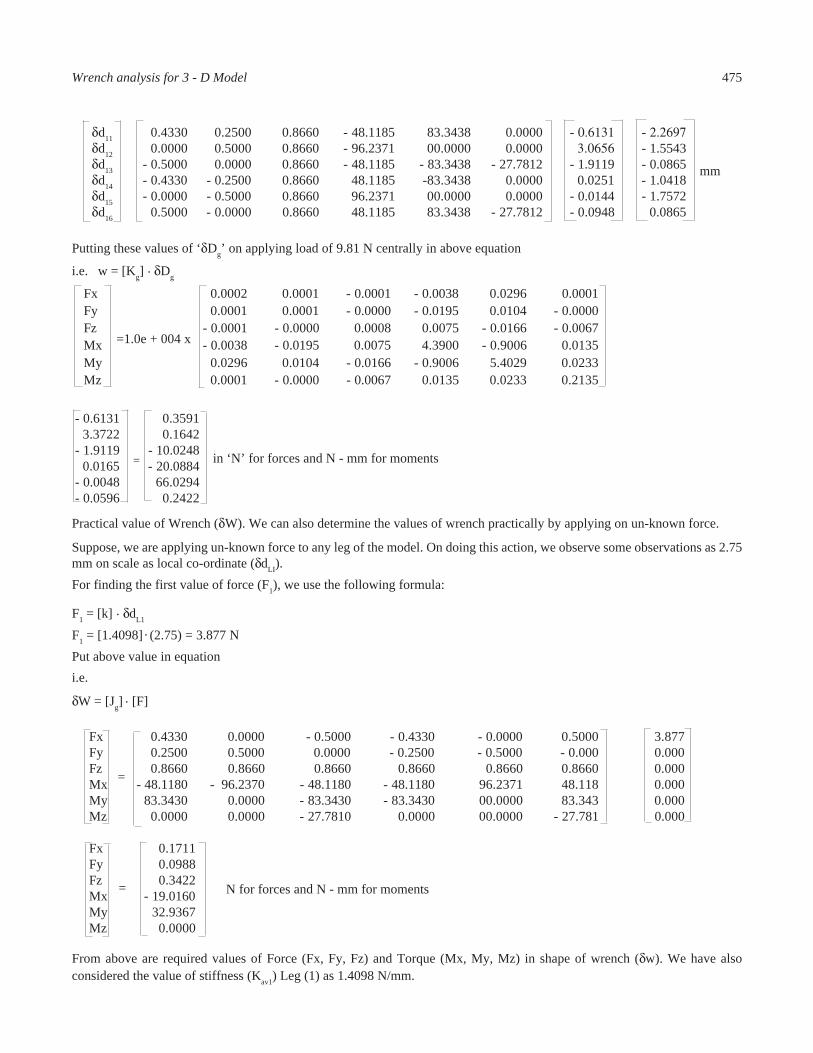
δd11 0.4330 0.2500 0.8660 - 48.1185 83.3438 0.0000 - 0.6131 - 2.2697δd12 0.0000 0.5000 0.8660 - 96.2371 00.0000 0.0000 3.0656 - 1.5543δd13 - 0.5000 0.0000 0.8660 - 48.1185 - 83.3438 - 27.7812 - 1.9119 - 0.0865δd14 - 0.4330 - 0.2500 0.8660 48.1185 -83.3438 0.0000 0.0251 - 1.0418δd15 - 0.0000 - 0.5000 0.8660 96.2371 00.0000 0.0000 - 0.0144 - 1.7572δd16 0.5000 - 0.0000 0.8660 48.1185 83.3438 - 27.7812 - 0.0948 0.0865
Putting these values of ‘δDg’ on applying load of 9.81 N centrally in above equation
i.e. w = [Kg] . δDg
Fx 0.0002 0.0001 - 0.0001 - 0.0038 0.0296 0.0001Fy 0.0001 0.0001 - 0.0000 - 0.0195 0.0104 - 0.0000Fz - 0.0001 - 0.0000 0.0008 0.0075 - 0.0166 - 0.0067Mx - 0.0038 - 0.0195 0.0075 4.3900 - 0.9006 0.0135My 0.0296 0.0104 - 0.0166 - 0.9006 5.4029 0.0233Mz 0.0001 - 0.0000 - 0.0067 0.0135 0.0233 0.2135
- 0.6131 0.35913.3722 0.1642
- 1.9119 - 10.02480.0165 - 20.0884
- 0.0048 66.0294- 0.0596 0.2422
Practical value of Wrench (δW). We can also determine the values of wrench practically by applying on un-known force.
Suppose, we are applying un-known force to any leg of the model. On doing this action, we observe some observations as 2.75mm on scale as local co-ordinate (δdLI).For finding the first value of force (F1), we use the following formula:
Fx 0.4330 0.0000 - 0.5000 - 0.4330 - 0.0000 0.5000 3.877Fy 0.2500 0.5000 0.0000 - 0.2500 - 0.5000 - 0.000 0.000Fz 0.8660 0.8660 0.8660 0.8660 0.8660 0.8660 0.000Mx - 48.1180 - 96.2370 - 48.1180 - 48.1180 96.2371 48.118 0.000My 83.3430 0.0000 - 83.3430 - 83.3430 00.0000 83.343 0.000Mz 0.0000 0.0000 - 27.7810 0.0000 00.0000 - 27.781 0.000
Fx 0.1711Fy 0.0988Fz 0.3422Mx - 19.0160My 32.9367Mz 0.0000
From above are required values of Force (Fx, Fy, Fz) and Torque (Mx, My, Mz) in shape of wrench (δw). We have alsoconsidered the value of stiffness (Kav1) Leg (1) as 1.4098 N/mm.
mm
=1.0e + 004 x
in ‘N’ for forces and N - mm for moments=
=
= N for forces and N - mm for moments
F1 = [k] . δdL1
F1 = [1.4098] (2.75) = 3.877 NPut above value in equationi.e.
δW = [Jg] . [F]
.
475Wrench analysis for 3 - D Model
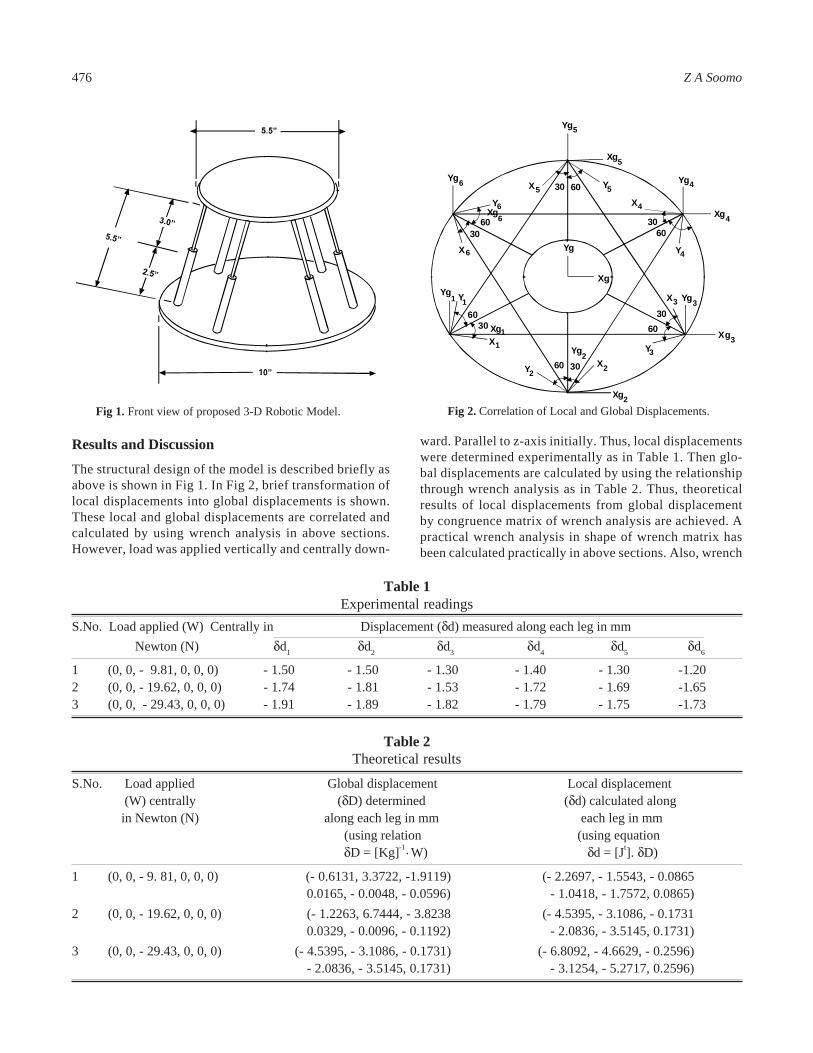
Results and DiscussionThe structural design of the model is described briefly asabove is shown in Fig 1. In Fig 2, brief transformation oflocal displacements into global displacements is shown.These local and global displacements are correlated andcalculated by using wrench analysis in above sections.However, load was applied vertically and centrally down-
Table 1Experimental readings
S.No. Load applied (W) Centrally in Displacement (δd) measured along each leg in mm Newton (N) δd1 δd2 δd3 δd4 δd5 δd6
1 (0, 0, - 9.81, 0, 0, 0) - 1.50 - 1.50 - 1.30 - 1.40 - 1.30 -1.202 (0, 0, - 19.62, 0, 0, 0) - 1.74 - 1.81 - 1.53 - 1.72 - 1.69 -1.653 (0, 0, - 29.43, 0, 0, 0) - 1.91 - 1.89 - 1.82 - 1.79 - 1.75 -1.73
Fig 2. Correlation of Local and Global Displacements.
Table 2Theoretical results
S.No. Load applied Global displacement Local displacement (W) centrally (δD) determined (δd) calculated along in Newton (N) along each leg in mm each leg in mm
(using relation (using equation δD = [Kg]-1. W) δd = [Jt]. δD)
1 (0, 0, - 9. 81, 0, 0, 0) (- 0.6131, 3.3722, -1.9119) (- 2.2697, - 1.5543, - 0.08650.0165, - 0.0048, - 0.0596) - 1.0418, - 1.7572, 0.0865)
2 (0, 0, - 19.62, 0, 0, 0) (- 1.2263, 6.7444, - 3.8238 (- 4.5395, - 3.1086, - 0.17310.0329, - 0.0096, - 0.1192) - 2.0836, - 3.5145, 0.1731)
3 (0, 0, - 29.43, 0, 0, 0) (- 4.5395, - 3.1086, - 0.1731) (- 6.8092, - 4.6629, - 0.2596)- 2.0836, - 3.5145, 0.1731) - 3.1254, - 5.2717, 0.2596)
Fig 1. Front view of proposed 3-D Robotic Model.
ward. Parallel to z-axis initially. Thus, local displacementswere determined experimentally as in Table 1. Then glo-bal displacements are calculated by using the relationshipthrough wrench analysis as in Table 2. Thus, theoreticalresults of local displacements from global displacementby congruence matrix of wrench analysis are achieved. Apractical wrench analysis in shape of wrench matrix hasbeen calculated practically in above sections. Also, wrench
476 Z A Soomo
Y56030Yg4
Xg4
X4
3060
Y4
3X3
Xg3
3060
Y3X2
Xg2
Yg23060
Xg130
60
X1
Y1Yg
1
3060
X6
YXg
6
Xg
Yg
Yg5
Xg5
X5Yg6
6
Y2
Yg
matrix depending upon elements of forces and momentsin x,y,z directions have also been determined in abovesections. In this way global displacements are convertedinto local displacements by already calculated Jacobianmatrix in Table 2.In matrix from, wrench analysis is shown by six elements.First three elements represent force analysis in X, Y and Zdirections. While last three elements of matrix represent themoments in concerned directions.
ConclusionThe wrench analysis is applied and calculated on a new 3-Dmodel shown in Fig 1. It can be fitted into robotic End-Effec-tor. For this, concerned wrench equations are discussed. Therelative factors are calculated and investigated practically aswell as theoretically. Thus, unknown applied forces and con-cerned moments in x, y, and z-axes are calculated. The glo-bal displacements are determined by congruence and wrenchanalysis. Then local displacements are obtained by correla-tion of global displacements through jacobian (J). Besideswrench analysis, this 3-D Robotic model is also used for cal-culating the force and local or global displacements apart fromits stiffness.
ReferencesGhaffor A, Kerr D R 1992 “In-grasp robotic fine motion with
frictionless elastic point contacts”, J Mech Eng SCI Pro1 March E Part C 41 - 47.
Ghaffoor A, Dai J S, Duffy J 2002 “Fine motion control basedon constraint criteria under pre-loading configurations”Journal of Robotic systems by John Wiley & Sons, Inc.,USA 17 (4) 171 - 185.
Kerr D R, Sanger D J S, Duffy, J 1991 “Redundant grasps,redundant manipulators, and their dual relationship.”J Robotic Systems RS 459.
Ghaffoor A, Dai J S, Duffy J, Grasp stiffness matrix for softfinger contact model in robotic applications” 2000ASME Design Engineering Technical Conference, Sep-tember 10 - 13, 2000 Baltimore, Maryland, USA.
Klafter R D, Tachnielewski, Michael Negin, 1989 Robotics En-gineering, An Integrated Approach, Prentice Hall, Ist ed.
Soomro Z A, “Design Modeling & Simulation of RoboticEnd-Effector For In-grasp Fine Manipulation Using Par-allel compliant Mechanism” Msc-26 Thesis, College ofElectrical and Mechanical Engineering National Univer-sity of Science and Technology Rawalpindi, Pakistan-2001.
477Wrench analysis for 3 - D Model
CONTENTS OF VOL. 46
Vol. 46(No.1) January - Feburary, 2003
PHYSICAL SCIENCES
Mixed ligand transition metal complexes of tridentate schiff base with thiocyanateM.S.Islam, M.A.Farooque and M.A.K.Bodruddoza (Bangladesh) 1
Preparation and characterization of activated carbon from Babul (Acacia arabica) and coconut shells byphysical activation in a fluidized bed reactorT.H.Usmani, M.T.Motan, M.Mumtaz and M.A.Ahmed (Pakistan) 5
Quality parameters of some natural rubber (NR) clones indigenous to Nigeria. II. Ionic content, stability anddegradation resistance of natural rubberB.F.Adeosun, O.Olaofe and J.D.Ajayi (Nigeria) 10
Dielectric dispersive behaviour of silicon mono oxide thin film sandwiched structure annealed at differenttemperaturesS.S.Ahmed, M.Yaqub and A.Hussain (Pakistan) 14
Natural rubber loaded with local materials. III. Creep propertiesB.F.Adeosun and O.Olaofe (Nigeria) 20
Synthesis of 2' 4' - dihydroxy-6' - methoxy - 3, 4 - methylenedioxydihydrochalcone and 2', 4', 6' - trihydroxy - 4 -methoxydihydrochalconeS.Alam and A.Islam (Bangladesh) 27
SHORT COMMUNICATION
Synthesis of Karanjin, naturally occurring furanoflavoneM.A.Hossain, A.K.Das and S.M.Salehuddin (Bangladesh) 31
BIOLOGICAL SCIENCES
Identification of the morphological characters influencing the infestation rate of yellow stem borerM.Shahjahan and M.Hossain (Bangladesh) 33
Monitoring of pesticide residues in human milkZ.Parveen and S.Z.Masud (Pakistan) 43
Production and some important properties of a partially purified rennin-like extracellular enzyme fromFusarium subglutinans (Wollenweber & Reinking) Nelson et al grown staticallyH.S.Hamdy (Egypt) 47
Population size of red junglefowl (Gallus gallus spadiceus) in agriculture areasM.Zakaria, M.I.Arshad and A.S.Sajap (Malaysia) 52
ii
ContentsPak. J. Sci. Ind. Res. 2003, Vol. 46 (6)
Utilization of seabuckthorn fruit for the preparation of granulesS.Wadood, H.Abid, H.Ara, M.Tariq and W.H.Shah (Pakistan) 58
Genetic distance and its relation to the performance of intrahirsutum F1 hybridsM.J.Baloch (Pakistan) 63
SHORT COMMUNICATION
Nutritional and technological evaluation of wheat bread supplemented with peanut and soybean floursM.Jan, F.Mahmood, A.Zeb and M.A.Chaudry (Pakistan) 68
TECHNOLOGY
Comparative efficiency of different feed additives on the performance of quail chicksS.Ali, T.Firdos, W.H.Shah and R.Iqbal (Pakistan) 70
Vol. 46(No.2) March - April, 2003
INTRODUCTION i - iii
ACKNOWLEDGEMENT iv
PHYSICAL SCIENCES
Desulphurization of lignitic coals using aqueous cupric chlorideA.R.Khan, M.H.Khan, S.Kumar and S.F.Sibtain (Pakistan) 73
Acidity of the effluents produced during air blowing of asphaltM.A.Quddus, S.N.Sarwar and F.Khan (Pakistan) 78
Simple one - step syntheses of heterocyclic systems from 2 - phenyl - 4 - thienylmethylidene - 5(4H) - oxazoloneH.M.F.Madkour (Egypt) 81
Dielectric relaxation studies of some primary alcohols and their mixture with waterS.S.Ahmad and M.Yaqub (Pakistan) 88
Synthesis and anti-microbial activity of some heterocycles: Part-IIK.M.M.Rahman, A.Z.M.S.Chowdhury, M.M.H.Bhuiyan, M.K.Hossain and M.K.Uddin (Bangladesh) 95
Comparative statistical approach for the assessment of pollution of heavy metals in Rawal Lake water and mainstreams entering Rawal LakeH.Tahir, F.Uddin, M.Saleem and M.Afzal (Pakistan) 99
Investigation of Pb, Zn, Mn, Ni, Co and Cr in insoluble dustfallF.U.Khan, B.Shakila, S.Jehangir and M.Ashfaq (Pakistan) 104
iii
ContentsPak. J. Sci. Ind. Res. 2003, Vol. 46 (6)
+4
BIOLOGICAL SCIENCES
The precarious status of the Indus dolphin (Platanista minor) between Guddu and Sukkur Barrages in 1999F.M.Slater, G.S.Gachal, S.M.Yusuf and B.A.Channar (U.K.) 110
Potassium adsorption behaviour of three Malaysian rice soilsA.T.M.A.Choudhury and Y.M.Khanif (Malaysia) 117
Nutritional evaluation of diets of low - income rural population of NWFP, PakistanM.Jan, F.Mahmood, A.Zeb and M.A.Chaudry (Pakistan) 122
Genetic variability, partial regression, co - heritability studies and their implication in selection of highyielding Potato genotypesM.Z.Iqbal and S.A.Khan (Pakistan) 126
Response of rice to nitrogenous fertilizer and irradiated sewage sludgeF.Azam, A.Lodhi and M.H.Sajjad (Pakistan) 129
Antibacterial activities of Thymus serpyllum essential oilM.ur Rahman and S.Gul (Pakistan) 135
SHORT COMMUNICATION
Nutrient indexing of maize in the submontane region of Indian PunjabD.S.Benipal, I.M.Chhibba and C.L.Arora (India) 139
TECHNOLOGY
Pyrogallol as a reagent for spectrophotometric determination of ammonium - nitrogen (NH -N) in aqueous solutionP.O.Okolo and A.Jideonwo (Nigeria) 141
Vol. 46(No.3) May - June, 2003
PHYSICAL SCIENCES
Chemical compositions and phytochemical screening of the seeds of Garcinia kola (Bitter kola)M.F.Asaolu (Nigeria) 145
Planetary orbits in axisymmetric vacuum gravitational fieldsM.J.Iqbal and J.Quamar (Pakistan) 148
Effect of lithium chloride and sodium chloride on ionic interaction of dilute solution in aqueous butanolA.R.Khan, F.Uddin and R.Saeed (Pakistan) 151
Heavy metals in water and sediment of the lower Ikpoba River, Benin city, NigeriaF.A.Oguzie (Nigeria) 156
iv
ContentsPak. J. Sci. Ind. Res. 2003, Vol. 46 (6)
Low temperature autocatalytic nickel depositionI.H.Khan, S.T.Sheikh, C.A.Amin and K.Javed (Pakistan) 161
Studies on the constituents of Hibiscus rosa - sinensisM.A.Hossain and S.A.Tarafdar (Bangladesh) 164
The glycerides structure of Citrullus colocynthisM.A.Javed, T.Kausar, M.Saleem and G.R.Khan (Pakistan) 167
SHORT COMMUNICATION
Biological activity of 2, 3 - di(quinolyl - 2) - 6 -methyl quinoxalineN.Ansar, S.Kaban and R.Ahmed (Pakistan) 171
BIOLOGICAL SCIENCES
Comparative analysis and nutritional composition of mulberry fruit Morus alba plus seabuckthorn (Hippophae)and their productsM.N.Alizai, S.Rehman and W.H.Shah (Pakistan) 174
The genetic effects of combining abilities on oil and protein contents in Gossypium hirsutum L. seedF.M.Azhar and A.A.Khan (Pakistan) 177
Breeding biology of the freshwater copepod, Heliodiaptomus viduus (Gurney) and its prospects as livefood organismK.Altaf (India) 180
Effect of Areca nut extracts on some digestive enzymes in vitroT.A.Kumosani (Saudi Arabia) 188
Population dynamics and the management of the commercial shrimp Penaeus semisulcatusM.G.Mustafa and S.Ali (Bangladesh) 193
Stability of chloroquine phosphate tablets inoculated with bacterial speciesI.F.Obuekwe, M.U.Iwuagu and C.A.Orhe (Nigeria) 203
Effect of supplementation of detoxified matri flour with wheat flour on the quality of pan breadS.A.Lodhi, S.-ur-Rehman and N.Huma (Pakistan) 207
SHORT COMMUNICATIONS
Location of fungi in pumpkin seedN.Sultana (Pakistan) 211
Fatty acid and lipid composition of Plantago ovataM.A.Javed, S.Mahmud, S.Ali and T.Aman (Pakistan) 213
v
ContentsPak. J. Sci. Ind. Res. 2003, Vol. 46 (6)
TECHNOLOGY
Modification and development in electrolytic analyzer instrumentN.Ahmad, S.Ahmad, M.Arif and A.Saghir (Pakistan) 215
REVIEW ARTICLE
Road traffic noise in Pakistan - a reviewG.H.Shaikh (Pakistan)
Vol. 46(No.4) July - August, 2003
PHYSICAL SCIENCES
Vibration monitoring and fault diagnosis of an I.D. fan at a cement plantT.Hafeez, A.Ahmed, G.Y.Chohan and M.Amir (Pakistan) 225
Spectrophotometric method of the determination of gold (III) by using imipramine hydrochloride andpromethazine hydrochlorideB.Dembinski, M.Kurzawa, A.Szydlowska-Czerniak (Poland) 230
SHORT COMMUNICATIONS
A flavone from the seeds of Carum carvi L. (Umbelliferae)M.A.Rahman and M.A.Hossain (Bangladesh) 235
Condensation of some hetaryl substituted diketones with aromatic diamineS.Kaban and N.Ansar (Pakistan) 236
Effect of part replacement of silica sand with carbon black on composite propertiesB.F.Adeosun and O.Olaofe (Nigeria) 239
BIOLOGICAL SCIENCES
Studies on the production of spore crystal by Bacillus thuringiensis CAMB 3 - 023 in the stirred fermentorA.U.Zafar, M.A.Qadeer and S.Riazuddin (Pakistan) 242
Relationships between heavy metal content and body weight of selected freshwater fish species of the lower IkpobaRiver in Benin City, NigeriaF. A.Oguzie (Nigeria) 246
Cystic echinococcosis in domestic ruminants in Cox's Bazar of BangladeshM.K.Islam, S.C.Basak, S.Majumder, S.A.Sarder, A.W.M.S.Islam and M.M.H.Mondal (Bangladesh) 251
The food and feeding habits of fishes of the Jamieson River, NigeriaI.P.Oboh, C.U.Edema and O.- L.Tongo (Nigeria) 255
vi
ContentsPak. J. Sci. Ind. Res. 2003, Vol. 46 (6)
Estimation of leaf damage of banana affected by banana leaf and fruit beetle, Nodostoma viridipennis Most.(Coleoptera: Eumolpidae) in BangladeshZ.M.S.Zahan, M.A.Ahad, M.S.Bari and M.A.Sardar (Bangladesh) 261
Phytase production by fermentationA.D.Khan, N.Ijaz and T.Kausar (Pakistan) 265
Determination of protein, nitrite and nitrate in animal protein sources in NigeriaE.I.Adeyeye, V.O.E.Akpambang and I.A.Adebomojoa (Nigeria) 270
Genotype x environment interaction in relation to diallel crosses for flower characters in bean (Lablab purpureus)S.Khanam and M.A.Newaz (Bangladesh) 277
Elemental analysis of Calendula officinalis plant and its probable therapeutic role in healthS.Ahmed, A.Rahman, M.Qadiruddin and S.Qureshi (Pakistan) 283
Phosphorus adsorption in representative soils of Peshawar Valley (NWFP)M.Ali, M.S.Sarir, M.U.Shirazi, S.M.Alam and R.U.Ansari (Pakistan) 288
Gene action for some quantitative characters in upland cotton (Gossypium hirsutum L .)M.A.Chandio, M.S.Kalwar and G.M.Baloch (Pakistan) 295
Studies on detoxification of feeds and feed ingredientsS.Ali, T.Kausar, W.H.Shah and A.H.K. Niazi (Pakistan) 300
SHORT COMMUNICATION
Effect of Raphanus sativus Linn oil on rabbit skinM.Mirza and Z.Yaqeen (Pakistan) 304
TECHNOLOGY
Commercial extraction and resolution of silymarin isomersL.Khan, N.Shafi, S.Farooq, S.N.Gilani, T.Mahmood and N.Ahmad (Pakistan) 307
Vol. 46(No.5) September - October, 2003
PHYSICAL SCIENCES
Latexes from Euphorbia caducifolia - Isolation and characterisation of rubber hydrocarbon. Part - IA.R.Khan and T.Akhtar (Pakistan) 311
Preparation, characterization and molecular models of the complexes of quadridentate tripodal ligand tren[tren = tris(2 - aminoethyl) amine] with Ag(I), Cd(II), Hg(II), Zr(IV) and U(VI)M.Q.Ehsan, M.H.Rashid and S.M.S.Islam (Bangladesh) 317
Extraction and chemical quality characteristics evaluation of orange peel pectinZ.-ur-Rehman, F.Habib and S.I.Zafar ((Pakistan) 323
vii
ContentsPak. J. Sci. Ind. Res. 2003, Vol. 46 (6)
Chemical polymorphism in AsteraceaeR.Rajalakshmi and J.Jose (India) 327
Some physical parameters of the sandspit backwaters, Karachi coastR.Sultana and J.Mustaquim (Pakistan) 333
Dissociation extraction process for the separation of isomeric organic compoundsA.S.Ahmed, M.Akhtar and A.Hamid (Pakistan) 344
Thermal stabilisation of PVC with Jatropha seed, Khaya seed and rubber seed oils. Effect of barium andcadmium soaps of the seed oils on the thermal degradation of PVCF.E.Okieimen (Nigeria) 348
BIOLOGICAL SCIENCES
A study on the feeding responses of a filter - feeding Cyclops sp. on various concentrations of Chlorella vulgarisM.M.M.Alam, M.I.Miah and M.A.Habib (Bangladesh) 354
Effect of cooking method and length of cooking time on nutritive value of various bean brothsZ.-ur-Rehman, S.Samreen and W.H.Shah (Pakistan) 358
Morphological studies of the schistosomulum of Schistosoma mansoni and Schistosoma margrebowieiin lungs of miceI.B.Kalhoro and S.Jalali (Pakistan) 363
North Carolina design - 11 Analysis for estimating genetic parameters in cotton (Gossypium hirsutum L.)M.J.Baloch (Pakistan) 367
Performances of newly developed cotton strains for economic and fibre traits in national coordinated varietal trialsM.Arshad, M.Afzal, M.I.Khan and R.Mahmood (Pakistan) 373
Nutritional qualities of smoked shrimp from the Sundarbans mangrove area, BangladeshM.E.Hoq, M.N.Islam and M.Kamal (Bangladesh) 376
Effect of radiation on the physico - chemical characteristics of tomato during storageN.G.Dar, Ihsanullah and T.N.Khattak (Pakistan) 383
TECHNOLOGY
Retention of nutritional quality of soybean during extrusion cookingM. Khan, H. E. Huff, F. Hsieh, S. Grebing, J. Porter and Y. Li (USA) 389
viii
ContentsPak. J. Sci. Ind. Res. 2003, Vol. 46 (6)
Vol. 46(No.6) November - December, 2003
ACKNOWLEDGEMENT i
PHYSICAL SCIENCES
Heavy metal ions concentration in wheat plant (Triticum aestivum L .) irrigated with city effluentS.Farid (Pakistan) 395
Environmental impact assesment of air pollution in different areas of KarachiD.R.Hashmi and M.I.Q.Khani (Pakistan) 399
Synthesis of hetero-bicyclic compounds Part - X. Formation of 2H, 4H, 5H 2, 2 - diphenyl - 4, 5 - dioxopyrido[4, 3 - d] 1, 3 dioxinA.Salam and A.Akhtar (Pakistan) 406
Ternary liquid equilibria of ethanol - water - oleyl alcohol and ethanol - water - oleic acid systemsM.S.Rahman, M.A.Rahman and M.N.Nabi (Bangladesh) 409
Electrocapillary and flotation studies using potassium ethylxanthate, dithiophosphate collectors and their mixtureM.Riaz, F.Khan, Mumtaz, N. Jan and N.Pirzada (Pakistan) 414
The distribution of Mn, Zn, Cu, Cr, Ni, and Pb around two major refuse dumpsites in Benin city, NigeriaE.E.Ukpebor, P.O.Oviasogie and C.A.Unuigbe (Nigeria) 418
Simulation of chloride transport based descriptive soil structureM.M.-ul-Hassan, M.S.Akhtar, S.M.Gill and G.Nabi (Pakistan) 424
Studies of the polynuclear complexes of labile ligands of vitamin B1 and Zn (II), Cd (II) and Hg (II) with Fe (III)J.O.Ojo (Nigeria) 432
SHORT COMMUNICATIONS
Synthesis of 3 - methoxy - 4'- prenyloxy - furano (2", 3":7, 8) flavoneM.A.Hossain and S.M.Salehuddin (Bangladesh) 436
BIOLOGICAL SCIENCES
Variation of heavy metal concentrations in water and freshwater fish in Niger delta waters - A case study ofBenin RiverM.O.James and P.O.Okolo (Nigeria) 439
Stability of rust resistance and yield potential of some Icarda bread wheat lines in PakistanS.J.A.Shah, A.J.Khan, F.Azam, J.I.Mirza and A. ur Rehman (Pakistan) 443
Leaf phenolics of different varieties of tropical rapeseed at various growing stagesM.A.Chaudry, N.Bibi, A.Badshah, M.Khan and Z.Ali (Pakistan) 447
ix
ContentsPak. J. Sci. Ind. Res. 2003, Vol. 46 (6)
Levels of cadmium, chromium and lead in dumpsites soil, earthworm (Lybrodrilus violaceous), housefly (Muscadomestica) and dragonfly (Libellula luctosa)A.A.Adeniyi, A.B.Idowu and O.O.Okedeyi (Nigeria) 452
Available and unavailable carbohydrate content of black gram (Vigna mungo) and chick - pea (Cicer arietinum) asaffected by soaking and cooking processesZ.-ur-Rehman, M.Rashid and A.M.Salariya (Pakistan) 457
Observations on Rafiqius bodenheimeri (Steiner 1936) Khan and Hussain 1998 and Discolaimus lahorensis Khan,1998 from Karachi, SindhH.A.Khan and S.A.Khan (Pakistan) 462
Microbial production of xylitol from acid treated corn cobsR. F.Allam (Egypt) 465
SHORT COMMUNICATION
Antibacterial activity of Euphorbia heterophylla Linn (Family - Euphorbiaceae)Falodun A., E.O.P.Agbakwuru and G.C.Ukoh (Nigeria) 471
TECHNOLOGY
Wrench analysis for 3 - D model used in robotic end - effectorZ.A.Soomro (Pakistan) 473
Contents of Volume 46 ii
Author Index xi
Subject Index xiv
x
ContentsPak. J. Sci. Ind. Res. 2003, Vol. 46 (6)
Abid,H. ............................................................................ 58Adebomojo, I.A. ............................................................ 270Adeniyi, A.A. ................................................................ 452Adeosun, B.F. .................................................... 10, 20, 239Adeyeye, E.I. ................................................................. 270Afzal, M. ........................................................................ 373Afzal, M. .......................................................................... 99Agbakwuru, E.O.P. ........................................................ 471Ahad, M.A. .................................................................... 261Ahmad, N. ..................................................................... 215Ahmad, N. ..................................................................... 307Ahmad, S. ...................................................................... 215Ahmad, S.S. ..................................................................... 88Ahmed, A. ..................................................................... 225Ahmed, A.S. .................................................................. 344Ahmed, M.A. ..................................................................... 5Ahmed, R. ...................................................................... 171Ahmed, S. ...................................................................... 283Ajayi, J.D. ........................................................................ 10Akhtar, A. ...................................................................... 406Akhtar, M. ..................................................................... 344Akhtar, M.S. .................................................................. 424Akhtar, T. ....................................................................... 311Akpambang, V.O.E. ...................................................... 270Alam, M.M.M................................................................ 354Alam, S. ........................................................................... 27Alam, S.M. .................................................................... 288Ali, M. ........................................................................... 288Ali, S. ............................................................................. 193Ali, S. ............................................................... 70, 213, 300Ali, Z. ............................................................................. 447Alizai, M.N. ................................................................... 174Allam, R.F. .................................................................... 465Altaf, K. ......................................................................... 180Aman, T. ........................................................................ 213Amin, C.A. .................................................................... 161Amir, M. ........................................................................ 225Ansar, N. ................................................................ 171, 236Ansari, R.U. ................................................................... 288Ara, H. ............................................................................. 58Arif, M. .......................................................................... 215Arora, C.L. ..................................................................... 139Arshad, M. ..................................................................... 373
Arshad, M.I. ..................................................................... 52Asaolu, M.F. .................................................................. 145Ashfaq, M. ..................................................................... 104Azam, F. ........................................................................ 129Azam, F. ........................................................................ 443Azhar, F.M..................................................................... 177
Badshah, A. ................................................................... 447Baloch, G.M. ................................................................. 295Baloch, M.J. ............................................................. 63, 367Bari, M.S. ...................................................................... 261Basak, S.C. .................................................................... 251Benipal, D.S. .................................................................. 139Bhuiyan, M.M.H. ............................................................ 95Bibi, N. .......................................................................... 447Bodruddoza, M.A.K. ......................................................... 1
Chandio, M.A. ............................................................... 295Channar, B.A. ................................................................ 110Chaudhry, M.A. ................................................. 68,122,447Chhibba, I.M. ................................................................. 139Chohan, G.Y. ................................................................. 225Choudhury, A.T.M.A. ................................................... 117Chowdhury, A.Z.M.S. ..................................................... 95Czerniak, A.S. ................................................................ 230
Dar, N.G. ....................................................................... 383Das, A.K. ......................................................................... 31Dembinski, B. ................................................................ 230
Edema, C.U. .................................................................. 255Ehsan, M.Q. ................................................................... 317
Falodun, A. .................................................................... 471Farid, S. ......................................................................... 395Farooq, S. ....................................................................... 307Farooque, M.A. ................................................................. 1Firdos, T. ......................................................................... 70
Gachal, G.S. ................................................................... 110Gilani, S.N. .................................................................... 307Gill, S.M. ....................................................................... 424Grebing, S. ..................................................................... 389Gul, S. ............................................................................ 135
Author Index
AUTHOR INDEX TO VOLUME 46
Pak. J. Sci. Ind. Res. 2003, Vol. 46 (6)
xi
Habib, F. ........................................................................ 323Habib, M.A.B. ............................................................... 354Hafeez, T. ...................................................................... 225Hamdy, H.S. .................................................................... 47Hamid, A. ...................................................................... 344Hashmi, D.R. ................................................................. 399Hassan, M.M.- ul ........................................................... 424Hoq, M.E. ...................................................................... 376Hossain, M. ...................................................................... 33Hossain, M.A. ............................................. 31,164,235,436Hossain, M.K. .................................................................. 95Hsieh, F. ......................................................................... 389Huff, H.E. ...................................................................... 389Huma, N. ....................................................................... 207Hussain, A. ...................................................................... 14
Idowu, A.B. ................................................................... 452Ihsanullah ...................................................................... 383Ijaz, N. ........................................................................... 265Iqbal, M.J. ...................................................................... 148Iqbal, M.Z. ..................................................................... 126Iqbal, R. ........................................................................... 70Islam, A. .......................................................................... 27Islam, A.W.M.S. ............................................................ 251Islam, M.K. .................................................................... 251Islam, M.N. .................................................................... 376Islam, M.S. ........................................................................ 1Islam, S.M.S. ................................................................. 317Iwuagu, M.U. ................................................................. 203
Jalali, S. ......................................................................... 363James, M.O. ................................................................... 439Jan, M. ...................................................................... 68,122Jan, N. ............................................................................ 414Javed, K. ........................................................................ 161Javed, M.A.............................................................. 167,213Jehangir, S. .................................................................... 104Jideonwo, A. .................................................................. 144Jose, J. ............................................................................ 327
Kaban, S. ................................................................ 171,236Kalhoro, I.B. .................................................................. 263Kalwar, M.S. .................................................................. 295Kamal, M. ...................................................................... 376Kausar, T. ........................................................ 167,265,300Khan, A.A. ..................................................................... 177Khan, A.D. ..................................................................... 265
Khan, A.J. ...................................................................... 443Khan, A.R. ......................................................... 73,151,311Khan, F. ........................................................................... 78Khan, F. ......................................................................... 414Khan, F.U. ..................................................................... 104Khan, G.R. ..................................................................... 167Khan, H.A. ..................................................................... 462Khan, I.H. ...................................................................... 161Khan, L. ......................................................................... 307Khan, M. ........................................................................ 389Khan, M. ........................................................................ 447Khan, M.H. ...................................................................... 73Khan, M.I. ..................................................................... 373Khan, S.A. ..................................................................... 126Khan, S.A. ..................................................................... 462Khanam, S. .................................................................... 277Khani, M.I.Q. ................................................................. 399Khanif, Y.M................................................................... 117Khattak, T.N. ................................................................. 383Kumar, S. ......................................................................... 73Kumosani, T.A. ............................................................. 188Kurzawa, M. .................................................................. 230
Li, Y. .............................................................................. 389Lodhi, A. ........................................................................ 129Lodhi, S.A. .................................................................... 207
Madkour, H.M.F. ............................................................. 81Mahmood, F. ............................................................ 68,122Mahmood, R. ................................................................. 373Mahmood, T. ................................................................. 307Mahmud, S. ................................................................... 213Majumder, S. ................................................................. 251Masud, S.Z. ...................................................................... 43Miah, M.I. ...................................................................... 354Mirza, J.I. ....................................................................... 443Mirza, M. ....................................................................... 304Mondal, M.M.H. ............................................................ 251Motan, M.T. ....................................................................... 5Mumtaz .......................................................................... 414Mumtaz, M. ....................................................................... 5Mustafa, M.G. ................................................................ 193Mustaquim, J. ................................................................ 333
Nabi, G. ......................................................................... 424Nabi, M.N. ..................................................................... 409Newaz, M.A. .................................................................. 277
Author IndexPak. J. Sci. Ind. Res. 2003, Vol. 46 (6)
xii
Niazi, A.H.K. ................................................................. 300
Oboh, I.P. ....................................................................... 255Obuekwe, I.F. ................................................................ 203Oguzie, F.A. ........................................................... 156,246Ojo, J.O. ......................................................................... 432Okedeyi,O.O. ................................................................. 452Okieimen, F.E. ............................................................... 348Okolo, P.O. ............................................................. 141,439Olaofe, O. ............................................................ 10,20,239Orhe, C.A....................................................................... 203Oviasogie, P.O. .............................................................. 418
Parveen, Z. ....................................................................... 43Pirzada, N. ..................................................................... 414Porter, J. ......................................................................... 389
Qadeer, M.A. ................................................................. 242Qadiruddin, M. .............................................................. 283Quamar, J. ...................................................................... 148Quddus, M.A. .................................................................. 78Qureshi, S. ..................................................................... 283
Rahman, A.- ur .............................................................. 283Rahman, K.M.M. ............................................................. 95Rahman, M.A. ............................................................... 235Rahman, M.A. ............................................................... 409Rahman, M.S. ................................................................ 409Rahman, M.- ur ............................................................. 135Rajalakshmi, R. ............................................................. 327Rashid, M. ..................................................................... 457Rashid, M.H. .................................................................. 317Rehman, A.- ur .............................................................. 443Rehman, S. ..................................................................... 174Rehman, S.- ur ............................................................... 207Rehman, Z.- ur ................................................. 323,358,457Riaz, M. ......................................................................... 414Riazuddin, S. ................................................................. 242
Saeed, R. ........................................................................ 151Saghir, A. ....................................................................... 215Sajap, A.S. ....................................................................... 52Sajjad, M.H. ................................................................... 129Salam, A. ....................................................................... 406Salariya, A.M. ................................................................ 457
Saleem, M. ..................................................................... 167Saleem, M. ....................................................................... 99Salehuddin, S.M. ...................................................... 31,436Samreen, S. .................................................................... 358Sardar, M.A. .................................................................. 261Sarder, S.A. .................................................................... 251Sarir, M.S. ...................................................................... 288Sarwar, S.N. ..................................................................... 78Shafi, N. ......................................................................... 307Shah, S.J.A. ................................................................... 443Shah, W.H. ............................................ 58,70,174,300,358Shahjahan, M. .................................................................. 33Shaikh, G.H. .................................................................. 219Shakila, B. ..................................................................... 104Sheikh, S.T. ................................................................... 161Shirazi, M.U. ................................................................. 288Sibtain, S. F. .................................................................... 73Slater, F.M. .................................................................... 110Soomro, Z.A. ................................................................. 473Sultana, N. ..................................................................... 211Sultana, R. ..................................................................... 333Szydlowska – Czerniak, A. ........................................... 230
Tahir, H. ........................................................................... 99Tarafdar, S.A. ................................................................ 164Tariq, M. .......................................................................... 58Tongo, O.L. ................................................................... 255
Uddin, F. ................................................................... 99,151Uddin, M.K. ..................................................................... 95Ukoh, G.C. ..................................................................... 471Ukpebor, E.E. ................................................................ 418Unuigbe, C.A. ................................................................ 418Usmani, T.H. ..................................................................... 5
Wadud, S.S. ..................................................................... 58
Yaqeen, Z. ..................................................................... 304Yaqub, M. ................................................................... 14,88Yusuf, S.M..................................................................... 110
Zafar, A.U. ..................................................................... 242Zafar, S.I. ....................................................................... 323Zahan, Z.M.S. ................................................................ 261Zakaria, M. ...................................................................... 52Zeb, A. ...................................................................... 68,122
Pak. J. Sci. Ind. Res. 2003, Vol. 46 (6) Author Index
xiii
Acacia arabica ............................................................. 5 - 8Acartia californiensis ............................................ 185,186Acartia tonsa ................................................................. 186Acartia plumosa ............................................................ 1865-Acetyl - 4 - hydroxybenzofuran (4) ............................ 31
synthesis of ............................................................... 31Acid detergent fibre (ADF) ................................... 457,461Activated carbon ...........................................................5 - 8
from babul (Acacia arabica) ................................. 5 - 8from coconut shells ...............................................5 - 8
Activation energy (En) ......................................... 151 - 154of LiCl .......................................................... 151 - 154of NaCl ......................................................... 151 - 154of salts .......................................................... 151 - 154
Acutic toxicity test ......................................................... 304Adsorpiton ........................................................... 117 - 121Adsorption isotherm ............................................ 288 - 294Air pollution ........................................................ 399 - 405
disease caused by ......................................... 399 - 405Algae.................................................................... 255 - 260Allylisothiocyanate .............................................. 300 - 302
analysis of .................................................... 300 - 302in meals ........................................................ 300 - 302
3 - C - Allylresacetophenone ............................. 31,436,437synthesis of ...................................................... 436,437
4 - O - Allylresacetophenone ............................. 31,436,437synthesis of ................................................. 31,436,437
Alternaria alternata ...................................... 97,98,211,2124 - Amino - 5,6 - dimethyl - 2 - phenylthieno ................. 95 [2,3 - d] pyrimidine
anti-bacterial studies of ....................................... 96,97anti-fungal studies of ........................................ 96 - 98synthesis of ............................................................... 95
2 - Amino - 4,5 - dimethylthiophene - 3 - ............... 95 - 98 carbonitrile
anti-bacterial studies of .................................... 96 - 98anti-fungal studies of ........................................ 96 - 98
4 - Amino - 5,6 - dimethylthieno [2,3 - d] pyrimidine .... 95anti-bacterial studies of ...................................... 96,97anti- fungal studies of ....................................... 96 - 98synthesis of ............................................................... 95
7 - Amino - 2,2 - diphenyl 5 - diphenyl - ............ 406 - 408 4,5 - dioxopyrano [4,3 - d] - 1,3-dioxin
isomerization of ............................................ 406 - 408synthesis of ................................................... 406 - 408
4 - Amino - 2,5,6 - trimethylthieno [2,3-d] pyrimidine .. 95anti-bacterial studies of ............................................ 95
anti-fungal studies of ................................................ 9513C - NMR of ............................................................ 951H - NMR of ............................................................. 96synthesis of ............................................................... 95
Aminopyranodioxin ............................................ 406 - 408from benzophenone ...................................... 406 - 408synthesis of ................................................... 406 - 408
Ammonium sulphate .............................................. 129,131effect of .................................................................. 129
Amoxil ................................................................. 135 - 137α-Amylase ........................................................... 188 - 191
activity of ....................................................... 189 -191α-Amylase activity .............................................. 189 - 191
effect of Areca nut extract on ....................... 188 - 191Analysis of variance ....................................... 53,295 - 298
for genotypes ........................................... 53,295 - 298Anhydrogalacturonic acid ............................................. 323
of pectin .................................................................. 323Ankistrodesmus sp ......................................................... 354
nutrients from ......................................................... 354ANOVA ........................................................................ 453
for metals estimation ............................................. 453Anti - bacterial activity .......................... 135 - 137,471,472
of Euphorbia heterophylla ............................. 471,472Anti - fungal activity ............................................... 96 - 98
of 2 - amino - 4, 5 - dimethyl - thiophen - ....... 96 - 98 3 - carbonitrileof 4 - amino - 5, 6 - dimethyl - thieno ........ ......97 - 98 [2, 3 - d] pyrimidineof 4 - amino - 2, 5, 6 - trimethyl - thieno ......... 97 - 98 [2, 3 - d] pyrimidineof heterocycles ................................................. 96 - 98of thieno [2, 3 - d] pyrimidines ........................ 96 - 98
Areca catechu ...................................................... 188 - 191Aromatic diamine ................................................ 236 - 238Artemia ......................................................................... 183Artocarpus integer ........................................................... 53Aspergillus flavus ................................................... 211,212Aspergillus niger ................................... 211,212,265 - 269
phytase production by .................................. 265 - 269Aspergillus terreus ................................................. 211, 212Aspergillus wentii .................................................. 211, 212Asphalt ..................................................................... 78 - 80
air blowing of ................................................... 78 - 80of petroleum asphalt ......................................... 78 - 80with catalyst ...................................................... 78 - 80with metalic salts .............................................. 78 - 80
xiv
SUBJECT INDEX TO VOLUME 46
Pak. J. Sci. Ind. Res. 2003, Vol. 46 (6) Subject Index
Asteraceae ............................................................ 327 - 331essential oil from .......................................... 327 - 321
Atmospheric pollution ................................................... 104Atomic Absorption Spectrometry ............. 20,99 - 109,139
247 - 249,418 - 422,452 - 454for heavy metal analysis ............................... 247 - 249for mineral analysis .................................................. 20K-determination by ........................................ 99 - 103of Cr .............................................................. 104 - 109of Co ............................................................. 104 - 109of Cu ....................................................................... 139of dust samples .............................................. 104 -109of Fe ........................................................................ 139of Mn ............................................................ 104 - 109of Ni .............................................................. 104 - 109of Pb ............................................................. 104 - 109of trace metal ......................................... 104,452 - 454of Zn ....................................................................... 104waste water analysis by ............................................ 99water analysis by ...................................................... 99
Auchenoglanis biscutatus .................................... 256 - 257Autocatalytic nickel deposition .............................. 161,162
at lower temperature ............................................... 161with hypophosphite ................................................ 161with reducing agents .............................................. 161
Available carbohydrates ...................................... 457 - 461in black gram ............................................... 457 - 461in chick-pea .................................................. 457 - 461
Axisymmetric static vacuum field ................................. 150
Bacillus cereus.............................................................. 203Bacillus cereus BTCC 19 ........................................... 96,97Bacillus megaterium ............................................ 135 - 137Bacillus megaterium BTCC 18 ............................... 96 - 98Bacillus subtilis ........... 96,97,135 - 137,203 - 206,471,472
effect on stability .......................................... 203 - 206Bacillus thuringiensis .......................................... 242 - 245
bioinsecticide from ................................................ 242fermentation of ................................................ 243,244spore crystal production .................................. 242,243
Barbus spp ..................................................................... 380Bean broth ........................................................... 358 - 362
cooking time effect on .................................. 358 - 362nutritive value of .......................................... 358 - 362
γ – BHC ................................................................... 43 - 45Biomphalaria glabrata .................................................. 363Black grams ......................................................... 457 - 461
carbohydrates in .................................................... 457cooking effect of .................................................... 457soaking effect of ..................................................... 457
Borneol ................................................................... 328,329Botryodiplodia theobromae .................................... 211,212Bowman - Birk Inhibitor (BBI) ..................................... 392Brachionus calyciflorus ................................................. 356Brachionus plicatilis ..................................................... 356Brassica carinata................................................ 447 - 450
leucoanthocyanidine in................................. 447 - 450polyphenols from ......................................... 447 - 450procyanidine in ............................................. 447 - 450sinapine in .................................................... 447 - 450total phenols in ............................................. 447 - 450
Brassica juncea ................................................... 447 - 450polyphenols in .............................................. 447 - 450procyanidine in ............................................. 447 - 450sinapine in .................................................... 447 - 450total phenols in ............................................. 447 - 450
Brassica napus .................................................... 447 - 450leaf phenolics in ........................................... 447 - 450procyanidine in ............................................. 447 - 450sinapine in .................................................... 447 - 450total phenols in ............................................. 447 - 450
Break throug curve (BTCs) ................................. 426 - 430Bromethazine hydrochloride ............................... 230 - 234Brycinus longipinnis ............................................ 257 - 259Bulinus natalensis .......................................................... 363
Calanus finmarcricus ...................................... 183,184,186Calendula officinalis ........................................... 283 - 286
ash in ...................................................................... 283calcium in ............................................................... 283cobalt in .................................................................. 283copper in ................................................................. 283elements analysis of ..................................... 283 - 286extraction ................................................................ 284iron in ..................................................................... 283magnesium in ......................................................... 283manganese in .......................................................... 283
Calorific method .............................................................. 20for carbon determination .......................................... 20
Calorific values (CV) ...................................................... 73of ash ........................................................................ 73of cupric ions ............................................................ 73of lignitic coals ......................................................... 73of sulfur drops .......................................................... 73
Calorimetric method ........................................................ 20for alumina ............................................................... 20for silica sulphur ....................................................... 20
Camelus bactriamus ...................................................... 271nitrate in .................................................................. 271nitrite in .................................................................. 271
xv
Pak. J. Sci. Ind. Res. 2003, Vol. 46 (6) Subject Index
protein in ................................................................ 271Candida albicans .................................................... 465,466
xylitol production by .................................... 465 - 469Candida kefyr ......................................................... 465,466
xylitol production by .................................... 465 - 469Candida lipolytica ............................................... 465 - 466
xylitol production by .................................... 465 - 469Candida lipolytica CAIM .................................... 465 - 469Candida tropicalis ............................................... 465 - 469
xylitol production by .................................... 465 - 469Candida utilis ...................................................... 465 - 467
xylitol production by .................................... 465 - 469Capacitance.............................................................. 14 - 18Carbohydrates ...................................................... 457 - 461
available ................................................................. 457effect of cooking ................................................... 457non-available ......................................................... 457
Carbon black ................................................................. 239hardness of ..................................................... 239,240hysteresis of .................................................... 239,240mechanical properties of ................................ 239,240modulus of ...................................................... 239,240resilience of ..................................................... 239,240tensile strength of ............................................ 239,240
Carum carvi .................................................................. 235flavone from ........................................................... 235myricetine from ...................................................... 2354´,5,7- trihydroxy - 2´ - methoxyflavone from ...... 235
β - Caryophyllene ................................................... 328,329Castillea elastica .......................................................... 311Catalyst ................................................................... 78 - 80
chromium chloride as ...................................... 78 - 80cobalt chloride as ............................................. 78 - 80copper chloride as ........................................... 78 - 80ferric chloride as ............................................... 78 - 80magnesium chloride as .................................... 78 - 80magnesium dioxide as ..................................... 78 - 80manganese chloride as ...................................... 78 - 80nickel chloride as .............................................. 78 - 80stannic chloride as ............................................ 78 - 80
Cathodic Stripping Voltammetry (CSV) ......................... 99waste water analysis by ............................................ 99water analysis by ...................................................... 99
Celestial mechanics ...................................................... 148Cellulose ....................................................................... 457Cement plant ........................................................ 225 - 229Centrifugal chromatography ............................... 307 - 309
1H-NMR spectra of ................................................ 308mass spectra of ....................................................... 308of silymarin .................................................. 307 - 309
resolution of .......................................................... 308UV spectra of ........................................................ 30813C-NMR spectra of ................................................ 308
Cephaliophora irregularis ..................................... 211,212Cereal detoxification ........................................... 300 - 302Cereals ................................................................ 300 - 302
antinutritive factors ........................................ 302,303chemical composition of .............................. 300 - 302
Chaetomium funicola ........................................... 211,212Chaetomium globossum ........................................ 211,212Chaetomium olivaceum ......................................... 211,212Chalcone ............................................... 164 - 166,235,436
anti-bacterial activity of ......................................... 235anti-cancer activity of ............................................. 235anti-fungal activity of ............................................. 235anti-inflammatory activity of ................................. 235anti-microbial activity of ........................................ 235anti-tumor activity of .............................................. 235flavone synthesis .................................................... 436insect feeding activity of ........................................ 235prostaglandin binding activity of .......................... 235synthesis of ............................................................ 436
Channa obscura ................................. 246 - 249,257 - 259Cd in ....................................................................... 247Cu in ...................................................................... 247Pb in ........................................................................ 247statistical analysis ................................................... 242Zn in ...................................................................... 247
Channa spp .................................................................... 379Characidae ........................................................... 256 - 260Chemical polymorphism ..................................... 327 - 331Chick-pea ............................................................. 457 - 461
cooking effect of ......................................... 457 - 461soaking effect of ........................................... 457 - 461starch in ........................................................ 457 - 461
Chitinase ........................................................................ 304chitin hydrolysing activity in ................................ 304
Chlorella vulgaris ......................................................... 354Chloride transport ................................................ 424 - 430
in soils ......................................................... 424 - 430simualtion of ................................................. 424 - 430
Chloroacetaldehyde ................................................ 95 - 98Chlorogenic acid ................................................. 300 - 302
analysis of .................................................... 301 - 302Chloroquine phosphate tablets ........................... 203 - 206
disintegration of ........................................... 203 - 205dissolution of ................................................ 203 - 205hardness of ................................................... 203 - 205
Chlorpyrifos ............................................................. 43 - 45Chromidotilapia guentheri ................. 246 - 249,257 - 259
xvi
Pak. J. Sci. Ind. Res. 2003, Vol. 46 (6) Subject Index
Cd in ...................................................................... 247Cu in ...................................................................... 247Pb in ........................................................................ 247Zn in ...................................................................... 247
Chrysichthys furcatus ......................................... 256 - 257feeding habits of .................................................... 256
Chrysichthys nigrodigitatus ......................... 257,439 - 442Cd in ............................................................. 439 - 442Fe in ............................................................. 439 - 442Pb in ............................................................. 439 - 442Zn in ............................................................. 439 - 442
α-Chymotrypsin .................................................. 188 - 191activity of ..................................................... 189 - 191
α-Chymotrypsin activity ..................................... 189 -191effect of Areca nut extract on ....................... 188 -191
Cicer arietinum ............................ 207,358 - 361,457 - 461(Chick - pea)
available carbohydrates in ........................... 457 - 461chemical analysis of ..................................... 358 - 361non - available carbohydrates in .................. 457 - 461nutritive value of .......................................... 358 - 361protein contents of .................................................. 360total minerals of ...................................................... 361total polyphenols of ................................................ 361total soluble sugars of ............................................. 360
Cichlid perches .............................................................. 257Cichlidae .............................................................. 256 - 260Citrullus colocynthis ............................................ 167 - 169
fatty acid in ............................................................. 167glycerides in ................................................. 167 - 169seed oil of ..................................................... 167 - 169triacylgycerols in .................................................... 162
Clarias anguillaris ........................................................ 271nitrate in ................................................................. 271nitrite in .................................................................. 271protein in ................................................................ 271
Clarias gariepinus .............................. 246 - 249,257 - 259Cd in ...................................................................... 247Cu in ...................................................................... 247Pb in ........................................................................ 247Zn in ...................................................................... 247
Clariidae .............................................................. 256 - 260Clone TJI ................................................................. 10 - 13
latex of .............................................................. 10 - 13Clostridium botulinum ................................................... 270Co - heritability .................................................... 126 - 128
genotypic coefficient of ................................ 126 - 128phenotype variability of .............................. 126 - 128
Coconut shells .............................................................. 5 - 8characteresization of .............................................. 5 - 8
physical activation of ............................................ 5 - 8preparation of ........................................................ 5 - 8
Coefficient of infection ...................................... 443 - 445in bread wheat .............................................. 443 - 445
Cole - Cole plots ...................................................... 88 - 92for ethyl alcohol ............................................... 88 - 92for methylalcohol ............................................. 88 - 92for 1 - propanol ................................................. 88 - 92
Coleoptera............................................................ 261 - 264Collectotrichum corchori ........................................... 97,98Combined analysis ....................................................... 374
fibre traits performance .......................................... 374genotype of ................................................... 373 - 375in cotton stranis ..................................................... 374of variance .............................................................. 374response of ............................................................ 374yield of .......................................................... 373 - 375
Combining ability ................................................ 177 - 179genetic effect of .............................................. 177-179
Community annoyance criteria ..................................... 219Condensation ...................................................... 236 - 238
of 1, 2-di(methylquinolyl-2) -1, 2- .................. 236,237 ethanedioneof 1, 2-di(quinolyl-2) -1, 2 ethanedione ......... 236,237of hetaryl substituted diketones .................... 236 - 238
Condensation diketones ....................................... 236 - 238biological activity of .................................... 236 - 238
Conductance ........................................................... 14 - 18Contamination ......................................................... 43 - 45
in human milk .................................................. 43 - 45Convection dispersion equation model (CDE).............. 424Coordinated complexes ................................................. 317
of Co (II) ................................................................. 317of Cr (III) ................................................................ 317of Cu (II) ................................................................. 317of Fe (II) ................................................................. 317of Mn (II) ................................................................ 317of Ni (II) ................................................................. 317of Zn (II) ................................................................. 317
Coordination chemistry .................................................... 1of metal ions .............................................................. 1of thiocyano complexes.............................................. 1of transition metals ..................................................... 1
Copepoda ............................................................ 180 - 186Copolotoda .................................................................... 180Correlation coefficient ............................................. 37 - 39
of rice................................................................ 37 - 39Correlation matrix ................................................... 33 - 42
of rice plant ....................................................... 33 - 37Coryphaena hippurus ......................................... 180 - 185
xvii
Pak. J. Sci. Ind. Res. 2003, Vol. 46 (6) Subject Index
Cotton pesticides ..................................................... 43 - 45Cotton seed meal ................................................ 300 - 302Cotton seed oil .................................................... 177 - 179
genetic effects on .......................................... 177 - 179Cryptococcus laurentii Y-2536 .............................. 465,466
xylitol production by ................................... 465 - 469Cucurbita pepo ....................................................... 211,212
fungal infection in .......................................... 211,212seed borne fungi in ......................................... 211,212
Curvularia clavata ................................................. 211,212Curvularia lunata ......................................... 97,98,211,212
absorption spectra of .............................................. 142effect of pH on ....................................................... 142effect of reaction time ........................................... 142of pyrogallol / NH4
+-N ........................................... 142Cyclops sp ............................................................ 354 - 357
feeding responses of ..................................... 354 - 357Cyfluthrin ................................................................ 43 - 45
in human milk ................................................. 43 - 45Cyhalothrin .............................................................. 43 - 45
in human milk .................................................. 43 - 45Cynoglossus senegalensis ............................................. 271
nitrate in ................................................................. 271nitrite in ................................................................. 271protein in ................................................................ 271
Cypermethrin .......................................................... 43 - 45in human milk .................................................. 43 - 45
Cystic echinococcosis ......................................... 251 - 254in ruminants .................................................. 251 - 254
δ - Cadinene ........................................................... 328,329
P,P’ - DDT ............................................................... 43 - 45Debaryomycis hansenii ...................................... 465 - 469
xylitol production by ...................................... 465,466Degradation ......................................................... 348 - 352
nonoxidative ................................................. 348 - 352oxidative ...................................................... 348 - 352
Desulphurization ..................................................... 73 - 76by an oxidant ............................................................ 73by ash........................................................................ 73by cupric ions ........................................................... 73effect of coal concentration ...................................... 76effect of CuCl2 on ..................................................... 74effect of temperture .................................................. 75effect of time ............................................................ 74
Determination ................................. 99 - 103,144,270 - 275in amphibians ......................................................... 270in camel .................................................................. 270in natural water ....................................................... 144in nitrite ........................................................ 270 - 275
in portable water ..................................................... 144in prawns ................................................................ 270in snakes ...................................................... ................in waste samples ............................................ 99 - 103in water .......................................................... 99 - 103of ammonium nitrogen ........................................... 141of heavy metals .............................................. 99 - 103of nitrate ....................................................... 270 - 275of protein ................................................................ 270of trace metals ......................................................... 99
Detoxification ..................................................... 300 - 303feed studies of ............................................... 300 - 302of cotton seed meal ...................................... 300 - 302of mustard seed meal ................................... 300 - 302of rice bran meal .......................................... 300 - 302of sunflower seed meal ................................ 300 - 302soy bean seed meal ...................................... 300 - 302
Detoxified matri flour .......................................... 207 - 210ash in ............................................................ 207 - 209evaluation of ................................................. 207 - 209crude fat in ................................................... 207 - 210crude fibre in ............................................... 207 - 210crude protein in ..................................................... 207supplementation effect of ............................ 207 - 210
Diatoms ................................................................ 255 - 2605H-Dibenz [b,f] azepine ................................................ 230
derivatives of .......................................................... 230Dieldrin .................................................................... 43 - 45Dielectric relaxation ................................................ 88 - 93
molecular structure determination by...................... 88of ethyl alcohol ................................................. 88 - 92of methyl alcohol .............................................. 88 - 92of 1 - propanol .................................................. 88 - 92
Dielectric spectroscopy ........................................... 88 - 94of binary mixtures ............................................... 92,93of intermolecular forces ...................................... 92,93of molecular motion ............................................ 92,93of 1 - propanol + water mixture .......................... 92,93
Dielectric spectroscopy .................................................. 14Diet food .............................................................. 122 - 124
food ingredient analysis of .............................. 123,124nutritional composition of ............................ 122 - 124
Differential Scanning caloriometry (DSC) .................... 315Digestion ........................................................................ 247
of edible muscles .................................................... 247of fish species ......................................................... 247
Dihydrochalcones .................................................... 27 - 30elemental analysis ............................................ 27 - 301H-NMR spectra of ........................................... 27 - 30IR spectra of ..................................................... 27 - 30
xviii
Pak. J. Sci. Ind. Res. 2003, Vol. 46 (6) Subject Index
UV spectra of ................................................... 27 - 302´, 4´ - Dihdroxy - 6 - methoxy - 3, 4 - methylene- ... 27 - 30 dioxydihydro chalcone
characterization of ........................................... 27 - 30from Iryanthera sagotiana ............................... 27 - 30synthesis of ...................................................... 27 - 30
Dimethoate .............................................................. 43 - 458,9 - Dimethyl - 5 - phenylimidazo [1,2 - c]- ............ 95 - 98 thieno [3,2 - e] pyrimidine
anti-bacterial activity of .................................. 96 - 98anti-fungal activity of ....................................... 96 - 9813C-NMR................................................................... 971H-NMR studies of .................................................. 97synthesis of .............................................................. 96
2,3 - Di (6-methyl quinolyl - 2) - 6 - methyl- .................. 236 quinoxaline
structure of .............................................................. 236synthesis of ............................................................. 236
Dinuclear complexes .......................................... 432 - 434electronic studies of ............................................... 434elementary analysis of .................................. 432 - 434infrared studies of ......................................... 432 - 434magnetic moment of .............................................. 434structure of ............................................................. 434visible spectra studies of ............................. 432 - 434
2H,4H,5H,2,2-Diphenyl - 4,5-dioxopyrido - ...... 406 - 408 [4,3 - d]1,3 dioxin
synthesis of ................................................... 406 - 4082,3 - Di (quinolyl - 2) - 6 - methyl quinoxaline ..... 236,237
1H-NMR spectra of ......................................... 236,237elemental analysis of ...................................... 236,237mass spectral data of ...................................... 236,237synthesis of ..................................................... 236,237UV spectra of ……………………………….. 236,237
Discolaimus lahorensis ....................................... 462 - 464environmental factors effect ................................... 462
Dissociation constants ........................................ 344 - 347Dissociation extraction ....................................... 344 - 347
of isomeric organic compounds ............................ 344Distance sampling method ..................................... 52 - 56
density of .......................................................... 52 - 56estimation size of ............................................. 52 - 56habitat of .......................................................... 52 - 56Red Junglefowl density by .............................. 52 - 56
Distichodus rostradus ................................................... 271nitrate in .................................................................. 271nitrite in .................................................................. 271protein in ................................................................ 271
Drechslera halodes ................................................ 211,212Drechslera spicifera .............................................. 211,212
Dried Brewer Yeast .................................................... 70,71chemical composition of ..................................... 70,71
Dropping Mercury Electrode (DME) ................. 414 - 417Dumpsite soil ...................................................... 452 - 445
Cd in ............................................................. 452 - 454Cr in ............................................................. 452 - 454Pb in............................................................. 452 - 454physico - chemical analysis of .............................. 453
Duncan’s Munltiple range .............................................. 53Dust samples analysis .......................................... 104 - 109
Echinococcus granulosus ................................... 251 - 254in ruminants .................................................. 251 - 254
Effluents ................................................. 78 - 80,395 - 397acidity of ........................................................... 78 - 80Cd in ............................................................. 395 - 397Co in ............................................................ 395 - 397Cr in ............................................................. 395 - 397heavy metals in ............................................ 395 - 397Ni in .............................................................. 395 - 397variation in....................................................... 78 - 80
Einstein equation ................................................ 148 - 150Electro gravimetric process ........................................... 215
of analysis ............................................................... 215of electro gravimetric ............................................. 215
Electrocapillary curve .......................................... 414 - 417Electrolytic analyzer ........................................... 215 - 217
electronic circuit for ....................................... 215,216modification in ............................................ 215 - 217
Electronic control circuit ............................................... 215of operation .................................................. 215 - 216of schematic circuit ................................................ 216
Electronic spectra .............................................................. 3of Cu (II) complexes .................................................. 3of Pd (II) complexes ................................................... 3of Ti (III) complexes .................................................. 3of V (IV) complexes ................................................... 3
Elemental analysis ........................................................ 284by atomic absorbtion photometer .......................... 284by flame photometer ............................................. 284
Endosulfan ............................................................... 43 - 45Enterobacter .................................................................. 468
xylitol production by .............................................. 467Environmental impact ........................................ 399 - 405
of air pollution ............................................. 399 - 405Enzyme .................................................................... 47 - 50
precipitation of .................................................... 47,48rennin like ......................................................... 47 - 50
Epilabidocera amphirites ............................................. 183Erpetoichthys calabaricus ................................... 257 - 259
xix
Pak. J. Sci. Ind. Res. 2003, Vol. 46 (6) Subject Index
Escherichia coli ................................................... 135 - 137Escherichia coli ATCC 25922 ................................. 96,97Escherichia coli NCTC 10418 ............................... 471,472Essential oil ......................................... 135 - 137,327 - 332
anti - microbial activity of ........................... 135 - 137components of .............................................. 327 - 332composition of ............................................. 327 - 332determination of .......................................... 135 - 137extraction of ................................................. 135 - 137from hydro - distillation ......................................... 327isolation of .................................................... 327 - 332qualitative analysis ...................................... 327 - 332quantitative analysis .................................... 327 - 332
Ethanol - water - oleic acid ................................. 409 - 412to plait points ............................................... 411 - 412to tie lines for ................................................ 411 - 412
Ethanol - water - oleyl alcohol ........................... 409 - 412solubility data of .................................................... 410to binodol curves .................................................... 410to plait points ………………………………. 411 - 412to tie lines for ................................................ 411 - 412
Eumolpidae ......................................................... 261 - 264Euphorbia ..................................................................... 311Euphorbia antiguorum ................................................. 311Euphorbia caducifolia ......................................... 311 - 315
13C-NMR spectra of ............................................... 311compositon of ......................................................... 312elemental analysis .................................................. 3131H-NMR spectra of ................................................ 311hydrocarbons in ...................................................... 312IR spectra of .......................................................... 313latexes from ................................................. 311 - 315
Euphorbia heterophylla .......................................... 471,472antibacterial activity of .................................... 471,472
Euphorbia neriiflora ..................................................... 311Euphorbia nivulia ......................................................... 311Euphorbia pepulus ....................................................... 311Euphorbia royleane ...................................................... 311Euphorbia sp. ...................................................... 311 - 315Euphorbiaceae ............................................................... 471Eurytemora affinis ......................................................... 185
Farnesene ................................................................ 328,329Fatty acid ................................................................ 213,214
from Plantago ovata ....................................... 213,214gas chromatography for ......................................... 213
Feed .................................................................... 300 - 302ingredients of ............................................... 300 - 303
Feed additives ............................................................. 70,71studies of ............................................................. 70,71
Feeding habits ............................................................... 256of fishes ................................................................. 256
Fenpropathrin ............................................................. 43,45Ficus elastica ................................................................ 311Filler paricle size ............................................................. 20
of natural rubber ....................................................... 20FiSAT ................................................................. 193 - 201
population parameters estimation by .......... 193 - 201Flame atomic absorption ....................... 99 - 103,156 - 159 spectrophometer
Cd determination by ....................... 99 - 103,156 - 159Co determination by ....................................... 99 - 103Cr determination by ...................... 99 - 103,156 - 159Cu determination by ....................... 99 - 103,156 - 159Fe determination by ...................................... 156 - 159for metals detection ..................................... 156 - 159Mn determination by .................................... 156 - 159Ni determination by ....................................... 99 - 103Pb determination by ..................................... 156 - 159Zn determination by ...................................... 99 - 103
Flavone ................................................................... 235,436from Carum carvi ................................................. 235synthesis of ............................................................. 436
Flavonoids ........................................................... 436 - 438Flotation .............................................................. 414 - 417
with dithiophosphate (Dtp) .......................... 414 - 417with potassium ethylxanthate (KEtx) .......... 414 - 417
Fluidized bed reactor ....................................................5 - 8Food habits ......................................................... 255 - 260
of fishes ........................................................ 255 - 260Frequency Domain spectrum................................. 227,228
of I.D. fan ........................................................ 227,228Frequency Response Analyzer ............................... 14 - 18
measurement by .............................................. 14 - 18Frequency spectrum analysis .................................. 225,226
of vibrations in I.D.Fan ................................... 225,226of vibration velocity ....................................... 225,226
Frequency spectrum analysis .................................. 225,226of I.D.Fan .................................................... 225 - 226
Furanoflavone ......................................................... 164,165(5-Methoxy-3´-methyl-3´,4´-methylenedioxy- furono [2´´3´´ : 7,8] flavone)
from Hibiscus rosa-sinensis ........................... 164,165gas-liquid chromatography of ......................... 164,1651H-NMR spectra of .......................................... 164,165isolation of ....................................................... 164,165IR spectra of .................................................... 164,165mass spectra of ................................................ 164,165structure of ....................................................... 164,165UV spectra of .................................................. 164,165
xx
Pak. J. Sci. Ind. Res. 2003, Vol. 46 (6) Subject Index
Fusarium moniliforme .......................................... 211,212Fusarium oxysporum .............................................. 211,212Fusarium semitectum.............................................. 211,212Fusarium solani ..................................................... 211,212Fusarium subglutinans ............................................ 47 - 51Fuserium equiseti ....................................................... 97,98
Gallus gallus spadiceus .......................................... 52 - 56(Red Junglefowl)
habitat studies of ............................................... 52 - 56population size of ............................................ 52 - 56
Garcinia kola ....................................................... 145 - 147(Bitter Kola)
alkaloids in ............................................................. 146anthraquinones in ................................................... 146ash in ...................................................................... 145carbohydrate in ....................................................... 145Cd in ............................................................. 145 - 147chemical composition of .............................. 145 - 147Co in ............................................................. 145 - 147Cu in ............................................................. 145 - 147cyanate in................................................................ 146fat in ........................................................................ 145Fe in .............................................................. 145 - 147K in ............................................................... 145 - 147Mg in ............................................................ 145 - 147minerals in .................................................... 145 - 147Mn in ............................................................ 145 - 147moisture in .............................................................. 145oxalate in .................................................................... 1
Gas chromatography (GC) ........................ 43,44,327 - 332for essential oil ............................................. 327 - 332of human milk .......................................................... 44of pesticides ......................................................... 43,44
Gas liquid chromatogrpaphy .............................. 343 - 347of isomeric compounds .............................. 343 - 347
General combining ability (GCA) ....... 177 -179,277 - 281 367 - 372
effects on cotton seed oil ............................... 177 -179effects on protein .......................................... 177 - 179of Gossypium hirsutum................................ 367 - 372
Genetic analysis .................................................. 177 - 179by Griffing’s method ................................... 177 - 179
Germacrene - D ..................................................... 328,329Gibbs free energy ................................................ 151 - 154
of hydration solvation .................................. 151 - 154of ion - ion interactions ................................ 151 - 154of ion - solvent interactions .......................... 151 - 154
Global displacements ........................................... 472 - 476Glucosamine estimation ............................................... 268
by enzymes ............................................................ 268Gold (III) halide complexes ............................... 230 - 234
determination of .................................................... 230elemental analysis of .............................................. 230halide complexes of ...................................... 230 - 234IR spectra of ................................................. 230 - 233of Gold III .............................................................. 230spectrophotometric studies of ...................... 230 - 234thermal analysis of ................................................. 230UV spectra of ............................................... 230 - 233
Gossypium hirsutum ................63 - 66,177 - 179,295 - 298 367 - 371,373 - 375
additive variance for ..................................... 367 - 371analysis of variance ...................................... 295 - 298breeding potential of .................................... 295 - 298combining ability on .................................... 177 - 179cotton leaf curl virus (CLCV) of ...................... 63 - 66cotton strains of ............................................ 373 - 375crosses of ..................................................... 177 - 179diallel crosses of ........................................... 295 - 298disease in .......................................................... 63 - 66dominant variance for .................................. 367 - 371exotic line crosses of ........................................ 63 - 66F1 hybrids of cotton .......................................... 63 - 66fibre traits performance .......................................... 374for genetic parameters ................................. 367 - 371for genotypes ................................................ 295 - 298gene action in ............................................... 295 - 298genetic parameters of ................................... 367 - 371genotype for ................................................. 373 - 375North Carolina Design - 11 analysis of ........ 367 - 371oil contents in ............................................... 177 - 179protein contents in ........................................ 177 - 179response of .................................................. 373 - 375yield of ......................................................... 373 - 375
Gossypol ............................................................. 300 - 302in cotton seed meal ....................................... 300 - 302
Granular activated carbon ........................................... 5 - 8by physical activation ............................................ 5 - 8
Gravitational field ............................................... 148 - 150Griffing’s method ................................................ 177 - 179Gymnarchus niloticus .................................................... 271
nitrate in .................................................................. 271nitrite in .................................................................. 271protein in ................................................................ 271
Hands method ...................................................... 409 - 412for tie line correlation ................................... 409 - 412
Hansenula polymorpha .......................................... 465,466xylitol production by .................................... 465 - 469
xxi
Pak. J. Sci. Ind. Res. 2003, Vol. 46 (6) Subject Index
Heavy metals ...... 156 - 159,246 - 250,395 - 397,418 - 422 439 - 442,452 - 454
concentration of ............................................ 418 - 422Cr as .............................................................. 418 - 422Cu as ............................................................. 418 - 422determination of ........................................... 418 - 422in animals ..................................................... 452 - 454in Clarias gariepinus ..............................................246in edible muscle ............................................ 246 - 249in fish ...................................................................... 246in freshwater fish .......................................... 439 - 442in Mytilus edulis ..................................................... 246in refuse dumpsites ....................................... 418 - 422in sediments .................................................. 156 - 159in soil ........................................................... 452 - 454in Triticum aestivum ..................................... 395 - 397in water ......................................... 156 - 159,439 - 442Mn as ............................................................ 418 - 422Ni as .............................................................. 418 - 422Pb as ............................................................. 418 - 422physio-cochemical studies of ................................. 420pollution by .................................................. 452 - 454variation of .................................................. 439 - 442Zn as ............................................................. 418 - 422
Heavy metal pollution ......................................... 104 - 109Heazlewoodite (Ni3S2) ......................................... 414 - 417
flotation studies of ........................................ 414 - 417synergistic effect of ................................................ 414
Heliodiaptomus viduus ....................................... 180 - 186breeding biology of ...................................... 180 - 186
Hemicellulose ........................................................ 457,459Hemichromis bimaculatus .................................. 257 - 259Hemichromis fasciatus ........................................ 257 - 259Herbical activity ...................................................... 95 - 98
of imidazolo [4,5 - e]pyrido - ........................... 95 - 98 [1,2 - 3] pyrimidines
Heritiera fomes .............................................................. 376Hetaryl substituted diketones .............................. 236 - 238
condensation of ...................................................... 236Heterosis ................................................................. 63 - 66
genetic basis ..................................................... 63 - 66Hevea ............................................................................. 311Hibiscus rosa - sinensis .......................................... 164,165
furanoflavone from ......................................... 164,165ovalichalcone from .......................................... 164,165
Hippophae rhamnoldes ........................................... 58 - 61acidity of ................................................................... 60carotein in ............................................................ 59,60chemical composition of ..................................... 59,60fibre of ...................................................................... 60
fruit pulp of ...................................................... 58 - 61moisture in ............................................................... 59oil in ..................................................................... 59,60pectin in ............................................................... 59,60
1H-NMR spectra ............................................................. 1,3of complexes .............................................................. 3of ligand .................................................................. 1,3
α - Humulene.......................................................... 328,329Hydrogenation ......................................................... 27 - 30
by acetic acid .................................................... 27 - 30of dihydroxy chalcones .................................... 27 - 30by H2 - Pd / C.................................................... 27 - 30
Hydrophones (PODS) in ..................................... 110 - 1154 - Hydroxybenzofuran - 5 - chalcone ............................ 31
synthesis of ...................................................... 31 - 322 - Hydroxy - furano(2´3´,4,3) acetophenone ........ 436,437
1H-NMR spectra of .......................................... 436,437IR spectra of .................................................... 436,437synthesis of ...................................................... 436,437UV spectra of .................................................. 436,437
7 - Hydroxy - 8 - phenylfuro [2, 3- h] - ..................... 31, 32 benzopyran - 6 - one
1H-NMR spectra of ................................................... 32synthesis of ....................................................... 31 - 32UV spectra of ........................................................... 32
2´ - Hydroxy - 4 - prenyloxy - furano ................. 436 - 438 (2´´,3´´ : 4´,3´) chalcone
1H-NMR spectra of .......................................... 437,438IR spectra of ........................................................... 437synthesis of ...................................................... 436,437UV spectra of ......................................................... 437
3 - Hydroxy - 4 - prenyloxy - furano ................... 436 - 438 (2´´,3´´: 7,8) flavone
1H-NMR spectra of .......................................... 437,438IR spectra of ........................................................... 437synthesis of ...................................................... 436,437UV spectra of ......................................................... 437
Hyperchem Molecular modeling programe .................. 317Hyperopisus bebe occidentalis ........................... 257 - 259Hypohosphite ................................................................. 161
ICARDA bread wheat lines ................................. 443 - 445yield potential of .......................................... 443 - 445
Imidazo [1,2 - c] thieno [3,2] pyrimidines .............. 95 - 98anti - bacterial activity of ................................ 95 - 98anti - fungal activity of ............................................ 95anti - malarial activity of ................................. 95 - 98anti - microbial activity of ................................ 95 - 98biological activity of ....................................... 95 - 98herbicidal activity of ........................................ 95 - 98
xxii
Pak. J. Sci. Ind. Res. 2003, Vol. 46 (6) Subject Index
imidazolo [4,5 - e] pyrido [1,2 - a] - ................ 95 - 98 pyrimidineswith chloroacetaldehyde ................................... 95 - 98
Imipramine .......................................................... 230 - 234(5 - 3 - Dimethylaminopropyl) - 10,11 - ............. 230 - 234 dihydro - 5H - dibenz [b,f] azepine)
hydrochloride of ........................................... 230 - 234imipramine hydrochloride ............................ 230 - 234IR spectra of ................................................. 230 - 234UV-VIS spectra of .......................................... 232, 233
Imipramine tetrabromoaurate ........................................ 231IR spectra of ................................................. 231 - 234thermal analysis of .......................................... 232,233
INABA-ET (Vibrio) AE 14748 .................................. 96,97Inductively Compled Plasma Emission - ................. 99,123 Spectrometry (ICP-AES)
of maize nutrients ................................................... 123waste water analysis by ............................................ 99water analysis by ...................................................... 99
Infection .................................................................. 211,212Infrared spectra ............................................................. 432
of complexes ......................................................... 433of labile ligands ...................................................... 433
Insects .................................................................. 255 - 260Intrahirsutum F1 hybrid ........................................... 63 - 66
performance of ................................................. 63 - 66β - Ionone ............................................................... 328,329IR spectra ...................................................................... 1 - 3
of Schiff bases ......................................................... 2,3of thiocyanate ligand ............................................... 2,3
Iryanthera laevis .............................................................. 27Iryanthera sagotiana ...................................................... 27Isomeric compounds...................................................... 344
separation of gas liquid chromatography ..... 344 - 347
Jamieson river ..................................................... 255 - 260fishes of ........................................................ 255 - 260
Jatropha multifida ............................................... 348 - 353barium soap of .............................................. 248 - 353fatty acid of .................................................. 348 - 349physico-chemical studies of ......................... 348 - 349seed oil of ..................................................... 348 - 353
Jones-Dole equation ........................................... 151 - 154A coefficient of ............................................. 151 - 154B coefficient of ............................................. 151 - 154
Kanamycin ........................................................... 135 - 137Karajin ........................................................................ 31,32 (7 - Methoxy - 8 - phenylfuro - (2,3 - h) benzopyran - 6 - one)
1H-NMR spectra of ................................................... 31from Tephorsia purpurea ......................................... 31IR spectra of ............................................................. 31synthesis of .......................................................... 31,32UV spectra of ........................................................... 31
Keplerian laws .............................................................. 149Keratella sp ................................................................... 354Khaya senegalensis ............................................. 348 - 353
cadium soap of ............................................ 348 - 353fatty acid of .................................................. 348 - 349physico-chemical studies of ......................... 348 - 353seed oil of ..................................................... 348 - 353
Klebsiella pneumoniae ........................................... 471,472Kluyveromyces bulgaricus.................................. 465 - 469
fermentation of ............................................. 465 - 469xylitol from................................................... 465 - 469
Kunitz trypsin Inhibitor (KTI) ....................................... 392
Lablab purpureus ................................................ 277 - 281combining ability effects of ......................... 277 - 282diallel analysis of ......................................... 277 - 281environmental heterogeneity of .................. 277 - 281
Lactobacillus acidophilus.................................... 135 - 137Lamiaceae ............................................................ 135 - 137Landolphia..................................................................... 311Langmuir adsorption equation ............................ 117 - 121Lathyrus sativus ............................................................. 207Lattices ............................................................................ 10
anion analysis of ....................................................... 11elemental analysis of ................................................ 11local clones of........................................................... 10of plasticity retention index ................................. 11,12oxidation degradation of .......................................... 10
Leaf damage ........................................................ 262 - 264by Nodostoma viridipennis .......................... 261 - 264of banana ...................................................... 261 - 264
Leaf phenolics ..................................................... 447 - 450of rapeseed ................................................... 447 - 450
Lens culinaris ...................................................... 358 - 361(Lentils)
chemical analysis of ..................................... 358 - 361nutritive value of .......................................... 358 - 361protein contents of .................................................. 360total minerals of ...................................................... 361total polyphenols of ................................................ 361total soluble sugars of ............................................. 360
Libellula luctosa .................................................. 452 - 454Cd in ............................................................. 452 - 454Cr in .............................................................. 452 - 454Pb in.............................................................. 452 - 454
xxiii
Pak. J. Sci. Ind. Res. 2003, Vol. 46 (6) Subject Index
physico - chemical analysis of ............................... 453Ligands ................................................................ 432 - 434
of vitamin B1 ............................................... 432 - 434synthesis of ............................................................ 432
Lignin ............................................................................ 457Lignitic coal ............................................................. 73 - 76Limonene ................................................................ 328,329Linalool .................................................................. 328,329α - Lipase activity ................................................. 189 -191
effect of Areca nut extract on ........................ 188 -191Lipase .................................................................. 188 - 191
activity of ...................................................... 189 - 191statistical analysis .................................................. 189
Lipomyces lipofenes ................................................ 465,466xylitol production by .................................... 465 - 469
Lithium chloride .................................................. 151 - 154effect on ionic interaction ............................. 151 - 155viscsoity of ................................................... 151 - 152
Lybrodrilus violaceous ....................................... 452 - 454(Earthworm)
Cd in ............................................................. 452 - 454Cr in .............................................................. 452 - 454Pb in .............................................................. 452 - 454physico - chemical analysis of ............................... 453
Lycopersicon esculentum .................................... 383 - 388optical density of .......................................... 384 - 386pH of ............................................................. 383 - 385physico - chemical characteristics of ............ 383 -387radiation effect on ........................................ 383 - 388ripening percentage of .................................. 384 - 386vitamin C contents of ................................... 384 - 386
Macrobrachium rosenbergii ................................... 185,376Macrobrachium spp. ..................................................... 376Macrobrachium vollenhovenii ...................................... 271
nitrate in .................................................................. 271nitrite in .................................................................. 271protein in ................................................................ 271
Macrophomina phaseolina .......................... 97,98,211,212Macrophytes ........................................................ 255 - 260Maize ...................................................................... 139,140
Ca in ................................................................ 139,140Cu in ................................................................ 139,140Fe in ................................................................. 139,140K in ................................................................. 139,140Mg in ............................................................... 139,140Mn in ............................................................... 139,140Mo in ............................................................... 139,140sulphrur in ....................................................... 139,140Zn in ................................................................ 139,140
Malapterusus electricus ................................................. 271nitrate in .................................................................. 271nitrite in .................................................................. 271protein in ................................................................ 271
Malnutrition ......................................................... 122 - 124chemical composition of ................................. 123,124
Malvaceae ...................................................................... 164Manihot giaziievii .......................................................... 311Mercaptobenzothiazole ................................................ 239Metal Soaps ......................................................... 348 - 353
of barium ...................................................... 348 - 353of cadmium ................................................... 348 - 353
Metapenaeus brevicornis .................................... 376 - 381(Smoked shrimp)
amino acid value of ..................................... 376 - 381ash in ...................................................................... 378compositon of ............................................... 376 - 381lipid in ............................................................ 378,379minerals of .................................................... 376 - 381nutritional quality of ..................................... 376 - 381peroxide value (POV) .................................. 378 - 379physical properties of. .................................. 376 - 381preservation of .............................................. 376 - 381
Metapenaeus dobsoni ................................................... 376Metapenaeus monocerous ............................................. 376Methamidophos ....................................................... 43 - 453 - Methoxy - 4´ - prenyloxy - furano - ............... 436 - 438 (2´´,3´´ : 7,8) flavone
from β - resacetophenone ............................. 436 - 4381H-NMR spectra of ................................................. 436IR spectra of ........................................................... 436mass spectra of ....................................................... 436synthesis of ................................................... 436 - 438UV spectra of ......................................................... 436
α - Methrin .............................................................. 43 - 45in human milk .................................................. 43 - 45
Methyl chavicol ...................................................... 328,329Metschnikowia pulcherrima ................................... 465,466
xylitol production by .................................... 465 - 469Microbial rennin .............................................................. 47
from Absidia cylindrospora ..................................... 47from Endothia parasitica ......................................... 47from Fusarium moniliforme ..................................... 47from Mucor miehei ................................................... 47from Mucor pusillus ................................................. 47from Penicillium citrinum .................................. 47-50from Penicillium expansum ................................ 47-50from Penicillium oxalicum ................................. 47-50
Micrococcus leuteus ............................................ 135 - 137Milk clotting activity ............................................... 47 - 50
xxiv
Pak. J. Sci. Ind. Res. 2003, Vol. 46 (6) Subject Index
assay of ............................................................. 47 - 50Mineral analysis ............................................................... 20
by AAS ..................................................................... 20by calorimetric method ............................................ 20of charcoal ................................................................ 20of clay ....................................................................... 20of lime stone ............................................................. 20of silica sand ............................................................. 20
Mochokidae ......................................................... 256 - 260Molar conductivity .............................................. 432 - 434
of complexes ................................................ 432 - 434Molecular model ............................................................ 3172-Monoacylglcerols ............................................. 167 - 169Monocrotophos ........................................................ 43 - 45Monoterpenoids ................................................... 327 - 332Mormyridae ......................................................... 256 - 260Morus alba .......................................................... 174 - 176(Mulberry)
composition of .............................................. 174 - 176minerals in .................................................... 174 - 176
Morus nigra ................................................................... 174Mulbery beverage base ........................................ 174 - 176
ascorbic acid in ............................................. 174 - 176ash in ............................................................ 174 - 176calcium in ..................................................... 174 - 176citric acid in .................................................. 174 - 176composition of .............................................. 174 - 176iron in ........................................................... 174 - 176juice / pulp in ................................................ 174 - 176mineral in ...................................................... 174 - 176moisture in .................................................... 174 - 175phosphorous in ............................................. 174 - 176
potassium in .................................................. 174 - 176Musa spp .............................................................. 261 - 264
leaf damage of .............................................. 261 - 264Musca domestica ................................................. 452 - 454 (Housefly)
Cd in ............................................................. 452 - 454Cr in .............................................................. 452 - 454Pb in .............................................................. 452 - 454physico - chemical analysis of ..................... 452 - 454
Mustard seed meal ......................................................... 302allylisothiocyanate in .................................... 300 - 302
Myrothecium roridum ............................................. 211,212Myrothecium verrucaria ......................................... 211,212Mytilus edulis .......................................................... 246,247
Cd in ....................................................................... 247Cu in ....................................................................... 247Pb in ........................................................................ 247Zn in ....................................................................... 247
Nadosenia fluvence ................................................. 465,466xylitol production by .................................... 465 - 469
Natural rubber ....................................... 10 - 13,20 - 25,311chemical composition of .................................. 20 - 22composite of ..................................................... 20 - 25creep properties of ........................................... 20 - 25degradation resistance of .................................. 10 - 12formulation of ................................................... 20 - 21from bark of Castillea elastica ............................... 311from bark of Euphorpia caducifolia ...................... 311from bark of Ficus elastica .................................... 311from bark of Hevea ................................................ 311from bark of Landolphia ........................................ 311from bark of Manihot giaziievii ............................. 311ionic content of ................................................. 10 - 12loaded with charcoal ........................................ 20 - 25loaded with clay ............................................... 20 - 25loaded with limestone....................................... 20 - 25loaded with silica sand ..................................... 20 - 25protein in .......................................................... 10 - 13stability of ......................................................... 10 - 12
Natural rubber clones .............................................. 10 - 12(NNRL) of ........................................................ 10 - 12(NNRG) of ........................................................ 10 - 12
Natural rubber composites ................................... 239 - 241effect of charcoal .................................................... 239effect of clay .......................................................... 239effect of limestone .................................................. 239properties of ................................................. 239 - 241silica sand effect on ............................................... 239
Nematodes ........................................................... 462 - 464Nephelium lappaceum ..................................................... 53Neurotoxin ..................................................................... 207Neutral detergent fibre (NDF) ................................ 457,459Neutron Activation Analysis (NAA) ............................... 99
waste water analysis by ............................................ 99water analysis by ...................................................... 99
Nickel plating ................................................................ 161Nitrate .................................................................. 270 - 275
determination ................................................ 270 - 275Nitrite ................................................................... 270 - 275
determination ............................................... 270 - 275Nitrogen fertilizers .................................................. 129,131
increase in yield ............................................... 129,131Nodostoma subcostatum ...................................... 261 - 264Nodostoma viridipennis ....................................... 261 - 264
infestation of ........................................................... 264leaf damage by ............................................. 261 - 264
Non oxidative degradation ..................................... 348,349Non Reducing sugar ............................................ 457 - 459
xxv
Pak. J. Sci. Ind. Res. 2003, Vol. 46 (6) Subject Index
Notopteridae ....................................................... 256 - 260Nypa fruticans .............................................................. 376
Oilseed cake ......................................................... 300 - 302antinutritive factors ...................................... 302 - 303phytic acid in ................................................ 300 - 302
Oithona nana ................................................................. 185Orange peel pectin ............................................... 323 - 325
extraction of ................................................. 323 - 325Oreochromis niloticus ................................................... 271
nitrate in .................................................................. 271nitrite in .................................................................. 271protein in ................................................................ 271
Organophosphorus pesticides .................................. 43 - 45in human milk .................................................. 43 - 45
Oryza sativa ......................................................... 129 - 130response to nitrogen fertilizer ................................. 129
Ovalichalcone ......................................................... 164,165from Hibiscus rosa-sinensis ............................ 164,165gas-liquid chromatography of ......................... 164,1651H-NMR spectra of .......................................... 164,165IR spectra of .................................................... 164,165isolation of ....................................................... 164,165mass spectra of ................................................ 164,165structure of ....................................................... 164,165UV spectra of .................................................. 164,165
Beta - N - Oxalyl - L - alpha - beta - diamino - ............ 207 propionic acid (DDAP)[Beta - N - Oxalyl - amino - L - alanine (BOAA)] ........ 207
Pachysolen tannophilus Y - 2460 .......................... 465,466xylitol production by .................................... 465 - 469
Palaemon styliferus ....................................................... 376Pancreatic lipase .................................................. 168 - 169Papyrocranus afer ............................................... 257 - 259Path Coefficient Analysis ........................................ 33 - 42
for rice pests ..................................................... 33 - 42Pectin methoxyl content ................................................ 323
of pectin .................................................................. 323Pelvicachromis pulcher ....................................... 257 - 259Penacus kerathurus ....................................................... 271
nitrate in .................................................................. 271nitrite in .................................................................. 271protein in ................................................................ 271
Penaeus indicus ............................................................. 376Penaeus latisulcatus ...................................................... 185Penaeus monodon ......................................................... 376Penaeus semisulcatus .......................................... 193 - 201(Black tiger shrimp)
isopleths diagram of ..................................... 193 - 196
Jones and van Zalinge Plot of ...................... 193 - 201length cohort analysis of ........................................ 193length frequency data of ............................... 193 - 201of Penaeus semisulcatus ............................... 193 - 199population dynamics of ................................ 193 - 201population parameters of .............................. 193 - 201yield per recruit for ....................................... 193 - 196
Penicillium purpurogenum .................................... 211,212Pesticide ................................................................... 43 - 45
metabolites of ........................................................... 43of cotton crops .......................................................... 43
Pesticide residues ..................................................... 43 - 45analysis of ......................................................... 43 - 45in human milk .................................................. 43 - 45
Petrocephalus bane ansorgii ............................... 257 - 259Peudocalanus ................................................................ 183Phase analysis ...................................................... 226 - 228
of axil vibration ............................................... 226,227of machine structure ........................................ 226,227of relative motion ............................................ 226,227
β - Phellandrene ...................................................... 328,329Phenotiasine ................................................................... 230
derivatives of .......................................................... 230Phosphorus adsorption ........................................ 288 - 294
in soils .......................................................... 288 - 294physico - chemical properties of .................. 288 - 294
Phractolaemidae .................................................. 256 - 260Phractolaemus ansorgii ...................................... 257 - 259Phytase production .............................................. 265 - 269
by Aspergillus niger ..................................... 265 - 269Phytic acid ........................................... 265 - 269,300 - 302
analysis of ........................................................ 300,301determination of ..................................................... 267in meals ........................................................... 300,302in oil seed cakes ............................................ 300 - 302
Phytochemical screening ....................................... 145,146of anthraquinnones .......................................... 145,146of cyanate ........................................................ 145,146of fresh seeds ................................................... 145,146of Garcinia kola .............................................. 145,146of oxalate ......................................................... 145,146of phytate ......................................................... 145,146of saponins ...................................................... 145,146of tannin .......................................................... 145,146
4-Picaline ....................................................................... 344separation of ................................................. 343 - 347
Pichia stipitis ................................................................. 467glycerol production by ........................................... 467ribitol production by ............................................... 467xylitol production by .............................................. 467
xxvi
Pak. J. Sci. Ind. Res. 2003, Vol. 46 (6) Subject Index
3-Picoline ....................................................................... 344separation of ........................................................... 344
Piperitone ................................................................ 328,329α - Pinene ............................................................ 328 - 330β - Pinene ............................................................. 328 - 330Planetary orbits .................................................... 148 - 150Plantago ovata ....................................................... 213,214
fatty acids of .................................................... 213,214lipid composition of ........................................ 213,214
Plasticity retention index ................................................. 11Platanista minor .................................................. 110 - 115(Indus dolphin)
ecological study of ....................................... 110 - 115statistical study of ................................................... 111
Pollutants ............................................................. 399 - 405CO as ............................................................ 399 - 405impact of ....................................................... 399 - 405NO as ............................................................ 399 - 405NOx as .......................................................... 399 - 405O3 as .............................................................. 399 - 405SO2 as ........................................................... 399 - 405
Pollution .............................................................. 452 - 454by heavy metals ............................................ 452 - 454
Polynuclear complexes ........................................ 432 - 434electronic spectra of ............................................... 434elementary analysis of .................................. 432 - 434infrared studies of ......................................... 432 - 434magnetic moment of ............................................... 434of labile ligands ............................................ 432 - 434visible spectra studies of .............................. 432 - 434
Polyphenols ........................................................ 447 - 450extraction of ................................................. 447 - 450in Brassica carinata ..................................... 447 - 450in Brassica juncea ........................................ 447 - 450in Brassica napus ......................................... 447 - 450spectrophotometric studies of ...................... 447 - 450
Polypteridae ......................................................... 256 - 260Polyvinyl chloride (PVC) .................................... 348 - 353
degradation ................................................... 348 - 353synergistic effect of ...................................... 348 - 353
Potassium ............................................................. 117 - 121adsorption in rice .......................................... 117 - 121deficiency ..................................................... 117 - 121in rice ...................................................................... 117
Power law ................................................................ 14 - 18Preferential flow model ....................................... 424 - 4304 - O - Prenyloxybenzaldehyde ............................. 436,437
1H NMR sectra of ........................................... 436,437IR spectra of ................................................... 436,437synthesis of ..................................................... 436,437
Preparation ......................................... 5 - 8,68,69,348 - 351activated carbon ................................................... 5 - 8basic ingredients .................................................. 68,69composition of ..................................................... 68,69of metal soap ................................................ 348 - 351organoleptic evaluation of ................................... 68,69role of supplementation in ................................... 68,69supplemented with oil seed flours ....................... 68,69supplemented with soy bean flours ..................... 68,69
Profenos ................................................................... 43 - 45Promethazine ....................................................... 230 - 234 (10 - (2 - Dimethyl - aminopropyl) - phenothiazine)
hydrochloride of ........................................... 230 - 234Promethazine hydrochloride ............................... 230 - 234
IR spectra of ........................................................... 231Promethazine tetrabromoaurate ..................................... 231
IR spectra of ........................................................... 231Protein ............................................. 47,177 - 179,270 - 275
assay of ..................................................................... 48determination ................................................ 270 - 275genetic effect on ........................................... 177 - 179
Proteolytic activity................................................... 47 - 49assay of ............................................................. 47 - 50
Pseudomonas aeruginosa ....................................... 471,472Pseudotolithus elongatus .................................... 439 - 442
Cd in ............................................................ 439 - 442Fe in .............................................................. 439 - 442Pb in.............................................................. 439 - 442Zn in ............................................................. 439 - 442
Pyranodioxin ....................................................... 406 - 408Pyridodioxin ........................................................ 406 - 408Pyrogallol ............................................................ 141 - 144
absorption spectra of .............................................. 142as a reagent ................................................... 141 - 144for NH4
+ determination ........................................... 1411,2,3 - trihydroxybenzene ............................ 141 - 144
Python sp. ...................................................................... 271nitrate in .................................................................. 271nitrite in .................................................................. 271protein..................................................................... 271
Quadridentate tripodal ligand .............................. 317 - 322synthesis of ................................................... 317 - 322
Quail chicks ................................................................ 70,71Quinalphos............................................................... 43 - 45Quinoxalines .................................................................. 236
Rafiqius amurensis ........................................................ 462Rafiqius bodenheimeri ......................................... 462 - 464(Acrobeloides bodenheimeri)
xxvii
Pak. J. Sci. Ind. Res. 2003, Vol. 46 (6) Subject Index
Rafiqius camberensis ..................................................... 462(Acrobeloides camberensis)Rafiqius saeedi ........................................................ 462,463(Acrobeloides saeedi)Rana adspera ................................................................. 271
nitrate in .................................................................. 271nitrite in .................................................................. 271protein in ................................................................ 271
Raphnus sativus ................................................... 304 - 306chitinase in .............................................................. 304essential oil of .................................................. 304,305of seed oil ..................................................... 304 - 306vitamin B ................................................................ 304vitamin C ................................................................ 304
Raphanus sativus oil ............................................... 304,305effect on .......................................................... 304,305
Reducing agents ............................................................ 161Reducing sugar ....................................................... 457,459Reductions ............................................................... 73 - 76Regression equations ............................................... 33 - 42Relaxation time ................................................................ 88
of alcohols ............................................................... 88Rennin...................................................................... 47 - 51
in cultures ................................................................. 47Resistance ................................................................ 33 - 42
in aus season ..................................................... 33 - 42Rice .......................................................................... 37 - 39
pests of .............................................................. 33 - 42Rice bran meal ..................................................... 300 - 302Rice soil ............................................................... 117 - 121
from Malaysian ............................................. 117 -1213-D-Robotic End-Effector .................................. 472 - 476Rodotorula rulsa ..................................................... 465,466
xylitol production by .................................... 465 - 469Rubber ................................................................. 348 - 353
seed oil of ..................................................... 348 - 353Rubber hydrocarbon ...................................................... 312
elemental analysis of .................................... 311 - 315Rumen meal ................................................................ 70,71
chemical composition of ..................................... 70,71Ruminants ...................................................................... 251
cystic echinococcosis in ......................................... 251epidemiology of ........................................... 251 - 254
Rust resistance ..................................................... 443 - 445in bread wheat .............................................. 443 - 445stability of .................................................... 443 - 445
Sabinene ................................................................ 328,329Saccharomyces cerevisiae ...................................... 465,466
xylitol production by .................................... 465 - 469
Saccharomyces cerevisiae var eulisandans ............ 465,466xylitol production by .................................... 465 - 469
Saccharomyces diastaticus ..................................... 465,466xylitol production by .................................... 465 - 469
Saccharomyces lipolytica .................................... 465 - 469xyletol production by ................................... 465 - 467
Saccharomyces lipolytica CAIM ............................ 465,466xylitol production by .................................... 465 - 469
Saccharomyces rouxii CAIM 2N ........................ 465 - 469xylitol production by .................................... 465 - 469
Saccharomyces uvarum .......................................... 465,466xylitol production by .................................... 465 - 469
Salmonella typhi .................................................. 135 - 137Salmonella typhi AE 14612 ....................................... 96,97Salt spray test ................................................................. 162
for corrosion accelerated salt spray test ................. 162for electro deposits ................................................. 162for nickel deposits .................................................. 162
Sandspit backwater .............................................. 333 - 343dissolved oxygen in ................................................ 333organic carbon in .................................................... 333pH of ....................................................................... 333salanity of ............................................................... 333temperature in ........................................................ .333
Schilbe mystus ..................................................... 257 - 259Schilbeidae ......................................................... 256 - 260Schizosaccharomyces japonicus .......................... 465 - 469
xylitol from ................................................... 465 - 469Schwarzschild Field ....................................................... 148
perturbation on ....................................................... 148Scirpophaga incertulus .................................................... 33Seabuckthorn (Hippophae) .................................. 174 - 176
amino aicd in .......................................................... 174carbohydrates in ..................................................... 174organic acid in ........................................................ 174vitamins in .............................................................. 174
Seabuckthorn granules ............................................ 58 - 61microbiological analysis of .............................. 58 - 61mineral analysis of .............................................. 59,60nutritional analysis of ....................................... 56 - 61physico - chemical studies of ........................... 58 - 61sensory evaluation of ........................................... 59,61statistical analysis of ................................................. 59
Seed oil ................................................................... 348,349fatty acid of ...................................................... 348,349physico-chemical studies of ......................... 348 - 353
Selenastrum sp ............................................................... 354β - Selinene ............................................................. 328,329Separation factor .................................................. 344 - 347Sesquiterpenoids .................................................. 327 - 332
xxviii
Pak. J. Sci. Ind. Res. 2003, Vol. 46 (6) Subject Index
Sewage sludge ..................................................... 129 - 133effect in N uptake ......................................... 129 - 133increase in rice yield .................................... 129 - 133γ-irradiated .................................................... 129 - 133
Shigella dysenteriae AE 14396 ............................... 96 - 98Shigella ferrarie ................................................... 135 - 137Shistosoma mansoni ............................................ 363 - 365
morphological studies of .............................. 363 - 365shistosomulum of ......................................... 363 - 365
Shistosoma margrebowiei ................................... 363 - 365morphological studies of .............................. 363 - 365shistosomulum of ......................................... 363 - 365
Shrimps ................................................................ 255 - 260Silicon mono-oxide ................................................. 14 - 18
dielectric dispersive behaviour of .................... 14 - 18Silybin ............................................................................ 307
structure of .............................................................. 308Silybum marianum .............................................. 307 - 309
effect in bile duct .................................................... 307effect in jaundice .................................................... 307effect in spleen ....................................................... 307in treatment of liver disease ................................... 307silymarin isomers extraction from ............... 307 - 309
Silychristin .............................................................. 307,308structure of .............................................................. 308
Silydianin ................................................................ 307,308structure of .............................................................. 308
Silymarinextraction of ................................................. 307 - 310isomers of ..................................................... 307 - 310
Sodium chloride .................................................. 151 - 154effect on ionic interaction ............................. 151 - 154Jone-Dole equation for .................................... 151,152value of A coefficient ...................................... 151,152value of B coefficient ...................................... 151,152viscosity of ...................................................... 151,152
Soil ............................................................... 139,424 - 430dispersivity value of ............................................... 424drainage to peak concentration (Dp) of .................. 424kurtosis of ............................................................... 424physico - chemical studies of ................................. 139skewness of ............................................................ 424soil structure ........................................................... 424symmetry coefficient (SC) of ................................. 424time to peak concentration of ................................. 424
Solanum tuberosum ............................................. 126 - 128genetic variability in ..................................... 126 - 128partial regression in ...................................... 126 - 128
Solartron Frequency Respouse Analyzer ........................ 16Sordaria fumicola ................................................... 211,212
Sordaria tetraspora ................................................ 211,212Soybean ............................................................... 389 - 394
extrusion cooking of ..................................... 389 - 394nitrogen solubility index (NSI) of ................ 389 - 394nutritional quality of ..................................... 389 - 394trypsin inhibitor activity of ........................... 389 - 394
Soybean meal ...................................................... 300 - 302trypsin inhibitor in ........................................ 300 - 302
Specific combining ability (SCA) ....... 177 - 179,272 - 281 367 - 372
of Gossypium hirsutum................................. 367 - 372Spectra .................................................................... 236,237
MS spectra ....................................................... 236,237NMR spectra ................................................... 236,237UV spectra .............................................................. 237
Spectrometry ....................................................... 141 - 144Sphaeranthus indicus .................................................... 328
essential oil from ................................................... 328Spilanthes ciliata ........................................................... 328
essential oil from .................................................... 328Stability................................................................ 203 - 206
of chloroquine phosphate tablets .................. 203 - 206Stachybotrys atra .................................................... 211,212Staphylococcus albus ......................................... 135 - 137Staphylococcus aureus ........................ 135 - 137,203 - 206
effect on stability ......................................... 203 - 206Staphylococcus aureus ATCC 6538 ......................... 96,97Staphylococcus aureus NCTC 6271 .................... 471,472Starch ..................................................................... 457,461
chemical analysis of ........................................ 457,459Starch digestibility ............................................... 457 - 461
of black grams ........................................................ 457of chick-pea ............................................................ 457
Statistical analysis .................... 99 - 103,119,271 - 273,374by MSTATC ........................................................... 374for trace metals ............................................... 99 - 103in cotton strains ...................................................... 374of nitrate ................................................................. 271of nitrite .................................................................. 271of protein ...................................................... 271 - 273
Stearic acid .................................................................... 239Stoichiometry ...................................................... 432 - 434
of complexes ................................................ 432 - 434Streptomyces aureus ...................................................... 236Streptomycin ....................................................... 135 - 137N - Substiluted 4, 5 - dioxo, 2, 2 - diphenyl - ...... 406 - 408 7 - hydroxy - 6 - pyrido [4, 3 - d] 1, 3 dioxin
synthesis of ................................................... 406 - 408UV studies of ............................................... 406 - 408
Sulphur .......................................................................... 239
xxix
Pak. J. Sci. Ind. Res. 2003, Vol. 46 (6) Subject Index
Sunflower meal .................................................... 300 - 302chlorogenic acid in ....................................... 300 - 302
Supplementation .................................................. 207 - 210amylographic characteristics of .................... 207 - 210bread characteristic of .................................. 207 - 210faringographic characteristics of .................. 207 - 210flour of Lathyrus sativus (Matri) .................. 207 - 210mixographic characteristics of ..................... 207 - 210
Surface tension measurements ............................ 414 - 417of mercury .............................................................. 415
Synedrella nodiflora ...................................................... 328essential oil from .................................................... 328
Synodontis eupterus ............................................. 257 - 259Synodontis omias ................................................ 257 - 259Synthesis ..................................... 1 - 3,27 - 32,95,406 - 408
by Aldol condensation.............................................. 31by Claisen - Schmidt reaction .......................... 27 - 3013C-NMR of .............................................................. 951H-NMR of .............................................................. 95of hetero-bicyclic compounds ...................... 406 - 408of karanjin ........................................................... 31,32of thiocyanate complexes ...................................... 1 - 3of tridentate Schiff base......................................... 1 - 3of two dihydrochalcones .................................. 27 - 30
Synthetic pyrethroid ................................................ 43 - 45of pesticides ...................................................... 43 - 45
Systematics ........................................................................ 1
Tagetes erecta cv orange ............................................... 328essential oil from .................................................... 328
Tagetes patula ............................................................... 328essential oil from .................................................... 328
Teleost fishes ....................................................... 255 - 260food items of ................................................ 255 - 260gut fullness in ............................................... 255 - 260in Jamieson river .......................................... 255 - 260stomach contents of ................................................ 257
Temkin equation ............................................................ 119for K adsorpton ...................................................... 119
Temora stylifera ................................................... 183 - 186Tenualosa ilisha ............................................................ 376Tephorsia purpurea ......................................................... 31Ternary equilibrium data ..................................... 409 - 412
for ethanol - water - oleic acid ..................... 409 - 412for ethanol - water - oleyl alcohol ................ 409 - 412
Ternary Liquid Equilibria .................................... 409 - 412Thermal degradation............................................ 348 - 352
of PVC .......................................................... 348 - 353Thermal stablisation ............................................ 348 - 352
of Jatropha ...................................................... 348,349
of Khaya .......................................................... 348,349of PVC .......................................................... 348 - 352
Thermogravimetric study .................................... 348 - 353of PVC degradation ...................................... 348 - 253
Thieno [2,3 d] pyrimidines ...................................... 95 - 98anti-bacterial activity of .................................. 95 - 98anti-microbial activity of .................................. 95 - 98derivatives of ............................................................ 95synthesis of ....................................................... 95 - 98with chloroacetaldehyde ................................... 95 - 98
Thiocyanato complexes ................................................1 - 3of Schiff base .........................................................1 - 3
Thymol ................................................................... 328,329Thymus serpyllum ................................................ 135 - 137
antibacterial activity of ................................. 135 - 137essential oil of ............................................... 135 - 137
Tilapia macrocephala .......................................... 257 - 259Tilapia mariae ..................................... 257 - 259,439 - 442
Cd in ............................................................. 439 - 442Fe in .............................................................. 439 - 442Pb in .............................................................. 439 - 442Zn in ............................................................. 439 - 442
Tilapia melanopleura .......................................... 257 - 259Tilapia zillii ........................................................ 257 - 259Total soluble sugar ................................................. 457,459 chemical analysis of ........................................ 457,459Toxin ............................................................................ 207Traffic noise ......................................................... 219 - 222
in Pakistan .................................................... 219 - 222of Road ......................................................... 219 - 222
Transition metal ............................................................1 - 3of biodentate ligands .............................................1 - 3of Cu (II) complexes .............................................1 - 3of Pd (II) complexes ............................................. 1 - 3of Ti (II) complexes ..............................................1 - 3of tridentate ligands ...............................................1 - 3of unidentate ligands .............................................1 - 3of V (IV) complexes ..............................................1 - 3
Transition metal complexes .......................................... 1 - 3conductivity of ...................................................... 1 - 3electronic specta of ................................................1 - 3elemental analysis of ............................................ 1 - 3IR spectra of ..........................................................1 - 3megnatic studies of ................................................1 - 3NMR spectra of .....................................................1 - 3structure of .................................................................. 3
Triacylglycerols ................................................... 164 - 169fatty acid contents of ............................................. 168
Trichosporon cutaneum .......................................... 465,466xylitol production by .................................... 465 - 469
xxx
Pak. J. Sci. Ind. Res. 2003, Vol. 46 (6) Subject Index
Tridentate Schiff Base .................................................. 1 - 3synthesis of ............................................................ 1 - 3
2´,4´,6´-Trihydroxy - 4 - methoxydihydro - ............ 27 - 30 chalcone
characterization of .................................................... 27synthesis of ....................................................... 27 - 30
4´,5,7 - Trihydroxy - 2´ - methoxyflavone .................... 2351H-NMR spectra of ................................................. 235IR spectra of ........................................................... 235mass spectra of ....................................................... 235structure of .............................................................. 235UV spectra of ......................................................... 235
5,8,9-Trimethylimidazo [1,2 - c] thieno - ................ 95 - 98 [3,2 - e] pyrimidine
anti-bacterial activity of ................................... 96 - 98anti-fungal activity of ....................................... 96 - 9813C-NMR................................................................... 971H-NMR studies of ................................................... 97synthesis of ............................................................... 96
Tripodal ligand ................................................... 317 - 322electronic spectra of ........................................ 318,319IR spectra of ........................................................... 317synthesis with Ag (I) ............................................. 317synthesis with Cd (II) ............................................. 317synthesis with Hg (II) ............................................. 317synthesis with U (VI) ............................................. 317synthesis with Zr (IV) ............................................ 317UV spectra of ......................................................... 317
Triticum aestivum ................................................ 395 - 397Cd in ............................................................. 395 - 397Co in ............................................................. 395 - 397Cr in .............................................................. 395 - 397Ni in .............................................................. 395 - 397
Trypsin inhibitor .................................. 300 - 302,389 - 394analysis of ........................................................ 301,302in soy bean meal ........................................... 300 - 302of soybean .................................................... 389 - 394
Trypsin inhibitor activity (TIA) ............................ 389-394
Ulocladium atrum ................................................... 211,212Unavailable carbohydrates .................................. 457 - 461
in black gram ................................................ 457 - 461in chick-pea ................................................. 457 - 461
Variation .............................................................. 126 - 128genetic paramters of ..................................... 126 - 128in Solanum tuberosum .................................. 126 - 128
Vibration analysis .......................................................... 225Vibration monitoring ........................................... 225 - 229Vibrio cholera ...................................................... 135 - 137
Vicia faba ............................................................ 359 - 361(Red kidney beans)
chemical analysis of ..................................... 358 - 362nutritive value of .......................................... 358 - 361protein contents of .................................................. 360total minerals of ...................................................... 361total polyphenols of ................................................ 361total soluble sugars of ............................................. 360
Vigna mungo................................. 358 - 362,379,457 - 461(Black grams)
chemical analysis of ..................................... 358 - 361nutritive value of .......................................... 358 - 361protein contents of .................................................. 360total minerals of ...................................................... 361total polyphenols of ................................................ 361total soluble sugars of ............................................. 360
Vigna sinensis ...................................................... 358 - 361(White kidney beans)
chemical analysis of ..................................... 358 - 361nutritive value of .......................................... 358 - 361protein contents of .................................................. 360total minerals of ...................................................... 361total polyphenols of ................................................ 361total soluble sugars of ............................................. 360
Vitamin B1 (Hvit) ................................................ 432 - 434(Thiamine chloride hydrochloride) ..................... 432 - 434
chloride of Cd ............................................... 432 - 434chloride of Fe (III) ........................................ 432 - 434chloride of Hg .............................................. 432 - 434chloride of Zn ............................................... 432 - 434ligands of ...................................................... 432 - 434structure of .............................................................. 432
Vulcanizates ............................................................. 10,239effect of silica sand ................................................. 239from rubber ............................................................... 10
Water sediments .................................................. 156 - 159Wedelia chinensis .......................................................... 328
essential oil from .................................................... 328Wedelia trilobata ........................................................... 328
essential oil from .................................................... 328Wheat bread ................................................................ 68,69
nutritional evaluation of ...................................... 68,69supplemented with peanut ................................... 68,69
Wrench analysis ................................................... 472 - 476for 3-D robotic Model .................................. 472 - 476wrench equation ........................................... 472 - 476
Xenomystus nigri ................................................. 257 - 259Xenopeltis unicolor ........................................................ 271
xxxi
Pak. J. Sci. Ind. Res. 2003, Vol. 46 (6) Subject Index
xxxii
Pak. J. Sci. Ind. Res. 2003, Vol. 46 (6) Subject Index
nitrate in .................................................................. 271nitrite in .................................................................. 271protein in ................................................................ 271
Xylitol .................................................................. 465 - 469effect of aeration .................................................... 466effect of cultivation technique ......................... 466,467effect of pH.................................................. 467 - 468effect of nitorgen concentration ................... 467 - 469effect of nitrogen sources ....................................... 467from corn cobs.............................................. 465 - 469microbial production of ................................ 465 - 469
production of ................................................ 465 - 469xylose in ....................................................... 465 - 469
Yellow rust resistance .......................................... 443 - 445of some bread wheat ..................................... 443 - 445
Yellow stem borer (YSB) ........................................ 33 - 42infestation rate of ...................................................... 33
Zinc bacitracin ......................................................... 70 - 72Zinc oxide ...................................................................... 239Zonocerus variegatus .................................................... 271Zooplankton ......................................................... 255 - 260

PAKISTAN JOURNAL OF SCIENTIFIC AND INDUSTRIAL RESEARCHPCSIR - Scientific Information Centre
PCSIR Laboratories Campus, Karachi - 75280, PakistanPh:92 - 021 - 8151739 - 43, Fax:92 - 021 - 8151738, E-mail: [email protected] and [email protected]
EXCHANGE FORMWe wish to receive Pakistan Journal of Scientific and Industrial Research in exchange of :
Name of Journal: _____________________________________________________Frequency: _____________________________________________________Subjects Covered: _____________________________________________________Institution: _____________________________________________________Address: _____________________________________________________
__________________________________________________________________________________________________________
Signature: _____________________________________________________Name: _____________________________________________________Designation: _____________________________________________________Date: _____________________________________________________E-mail: _____________________________________________________Fax: _____________________________________________________Phone: _____________________________________________________
- - - - - - - - - - - - - - - - - - - - - - - - - - - - - - - - - - - - - - - - - - - - - - - - - - - - - - - - - - - - - - - - - - - - - - - - - - - - - - - - - - - - - -
PAKISTAN JOURNAL OF SCIENTIFIC AND INDUSTRIAL RESEARCHPCSIR - Scientific Information Centre
PCSIR Laboratories Campus, Karachi - 75280, PakistanPh:92 - 021 - 8151739 - 43, Fax:92 - 021 - 8151738, E-mail: [email protected] and [email protected]
SUBSCRIPTION FORMI / we wish to subscribe to ‘Pakistan Journal of Scientific and Industrial Research’. The filled in proforma is beingreturned for compliance.
Subscriber’s data:Name: _____________________________________________________Address: _____________________________________________________
__________________________________________________________________________________________________________
E-mail: _____________________________________________________Fax: _____________________________________________________Phone: _____________________________________________________
Signature: _____________________________________________________Order No. (if any): _____________________________________________________
Tick the relevant box: Send invoice Bill later on Cheque for ...............enclosed
Subscription Rates: Local: Rs. 350/ = per copy; Rs. 2000/ = per volumeForeign: US$ 70/ = per copy; US$ 400/ = per volume
Payment should be made through cross cheque in favour of Pakistan Journal of Scientific and Industrial Research andmailed to the Director PCSIR - Scientific Information Centre, Pakistan
Pakistan Journal of Scientific and Industrial Researchpublishes original research in all scientific and technologicalfields in the form of research articles, short communicationsand critical reviews. All manuscripts are evaluated by subjectexperts. However, authenticity of the contents will be the soleresponsibility of the authors.
The papers should be submitted with a covering lettersigned by all the authors, with their names, addresses andhighest qualifications, indicating the corresponding authorand certifying that the paper has neither been, nor will be sentelsewhere for publication. Names and addresses of four ex-perts of the relevant field including two foreign referees shouldalso be provided. In case a paper is withdrawn after registra-tion, the author/s will be billed for service charges.
Three legible double spaced typed copies of the manu-script are to be submitted containing, in order, Running Title(not more than 60 characters), Title of the article, full names,addresses, telephone numbers, fax numbers, e-mail addressesof all the Authors, Abstract (not more than 150 words), threeor more Key Words, Introduction, Materials and Methods,Results and Discussion, Illustrations and References.
All illustrations including figures, drawings and photo-graphs should be of good quality, suitably labelled, captioned,numbered and referred to in the text alongwith tables andreferences. The drawings should be in black ink, on art ortracing paper, drawn to fit in single or double columns (8 or16.5 cm) on reduction. Letterings and symbols should be ofsufficient size so as to be clearly legible on reduction. UseIUPAC rules for units and their abbreviations.
Three sets of original coloured or black & whitephotographs(s), mounted on light weight white card board,should be provided. In case of coloured photographs(s), 50%printing expenses would have to be borne by the author(s).
References should be cited in the text by the last name ofthe author (both authors if only two, the first author and et alwhen more than two) followed by the year, in chronologicalorder.
All references in the bibliography should be listed inalphabetical order of the authors’ last names followed by dateof publication and other complete details as given in the ex-amples.
EXAMPLESJournal ArticlesIn Bibliography:Reid R W, Watson J A 1995 Reaction of lodgepole pine to
attack by blue stain fungi. Can J Bot 45 (2 Part 1) 45-50.Weenen H, Nkunya M H H, Bray D H, Mwasumbi L B, Kinabo
L S, Kilimali V A E B 1990 Antimalarial activity of Tanza-nian plants. Plant Medic 56(4) 368-370.
Solhein H 1992a The early stages of fungal invasion inNorway spruce. Can J Bot 70 (4 Ser A) 112-119.
Solhein H 1992b Fungal succession in sapwood. Eur J Pathol22 143-158.
In Text:(Reid and Watson 1995)(Solhein 1992a)(Solhein 1992a & b)(Weenen et al 1990; Solhein 1992a; Reid and Watson 1995)
Chapters of BooksDemarchi DA, Marsh RD, Harcombe AP, Lea EC 1990 The
environment. In: The Birds of British Columbia, edsCambell R W & McNall M C E. Royal British ColumbiaMuseum, Victoria, B C USA, Vol 2, 2nd ed, pp 366-425.
BooksBennet O C, Myers J E 1974 Momentum, Heat and Mass Trans-
fer. McGraw Hill, New York, USA, pp 540-562.
ThesisHu C 1989 A comparative study of peanut peroxidase isozyme.
Ph.D thesis, Department of Plant Sciences, University ofWestern Ontario, London, Ontario, Canada.
Papers of Conferences/Symposia/SeminarsJhonson S R, Knapp A K 1994 The role of fire in Spartina
pectinator dominated tallgrass prairie wetlands. In: Pro-ceedings on 19th Tall Timbers Fire Ecology Conference,Tallahassee, Fl, USA, November 3-6, 1993.
Technical ReportsTiller FM, Leu WF 1984 Solid Liquid Separation for Lique-
fied Coal Industries. Final Report for RP - 1411-1. EPRI,AP-3599, Electric Power Research Institute, Palo Atto,CA, USA.
PatentsVerschuur E 1978 Agglomerating Coal Slurry Particles. US
Patent 4126426.
Two hard copies of the revised paper should be sentalong with an electronic copy in Page Maker 6, 6.5, MS Word,Excel, Word Perfect 5.1, IMB compitable. Responsibility forany error/omission in the paper lies with the author.
The manuscripts should be addressed to:
Executive Editor, Pakistan Journal of Scientific and Indus-trial Research, Scientific Information Centre, PCSIRLaboratories Campus, Karachi-75280, Pakistan.Phone: (92-021) 8151739, 8151741-3,Fax: (92-021)-8151738E-mail: [email protected] and [email protected]
INSTRUCTIONS TO AUTHORS