Embed Size (px)
Citation preview

JOURNAL OF GEOPHYSICAL RESEARCH, VOL. 91, NO. B1, PAGES 633-652, JANUARY 10, 1986
Paleomagnetism and K-Ar Ages of Volcanic Rocks From Long Valley Caldera, California
EDWARD A. MANKINEN, C. SHERMAN GROMM•, G. BRENT DALRYMPLE, MARVIN A. LANPHERE, AND ROY A. BAILEY
U.S. Geolo•lical Survey, Menlo Park, California
Paleomagnetic measurements and K-Ar age determinations on volcanic rocks from Long Valley caldera, California, have enabled further refinement of eruptive activity within this large silicic volcanic center. K-Ar age determinations show that postcaldera volcanic eruptions began 0.73 m.y. ago and continued periodically until about 50,000 years ago. The eruptions were not temporally random but tended to occur in distinct episodes separated by periods of quiescence. Volcanism in the western half of the caldera was particularly intense between 0.15 and 0.50 m.y. ago, when many units ranging in composition from basalt to rhyolite were erupted. An average of the virtual geomagnetic poles for 33 units from the caldera yields a paleomagnetic pole at 89.7øN, 138.4øE, (595 = 5.1ø), which is indistinguish- able from the earth's rotational axis. The ancient geomagnetic field dispersion about this mean pole is 16.0 ø , with upper and lower limits of 19.3 ø and 13.6 ø , respectively.
INTRODUCTION
Long Valley, California, is a major topographic depression on the east side of the Sierra Nevada about 30 km south of
Mono Lake. Gilbert [1938, 1941] identified Long Valley as the likely source of the voluminous Bishop Tuff and related ash deposits in the western United States and suggested that the depression itself was related to the extrusion of magma from beneath the valley. Geophysical studies by Pakiser [1961] and Pakiser et al. [1964] outlined the extent and depth of this depression. Smith and Bailey [1968] recognized Long Valley as a resurgent caldera. It is thought to be one of only three calderas in the western United States (along with Valles cal- dera in New Mexico and Yellowstone caldera in Wyoming) of sufficient size and youth to contain residual magma in their chambers [Bailey et al., 1976].
This paper presents primarily the results of a paleomagnetic investigation of volcanic rocks within the caldera. The paleo- magnetic data are supplemented by several new potassium- argon age determinations and a recalculation of age data pre- viously published [Bailey et al., 1976] using revised '•øK decay constants [Steiger and d•iger, 1977]. The paleomagnetic study was undertaken to (1) search for the Blake Reversed-Polarity Subchron or other reversed events within the Brunhes
Normal-Polarity Chron; (2) refine the timing of postcaldera eruptions in Long Valley; (3) obtain information about pa- leosecular variation in the western United States; and (4) in- vestigate the magnetic properties of various silicic rocks that have hitherto been little studied.
SUMMARY OF VOLCANIC HISTORY
Volcanism in the Long Valley area began about 3.2 n•.y. ago with the widespread eruption of trachybasaltic/and.½sitic lavas, followed locally by less voluminous quartz latite domes and flows in the vicinity of the present site of Long •alley caldera. These precaldera mafic and intermediate lavas, prob- ably from mantle and deep crustal sources, were precursors to development of a large shallow magma chamber from which most of the subsequent, more silicic Long Valley eruptions were derived. The rhyolite complex at Glass Mountain, ex- posed in the northeast wall and rim of Long Valley caldera,
This paper is not subject to U.S. copyright. Published in 1986 by the American Geophysical Union.
Paper number 5B5649.
was built by early eruptions from this shallow magma chamber between 1.9 and 0.8 m.y. ago [Metz and Mahood, 1984]. Catastrophic rupturing of the roof of this chamber was accompanied by devastating Plinian and ash flow eruptions 0.73 m.y. ago. These eruptions caused collapse of the roof of the chamber to form Long Valley caldera and produced the extensive deposits of Bishop Tuff that surround it.
Almost immediately after caldera collapse, eruptions re- sumed on the caldera floor, resulting in the accumulation of thick rhyolite tuffs and the outpouring of hot, fluidal rhyolite flows. These early postcaldera rhyolites consist typically of aphyric to sparsely porphyritic obsidian, containing only a few percent phenocrysts of plagioclase, hypersthene, Fe-Ti oxides, and biotite (in decreasing abundance). Eruption of this early rhyolite persisted during a relatively short time span (< 100,000 years) between 0.73 and 0.62 m.y. ago. These erup- tions were accompanied by resurgent doming of the caldera floor which resulted in contemporaneous uplift and faulting of the early rhyolite tuffs and flows. As a consequence, the west central part of the caldera is now occupied by a broad, arched resurgent dome that is 10 km in diameter and 500 m high, and is transected by a 2-km-wide, complexly faulted, northwest- trending medial graben. During resurgence a caldera lake also was forming, so that the rising dome formed an island within it. Continued rise of the dome eventually caused the lake to overflow the topographically low southeast caldera rim, re- sulting in downcutting of the Owens River Gorge and gradual draining of the lake.
During the past 0.5 m.y. as the lake receded, eruptions were confined to the caldera moat peripheral to the resurgent dome. This moat rhyolite contrasts texturally and mineral- ogically with the early rhyolite in being coarsely prophyritic and typically containing large phenocrysts of plagioclase, sani- dine, quartz, hornblende, biotite, and Fe-Ti oxides (in decreas- ing abundance). It is also characteristically pumiceous and was apparently quite viscous, as domes and flows are usually thick, steep-sided, and of limited extent. The moat rhyolite erupted during three distinct episodes, each comprising four or five individual domes or flows with associated pyroclastics and each localized in a different sector of the caldera moat.
The eruptive episode occurred at about 0.5 m.y. ago on the north flank of the resurgent dome, about 0.3 m.y. ago in the southeast moat, and about 0.1 m.y. ago in the west moat. Thus the moat rhyolite episodes are separated by approxi- mately 0.2-m.y. intervals and follow a clockwise succession
633
634 MANKINEN ET AL.' LONG VALLEY: PALEOMAGNETISM AND K-AP. AGES
around the resurgent dome. The cause of this 0.2-m.y. perio- dicity is poorly understood, but it may be related to the time required to develop sufficient vapor pressure in the magma chamber to drive eruptions [Bailey et al., 1976] or to the periodic influx of basalt into the roots of the magmatic system, causing periodic thermal and convective rejuvenation of the shallower siiicic chamber [Bailey, 1984].
During the latter part of the moat rhyolite sequence, be- tween 0.25 and 0.05 m.y. ago, trachybasaltic and quartz latitic lavas began erupting in and near the west moat of the caldera. These mafic and intermediate lavas resemble the 3.2-m.y,-old precaldera mafic-intermediate sequence, but are less extensive, and are localized along a linear zone extending northward from the Devils Postpile through the west moat of Long Valley caldera to the north shore of Mono Lake. The largest concentration of these young mafic-intermediate lavas is in the western part of Long Valley caldera, where at least 30 cinder cones and other types of vents can be identified. Tra- chybasaltic flows from these vents inundated the western cal- dera floor, some flowing eastward around the resurgent dome, sending long tongues into the north and south moats. The largest accumulation of quartz latite lavas is on Mammoth Mountain, a large cumulovolcano on the southwest caldera rim; other large quartz latite domes occur within the south- west and northwest moat. These quartz latites, previously re- ferred to as "rim rhyodacites" [Bailey et al., 1976] and thought to be derived from deeper levels in the Long Valley magma chamber, are now considered along with the tempo- rally associated trachybasaltic lavas to represent a new cycle of mafic-intermediate volcanism from a source deeper than the silicic Long Valley magma chamber, from which the early and moat rhyolites erupted (R. A. Bailey, unpublished data, 1985).
From 50,000 years ago, when the youngest summit dome on Mammoth Mountain erupted, to 550 years ago, no eruptions are known to have occurred in Long Valley. However, vol- canism did continue further north at the Mono Craters where
some 30 rhyolite domes and associated pyroclastics erupted between 40,000 and 600 years ago [Wood, 1979, 1983; Sieh, 1984]. Apparent southward extension of this activity 550 years ago resulted in eruption of the Inyo rhyolite domes in the northwest moat of Long Valley caldera as well as several phreatic explosion craters on the summit and south flank of Deer Mountain and on the north face of Mammoth Mountain
[Miller, 1985]. Recently intensified seismicity and ground de- formation in the area and numerous recent research studies
indicate that magma persists at depth beneath Long Valley caldera and suggest the potential for future eruptions in the area [Miller et al., 1982].
The rocks sampled in this paleomagnetic study include the postcaldera early rhyolites and moat rhyolites of Long Valley and the trachybasaltic and quartz latitic rocks of the younger cycle that occur in the west moat of the caldera. They span the period from 0.75 m.y. to 50,000 years ago.
METHODS
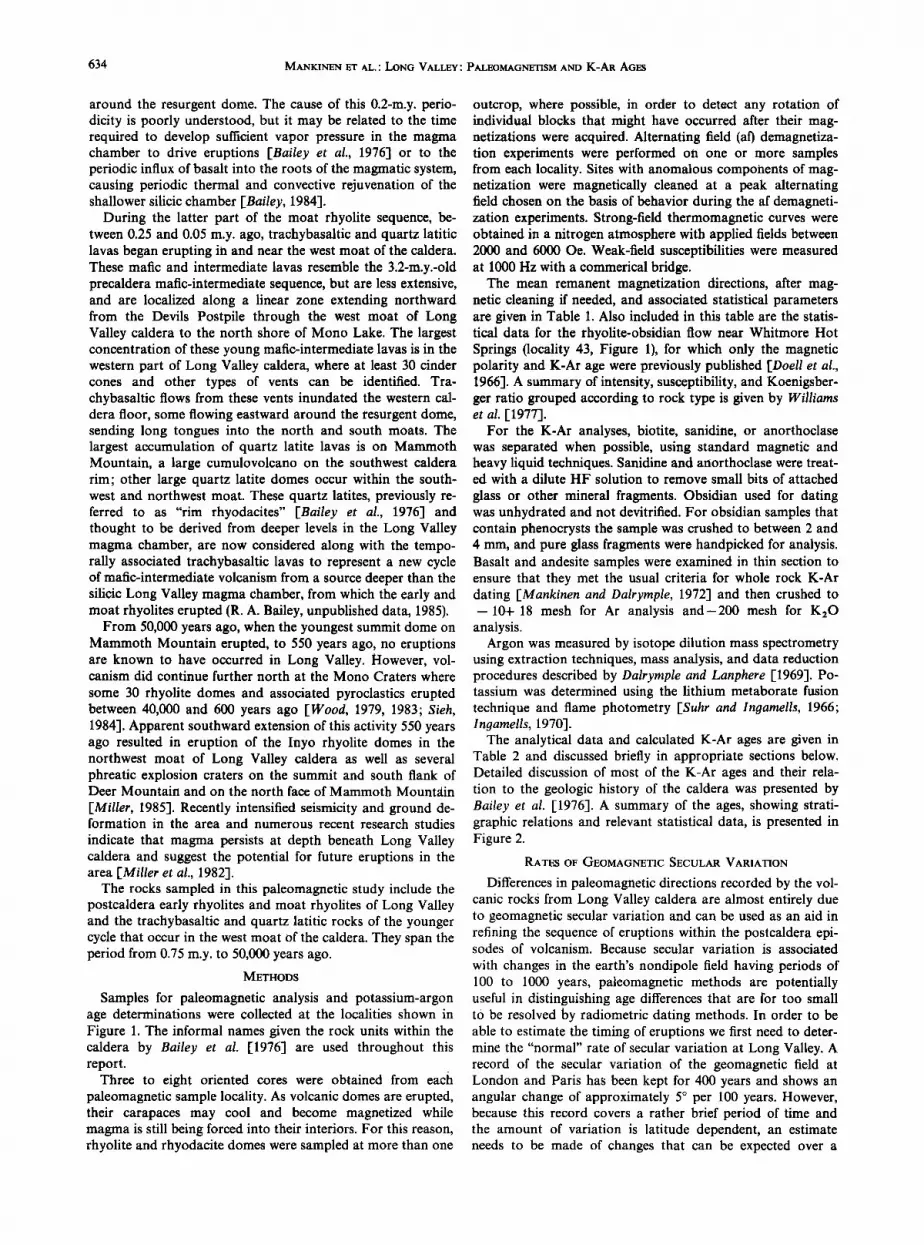
Samples for paleomagnetic analysis and potassium-argon age determinations were collected at the localities shown in Figure 1. The informal names given the rock units within the caldera by Bailey et al. [1976] are used throughout this report.
Three to eight oriented cores were obtained from each paleomagnetic sample locality. As volcanic domes are erupted, their carapaces may cool and become magnetized while magma is still being forced into their interiors. For this reason, rhyolite and rhyodacite domes were sampled at more than one
outcrop, where possible, in order to detect any rotation of individual blocks that might have occurred after their mag- netizations were acquired. Alternating field (af) demagnetiza- tion experiments were performed on one or more samples from each locality. Sites with anomalous components of mag- netization were magnetically cleaned at a peak alternating field chosen on the basis of behavior during the af demagneti- zation experiments. Strong-field therrnomagnetic curves were obtained in a nitrogen atmosphere with applied fields between 2000 and 6000 Oe. Weak-field susceptibilities were measured at 1000 Hz with a commerical bridge.
The mean remanent magnetization directions, after mag- netic cleaning if needed, and associated statistical parameters are given in Table 1. Also included in this table are the statis- tical data for the rhyolite-obsidian flow near Whitmore Hot Springs (locality 43, Figure 1), for which only the magnetic polarity and K-Ar age were previously published [Doell et al., 1966]. A summary of intensity, susceptibility, and Koenigsber- ger ratio grouped according to rock type is given by Williams et al. [1977].
For the K-Ar analyses, biotite, sanidine, or anorthoclase was separated when possible, using standard magnetic and heavy liquid techniques. Sanidine and anorthoclase were treat- ed with a dilute HF solution to remove small bits of attached
glass or other mineral fragments. Obsidian used for dating was unhydrated and not devitrified. For obsidian samples that contain phenocrysts the sample was crushed to between 2 and 4 mm, and pure glass fragments were handpicked for analysis. Basalt and andesite samples were examined in thin section to ensure that they met the usual criteria for whole rock K-Ar dating [Mankinen and Dalrymple, 1972] and then crushed to -10+ 18 mesh for Ar analysis and-200 mesh for K20
analysis. Argon was measured by isotope dilution mass spectrometry
using extraction techniques, mass analysis, and data reduction procedures described by Dalrymple and Lanphere [1969]. Po- tassium was determined using the lithium metaborate fusion technique and flame photometry [Suhr and In•tamells, 1966; InflameIls, 1970].
The analytical data and calculated K-Ar ages are given in Table 2 and discussed briefly in appropriate sections below. Detailed discussion of most of the K-Ar ages and their rela- tion to the geologic history of the caldera was presented by Bailey et al. [1976]. A summary of the ages, showing strati- graphic relations and relevant statistical data, is presented in Figure 2.
RATES OF GEOMAGNETIC SECULAR VARIATION
Differences in paleomagnetic directions recorded by the vol- canic rocks from Long Valley caldera are almost entirely due 4o geomagnetic secular variation and can be used as an aid in refining the sequence of eruptions within the postcaldera epi- sodes of volcanism. Because secular variation is associated
with changes in the earth's nondipole field having periods of 100 to 1000 years, paleomagnetic methods are potentially useful in distinguishing age differences that are for too small to be resolved by radiometric dating methods. In order to be able to estimate the timing of eruptions we first need to deter- mine the "normal" rate of secular variation at Long Valley. A record of the secular variation of the geomagnetic field at London and Paris has been kept for 400 years and shows an angular change of approximately 5 ø per 100 years. However, because this record covers a rather brief period of time and the amount of variation is latitude dependent, an estimate needs to be made of changes that can be expected over a

MANKINEN ET AL.' LONG VALLEY: PALEOMAGNETISM AND K-AR AGES 635
I I
I !
) (
I I
/ /
/
636 MANKINEN ET AL.' LONG VALLEY' PALEOMAGNETISM AND K-AR AGES
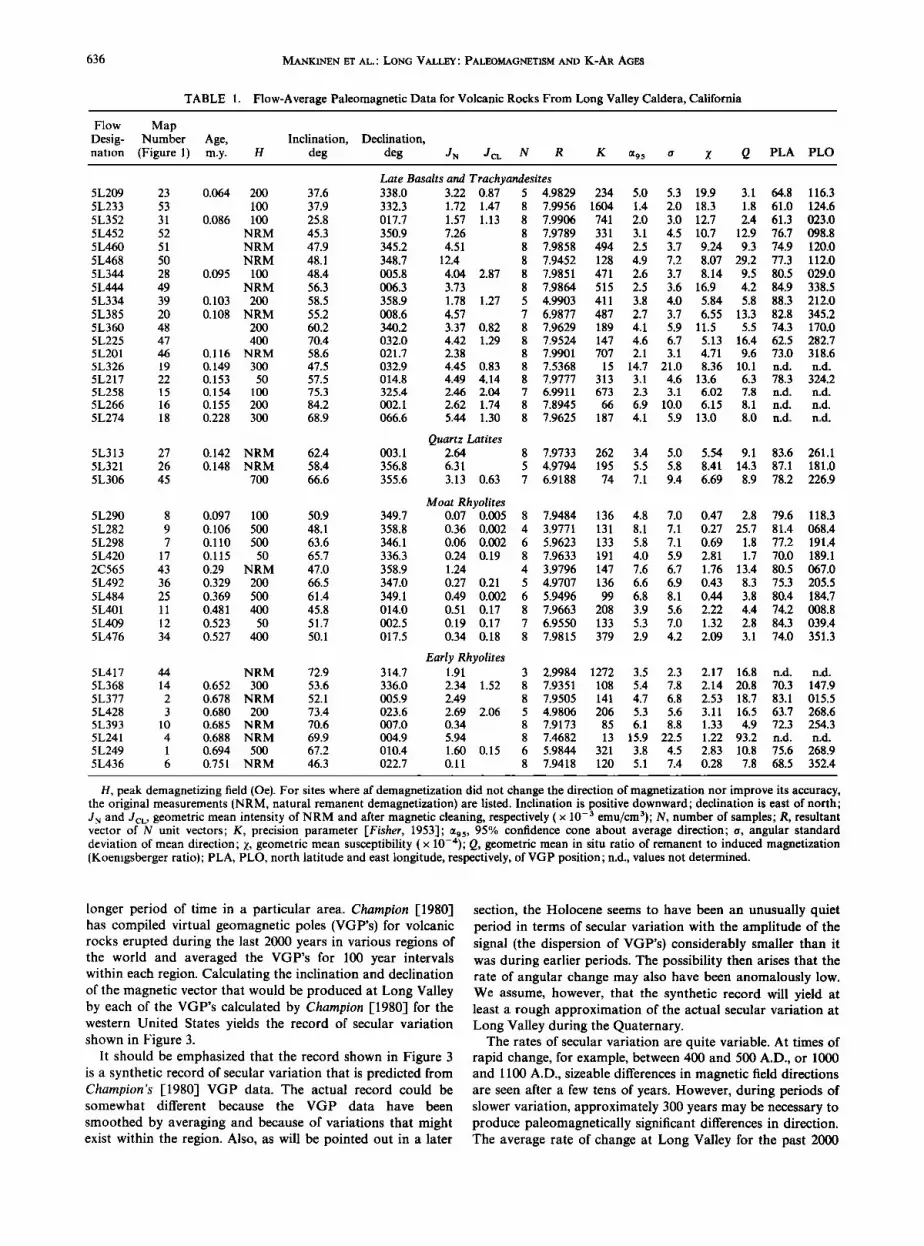
TABLE 1. Flow-Average Paleomagnetic Data for Volcanic Rocks From Long Valley Caldera, California
Flow Map Desig- Number Age, nation (Figure 1) m.y.
Inclination, Declination, H deg deg JN JCL N R K •9s a Z Q PLA PLO
5L209 23
5L233 53 5L352 31
5L452 52 5L460 51
5L468 50 5L344 28
5L444 49 5L334 39
5L385 20 5L360 48
5L225 47 5L201 46 5L326 19
5L217 22 5L258 15
5L266 16 5L274 18
5L313 5L321
5L306
5L290
5L282
5L298
5L420 2C565 5L492
5L484
5L401 5L409
5L476
Late Basalts and Trachyandesites 0.064 200 37.6 338.0 3.22 0.87 5 4.9829 234 5.0 5.3 19.9 3.1 64.8 116.3
100 37.9 332.3 1.72 1.47 8 7.9956 1604 1.4 2.0 18.3 1.8 61.0 124.6 0.086 100 25.8 017.7 1.57 1.13 8 7.9906 741 2.0 3.0 12.7 2.4 61.3 023.0
NRM 45.3 350.9 7.26 8 7.9789 331 3.1 4.5 10.7 12.9 76.7 098.8 NRM 47.9 345.2 4.51 8 7.9858 494 2.5 3.7 9.24 9.3 74.9 120.0 NRM 48.1 348.7 12.4 8 7.9452 128 4.9 7.2 8.07 29.2 77.3 112.0
0.095 100 48.4 005.8 4.04 2.87 8 7.9851 471 2.6 3.7 8.14 9.5 80.5 029.0 NRM 56.3 006.3 3.73 8 7.9864 515 2.5 3.6 16.9 4.2 84.9 338.5
0.103 200 58.5 358.9 1.78 1.27 5 4.9903 411 3.8 4.0 5.84 5.8 88.3 212.0 0.108 NRM 55.2 008.6 4.57 7 6.9877 487 2.7 3.7 6.55 13.3 82.8 345.2
200 60.2 340.2 3.37 0.82 8 7.9629 189 4.1 5.9 11.5 5.5 74.3 170.0 400 70.4 032.0 4.42 1.29 8 7.9524 147 4.6 6.7 5.13 16.4 62.5 282.7
0.116 NRM 58.6 021.7 2.38 8 7.9901 707 2.1 3.1 4.71 9.6 73.0 318.6 0.149 300 47.5 032.9 4.45 0.83 8 7.5368 15 14.7 21.0 8.36 10.1 n.d. n.d. 0.153 50 57.5 014.8 4.49 4.14 8 7.9777 313 3.1 4.6 13.6 6.3 78.3 324.2 0.154 100 75.3 325.4 2.46 2.04 7 6.9911 673 2.3 3.1 6.02 7.8 n.d. n.d. 0.155 200 84.2 002.1 2.62 1.74 8 7.8945 66 6.9 10.0 6.15 8.1 n.d. n.d. 0.228 300 68.9 066.6 5.44 1.30 8 7.9625 187 4.1 5.9 13.0 8.0 n.d. n.d.
Quartz Latites 27 0.142 NRM 62.4 003.1 2.64 8 7.9733 262 3.4 5.0 5.54 9.1 83.6 261.1 26 0.148 NRM 58.4 356.8 6.31 5 4.9794 195 5.5 5.8 8.41 14.3 87.1 181.0 45 700 66.6 355.6 3.13 0.63 7 6.9188 74 7.1 9.4 6.69 8.9 78.2 226.9
Moat Rhyolites 8 0.097 100 50.9 349.7 0.07 0.005 8 7.9484 136 4.8 7.0 0.47 2.8 79.6 118.3 9 0.106 500 48.1 358.8 0.36 0.002 4 3.9771 131 8.1 7.1 0.27 25.7 81.4 068.4 7 0.110 500 63.6 346.1 0.06 0.002 6 5.9623 133 5.8 7.1 0.69 1.8 77.2 191.4
17 0.115 50 65.7 336.3 0.24 0.19 8 7.9633 191 4.0 5.9 2.81 1.7 70.0 189.1 43 0.29 NRM 47.0 358.9 1.24 4 3.9796 147 7.6 6.7 1.76 13.4 80.5 067.0 36 0.329 200 66.5 347.0 0.27 0.21 5 4.9707 136 6.6 6.9 0.43 8.3 75.3 205.5 25 0.369 500 61.4 349.1 0.49 0.002 6 5.9496 99 6.8 8.1 0.44 3.8 80.4 184.7 11 0.481 400 45.8 014.0 0.51 0.17 8 7.9663 208 3.9 5.6 2.22 4.4 74.2 008.8 12 0.523 50 51.7 002.5 0.19 0.17 7 6.9550 133 5.3 7.0 1.32 2.8 84.3 039.4 34 0.527 400 50.1 017.5 0.34 0.18 8 7.9815 379 2.9 4.2 2.09 3.1 74.0 351.3
Early Rhyolites 5L417 44 NRM 72.9 314.7 1.91 3 2.9984 1272 3.5 2.3 2.17 16.8 n.d. n.d. 5L368 14 0.652 300 53.6 336.0 2.34 1.52 8 7.9351 108 5.4 7.8 2.14 20.8 70.3 147.9 5L377 2 0.678 NRM 52.1 005.9 2.49 8 7.9505 141 4.7 6.8 2.53 18.7 83.1 015.5 5L428 3 0.680 200 73.4 023.6 2.69 2.06 5 4.9806 206 5.3 5.6 3.11 16.5 63.7 268.6 5L393 10 0.685 NRM 70.6 007.0 0.34 8 7.9173 85 6.1 8.8 1.33 4.9 72.3 254.3 5L241 4 0.688 NRM 69.9 004.9 5.94 8 7.4682 13 15.9 22.5 1.22 93.2 n.d. n.d. 5L249 1 0.694 500 67.2 010.4 1.60 0.15 6 5.9844 321 3.8 4.5 2.83 10.8 75.6 268.9 5L436 6 0.751 NRM 46.3 022.7 0.11 8 7.9418 120 5.1 7.4 0.28 7.8 68.5 352.4
H, peak demagnetizing field (Oe). For sites where af demagnetization did not change the direction of magnetization nor improve its accuracy, the original measurements (NRM, natural remanent demagnetization) are listed. Inclination is positive downward; declination is east of north; JN and JcL, geometric mean intensity of NRM and after magnetic cleaning, respectively ( x 10-3 emu/cm3); N, number of samples; R, resultant vector of N unit vectors; K, precision parameter [Fisher, 1953]; %5, 95% confidence cone about average direction; a, angular standard deviation of mean direction; •, geometric mean susceptibility ( x 10-'*); Q, geometric mean in situ ratio of remanent to induced magnetization (Koenigsberger ratio); PLA, PLO, north latitude and east longitude, respectively, of VGP position; n.d., values not determined.
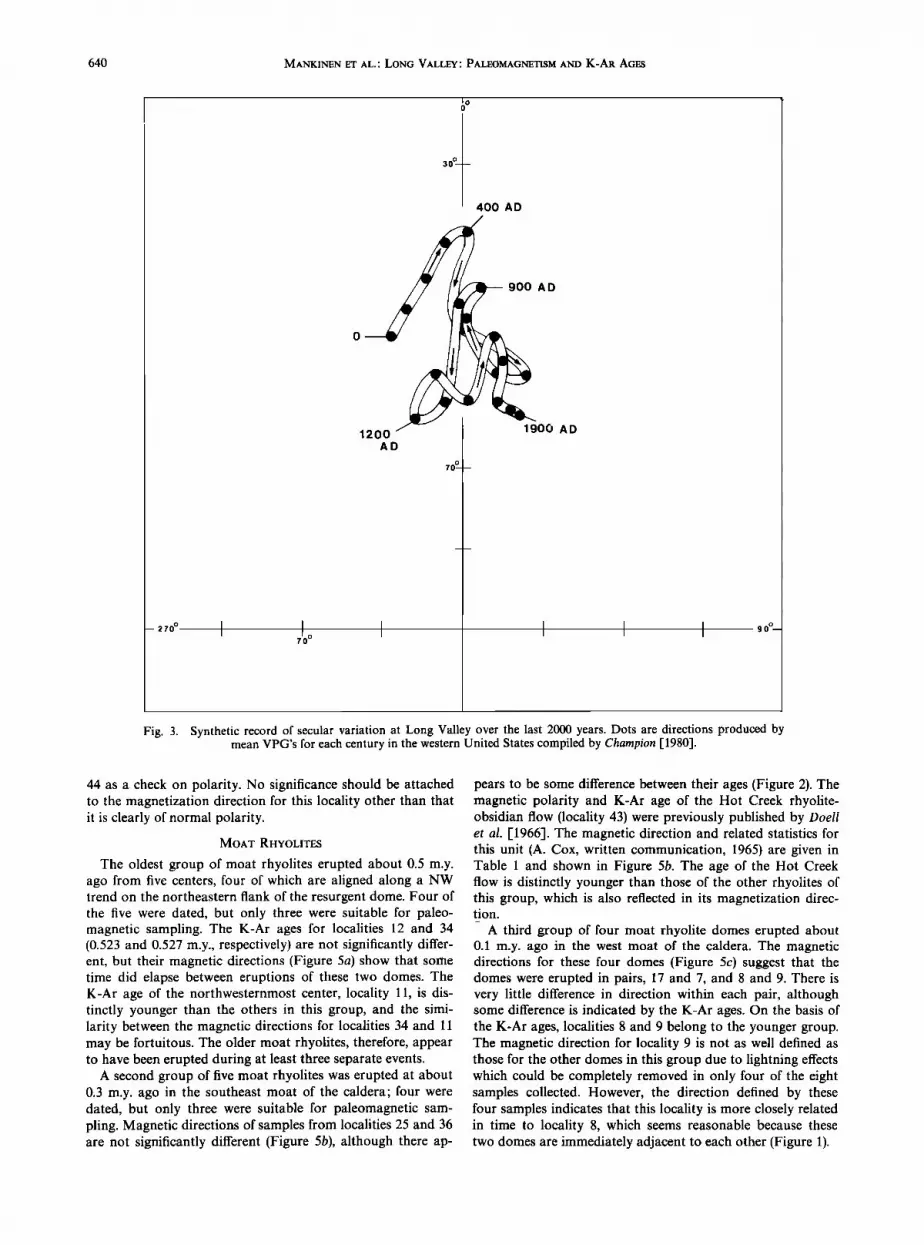
longer period of time in a particular area. Champion [1980] has compiled virtual geomagnetic poles (VGP's) for volcanic rocks erupted during the last 2000 years in various regions of the world and averaged the VGP's for 100 year intervals within each region. Calculating the inclination and declination of the magnetic vector that would be produced at Long Valley by each of the VGP's calculated by Champion [1980] for the western United States yields the record of secular variation shown in Figure 3.
It should be emphasized that the record shown in Figure 3 is a synthetic record of secular variation that is predicted from Champion's [1980] VGP data. The actual record could be somewhat different because the VGP data have been
smoothed by averaging and because of variations that might exist within the region. Also, as will be pointed out in a later
section, the Holocene seems to have been an unusually quiet period in terms of secular variation with the amplitude of the signal (the dispersion of VGP's) considerably smaller than it was during earlier periods. The possibility then arises that the rate of angular change may also have been anomalously low. We assume, however, that the synthetic record will yield at least a rough approximation of the actual secular variation at Long Valley during the Quaternary.
The rates of secular variation are quite variable. At times of rapid change, for example, between 400 and 500 A.D., or 1000 and 1100 A.D., sizeable differences in magnetic field directions are seen after a few tens of years. However, during periods of slower variation, approximately 300 years may be necessary to produce paleomagnetically significant differences in direction. The average rate of change at Long Valley for the past 2000

MANKINEN ET AL.' LONG VALLEY' PALEOMAGNETISM AND K-AR AGES 637
TABLE 2. K-Ar Ages and Analytical Data for Volcanic Rocks From Long Valley Caldera, California
Sample
Argon
Map Material K20,* Weight, '•øArrad, 100'•øArrad (Figure 1) Rock Type Dated wt % g 10 -•2 mol/g '•øAr total
Calculated Age, 106 years
72G001
72G002
72G003
72G004
72G005
72G006
72G007
72G008
72G009
72G010
72G011
72G012
72G013
72G014
72G015 72G016 72G017
73G001 73G008 73G009
73G010 73G012
73G013
73G014
73G016
73G017
73G018
73G019 73G021
73G022
1 Aphryic Obsidian 5.10(2) rhyolite
2 Biotite Obsidian 5.24(2) rhyolite
3 Pyroxene Obsidian 5.25 ñ 0.06(4) rhyolite
4 Pyroxene Obsidian 5.22(2) rhyolite
5 Hornblende- Sanidine 10.96(2) biotite
rhyolite 6 Pyroxene Obsidian 5.02(2)
rhyolite 7 Hornblende- Sanidine 10.88(2)
biotite
rhyolite 8 Hornblende- Sanidine 11.24(2)
biotite
rhyolite 9 Hornblende- Sanidine 11.32(2)
biotite
rhyolite 10 Aphryic Obsidian 5.07(2)
rhyolite 11 Hornblende- Sanidine 10.64(2)
biotite
rhyolite 12 Hornblende- Sanidine 10.45(2)
biotite
rhyolite 13 Aphryic Obsidian 5.14(2)
rhyolite 14 Pyroxene Obsidian 5.15(2)
rhyolite 15 Basalt Basalt 1.65(2) 16 Basalt Basalt 1.66(2) 17 Hornblende- Sanidine 10.63(2)
biotite
rhyolite 18 Andesite Andesite 2.13 ñ 0.01(4) 19 Basalt Basalt 2.00 q- 0.01(4) 20 Basalt Basalt 1.63 ñ 0.05(8)
21 Andesite Andesite 3.01 ñ 0.01(4) 22 Basalt Basalt 2.26 ñ 0.01(4)
Basalt 2.30 _ 0.04(4)
32 Basalt Basalt 1.42 __+ 0.01(4) Basalt 1.42 q- 0.01(4)
23 Basalt Basalt 1.82 q- 0.01(4)
Basalt 1.79 q- 0.01(4)
24 Biotite Sanidine 9.75 ñ 0.26(4) rhyolite
25 Hornblende- Sanidine 11.34 ñ 0.03(4) biotite
rhyolite Biotite 8.93 ñ 0.06(4)
26 Rhyodacite Biotite 8.60(2)
27 Rhyodacite Biotite 7.12(2) 28 Basalt Basalt 1.57 ñ 0.01(4)
33 Hypersthene- Sanidine 7.36(2) augite- biotite
quartz latite Biotite 8.50(2) q- 0.021
3.461 4.948 29.1 3.470 5.189 43.5 4.228 5.125 53.4 4.188 5.070 16.5 3.870 5.199 16.7 4.075 5.131 34.6 4.426 5.312 34.7 4.442 5.057 57.0 5.828 5.263 48.2
4.089 5.583 46.4 4.197 5.280 45.3
12.182 1.724 64.4
5.080 1.330 9.1 5.872 1.590 33.5
6.755 1.735 38.8 6.112 1.744 34.2
3.430 5.145 43.9 4.458 4.967 53.0 7.160 7.440 40.7 6.544 7.293 40.4
5.799 8.023 62.3 5.158 7.730 76.0
4.932 4.992 54.5 5.384 5.036 41.6 3.955 4.958 57.4 3.908 4.725 34.5
10.578 0.3665 3.1 11.078 0.3716 8.8 4.347 1.890 24.8
12.901 1.728 32.2
9.102 0.6996 2.8 8.379 0.4280 8.8
14.187 0.2011 4.3 12.256 0.2708 13.3 14.401 12.79 70.2 7.784 0.3717 4.7 5.837 0.4824 5.5
14.688 0.6170 6.1 9.254 1.080 5.8
10.534 0.2120 1.6 14.129 0.3126 1.2 15.280 0.3225 1.3 12.806 0.1484 4.3 11.736 0.1945 3.5 14.770 0.5990 2.1 15.034 1.134 5.7
1.053 27.75 61.6
4.084 6.029 55.5 3.433 5.812 58.2
1.337 6.645 4.5 1.688 2.212 4.1 1.995 1.423 2.8 1.897 1.460 2.6
10.930 0.2245 4.8 11.928 0.2108 5.7 3.168 1.095 9.2 3.029 0.5492 5.2
6.430 1.581 3.0
0.694 + 0.017
0.678 q- 0.028
0.680 q- 0.029
0.688 + 0.014
0.333 + 0.010
0.751 q- 0.016 0.110 q- 0.011
0.097 q- 0.006
0.106 ñ o.002
0.692 q- 0.014
0.481 ñ 0.010
0.523 + 0.011
0.677 q- 0.014
0.652 q- 0.014 0.154 + 0.072 0.155 q- 0.028
0.115 + 0.003
0.228 ñ 0.082 0.149 + 0.016
0.108 + 0.012 2.95 q- 0.09
0.129 q- 0.026
0.214 q- 0.034 o. 104 q- 0.064
0.156 q- 0.086
0.064 ñ 0.014
0.373 q- 0.065 1.96 ñ 0.06
0.362 ñ 0.008
0.517 q- 0.109
0.148 ñ 0.031 0.142 + 0.081
0.095 q- 0.013
0.070 ñ 0.012
0.129 q- 0.065

638 MANKINEN ET AL.' LONG VALLEY' PALEOMAGNETISM AND K-AR AGES
TABLE 2. (continued)
Map Sample (Figure 1)
Material K20,* Weight, Rock Type Dated wt % g
Argon
4øArrad, 1004øArrad Calculated Age, 10 -•2 mol/g 4øAr total 10 6 years
73G023 29
73G024 30
73G025 31
74G001 34
74G002 35
Rhyodacite Sanidine 7.76(2) 2.251 Biotite 8.58 +_ 0.02(4) 4.807
3.054
Rhyodacite Biotite 8.22(2) 2.633 1.841
Andesite Andesite 2.63 d- 0.01(4) 9.418 7.543
Hornblende- Sanidine 10.62 d- 0.08(6) 2.419 biotite 5.343
rhyolite
Hornblende- biotite
rhyolite
Biotite 8.54 +_ 0.11(6) 5.148 2.318
Sanidine 10.60 d- 0.08(4) 4.786
0.5824 9.2 0.052 4- 0.010 1.090 2.1
1.397 2.8 0.097 d- 0.025 1.483 2.6
1.436 2.4 0.123 d- 0.035 0.3195 14.8
0.3656 7.1 0.086 d- 0.010 8.380 24.4
7.833 60.7 0.527 +_ 0.012
8.523 12.2
6.955 7.7 0.654 d- 0.041 7.704 67.2 0.505 d- 0.015
Biotite 8.48 d- 0.04(4) 5.447 8.873 8.9 0.727 d- 0.087 74G003 36 Hornblende- Sanidine 9.72(2) 3.625 4.840 6.7
biotite 3.674 4.223 3.5
rhyolite 5.094 5.553 5.4 5.009 4.229 6.8 0.329 -_t-_ 0.023
74G004 37 Rhyolite Biotite 8.12(2) 5.357 2.522 4.0 4.772 3.915 4.4 0.256 _+ 0.046
74G005 38 Augite- Biotite 8.17(2) 4.520 1.905 2.7 biotite 4.473 2.967 5.0 0.215 d- 0.039
rhyodacite 74G006 39 Dacite Dacite 3.91 d- 0.03(4) 20.414 0.6650 7.8
19.704 0.5744 25.4 0.103 +_ 0.009 74G009 40 Biotite Anorthoclase 2.69 d- 0.05(6) 13.032 0.8487 14.8
rhyolite 14.156 0.6249 12.7 0.212 d- 0.018 Biotite 7.82 +_ 0.08(4) 4.651 1.709 2.6
3.454 2.353 3.1 0.186 d- 0.038 74G010 41 Basalt Basalt 1.55 d- 0.03(12) 14.828 1.890 5.1
20.000 1.497 4.1
20.111 1.651 2.9 0.729 _+ 0.092 74G011 42 Basalt Basalt 0.977 +_ 0.014(12) 19.700 0.3191 5.3
18.992 0.3561 5.2 0.239 +_ 0.029
509-27-6 43 Rhyolite Obsidian 4.85 d- 0.03(4) 5.429 2.008 19.7 0.288 d- 0.031
Ages calculated using 1976 International Union of Geological Sciences (ICSU), Ottawa, Ont. constants [Steiger and Jiiger, 1977]: Lambda B = 4.962 x 10 -•ø yr -•, lambda E = 0.581 x 10 -•ø yr -•, K-40/K-total = 1.167 x 10 -4 mol/mol. Errors are estimates of analytical precision at the 68% confidence level for single measurements and of the standard error of the weighted means for replicate measurements. Means are weighted by the inverse of the variance.
*Mean and, where more than two measurements were made, standard deviation. Number of measurements is in parentheses.
years appears to be about 8 ø of arc per 200 years. Thus, as a first approximation, the fact that two or more volcanic units yield the same K-Ar age and paleomagnetic direction would be permissive evidence that the units could have been erupted within 100 years of each other. Similarly, units that yield the same K-Ar age but statistically different paleomagnetic direc- tions must differ in age by more than 200 years.
EARLY RHYOLITES
Paleomagnetic and K-Ar samples were collected from 8 of the 12 early rhyolite domes and flows exposed on the re- surgent dome. The average remanent magnetization directions for these units are shown in Figure 4. Five of the rhyolites sampled, localities 1, 2, 3, 4, and 10, yielded ages that are not significantly different from each other (Table 2 and Figure 2). K-Ar localities 10 and 13 are in the same flow, and the mean age for this rhyolite unit is 0.685 + 0.008 m.y. The mean mag- netization directions for four of these rhyolites (localities 1, 3, 4, and 10) are also quite similar, providing evidence that they could have erupted at about the same time. However, there is
a large uncertainty in the direction determined for sample locality 4, where samples were collected from four small out- crops on the obsidian carapace of the rhyolite dome. The directions at each outcrop are somewhat different, showing that rotation of the individual blocks had occurred after cool-
ing due either to extrusion mechanics or subsequent faulting. Thus, while the mean direction of all the outcrops coincides with the directions for localities 1, 3a, and 10, the agreement could be fortuitous.
Two outcrops were sampled at locality 3. The outcrop at locality 3a is large and well exposed and is probably undis- turbed, as evidenced by the close agreement of its mag- netization direction with the directions for localities 1 and 10, which are statistically similar in age. In contrast, the western- most outcrop (3b) was small and poorly exposed, so only three samples were collected. As can be seen in Figure 4, this out- crop has apparently been rotated, approximately 35 ø to 40 ø toward the southwest.
The magnetization direction for the rhyolite at locality 2 is different from that for other rhyolite units of the same appar- ent age, indicating that it was erupted at a somewhat different

MANKINEN ET AL.' LONG VALLEY' PALEOMAGNETISM AND K-AR AGES 639
I K-AR AGE ROCK UNIT MAP NO. l ( 10 6 YEARS)
31 0.086 +_ 0.010
• • 28 0.095 + 0.013
< LU 20 0.108 +__ 0.012
m < >..< 19 0.149 _+ 0.016 LU -r' 15 0.154 + 0.072 I-- -
a::: 16 0.155 + 0.028 18 0.228 +_ 0.082
29 0.052 _+ 0.010
33 0.070 +_ 0.012
• • 39 0.103 __ 0.009 • O 30 0.123+0.035
N O 27 0.142 _+ 0.081 a::: "r' 26 0.148 + 0.031
8 • 40 0.212_+ 0.018 38 0.215 +_ 0.039
37 0.256 ñ 0.046
8 0.097 _+ 0.006
9 0.106 ñ 0.002
7 0.110 +__ 0.011
• 17 0.115 .-,- 0.003 _ 43 0.288 + 0.031
_
._,1
O 36 0.329 + 0.023 >.. _
a:::: 5 0.333 + 0.010 _
< 25 0.362 ñ 0.008 O
• 11 0.481 +__ 0.010
35 0.505 + 0.015
12 0.523 +_ 0.011
34 0.527 _.+ 0.012
BIOTITE 2 0.678 ,_. 0.028
• ,,, 14 0.652 ñ 0.014 LU Z • bU 3 0.680 + 0.029 -- X -
d o >- a::: 4 0.688 + 0.014 m a_ 6 0.751 ñ 0.016
• O 13 0.677 + 0.014
LU • 10 0.692 _+ 0.014 < 1 0.694 • 0.017
BISHOP TUFF 0.727 ñ 0.015
PRECALDERA 24 1.96 ', 0.06 ROCKS 21 2.95 + 0.09
_
Fig. 2. Maximum probability, in Dercent, that the calculated ages of any two volcanic units are truly different and not the result of random errors in the analytical procedure. A probability of more than 99% is indicated by a pound sign. For six samples containing biotite and sanidine or anorthoclase the age plotted is that of the feldspar.
time. However, its age may differ by only a few hundred years, which would be unresolvable by radiometric dating methods. Another possibility is that this entire unit was tilted during resurgence, as has apparently occurred in other areas near the center of the structural dome [Bailey et al., 1976]. Because of the wide geographic distribution of localities 1, 3, 4, and 10 about the central resurgent dome any appreciable radial tilt- ing during resurgence should be reflected in the magnetic di- rections of these units if they are truly all the same age. The
fact that there is little difference in magnetic direction suggests that differential tilting did not accompany uplift and that the tilting that has been observed is local in extent. For these four units to be of different ages and to have identical mag- netization directions through either coincidence or random rotation seems highly unlikely.
Outcrops of the early rhyolite flow on the northeastern side of the resurgent dome are poorly exposed and very limited. For this reason, only 3 samples could be collected at locality
640 MANKINEN ET AL.: LONG VALLEY: PALEOMAGNETISM AND K-AR AGES
400 AD
900 A D
1200 AD
1900 AD
2?0ø { I 70 ø
Fig. 3. Synthetic record of secular variation at Long Valley over the last 2000 years. Dots are directions produced by mean VPG's for each century in the western United States compiled by Champion [1980].
44 as a check on polarity. No significance should be attached to the magnetization direction for this locality other than that it is clearly of normal polarity.
MOAT RHYOLITES
The oldest group of moat rhyolites erupted about 0.5 m.y. ago from five centers, four of which are aligned along a NW trend on the northeastern flank of the resurgent dome. Four of the five were dated, but only three were suitable for paleo- magnetic sampling. The K-Ar ages for localities 12 and 34 (0.523 and 0.527 m.y., respectively) are not significantly differ- ent, but their magnetic directions (Figure 5a) show that some time did elapse between eruptions of these two domes. The K-Ar age of the northwesternmost center, locality 11, is dis- tinctly younger than the others in this group, and the simi- larity between the magnetic directions for localities 34 and 11 may be fortuitous. The older moat rhyolites, therefore, appear to have been erupted during at least three separate events.
A second group of five moat rhyolites was erupted at about 0.3 m.y. ago in the southeast moat of the caldera; four were dated, but only three were suitable for paleomagnetic sam- pling. Magnetic directions of samples from localities 25 and 36 are not significantly different (Figure 5b), although there ap-
pears to be some difference between their ages (Figure 2). The magnetic polarity and K-Ar age of the Hot Creek rhyolite- obsidian flow (locality 43) were previously published by Doell et al. [1966]. The magnetic direction and related statistics for this unit (A. Cox, written communication, 1965) are given in Table 1 and shown in Figure 5b. The age of the Hot Creek flow is distinctly younger than those of the other rhyolites of this group, which is also reflected in its magnetization direc- tion.
A third group of four moat rhyolite domes erupted about 0.1 m.y. ago in the west moat of the caldera. The magnetic directions for these four domes (Figure 5c) suggest that the domes were erupted in pairs, 17 and 7, and 8 and 9. There is very little difference in direction within each pair, although some difference is indicated by the K-Ar ages. On the basis of the K-Ar ages, localities 8 and 9 belong to the younger group. The magnetic direction for locality 9 is not as well defined as those for the other domes in this group due to lightning effects which could be completely removed in only four of the eight samples collected. However, the direction defined by these four samples indicates that this locality is more closely related in time to locality 8, which seems reasonable because these two domes are immediately adjacent to each other (Figure 1).

MANKINEN ET AL.' LONG VALLEY' PALEOMAGNETISM AND K-AR AGES 641
NORTH
"3b
_
i / 10••/• \ I 44(• 3•••_• //I 4
Early rhyolite$
Fig. 4. Average remanent magnetization directions after magnetic cleaning for the early rhyolites. Ovals, 95% confi- dence limits about the mean directions. Diamond, direction produced at Long Valley by an axial dipole field. All directions on lower hemisphere of an equal-area projection.
MODE OF ERUPTION
In the sections that follow, it will be shown that the 0.1- m.y.-old moat rhyolites were accompanied by many other eruptions in the west moat of the caldera. However, here only the moat rhyolites are considered, since they are genetically related and probably controlled by the same sets of ring frac- tures. Because all the moat rhyolites typically show magnetic directions close to the average dipole field direction for the area, it is difficult to use them to differentiate between individ- ual eruptions. In fact, the possibility that eruptions within each group of moat rhyolites occurred over a much shorter time span than that indicated by the K-Ar ages cannot be precluded solely on the basis of magnetic directions. Similarly, within each group it is difficult to distinguish increasingly small time differences with the K-Ar determinations. However, if the results of both methods are considered, the paleo- magnetic results support the impression given by the K-Ar ages that the eruptions tended to be episodic even within each group of rhyolites. The rhyolites at localities 12 and 34 in the 0.5-m.y.-old group probably erupted at somewhat different times even though the ages are the same within analytical error. The angular difference between their magnetic direc- tions is only 9.6 ø , however, so the time involved need not be more than a few decades. Thus, in this group, one eruptive episode (12 and 34) at 0.52 m.y. seems to have been followed some 40,000 years later by eruption of the flow at locality 11. The dome at locality 35 may or may not represent an inter- mediate event.
Data for the 0.3-m.y.-old group of moat rhyolites could be interpreted in two ways. One episode may include events at localities 5, 25, and 36 about 0.34 m.y. ago, followed 50,000 years later by the flow at locality 43. Perhaps more likely, the flow at locality 25 erupted at 0.37 m.y. was followed by erup- tions at localities 5 and 36 at 0.33 m.y., ending with that at locality 43 after another 40,000 years. The eruptive sequence of the third (0.1 m.y. old) group of moat rhyolites is more obvious with the eruptions at sites 17 and 7 occurring about 0.112 m.y. ago followed some 10,000 years later by those at sites 8 and 9. However the data are interpreted, it is apparent that the eruptions did not occur randomly within the main dome-building episodes. Within each 0.2-m.y. episode, the eruptions seem to have occurred in discrete intervals, or pulses, each separated by some tens of thousands of years.
QUARTZ LATITES (RIM RHYODACITES)
Sample localities described in this report are confined to the largest of the quartz latite areas in the southwest part of the caldera. Only three localities were sampled for paleomagnetic study, and these are located in the caldera moat. Additional K-Ar samples were collected from six units on Mammoth Mountain, a massive and complex cumulovolcano on the cal- dera rim. The K-Ar determinations (Table 2) suggest episodic eruption of quartz latite in a manner similar to that of the moat rhyolites and early rhyolites. This impression is rein- forced by the coincidence of magnetization directions for units at localities 26, 27, and 45 (Figure 6). Localities 26 and 45 are in different parts of the same unit, and their magnetization directions are not statistically different at the 95% confidence level using the method of McFadden and dones [1981]. K-Ar ages for localities 27 and 45 are nearly identical, as are their magnetization directions. The close agreement in magnetic di- rection between the three localities is at least suggestive of eruption at about the same time.
Bailey et al. [1976] considered the biotite ages more reliable than the plagioclase ages for rocks from Mammoth Mountain. Petrographic studies showed that the plagioclase crystals had complex histories and probable xenocrystic cores. K-Ar results from coexisting biotite and plagioclase showed that the plagioclase ages were more variable and consistently older. Additional determinations on coexisting sanidine and biotite now show that the biotite ages are also somewhat in error. For rocks this young, sanidine might be expected to yield more reliable ages because it commonly contains less atmo- spheric argon than biotite. Moreover, there is evidence for some extraneous •øAr in other biotites from Long Valley. Bio- tites from moat rhyolite localities 25, 34, and 35 yield ages approximately 30% older than those on coexisting sanidine (Table 3). For the younger rocks on Mammoth Mountain, this effect is even more pronounced with biotite ages approxi- mately 45% older than sanidine ages of rocks from localities 29 and 33. If this relationship holds for other caldera rocks as well, the ages for the quartz latites at other localities may actually be closer to the lower limits of their uncertainty ranges. This would place the quartz latites at localities 26 and 27 closer to 0.100 m.y. in age, a possibility that will be con- sidered again in a later section.

642 MANKINEN ET AL.' LONG VALLEY' PALEOMAGNETISM AND K-Alz AGES
NORTH
0.5 m.y. Moat rhyolites NORTH
25
0.3 m.y. Moat rhyolites NORTH
I -t- _ _ I I 0.1 m.y. Moat rhyolites ]
Fig. 5. Average remanent magnetization directions after magnetic cleaning for (a) 0.5-m.y., (b) 0.3-m.y., and (c) 0.1-m.y. groups of moat rhyolites. Symbols as for Figure 4.
LATE BASALTS AND TRACHYANDESITES
Magnetic directions for these mafic units are shown in Figure 7a. Four of the basaltic flows along the western margin of the resurgent dome are unquestionably of normal polarity
(Figure 7b), but their directions were not used in the calcula- tion of a mean VGP for the caldera. The flow at site 19 was
sampled at two outcrops, both of which were somewhat jum- bled, due either to frost action or recent faulting. While indi-

MANKINEN ET AL.' LONG VALLEY' PALEOMAGNETISM AND K-AR AGES 643
Fig. 6.
NORTH
26
45
Quartz latites
Average remanent magnetization directions after magnetic cleaning for the postcaldera quartz latites. Symbols as for Figure 4.
vidual samples appear to reach stable end points during af demagnetization, little agreement between samples was found, which indicates that many of the blocks have been rotated with respect to each other.
Magnetization directions determined for localities 15, 16, and 18 (Figure 7b) have anomalously steep inclinations. Be- cause the flow at locality 18 is significantly older than those at localities 15 and 16 and because the latter two flows also
appear to have erupted at different times based on their mag- netization directions, it is surprising that they should all have such unusual directions. A possibility is that the structural block containing these three sites has been tilted (approxi- mately 20 ø ) toward the north or northwest. While faults bounding this structural block have not been recognized, there is some indication that the flows may have been erupted onto an unstable surface which has subsequently slumped, tilting the flows toward the north. Alternatively, they may be tilted by late uplift of the resurgent dome.
The south moat of the caldera is a broad area of low relief
covered by thick growth of sage. Palcomagnetic directions of the localities sampled (Figure 7c) agree with the succession mapped by Bailey [1974] and show that considerable time elapsed between some of the eruptions. Localities 23 and 53 were thought either to be from the same eruption or to be very closely related in time [Bailey, 1974], and this suggestion is substantiated (Figure 7c). These magnetization directions are far enough removed from the dipole field direction that they are unlikely to be the same through coincidence.
Sample localities 22 and 46 are in flows that underlie and overlie, respectively, the Casa Diablo till of Curry [1971]. On the basis of single K-Ar determinations on the underlying and two overlying flows, Curry [1971] assigned an age of about 0.4 m.y. to the Casa Diablo till. Age determinations by Bailey et al. [1976] showed the till to have an age between 0.062 m.y. and 0.126 m.y. and thus to be possibly equivalent in age to the Mono Basin till of Sharp and Birman [1963]. However, the reproducibility of the argon measurements for the two basalt flows [Bailey et al., 1976] was poor, and a new sample from the original collection was prepared for analysis from the upper and lower flows as well as two samples from the middle flow. For samples from all three flows the K20 contents of the duplicate preparations are in good agreement, but the argon
contents are not. The latter differ by as much as an order of magnitude. Sample 74G010 is 0.729 + 0.092 m.y. compared with a mean age of 0.122 + 0.054 for 73G013 from the same flow. The upper flow (73G014) contains visible granitic in- clusions. This fact, plus the large variation in '•øArrad contents, indicates that all three flows probably contain extraneous argon, and so none of the ages can be considered reliable. The age of the Casa Diablo till, however, is still constrained by the youngest apparent age of the underlying flow. On this basis, the age of the Casa Diablo till is less than 0.126 m.y.
WEST MOAT VOLCANISM
Eruptions in the west moat of the caldera probably began about 0.23 m.y. ago with the eruption of trachyandesite (local- ity 18) and continued until 550 years ago with the eruption of the youngest of the Inyo rhyolite domes [Miller et al., 1982; Miller, 1985]. One of the most active periods of volcanism in Long Valley occurred about 0.1 m.y. ago when a variety of rock types ranging in composition from basalt through rhyo- lite erupted in the west moat. Magnetization directions of 14 units sampled are shown in Figure 8a. All directions are tight- ly grouped and show little of the usual dispersion due to secular variation. This suggests that all eruptions occurred within a short period of time or that they were grouped in episodes of multiple eruptions. Flows sampled at localities 39, 49, and 28 (Figure 7a) are in stratigraphic sequence. When all directions are plotted without their confidence limits, the change in direction recorded by these three flows (solid circles, Figure 8b) defines an age trend on which the other units sam- pled could fall. All dated units fit within this trend, with Deer Mountain (locality 17) being one of the oldest eruptions and the rhyolite dome at locality 8 (Knolls dome) among the youngest. The directions of the 3 quartz latites, localities 26, 27, and 45 (triangles, Figure 8b), also fit within this age trend, suggesting but not proving that their ages may be nearer 0.1 m.y. than 0.15 m.y. as discussed earlier. The four directions at the tip of the arrow (Figure 8b) belong to the rhyolite dome at locality 8 and to the three an&site flows sampled in south Inyo crater (localities 50, 51, and 52). This crater is the southernmost of three phreatic explosion craters on the south flank of Deer Mountain that formed at about 550 years B.P. [Miller, 1985]. No primary lava was ejected with these ex-

644 MANKINEN ET AL.: LONG VALLEY: PALEOMAGNETISM AND K-AR AGES
TABLE 3. Magnetic Properties of Samples
Map (Fig. 1) Sample `INRM Z MDF Jrs Js Jrs/Js Tc
Late Basalts
23 211 3.700 26.700 150 0.2980 2.020 0.148 537 53 236 1.680 18.000 250 0.4270 2.200 0.194 565 31 353 0.823 12.700 175 0.0710 0.938 0.076 509 52 455 5.520 9.350 300 0.2060 1.250 0.165 540 51 461 4.580 9.140 425 0.1560 0.994 0.157 544 50 473 25.700 4.660 450 0.1570 0.670 0.234 (250), 400 28 345 4.110 9.070 400 0.1450 0.955 0.152 565 49 447 2.690 17.300 175 0.1810 1.640 0.110 532 39 335 1.300 9.200 125 0.0856 0.717 0.119 500 20 392 3.490 6.480 375 0.1930 0.960 0.201 570 48 364 2.990 10.100 75 0.0562 0.655 0.086 158 47 227 3.280 6.010 150 0.0858 0.585 0.147 190, 553 46 206 1.870 4.230 400 0.0532 0.497 0.107 565 19 328 5.350 9.520 50 0.1080 0.836 0.129 228, 556 22 219 4.410 15.500 200 0.1830 1.440 0.127 559 15 261 2.410 7.520 200 0.1800 0.862 0.209 557 16 271 3.040 6.980 350 0.2330 1.130 0.206 569 18 281 6.870 17.500 100 0.2390 1.650 0.145 (539), 565
Quartz Latites 27 315 3.130 7.300 350 0.1240 0.835 0.149 (535), 560 26 325 4.350 6.800 n.d. 0.1230 0.639 0.192 (521), 555 45 307 4.870 7.460 100 0.0214 0.489 0.044 525
Moat Rhyolites 8 290 0.131 n.d. < 100 0.0035 0.076 0.046 (534), 552 9 285 0.782 0.111 125 0.0021 0.067 0.031 (503), 541 7 301 0.347 n.d. < 100 0.0096 0.168 0.057 564
17 420 0.239 2.640 200 0.0123 0.286 0.043 (523), 550 43 566 1.360 1.940 500 0.0301 0.257 0.117 542 36 496 0.264 0.222 475 0.0030 0.036 0.083 556 25 488 3.020 n.d. 50 0.0065 0.103 0.063 538 11 401 0.293 2.050 350 0.0263 0.245 0.107 551 12 416 0.252 0.864 n.d. 0.0067 0.108 0.062 (528), 561 34 477 1.130 n.d. 75 0.0100 0.189 0.053 532
Early Rhyolites 44 418 3.230 2.330 525 0.0594 0.280 0.212 558 14 376 2.810 2.660 325 0.0442 0.258 0.171 540 2 377 3.790 2.770 350 0.0566 0.328 0.173 540 3 431 2.740 3.760 300 0.0632 0.345 0.183 536
10 399 0.302 0.968 350 0.0239 0.152 0.157 564 4 245 2.620 1.400 425 0.0271 0.201 0.135 535 1 255 2.390 2.780 150 0.0443 0.258 0.172 556 6 436 0.345 0.109 400 0.0037 0.025 0.149 560
dNRM, intensity of NRM ( x 10-3 emu/cm3); Z, susceptibility ( x 10-'•); MDF, median demagnetizing field (Oe); J•s, saturation remanence (emu/g); .l s, saturation magnetization (emu/g); T c, Curie temperature (deg C). Curie temperatures in parentheses determined by extrapolation (see text); n.d., values not determined.
plosions, and the sampled flows predate the craters. While the age of these flows is uncertain and they might coincidentally have the directions shown, the fact that all other units sam- pled in the west moat fit in this tight grouping of directions suggests that these flows could be very close in age to the Knolls dome at locality 8.
It is unlikely that these west moat eruptions could have occurred continuously over as short an interval of time as would be indicated by direct comparison of their mag- netization directions with the secular variation rates shown in
Figure 3. The K-Ar ages indicate a period of about 20,000 years for them, and taking the uncertainty in the ages into account, a period of at least 10,000 years seems to be required. A directional change such as indicated in Figure t 8b would suggest a period of a few hundred years at most unless the rates of secular variation were unusually slow at about this time. An alternative explanation is that many closely spaced eruptions occurred at discrete time intervals such as suggested
by Figure 8c. In this interpretation the eruptive episodes may be separated by approximately 10,000 years, with the units sampled at localities 9 and 28 possibly belonging to another episode about 0.10 m.y. ago. The quartz latites may belong to an episode as shown in Figure 8c, or, more likely, at least two belong to the episode at 0.105 m.y. as shown by the means plotted in Figure 7b, and the third, to the 0.115-m.y. group. If the simple progression of magnetization directions in Figure 8b accurately represents secular variation, then the rate of variation would necessarily have been between 10 and 100 times slower than during the past 2,000 years. The fact that the discrete episodes also appear to define a progression is only coincidental because the magnetic field direction would have returned repeatedly to points near the axial dipole field direction over a 20,000 year interval. Whatever method is used to interpret the eruptive history of this part of the caldera, it is apparent that many eruptions occurred over a very short period of time.

MANKINEN ET AL.' LONG VALLEY: PALEOMAGNETISM AND K-AR AGES 645
NORTH
Late basalts & Eachyates NORTH
NORTH
23
22
• •)46
47
i + South moat flows
c
Fig. 7. (a) Average remanent magnetization directions after magnetic cleaning for all late trachybasalts and tra- chyandesites sampled. (b) Directions for flows thought to have been rotated. (c) Directions for reliable flows in the south moat of the caldera. Symbols as for Figure 4.
MAGNETIC PROPERTIES
Thermomagnetic analyses and measurement of rock mag- netic properties were made on one specimen from each local- ity sampled. Results of these measurements are given in Table
3. Saturation remanence (Jrs) and saturation magnetization (Js) were measured on the same sample used for thermomag- netic experiments. If the magnetic oxides are single domain, J,.s/Js ranges from 0.50 to 0.87, while values between 0.1 and 0.5 represent either pseudosingle domains or mixtures of

646 MANKINEN ET AL.' LONG VALLEY: PALEOMAGNETISM AND K-AR AGES
700
NORTH
+ - 0.1 rn.y. West
moat volcanic rocks
A
NORTH
I __ q- I I 9oøJ Means, west moat rocks j
NORTH
28
Means, possible eruptive groups Fig. 8. (a) Average remanent magnetization directions and associated confidence ovals for all units sampled in the
west moat of the caldera that are approximately 0.1 m.y. old. (b) Mean directions of all units in Figure 8a showing apparent change in direction with decreasing age in direction of arrow. Triangles, means of quartz latites; solid circles, flows in stratigraphic sequence. (c) Mean directions of possible groups of eruptions separated by approximately 10,000 years (see text). Other symbols as for Figure 4.

MANKINEN ET AL.' LONG VALLEY' PALEOMAGNETISM AND K-AR AGES 647
0.10 -
O.OS -
0.0 0
A
TYPE
1•0
• TYPE 0.15
0.10
O.OS
o.o. , , , 0 100 300 500
0.30-
0.20-
v
Z 0
•, 0.10-
N
Z
ß o.o o
c
TYPE 3
EARLY RHYOLITE
i I t j lOO 300 5oo
0.08
ß
0.04.
o.o
TYPE 4
MOAT RHYOLITE
0 1•0 I 31•0 I ' I I SO0
TEMPERATURE(DEGREES, C.)
Fig. 9. Four types of strong-field thermomagnetic heating curves commonly observed for silicic rocks from the Long Valley magma chamber. All samples heated at 10øC/min. Dashed lines show extrapolation method of obtaining original Curie temperature (see text).
domain types [Stacey and Banerjee, 1974]. The measured due to the presence of ilmenohematite, titanomagnetite, and ratios in these rocks are all less than about 0.2, which could ' titanomaghemite, respectively. A comparison of some of the indicate that fairly large pseudo single domain grains pre- dominate. If, however, most of the magnetic grains in the Long Valley rocks contain magnetite/ilmenite intergrowths, Jrs/Js for single-domain particles could be reduced to 0.30 due to large magnetic interactions [Davis and Evans, 1976]. A few samples, particularly those from the moat rhyolites, have ratios less than 0.1, indicating the exlusive presence of multi- domain grains. However, this domain structure does not appear to be reflected in a lower magnetic stability of NRM. Although the median demagnetizing field (MDF) is low for some of the moat rhyolites having a low Jrs/J• ratio, the MDF in these particular units is a reflection of the removal of large anomalous components of magnetization that are probably the result of lightning strikes.
Four types of strong-field thermomagnetic curves are com- monly observed for silicic rocks related to the Long Valley magma chamber, and these are shown in Figure 9. Only the heating curves are shown for clarity. A description of the ther- momagnetic curves for samples of the Bishop Tuff was given by Williams et al. [1977]. Inflections in the heating curves for samples of Bishop Tuff were found at temperatures of ap- proximately 620 ø, 560 ø, and 350øC, which were thought to be
Bishop Tuff curves will be made with those of younger erup- tive rocks from the Long Valley chamber. Ilmenohematite was detected in only a few samples of Bishop Tuff and will not be discussed further.
Type 1 thermomagnetic curves (Figure 9a), which indicate the presence of a single ferrimagnetic phase, are fairly common for all rock types analyzed. This phase may be a primary low-Ti titanomagnetite or may result from high-temperature deuteric oxidation of a primary Ti-rich titanomagnetite to form a low-Ti titanomagnetite containing ilmenite lamellae.
The lower temperature inflection point in the type 2 mag- netization curves exhibited by the Bishop Tuff samples (Figure 9b) was previously thought to be due to the presence of titano- maghemite [Williams et al., 1977]. Some samples from the Lava Creek tuff in the Yellowstone region exhibit very similar heating curves, which Reynolds [1977] also attributed to the presence of titanomaghemite or maghemite. Type 3 mag- netization curves shown by samples of andesite and dacite from the Clear Lake volcanic field [Mankinen et al., 1981] are also similar to the type 2 Bishop Tuff curves. Mankinen et al. [1981] suggested that this type of curve could be due to the presence of titanomaghemite or could indicate the presence of

648 MANKINEN ET AL.' LONG VALLEY' PALEOMAGNETISM AND K-Av, AGES
TABLE 4. Paleomagnetic Data for Combined Localities
Localities Inclination, Declination, Combined deg deg N R K %5 a PLA PLO
23, 53 37.9 334.5 50, 51, 52 47.1 348.3 26, 27, 45 62.9 359.0 8, 9 50.0 352.8 7, 17 64.9 340.7 25, 36 63.7 348.2 1, 3, 10 70.4 011.9
13 12.9691 388 2.1 4.1 62.5 121.6 24 23.8946 218 2.8 5.5 76.5 110.5 20 19.8342 115 3.1 7.6 83.3 234.7 12 11.9085 120 4.0 7.4 81.0 104.0 14 13.9143 152 3.2 6.6 73.1 189.9 11 10.9094 110 4.4 7.7 78.3 196.0 19 18.8525 122 3.1 7.3 71.4 263.1
See Table 1 for explanation.
two stoichiometric titanomagnetite phases. Magnetic measure- ments and petrologic studies of the Bishop Tuff now indicate that the presence of two titanomagnetite phases is the most likely explanation for this type of thermomagnetic curve.
As a rock containing titanomaghemite is heated, the titano- maghemite spontaneously inverts into its various breakdown products (commonly Ti-poor titanomagnetite and ilmenite), and the magnetization upon cooling is typically many times stronger than before heating due to the formation of new magnetite. However, type 2 curves do not show this behavior, and the cooling curves retrace only the portion of the heating curve that corresponds to the magnetic material with the high- est Curie temperature. This change occurs whether the sam- ples are heated in air or in vacuum, and the heating must convert the material having the lower Curie temperature into nonmagnetic or very weakly magnetic components. If two ti- tanomagnetite phases are present, they probably result from cooling that was too rapid to allow complete high- temperature deuteric oxidation of an originally homogeneous titanomagnetite to Ti-poor titanomagnetite and ilmenite. Per- haps it is significant that the samples we have analyzed that show a large portion of the low Curie temperature material were all collected from one of the earliest (and coolest) of a succession of eruptions of Bishop Tuff !-Hildreth, 1979]. One way to obtain an estimate of Curie temperature of the pre- sumed Ti-rich phase is to extrapolate the continuation of the low-temperature part of the heating curve past the inflection point until it intersects the paramagnetic part of the curve as shown by the dotted lines in Figure 9b. Admittedly, this method is somewhat subjective, but it should yield an ap- proximate Curie temperature for the original, unoxidized tita- nomagnetite. For the Bishop Tuff, this method yields Curie temperatures of slightly greater than 400øC for all samples that show this inflection. Assuming that this Curie temper- ature is representative of the titanomagnetite and using the temperature contours on the ulv6spinel-magnetite- hematite-pseudobrookite quadrilateral given by Gromm• et al. [1979], an ulv6spinel content of not more than 30% is indi- cated. This estimate is in excellent agreement with Hildreth [1979], who found that the ulv6spinel content of micropheno- crysts of unoxidized, unexsolved titanomagnetites from the Bishop Tuff range from 25.3 to 28.0 mol %.
The magnetic mineralogy of the early rhyolites is similar to that of the Bishop Tuff, which might be expected because they are closely related in time and may have tapped similar levels in the magma chamber. Samples from localities 2, 4, and 44 have single Curie temperatures and yield well-defined type 1 heating curves. Samples from the other localities probably originally had two titanomagnetite phases, as did the Bishop Tuff. However, the amount of Ti-rich titanomagnetite in these samples is either much less than that in the Bishop Tuff or occurs as a range of titanomagnetite populations. Conse-
quently, the inflection point can no longer be clearly seen. Heating curves from these samples show only a slight depres- sion at about 300øC (Figure 9c), and no extrapolation of the original Curie temperature is possible. Curie temperatures de- termined for these samples (Table 4) are only for the Ti-poor titanomagnetite phase.
The moat rhyolites and quartz latites again show either nearly coincident type 1 heating and cooling curves or contain two stoichiometric titanomagnetite populations. Using the ex- trapolation method as described for the Bishop Tuff, the lower Curie temperatures for these rocks average 525 ø (type 4, Figure 9d; Table 4). Plotting this value on the compositional diagram shows that the titanomagnetites in most of the later eruptive rocks have a considerably lower titanium content (--, 10%) than either the Bishop Tuff or the early rhyolites. Only the moat rhyolites sampled at localities 25 and 36 in the eastern part of the caldera show the type 3 curves commonly seen in the early rhyolites.
The late basalts and trachyandesites show a magnetic min- eralogy that is typical of basaltic rocks. A sample from the basalt flow at locality 48 has a single Curie temperature at 158øC. Because the thermomagnetic curve for this sample is nearly reproducible between heating and cooling and shows no evidence of a disproportionation peak, the oxidation pa- rameter for this sample is probably less than about 0.3 or 0.4 [Gromm• and Mankinen, 1976]. For a nearly stoichiometric titanomagnetite with this Curie temperature, the ulv6spinel content is about 60%. Two samples have two Curie temper- atures, one at about 200 ø and another at slightly greater than 550øC. These are samples that were incompletely oxidized at high temperature, resulting in two separate magnetic phases. The average Curie temperature for the basaltic rocks from Long Valley is 55•9 ø _+ 15øC. The titanomagnetites in the more silicic rocks in the late basalt group (localities 31 and 39) have lower Ti contents, as would be expected, and Curie temper- atures of about 500øC. The oxide in the andesite at locality 18 has the lowest Ti content, is cation-deficient, and yields a type 4 heating curve similar to the moat rhyolites and rim rhyoda- cites.
The andesite flows exposed in southernmost Inyo Crater (localities 50, 51, and 52) illustrate the increase in oxide cation deficiency due to weathering. The magnetic directions of these flows (Figure 7a) show that all three were erupted in rapid succession. The lowest of the flows (Figure 10a) contains a nonstoichiometric oxide, but the originally low Curie temper- ature (250øC) is still very apparent. The middle flow (Figure 10b) is clearly more oxidized, but the presence of a lower Curie temperature can still be seen. The uppermost flow is the most highly oxidized, and little evidence of the original Curie temperature remains (Figure 10c).
PALEOMAGNETIC POLE AND PALEOSECULAR VARIATION
All reliable data in Table 1 were used to calculate a mean
magnetic field direction, a mean paleomagnetic pole, and as- sociated statistical parameters. Those units thought to be re- lated were omitted from the analyses, as were units whose 95% confidence limits were greater than 9 ø . Also omitted were the units at localities 15, 16, and 18, which are on the structur- al block thought to be tilted. No units have virtual geomag- netic pole (VGP) latitudes less than 50øN. Because many erup- tions occurred at approximately the same time, an attempt was also made to remove the bias introduced by multiple sampling of the same field direction. Samples from all units within each rock type thought to have been erupted at the same time were averaged to give a mean for that instanta-

MANKINEN ET AL.' LONG VALLEY' PALEOMAGNETISM AND K-AR AGES 649
0.40
0.20-
0.0 0
- MAP NO. 60
1(•0 i 3•0 t 5(•0 "
0.80-
0.40-
B ooo I I i
o lOO 300
MAP NO, 51
(mlddl© flow)
• MAP NO. 52
0.80-
I I I I I ,- 100 300 500
TEMPERATURE (DEGREES, C.)
Fig. 10. Strong-field thermomagnetic heating curves for samples from the three andesite flows sampled in South Inyo Crater showing changes presumably due to low-temperature oxidation (weathering).
lu 0.40-
Z
O
N
z
ß o.o o
neous field direction. Results of these averages are given in Table 4; these means were given unit weight in the final calcu- lations. Statistical analyses of all reliable units and all units after averaging for multiple eruptions are given in Table 5.
At many localities it has been found that when a set of VGP's is averaged, the resulting mean pole does not parallel the Earth's rotational axis as it should if, over a long time, the
Earth's field is represented by a geocentric axial dipole. McEl- hinny and Merrill [1975] noted that nearly one half of the paleomagnetic poles covering parts of the last 5 m.y. have 95% confidence limits that do not include the geographic pole, although regionally averaged poles nearly always do. Also, many of these discrepant poles are situated on lines of longitude that are approximately 180 ø away from the mean site longitudes (the "farside" effect). There also seems to be some tendency toward an eastward deflection of declination from the expected value of 0 ø, although this tendency is not well established. Because the time-averaged geomagnetic field was thought to have zonal symmetry, offsets of the VGP were first thought to be due to a tilt of the dipole field [Cox and Doell, 1964] and were later explained as being due to a north- ward displacement of the axial dipole [Wilson, 1970]. Cox [1975] proposed an alternative model in which the discrepant poles could be explained by a lack of zonal symmetry in the nondipole field. In this model, the core-surface sources pro- ducing the nondipole field are not randomly distributed but occur preferentially at certain latitudes. During periods of normal polarity, flux lines were believed to emerge from low latitudes in the core and reenter at mid-latitudes, producing a field similar to the present-day nondipole field. By rotating the present nondipole field, Cox [1975] was able to show a shal- lowing of magnetic inclinations in low and mid-latitudes (pro- ducing farside VGP's) in an amount comparable to that seen in the paleomagnetic data. The difference between the incli- nation measured at a site and that expected from a geocentric dipole (AI) was used by Cox [1975] as a measure of the amount of zonal asymmetry. At the latitude of Long Valley, AI should be-2.0 ø according to the Cox [1975] model. Mer- rill and McElhinney [1977] show a AI of-3.4 ø (a = 1.0 ø) for normal data in the latitudinal band 30 ø to 40øN, although in the longitudinal sector between 120 ø and 300øE, AI was found to be-1.9 ø (a = 0.6ø). AI for Long Valley is-1.3 ø using all data and-2.4 ø using the selected data group. While these values are in agreement with the models, neither of the two mean directions is significantly different from the field ex- pected from a geocentric dipole. Similarly, neither of the calcu- lated paleomagnetic pole positions (Table 5 and Figure 11) is distinguishable from the geographic axis. Thus, notwith- standing the periodic and episodic eruptions of these volcanic rocks, the effects of secular variation of the nondipole field have been successfully averaged.
Because virtually all asymmetry of the nondipole field has apparently been averaged out by the Long Valley rocks, the dispersion of these VGP's should give a reasonably accurate measure of the paleosecular variation for this latitude. The dispersion given in Table 5 is the dispersion about the mean directions. While the dispersion of VGP's about the geograph- ic pole is also commonly used, the values for both are nearly identical in this case, differing by only 0.2 ø for the selected data set. In Table 5, Sr is the total dispersion and SF is the ancient field dispersion as used by McElhinney and Merrill [1975]. $F has been corrected for the within-site dispersion due to experimental errors, but no correction has been made for the effects of local magnetic anomalies. S, and S• are the upper and lower 95% confidence limits, respectively, for SF calculated using the method of Cox [1969].
For all reliable units from Long Valley, the 95% confidence limits about SF- 16.0 ø are 19.3 ø and 13.6 ø. This is somewhat larger than the value of SF = 12.5 ø reported by Doell and Cox [1972] for 21 lava flows from the western United States. How- ever, McElhinny and Merrill [1975] report an almost identical value of SF = 16.3 ø (S, = 18.4 ø, S• = 14.7 ø) for the western

650 MANKINEN ET AL.' LONG VALLEY' PALEOMAGNETISM AND K-AP, AGES
TABLE 5. Statistical Analysis of Flow Average Data
Data Lati- Longi- Analyzed tude tude N R K o•9 5 ST SF Su Sl
All units 89.7 138.4 33 31.7280 25 5.1 16.3 16.0 19.3 13.6 Selected units 87.6 006.1 23 22.1476 26 6.1 16.1 15.9 20.1 13.2
Data Incli- Decli-
Analyzed nation nation N R K •95 Sx SF S, S•
All units 55.8 359.4 33 32.0834 35 4.3 13.8 13.6 16.4 11.6 Selected units 54.7 002.5 23 22.3779 35 5.2 13.7 13.6 17.2 11.3
Latitude and Longitude, north latitude and east longitude, respectively, of paleomagnetic pole; N, number of units analyzed; R, resultant vector; K, precision parameter [Fisher, 1953]; •95, 95% confi- dence cone about mean pole; S,, total angular dispersion about mean pole; SF, ancient field dispersion (experimental errors removed); S, and S•, upper and lower limits, respectively, of SFfrom Cox [1969].
United States on the basis of 76 units spanning the last 5 m.y. Champion [1980] reports a total dispersion S T of 12.2 ø for 77 Holocene lave flows from the western United States. The very low dispersion reported by Champion [1980] combined with the limited Recent data summarized by McElhinny and Mer- rill [1975] indicate that very recently the geomagnetic field has been unusually quiet. The fact that Brunhes age (<0.7 m.y.) volcanic rocks from Long Valley show the same disper- sion as that reported for the same region for the last 5 m.y. by McElhinny and Merrill [1975] tends to support this idea. The 21 lava flows reported by Doell and Cox [1972] may not have adequately sampled the total range of dispersion for this region.
DISCUSSION
No evidence was found for the Blake reversed episode, which was proposed on the basis of reversed magnetic incli- nations in sedimentary cores from the western North Atlantic Ocean [Smith and Foster, 1969; Denham, 1976; Denham et al., 1977]. The reversed inclinations found in these cores occur
o
ß I ß ß øø
6oø•
ii• ONG .'. VALLEY
.,
.,
Fig. 11. VGP positions (dots) of reliable volcanic units from Long Valley caldera. Asterisk, overall mean with its associated 95% confi- dence limit. Portion of equal-area projection.
within the late Pleistocene X faunal zone of Ericson et al.
[1961] and represent a portion of the interval between 0.075 and 0.125 m.y. ago [Denham, 1976]. A record of what may also be the Blake episode has been found in an unoriented core that penetrated a sequence of offshore clay near Reggio de Calabria in southern Italy [Creer et al., 1980]. More re- cently, Nishimura et al. [ 1984] have described a reversely mag- netized tuff in the Sigura-gura Formation near Lake Toba, Sumatra, that has yielded ages of 75,000 years (K-Ar) and 0.10 + 0.2 m.y. (fission track), and which they correlate with the Blake episode. Paleomagnetic measurements performed on samples from the Lake Toba tuff are reported in detail by Sasajima et al. [1984], who also review these and other cur- rently available evidence for the Blake episode. The fact that no reversed volcanic units of this age were found in Long Valley may be interpreted in several ways. First, the Blake episode might have been a regional rather than global phe- nomenon [Denham, 1976], although the results from Italy and Indonesia, if confirmed, suggest the possibility of a global event at about 0.1 m.y. Sasajima et al. [1984] consider that the balance of evidence does favor a global geomagnetic event. The numerous volcanic eruptions in the west moat of Long Valley caldera from about 0.115 m.y. to about 0.095 m.y. ago, all of which record normal polarity, may therefore indicate that the Blake episode occurred just prior to or after this time interval. Second, it is possible that the episodic nature of the volcanism is a factor because we have shown that the eruptive periods in the west moat may have been separated by approxi- mately 10,000 years. Some short events may have a duration of 10,000 years or less [Mankinen and GrommJ, 1982], and the Blake episode itself has been estimated to have lasted about 5,000 years [Smith and Foster, 1969; Denham, 1976]. Finally, it is possible that the Blake episode was recorded by one of the numerous Long Valley eruptions but that the products of that eruption were not sampled during this study. Lacustrine silts associated with a tephra layer in Long Valley have reversed polarity [Liddicoat et al., 1980]. This reversal definitely oc- curred during the Brunhes chron, but its absolute age is not known. However, trace-element chemistry of the tephra shows a close affinity to the 0.05- to 0.150-m.y. old quartz latites of Mammoth Mountain [Liddicoat et al., 1980].
Potassium-argon dating has demonstrated a periodicity in eruptive cycles in large silicic yolcanic centers such as the Valles caldera, New Mexico [Doell et al., 1968], the Geysers- Clear Lake area, California [Donnelly, 1977; Donnelly-Nolan et al., 1981] and Long Valley [Bailey et al., 1976]. However, the resolution of the K-Ar method is often unable to deter-
mine the pattern of eruption within each period of activity.

MANKINEN ET AL.: LONG VALLEY: PALEOMAGNETISM AND K-AP, AGES 651
Because secular changes in the geomagnetic field occur fairly rapidly, paleomagnetic studies can distinguish much shorter intervals of time (102 to 10 3 years) than can radiometric dating methods. The present study and studies in the Clear Lake area [Mankinen et al., 1981] show that many eruptions can occur during very short periods of time. Inspection of the paleo- magnetic data for the ring domes of the Valles caldera [Doell et al., 1968], which are analogous to the moat rhyolites of Long Valley, suggests that the pattern of eruption may be quite similar in both areas. The oldest ring domes sampled in the Valles caldera (sites S34 and S35) are statistically different in age and in paleomagnetic direction. With the next younger group, sites S37 and S38 give identical ages, but the magnetic directions are distinctly different (normal and intermediate po- larity). However, these units were erupted during the transi- tion from normal to reversed polarity at the end of the Jara- millo Normal Subchron [Doell and Dalryrnple, 1966; Doell et al., 1968], and the time involved may be no more than a few tens or hundreds of years [Mankinen et al., 1981]. Within the group of Valles ring domes that is approximately 0.7 m.y. old, sites S40 and S41 show little difference in age and have identi- cal directions of magnetization, which suggests that these domes may have erupted at about the same time. Their erup- tion was preceded by the eruption at site S39 approximately 20,000 years earlier. Combining the dates and paleomagnetic directions of the approximately 0.5-m.y.-old group of domes suggests that the eruption at site S42 was followed some 40,000 years later by those at sites S34 and S44, which in turn were followed by the dome at site S45 approximately 30,000 years later.
For these two studies the eruptive pattern suggests that within each long (10 s year) period of active volcanism, shorter episodes of eruption also occur that are separated by a few tens of thousands of years. These shorter episodes may be single eruptions, or they may consist of a few eruptions oc- curring almost simultaneously, separated by no more than a few hundred years. Detailed K-Ar and paleomagnetic studies in other large silicic centers will be very useful in determining if the pattern suggested here is a feature common to other such areas.
Acknowledgments. We thank R. Drake, J. Hagstrum, J. Hillhouse, and one anonymous reviewer for their helpful comments.
REFERENCES
Bailey, R. A., Preliminary geologic map and cross sections of the Casa Diablo geothermal area, Long Valley caldera, Mono County, Cali- fornia, scale 1:62,500, U.S. Geol. Surv. Open File Map, 2 sheets, 1974.
Bailey, R. A., Chemical evolution and chemical state of the Long Valley magma chamber, U.S. Geol. Surv. Open File Rep. 84-939, 24-40, 1984.
Bailey, R. A., G. B. Dalrymple, and M. A. Lanphere, Volcanism, structure, and geochronology of Long Valley caldera, Mono County, California, J. Geophys. Res., 81, 725-744, 1976.
Champion, D. E., Holocene geomagnetic secular variation in the western United States--Implications for the global geomagnetic field, U.S. Geol. Surv. Open File Rep. 80-824, 1-326, 1980.
Cox, A., Confidence limits for the precision parameter k, Geophys. J. R. Astron. Soc., 18, 545-549, 1969.
Cox, A., The frequency of geomagnetic reversals and the symmetry of the nondipole field, Rev. Geophys., 13, 35-51, 1975.
Cox, A., and R. R. Doell, Long period variations of the geomagnetic field, Bull. Seisrnol. Soc. Am., 54, 2243-2270, 1964.
Creer, K. M., P. W. Readman, and A.M. Jacobs, Paleomagnetic and paleontological dating of a section at Gioia Tauro, Italy: Identifi- cation of the Blake event, Earth Planet. Sci. Lett., 50, 289-300, 1980.
Curry, R. R., Glacial and Pleistocene history of the Mammoth Lakes Sierra, California--A geologic guidebook, Univ. Mont. Geol. Ser. Publ., 2, 1-49, 1971.
Dalrymple, G. B., and M. A. Lanphere, Potassium-Argon Dating, W. H. Freeman, San Francisco, Calif., 1969.
Davis, P.M., and M. E. Evans, Interacting single-domain properties of magnetite intergrowths, J. Geophys. Res., 81, 989-994, 1976.
Denham, C. R., Blake polarity episode in two cores from the Greater Antilles outer ridge, Earth Planet. Sci. Lett., 29, 422-434, 1976.
Denham, C. R., R. F. Anderson, and M.P. Bacon, Paleomagnetism and radiochemical age estimates for late Brunhes polarity episodes, Earth Planet. Sci. Lett., 35, 384-397, 1977.
Doell, R. R., and A. Cox, The Pacific geomagnetic secular variation anomaly and the question of lateral uniformity in the lower mantle, in The Nature of the Solid Earth, edited by E. C. Richardson, pp. 245-284, McGraw-Hill, New York, 1972.
Doell, R. R., and G. B. Dalrymple, Geomagnetic polarity epochs: A new polarity event and the age of the Brunhes-Matuyama bound- ary, Science, 152, 1060-1061, 1966.
Doell, R. R., G. B. Dalrymple, and A. Cox, Geomagnetic polarity epochs: Sierra Nevada data, 3, J. Geophys. Res, 71, 531-541, 1966.
Doell, R. R., G. B. Dalrymple, R. L. Smith, and R. A. Bailey, Paleo- magnetism, potassium-argon ages, and geology of rhyolites and associated rocks of the Valles Caldera, New Mexico, Mern. Geol. Soc. Am., 116, 211-248, 1968.
Donnelly, J. M., Geochronology and evolution of the Clear Lake volcanic field, Ph.D. thesis, 48 pp., Univ. of Calif., Berkeley, 1977.
Donnelly-Nolan, J. M., B.C. Hearn, Jr., G. H. Curtis, and R. E. Drake, Geochronology and evolution of the Clear Lake Volcanics, U.S. Geol. Surv. Prof Pap., 1141, 47-60, 1981.
Ericson, D. B., M. Ewing, G. A. Wollin, and B.C. Heezen, Atlantic deep sea sedimentary cores, Geol. Soc. Am. Bull., 72, 193-286, 1961.
Fisher, R. A., Dispersion on a sphere: Proc. R. Soc. London, 217, Ser. A, 295-305, 1953.
Gilbert, C. M., Welded tuff in eastern California, Geol. Soc. Am. Bull., 49, 1829-1862, 1938.
Gilbert, C. M., Late Tertiary geology southeast of Mono Lake, Cali- fornia, Geol. Soc. Am. Bull., 52, 781-816, 1941.
Gromm6, C. S., and E. A. Mankinen, Natural remanent mag- netization, magnetic properties, and oxidation of titanomagnetite in basaltic rocks from DSDP leg 34, in Initial Rep. Deep Sea Drill. Proj., 34, 485-494, 1976.
Gromm6, C. S., E. A. Mankinen, M. Marshall, and R. S. Coe, Geo- magnetic paleointensities by the Thelliers' method from submarine pillow basalts: Effects of seafloor weathering, J. Geophys. Res., 84, 3553-3575, 1979.
Hildreth, W., The Bishop Tuff: Evidence for the origin of compo- sitional zonation in silicic magma chambers, Spec. Pap. Geol. Soc. Am., 180, 43-75, 1979.
Ingamells, C. O., Lithium metaborate flux in silicate analysis, Anal. Chirn. Acta, 52, 323-334, 1970.
Liddicoat, J. C., K. R. Lajoie, R. A. Bailey, A.M. Sarna-Wojcicki, P. C. Russell, and M. Woodward, Reversal of the paleomagnetic field in Brunhes-age lacustrine sediments in Long Valley and Mono basin, California, Eos Trans. AGU, 61, 215, 1980.
Mankinen, E. A., and G. B. Dalrymple, Electron microprobe evalu- ation of terrestrial basalts for whole-rock K-Ar dating, Earth Planet. Sci. Lett., 17, 89-94, 1972.
Mankinen, E. A., and C. S. Gromm6, Paleomagnetic data from the Coso Range, California and current status of the Cobb Mountain normal geomagnetic polarity event, Geophys. Res. Lett., 9, 1279- 1282, 1982.
Mankinen, E. A., J. M. Donnelly-Nolan, C. S. Gromm6, and B.C. Hearn, Jr., Paleomagnetism of the Clear Lake Volcanics and new limits of the Jaramillo normal polarity event, U.S. Geol. Surv. Prof. Pap., 1141, 67-82, 1981.
McElhinny, M. W., and R. T. Merrill, Geomagnetic secular variation over the past 5 m.y., Rev. Geophys., 13, 687-708, 1975.
McFadden, P. L., and D. L. Jones, The fold test in paleomagnetism, Geophys. J. R. Astron. Soc., 67, 53-58, 1981.
Merrill, R. T., and M. W. McElhinny, Anomalies in the time-averaged paleomagnetic field and their implications for the lower mantle, Rev. Geophys., 15, 309-323, 1977.
Metz, J., and G. Mahood, Eruptive history of Glass Mountain, Long Valley, California: Precursors to a large explosive eruption, U.S. Geol. Surv. Open File Rep. 84-939, 41-62, 1984.
Miller, C. D., Holocene eruptions at the Inyo volcanic chain, Califor- nia: Implications for possible eruptions in Long Valley caldera, Geology, 13, 14-17, 1985.
Miller, C. D., D. R. Mullineaux, D. R. Crandell, and R. A. Bailey, Potential hazards from future volcanic eruptions in the Long Valley-Mono Lake area, east-central California and southwest

652 MANKINEN ET AL.-' LONG VALLEY: PALEOMAGNETISM AND K-AR AGES
Nevada--A preliminary assessment, U.S. Geol. Surv. Circ., 877, 1-10, 1982.
Nishimura, S., E. Abe, J. Nishida, T. Yokoyama, A. Dharma, P. He- hanussa, and F. Hehuwat, A gravity and volcanostratigraphic inter- pretation of the Lake Toba region, North Sumatra, Indonesia, Tec- tonophysics, 109, 253-272, 1984.
Pakiser, L. C., Gravity, volcanism, and crustal deformation in Long Valley, California, U.S. Geol. Surv. Prof. Pap., 424-B, B250-B253, 1961.
Pakiser, L. C., M. F. Kane, and W. N. Jackson, Structural geology and volcanism of Owens Valley, California--A geophysical study, U.S. Geol. Surv. Prof. Pap., 438, 1-68, 1964.
Reynolds, R. L., Paleomagnetism of welded tuffs of the Yellowstone Group, J. Geophys. Res., 82, 3677-3693, 1977.
Sasajima, S., S. Nishimura, and K. Hirooka, The Blake geomagnetic event as inferred from late Brunhes ignimbrites in southwest Japan and west Indonesia, J. Geomagn. Geoelectr., 36, 203-214, 1984.
Sharp, R. P., and J. H. Birman, Additions to the classical sequence of Pleistocene glaciation, Sierra Nevada, California, Geol. Soc. Am. Bull., 74, 1079-1086, 1963.
Sieh, K., Most recent eruptions of the Mono Craters, eastern Califor- nia, U.S. Geol. Surv. Open File Rep. 84-939, 96-129, 1984.
Smith, J. D., and J. H. Foster, Geomagnetic reversal in Brunhes normal polarity epoch, Science, 163, 565-567, 1969.
Smith, R. L., and R. A. Bailey, Resurgent cauldrons, Mem. Geol. Soc. Am., ! !6, 613-662, 1968.
Stacey, F. O., and S. K. Banerjee, The Physical Principles of Rock Magnetism, Elsevier, New York, 1974.
Steiger, R. H., and E. J/iger, Subcommission on geochronology-- Convention on the use of decay constants in geo- and cosmochron- ology, Earth Planet. Sci. Lett., 36, 359-362, 1977.
Suhr, N.H., and C. O. Ingamells, Solution technique for analysis of silicates, Anal. Chem., 38, 730-734, 1966.
Williams, D. L., F. Berkman, and E. A. Mankinen, Implications of a magnetic model of the Long Valley caldera, California, J. Geophys. Res., 82, 3030-3038, 1977.
Wilson, R. L., Permanent aspects of the earth's non-dipole magnetic field over Upper Tertiary times, Geophys. J. R. Astron. Soc., 19, 417-439, 1970.
Wood, S., Mono craters, California: History of rhyolite volcanism, Geol. Soc. Am. Abstr. Programs, 9, 528-529, 1979.
Wood, S., Chronology of Late Pleistocene and Holocene volcanics, Long Valley and Mono basin geothermal areas, eastern California, U.S. Geol. Surv. Open File Rep., 83-747, 1-76, 1983.
R. A. Bailey, G. B. Dalrymple, C. S. Gromm6, M. A. Lanphere, and E. A. Mankinen, U.S. Geological Survey, 345 Middlefield Road, Menlo Park, CA 94025.
(Received May 20, 1985; revised August 21, 1985;
accepted August 23, 1985.)


