Embed Size (px)
Citation preview
Palo Alto Mercedes Benz and Audi Dealership Project
Noise Assessment Study
May 2019 | YSM-01
Prepared for:
YSM Design305 North Coast Highway, Suite L
Laguna Beach, CA 92651
Prepared by:
HELIX Environmental Planning, Inc.7578 El Cajon Boulevard
La Mesa, CA 91942
Palo Alto Mercedes Benz and Audi Dealership Project
Noise Assessment Study
Prepared for:
YSM Design
305 North Coast Highway, Suite L Laguna Beach, CA 92651
Prepared by:
HELIX Environmental Planning, Inc.
7578 El Cajon Boulevard La Mesa, CA 91942
May 2019 | YSM-01
i
TABLE OF CONTENTS
Section Page
EXECUTIVE SUMMARY ............................................................................................................................. ES-1
1.0 INTRODUCTION ................................................................................................................................ 1
1.1 Purpose of the Report ......................................................................................................... 1 1.2 Project Location .................................................................................................................. 1 1.3 Project Description ............................................................................................................. 1 1.4 Noise and Sound Level Descriptors and Terminology ........................................................ 1
1.4.1 Descriptors ............................................................................................................. 1 1.4.2 Terminology ........................................................................................................... 2
1.5 Regulatory Framework ....................................................................................................... 3 1.5.1 California Noise Control Act ................................................................................... 3 1.5.2 City of Palo Alto Comprehensive Plan ................................................................... 3 1.5.3 City of Palo Alto Noise Ordinance .......................................................................... 3
2.0 ENVIRONMENTAL SETTING .............................................................................................................. 5
2.1 Surrounding Land Uses ....................................................................................................... 5 2.2 Noise-Sensitive Land Uses .................................................................................................. 5 2.3 Existing Noise Environment ................................................................................................ 5
2.3.1 Ambient Noise Survey ............................................................................................ 6
3.0 ANALYSIS, METHODOLOGY, AND ASSUMPTIONS ............................................................................ 7
3.1 Methodology....................................................................................................................... 7 3.1.1 Ambient Noise Survey ............................................................................................ 7 3.1.2 Noise Modeling Software ...................................................................................... 8
3.2 Assumptions ........................................................................................................................ 8 3.2.1 Construction Equipment ........................................................................................ 8 3.2.2 Local Ambient Noise Level ..................................................................................... 9 3.2.3 Operation ............................................................................................................... 9
3.3 Guidelines for the Determination of Significance............................................................. 12
4.0 IMPACTS ......................................................................................................................................... 13
4.1 Issue 1: Excessive Noise Levels ......................................................................................... 13 4.1.1 Temporary Construction Noise ............................................................................ 13 4.1.2 Permanent On-Site Operational Noise ................................................................ 13 4.1.3 Project-Generated Transportation Noise ............................................................ 17 4.1.4 Exposure to Excessive Noise for New Uses ......................................................... 17
4.2 Issue 2: Excessive Vibration .............................................................................................. 18 4.2.1 Construction Vibration ......................................................................................... 18 4.2.2 Operational Vibration .......................................................................................... 18
4.3 Issue 3: Airport Noise Exposure ........................................................................................ 18
ii
TABLE OF CONTENTS (cont.)
Section Page
5.0 LIST OF PREPARERS ........................................................................................................................ 19
6.0 REFERENCES ................................................................................................................................... 20
LIST OF APPENDICES A On-Site Noise Measurements B Traffic Noise C Blower Assembly Data Sheets D Generator Data Sheets E HVAC Data Sheets F Construction Noise Modeling Outputs
LIST OF FIGURES No. Title Follows Page 1 Regional Location ............................................................................................................................. 2 2 Surrounding Land Use and Noise Measurement Locations ............................................................. 2 3 Site Plan ........................................................................................................................................... 2 4 Noise Contours – Car Wash with Doors Open ............................................................................... 14 5 Noise Contours – Car Wash with Doors Closed ............................................................................. 14 6 Noise Contours – Generators with Sound Walls ............................................................................ 16
LIST OF TABLES No. Title Page 1 Land Use Compatibility for Community Noise Environment ........................................................... 3 2 Project Site Visit Noise Measurement Results ................................................................................. 6 3 Car Wash Door Noise Reduction Index Curve................................................................................ 10 4 HVAC System Noise Data ............................................................................................................... 10 5 Project Traffic Volumes .................................................................................................................. 12 6 Modeled Car Wash Noise Levels .................................................................................................... 14 7 Modeled Generator Noise Levels .................................................................................................. 15 8 Modeled HVAC and Parking Noise Levels ...................................................................................... 16 9 Modeled On-site Noise Levels ....................................................................................................... 16 10 Modeled Off-site Traffic Noise Levels ............................................................................................ 17
iv
ACRONYMS AND ABBREVIATIONS
ANSI American National Standards Institute APN Assessor’s Parcel Number ASHRAE American Society of Heating, Refrigeration, and Air Conditioning Engineers CAD Computer Aided Design CadnaA Computer Aided Noise Abatement Caltrans California Department of Transportation CEQA California Environmental Quality Act City City of Palo Alto CNEL Community Noise Equivalent Level CS City of Palo Alto Commercial Services Zone dB decibel dBA A-weighted decibels FHWA Federal Highway Administration HVAC Heating, ventilation, and air conditioning Hz Hertz in/sec inches per second kHz kilohertz LDN Day-Night level LEQ equivalent sound level LMAX maximum noise level mPa micro-Pascals NSLU noise-sensitive land use PPV peak particle velocity RCNM Roadway Construction Noise Model SF square feet SPL sound pressure level STC sound transmission class SWL sound power level
v
ACRONYMS AND ABBREVIATIONS (cont.)
TIA Transportation Impact analysis TNM Traffic Noise Model US-101 U.S. Highway 101
Palo Alto Mercedes Benz and Audi Dealership Project Noise Assessment Study | May 2019
ES-1
EXECUTIVE SUMMARY This report presents an assessment of potential construction and operational noise impacts associated with the proposed Palo Alto Mercedes Benz and Audi Dealership Project (project), located at the southeast corner of Embarcadero Road and East Bayshore Road, at 1700 and 1730 Embarcadero Road in the City of Palo Alto, California. The project would construct a new Mercedes-Benz automobile dealership showroom and new parking garage and service facilities for the Mercedes-Benz and Audi dealerships, on a 4.82-acre site.
Anticipated construction noise impacts would generate elevated noise levels for adjacent land uses. Noise from project construction equipment would not exceed the City noise ordinance construction noise limits and the project would not result in a temporary increase ambient noise levels in the vicinity of the project in excess of standards established by the City. Construction vibration impacts at neighboring uses would be less than significant.
Operation of the project’s proposed car wash and backup generators would result in significant noise impacts at nearby property lines. With implementation of mitigation measure MM-1 to install automated door on the car wash tunnel entrance and exit, car wash operational impacts would be reduced to less than significant. Operation of the proposed backup generators would be reduced to less than significant levels with implementation of MM-2 to install sound walls around the generators. Long-term operational noise related to the proposed buildings’ mechanical equipment and parking areas would not result in a significant increase in ambient noise levels. With the mitigation measures described in the report, the combined operations of the car wash, rooftop heating, ventilation, and air conditioning (HVAC), parking areas, and backup generators would not exceed allowable exterior limits established by the City of Palo Alto (City) noise ordinance at the project property lines.
The project would add traffic to nearby roadways. The estimated maximum increase in traffic noise at the nearest receptors to project affect roadways would not result in a perceptible change in ambient noise levels. Impacts related to traffic noise increases would be less than significant.
The project would not expose people residing or working in the project area to excessive noise from a nearby public use airport or private airstrip and impacts related to aircraft noise would be less than significant.

Palo Alto Mercedes Benz and Audi Dealership Project Noise Assessment Study | May 2019
ES-2
This page intentionally left blank
Palo Alto Mercedes Benz and Audi Dealership Project Noise Assessment Study | May 2019
1
1.0 INTRODUCTION 1.1 PURPOSE OF THE REPORT
This report analyzes potential noise and vibration impacts associated with the proposed Palo Alto Mercedes Benz and Audi Dealership Project (project). The analysis includes a description of existing conditions in the project vicinity, an assessment of potential impacts associated with project construction, and an evaluation of project operational impacts. Analysis within this report addresses the relevant issues listed in Appendix G of the California Environmental Quality Act (CEQA) Guidelines.
1.2 PROJECT LOCATION
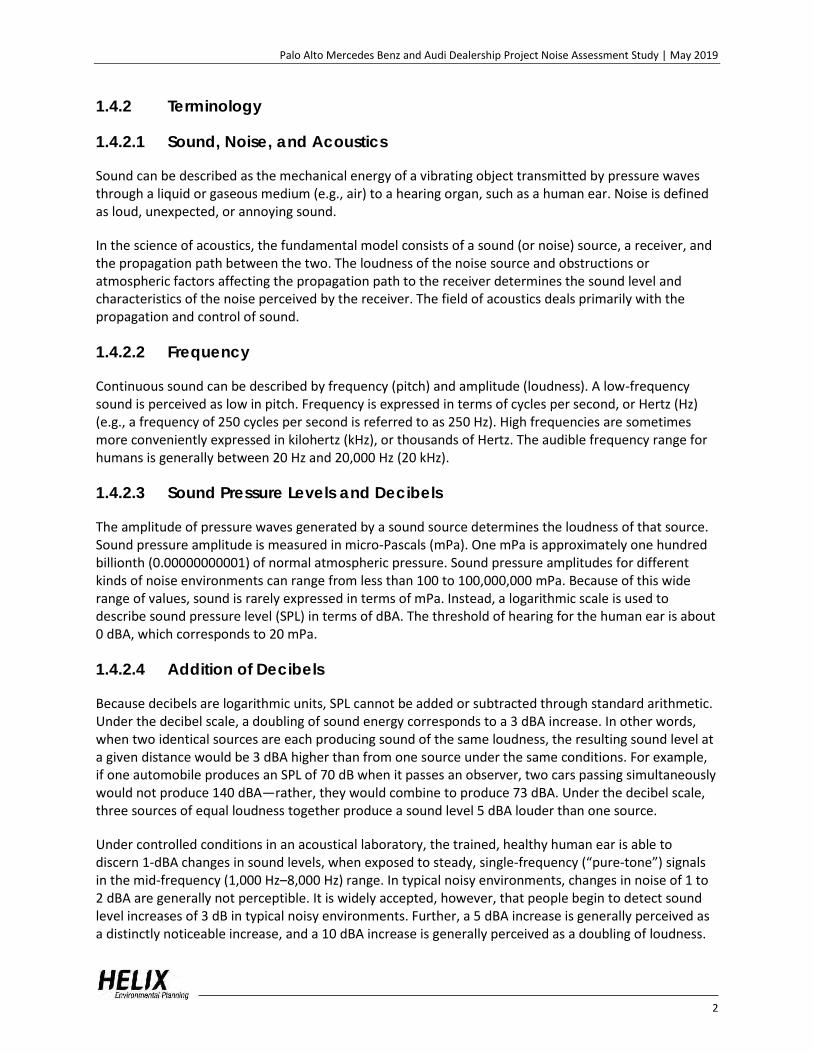
The project is located on a 4.82-acre site comprising Assessor’s Parcel Numbers [APNs] 008-03-066 and 008-03-084. The property is located at 1700 and 1730 Embarcadero Road in the City of Palo Alto, at the southeast corner of Embarcadero Road and East Bayshore Road. The project site is located approximately 850 feet east of U.S. Highway 101 (US-101). See Figure 1, Regional Location, and Figure 2, Surrounding Land Use and Noise Measurement Locations.
1.3 PROJECT DESCRIPTION
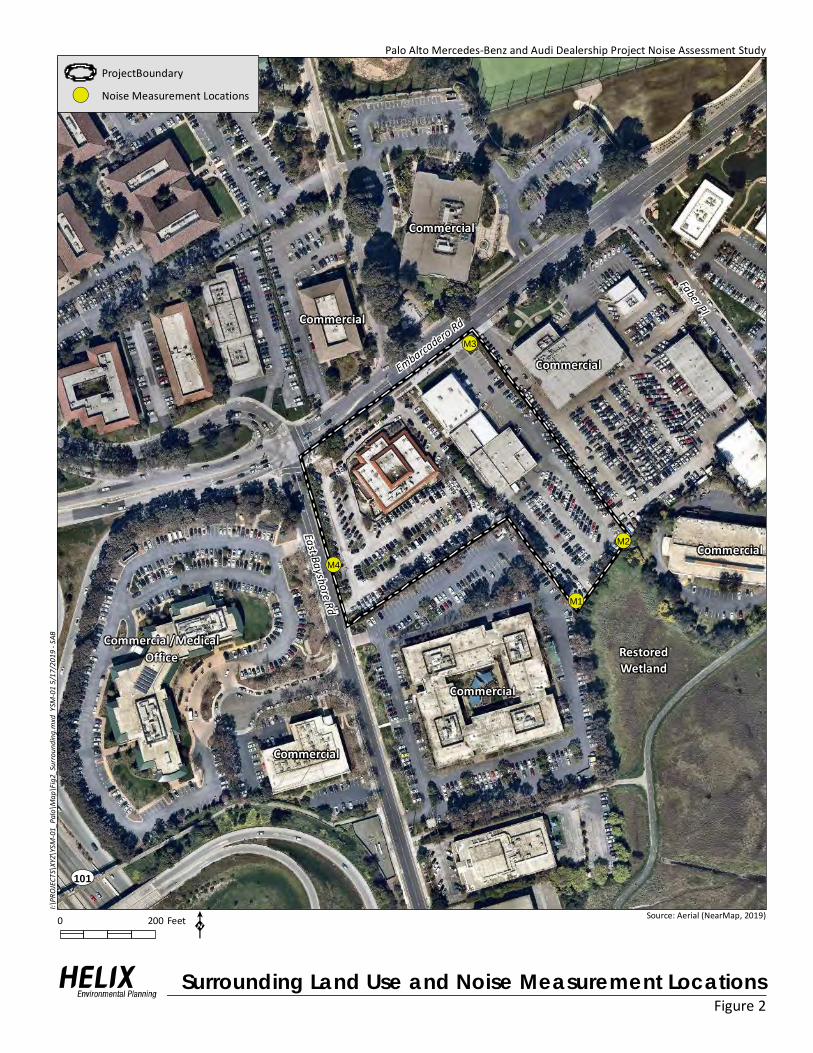
The project would demolish an existing vacant restaurant and Audi dealership service building. A Mercedes-Benz showroom totaling approximately 54,000 square feet (SF) would be constructed to provide a ground level showroom, offices, employee facilities, and a large open area at the middle of the building for an automated car stacking system. An approximately 106,000 SF combined service building and two-story parking garage (3 parking levels) would extend across the rear of the new Mercedes-Benz and existing Audi showrooms. Two backup generators would be included in the project, one located to the rear of the Audi portion of parking garage and one on the southwest side of the Mercedes Benz portion of the parking garage. An approximately 2,155-SF detached automated car wash would be located to the rear of the Audi portion of the project site. Paved drive isles and surface parking area would be located along the perimeter of the buildings. See Figure 3, Site Plan.
1.4 NOISE AND SOUND LEVEL DESCRIPTORS AND TERMINOLOGY
1.4.1 Descriptors
All noise level or sound level values presented herein are expressed in terms of decibels (dB), with A-weighting (dBA) to approximate the hearing sensitivity of humans. Time-averaged noise levels are expressed by the symbol LEQ, with a specified duration. The Community Noise Equivalent Level (CNEL) is a 24-hour average, where noise levels during the evening hours of 7:00 p.m. to 10:00 p.m. have an added 5 dBA weighting, and noise levels during the nighttime hours of 10:00 p.m. to 7:00 a.m. have an added 10 dBA weighting. This is similar to the Day Night sound level (LDN), which is a 24-hour average with an added 10 dBA weighting on the same nighttime hours but no added weighting on the evening hours. Sound levels expressed in CNEL or LDN are always reported in dBA. These metrics are used to express noise levels for both measurement and municipal regulations, as well as for land use guidelines and enforcement of noise ordinances.
Palo Alto Mercedes Benz and Audi Dealership Project Noise Assessment Study | May 2019
2
1.4.2 Terminology
1.4.2.1 Sound, Noise, and Acoustics
Sound can be described as the mechanical energy of a vibrating object transmitted by pressure waves through a liquid or gaseous medium (e.g., air) to a hearing organ, such as a human ear. Noise is defined as loud, unexpected, or annoying sound.
In the science of acoustics, the fundamental model consists of a sound (or noise) source, a receiver, and the propagation path between the two. The loudness of the noise source and obstructions or atmospheric factors affecting the propagation path to the receiver determines the sound level and characteristics of the noise perceived by the receiver. The field of acoustics deals primarily with the propagation and control of sound.
1.4.2.2 Frequency
Continuous sound can be described by frequency (pitch) and amplitude (loudness). A low-frequency sound is perceived as low in pitch. Frequency is expressed in terms of cycles per second, or Hertz (Hz) (e.g., a frequency of 250 cycles per second is referred to as 250 Hz). High frequencies are sometimes more conveniently expressed in kilohertz (kHz), or thousands of Hertz. The audible frequency range for humans is generally between 20 Hz and 20,000 Hz (20 kHz).
1.4.2.3 Sound Pressure Levels and Decibels
The amplitude of pressure waves generated by a sound source determines the loudness of that source. Sound pressure amplitude is measured in micro-Pascals (mPa). One mPa is approximately one hundred billionth (0.00000000001) of normal atmospheric pressure. Sound pressure amplitudes for different kinds of noise environments can range from less than 100 to 100,000,000 mPa. Because of this wide range of values, sound is rarely expressed in terms of mPa. Instead, a logarithmic scale is used to describe sound pressure level (SPL) in terms of dBA. The threshold of hearing for the human ear is about 0 dBA, which corresponds to 20 mPa.
1.4.2.4 Addition of Decibels
Because decibels are logarithmic units, SPL cannot be added or subtracted through standard arithmetic. Under the decibel scale, a doubling of sound energy corresponds to a 3 dBA increase. In other words, when two identical sources are each producing sound of the same loudness, the resulting sound level at a given distance would be 3 dBA higher than from one source under the same conditions. For example, if one automobile produces an SPL of 70 dB when it passes an observer, two cars passing simultaneously would not produce 140 dBA—rather, they would combine to produce 73 dBA. Under the decibel scale, three sources of equal loudness together produce a sound level 5 dBA louder than one source.
Under controlled conditions in an acoustical laboratory, the trained, healthy human ear is able to discern 1-dBA changes in sound levels, when exposed to steady, single-frequency (“pure-tone”) signals in the mid-frequency (1,000 Hz–8,000 Hz) range. In typical noisy environments, changes in noise of 1 to 2 dBA are generally not perceptible. It is widely accepted, however, that people begin to detect sound level increases of 3 dB in typical noisy environments. Further, a 5 dBA increase is generally perceived as a distinctly noticeable increase, and a 10 dBA increase is generally perceived as a doubling of loudness.
!
!
!
!!! !
!!
!!
!
!
!
!
!!
!
!! ! !
!
!
!
!
!!
!
!
!!
!
!
!!
!
!! !
!
!
!!
!!
!!!!
!!
!!
! !
!!
!!
! !
!
!
!
!
!!
!!
!
!! !
!!
!!
!
!
!
!
!
!
!
!
!
!
!
!
!!
!!!
!
!
!
!
!!
!!
!!
!!!!
!!!
!!
!
!
!
!!
!
!
!!
!
!
!
!
!!
!
!
! !
!
!
!!
! ! ! !
! !
!
!
!!
!
!!
! !
!
!
!
!!
!
!
!!
!!
!
!
!
!
!!
!!
!!
!!
!
!
!
!
!
!
!
!!
!!
!
!
!!
!
!!
!!
!
!!
!
!
!!
!
!
!
!
!!
!!
!
!
!
!!
!!
!!
!
!!
!
!
!
!
!
!
!
!!
!!
!
!
!
!
!!
!
!
!!
!
!
!
!
!!
!!
!
!!
!
!
!
!!
!!
!!
! !
!!
!!
!!
!
!!
!
!
!
!!
!
!
!
!
!
!!!
!
!
!
!
!
!
!!
!!
!
!
!!
!!
!!
!
!
!
!
!!
!!
!!
!!
!!
!
!!
!
!
!!
!!
!!!!
!!
!
!
!!
!!
!!
!!
!
!
!!
!!
!
!
!!
!
!!
!
!!
!!
!!
!
!
!!
!
!
!!
!!
!!
!!
!
!
!!
!!
!!
!!
!
!
!
!
!
!!
!
!
!
!!
!
!
!
!
!!
!!
!!
!
!
!
!
!!
!
!
!
!
!!
!!
!!
!
!!
!
!
!!
!
!
!
!
!!
!
!!!
!
!
!
!!
!!
!
!
!!
!
!
!!
!!!
!!!
!!!!
!
!
!
!
!!
!!
!!
!!
!!!
!
!
!!! !!
!!!
!
!!
!
!
!
!!
!!
!!
!!
!!
!!!
!
!
!
!
!
!!
!!
!
!!
!!
!!
!
!
!!!
!
!
!
!!
!
!
!!
!
!
!!
!
!
!
!
!
!
!
!
!!
!!
!
!!
!
!
!
!
!!
!
!
!! !
!!
!
!
!
!
!
!
!!
!
!
!
!
!
!
!!
!
!
!!
!
!
!! ! !
!
!
!!
!! !!
!
!
!
!
!
!
!
!
!
!! !
!!
!
!!
!!
!!
!!
!!
!!
!!
!!
!!
!!
!!
!!
!
!
!!
!!
!
!
!
!
!
!
!
!
!
!
!!
!
!
!
!
!!
!!
!!
!!!
!
!
!
!
!!
!!
!
!
!
!
!!
!!
!
!
!
!
!!
!
!
!
!!!
!
!
!!!!!
!
!
!!
!! !
!!
!
!!
!! !!
!!
!!
! !
!
!
!
!
!
!!
!
!
!
!
!
!!
!
!!
!
!
!!
!!
!
!
!
!
!!
!
!!
!
!!
!!
!!
!!
!!
!!
!
!
!!
!!
!!
!!
!
!
!!
!
!!
!
!
!!
!!
!!
!!
!!
!!
!
!
!!
!
!
!
!!
!
!
!
!
!!
!
!
!
!
!!
!!
!
!
!
!
!!
!!!!
!!
!!
!
!
!!
!
!
!
!
!!
!!
!
!
!
!
!
!
!
!
!
!!
!!
!!
!!
!!
!
!
!
!
!!
! !
! !
!!
!
!
!
!
!
!
! !
!!
!!
!
!
!!!
!
!
!
!!
!!
!!
!!
!!
!!
!!
!
!
!
!!
!!
!!
!!
!
!!
!!
!!
!
!!
! !
!!
!!
!!
!
!
!
!
!
!!
!
!
!!
!!
!!
!!
!
!!
!!
!
!
!
!!
!
!!
!
!
!
!
!
!
!!
!
!
!!
!
!
!!!
!
!!
!
!!!
!!
!!
!!
!!
!!
!
!
!
!
!!
!!
!
!
!
!
!
!
!
!!
!
!
!
!
!!!
!
!
!!!
!!
!
!
!
!
!
!!
!
!
!!
!!
!!
!!
!
!
!
!
!
!
!
!
!!
!
!
!!!
!
!
!
!
!
!
!!
!
!
!
!
!
!
!!!
!
!
!
!
!
!
!!
!!
! !
!
!!
!
!!
!!
!!
!
!
!!
!!
!
!
!!
!!
!
!!
!!
!
!
!
!!
!
!
!!
!
!
!
!!
!
!
!
!
!
!
!
!
!
!
!!
!
!!
!
!!
!
!!
!
!
!!
!!
!!
!!
!
!!
!!
!
!!
!
!
!
!!
!!
!!
! !
!!
!
!
!!
!!
!
!
!
!
!!
!!
!
!
! !
!
!
!
!
!!
! !
!
!
!
!
!
!
!
!
!
!
!
!
!!
!
!
!
!
!
!!
!!
!!
!!
!
!
! !
!!
!
!!
!
!
!
!
!
!!
!!
!
!!
!
!
! !
!!
!
!
!
!!
!
!!
!
!
!!!
!
!!
! !
!
! !
!
!! !!
!
!
!
!!
!!
!
!
!
!
!
!!
!!
!
! !
!
!
!
!
!
!
!
!
!
!!
!
!
!!
!
!
!
!
!
!
!
!
!
!
!!
!!
!!
!!
!!
!!
!!
!
!!!!
!
!
!
!
!
!!!!
! !
!
!
!!!
!
!!
!
!!!
!
!!!
!
!
!
!
!!
!
!!
!!
!
!!
!!
!
!
!!
!!
!
!
!
! !!
!
!!
!!!
!!
!!
!!
!
!
!
!
!!
!!
!!
!!!
!!
!!
!
!
!
!!
!!! !!
!
!
!
!
!
!
!!
!!
!
!
!
!
!
!
!
!!
!
!
!!
!!
!!
!!
!!
!!
!!
!
!
!
!
!!
!
!
!
!
!
!
!
!
!!
!
!
!
!
!!
!!
!
!
!
!
!
!
!
!
!
!
!
!
!!
!!
!
!
! !
!!
!
!!!
!
!
!!
!
!
!!
!
!
!!
!!
!!!
!
!
!!
!
!!
!!
!!
!!
!
!
!!
!
!
!
!
!!
!!
!
!
!!
!! !
!!
!!
!
!
!
!
!
!
!!
!
!
!!
!!
!!
!
!
!!
!!
!
!
!!
!!
!!
!!
!!
!!
!
!
!
!
!!
!!
!!
!!
!!
!!
!
!
!!
!!!
!
!
!
!! !
!
!!
!
!
!
!!!! !
!!
!
!
!!
!!
!!
!!
!
!
!!
!
!
!
!
!!
!
!
!!
!!
!!
!!
!!
!
!
!!
!
!!
!
!!!! !
!
!
!!
!!! !!
!!
!!
!
!!
!
!!
!!
!
!
!!
!
!!
!
!
!
!
!
!!
!!
!
!
!
!!!
!
!
!!
!
!!
!
!
!
!
!
!
!
!!
!
!
!!
!
!!
!!!
!
!
!!!!
!!
!
!!!
!!!!
!
!!
!
!
!!
!
!
!
!!
!
!
!!
!
!!!
!!
!!
!!!
!
!
!!
!!
!
!!
!
!
!!
!!
!
!
!
!!
!
!
!
!
!!
!
!
!
!
!
!
!
!
!
!
!!
!
!
!
!!
!!
!
!
!
!
!
!!
! !!!
!
!
!!!!
!
!!
!
!
!
!
!
!
!!
!
!!
!
!
!
!!!
!
!!
!
!
!
!
!!
!!
!!
!
!
!
!
!
!!
!
!
!!
!!
!
!!
!!
!
!
!
!!
!!
!
!
!!
!!
!!
!!!!
!!
!!
!!
!
!
!
!!
!
!
!
!!
!!
!!
!
!
!
!
!
!!
!!
!
!!
!!
!!
!
!!
!!
!!
!!
!
!
!
!
!
!
!!
!!
!!
!
!
!
!
!
!!
! !
!!
!
Project Site
Reservoir DeLos Frijoles
Deer Creek
San PabloReservoirBriones Reservoir
Lake AnzaLafayetteReservoir Marsh Creek
Reservoir
BigLagoon
CliftonCourt Forebay
Rodeo Lagoon
Upper SanLeandro Reservoir
MountainLake
BethanyReservoir
LaurelSpringClub
SanAndreas
LakeLake del
Valle
Foothills Park
PomponioReservoir
MindegoLake
Almaden Reservoir
SunsetReservoir Seneca
ReservoirLake Chabot
Lake Merced NorthBasin
Frick Lake
PattersonReservoir
Don CastroReservoir
San AntonioReservoirCentral Lake
Lower CrystalSprings
Reservoir Middlefield Reservoir
Calaveras Reservoir
Searsville LakeCherry FlatReservoir
HallsValleyLake
IsabelValley
ReservoirStevens Creek Reservoir
Lake LucerneCoyote
Percolation
Lake Elizabeth
Lexington ReservoirGuadalupeReservoir
Lexington Reservoir
AndersonLake
SempervirensReservoir
Lone LakeCalero Reservoir
Lake Elsman Mud Lake
GreenOaksNo. 1 Loch Lomond
Mill Creek ChesbroReservoir
CoyoteLake
Devils Lake
UvasReservoirMillpond
LakeBuzzardLagoon Peabody
CottonwoodLake
LakeCunningham
SandyWool Lake
Los VaquerosReservoir
HorseshoeLake
Lake Temescal
SAN
JOAQ
UIN
COUN
TY
ALAM
EDA
COUN
TY
CONTRA COSTA COUNTY
ALAMEDA COUNTYSA
NT A
C R U Z
C OU N T Y
SANTA CLARACOUNTY
ALAMEDA COUNTY
GILROY
MORGAN HILL
LOS GATOS
SARATOGACAMPBELL
CUPERTINO
LOS ALTOSHILLS
LOSALTOSSANTACLARA
SUNNYVALE
SAN JOSE
MILPITASMOUNTAINVIEW
PALOALTO
NEWARKFREMONT
UNION CITY
HAYWARD
PLEASANTONLIVERMORE
DUBLIN
SAN RAMONALAMEDA
PIEDMONTDANVILLE
EMERYVILLE MORAGA
OAKLAND
ALBANYBERKELEY
ORINDA
EL CERRITO
LAFAYETTEWALNUT CREEK
CLAYTONBRENTWOOD
PLEASANT HILLANTIOCH OAKLEYCONCORD
RICHMOND
MARTINEZ
SANFRANCISCO
REDWOODCITY
SOUTH SANFRANCISCO
DALY CITY
MILL VALLEYLARKSPUR SANRAFAEL
SANTACRUZ
BRISBANE
FOSTER CITY
HALF MOON BAY
PACIFICA
TRACY
WATSONVILLE
SCOTTSVALLEY
WOODSIDEATHERTON
SANCARLOSBELMONT
HILLSBOROUGH
SANBRUNO
COLMA
PORTOLAVALLEY
MENLOPARK
SANMATEOBURLINGAME
MILLBRAE
CAPITOLA
EAST PALOALTO
SAUSALITOBELVEDERE
TIBURON
UV77
UV262UV114
UV580
UV260UV980
UV380
UV123
UV35
UV80
UV9
UV87
UV4UV131
UV152
UV24
UV84
UV1
UV101
UV61
UV238
UV13
UV680
UV185
UV880
UV237
UV92
UV17
UV82
UV1
UV280
UV85
UV101
Figure 1Regional Location
I:\PRO
JECTS\
XYZ\YS
M-01_
Palo\M
ap\Fi
g1_Reg
ional.m
xd YSM
-01 5/
17/201
9 - SA
B
Source: Base Map Layers (ESRI, 2013)
K
Palo Alto Mercedes-Benz and Audi Dealership Project Noise Assessment Study
0 8 Miles
Pacific Ocean
!(
!(
!(
!(
UV101
Faber Pl
East Bayshore Rd
Embarcadero Rd
M1
M2
M3
M4
Commercial
Commercial
Commercial
RestoredWetland
Commercial/MedicalOffice
Commercial
Commercial
Commercial
Figure 2Surrounding Land Use and Noise Measurement Locations
I:\PRO
JECTS\
XYZ\YS
M-01_
Palo\M
ap\Fi
g2_Sur
round
ing.m
xd YS
M-01
5/17/2
019 -
SAB
Source: Aerial (NearMap, 2019)
K
Palo Alto Mercedes-Benz and Audi Dealership Project Noise Assessment Study
0 200 Feet
ProjectBoundary
!( Noise Measurement Locations
Palo Alto Mercedes-Benz and Audi Dealership Project Noise Assessment StudyI:\
PRO
JECT
S\XY
Z\YS
M-0
1_Pa
lo\M
ap\F
ig3_
Site
Plan
.indd
Y
SM-0
1 5
/17/
19 -
SAB
Site PlanFigure 3
Source: YSM Design 2019
P - Pass
enger Ca
r
WB-67 - Interstate
Semi-Trailer
P - Pass
enger Ca
r
EVEV
EV
EV
EVEV
EVEV
EV
EV
EVEV
EV
NEW AUDI
MERCEDES-BENZ
EX AUDI
EMBARCADERO RD
E BA
YSHO
RE R
D
EXISTING HIGH VOLTAGE TRANSMISSION TOWERPROPOSED MERCEDES-BENZ
PYLON SIGN
8CUSTOMER
2 VAN ACCESSIBLECUSTOMER
13DISPLAY
5CUSTOMER
3 SERVICE
4CUSTOMER
7DISPLAY
1 CUSTOMER
4CUSTOMER
7
4
RAMP UP
RAM
P UP
GENERATOR
GENERATOR
ACCESSIBLE PATH
DUMPSTER ENCLOSURE-LANDFILL-RECYCLE-COMPOST
BIKE RACKS
BIKE RACKS
FLAGPOLE
FLAGPOLE
AUDICARWASHEX AUDIMBSERVICE DRIVE
BIKE RACKS
DISPLAY PAD 175 SF
TRANSMISSION TOWER ACCESS PAD NOT FOR DISPLAY
FFE = 11.50
FFE = 11.50 FFE
= 11
.50
FFE = 11.50
BFE = 10.50
SEE
CIVI
L FOR
REM
AIND
ER O
F
SIDE
WAL
KS A
ND S
TREE
T SC
OPE
RETAINING WALL
ACCESSIBLE PATH
ACCESSIBLE PATH TO EMBARCADERO
OIL WATER SEPARATOR
88' - 11"
85' - 5"
96' - 7"
3 ACCESSIBLE CUSTOMER
VAN
EVSE
EVSE
EVSE
EVSE
EVSE
EVSE
EVSE EVSE
EVSE EVSE
EVSEEVSE
EVSE - 14 EVSE INSTALLED ON GRADE
CAV
CAV
CAV
CAV CAV
EVSECAV
EVSECAV
CAV
CAV
CAV - 18 CLEAN AIR VEHICLE PARKING
CAV CAV
CAV CAV
CAV
CAV
VANCAV
CAV
CAV
OFF STREET LOADING ZONE
OFF
STRE
ET L
OADI
NG Z
ONE
CARWASH
P2
P2
SETBACK
5' - 0"
10' -
0" S
ETBA
CK
5' - 0" SETBACK
SETBACK5' - 0"
5' - 0" SETBACK
5' - 0
" SET
BACK
45' -
5 1/
2"
18' -
10 3
/8"
26' - 5 1/2"
87' -
8 1/
2"
48' - 6 1/2"
28' -
9 1/
8"
83' - 11 5/8"84' - 8 1/2"
MERCEDES BENZ / AUDI of PALO ALTOARCH SITE PLAN
MAGNETIC NORTH
Palo Alto Mercedes Benz and Audi Dealership Project Noise Assessment Study | May 2019
3
No known studies have directly correlated the ability of a healthy human ear to discern specific levels of change in traffic noise over a 24-hour period. Many ordinances, however, specify an increase of 3 CNEL as a threshold to determine whether a project would result in a substantial increase in noise levels. This is based on the concept of a doubling in noise energy resulting in a 3 dBA change in noise, which is the amount of change in noise necessary for the increase to be perceptible to the average healthy human ear.
1.5 REGULATORY FRAMEWORK
1.5.1 California Noise Control Act
The California Noise Control Act is a section within the California Health and Safety Code that describes excessive noise as a serious hazard to the public health and welfare and that exposure to certain levels of noise can result in physiological, psychological, and economic damage. It also finds that there is a continuous and increasing bombardment of noise in the urban, suburban, and rural areas. The California Noise Control Act declares that the State of California has a responsibility to protect the health and welfare of its citizens by the control, prevention, and abatement of noise. It is the policy of the State to provide an environment for all Californians free from noise that jeopardizes their health or welfare.
1.5.2 City of Palo Alto Comprehensive Plan
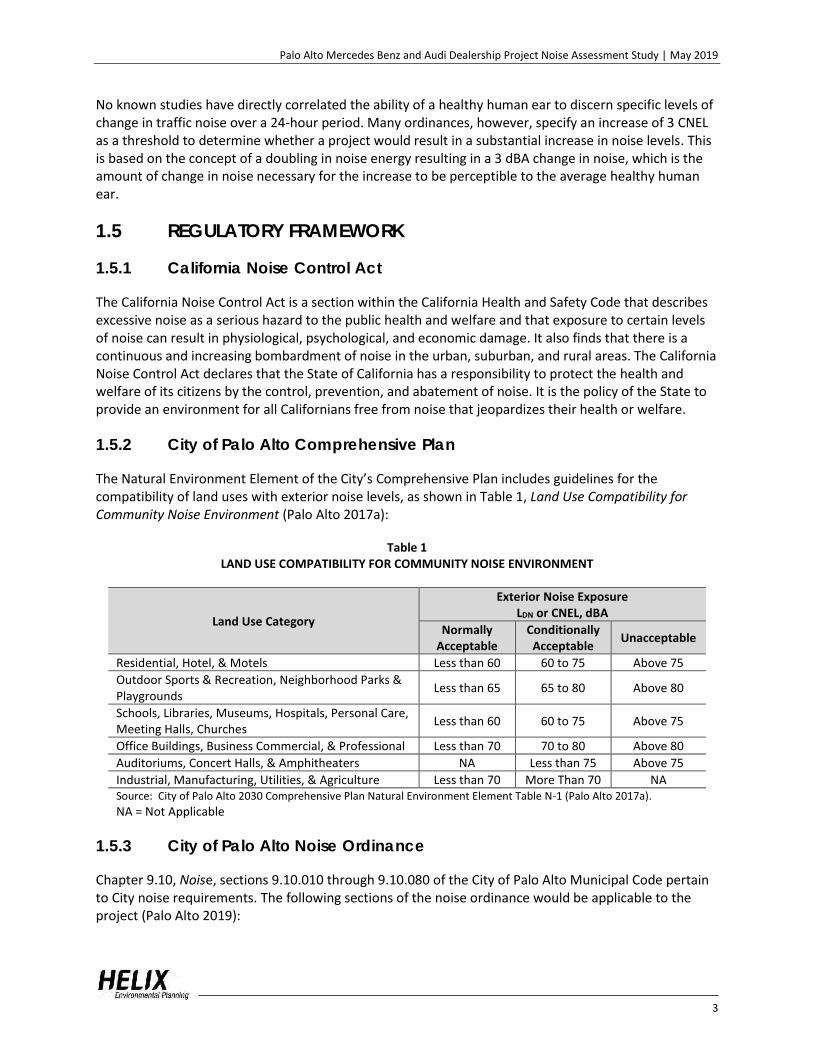
The Natural Environment Element of the City’s Comprehensive Plan includes guidelines for the compatibility of land uses with exterior noise levels, as shown in Table 1, Land Use Compatibility for Community Noise Environment (Palo Alto 2017a):
Table 1 LAND USE COMPATIBILITY FOR COMMUNITY NOISE ENVIRONMENT
Land Use Category
Exterior Noise Exposure LDN or CNEL, dBA
Normally Acceptable
Conditionally Acceptable
Unacceptable
Residential, Hotel, & Motels Less than 60 60 to 75 Above 75
Outdoor Sports & Recreation, Neighborhood Parks & Playgrounds
Less than 65 65 to 80 Above 80
Schools, Libraries, Museums, Hospitals, Personal Care, Meeting Halls, Churches
Less than 60 60 to 75 Above 75
Office Buildings, Business Commercial, & Professional Less than 70 70 to 80 Above 80
Auditoriums, Concert Halls, & Amphitheaters NA Less than 75 Above 75
Industrial, Manufacturing, Utilities, & Agriculture Less than 70 More Than 70 NA Source: City of Palo Alto 2030 Comprehensive Plan Natural Environment Element Table N-1 (Palo Alto 2017a).
NA = Not Applicable
1.5.3 City of Palo Alto Noise Ordinance
Chapter 9.10, Noise, sections 9.10.010 through 9.10.080 of the City of Palo Alto Municipal Code pertain to City noise requirements. The following sections of the noise ordinance would be applicable to the project (Palo Alto 2019):
Palo Alto Mercedes Benz and Audi Dealership Project Noise Assessment Study | May 2019
4
9.10.020 Definitions.
(b) "Precision sound level meter" means a device for measuring sound level in decibel units within the performance specifications in the American National Standards Institute Standard S1.4, "Specification for Sound Level Meters."
(c) "Noise level" means the maximum continuous sound level or repetitive peak sound level, produced by a source or group of sources as measured with a precision sound level meter. In order to measure a noise level, the controls of the precision sound level meter should be arranged to the setting appropriate to the type of noise being measured.
(d) "Local ambient" means the lowest sound level repeating itself during a six-minute period as measured with a precision sound level meter, using slow response and "A" weighting. The minimum sound level shall be determined with the noise source at issue silent, and in the same location as the measurement of the noise level of the source or sources at issue. However, for purposes of this chapter, in no case shall the local ambient be considered or determined to be less than: (1) 30 dBA for interior noise in Section 9.10.030(b); (2) 40 dBA in all other sections. If a significant portion of the local ambient is produced by one or more individual identifiable sources which would otherwise be operating continuously during the six-minute measurement period and contributing significantly to the ambient sound level, determination of the local ambient shall be accomplished with these separate identifiable noise sources silent.
(f) "Property plane" means a vertical plane including the property line which determines the property boundaries in space.
9.10.040 Commercial and industrial property noise limits.
No person shall produce, suffer or allow to be produced by any machine or device, or any combination of same, on commercial or industrial property, a noise level more than 8 dB above the local ambient at any point outside of the property plane.
9.10.060 Special provisions.
The special exceptions listed in this section shall apply, notwithstanding the provisions of Sections 9.10.030 through 9.10.050.
Said exceptions shall apply only to the extent and during the hours specified in each of the following enumerated exceptions.
(a) General Daytime Exception. Any noise source which does not produce a noise level exceeding 70 dBA at a distance of 25 feet under its most noisy condition of use shall be exempt from the provisions of Sections 9.10.030(a), 9.10.040 and 9.10.050(a) between the hours of 8:00 a.m. and 8:00 p.m. Monday through Friday, 9:00 a.m. and 8:00 p.m. on Saturday, except Sundays and holidays, when the exemption herein shall apply between 10:00 a.m. and 6:00 p.m.
(b) Construction. Except for construction on residential property as described in subsection (c) of this section, construction, alteration and repair activities which are authorized by valid
Palo Alto Mercedes Benz and Audi Dealership Project Noise Assessment Study | May 2019
5
city building permit shall be prohibited on Sundays and holidays and shall be prohibited except between the hours of 8:00 a.m. and 6:00 p.m. Monday through Friday, 9:00 a.m. and 6:00 p.m. on Saturday provided that the construction, demolition or repair activities during those hours meet the following standards:
(1) No individual piece of equipment shall produce a noise level exceeding 110 dBA at a distance of 25 feet. If the device is housed within a structure on the property, the measurement shall be made outside the structure at a distance as close to 25 feet from the equipment as possible.
(2) The noise level at any point outside of the property plane of the project shall not exceed 110 dBA.
2.0 ENVIRONMENTAL SETTING 2.1 SURROUNDING LAND USES
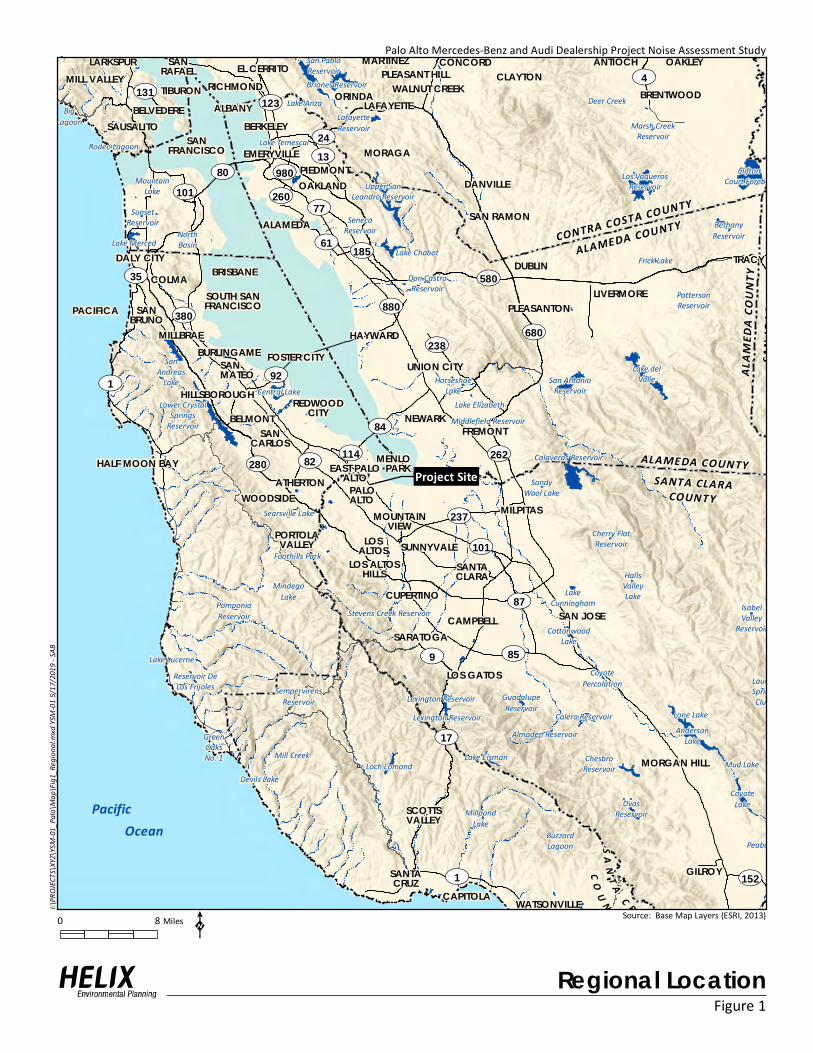
Surrounding land uses include developed commercial office and retail auto sales properties adjacent to project site to the south and east, developed commercial properties across Embarcadero Road to the north, and a medical office building across East Bayshore Road to the west. The southeastern edge of the project site is adjacent to an open-space/restored wetland (designated Open Space/Controlled Development in the City’s 2030 Comprehensive Plan [Palo Alto 2017b]). A multi-use trail crosses the open space approximately 280 feet southeast of the project site. The project site is zoned Commercial Services (CS) and is designated Service Commercial in the City’s 2030 Comprehensive Plan (Palo Alto 2017b). The project site is currently occupied by a vacant restaurant building at 1700 Embarcadero Road and the existing Audi auto dealership at 1730 Embarcadero Road. See Figure 1, Regional Location, and Figure 2, Surrounding Land Use and Noise Measurement Locations.
2.2 NOISE-SENSITIVE LAND USES
Noise-sensitive land uses (NSLUs) are land uses that may be subject to stress and/or interference from excessive noise. The City’s 2030 Comprehensive Plan Natural Environment Element includes the following in the definition of NSLUs: residences, schools, hospitals, convalescent homes, senior and child care facilities and public conservation land (Palo Alto 2017a). Noise receptors are individual locations that may be affected by noise. The closest NSLUs to the project site is the Hope Technology School approximately 420 feet (0.08 mile) to the south beyond an office building. According to Map L-6, from the 2030 Comprehensive Plan, the closest designated public conservation land is located approximately 1,000 feet (0.19 mile) southeast of the project site (Palo Alto 2017b). The closest residential NSLUs are multi-family building approximately 1,130 feet (0.21 mile) to the southwest across US-101.
2.3 EXISTING NOISE ENVIRONMENT
The existing noise environment is dominated by vehicular traffic noise on US-101, approximately 850 feet (0.16 mile) to the west. Other noise sources include traffic on local streets and general noise associated with parking lots and commercial building HVAC systems on the project site and on adjacent commercial properties. The nearest airport to the project site is the Palo Alto Airport, a general aviation airport located approximately 3,400 feet (0.64 mile) to the northeast. The project is subject to general
Palo Alto Mercedes Benz and Audi Dealership Project Noise Assessment Study | May 2019
6
aviation aircraft noise from aircraft approaching and departing from the Palo Alto airport as well as noise from commercial aircraft noise approaching the San Francisco International Airport, 17 miles to the northwest. In addition, occasional overflights of the project site occur from military and commercial aircraft operating at Moffett Federal Airfield, 4 miles to the southeast, and commercial aircraft operating at San Jose International Airport, 11 miles to the southeast.
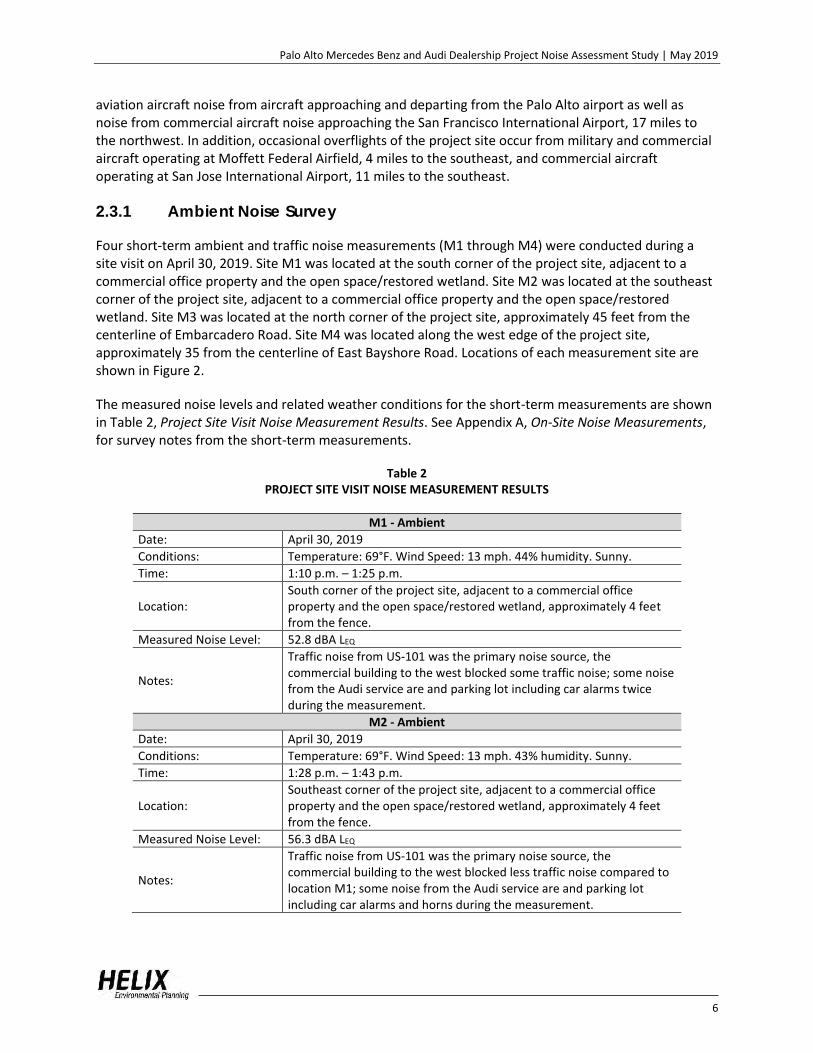
2.3.1 Ambient Noise Survey
Four short-term ambient and traffic noise measurements (M1 through M4) were conducted during a site visit on April 30, 2019. Site M1 was located at the south corner of the project site, adjacent to a commercial office property and the open space/restored wetland. Site M2 was located at the southeast corner of the project site, adjacent to a commercial office property and the open space/restored wetland. Site M3 was located at the north corner of the project site, approximately 45 feet from the centerline of Embarcadero Road. Site M4 was located along the west edge of the project site, approximately 35 from the centerline of East Bayshore Road. Locations of each measurement site are shown in Figure 2.
The measured noise levels and related weather conditions for the short-term measurements are shown in Table 2, Project Site Visit Noise Measurement Results. See Appendix A, On-Site Noise Measurements, for survey notes from the short-term measurements.
Table 2 PROJECT SITE VISIT NOISE MEASUREMENT RESULTS
M1 - Ambient
Date: April 30, 2019
Conditions: Temperature: 69°F. Wind Speed: 13 mph. 44% humidity. Sunny.
Time: 1:10 p.m. – 1:25 p.m.
Location: South corner of the project site, adjacent to a commercial office property and the open space/restored wetland, approximately 4 feet from the fence.
Measured Noise Level: 52.8 dBA LEQ
Notes:
Traffic noise from US-101 was the primary noise source, the commercial building to the west blocked some traffic noise; some noise from the Audi service are and parking lot including car alarms twice during the measurement.
M2 - Ambient
Date: April 30, 2019
Conditions: Temperature: 69°F. Wind Speed: 13 mph. 43% humidity. Sunny.
Time: 1:28 p.m. – 1:43 p.m.
Location: Southeast corner of the project site, adjacent to a commercial office property and the open space/restored wetland, approximately 4 feet from the fence.
Measured Noise Level: 56.3 dBA LEQ
Notes:
Traffic noise from US-101 was the primary noise source, the commercial building to the west blocked less traffic noise compared to location M1; some noise from the Audi service are and parking lot including car alarms and horns during the measurement.
Palo Alto Mercedes Benz and Audi Dealership Project Noise Assessment Study | May 2019
7
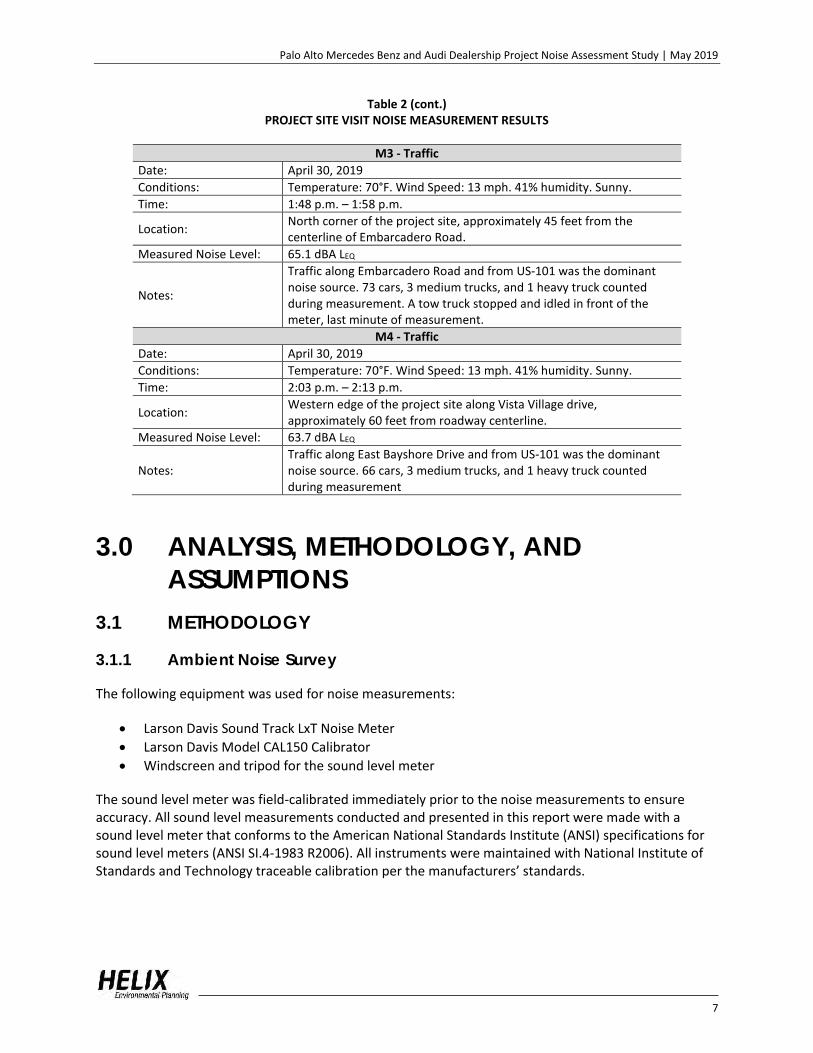
Table 2 (cont.) PROJECT SITE VISIT NOISE MEASUREMENT RESULTS
M3 - Traffic
Date: April 30, 2019
Conditions: Temperature: 70°F. Wind Speed: 13 mph. 41% humidity. Sunny.
Time: 1:48 p.m. – 1:58 p.m.
Location: North corner of the project site, approximately 45 feet from the centerline of Embarcadero Road.
Measured Noise Level: 65.1 dBA LEQ
Notes:
Traffic along Embarcadero Road and from US-101 was the dominant noise source. 73 cars, 3 medium trucks, and 1 heavy truck counted during measurement. A tow truck stopped and idled in front of the meter, last minute of measurement.
M4 - Traffic
Date: April 30, 2019
Conditions: Temperature: 70°F. Wind Speed: 13 mph. 41% humidity. Sunny.
Time: 2:03 p.m. – 2:13 p.m.
Location: Western edge of the project site along Vista Village drive, approximately 60 feet from roadway centerline.
Measured Noise Level: 63.7 dBA LEQ
Notes: Traffic along East Bayshore Drive and from US-101 was the dominant noise source. 66 cars, 3 medium trucks, and 1 heavy truck counted during measurement
3.0 ANALYSIS, METHODOLOGY, AND ASSUMPTIONS
3.1 METHODOLOGY
3.1.1 Ambient Noise Survey
The following equipment was used for noise measurements:
• Larson Davis Sound Track LxT Noise Meter
• Larson Davis Model CAL150 Calibrator
• Windscreen and tripod for the sound level meter
The sound level meter was field-calibrated immediately prior to the noise measurements to ensure accuracy. All sound level measurements conducted and presented in this report were made with a sound level meter that conforms to the American National Standards Institute (ANSI) specifications for sound level meters (ANSI SI.4-1983 R2006). All instruments were maintained with National Institute of Standards and Technology traceable calibration per the manufacturers’ standards.
Palo Alto Mercedes Benz and Audi Dealership Project Noise Assessment Study | May 2019
8
3.1.2 Noise Modeling Software
Modeling of the exterior noise environment for this report was accomplished using the Computer Aided Noise Abatement (CadnaA) version 2019 model. CadnaA is a program developed by DataKustik for predicting noise impacts in a wide variety of conditions. It allows for the input of project-related information, such as noise source data, barriers, structures, and topography to create a detailed model, and uses the methodology from the U.S. Department of Transportation Federal Highway Administration (FHWA) Traffic Noise Model TNM version 2.5. The noise models used in this analysis were developed from Computer Aided Design (CAD) plans provided by the project architect. Input variables included mechanical equipment reference noise levels, estimated parking lot activity, road alignment, elevation, lane configuration, area topography, projected traffic volumes, estimated truck composition percentages, and vehicle speeds.
The anticipated noise reduction from the implementation of automated doors on the car wash tunnel entrance and exit was modeled using the Insul Sound Transmission Class (STC) prediction program developed by Marshall Day Acoustics. The STC for the door material is entered into the Insul program to provide the STC noise reduction index curve used in CadnaA to predict interior to exterior noise through a panel.
The one-hour LEQ noise level is calculated utilizing peak-hour traffic; peak-hour traffic volumes can be estimated based on the assumption that 10 percent of the average daily traffic would occur during a peak hour. The one-hour LEQ noise level output calculated by the model based on the 10 percent peak hour traffic is equivalent to the CNEL (Caltrans 2013a).
Project construction noise was analyzed using the Roadway Construction Noise Model ([RCNM]; FHWA 2008), which utilizes estimates of sound levels from standard construction equipment based on measurements and surveys conducted on a project site in Boston, Massachusetts.
3.2 ASSUMPTIONS
3.2.1 Construction Equipment
Construction activities would include demolition, site preparation, building construction, paving, and architectural coatings (e.g., painting). Construction activities would use a variety of construction equipment, including, but not limited to: graders, rubber-tired dozers, loaders/backhoes, excavators, cranes, forklifts, water trucks, vibratory rollers, and pavers. The most intensive construction noise would be during the demolition and grading phases, which could involve the simultaneous uses of multiple pieces of heavy equipment. For construction noise modeling, a worst-case scenario of a grader, excavator, and rubber-tired dozer operating simultaneously during the grading phase was assumed.
The most likely source of vibration during project construction would be a vibratory roller, which may be used to achieve soil compaction as part of foundation construction and fill compaction. Due to the soil conditions at the project site, the project building would be supported by pile foundation systems. According to the Geotechnical Investigation report for the project, an auger cast pile foundation system is recommended (Romig 2018). The equipment required to install an auger cast pile foundation is not a significant source of vibrations compared to impact or vibratory driven pile foundations.
Palo Alto Mercedes Benz and Audi Dealership Project Noise Assessment Study | May 2019
9
3.2.2 Local Ambient Noise Level
To determine compliance with the City’s noise ordinance, the local ambient exterior noise level at the project property in the vicinity of proposed project operational noise sources is used. As described in section 2.3.1, two 15-minute noise measurement were conducted near the property line at the quietest portion of the project site, adjacent to the open space/restored wetland to the south. During the measurements, it was noted that the dominant source of noise in the area is from traffic on US-101, approximately 850 feet (0.16 mile) west of the project site. Because traffic volumes on US-101 vary throughout the day, the local ambient noise level on the project site fluctuates. Hourly data for traffic volumes on US-101 was not available. Typical hourly traffic distribution for U.S. metropolitan freeways was developed in a report by Wyle Laboratories, “Development of Ground Transportation Systems Noise Contours for the San Diego Region” (December 1973). Similar traffic distribution patterns were noted in a study prepared by Ogden International, “Road Travel Survey” (1986). Using the hourly traffic distribution from the above reports, any hourly traffic noise level can be calculated. The estimated average daytime (7:00 a.m. to 7:00 p.m.) ambient noise level is 52.9 dBA LEQ at measurement location M1 and 56.4 dBA LEQ at measurement location M2. The estimated hourly local ambient noise levels for all hours are provided in Appendix B, Traffic Noise.
3.2.3 Operation
Anticipated operational noise sources are assumed to include machine operations related to the automated car wash, backup generators, rooftop HVAC units, and parking lots noise. In addition, the project would generate vehicular traffic that would add to noise levels on nearby roadways. This analysis assumes that the proposed project would operate on the same schedule as the existing Audi dealership: Monday through Friday from 7:30 a.m. to 7:00 p.m., Saturday from 8:00 a.m. to 7 p.m. and Sunday (showroom only) from 10 a.m. to 6 p.m.
3.2.3.1 Car Wash
Blower
Noise generated by the car wash is assumed to be from several internal sources. The loudest single source is the air-blast drying systems (blower) just inside the car wash exit. The blower units to be used at the project’s car wash are a Broadway Equipment Company 45 horsepower assembly. The manufacturer’s data sheet indicates that the blowers would generate a noise level of 83.0 dBA at a distance of 30 feet from the car wah tunnel exit, and a noise level of 79.1 dBA at a distance of 30 feet from the car wah tunnel entrance, with the car wash tunnel doors open. The sheet is attached as Appendix C, Blower Assembly Data Sheets. All systems were modeled with the blowers operating in steady state (maximum noise level).
Automated Doors
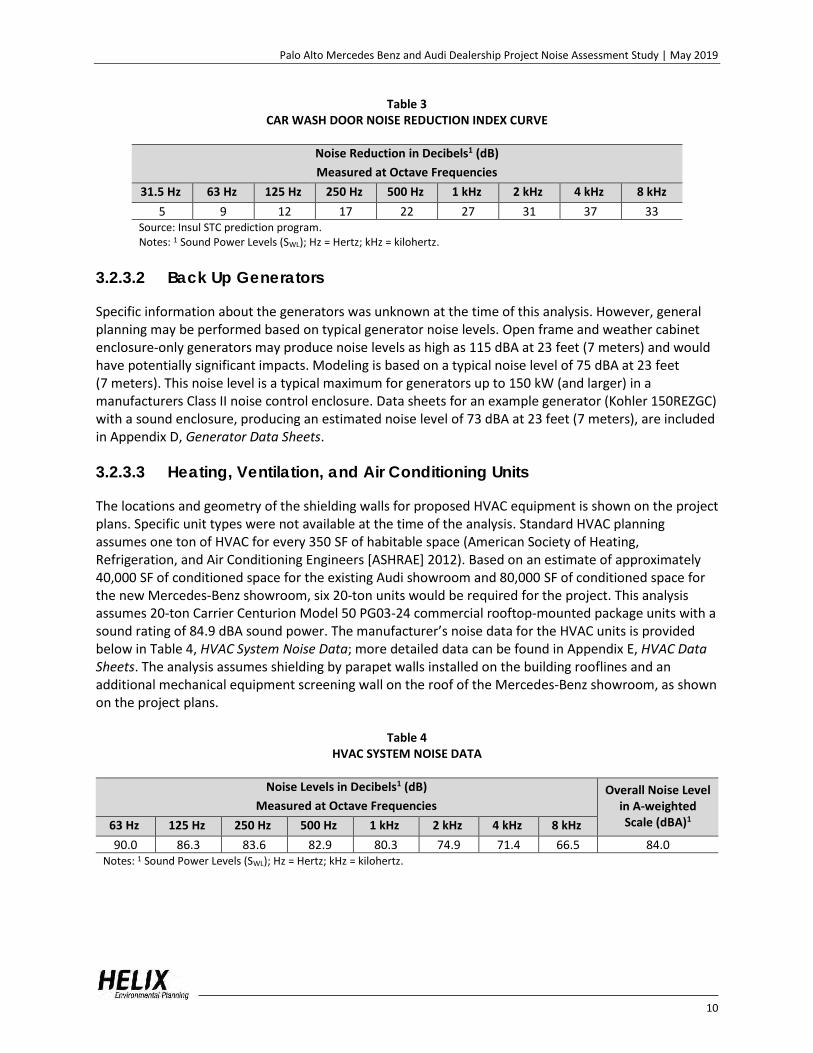
The noise reduction resulting from the implementation of automated doors on the carwash tunnel entrance and exit was modeled assuming a door construction of 22-gauge (0.2999-inches thickness) steel door panel sections (typical for lightweight doors). The estimated reduction is shown in Table 3, Car Wash Door Noise Reduction Index Curve.
Palo Alto Mercedes Benz and Audi Dealership Project Noise Assessment Study | May 2019
10
Table 3 CAR WASH DOOR NOISE REDUCTION INDEX CURVE
Noise Reduction in Decibels1 (dB)
Measured at Octave Frequencies
31.5 Hz 63 Hz 125 Hz 250 Hz 500 Hz 1 kHz 2 kHz 4 kHz 8 kHz
5 9 12 17 22 27 31 37 33 Source: Insul STC prediction program. Notes: 1 Sound Power Levels (SWL); Hz = Hertz; kHz = kilohertz.
3.2.3.2 Back Up Generators
Specific information about the generators was unknown at the time of this analysis. However, general planning may be performed based on typical generator noise levels. Open frame and weather cabinet enclosure-only generators may produce noise levels as high as 115 dBA at 23 feet (7 meters) and would have potentially significant impacts. Modeling is based on a typical noise level of 75 dBA at 23 feet (7 meters). This noise level is a typical maximum for generators up to 150 kW (and larger) in a manufacturers Class II noise control enclosure. Data sheets for an example generator (Kohler 150REZGC) with a sound enclosure, producing an estimated noise level of 73 dBA at 23 feet (7 meters), are included in Appendix D, Generator Data Sheets.
3.2.3.3 Heating, Ventilation, and Air Conditioning Units
The locations and geometry of the shielding walls for proposed HVAC equipment is shown on the project plans. Specific unit types were not available at the time of the analysis. Standard HVAC planning assumes one ton of HVAC for every 350 SF of habitable space (American Society of Heating, Refrigeration, and Air Conditioning Engineers [ASHRAE] 2012). Based on an estimate of approximately 40,000 SF of conditioned space for the existing Audi showroom and 80,000 SF of conditioned space for the new Mercedes-Benz showroom, six 20-ton units would be required for the project. This analysis assumes 20-ton Carrier Centurion Model 50 PG03-24 commercial rooftop-mounted package units with a sound rating of 84.9 dBA sound power. The manufacturer’s noise data for the HVAC units is provided below in Table 4, HVAC System Noise Data; more detailed data can be found in Appendix E, HVAC Data Sheets. The analysis assumes shielding by parapet walls installed on the building rooflines and an additional mechanical equipment screening wall on the roof of the Mercedes-Benz showroom, as shown on the project plans.
Table 4 HVAC SYSTEM NOISE DATA
Noise Levels in Decibels1 (dB)
Measured at Octave Frequencies Overall Noise Level
in A-weighted Scale (dBA)1 63 Hz 125 Hz 250 Hz 500 Hz 1 kHz 2 kHz 4 kHz 8 kHz
90.0 86.3 83.6 82.9 80.3 74.9 71.4 66.5 84.0 Notes: 1 Sound Power Levels (SWL); Hz = Hertz; kHz = kilohertz.
Palo Alto Mercedes Benz and Audi Dealership Project Noise Assessment Study | May 2019
11
3.2.3.4 Parking Lot Noise
The project would include a total of 382 parking spaces for retail sales vehicle inventory and display, customer and employee parking, and parking for vehicles waiting for service. The noise modeling includes 41 at-grade parking spaces around the perimeter of the buildings, and 220 outdoor spaces on the third floor of the proposed parking garage. Typical parking lots noise events include vehicle movement, engines starting and stopping, doors slamming, car alarms and horns, and conversations. The project’s parking spaces were modeled as parking areas in CadnaA which estimates the noise generated based on the number of events (vehicle entering or leaving a space) per parking space per hour. Based on the project trip generation from the Transportation Impact Analysis (TIA), an average of 332 vehicles are anticipated to enter and exit the project driveways during the peak hour, or approximately 3,320 vehicles per day (Hexagon 2019). Based on the trip generation, the following conservative (high) estimate of events per hour per space was used in the model: 2 per hour for the 41 at-grade spaces and 1 per hour for the third-floor parking garage outdoor space. The parking spaces on the first and second floor of the parking garage would be substantially shielded by the building structure and are not included in the model.
3.2.3.5 Off-Site Traffic Noise
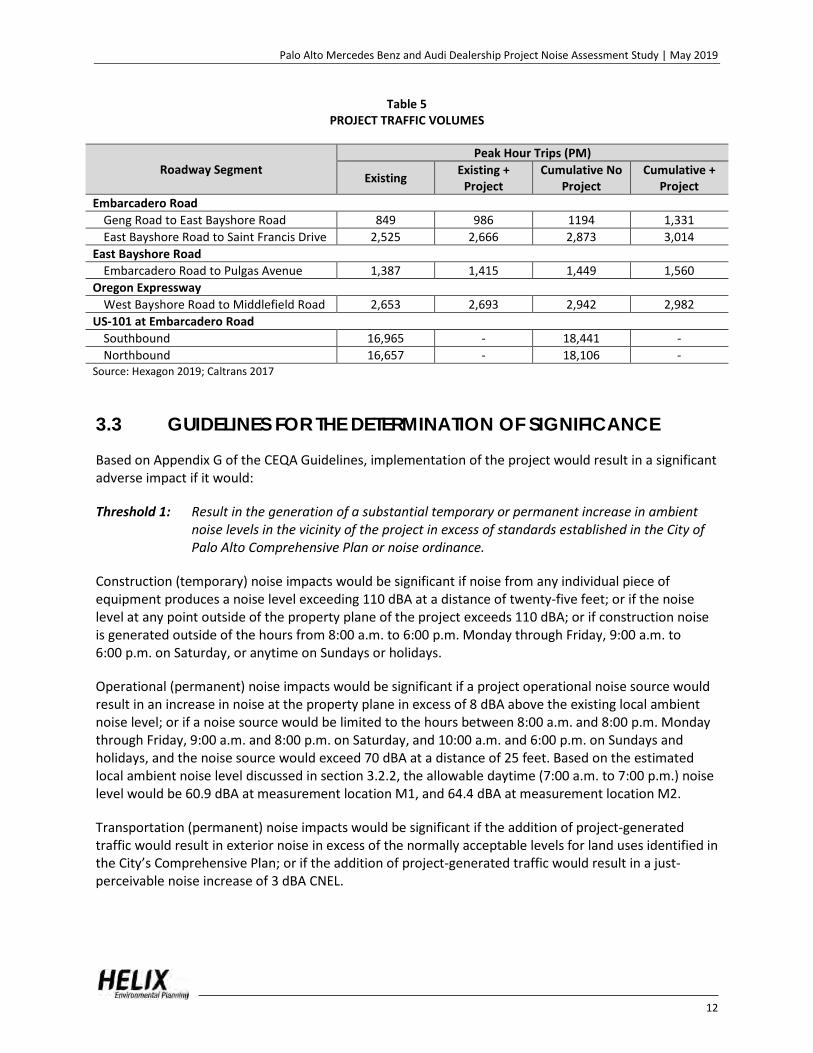
Off-site traffic noise modeling is based on data in the TIA (Hexagon 2019) for four scenarios: existing, existing plus project; cumulative , and cumulative plus project. Table 5, Project Traffic Volumes displays the traffic volumes on surrounding streets. Existing traffic data for the nearby US-101 is based on the peak hour traffic estimates from Caltrans for 2017 for the Embarcadero Road segment in Palo Alto of 16,500 vehicles in the southbound directions and 16,200 vehicles in the northbound direction (Caltrans 2017). To estimate future traffic volumes on US-101 in the project vicinity, a compound growth factor of 1.4 percent per year was applied (Hexagon 2019). Anticipated future traffic noise levels are based on the forecasted traffic volumes. All traffic was modeled using the posted speed limits: 25 miles per hour (mph) for Embarcadero Road and East Bayshore Road, 35 mph for Oregon Expressway, and 65 mph for US-101. A typical vehicle mix of 96 percent cars and light trucks, 3 percent medium trucks, and 1 percent heavy trucks was used for modeling existing and future noise conditions in the vicinity of the project for all segments. Forecasts for the cumulative scenario are used to model anticipated future noise levels at the project site. Traffic volumes for all scenarios can be found in Appendix B, Traffic Noise.
Palo Alto Mercedes Benz and Audi Dealership Project Noise Assessment Study | May 2019
12
Table 5 PROJECT TRAFFIC VOLUMES
Roadway Segment Peak Hour Trips (PM)
Existing Existing + Project
Cumulative No Project
Cumulative + Project
Embarcadero Road Geng Road to East Bayshore Road 849 986 1194 1,331 East Bayshore Road to Saint Francis Drive 2,525 2,666 2,873 3,014
East Bayshore Road Embarcadero Road to Pulgas Avenue 1,387 1,415 1,449 1,560
Oregon Expressway West Bayshore Road to Middlefield Road 2,653 2,693 2,942 2,982
US-101 at Embarcadero Road Southbound 16,965 - 18,441 - Northbound 16,657 - 18,106 -
Source: Hexagon 2019; Caltrans 2017
3.3 GUIDELINES FOR THE DETERMINATION OF SIGNIFICANCE
Based on Appendix G of the CEQA Guidelines, implementation of the project would result in a significant adverse impact if it would:
Threshold 1: Result in the generation of a substantial temporary or permanent increase in ambient noise levels in the vicinity of the project in excess of standards established in the City of Palo Alto Comprehensive Plan or noise ordinance.
Construction (temporary) noise impacts would be significant if noise from any individual piece of equipment produces a noise level exceeding 110 dBA at a distance of twenty-five feet; or if the noise level at any point outside of the property plane of the project exceeds 110 dBA; or if construction noise is generated outside of the hours from 8:00 a.m. to 6:00 p.m. Monday through Friday, 9:00 a.m. to 6:00 p.m. on Saturday, or anytime on Sundays or holidays.
Operational (permanent) noise impacts would be significant if a project operational noise source would result in an increase in noise at the property plane in excess of 8 dBA above the existing local ambient noise level; or if a noise source would be limited to the hours between 8:00 a.m. and 8:00 p.m. Monday through Friday, 9:00 a.m. and 8:00 p.m. on Saturday, and 10:00 a.m. and 6:00 p.m. on Sundays and holidays, and the noise source would exceed 70 dBA at a distance of 25 feet. Based on the estimated local ambient noise level discussed in section 3.2.2, the allowable daytime (7:00 a.m. to 7:00 p.m.) noise level would be 60.9 dBA at measurement location M1, and 64.4 dBA at measurement location M2.
Transportation (permanent) noise impacts would be significant if the addition of project-generated traffic would result in exterior noise in excess of the normally acceptable levels for land uses identified in the City’s Comprehensive Plan; or if the addition of project-generated traffic would result in a just-perceivable noise increase of 3 dBA CNEL.
Palo Alto Mercedes Benz and Audi Dealership Project Noise Assessment Study | May 2019
13
Threshold 2: Result in the generation of excessive groundborne vibration or groundborne noise levels.
Excessive ground-borne vibration would occur if construction-related ground-borne vibration exceeds the “strongly perceptible” vibration annoyance potential criteria for human receptors, as specified by Caltrans (2013b), of 0.1 inches per second peak particle velocity (PPV), and 0.2 inches per second PPV for architectural damage (e.g., cracking of plaster) to normal structures for continuous/frequent intermittent construction sources (such as vibratory compaction equipment).
Threshold 3: For a project located within the vicinity of a private airstrip or an airport land use plan, or where such a plan has not been adopted, within two miles of a public use airport or private airstrip, expose people residing or working in the project area to excessive noise.
Excessive noise exposure from aircraft is defined as noise levels that exceed the standards in the City’s Comprehensive Plan Natural Environment Element for the associated land use.
4.0 IMPACTS 4.1 ISSUE 1: EXCESSIVE NOISE LEVELS
Result in the generation of a substantial temporary or permanent increase in ambient noise levels in the vicinity of the project in excess of standards established in the City of Palo Alto Comprehensive Plan or noise ordinance?
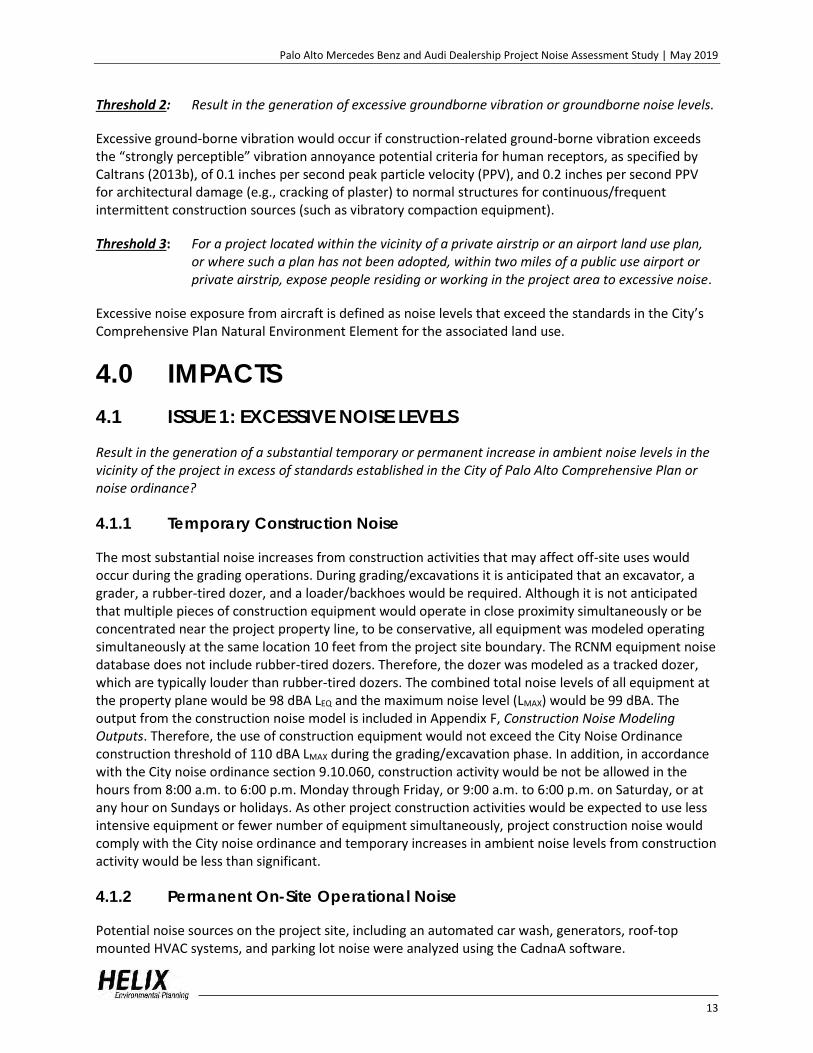
4.1.1 Temporary Construction Noise
The most substantial noise increases from construction activities that may affect off-site uses would occur during the grading operations. During grading/excavations it is anticipated that an excavator, a grader, a rubber-tired dozer, and a loader/backhoes would be required. Although it is not anticipated that multiple pieces of construction equipment would operate in close proximity simultaneously or be concentrated near the project property line, to be conservative, all equipment was modeled operating simultaneously at the same location 10 feet from the project site boundary. The RCNM equipment noise database does not include rubber-tired dozers. Therefore, the dozer was modeled as a tracked dozer, which are typically louder than rubber-tired dozers. The combined total noise levels of all equipment at the property plane would be 98 dBA LEQ and the maximum noise level (LMAX) would be 99 dBA. The output from the construction noise model is included in Appendix F, Construction Noise Modeling Outputs. Therefore, the use of construction equipment would not exceed the City Noise Ordinance construction threshold of 110 dBA LMAX during the grading/excavation phase. In addition, in accordance with the City noise ordinance section 9.10.060, construction activity would be not be allowed in the hours from 8:00 a.m. to 6:00 p.m. Monday through Friday, or 9:00 a.m. to 6:00 p.m. on Saturday, or at any hour on Sundays or holidays. As other project construction activities would be expected to use less intensive equipment or fewer number of equipment simultaneously, project construction noise would comply with the City noise ordinance and temporary increases in ambient noise levels from construction activity would be less than significant.
4.1.2 Permanent On-Site Operational Noise
Potential noise sources on the project site, including an automated car wash, generators, roof-top mounted HVAC systems, and parking lot noise were analyzed using the CadnaA software.
Palo Alto Mercedes Benz and Audi Dealership Project Noise Assessment Study | May 2019
14
4.1.2.1 Car Wash
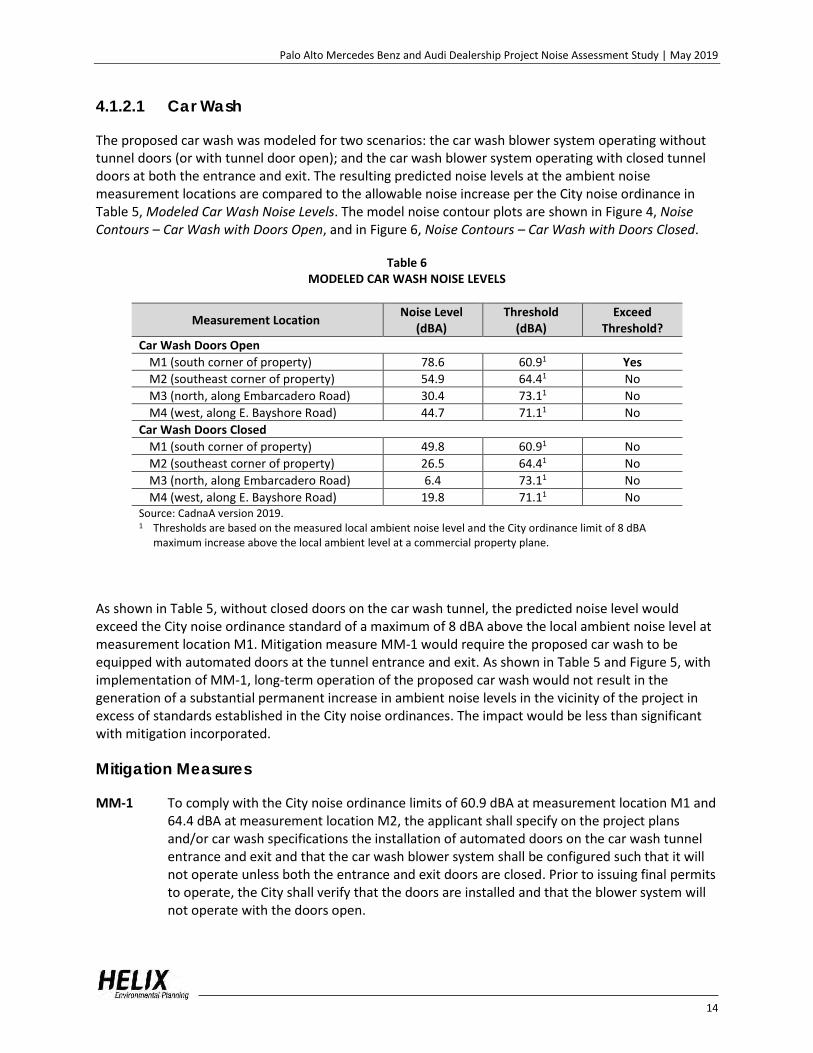
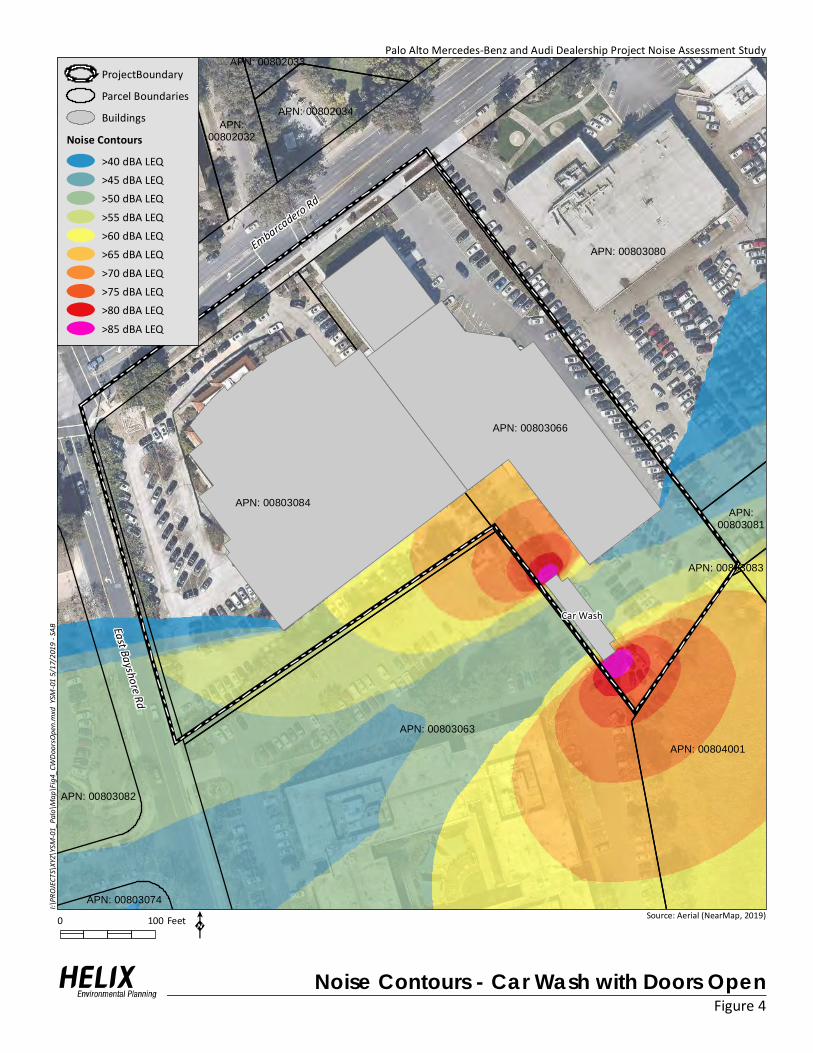
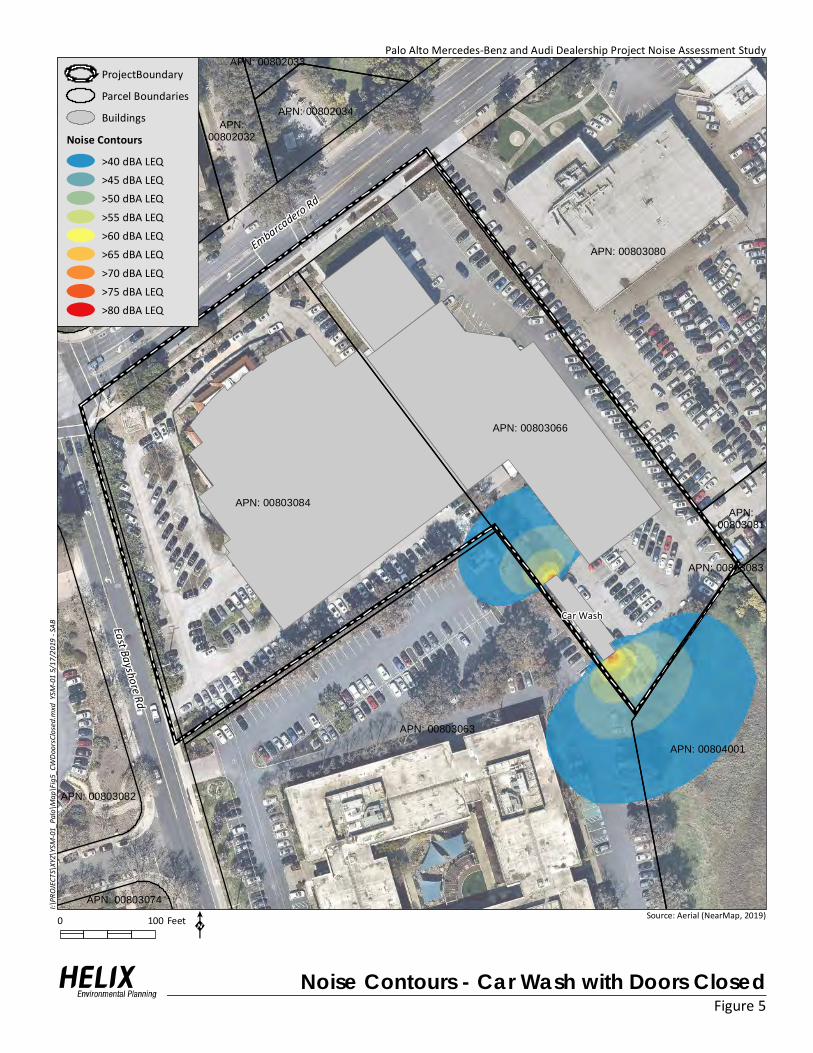
The proposed car wash was modeled for two scenarios: the car wash blower system operating without tunnel doors (or with tunnel door open); and the car wash blower system operating with closed tunnel doors at both the entrance and exit. The resulting predicted noise levels at the ambient noise measurement locations are compared to the allowable noise increase per the City noise ordinance in Table 5, Modeled Car Wash Noise Levels. The model noise contour plots are shown in Figure 4, Noise Contours – Car Wash with Doors Open, and in Figure 6, Noise Contours – Car Wash with Doors Closed.
Table 6 MODELED CAR WASH NOISE LEVELS
Measurement Location Noise Level
(dBA) Threshold
(dBA) Exceed
Threshold?
Car Wash Doors Open
M1 (south corner of property) 78.6 60.91 Yes
M2 (southeast corner of property) 54.9 64.41 No
M3 (north, along Embarcadero Road) 30.4 73.11 No
M4 (west, along E. Bayshore Road) 44.7 71.11 No
Car Wash Doors Closed
M1 (south corner of property) 49.8 60.91 No
M2 (southeast corner of property) 26.5 64.41 No
M3 (north, along Embarcadero Road) 6.4 73.11 No
M4 (west, along E. Bayshore Road) 19.8 71.11 No Source: CadnaA version 2019. 1 Thresholds are based on the measured local ambient noise level and the City ordinance limit of 8 dBA
maximum increase above the local ambient level at a commercial property plane.
As shown in Table 5, without closed doors on the car wash tunnel, the predicted noise level would exceed the City noise ordinance standard of a maximum of 8 dBA above the local ambient noise level at measurement location M1. Mitigation measure MM-1 would require the proposed car wash to be equipped with automated doors at the tunnel entrance and exit. As shown in Table 5 and Figure 5, with implementation of MM-1, long-term operation of the proposed car wash would not result in the generation of a substantial permanent increase in ambient noise levels in the vicinity of the project in excess of standards established in the City noise ordinances. The impact would be less than significant with mitigation incorporated.
Mitigation Measures
MM-1 To comply with the City noise ordinance limits of 60.9 dBA at measurement location M1 and 64.4 dBA at measurement location M2, the applicant shall specify on the project plans and/or car wash specifications the installation of automated doors on the car wash tunnel entrance and exit and that the car wash blower system shall be configured such that it will not operate unless both the entrance and exit doors are closed. Prior to issuing final permits to operate, the City shall verify that the doors are installed and that the blower system will not operate with the doors open.
East Bayshore Rd
Embarcadero Rd
Car Wash
APN: 00802033
APN: 00803074
APN:00802032
APN: 00803080
APN: 00803084
APN: 00802017
APN: 00804001
APN:00803081
APN: 00803063
APN:00802026
APN: 00803066
APN: 00802034
APN: 00803083
APN: 00803082
Figure 4Noise Contours - Car Wash with Doors Open
I:\PRO
JECTS\
XYZ\YS
M-01_
Palo\M
ap\Fi
g4_CW
Doors
Open.
mxd Y
SM-01
5/17/
2019 -
SAB
Source: Aerial (NearMap, 2019)
K
Palo Alto Mercedes-Benz and Audi Dealership Project Noise Assessment Study
0 100 Feet
ProjectBoundary
Parcel Boundaries
Buildings
Noise Contours>40 dBA LEQ>45 dBA LEQ>50 dBA LEQ
>55 dBA LEQ>60 dBA LEQ>65 dBA LEQ
>70 dBA LEQ>75 dBA LEQ>80 dBA LEQ
>85 dBA LEQ
East Bayshore Rd
Embarcadero Rd
Car Wash
APN: 00802033
APN: 00803074
APN:00802032
APN: 00803080
APN: 00803084
APN: 00802017
APN: 00804001
APN:00803081
APN: 00803063
APN:00802026
APN: 00803066
APN: 00802034
APN: 00803083
APN: 00803082
Figure 5Noise Contours - Car Wash with Doors Closed
I:\PRO
JECTS\
XYZ\YS
M-01_
Palo\M
ap\Fi
g5_CW
Doors
Closed
.mxd
YSM-
01 5/1
7/2019
- SAB
Source: Aerial (NearMap, 2019)
K
Palo Alto Mercedes-Benz and Audi Dealership Project Noise Assessment Study
0 100 Feet
ProjectBoundary
Parcel Boundaries
Buildings
Noise Contours>40 dBA LEQ>45 dBA LEQ>50 dBA LEQ
>55 dBA LEQ>60 dBA LEQ>65 dBA LEQ
>70 dBA LEQ>75 dBA LEQ>80 dBA LEQ
Palo Alto Mercedes Benz and Audi Dealership Project Noise Assessment Study | May 2019
15
4.1.2.2 Backup Generators
The proposed backup generators were modeled in the locations shown on the project site plan (see Figure 3) for two scenarios: with and without a 9-foot sound wall around each generator. The resulting predicted noise levels at the ambient noise measurement locations are compared to the allowable noise increase per the City noise ordinance in Table 7, Modeled Generator Noise Levels. The modeled noise contour plot for the generators with the surrounding sound walls is shown in Figure 6, Noise Contours – Generators with Sound Walls.
Table 7 MODELED GENERATOR NOISE LEVELS
Measurement Location Noise Level
(dBA) Threshold
(dBA) Exceed
Threshold?
Generator No Barrier
M1 (south corner of property) 62.0 60.91 Yes
M2 (southeast corner of property) 64.6 64.41 Yes
M3 (north, along Embarcadero Road) 31.4 73.11 No
M4 (west, along E. Bayshore Road) 64.5 71.11 No
Generator With Barrier
M1 (south corner of property) 46.8 60.91 No
M2 (southeast corner of property) 49.9 64.41 No
M3 (north, along Embarcadero Road) 29.9 73.11 No
M4 (west, along E. Bayshore Road) 49.3 71.11 No Source: CadnaA version 2019. 1 Thresholds are based on the measured local ambient noise level and the City ordinance limit of 8 dBA
maximum increase above the local ambient level at a commercial property plane.
As shown in Table 6, without the sound walls, the predicted noise level would exceed the City noise ordinance standard of a maximum of 8 dBA above the local ambient noise level at measurement locations M1 and M2. Mitigation measure MM-2 would require the installation of high sound walls around the generators with a minimum height 1.5 feet higher than the installed height of the generator enclosure. With implementation of MM-2, operation of the proposed backup generators would not result in the generation of a substantial temporary or permanent increase in ambient noise levels in the vicinity of the project in excess of standards established in the City noise ordinances. The impact would be less than significant with mitigation incorporated.
Mitigation Measures
MM-2 To comply with the City noise ordinance limits of 60.9 dBA at measurement location M1 and 64.4 dBA at measurement location M2, the applicant shall specify on the project plans the installation of sound walls around the generators with a minimum height 1.5 feet higher than the installed height of the generator enclosure. The walls shall be constructed of a material with a minimum STC rating of 20 and there shall be no gaps or holes in or under the walls. Doors installed in the sound wall shall be the full height of the wall and have a minimum STC rating of 20 and shall be installed such that, when closed, there are no gaps around or under the door. Prior to issuing final permits to operate or occupy, the City shall verify that the sound walls are installed as specified on the project plans.
Palo Alto Mercedes Benz and Audi Dealership Project Noise Assessment Study | May 2019
16
4.1.2.3 HVAC Systems and Parking Lots
HVAC systems in the rooftop location shown on the project plans and in the existing locations for the Audi showroom were modeled along with the parapet walls shown on the project plans. Outdoor parking areas around the building and on the third floor of the parking garage modeled as discussed in section 3.2.3, above. The combined noise levels for all HVAC systems and outdoor parking areas are compared to the allowable noise increase per the City noise ordinance in Table 8, Modeled HVAC and Parking Noise Levels.
Table 8 MODELED HVAC AND PARKING NOISE LEVELS
Measurement Location Level (dBA)
Threshold (dBA)
Exceed Threshold?
M1 (south corner of property) 43.7 60.91 No
M2 (southeast corner of property) 49.5 64.41 No
M3 (north, along Embarcadero Road) 57.0 73.11 No
M4 (west, along E. Bayshore Road) 47.9 71.11 No Source: CadnaA version 2019. 1 Thresholds are based on the measured local ambient noise level and the City ordinance limit of 8 dBA
maximum increase above the local ambient level at a commercial property plane.
As shown in Table 7, noise levels from HVAC systems and parking areas would remain well below the City noise ordinance limits at a commercial property plane. Therefore, long-term operation of the proposed dealership buildings and parking areas would not result in the generation of a substantial permanent increase in ambient noise levels in the vicinity of the project in excess of standards established in the City noise ordinances and the impact would be less than significant.
4.1.2.4 Combined On-Site Operational Noise Sources
The combined noise levels for the car wash (with mitigation incorporated), the backup generators (with mitigation incorporated), HVAC systems, and outdoor parking areas are compared to the allowable noise increase per the City noise ordinance in Table 9, Modeled On-Site Noise Levels. These noise levels assume all noise sources are running at steady state simultaneously.
Table 9 MODELED ON-SITE NOISE LEVELS
Measurement Location Level (dBA)
Threshold (dBA)
Exceed Threshold?
M1 (south corner of property) 52.3 60.91 No
M2 (southeast corner of property) 52.7 64.41 No
M3 (north, along Embarcadero Road) 57.0 73.11 No
M4 (west, along E. Bayshore Road) 51.7 71.11 No Source: CadnaA version 2019. 1 Thresholds are based on the measured local ambient noise level and the City ordinance limit of 8 dBA
maximum increase above the local ambient level at a commercial property plane.
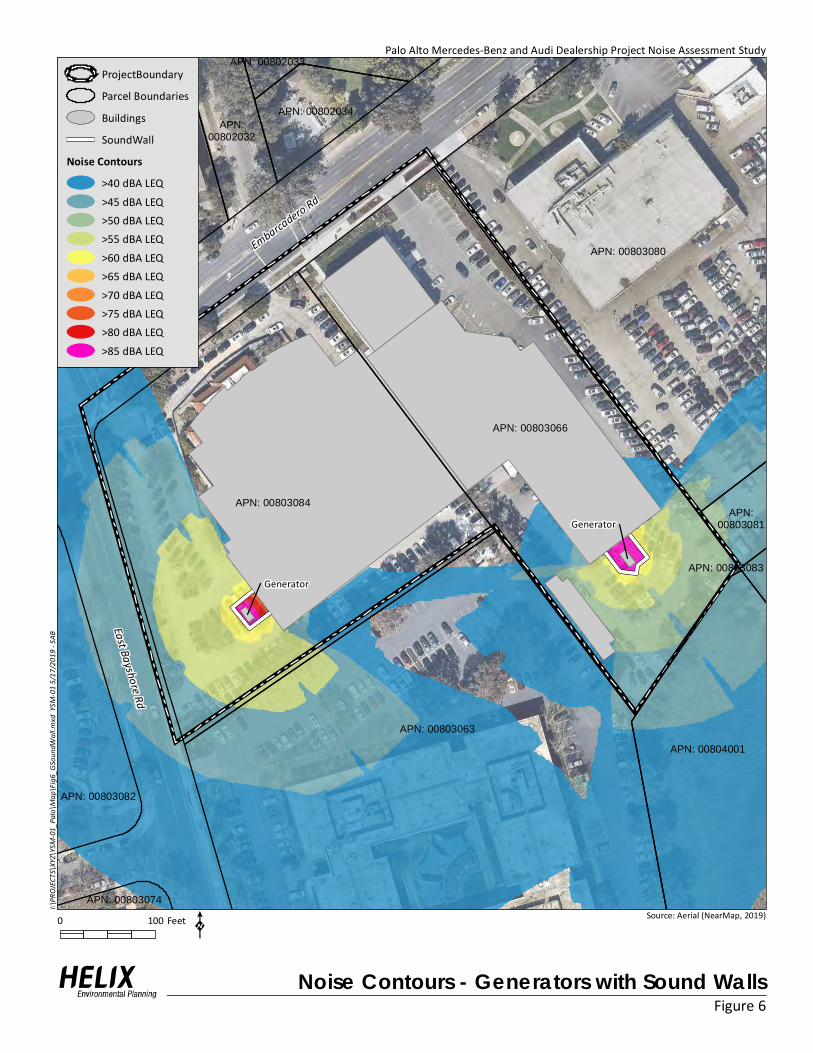
East Bayshore Rd
Embarcadero Rd
Generator
Generator
APN: 00802033
APN: 00803074
APN:00802032
APN: 00803080
APN: 00803084
APN: 00802017
APN: 00804001
APN:00803081
APN: 00803063
APN:00802026
APN: 00803066
APN: 00802034
APN: 00803083
APN: 00803082
Figure 6Noise Contours - Generators with Sound Walls
I:\PRO
JECTS\
XYZ\YS
M-01_
Palo\M
ap\Fi
g6_GS
oundW
all.mx
d YSM
-01 5/
17/20
19 - SA
B
Source: Aerial (NearMap, 2019)
K
Palo Alto Mercedes-Benz and Audi Dealership Project Noise Assessment Study
0 100 Feet
ProjectBoundary
Parcel Boundaries
Buildings
SoundWall
Noise Contours>40 dBA LEQ
>45 dBA LEQ>50 dBA LEQ>55 dBA LEQ
>60 dBA LEQ>65 dBA LEQ
>70 dBA LEQ>75 dBA LEQ>80 dBA LEQ
>85 dBA LEQ
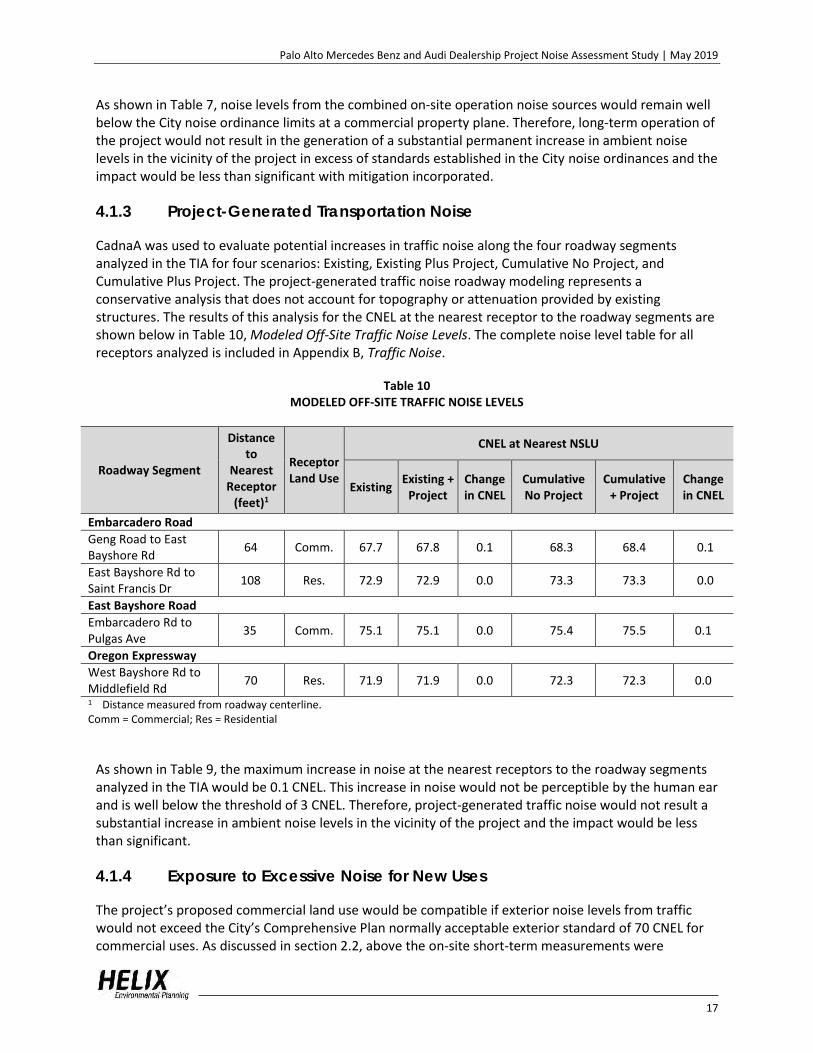
Palo Alto Mercedes Benz and Audi Dealership Project Noise Assessment Study | May 2019
17
As shown in Table 7, noise levels from the combined on-site operation noise sources would remain well below the City noise ordinance limits at a commercial property plane. Therefore, long-term operation of the project would not result in the generation of a substantial permanent increase in ambient noise levels in the vicinity of the project in excess of standards established in the City noise ordinances and the impact would be less than significant with mitigation incorporated.
4.1.3 Project-Generated Transportation Noise
CadnaA was used to evaluate potential increases in traffic noise along the four roadway segments analyzed in the TIA for four scenarios: Existing, Existing Plus Project, Cumulative No Project, and Cumulative Plus Project. The project-generated traffic noise roadway modeling represents a conservative analysis that does not account for topography or attenuation provided by existing structures. The results of this analysis for the CNEL at the nearest receptor to the roadway segments are shown below in Table 10, Modeled Off-Site Traffic Noise Levels. The complete noise level table for all receptors analyzed is included in Appendix B, Traffic Noise.
Table 10 MODELED OFF-SITE TRAFFIC NOISE LEVELS
Roadway Segment
Distance to
Nearest Receptor
(feet)1
Receptor Land Use
CNEL at Nearest NSLU
Existing Existing +
Project Change in CNEL
Cumulative No Project
Cumulative + Project
Change in CNEL
Embarcadero Road
Geng Road to East Bayshore Rd
64 Comm. 67.7 67.8 0.1 68.3 68.4 0.1
East Bayshore Rd to Saint Francis Dr
108 Res. 72.9 72.9 0.0 73.3 73.3 0.0
East Bayshore Road
Embarcadero Rd to Pulgas Ave
35 Comm. 75.1 75.1 0.0 75.4 75.5 0.1
Oregon Expressway
West Bayshore Rd to Middlefield Rd
70 Res. 71.9 71.9 0.0 72.3 72.3 0.0
1 Distance measured from roadway centerline. Comm = Commercial; Res = Residential
As shown in Table 9, the maximum increase in noise at the nearest receptors to the roadway segments analyzed in the TIA would be 0.1 CNEL. This increase in noise would not be perceptible by the human ear and is well below the threshold of 3 CNEL. Therefore, project-generated traffic noise would not result a substantial increase in ambient noise levels in the vicinity of the project and the impact would be less than significant.
4.1.4 Exposure to Excessive Noise for New Uses
The project’s proposed commercial land use would be compatible if exterior noise levels from traffic would not exceed the City’s Comprehensive Plan normally acceptable exterior standard of 70 CNEL for commercial uses. As discussed in section 2.2, above the on-site short-term measurements were
Palo Alto Mercedes Benz and Audi Dealership Project Noise Assessment Study | May 2019
18
65.1 dBA LEQ at location M3 along Embarcadero Road and 63.7 dBA LEQ at location M4 along East Bayshore Road. These measurements were taken at approximate 2:00 p.m. on a weekday. According to the Caltrans Technical Noise Supplement to the Traffic Noise Protocol, the peak-hour traffic LEQ is equivalent to the CNEL (Caltrans 2013a). Conservatively assuming that the peak-hour traffic would be twice the volume compared to the measurement period, resulting in a 3 dBA increase, the maximum noise level on the project property line would be 68.1 CNEL, less than the City’s Comprehensive Plan normally acceptable exterior standard of 70 CNEL for commercial uses line. Therefore, the project would be compatible with the City’s exterior noise standard for commercial land uses.
4.2 ISSUE 2: EXCESSIVE VIBRATION
Would the project expose persons to or generate excessive groundborne vibration or groundborne noise levels?
4.2.1 Construction Vibration
The largest potential on-site source of vibration during project construction would be a vibratory roller (primarily used to achieve soil compaction as part of the foundation and paving construction). A vibratory roller could be used approximately 50 feet from the nearest off-site commercial structure to the northeast of the project site. A vibratory roller would create approximately 0.210 inch per second PPV at a distance of 25 feet (Caltrans 2013b). A 0.210 inch per second PPV vibration level would equal 0.098 inch per second PPV at a distance of 50 feet.1 This would be lower than what is considered a “strongly perceptible” thresholds for humans of 0.1 inches per second PPV, and the architectural damage threshold to normal structures of 0.2 inches per second PPV. Therefore, although a vibratory roller may be perceptible to nearby human receptors, temporary groundborne vibration and groundborne noise impacts associated project construction would be less than significant.
4.2.2 Operational Vibration
Long-term operation of the project would not be a significant source of gourndborne vibrations or groundborne noise and there would be no impact.
4.3 ISSUE 3: AIRPORT NOISE EXPOSURE
Would the project expose people residing or working in the project area to excessive noise from a nearby public use airport or private airstrip?
The nearest airport to the project site is the Palo Alto Airport located approximately 3,400 feet (0.64 mile) to the northeast. According to the Comprehensive Land Use Plan for the Palo Alto Airport, the project site is not within the 55 CNEL noise contour for the year 2022 (Santa Clara County 2016a). Moffett Federal Airfield is located approximately 4 miles to the southeast. According to the Comprehensive Land Use Plan for Moffett Field the project site is not within the Airport Influence Area 65 CNEL noise contour for the year 2022 (Santa Clara County 2016b). The San Francisco International Airport (SFO) is located approximately 17 miles to the northwest. Some aircraft on approach to SFO overfly the project site. However, according to the SFO Noise Exposure Map for the year 2019, the
1 Equipment PPV = Reference PPV * (25/D)n (in/sec), where Reference PPV is PPV at 25 feet, D is distance from equipment to
the receiver in feet, and n = 1.1 (the value related to the attenuation rate through the ground)(Caltrans 2013b).
Palo Alto Mercedes Benz and Audi Dealership Project Noise Assessment Study | May 2019
19
project site is not within the 65 CNEL noise contour (San Francisco 2015). Therefore, noise from nearby airports would not expose people working in the project area to noise in excess of the City’s Comprehensive Plan normally acceptable exterior standard of 70 CNEL for commercial uses and the impact would be less than significant.
5.0 LIST OF PREPARERS Martin Rolph, Noise Analyst Jason Runyan, Noise Analyst Charles Terry, Principal Acoustician Joanne M. Dramko, AICP, Senior Technical Specialist, QA/QC HELIX Environmental Planning, Inc. 7578 El Cajon Boulevard La Mesa, CA 91942
Palo Alto Mercedes Benz and Audi Dealership Project Noise Assessment Study | May 2019
20
6.0 REFERENCES American Society of Heating, Refrigeration, and Air Conditioning Engineers (ASHRAE). 2012. ASHRAE
Handbook.
California Department of Transportation (Caltrans). 2017. 2017 Traffic Volumes (for all vehicles on CA State Highways). Available at: http://www.dot.ca.gov/trafficops/census/volumes2017/.
2013a. Technical Noise Supplement (TeNS) to the Traffic Noise Protocol. September. Available at: http://www.dot.ca.gov/hq/env/noise/pub/TeNS_Sept_2013B.pdf.
2013b. Transportation and Construction Vibration Guidance Manual, Environmental Engineering, Hazardous Waste, Air, Noise, Paleontology Office. September. Available at: http://www.dot.ca.gov/hq/env/noise/pub/TCVGM_Sep13_FINAL.pdf..
Hexagon Transportation Consultants, Inc. 2019. 1700-1730 Embarcadero Road Audi and Mercedes Benz Dealerships Transportation Impact Analysis. February.
Ogden International. 1986. Road Travel Survey.
Palo Alto, City of. 2019. Palo Alto Municipal Code. Local legislation current through Ordinance No. 5460, passed April 1,2019. Available at: http://library.amlegal.com/nxt/gateway.dll/California/paloalto_ca/paloaltomunicipalcode?f=templates$fn=default.htm$3.0$vid=amlegal:paloalto_ca.
2017a. Comprehensive Plan 2030. November 13. Available at: https://www.cityofpaloalto.org/civicax/filebank/documents/62915.
2017b. Comprehensive Plan 2030 Map L-6, Comprehensive Plan Land Use Designations. Available at: https://www.cityofpaloalto.org/civicax/filebank/documents/8188.
Romig Engineers, Inc., 2018. Geotechnical Investigation Mercedes-Benz/Audi Dealerships 1700 and 1730 Embarcadero Road, Palo Alto, California. May.
San Francisco, City and County of. 2015. San Francisco International Airport 2019 Noise Exposure Map. August 13. Available at: https://media.flysfo.com/media/sfo/noise-abatement/sfo_p150_2019-nem-36x24-plot-signed_ada.pdf
Santa Clara, County of. 2016a. Comprehensive Land Use Plan, Palo Alto Airport. November 16. Available at: https://www.sccgov.org/sites/dpd/DocsForms/Documents/ALUC_PAO_CLUP.pdf.
2016b. Comprehensive Land Use Plan, Moffett Federal Airfield. November 18. Available at: https://www.sccgov.org/sites/dpd/DocsForms/Documents/ALUC_NUQ_CLUP.pdf.
Palo Alto Mercedes Benz and Audi Dealership Project Noise Assessment Study | May 2019
21
U.S. Department of Transportation Federal Highway Administration (FHWA). 2008. Roadway Construction Noise Model (RCNM) Version 1.1. Available at: https://www.fhwa.dot.gov/environment/noise/construction_noise/rcnm/.
2004. Traffic Noise Model (TNM) Version 2.5. Available at: https://www.fhwa.dot.gov/environment/noise/traffic_noise_model/tnm_v25/.
Wyle Laboratories. 1973. Development of Ground Transportation Systems Noise Contours for the San Diego Region.
Palo Alto Mercedes Benz and Audi Dealership Project Noise Assessment Study | May 2019
22
This page intentionally left blank
Appendix AOn-Site Noise Measurements
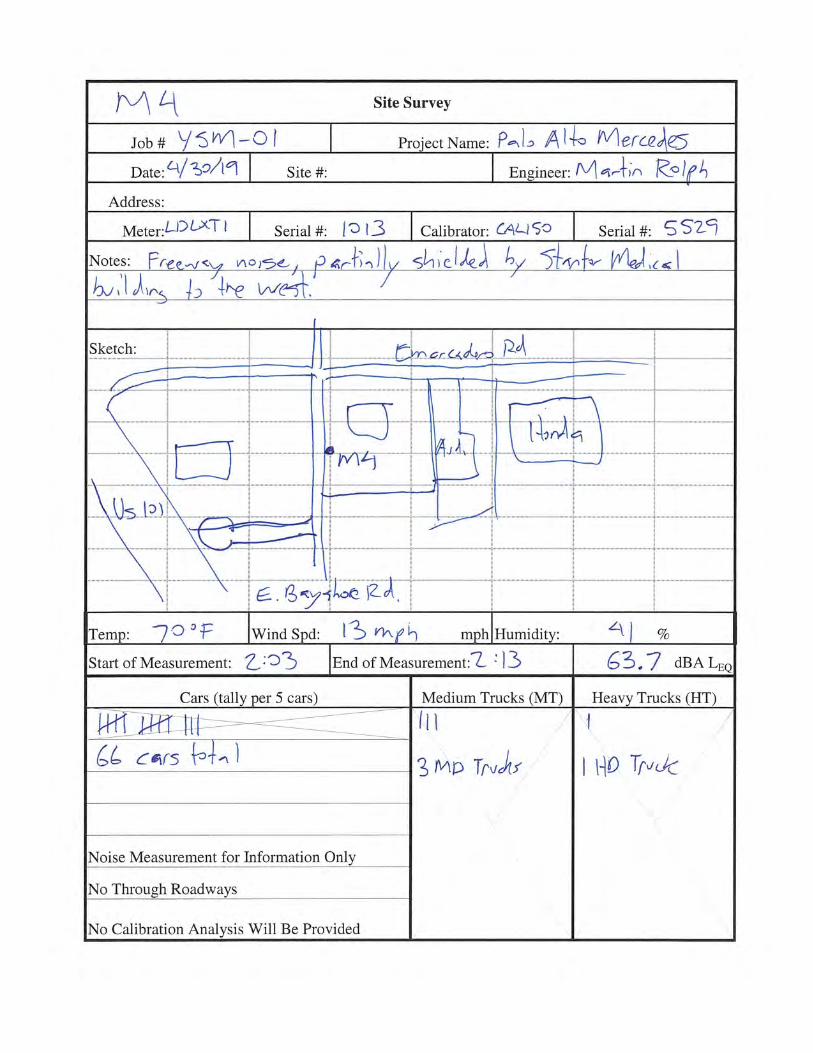
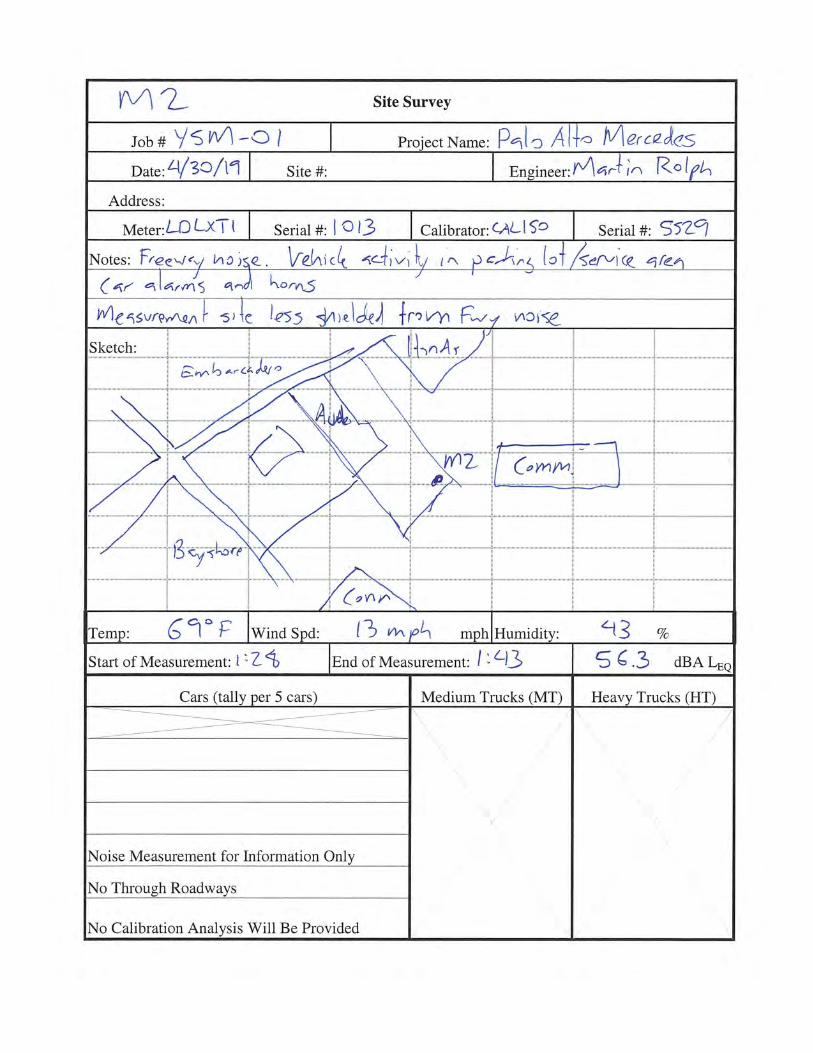
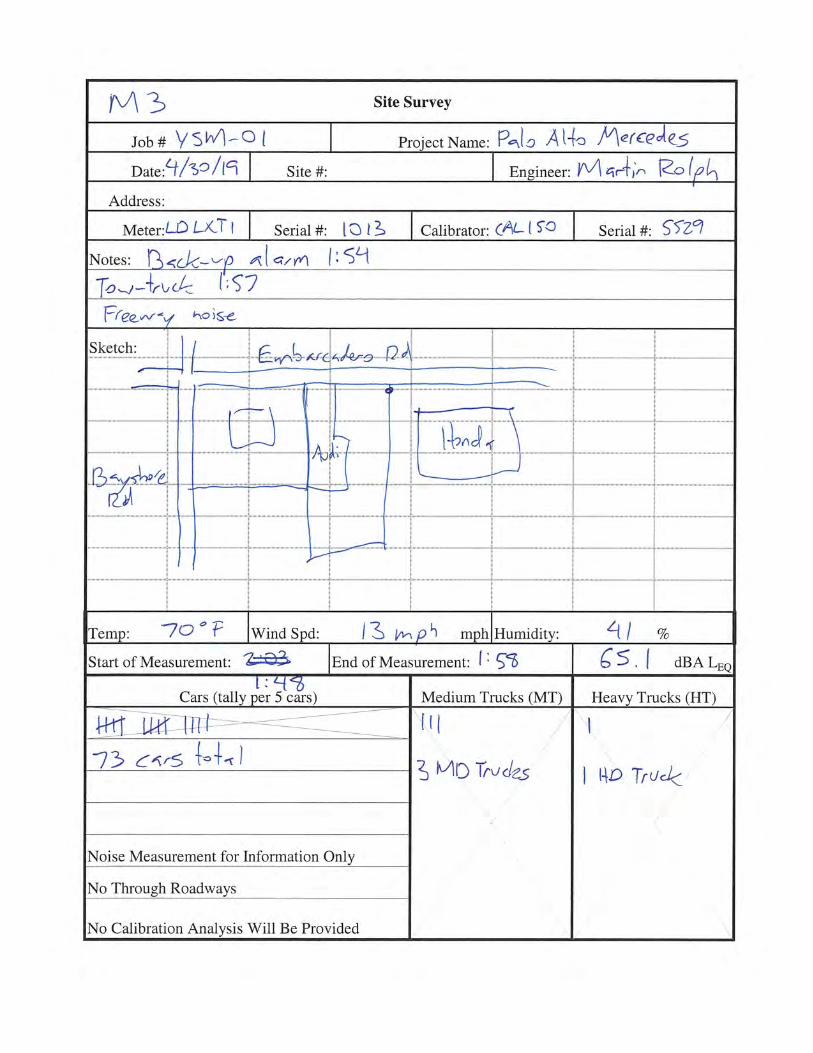
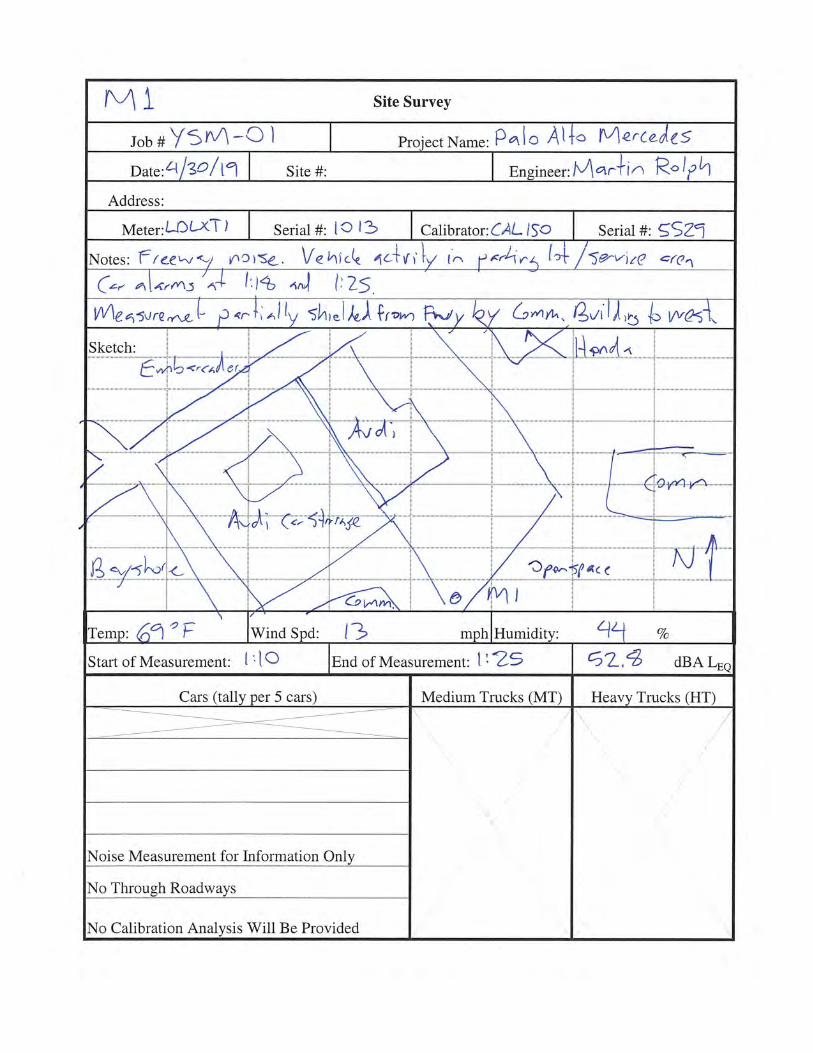
Appendix BTraffic Noise
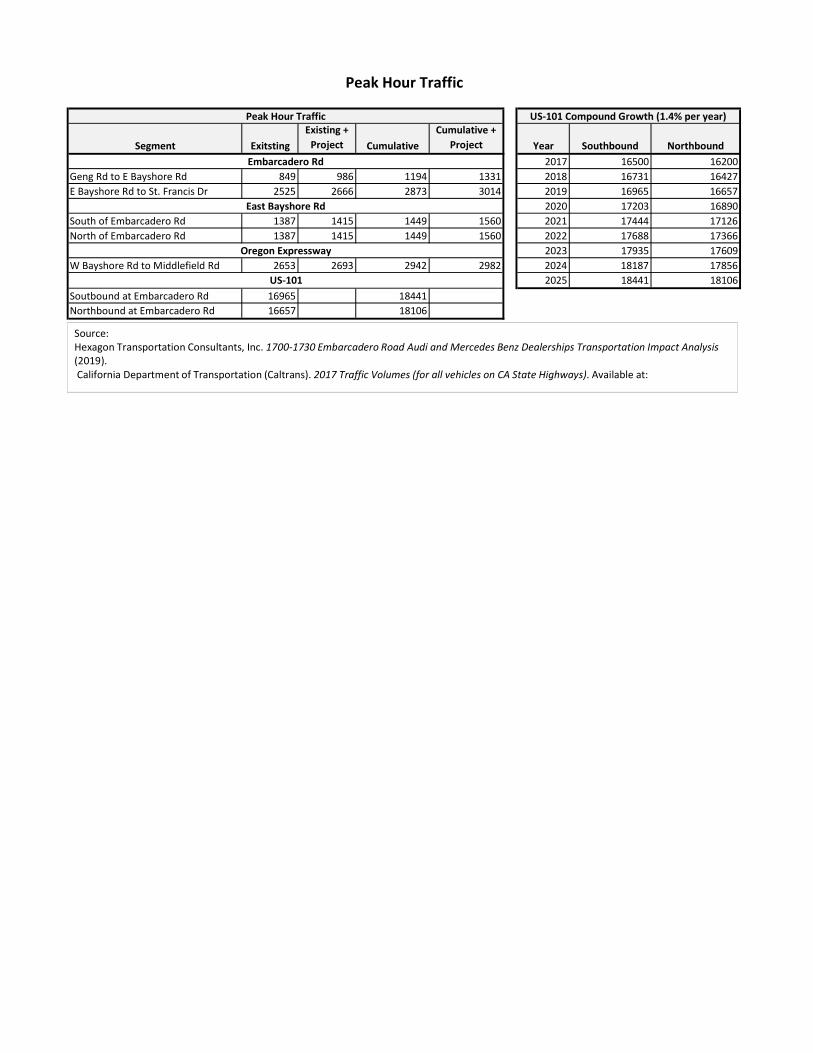
Segment ExitstingExisting +
Project CumulativeCumulative +
Project Year Southbound Northbound2017 16500 16200
Geng Rd to E Bayshore Rd 849 986 1194 1331 2018 16731 16427E Bayshore Rd to St. Francis Dr 2525 2666 2873 3014 2019 16965 16657
2020 17203 16890South of Embarcadero Rd 1387 1415 1449 1560 2021 17444 17126North of Embarcadero Rd 1387 1415 1449 1560 2022 17688 17366
2023 17935 17609W Bayshore Rd to Middlefield Rd 2653 2693 2942 2982 2024 18187 17856
2025 18441 18106Soutbound at Embarcadero Rd 16965 18441Northbound at Embarcadero Rd 16657 18106
Oregon Expressway
US-101
Peak Hour Traffic
Peak Hour Traffic US-101 Compound Growth (1.4% per year)
Embarcadero Rd
East Bayshore Rd
Source: Hexagon Transportation Consultants, Inc. 1700-1730 Embarcadero Road Audi and Mercedes Benz Dealerships Transportation Impact Analysis(2019).California Department of Transportation (Caltrans). 2017 Traffic Volumes (for all vehicles on CA State Highways). Available at:
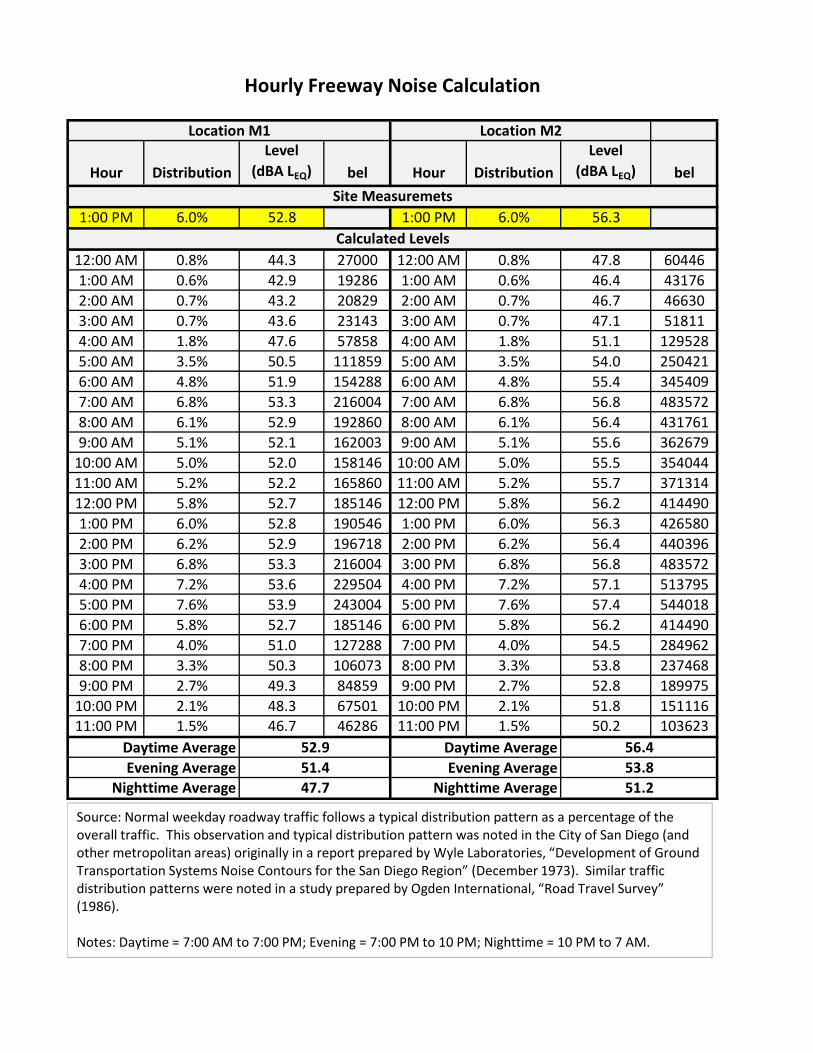
Hour DistributionLevel
(dBA LEQ) bel Hour DistributionLevel
(dBA LEQ) bel
1:00 PM 6.0% 52.8 1:00 PM 6.0% 56.3
12:00 AM 0.8% 44.3 27000 12:00 AM 0.8% 47.8 604461:00 AM 0.6% 42.9 19286 1:00 AM 0.6% 46.4 431762:00 AM 0.7% 43.2 20829 2:00 AM 0.7% 46.7 466303:00 AM 0.7% 43.6 23143 3:00 AM 0.7% 47.1 518114:00 AM 1.8% 47.6 57858 4:00 AM 1.8% 51.1 1295285:00 AM 3.5% 50.5 111859 5:00 AM 3.5% 54.0 2504216:00 AM 4.8% 51.9 154288 6:00 AM 4.8% 55.4 3454097:00 AM 6.8% 53.3 216004 7:00 AM 6.8% 56.8 4835728:00 AM 6.1% 52.9 192860 8:00 AM 6.1% 56.4 4317619:00 AM 5.1% 52.1 162003 9:00 AM 5.1% 55.6 362679
10:00 AM 5.0% 52.0 158146 10:00 AM 5.0% 55.5 35404411:00 AM 5.2% 52.2 165860 11:00 AM 5.2% 55.7 37131412:00 PM 5.8% 52.7 185146 12:00 PM 5.8% 56.2 4144901:00 PM 6.0% 52.8 190546 1:00 PM 6.0% 56.3 4265802:00 PM 6.2% 52.9 196718 2:00 PM 6.2% 56.4 4403963:00 PM 6.8% 53.3 216004 3:00 PM 6.8% 56.8 4835724:00 PM 7.2% 53.6 229504 4:00 PM 7.2% 57.1 5137955:00 PM 7.6% 53.9 243004 5:00 PM 7.6% 57.4 5440186:00 PM 5.8% 52.7 185146 6:00 PM 5.8% 56.2 4144907:00 PM 4.0% 51.0 127288 7:00 PM 4.0% 54.5 2849628:00 PM 3.3% 50.3 106073 8:00 PM 3.3% 53.8 2374689:00 PM 2.7% 49.3 84859 9:00 PM 2.7% 52.8 189975
10:00 PM 2.1% 48.3 67501 10:00 PM 2.1% 51.8 15111611:00 PM 1.5% 46.7 46286 11:00 PM 1.5% 50.2 103623
Daytime Average Daytime AverageEvening Average Evening Average
Nighttime Average Nighttime Average51.4 53.847.7 51.2
Hourly Freeway Noise Calculation
Location M1 Location M2
Site Measuremets
Calculated Levels
52.9 56.4
Source: Normal weekday roadway traffic follows a typical distribution pattern as a percentage of the overall traffic. This observation and typical distribution pattern was noted in the City of San Diego (and other metropolitan areas) originally in a report prepared by Wyle Laboratories, “Development of Ground Transportation Systems Noise Contours for the San Diego Region” (December 1973). Similar traffic distribution patterns were noted in a study prepared by Ogden International, “Road Travel Survey” (1986).
Notes: Daytime = 7:00 AM to 7:00 PM; Evening = 7:00 PM to 10 PM; Nighttime = 10 PM to 7 AM.
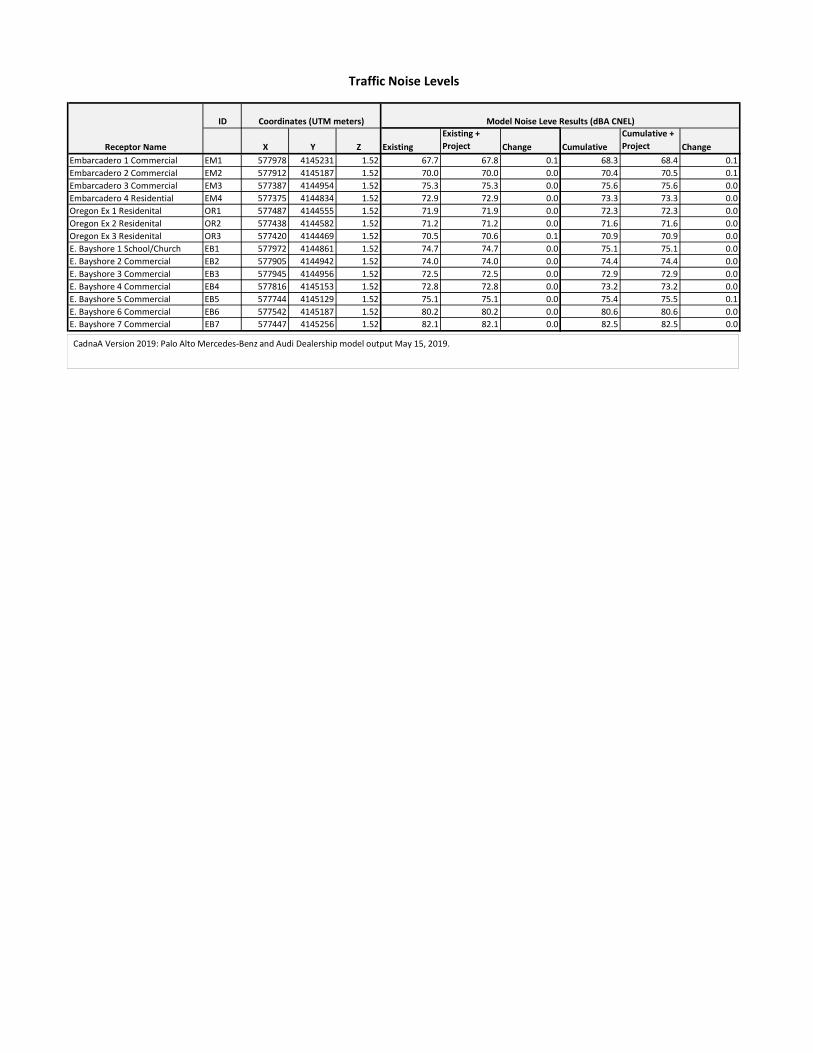
ID
X Y Z ExistingExisting + Project Change Cumulative
Cumulative + Project Change
Embarcadero 1 Commercial EM1 577978 4145231 1.52 67.7 67.8 0.1 68.3 68.4 0.1Embarcadero 2 Commercial EM2 577912 4145187 1.52 70.0 70.0 0.0 70.4 70.5 0.1Embarcadero 3 Commercial EM3 577387 4144954 1.52 75.3 75.3 0.0 75.6 75.6 0.0Embarcadero 4 Residential EM4 577375 4144834 1.52 72.9 72.9 0.0 73.3 73.3 0.0Oregon Ex 1 Residenital OR1 577487 4144555 1.52 71.9 71.9 0.0 72.3 72.3 0.0Oregon Ex 2 Residenital OR2 577438 4144582 1.52 71.2 71.2 0.0 71.6 71.6 0.0Oregon Ex 3 Residenital OR3 577420 4144469 1.52 70.5 70.6 0.1 70.9 70.9 0.0E. Bayshore 1 School/Church EB1 577972 4144861 1.52 74.7 74.7 0.0 75.1 75.1 0.0E. Bayshore 2 Commercial EB2 577905 4144942 1.52 74.0 74.0 0.0 74.4 74.4 0.0E. Bayshore 3 Commercial EB3 577945 4144956 1.52 72.5 72.5 0.0 72.9 72.9 0.0E. Bayshore 4 Commercial EB4 577816 4145153 1.52 72.8 72.8 0.0 73.2 73.2 0.0E. Bayshore 5 Commercial EB5 577744 4145129 1.52 75.1 75.1 0.0 75.4 75.5 0.1E. Bayshore 6 Commercial EB6 577542 4145187 1.52 80.2 80.2 0.0 80.6 80.6 0.0E. Bayshore 7 Commercial EB7 577447 4145256 1.52 82.1 82.1 0.0 82.5 82.5 0.0
Traffic Noise Levels
Model Noise Leve Results (dBA CNEL)
Receptor Name
Coordinates (UTM meters)
CadnaA Version 2019: Palo Alto Mercedes-Benz and Audi Dealership model output May 15, 2019.

Appendix CBlower Assembly Data Sheets
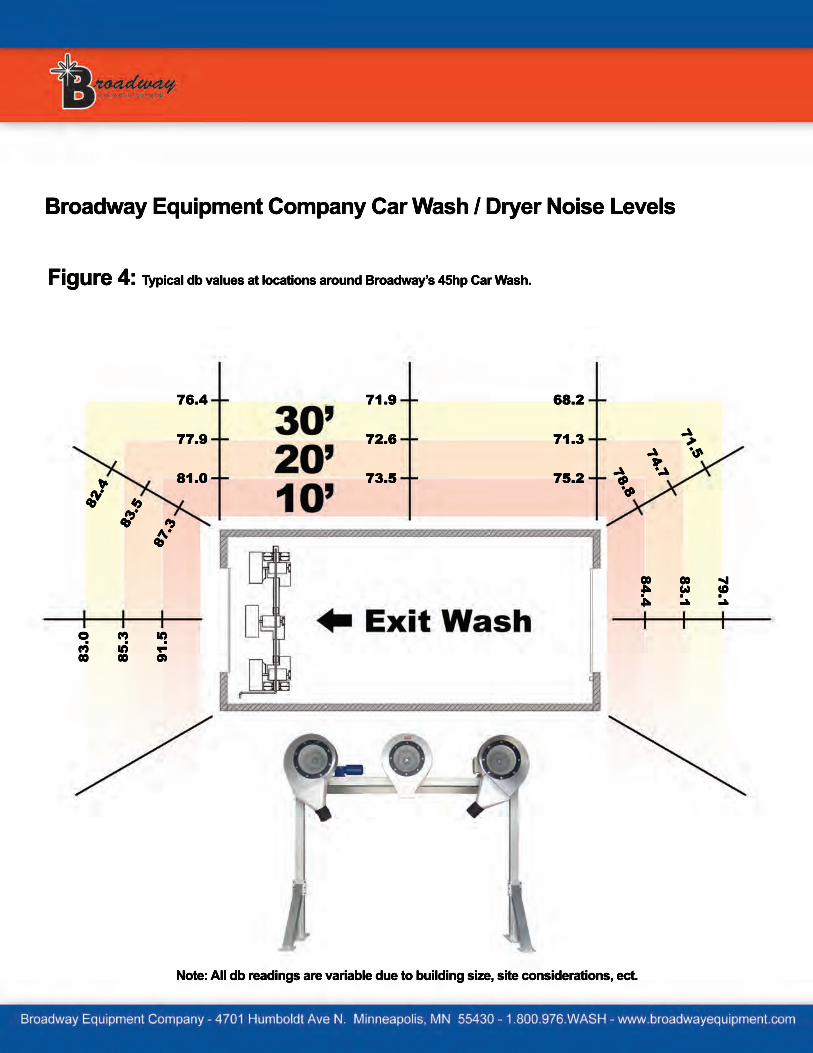
83.0
85.3
91.5
76.4
77.9
81.0
71.9
72.6
73.5
68.2
71.3
75.2
79.1
83.1
84.4
71.574.778.8
82.4
83.5
87.3
Broadway Equipment Company Car Wash / Dryer Noise Levels
Figure 4:Typical db values at locations around Broadway’s 45hp Car Wash.
Note: All db readings are variable due to building size, site considerations, ect.
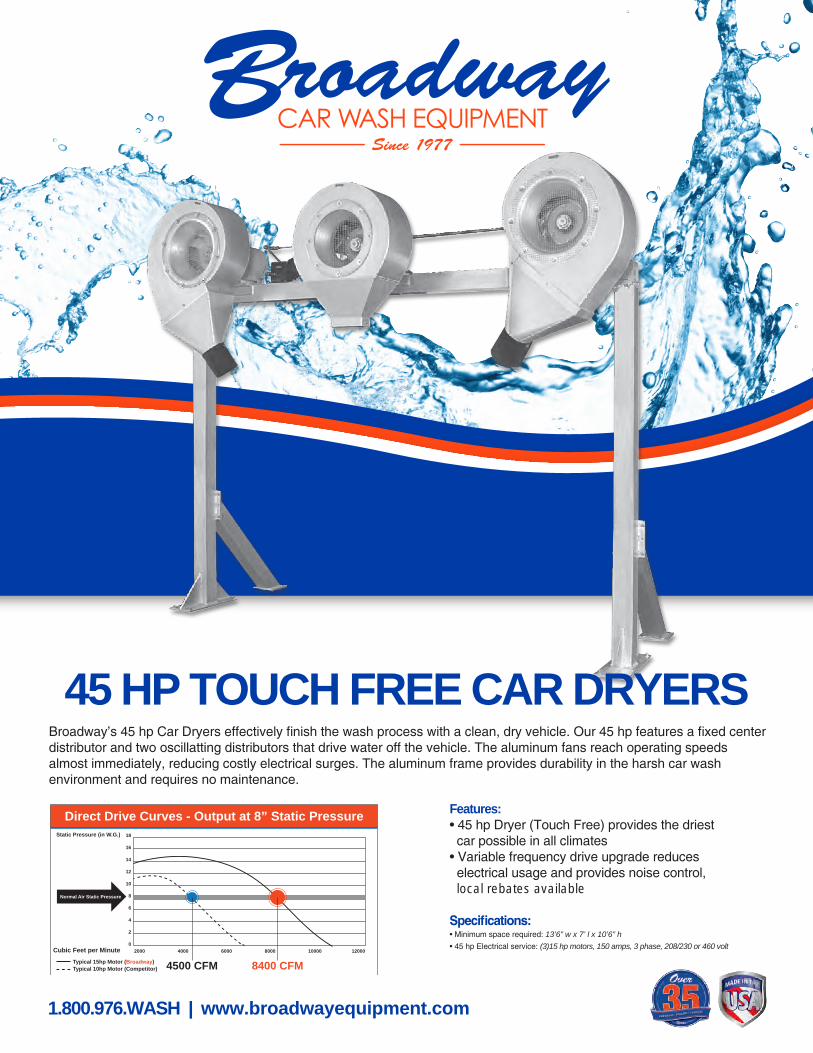
1.800.976.WASH | www.broadwayequipment.com
Broadway’s 45 hp Car Dryers effectively finish the wash process with a clean, dry vehicle. Our 45 hp features a fixed center distributor and two oscillatting distributors that drive water off the vehicle. The aluminum fans reach operating speeds almost immediately, reducing costly electrical surges. The aluminum frame provides durability in the harsh car wash environment and requires no maintenance.
1.800.976.WASH | www.broadwayequipment.com
45 HP TOUCH FREE CAR DRYERS
Normal Air Static Pressure
Cubic Feet per Minute
Typical 10hp Motor (Competitor)
Typical 15hp Motor (Broadway)
18
16
14
12
10
8
6
4
2
0
2000 4000 6000 8000 10000 12000
Direct Drive Curves - Output at 8” Static Pressure
Static Pressure (in W.G.)
4500 CFM 8400 CFMFeatures:• 45 hp Dryer (Touch Free) provides the driest car possible in all climates• Variable frequency drive upgrade reduces electrical usage and provides noise control, local rebates available
Specifications:• Minimum space required: 13’6” w x 7’ l x 10’6” h• 45 hp Electrical service: (3)15 hp motors, 150 amps, 3 phase, 208/230 or 460 volt
Features:• 45 hp Dryer (Touch Free) provides the driest car possible in all climates• Variable frequency drive upgrade reduceselectrical usage and provides noise control,local rebates available
Specifications:• Minimum space required: 13’6” w x 7’ l x 10’6” h• 45 hp Electrical service: (3)15 hp motors, 150 amps, 3 phase, 208/230 or 460 volt
Appendix DGenerator Data Sheets
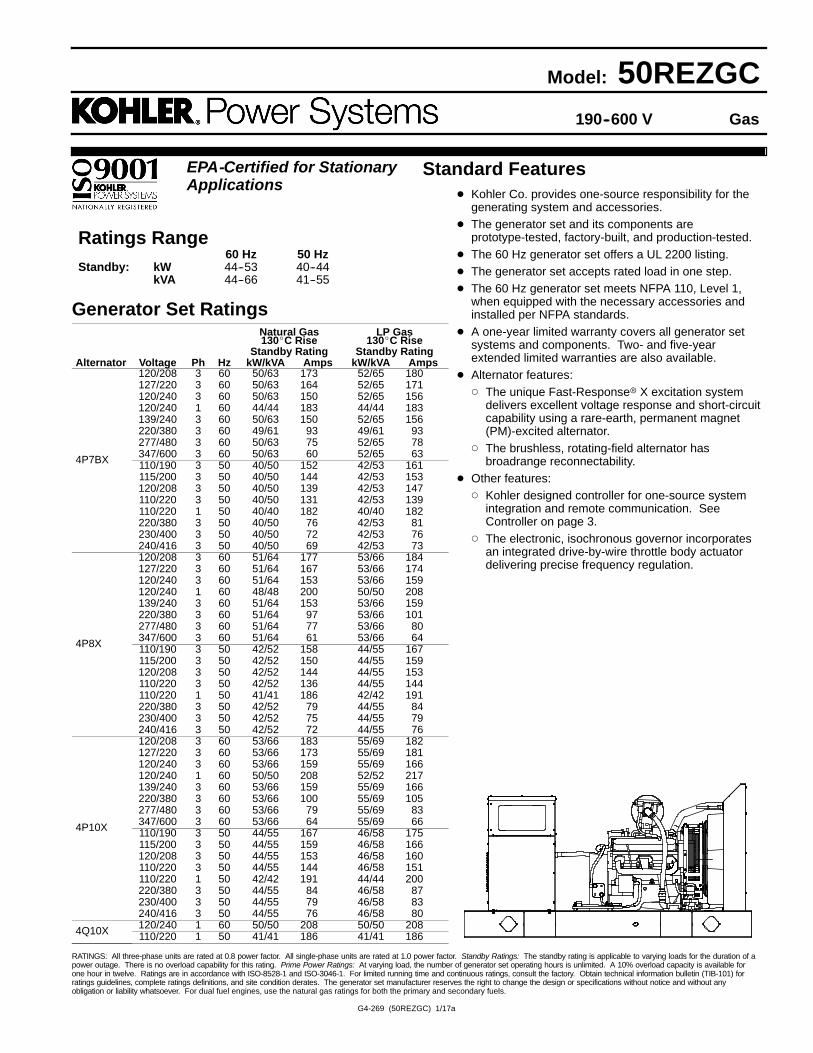
Standard FeaturesD Kohler Co. provides one-source responsibility for the
generating system and accessories.D The generator set and its components are
prototype-tested, factory-built, and production-tested.D The 60 Hz generator set offers a UL 2200 listing.D The generator set accepts rated load in one step.D The 60 Hz generator set meets NFPA 110, Level 1,
when equipped with the necessary accessories andinstalled per NFPA standards.
D A one-year limited warranty covers all generator setsystems and components. Two- and five-yearextended limited warranties are also available.
D Alternator features:d The unique Fast-Responser X excitation system
delivers excellent voltage response and short-circuitcapability using a rare-earth, permanent magnet(PM)-excited alternator.
d The brushless, rotating-field alternator hasbroadrange reconnectability.
D Other features:d Kohler designed controller for one-source system
integration and remote communication. SeeController on page 3.
d The electronic, isochronous governor incorporatesan integrated drive-by-wire throttle body actuatordelivering precise frequency regulation.
Ratings Range60 Hz 50 Hz
Standby: kW 44--53 40--44kVA 44--66 41--55
Model: 50REZGC190--600 V Gas
EPA-Certified for StationaryApplications
G4-269 (50REZGC) 1/17a
Generator Set RatingsNatural Gas LP Gas130_C Rise 130_C Rise
Standby Rating Standby RatingAlternator Voltage Ph Hz kW/kVA Amps kW/kVA Amps
4P7BX
120/208 3 60 50/63 173 52/65 180127/220 3 60 50/63 164 52/65 171120/240 3 60 50/63 150 52/65 156120/240 1 60 44/44 183 44/44 183139/240 3 60 50/63 150 52/65 156220/380 3 60 49/61 93 49/61 93277/480 3 60 50/63 75 52/65 78347/600 3 60 50/63 60 52/65 63110/190 3 50 40/50 152 42/53 161115/200 3 50 40/50 144 42/53 153120/208 3 50 40/50 139 42/53 147110/220 3 50 40/50 131 42/53 139110/220 1 50 40/40 182 40/40 182220/380 3 50 40/50 76 42/53 81230/400 3 50 40/50 72 42/53 76240/416 3 50 40/50 69 42/53 73
4P8X
120/208 3 60 51/64 177 53/66 184127/220 3 60 51/64 167 53/66 174120/240 3 60 51/64 153 53/66 159120/240 1 60 48/48 200 50/50 208139/240 3 60 51/64 153 53/66 159220/380 3 60 51/64 97 53/66 101277/480 3 60 51/64 77 53/66 80347/600 3 60 51/64 61 53/66 64110/190 3 50 42/52 158 44/55 167115/200 3 50 42/52 150 44/55 159120/208 3 50 42/52 144 44/55 153110/220 3 50 42/52 136 44/55 144110/220 1 50 41/41 186 42/42 191220/380 3 50 42/52 79 44/55 84230/400 3 50 42/52 75 44/55 79240/416 3 50 42/52 72 44/55 76
4P10X
120/208 3 60 53/66 183 55/69 182127/220 3 60 53/66 173 55/69 181120/240 3 60 53/66 159 55/69 166120/240 1 60 50/50 208 52/52 217139/240 3 60 53/66 159 55/69 166220/380 3 60 53/66 100 55/69 105277/480 3 60 53/66 79 55/69 83347/600 3 60 53/66 64 55/69 66110/190 3 50 44/55 167 46/58 175115/200 3 50 44/55 159 46/58 166120/208 3 50 44/55 153 46/58 160110/220 3 50 44/55 144 46/58 151110/220 1 50 42/42 191 44/44 200220/380 3 50 44/55 84 46/58 87230/400 3 50 44/55 79 46/58 83240/416 3 50 44/55 76 46/58 80
4Q10X 120/240 1 60 50/50 208 50/50 208110/220 1 50 41/41 186 41/41 186
RATINGS: All three-phase units are rated at 0.8 power factor. All single-phase units are rated at 1.0 power factor. Standby Ratings: The standby rating is applicable to varying loads for the duration of apower outage. There is no overload capability for this rating. Prime Power Ratings: At varying load, the number of generator set operating hours is unlimited. A 10% overload capacity is available forone hour in twelve. Ratings are in accordance with ISO-8528-1 and ISO-3046-1. For limited running time and continuous ratings, consult the factory. Obtain technical information bulletin (TIB-101) forratings guidelines, complete ratings definitions, and site condition derates. The generator set manufacturer reserves the right to change the design or specifications without notice and without anyobligation or liability whatsoever. For dual fuel engines, use the natural gas ratings for both the primary and secondary fuels.
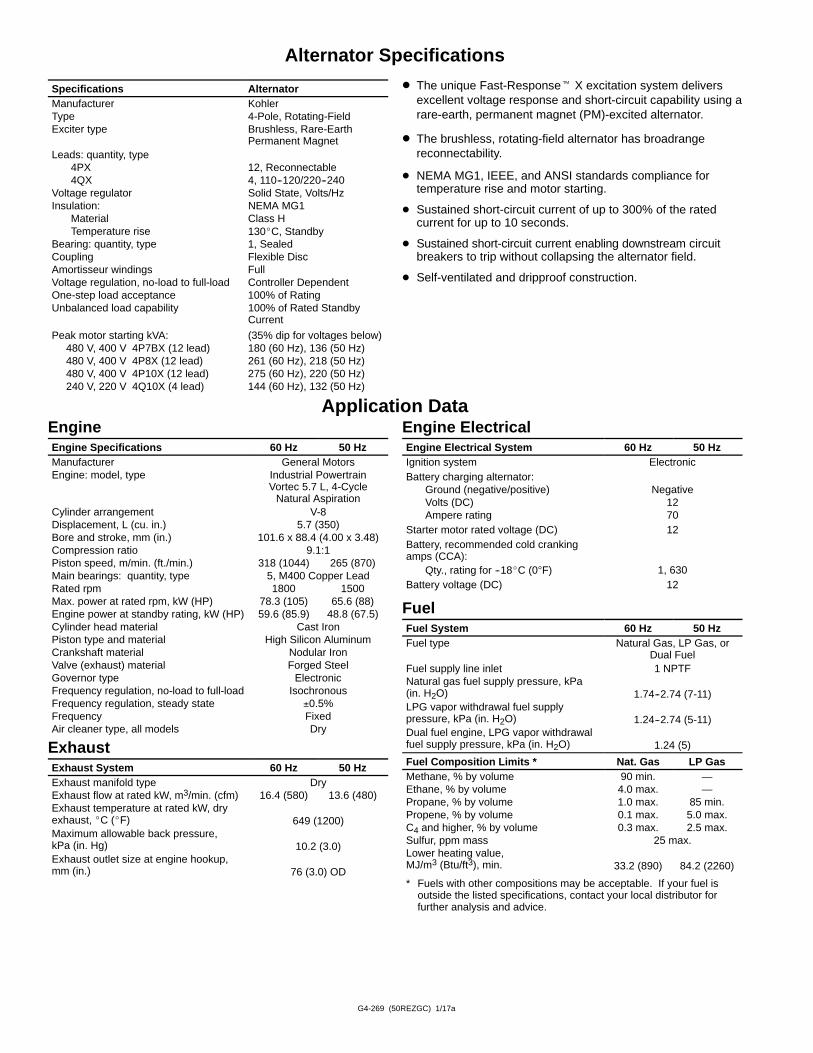
G4-269 (50REZGC) 1/17a
Alternator Specifications
Specifications AlternatorManufacturer KohlerType 4-Pole, Rotating-FieldExciter type Brushless, Rare-Earth
Permanent MagnetLeads: quantity, type
4PX 12, Reconnectable4QX 4, 110--120/220--240
Voltage regulator Solid State, Volts/HzInsulation: NEMA MG1
Material Class HTemperature rise 130_C, Standby
Bearing: quantity, type 1, SealedCoupling Flexible DiscAmortisseur windings FullVoltage regulation, no-load to full-load Controller DependentOne-step load acceptance 100% of RatingUnbalanced load capability 100% of Rated Standby
CurrentPeak motor starting kVA: (35% dip for voltages below)
480 V, 400 V 4P7BX (12 lead) 180 (60 Hz), 136 (50 Hz)480 V, 400 V 4P8X (12 lead) 261 (60 Hz), 218 (50 Hz)480 V, 400 V 4P10X (12 lead) 275 (60 Hz), 220 (50 Hz)240 V, 220 V 4Q10X (4 lead) 144 (60 Hz), 132 (50 Hz)
D The unique Fast-Responset X excitation system deliversexcellent voltage response and short-circuit capability using arare-earth, permanent magnet (PM)-excited alternator.
D The brushless, rotating-field alternator has broadrangereconnectability.
D NEMA MG1, IEEE, and ANSI standards compliance fortemperature rise and motor starting.
D Sustained short-circuit current of up to 300% of the ratedcurrent for up to 10 seconds.
D Sustained short-circuit current enabling downstream circuitbreakers to trip without collapsing the alternator field.
D Self-ventilated and dripproof construction.
Application DataEngineEngine Specifications 60 Hz 50 HzManufacturer General MotorsEngine: model, type Industrial Powertrain
Vortec 5.7 L, 4-CycleNatural Aspiration
Cylinder arrangement V-8Displacement, L (cu. in.) 5.7 (350)Bore and stroke, mm (in.) 101.6 x 88.4 (4.00 x 3.48)Compression ratio 9.1:1Piston speed, m/min. (ft./min.) 318 (1044) 265 (870)Main bearings: quantity, type 5, M400 Copper LeadRated rpm 1800 1500Max. power at rated rpm, kW (HP) 78.3 (105) 65.6 (88)Engine power at standby rating, kW (HP) 59.6 (85.9) 48.8 (67.5)Cylinder head material Cast IronPiston type and material High Silicon AluminumCrankshaft material Nodular IronValve (exhaust) material Forged SteelGovernor type ElectronicFrequency regulation, no-load to full-load IsochronousFrequency regulation, steady state 0.5%Frequency FixedAir cleaner type, all models Dry
ExhaustExhaust System 60 Hz 50 HzExhaust manifold type DryExhaust flow at rated kW, m3/min. (cfm) 16.4 (580) 13.6 (480)Exhaust temperature at rated kW, dryexhaust, _C (_F) 649 (1200)Maximum allowable back pressure,kPa (in. Hg) 10.2 (3.0)Exhaust outlet size at engine hookup,mm (in.) 76 (3.0) OD
Engine ElectricalEngine Electrical System 60 Hz 50 HzIgnition system ElectronicBattery charging alternator:
Ground (negative/positive) NegativeVolts (DC) 12Ampere rating 70
Starter motor rated voltage (DC) 12Battery, recommended cold crankingamps (CCA):
Qty., rating for --18_C (0F) 1, 630Battery voltage (DC) 12
FuelFuel System 60 Hz 50 HzFuel type Natural Gas, LP Gas, or
Dual FuelFuel supply line inlet 1 NPTFNatural gas fuel supply pressure, kPa(in. H2O) 1.74--2.74 (7-11)LPG vapor withdrawal fuel supplypressure, kPa (in. H2O) 1.24--2.74 (5-11)Dual fuel engine, LPG vapor withdrawalfuel supply pressure, kPa (in. H2O) 1.24 (5)Fuel Composition Limits * Nat. Gas LP GasMethane, % by volume 90 min. —Ethane, % by volume 4.0 max. —Propane, % by volume 1.0 max. 85 min.Propene, % by volume 0.1 max. 5.0 max.C4 and higher, % by volume 0.3 max. 2.5 max.Sulfur, ppm mass 25 max.Lower heating value,MJ/m3 (Btu/ft3), min. 33.2 (890) 84.2 (2260)
* Fuels with other compositions may be acceptable. If your fuel isoutside the listed specifications, contact your local distributor forfurther analysis and advice.
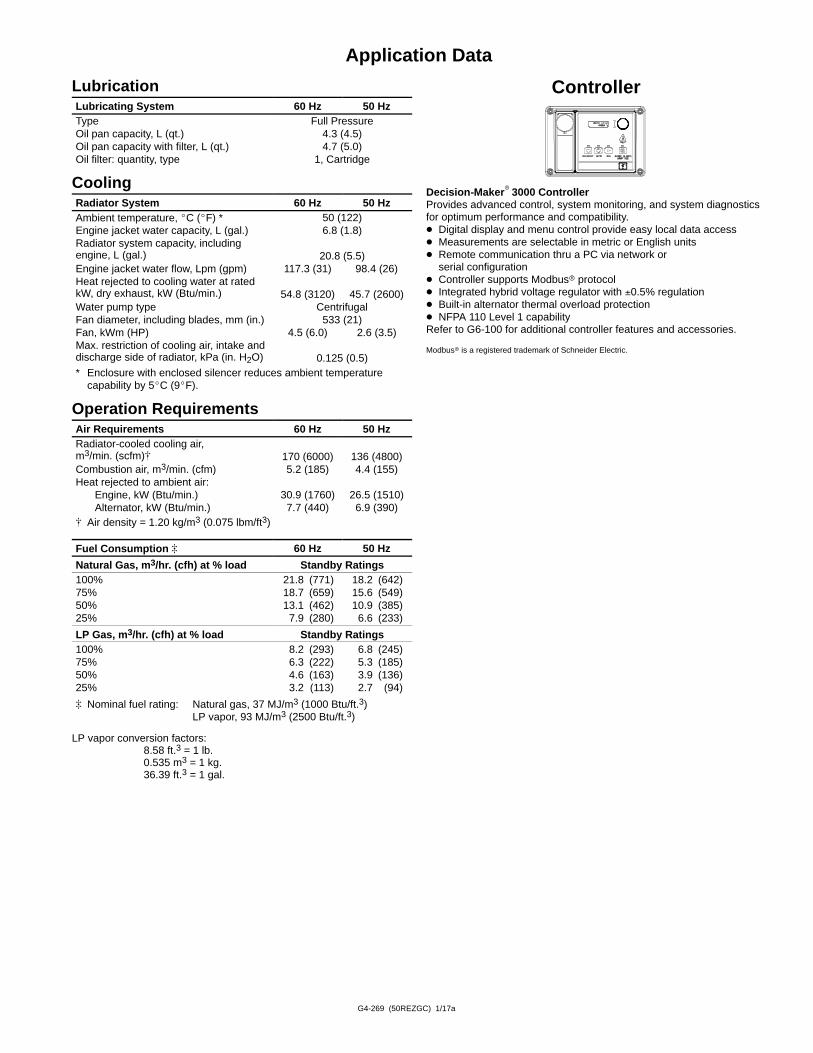
G4-269 (50REZGC) 1/17a
Application Data
LubricationLubricating System 60 Hz 50 HzType Full PressureOil pan capacity, L (qt.) 4.3 (4.5)Oil pan capacity with filter, L (qt.) 4.7 (5.0)Oil filter: quantity, type 1, Cartridge
CoolingRadiator System 60 Hz 50 HzAmbient temperature, _C (_F) * 50 (122)Engine jacket water capacity, L (gal.) 6.8 (1.8)Radiator system capacity, includingengine, L (gal.) 20.8 (5.5)Engine jacket water flow, Lpm (gpm) 117.3 (31) 98.4 (26)Heat rejected to cooling water at ratedkW, dry exhaust, kW (Btu/min.) 54.8 (3120) 45.7 (2600)Water pump type CentrifugalFan diameter, including blades, mm (in.) 533 (21)Fan, kWm (HP) 4.5 (6.0) 2.6 (3.5)Max. restriction of cooling air, intake anddischarge side of radiator, kPa (in. H2O) 0.125 (0.5)* Enclosure with enclosed silencer reduces ambient temperature
capability by 5_C (9_F).
Operation RequirementsAir Requirements 60 Hz 50 HzRadiator-cooled cooling air,m3/min. (scfm)[ 170 (6000) 136 (4800)Combustion air, m3/min. (cfm) 5.2 (185) 4.4 (155)Heat rejected to ambient air:
Engine, kW (Btu/min.) 30.9 (1760) 26.5 (1510)Alternator, kW (Btu/min.) 7.7 (440) 6.9 (390)
[ Air density = 1.20 kg/m3 (0.075 lbm/ft3)
Fuel Consumption ] 60 Hz 50 Hz
Natural Gas, m3/hr. (cfh) at % load Standby Ratings100% 21.8 (771) 18.2 (642)75% 18.7 (659) 15.6 (549)50% 13.1 (462) 10.9 (385)25% 7.9 (280) 6.6 (233)LP Gas, m3/hr. (cfh) at % load Standby Ratings100% 8.2 (293) 6.8 (245)75% 6.3 (222) 5.3 (185)50% 4.6 (163) 3.9 (136)25% 3.2 (113) 2.7 (94)] Nominal fuel rating: Natural gas, 37 MJ/m3 (1000 Btu/ft.3)
LP vapor, 93 MJ/m3 (2500 Btu/ft.3)
LP vapor conversion factors:8.58 ft.3 = 1 lb.0.535 m3 = 1 kg.36.39 ft.3 = 1 gal.
Controller
Decision-Makerr 3000 ControllerProvides advanced control, system monitoring, and system diagnosticsfor optimum performance and compatibility.D Digital display and menu control provide easy local data accessD Measurements are selectable in metric or English unitsD Remote communication thru a PC via network or
serial configurationD Controller supports Modbusr protocolD Integrated hybrid voltage regulator with 0.5% regulationD Built-in alternator thermal overload protectionD NFPA 110 Level 1 capabilityRefer to G6-100 for additional controller features and accessories.
Modbusr is a registered trademark of Schneider Electric.
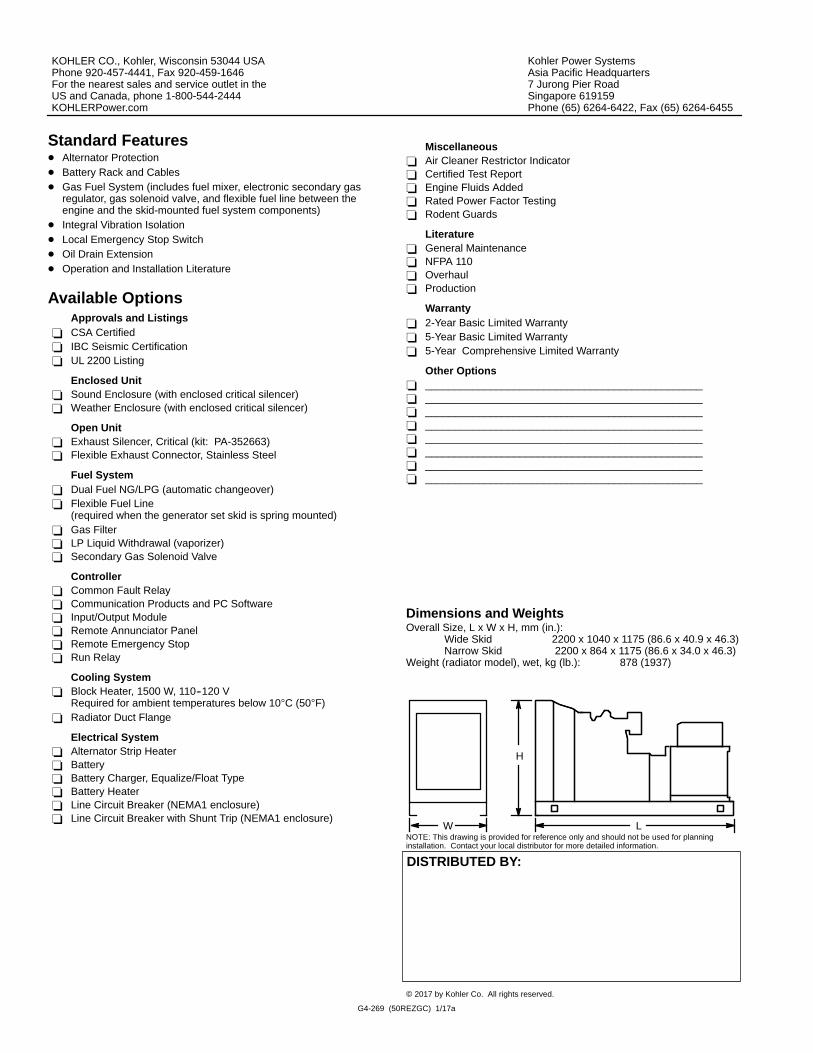
Overall Size, L x W x H, mm (in.):Wide Skid 2200 x 1040 x 1175 (86.6 x 40.9 x 46.3)Narrow Skid 2200 x 864 x 1175 (86.6 x 34.0 x 46.3)
Weight (radiator model), wet, kg (lb.): 878 (1937)
2017 by Kohler Co. All rights reserved.
DISTRIBUTED BY:
Dimensions and Weights
NOTE: This drawing is provided for reference only and should not be used for planninginstallation. Contact your local distributor for more detailed information.
H
W L
G4-269 (50REZGC) 1/17a
Standard FeaturesD Alternator ProtectionD Battery Rack and CablesD Gas Fuel System (includes fuel mixer, electronic secondary gas
regulator, gas solenoid valve, and flexible fuel line between theengine and the skid-mounted fuel system components)
D Integral Vibration IsolationD Local Emergency Stop SwitchD Oil Drain ExtensionD Operation and Installation Literature
Available OptionsApprovals and Listings
- CSA Certified- IBC Seismic Certification- UL 2200 Listing
Enclosed Unit- Sound Enclosure (with enclosed critical silencer)- Weather Enclosure (with enclosed critical silencer)
Open Unit- Exhaust Silencer, Critical (kit: PA-352663)- Flexible Exhaust Connector, Stainless Steel
Fuel System- Dual Fuel NG/LPG (automatic changeover)- Flexible Fuel Line
(required when the generator set skid is spring mounted)- Gas Filter- LP Liquid Withdrawal (vaporizer)- Secondary Gas Solenoid Valve
Controller- Common Fault Relay- Communication Products and PC Software- Input/Output Module- Remote Annunciator Panel- Remote Emergency Stop- Run Relay
Cooling System- Block Heater, 1500 W, 110--120 V
Required for ambient temperatures below 10C (50F)- Radiator Duct Flange
Electrical System- Alternator Strip Heater- Battery- Battery Charger, Equalize/Float Type- Battery Heater- Line Circuit Breaker (NEMA1 enclosure)- Line Circuit Breaker with Shunt Trip (NEMA1 enclosure)
Miscellaneous- Air Cleaner Restrictor Indicator- Certified Test Report- Engine Fluids Added- Rated Power Factor Testing- Rodent Guards
Literature- General Maintenance- NFPA 110- Overhaul- Production
Warranty- 2-Year Basic Limited Warranty- 5-Year Basic Limited Warranty- 5-Year Comprehensive Limited Warranty
Other Options- _______________________________________________- _______________________________________________- _______________________________________________- _______________________________________________- _______________________________________________- _______________________________________________- _______________________________________________- _______________________________________________
Kohler Power SystemsAsia Pacific Headquarters7 Jurong Pier RoadSingapore 619159Phone (65) 6264-6422, Fax (65) 6264-6455
KOHLER CO., Kohler, Wisconsin 53044 USAPhone 920-457-4441, Fax 920-459-1646For the nearest sales and service outlet in theUS and Canada, phone 1-800-544-2444KOHLERPower.com
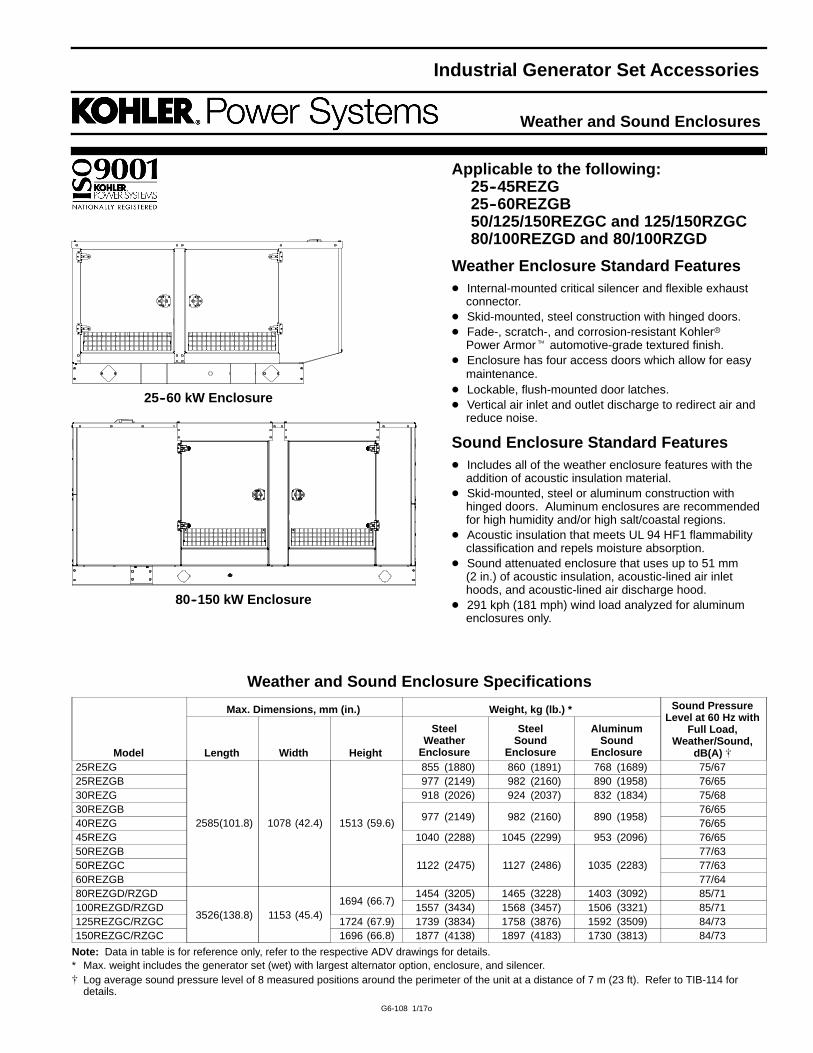
Weather and Sound Enclosures
Industrial Generator Set Accessories
Applicable to the following:25--45REZG25--60REZGB50/125/150REZGC and 125/150RZGC80/100REZGD and 80/100RZGD
Weather Enclosure Standard FeaturesD Internal-mounted critical silencer and flexible exhaust
connector.D Skid-mounted, steel construction with hinged doors.D Fade-, scratch-, and corrosion-resistant Kohlerr
Power Armort automotive-grade textured finish.D Enclosure has four access doors which allow for easy
maintenance.D Lockable, flush-mounted door latches.D Vertical air inlet and outlet discharge to redirect air and
reduce noise.
Sound Enclosure Standard FeaturesD Includes all of the weather enclosure features with the
addition of acoustic insulation material.D Skid-mounted, steel or aluminum construction with
hinged doors. Aluminum enclosures are recommendedfor high humidity and/or high salt/coastal regions.
D Acoustic insulation that meets UL 94 HF1 flammabilityclassification and repels moisture absorption.
D Sound attenuated enclosure that uses up to 51 mm(2 in.) of acoustic insulation, acoustic-lined air inlethoods, and acoustic-lined air discharge hood.
D 291 kph (181 mph) wind load analyzed for aluminumenclosures only.
80--150 kW Enclosure
25--60 kW Enclosure
G6-108 1/17o
Weather and Sound Enclosure Specifications
Model
Max. Dimensions, mm (in.) Weight, kg (lb.) * Sound PressureLevel at 60 Hz with
Full Load,Weather/Sound,
dB(A) [Length Width Height
SteelWeather
Enclosure
SteelSound
Enclosure
AluminumSound
Enclosure25REZG
2585(101.8) 1078 (42.4) 1513 (59.6)
855 (1880) 860 (1891) 768 (1689) 75/6725REZGB 977 (2149) 982 (2160) 890 (1958) 76/6530REZG 918 (2026) 924 (2037) 832 (1834) 75/6830REZGB
977 (2149) 982 (2160) 890 (1958)76/65
40REZG 76/6545REZG 1040 (2288) 1045 (2299) 953 (2096) 76/6550REZGB
1122 (2475) 1127 (2486) 1035 (2283)77/63
50REZGC 77/6360REZGB 77/6480REZGD/RZGD
3526(138.8) 1153 (45.4)1694 (66.7)
1454 (3205) 1465 (3228) 1403 (3092) 85/71100REZGD/RZGD 1557 (3434) 1568 (3457) 1506 (3321) 85/71125REZGC/RZGC 1724 (67.9) 1739 (3834) 1758 (3876) 1592 (3509) 84/73150REZGC/RZGC 1696 (66.8) 1877 (4138) 1897 (4183) 1730 (3813) 84/73
Note: Data in table is for reference only, refer to the respective ADV drawings for details.* Max. weight includes the generator set (wet) with largest alternator option, enclosure, and silencer.[ Log average sound pressure level of 8 measured positions around the perimeter of the unit at a distance of 7 m (23 ft). Refer to TIB-114 for
details.
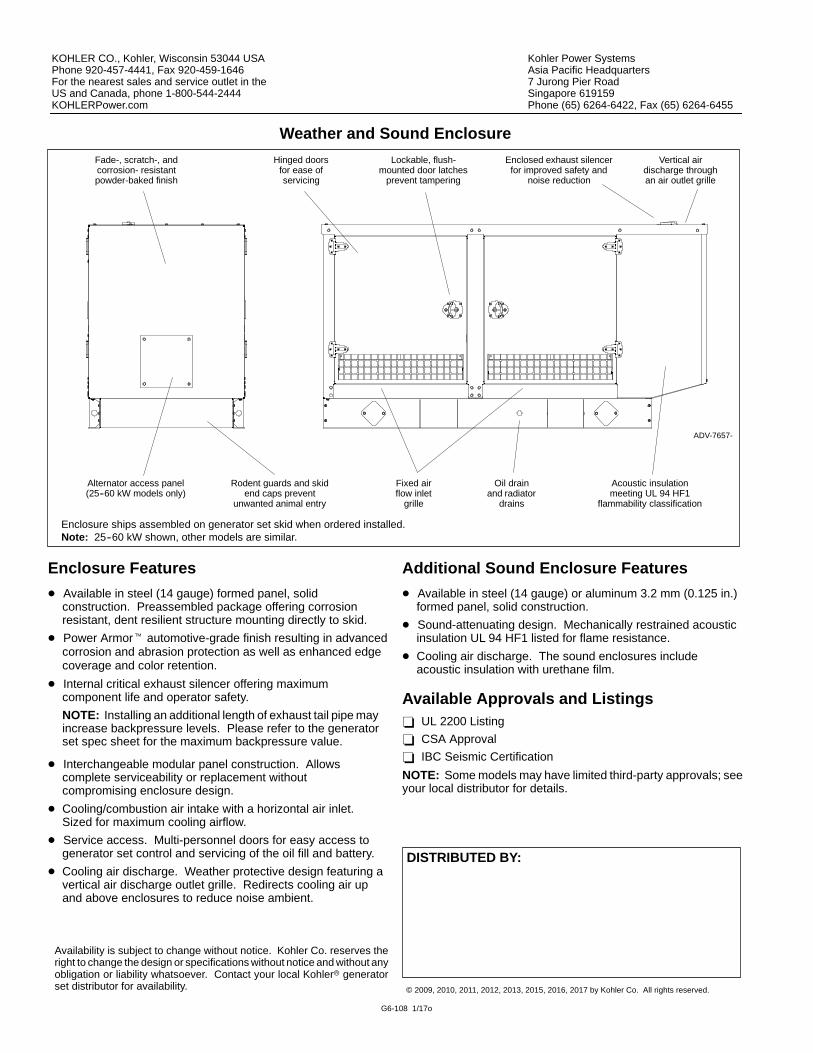
2009, 2010, 2011, 2012, 2013, 2015, 2016, 2017 by Kohler Co. All rights reserved.
DISTRIBUTED BY:
G6-108 1/17o
Weather and Sound Enclosure
ADV-7657-
Hinged doorsfor ease ofservicing
Lockable, flush-mounted door latches
prevent tampering
Fixed airflow inlet
grille
Rodent guards and skidend caps prevent
unwanted animal entry
Oil drainand radiator
drains
Fade-, scratch-, andcorrosion- resistantpowder-baked finish
Vertical airdischarge throughan air outlet grille
Enclosed exhaust silencerfor improved safety and
noise reduction
Acoustic insulationmeeting UL 94 HF1
flammability classification
Alternator access panel(25--60 kW models only)
Enclosure ships assembled on generator set skid when ordered installed.Note: 25--60 kW shown, other models are similar.
Enclosure Features
D Available in steel (14 gauge) formed panel, solidconstruction. Preassembled package offering corrosionresistant, dent resilient structure mounting directly to skid.
D Power Armort automotive-grade finish resulting in advancedcorrosion and abrasion protection as well as enhanced edgecoverage and color retention.
D Internal critical exhaust silencer offering maximumcomponent life and operator safety.NOTE: Installing an additional length of exhaust tail pipe mayincrease backpressure levels. Please refer to the generatorset spec sheet for the maximum backpressure value.
D Interchangeable modular panel construction. Allowscomplete serviceability or replacement withoutcompromising enclosure design.
D Cooling/combustion air intake with a horizontal air inlet.Sized for maximum cooling airflow.
D Service access. Multi-personnel doors for easy access togenerator set control and servicing of the oil fill and battery.
D Cooling air discharge. Weather protective design featuring avertical air discharge outlet grille. Redirects cooling air upand above enclosures to reduce noise ambient.
Additional Sound Enclosure Features
D Available in steel (14 gauge) or aluminum 3.2 mm (0.125 in.)formed panel, solid construction.
D Sound-attenuating design. Mechanically restrained acousticinsulation UL 94 HF1 listed for flame resistance.
D Cooling air discharge. The sound enclosures includeacoustic insulation with urethane film.
Available Approvals and Listings- UL 2200 Listing- CSA Approval- IBC Seismic CertificationNOTE: Some models may have limited third-party approvals; seeyour local distributor for details.
Kohler Power SystemsAsia Pacific Headquarters7 Jurong Pier RoadSingapore 619159Phone (65) 6264-6422, Fax (65) 6264-6455
KOHLER CO., Kohler, Wisconsin 53044 USAPhone 920-457-4441, Fax 920-459-1646For the nearest sales and service outlet in theUS and Canada, phone 1-800-544-2444KOHLERPower.com
Availability is subject to change without notice. Kohler Co. reserves theright to change the design or specifications without notice and without anyobligation or liability whatsoever. Contact your local Kohlerr generatorset distributor for availability.
Appendix EHVAC Data Sheets
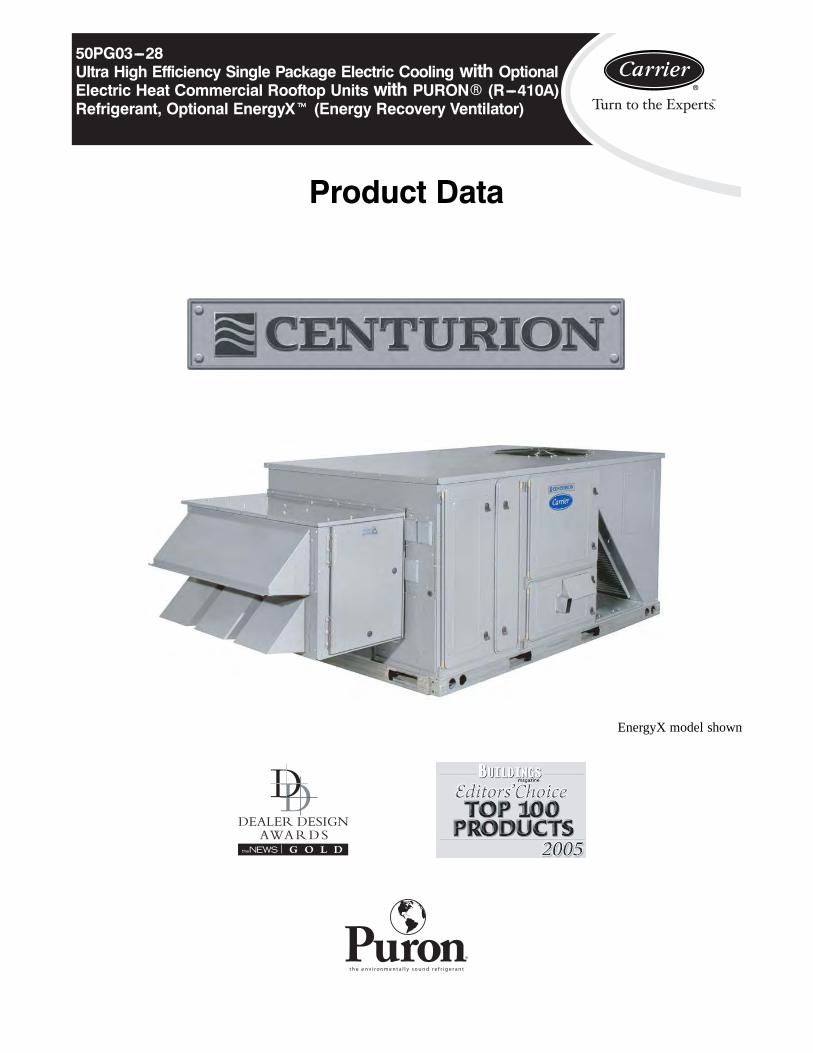
50PG03---28Ultra High Efficiency Single Package Electric Cooling with OptionalElectric Heat Commercial Rooftop Units with PURONR (R---410A)Refrigerant, Optional EnergyXt (Energy Recovery Ventilator)
Product Data
EnergyX model shown
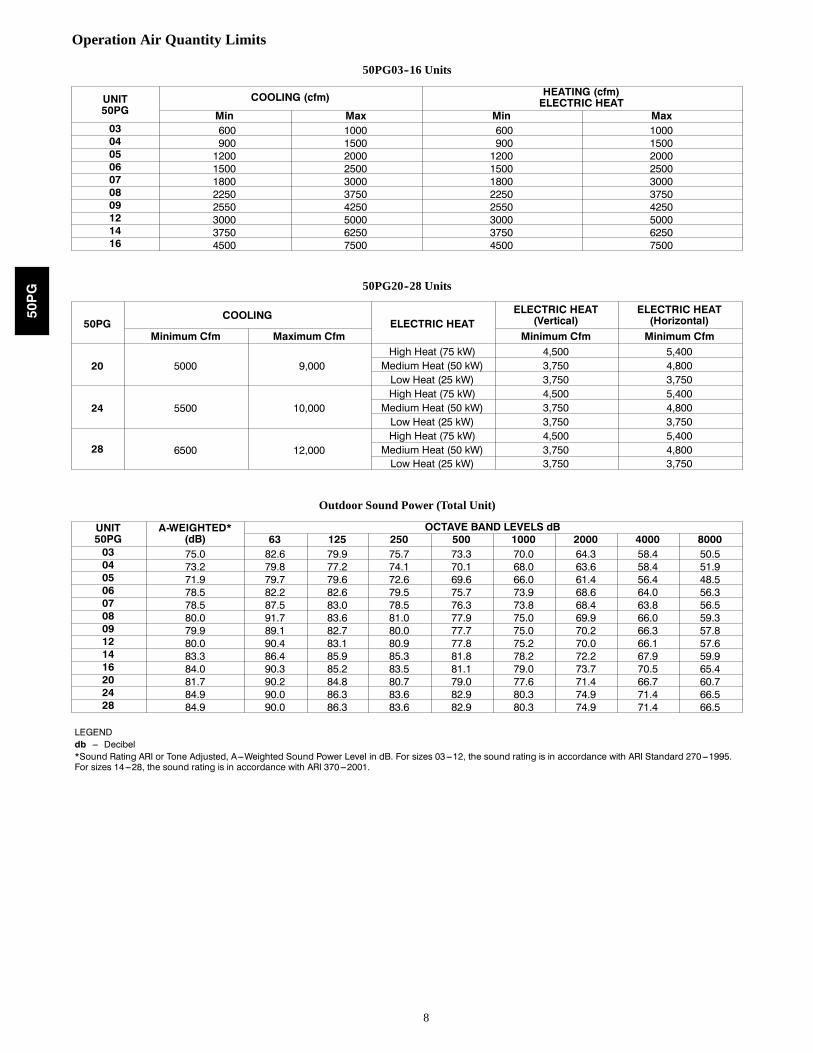
8
Operation Air Quantity Limits
50PG03--16 Units
UNIT50PG
COOLING (cfm) HEATING (cfm)ELECTRIC HEAT
Min Max Min Max03 600 1000 600 100004 900 1500 900 150005 1200 2000 1200 200006 1500 2500 1500 250007 1800 3000 1800 300008 2250 3750 2250 375009 2550 4250 2550 425012 3000 5000 3000 500014 3750 6250 3750 625016 4500 7500 4500 7500
50PG20--28 Units
50PGCOOLING
ELECTRIC HEATELECTRIC HEAT(Vertical)
ELECTRIC HEAT(Horizontal)
Minimum Cfm Maximum Cfm Minimum Cfm Minimum Cfm
20 5000 9,000High Heat (75 kW) 4,500 5,400Medium Heat (50 kW) 3,750 4,800Low Heat (25 kW) 3,750 3,750
24 5500 10,000High Heat (75 kW) 4,500 5,400Medium Heat (50 kW) 3,750 4,800Low Heat (25 kW) 3,750 3,750
28 6500 12,000High Heat (75 kW) 4,500 5,400Medium Heat (50 kW) 3,750 4,800Low Heat (25 kW) 3,750 3,750
Outdoor Sound Power (Total Unit)
UNIT50PG
A-WEIGHTED*(dB)
OCTAVE BAND LEVELS dB63 125 250 500 1000 2000 4000 8000
03 75.0 82.6 79.9 75.7 73.3 70.0 64.3 58.4 50.504 73.2 79.8 77.2 74.1 70.1 68.0 63.6 58.4 51.905 71.9 79.7 79.6 72.6 69.6 66.0 61.4 56.4 48.506 78.5 82.2 82.6 79.5 75.7 73.9 68.6 64.0 56.307 78.5 87.5 83.0 78.5 76.3 73.8 68.4 63.8 56.508 80.0 91.7 83.6 81.0 77.9 75.0 69.9 66.0 59.309 79.9 89.1 82.7 80.0 77.7 75.0 70.2 66.3 57.812 80.0 90.4 83.1 80.9 77.8 75.2 70.0 66.1 57.614 83.3 86.4 85.9 85.3 81.8 78.2 72.2 67.9 59.916 84.0 90.3 85.2 83.5 81.1 79.0 73.7 70.5 65.420 81.7 90.2 84.8 80.7 79.0 77.6 71.4 66.7 60.724 84.9 90.0 86.3 83.6 82.9 80.3 74.9 71.4 66.528 84.9 90.0 86.3 83.6 82.9 80.3 74.9 71.4 66.5
LEGENDdb --- Decibel*Sound Rating ARI or Tone Adjusted, A---Weighted Sound Power Level in dB. For sizes 03---12, the sound rating is in accordance with ARI Standard 270---1995.For sizes 14---28, the sound rating is in accordance with ARI 370---2001.
50PG
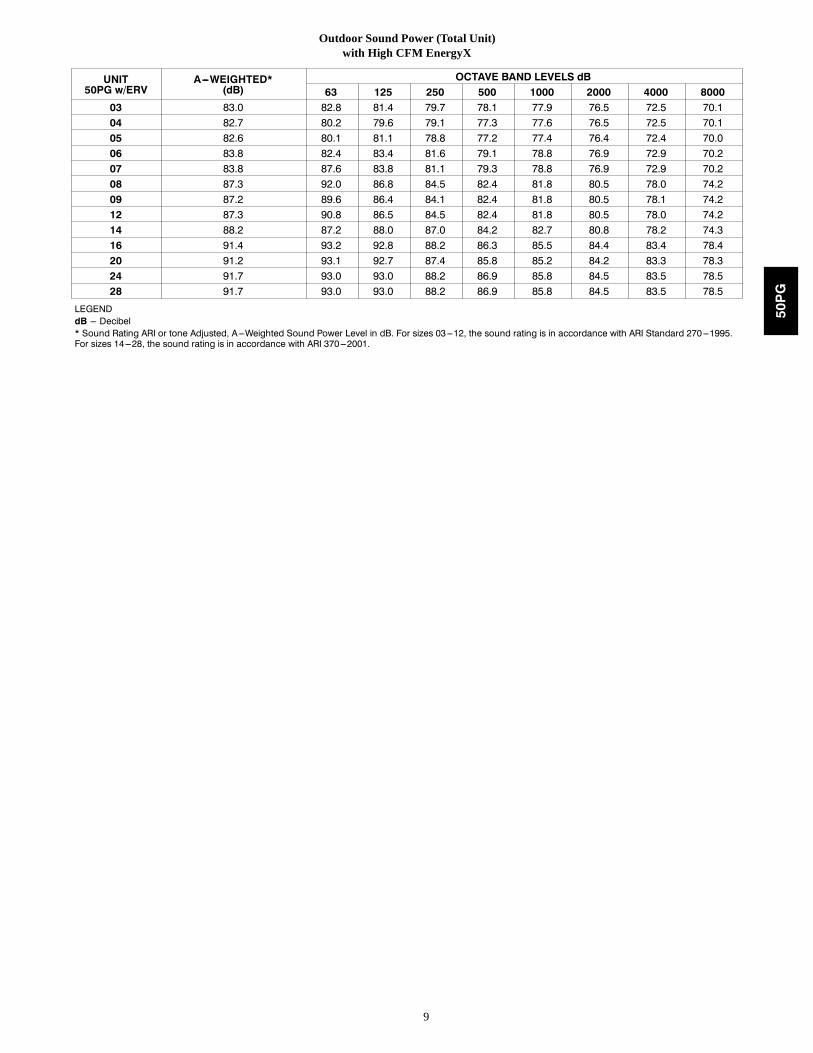
9
Outdoor Sound Power (Total Unit)with High CFM EnergyX
UNIT50PG w/ERV
A---WEIGHTED*(dB)
OCTAVE BAND LEVELS dB63 125 250 500 1000 2000 4000 8000
03 83.0 82.8 81.4 79.7 78.1 77.9 76.5 72.5 70.104 82.7 80.2 79.6 79.1 77.3 77.6 76.5 72.5 70.105 82.6 80.1 81.1 78.8 77.2 77.4 76.4 72.4 70.006 83.8 82.4 83.4 81.6 79.1 78.8 76.9 72.9 70.207 83.8 87.6 83.8 81.1 79.3 78.8 76.9 72.9 70.208 87.3 92.0 86.8 84.5 82.4 81.8 80.5 78.0 74.209 87.2 89.6 86.4 84.1 82.4 81.8 80.5 78.1 74.212 87.3 90.8 86.5 84.5 82.4 81.8 80.5 78.0 74.214 88.2 87.2 88.0 87.0 84.2 82.7 80.8 78.2 74.316 91.4 93.2 92.8 88.2 86.3 85.5 84.4 83.4 78.420 91.2 93.1 92.7 87.4 85.8 85.2 84.2 83.3 78.324 91.7 93.0 93.0 88.2 86.9 85.8 84.5 83.5 78.528 91.7 93.0 93.0 88.2 86.9 85.8 84.5 83.5 78.5
LEGENDdB --- Decibel* Sound Rating ARI or tone Adjusted, A---Weighted Sound Power Level in dB. For sizes 03---12, the sound rating is in accordance with ARI Standard 270---1995.For sizes 14---28, the sound rating is in accordance with ARI 370---2001.
50PG
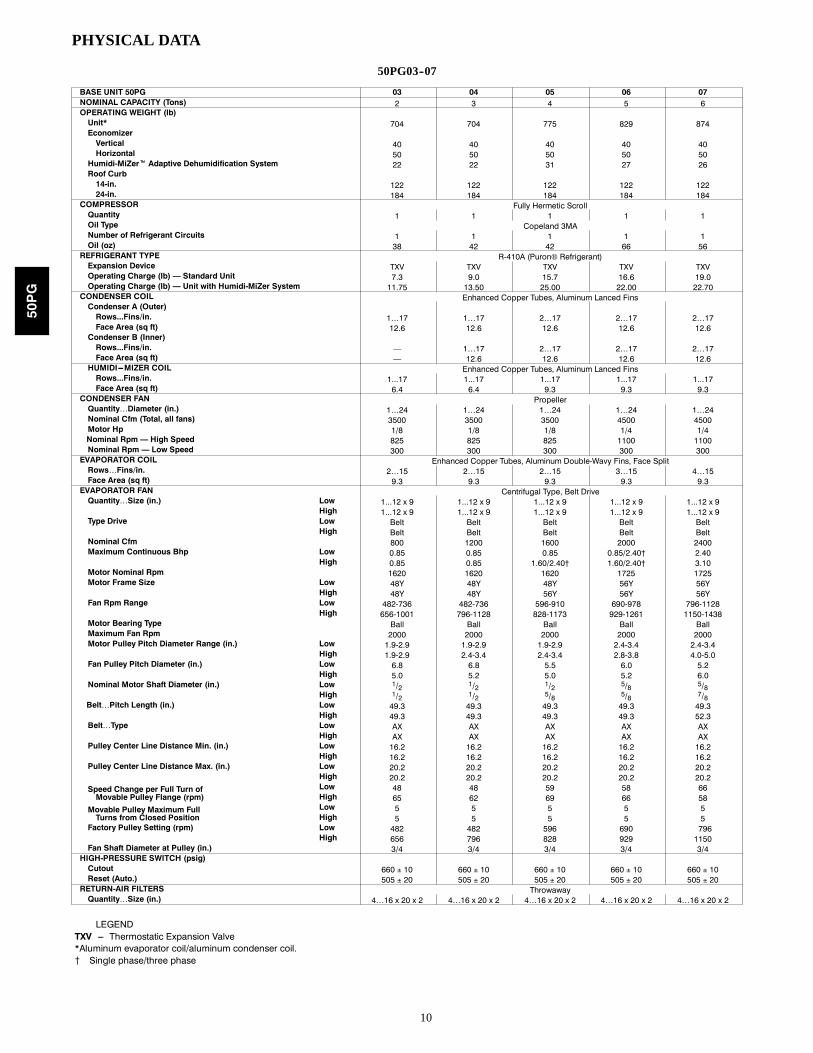
10
PHYSICAL DATA
50PG03--07
BASE UNIT 50PG 03 04 05 06 07NOMINAL CAPACITY (Tons) 2 3 4 5 6OPERATING WEIGHT (lb)Unit* 704 704 775 829 874EconomizerVertical 40 40 40 40 40Horizontal 50 50 50 50 50Humidi-MiZert Adaptive Dehumidification System 22 22 31 27 26Roof Curb14-in. 122 122 122 122 12224-in. 184 184 184 184 184
COMPRESSOR Fully Hermetic ScrollQuantity 1 1 1 1 1Oil Type Copeland 3MANumber of Refrigerant Circuits 1 1 1 1 1Oil (oz) 38 42 42 66 56REFRIGERANT TYPE R-410A (Puron® Refrigerant)Expansion Device TXV TXV TXV TXV TXVOperating Charge (lb) — Standard Unit 7.3 9.0 15.7 16.6 19.0Operating Charge (lb) — Unit with Humidi-MiZer System 11.75 13.50 25.00 22.00 22.70CONDENSER COIL Enhanced Copper Tubes, Aluminum Lanced FinsCondenser A (Outer)Rows...Fins/in. 1…17 1…17 2…17 2…17 2…17Face Area (sq ft) 12.6 12.6 12.6 12.6 12.6Condenser B (Inner)Rows...Fins/in. — 1…17 2…17 2…17 2…17Face Area (sq ft) — 12.6 12.6 12.6 12.6HUMIDI---MIZER COIL Enhanced Copper Tubes, Aluminum Lanced FinsRows...Fins/in. 1...17 1...17 1...17 1...17 1...17Face Area (sq ft) 6.4 6.4 9.3 9.3 9.3
CONDENSER FAN PropellerQuantity…Diameter (in.) 1…24 1…24 1…24 1…24 1…24Nominal Cfm (Total, all fans) 3500 3500 3500 4500 4500Motor Hp 1/8 1/8 1/8 1/4 1/4Nominal Rpm — High Speed 825 825 825 1100 1100Nominal Rpm — Low Speed 300 300 300 300 300EVAPORATOR COIL Enhanced Copper Tubes, Aluminum Double-Wavy Fins, Face SplitRows…Fins/in. 2…15 2…15 2…15 3…15 4…15Face Area (sq ft) 9.3 9.3 9.3 9.3 9.3EVAPORATOR FAN Centrifugal Type, Belt DriveQuantity…Size (in.) Low 1...12 x 9 1...12 x 9 1...12 x 9 1...12 x 9 1...12 x 9
High 1...12 x 9 1...12 x 9 1...12 x 9 1...12 x 9 1...12 x 9Type Drive Low Belt Belt Belt Belt Belt
High Belt Belt Belt Belt BeltNominal Cfm 800 1200 1600 2000 2400Maximum Continuous Bhp Low 0.85 0.85 0.85 0.85/2.40† 2.40
High 0.85 0.85 1.60/2.40† 1.60/2.40† 3.10Motor Nominal Rpm 1620 1620 1620 1725 1725Motor Frame Size Low 48Y 48Y 48Y 56Y 56Y
High 48Y 48Y 56Y 56Y 56YFan Rpm Range Low 482-736 482-736 596-910 690-978 796-1128
High 656-1001 796-1128 828-1173 929-1261 1150-1438Motor Bearing Type Ball Ball Ball Ball BallMaximum Fan Rpm 2000 2000 2000 2000 2000Motor Pulley Pitch Diameter Range (in.) Low 1.9-2.9 1.9-2.9 1.9-2.9 2.4-3.4 2.4-3.4
High 1.9-2.9 2.4-3.4 2.4-3.4 2.8-3.8 4.0-5.0Fan Pulley Pitch Diameter (in.) Low 6.8 6.8 5.5 6.0 5.2
High 5.0 5.2 5.0 5.2 6.0Nominal Motor Shaft Diameter (in.) Low 1/2 1/2 1/2 5/8 5/8
High 1/2 1/2 5/8 5/8 7/8Belt…Pitch Length (in.) Low 49.3 49.3 49.3 49.3 49.3
High 49.3 49.3 49.3 49.3 52.3Belt…Type Low AX AX AX AX AX
High AX AX AX AX AXPulley Center Line Distance Min. (in.) Low 16.2 16.2 16.2 16.2 16.2
High 16.2 16.2 16.2 16.2 16.2Pulley Center Line Distance Max. (in.) Low 20.2 20.2 20.2 20.2 20.2
High 20.2 20.2 20.2 20.2 20.2Speed Change per Full Turn ofMovable Pulley Flange (rpm)
Low 48 48 59 58 66High 65 62 69 66 58
Movable Pulley Maximum FullTurns from Closed Position
Low 5 5 5 5 5High 5 5 5 5 5
Factory Pulley Setting (rpm) Low 482 482 596 690 796High 656 796 828 929 1150
Fan Shaft Diameter at Pulley (in.) 3/4 3/4 3/4 3/4 3/4HIGH-PRESSURE SWITCH (psig)Cutout 660 ± 10 660 ± 10 660 ± 10 660 ± 10 660 ± 10Reset (Auto.) 505 ± 20 505 ± 20 505 ± 20 505 ± 20 505 ± 20RETURN-AIR FILTERS ThrowawayQuantity…Size (in.) 4…16 x 20 x 2 4…16 x 20 x 2 4…16 x 20 x 2 4…16 x 20 x 2 4…16 x 20 x 2
LEGENDTXV --- Thermostatic Expansion Valve*Aluminum evaporator coil/aluminum condenser coil.{ Single phase/three phase
50PG
www.hussmann.com
Proto-Aire Outdoor Protocol
Environmental Benefits Compared to Traditional Rack Systems.- Better energy efficiency reduces use of fossil fuels, reduces air pollution.
- Significantly smaller refrigerant charge reduces use of HFCs.
- Significantly lower refrigerant leak rate.
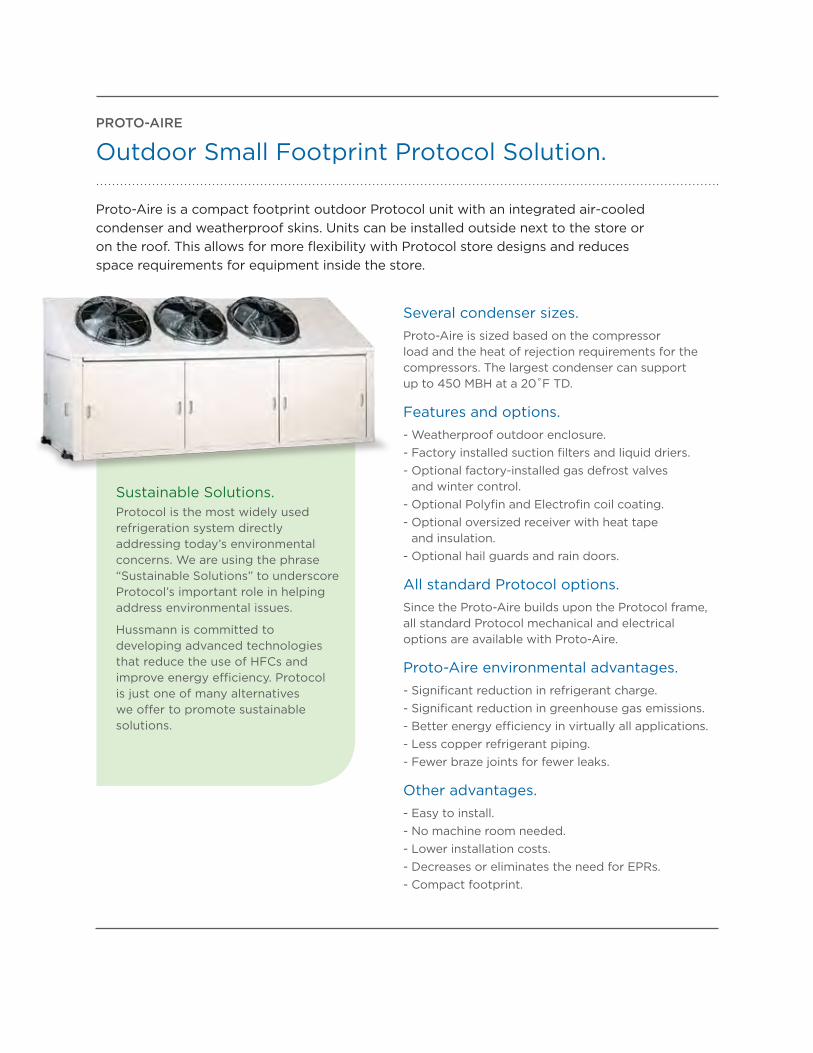
proto-AIrE
Outdoor Small Footprint Protocol Solution.
Several condenser sizes.Proto-Aire is sized based on the compressor load and the heat of rejection requirements for the compressors. The largest condenser can support up to 450 MBH at a 20˚F TD.
Features and options.- Weatherproof outdoor enclosure.- Factory installed suction filters and liquid driers.- Optional factory-installed gas defrost valves
and winter control.- Optional Polyfin and Electrofin coil coating.- Optional oversized receiver with heat tape
and insulation.- Optional hail guards and rain doors.
All standard Protocol options.Since the Proto-Aire builds upon the Protocol frame, all standard Protocol mechanical and electrical options are available with Proto-Aire.
Proto-Aire environmental advantages.- Significant reduction in refrigerant charge.- Significant reduction in greenhouse gas emissions.- Better energy efficiency in virtually all applications.- Less copper refrigerant piping.- Fewer braze joints for fewer leaks.
Other advantages.- Easy to install.- No machine room needed.- Lower installation costs.- Decreases or eliminates the need for EPRs.- Compact footprint.
Proto-Aire is a compact footprint outdoor Protocol unit with an integrated air-cooled condenser and weatherproof skins. Units can be installed outside next to the store or on the roof. This allows for more flexibility with Protocol store designs and reduces space requirements for equipment inside the store.
Sustainable Solutions.Protocol is the most widely used refrigeration system directly addressing today’s environmental concerns. We are using the phrase “Sustainable Solutions” to underscore Protocol’s important role in helping address environmental issues.
Hussmann is committed to developing advanced technologies that reduce the use of HFCs and improve energy efficiency. Protocol is just one of many alternatives we offer to promote sustainable solutions.
Enabling excellence in food retailing.
Proto-Aire dimensions.
NOTE: We reserve the right to change or revise specifications and product design in connection with any feature of our products. Such changes do not entitle the buyer to corresponding changes, improvements, additions, or replacements for equipment previously sold or shipped.
For additional resources, contact your representative or visit www.hussmann.com.
L H D Weight
Nomenclature (in) (in) (in) (lb)
3 and 4 Fan 128 56.5 42 2800
6 Fan (Super) 185 56.5 42 3700

Printed in U.S.A. ©2012 Hussmann Corporation ProtoAire_082515
Hussmann Corporation 12999 St. Charles Rock Rd.Bridgeton, MO 63044-2483Ph: 314.291.2000
www.hussmann.com
Appendix FConstruction Noise Modeling Outputs
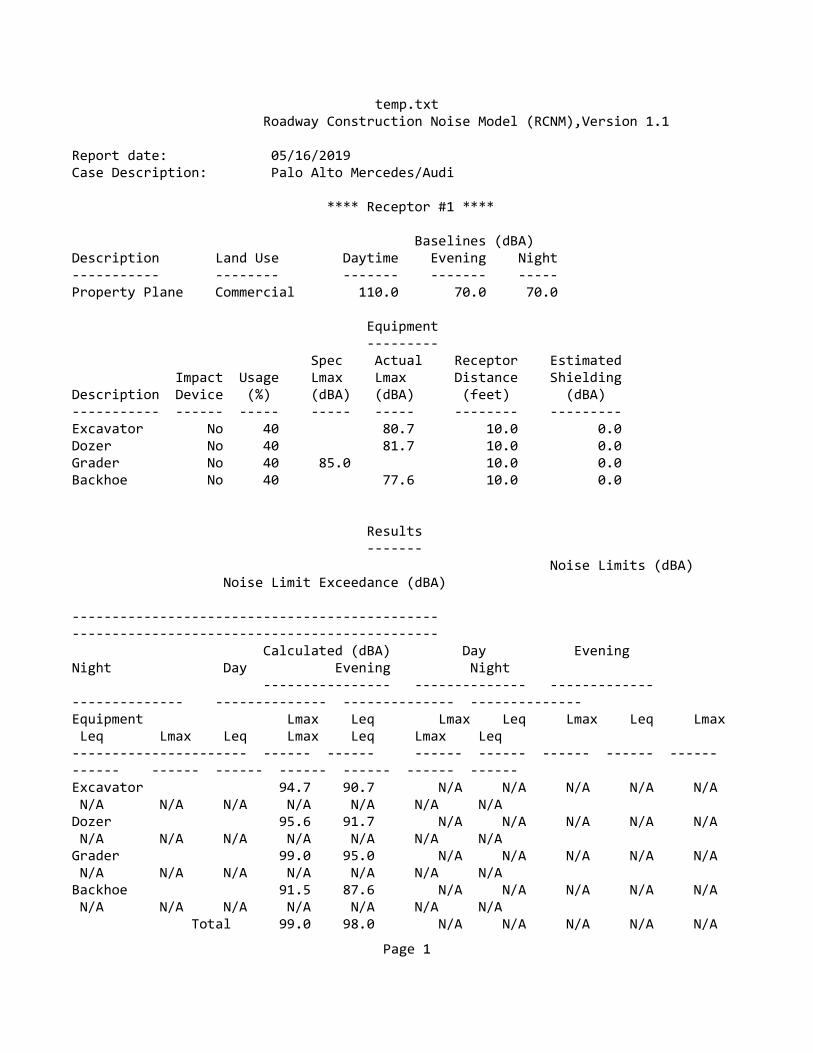
temp.txt Roadway Construction Noise Model (RCNM),Version 1.1
Report date: 05/16/2019Case Description: Palo Alto Mercedes/Audi
**** Receptor #1 ****
Baselines (dBA)Description Land Use Daytime Evening Night----------- -------- ------- ------- -----Property Plane Commercial 110.0 70.0 70.0
Equipment --------- Spec Actual Receptor Estimated Impact Usage Lmax Lmax Distance ShieldingDescription Device (%) (dBA) (dBA) (feet) (dBA)----------- ------ ----- ----- ----- -------- ---------Excavator No 40 80.7 10.0 0.0Dozer No 40 81.7 10.0 0.0Grader No 40 85.0 10.0 0.0Backhoe No 40 77.6 10.0 0.0 Results ------- Noise Limits (dBA) Noise Limit Exceedance (dBA) ---------------------------------------------- ---------------------------------------------- Calculated (dBA) Day Evening Night Day Evening Night ---------------- -------------- ------------- -------------- -------------- -------------- --------------Equipment Lmax Leq Lmax Leq Lmax Leq Lmax Leq Lmax Leq Lmax Leq Lmax Leq---------------------- ------ ------ ------ ------ ------ ------ ------ ------ ------ ------ ------ ------ ------ ------Excavator 94.7 90.7 N/A N/A N/A N/A N/A N/A N/A N/A N/A N/A N/A N/ADozer 95.6 91.7 N/A N/A N/A N/A N/A N/A N/A N/A N/A N/A N/A N/AGrader 99.0 95.0 N/A N/A N/A N/A N/A N/A N/A N/A N/A N/A N/A N/ABackhoe 91.5 87.6 N/A N/A N/A N/A N/A N/A N/A N/A N/A N/A N/A N/A Total 99.0 98.0 N/A N/A N/A N/A N/A
Page 1
temp.txt N/A N/A N/A N/A N/A N/A N/A
Page 2