Embed Size (px)
Citation preview
Industry Assessment of Automobile Dealership industry in India July 2021
2
Table of contents
1 Macroeconomic scenario ................................................................................................................................... 3
Global overview ..................................................................................................................................................... 3
India macroeconomic review ................................................................................................................................. 4
GDP to recover over the medium term.................................................................................................................. 7
Review and outlook on Inflation ............................................................................................................................ 8
Review of allied sectors ......................................................................................................................................... 9
Auto finance ......................................................................................................................................................... 11
Agri variables ....................................................................................................................................................... 13
2 Automotive industry in India ............................................................................................................................ 16
3 Review and outlook on Indian passenger vehicle industry .......................................................................... 23
Review of Indian PV industry (fiscals 2016 to 2021) ........................................................................................... 23
Outlook on the Indian PV industry (fiscals 2021 - 2026P)................................................................................... 38
4 Review and outlook of pre-owned PV industry in India ................................................................................ 48
Review of the pre-owned PV industry in India .................................................................................................... 48
Long-term outlook................................................................................................................................................ 52
Key drivers for growth in the pre-owned PV segment ......................................................................................... 53
5 Review and outlook on the Indian CVs industry ............................................................................................ 57
Review of Indian CVs industry (fiscals 2016 – 2021) .......................................................................................... 57
Outlook of the Indian CV industry (between fiscals 2021 and 2026P) ................................................................ 69
6 Automobile dealership industry in India ......................................................................................................... 78
Dealership scenario in India ................................................................................................................................ 79
PV dealership landscape ..................................................................................................................................... 80
Dealer additions ................................................................................................................................................... 83
Average dealership sales .................................................................................................................................... 85
Dealer profitability ................................................................................................................................................ 86
Dealer returns ...................................................................................................................................................... 88
Added advantage for large dealers ..................................................................................................................... 88
CV dealership landscape .................................................................................................................................... 90
Dealership additions ............................................................................................................................................ 91
Average dealership sales .................................................................................................................................... 93
Dealer profitability ................................................................................................................................................ 94
Dealer returns ...................................................................................................................................................... 95
Added advantages for large dealers ................................................................................................................... 95
7 Player comparison ............................................................................................................................................ 97
3
1 Macroeconomic scenario
Global overview
The global economy is gradually getting back on its feet after the steep fall it suffered due to Covid-19 that started
over a year ago. But the resurgence of afflictions has prompted some governments to reimpose lockdowns to
contain their spread. Nevertheless, multiple vaccine approvals in December, commencement of vaccination, and
better-than-expected economic indicators in some parts of the world prompted the International Monetary Fund
(IMF) to raise its estimates of global economic growth.
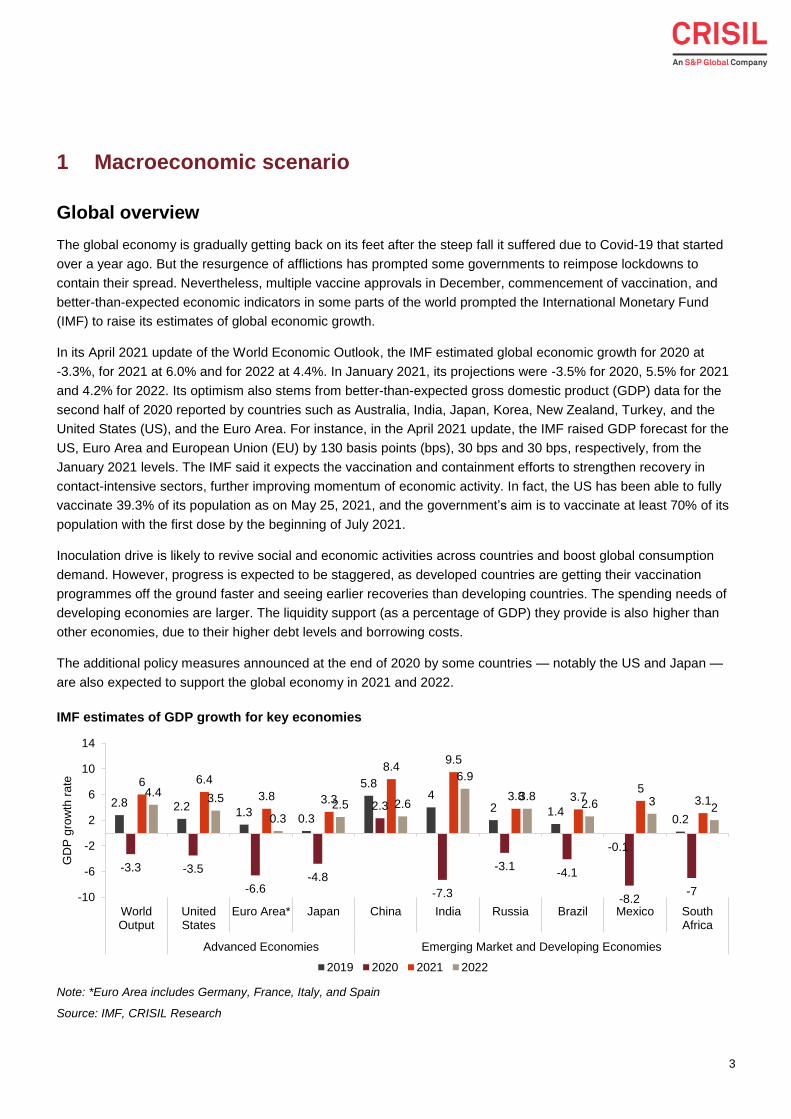
In its April 2021 update of the World Economic Outlook, the IMF estimated global economic growth for 2020 at
-3.3%, for 2021 at 6.0% and for 2022 at 4.4%. In January 2021, its projections were -3.5% for 2020, 5.5% for 2021
and 4.2% for 2022. Its optimism also stems from better-than-expected gross domestic product (GDP) data for the
second half of 2020 reported by countries such as Australia, India, Japan, Korea, New Zealand, Turkey, and the
United States (US), and the Euro Area. For instance, in the April 2021 update, the IMF raised GDP forecast for the
US, Euro Area and European Union (EU) by 130 basis points (bps), 30 bps and 30 bps, respectively, from the
January 2021 levels. The IMF said it expects the vaccination and containment efforts to strengthen recovery in
contact-intensive sectors, further improving momentum of economic activity. In fact, the US has been able to fully
vaccinate 39.3% of its population as on May 25, 2021, and the government’s aim is to vaccinate at least 70% of its
population with the first dose by the beginning of July 2021.
Inoculation drive is likely to revive social and economic activities across countries and boost global consumption
demand. However, progress is expected to be staggered, as developed countries are getting their vaccination
programmes off the ground faster and seeing earlier recoveries than developing countries. The spending needs of
developing economies are larger. The liquidity support (as a percentage of GDP) they provide is also higher than
other economies, due to their higher debt levels and borrowing costs.
The additional policy measures announced at the end of 2020 by some countries — notably the US and Japan —
are also expected to support the global economy in 2021 and 2022.
IMF estimates of GDP growth for key economies
Note: *Euro Area includes Germany, France, Italy, and Spain
Source: IMF, CRISIL Research
2.8 2.21.3
0.3
5.84
2 1.4
-0.1
0.2
-3.3 -3.5
-6.6-4.8
2.3
-7.3
-3.1-4.1
-8.2-7
6 6.4
3.8 3.3
8.49.5
3.8 3.75
3.14.4
3.5
0.3
2.5 2.6
6.9
3.82.6 3
2
-10
-6
-2
2
6
10
14
WorldOutput
UnitedStates
Euro Area* Japan China India Russia Brazil Mexico SouthAfrica
Advanced Economies Emerging Market and Developing Economies
GD
P g
row
th r
ate
2019 2020 2021 2022
4
However, the IMF also raised a few concerns that could derail the momentum. They are emerging new variants of
the virus that are resulting in new waves and lockdowns, logistical problems with vaccine distribution and
uncertainty about vaccine uptake. High-frequency data from some economies suggest that the pace of recovery
slowed down in the fourth quarter of 2020.
With vaccine availability, the IMF expects demand to recover. Oil price, too, is expected to rise in 2021, although
average will remain below 2019 levels. Non-oil commodity prices are also expected to increase in 2021, with
metals likely to see strong appreciation. Nevertheless, even with the expected recovery, the IMF does not expect
output gaps to close until after 2022. Consistent with negative output gaps, it also forecasts inflation in both,
advanced and emerging economies in 2021 and 2022 will remain subdued in comparison with their historical
averages.
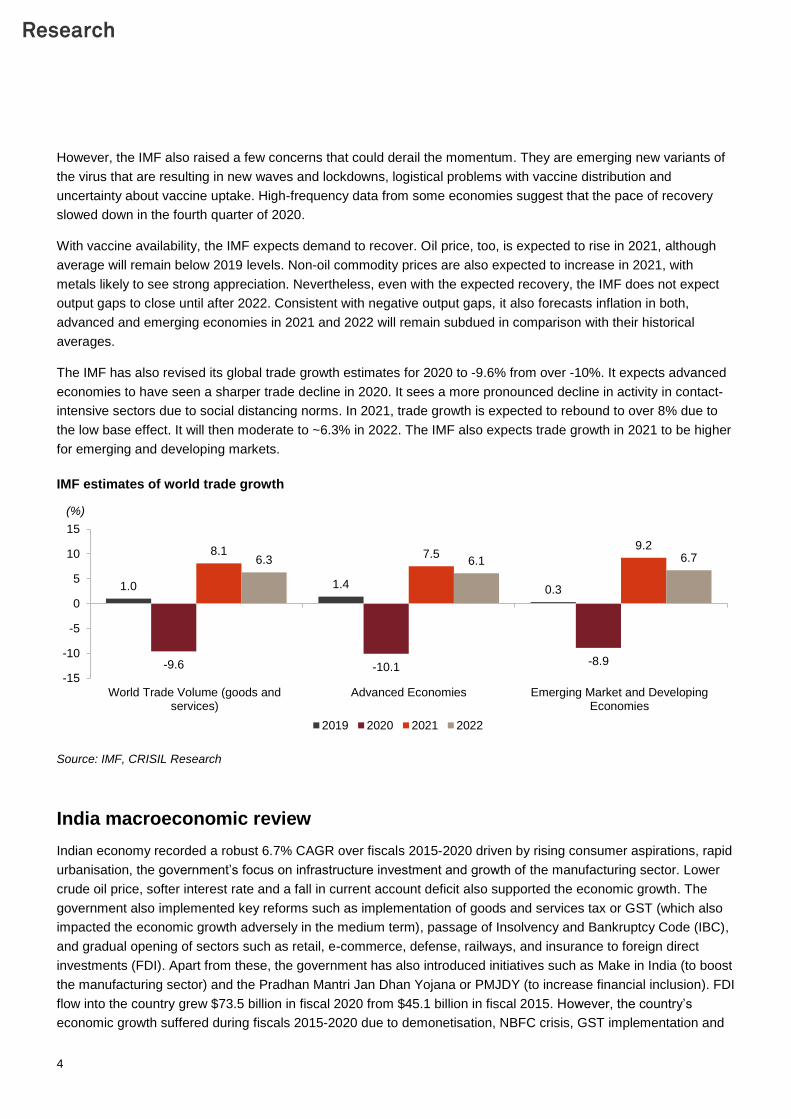
The IMF has also revised its global trade growth estimates for 2020 to -9.6% from over -10%. It expects advanced
economies to have seen a sharper trade decline in 2020. It sees a more pronounced decline in activity in contact-
intensive sectors due to social distancing norms. In 2021, trade growth is expected to rebound to over 8% due to
the low base effect. It will then moderate to ~6.3% in 2022. The IMF also expects trade growth in 2021 to be higher
for emerging and developing markets.
IMF estimates of world trade growth
Source: IMF, CRISIL Research
India macroeconomic review
Indian economy recorded a robust 6.7% CAGR over fiscals 2015-2020 driven by rising consumer aspirations, rapid
urbanisation, the government’s focus on infrastructure investment and growth of the manufacturing sector. Lower
crude oil price, softer interest rate and a fall in current account deficit also supported the economic growth. The
government also implemented key reforms such as implementation of goods and services tax or GST (which also
impacted the economic growth adversely in the medium term), passage of Insolvency and Bankruptcy Code (IBC),
and gradual opening of sectors such as retail, e-commerce, defense, railways, and insurance to foreign direct
investments (FDI). Apart from these, the government has also introduced initiatives such as Make in India (to boost
the manufacturing sector) and the Pradhan Mantri Jan Dhan Yojana or PMJDY (to increase financial inclusion). FDI
flow into the country grew $73.5 billion in fiscal 2020 from $45.1 billion in fiscal 2015. However, the country’s
economic growth suffered during fiscals 2015-2020 due to demonetisation, NBFC crisis, GST implementation and
1.0 1.4 0.3
-9.6 -10.1-8.9
8.1 7.59.2
6.3 6.1 6.7
-15
-10
-5
0
5
10
15
World Trade Volume (goods andservices)
Advanced Economies Emerging Market and DevelopingEconomies
2019 2020 2021 2022
(%)
5
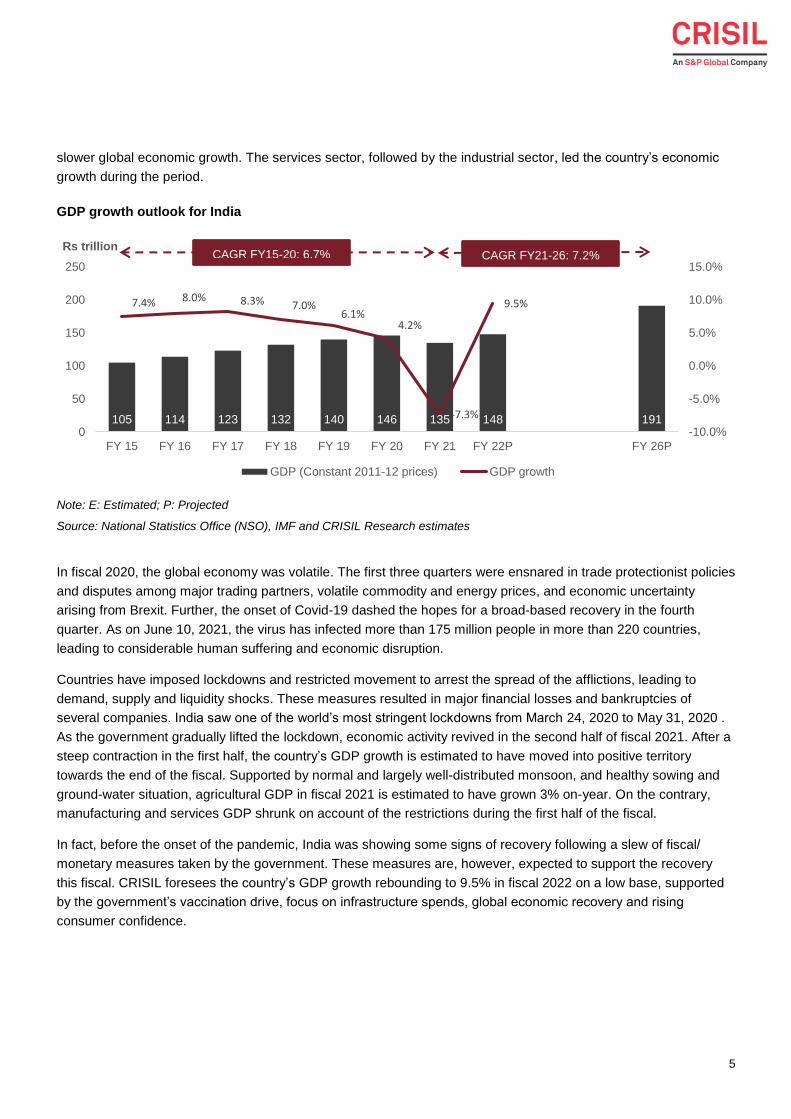
slower global economic growth. The services sector, followed by the industrial sector, led the country’s economic
growth during the period.
GDP growth outlook for India
Note: E: Estimated; P: Projected
Source: National Statistics Office (NSO), IMF and CRISIL Research estimates
In fiscal 2020, the global economy was volatile. The first three quarters were ensnared in trade protectionist policies
and disputes among major trading partners, volatile commodity and energy prices, and economic uncertainty
arising from Brexit. Further, the onset of Covid-19 dashed the hopes for a broad-based recovery in the fourth
quarter. As on June 10, 2021, the virus has infected more than 175 million people in more than 220 countries,
leading to considerable human suffering and economic disruption.
Countries have imposed lockdowns and restricted movement to arrest the spread of the afflictions, leading to
demand, supply and liquidity shocks. These measures resulted in major financial losses and bankruptcies of
several companies. India saw one of the world’s most stringent lockdowns from March 24, 2020 to May 31, 2020 .
As the government gradually lifted the lockdown, economic activity revived in the second half of fiscal 2021. After a
steep contraction in the first half, the country’s GDP growth is estimated to have moved into positive territory
towards the end of the fiscal. Supported by normal and largely well-distributed monsoon, and healthy sowing and
ground-water situation, agricultural GDP in fiscal 2021 is estimated to have grown 3% on-year. On the contrary,
manufacturing and services GDP shrunk on account of the restrictions during the first half of the fiscal.
In fact, before the onset of the pandemic, India was showing some signs of recovery following a slew of fiscal/
monetary measures taken by the government. These measures are, however, expected to support the recovery
this fiscal. CRISIL foresees the country’s GDP growth rebounding to 9.5% in fiscal 2022 on a low base, supported
by the government’s vaccination drive, focus on infrastructure spends, global economic recovery and rising
consumer confidence.
105 114 123 132 140 146 135 148 191
7.4% 8.0% 8.3% 7.0%6.1%
4.2%
-7.3%
9.5%
-10.0%
-5.0%
0.0%
5.0%
10.0%
15.0%
0
50
100
150
200
250
FY 15 FY 16 FY 17 FY 18 FY 19 FY 20 FY 21 FY 22P FY 26P
Rs trillion
GDP (Constant 2011-12 prices) GDP growth
CAGR FY15-20: 6.7% CAGR FY21-26: 7.2%
6
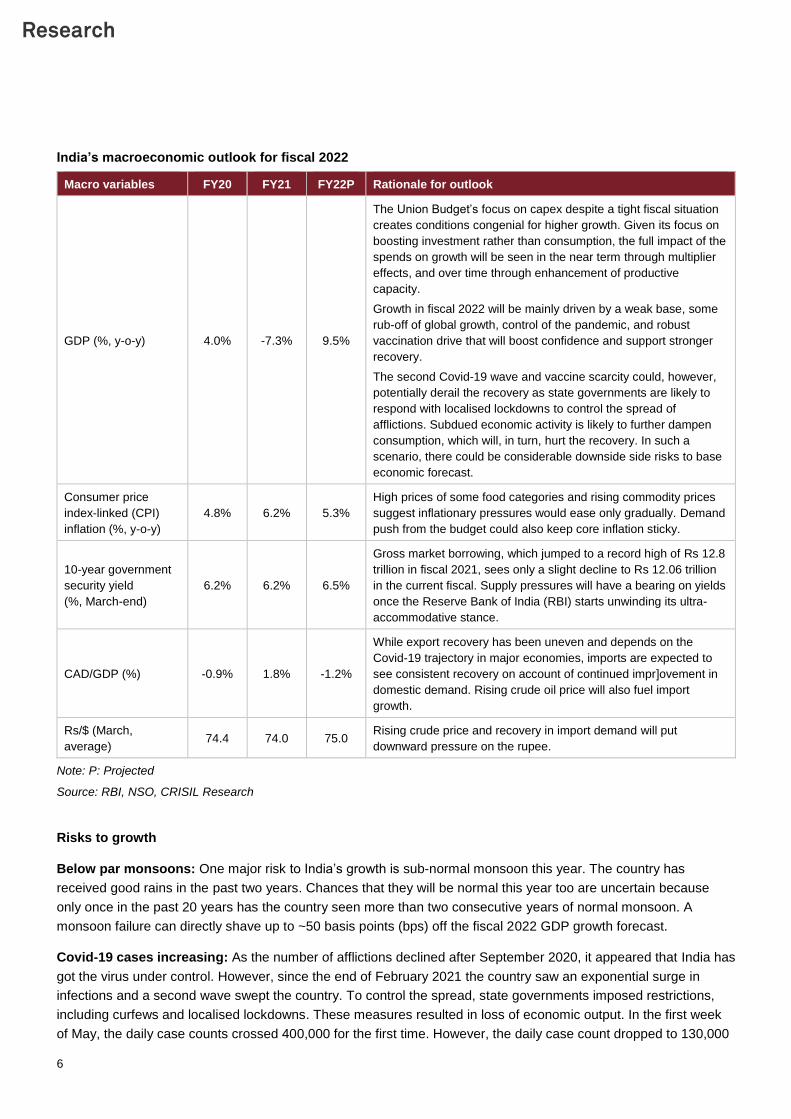
India’s macroeconomic outlook for fiscal 2022
Macro variables FY20 FY21 FY22P Rationale for outlook
GDP (%, y-o-y) 4.0% -7.3% 9.5%
The Union Budget’s focus on capex despite a tight fiscal situation
creates conditions congenial for higher growth. Given its focus on
boosting investment rather than consumption, the full impact of the
spends on growth will be seen in the near term through multiplier
effects, and over time through enhancement of productive
capacity.
Growth in fiscal 2022 will be mainly driven by a weak base, some
rub-off of global growth, control of the pandemic, and robust
vaccination drive that will boost confidence and support stronger
recovery.
The second Covid-19 wave and vaccine scarcity could, however,
potentially derail the recovery as state governments are likely to
respond with localised lockdowns to control the spread of
afflictions. Subdued economic activity is likely to further dampen
consumption, which will, in turn, hurt the recovery. In such a
scenario, there could be considerable downside side risks to base
economic forecast.
Consumer price
index-linked (CPI)
inflation (%, y-o-y)
4.8% 6.2% 5.3%
High prices of some food categories and rising commodity prices
suggest inflationary pressures would ease only gradually. Demand
push from the budget could also keep core inflation sticky.
10-year government
security yield
(%, March-end)
6.2% 6.2% 6.5%
Gross market borrowing, which jumped to a record high of Rs 12.8
trillion in fiscal 2021, sees only a slight decline to Rs 12.06 trillion
in the current fiscal. Supply pressures will have a bearing on yields
once the Reserve Bank of India (RBI) starts unwinding its ultra-
accommodative stance.
CAD/GDP (%) -0.9% 1.8% -1.2%
While export recovery has been uneven and depends on the
Covid-19 trajectory in major economies, imports are expected to
see consistent recovery on account of continued impr]ovement in
domestic demand. Rising crude oil price will also fuel import
growth.
Rs/$ (March,
average) 74.4 74.0 75.0
Rising crude price and recovery in import demand will put
downward pressure on the rupee.
Note: P: Projected
Source: RBI, NSO, CRISIL Research
Risks to growth
Below par monsoons: One major risk to India’s growth is sub-normal monsoon this year. The country has
received good rains in the past two years. Chances that they will be normal this year too are uncertain because
only once in the past 20 years has the country seen more than two consecutive years of normal monsoon. A
monsoon failure can directly shave up to ~50 basis points (bps) off the fiscal 2022 GDP growth forecast.
Covid-19 cases increasing: As the number of afflictions declined after September 2020, it appeared that India has
got the virus under control. However, since the end of February 2021 the country saw an exponential surge in
infections and a second wave swept the country. To control the spread, state governments imposed restrictions,
including curfews and localised lockdowns. These measures resulted in loss of economic output. In the first week
of May, the daily case counts crossed 400,000 for the first time. However, the daily case count dropped to 130,000
7
in the first week of June and the state governments started gradually relaxing the restrictions. However, there are
fears of an impending third wave, which could put downward pressure on the growth outlook for the fiscal. If the
magnitude of the afflictions in the possible third wave is as drastic as that of the second wave, the states will be
forced to put in place more stringent measures. This can have a debilitating impact on economic activity and, in
turn, growth. Availability of vaccine and pace of vaccination will be a key monitorable; issues pertaining to
availability of vaccine is likely to hinder and delay economic recovery.
Geopolitical developments: Geopolitical developments, most importantly the US-China trade war, do have a
significant impact on global GDP growth and export earnings and capital flows into emerging markets such as
India. While there is some respite after the two countries signed the phase-I of their trade deal, several issues
remain unresolved. Any re-escalation of tensions could work adversely. Developments in the Middle East could
also disrupt crude oil supply and raise price, hurting a wide range of macroeconomic parameters for India, including
current account deficit, inflation and, even, GDP growth.
Persistent stress in financial sector: This was one of the major drags on GDP growth past fiscal as gross non-
performing assets (GNPAs) rose 60 bps over fiscal 2020 to 8.8%. GNPAs are expected to further rise 170 bps in
the current fiscal driven by delinquencies in the micro-small and medium enterprise (MSME) and retail segments.
Apart from this, liquidity issues of non-banking financial companies (NBFCs) and risk aversion of lenders are other
issues in the financial sector. Lenders’ fear of defaults is hampering credit growth and transmission of monetary
policy easing. Easing of these constraints in the financial system is critical for pick-up in growth and remains a key
monitorable.
GDP to recover over the medium term
CRISIL Research expects India’s GDP to grow ~9.5% in the current fiscal and at an average of 6.6% over fiscals
2023-2026. The country is expected to emerge as one of fastest growing major economies supported by the
following factors:
Focus on investments rather than consumption to enhance the productive capacity of the economy. This fiscal
the government is focussing on capital expenditure despite a weak outlook for revenue realisation.
The Union Budget 2021-22 has also laid out clear focus on mid-term growth trajectory. The government has set
the fiscal glide path to 4.5% for fiscal 2026 from 6.8% in fiscal 2022. This underscores the government’s continued
focus on expenditure over the medium term.
Reforms undertaken over the past few years such as:
‒ The production-linked incentive (PLI) scheme, aimed at incentivising local manufacturing by giving volume-
linked incentives to manufacturers in specified sectors
‒ Steep cut in corporate tax announced by the government in fiscal 2021, to attract more investments into
the country and boost domestic manufacturing sector output over the medium to long term
‒ Key structural reforms such as implementation of GST and IBC, which will begin to show their impact over
the long term
‒ Reform measures aimed at enhancing financial inclusion such as PMJDY, which will broaden the base of
the banking ecosystem, leading to higher lending and investment
‒ Government initiatives such as Digital India, which will aid digitalisation of the economy. This will improve
the efficiency leading to faster growth
8
A raft of reform measures by the government and the expansionary stance of the monetary policy are leading to
a steady pick-up in consumption demand.
Policies aimed towards greater formalisation of the economy are bound to lead to an acceleration in per capita
income growth.
The total length of nation highways in the country has grown from ~97,800 km in fiscal 2015 to ~136,400 km in
fiscal 2021. Under the National Infrastructure Pipeline, investments in roads and highways sector are likely to
continue to grow robustly in the medium term. These initiatives are likely to strengthen supply chain and reduce
transit time and logistics costs for the manufacturing sector.
Review and outlook on Inflation
Inflation down on base effect
CPI inflation moderated to 5.6% on-year in July, compared with 6.3% the previous month and 6.7% in July 2020.
The moderation was driven by food inflation, which printed at 4% in July, compared with 5.1% the previous month
and 9.3% in July 2020. Fuel inflation was almost stable at 12.4% in July compared with 12.6% the previous month,
and higher than 2.7% in July 2020. Core inflation moderated to 5.8% in July from 6.1% the previous month, but
higher than 5.6% in July 2020. Sequentially, headline CPI grew 0.2% on-month, driven by fuel (0.6%) and core
(0.5%), though food inflation declined 0.2%. Rural CPI inflation moderated to a greater extent, at 5.5% on-year in
July compared with 6.2% the previous month, while urban inflation reduced to 5.8% from 6.4%
How key items saw inflation move
CPI inflation for food and beverages combined slowed to 4.5% on-year in July from 5.6% the previous month.
Sequentially, prices declined 0.2% on-month as opposed to a 0.5% growth seen in June
Cereals, vegetables and fruits drove the decline. Cereal inflation declined for the sixth successive month, at -1.7% on-year, though on-month basis, the decline was 0.5%. Vegetable inflation declined for the eighth consecutive month at -7.7% on-year, and by 0.8% on-month. Fruits inflation was 8.9% higher on-year, but 0.9% lower on-month
Edible oils and pulses also saw inflation easing, as government reduced import duties on these items. Edible oils inflation, while staying high at 32.5% on-year, was 0.5% lower on-month. Reduction in import duty helped cap the rise in edible oil prices, even as international prices jumped 1.1% on-month and 50.4% on-year3. Pulses prices, while 9% higher on-year, were 0.7% lower on-month. Similarly, egg prices were 20.8% higher on-year but 1% lower on-month
Other protein items, though, continued to see rising inflation. Milk prices rose 2.7% on-year as well as 0.8% on-month. Meat and fish grew 8.3% on-year and 2.2% on-month
Prepared meals, snacks and sweets prices grew 6% on-year, but declined 0.3% on-month. Sugar and confectionery were 0.5% lower on-year and 0.4% lower on-month
Fuel inflation remained in double digits at 12.4% in July compared with 12.6% the previous month. On-month, prices rose 0.6%, stronger than 0.3% in June. Crude oil prices were 1.8% higher on-month and 73.8% higher on-year at $74.4 per barrel on average in July
Core inflation came back below 6% after two months, at 5.8% on-year in July compared with 6.1% the previous month. Sequentially however, pressures grew, with 0.5% on-month growth compared with 0.2% the previous month.
9
Rising sequential pressures were primarily seen for clothing and footwear (6.5% on-year and 0.5% on-month), household goods and services (4.9% on-year and 0.4% on-month) and personal care and effects (3.8% on-year and 0.2% on-month), indicating firms are passing on rising input costs to consumers in these items
Transport and communication inflation remained in double digits for sixth consecutive month, at 10.5% on-year. Sequentially, too, prices rose 0.9% on-month, driven by rising petrol and diesel prices
Health inflation remained high, at 7.7% on-year and 0.4% on-month
Housing inflation inched up slightly, growing 3.9% on-year and 0.3% on-month
WPI inflation eases to 11.2% yoy in July 2021
Inflation based on wholesale price index (WPI) stayed in double digits for the fourth successive month, though the
rate moderated to 11.2% yoy in July compared with 12.1% in the previous month. To be sure, WPI inflation, after
peaking at 13.1% in May 2021, has been subsiding as the adverse impact of a low base wanes (last year, WPI
inflation printed -3.4% on-year in May, -1.8% in June, and -0.2% in July).
However, sequentially, prices have been rising. On a seasonally-adjusted basis, WPI rose 0.5% on-month in July,
stronger than 0.2% in the previous month.
Manufacturing WPI has been the key factor fanning WPI. While WPI inflation moderated for food (4.5% on-year in
July vs 6.7% in the previous month), and fuel and power (26% vs 32.8%), it rose for manufacturing (11.2% vs
10.9%).
In fact, if we look at CRISIL’s Core Inflation Indicator – a more stable measure of manufacturing inflation that
excludes the volatile metals component – it too rose to 8.5% on-year in July from 8.1%. That indicates a broad-
based rise in manufacturing costs. Key contributors to the rise have been edible oils (42.9%), textiles (15.6%), and
chemicals (11.1%).
Inflation outlook
Inflation continues to face pressure from high international commodity prices, including edible oils and metals,
which are at decadal highs and crude oil prices which remain beyond the comfort zone at over ~$70 per barrel.
Recent data has indicated firms passing on rising input costs to consumers despite weak demand conditions. We
expect the pass-through to gain more steam as domestic demand strengthens in the second half of this fiscal.
The lid on overall inflation will be kept by food, as it benefits from the high base of last year. However, the progress
of monsoon and impact of rising global food prices will remain a key monitorable.
Due to these factors, we have revised up our forecast for CPI inflation to 5.8% for fiscal 2022 from 5.3% estimated
earlier. Despite the rise, it will be lower compared with 6.2% last year.
Review of allied sectors
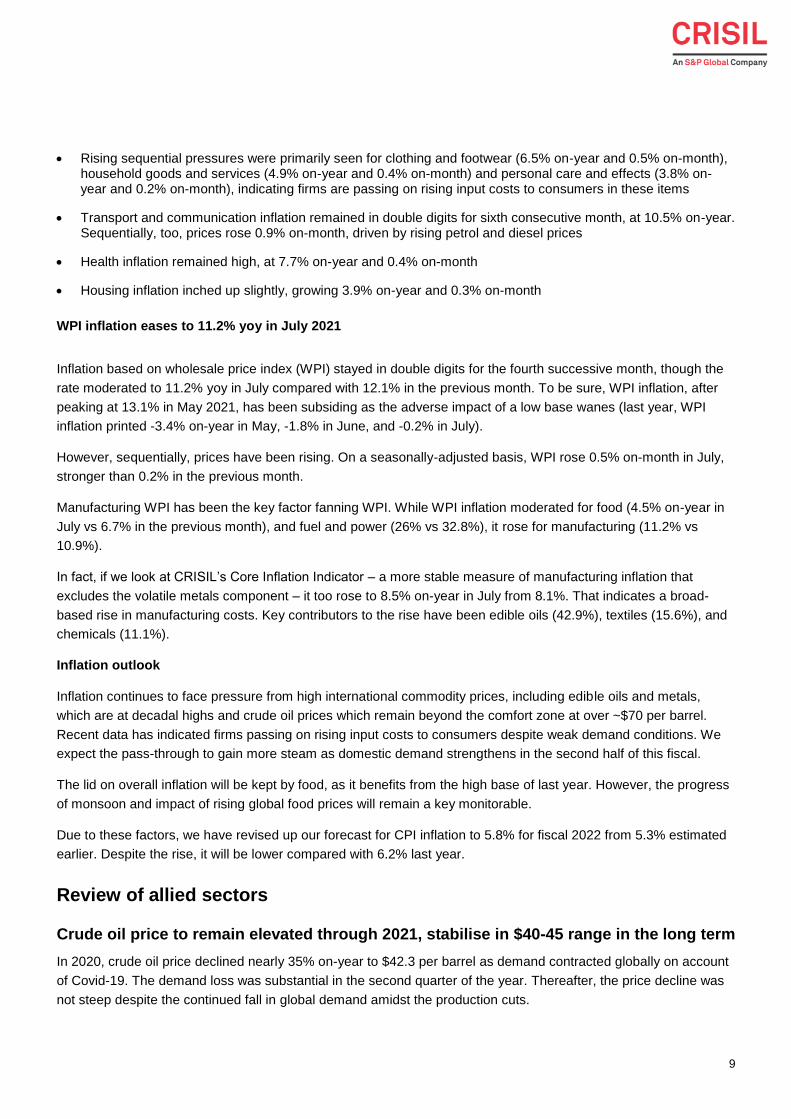
Crude oil price to remain elevated through 2021, stabilise in $40-45 range in the long term
In 2020, crude oil price declined nearly 35% on-year to $42.3 per barrel as demand contracted globally on account
of Covid-19. The demand loss was substantial in the second quarter of the year. Thereafter, the price decline was
not steep despite the continued fall in global demand amidst the production cuts.
10
In 2021, oil prices are expected to increase to $65-70 per barrel led by recovery in demand. Also, prices remained
elevated in Q1 at $60.6 per barrel due to continued production cuts by OPEC+ (OPEC - Organization of the
Petroleum Exporting Countries, OPEC+ is a group of 23 nations led by Saudi Arabia and including Russia) as well
as production loss in US due to deep freeze in Texas. Prices increased even further in Q2 to $68.6 per barrel amid
production cuts and gradual recovery in oil demand. Going forward, we expect prices to remain below $72 per
barrel led by increasing supply by OPEC+ members.
Containment of Covid-19 and rollout of vaccine to remain a challenge. From a crude oil demand perspective, it
would be important to see the impact of Covid-19 for the rest of the year, specifically when it will be restricted and
to what extent and when economic activities would recover. On the supply side, a production change from Saudi
Arabia, the United Arab Emirates (UAE) and other OPEC countries and Russia and any disruptions from the United
States (US) have to be closely monitored.
Crude oil price trend ($/barrel)
Source: Industry, CRISIL Research
Prices are expected to be $40-45 per barrel in the next 4-5 years as oil demand would remain sluggish on account
of declining global economic growth and fuel diversification. As oil producing nations have heavily invested in the
upstream sector, any long-term pact to manage oil supply would not be feasible for longer duration.
Moreover, competition from alternative technologies is expected to play a pivotal role in energy dynamics
and significantly impact crude oil demand from the road transport segment. This is especially in the Organisation for
Economic Cooperation and Development (OECD) and a few non-OECD countries such as China and India, given
the aggressive government push. In the long run, demand is expected to see slower growth considering consumption
from road transport would remain sensitive to electric vehicle expansion. This would be further impacted by global
economic conditions and trade war among major economies.
As a result, long-term oil prices are expected to settle at $40-45 per barrel through 2025.
Rupee expected to weaken as second wave grips businesses
During the first wave of Covid-19, industrial production had come to a halt, exports had tanked and rupee exchange
rate against the dollar had climbed to 76 in April 2020. The recovery that started in the third quarter of the fiscal
11
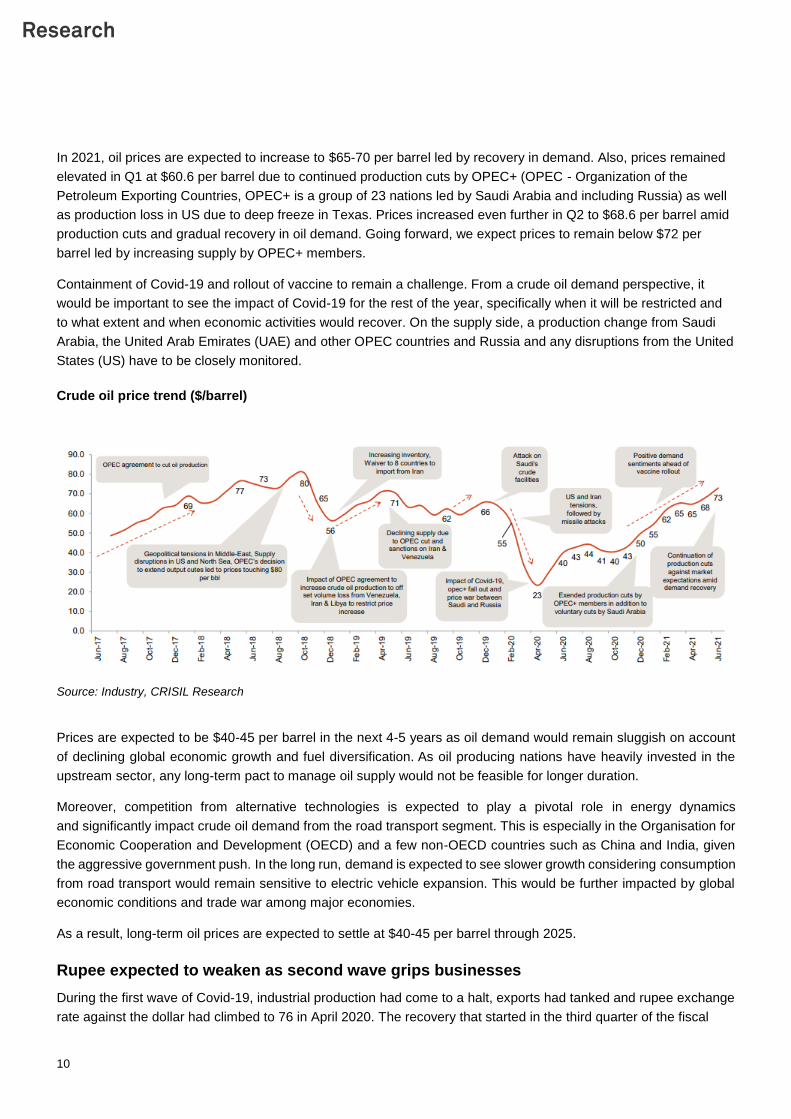
was slow but encouraging. GST collection crossed Rs 1 lakh crore in September 2020. As the stock market
zoomed on hopes of economic revival foreign investment flowed in and the rupee strengthened. The surge in cases
and rise in imports balanced out. Exchange rate remained mostly stable around 73 mark in the last quarter of fiscal
2021.
Exchange rate INR-USD
Source – RBI, CRISIL Research
However, the second wave put downward pressure on the rupee. A steep surge in afflictions dampened investor
sentiment. As states implemented localised lockdowns of varying severity, economic activity and industrial
production again came to a halt. Widening of the trade deficit and increasing crude price added to the depreciation
pressure. As the US ramps up its vaccination, the dollar index is expected to get a further boost putting more
pressure on the rupee. Overall, despite expectation of high single-digit growth of the Indian economy in fiscal 2022,
the rupee is likely to depreciate further to 75 due to weak economic momentum. US Fed’s actions may weaken the
rupee as they bring measures to contain inflation.
Auto finance
Rates on a downtrend
Yields in the auto finance segment have been declining over the past two-three years, due to softening of retail
inflation and a fall in G-sec yields. With the implementation of the marginal cost of funds-based lending rate
(MCLR) regime from April 1, 2016, auto finance rates have remained subdued, as banks have been forced to pass
on benefits of softer interest rate to end-consumers. This has brought yields down 100-130 bps since fiscal 2015.
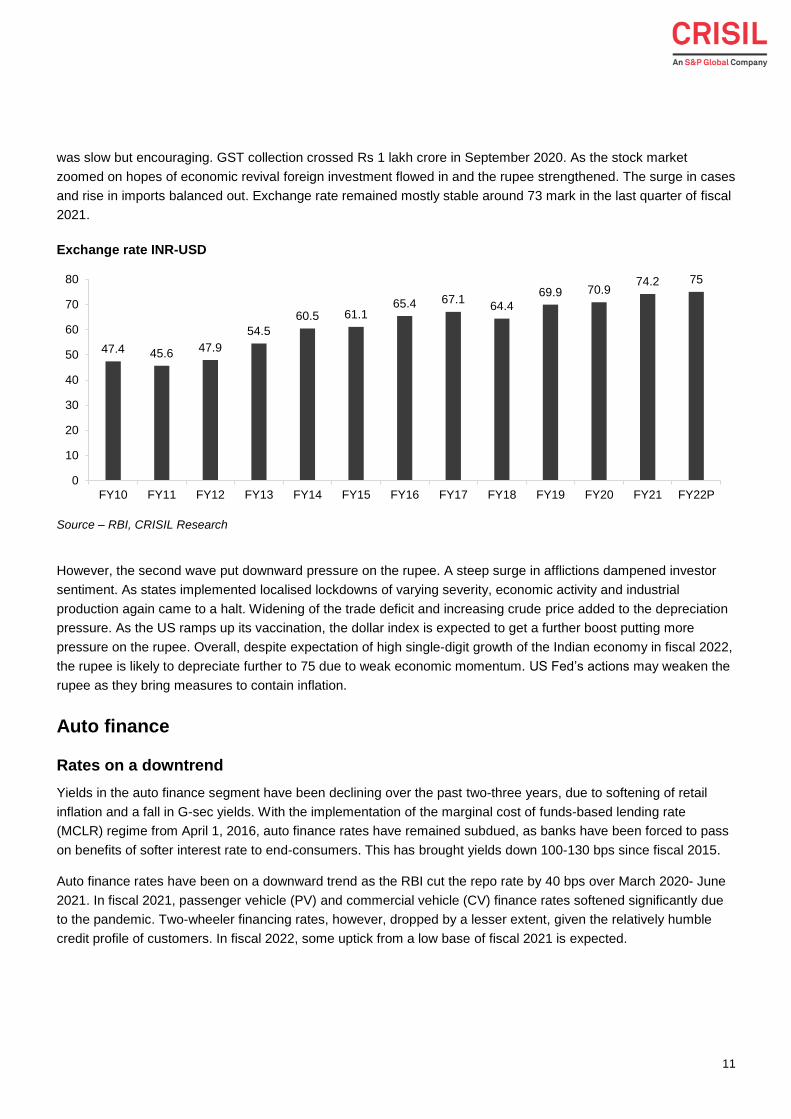
Auto finance rates have been on a downward trend as the RBI cut the repo rate by 40 bps over March 2020- June
2021. In fiscal 2021, passenger vehicle (PV) and commercial vehicle (CV) finance rates softened significantly due
to the pandemic. Two-wheeler financing rates, however, dropped by a lesser extent, given the relatively humble
credit profile of customers. In fiscal 2022, some uptick from a low base of fiscal 2021 is expected.
47.4 45.647.9
54.5
60.5 61.165.4 67.1
64.469.9 70.9
74.2 75
0
10
20
30
40
50
60
70
80
FY10 FY11 FY12 FY13 FY14 FY15 FY16 FY17 FY18 FY19 FY20 FY21 FY22P
12
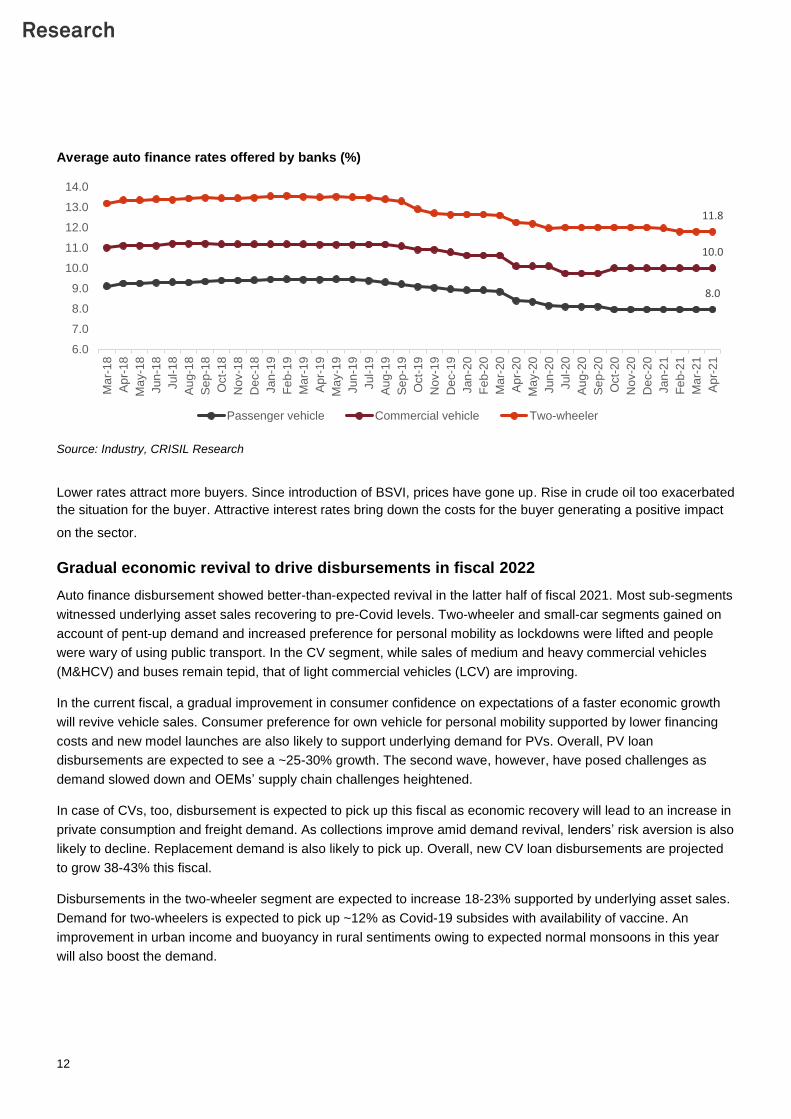
Average auto finance rates offered by banks (%)
Source: Industry, CRISIL Research
Lower rates attract more buyers. Since introduction of BSVI, prices have gone up. Rise in crude oil too exacerbated
the situation for the buyer. Attractive interest rates bring down the costs for the buyer generating a positive impact
on the sector.
Gradual economic revival to drive disbursements in fiscal 2022
Auto finance disbursement showed better-than-expected revival in the latter half of fiscal 2021. Most sub-segments
witnessed underlying asset sales recovering to pre-Covid levels. Two-wheeler and small-car segments gained on
account of pent-up demand and increased preference for personal mobility as lockdowns were lifted and people
were wary of using public transport. In the CV segment, while sales of medium and heavy commercial vehicles
(M&HCV) and buses remain tepid, that of light commercial vehicles (LCV) are improving.
In the current fiscal, a gradual improvement in consumer confidence on expectations of a faster economic growth
will revive vehicle sales. Consumer preference for own vehicle for personal mobility supported by lower financing
costs and new model launches are also likely to support underlying demand for PVs. Overall, PV loan
disbursements are expected to see a ~25-30% growth. The second wave, however, have posed challenges as
demand slowed down and OEMs’ supply chain challenges heightened.
In case of CVs, too, disbursement is expected to pick up this fiscal as economic recovery will lead to an increase in
private consumption and freight demand. As collections improve amid demand revival, lenders’ risk aversion is also
likely to decline. Replacement demand is also likely to pick up. Overall, new CV loan disbursements are projected
to grow 38-43% this fiscal.
Disbursements in the two-wheeler segment are expected to increase 18-23% supported by underlying asset sales.
Demand for two-wheelers is expected to pick up ~12% as Covid-19 subsides with availability of vaccine. An
improvement in urban income and buoyancy in rural sentiments owing to expected normal monsoons in this year
will also boost the demand.
8.0
10.0
11.8
6.0
7.0
8.0
9.0
10.0
11.0
12.0
13.0
14.0
Ma
r-1
8
Ap
r-18
Ma
y-1
8
Jun
-18
Jul-
18
Au
g-1
8
Se
p-1
8
Oct-
18
No
v-1
8
De
c-1
8
Jan
-19
Fe
b-1
9
Ma
r-1
9
Ap
r-19
Ma
y-1
9
Jun
-19
Jul-
19
Au
g-1
9
Se
p-1
9
Oct-
19
No
v-1
9
De
c-1
9
Jan
-20
Fe
b-2
0
Ma
r-2
0
Ap
r-20
Ma
y-2
0
Jun
-20
Jul-
20
Au
g-2
0
Se
p-2
0
Oct-
20
No
v-2
0
De
c-2
0
Jan
-21
Fe
b-2
1
Ma
r-2
1
Ap
r-21
Passenger vehicle Commercial vehicle Two-wheeler
13
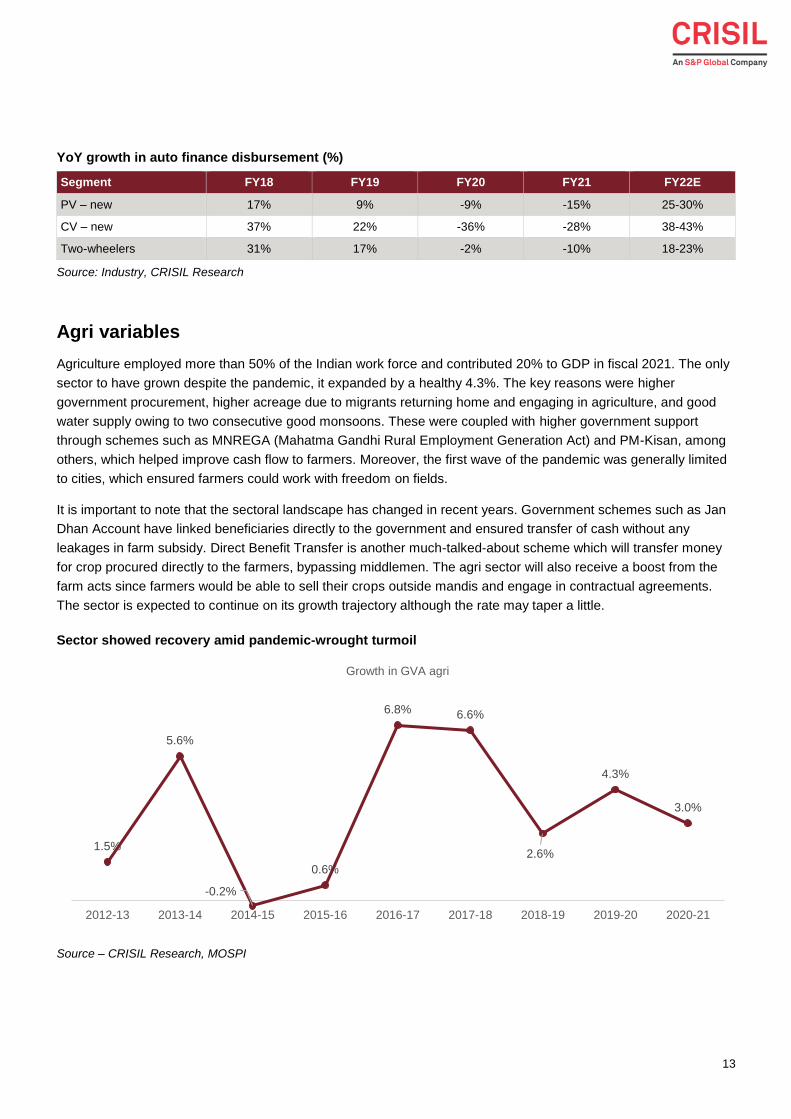
YoY growth in auto finance disbursement (%)
Segment FY18 FY19 FY20 FY21 FY22E
PV – new 17% 9% -9% -15% 25-30%
CV – new 37% 22% -36% -28% 38-43%
Two-wheelers 31% 17% -2% -10% 18-23%
Source: Industry, CRISIL Research
Agri variables
Agriculture employed more than 50% of the Indian work force and contributed 20% to GDP in fiscal 2021. The only
sector to have grown despite the pandemic, it expanded by a healthy 4.3%. The key reasons were higher
government procurement, higher acreage due to migrants returning home and engaging in agriculture, and good
water supply owing to two consecutive good monsoons. These were coupled with higher government support
through schemes such as MNREGA (Mahatma Gandhi Rural Employment Generation Act) and PM-Kisan, among
others, which helped improve cash flow to farmers. Moreover, the first wave of the pandemic was generally limited
to cities, which ensured farmers could work with freedom on fields.
It is important to note that the sectoral landscape has changed in recent years. Government schemes such as Jan
Dhan Account have linked beneficiaries directly to the government and ensured transfer of cash without any
leakages in farm subsidy. Direct Benefit Transfer is another much-talked-about scheme which will transfer money
for crop procured directly to the farmers, bypassing middlemen. The agri sector will also receive a boost from the
farm acts since farmers would be able to sell their crops outside mandis and engage in contractual agreements.
The sector is expected to continue on its growth trajectory although the rate may taper a little.
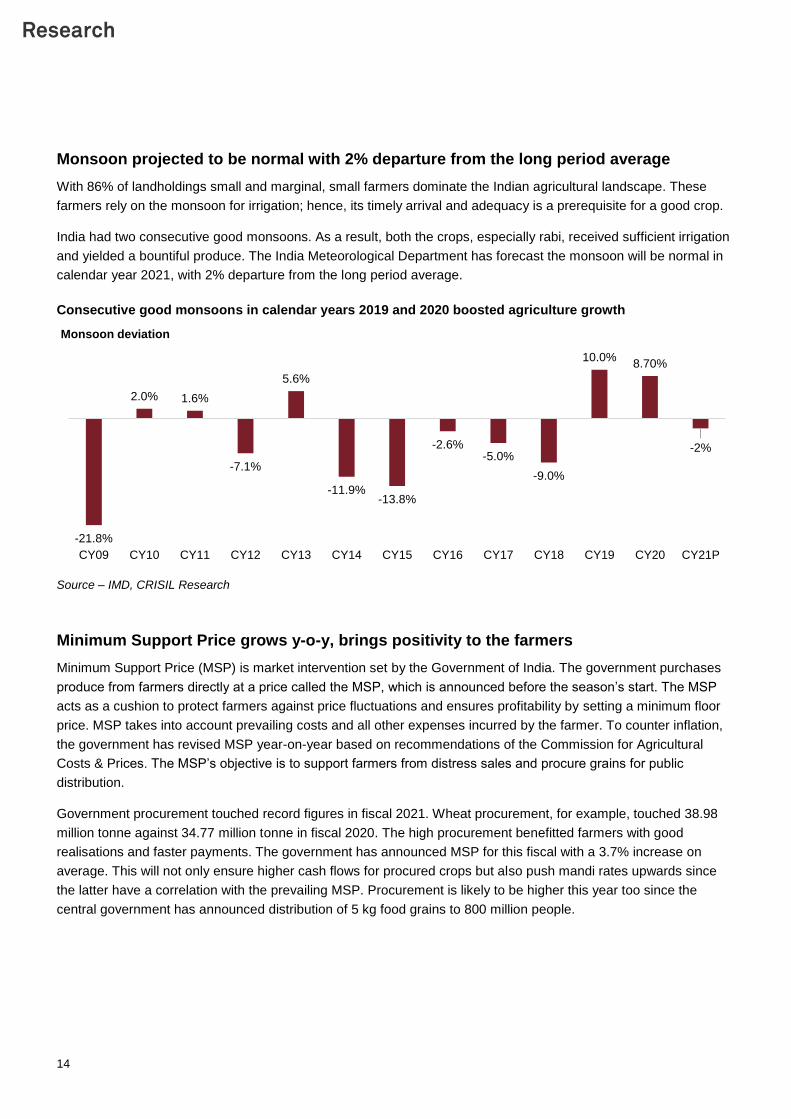
Sector showed recovery amid pandemic-wrought turmoil
Source – CRISIL Research, MOSPI
1.5%
5.6%
-0.2%
0.6%
6.8% 6.6%
2.6%
4.3%
3.0%
2012-13 2013-14 2014-15 2015-16 2016-17 2017-18 2018-19 2019-20 2020-21
Growth in GVA agri
14
Monsoon projected to be normal with 2% departure from the long period average
With 86% of landholdings small and marginal, small farmers dominate the Indian agricultural landscape. These
farmers rely on the monsoon for irrigation; hence, its timely arrival and adequacy is a prerequisite for a good crop.
India had two consecutive good monsoons. As a result, both the crops, especially rabi, received sufficient irrigation
and yielded a bountiful produce. The India Meteorological Department has forecast the monsoon will be normal in
calendar year 2021, with 2% departure from the long period average.
Consecutive good monsoons in calendar years 2019 and 2020 boosted agriculture growth
Source – IMD, CRISIL Research
Minimum Support Price grows y-o-y, brings positivity to the farmers
Minimum Support Price (MSP) is market intervention set by the Government of India. The government purchases
produce from farmers directly at a price called the MSP, which is announced before the season’s start. The MSP
acts as a cushion to protect farmers against price fluctuations and ensures profitability by setting a minimum floor
price. MSP takes into account prevailing costs and all other expenses incurred by the farmer. To counter inflation,
the government has revised MSP year-on-year based on recommendations of the Commission for Agricultural
Costs & Prices. The MSP’s objective is to support farmers from distress sales and procure grains for public
distribution.
Government procurement touched record figures in fiscal 2021. Wheat procurement, for example, touched 38.98
million tonne against 34.77 million tonne in fiscal 2020. The high procurement benefitted farmers with good
realisations and faster payments. The government has announced MSP for this fiscal with a 3.7% increase on
average. This will not only ensure higher cash flows for procured crops but also push mandi rates upwards since
the latter have a correlation with the prevailing MSP. Procurement is likely to be higher this year too since the
central government has announced distribution of 5 kg food grains to 800 million people.
-21.8%
2.0% 1.6%
-7.1%
5.6%
-11.9%-13.8%
-2.6%-5.0%
-9.0%
10.0%8.70%
-2%
CY09 CY10 CY11 CY12 CY13 CY14 CY15 CY16 CY17 CY18 CY19 CY20 CY21P
Monsoon deviation
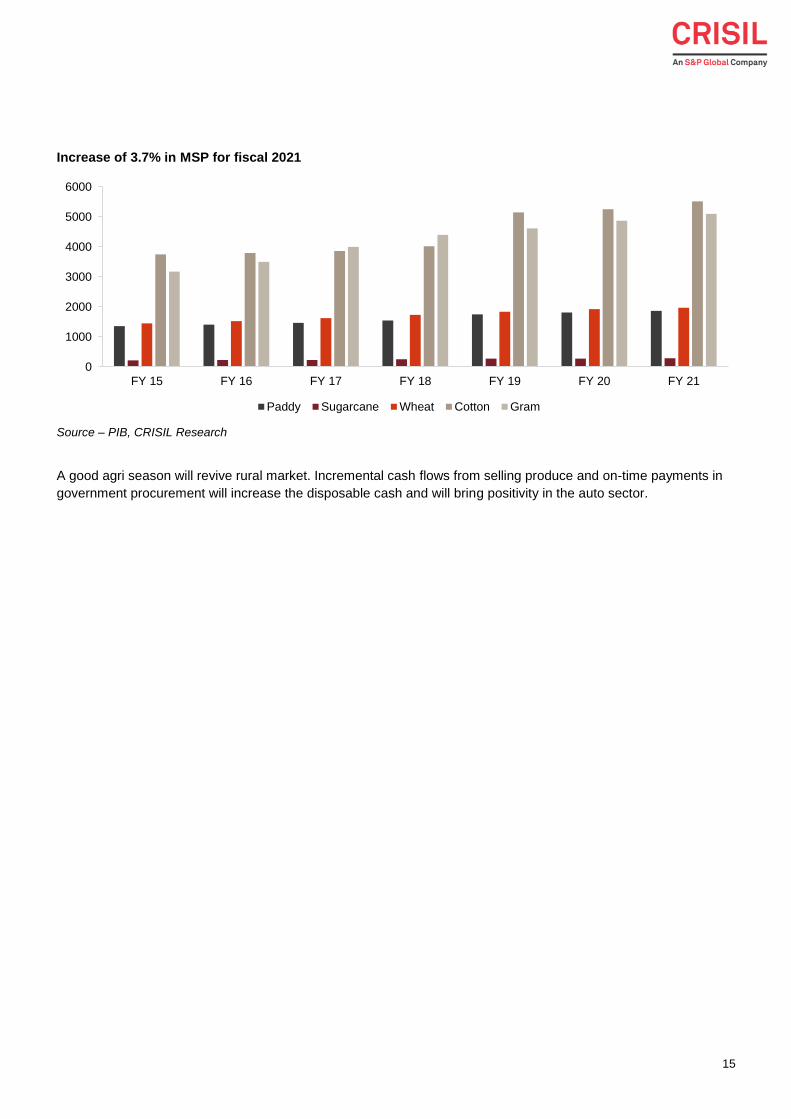
15
Increase of 3.7% in MSP for fiscal 2021
Source – PIB, CRISIL Research
A good agri season will revive rural market. Incremental cash flows from selling produce and on-time payments in
government procurement will increase the disposable cash and will bring positivity in the auto sector.
0
1000
2000
3000
4000
5000
6000
FY 15 FY 16 FY 17 FY 18 FY 19 FY 20 FY 21
Paddy Sugarcane Wheat Cotton Gram
16
2 Automotive industry in India
The automobile industry is one of the primary contributors to the Indian economy. Its current contribution to India’s
GDP is ~7% and it employs ~3.5 crore people directly and indirectly. India’s domestic market is the fourth largest
auto market in the world, with domestic sales of over 27 million vehicles at its peak in fiscal 2019.
The domestic industry had been growing on the back of healthy economic growth until fiscal 2017. In fiscal 2018,
however, the impact of demonetisation and the GST-induced uncertainty pared GDP growth to 6.8%, its lowest in
four years.
The consequent economic slowdown and dull consumer sentiment affected the industry’s growth in fiscal 2019.
This, among other factors such as inventory correction for Bharat Stage-VI (BS-VI) upgradation, led to a de-growth
in fiscal 2020. The Covid-19 pandemic also hit the automotive industry hard and sales dropped 12% on the already
low base of fiscal 2020 to 19.5 million in fiscal 2021.
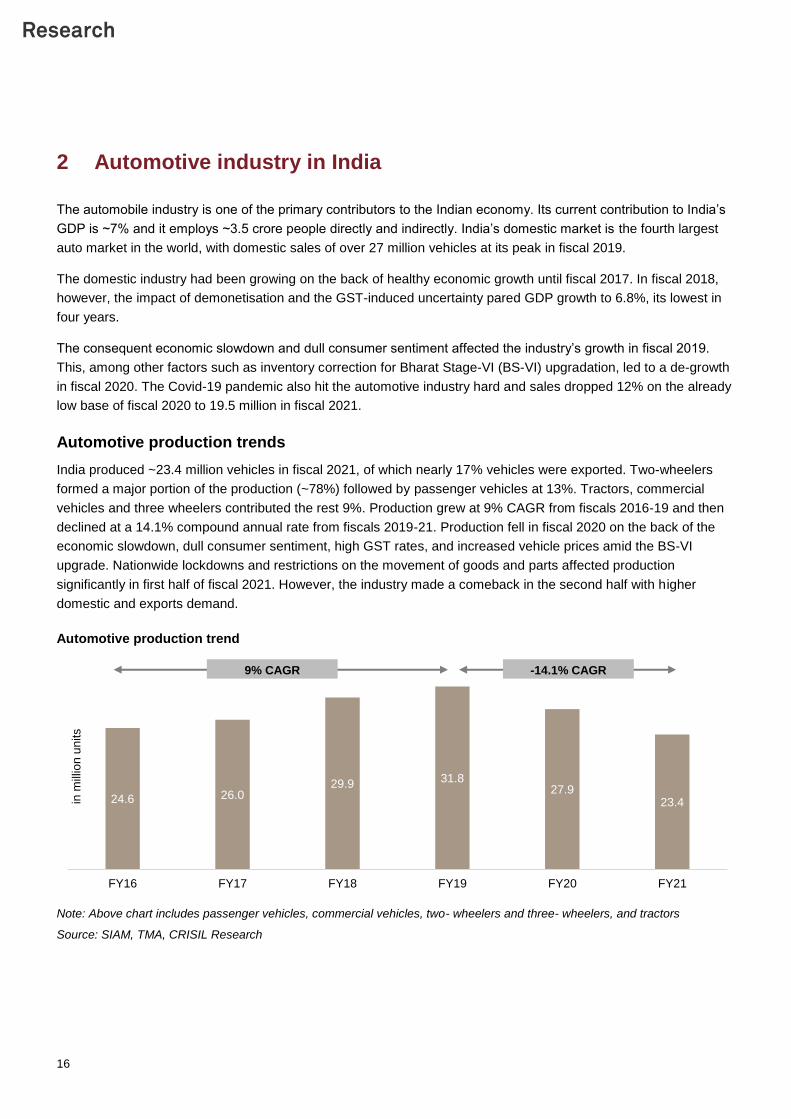
Automotive production trends
India produced ~23.4 million vehicles in fiscal 2021, of which nearly 17% vehicles were exported. Two-wheelers
formed a major portion of the production (~78%) followed by passenger vehicles at 13%. Tractors, commercial
vehicles and three wheelers contributed the rest 9%. Production grew at 9% CAGR from fiscals 2016-19 and then
declined at a 14.1% compound annual rate from fiscals 2019-21. Production fell in fiscal 2020 on the back of the
economic slowdown, dull consumer sentiment, high GST rates, and increased vehicle prices amid the BS-VI
upgrade. Nationwide lockdowns and restrictions on the movement of goods and parts affected production
significantly in first half of fiscal 2021. However, the industry made a comeback in the second half with higher
domestic and exports demand.
Automotive production trend
Note: Above chart includes passenger vehicles, commercial vehicles, two- wheelers and three- wheelers, and tractors
Source: SIAM, TMA, CRISIL Research
24.6 26.029.9 31.8
27.923.4
FY16 FY17 FY18 FY19 FY20 FY21
in m
illio
n u
nits
9% CAGR -14.1% CAGR
17
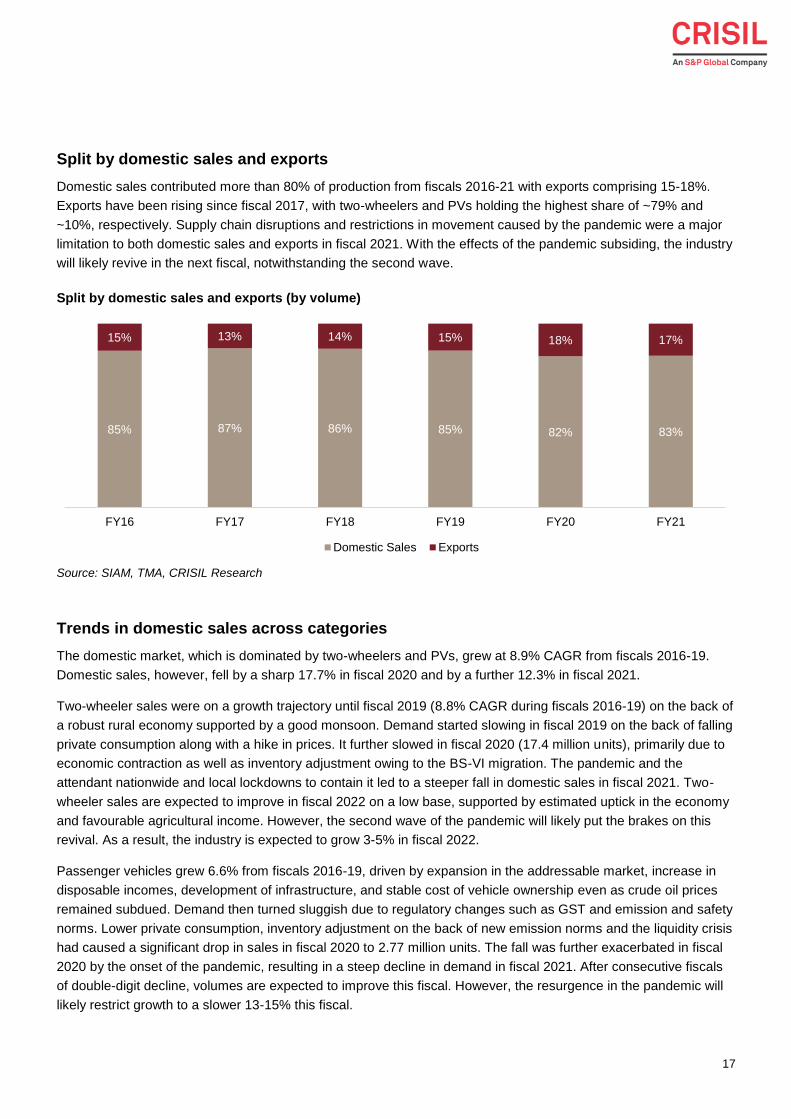
Split by domestic sales and exports
Domestic sales contributed more than 80% of production from fiscals 2016-21 with exports comprising 15-18%.
Exports have been rising since fiscal 2017, with two-wheelers and PVs holding the highest share of ~79% and
~10%, respectively. Supply chain disruptions and restrictions in movement caused by the pandemic were a major
limitation to both domestic sales and exports in fiscal 2021. With the effects of the pandemic subsiding, the industry
will likely revive in the next fiscal, notwithstanding the second wave.
Split by domestic sales and exports (by volume)
Source: SIAM, TMA, CRISIL Research
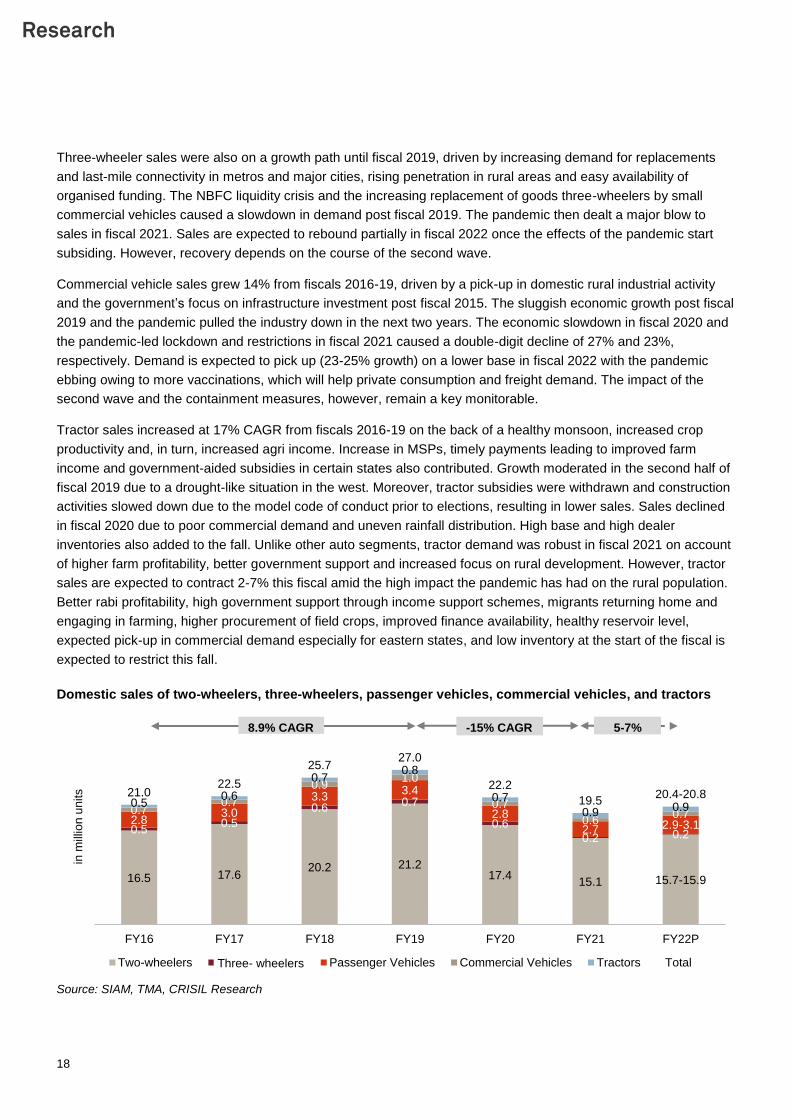
Trends in domestic sales across categories
The domestic market, which is dominated by two-wheelers and PVs, grew at 8.9% CAGR from fiscals 2016-19.
Domestic sales, however, fell by a sharp 17.7% in fiscal 2020 and by a further 12.3% in fiscal 2021.
Two-wheeler sales were on a growth trajectory until fiscal 2019 (8.8% CAGR during fiscals 2016-19) on the back of
a robust rural economy supported by a good monsoon. Demand started slowing in fiscal 2019 on the back of falling
private consumption along with a hike in prices. It further slowed in fiscal 2020 (17.4 million units), primarily due to
economic contraction as well as inventory adjustment owing to the BS-VI migration. The pandemic and the
attendant nationwide and local lockdowns to contain it led to a steeper fall in domestic sales in fiscal 2021. Two-
wheeler sales are expected to improve in fiscal 2022 on a low base, supported by estimated uptick in the economy
and favourable agricultural income. However, the second wave of the pandemic will likely put the brakes on this
revival. As a result, the industry is expected to grow 3-5% in fiscal 2022.
Passenger vehicles grew 6.6% from fiscals 2016-19, driven by expansion in the addressable market, increase in
disposable incomes, development of infrastructure, and stable cost of vehicle ownership even as crude oil prices
remained subdued. Demand then turned sluggish due to regulatory changes such as GST and emission and safety
norms. Lower private consumption, inventory adjustment on the back of new emission norms and the liquidity crisis
had caused a significant drop in sales in fiscal 2020 to 2.77 million units. The fall was further exacerbated in fiscal
2020 by the onset of the pandemic, resulting in a steep decline in demand in fiscal 2021. After consecutive fiscals
of double-digit decline, volumes are expected to improve this fiscal. However, the resurgence in the pandemic will
likely restrict growth to a slower 13-15% this fiscal.
85% 87% 86% 85% 82% 83%
15% 13% 14% 15% 18% 17%
FY16 FY17 FY18 FY19 FY20 FY21
Domestic Sales Exports
18
Three-wheeler sales were also on a growth path until fiscal 2019, driven by increasing demand for replacements
and last-mile connectivity in metros and major cities, rising penetration in rural areas and easy availability of
organised funding. The NBFC liquidity crisis and the increasing replacement of goods three-wheelers by small
commercial vehicles caused a slowdown in demand post fiscal 2019. The pandemic then dealt a major blow to
sales in fiscal 2021. Sales are expected to rebound partially in fiscal 2022 once the effects of the pandemic start
subsiding. However, recovery depends on the course of the second wave.
Commercial vehicle sales grew 14% from fiscals 2016-19, driven by a pick-up in domestic rural industrial activity
and the government’s focus on infrastructure investment post fiscal 2015. The sluggish economic growth post fiscal
2019 and the pandemic pulled the industry down in the next two years. The economic slowdown in fiscal 2020 and
the pandemic-led lockdown and restrictions in fiscal 2021 caused a double-digit decline of 27% and 23%,
respectively. Demand is expected to pick up (23-25% growth) on a lower base in fiscal 2022 with the pandemic
ebbing owing to more vaccinations, which will help private consumption and freight demand. The impact of the
second wave and the containment measures, however, remain a key monitorable.
Tractor sales increased at 17% CAGR from fiscals 2016-19 on the back of a healthy monsoon, increased crop
productivity and, in turn, increased agri income. Increase in MSPs, timely payments leading to improved farm
income and government-aided subsidies in certain states also contributed. Growth moderated in the second half of
fiscal 2019 due to a drought-like situation in the west. Moreover, tractor subsidies were withdrawn and construction
activities slowed down due to the model code of conduct prior to elections, resulting in lower sales. Sales declined
in fiscal 2020 due to poor commercial demand and uneven rainfall distribution. High base and high dealer
inventories also added to the fall. Unlike other auto segments, tractor demand was robust in fiscal 2021 on account
of higher farm profitability, better government support and increased focus on rural development. However, tractor
sales are expected to contract 2-7% this fiscal amid the high impact the pandemic has had on the rural population.
Better rabi profitability, high government support through income support schemes, migrants returning home and
engaging in farming, higher procurement of field crops, improved finance availability, healthy reservoir level,
expected pick-up in commercial demand especially for eastern states, and low inventory at the start of the fiscal is
expected to restrict this fall.
Domestic sales of two-wheelers, three-wheelers, passenger vehicles, commercial vehicles, and tractors
Source: SIAM, TMA, CRISIL Research
16.5 17.620.2 21.2
17.415.1 15.7-15.9
0.50.5
0.60.7
0.6
0.2 0.2
2.83.0
3.33.4
2.8
2.7 2.9-3.1
0.70.7
0.91.0
0.7
0.60.7
0.50.6
0.70.8
0.7
0.9 0.9
21.022.5
25.727.0
22.2
19.520.4-20.8
FY16 FY17 FY18 FY19 FY20 FY21 FY22P
in m
illio
n u
nits
Two-wheelers Three-wheelers* Passenger Vehicles Commercial Vehicles Tractors Total
8.9% CAGR -15% CAGR 5-7%
Three- wheelers
19
Impact of Covid-19
After a sluggish fiscal 2020, the pandemic dragged down domestic sales by 12% in fiscal 2021. Three-wheelers
was the most impacted segment, contracting 66%, followed by commercial vehicles which fell 21%.
Two-wheeler sales skidded 13% on-year as nationwide and local lockdowns were imposed to contain the spread of
Covid-19. The subsequent toll on economic activity impacted the income of the average two-wheeler buyer.
Impact on the PV segment was limited due to recent competitively priced launches, limited financial impact on the
car-buying population and the increased need for personal mobility to maintain social distancing. Major supply
issues amid the restrictions and the shortage of semiconductors restricted the growth in PVs.
The three-wheeler segment was the worst hit among the auto segments in fiscal 2021 with a steep 66%
contraction. The pandemic and the subsequent lockdown/ restrictions, ban on rail/bus travel, closing of schools/
colleges, and work from home for most offices almost eliminated the need for last-mile connectivity. The
apprehension to use shared mobility exacerbated the situation. In turn, the dominant passenger segment within
three-wheelers was severely hit and its sales nosedived 74%. However, some traction for goods three-wheelers
with continued end-user demand for fast-moving consumer goods and e-commerce provided a breather. The
second wave is expected to restrict the industry’s revival in this fiscal as well. CRISIL Research expects the three-
wheeler industry to clock a meagre 10-12% growth after consecutive drops in fiscals 2020 and 2021.
The pandemic had impacted freight demand and private consumption, hampering demand for both light
commercial vehicles (LCVs: < 7.5T gross vehicle weight or GVW) and medium and heavy commercial vehicles
(MHCVs) in fiscal 2021. Bus demand, too, fell due to a significant decline in mass transportation on account of
social distancing norms. While volumes are projected to improve this fiscal over a low base, the second wave is
expected to impact sales significantly in the first quarter of the fiscal.
However, tractor sales bucked the trend and soared ~27% on-year owing to high investment by farmers on
agriculture activities amid the absence of any other investment opportunity due to the pandemic. Positive rural
sentiment, higher government procurement, better crop output, and increased government focus on rural
expenditure led to the improved demand despite the slowdown in commercial demand.
Regulatory policies
Emission norms
BS-VI emission standards are issued by the government to regulate the output of air pollutants from motor vehicles.
In February 2016, the government decided to skip BS-V standards and move directly to BS-VI norms by April 2020.
The stringent BS-VI norms incorporate substantial tightening of nitrogen oxides (NOx) and particulate matter (PM).
These emission standards pushed vehicle prices higher. There was a larger price increase in the diesel segment
due to the significant upgradation of engines and exhaust systems.
The increased vehicle prices and subdued finance availability post the implementation of the norms resulted in a
sudden increase in both the initial cost of acquisition and total cost of ownership even as the freight scenario
remained lacklustre, impacting viability for transporters.
20
Electric mobility in India
The central and state governments, through various ministries, have formulated several policies for the
development of the electric vehicle (EV) sector in India.
Reduction in the GST rate for EVs and chargers
Income tax deduction of Rs 1.5 lakh on EV loans
Announcement of FAME-II (Faster Adoption and Manufacturing of (Hybrid &) Electric Vehicles) subsidy for two-
and three-wheelers and commercial PVs and buses. Under FAME-II, the central government has also sanctioned
2,636 charging stations across 62 cities
Revision of vehicle warranty to three years (up to 20,000 km) from the one year earlier
Announcement of the Phased Manufacturing Plan (PMP) to discourage imports and encourage localisation in an
effort to reduce the cost of electric components such as traction motors, traction motor controllers, battery packs,
and battery management systems
Various states have announced their specific EV policies offering incentives such as reduced rates for EV
charging, rebates on road tax, interest-free loans for auto component manufacturers, and cost split for skill
development
While these steps will certainly support development of the EV ecosystem in India, CRISIL Research believes EV
adoption will be slow and gradual. The pace of electrification will also differ across vehicle segments. Two- and
three-wheelers are likely to lead electrification and achieve penetration levels of ~18% and ~8%, respectively, by
fiscal 2026. PV electrification is expected to reach ~4% by fiscal 2026. The automotive component industry is
unlikely to be highly impacted by EV adoption in the near term.
However, the shift to EVs offers a competitive advantage to auto component manufacturers having the know-how
of EV components.
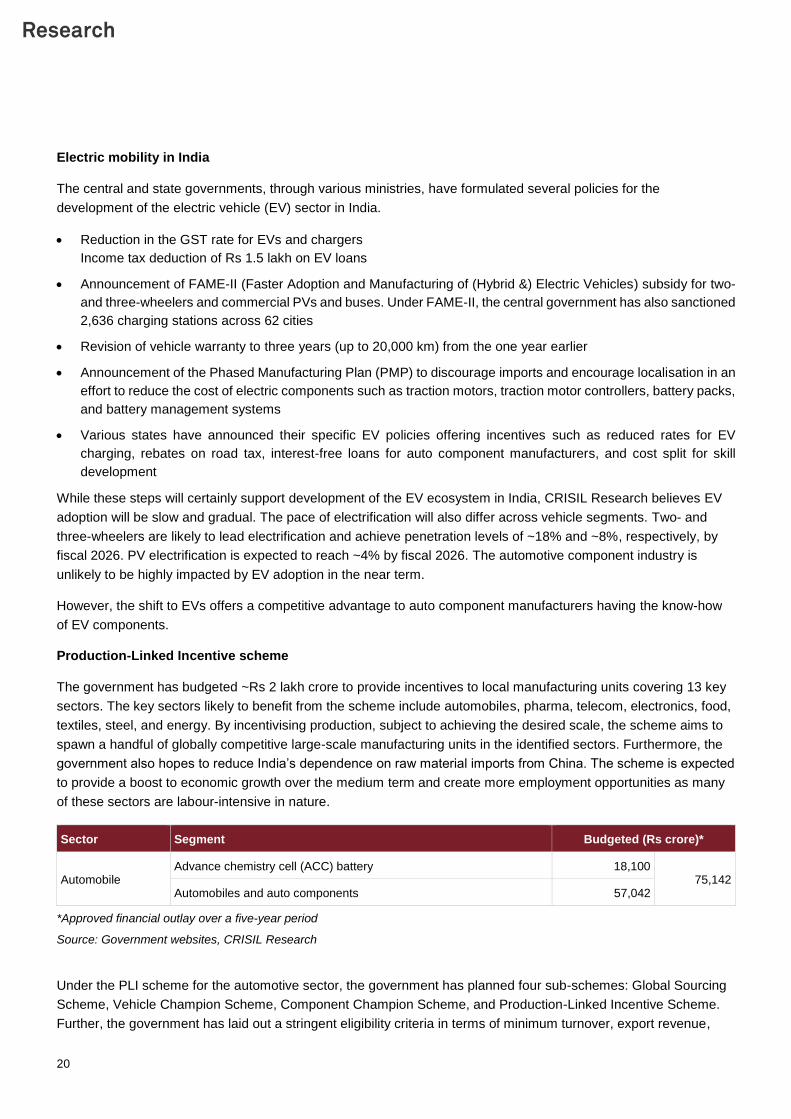
Production-Linked Incentive scheme
The government has budgeted ~Rs 2 lakh crore to provide incentives to local manufacturing units covering 13 key
sectors. The key sectors likely to benefit from the scheme include automobiles, pharma, telecom, electronics, food,
textiles, steel, and energy. By incentivising production, subject to achieving the desired scale, the scheme aims to
spawn a handful of globally competitive large-scale manufacturing units in the identified sectors. Furthermore, the
government also hopes to reduce India’s dependence on raw material imports from China. The scheme is expected
to provide a boost to economic growth over the medium term and create more employment opportunities as many
of these sectors are labour-intensive in nature.
Sector Segment Budgeted (Rs crore)*
Automobile Advance chemistry cell (ACC) battery 18,100
75,142 Automobiles and auto components 57,042
*Approved financial outlay over a five-year period
Source: Government websites, CRISIL Research
Under the PLI scheme for the automotive sector, the government has planned four sub-schemes: Global Sourcing
Scheme, Vehicle Champion Scheme, Component Champion Scheme, and Production-Linked Incentive Scheme.
Further, the government has laid out a stringent eligibility criteria in terms of minimum turnover, export revenue,
21
and investments in fixed assets to ensure that implementation offers the desired results. Auto OEMs need to show
a minimum turnover of Rs 100 billion, minimum exports of Rs 10 billion, and a minimum investment in fixed assets
of Rs 35 billion to be eligible. Auto component manufacturers need to show a minimum turnover of Rs 10 billion,
minimum exports of Rs 2 billion, and a minimum investment in fixed assets of Rs 3.5 billion. The PLI scheme is
expected to benefit auto component manufacturers in terms of increased demand from domestic vehicle production
and increased competitiveness in export markets.
Impact of the Union Budget 2021-22 on the automotive sector
Key budget proposals
Scrappage policy: Vehicles to undergo fitness tests –PVs that are over 20 years old and CVs that are over 15
years old
Import duty on specific auto components increased from 7.5-10% to 15%
Infrastructure push with an increase in outlay of ~10% vs revised estimate for fiscal 2021 under the Ministry of
Road Transport & Highways
Agriculture infrastructure cess of Rs 2.5/litre on petrol and Rs 4/litre on diesel. However, the rise in cess to be
offset by reduction in ‘special additional’ and ‘additional’ excise duties
Removal of anti-dumping duty/ countervailing duty and reduction in customs duty on steel
Rs 18,000 crore scheme to support augmentation of public bus transport services through the public-private
partnership model to enable private players to finance, acquire, operate and maintain over 20,000 buses
Customs duty on carbon black (tyre raw material) increased from 5% to 7.5%, but reduced on caprolactam (used
to manufacture nylon tyre cord fabric, a tyre raw material) from 7.5% to 5%
FAME (II) will provide an incentive to EV buyers and is expected to boost market sentiment. Modification to
FAME (II), released on June, 11, 2021, has increased the incentive per KWh by 50% and overall cap on
incentive from 20% to 40% of the vehicle price
22
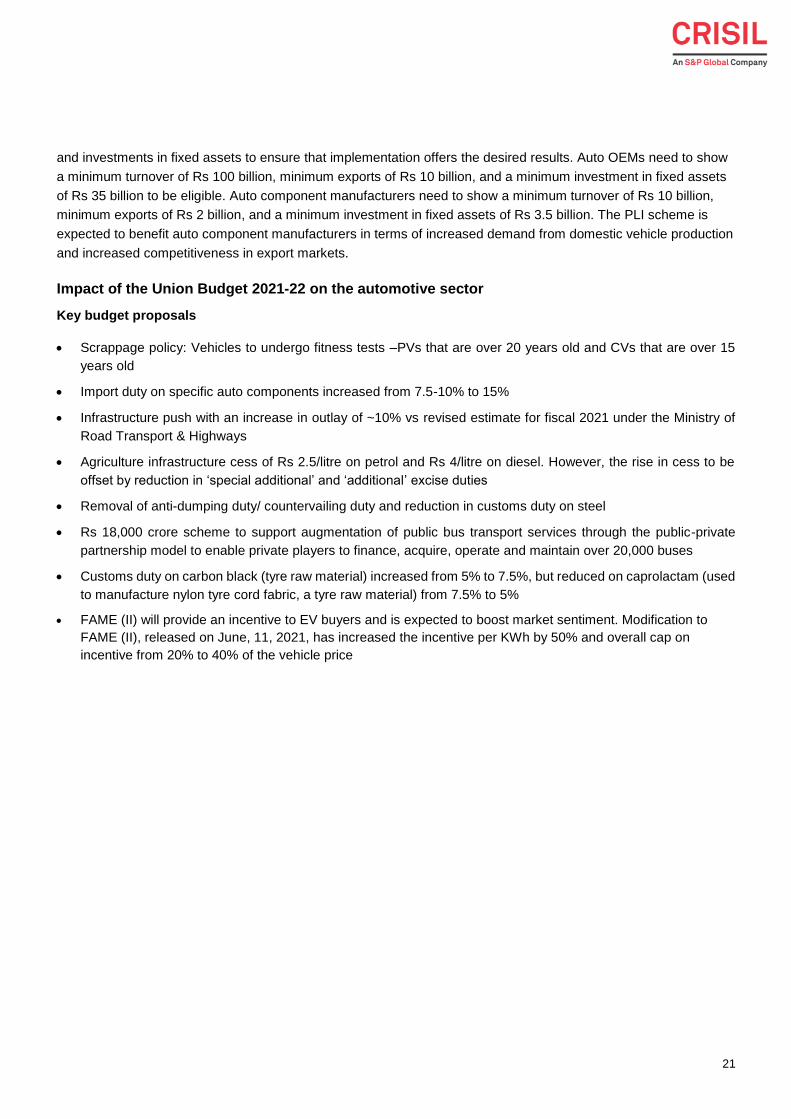
EV policy BE 2021 (Rs crore) RE 2021 (Rs crore) BE 2022 (Rs crore)
FAME 693 318 757
Note: BE: Budgeted Estimate, RE: Revised Estimate
FAME- Faster Adoption and Manufacturing of (Hybrid and) Electric Vehicle
Source: CRISIL Research
Budget impact
The number of PVs over 20 years old is quite limited, while more incentives would be needed to promote
scrapping of CVs over 15 years. For example, an incentive of over Rs 1 lakh would be needed for a medium CV
(MCV, 18.5-tonne truck), in addition to the scrap value, for transporters to scrap their 15-year and older MCVs.
MCVs have a high share in the 15-year and older population. Without an incentive, we do not see the scheme
providing impetus to CV sales
The higher import duty on select auto components is in line with the sharper focus on localisation. Given that
average localisation for automobile OEMs is ~90%, only those with lower localisation, especially large-car and
high-end sports utility vehicle makers (representing <15% of PV sales), are expected to see cost escalation
CV demand, especially for tippers, will get some support from the construction-led infrastructure push in sectors
such as roads and urban infrastructure
Considering average state transport undertaking purchases (including hire purchases) over the past five years
at ~10,500 units, the Rs 18,000-crore outlay to acquire and operate over 20,000 buses should support bus
demand. It is important to understand the modalities of the scheme and the duration over which the procurement
will be spread
Automotive Mission Plan 2016-2026
The second Automotive Mission Plan (AMP 2016-2026) outlines the growth trajectory of Indian automotive industry.
Its key highlights are as follows:
The industry to grow 3.5 to 4 times its current value of $74 billion to $260-300 billion
Set following growth targets for various vehicle segments:
‒ Passenger vehicles to increase between 9.4 and 13.4 million units
‒ CVs to grow between 2 and 3.9 million units
‒ Two-wheelers to grow between 50.6 and 55.5 million units
‒ Tractors to grow between 1.5 and 1.7 million units
India to be among top three global automotive industries in terms of engineering, manufacturing and export of
vehicles and auto components
The industry to contribute over 12% to India's GDP and generate about 65 million additional jobs
The industry to be made the engine of 'Make in India' initiative
Increase exports to 35-40% of overall output
Implement End-of-Life policy for automotive vehicles and components
The auto-component industry to grow between Rs 59.35 billion and Rs 73.20 billion
23
3 Review and outlook on Indian passenger vehicle industry
Review of Indian PV industry (fiscals 2016 to 2021)
Historical production
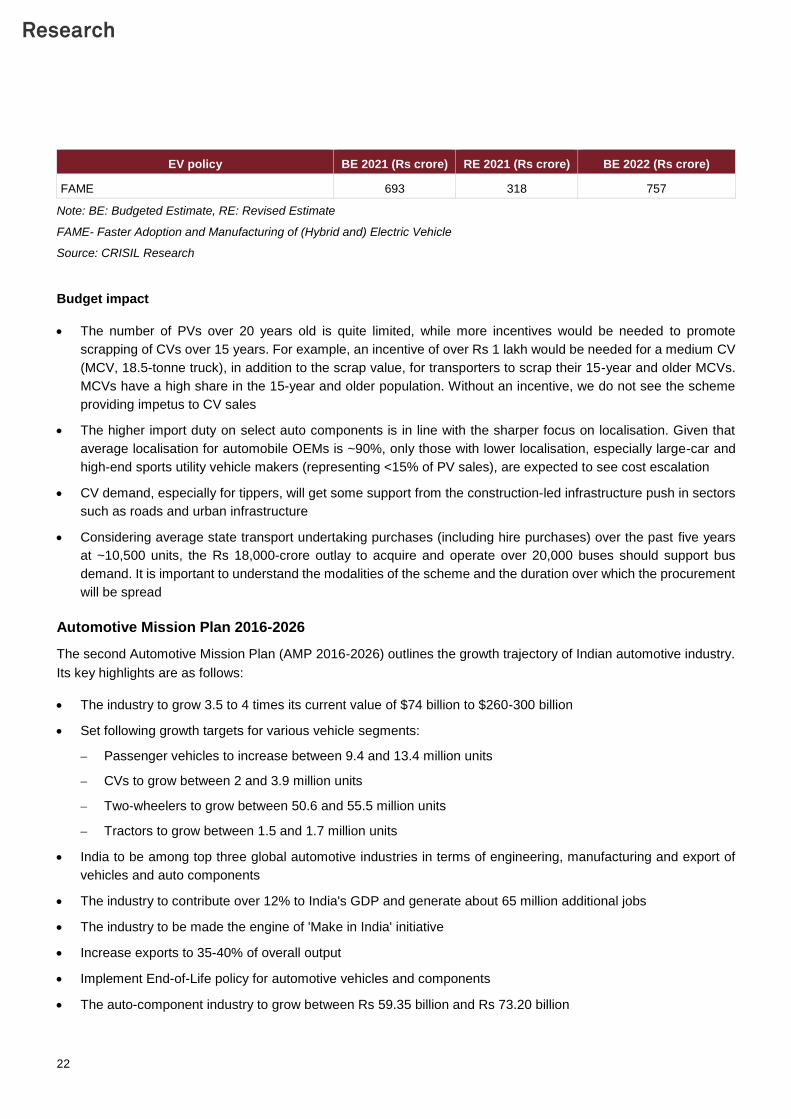
Production of PVs in India rose a healthy 5.2% CAGR between fiscals 2016 and 2019, despite demonetisation and
teething issues in the implementation of GST. Domestic demand as well as exports rose over the period.
Domestic demand was driven by overall favourable economic environment, increase in disposable income,
expansion of the addressable market, development of infrastructure, and stable cost of vehicle ownership as crude
oil prices stayed low, except in the few months when output was reduced because of sanctions imposed on Iran.
Exports, during fiscals 2016 and 2019 grew supported by increased demand from new markets like Saudi Arabia,
the UAE and South Africa.
Source: SIAM, CRISIL Research
The situation deteriorated considerable over fiscals 2019 to 2021, posting a negative 12% CAGR, owing to various
issues:
In fiscal 2019, production was flat, with India manufacturing 4.03 million PVs, of which 3.38 million vehicles were
sold in the domestic market and 0.68 million were exported. Emission and safety norms introduced by the
government resulted in sluggish growth of the PV industry, post fiscal 2018.
In fiscal 2020, subdued private consumption amid sluggish economic growth and inventory adjustment because of
the change in emission norms to BS-VI from BS-IV, the NBFC liquidity crisis, and outbreak of Covid-19 dragged
domestic sales lower by 18% on-year, while exports stayed flat. This lowered production by 15% on-year.
Amid challenges heaped by the pandemic, the country’s GDP contracted 7.3% in fiscal 2021. However, while PV
production declined ~11% and exports plunged ~41%, domestic sales fell only ~2%. The impact on domestic sales
was limited as personal mobility received a boost as social distancing because of Covid-19 led to people avoiding
public transportation and shared mobility services.
3.53.8 4.0 4.0
3.43.1
FY16 FY17 FY18 FY19 FY20 FY21
(mil
lio
n u
nit
s)
5.2% CAGR -12% CAGR
24
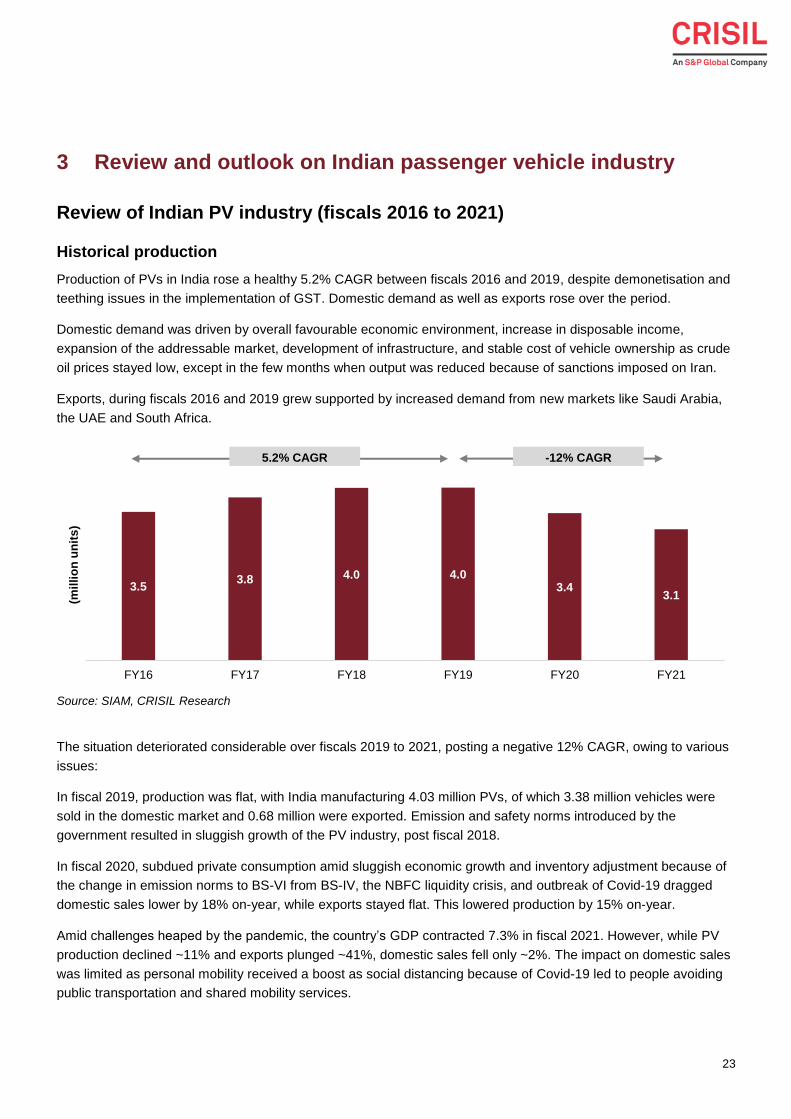
In the case of sales, on the domestic front, the PV industry clocked 6.6% CAGR between fiscals 2016 and 2019. A
large part of the increase was because of 14.9% CAGR in sales of UVs. Between fiscals 2019 and 2021 as well,
though sales plunged, UV sales supported a further slide, rising a slight 0.5% CAGR. Dragging the overall PV sales
number was a 17.0% CAGR decline car sales.
Review of domestic PV sales
Source: SIAM, CRISIL Research
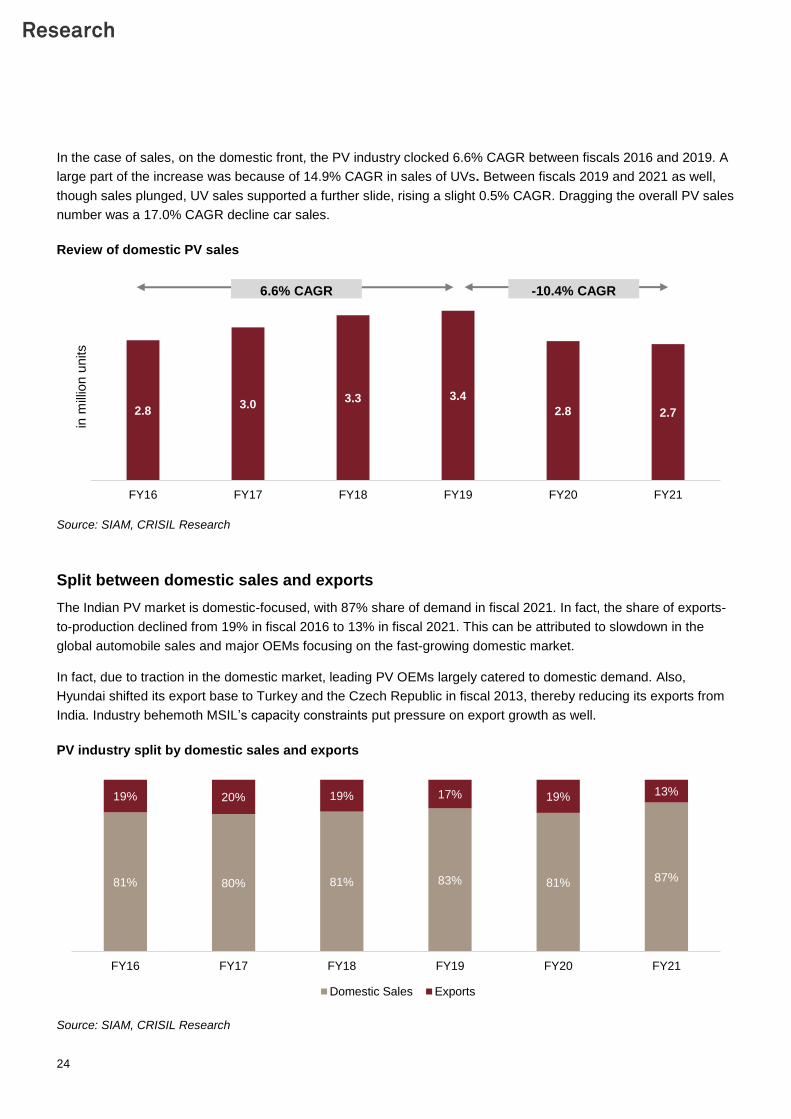
Split between domestic sales and exports
The Indian PV market is domestic-focused, with 87% share of demand in fiscal 2021. In fact, the share of exports-
to-production declined from 19% in fiscal 2016 to 13% in fiscal 2021. This can be attributed to slowdown in the
global automobile sales and major OEMs focusing on the fast-growing domestic market.
In fact, due to traction in the domestic market, leading PV OEMs largely catered to domestic demand. Also,
Hyundai shifted its export base to Turkey and the Czech Republic in fiscal 2013, thereby reducing its exports from
India. Industry behemoth MSIL’s capacity constraints put pressure on export growth as well.
PV industry split by domestic sales and exports
Source: SIAM, CRISIL Research
2.83.0
3.3 3.4
2.8 2.7
FY16 FY17 FY18 FY19 FY20 FY21
in m
illio
n u
nits
6.6% CAGR -10.4% CAGR
81% 80% 81% 83% 81% 87%
19% 20% 19% 17% 19% 13%
FY16 FY17 FY18 FY19 FY20 FY21
Domestic Sales Exports
25
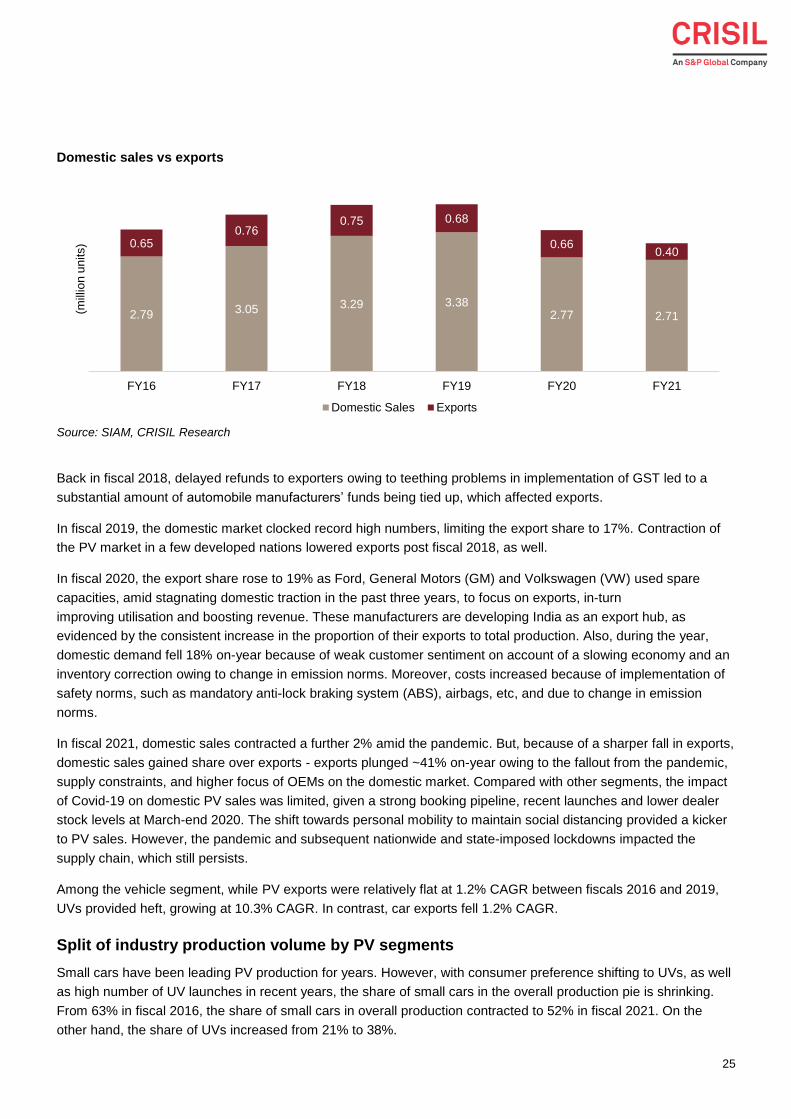
Domestic sales vs exports
Source: SIAM, CRISIL Research
Back in fiscal 2018, delayed refunds to exporters owing to teething problems in implementation of GST led to a
substantial amount of automobile manufacturers’ funds being tied up, which affected exports.
In fiscal 2019, the domestic market clocked record high numbers, limiting the export share to 17%. Contraction of
the PV market in a few developed nations lowered exports post fiscal 2018, as well.
In fiscal 2020, the export share rose to 19% as Ford, General Motors (GM) and Volkswagen (VW) used spare
capacities, amid stagnating domestic traction in the past three years, to focus on exports, in-turn
improving utilisation and boosting revenue. These manufacturers are developing India as an export hub, as
evidenced by the consistent increase in the proportion of their exports to total production. Also, during the year,
domestic demand fell 18% on-year because of weak customer sentiment on account of a slowing economy and an
inventory correction owing to change in emission norms. Moreover, costs increased because of implementation of
safety norms, such as mandatory anti-lock braking system (ABS), airbags, etc, and due to change in emission
norms.
In fiscal 2021, domestic sales contracted a further 2% amid the pandemic. But, because of a sharper fall in exports,
domestic sales gained share over exports - exports plunged ~41% on-year owing to the fallout from the pandemic,
supply constraints, and higher focus of OEMs on the domestic market. Compared with other segments, the impact
of Covid-19 on domestic PV sales was limited, given a strong booking pipeline, recent launches and lower dealer
stock levels at March-end 2020. The shift towards personal mobility to maintain social distancing provided a kicker
to PV sales. However, the pandemic and subsequent nationwide and state-imposed lockdowns impacted the
supply chain, which still persists.
Among the vehicle segment, while PV exports were relatively flat at 1.2% CAGR between fiscals 2016 and 2019,
UVs provided heft, growing at 10.3% CAGR. In contrast, car exports fell 1.2% CAGR.
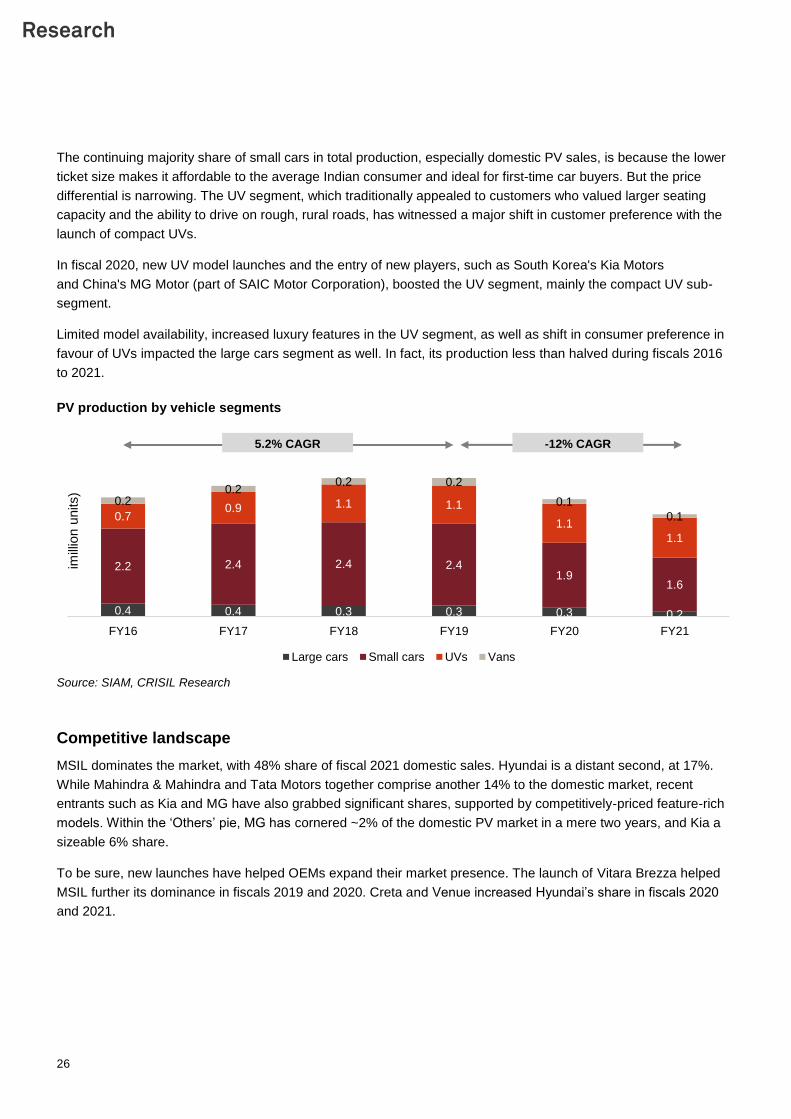
Split of industry production volume by PV segments
Small cars have been leading PV production for years. However, with consumer preference shifting to UVs, as well
as high number of UV launches in recent years, the share of small cars in the overall production pie is shrinking.
From 63% in fiscal 2016, the share of small cars in overall production contracted to 52% in fiscal 2021. On the
other hand, the share of UVs increased from 21% to 38%.
2.79 3.05 3.29 3.382.77 2.71
0.650.76
0.75 0.68
0.660.40
FY16 FY17 FY18 FY19 FY20 FY21
(mill
ion
un
its)
Domestic Sales Exports
26
The continuing majority share of small cars in total production, especially domestic PV sales, is because the lower
ticket size makes it affordable to the average Indian consumer and ideal for first-time car buyers. But the price
differential is narrowing. The UV segment, which traditionally appealed to customers who valued larger seating
capacity and the ability to drive on rough, rural roads, has witnessed a major shift in customer preference with the
launch of compact UVs.
In fiscal 2020, new UV model launches and the entry of new players, such as South Korea's Kia Motors
and China's MG Motor (part of SAIC Motor Corporation), boosted the UV segment, mainly the compact UV sub-
segment.
Limited model availability, increased luxury features in the UV segment, as well as shift in consumer preference in
favour of UVs impacted the large cars segment as well. In fact, its production less than halved during fiscals 2016
to 2021.
PV production by vehicle segments
Source: SIAM, CRISIL Research
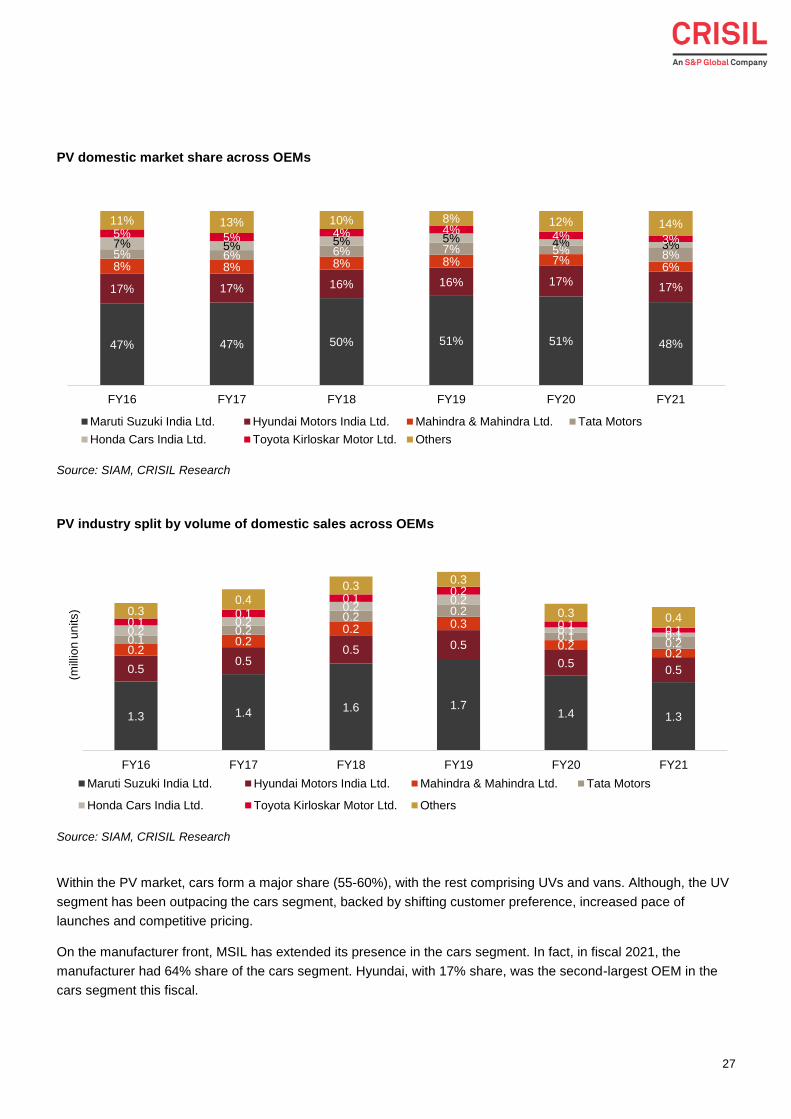
Competitive landscape
MSIL dominates the market, with 48% share of fiscal 2021 domestic sales. Hyundai is a distant second, at 17%.
While Mahindra & Mahindra and Tata Motors together comprise another 14% to the domestic market, recent
entrants such as Kia and MG have also grabbed significant shares, supported by competitively-priced feature-rich
models. Within the ‘Others’ pie, MG has cornered ~2% of the domestic PV market in a mere two years, and Kia a
sizeable 6% share.
To be sure, new launches have helped OEMs expand their market presence. The launch of Vitara Brezza helped
MSIL further its dominance in fiscals 2019 and 2020. Creta and Venue increased Hyundai’s share in fiscals 2020
and 2021.
0.4 0.4 0.3 0.3 0.3 0.2
2.2 2.4 2.4 2.41.9
1.6
0.70.9 1.1 1.1
1.1
1.1
0.20.2
0.2 0.2
0.1
0.1
FY16 FY17 FY18 FY19 FY20 FY21
imill
ion u
nits)
Large cars Small cars UVs Vans
5.2% CAGR -12% CAGR
27
PV domestic market share across OEMs
Source: SIAM, CRISIL Research
PV industry split by volume of domestic sales across OEMs
Source: SIAM, CRISIL Research
Within the PV market, cars form a major share (55-60%), with the rest comprising UVs and vans. Although, the UV
segment has been outpacing the cars segment, backed by shifting customer preference, increased pace of
launches and competitive pricing.
On the manufacturer front, MSIL has extended its presence in the cars segment. In fact, in fiscal 2021, the
manufacturer had 64% share of the cars segment. Hyundai, with 17% share, was the second-largest OEM in the
cars segment this fiscal.
47% 47% 50% 51% 51% 48%
17% 17% 16% 16% 17%17%
8% 8% 8% 8% 7%6%
5% 6% 6% 7% 5% 8%7% 5% 5% 5% 4% 3%5% 5% 4% 4%
4% 3%
11% 13% 10% 8% 12% 14%
FY16 FY17 FY18 FY19 FY20 FY21
Maruti Suzuki India Ltd. Hyundai Motors India Ltd. Mahindra & Mahindra Ltd. Tata Motors
Honda Cars India Ltd. Toyota Kirloskar Motor Ltd. Others
1.3 1.4 1.6 1.71.4 1.3
0.50.5
0.5 0.5
0.50.5
0.20.2
0.2 0.3
0.20.2
0.10.2
0.20.2
0.10.2
0.20.2
0.20.2
0.1 0.10.1
0.1
0.10.2
0.10.1
0.30.4
0.30.3
0.3 0.4
FY16 FY17 FY18 FY19 FY20 FY21
(mill
ion
un
its)
Maruti Suzuki India Ltd. Hyundai Motors India Ltd. Mahindra & Mahindra Ltd. Tata Motors
Honda Cars India Ltd. Toyota Kirloskar Motor Ltd. Others
28
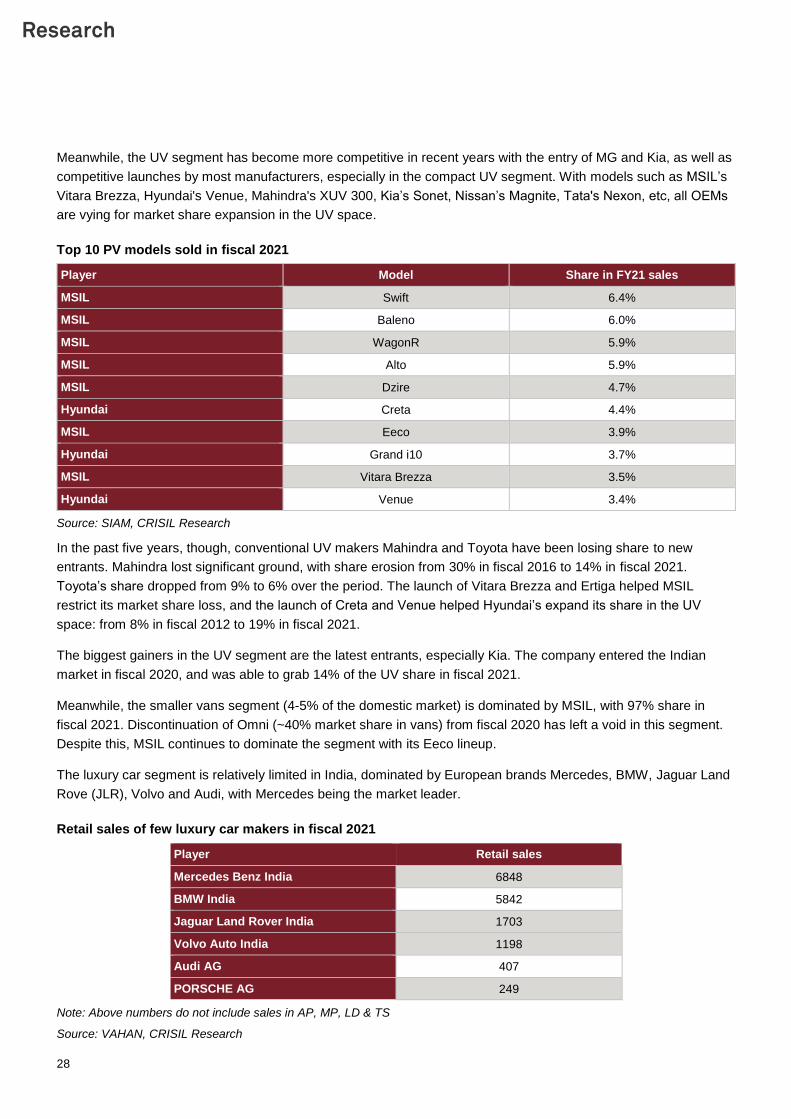
Meanwhile, the UV segment has become more competitive in recent years with the entry of MG and Kia, as well as
competitive launches by most manufacturers, especially in the compact UV segment. With models such as MSIL’s
Vitara Brezza, Hyundai's Venue, Mahindra's XUV 300, Kia’s Sonet, Nissan’s Magnite, Tata's Nexon, etc, all OEMs
are vying for market share expansion in the UV space.
Top 10 PV models sold in fiscal 2021
Player Model Share in FY21 sales
MSIL Swift 6.4%
MSIL Baleno 6.0%
MSIL WagonR 5.9%
MSIL Alto 5.9%
MSIL Dzire 4.7%
Hyundai Creta 4.4%
MSIL Eeco 3.9%
Hyundai Grand i10 3.7%
MSIL Vitara Brezza 3.5%
Hyundai Venue 3.4%
Source: SIAM, CRISIL Research
In the past five years, though, conventional UV makers Mahindra and Toyota have been losing share to new
entrants. Mahindra lost significant ground, with share erosion from 30% in fiscal 2016 to 14% in fiscal 2021.
Toyota’s share dropped from 9% to 6% over the period. The launch of Vitara Brezza and Ertiga helped MSIL
restrict its market share loss, and the launch of Creta and Venue helped Hyundai’s expand its share in the UV
space: from 8% in fiscal 2012 to 19% in fiscal 2021.
The biggest gainers in the UV segment are the latest entrants, especially Kia. The company entered the Indian
market in fiscal 2020, and was able to grab 14% of the UV share in fiscal 2021.
Meanwhile, the smaller vans segment (4-5% of the domestic market) is dominated by MSIL, with 97% share in
fiscal 2021. Discontinuation of Omni (~40% market share in vans) from fiscal 2020 has left a void in this segment.
Despite this, MSIL continues to dominate the segment with its Eeco lineup.
The luxury car segment is relatively limited in India, dominated by European brands Mercedes, BMW, Jaguar Land
Rove (JLR), Volvo and Audi, with Mercedes being the market leader.
Retail sales of few luxury car makers in fiscal 2021
Player Retail sales
Mercedes Benz India 6848
BMW India 5842
Jaguar Land Rover India 1703
Volvo Auto India 1198
Audi AG 407
PORSCHE AG 249
Note: Above numbers do not include sales in AP, MP, LD & TS
Source: VAHAN, CRISIL Research
29
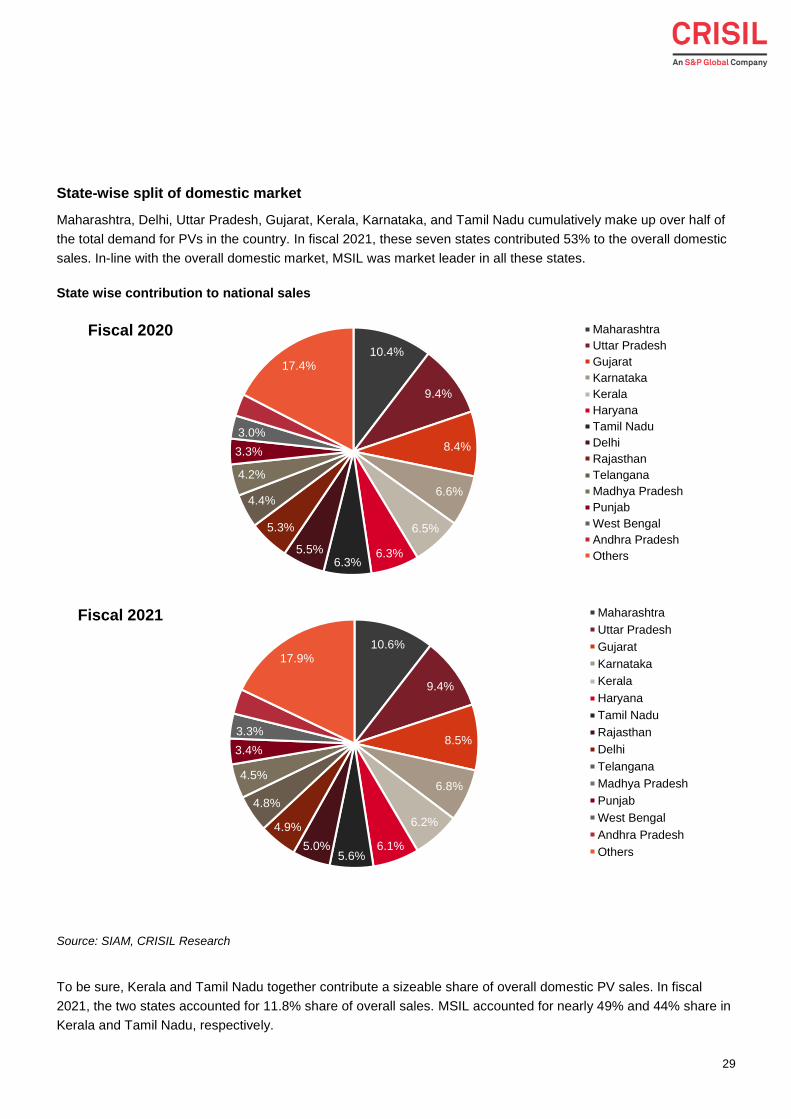
State-wise split of domestic market
Maharashtra, Delhi, Uttar Pradesh, Gujarat, Kerala, Karnataka, and Tamil Nadu cumulatively make up over half of
the total demand for PVs in the country. In fiscal 2021, these seven states contributed 53% to the overall domestic
sales. In-line with the overall domestic market, MSIL was market leader in all these states.
State wise contribution to national sales
Source: SIAM, CRISIL Research
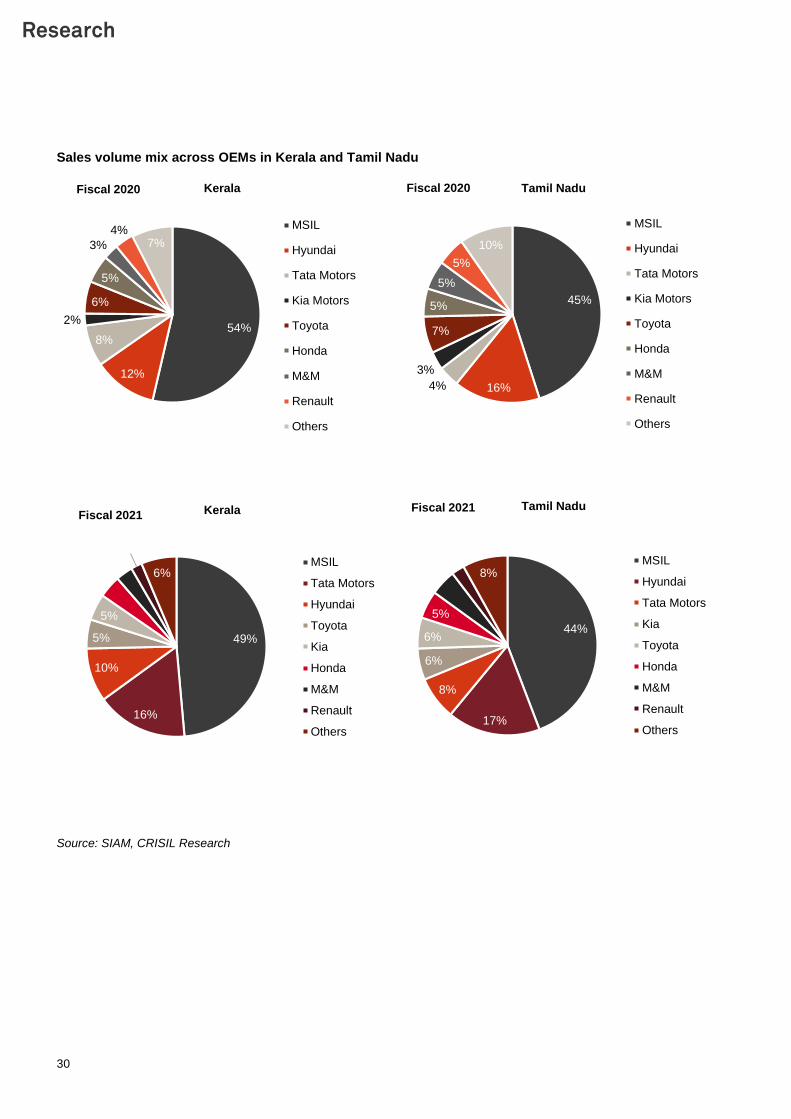
To be sure, Kerala and Tamil Nadu together contribute a sizeable share of overall domestic PV sales. In fiscal
2021, the two states accounted for 11.8% share of overall sales. MSIL accounted for nearly 49% and 44% share in
Kerala and Tamil Nadu, respectively.
10.4%
9.4%
8.4%
6.6%
6.5%
6.3%6.3%
5.5%
5.3%
4.4%
4.2%
3.3%
3.0%
2.9%
17.4%
Fiscal 2020 Maharashtra
Uttar Pradesh
Gujarat
Karnataka
Kerala
Haryana
Tamil Nadu
Delhi
Rajasthan
Telangana
Madhya Pradesh
Punjab
West Bengal
Andhra Pradesh
Others
10.6%
9.4%
8.5%
6.8%
6.2%
6.1%5.6%
5.0%
4.9%
4.8%
4.5%
3.4%
3.3%
3.2%
17.9%
Fiscal 2021 Maharashtra
Uttar Pradesh
Gujarat
Karnataka
Kerala
Haryana
Tamil Nadu
Rajasthan
Delhi
Telangana
Madhya Pradesh
Punjab
West Bengal
Andhra Pradesh
Others
30
Sales volume mix across OEMs in Kerala and Tamil Nadu
Source: SIAM, CRISIL Research
54%
12%
8%
2%
6%
5%
3%
4%7%
Kerala
MSIL
Hyundai
Tata Motors
Kia Motors
Toyota
Honda
M&M
Renault
Others
Fiscal 2020
45%
16%4%
3%
7%
5%
5%
5%
10%
Tamil Nadu
MSIL
Hyundai
Tata Motors
Kia Motors
Toyota
Honda
M&M
Renault
Others
Fiscal 2020
49%
16%
10%
5%
5%
4%
3%2%
6%
Kerala
MSIL
Tata Motors
Hyundai
Toyota
Kia
Honda
M&M
Renault
Others
Fiscal 2021
44%
17%
8%
6%
6%
5%
5%
2%
8%
Tamil Nadu
MSIL
Hyundai
Tata Motors
Kia
Toyota
Honda
M&M
Renault
Others
Fiscal 2021
31
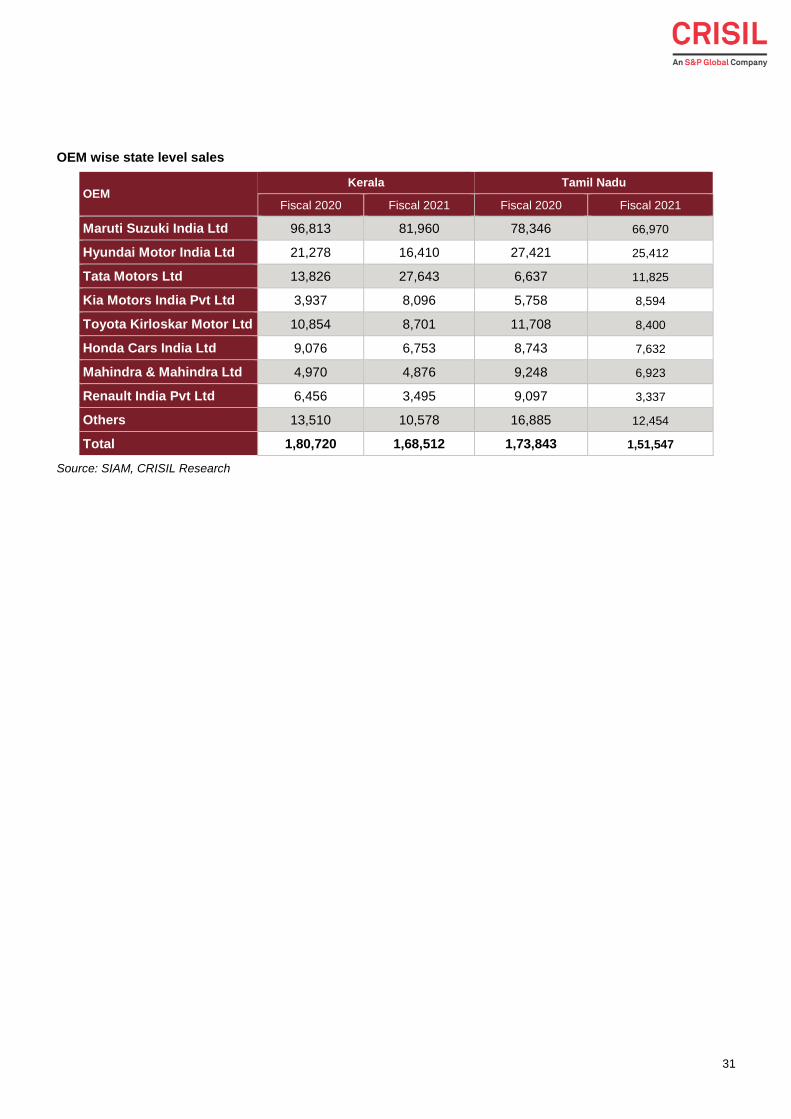
OEM wise state level sales
OEM Kerala Tamil Nadu
Fiscal 2020 Fiscal 2021 Fiscal 2020 Fiscal 2021
Maruti Suzuki India Ltd 96,813 81,960 78,346 66,970
Hyundai Motor India Ltd 21,278 16,410 27,421 25,412
Tata Motors Ltd 13,826 27,643 6,637 11,825
Kia Motors India Pvt Ltd 3,937 8,096 5,758 8,594
Toyota Kirloskar Motor Ltd 10,854 8,701 11,708 8,400
Honda Cars India Ltd 9,076 6,753 8,743 7,632
Mahindra & Mahindra Ltd 4,970 4,876 9,248 6,923
Renault India Pvt Ltd 6,456 3,495 9,097 3,337
Others 13,510 10,578 16,885 12,454
Total 1,80,720 1,68,512 1,73,843 1,51,547
Source: SIAM, CRISIL Research
32
Key regulations / developments affecting PV industry
Demonetisation
Demonetisation had little impact on PV sales because dealers resorted to alternate sources to accepting payment,
such as cheques, cards, and e-wallets for purchasing vehicles. However, due to overall negative economic
sentiment, the industry posted flat growth in November and December 2016.
Implementation of GST
Economic disruption caused by implementation of GST impacted the industry in the short run. However, the impact
on the PV segment was limited as GST rates of major car segments is comparable with the previous tax regime.
However, increased cess impacted luxury cars prices.
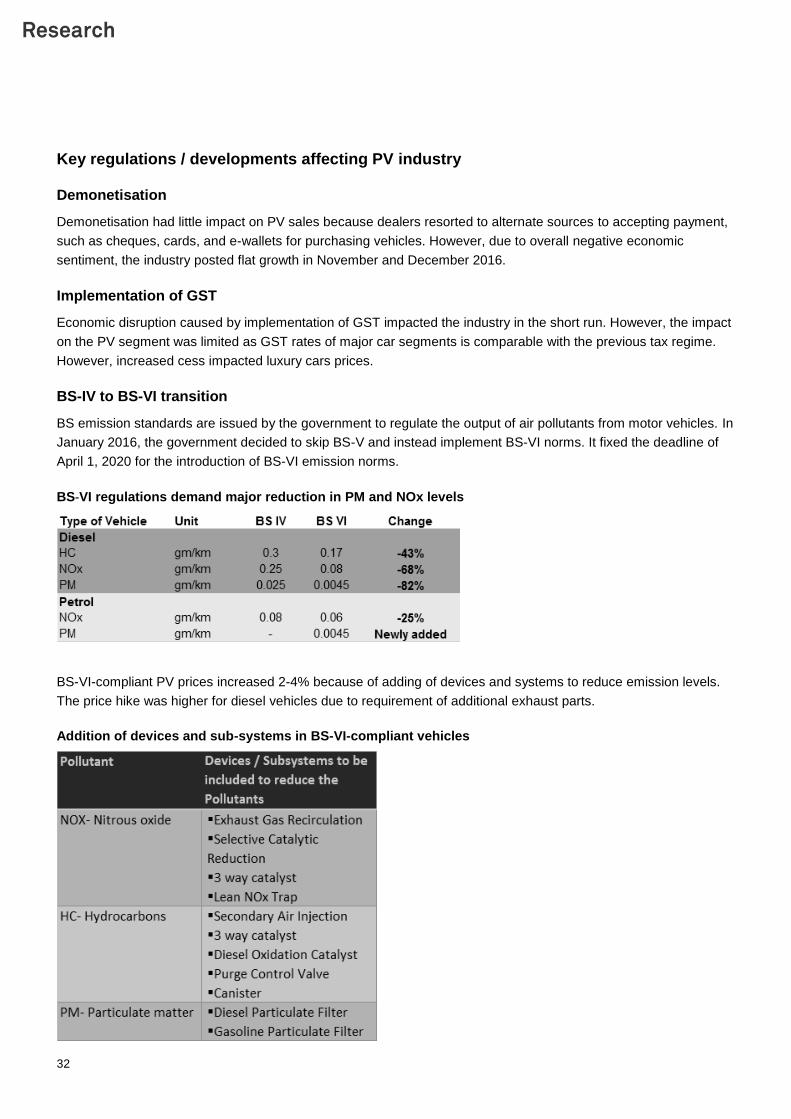
BS-IV to BS-VI transition
BS emission standards are issued by the government to regulate the output of air pollutants from motor vehicles. In
January 2016, the government decided to skip BS-V and instead implement BS-VI norms. It fixed the deadline of
April 1, 2020 for the introduction of BS-VI emission norms.
BS-VI regulations demand major reduction in PM and NOx levels
BS-VI-compliant PV prices increased 2-4% because of adding of devices and systems to reduce emission levels.
The price hike was higher for diesel vehicles due to requirement of additional exhaust parts.
Addition of devices and sub-systems in BS-VI-compliant vehicles
33
Safety norms
As per the Bharat New Vehicle Safety Assessment Programme, introduced from October 2017, new cars sold in
India need to go through mandatory crash testing, and need to comply with voluntary star ratings based on the
results.
The car testing protocols are:
Frontal offset testing (64 kmph proposed)
Side impact testing
Pedestrian protection testing
Rear impact testing
While full frontal crash test is already implemented for new car models and LMV of GVW <1,500 kg, the test was
implemented for all car models from October 1, 2019. As per the rules, a car has to go through tests pertaining to
full frontal crash test, 40% overall offset frontal crash test, and test of moving deformable barrier crash
perpendicular into a stationary vehicle. A test pertaining to pedestrian impact on the hood of a vehicle was
implemented from October 1, 2018 for new car models. Points are awarded to a car based on the safety features,
such as ABS, seat-belt reminders, child lock, and electronic stability control (ESC). A note: the government is
considering making ESC and autonomous emergency braking (AEB) mandatory on all models from fiscal 2023.
Other safety systems include mandatory air bag for the driver. The government has proposed mandatory airbags
for front passengers in all cars. For new models, the front passenger airbag was made mandatory from April 1,
2021, while for models currently sold in the market, it was mandatory from June 1, 2021.
Some other safety measures are:
Seat-belt reminders
Alert systems for speeds beyond 80 kmph
Reverse parking alerts
Manual override over central locking system for emergencies
MEIS replaced by RoDTEP
The central government discontinued the Merchandise Exports from India Scheme (MEIS) from January 1, 2021,
as it was not compliant with World Trade Organization norms. Exporters will then be reimbursed duty paid on inputs
through the new Remission of Duties or Taxes on Export Products (RoDTEP) scheme, the rates for which are
being formulated.
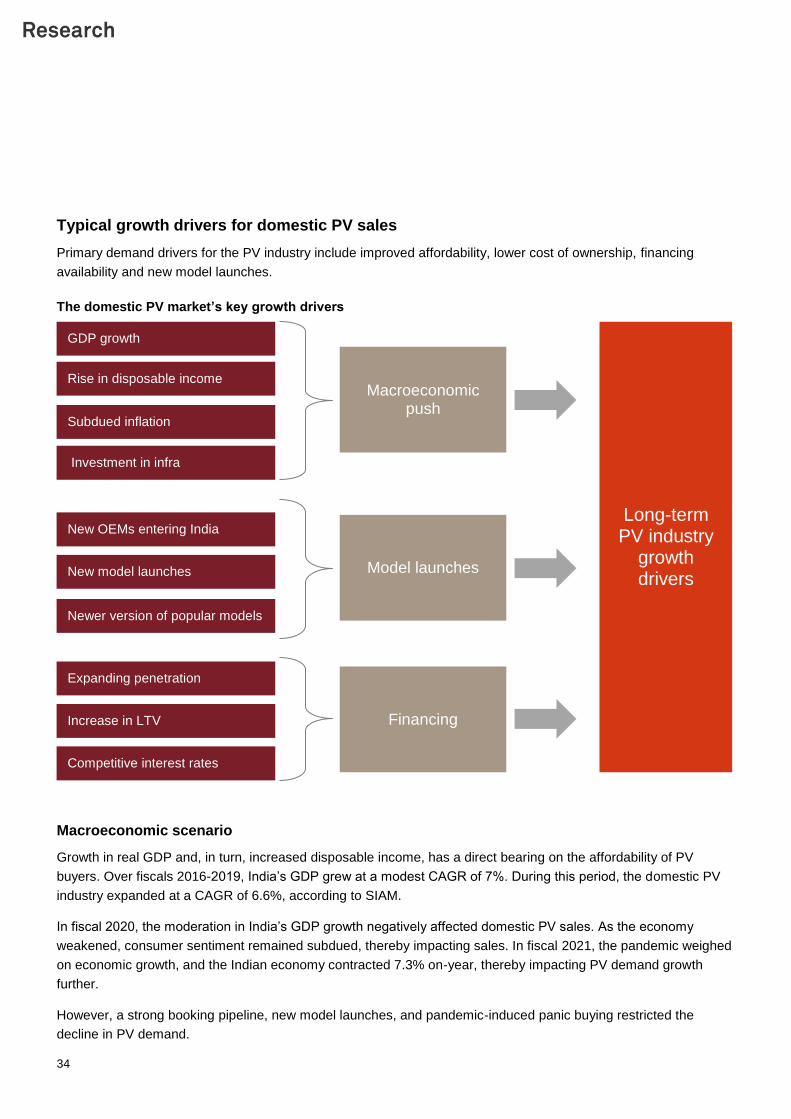
34
Typical growth drivers for domestic PV sales
Primary demand drivers for the PV industry include improved affordability, lower cost of ownership, financing
availability and new model launches.
The domestic PV market’s key growth drivers
Macroeconomic scenario
Growth in real GDP and, in turn, increased disposable income, has a direct bearing on the affordability of PV
buyers. Over fiscals 2016-2019, India’s GDP grew at a modest CAGR of 7%. During this period, the domestic PV
industry expanded at a CAGR of 6.6%, according to SIAM.
In fiscal 2020, the moderation in India’s GDP growth negatively affected domestic PV sales. As the economy
weakened, consumer sentiment remained subdued, thereby impacting sales. In fiscal 2021, the pandemic weighed
on economic growth, and the Indian economy contracted 7.3% on-year, thereby impacting PV demand growth
further.
However, a strong booking pipeline, new model launches, and pandemic-induced panic buying restricted the
decline in PV demand.
GDP growth
Rise in disposable income
Subdued inflation
New OEMs entering India
New model launches
Newer version of popular models
Expanding penetration
Competitive interest rates
Increase in LTV
Macroeconomic push
Model launches
Financing
Long-term PV industry
growth drivers
Investment in infra
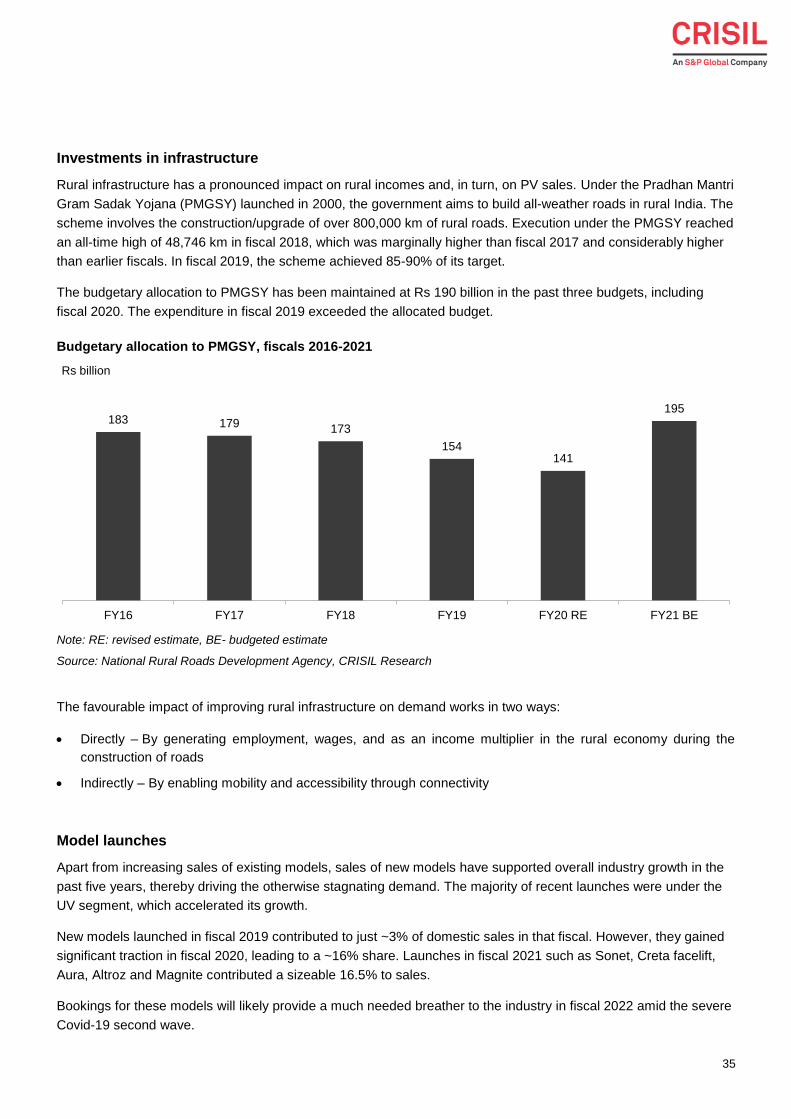
35
Investments in infrastructure
Rural infrastructure has a pronounced impact on rural incomes and, in turn, on PV sales. Under the Pradhan Mantri
Gram Sadak Yojana (PMGSY) launched in 2000, the government aims to build all-weather roads in rural India. The
scheme involves the construction/upgrade of over 800,000 km of rural roads. Execution under the PMGSY reached
an all-time high of 48,746 km in fiscal 2018, which was marginally higher than fiscal 2017 and considerably higher
than earlier fiscals. In fiscal 2019, the scheme achieved 85-90% of its target.
The budgetary allocation to PMGSY has been maintained at Rs 190 billion in the past three budgets, including
fiscal 2020. The expenditure in fiscal 2019 exceeded the allocated budget.
Budgetary allocation to PMGSY, fiscals 2016-2021
Note: RE: revised estimate, BE- budgeted estimate
Source: National Rural Roads Development Agency, CRISIL Research
The favourable impact of improving rural infrastructure on demand works in two ways:
Directly – By generating employment, wages, and as an income multiplier in the rural economy during the
construction of roads
Indirectly – By enabling mobility and accessibility through connectivity
Model launches
Apart from increasing sales of existing models, sales of new models have supported overall industry growth in the
past five years, thereby driving the otherwise stagnating demand. The majority of recent launches were under the
UV segment, which accelerated its growth.
New models launched in fiscal 2019 contributed to just ~3% of domestic sales in that fiscal. However, they gained
significant traction in fiscal 2020, leading to a ~16% share. Launches in fiscal 2021 such as Sonet, Creta facelift,
Aura, Altroz and Magnite contributed a sizeable 16.5% to sales.
Bookings for these models will likely provide a much needed breather to the industry in fiscal 2022 amid the severe
Covid-19 second wave.
183 179 173
154141
195
FY16 FY17 FY18 FY19 FY20 RE FY21 BE
Rs billion
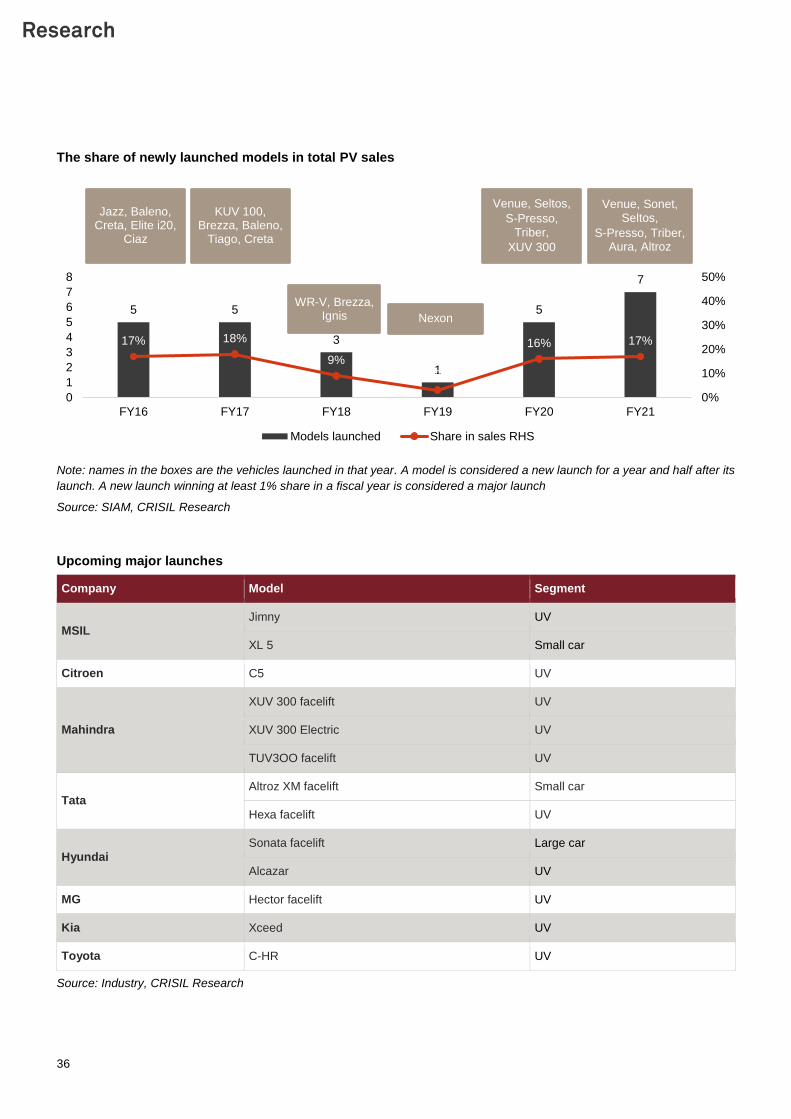
36
The share of newly launched models in total PV sales
Note: names in the boxes are the vehicles launched in that year. A model is considered a new launch for a year and half after its
launch. A new launch winning at least 1% share in a fiscal year is considered a major launch
Source: SIAM, CRISIL Research
Upcoming major launches
Company Model Segment
MSIL
Jimny UV
XL 5 Small car
Citroen C5 UV
Mahindra
XUV 300 facelift UV
XUV 300 Electric UV
TUV3OO facelift UV
Tata
Altroz XM facelift Small car
Hexa facelift UV
Hyundai
Sonata facelift Large car
Alcazar UV
MG Hector facelift UV
Kia Xceed UV
Toyota C-HR UV
Source: Industry, CRISIL Research
5 5
3
1
5
7
17% 18%
9%
3%
16% 17%
0%
10%
20%
30%
40%
50%
0
1
2
3
4
5
6
7
8
FY16 FY17 FY18 FY19 FY20 FY21
Models launched Share in sales RHS
Jazz, Baleno, Creta, Elite i20,
Ciaz
KUV 100, Brezza, Baleno,
Tiago, Creta
Venue, Sonet, Seltos,
S-Presso, Triber, Aura, Altroz
WR-V, Brezza, Ignis Nexon
Venue, Seltos,
S-Presso,
Triber,
XUV 300
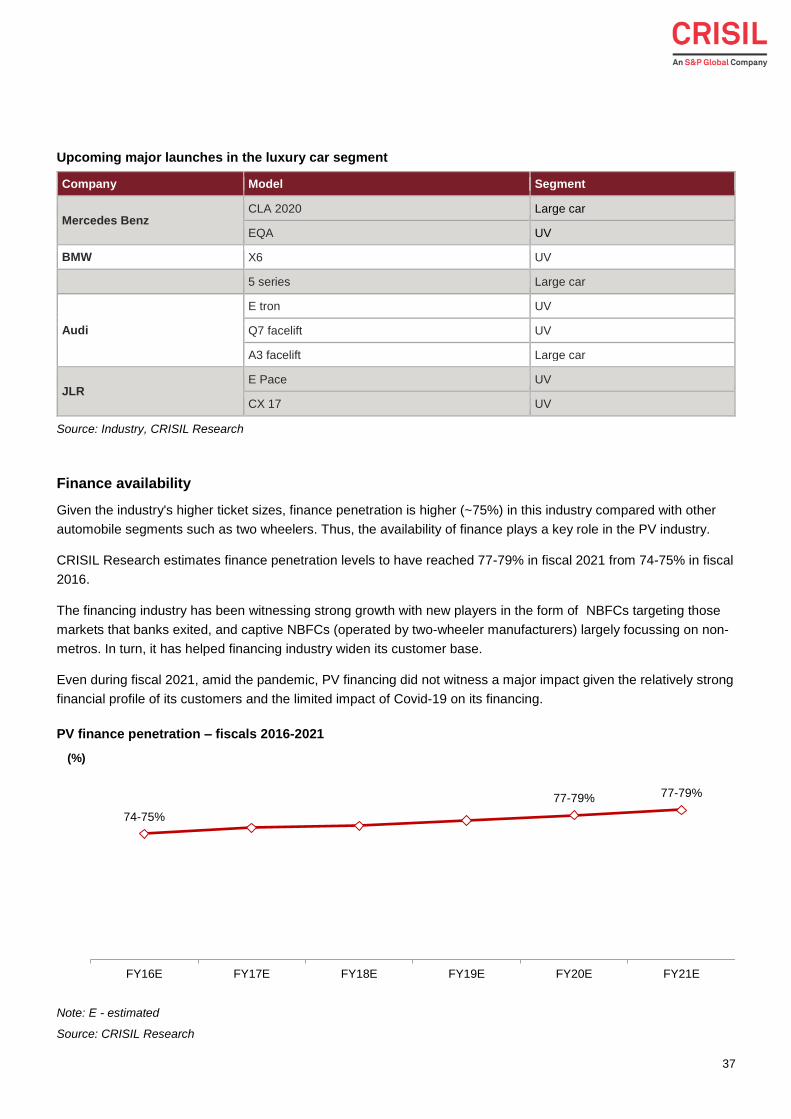
37
Upcoming major launches in the luxury car segment
Company Model Segment
Mercedes Benz CLA 2020 Large car
EQA UV
BMW X6 UV
5 series Large car
Audi
E tron UV
Q7 facelift UV
A3 facelift Large car
JLR E Pace UV
CX 17 UV
Source: Industry, CRISIL Research
Finance availability
Given the industry's higher ticket sizes, finance penetration is higher (~75%) in this industry compared with other
automobile segments such as two wheelers. Thus, the availability of finance plays a key role in the PV industry.
CRISIL Research estimates finance penetration levels to have reached 77-79% in fiscal 2021 from 74-75% in fiscal
2016.
The financing industry has been witnessing strong growth with new players in the form of NBFCs targeting those
markets that banks exited, and captive NBFCs (operated by two-wheeler manufacturers) largely focussing on non-
metros. In turn, it has helped financing industry widen its customer base.
Even during fiscal 2021, amid the pandemic, PV financing did not witness a major impact given the relatively strong
financial profile of its customers and the limited impact of Covid-19 on its financing.
PV finance penetration – fiscals 2016-2021
Note: E - estimated
Source: CRISIL Research
74-75%
77-79% 77-79%
FY16E FY17E FY18E FY19E FY20E FY21E
(%)
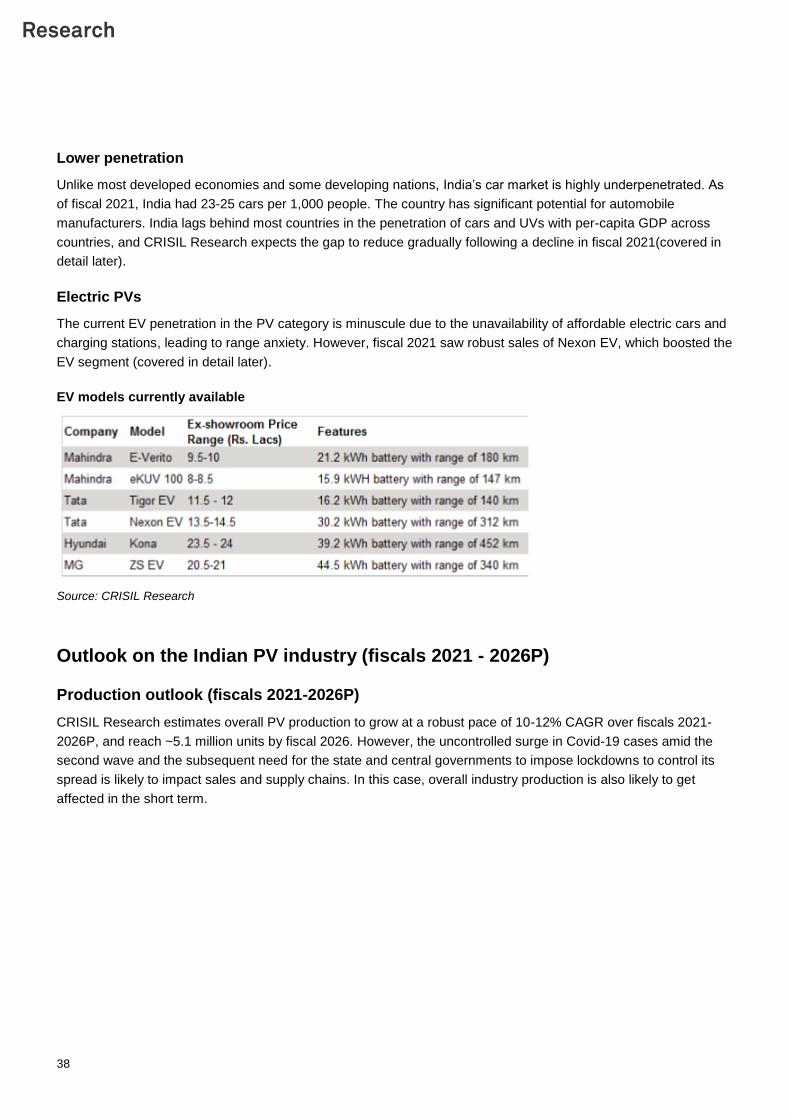
38
Lower penetration
Unlike most developed economies and some developing nations, India’s car market is highly underpenetrated. As
of fiscal 2021, India had 23-25 cars per 1,000 people. The country has significant potential for automobile
manufacturers. India lags behind most countries in the penetration of cars and UVs with per-capita GDP across
countries, and CRISIL Research expects the gap to reduce gradually following a decline in fiscal 2021(covered in
detail later).
Electric PVs
The current EV penetration in the PV category is minuscule due to the unavailability of affordable electric cars and
charging stations, leading to range anxiety. However, fiscal 2021 saw robust sales of Nexon EV, which boosted the
EV segment (covered in detail later).
EV models currently available
Source: CRISIL Research
Outlook on the Indian PV industry (fiscals 2021 - 2026P)
Production outlook (fiscals 2021-2026P)
CRISIL Research estimates overall PV production to grow at a robust pace of 10-12% CAGR over fiscals 2021-
2026P, and reach ~5.1 million units by fiscal 2026. However, the uncontrolled surge in Covid-19 cases amid the
second wave and the subsequent need for the state and central governments to impose lockdowns to control its
spread is likely to impact sales and supply chains. In this case, overall industry production is also likely to get
affected in the short term.
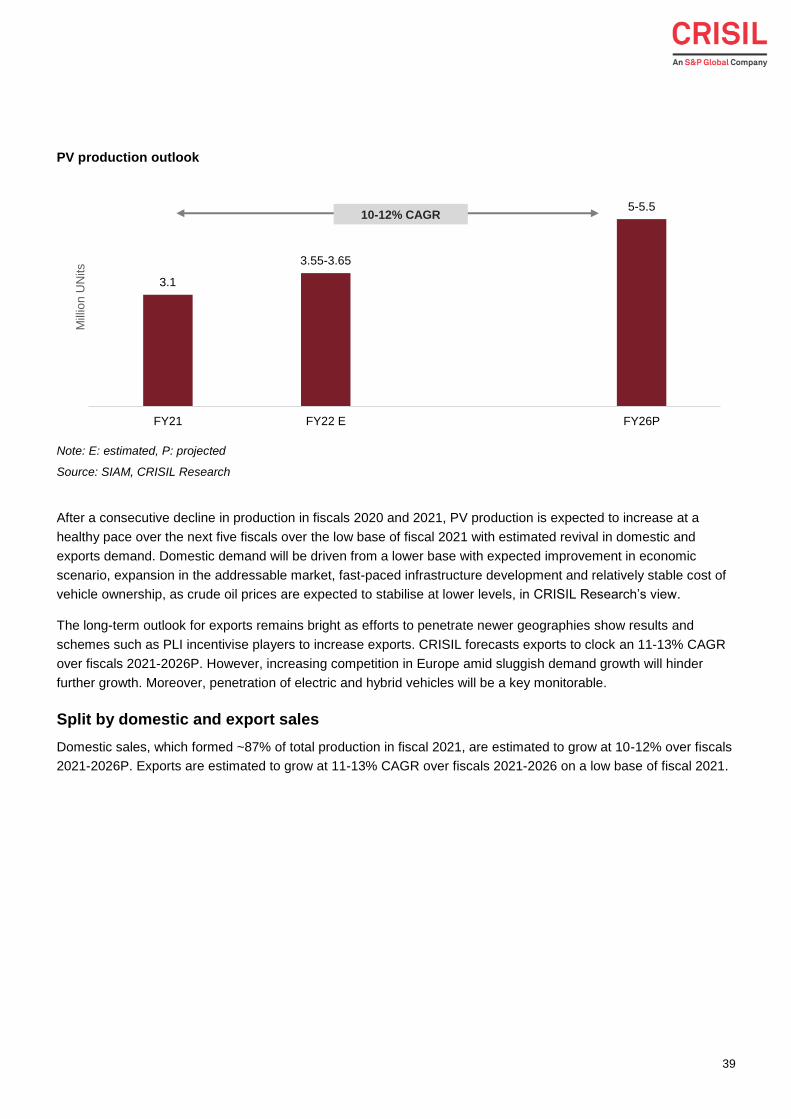
39
PV production outlook
Note: E: estimated, P: projected
Source: SIAM, CRISIL Research
After a consecutive decline in production in fiscals 2020 and 2021, PV production is expected to increase at a
healthy pace over the next five fiscals over the low base of fiscal 2021 with estimated revival in domestic and
exports demand. Domestic demand will be driven from a lower base with expected improvement in economic
scenario, expansion in the addressable market, fast-paced infrastructure development and relatively stable cost of
vehicle ownership, as crude oil prices are expected to stabilise at lower levels, in CRISIL Research’s view.
The long-term outlook for exports remains bright as efforts to penetrate newer geographies show results and
schemes such as PLI incentivise players to increase exports. CRISIL forecasts exports to clock an 11-13% CAGR
over fiscals 2021-2026P. However, increasing competition in Europe amid sluggish demand growth will hinder
further growth. Moreover, penetration of electric and hybrid vehicles will be a key monitorable.
Split by domestic and export sales
Domestic sales, which formed ~87% of total production in fiscal 2021, are estimated to grow at 10-12% over fiscals
2021-2026P. Exports are estimated to grow at 11-13% CAGR over fiscals 2021-2026 on a low base of fiscal 2021.
3.1
3.55-3.65
5-5.5
FY21 FY22 E FY26P
Mill
ion
UN
its
10-12% CAGR
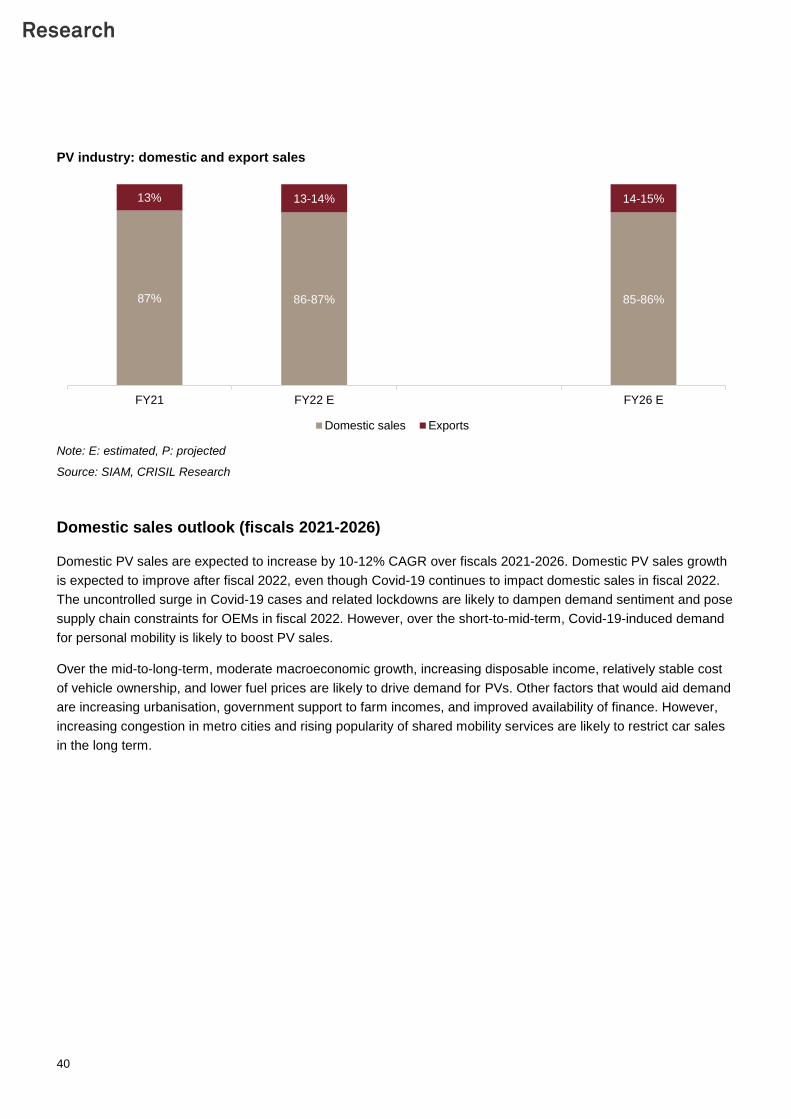
40
PV industry: domestic and export sales
Note: E: estimated, P: projected
Source: SIAM, CRISIL Research
Domestic sales outlook (fiscals 2021-2026)
Domestic PV sales are expected to increase by 10-12% CAGR over fiscals 2021-2026. Domestic PV sales growth
is expected to improve after fiscal 2022, even though Covid-19 continues to impact domestic sales in fiscal 2022.
The uncontrolled surge in Covid-19 cases and related lockdowns are likely to dampen demand sentiment and pose
supply chain constraints for OEMs in fiscal 2022. However, over the short-to-mid-term, Covid-19-induced demand
for personal mobility is likely to boost PV sales.
Over the mid-to-long-term, moderate macroeconomic growth, increasing disposable income, relatively stable cost
of vehicle ownership, and lower fuel prices are likely to drive demand for PVs. Other factors that would aid demand
are increasing urbanisation, government support to farm incomes, and improved availability of finance. However,
increasing congestion in metro cities and rising popularity of shared mobility services are likely to restrict car sales
in the long term.
87% 86-87% 85-86%
13% 13-14% 14-15%
FY21 FY22 E FY26 E
Domestic sales Exports
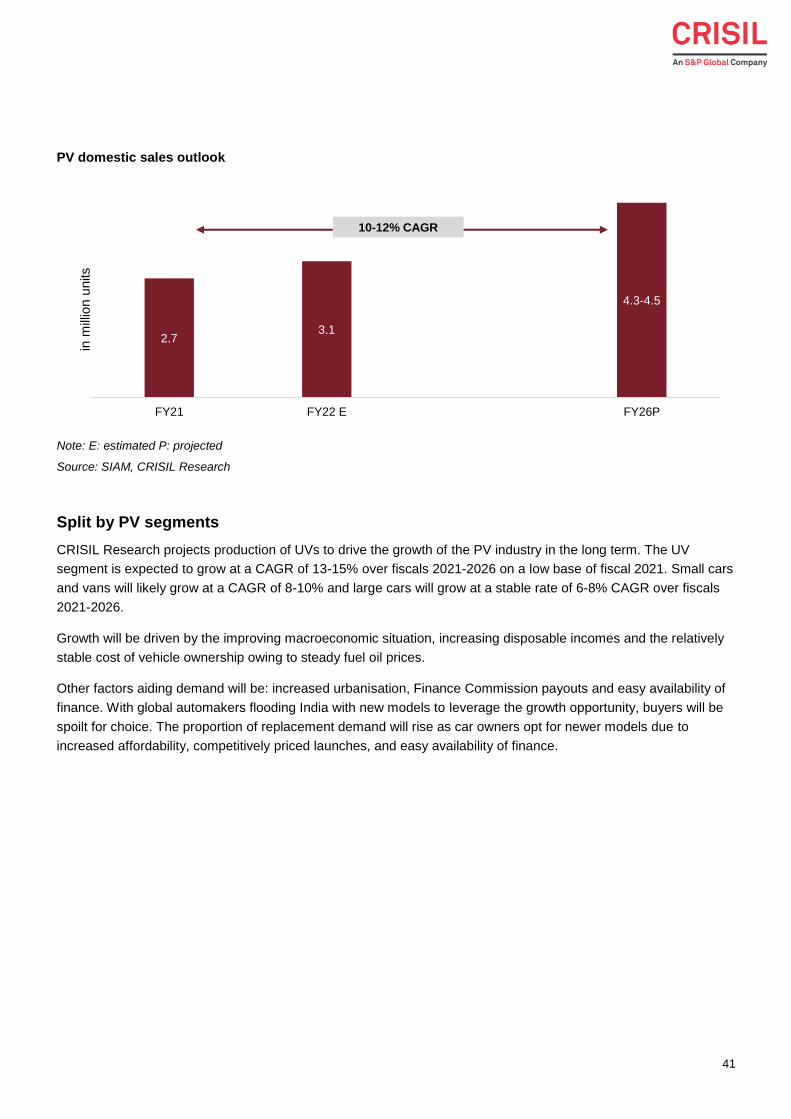
41
PV domestic sales outlook
Note: E: estimated P: projected
Source: SIAM, CRISIL Research
Split by PV segments
CRISIL Research projects production of UVs to drive the growth of the PV industry in the long term. The UV
segment is expected to grow at a CAGR of 13-15% over fiscals 2021-2026 on a low base of fiscal 2021. Small cars
and vans will likely grow at a CAGR of 8-10% and large cars will grow at a stable rate of 6-8% CAGR over fiscals
2021-2026.
Growth will be driven by the improving macroeconomic situation, increasing disposable incomes and the relatively
stable cost of vehicle ownership owing to steady fuel oil prices.
Other factors aiding demand will be: increased urbanisation, Finance Commission payouts and easy availability of
finance. With global automakers flooding India with new models to leverage the growth opportunity, buyers will be
spoilt for choice. The proportion of replacement demand will rise as car owners opt for newer models due to
increased affordability, competitively priced launches, and easy availability of finance.
2.73.1
4.3-4.5
FY21 FY22 E FY26P
in m
illio
n u
nits
10-12% CAGR
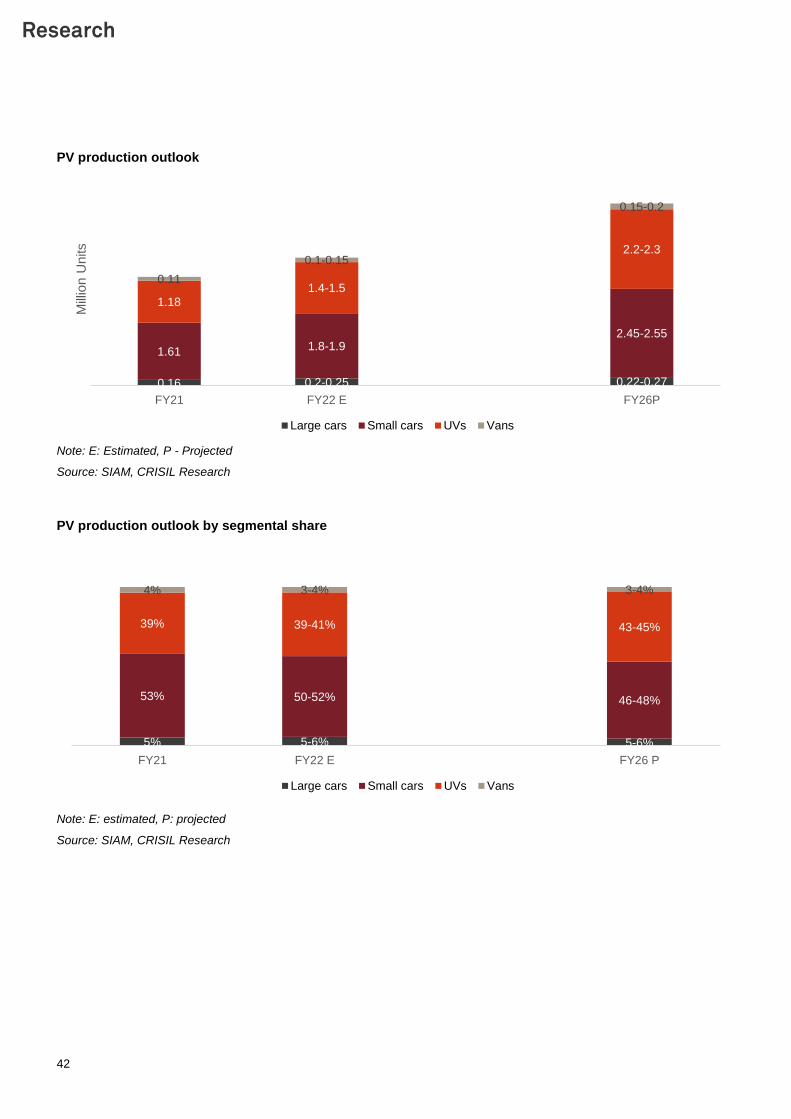
42
PV production outlook
Note: E: Estimated, P - Projected
Source: SIAM, CRISIL Research
PV production outlook by segmental share
Note: E: estimated, P: projected
Source: SIAM, CRISIL Research
0.16 0.2-0.25 0.22-0.27
1.61 1.8-1.92.45-2.55
1.181.4-1.5
2.2-2.3
0.11
0.1-0.15
0.15-0.2
FY21 FY22 E FY26P
Mill
ion U
nits
Large cars Small cars UVs Vans
5% 5-6% 5-6%
53% 50-52% 46-48%
39% 39-41% 43-45%
4% 3-4% 3-4%
FY21 FY22 E FY26 P
Large cars Small cars UVs Vans
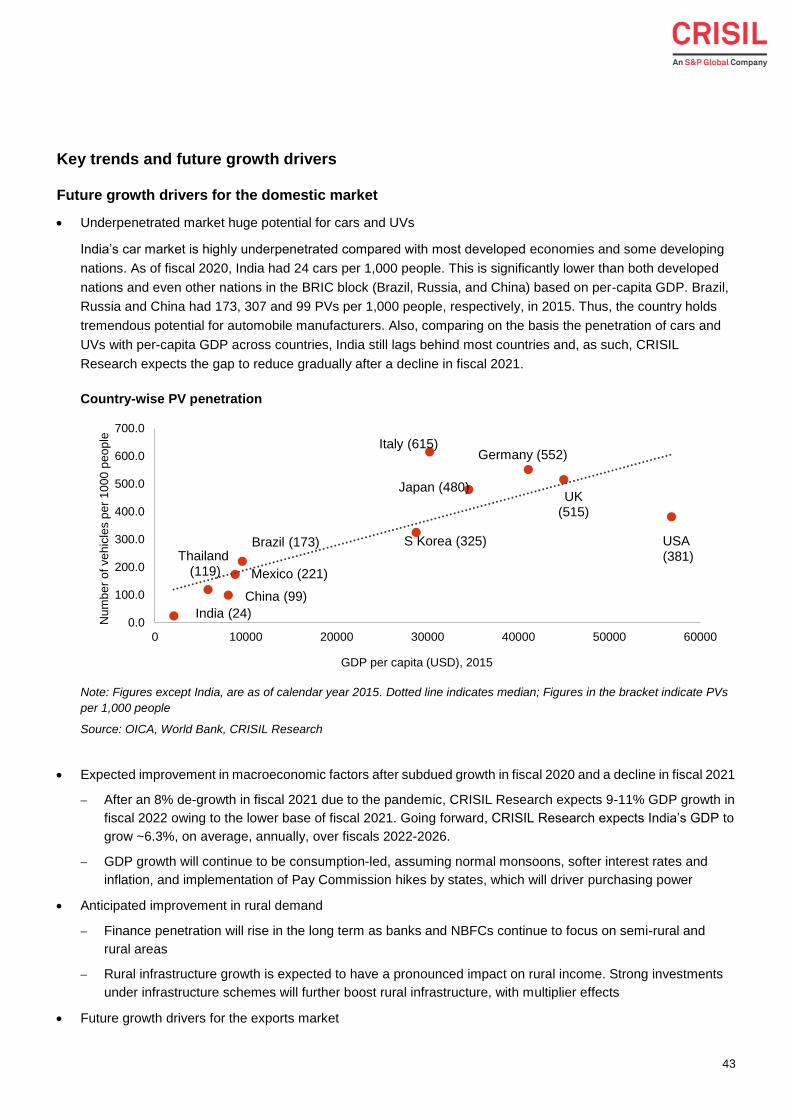
43
Key trends and future growth drivers
Future growth drivers for the domestic market
Underpenetrated market huge potential for cars and UVs
India’s car market is highly underpenetrated compared with most developed economies and some developing
nations. As of fiscal 2020, India had 24 cars per 1,000 people. This is significantly lower than both developed
nations and even other nations in the BRIC block (Brazil, Russia, and China) based on per-capita GDP. Brazil,
Russia and China had 173, 307 and 99 PVs per 1,000 people, respectively, in 2015. Thus, the country holds
tremendous potential for automobile manufacturers. Also, comparing on the basis the penetration of cars and
UVs with per-capita GDP across countries, India still lags behind most countries and, as such, CRISIL
Research expects the gap to reduce gradually after a decline in fiscal 2021.
Country-wise PV penetration
Note: Figures except India, are as of calendar year 2015. Dotted line indicates median; Figures in the bracket indicate PVs
per 1,000 people
Source: OICA, World Bank, CRISIL Research
Expected improvement in macroeconomic factors after subdued growth in fiscal 2020 and a decline in fiscal 2021
‒ After an 8% de-growth in fiscal 2021 due to the pandemic, CRISIL Research expects 9-11% GDP growth in
fiscal 2022 owing to the lower base of fiscal 2021. Going forward, CRISIL Research expects India’s GDP to
grow ~6.3%, on average, annually, over fiscals 2022-2026.
‒ GDP growth will continue to be consumption-led, assuming normal monsoons, softer interest rates and
inflation, and implementation of Pay Commission hikes by states, which will driver purchasing power
Anticipated improvement in rural demand
‒ Finance penetration will rise in the long term as banks and NBFCs continue to focus on semi-rural and
rural areas
‒ Rural infrastructure growth is expected to have a pronounced impact on rural income. Strong investments
under infrastructure schemes will further boost rural infrastructure, with multiplier effects
Future growth drivers for the exports market
0.0
100.0
200.0
300.0
400.0
500.0
600.0
700.0
0 10000 20000 30000 40000 50000 60000
Num
be
r o
f ve
hic
les p
er
10
00
pe
op
le
GDP per capita (USD), 2015
Brazil (173)Thailand
(119)
India (24)
China (99)
Mexico (221)
S Korea (325)
Japan (480)
Italy (615)Germany (552)
UK(515)
USA(381)
44
‒ Capacity expansion by top players
‒ Stable crude oil prices to aid demand from African and Latin American geographies
‒ Continued expansion undertaken by players into newer markets
‒ Production-linked incentive (PLI) scheme likely to boost exports
Enhanced product offering
‒ New models launched by manufacturers
‒ Increase in offerings because of new entrants such as Kia Motors and MG Motors
Cars on subscription
‒ Cars have always been an aspirational purchase for Indian consumers. However, new startup business
models based on ‘cars on subscription’ are gaining traction because of convenience, low upfront costs, and
the involvement of young, dynamic population in the customer base, which prefers an asset-light lifestyle
‒ In the case of a fixed-cost subscription, the consumer pays a periodic sum of money for the use of a
vehicle for the subscribed period. Subscriptions can be for any length of time and can be cancelled at any
point of time. It also allows customers to upgrade or change cars after the subscription period. Associated
costs of the car, such as insurance, taxes, service and maintenance, repairs and roadside assistance, are
borne by subscription providers. This reduces the down-payment burden for consumers, along with the
additional costs associated with car ownership
‒ The subscription-based car ownership increases the affordability of consumers substantially
‒ Subscribing for a vehicle entails a lower initial cost compared with buying a new car, which requires
significant down-payment. Thus, it can have a positive impact on the industry and increase the penetration
of cars in the country
‒ However, as a significant number of customers are first-time car buyers, the aspirational value of
ownership can impair the success of the subscription-based model offering
‒ Currently, retail leasing is still at a nascent stage in India and, thus, remains a key monitorable in the long
term
Impact of regulatory changes on domestic PV sales
Corporate average fuel efficiency (CAFE) norms
The Paris Agreement, effectuated in November 2016, and ratified by India, set the objective of limiting the global
temperature rise this century well below 2 degree Celsius over pre-industrial levels and to pursue efforts to limit the
temperature increase even further to 1.5 degrees Celsius. The greenhouse gases emissions reduction that would
be compatible with this target would require a significant increase in the share of zero or low emission vehicles over
the coming years. These regulations, combined with growing environmental and sustainability consciousness of the
population, will lead to a major transformation of the global auto industry from internal combustion engine to green
mobility technologies (such as hybrid vehicles, BEVs, fuel cell vehicles and alternative-fuel vehicles).
Fuel consumption standards for Indian vehicles came into force in April 2017 in India for petrol, diesel, and liquefied
petroleum gas (LPG) and compressed natural gas (CNG) PVs. These standards are based on the CAFE system
and target to improve fuel consumption of PVs by fiscal 2022. The policy supports a continuous reduction in CO2
emissions through CAFE regulations.
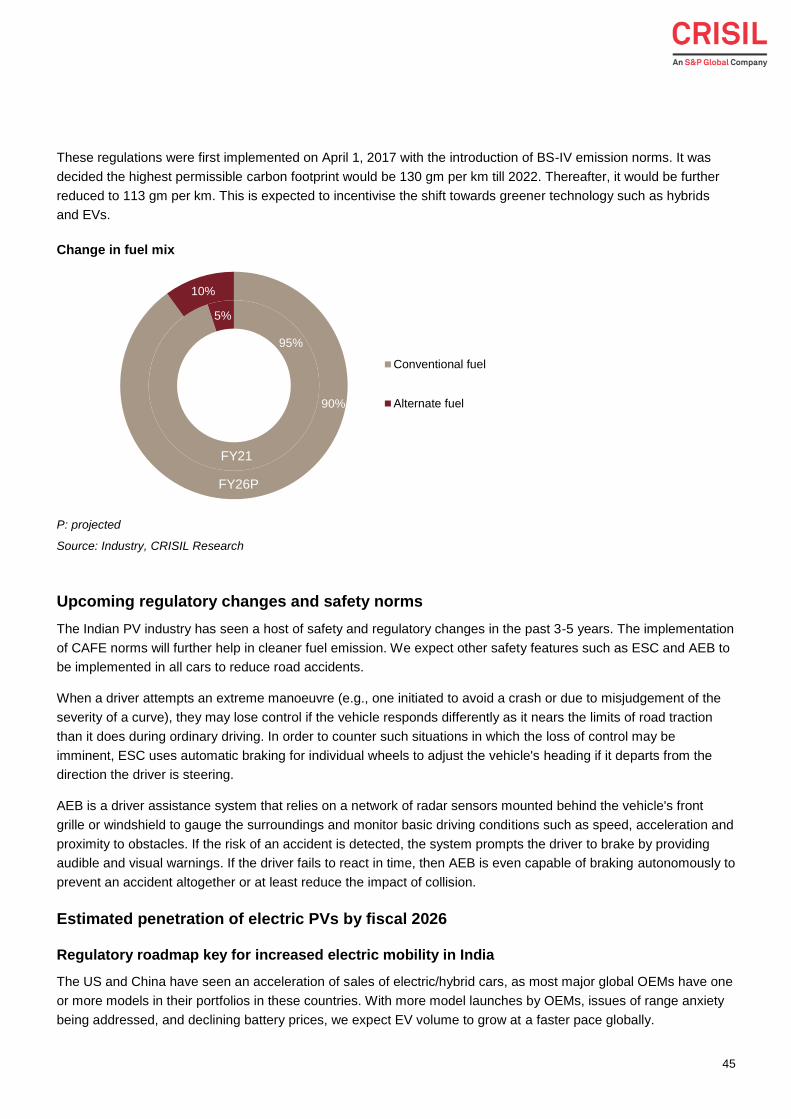
45
These regulations were first implemented on April 1, 2017 with the introduction of BS-IV emission norms. It was
decided the highest permissible carbon footprint would be 130 gm per km till 2022. Thereafter, it would be further
reduced to 113 gm per km. This is expected to incentivise the shift towards greener technology such as hybrids
and EVs.
Change in fuel mix
P: projected
Source: Industry, CRISIL Research
Upcoming regulatory changes and safety norms
The Indian PV industry has seen a host of safety and regulatory changes in the past 3-5 years. The implementation
of CAFE norms will further help in cleaner fuel emission. We expect other safety features such as ESC and AEB to
be implemented in all cars to reduce road accidents.
When a driver attempts an extreme manoeuvre (e.g., one initiated to avoid a crash or due to misjudgement of the
severity of a curve), they may lose control if the vehicle responds differently as it nears the limits of road traction
than it does during ordinary driving. In order to counter such situations in which the loss of control may be
imminent, ESC uses automatic braking for individual wheels to adjust the vehicle's heading if it departs from the
direction the driver is steering.
AEB is a driver assistance system that relies on a network of radar sensors mounted behind the vehicle's front
grille or windshield to gauge the surroundings and monitor basic driving conditions such as speed, acceleration and
proximity to obstacles. If the risk of an accident is detected, the system prompts the driver to brake by providing
audible and visual warnings. If the driver fails to react in time, then AEB is even capable of braking autonomously to
prevent an accident altogether or at least reduce the impact of collision.
Estimated penetration of electric PVs by fiscal 2026
Regulatory roadmap key for increased electric mobility in India
The US and China have seen an acceleration of sales of electric/hybrid cars, as most major global OEMs have one
or more models in their portfolios in these countries. With more model launches by OEMs, issues of range anxiety
being addressed, and declining battery prices, we expect EV volume to grow at a faster pace globally.
95%
5%
90%
10%
Conventional fuel
Alternate fuel
FY21
FY26P
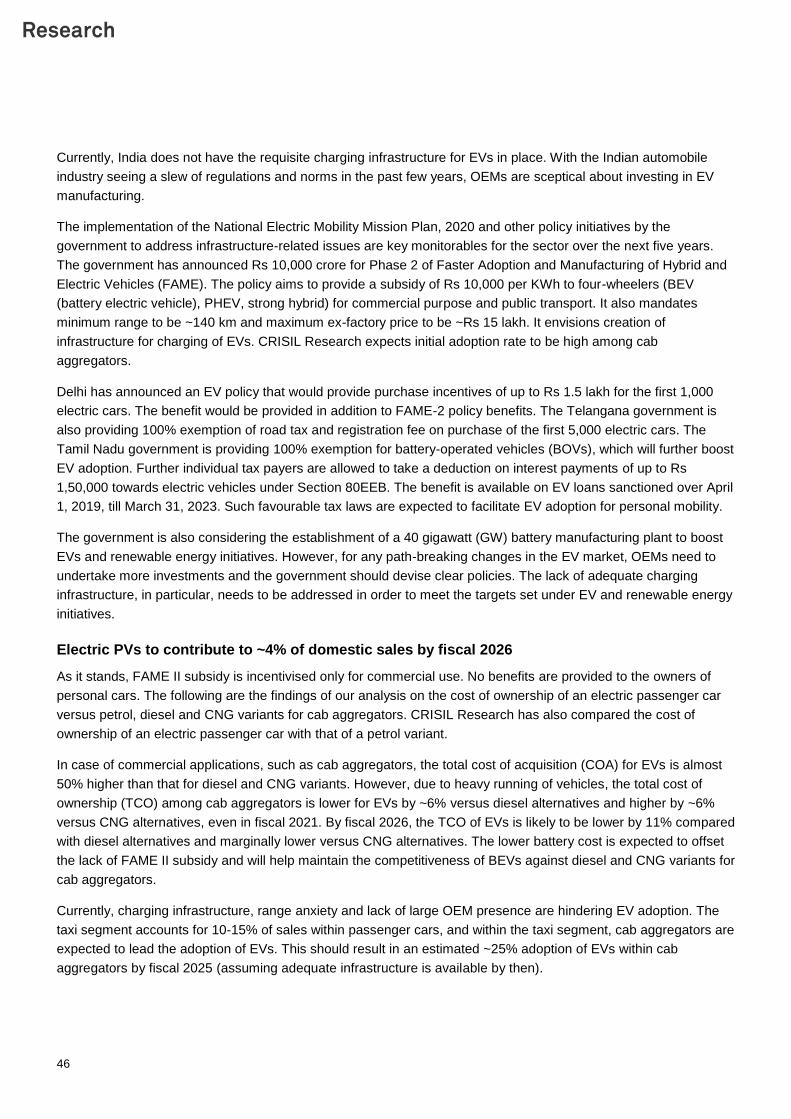
46
Currently, India does not have the requisite charging infrastructure for EVs in place. With the Indian automobile
industry seeing a slew of regulations and norms in the past few years, OEMs are sceptical about investing in EV
manufacturing.
The implementation of the National Electric Mobility Mission Plan, 2020 and other policy initiatives by the
government to address infrastructure-related issues are key monitorables for the sector over the next five years.
The government has announced Rs 10,000 crore for Phase 2 of Faster Adoption and Manufacturing of Hybrid and
Electric Vehicles (FAME). The policy aims to provide a subsidy of Rs 10,000 per KWh to four-wheelers (BEV
(battery electric vehicle), PHEV, strong hybrid) for commercial purpose and public transport. It also mandates
minimum range to be ~140 km and maximum ex-factory price to be ~Rs 15 lakh. It envisions creation of
infrastructure for charging of EVs. CRISIL Research expects initial adoption rate to be high among cab
aggregators.
Delhi has announced an EV policy that would provide purchase incentives of up to Rs 1.5 lakh for the first 1,000
electric cars. The benefit would be provided in addition to FAME-2 policy benefits. The Telangana government is
also providing 100% exemption of road tax and registration fee on purchase of the first 5,000 electric cars. The
Tamil Nadu government is providing 100% exemption for battery-operated vehicles (BOVs), which will further boost
EV adoption. Further individual tax payers are allowed to take a deduction on interest payments of up to Rs
1,50,000 towards electric vehicles under Section 80EEB. The benefit is available on EV loans sanctioned over April
1, 2019, till March 31, 2023. Such favourable tax laws are expected to facilitate EV adoption for personal mobility.
The government is also considering the establishment of a 40 gigawatt (GW) battery manufacturing plant to boost
EVs and renewable energy initiatives. However, for any path-breaking changes in the EV market, OEMs need to
undertake more investments and the government should devise clear policies. The lack of adequate charging
infrastructure, in particular, needs to be addressed in order to meet the targets set under EV and renewable energy
initiatives.
Electric PVs to contribute to ~4% of domestic sales by fiscal 2026
As it stands, FAME II subsidy is incentivised only for commercial use. No benefits are provided to the owners of
personal cars. The following are the findings of our analysis on the cost of ownership of an electric passenger car
versus petrol, diesel and CNG variants for cab aggregators. CRISIL Research has also compared the cost of
ownership of an electric passenger car with that of a petrol variant.
In case of commercial applications, such as cab aggregators, the total cost of acquisition (COA) for EVs is almost
50% higher than that for diesel and CNG variants. However, due to heavy running of vehicles, the total cost of
ownership (TCO) among cab aggregators is lower for EVs by ~6% versus diesel alternatives and higher by ~6%
versus CNG alternatives, even in fiscal 2021. By fiscal 2026, the TCO of EVs is likely to be lower by 11% compared
with diesel alternatives and marginally lower versus CNG alternatives. The lower battery cost is expected to offset
the lack of FAME II subsidy and will help maintain the competitiveness of BEVs against diesel and CNG variants for
cab aggregators.
Currently, charging infrastructure, range anxiety and lack of large OEM presence are hindering EV adoption. The
taxi segment accounts for 10-15% of sales within passenger cars, and within the taxi segment, cab aggregators are
expected to lead the adoption of EVs. This should result in an estimated ~25% adoption of EVs within cab
aggregators by fiscal 2025 (assuming adequate infrastructure is available by then).
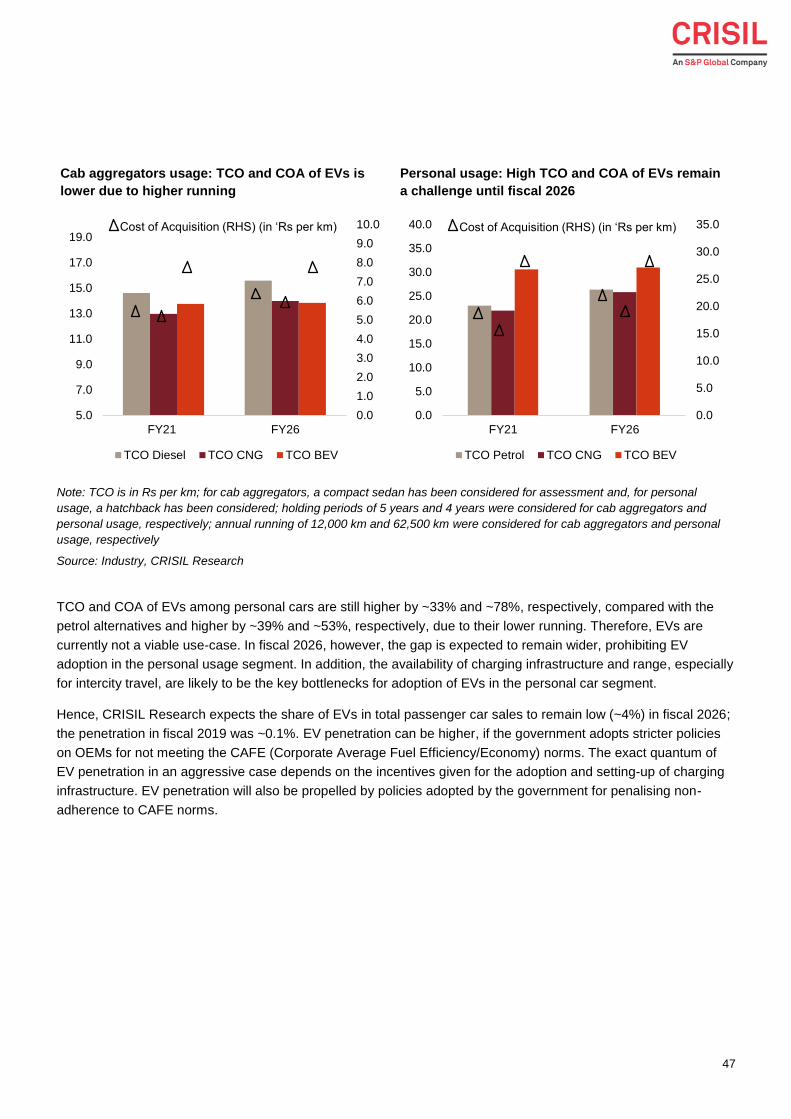
47
Cab aggregators usage: TCO and COA of EVs is
lower due to higher running
Personal usage: High TCO and COA of EVs remain
a challenge until fiscal 2026
Note: TCO is in Rs per km; for cab aggregators, a compact sedan has been considered for assessment and, for personal
usage, a hatchback has been considered; holding periods of 5 years and 4 years were considered for cab aggregators and
personal usage, respectively; annual running of 12,000 km and 62,500 km were considered for cab aggregators and personal
usage, respectively
Source: Industry, CRISIL Research
TCO and COA of EVs among personal cars are still higher by ~33% and ~78%, respectively, compared with the
petrol alternatives and higher by ~39% and ~53%, respectively, due to their lower running. Therefore, EVs are
currently not a viable use-case. In fiscal 2026, however, the gap is expected to remain wider, prohibiting EV
adoption in the personal usage segment. In addition, the availability of charging infrastructure and range, especially
for intercity travel, are likely to be the key bottlenecks for adoption of EVs in the personal car segment.
Hence, CRISIL Research expects the share of EVs in total passenger car sales to remain low (~4%) in fiscal 2026;
the penetration in fiscal 2019 was ~0.1%. EV penetration can be higher, if the government adopts stricter policies
on OEMs for not meeting the CAFE (Corporate Average Fuel Efficiency/Economy) norms. The exact quantum of
EV penetration in an aggressive case depends on the incentives given for the adoption and setting-up of charging
infrastructure. EV penetration will also be propelled by policies adopted by the government for penalising non-
adherence to CAFE norms.
0.0
1.0
2.0
3.0
4.0
5.0
6.0
7.0
8.0
9.0
10.0
5.0
7.0
9.0
11.0
13.0
15.0
17.0
19.0
FY21 FY26
TCO Diesel TCO CNG TCO BEV
Cost of Acquisition (RHS) (in ‘Rs per km)
0.0
5.0
10.0
15.0
20.0
25.0
30.0
35.0
0.0
5.0
10.0
15.0
20.0
25.0
30.0
35.0
40.0
FY21 FY26
TCO Petrol TCO CNG TCO BEV
Cost of Acquisition (RHS) (in ‘Rs per km)
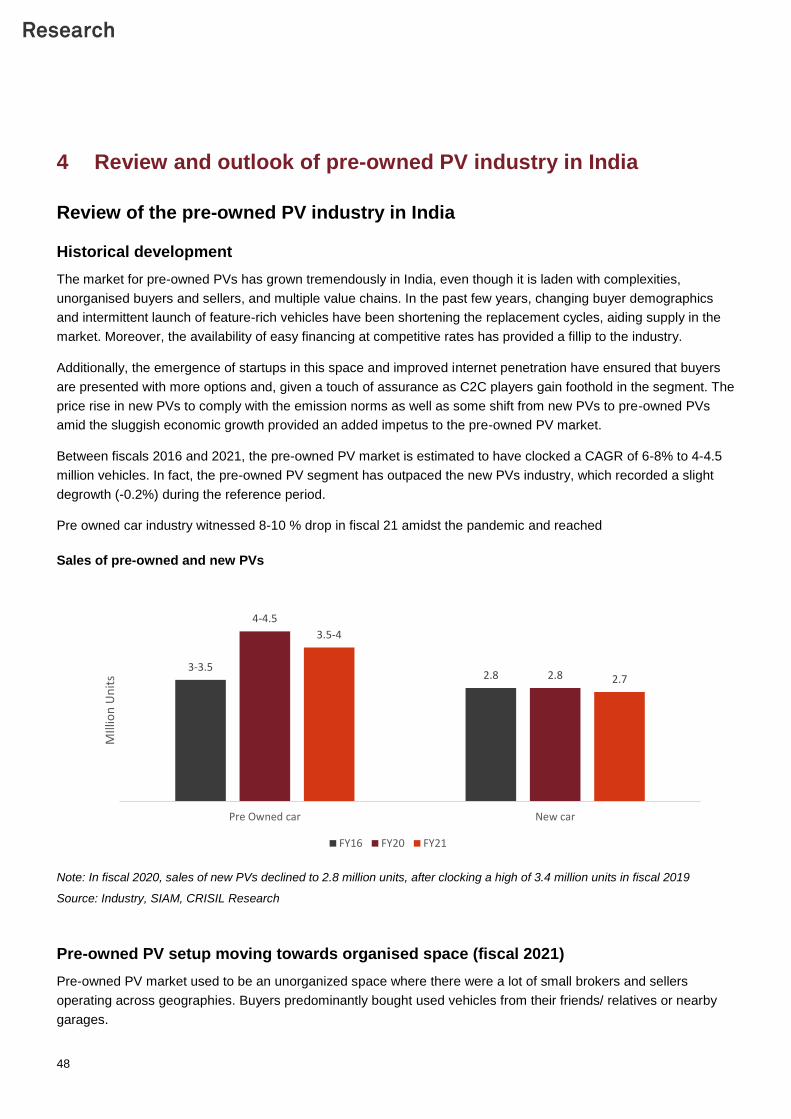
48
4 Review and outlook of pre-owned PV industry in India
Review of the pre-owned PV industry in India
Historical development
The market for pre-owned PVs has grown tremendously in India, even though it is laden with complexities,
unorganised buyers and sellers, and multiple value chains. In the past few years, changing buyer demographics
and intermittent launch of feature-rich vehicles have been shortening the replacement cycles, aiding supply in the
market. Moreover, the availability of easy financing at competitive rates has provided a fillip to the industry.
Additionally, the emergence of startups in this space and improved internet penetration have ensured that buyers
are presented with more options and, given a touch of assurance as C2C players gain foothold in the segment. The
price rise in new PVs to comply with the emission norms as well as some shift from new PVs to pre-owned PVs
amid the sluggish economic growth provided an added impetus to the pre-owned PV market.
Between fiscals 2016 and 2021, the pre-owned PV market is estimated to have clocked a CAGR of 6-8% to 4-4.5
million vehicles. In fact, the pre-owned PV segment has outpaced the new PVs industry, which recorded a slight
degrowth (-0.2%) during the reference period.
Pre owned car industry witnessed 8-10 % drop in fiscal 21 amidst the pandemic and reached
Sales of pre-owned and new PVs
Note: In fiscal 2020, sales of new PVs declined to 2.8 million units, after clocking a high of 3.4 million units in fiscal 2019
Source: Industry, SIAM, CRISIL Research
Pre-owned PV setup moving towards organised space (fiscal 2021)
Pre-owned PV market used to be an unorganized space where there were a lot of small brokers and sellers
operating across geographies. Buyers predominantly bought used vehicles from their friends/ relatives or nearby
garages.
3-3.52.8
4-4.5
2.8
3.5-4
2.7
Pre Owned car New car
MIll
ion
Un
its
FY16 FY20 FY21
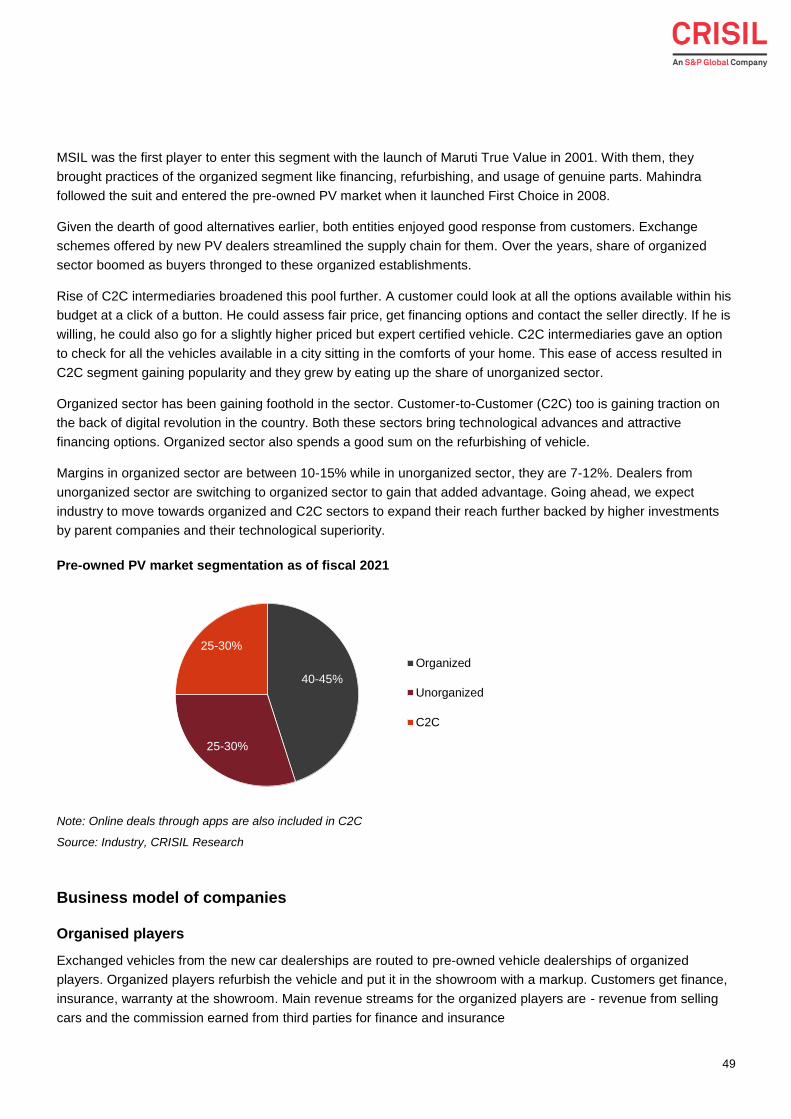
49
MSIL was the first player to enter this segment with the launch of Maruti True Value in 2001. With them, they
brought practices of the organized segment like financing, refurbishing, and usage of genuine parts. Mahindra
followed the suit and entered the pre-owned PV market when it launched First Choice in 2008.
Given the dearth of good alternatives earlier, both entities enjoyed good response from customers. Exchange
schemes offered by new PV dealers streamlined the supply chain for them. Over the years, share of organized
sector boomed as buyers thronged to these organized establishments.
Rise of C2C intermediaries broadened this pool further. A customer could look at all the options available within his
budget at a click of a button. He could assess fair price, get financing options and contact the seller directly. If he is
willing, he could also go for a slightly higher priced but expert certified vehicle. C2C intermediaries gave an option
to check for all the vehicles available in a city sitting in the comforts of your home. This ease of access resulted in
C2C segment gaining popularity and they grew by eating up the share of unorganized sector.
Organized sector has been gaining foothold in the sector. Customer-to-Customer (C2C) too is gaining traction on
the back of digital revolution in the country. Both these sectors bring technological advances and attractive
financing options. Organized sector also spends a good sum on the refurbishing of vehicle.
Margins in organized sector are between 10-15% while in unorganized sector, they are 7-12%. Dealers from
unorganized sector are switching to organized sector to gain that added advantage. Going ahead, we expect
industry to move towards organized and C2C sectors to expand their reach further backed by higher investments
by parent companies and their technological superiority.
Pre-owned PV market segmentation as of fiscal 2021
Note: Online deals through apps are also included in C2C
Source: Industry, CRISIL Research
Business model of companies
Organised players
Exchanged vehicles from the new car dealerships are routed to pre-owned vehicle dealerships of organized
players. Organized players refurbish the vehicle and put it in the showroom with a markup. Customers get finance,
insurance, warranty at the showroom. Main revenue streams for the organized players are - revenue from selling
cars and the commission earned from third parties for finance and insurance
40-45%
25-30%
25-30%
Organized
Unorganized
C2C
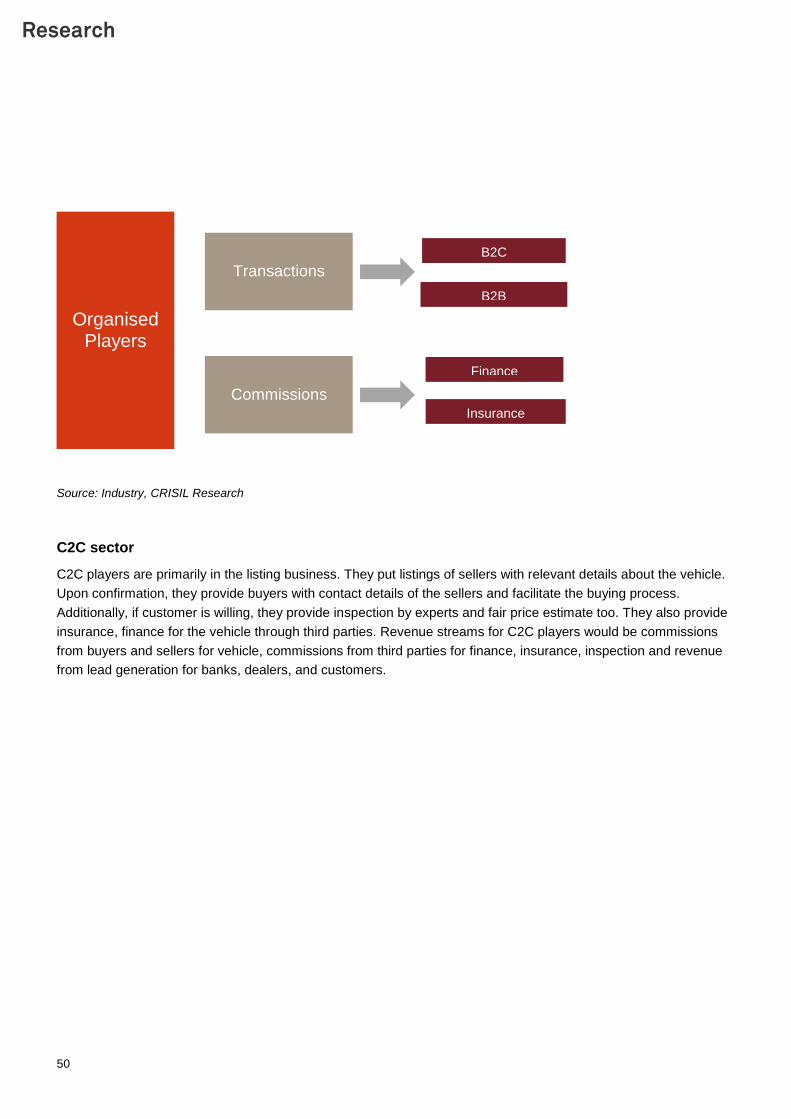
50
Source: Industry, CRISIL Research
C2C sector
C2C players are primarily in the listing business. They put listings of sellers with relevant details about the vehicle.
Upon confirmation, they provide buyers with contact details of the sellers and facilitate the buying process.
Additionally, if customer is willing, they provide inspection by experts and fair price estimate too. They also provide
insurance, finance for the vehicle through third parties. Revenue streams for C2C players would be commissions
from buyers and sellers for vehicle, commissions from third parties for finance, insurance, inspection and revenue
from lead generation for banks, dealers, and customers.
B2C
B2B
Finance
Insurance
Transactions
Commissions
Organised Players
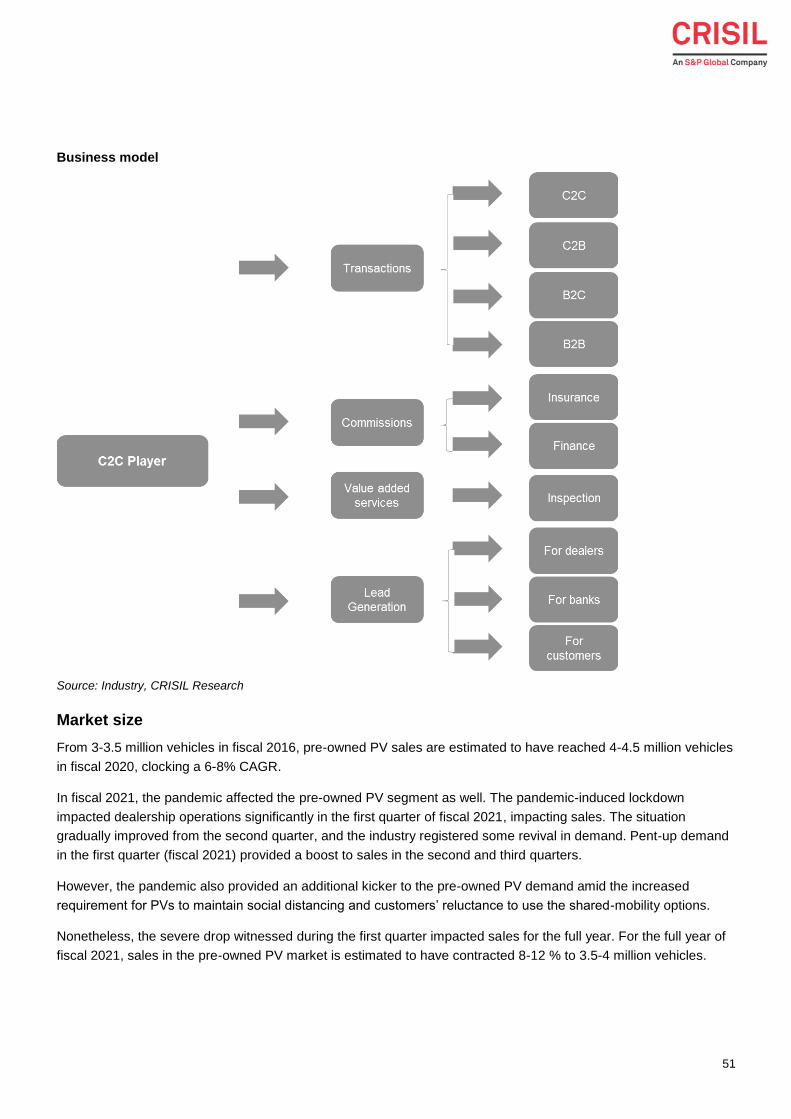
51
Business model
Source: Industry, CRISIL Research
Market size
From 3-3.5 million vehicles in fiscal 2016, pre-owned PV sales are estimated to have reached 4-4.5 million vehicles
in fiscal 2020, clocking a 6-8% CAGR.
In fiscal 2021, the pandemic affected the pre-owned PV segment as well. The pandemic-induced lockdown
impacted dealership operations significantly in the first quarter of fiscal 2021, impacting sales. The situation
gradually improved from the second quarter, and the industry registered some revival in demand. Pent-up demand
in the first quarter (fiscal 2021) provided a boost to sales in the second and third quarters.
However, the pandemic also provided an additional kicker to the pre-owned PV demand amid the increased
requirement for PVs to maintain social distancing and customers’ reluctance to use the shared-mobility options.
Nonetheless, the severe drop witnessed during the first quarter impacted sales for the full year. For the full year of
fiscal 2021, sales in the pre-owned PV market is estimated to have contracted 8-12 % to 3.5-4 million vehicles.
52
Impact of Covid-19
Covid-19 led to a major setback for the auto industry. Sales plummeted in April and May 2020, and everything
came to a sudden halt. Organised players, which represent 40-45% of the overall segment, remained closed during
the first quarter of fiscal 2021. The industry started picking up again after June 2020, primarily because more
people wanted to have a PV instead of using shared transport.
While the industry was undergoing digital transformation as new PV dealers, a number of them for the first time
tried building their brand online. An online model was already in place for pre-owned PVs, with the advent of
startups that provided an additional boost to their sales. Backed by pent-up demand, increased need for personal
mobility, and reluctance to spend a significant share of savings amid the pandemic-induced economic uncertainty,
the pre-owned PV industry registered some revival from the second quarter of fiscal 2021.
However, as the new-PVs industry faced challenges in the supply chain domain, more customers, who wanted to
buy a new PV, held on to their old vehicles because deliveries were stretched to even six months. Hence, the value
chain of pre-owned PVs also got affected, as there were fewer vehicles in supply, while the demand was soaring.
According to CRISIL Research’s estimates, the share of vehicles bought with an exchange option came down from
35-40% in fiscal 2020 to around 30% in fiscal 2021, implying that, for every 100 new PVs sold, there were 5-10
fewer vehicles coming in for exchange, while demand for additional vehicles had spiked by the same number. This
restricted the pre-owned PV industry revival in fiscal 2021.
Hence, after a sharp drop in the first quarter of fiscal 2021 and the restricted revival in the past three quarters, sales
of pre-owned PVs dropped 8-12% to 3.5-4 million units in fiscal 2021.
However, pre-owned PV sales continued to outpace new-PV sales even in fiscal 2021, with the ratio of pre-owned
PVs to new-PV sales hovering around 1.3-1.7 during the year.
Scenario in fiscal 2022
With Covid-19 first wave nearly subsiding by the fourth quarter and the vaccination drive picking up pace; Indian
economy as well as the overall auto industry were geared up for a healthy revival in fiscal 2022, from a low base of
fiscals 2020 and 2021. However, the resurgence of Covid-19 in a much severe form, the second wave derailed this
estimated revival. Sales in April 2020 were impacted and sales in May were nearly wiped off with stringent
lockdowns by most states.
With cases plateauing in most states, staggered removal of lockdowns has started from June 2021. However,
unlike in fiscal 2021, the much-severe second wave has significantly impacted rural customers as well. Most
customers are in a saving mode, with increased medical expenses and are unwilling to spend on discretionary
items. A revival in customer sentiment remains a key monitorable.
Long-term outlook
On a long-term horizon, CRISIL Research expects a healthy revival in the pre-owned PV market. The pre-owned
PV segment is expected to grow at a 12-14% CAGR between fiscals 2021 and fiscal 2026 to 6.8-7.3 million
vehicles; the rise is amplified by a lower base in fiscal 2021. Increased need for personal mobility, rising aspirations
of customers, growing disposable income, lowering replacement cycles and increasing financial penetration will
drive the growth. The expanding share of the organised segment will provide an added boost to demand.
Given that India’s vehicle ownership (23-25 vehicles / 1000 people) still lags that of developed and most developing
economies, there is tremendous room for growth in the coming years. Moreover, the consumer outlook has
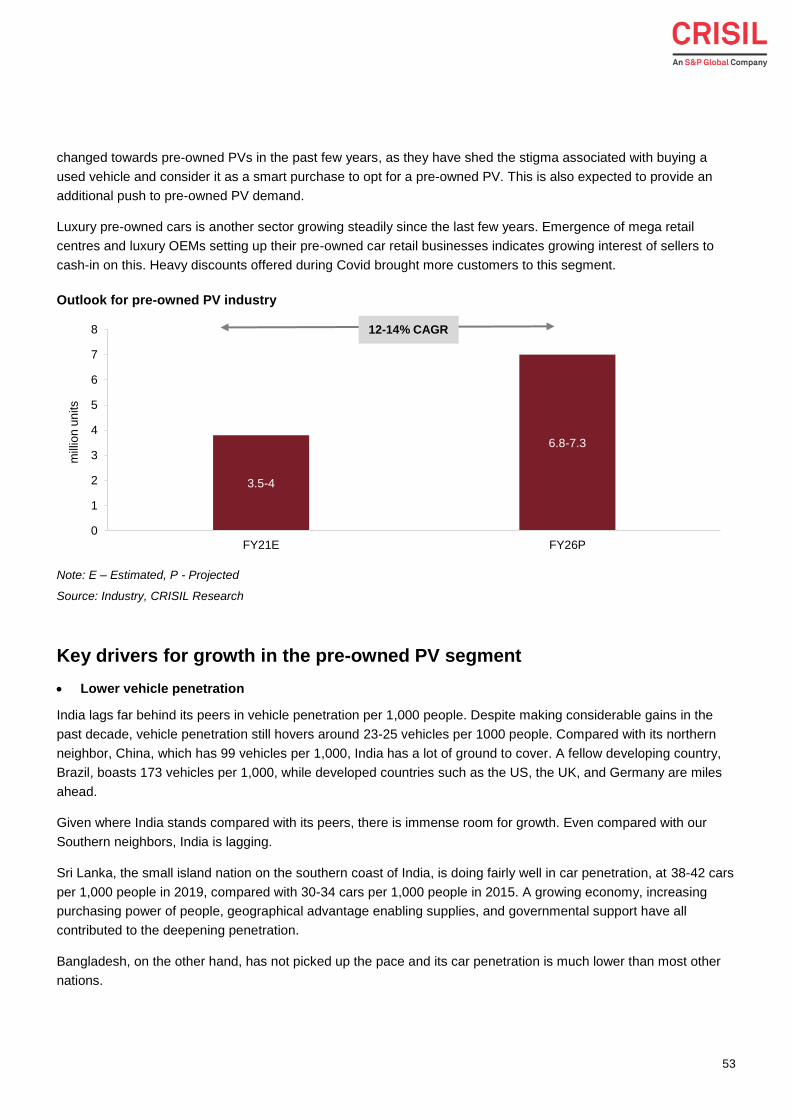
53
changed towards pre-owned PVs in the past few years, as they have shed the stigma associated with buying a
used vehicle and consider it as a smart purchase to opt for a pre-owned PV. This is also expected to provide an
additional push to pre-owned PV demand.
Luxury pre-owned cars is another sector growing steadily since the last few years. Emergence of mega retail
centres and luxury OEMs setting up their pre-owned car retail businesses indicates growing interest of sellers to
cash-in on this. Heavy discounts offered during Covid brought more customers to this segment.
Outlook for pre-owned PV industry
Note: E – Estimated, P - Projected
Source: Industry, CRISIL Research
Key drivers for growth in the pre-owned PV segment
Lower vehicle penetration
India lags far behind its peers in vehicle penetration per 1,000 people. Despite making considerable gains in the
past decade, vehicle penetration still hovers around 23-25 vehicles per 1000 people. Compared with its northern
neighbor, China, which has 99 vehicles per 1,000, India has a lot of ground to cover. A fellow developing country,
Brazil, boasts 173 vehicles per 1,000, while developed countries such as the US, the UK, and Germany are miles
ahead.
Given where India stands compared with its peers, there is immense room for growth. Even compared with our
Southern neighbors, India is lagging.
Sri Lanka, the small island nation on the southern coast of India, is doing fairly well in car penetration, at 38-42 cars
per 1,000 people in 2019, compared with 30-34 cars per 1,000 people in 2015. A growing economy, increasing
purchasing power of people, geographical advantage enabling supplies, and governmental support have all
contributed to the deepening penetration.
Bangladesh, on the other hand, has not picked up the pace and its car penetration is much lower than most other
nations.
3.5-4
6.8-7.3
0
1
2
3
4
5
6
7
8
FY21E FY26P
mill
ion
un
its
12-14% CAGR
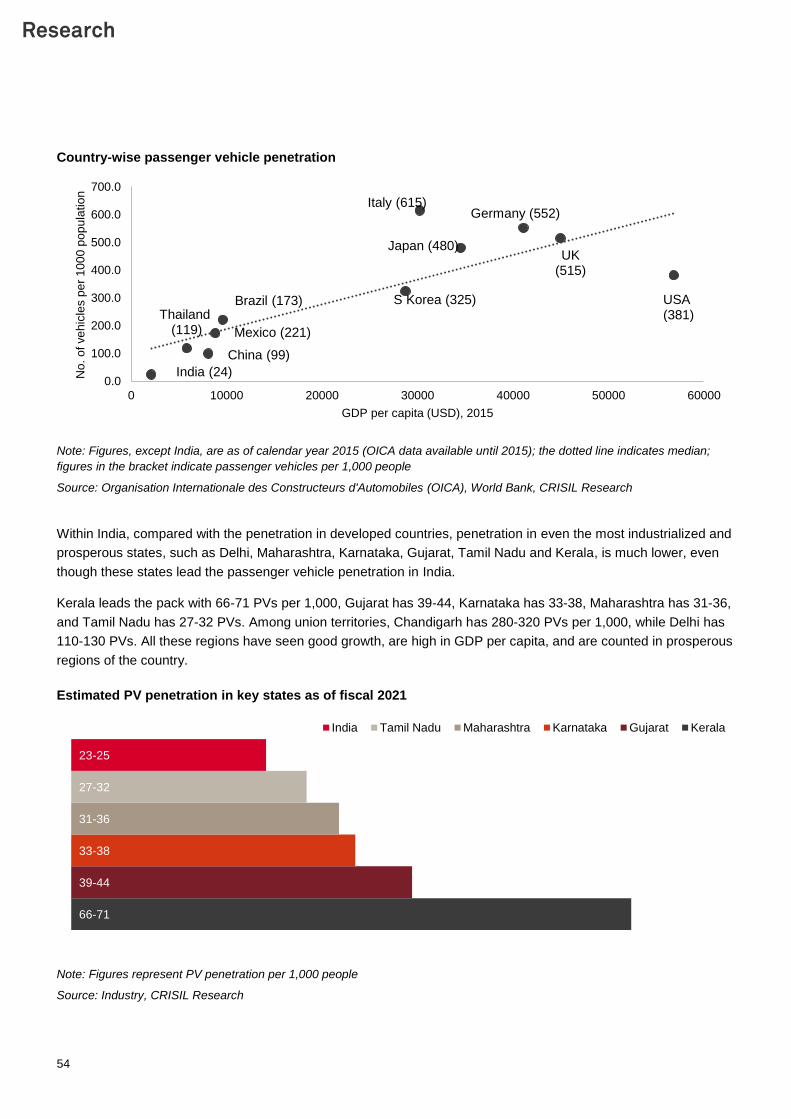
54
Country-wise passenger vehicle penetration
Note: Figures, except India, are as of calendar year 2015 (OICA data available until 2015); the dotted line indicates median;
figures in the bracket indicate passenger vehicles per 1,000 people
Source: Organisation Internationale des Constructeurs d'Automobiles (OICA), World Bank, CRISIL Research
Within India, compared with the penetration in developed countries, penetration in even the most industrialized and
prosperous states, such as Delhi, Maharashtra, Karnataka, Gujarat, Tamil Nadu and Kerala, is much lower, even
though these states lead the passenger vehicle penetration in India.
Kerala leads the pack with 66-71 PVs per 1,000, Gujarat has 39-44, Karnataka has 33-38, Maharashtra has 31-36,
and Tamil Nadu has 27-32 PVs. Among union territories, Chandigarh has 280-320 PVs per 1,000, while Delhi has
110-130 PVs. All these regions have seen good growth, are high in GDP per capita, and are counted in prosperous
regions of the country.
Estimated PV penetration in key states as of fiscal 2021
Note: Figures represent PV penetration per 1,000 people
Source: Industry, CRISIL Research
0.0
100.0
200.0
300.0
400.0
500.0
600.0
700.0
0 10000 20000 30000 40000 50000 60000
No
. o
f ve
hic
les p
er
10
00
po
pu
latio
n
GDP per capita (USD), 2015
Brazil (173)Thailand
(119)
India (24)
China (99)
Mexico (221)
S Korea (325)
Japan (480)
Italy (615)Germany (552)
UK(515)
USA(381)
66-71
39-44
33-38
31-36
27-32
23-25
India Tamil Nadu Maharashtra Karnataka Gujarat Kerala
55
Nascent stage of pre-owned PV industry
The pre-owned PV market is still in its nascent stage in India with a lot of ground to cover. As mentioned
earlier, all organised players started in this millennium, while the C2C startups are not even a decade old. Their
success in this limited timeframe indicates demand that was unaddressed earlier. Both these sectors are
expected to consolidate their position in the coming years, as investment pours into both.
The ratio of pre-owned PVs to new PVs, currently at 1.3-1.7, is estimated to improve further in the coming
years. Other countries in comparison are China (0.4-0.7) and the majority of developed countries (2 and
above). It reflects that the pre-owned PV market is in the early stages in India and developed economies are
much better places in this space, since the pre-owned PV segment is more organised in those countries. As
this segment gets more organised, customers get more choices, better sales and after-sales support, as well
as cheaper financing options.
Advent of startups
Mushrooming of startups in the pre-owned PV market space bodes well for the segment. Trust is higher among
buyers now, with the assurance of guaranteed refunds by C2C players and their technology enabling them to
serve customers better by providing bulk of their services online. Players such as Cars24, Carwale, Cardekho
and Droom engage in this space, and listing platforms, such as Olx and Quikr, also have come up. Spinny is
another startup getting popular; it is only active in pre-owned PV space and sells verified vehicles only.
Internet penetration has grown at a rapid pace in the past few years and urbanisation too has grown. Along
with that, the onset of Covid-19 has made people switch from public transport to PVs. This phenomenon is
expected to support the already growing demand and more young millennial customers are expected to opt for
a pre-owned PV. In the long term, the C2C sector is expected to grow faster than the unorganised segment,
backed by the technological enhancements and ease of use.
Shortening PV replacement cycle
In the past few years, the vehicle replacement cycle has been coming down from 6-8 years a few years ago to
about 4-6 years in fiscal 2021. The sharp rise in launches of advanced, feature-rich, trendy-looking vehicles at
competitive prices has been pushing the young customer demographic to sell off their old vehicles for one of
the latest ones.
Lucrative exchange options offered by most OEMs as well as easy vehicle-selling avenues, facilitated by C2C
and organised players, are providing an added push to customers contemplating about exchanging their
vehicles.
Thus, the shortening replacement cycle of the new vehicle buyers is also supporting the growth of the pre-
owned PV industry.
Younger demographic
According to Indian Census 2011 projections, India continues to have a very young demographic with an
estimated 61% of its population below 35 years and a median age of around 28 years by 2021. This younger
demographic does not see any stigma with buying a pre-owned PV unlike the older ones and they have
contributed to the acceptance of pre-owned PV segment, especially in small towns and cities. They are also
more tech-savvy and, hence, a target segment for C2C intermediaries such as Quikr and Carwale.
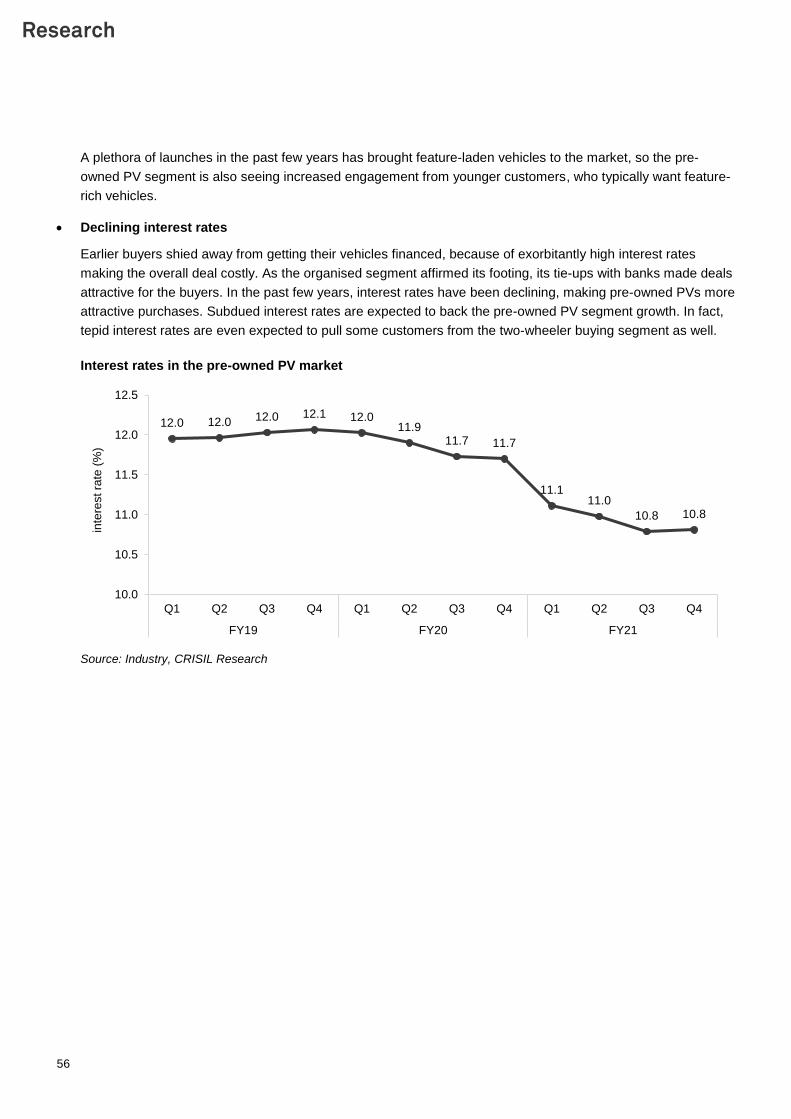
56
A plethora of launches in the past few years has brought feature-laden vehicles to the market, so the pre-
owned PV segment is also seeing increased engagement from younger customers, who typically want feature-
rich vehicles.
Declining interest rates
Earlier buyers shied away from getting their vehicles financed, because of exorbitantly high interest rates
making the overall deal costly. As the organised segment affirmed its footing, its tie-ups with banks made deals
attractive for the buyers. In the past few years, interest rates have been declining, making pre-owned PVs more
attractive purchases. Subdued interest rates are expected to back the pre-owned PV segment growth. In fact,
tepid interest rates are even expected to pull some customers from the two-wheeler buying segment as well.
Interest rates in the pre-owned PV market
Source: Industry, CRISIL Research
12.0 12.0 12.0 12.1 12.011.9
11.7 11.7
11.111.0
10.8 10.8
10.0
10.5
11.0
11.5
12.0
12.5
Q1 Q2 Q3 Q4 Q1 Q2 Q3 Q4 Q1 Q2 Q3 Q4
FY19 FY20 FY21
inte
rest ra
te (
%)
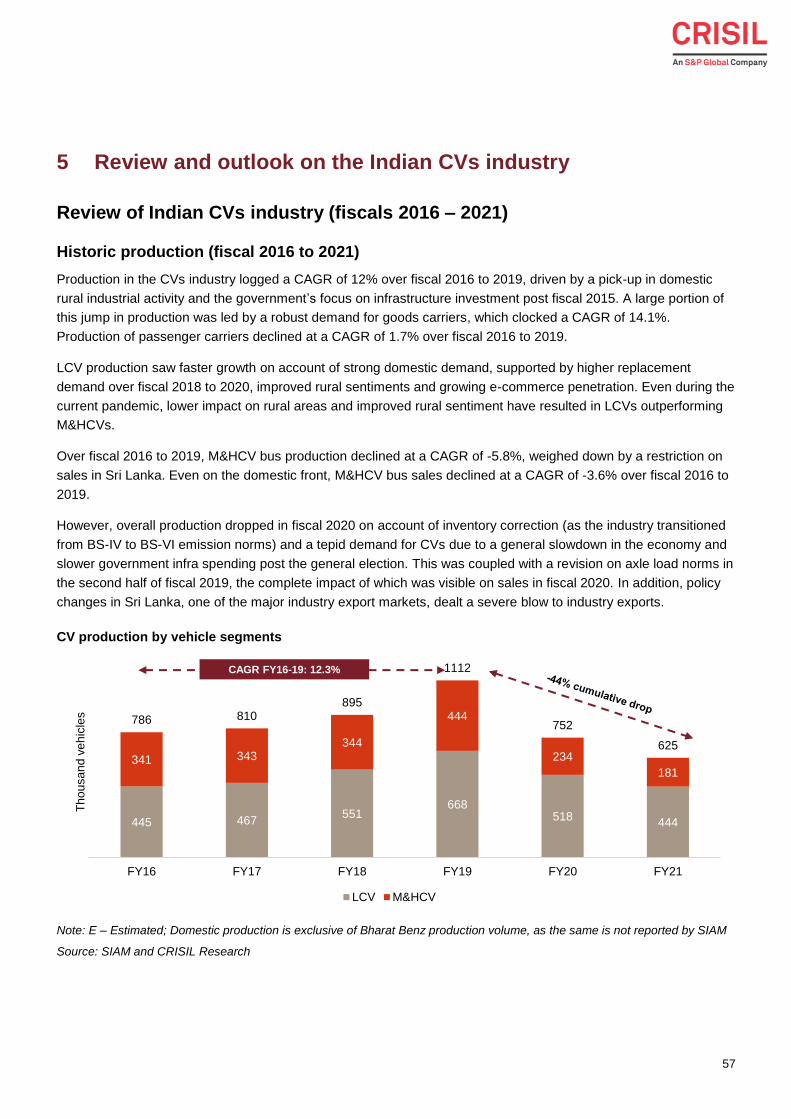
57
5 Review and outlook on the Indian CVs industry
Review of Indian CVs industry (fiscals 2016 – 2021)
Historic production (fiscal 2016 to 2021)
Production in the CVs industry logged a CAGR of 12% over fiscal 2016 to 2019, driven by a pick-up in domestic
rural industrial activity and the government’s focus on infrastructure investment post fiscal 2015. A large portion of
this jump in production was led by a robust demand for goods carriers, which clocked a CAGR of 14.1%.
Production of passenger carriers declined at a CAGR of 1.7% over fiscal 2016 to 2019.
LCV production saw faster growth on account of strong domestic demand, supported by higher replacement
demand over fiscal 2018 to 2020, improved rural sentiments and growing e-commerce penetration. Even during the
current pandemic, lower impact on rural areas and improved rural sentiment have resulted in LCVs outperforming
M&HCVs.
Over fiscal 2016 to 2019, M&HCV bus production declined at a CAGR of -5.8%, weighed down by a restriction on
sales in Sri Lanka. Even on the domestic front, M&HCV bus sales declined at a CAGR of -3.6% over fiscal 2016 to
2019.
However, overall production dropped in fiscal 2020 on account of inventory correction (as the industry transitioned
from BS-IV to BS-VI emission norms) and a tepid demand for CVs due to a general slowdown in the economy and
slower government infra spending post the general election. This was coupled with a revision on axle load norms in
the second half of fiscal 2019, the complete impact of which was visible on sales in fiscal 2020. In addition, policy
changes in Sri Lanka, one of the major industry export markets, dealt a severe blow to industry exports.
CV production by vehicle segments
Note: E – Estimated; Domestic production is exclusive of Bharat Benz production volume, as the same is not reported by SIAM
Source: SIAM and CRISIL Research
445 467551
668518
444
341 343344
444
234
181
786 810895
1112
752
625
FY16 FY17 FY18 FY19 FY20 FY21
Th
ou
sa
nd
ve
hic
les
LCV M&HCV
CAGR FY16-19: 12.3%
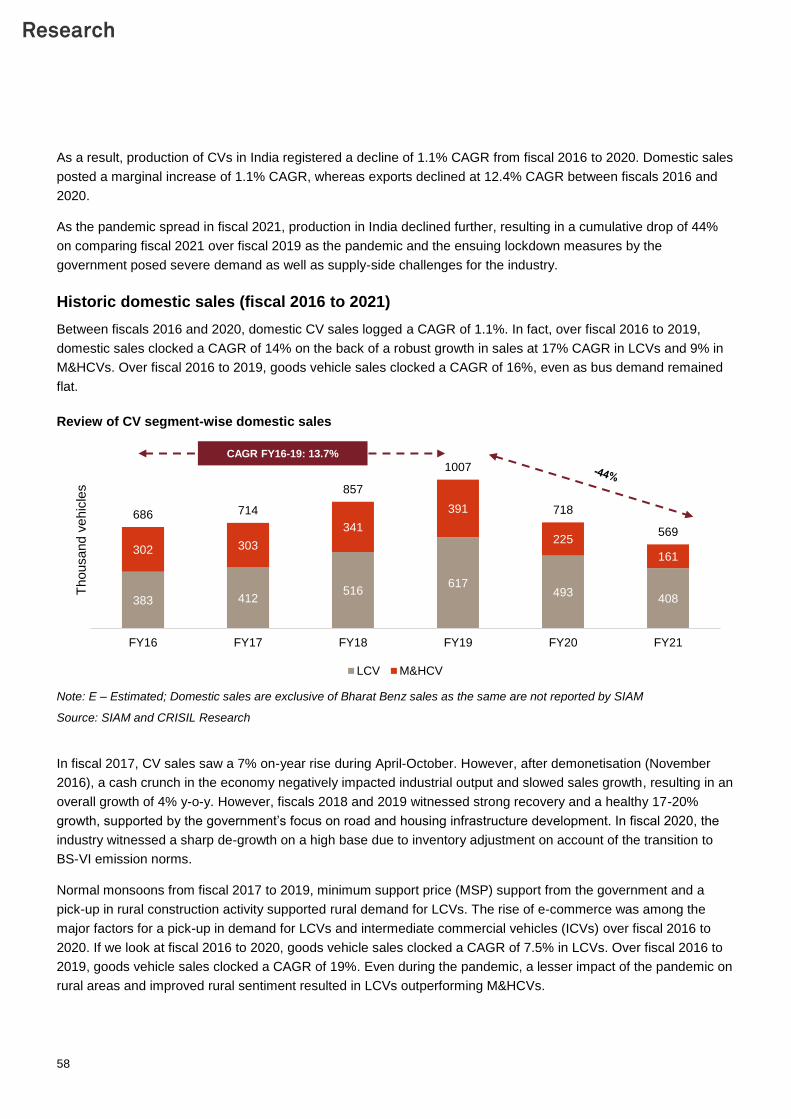
58
As a result, production of CVs in India registered a decline of 1.1% CAGR from fiscal 2016 to 2020. Domestic sales
posted a marginal increase of 1.1% CAGR, whereas exports declined at 12.4% CAGR between fiscals 2016 and
2020.
As the pandemic spread in fiscal 2021, production in India declined further, resulting in a cumulative drop of 44%
on comparing fiscal 2021 over fiscal 2019 as the pandemic and the ensuing lockdown measures by the
government posed severe demand as well as supply-side challenges for the industry.
Historic domestic sales (fiscal 2016 to 2021)
Between fiscals 2016 and 2020, domestic CV sales logged a CAGR of 1.1%. In fact, over fiscal 2016 to 2019,
domestic sales clocked a CAGR of 14% on the back of a robust growth in sales at 17% CAGR in LCVs and 9% in
M&HCVs. Over fiscal 2016 to 2019, goods vehicle sales clocked a CAGR of 16%, even as bus demand remained
flat.
Review of CV segment-wise domestic sales
Note: E – Estimated; Domestic sales are exclusive of Bharat Benz sales as the same are not reported by SIAM
Source: SIAM and CRISIL Research
In fiscal 2017, CV sales saw a 7% on-year rise during April-October. However, after demonetisation (November
2016), a cash crunch in the economy negatively impacted industrial output and slowed sales growth, resulting in an
overall growth of 4% y-o-y. However, fiscals 2018 and 2019 witnessed strong recovery and a healthy 17-20%
growth, supported by the government’s focus on road and housing infrastructure development. In fiscal 2020, the
industry witnessed a sharp de-growth on a high base due to inventory adjustment on account of the transition to
BS-VI emission norms.
Normal monsoons from fiscal 2017 to 2019, minimum support price (MSP) support from the government and a
pick-up in rural construction activity supported rural demand for LCVs. The rise of e-commerce was among the
major factors for a pick-up in demand for LCVs and intermediate commercial vehicles (ICVs) over fiscal 2016 to
2020. If we look at fiscal 2016 to 2020, goods vehicle sales clocked a CAGR of 7.5% in LCVs. Over fiscal 2016 to
2019, goods vehicle sales clocked a CAGR of 19%. Even during the pandemic, a lesser impact of the pandemic on
rural areas and improved rural sentiment resulted in LCVs outperforming M&HCVs.
383 412516
617493
408
302 303
341
391
225
161
686 714
857
1007
718
569
FY16 FY17 FY18 FY19 FY20 FY21
Thousand v
ehic
les
LCV M&HCV
CAGR FY16-19: 13.7%
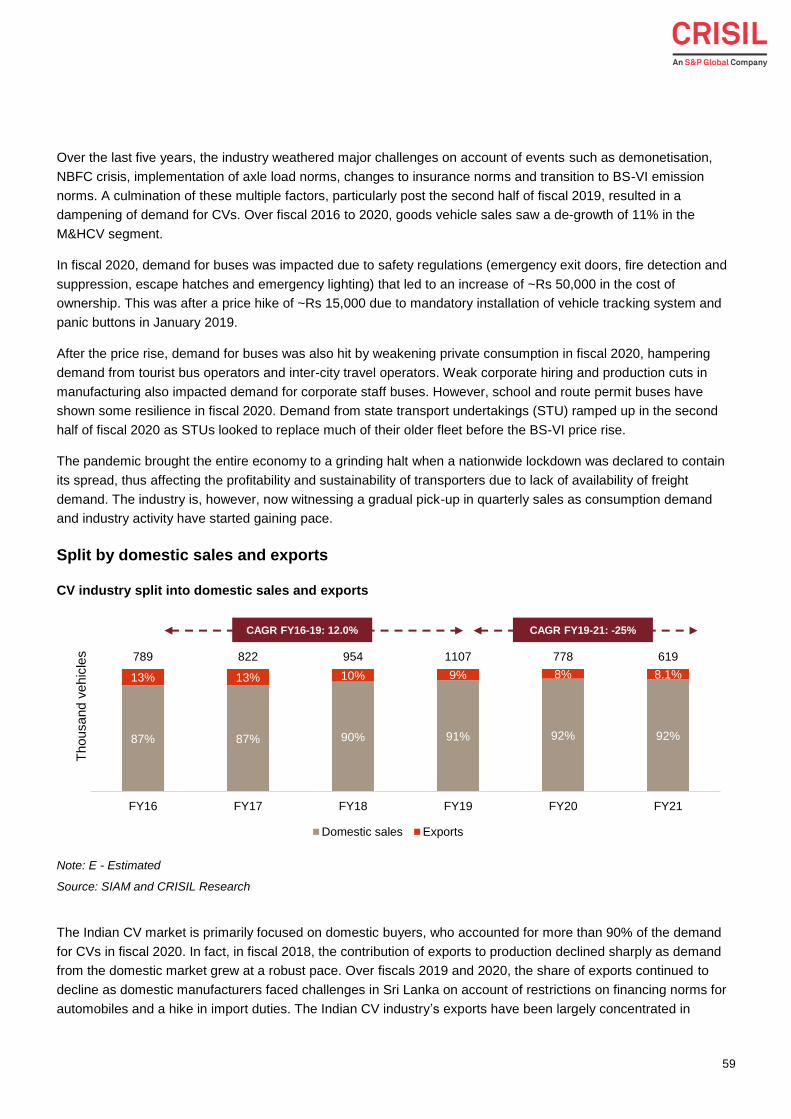
59
Over the last five years, the industry weathered major challenges on account of events such as demonetisation,
NBFC crisis, implementation of axle load norms, changes to insurance norms and transition to BS-VI emission
norms. A culmination of these multiple factors, particularly post the second half of fiscal 2019, resulted in a
dampening of demand for CVs. Over fiscal 2016 to 2020, goods vehicle sales saw a de-growth of 11% in the
M&HCV segment.
In fiscal 2020, demand for buses was impacted due to safety regulations (emergency exit doors, fire detection and
suppression, escape hatches and emergency lighting) that led to an increase of ~Rs 50,000 in the cost of
ownership. This was after a price hike of ~Rs 15,000 due to mandatory installation of vehicle tracking system and
panic buttons in January 2019.
After the price rise, demand for buses was also hit by weakening private consumption in fiscal 2020, hampering
demand from tourist bus operators and inter-city travel operators. Weak corporate hiring and production cuts in
manufacturing also impacted demand for corporate staff buses. However, school and route permit buses have
shown some resilience in fiscal 2020. Demand from state transport undertakings (STU) ramped up in the second
half of fiscal 2020 as STUs looked to replace much of their older fleet before the BS-VI price rise.
The pandemic brought the entire economy to a grinding halt when a nationwide lockdown was declared to contain
its spread, thus affecting the profitability and sustainability of transporters due to lack of availability of freight
demand. The industry is, however, now witnessing a gradual pick-up in quarterly sales as consumption demand
and industry activity have started gaining pace.
Split by domestic sales and exports
CV industry split into domestic sales and exports
Note: E - Estimated
Source: SIAM and CRISIL Research
The Indian CV market is primarily focused on domestic buyers, who accounted for more than 90% of the demand
for CVs in fiscal 2020. In fact, in fiscal 2018, the contribution of exports to production declined sharply as demand
from the domestic market grew at a robust pace. Over fiscals 2019 and 2020, the share of exports continued to
decline as domestic manufacturers faced challenges in Sri Lanka on account of restrictions on financing norms for
automobiles and a hike in import duties. The Indian CV industry’s exports have been largely concentrated in
87% 87% 90% 91% 92% 92%
13% 13% 10% 9% 8% 8.1%
789 822 954 1107 778 619
FY16 FY17 FY18 FY19 FY20 FY21
Thousand v
ehic
les
Domestic sales Exports
CAGR FY16-19: 12.0% CAGR FY19-21: -25%
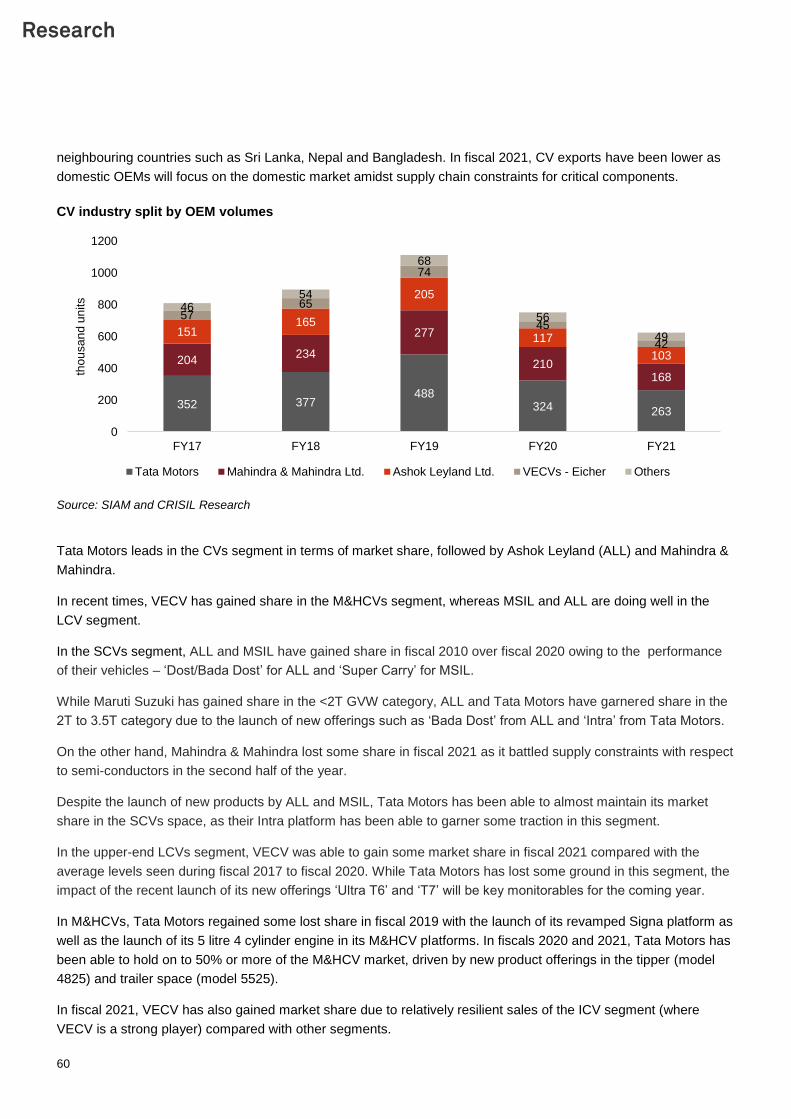
60
neighbouring countries such as Sri Lanka, Nepal and Bangladesh. In fiscal 2021, CV exports have been lower as
domestic OEMs will focus on the domestic market amidst supply chain constraints for critical components.
CV industry split by OEM volumes
Source: SIAM and CRISIL Research
Tata Motors leads in the CVs segment in terms of market share, followed by Ashok Leyland (ALL) and Mahindra &
Mahindra.
In recent times, VECV has gained share in the M&HCVs segment, whereas MSIL and ALL are doing well in the
LCV segment.
In the SCVs segment, ALL and MSIL have gained share in fiscal 2010 over fiscal 2020 owing to the performance
of their vehicles – ‘Dost/Bada Dost’ for ALL and ‘Super Carry’ for MSIL.
While Maruti Suzuki has gained share in the <2T GVW category, ALL and Tata Motors have garnered share in the
2T to 3.5T category due to the launch of new offerings such as ‘Bada Dost’ from ALL and ‘Intra’ from Tata Motors.
On the other hand, Mahindra & Mahindra lost some share in fiscal 2021 as it battled supply constraints with respect
to semi-conductors in the second half of the year.
Despite the launch of new products by ALL and MSIL, Tata Motors has been able to almost maintain its market
share in the SCVs space, as their Intra platform has been able to garner some traction in this segment.
In the upper-end LCVs segment, VECV was able to gain some market share in fiscal 2021 compared with the
average levels seen during fiscal 2017 to fiscal 2020. While Tata Motors has lost some ground in this segment, the
impact of the recent launch of its new offerings ‘Ultra T6’ and ‘T7’ will be key monitorables for the coming year.
In M&HCVs, Tata Motors regained some lost share in fiscal 2019 with the launch of its revamped Signa platform as
well as the launch of its 5 litre 4 cylinder engine in its M&HCV platforms. In fiscals 2020 and 2021, Tata Motors has
been able to hold on to 50% or more of the M&HCV market, driven by new product offerings in the tipper (model
4825) and trailer space (model 5525).
In fiscal 2021, VECV has also gained market share due to relatively resilient sales of the ICV segment (where
VECV is a strong player) compared with other segments.
352 377488
324 263
204234
277
210168
151165
205
117
103
5765
74
45
42
4654
68
56
49
0
200
400
600
800
1000
1200
FY17 FY18 FY19 FY20 FY21
tho
usa
nd
un
its
Tata Motors Mahindra & Mahindra Ltd. Ashok Leyland Ltd. VECVs - Eicher Others
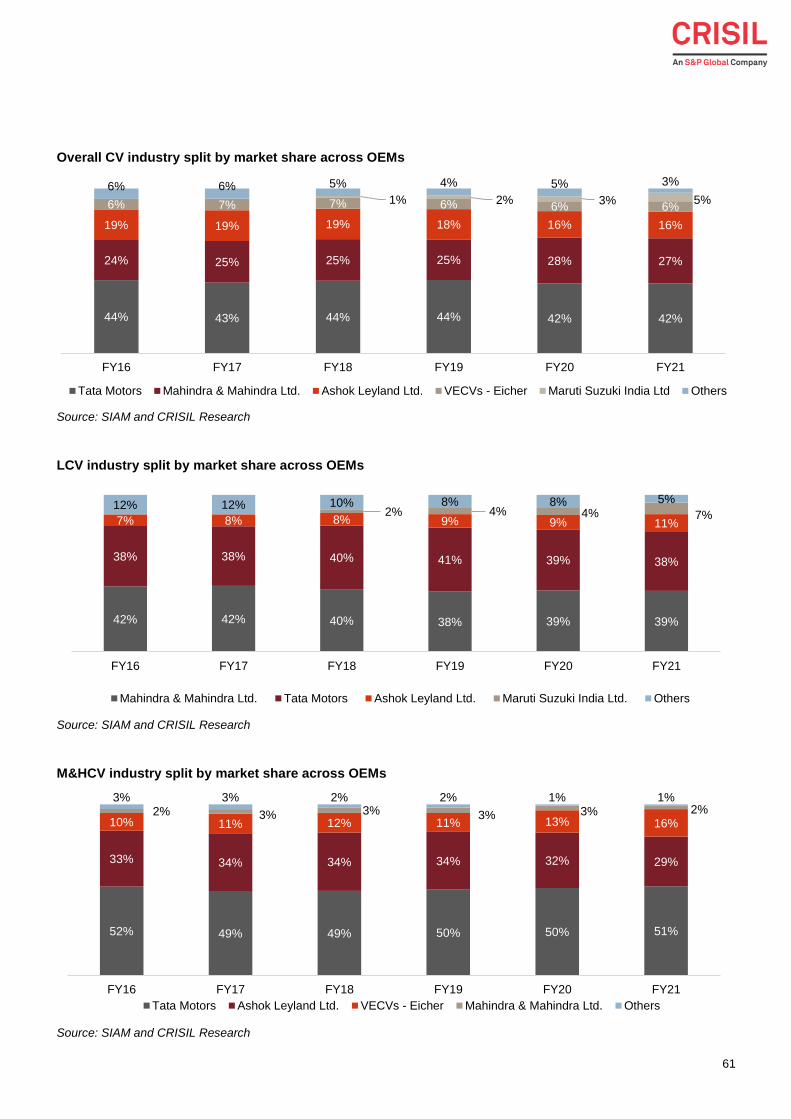
61
Overall CV industry split by market share across OEMs
Source: SIAM and CRISIL Research
LCV industry split by market share across OEMs
Source: SIAM and CRISIL Research
M&HCV industry split by market share across OEMs
Source: SIAM and CRISIL Research
44% 43% 44% 44% 42% 42%
24% 25% 25% 25% 28% 27%
19% 19% 19% 18% 16% 16%
6% 7% 7% 6% 6% 6%1% 2% 3% 5%
6% 6% 5% 4% 5% 3%
FY16 FY17 FY18 FY19 FY20 FY21
Tata Motors Mahindra & Mahindra Ltd. Ashok Leyland Ltd. VECVs - Eicher Maruti Suzuki India Ltd Others
42% 42% 40% 38% 39% 39%
38% 38% 40% 41% 39% 38%
7% 8% 8% 9% 9% 11%2% 4% 4% 7%
12% 12% 10% 8% 8% 5%
FY16 FY17 FY18 FY19 FY20 FY21
Mahindra & Mahindra Ltd. Tata Motors Ashok Leyland Ltd. Maruti Suzuki India Ltd. Others
52% 49% 49% 50% 50% 51%
33% 34% 34% 34% 32% 29%
10% 11% 12% 11% 13% 16%2% 3% 3% 3% 3% 2%
3% 3% 2% 2% 1% 1%
FY16 FY17 FY18 FY19 FY20 FY21
Tata Motors Ashok Leyland Ltd. VECVs - Eicher Mahindra & Mahindra Ltd. Others
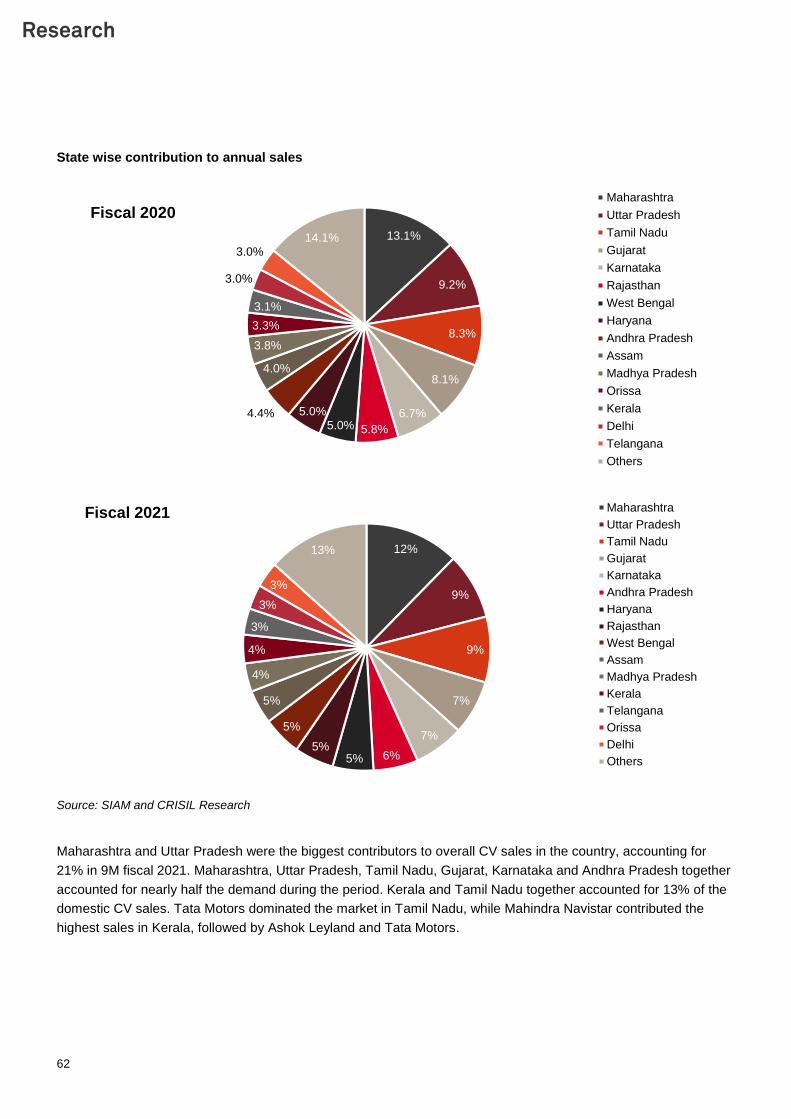
62
State wise contribution to annual sales
Source: SIAM and CRISIL Research
Maharashtra and Uttar Pradesh were the biggest contributors to overall CV sales in the country, accounting for
21% in 9M fiscal 2021. Maharashtra, Uttar Pradesh, Tamil Nadu, Gujarat, Karnataka and Andhra Pradesh together
accounted for nearly half the demand during the period. Kerala and Tamil Nadu together accounted for 13% of the
domestic CV sales. Tata Motors dominated the market in Tamil Nadu, while Mahindra Navistar contributed the
highest sales in Kerala, followed by Ashok Leyland and Tata Motors.
13.1%
9.2%
8.3%
8.1%
6.7%
5.8%5.0%5.0%4.4%
4.0%
3.8%
3.3%
3.1%
3.0%
3.0%14.1%
Fiscal 2020Maharashtra
Uttar Pradesh
Tamil Nadu
Gujarat
Karnataka
Rajasthan
West Bengal
Haryana
Andhra Pradesh
Assam
Madhya Pradesh
Orissa
Kerala
Delhi
Telangana
Others
12%
9%
9%
7%
7%
6%5%5%
5%
5%
4%
4%
3%
3%
3%
13%
Fiscal 2021 Maharashtra
Uttar Pradesh
Tamil Nadu
Gujarat
Karnataka
Andhra Pradesh
Haryana
Rajasthan
West Bengal
Assam
Madhya Pradesh
Kerala
Telangana
Orissa
Delhi
Others
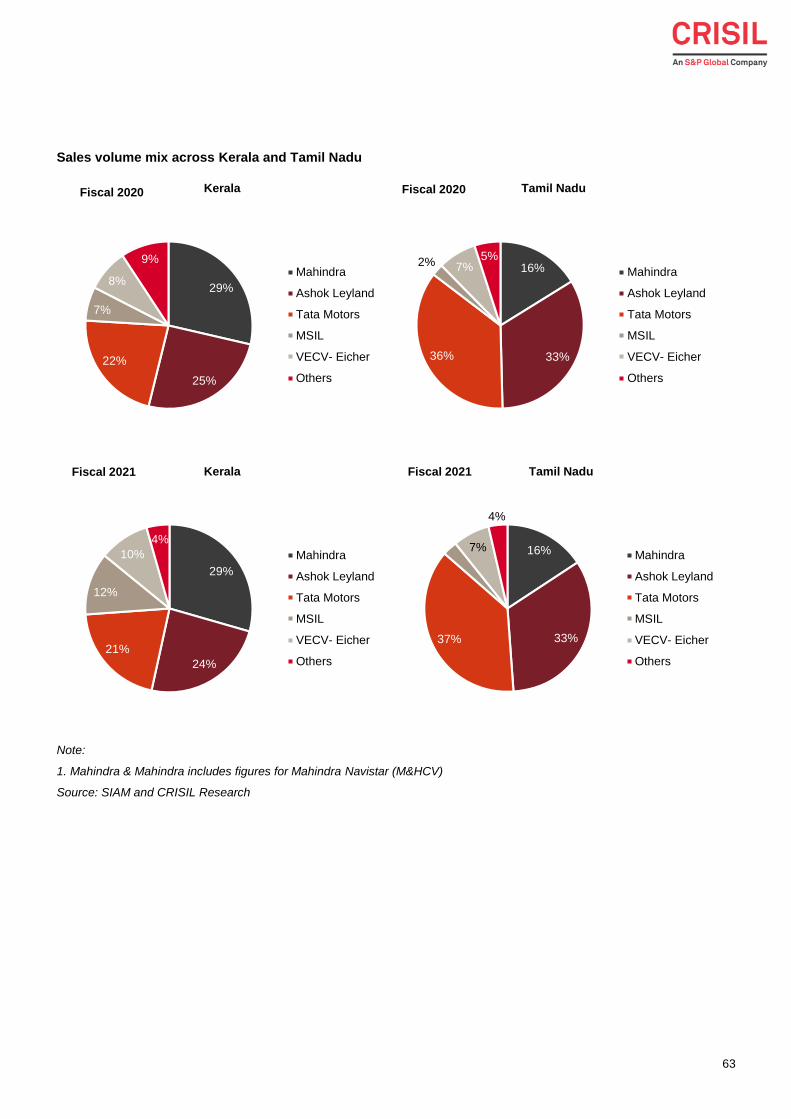
63
Sales volume mix across Kerala and Tamil Nadu
Note:
1. Mahindra & Mahindra includes figures for Mahindra Navistar (M&HCV)
Source: SIAM and CRISIL Research
29%
25%
22%
7%
8%
9%
Kerala
Mahindra
Ashok Leyland
Tata Motors
MSIL
VECV- Eicher
Others
16%
33%36%
2% 7%5%
Tamil Nadu
Mahindra
Ashok Leyland
Tata Motors
MSIL
VECV- Eicher
Others
Fiscal 2020
29%
24%
21%
12%
10%
4%
Kerala
Mahindra
Ashok Leyland
Tata Motors
MSIL
VECV- Eicher
Others
Fiscal 2021
16%
33%37%
3%7%
4%
Tamil Nadu
Mahindra
Ashok Leyland
Tata Motors
MSIL
VECV- Eicher
Others
Fiscal 2021
Fiscal 2020
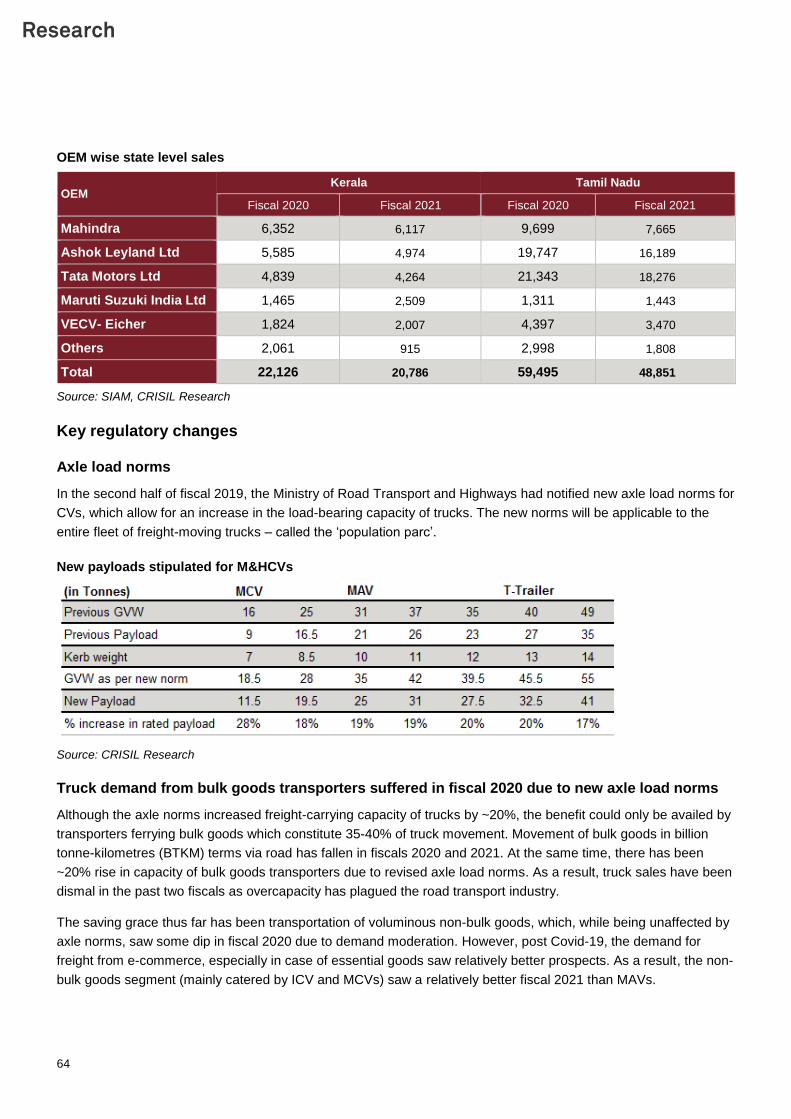
64
OEM wise state level sales
OEM Kerala Tamil Nadu
Fiscal 2020 Fiscal 2021 Fiscal 2020 Fiscal 2021
Mahindra 6,352 6,117 9,699 7,665
Ashok Leyland Ltd 5,585 4,974 19,747 16,189
Tata Motors Ltd 4,839 4,264 21,343 18,276
Maruti Suzuki India Ltd 1,465 2,509 1,311 1,443
VECV- Eicher 1,824 2,007 4,397 3,470
Others 2,061 915 2,998 1,808
Total 22,126 20,786 59,495 48,851
Source: SIAM, CRISIL Research
Key regulatory changes
Axle load norms
In the second half of fiscal 2019, the Ministry of Road Transport and Highways had notified new axle load norms for
CVs, which allow for an increase in the load-bearing capacity of trucks. The new norms will be applicable to the
entire fleet of freight-moving trucks – called the ‘population parc’.
New payloads stipulated for M&HCVs
Source: CRISIL Research
Truck demand from bulk goods transporters suffered in fiscal 2020 due to new axle load norms
Although the axle norms increased freight-carrying capacity of trucks by ~20%, the benefit could only be availed by
transporters ferrying bulk goods which constitute 35-40% of truck movement. Movement of bulk goods in billion
tonne-kilometres (BTKM) terms via road has fallen in fiscals 2020 and 2021. At the same time, there has been
~20% rise in capacity of bulk goods transporters due to revised axle load norms. As a result, truck sales have been
dismal in the past two fiscals as overcapacity has plagued the road transport industry.
The saving grace thus far has been transportation of voluminous non-bulk goods, which, while being unaffected by
axle norms, saw some dip in fiscal 2020 due to demand moderation. However, post Covid-19, the demand for
freight from e-commerce, especially in case of essential goods saw relatively better prospects. As a result, the non-
bulk goods segment (mainly catered by ICV and MCVs) saw a relatively better fiscal 2021 than MAVs.
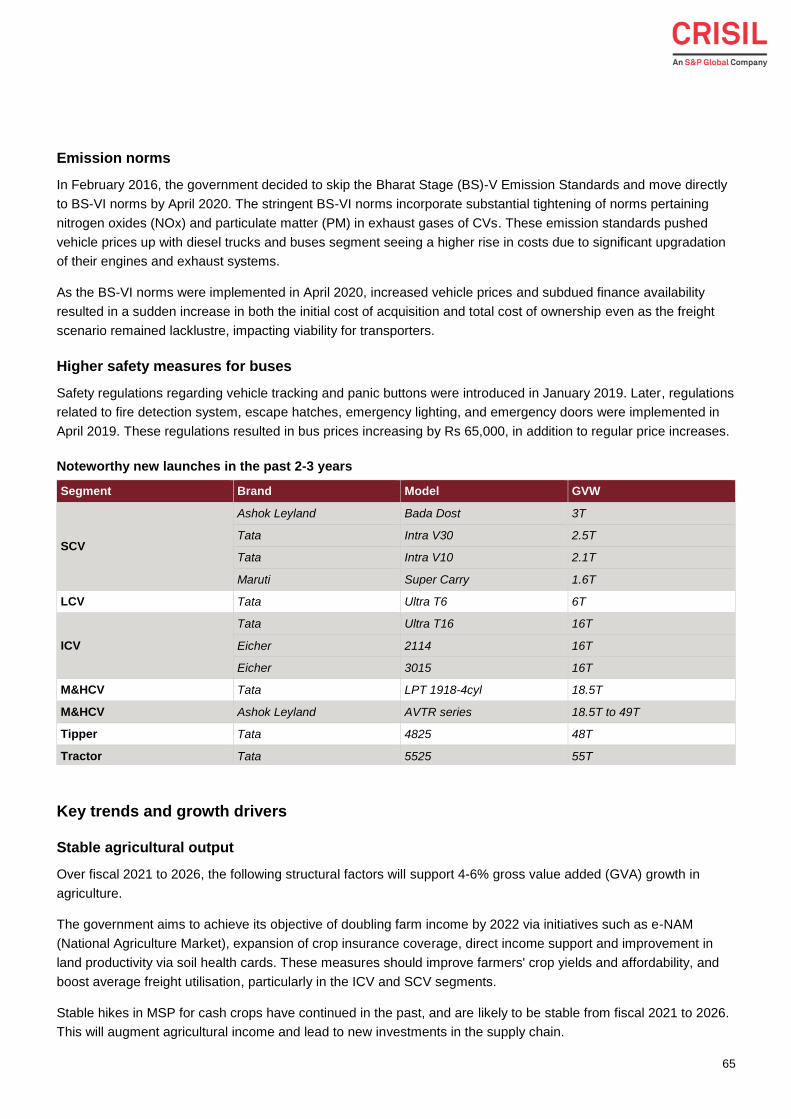
65
Emission norms
In February 2016, the government decided to skip the Bharat Stage (BS)-V Emission Standards and move directly
to BS-VI norms by April 2020. The stringent BS-VI norms incorporate substantial tightening of norms pertaining
nitrogen oxides (NOx) and particulate matter (PM) in exhaust gases of CVs. These emission standards pushed
vehicle prices up with diesel trucks and buses segment seeing a higher rise in costs due to significant upgradation
of their engines and exhaust systems.
As the BS-VI norms were implemented in April 2020, increased vehicle prices and subdued finance availability
resulted in a sudden increase in both the initial cost of acquisition and total cost of ownership even as the freight
scenario remained lacklustre, impacting viability for transporters.
Higher safety measures for buses
Safety regulations regarding vehicle tracking and panic buttons were introduced in January 2019. Later, regulations
related to fire detection system, escape hatches, emergency lighting, and emergency doors were implemented in
April 2019. These regulations resulted in bus prices increasing by Rs 65,000, in addition to regular price increases.
Noteworthy new launches in the past 2-3 years
Segment Brand Model GVW
SCV
Ashok Leyland Bada Dost 3T
Tata Intra V30 2.5T
Tata Intra V10 2.1T
Maruti Super Carry 1.6T
LCV Tata Ultra T6 6T
ICV
Tata Ultra T16 16T
Eicher 2114 16T
Eicher 3015 16T
M&HCV Tata LPT 1918-4cyl 18.5T
M&HCV Ashok Leyland AVTR series 18.5T to 49T
Tipper Tata 4825 48T
Tractor Tata 5525 55T
Key trends and growth drivers
Stable agricultural output
Over fiscal 2021 to 2026, the following structural factors will support 4-6% gross value added (GVA) growth in
agriculture.
The government aims to achieve its objective of doubling farm income by 2022 via initiatives such as e-NAM
(National Agriculture Market), expansion of crop insurance coverage, direct income support and improvement in
land productivity via soil health cards. These measures should improve farmers' crop yields and affordability, and
boost average freight utilisation, particularly in the ICV and SCV segments.
Stable hikes in MSP for cash crops have continued in the past, and are likely to be stable from fiscal 2021 to 2026.
This will augment agricultural income and lead to new investments in the supply chain.
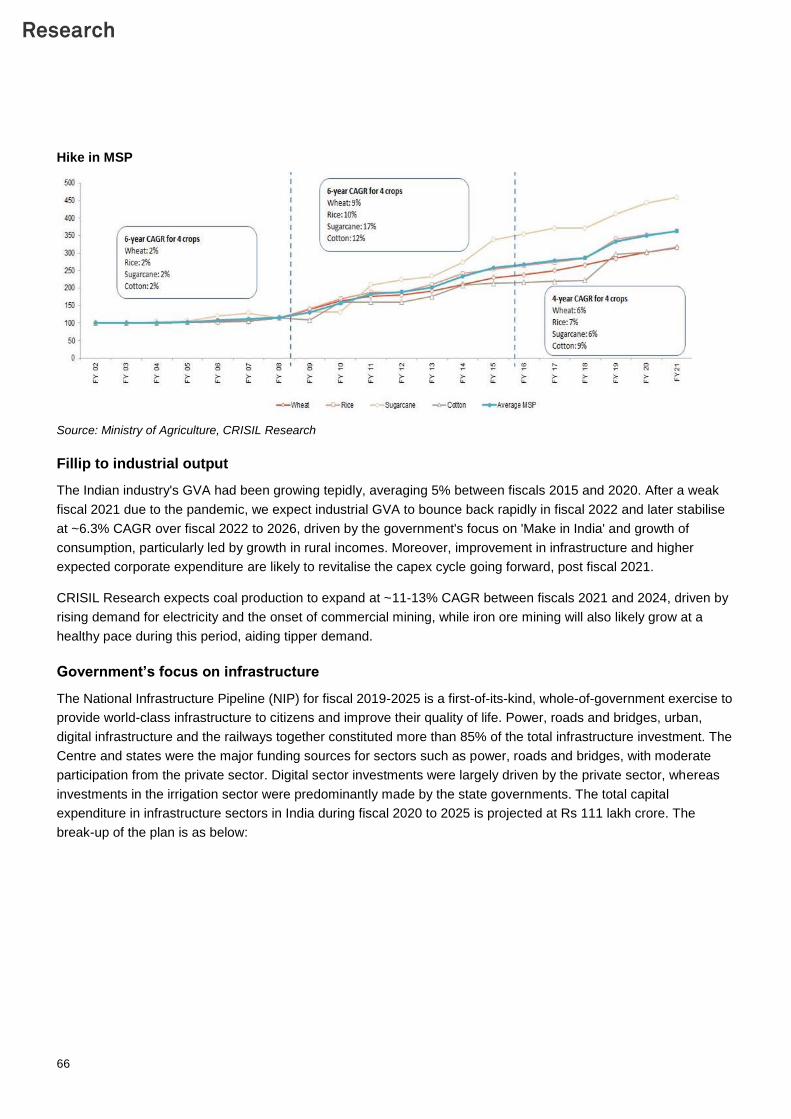
66
Hike in MSP
Source: Ministry of Agriculture, CRISIL Research
Fillip to industrial output
The Indian industry's GVA had been growing tepidly, averaging 5% between fiscals 2015 and 2020. After a weak
fiscal 2021 due to the pandemic, we expect industrial GVA to bounce back rapidly in fiscal 2022 and later stabilise
at ~6.3% CAGR over fiscal 2022 to 2026, driven by the government's focus on 'Make in India' and growth of
consumption, particularly led by growth in rural incomes. Moreover, improvement in infrastructure and higher
expected corporate expenditure are likely to revitalise the capex cycle going forward, post fiscal 2021.
CRISIL Research expects coal production to expand at ~11-13% CAGR between fiscals 2021 and 2024, driven by
rising demand for electricity and the onset of commercial mining, while iron ore mining will also likely grow at a
healthy pace during this period, aiding tipper demand.
Government’s focus on infrastructure
The National Infrastructure Pipeline (NIP) for fiscal 2019-2025 is a first-of-its-kind, whole-of-government exercise to
provide world-class infrastructure to citizens and improve their quality of life. Power, roads and bridges, urban,
digital infrastructure and the railways together constituted more than 85% of the total infrastructure investment. The
Centre and states were the major funding sources for sectors such as power, roads and bridges, with moderate
participation from the private sector. Digital sector investments were largely driven by the private sector, whereas
investments in the irrigation sector were predominantly made by the state governments. The total capital
expenditure in infrastructure sectors in India during fiscal 2020 to 2025 is projected at Rs 111 lakh crore. The
break-up of the plan is as below:
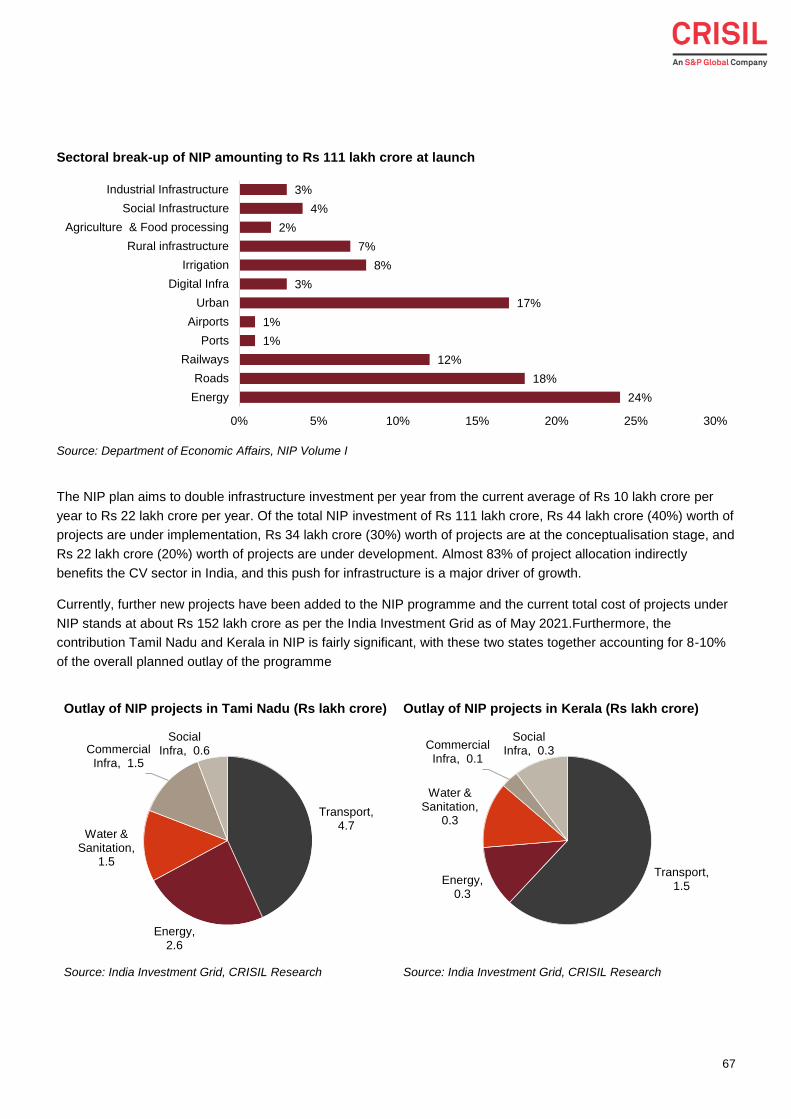
67
Sectoral break-up of NIP amounting to Rs 111 lakh crore at launch
Source: Department of Economic Affairs, NIP Volume I
The NIP plan aims to double infrastructure investment per year from the current average of Rs 10 lakh crore per
year to Rs 22 lakh crore per year. Of the total NIP investment of Rs 111 lakh crore, Rs 44 lakh crore (40%) worth of
projects are under implementation, Rs 34 lakh crore (30%) worth of projects are at the conceptualisation stage, and
Rs 22 lakh crore (20%) worth of projects are under development. Almost 83% of project allocation indirectly
benefits the CV sector in India, and this push for infrastructure is a major driver of growth.
Currently, further new projects have been added to the NIP programme and the current total cost of projects under
NIP stands at about Rs 152 lakh crore as per the India Investment Grid as of May 2021.Furthermore, the
contribution Tamil Nadu and Kerala in NIP is fairly significant, with these two states together accounting for 8-10%
of the overall planned outlay of the programme
Outlay of NIP projects in Tami Nadu (Rs lakh crore) Outlay of NIP projects in Kerala (Rs lakh crore)
Source: India Investment Grid, CRISIL Research Source: India Investment Grid, CRISIL Research
24%
18%
12%
1%
1%
17%
3%
8%
7%
2%
4%
3%
0% 5% 10% 15% 20% 25% 30%
Energy
Roads
Railways
Ports
Airports
Urban
Digital Infra
Irrigation
Rural infrastructure
Agriculture & Food processing
Social Infrastructure
Industrial Infrastructure
Transport, 4.7
Energy, 2.6
Water & Sanitation,
1.5
Commercial Infra, 1.5
Social Infra, 0.6
Transport, 1.5
Energy, 0.3
Water & Sanitation,
0.3
Commercial Infra, 0.1
Social Infra, 0.3
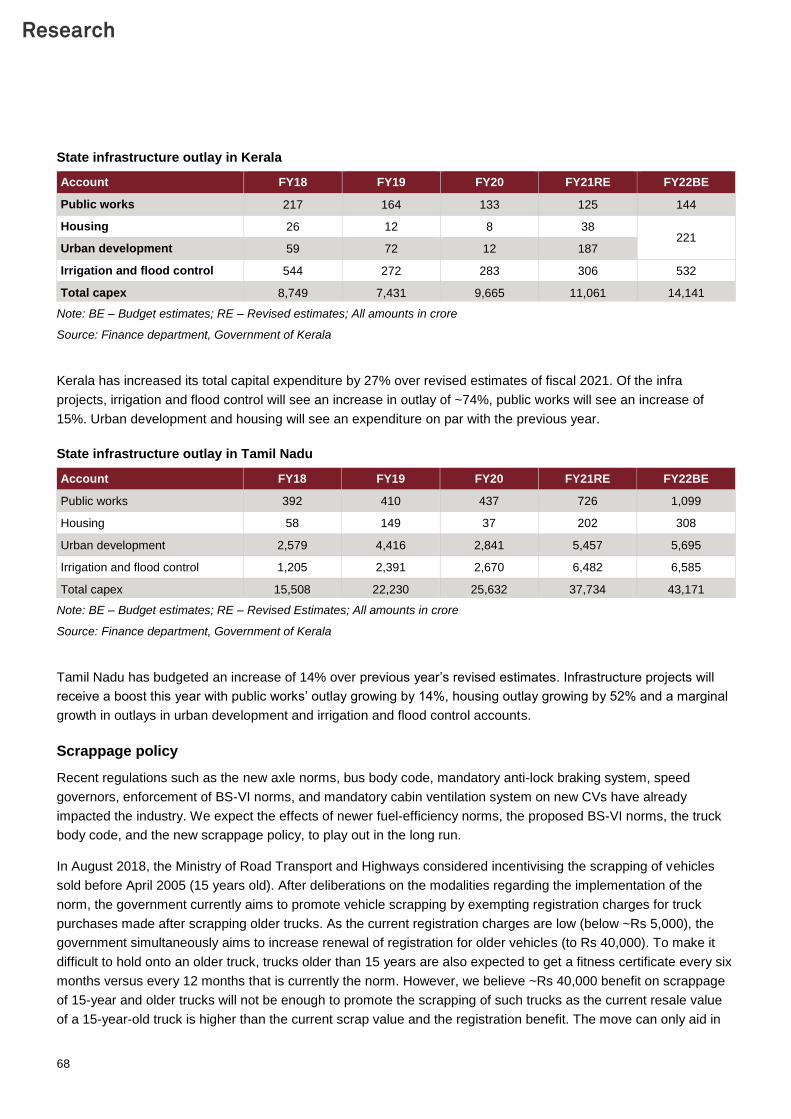
68
State infrastructure outlay in Kerala
Account FY18 FY19 FY20 FY21RE FY22BE
Public works 217 164 133 125 144
Housing 26 12 8 38 221
Urban development 59 72 12 187
Irrigation and flood control 544 272 283 306 532
Total capex 8,749 7,431 9,665 11,061 14,141
Note: BE – Budget estimates; RE – Revised estimates; All amounts in crore
Source: Finance department, Government of Kerala
Kerala has increased its total capital expenditure by 27% over revised estimates of fiscal 2021. Of the infra
projects, irrigation and flood control will see an increase in outlay of ~74%, public works will see an increase of
15%. Urban development and housing will see an expenditure on par with the previous year.
State infrastructure outlay in Tamil Nadu
Account FY18 FY19 FY20 FY21RE FY22BE
Public works 392 410 437 726 1,099
Housing 58 149 37 202 308
Urban development 2,579 4,416 2,841 5,457 5,695
Irrigation and flood control 1,205 2,391 2,670 6,482 6,585
Total capex 15,508 22,230 25,632 37,734 43,171
Note: BE – Budget estimates; RE – Revised Estimates; All amounts in crore
Source: Finance department, Government of Kerala
Tamil Nadu has budgeted an increase of 14% over previous year’s revised estimates. Infrastructure projects will
receive a boost this year with public works’ outlay growing by 14%, housing outlay growing by 52% and a marginal
growth in outlays in urban development and irrigation and flood control accounts.
Scrappage policy
Recent regulations such as the new axle norms, bus body code, mandatory anti-lock braking system, speed
governors, enforcement of BS-VI norms, and mandatory cabin ventilation system on new CVs have already
impacted the industry. We expect the effects of newer fuel-efficiency norms, the proposed BS-VI norms, the truck
body code, and the new scrappage policy, to play out in the long run.
In August 2018, the Ministry of Road Transport and Highways considered incentivising the scrapping of vehicles
sold before April 2005 (15 years old). After deliberations on the modalities regarding the implementation of the
norm, the government currently aims to promote vehicle scrapping by exempting registration charges for truck
purchases made after scrapping older trucks. As the current registration charges are low (below ~Rs 5,000), the
government simultaneously aims to increase renewal of registration for older vehicles (to Rs 40,000). To make it
difficult to hold onto an older truck, trucks older than 15 years are also expected to get a fitness certificate every six
months versus every 12 months that is currently the norm. However, we believe ~Rs 40,000 benefit on scrappage
of 15-year and older trucks will not be enough to promote the scrapping of such trucks as the current resale value
of a 15-year-old truck is higher than the current scrap value and the registration benefit. The move can only aid in
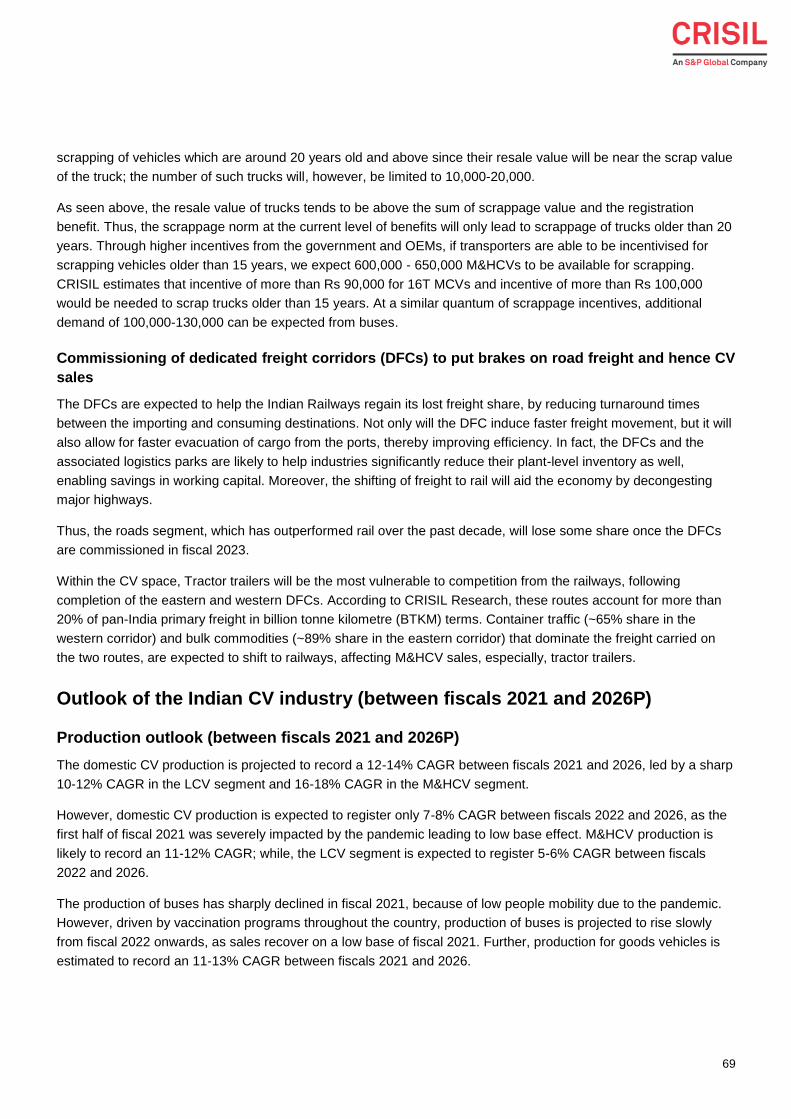
69
scrapping of vehicles which are around 20 years old and above since their resale value will be near the scrap value
of the truck; the number of such trucks will, however, be limited to 10,000-20,000.
As seen above, the resale value of trucks tends to be above the sum of scrappage value and the registration
benefit. Thus, the scrappage norm at the current level of benefits will only lead to scrappage of trucks older than 20
years. Through higher incentives from the government and OEMs, if transporters are able to be incentivised for
scrapping vehicles older than 15 years, we expect 600,000 - 650,000 M&HCVs to be available for scrapping.
CRISIL estimates that incentive of more than Rs 90,000 for 16T MCVs and incentive of more than Rs 100,000
would be needed to scrap trucks older than 15 years. At a similar quantum of scrappage incentives, additional
demand of 100,000-130,000 can be expected from buses.
Commissioning of dedicated freight corridors (DFCs) to put brakes on road freight and hence CV
sales
The DFCs are expected to help the Indian Railways regain its lost freight share, by reducing turnaround times
between the importing and consuming destinations. Not only will the DFC induce faster freight movement, but it will
also allow for faster evacuation of cargo from the ports, thereby improving efficiency. In fact, the DFCs and the
associated logistics parks are likely to help industries significantly reduce their plant-level inventory as well,
enabling savings in working capital. Moreover, the shifting of freight to rail will aid the economy by decongesting
major highways.
Thus, the roads segment, which has outperformed rail over the past decade, will lose some share once the DFCs
are commissioned in fiscal 2023.
Within the CV space, Tractor trailers will be the most vulnerable to competition from the railways, following
completion of the eastern and western DFCs. According to CRISIL Research, these routes account for more than
20% of pan-India primary freight in billion tonne kilometre (BTKM) terms. Container traffic (~65% share in the
western corridor) and bulk commodities (~89% share in the eastern corridor) that dominate the freight carried on
the two routes, are expected to shift to railways, affecting M&HCV sales, especially, tractor trailers.
Outlook of the Indian CV industry (between fiscals 2021 and 2026P)
Production outlook (between fiscals 2021 and 2026P)
The domestic CV production is projected to record a 12-14% CAGR between fiscals 2021 and 2026, led by a sharp
10-12% CAGR in the LCV segment and 16-18% CAGR in the M&HCV segment.
However, domestic CV production is expected to register only 7-8% CAGR between fiscals 2022 and 2026, as the
first half of fiscal 2021 was severely impacted by the pandemic leading to low base effect. M&HCV production is
likely to record an 11-12% CAGR; while, the LCV segment is expected to register 5-6% CAGR between fiscals
2022 and 2026.
The production of buses has sharply declined in fiscal 2021, because of low people mobility due to the pandemic.
However, driven by vaccination programs throughout the country, production of buses is projected to rise slowly
from fiscal 2022 onwards, as sales recover on a low base of fiscal 2021. Further, production for goods vehicles is
estimated to record an 11-13% CAGR between fiscals 2021 and 2026.
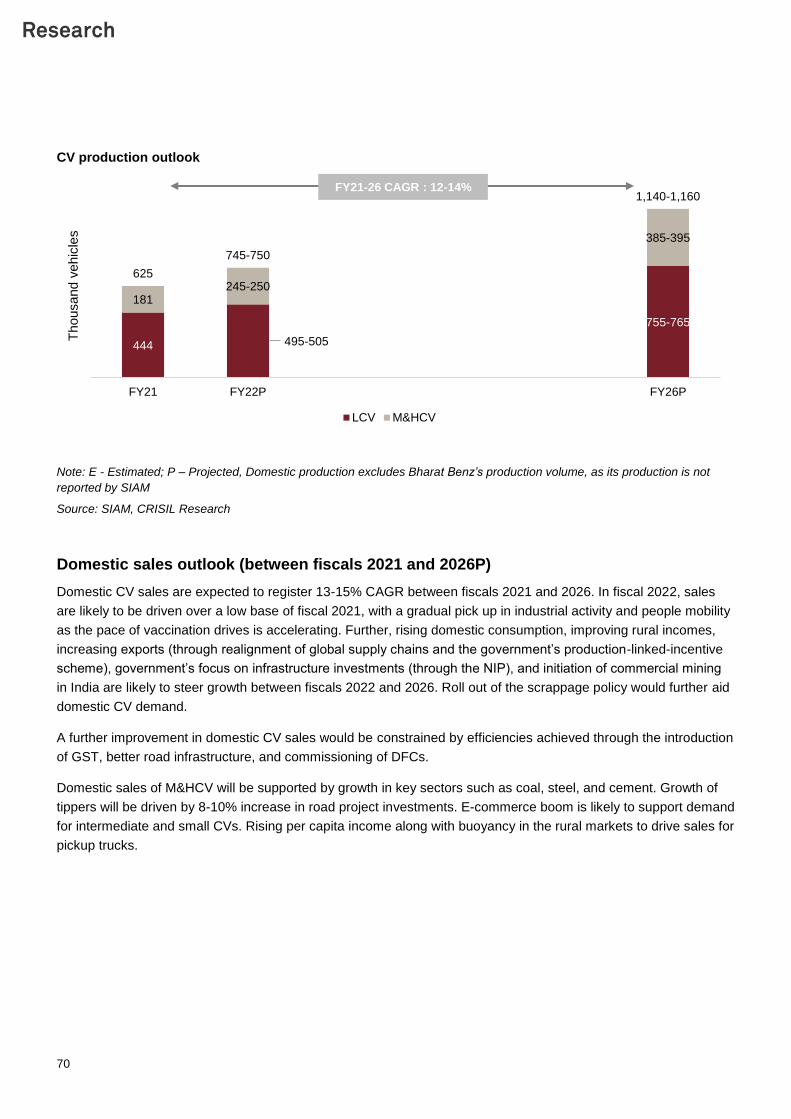
70
CV production outlook
Note: E - Estimated; P – Projected, Domestic production excludes Bharat Benz’s production volume, as its production is not
reported by SIAM
Source: SIAM, CRISIL Research
Domestic sales outlook (between fiscals 2021 and 2026P)
Domestic CV sales are expected to register 13-15% CAGR between fiscals 2021 and 2026. In fiscal 2022, sales
are likely to be driven over a low base of fiscal 2021, with a gradual pick up in industrial activity and people mobility
as the pace of vaccination drives is accelerating. Further, rising domestic consumption, improving rural incomes,
increasing exports (through realignment of global supply chains and the government’s production-linked-incentive
scheme), government’s focus on infrastructure investments (through the NIP), and initiation of commercial mining
in India are likely to steer growth between fiscals 2022 and 2026. Roll out of the scrappage policy would further aid
domestic CV demand.
A further improvement in domestic CV sales would be constrained by efficiencies achieved through the introduction
of GST, better road infrastructure, and commissioning of DFCs.
Domestic sales of M&HCV will be supported by growth in key sectors such as coal, steel, and cement. Growth of
tippers will be driven by 8-10% increase in road project investments. E-commerce boom is likely to support demand
for intermediate and small CVs. Rising per capita income along with buoyancy in the rural markets to drive sales for
pickup trucks.
444 495-505
755-765
181245-250
385-395
625
745-750
1,140-1,160
FY21 FY22P FY26P
Thousand v
ehic
les
LCV M&HCV
FY21-26 CAGR : 12-14%
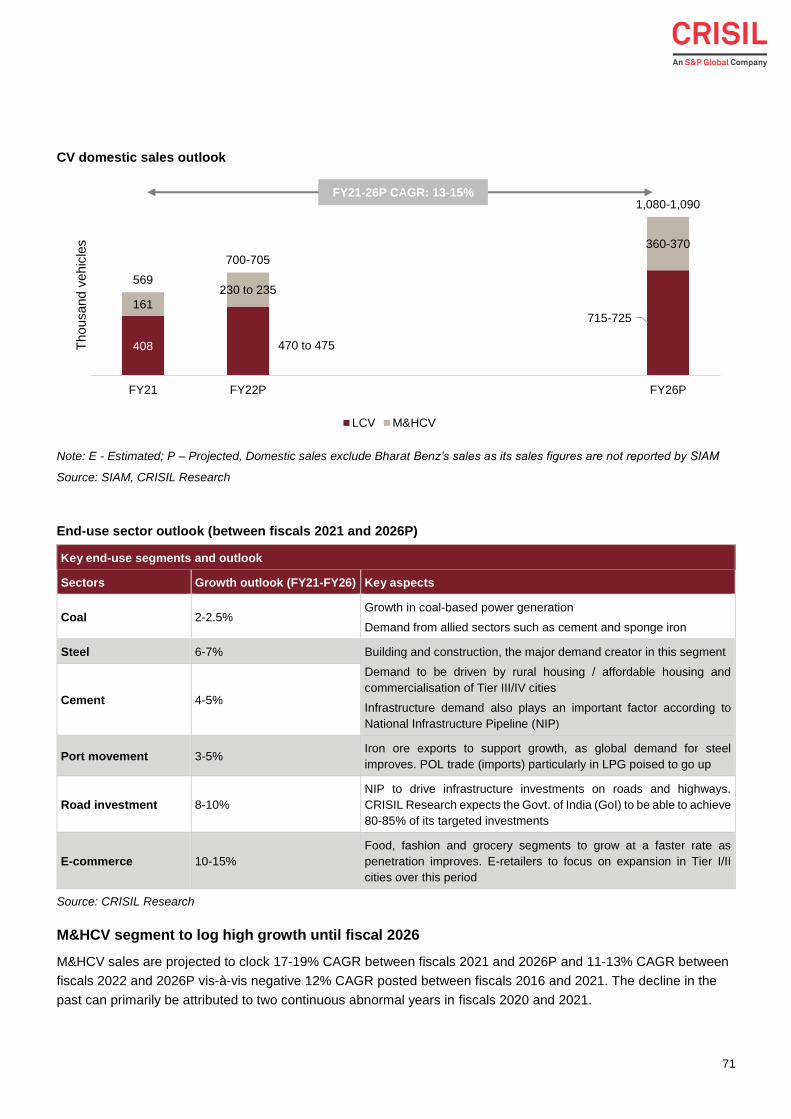
71
CV domestic sales outlook
Note: E - Estimated; P – Projected, Domestic sales exclude Bharat Benz’s sales as its sales figures are not reported by SIAM
Source: SIAM, CRISIL Research
End-use sector outlook (between fiscals 2021 and 2026P)
Key end-use segments and outlook
Sectors Growth outlook (FY21-FY26) Key aspects
Coal 2-2.5% Growth in coal-based power generation
Demand from allied sectors such as cement and sponge iron
Steel 6-7% Building and construction, the major demand creator in this segment
Demand to be driven by rural housing / affordable housing and
commercialisation of Tier III/IV cities
Infrastructure demand also plays an important factor according to
National Infrastructure Pipeline (NIP)
Cement 4-5%
Port movement 3-5% Iron ore exports to support growth, as global demand for steel
improves. POL trade (imports) particularly in LPG poised to go up
Road investment 8-10%
NIP to drive infrastructure investments on roads and highways.
CRISIL Research expects the Govt. of India (GoI) to be able to achieve
80-85% of its targeted investments
E-commerce 10-15%
Food, fashion and grocery segments to grow at a faster rate as
penetration improves. E-retailers to focus on expansion in Tier I/II
cities over this period
Source: CRISIL Research
M&HCV segment to log high growth until fiscal 2026
M&HCV sales are projected to clock 17-19% CAGR between fiscals 2021 and 2026P and 11-13% CAGR between
fiscals 2022 and 2026P vis-à-vis negative 12% CAGR posted between fiscals 2016 and 2021. The decline in the
past can primarily be attributed to two continuous abnormal years in fiscals 2020 and 2021.
408 470 to 475
715-725161
230 to 235
360-370
569
700-705
1,080-1,090
FY21 FY22P FY26P
Thousand v
ehic
les
LCV M&HCV
FY21-26P CAGR: 13-15%
72
Going ahead, improved product mix (i.e. higher growth in MAV and T-Trailer demand, especially in case of newer
high tonnage 4x2 tractor trailers) will lead to better tonnage addition. We, however, note that long-term growth
forecast is over a very low base, with sales in fiscal 2021 being less than half of what they were in fiscal 2019.
Factors driving long-term M&HCV sales include improving industrial activity, steady agricultural output, and the
government’s focus on infrastructure. However, further volume growth will be limited by efficiencies achieved post
introduction of the GST regime and better road infrastructure, along with commissioning of the DFCs.
LCV sales to grow at a modest pace in the long run
LCV demand is expected to record 11-13% CAGR between fiscals 2021 and 2026P, owing to higher private
consumption, low penetration levels providing headroom for growth, greater availability of redistribution freight, and
improved finance availability post fiscal 2021.
Within LCVs, the shift towards pick-ups (which carry higher loads) from sub-one tonne vehicles, though, will curb a
sharper increase in sales volume, as fewer trucks will be required to transport the same quantity. Moreover, upper-
end light commercial vehicles (ULCVs) offer the transporter lower returns, compared with ICVs, and are most
suited for captive use. However, entry restrictions on ICV trucks and higher tonnage MHCVs within city limits are
likely to keep LCV demand buoyant. However, higher toll on ULCV trucks vis-à-vis pick-ups will limit ULCV trucks’
growth.
Bus demand to grow moderately in the long run
CRISIL Research projects domestic bus sales to record 44-46% CAGR between fiscals 2021 and 2026P on a very
low base of fiscal 2021, due to increasing demand for inter-city/-state travel, aided by better road infrastructure, and
higher personal disposable incomes. This unregulated segment primarily caters to demand from schools,
companies and inter-city travel by private operators. A large part of the demand will originate from replacement of
Jawaharlal Nehru National Urban Renewal Mission buses, which were sold during fiscals 2011 and 2012, once
funds are released by the Centre and state governments to purchase the buses. This replacement is expected to
gain pace post fiscal 2021, aiding long-term MCV bus growth. However, further expansion in bus sales would be
affected by the commissioning of metro rails and monorails in several cities.
Split by domestic sales and exports
With exports projected to register 15%-16% CAGR between fiscals 2022 and 2026P, its contribution to overall
production is likely to rise marginally by fiscal 2026 from fiscal 2022. Nevertheless, the Indian CV industry is likely
to remain domestic-focussed, with domestic sales comprising ~93% of production even in fiscal 2026.
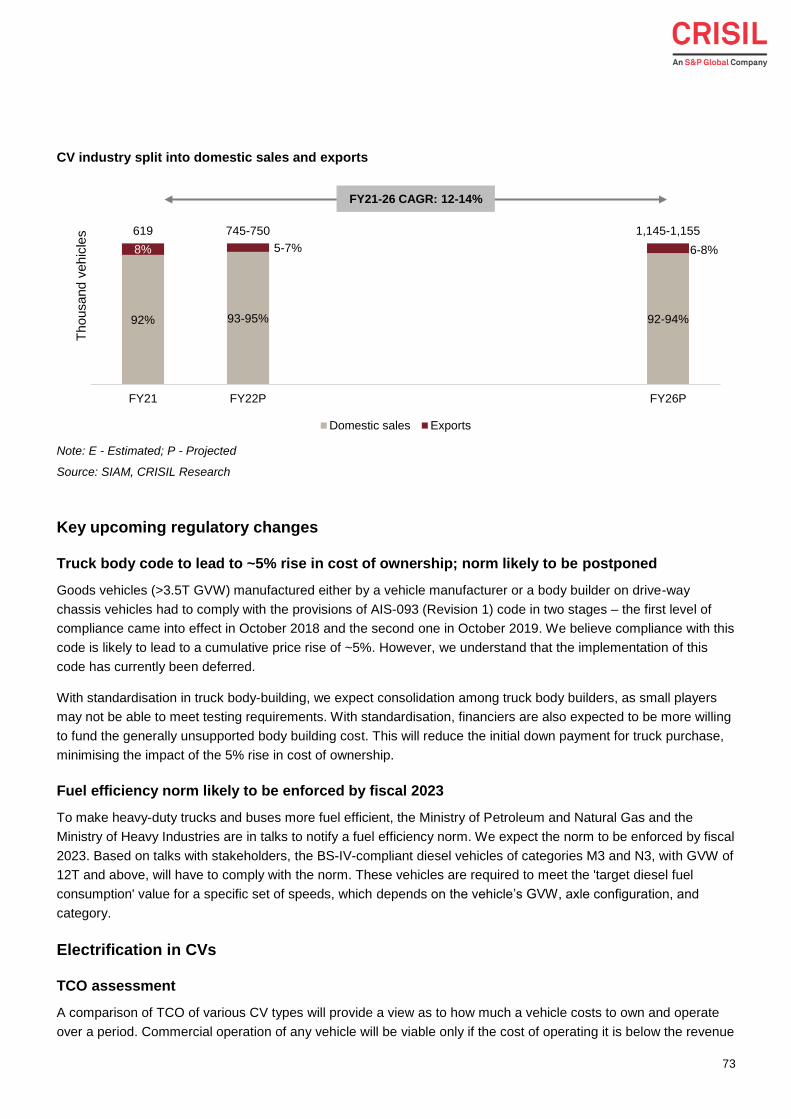
73
CV industry split into domestic sales and exports
Note: E - Estimated; P - Projected
Source: SIAM, CRISIL Research
Key upcoming regulatory changes
Truck body code to lead to ~5% rise in cost of ownership; norm likely to be postponed
Goods vehicles (>3.5T GVW) manufactured either by a vehicle manufacturer or a body builder on drive-way
chassis vehicles had to comply with the provisions of AIS-093 (Revision 1) code in two stages – the first level of
compliance came into effect in October 2018 and the second one in October 2019. We believe compliance with this
code is likely to lead to a cumulative price rise of ~5%. However, we understand that the implementation of this
code has currently been deferred.
With standardisation in truck body-building, we expect consolidation among truck body builders, as small players
may not be able to meet testing requirements. With standardisation, financiers are also expected to be more willing
to fund the generally unsupported body building cost. This will reduce the initial down payment for truck purchase,
minimising the impact of the 5% rise in cost of ownership.
Fuel efficiency norm likely to be enforced by fiscal 2023
To make heavy-duty trucks and buses more fuel efficient, the Ministry of Petroleum and Natural Gas and the
Ministry of Heavy Industries are in talks to notify a fuel efficiency norm. We expect the norm to be enforced by fiscal
2023. Based on talks with stakeholders, the BS-IV-compliant diesel vehicles of categories M3 and N3, with GVW of
12T and above, will have to comply with the norm. These vehicles are required to meet the 'target diesel fuel
consumption' value for a specific set of speeds, which depends on the vehicle’s GVW, axle configuration, and
category.
Electrification in CVs
TCO assessment
A comparison of TCO of various CV types will provide a view as to how much a vehicle costs to own and operate
over a period. Commercial operation of any vehicle will be viable only if the cost of operating it is below the revenue
92% 93-95% 92-94%
8% 5-7% 6-8%
619 745-750 1,145-1,155
FY21 FY22P FY26P
Thousand v
ehic
les
Domestic sales Exports
FY21-26 CAGR: 12-14%
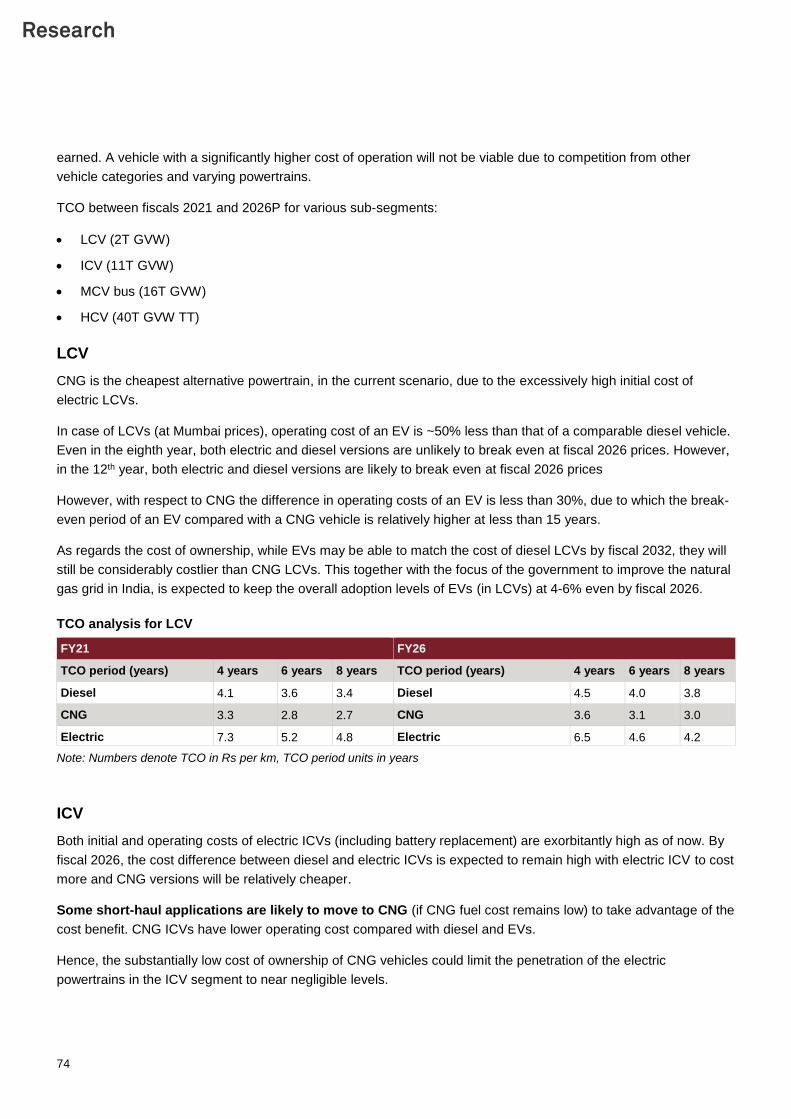
74
earned. A vehicle with a significantly higher cost of operation will not be viable due to competition from other
vehicle categories and varying powertrains.
TCO between fiscals 2021 and 2026P for various sub-segments:
LCV (2T GVW)
ICV (11T GVW)
MCV bus (16T GVW)
HCV (40T GVW TT)
LCV
CNG is the cheapest alternative powertrain, in the current scenario, due to the excessively high initial cost of
electric LCVs.
In case of LCVs (at Mumbai prices), operating cost of an EV is ~50% less than that of a comparable diesel vehicle.
Even in the eighth year, both electric and diesel versions are unlikely to break even at fiscal 2026 prices. However,
in the 12th year, both electric and diesel versions are likely to break even at fiscal 2026 prices
However, with respect to CNG the difference in operating costs of an EV is less than 30%, due to which the break-
even period of an EV compared with a CNG vehicle is relatively higher at less than 15 years.
As regards the cost of ownership, while EVs may be able to match the cost of diesel LCVs by fiscal 2032, they will
still be considerably costlier than CNG LCVs. This together with the focus of the government to improve the natural
gas grid in India, is expected to keep the overall adoption levels of EVs (in LCVs) at 4-6% even by fiscal 2026.
TCO analysis for LCV
FY21 FY26
TCO period (years) 4 years 6 years 8 years TCO period (years) 4 years 6 years 8 years
Diesel 4.1 3.6 3.4 Diesel 4.5 4.0 3.8
CNG 3.3 2.8 2.7 CNG 3.6 3.1 3.0
Electric 7.3 5.2 4.8 Electric 6.5 4.6 4.2
Note: Numbers denote TCO in Rs per km, TCO period units in years
ICV
Both initial and operating costs of electric ICVs (including battery replacement) are exorbitantly high as of now. By
fiscal 2026, the cost difference between diesel and electric ICVs is expected to remain high with electric ICV to cost
more and CNG versions will be relatively cheaper.
Some short-haul applications are likely to move to CNG (if CNG fuel cost remains low) to take advantage of the
cost benefit. CNG ICVs have lower operating cost compared with diesel and EVs.
Hence, the substantially low cost of ownership of CNG vehicles could limit the penetration of the electric
powertrains in the ICV segment to near negligible levels.
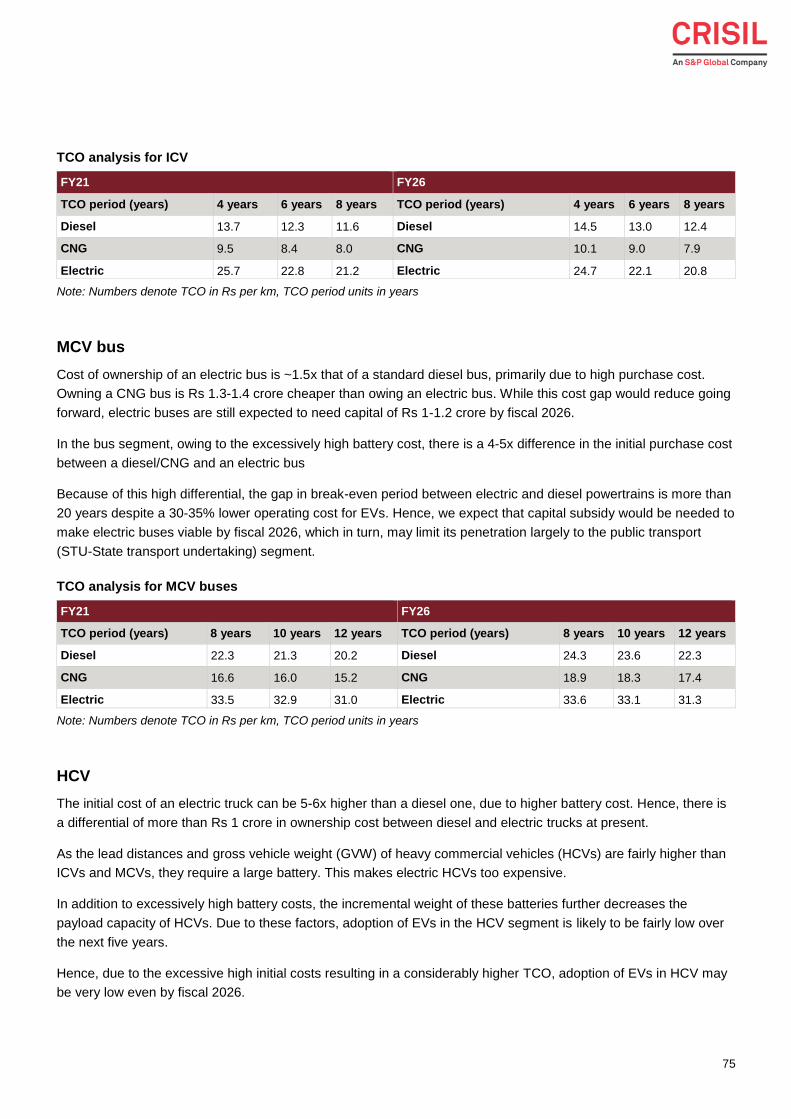
75
TCO analysis for ICV
FY21 FY26
TCO period (years) 4 years 6 years 8 years TCO period (years) 4 years 6 years 8 years
Diesel 13.7 12.3 11.6 Diesel 14.5 13.0 12.4
CNG 9.5 8.4 8.0 CNG 10.1 9.0 7.9
Electric 25.7 22.8 21.2 Electric 24.7 22.1 20.8
Note: Numbers denote TCO in Rs per km, TCO period units in years
MCV bus
Cost of ownership of an electric bus is ~1.5x that of a standard diesel bus, primarily due to high purchase cost.
Owning a CNG bus is Rs 1.3-1.4 crore cheaper than owing an electric bus. While this cost gap would reduce going
forward, electric buses are still expected to need capital of Rs 1-1.2 crore by fiscal 2026.
In the bus segment, owing to the excessively high battery cost, there is a 4-5x difference in the initial purchase cost
between a diesel/CNG and an electric bus
Because of this high differential, the gap in break-even period between electric and diesel powertrains is more than
20 years despite a 30-35% lower operating cost for EVs. Hence, we expect that capital subsidy would be needed to
make electric buses viable by fiscal 2026, which in turn, may limit its penetration largely to the public transport
(STU-State transport undertaking) segment.
TCO analysis for MCV buses
FY21 FY26
TCO period (years) 8 years 10 years 12 years TCO period (years) 8 years 10 years 12 years
Diesel 22.3 21.3 20.2 Diesel 24.3 23.6 22.3
CNG 16.6 16.0 15.2 CNG 18.9 18.3 17.4
Electric 33.5 32.9 31.0 Electric 33.6 33.1 31.3
Note: Numbers denote TCO in Rs per km, TCO period units in years
HCV
The initial cost of an electric truck can be 5-6x higher than a diesel one, due to higher battery cost. Hence, there is
a differential of more than Rs 1 crore in ownership cost between diesel and electric trucks at present.
As the lead distances and gross vehicle weight (GVW) of heavy commercial vehicles (HCVs) are fairly higher than
ICVs and MCVs, they require a large battery. This makes electric HCVs too expensive.
In addition to excessively high battery costs, the incremental weight of these batteries further decreases the
payload capacity of HCVs. Due to these factors, adoption of EVs in the HCV segment is likely to be fairly low over
the next five years.
Hence, due to the excessive high initial costs resulting in a considerably higher TCO, adoption of EVs in HCV may
be very low even by fiscal 2026.
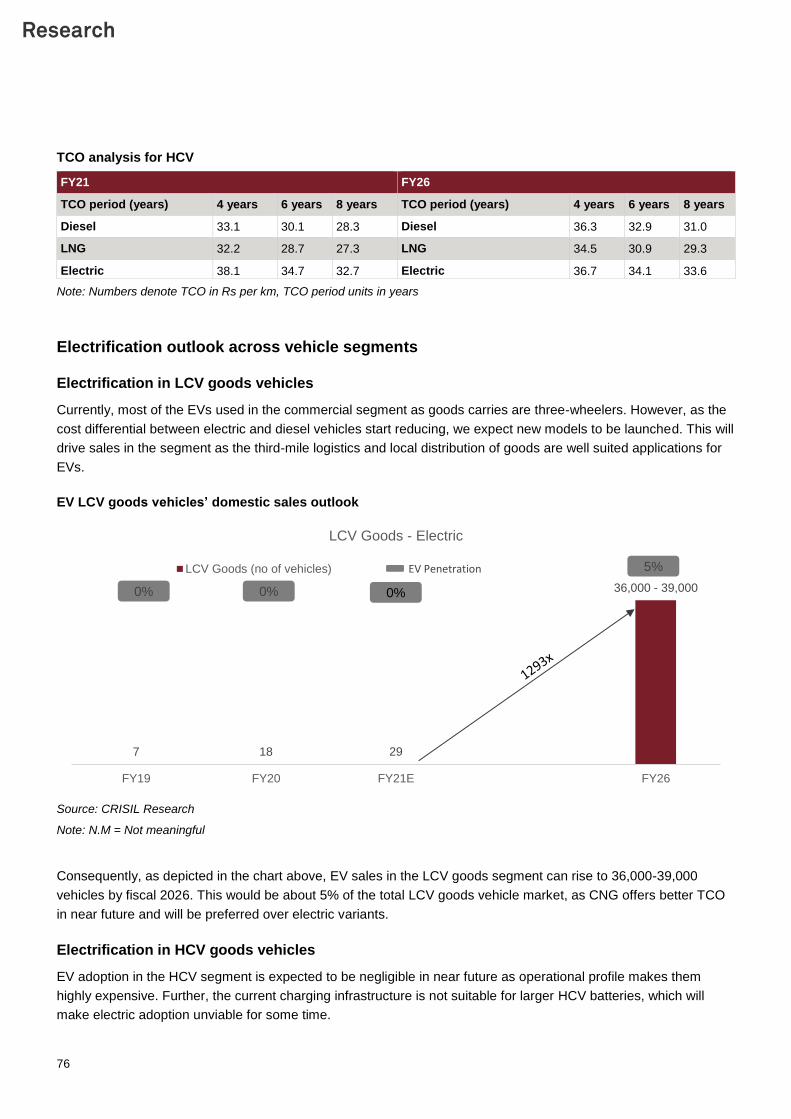
76
TCO analysis for HCV
FY21 FY26
TCO period (years) 4 years 6 years 8 years TCO period (years) 4 years 6 years 8 years
Diesel 33.1 30.1 28.3 Diesel 36.3 32.9 31.0
LNG 32.2 28.7 27.3 LNG 34.5 30.9 29.3
Electric 38.1 34.7 32.7 Electric 36.7 34.1 33.6
Note: Numbers denote TCO in Rs per km, TCO period units in years
Electrification outlook across vehicle segments
Electrification in LCV goods vehicles
Currently, most of the EVs used in the commercial segment as goods carries are three-wheelers. However, as the
cost differential between electric and diesel vehicles start reducing, we expect new models to be launched. This will
drive sales in the segment as the third-mile logistics and local distribution of goods are well suited applications for
EVs.
EV LCV goods vehicles’ domestic sales outlook
Source: CRISIL Research
Note: N.M = Not meaningful
Consequently, as depicted in the chart above, EV sales in the LCV goods segment can rise to 36,000-39,000
vehicles by fiscal 2026. This would be about 5% of the total LCV goods vehicle market, as CNG offers better TCO
in near future and will be preferred over electric variants.
Electrification in HCV goods vehicles
EV adoption in the HCV segment is expected to be negligible in near future as operational profile makes them
highly expensive. Further, the current charging infrastructure is not suitable for larger HCV batteries, which will
make electric adoption unviable for some time.
7 18 29
36,000 - 39,000
FY19 FY20 FY21E FY26
LCV Goods - Electric
LCV Goods (no of vehicles) EV Penetration
0% 0%
5%
0%
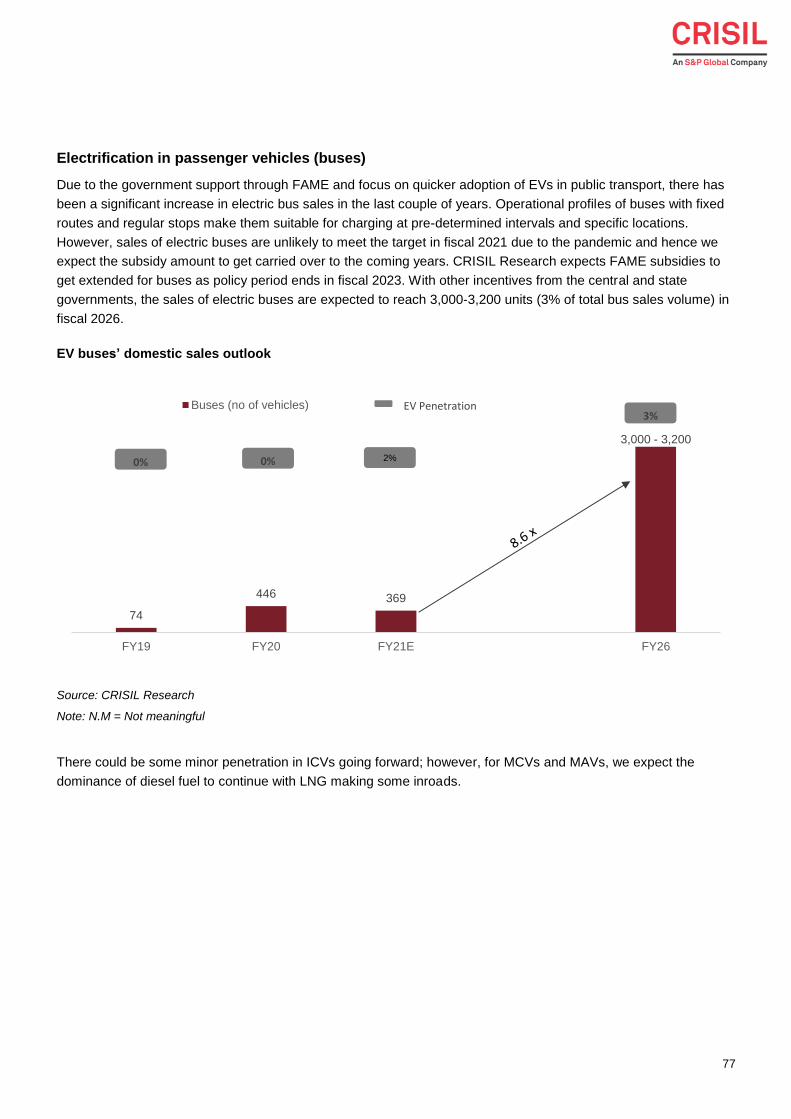
77
Electrification in passenger vehicles (buses)
Due to the government support through FAME and focus on quicker adoption of EVs in public transport, there has
been a significant increase in electric bus sales in the last couple of years. Operational profiles of buses with fixed
routes and regular stops make them suitable for charging at pre-determined intervals and specific locations.
However, sales of electric buses are unlikely to meet the target in fiscal 2021 due to the pandemic and hence we
expect the subsidy amount to get carried over to the coming years. CRISIL Research expects FAME subsidies to
get extended for buses as policy period ends in fiscal 2023. With other incentives from the central and state
governments, the sales of electric buses are expected to reach 3,000-3,200 units (3% of total bus sales volume) in
fiscal 2026.
EV buses’ domestic sales outlook
Source: CRISIL Research
Note: N.M = Not meaningful
There could be some minor penetration in ICVs going forward; however, for MCVs and MAVs, we expect the
dominance of diesel fuel to continue with LNG making some inroads.
74
446 369
3,000 - 3,200
FY19 FY20 FY21E FY26
Buses (no of vehicles) EV Penetration
0% 0%
3%
2%
78
6 Automobile dealership industry in India
Dealership forms an intrinsic part of the automobile sector playing the role of an intermediary between the
customers and the manufacturers. The dealership plays an indispensable role in the overall vehicle supply chain
providing local vehicle distribution channel based on a contract with an automaker. It also plays a key role in the
aftermarket space by providing maintenance services and supplying spares/automotive parts as well as
accessories.
From manufacturers’ perspective, dealers play the crucial role of retail distribution at regional, city and local leve ls
and also provide manufacturers with customer insights that are very useful in the production planning of
manufacturers.
Dealers support customers from the initial phase with guidance for vehicle selection and also assist in the
necessary vehicle financing. They facilitate a smooth transfer of vehicle from manufacturer to customer, assisting in
registration and required insurance formalities. Additionally, the dealers also provide required support for
accessorising and vehicle customisation.
For financial institutions, dealerships provide a huge business opportunity in the form of retail finance as well as
inventory funding. Even for insurance providers, dealerships act as an easy avenue of new customer acquisitions.
A dealership is a one-stop shop for all the below requirements:
Buying a new vehicle
Vehicle repair & servicing
Regular maintenance/ AMC
Buying necessary spares/ lubricants
Vehicle accident repair
Buying a pre-owned vehicle
Selling/ exchanging the old vehicle
Availing required financing
Buying vehicle insurance
Renewing vehicle insurance
Vehicle registration
Vehicle customisation/ beautification
Buying accessories
Insurance claims (for accident repair)
Availing additional services such as anti-rust coating, paint protection, interior clean up, etc.
There are more than 17,000 dealerships with nearly 27,000 touchpoints across India catering to customers of two-
wheelers, passenger vehicles, CVs, three-wheelers and tractors. These dealerships employ 4-4.5 million people at
sales outlets and associated service centres combined.
79
Two-wheelers dominate the number of dealerships with nearly 60% share, followed by the passenger vehicles
segment with ~15% share and CVs forming another ~10%. The remaining is formed by three-wheelers and tractor
dealers. Presence of three-wheelers and tractor distributorships is relatively limited.
Dealership scenario in India
In India, a typical dealer is associated with one or more manufacturers across vehicle segments: CVs, PVs, two-
wheelers, three-wheelers & tractors. While smaller dealers associate with one particular manufacturer of a single
vehicle segment, larger dealers associate with multiple manufacturers across segments, diversifying their
investments. For instance, a large dealer can be associated with 1-2 PV manufacturers, 1-2 CV manufacturers and
one two-wheeler manufacturer, subject to the trading agreements with the OEMs.
Dealers normally have three types of outlets: sales-service-spares (3S), only sales (1S), and only workshops. Most
large dealers have multiple outlets or touch points with a few 3S outlets and many workshops/ service stations
across the city. They also have a large sub-dealer network that works under the umbrella dealership and caters to
smaller semi-urban/ rural areas nearby. A few dealers also have ARDs (authorised representative of the dealer)
that provide the minimal required services to customers in rural areas. ARDs are more prominent in the two-
wheeler segment.
For PV dealers, the main dealer has a few 3S dealership outlets in major cities, complemented by a large number
of workshops catering to service and maintenance demand. Moreover, PV dealers also have an affiliated OEM
franchised dealership for pre-owned vehicles like True Value, H-Promise, U Trust, etc.
CV dealers typically have their 3S dealerships outside the city, while the smaller, only sales outlets (especially for
LCVs) are located within the city. They also have a large number of workshops on the major highways providing
service support. Separate affiliated pre-owned vehicle dealerships are not common in the CV segment.
Small dealers normally have 1-3 sales outlets and 2-4 workshops in one particular city or town. Large dealers have
10-15 outlets in multiple cities across 1-2 states, with 20-40 service outlets and a network of sub-dealers.
Larger dealerships offer significant advantages and better profitability to dealers in terms of economies of scale,
better OE negotiations, increased workshop revenue, better insurance finance deals as well as higher customer
retention. (These advantages have been discussed in detail in subsequent chapters).
However, dealers are not able to expand exponentially in a short span of time, given the very high investment
required to open a dealership as well as due to the agreement conditions set by manufacturers. Manufacturers
expand their dealerships mainly on the basis of the estimated market potential and their market share goals and
typically do not allow unrestrained dealership expansion.
That leaves consolidation as the primary source of business expansion for the dealers. Consolidation is achieved
by acquiring smaller dealerships as well as obtaining the dealership code from a defunct dealership.
Currently there are only a handful of very large dealerships in India with 100+ outlets and a presence across 4-5
states. Compared with global dealership giants like Penske Automotive ( ~320 dealerships across the US & the
UK), Carvana Motors ( ~270 dealerships across the US), Lithia Motors ( ~210 dealerships), Group 1 automotive (
~ 185 dealerships across the US, the UK and Brazil) , Indian dealerships are still in the development stages with
significant room for expansion. Their large size help global dealerships expand their topline as well as bottomline
revenue, earning a few billion USD in revenue and 8-12% in gross profits.
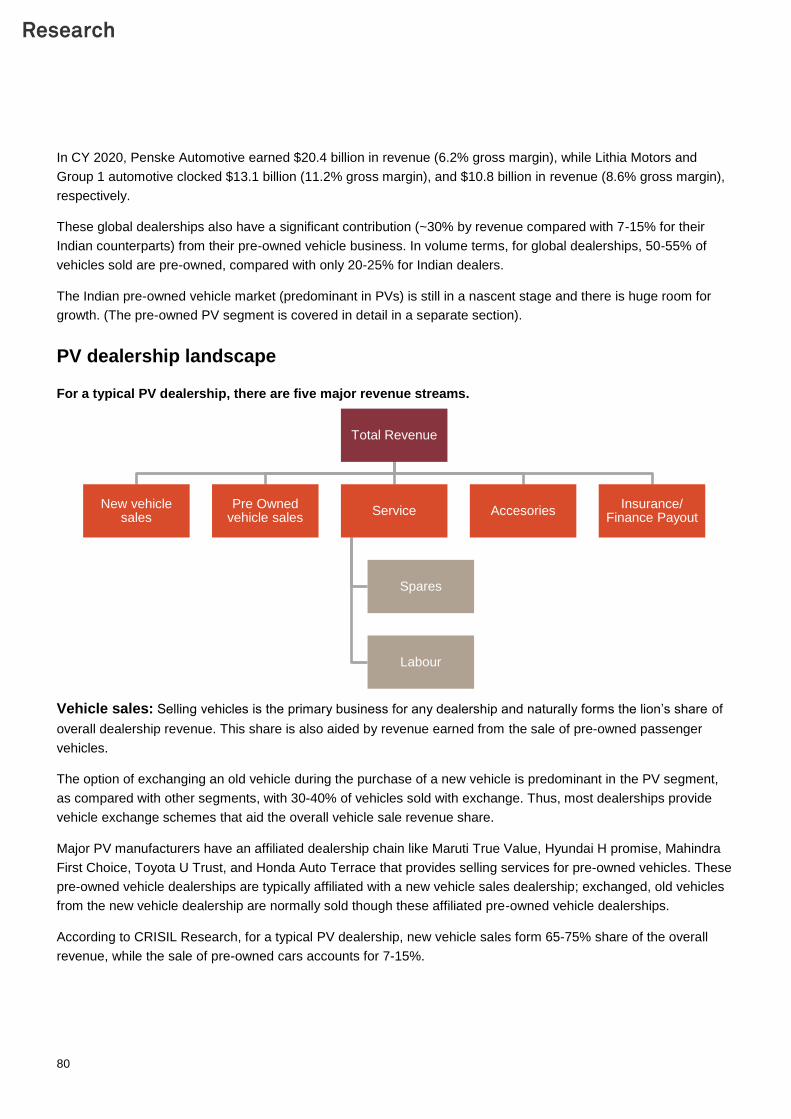
80
In CY 2020, Penske Automotive earned $20.4 billion in revenue (6.2% gross margin), while Lithia Motors and
Group 1 automotive clocked $13.1 billion (11.2% gross margin), and $10.8 billion in revenue (8.6% gross margin),
respectively.
These global dealerships also have a significant contribution (~30% by revenue compared with 7-15% for their
Indian counterparts) from their pre-owned vehicle business. In volume terms, for global dealerships, 50-55% of
vehicles sold are pre-owned, compared with only 20-25% for Indian dealers.
The Indian pre-owned vehicle market (predominant in PVs) is still in a nascent stage and there is huge room for
growth. (The pre-owned PV segment is covered in detail in a separate section).
PV dealership landscape
For a typical PV dealership, there are five major revenue streams.
Vehicle sales: Selling vehicles is the primary business for any dealership and naturally forms the lion’s share of
overall dealership revenue. This share is also aided by revenue earned from the sale of pre-owned passenger
vehicles.
The option of exchanging an old vehicle during the purchase of a new vehicle is predominant in the PV segment,
as compared with other segments, with 30-40% of vehicles sold with exchange. Thus, most dealerships provide
vehicle exchange schemes that aid the overall vehicle sale revenue share.
Major PV manufacturers have an affiliated dealership chain like Maruti True Value, Hyundai H promise, Mahindra
First Choice, Toyota U Trust, and Honda Auto Terrace that provides selling services for pre-owned vehicles. These
pre-owned vehicle dealerships are typically affiliated with a new vehicle sales dealership; exchanged, old vehicles
from the new vehicle dealership are normally sold though these affiliated pre-owned vehicle dealerships.
According to CRISIL Research, for a typical PV dealership, new vehicle sales form 65-75% share of the overall
revenue, while the sale of pre-owned cars accounts for 7-15%.
Total Revenue
New vehicle sales
Pre Owned vehicle sales
Service
Spares
Labour
AccesoriesInsurance/
Finance Payout
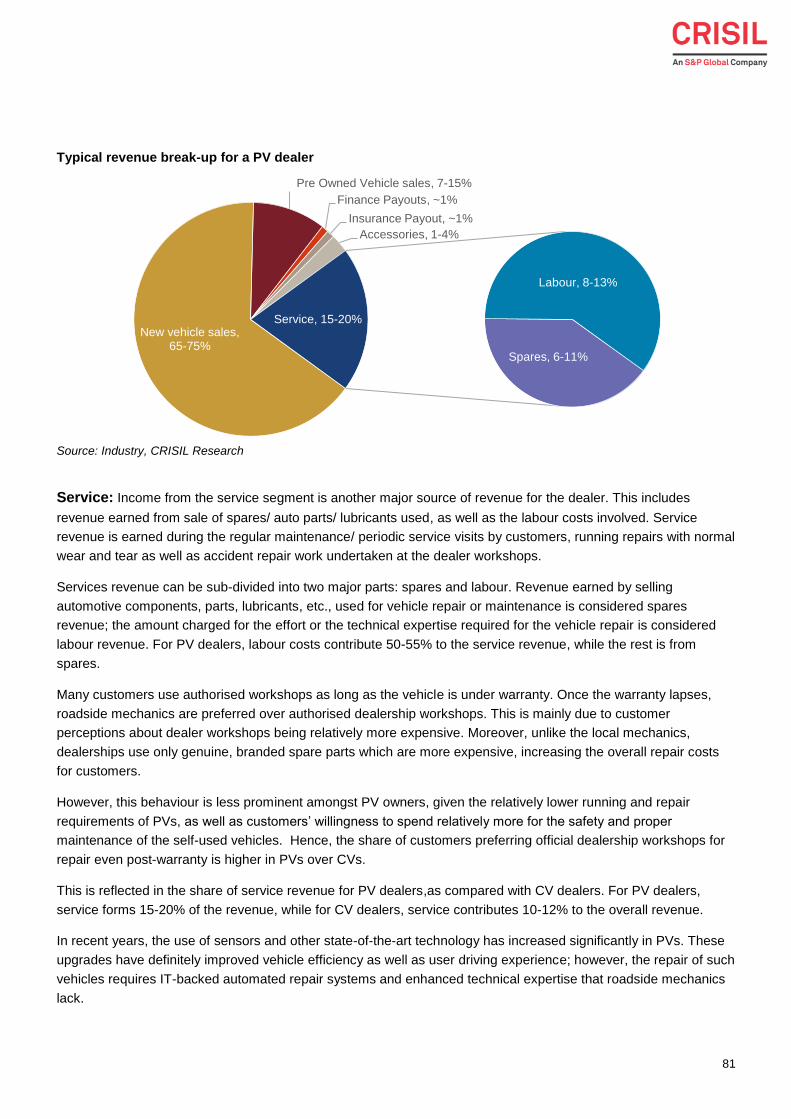
81
Typical revenue break-up for a PV dealer
Source: Industry, CRISIL Research
Service: Income from the service segment is another major source of revenue for the dealer. This includes
revenue earned from sale of spares/ auto parts/ lubricants used, as well as the labour costs involved. Service
revenue is earned during the regular maintenance/ periodic service visits by customers, running repairs with normal
wear and tear as well as accident repair work undertaken at the dealer workshops.
Services revenue can be sub-divided into two major parts: spares and labour. Revenue earned by selling
automotive components, parts, lubricants, etc., used for vehicle repair or maintenance is considered spares
revenue; the amount charged for the effort or the technical expertise required for the vehicle repair is considered
labour revenue. For PV dealers, labour costs contribute 50-55% to the service revenue, while the rest is from
spares.
Many customers use authorised workshops as long as the vehicle is under warranty. Once the warranty lapses,
roadside mechanics are preferred over authorised dealership workshops. This is mainly due to customer
perceptions about dealer workshops being relatively more expensive. Moreover, unlike the local mechanics,
dealerships use only genuine, branded spare parts which are more expensive, increasing the overall repair costs
for customers.
However, this behaviour is less prominent amongst PV owners, given the relatively lower running and repair
requirements of PVs, as well as customers’ willingness to spend relatively more for the safety and proper
maintenance of the self-used vehicles. Hence, the share of customers preferring official dealership workshops for
repair even post-warranty is higher in PVs over CVs.
This is reflected in the share of service revenue for PV dealers,as compared with CV dealers. For PV dealers,
service forms 15-20% of the revenue, while for CV dealers, service contributes 10-12% to the overall revenue.
In recent years, the use of sensors and other state-of-the-art technology has increased significantly in PVs. These
upgrades have definitely improved vehicle efficiency as well as user driving experience; however, the repair of such
vehicles requires IT-backed automated repair systems and enhanced technical expertise that roadside mechanics
lack.
New vehicle sales, 65-75%
Pre Owned Vehicle sales, 7-15%
Finance Payouts, ~1%
Insurance Payout, ~1%
Accessories, 1-4%
Spares, 6-11%
Labour, 8-13%
Service, 15-20%
82
CRISIL Research expects the share of revenue from services to expand going forward on the back of the increased
requirement for technical expertise as well as supporting repair infrastructure to repair the latest advanced vehicles
that only dealerships can provide.
Accessories: For a PV owner, parking sensor/camera, GPS/ navigation system, LED headlamps, music system,
speakers, seat covers, floor mats, car cover, wheel covers, air fresheners, tyre inflators, etc., form part of the
requisite accessories list. Depending on the vehicle and the variant, a few of these accessories come pre-installed/
packaged with the car price. However, for most vehicles, many of these have to be bought separately. All PV
dealers provide a collection of such accessories at their showrooms.
Moreover, dealers also provide a few value-added services like:
Sunscreen film
Anti-rust coating
Under body coating
Rodent repellent
Ceramic coating
Fumigation
Upholstery cleaning
AC cleaning and disinfecting
Paint/ polish protection
Windscreen treatment
Headlight/taillight treatment
Sale of these accessories and value-added services provides an additional source of revenue for the dealers. The
revenue from accessories typically forms 1-4% of the overall revenue for PV dealers. Value-added services are
also are very high in terms of margins.
Finance payouts: Financing is an integral part of vehicle purchase. For the PV segment, finance penetration is
between 75-80%. PV dealers facilitate easy financing for their customers through tie-ups with various PSU banks
and NBFCs. Representatives of these financial institutions are stationed in the dealerships and help customers
avail financing for their vehicle purchase.
For every financing deal done from his dealership, the dealer receives a percentage of the financed amount as his
commission or finance payout, which forms part of his overall revenue. From 0.5% of the financed amount, larger
dealers can even earn commissions up to 3% of the financed amount.
These finance payouts contribute nearly 1% to the dealer’s revenue.
Insurance payouts: When purchasing a new vehicle, the Motor Vehicles Act mandates customers to avail
vehicle insurance for the safety of the vehicle, the customer as well as any third party involved in case of an
accident.
To comply with the same, dealers provide support to customers through various insurance schemes offered by
insurance companies registered with the Insurance Regulatory and Development Authority (IRDA). Normally, more
than 90% of the customers avail insurance through dealers while purchasing a new car. Moreover, most customers
83
get their insurance renewed from the dealers after the expiry of initial coverage, providing another fillip to dealer
revenue, especially for larger dealers who have a significant vintage. Currently, customers have to renew their
insurance coverage every year.
In line with finance pay outs, dealers also earn a percentage of premium as a commission from the vehicle
insurance done at their dealerships. Larger dealers can even get up to 19.5% of premium as a commission. These
commissions form ~1% of dealers’ overall revenue.
Dealer additions
PV dealerships form ~15% of overall dealerships in India and contribute to ~20% of the overall touchpoints.
Primary PV dealerships are typically based out of large cities with multiple outlets throughout the city and a sub-
dealer network covering nearby semi-urban and rural areas. All the multiple outlets and sub-dealers work under the
umbrella dealership where the primary dealership handles overall ordering and procurement.
Dealerships are allotted by manufacturers based on their coverage of that region, mapping of the competition,
expected retail sales and their market share goals. Dealer expansion is primarily done taking into account the
macroeconomic environment and the future growth prospects of the industry. Manufacturers also introduce
dealerships in line with their long-term goals.
On the other hand, manufacturers also face dealer closures due to unfavourable market conditions, lack of financial
discipline, especially among smaller dealers, as well as some extenuating circumstances making the dealership
unviable. In such cases, manufacturers also take corrective actions with the introduction of new dealers in that area
to maintain their coverage.
After the financial crisis of fiscal 2008, the domestic PV industry registered a healthy expansion from fiscal 2009 to
2010. In line with the increased demand, manufacturers expanded their dealership network at a fast pace during
that time period, also backed by high GDP growth of 8-8.5% y-o-y. During fiscal 2012 to 2014, dealer additions
slowed down in sync with the tapered economic growth.
From fiscal 2015, dealer additions picked up pace, backed by improvement in economic growth, with Maruti
providing the major growth impetus. In 2015, Maruti introduced NEXA, a new network of dealerships for its
premium cars- the S-Cross, Baleno, Ciaz and Ignis. The company undertook the expansion of this new network
over the next few years. This addition was on top of MSIL’s normal dealership network, rebranded as ARENA.
Moreover, other manufacturers like Tata Motors also expanded their dealership network in a bid to push their
newly-launched models, accelerating dealership expansion to 10-12% CAGR during fiscal 2016 to 2018.
In fiscal 2018, General Motors wound up its India operations and closed its nearly 300 dealerships. However, about
250 of those dealerships were reattached to other manufacturers over a 1-2 year period.
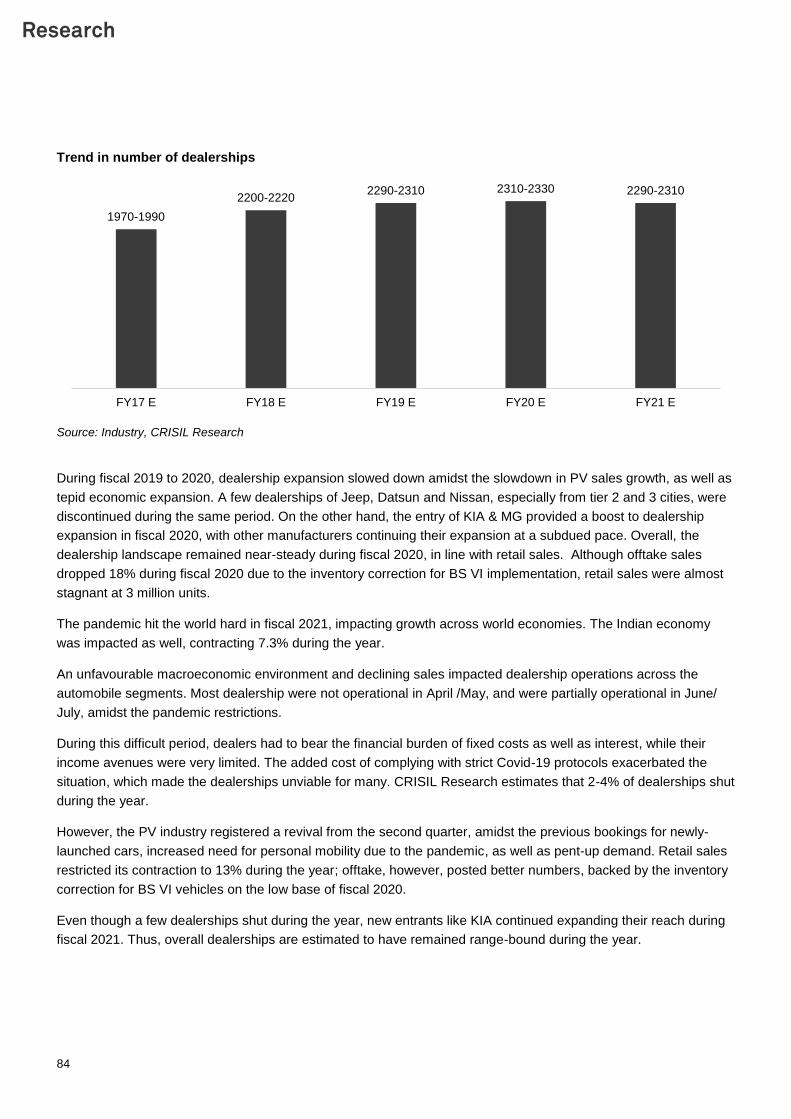
84
Trend in number of dealerships
Source: Industry, CRISIL Research
During fiscal 2019 to 2020, dealership expansion slowed down amidst the slowdown in PV sales growth, as well as
tepid economic expansion. A few dealerships of Jeep, Datsun and Nissan, especially from tier 2 and 3 cities, were
discontinued during the same period. On the other hand, the entry of KIA & MG provided a boost to dealership
expansion in fiscal 2020, with other manufacturers continuing their expansion at a subdued pace. Overall, the
dealership landscape remained near-steady during fiscal 2020, in line with retail sales. Although offtake sales
dropped 18% during fiscal 2020 due to the inventory correction for BS VI implementation, retail sales were almost
stagnant at 3 million units.
The pandemic hit the world hard in fiscal 2021, impacting growth across world economies. The Indian economy
was impacted as well, contracting 7.3% during the year.
An unfavourable macroeconomic environment and declining sales impacted dealership operations across the
automobile segments. Most dealership were not operational in April /May, and were partially operational in June/
July, amidst the pandemic restrictions.
During this difficult period, dealers had to bear the financial burden of fixed costs as well as interest, while their
income avenues were very limited. The added cost of complying with strict Covid-19 protocols exacerbated the
situation, which made the dealerships unviable for many. CRISIL Research estimates that 2-4% of dealerships shut
during the year.
However, the PV industry registered a revival from the second quarter, amidst the previous bookings for newly-
launched cars, increased need for personal mobility due to the pandemic, as well as pent-up demand. Retail sales
restricted its contraction to 13% during the year; offtake, however, posted better numbers, backed by the inventory
correction for BS VI vehicles on the low base of fiscal 2020.
Even though a few dealerships shut during the year, new entrants like KIA continued expanding their reach during
fiscal 2021. Thus, overall dealerships are estimated to have remained range-bound during the year.
1970-1990
2200-22202290-2310 2310-2330 2290-2310
FY17 E FY18 E FY19 E FY20 E FY21 E
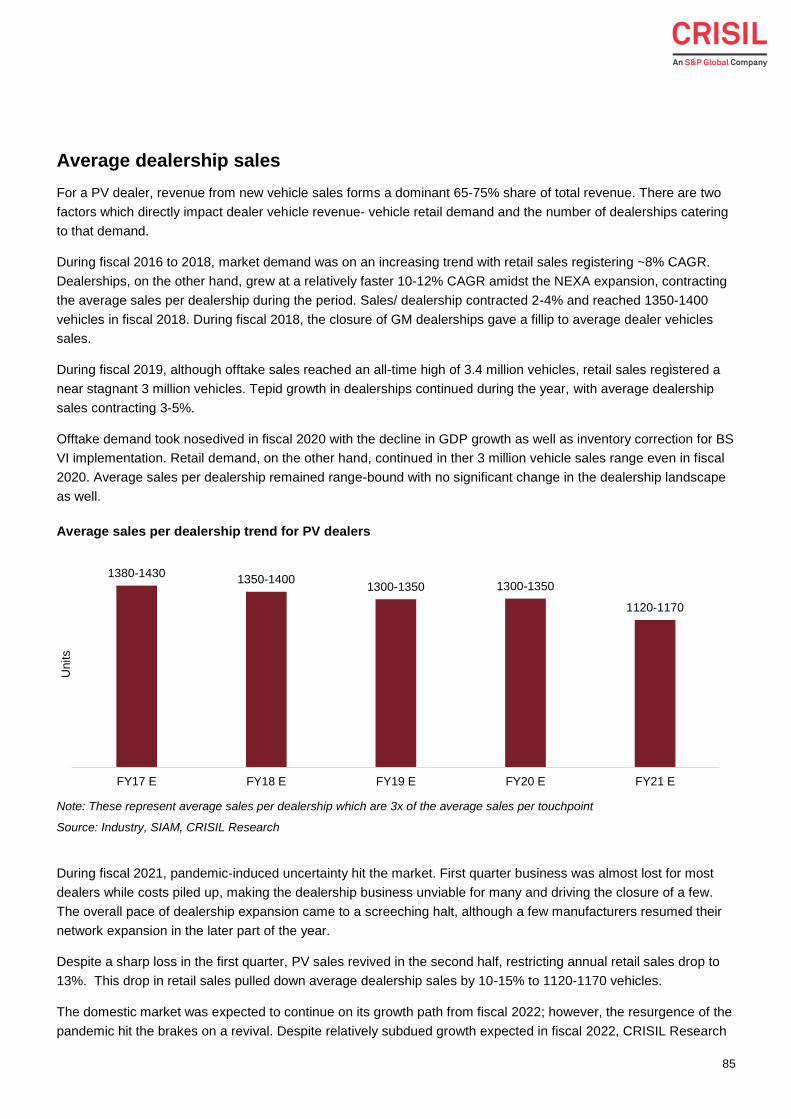
85
Average dealership sales
For a PV dealer, revenue from new vehicle sales forms a dominant 65-75% share of total revenue. There are two
factors which directly impact dealer vehicle revenue- vehicle retail demand and the number of dealerships catering
to that demand.
During fiscal 2016 to 2018, market demand was on an increasing trend with retail sales registering ~8% CAGR.
Dealerships, on the other hand, grew at a relatively faster 10-12% CAGR amidst the NEXA expansion, contracting
the average sales per dealership during the period. Sales/ dealership contracted 2-4% and reached 1350-1400
vehicles in fiscal 2018. During fiscal 2018, the closure of GM dealerships gave a fillip to average dealer vehicles
sales.
During fiscal 2019, although offtake sales reached an all-time high of 3.4 million vehicles, retail sales registered a
near stagnant 3 million vehicles. Tepid growth in dealerships continued during the year, with average dealership
sales contracting 3-5%.
Offtake demand took nosedived in fiscal 2020 with the decline in GDP growth as well as inventory correction for BS
VI implementation. Retail demand, on the other hand, continued in ther 3 million vehicle sales range even in fiscal
2020. Average sales per dealership remained range-bound with no significant change in the dealership landscape
as well.
Average sales per dealership trend for PV dealers
Note: These represent average sales per dealership which are 3x of the average sales per touchpoint
Source: Industry, SIAM, CRISIL Research
During fiscal 2021, pandemic-induced uncertainty hit the market. First quarter business was almost lost for most
dealers while costs piled up, making the dealership business unviable for many and driving the closure of a few.
The overall pace of dealership expansion came to a screeching halt, although a few manufacturers resumed their
network expansion in the later part of the year.
Despite a sharp loss in the first quarter, PV sales revived in the second half, restricting annual retail sales drop to
13%. This drop in retail sales pulled down average dealership sales by 10-15% to 1120-1170 vehicles.
The domestic market was expected to continue on its growth path from fiscal 2022; however, the resurgence of the
pandemic hit the brakes on a revival. Despite relatively subdued growth expected in fiscal 2022, CRISIL Research
1380-14301350-1400
1300-1350 1300-1350
1120-1170
FY17 E FY18 E FY19 E FY20 E FY21 E
Units
86
expects the market to rebound in the long run and clock 10-12% CAGR from fiscal 2021 levels (2.7 million) to reach
~4.5 million by fiscal 26.
Going forward, dealership additions are expected to be in sync with economic growth as well as the estimated
growth in PV sales. New entrants are expected to continue their network expansion, especially in tier 2/ tier 3 cities,
while dealership expansion for established players is expected to remain relatively subdued, providing a push to
average sales per dealerships levels in the long term.
Dealer profitability
Margins received from the revenue segments vary significantly. Although vehicle sales dominate overall revenue,
returns from the same are among the lowest; on the other hand, service /spares and accessories sales form a
relatively smaller share of total revenue but their contribution to overall profits is significant.
Deep dive into the profitability of each revenue segment:
New vehicle sales: The margin earned by the dealer from new vehicle sales is the per vehicle margin paid by
the manufacturer to the dealer. Manufacturers pay dealers a percentage of the vehicle price as a fixed margin.
While this margin is decided by the manufacturer and is similar for all the dealers of that particular manufacturer
across India, it does vary from manufacturer to manufacturer.
Typically, luxury PV manufacturers offer relatively higher margins to their dealers, given the limited demand for
luxury vehicles in India as well as the extravagant buying experience provided by the dealers.
For PVs, the per vehicle sales margin hovers around 2-4%, varying marginally from manufacturer to
manufacturer. Luxury PV manufacturers provide a relatively higher margin of 5-7% per vehicle.
Over and above this per vehicle margin, manufacturers also offer added incentives to dealers, based on the
dealer’s performance, the quantum of the vehicles sold by the dealer, target completion, manufacturer market
share goals, seasonality, etc. These incentives vary from region to region as well as from dealer to dealer.
For a well-established large dealer, these incentives can provide an additional margin of 3-5% per vehicle,
taking the overall margin achieved per vehicle to 6-8% for a normal PV dealer. A luxury vehicle dealer can
achieve a 10-12% per vehicle margin, including incentives.
Pre-owned vehicle sales: The pre-owned vehicle sales segment is more common in the PV segment, as
compared with CVs. Most manufacturers offer exchange schemes at their new vehicle sales outlets.
The pre-owned vehicles received in exchange are typically routed to their pre-owned vehicle sales arms like
True Value, First Choice, U Trust, Auto Terrace, H Promise, etc., where the old vehicles are refurbished and
sold to customers.
Margins in the pre-owned vehicle sales segment vary significantly from vehicle to vehicle, depending on the
vintage and the state of the vehicle being sold. It also depends on the original make of the vehicle. Even in the
pre-owned vehicle market, a few brands enjoy higher traction while others are normally avoided. Although
these notions are primarily based only on customer brand perceptions, they play a sizeable role in pre-owned
vehicle price negotiations.
Margins in this segment vary from 5-15%.
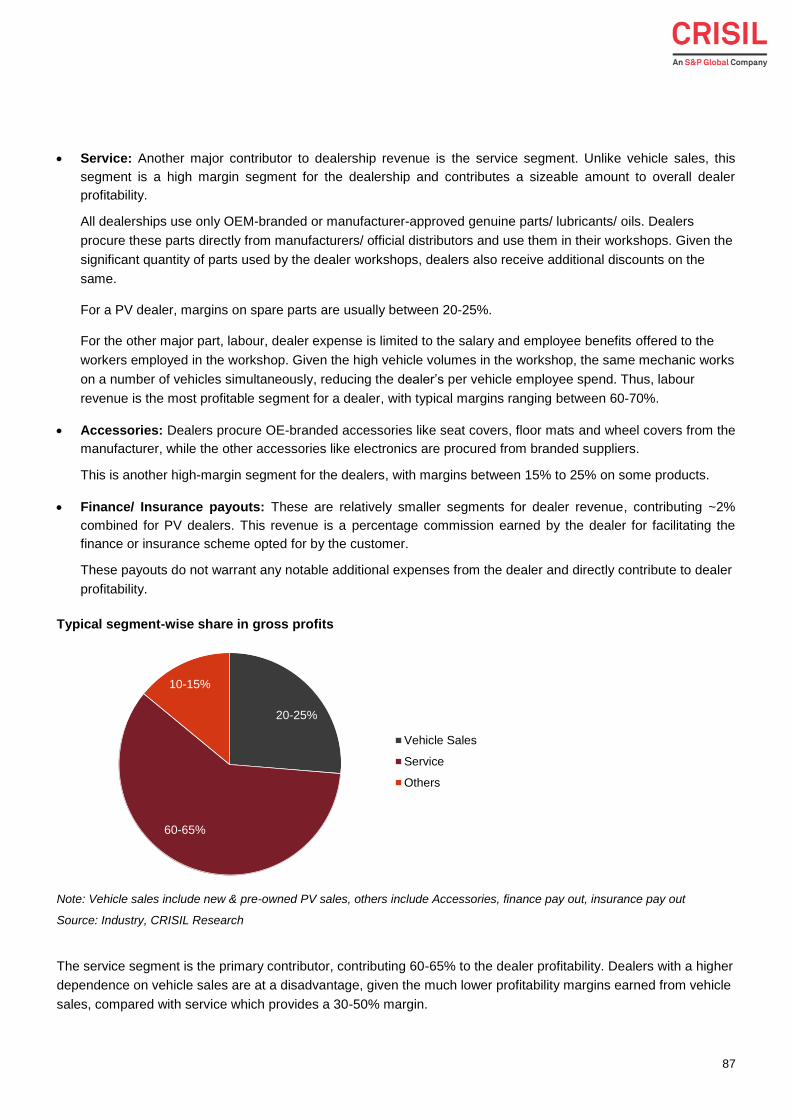
87
Service: Another major contributor to dealership revenue is the service segment. Unlike vehicle sales, this
segment is a high margin segment for the dealership and contributes a sizeable amount to overall dealer
profitability.
All dealerships use only OEM-branded or manufacturer-approved genuine parts/ lubricants/ oils. Dealers
procure these parts directly from manufacturers/ official distributors and use them in their workshops. Given the
significant quantity of parts used by the dealer workshops, dealers also receive additional discounts on the
same.
For a PV dealer, margins on spare parts are usually between 20-25%.
For the other major part, labour, dealer expense is limited to the salary and employee benefits offered to the
workers employed in the workshop. Given the high vehicle volumes in the workshop, the same mechanic works
on a number of vehicles simultaneously, reducing the dealer’s per vehicle employee spend. Thus, labour
revenue is the most profitable segment for a dealer, with typical margins ranging between 60-70%.
Accessories: Dealers procure OE-branded accessories like seat covers, floor mats and wheel covers from the
manufacturer, while the other accessories like electronics are procured from branded suppliers.
This is another high-margin segment for the dealers, with margins between 15% to 25% on some products.
Finance/ Insurance payouts: These are relatively smaller segments for dealer revenue, contributing ~2%
combined for PV dealers. This revenue is a percentage commission earned by the dealer for facilitating the
finance or insurance scheme opted for by the customer.
These payouts do not warrant any notable additional expenses from the dealer and directly contribute to dealer
profitability.
Typical segment-wise share in gross profits
Note: Vehicle sales include new & pre-owned PV sales, others include Accessories, finance pay out, insurance pay out
Source: Industry, CRISIL Research
The service segment is the primary contributor, contributing 60-65% to the dealer profitability. Dealers with a higher
dependence on vehicle sales are at a disadvantage, given the much lower profitability margins earned from vehicle
sales, compared with service which provides a 30-50% margin.
20-25%
60-65%
10-15%
Vehicle Sales
Service
Others
88
Moreover, under unforeseen circumstances like the pandemic, when significant uncertainty was looming over
vehicle sales, regular servicing /repair/ spare sales provided a much needed breather to the dealers.
Even in the longer run, dealers with a greater focus on the service segment are expected to have an edge over
others.
In line with the average sales, dealer revenue from vehicle sales was also on a downward trajectory since fiscal
2016, with sales revenue suffering a big blow in fiscal 2020. The first half of fiscal 21 was very difficult for dealers,
with the second half providing some relief.
Although we expect some improvement in vehicle sales revenue for dealers in the long run, it is not expected to
majorly support dealer profitability.
Despite being the preliminary revenue contributor, the profitability of the vehicle sales segment is relatively low (2-
4%, not including incentives), as compared with the second largest contributor- service. And although
manufacturers have supported dealers by increasing vehicle margins/ incentives over the years, the major support
to dealer profitability came from the service segment, especially during the difficult period of fiscal 2021.
The first quarter was nearly washed away for most dealers amidst the lockdown & other restrictions. During that
period, dealers still had to bear the costs for rent, salary, financing, etc. And although there were some salary cuts,
a reduction in the workforce as well as some support from banks in terms of a moratorium, there was a significant
impact on dealer finances with no vehicle sales revenue coming in. Moreover, during the unlock period and the
subsequent months, dealers had to pay for additional costs for complying with manufacturer-specified Covid 19
protocols. All this had a negative bearing on dealer profitability.
And although the improvement in demand during the second half of fiscal 2021 provided some relief to dealers, the
primary support to dealer profitability came from the services segment.
Dealer returns
EBITDA (earnings before interest, taxes, depreciation and amortisation) margins for PV dealers are typically in the
range of 2-5%. Large dealers, given higher economies of scale, operate at 3.5-5% margins, while smaller dealers
operate at 2-3%.
Return on capital employed (ROCE) for PV dealers is generally in the range of 11-13%, lower than that for two-
wheeler dealers given high dealership set-up costs. However, it is higher than that for CV dealers due to lower
investments required for maintaining inventories and higher contribution of the high-margin services business.
Returns for PV dealers have been under pressure in the last few years amid the continued decline in average
dealership sales. CRISIL Research expects some improvement going forward with potential improvement in sales
and services revenue.
Added advantage for large dealers
Large dealers, given the sheer size of the business, receive added benefits as well as higher economies of scale
backing their better finances. A few of the major advantages are:
Better OE negotiations: Large dealers enjoy higher bargaining power, as compared with smaller dealers,
helping them bag better deals with manufacturers, thus boosting their profitability. Moreover, large dealers also
get higher incentives per vehicle with the higher number of vehicles sold aiding their profitability further.
89
Better deals with vendors: While procuring supplies like tyres, paint and spares from other vendors, large
dealers have an edge over their smaller counterparts, ensuring higher profitability.
Greater share of service revenue: Bigger dealers typically have a large number of sales outlets and an even
larger number of workshops catering to the repair & service segment. This enables them to serve a higher number
of vehicles, boosting their high-margin service revenue. For large dealers, the service to sale ratio, or the number
of vehicles serviced to number of vehicles sold, can be in the range of (15-20): 1, whereas for smaller dealers
this ratio is much flatter. Moreover, their service centres are highly automated with larger spares inventory,
helping large dealers provide faster as well as better customer service. With the fast increasing advancements
in vehicles, larger dealers with an exhaustive, IT-backed, state-of-the-art set-ups will be able to service new-age
vehicles, providing a-boost to their service segment revenue in the longer term.
Better insurance/ finance deals: Dealers earn a percentage of financed amount/ insurance premium as
commission from financers/ insurance companies. The percentage earned as commission varies from dealer to
dealer, depending on the volume of customers generated for the service providers. Hence, bigger dealers enjoy
leverage over their smaller counterparts because of the much larger number of customers provided to the service
providers. In certain cases, we have come across insurance pay outs as high as 19% of the premium paid.
Higher customer retention: Bigger dealers provide a better buying experience to their customers, offering a
relatively lavish ambience, individual attention, better bargains, including higher dealer discounts, faster delivery,
wider accessory choices, immediate availability for accessories/spares, value-added services like customisation,
vehicle detailing, paint protection, etc, During the Covid-19 pandemic, amidst restrained public movement, many
large dealers provided home delivery of vehicles as well. All these benefits help bigger dealers retain a large
share of their customers, ensuring long-term sales growth.
Higher enquiry generation: Bigger dealers typically have a large call centre connecting with potential customers
and following up with existing customers. These call centres provide a wider network coverage and better
customer reach across platforms. This helps larger dealers generate more leads and, in turn, generate higher
sales. These initiatives were especially helpful during the pandemic when most dealerships were closed, limiting
walk-in enquiry generation.
Value-added services: Over and above the normal services and accessories, dealers, especially the large ones,
provide value-added services to their customers. These include services like interior/ exterior anti-rust treatment,
body beautification, exterior paint polish treatment, vinyl floor mat fixing, fabric cleaning, etc., which generated
additional revenue for the dealer. These are high-margin services and contribute significantly to dealer profits.
Others: Large dealers also benefit from centralisation of their services as well as better utilisation of their shared
services like call centres, IT backend services, HR, admin, etc.
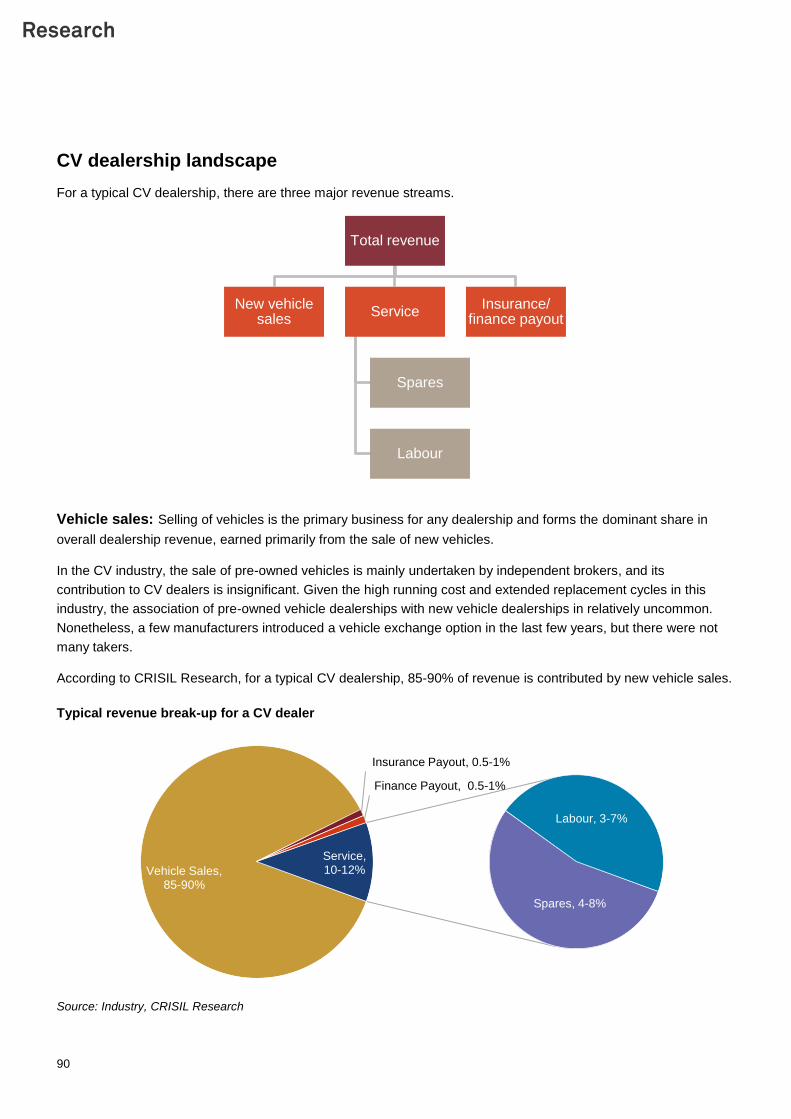
90
CV dealership landscape
For a typical CV dealership, there are three major revenue streams.
Vehicle sales: Selling of vehicles is the primary business for any dealership and forms the dominant share in
overall dealership revenue, earned primarily from the sale of new vehicles.
In the CV industry, the sale of pre-owned vehicles is mainly undertaken by independent brokers, and its
contribution to CV dealers is insignificant. Given the high running cost and extended replacement cycles in this
industry, the association of pre-owned vehicle dealerships with new vehicle dealerships in relatively uncommon.
Nonetheless, a few manufacturers introduced a vehicle exchange option in the last few years, but there were not
many takers.
According to CRISIL Research, for a typical CV dealership, 85-90% of revenue is contributed by new vehicle sales.
Typical revenue break-up for a CV dealer
Source: Industry, CRISIL Research
Total revenue
New vehicle sales
Service
Spares
Labour
Insurance/ finance payout
Vehicle Sales, 85-90%
Insurance Payout, 0.5-1%
Finance Payout, 0.5-1%
Spares, 4-8%
Labour, 3-7%
Service, 10-12%
91
Services: Income from the services segment is another major source of revenue for the dealer. The services
segment can be divided into two major sub-segments: spares and labour. Revenue from the sale of automotive
components, parts, lubricants, etc. for vehicle repair or maintenance is considered spares revenue. Labour revenue
represents the amount charged for the effort or technical expertise provided for vehicle repair. For CV dealers,
labour contributes 45-50% of services revenue, and spares the rest.
In CV dealerships, income from services is relatively limited to only 10-12% of overall revenue. Fleet operators
normally use authorised workshops only during the AMC (annual maintenance contract) period, and thereafter
prefer their own workshops or non-authorised mechanics.
CRISIL Research, however, expects the share of revenue from services to expand on the back of increased
demand for technical expertise to repair the latest advanced vehicles – only authorised dealerships can provide
this.
Over the years, for a safer, more efficient drive, the use of electronic engine control unit and various sensors in CVs
has surged. Moreover, the implementation of emission norms, BS-IV and BS-VI, has propelled the use of
sophisticated technology in vehicles.
As diesel vehicles are more polluting than their petrol counterparts, they witnessed a significant upgradation to
comply with stringent emission norms. Thus, the impact of increased engine complexity and advanced active
emissions control technology systems (e.g. selective catalytic reduction technology) was more pronounced on CVs,
which are solely diesel vehicles.
These technological advances, however, necessitate sophisticated IT-backed tools to repair vehicles. Thus, in such
cases, non-authorised mechanics can provide only limited assistance. With more customers opting for authorised
workshops, CV dealers’ services revenue will receive a boost.
Finance payout: Financing of vehicles is an integral part of vehicle purchase. For the CV segment, finance
penetration is above 95%. CV dealers facilitate easy financing to their customers through tie-ups with various
financial institutions. Representatives of these financial institutions are stationed at the dealerships and help
customers avail financing for their vehicle purchase.
For every financing deal, the vehicle dealer receives a percentage of the financed amount as commission or
finance payout – this contributes 0.5-1% of dealer revenue.
Insurance payout: While purchasing a new vehicle, the Motor Vehicles Act requires customers to purchase
vehicle insurance as well. Dealers provide support to customers through various insurance schemes offered by
insurance companies registered with the Insurance Regulatory and Development Authority.
As in the case of finance payout, the dealer earns a percentage as commission from vehicle insurance purchased
at the dealership – this contributes 0.5-1% of dealer revenue.
Dealership additions
CV dealerships form ~10% of overall dealerships in India and contribute ~15% of overall touchpoints.
These dealerships are typically located on the city outskirts and have a sub-dealer network covering nearby semi-
urban and rural areas. All the sub-dealers work under the umbrella dealership, where the primary dealer handles
overall ordering and procurement. Typically, the main dealership has an attached workshop and provides 3S
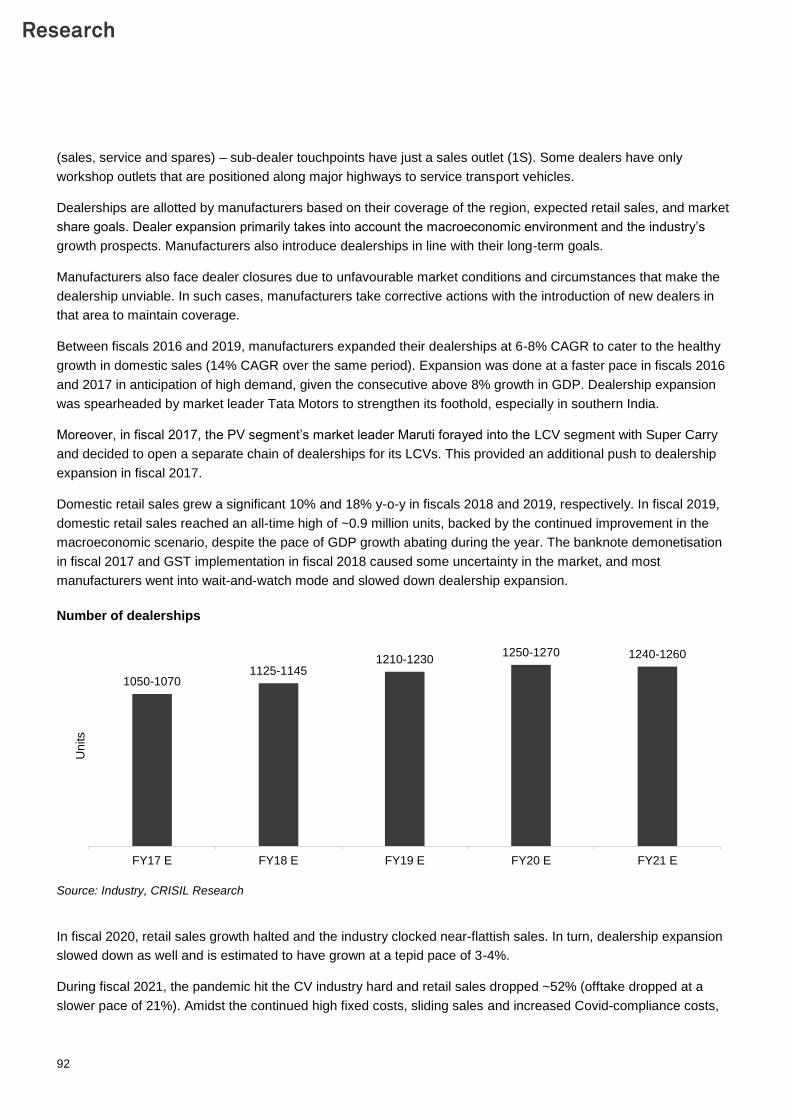
92
(sales, service and spares) – sub-dealer touchpoints have just a sales outlet (1S). Some dealers have only
workshop outlets that are positioned along major highways to service transport vehicles.
Dealerships are allotted by manufacturers based on their coverage of the region, expected retail sales, and market
share goals. Dealer expansion primarily takes into account the macroeconomic environment and the industry’s
growth prospects. Manufacturers also introduce dealerships in line with their long-term goals.
Manufacturers also face dealer closures due to unfavourable market conditions and circumstances that make the
dealership unviable. In such cases, manufacturers take corrective actions with the introduction of new dealers in
that area to maintain coverage.
Between fiscals 2016 and 2019, manufacturers expanded their dealerships at 6-8% CAGR to cater to the healthy
growth in domestic sales (14% CAGR over the same period). Expansion was done at a faster pace in fiscals 2016
and 2017 in anticipation of high demand, given the consecutive above 8% growth in GDP. Dealership expansion
was spearheaded by market leader Tata Motors to strengthen its foothold, especially in southern India.
Moreover, in fiscal 2017, the PV segment’s market leader Maruti forayed into the LCV segment with Super Carry
and decided to open a separate chain of dealerships for its LCVs. This provided an additional push to dealership
expansion in fiscal 2017.
Domestic retail sales grew a significant 10% and 18% y-o-y in fiscals 2018 and 2019, respectively. In fiscal 2019,
domestic retail sales reached an all-time high of ~0.9 million units, backed by the continued improvement in the
macroeconomic scenario, despite the pace of GDP growth abating during the year. The banknote demonetisation
in fiscal 2017 and GST implementation in fiscal 2018 caused some uncertainty in the market, and most
manufacturers went into wait-and-watch mode and slowed down dealership expansion.
Number of dealerships
Source: Industry, CRISIL Research
In fiscal 2020, retail sales growth halted and the industry clocked near-flattish sales. In turn, dealership expansion
slowed down as well and is estimated to have grown at a tepid pace of 3-4%.
During fiscal 2021, the pandemic hit the CV industry hard and retail sales dropped ~52% (offtake dropped at a
slower pace of 21%). Amidst the continued high fixed costs, sliding sales and increased Covid-compliance costs,
1050-10701125-1145
1210-12301250-1270 1240-1260
FY17 E FY18 E FY19 E FY20 E FY21 E
Units
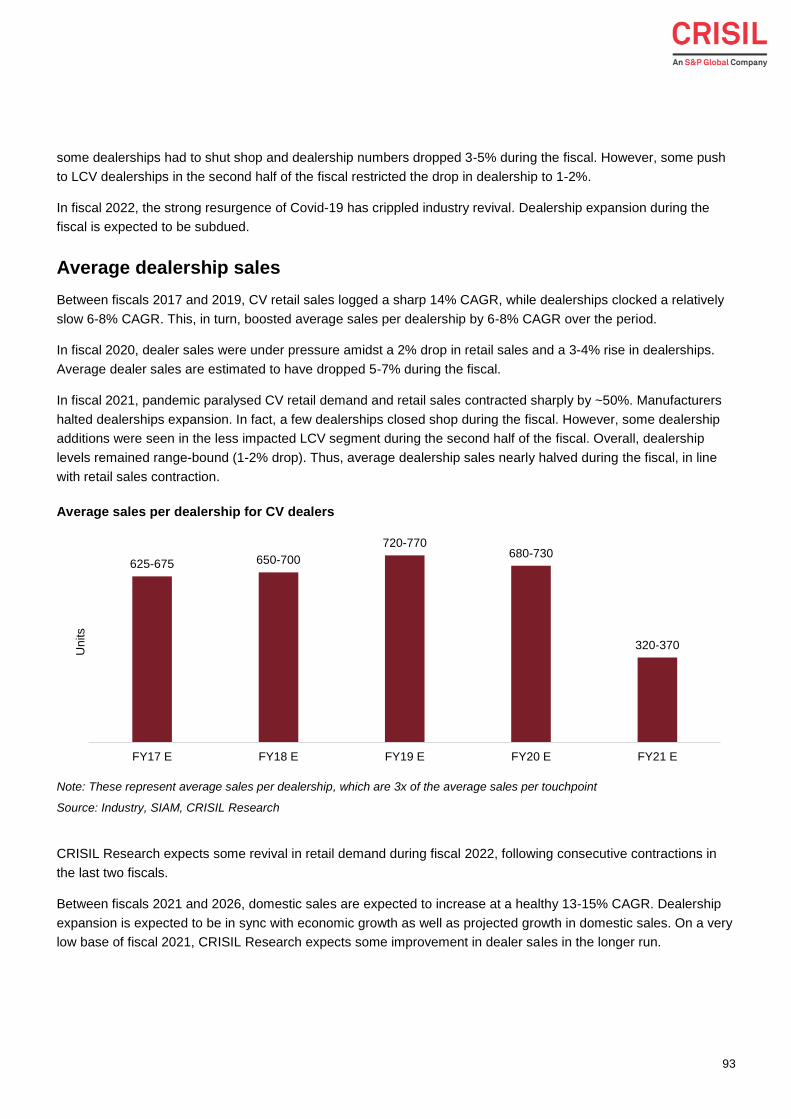
93
some dealerships had to shut shop and dealership numbers dropped 3-5% during the fiscal. However, some push
to LCV dealerships in the second half of the fiscal restricted the drop in dealership to 1-2%.
In fiscal 2022, the strong resurgence of Covid-19 has crippled industry revival. Dealership expansion during the
fiscal is expected to be subdued.
Average dealership sales
Between fiscals 2017 and 2019, CV retail sales logged a sharp 14% CAGR, while dealerships clocked a relatively
slow 6-8% CAGR. This, in turn, boosted average sales per dealership by 6-8% CAGR over the period.
In fiscal 2020, dealer sales were under pressure amidst a 2% drop in retail sales and a 3-4% rise in dealerships.
Average dealer sales are estimated to have dropped 5-7% during the fiscal.
In fiscal 2021, pandemic paralysed CV retail demand and retail sales contracted sharply by ~50%. Manufacturers
halted dealerships expansion. In fact, a few dealerships closed shop during the fiscal. However, some dealership
additions were seen in the less impacted LCV segment during the second half of the fiscal. Overall, dealership
levels remained range-bound (1-2% drop). Thus, average dealership sales nearly halved during the fiscal, in line
with retail sales contraction.
Average sales per dealership for CV dealers
Note: These represent average sales per dealership, which are 3x of the average sales per touchpoint
Source: Industry, SIAM, CRISIL Research
CRISIL Research expects some revival in retail demand during fiscal 2022, following consecutive contractions in
the last two fiscals.
Between fiscals 2021 and 2026, domestic sales are expected to increase at a healthy 13-15% CAGR. Dealership
expansion is expected to be in sync with economic growth as well as projected growth in domestic sales. On a very
low base of fiscal 2021, CRISIL Research expects some improvement in dealer sales in the longer run.
625-675 650-700
720-770680-730
320-370
FY17 E FY18 E FY19 E FY20 E FY21 E
Units
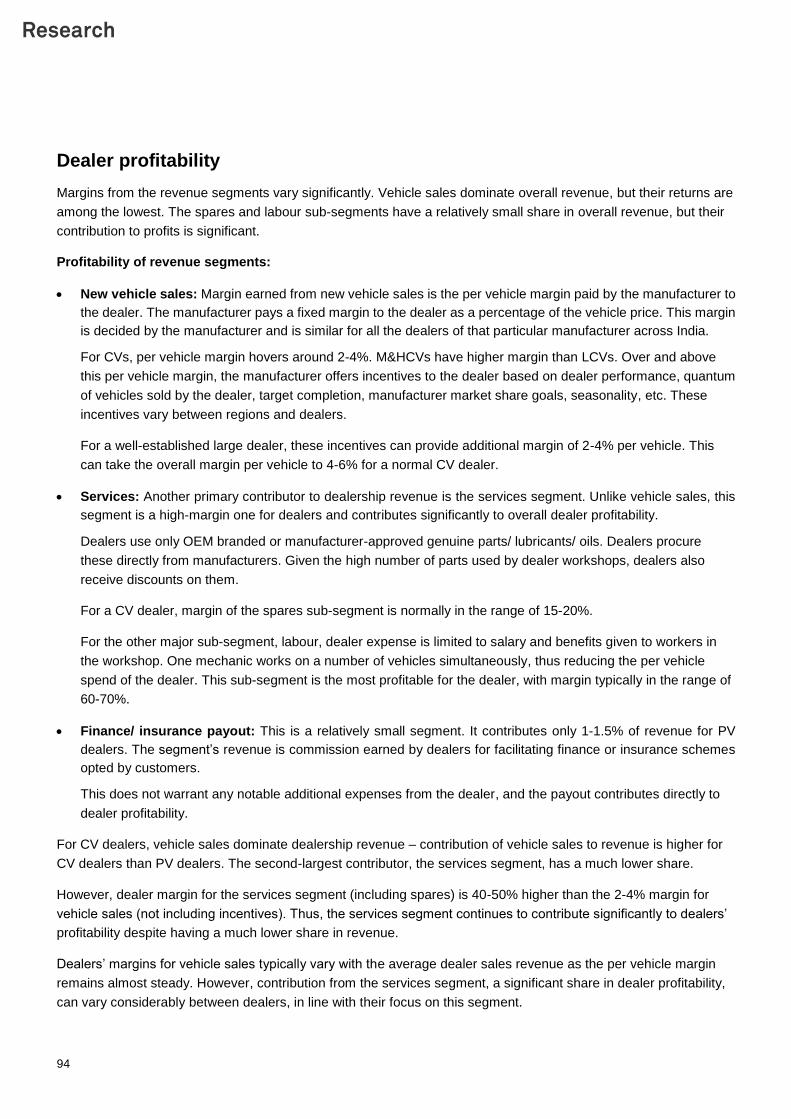
94
Dealer profitability
Margins from the revenue segments vary significantly. Vehicle sales dominate overall revenue, but their returns are
among the lowest. The spares and labour sub-segments have a relatively small share in overall revenue, but their
contribution to profits is significant.
Profitability of revenue segments:
New vehicle sales: Margin earned from new vehicle sales is the per vehicle margin paid by the manufacturer to
the dealer. The manufacturer pays a fixed margin to the dealer as a percentage of the vehicle price. This margin
is decided by the manufacturer and is similar for all the dealers of that particular manufacturer across India.
For CVs, per vehicle margin hovers around 2-4%. M&HCVs have higher margin than LCVs. Over and above
this per vehicle margin, the manufacturer offers incentives to the dealer based on dealer performance, quantum
of vehicles sold by the dealer, target completion, manufacturer market share goals, seasonality, etc. These
incentives vary between regions and dealers.
For a well-established large dealer, these incentives can provide additional margin of 2-4% per vehicle. This
can take the overall margin per vehicle to 4-6% for a normal CV dealer.
Services: Another primary contributor to dealership revenue is the services segment. Unlike vehicle sales, this
segment is a high-margin one for dealers and contributes significantly to overall dealer profitability.
Dealers use only OEM branded or manufacturer-approved genuine parts/ lubricants/ oils. Dealers procure
these directly from manufacturers. Given the high number of parts used by dealer workshops, dealers also
receive discounts on them.
For a CV dealer, margin of the spares sub-segment is normally in the range of 15-20%.
For the other major sub-segment, labour, dealer expense is limited to salary and benefits given to workers in
the workshop. One mechanic works on a number of vehicles simultaneously, thus reducing the per vehicle
spend of the dealer. This sub-segment is the most profitable for the dealer, with margin typically in the range of
60-70%.
Finance/ insurance payout: This is a relatively small segment. It contributes only 1-1.5% of revenue for PV
dealers. The segment’s revenue is commission earned by dealers for facilitating finance or insurance schemes
opted by customers.
This does not warrant any notable additional expenses from the dealer, and the payout contributes directly to
dealer profitability.
For CV dealers, vehicle sales dominate dealership revenue – contribution of vehicle sales to revenue is higher for
CV dealers than PV dealers. The second-largest contributor, the services segment, has a much lower share.
However, dealer margin for the services segment (including spares) is 40-50% higher than the 2-4% margin for
vehicle sales (not including incentives). Thus, the services segment continues to contribute significantly to dealers’
profitability despite having a much lower share in revenue.
Dealers’ margins for vehicle sales typically vary with the average dealer sales revenue as the per vehicle margin
remains almost steady. However, contribution from the services segment, a significant share in dealer profitability,
can vary considerably between dealers, in line with their focus on this segment.
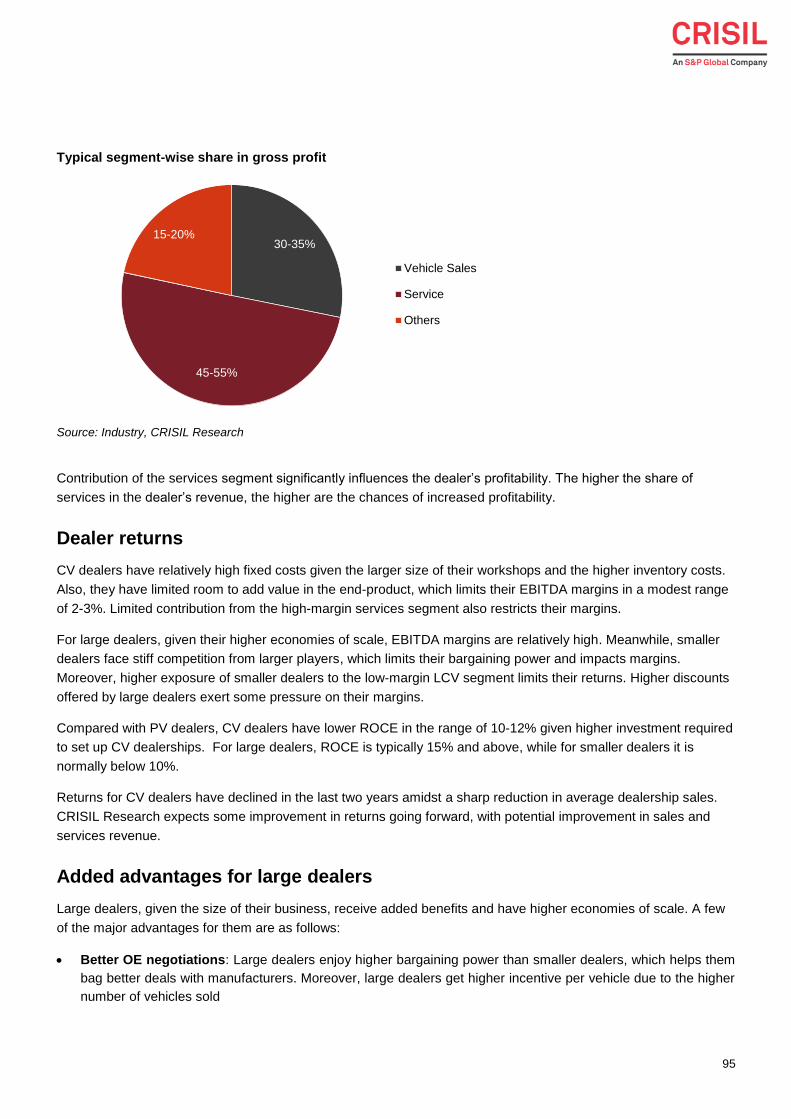
95
Typical segment-wise share in gross profit
Source: Industry, CRISIL Research
Contribution of the services segment significantly influences the dealer’s profitability. The higher the share of
services in the dealer’s revenue, the higher are the chances of increased profitability.
Dealer returns
CV dealers have relatively high fixed costs given the larger size of their workshops and the higher inventory costs.
Also, they have limited room to add value in the end-product, which limits their EBITDA margins in a modest range
of 2-3%. Limited contribution from the high-margin services segment also restricts their margins.
For large dealers, given their higher economies of scale, EBITDA margins are relatively high. Meanwhile, smaller
dealers face stiff competition from larger players, which limits their bargaining power and impacts margins.
Moreover, higher exposure of smaller dealers to the low-margin LCV segment limits their returns. Higher discounts
offered by large dealers exert some pressure on their margins.
Compared with PV dealers, CV dealers have lower ROCE in the range of 10-12% given higher investment required
to set up CV dealerships. For large dealers, ROCE is typically 15% and above, while for smaller dealers it is
normally below 10%.
Returns for CV dealers have declined in the last two years amidst a sharp reduction in average dealership sales.
CRISIL Research expects some improvement in returns going forward, with potential improvement in sales and
services revenue.
Added advantages for large dealers
Large dealers, given the size of their business, receive added benefits and have higher economies of scale. A few
of the major advantages for them are as follows:
Better OE negotiations: Large dealers enjoy higher bargaining power than smaller dealers, which helps them
bag better deals with manufacturers. Moreover, large dealers get higher incentive per vehicle due to the higher
number of vehicles sold
30-35%
45-55%
15-20%
Vehicle Sales
Service
Others
96
Better deals with vendors: While procuring supplies such as tyres, paint and spares from vendors, large dealers
have an edge over their smaller counterparts
Higher share of services revenue: Along with a high number of sales outlets, large dealers also have many
workshops catering to the services segment. For large dealers, the services-to-sales ratio, i.e. the number of
vehicles serviced to the number of vehicles sold, can be 10-15:1, whereas for smaller dealers this ratio is much
flatter. Moreover, service centres of large dealers are highly automated and have higher spares inventory levels,
helping them provide faster and better service to customers. With OBD II and major upgradations for BS-VI
compliance, the CV segment is going through a major technological upgrade. Going forward, large dealer
workshops armed with latest IT-backed instruments will be able to service and repair new-age vehicles, providing
a boost to high-margin services revenue
Better insurance/ finance deals: Dealers earn a percentage of financed amount/ insurance premium as
commission from financial institutions/ insurance companies. The percentage varies between dealers depending
on the volume of customers provided to the service providers. Hence, large dealers benefit more than their
smaller counterparts
Higher customer retention: Compared with smaller dealers, large dealers can offer higher discounts to
customers over and above the discounts offered by manufacturers. For typical CV customers and fleet owners,
discounts are important selection criteria given the minimal scope of value addition in CVs. Thus, these discounts
helps large dealers retain their customer base
Others: Large dealers also benefit from centralisation of their services, and better utilisation of their shared
services such as call centres, IT backend services, human resources, and admin.
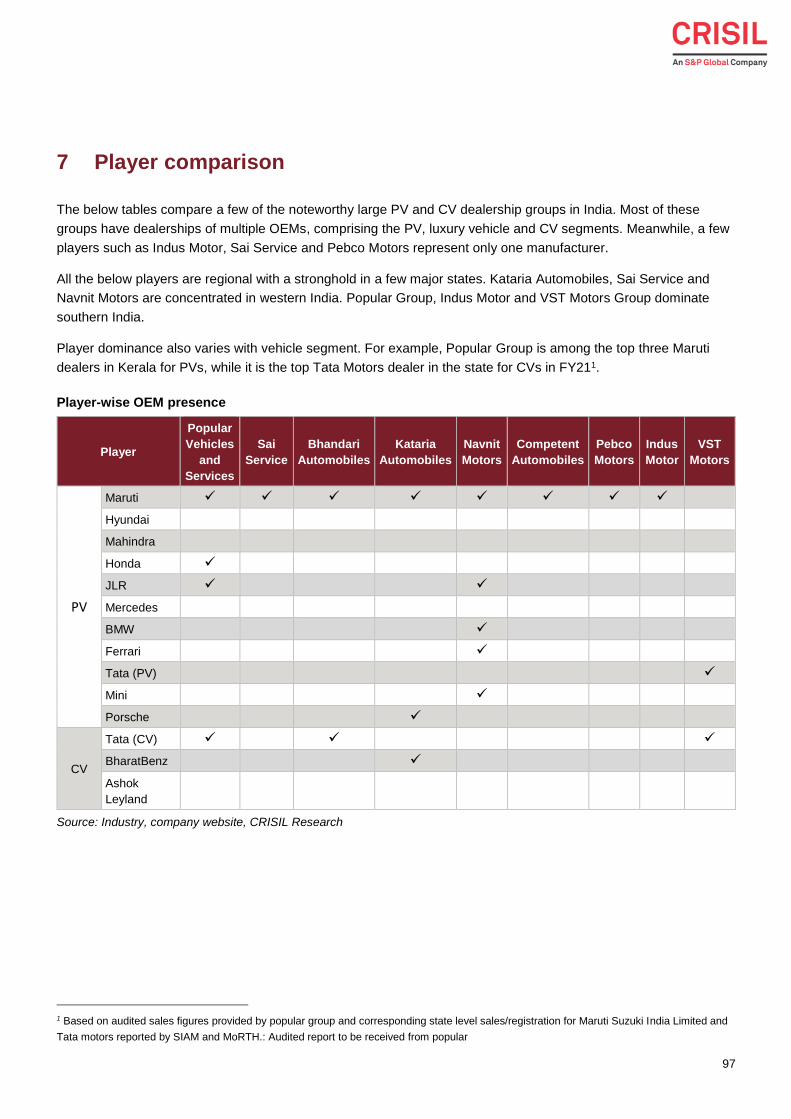
97
7 Player comparison
The below tables compare a few of the noteworthy large PV and CV dealership groups in India. Most of these
groups have dealerships of multiple OEMs, comprising the PV, luxury vehicle and CV segments. Meanwhile, a few
players such as Indus Motor, Sai Service and Pebco Motors represent only one manufacturer.
All the below players are regional with a stronghold in a few major states. Kataria Automobiles, Sai Service and
Navnit Motors are concentrated in western India. Popular Group, Indus Motor and VST Motors Group dominate
southern India.
Player dominance also varies with vehicle segment. For example, Popular Group is among the top three Maruti
dealers in Kerala for PVs, while it is the top Tata Motors dealer in the state for CVs in FY211.
Player-wise OEM presence
Player
Popular
Vehicles
and
Services
Sai
Service
Bhandari
Automobiles
Kataria
Automobiles
Navnit
Motors
Competent
Automobiles
Pebco
Motors
Indus
Motor
VST
Motors
PV
Maruti
Hyundai
Mahindra
Honda
JLR
Mercedes
BMW
Ferrari
Tata (PV)
Mini
Porsche
CV
Tata (CV)
BharatBenz
Ashok
Leyland
Source: Industry, company website, CRISIL Research
1 Based on audited sales figures provided by popular group and corresponding state level sales/registration for Maruti Suzuki India Limited and
Tata motors reported by SIAM and MoRTH.: Audited report to be received from popular
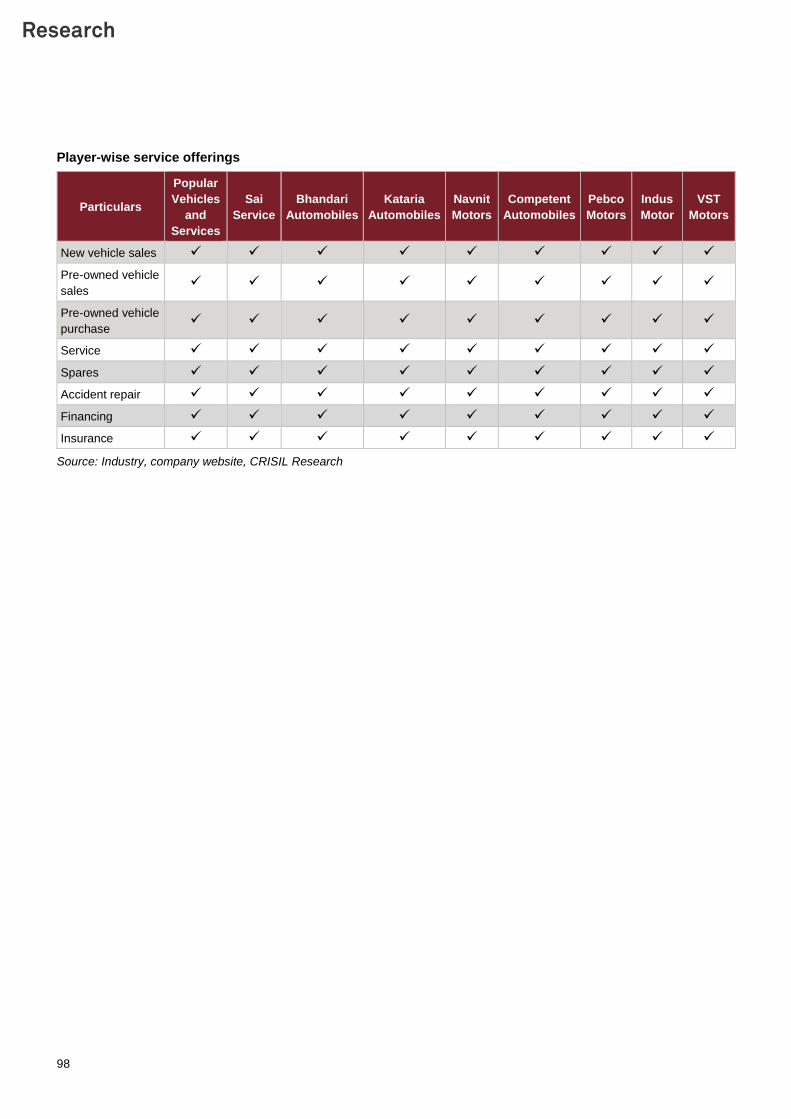
98
Player-wise service offerings
Particulars
Popular
Vehicles
and
Services
Sai
Service
Bhandari
Automobiles
Kataria
Automobiles
Navnit
Motors
Competent
Automobiles
Pebco
Motors
Indus
Motor
VST
Motors
New vehicle sales
Pre-owned vehicle
sales
Pre-owned vehicle
purchase
Service
Spares
Accident repair
Financing
Insurance
Source: Industry, company website, CRISIL Research
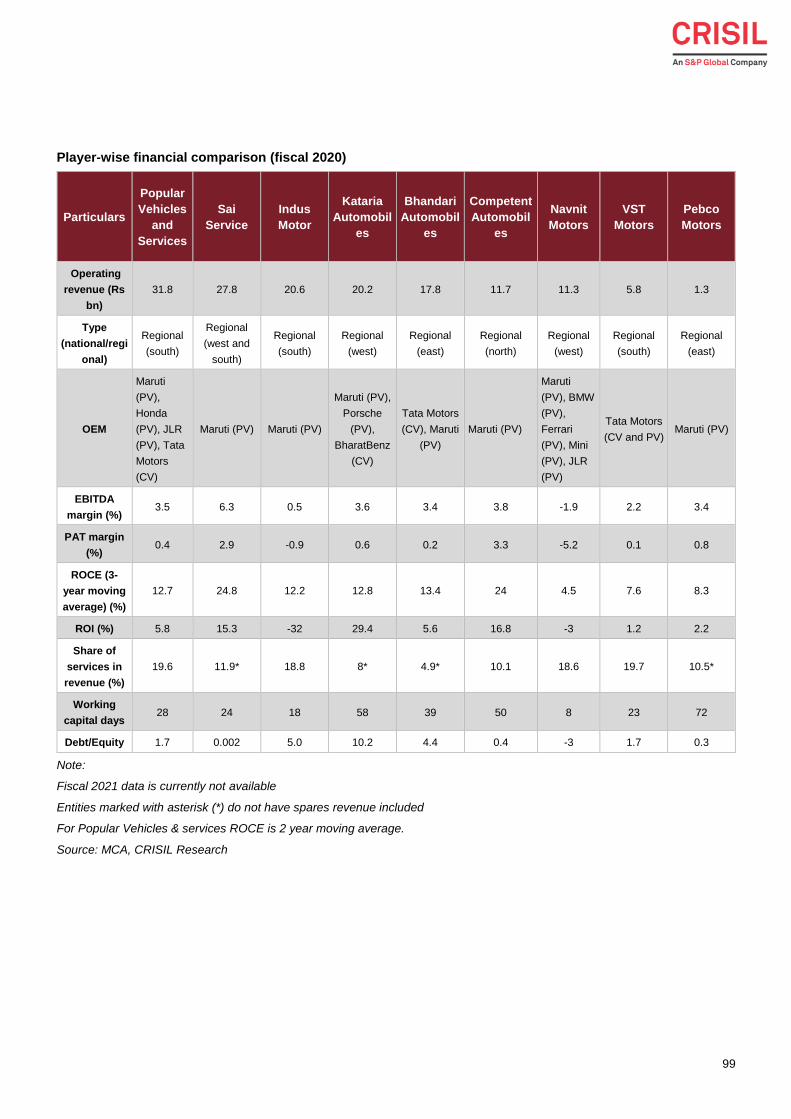
99
Player-wise financial comparison (fiscal 2020)
Particulars
Popular
Vehicles
and
Services
Sai
Service
Indus
Motor
Kataria
Automobil
es
Bhandari
Automobil
es
Competent
Automobil
es
Navnit
Motors
VST
Motors
Pebco
Motors
Operating
revenue (Rs
bn)
31.8 27.8 20.6 20.2 17.8 11.7 11.3 5.8 1.3
Type
(national/regi
onal)
Regional
(south)
Regional
(west and
south)
Regional
(south)
Regional
(west)
Regional
(east)
Regional
(north)
Regional
(west)
Regional
(south)
Regional
(east)
OEM
Maruti
(PV),
Honda
(PV), JLR
(PV), Tata
Motors
(CV)
Maruti (PV) Maruti (PV)
Maruti (PV),
Porsche
(PV),
BharatBenz
(CV)
Tata Motors
(CV), Maruti
(PV)
Maruti (PV)
Maruti
(PV), BMW
(PV),
Ferrari
(PV), Mini
(PV), JLR
(PV)
Tata Motors
(CV and PV) Maruti (PV)
EBITDA
margin (%) 3.5 6.3 0.5 3.6 3.4 3.8 -1.9 2.2 3.4
PAT margin
(%) 0.4 2.9 -0.9 0.6 0.2 3.3 -5.2 0.1 0.8
ROCE (3-
year moving
average) (%)
12.7 24.8 12.2 12.8 13.4 24 4.5 7.6 8.3
ROI (%) 5.8 15.3 -32 29.4 5.6 16.8 -3 1.2 2.2
Share of
services in
revenue (%)
19.6 11.9* 18.8 8* 4.9* 10.1 18.6 19.7 10.5*
Working
capital days 28 24 18 58 39 50 8 23 72
Debt/Equity 1.7 0.002 5.0 10.2 4.4 0.4 -3 1.7 0.3
Note:
Fiscal 2021 data is currently not available
Entities marked with asterisk (*) do not have spares revenue included
For Popular Vehicles & services ROCE is 2 year moving average.
Source: MCA, CRISIL Research
Argentina | China | Hong Kong | India | Poland | Singapore | UAE | UK | USA
CRISIL Limited: CRISIL House, Central Avenue, Hiranandani Business Park, Powai, Mumbai – 400076. India
Phone: + 91 22 3342 3000 | Fax: + 91 22 3342 3001 | www.crisil.com
About CRISIL Limited
CRISIL is a leading, agile and innovative global analytics company driven by its mission of making markets function
better.
It is India’s foremost provider of ratings, data, research, analytics and solutions with a strong track record of growth,
culture of innovation, and global footprint.
It has delivered independent opinions, actionable insights, and efficient solutions to over 100,000 customers through
businesses that operate from India, the US, the UK, Argentina, Poland, China, Hong Kong and Singapore.
It is majority owned by S&P Global Inc, a leading provider of transparent and independent ratings, benchmarks, analytics
and data to the capital and commodity markets worldwide.
About CRISIL Research
CRISIL Research is India's largest independent integrated research house. We provide insights, opinion and analysis on
the Indian economy, industry, capital markets and companies. We also conduct training programs to financial sector
professionals on a wide array of technical issues. We are India's most credible provider of economy and industry
research. Our industry research covers 86 sectors and is known for its rich insights and perspectives. Our analysis is
supported by inputs from our large network sources, including industry experts, industry associations and trade channels.
We play a key role in India's fixed income markets. We are the largest provider of valuation of fixed income securities to
the mutual fund, insurance and banking industries in the country. We are also the sole provider of debt and hybrid indices
to India's mutual fund and life insurance industries. We pioneered independent equity research in India, and are today the
country's largest independent equity research house. Our defining trait is the ability to convert information and data into
expert judgments and forecasts with complete objectivity. We leverage our deep understanding of the macro-economy
and our extensive sector coverage to provide unique insights on micro-macro and cross-sectoral linkages. Our talent pool
comprises economists, sector experts, company analysts and information management specialists.
CRISIL Privacy
CRISIL respects your privacy. We may use your contact information, such as your name, address, and email id to fulfil your
request and service your account and to provide you with additional information from CRISIL. For further information on
CRISIL’s privacy policy please visit www.crisil.com/privacy.
Disclaimer
CRISIL Research, a division of CRISIL Limited (CRISIL) has taken due care and caution in preparing this Report based on the
information obtained by CRISIL from sources which it considers reliable (Data). However, CRISIL does not guarantee the
accuracy, adequacy or completeness of the Data / Report and is not responsible for any errors or omissions or for the results
obtained from the use of Data / Report. This Report is not a recommendation to invest / disinvest in any company covered in the
Report. CRISIL especially states that it has no financial liability whatsoever to the subscribers/ users/ transmitters/ distributors of
this Report. CRISIL Research operates independently of, and does not have access to information obtained by CRISIL Ratings
Limited / CRISIL Risk and Infrastructure Solutions Limited (CRIS), which may, in their regular operations, obtain information of a
confidential nature. The views expressed in this Report are that of CRISIL Research and not of CRISIL Ratings Limited / CRIS.
No part of this Report may be published / reproduced in any form without CRISIL’s prior written approval