Embed Size (px)
Citation preview

Paper to be presented at the 25th Celebration Conference 2008
onENTREPRENEURSHIP AND INNOVATION - ORGANIZATIONS, INSTITUTIONS,
SYSTEMS AND REGIONSCopenhagen, CBS, Denmark, June 17 - 20, 2008
THE LIFECYCLE OF REGIONS
Stephan HeblichMax Planck Institute of Economics
David AudretschMax Planck Institute of Economics
Oliver FalckIfo Institute for Economic Research
Maryann FeldmanUniversity of Georgia
Abstract:Major economic transitions, even when they are disruptive, do not occur instantaneously but rather occur overtime, as regions within a country change at different rates. Accordingly, these dynamics may be reflected in ageographic lifecycle with different regions characterized by different phases analogous to the industry lifecyclemodel. In accordance with this argument, this paper tests the hypothesis that regions can be characterized asevolving over a predictable and well-defined lifecycle: (1) an initial entrepreneurial phases where Jacobsexternalities and inter-industry startups prevail: (2) a routinized phase where innovation takes place within top-performing incumbents: (3) a second entrepreneurial phase characterized by Marshall-Arrow-Romerexternalities, leading to intra-industry startups in niches: and (4) a second phase of routinization, in which nofurther innovation takes place, but is instead a phase of structural change. Using data on 74 West Germanplanning regions, we find compelling evidence of a spatial lifecycle.
JEL - codes: R12, O18, O31
The Lifecycle of Regions
Abstract
Major economic transitions, even when they are disruptive, do not occur
instantaneously but rather occur over time, as regions within a country change at different
rates. Accordingly, these dynamics may be reflected in a geographic lifecycle with
different regions characterized by different phases analogous to the industry lifecycle
model. In accordance with this argument, this paper tests the hypothesis that regions can
be characterized as evolving over a predictable and well-defined lifecycle: (1) an initial
entrepreneurial phases where Jacobs externalities and inter-industry startups prevail; (2) a
routinized phase where innovation takes place within top-performing incumbents; (3) a
second entrepreneurial phase characterized by Marshall-Arrow-Romer externalities,
leading to intra-industry startups in niches; and (4) a second phase of routinization, in
which no further innovation takes place, but is instead a phase of structural change. Using
data on 74 West German planning regions, we find compelling evidence of a spatial
lifecycle.
JEL Classification: R12, O31, O18
Keywords: Innovation, Regional Development, Spatial Lifecycle, Knowledge Externalities, Entrepreneurship
1
1. Introduction
Economic development certainly has a spatial dimension that leaves its mark on
places. This is obvious in the transition from an agrarian to an industrial society, and
equally true in the contemporary transition to a knowledge-based society. The former
transition, from an agrarian to an industrial society, was accompanied by a rapid increase
in urbanization. Depending on the industry, prime location was determined either by
proximity to input factors such as timber, coal, wool, or water, or by proximity to markets
with high demand for the produced goods (Weber 1909). The current transition to a
knowledge-based society is largely driven by decreasing transportation costs with global
sourcing. Production may be distributed over a large area of the globe, depending on
particular regional advantages. For example, labor-intensive production migrates to
developing regions and countries with comparatively low wages, whereas capital- and,
especially, knowledge-intensive production is concentrated in developed areas and
countries with a highly qualified labor force that can support innovation. According to
Duranton and Puga (2001), the difference between the invention and creation of products
on the one hand and pure production on the other hand has led to a spatial distribution of
production where the former takes place in regions rich with knowledge-based location
factors. In contrast, the later phase takes place in regions tailored to the demand of
industrial production—relatively cheap industry parks and low wages, along with a
specialized pool of qualified but not necessarily highly qualified workers. This suggests a
division of economic fortune that is dependent on the characteristics of places and does
not allow the fortune of places to change and evolve—a rather unsatisfying policy
implication for lagging regions.

2
Given that the regional distribution of production does not reflect natural resource
or transportation advantages, it may be dependent on structural characteristics of the
prominent industry and mimic the industry lifecycle. In this paper, we argue that regional
economic dynamics are reflected in a spatial lifecycle with different regions at different
phases of the lifecycle. Some regions have evolved into centers of knowledge-based
production, others are still dominated by industrial production, and yet others are in the
process of structural change.
This conceptualization allows us to integrate literature on innovation, industry
dynamics, and regional growth into a single theory—that of the spatial lifecycle.
Basically, every region has an endowment of resources that determines its technological
regime (Nelson and Winter 1984). Audretsch and Fritsch (2002) introduce the idea of
four different regional growth regimes. Falck and Heblich (2008) organize these four
technological regimes along a knowledge-based lifecycle, as proposed by Gort and
Klepper (1982). In doing so, Falck and Heblich implicitly assume the existence of a
spatial lifecycle where a region’s position along the lifecycle is determined by the
maturity of its industry structure. Implications for regional dynamics can then be deduced
from Schumpeterian growth theory (Aghion and Howitt 1992). Accordingly, regions
dominated by leading-edge technology industries will exhibit superior economic
performance. Firms in these regions constantly face the threat of new firms entering the
market and they thus have a strong incentive to innovate and keep pace with
technological progress so as to prevent entry by competitors (Aghion et al. 2006). These
regions are the archetype cluster, as defined by Porter (1998). In contrast, regions
3
characterized by technology-lagging industries face a high risk of becoming victims of
structural change as firms in this industry are likely to be forced out of the market.
The purpose of this paper is to provide an empirical test of regional evolution over
a spatial lifecycle. Along this line, the paper is organized as follows. Section 2 introduces
the concept of a spatial lifecycle and presents several hypotheses on the determinants of
regional dynamics in terms of entry. We present our data in Section 3 and our method-
ology in Section 4. On the basis of these, the hypotheses involving the existence of a
spatial lifecycle are empirically tested in Section 5. We conclude with implications for
further research in Section 6.
2. Theoretical Background
Schumpeter (1912, 1942) and the ensuing Schumpeterian growth theory (cf.
Aghion and Howitt, 1992) highlight the importance of innovation for economic
development. In a self-propelling process, the struggle for future rents induces actors to
commercialize innovations that replace old products and, occasionally, also displace
incumbent firms and existing industries. The constant struggle for future rents fuels a
process of creative destruction that results in ongoing dynamics and growth. Along the
product lifecycle, innovations have a twofold impact (Utterback and Abernathy, 1975;
Abernathy and Utterback, 1978): process innovations increase the efficiency of
production within a given lifecycle and thus support movement along the lifecycle;
product innovations have the potential to initiate new lifecycles, especially if the
innovative activity is radical in nature. However, at the beginning of a new lifecycle,
4
there might be several new products competing to become the standard.1 With time, this
competition usually results in the emergence of a dominant product technology—in this
fight to the death the other products will not survive beyond the earliest stage of the
lifecycle. In Schumpeter’s theory, product innovations are usually the work of
independent entrepreneurs (Schumpeter 1912), whereas process innovations are the
routine results of large enterprises with large and specialized research laboratories
(Schumpeter 1942).
Cohen and Klepper (1996a, 1996b) formalize the nexus between firm size and
innovation in a model that distinguishes between product and process innovation with
respect to firm size. They argue that process innovation lowers the average cost of
production: if the firm does not license its process innovation, the only way to benefit is
to produce output. The higher the volume of production, the higher the total gross benefit
of an innovation. Hence, larger firms are able to derive a higher return from a process
innovation than are smaller firms, simply because the larger firms can spread this benefit
over a greater production volume. The result is not obvious for product innovation that
creates a completely new market. If there are no strong reasons for believing that the
volume of sales on the new market is related to ex-ante size, there is obviously no reason
for large (incumbent) businesses to spend much time or money on product innovation. It
is partially for this reason that Aghion et al. (2006) stress the importance of firm entry for
innovation.
In Nelson and Winter’s (1984) theory of technological regimes, product
innovation is characteristic of what Winter (1982) terms the entrepreneurial regime,
1 E.g., a current example is the HD-DVD vs. Blueray Disc and HD-VMD contest to be successor to the DVD format.

5
whereas the process innovation phase is more often found in what he terms as the
routinized regime. Based on that idea, Gort and Klepper (1982) create a knowledge-based
lifecycle which orders characteristics of these technological regimes with respect to time.
This lifecycle is applied to a single product, but its basic assumptions are applicable to
the industry lifecycle theory (Klepper, 1996).
Gort and Klepper concentrate on the chronology of the technological regimes;
Audretsch and Feldman (1996) and Audretsch and Fritsch (2002) add a spatial dimension
and characterize regions according to the prevailing technological regime. Falck and
Heblich (2008) put forward the idea of a regional lifecycle where regions are
characterized by prevailing technological regimes that, in turn, are ordered along a
lifecycle as in Gort and Klepper.
The regional lifecycle theory also takes into consideration the geography of
knowledge. In the current Information Age characterized by innovative activity which is
largely knowledge driven, innovators derive great benefit from former accumulated
knowledge. The existing stock of knowledge is assumed to be a nonrival input so that
everyone engaged in R&D has free access to the entire stock of knowledge at the same
time. Along this line, Jaffe et al. (1993) found evidence that regionally developed
knowledge is most likely to boost the accumulation of further knowledge within the same
region. Similar evidence is found for the spatial distribution of innovative activity by
Feldman (1994) who argues that the cost of innovation is lower in geographic
agglomerations, hence resources are more productive. Audretsch and Feldman (1996)
argue that tacit knowledge is, at least in part, bound to a certain region and embodied in
6
skilled labor. Stam’s (2006) empirical findings that entrepreneurs are not geographically
mobile is additional support for the importance of location.
Assuming that a region’s stock of knowledge is determined by interpersonal
knowledge flows as well as by the prevailing industry structure and the degree of industry
agglomeration, the literature distinguishes at least two types of knowledge spillover that
may occur in a region. MAR externalities describe the intra-industry spillovers
characteristic of industrial agglomerations dominated by one industry. In contrast, Jacobs
externalities are found in regions with a diversified infrastructure, usually urban
agglomerations (Glaeser et al. 1992). According to Duranton and Puga’s (2001) spatially
distributed product lifecycle, the formative, innovative stages of the lifecycle are more
likely to locate in regions with diverse economies and corresponding inter-industry
spillovers, both of which will be of benefit to the creation of a new product. However,
once the innovation has taken place and a product line or process is settled, the actual
production is moved to more specialized localizations.
Industry and regional dynamics are thus closely linked. Economically diverse
regions are most likely to be the home of products in the early stages of the lifecycle and
inter-industrial knowledge spillovers or Jacobs externalities prevail. In more mature
phases of the lifecycle when a dominant product is established, production becomes more
specialized in regions and R&D effort becomes much more focused. Accordingly, there
is less knowledge created to spill over. In this phase, innovation is more likely to be
produced within large firms’ specialized research laboratories for their own use.
However, specialization will ultimately lead to increasing consumer
dissatisfaction with standardized products, which in turn provides an opportunity for

7
niche producers (Hippel 2007). In this stage former industry experience can uncover
incremental product variations, resulting in niche markets that complement incumbents.
Thus, these product niches offer entrepreneurial opportunities where intra-industry
spillovers (MAR externalities) prevail. In the final last phase of routinization
entrepreneurial opportunities are exploited and a decreasing number of incumbents fight
for the remaining rents in stagnating market.
This concept of a spatial lifecycle, suggests four unique stages:
1. The first entrepreneurial phase, during which both incumbents and
entrepreneurs benefit from inter-industry spillovers.
2. The first routinized phase, during which R&D in large firms with specialized
research laboratories becomes increasingly focused. In this phase, large firms
are having the resources to push forward the technology frontier and,
accordingly, entry is of minor importance.
3. The second entrepreneurial phase, during which specialization creates
entrepreneurial opportunities in niche markets. In this phase, entrepreneurs
benefit from intra-industry knowledge spillovers, especially in form of former
industry experience that leads to the exploitation of potential niches.
4. The second routinization phase, during which no innovation occurs and a few
incumbents survive on remaining rents in a stagnating market. This last phase
of the spatial lifecycle is characterized by structural change and thus is
accompanied by firm closure and its corresponding employment losses.

8
Implicit in these four stages is the endogeneity between a region’s location factors
and the dynamics along the spatial lifecycle. In the past, the most important location
factors involved natural resources and factor endowments, but in this day of steadily
decreasing transaction and transportation costs, human capital—the basis of knowledge
and creativity have become increasingly important. However, building human capital to
make a region attractive takes time, something that has not changed since Marshall’s days
as evidenced by his remark that location factors change slowly and gradually—natura
non facit saltum (nature does not make jumps).2 Thus a region’s position along the
lifecycle will manifest only over the long run and typically cannot be observed using
available data. However, an interregional comparison of location factors within a
relatively short timespan (i.e., 15 years) should be able to reveal important differences
that lead to a particular region being dominated either by a diverse or a specialized
industry structure, from which we may draw fairly solid conclusions as to the region’s
position along the regional lifecycle.
3. Data
To test the spatial lifecycle theory, we use data on 74 West German planning
regions (excluding Berlin).3 These regions were categorized by infrastructure, industrial
specialization and economic diversity. The first category describes the quality of
available infrastructure in the region, using indicators provided by the Office for
Building and Regional Planning to characterize the quality of the available infrastructure
(cf. Maretzke 2005): the accessibility of the nearest three national or international
2 Marshall (1890) adopted this motto for his Principles of Economics. 3 Planning regions consist of several districts and include at least one core city and its surrounds.

9
agglomerations via road and rail combined; the accessibility of European metropolises
via road and air combined; and the availability of modern transportation systems.
These infrastructure indicators are modern in that they are not suitable for the
transportation of heavy input factors such as coal or steel, which were crucial in the age
of industrialization. However, today’s knowledge-based society requires transportation
facilities that link residents of a region to other regions, especially cities, and therefore
allow for the exchange and the inflow of fresh knowledge. Our infrastructure indicators
reflect accessibility in this latter conceptualization.
The second category describes specialization and thus characterizes MAR
externalities in the region. All indicators are based on regional employment data derived
from the German Social Insurance Statistics (see Fritsch and Brixy 2004 for a description
of this data source). The Social Insurance Statistics requires every employer to furnish
certain information (e.g., qualifications) about every employee subject to obligatory
social insurance. The share of employees in manufacturing compared to the number of all
employees subject to social security in the region describes the industry mix in the
region. Based on this, we use the Herfindahl index, calculated as the sum of the squares
of the employment shares of each industry in manufacturing, as an indicator for the
concentration of manufacturing industries. Finally, the technological regime variable—
calculated as the share of employees with a degree in engineering or natural science in
small businesses compared to the total number of employees with a degree in engineering
or natural science—describes the role of large firms in regional R&D.4 Thereby, a small
4 The share of employees with a degree in engineering or natural science is highly correlated (0.9079) with the region’s share of employees in R&D. This suggests that engineers and natural scientists represent a region’s major source of R&D.

10
value signifies the predominance of large firms in regional R&D while a large number
indicates the importance of small firms in regional R&D.
The third group of variables describes diversity in a region and therefore indicates
Jacobs externalities. Bohemians, along with jack-of-all-trades small business employees
characterize the diversity of the regional labor market. Further, the share of employees in
business services, the share of patents applied for by residents, and the share of patents
applied for by local research institutions are indicators of diversity in regional knowledge
stock. To measure this, patent data are taken from the German Patent Atlas. The German
Patent Atlas provides information on the number of patents applied for in a planning
region and distinguishes between three groups of applicants—businesses, universities and
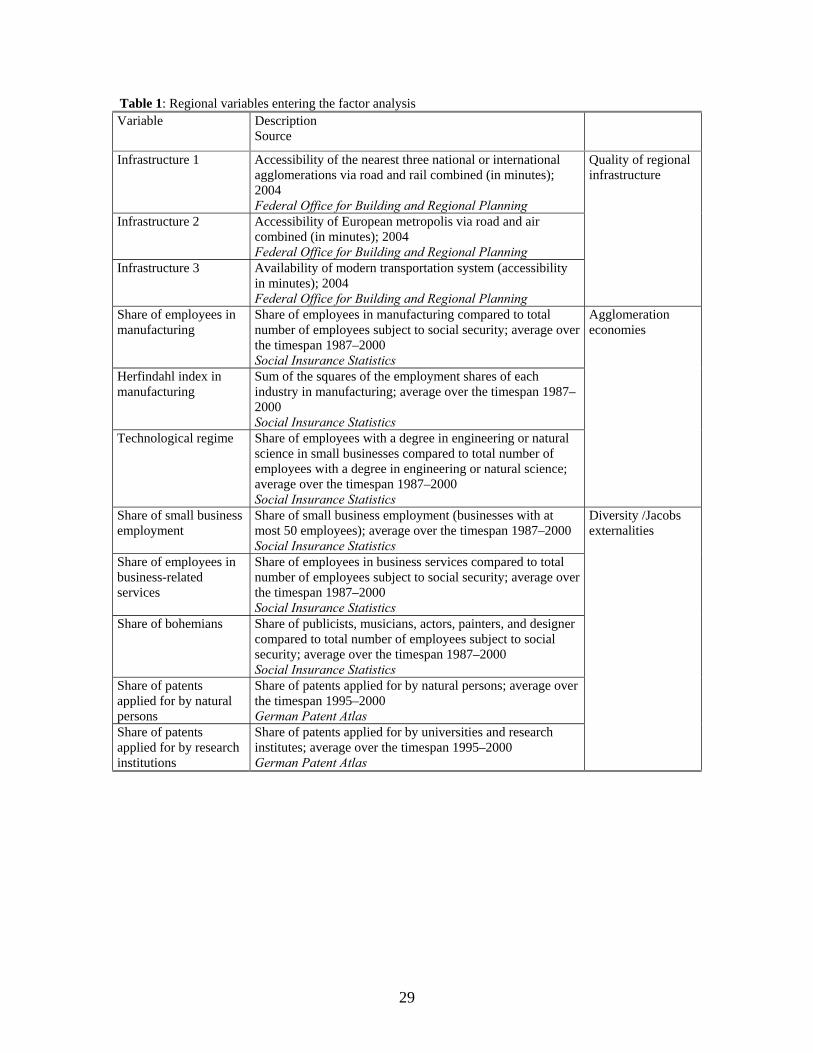
research institutes, and natural persons (cf. Greif and Schmiedl 2002). Table 1
summarizes all three groups of variables.
<< Insert Table 1 around here >>
To determine whether this large number of indicators actually can reveal
commonalities across our three dimensions—infrastructure, specialization, and
diversity—we start with a principal factor analysis (cf. Fabrigar et al. 1999) of all the
regional variables (cf. Table 1). All variables were standardized by calculating the mean
and dividing by the standard deviation. The Kayser criterion (Cattel 1966) and the scree
test on the eigenvalues of the factors suggest retaining two factors with eigenvalues larger
than 1. In the eigenvalue graph there is a breakpoint after the second factor where the
curve flattens out. To clarify the data structure, we used orthogonal rotation on the
remaining factors. It turns out that all variables in the Diversity Group have important
cross-loadings. Costello and Osborne (2005) argue that cross-loading indicators should
11
be dropped from the analysis. Thus, we drop these variables and reran the factor analysis.
Note that dropping some of the variables is meaningful in itself. For example, the cross-
loading of the variable share of bohemians may be due in part to Germany’s historical
past; its system of mini-states created a high density of cultural facilities, for example,
theaters. The results of this practice mean that the cultural facilities that attract bohemians
are rather evenly distributed across the entire country, that is, there is not much regional
variation in this respect. For a similar reason we drop the variable business services,
which contains the banking sector. The tripartite German banking system consists of
private, mutual, and public banks that guarantee a more or less even distribution of banks
across all regions. Accordingly, this variable also does not exhibit much variation. After
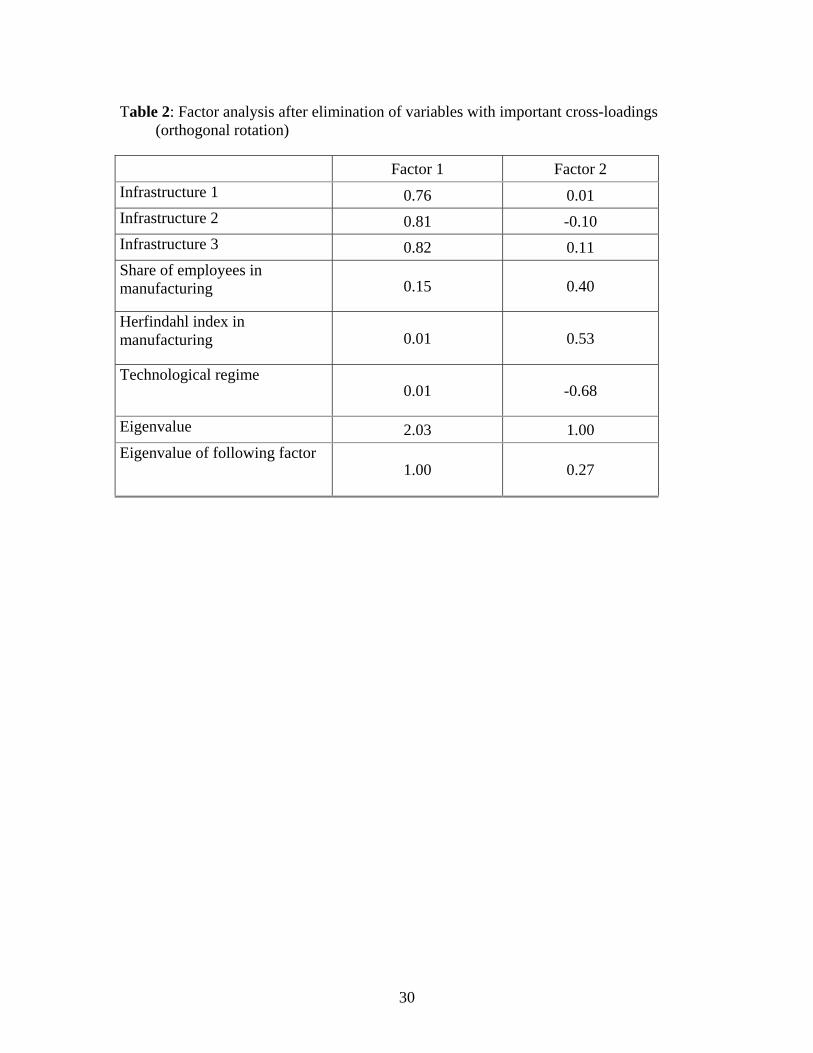
dropping these variables, two factors were retained that are orthogonally rotated to get a
clearer structure. The results of this second factor analysis are displayed in Table 2.
<< Insert Table 2 around here >>
The remaining first factor is highly and positively correlated with the three
infrastructure variables. Therefore, it is regarded as an indicator of the quality of the
region’s infrastructure that facilitates the inflow of knowledge. The second factor reflects
agglomeration economics. This factor is positively correlated with the share of employees
in manufacturing and with the Herfindahl index; however it is negatively correlated with
the technological regime indicator.
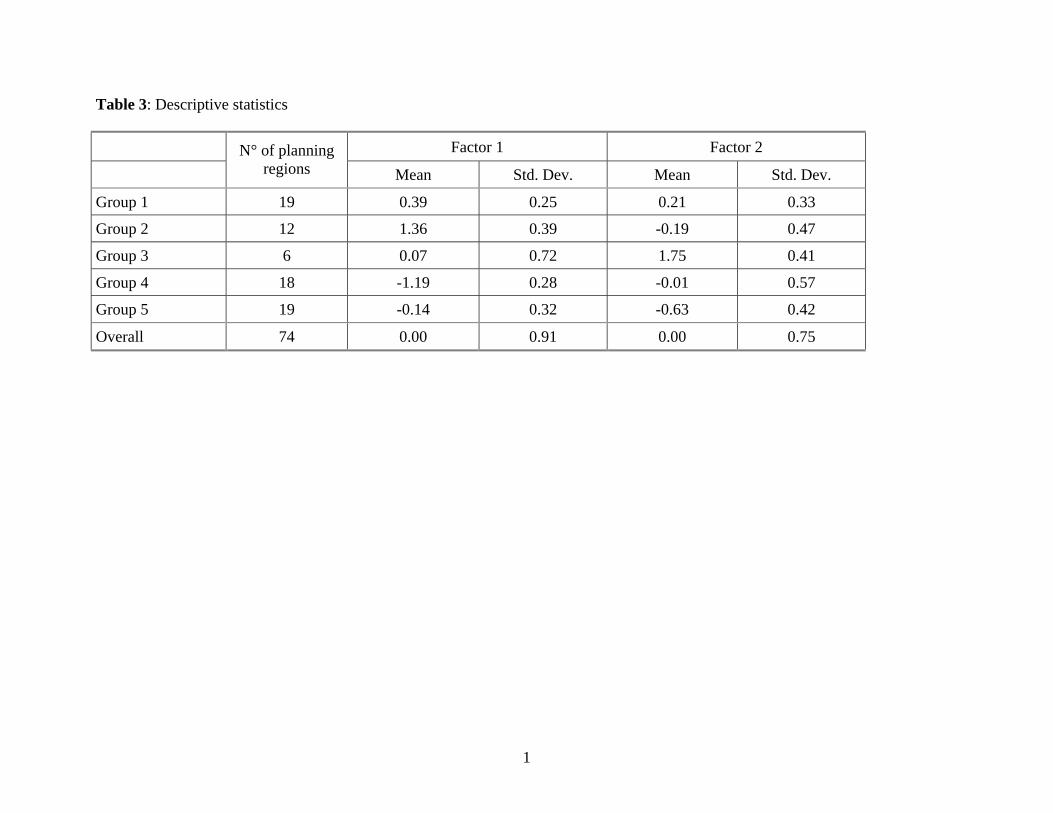
Based on these two factors, we group West German planning regions by means of
a hierarchical Ward’s linkage cluster analysis (Ward 1963). Table 3 provides descriptive
statistics of the two factors by group. The table reveals that Group 1 does not have an
extreme value in either Factor 1 or Factor 2. Group 2 is characterized by the highest value

12
of Factor 1, indicating the worst accessibility value, whereas Group 4 has the lowest
value of Factor 1 and thus the best accessibility. Finally, Group 3 has the highest value of
Factor 2, indicating an exceedingly high degree of agglomeration, while Group 5 has the
lowest value of Factor 2 and thus is least agglomerated.
<< Insert Figure 1 around here >>
<< Insert Table 3 around here >>
Table 4 shows the results of pair wise tests on the equality of means across the
five groups. This procedure helps to order the five groups with respect to the values of
Factor 1 and Factor 2. Regarding Factor 1, we already know that Group 2 and Group 4
mark the upper and lower borders, respectively. Further, there is no significant difference
between Group 1 and Group 3 or between Group 3 and Group 5. This suggests that all
three groups have a fair accessibility: Group 1’s accessibility is the worst among the three
and Group 5’s is the best of the three. Regarding Factor 2, Group 3 and Group 5 mark the
upper and lower borders. In between, there is no significant difference between Group 1
and Group 4 or between Group 2 and Group 4. Accordingly, Group 1 tends to be
relatively more agglomerated while Group 2 tends to be a bit less agglomerated.
<< Insert Table 4 around here >>
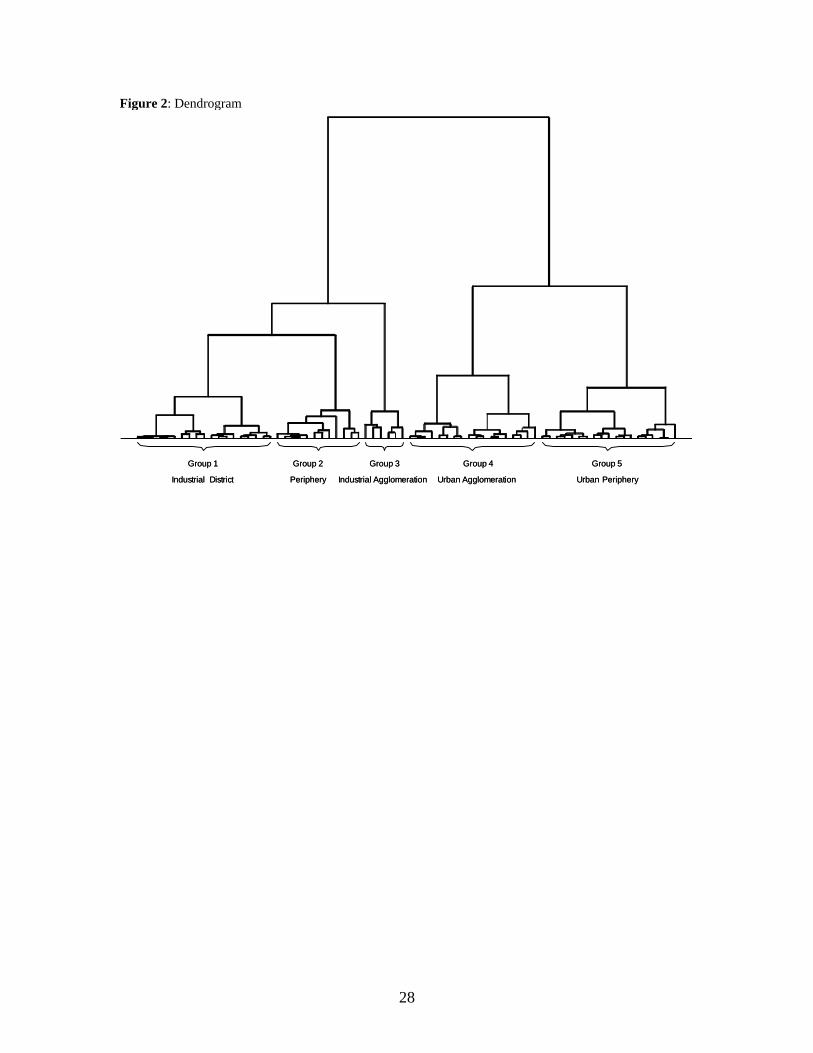
Figure 1 presents the corresponding dendrogram for the cluster analysis, where
we identify five different geographic regions labeled as follows.
Group 1—Industrial Districts. This group’s accessibility values indicate that its
members are located in rather rural areas and, as our map suggests, often near
industrial agglomerations. Their tendency toward agglomeration further indicates
a rather specialized spatial pattern of production. The industrial districts of this

13
group evolve over time to become home to smaller manufacturers along the
supply chain of large companies in industrial agglomerations. Included in this
group is the well-known industrial district of metal producers south of Stuttgart.
Group 2—Periphery. The regions in this group have the worst accessibility scores
and a rather diverse industry structure. This group has either already experienced
structural change or is in the process of it. One example of a region that belongs
to this group is the area around Hof (Upper Franconia), in former times one of
Europe’s major textile industry locations, but now large parts of these industries
have moved to low wage countries and left a large structural gap of
unemployment.
Group 3—Industrial Agglomeration. This group has the highest industry
concentration and fair accessibility values. Included in this group are production
facilities such as the one for BASF in Ludwigshafen, Volkswagen in Wolfsburg,
or Audi in Ingolstadt.
Group 4—Urban Agglomeration. This group is characterized by the highest
accessibility and an average degree of agglomeration. As illustrated in Figure 2,
urban agglomerations include metropolises such as Munich, Frankfurt, Cologne,
and Hamburg.
Group 5—Urban Periphery. This group is quite similar to Group 1. However, it is
has slightly better accessibility and less industry agglomeration. In contrast to
Group 1, Group 5 benefits more from the metropolis’s infrastructure than from its
industry structure. Group 5 regions offer centrality and nature-oriented living

14
conditions at a reasonable price and are especially attractive to medium-sized
companies of various industries.
<< Insert Figure 2 around here >>
An establishment file from German Social Insurance Statistics provides
longitudinal information about regional establishments and their employees. The unit of
measurement is the establishment, not the company and the empirical data include two
categories of entities: firm headquarters and subsidiaries. Each establishment with at least
one employee has a permanent individual code number, allowing startups and closures to
be identified.5 Our entry data consist of the number of entries in 23 manufacturing
industries in 74 West German planning regions over time (1987–2000).
Because the concern of this paper is on endogenous regional dynamics our focus
is on new firms founded by employees who previously worked in the region’s incumbent
firms. The potential pool of founders in a certain year t in planning region r and industry i
is, therefore, the number of employees in region r in 1−t . We are interested in estimating
whether the propensity to start a business varies across the five regional groups.
Therefore, we estimate the following count-data Poisson model with group (by region)
robust standard errors:
1321 ??))(log( −+++++= rtsiiiisirt empltimetimetimeEntryE δβββαα ,
5 The appearance of a new code number is interpreted as a startup, and the disappearance of a code number is interpreted as a closure. New businesses with more than 20 employees in the first year of their existence are excluded. As a result, a considerable number of new subsidiaries of large firms contained in the database are not counted as startups because the foundation of new subsidiaries of large firms is likely to follow different rules than entrepreneurial startups. However, the share of new establishments in the data with more than 20 employees in the first year is rather small (about 2.5%). Ignoring size limits does not lead to any significant change in our results.

15
where entryirt is the number of new establishments in manufacturing industry i in region r
in year t, αs are fixed effects for our five regional types, and αi are industry-specific fixed
effects. Furthermore, we control for industry-specific dynamics over time by adding time,
time², and time³. δs is the coefficient of interest. It gives us the group-specific propensity
to start a business of regional employees empl in year 1−t .
In a further step we added the share of employees s_empl in the respective
industry i in region r at time 1−t to the model:
11321 _??))(log( −− ++++++= irtsrtsiiiisirt emplsempltimetimetimeEntryE ϕδβββααThe regional group-specific coefficient φs can be interpreted as the influence of industry
experience on the propensity to start a business, conditional on the number of employees
in the region in year 1−t .
4. Empirical Analysis
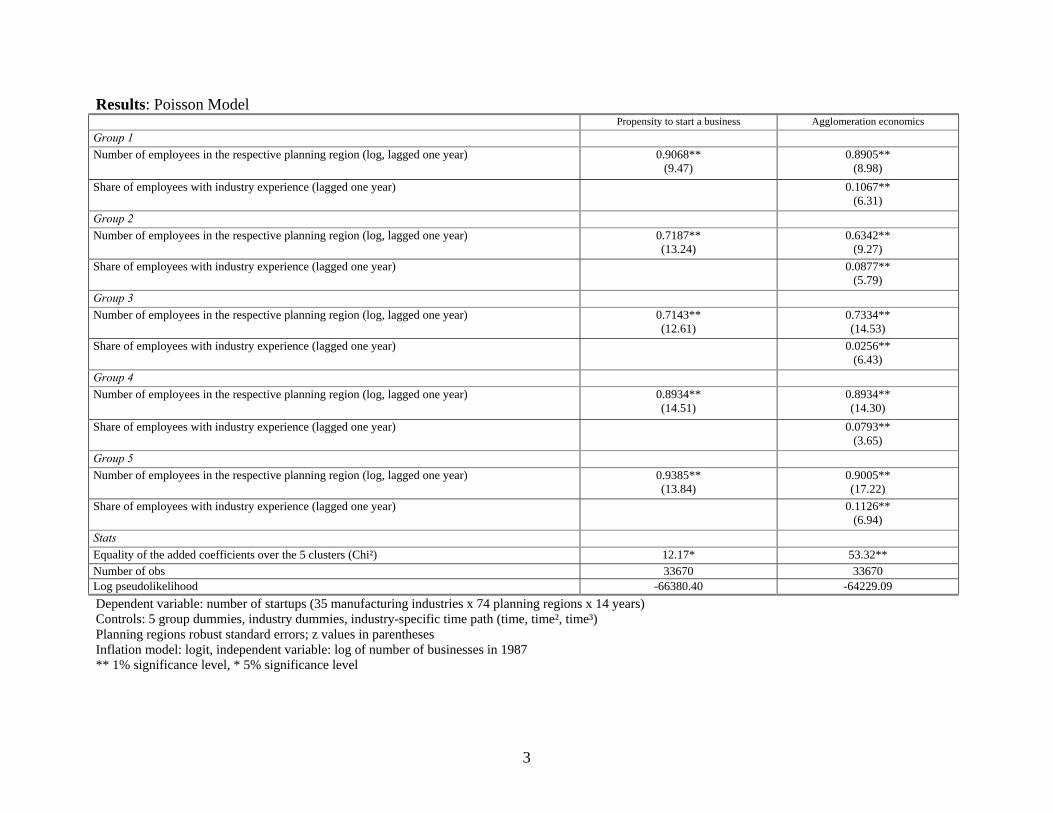
Table 5 displays the results of the Poisson model. The concept of a spatial
lifecycle suggests that regions at different phases of the lifecycle will exhibit different
characteristics. As described in Section 2, we classify the regional lifecycle into four
phases where each phase is characterized by (1) the prevailing technological regime—
entrepreneurial or routinized—and (2) its knowledge flows—interindustry or
intraindustry. To illustrate, Column I of Table 5 shows the average propensity of the total
regional population to start a business in a certain manufacturing industry. To this end,
we expect entrepreneurial regimes to provide an overall atmosphere that is conducive to
new business creation, whereas routinized regimes are less conducive to new business
creation. This distinction is clearly reflected in the data, where the periphery (Group 2)
and the industrial agglomerations (Group 3) represent routinized regimes, and industrial

16
districts (Group 1), urban agglomerations (Group 4), and the urban periphery (Group 5)
are entrepreneurial regimes.
Column II of Table 5 sets forth the one-year lagged share of employees with
experience in a respective manufacturing industry, taking into consideration the regional
creation of MAR externalities and the propensity that these externalities are
commercialized by entrepreneurs who start a new firm in the same industry. Again, the
empirical results show a clear pattern: industrial districts (Group 1) and urban peripheries
(Group 5) are the most likely to engage in entrepreneurship, while industrial
agglomerations (Group 3) are the least likely to do so. MAR externalities exist in the
Group 1 and Group 5 regions and influence entrepreneurial intentions, whereas
knowledge spillovers into entrepreneurship are of minor importance in industrial
agglomerations. Peripheries (Group 2) and urban agglomerations (Group 4) fall in
between as far as propensity toward entrepreneurship goes.
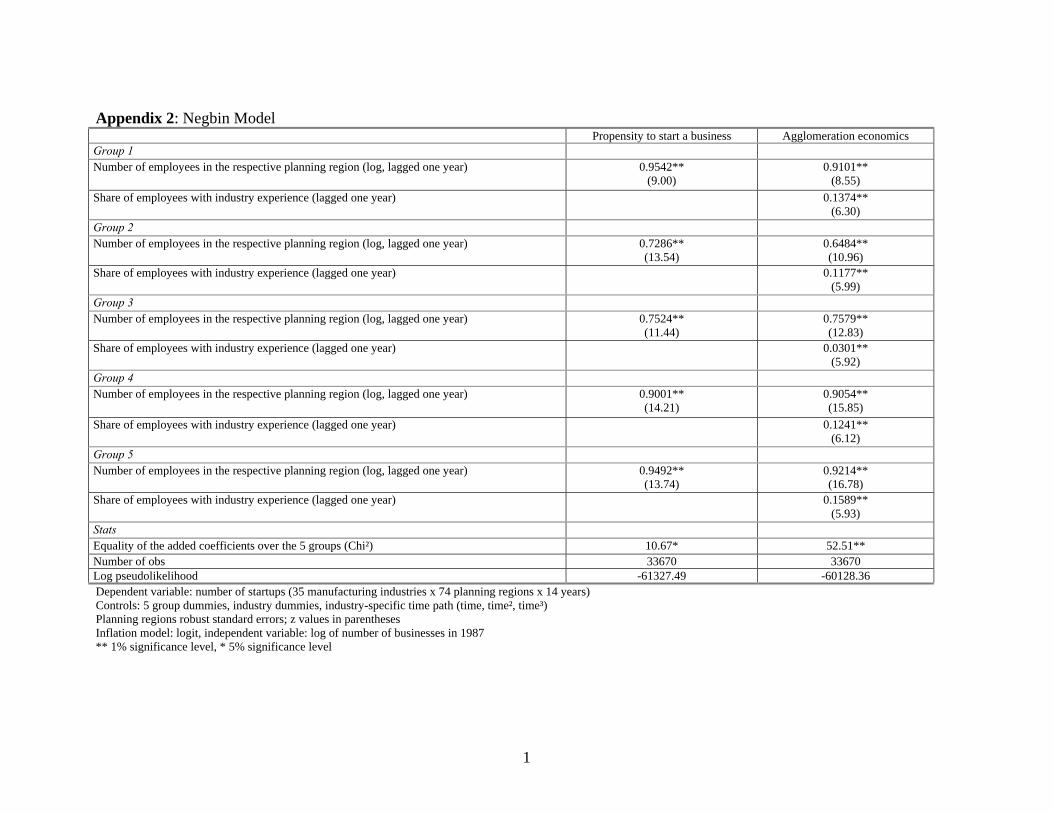
4.1. Robustness Checks
For robustness checks, we estimated a negative binomial model that allocates a
higher density to the tails of the distribution. Furthermore, we estimated zero-inflated
models to account for the fact that zero as an outcome is driven by forces other than the
nonzero outcomes. In the inflation model, the number of employees in the respective
region and manufacturing industry at the starting point 0=t (1987) entered as
explanatory variable. Here, the number of employees in a certain industry in a certain
region at 0=t is an indicator of whether industry i existed in region r at the beginning of
the period of analyses. The rationale behind this idea is that there might be further
barriers to entry in the situation where an industry did not exist at all in a certain region.
17
In all of these specifications, the results are very similar to the basic Poisson model.
However, for the sake of completeness, we report these results in the Appendix.
4.2. Results
Taken together, the findings give rise to the following descriptions of our four
spatial lifecycle phases.
Phase 1: The Urban Agglomerations (Group 4)
Urban agglomerations provide the creative environment described by Florida
(2002) and Glaeser et al. (2001) that attracts headquarters and R&D laboratories from the
manufacturing sector. Important drivers of regional knowledge production are the
incumbent (basic) research laboratories. However, regional production of knowledge is
only a partial explanation; of equal importance is the region’s ability to commercialize
the new knowledge and create value instead of positive externalities. Urban
agglomerations usually live up to these expectations and provide a fertile environment for
the commercialization of new ideas—in incumbent firms and also in startups, as
indicated by the relatively high propensity to start a business in a manufacturing industry
with respect to the overall population. Further, a relatively low value for industry
experience suggests that entry is driven more by interindustry spillovers (Jacobs
externalities) than by intraindustry spillovers (MAR externalities).
These regional characteristics suggest that urban agglomerations are generated
during the first phase of a spatial lifecycle when a rather diverse industry structure along
with corresponding Jacobs externalities stimulate a creative atmosphere supportive of
leading-edge technological innovation.

18
Phase 2: The Industrial Agglomerations (Group 3)
Industrial agglomerations are characterized by a high degree of specialization.
According to Markusen (1996), these regions are dominated by few large incumbent
firms, often called hubs, because there is a concentration of spokes—the suppliers—
surrounding them. In industrial agglomerations, workers’ loyalties are to the core firms
first, then to the district and only after that to small firms. If jobs open up in hub firms,
workers will often abandon smaller employers to get onto the hub firm’s payroll
(Markusen 1996, p. 303). This results in a routinized regime with a low propensity to
start a business. Additionally, the low value of the industry experience coefficient
suggests that knowledge is processed within incumbent firms and is not likely to spill
over into entrepreneurship. However, this routinization does not mean that these large
incumbents are not pushing at the technology frontier. They are drivers of innovation in
competitive industries, but the large amount of capital needed, along with the importance
of specialization and routinization, act as entry barriers.
Given these characteristics, the industrial agglomerations can be regarded as
routinized but still innovative regimes at the technology frontier. They are in the second
phase of the spatial lifecycle, where innovation is driven by routinized top-performing
incumbents.
Phase 3: Industrial Districts and Urban Peripheries
Industrial Districts (Group 1)
Industrial districts are rather specialized regions located in more peripheral areas.
However, they benefit from their proximity to centers of industrial production where
actual and potential clients are located. Typically, industrial districts are characterized by
19
firms that have specialized in a market segment along the supply chain and in these niche
markets they often hold a leading position. This phenomenon is discussed in more detail
in Simon’s (1996) work on hidden champions, which was recently updated by Venohr
and Meyer (2007) with a special focus on Germany. According to these authors,
Germany’s hidden champions are most likely to be family owned and located in small
towns; yet, they may hold as much as 90% of the market share in a niche market. These
regions’ entrepreneurial atmosphere is reflected in the high propensity of their residents
to start a business. Further, MAR externalities are important in these regions because new
firms are likely to start in niche markets where they specialize in the further development
of an existing product. In doing so, they benefit from the tendency of vertical
disintegration that occurs when specialized suppliers cooperate closely with downstream
firms.
Given that firms in industrial districts are not creating new products but are,
instead, further developing or optimizing existing ones, we place industrial districts in the
third phase of the spatial lifecycle. In this phase, mass markets create room for
incremental innovations in niche markets.
Urban Peripheries (Group 5)
Urban peripheries are the least agglomerated and can be found in proximity to
urban agglomerations. This suggests that urban peripheries profit from proximity to urban
agglomerations but retain certain advantages of not being part of the urban agglomeration
itself, for example, lower real estate prices. Therefore, they are likely to be the home of
specialized small and medium-sized companies. Similar to industrial districts, these
regions are likely to produce hidden champions. However, whereas the hidden champions
20
of industrial districts seemingly benefit from their proximity to centers of industrial
production and the accompanying specific demand, the hidden champions of urban
peripheries appear to benefit from their connection to an urban agglomeration and its
correspondingly diverse demands. This is reflected in the tendency of urban peripheries
to be less agglomerated and thus less specialized. Further, we know that the intense
dynamics of an urban agglomeration spreads to supplier markets where the need for
flexibility creates an entrepreneurial atmosphere. And, in fact, there is a high degree of
entrepreneurship in urban peripheries. Moreover, the high importance of former industry
experience suggests that startups in the urban peripheries rely on existing knowledge and
experience instead of being radically innovative. This supports our assumption that urban
peripheries are also home to businesses that concentrate on improving existing products
for niche markets.
We place urban peripheries in the third phase of the spatial lifecycle and for the
same reasons as we placed industrial districts in that phase. They are characterized by
entrepreneurship, but it is an entrepreneurship grounded in incremental innovations based
on intraindustry experience, instead of one more focused toward the truly new.
Phase 4: Peripheries (Group 2)
Peripheries are regions located in less accessible geographic areas—they have the
lowest accessibility scores. Further, the propensity for these regions to be less
agglomerated suggests that they are lacking distinct industry structure. When we examine
a few of the regions classified as peripheries, one explanation for this lack of industry
structure becomes clearer: these regions are or have been subject to massive structural
change and are about to realign. Take, for example, Higher Franconia, formerly the

21
European center of textile and pottery production. However, globalization, and all that
the term implies regarding wage and transportation costs, led to this region losing its
competitiveness, leaving behind an enormous population of low-skilled workers. This
type of region is hit exceptionally hard by structural change, as it does not have a large
enough or appropriate stock of regional knowledge that could act as the basis for a new,
competitive industry. Unsurprisingly, residents of this type of region have a very low
propensity for starting a business. Nonetheless, the relatively high importance of the
share of employees with industry experience suggests that former industry experience
and the corresponding MAR externalities could support at least some start-up activity in
this type of region. However, such startups, to be successful, urgently need to broaden
their previous industry experience by combining it with the latest high-tech knowledge
(e.g., former cloth producers who have a great deal of experience with textiles could
combine this experience with new technology to produce high-tech textiles for the
aerospace industry).
We place peripheries in the fourth and last phase of the spatial lifecycle to
emphasize that these regions are at the end of their current life. Their only hope is to be
reincarnated in the future, but the shape of their reincarnation will have less to do with
karma, and everything to do with creativity and a corresponding commercialization of
entrepreneurial opportunities.
5. Conclusions
Our results demonstrate the saliency of the regional lifecycle. We demonstrate
that regional dynamics are affected by the stage at which a region is operating. The
finding allows us to make a general distinction between entrepreneurial and routinized

22
regions. We find two types of entrepreneurial and two types of routinized regions that
vary along a spatial lifecycle. The first phase of the lifecycle is characterized by an
entrepreneurial atmosphere and interindustry spillovers, the second one by routinization
and innovation by incumbents, the third by a type of aging entrepreneurship that is more
concerned with the creation of niche markets than with the development of new products,
and, finally, the fourth phase, which is one of structural change. Here, new structures
must be developed eventually the region’s position along the lifecycle.
We add to the literature in three ways: First, we integrate the literature to provide
a spatial lifecycle model. Second, we categorize regions along this spatial lifecycle with
regard to their knowledge creation capability; third, we test the importance of the
existence of knowledge spillovers for start-up dynamics along the regional lifecycle.
Within entrepreneurial regions, we argue that one type, the Urban agglomerations,
benefits from interindustry spillovers (Jacobs externalities), leading to radical product
innovations while the other tow types, Urban Peripheries and Industrial Districts, both
benefit from intraindustry spillovers (MAR externalities), leading to incremental
innovations in niche markets. Regarding the two routinized groups of regions, we argue
that in one type, the industrial agglomerations, knowledge is both created and absorbed
by highly specialized incumbents. Their efficient knowledge production contributes to
their competitiveness, but it also prevents the emergence of externalities. In the second
type of regions, the peripheries, knowledge flows are of high importance but very scarce.
This situation arises when a structural change leads to a high depreciation of the regional
knowledge stock and thus very little potential for spillover.

23
Applying a regional count-data model for the number of startups in a region, we
find that dynamics influenced by entry are high in urban agglomerations, urban
peripheries, and industrial districts. In contrast, dynamics influenced by entry are of
minor importance in industrial agglomerations and peripheries. In entrepreneurial
regions, new firm entry drives dynamics; in routinized regions, dynamics spring—if at
all—from incumbent firms. In our analyses, we emphasized the importance of the
regional knowledge stock and its creation and diffusion. Depending on the phase of a
region’s routinization, knowledge creation is accompanied by a varying degree of
spillovers. Further, the degree of agglomeration determines whether knowledge spillovers
will be contained within the same industry and lead to improvements or inspire radical
innovations in other industries.
These initial findings provide a rich basis for further research. Does mobility
between regions mean that knowledge may be imported, and, if so, what are the
ramifications of this on economic growth and diversity? How, exactly, does a regional
knowledge stock develop? How do historic events, cultural linkages, or geographic
characteristics influence its development? Does supply and demand play any part in the
accumulation of regional knowledge stock? We are well aware that proper use of
customer feedback can drastically decrease the time needed to get a desirable product to
market, but might it not be the case that customer feedback could have an impact on a
company’s position on the spatial lifecycle, too? We hope these questions spark an
interest, and in doing so, simulate further research.

24
References
Abernathy, W.J. & J.M. Utterback (1978). Patterns of Innovation in Industry, Technology Review, 80, 40-47.
Aghion, P. & P. Howitt (1992). A Model of Growth through Creative Destruction, Econometrica, 60, 323–351.
Aghion P., R. Blundell, R. Griffith, P. Howitt, & S. Prantl (2006). The Effects of Entry on Incumbent Innovation and Productivity, NBER Working Paper 12027.
Audretsch, D. & M. Fritsch (2002). Growth Regimes Over Time and Space, Regional Studies, 36, 113–124.
Audretsch, D. B. and M. P. Feldman. (1996). Innovative Clusters and the Industry Life-cycle, The Review of Industrial Organization, 11: 253-273.
Cattel, R. B. (1966). The scree test for the number of factors, Multivariate Behavioral Research, 1, 245-276.
Cohen, W., & S. Klepper (1996a). A Reprise of Size and R&D, Economic Journal,106, 925–951.
Cohen, W. & S. Klepper. (1996b). Firm Size and the Nature of Innovation Within Industries: The Case of Process and Product R&D, Review of Economics and Statistics, 78, 232–243.
Costello, A.B., Osborne, J. (2005). Best practices in exploratory factor analysis: four recommendations for getting the most from your analysis, Practical Assessment Research & Evaluation, 10, 1-9.
Duranton, G. & Puga, D. (2001). Nursery cities: Urban diversity, process innovation, and the life cycle of products, American Economic Review, 91, 1454–1477.
Fabrigar, L.R., D.T. Wegner, R.C. MacCallum, & E.J. Strahan (1999). Evaluating the use of exploratory factor analysis in psychological research, Psychological Methods, 4: 272-299.
Falck, O. & Heblich, S. (2008). Modern Location Factors in Dynamic Regions, European Planning studies, forthcoming.
Feldman, M. (1994). The Geography of Innovation. Boston: Kluwer Academic Publishers.
Florida, R. (2002). The Rise of the Creative Class. New York, NY: Basic Books.
Fritsch, M. & U. Brixy (2004). The Establishment File of the German Social Insurance Statistics, Schmollers Jahrbuch/Journal of Applied Social Science Studies, 124: 183–190.

25
Glaeser, E., H. Kallal, J. Scheinkman, & A. Schleifer (1992). Growth of Cities, Journal of Political Economy, 100, pp. 1126–1152.
Glaeser, E., J. Kolko, & A. Saiz (2001). Consumer City, Journal of Economic Geography, 1, 27–50.
Gort, M. & S. Klepper (1982). Time Paths in the Diffusion of Product Innovations, Economic Journal, 92, 630–653.
Greif, S. & D. Schmiedl (2002). Patentatlas Deutschland – Dynamik und Struktur der Erfindertätigkeit. Munich: Deutsches Patent- und Markenamt.
Hippel, E. von (2007). Horizontal innovation networks—by and for users, Industrial and Corporate Change, 16, 293–315.
Jaffe, A., M. Trajtenberg, & R. Henderson (1993). Geographic Localization of Knowledge Spillovers as Evidenced by Patent Citations, Quarterly Journal of Economics, 63, 577–598.
Klepper, S. (1996). Entry, Exit, Growth, and Innovation over the Product Life Cycle, The American Economic Review, 86, 562-583.
Maretzke, S. (2005). Aktualisierung des Infrastrukturindikators für die Neuabgrenzung der Fördergebiete der Gemeinschaftsaufgabe “Verbesserung der regionalen Wirtschaftsstruktur”, Bonn: Bundesamtes für Bauwesen und Raumordnung.
Marshall, A. (1890). Principles of Economics. London: Macmillan.
Markusen, A. (1996). Sticky Places in Slippery Space: A Typology of Industrial Districts, Economic Geography, 72, 293-313.
Nelson, R.. & S. Winter (1982). An Evolutionary Theory of Economic Change. Cambridge, MA: Harvard University Press.
Porter, M. (1998). On Competition. Boston: Harvard Business School Press.
Schumpeter, J.A. (1942). Capitalism, Socialism and Democracy. New York: Harper & Brothers.
Schumpeter, J.A.(1912). The theory of economic development, New York: Oxford University Press.
Simon, H. (1996). Hidden Champions, Lessons from 500 of the World’s Best Unknown Companies. Boston: Harvard Business School Press.
Stam, E. (2006). Why Butterflies Don’t Leave. Locational behaviour of entrepreneurial firms, Discussion Papers on Entrepreneurship, Growth and Public Policy 2006-20. Utterback J.M. & W. J. Abernathy (1975). A Dynamic Model of Product and Process
Innovation, Omega, 3, 639-656.
26
Venohr, B. & K.E. Meyer (2007). The German Miracle Keeps Running: How Germany’s Hidden Champions Stay Ahead in the Global Economy, Working Paper 30, FHW Berlin.
Ward, J. H. (1963). Hierarchical grouping to optimize an objective function. Journal of the American Statistical Association 58: 236-244.
Weber, A. (1909). Über den Standort der Industrie: Reine Theorie des Standorts, Tübingen: Verlag von J.C.B. Mohr.
Winter, S.G. (1984). Schumpeterian competition in alternative technological regimes, Journal of Economic Behavior and Organization 5, 287–320.

27
Figure 1: Regional Groups in West Germany
Industrial Distric t
PeripheryIndustrial Agglomeration
Urban AgglomerationUrban Periphery
28
Figure 2: Dendrogram
Group 1
Industrial District
Group 2
Periphery
Group 3
Industrial Agglomeration
Group 4
Urban Agglomeration
Group 5
Urban Periphery
Group 1
Industrial District
Group 2
Periphery
Group 3
Industrial Agglomeration
Group 4
Urban Agglomeration
Group 5
Urban Periphery
29
Table 1: Regional variables entering the factor analysis Variable Description
Source
Infrastructure 1 Accessibility of the nearest three national or international agglomerations via road and rail combined (in minutes); 2004 Federal Office for Building and Regional Planning
Infrastructure 2 Accessibility of European metropolis via road and air combined (in minutes); 2004 Federal Office for Building and Regional Planning
Infrastructure 3 Availability of modern transportation system (accessibility in minutes); 2004 Federal Office for Building and Regional Planning
Quality of regional infrastructure
Share of employees in manufacturing
Share of employees in manufacturing compared to total number of employees subject to social security; average over the timespan 1987–2000 Social Insurance Statistics
Herfindahl index in manufacturing
Sum of the squares of the employment shares of each industry in manufacturing; average over the timespan 1987–2000 Social Insurance Statistics
Technological regime Share of employees with a degree in engineering or natural science in small businesses compared to total number of employees with a degree in engineering or natural science; average over the timespan 1987–2000 Social Insurance Statistics
Agglomeration economies
Share of small business employment
Share of small business employment (businesses with at most 50 employees); average over the timespan 1987–2000 Social Insurance Statistics
Share of employees in business-related services
Share of employees in business services compared to total number of employees subject to social security; average over the timespan 1987–2000 Social Insurance Statistics
Share of bohemians Share of publicists, musicians, actors, painters, and designer compared to total number of employees subject to social security; average over the timespan 1987–2000 Social Insurance Statistics
Share of patents applied for by natural persons
Share of patents applied for by natural persons; average over the timespan 1995–2000 German Patent Atlas
Share of patents applied for by research institutions
Share of patents applied for by universities and research institutes; average over the timespan 1995–2000 German Patent Atlas
Diversity /Jacobs externalities
30
Table 2: Factor analysis after elimination of variables with important cross-loadings (orthogonal rotation)
Factor 1 Factor 2 Infrastructure 1 0.76 0.01 Infrastructure 2 0.81 -0.10 Infrastructure 3 0.82 0.11 Share of employees in manufacturing 0.15 0.40
Herfindahl index in manufacturing 0.01 0.53
Technological regime 0.01 -0.68
Eigenvalue 2.03 1.00 Eigenvalue of following factor
1.00 0.27
1
Table 3: Descriptive statistics Factor 1 Factor 2
N° of planning
regions Mean Std. Dev. Mean Std. Dev.
Group 1 19 0.39 0.25 0.21 0.33
Group 2 12 1.36 0.39 -0.19 0.47
Group 3 6 0.07 0.72 1.75 0.41
Group 4 18 -1.19 0.28 -0.01 0.57
Group 5 19 -0.14 0.32 -0.63 0.42
Overall 74 0.00 0.91 0.00 0.75

2
Table 4: Test for equality of mean (t test, Factor 1, Factor 2)
Group 1 Group 2 Group 3 Group 4 Group 5
Group 1 -8.43*** 2.83***
1.69 -9.25***
17.80*** 1.50
5.74*** 6.78***
Group 2 5.00*** -8.50***
20.66*** -0.90
11.69*** 2.63**
Group 3 6.29*** 6.89***
1.06 11.93***
Group 4 -10.33*** 3.69***
Group 5
Factor 1: Equality of all means F-statistic: 101.61***
Factor 2: Equality of all means F-statistic: 32.88***
3
Results: Poisson Model Propensity to start a business Agglomeration economics Group 1 Number of employees in the respective planning region (log, lagged one year) 0.9068**
(9.47) 0.8905**
(8.98) Share of employees with industry experience (lagged one year) 0.1067**
(6.31) Group 2 Number of employees in the respective planning region (log, lagged one year) 0.7187**
(13.24) 0.6342**
(9.27) Share of employees with industry experience (lagged one year) 0.0877**
(5.79) Group 3 Number of employees in the respective planning region (log, lagged one year) 0.7143**
(12.61) 0.7334** (14.53)
Share of employees with industry experience (lagged one year) 0.0256** (6.43)
Group 4 Number of employees in the respective planning region (log, lagged one year) 0.8934**
(14.51) 0.8934** (14.30)
Share of employees with industry experience (lagged one year) 0.0793** (3.65)
Group 5 Number of employees in the respective planning region (log, lagged one year) 0.9385**
(13.84) 0.9005** (17.22)
Share of employees with industry experience (lagged one year) 0.1126** (6.94)
Stats Equality of the added coefficients over the 5 clusters (Chi²) 12.17* 53.32** Number of obs 33670 33670 Log pseudolikelihood -66380.40 -64229.09 Dependent variable: number of startups (35 manufacturing industries x 74 planning regions x 14 years) Controls: 5 group dummies, industry dummies, industry-specific time path (time, time², time³) Planning regions robust standard errors; z values in parentheses Inflation model: logit, independent variable: log of number of businesses in 1987 ** 1% significance level, * 5% significance level

1
Appendix: Different Count-Data Models Appendix 1: Zero-Inflated Poisson Model Propensity to start a business Agglomeration Economics Group 1 Number of employees in the respective planning region (log, lagged one year) 0.8684**
(9.33) 0.8577**
(8.81) Share of employees with industry experience (lagged one year) 0.1018**
(6.03) Group 2 Number of employees in the respective planning region (log, lagged one year) 0.6708**
(11.26) 0.5941**
(8.03) Share of employees with industry experience (lagged one year) 0.0815**
(5.88) Group 3 Number of employees in the respective planning region (log, lagged one year) 0.6807**
(13.08) 0.6991** (15.13)
Share of employees with industry experience (lagged one year) 0.0241** (5.89)
Group 4 Number of employees in the respective planning region (log, lagged one year) 0.8803**
(14.27) 0.8809** (14.04)
Share of employees with industry experience (lagged one year) 0.0800** (3.71)
Group 5 Number of employees in the respective planning region (log, lagged one year) 0.9184**
(13.68) 0.8830** (17.23)
Share of employees with industry experience (lagged one year) 0.1103** (6.92)
Stats Equality of the added coefficients over the 5 groups (Chi²) 14.87** 50.88** Number of obs 33670 33670 Nonzero obs 21707 21707 Zero obs 11963 11963 Log pseudolikelihood -65543.03 -63508.74 Dependent variable: number of startups (35 manufacturing industries x 74 planning regions x 14 years) Controls: 5 group dummies, industry dummies, industry-specific time path (time, time², time³) Planning regions robust standard errors; z values in parentheses Inflation model: logit, independent variable: log of number of businesses in 1987 ** 1% significance level, * 5% significance level
1
Appendix 2: Negbin Model Propensity to start a business Agglomeration economics Group 1 Number of employees in the respective planning region (log, lagged one year) 0.9542**
(9.00) 0.9101**
(8.55) Share of employees with industry experience (lagged one year) 0.1374**
(6.30) Group 2 Number of employees in the respective planning region (log, lagged one year) 0.7286**
(13.54) 0.6484** (10.96)
Share of employees with industry experience (lagged one year) 0.1177** (5.99)
Group 3 Number of employees in the respective planning region (log, lagged one year) 0.7524**
(11.44) 0.7579** (12.83)
Share of employees with industry experience (lagged one year) 0.0301** (5.92)
Group 4 Number of employees in the respective planning region (log, lagged one year) 0.9001**
(14.21) 0.9054** (15.85)
Share of employees with industry experience (lagged one year) 0.1241** (6.12)
Group 5 Number of employees in the respective planning region (log, lagged one year) 0.9492**
(13.74) 0.9214** (16.78)
Share of employees with industry experience (lagged one year) 0.1589** (5.93)
Stats Equality of the added coefficients over the 5 groups (Chi²) 10.67* 52.51** Number of obs 33670 33670 Log pseudolikelihood -61327.49 -60128.36 Dependent variable: number of startups (35 manufacturing industries x 74 planning regions x 14 years) Controls: 5 group dummies, industry dummies, industry-specific time path (time, time², time³) Planning regions robust standard errors; z values in parentheses Inflation model: logit, independent variable: log of number of businesses in 1987 ** 1% significance level, * 5% significance level
2
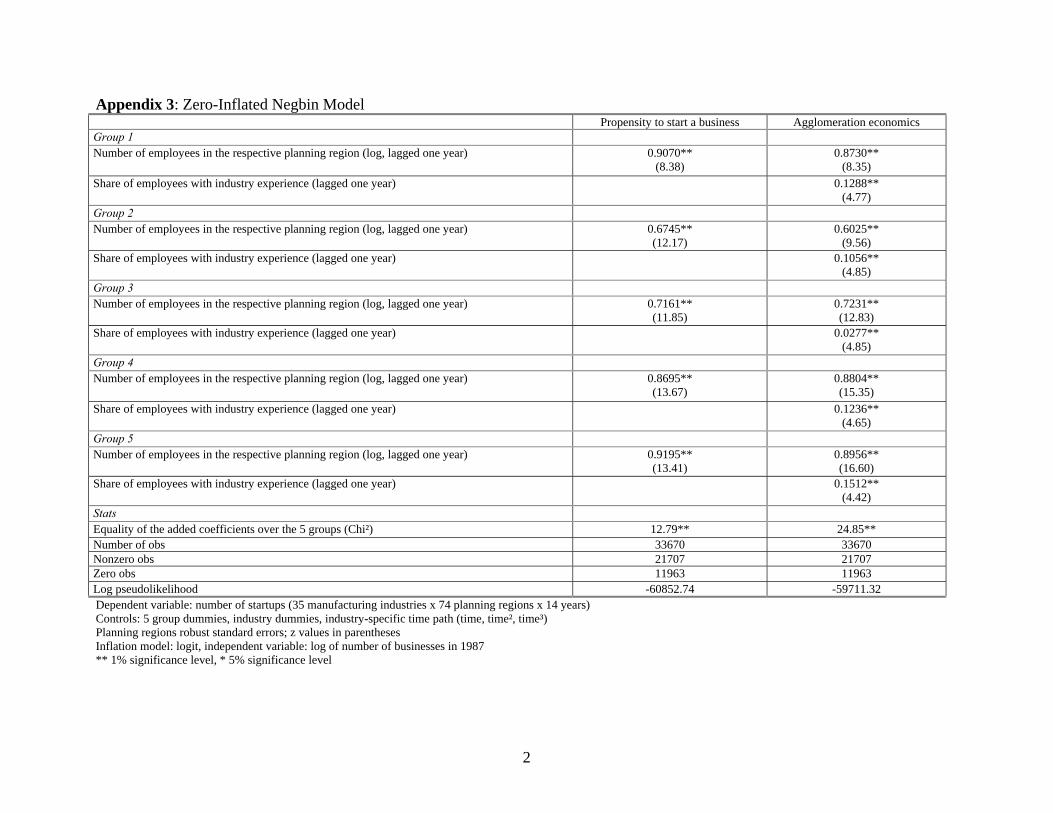
Appendix 3: Zero-Inflated Negbin Model Propensity to start a business Agglomeration economics Group 1 Number of employees in the respective planning region (log, lagged one year) 0.9070**
(8.38) 0.8730**
(8.35) Share of employees with industry experience (lagged one year) 0.1288**
(4.77) Group 2 Number of employees in the respective planning region (log, lagged one year) 0.6745**
(12.17) 0.6025**
(9.56) Share of employees with industry experience (lagged one year) 0.1056**
(4.85) Group 3 Number of employees in the respective planning region (log, lagged one year) 0.7161**
(11.85) 0.7231** (12.83)
Share of employees with industry experience (lagged one year) 0.0277** (4.85)
Group 4 Number of employees in the respective planning region (log, lagged one year) 0.8695**
(13.67) 0.8804** (15.35)
Share of employees with industry experience (lagged one year) 0.1236** (4.65)
Group 5 Number of employees in the respective planning region (log, lagged one year) 0.9195**
(13.41) 0.8956** (16.60)
Share of employees with industry experience (lagged one year) 0.1512** (4.42)
Stats Equality of the added coefficients over the 5 groups (Chi²) 12.79** 24.85** Number of obs 33670 33670 Nonzero obs 21707 21707 Zero obs 11963 11963 Log pseudolikelihood -60852.74 -59711.32 Dependent variable: number of startups (35 manufacturing industries x 74 planning regions x 14 years) Controls: 5 group dummies, industry dummies, industry-specific time path (time, time², time³) Planning regions robust standard errors; z values in parentheses Inflation model: logit, independent variable: log of number of businesses in 1987 ** 1% significance level, * 5% significance level