Embed Size (px)
Citation preview
14th InternationalWater SupplyCongress
-7 1
I W S A 8 2
I4ème CongrèsInternationaldes Distributionsd'Eau
Papers -Documents
Thursday/ Friday, 9-10 September 1982
Jeudi /Vendredi, 9-10 Septembre 1982
SEMINAR ON DEVELOPING COUNTRIES.
SEMINAIRE POUR LES PAYS EN VOIE DE DEVELOPPEMENT. - ,Icp 33 fO)
The papers received at 12th August, 1982 for presentation at the Seminar.(Reçu le 12 août)
SESSION II - WORKSHOP ON MANAGEMENT AND ORGANISATION. Page.ATELIER "GESTION ET ORGANISATION
X Management and Organisation of the NationalWater Resources in Seneqal.Gestion et organisation des ressourcesnationales d'eau au Sénégal.A. FALL (SENEGAL) " ~ 1 - 2 4
Management and Organisation in Rural Areas.Gestion et organisation dans les zonesrurales.S. K. TASGAONKAR (INDIA) 25 - 35
SESSION III - SPECIAL SUBJECTS - SUJETS SPECIAUX.
v Need for Well Survey and Groundwater Data 36 - 51 (PART I)Banking System as a tool to ascertain thepotential of groundwater resources. 52 - 72 (PART I I )Evaluation des ressources souterraines parl'emploi d'une banque de données sur les 73 - 80 (PART I I I )nappes et l'étude des sources.Z. HAMAN (DENMARK)
Desalination - DessalementD. ARGO (U.S.A.) 81 - 128
SESSION IV - WORKSHOP ON DISTRIBUTION - ATELIER "DISTRIBUTION".
V Materials for Pipes.Matériaux de conduites.J. T. VAN DER ZWAN (NETHERLANDS) 129 - 138
Operation and Maintenance of distributionNetworks.Exploitation et Entretien des reseaux dedistr ibut ion.F. OUALI (TUNISIA) 139 - 150
y Water Supply in New Caledonia^ L'Alimentation d'Eau en Nouvelle Caledonie
J. POULAIN (FRANCE) 151 - 183
T J B P •'>••'"
à, ^ " ^ cerones Ü G ^' 7
ISESSION VI - WORKSHOP: SUPPLY TO CONSUMER |
ATEL1EK "MJUKN11UKE AU CONSOMMATEUR"
. F i r s t Experiences wi th a Women-Orientated m.X Project for the Water Decade.
1ère experience d'un projet de la Décennie •destiné aux femmes. •SAMIA AL AZHARIA JAHN (SUDAN) 184 - 187
y Design and Construction of Trinidad Water *A Supply. f
Distr ibut ion d'eau à la T r in i té . IFRED E. HAREM-(U.S.A.) 188 - 198
Metering/Comptage I .R. MOURTADA (SYRIA) 199-213
I•1•
•
SESSION II
LA POLITIQUE DE L'EAU AU SENEGAL.
Mr. A. B. FALL, SENEGAL.
INTRODUCTION .
Le Sénégal est situé à l'extrême Ouest de l'Afrique tropi-cale entre 12° et 16°30 de latitude Nord, ll°30 et 17°30 de longi-tude Ouest.
Le pays est très plat sauf à l'Est, il a une superficie de196 722 km2. La population du Sénégal est estimée a 5 507 684habitants pour 1979, avec un taux d'accroissement de 2,8 %. Sadensité moyenne est de 28 habitants/km2.
Le climat est caractérisé par des pluies de mousson desaison chaude (été, ici hivernage) et d'une période de plus en pluscourte (3 à 5 mois), et de plus en plus abondantes (200 à 1500 mm)du Nord vers le Sud et par des températures qui croissent du rivagevers l'intérieur. Il est bordé sur 500 km environ, à l'Ouest, parl'Océan Atlantique.
On distingue une zone subcanarienne (côté Nord-Ouest) oùdurant les six mois d'hiver, l'alizé rend la température supportable,une zone sahélienne couvrant le 1/3 Nord du pays, où la savaneherbacée annonce le désert ; les zones de forets-galeries du typeguiñeen au Sud et Sud-Ouest.
Le Sénégal dispose de ressources en eau variées mais lamise en oeuvre de ces ressources devra tenir compte de leurs carac-téristiques variables et surtout de leur capacité, de l'importancedes besoins en eau de différentes natures et la tendance de l'évo-lution de ces ressources et des besoins en eau. Dans le cadre decette communication nous faisons dans un premier temps le point denos ressources en eau.
En partant d'une connaissance approfondie des ressourcesdisponibles, nous avons défini dans la deuxième partie de ce documentles besoins actuels et leur évolution dans le temps.
Ces besoins concernent les hommes, les animaux, l'agriculture,l'industrie et le tourisme.
Enfin, nous terminerons par des perspectives en rapport avecles objectifs globaux du Vie Plan visant à combler les insuffisancesqualitatives et quantitatives d'eau qui prévalent tant en milieuurbain que rural.
- 1 -
I - APERÇU SUR LES RESSOURCES EN EAUX
III
Ces ressources varient d'une région a une autre et dépende»fortement des conditions climatiques et de la nature des sols. On ™distinguera les eaux de pluies, les eaux de surface et les eaux _souterraines.-; . I
I.1.- Les eaux de pluies ILes pluies sont conditionnées par le régime des vents et
influencées par la température et 1 ' evaporation. Elles approvision-anent plus ou moins les autres catégories d'eau, selon la zone |considérée.
Au Sénégal, pays sahélien, le régime des pluies estcaractérisé par : ?
.a) - leur répartition dans le temps/ de Mai a Qç^obre auSud et à l'Est du pays, de Juillet à Octobre dans ïe.Nord., . ,
.b) - l'irrégularité dans l'espace et dans le temps, quiaffecte aussi bien les totaux annuels que la répartition des pluiesau cours d'une même saison.
.c) - une opposition marquée entre une longue saison sèchede 7 à 9 mois avec une saison pluvieuse de .3 ò 5 mois .. ' ,:r. -
Les normales pluviomètriques croissent de 250 mm au Nordà 1500 mm au Sud. .
III
II
Les pluies tombant actuellement sur le Sénégal représententun volume de 100 à 200 milliards de tn3 d'eau. La plus grande partit(¿0 à 80 %) de cette eau, échappe par evaporation ou ruissellementvers les bas fonds, parfois marécageux et salés. •
I.2.- Les eaux de surface • ••> • IEn raison de sa faible pluviométrie et de l'importance de
1'evaporation, le Sénégal n'est pas doté de possibilités important»*en eaux de surface. Le réseau hydrographique est-mol réparti, en |particulier vr\ vaste territoire sans cours d-'eau^pérennes s'étend,pratiquement entre le Fleuve Sénégal au Nord et le Saloum au Sud- •Ouest. • • 2 - - .- I
On distingue ainsi
- Les cours d'eau internationaux résultant d'écoulements à longuedistance qui descendent des contreforts du Fouta-Djallon. Ilscharrient d'importants apports provenant des régions g*uinéennesabondamment arrosées, leur régime est fortement affecté sur leurpartie aval par le climat sahélien. Ces grands axes sont :
I
- 2 -
. Le Sénégal et
. La Gambie.
. Le Sénégal
Long de 1790 km, le fleuve Sénégal prend sa source dans leFouta Djallon, en Guinée-Conakry, traverse la partie occidentale duMali, puis constitue sur tout le reste de son parcours la ligne fron-tière entre les territoires du Sénégal et de la Mauritanie.
La valeur moyenne des débits, calculés sur 65 ans (1903-1968)est de 771 m3/s à Bakel, soit un volume moyen annuel écoulé de24 milliards de m3.
Il faut signaler que le lit du fleuve sur une longueur de250 km, depuis l'embouchure, se trouve nettement en dessous du niveaumoyen de l'océan, il en résulte en période d'étiage, une avancée d'eausalée jusqu'à 183 km de l'embouchure avec une fréquence de dépassementde 5 0 % . Le bassin supérieur du Sénégal en amont de Bakel est trèsaccidenté et parcouru par quatre affluents principaux : la Falémé,le Bafing, le Bakoye et le Baoulé.
•• t ~ka Gambie
Long de 1130 km, elle prend sa source au Fouta Djallon. Cefleuve est moins bien connu que le Sénégal. Cependant, les donnéesrecueillies à la station de Goulombo qui date de 1953 ont permis decaractériser en ce point le régime du fleuve.
- Valeur moyenne des débits (module média ) = 300 m3)- Volume moyen annuel écoulé : 9,460 Milliards de m3
L'équilibre saisonnier entre la poussée des marées et celle des eauxde crue fait remonter l'eau salée jusqu'à 260 km de Banjul (situé à1'embouchure).
Le bassin versant du fleuve Gambie couvre 75 000 m2 enmajorité au Sénégal :
— Sénégal - 53 000 km2--Gambie 12 000 km2- Guinée-Conakry 10 000 km2.
Le bassin versant utile est dans sa quasi totalité au SénégalOriental où coulent ses principaux affluents : Sandougou, Niériko,Niokolo-Koba, Koulountou. Un autre affluent-défluent, le Bao-Bolonest situé dans la région du Sine-Saloun (Sénégal).
- Les cours d'eau nationaux : il s'agit essentiellement de la Casamanceet du Saloum, ils sont très peu connus par rapport ao Sénégal et à laGambie.
- 3 -
III
Le régime de la Casamance à Kolda situé ò 230 km de l'embou-Mchure, se caractérise comme suit en année normale :
IValeur moyenne des débitsVolume moyen annuel écoulé
6,1 m3/s192,4 Milliards de m3.
Comme pour ]e Sénégal, l'utilisation des eaux des autresfleuves (Gambie, Casamance, Kayanga, Saloum, Somone) et l'aménagementde leurs bassins sont subordonnés à une connaissance très pousséedu fleuve, de son régime, du sol, des conditions climatiques, humainanimales, végétales du bassin versant.
1- Lacs et Niayes I
Le lac le plus important du Sénégal est celui du Guiers avec!une superficie moyenne de 200 km2 (cote : + 0,00 IGN) réalimenté par™le fleuve Sénégal, il fournit quelques 41 000 m3/j pour l'alimentatien eau de DAKAR et des centres situés le long de la conduite d'amené
Dans les Niayes aussi, entre DAKAR etAtlantique, existent des ressources en eau demarigots) salée ou nonencore permis de les
LOMPOUL, sur la côtesurface (lacs et
mais lesquantifier.
études hydrologiques n'ont pasIII
I
- 4 -
I.3.- Les eaux souterraines
Les nappes acquifères du Sénégal sont situées dans desterrains sédimentaires dont l'épaisseur peut être considérable(jusqu'à 1700 m par endroit). D'une façon générale, les nappesutilisables sont situées entre 10 et 550 m de profondeur. L'eausouterraine est partout présente sauf dans le triangle Sud-Estoù le socle ancien affleure.
Les vastes réserves d'eau souterraine peuvent être classées en3 (trois) catégories :
- Les nappes phréatiques ou superficielles, ce sont :
. la nappe du continental terminal ò l'Est duméridien lé°. Elle est entre 0 et 20 m en Casamonceet entre 40 et 60 m (voir localement à 120 m) auNord de l'axe Kaolack - Tambacounda. Ses débitssont intéressants sauf au Nord.
. A l'Ouest du méridien 16°, on rencontre les nappeslogées dans les formations géologiques situéesentre le maestrichtien et le quaternaire.
- La nappe profonde des sables maestrichiens que l'ontrouve généralement entre 200 et 400 m, parfois à 100 m et au-dessus de 500 m avec de forts débits couvre les 2/3 du territoiremême si la qualité de ses eaux n'est pas toujours bonne et sescaractéristiques hydrogéologiques favorables.
- Les ressources moins abondantes du socle ancien :nappes discontinues rencontrées dans les terrains d'altérationou de fissuration.
- 5 -
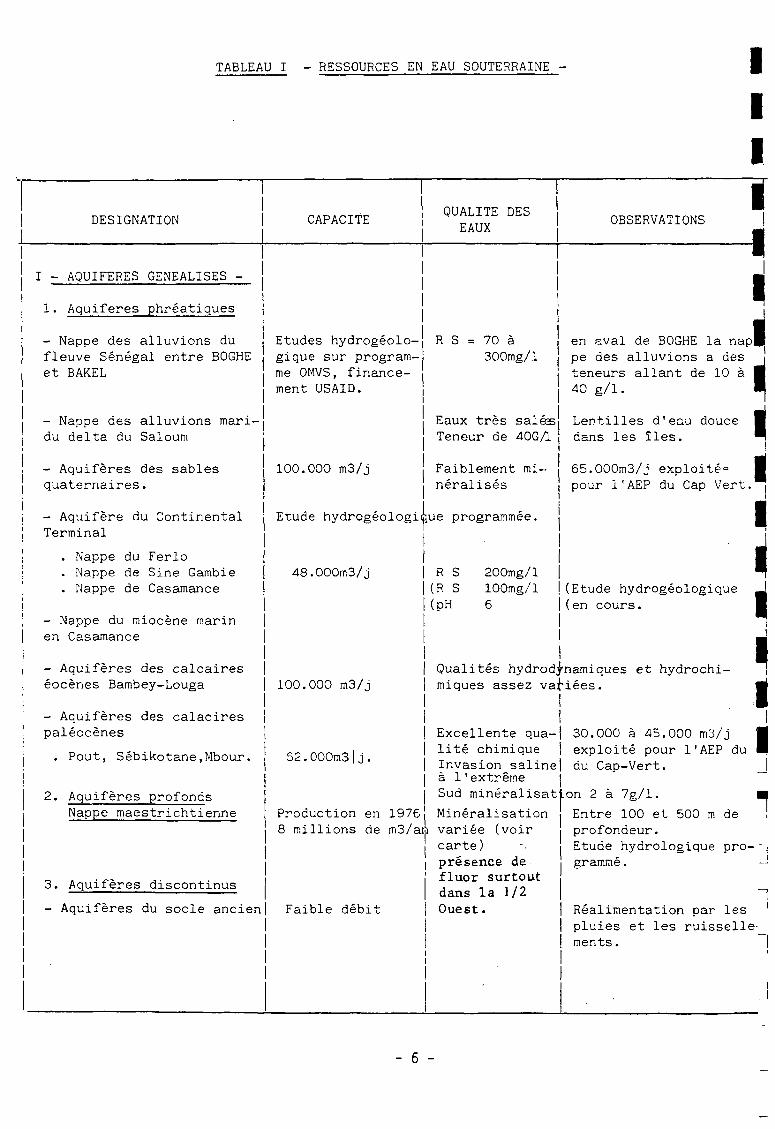
TABLEAU I - RESSOURCES EN EAU SOUTERRAINE - III1I
DESIGNATIONQUALITE DES
EAUXOBSERVATIONS
I - AQUIFERES GENEALISES -
1. Aquiferes phréatiques
- Nappe des alluvions dufleuve Sénégal entre BOGHEet BAKEL
- Nappe des alluvions mari-du delta du Saloum
- Aquiferes des sablesquaternaires.
- Aquifère du ContinentalTerminal
. Nappe du Ferio
. Nappe de Sine Gambie
. Nappe de Casamance
- Nappe du miocène marinen Casamance
- Aquiferes des calcaireséocènes Bambey-Louga
- Aquiferes des calacirespaléocènes
. Pout, Sébikotane.Mbour.
2. Aquiferes profondsNappe maestrichtienne
3. Aquiferes discontinus
- Aquiferes du socle ancien
Etudes hydrogéolo-gique sur program-me OMVS, finance-ment USAID.
100.000 m3/j
R S = 70 à300mg/l
Eaux très salésTeneur de 40GA
Faiblement mi-néralisés
en çval de BOGHE la nap;pe des alluvions a desteneurs allant de 10 à40 g/1.
Lentilles d'eau doucedans les îles.
65.000m3/j exploité»pour l'AEP du Cap Vert.
!
•Etude hydrogéologicue programmée.
48.000m3/j
100.000 m3/j
S2.000m3|
Production en 1976
R S(R S(pH
200mg/l100mg/l6
(Etude hydrogéologique(en cours.
Qualités hydrodynamiques et hydrochi-miques assez variées.
Excellente qua-lité chimiqueInvasion saline|a 1'extrêmeSud minéralisation 2 à 7g/l.
Minéralisation8 millions de m3/an variée (voir
carte)I présence defluor surtoutdans la 1/2
Faible débit | Ouest.
j30.000 à 45.000 m3/j Mexploité pour l'AEP du •du Cap-Vert. J
Entre 100 et 500 m de .profondeur.Etude hydrologique pro-"gramme.
Réalimentation par les 'pluies et les ruisselle-_ments. |
- 6 -
».•>*, A
W
'» X«
1
4b
5.
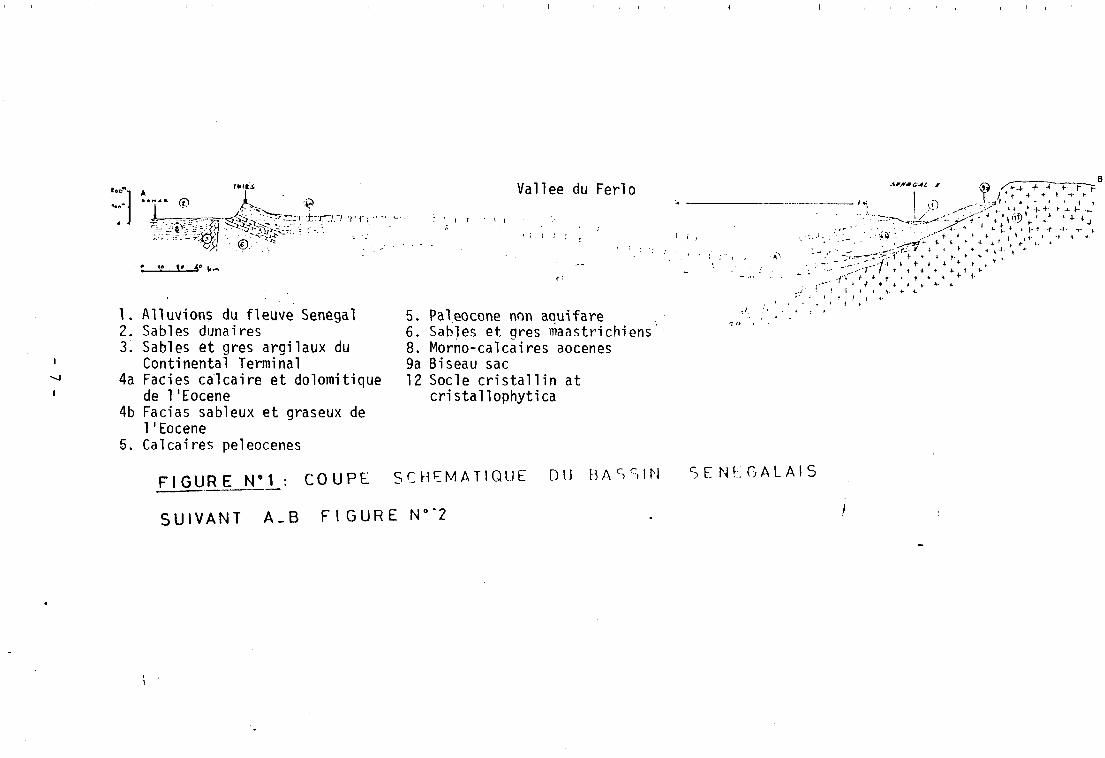
Vallée du Ferio
' Y: ' -• : ; i i • i i
Alluvions du fleuve Senegal 5.2. Sables dunaires 6.3. Sables et gres argilaux du 8.
Continental Terminal 9a4a Faciès calcaire et dolomitique 12
de 1 'EoceneFacias sableux et graseux de1 'EoceneCalcaires pel eocenes
Paleocone non aqui fareSables et qres maastrichiensMorno-calcaires aocenesBiseau sacSocle cristallin atcri stallophytica
C O U P E S C H E M A T I Q U E DU BA S S I N
1 ; ,
. ' • *
. i .
: • —
y" ,i i
• i i
• • • - : ~
: i!)- •.
+ 4-f V-
1-
;.f) ^ < - } . •• * ' ' ' t -
V
t
-t
- i - ••
+ * J- -»- i
+ -*-
S E N E G A L A I S
S U I V A N T A _ B F I G U R E No>2
•J;
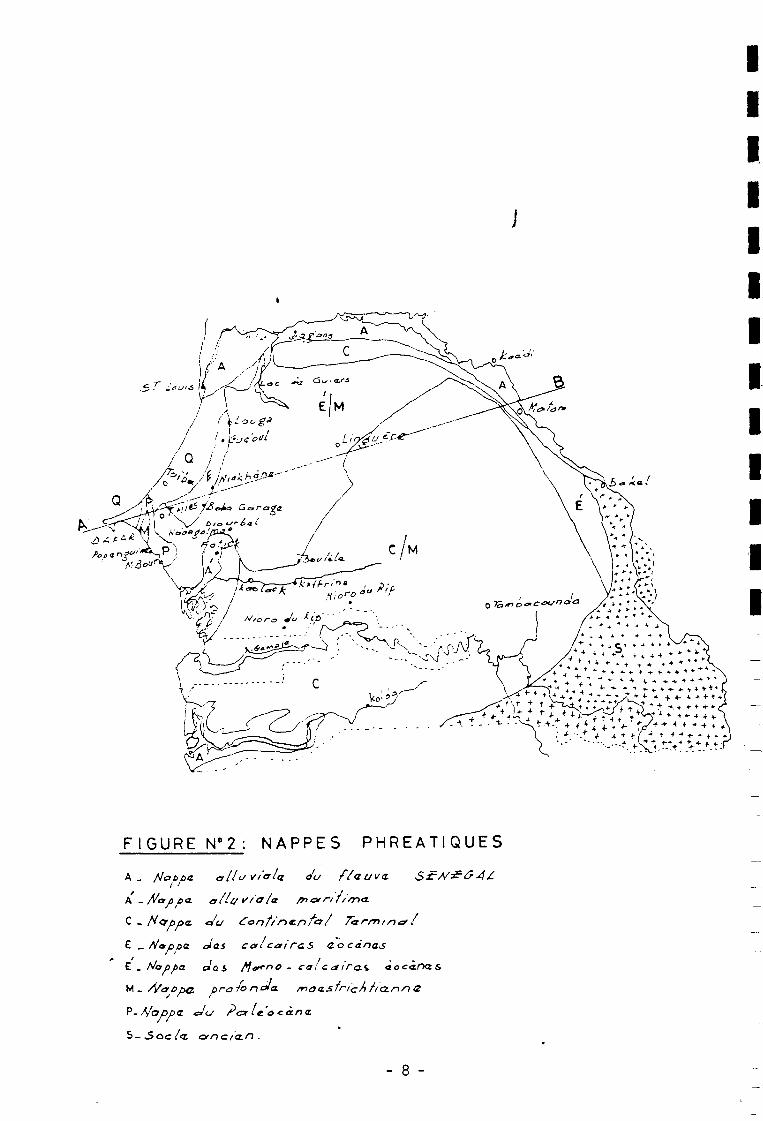
FIGURE N° 2 : NAPPES PHREATIQUES
A . flabùa alluvialtz au f/auva.
A' _ //afoa a f¿u vt a ¡a /no/n f
C _ Mer boa. du ¿onf/nen/o/
E _ /VaroDO. cJas cal cai r^s co cànas
E . Nappa. das Me^~r>° - ca! c a irai
M _ //crDbG. bro 1onota. /naa.S/r/cA /
P-//aûDC tJ<j Par te'o cãn <r
S - j o c / « atn<z/a.n .
- 8 -
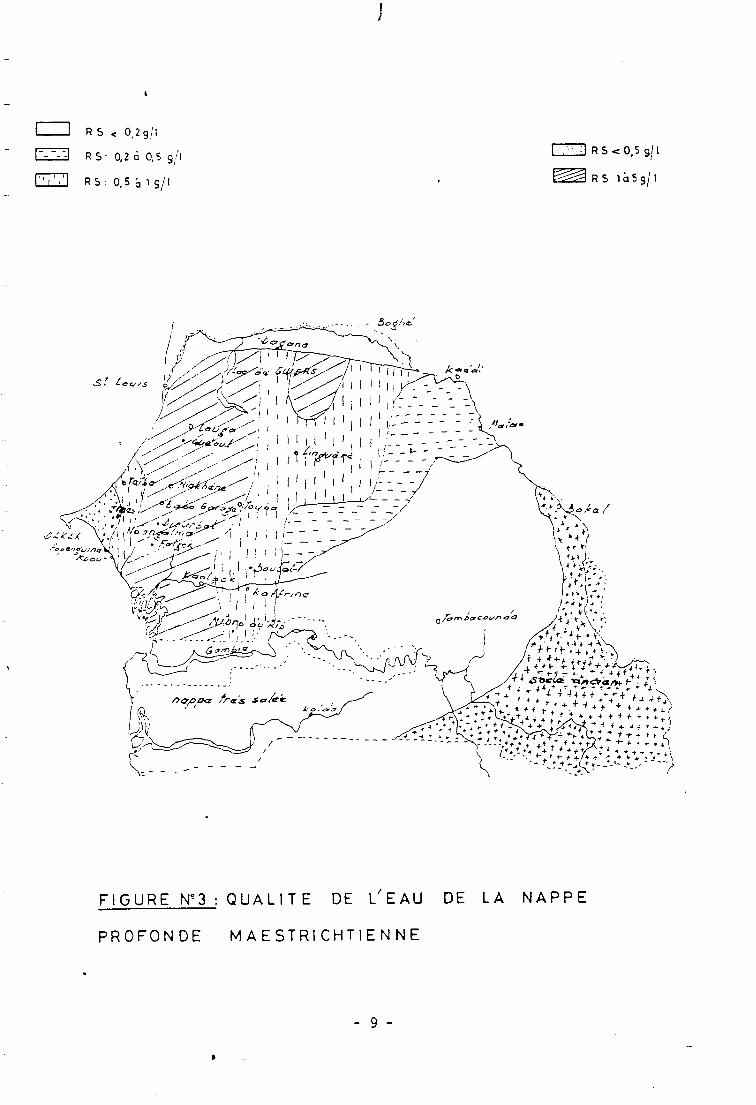
RS < 0,2 g/l
R S : 0,2 ó 0,5 g/l
R S : 0,5 à 1 g / l
RS < 0,5 g/1
RS l ù S g ^ l
- òotfrta.'
St ¿
Lois <<,; , ¡ i ' , i ' i i i , ';_-_-- . - -_-.-.%
F I G U R E N-3 : Q U A L I T E DE L ' E A U DE LA N A P P E
P R O F O N D E M A E S T R I C H T I E N N E
- 9 -
F I G U R E NCA : E X P L O 1 T A B I L I T E DES N A P P E S PAR Z O N E
- 10 -
Fig. 1 : Coupe schématique du bassin sédimentaire sénégalais(Coupe AB).
Fig. 2 : Nappes phréatiquesFig. 3 : Nappe profonde du maestrichtien.
Il ressort de ce qui précède, qu'il existe de l'eausouterraine en grande quantité sur le territoire du Sénégal. Ils'agit comme pour l'eau de surface d'ailleurs, de la mettre enexploitation de la façon la plus rationnelle possible selon lesobjectifs visés par la politique de développement adoptée pourchacun des secteurs concernés : besoins des hommes, du bétail, del'agriculture et de l'industrie.
La qualité des eaux est généralement acceptable, saufpour le maestrichtien qui est salé en Casamance et très chargédans une bande centrale Nord-Sud délimitée grossièrement al'Ouest par une ligne Léona-Méchhé-Joal, et, à l'Est par leméridien 15°3°'. Le tableau précédent donne également la capacitéde quelques nappes actuellement connues. Les différentes études encours et projetées permettront de faire l'inventaire exact deces ressources, de quantifier les besoins, de planifier et degérer ces ressources.
Pour le moment, compte tenu de l'état des connaissancesexposées plus haut, nous synthétisons ci-après une possibilitéd'exploitation des eaux souterraines par zone.
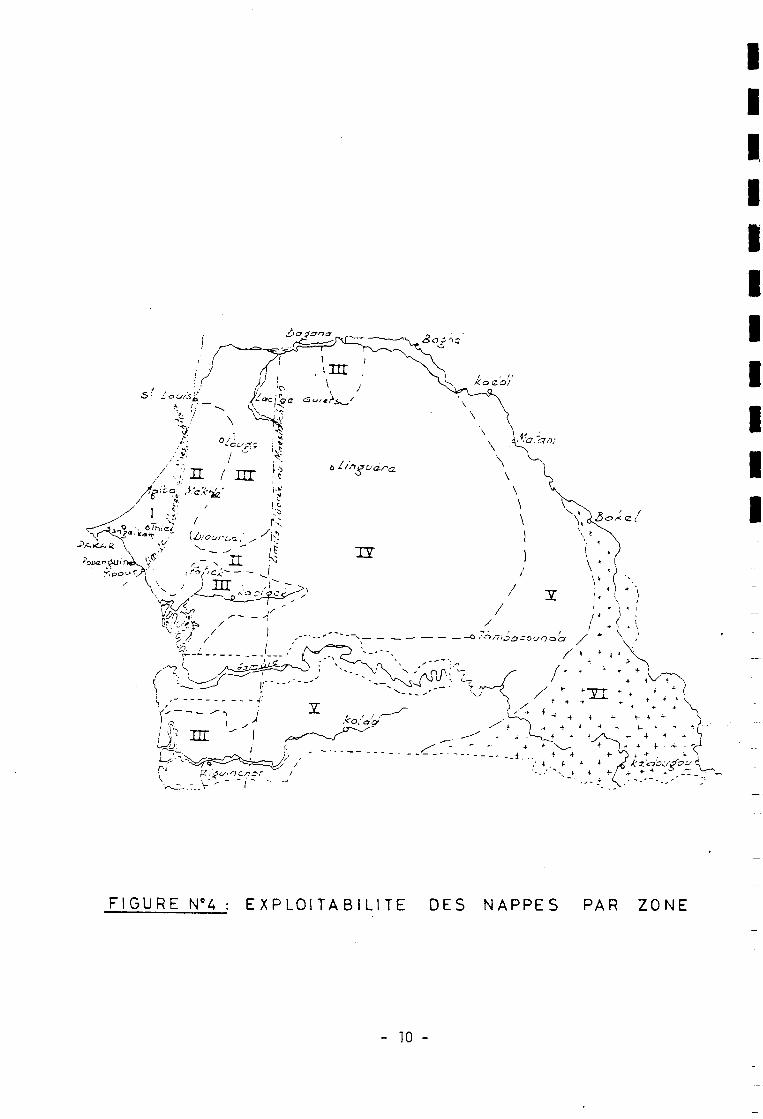
Fig. 4 : Exploitabilité des nappes par secteur.
- Zone I : A l'Ouest de la ligne Méckhé-Mbour : Ressourcesimportantes, généralement de bonne qualité aussi bien pour l'AEPque pour l'irrigation (nappes phréatiques + maestrichtien).Cependant, celle du Cap-Vert sont déjà surexploitées.
- Zone II : Elle correspond à l'aquifère des calcaires éocènes deBambey, Couga et à celui des calcaires Paléocènes de Mbour, Fatickqui y donne une eau de bonne qualité avec de bons débits parendroits. Elles peuvent satisfaire les besoins des villages, descentres urbains et l'irrigation de petits périmètres agricolesà condition que les coûts d'exploitation restent modiques.
- Zone III : Elle comprend les zones deltaïques et celle deforte minéralisation du maestrichtien. Les quelques nappesphréatiques (lentilles) existantes ne peuvent satisfaire quel'AEP des villages et de centres moyens. On recherche les uti-lisations (agricoles ou pastorales) pouvant s'accommoder à laqualité de ces eaux.
- 11 -
III
- Zone IV : Les nappes phréatiques y sont faibles au Centre et à •1'Ouest, notamment dans la zone sylvo-pastorale. Cependant, la nappemaestrichtienne permet de résoudre les problèmes d'AEP ou d'irrigatioBpar forages profonds. Compte tenu des débits importants on envisage •des utilisations multiples des points d'eau (utilisation pastorales) _cultures fourragères, AEP). I
- Zone V : Les ressources y sont importantes aussi bien pour lesnappes phréatiques que pour la nappe profonde du maestrichien etl'eau est de bonne qualité. Les nappes phréatiques peuvent satisfairepar forage ou puits la plupart des besoins en eau pour l'AEP ou pourl'irrigation sans qu'il soit nécessaire de capter le Maestrichtien.
- Zone VI -: C'est la zone du socle ancien où les ressources en eau •souterraines sont toujours faibles et la satisfaction de gros besoins!ne pourra être assurée que par les importants cours d'eau de cesecteur et des retenus collinaires. I
Ayant défini plus haut les différentes ressources en eaudisponibles au Sénégal, il s'agit maintenant de cerner les besoins •en eau actuelle et leur évolution dans le futur.
II - BESOINS EN EAU ACTUELS ET LEUR EVOLUTION DANS LE FUTUR
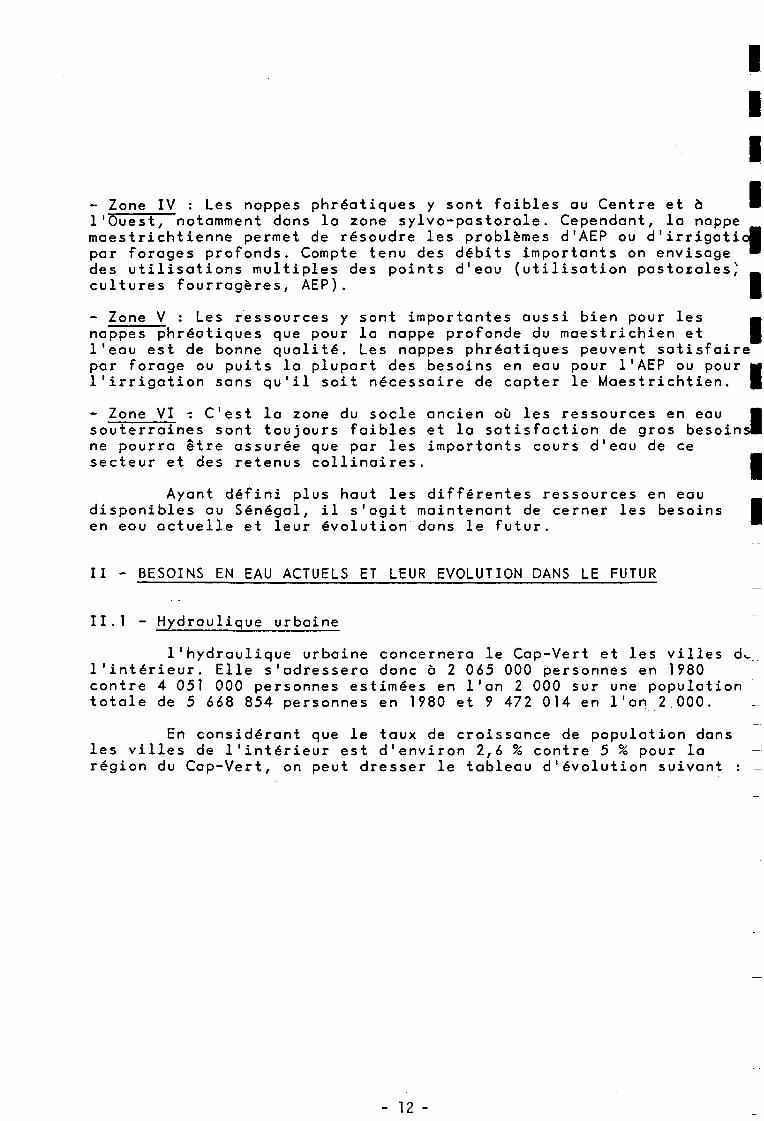
11.1 - Hydraulique urbaine
l'hydraulique urbaine concernera le Cap-Vert et les villes d .l'intérieur. Elle s'adressera donc a 2 065 000 personnes en 1980contre 4 051 000 personnes estimées en l'an 2 000 sur une populationtotale de 5 668 854 personnes en 1980 et 9 472 014 en l'an 2 000.
En considérant que le taux de croissance de population dansles villes de l'intérieur est d'environ 2,6 % contre 5 % pour la —région du Cap-Vert, on peut dresser le tableau d'évolution suivant :
- 12 -
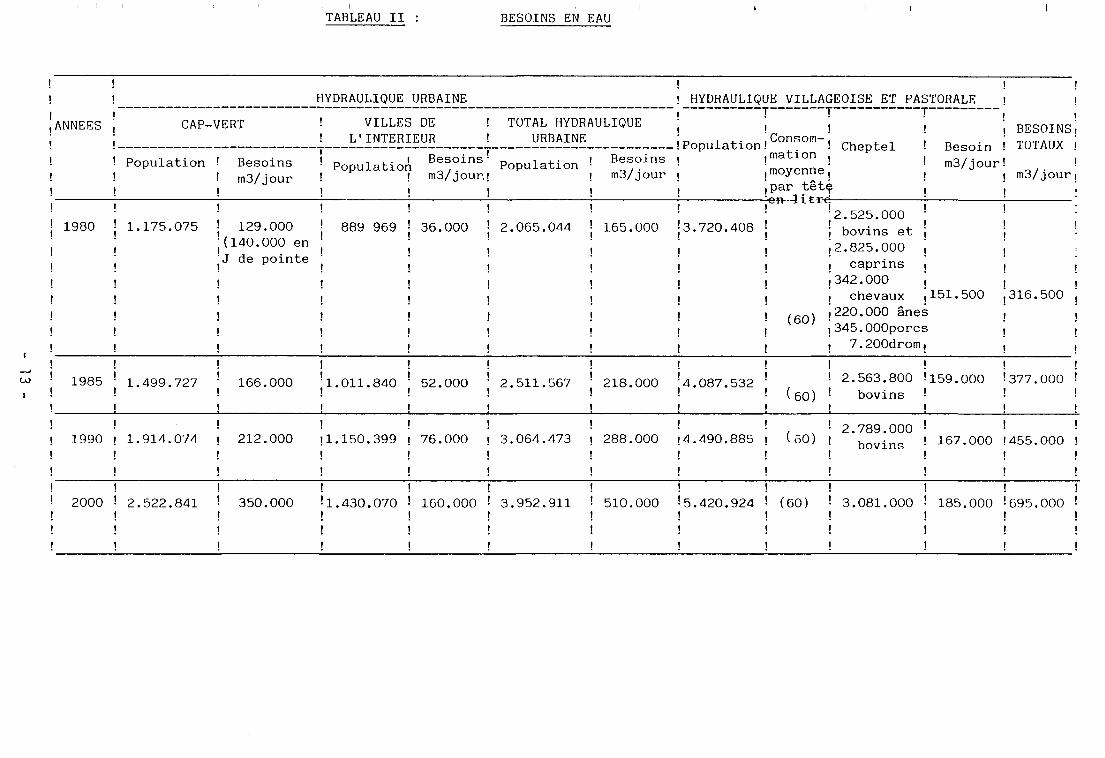
TABLEAU II BESOINS EN EAU
HYDRAULIQUE URBAINE ! HYDRAULIQUE VILLAGEOISE ET PASTORALE
ANNEES CAP-VERT
Population Besoinsm3/jour
VILLES DE !L'INTERIEUR !
Besoins•m3/jour,;
TOTAL HYDRAULIQUEURBAINE
Population Population ! BesoinsI m3/jour
I
1980 1.175.075 j 129.000'(140.000 en•J de pointe
,-, IX.- i Consom—.Population! ! Cheptel
,mation ,,moyenne,,par têtç
I BESOINS;Besoin ! TOTAUX !m3/jour! !
i m3/jouri
889 969 36.000 2.065.044 165.000 ¡3.720.408
!2.525.000j bovins et¡2.825.000I caprins¡342.000i chevaux
(60)
,151.500¡220.000 ânesi345.000porcs¡ 7.200drom,
,316.500
to
i
1985 1.499.727
! t
166.000 jl.011.840 | 52.000 2.511.567 j 218.000 •4.087.532(60)
i ;
! 2.563.800 '159.000! bovins
i i
! 377.000 !i i
i i
1990 ! 1.914.074 i 212.000; i
i i
il.150.399 I 76.000i i
! ! ! !! 3.064.473 ] 288.000 ¡4.490.885 )! ! ! !i l i t
(50)2.789.000
bovins 167.000 1455.000 !
i
i
2000 ! 2.522.841I
350.000! t
¡1.430.070 ! 160.000 3.952.911 ! 510.000i
¡5.420.924 ! (60); ;t ;i i
3.081.000 185.000i ¡
'•695.000 '•
i
III
Actuellement, 37 villes bénéficient d'un réseau d'adduction d'eau Iet sont incorporées dans la concession de la SONEES. •
L'hydraulique urbaine s'adresse à cette population des Ivillesqui, non seulement augmente en nombre mais, avec l'élévation^de son niveau de vie, devient de plus en plus consommatrice d'eauet de plus en plus exigeante quant à la qualité de celle-ci.
A l'examen de ce tableau, on constate que les besoins en •eau du Cap-Vert à partir de 1980 ne sont plus couverts par la |production des nappes de la presqu'île (138 000 m3/j).
Face à ces contraintes, il apparaît nécessaire de prendre Ides mesures tant pour augmenter les quantités que pour sélectionnerles différents utilisateurs. Les maraîchers du Cap-Vert devront Id'une part, cesser de croître, d'autre part, s'alimenter à partir^d'eau brute et d'eau usée traitée. _
Pour parler des centres de l'intérieur, nous disons que la"consommation d'eau est relativement faible. En effet, elle est de3é 000 m3/j en 1980.
II.2.- L'hydraulique villageoise et pastorale •
II ressort de ce tableau, que les besoins réels du monderural sont supérieurs aux productions actuelles enregistrées. LesBbesoins totaux en 1980 s'élèvent à 151 500 m3/j . Pour la même |période (1980), il existait 1050 captages perennes produisant23 000 m3/j et 40 000 puits de construction artisanale dont •30 000 fonctionnent toute l'année. •
Dans le cadre d'une vision globale de développement, les Iprojets hydrauliques tiendront compte des besoins de la reforesta*tion, et seront conçus de manière à permettre des actions de _reboisement aux alentours des forages, ce qui permettra non Iseulement d'améliorer l'environnement et de freiner le désert,mais aussi de mettre à la disposition des pasteurs des produitsde cueillettes.
II.3.- L'hydraulique agricole • •
L'agriculture est la base actuelle de notre économienationale, car le Sénégal est un pays essentiellement agricole •dont 71 % travaillent à la campagne. La politique du Gouvernement»est de s'orienter vers les cultures irriguées (canne à sucre, riz,tomate), les cultures pluviales (arachide, mil, sorgho, coton, Iniébé) et les cultures fruitières. •
Toutes ces cultures dépendent largement des eaux desurface et de pluies. Les eaux souterraines sont utilisées —comme appoint. _
- 14 -
Cette politique est soutenue essentiellement par des grandsprojets régionaux qui s'articulent autour des fleuves Sénégal et Gambie
Les objectifs globaux du Vlème Plan visent à combler lesinsuffisances qualitatives et quantitatives qui prévalent en milieurural et urbain. Le Gouvernement porte une attention particulière àl'hydraulique rurale qui absorbera 66 % des investissements prévusdans le secteur de l'eau pendant la période de 1981 à 1985. Comptetenu de ce qui précède, une politique nationale de la gestion del'eau doit être menée. C'est ce que nous allons voir dans la troisièmepartie.
III - GESTION DES RESSOURCES EN EAU ET PERSPECTIVES
La gestion de l'eau permettra son utilisation pour unemeilleure satisfaction en qualité et en quantité des besoins croissantsdes populations, du bétail, de l'agriculture et de l'industrie. Lasatisfaction des besoins de ces secteurs d'activités nécessite laremise ò jour constante des connaissances sur les ressources en eau,sur leur qualité et quantité, sur leurs limites d'exploitation et lesmoyens de les maîtriser.
A cet effet, le Sénégal a intensifié les études hydrologiqueset hydrogéologiques en insistant sur les inventaires des ressourcesen eau souterraine, et sur la gestion et la protection des nappessoumises à l'exploitation.
Au Sénégal, les pluies tombant annuellement sur le territoirereprésentent un volume très important d'eau, dont une partie permetaux cultures sous pluies de se développer, une autre réalimente lesréserves souterraines, tandis que le reste (¿0 à 80 %) échappe parevaporation ou par ruissellement.
Afin de réduire cette perte d'eau énorme, une étude despossibilités de stockage des eaux de ruissellement a démarré dans leSud du Sine-Saloum, en Casamance et au Sénégal-Oriental où lesconditions naturelles semblent plus favorables.
Au même moment, avec ses faibles moyens le Sénégal pratique,à petite échelle les techniques de pluies provoquées.
Le réseau hydrographique du Sénégal est mal réparti. C'estce qui explique les difficultés des populations et du bétail às ' alimenter.
A cet effet, la présence du fleuve Sénégal atténue quelquepeu ces difficultés.
- 15 -
III
Cependant la situation reste dramatique dans plusieursv-epenaanx ia sixuaxion resxe aramaxique aans plusieurs Hlocalités de cette région où les besoins des hommes, des animaux^et de l'agriculture sont en concurrence devant les ressourcesexistantes. Des mesures de sauvegarde ont été prises, et le •principe d'une priorité aux besoins domestiques affirmé a été |adopté.
La politique de l'eau dans cette région doit tenir •compte de trois zones différentes : la zone du Delta, la zonede la Vallée et la zone sylvopastorale. La zone du Delta est Icaractérisée par la salinité de ses eaux. Les seules ressources 'actuelles sont celles du Fleuve.
Dans le cadre de l'organisation pour la mise en valeurdu Fleuve Sénégal (OMVG), il est prévu d'ici 1986 la constructionde deux barrages : DIAMA et MANANTALI. Le barrage de Diama qui •est en cours de construction est un barrage antisel et d'irrigaticII permettra d'irriguer environ 42 000 ha dont près de 28 000 ha™au Sénégal, de même que le remplissage des dépressions intérieur^tels que le lac de Guiers, le Lampsar, etc...
A partir de la réserve du barrage, les besoins en eau d e |populations (villes et villages) situées le long du Fleuve serontlargement satisfaits, tandis que le remplissage correct et permaftdu Lac de Guiers permettra d'améliorer notablement 1 ' alimentatio™en eau de DAKAR et tous les Centres situés le long de la conduite.
Le barrage de Diama laissera cependant non résolus les 'problèmes de certains villages du Gandiolais, du Toubé, de lazone de Mpal, Rao, Fass, d'importants travaux d'adduction à •partir de la réserve de Diama devront être envisagés.
Il reste aussi après un inventaire systématique à faireappel aux lentilles d'eau douce qui y existent.
Le barrage de Manantali, situé au Mali, permettra |d'irriguer 255 000 ha dont 170 000 ha au Sénégal.
L'alimentation des nappes alluviales de la sous-région _de la vallée est en rapport avec les crues du Fleuve donc avecla régulation du débit du fleuve. Une fois que les études entre-prises permettront de définir les modalités de leur exploitation,-les nappes alluviales seront captées de préférence av Maestrichier
La sous-région de la zone sylvopastorale est caractériséepar le bilan hydrologique particulièrement déficitaire. A l'in-térieur d'une zone délimitée par une ligne Nord-Sud passant entrCoki et Dhara, et d'une autre ligne entre GUEDE et PODOR, les -formations qui s'y succèdent sont plus ou moins stériles et lesdébits y sont donc très faibles.
- 16 -
L'alimentation des petits villages y est quasi impossible.Seul le captage du Maestrichien par des forages profonds etcoûteux permet de faire face aux besoins des populations et dubétail, tout en évitant la surcharge des pâturages au pied desforages mais en envisageant aussi, selon lo rentabilité de l'opé-ration,' des cultures fourragères complémentaires.
En liaison avec la Direction de l'Aménagement du Territoireun regroupement des villages doit être entrepris, seul moyen dejustifier un programme hydraulique cohérent, avec une bonne distri-bution géographique des forages.
Dans l'autre zone allant de l'Est de la région de Louga,du Nord-Est du Sine-Saloum et du Nord-Est du Sénégal-Oriental,tout projet de développement devra obéir à un préalable, qui estcelui du regroupement des populations en cellules d'activitéshomogènes.
Une autre situation est celle de la zone qui va du Dieneau Sénégal-Oriental et du Sud-Est du Sine-Saloum. En plus duMaestrichien, il y existe des possibilités d'exploitation desaquifères dans des conditions d'exhaure satisfaisants. Cette zoneoffre les conditions générales les plus favorables qui y autorisentun développement basé sur l'agriculture et l'élevage.
Le Sénégal-Oriental est l'une des régions les plus arroséesdu pays (700 mm à 1 300 mm).
De même la topographie et la nature des terrains y ontpermis l'existence d'importantes quantités d'eaux de surfacenotamment : la Falémé, la Gambie et les eaux de ruissellement.
Le Falémé fait partie du programme de deuxième générationl'OMVG qui prévoit un barrage à Gourbassi pour en réguler le courstandis que la Gambie fait l'objet d'études dans le cadre de l'OMVG(projets de barrage hydroélectrique à Kébréti et Sambagalou et debarrage antisel dans la basse vallée de la Gambie).
Malgré l'important ruissellement des eaux de pluies, leterritoire est sec dans sa partie Sud-Est où il est envisagé laréalisation de petits barrages pour le stockage des eaux decaptages dans des terrains d'altération et de fissuration pourl'alimentation des hommes, du bétail et de l'agriculture. Cependantles problèmes sanitaires qui seront posés n'ont pas été perdus devue .
Le Sénégal-Oriental est également pourvu en ressourcessouterraines.
Sur le plan général, la région possède des ressourcessuffisantes qui lui permettent d'avoir de grandes ambitions dansles domaines agricole et industriel.
- 17 -
III
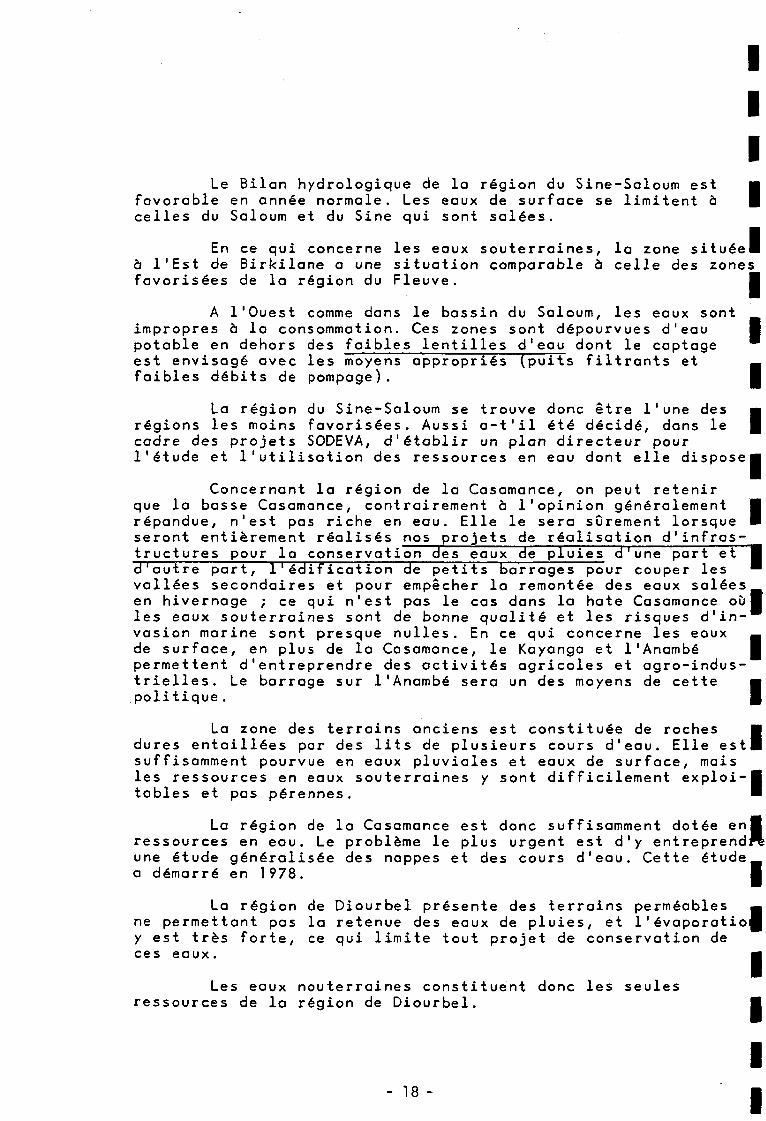
Le Bilan hydrologique de la région du Sine-Saloum est •favorable en année normale. Les eaux de surface se limitent à |celles du Saloum et du Sine qui sont salées.
En ce qui concerne les eaux souterraines, la zone situéelà l'Est de Birkilane a une situation comparable à celle des zonesfavorisées de la région du Fleuve. I
A l'Ouest comme dans le bassin du Saloum, les eaux sontimpropres à la consommation. Ces zones sont dépourvues d'eau •potable en dehors des faibles lentilles d'eau dont le captageest envisagé avec les moyens appropriés (puits filtrants et _faibles débits de pompage). I
La région du Sine-Saloum se trouve donc être l'une des •régions les moins favorisées. Aussi a-t'il été décidé, dans le |cadre des projets SODEVA, d'établir un plan directeur pourl'étude et l'utilisation des ressources en eau dont elle dispose»
Concernant la région de la Casamance, on peut retenirque la basse Casamance, contrairement à l'opinion généralement •répandue, n'est pas riche en eau. Elle le sera sûrement lorsque •seront entièrement réalisés nos projets de réalisation d'infras-tructures pour la conservation des eaux de pluies d'une part et •d'autre part, 1 ' édification ¡Je petits barrages pour couper les ^vallées secondaires et pour empêcher la remontée des eaux saléesen hivernage ; ce qui n'est pas le cas dans la hate Casamance ouiles eaux souterraines sont de bonne qualité et les risques d'in-vasion marine sont presque nulles. En ce qui concerne les eaux _de surface, en plus de la Casamance, le Kayanga et l'Anambé Ipermettent d'entreprendre des activités agricoles et agro-indus-trielles. Le barrage sur l'Anambé sera un des moyens de cettepolitique.
La zone des terrains anciens est constituée de roches •dures entaillées par des lits de plusieurs cours d'eau. Elle estlsuffisamment pourvue en eaux pluviales et eaux de surface, maisles ressources en eauxtables et pas perennes.
p o e e p a l e s et urace,les ressources en eaux souterraines y sont difficilement exploi-B
•
La région de la Casamance est donc suffisamment dotée enlressources en eau. Le problème le plus urgent est d'y entreprend^une étude généralisée des nappes et des cours d'eau. Cette étudea démarré en 1978. I
La région de Diourbel présente des terrains perméables _ne permettant pas la retenue des eaux de pluies, et 1'évaporatio^y est très forte, ce qui limite tout projet de conservation deces eaux. •
Les eaux nouterraines constituent donc les seulesressources de la région de Diourbel. •
- 18 -
II
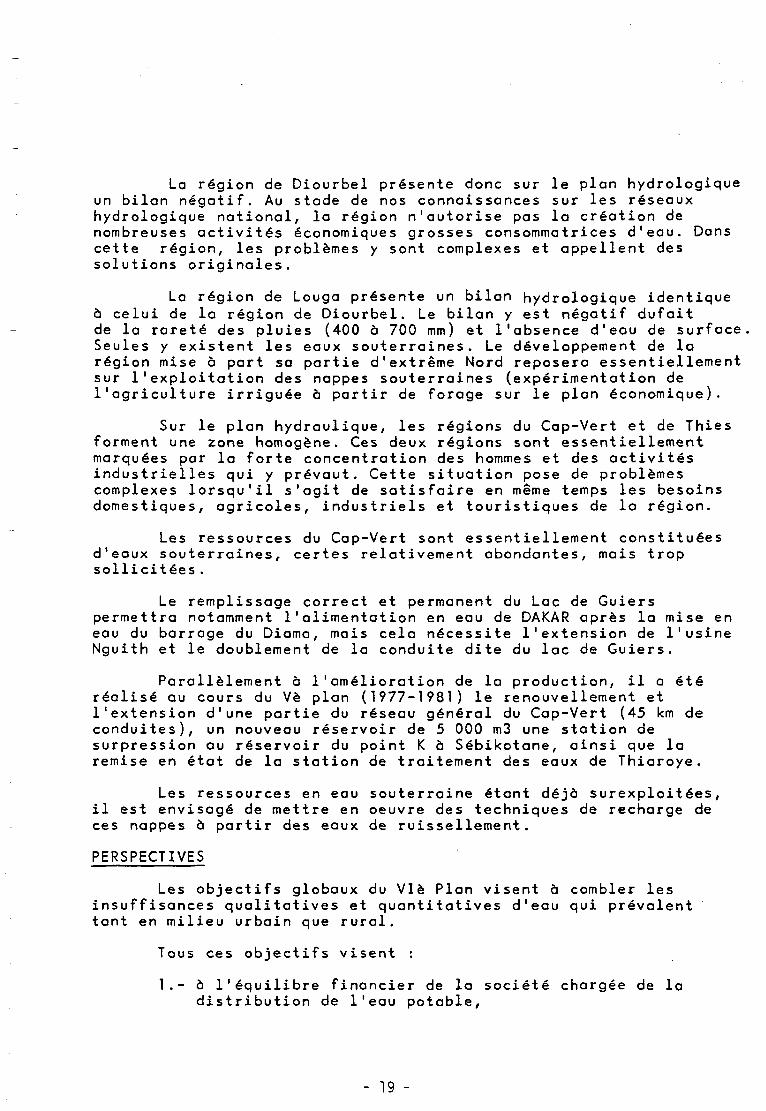
La région de Diourbel présente donc sur le plan hydrologiqueun bilan négatif. Au stade de nos connaissances sur les réseauxhydrologique national, la région n'autorise pas la création denombreuses activités économiques grosses consommatrices d'eau. Danscette région, les problèmes y sont complexes et appellent dessolutions originales.
La région de Louga présente un bilan hydrologique identiqueà celui de la région de Diourbel. Le bilan y est négatif dufaitde la rareté des pluies (400 à 700 mm) et l'absence d'eau de surfaceSeules y existent les eaux souterraines. Le développement de larégion mise à part sa partie d'extrême Nord reposera essentiellementsur l'exploitation des nappes souterraines (expérimentation del'agriculture irriguée à partir de forage sur le plan économique).
Sur le plan hydraulique, les régions du Cap-Vert et de Thiesforment une zone homogène. Ces deux régions sont essentiellementmarquées par la forte concentration des hommes et des activitésindustrielles qui y prévaut. Cette situation pose de problèmescomplexes lorsqu'il s'agit de satisfaire en même temps les besoinsdomestiques, agricoles, industriels et touristiques de la région.
Les ressources du Cap-Vert sont essentiellement constituéesd'eaux souterraines, certes relativement abondantes, mais tropsollicitées.
Le remplissage correct et permanent du Lac de Guierspermettra notamment l'alimentation en eau de DAKAR après la mise eneau du barrage du Diama, mais cela nécessite l'extension de l'usineNguith et le doublement de la conduite dite du lac de Guiers.
Parallèlement à l'amélioration de la production, il a étéréalisé au cours du Vè plan (1977-1981) le renouvellement etl'extension d'une partie du réseau général du Cap-Vert (45 km deconduites), un nouveau réservoir de 5 000 m3 une station desurpression au réservoir du point K à Sébikotane, ainsi que laremise en état de la station de traitement des eaux de Thiaroye.
Les ressources en eau souterraine étant déjà surexploitées,il est envisagé de mettre en oeuvre des techniques de recharge deces nappes à partir des eaux de ruissellement.
PERSPECTIVES
Les objectifs globaux du Vie Plan visent à combler lesinsuffisances qualitatives et quantitatives d'eau qui prévalenttant en milieu urbain que rural.
Tous ces objectifs visent :
1.- à l'équilibre financier de la société chargée de ladistribution de l'eau potable,
- 19 -
III
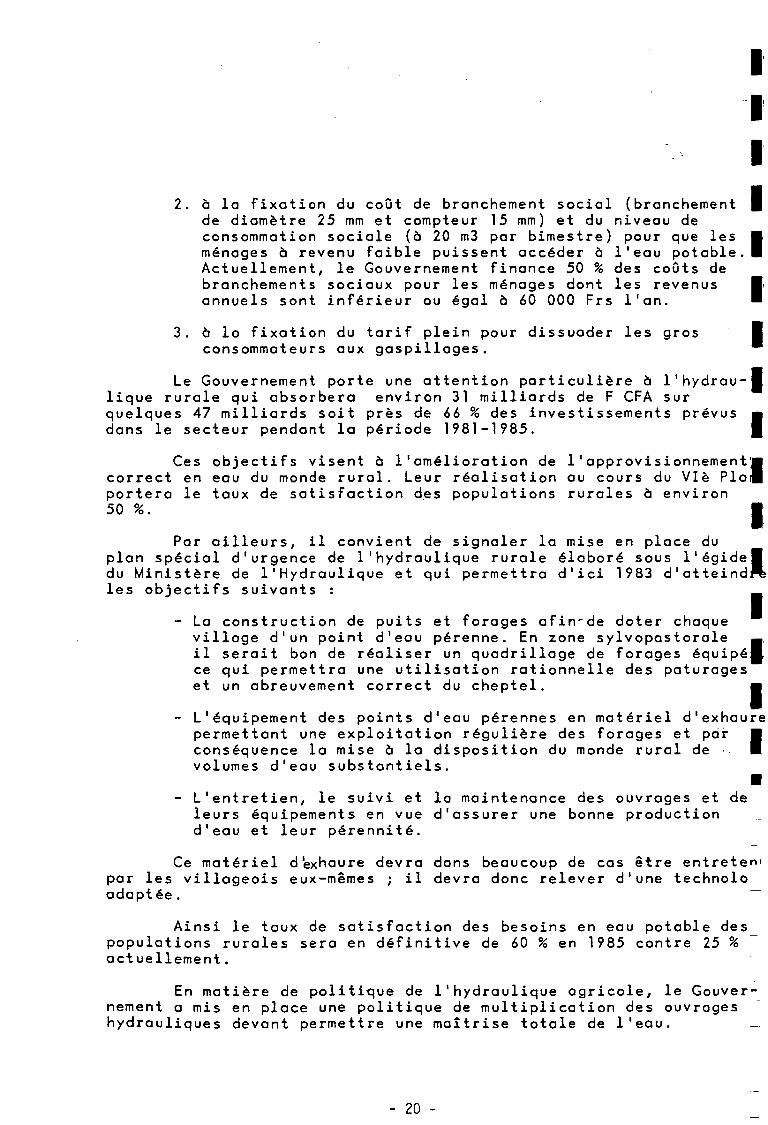
2. à la fixation du coût de branchement social (branchement |de diamètre 25 mm et compteur 15 mm) et du niveau deconsommation sociale (à 20 m3 par bimestre) pour que les •ménages à revenu faible puissent accéder à l'eau potable. IActuellement, le Gouvernement finance 50 % des coûts debranchements sociaux pour les ménages dont les revenus Mannuels sont inférieur ou égal a 60 000 Frs l'an. '
3. à la fixation du tarif plein pour dissuader les gros •consommateurs aux gaspillages. ™
Le Gouvernement porte une attention particulière à l'hydrau-Blique rurale qui absorbera environ 31 milliards de F CFA surquelques 47 milliards soit près de 66 % des investissements prévus mdans le secteur pendant la période 1981-1985. |
Ces objectifs visent à l'amélioration de l'approvisionnement1»correct en eau du monde rural. Leur réalisation au cours du Vie PlaJIportera le taux de satisfaction des populations rurales à environ50 %.
Par ailleurs, il convient de signaler la mise en place duplan spécial d'urgence de l'hydraulique rurale élaboré sous l'égideBdu Ministère de l'Hydraulique et qui permettra d'ici 1983 d'atteindftles objectifs suivants : _
- La construction de puits et forages afin-de doter chaquevillage d'un point d'eau perenne. En zone sylvopastorale «il serait bon de réaliser un quadrillage de forages équipé^ce qui permettra une utilisation rationnelle des pâturageset un abreuvement correct du cheptel. •
- L'équipement des points d'eau perennes en matériel d'exhaurepermettant une exploitation régulière des forages et par •conséquence la mise a la disposition du monde rural de • Ivolumes d'eau substantiels.
•- L'entretien, le suivi et la maintenance des ouvrages et de-
leurs équipements en vue d'assurer une bonne productiond'eau et leur pérennité.
Ce matériel d'exhaure devra dans beaucoup de cas être éntrete"1
par les villageois eux-mêmes ; il devra donc relever d'une technoloadaptée. ~~
Ainsi le taux de satisfaction des besoins en eau potable despopulations rurales sera en définitive de 60 % en 1985 contre 25 %actuellement.
En matière de politique de l'hydraulique agricole, le Gouver-nement a mis en place une politique de multiplication des ouvrageshydrauliques devant permettre une maîtrise totale de l'eau. _.
- 20 -
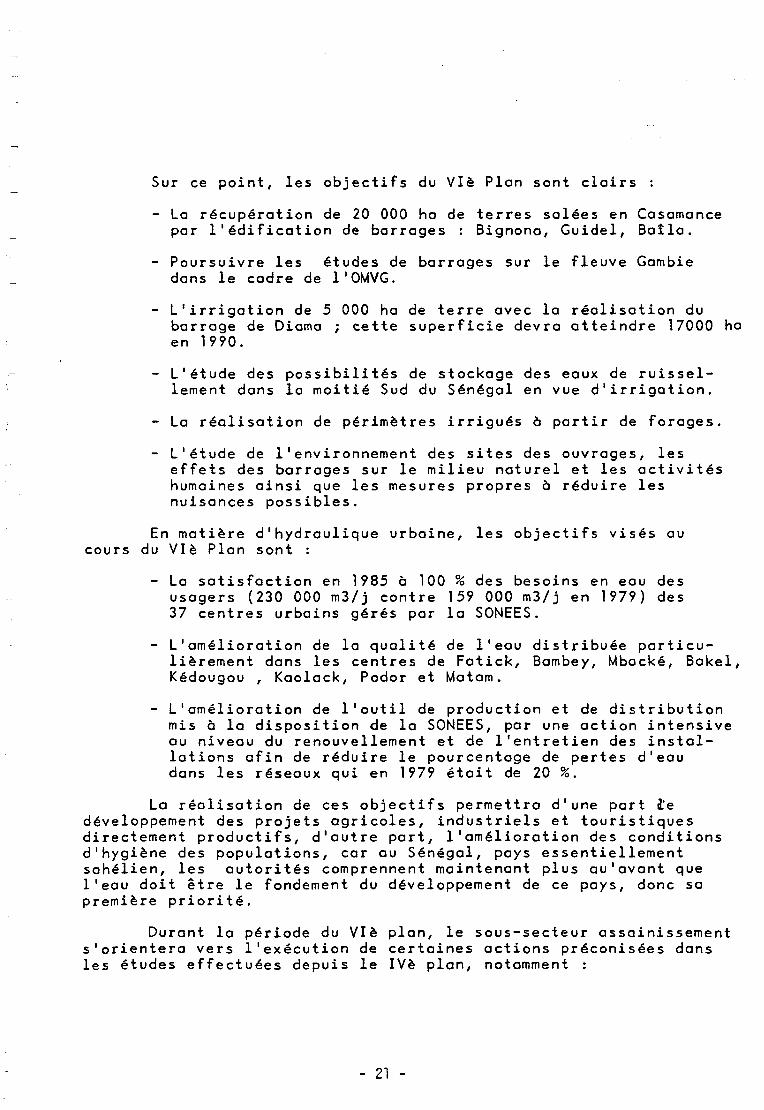
Sur ce point, les objectifs du Vie Plan sont clairs :
- La récupération de 20 000 ha de terres salées en Casamoncepar l'édification de barrages : Bignona, Guidel, Baîla.
- Poursuivre les études de barrages sur le fleuve Gambiedans le cadre de l'OMVG.
- L'irrigation de 5 000 ha de terre avec la réalisation dubarrage de Diama ; cette superficie devra atteindre 17000 haen 1990.
- L'étude des possibilités de stockage des eaux de ruissel-lement dans la moitié Sud du Sénégal en vue d'irrigation.
- La réalisation de périmètres irrigués à partir de forages.
- L'étude de l'environnement des sites des ouvrages, leseffets des barrages sur le milieu naturel et les activitéshumaines ainsi que les mesures propres à réduire lesnuisances possibles.
En matière d'hydraulique urbaine, les objectifs visés aucours du Vie Plan sont :
- La satisfaction en 1985 à 100 % des besoins en eau desusagers (230 000 m3/j contre 159 000 m3/j en 1979) des37 centres urbains gérés par la SONEES.
- L'amélioration de la qualité de l'eau distribuée particu-lièrement dans les centres de Fatick, Bambey, Mbacké, Bakel,Kédougou , Kaolack, Podor et Matam.
- L'amélioration de l'outil de production et de distributionmis à la disposition de la SONEES, par une action intensiveau niveau du renouvellement et de l'entretien des instal-lations afin de réduire le pourcentage de pertes d'eaudans les réseaux qui en 1979 était de 20 %.
La réalisation de ces objectifs permettra d'une part l'edéveloppement des projets agricoles, industriels et touristiquesdirectement productifs, d'autre part, l'amélioration des conditionsd'hygiène des populations, car au Sénégal, pays essentiellementsahélien, les autorités comprennent maintenant plus au'avant quel'eau doit être le fondement du développement de ce pays, donc sapremière priorité.
Durant la période du Vie plan, le sous-secteur assainissements'orientera vers l'exécution de certaines actions préconisées dansles études effectuées depuis le IVè plan, notamment :
III
- La réalisation d'infrastructures pour l'assainissement Ide Dakar et ses environ, ainsi que des capitalesrégionales, a
- La collecte et le traitement des déchets solides,
- Les études des plans directeurs d'assainissement pour |certaines agglomérations de l'intérieur,
- La promotion de l'assainissement en milieu rural notammeBcpar éducation sanitaire permanente, et amener les villageoà se doter de latrines familiales, à les utiliser et à ftentretenir,
- La mise en place d'une législation pour l'application Ides normes d'assainissement.
Parallèlement, des études de faisabilité technique d'une Isuralimentation des nappes à partir des eaux usées traitéesdevraient être menées (ou simplement d'une réutilisation pour desbesoins agricoles).
De la même manière, on pourrait envisager les possibilités*de suralimentation de la nappe infrabasaltique à partir des eaux.lpluviales. Certains problèmes que nous venons d'évoquer trouverontpeut être leur solution dans le dessalement d'eau de mer ou d'eauBsaumâtre. Actuellement les stations de dessalement sont tributairesdu coût de l'énergie. Elles pourront peut être fonctionner demainà l'énergie solaire ou éolienne. I
Lorsqu'on évoque l'évolution des techniques de dessalement^c'est plus précisément dans le choix des sources d'énergie que selmanifeste cette évolution et les chercheurs se sont rendu compteque les procédés d'osmose inverse, tels qu'ils sont actuellementutilisés se révélaient les mieux adaptés à un couplage avec dessources d'énergie renouvelables, solaire ou éolienne.
La capacité des ressources en eau, l'importance des besoin(en eau de différentes natures et la tendance à l'évolution de cesressources et besoins constituent les termes essentiels, à maitriBepour une judicieuse politique de l'eau. I
Compte tenu de la situation particulière de la zone sahéliBrne, les actions et mesures seront tournées désormais dans le senslde l'étude systématique des ressources en eau et de leur utilisaticrationnelle. I
Ceci va nécessiter la mise en oeuvre pendant la période du—
Vie Plan d'importants moyens financiers et humains ainsi qu'ins- Ititutionnels.
- 22 -
III
RESUME
Sur le territoire du Sénégal, il existe de l'eau. Il s'agitde la mettre en exploitation ; c'est à dire, en réalisant leséquipements nécessaires, en affectant les ressources aux besoinsqui correspondent le plus ò leur qualité technique, à leur impor-tance quantitative, au coût de leur mise en oeuvre, et aussi encorrigeant la mauvaise répartition géographique nationale des eauxen les utilisant, cependant autant que possible, là où elles setrouvent pour des considérations économiques.
Il s'agit aussi d'être toujours prêt à satisfaire les besoinsen eau des humains, du bétail, de l'agriculture et de l'industrie.
Cela nécessite une connaissance constamment remise à jourde nos ressources en cernant les ressources potentielles du pays,leurs capacités, leurs qualités, leurs limites d'exploitation,les moyens de les maîtriser, les besoins en eau actuels et leurévolution dans le futur.
Les objectifs globaux du Vie Plan visent à combler lesinsuffisances qualitatives et quantitatives d'eau qui prévalenttant en milieu urbain que rural.
Le Gouvernement porte une attention particulière àl'hydraulique rurale qui absorbera environ 31 milliards de F CFA surquelques 47 milliards soit près de 66 ù des investissements prévusdans le secteur pendant la période 1981-1985.
- 23 -
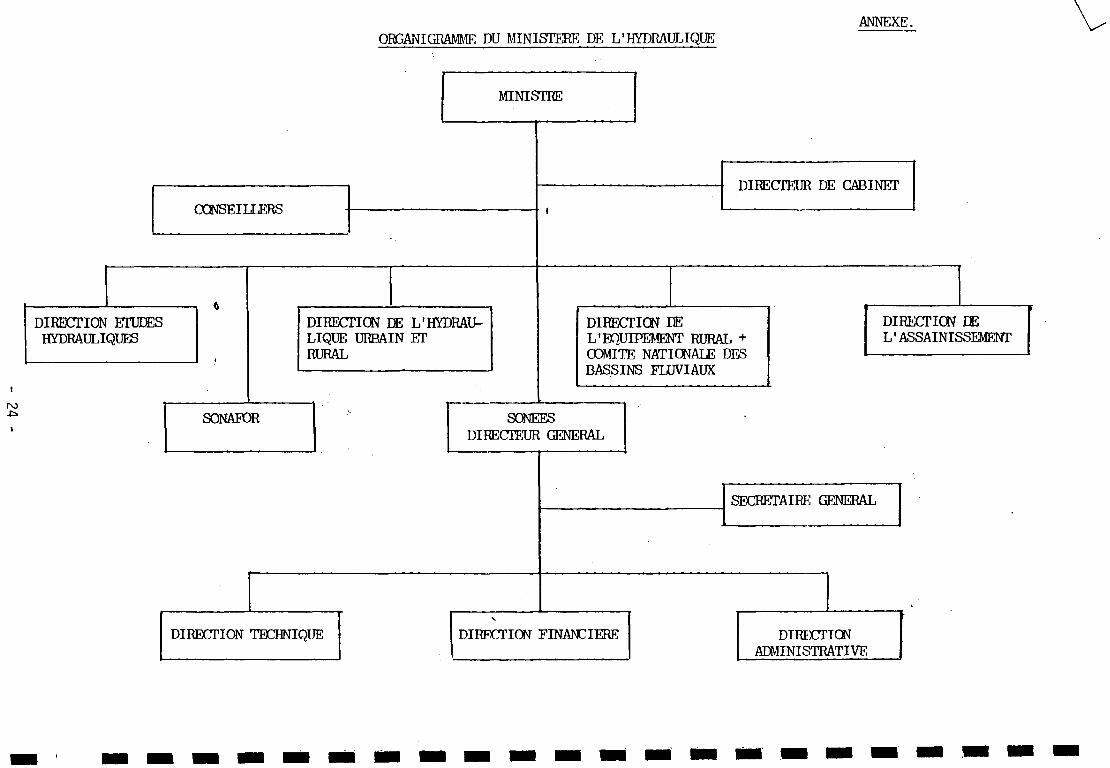
ANNEXE.ORGANIGRAMME DU MINISTERE DE L ' HYDRAULIQUE
MINISTRE
CONSEILLERS
DIRECTION ETUDESHYDRAULIQUES
PO
SONAFOR
DIRECTION DE L'HYDRAU-LIQUE URBAIN ETRURAL
DIRECTION TECHNIQUE
DIRECTEUR DE CABINET
DIRECTION DEL'EQUIPEMENT RURAL +COMITE NATIONALE DESBASSINS FLUVIAUX
DIRECTION DEL'ASSAINISSEMENT
SONEESDIRECTEUR GENERAL
SECRETAIRE GENERAL
DIRECTION FINANCIERE DIRECTIONADMINISTRATIVE
SESSION II.
MANAGEMENT AND ORGANISATION - RURAL AREAS.
S. K. Tasgaonkar, Chief Engineer, Maharashtra Water Supplyand Sewerage Project, 4th Floor, Express Towers, NarimanPoint, Bombay - 400021, INDIA.
S U M M A R Y
Management of rural water supply systems assumes importance in theInternational Water Supply and Sanitation Decade, since, for thefirst time, assets of water supply in rural areas will have beencreated on a very large scale by year 1990. Rural areas sufferfrom many problems such as weak organizational structure, multi-plicity of agencies, absence of clearly defined jurisdictions, non-availability of trained personnel, lack of motivation and so on.While implementation of the programme gets adequate attention andmonetary support, operation and maintenance of the systems remainsa neglected subject. In certain cases, design norms adopted frompoint of economy in capital cost may create problems in maintenanceand it may be difficult to generate sufficient funds for operation.Thus, there may be need to have a fresh look at the planning process,implementation policy, community participation, organizationalrequirements for operation and maintenance and so on. The authorhas tried to highlight various aspects of rural water supplymanagement including the problems in existing systems and suggestionsfor certain improvements.
- x - x - x - x - x -
1.0 INTRODUCTION
Management of a rural water supply programme appears simple,because, the rural systems are small in size, relativelystraightforward, not involving highly sophisticated worksand apparently not needing skilled operation and maintenance.Urban schemes, on the other hand, are big in size, complex,needing special skills and hence are comparatively difficultto manage. However, with the massive programme undertaken ina developing country under its commitment to provide potablewater supply to problem villages in the International WaterSupply and Sanitation Decade, the management of rural systemswould pose a number of problems, at least comparable in sizewith urban water supply management. These problems requirecareful consideration.
2.0 PRINCIPLES OF MANAGEMENT
Whether it is a rural system or an urban system, the principlesof management broadly remain the same. A good management of awater supply system involves:-
- 25 -
I
a) planning, construction and maintenance ofadequate facility of water supply,
b) efficient and economical operation andmaintenance,
c) efficient administration at all stages,
d) efficient financial management,
e) efficient material management,
f) good public relations and a satisfactoryservice to consumers,
g) development of technical and financialplans for future expansion.
3.0 MANAGEMENT OF RURAL WATER SUPPLY
Management of rural water supply system encompasses followingaspects :
a) policy making and planning,
b) financing,
c) programming and implementation,
d) operation and maintenance.
3.1 Policy Making and Planning
Usual popular belief is that policy for rural water supply isto be drawn up by the political wing of the Government and theagency which actually implements or the beneficiaries them-selves have little role to play. But this thinking is notcorrect. Policy does not mean only fixing up broad objectivesof a programme. It has to take into consideration all aspectswhich affect the programme. Policy making is to be followedby action in field and hence in framing the policy, the pro-fessionals in charge of implementation have to be as muchinvolved as the political wing. Constraints on resources likefinance or material, shortage of skilled personnel, nonavaila-bility of technical know-how are some of the problems indeveloping countries which ultimately affect the planning ofthe rural water supply programme and a constant interactionbetween the political wing and the professional wing of theGovernment will bring forth the difficulties in the path ofachieving the desired objectives.
In many cases, the policies are framed without proper assess-ment of contributory factors with the result that :
i) Assessment of problem is not properly done. Identifi-cation of problem villages is done through inadequateand improper survey and in certain cases, real problem
- 26 -
villages may remain in the background while otherwiseinfluential villages get preference. In course oftime, re-assessment of the list is called for. Natu-rally this upsets the entire planning based on earlierestimates because the goals are to be modified andlimited finances are required to be redistributed overa larger population. These slippages in planningresult in failure in target achievements.
ii) Since the planning does not take into account thehydrogeological features of the region, the most optimumuse of available water sources is not always made.
iii) There is no control on extraction of water from a parti-cular source with the result that a number of agenciesor communities depend on the same source irrespective ofwhether it can cater for the needs of all or not. Theresult is that ground water table goes down rapidly,the surface sources become less and less dependable andexpensive solutions of impounding reservoirs are to befound out.
All these factors adversely affect the earlier planning sincefresh plans are to be drawn, additional finances are to besearched and achievement targets are to be reduced.
In order that the planning is fruitful, it is necessary -
a) to assess the problem nature of the villages througha scientific assessment by involving the professionalswho matter in the programme,
b) to entrust the programme of development of waterresource to a single agency so that water demands forconflicting interests do not result in wasteful useof water,
c) to accord priority on the basis of real needs withoutbeing influenced by other considerations.
3.2 Financing
The possible sources of funds for financing village waterprogramme may be -
Government budgets (both Central & States),
Foreign assistance,
Financial institutions,
Cross subsidy from urban systems,
Contribution from the villages themselves.
Of these, the most important is the Government budget, whichtakes care of almost 90 per cent of the burden. The foreignassistance is valuable for certain projects, but its overall
- 27 -
II
impact on the programme of a nation or a State is much smaller. IThe foreign assistance which is in the form of loans may alsoimpose restrictions on the receiving agencies in the matter oforganization, accounting and re-distribution of revenues fromthe systems with the result that the systems benefitting fromsuch assistance are few and selective and the receiving agenciestend to shy away from asking assistance from such agencies forfuture projects. Financial institutions like Life InsuranceCorporation are already supporting the rural water supply pro- •gramme in a substantial way. Cross subsidy from urban systems Ior from industries and commercial establishments is possibleif there is unified agency in charge of water supply programme. IIn many cases profitable systems are exploited by one agency •while other agencies responsible for domestic rural water supplyfind it extremely difficult to provide funds both for construe- Ition and maintenance. Contributions from villages are now an ™accepted concept, but the paying capacity of villages is, at _times, limited. Secondly, villages are unwilling to pay for Ithe cost, because they regard water supply as a natural right,or because they do not appreciate the benefits of improvedwater systems. A considerable motivation and health educationis necessary to impress on the villages the need for theirparticipation - both in capital cost and also in recurrent costs»
i) It is desirable that beneficiaries contributetowards the service provided. •
ii) Availability of. such funds can accommodatelarger number of villages and reduce the burden Ion Government. •
iii) It inculcates the habit of generating funds Ineeded for operation and maintenance. •
iv) Sense of responsibility and sense of owning thesystem is vital for success of such programme.
3.2.1 Village Share in Capital Cost IUsually, it is about 10 per cent of the capital cost. Villages •which have predominant backward class population are exempt |from this contribution. Governments often provide loanassistance for such contribution. For example, in Maharashtra •State (India), if villages raise 2 per cent share from their •own resources, it is entitled for loan for remaining 8 per _cent. Lack of motivation, however, often results in poor res-ponse even in the matter of applying for such loan. In many •cases, villages do not pay even 2 per cent share and do notcare to approach for loan for balance share. The requirement ofbeneficiaries' contribution remains unfulfilled and the imple-menting agencies are put in a position where, either the workcannot be started or work is to be taken up without botheringfor the village share. First course affects the achievements,while the second course overlooks the need for following •regulations in this regard. |
Achievement of targets in the decade needs that such problems
- 28 -
are resolved with some definite line of approach. Where Govern-ments are willing to provide loan assistance to villages, it isbetter that the financing provides for full funds throughGovernment with part of it (say 10 per cent) treated as loan tobe recovered in easy instalments. Such course, while ensuringparticipation of villages, may be able to remove some of theproblems in implementation due to lack of adequate responsefrom the villages in the matter of payment of their share.
3.2.2 Village Responsibility towards Operation & Maintenance
This is among the most neglected responsibilities of rural wateragencies. While great emphasis is laid on early completion ofwater supply schemes, very little thought is given to the assess-ment of cost and manpower requirements of operating the com-pleted projects.
The financial aspect of operation and maintenance itself is amajor problem in rural systems. It has been accepted thatvillages should generate funds from their internal resources tofully meet the operating and maintenance cost. In villages offairly big size and where independent systems exist for indi-vidual villages, the problem is comparatively easy. Villagesown the scheme, run them through their own staff and collectrevenue through consumers. But in case of integrated regionalwater supply scheme serving more than one village, the problembecomes acute. Firstly, these villages do not consider thesystem as belonging to them. They do not feel obliged to re-cover revenue. Operation and maintenance has to be done bysome central agency, which is unable to recover the cost towardsoperation. There are, in many cases, no clear cut policiesabout who should operate such systems. Even where policies aredrafted, the agencies responsible for the operation are eitherunwilling or unequal to the task. The arrears go on mountingwith the result that in many cases the schemes are not operatedand villagers again go in search of their old, unsafe watersupply sources.
While the policy of limiting the supply through public stand-pipes is justified on the ground of reducing capital cost, itis an established fact that villages, where individual houseconnections are possible, are in a better financial position tooperate the scheme. It will, thus, appear that a blanketdecision like supply through public standpipes only tends toresult in problems in maintenance, since subsequent addition ofdistribution net-work is either not possible or is expensive.A flexible approach in this particular aspect is likely to bebeneficial.
4.0 PROGRAMMING AND IMPLEMENTATION
4.1 While planning determines the overall shape of a village watersupply programme, and looks forward over a period of severalyears, programming is more short-term and concerns moredetailed question of who or which department within the agencywill do what over the next few months or few years.
- 29 -
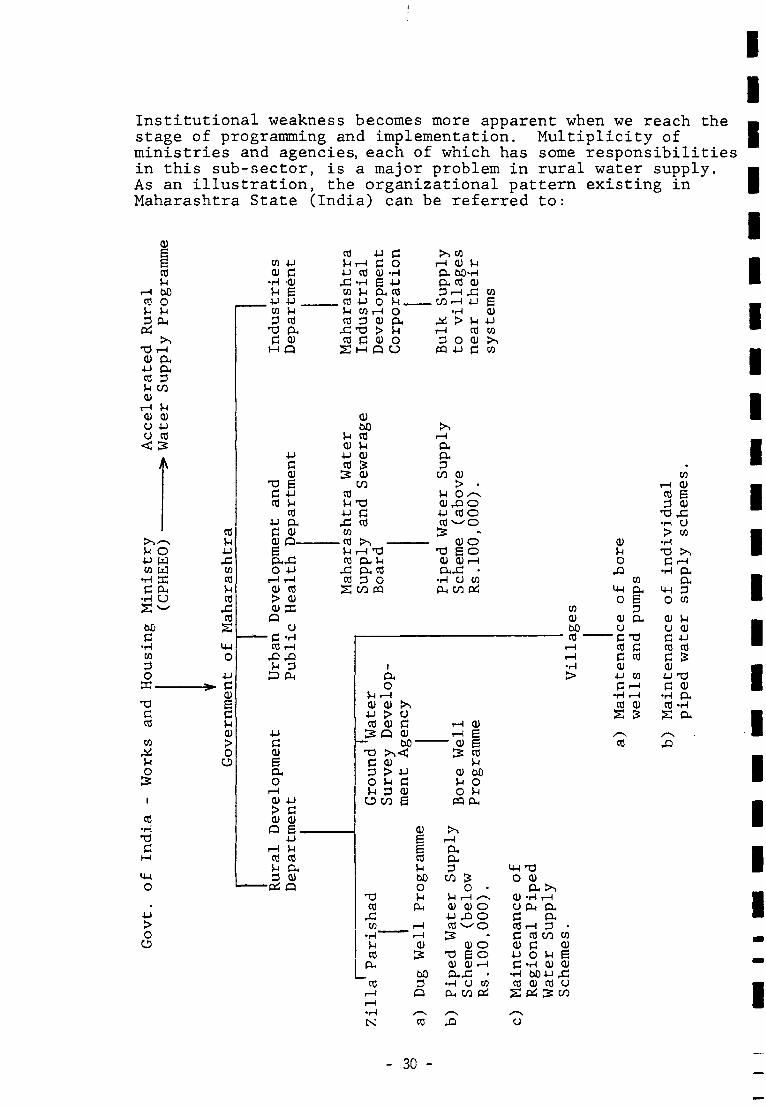
Institutional weakness becomes more apparent when we reach thestage of programming and implementation. Multiplicity ofministries and agencies, each of which has some responsibilitiesin this sub-sector, is a major problem in rural water supply.As an illustration, the organizational pattern existing inMaharashtra State (India) can be referred to:
0 1
COU
r-l 00cO Ou u3 PMPá
XJr-l01 Ou4J exCO 3l-l COd)
O) dlü 4-1O CO
A
u o4-> Wco W
•H xtí PM
•rl CJ
bütíCO
o
X)
cO
COASrlO¡2
cO•i-ÍXI
tí
4Jtí
cO
X!cocO
cO
cO
«4-1O
4-1tídl
iS-id)
oo
•H '01
4J 4Jco ^i3 co
XI O-tí di
M O
OH01
4-1
tí01
x) ËC 4-1CO U
CO4-1tí01PHXIO 4-1
i—I i—IO) cO> dld) BQ
ü" t í «HXi XIrl 3
H> PM
4-Jtíd)
Ë
dl 4J> tíd> d)
Q Ë-4J
CO coU OH
-pá o
CO 4-1 tírl r-l tí O4 J CO CU - HXI -H E 4-1
CO >-l O H CO4-1 O UCO r - l3 01
}-l
efl
cO C cuSM Q
oOHuo
CUbO
i-i cOO> U4J O)cO £5 d)
cOU X)4-> CX! cOCO
- cO >•>}-i i—i T3CO O - r l
X I O H COefl 3 o
S CO CQ
I
Oí-ll-l01 01 ¡^4J > ücO <U tí
¡2 Q O)bO-
X) >-><¡tí 013 > 4->O U tíU 3 dlUCO Ë
>-> cor-l d)OH Où'O H CO dl
. CO r- l 4JCO
3 OPQ 4-1
dlU 4->cO coCU >•>C co
OH
o-CO 01
S-l O s-\01 Xi O4-1 CO O
dioxi BOdl dl r-lo-x; •
• r l CJ COP M CO Pá
dl
01cO
CU bOU OO U
PQ PM
COX!co
•H"
cOP M
"cO
cu
IS-i
bOO
PM
OHOH3co
d) O) O4-1 XI OcO v—' O
COd)bOcO —- iH
>
CUr lO
X I
«4-1O
01o
— tícOtídl4-1
•HCO
s
coO H
Ë3O H
X )tícO
cor-lr - lCU
i—1cO3
X I• r l£>
•HX !tí
•rl
«4-1O
CUOtíCOtíCU4-1
•rlCO
CO0)ËO!
X!OCO
r-lO H
O-3co
u014JcO
X)o>O H
•HO H
cO
«4-1 X IO O)
OHCU ' r i rO PM O-CcOi
O-3
C co co co0)
bO
O
X)0)
a•HPM
dlËdl
.XiO
CO
oo,—1
coPá
d)4-1tí
•HCO
tío• r l
U01
M 4-10)
PáCO12
01Ë01X!O
CO
cO
- 30 -
While the responsibility of planning is with two departments,the implementation is entrusted to three different organi-zations. The Zilla Parishad (District Council) looks aftersmall water supply schemes costing less than Rs.100,000.Ground Water Survey and Development Agency drills bore wellsand fits hand pumps or power pumps on these wells. The agencymainly concentrates on small villages. For bigger villages,the problem is mainly solved by providing piped water schemes,which are looked after by the Maharashtra Water Supply &Sewerage Board. At a few places, Maharashtra IndustrialDevelopment Corporation, which essentially provides infra-structure facilities for industries, provides water forvillages located close to its own system. All these agenciesare under different ministries. At times, the jurisdictionsare not well defined and there can be overlapping activities.The most optimum use of available resources - both water andfinance - may not always be possible.
Co-ordination Committees exist at District level to choosethe type of source, viz., bore wells or other sources. Theseare expected to suggest villages, where a less expensive borewell is feasible, so that expensive solution of piped watersystem is adopted only where no other alternative exists.Possibility of delays in taking decisions or arbitrariness incertain decisions cannot always be ruled out.
In certain small States or Union territories, problems arisedue to a comparatively weak organizational set-up and a largescale dependence on Central Government in all vital matterslike approval to individual projects, sanction for tenders, andso on.
If the decade target is to be achieved in this sector, certainimprovements in the organizational set-up may be called for,and some suggestions as under are worth considering:-
a) All the implementing agencies can be brought undera common ministry which should look after the sectorof water supply.
There can be one apex agency to control and co-ordinatethe implementation work so that overlapping jurisdic-tions and conflicting interests are eliminated.
b) The areas of operation can be defined so that allagencies are aware of their responsibilities.
c) Effective decentralisation of decision making powerswill greatly help the speedy implementation.
4.2 Staffing
Inadequate staffing of suitable personnel is likely to be amajor constraint in many developing countries. One of thereasons is that the responsibility of water supply is usuallywith government which does not attract qualified persons dueto comparatively lower salaries. Village programme also meanslow prestige, poor living conditions, low technological
- 31 -
II
standards affording little incentive to engineers and other _professionals and little scope for career development. At timesBa short term solution is found out by appointing consultants fordesigns and even supervision of construction programme. Butthis results in weakening the organizational structure frompoint of view of not only construction but also operation andmaintenance. For attracting suitably qualified professionals,perhaps, the most effective step may be to declare rural watersupply to be a key development sector and pay greater attentionto personnel motivation. •
5.0 OPERATION AND MAINTENANCE
While attention is concentrated on the work of implementation, ^very little attention towards organizational requirement foroperation and maintenance is usually given. Schemes are con- Istructed without any clear assessment of the manpower needed tokeep them in operation or of the logistical problems involved,besides requirement of funds. As a result, a high percentageof water supply systems break down soon after they are broughtinto service. The danger is more obvious in cases where •foreign help is limited to only construction programme. Also |where the implementing agency is not responsible for the mainte-nance, it may tend to overlook the possible difficulties in •future. I
The villages, are considered to be responsible to operate and •maintain the systems. Non-availability of suitable skilled •staff, inability of villages to raise funds for operation andmaintenance and absence of sufficient motivation at village Ilevel result in early breakdown of the system and people ™continue to depend on their old habits of fetching water fromsources, which are neither hygienic nor sufficient. Thus, even Ithough the Government may have fulfilled its responsibility of m
construction, the problem of operation and maintenance willhave remained unsolved for want of adequate governmental support
Various organizational options are available in this case: • •
i) Ownership by the water agency (or local authority),
ii) Ownership by the water agency with some management Ipower delegated to a village level management committee,
iii) Ownership by private individual with charges to the ™public,
iv) Ownership by a water users' society from which ™non-subscribers may be excluded, _
v) Ownership by the local community like the villageadministration. M
First option presents fewer problems of management at the villagelevel. However, the cost of both construction and maintenance •may be higher and it may lead to fewer villages with better |paying capacity having access to improved supplies, when theoverall programme is considered. •
- 32 -
I
Second option - with overall control of water agency butinvolvement of local population both in construction and main-tenance phase - may pose problem in realising regular commit-ment of labour or cash on a voluntary basis. Since peoplemay consider that they have done their part in making thecontribution, collection of water rates and other charges willbe difficult.
Third option of private agency may solve the problem of manage-ment, but such agencies may tend to be selective depending oncost of maintenance and in systems involving expensivemaintenance the government may have to subsidise. Otherwisecharges to people will be heavy and again access to the systemwill remain limited to the richer few.
Co-operative Societies may appear to be attractive, but thesystem can lead to faction fights, politics, etc. and hence thebenefit will be limited to certain pockets only.
Where villages have regular corporate bodies, as in India, themanagement of system by the village administration should bethe logical solution. Villages have powers to levy taxes.Only difficulty is the lack of motivation resulting in villageadministration becoming non-responsive to its commitments andduties. Short term interests can affect the taxation policyresulting in non-realisation of revenue and continued depen-dence on Government for maintenance.
In India, where individual villages are having separate systems,the last option of village level management for operation andmaintenance is practised. While some village systems may sufferbecause of untrained staff at village level and inefficientfinancial management, there are large number of villages whichare successfully operating the systems. When a system coversmore than one village, the problems are more apparent. Thepresent policy requires the Zilla Parishads (district levelcouncils) to undertake the responsibility of operation and main-tenance. But this organization is not involved in the construc-tion phase and faces problems like non-availability of adequatetrained personnel. The system can also suffer due to uncertaintyabout realising sufficient revenues which acts as the maindeterrent with the result that some of such systems remain un-utilised and uncared for. Perhaps entrusting the job of mainte-nance to the agencies which implement the construction programmeand ensuring realisation of revenue by imposing adequate taxescan be a proper solution. But this needs, firstly, the correctdiagnosis of the problem and flexibility in attitude towardsthe existing pattern.
6.0 TRAINING
Non-availability of adequate skills, both for construction workand for operation and maintenance is going to be a major short-coming in the decade. The construction programme may not meetwith any major difficulty in countries like India, where suffi-ciently strong agencies exist. But when it comes to operationand maintenance, things can be really depressing. The pace of
- 33 -
II
creating new assets brings forth urgent need for inclusion of •substantial training element in the village water programmes. |However, few countries make adequate provisions for the train-ing.
The assessment of training needs will reveal that the wholerange of skills needs to be considered, as listed below: •
a) Local operating staff, such as plumbers,mechanics, electrical operators, fitters, Ibricklayers, well drillers; '
b) Supervisory staff such as foremen, Isanitary inspectors;
c) Technical staff, such as engineers,chemists, bacteriologists;
d) Administrative staff, such as accountants |and supporting staff, administrators andcommunity organisers. •
In the early stages, large training centres may not be necessary.But in the latter half of the decade, facilities may be needed •on a larger scale. Common training facilities for urban and •rural water supply personnel appear to be the most desirablefeature, since this can bring out optimum results from the Iavailable facilities. •
Though efforts so far are discouraging, there are signs of the Ichange for the better. For example, in many States in India,training facilities are being thought over. Maharashtra WaterSupply and Sewerage Board has a provision for creating traininginstitute in the current Five Year Plan and this facilitywill be mainly utilised for training of operating staff and •supervisory staff. |
7.0 CONCLUSION |
To summarise, it may be stated that in order to make the ruralwater supply programme successful: I
i) It is necessary to involve the implementing agenciesand professionals in the policy making. I
ii) For effective and optimum use of resources, it is _necessary to have one single ministry responsible Ifor water supply and one single apex body to co-ordinate the work of different implementing agencies. •
iii) Village participation is vital for the success of theprogramme. But, where villages are financially weak, •there is need for the Governments to provide loans |for the capital share and arrange for speedy completionof the programme rather than to wait for villages to •respond fully. •
II

iv) Operation and Maintenance need more attentionthan hitherto given. Training of staff atoperating level and well defined policy regardingagencies to operate schemes involving more thanone village are important considerations.
- 35 -
SESSICN III,
ESTABLISHMENT OF GROUNDWATER DATA BANK.
Z. Hainan, I. Krliger A/S Oonsulting Engineers,DENMARK.
(A) PART ONE
SYSTEM APPROACH
INTRODUCTION
General
Investigation of possibilities for groundwater withdrawal shouldalways be considered in any water resources development, eventhough surface water may be available. The quality of groundwateris always nearly constant, chemically and physically, and tempe-rature fluctuations are small. Groundwater withdrawn from proper-ly located, designed and constructed wells will be clear andclean and can easily be protected against pollution. Because ofthis characteristic of groundwater, the need for treatment isminimized and in some cases entirely eliminated. Lower investmentcost is realized because development requires shorter pipelinessince groundwater supplies are usually available nearby. Further-more, huge underground storage eliminates the need for large sur-face reservoirs.
In any large scale groundwater development a thorough and syste-matic assessment must be made of the available groundwater re-sources. The results of all groundwater studies must be presentedin a usable form.
To achieve these objectives, the establishment of a reliableGroundwater Data Bank, a continuous collection of new data andthe processing of data on a regular basis is the most importantrequirement in the planning of groundwater development.
Once established the Groundwater Data Bank contributes to optimi-sation of the water resources development budgets, it enhancesthe knowledge about aquifers in a particular area and provides areliable guidance for drillers as to the depth of drilling, andwell construction thus often reducing the overall cost of dril-ling.
Finally, the Groundwater Data Bank provides a reliable backgroundfor establishment of rules and regulations for environmental pro-tection of this precious resource. Therefore, the importance ofestablishment of Groundwater Data Bank can never be too stronglyemphasized.
- 36 -
Some undesirable consequences of groundwater development
Whenever there is available groundwater near a population centre,wells are drilled (in most cases by enterprising individuals ororganisations) to abstract groundwater for water supply pur-poses. Reporting of well records to a central body capable ofappreciating the significance of proper development of ground-water has seldom been practiced under such conditions. The analy-sis of depth of drilling and the rate of decline of groundwaterlevel reveals a following regular pattern of events as a conse-quence of uncontrolled groundwater abstraction in such areas.
At the beginning few wells are drilled (often not penetrating thewhole thickness of the aquifer) and development of the aquiferbegins. More wells are added as time goes by and withdrawal fromthe aquifer gradually increases. As a consequence of this, thecone of influence, created by pumping, extends and deepens pro-portionally to the magnitude of withdrawal. Depending on theyielding characteristics and the size of the aquifer in questionthe total groundwater abstraction is usually smaller than thetotal recharge for quite a period. If it stays this way the with-drawal from aquifer would usually remain below its rate of re-plenishment and the decline of groundwater level would eventuallycease.
However, in uncontrolled development of an aquifer, more oftenthan not, the rate of withdrawal reaches the point in time whenwithdrawal exceeds the rate of replenishment and the mining ofgroundwater occurs.
As a consequence of such a development the water level declinescontinuously, the cost of pumping and the drilling depth in-creases and the groundwater quality may be adversely affected.Very often such a development can be attributed to the unsatis-factory drilling practices and an erroneous overall planning ofthe groundwater development. This results in a rather bad publi-city of the groundwater source and in the worst case leads to thenegligent utilisation of this otherwise reliable source of water.
There are numerous examples all over the world of this trend ingroundwater development.
As a rule, better the aquifer, longer the period before a quanti-tative evaluation of this important resource is undertaken. Whenthis becomes necessary, the development (of an aquifer) is usual-ly in a very advanced stage and the situation is often out ofcontrol.
Due to the fact that groundwater is usually a stable resourceboth quantitatively and qualitatively, with the predictablevariations in water levels, a systematic collection of data andan evaluation of aquifer potential for withdrawal is rarelyattempted in the beginning of groundwater development. Withoutreliable historical records regarding wells, their number andlocations, groundwater withdrawal, changes in water levels andwater quality data, the rational analysis of the past history of
- 37 -
aquifer development cannot be undertaken and consequently thefuture projections are becoming less accurate.
If the systematic reporting of data from boreholes and wells isinitiated at an early stage, and development of groundwaterreservoir is progressively followed through these records, theundesirable consequences of an uncontrolled groundwater develop-ment may be foreseen well in advance and effectively prevented.
Experience has shown that usually the government agencies havethe potential to appreciate the necessity for coordinated plan-ning of water resources and to initiate a systematic collectionof groundwater data and the establishment of a comprehensiveGroundwater Data Bank.
GROUNDWATER DATA BANK SYSTEM
General
In the following sections the basic elements of Groundwater DataBank system, which may be adjusted and expanded to take care ofthe special local requirements, are explained and illustrated.
The records from the Groundwater Data Bank may be advantageouslyused for the following purposes:
a) To provide a progressive build-up of knowledge ofgroundwater conditions in an area,
b) To provide a reliable background for water resourcesmaster planning and selection of the most promisingareas for the groundwater resources development,
c) To optimise the number of wells, drilling depth and wellconstruction,
d) To administer and control the groundwater abstraction,
e) To control the groundwater quality,
f) To protect the groundwater from pollution,
g) To provide a better management of the groundwater re-sources.
In order to achieve these objectives the procedures for coordi-nated collection of groundwater data must be estalished and pro-mulgated among the different users of groundwater.
Legislation Aspects
An efficient collection of groundwater data must be supported byan adequate legislation.
- 38 -
This is an essential requirement for building up of the Ground-water Data Bank, provided it is obeyed continuously.
After a borehole is drilled (and well constructed) the owner, orhis authorized representative (often drilling company), should berequired to forward the strata logs and other numerical data fromthe wells to a controlling body which considers the appropriationof waters and issues the Water Right or Water Permit for ground-water abstraction.
An efficient management of groundwater resources and control ofwithdrawal is achieved by giving the right to withdraw a speci-fied amount of groundwater from aquifer in the areas to theapproved applicants.
To obtain such Water Permit (Water Right) the applicant shouldprovide the following data:
a) Strata and other logs (e.g. geophysical logs).
b) Records of water level encountered during drilling.
c) Construction characteristics of well casing and screen.
d) Pumping test data, preferably with the prognosis ofwater level decline as a function of time and distancefor a desired withdrawal.
e) Desired withdrawal which should be well documented.
f) Groundwater quality data.
From these data, the relevant authorities will be able to assessproperly the consequences of groundwater withdrawal and hence-forth issue the Water Permit (Water Right) for pumping of anappropriate volume of groundwater. The issuance of Water Permitimplies that the prescribed withdrawal must not be exceeded with-out the legal consequences to the applicant.
Experience has shown that in introducing such a system the exces-sive and unlawful withdrawal and in many instances the mismanage-ment of the groundwater resources is efficiently prevented.
Well Records Section
In order to organise an efficient Groundwater Data Bank the WellRecords Section must be established with the purpose of receiv-ing, filing, keeping, administrating, and releasing data pertain-ing to groundwater. The staff experienced in collection of data,location of wells and processing of collected data should be madeavailable for day to day operation of the Well Records Section.
- 39 -
Base Map (Fig. A1)
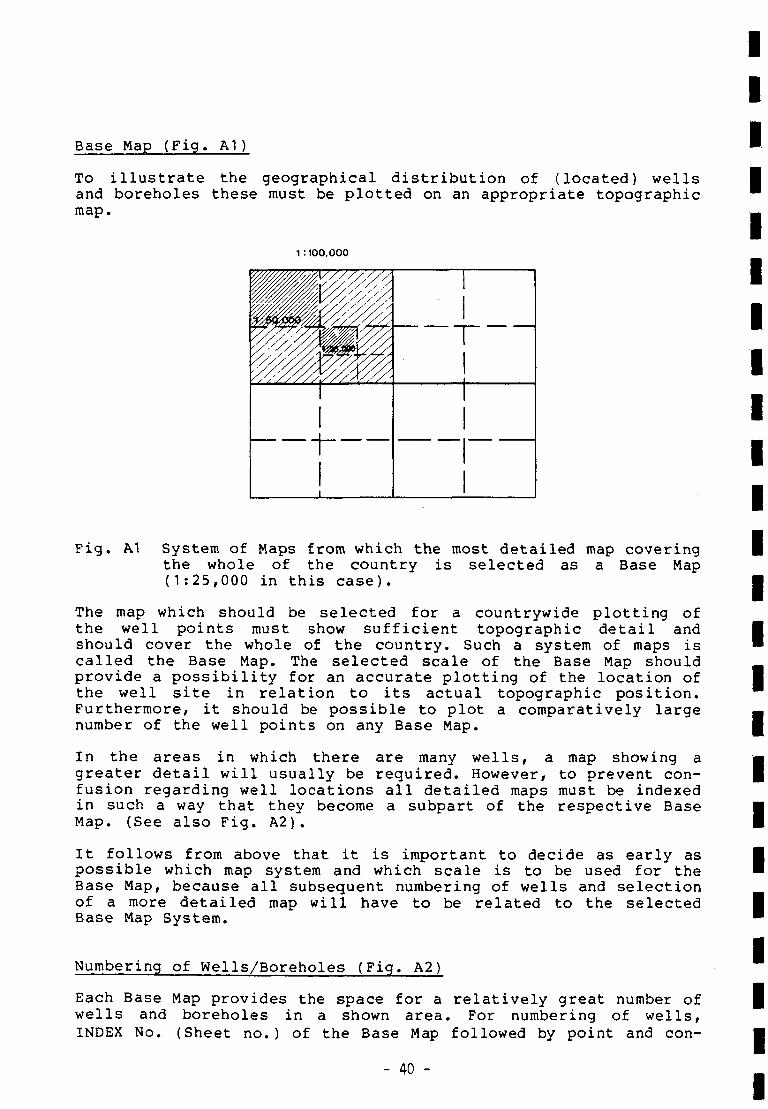
To illustrate the geographical distribution of (located) wellsand boreholes these must be plotted on an appropriate topographicmap.
i :100.00o
Fig. A1 System of Maps from which the most detailed map coveringthe whole of the country is selected as a Base Map(1:25,000 in this case).
The map which should be selected for a countrywide plotting ofthe well points must show sufficient topographic detail andshould cover the whole of the country. Such a system of maps iscalled the Base Map. The selected scale of the Base Map shouldprovide a possibility for an accurate plotting of the location ofthe well site in relation to its actual topographic position.Furthermore, it should be possible to plot a comparatively largenumber of the well points on any Base Map.
In the areas in which there are many wells, a map showing agreater detail will usually be required. However, to prevent con-fusion regarding well locations all detailed maps must be indexedin such a way that they become a subpart of the respective BaseMap. (See also Fig. A2).
It follows from above that it is important to decide as early aspossible which map system and which scale is to be used for theBase Map, because all subsequent numbering of wells and selectionof a more detailed map will have to be related to the selectedBase Map System.
Numbering of Wells/Boreholes (Fig. A2)
Each Base Map provides the space for a relatively great number ofwells and boreholes in a shown area. For numbering of wells,INDEX No. (Sheet no.) of the Base Map followed by point and con-
- 40 -
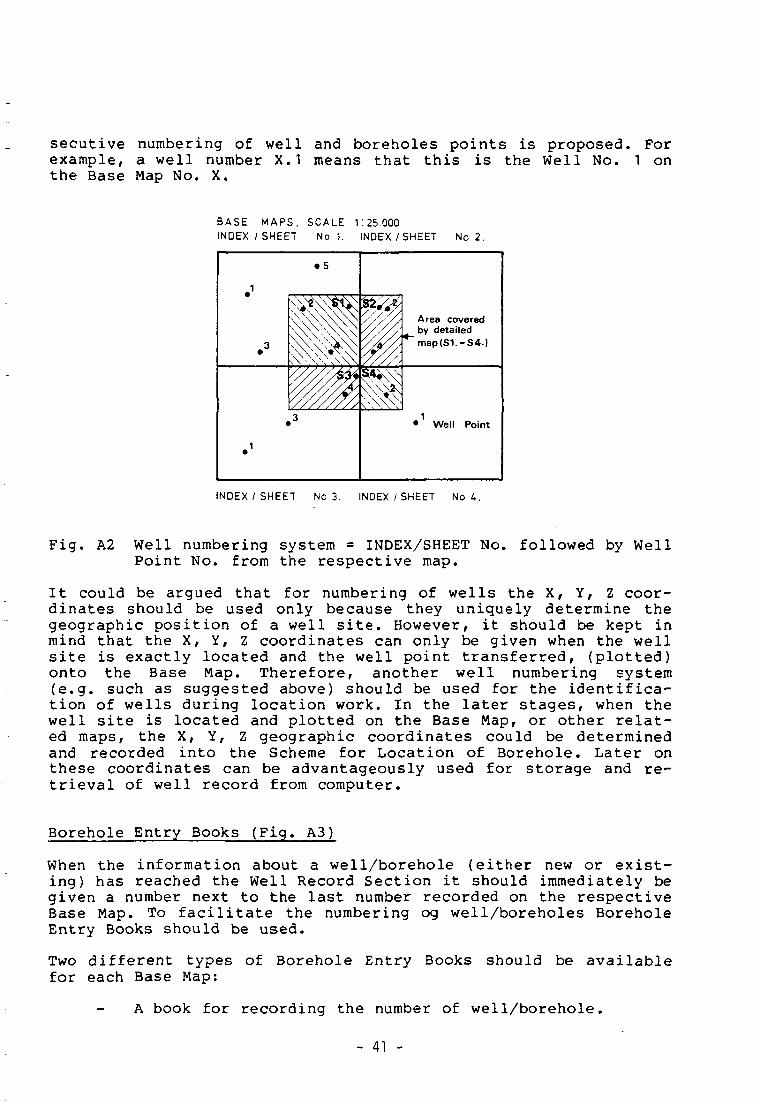
secutive numbering of well and boreholes points is proposed. Forexample, a well number X.1 means that this is the Well No. 1 onthe Base Map No. X.
BASE MAPS. SCALE r. 25.000INDEX /SHEET No 1. INDEX / SHEET No 2.
Area coveredby detailedmap|S1.-S4.)
• Well Point
F i g . A2
INDEX / SHEET No 3. INDEX / SHEET No U.
Well numbering system = INDEX/SHEET No. followed by WellPoint No. from the respective map.
It could be argued that for numbering of wells the Xf Y, Z coor-dinates should be used only because they uniquely determine thegeographic position of a well site. However, it should be kept inmind that the X, Y, Z coordinates can only be given when the wellsite is exactly located and the well point transferred, (plotted)onto the Base Map. Therefore, another well numbering system(e.g. such as suggested above) should be used for the identifica-tion of wells during location work. In the later stages, when thewell site is located and plotted on the Base Map, or other relat-ed maps, the X, Y, Z geographic coordinates could be determinedand recorded into the Scheme for Location of Borehole. Later onthese coordinates can be advantageously used for storage and re-trieval of well record from computer.
Borehole Entry Books (Fig. A3)
When the information about a well/borehole (either new or exist-ing) has reached the Well Record Section it should immediately begiven a number next to the last number recorded on the respectiveBase Map. To facilitate the numbering og well/boreholes BoreholeEntry Books should be used.
Two different types of Borehole Entry Books should be availablefor each Base Map:
A book for recording the number of well/borehole.
- 41 -
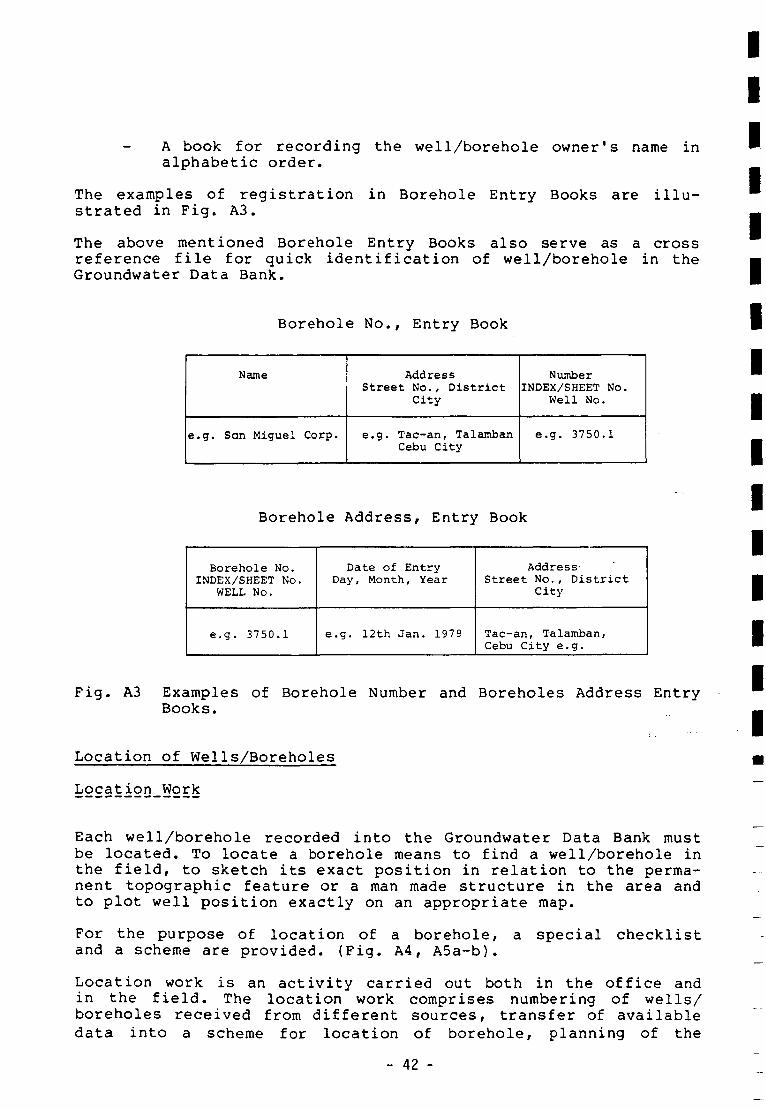
A book for recording the well/borehole owner's name inalphabetic order.
The examples of registrationstrated in Fig. A3.
in Borehole Entry Books are illu-
The above mentioned Borehole Entry Books also serve as a crossreference file for quick identification of well/borehole in theGroundwater Data Bank.
Borehole No., Entry Book
Name
e.g. San Miguel Corp.
AddressStreet No., District
City
e.g. Tac-an, TalambanCebu City
NumberINDEX/SHEET No.
Well No.
e.g. 3750.1
Borehole Address, Entry Book
Borehole No.INDEX/SHEET No.
WELL No.
e.g. 3750.1
Date of EntryDay, Month, Year
e.g. 12th Jan. 1979
AddressStreet No., District
City
Tac-an, Talamban,Cebu City e.g.
Fig. A3 Examples of Borehole Number and Boreholes Address EntryBooks.
Location of Wells/Boreholes
Location Work
Each well/borehole recorded into the Groundwater Data Bank mustbe located. To locate a borehole means to find a well/borehole inthe field, to sketch its exact position in relation to the perma-nent topographic feature or a man made structure in the area andto plot well position exactly on an appropriate map.
For the purpose of location of a borehole, a special checklistand a scheme are provided. (Fig. A4, A5a-b).
Location work is an activity carried out both in the office andin the field. The location work comprises numbering of wells/boreholes received from different sources, transfer of availabledata into a scheme for location of borehole, planning of the
- 42 -
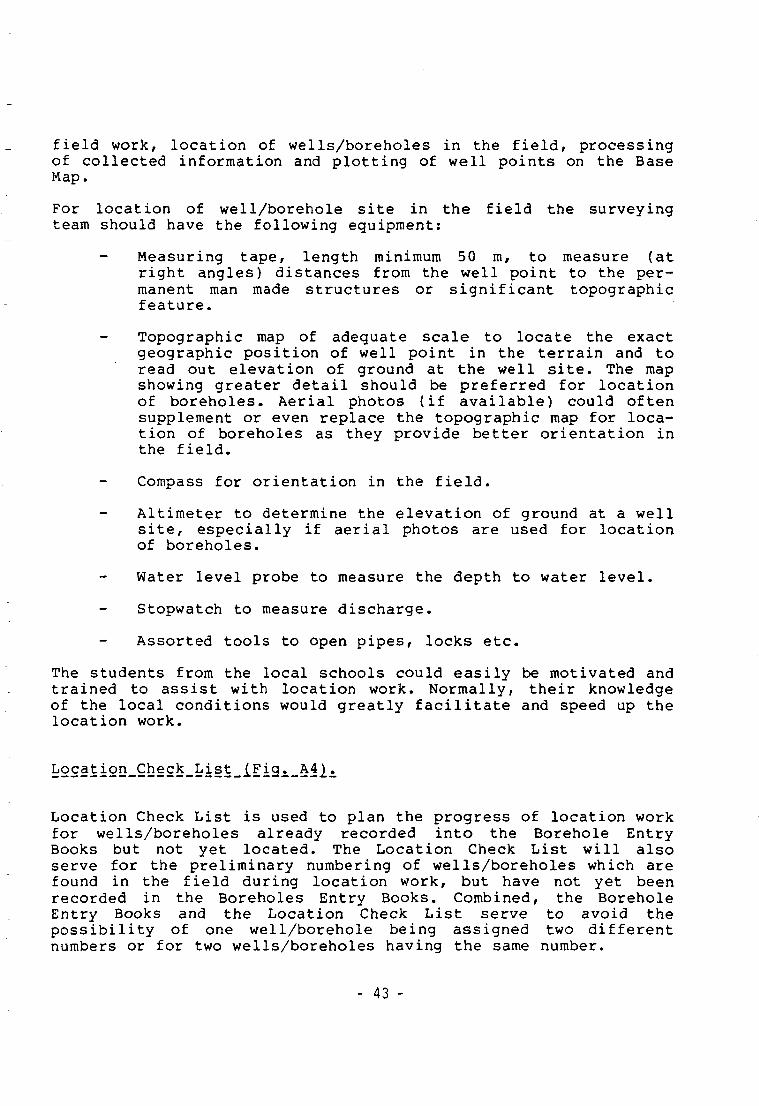
field work, location of wells/boreholes in the field, processingof collected information and plotting of well points on the BaseMap.
For location of well/borehole site in the field the surveyingteam should have the following equipment:
Measuring tape, length minimum 50 m, to measure (atright angles) distances from the well point to the per-manent man made structures or significant topographicfeature.
Topographic map of adequate scale to locate the exactgeographic position of well point in the terrain and toread out elevation of ground at the well site. The mapshowing greater detail should be preferred for locationof boreholes. Aerial photos (if available) could oftensupplement or even replace the topographic map for loca-tion of boreholes as they provide better orientation inthe field.
Compass for orientation in the field.
Altimeter to determine the elevation of ground at a wellsite, especially if aerial photos are used for locationof boreholes.
Water level probe to measure the depth to water level.
Stopwatch to measure discharge.
Assorted tools to open pipes, locks etc.
The students from the local schools could easily be motivated andtrained to assist with location work. Normally, their knowledgeof the local conditions would greatly facilitate and speed up thelocation work.
Location Check List is used to plan the progress of location workfor wells/boreholes already recorded into the Borehole EntryBooks but not yet located. The Location Check List will alsoserve for the preliminary numbering of wells/boreholes which arefound in the field during location work, but have not yet beenrecorded in the Boreholes Entry Books. Combined, the BoreholeEntry Books and the Location Check List serve to avoid thepossibility of one well/borehole being assigned two differentnumbers or for two wells/boreholes having the same number.
- 43 -
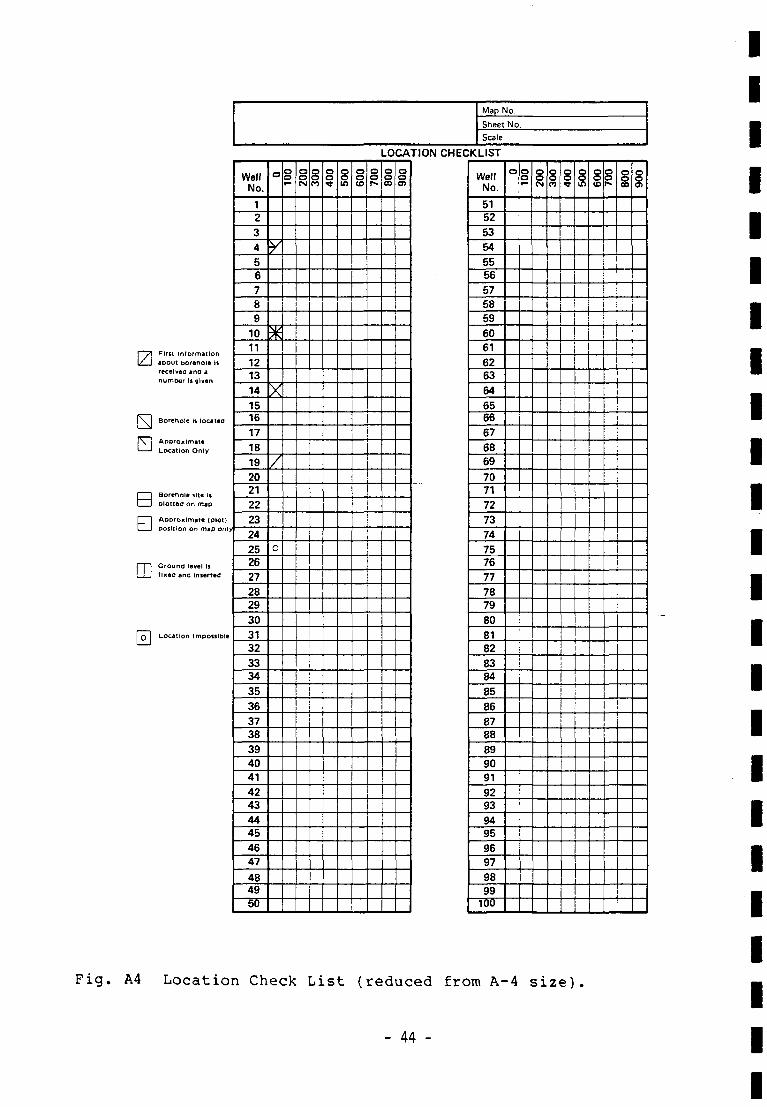
Map No.
Sheet No.Scale
First Informationabout borehole isreceived and anumber li given
Borehole is located
ApproximateLocation Only
Location impossible
LOCATION CHECKLIST
B Borehole site isplotted on map
•Approximate (plot)position on map only
Ground level isfixed and Inserted
WellNo.
1234567891011121314151617181920212223242526272829303132333435363738394041424344454647
484950
o
y
X
/
0
100
200
300
i
I
i
;!
400
009 600
700
I |
i
i |
I
¡
II
II
800
006 WellNo.
51525354555657585960616263646566676869
707172737475767778798081828384858687888990919293949596979899100
o
100
200
300
400
009
j !
¡
I
i
!
g§l
j
800
900
Fig. A4 Location Check List (reduced from A-4 size)
- 44 -
IIIIIIIIIIIIIIIIIIIIIIII
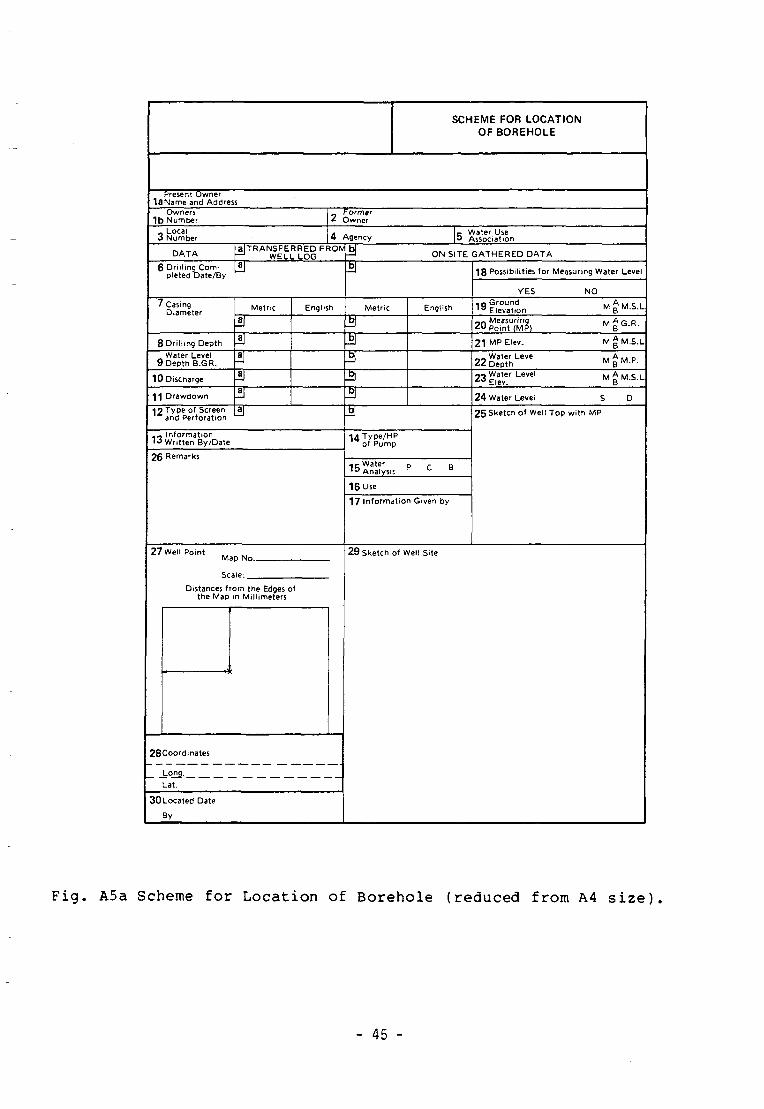
SCHEME FOR LOCATIONOF BOREHOLE
Present Owneri8Name and Address
Owners1b Number
FormerOwner
n Localo Number 4 Agency c Water Use
P Association
DATATRANSFERRED FROM b f
WELL LOG •—' ON SITE GATHERED DATA6 Drilling Com-
pleted "Date/By °r 18 Possibilities for Measuring Water Level
YES NO
7 CasingDiameter Metric English Metric
3English 19 Ground
ElevationMeasuringPoint (MP)
8 Drilling Depth •I 3 21 MP Elev. M AM.S.L
Water Level9 Depth B.GR. 3 __ Water Level
ZZ Depth M g M.P.
10 DischargeWater LevelElev. M AM.S.L
D
11 Drawdown 24 Water Level19 Type of Screen
and Perforation
Informationritten By/Date
26 Remarks
25Sketch of Well Top with MP
14 Type/HPof Pump
15 WaterAnalysis
16 Use
17 Information Given by
27 Well PointMap No—
Scale:.Distances from the Edges of
the Map in Millimeters
28Coordinates
Lat.
30 Located Date
By
29 Sketch of Well Site
Fig. A5a Scheme for Location of Borehole (reduced from A4 size)
- 45 -
Sçheme_for_Loçation_of_Borehgle_XFigi_A5a-b|i
Normally, the Scheme for location of Borehole is utilised firstin the office, to transfer relevant data about the well into ascheme. Thereafter, the scheme is used by a location team in thefield, to sketch the exact location of a well in relation to theexisting man made permanent structures and/or significant topo-graphic features and to record some other data gathered on siteduring the location work (see example in Fig. A5b).
The manual, explaining step by step the procedures for completionof the Scheme for Location of Borehole is prepared and could bemade available separately from this paper.
Transfer_of_loçated_well_pgint_tg_the_Base_Map__iFigi_A61i
After completion of location work in the field, the Scheme forLocation of Borehole is again used in the office to plot the wellpoint onto the Base Map.
After a well is plotted, the X, Y,(Z) coordinates (either rela-tive to the edges of the map or the true geographic coordinates)will be read out and recorded into the scheme.
To find a particular well point on the Base Map the following twotypes of coordinates may be used:
a) Well point is located at the recorded distances asmeasured from the edges of the respective map.
b) Well point is located at the intersection of recorded,geographic X, Y coordinates.
By knowing the Index Number of the Base Map, on which aparticular well is plotted, and the X, Y coordinates of the wellsite (either universal or related to the edges of the particularmap), it is easy to find a well point on the Base Map. When thewell records are computerised, the X, Y, Z geographic coordinatescould be uniformly used for the computer plot of well points andfor the identification of the particular well.
- 46 -
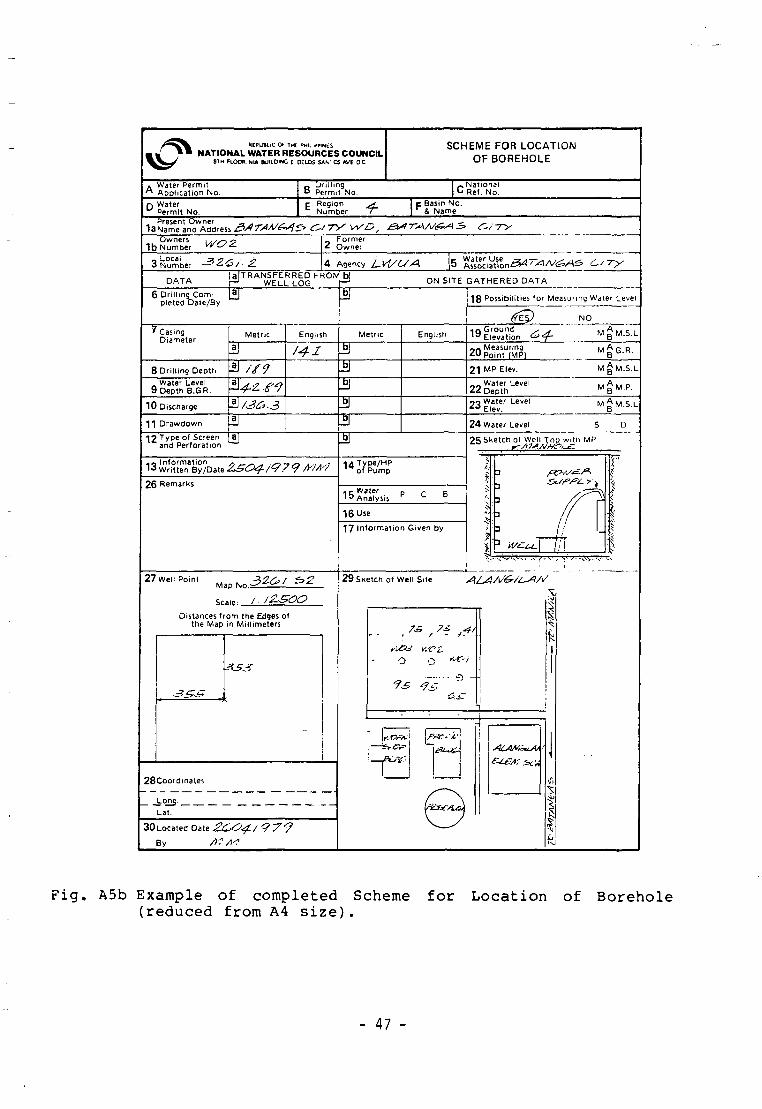
REPUBLIC O> TK£ PHU ppwES
NATIONAL WATER RESOURCES COUNCIL8 Î K FLOOR. NIA BUILDING f DÉLOS SAN 05 AVE OC
SCHEME FOR LOCATIONOF BOREHOLE
Water Permit' Application No.
D Drilling•* Permit t\
~ Nationalc Ref . No.
WaterPermit No.
RegionNumber 1 p Basin No.
r & Name
Owners1b Number
_ Local .33 Number - ^
FormerOwner
4 Agency
DATA
6 Drilling Conv [5Jpleted Date/By
|a|TRANSFERRED FROM bl>—' WELL LOG •—'
» CasingDiameter
8 Drilling Depth
Metric English
ON SITE GATHERED DATA
Metric English
18 Possibilities for Mcasuung Water Level
NO
19 GroundElevation M^M.S.L
Measuring¡oint (MP) MAG.R.
21 MP Elev. MAM.S.L
Water Level9 Depth B.GR.
_ „ Water Level22 Depth M P .
10 Discharge> Water Level*Elev. M AM.S.L
11 Drawdown £12 Type of Screenand Perforation
L3 24 Water Level
25 Sketch of Well Toji wi_th MP
« M intormation *• _ -. .-^ -r • ^ •., . .?'3 Written By/Date 2>SO^-/l?79 MM
IA Type/HPof Pump
26 RemarksWaterAnalysis p r
P C
16 Use
17 Information Given by
'•
>•
i
ft1-
\\\
V
(1'A,
27 Well PointMap No.:
29 Sketch of Well Site
Distances from the Edges ofthe Map in Millimeters
JSS .,
28Coordinates
Lat.
30Located Date
By A " A?
Fig. A5b Example of completed Scheme for Location of Borehole(reduced from A4 size).
- 47 -
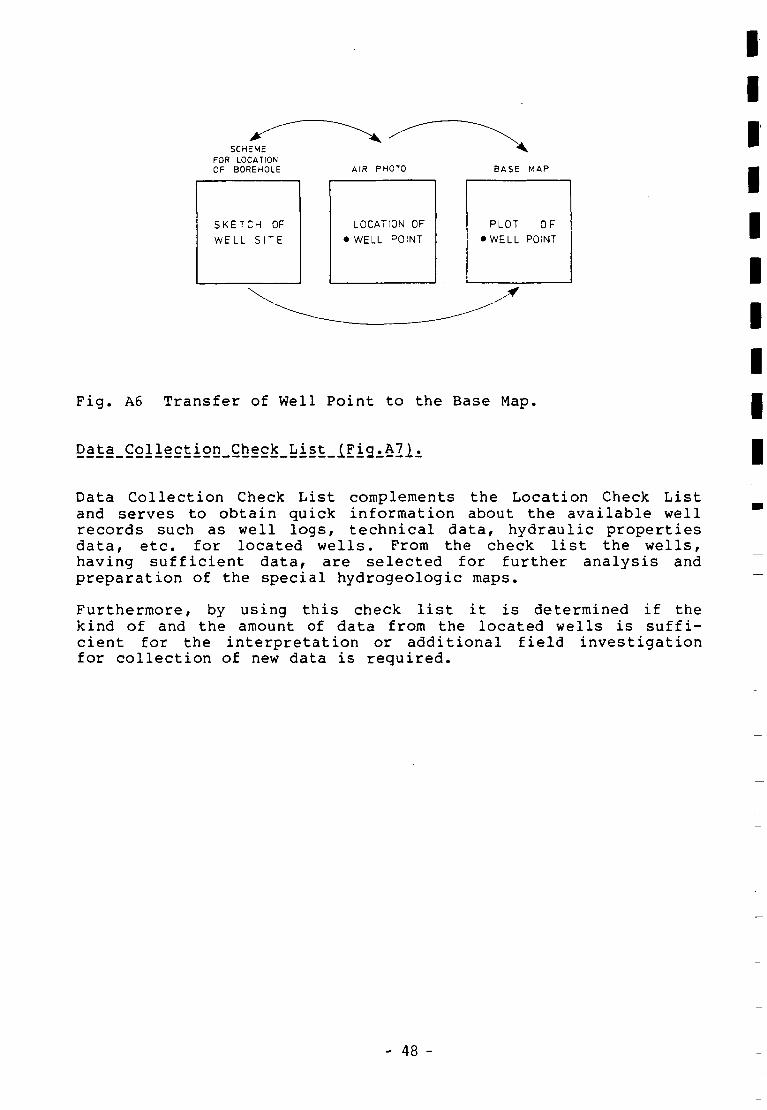
SCHEMEFOR LOCATIONOF BOREHOLE AIR PHOTO
SKETCH OF
WELL SITE
LOCATION OF
• WELL POINT •
BASE
PLOT
WELL
MAP
OFPOINT
Fig. A6 Transfer of Well Point to the Base Map.
IIIIIIIIII
Data Collection Check List complements the Location Check Listand serves to obtain quick information about the available wellrecords such as well logs, technical data, hydraulic propertiesdata, etc. for located wells. From the check list the wells,having sufficient data, are selected for further analysis andpreparation of the special hydrogeologic maps.
Furthermore, by using this check list it is determined if thekind of and the amount of data from the located wells is suffi-cient for the interpretation or additional field investigationfor collection of new data is required.
- 48 -
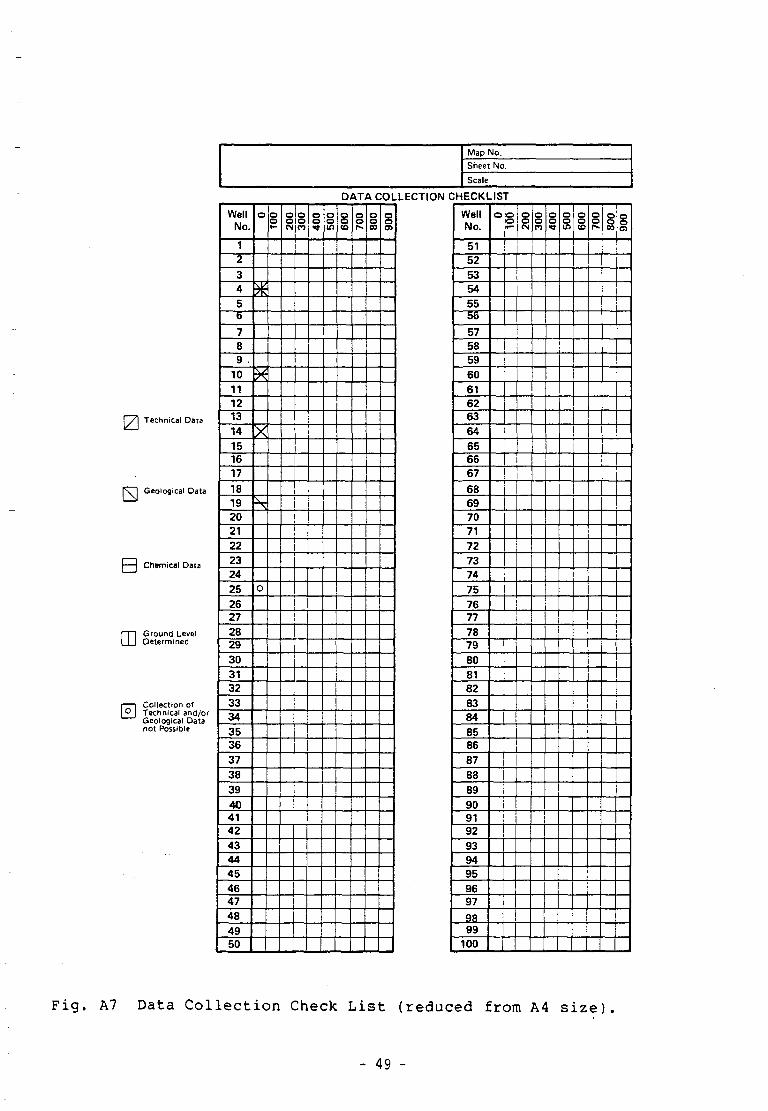
Map No.Sheet No.
Scale
DATA COLLECTION CHECKLIST
Technical Data
Geological Data
Chemical Data
Ground LevelDetermined
Collection ofTechnical and/orGeological Datanot Possible
WellNo.
1
2
34
56
789 .
10
11
1213
14
151617
18
19
20
21
22
23
24
25
2627
2829
30
3132
3334
3536
37
38
39
404142
4344
45
4647
48
4950
o
x
o
100
200 g
CO
Í
II
OO
P
I
]
I
!
500
[ 009 700 I
800
I 006"
WellNo.
5152
5354
5556
5758
59
60
616263
64
6566
67
68
6970
71
72
7374
75
7677
7879
80
8182
8384
8586
87
88
89
909192
93
9495
9697
9899
100
o
100 g
1[
!
j
!
¡
1
i
300 1
400
1
1
500
600 1
700 |
008FÕÕ6
i
Fig. A7 Data Collection Check List (reduced from A4 size)
- 49 -
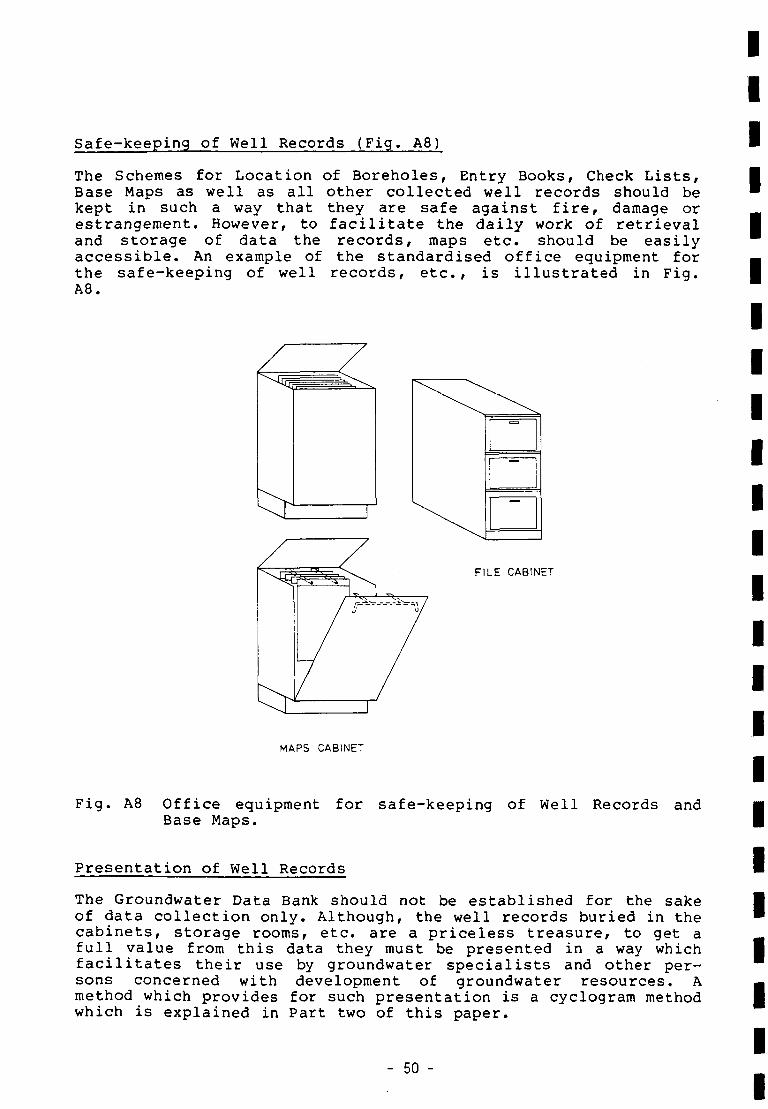
Safe-keeping of Well Records (Fig. A8)
The Schemes for LocationBase Maps as well as allkept in such a way thatestrangement. However, toand storage of data theaccessible. An example ofthe safe-keeping of wellA8.
of Boreholes, Entry Books, Check Lists,other collected well records should bethey are safe against fire, damage orfacilitate the daily work of retrievalrecords, maps etc. should be easilythe standardised office equipment forrecords, etc., is illustrated in Fig.
1—*
FILE CABINET
MAPS CABINET
Fig. A8 Office equipment for safe-keeping of Well Records andBase Maps.
Presentation of Well Records
The Groundwater Data Bank should not be established for the sakeof data collection only. Although, the well records buried in thecabinets, storage rooms, etc. are a priceless treasure, to get afull value from this data they must be presented in a way whichfacilitates their use by groundwater specialists and other per-sons concerned with development of groundwater resources. Amethod which provides for such presentation is a cyclogram methodwhich is explained in Part two of this paper.
- 50 -
IIIIIIIIIIIIIIIIIIIIIIII

REFERENCES:
Z. Haman, 1978 : Importance of Groundwater Data Bank for OptimumPlanning of Groundwater Development.Proceedings Philippine Institute of Civil Engi-neers, Conference Cebu, Philippines.
Z. Haman, 1979 : Groundwater Data Bank.System Approach and Case History. UNDP/NWRC openfile report. Manila/New York.
- 51 -
E S T A B L I S H M E N T O F G R O U N D W A T E R
D A T A B A N K
By Z. HamanI . K r ü g e r A/S
Consulting Engineers, Denmark
(B) PART TWO
CYCLOGRAM METHOD FOR MAPPING OF BOREHOLE/WELL RECORDS
INTRODUCTION
The purpose of mapping of borehole (well) data is to illustratestrata logs and other relevant data about boreholes/wells in sucha way that the type of aquifer(s), lithological composition ofpenetrated strata, the boundary conditions as well as aquifer hy-draulic paramètres can easily be defined.
The well records provide a source of data for the construction ofdifferent (hydrogeological) maps and graphs from which the abovementioned properties are determined. Among these maps the mapshowing location of boreholes, vertical position of penetratedstrata and other records from existing wells and boreholes is anessential tool for proper interpretation of the groundwater con-ditions in an area. Such map is called the Base Map of well re-cords.
There are many ways of graphical illustration of well records.The vertical and horizontal extent of penetrated strata is usual-ly illustrated in the form of cross-sections or-some sort of thethree-dimensional diagrammes (block, panel diagrammes, etc.).However, the mentioned types of graphs have a drawback becauseeach time a new information from a borehole is gathered, the dia-grammes have to be redrawn and reinterpreted. Furthermore, when alarge number of boreholes have to be presented, many diagrammesare needed and the presentation easily becomes confusing.
By using the cyclogram mapping technique, the principles of whichare given in the following section, the above mentioned disadvan-tages are avoided.
PRESENTATION OF CYCLOGRAM METHOD
Well Record Cyclogram - Explanation
The log of penetrated strata, as obtained from a driller, is usu-ally presented in a form of cross-section (Fig. B1, point a).
- 52 -
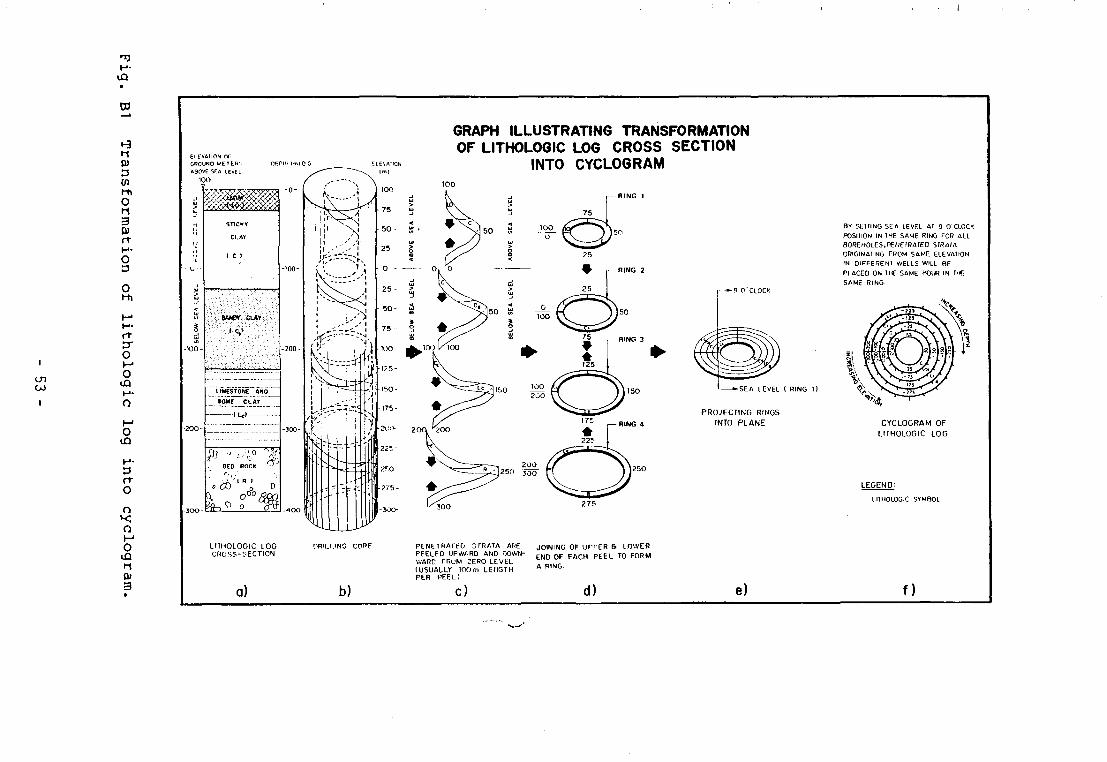
H-lu
OíCO
CD
(U3V)l-hO
3OrtH-OD
OHi
ftD"OMOuaH-O
Oua
rtoooMOidi-<0)
GROUND METE"* -
ABOVE STA lEvEL
100
GRAPH ILLUSTRATING TRANSFORMATIONOF LITHOLOGIC LOG CROSS SECTION
INTO CYCLOGRAM
>
j'j
>
<
§
-Wû-
200-
îTÎCKY
Cl.AV
I C I
LIWSTONE ANO
JOMÍ~CLÃY~
ÍÍJ : ' '/ '. ° 'BCD ROCK
•*¿o"' i n , ;•X o D o ^
—
0
LIIHOLOOIC LOGCROSS-SECTION
PRlLi.iNO COPf PENETRArtO STRATA ARE JOINING OF uri'ER & LOWER
(USUALLY 100m LENGTHPER PEEL]
— 9 O'CLOCK
SEA LEVEL ( RING 1)
PROJECTING RINGSINTO PLANE
a) b) c) d) e)
BY SfctlING SEA LEVEL AI 9 0 CLOCKP0SI1I0N IN THE SAME RING FOR ALLBOREHOLES.P6WEIRAIED SWAIAORIGINATING TROM SAME ELEVATIONIN DIFFERENT WELLS WILL BEPIACED ON THE SAME HOUR IN THESAME RING
CYCLOGRAM OFUTHOLOGIC LOG
LEGEND.
UTHOLOGIC SYMBOL
f)
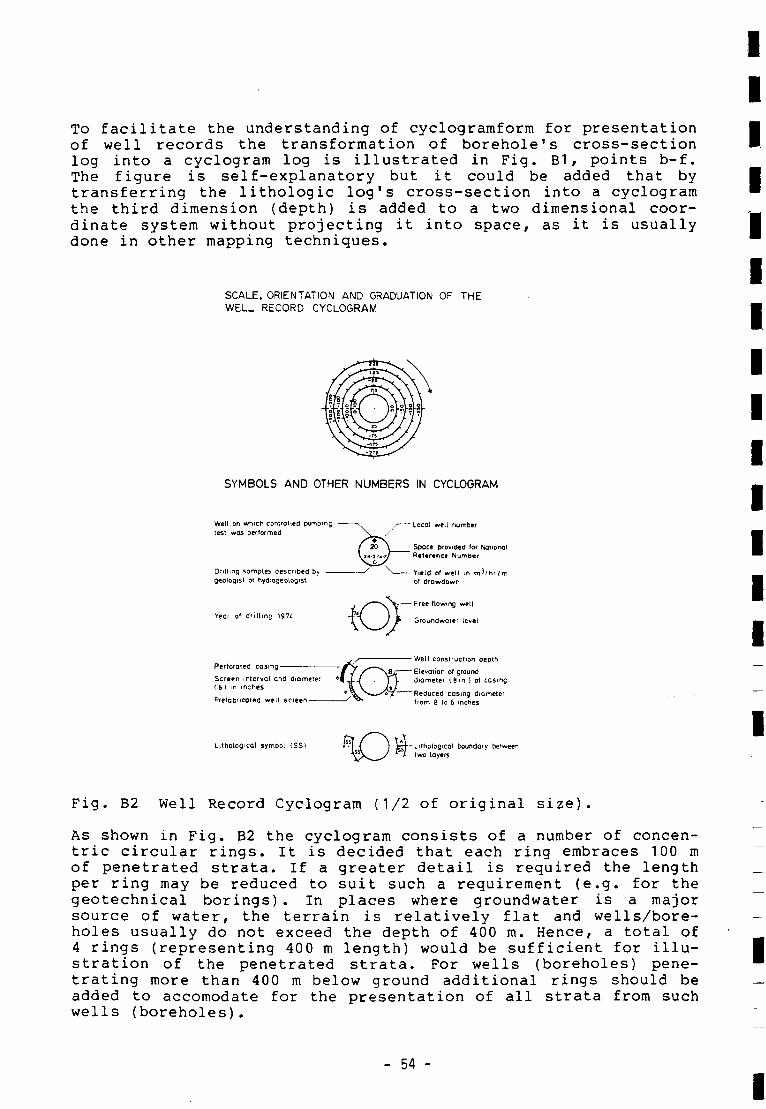
To facilitate the understanding of cyclogramform for presentationof well records the transformation of borehole's cross-sectionlog into a cyclogram log is illustrated in Fig. B1 , points b-f.The figure is self-explanatory but it could be added that bytransferring the lithologie log's cross-section into a cyclogramthe third dimension (depth) is added to a two dimensional coor-dinate system without projecting it into space, as it is usuallydone in other mapping techniques.
SCALE, ORIENTATION AND GRADUATION OF THEWELL RECORD CYCLOGRAM
SYMBOLS AND OTHER NUMBERS IN CYCLOGRAM
Well.on which controlled pumpingtest was performed
Drilling samples Described bygeologist at hydrogeologist
Year oi drilling 197¿
Perforated casing
Screen interval and diameter(6 ) m inches
Prefabricated well screen
— Locai well number
Space provided for NationalR«ftrtnct Number
Yield of well in m^/hr/mof drowdown
— Free flowing well
— Groundwater level
Well construction aepth
Elevation of grounddiameter (Bin 1 of cesinç
Reduced casing diameterfrom 8 to 6 inches
lithological symbol 1SS) -Lithological boundary betweentwo layers
Fig. B2 Well Record Cyclogram (1/2 of original size).
As shown in Fig. B2 the cyclogram consists of a number of concen-tric circular rings. It is decided that each ring embraces 100 mof penetrated strata. If a greater detail is required the lengthper ring may be reduced to suit such a requirement (e.g. for thegeotechnical borings). In places where groundwater is a majorsource of water, the terrain is relatively flat and wells/bore-holes usually do not exceed the depth of 400 m. Hence, a total of4 rings (representing 400 m length) would be sufficient for illu-stration of the penetrated strata. For wells (boreholes) pene-trating more than 400 m below ground additional rings should beadded to accomodate for the presentation of all strata from suchwells (boreholes).
- 54 -
In the cyclogram shown in Fig. B2 the reference level (sea level)is selected at 9 o'clock in the interior ring. Hence, by movingcounterclockwise in the interior ring the elevation increasesfrom zero to 100 m above sea level. Opposite, by moving clock-wise, the elevation decreases (depth increases) to sea level at 9o'clock again. The elevations below sea level are indicated inthe three outer rings which show the elevations from sea leveldown to 300 m below sea level. It should be mentioned here thatany other elevation could be selected in any of the rings as areference level. However, it is required that the selected refer-ence level is the same for all boreholes presented in the samecyclogram map.
To complete a well record cyclogram other data (symbols and num-bers) are added into or around cyclogram. As seen in Fig. B2 thecomposition of penetrated strata is described by symbols (let-ters) which are placed in the respective sections of the circularrings. Furthermore, the paramètres such as well discharge, draw-down, groundwater level, dimensions and intervals of screen andcasing, year of drilling, adopted well numbering system and otherrelevant data are indicated by symbols or digits.
Hydrogeological Interpretation of Cyclogram Map
As shown in Fig. B2 the lithological composition of penetratedstrata shown in the circular rings is indicated by different sym-bols (letters). The lithostratigraphic as well as the hydrogeolo-gical interpretation of strata can be illustrated by colouring(or shading) the different sections of the rings.
However, it should be pointed out that the above two mentionedinterpretations are fundamentally different. Namely, while thelithostratigraphic interpretation is concerned mainly with thedetermination of age of layers or rocks the essence of the hydro-geological interpretation is the determination of permeability ofthe rock or layer which may or may not be related to its age.Consequently, the penetrated strata are classified into permeableand less permeable layers from which the ability of differentlayers to store water and form an aquifer is evaluated.
In the cyclogram map permeable, semi-permeable and impermeablestrata are usually coloured by blue, violet, and brown colours,respectively. If permeable strata are composed of different typesof rocks and/or if there is a difference in the degree of conso-lidation different colours (shades) can be used to distinguishbetween such strata (e.g. blue for sand and gravel and green for1imestone).
Correlation of Strata by using Cyclogram Map
To correlate layers means to determine the strata having similarcharacteristics e.g. lithology, permeability, etc. and to extra-polate vertical and horizontal extent of such strata in the spacein between two or more boreholes.
- 55 -
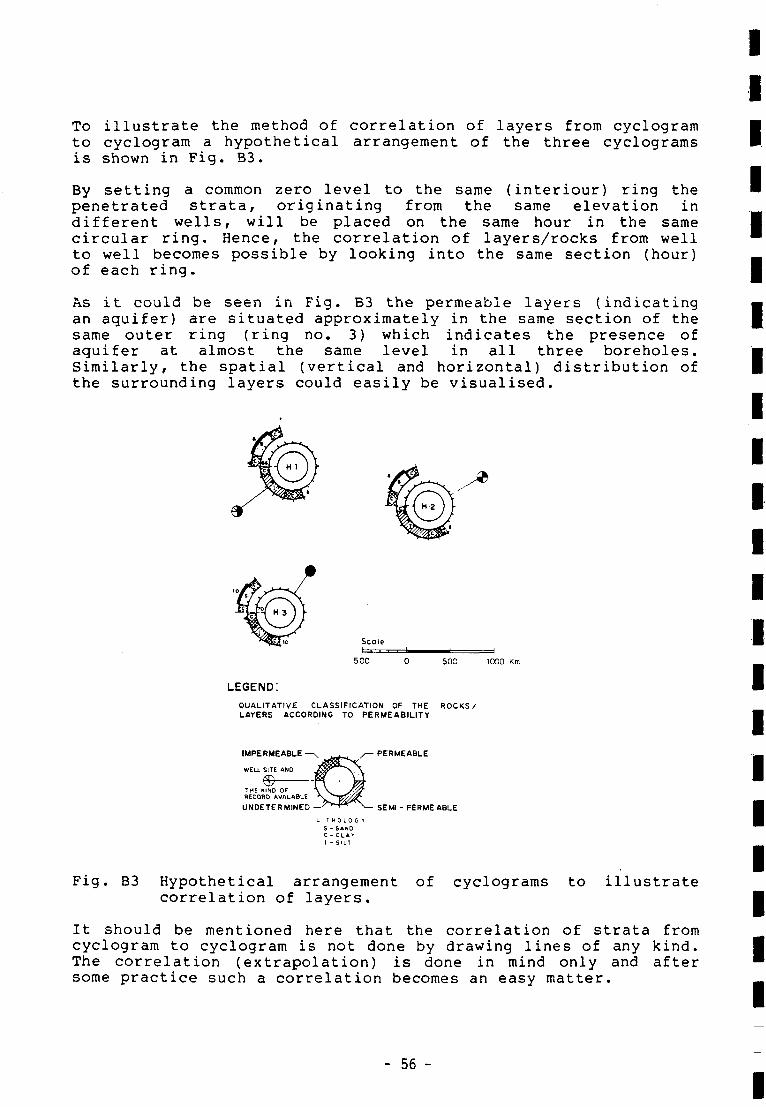
To illustrate the method of correlation of layers from cyclogramto cyclogram a hypothetical arrangement of the three cyclogramsis shown in Fig. B3.
By setting a common zero level to the same (interiour) ring thepenetrated strata, originating from the same elevation indifferent wells, will be placed on the same hour in the samecircular ring. Hence, the correlation of layers/rocks from wellto well becomes possible by looking into the same section (hour)of each ring.
As it could be seen in Fig. B3 the permeable layers (indicatingan aquifer) are situated approximately in the same section of thesame outer ring (ring no. 3) which indicates the presence ofaquifer at almost the same level in all three boreholes.Similarly, the spatial (vertical and horizontal) distribution ofthe surrounding layers could easily be visualised.
Scale
LEGEND:
500 0
QUALITATIVE CLASSIFICATION OF THELAYERS ACCORDING TO PERMEABILITY
IMPERMEABLE - ^
WELL SITE AND
THE KIND OPRECORD AVALABLE
UNDETERMINED -
&
IL I U
S -c -1 -
I O L O G vSANDCLAYS I L T
— PERMEABLE
500 10
ROCKS/
— SEMI-PERMEABLE
Fig. B3 Hypothetical arrangementcorrelation of layers.
of cyclograms to illustrate
It should be mentioned here that the correlation of strata fromcyclogram to cyclogram is not done by drawing lines of any kind.The correlation (extrapolation) is done in mind only and aftersome practice such a correlation becomes an easy matter.
- 56 -
However, it should be pointed out that on the cyclogram map thehorizontal or slightly inclined layers can be directly correlat-ed, only. If the layers are inclined and the distances betweenthe boreholes are great or if there are substantial changes inthe vertical position of the same layer, due to tectonic move-ments, the meaningful correlation of the horizontal extent ofsuch layers could become difficult if not entirely impossible.
Ultimately, when the correlation of layers is not possible, dueto the above mentioned reasons, the cyclogram map should be usedas a Base Map, showing penetrated strata in three dimensions andother numerical and technical data of individual wells only,i.e. the cyclogram map becomes a graphical Well Records DataBank and should be treated as such.
While mapping a borehole data by cyclogram method, it is also im-portant to remember that the elevation of ground level at theborehole site should be determined as correct as possible. Other-wise, the layers shown in the cyclograms will be vertically dis-placed and the correlation of layers in between different cyclo-grams will to a certain degree become inaccurate.
SYSTEMISATION OF WELL/BOREHOLE RECORDS FOR CONSTRUCTION OFCYCLOGRAMS
To obtain a spatial picture of penetrated strata the records ofwells/boreholes from the Groundwater Data Bank must be shown insome sort of diagrammes. As previously mentioned the cyclogrammethod is used for the three dimensional presentation of well/borehole records.
In order to prepare a well record cyclogram the well(s)/bore-hole(s) records, obtained from the different sources must be sys-temised. This is done by using Well Log Record Sheet (Fig. B4a)into which the relevant data from each well/borehole are trans-ferred .
The manual describing in details the procedures for completion ofthe Well Log Record Sheet is prepared and can be made availableseparately from this paper.
Well records which are being transferred into the Well Log RecordSheet are treated in the following way.
All numerical values of well/borehole, with exception of thedimensions for screens and pipes which are traditionallygiven in inches, are converted into the metric system (a con-version graph is available with the above mentioned manual).
The composition of penetrated strata is reviewed, describedbriefly and the abbreviated symbols indicating the lithologi-cal composition of different strata or rocks are assigned toeach depth interval in the Well Log Record Sheet.
- 57 -
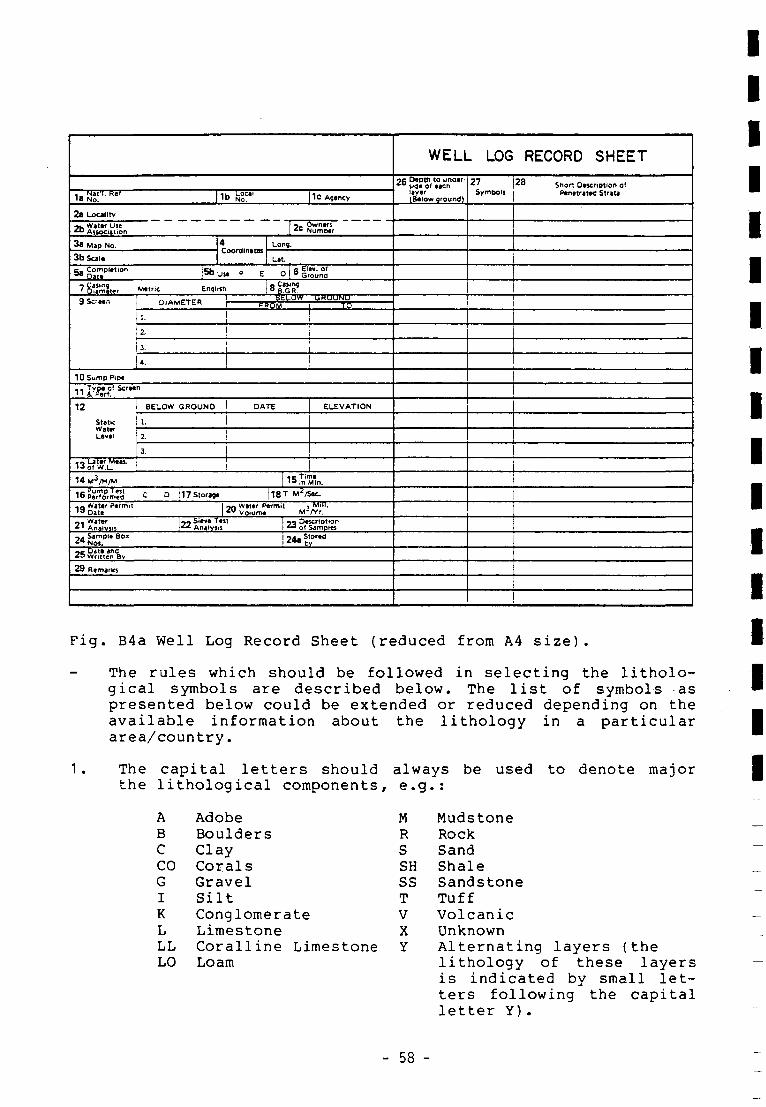
1aí!S!'H<" MbfeS"' |1CA,.ncy
2a Locjiitv•n, water U K"> Association3a M » No.
3b Seal*
4Coordinates
5 Owners* c Number
Long.
L a t
5a=°r.B" t lon Í5b U M o E oc Eltv. ot
Ground
7SÎÎÎ5λ, Metric En,l,,h 18 Í"gS!9 Screen DIAMETER BELUW (iKUUNU
P»OMi- !
2-
3.
4.
TO
i
10 Sump Pio«- - T V M o* Screen11 4'Perf.
12
StaticWaterLavtl
BELOW GROUND
1.
2.
3.
• A Later Meas.130tw.u !
DATE
14 M3/H/M
ELEVATION
«c Time1 3 in Min.
16pï?oB.m?J C D ii7Storjoe | i8T M2/Sec. Q Water P«rmit1 9 Dat»- . Water* ' AnaWíis
~« Water Permit , Mill.M Volume MJ/Yr.- « Sieve Test*~* Analysis
Ojt Sampit Box2 4 No».
TC DescriDtion* * o( Samples2 4 - Stored" • by
o e Date anaZ» Written By
29 Remarks
WELL LOG RECORD SHEETnet Oeotn to unatr-* w side o* «acn
Idyor(B*low ground)
27 |28 S h o n Dkwcnotlon ofPenetrated Strata
¡
Fig. B4a Well Log Record Sheet (reduced from A4 size).
The rules which should be followed in selecting the litholo-gical symbols are described below. The list of symbols aspresented below could be extended or reduced depending on theavailable information about the lithology in a particulararea/country.
1. The capital letters shouldthe lithological components,
ABCCOGIKLLLLO
AdobeBouldersClayCoralsGravelSiltConglomerateLimestoneC o r a l l i n e LimestoneLoam
always be used to denote majore . g
MRSSHSSTVXY
•• •
MudstoneRockSandShaleSandstoneTuffVolcanicUnknownAlternating layers (theli thology of these layersis indicated by small l e t -te r s following the capi tall e t t e r Y).
- 58 -
2. The small letters should always be used to denote secondaryor minor lithological components, e.g.:
abcCO
gik
adobebouldersclaycoralsgravelsiltconglomerate
111lomsshsstV
limestonecoralline limestoneloammudstonesandshalesandstonetuffvolcanic
3. It should be noted that in the boxes reserved for Short Des-cription of Penetrated Strata and Symbols the following ruleshould be applied when describing borehole samples.
a) When two lithological components occur in more or lessthe same proportions and are considered as major compo-nents the word "and" should always be written in betweentwo descriptions. The abbreviated symbols for each com-ponent are then written both by capital letters.
Example: Gravel "and" SandSymbols: GS
b) when one lithological component is a major component andthe amount of the second component is smaller the word"with" should always be written in between the two des-criptions. The abbreviated symbol for the second litho-logical component is then written by a small letter.
Example: Gravel "with" sandSymbols: Gs
c) The use of adjective indicates a secondary lithologicalcomponent. The abreviated symbol for secondary componentis then written by a small letter.
Example: Clayey sandSymbols: Sc
d) Physical and other properties of borehole's samplesshould always be written after the lithological descrip-tion. The symbols for these properties should be writtenby using the small letters which are not used in thelist for the lithological description.
Examples Symbols
fine fmedium dcoarse rhard hsoft ocalcareous uetc.
- 59 -
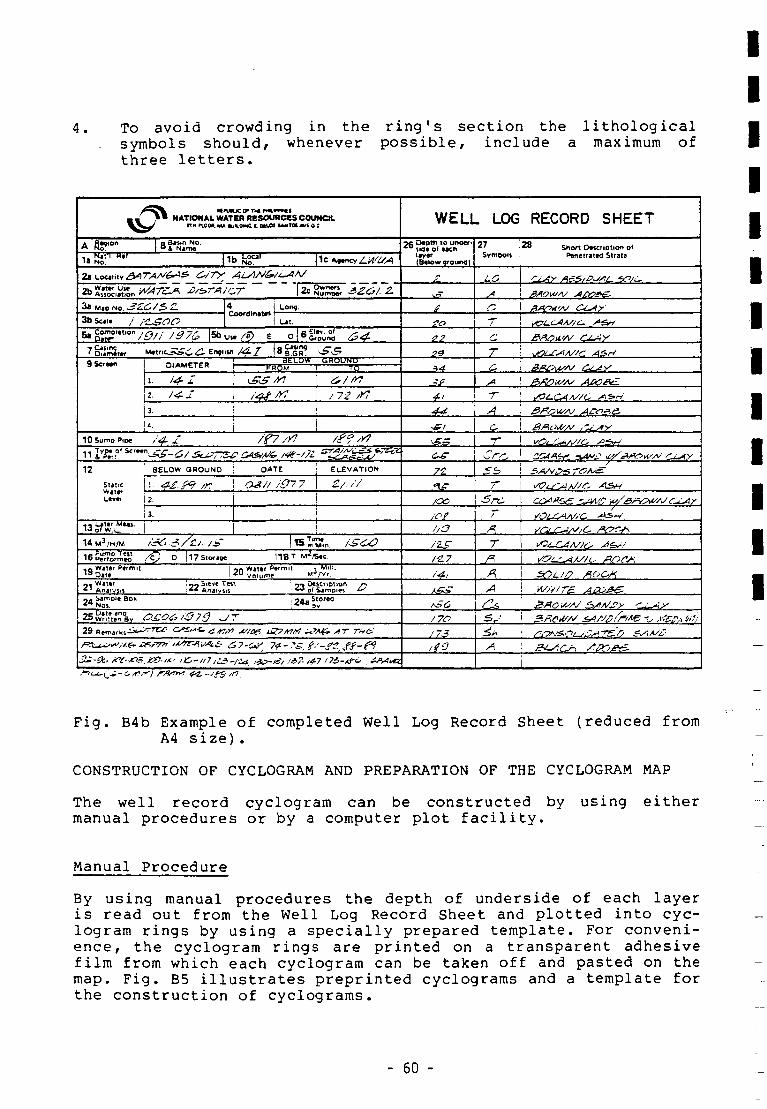
4. To avoid crowding in the ring's section the lithologicalsymbols should, whenever possible, include a maximum ofthree letters.
NATIONAL WATER RESOURCES COUNCH.•TM ru>OA.M* hj«.OMC. t nuoi MAHJXM MA O C
W E L L LOG RECORD S H E E T
A a*»""1« Nit I.1» No. \U Agency/.¿^¿r»
oc Deptft to unoer-* w tide ot e*c*i
layer(Below ground)
27Symools
128 Short Deicnotion OTPenetrated Strata
C-/7Y LO/. Z.
3a Mao NO. JZ3b Scan / /•ÍSQO
4Coordinate
Long.
|5b O I ° around
7"9 Screen DIAMETER BELOW GHOUNU
r•44
sir/
ACO&&
10 Sumo Pioe
12 : 8EL0W GROUND OATE ELEVATION .53Static !wate- ! —Levei 12.
//T ¿V-
iî. ÍOÍ«^ Later Meas, i1 3 Q I W L I
/«'•î/£/ /ÍÇ Tli7S>o.a9«
water Permit* Dat<
I j o Water Permit 3 M'".SOL! O
? 1 water^ ' Anaivsn
Oescnotionp) Samo.es
!24aï'zp.an:.
29 R. WMÇ, AT 173
/JO7- ,4-7
Fig. B4b Example of completed Well Log Record Sheet (reduced fromA4 size).
CONSTRUCTION OF CYCLOGRAM AND PREPARATION OF THE CYCLOGRAM MAP
The well record cyclogram can be constructed by using eithermanual procedures or by a computer plot facility.
Manual Procedure
By using manual procedures the depth of underside of each layeris read out from the Well Log Record Sheet and plotted into cyc-logram rings by using a specially prepared template. For conveni-ence, the cyclogram rings are printed on a transparent adhesivefilm from which each cyclogram can be taken off and pasted on themap. Fig. B5 illustrates preprinted cyclograms and a template forthe construction of cyclograms.
- 60 -
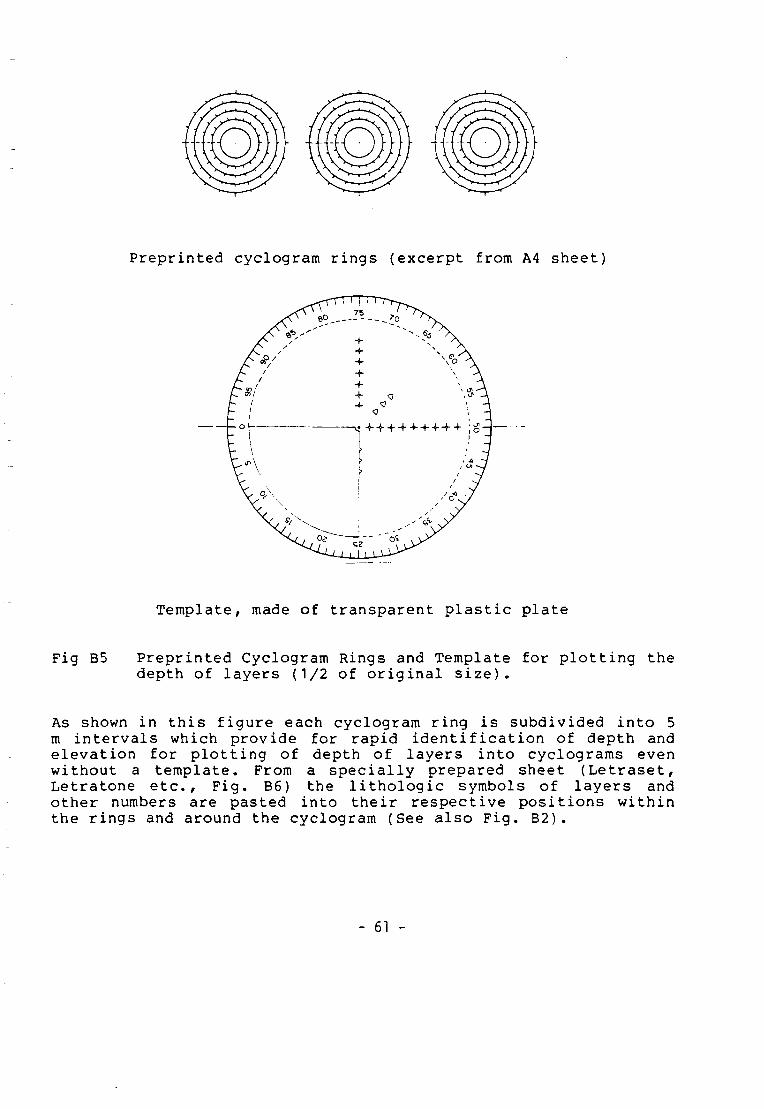
Preprinted cyclogram rings (excerpt from A4 sheet)
Template, made of transparent plastic plate
Fig B5 Preprinted Cyclogram Rings and Template for plotting thedepth of layers (1/2 of original size).
As shown in this figure each cyclogram ring is subdivided into 5m intervals which provide for rapid identification of depth andelevation for plotting of depth of layers into cyclograms evenwithout a template. From a specially prepared sheet (Letraset,Letratone etc., Fig. B6) the lithologie symbols of layers andother numbers are pasted into their respective positions withinthe rings and around the cyclogram (See also Fig. B2).
- 61 -
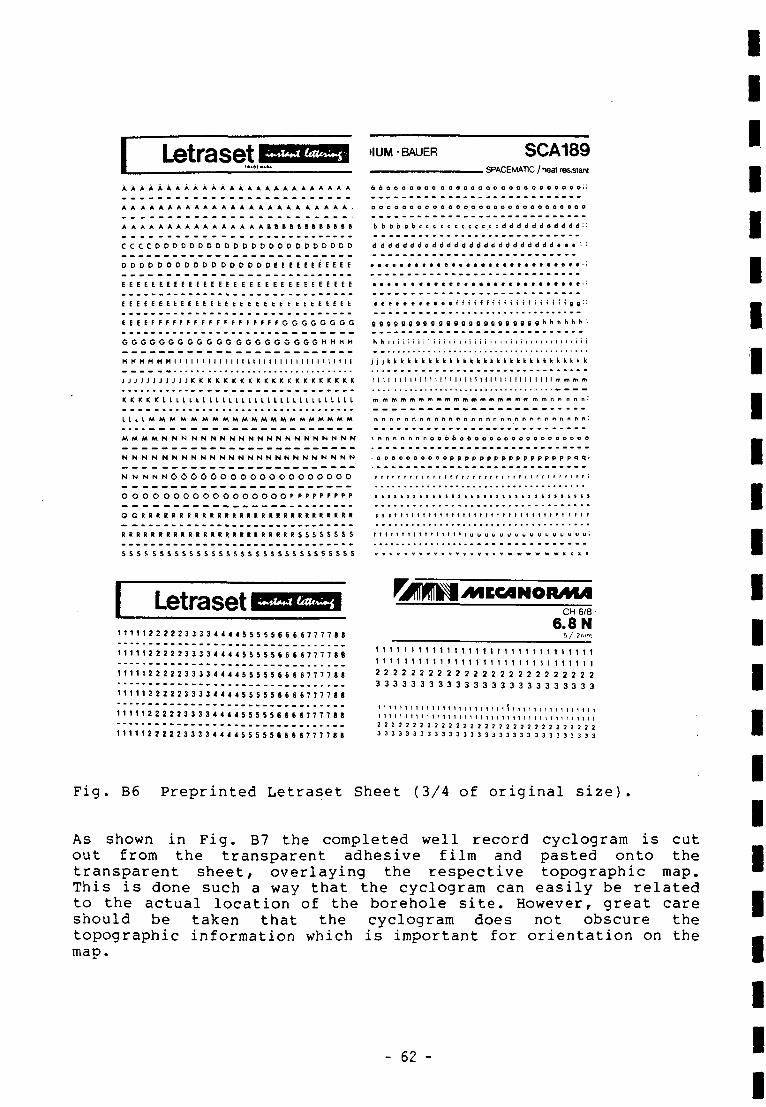
I LetrasetI ÏÏÏ
HUM - BAUER SCA189. SPACEMATIC / heat resstant
A A A A A A A A A A A A A A A A A A A A A A A A A ,
b b b b b b d d d d d d d d :
C C C C D D D D D D D D D D D D D D D D D D D D D D D d d d d d d d d d d d d d d d d d d d d d d d d d t » . - :
D D D D D D D D D D D D D D D D D E E E E E E E E E E E . . . . t . . . . . . . . . . . . . . . . . . . . . . . .
E E E E E E £ E E E E E E E E E E E E E E E E E E E E E E E E . . . t . . . . . c e ? . . . . . . e . . . . . . . . r
[ E E E E Í Í I Í l t t í t l í l i t í í I l t l I í t í l t iiiiiiiilnHiHltili¡ilri¡lííII::
E E E E F F F F F F F F F F F F F F F P F F G G G G G G G G
G G G G G G G G G G G G G G G G G G G G G H M M H
H H H H H H I M I I I M I I I I I I I I I M I I I I I I M t l M l i jjj k k k k k k k k k k k k k k k V k k k k k k k k k k k k k k
J J J J J J J J J J J K K K I C K I C K K K I C K K K K K K K K K K K t I 1 I I M M M I 1 I 1 M M I I 1 I M I ! I I I I I I I I I i
K K K P C K l l L l l l l l L l L l l l l l l l l l L l l l l t l l l l m m m m m m m m m m m m m m m m m i u m m c i
L L L L M M M M M M M M M M M M M M M M M M M M M
M M M M N N N N N N N N N N N N N N N N N N N N K T
N N N N N N N N N N N N N N N N N N N N N N N N N
N N N N N 0 0 Ô 0 Û O O O O O O O O O O 0 O O O
O O O O O O O O O O O O O O O O O P P P P P P P P P
O a R R K R R R R R R R K R R R I t R R R R R R R R R I t i t R R R ( i i t t t t t t t t t t i t t M l t t t t t t t t t t t t t t t t t t
R R R R R K R R R S R R R R R R R R R R R R R R S S & S S S S S
S S S i S S S S S S S S S S S S S S S S S S S S 5 S S S S S S S
t t t t t t t t t t i l t t l t l u
I Letraset1 1 1 1 1 2 2 2 2 2 3 3 3 3 4 4 4 4 5 5 5 5 5 6 6 6 6 7 7 7 7 » »
1 1 1 1 1 2 2 2 2 2 3 3 3 3 4 4 4 4 5 5 5 5 5 6 6 6 6 7 7 7 7 8 Î
1 1 1 1 1 2 2 2 2 2 3 3 3 3 4 4 4 4 5 5 5 5 5 6 6 6 6 7 7 7 7 8 8
1 1 1 1 1 2 2 2 2 2 3 3 3 3 4 4 4 4 5 5 5 5 5 6 6 6 6 7 7 7 7 8 »
1 1 1 1 1 2 2 2 2 2 3 3 3 3 4 4 4 4 5 5 5 5 5 6 6 6 6 7 7 7 7 8 8
1 1 1 1 1 2 2 2 2 2 3 3 3 3 4 4 4 4 5 5 5 5 5 6 6 6 6 7 7 7 7 » »
CH 6/8
6.8 N5 / 2r.»r.
'111111111111111111111111111111''''''''111111111111111111111112 2 2 2 2 2 2 2 2 2 2 2 2 2 2 2 2 2 2 2 2 2 2 2 23 3 3 3 3 3 3 3 3 3 3 3 3 3 3 3 3 3 3 3 3 3 3 3 3
1 ' ' ' ' ' ' ' ' ' ' ' 1 1 1 I 1 1 1 I 1 1 1 1 Í ) 1 1 1 1 , t ! ! , , , , , , ,1 ' Î 1 1 1 ' 1 1 1 1 1 1 1 1 1 1 1 1 1 t 1 1 1 1 1 1 1 1 1 1 1 1 1 1 1 1 1 1 1 1! ! Í J l ! í ¡ ! ! ! l ! ¡ ! ! í l l ! ! l ! l ! l l ! í í ¡3 3 3 3 3 3 3 3 3 3 3 3 3 3 3 3 3 3 3 3 3 3 3 3 3 3 3 3 3 3 3
Fig. B6 Preprinted Letraset Sheet (3/4 of original size).
As shown in Fig. B7 the completed well record cyclogram is cutout from the transparent adhesive film and pasted onto thetransparent sheet, overlaying the respective topographic map.This is done such a way that the cyclogram can easily be relatedto the actual location of the borehole site. However, great careshould be taken that the cyclogram does not obscure thetopographic information which is important for orientation on themap.
- 62 -
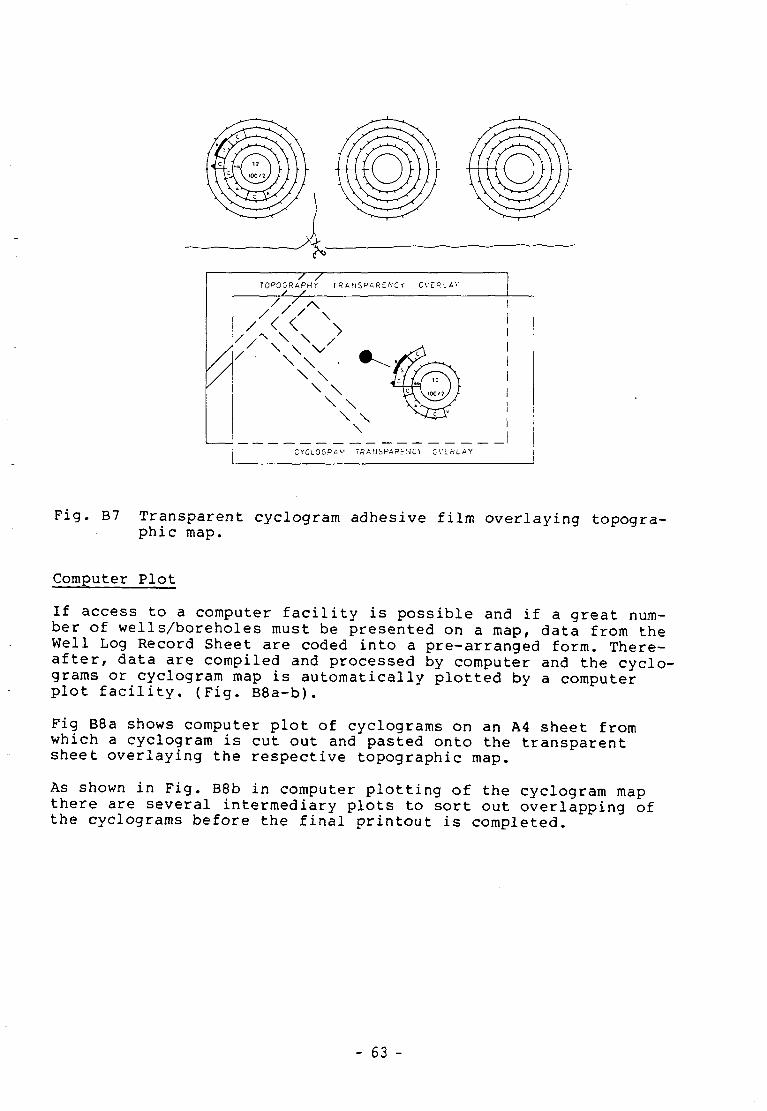
TOMOGRAPHY TRANSPARENCY CVE-RLA'
Fig. B7 Transparent cyclogram adhesive film overlaying topogra-phic map.
Computer Plot
If access to a computer facility is possible and if a great num-ber of wells/boreholes must be presented on a map, data from theWell Log Record Sheet are coded into a pre-arranged form. There-after, data are compiled and processed by computer and the cyclo-grams or cyclogram map is automatically plotted by a computerplot facility. (Fig. B8a-b).
Fig B8a shows computer plot of cyclograms on an A4 sheet fromwhich a cyclogram is cut out and pasted onto the transparentsheet overlaying the respective topographic map.
As shown in Fig. B8b in computer plotting of the cyclogram mapthere are several intermediary plots to sort out overlapping ofthe cyclograms before the final printout is completed.
- 63 -
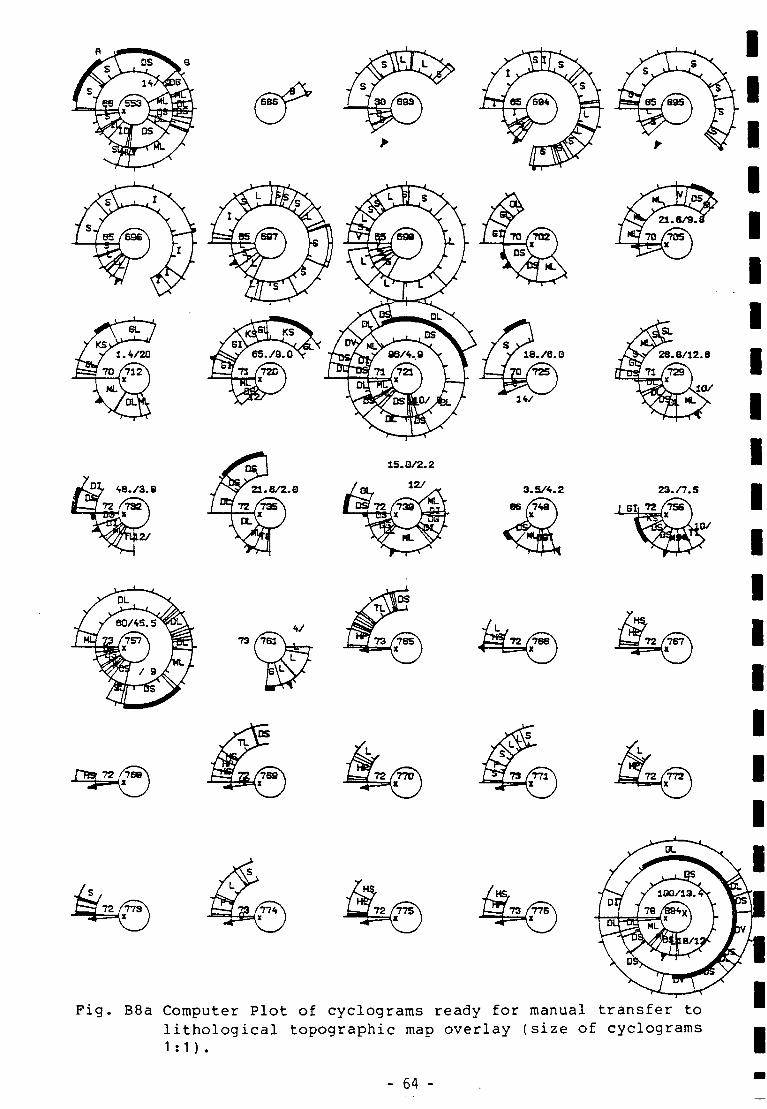
73
HS,
Fig. B8a Computer Plot of cyclograms ready for manual transfer tolithological topographic map overlay (size of cyclograms1:1).
- 64 -
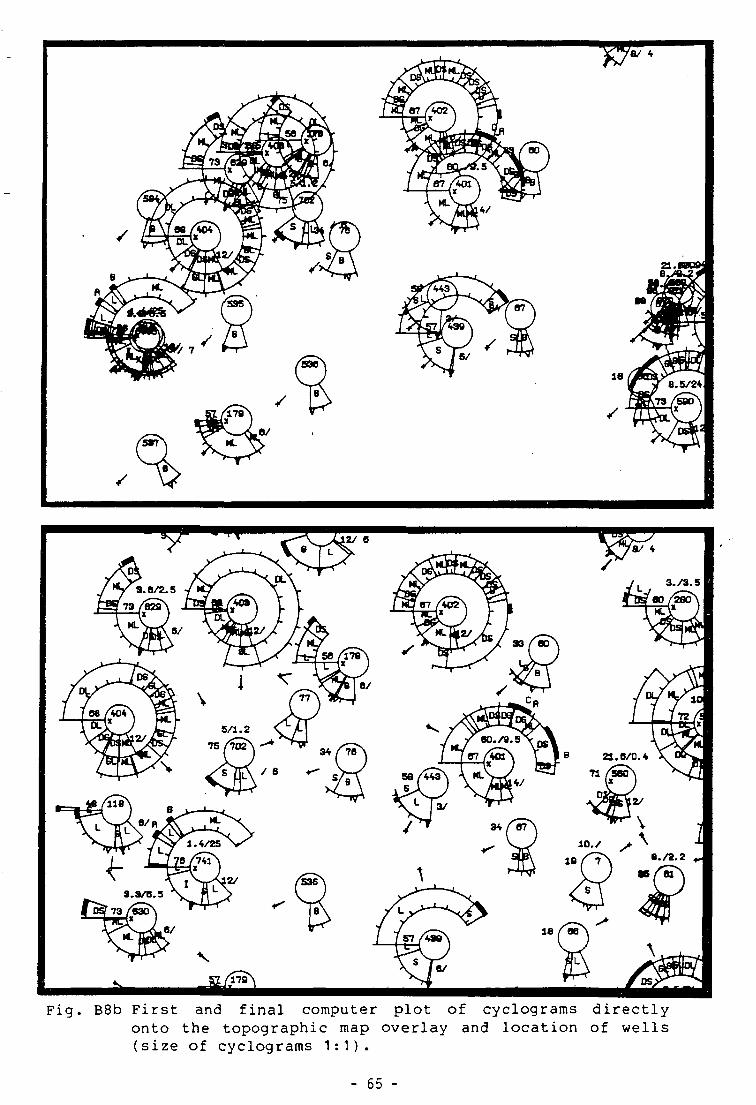
Fig. B8b First and final computer plot of cyclograms directlyonto the topographic map overlay and location of wells(size of cyclograms 1:1).
- 65 -
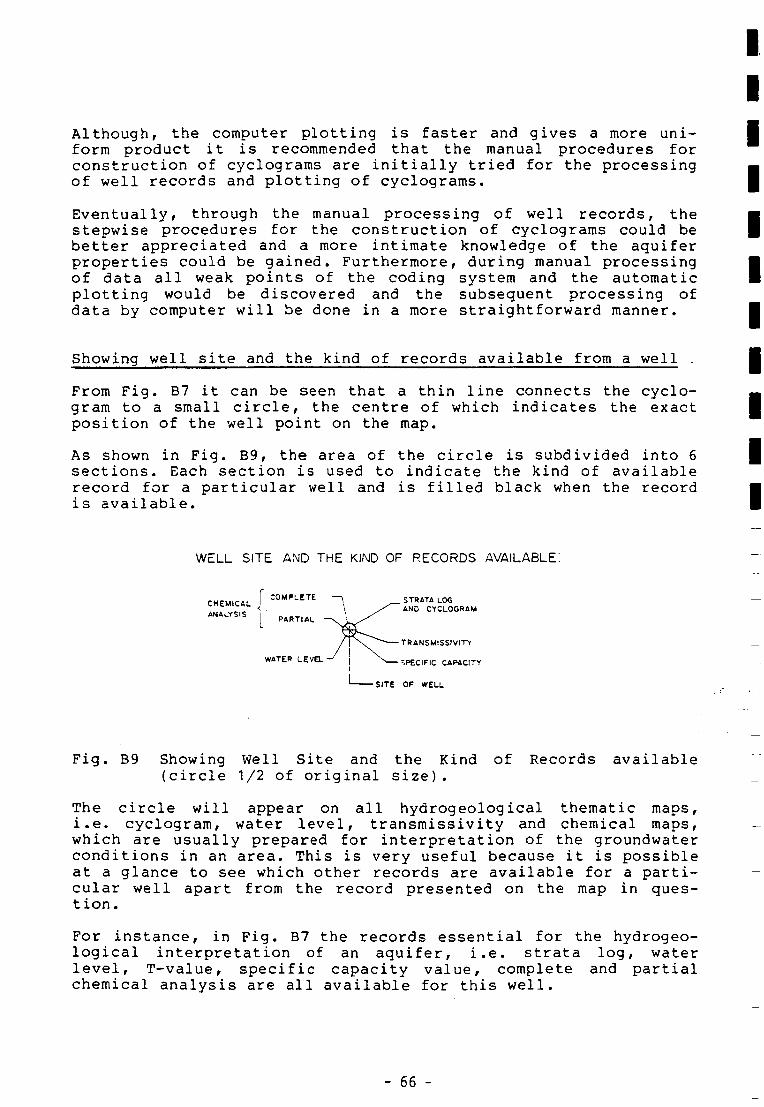
Although, the computer plotting is faster and gives a more uni-form product it is recommended that the manual procedures forconstruction of cyclograms are initially tried for the processingof well records and plotting of cyclograms.
Eventually, through the manual processing of well records, thestepwise procedures for the construction of cyclograms could bebetter appreciated and a more intimate knowledge of the aquiferproperties could be gained. Furthermore, during manual processingof data all weak points of the coding system and the automaticplotting would be discovered and the subsequent processing ofdata by computer will be done in a more straightforward manner.
Showing well site and the kind of records available from a well .
From Fig. B7 it can be seen that a thin line connects the cyclo-gram to a small circle, the centre of which indicates the exactposition of the well point on the map.
As shown in Fig. B9, the area of the circle is subdivided into 6sections. Each section is used to indicate the kind of availablerecord for a particular well and is filled black when the recordis available.
WELL SITE AND THE KIND OF RECORDS AVAILABLE:
Í C 0 M P L E T E - \ ^ _ STRATA LOCCHEMICAL
PARTIAL ~~vLf/'^
-TRANSMISSIVITY
WATER LEVEL -J | N SPECIFIC CAPACITY
-SITE OP WELL
Fig. B9 Showing Well Site and the Kind of Records available(circle 1/2 of original size) .
The circle will appear on all hydrogeological thematic maps,i.e. cyclogram, water level, transmissivity and chemical maps,which are usually prepared for interpretation of the groundwaterconditions in an area. This is very useful because it is possibleat a glance to see which other records are available for a parti-cular well apart from the record presented on the map in ques-tion.
For instance, in Fig. B7 the records essential for the hydrogeo-logical interpretation of an aquifer, i.e. strata log, waterlevel, T-value, specific capacity value, complete and partialchemical analysis are all available for this well.
- 66 -
It should be kept in mind that while correlating strata, theposition of cyclogram should not be confused with the actualposition of the well site which is given by the circle. After alittle practice one easily learns how to keep (in mind) locationsof wells separated from the locations of cyclograms.
PROCEDURES OF EDITING OF THE CYCLOGRAM MAP
When all cyclograms are plotted on the map the legend (comparedby combining Fig. B2, B3, B9 and adding lithological symbols,location map of the study area and the title block) is added tothe map and a blueprint of the transparent sheet is made for fur-ther interpretation (see also Fig. C1, phase III).
Depending on the available printing facilities, desired number ofcopies as well as the available funds, the final editing of thecyclogram map could proceed in two different ways, i.e. manualediting or editing by printing.
Manual Editing
In manual editing the main topographic features, usually thecoast line, hydrography, roads and the names of important placesare traced or copied to the same transparent sheet on which thecyclograms are pasted. (Fig. B10).
The blueprint(s) is (are) then made from the transparent sheetand the cyclograms are coloured by hand. This process providesthe cheapest way of preparation of the cyclogram map. However,for the final report the drawback of manual editing is that manyof the topographical features are not shown on the map and thenumber of interpreted cyclogram maps is limited as each copy mustbe coloured by hand to obtain the final product. Furthermore,when a great number of boreholes is presented on the cyclogrammap colouring by hand consumes a lot of time and the unit costper map increases proportionally to the number of copies.
Manually edited cyclogram map should always be used as guidanceduring an investigation and for the preliminary report because itcan easily be updated at a modest cost.
It should be mentioned here that in manually edited map, cyclo-grams are always reproduced in size 1:1 (as shown in Fig. B10)because colouring by hand would become difficult if the cyclo-grams are reduced. Therefore, normally edited cyclogram map some-times assumes the size which is not handy. When editing the cyc-logram map by printing there is a possibility to reduce the cyc-lograms to 1/2 of the original size (which is still quite leg-ible) because the colours are printed into the respective ringsections (see Fig. B11c and B11d).
- 67 -
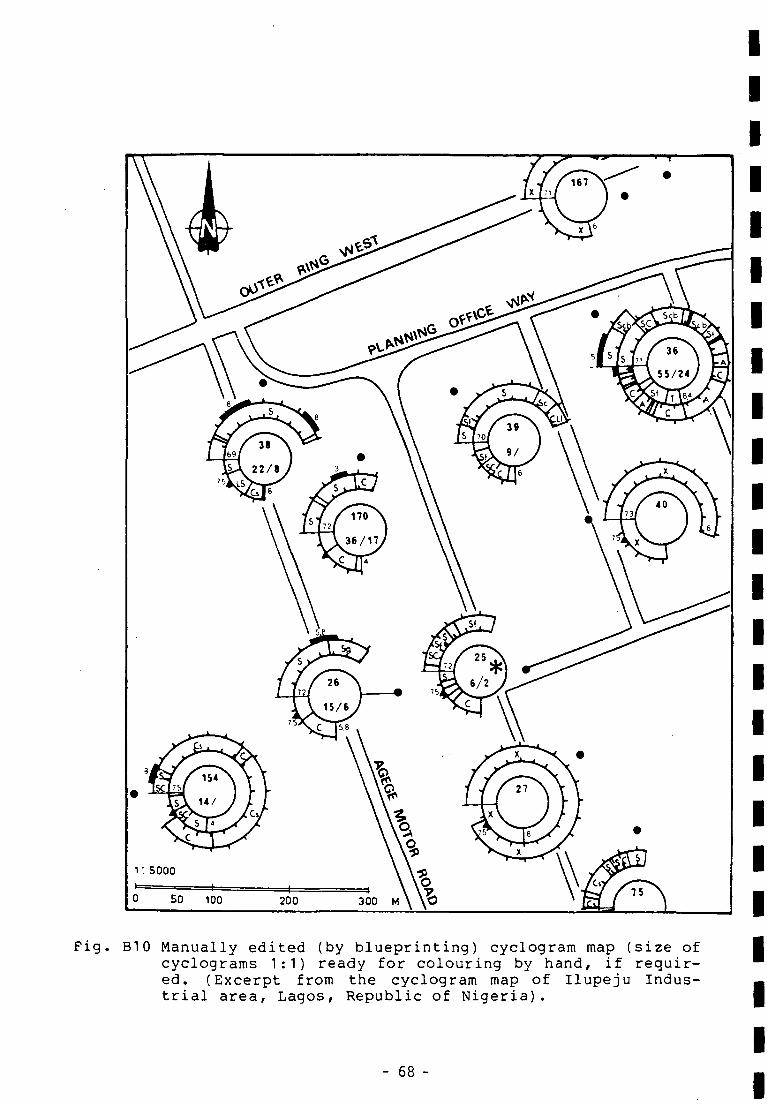
i : 5000
50 100 200 300 M
Fig. B10 Manually edited (by blueprinting) cyclogram map (size ofcyclograms 1:1) ready for colouring by hand, if requir-ed. (Excerpt from the cyclogram map of Ilupeju Indus-trial area, Lagos, Republic of Nigeria).
- 68 -
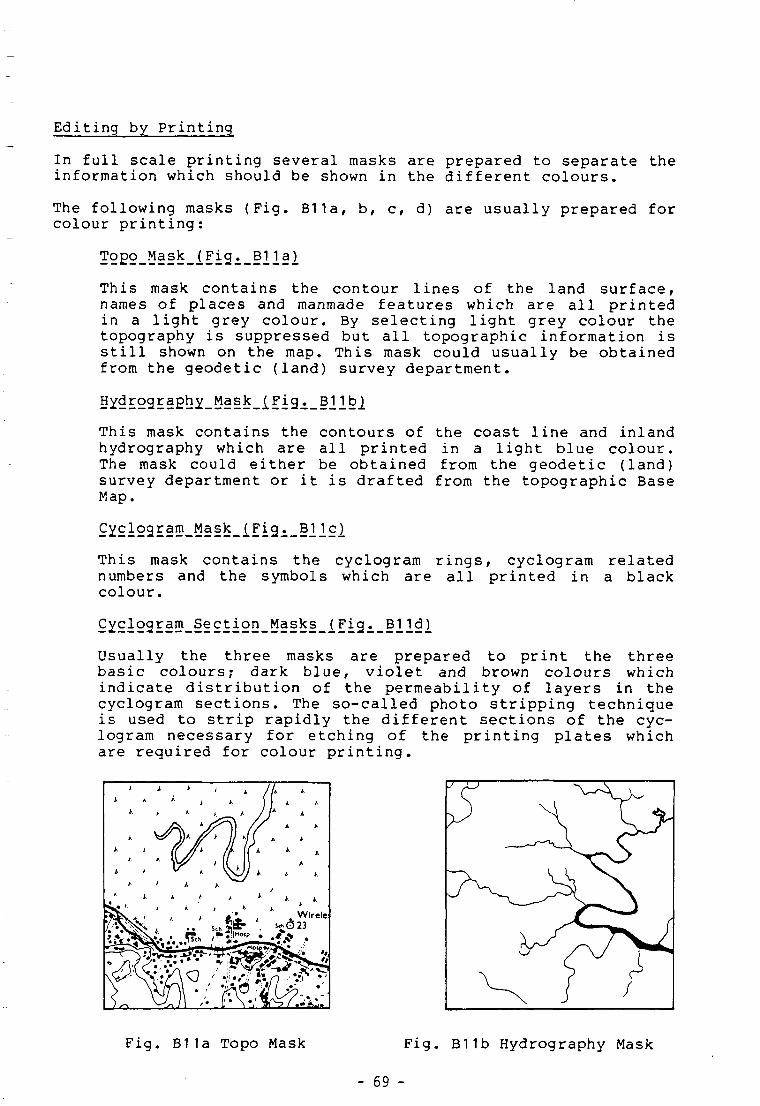
Editing by Printing
In full scale printing several masks are prepared to separate theinformation which should be shown in the different colours.
The following masks (Fig. B11a, b, c, d) are usually prepared forcolour printing:
This mask contains the contour lines of the land surface,names of places and manmade features which are all printedin a light grey colour. By selecting light grey colour thetopography is suppressed but all topographic information isstill shown on the map. This mask could usually be obtainedfrom the geodetic (land) survey department.
This mask contains the contours of the coast line and inlandhydrography which are all printed in a light blue colour.The mask could either be obtained from the geodetic (land)survey department or it is drafted from the topographic BaseMap.
This mask contains the cyclogram rings, cyclogram relatednumbers and the symbols which are all printed in a blackcolour.
Usually the three masks are prepared to print the threebasic colours; dark blue, violet and brown colours whichindicate distribution of the permeability of layers in thecyclogram sections. The so-called photo stripping techniqueis used to strip rapidly the different sections of the cyc-logram necessary for etching of the printing plates whichare required for colour printing.
Fig. B11a Topo Mask Fig. B11b Hydrography Mask
- 69 -
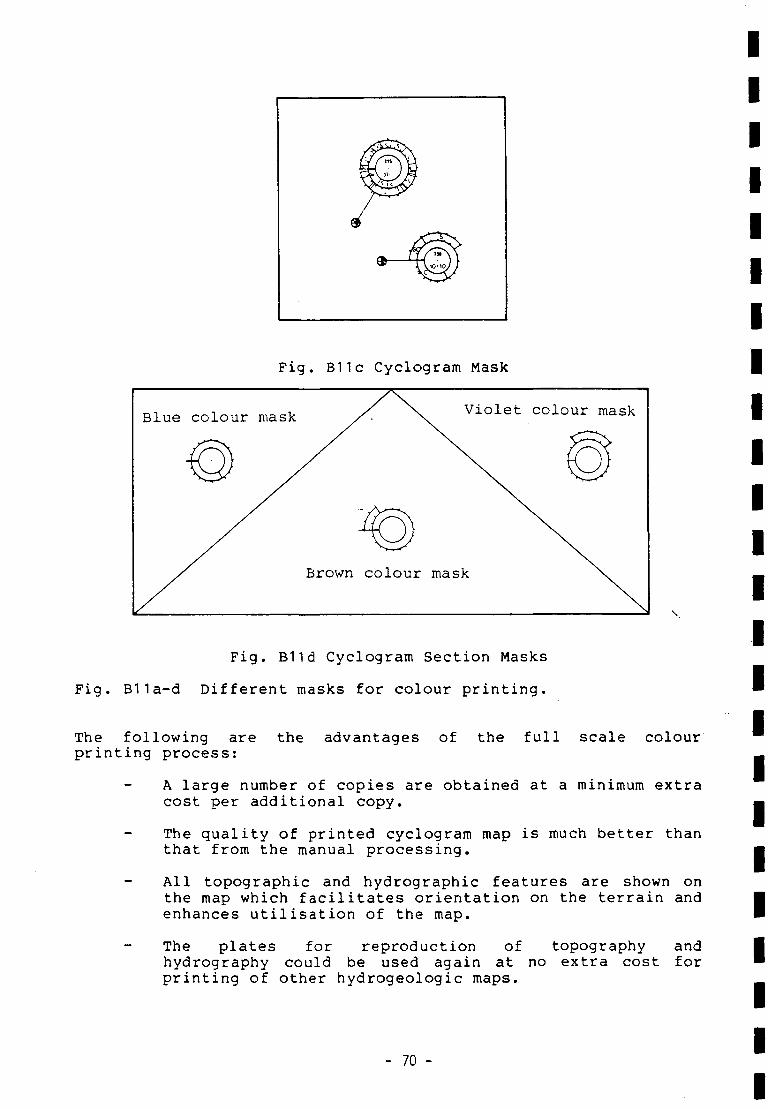
Fig. B11c Cyclogram Mask
Blue colour mask Violet colour mask
Brown colour mask
Fig. B11 d Cyclogram Section Masks
Fig. Bi1a-d Different masks for colour printing.
The following are the advantages of the full scale colourprinting process:
A large number of copies are obtained at a minimum extracost per additional copy.
The quality of printed cyclogram map is much better thanthat from the manual processing.
All topographic and hydrographie features are shown onthe map which facilitates orientation on the terrain andenhances utilisation of the map.
The plates for reproduction of topography andhydrography could be used again at no extra cost forprinting of other hydrogeologic maps.
- 70 -
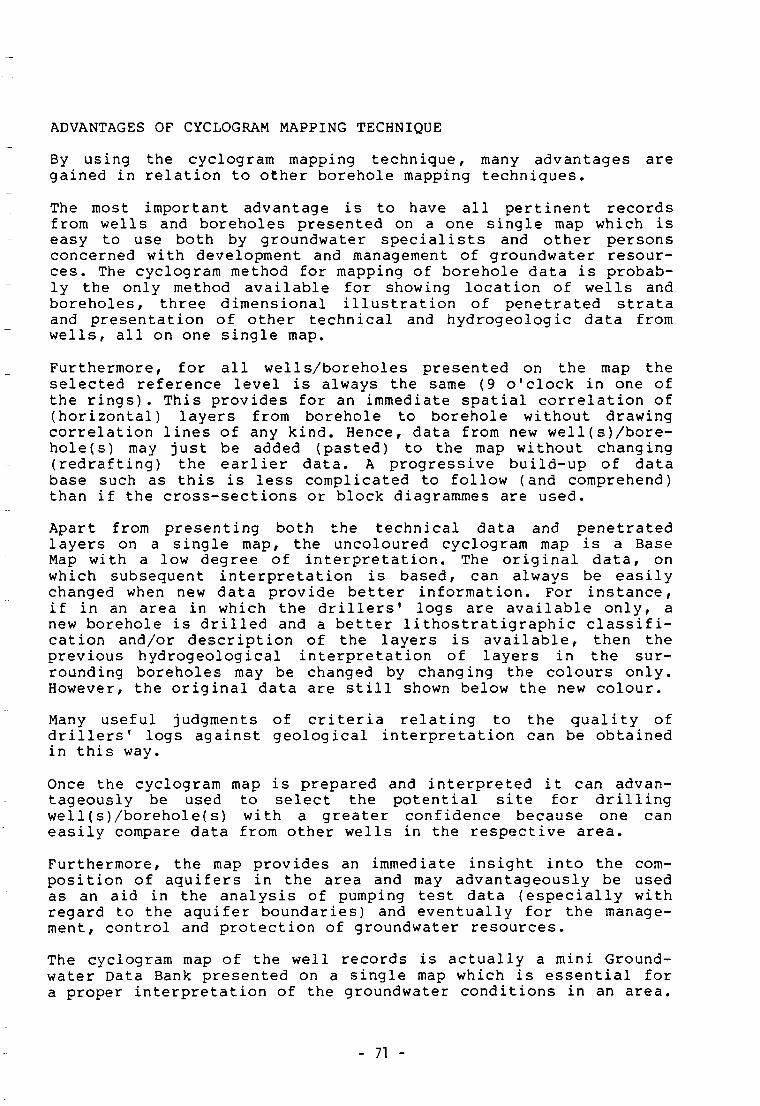
ADVANTAGES OF CYCLOGRAM MAPPING TECHNIQUE
By using the cyclogram mapping technique, many advantages aregained in relation to other borehole mapping techniques.
The roost important advantage is to have all pertinent recordsfrom wells and boreholes presented on a one single map which iseasy to use both by groundwater specialists and other personsconcerned with development and management of groundwater resour-ces. The cyclogram method for mapping of borehole data is probab-ly the only method available for showing location of wells andboreholes, three dimensional illustration of penetrated strataand presentation of other technical and hydrogeologic data fromwells, all on one single map.
Furthermore, for all wells/boreholes presented on the map theselected reference level is always the same (9 o'clock in one ofthe rings). This provides for an immediate spatial correlation of(horizontal) layers from borehole to borehole without drawingcorrelation lines of any kind. Hence, data from new well(s)/bore-hole(s) may just be added (pasted) to the map without changing(redrafting) the earlier data. A progressive build-up of database such as this is less complicated to follow (and comprehend)than if the cross-sections or block diagrammes are used.
Apart from presenting both the technical data and penetratedlayers on a single map, the uncoloured cyclogram map is a BaseMap with a low degree of interpretation. The original data, onwhich subsequent interpretation is based, can always be easilychanged when new data provide better information. For instance,if in an area in which the drillers' logs are available only, anew borehole is drilled and a better lithostratigraphic classifi-cation and/or description of the layers is available, then theprevious hydrogeological interpretation of layers in the sur-rounding boreholes may be changed by changing the colours only.However, the original data are still shown below the new colour.
Many useful judgments of criteria relating to the quality ofdrillers' logs against geological interpretation can be obtainedin this way.
Once the cyclogram map is prepared and interpreted it can advan-tageously be used to select the potential site for drillingwell(s)/borehole(s) with a greater confidence because one caneasily compare data from other wells in the respective area.
Furthermore, the map provides an immediate insight into the com-position of aquifers in the area and may advantageously be usedas an aid in the analysis of pumping test data (especially withregard to the aquifer boundaries) and eventually for the manage-ment, control and protection of groundwater resources.
The cyclogram map of the well records is actually a mini Ground-water Data Bank presented on a single map which is essential fora proper interpretation of the groundwater conditions in an area.
- 71 -
REFERENCES
Andersen, L.J., 1973
Haman, Z., 1976
Haman, Z., 1978
Haman, Z., 1979
Kampsax-Kriiger, 1981
Cyclogram Technique for Geological Mappingof Borehole Data.The Geological Survey of Denmark. IllSeries no. 41, Copenhagen, Denmark.
Investigation of Groundwater Resources inBatangas Water District, South Luzon,Philippines (modified cyclogram method formapping of well records).Proceedings Nordic Hydrologie Conference,Reykjavik, Island 1976.
Danish cyclogram technique for mapping ofborehole data modified for use in investi-gation of groundwater resources outside ofDenmark (unpublished).
Groundwater Data Bank. System Approach andCase History. Prepared for UNDP/NWRC. NewYork/Manila. Open file Report.
The Groundwater Data Bank and the Cyclo-gram Technique, prepared for Local WaterUtilities Administration, Republic of thePhilippines.
- 72 -
D A T A B A N K
By Z. HainanI . Krüger A/S
Consul t ing E n g i n e e r s , Denmark
(C) PART THREE
EXAMPLES OF GROUNDWATER DATA BANKS ESTABLISHEDIN THE REPUBLIC OF THE PHILIPPINES
INTRODUCTION
The presence of many shallow and deep wells in the urban and ru-ral areas indicate that groundwater is utilised extensively inthe Philippines.
Several agencies, headed by the National Water Resources Councilof the Philippines (NWRC), are involved in the exploitation ofthe groundwater resources.
For the communities with less than 20,000 inhabitants, the RuralWater Development Corporation (RWDC) is the governing agency fordevelopment of water supply systems.
For Metro Manila, the Metropolitan Water and Sewerage System(MWSS) directs planning and use of the water resources.
For the communities with 20,000 inhabitants and more, with theexception of the Metro Manila, the Local Water Utilities Admini-stration (LWUA) is the official body entrusted with the task ofplanning and development of water resources and the water supplysystems.
Each of the above mentioned agencies is undertaking data collec-tion and evaluation of the groundwater sources.
In the following sections some examples of establishement of theGroundwater Data Banks will be described and illustrated.
LWUA1S GROUNDWATER DATA BANK
For each community exceeding 20,000 inhabitants, a Water District(WD) will be formed. It is expected that approximately 700 WaterDistricts will be established in the Philippines at the turn ofthe century. Consequently, approximately 50% of the total Philip-pine population (presently estimated to about 45 mill.) will beprovided with piped water via Water Districts by the year 2000.
- 73 -
As groundwater sources play an important role in the urban watersupply, the importance of systematic data collection, evaluationand planning of groundwater sources development, has been recog-nised by LWUA. Consequently, in the early 1979, the GroundwaterData Bank (GDB) section was formed, within the HydrogeologicalDivision of LWUA, with a duty to establish hydrogeological database required for an efficient development of groundwater sour-ces.
Initially, LWUA1s GDB was staffed by three engineers supported byone draftsman, a secretary and a consultant. By the end of Sep-tember 1980 the GDB staff consisted of 8 engineers, two drafts-men, a secretary and one consultant. Presently GDB is operatedand managed entirely by LWUA's engineers.
In the ititial stages of GDB establishment, two pilot projects(Batangas and Baguio Water Districts) were selected to introducethe procedures for collection of groundwater data and to trainLWUA's staff. The cities of Batangas and Baguio were selected asthey represent two typical hydrogeological and geomorphologicalenvironments in the Philippines.
The Consultants' (Kampsax-Krüger) task was related to transfer ofthe hydrogeological know-how to LWUA's engineers and assisting inthe establishment of Well Records Section and the system of col-lection, processing, storage and retrieval of well records alongthe lines described in the previous sections.
Establishment of GDB for Water Districts (more than 200 WD, sta-tus mid 1982) is in progress and the cyclogram mapping is carriedout regularly by LWUA's staff as part of the groundwater investi-gations for the future water supply systems of each Water Dis-trict. In the Philippines a water quality data collection systemwas also established in 1980 so today LWUA is able to provide theprofessional assistance to Water Districts in the investigationsof both groundwater quantity and quality for water supply purpos-es.
In Fig. C1 , C2 and C3 the phases and procedures followed in theestablishment of LWUA's GDB for Water Districts are illustrated.
NWRC'S GROUNDWATER DATA BANK
As previously mentioned, NWRC is the national agency entrustedwith the task of co-ordinating, planning and assessment of waterresources utilisation in the Philippines and issuance of WaterPermits for groundwater withdrawal.
With respect to groundwater, the NWRC role is to collect andstore all available groundwater data and to use these data in theassessment of groundwater potential in he Philippines.
In 1979, NWRC embarked on the UNDP supported programme whichamong other things, was supposed to provide assistance for syste-
- 74 -
misation of well records and reorganisation of the existinggroundwater data bank. During the period 1979-1980 the differentforms for groundwater data collection were prepared:
- Scheme for Location of Borehole with Manual for completion ofthe scheme.
- Borehole Entry Books
- Drillers Well Log Record Sheet
- Pumping Test Data Sheet
- Well Log Records Sheet for cyclogram mapping with Manual forcompletion of the Sheet.
- Different Check Lists for the control of data collection.
- Water Quality Data Sheet with Manual for completion of theSheet.
The organisational aspects of NWRC GDB were considered and theprocedures for collection of new and existing borehole data wereoutlined as shown in Fig. C4 and C5. The training was provided toNWRC engineering staff regarding collection and processing ofgroundwater data into GDB.
The equipment for manipulation of maps and data is proposed asillustrated in Fig. C6.
- 75 -
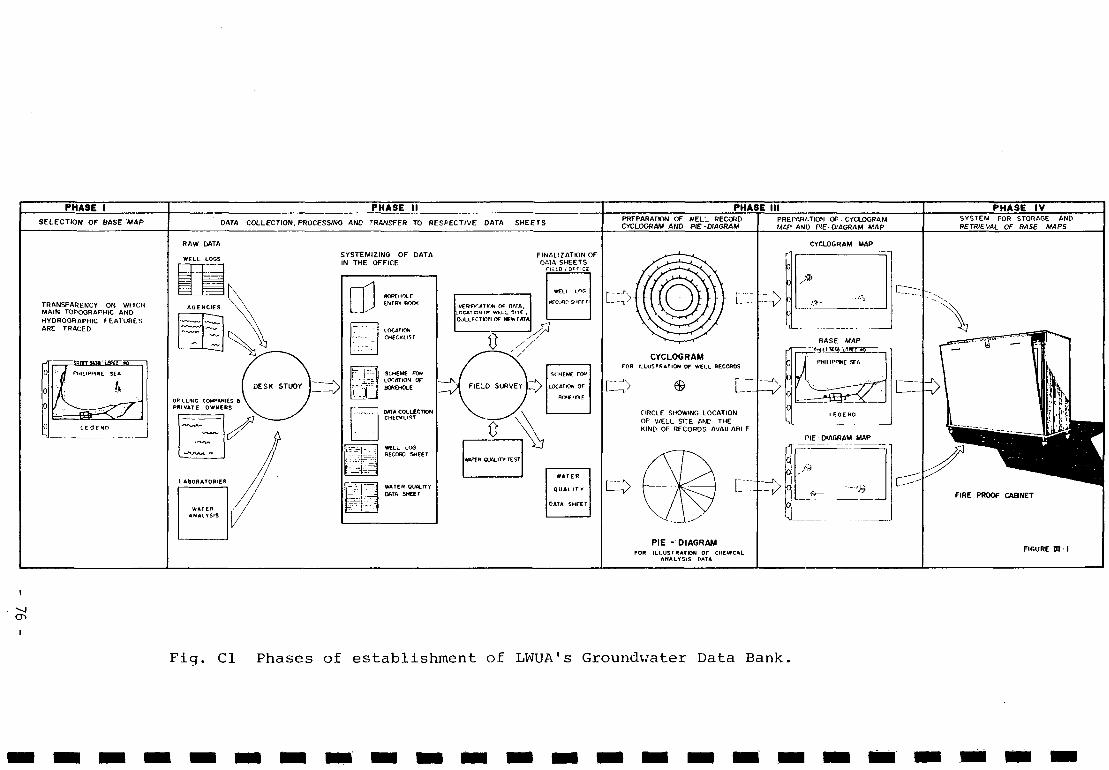
PHASE I PHASE II PHASE IIISYSTEM FOR STORAGE ANDRETRIEVAL OF BASE MAPS
PREPARATION OF CYCLOGRAMMAP ANU PIEOIAGRAM MAP
SELECTION OF BASE MAP DATA COLLECTION. PROCESSING AND TRANSFER TO RESPECTIVE DATA SHEETSPREPARATION OF «EL"_ RECORDCYCLOGRAM ANO PIE-DIAGRAM
TRANSPARENCY ON WHICHMAIN TOPOGRAPHIC ANDHYDROGRAPHIC FEATURESARE TRACED
SYSTEMIZING OF DATAIN THE OFFICE
niLJJ- • • • • .
'r 1 ::J1 - ]_-- !
oJp.—u
P •• • - : - . = - •
; - •"- I !
BORfHHLEENTRY BOOK
LOCATIONCNECKl/ST
SCHEME FORLOCATION OF
SOfTCHOLE
DATA COLLECTIONCHECKLIST
WELL LOGRECORD SHEET
WATER QUALITYDATA SHEET
FlfJÛUZATION OFDATA SHEETS
tnraTifw Of DATA..OCATKJMtlT WCLL SlTC ,COLLECTION OF NCWTATA
WATER QLWLITYTEST
WATER
Q U A L I T Y
DATA SHEET
CYCLOGRAM
CIRCLE SHOWING LOCATIONOF V/ELL SITE AMD THEKIND OF RECORDS AVAILABLE
PIE -DIAGRAM
—Icr.
Fig. Cl Phases of establishment of LWUA's Groundv.'ater Data Bank,
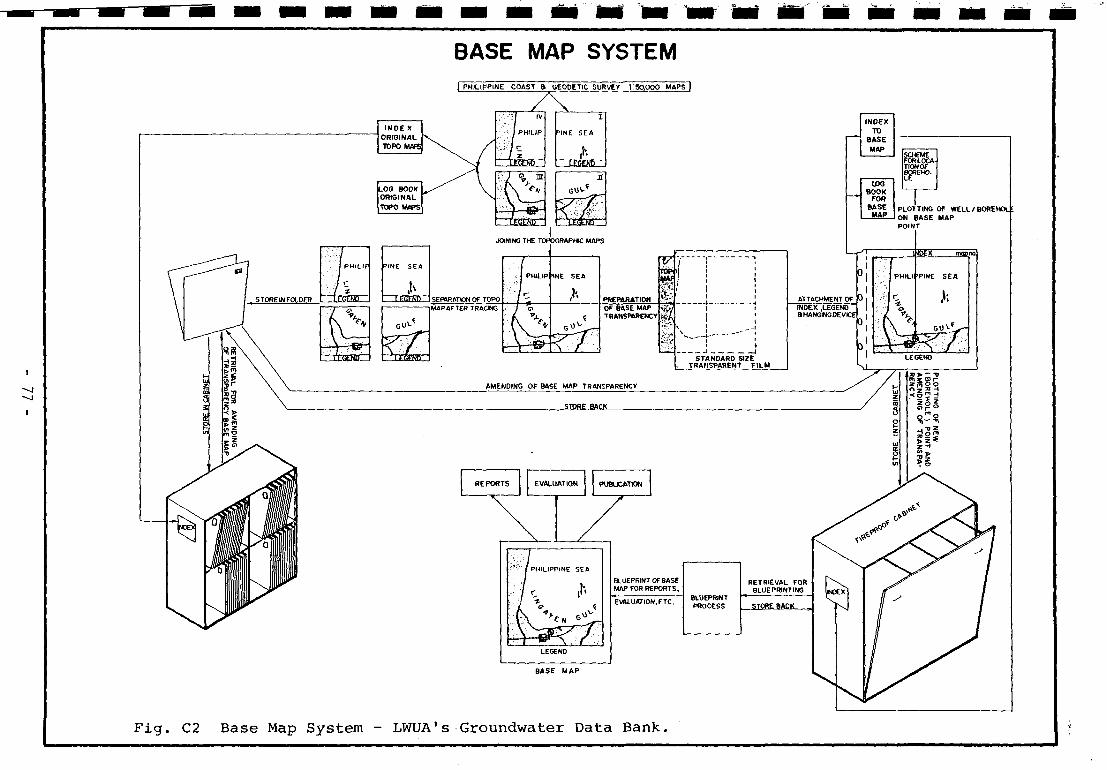
BASE MAP SYSTEM| PHILIPPINE COAST a GEODETIC SURVEY 1:50,000 MAPS]
S TORE IN FOLDER
I N D E XORIGINALTOPO MAPS
LOO BOOKORIGINALTOPO MOPS
; , . ; / iv
' <ví PHILIP
-JFLT-
" 7 IÍB1 ~LFSFNO
1
'INE SEA
CE5ENT5
X
LF(*NÒ
JOINING THE TOPOGRAPHIC MAPS
I EÜFNO SEPARATION OF TOPOMAP AFTER TRACNG
PREPARATIONOF BASE MAPTRANSPARENCY ^,
INOEXTO
BASEMAP
UK3BOOK
FOBBASE
MAP
TIONOFBQREHO-
PLOTTING Of WELL/BOREHOLLON BASE MAPPOINT
IIDEX
PHILIi 'PINE SEA
AMENDING OF BASE MAP TRANSPARENCY
STORE BACK
REPORTS EVALUATION PUBLICATION
PHILIPPINE
r*
SEA
BLUEPRINT Of BASEMAP FOR REPORTS,
EVALUATION.ETC.BLUEPRINTPROCESS
BASE MAP
Fig. C2 Base Map System - LWUA1s Groundwater Data Bank.
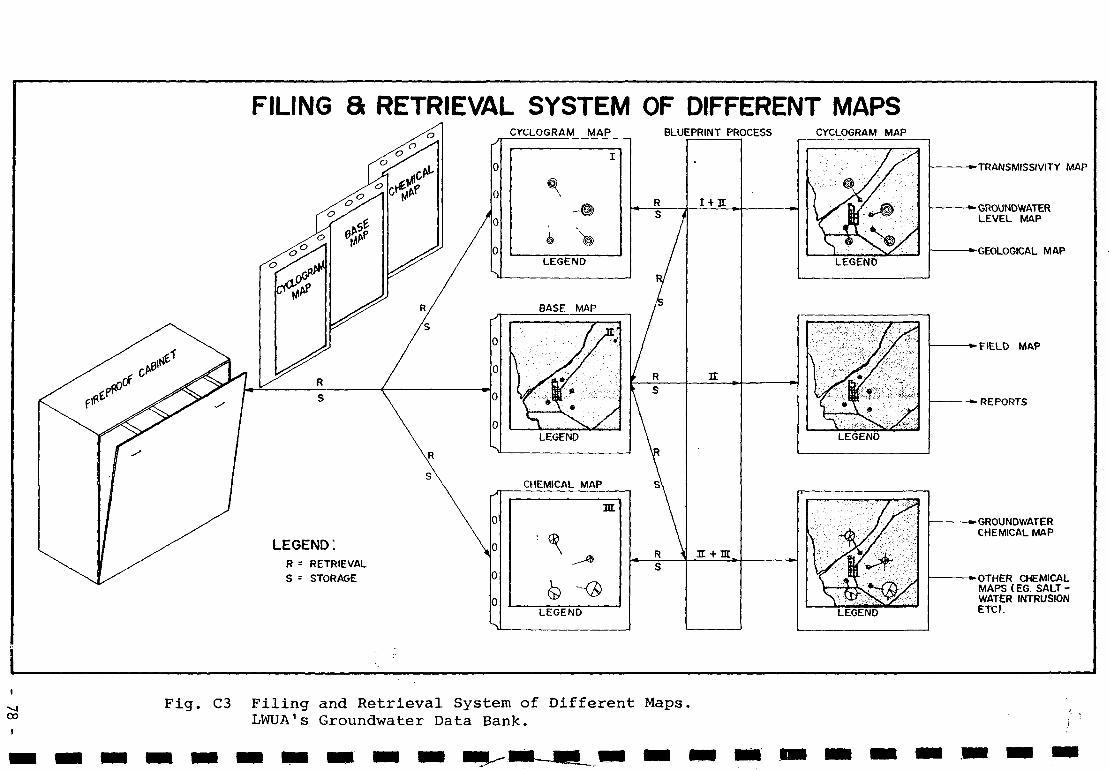
FILING a RETRIEVAL SYSTEM OF DIFFERENT MAPSCVCLOGRAM MAP
LEGEND !R = RETRIEVALS = STORAGE
LEGEND
BLUEPRINT PROCESS CYCLOGRAM MAP
LEGEND
LEGEND
LEGEND
-TRANSMISSIVITY MAP
-GROUNDWATERLEVEL MAP
'GEOLOGICAL MAP
- • F I E L D MAP
-*• REPORTS
-*-GROUNDWATERCHEMICAL MAP
-•OTHER CHEMICALMAPS ( EG. SALT -WATER INTRUSIONETC).
Fig. C3 Filing and Retrieval System of Different Maps.LWUA's Groundwater Data Bank.
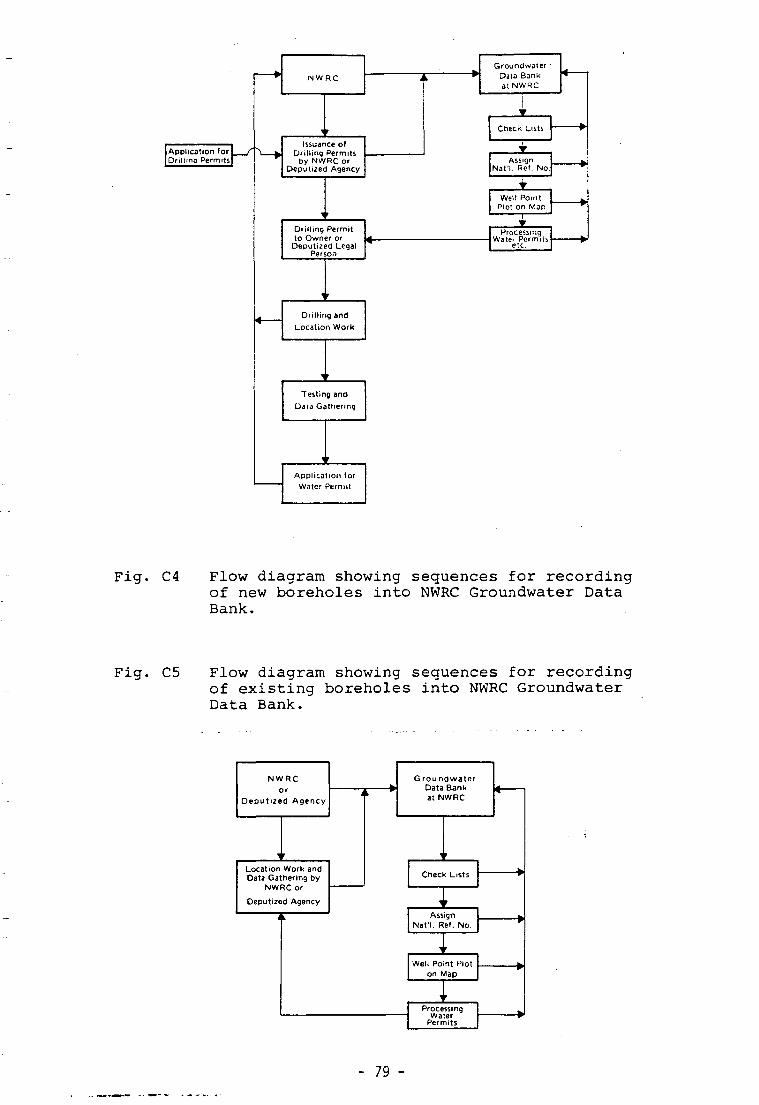
Application forDrillinq Permits
NWRC
Issuance ofDrilling Permitsby NWRC or
Deputized Agency
Drilling Permitto Owner or
Deputized LegalPerson
Drilling andLocation Work
Testing andDato Gathering
Application forWater Permit
Groundwater •Data Bankat NWRC
Check Lists
AssignNat'i. Ref. No
Well PointPlot on Map
ProcessingWatei Permits
etc.
Fig. C4 Flow diagram showing sequences for recordingof new boreholes into NWRC Groundwater DataBank.
Fig. C5 Flow diagram showing sequences for recordingof existing boreholes into NWRC GroundwaterData Bank.
NW
Deputize
RC)rd Agency
r
Location Work andData Gathering by
NWRC or
Deputized Agency
i i
G rou ndwaterData Bankat NWRC
t
Check Lists
f
AssignNat'l. Ref. No.
^ f
Well Point Ploton Map
t
ProcessingWater
Permits
- 79 -
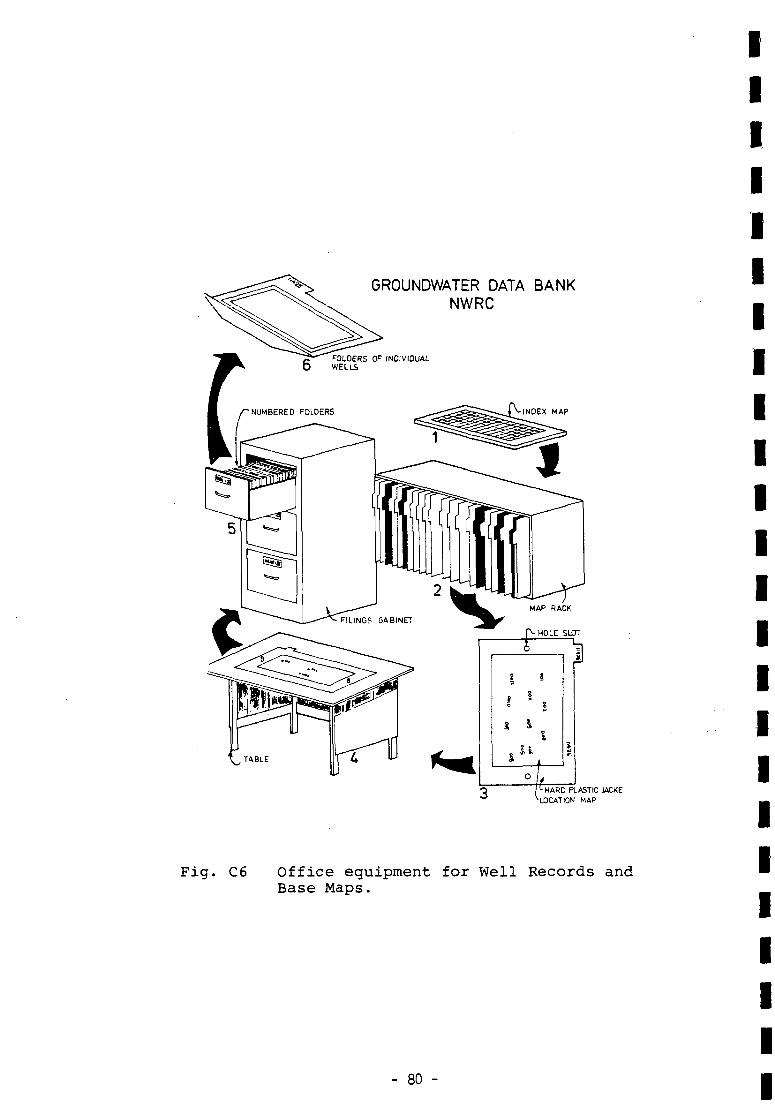
GROUNDWATER DATA BANKNWRC
c - FOLDERS OF INDIVIDUALD WELLS
INDEX MAP
O j LHARD PLASTIC JACKE^LOCATION MAP
Fig. C6 Office equipment for Well Records andBase Maps.
- 80 -
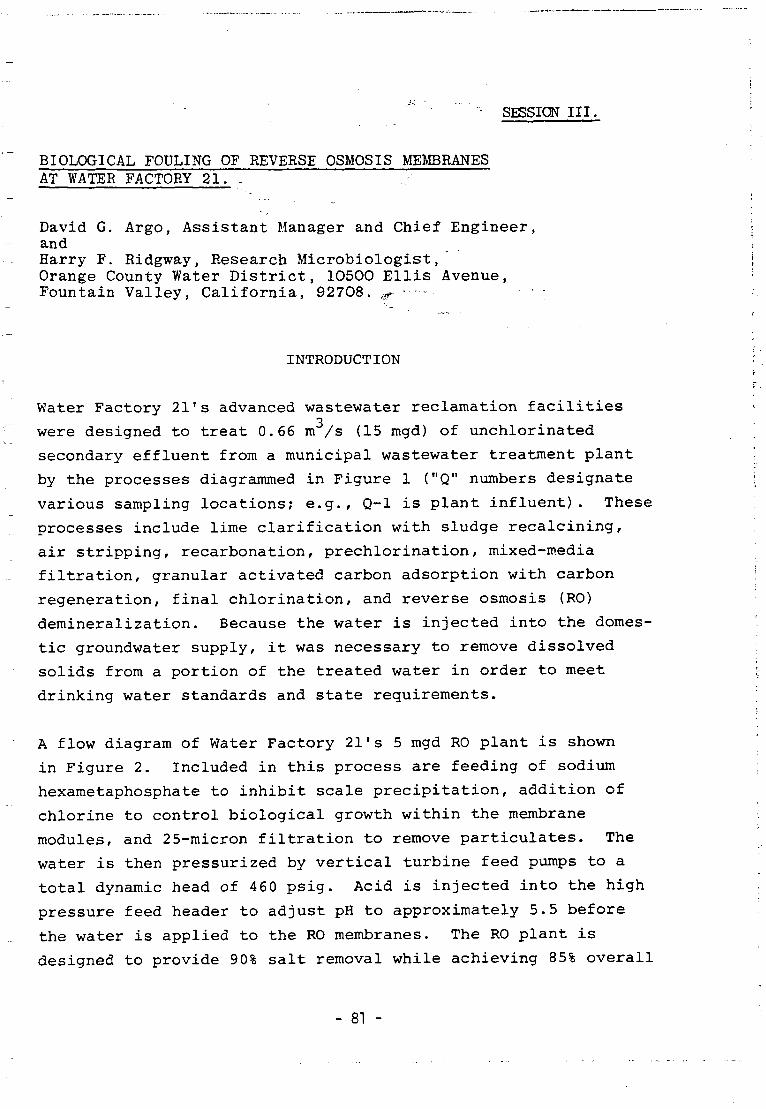
"•• SESSION III,
BIOLOGICAL FOULING OF REVERSE OSMOSIS MEMBRANESAT WATER FACTORY 21. -
David G. Argo, Assistant Manager and Chief Engineer,andHarry F. Ridgway, Research Microbiologist,Orange County Water District, 10500 Ellis Avenue,Fountain Valley, California, 92708. ¿r -
INTRODUCTION
Water Factory 21's advanced wastewater reclamation facilities
were designed to treat 0.66 m /s (15 mgd) of unchlorinated
secondary effluent from a municipal wastewater treatment plant
by the processes diagrammed in Figure 1 ("Q" numbers designate
various sampling locations; e.g., Q-l is plant influent). These
processes include lime clarification with sludge recalcining,
air stripping, recarbonation, prechlorination, mixed-media
filtration, granular activated carbon adsorption with carbon
regeneration, final chlorination, and reverse osmosis (R0)
demineralization. Because the water is injected into the domes-
tic groundwater supply, it was necessary to remove dissolved
solids from a portion of the treated water in order to meet
drinking water standards and state requirements.
A flow diagram of Water Factory 21's 5 mgd R0 plant is shown
in Figure 2. Included in this process are feeding of sodium
hexametaphosphate to inhibit scale precipitation, addition of
chlorine to control biological growth within the membrane
modules, and 2 5-micron filtration to remove particulates. The
water is then pressurized by vertical turbine feed pumps to a
total dynamic head of 460 psig. Acid is injected into the high
pressure feed header to adjust pH to approximately 5.5 before
the water is applied to the RO membranes. The RO plant is
designed to provide 90% salt removal while achieving 85% overall
- 81 -
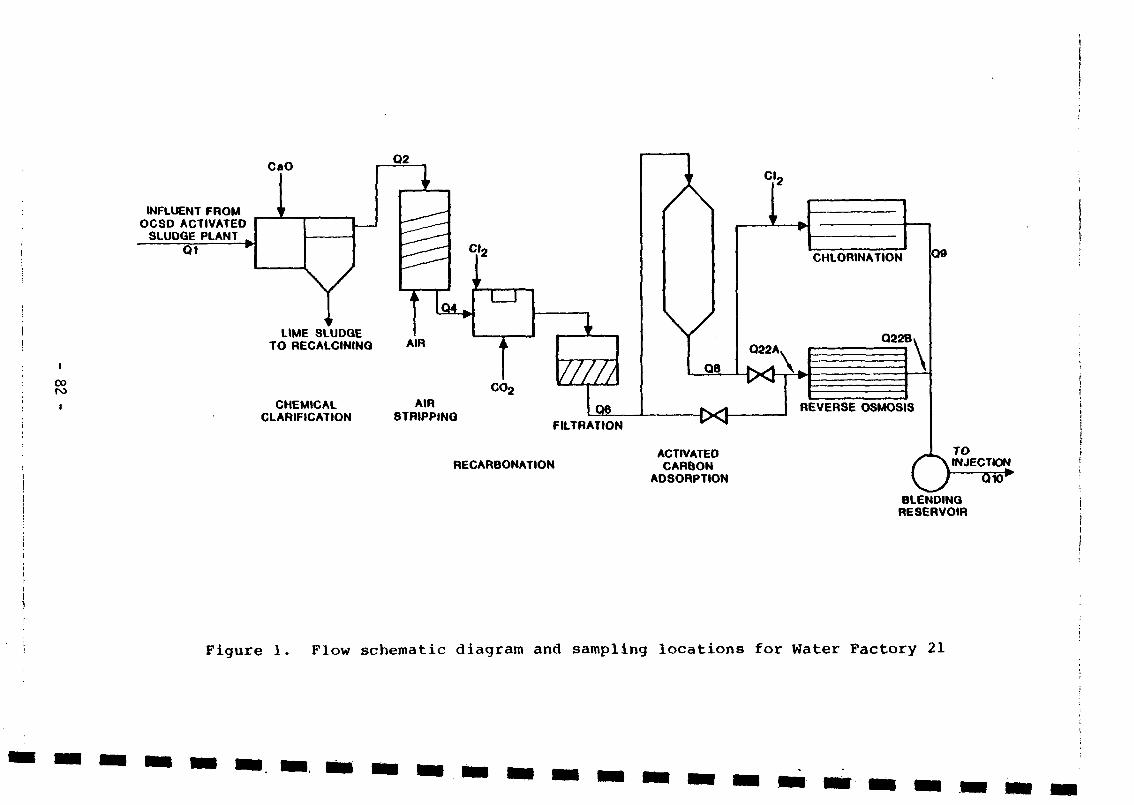
00ro
CaO
INFLUENT FROMOCSO ACTIVATED
SLUDGE PLANTQ1
LIME SLUDGETO RECALCININQ AIR
CO2
CHEMICALCLARIFICATION
AIRSTRIPPING PA-
FILTRATION
RECARBONATION
YQ8
ICHLORINATION
O22AQ22B
Y
-IX-
\
REVERSE OSMOSIS
ACTIVATEDCARBON
ADSORPTION
0 0
ÓTOINJECTION
BLENDINGRESERVOIR
Figure 1. Flow schematic diagram and sampling locations for Water Factory 21
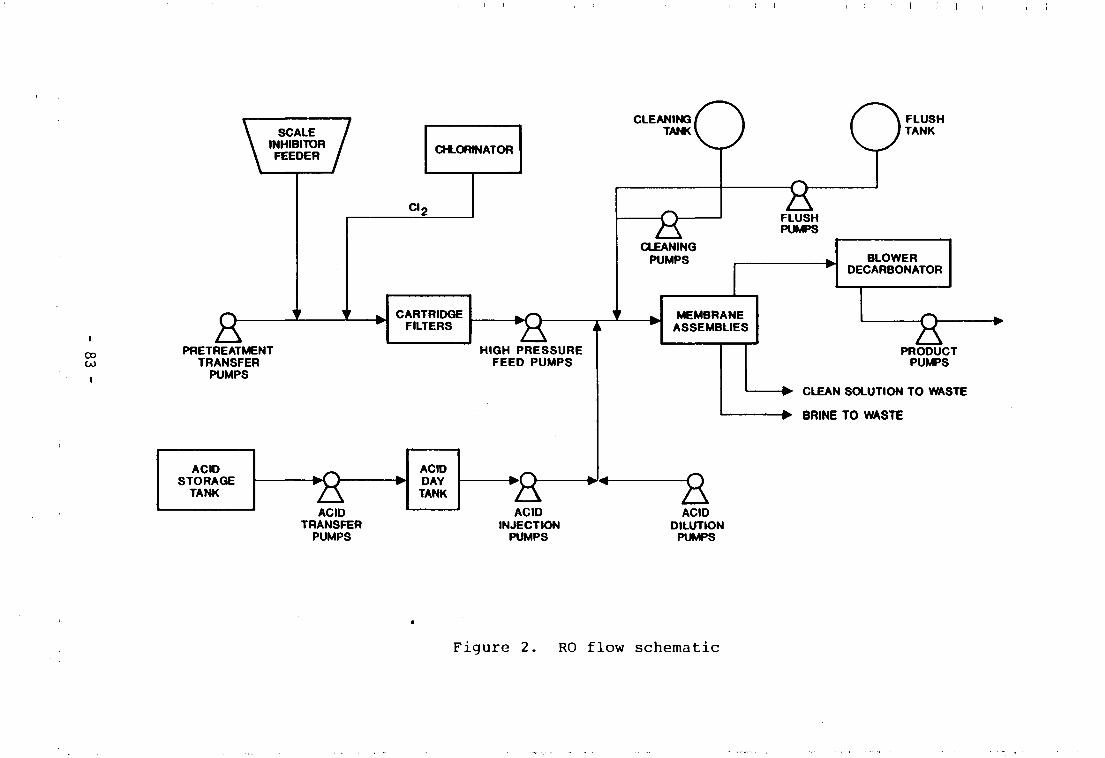
\ SCALE j\ INHIBITOR /\ FEEDER /
\
fCHLORINATOR
CI 2
CARTRIDGEFILTERS
L
CLEANINGTANKO
ooLO
PRETREATMENTTRANSFERPUMPS
ACIDTRANSFERPUMPS
HIGH PRESSUREFEED PUMPS
CLEANINGPUMPS
MEMBRANEASSEMBLIES
OFLUSHTANK
FLUSHPUMPS
ACIDINJECTION
PUMPS
ACIDDILUTION
PUMPS
BLOWERDECARBONATOR
"fi"PRODUCT
PUMPS
- > CLEAN SOLUTION TO WASTE
-*• BRINE TO WASTE
Figure 2. RO flow schematic
water recovery. The démineraiized water receives post-treatment
in two packed tower decarbonators to air strip the dissolved
carbon dioxide which results from pH adjustment. A detailed
description of the RO plant's design criteria has been provided
in previous reports.1'2
The 5 mgd plant has been in operation for over four years.
During this time it has been necessary to replace the original
membrane because of performance loss due to fouling. The purpose
of this report is to present the details of studies conducted by
the Orange County Water District over the last two and one half
years. These studies have sought to identify the cause of
membrane flux decline and to find means to mitigate or control
this loss of performance. The report also summarizes the
system's overall performance during the past two years.
5 MGD REVERSE OSMOSIS SYSTEM
The 5 mgd RO system consists of six identical subunits. Each of
these consists of 42 pressure vessels mounted on a structural
steel frame in a 4-2-1 array; i.e, 24 pressure vessels in series
with 12 more vessels, and these in series with six more pressure
vessels. The operating pressure and product water recovery are
adjustable for each subunit. Although the feed pressure has
varied, recovery has been maintained at a constant 8 5%. Four of
the six subunits were reloaded in the last half of 1979 with
Fluid Systems (FSD) Model 8150-HR spiral membranes. FSD product
specifications for these elements indicate a minimum rejection
of 96% NaCl and a nominal flux of 12.5 gfd at 420 psig and 77°F.
The other two subunits were reloaded in December 1979 with a
different CA type of membrane, but their performance was very
similar to that of units loaded with the HR type. Therefore,
any discussion of plant performance will be limited to subunit
IA, since it is typical of all the subunits and has had the
longest period of operation.
- 84 -
Figure 3 plots the normalized flux versus time and rejection
versus time for subunit 1A from July 1979 to September 1981 and
shows when the subunit was cleaned. The flux was normalized to a
referenced temperature of 77°F and a net operating pressure of
400 psig, by applying a temperature and pressure correction factor
based on the monthly average for both. The rejection shown is an
average of the weekly rejection calculations made for the subunit
during any given month.
Previously reported data1 demonstrated that the best correlation
obtained when plotting normalized flux as a function of time was
a linear relationship rather than a log-log relationship. This
is due to the fact that the major reason for the flux decline in
this RO application is membrane fouling as opposed to membrane
compaction. It has been demonstrated empirically that a fouling
flux decline is best characterized by a linear relationship and
that a log-log relationship would best define a compaction flux
decline. Figure 3 shows that the flux declined rapidly from July
1979 to October 1980 and that the rate of flux decline was much
less severe from October 1980 to September 1981. This transition
in flux decline rate appears to take place after about 9,000
hours of operation. A linear regression calculation (least
squares) for these two periods was used to determine the flux
decline rate, which is the slope of the solid line shown on
Figure 3. The flux decline rate or slope for the period from
July 1979 to October 1980 was -0.226 gfd/month. For the period
from October 198 0 to September 1981, the flux decline rate decreased
to -0.025 gfd/month, which is about an order of magnitude difference.
The highest flux was 11.18 gfd observed in July 1979, immediately
after reloading and startup of the new membranes. The flux
declined steadily to a minimum of 6.84 gfd in December 1980.
Following a holiday shutdown, the flux increased to 7.39 gfd in
January 1981 and the level was maintained between this value and
6.77 gfd through September 1981. During this ten-month period,
the unit was cleaned five times. The mean flux maintained for
1981 was 7.09 + 0.21 gfd.
- 85 -
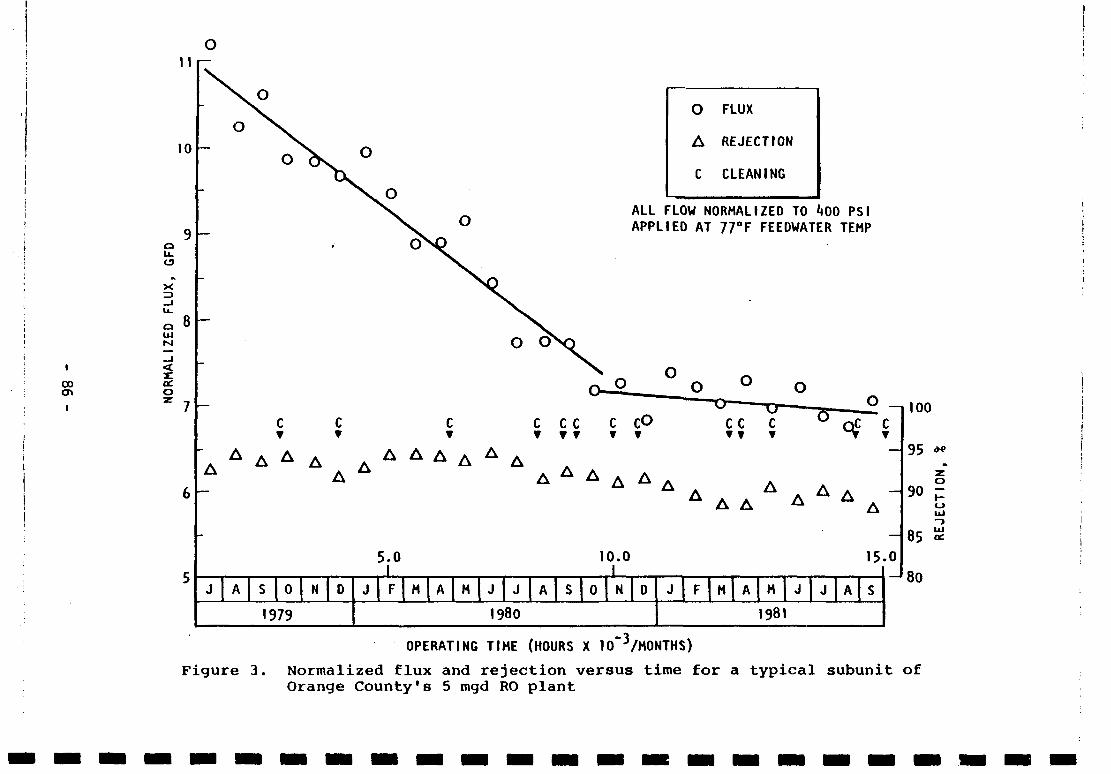
n
00
en
10
au.
ouiM
ceo
C
O
A
C
FLUX
REJECTION
CLEANING
ALL FLOW NORMALIZED TO l»00 PS IAPPLIED AT 77°F FEEDWATER TEMP
A A A
J A S 0 N D
1979
J
5.0
F M A M J | J | A s
10.01
0 N D
1980
J F M A M | J J | A
15.
s
1981
-J80
OPERATING TIME (HOURS X 10"3 /M0NTHS)
Figure 3. Normalized flux and rejection versus time for a typical subunit ofOrange County's 5 mgd RO plant
Earlier investigation3 of several modules removed after the
12,000 hours of operation indicates that the principal cause of
the observed flux decline is the accumulation of fouling material
on the surface of the membrane. Again, several elements were
removed after 15,000 hours and some of the fouling material was
scraped from the membrane surface and analyzed to determine the
composition of the foulant. The results of this testing are
shown in Table 1. Data are given for typical elements removed
from all three arrays (first, second and third passes), indicating
again that between 87% and 92% of the fouling material is organic.
Further research designed to identify the exact composition of
this organic foulant has been conducted, and the results of these
studies are summarized in a subsequent section of this report.
Besides a decline in flux, a long term decline in rejection
characteristics was also observed. Rejection, after reloading,
was 92.6% based on feedwater and improved to 94.7% the next
month, apparently due to the development of a dynamic membrane as
the fouling layer plugged minute membrane imperfections. Following
this initial improvement, rejection started to decline and after
six months had fallen to 92.0%. During 198 0 it varied from a
high of 94.8% to a low of 91.0% with a mean of 92.9 + 1.3%.
After the holiday shutdown in December 1980, when the subunit was
out of service for a period of 41 days, there was a decline in
rejection from 91.5% to 90.3%. The rejection fell to 89.2% in
February 1981 and remained about the same through August 1981.
Following a cleaning in August which was unusually effective in
flux restoration, the rejection declined to a low of 87.9%,
indicating that removal of protective foulant had exposed a
slightly degraded membrane. The principal cause of the gradual
decline observed in salt rejection is believed to be a combination
of fouling and gradual hydrolysis of the membrane. Typical
annual average rejection of other feedwater constituents for the
RO system during operation from October 1980 through September
1981 is given in Table 2. The membrane had been in service about
9,000 hours prior to October 1980, and by September 1981 had been
in service almost 16,000 hours.
- 87 -
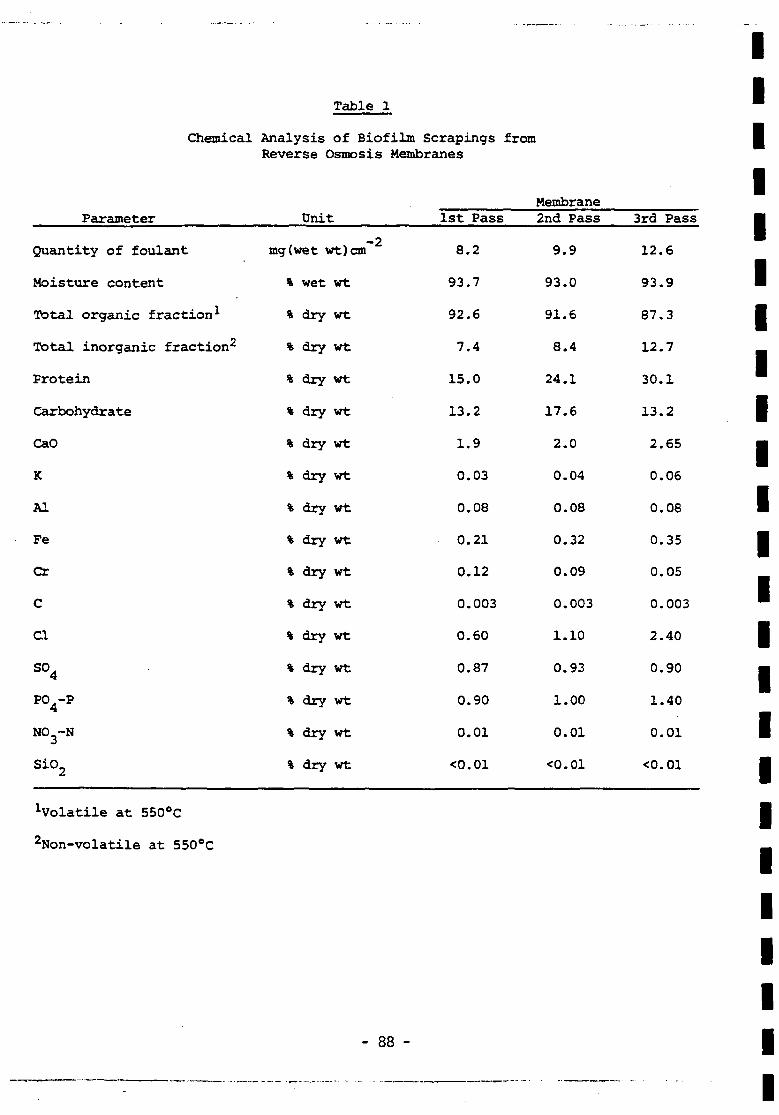
Table 1
Chemical Analysis of Biofilm Scrapings fromReverse Osmosis Membranes
MembraneParameter
Quantity of foulant
Moisture content
Total organic fraction1
Total inorganic fraction2
Protein
Carbohydrate
CaO
K
Al
Fe
Cr
C
ci
S04
PO4-P
NO -N
sio2
Unit
mg(wet wt)cm
% wet wt
% dry wt
% dry wt
% dry wt
% dry wt
% dry wt
% dry wt
% dry wt
% dry wt
% dry wt
% dry wt
% dry wt
% dry wt
% dry wt
% dry wt
% dry wt
1st Pass
8.2
93.7
92.6
7.4
15.0
13.2
1.9
0.03
0.08
0.21
0.12
0.003
0.60
0.87
0.90
0.01
<0.01
2nd Pass
9.9
93.0
91.6
8.4
24.1
17.6
2.0
0.04
0.08
0.32
0.09
0.003
1.10
0.93
1.00
0.01
<0.01
3rd Pass
12.6
93.9
87.3
12.7
30.1
13.2
2.65
0.06
0.08
0.35
0.05
0.003
2.40
0.90
1.40
0.01
<0.01
Volatile at 550°C
2Non-volatile at 550°C
- 88 -
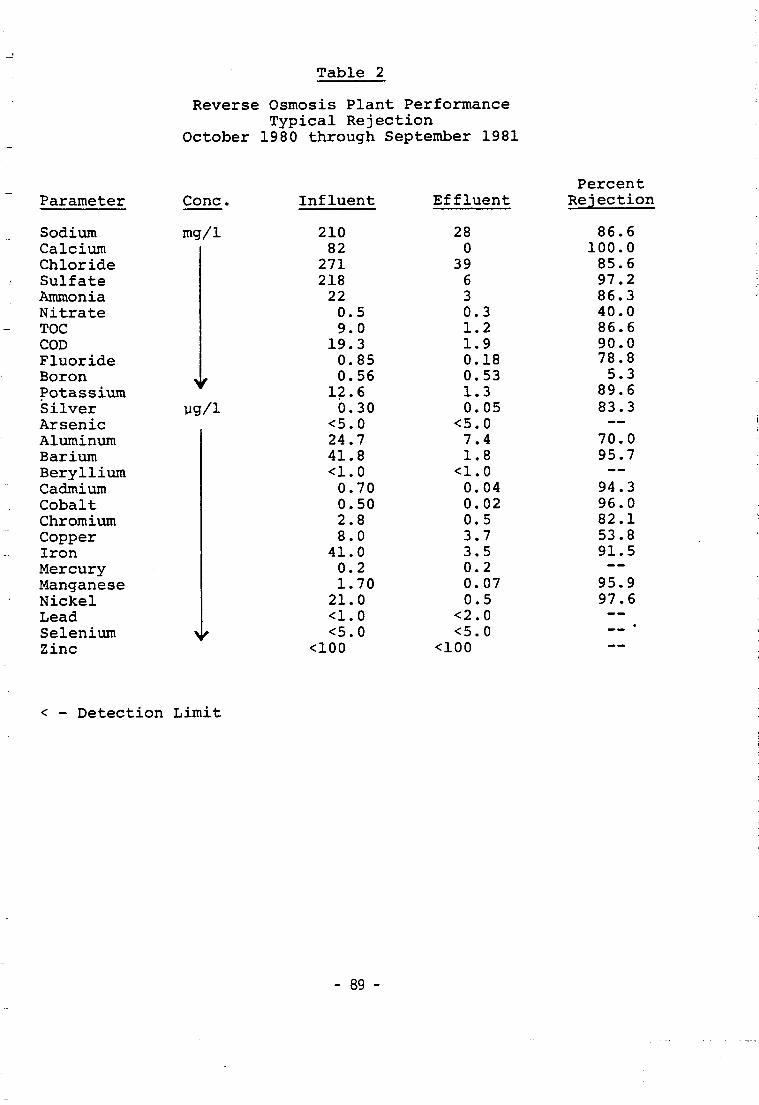
Table 2
Reverse Osmosis Plant PerformanceTypical Rejection
October 1980 through September 1981
Parameter
SodiumCalciumChlorideSulfateAmmoniaNitrateTOCCODFluorideBoronPotassiumSilverArsenicAluminumBariumBerylliumCadmiumCobaltChromiumCopperIronMercuryManganeseNickelLeadSeleniumZinc
Cone.
mg/1
\
yg/i
>f
Influent
21082
271218220.59.0
19.30.850.56
12.6Ò.30
<5.024.741.8<1.00.700.502.88.0
41.00.21.7021.0<1.0<5.0
<100
Effluent
280
39630.31.21.90.180.531.30.05
<5.07.41.8<1.00.040.020.53.73.50.20.070.5
<2.0<5.0
<100
PercentRejection
86.6100.085.697.286.340.086.690.078.85.3
89.683.3—70.095.7--94.396.082.153.891.5——95.997.6—
*—
< - Detection Limit
- 89 -
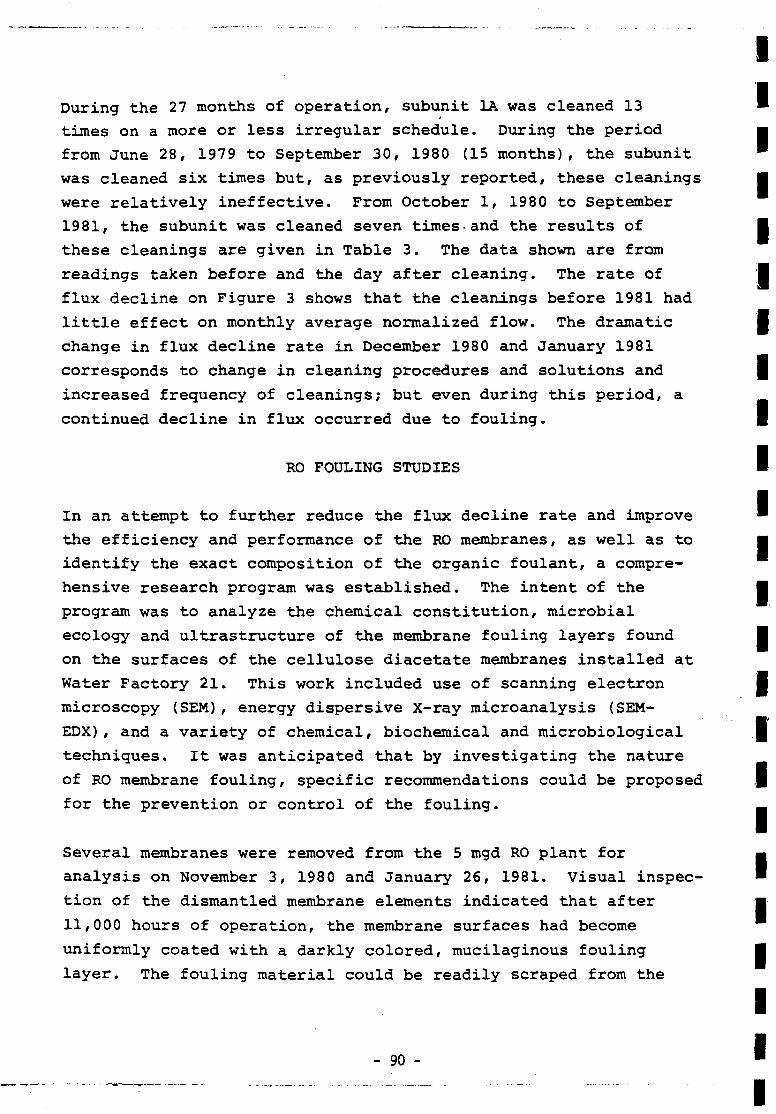
During the 27 months of operation, subunit 1A was cleaned 13
times on a more or less irregular schedule. During the period
from June 28, 1979 to September 30, 1980 (15 months), the subunit
was cleaned six times but, as previously reported, these cleanings
were relatively ineffective. From October 1, 1980 to September
1981, the subunit was cleaned seven times and the results of
these cleanings are given in Table 3. The data shown are from
readings taken before and the day after cleaning. The rate of
flux decline on Figure 3 shows that the cleanings before 1981 had
little effect on monthly average normalized flow. The dramatic
change in flux decline rate in December 1980 and January 1981
corresponds to change in cleaning procedures and solutions and
increased frequency of cleanings; but even during this period, a
continued decline in flux occurred due to fouling.
RO FOULING STUDIES
In an attempt to further reduce the flux decline rate and improve
the efficiency and performance of the RO membranes, as well as to
identify the exact composition of the organic foulant, a compre-
hensive research program was established. The intent of the
program was to analyze the chemical constitution, microbial
ecology and ultrastructure of the membrane fouling layers found
on the surfaces of the cellulose diacetate membranes installed at
Water Factory 21. This work included use of scanning electron
microscopy (SEM), energy dispersive X-ray microanalysis (SEM-
EDX), and a variety of chemical, biochemical and microbiological
techniques. It was anticipated that by investigating the nature
of RO membrane fouling, specific recommendations could be proposed
for the prevention or control of the fouling.
Several membranes were removed from the 5 mgd RO plant for
analysis on November 3, 1980 and January 26, 1981. Visual inspec-
tion of the dismantled membrane elements indicated that after
11,000 hours of operation, the membrane surfaces had become
uniformly coated with a darkly colored, mucilaginous fouling
layer. The fouling material could be readily scraped from the
- 90 -
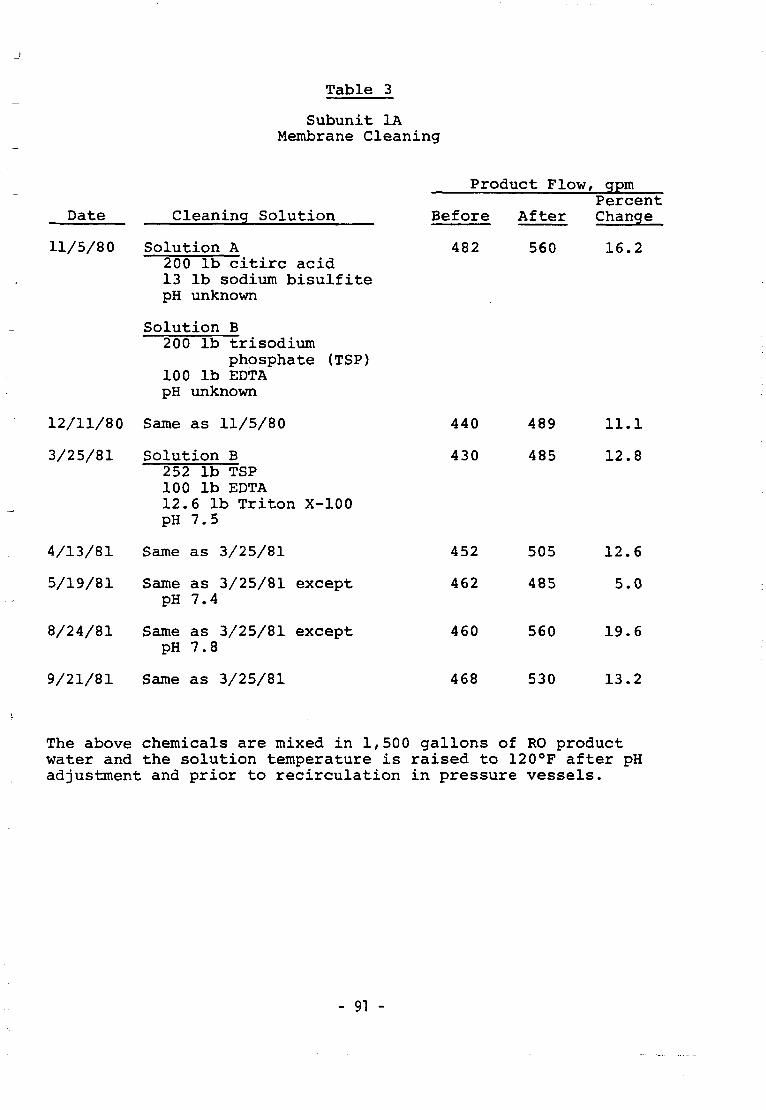
Table 3
Subunit IAMembrane Cleaning
Date Cleaning Solution
Product Flow, gpmPercentChangeBefore After
11/5/80 Solution A200 lb citirc acid13 lb sodium bisulfitepH unknown
Solution B
482 560 16.2
12/11/80
3/25/81
4/13/81
5/19/81
8/24/81
9/21/81
200 lb trisodiumphosphate (TSP)
100 lb EDTApH unknown
Same as 11/5/80
Solution B252 lb TSP100 lb EDTA12.6 lb Triton X-100pH 7.5
Same as 3/25/81
Same as 3/25/81 exceptpH 7.4
Same as 3/25/81 exceptpH 7.8
Same as 3/25/81
440
430
452
462
460
468
489
485
505
485
560
530
11.1
12.8
12.6
5.0
19.6
13.2
The above chemicals are mixed in 1,500 gallons of RO productwater and the solution temperature is raised to 120°F after pHadjustment and prior to recirculation in pressure vessels.
- 91 -
membranes and, upon chemical analysis, was found to be approxi-
mately 93% water by weight (Table 1). Nearly 90% of the dry
(dehydrated) weight of the fouling material was organic in
composition, since it could be volatilized at 550°C. Calcium,
phosphorus, sulfur and chlorine were the major elements
constituting the remaining inorganic fraction as determined by
conventional chemical analysis and SEM-EDX. As much as 30% of
the dry weight of the fouling material consisted of protein
while up to 17% consisted of carbohydrate, suggesting that bio-
logically synthesized macromolecules were an important component
of the fouling layer. Indeed, bacteriological plate countsQ
indicated up to 5 X 10 colony forming units (cfu) per gram of
native biofilm (Table 4). These data suggested that the organic
fouling layer was composed primarily of layers of living and dead
bacterial cells.
In order to define what role the feedwater might play in the
microbiological fouling of the RO membrane surface, water samples
were also collected on the same days the membranes were removed.
Chemical analyses of these water samples showed that the data
fell within the limits of variability of the average chemical
data of the preceding one-year period (see Table 5). Hence, the
11/3/80 and 1/26/81 data appear to be representative of the long-
term water chemistry for the various treatment processes at Water
Factory 21. From a microbiological standpoint, there were ample
concentrations of dissolved minerals and organic substances for
bacteria to proliferate at each treatment process preceding RO.
The presence of substantial concentrations of dissolved organic
matter in Q-l, Q-2, Q-5, Q-6, Q-8, Q-9 and Q-22A water samples
was indicated by measurement of TOC, COD, and UV absorbance.
These organic substances serve as a potential source of nutrients
for the growth of microorganisms at the various treatment processes.
To provide more detailed information regarding the water being
treated by the RO membranes, water samples collected at each
treatment location were filtered through 0.2ym pore size Nuclepore
membrane filters and examined by SEM. Figure 4 is a series of
- 92 -
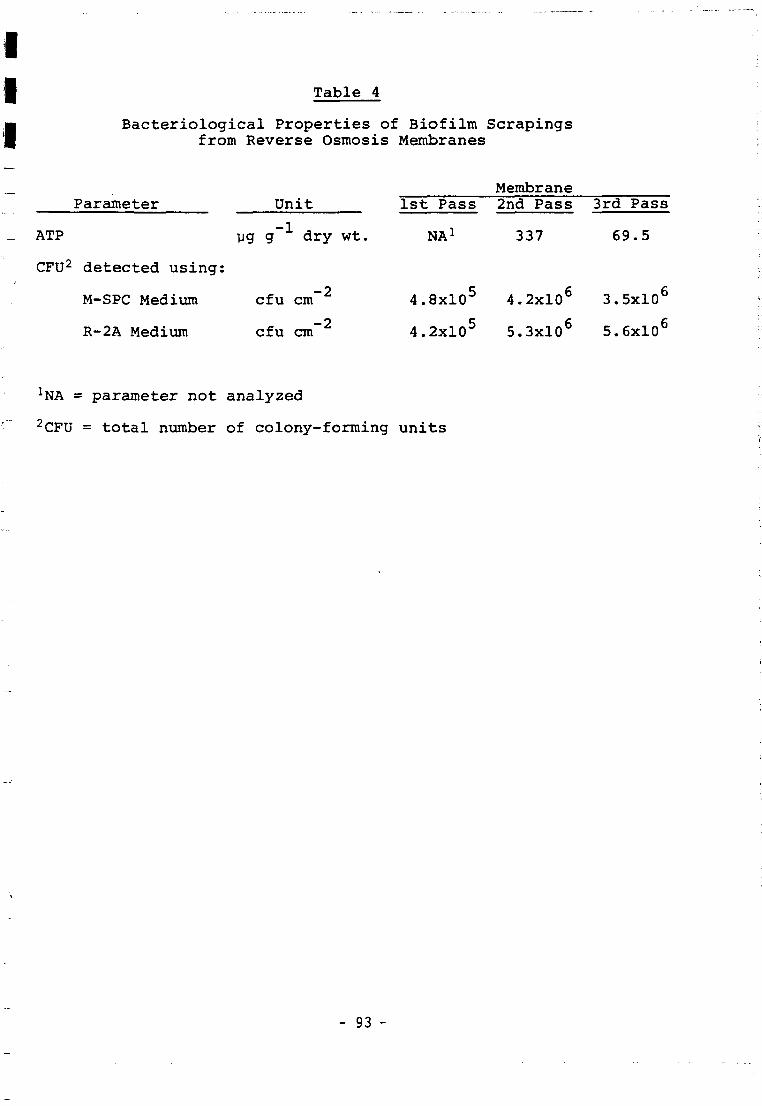
Table 4
Bacteriological Properties of Biofilm Scrapingsfrom Reverse Osmosis Membranes
Membrane
ATP
CFU2
Parameter
detected using:
M-SPC Medium
R-2A Medium
Unit
yg g dry wt.
cfu cm
cfu cm"
1st Pass
4,
4,
NA1
.8xlO5
.2xlO5
2nd Pass
337
4.2xlO6
5.3xlO6
3rd Pass
69.5
3.5xlO6
5.6xlO6
*NA - parameter not analyzed
2CFU = total number of colony-forming units
- 93 -
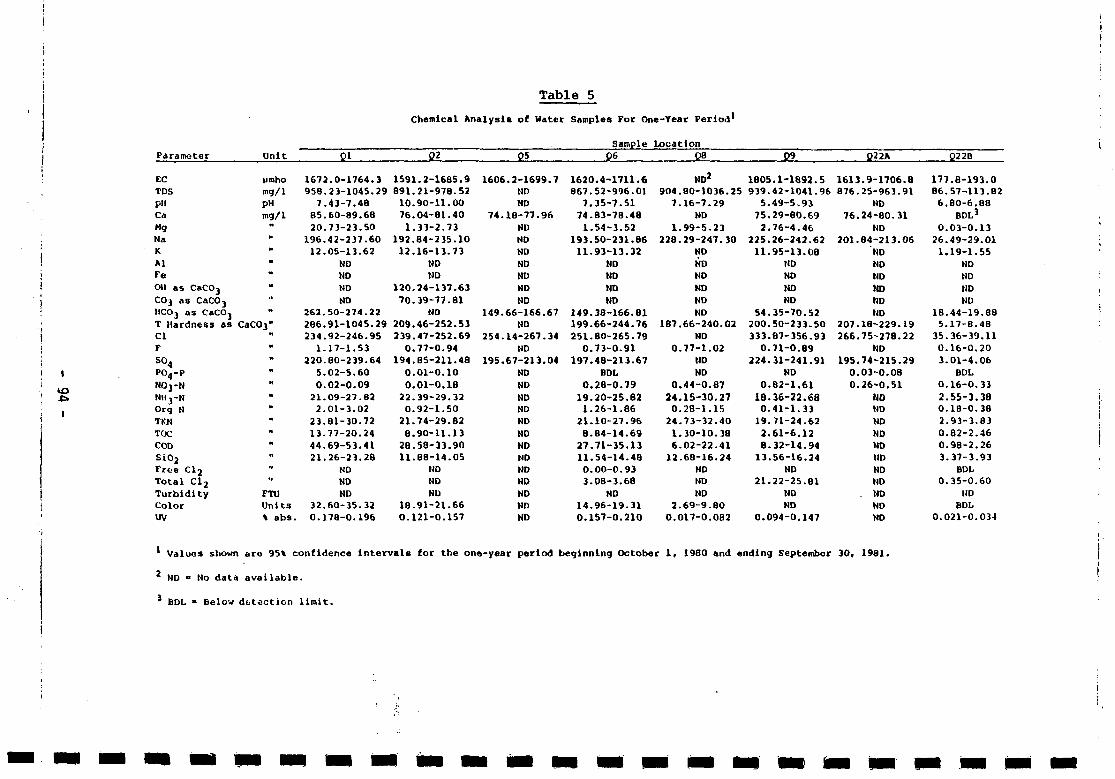
Table 5
IO
Chemical Analysis of Water Samples Por One-Year Period1
Sample locationParameter
ECTDSpliCa
MgNaKAlFeCXI as CaCOj
CO3 as CaCOjHCOj as CaCOjT Hardness asClrso4PO4-P
NO3-NNH3-NOrg HTKNTOCCODSiO2
Frc-e CljTotal Cl2
TurbidityColorUV
Unit
ii mho
mg/1pHmg/1
M
H
M
M
tt
M
"
M
CaCO3"H
H
*»
M
*
«I
FTUUnitst abs.
01
1672.0-1764.3958.23-1045.297.43-7.48
85.60-89.6820.73-23.50
196.42-237.6012.05-13.62
N0NDNDND
262.50-274.22286.91-1045.29234.92-246.951.17-1.53
220.80-239.645.02-5.600.02-0.0921.09-27.822.01-3.0223.81-30.7213.77-20.2444.69-53.4121.26-23.28
NDNDND
32.60-35.320.178-0.196
02
1591.2-1685.9891.21-978.5210.90-11.0076.04-81.401.33-2.73
192.84-235.1012.16-13.73
NOND
120.24-137.6370.39-77.81
ND209.46-252.53239.47-252.690.77-0.94
194.85-211.480.01-0.100.01-0.1822.39-29.320.92-1.5021.74-29.828.90-11.1328.58-33.9011.88-14.05
NDNDND
18.91-21.660.121-0.157
05
1606.2-1699.7NDND
74.18-77.96NDNDNDNDNDNDND
149.66-166.67ND
254.14-267.34ND
195.67-213.04NDNDNDNDNDN0NDNDNDNDNDNDND
06
1620.4-1711.6867.52-996.017.35-7.5174.83-78.481.54-3.52
193.50-231.8611.93-13.32
NDNDNDND
149.38-166.81199.66-244.76251.80-265.790.73-0.91
197.48-213.67BOL
0.28-0.7919.20-25.821.26-1.8621.10-27.968.84-14.6927.71-35.1311.54-14.480.00-0.933.08-3.68
ND14.96-19.310.157-0.210
08
ND2
904.80-1036.257.16-7.29
ND1.99-5.23
228.29-247.30NDNDNDNDNDND
187.66-240.02ND
0.77-1.02NDND
0.44-0.8724.15-30.270.28-1.1524.73-32.401.30-10.386.02-22.4112.68-16.24
NDNDND
2.69-9.800.017-0.082
09
1805.1-1892.5939.42-1041.965.49-5.9J75.29-80.692.76-4.46
22S.26-242.6211.95-13.08
NDNDNDND
54.35-70.522OO.5O-233.5O333.87-356.930.71-0.89
224.31-241.91ND
0.82-1.6118.36-22.680.41-1.3319.71-24.622.61-6.128.32-14.9413.56-16.24
ND21.22-25.81
NDND
0.094-0.147
Q22A
1613.9-1706.8876.25-963.91
ND76.24-80.31
ND201.84-213.06
NDNDNDNDNDND
207.18-229.19266.75-278.22
ND195.74-215.29O.O3~O.O8
0.26-0.51
NONDNDNDNDNDNDND
. NDNDND
02 2B
177.8-193.086.57-113.826.80-6.88
BDL3
0.03-0.1326.49-29.011.19-1.55
NDNDNDND
18.44-19.885.17-B.4835.36-39.110.16-0.203.01-4.06
BDL0.16-0.332.55-3.380.18-0.382.93-3.830.82-2.460.98-2.263.37-3.93
BDL0.35-0.60
IJDBDL
0.021-0.034
1 Values shown are 95% confidence intervals for the one-year period beginning October 1, 1980 and ending September 30, 1981.
2 ND - No data available.
* BDL « Below detection limit.
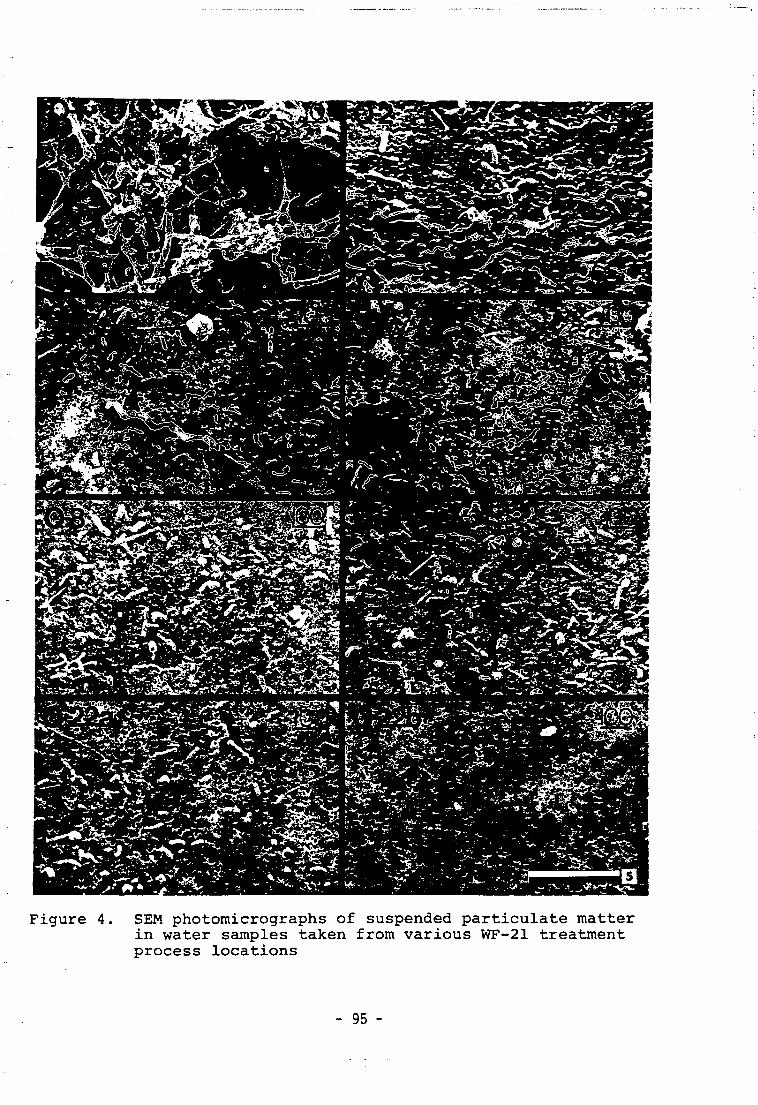
Figure 4. SEM photomicrographs of suspended particulate matterin water samples taken from various WF-21 treatmentprocess locations
- 95 -
SEM photomicrographs of the suspended particulate matter found at
various sampling locations throughout the treatment train at
Water Factory 21. The number in the upper right hand corner of
each photograph indicates the volume in milliliters of the water
sample filtered (47mm diameter filter). The lower number is a
reference bar measuring 5 um in length. The plant influent water
(Q-l) contained the highest concentration of particulate debris,
which apparently consisted of massive aggregations (floes) of
rod-shaped and filamentous microorganisms. Direct enumeration of
bacteria in the scanning electron micrographs indicated that the
total number of bacteria per field (i.e., viable plus nonviable
cells) remained relatively constant (approximately 5 X 10
cells/ml) from one treatment process to the next, with the excep-
tion of Q-l and Q-22B water where the numbers were considerably
higher and lower, respectively.
In order to determine the viability of the bacteria observed in
the SEM micrographs, five different tests were made and the
results compared. The five parameters were: (1) the concentra-
tion of adenosine-5'-triphosphate (ATP) to give a relative
indication of the number of viable bacteria in the water sample,
(2) direct microscopic counts of the total number of viable
microorganisms using epifluorescent light microscopy, (3) direct
counts of both viable and dead bacterial cells using SEM of
filtered water samples, (4) enumeration of bacterial colonies on
m-SPC medium, and (5) enumeration of bacterial colonies on
Reasoner's low-nutrient R-2A medium.k Figure 5 is a graphic
summary of the results. The data show an approximate two-log
reduction in total number of bacteria after lime treatment.
Total bacterial numbers remained relatively constant at about
5 X 10 cells/ml throughout the remaining treatment processes.
However, viable bacterial counts fluctuated dramatically, depend-
ing upon treatment location, with the lowest counts observed at
points in the process where chlorine disinfection was employed
(Q5 and Q9). The graph shows that the RO feedwater (Q-22A) had a
total bacterial count of about 7.5 X 10 cells/ml and a viable
- 96 -
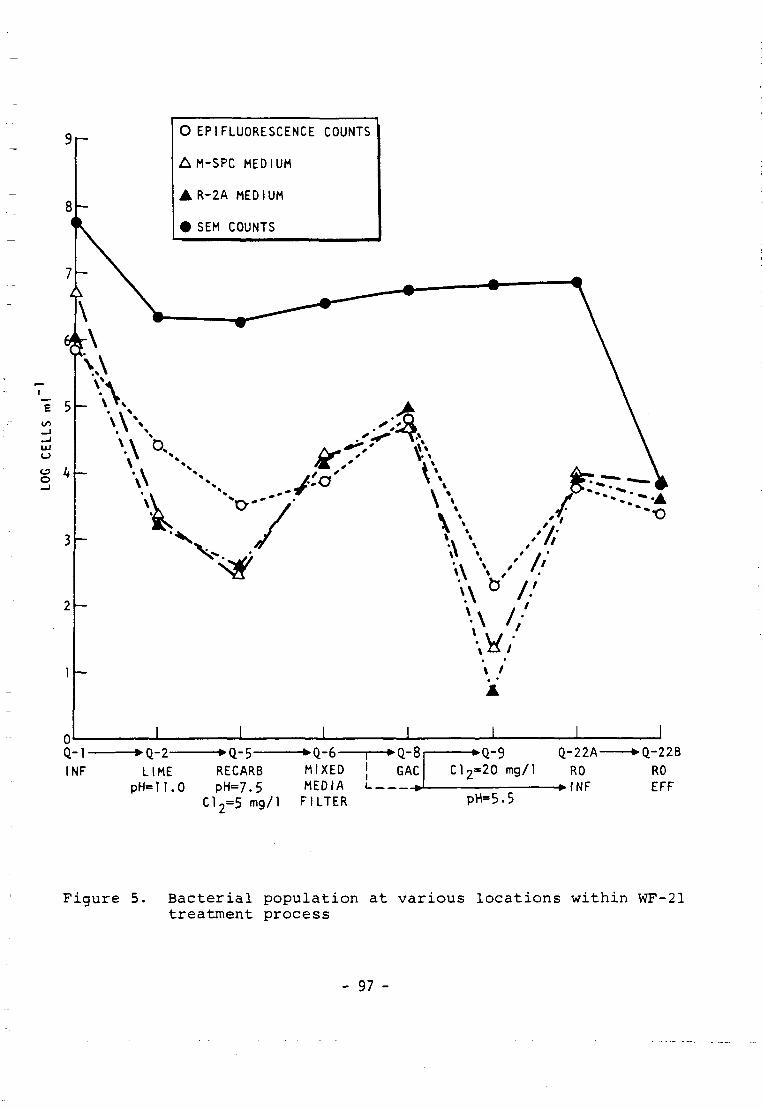
O EPI FLUORESCENCE COUNTS
AM-SPC MEDIUM
• R-2A MEDIUM
• SEM COUNTS
i
i 5to
g *
\%-W
k /'••vV.. \\ \ / //
Mi\ i
iQ - l -INF
• •Q-2- • •Q-5 - • • Q - 6 -MIXED
•>Q-8GACLIME RECARB
pH=11.0 pH=7.5 MEDIA iCl2=5 mg/1 FILTER
*Q-9Cl2=20 mg/l
pH=5.5
Q-22A-RO
-•INF
-0.-22BROEFF
Figure 5. Bacterial population at various locations within WF-21treatment process
- 97 -
bacterial count of 1.0 X 10 cells/ml. Apparently, substantial
regrowth of microorganisms took place during the mixed-media
filtration and granular activated carbon adsorption processes
immediately preceding the RO plant. Microbial isolates of dif-
ferent bacterial genera recovered from the RO feedwater indicated
that most of the organisms were Flavobacterium/Moraxella,
Corynebacterium/Arthrobacter, or Pseudomonas/Alcaligenes.
Examination of RO Membrane Surface
The surfaces of the RO membranes were examined using SEM. Figure
6 is a series of photomicrographs of the feedwater side of the
RO membrane surface, showing the existence of a fouling layer
with a surface texture that appears rough at low magnification.
At higher magnification, the SEM revealed that the outermost
surface of the biofilm consisted of a complex network of fissures
and cavities which harbored large numbers of rod-shaped or
filamentous microorganisms. The rod-shaped bacterial cells were
generally on the order of 0.3 to 0.5pm in diameter and about 0.7
to 0.9ym in length. All of the bacteria occupying a single
microcolony generally exhibited a similar morphological
appearance suggesting that cell growth and multiplication had
occurred in_ situ. In nearly every instance examined, the indi-
vidual bacterial cells were observed to be firmly attached to
the biofilm surface by means of a network of extracellular
polymeric fibrils which radiated outward from the cell surface
(Figure 7). Though these extracellular fibrils were not puri-
fied and chemically analyzed in this investigation, it is likely
that they consist of acidic mucopolysaccharides or glycoproteins,
which have been experimentally demonstrated to be involved in
surface adhesion of a wide variety of bacterial cell types.5
It was sometimes possible to examine the biofilm in a pseudo-
sagittal or edgewise orientation where the RO membrane had been
sliced or torn and subsequently curled away from the membrane
surface during dehydration (Figures 8 and 9). In such an orien-
tation the overall biofilm thickness was readily determined to
- 98 -
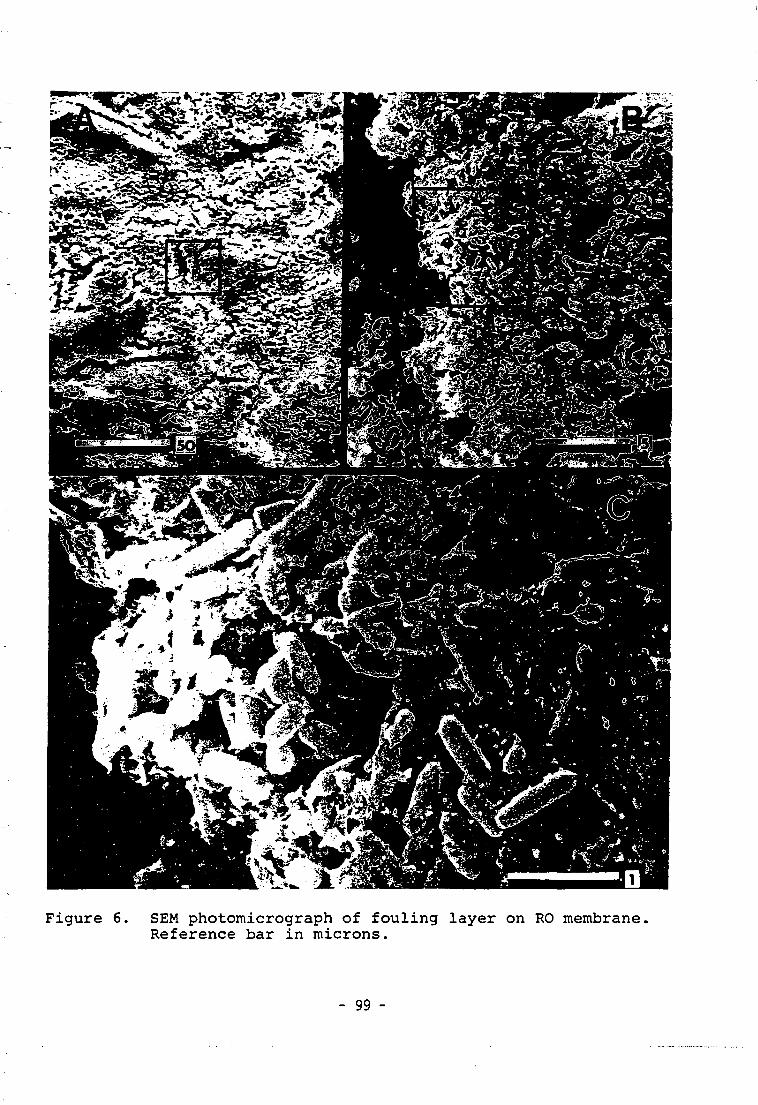
Figure 6. SEM photomicrograph of fouling layer on RO membrane.Reference bar in microns.
- 99 -
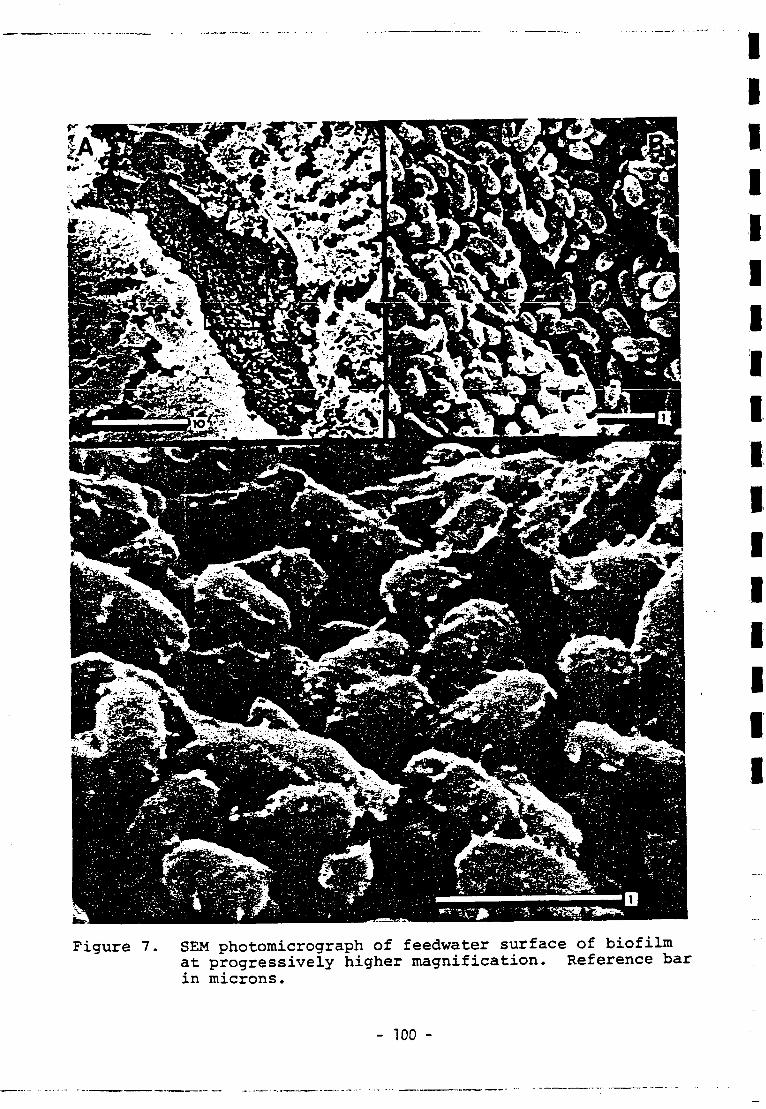
Figure 7. SEM photomicrograph of feedwater surface of biofilmat progressively higher magnification. Reference barin microns.
- 100 -
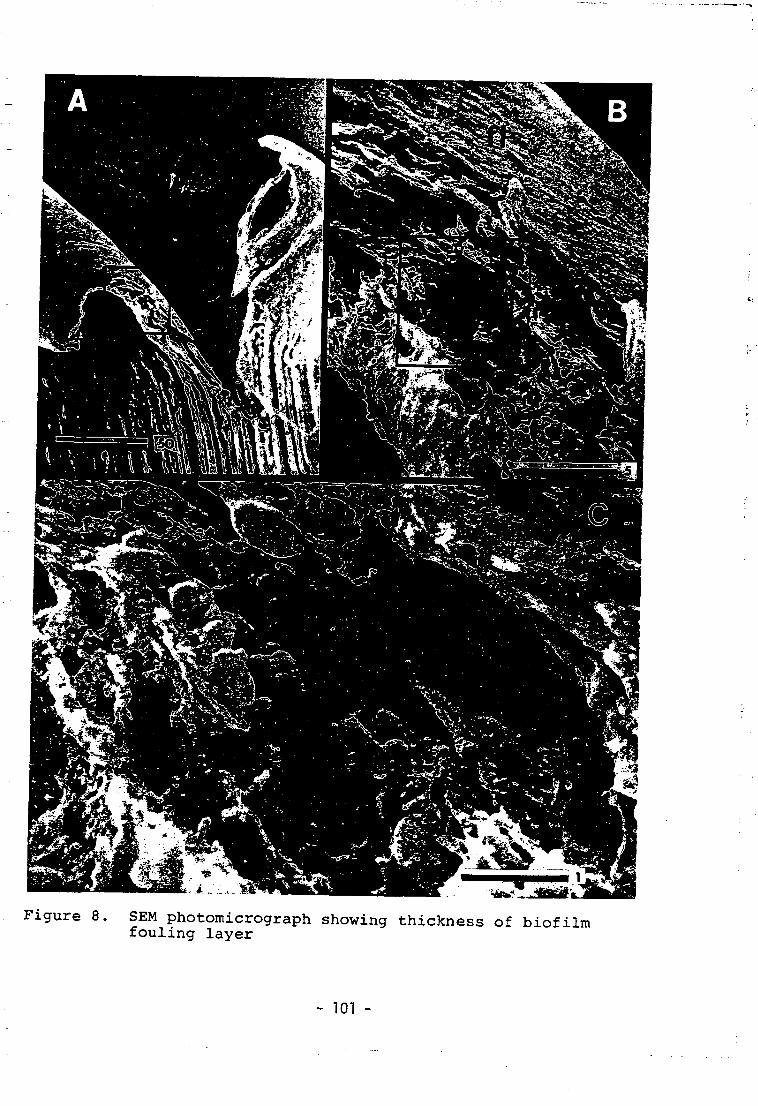
Figure 8. SEM photomicrograph showing thickness of biofilmfouling layer
- 101 -
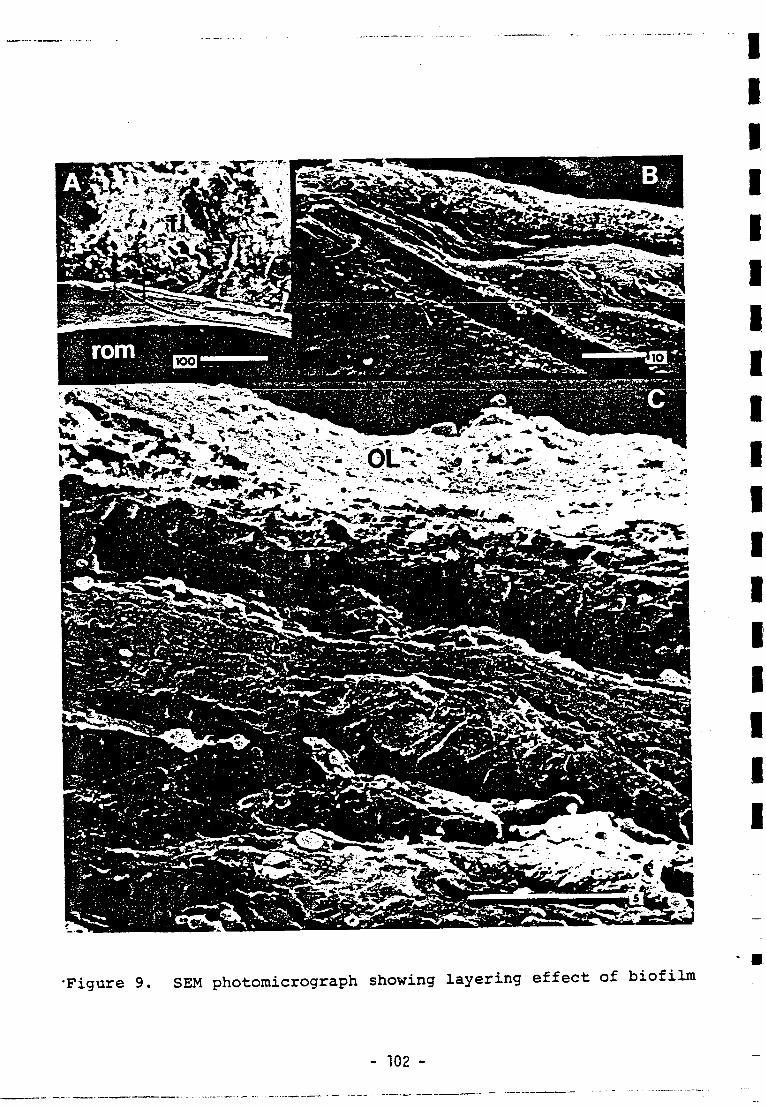
•Figure 9. SEM photomicrograph showing layering effect of biofilm
- 102 -
be from 10 to 20ym. In addition, the biofilm was seen to possess
a distinct laminar construction in the edgewise orientation,
whereby several individual lamellae of apparently compressed
bacterial cells were layered upon one another, collectively
constituting the biofilm. Each of the layers was on the order of
3 to 5ym in thickness, the outermost layer (on the feedwater
surface of the membrane) being the least compacted. Presumably
this outermost layer would correspond to the most recently
deposited fouling material.
Bacterial Enumeration
The number of viable microorganisms associated with the RO
membrane fouling layer was determined by quantitatively plating
samples of the fouling material onto m-SPC and R-2A nutrient
media using a membrane filtration technique. The total number of
colony-forming units (cfu) detected in the biofouling material
from first, second and third pass membranes are shown in Table 4.
The number of viable bacteria in the fouling material (expressed2
as cfu/cm of membrane surface) varied from a low value of
approximately 5 X 10 for the first pass membrane to approxi-
mately 5 X 10 for the third pass membrane. In addition, rela-
tively high concentrations of intracellular ATP were detected in
the fouling material from the second and third pass RO membranes,
indicating the presence of large numbers of viable bacterial
cells. Identification of bacterial isolates found in the RO
membrane fouling layer are summarized in Figure 10. Elements
from the first, second and third passes are identified by the
numbers 1, 2 and 3 on the figure. Bacterial isolates were grown
on two different nutritional media (m-SPC and R-2A), and the bar
graphs indicate the percent of isolates identified. The major
bacterial genus (Acinetobacter) associated with the heavily
fouled feedwater surface of the RO membrane constituted approxi-
mately 78% (on both m-SPC and R-2A) of the total number of isolates
examined from the feedwater surfaces of all three elements.
- 103 -
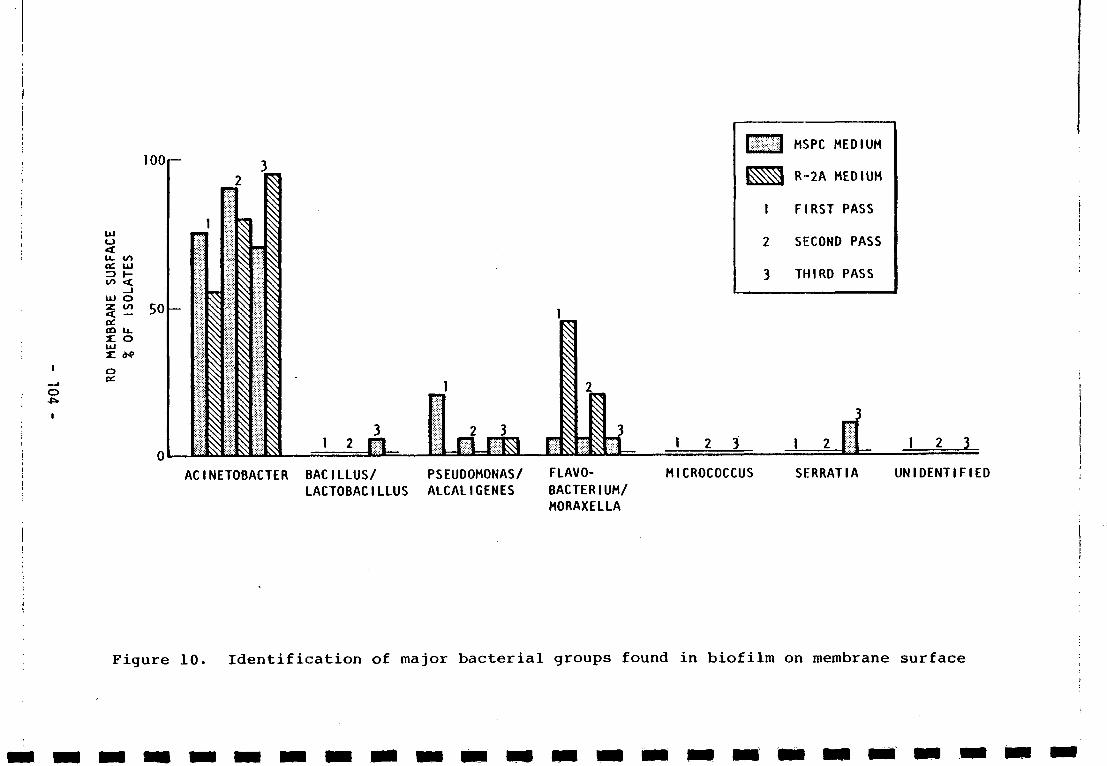
I
o
I
100
o<CC UJ
!2 505a:co u.X. O
o
I 22 3m
1
2
3
MSPC MEDIUM
R-2A MEDIUM
FIRST PASS
SECOND PASS
THIRD PASS
ACINETOBACTER BACILLUS/ PSEUD0M0NAS/LACTOBACILLUS ALCALI GENES
FLAVO-BACTERIUM/MORAXELLA
MICROCOCCUS SERRAT IA UNIDENTIFIED
Figure 10. Identification of major bacterial groups found in biofilm on membrane surface
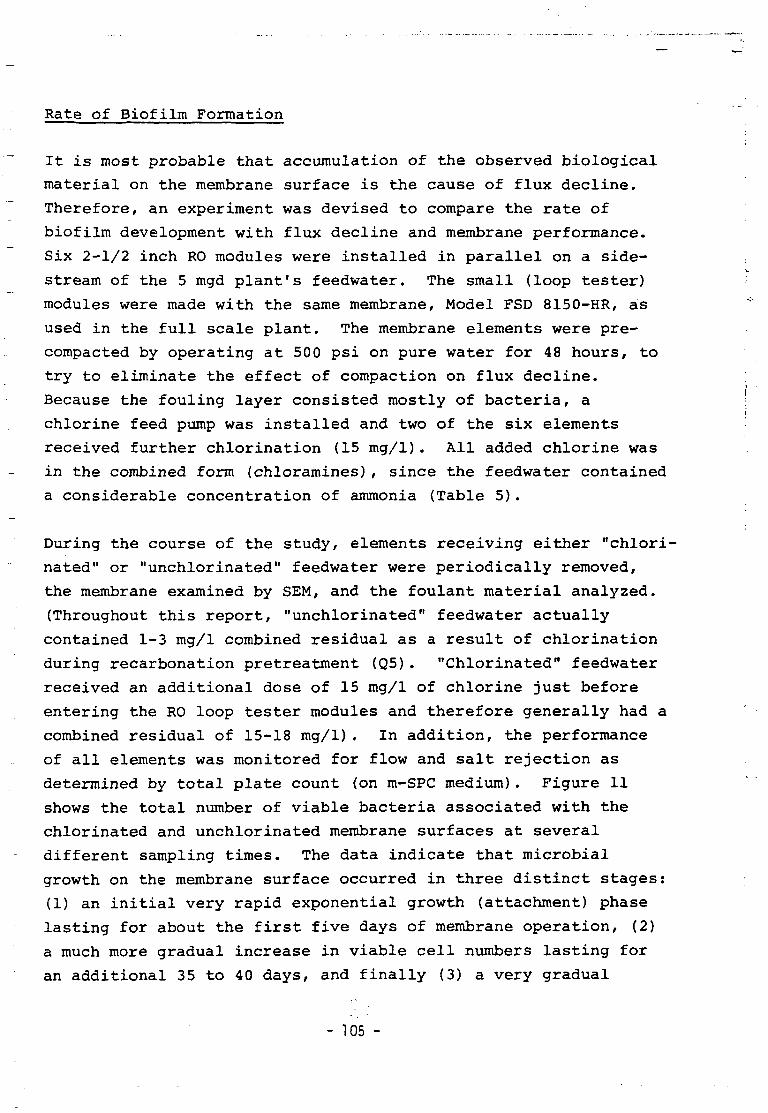
Rate of Biofilm Formation
It is most probable that accumulation of the observed biological
material on the membrane surface is the cause of flux decline.
Therefore, an experiment was devised to compare the rate of
biofilm development with flux decline and membrane performance.
Six 2-1/2 inch RO modules were installed in parallel on a side-
stream of the 5 mgd plant's feedwater. The small (loop tester)
modules were made with the same membrane, Model FSD 8150-HR, as
used in the full scale plant. The membrane elements were pre-
compacted by operating at 500 psi on pure water for 48 hours, to
try to eliminate the effect of compaction on flux decline.
Because the fouling layer consisted mostly of bacteria, a
chlorine feed pump was installed and two of the six elements
received further chlorination (15 mg/1). All added chlorine was
in the combined form (chloramines), since the feedwater contained
a considerable concentration of ammonia (Table 5).
During the course of the study, elements receiving either "chlori-
nated" or "unchlorinated" feedwater were periodically removed,
the membrane examined by SEM, and the foulant material analyzed.
(Throughout this report, "unchlorinated" feedwater actually
contained 1-3 mg/1 combined residual as a result of chlorination
during recarbonation pretreatment (Q5). "Chlorinated" feedwater
received an additional dose of 15 mg/1 of chlorine just before
entering the RO loop tester modules and therefore generally had a
combined residual of 15-18 mg/1). In addition, the performance
of all elements was monitored for flow and salt rejection as
determined by total plate count (on m-SPC medium). Figure 11
shows the total number of viable bacteria associated with the
chlorinated and unchlorinated membrane surfaces at several
different sampling times. The data indicate that microbial
growth on the membrane surface occurred in three distinct stages:
(1) an initial very rapid exponential growth (attachment) phase
lasting for about the first five days of membrane operation, (2)
a much more gradual increase in viable cell numbers lasting for
an additional 35 to 40 days, and finally (3) a very gradual
- 105 -
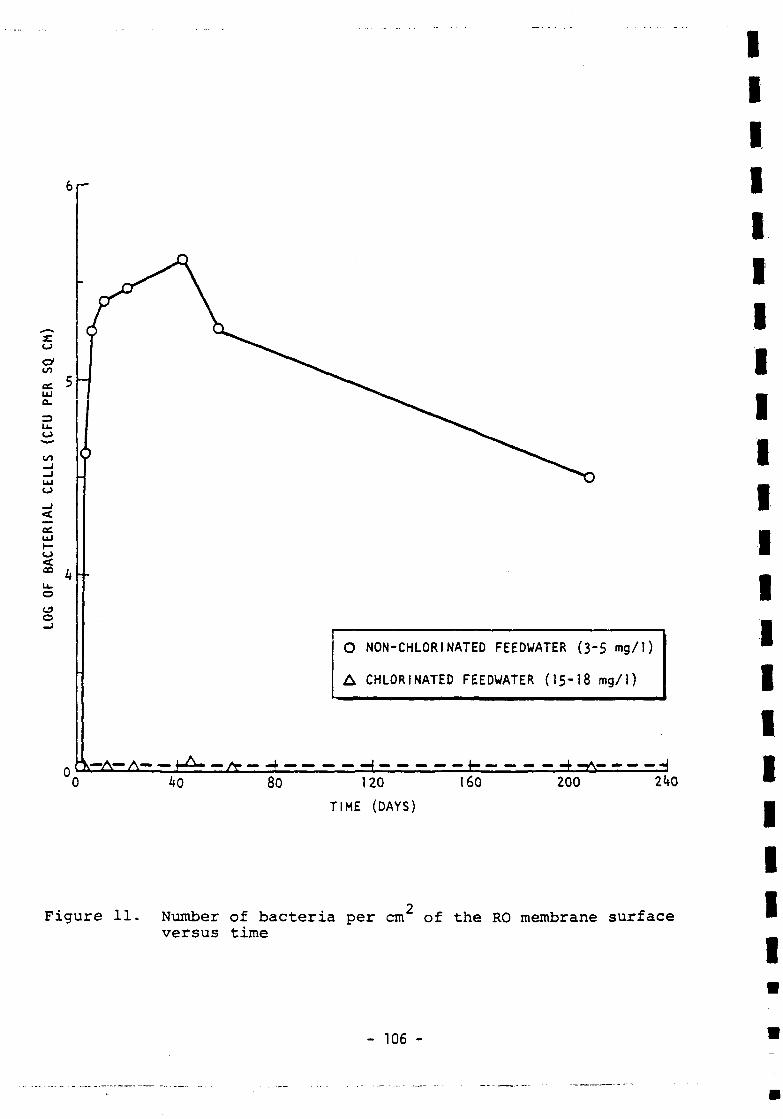
to
CCLUÛ.
u.
to
<ae.
o
O NON-CHLORINATED FEEDWATER (3"5 mg/1)
A CHLORINATED FEEDWATER (15"18 mg/1)
—A— A H ^ » — A- 1- — 1hO 80 120
TIME (DAYS)
160 200
Figure 11. Number of bacteria per cm of the RO membrane surfaceversus time
IIIII1IIIIIIIIIIIIIII
- 106 -
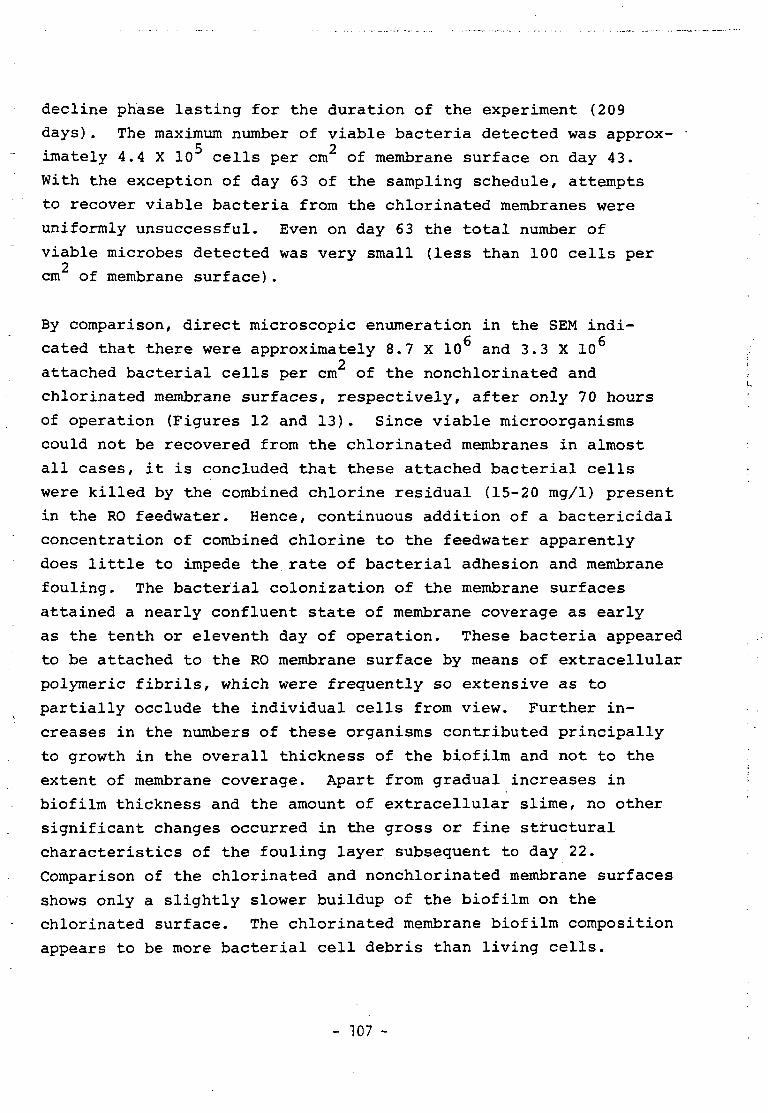
decline phase lasting for the duration of the experiment (209
days). The maximum number of viable bacteria detected was approx- •5 2
imately 4.4 X 10 cells per cm of membrane surface on day 43.
With the exception of day 63 of the sampling schedule, attempts
to recover viable bacteria from the chlorinated membranes were
uniformly unsuccessful. Even on day 63 the total number of
viable microbes detected was very small (less than 100 cells per2
cm of membrane surface).
By comparison, direct microscopic enumeration in the SEM indi-
cated that there were approximately 8.7 X 10 and 3.3 X 10²
attached bacterial cells per cm of the nonchlorinated and
chlorinated membrane surfaces, respectively, after only 70 hours
of operation (Figures 12 and 13). Since viable microorganisms
could not be recovered from the chlorinated membranes in almost
all cases, it is concluded that these attached bacterial cells
were killed by the combined chlorine residual (15-20 mg/1) present
in the RO feedwater. Hence, continuous addition of a bactericidal
concentration of combined chlorine to the feedwater apparently
does little to impede the rate of bacterial adhesion and membrane
fouling. The bacterial colonization of the membrane surfaces
attained a nearly confluent state of membrane coverage as early
as the tenth or eleventh day of operation. These bacteria appeared
to be attached to the RO membrane surface by means of extracellular
polymeric fibrils, which were frequently so extensive as to
partially occlude the individual cells from view. Further in-
creases in the numbers of these organisms contributed principally
to growth in the overall thickness of the biofilm and not to the
extent of membrane coverage. Apart from gradual increases in
biofilm thickness and the amount of extracellular slime, no other
significant changes occurred in the gross or fine structural
characteristics of the fouling layer subsequent to day 22.
Comparison of the chlorinated and nonchlorinated membrane surfaces
shows only a slightly slower buildup of the biofilm on the
chlorinated surface. The chlorinated membrane biofilm composition
appears to be more bacterial cell debris than living cells.
- 107 -
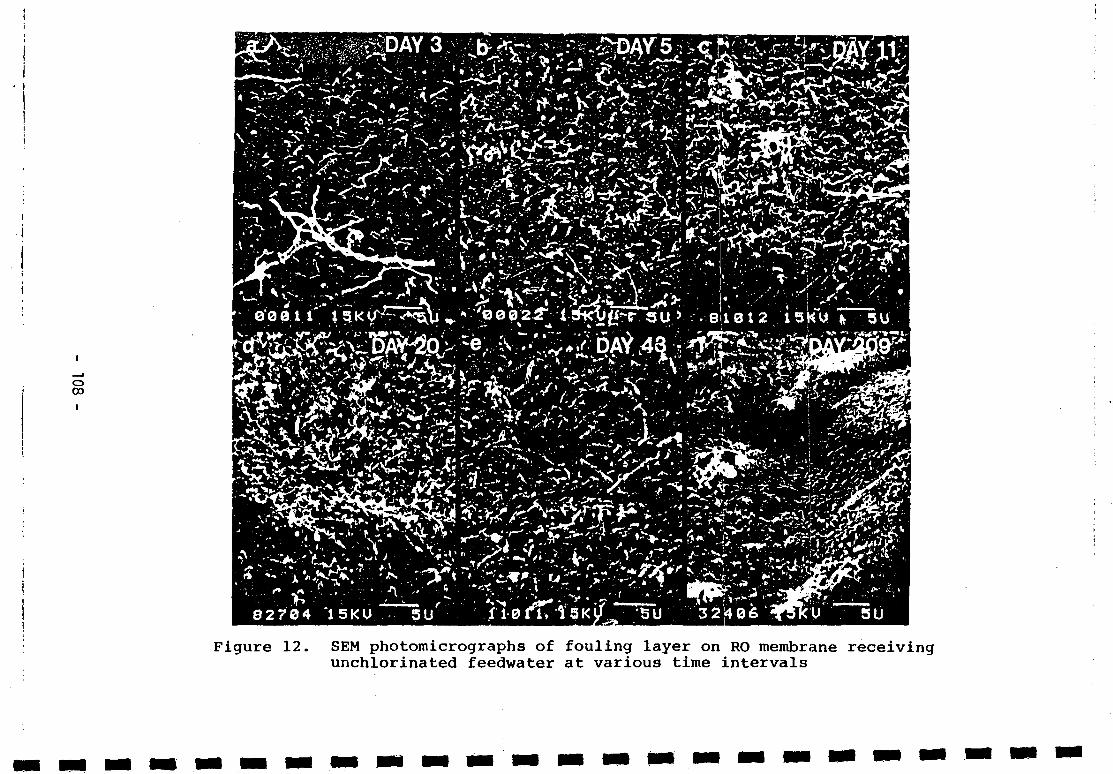
oCD
Figure 12. SEM photomicrographs of fouling layer on RO membrane receivingunchlorinated feedwater at various time intervals
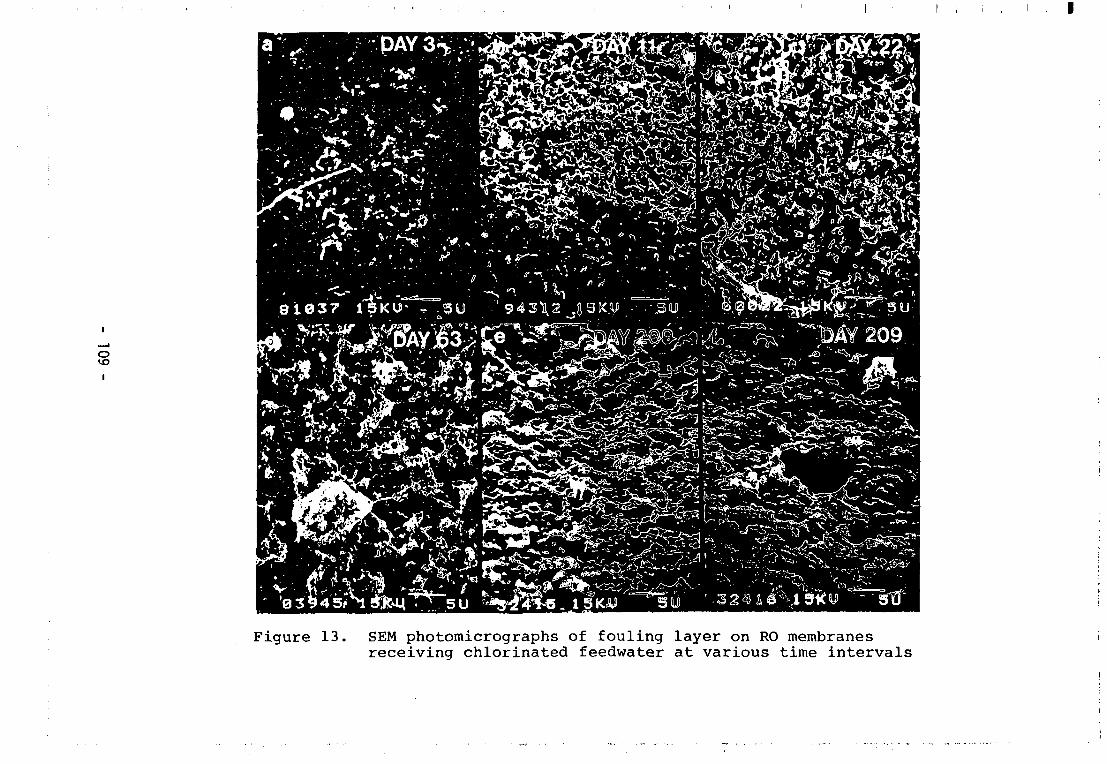
I I
oIO
Figure 13. SEM photomicrographs of fouling layer on RO membranesreceiving chlorinated feedwater at various time intervals
I1I
Figure 13 illustrates the rate of biofilm development for the RO
membranes receiving a feedwater containing approximately 15-20
mg/1 combined chlorine. However, the membrane shown in panel d
(i.e., day 63) received feedwater containing 10-15 mg/1 free •
chlorine for a period of two or three days prior to sacrificing
that element and taking the picture shown. Just before the 63rd I
day the ammonia concentration in the feedwater was significantly
reduced by nitrification in the biological treatment process I
preceding the RO plant. As a result, the 15 mg/1 chlorine dose
added was in the free residual form. Note the extensive cellular £
aggregation and the destruction of the normal rod-shaped morphology
of the bacteria after exposure to free chlorine. In addition, a |
short-term high free chlorine residual produced numerous holes in _
the membrane surface (panel f). However, exposure to even 15 •
mg/1 of free chlorine residual, while damaging the membrane, did m
not remove the 63-day-old biofilm. *
These chlorine-induced lesions, illustrated in Figure 14, were
distributed more or less evenly over the membrane surface and, I
in most instances, completely penetrated the very thin (0.2um)
semipermeable portion of the cellulose diacetate membrane. The I
appearance of these holes was chronologically correlated with
rapid deterioration of membrane function, such as loss of specific |
ion rejection characteristics or sudden increases in membrane
flux (Figure 15).
The extensive microbiological fouling of the RO membrane surfaces
was also reflected in the accumulation of various biochemical
substances. The rate of accumulation of total protein and carbo-
hydrate versus time is plotted in Figures 16 and 17. On both the
chlorinated and nonchlorinated membranes, these parameters dis-
played the most rapid increases during the initial 5 to 10 days
of membrane operation. Like bacterial growth, this initial rapid
increase in the biochemical parameters was followed by a more
gradual rate of fouling for the remaining duration of the experi-
mental period.
- no -
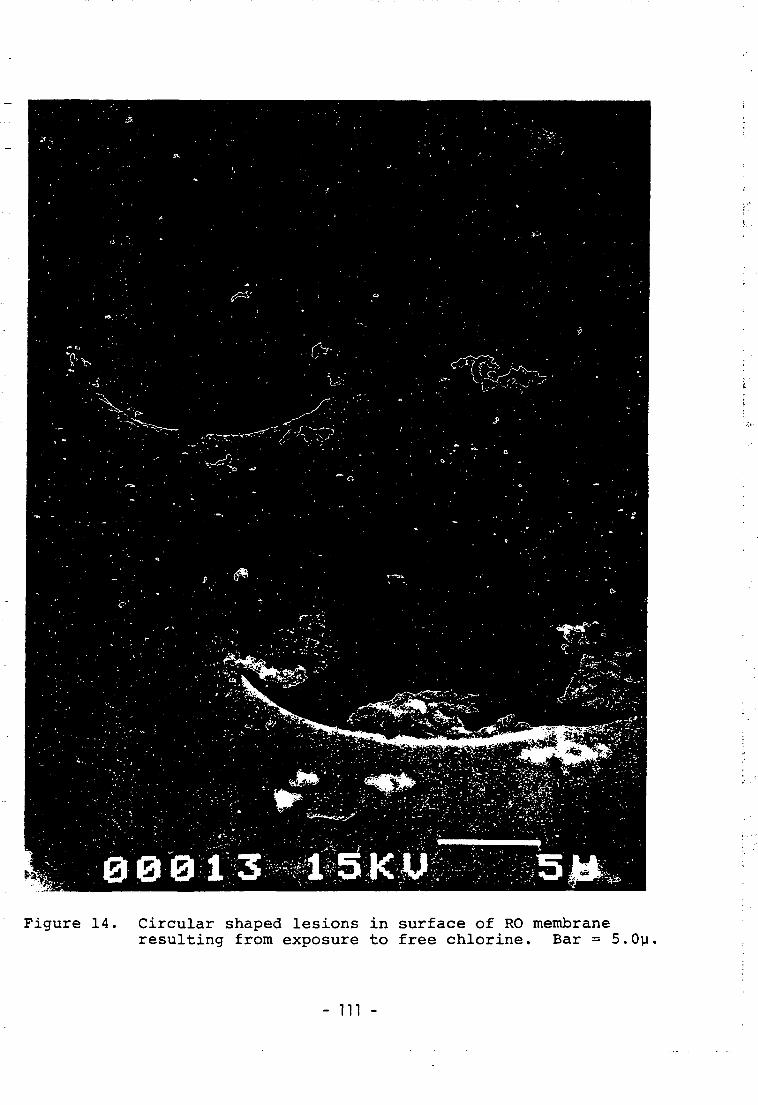
Figure 14. Circular shaped lesions in surface of RO membraneresulting from exposure to free chlorine. Bar = 5.0y.
- Ill -
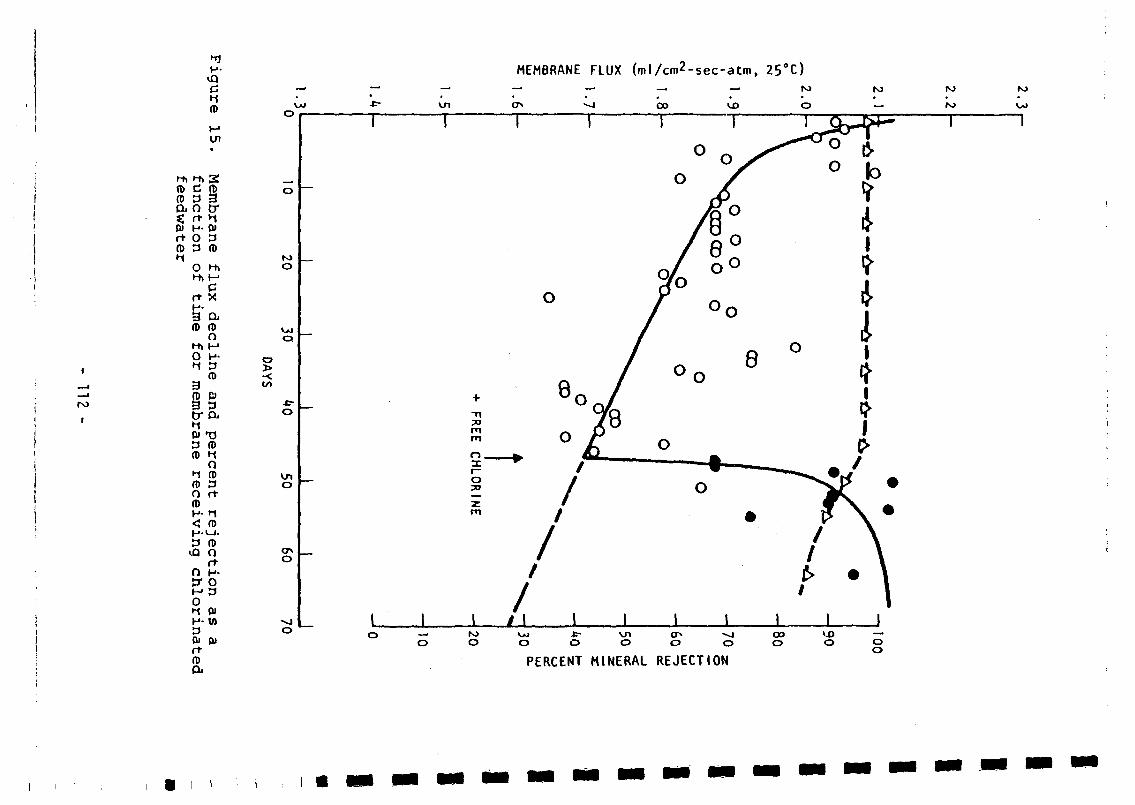
MEMBRANE FLUX (ml/cmZ-sec-atm, 25°C)
i
c(D
H ) f~t> 3»(D d to(D 3 3
a o crOl H- 0»
(D 3 (DO HiHi Mrt X
(D (DO
H\ MO H-
m3(D Ê>3 3t r DJ
Oí T33 ÍDfD H.
O•-( fD
O rt
3 (DiQ O
O H-3" OM 3Oti fuH- M3(U Dlft(D
a»
Q
>
o
co U )
too
O
O Ocr>o O
ooo o o
oo oPERCENT MINERAL REJECTION
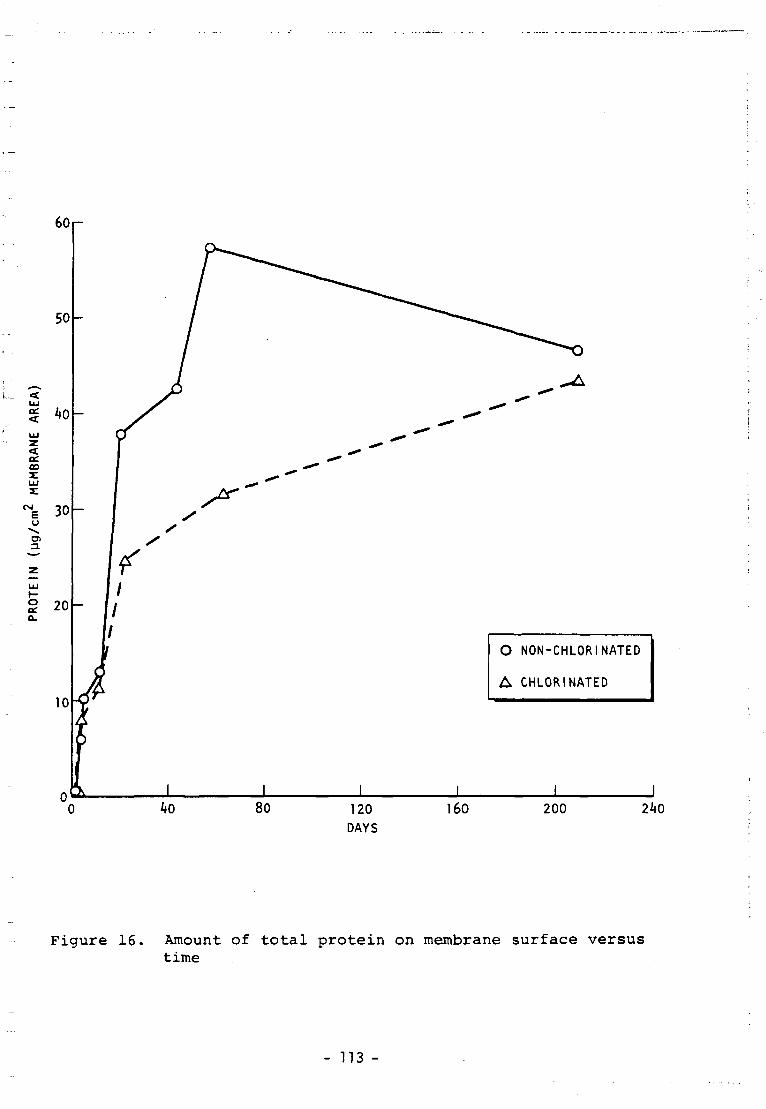
60i-
50
i.,- <LU<
oo
1= 30uOÍ
2 20
10
80 120DAYS
O NON-CHLORINATED
A CHLORINATED
160 200 240
Figure 16. Amount of total protein on membrane surface versustime
- 113 -
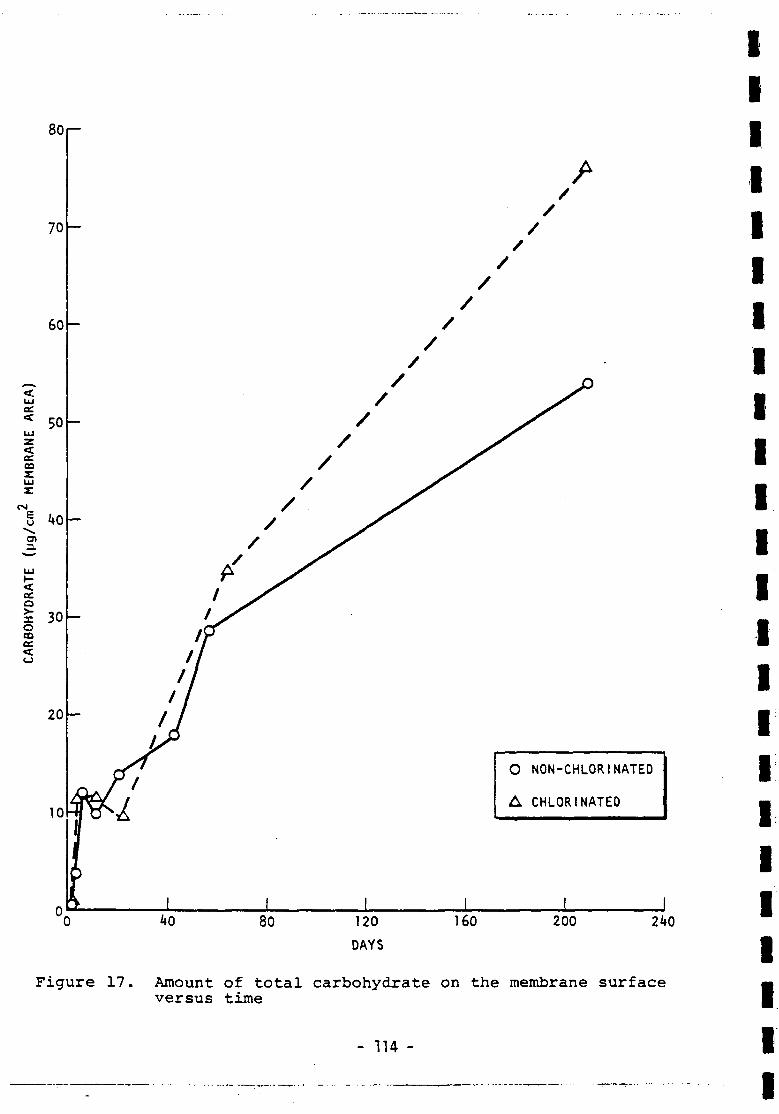
80
70
60
50ce<
<ceta
u•v.3.
LU
<ceaÈ 30omce
ko
20
10
O NON-CHLORINATED
A CHLORINATED
80 120
DAYS
160 200 240
Figure 17. Amount of total carbohydrate on the membrane surfaceversus time
- 114 -
One of the major objectives of this study was to try to correlate
the buildup of bacteria on the membrane surface with flux decline.
Figure 18 plots the flux and rejection versus time for two modules
operated for 120 days during the biofilm kinetic studies. Figure
18a gives the performance for a module receiving feedwater iden-
tical to that for the full-scale RO plant (i.e., "unchlorinated"
feedwater), while Figure 18b plots the performance of an identical
module receiving "chlorinated" feedwater (15 mg/1 chlorine added).
As previously discussed, the chlorine usually reacted with the
ammonia in the feed so that the membrane received only chloramines.
The operating time for these two membranes was identical. A ],:.
comparison of Figures 18a and b shows that the rate of flux :
decline was greater for the element receiving chlorinated feed .'
than for the one receiving unchlorinated feed. This was opposite
to the anticipated result, but not totally surprising since the [
SEM microphotos had shown that chlorination did not prevent
adhesion of the bacteria to the membrane surface. However, based
on that observation, one would expect the rate of flux decline
for the two membranes to be about the same. As shown by the
figures, the flux decline ratios were not similar and the slope
(m value) for the chlorinated feedwater was about five times
greater than the flux decline for the unchlorinated feed. There
are two possible explanations for the observed difference in
performance: (1) The biofilm on the membrane receiving chlorinated
feedwater is composed of dead bacteria. This may have caused the
foulant to become more densely compacted than that composed of
viable organisms. (2) The chloramines, while not appearing to
affect membrane salt rejection, may have reacted with the membrane
to reduce its flux characteristics. It was observed that the
membranes which received chlorinated feedwater were more brittle,
and physical changes were observed in the membrane material
itself.
In a further attempt to correlate flux with accumulation of
biochemical substances, percentage of change in several bio-
chemical parameters such as protein, carbohydrate, UV absorbance,
muramic acid and flux were plotted against time for membranes
- 115 -
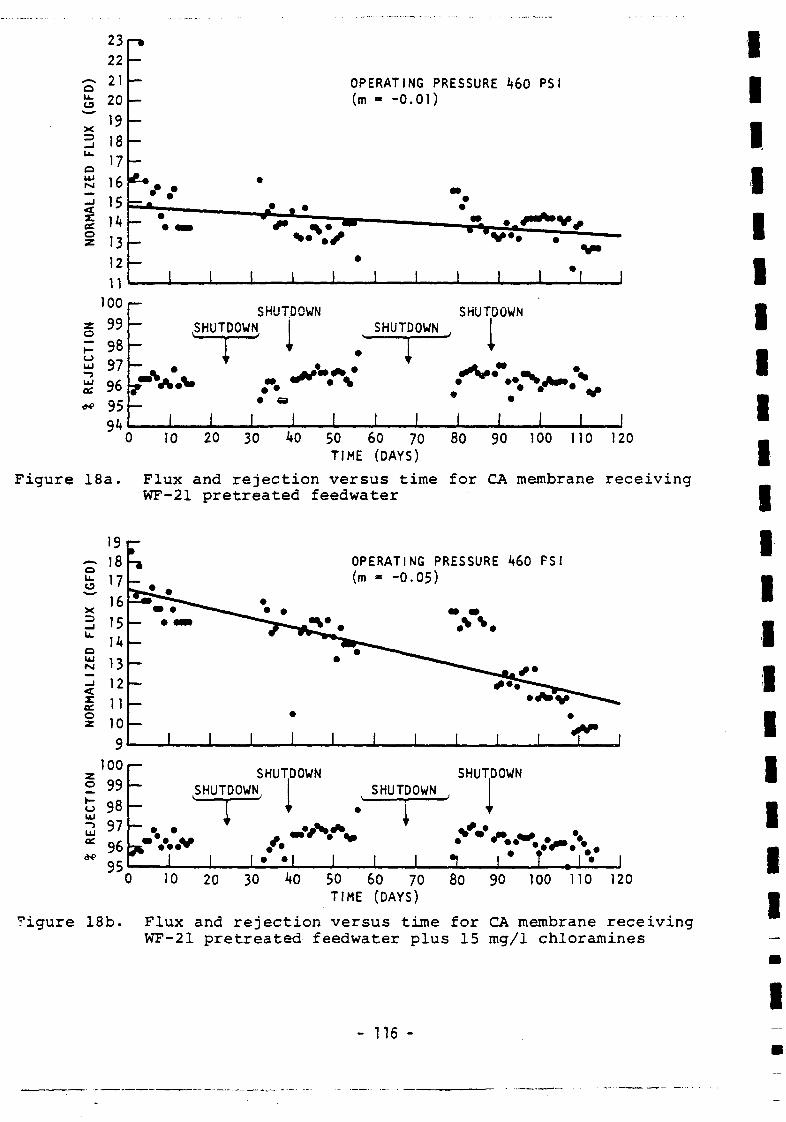
ou.13
X
_l
u.oUlINI
_l<
a:oz
23
22
21
20
19
18
17
16
15
U»
13
12
U
100
99
h- 98
S 97S 96*«• 95
Figure 18a.
19
fe 17
OPERATING PRESSURE kdO PS I(m - - 0 . 0 1 )
zo
—
• " " «
SHUTDOWN
1
1 1 1
SHUTDOWN
I :S fiS
1 1
SHUTDOWN
1
1 1
SHUTDOWN
• I
•1 1 1 1
10 20 30 kO 50 60 70TIME (DAYS)
80 90 100 110 120
Flux and rejection versus time for CA membrane receivingWF-21 pretreated feedwater
X
oui
ecOz
i i i
OPERAT 1(m - -0
1 1 1
NG PRESSURE.05)
1 1 1
460
«*¿!•
FSI
>
^
I T^
16 -=5^15|-
1312
11
10
9100
9998979695
SHUTDOWNSHUTDOWN, I
SHUTDOWNSHUTDOWN
I I10 20 30 50 60 70
TIME (DAYS)80 90 100 110 120
Tigure 18b. Flux and rejection versus time for CA membrane receivingWF-21 pretreated feedwater plus 15 mg/1 chloramines
IIIIIIIIIIIIIIIIIIII
- 116 -
receiving the unchlorinated feed. The rate of accumulation of
the biochemical substances on the membrane surfaces was found to
correlate inversely with the rate of membrane flux decline
(Figure 19). Therefore, it is tentatively concluded that the
gradual loss of water flux through the RO membranes is partially
caused by the attachment and growth or accumulation of microbial
cells on the membrane surfaces.
Evaluation of Cleaning Solutions in Removal of Biofilm
The membrane elements which were removed from the sidestream loop
tester to evaluate the development of the biofilm were also used
to evaluate different cleaning solutions. Small strips of the
membrane which were covered with an undisturbed fouling layer
were placed in sterile glass bottles, different cleaning solutions
(Table 6) added to each, and then mixed for one hour at 35°C.
Afterwards the membrane strips were removed, inspected by SEM,
and analyzed by means of a battery of assays including ATP analysis,
bacterial enumeration and biochemical analyses. One strip placed
in a phosphate buffer served as an experimental control (i.e.,
the treatment control membrane). The appearance of the treated
membranes in the SEM was compared with that of the corresponding
treatment control membrane, and the cleaner was then assigned a
grade on a relative 0 to 4+ scale based on a subjective evaluation
of the extent of biofilm removal. The grading system is explained
in more detail in Table 7.
In Figures 20-22 are shown a series of representative SEM
photomicrographs illustrating the effects of selected cleaning
treatments on biofilm removal, and in Table 8 is given the grade
assigned to each cleaner. Figure 20 shows a series of eight
photomicrographs of membranes cleaned with seven different cleaners
after receiving unchlorinated feedwater for 11 days. The code
in the top left-hand corner corresponds to the type of cleaning
solution used (see Table 6), and the effectiveness of each is
noted in the upper right-hand corner according to the grading
system outlined in Table 7. Figure 21 shows a series of photo-
micrographs of membranes receiving chlorinated feedwater which
- 117 -
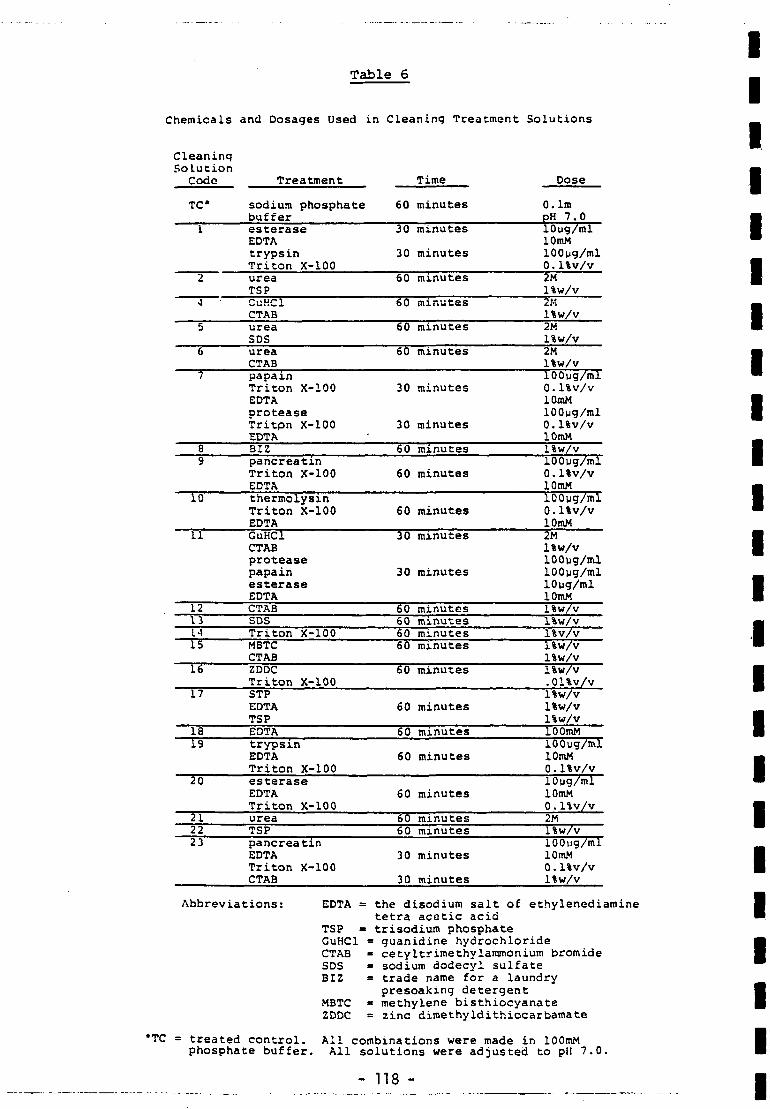
Table 6
Chemicals and Dosages Used in Cleaning Treatment Solutions
CleaninqSoLution
Code
11
Treatment Time Dose
TC*
i
2
4
5
6
sodium phosphatebufferesteraseEDTAtrypsinTriton X-100ureaTSPGuKClCTABureaSDSureaCTAB
60 minutes
30 minutes
30 minutes
60 minutes
60 minutes
60 minutes
60 minutes
0.1mpH 7.010ug/mllOmM100ug/ml0.l%v/v2Ml%w/v2Kl%w/v2Ml%w/v2Ml%w/v
papainTriton X-100EDTAproteaseTritpn X-100EDTA
30 minutes
30 minutes-
lOOug/ml0.1%v/vlOffiMlOOpg/ml0.1%v/vlOmM
89
10
BIZpancreatinTriton X-100EDTAthermolysinTriton X-100EDTA
60 minutes
60 minutes
60 minutes
l%w/v100yg/ml0.1%v/vlOmM100yg/ml0.l%v/vlOmM
GuHClCTABproteasepapainesteraseEDTA
30 minutes
30 minutes
2Ml%w/v100ug/ml100ug/mllOug/mllOmM
1213M15
16
17
1819
20
212223
CTABSDSTriton X-100MBTCCTABZDDCTriton X-100STPEDTATSPEDTAtrypsinEDTATriton X-100esteraseEDTATriton X-100ureaTSPpancreatinEDTATriton X-100CTAB
60 minutes60 minutes60 minutes60 minutes
60 minutes
60 minutes
60 minutes
60 minutes
60 minutes
60 minutes60 minutes
30 minutes
30 minutes
l%w/vl%w/vl%v/vl%w/vl%w/v1%W/V.01%v/vl%w/vl%w/vl%w/vlOOmM100ug/mllOmM0.1%v/v10ug/mllOmM0.1%v/v2Ml%w/v100ug/mllOmM0.1%v/vl%w/v
Abbreviations: EDTA = the disodium salt of ethylenediaminetetra acetic acid
TSP « trisodium phosphateGuHCl = guanidine hydrochlorideCTAB « cetyltrimethylammonium bromideSDS = sodium dodecyl sulfateBIZ = trade name for a laundry
presoaking detergentMBTC «= méthylène bisthiocyanateZDDC = zinc dimethyldithiocarbamate
*TC = treated control. All combinations were made in lOOmMphosphate buffer. All solutions were adjusted to pH 7.0.
- 118 -
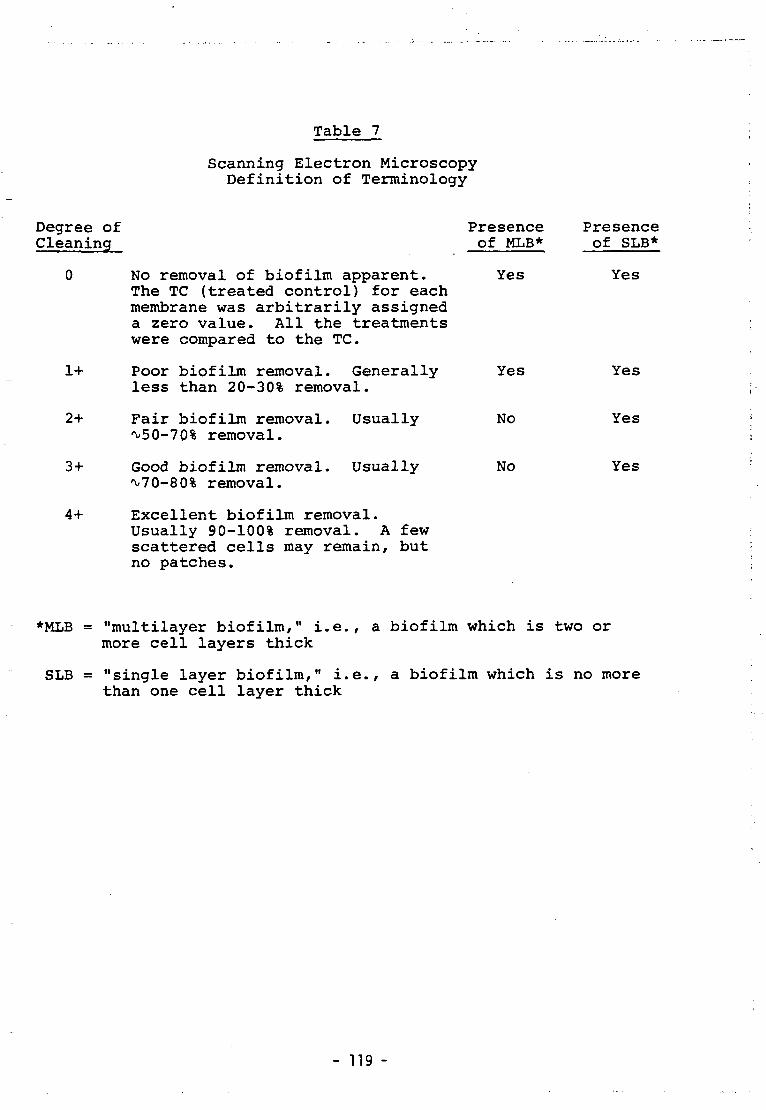
Table 7
Scanning Electron MicroscopyDefinition of Terminology
Degree of Presence PresenceCleaning of MLB* of SLB*
0 No removal of biofilm apparent. Yes YesThe TC (treated control) for eachmembrane was arbitrarily assigneda zero value. All the treatmentswere compared to the TC.
1+ Poor biofilm removal. Generally Yes Yesless than 20-30% removal.
2+ Fair biofilm removal. Usually No Yes^50-70% removal.
3+ Good biofilm removal. Usually No Yes^70-80% removal.
4+ Excellent biofilm removal.Usually 90-100% removal. A fewscattered cells may remain, butno patches.
*MLB = "multilayer biofilm," i.e., a biofilm which is two ormore cell layers thick
SLB = "single layer biofilm," i.e., a biofilm which is no morethan one cell layer thick
- 119 -
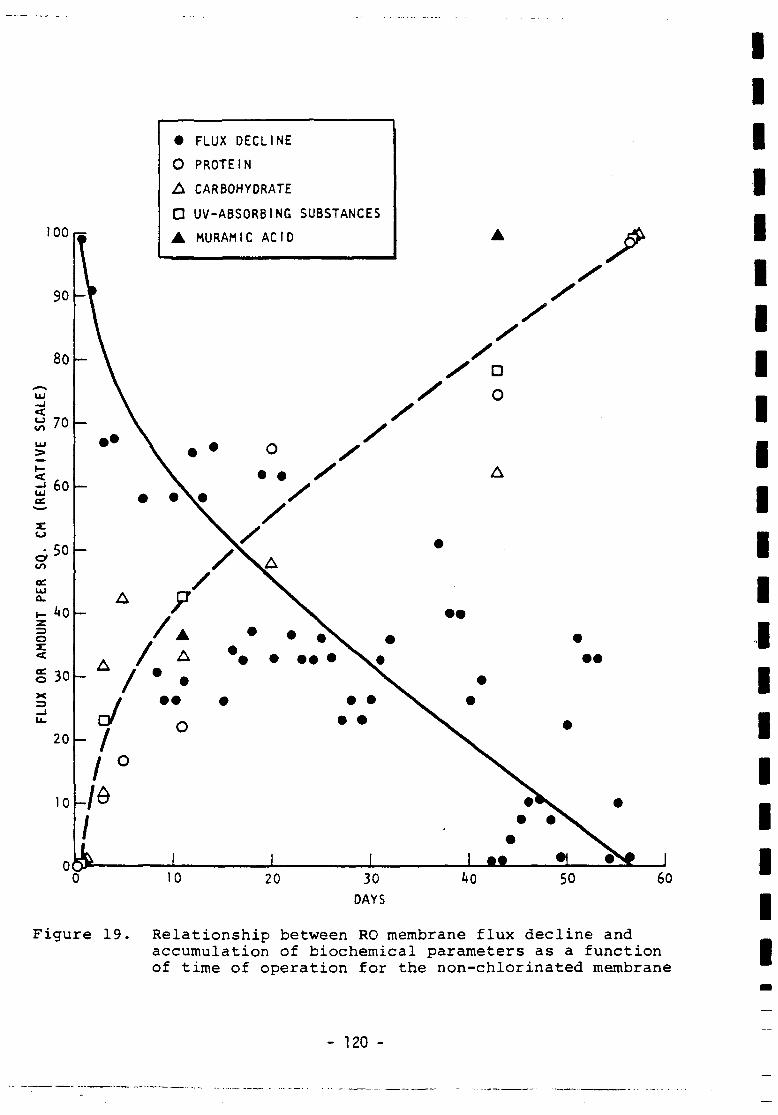
100
• FLUX DECLINE
O PROTEIN
A CARBOHYDRATE
D UV-ABSORBING SUBSTANCES
A MURAM IC ACID
•
i
Figure 19 Relationship between RO membrane flux decline andaccumulation of biochemical parameters as a functionof time of operation for the non-chlorinated membrane
IIIIIIIIIIIIIIIIIIIII
- 120 -
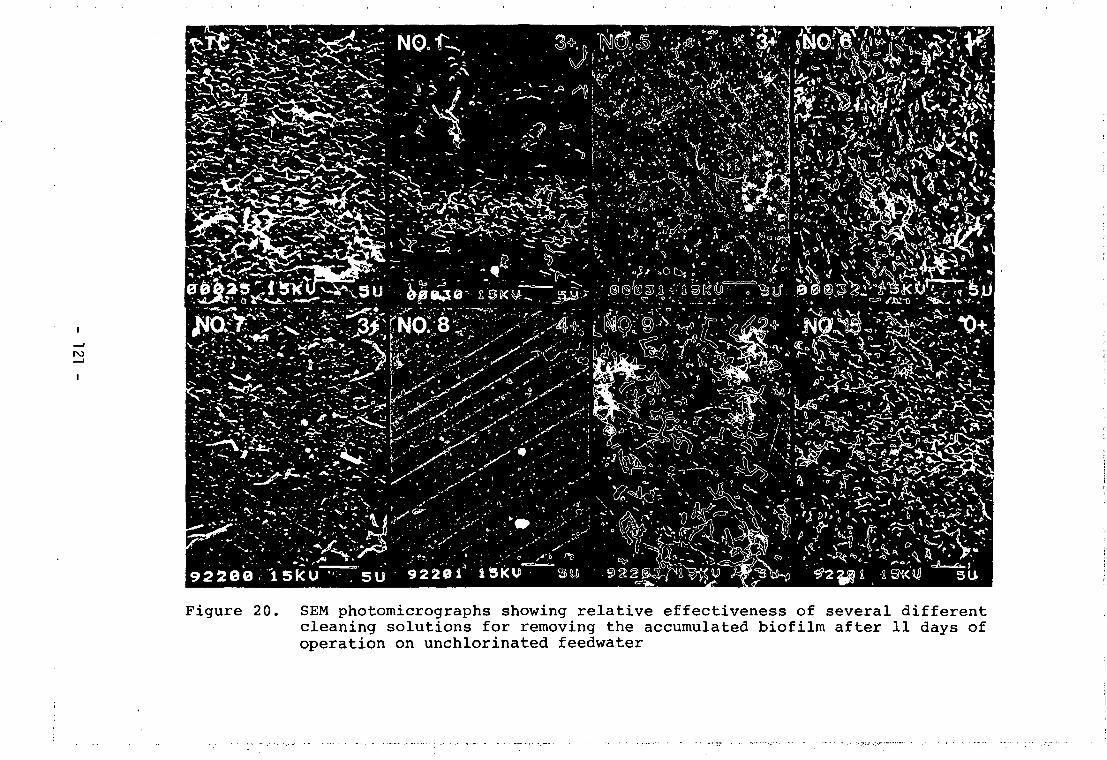
I
Figure 20. SEM photomicrographs showing relative effectiveness of several differentcleaning solutions for removing the accumulated biofilm after 11 days ofoperation on unchlorinated feedwater
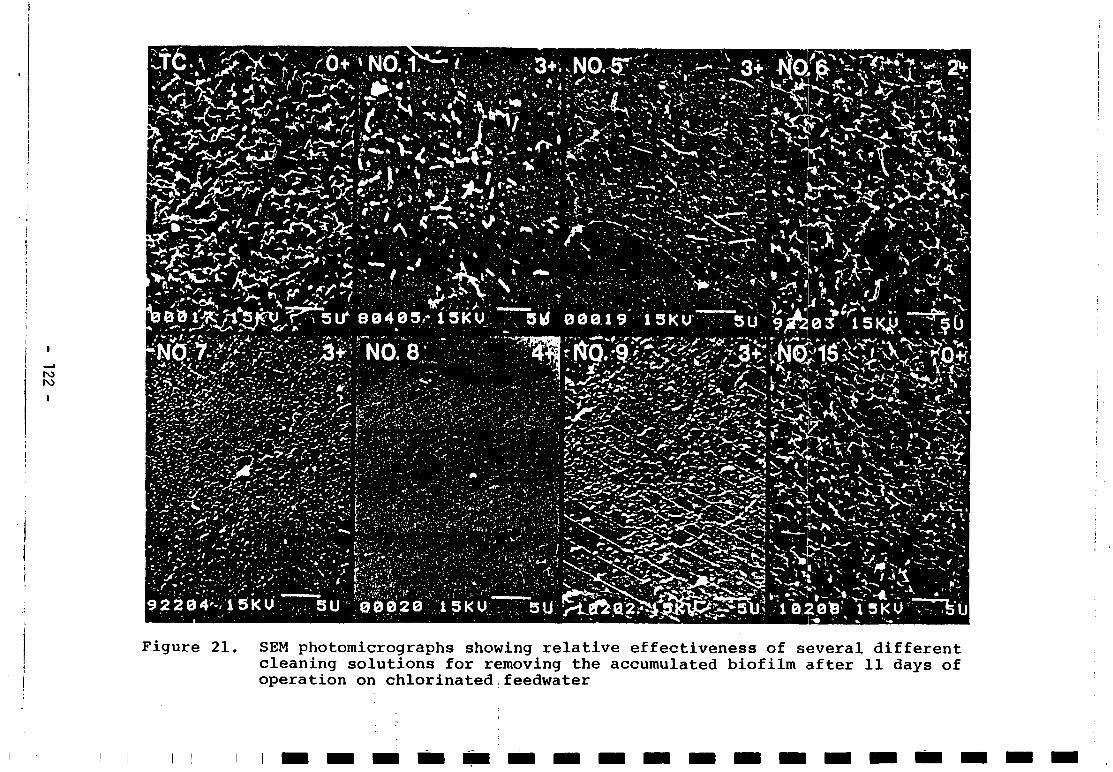
Figure 21. SEM photomicrographs showing relative effectiveness of several differentcleaning solutions for removing the accumulated biofilm after 11 days ofoperation on chlorinated feedwater
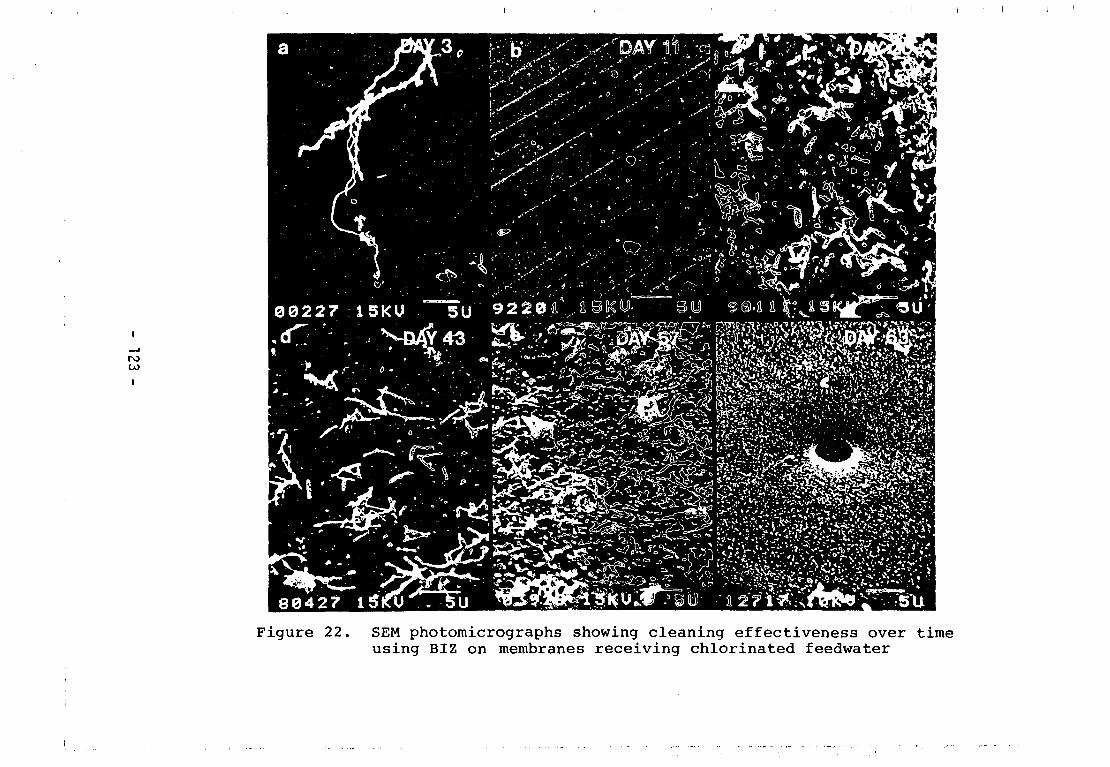
I . I
CO
Figure 22. SEM photomicrographs showing cleaning effectiveness over timeusing BIZ on membranes receiving chlorinated feedwater
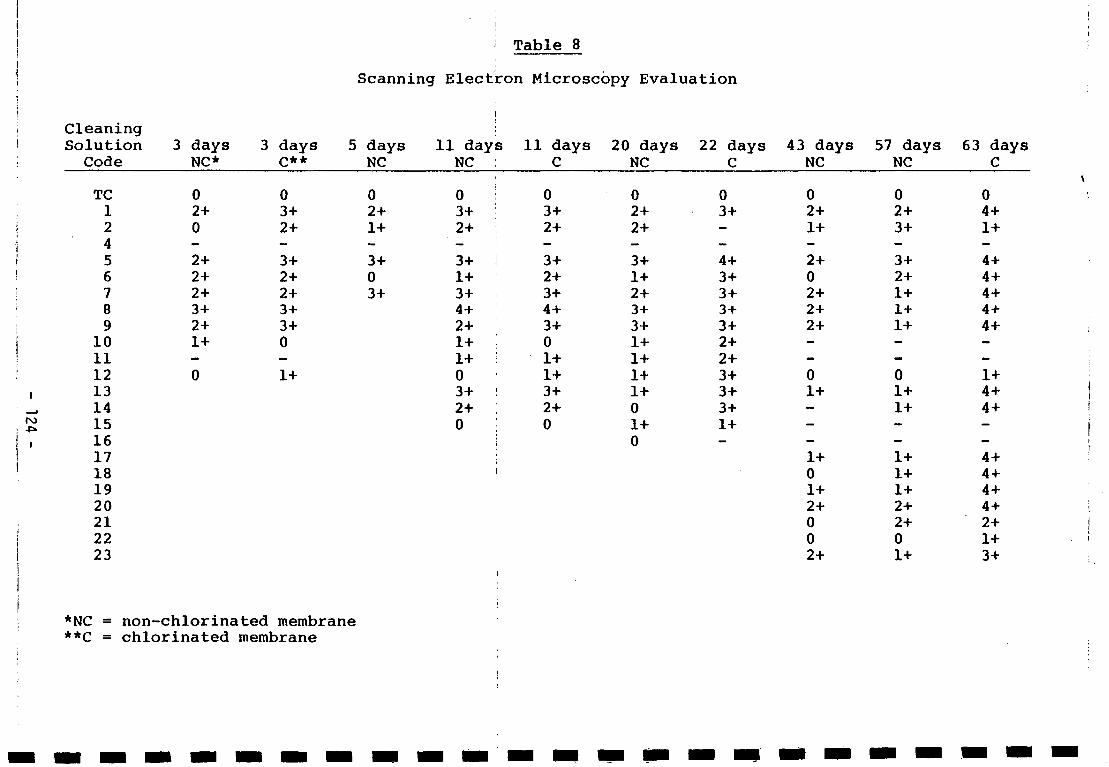
I
i
CleaningSolutionCode
TC12A1
5678910111213141516
3 daysNC*
02+0
2+2+2+3+2+1+-0
3 daysc**
03+2+
3+2+2+3+3+0—1+
Scanning
5 daysNC
02+1+
3+03+
Elect
11 dayNC
03+2+
3+1+3+4+2+1+1+03+2+0
re
s
Table 8
3n Microscopy
11 days 20C
03+2+
3+2+3+4+3+01+1+3+2+0
Evaluation
daysNC
02+2+
3+1+2+3+3+1+1+1+1+01+0
22 daysC
03+-
4+3+3 +3+3+2+2+3+3+3+1+_
43 daysNC
02+1+
2+02+2+2+--01+--
57 daysNC
02+3+
3+2+1+1+1+--01+1+-
63 daysC
04+1+
4+4+4 +4 +4+—-1+4+4 +-_
17181920212223
1+01+2+002+
1+1+1+2+2+01+
4+4 +4 +4+2+1+3+
*NC = non-chlorinated membrane**C = chlorinated membrane
were cleaned with the same solutions used in Figure 18. Figure 22
shows a series of photomicrographs which indicates a decreasing
effectiveness of the cleaner (BIZ) with biofilm use for the
chlorinated membranes. No cleaner tested consistently removed
all of the biofilm from all of the membranes. Moreover, some
cleaners seemed to work well one time, but poorly at other times.
However, some general trends in the data were discernible. For
example, inspection of the data in Table 8 indicates that biofilm
removal from the membranes which received chlorinated feedwater
was, in general, more efficient than removal from membranes which
received unchlorinated feedwater. This effect is probably due to the
bactericidal action of chlorine and to the partial oxidation of
cellular material by the combined chlorine compounds. Whereas
bacteria killed by chlorine may still be capable of passively
attaching to the RO membrane surfaces, they would be expected to
be dislodged more easily than living microorganisms, since they
are unable to manufacture and secrete adhesive extracellular
polymers, which have been demonstrated to be required for irre-
versible attachment of microorganisms to surfaces.5 Another trend
which was evident in the data was that most cleaners appeared to
become less effective as the age of the biofilm increased (Figure
22). A number of factors may account for this apparent decrease
in cleaning effectiveness with time, such as increases in biofilm
thickness or the degree of compaction, changes in the types of
extracellular polymers being synthesized by the fouling micro-
organisms, or the accumulation of specific heavy metals (such as
cadmium, chromium or copper) on the membrane surfaces which could
inhibit enzyme activity during cleaning.
The best cleaners appeared to be the commercial laundry detergent
BIZ, urea-SDS, papain-Triton X-100-EDTA/protease-Triton X-100-
EDTA, esterase-EDTA/trypsin-Triton X-100, pancreatin-Triton X-
100-EDTA, and esterase-Triton X-100. With the exception of the
urea-SDS combination, all of these treatments involved the use
of enzymes which can attack and degrade a variety of different
kinds of extracellular polymeric molecules, such as glycoproteins
or mucopolysaccharides, which appear in the electron microscope
- 125 -
to be involved in the attachment of bacteria to the RO membrane
surfaces. These findings emphasize the effectiveness of proteo-
lytic and glycosidic enzymes, at least under the laboratory test
conditions employed.
CONCLUSIONS
1. During long-term operation (28 months), Water Factory 21's
wastewater demineralization plant experienced an overall
flux decline rate of -0.159 gfd/month due to fouling.
This represents a 40% decline in flow.
2. Analysis of the fouling layer removed from the membrane
surface revealed that the material was about 90% organic
and contained considerable quantities of carbohydrate,
protein and ATP, which are indicators of the presence of
bacteria.
3. Scanning electron microscopy (SEM) showed a total bacterial
count of about 7.5 X 10 cells/ml and a viable bacterial4
count of 1.0 X 10 cells/ml in the feedwater.
4. SEM showed that the fouling layer consisted primarily of
bacteria which attached to the surfaces of the cellulose
acetate membranes.
5. The major bacterial groups found in the fouling layer were
of the genera Acinetobacter, Pseudomonas, and Flavobacterium/
Moraxella.
6. Microbial attachment (growth) on the membrane surfaces
occurred in three distinct stages: (1) an initial expo-
nential growth phase lasting for about the first five days
of membrane operation, (2) a much more gradual increase in
bacterial numbers lasting for an additional 35 to 40 days,
and (3) a slow decline phase lasting for the duration of
the membranes' operation.
- 126 -
7. The increase in bacterial numbers associated with the RO
membranes was inversely related to a progressive decline
in membrane water flux.
8. Bactericidal concentrations of combined chloramines
(at 15 mg/1) failed to prevent bacterial adhesion to the
membranes or water flux decline. In fact, comparison of
the chlorinated versus non-chlorinated membranes indicated
a much greater flux decline (m = -0.05) for the membranes
receiving the feedwater containing the 15 mg/1 chloramines
than the membranes receiving feedwater containing only 1-3
mg/1 chloramines (m = -0.01).
9. Continuous exposure to 15 mg/1 chloramines did not adversely
affect the mineral rejection characteristics of the membranes.
However, when the membranes were exposed to a free chlorine
residual of 10 to 15 mg/1 for a few days, they were rapidly
destroyed. A loss of rejection and an increase in flow were
correlated with structural changes (holes) occurring in the
membranes, as visualized by SEM.
10. Evaluation of a number of different cleaning solutions
indicated several were capable of removing the biofilm in
laboratory experiments. The membranes receiving chlorinated
feedwater appeared to clean better than those receiving
non-chlorinated feed. All cleaners seemed to be less
effective over time as the amount of biofilm on the
membrane surfaces increased. The most effective solutions
were combinations of detergents and enzymes.
- 127 -
REFERENCES
Evaluation of Membrane Processes and Their Role in Wastevater
Reclamation, Volume II, Orange County Water District report to
OWRT, November 1980.
2Argo, D. G., and J. G. Moutes. Wastewater reclamation by reverse
osmosis, JWPCF, S±, 590 (1979).
3Evaluation of Membrane Processes and Their Role in Wastevater
Reclamation, Volume I, Orange County Water District report to
OWRT, November 1979.
**Means, E. G., L. Hanami, H. F. Ridgway and B. H. Olson. Eval-
uating mediums and plating techniques for enumerating bacteria
in water distribution systems. Journal AWWA 12^, 585-590 (1981).
5Marshall, K. C. Interfaces in Microbial Ecology. Harvard
University Press, Cambridge, Mass.
6Marshall, K. C , R. Stout and R. Mitchell. Mechanism of the
initial events in the_sorption of marine bacteria to surfaces.
J. Gen. Microbiol. 68, 337-348 (1971).
- 128 -
SESSION IV.
MATERIAL K B PIPES.
Ir. J. T. van der Zwan, The Netherlands Testing and ResearchInstitute, KIWA.
1. Introduction.
A considerable proportion of the capital investments in water industry
is used for the pipes and fittings in the underground system for
transport and distribution.
It is obvious that in safeguarding a continuous water supply the transport
and distribution system should stand firm.
A well balanced choice of the materials for these pipes and fittings will
have a direct influence on the planning and construction phase, and, it
may be even more, on the following operation and maintenance phase.
For the selection of the most appropriate materials some basic principles
have to be considered.
Material properties, related to local circumstances and costs only, do not
present sufficient guidelines for this selection. An "overall" planning
of the materials to be used is highly recommendable.
Tais paper deals with
- a material survey (paragraph 2)
- fitness for purpose (paragraph 3)
- the need for a material policy (paragraph 4).
The ultimate choosing of the materials should be done after the consider-
ation of the mentioned paragraphs, in particular after the evaluation of
the available and suitable materials, the local circumstances and directives
from policy viewpoints, all in relation with the financial aspects of such
choices.
In former days it was quite connon to use cast iron pipe and fittings
with their thick rigid walls.
Most of these systems are still in good condition. Used in less aggressive
soils the light external corrosion attack may be surprising. By improved
technology other materials became available at the lowest possible prices.
Some disadvantages were not known from the beginning and need now to be
considered carefully as far as relevant.
- 129 -
As an example the permeability of plastics excludes this mate-
rial from applications at certain local conditions.
The health risks of asbestos fibres in asbestoscement pipes
require a well conditioned and controlled water quality and
the observation of codes of practice during operation and
maintenance.
The risk of corrosion of thin walled steel and ductile iron
pipes requires adequate internal and external protective
measurements.
It has to be stated that these disadvantages should not
exclude these materials from a material selection; it only
introduces some restrictions.
- 130 -
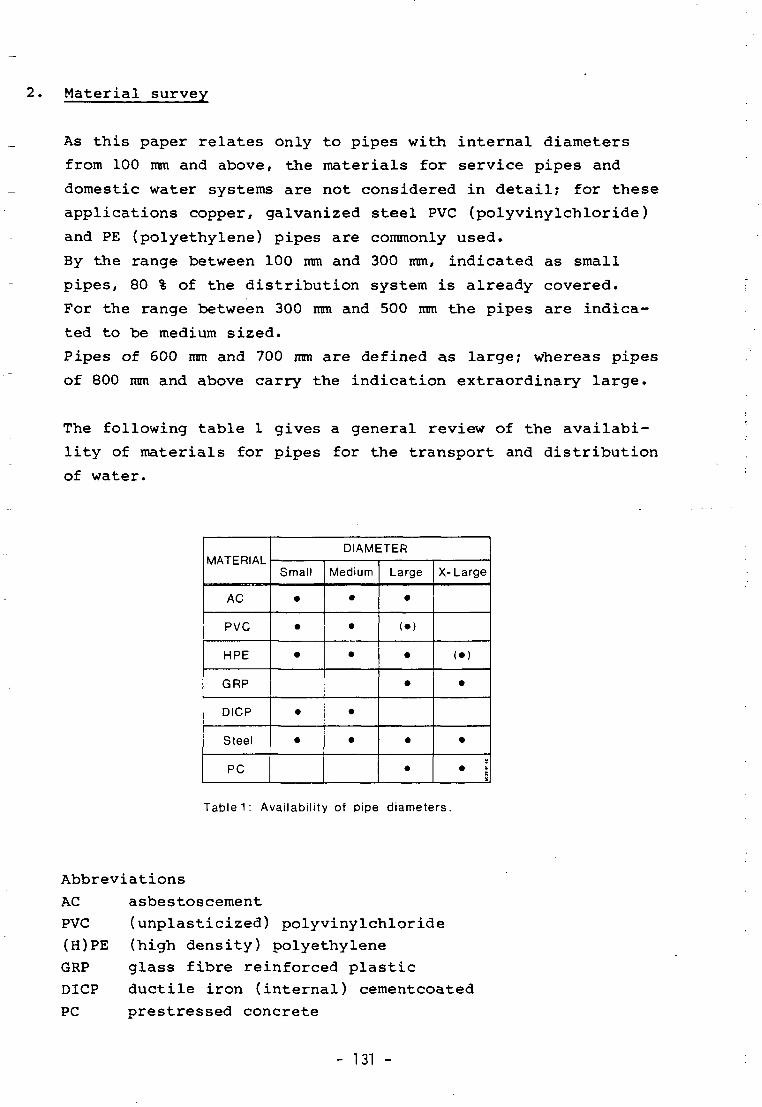
2. Material survey
As this paper relates only to pipes with internal diameters
from 100 mm and above, the materials for service pipes and
domestic water systems are not considered in detail; for these
applications copper, galvanized steel PVC (polyvinylchloride)
and PE (polyethylene) pipes are commonly used.
By the range between 100 mm and 300 mm, indicated as small
pipes, 80 % of the distribution system is already covered.
For the range between 300 mm and 500 mm the pipes are indica-
ted to be medium sized.
Pipes of 600 mm and 700 mm are defined as large; whereas pipes
of 800 mm and above carry the indication extraordinary large.
The following table 1 gives a general review of the availabi-
lity of materials for pipes for the transport and distribution
of water.
MATERIAL
AC
PVC
HPE
GRP
DICP
Steel
PC
DIAMETER
Small
•
•
•
•
•
Medium
•
•
•
•
•
Large
•
(•)
•
•
•
•
X-Large
(•)
•
•
• ;
Table 1 : Availability of pipe diameters.
Abbreviations
AC asbestoscement
PVC (unplasticized) polyvinylchloride
(H)PE (high density) polyethylene
GRP glass fibre reinforced plastic
DICP ductile iron (internal) cementcoated
PC prestressed concrete
- 131 -
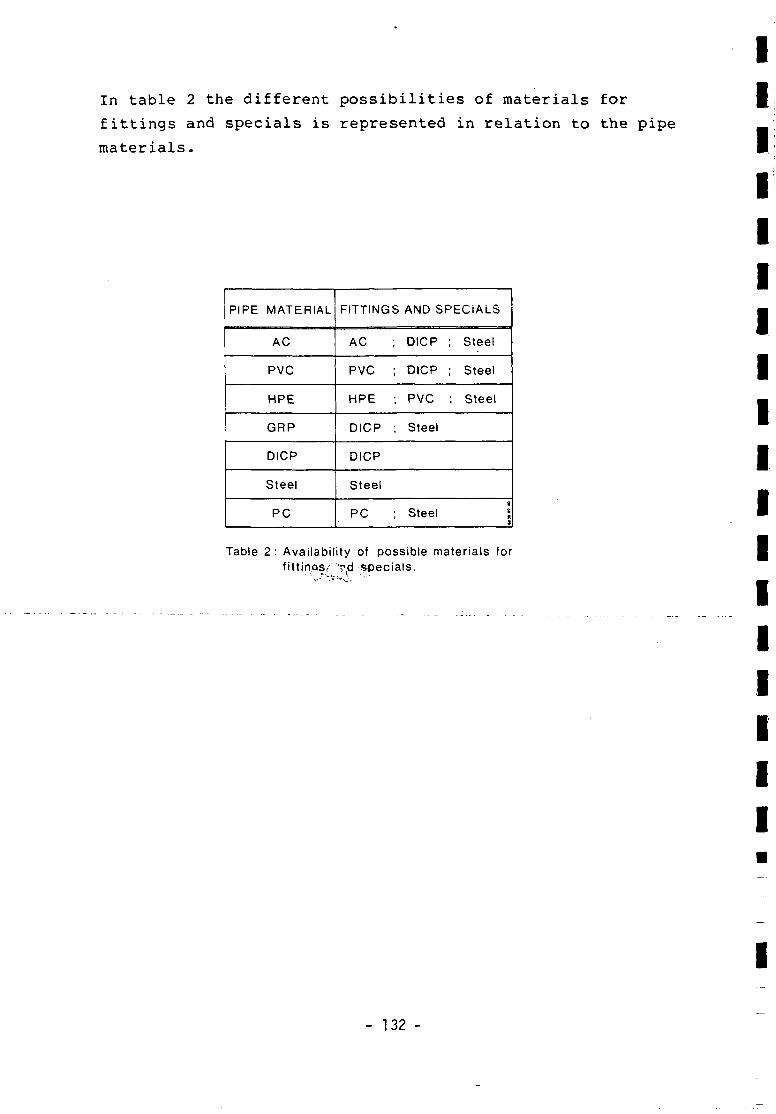
In table 2 the different possibilities of materials for
fittings and specials is represented in relation to the pipe
materials.
PIPE MATERIAL
AC
PVC
HPE
GRP
DICP
Steel
PC
FITTINGS
AC ;
PVC ;
HPE ;
DICP ;
DICP
Steel
PC ;
AND SPECIALS
DICP •
DICP ;
PVC
Steel
Steel
Steel
Steel
Steel
S:c
Table 2 : Availability of possible materials forSf' Td specials.
- 132 -
3. Fitness for purpose
The main technical criteria for selecting the materials are
formed by the relevant technical requirements and the specific
local circumstances under which these materials have to be
applied.
The suitability on a technical level of these materials has to
be verified by considering various aspects such as:
General properties
- resistance to internal pressure
- resistance to external loads
- resistance to possible damages, due to transport, handling
and construction
- permeability, toxicity
Specific properties
- corrosion resistence (related to both the water to be
transported and the aggressivity of the soil under
consideration)
- changes in material properties due to storage conditions
Operational properties
- operational flexibility regarding construction, repairs,
connections
- local experience and workmanship
- evaluated experience from other countries.
This checklist could be enlarged with other relevant aspects
and be used in a simple scoring system if desired. This could
increase the understanding on the possibilities of applica-
tion.
Without presenting detailed specifications of the various pipe
materials, complete pipeline systems may be distinguished
generally in a range from flexible to rigid systems which
stands in relation to the actual soil conditions.
Systems realized with Steel, GRP, PVC and HPE pipes could be
regarded to be flexible, whilst AC, PC and cast iron pipes are
- 133 -
forming rigid systems. Systems with ductile iron pipes have to
be classified somewhere between these two.
It is quite obvious that the soil conditions play an important
role, in particular when flexible pipes, with the present thin
walls, have to rely on the supporting capacity of the soil.
The flexible pipes have a rather low own strenght and show
deflection under vertical loads; the latter resulting in side-
ward moves which create passive soil pressures. The pipes can
follow easily contour lines and have bends with a short wor-
king length, nevertheless they need an adequate (self)
anchoring because of the easy movements.
The more rigid systems may fail by rupture of the pipes at
even small deflections. The capability of rigid pipes to
resist to external loads is a more direct one.
The heavy pipes have to be handled very carefully whilst unfa-
vourable soil conditions may require a foundation.
Deflection of the pipes due to stone ridges and the like may
damage these type of pipes.
Although careful laying techniques and adequate supervision
being always recommendable, a good understanding of the be-
haviour of the pipes in relation to the soil conditions is of
decisive importance.
Taking PVC pipes under different soil conditions as an
example, some remarks could be made.
For sandy soils the compression of the backfill has an in-
fluence on the behaviour of the pipes. In general one could
state that if a pipe is laid good it will remain in good con-
dition; unfortunately if it is laid bad it remains bad.
For clay soils many influences as a result of the laying tech-
niques may be introduced; rerounding effects as a result of
the internal pressure may be expected.
From peaty soils no supporting effect may be expected at all;
therefore advantages of soil support for flexible pipes may
not be considered.
Another remark has to be made with regard to the use of
flexible connections (with rubber rings) within rigid pipe
- 134 -

systems. In such cases attention has to be given to the
fact that deflections may occur. The use of rigid (welded)
connections in flexible systems has no real influence on
the flexibility of the system as a whole.
- 135 -
4. Material policy
Any selection of materials should be based on an "overall
plan" on materials to be used.
This "overall plan", preferable at a national or a regional
base, should be at least valid for the whole of a watercom-
pany; it shall include the adoption of a predetermined quality
level with reference to the relevant standards.
Optionally the use of locally produced materials as well as a
realistic limitation within the pipe materials and fittings
range may be considered. Nevertheless, such a restricted range
should always allow for a competitive choice in relation to
the soil conditions as present.
On short term, for new plans and renovation projects, any
material choice will fit in this overall pipe material plan.
It has to be mentioned before all that all considered mate-
rials, internally and externally protected as far as neces-
sary, should meet the same technical and functional specifica-
tions and design criteria.
The adoption of a certain quality level and certain standards
has long term advantages for the operation by watercompanies.
Operation and maintenance are simplified if there is an uni-
formity in the application of materials.
Material selection on a prices basis only - as the quality
level has already been satisfied and the materials fit in the
"overall plan" - directs to a more justified and competitive
position for each pipe and fitting manufacturer.
The warrant of the quality level, which includes the results
of standardisation, testing and inspection, gives the manufac-
turer the assurance that the required quality level is fixed
and valuable for all manufacturers. For the manufacturers
no competition on basic quality, so no falsification or tech-
nical trade barriers will exist; this has a positive effect on
the (local) water related industries.
All these foregoing considerations, including the fitness for
purpose aspects as indicated in paragraph 3, may be translated
- 136 -
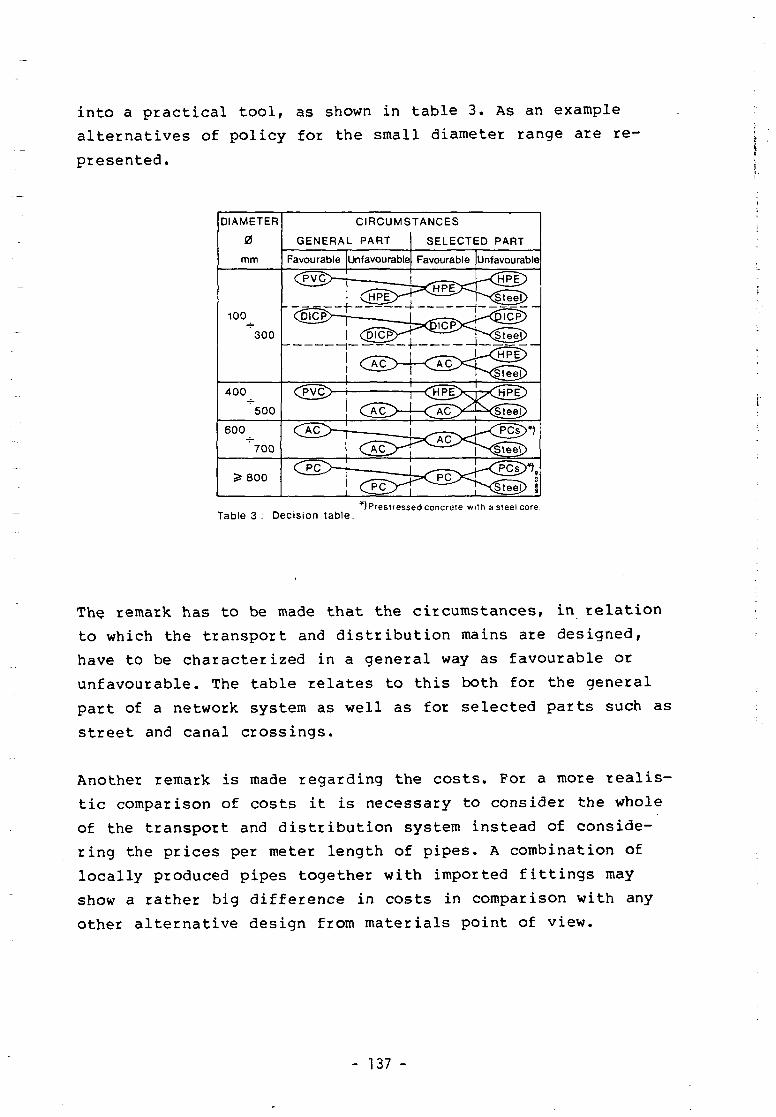
into a practical tool, as shown in table 3. As an example
alternatives of policy for the small diameter range are re-
presented.
DIAMETER
0
mm
CIRCUMSTANCES
GENERAL PART SELECTED PART
Table 3 : Decision table.*)Prestressed concrete with a steel core
The remark has to be made that the circumstances, in relation
to which the transport and distribution mains are designed,
have to be characterized in a general way as favourable or
unfavourable. The table relates to this both for the general
part of a network system as well as for selected parts such as
street and canal crossings.
Another remark is made regarding the costs. For a more realis-
tic comparison of costs it is necessary to consider the whole
of the transport and distribution system instead of conside-
ring the prices per meter length of pipes. A combination of
locally produced pipes together with imported fittings may
show a rather big difference in costs in comparison with any
other alternative design from materials point of view.
- 137 -
5. Summary
The selection of materials appropriate for pipes for water
transport and distribution depends on several considerations
such as appropriate technical requirements, local conditions,
directives for material policy and economical aspects.
Although the choice of materials seems to be relevant for the
planning phase, the following operation and maintenance phase
for the transport and distribution system also requires the
suitable decisions in order that a sufficient functioning may
be expected.
Within a limited range of pipe materials and fittings all
being in accordance with a certain quality level the necessary
decision has to be made.
A systematic approach as well as the use of standards has
advantages for both the watercompany and the local industries
producing such materials.
Although costs always seem to be the most important decisive
point for the selection of materials, this paper indicates
also other points, such as the study before of solutions,
estimated to be equivalent in a technical way, on the base of
an overall plan on the materials to be used.
- 138 -
SESSION IV.
L'ENTRETIEN DANS LES RESEAUX DE DISTRIBUTION.' .... j
F . O u a l i , S . O . N . E . D . E . , T u n i s , TUNISIA. . |
I - INTRODUCTION
Pour un Service des Eaux, la bonne marche de son exploitation est ;
intimement liée au soin qu'il apporte à son Equipement.
Un équipement mal entretenu voit ses qualités disparaître bien ;vite même s'il a été acquis conformément à des caractéristiques 'bien précises et si des techniciens qualifiés le font fonctionner. '.
Les soins qu'il faut lui consacrer sont de deux sortes:
. L'ENTRETIEN CURATIF : ce genre d'entretien présente générale- :ment un caractère urgent, la réparation de l'équipement devant ;se faire après un arrêt intempestif.
!. L'ENTRETIEN PREVENTIF : est un entretien de surveillance, ilpart du principe que la réparation doit intervenir avant larupture, la prévenir donc doit tendre à supprimer ou a réduirel'entretien curatif.
II - CRITERES DE L'ENTRETIEN
Les responsables qui désirent maintenir à un niveau acceptableles travaux d'entretien curatif doivent accorder à l'entretiende l'équipement la même attention qu'ils accordent à son fonc-tionnement.
Un entretien bien conçu doit répondre à 5 Critères ;
C/A - Bien définir exactement le Personnel compétent :chargé de l'entretien
C/B - La Direction doit expliquer les raisons pour les-quelles elle exige l'entretien préventif et prou-ver qu'elle y tient.
C/C - Fournir pour l'entretien, les pièces de rechanges,les outils, les instruments de contrôles ainsi queles facilités d'atelier nécessaires donc un budgetadéquat.
C/D - Etablir un planning à déroulement périodique
C/E - Instaurer un contrôle du programme d'entretien etles supports adéquats de relevés et rapports.
- 139 -
C/A - LE PERSONNEL
II est conseillé dans la mesure du possible d'éviter deconfier au personnel chargé du fonctionnement des instal-lations, la charge de procéder â leur entretien car ils enviennent à négliger soit l'un soit l'autre. Le personneldoit être qualifié et expérimenté.
Le personnel opérationnel et celui d'entretien doiventcoopérer pour éviter toute gêne mutuelle entraînant unemauvaise qualité de service pour l'abonné. L'expérienceacquise sur le réseau de la ville de Tunis (1000.000 Habi-tants) a montré que la qualité de service (mesurée par le gnombre de réclamations), s'est améliorée nettement depuis |qu'il y eut séparation du fonctionnel, de l'entretien pro-grammable, m
De même la mise en place de surveillants de réseau parquartiers a permis, : •
. une meilleure détection de fuites I
. une surveillance des conduites principales dedistributions pour éviter toute détérioration •par des constructions sauvages, ou par la suite |de travaux d'autres corps d'états ne connaissantpas avec exactitude la situation du réseau. •
C/B - LA POLITIQUE D'ENTRETIEN
lui accorde. Il doit décider que l'entretien est un stadeimporttable.
C/C - LES OUTILS - LES PIECES DE RECHANGE - LE MATERIEL DE
- 140 -
ILe responsable doit affirmer clairement sa politique et •doit par la suite prouver activement toute la valeur qu'il I
important de l'exploitation du réseau et non un mal inévi- •
Ainsi le principe de l'entretien régulier et complet d'un Méquipement entraine des bénéfices économiques et opération- •*neis obtenus quand l'équipement reste en parfait état de _fonctionnement évitant de longues périodes d'arrêt pour •réparations.
IVERIFICATION L'ATELIER ET LE BUDGET D'ENTRETIEN |
Un bon d'entretien nécessite : g
- Les Outils indispensables I
- une bonne connaissance du réseau
- des appuis logistiques I
- un Budget suffisant
II
1- LES OUTILS
En effet il est impératif de mettre à la dispositiondes équipes d'entretien les outils nécessaires touten veillant à l'adaptation desmoyens humains et maté-riels à la nature du travail (un bon éclairage lanuit - un terrassement mécanique en cas de grande pro-fondeur.un matériel de pompage correspondant au débitâ évacuer).
2- CONNAISSANCE DU RESEAU
Une mise à jour du réseau continue permettra d'avoirun fond de plan correspondant â la réalité et outilindispensable au surveillant de réseau chargé desdiverses manoeuvres.
Une localisation des casses sur une carte a permispour Tunis, de bien connaître les "points noirs" etde bien délimiter les zones à recalibrer.
3- APPUIS LOGISTIQUES
Un atelier d'entretien et de réparation est aussi né-cessaire pour assurer la bonne marche de l'exploita-tion, qu'un laboratoire d'analyses installé près d'unestation de traitement des eaux.
De même une liaison radio permet un contact rapidepour communication de l'information donc un gain surle coût de l'entretien et une efficacité appréciée parles abonnés.
4- BUDGET
II est impératif que le budget de fonctionnement d'unservice des eaux comprenne un poste relatif à 1'achatde nouveaux outils d'entretien, leur renouvellement etl'achat du matériel de vérification.
POUR LA SONEDE
1) II a toujours été consacré pour l'entretien entre20 % et 30 % du budget d'investissement de renouvelle-ment. Le résultat a confirmé le bien fondé de cetteoption.
2) La main d'oeuvre pour l'entretien représente les35 % de la main d'oeuvre totale relative à l'activitéd'exploitation.
3) Le coût de l'entretien représente en moyenne 19% duprix de revient du m3 d'eau selon les résultats de lacomptabilité analytique de 1981.
- 141 -
Le Prix de revient en m3 d'eau vendu= 96 Millimes
Coût de l'entretien - Matière = 5,57 Millimes soit 6 %
Main d'oeuvre = 12,58 Millimes soit 13% J
18,15 soit 19% •Nota : 100 millimes <v 1 NF I
II ne faut surtout pas tomber dans le défaut d'une analysetrop rapide qui ferait apparaître qu'il est plus faciled'investir que d'entretenir .Donc il vaut mieux tout en aug-mentant les actifs de production, mieux gérer strictementceux de ladistribution.
C/D - PLANNING D'ENTRETIEN
minimum de fiches et de documents.
IAfin d'assurer la permanence de son fonctionnement tout ser- Ivice des eaux doit avoir son programme d'entretien préventif. •Cet entretien comprend les inspections et les soins nécessai- _res au bon fonctionnement de l'équipement, il ne réussit qu'a Icondition d'être planifié avec soin et exécuté selon un pro-gramme préétabli. m
C/E - ETATS D'ENTRETIENS - RELEVES •
Une bonne exécution d'un programme d'entretien nécessite unI
La partie d'entretien planifié et à caractère périodique doit •figurer sur des tableaux et inscrite sur un calendrier des |tâches car les opérations d'entretien sont si nombreuses qu1
on ne peut se fier à la mémoire d'un employé. '•
A titre d'exemple
L'expérience sur le réseau de Tunis, a montré qu'il était |ridicule et aberrant de compter sur la mémoire d'un surveil-lant de réseau ou d'un ouvrier pour retrouver l'emplacement •d'une vanne dont la manoeuvre était nécessaire, pour cela il |a été décidé :
1 - d'adopter une signalisation in situe par des balises( à Irayures horizontales rouges et blanches) par analogieaux signalisations adoptées pour les bouches à incendie. I
2 - d'adopter un attachement sur fiche (cf modèle ci-jointAnnexe 1) qui permet en cas de perte de la balise une •localisation et une remise â jour de la vanne. *
Chaque opération d'entretien doit faire l'objet d'un •bon de travail (cf modèle ci-joint Annexe 2) ce quipermet à la comptabilité analytique, moyennant une codi-fication des diverses opérations d'entretien, de détermi-ner le coût par nature d'intervention.
- 142 - .-•
IIII
III - CONSETANCE DE L'ENTRETIEN DU RESEAU DE DISTRIBUTION
Le tableau ci-joint en Annexe 3 fait état de certaines opéra-tions d'entretien ainsi que leur impact sur le rendement d'unréseau de distribution. En plus nous nous proposons d'étudierun facteur important d'économie consistant en une améliora-tion du rendement du réseau par une réduction des pertes duesà des fuites.
. NATURE DES FUITES :
II s'agit essentiellement de fuites engendrées par les .défauts d'étancheîté sur les conduites aux joints et auxbranchements.
. RENDEMENT D'UN RESEAU :
est défini comme le rapport entre le volume distribué et levolume consomma. •
Pour Tunis le rendement se maintient depuis 5 Années à 75 %.
Pour améliorer ce chiffre, le gestionnaire ne doit pas secontenter de colmater les grosses fuites susceptibles d'en-traîner des préjudices aux tiers mais doit les recherchersystématiquement avant qu'elles ne deviennent visibles.
l'effort entrepris par la SONEDE dans ce sens a permis de stabiliser les 2 ratios objet de l'Annexe 4.
CassesR 1 =
Km de conduites
FuitesR 2 =
Km de conduites
IV - RELATION ENTRE ENTRETIEN ET GESTION DES ABONNES
En vue de maintenir un boft rapport avec le public et comptetenu du fait que les réparations d'urgence et l'entretien pro-grammable retiennent l'attention de l'abonné, tout service deseaux se doit de tenir compte de ces incidences dans la planifi-cation des tâches, car on considère que :
" Le Réseau de Distribution estune ligne de communicationdirecte avec les Abonnés "
- 143 -
Dans la mesure du possible, tous les consommateurs qui peuventêtre touchés par des travaux doivent être prévenus. Il fautnon seulement les avertir mais aussi organiser les travaux defaçon à réduire les inconvénients qui en découlent., c'estainsi que pour citer toujours l'exemple de la ville de TUNIS:
1) Tous les travaux de raccordements pour mise en service .de nouvelles installations ou équipements (changementde vannes de sectionnement ou autres matériels hydromé-caniques) sont prévus la nuit et signalés par voie depresse et de radio 48 heures à l'avance. Ceci permetnotamment aux abonnés gros consommateur de planifierleur travail pour réduire au minimum 1'effet de cettecoupure.
2) Même pour les raparations, il faut s'appliquer à ré-duire au minimum le nombre de clients incommodés et la
promptitude des reparation est propice aux bonnes rela-tions avec les abonnés.
V - • CONCLUSION
Nous pouvons dire que l'entretien est comme une assurance,elle ne parait chère qu'avant l'incident, la qualité et lacontinuité de service étant d'une importance capitale pourun distributeur d'eau, il en ressort qu'on ne peut obtenirune bonne gestion sans un bon entretien des installations.
- 144 -
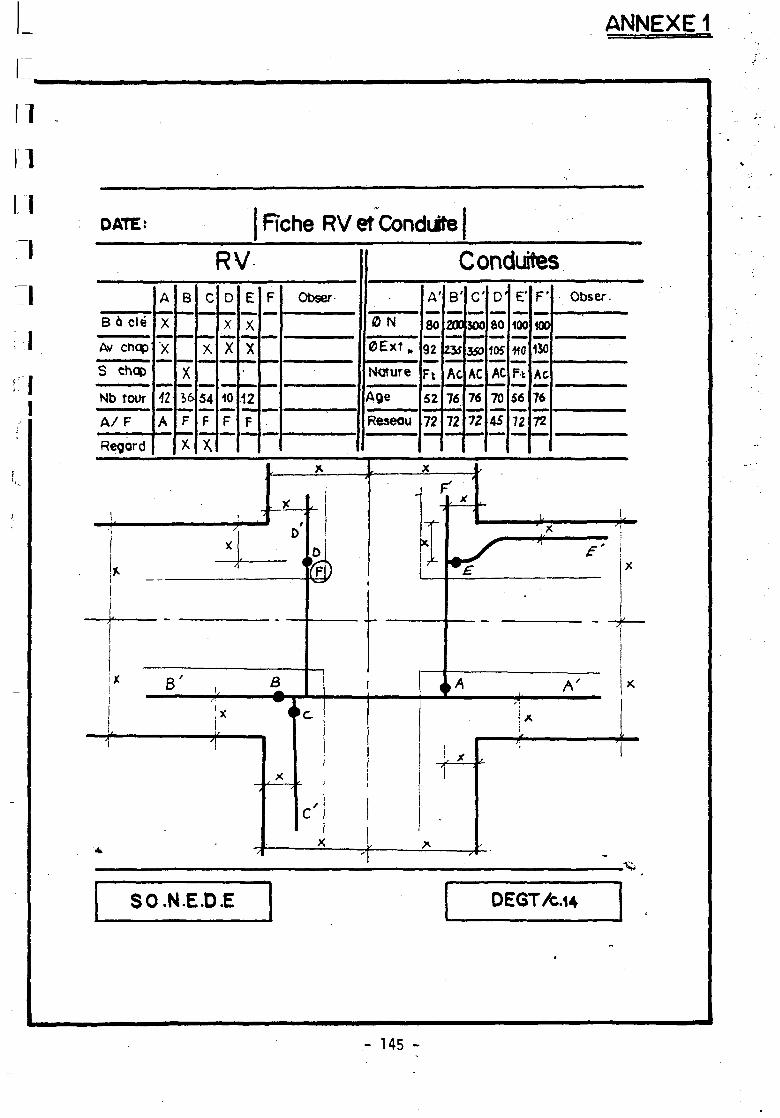
ANNEXE 1
I.I
i l
11
.1DATE:
Bò clé
Av chqp
S chqp
Nb tour
A / F
Regard
i
—
¡X
1
L1
A
X
X
M
A
B
B
X16
F
X
C
X
54
F
X
i
i
RVD
X
X
10
F
*A
£
X
X
12
F
RcheRV et Conduite
F Obser
t *
[
B
X
>
(F\_:
'C
)
Conduites
0 N
0 E x t B
Nature
Age
Reseou
-
i
CX
A'
80
q?
Ft
52
72
X
f
K
<
B'
ÍW
I V
Ac
76
72
C
MX
AC
76
72
i *
, X
' D'
) 60
M Oí
AC
70
45
- -
E'
100
•MO
Ft
56
72
s
/
y
t
F'
100
150
AC
76
72
Obser.
• X ' !
A'
X
' I
SO.N.E.D.E DEGT/fe.14
- 145 -
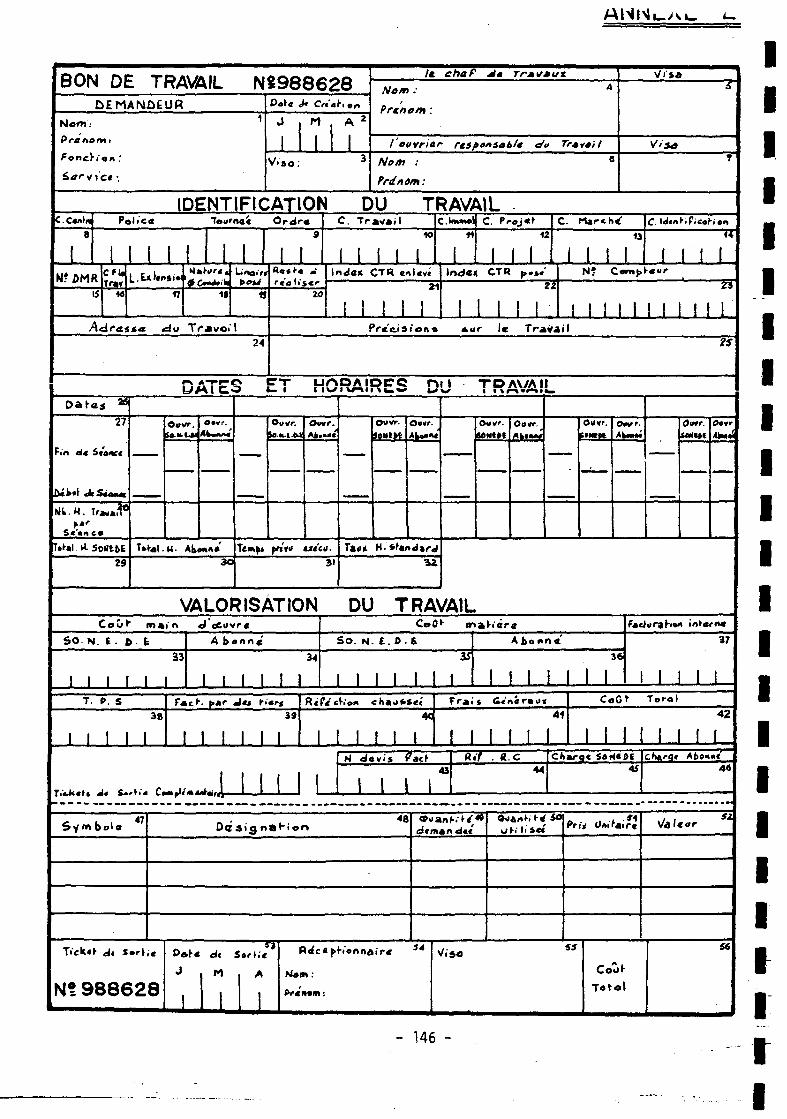
BON DE TRAVAIL NS988628DEMANDEUR
Nom.
PrantFonc)
á^ry
iD«r« > C«or,oo
J
1M A 2
V.-.O: 3
lã. ehttP Mm TrjufMux
Nam : 4
Prénom :
l'ovvriûr rtS fi on sa b/t e/v Tr»</*¡ 1
Nom : 8
frdnom :
S
VisaT
IDENTIFICATION DU TRAVAILC.C«»fn
8
1
Polica Tourna* Ordra
IN! ÛMR
15
L.&xUs,.17
I IM«f-r*.
1 Í
Uno,,.
Adras**. <du Travo.'l24
9
Rat fa „•
20
C. Travail
1 1 !10
lnd«>t CTR enlevé2"
1 1 1 1 !
C Immol
•H
1
C. rVoj«r12
|
\nà** CTR f>«>«'
1
1 I I I
C. March*
I I
C. MtnriP.'coN'cn
1 II 1N? Cern)>r«ur
! ! 1 ! 1 1 |Precis l'on « <ur le Travail
?S
DATES ET HORAIRES DU TRAVAILDatas K
Fin dt
27
Stance
"¡i omit
ML. H. Umfc
S<inc«Ural. 0. SoHtbE
29
O»vr.
Ural. H. Ako*««3 O
>a«.l.MOm,r.
Tem^ pi«m txt'cii-
Ooir.
Tai** H-^*n¿\r<•4Z
VALORISATION DU TRAWCour* mai'n d cCcvrc
S O . N . S . fc. fe
1 1 1 1T. P. S
1 1 1
38
33A benne
I I
I I I
Symbol»
39
Ovvr. Oovr.
- i — .
MLCoOr mikfiârc
So. N. £. 0 . 6
1 1 1
14C
1
A bo e»n«'
1Frais ¿«niraix
|
H d**¡i Fact43
l i l t
<| |
ft./ . «.c c44
3<
1
faauraK»» inrerrur
h
1 1
37
1CaQy Tofol
1 1:harg« SflHept
4 i
MMCharq* Abo«««
44
•48
Ocsio n f iHen
T.ík.r A< Sor\,<
N? 986628M
IA
1»
d*°mVnd«'*
Nom.
* rV.y ü-ira.r'í
Viso 5 Í
Val*»"* *2
- 146 -
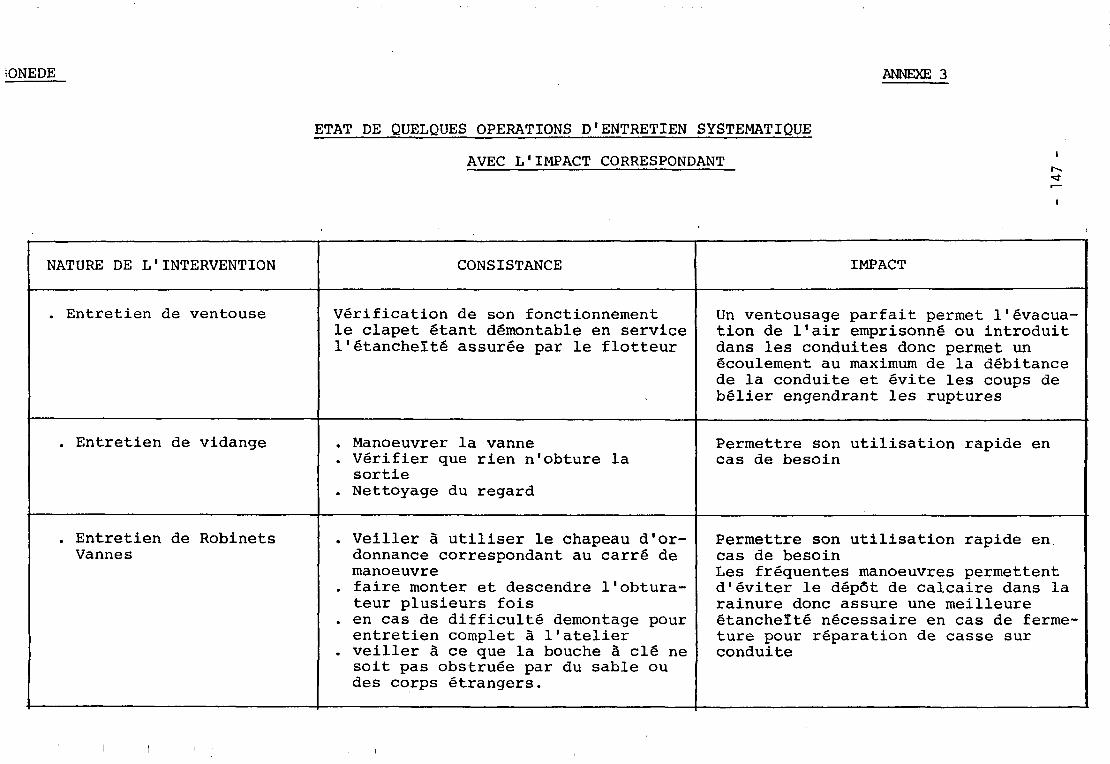
iONEDE ANNEXE 3
ETAT DE QUELQUES OPERATIONS D'ENTRETIEN SYSTEMATIQUE
AVEC L'IMPACT CORRESPONDANT
NATURE DE L'INTERVENTION
. Entretien de ventouse
. Entretien de vidange
. Entretien de RobinetsVannes
CONSISTANCE
Vérification de son fonctionnementle clapet étant démontable en servicel'étancheïté assurée par le flotteur
. Manoeuvrer la vanne
. Vérifier que rien n'obture lasortie
. Nettoyage du regard
. Veiller à utiliser le chapeau d'or-donnance correspondant au carré demanoeuvre
. faire monter et descendre l'obtura-teur plusieurs fois
. en cas de difficulté démontage pourentretien complet à l'atelier
. veiller à ce que la bouche à clé nesoit pas obstruée par du sable oudes corps étrangers.
IMPACT
Un ventousage parfait permet 1'évacua-tion de l'air emprisonné ou introduitdans les conduites donc permet unécoulement au maximum de la débitancede la conduite et évite les coups debélier engendrant les ruptures
Permettre son utilisation rapide encas de besoin
Permettre son utilisation rapide en,cas de besoinLes fréquentes manoeuvres permettentd'éviter le dépôt de calcaire dans larainure donc assure une meilleureétancheïté nécessaire en cas de ferme-ture pour réparation de casse surconduite
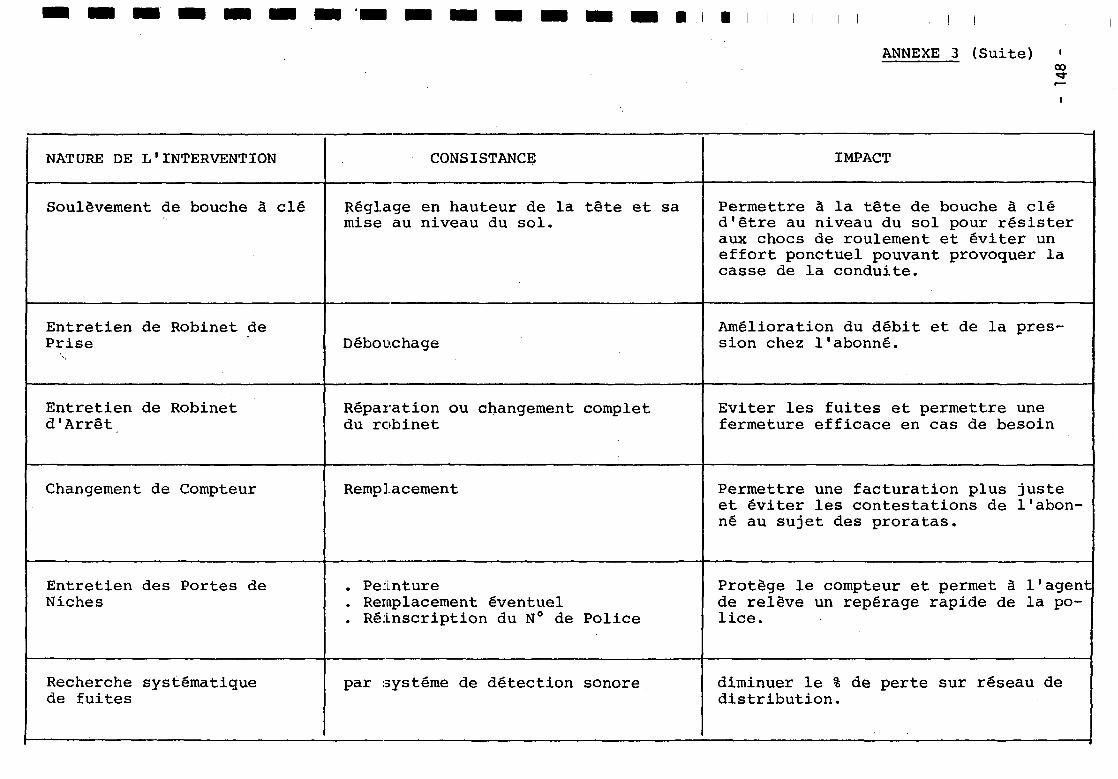
ANNEXE 3 ( S u i t e ) •CO
NATURE DE L'INTERVENTION
Soulèvement de bouche à clé
Entretien de Robinet dePrise
Entretien de Robinetd'Arrêt
Changement de Compteur
Entretien des Portes deNiches
Recherche systématiquede fuites
CONSISTANCE
Réglage en hauteur de la tête et samise au niveau du sol.
Débouchage
Réparation ou changement completdu robinet
Remplacement
. Peinture
. Remplacement éventuel
. Réinscription du N° de Police
par système de détection sonore
IMPACT
Permettre à la tête de bouche à cléd'être au niveau du sol pour résisteraux chocs de roulement et éviter uneffort ponctuel pouvant provoquer lacasse de la conduite.
Amélioration du débit et de la pres-sion chez l'abonné.
Eviter les fuites et permettre unefermeture efficace en cas de besoin
Permettre une facturation plus justeet éviter les contestations de l'abon-né au sujet des proratas.
Protège le compteur et permet à 1'agentde relève un repérage rapide de la po-lice.
diminuer le % de perte sur réseau dedistribution.
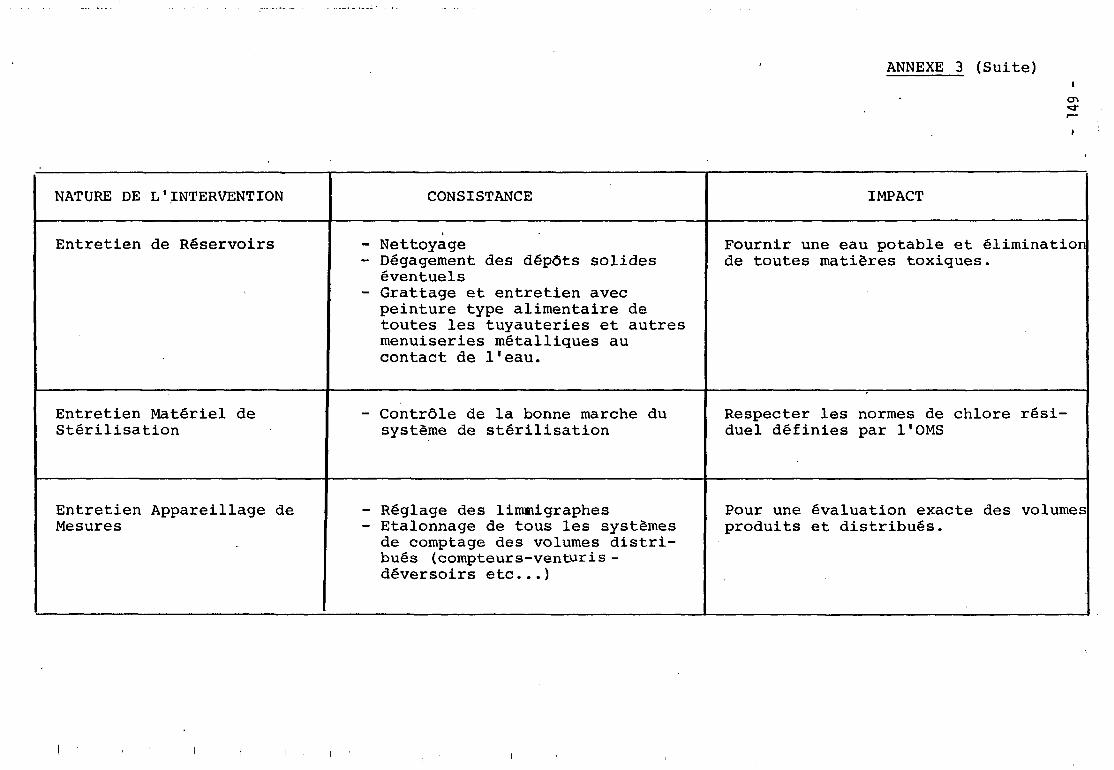
ANNEXE 3 (Sui te)
NATURE DE L'.INTERVENTION
Entretien de Réservoirs
Entretien Matériel deStérilisation
Entretien Appareillage deMesures
CONSISTANCE
- Nettoyage- Dégagement des dépôts solides
éventuels- Grattage et entretien avecpeinture type alimentaire detoutes les tuyauteries et autresmenuiseries métalliques aucontact de l'eau.
- Contrôle de la bonne marche dusystème de stérilisation
- Réglage des limmigraphes- Etalonnage de tous les systèmesde comptage des volumes distri-bués ( compteur s-ventur i s -déversoirs etc..)
IMPACT
Fournir une eau potable et éliminationde toutes matières toxiques.
Respecter les normes de chlore rési-duel définies par l'OMS
Pour une évaluation exacte des volumesproduits et distribués.
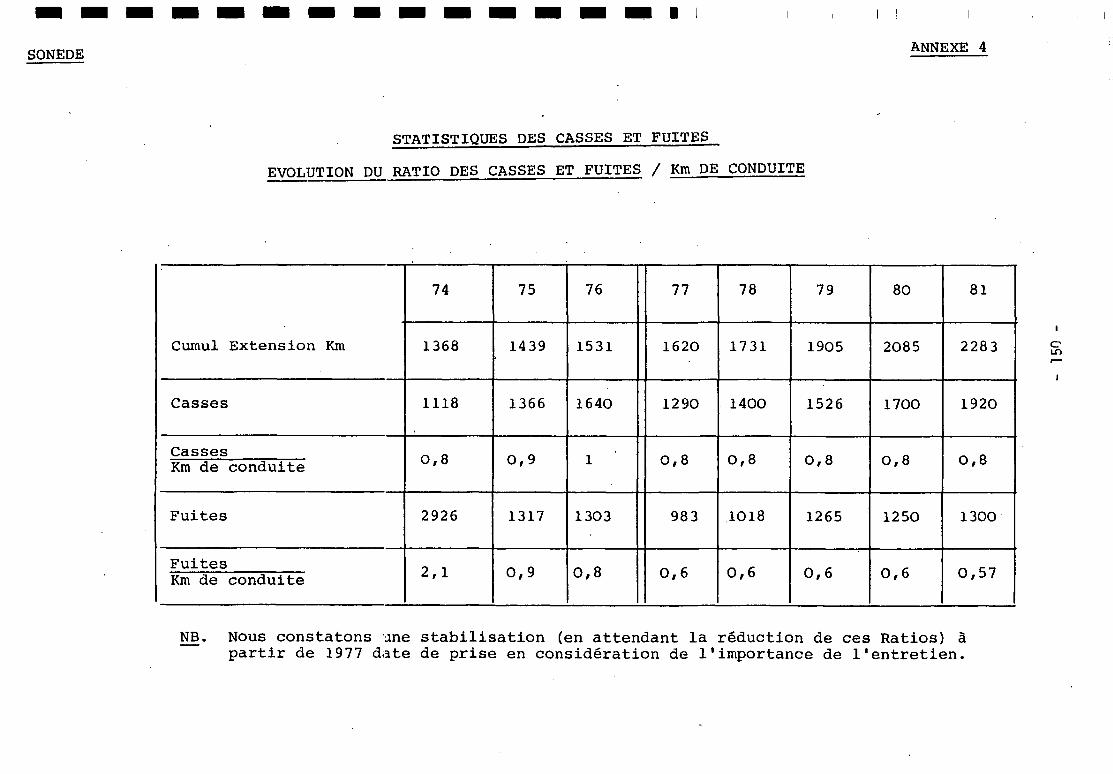
SONEDE ANNEXE 4
STATISTIQUES DES CASSES ET FUITES
EVOLUTION DU RATIO DES CASSES ET FUITES / Km DE CONDUITE
Cumul Extension Km
Casses
CassesKm de conduite
Fuites
FuitesKm de conduite
74
1368
1118
O,8
2926
2,1
75
1439
1366
0,9
1317
0,9
76
1531
1640
1
1303
0,8
77
1620
1290
O,8
983
0,6
78
1731
1400
0,8
1018
0,6
79
1905
1526
0,8
1265
0,6
80
2085
1700
0,8
1250
0,6
81
2283
1920
O,8
1300
0,57
NB. Nous constatons une stabilisation (en attendant la réduction de ces Ratios) àpartir de 1977 date de prise en considération de l'importance de l'entretien.
oLO
SESSION IV.
L'APPROVISIONNEMENT EN EAU POTABLE DE QUELQUES ILES FRANÇAISESDE L'OCEAN PACIFIQUE.
M. Jean POULAIN, UNELCO, Paris, FRANCE.
Introduction
Si l 'on pose à brûle-pourpoint la question d'indiquer quelles sont
les régions du globe les plus favorisées du point de vue de l ' u t i l i s a t i o n à
volonté d'eau naturellement pure, i l y a f o r t à parier que la personne
interpellée répondra: mais ce sont bien sur les regions montagneuses et les
î l es , peu ou pas peuplées, qui existent encore dans quelques mers. Cette
réponse peut même provenir de spécialistes ayant une grande expérience dans
le traitement et la d is t r ibut ion d'eau mais n'ayant pas eu jusqu'alors
l'occasion, ou la cur ios i té , d'e'tudier ce problème dans son ensemble.
La réa l i té est , la plus souvent, bien différente de ces vues
édéniques. Nous ne traiterons pas i c i des distr ibut ions d'eau dans les
régions de montagne et notamment dans celles situées à 1 000 m et plus
d 'a l t i tude. L'un de nous a déjà indiqué, à plus d'une reprise, q u ' i l est
rare de trouver dans les régions élevées des eaux de quali té t e l l e qu'on
puisse les distr ibuer sans traitement aux consommateurs et encore plus rare
de disposer, en permanence et naturellement, des dib i ts suff isant à
l 'al imentation de co l l ec t i v i tés , même modestes, de quelques centaines à
quelques mi l l ie rs d'habitants.
On étudiera dans ce rapport le captage et la d is t r ibut ion de l 'eau
potable dans quelques î les de l'Océanie pour voir comment on peut trouver,
dans ces cas par t i cu l ie rs , une solution satisfaisante à la fo is sur les
plans qua l i t a t i f et quant i ta t i f . Les insta l la t ions qui seront décrites se
trouvent dans deux des Terr i to i res français du Pacifique Sud.
La Société UNELCO s'occupe d'eau dans ces régions depuis plus de
vingt ans, mais e l le n'a pas l 'exc lus iv i té de ce service. Aussi, n'avons-
nous pas la prétention de fournir une analyse exhaustive. Décrivant quelques
instal lat ions dont nous avons la charge en y ajoutant celles de NOUMEA
exploitées par un service municipal, nous nous bornerons à la plantation
du décor des besoins à sat is fa i re des ressources disponibles, des moyens
mis en oeuvre pour accorder les uns et les autres.
- 151 -
2 . Ile de la Nouvelle-Calédonie avec les îles et archipels voisins» (îledes Pins, archipel des îles Loyauté, archipel des îles Belep, îlesChesterfield).
IIIIIII
. , . _ _ Iw e s t une xj.c a.i.jL.cngc£ *a environ twv ¿Cm et u une xctL^eui at> >c:¿ coxiâtcuiLe
d'une cinquantaine de lor,. Elle est bordée sur tout son pourtour par un récif- •
2 .1 . Géographie
La Nouvelle-Calédonie, découverte par COOK la 5 Septembre 1774, estla troisième î l e du Pacifique par la superficie (16 750 km2). Elle est situéeentre les méridiens 163 et 168 Est et entre les I8ème et 23ème parallèles Sudà 190 km au Nord, en moyenne, du Tropique du Capricorne.
Fie. 1:arte de laNouvelle,¡alédor.ie et barrière qui est l 'un des plus grands et des plus beaux du monde (plus de
Lovauté ^ ®® km a u t o t a l ) e t d ' u n lagon d'une exceptionnelle beauté.
2*2> L££-li^s_i2Z2iilÉ (Lifou, Karê, Ouvéa, Valpole et Tiga)
III
Ces îles ont une surface totale d'environ 2 000 km2. A l'exception
d*Ouvéa, elles n'ont pas de lagon car ce sont des édifices coralliens soulevés.
Elles sont bordées de falaises abruptes, le sol y est assez perméable (phénomèn
karstiques); elles sont dépourvues de cours d'eau.
2.3. Géologie de la Nouvelle-Calédonie
1IILa Nouvelle-Calédonie, que l'on appelle aussi "Grande-Terre", n'est pas
une formation volcanique. C'est une relique d'un ancien continent disparu •
dont les débris se sont accumulés au fond d'un géosynclinal (géosynclinal papou)
situé entre la Nouvelle-Zélande et la Nouvelle-Guinée. I
Ces sédiments profonds ont subi un plissement intense à l'oligocène, I
plissement contemporain de celui des Alpes et de l'Himalaya. En même temps des
roches basiques profondes (basaltes, péridotites) se répandaient dans et sur cesB
terrains sédimentaires. Ce phénomène est à l'origine des minéralisations impor-
tantes qui font en bonne partie la richesse de la Nouvelle-Calédonie, il lui g
confère aussi son relief particulier. Ces caractères pétrographiques ont
également des répercussions sur les gîtes acuifères et sur la qualité de leurs |
eaux, aussi bien superficielles que souterraines.
- 152 -II
L'île des Pins et les îles Belep présentent les mêmes caractères
géologiques généraux que la Grande-Terre.
2.4. Géologie des îles Loyauté
En l'absence de sondages systématiques profonds, i l est encore difficile,
à l'heure actuelle, d'avoir une idée précise de la structure géologique des
îles Loyauté. Il semble qu'elles soient dues à une intrusion de basaltes dans
des formations sédimentaires. Des coraux se sont alors développés sur le pourtour
des îles et le tout a subi un mouvement de surrection. Ces grandes masses calcaires
émergées ont donné lieu ensuite par dissolution à la formation de karst qui
renîerment parfois des aquifères utilisables.
3. Précipitations
La Nouvelle-Calédonie qui se trouve en zone tropicale ne devrait recevoir
que très peu de pluie comme c'est le cas en Australie, sa voisine. Mais la
forme particulière de la Grande-Terre, son insularité et l'action des vents
alizés venant buter sur des reliefs accusés font que l ' î l e est bien arrosée
bien que d'une façon irrégulière, dans l'espace comme dans le temps.
La grande saison des pluies se situe en mars et avril et la petite en
juillet-août. Le versant Est, expcsé aux alizés est environ deux fois plus
arrosé que l'Ouest et les reliefs agissant comme condensateurs reçoivent 2 à
2,5 fois plus d'eau que les parties basses de la côte Ouest. La moyenne des
pluies est de 3 000mr, par an à Yaté alors qu'elle n'est que de 800 mm à Voh,
région la plus sèche de la Grande-Terre.
Ces chiffres situeraient la Nouvelle-Calédonie parmi les régions les
plus favorisées du globe quant à la pluviométrie. Malheureusement une bonne
partie de ces précipitations se présente sous forme d'averses brutales - jusqu'à
650 mm en un seul jour ! -.Les terrains n'étant en général que très peu permé-
ables, les eaux s'écoulent rapidement et une petite partie seulement de celles-ci
cénètre dans le sol.
- 153 -
II
Fig. 4 Le régime pluvial des îles Loyauté ressemble à celui de la côte Est
ci pi ca^io.is Grande-Terre, mais l'absence de relief accusé fait oue la hauteur Paux î lesci pi ca^io.is Grande-Terre, mais l'absence de relief accusé fait oue la hauteuraux î lesLoyauté moyenne annuelle des précipitations se situe aux environs de 1 80C mm. Lifou _
reçoit en général de 100 à 200 ran de plus que Maré et Ouvéa.
I4. Ressources en eau I
4 .1 . Eaux_superfiçielles de la Nouvelle-Calédonie^ et_des îles^voisines g
Les terrains de la Grande-Terre étant pour une bonne part très peu |
perméables, i l faut s'attendre à un ruissellement intense sur la plus grande _
partie de l ' î l e . I l existe une bonne cinquantaine de cours d'eau dans l ' î l e . •
Presque tous ont des cours transversaux si bien qu'aucun n'atteint 50 1er.. _
Un seul, le Diahot, qui est longitudinal,s'étend sur 90 km environ. Ces cours •
d'eau sont plutôt des torrents à pente forte et irrégulière, entrecoupés de •
cascades. Leur régime est très variable, les débits peuvent passer de 1 à 7
ou même davantage en un temps très court. Le débit de la Yaté, par exemple, •
est passé au moment du cyclone des 26 et 27 Février 1951 de 91 à 944 m3/sec.
en quelques heures le 26, puis à 1 710 m3/sec. le 27» Les débits étant tous I
étroitement liés aux précipitations, les nappes alluviales qui se trouvent
en général au voisinage de l'embouchure du cours d'eau ne jouent qu'un rôle I
régulateur peu important.
4.2. Eaux souterraines de Nouvelle-Calédonie et des î les voisinesII
Le régime torrentiel de la plupart des cours d'eau néo-calédoniens, •
l'érosion forte du fait de la denudation des terres entraînent des transports
solides importants au moment des crues. Les fortes déclivités empêchent cependJ|'
que ces alluvions se déposent et la sédimentation ne peut s'effectuer qu'à
l'embouchure des rivières, c'est-à-dire le plus souvent dans le lagon. I
L'existence d'aquifères souterrains étendus est donc réduite. NOUMEA, par
exemple, a dO. , dès sa création, faire appel aux eaux de la Yahoué puis de I
la Dumbéa malgré la présence d'eaux souterraines à une cinquantaine de km à
l'Ouest ¿ans la plaine des Lacs.
I- 154 -
Les seules ressources aquifères des îles Loyauté sont souterraines.
Ces îles étant d'origine corallienne, extérieurement et superficiellement
du moins, i l s'est peu à peu formé en profondeur un réseau hydrographique
par dissolution du carbonate de calcium (réseau karstique). Ces eaux sont
exploitées par pompages.
La nappe aquifere cíes îles Loyauté s'apparente à celle de l ' î l e de
Wallis, qui a fait l'objet d'une étude approfondie sur laquelle nous reviendrons
plus loin.
4*3. Sau_douce artificielle
On peut mentionner ici , bien qu'il ne s'agisse pas d'un phénomène
naturel, la nécessité dans les îles ne disposant pas de ressources en eau
douce suffisantes de mettre en oeuvre les différents procédés de dessalement
d'eau de mer : distillation, osmose inverse, congélation, e t c . . Ces procédés
sont utilisés ailleurs avec succès (îles anglo-normandes, émirats du Golfe,
e t c . . . ) .
5. Qualité des eaux à disposition (selon les normes de l'O K S)
5.1. Qualité
D'une façon générale les eaux de la Grande-Terre sont très douces et
présentent souvent un caractère agressif,•celles des îles Loyauté sont plus
minéralisées. Outre une forte teneur en calcium, les eaux de l ' î l e d'Ouvéa
sont nettement saumâtres
5.2. Qualité_bactériolocique
La faible densité de population sur la Grande-Terre diminue les risques
de pollution. Des contrôles réguliers, tant officiels que par les distributeurs
n'ont pas fait apparaître des teneurs suspectes en microcrgar.ismes indésirables.
- 155 -
Tableau Iavec carte
descommunes
IIIIIIIIIII
I I n'en est pas de m&ne aux îles Loyauté qui ne sont alimentées que par
des eaux souterraines assez mal protégées par un sol et un sous-scl perméablesJB
Un programme de controle systématique plus étendu que l'actuel et
conforme aux recommandations de l'O M S est à l'étude pour l'ensemble du
Territoire.
5.3» Causes de pollution
Les risques de pollution chimique et bactériologique sor.t faibles
sur la Grande-Terre étant donné la dispersion de la population. Seuls NOUMEA
et ses enviions sont relativement très peuplés mais l'eau alimentant la ville,
provenant d'une région située loin de l'agglomération, les risques de conta-
mination sont très réduits.
La densité de la population est d'ailleurs de deux à cinq fois supérieure
à celle de la Grande-Terre. . IIII
La population totale de la Nouvelle-Calédonie était de 139 600 habitants
en 1980 comprenant 35,6 % d'européens, 43,4 % de mélanésiens autochtones et •
21 % d'étrangers non-européens.
6. Démographie
6.1. Répartition des pogulations^en_milieu urbain_et rural. Genre de vie
La répartition est fort hétérogène (voir tableau i ) . La nature du
relief et l'existence de petites plaines en bordure de mer ont incité les
indigènes à s 'établir sur la bande cÔtière. Peu sont remontés vers l ' intérieur.
I
- 156 -
III
Les Européens se trouvent pour une bonne part à NOUMEA où i ls représentent
environ le tiers de la population et les mélanésiens un peu moins de la moitié,
le reste comprenant les étrangers non-européens (indonésiens, Tahitiens,
Vallisïens, Vietnamiens). En 1970 27 % de la population européenne se trouvait
sur la côte Ouest et 12 % sur la cote Est.
Les indigènes ont conservé leur ancien mode de vie en milieu rural. I ls
habitent des villages traditionnels ou "tribus" dont les cases sont le plus
souvent en bois, recouvertes de lianes et de feuilles.
Les européens en milieu rural habitent soit des fermes isolées, soit
des maisons campagnardes en dur groupées dans des villages de tai l le modeste.
6.2. Be oi_ns_en_e TJi_à satisfaâre pour ces P£Pul¿t^ons
On admet, en général, qu'une consommation de 15C li tres par habitant
et par jour est la moj'enne la plus habituelle en Europe et correspond à un
genre de vie satisfaisant tant du point de vue de l'hygiène que du confort.
I l ne fait pas de doute que ce chiffre devrait être révisé en fonction des
besoins accrus consécutifs à l'élévation générale du niveau de vie. Un chiffre
de 250 l/hab/j paraît actuellement plus proche de la réal i té .
L'observation a montré qu'en Nouvelle-Calédonie et plus généralement
dans toute l'Océanie, c'est ce dernier chiffre qu'il faut prendre en considé-
ration dans le calcul des installations d'adduction et de distribution d'eau
potable et,surtout s ' i l faut irriguer des cultures, i l est prudent de doubler
ce chiffre.
Il faut cependant remarquer que dans les î les la faiblesse de l'entretien
et l'usage des installations privées contribuent pour une bonne part à gaspiller
l'eau distribuée.
De fait la consommation d'eau potable peut varier de 1 à 3 d'un abonné
à l 'autre, et,plus parfois, entre la saison des pluies et la saison sèche.
C'est, bien entendu, en saison chaude que les ressources sent les plus faibles.
- 157 -
7. Techniques d'épuration
7.1. Coagulation, décantation, filtration
IIII
Seule la vi l le de NOUMEA possède une installation de traitement d'eau •
de surface. La rivière Dumbéa a été barrée en 1952-1953 par un barrage-voûte
de 25 m de haut créant une retenue de 400 000 m3 environ. Des conduites posées I
en 1970 amènent l'eau à l'usine de traitement du Mont Té puis aux réservoirs.
Cette eau est désinfectée au chlore gazeux avant distribution. •
/.2. uesiniectionII
Se basant sur les résultats d'analyses bactériologiques qu'elle a fait
effectuer, notre société est intervenue auprès des Services de la Santé et |
du Génie Rural pour qu'on dote désormais systématiquement tous les réseaux de _
distribution de dispositifs efficaces de désinfection des eaux de consommation.m
I7.3. PrP.£gãéstspéciaux (distillation, osmose inverse, congélation, etc...)
Lorsque les ressources en eau douce sont inexistantes ou insuffisantes,
il est nécessaire de faire appel à des unités de dessalement d'eau de mer
ou d'eau saumâtre.
III
Deux types d'appareils sont.actuellement utilisés simultanément sur •
l ' î l e d'Ouvéa où une telle insuffisance se fait sentir :
- les distillateurs solaires qui utilisent directement l'énergie calorifique
du soleil grâce à des panneaux absorbeurs. On peut ainsi obtenir quelques I
litres d'eau douce par jour et par m2 de panneaux. Ces dispositifs n'exigent
pas un apport d'énergie autre que le solaire.; I
Fig.5 - les osrr.oseurs, dont le principe consiste à appliquer à une solution aqueuse
* *41 y~ " de sels, retenue par une membrane semi-perméable,une pression supérieure à
inverse la pression csmotique de cette solution. Dans ces conditions, seule l'eau
pure traverse la membrane qui retient les sels. ' _
- 158 -
I
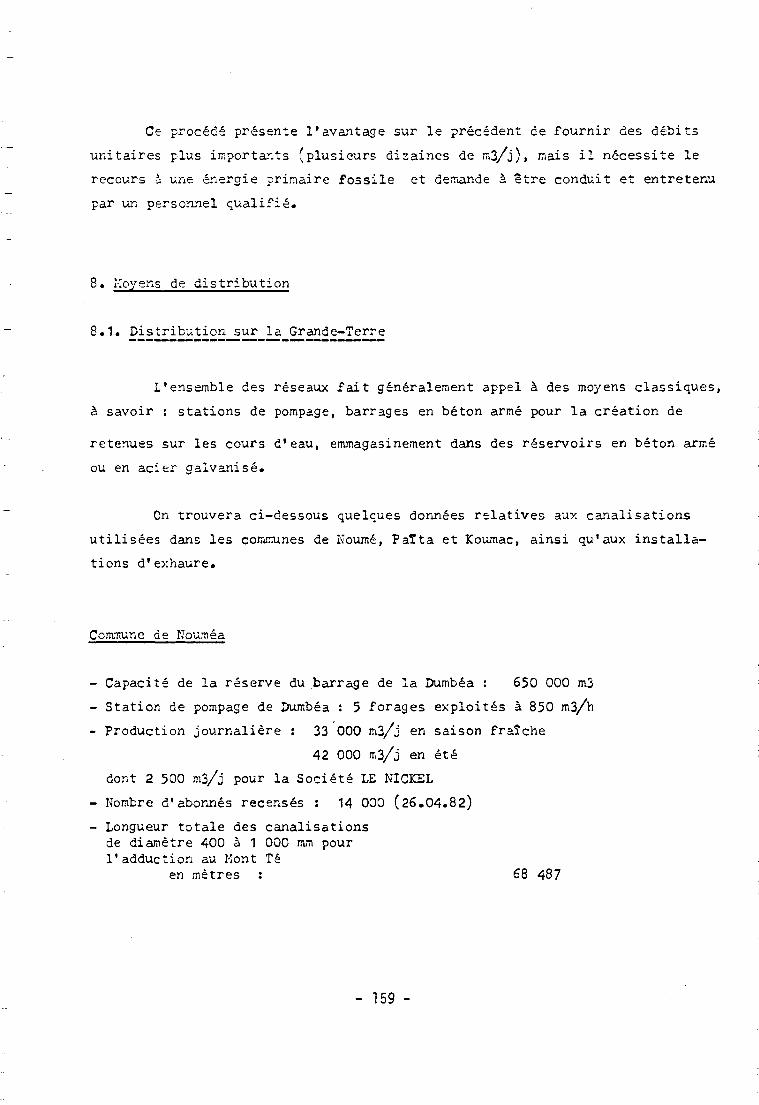
Ce procédé présente l'avantage sur le précédent de fournir des débits
unitaires plus importants (plusieurs dizaines de rn3/j), mais i l nécessite le
recours à une énergie primaire fossile et demande à être conduit et entretenu
par un personnel qualifié.
8. Moyens de distribution
8.1. Distribution_sur la Grande-Terre
L'ensemble des réseaux fai t généralement appel à des moyens classiques,
à savoir : stations de pompage, barrages en béton armé pour la création de
retenues sur les cours d'eau, emmagasinement dans des réservoirs en béton armé
ou en acier galvanisé.
Cn trouvera ci-dessous quelques données relatives aux canalisations
utilisées dans les communes de Koumé, PaTta et Koumac, ainsi qu'aux instal la-
tions d'exhaure.
Commune de Nouméa
- Capacité de la réserve du barrage de la Dumbéa : 650 000 m3
- Station de pompage de Dumbéa : 5 forages exploités à 850 m3/h
- Production journalière : 33 000 iu3/j en saison fraîche
42 000 m3/j en été
dont 2 500 m3/j pour la Société LE NICKEL
- Nombre d'abonnés recensés : 14 000 (26.04.82)
- Longueur totale des canalisationsde diamètre 400 à 1 000 mm pourl'adduction au Kont Té
en mètres : 68 487
- 159 -
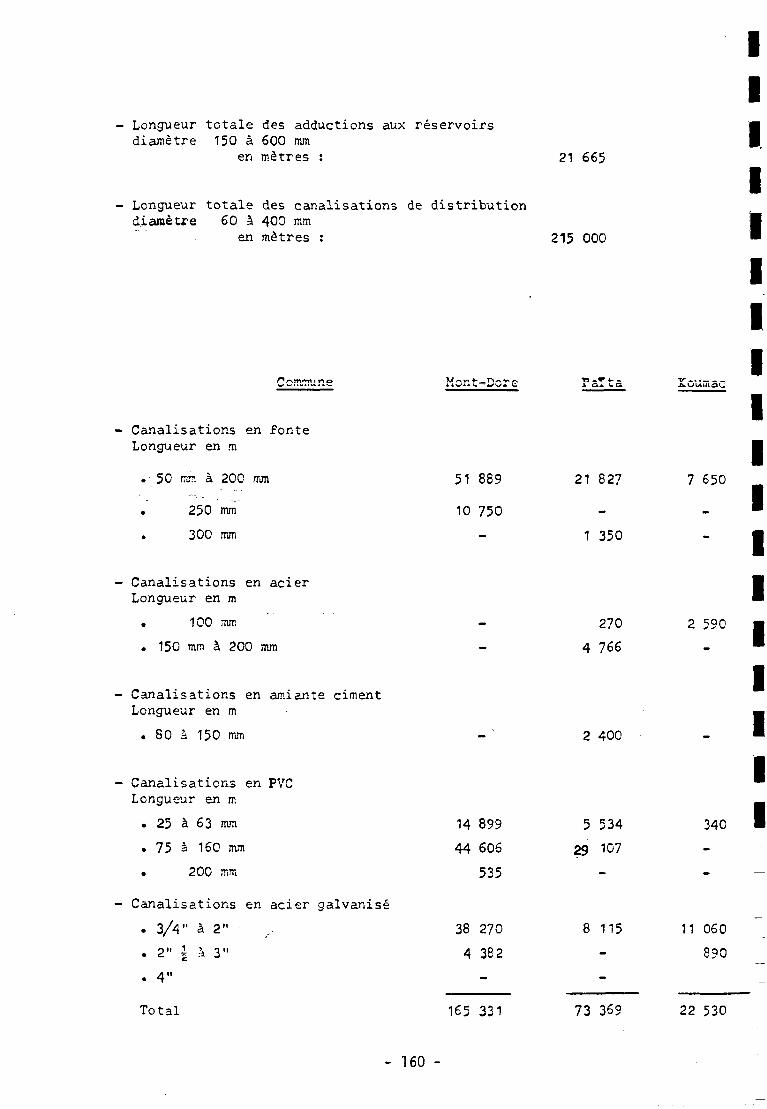
Longueur totale des adductions aux réservoirsdiamètre 150 à 600 mm
en mètres : 21 665
Longueur totale des canalisations de distributiondiamètre 60 à 400 mm
en mètres : 215 000
Canalisations en fonteLongueur en m •
.•50 mm à 200 mm 51 889 21 827 7 650
250 mm 10 750 - •
300 mm - 1 350 - •
Canalisations en acier MLongueur en m •
100 mm - 270 2 590 •
. 150 mm à 200 mm - 4 766 - "
Canalisations en amiante cimentLongueur en m
. 80 à 150 mm
Canalisations en PVCLongueur en m
• 25 à 63 mm
. 75 à 160 mm
. 200 mm
Canalisations en acier galvanisé
. 3/4" à 2"
. 2" ¿ à 3"
. 4"
- -
14 899
44 606
535
38 270
4 382
-
2
5
29
8
400
534
107
-
115
-
-
-
340
-
-
11 060
890
Total 165 331 73 369 22 530
- 160 -
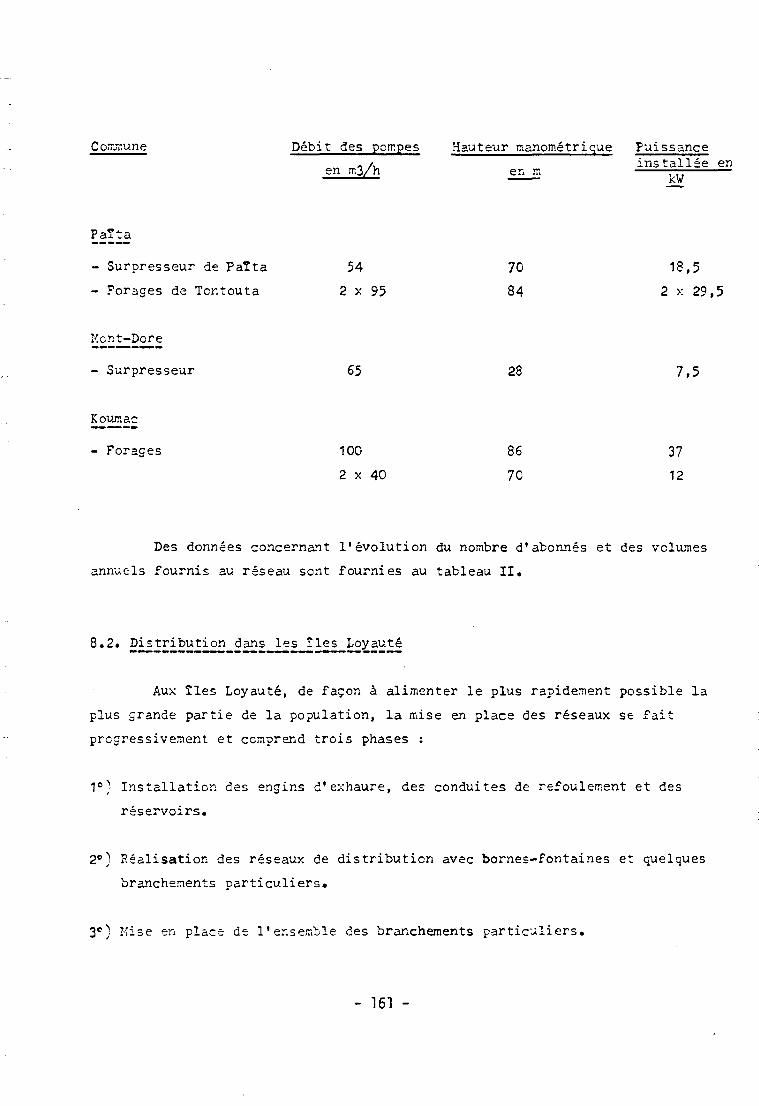
Commune Débit des porr.pes Hauteur manométrique pu i s sance_ /. installée enen m3/h en m —
Paîta
- Surpresseur de Paîta 54 70 18,5
- Forages de Tcntouta 2 x 95 84 2 x 29,5
Kcnt-Dore
- Surpresseur 65 28 7,5
Koumac
- Forages 100 86 37
2 x 40 70 12
Des données concernant l'évolution du nombre d'abonnés et des volumes
annuels fournis au réseau sont fournies au tableau II.
8.2. Distribution dans les îles Loyauté
Aux îles Loyauté, de façon à alimenter le plus rapidement possible la
plus grande partie de la population, la mise en place des réseaux se fait
progressivement et comprend trois phases :
1e} Installation des engins d'exhaure, des conduites de refoulement et des
réservoirs.
2e) Réalisation des réseaux de distribution avec bornes-fontaines et quelques
branchements particuliers.
3e) Kise en place de l'ensemble des branchements particuliers.
- 161 -
3.3. Pompage^solaire
Dans certains cas, i l peut être fait appel à du matériel de pompage
solaire, notamment en ce qui concerne l'alimentation de certains villages et
tribus isolés.
Citons, à t i t re d'exemple, une installation de pompage solaire mise
en place par UNELCO dans l ' î l e d'Ouvéa (îles Loyauté).
Cette pc.T.pe est susceptible de refouler un débit de 3 m3/j à 10 m HMT I
pour une puissance moteur de 80 **»• Dans les conditions moyennes d: ensoleille—
ment de l ' î l e , i l faut une puissance crête de panneaux de 100 V correspondant |
à une surface des cellules voltaïques de 1 m2.
Si ce type de matériel s'adapte particulièrement bien à des débits
et des pressions de l'ordre de ceux cités précédemment, i l est possible, dans
l 'é ta t actuel de la technologie, d'envisager des installations beaucoup plus
puissantes de l'ordre de plusieurs centaines de Watts, dans la mesure où la
mise en place d'une infrastructure électrique propre entraînerait un surcoût
important par rapport à la solution solaire.
9. Structure- juridique de l 'industrie de l'eau en Nouvelle-Calédonie
A NOUKEA,la production, le traitement et la distribution sont du
ressort du service des eaux municipal. La production et la distribution sont
assurées par affermage dans les communes du Mont-Dore et de Paîta et par une
régie privée à Koumac.
Dans toutes les autres municipalités du Territoire, la municipalité
assure elle-même le service oublie de l*eau.
- 162 -
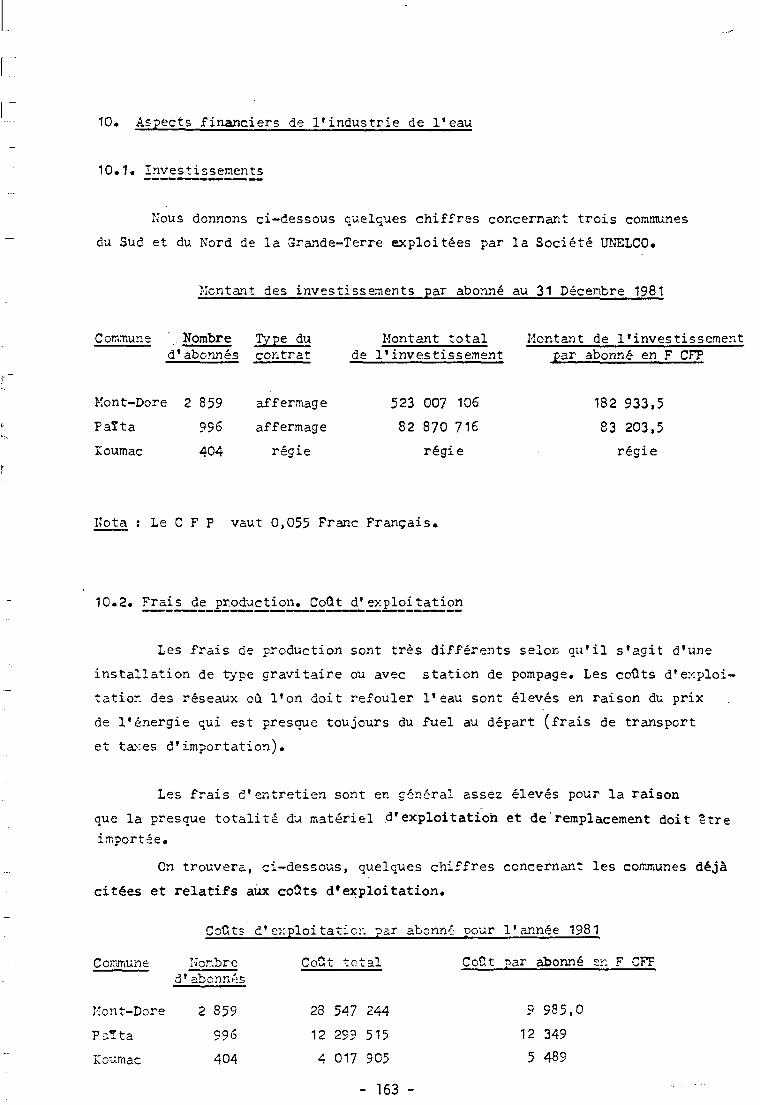
10. Aspects financiers de l'industrie de l'eau
10.1. Investissements
Nous donnons ci-dessous quelques chiffres concernant t rois communes
du Sud et du Nord de la Grande-Terre exploitées par la Société UNELCO.
Mentant des investissements par abonné au 31 Décembre 1981
Commune "... Nombre Type du Montant total Montant de l'investissementd'abonnés contrat de l'investissement par abonné en F CFP
Kont-Dore 2 859 affermage 523 007 106 182 933,5
Païta 996 affermage 82 870 716 83 203,5
Koumac 404 régie régie régie
Nota : Le C F P vaut 0,055 Franc Français .
10.2. Frais_de production. Coût_d'exploitation
Les f ra i s de production sont t r è s différents selon q u ' i l s ' ag i t d'une
in s t a l l a t i on de type grav i ta i re ou avec s t a t ion de pompage. Les coûts d 'exploi-
ta t ion des réseaux où l 'on doit refouler l 'eau sont élevés en raison du prix
de l ' énergie qui est presque toujours du fuel au départ ( f ra i s de transport
et ta>:es d ' importat ion) .
Les f ra i s d ' en t re t ien sont en général assez élevés pour la raison
que la presque t o t a l i t é du matériel d 'exploi ta t ion et de remplacement doit ê t re
importée.
On trouvera, ci-dessous, quelques chiffres concernant les communes déjà
citées et relatifs aux coûts d'exploitation.
Coût? d'exploitation par abonné pour l'année 1981
Commune
Kont-Dore
Paî ta
ICouniac
Norr.br ed'abonnés
2 859
996
404
coa
23
12
4
t total
547 244
299 515
017 905
Coût par
Q
12
5
abonné en F CFP
985,0
349
489
- 163 -
10.2.
Fij.6
II
La tarification en vigueur à NOUMEA, dans les exploitations gérées par •
UNELCC et dans les communes assurant elles-mêmes la gestion, est, en général, •
fixée comme suit :
a) Taxe trimestrielle de location et d'entretien des compteurs, plus taxe
trimestrielle d'entretien des branchements. I
b) Tarification progressive en fonction du volume consommé et forfait pour les •A r\ — •*„.-.: — *»
Le tableau III résume cette tarification.
I11. Iles Valus et Futuna m
Ces deux petits archipels : Wallis d'une part, Futuna et Alofi d'autre •
part, constituent un territoire d'outre-mer depuis le neis de Décembre 1959.
II
11.1. Géographie et géologie •
ICarte des
îles Vallis Ces archipels sont situés dans le Pacifique central à 2 050 km environ
au IIcrd-Est de la Nouvelle-Calédonie, par 14° Sud et 178° Ouest environ.
230 km seulement séparent l'archipel des Valus de celui de Home (Futuna et
Alcfi). Toutes ces îles sont volcaniques et offrent un relief appréciable, le _
point c\il-inant se trouvant à 120 mètres environ au-dessus du niveau de la mer. I
I- 164 - . I
III
Le volcanisme, relativement récent (fin du tertiaire et début du
quaternaire), est à faciès basaltique. Plusieurs des anciens cratères renferment
dœ lacs d1eau douce, dont certains sont très profonds (uns centaine de mètres
pour le lac Lalolalo).
Les terrains volcaniques de l ' î l e ont été fortement fracturés par des
phénomènes explosifs (intrusion de la mer dans les épanchèrents incandescents
de basalte) du type Krakatoa. .Les coulées anciennes sont très altérées et
renferment avec les cir.érites et les tufs une nappe phréatique alimentée par
les précipitations.
11.2. Précipitations
La pluviométrie est plus élevée à Vallis et Futuna qu'en Nouvelle-Calédonie.
Elle dépasse en moyenne 3 000 mm par an. Les pluies sont assez régulièrement
réparties dans le temps et dans l'espace, à l'exception toutefois des cyclones
11.3. Hessources en eau. Qualité des eaux
En ce qui concerne l ' î l e de FUTUTÍA, le réseau hydrographique existant
assure des ressources de surfaces tout à fait satisfaisantes. A t i t re d'exemple,
précisons que le cours d'eau principal a un débit voisin de 100 l/s à l 'étiage.
L'île de Vallis, par contre, est totalement dépourvue de cours c'eau.
Les eaux de pluie s'infiltrent immédiatement et flottant sur l'eau salée, consti-
tuant ainsi une lentille d'eau douce.
Le seul moyen d'utiliser cette réserve d'eau douce consiste à creuser
des puits de diamètre et de profondeur convenables et de procéder à ces prélève-
ments de façor. très prudente afin d'éviter l'intrusion d'eau salée dans les
ouits.
- 165 -
Il existe quatre stations de pompage à Vallis : Mua au Sud-Est, Holo
au centre, Lcka-HihiFo au Nord-Est et Afala, près d'Holo, qui alimente
l'ensemble des bâtiments administratifs du Territoire.
I
IIII
A parties forages qui alimentent ces stations, i l existe une quinzaine
de petits puits privés. I
Les points d'affleurement de la nappe sont constitués par plusieurs I
des nombreu:: lacs de cratères qui parsèment l ' î l e et par les sources qui
s'écoulent dans la mer au niveau de la plate-forme corallienne. A t i t re d'exempft
cri peut noter que le lac Lalolaio représente à lui seul une réserve de
2C 000 000 m 3 d'eau douce.
La qualité des eaux de la nappe est, en général, très bonne. La dureté |
est comprise le plus souvent entre 2 et 5° fr sauf dans les zones coralliennes,™
près du l i t toral , où la présence abondante de CO.Ca peut faire monter la •
dureté jusqu'à 25° fr. La teneur en ion Cl"* est presque toujours inférieurs
à 15 r.g/l et n'atteint que rarement 50 mg/l. Ce résultât indique bier¿ qu'il
n'y s pas actuellement d'invasion de la nappe aquifère par les eaux marines. •
La teneur en ion C0oH~ est comprise entre 15 et 40 mg/l. La température de
l'eau dans les stations de pompage, puits, lacs et sources,se situe toujours I
entre 27 et 30°C.
IUne stérilisation générale au chlore gazeux des eaux captées et dis-
tribuées est à l'étude et sera réalisée prochainement. •
I11.4. La lentille d'eau douce
IElle constitue le cas propre aux nappes phréatiques insulaires lorsque •
les îles sont de faible étendue.
IUne étude détaillée a montré que lorsque les terrains aquiferes sont
suffisaient horr.ogènes le toit de la nappe (surface supérieure) et l'interface I
eau douce-eau salée (base de la nappe d'eau douce) représentent des paraboloides
de révolution plus ou moins réguliers. C'est ce qui a valu à ces formations
le nom de lenti l les,
- 166 - ,,
L'étude de la lentil le de Val l is a été entreprise par UIJELCO et la
Société ARLAB à l ' ini t ia t ive du Génie Rural. Cette étude a permis de préciser,
avec l'étendue des réserves aquifères disponibles, le meilleur mode d'exploi-
tation grâce à une modélisation mathématique.
Fig. 7 Une loi dite de Ghyben-Herzberg montre que les épaisseurs de la lenti l le
\ „ ~ de part et d'autre du niveau de la mer sont dans un rapport ne dépendant que
lentille des masses volumiques de l'eau deuce et de l'eau salée ; ce rapport est égal
à 27 dans l'Océan Pacifique. Dans ces conditions, si l'on explore convenablement
la nappe par des piézomètres judicieusement placés, on peut obtenir de bonnes
valeurs qui permettront une exploitation rationnelle de l'aquifère.
En temps normal, c'est-à-dire en l'absence d'exploitation, l'équilibre
s'établit comme"suit :
Débit des résurgences = débit de l'eau infiltrée dans l'aquifère.
Toute modification des précipitations aura donc une répercussion plus
ou moins rapide sur l'épaisseur de la lent i l le .
Lorsqu'on exploite la nappe aquifère, un nouvel équilibre s 'établit :
Débit des résurgences + débit pompé = débit de l'eau infiltrée dans l'aquifère.
Si le débit pompe augmente, le volume de la lentille diminue et l'on
provoque une remontée de l'interface eau salée-eau douce avec risque d'intrusion
d'eau salée dans les puits.
De plus, le toit de la lentil le subit,lors des pompages, un rabattement
dépendant de la transmissivité et du coefficient d'emmagasinement des terrains
contenant la nappe.
La remontée R de l'interface est donnée par :
R = 27r (pour l'Océan Pacifique)
r étant le rabattement.
Enfin si les terrains du rivage sent suffisamment perméables, la
lentille peut éprouver un battement consécutif aux mouvements de la marée.
- 167 -
II
Des études approfondies seront donc toujours nécessaires avant toute I
exploitation d'un acuifère insulaire pour préciser :
I- la profondeur du toit de la nappe et sa réaction aux précipitations
- l'influence des marées
- la variation de la salinité en fonction de la profondeur des captages _
auxquelles il sera indispensable d'ajouter des essais de pompage prolongés
avant toute mise er. exploitation.
I11.5. Dé
I
Les archipels Vallis et Home sont très peuplés. On compte 5 400
habitants à Vallis, -/• sur 275 km2. La densité de population est donc de _
près da 20 au km2. A Futuna et Alofi, il y a 3 C00 habitants sur 95 km2, I
soit près de 32 au km2. _
11.6. Techniques ¿¿épuration et distribution *
Comme on vient de le voir, les eaux distribuées à Vallis sont uniquement
d'origine souterraine. La nature des terrains aquifères et le genre de vie des I
habitants ne font pas craindre de pollutions dans l'immédiat. L'eau pompée
est donc utilisée telle quelle, mais l'on s'apprête à installer des dispositifs»
de stérilisation au chlore gazeux sur l'ensemble du réseau.
ILes réseaux de distribution, comme les stations de pompage, font appel
à un matériel tout à fait classique, tel qu'on l 'u t i l i se en Europe.
I- 168 -
IIII
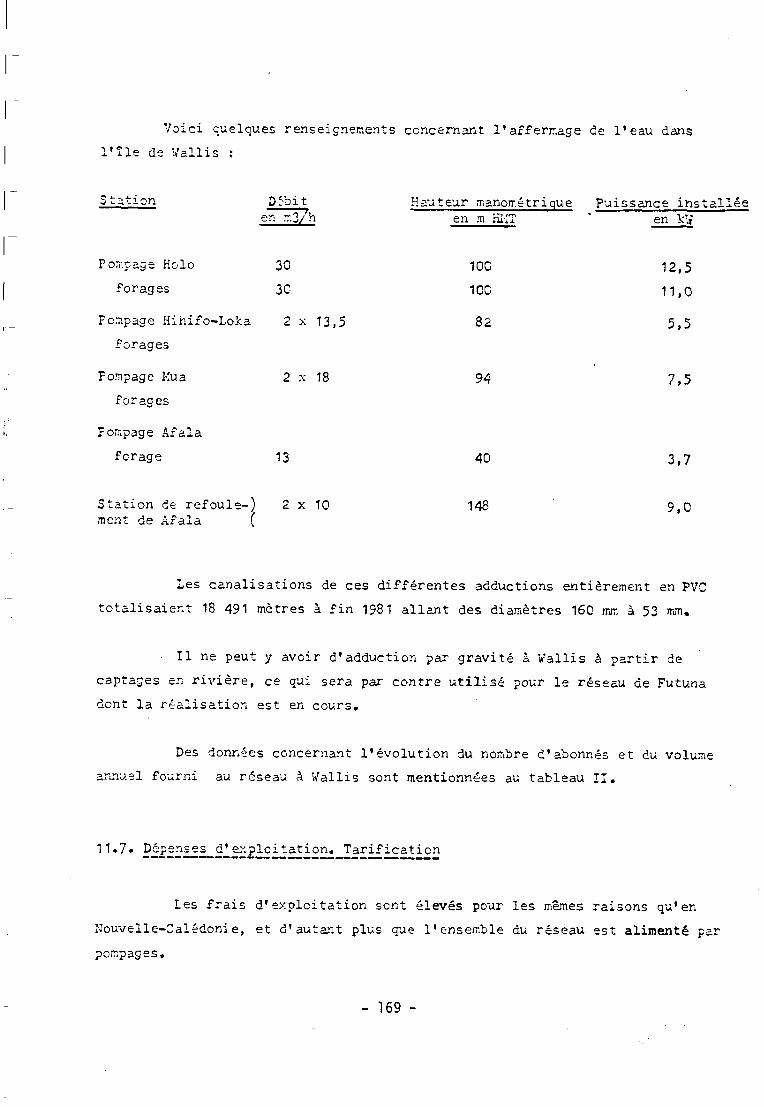
Voici quelques renseignements concernant l'affermage de l'eau dans
l ' î l e de Vallis :
station
Pompage Holo
forages
Débiten rr.3/h
30
30
Pompage Hihifo-Loka 2 x 13,5
forages
Pompage Kua
forages
Pompage Ai ala
forage
2 x 13
13
Station de refoule-) 2 x 10ment de Afala (
Hauteur manorr.étrique Puissance installéeen m HI-IT * en kW
100
100
82
94
40
148
12,5
11,0
5,5
7,5
3,7
9,0
Les canalisations de ces différentes adductions entièrement en PVC
totalisaient 18 491 mètres à fin 1981 allant des diamètres 160 mm à 53 mm.
• II ne peut y avoir d'adduction par gravité à Vallis à partir de
captages en rivière, ce qui sera par contre utilisé pour le réseau de Futuna
dont la réalisation est en cours.
Des données concernant l'évolution du nombre d'abonnés et du volume
annuel fourni au réseau à Vallis sont mentionnées au tableau II.
11.7» D_épenses_d' exploitation. Tarification
Les frais d'exploitation sont élevés pour les mêmes raisons qu'en
Nouvelle-Calédonie, et d'autant plus que l'ensemble du réseau est alimenté pa:
pompages.
- 169 -
II
Le système de tarification appliqué dans l'archipel Wallis est le même •
qu'en Nouvelle-Calédonie, c'est-à-dire une tarification progressive en
fonction des volumes consonur,és avec une première tranche forfaitaire pour J
les premiers 50 m3 trimestriels. _
On trouvera ci-dessous quelques chiffres concernant les coûts d'exploi-™
tation par abonné pour l'année 1981 : •
IAffermage de Val l i s Nombre Coût t o t a l Coût par abonné
d'abonnés en F CFP en F CFP •
732 4 017 905 5 489 •
I11.8. Nature juridique du producteur et du distributeur
La gestion du réseau d'eau potable de Vallis est confiée par affermage
à une société privée qui a la charge de son entretien et de la perception
des redevances. Mais le réseau reste la propriété du Territoire. |
I12. Conclusions •
IComme nous avons tenté de le faire ressortir dans cet exposé, la dis-
tribution de l'eau potable dans les î les de l'Océanie que nous avons étudiées
ne pose, en général, pas de problème nouveau, ni sur le plan technique, ni
sur celui de la qualité de l'eau.
La principale difficulté réside dans l'obtention de ressources suffi-
santes, en raison du caractère insulaire de ces territoires.
II
Dans certains cas, il est indispensable de faire appel à des techniques*
évoluées (distillation solaire, osmose inverse, e t c . ) , dont l'application ne m
peut se faire qu'après une étude approfondie des ressources et des besoins. •
- 170 - -- ™
I
III Seuls des spécialistes connaissant parfaitement le contexte particulier
des îles à l ' instar d'UNELCO, peuvent se lancer dans ces nouvelles applications.
™ En ce qui concerne l'aspect financier de la distribution de l'eau
potable dans les îles de l'Océanie, et notamment en.ce qui touche au mentant
— des redevances, or. notera que dans ce domaine aussi la vision paradisiaque
que l'or, accole volontiers à ces territoires lointains doit être tempérée,
~~ En effet, les conditions particulières aux îles et spécialement aux petites,
fait que le prix ce l'eau de qualité ne peut être que plus élevé comparé à
celui pratiqué sur les continents.
- 171 -
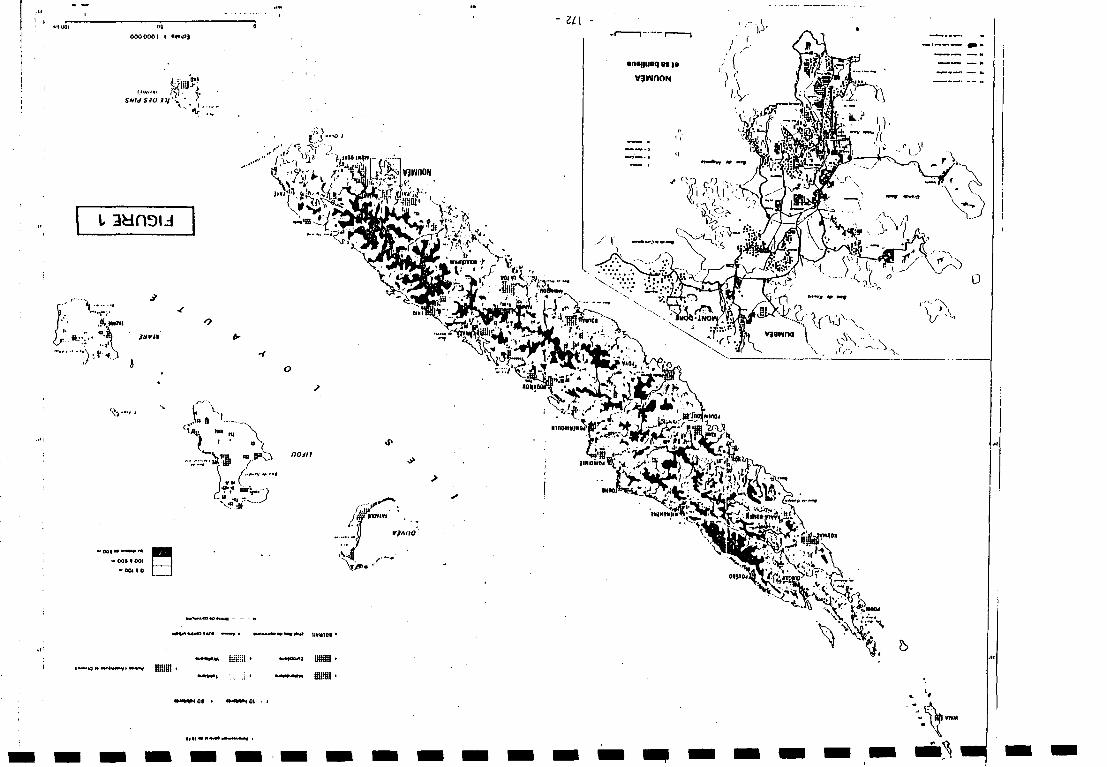
- '¿¿I -
SMrfSJOJJ/*-.
("i""0 '
I 3H0DIJ
V' •• í \
u-" "VVV
-OOlfOOi I [
-oono I I
i tM*ia i» —t*j**nt ^ M«n«
As::- \ < ••:> .;::i
J>
/^Pim.wrjnito
•wM» • •unu»<»«i>'>*<i*4> uvvnai
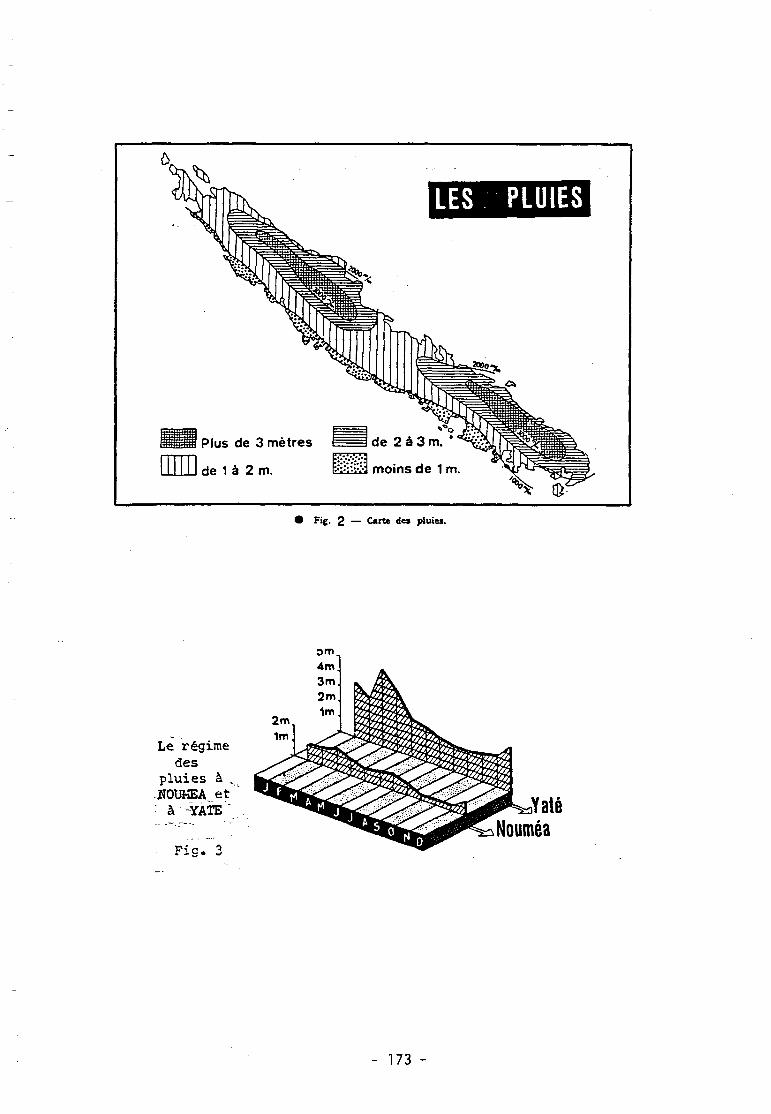
LES PLUIES
1IIPlus de 3 mètres
de 1 à 2 m.
Fig. 2 — Curte des pluies.
Le régimedes
pluies à ...HOUKEA et• à -YATE "
Fig . 3
YatéNouméa
- 173 -
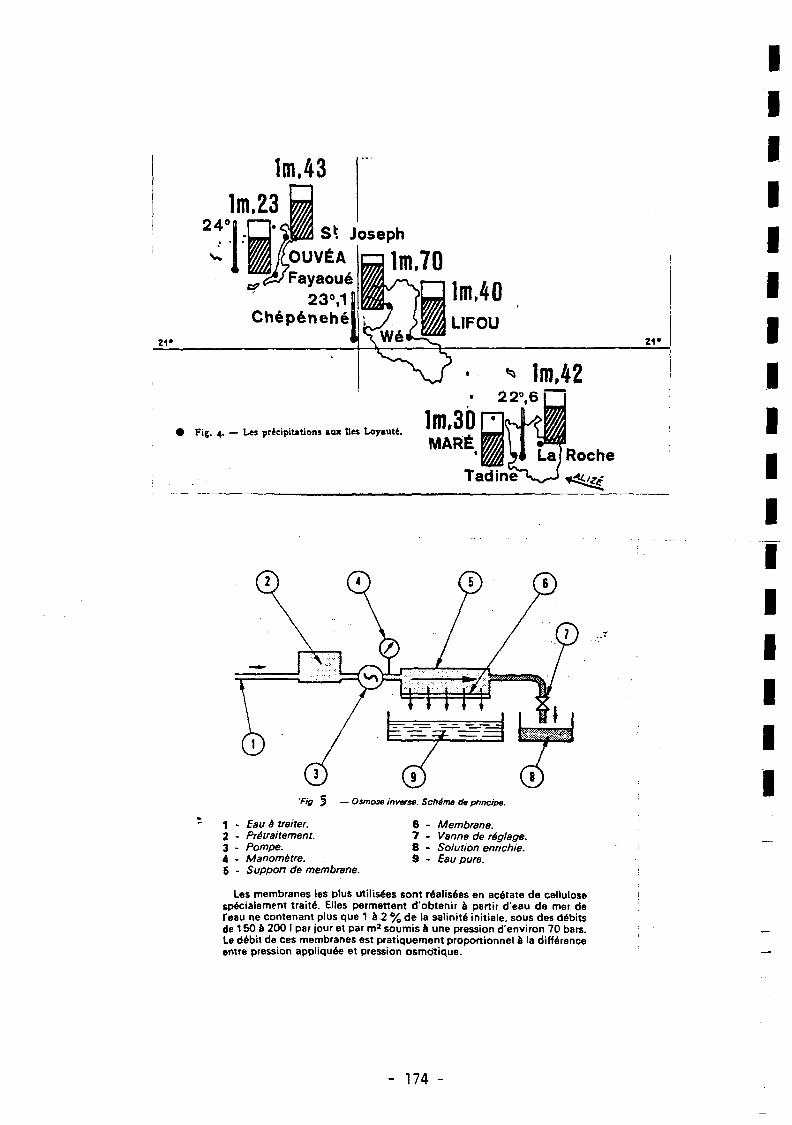
1m.431m.23
21*
Chépénehlm,40LIFOU
21 •
1m,42
Fig, 4. — Les précipitations aux Uet Loyauté, 1m,3QMARÉ
226,6
TadineLai Roche
5 — Osmose inverse. Schám» th principe.
1 - £au à traiter.2 • Prétraitement.3 - Pompe.4 - Manomètre.5 - Support de membrane.
6 - Membrane.7 - Vanne de réglage.8 - Solution enrichie.9 - Eau pure.
Les membranes les plus utilisées sont réalisées en acétate de cellulosespécialement traité. Elles permettent d'obtenir è partir d'eau de mer del'eau ne contenant plus que 1 à-2 % de la salinité initiale, sous des débitsde 150 à 200 I par jour et par m2 soumis à une pression d'environ 70 bars.Le débit de ces membranes est pratiquement proportionnel à la différenceentre pression appliquée et pression osmotique.
IIIIIIIIIIIIIIIII
- 174 -
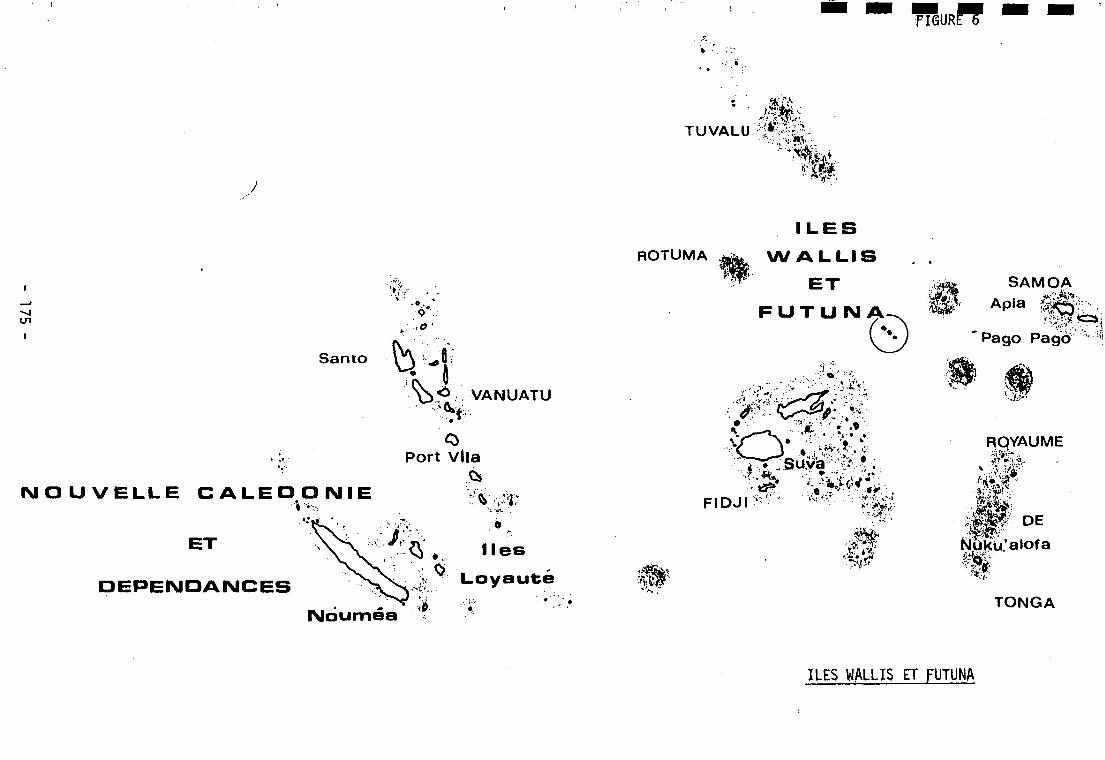
FIGURff " *
TUVALU ' #
i
Santo
• # , • .
¿-: - o '
VANUATU
Port Vila
NOUVELLE CALEDONIE
DEPENDANCES
Noumea
ROTUMA
ILES
WALLIS
FUTU NA
• •,.' ' ••'•i""-'-:' • • ' • • . - * • £ ' * ' .
*£!-V\t-"
F I D J I ' - ••v"*'' •'••tfy
SAMOA
Apia
Pago
RQYAUME
^tJIP' DENukualofa
TONGA
ILES WALLIS ET
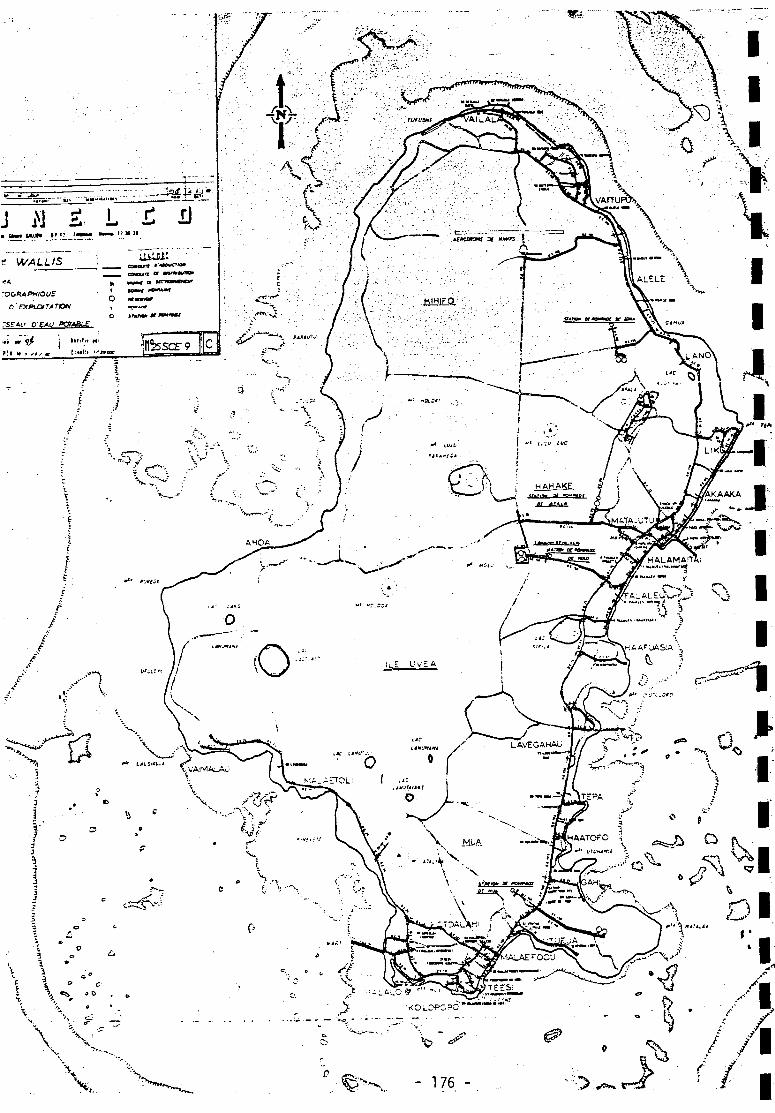
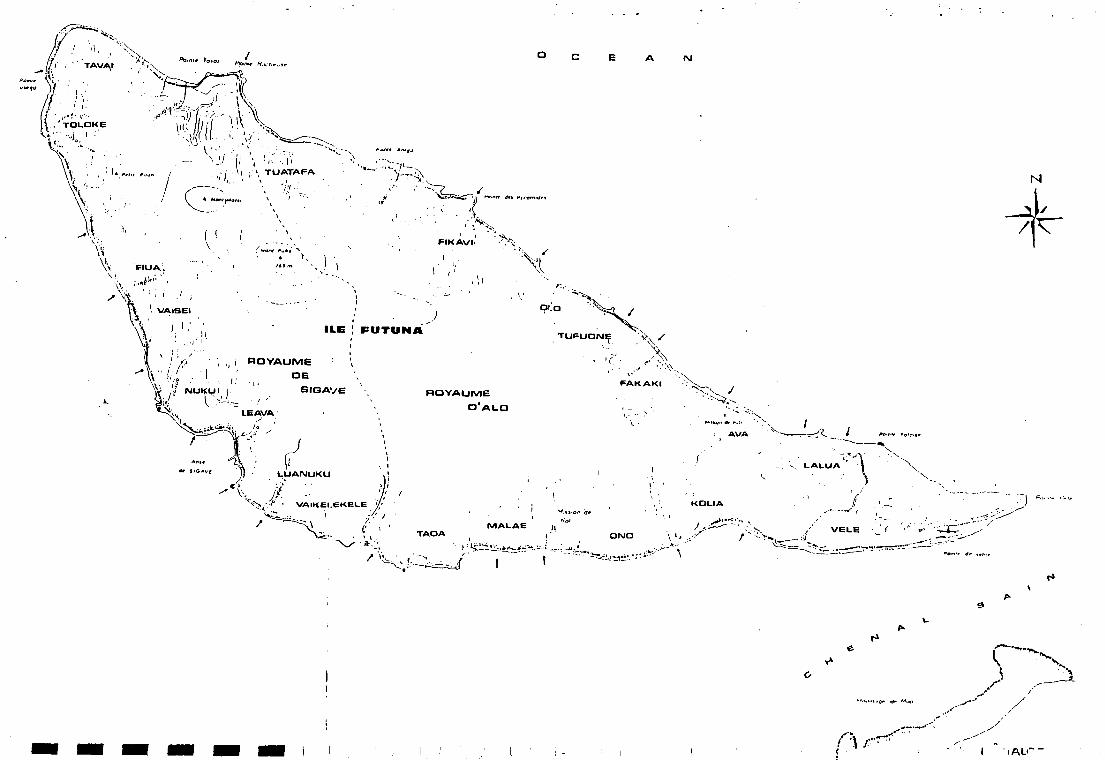
A IM
, ; / ' * i . ¡:>. TUATAFAN
LALUA
VELE • f • »• - ;
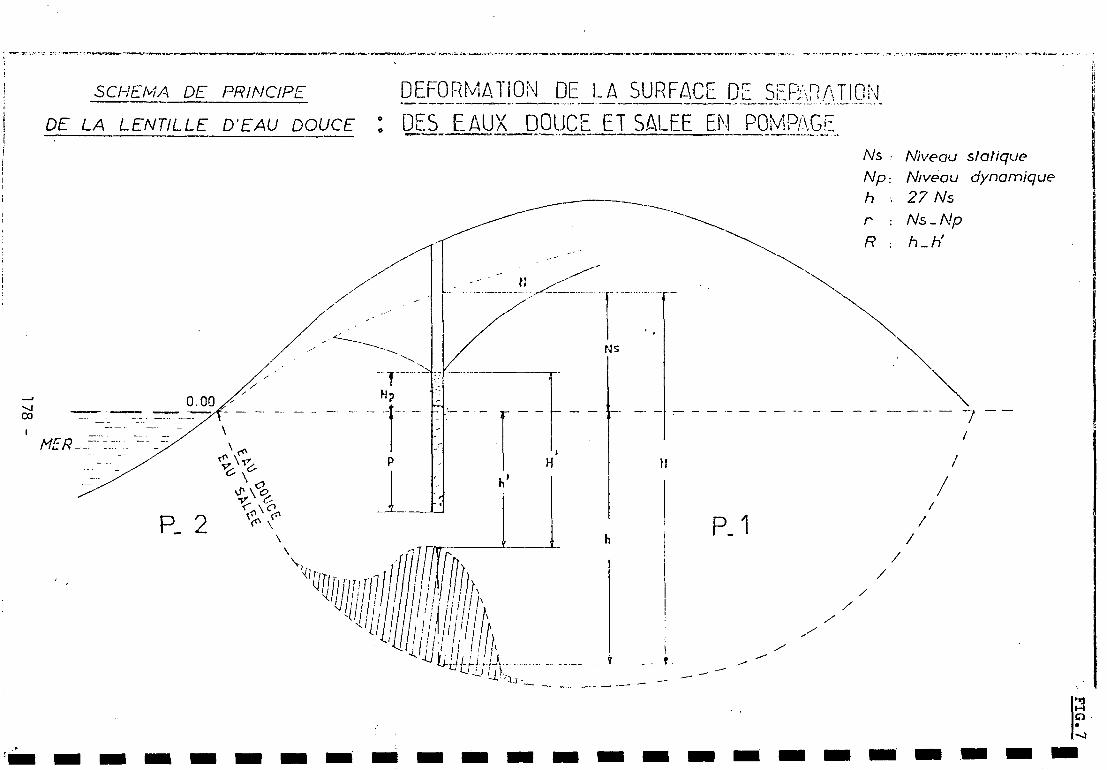
SCHEMA DE PRINCIPE DEFORMATION DE LA SURFACE DE SEPARATION-DE LA LENTILLE DTAU DOUCE : DES FAUX DOUCE ET SALEE EN POMPAGE
A/s : Niveau statiqueNp -, Niveau dynamiqueh . 27 A/s
r : A/s _ Np
R -, h.H
MO
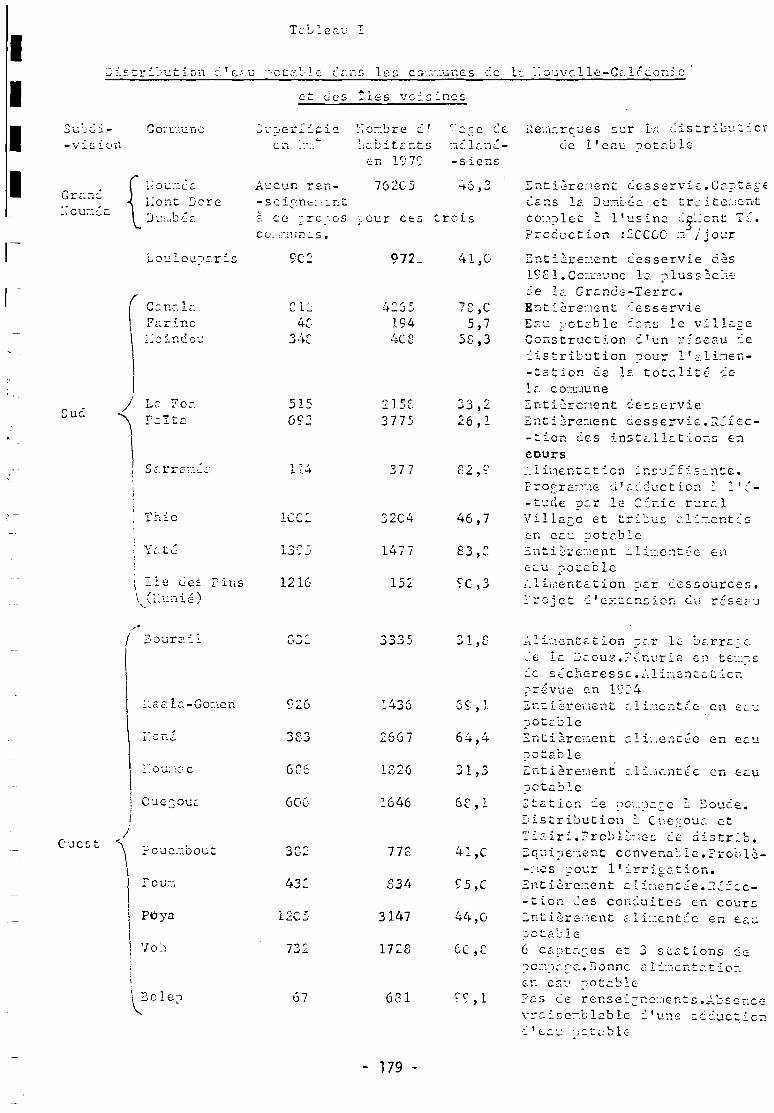
IIII
a D ¿ e a u i
'e-.u -•ct-ble a n s les cî-.rvûr.£s ce le; Nouvel le-Ca l-'donic
- V i S i C
.-.cunea
i\ Ou'-.iCc-
ilont DcreDunbéa
Sud
larme
i- or."S Peí ti
et oes lies veis-nés
-•" i
e n .:•::
Aucun ren-
habitants ndlané-en 1979 -siens
762G5 46,3
e. ¿¿enarques sur la d i s t r i b u t o rce l 'eau ootabie
a ce prepos pour ces troisce: "¡ur;s.
Sarranéa
iriio
Yaté-
\ lie ues Tins\(Uunié)
ÇC2
ni4C
515
114
1CC2
1395
1216
972_
215£3775
377
32C4
1477
152
41,0
42651944C8
7 £5
58
,c,7,3
33,226,1
£52,9
46,7
S3,C
9C,3
I nt i èr e:2C-r.£ ci e s s e r v i c. C f.p t a¿ eCans la DuiTibéa et tre i t è ren tcomplet à l 'us ine ¿çl.'ont T;'.? reçue t ion :2GCGG in"*/jour
Sritière:.ient desservie ces-19£l.Gcr.rruine la plussòche¿e la Grcr.cG-Terre.Entièrer.ieni: ResservieE^u potable dens le vilkjeConstruction d'un rc'seau dedistribution pour l'alimen--tation de 1= totalité delr. coxjuneïntièrer:\ent desservieSnti àrer.ient desservie. Rdfec--tion des installations enenurs:. 1 i;r.entat don ir.cuf f i santé.P r o g r a r m e d ' a d d u c t i o n à l ' i --tude par le G'r.ic ruralVillage et tribus ali-entc'sen eau potableZntii-re^ent alimentée eneau potableAlimentation piar dessources.Trajet d'extension du rcse;-u
/ B ourai!
1'íc.c. Ir.-Gone n
:.ou;-.:nc
Cue~oua
Ouest "S ..
iour:.
j P6ya
i Voh
1 Bêle-.
383
6C6
6C6
12C5
67
3335
1436
2667
1326
1646
77£
S34
3147
172S
681
r- c i
64,4
JIjJ
6S,1
95,C
44, G
6C,C
Alinentation par le barragede la Daouz.Pénurie en te:;:-sde sécheresse. Al inenta tier.prévue en 19C4Entièrenent al inentée en eaupotableSntièrenent alinentée en eaupotableEntièrenent al inentée en eaupotableStation de pc-..:pa e à Boude.Distribution à C U C Ï O U Ô etTiairi.Prcblanec de distrib.Equipev.ient cenvenab le .Problè--:.;es pour l'irrigation.Entièrenent alinentde.Rcftc--tion des coiiduites en coursEntièrenent alinentée en eaupotable6 captares et 3 stations depcnpagc. Bonne a liner.tatior,en eau potablePas de renseignements.Absencevraisemblable d'une adduction•_ Lui. ;Di.i¡Bli;
- 179 -
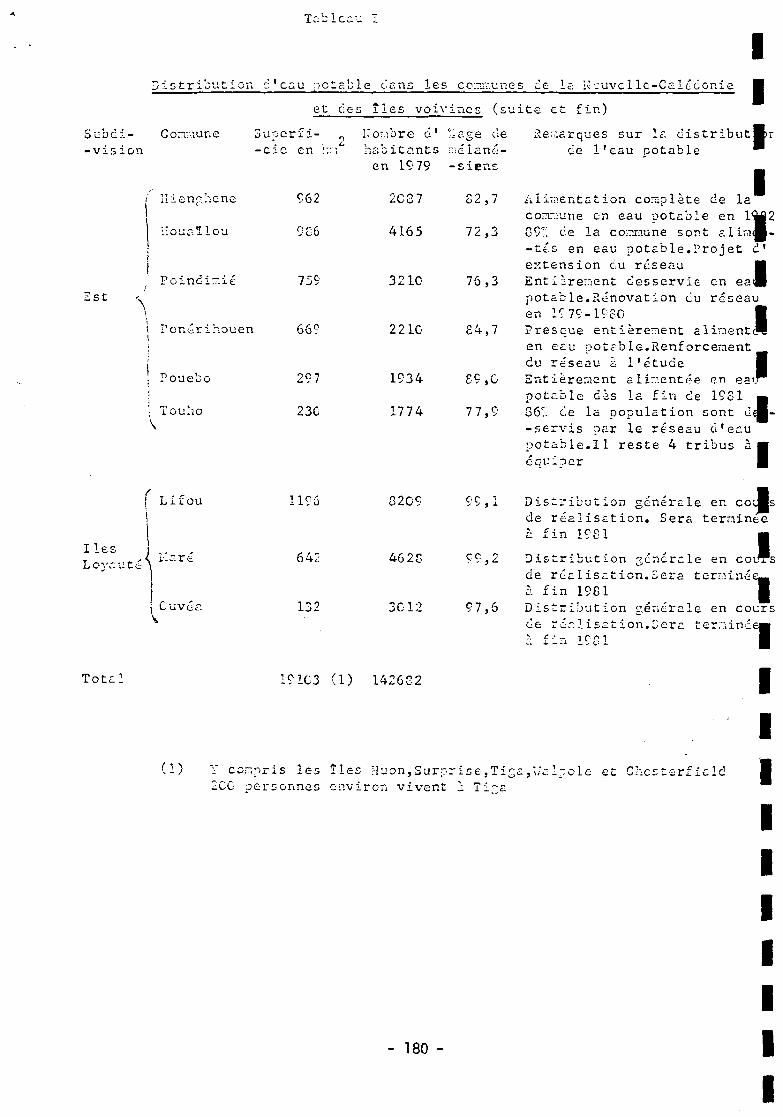
T '• b ~< a - • • 7
Distribution c'cau potable dans les communes de la ¡••cuvcllc-Caléconie
et des îles voivines (suite et fin)
Subdi--vis ion
Commune 3u-c
i ¡îienghene
I Houaîlou
Sst ^Poindimié
Ponérihouen
Pouebo
; TOUllO
perfi-ic en km'
962
9G6
759
66?
29 7
230
, Nombre d'habitantsen 19 79
2087
4165
321C
2210
1934
1774
"age cmélané- s i ens
82,7
72,3
76,3
£4,7
89 ,0
77,9
?otal
II
IAlimentation complète de lacorr.-une en eau potable enG9": ce la co;-nraune sont alira-tis en eau potable.Projet d1
extension du réseauEntièretaent desservie enpotable.Rénovation eu réseauen 1C79-1980Presque entièrement alimenten eau potable.Renforcementdu réseau h l'étude •Entièrement alimentée en eaupotable dis la fin de 19S186/- de la population sont ¿-servis par le réseau d'eaupotable.Il reste 4 tribus àéquiper
I
I( LifI O U
l-lcré
j Cuver.S.
1196
642
132
82G9
4628
3012
9 9 , 1
Ç Ç , 2
97,6
Distribution genérale en coasde réalisation. Sera terminéeà fin 19S1
1Distribution générale en coursde réalisation.Sera terminée—à fin 1981 gDistribution générale en coursde réalisation.Gera terminei
fin 19c1
19103 (D 142682
(D •; compris les îles Huon,Surprise ,Tiga ,Ua Ipole et ChesterfieldICC oc-rsonnes environ vivent à Ti~a
- 180 -
1IIIIIIIIII
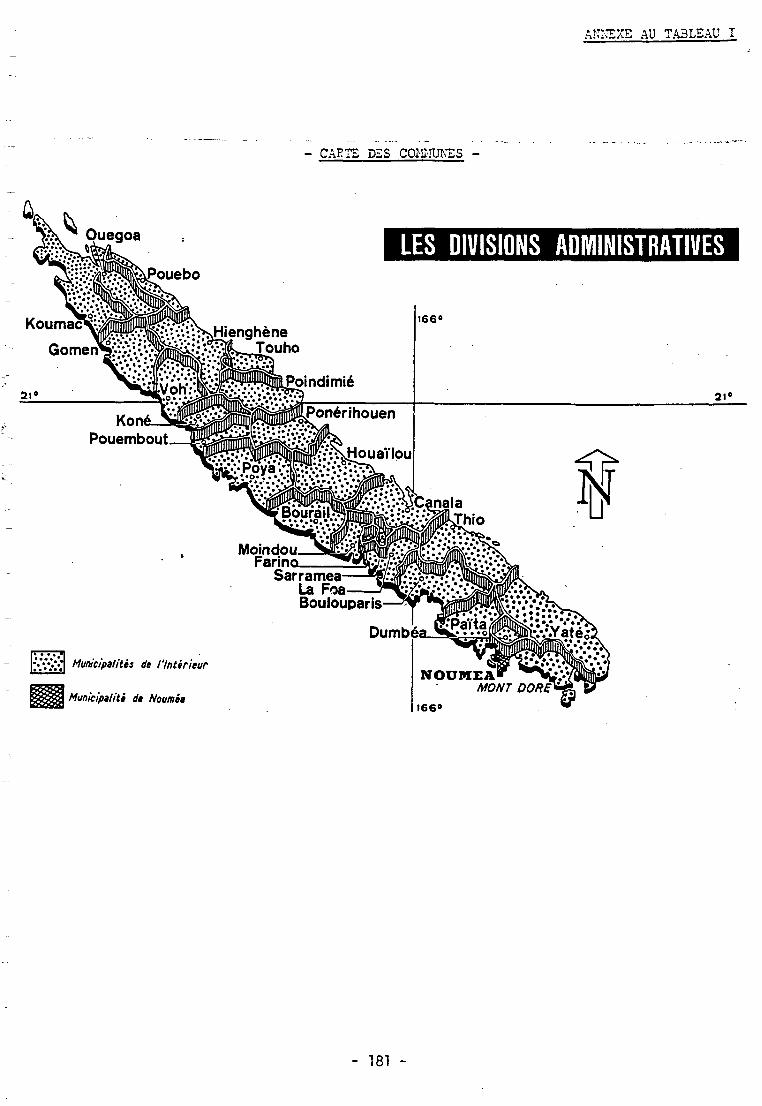
AÎH-ÎEXE AU TA3LEAU I
- CAETE DES COMMUNES -
LES DIVISIONS ADMINISTRATIVES
Ponérihouen
Houaïlou
MoindouFarina
Municipalités de l'Intérieur
Municipalité de Nouméa
SarrameaLa FoaBoulouparis
Dumbéa.
NOUMEA»MONT DORÉ*
166°
- 181 -
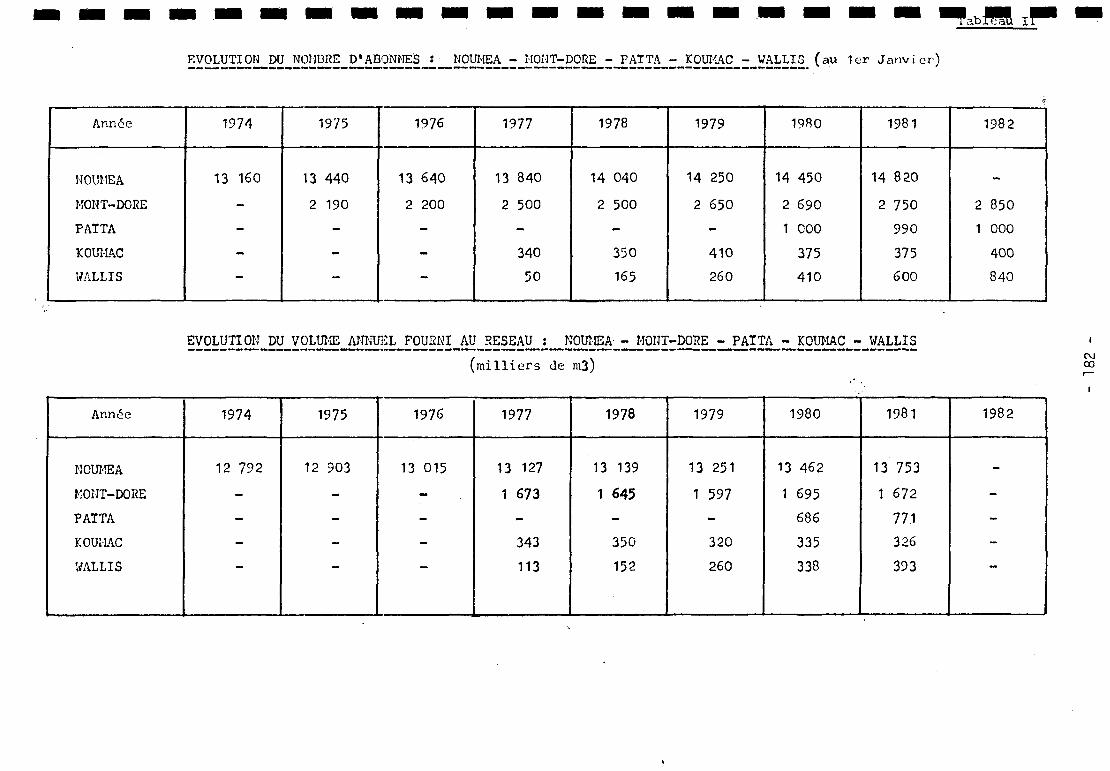
EVOLUTION DU NOMBRE D'ABONNES : NOUMEA - MONT-DORE - PATTA - KOUMAC - VALLIG ( a u 1er J a n v i e r )
a b l ë a u II
Année
NOUMEA
MONT-DORE
PATTA
KOUMAC
WALLIS
1974
13 160
-
-
-
-
1975
13 440
2 190
-
-
-
1976
13 640
2 200
-
-
-
1977
13 840
2 500
-
340
50
1978
14 040
2 500
-
350
165
1979
14 250
2 650
~
410
260
1980
14 450
2 690
1 000
375
410
1981
14 820
2 750
990
375
600
1982
_
2 850
1 000
400
840
EVOLUTION DU_VOLUME ANNUEL FOURNI AU EESJAU_ : _NOUMEA :^9i JT-DORE_-J^ÏTA_;^K0UMAC - WALLIS
( m i l l i e r s de m3)
Année
NOUMEA
MONT-DORE
PATTA
KOUMAC
WALLIS
1974
12 792
-
-
-
1975
12 903
-
-
-
1976
13 015
-
-
-
1977
13 127
1 673
-
343
113
1978
13 139
1 645
-
350
152
1979
13 251
1 597
-
320
260
1980
13 462
1 695
686
335
338
1981
13 753
1 672
771326
393
1982
_
-
-
-
ouco
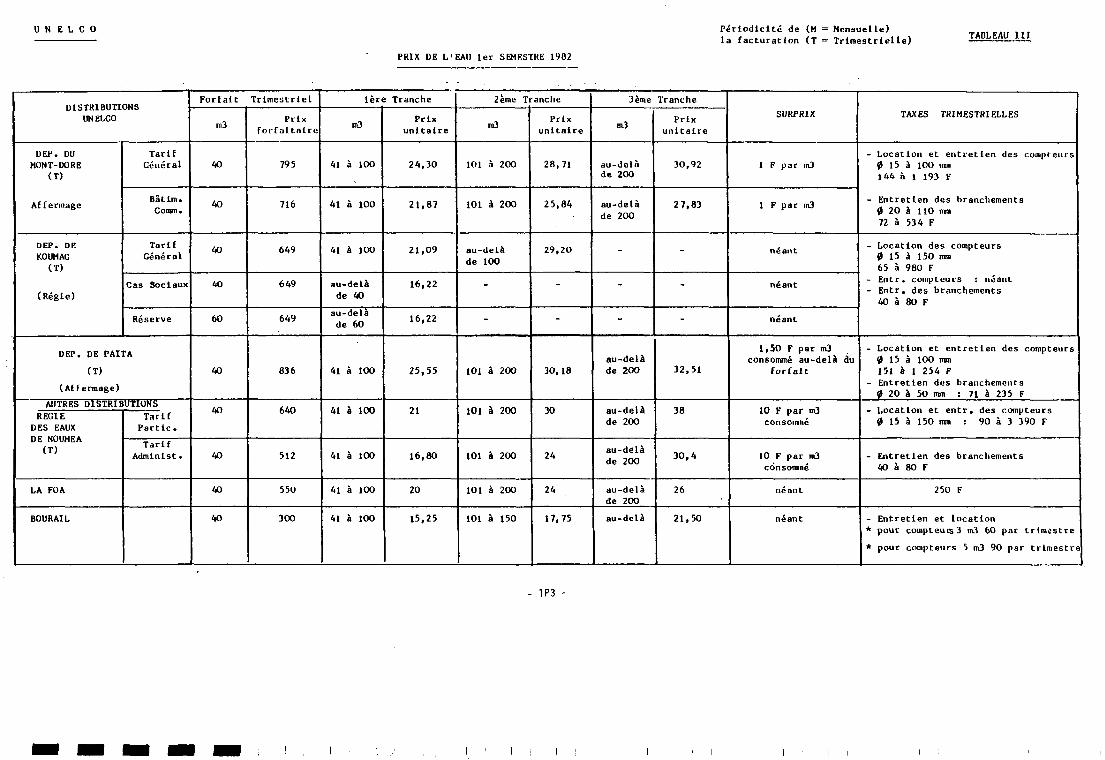
UN E L C O Périodicité de (H = Mensuelle)la facturation (T = Trimestrielle)
TABLEAU 111
PRIX DE L'EAU 1 e r SEMESTRE 1902
DISTRIBUTIONSUNELCO
UEP. DUMONT-DORE
<T)
Affermage
DEP. DEKOUMAC
(T)
(Régie)
TarifGénéral
Bâtlm.Coran.
TarifGénéral
Cas Sociaux
Réserve
DEP. DE PAITA
(T)
(Affermage)
AUTRES DISTRIBUTIONS
REGIEDES EAUXDE NOUMEA
(T)
LA FOA
BOURAIL
TarifPartie.
TarifAdmlnlst.
Forfait Trimestriel
m3
40
40
40
40
60
40
40
40
40
40
Prixforfaitaire
795
716
649
649
649
836
640
512
550
300
1ère Tranche
m3
41 à 100
41 à 100
41 à 1OO
au-delàde 40
au-delàde 60
41 à 100
41 à 100
41 à 100
41 à 100
41 à 100
Prixunitaire
24,30
21,87
21,09
16,22
16,22
25,55
21
16,80
20
15,25
2ème Tranche
nû
101 à 200
101 à 200
au-delàde 100
-
-
101 à 200
101 à 200
101 à 200
101 à 200
101 à 150
Prixunitaire
28,71
25,84
29,20
-
-
30,18
30
24
24
17,75
3ème Tranche
m3
au-delàde 200
au-delàde 200
-
-
-
au-delàde 200
au-delàde 200
au-delàde 200
au-delàde 200au-delà
Prixunitaire
30,92
2 7,83
-
-
-
32,51
38
30,4
26
21,50
SURPRIX
1 F par m3
1 F par m3
néant
néant
néant
1,50 F par m3consommé au-delà du
forfait
10 F par m3consommé
10 F par ra3consommé
néant
néant
TAXES TRIMESTRIELLES
- Location et e n t r e t i e n des compteurs0 15 à 100 imn144 à 1 193 F
- Entretien des branchements0 20 à 110 mm72 à 534 F
- Location des compteurs0 15 à 150 mm65 à 980 F
- Entr. compteurs : néant- Entr. des branchements
40 à 80 F
- Location et e n t r e t i e n des compteurs0 15 à 100 mm151 à 1 254 F
- Entretien des branchements9 20 à 50 mm : 71 à 235 F
- Location e t e n t r . des compteurs(9 15 à 150 non : 90 à 3 390 F
- Entret ien des branchements40 à 80 F
250 F
- Entretien et l oca t ion* pour compteuis3 cnJ 60 par tr imestre
* pour compteurs 5 m3 90 par tr imestre
- 1P3 -
SESSION VI.
Samia Al Azhara Jahn, SUDAN.
Introduction.
II
FIRST EXPERIENCES WITH A WOMEN-SPECIFIC PROJECT FOR THE WATER DECADE. I
II
In the Western World drinking water is taken as far as possible from •ground water sources. If they are insufficient and it becomes necessary |to use surface waters from rivers and lakes or even to re-cycle water usedfor industrial purposes, specialised engineers and chemists have to deal •with the technical details of water treatment, which is then carried out Iby public water works. The quality standards are under the control ofhealth authorities which are following reconmendations issued by National •Boards and the World Health Organisation. The main responsibility for •water supply is given to men, and the main objective of modern conventionalwater treatment is to secure the health of the users. I
The situation is quite different in rural Africa. There the women have _the main responsibility for the water which is consumed by the family. In Icase the water source consists of surface water, women try in certain areasto draw the clearest and cleanest possible water for their drinking water _supplies. This may mean additional long exhausting water trips or bold Jdangerous climbing to natural rock reservoirs where the rain water iskept clear whereas it might have becane highly turbid in a natural or •artificial basin at the foot of the rock. Other traditional practices |to provide drinking water of better quality consist of simple treatmentsin the houses such as different methods of filtration, prolonged storage, •water coagulation and attempts at disinfection (Jahn 1981). Where women Ialready try to provide clearer and cleaner water without offensive smelland taste, their actions are stimulated mainly by aesthetic and religious Iconsiderations. The health aspects of a concern for better water quality •are so far only understood by a few. _
The present paper deals with a project in which scientificallyrevised traditional methods of water coagulation in the Northern Sudan _are intended to be taught as an appropriate domestic self-help programme gto rural women using water from rivers, irrigation canals, rain pondsand artificial rain water storage basins. This pilot project is supported •by the German Agency for Technical Cooperation (GTZ). |
Water coagulation technology adapted to village level. J
To clarify Nile water to residual turbidities of 1-2 FTU throughout _the year is not an easy task, no matter whether the raw water is very |muddy or only of a milky opaque appearance. In the urban water worksin Khartoum jar tests for the determination of the suitable alum •concentration are therefore carried out almost daily. In villages where |women presently practice traditional clarification during the floodseason the results of their treatment are very different. If they are •well experienced, their water can have residual turbidities of 5-10 ITU I
I- 184 - .
I
or even less after 1 - 2 hours, whereas a less skilled woman might onlyobtain whitish turbid water of 100-200 ITU. In another house theimprovement may be even less (Jahn 1977). During the dry season riverwaters with turbidities of 50-150 FTU are so far accepted fatalisticallyas "untreatable".
To optimise domestic rural water treatment both for the sake of aphysico-chemical improvement which can be easily observed by the wonenand for a better removal of mircoorganisms, which might be pathogènes,a simplified village jar test has been designed. The one litre beakersof the conventional test were replaced by small enamel buckets eachfilled with 4 litres of raw water. Dosing is carried out in terms ofseeds to be powdered or spoons of crushed clay, and uniformous slowstirring during flocculation is perfoimed by hand and by pronouncinga suitable formula (cf. Jahn 1981, Chapter 7).
This method was well accepted and understood by three girls fromAhfad University College for Women in Cmdurman and four female teachers(age 20-30 years) from Alti on the Blue Nile. The urban College girlsfor whan water purification was simply a new subject in their curriculumdid not object when I taught them to stir the water in a clockwisedirection. The rural teachers on the other hand wondered whether theycould stir counter-clockwise. This was a valuable hint. Arabic iswritten from right to left, and in olden times the clocks in the MiddleEast actually rotated in reversed direction. Thus it was natural forthese women to think that stirring during flocculation should be donecounter-clockwise.
Both groups of women could perform village jar tests on their own assoon as they had seen a few demonstrations, but it was very difficult forthem to utilise the results for the indication of the proper dose for awater jar with known capacity. This required calculations which were ahard problem for these young women, perhaps because of the lack ofemphasis on practical application in their previous school education.More training and the provision of tables fran which they can directlyread the results will solve the problem. Rural "elite women" such asthose teachers should carry out a "village jar test" once per week. Theresult should then be spread to all houses by aid of the school childrenor verbal messages. An advance for the most suitable "dose per jar" mustbe combined with a previous simple marking of the jar type concerning itscapacity.
The success of domestic water treatments depends to a great extentalso on proper kinetic adjustment of the methods. The time needed toobtain a residual turbidity of 5 ÏTU or less, which is perceived by therural women as "perfectly clear water" can be 1 - 2 hrs. if turbid Nilewater is clarified with a traditional plant flocculant such as thepowdered seeds from the "clarifier tree" (MofUnga o¿e¿^zAa). This requiresthat handstirring during flocculation was performed for 5 - 1 0 min. at aspeed of 15 - 20 rpm. With much faster and irregular stirring the sameclarification result may be first observed after 1 0 - 2 0 hrs., and if thecoagulant-suspension is added to the raw water without agitation at all,it can take 4 - 8 hrs. before the water has reached this low turbidity.A suspension of fluvial clays with clarifying properties, called inSudanese Arabic "rauwaq" (clarifier) should never be added under faststirring and it does not improve turbidities < 200-250 FTÜ. No matter
- 185 -
Iwhether the clays are then added with or without agitation the river water •is either hardly affected, or its turbidity even increases to several timesits original value (cf. Jahn 1981 and forthcoming).
Educated as well as illiterate women listened politely to advice on •adequate stirring during water treatment. However they were obviously |not convinced about this matter before I thought to demonstrate to thema simple experiment which they could assess after a quarter of an hour. •This consisted of adding an optimum dose of alum to equal amounts of |turbid water in three transparent water glasses. The first was leftwithout agitation, the second stirred slowly and the third stirred very •fast. •
To remind the women about stirring during flocculation and to Ifacilitate their efforts, we constructed an anchor-shaped stirrer which •is mounted into a well-fitting jar cover and this tool can be manufactured _from cheap local materials such as palm-leaves and bamboo or other types Iof branch—wood (Jahn and Qnar 1982), It. will be tested in the laboratoryand the field during the coming months. m
Among the traditional Sudanese plant flocculants, Moringa. oL2À.{wxseeds are the most promising. However there are not enough trees at •present. Last year another group of girls frcm Ahf ad College had already Istarted cultivation experiments from seeds and cuttings. Also the FederalMinistry for Economic Cooperation in Bonn granted us a special small fund •for a tree nursery for wanen which is now under construction in the campus Iof the Forestry Research Station in Soba outside Khartoum. Short theoreticaland practical courses shall be taught there to girls and women from the ISchool for Gardening and Heme Management in Khartoum and from the Teacher •Training College in Cmdurman. Those who will later work in rural areaswhere natural coagulants are needed are then supposed to teach the village Iwooen how to grow this useful tree in their own compound.
A further group of College students and two teachers for rural adulteducation classes with particular stress on practical training in hanemanagement have also already shared my efforts to establish supplementary •programmes dealing with the manufacture of simple tools for the improvement |of water hygiene and water storage (cf. Jahn 1981, Chapter 7) and thedesign of posters for accompanying education. . •
Conclusions. «
The response of different types of Sudanese women to this women-specificWater Decade Project has been very promising so far. Yet it is necessary •to examine critically the limits of the tasks which can be allotted to them |with benefit. College girls from urban society can be valuable for smallprojects, but they are usually more interested in getting their diploma •than in work which they are hardly allowed to continue in the future. The •most useful teachers for rural water improvement projects are middle-agedwomen specialised in adult education and home management. However, if Ithey live in the capital they can only teach in villages no further than •50 km and then only when transportation is easy. Rural "elite women" may —feel their responsibility as backbones for water supply improvements but •they get easily frustrated if the tasks designed for them are not easy andattractive enough. Without their reliable participation there is not much M
- 186 - "
I
Ihope for lasting effects on the methods of their less educated sistersin the community.
Fortunately we have been able to establish a small laboratory forstudies on traditional water treatment in Soba and have started tocollaborate with the Bacteriological Unit of the University Hospitalthere. Thus we will be able to canpare optimun parameters forclarification of specific natural waters with optimum parameters forbacterial removal. If these determinations are related to seasonalfluctuations in raw water quality we could for example issue monthlycoagulant dose ranges for any available local flocculant for Geziravillages on the Blue Nile or other areas with surface water difficultiesin order to shorten and simplify the local tests even more. This wouldhopefully result in greater concern of the village wcnen to participatein future progranmes for safer and more aesthetically pleasing water inall households of the community.
REFERENCES.
JAHN, Sanaa Al Azharia: Traditional Methods of Water Purification inthe Riverain Sudan in Relation to Geographic and Socio-EconomicConditions. Erdkunde (Bonn) 37 (1977) 120-130.
IBID. : Traditional Water Purification in Tropical Developing CountriesExisting Methods and Potential Application (Manual). Publicationof the German Agency for Technical Cooperation (GTZ) No. 117,Eschborn 1981.
JAHN, Samia Al Azharia and OMAR, Abdallah Hussàan: How to manufactureequipment for improved traditional water treatment and waterstorage fran local materials. (To be published in 1982).
- 187 -
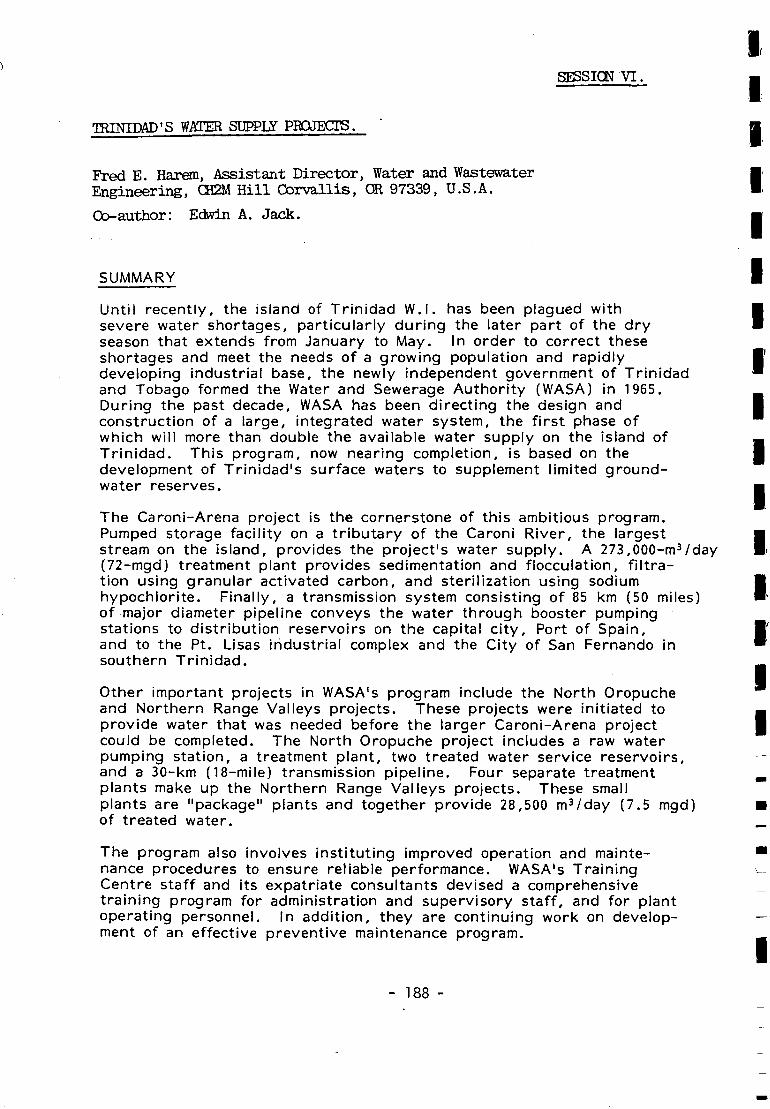
SESSION VI.
TRINIDAD'S WATER SUPPIX PROJECTS.
Fred E. Harem, Assistant Director, Water and WastewaterEngineering, CH2M Hill Corvallis, OR 97339, U.S.A.
Co-author: Edwin A. Jack.
SUMMARY
Until recently, the island of Trinidad W.I. has been plagued withsevere water shortages, particularly during the later part of the dryseason that extends from January to May. In order to correct theseshortages and meet the needs of a growing population and rapidlydeveloping industrial base, the newly independent government of Trinidadand Tobago formed the Water and Sewerage Authority (WASA) in 1965.During the past decade, WASA has been directing the design andconstruction of a large, integrated water system, the f irst phase ofwhich will more than double the available water supply on the island ofTrinidad. This program, now nearing completion, is based on thedevelopment of Trinidad's surface waters to supplement limited ground-water reserves.
The Caroni-Arena project is the cornerstone of this ambitious program.Pumped storage facility on a tributary of the Caroni River, the largeststream on the island, provides the project's water supply. A 273,000-m3/day(72-mgd) treatment plant provides sedimentation and flocculation, f i l t ra-tion using granular activated carbon, and sterilization using sodiumhypochlorite. Finally, a transmission system consisting of 85 km (50 miles)of major diameter pipeline conveys the water through booster pumpingstations to distribution reservoirs on the capital city. Port of Spain,and to the Pt. Lisas industrial complex and the City of San Fernando insouthern Trinidad.
Other important projects in WASA's program include the North Oropucheand Northern Range Valleys projects. These projects were initiated toprovide water that was needed before the larger Caroni-Arena projectcould be completed. The North Oropuche project includes a raw waterpumping station, a treatment plant, two treated water service reservoirs,and a 30-km (18-mile) transmission pipeline. Four separate treatmentplants make up the Northern Range Valleys projects. These smallplants are "package" plants and together provide 28,500 m3/day (7.5 mgd)of treated water.
The program also involves instituting improved operation and mainte-nance procedures to ensure reliable performance. WASA's TrainingCentre staff and its expatriate consultants devised a comprehensivetraining program for administration and supervisory staff, and for plantoperating personnel. In addition, they are continuing work on develop-ment of an effective preventive maintenance program.
- 188 -
The program has not been accomplished without difficulties, some ofwhich were exacerbated by the fact that Trinidad does not have thetechnology and resources common to more developed areas. In theprocess, they have organized and developed a major engineering firm ofnationals that has the capability of performing many of the country'songoing projects in housing, transportation, and the environmentalfields. Despite these problems, the water supply development programhas been a success, and is a credit to the people and government ofTrinidad and Tobago.
TRINIDAD'S WATER SUPPLY PROGRAM
Travelogues for the Republic of Trinidad and Tobago depict therhythms of calypso and carnival, but much more important to theinhabitants of these two islands is the rapid pace of their nation's socialand economic development. A reliable water supply is a critical factorin this development, not only to meet increased demands from newindustries but also to accommodate increased agricultural production anda population expected to grow from 1 million in 1970 to almost1.7 million in the year 2000.
Although rainfall is plentiful from June to December, the country'swater systems have been plagued with both supply and transmissionproblems. In the past, demands have far exceeded supplies during thedry season, and localized shortages have been painfully evident.
In 1965, the water system on the island of Trinidad consisted of anuncoordinated arrangement of 66 separate supplies, some of which weresmall, isolated rural river intakes supplying less than 100,000 gpd. Atthat time, the maximum capacity of the country's supplies was about305,000 m3/day (80 mgd), but reliable supplies were considerably lessespecially during the dry season. Treatment varied with water quality,but most supplies were simply chlorinated. Since many of the watersystems depended on electric-powered pumps, severe shortages occurredwhenever power outages lasted more than a few hours.
The capabilities of transmission systems has also varied. In 1974, astudy showed that half of the island's population had water piped totheir homes, 45 percent got their water from public standpipes, and theother 5 percent obtained their water in a variety of ways. People inthe more remote areas relied on roof catchments or tank trucks fortheir supplies of potable water.
The same 1974 study estimated future demand and projected deficienciesof 245,000 m3/day (64 mgd) by 1985 and 490,000 m3/day (129 mgd) bythe year 2000. These estimates, however, did not allow for futuredevelopment of major industries, so the actual deficiency could be muchgreater if the water supply and arterial transmission systems were notexpanded.
Ensuring a year-round water supply to all areas of the country is oneof the primary objectives of the Water and Sewage Authority (WASA),which was formed in 1965. For more than 10 years, CH2M HILL, in
- 189 -
association with its local counterpart, Trintoplan Consultants, L td . , hasbeen helping WASA achieve this goal through design and construction ofa large, integrated water system on the island of Trinidad (seeFigure 1 ).
Traditionally, groundwater has been the primary water resource onTrinidad. Aquifers have been identified in all areas of the island, butonly 205,000 m3/day (54 mgd) of an estimated capacity of 325,000 m3/day(86 mgd) is being used at the present time. As the 1974 study showed,even if the additional 120,000 m3/day (32 mgd) of groundwater wereavailable, the country would still face a serious water shortage. Inaddition, the study reported salt water was intruding into some of thegroundwater supplies in northern Trinidad because of overdraft, andhigh quality groundwater sources were becoming difficult to f ind.
Thus, WASA turned to the development of surface water resources, pr i -marily the numerous small rivers that flow down from Trinidad's threemountain ranges: the Northern Range, the Central Range, and theln\A/-l\/inn ^nuthprn Ranns Rainfall Ic hsauioct in the Wnrthorn Ranno• — • • ' / " ' & - • — * * • • — • * 3 ~ - • • — • • — • • — * — — • • — ~ * • * • - • • — . . ~ . w . . v . . . . . « ~ . . ^ v /
exceeding 120 inches per year in the North Oropuche River watershed.
Before WASA began its program, the country's only sizeable surfacewater developments had been limited to the Quare River in the NorthernRange, the Navet River in the Central Range, and the HillsboroughRiver on Tobago. Trinidad's largest r iver, the Caroni, was undevelopedas a water supply except for limited withdrawals for irrigation, indus-trial use, and gravel washing. Together, the surface water systemsprovided approximately 112,500 m3/day (30 mgd) with the dependableyield often considerably less.
After analyzing projected demands and available supplies, WASA adopteda comprehensive plan to provide water to the entire island of Trinidad.This program was a major undertaking for WASA, not only for construc-tion of facilities but also for recruitment and training of personnel tosupervise, operate, and maintain a sophisticated, integrated watersupply system.
THE CARONI-ARENA PROJECT
The Caroni-Arena project is the cornerstone of this ambitious program.This completely new system is one of the largest and most complexwaterworks projects undertaken in the Caribbean. When completed, theproject will add 273,000 m3/day (72 mgd) to Trinidad's potable andindustrial water supply. The project consists of three basic elements:
o Pumped storage situated on the Arena River
o A treatment plant on the Caroni River near Piarco Interna-tional Airport
- 190 -
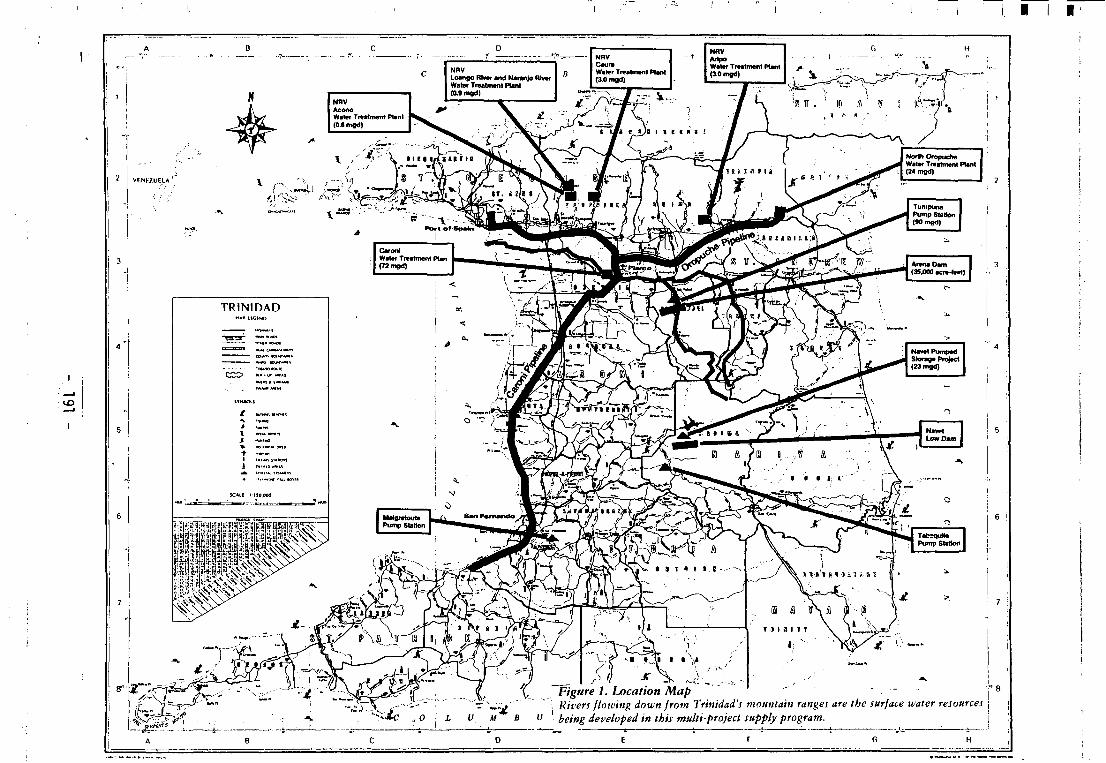
ArvnaDwn I : 3(35,000 act^nMt) f
NRVLoango Rh»r and Naran|o RhnWater Treatment Plant(0.9 my))
(, Figure 1. location Map* \ Rivers flowing down from Trinidad's mountain ranges are the surface water resources
., o I L V H*" B u being developed in this multi-project supply program.
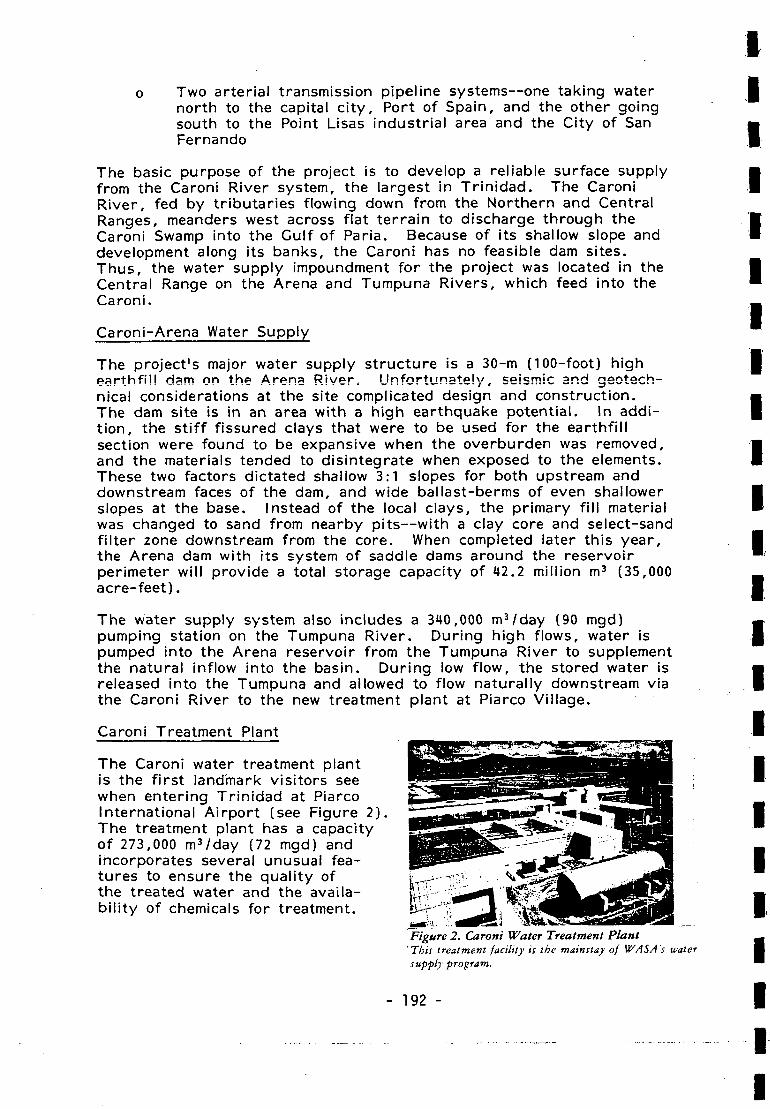
o Two arterial transmission pipeline systems—one taking waternorth to the capital ci ty. Port of Spain, and the other goingsouth to the Point Lisas industrial area and the City of SanFernando
The basic purpose of the project is to develop a reliable surface supplyfrom the Caroni River system, the largest in Trinidad. The CaroniRiver, fed by tributaries flowing down from the Northern and CentralRanges, meanders west across flat terrain to discharge through theCaroni Swamp into the Gulf of Paria. Because of its shallow slope anddevelopment along its banks, the Caroni has no feasible dam sites.Thus, the water supply impoundment for the project was located in theCentral Range on the Arena and Tumpuna Rivers, which feed into theCaroni.
Caroni-Arena Water Supply
The project's major water supply structure is a 30-m (100-foot) highpgrthfü! dsro on the Arena River4 Unfortunately, seismic and geotech-nical considerations at the site complicated design and construction.The dam site is in an area with a high earthquake potential. In addi-t ion, the stiff fissured clays that were to be used for the earthfillsection were found to be expansive when the overburden was removed,and the materials tended to disintegrate when exposed to the elements.These two factors dictated shallow 3:1 slopes for both upstream anddownstream faces of the dam, and wide ballast-berms of even shallowerslopes at the base. Instead of the local clays, the primary fill materialwas changed to sand from nearby pits—with a clay core and select-sandfilter zone downstream from the core. When completed later this year,the Arena dam with its system of saddle dams around the reservoirperimeter will provide a total storage capacity of 42.2 million m3 (35,000aere-feet).
The water supply system also includes a 340,000 m3/day (90 mgd)pumping station on the Tumpuna River. During high flows, water ispumped into the Arena reservoir from the Tumpuna River to supplementthe natural inflow into the basin. During low flow, the stored water isreleased into the Tumpuna and allowed to flow naturally downstream viathe Caroni River to the new treatment plant at Piarco Village.
Caroni Treatment Plant
The Caroni water treatment plantis the first landmark visitors seewhen entering Trinidad at PiarcoInternational Airport (see Figure 2).The treatment plant has a capacityof 273,000 m3/day (72 mgd) andincorporates several unusual fea-tures to ensure the quality ofthe treated water and the availa-bility of chemicals for treatment.
Figure 2. Caroni Water Treatment PlantThis treatment facility is the mainstay of WASA's watersupply program.
- 192 -
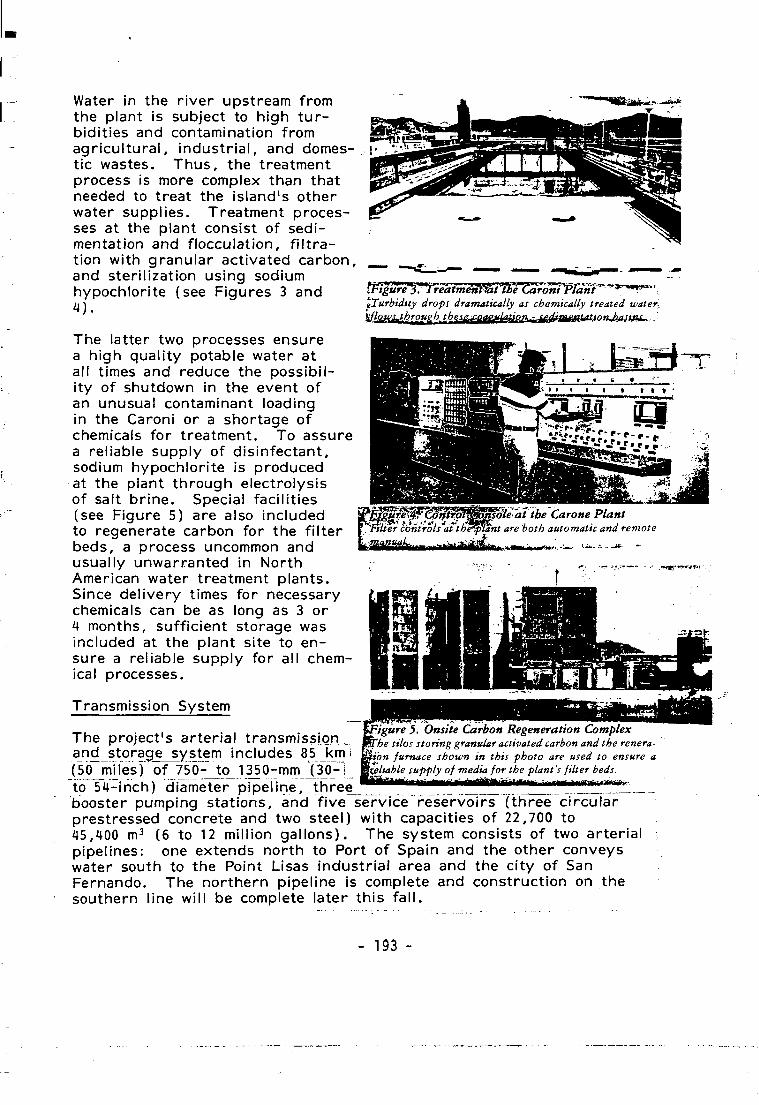
i
^Turbidity drops dramatically as chemically treated water
Water in the river upstream fromthe plant is subject to high tur-bidities and contamination fromagricultural, industrial, and domes-tic wastes. Thus, the treatmentprocess is more complex than thatneeded to treat the island's otherwater supplies. Treatment proces-ses at the plant consist of sedi-mentation and flocculation, f i l t ra-tion with granular activated carbon,and sterilization using sodiumhypochlorite (see Figures 3 and4).
The latter two processes ensurea high quality potable water atall times and reduce the possibil-ity of shutdown in the event ofan unusual contaminant loadingin the Caroni or a shortage ofchemicals for treatment. To assurea reliable supply of disinfectant,sodium hypochlorite is producedat the plant through electrolysisof salt brine. Special facilities(see Figure 5) are also includedto regenerate carbon for the filterbeds, a process uncommon andusually unwarranted in NorthAmerican water treatment plants.Since delivery times for necessarychemicals can be as long as 3 or4 months, sufficient storage wasincluded at the plant site to en-sure a reliable supply for all chem-ical processes.
Transmission System
The project's arterial transmission....anci storage system includes 85 km i(50_mHes~) õT75Õ^_to_ 1350-mmJf3(H_to 54-inch) diameter pipeline, three ^™*"***—•"'•••"•"•'""•'w '"'""""^'JZ'll..--booster pumping stations, and five service reservoirs (three circularprestressed concrete and two steel) with capacities of 22,700 to45,400 m3 (6 to 12 million gallons). The system consists of two arterialpipelines: one extends north to Port of Spain and the other conveyswater south to the Point Lisas industrial area and the city of SanFernando. The northern pipeline is complete and construction on thesouthern line will be complete later this fal l.
^^^^^^Sle^attbeCarone Plantmirols*áttbe%jftant are bo'tlter controls at theffilant are both automatic and remote
• o . - ' * • - ' • - * - •*- - - J * - -
Figure 5. Omite Carbon Regeneration ComplexThe silos storing granular activated carbon and the renera-
furnace shown in this photo are used to ensure aReliable supply of media for the plant's filter beds.
- 193 -
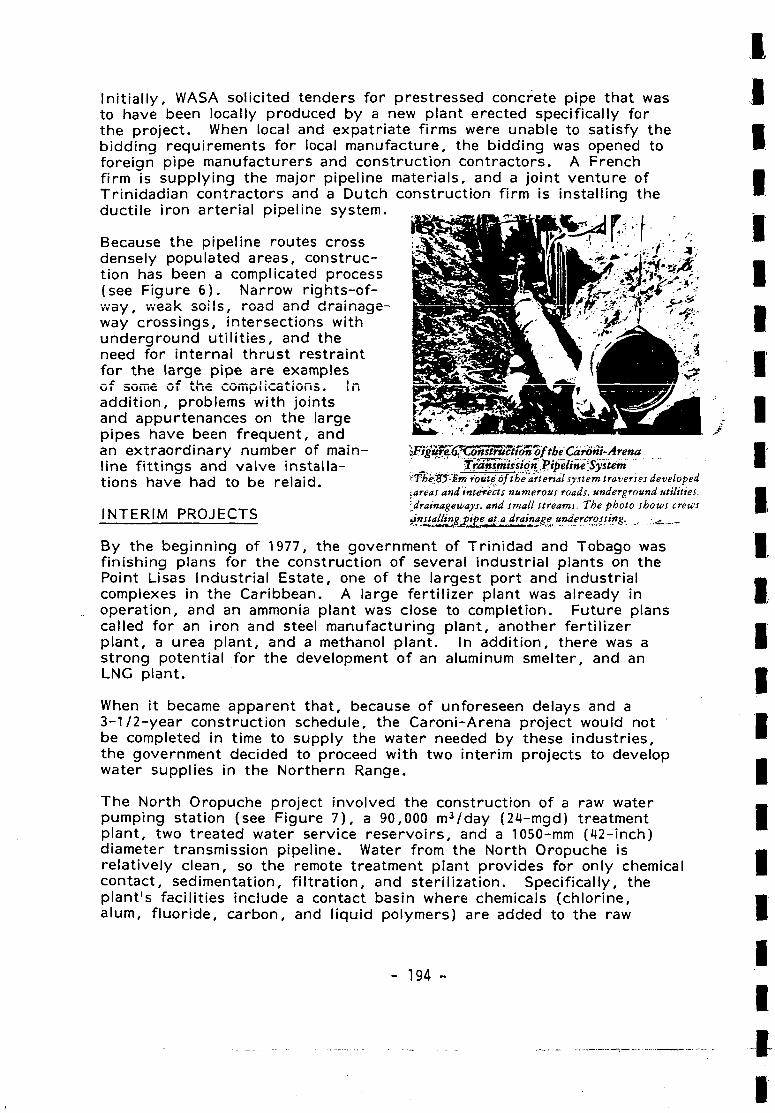
Initially, WASA solicited tenders for prestressed concrete pipe that wasto have been locally produced by a new plant erected specifically forthe project. When local and expatriate firms were unable to satisfy thebidding requirements for local manufacture, the bidding was opened toforeign pipe manufacturers and construction contractors. A Frenchfirm is supplying the major pipeline materials, and a joint venture ofTrinidadian contractors and a Dutch construction firm is installing theductile iron arterial pipeline system.
Because the pipeline routes crossdensely populated areas, construc-tion has been a complicated process(see Figure 6). Narrow rights-of-way, weak soils, road and drainage-way crossings, intersections withunderground util it ies, and theneed for internal thrust restraintfor the large pipe are examplesof Sûffic of the CGiTipîiC3tiûfï5. Inaddition, problems with jointsand appurtenances on the largepipes have been frequent, andan extraordinary number of main-line fittings and valve installa-tions have had to be relaid.
INTERIM PROJECTS
^ i - A renaTransmission'Pipeline'System
m route'of the~arterial system traverses developed¿areas and intèrects numerous roads, underground utilities,' drainageways, and small streams. The photo shows crewsinstalling pipe at a drainage undercrossing. , ^
By the beginning of 1977, the government of Trinidad and Tobago wasfinishing plans for the construction of several industrial plants on thePoint Lisas Industrial Estate, one of the largest port and industrialcomplexes in the Caribbean. A large fertilizer plant was already inoperation, and an ammonia plant was close to completion. Future planscalled for an iron and steel manufacturing plant, another fertilizerplant, a urea plant, and a methanol plant. In addition, there was astrong potential for the development of an aluminum smelter, and anLNG plant.
When it became apparent that, because of unforeseen delays and a3-1/2-year construction schedule, the Caroni-Arena project would notbe completed in time to supply the water needed by these industries,the government decided to proceed with two interim projects to developwater supplies in the Northern Range.
The North Oropuche project involved the construction of a raw waterpumping station (see Figure 7), a 90,000 m3/day (24-mgd) treatmentplant, two treated water service reservoirs, and a 1050-mm (42-inch)diameter transmission pipeline. Water from the North Oropuche isrelatively clean, so the remote treatment plant provides for only chemicalcontact, sedimentation, f i l tration, and sterilization. Specifically, theplant's facilities include a contact basin where chemicals (chlorine,alum, fluoride, carbon, and liquid polymers) are added to the raw
- 194 -
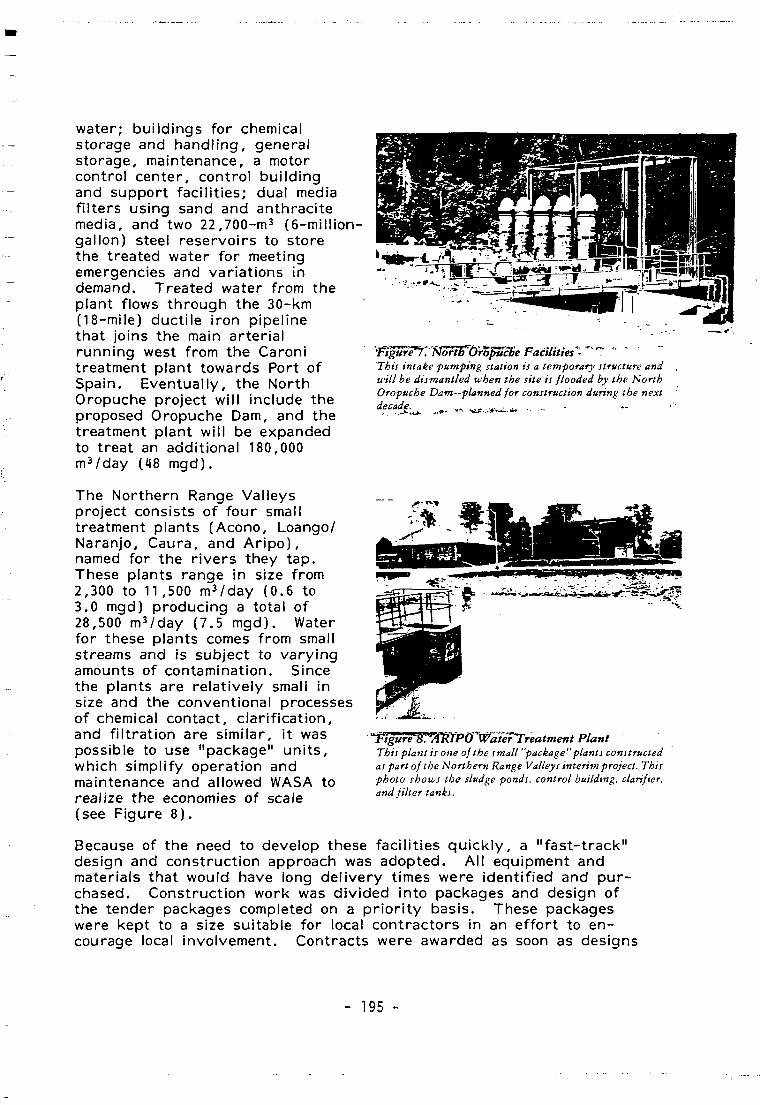
water; buildings for chemicalstorage and handling, generalstorage, maintenance, a motorcontrol center, control buildingand support facilities; dual mediafilters using sand and anthracitemedia, and two 22,700-m3 (6-million-gallon) steel reservoirs to storethe treated water for meetingemergencies and variations indemand. Treated water from theplant flows through the 30-km(18-mile) ductile iron pipelinethat joins the main arterialrunning west from the Caronitreatment plant towards Port ofSpain. Eventually, the NorthOropuche project will include theproposed Oropuche Dam, and thetreatment plant will be expandedto treat an additional 180,000m3/day (48 mgd).
The Northern Range Valleysproject consists of four smalltreatment plants (Acono, Loango/Naranjo, Caura, and Aripo),named for the rivers they tap.These plants range in size from2,300 to 11,500 m3/day (0.6 to3.0 mgd) producing a total of28,500 m3/day (7.5 mgd). Waterfor these plants comes from smallstreams and is subject to varyingamounts of contamination. Sincethe plants are relatively small insize and the conventional processesof chemical contact, clarification,and filtration are similar, it waspossible to use "package" units,which simplify operation andmaintenance and allowed WASA torealize the economies of scale(see Figure 8).
Figurê^K^tfórib^ÕropucBe Facilities"^ TThis intake pumping station is a temporary structure andwill be dismantled when the site is flooded by the NorthOropuche Dam—planned for construction during the nextdecade. . _ „ ^...•*^ii. .. ...
PlantThis plant is one of the small "package" plants constructedas part of the Northern Range Valleys interim project. Thisphoto shows the sludge ponds, control building, clarifier,and filter tanks.
Because of the need to develop these facilities quickly, a "fast-track"design and construction approach was adopted. All equipment andmaterials that would have long delivery times were identified and pur-chased. Construction work was divided into packages and design ofthe tender packages completed on a priority basis. These packageswere kept to a size suitable for local contractors in an effort to en-courage local involvement. Contracts were awarded as soon as designs
- 195 -
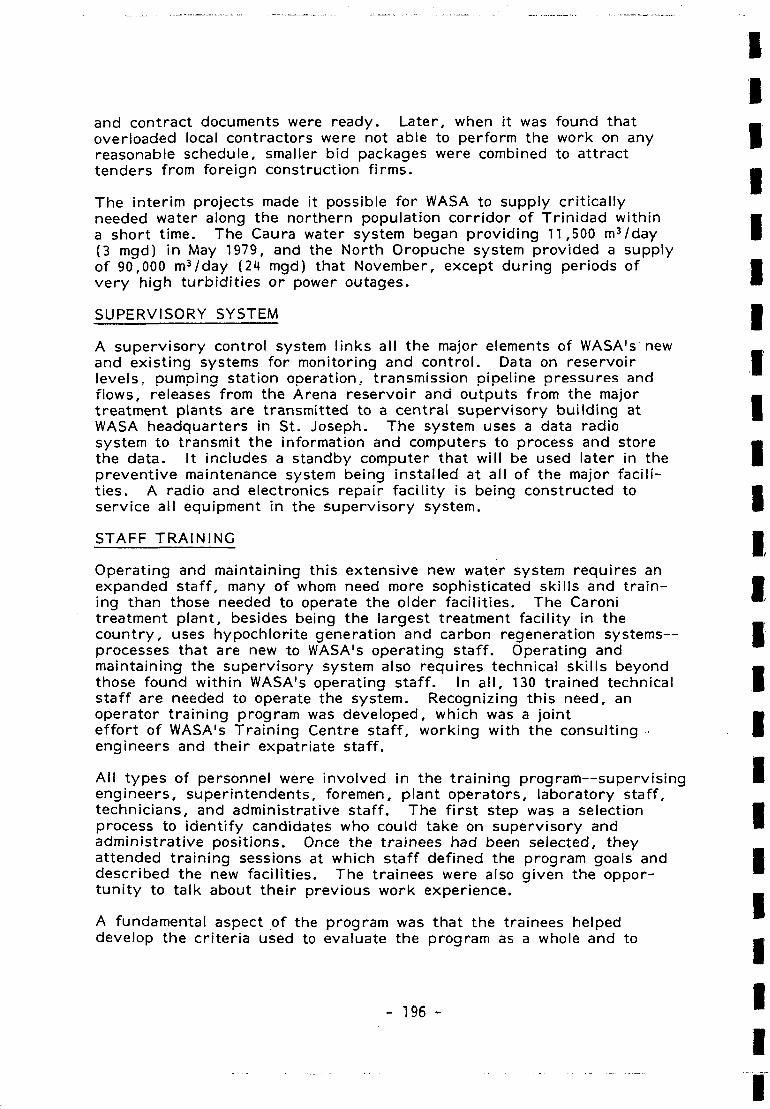
and contract documents were ready. Later, when it was found thatoverloaded local contractors were not able to perform the work on anyreasonable schedule, smaller bid packages were combined to attracttenders from foreign construction firms.
The interim projects made it possible for WASA to supply criticallyneeded water along the northern population corridor of Trinidad withina short time. The Caura water system began providing 11,500 m3/day(3 mgd) in May 1979, and the North Oropuche system provided a supplyof 90,000 m3/day (24 mgd) that November, except during periods ofvery high turbidities or power outages.
SUPERVISORY SYSTEM
A supervisory control system links all the major elements of WASA1 s newand existing systems for monitoring and control. Data on reservoirlevels, pumping station operation, transmission pipeline pressures andflows, releases from the Arena reservoir and outputs from the majortreatment plants are transmitted to a central supervisory building atWASA headquarters in St. Joseph. The system uses a data radiosystem to transmit the information and computers to process and storethe data. It includes a standby computer that will be used later in thepreventive maintenance system being installed at all of the major facili-ties. A radio and electronics repair facility is being constructed toservice all equipment in the supervisory system.
STAFF TRAINING
Operating and maintaining this extensive new water system requires anexpanded staff, many of whom need more sophisticated skills and train-ing than those needed to operate the older facilities. The Caronitreatment plant, besides being the largest treatment facility in thecountry, uses hypochlorite generation and carbon regeneration systems—processes that are new to WASA's operating staff. Operating andmaintaining the supervisory system also requires technical skills beyondthose found within WASA's operating staff. In al l , 130 trained technicalstaff are needed to operate the system. Recognizing this need, anoperator training program was developed, which was a jointeffort of WASA's Training Centre staff, working with the consultingengineers and their expatriate staff.
All types of personnel were involved in the training program—supervisingengineers, superintendents, foremen, plant operators, laboratory staff,technicians, and administrative staff. The first step was a selectionprocess to identify candidates who could take on supervisory andadministrative positions. Once the trainees had been selected, theyattended training sessions at which staff defined the program goals anddescribed the new facilities. The trainees were also given the oppor-tunity to talk about their previous work experience.
A fundamental aspect of the program was that the trainees helpeddevelop the criteria used to evaluate the program as a whole and to
- 196 -
evaluate their individual performance. This participatory approach wasnew to most of them, but it generated enthusiasm and gave the traineesa greater sense of involvement. Besides learning specific technicalskills, trainees were encouraged to develop their communication andmathematics skills, their problem-solving abilities, and their ability totrain others. Once the plants began startup operations, trainees weregiven on-the-job training in several job classifications. Program coordi-nators evaluated each trainee's performance and determined job assignments.
Other aspects of the training program involved overseas training forseveral trainees. This training consisted of courses given by equip-ment manufacturers, special tours of operating facilities and academicinstitutions in the U.S., seminars, workshops, and conferences.Special consultants were also used to provide training in specific topics.Finally, several manufacturers and suppliers provided onsite startupand operational assistance during the training process. All operatingplant personnel have now completed the training program, and mainte-nance and follow-up training is a regular part of staff development.
CONCLUSION
Caroni-Arena and the interim projects have added a total of 391,500m3/day (103 mgd), more than doubling the 1974 water supply. The145 km (90 miles) of transmission and distribution pipelines will ensurethat this additional water is delivered to water-short communitiesthroughout the island.
Like any complex construction program, these projects have not beenwithout their difficulties, some of which were exacerbated by the factthat Trinidad did not have the technology and resources common tomore developed areas. Limited topographical, hydrological, and geo-logical data impaired design activities. While the government and WASAfully intended to use local contractors as widely as possible, much ofthe work was more complex than the smaller local firms were able toschedule and manage successfully. Obtaining equipment and materialswas difficult, and projects were significantly affected by the delays.Because of the construction boom caused by this and other projects, allbuilding materials and skilled construction workers were in shortsupply. Problems with inadequate communications systems and electricalpower supplies also caused the program frustrating and costly delays.
The staff training program has facilitated startup and operation tremen-dously. In addition to providing trained staff for the new water proj-ects, staff are being trained for upgrading performance at existingfacilities, such as the Navet plant in central Trinidad. The TrainingCentre has established a basic water training course to continue thisprogram on a sustained basis.
WASA is working hard to resolve the problems of adapting an old,relatively simple system to more sophisticated technology. The principaltask remaining is to fully implement a preventive maintenance program,and to train staff who will ensure operation at design capacities. Thesuccess of this preventive maintenance program is essential for sus-tained reliability of the system.
- 197 -
Despite the problems WASA has encountered, the program has been asuccess and will enhance the country's economic potential and thegeneral welfare of its people. One of the major reasons for this suc-cess has been the cooperation, assistance, and counsel of the followinggovernment and private agencies:
o Ministry of Financeo Water and Sewerage Authorityo Ministry of Works (Highway and Drainage Divisions)o Ministries of National Security; Public Utilities; Agriculture,
Lands and Fisheries; and Industry and Commerceo Central Tenders Boardo Attorney General's Officeo Port Authorityo Immigration Officeo Central Bank of Trinidad and Tobagon TrinirtaH anrl Tnhann Tolonhnno r^mnanv/ I imitorl
o Trinidad and Tobago Electricity Commissiono Electrical Inspectorateo Licensing Authorityo Valuation Divisiono John Hunt and Company, Accountants
-198 -
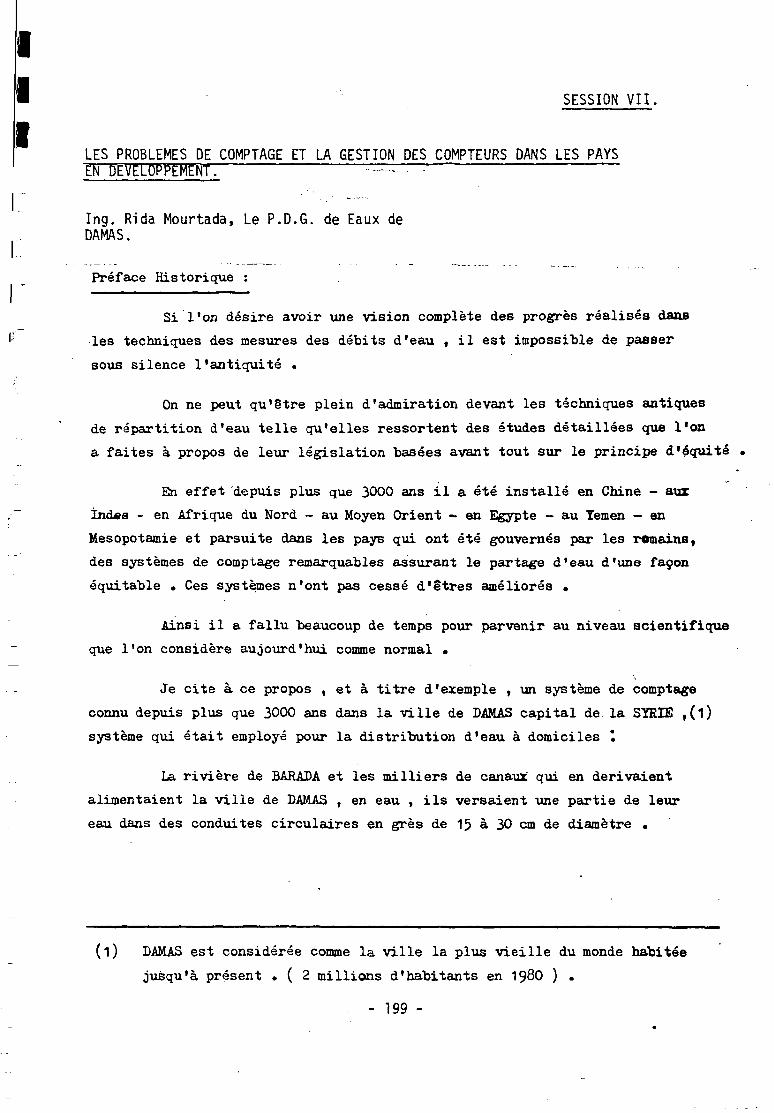
I SESSION VII.
LES PROBLEMES DE COMPTAGE ET LA GESTION DES COMPTEURS DANS LES PAYSEN DEVELOPPEMENT. —rr~r—
Ing. Rida Mourtada, Le P.D.G. de Eaux deDAMAS.
Préface Historique :
Si l'on désire avoir une vision complète des progrès réalisés dans
les techniques des mesures des débits d'eau » il est impossible de passer
sous silence l'antiquité .
On ne peut qu'être plein d'admiration devant les techniques antiques
de répartition d'eau telle qu'elles ressortent des études détaillées que l'on
a faites à propos de leur législation basées avant tout sur le principe d'équité
En effet depuis plus que 3000 ans il a été installé en Chine - aux
Indes - en Afrique du Nord - au Moyen Orient ~ en Egypte - au Temen - en
Mésopotamie et parsuite dans les pays qui ont été gouvernés par les romains,
des systèmes de comptage remarquables assurant le partage d'eau d'une façon
équitable • Ces systèmes n'ont pas cessé d'êtres améliorés •
Ainsi il a fallu beaucoup de temps pour parvenir au niveau scientifique
que l'on considère aujourd'hui comme normal •
Je cite à ce propos , et à titre d'exemple , un système de comptage
connu depuis plus que 3000 ans dans la ville de DAMAS capital de la SYRIE f(i)
système qui était employé pour la distribution d'eau à domiciles \
La rivière de BARADA et les milliers de canaux qui en dérivaient
alimentaient la ville de DAMAS , en eau , ils versaient une partie de leur
eau dans des conduites circulaires en grès de 15 à 30 cm de diamètre .
(i) DAMAS est considérée comme la ville la plus vieille du monde habitée
jusqu'à présent • ( 2 millions d'habitants en I98O ) .
- 199 -
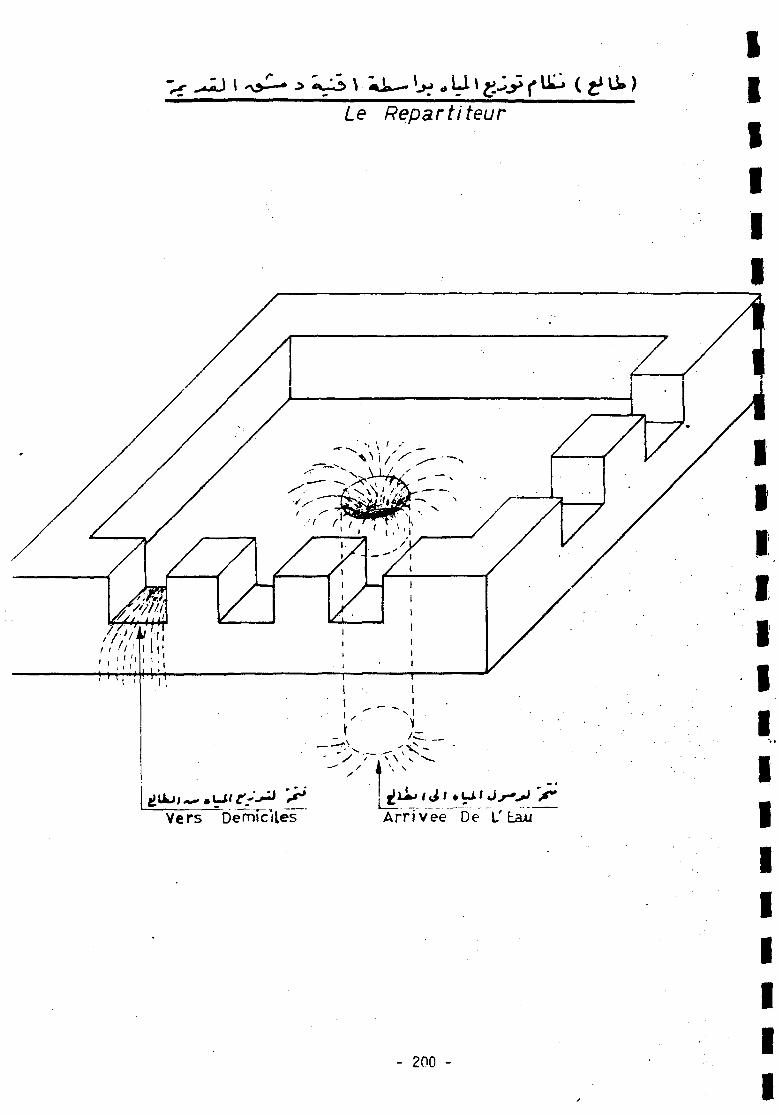
¿e Répartiteur
IIIII
Vers Demiciles Ar r i vée De L' Eaxi
- 200 -
ICes conduites distribuaient l'eau par gravité au moyen de répartiteurs
aboutissant aux domiciles des Consommateurs . Le répartiteur est l'appareil de
jauge et de distribution d'eau . C'est une cuvette en pierre taillée d'une
seule pièce de section carrée de 50 à 250 cm.de diamètre et de 10 à 25 cm de
profondeur , ayant à son centre un orifice de 100 à 250 mm de diamètre • Cet
orifice est l'aboutissement de la tête aval d'un siphon . Sur les bords de
la cuvette se trouvent des entailles de sections rectangulaires , plus ou
moins larges qui constituent plusieurs déversoirs qui partagaient l'eau • En
dessous de chaque déversoir une conduite recueille la part du bénéficiaire
et la conduit par un siphon chez les consommateurs .
Ainsi la quantité d'eau déversée dans chaque conduite était repérée
par la surface de passage .
Le présent rapport sans être technique ni prétendre épuiser le sujet t
se propose d'examiner la nécessité de l'installation d'un système de compteur
chez les abonnés , et les procédés à suivre , surtout dans les pays en
développement , pour assurer une bonne gestion des compteurs , la technique
des appareils de comptage ne sera abordée •
I - COMPTAGE
1.1. Introduction :
la mesure d'un débit d'eau dans une conduite est une opération très
courante et connue du grand public . De plus en plus , les branchements
d'abonnés raccordés à un réseau public sont munis de compteurs et des dizaines
de millions de ces appareils fonctionnement de par le monde . La generalisation
du comptage de l'eau fournie aux usagers pour en permettre une facturation
précise correspond à un souci d'éviter un gaspillage par les utilisateurs ,
d'un bien dont le coût de production par la collectivité n'est pas négligeable .
- 201 -
Ce coût augmente de plus en plus parsuite de la pollution croissante W
de ressources naturelles , des exigences accrues des usagers, des progrès de la
technologie qui permettent de faire face à l'une et de satisfaire les autres , V
et parsuite et également de la raréfaction des ressources face à une demande
sans cesse plus importante . Dans ce cas il convient de gérer avec économie •
la production et la distribution de l'eau potable . Il ne suffit pas de lutter
contre le gaspillage chez l'usager . Il faut franchir un pas de plus et g
assurer la meilleure gestion du réseau public •
Ceci entraine la connaissance précise de son fonctionnement et en
particulier la mesure des débits en différents points des installations de •
prélèvement , de traitement et de distribution , et même chez les usagers .
1.2. Mesure des grands débits
- évaluer les extensions futurs des réseaux
- 202 -
II
. Les instruments des mesures des grands débits sont utilisés à
plusieurs fin : . |
- mesure en continue des débits instantanés , —.
- mesure des débits moyens , horaires , journaliers • m
- totalisations des débits . m
• Leur domaine d'application s'étend d'abord sur les stations de traite-
ment pour : Jf
- connaitre les débits d'eau brute prélevés .
- asservir l'injection des réactifs au débit à traiter . •
- assurer la conduite des installations .
- contrôler les débits admis dans les réseaux , soit gravitairement p
soit par refoulement .
. D'autre part sur les réseaux de distribution pour : '
- optimiser le fonctionnement des équipements de pompage • M
- connaitre le fonctionnement des principaux feeders et des
intercommunications « •
- compter les ventes en gros •
- surveiller le rendement des réseaux , rechercher les fuites • I
IIIII
I1.3» Comptage chez les abonnés :
1.3»1» Avantages du comptage :
La tendance actuelle pour la limitation du coût de l'eau pour le
public nécessite entre autre la prise des mesures suivantes :
- réduire la consommation de l'énergie •
- retarder les investissements.
- lutter contre le gaspillage .
- encourager la conservation de l'eau •
Le mesurage de l'eau est l'une des méthodes qui ont fait leurs preuves
pour atteindre ces ojectifs . Les donnés publiés indiquent que des économies
de l'ordre de 20 à 40$ ont été réalisés par divers services d'eau après
installation de compteurs chez les abonnés .
Il a été également démontré que le mesurage de l'eau :
- fournit un moyen équitable de faire payer l'eau .
- Il donne d'utiles informations à la direction pour sa gestion
quotidienne •
- les renseignements obtenus se sont prouvés importants pour la
planification à long terme •
- le comptage permet l'application d'un tarif progressif là ou ce
tarif est adopté pour une consommation plus élevée qu'un limite
déterminé , et facilite l'application de ce tarif au moment ou
le service d'eau le juge nécessaire •
1.3»2. Facteurs influant sur la décision concernant le comptage .
Certaines théories supposent qu'à côté de ces avantages , le mesurage
a un coût qui peut dépasser les bénéfices à en espérer et il y aura des cas
ou il ne conviendra pas , et que les facteurs à considérer avant de prendre
une décision sur le comptage sont financières et économiques , techniques ,
sociales , culturelles et de gestions .
- 203 -
II
L'objectif de l'analyse financière et économique est de déterminer
si les économies réalisées grâce au mesurage sont égales ou supérieures aux V
coûts .Les économies sont de deux types , à court et à long terme . Les
économies à court terme concernent essentiellemnt la réduction des dépenses •
d'énergie , de réactifs et d'entretien que l'on obtient lorsqu'il faut
produire moins d'eau pour couvrir les besoins immédiats ; les économies à B
long terme ré autant d'une part des investissements quand la capacité des
ouvrages existants peut satisfaire les demandes pendant une plus longue m
période avant la réalisation des travaux de l'étape suivante •
Pour les économies immédiates comme à long terme , l'analyse est axée m
sur les estimations relatives à la réduction en pourcentage de l'utilisation de |
l'eau que l'on peut espérer après comptage • _
-|
Hais les facteurs techniques sont à considérer quand on décide pour
ou contre les compteurs : par exemple les réseaux ou la pression et la
distribution sont intermitente rencontrent un certain nombre de problèmes avec
les branchements munis de compteurs dont les moindres ne sont pas l'irréalisme
de lectures et les fréquentes pannes des compteurs .
Les facteurs sociaux relatifs au comptage sont relatifs à l'inaccep-
tation des consommateurs d'installer un système de comptage par ingorance de
l'intérêt que le système leur apporte et par refus de payer les prix des
compteurs .
1.3«3» Moyens à utiliser pour convaincre les abonnés :
Le service des eaux peut convaincre les abonnés d'adopter le comptage
par différents modes de publicité , surtout comme un moyen équitable de
distribution d'eau , aussi le service d'eau peut faire des facilités pour le
paiement du prix de compteurs installés •
- 204 -
Lo oas do la ville du DAMAU OBÍ à oitor , avant 1934 tous los abonnée
étaient munis da juugfaB ?(i) en 1?i>4 J"« Marviee dea §ttUX après 3tt (JáoitJion
d'installer des oompteurs chez leo abonnas qui comptaient 50000 t s'eat donna
un délai de 5 &ns pour poaer cea oompteurs •
Le service a employé tous les moyens pour convaincre les abonnas de
l'utilité des compteurs en accentuant sur l'équité , et a décidé d'autre part
de faire des sacrifices en faisant payer à l'abonné le-prix du compteur et les
frais d~_4?a pose-au-î-nix" de revient échelonnés sur un délai d'un an •
Aucune difficulté , sauf des cas minimes , n'a été renco&tre dans
l'application de cette décision •
1.3.4» La comptage comme moyen de discipline^:
II est à mentionner que l'expérience a montra qu'après que lés
consommateurs été habitués au comptage , leur mentalité a changé complè-
tement ainsi que leur attitude vis à vis du Bervice des eaux :
- ils évitaient le gaspillage dans l'utilisation de l'eau •
- ils réparaient leurs installations intérieures •
- ils sont devenus plus disciplinés et plus favorables vis à vis
des instructions du service . ' -
1.3.5» Conclusion t
Enfin , la décision finale d'installer les compteurs repose largement
sur les facteurs financiers et économiques • Les facteurs techniques comme les
facteurs sociaux et de gestion ne sont pas quantifiables et ne peuvent pas
être ignorés si l'on veut prendre une déoision saine •
(i) Ces jauges permettaient à l'abonné de consommer une quantité d'eau fixée
d'avance et en accord avec lui . Cette méthode ne donnait pas une idée
exacte de la consommation de chaque abonné à cause de la différence de
pression dans les différentes régions de la ville ( vallée - montagne );
d'autre part certains abonnés se permettaient d'agrandir l'ouverture de
la jauge ou de l'enlever complètement , ce qui leur permettait de consommer1
la quantité d'eau qu'il désiraient avec beaucoup de gaspillage et sans lapayer .
D'autre part ces jauges se trouvaient bouchés partiellement ou totalement
ce qui oausait beaucoup de réclamations •
- 205 - •
Mais en général le bilan est à la faveur de la pose des compteurs •
A l'heure actuelle dans certains pays ou la taxation forfaitaire
semblait être sérieusement implantée f les autorités compétentes sont entrain
de revoir leur position .
Les raisons principales de ce changement d'attitude semblent entre autre
le renchérissement des frais de production et de distribution , la limitation des
ressources en eau et peut être aussi l'opinion des consommateurs qui pourraient
avoir le sentiment d'être traités avec une plus grande équité par le système de
comptage que par la taxation forfaitaire .
Pour toutes ces raisons je pense qu'à l'avenir la tendence va plutôt
vers le comptage au déterminent de la taxation forfaitaire .
II. GESTION DES COMPTEURS I
•II.1. Introduction : •
1Maintenant que nous avens été conscients de l'utilité de l'installation •'
d'un système de comptage , nous allons aborder un sujet très important qui est ám
la gestion des compteurs . •. •
En effet , le compteur étant posé , il exige une bonne gestion afin qu'il ™
donne les résultats attendus du choix de l'installation d'un système de comptage • S
La gestion des compteurs est un travail très complexe qu'il faut faire g|
avec le plus grand soin que ça soit pour : *
- le choix des compteurs I
- l'installation des compteurs
- entretien et réparation des compteurs •
- documents concernant les compteurs
- relevé des compteurs . g
I- 206 -
III
II.2. Choix du compteur .
II*2.1. Type du compteur :
II est connu qu'il existe trois méthodes fondamentales pour mesurer
les quantités d'eau passant par les canalisations à savoir :
1.1 - par déplacement d'un volume
1.2 - par la mesure de la vitesse
1.3 - à l'aide d'une différence de pression
II est important de faire un choix rationnel et économique entre
les différents modèles proposés par les fabricants •
En prenant en consideration :
- L'exactitude et la sensibilité : surtout pour déceler plus
facilement les petites fuites qui peuvent se produire dans
les installations intérieures •
- La durée d'utilisation
Une fois qu'on a choisi le type convenable du compteur il est
recommandé de l'adopter définitivement ce qui facilite l'entretien
des compteurs par le personnel t ainsi que le .stokage d'un
nombre restrient de pièces de rechange .
II.2.2. Diamètre du compteur :
De nombreux facteurs conditionnent la façon dont une installation est
adoptée aux besoins de son utilisateur . Malheureusement on ne tient pas
toujours compte avant la pose du branchement et du compteur , des relations
qui existent entre ces facteurs •
Les facteurs les plus importants sont les suivants :
2.1 - La pression et le débit de l'eau au point du branchement dans la
conduite principale du réseau •
2.2 - La différence de niveau entre la conduite du réseau , et les
points de consommation dans les locaux des usagers .
2*3 - Les pertes des charges dans les branchements .
2.4 - Les pertes de charges dans les compteurs .
- 207 -
2.5 - Les pertes de charges dans les tuyauteries des "bâtiments et les
appareils d'utilisations .
2.6 - Les débits d'eau utilisées par l'usager .
Si l'on veut obtenir une installation convenable il faut pour
déterminer le diamètre du branchement et la taille du compteur
considérer tous ces facteurs .
Pour les branchements et les compteurs d'appartements individuels
on adopte en général un diamètre unique (1) . Pour les branchements et
les compteurs ce n'est que lors que l'on considère les grandes quantités
d'eau destinées à l'industrie ou au commerce que le choix des compteurs
à installer , pose réellement un problème , cependant si l'on veut
avoir une installation de mesure convenable , il faut bien peser sa
decision qu'ils s'agisse d'immeubles d'habitations , écoles ou autres
grands ensembles .
Pour rare qu'elle soit la pose des gros compteurs elle peut
engendrer tellement de dispositions différentes des canalisations qu'il
est difficile de fixer une norme unique , chaque cas nécessitant une
étude spéciale •
II.3. Pose des compteurs :
Le premier problème important à résoudre lors qu'on envisage la pose
des compteurs chez les usagers , est de décider s'il faut les installer dans les
locaux des usagers ou à l'extérieur ; sauf s'il est dû à l'absence d'un
emplacement intérieur convenable , cas dans lequel on n'a d'autre solution ;
le choix d'un emplacement extérieur peut procéder de deux raisons :
3.1 - Si l'on installe le compteur au trottoir , il sera à la limite des
zones relevant de la responsabilité du service des eaux et de
l'usager en ce qui concerne les fuites souterrainnes.
Par suite , les fuites qui peuvent se produire dans la partie du
branchement qui interesse 1'usager seront enregistrées par le
compteur .
(i) A DAMAS , vu que tous les branchements des locaux sont individuels , on a
adopté 0 12 m/m . Comme diamètre pour les branchements ainsi que pour les
compteurs , le service des eaux ayant posé des compteurs , de différentes
marques jusqu'à 1970, date ou une usine de fabrication de compteurs a été
installée en Syrie , des problèmes ont été confroatés en ce qui concerne
l'entretien de ces différents types de compteurs . A partir de 1970 le
service des eaux a procédé au changement systématique des compteurs qui
ont atteint l'âge de 10 ans , un contrat a ¿té passe avec cette usine pour
répeirer les compteurs moyennant un prix forfaitaire .
- 208 -
3.2 - On dépense moins de temps et d'argent pour relever les compteurs ,
et on ellimine les visites inutiles , qui se produisent lorsque
l'on veut relever un compteur placé à l'intérieur , du logement,
et que personne ne s'y trouve au moment voulu *
Nstons qu'il faut que le compteur soit posé dans une niche , qu'il
soit protégé du gel , et d'une façon qui permet sa pose ,
démontage t remplacement et relevée , ainsi que son entretien
sans difficulté , les portes de protection métalliques""seront
munies d'une serrure unique pour faciliter leur ouverture par
clef unique 'de la part des usagers et du personnel du service .(i)
II.4. Controle périodique des compteurs :
Bien que la meilleure façon connue de répartir équitablemçnt les
dépenses du service des eaux soit d'avoir un réseau entièrement équipé de compteurs
on risque de. provoquer de Sérieuses erreurs si tous ces compteurs ne sont pas
maintenus en bon et égal état de fonctionnement . Ainsi on ne tirera tout le
parti possible des appareils que si l'on établit unprogramme precis de leur
entretien •
Comme tout dispositif mécanique , un compteur d'eau s'use et au bout
d'un certain temps , perd de son efficacité optimale . Lá justesse de l'appareil
se détériore . avec la vieillessement du compteur , l'appareil ayant tendance à
sous estimer de plus en plus les consommations .
La durée pendant laquelle il conserve sa justesse globale depend beaucoup
de la qualité de l'eau qu'il mesure , dee débits traversant l'appareil . Il y a
cependant d'autres causes d'usures excessives ou d'erreurs de mesures .
Manifestement la seule façon de savoir si un compteur déterminé fonctionne
correctement est de l'essayer . Du point de vue de consommateur , la vérification
doit permettre de le protéger contre des erreurs de mesure qui risqueraient de
faire payer trop cher . CèFa interesse également la direction du service des eaux ,
sa plus grande préoccupation devant être la perte de revenus qu'entrainent- des
erreurs de comptage par sous estimation •
(i) A Damas dans les zones nouvellement urbanisés , les niches se trouvent
directement sur le mur du clôture dans urië niche distante d'une mètre de la
porte d'entrée et à l'intérieur du jardin , celle ci restant en général
ouverte . Tandis que dans la vieille ville , les compteurs se trouvent à
l'intérieur dea locaux juste derrière les portes d'entrée .
- 209 -
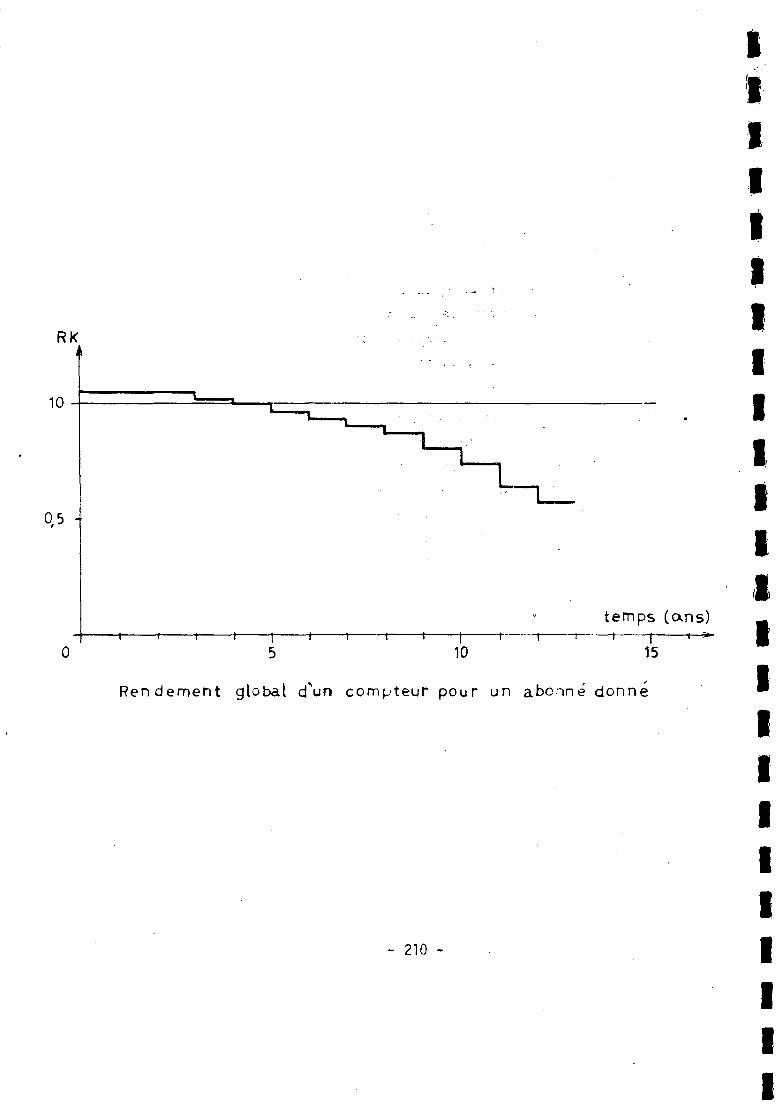
RK
10
0.5 -
-i r -I 1-
temps (ans)-i 1 1 r—»•-
O 5 10 15
Rendement global cfun compteur pour un abonné donne
II
- 210 -
La question à se poser lorsque l'on veut établir un programme d'entretien
est la suivante : avec quelle frequence doivent être essayas les appareils qui
font l'objet d'une surveillance constante ?
Malheureusement il n'existe pas de réponse unique à cette question ,
car le bilan économique dépend de nombreux facteurs tels que prix de l'eau ,
coût de la dépose , de la verification , de la réparation et de la repose de
compteurs .
On doit rechercher un équilibre raisonnable . Si les compteurs ne sont
pas entretenus , les services des eaux verra ses revenus diminuer . Inversement
si le coût d'un programme d'entretien dépasse le montant des pertes que l'on
subirait s'il n'existait pas , on provoque un gaspillage dont l'usager du service
fera finalement les frais .
On peut obtenir des indications utiles sur la proportion des pertes
dues au retard des compteurs en installant des compteurs neufs en série avec
les compteurs anciens en fonctionnement et grâce à un échantillonnage conve-
nable , en extrapolant pour évaluer les pertes dues aux compteurs qui sont en
service depuis un certain nombre d'années .
La fréquence des vérifications dépend du nombre des compteurs posés ,
des possibilités du service compétent , et de l'âge du compteur .
Les méthodes et appareils d'essais ainsi que l'implantation et
l'équipement de l'atelier d'entretien ont été objet de plusieurs études et
plusieurs publications .
II.5. Renouvellement des compteurs :
Des études ont été menées dans ce sens dans différents pays pour déterminer
notamment l'optimum de renouvellement des compteurs , la plupart des études se
posent la question : si on n'a pas intérêt à provoquer de façon systématique
un remplacement du compteur (après ou non control éventuel ) dès qu'il a atteint
un certain age .
Le délai optimum du remplacement dépend de la qualité de l'eau , de la
cossommation moyenne annuelle de l'abonné , du prix de vente de l'eau , du coût
du remplacement du compteur , du taux d'actualisation et , du rendement global
du compteur . Ce délai varie entre 6 et 10 ans • (1)
(1) A DAMAS ou l'eau est une eau de source d'une qualité excellante , le service
des eaux a adopté l'âge normal de 10 ans pour le remplacement systématique
d'un compteur à vitesse .
- 211 -
IIII.6. Documents concernant les compteurs :
Toute méthode d'archivage des fiches des compteurs doit permettre de p
retrouver les éléments fondamentaux qui sont : la taille , la marque , le modèle ,
la date d'achat et les données sur tous les controles et réparations subis .
Il existe d'innombrables méthodes pour archiver les documents qui •
intéressent les compteurs . L'essentiel est d'.adopter la méthode la plus simple
permettant d'avoir tous les renseignements nécessaires sans difficulté • M
II.7» Relevé des compteurs : V
Nous n'abordons pas ici le relevé des compteurs , qui est connue par les •
services des eaux . -,.,... ... .
Mais notons que le coût du relevé d'index dans'sa forme la plus courante , I1
c'est à dire basés sur l'intervention humaine , ne cesse de croitre en valeur
absolue et surtout en valeur relative •
Les causes en sont bien connues et peuvent se résumer -comme suit : •
- L'augmentation des salaires .
- L'extention de l'habitation vers l'extérieur des agglomérations avec comme S
conséquence un allongement de déplacement et un diminution du rendement individuéis
- La croissance du nombre d'absents lors du passage de releveur à cause du S
nombre plus important de ménages dont les deux conjoints travaillent .
Le relève d'index est donc rendu plus chère et plus difficile alors
que le processus surtout informatique de facturation exige une collecte programmée
c'est à dire régulière et complète .H
Nous trouvons utile de rappeler , pour compléter notre sujet , et bien ^
non encore exploitable commercialement , qu'une innovation remarquable dans la 9
technologie de comptage pourrait avoir un effet majeur à ce sujet ;
Depuis quelques années différents organismes étudient la relevée à distances tt
des compteurs par transmission à l'aide de cables électriques ou de réseaux
téléphoniques . I
Notons enfin qu'il ne faut pas perdre de vue que le releveur reste •
toujours le moyen unique de contact avec l'abonné qui est d'une importance
primordiale . M
- 212 - I
I
BIBLIOGRAPHIE.
1. La mesure des graunds debits en conduites fermées(G. BOSSY - J. GUILLAUME - F. DAMEZ)
Congres AIDEParis 1980.
2. Mode de tarification de V-'e'au en Angleterre et aupays de Galles dans .les. années 1980. - ...(DAVID KINNERSLEY)
AQUA No. 3, 81
3. Compteurs d'eau et comptage(ERNEST REITER)
AQUA No. 3, 81
4. Les problèmes du comptage et la gestion descompteurs en Tunisie(AHMAD FRIH - M. BENAICHA)
AQUA No. 3', 81
5. Gestion optimale des compteurs d'eauméthodologie et moyens(JEAN FRANCOIS B0ST)
Congrès AIDEParis 1980.
6. Méthodes actuelles et prospectives a matièrede releve des compteurs et de facturation etde consommation d'eau(A. DESMED)
Congrès AIDEKyoto 1978
7. Domestic water metering policies with particularreference to the developing countries(H. SHIPMAN)
Congrès AIDEKyoto 1978
8. Water use and consumption' (DAVID KINNERSLEY)
Congrès AIDEParis 1980
9. Evolution et contrôle des fuites dans lessystèmes de distribution(V. RAMAN)
AQUA No. 4, 78
10. Alimentation de la ville de DAMAS en eau potablea travers les âges(R. MOURTADA).
Conference
11. Les compteurs d'eau(Manuel des compteurs)
AWWA MG
- 213 -