Embed Size (px)
Citation preview
Partisan Asymmetries in Online Political Activity
Michael D. Conover1, Bruno Goncalves2,∗ Alessandro Flammini1, and Filippo Menczer1
1Center for Complex Networks and Systems Research,School of Informatics and ComputingIndiana University
2College of Computer and Information SciencesNortheastern University
We examine partisan differences in the behavior, communication patterns and social interactions ofmore than 18, 000 politically-active Twitter users to produce evidence that points to changing levels ofpartisan engagement with the American online political landscape. Analysis of a network defined bythe communication activity of these users in proximity to the 2010 midterm congressional electionsreveals a highly segregated, well clustered partisan community structure. Using cluster membershipas a high-fidelity (87% accuracy) proxy for political affiliation, we characterize a wide range of dif-ferences in the behavior, communication and social connectivity of left- and right-leaning Twitterusers. We find that in contrast to the online political dynamics of the 2008 campaign, right-leaningTwitter users exhibit greater levels of political activity, a more tightly interconnected social structure,and a communication network topology that facilitates the rapid and broad dissemination of politicalinformation.
arX
iv:1
205.
1010
v2 [
cs.S
I] 1
9 Ju
n 20
12
2
I. INTRODUCTION
Digitally-mediated communication has become an integral part of the American political landscape, providing citizens accessto an unprecedented wealth of information and organizational resources for political activity. So pervasive is the influenceof digital communication on the political process that almost one quarter (24%) of American adults got the majority of theirnews about the 2010 midterm congressional elections from online sources, a figure that has increased three-fold since the PewResearch Center began monitoring the statistic during the 2002 campaign (Pew Internet and American Life Project, 2010a).Relax the constraint that a majority of a person’s political news and information must come from online sources and the figurejumps to include the 54% of adult Americans who went online in 2010 to get political information. Critically, this activityprecipitates tangible changes in the beliefs and behaviors of voters, with 35% of internet users who voted in 2010 reporting thatpolitical information they saw or read online made them decide to vote for or against a particular candidate (Pew Internet andAmerican Life Project, 2010a).
Within this ecosystem of digital information resources, social media platforms play an especially important role in facilitat-ing the spread of information by connecting and giving voice to the voting public (Aday et al., 2010; Bennett, 2003; Farrelland Drezner, 2008). Networked and unmoderated, social media are characterized by the large-scale creation and exchange ofuser-generated content (Kaplan and Haenlein, 2010), a production and consumption model that stands in stark contrast to thecentralized editorial and distribution processes typical of traditional media outlets (Benkler, 2006; Sunstein, 2007).
In terms of political organization and engagement, the benefits of social media use are many. For voters, social media makeit easier to share political information, draw attention to ideological issues, and facilitate the formation of advocacy groups withlow barriers to entry and participation (Garrett, 2006; Tolbert and McNeal, 2003). The ease with which individual voters canconnect with one another directly also makes it easier to aggregate small-scale acts, as in the case of online petitions, fundraising,or web-based phonebanking (Land, 2009). Together, these features contribute to the widespread use of social media for politicalpurposes among the voting public, with as many as 21% of online adults using social networking sites to engage with the 2010congressional midterm elections (Pew Internet and American Life Project, 2010c). Moreover, a survey by the Pew Internet andAmerican Life Project finds that online political activity is correlated with more traditional forms of political participation, withindividuals who use blogs or social networking sites as a vehicle for civic engagement being more likely to join a political orcivic group, compared to other internet users (Pew Internet and American Life Project, 2010b).
Likewise, candidates and traditional political organizations benefit from a constituency that is actively engaged with socialmedia, finding it easier to raise money, organize volunteers and communicate directly with voters who use social media plat-forms (Lutz, 2009). Social media also facilitate the rapid dissemination of political frames, making it easy for key talking pointsto be communicated directly to a large number of constituents, rather than having to subject messages to the traditional mediafilter.
Considered in this light, it becomes clear why social media were argued to have played such an important role in the politicalsuccess of the Democratic party in the 2008 presidential and congressional elections (Carr, 2008; Creamer, 2008; Holahan,2008). Survey data from the Pew Research Center showed that, along the seven dimensions used to measure online politicalactivity, Obama voters were substantially more likely to use the internet as an outlet for political activity (Pew Internet andAmerican Life Project, 2008). In particular, Obama voters were more likely than McCain voters to create and share politicalcselectontent, and to engage politically on an online social network (Pew Internet and American Life Project, 2008). Moreover,a 2009 Edelman report found that in addition to a thirteen million member e-mail list, the Obama campaign enjoyed twice asmuch web traffic, had four times as many YouTube viewers and five times more Facebook friends compared to the McCaincampaign (Lutz, 2009). While the direct effect of any one media strategy on the success of a campaign is difficult to assess andquantify, the data show that Obama campaign had a clear advantage in terms of online voter engagement.
Motivated by the connection between the widely reported advantage in on-line mobilization and the result of the 2008 presi-dential election, we seek to understand structural shifts in the American political landscape with respect to partisan asymmetriesin online political engagement. We work toward this goal by examining partisan differences in the behavior, communicationpatterns and social interactions of more than 18, 000 politically-active users of the popular social media platform Twitter. Amongall social media services, Twitter makes an appealing analytical target for a number of reasons: the public nature of its content,the accessibility of the data through APIs, a strong focus on news and information sharing, and its prominence as a platform forpolitical discourse in America and abroad (Howard et al., 2011; Kwak et al., 2010). These features make a compelling case forusing this platform to study partisan political activity.
For this analysis we build on the findings of a previous study which established the macroscopic structure of domestic po-litical communication on Twitter, a social networking platform that allows individuals to create and share brief 140-charactermessages. In that work we employed clustering techniques and qualitative content analysis to demonstrate that the network ofpolitical retweets exhibits a highly segregated, partisan structure (Conover et al., 2011a). Despite this segregation, we found thatpolitically left- and right-leaning individuals engage in interaction across the partisan divide using mentions, a behavior stronglycorrelated with a type of cross-ideological provocation we term ‘content injection.’
3
Having established the large-scale structure of these communication networks, in this study we employ a variety of methodsto provide a more detailed picture of domestic political communication on Twitter. We characterize a wide range of differencesin the behavior, communication, geography and social connectivity of thousands of politically left- and right-leaning users.Specifically, we demonstrate that right-leaning Twitter users exhibit greater levels of political activity, tighter social bonds, and acommunication network topology that facilitates the rapid and broad dissemination of political information, a finding that standsin stark contrast to the online political dynamics of the 2008 campaign.
With respect to individual-level behaviors, we find that right-leaning Twitter users produce more than 50% more total politicalcontent and devote a greater proportion of their time to political discourse. Right-leaning users are also more likely to usehyperlinks to share and refer to external content, and are almost twice as likely than left-leaning users to self-identify theirpolitical alignment in their profile biographies. At the individual level, these behavioral factors paint a picture of a right-leaningconstituency comprised of highly-active, politically-engaged social media users, a trend we see reflected in the communicationand social networks in which these individuals participate.
Regarding connectivity patterns among users in these two communities we report findings related to three different networks,described by the set of explicitly declared follower/followee relationships, mentions, and retweets. Casting the declared followernetwork as the social substrate over which political information is most likely to spread, we find that right-leaning users exhibit agreater propensity for mutually-affirmed social ties, and that right-leaning users tend to form connections with a greater numberof individuals in total compared to those on the left. With respect to the way in which information actually propagates over thissubstrate in the form of retweets, right-leaning users enjoy a network structure that is more likely to facilitate the rapid and broaddissemination of political information. Additionally, right-leaning users exhibit a higher probability to rebroadcast content fromand to be rebroadcast by a large number of users, and are more likely to be members of high-order retweet network k-cores andk-cliques, structural features that are associated with the efficient spreading of information and adoption of political behaviorand opinions. Pointing definitively to a vocal, socially engaged, densely interconnected constituency of right-leaning users,these topological and behavioral features provide a significantly more nuanced perspective on political communication on thisimportant social media platform. Moreover, through its use digital trace data to illuminate a complex sociological phenomenon,this article illustrates the explanatory power of data science techniques and underscores the potential of this burgeoning scientificepistemology.
II. PLATFORM & DATA
A. The Twitter Platform
Twitter is a popular social networking and microblogging site where users can post 140-character messages containing textand hyperlinks, called tweets, and interact with one another in a variety of ways. In the present section we describe four of theplatform’s key features: follow relationships, retweets, mentions, and hashtags.
Twitter allows each user to broadcast tweets to an audience of users who have elected to subscribe to the stream of contenthe or she produces. The act of subscribing to a user’s tweets is known as following, and represents a directed, non-reciprocalsocial link between two users. From a content consumption perspective, each user can sample tweets from a variety of contentstreams, including the stream of tweets produced by the users he or she follows, as well as the set of tweets containing specifickeywords known as hashtags.
Hashtags are tokens prepended with a pound sign (i.e. #token) which, when displayed, function as a hyperlink to the streamof recent tweets containing the specified tag (Java et al., 2007). While they can be used to specify the topic of a tweet (i.e.#oil or #taxes), when used in political communication hashtags are commonly employed to identify one or more intendedaudiences, as in the case of the most popular political hashtags, #tcot and #p2, acronyms for “Top Conservative on Twitter”and “Progressives 2.0,” respectively. In this way, hashtags function to broaden the audience of a tweet, extending its visibilitybeyond a person’s immediate followers to include all users who seek out content associated with the tag’s topic or audience. Forthis reason, as outlined in Section III.A, we restrict our analysis to the set of tweets containing political hashtags, ensuring thatthe content under study is broadly public and expressly political in nature.
In addition to broadcasting tweets to the public at large, Twitter users can interact directly with one another in two primaryways: retweets and mentions. Retweets often act as a form of endorsement, allowing individuals to rebroadcast content generatedby other users, thus raising the content’s visibility (boyd et al., 2008). Mentions allow someone to address a specific user directlythrough the public feed, or, to a lesser extent, refer to an individual in the third person. In this study, we differentiate betweenmentions that occur in the body of the tweet and those that occur at the beginning of a tweet, as they correspond to distinct modesof interaction. Mentions located at the beginning of a tweet are known as ‘replies’, and typically represent actual engagement,while mentions in the body of a tweet typically constitute a third-person reference (Honeycutt and Herring, 2008). Together,retweets and mentions act as the primary mechanisms for explicit, public user-user interaction on Twitter.
4
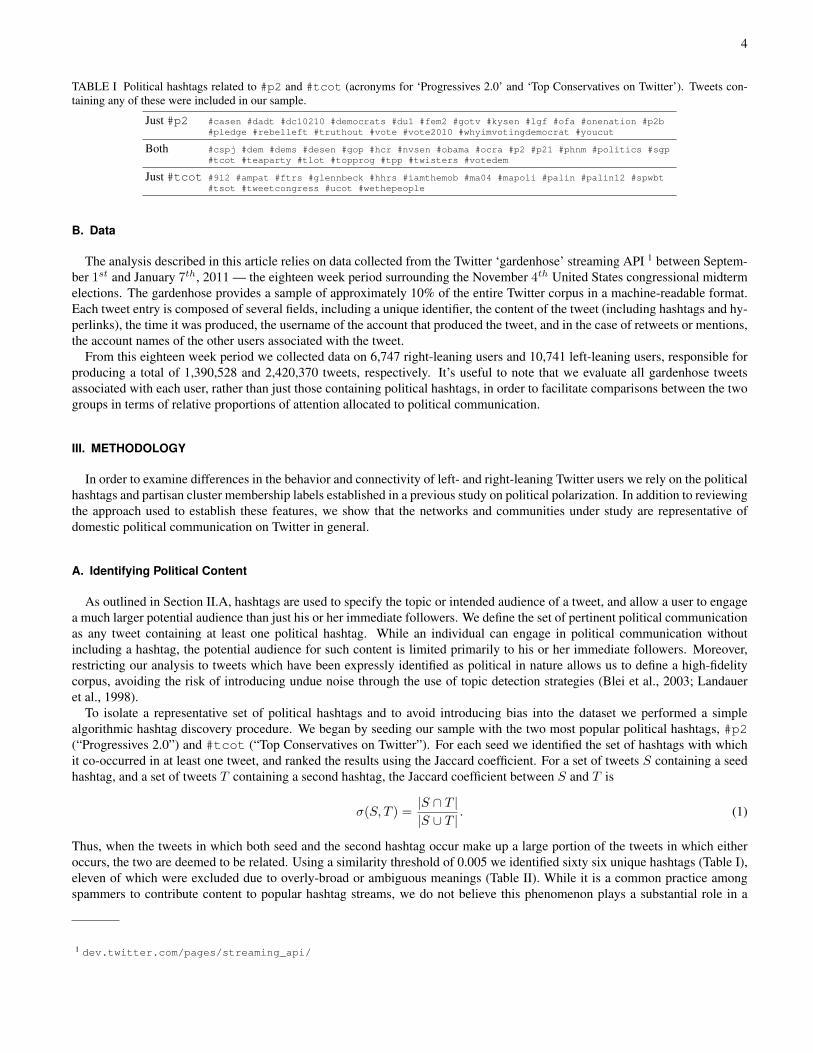
TABLE I Political hashtags related to #p2 and #tcot (acronyms for ‘Progressives 2.0’ and ‘Top Conservatives on Twitter’). Tweets con-taining any of these were included in our sample.
Just #p2 #casen #dadt #dc10210 #democrats #du1 #fem2 #gotv #kysen #lgf #ofa #onenation #p2b#pledge #rebelleft #truthout #vote #vote2010 #whyimvotingdemocrat #youcut
Both #cspj #dem #dems #desen #gop #hcr #nvsen #obama #ocra #p2 #p21 #phnm #politics #sgp#tcot #teaparty #tlot #topprog #tpp #twisters #votedem
Just #tcot #912 #ampat #ftrs #glennbeck #hhrs #iamthemob #ma04 #mapoli #palin #palin12 #spwbt#tsot #tweetcongress #ucot #wethepeople
B. Data
The analysis described in this article relies on data collected from the Twitter ‘gardenhose’ streaming API 1 between Septem-ber 1st and January 7th, 2011 — the eighteen week period surrounding the November 4th United States congressional midtermelections. The gardenhose provides a sample of approximately 10% of the entire Twitter corpus in a machine-readable format.Each tweet entry is composed of several fields, including a unique identifier, the content of the tweet (including hashtags and hy-perlinks), the time it was produced, the username of the account that produced the tweet, and in the case of retweets or mentions,the account names of the other users associated with the tweet.
From this eighteen week period we collected data on 6,747 right-leaning users and 10,741 left-leaning users, responsible forproducing a total of 1,390,528 and 2,420,370 tweets, respectively. It’s useful to note that we evaluate all gardenhose tweetsassociated with each user, rather than just those containing political hashtags, in order to facilitate comparisons between the twogroups in terms of relative proportions of attention allocated to political communication.
III. METHODOLOGY
In order to examine differences in the behavior and connectivity of left- and right-leaning Twitter users we rely on the politicalhashtags and partisan cluster membership labels established in a previous study on political polarization. In addition to reviewingthe approach used to establish these features, we show that the networks and communities under study are representative ofdomestic political communication on Twitter in general.
A. Identifying Political Content
As outlined in Section II.A, hashtags are used to specify the topic or intended audience of a tweet, and allow a user to engagea much larger potential audience than just his or her immediate followers. We define the set of pertinent political communicationas any tweet containing at least one political hashtag. While an individual can engage in political communication withoutincluding a hashtag, the potential audience for such content is limited primarily to his or her immediate followers. Moreover,restricting our analysis to tweets which have been expressly identified as political in nature allows us to define a high-fidelitycorpus, avoiding the risk of introducing undue noise through the use of topic detection strategies (Blei et al., 2003; Landaueret al., 1998).
To isolate a representative set of political hashtags and to avoid introducing bias into the dataset we performed a simplealgorithmic hashtag discovery procedure. We began by seeding our sample with the two most popular political hashtags, #p2(“Progressives 2.0”) and #tcot (“Top Conservatives on Twitter”). For each seed we identified the set of hashtags with whichit co-occurred in at least one tweet, and ranked the results using the Jaccard coefficient. For a set of tweets S containing a seedhashtag, and a set of tweets T containing a second hashtag, the Jaccard coefficient between S and T is
σ(S, T ) =|S ∩ T ||S ∪ T |
. (1)
Thus, when the tweets in which both seed and the second hashtag occur make up a large portion of the tweets in which eitheroccurs, the two are deemed to be related. Using a similarity threshold of 0.005 we identified sixty six unique hashtags (Table I),eleven of which were excluded due to overly-broad or ambiguous meanings (Table II). While it is a common practice amongspammers to contribute content to popular hashtag streams, we do not believe this phenomenon plays a substantial role in a
1 dev.twitter.com/pages/streaming_api/
5
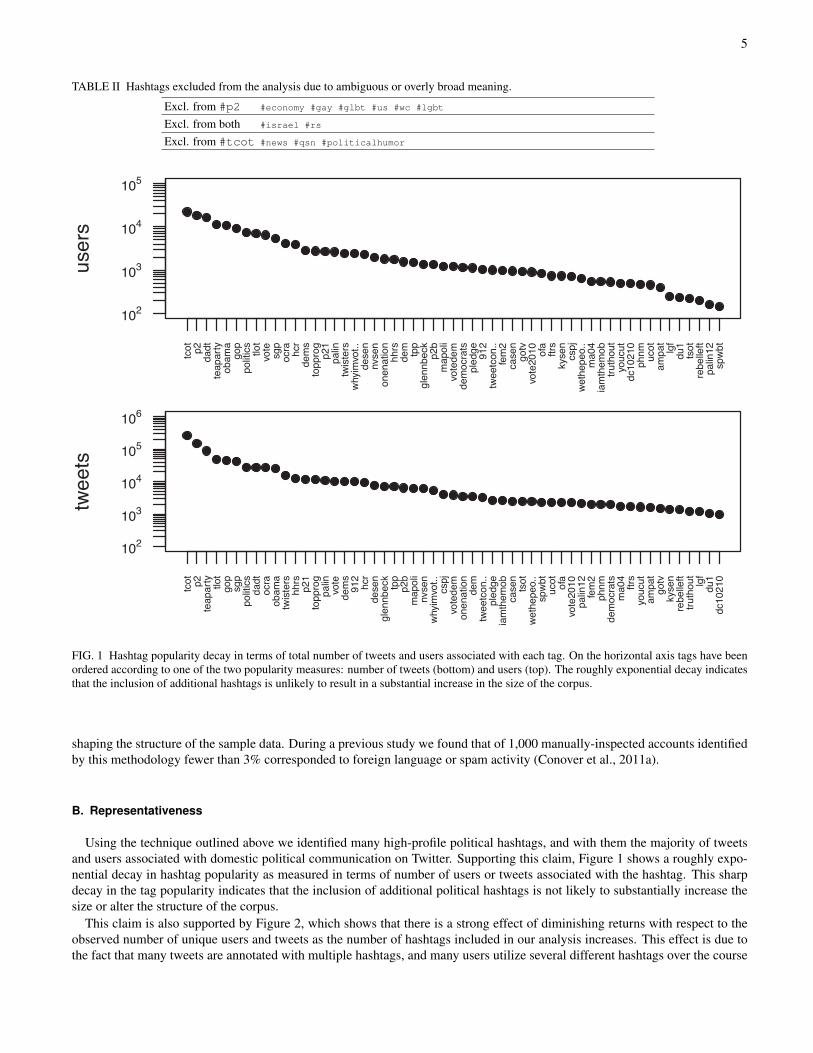
TABLE II Hashtags excluded from the analysis due to ambiguous or overly broad meaning.
Excl. from #p2 #economy #gay #glbt #us #wc #lgbt
Excl. from both #israel #rs
Excl. from #tcot #news #qsn #politicalhumor
102
103
104
105
106
tcot p2
teap
arty tlot
gop
sgp
polit
ics
dadt
ocra
obam
atw
iste
rshh
rsp2
1to
ppro
gpa
linvo
tede
ms
912
hcr
dese
ngl
ennb
eck
tpp
p2b
map
oli
nvse
nw
hyim
vot..
cspj
vote
dem
onen
atio
nde
mtw
eetc
on..
pled
geia
mth
emob
case
nts
otwe
thep
eo..
spw
btuc
ot ofa
vote
2010
palin
12fe
m2
phnm
dem
ocra
tsm
a04
ftrs
youc
utam
pat
gotv
kyse
nre
belle
fttru
thou
tlg
fdu
1dc
1021
0
twee
ts
102
103
104
105tc
ot p2da
dtte
apar
tyob
ama
gop
polit
ics
tlot
vote
sgp
ocra hc
rde
ms
topp
rog
p21
palin
twis
ters
why
imvo
t..de
sen
nvse
non
enat
ion
hhrs
dem tpp
glen
nbec
kp2
bm
apol
ivo
tede
mde
moc
rats
pled
ge 912
twee
tcon
..fe
m2
case
ngo
tvvo
te20
10 ofa
ftrs
kyse
ncs
pjwe
thep
eo..
ma0
4ia
mth
emob
truth
out
youc
utdc
1021
0ph
nm ucot
ampa
tlg
fdu
1ts
otre
belle
ftpa
lin12
spw
bt
user
s
FIG. 1 Hashtag popularity decay in terms of total number of tweets and users associated with each tag. On the horizontal axis tags have beenordered according to one of the two popularity measures: number of tweets (bottom) and users (top). The roughly exponential decay indicatesthat the inclusion of additional hashtags is unlikely to result in a substantial increase in the size of the corpus.
shaping the structure of the sample data. During a previous study we found that of 1,000 manually-inspected accounts identifiedby this methodology fewer than 3% corresponded to foreign language or spam activity (Conover et al., 2011a).
B. Representativeness
Using the technique outlined above we identified many high-profile political hashtags, and with them the majority of tweetsand users associated with domestic political communication on Twitter. Supporting this claim, Figure 1 shows a roughly expo-nential decay in hashtag popularity as measured in terms of number of users or tweets associated with the hashtag. This sharpdecay in the tag popularity indicates that the inclusion of additional political hashtags is not likely to substantially increase thesize or alter the structure of the corpus.
This claim is also supported by Figure 2, which shows that there is a strong effect of diminishing returns with respect to theobserved number of unique users and tweets as the number of hashtags included in our analysis increases. This effect is due tothe fact that many tweets are annotated with multiple hashtags, and many users utilize several different hashtags over the course
6
30000
40000
50000
60000
70000
tcot p2
dadt
teap
arty
obam
ago
ppo
litic
stlo
tvo
tesg
poc
ra hcr
dem
sto
ppro
gp2
1pa
lintw
iste
rsw
hyim
vot..
dese
nnv
sen
onen
atio
nhh
rsde
m tpp
glen
nbec
kp2
bm
apol
ivo
tede
mde
moc
rats
pled
ge 912
twee
tcon
..fe
m2
case
ngo
tvvo
te20
10 ofa
ftrs
kyse
ncs
pjwe
thep
eo..
ma0
4ia
mth
emob
truth
out
youc
utdc
1021
0ph
nm ucot
ampa
tlg
fdu
1ts
otre
belle
ftpa
lin12
spw
bt
user
s
250000
300000
350000
400000
450000
500000
tcot p2
teap
arty tlot
gop
sgp
polit
ics
dadt
ocra
obam
atw
iste
rshh
rsp2
1to
ppro
gpa
linvo
tede
ms
912
hcr
dese
ngl
ennb
eck
tpp
p2b
map
oli
nvse
nw
hyim
vot..
cspj
vote
dem
onen
atio
nde
mtw
eetc
on..
pled
geia
mth
emob
case
nts
otwe
thep
eo..
spw
btuc
ot ofa
vote
2010
palin
12fe
m2
phnm
dem
ocra
tsm
a04
ftrs
youc
utam
pat
gotv
kyse
nre
belle
fttru
thou
tlg
fdu
1dc
1021
0
twee
ts
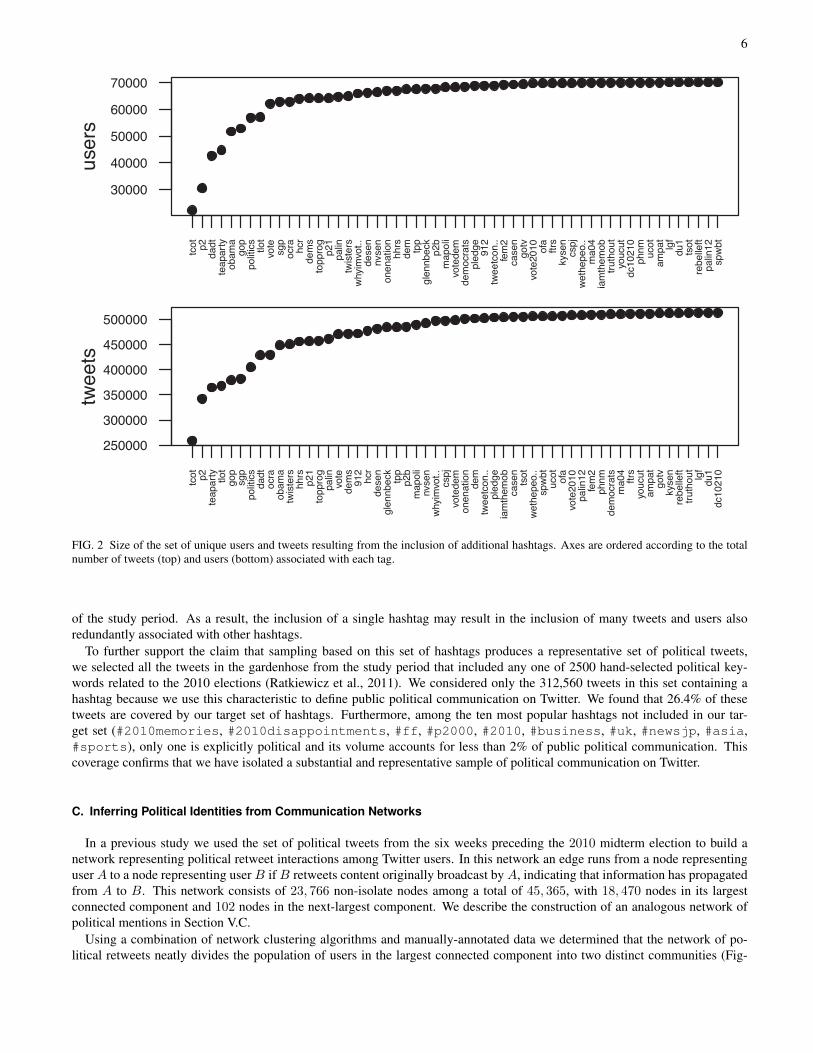
FIG. 2 Size of the set of unique users and tweets resulting from the inclusion of additional hashtags. Axes are ordered according to the totalnumber of tweets (top) and users (bottom) associated with each tag.
of the study period. As a result, the inclusion of a single hashtag may result in the inclusion of many tweets and users alsoredundantly associated with other hashtags.
To further support the claim that sampling based on this set of hashtags produces a representative set of political tweets,we selected all the tweets in the gardenhose from the study period that included any one of 2500 hand-selected political key-words related to the 2010 elections (Ratkiewicz et al., 2011). We considered only the 312,560 tweets in this set containing ahashtag because we use this characteristic to define public political communication on Twitter. We found that 26.4% of thesetweets are covered by our target set of hashtags. Furthermore, among the ten most popular hashtags not included in our tar-get set (#2010memories, #2010disappointments, #ff, #p2000, #2010, #business, #uk, #newsjp, #asia,#sports), only one is explicitly political and its volume accounts for less than 2% of public political communication. Thiscoverage confirms that we have isolated a substantial and representative sample of political communication on Twitter.
C. Inferring Political Identities from Communication Networks
In a previous study we used the set of political tweets from the six weeks preceding the 2010 midterm election to build anetwork representing political retweet interactions among Twitter users. In this network an edge runs from a node representinguser A to a node representing user B if B retweets content originally broadcast by A, indicating that information has propagatedfrom A to B. This network consists of 23, 766 non-isolate nodes among a total of 45, 365, with 18, 470 nodes in its largestconnected component and 102 nodes in the next-largest component. We describe the construction of an analogous network ofpolitical mentions in Section V.C.
Using a combination of network clustering algorithms and manually-annotated data we determined that the network of po-litical retweets neatly divides the population of users in the largest connected component into two distinct communities (Fig-
7
TABLE III Partisan composition of retweet cluster communities as determined through manual annotation of 1,000 random users. (See§ III.C).
Cluster Left Right Undecidable # NodesA (Top) 1.19% 93.4% 5.36% 7, 115
B (Bottom) 80.1% 8.71% 11.1% 11, 355
ure V.B) (Conover et al., 2011a). In brief, we used Rhaghavan’s label propagation method seeded with node labels determinedby Newman’s leading eigenvector modularity maximization method to assign cluster membership to each node (Newman, 2006;Raghavan et al., 2007). The final community assignments are consistent and robust to fluctuations in starting conditions (Conoveret al., 2011a). To determine whether these communities were composed of users from the political left and right, respectively,we used qualitative content analysis evaluate the tweets produced by 1,000 random users appearing in the intersection of themention and retweet networks (Kolbe, 1991; Krippendorff, 2004).
To establish the reproducibility of these results we had two authors, working independently, determine whether the content ofa user’s tweets express a ‘left’, ‘right’ or ‘undecidable’ political identity according to the coding rubric developed in a previousstudy (Conover et al., 2011a). These annotations were compared against the work of an independent non-author judge, andusing a well-established measure of inter-annotator agreement we report ‘nearly perfect’ inter-annotator agreement betweenauthor and non-author annotations for the ‘left’ and ‘right’ classes (Cohen’s Kappa values of .80 and .82, respectively) and ‘fairto moderate’ agreement for the ‘undecidable’ category (Cohen’s Kappa value of .42) (Kolbe, 1991; Krippendorff, 2004). Fromthese high levels of inter-annotator agreement we conclude that an objective outside party would be able to reproduce our classassignments for most users.
Based on this content analysis, we determined that the retweet network communities are highly politically homogeneous,consisting of 80.1% left- and 93.4% right-leaning users, respectively (Table III) (Conover et al., 2011a). In this study we usenetwork community membership as a proxy for the political identities of all 18, 470 users in the largest connected componentof the retweet network, and hereafter focus on the behavior of these users. Based on the relative proportions of right- and left-leaning users identified during the qualitative content analysis stage, this mechanism results in correct predictions for 87.3% ofusers in the largest connected component of the retweet network (Conover et al., 2011b).
In the following sections we leverage these data to explore, in detail, how users from the political left and right utilize thisimportant social media platform for political activity in different ways.
IV. BEHAVIOR: INDIVIDUAL-LEVEL POLITICAL ACTIVITY
Before examining structural differences in the social and communication networks of left- and right-leaning Twitter users, wefirst focus on political activity at the individual level. In this section we compare users in the left- and right-leaning communitiesin terms of their relative rates of content production, the amount of attention they allot to political communication, their respectiverates of political self-identification, and their propensity for sharing information resources in the form of hyperlinks.
Right-leaning users are substantially more active and politically engaged with this social media platform. Specifically, ouranalysis shows that left-leaning users produce less total political content, allocate proportionally less time to creating politicalcontent, are less likely to reveal their political ideology in their profile biography, and are less likely to share resources in theform of hyperlinks. All of these findings stand in stark contrast to survey data and media reportage of the 2008 online politicaldynamics, and provide evidence in support of the notion that right-leaning voters are becoming more politically engaged online.
A. Political Communication
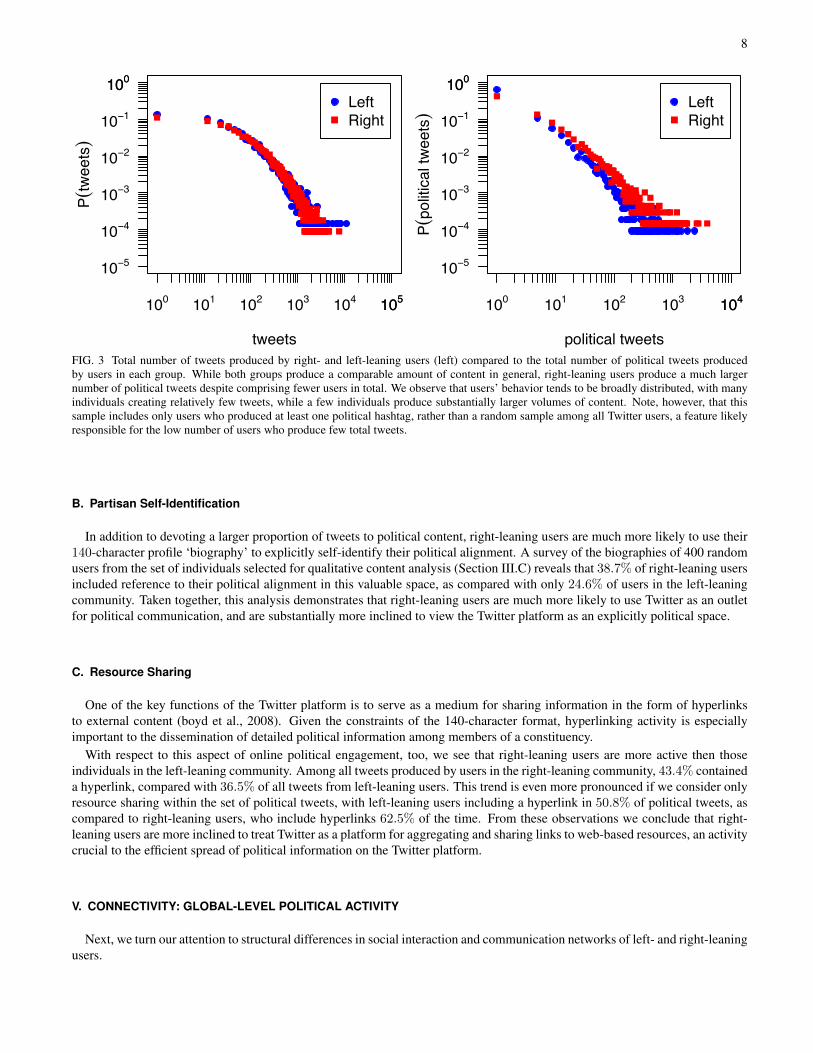
From the perspective of leveraging social media for political organization, the baseline level of activity among a constituencyis one of the most important characteristics of a population. Figure 3 shows that while left- and right-leaning users produceapproximately the same number of tweets per user, right-leaning individuals actually produce 54% more total political contentdespite comprising fewer users altogether. This trend is the result of divergent priorities among left- and right-leaning users, asright-leaning users devote a substantially larger portion of their activity on Twitter to political communication. In fact, right-leaning users were almost twice as likely to create political content, with 22% of all tweets produced by right-leaning userscontaining one or more of the political hashtags under study, compared to only 12% for left-leaning users.
8
political tweets
P(po
litic
al tw
eets)
100 101 102 103 104104
10−5
10−4
10−3
10−2
10−1
100100
LeftRight
tweets
P(tw
eets)
100 101 102 103 104 105105
10−5
10−4
10−3
10−2
10−1
100100
LeftRight
FIG. 3 Total number of tweets produced by right- and left-leaning users (left) compared to the total number of political tweets producedby users in each group. While both groups produce a comparable amount of content in general, right-leaning users produce a much largernumber of political tweets despite comprising fewer users in total. We observe that users’ behavior tends to be broadly distributed, with manyindividuals creating relatively few tweets, while a few individuals produce substantially larger volumes of content. Note, however, that thissample includes only users who produced at least one political hashtag, rather than a random sample among all Twitter users, a feature likelyresponsible for the low number of users who produce few total tweets.
B. Partisan Self-Identification
In addition to devoting a larger proportion of tweets to political content, right-leaning users are much more likely to use their140-character profile ‘biography’ to explicitly self-identify their political alignment. A survey of the biographies of 400 randomusers from the set of individuals selected for qualitative content analysis (Section III.C) reveals that 38.7% of right-leaning usersincluded reference to their political alignment in this valuable space, as compared with only 24.6% of users in the left-leaningcommunity. Taken together, this analysis demonstrates that right-leaning users are much more likely to use Twitter as an outletfor political communication, and are substantially more inclined to view the Twitter platform as an explicitly political space.
C. Resource Sharing
One of the key functions of the Twitter platform is to serve as a medium for sharing information in the form of hyperlinksto external content (boyd et al., 2008). Given the constraints of the 140-character format, hyperlinking activity is especiallyimportant to the dissemination of detailed political information among members of a constituency.
With respect to this aspect of online political engagement, too, we see that right-leaning users are more active then thoseindividuals in the left-leaning community. Among all tweets produced by users in the right-leaning community, 43.4% containeda hyperlink, compared with 36.5% of all tweets from left-leaning users. This trend is even more pronounced if we consider onlyresource sharing within the set of political tweets, with left-leaning users including a hyperlink in 50.8% of political tweets, ascompared to right-leaning users, who include hyperlinks 62.5% of the time. From these observations we conclude that right-leaning users are more inclined to treat Twitter as a platform for aggregating and sharing links to web-based resources, an activitycrucial to the efficient spread of political information on the Twitter platform.
V. CONNECTIVITY: GLOBAL-LEVEL POLITICAL ACTIVITY
Next, we turn our attention to structural differences in social interaction and communication networks of left- and right-leaningusers.
9
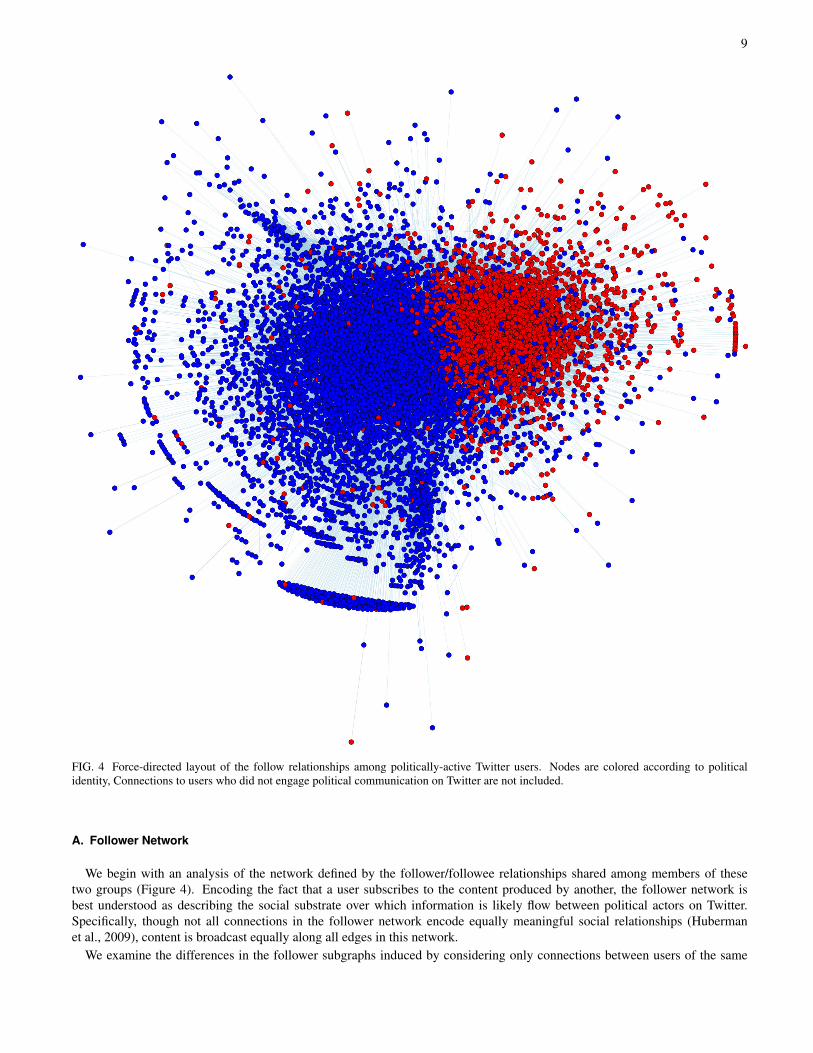
FIG. 4 Force-directed layout of the follow relationships among politically-active Twitter users. Nodes are colored according to politicalidentity, Connections to users who did not engage political communication on Twitter are not included.
A. Follower Network
We begin with an analysis of the network defined by the follower/followee relationships shared among members of thesetwo groups (Figure 4). Encoding the fact that a user subscribes to the content produced by another, the follower network isbest understood as describing the social substrate over which information is likely flow between political actors on Twitter.Specifically, though not all connections in the follower network encode equally meaningful social relationships (Hubermanet al., 2009), content is broadcast equally along all edges in this network.
We examine the differences in the follower subgraphs induced by considering only connections between users of the same
10
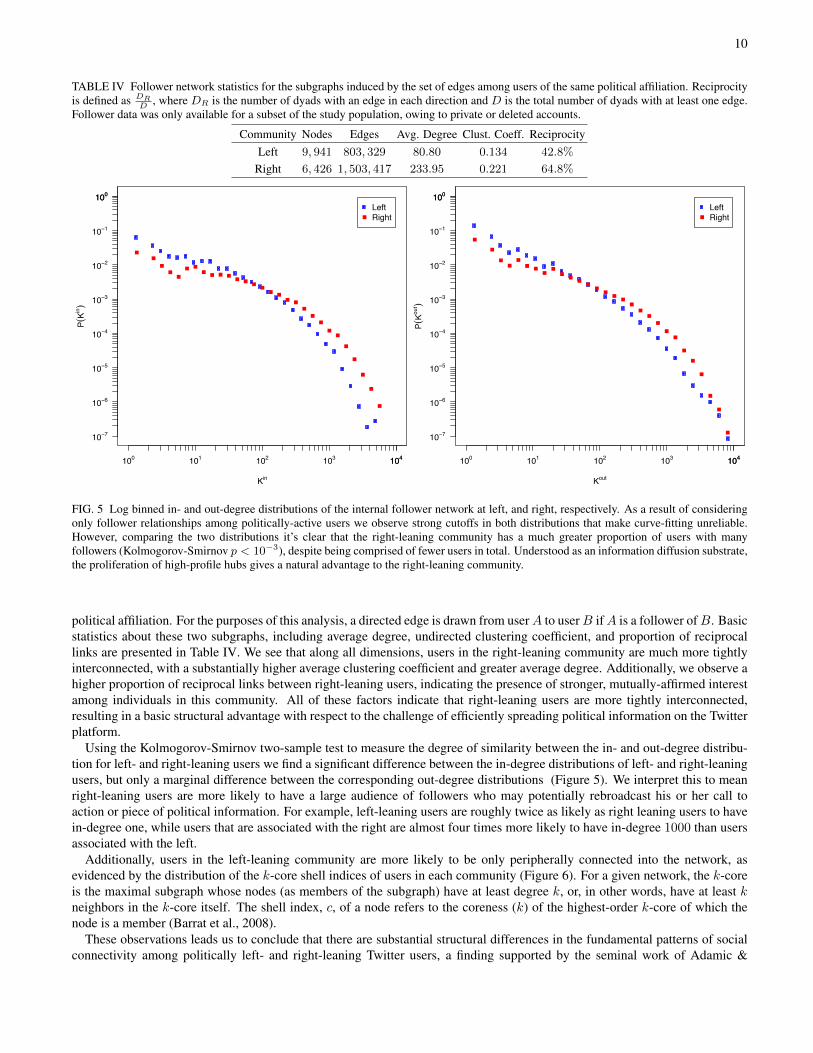
TABLE IV Follower network statistics for the subgraphs induced by the set of edges among users of the same political affiliation. Reciprocityis defined as DR
D, where DR is the number of dyads with an edge in each direction and D is the total number of dyads with at least one edge.
Follower data was only available for a subset of the study population, owing to private or deleted accounts.
Community Nodes Edges Avg. Degree Clust. Coeff. ReciprocityLeft 9, 941 803, 329 80.80 0.134 42.8%
Right 6, 426 1, 503, 417 233.95 0.221 64.8%
Kin
P(Kin)
�
��
� � �� � �
� ��
��
��
��
�
��
�
��
�
�
�
��
100 101 102 103 104104
10−7
10−6
10−5
10−4
10−3
10−2
10−1
100100
� LeftRight
Kout
P(Kou
t )
�
�
��
��
�
� ��
��
��
��
��
��
�
�
�
�
�
��
�
�
�
100 101 102 103 104104
10−7
10−6
10−5
10−4
10−3
10−2
10−1
100100
� LeftRight
FIG. 5 Log binned in- and out-degree distributions of the internal follower network at left, and right, respectively. As a result of consideringonly follower relationships among politically-active users we observe strong cutoffs in both distributions that make curve-fitting unreliable.However, comparing the two distributions it’s clear that the right-leaning community has a much greater proportion of users with manyfollowers (Kolmogorov-Smirnov p < 10−3), despite being comprised of fewer users in total. Understood as an information diffusion substrate,the proliferation of high-profile hubs gives a natural advantage to the right-leaning community.
political affiliation. For the purposes of this analysis, a directed edge is drawn from userA to userB ifA is a follower ofB. Basicstatistics about these two subgraphs, including average degree, undirected clustering coefficient, and proportion of reciprocallinks are presented in Table IV. We see that along all dimensions, users in the right-leaning community are much more tightlyinterconnected, with a substantially higher average clustering coefficient and greater average degree. Additionally, we observe ahigher proportion of reciprocal links between right-leaning users, indicating the presence of stronger, mutually-affirmed interestamong individuals in this community. All of these factors indicate that right-leaning users are more tightly interconnected,resulting in a basic structural advantage with respect to the challenge of efficiently spreading political information on the Twitterplatform.
Using the Kolmogorov-Smirnov two-sample test to measure the degree of similarity between the in- and out-degree distribu-tion for left- and right-leaning users we find a significant difference between the in-degree distributions of left- and right-leaningusers, but only a marginal difference between the corresponding out-degree distributions (Figure 5). We interpret this to meanright-leaning users are more likely to have a large audience of followers who may potentially rebroadcast his or her call toaction or piece of political information. For example, left-leaning users are roughly twice as likely as right leaning users to havein-degree one, while users that are associated with the right are almost four times more likely to have in-degree 1000 than usersassociated with the left.
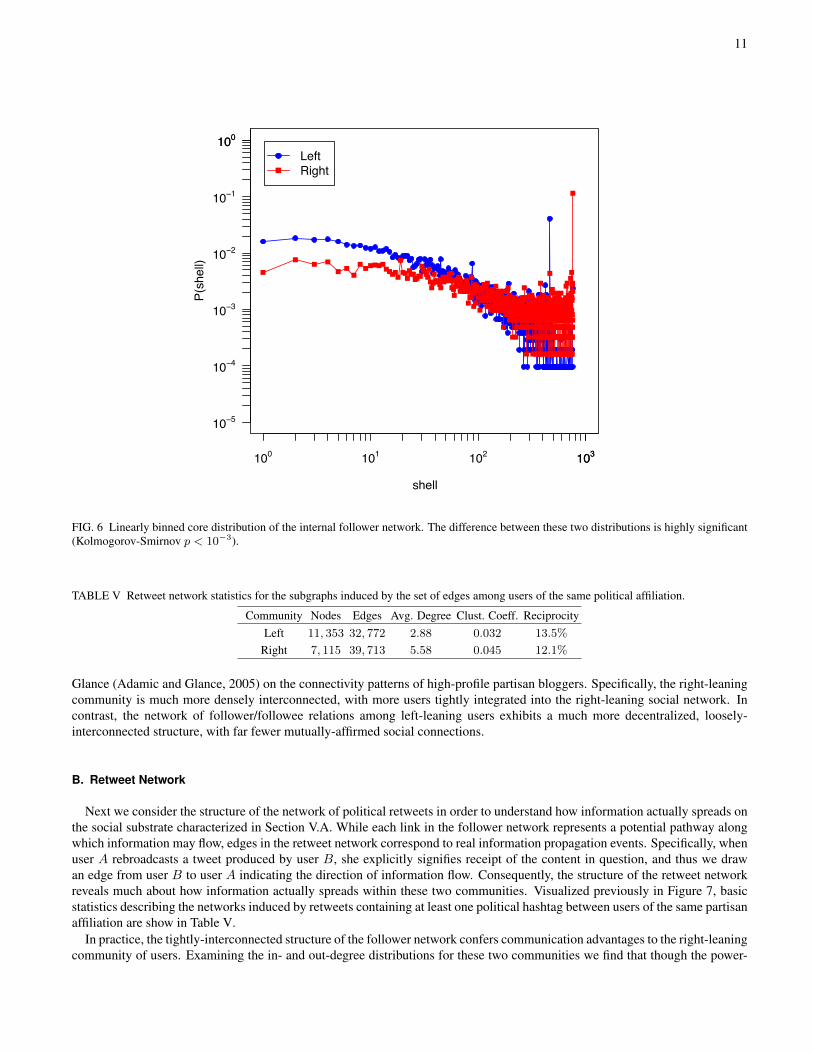
Additionally, users in the left-leaning community are more likely to be only peripherally connected into the network, asevidenced by the distribution of the k-core shell indices of users in each community (Figure 6). For a given network, the k-coreis the maximal subgraph whose nodes (as members of the subgraph) have at least degree k, or, in other words, have at least kneighbors in the k-core itself. The shell index, c, of a node refers to the coreness (k) of the highest-order k-core of which thenode is a member (Barrat et al., 2008).
These observations leads us to conclude that there are substantial structural differences in the fundamental patterns of socialconnectivity among politically left- and right-leaning Twitter users, a finding supported by the seminal work of Adamic &
11
shell
P(sh
ell)
LeftRight
100 101 102 103103
10−5
10−4
10−3
10−2
10−1
100100
FIG. 6 Linearly binned core distribution of the internal follower network. The difference between these two distributions is highly significant(Kolmogorov-Smirnov p < 10−3).
TABLE V Retweet network statistics for the subgraphs induced by the set of edges among users of the same political affiliation.
Community Nodes Edges Avg. Degree Clust. Coeff. ReciprocityLeft 11, 353 32, 772 2.88 0.032 13.5%
Right 7, 115 39, 713 5.58 0.045 12.1%
Glance (Adamic and Glance, 2005) on the connectivity patterns of high-profile partisan bloggers. Specifically, the right-leaningcommunity is much more densely interconnected, with more users tightly integrated into the right-leaning social network. Incontrast, the network of follower/followee relations among left-leaning users exhibits a much more decentralized, loosely-interconnected structure, with far fewer mutually-affirmed social connections.
B. Retweet Network
Next we consider the structure of the network of political retweets in order to understand how information actually spreads onthe social substrate characterized in Section V.A. While each link in the follower network represents a potential pathway alongwhich information may flow, edges in the retweet network correspond to real information propagation events. Specifically, whenuser A rebroadcasts a tweet produced by user B, she explicitly signifies receipt of the content in question, and thus we drawan edge from user B to user A indicating the direction of information flow. Consequently, the structure of the retweet networkreveals much about how information actually spreads within these two communities. Visualized previously in Figure 7, basicstatistics describing the networks induced by retweets containing at least one political hashtag between users of the same partisanaffiliation are show in Table V.
In practice, the tightly-interconnected structure of the follower network confers communication advantages to the right-leaningcommunity of users. Examining the in- and out-degree distributions for these two communities we find that though the power-
12
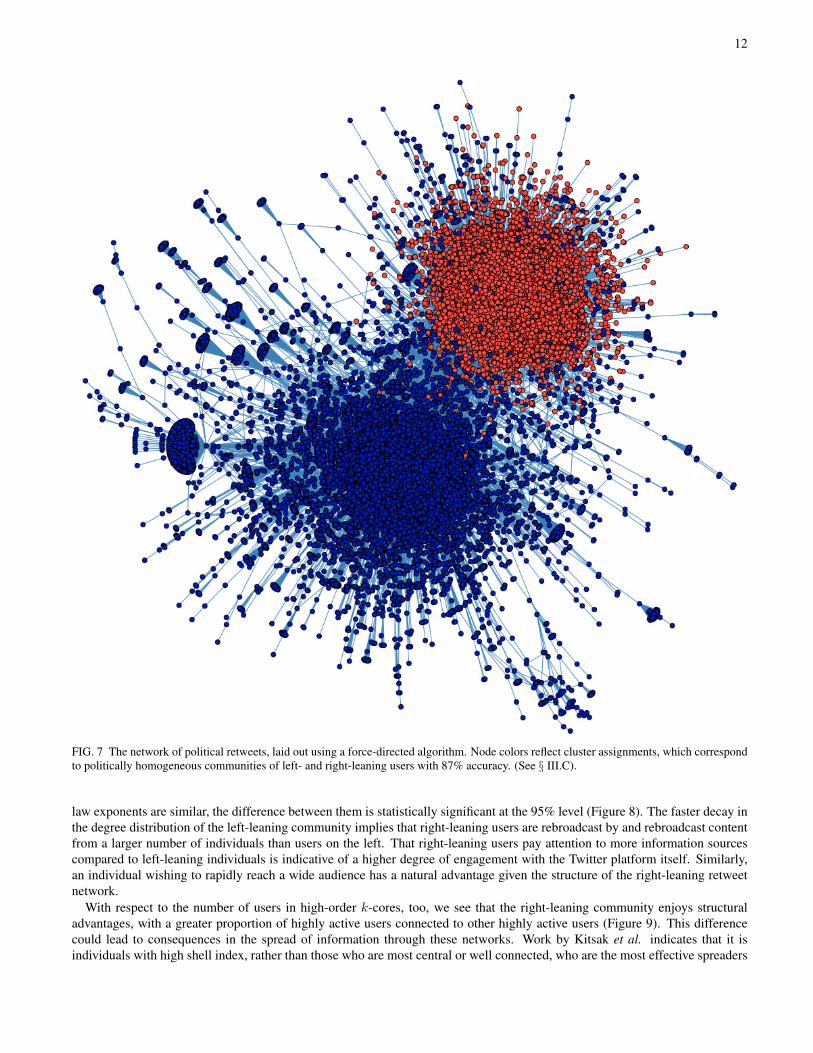
FIG. 7 The network of political retweets, laid out using a force-directed algorithm. Node colors reflect cluster assignments, which correspondto politically homogeneous communities of left- and right-leaning users with 87% accuracy. (See § III.C).
law exponents are similar, the difference between them is statistically significant at the 95% level (Figure 8). The faster decay inthe degree distribution of the left-leaning community implies that right-leaning users are rebroadcast by and rebroadcast contentfrom a larger number of individuals than users on the left. That right-leaning users pay attention to more information sourcescompared to left-leaning individuals is indicative of a higher degree of engagement with the Twitter platform itself. Similarly,an individual wishing to rapidly reach a wide audience has a natural advantage given the structure of the right-leaning retweetnetwork.
With respect to the number of users in high-order k-cores, too, we see that the right-leaning community enjoys structuraladvantages, with a greater proportion of highly active users connected to other highly active users (Figure 9). This differencecould lead to consequences in the spread of information through these networks. Work by Kitsak et al. indicates that it isindividuals with high shell index, rather than those who are most central or well connected, who are the most effective spreaders
13
Kleftout
PK le
ftou
t
100 101 102 103103
10
10
10
10
10
10
10
100100
Krightout
PK rig
htou
t
100 101 102 103103
10
10
10
10
10
10
10
100100
slope = 1.86(2)
Kleftin
PK le
ftin
100 101 102 103103
10
10
10
10
10
10
10
100100
slope = 2.01(2)
Krightin
PK rig
htin
100 101 102 103103
10
10
10
10
10
10
10
100100
slope = 1.91(2)
slope = 2.35(8)
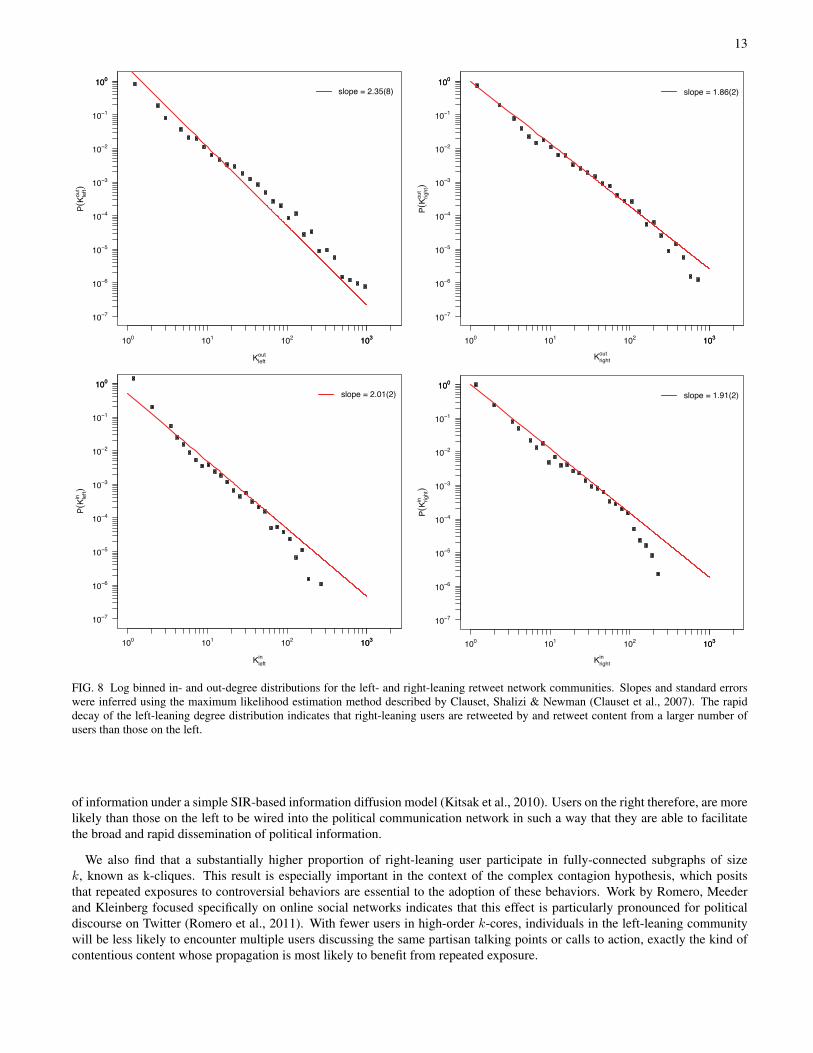
FIG. 8 Log binned in- and out-degree distributions for the left- and right-leaning retweet network communities. Slopes and standard errorswere inferred using the maximum likelihood estimation method described by Clauset, Shalizi & Newman (Clauset et al., 2007). The rapiddecay of the left-leaning degree distribution indicates that right-leaning users are retweeted by and retweet content from a larger number ofusers than those on the left.
of information under a simple SIR-based information diffusion model (Kitsak et al., 2010). Users on the right therefore, are morelikely than those on the left to be wired into the political communication network in such a way that they are able to facilitatethe broad and rapid dissemination of political information.
We also find that a substantially higher proportion of right-leaning user participate in fully-connected subgraphs of sizek, known as k-cliques. This result is especially important in the context of the complex contagion hypothesis, which positsthat repeated exposures to controversial behaviors are essential to the adoption of these behaviors. Work by Romero, Meederand Kleinberg focused specifically on online social networks indicates that this effect is particularly pronounced for politicaldiscourse on Twitter (Romero et al., 2011). With fewer users in high-order k-cores, individuals in the left-leaning communitywill be less likely to encounter multiple users discussing the same partisan talking points or calls to action, exactly the kind ofcontentious content whose propagation is most likely to benefit from repeated exposure.
14
core
P(co
re)
LeftRight
100 101 102102
10−3
10−2
10−1
100100
1 2 3 4 5 6 7 8 9 10
0.00.10.20.30.40.50.60.70.80.91.0
clique
P(cl
ique)
leftright
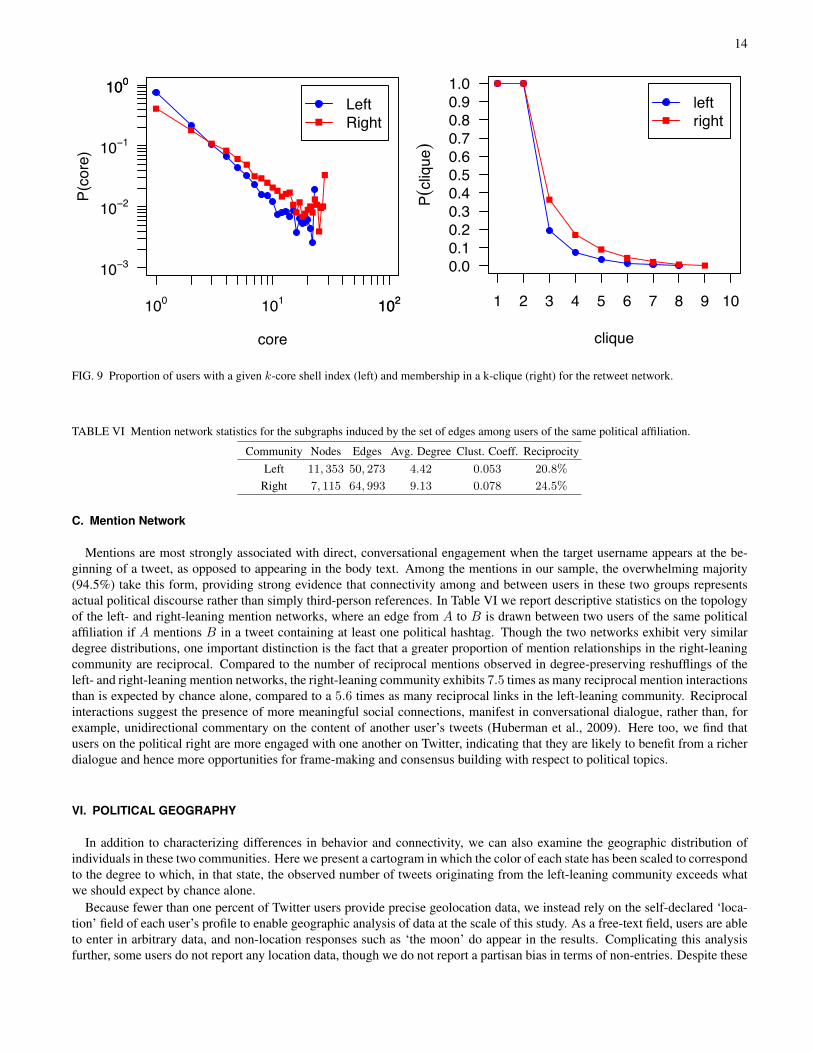
FIG. 9 Proportion of users with a given k-core shell index (left) and membership in a k-clique (right) for the retweet network.
TABLE VI Mention network statistics for the subgraphs induced by the set of edges among users of the same political affiliation.
Community Nodes Edges Avg. Degree Clust. Coeff. ReciprocityLeft 11, 353 50, 273 4.42 0.053 20.8%
Right 7, 115 64, 993 9.13 0.078 24.5%
C. Mention Network
Mentions are most strongly associated with direct, conversational engagement when the target username appears at the be-ginning of a tweet, as opposed to appearing in the body text. Among the mentions in our sample, the overwhelming majority(94.5%) take this form, providing strong evidence that connectivity among and between users in these two groups representsactual political discourse rather than simply third-person references. In Table VI we report descriptive statistics on the topologyof the left- and right-leaning mention networks, where an edge from A to B is drawn between two users of the same politicalaffiliation if A mentions B in a tweet containing at least one political hashtag. Though the two networks exhibit very similardegree distributions, one important distinction is the fact that a greater proportion of mention relationships in the right-leaningcommunity are reciprocal. Compared to the number of reciprocal mentions observed in degree-preserving reshufflings of theleft- and right-leaning mention networks, the right-leaning community exhibits 7.5 times as many reciprocal mention interactionsthan is expected by chance alone, compared to a 5.6 times as many reciprocal links in the left-leaning community. Reciprocalinteractions suggest the presence of more meaningful social connections, manifest in conversational dialogue, rather than, forexample, unidirectional commentary on the content of another user’s tweets (Huberman et al., 2009). Here too, we find thatusers on the political right are more engaged with one another on Twitter, indicating that they are likely to benefit from a richerdialogue and hence more opportunities for frame-making and consensus building with respect to political topics.
VI. POLITICAL GEOGRAPHY
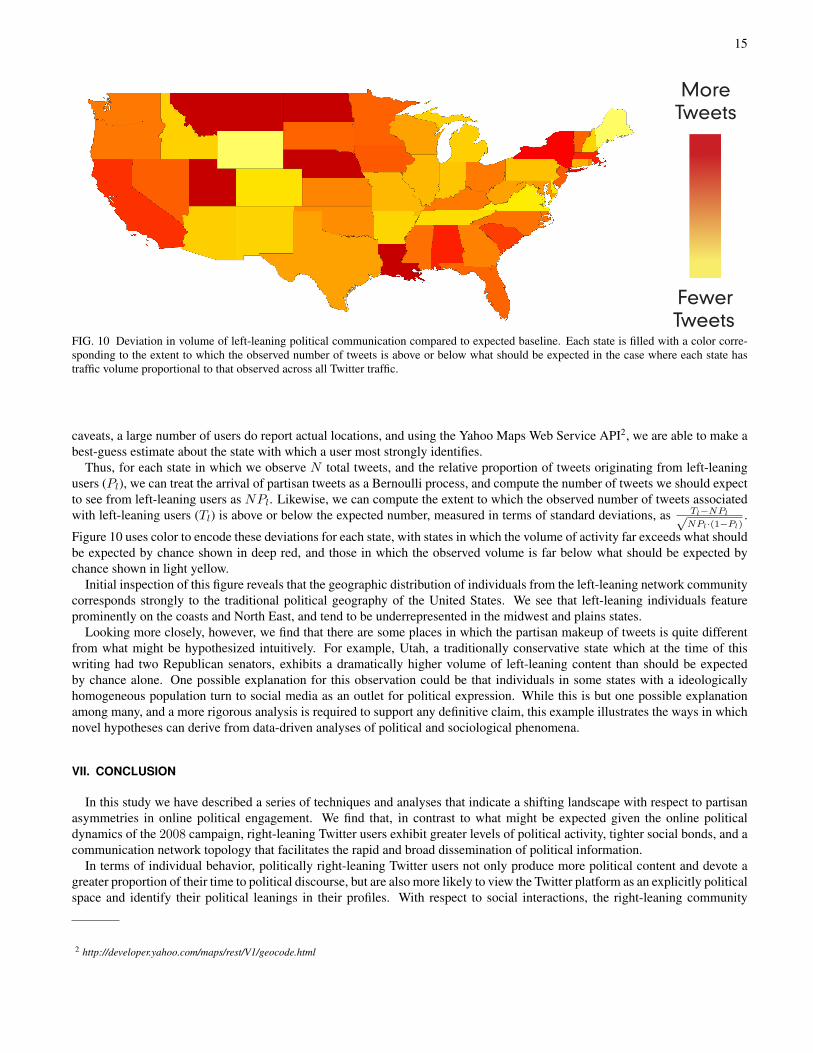
In addition to characterizing differences in behavior and connectivity, we can also examine the geographic distribution ofindividuals in these two communities. Here we present a cartogram in which the color of each state has been scaled to correspondto the degree to which, in that state, the observed number of tweets originating from the left-leaning community exceeds whatwe should expect by chance alone.
Because fewer than one percent of Twitter users provide precise geolocation data, we instead rely on the self-declared ‘loca-tion’ field of each user’s profile to enable geographic analysis of data at the scale of this study. As a free-text field, users are ableto enter in arbitrary data, and non-location responses such as ‘the moon’ do appear in the results. Complicating this analysisfurther, some users do not report any location data, though we do not report a partisan bias in terms of non-entries. Despite these
15
MoreTweets
Fewer Tweets
FIG. 10 Deviation in volume of left-leaning political communication compared to expected baseline. Each state is filled with a color corre-sponding to the extent to which the observed number of tweets is above or below what should be expected in the case where each state hastraffic volume proportional to that observed across all Twitter traffic.
caveats, a large number of users do report actual locations, and using the Yahoo Maps Web Service API2, we are able to make abest-guess estimate about the state with which a user most strongly identifies.
Thus, for each state in which we observe N total tweets, and the relative proportion of tweets originating from left-leaningusers (Pl), we can treat the arrival of partisan tweets as a Bernoulli process, and compute the number of tweets we should expectto see from left-leaning users as NPl. Likewise, we can compute the extent to which the observed number of tweets associatedwith left-leaning users (Tl) is above or below the expected number, measured in terms of standard deviations, as Tl−NPl√
NPl·(1−Pl).
Figure 10 uses color to encode these deviations for each state, with states in which the volume of activity far exceeds what shouldbe expected by chance shown in deep red, and those in which the observed volume is far below what should be expected bychance shown in light yellow.
Initial inspection of this figure reveals that the geographic distribution of individuals from the left-leaning network communitycorresponds strongly to the traditional political geography of the United States. We see that left-leaning individuals featureprominently on the coasts and North East, and tend to be underrepresented in the midwest and plains states.
Looking more closely, however, we find that there are some places in which the partisan makeup of tweets is quite differentfrom what might be hypothesized intuitively. For example, Utah, a traditionally conservative state which at the time of thiswriting had two Republican senators, exhibits a dramatically higher volume of left-leaning content than should be expectedby chance alone. One possible explanation for this observation could be that individuals in some states with a ideologicallyhomogeneous population turn to social media as an outlet for political expression. While this is but one possible explanationamong many, and a more rigorous analysis is required to support any definitive claim, this example illustrates the ways in whichnovel hypotheses can derive from data-driven analyses of political and sociological phenomena.
VII. CONCLUSION
In this study we have described a series of techniques and analyses that indicate a shifting landscape with respect to partisanasymmetries in online political engagement. We find that, in contrast to what might be expected given the online politicaldynamics of the 2008 campaign, right-leaning Twitter users exhibit greater levels of political activity, tighter social bonds, and acommunication network topology that facilitates the rapid and broad dissemination of political information.
In terms of individual behavior, politically right-leaning Twitter users not only produce more political content and devote agreater proportion of their time to political discourse, but are also more likely to view the Twitter platform as an explicitly politicalspace and identify their political leanings in their profiles. With respect to social interactions, the right-leaning community
2 http://developer.yahoo.com/maps/rest/V1/geocode.html
16
exhibits a higher proportion of reciprocal social and mention relationships, are more likely to rebroadcast content from a largenumber of sources, and are more likely to be members of high-order retweet network k-cores and k-cliques. Such structuralfeatures are directly associated with the efficient spreading of information and adoption of political behavior. Taken together,these features are indicative of a highly-active, densely-interconnected constituency of right-leaning users using this importantsocial media platform to further their political views.
This study is characteristic of an emerging mode of inquiry in the political and social sciences, whereby large-scale behavioraldata are aggregated and analyzed to shed quantitative light on questions whose scale was previously considered outside the realmof tractable analysis (Lazer et al., 2009). Using structural features of a digital communication network one can make high-fidelityinferences about the political identities of thousands of individuals. Such data provide a deeper understanding of the changinglandscape of American online political activity. Looking forward, techniques such as these are likely to become increasinglyimportant as the political and social sciences rely in greater measure on large-scale digital trace data describing human opinionand behavior.
AUTHOR’S CONTRIBUTIONS
MDC and BG collected the data and performed the analysis. MDC, BG, AF and FM conceived the experiments and wrote themanuscript.
REFERENCES
0B, 1.L. Adamic and N. Glance. The political blogosphere and the 2004 U.S. election: Divided they blog. In Proc. 3rd Intl. Workshop on Link
Discovery (LinkKDD), pages 36–43, 2005.S. Aday, H. Farrel, M. Lynch, J. Sides, J. Kelly, and E. Zuckerman. Blogs and bullets: New media in contentious politics. Technical report,
U.S. Institute of Peace, 2010.A. Barrat, M. Barthlemy, and A. Vespignani. Dynamical processes on complex networks. Cambridge University Press, 2008.Y. Benkler. The Wealth of Networks: How Social Production Transforms Markets and Freedom. Yale University Press, 2006.L. Bennett. New media power: The Internet and global activism. In N. Couldry and J. Curran, editors, Contesting media power: Alternative
media in a networked world, pages 17–37. Rowman and Littlefield, 2003.D. Blei, A. Ng, and M. Jordan. Latent dirichlet allocation. The Journal of Machine Learning Research, 3:993–1022, 2003.d. boyd, S. Golder, and G. Lotan. Tweet, tweet, retweet: Conversational aspects of retweeting on twitter. Proc. Hawaii Intl. Conf. on Systems
Sciences, pages 1–10, 2008.D. Carr. How Obama tapped into social networks’ power. The New York Times, November 2008.A. Clauset, C. Shalizi, and M. Newman. Power-law distributions in empirical data. Arxiv preprint arxiv:0706.1062, 2007.M. Conover, J. Ratkiewicz, M. Francisco, B. Goncalves, A. Flammini, and F. Menczer. Political polarization on twitter. In Fifth International
AAAI Conference on Weblogs and Social Media, page 89, 2011a.M. Conover, J. Ratkiewicz, B. Goncalves, J. Haff, A. Flammini, and F. Menczer. Predicting the political alignment of twitter users. In
Proceedings of 3rd IEEE Conference on Social Computing (SocialCom), 2011b.M. Creamer. Obama Wins! ... Ad Age’s Marketer of the Year. Advertising Age, May 2008.H. Farrell and D. Drezner. The power and politics of blogs. Public Choice, 134(1):15–30, January 2008.R. Garrett. Protest in an information society: A review of literature on social movements and new ICTs. Information, Communication &
Society, 9(2):202–224, 2006.C. Holahan. John McCain is way behind online. Bloomberg Businessweek, June 2008.C. Honeycutt and S. C. Herring. Beyond microblogging: Conversation and collaboration via Twitter. In Proc. 42nd Hawaii Intl Conf. on
System Sciences, 2008.P. Howard, A. Duffy, D. Freelon, M. Hussain, W. Marai, and M. Mazaid. Opening closed regimes, what was the role of social media during
the arab spring? Project on Information Technology Political Islam, pages 1–30, 2011.B. Huberman, D. Romero, and F. Wu. Social networks that matter: Twitter under the microscope. First Monday, 14(1):8, 2009.A. Java, X. Song, T. Finin, and B. Tseng. Why we Twitter: understanding microblogging usage and communities. In Proc. of the 9th WebKDD
and 1st SNA-KDD 2007 workshop on Web mining and social network analysis, 2007.A. Kaplan and M. Haenlein. Users of the world, unite! the challenges and opportunities of social media. Business Horizons, 53(1):59–68,
2010.M. Kitsak, L. Gallos, S. Havlin, F. Liljeros, L. Muchnik, H. Stanley, and H. Makse. Identifying influential spreaders in complex networks.
Nature Physics, 6:888–893, January 2010.R. H. Kolbe. Content analysis research: An examination of applications with directives for improving research reliability and objectivity. The
Journal of Consumer Research, 18(2):243–250, 1991.K. Krippendorff, editor. Content Analysis: An Introduction to Its Methodology. Sage Publications, 2004.
17
H. Kwak, C. Lee, H. Park, and S. Moon. What is twitter, a social network or a news media? In Proceedings of the 19th international conferenceon World wide web, pages 591–600. ACM, 2010.
M. Land. Networked activism. Harvard Human Rights Journal, 22:205, 2009.T. Landauer, P. Foltz, and D. Laham. An introduction to latent semantic analysis. Discourse processes, 25(2):259–284, 1998.D. Lazer, A. Pentland, L. Adamic, S. Aral, A. Barabasi, D. Brewer, N. Christakis, N. Contractor, J. Fowler, M. Gutmann, et al. Life in the
network: the coming age of computational social science. Science (New York, NY), 323(5915):721, 2009.M. Lutz. The social pulpit: Barack Obama’s social media toolkit. Technical report, Edelman, 2009.M. E. J. Newman. Finding community structure in networks using the eigenvectors of matrices. Physical Review E, 74(3):036104, Sep 2006.
doi:10.1103/PhysRevE.74.036104.Pew Internet and American Life Project. Social networking and online videos take off: Internet’s broader role in campaign 2008. Technical
report, Pew Research Center, 2008. URL http://people-press.org/reports/display.php3?ReportID=384.Pew Internet and American Life Project. The internet and campaign 2010. Technical report, Pew Research Center, 2010a.Pew Internet and American Life Project. The internet and civic engagement. Technical report, Pew Research Center, 2010b.Pew Internet and American Life Project. Social media and politics in 2010 campaign. Technical report, Pew Research Center, 2010c.U. N. Raghavan, R. Albert, and S. Kumara. Near linear time algorithm to detect community structures in large-scale networks. Physical
Review E, 76(3):036106, Sep 2007. doi:10.1103/PhysRevE.76.036106.J. Ratkiewicz, M. Conover, M. Meiss, B. Goncalves, S. Patil, A. Flammini, and F. Menczer. Truthy: Mapping the spread of astroturf in
microblog streams. In Proc. 20th Intl. World Wide Web Conf. (WWW), 2011.D. Romero, B. Meeder, and J. Kleinberg. Differences in the mechanics of information diffusion across topics: idioms, political hashtags, and
complex contagion on twitter. In Proceedings of the 20th international conference on World wide web, pages 695–704. ACM, 2011.C. R. Sunstein. Republic.com 2.0. Princeton University Press, August 2007. ISBN 0691133565.C. Tolbert and R. McNeal. Unraveling the effects of the internet on political participation? Political Research Quarterly, 56(2):175, 2003.