Embed Size (px)
Citation preview
Article
Party organization and partyproliferation in India
Pradeep Chhibber and Francesca Refsum JenseniusUniversity of California, USA
Pavithra SuryanarayanColumbia University, USA
AbstractTheories that explain variations in party systems typically emphasize the role of political institutions and social cleavages.Using a panel dataset of election returns from 15 Indian states from 1967 to 2004. this article establishes considerablevariation in the effective number of parties across states and over time, despite the same political institutions and relativelystable social cleavages. We argue that a hitherto ignored dimension, the level of party organization, has a significant impacton the nature of the party system. The level of party organization incentivizes politicians differently in terms of theirdecision to stay, join another party or float a new party, when their ambitions are thwarted within a party. To test thistheory, a unique indicator of party organization is developed on the basis of extensive qualitative research. We find that inIndian states where parties are more organized, both the effective number of parties and electoral volatility are lower.
KeywordsIndia, party factionalism, party organization, selecting leaders, South Asia
Introduction
Since the publication of Making Votes Count (Cox, 1997) it
is widely accepted that social cleavages, political institu-
tions or the interaction of cleavages and institutions jointly
influence the nature of a party system (usually understood
as the effective number of parties). An analysis of the party
systems across Indian states reveals that there is consider-
able variation in the effective number of parties, both
across states and within states over time, and that this var-
iation cannot be accounted for by social cleavages or polit-
ical institutions alone.
In this article, we claim that an oft overlooked factor
in the study of party systems – the level of party orga-
nization – has a significant impact on the effective num-
ber of parties in Indian states. In Indian states where the
parties that compete are more organized, not only is the
effective number of parties lower, but so is the volatility
of the party system.1 We attribute this variation to career
incentives faced by politicians in a political party.
In bringing together claims about the level of party orga-
nization and the party system, this article addresses a theo-
retical concern raised by Ware (2007), namely that a
neglected subject in the field of party politics is how a
party’s internal structure affects how it relates to other par-
ties in the system, and how it competes, cooperates or
merges with its opponents. The arguments proposed also
build on the insights from organizational theory about the
career incentives for politicians, and suggest that career
paths of politicians affect party systems.
In order to substantiate the theoretical claims in the arti-
cle, we develop a unique indicator of party organization.
This measure is created on the basis of extensive qualitative
research as well as survey data. We also control for social
cleavages based on multiple theoretical conceptualizations,
political institutions and socio-economic factors.
Paper submitted 12 July 2011; accepted for publication 12 November
2011
Replication data and code can be found at www.francesca.no
Corresponding author:
Francesca Refsum Jensenius, University of California at Berkeley, 210
Barrows Hall #1950, University of California at Berkeley, Berkeley,
CA 94720, USA.
Email: [email protected]
Party Politics1–17
ª The Author(s) 2012Reprints and permission:
sagepub.co.uk/journalsPermissions.navDOI: 10.1177/1354068811436059
ppq.sagepub.com
at UNIV DE LOS ANDES on January 21, 2015ppq.sagepub.comDownloaded from
The article proceeds as follows: We first present
aggregate election data from 15 Indian states to establish
that there is significant variation in the effective number
of parties both across states and over time. The subse-
quent section discusses institutional and cleavage the-
ories of party systems and how they have been studied
in the Indian case. The next section lays out the link
between the organization of parties and the effective
number of parties. Part five presents the operationaliza-
tion of our organizational variable and contains the esti-
mates of different statistical models using state assembly
election data for the 15 largest Indian states between
1967 and 2004.2 The results demonstrate that the orga-
nizational nature of political parties has a significant
influence on the party system.
Party proliferation in India 1967–2004
After decades of stable one-party rule by what has been
characterized as the ‘Congress System’ (Kothari, 1964), the
Indian party system has fragmented considerably. While
numerous scholars have focused on the reasons for party
fragmentation at the national level, attributing it to
increased voter mobilization (Yadav, 2000), shifting
dynamics of the fiscal prowess of the centre versus the
states (Chhibber and Kollman, 2004), the rise of a second
competitive party in Indian states (Chhibber and Noorud-
din, 2000) and anti-incumbency sentiments of the electo-
rate (Linden, 2004; Uppal, 2009), only recently have
scholars started to focus on state-level politics.
Data provided by the Election Commission of India
between 1967 and 2004 show that the nature and volatility
of the party systems vary both over time and across states.3
The effective number of parties (N) for the 15 largest states
in India is calculated using the measure in equation given
below, developed by Laakso and Taagepera (1979), where
pi represents the proportion of votes received by party i in a
state level election.4
N ¼ 1P
p2i
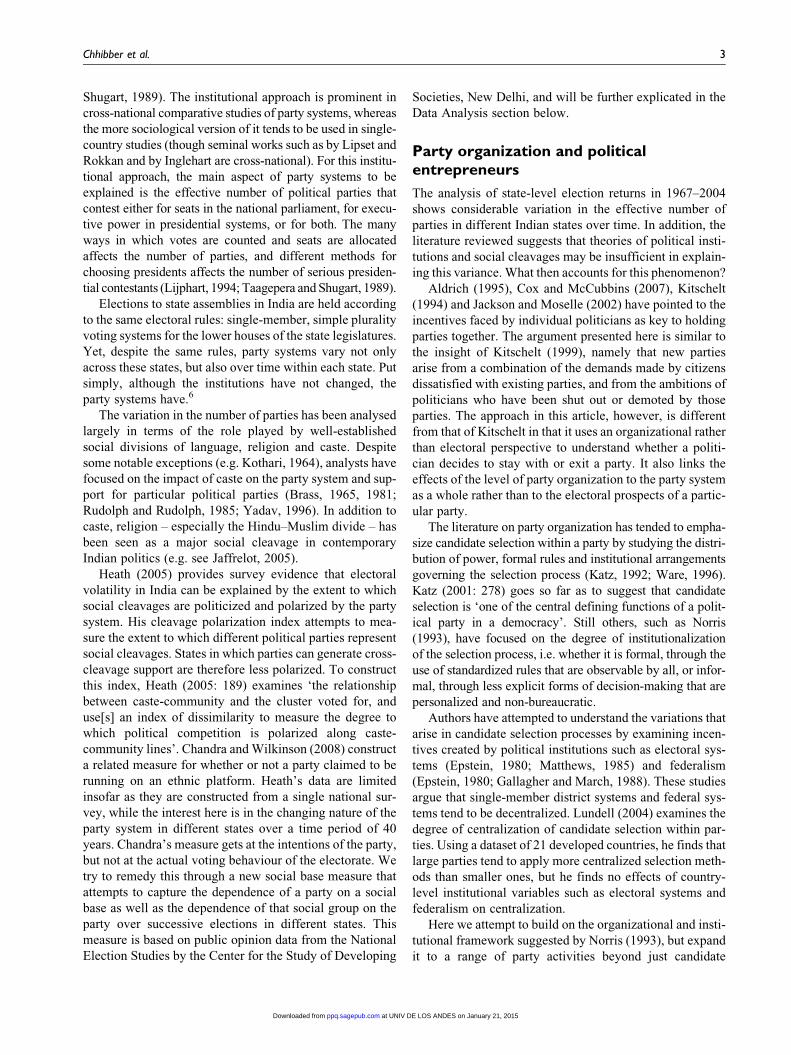
The average effective number of parties across 15
states in India has remained around 4 (when computed
by votes) and around 3 (when computed by seats) over 9
elections between 1967 and 2000 (Figure 1). The use of
the average effective number of parties in Figure 1 con-
ceals great variation in the number of parties across states.
The box plots in Figure 2 illustrate the median and var-
iance of the effective number of parties in each state over
time. For instance, both Assam and Punjab have a median
of about 4 effective number of parties from 1967 to 2004,
but while this number has been stable in Punjab it has fluc-
tuated in Assam (as reflected in the higher variance in the
box plot for Assam). These figures suggest that at the state
level there is no clear trend in the effective number of par-
ties.5 How can we explain this variation – both within and
across states?
Political institutions, social cleavages andthe effective number of parties
An important approach to party systems, of which Duverger
(1959) and Cox (1997) are two major bookends, focuses
attention on the influence of electoral laws on party systems
(Lijphart, 1994; Rae, 1967; Riker, 1982; Taagepera and
Figure 1. Average effective number of parties in 15 Indian states1967–2004. Figure 2. Variation in effective number of parties in 15 Indian
States 1967–2004.
2 Party Politics
at UNIV DE LOS ANDES on January 21, 2015ppq.sagepub.comDownloaded from
Shugart, 1989). The institutional approach is prominent in
cross-national comparative studies of party systems, whereas
the more sociological version of it tends to be used in single-
country studies (though seminal works such as by Lipset and
Rokkan and by Inglehart are cross-national). For this institu-
tional approach, the main aspect of party systems to be
explained is the effective number of political parties that
contest either for seats in the national parliament, for execu-
tive power in presidential systems, or for both. The many
ways in which votes are counted and seats are allocated
affects the number of parties, and different methods for
choosing presidents affects the number of serious presiden-
tial contestants (Lijphart, 1994; Taagepera and Shugart, 1989).
Elections to state assemblies in India are held according
to the same electoral rules: single-member, simple plurality
voting systems for the lower houses of the state legislatures.
Yet, despite the same rules, party systems vary not only
across these states, but also over time within each state. Put
simply, although the institutions have not changed, the
party systems have.6
The variation in the number of parties has been analysed
largely in terms of the role played by well-established
social divisions of language, religion and caste. Despite
some notable exceptions (e.g. Kothari, 1964), analysts have
focused on the impact of caste on the party system and sup-
port for particular political parties (Brass, 1965, 1981;
Rudolph and Rudolph, 1985; Yadav, 1996). In addition to
caste, religion – especially the Hindu–Muslim divide – has
been seen as a major social cleavage in contemporary
Indian politics (e.g. see Jaffrelot, 2005).
Heath (2005) provides survey evidence that electoral
volatility in India can be explained by the extent to which
social cleavages are politicized and polarized by the party
system. His cleavage polarization index attempts to mea-
sure the extent to which different political parties represent
social cleavages. States in which parties can generate cross-
cleavage support are therefore less polarized. To construct
this index, Heath (2005: 189) examines ‘the relationship
between caste-community and the cluster voted for, and
use[s] an index of dissimilarity to measure the degree to
which political competition is polarized along caste-
community lines’. Chandra and Wilkinson (2008) construct
a related measure for whether or not a party claimed to be
running on an ethnic platform. Heath’s data are limited
insofar as they are constructed from a single national sur-
vey, while the interest here is in the changing nature of the
party system in different states over a time period of 40
years. Chandra’s measure gets at the intentions of the party,
but not at the actual voting behaviour of the electorate. We
try to remedy this through a new social base measure that
attempts to capture the dependence of a party on a social
base as well as the dependence of that social group on the
party over successive elections in different states. This
measure is based on public opinion data from the National
Election Studies by the Center for the Study of Developing
Societies, New Delhi, and will be further explicated in the
Data Analysis section below.
Party organization and politicalentrepreneurs
The analysis of state-level election returns in 1967–2004
shows considerable variation in the effective number of
parties in different Indian states over time. In addition, the
literature reviewed suggests that theories of political insti-
tutions and social cleavages may be insufficient in explain-
ing this variance. What then accounts for this phenomenon?
Aldrich (1995), Cox and McCubbins (2007), Kitschelt
(1994) and Jackson and Moselle (2002) have pointed to the
incentives faced by individual politicians as key to holding
parties together. The argument presented here is similar to
the insight of Kitschelt (1999), namely that new parties
arise from a combination of the demands made by citizens
dissatisfied with existing parties, and from the ambitions of
politicians who have been shut out or demoted by those
parties. The approach in this article, however, is different
from that of Kitschelt in that it uses an organizational rather
than electoral perspective to understand whether a politi-
cian decides to stay with or exit a party. It also links the
effects of the level of party organization to the party system
as a whole rather than to the electoral prospects of a partic-
ular party.
The literature on party organization has tended to empha-
size candidate selection within a party by studying the distri-
bution of power, formal rules and institutional arrangements
governing the selection process (Katz, 1992; Ware, 1996).
Katz (2001: 278) goes so far as to suggest that candidate
selection is ‘one of the central defining functions of a polit-
ical party in a democracy’. Still others, such as Norris
(1993), have focused on the degree of institutionalization
of the selection process, i.e. whether it is formal, through the
use of standardized rules that are observable by all, or infor-
mal, through less explicit forms of decision-making that are
personalized and non-bureaucratic.
Authors have attempted to understand the variations that
arise in candidate selection processes by examining incen-
tives created by political institutions such as electoral sys-
tems (Epstein, 1980; Matthews, 1985) and federalism
(Epstein, 1980; Gallagher and March, 1988). These studies
argue that single-member district systems and federal sys-
tems tend to be decentralized. Lundell (2004) examines the
degree of centralization of candidate selection within par-
ties. Using a dataset of 21 developed countries, he finds that
large parties tend to apply more centralized selection meth-
ods than smaller ones, but he finds no effects of country-
level institutional variables such as electoral systems and
federalism on centralization.
Here we attempt to build on the organizational and insti-
tutional framework suggested by Norris (1993), but expand
it to a range of party activities beyond just candidate
Chhibber et al. 3
at UNIV DE LOS ANDES on January 21, 2015ppq.sagepub.comDownloaded from
selection. In addition, instead of focusing on the origins of
variations in party organization, we focus on how party
organization matters to the party system as a whole.
Organizational theory has long suggested that the struc-
tural factors underlying career development and advance-
ment in an organization have a bearing on an individual’s
decision to stay within or quit an organization (Thompson
et al., 1968). Career advancement in any organization
brings with it both intrinsic and extrinsic rewards, such as
pay, access to power, autonomy, prestige and the opportu-
nity to do more interesting work (Kanter, 1977). Greater
opportunities to access these rewards are likely to discou-
rage members of an organization from quitting (Lefkowitz,
1971). The level of party organization, which determines
the distribution of these career advancement incentives,
therefore becomes critical to the retention of members of
a political party. Party members are more likely to remain
loyal to a party in which career advancement is more
predictable.
Party organization is conceptualized in this article as a
collection of organizational characteristics that provide
clarity to politicians about their role in the organization,
such as the qualifications required to fill certain positions,
the process for upward mobility in the party, the rules of
succession planning, the organization’s tolerance for
intra-party factionalism and, finally, the extent to which
party decisions are taken based on clearly understood insti-
tutional norms as opposed to the whims of leaders. Conse-
quently, similar to the works of Wright (1971) and
Panebianco (1988), a less organized party is conceptualized
as one with an ad hoc, personalistic, leader-centric organi-
zational structure. In such organizations, activists often find
their career advancement prospects blocked by arbitrary
decision-making, nepotistic practices or the whims of a few
leaders at the top. These blocked career paths offer an
incentive to a politician to exit.
There are numerous examples in India of politicians
leaving their party because of blocked career paths. Franda
(1969: 799) notes that those who broke away from the
Communist Party of India (CPI) in 1964 to form the Com-
munist Party of India (Marxist) (CPI(M)), did so because of
the ‘frustration experienced by this lower level of Indian
communist leadership in its attempts to rise within the
movement’. Another example is how the senior Congress
politician N. D. Tiwari left the Congress in 1995 after he
felt that he was being sidelined by the party. He then
formed the All India Indira Congress (Tiwari), which was
named after him. The party contested only one election in
1996, winning four seats in the Lok Sabha. In 2010, Amar
Singh, the ostensible number two in the Samajwadi Party,
left the party once it became clear that the scions of
Mulayam Singh Yadav, the party leader, were next in the
succession line.
There is no reason, however, why blocked career paths
by themselves should lead to the proliferation of political
parties. Whether party activists decide to exit a party or not,
and what they decide to do once they exit, depends on the
alternatives that are available to them. The influence of less
organized parties is therefore not to be found solely in the
blocked career paths of particular politicians, but in the
options these politicians have once they exit a party. In a
less organized party, a member of another party is more
likely to gain lateral entry than in a more organized party.
Why? If a party is less organized, the decision about who
gets access to positions within a party or holds executive
office on behalf of the party is often arbitrary and is fre-
quently made by a leader. In a more organized party, how-
ever, this decision is made by the organization. Lateral
entry to powerful positions is much harder since other party
activists who have been associated with the party for a long
time would resist it, as such a move would have a large
impact on their own career paths.
These incentive structures lead to the expectation that
there will be greater movement by politicians from one
party to another to enhance their career prospects in a party
system where all parties are less organized. This should
lead to changes in the party system, in terms of the effective
number of parties. Exit to another party is likely if lateral
entry is possible. If lateral entry is ruled out, then an indi-
vidual politician who thinks that she has some independent
political standing has an incentive to form her own party.
Given this incentive structure, states where all parties are
less organized are expected to experience a moderate pro-
liferation of parties as politicians move from one party to
the other or start new parties. In states where parties are
more organized and less personalistic, with somewhat
transparent standards and rules for the career advancement
of party activists, there should be greater party loyalty, as
exit would be a less attractive option. At the same time, lat-
eral entry to another party is harder, so in cases where some
parties are organized and some are not, there might actually
be a greater proliferation of parties since defectors have
incentives to form their own parties. In states where all
political parties are more organized, it is expected that pol-
iticians – finding more institutionalized career paths – stay
within their party resulting in a lower effective number of
parties.
Given this logic, we should expect to also find a nega-
tive relationship between electoral volatility and the degree
to which parties are organized, i.e. that we should expect to
see higher volatility where parties are less organized. The
reasons are straightforward. When parties are more orga-
nized, politicians are less likely to switch between parties.
In contrast, in states where none of the parties are orga-
nized, politicians are more likely to move between parties
to further their careers. Why should the movement of pol-
iticians between parties lead to an increase in electoral
volatility? In the NES 2004 data, the respondents were
asked: ‘While voting, what is the most important consider-
ation for you?’ Of the people who responded to the
4 Party Politics
at UNIV DE LOS ANDES on January 21, 2015ppq.sagepub.comDownloaded from
question, 38 percent responded that the candidate was the
most important. Thus, since many voters in India follow
individual politicians, electoral volatility can serve as a
proxy for the movement of politicians between parties,
something that is otherwise hard to measure given the pau-
city of data.
The argument outlined above predicts a negative relation-
ship between electoral volatility and party organization. It
also predicts an inverted U-shaped relationship between the
effective number of parties and the degree to which parties
are organized. There is prima facie evidence for this:
� A typical case of a state with less organized parties is
the state of Haryana in the 1990s. In this case the
effective number of parties ranges between four and
six and electoral volatility ranges from 39 to 45 per-
cent by seats and by 70 to 87 percent by votes.
� West Bengal is a good example of a state with some
organized parties. In the 1990s, West Bengal had a
fairly stable party system with an effective number
of parties around three. The major parties were
CPI(M), BJP and Congress, of which the two former
were more organized parties. When Mamata Bane-
rjee was excluded from Congress in 1997 she
formed her own new party, the Trinamool Congress,
which has been very successful since. The effective
number of parties since then increased to about four
in the 2000 elections, and electoral volatility went up
from 6.4 percent in 1996 to 34.5 percent in 2001.
� The best example of a state where all parties are
organized is Rajasthan in the late 1990s and early
2000s. All major parties in the state are organized
and the effective number of parties by votes is low,
at three, and electoral volatility is also low, varying
between 10 and 15 percent, compared to a national
average of more than 20 percent. The national aver-
age of respondents who said that a ‘candidate’ was
the most important consideration while voting was
38 percent. This number is 10 percentage points
lower in Rajasthan (28 percent). This could indicate
either a greater coordination of voters around parties
rather than candidates, or that candidates tend to stay
within parties rather than move between parties,
both of which are a consequence of parties being
more organized.
Operationalizing party organization
While in general attempts to code party organization have
been limited, we follow in the footsteps of recent works by
scholars such as Fabre (2010) and Thorlakson (2009) and
create a coding scheme for categorizing parties as less or
more organized. Unlike those who examine the allocation
of power across central and regional party organization in
countries with two levels of political representation, we
focus on only the state-level organization of parties. Similar
to these authors, however, we create a multidimensional
measure of organization as described below.
A party was categorized as less organized when there
was no clear succession plan within the party, where party
functionaries’ roles were fluid and election-focused, and
where opportunities for upward mobility were either lim-
ited or prone to the whims of a few leaders. In addition, a
less organized party depended on the charisma of a single
leader and decision-making within the party was referred
to as ad hoc by commentators. In a more organized party,
career decisions for party activists and succession issues
were more transparent and routinized and the party did not
depend only on the personalities of individuals. In addition,
the parties showed organizational continuity that lasted
beyond elections.
To categorize state parties, data were gathered to deter-
mine the organizational structure of all parties in the 15
largest Indian states that gained more than 5 percent of the
vote-share at the state level during the state assembly elec-
tions held between 1967 and 2004, as reported by the Elec-
tion Commission of India. Parties were coded by state and
election year as more, moderately and less organized. More
organized parties were coded as 3, less organized parties as
1 and parties falling in between these two categories as 2.
The coding was based on extensive reading of secondary
sources about Indian party politics from the 1950s to 2004.
While most Indian parties are assumed to have an
unclear organizational structure, we found that party orga-
nization varies substantially across states and over time.
There are some states where parties have a highly routi-
nized party organization. The (CPI(M)) in West Bengal is
one such party. Bhattacharya (2002: 180) describes CPI(M)
as a party with a wide organizational network and stringent
control over party representatives, and in full control of the
selection of candidates. Survey responses from party acti-
vists suggest that the party made efforts to ‘provide promo-
tional opportunities according to certain well-laid
principles and procedures’ (Bhaumik, 1987: 162). The Tel-
ugu Desam Party (TDP) is an example of a less organized
party. The party was founded by a popular actor in the Tel-
ugu film industry, N. T. Rama Rao (NTR), who built the
TDP through his direct appeal to the masses and his themes
of Telugu nationalism. Innaiah (1982: 87) notes that:
Telugu Desam [ . . . ] was created by Mr Rama Rao and
everything rallies around him. He is the beginning and the
end of it. Even during the elections, the party set up some
candidates who were political light-weights but the people
voted for them just because of Mr Rama Rao [ . . . ] The
selection of candidates was made by Mr Rama Rao in con-
sultation with few others. The central office of the party
was located at Ramakrishna Studios [NTR’s movie studio]
till recently [ . . . ] Membership was enrolled in all villages
but elections were not conducted within the party.
Chhibber et al. 5
at UNIV DE LOS ANDES on January 21, 2015ppq.sagepub.comDownloaded from
The quotes about CPI(M) and TDP above illustrate the
type of information that served as the basis for our coding
of parties being more and less organized. To give a few
more examples, the Congress in Bihar in 1967 was coded
as a less organized party, since Pandey (1982: 147)
described it as having a ‘continuously declining organiza-
tional coherence and intensified internal factional strife’.
Similarly, Rudolph (1971: 1125) noted that in Madhya Pra-
desh and Rajasthan the Jan Sangh increased its share of the
vote because of princely and feudal influence rather than a
‘modern’ organization or ideology. Instances of more orga-
nized parties include the Communist party of India in West
Bengal (described above), but also the BJP in Karnataka,
described by Malik and Singh (1992) as possessing ‘an
exceptionally efficient organization’.
The data described above are a first-cut at coding the
level of internal organization of Indian parties at the state
level. The coding relies on the evaluations of political par-
ties by various authors and hence the quality of the coding
depends on the quality of those evaluations. In some cases,
we were unable to find specific references to the organiza-
tion of parties in a particular state in a particular election
year and had to interpolate from the years before and after.
While we would have liked to have had a more specific and
disaggregated coding scheme by each of the factors we
have identified as driving organization, the quality of the
sources did not allow it. Despite these issues, we believe
that the coding is contributing valuable information about
the Indian party system. In order to alleviate some of the
issues we cross-checked the coding with several state
experts in India and with the responses to questions in var-
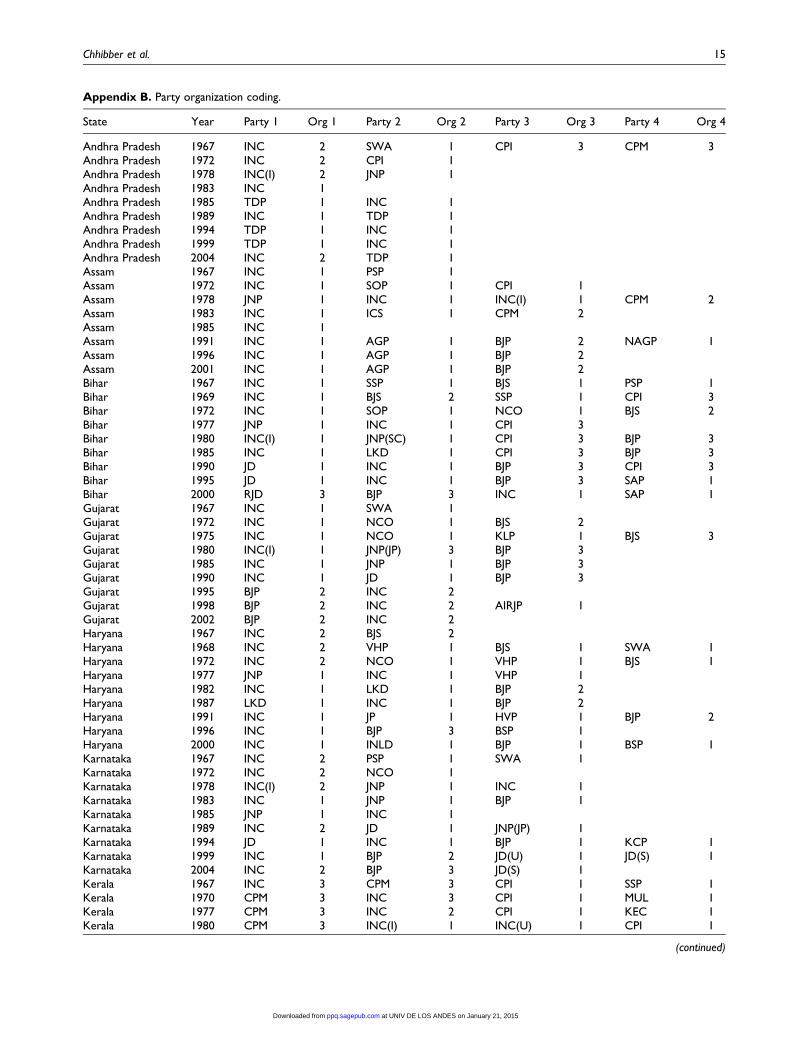
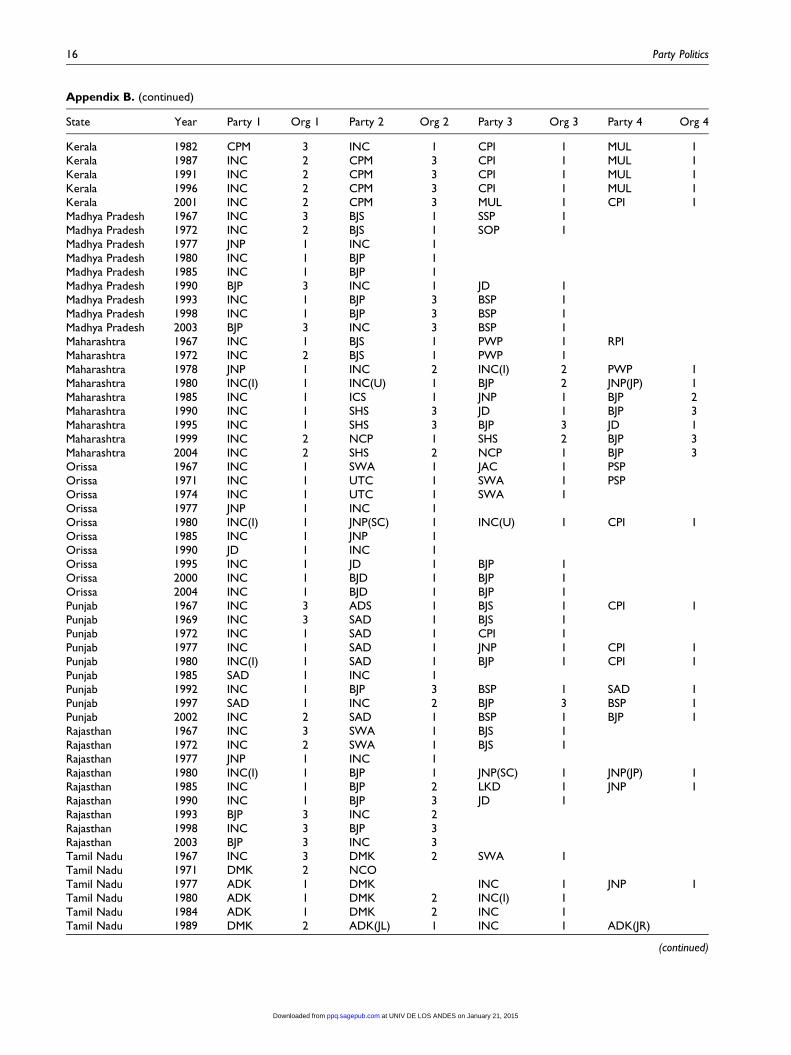
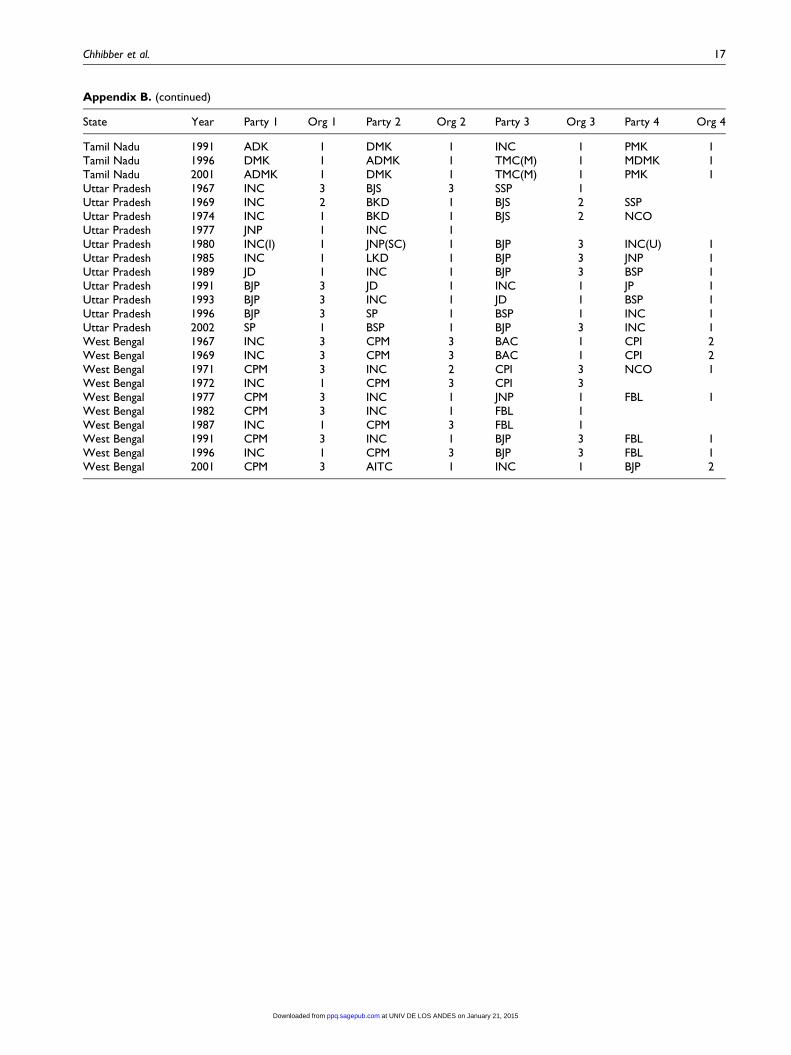
ious political surveys. We have also provided the coding
for the four largest parties in each state election from
1967 to 2004 in Appendix B, and have placed the full data-
set online in order to allow replication with alternative cod-
ing. The data will be available at www.francesca.no/data).
Our coding scheme allows for the same party label to be
coded as more organized in one state and less organized in
another state at the same time. This corresponds well with
the secondary literature on party organization in Indian
states which indicates that the level of party organization
can vary with individual leaders in power at the state level
and their relationship to other political leaders at the state
and national level. For example, the party organization
could easily deteriorate from one election to the next if the
central leadership decided to weaken an ambitious state
level leader. Similarly, the organization of a party might get
weaker if it was boycotted by another factional leader aspir-
ing to oust the current leadership. In short, the organization
of a party at the state level depends on the political aspira-
tions of the local, state level and national leadership and the
interactions between them.
We have also made efforts to ensure the reliability and
replicability of the coding by having each state coded by
two different authors who referred to the same source
materials. In the few cases where there were disagreements
in the coding of a state in an election year, all three authors
discussed and agreed on how to code the specific case. Of
the 138 state-years between 1967 and 2004, 56 percent of
the cases had no organized party, while 27.5 percent had
one organized party and 16 percent had two. The parties
coded as moderately and less organized were pooled
together as less organized, but the results presented in later
sections of the article were robust to the inclusion of the
moderately organized as more organized.
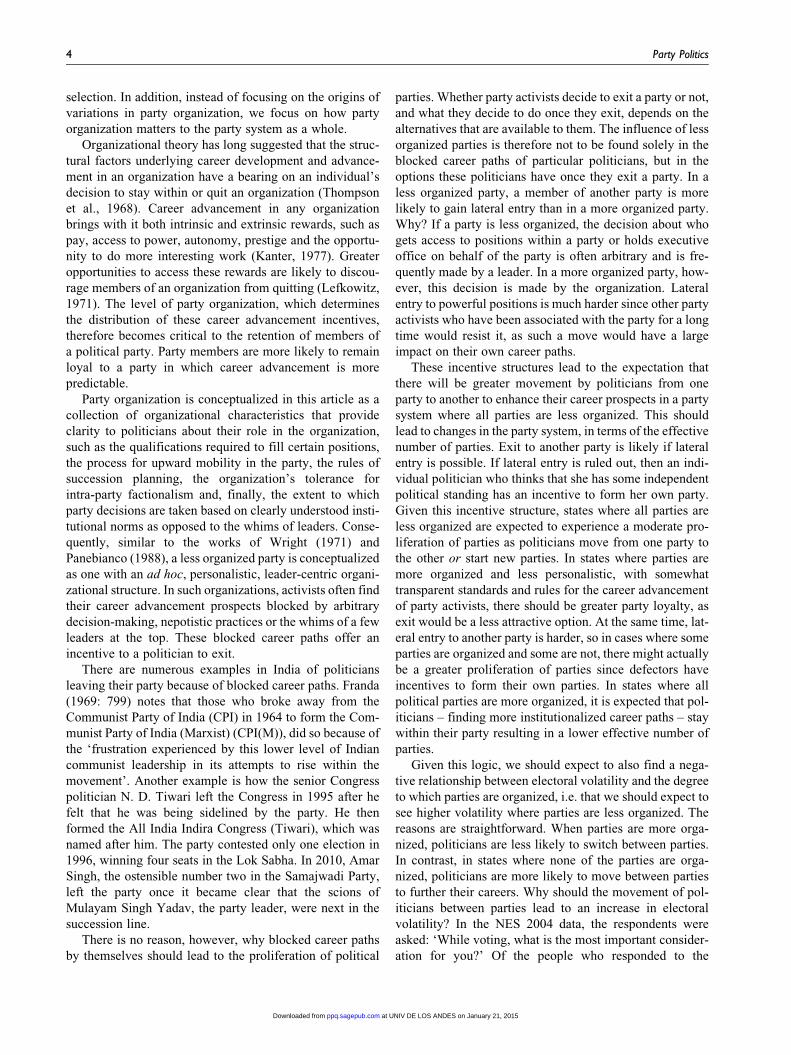
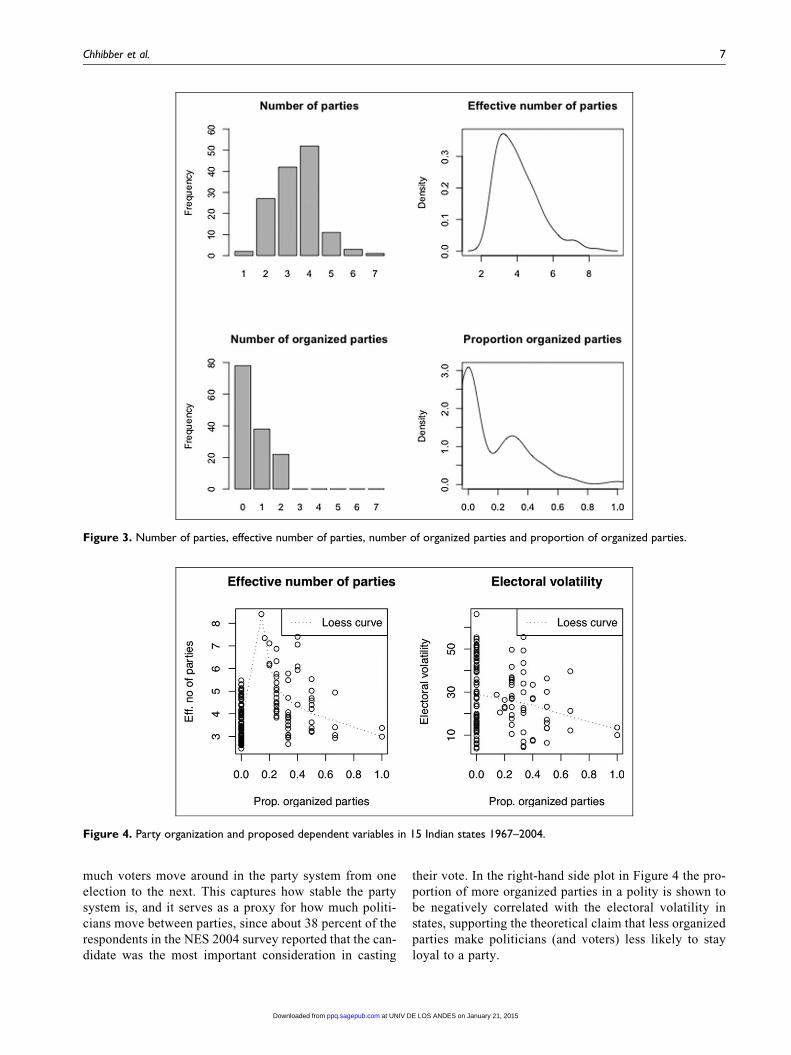
It is not the number of more organized parties but rather
the proportion of such parties in a party system that is the
variable of interest for this study.7 This is because the
dependent variable (effective number of parties) is so
highly correlated with the absolute number of more orga-
nized parties (0.76). The reason for this is fairly obvious:
where there is a low absolute number of parties, we would
expect to see a low absolute number of more organized par-
ties. The absolute number of more organized parties there-
fore might simply reflect the number of parties in a party
system. The proportion of more organized parties comes
closer to capturing our argument: whether the party system
is characterized by more or less organized parties and to what
extent this affects the incentives politicians and voters face in
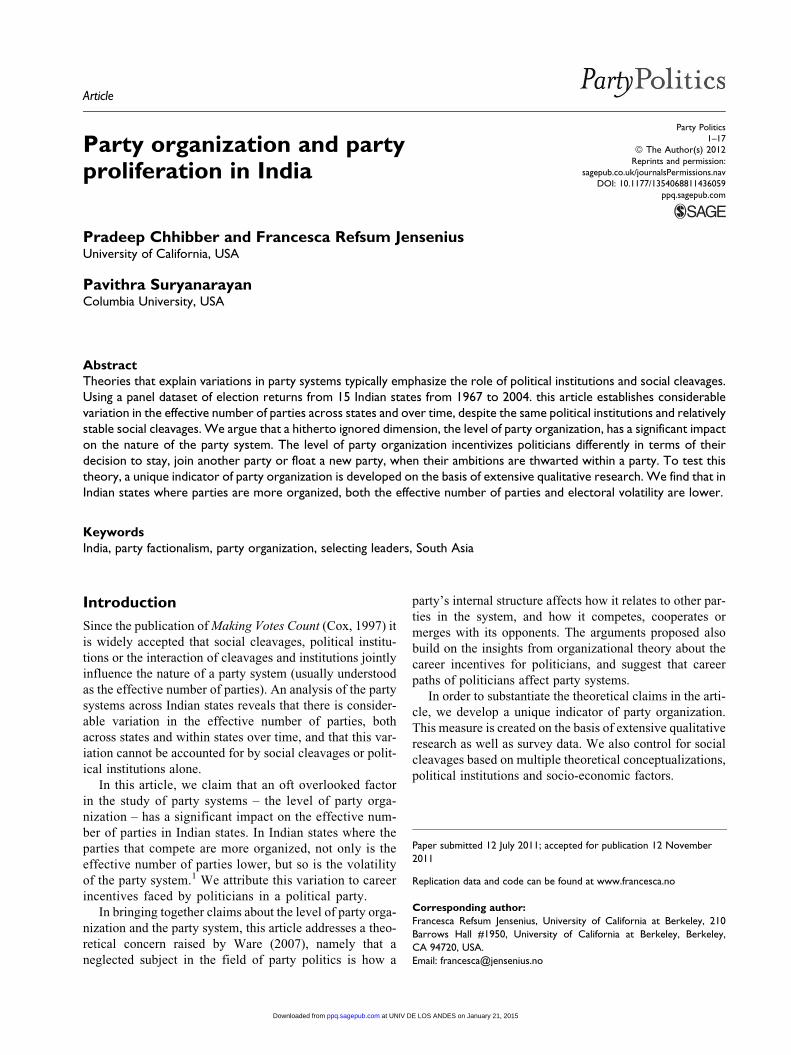
the party system. Figure 3 presents the frequency distribution
of the absolute number of parties gaining more than 5 percent
of the vote in the states in the study, the distribution of the
effective number of parties, the frequency distribution of the
number of organized parties and the distribution of the pro-
portion of more organized parties.8
Data analysis
In order to analyze the relationship between the proportion
of organized parties in a polity and the two outcome vari-
ables of interests – namely the effective number of parties
and party volatility – we merged our data about party orga-
nization with electoral data from the Election Commission
of India. The data covers state level elections in the 15
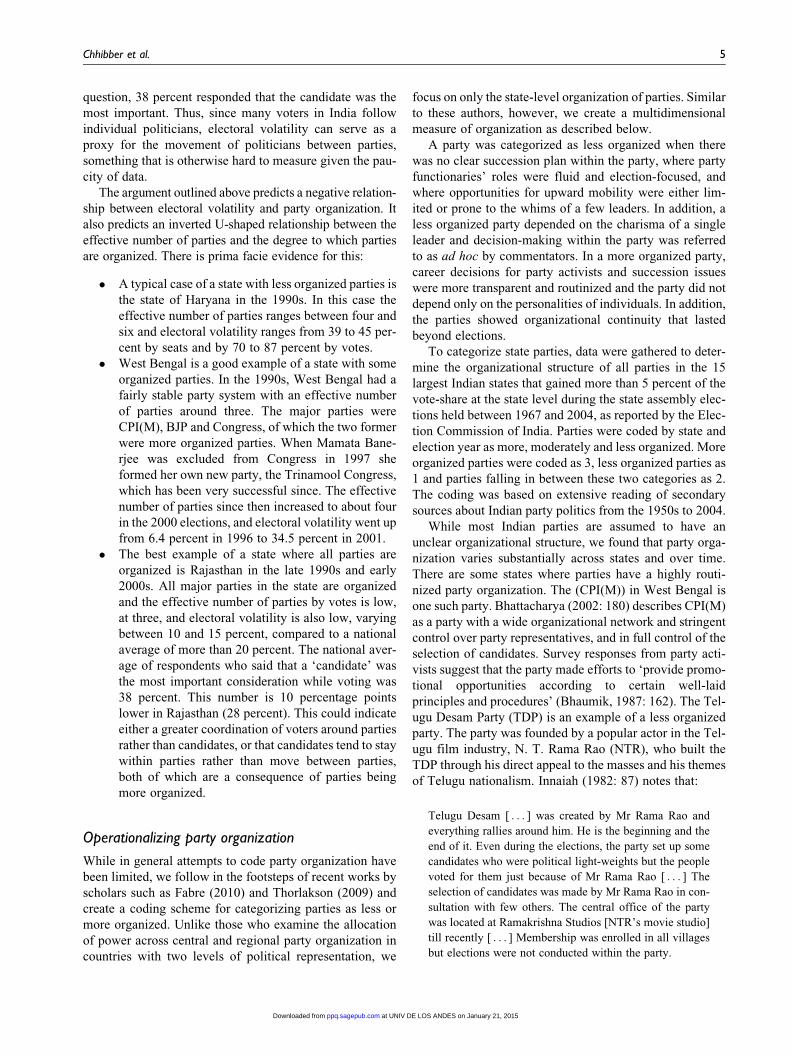
largest states in India from 1967 to 2004. The raw data
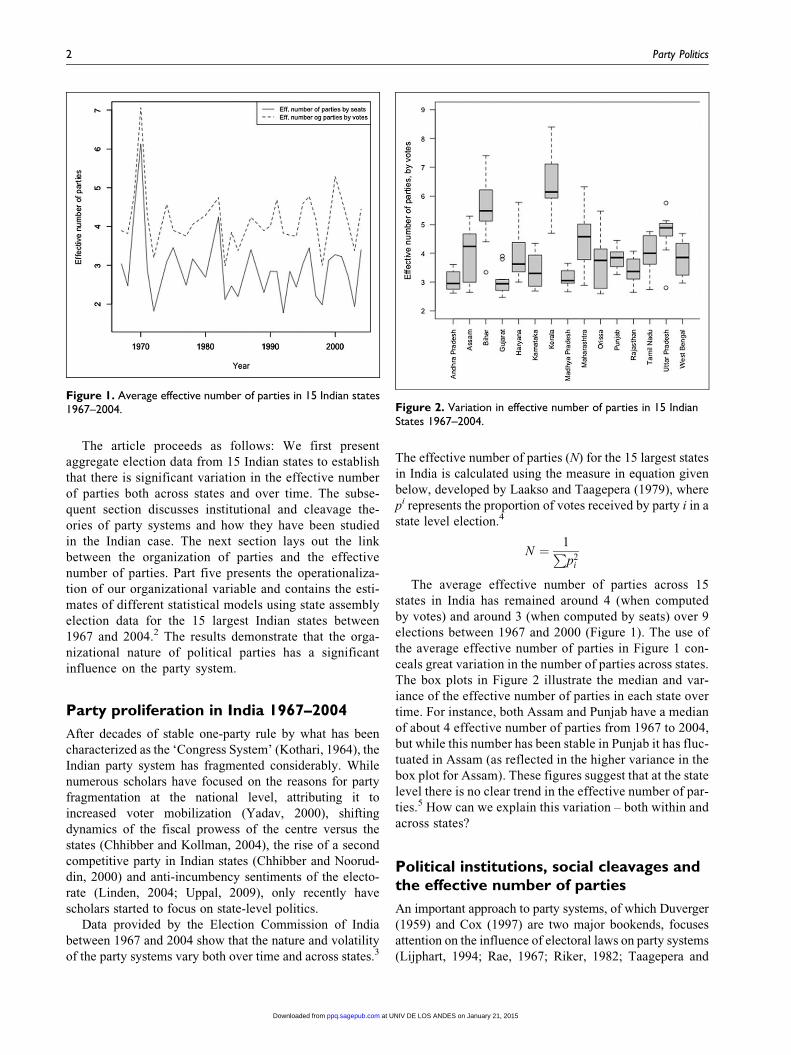
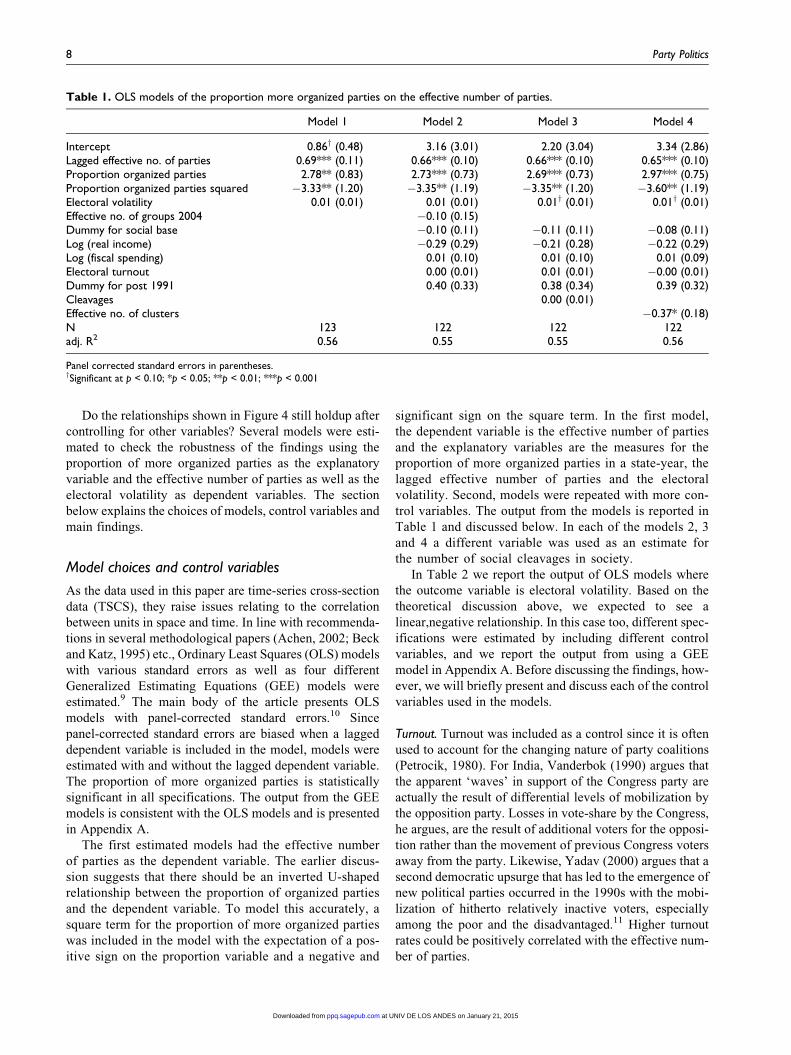
showing the relationships between the proportion orga-
nized parties and the two outcome variables is plotted in
Figure 4. As expected, both the mean and the variance for
the effective number of parties were the lowest when the
proportion of more organized parties in the state was high,
higher when the proportion was low and the highest in a
mixed system. This trend supports the claims laid out ear-
lier in the article, namely that defecting politicians are
more likely to form new parties rather than just join an
existing party when lateral entry into other existing parties
is difficult.
Closely linked to the stability of a party system is its
electoral volatility. While the measure for effective num-
ber of parties captures whether or not new parties are
formed, the measure for electoral volatility captures how
6 Party Politics
at UNIV DE LOS ANDES on January 21, 2015ppq.sagepub.comDownloaded from
much voters move around in the party system from one
election to the next. This captures how stable the party
system is, and it serves as a proxy for how much politi-
cians move between parties, since about 38 percent of the
respondents in the NES 2004 survey reported that the can-
didate was the most important consideration in casting
their vote. In the right-hand side plot in Figure 4 the pro-
portion of more organized parties in a polity is shown to
be negatively correlated with the electoral volatility in
states, supporting the theoretical claim that less organized
parties make politicians (and voters) less likely to stay
loyal to a party.
Figure 3. Number of parties, effective number of parties, number of organized parties and proportion of organized parties.
Figure 4. Party organization and proposed dependent variables in 15 Indian states 1967–2004.
Chhibber et al. 7
at UNIV DE LOS ANDES on January 21, 2015ppq.sagepub.comDownloaded from
Do the relationships shown in Figure 4 still holdup after
controlling for other variables? Several models were esti-
mated to check the robustness of the findings using the
proportion of more organized parties as the explanatory
variable and the effective number of parties as well as the
electoral volatility as dependent variables. The section
below explains the choices of models, control variables and
main findings.
Model choices and control variables
As the data used in this paper are time-series cross-section
data (TSCS), they raise issues relating to the correlation
between units in space and time. In line with recommenda-
tions in several methodological papers (Achen, 2002; Beck
and Katz, 1995) etc., Ordinary Least Squares (OLS) models
with various standard errors as well as four different
Generalized Estimating Equations (GEE) models were
estimated.9 The main body of the article presents OLS
models with panel-corrected standard errors.10 Since
panel-corrected standard errors are biased when a lagged
dependent variable is included in the model, models were
estimated with and without the lagged dependent variable.
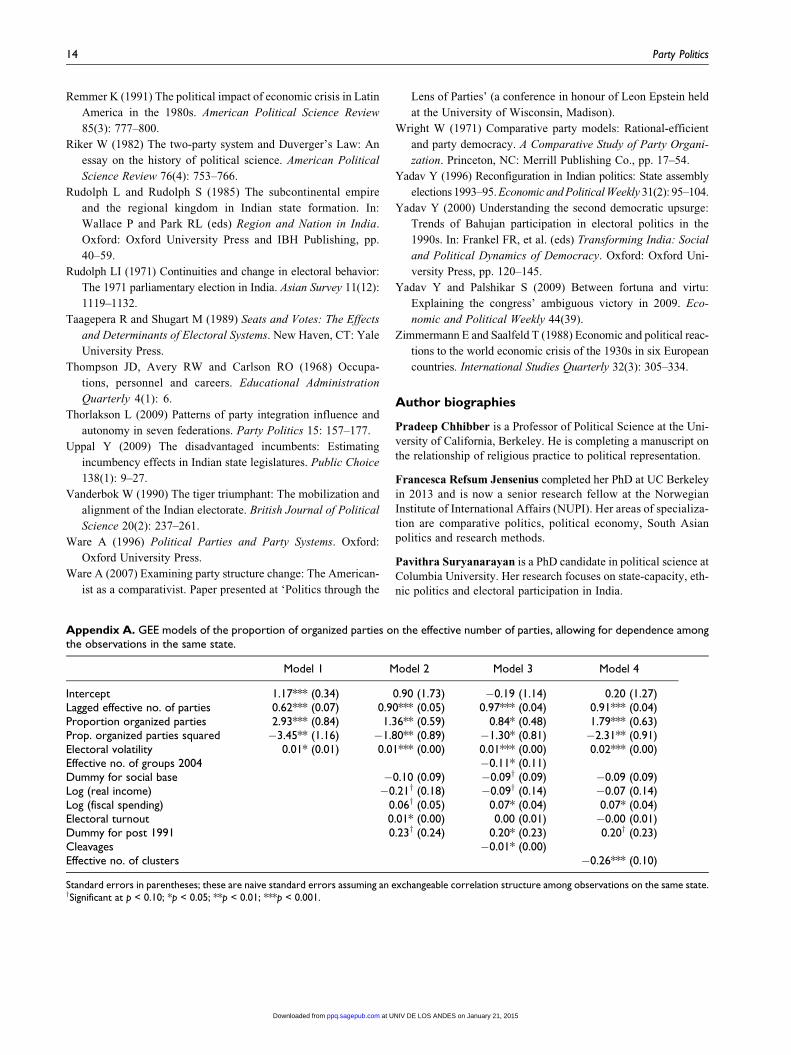
The proportion of more organized parties is statistically
significant in all specifications. The output from the GEE
models is consistent with the OLS models and is presented
in Appendix A.
The first estimated models had the effective number
of parties as the dependent variable. The earlier discus-
sion suggests that there should be an inverted U-shaped
relationship between the proportion of organized parties
and the dependent variable. To model this accurately, a
square term for the proportion of more organized parties
was included in the model with the expectation of a pos-
itive sign on the proportion variable and a negative and
significant sign on the square term. In the first model,
the dependent variable is the effective number of parties
and the explanatory variables are the measures for the
proportion of more organized parties in a state-year, the
lagged effective number of parties and the electoral
volatility. Second, models were repeated with more con-
trol variables. The output from the models is reported in
Table 1 and discussed below. In each of the models 2, 3
and 4 a different variable was used as an estimate for
the number of social cleavages in society.
In Table 2 we report the output of OLS models where
the outcome variable is electoral volatility. Based on the
theoretical discussion above, we expected to see a
linear,negative relationship. In this case too, different spec-
ifications were estimated by including different control
variables, and we report the output from using a GEE
model in Appendix A. Before discussing the findings, how-
ever, we will briefly present and discuss each of the control
variables used in the models.
Turnout. Turnout was included as a control since it is often
used to account for the changing nature of party coalitions
(Petrocik, 1980). For India, Vanderbok (1990) argues that
the apparent ‘waves’ in support of the Congress party are
actually the result of differential levels of mobilization by
the opposition party. Losses in vote-share by the Congress,
he argues, are the result of additional voters for the opposi-
tion rather than the movement of previous Congress voters
away from the party. Likewise, Yadav (2000) argues that a
second democratic upsurge that has led to the emergence of
new political parties occurred in the 1990s with the mobi-
lization of hitherto relatively inactive voters, especially
among the poor and the disadvantaged.11 Higher turnout
rates could be positively correlated with the effective num-
ber of parties.
Table 1. OLS models of the proportion more organized parties on the effective number of parties.
Model 1 Model 2 Model 3 Model 4
Intercept 0.86y (0.48) 3.16 (3.01) 2.20 (3.04) 3.34 (2.86)Lagged effective no. of parties 0.69*** (0.11) 0.66*** (0.10) 0.66*** (0.10) 0.65*** (0.10)Proportion organized parties 2.78** (0.83) 2.73*** (0.73) 2.69*** (0.73) 2.97*** (0.75)Proportion organized parties squared �3.33** (1.20) �3.35** (1.19) �3.35** (1.20) �3.60** (1.19)Electoral volatility 0.01 (0.01) 0.01 (0.01) 0.01y (0.01) 0.01y (0.01)Effective no. of groups 2004 �0.10 (0.15)Dummy for social base �0.10 (0.11) �0.11 (0.11) �0.08 (0.11)Log (real income) �0.29 (0.29) �0.21 (0.28) �0.22 (0.29)Log (fiscal spending) 0.01 (0.10) 0.01 (0.10) 0.01 (0.09)Electoral turnout 0.00 (0.01) 0.01 (0.01) �0.00 (0.01)Dummy for post 1991 0.40 (0.33) 0.38 (0.34) 0.39 (0.32)Cleavages 0.00 (0.01)Effective no. of clusters �0.37* (0.18)N 123 122 122 122adj. R2 0.56 0.55 0.55 0.56
Panel corrected standard errors in parentheses.ySignificant at p < 0.10; *p < 0.05; **p < 0.01; ***p < 0.001
8 Party Politics
at UNIV DE LOS ANDES on January 21, 2015ppq.sagepub.comDownloaded from
Social base. We developed an algorithm to measure the
extent to which a party has a clear social base and applied
it to survey data from six national elections: 1967, 1971,
1979, 1996, 1999 and 2004. The first three were surveys
conducted by the Centre for the Study of Developing Soci-
eties and the latter three part of the National Election Stud-
ies that were pioneered by Lokniti in 1996. For each
election, the party for which a respondent voted in each
of the 15 states was cross-tabulated with their demographic
characteristics. The key groups considered were: Hindu
upper castes; Scheduled Castes; Hindu Other Backward
Castes; Muslims; other religious denominations; Scheduled
Tribes.12
Parties were coded according to the following two indi-
cators of having a clear social base: (1) A party gets more
than 50 percent of votes from a specific group without any
other party getting more than 25 percent of votes from the
same group. This criterion ensures that the party under
consideration is clearly preferred by a particular social
group. (2) A party has a maximum of two support groups,
as defined in (1). This criterion ensures that the party is
indeed preferred by a few caste groups and is not the pre-
ference of many groups in society (which would make it a
catch-all party)
If a party fulfilled both of these criteria, it was classified
as a cleavage-based party; otherwise it was categorized as a
catch-all party. The social base data for the missing years
were supplemented by extended readings on Indian politics,
as described earlier in the article. Where data points were
missing, values were interpolated in cases where the coding
seemed to be the same before and after the time of the miss-
ing value.
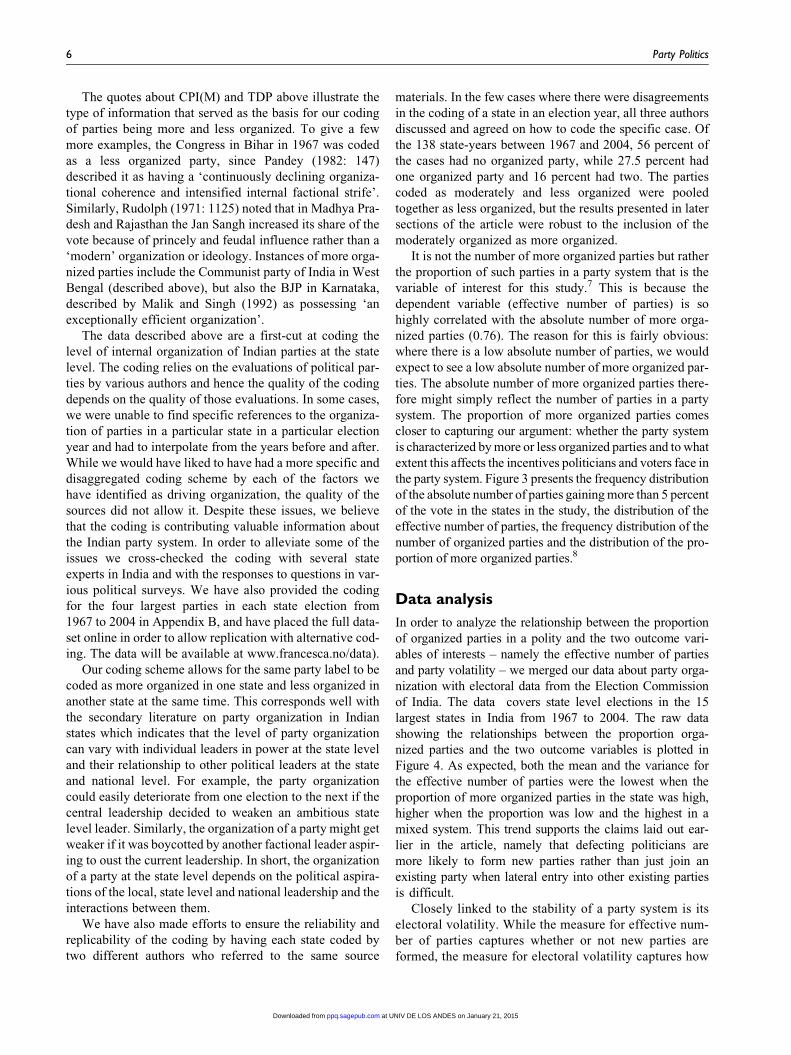
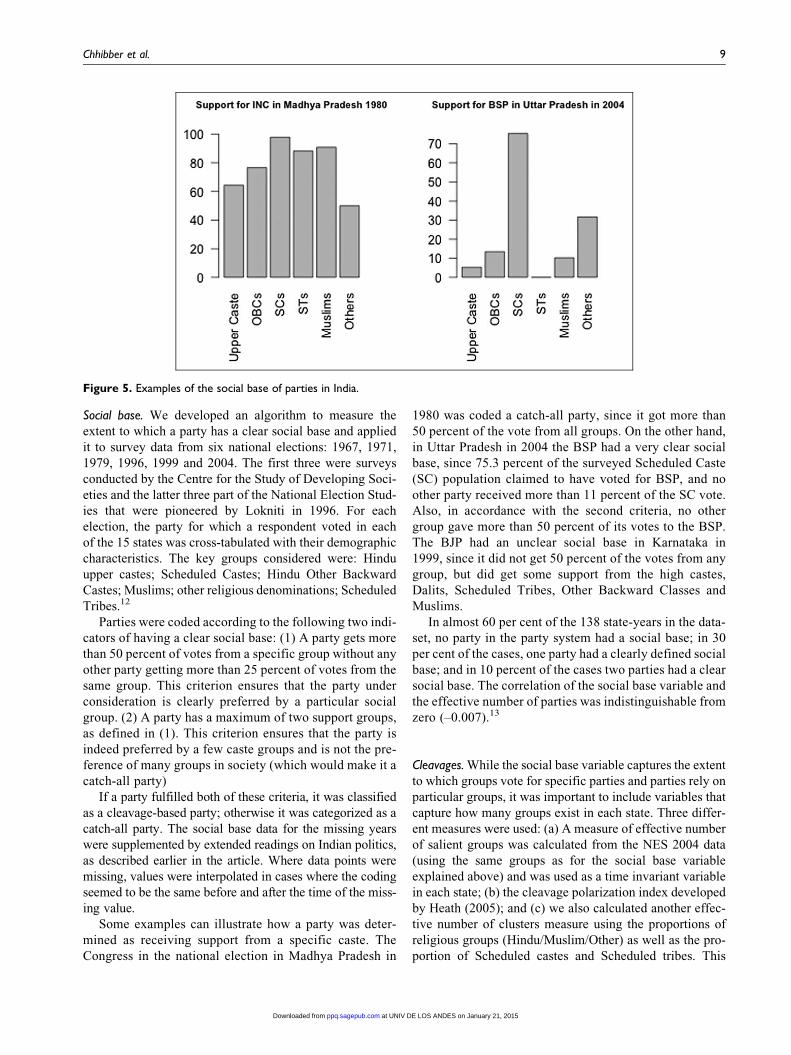
Some examples can illustrate how a party was deter-
mined as receiving support from a specific caste. The
Congress in the national election in Madhya Pradesh in
1980 was coded a catch-all party, since it got more than
50 percent of the vote from all groups. On the other hand,
in Uttar Pradesh in 2004 the BSP had a very clear social
base, since 75.3 percent of the surveyed Scheduled Caste
(SC) population claimed to have voted for BSP, and no
other party received more than 11 percent of the SC vote.
Also, in accordance with the second criteria, no other
group gave more than 50 percent of its votes to the BSP.
The BJP had an unclear social base in Karnataka in
1999, since it did not get 50 percent of the votes from any
group, but did get some support from the high castes,
Dalits, Scheduled Tribes, Other Backward Classes and
Muslims.
In almost 60 per cent of the 138 state-years in the data-
set, no party in the party system had a social base; in 30
per cent of the cases, one party had a clearly defined social
base; and in 10 percent of the cases two parties had a clear
social base. The correlation of the social base variable and
the effective number of parties was indistinguishable from
zero (–0.007).13
Cleavages. While the social base variable captures the extent
to which groups vote for specific parties and parties rely on
particular groups, it was important to include variables that
capture how many groups exist in each state. Three differ-
ent measures were used: (a) A measure of effective number
of salient groups was calculated from the NES 2004 data
(using the same groups as for the social base variable
explained above) and was used as a time invariant variable
in each state; (b) the cleavage polarization index developed
by Heath (2005); and (c) we also calculated another effec-
tive number of clusters measure using the proportions of
religious groups (Hindu/Muslim/Other) as well as the pro-
portion of Scheduled castes and Scheduled tribes. This
Figure 5. Examples of the social base of parties in India.
Chhibber et al. 9
at UNIV DE LOS ANDES on January 21, 2015ppq.sagepub.comDownloaded from
measure was based on data collected by Steven Wilkinson
and Yogendra Yadav.14
Economic variables. The study of economic voting has a
rich pedigree, and there is robust evidence for the claim
that economic factors shape voters’ decisions. The eco-
nomic performance of the state can particularly affect
the number of parties if a bad economic situation makes
voters switch loyalty and support another party.
Research on questions about how income affects voting
behaviour has primarily focused on the impact of eco-
nomic crisis on political stability. Zimmermann and
Saalfeld (1988) find that the economic crisis of the
1930s had powerful political effects in Europe, but that
the extent to which it undermined the political stability
of the state was conditioned by the success of national
consensus formation at the elite level. Bohrer and Tan
(2000) argues that ‘austerity’ plans enacted by European
states to bring their economies into compliance with the
European Monetary Union (EMU) requirements caused
voters to support parties of the Left in greater numbers
than before. In the Latin American context, Remmer
(1991: 781) finds that ‘elections held under conditions
of economic crisis [ . . . ] consistently produced losses for
governing parties’ and ‘in the overwhelming majority of
cases, [these] elections resulted in the defeat of the gov-
erning party or coalition’. As an indicator of the incum-
bent government’s performance, the average annual
growth rate of per capita state income since the previous
election was included as a control.15 Such growth is
expected to reduce party proliferation.16
Time. In India, the post-1990 period differs systematically
from the earlier time period for three reasons. First, Yadav
(1996) argues that mobilization of lower-caste voters has
increased substantially in the 1990s, which should lead to
higher party proliferation according to the mobilization
hypothesis. Second, as noted earlier, the voting age was
lowered from 21 to 18 in 1989. If this change had an effect
on party proliferation independently of the effect it had via
changes in turnout, then it should show up in this time
trend. Third, India’s economy was liberalized in 1991 and
has been growing rapidly since. To account for these poten-
tial differences, a dummy variable for the post-1991 period
was included.
Findings
As can be seen in Table 1, the coefficient for the proportion
of organized parties is a statistically significant predictor of
the effective number of parties across 15 Indian states
1967-2004 and this holds across all the model specifica-
tions. There is a negative and statistically significant rela-
tionship between effective number of clusters in a state
and the effective number of parties, while none of the other
control variables are statistically significant.
Other studies of the effective number of parties at the
state level in India sometimes get significant findings using
similar data, and so do we when calculating naı̈ve or robust
standard errors. However, when calculating naı̈ve stan-
dard errors, observations are assumed to be independent
of each other. This is not the case in these data, since the
observations in the same year and from the same state are
highly correlated with each other. Using panel-corrected
standard errors, which take into account the dependence
of the observations and therefore are much larger than
both naı̈ve and robust standard errors, show fewer vari-
ables are statistically significant in the models.
The proportion of more organized parties has a posi-
tive coefficient, while there is a negative coefficient for
the square term. This suggests that there indeed is an inverted
Table 2. OLS models of the proportion of more organized parties on electoral volatility.
Model 1 Model 2 Model 3 Model 4
Intercept 25.53*** (6.11) 113.50* (51.60) 123.99** (45.46) 111.59* (46.04)Lagged electoral volatility 0.15 (0.19) 0.06 (0.17) 0.06 (0.18) 0.06 (0.17)Proportion organized parties �13.12* (6.33) �11.50* (5.03) �10.70y (5.78) �11.94* (5.54)Effective no. of parties 1.19 (1.39)Effective no. of groups 2004 �0.34 (4.72)Dummy for social base �0.92 (2.10) �1.11 (2.03) �1.47 (1.98)Log (real income) �5.38 (5.31) �6.34 (4.84) �6.22 (4.50)Log (fiscal spending) �2.53 (1.97) �2.58 (1.83) �2.59 (1.90)Electoral turnout �0.21 (0.15) �0.19 (0.14) �0.13 (0.17)Dummy for post 1991 0.67 (5.01) 1.68 (4.94) 1.61 (5.02)Cleavages �0.01 (0.17)Effective no. of clusters 4.11 (4.02)N 108 108 108 108adj. R2 0.05 0.13 0.13 0.14
Panel corrected standard errors in parentheses.ySignificant at p < 0.10; *p < 0.05; **p < 0.01; ***p < 0.001.
10 Party Politics
at UNIV DE LOS ANDES on January 21, 2015ppq.sagepub.comDownloaded from
U-shaped relationship between the proportion of more orga-
nized parties and the effective number of parties in a party sys-
tem. Table 1 provides evidence that where all parties are more
organized there is a lower effective number of parties than
where all parties are less organized, but that in mixed systems
the effective number of parties can go even higher.
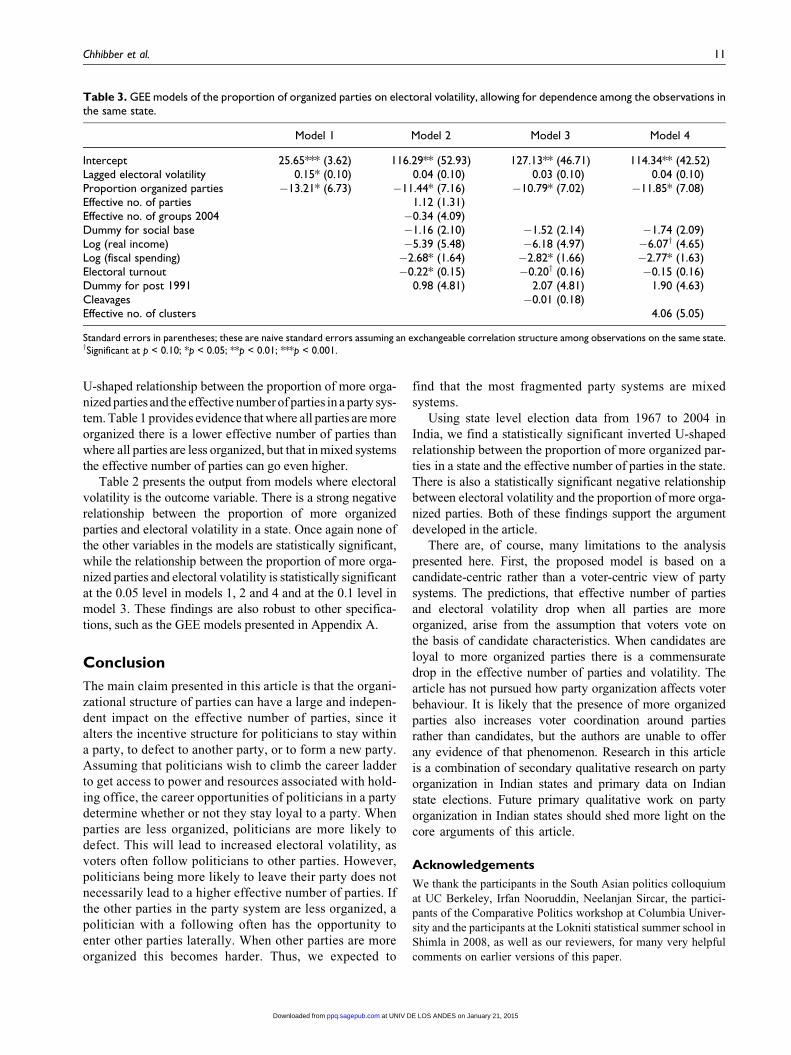
Table 2 presents the output from models where electoral
volatility is the outcome variable. There is a strong negative
relationship between the proportion of more organized
parties and electoral volatility in a state. Once again none of
the other variables in the models are statistically significant,
while the relationship between the proportion of more orga-
nized parties and electoral volatility is statistically significant
at the 0.05 level in models 1, 2 and 4 and at the 0.1 level in
model 3. These findings are also robust to other specifica-
tions, such as the GEE models presented in Appendix A.
Conclusion
The main claim presented in this article is that the organi-
zational structure of parties can have a large and indepen-
dent impact on the effective number of parties, since it
alters the incentive structure for politicians to stay within
a party, to defect to another party, or to form a new party.
Assuming that politicians wish to climb the career ladder
to get access to power and resources associated with hold-
ing office, the career opportunities of politicians in a party
determine whether or not they stay loyal to a party. When
parties are less organized, politicians are more likely to
defect. This will lead to increased electoral volatility, as
voters often follow politicians to other parties. However,
politicians being more likely to leave their party does not
necessarily lead to a higher effective number of parties. If
the other parties in the party system are less organized, a
politician with a following often has the opportunity to
enter other parties laterally. When other parties are more
organized this becomes harder. Thus, we expected to
find that the most fragmented party systems are mixed
systems.
Using state level election data from 1967 to 2004 in
India, we find a statistically significant inverted U-shaped
relationship between the proportion of more organized par-
ties in a state and the effective number of parties in the state.
There is also a statistically significant negative relationship
between electoral volatility and the proportion of more orga-
nized parties. Both of these findings support the argument
developed in the article.
There are, of course, many limitations to the analysis
presented here. First, the proposed model is based on a
candidate-centric rather than a voter-centric view of party
systems. The predictions, that effective number of parties
and electoral volatility drop when all parties are more
organized, arise from the assumption that voters vote on
the basis of candidate characteristics. When candidates are
loyal to more organized parties there is a commensurate
drop in the effective number of parties and volatility. The
article has not pursued how party organization affects voter
behaviour. It is likely that the presence of more organized
parties also increases voter coordination around parties
rather than candidates, but the authors are unable to offer
any evidence of that phenomenon. Research in this article
is a combination of secondary qualitative research on party
organization in Indian states and primary data on Indian
state elections. Future primary qualitative work on party
organization in Indian states should shed more light on the
core arguments of this article.
Acknowledgements
We thank the participants in the South Asian politics colloquium
at UC Berkeley, Irfan Nooruddin, Neelanjan Sircar, the partici-
pants of the Comparative Politics workshop at Columbia Univer-
sity and the participants at the Lokniti statistical summer school in
Shimla in 2008, as well as our reviewers, for many very helpful
comments on earlier versions of this paper.
Table 3. GEE models of the proportion of organized parties on electoral volatility, allowing for dependence among the observations inthe same state.
Model 1 Model 2 Model 3 Model 4
Intercept 25.65*** (3.62) 116.29** (52.93) 127.13** (46.71) 114.34** (42.52)Lagged electoral volatility 0.15* (0.10) 0.04 (0.10) 0.03 (0.10) 0.04 (0.10)Proportion organized parties �13.21* (6.73) �11.44* (7.16) �10.79* (7.02) �11.85* (7.08)Effective no. of parties 1.12 (1.31)Effective no. of groups 2004 �0.34 (4.09)Dummy for social base �1.16 (2.10) �1.52 (2.14) �1.74 (2.09)Log (real income) �5.39 (5.48) �6.18 (4.97) �6.07y (4.65)Log (fiscal spending) �2.68* (1.64) �2.82* (1.66) �2.77* (1.63)Electoral turnout �0.22* (0.15) �0.20y (0.16) �0.15 (0.16)Dummy for post 1991 0.98 (4.81) 2.07 (4.81) 1.90 (4.63)Cleavages �0.01 (0.18)Effective no. of clusters 4.06 (5.05)
Standard errors in parentheses; these are naive standard errors assuming an exchangeable correlation structure among observations on the same state.ySignificant at p < 0.10; *p < 0.05; **p < 0.01; ***p < 0.001.
Chhibber et al. 11
at UNIV DE LOS ANDES on January 21, 2015ppq.sagepub.comDownloaded from
Funding
This research received no specific grant from any funding agency
in the public, commercial or not-for-profit sectors.
Notes
1. See Nooruddin and Chhibber (2008) for a discussion of elec-
toral volatility in India.
2. The data were created in 2000 and therefore do not include
Jharkhand, Uttarakhand or Chhattisgarh in the sample.
3. Why the focus on state level politics? Contemporary Indian
elections have seen the emergence of the ‘state as the princi-
pal arena of political choice’ (Yadav and Palshikar, 2009:
401). Furthermore, it is argued that even the substance of
national elections ‘is defined through the filters of state-
level issues’ and ‘political preferences at the national level
derive from primary loyalties in the arena of state politics’
(p. 402).
4. We choose to focus on the effective number of parties
because we believe this is the measure that best captures com-
petition in Indian politics. An alternative would be to look at
the number of parties. Since there are many candidates in
India who run for election even though they have no chance
of getting a large vote-share, this gives a faulty perception of
party competition. Another common measure is the margin of
victory. However, since the realistic competition usually
takes place between three or four parties at both the constitu-
ency and state level, this does not capture dynamics in the
party systems.
5. There is also important regional variation within states, as
argued by, among others, Kumar (2011). Looking at varia-
tions in the regions within states is beyond the scope of this
paper, although we believe that our argument would apply
to the sub-state level and hope that this can explored in future
work.
6. Could the variance be explained by the uneven nature of the
application of institutional rules, as has been argued in several
Latin American countries (Greene, 2007; Levitsky and Mur-
illo, 2005; Magaloni, 2006). In India, the Election Commis-
sion and the government put enormous effort into ensuring
that elections are held as freely and fairly as possible across
the entire country. There were indeed election irregularities
in the past but they have become less frequent as the Election
Commission has become more forceful in ensuring compli-
ance with election laws (Kapur and Mehta, 2006).
7. The proportion of organized parties is calculated as the num-
ber of organized parties in our dataset divided by the number
of parties with more than 5 percent of the vote-share in the
state in each state election.
8. Something interesting to note is that several new parties,
which are created by politicians defecting from existing,
weak parties, end up relying on similarly weak organizational
structures. We believe this has to do with the defecting poli-
ticians wanting to keep power in their own hands since they
failed to get power in the party they left behind.
9. GEE models were used to try to correct for the fact that obser-
vations on the same state are correlated. The GEE package in
R with an exchangeable correlations structure was used
(Liang and Zeger, 1986: 13–22).
10. In order to calculate the panel-corrected standard errors, we
used the R-package pcse, written by Delia Bailey and
Jonathan N. Katz.
11. The voting age in India was lowered from 21 to 18 in 1989.
While this change did add to the electoral rolls, there is no
evidence that it changed the rates of turnout or the composi-
tion of the electorate in any systematic manner. Indeed, to the
extent that existing theories argue that younger voters are
more fluid, a plausible expectation would be that the change
in voting age should have led to increased volatility post-
1989. However, our data suggest that the opposite is true.
12. The data were also coded separately using rural–urban as well
as class categories, but no clear patterns were found.
13. We hope this algorithm seems convincing to those who have
argued that different proportions of jatis could lead to differ-
ent measures of effective number of groups than when using
caste categories.
14. We thank Oliver Heath, Steven Wilkinson and Yogendra
Yadav for making their data and measures available to us.
15. Data on income refer to per capita net state domestic product
(NSDP) at current prices, which we convert to real figures
using national-level inflation data. The source for these data
is the Indian Budget, available online at: http://indiabudget.
nic.in.
16. A possible concern arises in controlling for these economic
variables since they are likely to be correlated with a state’s
fiscal space. In our sample, a state’s growth rate is correlated
with fiscal space as a percentage of total revenue at a level of
0.25. When the measure of fiscal space is not normalized, the
correlation increases to 0.38. Likewise, the correlation of per
capita income with the two measures of fiscal space is 0.44
and 0.57, respectively. There is therefore little risk of multi-
collinearity being a problem, and this is borne out by the var-
iance inflation factors.
References
Achen C (2002) Toward a new political methodology: Microfoun-
dations and ART. Annual Review of Political Science 5(1):
423–450.
Aldrich J (1995) Why Parties?: The Origin and Transformation of
Political Parties in America. Chicago, IL: University of Chi-
cago Press.
Beck N and Katz J (1995) What to do (and not to do) with time-
series cross-section data. American Political Science Review,
pp. 634–647.
Bhattacharya M (2002) Panchayati Raj in West Bengal: Demo-
cratic De-centralisation Or Democratic Centralism. New
Delhi: Manak Publications.
Bhaumik DJ (1987) Political Movements in India: A Study of the
United Front Experiment in West Bengal. New Delhi: Anmol
Publications.
12 Party Politics
at UNIV DE LOS ANDES on January 21, 2015ppq.sagepub.comDownloaded from
Bohrer R and Tan A (2000) Left turn in Europe? Reactions to aus-
terity and the EMU. Political Research Quarterly 53(3): 575.
Brass P (1981) Class ethnic group and party in Indian politics.
World Politics: A Quarterly Journal of International Relations
33(3): 449–467.
Brass PR (1965) Factional Politics in an Indian State: The Con-
gress Party in Uttar Pradesh. Berkeley, CA: University of
California Press.
Chandra K and Wilkinson S (2008) Measuring the effect of
‘ethnicity’. Comparative Political Studies 41(4/5): 515.
Chhibber P and Kollman K (2004) The Formation of National
Party Systems; Federalism and Party Competition in Canada
Great Britain India and the United States. Princeton, NJ: Prin-
ceton University Press.
Chhibber P and Nooruddin I (2000) Party competition and frag-
mentation in Indian national elections: 1957–1998. In: Wallace
P and Ray R (eds) Indian Politics and the 1998 Elections:
Regionalism Hindutva and State Politics. New Delhi: Sage,
pp. 36–54.
Cox GW (1997) Making Votes Count: Strategic Coordination in the
World’s Electoral Systems. Political Economy of Institutions and
Decisions. Cambridge and New York: Cambridge University
Press.
Cox GW and McCubbins MD (2007) Legislative Leviathan:
Party Government in the House. Cambridge: Cambridge Uni-
versity Press.
Duverger M (1959) Political Parties. Their Organization and
Activity in the Modern State. Chichester: Wiley.
Epstein L (1980) Political Parties in Western Democracies. New
Brunswick, NJ: Transaction Books.
Fabre E (2010) Measuring party organization: The vertical dimen-
sion of the multi-level organization of state-wide parties in
Spain and the UK. Party Politics 17(3): 343–363.
Franda MF (1969) India’s third communist party. Asian Survey
9(11): 797–817.
Gallagher M and March M (1988) Candidate Selection in Compara-
tive Perspective: The Secret Garden of Politics. London: Sage.
Greene K (2007) Why Dominant Parties Lose: Mexico’s Demo-
cratization in Comparative Perspective. Cambridge: Cam-
bridge University Press.
Heath O (2005) Party systems, political cleavages and electoral
volatility in India: A state-wise analysis 1998–1999. Electoral
Studies 24(2): 177–199.
Innaiah N (1982) The Birth and Death of Political Parties in
India. Innaiah: Sole distributor Booklinks Corp Hyderabad.
Jackson M and Moselle B (2002) Coalition and party formation in a
legislative voting game. Journal of Economic Theory 103(1):
49–87.
Jaffrelot C (2005) The Sangh Parivar: A Reader. Oxford: Oxford
University Press.
Kanter RM (1977) Men and women of the organization. New
York: Basic Books.
Kapur D and Mehta P (2006) The Indian Parliament as an Insti-
tution of Accountability. UNRISD.
Katz R (1992) Party Organizations: A Data Handbook on Party
Organizations in Western Democracies 1960–90. London:
Sage.
Katz RS (2001) The problem of candidate selection and models of
party democracy. Party 7: 277–296.
Kitschelt H (1994) The Transformation of European Social
Democracy. Cambridge: Cambridge University Press.
Kitschelt H (1999) Continuity and Change in Contemporary
Capitalism. Cambridge: Cambridge University Press.
Kothari R (1964) The Congress ‘System’ in India. Asian Survey
4(12): 1161–1173.
Kumar A (ed.) (2011) Rethinking State Politics in India. Regions
within Regions. London: Routledge.
Laakso M and Taagepera R (1979) Effective number of parties: A
measure with application to West Europe. Comparative Polit-
ical Studies 12(1): 3–27.
Lefkowitz J (1971) Personnel turnover. Progress in Clinical Psy-
chology, pp. 69–90.
Levitsky S and Murillo M (2005) Argentine Democracy: The Pol-
itics of Institutional Weakness. Philadelphia, PA: Pennsylvania
State University Press.
Liang K and Zeger S (1986) Longitudinal data analysis using gen-
eralized linear models. Biometrika 73(1): 13.
Lijphart A (1994) Electoral Systems and Party Systems: A Study
of Twenty-seven Democracies 1945–1990. Oxford: Oxford
University Press.
Linden L (2004) Are incumbents really advantaged? The prefer-
ences for non-incumbents in Indian national elections. Unpub-
lished manuscript. Columbia University.
Lundell K (2004) Determinants of candidate selection. Party Pol-
itics 10(1): 25–47.
Magaloni B (2006) Voting for Autocracy: Hegemonic Party Survival
and its Demise in Mexico. Cambridge: Cambridge University
Press.
Malik YK and Singh VB (1992) Bharatiya janata party: An alter-
native to the congress (i)? Asian Survey 32(4): 318–336.
Matthews DR (1985) Legislative recruitment and legislative
careers. In: Patterson SC and Jewell M (eds) Handbook of
Legislative Research. Cambridge, MA: Harvard University
Press.
Nooruddin I and Chhibber P (2008) Unstable politics: Electoral
volatility in the Indian states. Comparative Political Studies
41(8 August): 1069–1081.
Norris P (1993) Conclusions: Comparing legislative recruitment.
In: Lovenduski J and Norris P (eds) Gender and Party Politics.
London: Sage.
Pandey J (1982) State Politics in India: A Study in Coalition Pol-
itics in an Indian State. New Delhi: Uppal Publishing House.
Panebianco A (1988) Political Parties: Organization and Power.
Cambridge: Cambridge University Press.
Petrocik J (1980) Contextual Sources of Voting Behavior. The
Electorate Reconsidered. Beverly Hills, CA: Sage.
Rae D (1967) The Political Consequences of Electoral Laws. New
Haven, CT: Yale University Press.
Chhibber et al. 13
at UNIV DE LOS ANDES on January 21, 2015ppq.sagepub.comDownloaded from
Remmer K (1991) The political impact of economic crisis in Latin
America in the 1980s. American Political Science Review
85(3): 777–800.
Riker W (1982) The two-party system and Duverger’s Law: An
essay on the history of political science. American Political
Science Review 76(4): 753–766.
Rudolph L and Rudolph S (1985) The subcontinental empire
and the regional kingdom in Indian state formation. In:
Wallace P and Park RL (eds) Region and Nation in India.
Oxford: Oxford University Press and IBH Publishing, pp.
40–59.
Rudolph LI (1971) Continuities and change in electoral behavior:
The 1971 parliamentary election in India. Asian Survey 11(12):
1119–1132.
Taagepera R and Shugart M (1989) Seats and Votes: The Effects
and Determinants of Electoral Systems. New Haven, CT: Yale
University Press.
Thompson JD, Avery RW and Carlson RO (1968) Occupa-
tions, personnel and careers. Educational Administration
Quarterly 4(1): 6.
Thorlakson L (2009) Patterns of party integration influence and
autonomy in seven federations. Party Politics 15: 157–177.
Uppal Y (2009) The disadvantaged incumbents: Estimating
incumbency effects in Indian state legislatures. Public Choice
138(1): 9–27.
Vanderbok W (1990) The tiger triumphant: The mobilization and
alignment of the Indian electorate. British Journal of Political
Science 20(2): 237–261.
Ware A (1996) Political Parties and Party Systems. Oxford:
Oxford University Press.
Ware A (2007) Examining party structure change: The American-
ist as a comparativist. Paper presented at ‘Politics through the
Lens of Parties’ (a conference in honour of Leon Epstein held
at the University of Wisconsin, Madison).
Wright W (1971) Comparative party models: Rational-efficient
and party democracy. A Comparative Study of Party Organi-
zation. Princeton, NC: Merrill Publishing Co., pp. 17–54.
Yadav Y (1996) Reconfiguration in Indian politics: State assembly
elections 1993–95. Economic and Political Weekly 31(2): 95–104.
Yadav Y (2000) Understanding the second democratic upsurge:
Trends of Bahujan participation in electoral politics in the
1990s. In: Frankel FR, et al. (eds) Transforming India: Social
and Political Dynamics of Democracy. Oxford: Oxford Uni-
versity Press, pp. 120–145.
Yadav Y and Palshikar S (2009) Between fortuna and virtu:
Explaining the congress’ ambiguous victory in 2009. Eco-
nomic and Political Weekly 44(39).
Zimmermann E and Saalfeld T (1988) Economic and political reac-
tions to the world economic crisis of the 1930s in six European
countries. International Studies Quarterly 32(3): 305–334.
Author biographies
Pradeep Chhibber is a Professor of Political Science at the Uni-
versity of California, Berkeley. He is completing a manuscript on
the relationship of religious practice to political representation.
Francesca Refsum Jensenius completed her PhD at UC Berkeley
in 2013 and is now a senior research fellow at the Norwegian
Institute of International Affairs (NUPI). Her areas of specializa-
tion are comparative politics, political economy, South Asian
politics and research methods.
Pavithra Suryanarayan is a PhD candidate in political science at
Columbia University. Her research focuses on state-capacity, eth-
nic politics and electoral participation in India.
Appendix A. GEE models of the proportion of organized parties on the effective number of parties, allowing for dependence amongthe observations in the same state.
Model 1 Model 2 Model 3 Model 4
Intercept 1.17*** (0.34) 0.90 (1.73) �0.19 (1.14) 0.20 (1.27)Lagged effective no. of parties 0.62*** (0.07) 0.90*** (0.05) 0.97*** (0.04) 0.91*** (0.04)Proportion organized parties 2.93*** (0.84) 1.36** (0.59) 0.84* (0.48) 1.79*** (0.63)Prop. organized parties squared �3.45** (1.16) �1.80** (0.89) �1.30* (0.81) �2.31** (0.91)Electoral volatility 0.01* (0.01) 0.01*** (0.00) 0.01*** (0.00) 0.02*** (0.00)Effective no. of groups 2004 �0.11* (0.11)Dummy for social base �0.10 (0.09) �0.09y (0.09) �0.09 (0.09)Log (real income) �0.21y (0.18) �0.09y (0.14) �0.07 (0.14)Log (fiscal spending) 0.06y (0.05) 0.07* (0.04) 0.07* (0.04)Electoral turnout 0.01* (0.00) 0.00 (0.01) �0.00 (0.01)Dummy for post 1991 0.23y (0.24) 0.20* (0.23) 0.20y (0.23)Cleavages �0.01* (0.00)Effective no. of clusters �0.26*** (0.10)
Standard errors in parentheses; these are naive standard errors assuming an exchangeable correlation structure among observations on the same state.ySignificant at p < 0.10; *p < 0.05; **p < 0.01; ***p < 0.001.
14 Party Politics
at UNIV DE LOS ANDES on January 21, 2015ppq.sagepub.comDownloaded from
Appendix B. Party organization coding.
State Year Party 1 Org 1 Party 2 Org 2 Party 3 Org 3 Party 4 Org 4
Andhra Pradesh 1967 INC 2 SWA 1 CPI 3 CPM 3Andhra Pradesh 1972 INC 2 CPI 1Andhra Pradesh 1978 INC(I) 2 JNP 1Andhra Pradesh 1983 INC 1Andhra Pradesh 1985 TDP 1 INC 1Andhra Pradesh 1989 INC 1 TDP 1Andhra Pradesh 1994 TDP 1 INC 1Andhra Pradesh 1999 TDP 1 INC 1Andhra Pradesh 2004 INC 2 TDP 1Assam 1967 INC 1 PSP 1Assam 1972 INC 1 SOP 1 CPI 1Assam 1978 JNP 1 INC 1 INC(I) 1 CPM 2Assam 1983 INC 1 ICS 1 CPM 2Assam 1985 INC 1Assam 1991 INC 1 AGP 1 BJP 2 NAGP 1Assam 1996 INC 1 AGP 1 BJP 2Assam 2001 INC 1 AGP 1 BJP 2Bihar 1967 INC 1 SSP 1 BJS 1 PSP 1Bihar 1969 INC 1 BJS 2 SSP 1 CPI 3Bihar 1972 INC 1 SOP 1 NCO 1 BJS 2Bihar 1977 JNP 1 INC 1 CPI 3Bihar 1980 INC(I) 1 JNP(SC) 1 CPI 3 BJP 3Bihar 1985 INC 1 LKD 1 CPI 3 BJP 3Bihar 1990 JD 1 INC 1 BJP 3 CPI 3Bihar 1995 JD 1 INC 1 BJP 3 SAP 1Bihar 2000 RJD 3 BJP 3 INC 1 SAP 1Gujarat 1967 INC 1 SWA 1Gujarat 1972 INC 1 NCO 1 BJS 2Gujarat 1975 INC 1 NCO 1 KLP 1 BJS 3Gujarat 1980 INC(I) 1 JNP(JP) 3 BJP 3Gujarat 1985 INC 1 JNP 1 BJP 3Gujarat 1990 INC 1 JD 1 BJP 3Gujarat 1995 BJP 2 INC 2Gujarat 1998 BJP 2 INC 2 AIRJP 1Gujarat 2002 BJP 2 INC 2Haryana 1967 INC 2 BJS 2Haryana 1968 INC 2 VHP 1 BJS 1 SWA 1Haryana 1972 INC 2 NCO 1 VHP 1 BJS 1Haryana 1977 JNP 1 INC 1 VHP 1Haryana 1982 INC 1 LKD 1 BJP 2Haryana 1987 LKD 1 INC 1 BJP 2Haryana 1991 INC 1 JP 1 HVP 1 BJP 2Haryana 1996 INC 1 BJP 3 BSP 1Haryana 2000 INC 1 INLD 1 BJP 1 BSP 1Karnataka 1967 INC 2 PSP 1 SWA 1Karnataka 1972 INC 2 NCO 1Karnataka 1978 INC(I) 2 JNP 1 INC 1Karnataka 1983 INC 1 JNP 1 BJP 1Karnataka 1985 JNP 1 INC 1Karnataka 1989 INC 2 JD 1 JNP(JP) 1Karnataka 1994 JD 1 INC 1 BJP 1 KCP 1Karnataka 1999 INC 1 BJP 2 JD(U) 1 JD(S) 1Karnataka 2004 INC 2 BJP 3 JD(S) 1Kerala 1967 INC 3 CPM 3 CPI 1 SSP 1Kerala 1970 CPM 3 INC 3 CPI 1 MUL 1Kerala 1977 CPM 3 INC 2 CPI 1 KEC 1Kerala 1980 CPM 3 INC(I) 1 INC(U) 1 CPI 1
(continued)
Chhibber et al. 15
at UNIV DE LOS ANDES on January 21, 2015ppq.sagepub.comDownloaded from
Appendix B. (continued)
State Year Party 1 Org 1 Party 2 Org 2 Party 3 Org 3 Party 4 Org 4
Kerala 1982 CPM 3 INC 1 CPI 1 MUL 1Kerala 1987 INC 2 CPM 3 CPI 1 MUL 1Kerala 1991 INC 2 CPM 3 CPI 1 MUL 1Kerala 1996 INC 2 CPM 3 CPI 1 MUL 1Kerala 2001 INC 2 CPM 3 MUL 1 CPI 1Madhya Pradesh 1967 INC 3 BJS 1 SSP 1Madhya Pradesh 1972 INC 2 BJS 1 SOP 1Madhya Pradesh 1977 JNP 1 INC 1Madhya Pradesh 1980 INC 1 BJP 1Madhya Pradesh 1985 INC 1 BJP 1Madhya Pradesh 1990 BJP 3 INC 1 JD 1Madhya Pradesh 1993 INC 1 BJP 3 BSP 1Madhya Pradesh 1998 INC 1 BJP 3 BSP 1Madhya Pradesh 2003 BJP 3 INC 3 BSP 1Maharashtra 1967 INC 1 BJS 1 PWP 1 RPIMaharashtra 1972 INC 2 BJS 1 PWP 1Maharashtra 1978 JNP 1 INC 2 INC(I) 2 PWP 1Maharashtra 1980 INC(I) 1 INC(U) 1 BJP 2 JNP(JP) 1Maharashtra 1985 INC 1 ICS 1 JNP 1 BJP 2Maharashtra 1990 INC 1 SHS 3 JD 1 BJP 3Maharashtra 1995 INC 1 SHS 3 BJP 3 JD 1Maharashtra 1999 INC 2 NCP 1 SHS 2 BJP 3Maharashtra 2004 INC 2 SHS 2 NCP 1 BJP 3Orissa 1967 INC 1 SWA 1 JAC 1 PSPOrissa 1971 INC 1 UTC 1 SWA 1 PSPOrissa 1974 INC 1 UTC 1 SWA 1Orissa 1977 JNP 1 INC 1Orissa 1980 INC(I) 1 JNP(SC) 1 INC(U) 1 CPI 1Orissa 1985 INC 1 JNP 1Orissa 1990 JD 1 INC 1Orissa 1995 INC 1 JD 1 BJP 1Orissa 2000 INC 1 BJD 1 BJP 1Orissa 2004 INC 1 BJD 1 BJP 1Punjab 1967 INC 3 ADS 1 BJS 1 CPI 1Punjab 1969 INC 3 SAD 1 BJS 1Punjab 1972 INC 1 SAD 1 CPI 1Punjab 1977 INC 1 SAD 1 JNP 1 CPI 1Punjab 1980 INC(I) 1 SAD 1 BJP 1 CPI 1Punjab 1985 SAD 1 INC 1Punjab 1992 INC 1 BJP 3 BSP 1 SAD 1Punjab 1997 SAD 1 INC 2 BJP 3 BSP 1Punjab 2002 INC 2 SAD 1 BSP 1 BJP 1Rajasthan 1967 INC 3 SWA 1 BJS 1Rajasthan 1972 INC 2 SWA 1 BJS 1Rajasthan 1977 JNP 1 INC 1Rajasthan 1980 INC(I) 1 BJP 1 JNP(SC) 1 JNP(JP) 1Rajasthan 1985 INC 1 BJP 2 LKD 1 JNP 1Rajasthan 1990 INC 1 BJP 3 JD 1Rajasthan 1993 BJP 3 INC 2Rajasthan 1998 INC 3 BJP 3Rajasthan 2003 BJP 3 INC 3Tamil Nadu 1967 INC 3 DMK 2 SWA 1Tamil Nadu 1971 DMK 2 NCOTamil Nadu 1977 ADK 1 DMK INC 1 JNP 1Tamil Nadu 1980 ADK 1 DMK 2 INC(I) 1Tamil Nadu 1984 ADK 1 DMK 2 INC 1Tamil Nadu 1989 DMK 2 ADK(JL) 1 INC 1 ADK(JR)
(continued)
16 Party Politics
at UNIV DE LOS ANDES on January 21, 2015ppq.sagepub.comDownloaded from
Appendix B. (continued)
State Year Party 1 Org 1 Party 2 Org 2 Party 3 Org 3 Party 4 Org 4
Tamil Nadu 1991 ADK 1 DMK 1 INC 1 PMK 1Tamil Nadu 1996 DMK 1 ADMK 1 TMC(M) 1 MDMK 1Tamil Nadu 2001 ADMK 1 DMK 1 TMC(M) 1 PMK 1Uttar Pradesh 1967 INC 3 BJS 3 SSP 1Uttar Pradesh 1969 INC 2 BKD 1 BJS 2 SSPUttar Pradesh 1974 INC 1 BKD 1 BJS 2 NCOUttar Pradesh 1977 JNP 1 INC 1Uttar Pradesh 1980 INC(I) 1 JNP(SC) 1 BJP 3 INC(U) 1Uttar Pradesh 1985 INC 1 LKD 1 BJP 3 JNP 1Uttar Pradesh 1989 JD 1 INC 1 BJP 3 BSP 1Uttar Pradesh 1991 BJP 3 JD 1 INC 1 JP 1Uttar Pradesh 1993 BJP 3 INC 1 JD 1 BSP 1Uttar Pradesh 1996 BJP 3 SP 1 BSP 1 INC 1Uttar Pradesh 2002 SP 1 BSP 1 BJP 3 INC 1West Bengal 1967 INC 3 CPM 3 BAC 1 CPI 2West Bengal 1969 INC 3 CPM 3 BAC 1 CPI 2West Bengal 1971 CPM 3 INC 2 CPI 3 NCO 1West Bengal 1972 INC 1 CPM 3 CPI 3West Bengal 1977 CPM 3 INC 1 JNP 1 FBL 1West Bengal 1982 CPM 3 INC 1 FBL 1West Bengal 1987 INC 1 CPM 3 FBL 1West Bengal 1991 CPM 3 INC 1 BJP 3 FBL 1West Bengal 1996 INC 1 CPM 3 BJP 3 FBL 1West Bengal 2001 CPM 3 AITC 1 INC 1 BJP 2
Chhibber et al. 17
at UNIV DE LOS ANDES on January 21, 2015ppq.sagepub.comDownloaded from