Embed Size (px)
Citation preview

I N S T I T U T E
Party Strength and Economic Growth
Michael Bernhard, Fernando Bizzarro, Michael Coppedge, John Gerring,Allen Hicken, Carl Henrik Knutsen, Staffan I. Lindberg and Svend-Erik Skaaning
Working Paper SERIES 2015:10
THE VARIETIES OF DEMOCRACY INSTITUTE
September 2015

Varieties of Democracy (V-Dem) is a new approach to conceptualization and measurement of democracy. It is co-hosted by the University of Gothenburg and University of Notre Dame. With a V-Dem Institute at University of Gothenburg with almost ten staff, and a project team across the world with four Principal Investigators, fifteen Project Managers (PMs), 30+ Regional Managers, 170 Country Coordinators, Research Assistants, and 2,500 Country Experts, the V-Dem project is one of the largest ever social science research-oriented data collection programs.
Please address comments and/or queries for information to:
V-Dem Institute
Department of Political Science
University of Gothenburg
Sprängkullsgatan 19, PO Box 711
SE 40530 Gothenburg
Sweden
E-mail: [email protected]
V-Dem Working Papers are available in electronic format at www.v-dem.net.
Copyright © 2015 University of Gothenburg, V-Dem Institute. All rights reserved.
1
Party Strength and Economic Growth∗
Michael Bernhard Raymond and Miriam Ehrlich Chair
University of Florida
Fernando Bizzarro
PhD Candidate University of Notre Dame
Michael Coppedge
Professor of Political Science University of Notre Dame
John Gerring
Professor of Political Science Boston University
Allen Hicken
Assistant Professor of Political Science University of Michigan
Carl Henrik Knutsen
Assistant Professor of Political Science University of Oslo
Staffan I. Lindberg
Professor of Political Science Director, V-Dem Institute
Gothenburg University
Svend-Erik Skaaning Associate Professor of Political Science
Aarhus University
* This research project was supported by Riksbankens Jubileumsfond, Grant M13-0559:1, PI: Staffan I. Lindberg, V-Dem Institute, University of Gothenburg, Sweden; by Swedish Research Council, 2013.0166, PI: Staffan I. Lindberg, V-Dem Institute, University of Gothenburg, Sweden and Jan Teorell, Department of Political Science, Lund University, Sweden; by Knut and Alice Wallenberg Foundation to Wallenberg Academy Fellow Staffan I. Lindberg, V-Dem Institute, University of Gothenburg, Sweden; by University of Gothenburg, Grant E 2013/43.

2
Abstract
This study argues that strong parties play a critical role in fostering economic development. The
theory explores how parties broaden the constituencies to which policy makers respond and help
politicians to solve coordination problems. These features ensure that politicians engage in better
economic management, provide productivity enhancing public services, and help ensure political
(and thus policy) stability. This, in turn, should enhance economic growth.
Drawing on a novel measure of party strength from the Varieties of Democracy
dataset, we test this hypothesis on data from more than 150 countries, with time series extending
from 1900 to 2012. We identify a sizeable and highly significant effect, and one that is robust to
a variety of specifications, estimators, and samples. The effect operates in both democracies and
autocracies and is fairly stable across various regions of the world and across time periods. We
also provide suggestive evidence about causal mechanisms, focusing on measures of economic
management, public goods, and political stability.
This paper contributes to two large literatures, respectively focusing on features of
political parties and on the institutional determinants of growth. While previous studies have
highlighted the role of parties in improving the quality of governance such claims are usually
limited in context – to democratic or authoritarian settings – and generally do not pertain to
distal outcomes such as per capita GDP growth. Studies of economic development, while
focused explicitly on growth, generally identify other long-run causal factors at work, e.g.,
geography, property rights, political constraints, colonial origins, inequality, social capital, or
human capital.

3
Introduction
Many scholars of international development subscribe to some version of institutionalism. They
believe that the vast cross-country differences in development evident today are primarily the
product of varying political institutions (Acemoglu & Robinson 2012; Fukuyama 2011; Haggard
et al. 2008; Hall & Jones 1999; Huntington 1968; Knack & Keefer 1995; North 1990; Rodrik et
al. 2004; Rothstein 2011). The story is plausible but hard to prove, prompting skepticism from
some quarters (e.g., Aron 2000; Chang 2011; Glaeser et al. 2004; Przeworski 2004; Sachs 2003;
Vollrath 2014).
Several impediments to falsifiability may be briefly mentioned. First, institutional
theories are often pitched at a high level of abstraction, relying on concepts such as good
institutions, inclusion, accountability, predation, rent-seeking, or good governance that are open
to many interpretations (e.g., Jutting 2003). Relatedly, measures of institutional quality are often
highly aggregated and highly correlated, making it difficult to distinguish one institutional feature
from another. They may also be limited in temporal or spatial coverage, or of questionable
validity when placed on the right side of a causal model (Arndt & Oman 2006; Kurtz & Schrank
2007; Thomas 2010). Ambiguously framed and hard to operationalize, institutional theories seem
to explain everything, or nothing. It is difficult to envision the ceteris paribus conditions of
arguments centered on the role of “good institutions.”
We propose to shift attention to a lower – and hopefully, more tractable – level of
analysis. Theorizing at the middle range, we claim a central role for political parties. We argue
that strong parties enhance growth by incentivizing leaders to cater to broad interests and
enabling them to solve coordination problems. In contrast to prior work, we argue that these
capabilities transcend regime-type; they matter as much for economic growth in democratic as in
authoritarian contexts, and for many of the same reasons. The theory we put forth thus builds
on, and bridges, two traditions of work on political parties, one focused on democracies and the
other on autocracies.
To test the theory we draw on a unique dataset from the Varieties of Democracy (V-
Dem) project (Coppedge et al. 2015). Based on coding by thousands of country experts and
covering most sovereign and semi-sovereign states over the past century, V-Dem provides
multiple indicators focused on different features of political parties, which we employ to
construct a composite index of Party Strength. Using this index, we conduct a variety of tests to
probe the relationship between political parties and economic growth. Estimators include fixed
effects, generalized method of moments (GMM), and instrumental variables.

4
In Section I, we present our theoretical argument about how party strength affects
economic growth. In Section II, we describe our data and the construction of the index of Party
Strength. In Section III, we explore country cases in East and Southeast Asia, which provide a
face validity test for the index and illustrate our theoretical argument. In Section IV, we estimate
the impact of Party Strength on growth in a global sample, finding a substantively large and
robust effect. In Section V, the relationship is subjected to a series of specification tests. In
Section VI, we conduct mediation analysis to test the presence of mechanisms suggested by our
theory. Section VII reviews the argument and discusses its ramifications.
I. Theory
A large literature extending back to the birth of modern political science attests to the
importance of political parties in establishing conditions for democratic stability and
accountability (Bryce 1888; Key 1949; Ranney 1962; Schattschneider 1942; Wilson 1908). More
recently, scholars have demonstrated the capacity of strong parties to resist clientelism and
provide public goods, functions that presumably enhance economic performance (Croissant &
Volkel 2012; Hicken & Kuhonta 2014; Hicken, Kollman & Simmons forthcoming; Keefer 2013;
Kitschelt 2000; Kitschelt & Wilkinson 2006; Levitsky 1998; Mainwaring & Scully 1995; Pierskalla
& Fernandez 2011; Powell & Tucker, 2013; Randall & Svåsand 2002; Simmons forthcoming;
Simmons et. al. 2014; Tommasi 2006; Ufen 2008).
Meanwhile, a distinct literature on autocratic regimes finds that institutionalized parties
help to stabilize authoritarian rule (Boix & Svolik 2013; Brownlee 2009; Greene 2007;
Huntington 1968; Magaloni 2006, 2008; Magaloni & Kricheli 2010; Svolik 2012). Researchers
have also noted that one-party regimes are associated with greater investment and stronger
growth performance than other types of autocracies (Gandhi 2008; Gehlbach & Keefer 2011;
Keefer 2007; Miller 2015; Wright 2008), though problems of causal identification persist
(Pepinsky 2014).
A schematic review of the literature on political parties in democratic and autocratic
contexts thus suggests that the strength of political parties matters in very different contexts.
This is not to say that parties operate the same way in democratic and autocratic
settings. Where multi-party elections exist parties are in direct competition with each other, for
example. However, the impact of parties on economic growth may depend less on inter-party

5
dynamics than on intra-party dynamics, i.e., the way in which parties are organized internally.1
Sweden (a strong-party regime within a democratic context) is different from Papua New Guinea
(where parties are small, weak, evanescent, and subordinate to individual politicians), just as
China (where all power is centralized in the Chinese Communist party) is different from Saudi
Arabia (a party-less monarchy). In both democratic and autocratic contexts we may expect the
strength of political parties to affect the incentives and behavior of elites, i.e., the choice of
public policies and the effectiveness with which those policies are implemented – and, ultimately,
long-term growth performance.
At this juncture, it is important to define several key terms. When referring to political
parties we are primarily concerned with the major parties within a polity, not the smaller and less
consequential ones. In polities where only one party is allowed to compete this is the only party
of theoretical interest. In party systems that are highly fragmented but where long-standing
coalitions perform the work of large parties (i.e., they act in a highly coordinated and predictable
fashion), coalitions perform the function of major parties.
Party strength is understood in terms of unity, centralization, organizational complexity,
and mass constituency. Where these traits are lacking – i.e., parties are weak or absent – other
forms of political organization predominate. Non-party formats may be characterized broadly as
personal rule, either familial or charismatic (Jackson & Rosberg 1982), group-based rule, where ethnic,
racial, or religious groups form the basis of power (Wimmer 2013), or military rule (Finer 1988;
Huntington 1957). These are the causal counterfactuals of our argument. To the extent that
parties are weak, a polity is assumed to be ruled by an individual, a social group, and/or a military
group.
It may seem axiomatic that strong parties are preferable to these other forms of political
organization. Nonetheless, it is important to specify – albeit in rather broad terms – why strong
parties are likely to facilitate stronger growth performance over the long term. Parties, we
surmise, align the interests of leaders with the interests of the party, (1) imposing constraints on
leaders, (2) institutionalizing power, and (3) elongating time-horizons. Parties also serve as
coordination mechanisms among powerful groups and interests within a society by virtue of (4)
their encompassing-ness, (5) their ability to overcome veto points, and (6) their effective
implementation of policies. Let us now unpack these complex relationships.
1 Work on parties in democracies usually focused on the “external dimension” of party system institutionalization, i.e., patterns of inter-party competition. Our conceptualization of party strength leans toward the “internal dimension” of party system institutionalization, i.e., party organizational structures and party rootedness in society (Mainwaring and Scully 1995 Levitsky 1998; Randall and Svåsand 2002; Ufen 2008; Croissant and Volkel 2012; Hicken and Kuhonta 2014; Powell and Tucker, 2013). The literature on autocratic parties, naturally, focuses mainly on the latter (e.g., Geddes 1999; Magaloni 2006; Gehlbach & Keefer 2011; Svolik 2012), with some attention to linkages between opposition party actors and the ruling party (e.g., Gandhi 2008).

6
First, strong parties provide a mechanism for constraining leaders so that s/he fulfills
the ambitions of the party rather than (or in addition to) his or her personal ambitions.
Constraints on leaders stem partly from the process of leadership selection, which in a strong
party is monopolized by party members. As such, it favors individuals with a demonstrated
commitment to the party, usually those who have risen through the ranks. Organization men,
not mavericks, are likely to emerge from a party-centered selection process. The chosen
individual, having been thoroughly socialized in the party, is unlikely to work against its wider
interests once installed in a top policymaking position. Nor is it likely that a leader would be able
to deviate from the party line, even if s/he so desired. Strong parties provide checks against
wayward leaders, employing internal mechanisms of control, often of an informal nature
(Gehlbach & Keefer 2011, 2012; Svolik 2012). Indeed, party activists and officials may resist
actions by the executive if they conflict with their interests and the long-term interests of the
party (Stokes 1999). Note also that party leaders need party members; they cannot afford to
alienate their base. More generally, we note that a tightly organized party structure – where
members are in continual contact with one another and have long-standing personal
relationships – allows party members to overcome collective action problems and thus to serve
as an effective counterweight to the top leadership (Svolik 2012).
For these reasons, we expect a modicum of accountability operating within a strong
party, even when there are no formal institutions mandating anything that might be described as
intra-party democracy. As evidence of this, one might consider the capacity of strong parties to
limit the tenure of rulers and, in some cases, to control the leadership selection process in
autocratic settings such as Vietnam (after Ho Chi Minh), China (in recent years), and Mexico
(under the PRI). It follows that we may regard the political party as providing a credible check
on executive power, preventing predatory behavior that might harm long-run growth, and thus
the party’s reputation and standing, in much the same fashion as is claimed for formal,
constitutional constraints (e.g., Acemoglu et al. 2001; Besley & Kudamatsu 2008; North &
Weingast 1989; Wright 2008).
Second, strong parties establish highly institutionalized spheres of politics and
policymaking. They may or may not be transparent in formulation, but they are clear in
execution so that investors and other actors know what to expect. More important, once
adopted, policies are likely to be sustained, and this track-record means that strong parties can
credibly commit to policies. Market uncertainties associated with unpredictable policy swings are
minimized, and growth performance should be enhanced. More generally, the institutionalization
of political conflict – and of leadership succession in particular – should enhance political

7
stability over the long run. As we will show, polities ruled by strong parties seem to be less
susceptible to civil war (see also Fjelde 2010), an occurrence with negative repercussions for
growth (Collier 1999, Gates et al. 2012).
Third, strong parties are typically enduring, and because of this longevity leaders and
others whose interests are aligned with a party’s fate are compelled to think about policymaking
from a long-term perspective. Studies have shown that a party’s image and overall support
among the citizenry is colored by the policies and overall performance achieved during periods
when the party ruled (e.g., Magaloni 2006). Legacies matter. This means that parties that expect
to stick around may have an incentive to invest in policies that are anticipated to increase long-
term growth, even if they impose short-term costs. For example, we might expect a strong party
to prioritize productive public investments in infrastructure and human capital over less
productive public spending and to promote policies conducive to private investment, even
though the gains from such policies accrue slowly over many years (e.g., Olson 1993; Simmons
forthcoming).
Fourth, strong parties often promote an encompassing vision (an ideology intended to
embrace most, if not all, citizens), a leadership cadre that includes representatives of most (non-
trivial) social groups, and a large membership base. A strong party is broad; indeed, it may
attempt to fuse its mission and identity with the nation. Groups who are integrated into a party
will also be integrated into politics and this, in turn, may serve to vitiate dissent and rebellion.
The encompassing vision, and (envisioned) constituency, of a strong party may encourage
leaders to prioritize public goods over targeted distribution of private goods, with positive
repercussions for growth (e.g., Bueno de Mesquita et al. 2003; Knutsen 2011a). Likewise, the
sheer size of a strong party means that clientelistic payoffs – designed to compensate party
members and supporters – are unlikely to be viable over the long term unless coupled with
strong growth performance. Distributive politics may be workable for a short time; but in the
absence of economic growth party elites will be unable to fill their coffers for very long (e.g.,
Morgan 2011). There is simply not enough pelf to go around. Growth is the only solution that
will placate members of a large party, not to mention the broader constituencies whose allegiance
they claim.
Fifth, strong parties can serve as a vehicle for formulating objectives and overcoming
potential veto points (see Tsebelis 2002) – whether located within government, in informal
institutions, or in the private sector. In particular, cohesion among elites is enhanced, allowing
party leaders to resolve coordination problems among themselves – striking deals that involve
intertemporal tradeoffs and enforcing those deals through time (Boix & Svolik 2013; Hicken &

8
Simmons 2008; Kuhonta 2011; Magaloni 2006; McGillivray 1997; Müller 2000; Nielson 2003;
Svolik 2012; Tommasi 2006). Focusing on democratic settings, Gerring & Thacker (2008: 36-37)
propose that “wherever parties are weak, policies are necessarily the product of ad hoc coalitions
and individual interests,” whereas a strong party “synchronizes individual career goals with the
party’s quest for political power.” In an autocratic setting, Magaloni (2008) shows how party
organizations, with their associated side-payments, perks and opportunities for future positions
and influence, strengthen the incentives of different actors to invest in the current regime. This
means that strong-party governments should be capable of reaching authoritative decisions on
important matters of public policy and making these decisions stick, establishing credible
commitment even in the absence of formal constitutional constraints (Gehlbach & Keefer 2011).
Finally, strong parties − with well-established organizations, monitoring and
information-processing capacities, and deep roots in society − are better able to implement
policies, once adopted. While the “developmental state” literature (e.g., Johnson 1982; Evans
1995; Leftwich 2000; Kohli 2004; Wade 1990) is normally interpreted as a brief for bureaucratic
rule it should be appreciated the extent to which ruling parties, in democracies and autocracies
alike, contributed to these outcomes. Parties characterized in the literature as strong have exerted
a transformational influence on societies by providing a level of organization, discipline, and
direction that societies would not otherwise possess. They have overturned class relations,
ensuring that the state is not the handmaiden of traditional elites. They have developed
infrastructure. They have penetrated remote countryside hamlets. They have served as agents of
modernization, with all its attendant disruption and more than occasional cruelty. They often
share a vision of state-supported development, but have been willing to abandon ideas and
programs, switching course when needed. Strong parties are thus a potent tool for modernizing
backward societies, with party leaders providing central direction, activists performing the grunt
work, and the state apparatus, in conjunction with para-military organizations, providing coercive
mechanisms, when needed (Haggard 1998; Huntington 1968; Hutchcroft & Rocamora 2003;
Kuhonta 2011; Pempel 1990; Slater 2010; Woo-Cummings 1999). Party-led modernization, in
turn, may serve as a precursor to long-term growth (see Murphy et al. 1989).
The foregoing institutions – constraints on leaders, institutionalization of power,
elongated time-horizons, encompassing-ness, overcoming veto points, and effective policy
implementation – should, in turn, enhance policy outcomes that are generally regarded as
conducive to growth. First, party strength should mitigate predatory policies and economic
mismanagement, e.g., when calibrating monetary and fiscal policies, thus promoting investment
and limiting inflation. Second, party strength should provide productivity-enhancing public
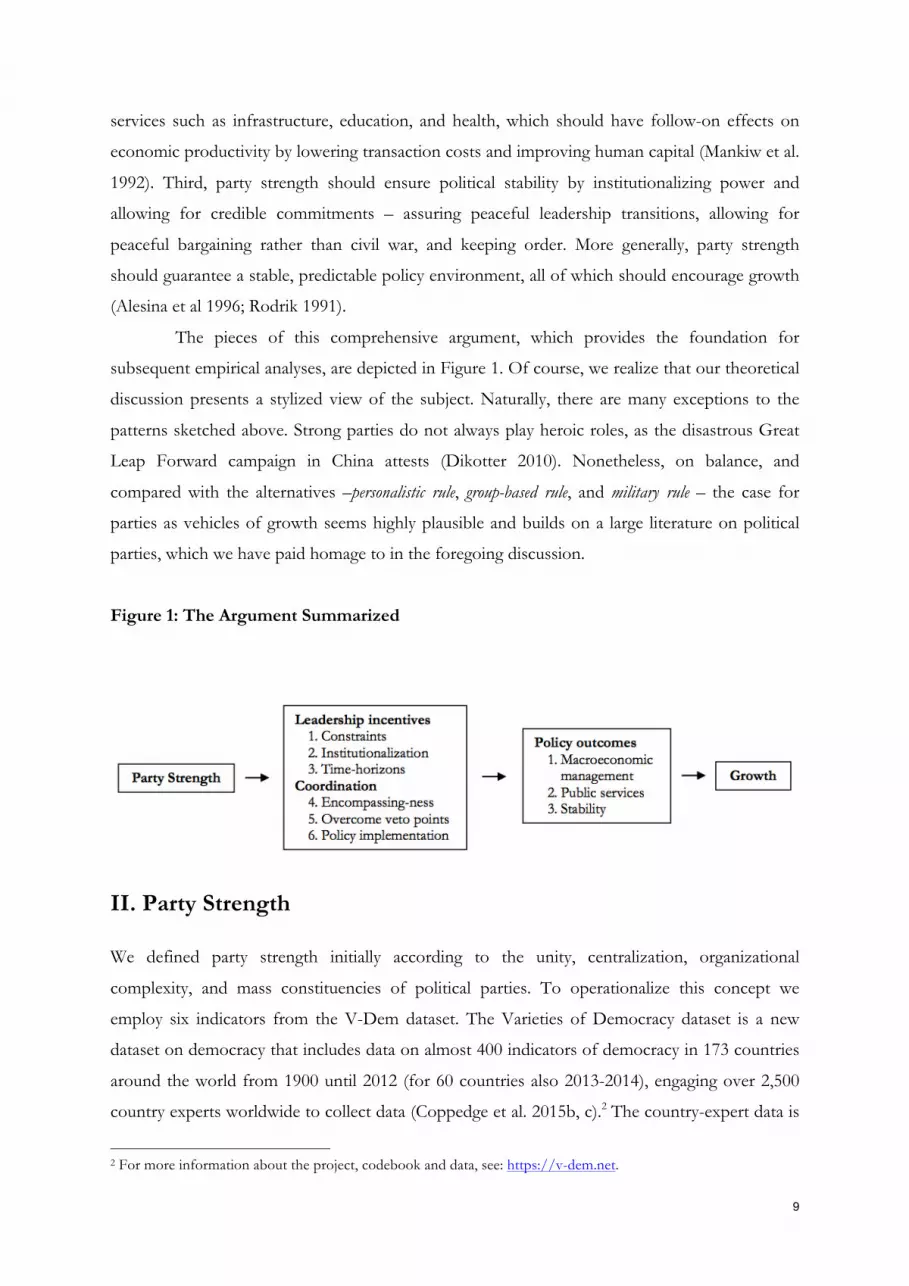
9
services such as infrastructure, education, and health, which should have follow-on effects on
economic productivity by lowering transaction costs and improving human capital (Mankiw et al.
1992). Third, party strength should ensure political stability by institutionalizing power and
allowing for credible commitments – assuring peaceful leadership transitions, allowing for
peaceful bargaining rather than civil war, and keeping order. More generally, party strength
should guarantee a stable, predictable policy environment, all of which should encourage growth
(Alesina et al 1996; Rodrik 1991).
The pieces of this comprehensive argument, which provides the foundation for
subsequent empirical analyses, are depicted in Figure 1. Of course, we realize that our theoretical
discussion presents a stylized view of the subject. Naturally, there are many exceptions to the
patterns sketched above. Strong parties do not always play heroic roles, as the disastrous Great
Leap Forward campaign in China attests (Dikotter 2010). Nonetheless, on balance, and
compared with the alternatives –personalistic rule, group-based rule, and military rule – the case for
parties as vehicles of growth seems highly plausible and builds on a large literature on political
parties, which we have paid homage to in the foregoing discussion.
Figure 1: The Argument Summarized
II. Party Strength
We defined party strength initially according to the unity, centralization, organizational
complexity, and mass constituencies of political parties. To operationalize this concept we
employ six indicators from the V-Dem dataset. The Varieties of Democracy dataset is a new
dataset on democracy that includes data on almost 400 indicators of democracy in 173 countries
around the world from 1900 until 2012 (for 60 countries also 2013-2014), engaging over 2,500
country experts worldwide to collect data (Coppedge et al. 2015b, c).2 The country-expert data is
2 For more information about the project, codebook and data, see: https://v-dem.net.

10
combined into country-year estimates using a state-of-the-art Bayesian ordinal item-response
theory model developed by a set of specialized methodologists (Pemstein et al. 2015). In this
paper we use the V-Dem data v4.2 (Coppedge et al. 2015a.).
These measure the extent to which political parties within a polity are characterized by:
(1) permanent national party organizations, (2) permanent local party branches, (3) centralized
mechanisms of candidate selection, (4) legislative cohesion, (5) minimal party switching (where
elected members of a party change their party affiliation in between elections), and (6)
programmatic (rather than clientelistic) linkages to their social base. Indicators are aggregated
through simple addition to form a Party Strength index, reflecting the expectation that each
element of the index is partially substitutable.
Further detail on these indicators, and discussions of how they map onto the
definitional attributes of the key concept, is contained in Appendix B. It bears emphasis that the
empirical results shown in subsequent tables are robust to the omission of any of these
indicators. Results are also robust to alternate aggregation rules for the index, such as principal
components analysis or multiplication. Both sets of results are shown in Table B2.
Figure 2 presents a histogram of the Party Strength index for all 16,221 country-year
observations in our dataset, revealing a distribution that approximates a normal curve. The index
varies from -1.73 to 1.36, with median and mean values of 0.03 and 0.00, respectively, and a
standard deviation of 0.53 (see Table A2 in Appendix A).
When observed over time across our global sample, Party Strength shows a long-term
secular increase, with a strong increase in the years directly following World War II, and a small
decline around 1990 (coinciding with the collapse of Communist one-party regimes in Eastern
Europe and the introduction of multi-party politics in many Africa countries), as shown in
Figure B1. Nevertheless, the overall increase over time is not dramatic. The mean score is about
-0.4 in 1900 and 0 in 2012. To be sure, this aggregate-level pattern is partly a product of a
changing sample, where newer countries are likely to have lower values on the index. It also
hides substantial variation across the sample, with some countries experiencing very large
changes (both positive and negative) over time.
Cross-country variation at any given point in time is substantial, as one might expect.
Some countries are characterized by strong parties (e.g., Sweden, Germany, Spain, the
Netherlands, and Vietnam with the highest scores in 2011) and others by weak or no parties
(e.g., Liberia, PNG, Saudi Arabia, and Haiti, which show the lowest scores in 2011). Point
estimates for all countries in 2011 are listed in Table B1. Importantly, not all point estimates are
distinguishable, as signaled by the confidence intervals accompanying each score.

11
Figure 2: Histogram of Party Strength
Convergent validity tests, shown in Appendix C, indicate that Party Strength is
positively associated with other indicators often regarded as measures of party strength or
institutionalization. This includes party age (the average age of the three largest parties in the
legislature), party vote volatility (change in share of votes received from election to election), and
party linkage (a stable and socially rooted party system), as shown in Table C3. In sub-sets of
relatively autocratic countries, Party Strength is much higher in regimes categorized as “Single-
party,” “One-party,” or “Dominant Multi-party,” than in regimes categorized by Geddes et al.
(2014) and Hadenius & Teorell (2007) as “Personalist,” “Military,” or “Monarchy,” as shown in
Tables C1 and C2.
It is worth noting that Party Strength is only modestly associated with common
measures of good governance (e.g., the Worldwide Governance Indicators) and democracy (e.g.,
Polity2). To be sure, Party Strength is higher in democracies and in countries that exhibit higher
degrees of rule of law and control of corruption. Yet, the modest correlations suggest that our
index is picking up a different concept than regime type or good governance, as commonly
understood.

12
III. Case Study Analysis
To provide further validation of the index, and to corroborate some of our expectations
(especially those about causal mechanisms), we begin our empirical foray by exploring countries
in a region of the world that exemplifies enormous variation in the factor of theoretical interest.
By common understanding, “East and Southeast Asia” includes Burma/Myanmar, Cambodia,
China, Indonesia, Japan, Laos, Malaysia, North and South Korea, the Philippines, Taiwan,
Thailand, and Vietnam. We exclude micro-states (e.g., Hong Kong, Singapore) as well as
countries generally classified as part of the Oceanic region (e.g., Australia, Papua New Guinea).
Note that while some regions of the world feature parties that are generally quite strong
(e.g., Western Europe), and other regions feature parties that are generally quite weak (e.g.,
Africa), East and Southeast Asia is hard to characterize on this dimension by virtue of its
manifest diversity. As such, this region of the world provides an ideal setting for a “most-similar”
style analysis, where variation in X is maximized while variation on background conditions is
minimized. Of course, being situated in the same geographic region does not entail that ceteris
paribus conditions have been achieved. Nonetheless, it provides some ex ante plausibility for
making cross-country comparisons given that countries in the same region are likely to share
many cultural and geographic features, and historical experiences (Gerring 2007).
The literature on the developmental trajectories of East and Southeast Asia has focused
on explaining the rapid growth and development of the so-called high performing Asian
economies vis-à-vis their underperforming neighbors. Johnson (1982) established the
“developmental state” genre with his work on Japan, which was followed by studies of the four
“tiger” economies (Taiwan, South Korea, Singapore, and Hong Kong)3, and the “mini-tigers”
(Indonesia, Malaysia, and Thailand).4 A common theme in this work is the importance of a
strong state that can engage in long-term developmental planning, establish developmental
priorities, mediate between competing interests, and coordinate the tasks related to development
among various public and private stake-holders. Importantly, most of the strong states were run
by strong parties. With few exceptions, high performing economies were governed by dominant
parties that enjoyed long time-horizons, had the power to maneuver around potential veto
points, could shield the bureaucracy from special interests, and could effectively oversee policy
implementation.5 While these tasks might still be carried out in the absence of a strong party (as
3 See Amsden 1989; Cheng 1990; Wade 1990; Haggard 1990; World Bank 1993; Rodrick 1995; Evans 1995; Campus and Root 1996; Woo-Cummings 1999. 4 See Lim 1983; Bowie 1991; Doner 1991, 2009; McVey 1992; MacIntyre 1994. 5 Again, there are important differences among states along each of these dimensions. See MacIntyre 1994 for example.

13
the South Korean and Thai cases demonstrate), much of what scholars have attributed to strong
states may well be a function of strong parties. In other words, by focusing on state capacity the
literature has sometimes neglected political capacity embedded in political parties (Leftwich 1995;
2008).
This, at any rate, is the impression one gets when one compares Party Strength
(measured by our index) with growth rates over the postwar period, as shown in Table 1.
Countries with the strongest growth trajectories such as China, Vietnam, Indonesia, Japan,
Taiwan, and Malaysia generally were characterized by stronger parties. (The Party Strength index
is centered on zero so a positive score signals an above-average score across the entire sample,
which includes most sovereign and semi-sovereign countries in the world.)
Table 1: East & Southeast Asian Cases at a Glance
___Party Strength___ _Growth_
Estimate Confidence interval GDP per cap China 0.787 0.646 0.928 5.060 Vietnam DR 0.707 0.511 0.902 4.464 Indonesia 0.546 0.368 0.725 3.183 Japan 0.518 0.337 0.699 4.458 Burma/Myanmar 0.509 0.323 0.695 3.945 South Korea 0.487 0.348 0.625 5.660 North Korea 0.429 0.186 0.672 0.827 Taiwan 0.428 0.226 0.631 5.593 Malaysia 0.225 0.113 0.336 3.748 Laos -0.091 -0.132 -0.050 1.754 Cambodia -0.105 -0.262 0.052 2.980 Thailand -0.440 -0.584 -0.296 4.214 Philippines -0.541 -0.617 -0.464 2.561
Note: Party Strength and per capita GDP growth averaged across the 1946-2012 period.
Readers will be aware that the group of countries classified as members of the East and
Southeast Asia region are heterogeneous along a number of dimensions that might be expected
to affect party strength and economic development, and hence serve as potential confounders in
our narrative. Arguably, a more satisfactory most-similar analysis may be attained by focusing on
a smaller group of countries that are more homogeneous on background characteristics. As
subjects for this focused comparison, we choose Indonesia, Malaysia, Philippines, and Thailand.
These four countries have long coastlines and are therefore exposed to international currents of
trade, technology, and ideas. They have no history of communist control or of “total” colonial
control exercised by Japan, and often regarded as a modernizing force (Kohli 1994). With the
exception of Thailand, they transitioned to independence at about the same time. And, they had
comparable socioeconomic characteristics at mid-century as measured by per capita GDP,
education, and urbanization.

14
Figure 3 plots the Party Strength index for these cases over the course of the past
century. (This includes periods of colonial rule, as coded by the V-Dem project.) Several features
of this comparison are notable. First, corresponding with the consensus in the literature,
Thailand and the Philippines consistently registered the lowest levels of party strength. In both
countries, parties are generally described as ephemeral alliances of convenience, with little
commitment to program or ideology and only tenuous connections to voters and societal groups
(Brownlee 2008; Croissant & Volkel 2012; Hicken 2006a, 2006b, 2009; Hicken & Kuhonta 2014;
Hutchroft & Rocamora 2003; Quimpo 2005; Ufen 2012). These stand in sharp contrast to
Indonesia and Malaysia, where party strength has historically been much stronger (Kuhonta
2011).
Figure 3: Party Development in Selected Cases
Note: Party Strength through time for selected East and Southeast Asian cases, including pre-independence periods.
The Party Strength index also appears to capture important changes to party systems
over time, as described in the scholarly literature. For example, the time-series for Thailand
shows a modest increase in party strength beginning in the late 1990s. This corresponds to
changes to the Thai party system occurring in the wake of the 1997 constitutional reforms and
the rise of Thaksin Shinawatra and the Thai Rak Thai party (Hicken 2006b, 2013). In Malaysia,

15
we see an increase in party strength in the 1950s, reflecting the creation of three ethnically-based
parties (UMNO, MCA and MIC) and their banding together to form the ruling Alliance—a pact
that has formed the core of the ruling coalition ever since. Indonesia’s graph picks up the period
of turbulent party competition after the country’s independence, which pitted secular nationalist,
Communist, and Islamic parties against each other. It also captures the substantial increase in
party strength accompanying the creation of Suharto’s ruling GOLKAR party in the late 1960s.
And, it registers the decline in the strength and rootedness of parties corresponding with the
return of democracy in 1998. The index, finally, shows a decline in party strength in Indonesia
since 2005, which fits nicely with accounts in the literature highlighting the deinstitutionalization
of Indonesia’s party system in the aftermath of a switch to open-list PR in 2008 (Aspinall 2014).
Considering more closely the cases of Thailand and Malaysia, a large gap is discernible
between Thailand and Malaysia for most of their history, as shown in Figure 3. Kuhonta (2011)
argues that the differences between these two party systems help account for the developmental
disparity between the countries. With its institutionalized and pragmatic parties, Malaysia was
poised to “create organizational power that is necessary to drive through social reforms, provide
capacity and continuity that sustain and protect a reform agenda, and maintain the ideological
moderation that is crucial for balancing pro-poor measures with growth and stability” (Kuhonta
2011, 4). By contrast, Thailand has featured parties distinguished by their lack of interest in
programmatic policies and a striking lack of institutionalization. The result was a policy
environment where needed public goods, reforms and investments were chronically
undersupplied, even while a fairly capable bureaucracy was able to maintain a macroeconomic
environment conducive to short term growth via foreign investment and factor accumulation
(Hicken 2001; Doner 2009; Kuhonta 2011). As a result, while both countries have experienced
periods of impressive rapid economic growth, “Malaysia has done significantly better than
Thailand in achieving equitable development” (Kuhonta 2011, 5).
Perhaps no case illustrates our argument more perfectly than the Philippines. Among
the states of East and Southeast Asia, the Philippines stands out with the lowest level of party
strength, as shown starkly in Figure 3. Moreover, the relative weakness of the party system in
Philippines is front-and-center in many accounts of the country’s disappointing economic
performance (de Dios & Hutchcroft 2003; Hawes 1992; Hutchcroft & Rocamora 2003; Mackie
& Villegas 1999). That the Philippines would emerge as the perpetual “sick man of Asia” was not
a foregone conclusion. Indeed, post-WWII the Philippines was widely-expected to emerge as
one of Asia’s success stories. However, the absence of party strength in the Philippines has been
one of the biggest obstacle to robust, sustained economic growth in the Philippines. Philippine

16
parties “are characterized by factionalism, frequent party switching…and party labels that
generally mean little to voters or candidates. As a result they…are not cohesive unitary actors
pursuing unique policy agendas. Rather, they are temporary alliances of narrowly oriented
politicians primarily concerned with distributing the spoils of government…to themselves and
their supporters” (Hicken 2008, 223).
As a result of the chronic undersupply of needed collective goods and comprehensive
national policies, economic growth in the Philippines has been weak, especially when compared
to the success of its neighbors, as shown in Table 1. At the conclusion of WWII the Philippines
was one of the wealthiest countries in the region, behind only Japan and Malaysia. However,
beginning in the 1970s the countries of first East Asia, then Southeast Asia, soared ahead of the
Philippines. As the other Asian economies grew at a staggering pace during the 1980s and 1990s
the Philippines fell further and further behind.
In the section below, we show that the relationship between party strength and
economic growth is not restricted to the East and South-East Asian context, but that the
observed differences between the Philippines and its neighboring countries reflect a more
general pattern, and that the correlation may be due to a causal effect of party strength on
growth.
IV. Global Analyses: Main Tests
We proceed to a global analysis that includes most sovereign countries observed across the past
century. Per capita GDP data is drawn from the Maddison Project (Bolt & van Zanden 2014).
We conduct numerous tests on the relationship between Party Strength and GDP per capita
growth, employing different estimation techniques, control variable sets, samples, time lag
specifications, and operationalizations of key concepts. We report only a selection of these tests,
presenting additional models in Appendix E. It is worth signaling at the outset that the basic
result – Party Strength enhances economic growth – is robust to an extent that has few parallels
in the literature on institutional determinants of growth.
We begin with a parsimonious specification, displayed in Model 1, Table 2. Here,
growth is regressed on Party Strength in an ordinary least squares model along with year and
country fixed effects, and GDP per capita (logged). The latter is intended to account for
convergence effects (Barro & Sala-i-Martin 2004) as well as the possibility that parties might be
stronger in richer countries. All right-side variables are lagged one period behind the outcome,
and (robust) errors are clustered by country to correct for panel-specific autocorrelation. This

17
benchmark model incorporates 10,147 country-year observations from 153 countries within a
time-series starting in 1900 and extending for up to 110 years.
The estimated coefficient and standard error for Party Strength in Model 1 indicate a
strong relationship with subsequent growth. Based on that model, Figure 4 plots the estimated
impact of hypothetical changes in Party Strength, surrounded by 95% confidence intervals.
Holding initial level of income constant, and controlling for country- and year-fixed effects, the
point estimate suggests that a 1-point increase in the Party Strength index boosts GDP per capita
growth in the subsequent year by about 1.6 percentage points. A 1-point difference in Party
Strength is not far from the 0.91-point difference in 2012 Party Strength scores between the
cases of Malaysia (0.36) and the Philippines (-0.55), discussed above. Such a difference in party
strength has substantial consequences for economic development over time. Model 1 suggests
that if two otherwise equal countries start out today with the 2012 Party Strength scores of
Malaysia and the Philippines, respectively, the former will grow to be twice as rich as the latter in
about fifty years. Subsequent tests introduce variations in this benchmark model to assess the
robustness of this finding.
Figure 4: Party Strength and predicted GDP per capita growth
Note: Predicted growth rates, surrounded by 95% confidence intervals, as a function of Party Strength based on Model 1, Table 2, with other independent variables at their means.

18
Table 2: Main Tests
1 2 3 4 5 6 7 8 9 10 11 Sample Full Full Full Full Full Full Full Imputed Full Democracies Autocracies Estimator OLS OLS OLS OLS OLS Sys. GMM 2SLS OLS OLS OLS OLS Time-periods 1 year 5 years 1 year 1 year 1 year 5 years 1 year 1 year 1 year 1 year 1 year
Party Strength 1.568*** 1.038*** 1.360*** 1.994*** 1.282*** 1.110*** 3.177*** 2.088*** (0.369) (0.355) (0.325) (0.649) (0.243) (0.218) (0.928) (0.631) Party Strength, L10 0.772** (0.357) Party Strength, stock 0.446*** (0.014) Party Strength, II 1.126 (1.240) Party Strength, III 1.574 (1.407) Party Strength, IV 2.343* (1.408) Party Strength, V 3.168** (1.440) Party Strength, VI 3.684** (1.502) GDPpc (ln) -2.023*** -2.830*** -1.653*** -2.162*** -2.290*** -0.468 -2.069*** -0.404*** -2.010** -6.041*** -2.214*** (0.353) (0.404) (0.313) (0.037) (0.325) (0.295) (0.196) (0.113) (0.346) (0.807) (0.622) Growth 0.180*** 0.116* (0.031) (0.649) Ec.growth, region 0.348*** (0.293) Ec.growth, globally -5.636*** (0.685) Year fixed effects ! ! ! ! ! ! ! ! ! ! ! Country fixed effects ! ! ! ! ! ! ! ! ! ! Countries 153 153 153 153 153 153 151 205 153 104 127 Years (Max) 110 21 100 110 109 21 109 114 110 108 100 Obs 10147 1822 9471 10147 9991 1814 9852 23146 10147 3702 5087 R2 (within) 0.109 0.206 0.101 0.108 0.136 0.128+ 0.109 0.207 0.116 Outcome: GDP per capita growth. Independent variables lagged by one time-period. Sample: Full (all available observations), Imputed (Honaker & King 2010), Democracies or Autocracies (Boix et al. 2013). Estimator: OLS (ordinary least squares), Sys GMM (system GMM [Blundell & Bond 1998]), 2SLS (two-stage least squares), standard errors clustered by country. *** p<.01 **p<.05 *p<.10. + Centered R-Squared

19
Model 2 in Table 2 employs variables measured across 5-year intervals (rather than
annually). Specifically, we generate a moving average of all variables and then run the benchmark
model using every fifth year (1900, 1905,…). This reduces the amount of information available
and blunts proximal relationships that may exist between Party Strength and growth. However, it
also reduces noise from short-term business cycles, and models the relationship in a more distal
fashion (note that a five-year lag replaces a one-year lag between right- and left-side factors).
While the point estimate for Party Strength is reduced (to 1.0), the relationship persists and
remains statistically significant at the 1% level.
In Model 3, we return to annualized data but this time we introduce a longer lag on the
variable of theoretical interest. Here, Party Strength is lagged ten years behind the outcome,
while per capita GDP retains its one-year lag. This model accounts for the possibility that it
might take considerable time for party characteristics to influence social and economic policies
and for these policies to affect the behavior of economic actors. It also reduces the possibility of
spurious results (since we are separating right- and left-side variables by a longer interval). The
estimated impact is somewhat weaker than in our benchmark model (with a one-period lag),
indicating that the relationship weakens as inputs and outputs are separated in time. However,
the coefficient remains positive and statistically significant.
Another approach to functional form, reported in Model 4, considers a country’s
historical experience with Party Strength as the determinant of growth. Following Gerring et al.
(2005), we generate a stock variable summarizing Party Strength scores over a country’s observed
time-series, with an annual discount rate of 1%. The estimated coefficient for Party Strength is
positive and highly significant, suggesting that this factor may have both short-term and long-
term effects. This result also offers further assurance that our findings are not the product of
simultaneity (factors that affect both right- and left-side variables). Note that the stock variable
extends back to 1900 (or the first year in which Party Strength is observed for a country).
In Model 5, we include a lagged dependent variable as an additional regressor in the
benchmark model. This dynamic model estimates how Party Strength at t-1 affects changes in
the economic growth rate from t-1 to t. The point estimate in this model is 1.4, and the t-value is
4.2 – remarkably close to our benchmark (Model 1). Another approach (not shown in Table 2)
deals with temporal confounders by measuring one-period changes in right- and left-side factors
– a first-difference model. This also shows a large (2.0) and statistically significant (t=2.2) effect
(see Appendix).
In Model 6, we test more complex dynamic panel model known as system generalized
method of moments, a version of GMM regarded as appropriate for studying sluggish variables

20
such as Party Strength (Blundell & Bond 1998).6 These tests reveal extremely large and highly
significant coefficients for Party Strength. However, model diagnostics suggest that the
overidentifying restrictions may not be valid in the 1-year specifications due to the large number
of instruments. Hence, we follow a standard approach for GMM models with long time series.
Specifically, instead of annual data we use data at five-year intervals, as in Model 2. This reduces
the number of time series units and thus the number of instruments, and allows for valid
identification (following the assumptions of the model). We allow four lags for instrumentation,
producing 123 instruments, well below the number of cross-sectional units (153), which is often
employed as a rule-of-thumb threshold (Roodman 2009). The Ar(2) test p-value is 0.38 and the
Hansen J-test p-value is 0.43, suggesting that Model 6 provides consistent estimates. Even when
modelling Party Strength as endogenous, the GMM model estimates that the short-term effect of
a one-point increase in Party Strength results in 2.0 percentage points additional growth
(significant at 1 percent), and the long-term effect (�party strength/(1-�lagged DV) is about 2.3
percentage points.
In Model 7, we adopt an instrumental-variable approach to causal identification. To
instrument for Party Strength, we adopt a technique developed for testing the effects of
institutional features on economic performance (Acemoglu et al. 2014; Knutsen 2011b; Miller
2015; Persson & Tabellini 2003). This technique rests on the assumption that institutional forms
are, in part, the product of diffusion (Weyland 2008). Insofar as we can measure pressures for
diffusion by taking account the institutional forms adopted by a country’s neighbors, and insofar
as the institutional evolution of these neighbors has no direct impact on the outcome of interest
(conditional on other factors in the causal model), we may regard such a factor as a valid
instrument, satisfying the exclusion restriction.
Specifically, we construct a variable that measures average levels of Party Strength in a
region (excluding the country in question) and another variable that measures average values of
Party Strength globally (also excluding the country in question), with the expectation that these
regional and global factors predict Party Strength in the country of interest. F-tests of these
instruments in the first stage regression confirm that they are very strong predictors, explaining a
substantial amount of variation in Party Strength (see Table E1). We also include on the right
6 The system GMM estimator includes level and differences regressions, and accounts for endogenous regressors by using lags of levels to instrument for differences and lags of differences to instrument for levels. Four lags are used for instrumentation (123 instruments in total), and Party Strength, ln GDP p.c. and lagged growth are modelled as endogenous. The Ar(2) test p-value is 0.38, and the Hansen J-test p-value is 0.43. To mitigate the “too-many-instruments” problem (Roodman 2009), we restrict the number of lags used for instrumentation (models using 2- 4 lags are reported for the 1-year specifications in the Appendix, and models using 2-6 lags are reported for the 5-year specifications). We test models only considering Party Strength as endogenous, but our favored specifications also consider income level and lagged growth as endogenous. The results are robust.

21
side of this model two variables measuring average growth rates regionally and globally to
mitigate the possibility that our diffusion instruments are correlated with economic performance.
The Sargan test of the exclusion restriction (p=0.16) suggest that the chosen instruments are
valid. If so, the estimated coefficient for Party Strength in Model 7 – which is strikingly similar to
our benchmark model – should provide a consistent estimate of the causal effect of Party
Strength on growth. To test the stability of this result, we conduct a number of robustness tests,
employing different sets of instruments and controls, as shown in Table E2. Results suggest that
our specifications is not susceptible to arbitrary choices of instruments.
Another threat to inference is posed by sample bias. Data for key variables is not
available for all countries; notably missing from our analysis are many micro-states. To mitigate
this problem we employ a multiple imputation algorithm with Amelia II (Honaker & King 2010),
which is adapted to the cross-section time-series structure of our data (see Appendix A for
model specifications). Ten imputed datasets are produced, encompassing 205 countries and a
time-series extending from 1900-2014. Model 8 reports the coefficients for the benchmark
model, averaged across these imputed datasets, and with standard errors that account for
variability across the datasets. The effect of Party Strength on growth remains positive (1.1),
although somewhat attenuated relative to our benchmark model, and highly significant (t=5.1).
To explore functional form we construct an ordinal measure of Party Strength
consisting of dummies representing different levels of Party Strength. Dummies are constructed
by dividing up the index – which stretches from -1.723 to 1.363 – into six equidistant units.
These dummies (excluding the first level as a reference category) replace our continuous measure
of Party Strength in Model 9. It will be seen that only the upper categories are statistically
significant, as one might expect (slight increases in Party Strength relative to the bottom category
are not enough to generate an effect that is statistically distinguishable from zero). For our
purposes, the salient result is that the coefficients increase in a monotonic, and nearly linear,
fashion from II to VI. This suggests that our linear index does a good job of capturing the true
functional form. It also reassures us that the effects measured in the benchmark model are not
driven by a small number of unusual cases.
To understand more about the robustness of our findings, and to test our claim that the
impact of Party Strength extends across regime-types, we divide the sample into democracies
(Model 10) and autocracies (Model 11) using the binary regime-type index constructed by Boix,
Miller & Rosato (“BMR” [2013]). The coefficients for Party Strength in both models are
comparable, and the t statistics are large, supporting our claim that the impact of Party Strength

22
on growth is orthogonal to regime-type. Strikingly, the coefficients for Party Strength in both
models are considerably higher than in our benchmark model.
V. Global Analyses: Robustness Tests
In Table 3, we conduct a series of specification tests intended to probe the sensitivity of the
Party Strength/growth relationship to potential confounders. All variables are defined in Table
A1, with descriptive statistics in Table A2.
Model 1 is a spare model, including only country and year dummies (excluding per
capita GDP). Model 2 adds several time-varying covariates to the benchmark specification,
including urbanization, life expectancy, petroleum production, intra-state armed conflict, and
inter-state armed conflict. Model 3 adds a number of fixed covariates to the benchmark model
including ethnic fractionalization, percent Muslim, percent Protestant, land area, legal origin
(English, French, et al.), regime-type (following the typology from Geddes et al. 2014), and
region dummies. These variables, which change little, if at all, across the period of observation,
replace the use of country fixed effects in a random effects model. Coefficient estimates for
Party Strength are stable and comparable to our benchmark model.
In the final specification tests of Table 3 (Models 4-5) we include a variety of indices
that purport to measure the quality of political institutions. This includes democracy, the quality
of public administration, political corruption, property rights, judicial power, judicial freedom
from political threats, and civil society freedom. Somewhat surprisingly, the estimated effect of
Party Strength on growth is even higher than in our benchmark model. Equally surprising, the
other institutional measures – with the notable exception of property rights – are not robust
predictors of growth.
The inclusion of these indices also mitigates a potential threat to inference stemming
from the foreknowledge that V-Dem coders have about the “left side” of our causal model.
Specifically, country experts may be more inclined to assign a high score to a country along some
institutional parameter during a period in which a country experiences high growth. If so, the
relationship we find in our benchmark model is spurious, a product of coding circularity.
However, we would expect this sort of coding bias – to the extent that it exists – to affect other
institutional variables since they are also coded by country experts (and in some cases, by the
same set of experts who coded the variables that comprise the Party Strength index). Moreover,
we would expect it to manifest itself more strongly with institutional variables that are widely
assumed to be associated with economic performance such as corruption control or property

23
rights. The fact that the main result holds even when controlling for these subjectively coded
institutions alleviates concern about this sort of confounding.

24
Table 3: Specification Tests 1 2 3 4 5
Estimator OLS OLS RE OLS OLS
Party Strength 1.221*** 1.242** 1.124*** 2.698*** 2.495*** (0.328) (0.483) (0.355) (0.496) (0.491)
GDPpc (ln) -2.564*** -0.681** -2.586*** -2.710*** (0.544) (0.291) (0.440) (0.451)
Urbanization -3.587 (2.713)
Life expectancy 0.017 (0.037)
Petroleum 0.001* (0.000)
Internal conflict -1.283*** (0.313)
External conflict -0.538 (0.474)
Ethnic fract -0.605 (0.711)
Latitude (ln) -0.066 (0.172)
Muslim -0.003 (0.005)
Protestant -0.002 (0.011)
Land area 0.000 (0.000)
Democracy, BMR -0.190 (0.375)
Democracy, Polity2 -0.047 (0.033)
Public administration 0.293 0.087 (0.211) (0.264)
Corruption control -0.406* -0.398* (0.205) (0.205)
Property rights 0.610*** 0.622*** (0.205) (0.216)
Judicial power -0.336 (0.218)
Judicial threats 0.578** (0.225)
Civil society freedom 0.128 (0.214)
Legal origin (dummies) ! Regime type, Geddes (dummies) ! Region FE ! Year FE ! ! ! ! ! Country FE ! ! ! ! Countries 153 106 136 147 147 Years (Max) 110 107 49 108 110 Obs 10148 6822 5667 7738 7955 R2 (within) (0.099) (0.113) (0.088) (0.138) (0.145)
Outcome: per capita GDP growth. Unit of analysis: country-year. FE: fixed effects. All right-side variables lagged by 1 year. Estimator: OLS (ordinary least squares), RE (random effects), standard errors clustered by country. *** p<.01 **p<.05 *p<.10.

25
Our theoretical argument about the role of political parties in conditioning growth
performance is intended to apply across many contexts. To probe the scope-conditions of the
theory, and to alleviate concerns about influential cases or time-periods, we run the benchmark
model in a series of split-sample tests, shown in Table 4. We begin by excluding certain regions
of the world – sub-Saharan Africa, Asia and the Pacific, Eastern Europe and the Post-Soviet
region, Latin America, the Middle East and North Africa, Western countries (Western Europe,
North America, Australia, New Zealand), and non-Western countries (the remainder). Models 1-
7 demonstrate that the relationship between Party Strength and growth persists in all of these
sub-sample tests. Moreover, the coefficient estimates vary within a narrow range (from 1.3 to
2.4) around the estimate from our full sample (1.6), as shown in Model 1, Table 2.
To check for variation through time, we run the benchmark model across a global
sample extending from 1900 to 1969 (Model 8) and 1970 to 2012 (Model 9). Again, we find
remarkable consistency. Experimenting with different cut-offs, we find that the point estimate is
typically somewhat higher for earlier periods but is more precisely estimated for the later periods
(due, presumably, to the larger sample). The relationship between Party Strength and growth
does not seem to be subject to strong period effects across the twentieth century.
Table 4: Split-Sample Tests
1 2 3 4 5 6 7 8 9
Sample minus
sub-Saharan Africa
minus Asia-
Pacific
minus Former Soviet
minus Latin
America
minus MENA
minus Western
minus Non-
Western
1900− 1969
1970− 2012
Party Strength 2.039*** 1.639*** 1.331*** 1.742*** 1.637*** 1.703*** 2.374*** 1.585** 1.323* (0.440) (0.433) (0.320) (0.406) (0.364) (0.405) (0.816) (0.671) (0.710)
GDPpc (ln) -2.576*** -2.834*** -1.581*** -1.958*** -1.926*** -1.774*** -5.786*** -5.654*** -3.803*** (0.486) (0.401) (0.308) (0.398) (0.396) (0.374) (1.560) (1.167) (0.643)
Year FE ! ! ! ! ! ! ! ! ! Country FE ! ! ! ! ! ! ! ! ! Countries 105 131 123 129 136 131 20 130 152 Years (Max) 110 110 110 110 110 110 110 70 40 Obs 7392 8603 9078 8232 9209 7941 2150 4658 5489 R2 (within) (.134) (.129) (.090) (.118) (.117) (.110) (.217) (.127) (.114) Outcome: per capita GDP growth. Unit of analysis: country-year. All right-side variables lagged by 1 year. FE: fixed effects. Estimator: ordinary least squares, standard errors clustered by country. *** p<.01 **p<.05 *p<.10
26
VI. Mediation Analysis
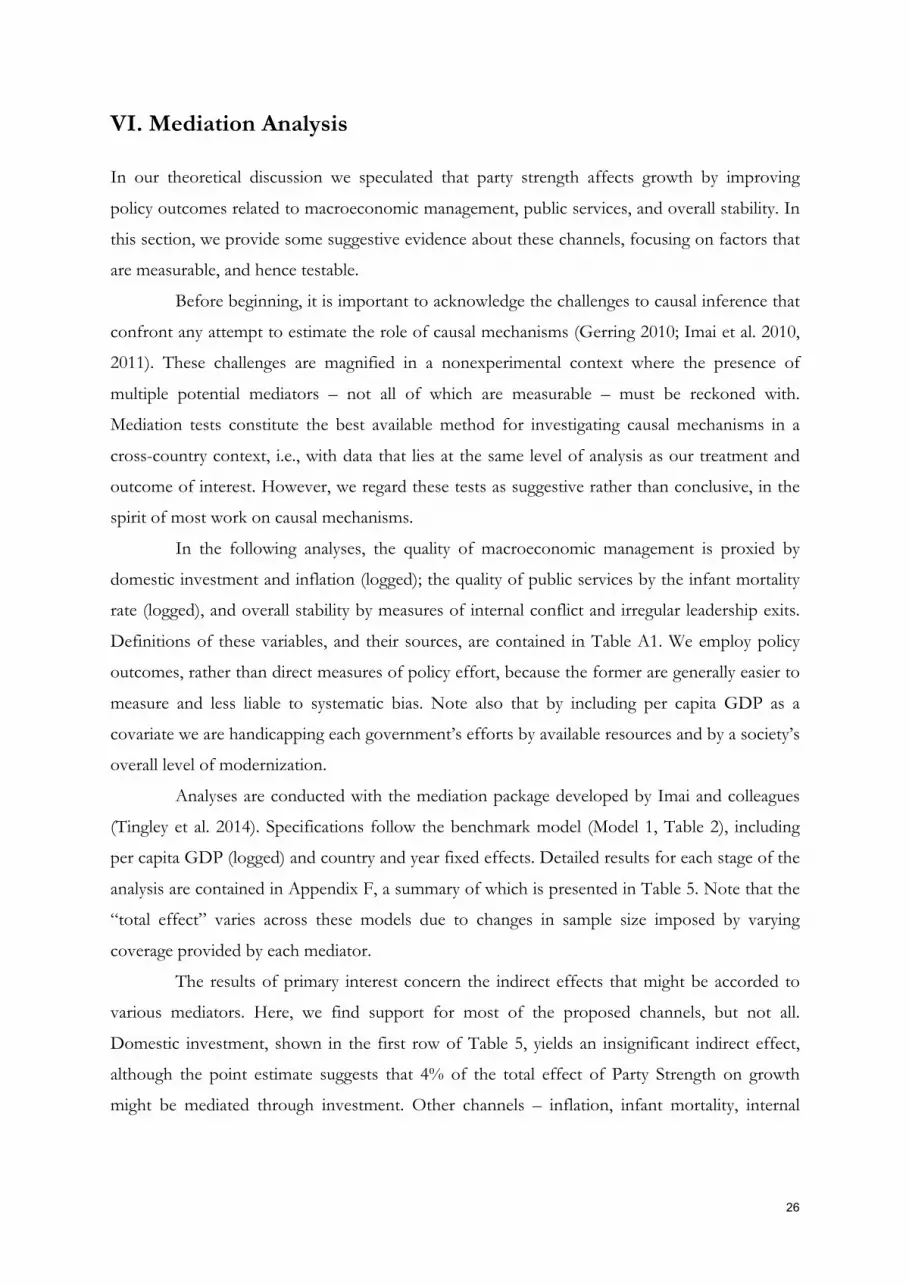
In our theoretical discussion we speculated that party strength affects growth by improving
policy outcomes related to macroeconomic management, public services, and overall stability. In
this section, we provide some suggestive evidence about these channels, focusing on factors that
are measurable, and hence testable.
Before beginning, it is important to acknowledge the challenges to causal inference that
confront any attempt to estimate the role of causal mechanisms (Gerring 2010; Imai et al. 2010,
2011). These challenges are magnified in a nonexperimental context where the presence of
multiple potential mediators – not all of which are measurable – must be reckoned with.
Mediation tests constitute the best available method for investigating causal mechanisms in a
cross-country context, i.e., with data that lies at the same level of analysis as our treatment and
outcome of interest. However, we regard these tests as suggestive rather than conclusive, in the
spirit of most work on causal mechanisms.
In the following analyses, the quality of macroeconomic management is proxied by
domestic investment and inflation (logged); the quality of public services by the infant mortality
rate (logged), and overall stability by measures of internal conflict and irregular leadership exits.
Definitions of these variables, and their sources, are contained in Table A1. We employ policy
outcomes, rather than direct measures of policy effort, because the former are generally easier to
measure and less liable to systematic bias. Note also that by including per capita GDP as a
covariate we are handicapping each government’s efforts by available resources and by a society’s
overall level of modernization.
Analyses are conducted with the mediation package developed by Imai and colleagues
(Tingley et al. 2014). Specifications follow the benchmark model (Model 1, Table 2), including
per capita GDP (logged) and country and year fixed effects. Detailed results for each stage of the
analysis are contained in Appendix F, a summary of which is presented in Table 5. Note that the
“total effect” varies across these models due to changes in sample size imposed by varying
coverage provided by each mediator.
The results of primary interest concern the indirect effects that might be accorded to
various mediators. Here, we find support for most of the proposed channels, but not all.
Domestic investment, shown in the first row of Table 5, yields an insignificant indirect effect,
although the point estimate suggests that 4% of the total effect of Party Strength on growth
might be mediated through investment. Other channels – inflation, infant mortality, internal

27
conflict, and irregular leader exit – show statistically significant results, with the proportion
mediated ranging from 3.6% to 8.5%.
In sum, observable proxies of policy outcomes related to economic management,
public services provision, and political stability seem to account for some of the effect of Party
Strength on growth. Together, they offer support for our hypotheses about the causal
mechanisms at work in our theory.
Importantly, each policy outcome variable is treated as a mediator in isolation. That is,
we analyze the possible mediating effects of a variable without taking account of other potential
mediators. Because mediating effects are likely to overlap one cannot simply add up the
proportions mediated by each of these variables to capture the total proportion mediated by all
of these causal pathways. (As time permits, we plan to test these factors in a combined model in
order to address this issue.)
Table 5: Summary of Mediation Analyses
Direct effect (c)
Mediator (M) (pol i cy out come)
Indirect effect (a)(b)
Proportion mediated
Total effect (a)+(b)(c) Countries Years Obs
0.910*** (0.578)
Investment (Macroeconomic management)
0.040 (0.071)
4.20% 0.951*** (0.591)
146 56 6428
1.060*** (0.594)
Inflation (ln) (Macroeconomic management)
0.088*** (0.045) 7.50% 1.149***
(0.569) 139 109 6875
1.431*** (0.501)
Infant mortality (ln) (Public services)
0.105*** (0.048) 6.90% 1.537***
(0.496) 150 109 8927
1.086*** (0.526)
Internal Conflict (Stability)
0.101*** (0.037) 8.50% 1.187***
(0.522) 111 109 8073
1.581*** (0.556)
Irregular Exit (Stability)
0.058** (0.051) 3.60% 1.640***
(0.556) 147 109 8860
Y: outcome, i.e., per capita GDP growth. X: independent variable of theoretical interest, i.e., Party Strength. M: possible mechanisms, i.e., indicators of macroeconomic management, public goods, and stability. Specification: Model 1, Table 2. Unit of analysis: country-year. Time periods: Party Strength measured in t, mediators measured at t+1, and GDP per capita measured at t+2. Standard errors clustered by country. *** p<.01 **p<.05 *p<.10
In addition to mediation analysis, we probe a variety of alternate outcomes that may
also help to shed light on causal mechanisms at work in the relationship between Party Strength
and economic growth, even though they cannot be analyzed in a mediation analysis (because
X
M
Y (c)
(a) (b)
28
they are derived from growth performance). Results from these tests are reported in Appendix
E.
First, we examine whether Party Strength reduces the likelihood of economic crisis,
understood as an episode of negative per capita GDP growth. This is variously coded as less
than 0, less than -3%, or less than -5%, to generate three dependent variables. Party Strength is
negatively associated with each of these outcomes when tested in our benchmark model with
ordinary least squares or logistic regression estimators, as shown in Table E3. The OLS point
estimate suggests that a 1-point increase in Party Strength reduces the probability of observing
negative growth in the following year by 8 percentage points (29 percent of observations have
negative growth).
Second, we examine whether Party Strength enhances the likelihood of periods of
sustained growth, understood as consecutive years of positive growth sustained across five- or
ten-year periods. Party Strength is associated with sustained growth episodes when tested in our
benchmark model using both outcome intervals, and employing either ordinary least squares or
logistic regression estimators, as shown in Table E4.
Third, we examine whether Party Strength reduces growth volatility, understood as the
standard deviation of growth performance over 10- and 15-year periods. Point estimates from
these models suggest that Party Strength reduces growth volatility, though these estimates are
statistically significant only when country fixed-effects are removed. Note that when growth
volatility is analyzed in a cross-country format the analysis typically does not include country
fixed-effects (e.g., Easterly et al. 2001). It seems fair to conclude that countries with stronger
parties not only have higher growth, on average, they also have less volatile growth rates.

29
Conclusion
In this study, we argue that strong parties play a critical role in fostering economic development.
Our theoretical argument highlights how parties broaden the constituencies to which policy
makers respond and help politicians to solve coordination problems. These features ensure that
politicians engage in better economic management, have incentives to provide productivity
enhancing public services, and help ensure political (and thus policy) stability. This, in turn,
should enhance economic growth.
Drawing on a novel measure of party strength from the Varieties of Democracy dataset,
we test this hypothesis on data from more than 150 countries, with time series extending from
1900 to 2012. We identify a sizeable and highly significant effect, and one that is robust to a
variety of specifications, estimators, and samples. The effect operates in both democracies and
autocracies and is fairly stable across various regions of the world and across time periods. We
also provide suggestive evidence about causal mechanisms, focusing on measures of economic
management, public goods, and political stability.
This paper thus contributes to two large literatures, respectively focusing on features of
political parties and on the institutional determinants of growth. While previous studies have
highlighted the role of parties in improving the quality of governance such claims are usually
limited in context – to democratic or authoritarian settings – and generally do not pertain to
distal outcomes such as per capita GDP growth. Studies of economic development, while
focused explicitly on growth, generally identify other long-run causal factors at work, e.g.,
geography, property rights, political constraints, colonial origins, inequality, social capital, or
human capital. In these respects, the present study is novel.
With respect to work in the new institutionalist vein it should be pointed out that our
argument – that “parties matter” for growth – does not impugn the role of the state, as measured
by formal, legal, and constitutional factors such as federalism, separate powers, the judiciary, the
bureaucracy, rule of law, and democracy. However, it should be noted that in our analyses the
character of political parties is a better predictor of subsequent economic performance than
these other factors – whether measured by indices drawn from the V-Dem project or from other
datasets. This may reflect our inability to properly measure these features of the state. But it may
also signal the relative importance of informal, or at least non-constitutional, institutions vis-à-vis
formal constitutional institutions in structuring long-run development (Helmke & Levitsky
2004). While formal institutions have garnered greater attention in comparative politics (with the
notable exception of studies centered on social capital), one might argue that informal

30
institutions such as political parties play the dominant role. This, in turn, revisits an intellectual
turn initiated over a century ago by the founders of American political science, who shifted their
attention from formal-legal institutions to informal institutions – foremost among them, political
parties (Bryce 1888; Ostrogorski 1902; Wilson 1908).
Although the evidence for a party-strength effect on growth is strong, several ancillary
questions bear further study. First, we need to know more about the prior causes, i.e., the causes
of party strength. Why do strong parties develop in some countries and not in others? Second,
our preliminary analysis of causal mechanisms might be extended and tested in greater depth
with better, or more complete, measures of intermediary factors. Third, we need to know more
about the possible impact of party strength on other domestic policies (e.g., social policies) and
on international policies (e.g., peace/war). If party strength matters for growth through affecting
the incentives of leaders and easing coordination problems, it stands to reason it might matter
for other outcomes of interest to the scholarly community and the laity.

31
References
Acemoglu, Daron, James A. Robinson. 2006. Economic Origins of Dictatorship and Democracy. New
York: Cambridge University Press.
Acemoglu, Daron, James A. Robinson. 2012. Why Nations Fail. New York: Crown Business.
Acemoglu, Daron, Simon Johnson, James A. Robinson. 2001. “The Colonial Origins of
Comparative Development: An Empirical Investigation.” American Economic Review 91(5):1369–
1401.
Acemoglu, Daron, Suresh Naidu, Pascual Restrepo, James A. Robinson. 2014. “Democracy Does
Cause Growth.” NBER Working Paper No. 20004.
Alesina, Alberto, Sule Ozler, Nouriel Roubini, Phillip Swagel. 1996. “Political Instability and
Economic Growth.” Journal of Economic Growth 1:2, 189-211.
Amsden, Alice. 1989. Asia's Next Giant: South Korea and Late Industrialization. New York: Oxford
University Press.
Arndt, Christiane, Charles Oman. 2006. The Uses and Abuses of Governance Indicators. OECD:
OECD Publishing.
Aron, Janine. 2000. “Growth and Institutions: A Review of the Evidence.” World Bank Research
Observer 15:1, 99-135.
Aspinall, Edward. 2014. “Parliament and Patronage.” Journal of Democracy 25.4: pp. 108-109.
Baron, Reuben M., David A. Kenny. 1986. “The Moderator-Mediator Variable Distinction in
Social Psychological Research: Conceptual, Strategic, and Statistical Considerations. Journal of
Personality and Social Psychology, 51 (6): 1173–1182.
Barro, Robert J., Xavier Sala-i Martin (2004). Economic Growth. Cambridge, MA.: The MIT Press.
Beck, Thorsten, George Clarke, Alberto Groff, Philip Keefer, and Patrick Walsh (2001). “New
Tools in Comparative Political Economy: The Database of Political Institutions.” World Bank
Economic Review 15 (1): 165–76.
Bertelsmann Foundation. 2014. “Bertelsmann Transformation Index.” Link: http://www.bti-
project.org/index/
Besley, Timothy, Masayuki Kudamatsu. 2006. “Health and Democracy.” American Economic Review
96(2): 313-338.
Besley, Timothy, Masayuki Kudamatsu. 2008. “Making Autocracy Work.” In E. Helpman (ed.)
Institutions and Economic Performance (Cambridge: Harvard University Press).
Blundell, Bond 1998. “Initial conditions and moment restrictions in dynamic panel data models.”
Journal of Econometrics 87, 115-143.

32
Boix, Carles, Michael K. Miller, Sebastian Rosato. 2013. “A Complete Data Set of Political
Regimes, 1800-2007.” Comparative Political Studies 46(12): 1523-1554.
Boix, Carles, Milan W. Svolik. 2013. “The Foundations of Limited Authoritarian Government:
Institutions, Commitment, and Power-Sharing in Dictatorships.” Journal of Politics 75:2, 300-16.
Bollen, Kenneth A.; Pamela Paxton. 2000. “Subjective Measures of Liberal Democracy.”
Comparative Political Studies 33(1): 58–86.
Bolt, J., J. L. van Zanden. 2014. “The Maddison Project: collaborative research on historical
national accounts.” The Economic History Review 67 (3): 627–651.
Bowie, Alasdair. 1991. Crossing the Industrial Divide: State, Society, and the Politics of Economic
Transformation in Malaysia. New York: Columbia University Press.
Brownlee, Jason. 2007. Authoritarianism in the Age of Democratization. Cambridge: Cambridge
University Press.
Brownlee, Jason. 2008. “Bound to Rule: Party Institutions and Regime Trajectories in Malaysia
and the Philippines.” Journal of East Asian Studies 8: 89-118.
Brownlee, Jason. 2009. “Portents of Pluralism: How Hybrid Regimes Affect Democratic
Transitions.” American Journal of Political Science 53:3, 515-532.
Bryce, James. 1888/1891. The American Commonwealth, 2 vols. Chicago: Charles H. Sergel.
Bueno de Mesquita, Bruce, Alistair Smith, Randolph M. Siverson, James D. Morrow. 2003. The
Logic of Political Survival. Cambridge: MIT Press.
Campos, Edgardo, Hilton L. Root. 1996. The Key to the East Asian Miracle: Making Shared Growth
Credible. Washington, DC: The Brookings Institution.
Chang, Ha-Joon. 2011. “Institutions and Economic Development: Theory, Policy and History.”
Journal of Institutional Economics 7:4, 473–98.
Cheng, Tun-jen. 1990. “Political Regimes and Development Strategies: South Korea and
Taiwan.” In G. Gerreffi and D. Wyman (eds.). Manufacturing Miracles: Patterns of Development in
Latin America and East Asia. Princeton: Princeton University Press.
Clinton, J. D.; David Lewis. 2008. “Expert Opinion, Agency Characteristics, and Agency
Preferences.” Political Analysis 16:1, 3–20.
Clinton, J. D.; J.S. Lapinski. 2006. “Measuring Legislative Accomplishment, 1877-1994.” American
Journal of Political Science 50:1, 232–49.
Collier, Paul. 1999. “On the Economic Consequences of Civil War.” Oxford Economic Papers 51:1,
168–83.
Coppedge, Michael, John Gerring, Staffan I. Lindberg, Jan Teorell, David Altman, Michael
Bernhard, M. Steven Fish, Adam Glynn, Allen Hicken, Carl Henrik Knutsen, Kelly McMann,

33
Daniel Pemstein, Svend-Erik Skaaning, Jeffrey Staton, Eitan Tzelgov, Yi-ting Wang, and
Brigitte Zimmerman. 2015a. “Varieties of Democracy: Dataset v4.” Varieties of Democracy
(V-Dem) Project.
Coppedge, Michael, John Gerring, Staffan I. Lindberg, Jan Teorell, David Altman, Michael
Bernhard, M. Steven Fish, Adam Glynn, Allen Hicken, Carl Henrik Knutsen, Kelly McMann,
Daniel Pemstein, Svend-Erik Skaaning, Jeffrey Staton, Eitan Tzelgov, and Yi-ting Wang.
2015b. “Varieties of Democracy: Codebook v4.” Varieties of Democracy (V-Dem) Project.
Coppedge, Michael, John Gerring, Staffan I. Lindberg, Jan Teorell, David Altman, Michael
Bernhard, M. Steven Fish, Adam Glynn, Allen Hicken, Carl Henrik Knutsen, Kelly McMann,
Daniel Pemstein, Svend-Erik Skaaning, Jeffrey Staton, Eitan Tzelgov, Yi-ting Wang, and
Brigitte Zimmerman. 2015c. “Varieties of Democracy: Methodology v4.” Varieties of
Democracy (V-Dem) Project.
Cox, Gary W. 1987. The Efficient Secret: The Cabinet and the Development of Political Parties in Victorian
England. Cambridge: Cambridge University Press.
Cox, Gary W., Mathew D. McCubbins. 2001. “The Institutional Determinants of Policy
Outcomes.” In Stephan Haggard and Mathew D. McCubbins, eds. Presidents, Parliaments, and
Policy (Cambridge: Cambridge University Press).
Croissant, Aurel, Philip Volkel. 2012. “Party System Types and Party System Institutionalization:
Comparing New Democracies in East and Southeast Asia.” Party Politics 18: 235-65.
de Dios, Emmanuel, Paul Hutchcroft. 2003. “Political Economy: Examining Current Challenges
in Historical Perspective.” In Arsenio M. Balisacan & Hal Hill, eds., The Philippines Economy:
Development, Policies, and Challenges (Oxford University Press).
Dikotter, Frank. 2010. Mao's Great Famine: The History of China's Most Devastating Catastrophe, 1958-
1962. New York: Walker Publishing Company.
Doner, Richard F. 1991. “Approaches to the Politics of Economic Growth in Southeast Asia.”
Journal of Asian Studies. 50:4 (November) 818-49.
Doner, Richard F. 2009. The Politics of Uneven Development: Thailand's Economic Growth in Comparative
Perspective. Cambridge: Cambridge University Press.
Easterly, William R., Roumeen Islam, Joseph Stiglitz. 2001. “Shaken and Stirred: Explaining
Growth Volatility.” World Bank: Annual World Bank Conference on Development
Economics.
Easterly, William, S. Rebello. 1993. “Fiscal Policy and Economic Growth: An Empirical
Investigation.” Journal of Monetary Economics 32:3, 417–58.

34
Evans, Peter B. 1995. Embedded Autonomy. States and Industrial Transformation. Princeton: Princeton
University Press.
Fearon, James. 1995. “Rationalist explanations for war.” International Organization 49:3, 379-414.
Finer, Samuel E. 1988. The Man on Horseback: The Role of the Military in Politics. Boulder, Colorado:
Westview Press.
Fjelde, Hanne. 2010. “Generals, Dictators, and Kings: Authoritarian Regimes and Civil Conflict,
1973-2004.” Conflict Management and Peace Science 27:3, 195–218.
Franzese, Robert J., Irfan Nooruddin, Karen Long Jusko. 2004. “Geographic versus Partisan Bases
of Representation: Party Unity and the Effective Constituency in US Distributive Politics.”
Presented at the annual meetings of the Midwest Political Science Association, April, 2004.
Chicago.
Fukuyama, Francis. 2011. The Origins of Political Order: From Prehuman times to the French Revolution.
New York: Farrar, Straus, Giroux.
Gandhi, Jennifer. 2008. Political Institutions under Dictatorship. Cambridge: Cambridge University
Press.
Gates, Scott, Håvard Hegre, Håvard M. Nygård, Håvard Strand. 2012. “Development
Consequences of Armed Conflict.” World Development 40:9, 1713-22.
Geddes, Barbara, Joseph Wright, Erica Frantz. 2014. “Autocratic Breakdown and Regime
Transitions: A New Data Set.” Perspectives on Politics 12:2, 313-31.
Geddes, Barbara. 1999. “What Do We Know About Democratization After Twenty Years?”
Annual Review of Political Science 2, 115-44.
Gehlbach, Scott, Philip Keefer. 2011. “Investment without Democracy: Ruling-party
Institutionalization and Credible Commitment in Autocracies.” Journal of Comparative Economics
39, 123–39.
Gehlbach, Scott, Philip Keefer. 2012. “Private Investment and the Institutionalization of
Collective Action in Autocracies: Ruling Parties and Legislatures.” Journal of Politics 74:2, 621-
35.
Gerring, John. 2007. Case Study Research: Principles and Practices. Cambridge: Cambridge University
Press.
Gerring, John. 2010. “Causal Mechanisms: Yes, But…” Comparative Political Studies 43:11
(November) 1499-1526.
Gerring, John, Philip Bond, William T. Barndt, Carola Moreno. 2005. “Democracy and
Economic Growth: A Historical Perspective.” World Politics 57:3, 323–364.

35
Gerring, John, Strom C. Thacker. 2008. A Centripetal Theory of Democratic Governance. Cambridge:
Cambridge University Press.
Glaeser, Edward L., Rafael La Porta, Florencio Lopez-de Silanes, Andrei Shleifer. 2004. “Do
Institutions Cause Growth?” Journal of Economic Growth 9:3, 271–303.
Goemans, Hein, Kristian Skrede Gleditsch, Glacomo Chiozza. 2009. “Introducing Archigos: A
Dataset of Political Leaders.” Journal of Peace Research 46: 269-283.
Greene, Kenneth F. 2007. Why Dominant Parties Lose: Mexico’s Democratization in Comparative
Perspective. Cambridge: Cambridge University Press.
Hadenius, Axel, Jan Teorell. 2007. “Pathways from Authoritarianism.” Journal of Democracy 18:1,
143-57.
Haggard, Stephan M. 1990. Pathways from the Periphery: The Politics of Growth in the Newly
Industrializing Countries. Ithaca: Cornell University Press.
Haggard, Stephan M. 1998. “Business, Politics and Policy in East and Southeast Asia.” In Henry
S. Rowen, ed., Behind East Asian Growth: The Political and Social Foundations of Prosperity
(Routledge) 78-104.
Haggard, Stephan M., Andrew MacIntyre, Lydia Tiede. 2008. “The Rule of Law and Economic
Development.” Annual Review of Political Science 11, 205-34.
Haggard, Stephan M., Mathew D. McCubbins (eds). 2001. Presidents, Parliaments, and Policy.
Cambridge: Cambridge University Press.
Hall, Robert, Charles Jones. 1999. “Why Do Some Countries Produce so much more Output per
Worker than Others?” Quarterly Journal of Economics 114:1, 83-116.
Hankla, Charles R. 2006a. “Party Strength and International Trade: A Cross-National Analysis.”
Comparative Political Studies 39: 1133-56.
Hankla, Charles R. 2006b. “Party Linkages and Economic Policy: An Examination of Indira
Gandhi’s India.” Business and Politics 8:3, 1-29.
Hawes, Gary. 1992. “Marcos, His Cronies and the Philippines Failure to Develop.” In Ruth
McVey, ed. Southeast Asian Capitalists (Ithaca: Cornell Southeast Asia Program).
Helmke, Gretchen, Steven Levitsky. 2004. “Informal Institutions and Comparative Politics: A
Research Agenda.” Perspectives on Politics 2:4 (December) 725-40.
Hicken, Allen. 2006a. “Stuck in the Mud: Parties and Party Systems in Democratic Southeast
Asia.” Taiwan Journal of Democracy 2:2 (December) 23-46.
Hicken, Allen. 2006b. “Party Fabrication: Constitutional Reform and the Rise of Thai Rak Thai”.
Journal of East Asian Studies 6:3, 381-408.
Hicken, Allen. 2008. “The Politics of Economic Recovery in Thailand and the Philippines.” In

36
Andrew MacIntyre, T.J. Pempel, John Ravenhill, eds., Crisis as Catalyst: Asia's Dynamic Political
Economy (Ithaca: Cornell University) 206-230.
Hicken, Allen. 2013. “Late to the Party: Institutional Reform and the Development of
Partisanship in Thailand.” Trans: National and Regional Studies of Southeast Asia 1:2, 1-15.
Hicken, Allen. Forthcoming. “Party Systems and the Politics of Development.” In Carol
Lancaster & Nicolas van de Walle, eds., Handbook on the Politics of Development (Oxford
University Press).
Hicken, Allen, Erik Martinez Kuhonta. 2014. “Rethinking Party System Institutionalization in
Asia.” In Allen Hicken & Erik Martinez Kuhonta (eds), Party and Party System Institutionalization
in Asia (Cambridge: Cambridge University Press).
Hicken, Allen, Joel Simmons. 2008. “The Personal Vote and the Efficacy of Education
Spending.” American Journal of Political Science 52:1, 109-124.
Hicken, Allen, Ken Kollman, Joel Simmons. Forthcoming. “Party System Nationalization and the
Provision of Public Health Services.” Political Science Research and Methods.
Honaker, James, Gary King. 2010. “What to Do about Missing Values in Time-Series Cross-
Section Data.” American Journal of Political Science 54:2, 561–581.
Huntington, Samuel P. 1957. The Soldier and the State; the Theory and Politics of Civil-Military Relations.
Cambridge: Belknap Press of Harvard University Press.
Huntington, Samuel P. 1968. Political Order in Changing Societies. New Haven: Yale University Press.
Hutchcroft, Paul, Joel Rocamora. 2003. “Strong Demands and Weak Institutions: The Origins
and Evolution of the Democratic Deficit in the Philippines.” Journal of East Asian Studies 3:2
(May-August) 259-92.
Imai, Kosuke, Luke Keele, Dustin Tingley, Teppei Yamamoto. 2011. “Unpacking the Black Box
of Causality: Learning about Causal Mechanisms from Experimental and Observational
Studies.” American Political Science Review 105:4, 765-89.
Imai, Kosuke, Luke Keele, Teppei Yamamoto. 2010. “Identification, Inference and Sensitivity
Analysis for Causal Mediation Effects.” Statistical Science 25:1, 51-71.
Jackman, Simon. 2004. “What Do We Learn from Graduate Admissions Committees? A Multiple
Rater, Latent Variable Model, with Incomplete Discrete and Continuous Indicators.” Political
Analysis 12 (4): 400–24.
Jackson, Robert H., Carl G. Rosberg. 1982. Personal Rule in Black Africa: Prince, Autocrat, Prophet,
Tyrant. Berkeley: University of California Press.
Johnson, Chalmers A. 1982. MITI and the Japanese Miracle. Stanford: Stanford University Press.
Johnson, Valen E., James H Albert. 1999. Ordinal Data Modeling. New York: Springer.

37
Junker, B. 1999. “Some Statistical Models and Computational Methods that may be Useful for
Cognitively-Relevant Assessment.” Carnegie Mellon University.
Jütting, Johannes. 2003. “Institutions and Development: A Critical Review.” OECD
Development Centre Working Paper No. 210.
Keefer, Philip. 2007. “Governance and economic growth in China and India.” In L.A. Winters &
S. Yusuf, eds., Dancing with Giants (Washington, DC: World Bank) 211–42.
Keefer, Philip. 2013. “Collective Action, Political Parties and the Political Economy of
Development.” Washington DC: The World Bank, Development Research Group,
Macroeconomics and Growth Team.
Key, V.O., Jr. 1949. Southern Politics in State and Nation. New York: Vintage.
Kitschelt, Herbert. 2000. “Linkages between Citizens and Politicians in Democratic Polities.”
Comparative Political Studies 33(6-7): 845-879.
Kitschelt, Herbert, Steven Wilkinson (eds). 2006. Patrons or Policies? Patterns of Democratic
Accountability and Political Competition. Cambridge: Cambridge University Press.
Kittel, Bernhard. 2006. “A Crazy Methodology?: On the Limits of Macroquantitative Social
Science Research.” International Sociology 21, 647-77.
Knack, Steven, Philip Keefer 1995. “Institutions and Economic Performance: Cross-Country
Tests Using Alternative Measures.” Economics and Politics. 7: 207-227.
Knutsen, Carl Henrik. 2011a. “Which Democracies Prosper? Electoral Rules, Form of
Government and Economic Growth.” Electoral Studies 30:1, 83-90.
Knutsen, Carl Henrik. 2011b. ”Democracy, Dictatorship and Protection of Property Rights.”
Journal of Development Studies 47:1, 164-182.
Kohli, Atul. 1994. “Where do High Growth Political Economies Come From? The Japanese
Lineage of Korea’s ‘Developmental State.’” World Development 22:9 (September) 1269-93.
Kohli, Atul. 2004. State-Directed Development Political Power and Industrialization in the Global Periphery.
Cambridge: Cambridge University Press.
Kuhonta, Erik Martinez. 2011. The Institutional Imperative: The Politics of Equitable Development in
Southeast Asia. Stanford: Stanford University Press.
Kurtz, Marcus, Andrew Schrank. 2007. “Growth and Governance: Models, Measures, and
Mechanisms.” Journal of Politics 69:2 (May).
Lake, David A., Matthew A. Baum. 2001. “The Invisible Hand of Democracy: Political Control
and the Provision of Public Services.” Comparative Political Studies 34: 587-621.
Leftwich, Adrian. 1995. “Bringing Politics Back In: Towards a Model of the Developmental
State.” The Journal of Development Studies 31(3): 400-427.

38
Leftwich, Adrian (ed). 2000. States of Development: On the Primacy of Politics in Development. London:
Polity.
Leftwich, Adrian. 2008. “Developmental States, Effective States and Poverty Reduction: The
Primacy of Politics.” UNRISD Project on Poverty Reduction and Policy Regimes. United Nations
Research Institute for Social Development
Levitsky, Steven. 1998. “Institutionalization and Peronism.” Party Politics 4:1, 77-92.
Lim, Linda. 1983. “Singapore's Success: The Myth of the Free Market Economy.” Asian Survey
23, pp. 752-764.
Lindberg, Staffan, Michael Coppedge, John Gerring, Jan Teorell, et al. 2014. “V-Dem: A New
Way to Measure Democracy.” Journal of Democracy 25:3, 159-69.
Lord, F. M., M.R. Novick. 1968. Statistical Theories of Mental Test Scores. Reading, MA: Addison-
Wesley.
MacIntyre, Andrew (ed). 1994. Business and Government in Industrializing East and Southeast Asia.
Ithaca: Cornell University Press.
Mackie, James, Benardo Villegas, 1999. “The Philippines: Still an Exceptional Case?” In James
Morley (ed.), Driven by Growth: Political Change in the Asia-Pacific Region (New York: Columbia
University Press) chapter 4.
Magaloni, Beatriz, Ruth Kricheli. 2010. “Political Order and One-Party Strength.” Annual Review
of Political Science 13: 123-143.
Magaloni, Beatriz. 2006. Voting for Autocracy: Hegemonic Party Survival and its Demise in Mexico.
Cambridge: Cambridge University Press.
Magaloni, Beatriz. 2008. “Credible Power-Sharing and the Longevity of Authoritarian Rule.”
Comparative Political Studies 41:4-5, 715-741.
Mainwaring, Scott, Timothy Scully (eds). 1995. Building Democratic Institutions: Party Systems in Latin
America. Stanford: Stanford University Press.
Mankiw, Gregory N., David Romer, David N. Weil. 1992. “A Contribution to the Empirics of
Economic Growth.” Quarterly Journal of Economics 107, 407-437.
Marshall, Monty, Ted Gurr, Keith Jaggers. 2014. Polity IV project: Dataset users’ manual.
http://www.systemicpeace.org/inscr/p4manualv2013.pdf
McGillivray, Fiona. 1997. “Party Discipline as a Determinant of The Endogenous Formation Of
Tariffs.” American Journal of Political Science 41(2):584-607.
McVey, Ruth, ed. 1992. Southeast Asian Capitalists. Ithaca, N.Y.: Southeast Asia Program, Cornell
University, pp. 7-35.

39
Miller, Michael K. 2015. “Electoral Authoritarianism and Human Development.” Comparative
Political Studies. Forthcoming.
Morgan, Jana. 2011. Bankrupt Representation and Party System Collapse. University Park, PA:
Pennsylvania State University Press.
Murphy, Kevin M., Andrei Shleifer, Robert W. Vishny. 1989. “Industrialization and the Big
Push.” Journal of Political Economy 97:5, 1003-1026.
Müller, Wolfgang C. 2000. “Political Parties in Parliamentary Democracies: Making Delegation
and Accountability Work.” European Journal of Political Research 37:3, 309-333.
Nielson, Daniel L. 2003. “Supplying Trade Reform Political Institutions and Liberalization in
Middle-Income Presidential Democracies.” American Political Science Review 47:3, 470-491.
North, Douglass C. 1990. Institutions, Institutional Change and Economic Performance. Cambridge:
Cambridge University Press.
North, Douglass C., Barry R. Weingast. 1989. “Constitutions and Commitment: The Institutions
Governing Public Choice in Seventeenth Century England.” Journal of Economic History 44:4,
803–832.
Olson, Mancur. 1993. “Dictatorship, Democracy, and Development.” American Political Science
Review 87:3, 567-576.
Olson, Mancur. 2000. Power and Prosperity: Outgrowing Communist and Capitalist Dictatorships. New
York: Basic Books.
Ostrogorski, Moisey Yakovlevich. 1902. Democracy and the Organization of Political Parties, 2 vols.
Macmillan and Company Limited.
Patz, Richard J., Brian W. Junker. 1999. “A Straightforward Approach to Markov Chain Monte
Carlo Methods for Item Response Models.” Journal of Educational and Behavioral Statistics 24,
146-78.
Pempel, T.J., ed. 1990. Uncommon Democracies: The One-Party Dominant Regimes. Ithaca, NY: Cornell
University Press.
Pemstein, Daniel, Eitan Tzelgov, Yi-ting Wang. 2015. “Evaluating and Improving Item Response
Theory Models for Cross-National Expert Surveys.” V-Dem Working Paper 2015:1.
Pemstein, Daniel, Stephen Meserve, James Melton. 2010. “Democratic Compromise: A Latent
Variable Analysis of Ten Measures of Regime Type.” Political Analysis 18(4): 426–449.
Pepinsky, Thomas. 2014. “The Institutional Turn in Comparative Authoritarianism.” British
Journal of Political Science 44:3, 631-53.
Persson, Torsten, Guido Tabellini. 2003. The Economic Effect of Constitutions. Cambridge,
Massachusetts: MIT Press.

40
Persson, Torsten, Guido Tabellini. 2004. “Constitutions and Economic Policy.” Journal of
Economic Perspectives 18:1, 75–98.
Pierskalla, Jan, Marco Fernandez. 2011. “Partisan Strategies and Political Economic Performance.
Do Modes of Democratic Accountability Affect Economic Fortunes?” Department of
Political Science, Duke University.
Pitcher, M. Anne. 2012. Party Politics and Economic Reform in Africa's Democracies. Cambridge:
Cambridge University Press.
Powell, E. N., Joshua A. Tucker. 2013. “Revisiting Electoral Volatility in Post-Communist
Countries: New Data, New Results and New Approaches.” British Journal of Political Science 44,
123-147.
Przeworski, Adam. 2004. “Institutions Matter?” Government and Opposition 39:2, 527-540.
Quimpo, Nathan Gilbert. 2005. “Yellow Pad: Trapo Parties and Corruption.” Business World
(October 10).
Randall, Vicky, Lars Svåsand. 2002. “Party Institutionalization in New Democracies.” Party Politics
8:1, 5-29.
Ranney, Austin. 1962. The Doctrine of Responsible Party Government: Its Origins and Present State.
Urbana: University of Illinois.
Rodrik, Dani. 1991. “Policy Uncertainty and Private Investment in Developing Countries.”
Journal of Development Economics 36:2, 141-162.
Rodrik, Dani. 1995. “Getting Interventions Right: How South Korea and Taiwan Grew Rich.”
Economic Policy April(20): 55-107.
Rodrik, Dani. 2007. One Economics, Many Recipes: Globalization, Institutions, and Economic Growth.
Princeton: Princeton University Press.
Rodrik, Dani, Arvind Subramanian, Francesco Trebbi. 2004. “Institutions Rule: The Primacy of
Institutions Over Geography and Integration in Economic Development.” Journal of Economic
Growth 9:2, 131–165.
Rogowski, Ronald L. 1987. “Trade and the Variety of Democratic Institutions.” International
Organization 41:2, 203–223.
Roodman, David. 2009. “A Note on the Theme of too many Instruments.” Oxford Bulletin of
Economics and Statistics 71:1, 135-158.
Rothstein, Bo. 2011. The Quality of Government: Corruption, Social Trust and Inequality in International
Perspective. Chicago: University of Chicago Press.
Sachs, Jeffrey. 2003. “Institutions Don’t Rule: Direct Effects of Geography on Per Capita
Income.” NBER Working Paper, No. w9490.

41
Schattschneider, E. E. 1942. Party Government. New York: Rinehart.
Seawright, Jason. 2007. “Democracy and Growth: A Case Study in Failed Causal Inference.” In
Gerardo Munck, ed., Regimes and Democracy in Latin America: Theories and Method (Oxford:
Oxford University Press).
Simmons, Joel W. Forthcoming. The Present or the Future? Political Parties, Time Horizons, and Long-
Run Economic Development. Cambridge: Cambridge University Press.
Simmons, Joel, Allen Hicken, Ken Kollman, Irfan Noorudin. 2014. “Dividing the Spoils: Party
Nationalization, Credibility, and Foreign Direct Investment.” Unpublished Manuscript.
Slater, Daniel. 2010. Ordering Power: Contentious Politics and Authoritarian Leviathans in Southeast Asia.
Cambridge: Cambridge University Press.
Sokoloff, Kenneth L., Stanley L. Engerman. 2000. “Institutions, Factor Endowments, and Paths
of Development in the New World.” Journal of Economic Perspectives 14:3 (Summer) 217-32.
Stasavage, David. 2005. “Democracy and Education Spending in Africa.” American Journal of
Political Science 49:2, 343-58.
Stokes, Susan C. 1999. “Political Parties and Democracy.” Annual Review of Political Science 2:243-
67.
Summers, Lawrence H. 1991. “The Scientific Illusion in Empirical Macroeconomics.”
Scandinavian Journal of Economics 93:2, 129-48.
Svolik, Milan. 2012. The Politics of Authoritarian Rule. Cambridge: Cambridge University Press.
Thomas, Melissa. 2010. “What Do the Worldwide Governance Indicators Measure?” European
Journal of Development Research 22: 31–54.
Tingley, Dustin,Teppei Yamamoto, Kentaro Hirose, Luke Keele and Kosuke Imai. 2014.
“mediation: R Package for Mediation Analysis.” Journal of Statistical Software 59(5): 1-38.
Tommasi. Mariano. 2006. “The Institutional Foundations of Public Policy.” Economia 6(2):1-36.
Treier, Shawn, and Simon Jackman. 2008. “Democracy as a Latent Variable.” American Journal of
Political Science 52(1): 201–17.
Tsebelis, George. 2002. Veto Players How Political Institutions Work. Princeton: Princeton
University Press.
Ufen, Andreas. 2008. “Political Party and Party System Institutionalization in Southeast Asia:
Lessons for Democratic Consolidation in Indonesia, the Philippines and Thailand.” The Pacific
Review 21:3, 327-350.
Ufen, Andreas. 2012. “Party Systems, Critical Junctures, and Cleavages in Southeast Asia.” Asian
Survey 52(3): 441-464.

42
Vollrath, Dietz. 2014. “The Skeptic’s Guide to Institutions.” Growth Economics Blog.
[https://growthecon.wordpress.com/2014/11/18/the-skeptics-guide-to-institutions-part-1/]
Wade, Robert. 1990. Governing the Market: Economic Theory and the Role of Government in East Asian
Industrialization. Princeton University Press: Princeton.
Weyland, Kurt. 2008. “Toward a New Theory of Institutional Change.” World Politics 60:2
(January) 281-314.
Wilson, Woodrow. 1908. Constitutional Government in the United States. New York: Columbia
University Press.
Wimmer, Andreas. 2013. Ethnic Boundary Making: Institutions, Power, Networks. Oxford: Oxford
University Press.
Woo-Cummings, Meredith (ed.). 1999. The Developmental State. Cornell University Press, Ithaca.
World Bank. 1993. The East Asian Miracle: Economic Growth and Public Policy. New York: Oxford
University Press.
Wright J. 2008. “To Invest or Insure? How Authoritarian Time Horizons Impact Foreign Aid
Effectiveness.” Comparative Political Studies 41:7, 971–1000.
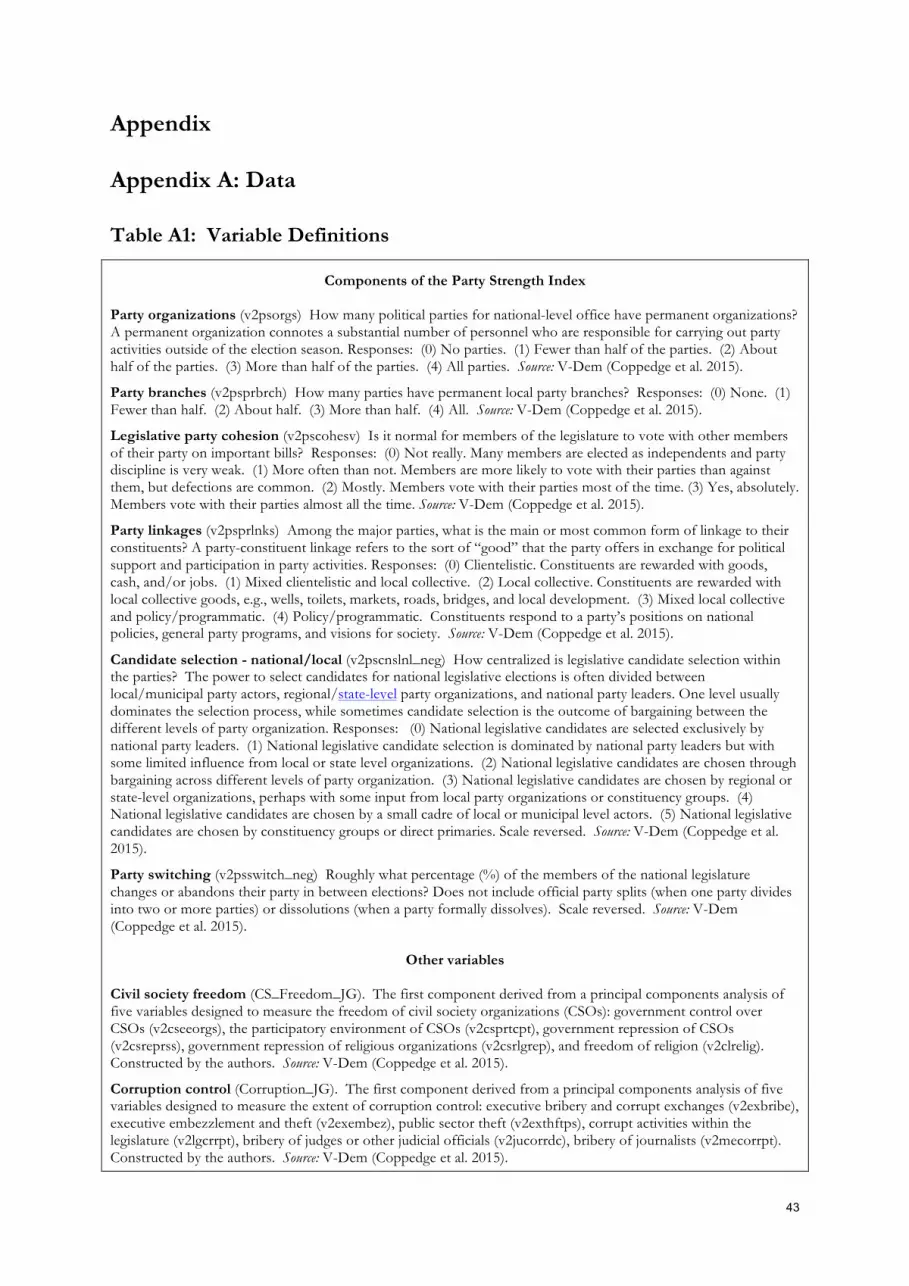
43
Appendix
Appendix A: Data
Table A1: Variable Definitions
Components of the Party Strength Index
Party organizations (v2psorgs) How many political parties for national-level office have permanent organizations? A permanent organization connotes a substantial number of personnel who are responsible for carrying out party activities outside of the election season. Responses: (0) No parties. (1) Fewer than half of the parties. (2) About half of the parties. (3) More than half of the parties. (4) All parties. Source: V-Dem (Coppedge et al. 2015).
Party branches (v2psprbrch) How many parties have permanent local party branches? Responses: (0) None. (1) Fewer than half. (2) About half. (3) More than half. (4) All. Source: V-Dem (Coppedge et al. 2015).
Legislative party cohesion (v2pscohesv) Is it normal for members of the legislature to vote with other members of their party on important bills? Responses: (0) Not really. Many members are elected as independents and party discipline is very weak. (1) More often than not. Members are more likely to vote with their parties than against them, but defections are common. (2) Mostly. Members vote with their parties most of the time. (3) Yes, absolutely. Members vote with their parties almost all the time. Source: V-Dem (Coppedge et al. 2015).
Party linkages (v2psprlnks) Among the major parties, what is the main or most common form of linkage to their constituents? A party-constituent linkage refers to the sort of “good” that the party offers in exchange for political support and participation in party activities. Responses: (0) Clientelistic. Constituents are rewarded with goods, cash, and/or jobs. (1) Mixed clientelistic and local collective. (2) Local collective. Constituents are rewarded with local collective goods, e.g., wells, toilets, markets, roads, bridges, and local development. (3) Mixed local collective and policy/programmatic. (4) Policy/programmatic. Constituents respond to a party’s positions on national policies, general party programs, and visions for society. Source: V-Dem (Coppedge et al. 2015).
Candidate selection - national/local (v2pscnslnl_neg) How centralized is legislative candidate selection within the parties? The power to select candidates for national legislative elections is often divided between local/municipal party actors, regional/state-level party organizations, and national party leaders. One level usually dominates the selection process, while sometimes candidate selection is the outcome of bargaining between the different levels of party organization. Responses: (0) National legislative candidates are selected exclusively by national party leaders. (1) National legislative candidate selection is dominated by national party leaders but with some limited influence from local or state level organizations. (2) National legislative candidates are chosen through bargaining across different levels of party organization. (3) National legislative candidates are chosen by regional or state-level organizations, perhaps with some input from local party organizations or constituency groups. (4) National legislative candidates are chosen by a small cadre of local or municipal level actors. (5) National legislative candidates are chosen by constituency groups or direct primaries. Scale reversed. Source: V-Dem (Coppedge et al. 2015).
Party switching (v2psswitch_neg) Roughly what percentage (%) of the members of the national legislature changes or abandons their party in between elections? Does not include official party splits (when one party divides into two or more parties) or dissolutions (when a party formally dissolves). Scale reversed. Source: V-Dem (Coppedge et al. 2015).
Other variables
Civil society freedom (CS_Freedom_JG). The first component derived from a principal components analysis of five variables designed to measure the freedom of civil society organizations (CSOs): government control over CSOs (v2cseeorgs), the participatory environment of CSOs (v2csprtcpt), government repression of CSOs (v2csreprss), government repression of religious organizations (v2csrlgrep), and freedom of religion (v2clrelig). Constructed by the authors. Source: V-Dem (Coppedge et al. 2015).
Corruption control (Corruption_JG). The first component derived from a principal components analysis of five variables designed to measure the extent of corruption control: executive bribery and corrupt exchanges (v2exbribe), executive embezzlement and theft (v2exembez), public sector theft (v2exthftps), corrupt activities within the legislature (v2lgcrrpt), bribery of judges or other judicial officials (v2jucorrdc), bribery of journalists (v2mecorrpt). Constructed by the authors. Source: V-Dem (Coppedge et al. 2015).

44
Democracy, Boix (e_mibmr). Dichotomous democracy measure based on contestation and participation. Countries coded democratic have (1) political leaders that are chosen through free and fair elections and (2) a minimal level of suffrage. Source: Boix et al. (2013).
Democracy, Polity2 (polity2). A weighted additive aggregation procedure across five sub-components: competitiveness and openness of executive recruitment, competitiveness and regulation of political participation, and constraints on the chief executive. Source: Polity IV database (Marshall, Gurr & Jaggers 2014).
External conflict (e_miinteco). Coded 1 if the country participated in an international armed conflict in a given year, 0 otherwise. The original source codebook (Brecke 2001) states that no war is coded as 0 and war is coded as 1. However, the data contains only 1’s along with missing data (no 0’s). Following the authors’ instructions (personal communication), we re-code missing observations as non-conflict (0) for countries where at least one year in the original times series (which runs from 1500 until present) was coded as 1. Sources: Clio Infra (clio-infra.eu), drawing on Brecke (2001), compiled by V-Dem (Coppedge et al. 2015).
Ethnic fractionalization (al_ethnic). The probability that two randomly chosen individuals within a society are members of different ethnic groups, calculated with the Herfindahl index. Source: Alesina et al (2003).
GDPpc, ln (e_migdppc_ln). Gross domestic product per capita, transformed by the natural logarithm. Source: Maddison Project (Bolt & van Zanden 2014).
Infant mortality rate, ln (e_peinfmor). Number of deaths prior to age 1 per 1000 live births in a year, transformed by the natural logarithm. Sources: Gapminder (gapminder.org), with additional data imputed from Clio-Infra (clio-infra.eu).
Inflation (e_miinflat). Annual inflation rate, missing data within a time-series interpolated with a linear model, transformed by the natural logarithm (after first converting negative values to positive values). Source: Clio Infra (clio-infra.eu).
Internal conflict (e_miinterc). Coded 1 if the country suffered in an internal armed conflict in a given year, 0 otherwise. The original source codebook (Brecke 2001) states that no war is coded as 0 and war is coded as 1. However, the data contains only 1’s along with missing data (no 0’s). Following the authors’ instructions (personal communication), we re-code missing observations as non-conflict (0) for countries where at least one year in the original times series (which runs from 1500 until present) was coded as 1. Sources: Clio Infra (clio-infra.eu), drawing on Brecke (2001), compiled by V-Dem (Coppedge et al. 2015).
Investment (pwt_isg1). Share of investment as a percentage of GDP. Source: Penn World Tables (Heston, Summers & Aten 2012).
Irregular Exit (exit_1_irregular1). Coded 1 if head of state (“leader”) died of natural causes while in power, retired due to ill health, lost office as a result of suicide, lost power through irregular means, or was deposed by another state. Source: Archigos (Goemans et al. 2009).
GDPpc growth (e_migdpgro). Annual growth rate of GDP per capita. Source: Maddison Project (Bolt & van Zanden 2014).
Judicial power (JudicialPower_JG). The first component derived from a principal components analysis of four variables designed to measure the extent of judicial power: compliance with high court decisions (v2juhccomp), compliance with judicial decisions made by judicial bodies other than the high court (v2jucomp), high court independence (v2juhcind), independence of judicial bodies other than the high court (v2juncind). Constructed by the authors. Source: V-Dem (Coppedge et al. 2015).
Judicial threats (JudicialThreats_JG). The first component derived from a principal components analysis of three variables designed to measure threats to the integrity of the judiciary: government attacks on the judiciary (v2jupoatck), attempts to pack the court with government supporters (v2jupack), and politically motivated purges of the judiciary (v2jupurge). Constructed by the authors. Source: V-Dem (Coppedge et al. 2015).
Land area (wdi_area). Land area, square kilometers. Source: World Development Indicators (World Bank 2013).
Latitude, ln (lp_lat_abst_ln). The absolute value of the latitude of the capital city, divided by 90 (so as to take values between 0 and 1), transformed by the natural logarithm. Source: La Porta et al. (1999).
Legal origin (lp_legor). The legal origin of the Company Law or Commercial code of each country, classified as (1) English Common Law, (2) French Commercial Code, (3) Socialist/Communist Laws, (4) German Commercial Code, (5) Scandinavian Commercial Code. Source: La Porta et al. (1999).
Life expectancy (e_pelifeex). Expected longevity at birth based on current age-specific mortality rates. Sources: Gapminder (gapminder.org), with additional data imputed from Clio Infra (clio-infra.eu).

45
Muslim (lp_muslim80). Muslims as percentage of population in 1980. Source: La Porta et al. (1999).
Party age (partyage). Average age of three largest parties in the lower (or unicameral) chamber of the national legislature. Source: Authors.
Party linkage index (bti_q5). The extent to which there is a stable and socially rooted party system, able to articulate and aggregate societal interests. This includes a consideration of the extent to which parties are socially rooted and organizationally institutionalized, the degree of clientelism and the effects it has in promoting or inhibiting stability, the fragmentation of the party system, the level of polarization, and the degree of voter volatility (Bertelsmann Transformation Index 2014).
Party vote volatility (total_EV_vote). Change in share of votes received by each party from election to election according to the Pedersen (1979) index. Source: Authors.
Petroleum (e_mipetrol). Real value of petroleum produced per capita. Source: Haber & Menaldo (2011).
Property rights (PropertyRts_JG). The first component derived from a principal components analysis of three variables designed to measure the strength of property rights: men’s right to acquire, possess, inherit, and sell private property (v2clprptym), women’s right to acquire, possess, inherit, and sell private property (v2clprptyw), and the extent of state ownership of the economy (v2clstown). Constructed by the authors. Source: V-Dem (Coppedge et al. 2015).
Protestant (lp_protmg80). Protestants as percentage of population in 1980. Source: La Porta et al. (1999).
Public administration (PublicAdmin_JG). The first component derived from a principal components analysis of five variables designed to measure the effectiveness of public administration: respect for the constitution by members of the executive (v2exrescon), extent to which public officials are rigorous and impartial in the performance of their duties (v2clrspct), extent to which the laws of the land are clear, well-publicized, coherent (consistent with each other), relatively stable from year to year, and enforced in a predictable manner (v2cltrnslw), the extent to which men can bring cases before the courts without risk to their personal safety, trials are fair, and men have effective ability to seek redress if public authorities violate their rights, including the rights to counsel, defense, and appeal (v2clacjstm), and the extent to which women can bring cases before the courts without risk to their personal safety, trials are fair, and women have effective ability to seek redress if public authorities violate their rights, including the rights to counsel, defense, and appeal (v2clacjstw). Constructed by the authors. Source: V-Dem (Coppedge et al. 2015).
Regime type (Geddes) (gwf_regimetype_num). Classification of autocratic regimes into ten categories. Source: Geddes, Wright & Frantz (2014).
Regime type (Hadenius, Teorell) (ht_regtype). Classification of regimes into eighteen categories. Source: Hadenius & Teorell (2007).
Urbanization (e_miurbani). Ratio of urban population to total population. Source: V-Dem (Coppedge et al. 2015), constructed from data from CLIO Infra (clio-infra.eu).

46
Table A2: Descriptive Statistics
Obs Mean Std. Dev. Min Max
1. Party Strength 16221 0.003 0.535 -1.723 1.363 2. Party Strength (Stock) 16221 63.649 40.218 0.007 192.944 3. Party Strength (5 Year avg) 3091 0.000 0.532 -1.723 1.363 4. Party Strength (Imputed) 249731 0.000 0.538 -2.197 1.807 5. PS No Switching 16235 0.003 0.563 -1.353 1.443 6. PS No Cohesion 16243 0.003 0.518 -1.647 1.387 7. PS No Candidate Selection 16221 0.003 0.700 -2.335 1.728 8. PS No Linkages 16221 0.004 0.551 -1.764 1.406 9. PS No Organizations 16222 0.001 0.505 -1.744 1.277 10. PS No Branches 16221 0.002 0.503 -1.736 1.249 11. PS with Nationalization 16146 0.002 0.551 -1.555 1.294 12. PS Principal Component 16221 0.000 1.000 -2.613 2.535 13. PS Multiplicative 16221 840.690 1032.827 0.000 6937.250 14. PS Regional Mean 16010 0.007 0.323 -0.496 0.882 15. PS Global Mean 16221 0.003 0.138 -0.240 0.253 16. Party System Institutionalization 16230 0.508 0.300 0.024 0.981 17. Party Switching 16244 -8.968 9.336 -62.944 0.000 18. Party Cohesion 16237 0.321 0.849 -2.024 1.868 19. Centralized Candidate Selection 16273 0.235 0.849 -3.010 2.001 20. Party Linkages 16284 0.149 0.878 -1.870 2.165 21. Party Organizations 16400 0.256 1.063 -1.880 2.404 22. Party Branches 16407 0.153 1.043 -1.988 2.254 23. Party Competitiveness across regions 16194 0.005 0.884 -2.012 1.762 24. GDP Growth 10694 1.933 6.452 -61.493 86.946 25. GDP Growth (5 year avg) 2092 1.904 3.748 -19.297 32.813 26. Regional GDP Growth (mean) 10491 1.923 2.806 -26.362 20.880 27. Global GDP Growth (mean) 10694 1.955 1.937 -5.703 9.315 28. GDP per capita 10907 7.844 1.037 5.315 10.667 29. GDP per capita (5 year avg) 2100 7.868 1.035 5.359 10.543 30. Boix et al. Regimes 11797 0.395 0.489 0.000 1.000 31. Geddes et al. Regimes 7952 4.832 3.831 1.000 11.000 32. Polity 2 11796 0.459 7.306 -10.000 10.000 33. Urbanization 20764 0.350 0.251 0.008 1.000 34. Life Expectancy 16610 55.432 14.804 11.600 83.905 35. Infant Mortality 13536 74.553 57.344 0.400 420.000 36. Investiment 8016 22.846 11.096 -11.496 93.637 37. Inflation 9982 40 514 -200 24411 38. Petroleum 10752 469.868 3087.011 0.000 78588.800 39. Internal Conflict 12932 0.098 0.297 0.000 1.000 40. External Conflict 16612 0.075 0.264 0.000 1.000 41. Ethnic Fractionalization 9416 0.435 0.260 0.000 0.930 42. Latitude (ln) 9810 -1.571 0.932 -4.500 -0.325 43. Muslim 9863 21.330 34.921 0.000 99.900 44. Protestant 9863 13.258 21.722 0.000 97.800 45. Land area 7904 716523 1755591 2 16400000 46. Legal Origin 9863 2.013 0.978 1.000 5.000 47. Public Administration (V-Dem) 16333 0.000 2.002 -4.678 5.609 48. Corruption (V-Dem) 11871 0.000 2.132 -4.385 4.896 49. Property Rights (V-Dem) 16515 0.000 1.515 -4.755 3.244 50. Judicial Power (V-Dem) 16412 0.000 1.772 -4.527 4.505 51. Judicial Threats (V-Dem) 16412 0.000 1.371 -5.265 3.741 52. Rule of Law (V-Dem) 12128 0.000 3.462 -7.922 8.180 53. Civil Society (V-Dem) 16511 0.000 1.956 -5.339 4.432

47
Appendix B: Measuring Party Strength
The Party Strength Index
We defined strong parties along four dimensions – unity, centralization, organizational complexity,
and a mass constituency. Chosen indicators, listed in Table A1, are intended to map onto this
definition, as discussed below.
Party organizations measures the extent to which political parties in a country have
permanent organizations, understood as personnel responsible for carrying out party activities in
between elections. This speaks most clearly to the organizational complexity of a party, but also
presumably to the strength of its ties to a mass constituency.
Party branches measures the existence of permanent local party branches. This, again, speaks
to organizational complexity and connections to constituencies.
Legislative party cohesion measures party voting in parliament, i.e., the extent to which a party’s
representatives vote together on important bills. This provides a direct measure of unity and an
indirect measure of centralization (and perhaps also of organizational complexity).
Party linkages measures the predominant relationship between parties and constituents in a
country, understood along a spectrum from clientelistic (constituents are rewarded with goods, cash,
or jobs), to localistic (constituents are rewarded with spending targeted on their district), to
programmatic (constituents’ relationship to a party is based on the party’s policies and overall
ideology). We regard clientelistic and localistic ties as a measure of decentralization; parties with
these characteristics are likely to contain strong local leaders who can resist pressures from the
leadership, perhaps egged on by their constituents. These characteristics are also likely to impair
party unity, especially if payoffs are discontinued (e.g., by a loss of power or by a fiscal crisis). At this
point, party members may look around for alternatives, and perhaps even bolt to another party that
can offer more attractive material incentives. By contrast, if a party is defined by its programmatic
appeals conflict among its members, or between leaders at the apex and the periphery, is likely to be
muted, as they agree on most issue-positions and on over-arching goals, and have strong incentives
to stick together to pursue those goals and may accept leadership cues in the service of achieving
those goals. Leninist parties are strong, in part, because of their clear ideological orientation.
Candidate selection measures the degree of centralization in the process of nominating
candidates for the national legislature. At one extreme, all candidates are chosen by national party
leaders. At the other extreme, candidates are chosen by constituency groups or direct primaries and
party leaders play a peripheral role. This provides a direct measure of party centralization and
presumably serves as an important ingredient of party unity.

48
Party switching measures the share of MPs who desert their party – either joining another
party or becoming an independent – in between elections. This serves as a direct measure of party
unity and an indirect measure of party centralization.
Figure B1: Party Strength Through Time
Party Strength, averaged over all countries in the sample, for each year from 1900-1912.

49
Table B1: Party Strength in 2011
Score Interval Sweden 1.052 0.819 1.285 Germany 1.039 0.808 1.270 Spain 1.003 0.786 1.219 Netherlands 0.935 0.699 1.171 Vietnam, DR 0.822 0.605 1.039 Belgium 0.786 0.540 1.033 China 0.755 0.632 0.878 Norway 0.741 0.534 0.948 Denmark 0.734 0.492 0.975 Austria 0.703 0.510 0.897 Australia 0.684 0.468 0.900 Uzbekistan 0.670 0.569 0.770 Portugal 0.653 0.491 0.816 Turkmenistan 0.652 0.490 0.814 France 0.637 0.502 0.773 New Zealand 0.634 0.418 0.851 Uruguay 0.633 0.449 0.816 Finland 0.627 0.424 0.829 Switzerland 0.615 0.407 0.824 UK 0.599 0.478 0.720 Estonia 0.583 0.403 0.762 Czech Rep 0.581 0.404 0.759 Montenegro 0.577 0.441 0.714 Chile 0.576 0.428 0.725 Greece 0.573 0.401 0.745 Poland 0.572 0.415 0.729 Bangladesh 0.572 0.488 0.656 Seychelles 0.547 0.296 0.798 Tajikistan 0.541 0.409 0.672 Japan 0.528 0.379 0.678 Mexico 0.523 0.384 0.661 Canada 0.505 0.318 0.692 Macedonia 0.497 0.353 0.641 Turkey 0.489 0.344 0.635 Mauritius 0.485 0.300 0.669 Slovakia 0.471 0.339 0.602 India 0.465 0.348 0.582 Kazakhstan 0.439 0.274 0.604 Barbados 0.436 0.174 0.697 Bosnia 0.431 0.321 0.541 North Korea 0.429 0.186 0.672 Trinidad 0.426 0.275 0.577 Slovenia 0.425 0.320 0.531 Pakistan 0.425 0.279 0.570 Ireland 0.425 0.275 0.574 Cape Verde 0.382 0.225 0.540 West Bank 0.380 0.249 0.512 Hungary 0.375 0.341 0.409 Sri Lanka 0.367 0.323 0.412 Lithuania 0.359 0.204 0.514 El Salvador 0.347 0.239 0.454 Croatia 0.347 0.234 0.459 Iceland 0.346 0.134 0.559 Bhutan 0.345 0.171 0.520 South Korea 0.342 0.202 0.483 South Africa 0.339 0.216 0.462 Syria 0.334 0.154 0.513
Score Interval Sudan 0.327 0.154 0.500 Rwanda 0.319 0.297 0.341 Azerbaijan 0.318 0.235 0.400 Armenia 0.316 0.225 0.408 Suriname 0.311 0.110 0.512 Kosovo 0.308 0.169 0.446 Lebanon 0.305 0.190 0.420 Venezuela 0.301 0.180 0.422 Malaysia 0.282 0.228 0.336 Russia 0.277 0.161 0.393 USA 0.277 0.229 0.325 South Sudan 0.277 0.077 0.476 Gaza 0.273 0.158 0.387 Thailand 0.263 0.124 0.402 Jamaica 0.260 0.047 0.473 Laos 0.256 0.228 0.284 Israel 0.255 0.107 0.404 Ethiopia 0.255 0.109 0.401 Cyprus 0.251 0.105 0.397 Albania 0.248 0.125 0.371 Serbia 0.238 0.157 0.319 Guyana 0.238 0.071 0.405 Niger 0.229 0.078 0.380 Georgia 0.227 0.120 0.334 Belarus 0.208 0.110 0.306 Bulgaria 0.208 0.126 0.290 Burma 0.198 0.066 0.330 Romania 0.187 -0.028 0.403 Botswana 0.187 0.041 0.334 Taiwan 0.182 0.085 0.278 Costa Rica 0.173 0.055 0.292 Latvia 0.168 0.041 0.295 Gambia 0.140 0.052 0.228 Indonesia 0.122 -0.017 0.261 Nicaragua 0.122 -0.005 0.249 Namibia 0.117 -0.014 0.249 Italy 0.109 -0.007 0.225 Mozambique 0.108 -0.021 0.237 Lesotho 0.099 -0.038 0.236 Bolivia 0.097 0.026 0.168 Burkina Faso 0.094 0.001 0.187 Nepal 0.094 -0.015 0.202 East Timor 0.091 -0.111 0.293 Cuba 0.084 -0.186 0.355 Moldova 0.080 -0.004 0.165 Ecuador 0.080 -0.039 0.198 Panama 0.077 -0.064 0.219 Morocco 0.061 -0.014 0.136 Burundi 0.047 0.029 0.064 Cameroon 0.026 -0.083 0.134 Tunisia 0.022 -0.112 0.156 Angola 0.019 -0.045 0.083 Ukraine 0.004 -0.042 0.050 Argentina -0.017 -0.104 0.070 Ivory Coast -0.026 -0.118 0.066 Gabon -0.029 -0.071 0.013 Togo -0.034 -0.124 0.055
Score Interval Brazil -0.035 -0.076 0.006 Tanzania -0.040 -0.106 0.025 Somaliland -0.047 -0.141 0.047 Zimbabwe -0.052 -0.265 0.161 Honduras -0.054 -0.127 0.019 DR -0.056 -0.171 0.060 Iraq -0.063 -0.103 -0.023 Egypt -0.068 -0.076 -0.060 Maldives -0.077 -0.079 -0.076 Yemen -0.094 -0.236 0.049 Sao Tome -0.094 -0.290 0.102 Ghana -0.101 -0.136 -0.066 Fiji -0.107 -0.370 0.156 Comoros -0.118 -0.246 0.010 Senegal -0.135 -0.195 -0.075 Paraguay -0.141 -0.288 0.005 Mali -0.170 -0.187 -0.153 Algeria -0.186 -0.222 -0.149 Congo, DR -0.193 -0.310 -0.076 Uganda -0.193 -0.313 -0.073 Zambia -0.197 -0.274 -0.120 Mongolia -0.213 -0.292 -0.133 Guinea -0.223 -0.253 -0.193 Cambodia -0.230 -0.236 -0.224 Iran -0.246 -0.287 -0.204 Congo, Rep -0.268 -0.339 -0.196 Jordan -0.273 -0.417 -0.129 Guinea-Biss -0.302 -0.311 -0.292 Nigeria -0.324 -0.383 -0.265 Colombia -0.341 -0.353 -0.329 Kenya -0.355 -0.379 -0.331 Sierra Leone -0.367 -0.475 -0.259 Solomon Is -0.377 -0.637 -0.117 CAR -0.400 -0.475 -0.325 Mauritania -0.407 -0.412 -0.401 Malawi -0.411 -0.427 -0.396 Djibouti -0.441 -0.472 -0.410 Peru -0.449 -0.506 -0.391 Benin -0.449 -0.486 -0.413 Vanuatu -0.455 -0.757 -0.153 Swaziland -0.467 -0.719 -0.215 Eritrea -0.558 -0.786 -0.329 Kyrgyzstan -0.566 -0.655 -0.476 Philippines -0.573 -0.591 -0.555 Somalia -0.589 -0.627 -0.551 Chad -0.700 -0.740 -0.660 Guatemala -0.735 -0.929 -0.542 Afghanistan -0.775 -0.793 -0.756 Madagascar -0.785 -0.840 -0.731 Libya -0.786 -0.849 -0.723 Qatar -0.865 -1.134 -0.596 Liberia -0.881 -0.897 -0.865 PNG -1.130 -1.191 -1.068 Saudi Arabia -1.143 -1.220 -1.067 Haiti -1.232 -1.252 -1.211
Point estimates for Party Strength for all countries in 2011 along with confidence intervals.

50
Alternative Measures of Party Strength
Questions can always be raised about the composition and aggregation of an index. Methods of
indexing involve many choices and readers may be concerned about the extent to which these
choices color the findings reported here. In Table B2, we systematically test alternate indices in
the benchmark model to gauge their performance.
Model 1 shows the benchmark model, in which growth is regressed on our additive
index of Party Strength, replicating Model 1 in Table 2, for purposes of comparison. Model 2
tests the first component drawn from a principal components analysis of the same six indicators.
Model 3 tests an index aggregated by multiplying the six indicators together. The next set of tests
(Models 4-9) remove indicators from the Party Strength index, seriatim. In Model 10, we
construct a party strength index (using our usual additive method of aggregation) that includes an
additional attribute, Party nationalization, as measured by the V-Dem dataset.

51
Table B2: Alternate Indices Tested in the Benchmark Model
_____Aggregation techniques_____ _______________Subtracting/adding Indicators to the original index_______________ Party
System Institution -alization
Index Additive (original)
Principal components
Multip- licative
– Switching
– Cohesion
– Candidate selection
– Linkages
– Organizations
– Branches
+ National ization
1 2 3 4 5 6 7 8 9 10 11
Coefficient 1.567*** 0.710** 0.473*** 1.435*** 1.493*** 1.267*** 1.369*** 1.497*** 1.420*** 1.404*** 1.576* (0.370) (0.281) (0.168) (0.385) (0.384) (0.332) (0.354) (0.347) (0.361) (0.371) (0.837)
GDPpc (ln) -2.023*** -1.950*** -1.975*** -1.989*** -2.035*** -2.014*** -1.972*** -2.012*** -2.007*** -1.952*** -1.897*** (0.354) (0.338) (0.350) (0.348) (0.358) (0.348) (0.353) (0.353) (0.354) (0.355) (0.334)
Year FE ! ! ! ! ! ! ! ! ! ! !
Country FE ! ! ! ! ! ! ! ! ! ! !
Countries 153 153 153 153 153 153 153 153 153 153 153
Years (Max) 110 110 110 110 110 110 110 110 110 110 110
Obs 10147 10147 10147 10147 10169 10147 10147 10147 10147 10122 10147
R2 within 0.1090 0.1069 0.1071 0.1087 0.1084 0.1084 0.1087 0.1090 0.1086 0.1082 0.1063
Alternate indices of party strength, and an index of party system institutionalization, tested in the benchmark model (Model 1, Table 2). Estimator: ordinary least squares, standard errors clustered by country. *** p<.01 **p<.05 *p<.10

52
Appendix C: Convergent Validity Tests
Table C1: Regime-types from Geddes et al. (2014)
1
Indirect Military -0.142* (-0.077) Military -0.303*** (-0.029) Military / Personal -0.381*** (-0.031) Monarchy -0.811*** (-0.023) Oligarchy -0.146** (-0.058) Party 0.052*** (-0.015) Party / Military -0.271*** (-0.041) Party / Military / Personal -0.063* (-0.036) Party / Personal -0.196*** (-0.025) Personal -0.470*** (-0.016) Constant 0.325*** (-0.008) Countries 148 Years 65 Obs 7653 R-Squared 0.222
Party Strength index regressed against nominal categories representing regime-types, as defined and coded by Geddes et al. (2014). Reference category is “Democracy.” Estimator: ordinary least squares, standard errors in parentheses. ***p<.01 **p<.05 *p<.10

53
Table C2: Regime-types from Hadenius & Teorell (2007)
1 No Party -1.025*** (0.075) Military -0.080** (0.025) Military no-party -0.291*** (0.061) Military multiparty 0.214*** (0.033) Military one-party 0.099** (0.032) One-party 0.367*** (0.020) Other -0.668*** (0.057) One-party monarchy 0.110 (0.221) Monarchy -0.840*** (0.044) Rebel regime -0.241*** (0.058) Civil war -0.393*** (0.054) Occupation -0.333*** (0.081) Theocracy -0.457*** (0.073) Transitional regimes -0.130** (0.063) No-party monarchy -0.449*** (0.046) Multiparty monarchy -0.131* (0.060) Democracy 0.380*** (0.015) Constant -0.030* (0.012) Countries 166 Years 39 Obs 5801 R2 0.309
Party Strength index regressed against nominal categories representing diverse regime-types as defined and coded by Hadenius & Teorell (2007). Reference category is “Limited multiparty and party-less.” Estimator: ordinary least squares, standard errors in parentheses. *** p<.01 **p<.05 *p<.10

54
Table C3: Other Indicators of Party Performance
Correlation w/ PS index Countries Years Obs
Party system institutionalization 0.340 123 5 520
Party vote volatility -0.465 49 64 1100
Party age 0.384 154 35 5582
Pearson’s r correlation between Party Strength index and other measures of party strength or institutionalization.

55
Appendix D: Data Collection
The Party Strength index is based on six indicators drawn from the Varieties of Democracy (V-
Dem) project, as are several of the covariates tested in Table 3 – Public administration, Rule of
law, Corruption control. Property rights, Judicial power, Judicial threats, and Civil society
freedom. It is important, therefore, to understand a bit about how the data was collected and
aggregated across coders. (For further information see Coppedge et al. (2015) and Pemstein et al.
(2015).)
Each indicator in the V-Dem dataset that is not factual in nature is coded by multiple
Country Experts, generally about five (5). Most experts do not possess the requisite expertise to
code the entire V-Dem questionnaire, which means that a single country will generally be coded
by a dozen or more experts, each working on different facets of the questionnaire. To date, V-
Dem has engaged in collaboration with over 2,500 Country Experts.
Recruitment
The following procedure is used to recruit Country Experts. First, we identify a list of potential
coders for a country (typically 100-200 names per country). This bulk of names on the list are
provided by Regional Managers (members of the V-Dem project located in universities and
think-tanks throughout the world) in consultation with other members of the V-Dem team.
Assistant Researchers (located at V-Dem Institute, University of Gothenburg) also contribute to
this list, using information about potential country experts gathered from the web. Other
members of the project team provide additional names if they have country-specific expertise. At
present, V-Dem has accrued a roster of 15,000+ potential Country Experts.
For each potential Country Expert on the resulting list, we compile basic information –
country of origin, current location, highest educational degree, current position, and area of
expertise in terms of the surveys the expert could code as evidenced by a short biographical
sketch and/or list of publications, website information and the like. We also take note of any
possible biases that might affect their ability to code questions in a dispassionate manner.
In selecting whom to recruit from this list five criteria come into play:
The most important selection criterion, naturally, is expertise in the country(ies) and the
section of the survey they are assigned to code. This is usually signified by an advanced degree in
the social sciences, law, or history; a record of publications; and positions in civil society that
establish their expertise in the chosen area (e.g. a well-known and respected journalist). Naturally,

56
potential coders are drawn to areas of the survey that they are most familiar with, and are unlikely
to agree to code topics they know little about. So, self-selection also works to achieve our primary
goal of matching questions in the survey with country-specific expertise.
The second criterion is origin in the country to be coded. V-Dem’s goal is that a
minimum of three out of five (60%) Country Experts should be nationals or permanent residents
of the country they code (preferably both). Exceptions are required for a few countries where it is
difficult to find in-country coders who are both qualified and independent of the governing
regime. This criterion should help avoid potential Western/Northern biases in the coding.
The third criterion is the prospective coder’s seriousness of purpose. By this, we mean a
person’s willingness to devote time to the project, to deliberate carefully over the questions asked
in the survey, and to report their honest judgment. Sometimes, personal acquaintanceship is
enough to convince a Regional Manager that a person is fit, or unfit, for the job. Sometimes, this
feature becomes apparent in communications with Project Coordinators that precede the offer to
work on V-Dem.
The fourth criterion is impartiality. V-Dem aims to recruit coders who will answer
survey questions in an impartial manner. This means avoiding those who might be beholden to
powerful actors – by reason of coercive threats or material incentives – or who serve as
spokespersons for a political party or ideological tendency (in some instances, such as North
Korea, this may entail avoiding all in-country coders). Where this is difficult, or where the reality
is difficult to determine, we aim to include a variety of coders who, collectively, represent an array
of views and political perspectives on the country in question.
The final criterion is obtaining diversity in professional background among the coders
chosen for a particular country. For certain areas (e.g the media, judiciary, and civil society
surveys) this entails a mixture of highly recognized professionals from the sector along with
academics who study these topics. Generally, it also means finding experts who are located at a
variety of institutions, universities and research institutes.
After weighing these five criteria, the 100-200 potential experts on the list are given a
rank from “1” to “3” indicating order of priority.
The two Project Coordinators at the V-Dem Institute, University of Gothenburg, then
handle the enrolment of Country Experts from the list of potential country experts. In handling
the recruitment, the continuously review the resulting mix of actual country experts in light of the
five criteria to ensure that V-Dem ends up with a set of experts for each country that fulfill our
standards.

57
If the quota of five Country Experts per section of the survey for each country is not
met, we work down the list of potential Country Experts until the quota is obtained. Others,
following the same procedure, replace those who fail to complete the survey in a reasonable time.
Coders receive a modest honorarium for their work that is proportional to the number of surveys
they have completed.
A number of steps are taken to assure informed consent and confidentiality among
participants. The on-line survey provides full information about the project (including this
document) and the use of the data, so that coders are fully informed. It also requires that
prospective coders certify that they accept the terms of the agreement. They can access the
surveys only with a randomized username that we assign and a secret password that they create
themselves. The data they supply is stored on a firewall-protected server. Any data released to the
public excludes information that might be used to identify coders. All personal identifying
information is kept in a separate database in order to ensure the protected identities of coders.
In order to ensure that we are able to recruit widely among potential experts, and in
order to minimize confusion due to unfamiliarity with English, questions are translated from
English into five additional languages: Arabic, French, Portuguese, Russian, and Spanish.
Approximately 15 percent of the experts code in a non-English version of the questionnaire.
About 35 percent of the Country Experts are women, and over 80 percent have PhDs
or MAs and are affiliated with research institutions, think tanks, or similar organizations.
Coding
Coding is carried out using the V-Dem online survey tool. The web-based coding interfaces are
directly connected with a postgres database where the original coder-level data is kept,
maintaining coder confidentiality.
In addition to country-specific ratings, Country Experts are requested to code several
additional countries that they are familiar with for a shorter time-slice. This «bridge» or «lateral»
coding assures cross-country equivalence by forcing coders to make explicit comparisons across
countries, and provides critical information for the measurement model (described below).
For each question, and for each country-year, experts are required to report a self-
assessed level of certainty. This is an indicator of their subjective level of uncertainty for the data
point they provide. This is scored on a scale from 0 to 100 with substantive anchor points for
each 10-percent interval.

58
Measurement
Having discussed the process of data collection, we proceed to the task of measurement. Under
this rubric, we include (a) the questionnaire, (b) our measurement model, (c) methods of
identifying error in measurement, (d) studies of measurement error, and (e) methods of
correcting error. In principle, the discussions are relevant for different types of data (A, B, and C
in the V-Dem scheme) but most if not all of them are much more acute when it comes to expert-
based coding of evaluative, non-factual yet critical indicators. Hence, most of the following is
focused on the C-type indicators.
The most important feature of a survey is the construction of the questionnaire itself. In
crafting indicators we have sought to construct questions whose meaning is clear and specific and
not open to a wide variety of interpretations. They should mean the same thing (more or less) in
each context and not suffer from temporal or spatial non-equivalence. Our methodology involves
enlisting some of the leading scholars in the world on different aspects of democracy and
democratization – known as Project Managers.
Each Project Manager was enrolled because of his/her specific and evidenced expertise
in a particular area (e.g. legislatures, executives, elections, civil society, and so on) and with a view
to generate a group that also had substantive experiences and expertise on all regions of the
world. Starting in 2009, Project Managers designed survey-questions in their area to measure
democraticness in relation to the different traditions of democratic theory. All suggestions were
reviewed and refined collectively over the course of two years. The V-Dem pilot test carried out
in 2011 served as an initial test of our questionnaire, prompting quite a few revisions in the next
round of surveys. Another round of collective deliberation followed that also involved a number
of consultations with scholars outside of the project team. The revised questions for C-coding
thus went through several rounds of review with the Project Managers and outside experts over
the course of two years before emerging in their final form, depicted in the Codebook.
Even with careful question design, a project of this nature cannot help but encounter
error. This may be the product of linguistic misunderstandings (recall that most of our coders do
not speak English as their first language and some take the survey in a translated form),
misunderstandings about the way in which a question applies to a particular context, factual
errors, errors due to the scarcity or ambiguity of the historical record, differing interpretations
about the reality of a situation, variation in standards, coder inattention, errors introduced by the
coder interface or the handling of data once it has been entered into the database, or random
mistakes.

59
Some of these errors are stochastic in the sense of affecting the precision of our
estimates but not their validity. Other errors are systematic, potentially introducing bias into the
estimates that we produce.
Having five coders for each question is immensely useful, as it allows us to identify
wayward coders as well as to conduct inter-coder reliability tests. These sorts of tests – standard
in most social science studies – are rarely if ever employed in extant democracy indices.
While we select experts carefully, they clearly exhibit varying levels of reliability and bias,
and may not interpret questions consistently. In such circumstances, the literature recommends
that researchers use measurement models to aggregate diverse measures where possible,
incorporating information characterized by a wide variety of perspectives, biases, and levels of
reliability (Bollen & Paxton 2000, Clinton & Lapinski 2006, Clinton & Lewis 2008, Jackman 2004,
Treier & Jackman 2008, Pemstein, Meserve & Melton 2010). To combine expert ratings for a
particular country/indicator/year to generate a single “best estimate” for each question, we
employ methods inspired by the psychometric and educational testing literature (see e.g. Lord &
Novick 1968, Jonson & Albert 1999, Junker 1999, Patz & Junker 1999).
The underpinnings of these measurement models are straightforward: they use patterns
of cross-rater (dis)agreement to estimate variations in reliability and systematic bias. In turn, these
techniques make use of the bias and reliability estimates to adjust estimates of the latent—that is,
only indirectly observed—concept (e.g. executive respect for the constitution, judicial
independence, or property rights) in question. These statistical tools allow us to leverage our
multi-coder approach to both identify and correct for measurement error, and to quantify
confidence in the reliability of our estimates. Variation in these confidence estimates reflect
situations where experts disagree, or where little information is available because few raters have
coded a case. These confidence estimates are tremendously useful. Indeed, the tendency of most
researchers to treat the quality of measures of complex, unobservable concepts as equal across
space and time, ignoring dramatic differences in ease of access and measurement across cases, is
fundamentally misguided, and constitutes a key threat to inference.
The majority of expert-coded questions are ordinal: they require raters to rank cases on
a discrete scale, generally with four or five response categories. To achieve scale consistency, we
fit ordinal IRT models to each question (see Johnson & Albert 1999 for a technical description of
these models). These models achieve three goals. First, they work by treating coders’ ordinal
ratings as imperfect reflections of interval-level latent concepts. Therefore, while an IRT model
takes ordinal values as input, its output is an interval-level estimate of the given latent trait (e.g.

60
election violence). Interval-valued estimates are valuable for a variety of reasons; in particular,
they are especially amenable to statistical analysis. Second, IRT models allow for the possibility
that coders have different thresholds for their ratings (e.g. one coder’s somewhat might fall above
another coder’s almost on the latent scale), estimate those thresholds from patterns in the data,
and adjust latent trait estimates accordingly. Therefore, they allow us to correct for this
potentially serious source of bias. This is very important in a multi-rater project like V-Dem,
where coders from different geographic or cultural backgrounds may apply differing standards to
their ratings. Finally, IRT models assume that coder reliability varies, produce estimates of rater
precision, and use these estimates—in combination with the amount of available data and the
extent to which coders agree—to quantify confidence in reported scores.
With lateral and bridge coding we are able to mitigate the incomparability of coders’
thresholds and the problem of cross-national estimates’ calibration. While helpful in this regard,
our tests indicate that given the sparsity of our data, even this extensive bridge-coding is not
sufficient in solving cross-national comparability issues. We therefore also employ a data-
collapsing procedure. At its core, this procedure relies on the assumption that as long as none of
the experts change their ratings for a given time period, we can treat the country-years in this
period as one year. The results of our statistical models indicate that this technique is extremely
helpful in increasing the weight given to lateral/bridge coders, and thus further mitigates cross-
national comparability problems.

61
Appendix E: Additional Results and Robustness Tests
Table E1: 2SLS Results for Model 7, Table 2 (first stage)
! 1"GDPpc (ln) 0.034*** (0.013)
Regional growth 0.00029 (0.00020)
Global growth 0.0049 (0.685)
Regional Party Strength 0.045*** (0.00020)
Global Party Strength -138.76*** (0.23)
Year FE ! Country FE ! Countries 151 Years (Max) 109 Obs 9852 Sargan test p-value 0.161 Cragg-Donald Wald F-statistic 1.8*10^5
Outcome: Party Strength. Independent variables lagged by one time-period. FE: fixed effects. Estimator: 2SLS (two-stage least squares); first-stage regression. *** p<.01 **p<.05 *p<.10 Note that the implausibly large (and negative) value on the global party strength instrument in this particular specification is due to the very high correlation with the year dummies (they are not perfectly correlated because global growth is always calculated exempting country in question). This is not important to the interpretation of the main result, since it is robust, for instance, to substituting the year dummies with a time trend, and to omitting the global instrument and only using the regional, as shown in Table E2. Furthermore, the instrument(s) in the first-stage regressions of these alternative specifications are also always very strong, as indicated by the Cragg-Donald Wald F-statistics shown in Table E2.

62
Table E2: Alternative 2SLS specifications (second stage)
1 2 3 4 5 6 7 Estimator FE FE FE FE RE RE RE
Party Strength 3.479** 5.581*** 3.667*** 6.620*** 0.881*** 1.743*** 1.739*** (1.766) (0.824) (0.787) (0.796) (0.129) (0.462) (0.458)
GDPpc (ln) -2.250*** -1.555*** -2.412*** -2.833*** -0.085 -0.400*** -0.440*** (0.281) (0.185) (0.230) (0.234) (0.067) (0.118) (0.128)
Regional growth 0.353*** 0.362*** 0.375*** 0.382*** 0.405*** 0.406*** (0.032) (0.031) (0.031) (0.029) (0.030) (0.030)
Global growth 0.130*** 0.135*** -6.401*** 0.103** 0.105** (0.044) (0.043) (0.692) (0.043) (0.043)
Time trend ! ! ! ! Year FE ! ! Country FE ! ! ! ! Instruments ! ! ! ! ! ! ! Regional party strength !! !! !! !! !! !! !! Global party strength ! !! !! !! !! !! !!Countries 151 151 151 153 151 151 151 Years (Max) 109 109 109 110 109 109 109 Obs 9852 9852 9852 10091 9852 9852 9852 Sargan test p-value - .00 .29 .48 - - - Cragg-Donald Wald F 183.70 460.34 495.13 528.63 - - - Outcome: per capita GDP growth. Units of analysis: country-year. Independent variables lagged by one time-period. Estimator: two-stage least squares with FE (fixed effects) or RE (random effects), second-stage results only. Test statistics not calculated for random effects models due to software limitations. *** p<.01 **p<.05 *p<.10.

63
Table E3: Party Strength and Economic Crises
1 2 3 4 5 6 Coding of outcome Growth<0 Growth<-3 Growth<-5 Estimator OLS Logit OLS Logit OLS Logit
Party Strength -0.080*** -0.466*** -0.052** -0.441** -0.038** -0.425* (0.026) (0.153) (0.020) (0.217) (0.016) (0.249)
GDPpc (ln) 0.045** 0.231** 0.045*** 0.443*** 0.032*** 0.461*** (0.018) (0.108) (0.015) (0.149) (0.012) (0.161)
Year FE ! ! ! ! ! ! Country FE ! ! ! ! ! ! Countries 153 152 153 149 153 146 Years (Max) 110 110 110 110 110 110 Obs 10147 10127 10147 10036 10147 9366
Outcome (Y): economic crisis, coded 1 if per capita GDP growth is below a designated value. Units of analysis: country-year. Independent variables lagged by one time-period. FE: fixed effects. Estimator: OLS (ordinary least squares), Logit (logistic regression), standard errors clustered by country. *** p<.01 **p<.05 *p<.10

64
Table E4: Party Strength and Sustained Growth Episodes
1 2 3 4 Y measured across… 5 years 10 years Estimator OLS Logit OLS Logit
Party Strength 0.111*** 0.684*** 0.064** 0.896** (0.035) (0.225) (0.031) (0.383)
GDPpc (ln) -0.110*** -0.739*** -0.136*** -1.844*** (0.032) (0.223) (0.030) (0.417)
Year FE ! ! ! ! Country FE ! ! ! ! Countries 153 152 153 118 Years (Max) 106 106 101 101 Obs 9473 9255 8633 6464
Outcome (Y): a prolonged growth period, coded 1 if per capita GDP growth is positive (>0) in consecutive years for a 5- or 10-year period. Independent variables lagged by this same time interval. FE: fixed effects. Estimator: OLS (ordinary least squares), Logit (logistic regression), standard errors clustered by country. *** p<.01 **p<.05 *p<.10
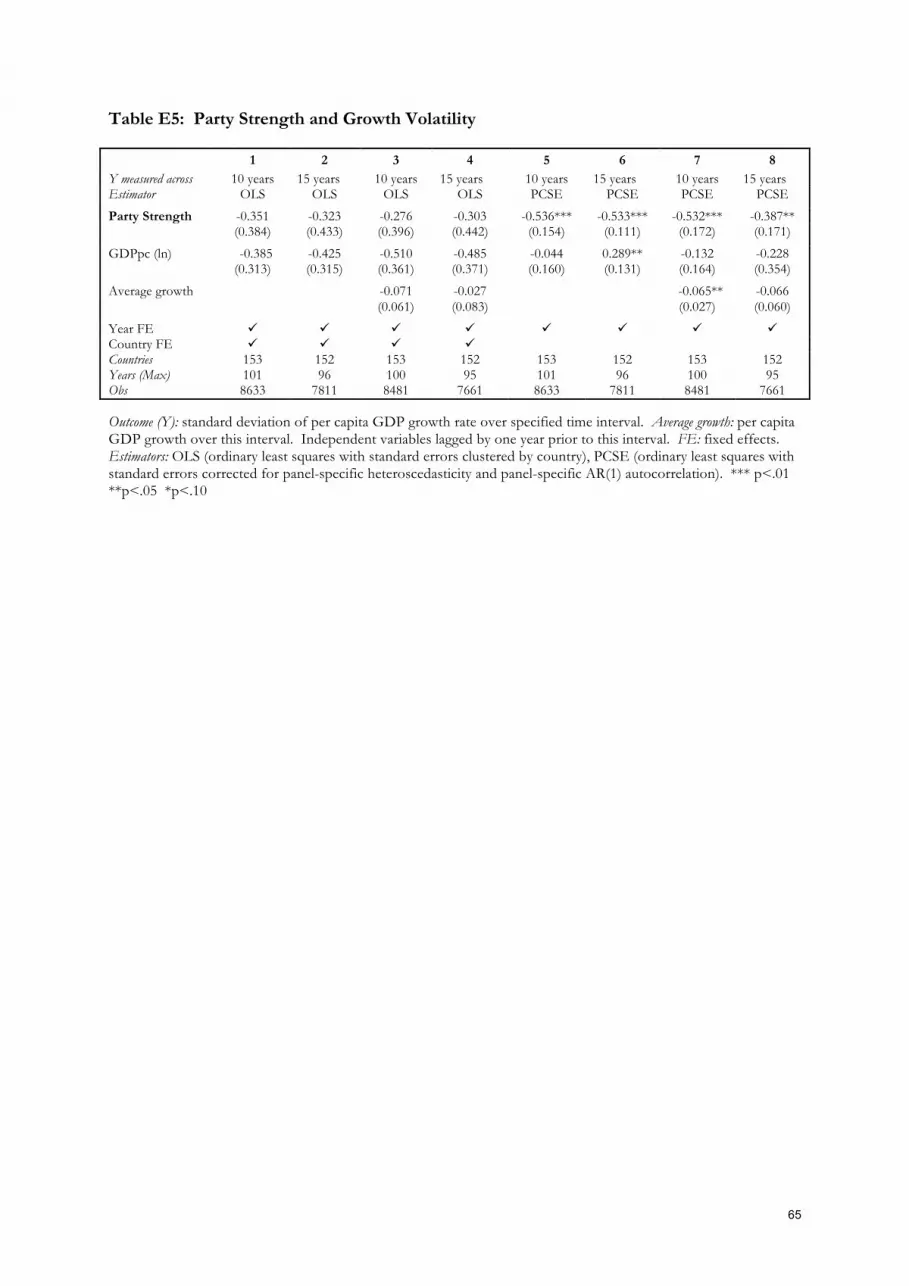
65
Table E5: Party Strength and Growth Volatility
1 2 3 4 5 6 7 8 Y measured across 10 years 15 years 10 years 15 years 10 years 15 years 10 years 15 years Estimator OLS OLS OLS OLS PCSE PCSE PCSE PCSE
Party Strength -0.351 -0.323 -0.276 -0.303 -0.536*** -0.533*** -0.532*** -0.387** (0.384) (0.433) (0.396) (0.442) (0.154) (0.111) (0.172) (0.171)
GDPpc (ln) -0.385 -0.425 -0.510 -0.485 -0.044 0.289** -0.132 -0.228 (0.313) (0.315) (0.361) (0.371) (0.160) (0.131) (0.164) (0.354)
Average growth -0.071 -0.027 -0.065** -0.066 (0.061) (0.083) (0.027) (0.060)
Year FE ! ! ! ! ! ! ! ! Country FE ! ! ! ! Countries 153 152 153 152 153 152 153 152 Years (Max) 101 96 100 95 101 96 100 95 Obs 8633 7811 8481 7661 8633 7811 8481 7661 Outcome (Y): standard deviation of per capita GDP growth rate over specified time interval. Average growth: per capita GDP growth over this interval. Independent variables lagged by one year prior to this interval. FE: fixed effects. Estimators: OLS (ordinary least squares with standard errors clustered by country), PCSE (ordinary least squares with standard errors corrected for panel-specific heteroscedasticity and panel-specific AR(1) autocorrelation). *** p<.01 **p<.05 *p<.10

66
Appendix F: Mediation Analysis
This appendix provides further detail about the mediation analyses summarized in Table 5. To
test potential pathways from Party Strength to Growth we employ the mediation package
developed by Imai et al. (2010), which estimates direct and indirect effects by jointly analyzing
results of a model predicting the mediator and a model predicting the outcome. The relationships
of interest are diagramed at the bottom of Table 5.
All analyses follow the specification of the benchmark model (Model 1, Table 2) which
includes per capita GDP (logged) along with country and year fixed-effects.
Party Strength and per capita GDP are set at t, the mediator at t+1, and growth at t+2. Statistical
significance for direct and indirect effects are estimated using quasi-bayesian confidence intervals
produced after 1000 (one thousand) simulations.
In the first stage of the analysis, a mediator – variously, Investment, Inflation, Infant
Mortality, Internal Conflict, and Irregular Exit – is regressed on Party Strength and per capita
GDP. Models predicting Investment, Inflation, and Infant Mortality) are linear mixed models.
Models for Internal Conflict and Irregular Exit are logistic mixed models with identical
specifications. In the second stage, growth is regressed on the mediator, Party Strength and GDP
per capita in a linear model. Details for each stage of the regression analysis are shown in Table
F1.

67
Table F1: Regression Results for the Mediation Analysis
1 2 3 4 5
Outcome Investment Growth Inflation Growth IMR Growth Internal conflict Growth Irregular
Exit Growth
Party Strength 3.811*** 0.917** -0.301*** 1.039*** -0.101*** 1.423*** -1.257*** 1.093*** -1.901*** 1.567***
(0.406) (0.311) (0.066) (0.304) (0.013) (0.264) (0.183) (0.269) (0.183) (0.277)
GDP per capita (ln) 4.322*** -2.907*** -0.710*** -3.025*** -0.494*** -3.358*** -1.484*** -2.642*** -0.009 -3.377***
(0.324) (0.25) (0.054) (0.251) (0.010) (0.238) (0.181) (0.227) (0.147) (0.227)
Investment 0.011
(0.010)
Inflation (ln) -0.295***
(0.057)
Infant mortality rate (ln) -1.043***
(0.222)
Internal conflict -1.401***
(0.231)
Irregular exit 0.454*
(0.200)
Country FE ! ! ! ! ! ! ! ! ! ! Year FE ! ! ! ! ! ! ! ! ! ! Countries 146 146 139 139 150 150 111 111 147 147 Years (Max) 56 56 109 109 109 109 109 109 109 109 Obs 6428 6428 6875 6875 8927 8927 8073 8073 8860 8860 Log-likelihood -20957.1 -19260.3 -10843.4 -20969.7 -1526.9 -27767.2 -1773.4 -25358.2 -2377.8 -27872.2 Deviance 41914.2 38520.5 21686.9 41939.3 3053.8 55534.5 3546.7 50716.4 4755.6 55744.5 BIC 43764.4 40379.4 23948.8 44210.1 5437.2 57926.9 5543.9 52731.6 7100.6 58107.7
Outcome: per capita GDP growth. Independent variable of interest: Party Strength. Unit of analysis: country-year. FE: fixed effects. Standard errors clustered by country. *** p<.01 **p<.05 *p<.10.

68
Appendix References
Alesina, Alberto, Arnaud Devleeschauwer, William Easterly, Sergio Kurlat, Romain Wacziarg.
2003. “Fractionalization.” Journal of Economic Growth 8:2, 155-94.
Bernhard, Michael, Christopher Reenock, Ekrem Karakoc, Dong-Joon Jung, & Keith Wegorst.
2015. «Party System Institutionalization in the World, Dataset.» Department of Political Science,
University of Florida.
Bertelsmann Transformation Index. 2014. BTI 2014 Codebook for Country Assessments. Accessed
24/08/2015:
http://www.bti-project.de/uploads/tx_itao_download/BTI2014_Codebook.pdf
Brecke, Peter. 2001. “The Long-Term Patterns of Violent Conflict in Different Regions of the
World.” Paper presented at the Uppsala Conflict Data Conference, Uppsala, Sweden.
Coppedge, Michael, John Gerring, Staffan I. Lindberg, Jan Teorell, David Altman, Michael
Bernhard, M. Steven Fish, Adam Glynn, Allen Hicken, Carl Henrik Knutsen, Kelly McMann,
Daniel Pemstein, Svend-Erik Skaaning, Jeffrey Staton, Eitan Tzelgov, Yi-ting Wang, and
Brigitte Zimmerman. 2015a. “Varieties of Democracy: Dataset v4.” Varieties of Democracy
(V-Dem) Project.
Coppedge, Michael, John Gerring, Staffan I. Lindberg, Jan Teorell, David Altman, Michael
Bernhard, M. Steven Fish, Adam Glynn, Allen Hicken, Carl Henrik Knutsen, Kelly McMann,
Daniel Pemstein, Svend-Erik Skaaning, Jeffrey Staton, Eitan Tzelgov, and Yi-ting Wang.
2015b. “Varieties of Democracy: Codebook v4.” Varieties of Democracy (V-Dem) Project.
Coppedge, Michael, John Gerring, Staffan I. Lindberg, Jan Teorell, David Altman, Michael
Bernhard, M. Steven Fish, Adam Glynn, Allen Hicken, Carl Henrik Knutsen, Kelly McMann,
Daniel Pemstein, Svend-Erik Skaaning, Jeffrey Staton, Eitan Tzelgov, Yi-ting Wang, and
Brigitte Zimmerman. 2015c. “Varieties of Democracy: Methodology v4.” Varieties of
Democracy (V-Dem) Project.
Goemans, Hein E., Kristian Skrede Gleditsch, Giacomo Chiozza. 2009. «Introducing Archigos:
A Data Set of Political Leaders.» Journal of Peace Research 46:2 (March) 269-183
Haber, Stephen, Victor Menaldo. 2011. “Do Natural Resources Fuel Authoritarianism? A
Reappraisal of the Resource Curse.” American Political Science Review 105:1, 1-26.
Heston, Alan, R. Summers, B. Aten. 2009. Penn World Table Version 7.1. Center for International
Comparisons of Production, Income and Prices at the University of Pennsylvania.

69
Imai, Kosuke, Luke Keele, Teppei Yamamoto. 2010. “Identification, Inference and Sensitivity
Analysis for Causal Mediation Effects.” Statistical Science 25:1, 51-71.
Kollman, Ken, Allen Hicken, Daniele Caramani, David Backer, David Lublin. 2014. Constituency-
Level Elections Archive. Produced and distributed by Ann Arbor, MI: Center for Political
Studies, University of Michigan.
La Porta, Rafael, Florencio Lopez-de-Silanes, Andrei Shleifer, Robert W. Vishny. 1999. “The
Quality of Government.” Journal of Economics, Law and Organization 15:1, 222-79.
Pedersen, Mogens N. 1979. «The Dynamics of European Party Systems: Changing Patterns of
Electoral Volatility.» European Journal of Political Research 7:1, 1-26.
Pemstein, Daniel, Eitan Tzelgov, Yi-ting Wang. 2015. “Evaluating and Improving Item Response
Theory Models for Cross-National Expert Surveys.” V-Dem Working Paper 2015: