Embed Size (px)
Citation preview
Hidden hunger in adolescent Mozambican girls: Dietary assessment, micronutrient status, and associations between dietary diversity and selected biomarkers
DEPARTMENT OF FOOD AND ENVIRONMENTAL SCIENCESFACULTY OF AGRICULTURE AND FORESTRYDOCTORAL PROGRAMME IN POPULATION HEALTHUNIVERSITY OF HELSINKI
LIISA KORKALO
dissertationes scholae doctoralis ad sanitatem investigandam universitatis helsinkiensis 5/2016
5/2016Helsinki 2016 ISSN 2342-3161 ISBN 978-951-51-1898-1
LIIS
A K
OR
KA
LO
Hid
den
hu
nger in
adolescen
t Mozam
bican girls
Recent Publications in this Series
92/2015 Katariina NurmiPrevention of Inflammatory Cellular Responses by Ethanol and Hemin – Interplay Between Inflammasomes and Processes Inhibiting Inflammation93/2015 Liang HeRare Genetic Variants and Complex Diseases - a Bayesian Approach94/2015 Jani SaksiStroke-Associated Carotid Atherosclerosis - a Role for FABP4 in Atheroma Vulnerability and Cardiometabolic Risk95/2015 Otto HemminkiCancer Immunotherapy with a Gene Modified Serotype 3 Oncolytic Adenovirus96/2015 Jukka KoskelaIndividual Trajectories in Asthma and COPD: A Longitudinal Perspective to Obstructive Lung Disease97/2015 Miira KlemettiTrends In Obstetric and Perinatal Outcomes of Women with Type 1 Diabetes During 1988-2011 – A Finnish Population-Based Observational Study98/2015 Ileana B. QuinteroPhysiological Functions of Prostatic Acid Phosphatase99/2015 Minna MatikainenLaunching New Products in the Finnish Pharmaceutical Industry: A Relationship Approach100/2015 Päivi Ylä-AnttilaPhagophore Membrane Connections and RAB24 in Autophagy101/2015 Kaisa KyöstiläIdentification of Novel Mutations and Molecular Pathways for Canine Neurodegeneration and Chondrodysplasia102/2015 Emmi JoensuuEpigenetic Alterations in Sporadic and Familial Cancers103/2015 Elina ReponenPreoperative Risk-Assessment Methods, Short-Term Outcome, and Patient Satisfaction in Elective Cranial Neurosurgery104/2015 Riina KandolinCardiac Sarcoidosis in Giant Cell Myocarditis in Finland106/2015 Karmen KappPolyphenolic and Essential Oil Composition of Mentha and Their Antimicrobial Effect107/2015 Dina PopovaNeurophysiological mechanisms of Plasticity Induced in Adult Brain1/2016 Pauliina SaurusRegulation of Podocyte Apoptosis in Diabetic Kidney Disease – Role of SHIP2, PDK1 and CDK22/2016 Sanna ToivonenDerivation of Hepatocyte Like Cells from Human Pluripotent Stem Cells3/2016 Marjaana PeltolaAMIGO-Kv2.1 Potassium Channel Complex: Identification and Association with Schizophrenia-Related Phenotypes4/2016 Niko-Petteri NykänenCellular Physiology and Cell-to-Cell Propagation of Tau in Neurodegeneration: The Impact of Late-Onset Alzheimer’s Disease Susceptibility Genes

Department of Food and Environmental Sciences
University of Helsinki
Liisa Korkalo
Hidden hunger in adolescent Mozambican girls:Dietary assessment, micronutrient status, and associations
between dietary diversity and selected biomarkers
ACADEMIC DISSERTATION
To be presented, with the permission of the Faculty of Agriculture and Forestry of the
University of Helsinki, for public examination in Auditorium XIV, University Main
Building, on February 5th, 2016, at 10 o’clock.
Helsinki 2016
Supervisors: Professor Marja Mutanen
Department of Food and Environmental Sciences
University of Helsinki, Finland
Adjunct Professor Maijaliisa Erkkola
Department of Food and Environmental Sciences
University of Helsinki, Finland
Reviewers: Associate Professor Kenneth Maleta
College of Medicine
University of Malawi, Malawi
Professor Inge Tetens
National Food Institute
Technical University of Denmark, Denmark
Opponent: Associate Professor Nanna Roos
Paediatric and International Nutrition
Department of Nutrition, Exercise and Sports (NEXS)
University of Copenhagen, Denmark
Cover photograph: Liisa Korkalo
ISBN 978-951-51-1898-1 (paperback)
ISBN 978-951-51-1899-8 (PDF)
ISSN 2342-3161 (print)
ISSN 2342-317X (online)
Hansaprint
Helsinki 2016

To the girls of Zambézia

ContentsAbstract 6
Abstracto 8
List of original publications 11
Abbreviations 12
1 Introduction 13
2 Review of the literature 152.1 Portion size estimation in dietary studies . . . . . . . . . . . . . . . . . . . . 15
2.1.1 Validity of portion size estimations using food photographs . . . . . . 15
2.2 Micronutrient status and intake in Sub-Saharan Africa . . . . . . . . . . . . . 18
2.2.1 Iron . . . . . . . . . . . . . . . . . . . . . . . . . . . . . . . . . . . 18
2.2.2 Zinc . . . . . . . . . . . . . . . . . . . . . . . . . . . . . . . . . . . 19
2.2.3 Selenium . . . . . . . . . . . . . . . . . . . . . . . . . . . . . . . . 20
2.2.4 Iodine . . . . . . . . . . . . . . . . . . . . . . . . . . . . . . . . . . 22
2.2.5 Vitamin A . . . . . . . . . . . . . . . . . . . . . . . . . . . . . . . . 23
2.2.6 Folate . . . . . . . . . . . . . . . . . . . . . . . . . . . . . . . . . . 24
2.3 Dietary diversity assessment in low-income settings . . . . . . . . . . . . . . 26
2.3.1 Role of dietary diversity in nutritional adequacy of diets . . . . . . . 28
2.3.2 Role of dietary diversity in micronutrient status . . . . . . . . . . . . 29
3 Aims of the study 31
4 Materials and methods 324.1 Setting . . . . . . . . . . . . . . . . . . . . . . . . . . . . . . . . . . . . . . 32
4.2 Field trips . . . . . . . . . . . . . . . . . . . . . . . . . . . . . . . . . . . . 33
4.3 Ethical issues . . . . . . . . . . . . . . . . . . . . . . . . . . . . . . . . . . 33
4.4 Study on validity of using food photographs in portion size assessment (Study I) 34
4.4.1 Preparatory work and food photographs . . . . . . . . . . . . . . . . 34
4.4.2 Participants and test protocol . . . . . . . . . . . . . . . . . . . . . . 35
4.4.3 Statistical methods . . . . . . . . . . . . . . . . . . . . . . . . . . . 36
4.5 The ZANE Study (Studies II-IV) . . . . . . . . . . . . . . . . . . . . . . . . 36
4.5.1 Study design and recruitment . . . . . . . . . . . . . . . . . . . . . . 36
4.5.2 Background questionnaire . . . . . . . . . . . . . . . . . . . . . . . 38
4.5.3 Anthropometry and biological samples . . . . . . . . . . . . . . . . 38
4.5.4 Dietary assessment . . . . . . . . . . . . . . . . . . . . . . . . . . . 42
4.5.5 Statistical methods . . . . . . . . . . . . . . . . . . . . . . . . . . . 45
4

5 Results 485.1 Estimates of portion size . . . . . . . . . . . . . . . . . . . . . . . . . . . . 48
5.2 Characteristics of the ZANE Study population . . . . . . . . . . . . . . . . . 51
5.3 Diet . . . . . . . . . . . . . . . . . . . . . . . . . . . . . . . . . . . . . . . 55
5.3.1 Dietary intake and food sources of iron, zinc, and phytate . . . . . . . 58
5.3.2 Dietary intake and food sources of vitamin A and folate . . . . . . . 58
5.4 Indicators of micronutrient status . . . . . . . . . . . . . . . . . . . . . . . . 62
5.5 Hidden hunger as a public health problem in Central Mozambique . . . . . . 64
5.6 Associations between dietary diversity scores and indicators of micronutrient
status . . . . . . . . . . . . . . . . . . . . . . . . . . . . . . . . . . . . . . 65
6 Discussion 666.1 Main findings . . . . . . . . . . . . . . . . . . . . . . . . . . . . . . . . . . 66
6.2 Dietary intake, micronutrient status indicators and their variation across
regions and seasons . . . . . . . . . . . . . . . . . . . . . . . . . . . . . . . 66
6.2.1 Minerals . . . . . . . . . . . . . . . . . . . . . . . . . . . . . . . . 66
6.2.2 Vitamins . . . . . . . . . . . . . . . . . . . . . . . . . . . . . . . . 68
6.3 Dietary recall methodology . . . . . . . . . . . . . . . . . . . . . . . . . . . 69
6.3.1 Using photographs in portion size estimation . . . . . . . . . . . . . 69
6.3.2 Under-reporting in 24-hour recalls of the ZANE Study . . . . . . . . 70
6.4 Dietary diversity as a predictor of hidden hunger . . . . . . . . . . . . . . . . 71
6.5 Limitations and strengths of the studies . . . . . . . . . . . . . . . . . . . . 72
6.5.1 Validity of portion size estimations using food photographs . . . . . . 72
6.5.2 ZANE Study and its representativeness . . . . . . . . . . . . . . . . 72
6.5.3 Biochemical measurements and interpretation of association with
dietary diversity . . . . . . . . . . . . . . . . . . . . . . . . . . . . 73
6.6 Implications for future research and action . . . . . . . . . . . . . . . . . . . 74
6.6.1 Methodological development of portion size assessment . . . . . . . 74
6.6.2 Improving nutritional status . . . . . . . . . . . . . . . . . . . . . . 74
6.6.3 Future directions of dietary diversity assessment . . . . . . . . . . . 77
6.7 Conclusions . . . . . . . . . . . . . . . . . . . . . . . . . . . . . . . . . . . 78
Acknowledgements 79
References 81
Appendix 93
5

Abstract
Poor micronutrient intake and status (also called ’hidden hunger’) may compromise the health
and work capacity of adolescent girls. In Mozambique, a low-income country with a high rate
of adolescent pregnancies, girls’ poor micronutrient status is also an important risk factor for
maternal and child mortality, adverse birth outcomes such as low birth weight, and impaired
cognitive performance of the child.
The main aims of this thesis were to examine the diet and micronutrient status of adolescent
girls in Central Mozambique and to study whether dietary diversity is associated with
biomarkers of micronutrient status. The thesis also includes a methodological study
assessing the validity of using food photographs in portion size estimation in adolescent
Mozambican girls.
The validity study on food photographs was conducted in 2009. Two local staple foods and
three sauces were selected as test foods and photographs of three different portion sizes were
produced for each of them. The participants (99 Mozambican girls aged 13-18 years) were
served weighted food portions, and after eating their meal, they were interviewed and asked
to estimate the size of their portions with the help of the food photographs. The findings of
this study indicated a tendency towards under-estimation of portion sizes. On the group level,
the results were acceptable, but large variation in the accuracy of individuals’ estimates was
found.
The ZANE Study was conducted in 2010. It was a population-based cross-sectional study
on the diet and nutritional status of 14- to 19-year-old girls in Zambézia Province. The study
regions included one urban area and two rural districts. Two separate samples of girls were
recruited: the first in January-February (’hunger season’, n=283) and the second in May-June
(harvest season, n=268). A 24-hour dietary recall interview and a seven-day food frequency
questionnaire interview were conducted for each participant. Blood and urine samples were
collected and blood haemoglobin, serum ferritin, serum zinc, serum selenium, urinary iodine,
plasma retinol and serum folate concentrations were analysed.
The ZANE Study revealed a low median energy intake calculated from the 24-hour recalls [5.2
MJ/day, interquartile range: 3.6, 7.4 (calculated using sampling weights); n=543]. This is in
line with the findings of the validity study and is at least partly explained by under-reporting.
Low intakes of several micronutrients and relatively high phytate:zinc molar ratios, typical for
diets in low-income settings, were found. Marked seasonal variation was noted for vitamin A
intake. According to the World Health Organization definitions, anaemia was a severe public
health problem and vitamin A deficiency a moderate public health problem. The serum ferritin
6
concentrations indicated that iron depletion was prevalent in the population. The population
was also found to have a risk of zinc deficiency. Folate status was considered to be generally
adequate, but an exception to this was the low serum folate concentrations in the urban area
in May-June. Mild to moderate iodine deficiency was found in the rural districts, whereas the
iodine status of urban girls was adequate. Selenium status was considered adequate.
In the last part of the thesis, associations between dietary diversity and low concentrations of
haemoglobin and serum/plasma ferritin, zinc, retinol, and folate in non-pregnant girls (n=227
in January-February and n=223 in May-June) were examined in logistic regression models
using three different dietary diversity scores. First, the Women’s Dietary Diversity Score
(WDDS), consisting of nine food groups was calculated from the 24-hour recalls according
to instructions by the Food and Agriculture Organization of the United Nations. The second
score employed a minimum portion size limit of 15 g (WDDS15g), and the third was based
on the seven-day food frequency questionnaires (7dWDDS). The most consistent findings of
this work were the associations observed for zinc. In January-February, after adjusting for
confounders, a low (≤3) WDDS and a low (≤5) 7dWDDS were each associated with higher
odds of having low serum zinc (≤25th percentile of the season-specific distribution) compared
with having a higher score. These associations were not present in May-June.
In conclusion, using food photographs in portion size estimation in adolescent Mozambican
girls showed an acceptable level of validity. There was, however, a tendency towards
under-reporting. In the future, producing and testing more comprehensive sets of locally
relevant food photographs will be useful for dietary studies in Sub-Saharan African settings.
Hidden hunger was found to be a public health problem among adolescent girls in Central
Mozambique. Actions are needed to prevent and control hidden hunger, especially with
regard to low iron, zinc, iodine, and vitamin A status. Programmes may need to be tailored
according to urban-rural differences in diet and micronutrient status. Some associations
between dietary diversity and micronutrient status may exist, especially in the case of zinc.
However, the associations seem to be season-specific, which may limit the practical
application of dietary diversity scores as tools to identify populations at risk of low
micronutrient status.
7

Abstracto
Uma ingestão pobre em micronutrientes (também chamado de "fome oculta"), pode
comprometer a saúde e a capacidade de trabalho das meninas adolescentes. Em
Moçambique, um país de baixa renda com uma elevada taxa de gravidez na adolescência, a
deficiência em micronutrientes nas meninas é também um importante factor de risco para
mortalidade materna e infantil, assim como para outros resultados adversos, como o baixo
peso ao nascer, e deficiente desempenho cognitivo da criança.
Os principais objectivos desta tese foram examinar a qualidade da dieta e os níveis de
micronutrientes nas raparigas adolescentes no centro de Moçambique e verificar se a
diversidade da dieta está associada aos bio-indicadores de micronutrientes. A tese também
incluiu um estudo metodológico com o objectivo de avaliar a validade do uso de fotografias
de alimentos (em porções estimadas) em raparigas adolescentes moçambicanas.
O estudo de validação das fotografias de alimentos foi realizado em 2009. Dois alimentos
básicos locais e três molhos (caril) foram seleccionados como teste e fotografias com três
diferentes porções foram elaboradas, para cada porção. Foram servidas refeições pesadas as
participantes (99 meninas de 13 a 18 anos de idade) e depois destas comerem a refeição, foram
entrevistadas e pedidas a estimarem o tamanho das suas refeições com a ajuda das fotografias
das diferentes porções de alimentos. Os resultados deste estudo indicaram uma tendência de
subestimação do tamanho das porções. Ao nível do grupo, os resultados foram aceitáveis,
mas foi encontrada uma grande variação na precisão das estimativas dos indivíduos.
O estudo ZANE foi realizado em 2010. Foi um estudo transversal de base populacional
sobre a dieta e o estado nutricional de raparigas, de 14 a 19 anos de idade, na Província da
Zambézia. As regiões abrangidas no estudo incluíram uma área urbana e dois distritos
rurais. Duas amostras diferentes de raparigas foram selecionadas: a primeira em
Janeiro-Fevereiro ("período de fome", n=283) e a segunda em Maio-Junho (época de
colheita, n=268). Uma entrevista sobre o consumo alimentar das últimas 24 horas e outra
sobre a frequência alimentar dos últimos sete dias foram realizadas a cada participante.
Amostras de sangue e de urina foram recolhidas, feitas análise sobre os níveis de
hemoglobina no sangue e concentrações de ferritina sérica, zinco sérico, selénio no soro,
iodo urinário, retinol no plasma e folato no soro.
No estudo ZANE verificou-se que a mediana da ingestão energética, calculada a partir do
consumo alimentar das últimas 24 horas, foi baixa [5.2 MJ / dia, intervalo entre os quartis:
3,6-7,4 (calculadas utilizando o peso da amostra); n = 543]. Isto está de acordo com as
conclusões do estudo de validade e é, pelo menos parcialmente explicado pelo facto das
8

raparigas subestimarem a porção consumida com base nas fotos com as porções de
alimentos. A baixa ingestão de vários micronutrientes e relativo altos níveis de relação molar
fitato/zinco, típico em dietas em grupos populacionais de baixa renda, foram encontrados.
Foi também registada uma variação sazonal na ingestão de vitamina A. Segundo as
definições da Organização Mundial de Saúde, a anemia foi identificada como um problema
de saúde pública grave enquanto que a deficiência de vitamina A foi consideradas como um
problema de saúde pública moderado. As concentrações de ferritina sérica indicaram que a
deficiência de ferro é prevalente na população. Também se identificou que a população tem
o risco de deficiência de zinco. O estado de folato foram considerados adequado de um
modo geral, mas uma excepção foram os baixos níveis de concentrações de folato sérico
baixos registados na área urbana no período de Maio-Junho. Deficiência de iodo ligeira a
moderada foi encontrada nos distritos rurais, enquanto os níveis de iodo das meninas
urbanas era adequada. O estado de selénio foram considerados adequados.
Na última parte da tese, as associações entre a diversidade alimentar e baixas concentrações
de hemoglobina, ferritina no soro, zinco no soro, retinol no plasma e folato no soro nas
raparigas não grávidas (n=227 em Janeiro-Fevereiro e n=223 em Maio-Junho) foram
examinados em modelos de regressão logística usando três diferentes pontuações da
diversidade alimentar. Na primeira pontuação, a pontuação da diversidade da dieta da
mulher (WDDS) consistiu em nove grupos de alimentos calculadas a partir do consumo
alimentar das ultimas 24 horas de acordo com as instruções da Organização para
Alimentação e Agricultura das Nações Unidas (FAO). A segunda pontuação utilizou um
limite mínimo de porção de 15 g (WDDS15g), e o terceira pontuação foi baseada nos
questionários de frequência alimentar dos últimos sete dias (7dWDDS). Os resultados mais
consistentes deste estudo foram as associações observadas para o zinco. Em
Janeiro-Fevereiro, depois do ajuste dos factores de confusão (confunding factors), uma baixa
(≤3) WDDS e uma baixa (≤5) 7dWDDS foram, cada um associado com maior chance de
ter baixo níveis de zinco sérico (percentil ≤25 da distribuição sazonal específica) em
comparação as altas pontuações. Essas associações não se registaram em Maio-Junho.
Em conclusão, o uso de fotografias de porção de alimentos em adolescentes Moçambicanas
mostrou um nível aceitável de validade. Entretanto, registou-se uma tendência das raparigas
subestimarem as porções consumidas. No futuro, a produção e testagem conjuntos mais
abrangentes de fotografias relevantes de alimentos locais será útil para estudos sobre dietas
em países da África Subsahariana. A fome oculta foi registada como um problema de saúde
pública entre as adolescentes no centro de Moçambique. Acções são necessárias para
prevenir e controlar a fome oculta, especialmente no que diz respeito aos baixo níveis de
ferro, zinco, iodo e de vitamina A. Os programas precisam de ser adaptados respondendo as
diferenças urbano-rurais em termos de dieta e níveis de micronutrientes. Alguma relação
9

entre a diversidade da dieta e os níveis de micronutrientes podem existir, especialmente no
caso do zinco. Entretanto, esta associação parece ser específicas a estação do ano, o que
pode limitar a aplicação prática do instrumento da pontuação da diversidade da dietética
para a identificar populações em risco de ter baixos níveis de micronutrientes.
10

List of original publications
This thesis is based on the following original publications, which are referred to in the text by
Roman numerals I-IV:
I Korkalo L, Erkkola M, Fidalgo L, Nevalainen J, Mutanen M. Food photographs in
portion size estimation among adolescent Mozambican girls. Public Health Nutr
2013;16:1558-1564.
II Korkalo L, Freese R, Fidalgo L, Selvester K, Ismael C, Mutanen M. A cross-sectional
study on the diet and nutritional status of adolescent girls in Zambézia Province,
Mozambique (the ZANE Study): Design, methods, and population characteristics.
JMIR Res Protoc 2014;3:e12. DOI: 10.2196/resprot.3109.
http://www.researchprotocols.org/2014/1/e12/
III Korkalo L, Freese R, Alfthan G, Fidalgo L, Mutanen M. Poor micronutrient intake and
status is a public health problem among adolescent Mozambican girls. Nutr Res
2015;35:664-673.
IV Korkalo L, Erkkola M, Heinonen AE, Freese R, Selvester K, Mutanen M. Associations
of dietary diversity scores and micronutrient status in adolescent Mozambican girls.
Submitted.
Publications I and III are reproduced with the kind permission of their copyright holders.
Publication II was published under the Creative Commons Attribution License
(http://creativecommons.org/licenses/by/2.0/).
In addition, some unpublished material is presented.
11

Abbreviations
BMI body mass index
BMR basal metabolic rate
CI confidence interval
DDS dietary diversity score
EAR estimated average requirement
FAO Food and Agriculture Organization of the United Nations
FFQ food frequency questionnaire
FGI Food Group Diversity Indicator
HDDS Household Dietary Diversity Score
hsCRP high-sensitivity C-reactive protein
IQR interquartile range
MAR mean adequacy ratio
MDD-W Minimum Dietary Diversity-Women
MPA mean probability of adequacy
OR odds ratio
PAMRDC Multisectoral Action Plan for the Reduction of Chronic Undernutrition
in Mozambique
RAE retinol activity equivalent
RNI recommended nutrient intake
SD standard deviation
UNICEF United Nations Children’s Fund
USDA United States Department of Agriculture
WDDS Women’s Dietary Diversity Score
WDDS15g Women’s Dietary Diversity Score with a 15 g minimum
WHO World Health Organization
7dWDDS seven-day Women’s Dietary Diversity Score
12

1 Introduction
Hidden hunger is a term used synonymously with chronic undernutrition of micronutrients.
It arises from inadequate intakes, sometimes combined with other factors, such as impaired
absorption in the gut or inflammation, which lead to anaemia and poor micronutrient status
of the body. The word ’hidden’ emphasizes that a large proportion of the global burden of
micronutrient deficiencies is found in the form of sub-clinical deficiencies with no visible
symptoms. Yet, hidden hunger bears serious consequences; in children it reduces growth
(Black et al. 2013), and throughout life it is linked to impaired immunity (Calder 2013) and
work capacity (Haas and Brownlie 2001). Hidden hunger is especially harmful during
conception and pregnancy; anaemia and micronutrient deficiencies are risk factors for
maternal mortality and impaired growth and development of the foetus (Ramakrishnan et al.
2012, Black et al. 2013). Despite a strong international consensus on the need to control and
prevent these deficiencies (United Nations Standing Committee on Nutrition 2015), serious
problems remain with regard to ensuring adequate micronutrient status of those living in the
poorest settings (Muthayya et al. 2013).
Adolescent pregnancies are common in Mozambique and many other countries of
Sub-Saharan Africa. United Nations Children’s Fund (UNICEF) statistics for Sub-Saharan
Africa show that 27% of girls have given birth by the age of 18 years (UNICEF 2014). The
relatively high nutritional requirements of adolescents related to securing final growth,
combined with the high rate of pregnancies, make adolescent girls a group that is vulnerable
to the adverse effects of undernutrition. Yet, the nutrition and health of this population group
have received less attention than they warrant. In recent years, there has been a call for more
research and action to improve the situation of adolescent girls (Temin and Levine 2009,
Patton et al. 2012).
Mozambique is one of the least developed countries in the world, with almost 60% of the
population living below the international poverty line (United Nations Development
Programme 2013). About 60% of the population is rural (World Bank 2012). According to
the latest statistics, the growth of up to 43% of children under the age of five years is stunted
(Ministério da Saúde et al. 2013). This is considered a very high prevalence (de Onis and
Blössner 1997), and reflects the chronic undernutrition affecting this country’s inhabitants.
Anaemia is also known to be a severe public health problem (Ministério da Saúde et al.
2013). Apart from the data on anaemia, up-to-date information on the dietary intake and
micronutrient status on Mozambican adolescents or adults is scanty. Such data are needed in
designing various actions to improve nutritional status and to set priorities in nutritional
policy.
13

The main aim of this thesis was to evaluate the diet and micronutrient status of adolescent
girls in Central Mozambique. This thesis is largely based on data collected in the ZANE
Study (Estudo do Estado Nutricional e da Dieta em Raparigas Adolescentes na Zambézia), a
cross-sectional study on the diet and nutritional status of adolescent girls in Zambézia
Province conducted in 2010. This thesis describes the public health problem of hidden
hunger through examining biochemical indicators of micronutrient status for iron, zinc,
selenium, iodine, vitamin A, and folate. With regard to dietary intake, the main focus is on
four micronutrients: iron, zinc, vitamin A, and folate.
In addition to the main aim, two different methodological questions, both related to the
assessment of food consumption, are examined here. Firstly, during a 24-hour dietary recall
interview the subject is expected to provide an accurate estimate of the amount of each food
eaten during the recall period, which is by no means an easy task. Nowadays, food
photographs suitable for the local customs of the study population are often produced to aid
portion size estimation. In the first paper of this thesis, the validity of using food
photographs among adolescent Mozambican girls was evaluated.
Secondly, dietary diversity scores (DDSs) have been promoted as tools for population-level
assessment of the quality of diets (Kennedy et al. 2010). This type of tools are inexpensive, do
not require a high level of technical or statistical expertise, and provide rapid results to guide
decision-making in, for example, agricultural and nutrition policy. Research in low-income
settings has shown that dietary diversity is correlated with dietary micronutrient adequacy
(Arimond et al. 2010). However, whether different DDSs are associated with biochemically
measured micronutrient status in different populations remains poorly understood. In the last
paper of this thesis, the aim was to determine whether the Women’s Dietary Diversity Score
(WDDS), promoted by the Food and Agriculture Organization of the United Nations (FAO)
(Kennedy et al. 2010), is associated with biochemical indicators of micronutrient status and
whether this score could serve as a proxy tool to predict micronutrient status.
14

2 Review of the literature
2.1 Portion size estimation in dietary studies
Twenty-four-hour dietary recalls and food frequency questionnaires (FFQs) filled in by an
interviewer are commonly used in low-income settings. The use of food records or
self-recorded FFQs is sometimes constrained by low rates of literacy. Along with the first
prerequisite for retrospective dietary assessment, the subject’s ability to memorize the foods
eaten, one of the most important challenges related to the accuracy of reported food
consumption is portion size estimation (McPherson et al. 2000). Besides these two main
factors, the motivation of the subject and the skills and persistence of the interviewer are
essential to a successful dietary interview (Acheson et al. 1980, McPherson et al. 2000).
To help a subject estimate the amount of food consumed, various aids can be used. Options
include dishware, food replicas, abstract three-dimensional models, two-dimensional line
drawings, real food, and food photographs. The term ’food photograph’ usually refers to
photographs of dishes or individual foods that are taken and printed in a standardized way.
Nowadays, instead of using printed atlases, food photographs are sometimes presented for
the subject on a computer screen (e.g. Foster et al. 2008a, Subar et al. 2010). Recently,
researchers have also tested new, ways of using photography to help quantify food portions.
For example, Jia et al. (2014) developed a chest-worn electronic device that takes
prospective, automatic photographs of foods eaten. Furthermore, in Bolivia, Lazarte et al.
(2012) tested a method in which the subjects photographed their food over one day and these
photographs were used to help estimate portions during a 24-hour recall interview
conducted the next day. As the use of digital cameras and mobile phones with cameras has
become common worldwide, these types of solutions might also prove useful in the future in
other low- and middle-income countries.
2.1.1 Validity of portion size estimations using food photographs
Limited studies have been conducted on the validity of portion size estimation using food
photographs in low- and middle-income settings (Venter et al. 2000, Huybregts et al. 2008,
Tueni et al. 2012, Bernal-Orozco et al. 2013). Therefore, in this section, the review of
literature includes also studies done in high-income settings. The study designs of the
previous assessments on the validity of food photographs in portion size estimation have
varied markedly. Roughly, the studies can be divided into two types according to the timing
of the presentation or serving of the test food. In the first type of study, the portion size
15

estimation occurs simultaneously with the presentation of the food (Nelson et al. 1994,
Lucas et al. 1995, Venter et al. 2000, Lillegaard et al. 2005, Ovaskainen et al. 2008,
Bernal-Orozco et al. 2013, Trolle et al. 2013). These studies aim to evaluate the subjects’
ability to perceive the amount of food pictured and relate that to the actual food in front of
them (Nelson and Haraldsdottir 1998). The results of these studies could be seen as
generalizable to situations where the subject fills in a food record with the help of a
photographic booklet. These studies also provide useful information from the point of view
of improving the design of food photographs (e.g. number of photographs per food, scale of
presentation, angle of photography, and appearance of the food). If the subjects perform
poorly in these studies, the photographs are not expected to be very useful in the second type
of study, described below, either. Although the task of estimating the size of a portion
situated right in front of oneself may seem straightforward, empirical tests have shown that
this is not always the case. Lillegaard et al. (2005), who tested food photographs in 9- to
19-year-old Norwegians, reported that the task was generally easy when the presented food
portion had the same appearance and size as the pictured food, but was clearly more difficult
when the presented food differed from the pictured food.
In the second type of study, the food was first eaten or presented and the portion size
estimation occurred when the food was no longer in sight of the subject (Faggiano et al.
1992, Nelson et al. 1996, Robinson et al. 1997, Robson and Livingstone 2000, Turconi et al.
2005, Foster et al. 2008a, Huybregts et al. 2008). This type of study design mimics the
real-life retrospective dietary assessment situation in the sense that there are two main tasks
required from the subject: 1) remembering the food eaten and 2) conceptualizing the food
(i.e. relating the mental image of the eaten food to the pictured amount) (Nelson and
Haraldsdottir 1998). The time from eating or seeing the food to the estimation has varied
from minutes (Nelson et al. 1996) to one day (Huybregts et al. 2008), and thus, the role of
memory is not the same in all studies.
Some studies have assessed different timings of portion size estimation (Frobisher and
Maxwell 2003, Foster et al. 2008b, Tueni et al. 2012, Ambrus et al. 2013), and the findings
have been conflicting. For example, Foster et al. (2008b) found no difference in the accuracy
of children’s estimations when they were done with the food in sight, just after eating, or 24
hours after eating. On the other hand, a European five-country study in adolescents and
adults found that the agreement between the actual amount of food and estimated amount
was better when the food was in sight, compared with at least one hour after eating (Ambrus
et al. 2013).
Most of the studies have concluded that in general the food photographs were useful tools in
portion size estimation (Lucas et al. 1995, Nelson et al. 1996, Robinson et al. 1997, Robson
16

and Livingstone 2000, Venter et al. 2000, Lillegaard et al. 2005, Turconi et al. 2005, Foster
et al. 2008a, Huybregts et al. 2008, Ovaskainen et al. 2008, Ambrus et al. 2013, Bernal-Orozco
et al. 2013). The study by Frobisher and Maxwell (2003) was an exception to this, concluding
that a photographic booklet designed for adults was unsuitable for children and alternative
methods should be tested for them. The European five-country study (Ambrus et al. 2013)
concluded that food photographs are valid for estimating the depicted foods, but foods with
substantially different shape and density may be quantified incorrectly. Several studies have
demonstrated that large variation exists between the accuracy of individuals’ estimations (e.g.
Nelson et al. 1996, Robson and Livingstone 2000, Lillegaard et al. 2005, Foster et al. 2008a),
suggesting that the method is more suitable for assessing food consumption at group level than
individual level.
17

2.2 Micronutrient status and intake in Sub-Saharan Africa
Overall, data on dietary intake and biochemical indicators of micronutrient status among
adolescent populations in Sub-Saharan Africa are scarce. Much of the information on
adolescent girls comes from school-based studies (VanderJagt et al. 2000, Leenstra et al.
2005, Alaofè et al. 2008, Amare et al. 2012), rather than population-based studies. In many
Sub-Saharan African countries, girls’ primary school enrolment figures are high, but by the
time girls reach adolescence, enrolment drops considerably; in 2012, it was estimated that
about one-third of adolescent girls of lower secondary school age were out of school (United
Nations Educational, Scientific and Cultural Organization Institute for Statistics and
UNICEF 2015). School-based samples are therefore often likely to represent better-off
segments of the population. A further complication in the search for information on the diet
and nutritional status of adolescent girls it that the results of girls aged 15 years or more are
sometimes not presented separately from adult women (Tatala et al. 1998, Vorster et al.
2005, Rohner et al. 2013a) because these girls are considered to belong to ’women of
child-bearing age’. For these reasons, in the following sections the current public health
status of iron, zinc, selenium, iodine, vitamin A, and folate in Sub-Saharan Africa is outlined
in general terms, rather than focusing solely on adolescent girls. Where available, previous
data on Mozambique are also presented.
2.2.1 Iron
Anaemia is a multifactorial condition, with the main causes being nutritional deficiencies
of iron and other nutrients, infectious diseases, and genetic haemoglobin disorders such as
thalassaemias. Globally, iron deficiency is acknowledged as the leading cause of anaemia
(Balarajan et al. 2011). Anaemia is a risk factor for maternal mortality (Black et al. 2013),
and evidence from iron supplementation studies shows that it is also a risk factor for low birth
weight of children (Haider et al. 2013). Moreover, anaemia is linked to impaired work capacity
(Haas and Brownlie 2001).
Torheim et al. (2010) conducted a systematic review of studies reporting women’s
micronutrient intake in low-resource settings and compared the values of central tendency
(mean and median) of intake of ten micronutrients to estimated average requirements
(EARs) and recommended nutrient intakes (RNIs). The review also included adolescent
girls from the age of 13 onwards, but in the original articles, the results were rarely presented
separately for adolescents and adults. The review indicated that mean or median calculated
intakes of iron in Sub-Saharan Africa varied tenfold, from the extremely low figure of 3.8
mg/day (Oldewage-Theron et al. 2006) to 36 mg/day (Bénéfice et al. 2001). However, most
18
often the mean/median intakes were far below EAR (28 mg/day for non-pregnant and 22
mg/day for pregnant females), and the interpretation was that the populations were at high
risk of inadequate intakes. Wiesmann et al. (2009) reported the baseline dietary intake of
409 Mozambican women participating in a project aimed at increasing the production and
consumption of orange-fleshed sweet potato in Zambézia Province in 2006. The median iron
intake was 10.8 mg/day.
The most commonly used indicator of anaemia is haemoglobin concentration. Haemoglobin
concentrations of different African populations, especially in children and women have been
extensively studied, as is evident from the review by Stevens et al. (2013). They concluded
that in the Eastern Africa region (including Mozambique) the estimated prevalence of anaemia
was 28% for non-pregnant women (using a cut-off of <120 g/l) and 36% for pregnant women
(cut-off <110 g/l). These findings suggested improvements relative to the situation in 1995,
when the respective prevalence estimates were 40% and 46%. For Mozambique, recent data
show that anaemia is highly prevalent; 54% of 15- to 49-year-old females were anaemic in
2011 (Ministério da Saúde et al. 2013).
As haemoglobin is not a specific indicator of iron deficiency, serum ferritin and transferrin
receptor are commonly used to assess iron status in a population. According to the World
Health Organization (WHO) (2011d), serum ferritin levels can be used as an indicator of
body iron stores. However, serum ferritin rises during inflammation, and in regions of
endemic infections its interpretation is difficult. Different researchers have used different
approaches in using markers of inflammation to adjust for inflammation, and therefore, the
comparison of results is sometimes challenging. Overall, the information on population
distributions of serum ferritin and transferrin receptor is much more scarce than that of
haemoglobin. It is, however, important to have an understanding of the burden of iron
deficiency anaemia globally. Stevens et al. (2013) estimated the proportion of anaemia that
is amenable to iron by modelling how much the population distributions of haemoglobin
would shift as a result of iron supplementation. This was done using results of meta-analyses
examining the increase of haemoglobin due to iron supplementation in women and children
with anaemia at baseline. They concluded that in women about 50% of anaemia is amenable
to iron.
2.2.2 Zinc
Zinc deficiency does not have specific clinical symptoms, and the idea that it could be a
serious public health problem was long overlooked. The evidence that this deficiency is
encountered in certain contexts started to emerge from the 1960s onwards (Shrimpton and
19

Shankar 2008), but the importance of zinc nutrition has received more attention on the
global nutrition agenda only in the last decade. Currently, zinc deficiency is known to arise
from dietary inadequacies, diseases that exacerbate zinc losses (e.g. diarrhoea), impaired
utilization (e.g. environmental enteropathy), and increased requirements (e.g. rapid growth,
pregnancy) (Gibson 2006, Lindenmayer et al. 2014).
Much of the research on zinc in developing countries has focused on elucidating the
potentially beneficial effect of zinc supplementation in reducing child mortality and
incidence of diarrhoea and improving linear growth (Mayo-Wilson et al. 2014). Recently,
much interest has been directed at examining the impact of zinc on public health (Solomons
2013). The effects of maternal low serum zinc concentrations remain poorly understood
(Black et al. 2013), but zinc supplementation has been found to be associated with a
reduction in the risk of preterm birth (Ota et al. 2015).
The review by Torheim et al. (2010) showed that data on zinc intakes in African populations
are scanty. Of the eight studies reporting zinc intake in non-pregnant non-lactating women (or
women with unknown status) in Sub-Saharan Africa, six were conducted in South Africa. The
median or mean intakes reported in these studies were in the relatively narrow range of 6.8-8.7
mg/day in all but two studies. This is close to the EAR of 7 mg/day, and thus the intakes were
generally considered to be low. Wiesmann et al. (2009) reported a similar median intake for
the Mozambican sample: 9.0 mg/day.
A population’s zinc status can be assessed by analysing the serum zinc concentration in a
representative sample (International Zinc Nutrition Consultative Group 2012). Limited
population-based data on the serum concentrations are, however, available from
Sub-Saharan Africa. Therefore, the current understanding of the relative likelihood of zinc
deficiency in different countries is based on population-level models that estimate intake of
zinc from national food balance sheets (Wessells and Brown 2012, Joy et al. 2014) and use
childhood stunting as a proxy-indicator for zinc status (Wessells and Brown 2012). Wessells
and Brown (2012) created a composite index based on these two approaches and reported
that globally, of the 32 countries identified as being at high risk of inadequate zinc intake, 21
were in Sub-Saharan Africa. Mozambique and the majority of its neighbouring countries
were included in this group. Joy et al. (2014) also placed Mozambique in the highest
category of risk of zinc deficiency.
2.2.3 Selenium
Adequate levels of serum selenium are needed to maintain optimal activity of plasma
glutathione peroxidases, which are a family of enzymes that act as antioxidants (Thomson
20

2004). No specific symptoms of selenium deficiency have been described other than for
severe and prolonged forms of deficiency such as Keshan disease (Mehdi et al. 2013).
Keshan disease is an endemic cardiomyopathy previously prevalent in certain areas of China,
where very poor selenium status was encountered. However, as the economic conditions in
China have improved, the disease has disappeared (see Sunde 2012). Some, but not all,
observational studies have found an association between low selenium status and increased
risk of cardiovascular disease, but results from supplementation trials have been inconclusive
(Joseph and Loscalzo 2013). Overall, selenium has understandably had a smaller role in the
global public health nutrition agenda than the other micronutrients covered in this section.
Selenium intakes have rarely been reported in dietary intakes studies in Sub-Saharan Africa.
Calculating selenium intakes is difficult, because the selenium content of food varies
substantially depending on soil characteristics such as selenium concentration and pH
(Fordyce 2007). A good example of this was the study by Hurst et al. (2013), which showed
that in Malawi, women’s duplicate diets collected from areas with high pH soils had about
eight-fold higher selenium contents compared with low pH soils. The serum concentrations
analysed for the same subjects also varied markedly according to the soil type.
Despite the apparent difficulty in estimating selenium intakes, Hurst et al. (2013) and Joy
et al. (2014) have taken on the challenge of drawing maps of the risk of inadequate dietary
selenium in Africa. Both analyses suggested that especially populations in Central and
Southern African countries, such as Zimbabwe, Zambia, and The Democratic Republic of
Congo, have a high risk of deficiency, whereas in West Africa, only a few countries were
considered at risk. The more recent analysis placed Mozambique in the group of countries
where the risk is high (in the range of 76-90%) (Joy et al. 2014). However, these estimates
were not based on information on selenium content of local foods in the different countries,
but on composition tables for Southern, Eastern, and Central regions, each having a single
value for an individual foods. Thus, within each of these broad regions, differences in the
estimates of the level of risk are not based on differences between the selenium content of
local foods, but rather on differences in the share of various foods contributing to the total
food consumption according to the food balance sheets. For these reasons, as the authors
point out, the results should be interpreted with caution.
Serum selenium concentrations are used as an indicator of selenium status, but data on the
concentrations in low-income countries are scarce (Combs 2001), and to my knowledge, no
population-based data are available for Sub-Saharan Africa. Previous data on selenium
concentrations in Mozambique are not available.
21

2.2.4 Iodine
Deficiency of iodine causes inadequate production of thyroid hormones, leading to multiple
adverse effects collectively known as iodine deficiency disorders. For adults, iodine
deficiency may cause goitre, hypothyroidism, and impaired mental function, but the most
serious consequence is damage to a foetus caused by maternal iodine deficiency
(Zimmermann et al. 2008). In his review of the evidence, Zimmermann et al. (2008)
concluded that severe iodine deficiency during pregnancy may cause stillbirth, abortion,
infant mortality, cretinism, congenital abnormalities, and impaired motor and cognitive
function of the child, but the effects of mild to moderate deficiency are less clear.
Furthermore, Zimmermann noted that distinguishing the effects of children’s current iodine
status from the long term effects caused by deficiency in-utero on cognitive performance is
difficult. However, evidence from randomized controlled studies among school-aged
children suggests that providing iodine to deficient populations may yield positive effects on
cognition (Zimmermann et al. 2006, Gordon et al. 2009).
Population status monitoring is usually done via spot urine measurement or measurement of
the iodine content of household salt sample using rapid test kits. Iodine content of soil varies
by region, and depleted soils are found especially in mountainous regions and flooded river
valleys. Therefore, in many areas of the world, the dietary intake is inevitably deficient,
unless foods (usually salt) are fortified with iodine. In 1994, a special session of the WHO
and UNICEF Joint Committee on Health Policy recommended universal iodization of salt to
prevent iodine deficiency disorders (UNICEF/WHO 1994). Globally, the efforts to achieve
and sustain universal salt iodization have been a public health success story requiring
commitment from public policy makers, private industry, and the third sector (Gautam
2007). The proportion of households in developing countries consuming iodized salt rose in
ten years (1990 to 2000) from an estimated 20% to 70% (UNICEF 2001). In Mozambique,
the latest national survey on household salt samples showed that 36% of households used
salt that was not iodized, despite salt iodization being mandatory (de Araujo et al. 2009).
Furthermore, in more than half of the households using iodized salt, the content failed to
reach adequate levels (≥15 mg/kg salt).
Another proof of success is revealed in a review of population data for urinary iodine
concentrations published in 2013 (Pearce et al. 2013). Data were available from the majority
of countries worldwide (152 countries), and of these, no country was classified as severely
deficient, nine countries were classified as moderately deficient, and 21 countries were
classified as mildly deficient. In Mozambique, the latest spot urine results for school-aged
children are from 2004 (WHO 2006), and show that the population continues to suffer from
mild iodine deficiency. Overall, in Mozambique, the progress towards eradication of iodine
22

deficiency seems to have lagged behind that of the other Southern and Eastern Africa – all of
Mozambique’s six neighbours, (South Africa, Swaziland, Zimbabwe, Zambia, Malawi, and
Tanzania) are currently classified as countries with adequate iodine nutrition (Pearce et al.
2013).
Calculating dietary iodine intake is challenging. The amount of iodine in iodized table salt
has been reported to vary between 15 and 80 mg/kg of salt (see Rohner et al. 2013b), and often
this information is not available in Sub-Saharan African countries. Furthermore, estimating
the salt content of family meals is also a challenge. Few researchers in Sub-Saharan Africa
have attempted to do this, exceptions being a study conducted in South Africa (Oldewage-
Theron et al. 2006), where iodine values are included in food composition tables (Sayed et al.
1999) and a study in the Democratic Republic of Congo (Barclay 2003), where the researchers
analysed the iodine content of food samples.
2.2.5 Vitamin A
The health problems caused by vitamin A deficiency are together termed vitamin A
deficiency disorders. Malnourished pregnant women, infants, and preschool children are
believed to be at the greatest risk of xerophthalmia, which includes different stages from
night blindness to blinding corneal disease. Vitamin A deficiency may also contribute to
anaemia and impaired growth of children (Palmer and West 2010). Vitamin A
supplementation in children has been shown to reduce the risk of diarrhoea-related mortality
and all-cause mortality (WHO 2011a). In women, night blindness during pregnancy has
been associated with increased infant mortality and low birth weight (Christian et al. 2001).
However, the current evidence on vitamin A supplementation of pregnant women shows no
effect on the risk of maternal mortality or neonatal mortality (WHO 2011b). The health
consequences of vitamin A deficiency in school-aged children and adolescents are poorly
understood (West and Darnton-Hill 2008).
Studies on dietary intake of vitamin A have suggested very large variation between different
settings (Torheim et al. 2010). Among non-pregnant non-lactating women, the difference
between the lowest (176 μg retinol equivalents/day; Oldewage-Theron et al. 2006) and
highest (2338 μg retinol equivalents/day; Huss-Ashmore and Curry 1991) mean was more
than tenfold. In the former study, the diet of women living in an informal settlement area in
South Africa was heavily based on different types of cereal foods, mainly maize, sorghum,
and bread, and contained only negligible amounts of vegetables or fruit. In the latter study,
by contrast, while the diet of women in Swaziland appeared to also be based on cereal
grains, it was more diverse, with year-round use of green leafy vegetables, and depending on
23
the season, other types of vegetables, such as pumpkin, with fruit and more animal-source
foods (e.g. meat and milk). For Mozambican women, a median intake of 695 μg retinol
equivalents/day has been reported (Wiesmann et al. 2009). It should be noted, however, that
dietary intake studies are often conducted at one time point of the year, although marked
seasonal variation in the intake has been reported (Bates et al. 1994).
Vitamin A status of populations can be assessed via plasma or serum retinol concentrations.
The blood concentration is not, however, considered a reliable marker of vitamin A stores of
the of an individual unless the stores are severely depleted or very high. In the less severe
state, serum retinol is homeostatically regulated and may not respond to changes in intake
(WHO 2011e). A good example of a study where serum concentrations did not reflect vitamin
A intake is that of Bates et al. (1994). They found that retinol concentrations of pregnant
women in Gambia remained almost constant at about 1.05μmol/l despite several-fold seasonal
fluctuations of intake of beta-carotene (their main dietary form of vitamin A).
The latest global review of vitamin A status was based on the WHO’s database of indicators
of vitamin A deficiency (WHO 2009). For the majority of countries in Sub-Saharan Africa,
including Mozambique, the public health problem, estimated based on retinol concentrations,
was judged to be severe for children and moderate for pregnant women.
2.2.6 Folate
The discussion around folate deficiency in low-income countries is usually focused on women
of reproductive age. There is consistent evidence that folic acid – the synthetic form used
in supplements and fortification – has a protective effect in preventing neural tube defects
in foetuses (De-Regil et al. 2010). Maternal supplementation with folic acid has also been
shown to reduce the incidence of megalobastic anaemia and to improve mean birth weights
of newborns (Lassi et al. 2013). Folate deficiency causes megaloblastic anaemia, but little
information is available on the role of folate as a causal factor for anaemia relative to iron
deficiency or other major factors such as malaria (Metz 2008).
Studies among Sub-Saharan African women have revealed that folate intakes vary
considerably. While several studies have found low intakes (88-155 μg/day) relative to the
RNI and EAR (Huss-Ashmore and Curry 1991, Bourne et al. 1993, Mazengo et al. 1997,
Oldewage-Theron et al. 2006), some have observed better intakes. For example, Barclay
(2003) evaluated the diet of women in rural Republic Democratic of Congo and conducted
chemical analyses of local ingredients, finding a mean folate intake of 536 μg/day (n=34).
24

Serum (or plasma) folate and red blood cell folate are the most commonly used biomarkers of
folate status. Since serum concentrations are prone to diurnal variation caused by recent food
intake, a single measurement is not highly reliable for individual-level assessment, but is well
suited for population-level assessment of status. Red blood cell folate is more stable from day
to day and better reflects the long-term status of an individual (Green 2011).
Currently, it is not possible to provide an overview of folate status in Sub-Saharan Africa due
to the small amount of data on serum or plasma concentrations. McLean et al. (2008)
reviewed the data globally and serum concentration values were available from only three
studies in Sub-Saharan African countries; concentrations in Nigeria and Zimbabwe
compared well with industrialized countries, but in South Africa the concentrations were at
the lower end in international comparisons. In the South African study, convenience samples
of urban and rural non-pregnant women showed mean plasma folate concentrations of 7.9
nmol/l and 9.8 nmol/l, respectively (Ubbink et al. 1999). More recently, the mean plasma
folate concentration of women in Côte d’Ivoire was found to be 7.4 nmol/l for rural women
and as low as 4.6 nmol/l for urban women (Rohner et al. 2013a). Given that the cut-off for
deficiency is 10 nmol/l (WHO 2012), these results from Côte d’Ivoire are alarming. After
the above-mentioned studies were conducted, both South Africa and Côte d’Ivoire have,
however, mandated fortification of industrially processed maize and/or wheat flours (Food
Fortification Initiative 2015a,b).
25

2.3 Dietary diversity assessment in low-income settings
High diversity is generally considered to be a positive feature in a diet (Ruel 2003). A
common sense assumption would be that the more different types of food items included in a
diet, the better the chance that all of the essential nutrients and other compounds with
positive health effects will be found in the diet. A study by Foote et al. (2004) was one of the
first to provide scientific evidence that, indeed, an increasing number of different foods is
associated with better dietary quality. Their models explaining mean probability of adequacy
(MPA) of micronutrient intake in an American population showed that total energy was an
important factor explaining the variation, but adding consumption from different food
groups significantly increased the explanatory power. The concept of dietary diversity is
considered especially useful in the lowest income populations, where the concern is that
diets are monotonous, heavily based on starchy staple foods, and deficient in many nutrients.
Over the past decade, considerable efforts have been put into the development and testing of
tools that measure the level of dietary diversity. These tools are used in, for example,
research, programme monitoring and evaluation, and food security assessment. The tools
have differed mainly with regard to four aspects: 1) how foods are counted (number of
individual food items or number of pre-defined food groups), 2) recall period (usually from
one to seven days), 3) number of interview rounds needed (one or two), and 4) level of
information collected (household or individual). An important conceptual aspect regarding
the last point is that the household-level indicators are designed to reflect the household’s
economic ability to access a variety of foods, and thus, they often include foods that are
nutritionally of low or no importance (coffee, tea, alcohol, condiments), whereas the
individual-level indicators specifically aim to reflect nutrient adequacy of the diet (Kennedy
et al. 2010).
Examples of different types of tools are given in Table 1. Four of the presented scores have
been used in Mozambique (Rose et al. 2002, World Food Programme, Vulnerability Analysis
and Mapping Branch 2008, FAO 2008, Wiesmann et al. 2009). The table also includes the
Household Dietary Diversity Score (HDDS) and WDDS, which were promoted by FAO
during the preparation of this thesis. The latter is a tool based on nine food groups, which
was published by the FAO after Food and Nutrition Technical Assistance II Project had
conducted a five-country project called the Women’s Dietary Diversity Project. This project
used data for women in Burkina Faso, Mali, Mozambique, Bangladesh, and Philippines and
assessed eight different Food Group Diversity Indicators (FGIs). The research group found
that the indicators based on six food groups did not perform as well as the other indicators.
The indicators with 21 food groups seemed to work best in some settings, but were
considered more difficult to use than those with fewer groups (Arimond et al. 2010).
26

Tab
le1:
Tools
for
asse
ssin
gdie
tary
div
ersi
ty.
Ref
eren
ceN
ame
of
tool
1O
rgan
izat
ion
that
has
use
d,te
sted
or
pro
mote
dth
eto
ol
Lev
elof
asse
ssm
ent
Rec
all
per
iod
nof
inte
rvie
ws
Food
gro
ups
counte
d(p
oin
ts)
Met
hod
of
calc
ula
tion
Rose
etal
.(2
002)
MD
AT
Min
istr
yof
Hea
lth,
Moza
mbiq
ue
house
hold
24
hours
2m
eat,
fish
,sh
ellfi
sh,eg
gs,
milk,ch
eese
,
yoghurt
,eg
gcu
star
d(4
);bea
ns,
nuts
,co
conut
(3);
cere
als,
tuber
s,bre
ad,sp
aghet
ti,co
okie
s,
cakes
(2);
veg
etab
les,
fruit,ju
ices
,oth
er
bev
erag
es(e
xcl
udin
gte
aan
dco
ffee
),fa
ts,
sugar
s,ja
m,m
ayonnai
se,to
mat
osa
uce
,
conden
sed
milk
(1)
Poin
tsar
eas
signed
toea
chfo
od
item
from
the
list
from
each
mea
lor
snac
k
tim
eth
atth
eyar
eco
nsu
med
Worl
dFood
Pro
gra
mm
e,
Vuln
erab
ility
Anal
ysi
s
and
Map
pin
gB
ranch
(2008)
FC
SW
orl
dFood
Pro
gra
mm
e
house
hold
7day
s1
mea
t,fish
,an
deg
gs
(4);
dai
ry(e
xcl
udin
gsm
all
amounts
of
milk
for
tea)
(4);
bea
ns
and
nuts
(3);
mai
nst
aple
s(2
);veg
etab
les
(1);
fruit
(1);
fats
(0.5
);su
gar
(0.5
)
Poin
tsar
eas
signed
tofo
od
gro
ups
from
each
day
that
they
are
consu
med
(max
.112
poin
ts)
Sw
indal
ean
dB
ilin
sky
(2006)
HD
DS
Food
and
Nutr
itio
n
Tec
hnic
al
Ass
ista
nce
III
Pro
ject
house
hold
24
hours
1st
aple
cere
als;
tuber
s;veg
etab
les;
fruit;m
eat,
poultry
and
org
ans;
eggs;
fish
and
seaf
ood;
legum
esan
dnuts
;fa
tsan
doils;
dai
ry;su
gar
;
tea,
coff
eean
dco
ndim
ents
Sim
ple
sum
of
food
gro
ups
consu
med
(max
.12)
FA
O(2
008)
HD
DS
(Moza
mbic
an
modifi
cation
in
Port
ugues
e)
FA
Ohouse
hold
24
hours
1st
aple
cere
als;
tuber
s;veg
etab
les;
fruit;m
eat,
poultry
and
org
ans;
eggs;
fish
and
seaf
ood;
legum
es;nuts
;fa
tsan
doil
seed
s;dai
ry;su
gar
;
coff
ee,te
aan
dal
coholic
dri
nks
Sim
ple
sum
of
food
gro
ups
consu
med
(max
.12)
Wie
sman
net
al.(2
009)
FG
I-6,FG
I-6R
,FG
I-9,
FG
I-9R
,FG
I-13,
FG
I-13R
,FG
I-21,
FG
I-21R
Food
and
Nutr
itio
n
Tec
hnic
al
Ass
ista
nce
II
Pro
ject
indiv
idual
wom
an
24
hours
1FG
I-9:
star
chy
stap
les;
legum
esan
dnuts
;dai
ry;
org
ans;
eggs;
mea
tfish
;vitam
inA
-ric
hdar
k
gre
enle
afy
veg
etab
les;
oth
ervitam
inA
-ric
h
veg
etab
les
and
fruit;oth
erfr
uit
and
veg
etab
les
Sim
ple
sum
of
food
gro
ups
consu
med
(max
.6,9,13
or
21).
Cal
cula
ted
with
(tools
with
letter
R)
or
withouta
rest
rict
ion
of
15
gm
inim
um
port
ion
Ken
ned
yet
al.(2
010)
HD
DS
FA
Ohouse
hold
24
hours
1ce
real
s;w
hite
tuber
san
dro
ots
;veg
etab
les,
dar
k
gre
enle
afy
veg
etab
les,
vitam
inA
-ric
htu
ber
s;
fruits;
mea
t;fish
;le
gum
es,nuts
,se
eds;
dai
ry;
fats
;sw
eets
;sp
ices
,co
ndim
ents
,bev
erag
es
Sim
ple
sum
of
food
gro
ups
consu
med
(max
.12).
Cal
cula
ted
with
or
without
are
stri
ctio
nof
15
gm
inim
um
port
ion
Ken
ned
yet
al.(2
010)
WD
DS
FA
Oin
div
idual
wom
an
24
hours
1sa
me
asFG
I-9
Sim
ple
sum
of
food
gro
ups
consu
med
(max
.9).
Cal
cula
ted
with
or
withouta
rest
rict
ion
of
15
gm
inim
um
port
ion
1FC
S,Food
Consu
mption
Sco
re;FG
I,Food
Gro
up
Div
ersi
tyIn
dic
ator;
HD
DS,H
ouse
hold
Die
tary
Div
ersi
tySco
re;M
DA
T,M
oza
mbic
anD
ietA
sses
smen
tTool;
WD
DS,W
om
en’s
Die
tary
Div
ersi
tySco
re.
27

Food variety scores are not presented in Table 1. These are scores where the consumption of
individual food items is calculated over a recall period (typically 7 days). The highest scores
may thus reach well over 30 (Ogle et al. 2001), and theoretically, there is no upper limit in the
score (unless data are collected by a method that is not open-ended, e.g. FFQ). The validity
of one type of a food variety score has been assessed in Mali (Torheim et al. 2003), and this or
similar scores have been used in other sub-Saharan African countries as well (e.g. Oldewage-
Theron and Kruger 2011, Belachew et al. 2013).
2.3.1 Role of dietary diversity in nutritional adequacy of diets
The question of whether a higher dietary diversity predicts a better micronutrient profile of
a diet has been addressed in several low-income country populations. Studies investigating
adults or school-aged children are covered here. A common approach has been to assign
each subject with a DDS based on their 24-hour recall data, and, using the same data set, to
calculate either MPA1 (Arimond et al. 2010, Arsenault et al. 2013) or mean adequacy ratio
(MAR)2 (Steyn et al. 2014) and to examine their correlations. An inherent weakness of this
approach is that since the same 24-hour recalls are used to generate both the DDS and the
MPA or MAR, the measurement errors in the data may be correlated. However, thus far, few
other types of data sets have been available to conduct such analyses.
The Women’s Dietary Diversity Project found correlations between a nine-item indicator
(FGI-9) and MPA, which ranged from 0.26 to 0.48 among non-pregnant non-lactating
women in the different countries. Correlations were slightly higher (0.34 to 0.52) when the
15-gram restriction was used (Arimond et al. 2010). After controlling for energy intake, the
correlations were, in both cases, attenuated (correlations were from 0.15 to 0.42 when no
gram restriction was used and 0.25 to 0.48 with the 15-gram restriction). The study by
Arsenault et al. (2013), conducted in Bangladesh used the same indicator as above, but
collected two non-consecutive 24-hour recalls for each woman and found similar results; the
correlation between MPA and the mean FGI-9 from the two days was 0.25, and, after
controlling for energy, it was 0.18.
1MPA is calculated using a probability approach from estimated usual intake distributions and estimated
requirement distributions. Usual intake distributions can be estimated from observed intake distributions by different
statistical methods when data on more than one day’s intake are available for at least a sub-sample of the population.
The probability of adequacy for each nutrient is calculated for each individual in the sample. MPA is then calculated
for each individual by averaging the probabilities of adequacy for each nutrient.2Nutrient adequacy ratio is calculated as the ratio of a subject’s intake of a nutrient to RNI, truncated at 1, and
MAR as mean of the nutrient adequacy ratios from the nutrients included in the analysis (Torheim et al. 2003, Steyn
et al. 2014). The weaknesses of this approach is that it does not consider the distribution of requirements or, when
applied to intakes based on single 24-hour recalls, the intra-individual variation in intake.
28

Steyn et al. (2014) analysed data from a study in South Africa where mothers reported the food
consumption of their school-aged children. They found a correlation of 0.56 between FGI-9
and MAR for 7- to 9-year-old children. An earlier study by Torheim et al. (2004) conducted
in Mali applied a different methodology: instead of 24-hour recalls, they used an FFQ and
calculated both a food variety score and a DDS for a sample of men and women. They also
found positive correlations between both of the tools and MAR, albeit less strong than Steyn
et al. (2014).
Although most of the above-mentioned studies have concluded that DDSs are promising
tools in predicting micronutrient adequacy (Torheim et al. 2004, Arimond et al. 2010, Steyn
et al. 2014), it should be noted that when examining the correlation of DDS and intake of
single micronutrients, the correlations are clearly not equally strong for all nutrients. An
analysis of the sample of Mozambican women, which was included in the Women’s Dietary
Diversity Project mentioned above, showed that all eight different FGIs correlated
significantly with estimates of usual intake for energy, thiamin, riboflavin, niacin, vitamin
B6, folate, vitamin C, vitamin A, and calcium with correlation coefficients in the range of
0.11-0.35. The correlations between the score and vitamin B12, iron, and zinc intakes were
statistically significant for some of the FGIs, but not all, and the significant coefficients were
generally low (between 0.10 and 0.23) (Wiesmann et al. 2009).
2.3.2 Role of dietary diversity in micronutrient status
DDSs can provide only a rough description of the diet and the different DDSs were not
originally designed to measure nutritional status. However, the measurement of
micronutrient status using biomarkers is costly, methodologically and logistically
challenging in low-income settings (except perhaps haemoglobin measurement), and may
increase participant refusals. Low-cost, non-invasive tools that allow surveys to categorize
population groups according their level of risk of micronutrient deficiencies are therefore
needed. Given the popularity of DDSs in low-income settings, it is important to determine
whether associations between dietary diversity and micronutrient status exist.
To date, only a few studies, which have focused on vitamin A and zinc, have addressed this
question. Studies in pregnant women in Southern Ethiopia (Gebreselassie et al. 2013) and
lactating women in Northern Kenya (Fujita et al. 2012) found that women with a low DDS
had an increased risk of having vitamin A deficiency relative to women with a higher score.
The Ethiopian study used an HDDS (Swindale and Bilinsky 2006), and reported that a low
HDDS (≤ 3 food groups) was associated with a higher odds of having serum retinol below
0.7 μmol/l, compared with a high HDDS (≥ 6) (Gebreselassie et al. 2013). The Kenyan study
29

used a 10-food group DDS and showed that an increasing DDS was negatively associated
with the odds of having serum retinol below 1.05 μmol/l (Fujita et al. 2012). The Ethiopian
researchers also found an association between DDS and serum zinc among pregnant women
(Gebremedhin et al. 2011). Although the authors of the Kenyan study concluded that the
DDS shows potential as a method for exploratory assessment of vitamin A status of adults
in a rural field setting (Fujita et al. 2012), given the current small amount of evidence from
geographically limited samples it is likely too early to draw generalized conclusions about
the possibilities of using DDSs in assessing micronutrient status of vitamin A or any other
nutrient.
30

3 Aims of the study
The main aim of this study was to investigate the diet and micronutrient status of adolescent
girls in two distinct seasons in urban and rural areas of Zambézia Province, Central
Mozambique.
Specific objectives were as follows:
• To produce food photographs of local foods to aid portions size estimation in dietary
assessment and to test their validity in adolescent girls.
• To assess nutrient intake and food sources of selected micronutrients among adolescent
girls in one city and two rural districts in January-February (’hunger season’) and in
May-June (harvest season).
• To investigate the micronutrient status of adolescent girls through assessment of
haemoglobin, serum ferritin, serum zinc, serum selenium, plasma retinol, serum
folate, and urinary iodine concentrations, to make comparisons across the different
regions and seasons, and to assess the level of the public health problem of
micronutrient deficiencies.
• To determine whether having a low DDS is associated with low concentrations of blood
haemoglobin, serum ferritin, serum zinc, plasma retinol, and serum folate.
31
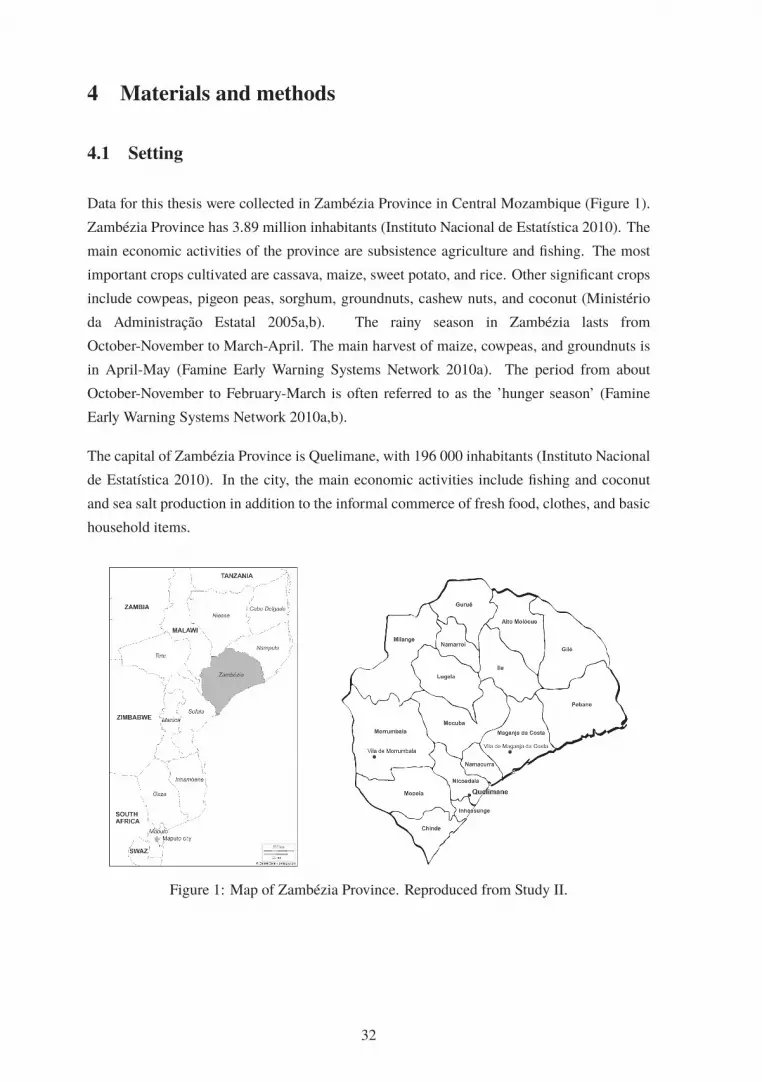
4 Materials and methods
4.1 Setting
Data for this thesis were collected in Zambézia Province in Central Mozambique (Figure 1).
Zambézia Province has 3.89 million inhabitants (Instituto Nacional de Estatística 2010). The
main economic activities of the province are subsistence agriculture and fishing. The most
important crops cultivated are cassava, maize, sweet potato, and rice. Other significant crops
include cowpeas, pigeon peas, sorghum, groundnuts, cashew nuts, and coconut (Ministério
da Administração Estatal 2005a,b). The rainy season in Zambézia lasts from
October-November to March-April. The main harvest of maize, cowpeas, and groundnuts is
in April-May (Famine Early Warning Systems Network 2010a). The period from about
October-November to February-March is often referred to as the ’hunger season’ (Famine
Early Warning Systems Network 2010a,b).
The capital of Zambézia Province is Quelimane, with 196 000 inhabitants (Instituto Nacional
de Estatística 2010). In the city, the main economic activities include fishing and coconut
and sea salt production in addition to the informal commerce of fresh food, clothes, and basic
household items.
Figure 1: Map of Zambézia Province. Reproduced from Study II.
32

4.2 Field trips
The planning of this thesis work and the larger ZANE Study started during a short
preparatory trip to Maputo and Zambézia in May 2008, which involved meetings with health
and food security authorities and potential collaborators. After this, a preliminary project
examining the food selection, food preparation methods, and food beliefs in the Maganja da
Costa and Nicoadala Districts was carried out. This project involved two field trips, the first
in December 2008 and the second in March 2009. During these field trips interviews and
group discussions were carried out and recipes typical of the area were collected. In
addition, samples of local foods were collected and transported to Finland, where they were
later sent to Finnish laboratories for nutrient content analyses. The findings of the
preliminary project are reported elsewhere (Korkalo et al. 2011b), and the results of the food
composition analyses are included in the Mozambican food composition tables (Korkalo
et al. 2011a) compiled as a part of this thesis work.
A study on the validity of food photographs in portion size assessment (Study I) was conducted
in Quelimane and Nicoadala in September 2009. The main study, called the ZANE Study
(Studies II-IV), was conducted in Quelimane, Maganja da Costa District, and Morrumbala
District during two field trips, the first in January-February 2010 and the second in May-June
2010.
4.3 Ethical issues
The protocol of the study on validity of food photographs in portion size assessment (Study
I) was approved by the University of Helsinki Viikki Campus Research Ethics Committee.
Written informed consent was obtained from all participants and the purpose of the study was
also orally explained. If the participant did not know how to write her name, informed consent
was indicated by a signature of a witness.
The ZANE Study (Studies II-IV) protocol was approved by the Bioethical Committee of the
Ministry of Health in Mozambique. Each eligible girl and a parent, husband, or guardian
was given an informed consent letter and its content was also orally explained. The informed
consent was signed by the girl. If she was under 18 years of age, a parent, husband, or guardian
also signed the form. If the girl or the adult did not know how to write their name, informed
consent was indicated by a fingerprint or a signature of a witness.
In both studies, the participation was voluntary and the participants had the right to withdraw
from the study at any time without consequences. They could also refuse to participate in
33

some part of the study, e.g. blood sampling. No incentives to participate were given in either
of the studies. However, in Study I, the participants were told they would be served some
food. In the ZANE Study (Studies II-IV), the participants were informed about the possibility
to receive their test results for pregnancy, anaemia, malaria, and HIV status.
In the ZANE Study, a nurse gave the results of pregnancy, haemoglobin, malaria, and
intestinal helminth infestation tests to those wishing to be informed, and she provided iron
supplements for participants with a haemoglobin concentration below the local cut-off of
110 g/l. Antihelminthics and malaria treatment were also provided according to the local
treatment regimen for those indicated. Participants who tested positive for HIV were
directed to the physician who was responsible for the study, for counselling and subsequent
treatment.
4.4 Study on validity of using food photographs in portion sizeassessment (Study I)
4.4.1 Preparatory work and food photographs
To gain understanding of the portion sizes typically eaten, visits to households were
organized to weigh food portions. In total, portions were weighed in 23 households; 20 of
these households contained an adolescent girl. The visits were scheduled at lunch or dinner
time such that the food portion of the girl could be weighed before she started her meal.
Five foods were chosen as test foods for the study on the validity of using food photographs:
1) rice, 2) thick maize porridge (called chima), 3) shrimp sauce made from dried shrimps with
coconut milk and onion, 4) cowpea sauce cooked with tomato and onion, and 5) fish sauce
made from small dried fish with tomato and onion. These foods were selected because they
were considered feasible to be cooked in the study setting and were known to be commonly
consumed in the study area. Food photographs depicting these foods were produced on the
study location before the study. Three different portion sizes (’small’, ’medium’, and ’large’)
of each food were placed on local plates and the portions were photographed immediately
after cooking. I took the photographs with a digital camera using a tripod with the camera
angle set at about 45 degrees. I adjusted the photographs in GIMP (Gnu Image Manipulation
Program) to appear approximately life-size in print and printed them on A4 photograph paper
with a portable ink-jet colour printer.
34

4.4.2 Participants and test protocol
The study was organized in the yards of local people who kindly invited the study team to
cook and serve the food and conduct the interviews there. The study was conducted over
six days. On each day, locally hired assistants asked adolescent girls from houses around the
study sites to volunteer as study participants. The sample was not selected randomly. Ten
to 21 girls participated each day, and the total number of participants was 100. The number
of participants recruited was decided based on the time and other resources available. One
participant had to be excluded from the data analysis due to a missing piece of the data. Thus,
the final sample included 99 girls. Participants were aged 13-18 years. The participants were
told that they would be offered food and some questions would be asked, but they were not
told they would be asked to estimate the size of their portion.
Data on age, marital status, schooling, household characteristics, language, number of
children, and self-reported pregnancy status at the time of the study were filled in on a short
background questionnaire. If possible, the date of birth was checked from an identity card.
Otherwise, the year of birth was estimated based on the girl’s and her family member’s
reports.
At the study site, food was cooked using the same recipes that were used when producing
the food photographs. Five different portion sizes of rice, shrimp sauce, cowpea sauce, and
fish sauce were served. The portion sizes were selected in a way that three portion sizes
were identical to photographs and two were between the photographs. Balls of thick maize
porridge were served in seven different portion sizes. Three of them were identical to the food
photographs and two were between the weights of the balls in the photographs. In addition,
one portion included two ’small’ balls and one included two ’medium’ balls. A list including
different combinations of the staple foods and sauces in random order was prepared and each
girl was served weighed portions of one staple food and one sauce according to this list. The
girls ate their meal and possible leftovers were weighed and recorded. A Maul electronic solar
scale with an accuracy of 2 grams was used for weighing.
After the meal (usually within the next half hour), I interviewed each subject individually with
the help of a local interpreter. I asked the girls to estimate the amount she had eaten with the
aid of the food photographs and to report if and how much leftovers remained. Empty plates
and a spoon, identical to those used during the meal, were also available to aid the interview.
As an interviewer, I was aware of the different portion sizes served, but neither myself nor the
interpreter was aware of which portion size from the random list was served to a particular
participant and we did not see them eating or returning leftovers.
35

4.4.3 Statistical methods
For Study I, the statistical analyses were conducted for each of the five test foods separately.
For this thesis summary, however, analyses were conducted after combining the foods into two
groups: staple foods and sauces, and the statistical methods for these analyses are described
below. This was done in order to gain a more general view of the results.
The mean and standard deviation (SD) for actual and estimated portion sizes were
calculated. The difference between the estimated and actual portion size was calculated for
each participant in two different ways, firstly as a gram difference and secondly as a
percentage difference [(estimated-actual)/actual × 100]. Mean and 95% confidence intervals
are presented for both variables. The proportions of participants whose estimate was within
±10%, below 10%, and above 10% of the actual portion sizes were calculated. In addition,
to better allow comparison with other studies, the proportion of participants with an error
rate in the range of >10% to ≤50% or > 50% (ignoring the sign of the error), and the
geometric mean of the ratio of the estimated to the actual portion size and 95% confidence
intervals were calculated. In addition, Bland-Altman plots with 95% limits of agreement
were drawn to examine the agreement between the actual and estimated portion sizes. Jitter
was added to the plots to separate overlapping observations. Statistical analyses were
conducted using IBM SPSS statistics 20 and R 3.0.1.
4.5 The ZANE Study (Studies II-IV)
4.5.1 Study design and recruitment
The ZANE Study was a cross-sectional study with a descriptive design. Two separate samples
of participants were recruited in 2010: one in January-February, the ’hunger season’, and one
in May-June, the harvest season. A target total sample size of 600 girls (300 per season) was
determined based on the resources available.
The study was carried out in three regions: Quelimane, Maganja da Costa District, and
Morrumbala District. Maganja da Costa is a coastal district and Morrumbala is an inland
district. For the purposes of sampling, these regions were further divided into five areas: 1)
Quelimane, 2) district town of Maganja da Costa 3) rural villages of Maganja da Costa, 4)
district town of Morrumbala, and 5) rural villages of Morrumbala.
The sampling design was planned using Census information from the year 2007 and locally
obtained maps. In Quelimane, the neighbourhoods included in the catchment areas of three
36

health centres were originally selected as the primary sampling units. In Maganja da Costa
and Morrumbala, the primary sampling units were neighbourhoods of the districts towns and
rural villages located within a 45- to 60-minute drive from the district towns. Villages located
further than that had to be excluded for logistical reasons.
First, in January-February, a sample of the primary sampling units was selected in each of
the five areas. This was done using probability proportional to size (in the city and district
towns, where population figures of the neighbourhoods were available) or random sampling
(in the rural areas where the population figures of the villages were not available). At this
stage, one of the health centres in Quelimane was excluded as a study centre when none of
the neighbourhoods in its catchment area got selected. Thus, the study centres, where
biological sampling, interviews and other assessments were carried out were two health
centres of Quelimane and the district hospitals of Maganja da Costa and Morrumbala.
Second, locally hired recruiters sketched a map of each selected neighbourhood or village
with the help of local leaders. The recruiters were instructed to follow a recruitment plan,
which included randomly selected starting points on the map and randomly selected directions
to walk in order to chart the households and to invite eligible girls to participate. Girls in
the age range of 15-18 years, who were able to visit the study centre and did not have any
significant illness preventing participation were considered eligible. Written informed consent
was given as described above. If no identity card or other document was available, the time
of birth was estimated with the help of family members. The recruited girls were invited to
participate in the study on the following day and participants who lived far from the study
centres were provided transport by car. In May-June, the same neighbourhoods and villages
were used and recruitment was done the same way as in January-February. Girls who had
already participated in January-February could not participate again in May-June.
Some practical challenges were encountered during the sampling process. Detailed maps with
clear demarcation of all villages and neighbourhoods were not available. In addition, the field
work periods were short, which entailed intensive time schedules, and study logistics needed
to achieve the sample were challenging. The complexity of the field conditions led to some
modifications of the original design. Some of the included neighbourhoods or villages had to
be selected non-randomly. For example, some rural villages that had been randomly selected
could not be included since the leaders of these villages were not supportive of the study, and
consequently, the selected village had to be replaced by a nearby settlement.
A total of 639 girls gave their consent to participate, 551 (86%) of whom actually
participated in the study (n=283 in January-February and n=268 in May-June). Throughout
the study, efforts were made to re-contact and re-invite those who had consented, but who
had not arrived at the study centre at the scheduled time. The number of eligible girls who
37

refused to participate in the study is unknown. The recruiters reported that the reasons for
not participating were, for example, being forbidden by parents, not having time, or being
afraid of the hospital or of blood sampling. The final sample includes twenty-seven
14-year-olds and four 19-year-olds due to mistakes in checking the age in recruitment. Their
data were, however, kept in the analysis, and thus, the final age range of the participants was
14-19 years. A diagram presenting the sampling design and the final sample sizes from each
study area is shown in Study II.
4.5.2 Background questionnaire
During the study visit a background interview was conducted for each participant. The
questionnaire included questions about schooling, mother tongue, marital status, number of
children, pregnancy and breastfeeding status of the participant, source of drinking water,
type of sanitation, source of energy for cooking, house construction materials, household
land possession, and ownership of livestock and other assets. For creating an asset index,
scores from 1 to 4 were assigned to selected asset items shown in the Supplementary
material of Study IV. Literacy was tested by asking each participant to read aloud a short test
sentence in Portuguese; being literate was defined as being able to read the whole sentence.
4.5.3 Anthropometry and biological samples
AnthropometryHeight was measured by a Seca 213 portable statiometer (Seca Ltd, Birmingham, England)
and recorded to the nearest 0.1 cm. Weight was measured using a digital weight scale (Beurer
glass bathroom scale GS 34, Beurer GmbH, Ulm, Germany) and recorded to the nearest 100 g.
During the anthropometric measurement, the participants were barefoot and dressed in their
normal light clothing. A body mass index-for-age (BMI-for-age) z-score and a height-for-age
z-score was calculated for each participant using the WHO Reference 2007 (www.who.int/
growthref/tools/en/).
Faecal and urine samplesThe recruiters gave each participant a faecal sample container and instructed them to deposit
a sample at home and bring it to the study centre. A total of 354 girls (64%) returned a faecal
sample. Laboratory technicians performed a direct wet mount with saline and examined the
specimen for the presence of helminth eggs or larvae under a microscope.
38

At the study centre, the participants were asked to provide a spot urine sample. The urine
samples were tested for pregnancy (Insight-HCG, Tulip Diagnostics, India; or Onsite HCG
Combo Rapid Test, CTK Biotech, USA). The test was performed on 420 girls (76%). In
addition, 11 non-tested participants were recorded as being visibly pregnant. Aliquots of
urine were pipetted to microcentrifuge tubes.
Pregnancy was defined based on the urine test result or the participant being visibly pregnant.
If this information was not available, those who self-reported not being pregnant were coded
as not pregnant and those who self-reported being pregnant were coded as having missing
information.
Venous and capillary blood samplesVenous blood samples (n=515) were taken from the antecubital vein by laboratory staff of
the study centres. The samples were drawn using 21 g needles in plastic serum (10 ml) and
K3EDTA (3 ml) tubes (BD Vacutainer R©, Becton Dickinson International, Erembodegem,
Belgium). The samples were handled by the Finnish researchers responsible for the biological
samples. The EDTA-blood sample was centrifuged to plasma at 4500 rpm for 10 minutes and
aliquots were frozen and stored at −15◦C to −20◦C. The serum tubes were allowed to stand at
room temperature (22-36◦C) for 30 minutes and were then centrifuged and frozen as described
above. The samples were transported to Maputo in a portable freezer by car, whereafter they
were packed in dry ice and shipped to Finland. In Finland, they were stored at −70◦C.
At the study center, EDTA-blood was used for haemoglobin determination with the
HemoCue R©Hb 301 System (HemoCue R© AB, Sweden). The presence of malaria
(Plasmodium falciparum) antigens (histidine-rich protein II (HRP-II) antigens) were
determined by using a one-step test (SD BIOLINE Malaria Ag P.f, Standard Diagnostics,
Korea). Antibodies to HIV-1/HIV-2 were detected using DetermineTM HIV-1/2 test kits
(Inverness Medical Japan, Japan), and positive results were confirmed with another test
(Uni-GoldTM HIV, Trinity Biotech, Ireland). When EDTA-blood was not available, capillary
blood was used for haemoglobin, malaria, and HIV tests.
Laboratory analysesAnalyses of serum high-sensitivity C-reactive protein (hsCRP), serum ferritin, serum
selenium, plasma retinol, serum folate, and urinary iodine were carried out at the National
Institute for Health and Welfare, Finland. An Architect ci8200 analyser (Abbott Diagnostics)
was used for immunoturbidometric analysis of hsCRP (CRP Vario 6K2602) and
chemiluminescent microparticle immunoassay analyses of ferritin (Ferritin 7K59) and folate
(Folate 1P7). Plasma samples for retinol analyses were extracted with hexane, evaporated
39

and dissolved in methanol. Samples were analysed by HPLC (Inertsil ODS-3 column 2.1 x
100 mm, 3 μm; GL Sciences, Japan). The mobile phase was methanol, 0.3 ml/min, 5 μl
were injected into the column, and retinol was detected by UV-detection at 325 nm. Retinol
was standardized by freshly prepared all-retinol standards in ethanol, the concentrations of
which were verified by spectrophotometry. The precision between series was 5.2%. Serum
selenium was determined by electrothermal atomic absorption spectrometry (Alfthan and
Kumpulainen 1982). Urinary iodine concentrations were analysed by the microplate method
of Ohashi et al. (2000).
Serum zinc concentrations were analysed at the MTT Agrifood Research Finland (now Natural
Resources Institute Finland) by plasma emission spectrometry (ICP-OES; Thermo Jarrell Ash
IRIS Advantage). The reference material was Seronorm Trace Elements Serum L-1 (Sero AS,
Norway).
Cut-offs for biomarkersTable 2 shows the cut-offs and exclusion criteria used to calculate the proportions of girls
with anaemia or low blood concentrations of ferritin, retinol, and folate, and the criteria used
to interpret the public health significance of the findings.
The blood samples were not fasting samples; they were collected at various times of the day,
and information about the trimester of pregnancy was not available. For these reasons, for
serum zinc, both the lower (<9 μmol/l and <7.6 μmol/l for non-pregnant and pregnant girls,
respectively) and the higher (<10.1 μmol/l and <8.6 μmol/l) cut-offs suggested by the
International Zinc Nutrition Consultative Group et al. (2004) were used. The true prevalence
of low serum zinc is expected to fall between the values calculated with these cut-offs. For
the same reasons, seasonal and regional comparisons for serum zinc concentrations are not
presented.
With regard to iodine, analyses from spot-urine samples cannot be used to define the iodine
status of individuals. However, the medians of urinary concentration in different sub-groups
were used to interpret the status in the population as shown in Table 3. For selenium, no cut-off
to define deficiency or low concentration has been established.
40

Tab
le2:
Cut-
off
sfo
rdefi
nin
glo
wbio
mar
ker
conce
ntr
atio
ns
and
inte
rpre
tation
of
public
hea
lth
signifi
cance
.
Cut-
off
sIn
terp
reta
tion
of
public
hea
lth
signifi
cance
Bio
mar
ker
Non-p
regnan
tPre
gnan
tPer
centa
ge
ofval
ues
bel
ow
cut-
off
s
Inte
rpre
tation
Sourc
eE
xcl
uded
from
anal
ysi
sin
Stu
dy
III
if:
Hae
moglo
bin
<120
g/l
<110
g/l
40%
or
hig
her
Anae
mia
isa
sever
epublic
hea
lth
pro
ble
m
(WH
O2011c)
20.0
-39.9
%A
nae
mia
isa
moder
ate
public
hea
lth
pro
ble
m
5.0
-19.9
%A
nae
mia
isa
mild
public
hea
lth
pro
ble
m
Ser
um
ferr
itin
<15μ
g/l
No
esta
blish
edcu
t-
off
20%
or
hig
her
Iron
dep
letion
ispre
val
ent
inth
e
popula
tion
(WH
O2011d)
hsC
RP
≥10
mg/l
(n=
34);
outlyin
gval
ue
(n=
1)
Ser
um
zinc
<9μ
mol/l
1<
7.6μ
mol/l
1
20%
or
hig
her
Popula
tion
isat
risk
of
zinc
defi
cien
cy(I
nte
rnat
ional
Zin
cN
utr
itio
n
Consu
ltat
ive
Gro
up
etal
.2004)
hsC
RP≥
10
mg/l
(n=
34)
<10.1μ
mol/l
2<
8.6μ
mol/l
2
Pla
sma
retinol
≤0.7
0μ
mol/l
3N
oes
tablish
edcu
t-
off
20%
or
hig
her
Vitam
inA
defi
cien
cyis
ase
ver
epublic
hea
lth
pro
ble
m
(WH
O2011e)
hsC
RP≥
10
mg/l
(n=
34)
10-1
9%
Vitam
inA
defi
cien
cyis
am
oder
ate
public
hea
lth
pro
ble
m
2-9
%V
itam
inA
defi
cien
cyis
am
ild
public
hea
lth
pro
ble
m
Ser
um
fola
te<
10
nm
ol/l
No
esta
blish
edcu
t-
off
No
esta
blish
edcu
t-
off
No
esta
blish
edin
terp
reta
tion
(WH
O2012)
1T
he
low
ercu
t-off
ssu
gges
ted
by
the
Inte
rnat
ional
Zin
cN
utr
itio
nC
onsu
ltat
ive
Gro
up.
2T
he
hig
her
cut-
off
ssu
gges
ted
by
the
Inte
rnat
ional
Zin
cN
utr
itio
nC
onsu
ltat
ive
Gro
up.
Both
the
low
eran
dhig
her
cut-
off
sw
ere
use
dbec
ause
the
blo
od
sam
ple
sw
ere
notfa
stin
gsa
mple
s;th
eyw
ere
collec
ted
atvar
ious
tim
esof
the
day
,an
dth
ere
was
no
info
rmat
ion
aboutth
etr
imes
ter
of
pre
gnan
cy.
The
true
pre
val
ence
of
low
seru
mzi
nc
isex
pec
ted
tofa
llbet
wee
nth
eval
ues
calc
ula
ted
with
thes
ecu
t-off
s.3
Acu
t-off
for
seru
mre
tinolw
asuse
d.
41

Table 3: Criteria for interpreting the median urinary concentrations, adapted from WHO
(2013).
Interpretation
Median urinary
iodine (μg/l)
Iodine intake of the
population
Iodine status of the population
Non-pregnant non-
lactating girls
<20 Insufficient Severe iodine deficiency
20-49 Insufficient Moderate iodine deficiency
50-99 Insufficient Mild iodine deficiency
100-199 Adequate Adequate iodine nutrition
200-299 Above requirements May pose a slight risk if more than
adequate iodine intake in the population
≥300 Excessive Risk of adverse health consequences
Pregnant girls
<150 Insufficient
150-249 Adequate
250-499 Above requirements
>500 Excessive
Lactating girls
<100 Insufficient
>100 Adequate
4.5.4 Dietary assessment
Twenty-four-hour dietary recallA 24-hour dietary recall interview was conducted for each participant. The interviews were
conducted by Finnish nutrition students, including myself, with the help of local interpreters,
and by Mozambican nutrition technicians. In some cases, the Mozambican interpreters did
not have a common language with the participant and, when needed, additional interpreters
were recruited ad hoc. All interviewers received training before the study.
At the beginning of the 24-hour recall, the interviewer asked the participant to recall her main
activities during the previous day. The interviewer made brief notes on these activities, after
which the participant was asked to recall all foods and beverages consumed during the day,
starting in the morning. The notes on activities were used to aid remembering all occasions
where some food or beverage was consumed. At the end of the interview, the interviewer read
aloud all foods recalled and asked if anything else came to mind.
To aid portion size estimation during in the interviews, a set of food photographs and locally
purchased dishware were used. The food photographs were slightly different from those used
in the validity study described above; the new photographs were scaled down from life-size by
approximately 5%, the white plates used for staple foods in the validity study were replaced
by orange plates and the amounts of food were adjusted in a way that the differences between
portions would be more clearly visible. These modifications were based on the results and
42

experiences gained from the validity study. In the new set, there were photographs depicting
11 different food items or dishes served warm, and additional photographs depicting other
food items such as bread, fruit, cookies, and pastries.
Food composition and calculation of nutrient intakesMozambican food composition tables and an electronic database were compiled for the
purposes of this study. The majority of the food composition data were taken from the
United States Department of Agriculture (USDA) National Nutrient Database for Standard
Reference (USDA 2008). Other sources included composition tables of other African
countries and also journal articles. Samples of 39 foods were collected during preparatory
field work (see Section 4.2) and analysed in Finland. A detailed list of sources of data for
each food item is presented in the tables (Korkalo et al. 2011a).
The original tables did not include values for phytate. An unpublished table of phytate content
of foods was later compiled from the literature in order to be able to calculate phytate intakes
and phytate:zinc molar ratios.
Iodine and selenium intakes of participants were not assessed. Data on the iodine content of
locally produced sea salt and iodized table salt used in the study area were not available. As
described in Section 2.2.3, selenium content of food is known to vary substantially depending
on soil characteristics such as selenium concentration and pH, and values for local foods were
not available.
NutriSurvey (www.nutrisurvey.de) was chosen as the software used for the entry and analysis
of the 24-hour recall data because its calculation procedure allows for the analysis of nutrient
intake from foods in two different ways: at the dish level and at the ingredient level. To
be able to enter composite dishes, information on recipes typical for the study location was
collected during preliminary field work and after the ZANE Study in June 2010. Recipes were
collected during home visits by recording the weight of each ingredient and the prepared
dish. A few recipes were also adapted from other sources such as the South African food
composition tables (Langenhoven et al. 1991) and a Mozambican cookbook (Rowan M, editor
2007). In addition, yield factors were needed to adjust for weight changes during cooking for
single ingredient dishes (e.g. boiled rice). These were taken from the literature (Matthews
and Garrison 1975, Bognár 2002). Nutrient retention factors for iron, zinc, retinol activity
equivalents (RAEs), and folate (to adjust for nutrient losses during cooking) were taken from
the USDA Table of Nutrient Retention Factors, Release 5 (USDA 2003). As there was no
established table of retention factors for phytate available, the phytate intakes were not adjusted
for changes during cooking. When entering the 24-hour recalls, the main ingredients of the
composite dish recipes were modified as reported by each participant.
43

Food frequency questionnaireA seven-day FFQ (Appendix) was designed specifically for this study. The questionnaire was
filled in by locally recruited lay personnel who were given training before the study. The FFQ
was not validated.
The FFQ included a list of 37 commonly consumed foods. In addition to the common food
items, there were two to three empty lines for other items belonging to each of the following
food groups: other nuts and seeds; other tubers; other vegetables; other fruit; other foods; and,
other beverages. The interviewer wrote the food on the empty lines. Furthermore, participants
were asked about the use of supplementary iron or other dietary supplements. The participants
were requested to estimate the number of times they had consumed any of these food items
during the last seven days. The response categories were as follows: none; 1 to 2; 3 to 4; 5 to
6; 7; more than 7 times.
Dietary diversity scoresOf the several different dietary diversity and food variety scores mentioned in previous
literature, in this thesis the focus is on WDDS because at the time of preparing Study IV, it
was promoted by FAO. More recently, FAO has, however, developed a new score called the
Minimum Dietary Diversity-Women (MDD-W) (FAO 2015). MDD-W is a 10-food group
indicator, meant for dietary diversity assessment in women and has a recommended cut-off
of 5. Some of the food groups included in MDD-W differ from those in WDDS. For
example, the group "legumes and nuts" is divided into two separate groups. However, as of
July 2015, the detailed instructions on the individual food items included in each food group
were not yet available.
Three different DDS variables were constructed. Firstly, the WDDS was constructed using the
24-hour recall data, following the food grouping instructions by FAO (Kennedy et al. 2010).
WDDS includes nine food groups and for each of these, a participant was coded as having
a score of one if they had reported consuming a food belonging to that group and the scores
of the nine food groups were summed. Secondly, since a 15-gram minimum has also been
proposed in order to avoid foods consumed in very small amounts from contributing to the
total score (Arimond et al. 2010), another score employing this limit (WDDS15g) was also
constructed. This means that the food group score was given only if the girls reported eating
at least 15 grams of a food belonging to that food group. Thirdly, using the FFQ data and the
same food grouping as above, a score representing the dietary diversity of the previous seven
days (7dWDDS) was constructed.
44

4.5.5 Statistical methods
In Studies II-IV, post-stratification sampling weights based on the total population of 15- to 19-
year-old girls in the five study areas were used in all analyses. The information on population
size was taken from the 2007 Census. All analyses were done using the Survey package in R
version 3.0.2.
Studies II and IIIThe analyses in Studies II and III include all participants with data available for each
variable presented, with the following exceptions: 1) 24-hour recall data was omitted for one
participant who reported nothing but water, 2) one outlying ferritin value (216.9 μg/l) was
excluded, and 3) to reduce bias in the descriptive analyses due to inflammation, the ferritin,
zinc, and retinol values for participants with hsCRP 10 mg/l (n=34) were omitted.
Medians with interquartile ranges (IQRs) were computed for the continuous dietary intake
and biomarker variables. Seasonal differences in the continuous variables were tested using
Mann-Whitney U-test. Overall regional differences were evaluated by the Kruskal-Wallis test.
This was followed by pairwise regional comparisons using Mann-Whitney U-tests.
Proportions with 95% confidence intervals (CIs) were computed for the dichotomous
variables. Seasonal differences and overall regional differences in proportions were
compared using Pearson Chi-squared tests. This was followed by pairwise testing of regional
differences.
P values <0.05 were considered statistically significant, except in the case of the pairwise
regional comparisons, where the significance level was set at P <0.017 (0.05/3) to account for
multiple comparisons.
Food sources of nutrients were calculated as mean intakes from each source and as
population proportions (Krebs-Smith et al. 1989). An estimate of basal metabolic rate
(BMR) for non-pregnant girls was calculated using the Schofield equations based on body
weight (FAO 2004). Mean ratio of reported energy intake to BMR was calculated to evaluate
overall bias in reported energy intake (Black 2000).
45
Study IVThe analyses of Study IV included all non-pregnant girls who had an analysed venous blood
sample and data for at least one of the two dietary assessment methods (n=227 in January-
February, n=223 in May-June, i.e. total n=450). Analyses using the 24-hour dietary recall
data and the FFQ data included 445 and 449 participants, respectively.
Univariate and multivariate logistic regression analyses were performed to examine
associations between DDS and concentration of blood haemoglobin, serum ferritin, serum
zinc, plasma retinol, and serum folate. To divide girls into those with low DDS and those
with medium to high DDS, the 25th percentiles of DDS variables with data from the two
seasons combined were used as cut-offs. For simplicity, the latter group is referred to as
’high DDS’. The proportions of users of different food groups in the low and high categories
by season were calculated and compared with Pearson Chi-squared tests.
Furthermore, 25th percentiles of the concentrations of haemoglobin, ferritin, zinc, retinol, and
folate were computed separately for each season and used to divide the girls into those with
low blood concentration and those without. It should be noted that these data driven cut-offs
indicate a concentration that is low relative to the study population. They are not cut-offs for
deficiency. This is especially important in the case of folate, for which the data driven cut-
offs are rather high. In addition to the data-driven cut-offs, the logistic regression analyses
were run using the established cut-offs shown in Table 2 (for zinc, the lower cut-off was used).
However, the latter type of analyses yielded cell sizes too small for analysis of folate in both
seasons and analysis of retinol in January-February.
The analyses were conducted stratified by season. Study area (with five categories), age,
BMI-for-age z-score, breastfeeding, hsCRP, literacy, and asset score were added as potential
confounders in the adjusted regression models. These variables were selected from the data
available based on previous literature and exploratory preliminary analyses. Dietary
supplement use was not included as a confounder as only seven of the 450 girls in this data
set reported using iron or other dietary supplements on the FFQ.
To gain some understanding of possible interactions between DDS and study area, interaction
terms were added to adjusted models using the study area variable divided into three categories
(Quelimane, Morrumbala, and Maganja da Costa). Due to the relatively small sample sizes,
it was not, however, possible to perform a comprehensive analysis of interactions, including
analyses further stratified by study area.
In the FFQs available, there were eight missing answers (0.2%) to the questions used to create
the food group scores of the 7dWDDS. Furthermore, 39 data points (0.4%) for individual asset
items, one (0.2%) for total asset score, four (0.9%) for current breastfeeding, and nine (2%) for
46

literacy test results were missing. These were imputed by hot deck imputation (Myers 2011)
in SPSS 22. The deck variables used were study area and season for the food group scores,
study area and age for breastfeeding, and study area for asset and literacy data. Cases with
missing data for dietary assessment, nutritional biomarkers, hsCRP, or BMI-for-age z-score
were omitted from the analyses pairwise. The significance level was set at P <0.05.
47

5 Results
5.1 Estimates of portion size
In Study I, the median age of the participants was 16 years. The majority, 63%, of the
participants reported having attended school for 4-7 years, while 37% reported having 8-10
years of schooling.
On average, the participants underestimated their portions of staple foods by 13% and portions
of sauces by 4% (Table 4). The mean gram difference for sauces was relatively small, −9
grams (Table 4). However, when examining the individual foods, the estimates for the shrimp
sauce and the fish sauce were very close to mean actual portions sizes, but the estimates for
cowpea sauces were less accurate, with a −25 gram mean difference (Study I).
Table 5 shows the geometric means of the ratio of estimated to actual portion size and the
proportions of participants classified according to the size of the error. Twelve percent of the
participants had an error rate of >50% (i.e. estimates were less than half of or more than 1.5
times as large as their actual portion) for the staple foods, whereas the respective proportion
was 25% for the sauces, showing that a part of the sample had difficulties in estimating their
portions.
48

Tab
le4:
Mea
nac
tual
and
estim
ated
port
ion
size
s,m
ean
diff
eren
cein
gra
ms,
and
mea
nper
centa
ge
diff
eren
cebet
wee
nth
ees
tim
ated
and
actu
alport
ions
(n=
99). Act
ual
port
ion
size
(g)
Est
imat
edport
ion
size
Diff
eren
ce(g
)1Per
centa
ge
diff
eren
ce2
Type
of
food
Mea
nSD
Mea
nSD
Mea
n95%
CI
Mea
n95%
CI
Sta
ple
food
259
106
209
104
−49
−67,−3
2−1
3−2
3,−4
Sau
ce93
51
83
42
−9−1
8,−7
−4−8
,−1
5
1E
stim
ated
−ac
tual
.2
(Est
imat
ed−
actu
al)/
actu
al×
100.
Tab
le5:
Geo
met
ric
mea
nof
the
ratio
of
estim
ated
toac
tual
port
ion
size
and
the
pro
port
ion
of
par
tici
pan
tsby
erro
rra
te(n
=99).
Rat
io1
%of
estim
ates
%of
estim
ates
within
aner
ror
rate
of:
Type
of
food
Geo
met
ric
mea
n
95%
CI
%of
estim
ates
within
±10%
of
actu
al
port
ion
size
2
bel
ow−1
0%
of
actu
al
port
ion
size
above
+10%
of
actu
al
port
ion
size
>10
to
≤50%
3>
50%
Sta
ple
food
0.7
90.7
2,0.8
636
52
12
52
12
Sau
ce4
0.9
20.8
4,1.0
125
42
32
49
25
1E
stim
ated
/act
ual
.2
Est
imat
ed/a
ctual
=0.9
-1.1
(i.e
.er
ror
rate≤1
0%
).3
Est
imat
ed/a
ctual
=0.5
-0.8
99
or
1.1
01-1
.50.
Her
eth
esi
gn
of
the
erro
ris
ignore
d.
4T
he
per
centa
ges
do
notad
dup
to100
due
toro
undin
g.
49

The Bland-Altman plots (Figures 2 and 3) visually depict the phenomenon described above;
for the staple foods, the percentage difference showed an underestimation at the group level,
but compared with the sauces there were fewer estimates of staple foods with a high rate of
error. For the sauces, the pattern was slightly different; although the group’s mean estimate
in grams is close to the actual mean amount, there was large variation in the accuracy of
individuals’ estimates.
Figure 2: A Bland-Altman plot showing the mean difference and 95% limits of agreement
between estimated and actual portion sizes for staple foods (n=99).
Figure 3: A Bland-Altman plot showing the mean difference and 95% limits of agreement
between estimated and actual portion sizes for sauces (n=99).
50

5.2 Characteristics of the ZANE Study population
The median age of the sample was 16 years, and 70% were attending school or studying (Table
6). Despite this relatively high figure for educational enrolment, literacy in Portuguese – the
official language of the country – was as low as 30%. Adolescent motherhood was common
in the study population; 29% had given birth or were pregnant at the time of the study.
Table 7 illustrates the differences in the living conditions between the study areas. In
Quelimane city, almost all of the girls had access to some type of toilet whereas in the rural
districts, 30-55% had no toilet at all. Subsistence farming is an important source of
livelihood in the study region. When the girls were asked what the household’s main source
of food is, 16% replied it is agriculture and the majority (74%) replied both agriculture and
purchased food. In the city, it was more common than in the rural areas to rely solely on
purchased food (Table 7).
Table 8 shows the anthropometric measurements for the non-pregnant girls. The majority of
the non-pregnant girls, 95%, were classified as being of normal weight, and the proportion
of non-pregnant overweight (BMI-for-age z-score >2 SD) girls was 2%. Of the 25 girls
classified as overweight, 20 lived in Quelimane. Only 11 out of the 481 non-pregnant girls
with anthropometric data were classified as thin (BMI-for-age z-score <−2 SD) and they
came from all of the study areas. Stunting was assessed in the whole sample, including the
pregnant girls and it was found that 18% (95/549) were stunted. No regional differences in
the proportions of girls classified as stunted were observed (Study II).
51

Tab
le6:
Bac
kgro
und
char
acte
rist
ics
of
the
sam
ple
.1
Tota
lQ
uel
iman
eM
agan
jada
Cost
aM
orr
um
bal
a
Hunger
seas
on
Har
ves
tse
ason
Hunger
seas
on
Har
ves
tse
ason
Hunger
seas
on
Har
ves
tse
ason
n=
551
n=
91
n=
88
n=
100
n=
84
n=
92
n=
96
Age,
med
ian
(min
,
max
)
16
(14,1
9)
16
(14,1
8)
16
(14,1
8)
16
(14,1
8)
16
(14,1
9)
16
(14,1
9)
16
(15,1
9)
Curr
ently
atte
ndin
g
schoolor
studyin
g
429/5
43
70
88/9
098
82/8
794
63/1
00
59
63/8
369
70/8
878
63/9
561
Liter
ate
247/5
37
30
78/9
087
67/8
876
36/9
435
31/8
331
16/8
814
19/9
413
Mar
ried
291/5
44
23
7/9
08
3/8
83
20/1
00
20
17/8
317
20/8
920
24/9
324
Has
giv
enbir
th94/5
44
19
15/8
917
7/8
88
15/9
915
15/8
315
17/9
019
25/9
529
Curr
ently
pre
gnan
t360/5
43
12
7/9
08
11/8
812
16/9
818
10/8
311
11/9
014
5/9
47
Has
giv
enbir
thor
is
curr
ently
pre
gnan
t
143/5
38
29
21/8
824
17/8
819
29/9
732
25/8
326
24/8
928
27/9
332
Curr
ently
bre
astf
eedin
g
55/5
43
12
21/8
87
17/8
83
29/9
78
25/8
37
24/8
912
27/9
321
1D
ata
are
n/tota
ln
and
wei
ghte
d%
,unle
ssoth
erw
ise
note
d.
Diff
eren
tvar
iable
shav
ediff
eren
tto
taln
due
tom
issi
ng
dat
a.2
Mar
ried
or
trad
itio
nal
lym
arri
ed,in
cludes
div
orc
edor
separ
ated
and
wid
ow
ed.
3Posi
tive:
uri
ne
test
resu
ltposi
tive/
vis
ibly
pre
gnan
t;neg
ativ
e:uri
ne
test
resu
ltneg
ativ
e,or
ifte
stre
sult
notav
aila
ble
,se
lf-r
eport
of
notbei
ng
pre
gnan
t.
52

Tab
le7:
Liv
ing
conditio
ns
of
par
tici
pan
ts’
house
hold
s.1
Tota
lQ
uel
iman
eM
agan
jada
Cost
aM
orr
um
bal
a
Hunger
seas
on
Har
ves
tse
ason
Hunger
seas
on
Har
ves
tse
ason
Hunger
seas
on
Har
ves
tse
ason
n=
551
n=
91
n=
88
n=
100
n=
84
n=
92
n=
96
Type
of
sanitat
ion
No
toilet
153/5
46
43
4/9
14
12/8
814
40/1
00
45
16/8
330
40/8
955
41/9
554
Pit
latr
ine
369/5
46
55
71/9
178
70/8
880
58/1
00
53
67/8
370
49/8
945
54/9
546
Flu
shto
ilet
24/5
46
216/9
118
6/8
87
2/1
00
20/8
30
0/8
90
0/9
50
Mai
nso
urc
eof
ener
gy
for
cookin
g
Fir
ewood
284/5
46
76
2/9
02
0/8
80
81/1
00
87
61/8
387
69/9
086
71/9
585
Char
coal
or
coal
260/5
46
24
87/9
097
88/8
8100
19/1
00
13
21/8
313
21/9
014
24/9
515
Ele
ctri
city
or
gas
2/5
46
01/9
02
0/8
80
0/1
00
87
1/8
387
0/9
086
0/9
585
Mai
nso
urc
esof
food
Agri
culture
66/5
47
16
1/9
11
5/8
86
8/1
00
818/8
327
15/9
018
19/9
522
Agri
culture
and
purc
has
e349/5
47
74
42/9
146
19/8
822
87/1
00
89
63/8
373
70/9
078
68/9
575
Purc
has
e122/5
47
940/9
144
64/8
873
3/1
00
22/8
30
5/9
04
8/9
53
Oth
er10/5
47
18/9
19
0/8
80
2/1
00
20/8
30
0/9
00
0/9
50
Ow
ner
ship
of
veh
icle
s
None
197/5
44
34
43/9
147
37/8
842
37/9
741
36/8
346
20/9
022
24/9
523
Bic
yle
284/5
44
60
26/9
129
35/8
840
54/9
755
43/8
353
63/9
072
63/9
573
Moto
rbik
eor
car2
63/5
44
622/9
124
16/8
818
6/9
74
4/8
31
7/9
05
8/9
54
1D
ata
are
n/tota
ln
and
wei
ghte
d%
.D
iffer
entvar
iable
shav
ediff
eren
tto
taln
due
tom
issi
ng
dat
a.2
Incl
udes
house
hold
sth
atow
na
bic
ycl
ean
da
moto
rize
dveh
icle
.
53

Tab
le8:
Hei
ght,
wei
ght,
and
hei
ght-
for-
age
and
body
mas
sin
dex
-for-
age
z-sc
ore
sfo
rnon-p
regnan
tgir
ls.1
Tota
lQ
uel
iman
eM
agan
jada
Cost
aM
orr
um
bal
a
Hunger
seas
on
Har
ves
tse
ason
Hunger
seas
on
Har
ves
tse
ason
Hunger
seas
on
Har
ves
tse
ason
n=
481
n=
82
n=
77
n=
82
n=
72
n=
79
n=
89
Hei
ght,
cm154
(150,157)
155
(151,160)
154
(151,157)
154
(149,157)
155
(150,157)
152
(149,157)
153
(150,156)
Hei
ght-
for-
age
z-sc
ore
−1.3
4(−
1.8
9,
−0.7
9)
−1.0
9(−
1.6
6,
−0.3
8)
−1.2
8(−
1.7
7,
−0.8
5)
−1.3
1(−
1.8
8,
−0.7
8)
−1.2
8(−
1.8
7,
−0.8
0)
−1.5
0(−
1.9
9,
−0.8
0)
−1.3
4(−
1.9
1,
−0.9
2)
Wei
ght,
kg
46.6
(42.2
,50.4
)49.0
(45.8
,54.6
)48.9
(44.1
,53.1
)47.1
(43.9
,50.4
)47.8
(43.3
,52.2
)45.8
(41.2
,49.2
)44.6
(40.8
,49.3
)
Body
mas
s
index
-for-
age
z-sc
ore
−0.4
0(−
0.9
4,
−0.0
8)
−0.1
3(−
0.7
2,
0.4
2)
−0.2
9(−
0.5
7,
0.6
1)
−0.2
7(−
0.8
8,
0.2
3)
−0.3
6(−
0.8
2,
0.1
1)
−0.4
6(−
0.9
3,
0.0
2)
−0.5
7(−
1.1
7,
−0.1
7)
1V
alues
are
med
ian
(inte
rquar
tile
range)
.
54

5.3 Diet
The main staple foods in the diets of adolescent girls were rice and stiff maize porridge in
Quelimane city, cassava porridge in Maganja da Costa District, and stiff maize porridge in
Morrumbala District. The staple food was typically eaten with a sauce or a stew. These sauces
or stews included ones based on dark green leafy vegetables (such as cassava or pumpkin
leaves), tomatoes and onion, or beans. Fish and seafood were commonly eaten, although the
reported amounts were often small. Of all the girls, 65% (396/543) reported some fish or
seafood in the 24-hour recall. Poultry, meat, or organs were eaten less often; 23% (108/543)
had eaten any food in this group during the previous day. The median reported energy intakes
were low, ranging from 4.2 MJ/day in Morrumbala District in January-February to 6.3 MJ/day
in Quelimane in May-June (Table 10). The mean ratio of energy intake to BMR for the non-
pregnant girls was 1.08 (n=474).
Figure 4 presents the distributions of the different DDSs. To illustrate the food groups
contributing to WDDS, Table 9 presents the proportion of girls consuming foods in the
different WDDS food groups by total score. Especially in January-February, dark green
leafy vegetables were commonly consumed by both those with low dietary diversity and
those with high diversity, whereas other food groups, such as eggs, were found only in the
diets of those with high diversity scores (Table 9). Two of the food groups of WDDS were
not useful in this study population in the sense that they captured very little differences
between individuals; all of the girls reported having consumed something from the starchy
staples group, and only one girl reported having consumed organ meat during the 24-hour
recall period.
55

Figure 4: Distributions of the different dietary diversity scores according to season (WDDS,
Women’s Dietary Diversity Score calculated from 24-hour dietary recalls; WDDS15g,
Women’s Dietary Diversity Score with a 15 g minimum calculated from 24-hour dietary
recalls; 7dWDDS, seven-day Women’s Dietary Diversity Score calculated from a food
frequency questionnaire).
56

Tab
le9:
Pro
port
ion
(%)
of
non-p
regnan
tgir
lsco
nsu
min
gdiff
eren
tfo
od
gro
ups
by
tota
lW
om
en’s
Die
tary
Div
ersi
tySco
re.
Sea
son
Sco
re1
nSta
rchy
stap
les
Dar
k
gre
en
leaf
y
veg
etab
les
Oth
er
vitam
in
A-r
ich
fruit
and
veg
etab
les
Oth
erfr
uit
&veg
Org
an
mea
t
Mea
tan
d
fish
Eggs
Leg
um
es,
nuts
and
seed
s
Milk
and
milk
pro
duct
s
Januar
y-F
ebru
ary
210
100
66
09
025
00
0
339
100
53
29
64
043
09
1
492
100
24
79
94
087
314
0
555
100
56
89
93
089
17
50
6
623
100
93
100
100
098
10
92
7
76
100
51
100
100
0100
66
100
83
Tota
l225
May
-June
210
100
20
020
060
00
0
371
100
23
084
074
019
0
495
100
37
890
279
379
2
536
100
83
0100
0100
14
98
4
66
100
64
53
100
0100
64
64
53
Tota
l218
1D
ue
tosm
alln,re
sults
are
notsh
ow
nfo
rsc
ore
of
1in
eith
erof
the
seas
ons,
and
for
score
of
7in
May
-June.
57

5.3.1 Dietary intake and food sources of iron, zinc, and phytate
Median intakes of iron were below RNI for 15- to 17-year-old girls (Table 10). The most
important sources of iron were cereals and fish in the city, cassava in the coastal district, and
cereals and dark green leafy vegetables in the inland district (Table 11). In Maganja da Costa,
iron intake was higher in May-June than in January-February (Table 10), which was mainly
due to a higher consumption of cassava, as seen in the larger contribution of cassava to total
intake (Table 11).
In all regions in both seasons, the intakes of zinc were clearly below RNI for 10- to 18-year-old
girls (Table 10). However, in all regions, zinc intakes were slightly higher in May-June than
in January-February. Cereals, cassava, sweet potato, and peanuts were important sources of
zinc (Table 11). The seasonal differences in phytate:zinc molar ratios were small. In January
February, the ratios varied from 14 in Maganja da Costa to 22 in Morrumbala (Table 10). The
higher ratios in Morrumbala reflect maize, which is high in phytate, having a more important
role in the diets of girls here than in their peers from the other regions (Supplementary material
of Study III).
5.3.2 Dietary intake and food sources of vitamin A and folate
In January-February, mango was the main source of vitamin A in all regions (Table 12) and
there was a clear seasonal pattern of several-fold higher RAE intakes than in May-June. WHO
has not set an RNI for vitamin A, but if compared with the recommended dietary allowance
(National Research Council 2006) for girls of this age, the median intakes even during the
mango season were below this figure (Table 10).
The median folate intakes were below the RNI for 10- to 18-year-old girls. The intake was
highest in Maganja da Costa and showed no seasonal variation (Table 10). When in season,
mango was the most important source of folate in the diet (as high as 70% in Maganja da
Costa). In May-June, the availability of citrus fruit (mainly oranges) compensated to some
extent for the fact that mango was no longer in season. However, in May-June, the shares
of different foods groups (cereals, roots and tubers, vegetables, fruit, nuts and coconut, and
legumes) as sources of folate were somewhat more similar than in January-February (Table
12).
58

Tab
le10:
Inta
ke
of
ener
gy
and
nutr
ients
among
all(p
regnan
tan
dnon-p
regnan
t)gir
ls.1
Quel
iman
eM
agan
jada
Cost
aM
orr
um
bal
a
Tota
lH
unger
seas
on
Har
ves
tse
ason
Hunger
seas
on
Har
ves
tse
ason
Hunger
seas
on
Har
ves
tse
ason
Hunger
seas
on
Har
ves
tse
ason
Inta
ke2
n=
543
n=
90
n=
86
n=
98
n=
83
n=
91
n=
95
Q vs.
MC
Q vs.
Mo
MC
vs.
Mo
Q vs.
MC
Q vs.
Mo
MC
vs.
Mo
RN
I/
RD
A
Ener
gy
(MJ)
5.2
5.8
6.3
5.2
5.6
4.2
5.1
∗N
S∗
NS
NS
∗N
S
(3.6
,7.4
)(4
.2,7.2
)(5
.1,8.4
)(3
.6,7.2
)(4
.3,7.7
)(3
.1,6.2
)(3
.5,7.7
)
Pro
tein
(E%
)10
10
11
∗7
10
∗11
10
∗N
S∗
‡‡
‡(8
,12)
(9,12)
(10,13)
(6,9)
(8,13)
(9,13)
(9,13)
Fat
(E%
)16
19
21
∗16
18
∗13
15
NS
∗N
SN
S∗
NS
(10,24)
(12,22)
(17,26)
(11,22)
(15,25)
(8,19)
(9,25)
Ch
(E%
)70
68
64
∗72
66
∗73
70
∗∗
NS
NS
∗∗
(62,77)
(63,75)
(60,70)
(65,78)
(57,70)
(66,78)
(61,76)
Fib
er(g
)21
17
18
23
35
∗18
18
∗N
S∗
∗N
S∗
(13,34)
(10,24)
(11,27)
(15,36)
(24,47)
(10,28)
(12,26)
Iron
(mg)
11.5
8.9
10.4
∗12.1
19.5
∗9.9
9.7
∗N
S∗
∗N
S∗
31
3
(7.2
,17.0
)(6
.3,12.2
)(7
.5,13.5
)(8
.4,17.6
)(1
3.9
,23.4
)(6
.5,14.3
)(6
.2,13.8
)
Zin
c(m
g)
4.5
4.9
5.5
∗3.3
5.3
∗4.1
5.3
∗∗
NS
NS
‡‡
‡14.4
4
(3.0
,6.4
)(3
.7,6.3
)(4
.3,7.6
)(2
.2,5.0
)(3
.8,7.3
)(2
.7,5.6
)(4
.1,8.9
)
RA
E(μ
g)
202
252
38
∗609
41
∗374
74
∗∗
NS
∗‡
‡‡
700
5
(38,595)
(43,507)
(20,117)
(326,1146)
(14,135)
(126,945)
(25,237)
Fola
te(μ
g)
164
160
123
217
188
163
117
∗N
S∗
∗N
S∗
400
6
(98,283)
(78,246)
(75,191)
(130,400)
(100,311)
(96,297)
(78,197)
Phyta
te(m
g)
822
814
1179
∗524
855
∗880
1079
∗∗
NS
∗‡
‡‡
(525,1232)
(578,1180)
(739,1680)
(272,703)
(565,1260)
(581,1185)
(758,1577)
Phyta
te:z
inc7
18
18
20
∗14
16
∗22
21
∗∗
∗‡
‡‡
(12,25)
(13,22)
(15,25)
(10,18)
(12,22)
(15,29)
(13,28)
1V
alues
are
med
ian
(inte
rquar
tile
range)
calc
ula
ted
from
24-h
our
die
tary
reca
lls.
Sea
sonal
diff
eren
ces
wer
ete
sted
usi
ng
Man
n-W
hitney
U-t
est.
Over
allre
gio
nal
diff
eren
ces
wer
eev
aluat
edby
the
Kru
skal
-Wal
lis
test
.
This
was
follow
edby
pai
rwis
ere
gio
nal
com
par
isons
usi
ng
Man
n-W
hitney
U-t
ests
.Sam
pling
wei
ghts
wer
euse
d.
Ch,
carb
ohydra
te;
E%
,per
centa
ge
of
tota
len
ergy
inta
ke;
MC
,M
agan
jada
Cost
aD
istr
ict;
Mo,
Morr
um
bal
aD
istr
ict;
NS,notsi
gnifi
cant;
Q,Q
uel
iman
e;R
AE
,re
tinolac
tivity
equiv
alen
t;R
DA
,re
com
men
ded
die
tary
allo
wan
ce;R
NI,
reco
mm
ended
nutr
ientin
take.
2N
utr
ientre
tention
fact
ors
wer
euse
dfo
rca
lcula
tion
of
mic
ronutr
ientin
takes
asdes
crib
edin
Stu
dy
II,w
ith
the
exce
ption
of
phyta
te,fo
rw
hic
hes
tablish
edre
tention
fact
or
table
sw
ere
notav
aila
ble
.3
RN
Ifo
rdie
tsw
ith
10%
bio
-avai
lability
(WH
Oan
dFA
O2004).
4R
NI
for
die
tsw
ith
low
bio
-avai
lability
(WH
Oan
dFA
O2004).
5R
DA
(Nat
ional
Res
earc
hC
ounci
l2006).
6R
NI
(WH
Oan
dFA
O2004).
7Phyta
te:z
inc
mola
rra
tios
calc
ula
ted
asfo
llow
s:(m
gphyta
te/6
60)/
(mg
zinc/
65.4
).∗
Sig
nifi
cantdiff
eren
ce(s
easo
nal
com
par
isons:
Pval
ue
<0.0
5;re
gio
nal
com
par
isons:
Pval
ue
<0.0
17).
‡O
ver
allte
stnon-s
ignifi
cant.
59
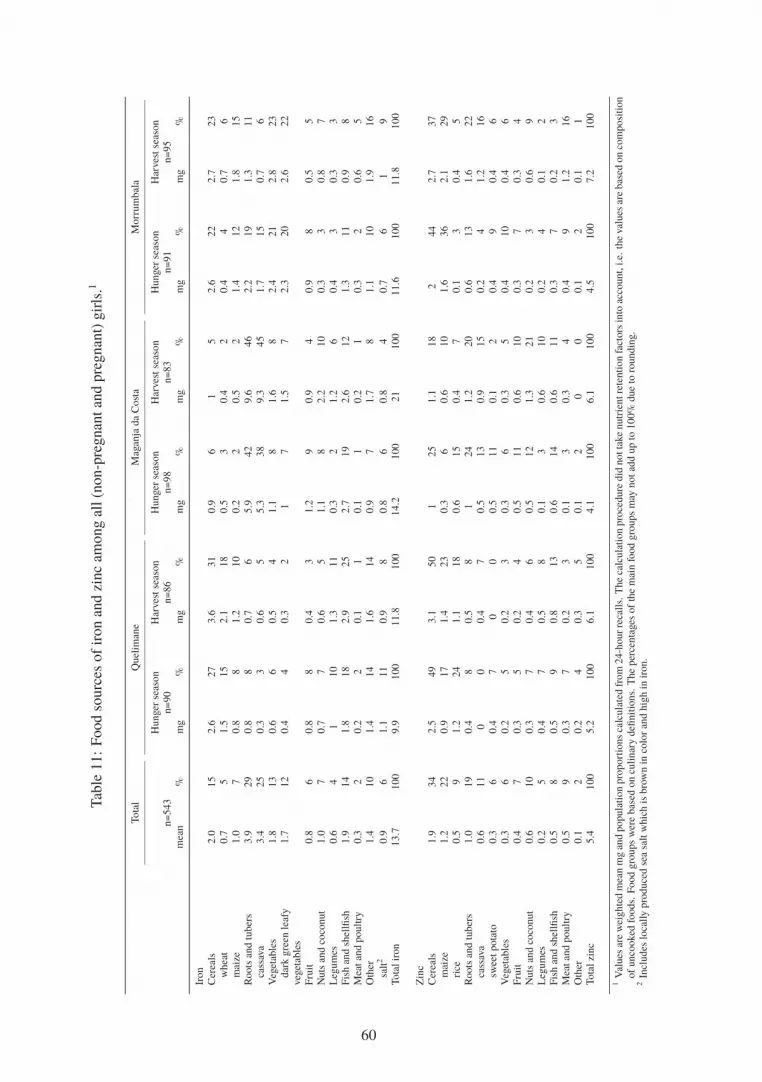
Tab
le11:
Food
sourc
esof
iron
and
zinc
among
all(n
on-p
regnan
tan
dpre
gnan
t)gir
ls.1
Tota
lQ
uel
iman
eM
agan
jada
Cost
aM
orr
um
bal
a
Hunger
seas
on
Har
ves
tse
ason
Hunger
seas
on
Har
ves
tse
ason
Hunger
seas
on
Har
ves
tse
ason
n=
543
n=
90
n=
86
n=
98
n=
83
n=
91
n=
95
mea
n%
mg
%m
g%
mg
%m
g%
mg
%m
g%
Iron
Cer
eals
2.0
15
2.6
27
3.6
31
0.9
61
52.6
22
2.7
23
whea
t0.7
51.5
15
2.1
18
0.5
30.4
20.4
40.7
6
mai
ze1.0
70.8
81.2
10
0.2
20.5
21.4
12
1.8
15
Roots
and
tuber
s3.9
29
0.8
80.7
65.9
42
9.6
46
2.2
19
1.3
11
cass
ava
3.4
25
0.3
30.6
55.3
38
9.3
45
1.7
15
0.7
6
Veg
etab
les
1.8
13
0.6
60.5
41.1
81.6
82.4
21
2.8
23
dar
kgre
enle
afy
veg
etab
les
1.7
12
0.4
40.3
21
71.5
72.3
20
2.6
22
Fru
it0.8
60.8
80.4
31.2
90.9
40.9
80.5
5
Nuts
and
coco
nut
1.0
70.7
70.6
51.1
82.2
10
0.3
30.8
7
Leg
um
es0.6
41
10
1.3
11
0.3
21.2
60.4
30.3
3
Fis
han
dsh
ellfi
sh1.9
14
1.8
18
2.9
25
2.7
19
2.6
12
1.3
11
0.9
8
Mea
tan
dpoultry
0.3
20.2
20.1
10.1
10.2
10.3
20.6
5
Oth
er1.4
10
1.4
14
1.6
14
0.9
71.7
81.1
10
1.9
16
salt
20.9
61.1
11
0.9
80.8
60.8
40.7
61
9
Tota
lir
on
13.7
100
9.9
100
11.8
100
14.2
100
21
100
11.6
100
11.8
100
Zin
c
Cer
eals
1.9
34
2.5
49
3.1
50
125
1.1
18
244
2.7
37
mai
ze1.2
22
0.9
17
1.4
23
0.3
60.6
10
1.6
36
2.1
29
rice
0.5
91.2
24
1.1
18
0.6
15
0.4
70.1
30.4
5
Roots
and
tuber
s1.0
19
0.4
80.5
81
24
1.2
20
0.6
13
1.6
22
cass
ava
0.6
11
00
0.4
70.5
13
0.9
15
0.2
41.2
16
swee
tpota
to0.3
60.4
70
00.5
11
0.1
20.4
90.4
6
Veg
etab
les
0.3
60.2
50.2
30.3
60.3
50.4
10
0.4
6
Fru
it0.4
70.3
50.2
40.5
11
0.6
10
0.3
70.3
4
Nuts
and
coco
nut
0.6
10
0.3
70.4
60.5
12
1.3
21
0.2
30.6
9
Leg
um
es0.2
50.4
70.5
80.1
30.6
10
0.2
40.1
2
Fis
han
dsh
ellfi
sh0.5
80.5
90.8
13
0.6
14
0.6
11
0.3
70.2
3
Mea
tan
dpoultry
0.5
90.3
70.2
30.1
30.3
40.4
91.2
16
Oth
er0.1
20.2
40.3
50.1
20
00.1
20.1
1
Tota
lzi
nc
5.4
100
5.2
100
6.1
100
4.1
100
6.1
100
4.5
100
7.2
100
1V
alues
are
wei
ghte
dm
ean
mg
and
popula
tion
pro
port
ions
calc
ula
ted
from
24-h
ourre
calls.
The
calc
ula
tion
pro
cedure
did
notta
ke
nutr
ientre
tention
fact
ors
into
acco
unt,
i.e.
the
val
ues
are
bas
edon
com
posi
tion
of
unco
oked
foods.
Food
gro
ups
wer
ebas
edon
culinar
ydefi
nitio
ns.
The
per
centa
ges
of
the
mai
nfo
od
gro
ups
may
notad
dup
to100%
due
toro
undin
g.
2In
cludes
loca
lly
pro
duce
dse
asa
ltw
hic
his
bro
wn
inco
lor
and
hig
hin
iron.
60

Tab
le12:
Food
sourc
esof
vitam
inA
and
fola
team
ong
all(n
on-p
regnan
tan
dpre
gnan
t)gir
ls.1
Tota
lQ
uel
iman
eM
agan
jada
Cost
aM
orr
um
bal
a
Hunger
seas
on
Har
ves
tse
ason
Hunger
seas
on
Har
ves
tse
ason
Hunger
seas
on
Har
ves
tse
ason
n=
543
n=
90
n=
86
n=
98
n=
83
n=
91
n=
95
mea
n%
mg
%m
g%
mg
%m
g%
mg
%m
g%
Vitam
inA
(RA
E)
Roots
and
tuber
s5
12
02
216
22
12
06
3
Veg
etab
les
146
31
67
16
57
51
119
14
148
89
202
31
160
84
dar
kgre
enle
afy
veg
etab
les
140
30
55
14
44
39
117
13
146
88
196
30
153
80
Fru
it297
64
301
74
11
10
726
83
74
426
66
74
man
go
291
63
291
71
00
723
83
00
420
65
00
Fis
han
dsh
ellfi
sh3
16
18
73
04
31
01
0
Mea
tan
dpoultry
41
10
11
00
11
30
13
7
Oth
er10
232
833
30
61
42
11
25
3
mar
gar
ine
and
butter
41
24
621
19
40
00
20
10
Tota
lR
AE
465
100
408
100
112
100
871
100
167
100
645
100
191
100
Fola
te
Cer
eals
27
10
28
11
38
18
10
315
535
13
40
19
mai
ze19
712
519
93
110
430
11
33
15
Roots
and
tuber
s26
10
11
413
626
831
11
16
641
19
cass
ava
16
61
011
514
424
84
229
14
Veg
etab
les
27
10
21
817
817
523
838
15
34
16
dar
kgre
enle
afy
veg
etab
les
21
87
35
215
520
730
12
27
12
Fru
it119
45
106
43
33
16
230
72
84
29
139
53
36
17
man
go
90
34
88
36
00
226
70
00
126
48
00
citr
us
fruit
21
81
026
12
10
81
28
31
25
12
Nuts
and
coco
nut
26
10
12
518
913
469
23
62
36
17
pea
nuts
20
76
315
72
158
20
31
34
16
Leg
um
es31
12
49
20
66
31
15
566
22
22
819
9
Oth
er10
420
826
12
93
62
83
10
5
Tota
lfo
late
266
100
247
100
210
100
321
100
294
100
264
100
217
100
1V
alues
are
wei
ghte
dm
ean
mg
and
popula
tion
pro
port
ions
calc
ula
ted
from
24-h
ourre
calls.
The
calc
ula
tion
pro
cedure
did
notta
ke
nutr
ientre
tention
fact
ors
into
acco
unt,
i.e.
the
val
ues
are
bas
edon
com
posi
tion
of
unco
oked
foods.
Food
gro
ups
wer
ebas
edon
culinar
ydefi
nitio
ns.
The
per
centa
ges
of
the
mai
nfo
od
gro
ups
may
notad
dup
to100%
due
toro
undin
g.
RA
E,re
tinolac
tivity
equiv
alen
t.
61

5.4 Indicators of micronutrient status
Table 13 presents the prevalence of anaemia and low serum/plasma concentrations of ferritin,
retinol, and folate in non-pregnant girls. The two prevalence estimates (95% CI) of low serum
zinc concentrations among non-pregnant girls, calculated using the cut-offs shown in Table 2,
were 32.7% (27.7-38.1%) and 57.3% (51.6-62.8%).
In both seasons, serum ferritin concentrations of girls in Morrumbala were higher than in
girls of the other regions (Study III). Similar, but less pronounced, differences were seen in
haemoglobin concentrations. Folate status was poorer among the urban girls than among
their rural counterparts. In January-February, almost one-third of the non-pregnant urban
girls were classified as folate deficient (Table 13). The seasonal variation in plasma retinol
concentrations was consistent with the differences in RAE intake, except in Morrumbala,
where the difference in plasma concentration was not statistically significant (Study III).
The median (IQR) concentration of serum selenium among the non-pregnant girls was 1.53
nmol/l (1.28, 1.84 nmol/l; n=442). In general, the selenium concentrations tended to be
higher in May-June, than in January-February, and some regional differences were observed
(Study III). The overall median (IQR) urinary iodine concentrations among the
non-pregnant, non-lactating girls, the pregnant girls, and the non-pregnant, lactating girls
were 55 μg/l (33, 96 μg/l; n=378), 54 μg/l (30, 87 μg/l; n=57) and 43 μg/l (24, 81 μg/l;
n=52), respectively. When examining the urinary iodine of non-pregnant, non-lactating girls
by region, the iodine concentrations in the urban area were significantly higher than in the
rural districts (Study III).
62

Tab
le13:
Pre
val
ence
of
indic
ators
of
under
nutr
itio
nam
ong
non-p
regnan
tgir
ls.
Tota
lQ
uel
iman
eM
agan
jada
Cost
aM
orr
um
bal
a
Hunger
seas
on
Har
ves
t
seas
on
Hunger
seas
on
Har
ves
t
seas
on
Hunger
seas
on
Har
ves
t
seas
on
Hunger
seas
on
Har
ves
tse
ason
n=
483
n=
83
n=
77
n=
82
n=
73
n=
79
n=
89
Q vs.
MC
Q vs.
Mo
MC
vs.
Mo
Q vs.
MC
Q vs.
Mo
MC
vs.
Mo
Anae
mia
case
s/to
taln
199/4
66
38/8
035/7
333/7
943/7
018/7
732/8
7
wei
ghte
d%
,(9
5%
CI)
42
(37-4
9)
48
(37-5
8)
48
(37-5
9)
NS
44
(32-5
5)
62
(48-7
6)
NS
26
(15-3
6)
41
(30-5
3)
NS
NS
∗N
SN
SN
SN
S
Low
seru
mfe
rritin
case
s/to
taln
157/4
27
41/7
040/7
022/7
231/6
511/7
612/7
4
wei
ghte
d%
,(9
5%
CI)
27
(23-3
2)
59
(47-7
0)
57
(46-6
9)
NS
27
(17-3
8)
53
(38-6
8)
∗10
(3-1
6)
13
(5-2
1)
NS
∗∗
∗N
S∗
∗L
ow
pla
sma
retinol
case
s/to
taln
71/4
26
12/7
024/6
84/7
214/6
55/7
612/7
5
wei
ghte
d%
,(9
5%
CI)
15
(11-1
9)
17
(8-2
5)
35
(24-4
7)
∗7
(0-1
3)
25
(12-3
8)
∗7
(1-1
3)
17
(8-2
7)
NS
‡‡
‡‡
‡‡
Low
seru
mfo
late
case
s/to
taln
42/4
48
6/7
422/7
01/7
54/6
72/7
77/8
5
wei
ghte
d%
,(9
5%
CI)
4(3
-6)
8(2
-14)
31
(21-4
2)
∗0.5
(0-2
)1
(0-2
)N
S2
(0-5
)4
(0-7
)N
S∗
NS
NS
∗∗
NS
1D
iffer
entvar
iable
shav
ediff
eren
tto
taln
due
tom
issi
ng
dat
a.Sea
sonal
diff
eren
ces
and
over
allre
gio
nal
diff
eren
ces
inpro
port
ions
wer
eco
mpar
edusi
ng
Pea
rson
Chi-
squar
edte
sts.
This
was
follow
edby
pai
rwis
ePea
rson
Chi-
squar
edte
stin
gof
regio
nal
diff
eren
ces.
MC
,M
agan
jada
Cost
aD
istr
ict;
Mo,M
orr
um
bal
aD
istr
ict;
NS,notsi
gnifi
cant;
Q,Q
uel
iman
e.‡
Over
allte
stnon-s
ignifi
cant.
∗Sig
nifi
cantdiff
eren
ce(s
easo
nal
com
par
isons:
Pval
ue
<0.0
5;re
gio
nal
com
par
isons:
Pval
ue
<0.0
17).
63

5.5 Hidden hunger as a public health problem in Central Mozambique
Using the criteria presented in Tables 2 and 3, the level of the public health problem of hidden
hunger among adolescent girls in Central Mozambique can be outlined as below. Selenium is
not listed here due to lack of established criteria for low blood concentrations.
Anaemia: Anaemia was found to be a severe public health problem in adolescent girls.
Iron: When examining all serum ferritin data for non-pregnant girls, iron depletion was
found to be prevalent in the study population. There were, however, regional differences in
prevalence of low serum ferritin: girls in Morrumbala had better status than girls in the other
regions.
Zinc: The study population was at risk of zinc deficiency.
Iodine: On the whole, the median urinary iodine concentration for non-pregnant,
non-lactating girls indicated mild iodine deficiency. The regional comparisons for this group
of girls indicated that the status was adequate in the urban area, but the population in the
rural districts suffered from mild to moderate deficiency.
Vitamin A: Overall, the prevalence of low plasma retinol in non-pregnant girls indicated that
vitamin A deficiency was a moderate public health problem. In two of the three study regions,
the situation was worse in May-June than in January-February.
Folate: When examining the whole sample of non-pregnant girls, low serum concentrations
seemed to be uncommon. Thus, although no population cut-off for the prevalence of low
concentrations has been established, folate deficiency was considered not to be a public health
problem (Study III). However, in May-June, low concentrations were more common in the
urban area than in the rural districts.
64

5.6 Associations between dietary diversity scores and indicators ofmicronutrient status
In January-February, when using the data-driven cut-offs, low WDDS (≤3) and low 7dWDDS
(≤5) were each associated with higher odds of having a low serum zinc concentration as
compared with having a higher dietary diversity in the unadjusted models (Study IV). These
associations remained statistically significant after adjusting for study area, age, BMI-for-age
z-score, breastfeeding, hsCRP, literacy and asset score. In addition, a similar association was
found for WDDS15g in the adjusted model. In May-June, no associations between dietary
diversity and serum zinc were observed when using the data-driven cut-offs (Study IV).
When using the literature cut-offs, the results for zinc were similar to those obtained with the
data-driven cut-offs. In January-February, the unadjusted odds ratios (ORs) for the
associations between WDDS and 7dWDDS and zinc were 2.03 (95% CI: 0.95-4.33 [P value
0.068]) and 2.83 (95% CI: 1.25-6.45 [P value 0.013]), respectively. After adjusting for
confounders, both of these associations remained significant (OR 2.57; 95% CI: 1.01-6.50 [P
value 0.048] and OR 3.01; 95% CI: 1.11-8.13 [P value 0.031], respectively). In May-June,
none of the unadjusted models suggested significant associations. However, after adjusting
for confounders, two models became statistically significant: low WDDS15g (≤3) was
associated with higher odds of having low haemoglobin (OR 2.6; 95% CI: 1.09-6.18 [P
value 0.033] and ferritin (OR 2.6; 95% CI: 1.09-6.18 [P value 0.032]). When using the
literature cut-offs, no other significant associations were found in either of the seasons.
Some interactions between the different geographic areas and dietary diversity were observed.
Interaction terms were significant in some of the models between WDDS15g or 7dWDDS and
haemoglobin, including the model mentioned above which suggested that in May-June there is
an association between WDDS15g and haemoglobin. Interaction terms were also significant
for most of the models for folate. Although there were no significant associations between
dietary diversity and folate status within the complete data, some conflicting results emerged
in different regions with different food habits, and between seasons. No interactions were
observed for zinc.
65

6 Discussion
6.1 Main findings
Hidden hunger was found to be a public health problem in adolescent girls in Central
Mozambique. In general, the dietary diversity of the girls was low. The diets were heavily
based on starchy staple foods and were generally low in protein, fat, iron, zinc, vitamin A,
and folate. However, seasonal and regional variation was present in some characteristics of
the diets, with vitamin A intake showing the most pronounced seasonal variation.
Regardless of the season or location, animal-source foods contributed very little to the
intakes of vitamin A and zinc. The diets also had moderately high to high phytate:zinc molar
ratios, impairing the bioavailability of zinc from the diet.
Anaemia, iron depletion, and deficiencies of zinc and vitamin A were found to be public health
problems in both urban and rural settings. Iodine deficiency was prevalent in the rural districts.
Folate status seemed to be sufficient in the rural areas, but the findings from the urban setting
suggested poorer folate status in this region.
6.2 Dietary intake, micronutrient status indicators and their variationacross regions and seasons
6.2.1 Minerals
The highest iron intakes were observed for the Maganja da Costa District. This was related
to the higher contribution of dietary iron from cassava, the main staple food in this region.
However, the biochemical indicators of iron status did not reflect a similar pattern; girls in the
Morrumbala District had higher serum ferritin concentrations than their peers in Quelimane
or Maganja da Costa. The apparent inconsistency of relatively high iron intake but low iron
status in Maganja da Costa could be explained by the iron values used in calculations of iron
intakes. When compiling the food composition database for this study, a sample of cassava
porridge cooked from dried cassava (without salt) was analysed and was found to contain 2.8
mg of iron/100 g (Korkalo et al. 2011a). This is several-fold higher than the value of 0.58
mg/100 g, which would have resulted, if for example, a West African database (Stadlmayr
et al. 2012) was used to calculate the porridge recipe. It is likely that the Zambézian sample
contained contamination iron. On the other hand, samples of maize and rice, the other main
staple foods of Zambézia, were not analysed but were taken from the literature and previous
databases.
66

What factors could explain the girls in Morrubala having clearly higher serum ferritin
concentrations relative to the other regions? Firstly, it should be noted that the interpretation
of serum ferritin concentration is known to be difficult in regions where infections are
widespread, as it acts as an acute-phase protein (WHO 2011d). To reduce the risk of
misinterpreting concentrations due to infection and inflammation, girls with elevated hsCRP
were, however, excluded from the analysis of serum ferritin. Secondly, the study regions may
have been dissimilarly affected by some factors related to iron status. These include a
number of genetic and environmental factors that were not examined here. Genetic
ferroportin polymorphisms are known to affect serum ferritin concentrations in African
populations (Kasvosve 2013). In addition, several studies have reported that hookworms and
malaria are associated with anaemia (Smith and Brooker 2010, Nankabirwa et al. 2014).
However, recent findings by Glinz et al. (2015) suggest that hookworm does not reduce
dietary iron absorption. Instead, their study provided new evidence to confirm the negative
association between malaria and iron status, showing that afebrile plamodium falciparum
malaria parasitemia reduces iron absorption. The suggested mechanism is that the afebrile
malaria causes low-grade inflammation, which increases serum hepcidin and thereby
reduces absorption (Glinz et al. 2015). In this study, almost all of the test results positive for
malaria were found in Maganja da Costa (Study II), and thus, the burden of malaria may
have contributed to the poor iron status, especially in this region. Lastly, there may be some
differences in the bio-availability of iron from the diets in different regions, as iron
absorption is affected by multiple enhancers (e.g. ascorbic acid and meat) and inhibitors
(e.g. phytate and polyphenols). Furthermore, Gibson et al. (2015) used an experimental cell
model to study the availability of contaminant iron from soil and found that extraneous soil
contamination in areas where soil is acidic may make a small contribution to iron nutrition,
whereas a sample from a calcareous soil did not show the same effect.
The regional and seasonal differences in zinc status were not tested in this study, but on the
whole, the zinc status was found to be poor. This might be explained by poor bio-availability
of zinc from the diets. The median phytate:zinc molar ratio for the ZANE sample was 18 and
molar ratios above 15 have been associated with low zinc status in different populations (see
Gibson 2006). The proportion of zinc from animal source foods, which have better zinc bio-
availability, was low compared with children in the US (Keast et al. 2013). A second factor that
may be related to the poor zinc status is environmental enteropathy (Lindenmayer et al. 2014).
Environmental enteropathy is a sub-clinical condition arising from faecal-oral contamination
in conditions where sanitation and hygiene are poor, resulting in blunting of intestinal villi and
inflammation (Korpe and Petri 2012). According to Lindenmayer et al. (2014), it probably
impairs the absorption of other nutrients as well, but to date, the literature on the interplay
between environmental enteropathy and single micronutrients is limited. Given the lack of
proper sanitation seen in the study regions, it is likely that environmental enteropathy plays a
67
role in the hidden hunger of Mozambican girls.
With regard to selenium, previous studies have found concentrations from 0.52 to 2.5 μmol/l
in apparently healthy subjects (Alfthan and Neve 1996), and a plasma glutathione peroxidase
is known to reach maximal activity at serum concentrations between 1.0 and 1.2 μmol/l
(Thomson 2004). The IQR of the concentrations among non-pregnant girls was above the
latter figures, and thus, the population status seems to be sufficient. However, because of
possible regional variation in selenium content of food, it cannot be concluded that selenium
status in other parts of Mozambique is sufficient. Selenium concentrations were higher in
May-June than in January-February. This difference was relatively small, but statistically
significant, in all regions.
The distributions of urinary iodine concentration were notably lower in the rural districts than
in Quelimane city. As there is no information on the selenium and iodine content of the local
foods, the reasons for the regional and seasonal variation in selenium and iodine status remain
unknown.
6.2.2 Vitamins
There is little doubt that the seasonal pattern of lower plasma retinol concentrations during
the harvest season seen in Quelimane and Maganja da Costa is the result of the large
seasonal variation in the diet. In these regions, more than 70% of all RAEs came from
mango during January-February. In May-June, when mango was no longer available, there
was no food that could have replaced the role of mango as a source of vitamin A. Similarly
to zinc, the proportion of vitamin A intake as preformed retinol from animal source foods
among Mozambican girls was very small compared with that for high-income country
children (Keast et al. 2013). The low intakes of preformed vitamin A, coupled with the
seasonal lack of beta-carotene-rich foods, largely explain why the vitamin A status was not
optimal in this population.
Seasonal differences were also found for folate status, but the differences in intakes were not
statistically significant. With regard to regional differences, the urban girls had lower folate
concentrations than their rural counterparts. This was despite the lack of differences in
calculated folate intakes. The reasons for the inconsistency between the status and intakes
may be explained in at least two ways. Firstly, although the differences between the relative
contribution of different foods as sources of folate cannot be statistically tested (because they
were calculated as population proportions), it seems clear that some regional differences
existed. Little is known about the differences in folate bio-availability from different foods or
the effect of cooking methods on the bio-availability. However, it has been experimentally
68

shown that the disruption of the food matrix while cooking spinach improves the
bio-availability of folate (van het Hof et al. 1999). In Zambézia, dark green leafy vegetables
are typically chopped or ground (as for cassava leaves) before cooking, and these vegetables
were more important sources of folate in the rural districts than in the city. Secondly,
inaccuracies in the folate values of the food composition database cannot be ruled out.
6.3 Dietary recall methodology
6.3.1 Using photographs in portion size estimation
The study on the validity of using food photographs in portion size assessment showed that
wide variation exists in individuals’ ability to estimate their portions with the help of food
photographs. However, at the group level, the results suggest an acceptable level of validity;
the geometric means of the ratio of estimated to actual portion size for the staple foods and
sauces were 0.79 and 0.92, respectively. Previously, Foster et al. (2008a) studied the use of
food photographs in 4- to 16-year-old children in the UK using a test protocol that included
eating a meal and estimating the portion sizes the next day. When they combined all the
different foods for analysis, the geometric mean of the ratio of estimated to actual portion size
was 1.18 (95% CI: 1.14-1.22), indicating overestimation. Thus, the error found in this thesis
was similar in size, but in the opposite direction relative to the children in the UK.
The proportions of observations with an error rate of ≤10% seem to have varied
considerably in different studies. In the study by Subar et al. (2010), adult subjects in the US
made estimations using photographs on the computer screen and only 14% of reports were
within an error rate of ≤10%. On the other hand, in the study by Nelson et al. (1994) in the
UK, where the photograph and the food were shown simultaneously, 31-55% of adults were
able to estimate the amount with this error rate. The findings of the present study are in the
range provided by the the above-mentioned studies and similar or slightly better that that of
the study in Mexico (Bernal-Orozco et al. 2013), where 20% of adolescents’ estimations
were within the error rate of ≤10%.
In general, much of the previous literature on validity of food photographs has focused on
discussing the skills of the subjects in providing an accurate estimation and whether
characteristics of the subject (e.g. age, education), design of the atlas (e.g. number of
portion sizes depicted), or study design issues (e.g. timing of presentation) are related to
this. While all of the above is essential, there has been little discussion or self-criticism by
the authors on the quality of the images themselves. This may be because of the subjectivity
of the issue or because the authors saw nothing to be improved in the photographs. One of
69

the few exceptions to this was the report by Lucas et al. (1995), which admitted that for one
food the quality of the photographs was not good. However, this topic should not be
completely neglected since the possibility exists that subjects may be distracted if the quality
of the image is not optimal. Appearance and placement of the food; the size, shape, and
colour of the plate; possible inclusion of identifiable objects for scale perception, and good
exposure and print quality are all qualities that can facilitate the process of estimation.
In my subjective opinion, in Study I, there were some quality issues that may have affected the
estimation: 1) the life-sized scale may not have been optimal since it seems that some of the
foods actually appear larger than they are, 2) a plate colour other than white might have been
better for the light-coloured staple foods, 3) the shaping of the lumps of thick maize porridge
was not as natural as possible, and 4) the differences between some of the portion sizes of the
sauces (especially the cowpea sauce) were not easy to perceive. Especially the first and last
point may partly explain the under-reporting of the staple foods and the difficulties the girls
had when estimating the sauces. The photographs used in Study I were produced in a short
amount of time, and thus, the lesson here is that the process of selecting the set of portion sizes
to be depicted and the other technical and design aspects of the photography require plenty of
time and some rounds of testing before an ’optimal’ quality will be achieved. Overall, given
the quality issues mentioned above, the results are relatively good.
6.3.2 Under-reporting in 24-hour recalls of the ZANE Study
The results of Study I cannot be used to draw direct conclusions on the validity of the
24-hour recalls done in the ZANE Study for two main reasons. Firstly, as described in
section 4.5.4, the photographs used in the ZANE Study were slightly different from those
used in the validity study, because I attempted to address the quality issues described above.
Secondly, in the validity study, the estimation was done soon after eating the meal, and
therefore, the effect of memory is assumed to have played a smaller role in the accuracy of
the estimates relative to the situation in the ZANE Study, where the previous day’s
consumption was recalled. Nevertheless, the underestimation found in the validity study is in
line with the finding that the mean ratio of energy intake to BMR in Study III was only 1.08.
This ratio falls below that expected for accurate reporting even in a population with light
physical activity (FAO 2004). It is thus highly probable that the calculated intake of energy
and nutrients based on the 24-hour recalls are underestimates and therefore, these results
should be interpreted with care.
70

6.4 Dietary diversity as a predictor of hidden hunger
The most consistent findings of Study IV were the associations between the different DDSs
and serum zinc in January-February. The same was not, however, observed in May-June.
Furthermore, it should be noted that in January-February, the data-driven cut-off was almost
equal to the literature cut-off. Thus, the findings from the two types of models being similar is
not surprising. Previously, the study by Gebremedhin et al. (2011) also reported an association
between DDS and serum zinc among pregnant women in Ethiopia. Low DDS seems to be
associated with a low serum zinc concentration under some circumstances, but more evidence
from different settings is needed before we know whether DDS could be used as a field tool
to assess the risk of zinc deficiency in populations.
The results of Study IV do not support those of previous studies describing associations
between DDS and vitamin A status (Fujita et al. 2012, Gebreselassie et al. 2013). One
potential reason for the conflicting results is that the composition of the diet of Mozambican
girls was different than that of the populations earlier investigated. In Mozambique, only a
couple of food groups were important sources of vitamin A, and these food groups were
consumed by the majority. Thus, the scores may not have been able to capture much
variation in the consumption of foods essential for vitamin A intake. The importance of the
two major sources is illustrated by the fact that in January-February, the group "other
vitamin A-rich fruit and vegetables" contributed, on average, 73% (as a population
proportion) of the total intake of RAEs, with the main source being mango. A majority of
the girls were users of this food group (68% during the previous day and 95% during the
previous seven days, as weighted percentages). In May-June, dark green leafy vegetables
contributed 82% of the total RAE intake, and this food group was consumed by 42% of the
girls during the previous day and by 89% during the previous seven days. For sake of
comparison, in the study by Fujita et al. (2012) vitamin A-rich foods (meat and fish, dairy,
and vitamin A-rich fruit and vegetables) tended to be consumed more commonly among
those with higher DDSs than among those with low scores.
Folate deficiency was rare in the ZANE Study population. Therefore, the findings of this
thesis do not imply that associations between dietary diversity and folate status could not be
detected in populations where low folate status is a larger problem.
71

6.5 Limitations and strengths of the studies
6.5.1 Validity of portion size estimations using food photographs
A limitation of Study I was that it only tested a small set of food photographs; all of the
important foods in the diets of Central Mozambique were not covered. However, our findings
contribute to the limited literature on validity of portion size estimation in low-income settings.
The strengths of Study I include the sample of participants being similar to the main study
population and foods actually being eaten by participants, not only shown to them.
6.5.2 ZANE Study and its representativeness
The data for the ZANE Study (Studies II-IV) were collected in Zambézia Province, Central
Mozambique. Due to the large size of the country, with its varying topography and climate
conditions and its multiple ethnic groups, the results of the study are not directly
generalizable to the whole nation. However, while the findings illustrate the magnitude and
type of seasonal and urban-rural differences found in the selected study areas, clear variation
in diet and micronutrient status are likely to occur also elsewhere in Mozambique and many
other parts of Sub-Saharan Africa.
The field studies were conducted in circumstances that sometimes posed challenges for the
study team. For example, the sampling was planned based on hand-drawn maps, where some
of the villages were not indicated. Furthermore, in a couple of cases, the village leaders
refused to collaborate with the study team, forcing the team to modify the original sampling
plan. The study logistics demanded that all participants be given transport to the study centre
for the biological sample collection, and because some of the roads were in poor condition,
the areas situated further than about a one-hour drive from the study centre had to be excluded.
However, even with these limitations, the sample is expected to give a good representation of
the target population. It includes girls from very different backgrounds from deprived urban
neighbourhoods to remote rural villages with poor road access.
The types of challenges in sampling and logistics described above likely explain why most of
the studies collecting blood samples for nutritional biomarkers in Sub-Saharan Africa
countries have been institution-based, rather than population-based. Population-based
information is, however, important for designing nutrition policy. With that being said,
probably the most important strength of the ZANE study is its population-based design
combined with a target age group, adolescent girls, that has received less attention than some
of the other nutritionally vulnerable age groups, namely pre-school children and adult
72
females. Before this study, no food composition database was publicly available for
Mozambique. The database compiled as a part of this study is now on-line and may be
useful for other researchers as well. Overall, despite the limitations in the design, this study
provides unique data for several micronutrients in a population that has been investigated
very little.
6.5.3 Biochemical measurements and interpretation of association withdietary diversity
With regard to the analyses of serum zinc concentrations (Studies III and IV), it should be
noted that inadequate zinc intake, fasting status of the subject, and infection are all factors that
cause metabolic redistribution of the body’s zinc stores, thus affecting the serum concentration
(see King 2011). Therefore, the blood samples being non-fasting samples is a limitation of the
analyses of serum zinc. In Study IV, it is possible that the lack of control of fasting status may
have led to misclassification of individuals with low and high concentrations. To adjust for the
effect of inflammation, hsCRP was used in Study III to exclude cases and in Study IV it was
used as a controlling variable. Furthermore, the laboratory supplies were not trace element-
free. However, had there been zinc contamination, the prevalence estimates for low serum
zinc would be underestimations, but the same conclusion would still hold; the population has
an elevated risk of zinc deficiency.
As in the case of serum zinc, there is also a risk that girls may have been misclassified
according to plasma retinol and serum folate concentrations in Study IV. As described in
Section 2.2.5, plasma retinol is homeostatically controlled and does not linearly correlate
with increases of liver stores, and serum folate is prone to diurnal changes due to shot term,
rather than long-term, food consumption. Thus, these indicators are considered to work
better in the assessment of deficiency at the population level than at the individual level. For
this reason, logistic models were used instead of linear models, as the former does not
assume a linear relationship between independent variables and the dependent variable.
When interpreting the results of Study IV, the relatively small sample size and the
cross-sectional nature of the data should also be taken into account. The data on diet and
micronutrient status were collected at the same time point, and the dietary data only reflected
the previous 24 hours or seven days. Therefore, the lack of associations for several
biomarkers of interest seen in this study does not necessarily imply that no associations
between a longer exposure to low dietary diversity (or exposure to more extreme low
diversity) and micronutrient status exist. Furthermore, the possibility of a chance finding
cannot be ruled out. The main strengths of Study IV are that it includes several different
73

biomarkers and that it is the first of this type of study to include data from two different
seasons.
6.6 Implications for future research and action
6.6.1 Methodological development of portion size assessment
The findings of Study I, together with previous research in Sub-Saharan African settings
(Venter et al. 2000, Huybregts et al. 2008), suggest that using food photographs to estimate
portion sizes produces results that are as good as in high-income countries. In the future, it
would be important to develop and test more culturally appropriate food photographs for use
in Sub-Saharan populations.
Future projects should develop more comprehensive sets of photographs, encompassing a
wider range of dishes and food items. Given that some dishes and food items are popular in
several African countries, at least some of them could be used by researchers in more than
one country. Furthermore, if larger resources were available, it might be useful to conduct
separate analyses addressing the following questions (as outlined by Nelson and
Haraldsdottir (1998)): 1) does the use of food photographs improve assessment compared
with the more traditional techniques (e.g. household utensils), 2) how well are foods in the
photographs perceived when the food is in the sight of the subject, 3) what design issues of
the photographs influence perception, and finally, 4) how well are foods eaten memorized
and conceptualized when no longer in sight. It may also be useful to examine whether
educational level influences the estimation skills. Previous studies in Africa have shown
conflicting results; Huybregts et al. (2008) observed that women who had gone to school
were more likely to choose a correct photograph, whereas Venter et al. (2000) found no
evidence that education affected the estimations. Study I provides some (close to statistically
significant) evidence that education may play a role in the ability to estimate portion sizes.
Future studies with larger, representative samples sizes are needed to confirm whether this is
the case in low-income settings.
6.6.2 Improving nutritional status
Improving the diets of adolescents is essential from two perspectives. Firstly, adolescent
girls should have a good nutritional status for the sake of their own health, productivity, and
well-being regardless of whether or not they become mothers. Secondly, in a region where
adolescent pregnancies are common, it is important that adolescent girls enter pregnancy
74

with a good nutritional status. The latter perspective tends to be stressed in nutrition
literature. However, when dealing with the nutritional and health problems related to
adolescent pregnancies, a strong focus should be on preventing unwanted pregnancies in the
first place. Indeed, it is well justified that the Multisectoral Action Plan for the Reduction of
Chronic Undernutrition in Mozambique (PAMRDC) (Ministry of Health 2010), a document
that outlines the country’s current nutrition policies, takes a comprehensive approach on the
nutrition of adolescent girls and addresses both nutritional status and reduction of adolescent
pregnancies. The findings of this thesis could be used to advocate actions to improve the
nutrition of adolescent Mozambican girls.
The situation analysis presented in the PAMRDC outlines that food insecurity and low
dietary diversity are problems in Mozambique. With regard to micronutrients, iron, vitamin
A, and iodine are specifically mentioned as problems. The findings of this thesis provide
new evidence to support the view that the deficiencies of these micronutrients need to be
addressed. With regard to iron, iron-folic acid supplementation programmes for specific
groups, such as pregnant women, are widely recognized as a key prevention strategy. WHO
stresses that early interventions to prevent anaemia in adolescent girls are critical in regions
where adolescent pregnancies are common (WHO 2014). However, besides targeted
supplementation, other strategies, ones that address wider population groups, are also
needed. These include prevention and control of malaria, de-worming, improved
environmental hygiene, food fortification, home fortification, and biofortification. Finally, in
the long-term, improved food security and dietary changes towards diets that include enough
foods that have high iron content combined with good bio-availability (especially cellular
animal foods; e.g. fish, poultry, meat, organs) and adequate amounts of enhancers of iron
absorption (e.g. vitamin C) are essential (Pasricha et al. 2013, WHO 2014, Parlesak et al.
2014). The latter changes in dietary patterns are acknowledged as requiring fundamental
socio-economic changes, but are the ultimate aims of development (Pasricha et al. 2013).
This study found that vitamin A was a moderate public health problem. However, it is possible
that the situation is worse during the months from the harvest season to the beginning of the
next mango season which were not covered by the ZANE Study. Thus, further research is
needed to gain a more comprehensive view of the seasonal changes in retinol concentrations.
However, the evidence from this study and from previous research in Mozambique (Low et al.
2007, Hotz et al. 2012) is sufficient to warrant interventions promoting the year-round use
of foods high in beta-carotene such as dark green leafy vegetables and orange-fleshed sweet
potato. With regard to iodine, the findings here suggest that there is an urgent need to increase
the coverage of iodized salt use, especially in rural areas.
75

Compared with iron, vitamin A, and iodine, the PAMRDC document gives less attention to
zinc. The ZANE Study was the first to measure serum zinc concentrations in a Mozambican
population and the adolescent girls were found to be at elevated risk of zinc deficiency. This
finding together with the previous analysis on indirect indicators of zinc status (Wessells and
Brown 2012) provide evidence that zinc deficiency is a public health problem in
Mozambique. Future projects should include investigating the zinc status in other population
groups as well. Zinc nutrition also warrants more attention in the nutritional policy. The
only specific mention of zinc in PAMRDC is a plan to begin a programme for zinc
supplementation of children with diarrhoea. However, the document discusses several
potential actions that are not specific to any nutrient, but have the potential to improve zinc
nutrition. These include, for example, provision of fortified supplements to children and
promotion of the production and consumption of foods with high nutritional value (Ministry
of Health 2010). Internationally, the latter is considered one of the key strategies to improve
the zinc content of family meals; increasing the availability and accessibility of cellular
animal foods would increase the amount of zinc with good bioavailability (and as mentioned
above, iron as well) in the diets (Gibson 2006).
Folate status was mainly adequate in the ZANE Study population, but low concentrations
were common in the urban area during the harvest season. Thus in the future there may
be a need to monitor the folate intake and status of the population, especially in the urban
areas. Experiences from elsewhere in Africa suggest that the process of nutrition transition
is linked to unfavourable dietary changes (Vorster et al. 2011). During urbanization some
traditional green leafy vegetables that are high in folate may become neglected and ’out of
fashion’ (Mnzava 1997). Interventions that target behavioural change could be developed to
reverse such a development. These interventions should target both undernutrition and the
risk factors for overweight simultaneously (Vorster et al. 2011), and their effectiveness should
be formally evaluated (Woodside et al. 2013).
In recent years, Mozambique has set up a National Committee for Food Fortification. In the
first phase of the programme, the aim is to fortify edible oils with vitamin A and wheat flour
with iron (sodium iron ethylenediaminetetraacetate), zinc, vitamin B12, and folic acid.
However, as of 2014, fortification was not yet mandatory by Mozambican law (Mungói
2014). An important future effort for researchers and policy makers will be to monitor the
programme and to scientifically evaluate its effect on the micronutrient status of the
population. However, as Gibson (2004) has pointed out, in a country where much of the
population relies heavily on subsistence farming and only consumes fortified foods to a
small extent or not at all, fortification alone will not provide a full solution to the problem of
hidden hunger.
76

6.6.3 Future directions of dietary diversity assessment
The findings of this study suggest that during the hunger season in Central Mozambique an
association exists between a nine-food group DDS and zinc status among adolescent girls.
However, taking into consideration that a consistent association was found for only one of
the biomarkers in only one season, these results for an adolescent population in Mozambique
do not provide clear support for the idea that WDDS could be used as a simple population-
level assessment tool to predict the risk of low blood concentrations of micronutrient status
indicators. The usefulness of the score in other Sub-Saharan African settings remains to be
confirmed. Future research in different settings should examine when (i.e. what season) this
type of tool works best, and, in more depth, why.
As described in section 4.5.4, during the preparation of this thesis, FAO announced that a new
dietary diversity score will be released. Thus an obvious task for researchers will be to assess
the usefulness of the new score in various settings. This will include examining whether it is
associated with dietary adequacy as well as nutritional status.
Finally, in the future, the use of DDSs may be extended to new areas. Nutrition transition
will continue in low- and middle-income countries, and therefore, tools are needed not only
for assessment of risk of undernutrition but also of risk of overnutrition. Some studies have
already tested DDSs in relation to overweight and risk factors for cardiovascular diseases (see
Steyn et al. 2014).
77

6.7 Conclusions
In Central Mozambique, adolescent girls in both rural and urban settings are at risk of
anaemia and deficiencies of several micronutrients. As hidden hunger is known to cause
adverse health consequences in adolescent girls as well as in other age groups, both targeted
and population-wide interventions are needed to combat micronutrient deficiencies in
Mozambique. The urban-rural and seasonal variations in diet need to be taken into account
when designing future studies and interventions aiming to improve the nutritional situation.
Furthermore, when designing interventions, both the risk of undernutrition and possible
adverse dietary changes linked to nutrition transition should be addressed simultaneously.
Food photographs are practical aids to help quantification of foods during dietary interviews.
For many nutrition researchers in Sub-Saharan Africa, these tools are, however, not easily
available. It would benefit researchers from several African countries to join forces to produce
and validate food photograph atlases that would include foods that are shared across wider
regions as well as some more local, but important foods. For the sake of easy access by large
numbers of nutritionists, these should be made available online.
Finally, higher dietary diversity may be linked to a better zinc status under certain
circumstances. However, before this observation can be translated into any practical
recommendations on the use of DDSs to identify population groups with elevated risk of
zinc deficiency, more data from different settings and age groups is needed.
78

Acknowledgements
The main funding, enabling field work to be conducted, was received from the Academy
of Finland and the Embassy of Finland in Maputo. In addition, I received personal funding
from the Finnish Cultural Foundation, the ABS Graduate School (Finnish Graduate School on
Applied Bioscience: Bioengineering, Food & Nutrition, Environment), the Agriculture and
Forestry Fund of the University of Helsinki, the Future Development Fund of the University of
Helsinki, the Finnish Concordia Fund, and the Foundation for Women in Research, Finland.
All financial support is gratefully acknowledged.
First and foremost, I owe my deep gratitude to all individuals, altogether approximately 650
girls – now young women – who participated in the studies in Quelimane, Nicoadala,
Maganja da Costa, and Morrumbala. I am also grateful to everyone who participated and
assisted in the preliminary study and in collection of additional information in the field, e.g.
recipe collection. This work could not have been done without the active participation of the
communities involved.
My passion for dietary assessment started not in Zambézia, but years earlier, in Namibia,
when collecting the material for my Master’s thesis. Since then, I have had the pleasure of
working in several different research projects in public health nutrition and dietary assessment
in the former National Public Health Institute (now National Institute for Health and Welfare),
Uppsala University, and University of Helsinki. Although only a few names are mentioned
here, I would like to thank all of my former and current work-mates for sharing the path to
my becoming a researcher. This path has had some bumps and turns, and I thank all those
who have encouraged me along the way. I do not know where the future will take me, but I
feel truly privileged having had the chance to work in such a fulfilling field and surrounded
by dedicated, talented, and helpful people.
Numerous people from Mozambique and Finland contributed to the planning and
implementation of the ZANE Study, and thus, to my thesis. This includes representatives of
ministries and provincial directorates, co-ordinators, study assistants, nurses, laboratory
personnel, interviewers, interpreters, recruiters, drivers, and many more. It was a pleasure to
work with a dedicated team ready to go the extra mile to achieve the goal of collecting this
unique data. In Mozambique, I would especially like to thank Lourdes Fidalgo, Kerry
Selvester, and Carina Ismael; without their experience and efforts in the arrangements and
co-ordination of field work, this research would not have been possible. I also thank Lourdes
Fidalgo for the Portuguese translation of the abstract for this thesis. Marcela Libombo and
Paulo Cordeiro were other key persons in bringing this research idea to life. Thank you!
79
I thank my supervisors Professor Marja Mutanen and Adjunct Professor Maijaliisa Erkkola for
their support and advice throughout this project. Marja was the principal investigator of the
projects carried out in Mozambique, and her determination in getting the work underway in
challenging field conditions and with uncertain funding was truly exceptional and admirable.
I am deeply grateful to Maijaliisa for her support and insights on epidemiology and research
methodology. Her encouragement and positive attitude have been instrumental to my research
work. I am grateful for my reviewers, Professor Inge Tetens and Associate Professor Ken
Maleta for their valuable comments on this thesis. I also thank Carol Pelli for the linguistic
review of the summary.
Warm thanks to Adjunct Professor Riitta Freese for taking on the huge responsibility for
everything related to laboratory work and anthropometry during the data collection and for
all the support and advice over the years. I sincerely thank Professor Jaakko Nevalainen,
Elina Vaara, and Dr. Sangita Kulathinal for important help with statistics and Sangita also
for encouraging me to use R. I thank Professor Seppo Laaksonen for help in planning the
sampling design. Warm thanks to Helena Hauta-alus, Arja Heinonen, Noora Kanerva, Taina
Öhman, and Kirsi Ali-Kovero for their contributions to data collection and processing. I am
grateful to Dr. Georg Alfthan for invaluable work with biochemical assessments and Heidi
Poikonen for the iodine and selenium analyses. I also thank my advisory board, Research
Professor Suvi Virtanen and Associate Professor Ulla Uusitalo, for encouragement
throughout this project.
Beyond those directly involved with the project, there are many other people to be thanked.
Special thanks to my long-time room-mates Helena Hauta-alus, Anna Hiltunen, and Vera
Mikkilä for sharing the joys and struggles of doing research and for all the discussions on
science, work, and life in general. Vera, you are an inspirational epidemiologist always ready
to share ideas. Thank you. Essi Päivärinta, Anne-Maria Pajari, Endla Lipre, and Mikael
Niku, thank you for encouragement and humour in everyday work. Pauliina Aarnio and Mari
Luntamo, thank you for peer support and our writing retreat, which gave me a much-needed
kick to wrap up the discussion section of this work.
Lastly, I wholeheartedly thank my sister Aino and her family and my parents Kaija and Erkki
for their loving support. And finally, there are no adequate words to thank Otto and Ilmari,
but I’m lucky in knowing that no words are needed.
Helsinki, January 2016
Liisa Korkalo
80

ReferencesAcheson KJ, Campbell IT, Edholm OG, Miller DS, Stock MJ. The measurement of food and energy intake in man–
an evaluation of some techniques. Am J Clin Nutr 1980;33:1147–1154.
Alaofè H, Zee J, Dossa R, O’Brien HT. Iron status of adolescent girls from two boarding schools in southern Benin.
Public Health Nutr 2008;11:737–746.
Alfthan G, Kumpulainen J. Determination of selenium in small volumes of blood plasma and serum by electrothermal
atomic absorption spectrometry. Anal Chim Acta 1982;140:221–227.
Alfthan G, Neve J. Reference values for serum selenium in various areas evaluated according to the TRACY protocol.
J Trace Elem Med Biol 1996;10:77–87.
Amare B, Moges B, Fantahun B, Tafess K, Woldeyohannes D, Yismaw G, et al. Micronutrient levels and nutritional
status of school children living in Northwest Ethiopia. Nutr J 2012;11:108. doi: 10.1186/1475-2891-11-108.
Ambrus A, Horváth Z, Farkas Z, Cseh J, Petrova S, Dimitrov P, et al. Pilot study in the view of a Pan-European
dietary survey - adolescents, adults and elderly [document on the Internet]. European Food Safety Authority;
2013. Available from: http://www.efsa.europa.eu/en/search/doc/508e.pdf.
Arimond M, Wiesmann D, Becquey E, Carriquiry A, Daniels MC, Deitchler M, et al. Simple food group diversity
indicators predict micronutrient adequacy of women’s diets in 5 diverse, resource-poor settings. J Nutr 2010;
140:2059S–2069S.
Arsenault JE, Yakes EA, Islam MM, Hossain MB, Ahmed T, Hotz C, et al. Very low adequacy of micronutrient
intakes by young children and women in rural Bangladesh is primarily explained by low food intake and limited
diversity. J Nutr 2013;143:197–203.
Balarajan Y, Ramakrishnan U, Ozaltin E, Shankar AH, Subramanian SV. Anaemia in low-income and middle-income
countries. Lancet 2011;378:2123–2135.
Barclay D. Micronutrient intake and status in rural Democratic Republic of Congo. Nutr Res 2003;23:659–671.
Bates CJ, Prentice AM, Paul AA. Seasonal variations in vitamins A, C, riboflavin and folate intakes and status of
pregnant and lactating women in a rural Gambian community: some possible implications. Eur J Clin Nutr 1994;
48:660–668.
Belachew T, Lindstrom D, Gebremariam A, Hogan D, Lachat C, Huybregts L, et al. Food insecurity, food based
coping strategies and suboptimal dietary practices of adolescents in Jimma Zone Southwest Ethiopia. PLoS One
2013;8:e57643. doi: 10.1371/journal.pone.0057643.
Bénéfice E, Garnier D, Ndiaye G. High levels of habitual physical activity in west African adolescent girls and
relationship to maturation, growth, and nutritional status: Results from a 3-year prospective study. Am J Hum
Biol 2001;13:808–820.
Bernal-Orozco MF, Vizmanos-Lamotte B, Rodríguez-Rocha NP, Macedo-Ojeda G, Orozco-Valerio M, Rovillé-
Sausse F, et al. Validation of a Mexican food photograph album as a tool to visually estimate food amounts
in adolescents. Br J Nutr 2013;109:944–952.
Black AE. Critical evaluation of energy intake using the Goldberg cut-off for energy intake:basal metabolic rate. A
practical guide to its calculation, use and limitations. Int J Obes Relat Metab Disord 2000;24:1119–1130.
81

Black RE, Victora CG, Walker SP, Bhutta ZA, Christian P, de Onis M, et al. Maternal and child undernutrition and
overweight in low-income and middle-income countries. Lancet 2013;382:427–451.
Bognár A. Tables of weight yield of food and retention factors of food constituents for the calculation of nutrition
composition of cooked foods (dishes) [document on the Internet]. Karlsruhe: Bundesforschungsanstalt für
Ernährung; 2002. Available from: www.webcitation.org/6L9JmM6NS.
Bourne LT, Langenhoven ML, Steyn K, Jooste PL, Laubscher JA, Van der Vyver E. Nutrient intake in the urban
African population of the Cape Peninsula, South Africa. The Brisk study. Cent Afr J Med 1993;39:238–247.
Calder PC. Feeding the immune system. Proc Nutr Soc 2013;72:299–309.
Christian P, West KP Jr, Khatry SK, LeClerq SC, Kimbrough-Pradhan E, Katz J, et al. Maternal night blindness
increases risk of mortality in the first 6 months of life among infants in Nepal. J Nutr 2001;131:1510–1512.
Combs GF. Selenium in global food systems. Br J Nutr 2001;85:517–547.
de Araujo SN, Dade A, de Fátima Zacarias M, Chipembe CS, Maunze XH, Singano CC. Final report
of the Multiple Indicator Cluster Survey, 2008 [document on the Internet]. 2009. Available from:
http://www.childinfo.org/files/MICS3_Mozambique_FinalReport_2008.pdf.
de Onis M, Blössner M. WHO global database on child growth and malnutrition [document on the Internet]. WHO;
1997. Available from: http://www.webcitation.org/6edGyOFb0.
De-Regil LM, Fernández-Gaxiola AC, Dowswell T, Peña Rosas JP. Effects and safety of periconceptional
folate supplementation for preventing birth defects. Cochrane Database Syst Rev 2010;(10):CD007950. doi:
10.1002/14651858.CD007950.pub2.
Faggiano F, Vineis P, Cravanzola D, Pisani P, Xompero G, Riboli E, et al. Validation of a method for the estimation
of food portion size. Epidemiology 1992;3:379–382.
Famine Early Warning Systems Network. Livelihood baseline profiles, Zambezi Basin, Mozambique [document on
the Internet]. 2010a. Available from: http://www.webcitation.org/6LDZqV1cz.
Famine Early Warning Systems Network. Mozambique food security outlook update, March 2010 [document on the
Internet]. 2010b. Available from: http://www.webcitation.org/6L9Guegp5.
FAO. Human energy requirements. Report of Joint FAO/WHO/UNU Expert Consultation, Rome, Italy, 17-24
October 2001. FAO Food and Nutrition Technical Report Series No. 1 [document on the Internet]. Rome: FAO;
2004. Available from: http://www.fao.org/docrep/007/y5686e/y5686e00.htm.
FAO. Report on use of the Household Food Insecurity Access Scale and Household Dietary Diversity
Score in two survey rounds in Manica and Sofala Provinces, Mozambique, 2006-2007. FAO food
security project GCP/MOZ/079/BEL. Version 2 [document on the Internet]. 2008. Available from:
http://www.webcitation.org/6L9I0iABI.
FAO. A brand new global dietary diversity indicator for women [web page]. 2015. Available from:
http://www.webcitation.org/6aQdOMK1v.
Food Fortification Initiative. Country Profile - Cote d’Ivoire [web page]. 2015a. Available from:
http://www.webcitation.org/6VtTer1yN.
Food Fortification Initiative. Country Profile - South Africa [web page]. 2015b. Available from:
http://www.webcitation.org/6VtSEKHqL.
82

Foote J, Murphy S, Wilkens L, Basiotis P, Carlson A. Dietary variety increases the probability of nutrient adequacy
among adults. J Nutr 2004;134:1779–1785.
Fordyce F. Selenium geochemistry and health. Ambio 2007;36:94–97.
Foster E, Matthews JNS, Lloyd J, Marsha L, Mathers JC, Nelson M, et al. Children’s estimates of food portion size:
the development and evaluation of three portion size assessment tools for use with children. Br J Nutr 2008a;
99:175–184.
Foster E, O’Keeffe M, Matthews JNS, Mathers JC, Nelson M, Barton KL, et al. Children’s estimates of food portion
size: the effect of timing of dietary interview on the accuracy of children’s portion size estimates. Br J Nutr 2008b;
99:185–190.
Frobisher C, Maxwell SM. The estimation of food portion sizes: a comparison between using descriptions of portion
sizes and a photographic food atlas by children and adults. J Hum Nutr Diet 2003;16:181–188.
Fujita M, Lo YJ, Baranski JR. Dietary diversity score is a useful indicator of vitamin A status of adult women in
Northern Kenya. Am J Hum Biol 2012;24:829–834.
Gautam KC. Global progress in addressing iodine deficiency through universal salt iodization: The makings of a
global public health success story – The second decade (1995-2007). SCN News 2007;(35):12–18.
Gebremedhin S, Enquselassie F, Umeta M. Prevalence of prenatal zinc deficiency and its association with socio-
demographic, dietary and health care related factors in rural Sidama, Southern Ethiopia: a cross-sectional study.
BMC Public Health 2011;11:898. doi: 10.1186/1471-2458-11-898.
Gebreselassie SG, Gase FE, Deressa MU. Prevalence and correlates of prenatal vitamin A deficiency in rural Sidama,
Southern Ethiopia. J Health Popul Nutr 2013;31:185–194.
Gibson RS. Strategies for preventing micronutrient deficiencies in developing countries [abstract]. Nutrition Society
of Australia and the Nutrition Society of New Zealand and IUNS and APCNS International Congress of Clinical
Nutrition, 11-13 August 2004, Brisbane, Queensland. Asia Pac J Clin Nutr 2004;13:S23.
Gibson RS. Zinc: the missing link in combating micronutrient malnutrition in developing countries. Proc Nutr Soc
2006;65:51–60.
Gibson RS, Wawer AA, Fairweather-Tait SJ, Hurst R, Young SD. Dietary iron intakes based on food composition
data may underestimate the contribution of potentially exchangeable contaminant iron from soil. J Food Comp
Anal 2015;40:19–23.
Glinz D, Hurrell RF, Righetti AA, Zeder C, Adiossan LG, Tjalsma H, et al. In Ivorian school-age children, infection
with hookworm does not reduce dietary iron absorption or systemic iron utilization, whereas afebrile Plasmodium
falciparum infection reduces iron absorption by half. Am J Clin Nutr 2015;101:2462–2470.
Gordon RC, Rose MC, Skeaff SA, Gray AR, Morgan KMD, Ruffman T. Iodine supplementation improves cognition
in mildly iodine-deficient children. Am J Clin Nutr 2009;90:1264–1271.
Green R. Indicators for assessing folate and vitamin B-12 status and for monitoring the efficacy of intervention
strategies. Am J Clin Nutr 2011;94:666S–672S.
Haas JD, Brownlie T. Iron deficiency and reduced work capacity: a critical review of the research to determine a
causal relationship. J Nutr 2001;131:676S–688S.
83

Haider BA, Olofin I, Wang M, Spiegelman D, Ezzati M, Fawzi WW, et al. Anaemia, prenatal iron use, and
risk of adverse pregnancy outcomes: systematic review and meta-analysis. BMJ 2013;346:f3443. doi:
10.1136/bmj.f3443.
Hotz C, Loechl C, de Brauw A, Eozenou P, Gilligan D, Moursi M, et al. A large-scale intervention to introduce
orange sweet potato in rural Mozambique increases vitamin A intakes among children and women. Br J Nutr
2012;108:163–176.
Hurst R, Siyame EWP, Young SD, Chilimba ADC, Joy EJM, Black CR, et al. Soil-type influences human
selenium status and underlies widespread selenium deficiency risks in Malawi. Sci Rep 2013;3:1425. doi:
10.1038/srep01425.
Huss-Ashmore R, Curry JJ. Diet, nutrition, and agricultural development in Swaziland. 2. Patterns of food
consumption. Ecol Food Nutr 1991;26:167–185.
Huybregts L, Roberfroid D, Lachat C, Van Camp J, Kolsteren P. Validity of photographs for food portion estimation
in a rural West African setting. Public Health Nutr 2008;11:581–587.
Instituto Nacional de Estatística. III Recenseameanto geral da populaça̋o e habitaça̋o 2007. Indicadores socio-
demográficos distritais – Provincia da Zambézia [document on the Internet]. 2010. Available from:
http://www.webcitation.org/6L9GMZBbn.
International Zinc Nutrition Consultative Group. Assessing population zinc status with serum zinc concentration.
IZiNCG Technical Brief No. 02. 2nd edition [document on the Internet]. 2012. Available from:
http://www.izincg.org/files/izincg-techbrief2-2012.pdf.
International Zinc Nutrition Consultative Group, Brown KH, Rivera JA, Bhutta Z, Gibson RS, King JC, et al.
International Zinc Nutrition Consultative Group (IZiNCG) technical document #1. Assessment of the risk of zinc
deficiency in populations and options for its control. Food Nutr Bull 2004;25:S99–S203.
Jia W, Chen HC, Yue Y, Li Z, Fernstrom J, Bai Y, et al. Accuracy of food portion size estimation from digital pictures
acquired by a chest-worn camera. Public Health Nutr 2014;17:1671–1681.
Joseph J, Loscalzo J. Selenistasis: epistatic effects of selenium on cardiovascular phenotype. Nutrients 2013;5:340–
358.
Joy EJM, Ander EL, Young SD, Black CR, Watts MJ, Chilimba ADC, et al. Dietary mineral supplies in Africa.
Physiol Plant 2014;151:208–229.
Kasvosve I. Effect of ferroportin polymorphism on iron homeostasis and infection. Clin Chim Acta 2013;416:20–25.
Keast DR, Fulgoni VL, Nicklas TA, O’Neil CE. Food sources of energy and nutrients among children in the United
States: National Health and Nutrition Examination Survey 2003–2006. Nutrients 2013;5:283–301.
Kennedy G, Ballard T, Dop M. Guidelines for measuring household and individual dietary diversity
[document on the Internet]. FAO; 2010. Available from: http://www.fao.org/3/f31af845-f69c-5aa8-bfb4-
04dea6b98e1d/i1983e00.pdf.
King JC. Zinc: an essential but elusive nutrient. Am J Clin Nutr 2011;94:679S–84S.
Korkalo L, Hauta-alus H, Mutanen M. Food composition tables for Mozambique. Version
2 [document on the Internet]. 2011a. Available from: http://www.helsinki.fi/food-and-
environment/research/groups/Food_composition_tables_for_Mozambique.pdf.
84

Korkalo L, Hauta-alus H, Mutanen M. Food selection, food preparation methods and food beliefs in two
districts of the Zambezia province: Finnish–Mozambican research collaboration on foods, diet and nutrition in
Mozambique. Project report [document on the Internet]. 2011b. Available from: http://www.helsinki.fi/food-and-
environment/research/groups/Report_of_the_preliminary_project_English.pdf.
Korpe PS, Petri WA. Environmental enteropathy: critical implications of a poorly understood condition. Trends Mol
Med 2012;18:328–336.
Krebs-Smith SM, Kott PS, Guenther PM. Mean proportion and population proportion: two answers to the same
question? J Am Diet Assoc 1989;89:671–676.
Langenhoven ML, Kruger M, Gouws E, Faber M. MRC Food Composition tables. 3rd edition. Tygerberg: Medical
Research Council; 1991.
Lassi ZS, Salam RA, Haider BA, A BZ. Folic acid supplementation during pregnancy for maternal
health and pregnancy outcomes. Cochrane Database Syst Rev 2013;(3):CD006896. doi:
10.1002/14651858.CD006896.pub2.
Lazarte CE, Encinas ME, Alegre C, Granfeldt Y. Validation of digital photographs, as a tool in 24-h recall, for the
improvement of dietary assessment among rural populations in developing countries. Nutr J 2012;11:61. doi:
10.1186/1475-2891-11-61.
Leenstra T, Petersen LT, Kariuki SK, Oloo AJ, Kager PA, ter Kuile FO. Prevalence and severity of malnutrition
and age at menarche; cross-sectional studies in adolescent schoolgirls in western Kenya. Eur J Clin Nutr 2005;
59:41–48.
Lillegaard IT, Overby NC, Andersen LF. Can children and adolescents use photographs of food to estimate portion
sizes? Eur J Clin Nutr 2005;59:611–617.
Lindenmayer GW, Stoltzfus RJ, Prendergast AJ. Interactions between zinc deficiency and environmental enteropathy
in developing countries. Adv Nutr 2014;5:1–6.
Low JW, Arimond M, Osman N, Cunguara B, Zano F, Tschirley D. A food-based approach introducing orange-
fleshed sweet potatoes increased vitamin A intake and serum retinol concentrations in young children in rural
Mozambique. J Nutr 2007;137:1320–1327.
Lucas F, Niravong M, Villeminot S, Kaaks R, Clavel-Chapelon F. Estimation of food portion size using photographs:
validity, strengths, weaknesses and recommendations. J Hum Nutr Diet 1995;8:65–74.
Matthews R, Garrison Y. Agriculture Handbook No. 102. Food yields summarized by different stages of preparation
[document on the Internet]. Washington, D.C.: USDA Agricultural Research Service; 1975. Available from:
http://www.ars.usda.gov/SP2UserFiles/Place/12354500/Data/Classics/ah102.pdf.
Mayo-Wilson E, Junior JA, Imdad A, Dean S, Chan XH, Chan ES, et al. Zinc supplementation for preventing
mortality, morbidity, and growth failure in children aged 6 months to 12 years of age. Cochrane Database Syst
Rev 2014;(5):CD009384. doi: 10.1002/14651858.CD009384.pub2.
Mazengo MC, Simell O, Lukmanji Z, Shirima R, Karvetti RL. Food consumption in rural and urban Tanzania. Acta
Trop 1997;68:313–326.
McLean E, de Benoist B, Allen LH. Review of the magnitude of folate and vitamin B12 deficiencies worldwide.
Food Nutr Bull 2008;29:S38–51.
85

McPherson R, Hoelscher DM, Alexander M, Scanlon KS, Serdula MK. Dietary assessment methods among school-
aged children: Validity and reliability. Prev Med 2000;31:S11–S33.
Mehdi Y, Hornick JL, Istasse L, Dufrasne I. Selenium in the environment, metabolism and involvement in body
functions. Molecules 2013;3:3292–3311.
Metz J. A high prevalence of biochemical evidence of vitamin B12 or folate deficiency does not translate into a
comparable prevalence of anemia. Food Nutr Bull 2008;29:S74–S85.
Ministério da Administração Estatal. Perfil do Distrito de Maganja da Costa, Província da Zambézia [document on the
Internet]. Ministério da Administração Estatal; 2005a. Available from: http://www.webcitation.org/6L9GZ5mwd.
Ministério da Administração Estatal. Perfil do Distrito de Morrumbala, Província da Zambézia [document on the
Internet]. Ministério da Administração Estatal; 2005b. Available from: http://www.webcitation.org/6L9GeDh4r.
Ministério da Saúde, Instituto Nacional de Estatística, ICF International. Moçambique Inquérito Demográfico e de
Saúde 2011 [document on the Internet]. Calverton (MD): Ministerio da Saude, Instituto Nacional de Estatística,
ICF International; 2013. Available from: http://www.webcitation.org/6L9BdS2N6.
Ministry of Health. Multisectoral Action Plan for the Reduction of Chronic Undernutrition in Mozambique
2011-2015 (2020) [document on the Internet]. 2010. Available from:http://scalingupnutrition.org/wp-
content/uploads/2013/02/Mozambique_PAMRDC_2011_2015.pdf.
Mnzava NA. Vegetable crop diversification and the place of traditional species in the tropics.
In: Guarino, L. editor. Traditional African Vegetables. Promoting the conservation and use of
underutilized and neglected crops. 16. Proceedings of the IPGRI International Workshop on Genetic
Resources of Traditional Vegetables in Africa: Conservation and Use, 29-31 August 1995, ICRAF-
HQ, Nairobi, Kenya [document on the Internet]. Institute of Plant Genetics and Crop Plant
Research, Gatersleben/International Plant Genetic Resources Institute; 1997. Available from:
http://www.bioversityinternational.org/fileadmin/bioversity/publications/Web_version/500/begin.htm#Contents.
Mungói EZ. Addressing nutrition needs in the post-2015 agenda [presentation slides]. Johannesburg, South Africa
June 30. 2014. Available from: http://www.webcitation.org/6aPDQSH5E.
Muthayya S, Rah JH, Sugimoto JD, Roos FF, Kraemer K, Black RE. The global hidden hunger indices and maps: an
advocacy tool for action. PLoS One 2013;8:e67860. doi: 10.1371/journal.pone.0067860.
Myers TA. Goodbye, listwise deletion: Presenting hot deck imputation as an easy and effective tool for handling
missing data. Commun Methods Meas 2011;5:297–310.
Nankabirwa J, Brooker SJ, Clarke SE, Fernando D, Gitonga CW, Schellenberg D, et al. Malaria in school-age children
in Africa: an increasingly important challenge. Trop Med Int Health 2014;19:1294–1309.
National Research Council. Dietary reference intakes: The essential guide to nutrient requirements. Washington,
D.C.: National Academies Press; 2006.
Nelson M, Atkinson M, Darbyshire S. Food photography. I: the perception of food portion size from photographs.
Br J Nutr 1994;72:649–663.
Nelson M, Atkinson M, Darbyshire S. Food photography II: use of food photographs for estimating portion size and
the nutrient content of meals. Br J Nutr 1996;76:31–49.
Nelson M, Haraldsdottir J. Food photographs: practical guidelines I. Design and analysis of studies to validate portion
size estimates. Public Health Nutr 1998;1:219–230.
86

Ogle BM, Hung PH, Tuyet HT. Significance of wild vegetables in micronutrient intakes of women in Vietnam: an
analysis of food variety. Asia Pac J Clin Nutr 2001;10:21–30.
Ohashi T, Yamaki M, Pandav CS, Karmarkar MG, Irie M. Simple microplate method for determination of urinary
iodine. Clin Chem 2000;46:529–536.
Oldewage-Theron W, Kruger R. Dietary diversity and adequacy of women caregivers in a peri-urban informal
settlement in South Africa. Nutrition 2011;27:420–427.
Oldewage-Theron WH, Dicks EG, Napier CE. Poverty, household food insecurity and nutrition: coping strategies in
an informal settlement in the Vaal Triangle, South Africa. Public Health 2006;120:795–804.
Ota E, Mori R, Middleton P, Tobe-Gai R, Mahomed K, Miyazaki C, et al. Zinc supplementation for
improving pregnancy and infant outcome. Cochrane Database Syst Rev 2015;(2):CD000230. doi:
10.1002/14651858.CD000230.pub5.
Ovaskainen ML, Paturi M, Reinivuo H, Hannila ML, Sinkko H, Lehtisalo J, et al. Accuracy in the estimation of food
servings against the portions in food photographs. Eur J Clin Nutr 2008;62:674–681.
Palmer A, West K. A quarter of a century of progress to prevent vitamin A deficiency through supplementation. Food
Rev Int 2010;26:270–301.
Parlesak A, Geelhoed D, Robertson A. Toward the prevention of childhood undernutrition: diet diversity strategies
using locally produced food can overcome gaps in nutrient supply. Food Nutr Bull 2014;35:191–199.
Pasricha SR, Drakesmith H, Black J, Hipgrave D, Biggs BA. Control of iron deficiency anemia in low- and middle-
income countries. Blood 2013;121:2607–2617.
Patton GC, Coffey C, Cappa C, Currie D, Riley L, Gore F, et al. Health of the world’s adolescents: a synthesis of
internationally comparable data. Lancet 2012;379:1665–1675.
Pearce EN, Andersson M, Zimmermann MB. Global iodine nutrition: Where do we stand in 2013? Thyroid 2013;
23:523–528.
Ramakrishnan U, Grant F, Goldenberg T, Zongrone A, Martorell R. Effect of women’s nutrition before and during
early pregnancy on maternal and infant outcomes: a systematic review. Paediatr Perinat Epidemiol 2012;26(Suppl
1):285–301.
Robinson F, Morritz W, McGuiness P, Hackett AF. A study of the use of a photographic food atlas to estimate served
and self-served portion sizes. J Hum Nutr Diet 1997;10:117–124.
Robson PJ, Livingstone MB. An evaluation of food photographs as a tool for quantifying food and nutrient intakes.
Public Health Nutr 2000;3:183–192.
Rohner F, Northrop-Clewes C, Tschannen AB, Bosso PE, Kouassi-Gohou V, Erhardt JG, et al. Prevalence and
public health relevance of micronutrient deficiencies and undernutrition in pre-school children and women of
reproductive age in Côte d’Ivoire, West Africa. Public Health Nutr 2013a;17:2016–28.
Rohner F, Zimmermann M, Jooste P, Pandav C, Caldwell K, Raghavan R, et al. Biomarkers of nutrition for
development–iodine review. J Nutr 2013b;144:1322S–1342S.
Rose D, Meershoek S, Ismael C, McEwan M. Evaluation of a rapid field tool for assessing household diet quality in
Mozambique. Food Nutr Bull 2002;23:181–189.
Rowan M, editor. Hoje Temos... Receitas de Moçambique. 3rd edition. Maputo: Paulinas; 2007.
87

Ruel MT. Operationalizing dietary diversity: a review of measurement issues and research priorities. J Nutr 2003;
133:3911S–3926S.
Sayed N, Frans Y, Schönfeldt HC. Composition of South African foods: Milk and milk products, eggs, meat and
meat products. Parow: Medical Research Council; 1999.
Shrimpton R, Shankar AH. Zinc deficiency. In: Semba RD, Bloem MW, editors. Nutrition and health in developing
countries. 2nd edition. New York: Humana Press; 2008.
Smith JL, Brooker S. Impact of hookworm infection and deworming on anaemia in non-pregnant populations: a
systematic review. Trop Med Int Health 2010;15:776–95.
Solomons N. Editorial. Ann Nutr Metab 2013;62:5–6.
Stadlmayr B, Charrondiere U, Enujiugha V, Bayili R, Fagbohoun E, Samb B, et al. West African food composition
table [document on the Internet]. Rome: Food and Agriculture Organization of the United Nations; 2012. Available
from: http://www.webcitation.org/6Yc6N9OSc.
Stevens GA, Finucane MM, De-Regil LM, Paciorek CJ, Flaxman SR, Branca F, et al. Global, regional, and national
trends in haemoglobin concentration and prevalence of total and severe anaemia in children and pregnant and
non-pregnant women for 1995-2011: a systematic analysis of population-representative data. Lancet Glob Health
2013;1:e16–e25. doi: 10.1016/S2214-109X(13)70001-9.
Steyn NP, Nel J, Labadarios D, Maunder EMW, Kruger HS. Which dietary diversity indicator is best to assess
micronutrient adequacy in children 1 to 9 y? Nutrition 2014;30:55–60.
Subar AF, Crafts J, Zimmerman TP, Wilson M, Mittl B, Islam NG, et al. Assessment of the accuracy of portion
size reports using computer-based food photographs aids in the development of an automated self-administered
24-hour recall. J Am Diet Assoc 2010;110:55–64.
Sunde RA. Selenium. In: Ross CA, Caballero B, Cousins RJ, Tucker KL, Ziegler TR, editors. Modern nutrition in
health and disease. 11th edition. Baltimore (MD): Lippincott Williams and Wilkins; 2012.
Swindale A, Bilinsky P. Household Dietary Diversity Score (HDDS) for measurement of
household food access: Indicator guide (version 2) [document on the Internet]. Washington,
D.C.: Food and Nutrition Technical Assistance III Project, FHI 360; 2006. Available from:
http://www.fantaproject.org/sites/default/files/resources/HDDS_v2_Sep06_0.pdf.
Tatala S, Svanberg U, Mduma B. Low dietary iron availability is a major cause of anemia: a nutrition survey in the
Lindi District of Tanzania. Am J Clin Nutr 1998;68:171–178.
Temin M, Levine R. Start with a girl: a new agenda for global health [document on the
Internet]. Washington, D.C.: Center for Global Development; 2009. Available from:
http://www.cgdev.org/files/1422899_file_Start_with_a_Girl_FINAL.pdf.
Thomson CD. Assessment of requirements for selenium and adequacy of selenium status: a review. Eur J Clin Nutr
2004;58:391–402.
Torheim LE, Barikmo I, Parr CL, Hatløy A, Ouattara F, Oshaug A. Validation of food variety as an indicator of diet
quality assessed with a food frequency questionnaire for Western Mali. Eur J Clin Nutr 2003;57:1283–1291.
Torheim LE, Ferguson EL, Penrose K, Arimond M. Women in resource-poor settings are at risk of inadequate intakes
of multiple micronutrients. J Nutr 2010;140:2051S –2058S.
88

Torheim LE, Ouattara F, Diarra MM, Thiam FD, Barikmo I, Hatløy A, et al. Nutrient adequacy and dietary diversity
in rural Mali: association and determinants. Eur J Clin Nutr 2004;58:594–604.
Trolle E, Vandevijvere S, Ruprich J, M E, Dofková M, de Boer E, et al. Validation of a food quantification picture
book targeting children of 0-10 years of age for pan-European and national dietary surveys. Br J Nutr 2013;
110:2298–2308.
Tueni M, Mounayar A, Birlouez-Aragon I. Development and evaluation of a photographic atlas as a tool for dietary
assessment studies in Middle East cultures. Public Health Nutr 2012;15:1023–1028.
Turconi G, Guarcello M, Berzolari FG, Carolei A, Bazzano R, Roggi C. An evaluation of a colour food photography
atlas as a tool for quantifying food portion size in epidemiological dietary surveys. Eur J Clin Nutr 2005;59:923–
931.
Ubbink JB, Christianson A, Bester MJ, Van Allen MI, Venter PA, Delport R, et al. Folate status, homocysteine
metabolism, and methylene tetrahydrofolate reductase genotype in rural South African blacks with a history of
pregnancy complicated by neural tube defects. Metabolism 1999;48:269–74.
UNICEF. Progress since the World Summit for Children: A statistical review [document on the Internet]. UNICEF;
2001. Available from: http://www.unicef.org/publications/files/pub_wethechildren_stats_en.pdf.
UNICEF. The state of the world’s children 2014 in numbers: every child counts [document on the Internet]. New
York: UNICEF; 2014. Available from: http://www.unicef.org/publications/index_71829.html.
UNICEF/WHO. World Summit for Children - Mid-decade goal: Iodine Deficiency Disorders.
UNICEF/WHO Joint Committee on Health Policy [document on the Internet]. 1994. Available from:
http://www.ceecis.org/iodine/01_global/01_pl/01_01_1994_summit.pdf.
United Nations Development Programme. Human development report 2013. New York: UNDP; 2013.
United Nations Educational, Scientific and Cultural Organization Institute for Statistics, UNICEF. Fixing the broken
promise of education for all: Findings from the global initiative on out-of-school children [document on the
Internet]. Montreal: UNESCO Institute for Statistics; 2015. Available from: http://dx.doi.org/10.15220/978-92-
9189-161-0-en.
United Nations Standing Committee on Nutrition. UN global nutrition agenda
(UNGNA) V. 1.0 [document on the Internet]. 2015. Available from:
http://unscn.org/files/Activities/SUN/EXE3_HDef_UN_Global_Nutrition_Agenda.pdf.
van het Hof KH, Tijburg LBM, Pietrzik K, Weststrate JA. Influence of feeding different vegetables on plasma levels
of carotenoids, folate and vitamin C. Effect of disruption of the vegetable matrix. Br J Nutr 1999;82:203–212.
VanderJagt DJ, Spelman K, Ambe J, Datta P, Blackwell W, Crossey M, et al. Folate and vitamin B12 status of
adolescent girls in northern Nigeria. J Natl Med Assoc 2000;92:334–340.
Venter CS, MacIntyre U, Vorster HH. The development and testing of a food portion photograph book for use in an
African population. J Hum Nutr Dietet 2000;13:205–218.
Vorster HH, Kruger A, Margetts BM. The nutrition transition in Africa: Can it be steered into a more positive
direction? Nutrients 2011;3:429–441.
Vorster HH, Venter CS, Wissing MP, Margetts BM. The nutrition and health transition in the North West Province
of South Africa: a review of the THUSA (Transition and Health during Urbanisation of South Africans) study.
Public Health Nutr 2005;8:480–490.
89

Wessells KR, Brown KH. Estimating the global prevalence of zinc deficiency: results based on zinc
availability in national food supplies and the prevalence of stunting. PLoS One 2012;7:e50568. doi:
10.1371/journal.pone.0050568.
West K, Darnton-Hill I. Vitamin A deficiency. In: Semba RD, Bloem MW, editors. Nutrition and health in developing
countries. 2nd edition. New York: Humana Press; 2008.
WHO. WHO global database on iodine deficiency, Mozambique [document on the Internet]. 2006. Available from:
http://www.webcitation.org/6L9BoJ8zy.
WHO. Global prevalence of vitamin A deficiency in populations at risk 1995–2005. WHO
global database on vitamin A deficiency [document on the Internet]. 2009. Available from:
http://whqlibdoc.who.int/publications/2009/9789241598019_eng.pdf?ua=1.
WHO. Guideline: Vitamin A supplementation in infants and children 6–59 months of age [document on the Internet].
2011a. Available from: http://whqlibdoc.who.int/publications/2011/9789241501767_eng.pdf.
WHO. Guideline: Vitamin A supplementation in pregnant women [document on the Internet]. 2011b. Available
from: http://whqlibdoc.who.int/publications/2011/9789241501781_eng.pdf.
WHO. Haemoglobin concentrations for the diagnosis of anaemia and assessment of severity [document on the
Internet]. 2011c. Available from: http://www.who.int/vmnis/indicators/haemoglobin/en/.
WHO. Serum ferritin concentrations for the assessment of iron status and iron deficiency in populations [document
on the Internet]. 2011d. Available from: http://www.who.int/vmnis/indicators/ferritin/en/.
WHO. Serum retinol concentrations for determining the prevalence of vitamin A deficiency in populations [document
on the Internet]. 2011e. Available from: http://www.who.int/vmnis/indicators/retinol/en/index.html.
WHO. Serum and red blood cell folate concentrations for assessing folate status in populations [document on the
Internet]. 2012. Available from: http://www.who.int/vmnis/indicators/serum_RBC_folate/en/index.html.
WHO. Urinary iodine concentrations for determining iodine status in populations [document on the Internet]. 2013.
Available from: http://www.who.int/vmnis/indicators/urinaryiodine/en/index.html.
WHO. Global nutrition targets 2025: Anaemia policy brief [document on the Internet]. 2014. Available from:
http://www.who.int/nutrition/topics/globaltargets_anaemia_policybrief.pdf.
WHO, FAO. Vitamin and mineral requirements in human nutrition: report of a joint FAO/WHO expert
consultation, Bangkok, Thailand, 21–30 September 1998 [document on the Internet]. 2004. Available from:
http://www.who.int/nutrition/publications/micronutrients/9241546123/en/.
Wiesmann D, Arimond M, Loechl C. Dietary diversity as a measure of the micronutrient adequacy
of women’s diets: Results from rural Mozambique site [document on the Internet]. Washington,
D.C.: Food and Nutrition Technical Assistance II Project, FHI 360; 2009. Available from:
http://www.fantaproject.org/sites/default/files/resources/WDDP_Mozambique_Dec09.pdf.
Woodside JV, Young IS, McKinley MC. Fruits and vegetables: measuring intake and encouraging increased
consumption. Proc Nutr Soc 2013;72:236–245.
World Bank. World development indicators 2012 [document on the Internet]. Washington, D.C.: World Bank; 2012.
Available from: http://data.worldbank.org/sites/default/files/wdi-2012-ebook.pdf.
90

World Food Programme, Vulnerability Analysis and Mapping Branch. Food consumption analysis. Calculation and
use of the food consumption score in food security analysis [document on the Internet]. 2008. Available from:
http://documents.wfp.org/stellent/groups/public/documents/manual_guide_proced/wfp197216.pdf.
Zimmermann MB, Connolly K, Bozo M, Bridson J, Rohner F, Grimci L. Iodine supplementation improves cognition
in iodine-deficient schoolchildren in Albania: a randomized, controlled, double-blind study. Am J Clin Nutr 2006;
83:108–114.
Zimmermann MB, Jooste PL, Pandav CS. Iodine-deficiency disorders. Lancet 2008;372:1251–1262.
91

Appendix: Food frequency questionnaire
Estudo do Estado Nutricional e da Dieta em Raparigas Adolescentes na Zambézia Questionario sobre a Frequencia do Consumo Alimentar
Numero do Código |__||__||__||__| Entrevistador: ______________ Data: ________________ Nome da rapariga:________________ Pense no que comeu nos ultimos 7 dias, por favor diga me quantos vezes consumiu os seguintes alimentos:
Nunca 1-2 3-4 5-6 7 Mais
de 7
1 Arroz
2 Chima de farinha de Milho
3 Chima de farinha de Mandioca
4 Chima de farinha de Milho e mandioca (mistura)
5 Mandioca cozida, seca ou fresco
6 Esquiga de Milho, cozida ou grelhada
7 Pão
8 Outros cereais (mapira, mexoeira, etc.)
9 Folhas verde escuras (folhas de: mandioca, abobora, feijao nhemba, batata doce, nhewé, folhas silvestres etc.)
10 Peixe, seco ou fresco
11 Camarão, seco ou fresco
12 Todwe
13 Galinha, pato, outros passaros
14 Carne, Caca
15 Orgãos (coracao, figado, estomago, intestinos etc.)
16 Ovos
17 Cogumelos
18 Oleo
SE Sim, especifique ___________________________
19 Manteiga ou margarina,
SE Sim, especifique ___________________________
20 Feijão, ervilha, lentilhas (nhemba, manteiga, boer, soroco, jugo, feijões silvestres etc.)
21 Coco, leite de coco
22 Amendoim, leite de amendoim
23 Castanha de caju, leite de castanha
24 Outras nozes e sementes (incluido os silvestres)
SE Sim, especifique ___________________________
SE Sim, especifique ___________________________
25 Tomate
26 Cebola
92

Nunca 1-2 3-4 5-6 7 Mais de 7
27 Abobora
28 Outros vegetais (cenoura, quiabo, pepino, pimento, vegetais silvestres etc.) SE Sim, especifique ______________________________
SE Sim, especifique ______________________________
SE Sim, especifique ______________________________
29 Batara doce de polpa alaranjada
30 Batata doce de polpa branca
31 Outras raizes (batata, inhame, macuti, raizes silvestres etc.)
SE Sim, especifique ___________________________
SE Sim, especifique ___________________________
32 Papaia, madura
33 Papaia, verde
34 Manga, madura
35 Manga, verde
36 Banana
37 Outros frutos (incluindo os silvestres)
SE Sim, especifique ______________________________
SE Sim, especifique ______________________________
SE Sim, especifique ______________________________
38 Bolos, bolinhos
39 Patanicua, canudo, biscoitos
40 Doces, chocolate
41 Acucar, cana de acucar, mel
42 Outras comidas*
SE Sim, especifique ___________________________
SE Sim, especifique ___________________________
SE Sim, especifique ___________________________
43 Bebidas (outras bebidas para alem de agua, cha ou cafe)**
SE SIM, especifique ___________________________
SE SIM, especifique ___________________________
44 Suplementos de ferro e outros suplementos (vitaminas)
SE SIM, especifique ___________________________
*ex. batatas fritas, pasta, queijo, yogurte, insectos, moluscos e mariscos, etc. ** ex. leite, refrigerantes, sumos, bebidas locais alcoolicas, etc. Comentarios: ___________________________________________________________________________
93


Hidden hunger in adolescent Mozambican girls: Dietary assessment, micronutrient status, and associations between dietary diversity and selected biomarkers
DEPARTMENT OF FOOD AND ENVIRONMENTAL SCIENCESFACULTY OF AGRICULTURE AND FORESTRYDOCTORAL PROGRAMME IN POPULATION HEALTHUNIVERSITY OF HELSINKI
LIISA KORKALO
dissertationes scholae doctoralis ad sanitatem investigandam universitatis helsinkiensis 5/2016
5/2016Helsinki 2016 ISSN 2342-3161 ISBN 978-951-51-1898-1
LIIS
A K
OR
KA
LO
Hid
den
hu
nger in
adolescen
t Mozam
bican girls
Recent Publications in this Series
92/2015 Katariina NurmiPrevention of Inflammatory Cellular Responses by Ethanol and Hemin – Interplay Between Inflammasomes and Processes Inhibiting Inflammation93/2015 Liang HeRare Genetic Variants and Complex Diseases - a Bayesian Approach94/2015 Jani SaksiStroke-Associated Carotid Atherosclerosis - a Role for FABP4 in Atheroma Vulnerability and Cardiometabolic Risk95/2015 Otto HemminkiCancer Immunotherapy with a Gene Modified Serotype 3 Oncolytic Adenovirus96/2015 Jukka KoskelaIndividual Trajectories in Asthma and COPD: A Longitudinal Perspective to Obstructive Lung Disease97/2015 Miira KlemettiTrends In Obstetric and Perinatal Outcomes of Women with Type 1 Diabetes During 1988-2011 – A Finnish Population-Based Observational Study98/2015 Ileana B. QuinteroPhysiological Functions of Prostatic Acid Phosphatase99/2015 Minna MatikainenLaunching New Products in the Finnish Pharmaceutical Industry: A Relationship Approach100/2015 Päivi Ylä-AnttilaPhagophore Membrane Connections and RAB24 in Autophagy101/2015 Kaisa KyöstiläIdentification of Novel Mutations and Molecular Pathways for Canine Neurodegeneration and Chondrodysplasia102/2015 Emmi JoensuuEpigenetic Alterations in Sporadic and Familial Cancers103/2015 Elina ReponenPreoperative Risk-Assessment Methods, Short-Term Outcome, and Patient Satisfaction in Elective Cranial Neurosurgery104/2015 Riina KandolinCardiac Sarcoidosis in Giant Cell Myocarditis in Finland106/2015 Karmen KappPolyphenolic and Essential Oil Composition of Mentha and Their Antimicrobial Effect107/2015 Dina PopovaNeurophysiological mechanisms of Plasticity Induced in Adult Brain1/2016 Pauliina SaurusRegulation of Podocyte Apoptosis in Diabetic Kidney Disease – Role of SHIP2, PDK1 and CDK22/2016 Sanna ToivonenDerivation of Hepatocyte Like Cells from Human Pluripotent Stem Cells3/2016 Marjaana PeltolaAMIGO-Kv2.1 Potassium Channel Complex: Identification and Association with Schizophrenia-Related Phenotypes4/2016 Niko-Petteri NykänenCellular Physiology and Cell-to-Cell Propagation of Tau in Neurodegeneration: The Impact of Late-Onset Alzheimer’s Disease Susceptibility Genes


