Embed Size (px)
Citation preview

arX
iv:1
503.
0135
1v1
[nl
in.C
D]
2 M
ar 2
015
Peculiarities of wave fields in nonlocal media
V.A.Danylenko1 and S.I.Skurativskyi1, a)
Division of geodynamics of explosion, Subbotin institute of Geophysics,
NAS of Ukraine
(Dated: 5 March 2015)
The article summarizes the studies of wave fields in structured non-equilibrium me-
dia describing by means of nonlocal hydrodynamic models. Due to the symmetry
properties of models, we derived the invariant wave solutions satisfying autonomous
dynamical systems. Using the methods of numerical and qualitative analysis, we have
shown that these systems possess periodic, multiperiodic, quasiperiodic, chaotic, and
soliton-like solutions. Bifurcation phenomena caused by the varying of nonlinearity
and nonlocality degree are investigated as well.
PACS numbers: 74D10, 74D30, 37G20, 34A45
Keywords: nonlocal models of structured media; traveling wave solutions; chaotic
attractor; homoclinic curve; invariant tori
1

In order to describe non-equilibrium media when the manifestations of intrin-
sic structure can not be ignored, we use hydrodynamic mathematical models.
Information about relaxing processes and interactions between structural ele-
ments is incorporated in the dynamical equations of state (DES) which, unlike
the local classic relations, now become nonlocal one in time and space. Using
the symmetry reduction scheme, we obtain the autonomous dynamical systems
describing the invariant wave solutions. By qualitative analysis methods, we
show that the dynamical systems possess periodic, multiperiodic, and chaotic
solutions obeying the Feigenbaum scenario. We study the quasiperiodic regimes
and their bifurcations. We also reveal the existence of homoclinic trajectories
of Shilnikov type and investigate the changes of homoclinic structures when
the bifurcation parameters vary. Hidden attractors, hysteretic phenomena are
discovered as well. As a result, depending on the chosen model for media, we
classify the wave solutions and their bifurcations and show that spatio-temporal
nonlocal models are promising for the describing of complicated wave regimes
in structured media.
I. INTRODUCTION
Open thermodynamic systems attract attention of scientists by their synergetic proper-
ties, their ability to produce localized nontrivial structures and order. Description of such
phenomena demands the creation of new and the refinement of already known mathematical
models.
According to Refs. 1–3, using the methods of non-equilibrium thermodynamics and the
internal variables concept4, the nonlinear temporally and spatially nonlocal mathematical
models for non-equilibrium processes in media with structure have been constructed. In this
report we present the results of investigations of wave processes in such media. To do this,
we use the following hydrodynamic type system
ρ+ ρux = 0, ρu+ px = γρm,
1
ρ2ΓεrτTP
[
−ρxx (1 + a) +1
ρ(ρx)
2 (1− aΓV0)
]
+ [−ρ (1 + a) +
2

+2
ρρ2(
1−a (ΓV0 − 1)
2
)
+1
τTP
ρ (1 + a)]
+ ω20ρ
1−ΓV0
0 ρΓV0 − (1)
−ω20ρ0 = b (p− p0) + bτTVp−
χT0
χT∞
bτ 2TVp− bΓεrτTV
(
pxx +ρxρpx
)
,
where
a = T0α∞ΓV0
(
ρ
ρ0
)ΓV0+1
, ω20 =
bc2S0α0T0
γ0,
b =χT0
ρ0τ 2TP
, χT0 = ρ−10 c−2
T0 = γ∞ρ−10 c−2
S0 ;
cT0, cS0 are the isothermal and adiabatic frozen velocities of sound; γ∞ is the frozen poly-
tropic index.
Using the characteristic quantities t0, u0, ρ0, let us construct the scale transformation
t = tt0, x = xt0u0, p = pρ0u20, ρ = ρρ0, u = uu0
σ =ΓεrτTV
(t0u0)2, τpT = τTV
χT0
χT∞
, τ =τTV
t0, h =
χT0
χT∞
τ 2, (2)
κ =ω20
bu20
= α0T0γ0
(
CT0
u0
)2
, χ =1
ρ0u20χT∞
≡(
CT∞
u0
)2
,
a = δnρn+1, δ = T0α∞, ΓV 0 = n,
which leads system (1) to the dimensionless form
ρ+ ρux = 0, ρu+ px = γρm,
σχρ−2[
−ρxx(1 + a) + ρ2xρ−1(1− an)
]
+
+hχ ρ−2[
−ρ(1 + a) + 2ρ2ρ−1(1− 0.5a(n− 1)) + τh−1ρ(1 + a)]
+
+κρn = p + τ p− hp− σ(
pxx + ρxpxρ−1)
.
(3)
We would like to emphasize that system (3) can be regarded as an hierarchical set of sub-
models which are complicated by means of taking new effects into account. We thus are
going to study the chain of nested models and classify their wave solutions using the methods
of qualitative and numerical analysis.
The remainder of the report is organized as follows. In Sec.II we begin our studies from
the simplified version of system (3) keeping the terms with the first temporal derivatives,
then attaching the terms with the second temporal or spatial derivatives. The form of
wave solutions and the description of techniques for their exploration are presented in de-
tail. Sec.III is devoted to the spatially nonlocal model which is used for investigating of
3
the Shilnikov homoclinic structures whose existence and bifurcations are extremely impor-
tant during chaotic regimes formation. The model incorporated both temporal and spatial
nonlocalities are presented in Sec.IV. Generalizations of the previous models by means of
introducing the third temporal derivatives and incorporating of physical nonlinearity are
given in Sec.V and Sec.VI, respectively. For all models we derive invariant wave solutions
and carry out the qualitative analysis of corresponding factor-systems.
II. WAVE SOLUTIONS OF THE MODELS WITH DES INCORPORATING
THE SECOND TEMPORAL OR SPATIAL DERIVATIVES
To begin with, let us consider the simplest model with relaxation derived from (3) at
δ = h = σ = 0, n = 1. As has been shown in Refs. 4 and 5, the system
ρ+ ρux = 0, ρu+ px = γρ, τ(p− χρ) = κρ− p, (4)
due to its symmetry properties6, admits the ansatz
u = U(ω) +D, ρ = ρ0 exp(ξt+ S(ω)), p = ρZ(ω), ω = x−Dt, (5)
where D is the constant velocity of wave front, ξ determines a slope of the inhomogeneity of
the steady solution (5). According to Ref. 5, solutions (5) are described by the plane system
of ODE which possesses limit cycles and homoclinic trajectories.
If we incorporate the second temporal derivatives in the last equation of system (3), then
the previous DES is generalized to the following one:
τ
(
dp
dt− χ
dρ
dt
)
= κρ− p− h
d2p
dt2+ χ
2
ρ
(
dρ
dt
)2
−d2ρ
dt2
. (6)
This model takes into account the dynamics of internal relaxation processes in more detail.
As has been shown in Ref. 7, wave solutions (5) are described by the system of ODE with
three dimensional phase space. This system possesses the limit cycles undergoing the period
doubling cascade, and chaotic attractors.
Consider now the model with relaxation and spatial nonlocality
τ (p− χρ) = κρ− p+ σ
pxx +1
ρpxρx − χ
(
ρxx −1
ρ
(
ρx
)2)
. (7)
4

Solutions (5) satisfy the following dynamical system
UdU
dω= UW, U
dZ
dω= γU + ξZ +W (Z − U2),
UdW
dω= U2[τ(γU + ξZ −WU2) + χτW + Z − κ]+
+σ[(ξ +W )(2U(γ − UW ) + χW ) + (UW )2] [σ(χ− U2)]−1
.
(8)
This system has the fixed point
U0 = −D, Z0 =κ
1− 2σ(ξ/D)2, W0 = 0, γ = ξZ0/D (9)
which is the only one lying in the physical parameter range.
We start from analyzing the linearized in the fixed point (9) system (8) with the matrix
M
M =
0 0 −D
γ ξ Z0 −D2
A B C
,
where
A =Dκξ(2ξσ −D2τ)
Qσ(2ξ2σ −D2), B =
D2(1 + ξτ)
Q, Q = σ(χ−D2),
C = Q−1
ξσ(
χ−D2)
−2D2κξσ
D2 − 2ξ2σ+D2τ
(
χ−D2)
.
The well-known Andronov-Hopf bifurcation theorem8 tells us that periodic solution creation
can take place if the spectrum of matrix M looks as (−α;±Ωi). This is so if the following
relations hold:
α = ξ + C > 0, (10)
Ω2 = AD −B(
Z0 −D2)
+ ξC > 0, (11)
αΩ2 = ξ (AD − Z0B) > 0. (12)
The first two take on the form of inequalities imposing some restrictions on the parameters.
The third one determines the neutral stability curve (NSC) in space (D2; κ) provided that
the remaining parameters are fixed. For σ = 0.76, ξ = 1.8, τ = 0.1, χ = 50, it looks like a
parabola with branches directed from left to right, see Fig.2a. Crossing the NSC from right
to left, we observe the limit cycle appearance. Development of limit cycle at decreasing D2
it is convenient to study by means of the Poincare section technique9,10.
5

Let us choose the plane W = 0 as an intersecting one and find coordinates of intersection
points of phase curves which cross-sect the intersecting plane only in one direction. Plotting
coordinate Z of the cross-section point along the vertical axis, and the value of the bifurcation
parameter D2 along the horizontal one, we will obtain the typical bifurcation diagrams
(Fig.1). From the analysis of diagram Fig.1a we can see that while parameter D2 decreases
the development of the limit cycle coincides with the Freihenbaum scenario, followed by the
creation of a chaotic attractor. Moreover, in the vicinity of the main limit cycle there are
the hidden attractors (depicted in Fig.1a by the symbols I and II). These attractors can be
visualized by the integrating of system (8) with special initial data only.
In Fig.1b we see the torus development at decreasing D2. According to the diagram, we
can distinguish tori with densely wound trajectories and striped tori.
Doing in the same way, we get the two-parameter bifurcation diagram (Fig.2) which
tells us that system (8) possesses the periodic, multiperiodic, quasiperiodic, and chaotic
trajectories.
Such a complicated structure of the phase space of the system can be coursed by homo-
clinic trajectory existence.
a) b)
FIG. 1. Bifurcation diagrams of system (8) in plane (D2, Z), obtained for χ = η = 50, ξ = 1.8, τ =
0.1, σ = 0.76 and (a) κ = 14, (b) κ = 1.
6

a b
FIG. 2. Left: bifurcation diagram of system (8) in parametric space (D2, κ): 1 – stable focus; 2 –
1T -cycle; 3 – torus; 4 – multiperiodic attractor; 5 – chaotic attractor; 6 – loss of stability. Right:
enlargement of part of the left figure: 6 – 3T -cycle.
III. HOMOCLINIC LOOPS OF SHILNIKOV TYPE AND THEIR
BIFURCATIONS
First it worth noting that existence of homoclinic trajectories, i.e. loops consisting of
the separatrix orbits of hyperbolic fixed point, plays a crucial role11,12 in the formation of
localized regimes in the phase space of dynamical system.
For the present, the question on the existence of homoclinic trajectory of Shilnikov type8,13
in system (8) has been treated numerically.
We investigate a set of points of parameter space (D2, κ) for which the trajectories
moving out of the origin along the one-dimensional unstable invariant manifold W u return
to the origin along the two-dimensional stable invariant manifold W s. In practice, for the
given values of parameters κ, D2, we numerically define a distance (the counterpart of split
function in Ref. 13, p.198) between the origin and point (XΓ(ω), Y Γ(ω),W Γ(ω)) of the phase
trajectory Γ (·; κ, D2):
fΓ(
κ, D2; ω)
=√
[XΓ(ω)]2 + [Y Γ(ω)]2 + [W Γ(ω)]2,
starting from the fixed Cauchy data (0, 0, 0.001). Next we determine
Φ(κ, D2) = minω
fΓ (13)
7

a) b)
FIG. 3. a) Projection of the homoclinic solution of system (8) onto the (X,W ) plane. b) A portrait
of subset of parameter space (D2, κ), corresponding to different intervals of function fΓmin(D
2, κ)
values and following Cauchy data: X(0) = Y (0) = 0, W (0) = 0.001: fΓmin > 1.2 for white colour;
0.6 < fΓmin ≤ 1.2 for light grey; 0.3 < fΓ
min ≤ 0.6 for grey; 0.01 < fΓmin ≤ 0.3 for deep grey;
fΓmin ≤ 0.01 for black.
for the part of the trajectory which lies beyond the point at which the distance gains its
first local maximum, providing that it still lies inside the ball centered at the origin and
having a fixed (sufficiently large) radius (for this case fΓ(ω) ≤ 5). The results are presented
in Figs.3b. The first is of the most rough scale among this series. Here, white color marks
the values of parameters κ, D2 for which Φ > 1.2, light grey corresponds to the cases when
0.9 < Φ < 1.2 and so on (further explanations are given in the subsequent captions). The
black coloured patches correspond to the case when Φ < 0.01. In Ref. 14 the structure of
the set of points from Fig. 3b has been studied in more detail.
IV. MODELS WITH DES TAKING SPATIAL AND TEMPORAL
NONLOCALITIES INTO ACCOUNT
Combining the model (6) and (7), we obtain the following spatio-temporal nonlocal model
τ (p− χρ) = κρ− p+ σ
pxx +1
ρpxρx − η
(
ρxx −1
ρ
(
ρx
)2)
− h
p+ η
(
2
ρ(ρ)2 − ρ
)
. (14)
8

This model has been studied in Refs. 15 and 16, when the parameters h and σ are regarded
as a small one, i.e., Eqs. (6) and (7) are perturbed by the terms with high derivatives. It
turned out that the wave localized regimes are saved under perturbations and undergo some
smooth changes.
V. MODELS INVOLVING DES WITH THE THIRD TEMPORAL
DERIVATIVES
If we need to describe the relaxing processes in more detail, then we can incorporate the
terms with the third temporal derivatives in DES (14). In this case DES has the form3
τ
(
dp
dt− χ
dρ
dt
)
= κρ− p+ σ
∂2p
∂x2+
1
ρ
∂p∂ρ
∂x∂x− χ
∂2ρ
∂x2−
1
ρ
(
∂ρ
∂x
)2
−
− h
d2p
dt2+ χ
2
ρ
(
dρ
dt
)2
−d2ρ
dt2
+h2
τ
d3p
dt3+
h2χ
τ
−6ρ3
ρ2+
6ρρ
ρ−
d3ρ
dt3
.
(15)
Solutions (5) satisfy the following dynamical system
UdU
dω= UW, U
dZ
dω= γU + ξZ +W (Z − U2), U
dW
dω= UR,
UdR
dω=(
bU3(
χ− U2))
−1−κU2 + ηξσW − 2ξσU2W + χτU2W − hξU4W+
+bξ2U4W − τU4W + ησW 2 + (χh− σ)U2W 2 − hU4W 2 + bξU4W 2 − bχU2W 3+
+bU4W 3 + γ (2ξσU + hξU3 − bξ2U3 + τU3 + 2σUW ) + U2Z + hξ2U2Z−
−bξ3U2Z + ξτU2Z + (−ησU + U3 σ + χh− 4bχW − hU2 + bξU2 + 4bWU2)R,
(16)
where b = h2/τ , and quadrature
UdS
dω= − (W + ξ) .
The fixed point of this system has the coordinates
U0 = −D,Z0 =κD2
D2 − 2σξ2,W0 = 0, R0 = 0. (17)
The conditions at which the linearized matrix M
J =
0 0 a1 0
a2 a3 a4 0
0 0 0 a5
a6 a7 a8 a9
=
0 0 −D 0
γ ξ Z0 −D2 0
0 0 0 −D
a6 a7 a8 a9
, (18)
9

a6 =κξ (−2ξσ +D2 (hξ − bξ2 + τ))
∆D (2ξ2σ −D2), a7 = −
1 + hξ2 − bξ3 + ξτ
∆,
a8 = −ξσ (η − 2Z0)−D4 (hξ − bξ2 + τ ) +D2 (χτ − 2ξσ)
D2∆,
a9 =χD2h−D4h+ bD4ξ +D2σ − ησ
D∆, ∆ = bD
(
χ−D2)
admits the spectrum (±Ω2i;−α1;−α2)
have the form
B2 =B1
B3+B0
B3
B1, B2
3 − 4B0B3
B1≥ 0, (19)
where B3 = −a3−a9, B2 = a3a9−a5a8, B1 = a5 (a3a8 − a1a6 − a4a7), B0 = a1a5 (a3a6 − a2a7)
are the coefficients of characteristic polynomial for the matrix M .
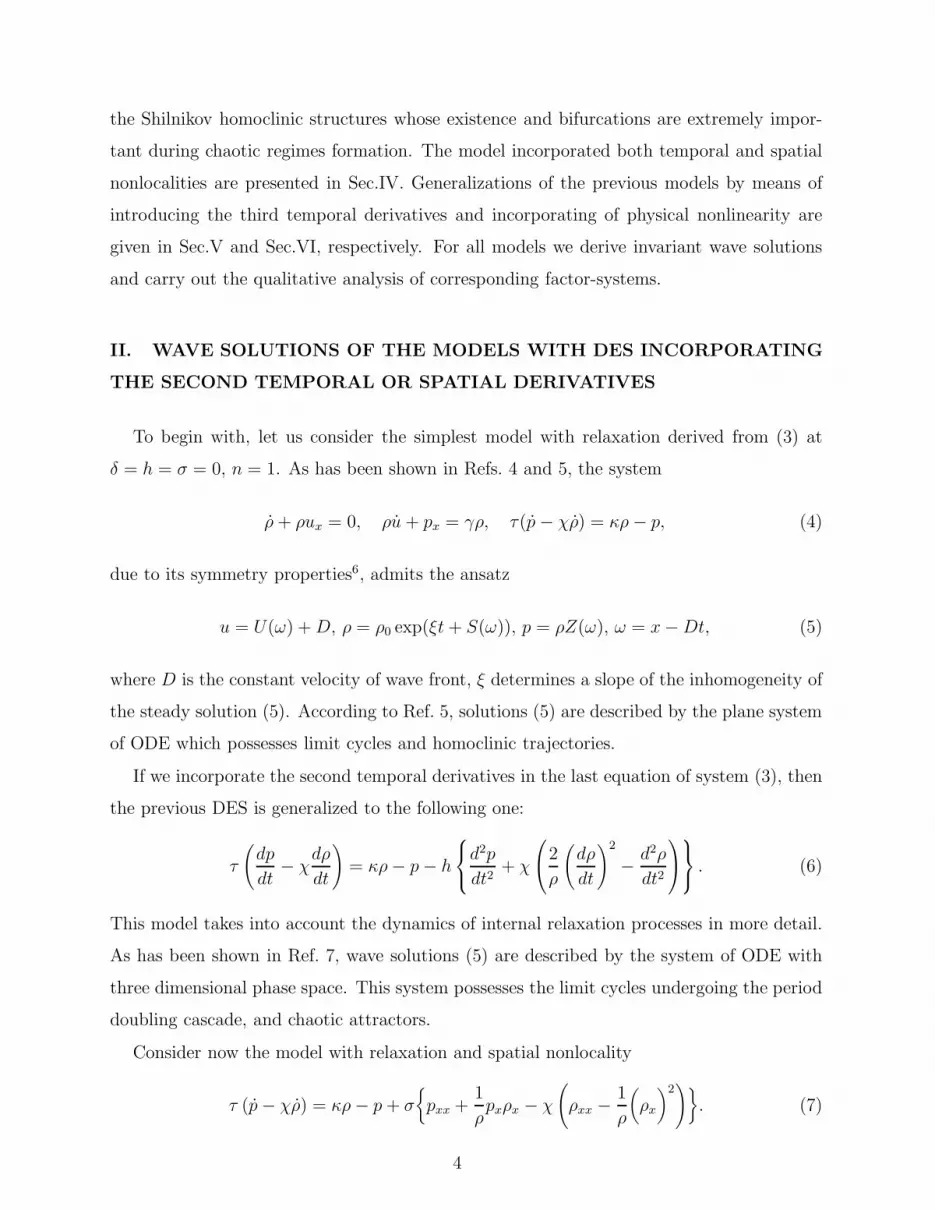
If we fix the parameters χ = η = 30, ξ = −1.9, h = 1, τ = 1, b = 1, σ = 2.7, then in the
plane (D2, κ) Eq. (19) defines the NSC. Crossing this curve in the point A(2.2852; 3.7), one
can observe the appearance of the limit cycle at D2 ≥ 2.2852.
In the Poincare diagram depicted at increasing D2 (Fig.4) we can identify the moments
of several period doubling bifurcations leading to the chaotic attractor creation. But the
chaotic attractor existing at a short interval of parameter D2 is destroyed. Instead of it
in the phase space of system (16) the complicated periodic trajectory resembling to a loop
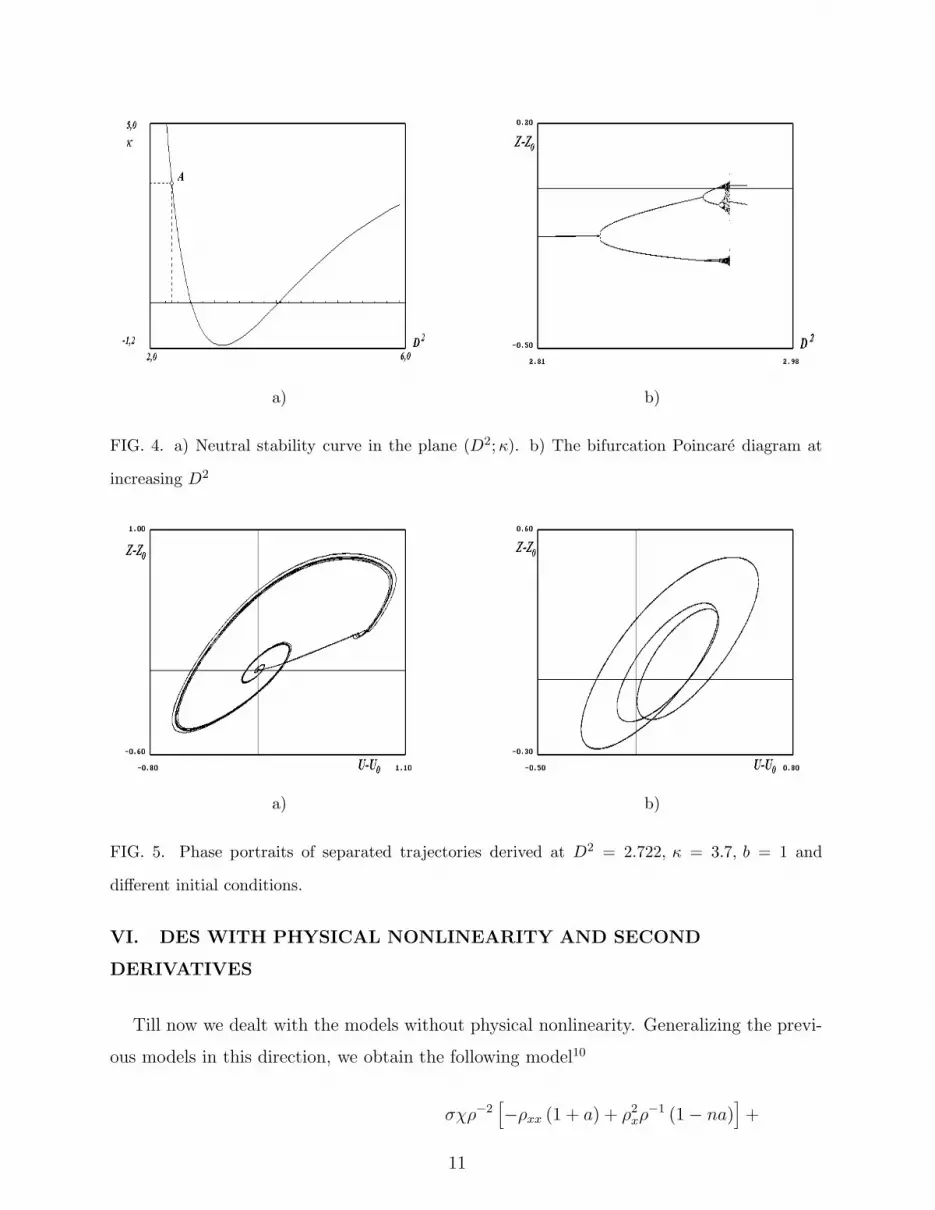
(Fig. 5a) appears.
Consider also the development of oscillating regimes whose basins of attraction are sepa-
rated from the basin of attraction of the main limit cycle. Integrating dynamical system (16)
from initial conditions (0; 0; 0; 0.01) atD2 = 2.722, we see that the phase space of the system,
in addition to the main limit cycle, contains the complicated trajectory (Fig. 5,a) which can
be regarded as a hidden attractor. From the analysis of Poincare diagram (Fig. 6a) it follows
that the system weakly responds to the growing of the parameter D2 until D2 = 2.7445.
When D2 > 2.7445, the system jumps to another type of oscillations followed by chaotic
regime creation.
If we plot the Poincare diagram at decreasing D2 (Fig. 6b) starting from the chaotic
attractor, then we observe the periodic trajectory (Fig.5b) that differs from the initial regime
(Fig.5a). Note that the periodic trajectory from Fig. 5b can be revealed directly by the
integration from the initial conditions (0; 0; 0; 0.1).
10
a) b)
FIG. 4. a) Neutral stability curve in the plane (D2;κ). b) The bifurcation Poincare diagram at
increasing D2
a) b)
FIG. 5. Phase portraits of separated trajectories derived at D2 = 2.722, κ = 3.7, b = 1 and
different initial conditions.
VI. DES WITH PHYSICAL NONLINEARITY AND SECOND
DERIVATIVES
Till now we dealt with the models without physical nonlinearity. Generalizing the previ-
ous models in this direction, we obtain the following model10
σχρ−2[
−ρxx (1 + a) + ρ2xρ−1 (1− na)
]
+
11

a) b)
FIG. 6. The bifurcation Poincare diagram of development of separated regime at increasing D2
(a) and decreasing D2. Here b = 1.
+hχρ−2[−ρ (1 + a) + 2ρ2ρ−1 (1− 0.5a(n− 1)) + τh−1ρ (1 + a)] + κρn = p+ (20)
+τ p− hp− σ(
pxx + ρxpxρ−1)
, a = δnρn+1.
Properties of solutions to system (20) can be found out using the symmetry of the system
with respect to the Galilei group6. One can be persuaded by direct verification that system
(20) allows operator
X =1
2ξ
∂
∂t+ t
∂
∂x+
∂
∂u.
Let us construct an anzatz with its invariants
ρ = R(ω), p = P (ω), u = 2ξt+ U(ω), ω = x− ξt2, (21)
where parameter ξ is proportional to acceleration of the wave front. Substitution (21) into
the system yields the following quadrature
UR = C = const
12

and the dynamical system
R′ = W, P ′ = γRm − 2ξR+C2
R2W,
W ′ = −(κRn+3 − PR3 − P ′R2Cτ − hP ′C2W + P ′R2σW+
+γmR2+mσW + χLτCW + γhmRmC2W + hχL(CWR−1)2−
−2C2σW 2 + χMσW 2 − 2C4hR−2W 2+
+2hχNC2R−2W 2 − 2R3σWξ − 2hRC2Wξ)×
((C2 − χL)R(σ + hC2R−2))−1,
(22)
where (·)′ =d
dω(·) , L = 1 + a,M = 1− an,N = 1− 0.5a(n− 1), a = δnRn+1.
The single isolated equilibrium (neglecting the trivial) point has the following coordinates
R0 =
(
2ξ
γ
)1/m− 1
, P0 = κRn0 , W0 = 0. (23)
In this point the linearized matrix M has the form
M =
0 0 1
a1 0 a2
a3 a4 a5
, (24)
where
a1 = 2ξ(n− 1), a2 = C2R−20 ,
a3 = (2C3h[
C2 − χL]
τ [γRm0 − 2ξR0]R
−20 +
+Cχ(n+ 1)(L− 1)τ∆− C[
C2 − χL]
τ∆−
−[
C2 − χL] (
C2hR−20 + σ
) (
κnR1+n0 − Cτ (γ(2 +m)Rm
0 − 6ξR0))
)/∆2,
a4 = R20∆
−1,
a5 =C2γh (nRn
0 −Rm0 )− C3τ + CχLτ +R2
0σ (γ [Rm0 + nRn
0 ]− 4R0ξ)
R0∆,
∆ =(
C2 − χL) (
C2hR−20 + σ
)
.
The NSC for system (22) has the following form
G (ξ, σ, n, h, τ, κ, χ) ≡ a5 (a3 + a2a4) + a1a4 = 0. (25)
Let us make the values of parameters fixed as follows:
γ = 1, χ = 10, C = −2.8, σ = 0.2, τ = 1.1, h = 3.2, δ = 1.4, n = m = 3.2.
13

Condition (25) allows us to find numerically the value of ξ0 = 0.157 corresponding to
birth of the limit cycle.
Let us consider in more detail the influence on the revealed regimes of parameters n and
δ changes, which determine nonlinearity of the medium in the dynamic equation of state.
Let us make the value of parameter ξ = 0.35 fixed, in case of which there is a limit cycle
with period 2T in the space of the system.
The diagram reveals some peculiarities of system’s (22) behavior. In particular, we would
like to pay attention to the presence of a ”special” point in the parameter plane, surrounded
by four different types of solutions. One can also see the ”windows” of periodicity (area 6)
among the chaotic area. To find out the structure of phase space in more detail near area 6
of Fig.7a, let us plot a one-parametric Poincare diagram (Fig.7b) for δ = 1.4 and a decrease
of parameter n.
In case of n close to 2, abrupt reconstruction of the chaotic attractor structure can be
observed, which is probably caused by the interaction of two (or more) co-existing attractors
of a dynamic system. In case of n ≈ 1.4 the chaotic trajectory is localized in a more narrow
area of phase space of system (22), stipulating the appearance of a specific window of
periodicity with a decrease of n. Analysis of a two-parametric bifurcation diagram for the
value of parameter κ = 2 (Fig.7a) shows that the area of existence of the chaotic attractor
increases and the windows of regular intervals in case of the increasing κ shift towards higher
values of the nonlinearity parameter n.
A crucially different set of bifurcations is observed in case of a change of parameter σ.
Let us fix the values of parameters γ = 1, χ = 10, C = −2.8, τ = 1.1, κ = 0.9, h = 3.2,
ξ = 0.35, n = m = 3.2 and δ = 0.4. Integrating system (22) with initial data (0, 0, 0.01)
and σ = 5 within phase space near the equilibrium point, in addition to the limit cycle,
other periodic trajectory has been found with a separated pool of attraction (development
of this regime with increasing of σ is presented in Fig.7b graph II).
The presence of such a regime leads to the thought of the existence of quasi-periodic
regimes. To look for such a regime let us plot a bifurcation diagram of Poincare for devel-
opment of basic limit cycle in case of increasing parameter σ (Fig.7b graph I).
Another bifurcation, leading to the appearance of the toroidal surface, has been discovered
in this system. An intersection of the toroidal attractor with the plane y3 = 0 forms a closed
curve, shown in Fig.8a. A further increase of parameter σ causes the synchronization of tore
14

a b
FIG. 7. a) Two-parametric bifurcation diagram in case of κ = 2 (for other values of parameters
and conventional symbols see Fig.3; b) Poincare bifurcation diagram for development of the torus
in case of γ = 1, χ = 10, C = −2.8, τ = 1.1, κ = 0.9, h = 3.2, δ = 0.4, ξ = 0.35, n = m = 3.2
and increasing σ, where graph I is the basic limit cycle, graph II – complicated periodic trajectory
with separated region of attraction.
frequencies, and finally an abrupt increase of vibrations amplitude, which shows the creation
of a crucial new dynamical behavior. To clarify the character of the produced regime, let
us analyze the Poincare section for the case of σ = 14.6 (Fig.8b). The plotted cross-section
is specific for chaotic attractor, which provides reasons for statements on the existence of
bifurcation of a quasi-periodic regime with a producing chaotic attractor.
It turned out that system (22) provides another type of chaotic attractor creation, namely,
intermittency. Let us fix γ = 1, χ = 50, C = −1.5, τ = 0.1, κ = 1.9, σ = 0.2, h = 0.9,
ξ = 0.18.
Plotting the Poincare bifurcation diagram (Fig. 9a), we see that a limit cycle undergoes
several period doubling bifurcations resulting in the chaotic attractor creation. But the
development of chaotic attractor is interrupted suddenly and new complicated periodic tra-
jectory appears which bifurcates in chaotic attractor as well at increasing n. Considering the
hereditary sequences (Fig.9b) for chaotic trajectories, we found that the graph of the map
Wi+1 = f(Wi) is close to the bissectrice at n = 4.25. As in the case with the Lorentz system,
existence of narrow passage leads to the alternation of the chaotic and regular behavior of
the system trajectories.
15

a b
FIG. 8. a) The Poincare cross-section of the torus surface in case of σ = 14 b) The Poincare
cross-section of a chaotic attractor in case of σ = 14.6. Fixed parameters γ = 1, χ = 10, C = −2.8,
τ = 1.1, κ = 0.9, h = 3.2, δ = 0.4, ξ = 0.35, n = m = 3.2.
a b
FIG. 9. a) The bifurcation diagram at increasing n. b) The graph of dependence Wi+1 vs Wi
at n = 4.25. The fixed values of parameters γ = 1.49, χ = 50, C = −1.5, τ = 0.1, κ = 1.9, σ =
0.2, h = 0.9, ξ = 0.18, δ = 0, 8.
VII. CONCLUSIONS
Finally, we have studied the hierarchical sequences of the mathematical models for non-
equilibrium media. Analyzing the wave fields in such media we have shown that derived
models possess the wide set of localized wave regimes. In particular, the models with relax-
16

ation admit the periodic, multiperiodic, chaotic solutions. Spatially nonlocal models have
in addition quasiperiodic and solitary wave solutions. All the models demonstrate the most
bifurcations and scenarios of chaotic regimes creation.
From the other hand, identifying internal variables with parameters undergoing fluctu-
ations, one can consider these investigations as the problem on the dissipative structures
creation under the influence of noise.
REFERENCES
1V. A. Vladimirov, V. A. Danylenko, and V. Y. Korolevych, “Nonlinear models for multi-
component relaxing media: dynamics of wave structures and qualitative analysis,” Preprint
(Subbotin Institute of Geophysics, 1990) in Ukrainian.
2T. B. Danevych and V. Danylenko, “Governing equations for nonlinear media with inter-
nal variables taking temporal and spatial nonlocalyties into account,” Preprint (Subbotin
Institute of Geophysics, 1999) in Ukrainian.
3T. B. Danevych, V. A. Danylenko, and S. I. Skurativskiy, Nonlinear mathematical models
of media with temporal and spatial nonlocalities (Subbotin Institute of Geophysics, 2008).
4V. A. Danylenko, V. V. Sorokina, and V. A. Vladimirov, Journal of Physics A 26, 7125–
7135 (1993), DOI:10.1088/0305-4470/26/23/047.
5V. A. Vladimirov, Opuscula Mathematica 23, 81–94 (2003).
6V. I. Lahno, S. V. Spichak, and V. I. Stogniy, Symmetry analysis of evolution type equa-
tions (Computer Research Institute, Moscow–Igevsk, 2004).
7V. N. Sidorets and V. A. Vladimirov, “On the peculiarities of stochastic invariant solutions
of a hydrodynamic system accounting for non-local effects,” in Symmetry in Nonlinear
Mathematical Physics, 2, edited by M. Shkil, A. Nikitin, and V. Boyko (Institute of
Mathematics, Kyiv, 1997) pp. 409–417.
8J. Guckenheimer and P. Holmes, Nonlinear oscillations, dynamical systems and bifurca-
tions of vector fields (Springer–Verlag, New York, 1987).
9M. Holodniok, A. Klic, M. Kubicek, and M. Marek, Methods of Analysis of Nonlinear
Dynamical Models (World Publishing House, Moscow, 1991).
10V. A. Danylenko and S. I. Skurativskyi, Rep. Math. Phys. 59, 45–51 (2007),
DOI:10.1016/S0034-4877(07)80003-6.
17

11N. V. Butenin, J. I. Neimark, and N. A. Fufaev, Introduction to the theory of nonlinear
oscillations (Nauka, Moscow, 1987).
12S. Wiggins, Introduction to applied nonlinear dynamical systems and chaos (Springer-
Verlag, New York, 1990).
13Y. A. Kuznetsov, Elements of applied bifurcation theory (Springer-Verlag, New York, 1998).
14V. A. Vladimirov and S. I. Skurativskyi, Rep. Math. Phys. 46, 287–294 (2000), DOI:
10.1016/S0034-4877(01)80034-3.
15V. A. Vladimirov, V. A. Danylenko, and S. I. Skurativskyi, Reports of NAS of Ukraine
12, 104 – 108 (2004).
16S. I. Skurativskyy, Nonlinear Phenom. Complex Syst. 4:4, 390–396 (2001).
18


