Embed Size (px)
Citation preview
The Jaganese Journal of Psychonomic Science
2010, Vol.29, No. I, l-16
Introduction
Early studies in visual psychophysics have demon-
strated that perception of line or dot segments and
gratings depends on their alignment relative to the
cardinal axes (i.e., horizontal and vertical). Perhaps
Jastrow (1893) was the first to show this kind of fact,
asking subjects to view a line segment and then
immediately set another segment to lie at the same
orientation. He found that the judgments of horizon-
tal or vertical segments were more accurate and less
variable than oblique segments. Craig and Lichten-
stein (1953) claimed that oblique segments that were
viewed with steady fixation disappeared more read-
ily and for longer durations than did horizontal or
vertical segments. Leibowitz, Meyers, and Grant
(1955) reported that single dots that were flashed to
+ Department of Psychology, University ofDhaka, Bangladesh (e-mail: karim. [email protected])
** Graduate School of Human and Socio-environ-ment Studies, Kanazawa University, Japan(e-mail: hkoj [email protected] az aw a-u.ac.jp)
Original Article
an eccentric position (i.e., relative to fixation) were
more accurately localized if they were positioned on
or near a cardinal axis. Leibowitz (1953), Campbell,
Kulikowski, and Levinson (1966), and Regan and
Price (1986) found that grating resolution/acuity
was better for horizontal and vertical orientations
than when the gratings were at a tilt. This has been
replicated in a more recent fMRI study with gratings
(Furmanski & Engel, 2000) and in psychophysical
studies on stereo-acuity (Mustillo, Francis, Oross,
Fox, &.Orban, 1988) and vernier acuity (Saarinen &
Levi, 1995b; Skrandies, Jedynak, & Fahle,2001;Wes-
theimer & Beard, 1998).
The superior accuracy, perceptibility and dis-
criminability can be accompanied by differentials in
variance. For example, Sulzer and Zener (1953) ob-
served variability in orientation judgment to be
minimal for horizontal, near minimal for vertical and
maximal for oblique segments. Bouma and Andries-
sen (1968) found minimal variability in collinearityjudgment at horizontal and vertical positions and
maximal variability at 45o. This has been confirmed
in a more recent study on collinearity judgment
Perceptual asymmetry in vernier offset discrimination
-a similar trend between the cardinal and oblique orientations-
A. K. M. Rezaul Kentu* and Haruyuki KoJtue**
Uniuersity of Dhaka* and Kanazawa Uniueristy**
Our previous study has demonstrated that in the cardinal orientation, offset detection dependson the relative position of the vernier bars, i.e., how the left and right or upper and lower vernierbars are displaced from each other in space (Karim & Kojima, 2008, 2010). The present studyexamined whether the fact can be generalized to the oblique orientation. Experiment 1 demon-strated that for a pair of vernier bars, one displaced from the other and arranged side-by-side witha large gap between them at l45o orientation observers were, on average, somewhat better atdiscriminating an offset if the relative position of the lower right-hand bar was to the right of theupper left-hand bar than vice versa. A similar asymmetry was evident in Experiment2, whereobservers judged vernier offset for a pair of bars at -45" orientation. In that case, average acuitywas significantly better when the relative position of the upper right-hand bar was to the right ofthe lower left-hand bar than the opposite. The asymmetries in performance were consistent across
the two orientations and did not diminish with learning, thus indicating configuration-speciflcprocessing of the vernier stimuli.
Key words: perceptual asymmetry, vernier, configuration, cardinal, oblique, invariance
Copyright 2010. The Japanese Psychonomic Society. All rights reserved.
The Japanese Journal of Psychonomic Science Vol. 29, No. 1
(Greene, Frawley, & Swimm,2000). All these asym-
metries or differentials are collectively known as the
"oblique effect" (Appelle, I972).
In addition to the oblique effect, there is evidence
of some other kinds of perceptual asymmetry. For
example, in orientation and angular position judg-
ments line segments or dots are seen as being closer
to the horizontal or vertical than is true (Bouma &
Andriessen, 1968; Jastrow, 1893; Sittig & De Graaf,
1994). It has been reported that subjects are good at
finding a target when the light is lit from the top-left
(Sun & Perona, 1998). This perceptual asymmetry is
most prominent in foveal vision (Mamassian,
Jentzsch, Bacon, & Schweinberger, 2003) and can be
modifled or reduced by training or visual experience
(Adams, Graf, & Ernst, 2004: Champion & Adams,
2007).
In a recent study, we tested humans' perception of
spatial offset by means of alignment judgment
(Karim & Kojima, 2008, 2010). The study indicated
within-cardinal asymmetry depending on how the
left and right or upper and lower vernier lines were
displaced from each other. Specifically, we demon-
strated that for a pair of horizontal line segments
arranged side-by-side with a large gap between them
observers were, on average, somewhat better at dis-
criminating a vertical offset if the right-hand seg-
ment was below the left-hand segment than vice
versa. We observed a similar kind of asymmetry
when observers judged horizontal offset for a pair of
vertically oriented line segments, one above the
other. In that case, performance was better when the
lower segment was to the left of the upper segment
than the opposite. Consistent with other studies
(Adams et al., 2004: Champion & Adams, 2007) we
also showed that perceptual asymmetry reduced
more or less with training. This means that the
asymmetric phenomena are modifiable through
learning. These findings motivated us to carry out
the present study with a two-fold purpose: to see (1)
whether the within-cardinal configurational asym-
metry in line alignment judgment can be generalized
to the oblique orientation and (2) whether it can be
shaped by learning as in the cardinal orientation. To
achieve these purposes, we conducted two experi-
ments using the line vernier stimuli at *45' and
- 45o orientations respectively.
Experiment I
Method
Obseruers. Eight paid undergraduate students of
normal, or corrected to normal vision, participated in
this experiment. All the observers were naive to the
experimental purpose and did not have any history
of psychophysiological or neurological illness.
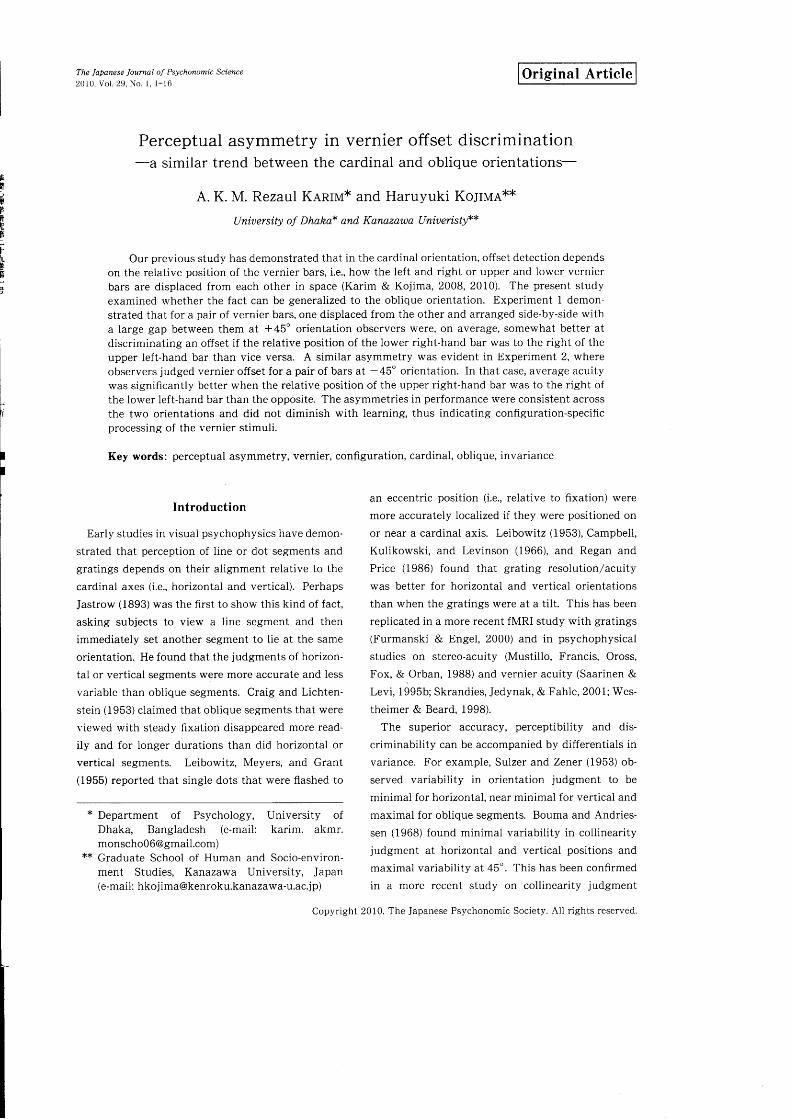
Stimuli and apparatus. Vernier stimuli, each com-
prising of two light bars either aligned or misaligned
at a 145" orientation, were generated using Borland
C+ + Builder 6. The offset sizes of the misaligned
verniers were 130, +90, +150, +210 and !270arcsec. One of the bars was displaced to the right (- )
or left (+ ) at right angles to the other, constant, bar.
The stimuli were white against a black background,
with a feature separation of 15 arcmin (Figure 1).
The width and length of each bar were 0.5 and 15
arcmin respectively. The luminance of the stimulus
and background were measured by a luminance me-
ter (TOPCON, BM-3). The Michelson contrast of each
stimulus was 0.98 (L-u*:90.43 cd/mz: Lmin:0.81 cd/m2). For displaying the stimuli we used a 2l-inch
color monitor (Eizo, FlexScan T962) of 1280x1024pixels and 85 Hz with a high-speed graphic card (3
Dlabs, Wildcat III 6110). From a viewing distance of
1.82 m, the angular resolution of each pixel was 30
arcsec.
Procedures. At the beginning, observers took a few
practice trials to get some practical knowledge of
how to respond with a keyboard. Then they were
run in two experimental sessions using the method
of constant stimuli. In one session, we presented five
possible vernier stimuli of the rightward offset (- )
and five aligned (null offset) verniers in random or-
der, each one repeating 80 times, at the centre of the
visual field. Similarly, we presented five possible
stimuli of the leftward offset (+) and five aligned
verniers in another session. The order of the two
sessions was counterbalanced between the observers
and between the training days for each observer. In
each session, the stimulus duration and response
stimulus interval were 100 ms and 1000 ms respec-
A. K. M. R. KanIvr and Haruyuki KolIue: Perceptual asymmetry in vernier offset discrimination
Figure 1. Schematic of the vernier stimuli used in Experiment 1. (a) Stimuli with rightward offset ofthe lower right-hand bar, (b) Stimuli with leftward offset of the lower right-hand bar, (c) Stimulus withnull-offset, (d) Stimuli with rightward offset of the upper left-hand bar, (e) Stimuli with leftward offsetof the upper left-hand bar. Vernier separation is defined in arcminutes as the parallel distance betweenthe endpoints of the upper left-hand and lower right-hand bars and vernier offset is defined inarcsecods as the perpendicular distance between the two bars. The dotted lines indicate theapproximate positions of the displaced bar with different offset sizes ("C" and "D" are used here andsubsequently where necessary to represent the "Constant" and "Displaced" bars respectively).
(e)(d)
tively. Observers in a dark room viewed the stimuli
binocularly using a chin and forehead rest from the
distance mentioned above. Because there was no
additional fixation point in order to avoid unwanted
positional cues available from that point, we asked
observers to always attend to the gap between the
vernier features (the centre of the display). They
indicated by a key press (F or J) whether the features
were aligned or misaligned, where incorrect re-
sponses were followed by an auditory feedback. The
two response keys were counterbalanced between
the observers.
The experiment was continued for six days, each
day covering 1600 trials in total (800 in each session).
A half of the observers were introduced to the stim-
uli with the lower-right bar being displaced right-
ward or leftward (Figure la,b) and the remaining
half with the upper-left bar being displaced in either
direction (Figure 1d,e). From the point of intersec-
tion of the polar axes (0, 0), the constant bar was
always at the same distance across the left-upper and
right-lower visual fields. However, observers were
not informed of which bar would be constant and
which one be displaced.
Data Drocessing and statistical analysis. In any
first hand data in-psychophysical experiment, the
clude perceiver sensitivity, but
with normal guessing habit and
often confounded
response bias. The
habitual guess or guessing bias and response bias are
reflected in observer's false alarm-such as responding
to a null-offset vernier as an offset one. So, we
calculated in each experimental session the propor-
tion of false alarm and the proportion of correct
offset detection at each offset for individual observ-
ers. Then, we excluded each observer's guessing bias
and response bias following two crucial steps as
below.
First, to exclude potential guessing bias we con-
verted subjective data in each training day using
Equation 1.
The Japanese Journal of Psychonomic Science Vol. 29, No. 1
v,: fff xloo (1)
Where, )zs represents the corrected number of "Yes"
responses to a vernier stimulus, and Yo and FA repre-
sent the observed proportion of "Yes" responses to a
vernier stimulus and the proportion of false alarm("Yes" response to a null-offset) respectively, in an
experimental session. Here, "Yes" response indicates
responding to any vernier stimulus as offset. This
equation converts any false alarm to '0' and 100%
correct offset detection to '100'.
Second, if an observer response were biased to-
ward a particular vernier configuration (non-uniform
distribution of response biases between the two con-
figurations) the proportion of false alarm would be
ultimately higher in that session as compared to the
session of an opposite configuration. So, we calcu-
lated subjective response biases in each training day
using Equation 2.
Response Bias:(FA,-FAt) x 100 (2)
Where, FA, and FA1 represent the proportions of
false alarm in the rightward and leftward offset ses-
sions respectively. The response bias score could
thus range between - 100 and * 100, with negative
and positive values reflecting leftward and right-ward biases respectively. A score approaching zero
indicates no response bias.
The response bias scores so obtained were ana-
lyzed in a series of one sample /-tests. If any ob-
server's response bias toward a particular displace-
ment/configuration were found to be signiflcant, the
frequency of biased responses was subtracted on
day-by-day basis from the guess-free frequency (see
Equation 1) of "Yes" responses to an offset vernier.
After such exclusion of guessing bias and response
bias, each observer's data in the rightward and left-
ward displacements were separately fitted by theprobit model (using XLSTAT;Addinosoft USA). Ac-
cording to Yesr/No paradigm, offset detection thresh-
olds were calculated at 50% correct detection of the
vernier misalignment. In order to minimize the
effect of presentation order (of the configuration) on
any pair of subjective scores, we averaged the
threshold data on every two successive days. Thus
in six days of training we obtained three pairs of
scores for each observer. We analyzed each ob-
server's threshold data in matched sample /-test and
group data in repeated measures ANOVA followed
by the post-hoc LSD test where appropriate. If the
sphericity assumption was violated for repeated
measures data we carried out these ANOVA using
the Greenhouse-Geisser (when e <.75) or Huynh-
Feldt (when l) e ).75) correction.
Results
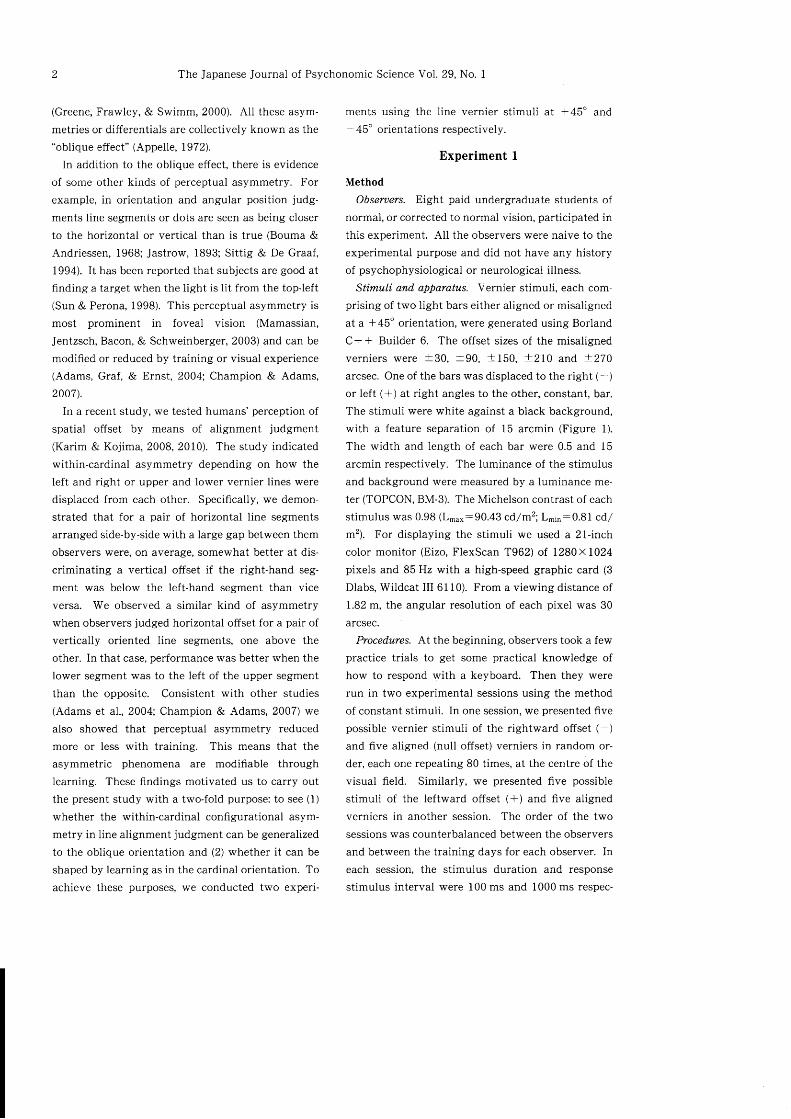
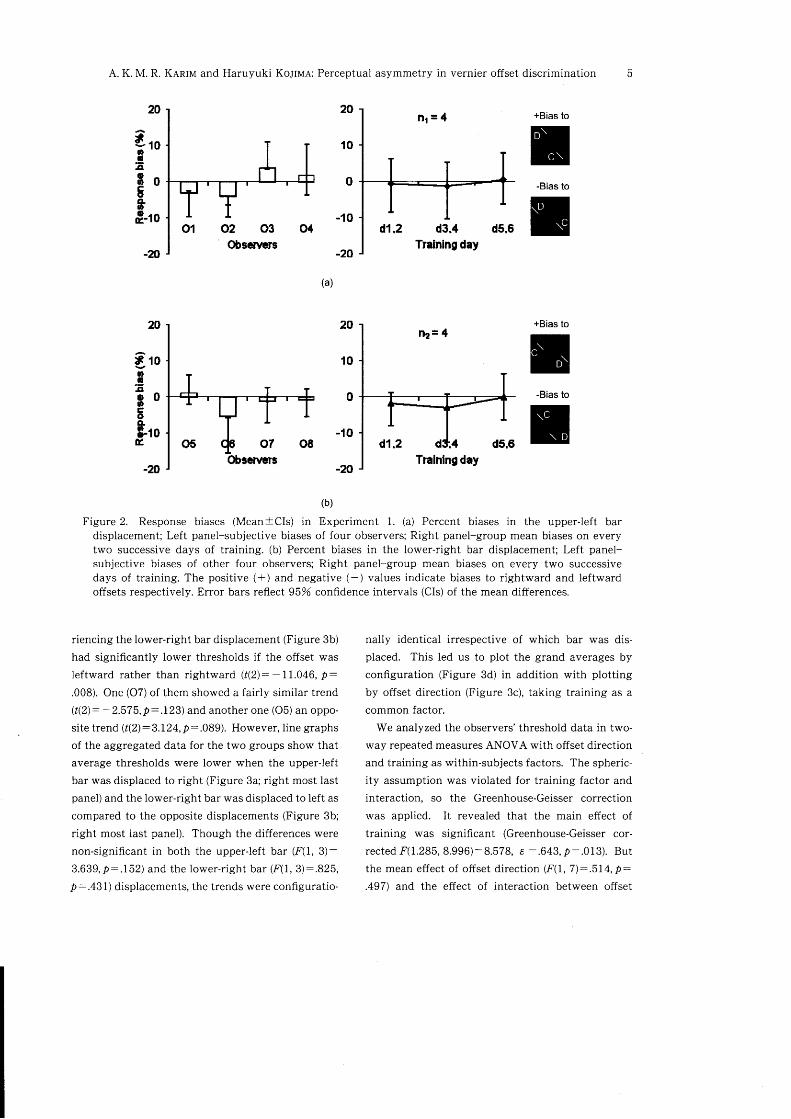
Response bias. Figure 2 shows mean subjective
response biases calculated over the training days
(left panels) and mean daily response biases for the
two observer groups (right panels). When subjected
to a series of one-sample /-tests we found that the
average response bias scores were significantly diffe-
rent from zero for 02 (t(5): -6.217, D:.002) and 06(f(S): -2.572,2:.040) only. So, before fitting anypsychometric functions for determining the offset
detection thresholds we excluded, on day-by-day ba-
sis, the response biases for these two observers.
As shown in the right panels, the mean response
bias scores obtained on every two successive days
were not significantly different from zero for the twoobserver groups who were introduced to the upper-
left bar (Figure 2a; t(3): -.231, D:.832 in d1,d2; t(3):-.51I,p:.645 in d3, d4 and /(3):.19U,2:.857 ind5, dO) and lower-right bar (Figure 2b; t(3): - 1.197,
D:.317 in dld2; /(3): - 1.404, D:.255 in d3, d4 and
f(3):.015, 2:.989 in d5, d6) displacements respec-
tively.
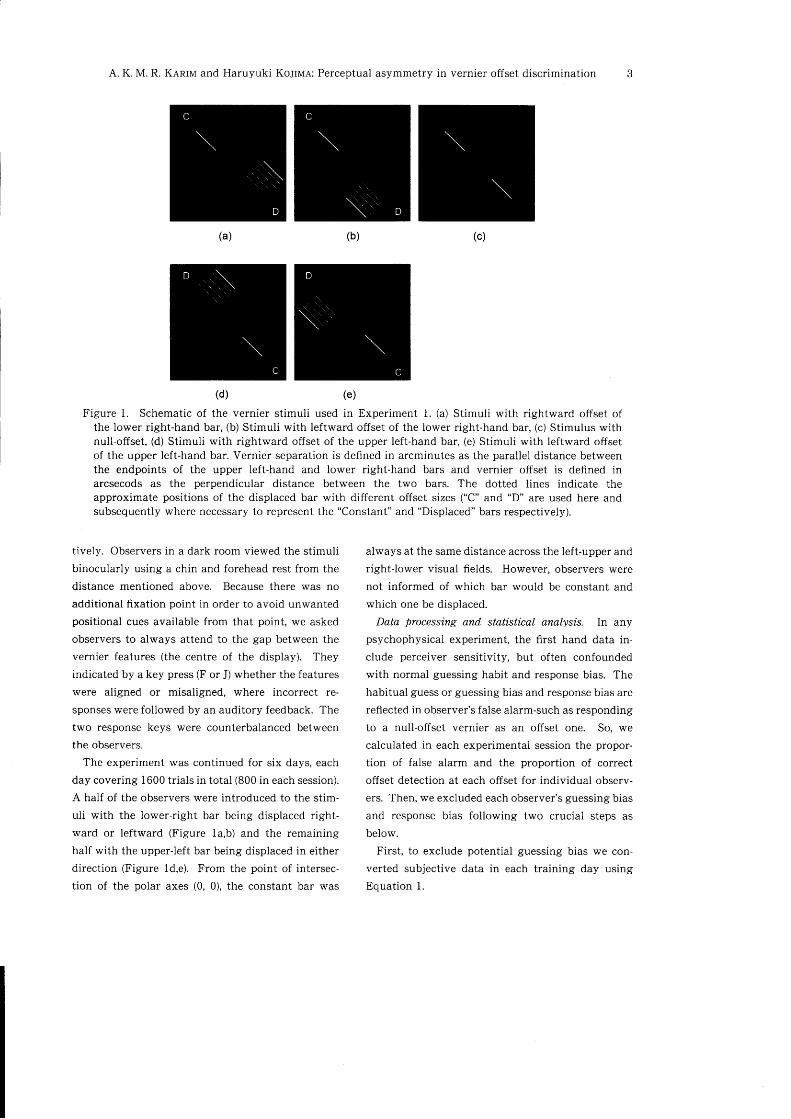
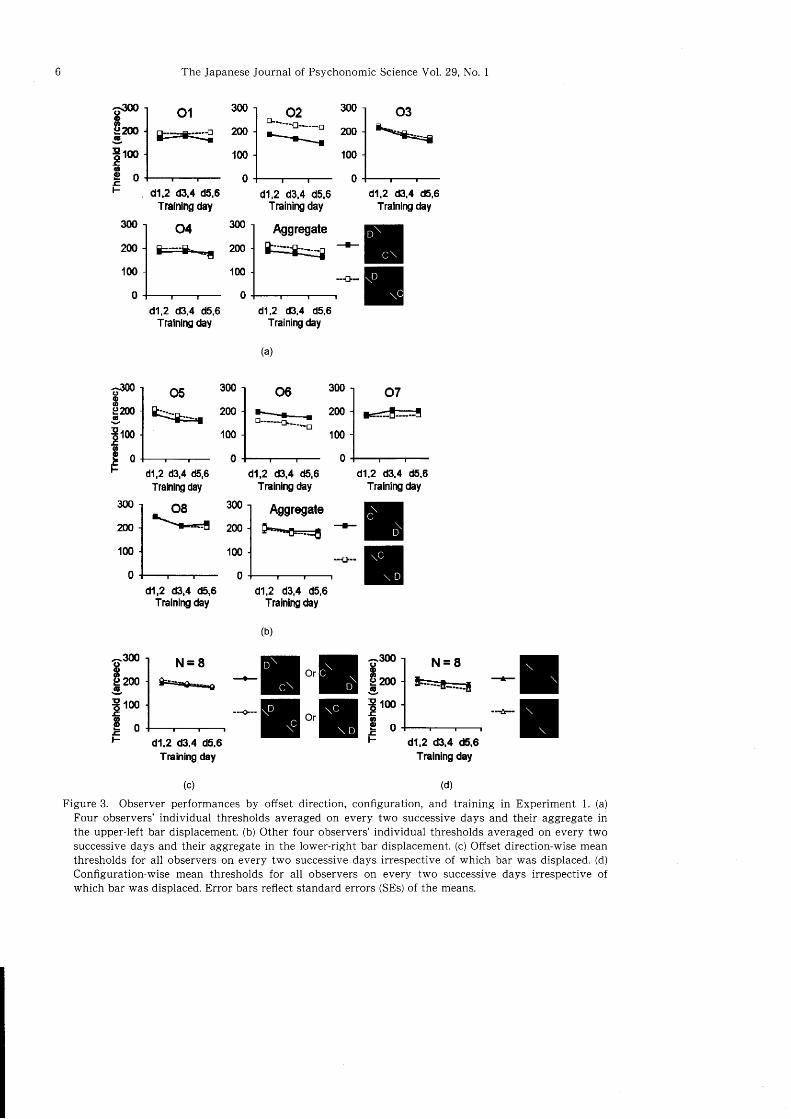
Offset direction, s|atial configuration and training
effects. Figure 3a, b displays the daily offset detec-
tion thresholds for individual observers and the cor-
responding aggregates for the two groups who expe-
rienced stimuli with the upper-left and lower-rightbar displacements respectively. A series of matched
sample /-tests applied to the individual observer data
demonstrated that one (O2) of the four observers
experiencing the upper-left bar displacement (Figure
3a) had significantly lower thresholds if the offset
was rightward rather than left ward (t(2):16.806,2:.004). Two of them (O1 and 03) showed a fairlysimilar trend (t{27:2.tnr, p:.104 for Ol; t(2):4.023,
b:.057 for O3). One (06)of the four observers expe-
A. K. M. R. Kanru and Haruyuki Koitva: Perceptual asymmetry in vernier offset discrimination
0
-10
-20
-20
0
-10
-20
(b)
Figure 2. Response biases (MeantCls) in Experiment 1. (a) Percent biases in the upper-left bardisplacement; Left panel-subjective biases of four observers; Right panel-group mean biases on everytwo successive days of training. (b) Percent biases in the lower-right bar displacement; Left panel-subjective biases of other four observers; Right panel-group mean biases on every two successivedays of training. The positive (+) and negative (-) values indicate biases to rightward and leftwardoffsets respectively. Error bars reflect 95% confidence intervals (CIs) of the mean differences.
20
*roa^a
$otF&-to
+Bias tot-Bias to
5+Bias toil-Bias to
E
-n
20
(a)
F10oa-qo0otroa9totr
riencing the lower-right bar displacement (Figure 3b)
had significantly lower thresholds if the offset was
leftward rather than rightward (t(2):-11.046, D:.008). One (O7) of them showed a fairly similar trend
(t(2): -2.575,p:.123) and another one (Ob) an oppo-
site trend (t(2):3.12n,1 :.089). However, line graphs
of the aggregated data for the two groups show that
average thresholds were lower when the upper-left
bar was displaced to right (Figure 3a; right most last
panel) and the lower-right bar was displaced to left as
compared to the opposite displacements (Figure 3b;
right most last panel). Though the differences were
non-significant in both the upper-left bar (F(1, 3):3.639, P:.152) and the lower-right bar (F(1, 3):.825,
D:.431) displacements, the trends were conflguratio-
nally identical irrespective of which bar was dis-
placed. This led us to plot the grand averages by
configuration (Figure 3d) in addition with plotting
by offset direction (Figure 3c), taking training as a
common factor.
We analyzed the observers'threshold data in two-
way repeated measures ANOVA with offset direction
and training as within-subjects factors. The spheric-
ity assumption was violated for training factor and
interaction, so the Greenhouse-Geisser correction
was applied. It revealed that the main effect of
training was significant (Greenhouse-Geisser cor-
rected F(1.285, 8.996):8.578, e :.643,2:.013). But
the mean effect of offset direction (F(1, 7;:.514, P:.497) and the effect of interaction between offset
o1
r4{]#$gurogtrm.Eao
EoF
3txl
200
100
0
6300o(ae200g
E,*goF
300
no
100
0
The Japanese Journal of Psychonomic Science Vol. 29, No. 1
02*"--'o------o
-*--a
300
200
100
0
300
M100
0
300
200
100
0
o3\"ft-.|
d1,2 d3.4 d5,6Trainlng dey
d1,2 d3,4 d5,6Tralnlng day
d1,2 d3,4 d5,6
TrahlrE day
d1,2 d3,4 d5,6Trainiry day
d1.2 d3.4 115.6
Trahing day
(c)
d1,2 d3,4 d5,6TrainirE day
d1.2 d3,4 d5,6Tralnlrp &y
dl,2 (B,4 d5,6Training day
(a)
tro
tE
300
200
100
0
d1,2 d3.4 d5,6Training day
dl,2 d3.4 d!t,6TralnlrE day
d1,? d3,4 d5,6Training &y
(b)
^300atoE zoo{9
E,*ago
*t",il9;::*E",EE": I
TFigure 3. Observer performances by offset direction, configuration, and training in Experiment 1. (a)
Four observers' individual thresholds averaged on every two successive days and their aggregate inthe upper-left bar displacement. (b) Other four observers' individual thresholds averaged on every twosuccessive days and their aggregate in the lower-right bar displacement. (c) Offset direction-wise meanthresholds for all observers on every two successive days irrespective of which bar was displaced. (d)
Configuration-wise mean thresholds for all observers on every two successive days irrespective ofwhich bar was displaced. Error bars reflect standard errors (SEs) of the means.
d1,2 (B,4 (F.6Training day
(d)
N=8*++.*.*-o
A. K. M. R. KenIu and Haruyuki Kolttrla: Perceptual asymmetry in vernier offset discrimination
direction and training were not significant (Green-
house-Geisser corrected F(1.462, 10.232):.693, € :.73L,P:.478). We also analyzed the data by the same
statistical procedures considering configuration and
training as within-subjects factors. We found that
the main effect of configuration was fairly large (F(1,
7):4.324, D:.076) and that of training was sig-
nificant (Greenhouse-Geisser corrected F(|.285,
8.996):8.578, e:.643,2:.013). But the effect of
interaction between the two factors wase not sig-
nificant (Huynh-Feldt corrected rq(1.940, 13.583):
.864, e:.784, f :.440). A further analysis of the
training effect done by the post hoc LSD test re-
vealed that the threshold was, fairly lower on the 3rd
and 4th day (41[: 187.890, SE:4.867,2:.066) than
on the lst and 2nd day (M:202.I39, SE:8.608), the
effect being significant on the Sth and 6th day of
training (M: 177.72I, SE:6.493, D:.0I2).Finally, we examined the configurational diffe-
rences in both pre- and post-training. We considered
the first two days' training as pre-training and the
last two days' training as post-training. The pre-
training mean threshold difference between the twoconfigurations was about 15 arcsec (S-o:8.67) and
the post-training difference was about 21 arcsec (S-E
:9.26) (Figure 3d). Matched sample /-test revealed
that the pre-training mean difference was fairly large
(t(Z): 1.7 26, D :.128) and the post-training difference
was nearly significant (t(7):2.244, 2:.060). The
post-training higher mean difference was unex-
pected, however, it was not significantly differentfrom the pre-training mean difference (t(7):1.157, P
-.285).
Experiment 2
Method
Obseruers. Twelve naive and paid adults of nor-
mal, or corrected to normal vision, participated in
this experiment.
Stimuli and apparatus. We used line vernier stim-
uli, either aligned or misaligned, at -45o orientation(Figure not shown). The offset sizes, stimulus con-
trast, feature separation, feature width and length
were all identical to the first experiment.
Procedures. Following the setup and procedures
identical to the first experiment, this experiment was
run for twelve days.
Data processi,ng and statistical analysis. The data
were fitted by the probit model after excluding sub-
jective guess and response bias where necessary fol-
lowing the same procedures as in Experiment 1.
Then, offset detection thresholds were calculated at
5096 correct detection of the vernier misalignment.
In order to reduce the effect of presentation order (of
the configuration) on any pair of subjective scores,
the threshold data were averaged on every two suc-
cessive days. Thus in twelve days of training sixpairs of scores were obtained for each observer.
Then, inferential analyses of the data were done
following the same statistical tools as in Experiment
1. One of the observers (O9) showing higher false
alarm than correct detection even at larger offsets
(i.e., response by guessing) was considered unreliable
and hence excluded from the analysis.
Results
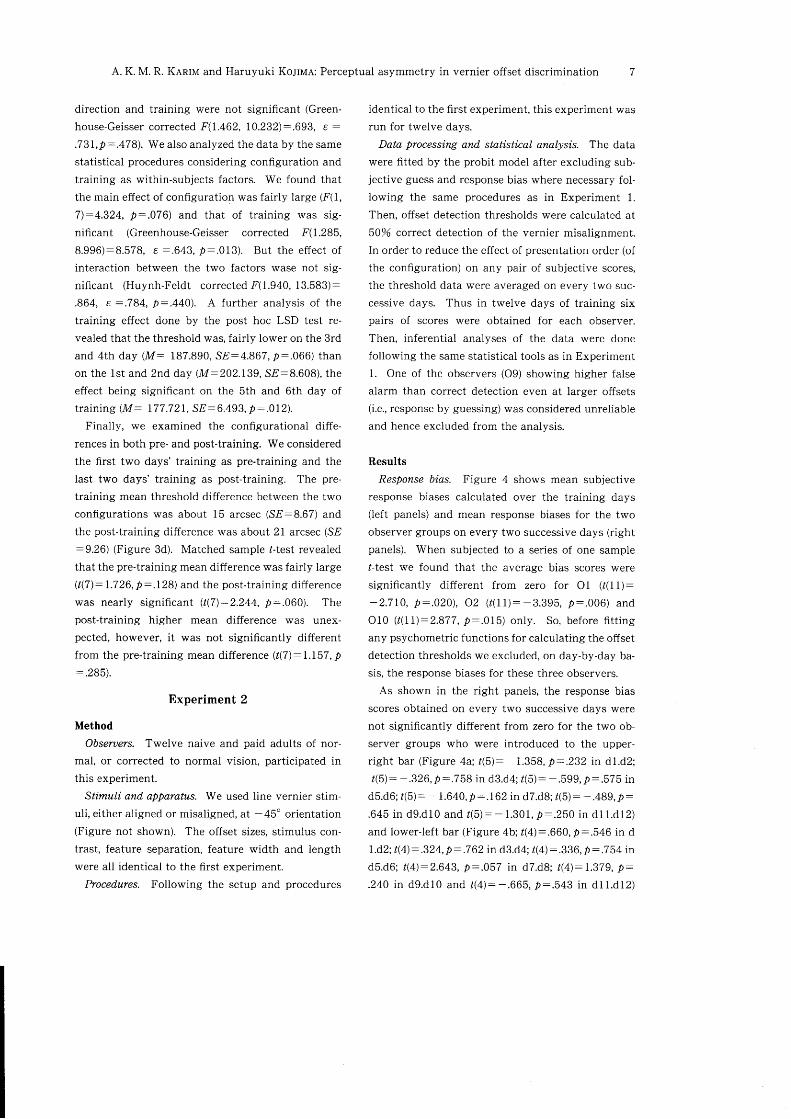
Response bias. Figure 4 shows mean subjective
response biases calculated over the training days
(left panels) and mean response biases for the twoobserver groups on every two successive days (rightpanels). When subjected to a series of one sample
/-test we found that the average bias scores were
significantly different from zero for 01 (t(11):
-2.7I0, p:.020), 02 (t!l):-3.395, 2:.006) and
010 ((11):2.877, D:.015) only. So, before fittingany psychometric functions for calculating the offset
detection thresholds we excluded, on day-by-day ba-
sis, the response biases for these three observers.
As shown in the right panels, the response bias
scores obtained on every two successive days were
not significantly different from zero for the two ob-
server groups who were introduced to the upper-
right bar (Figure 4a: t(5): - 1.358, D:.232 in dl.d2;
t(5): -.326, p:.758 in d3.d4; t(5): -.599, p:.575 ind5.d6;t(5): - I.640,P:.162 in d7.d3;t(5): -.489,P:.645 in dg.d10 and t(5):-1.301, D:.250 in d11.d12)
and lower-left bar (Figure 4b: t(4):.660, 2:.546 in dl.d2;[({):.324,P:.762 in d3.d4; /(4):.336, D:.754 ind5.d6; t(4):2.6nt, D:.057 in d7.d3; t(4):1.f,f$, p:.240 in dg.d10 and t(4): -.665, D:.543 in d11.d12)
The Japanese Journal of Psychonomic Science Vol. 29, No. I
-20
-20
(b)
Figure 4. Response biases (MeantCls) in Experiment 2. (a) Percent biases in the upper-right bardisplacement; Left panel-subjective biases of six observers; Risht panel-group mean biases on everytwo successive days of training. (b) Percent biases in the lower-left bar displacement; Left panel-subjective biases of other flve observers; Right panel-group mean biases on every two successive daysof training. The positive (*) and negative (-) values indicate biases to rightward and leftward offsetsrespectively. Error bars reflect 95% confldence intervals (CIs) of the mean differences.
20
Iroo-q.os0Ec&totr
t10oQ-oo0Dcoo.&toE
(a)
+Bias to
a-Bias to
n+Bias to
7-Bias to
n
TI
displacements respectively. The right panels also
indicate that the distribution of mean response bias
scores across the training days (whatever the degree)
was constantly leftward when the upper-right bar
was displaced (Figure 4a) and almost rightward
when the lower-left bar was displaced (Figure 4b).
These refer to the response biases toward an identi-
cal vernier configuration which did not reduce withtraining.
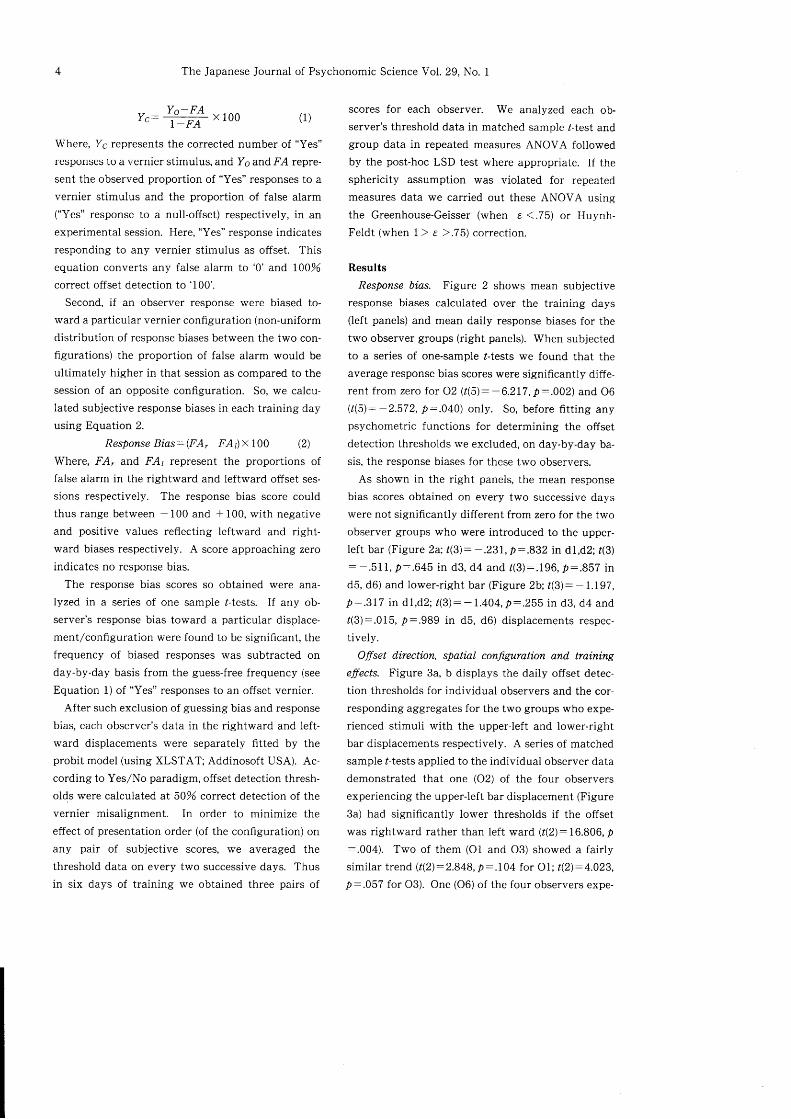
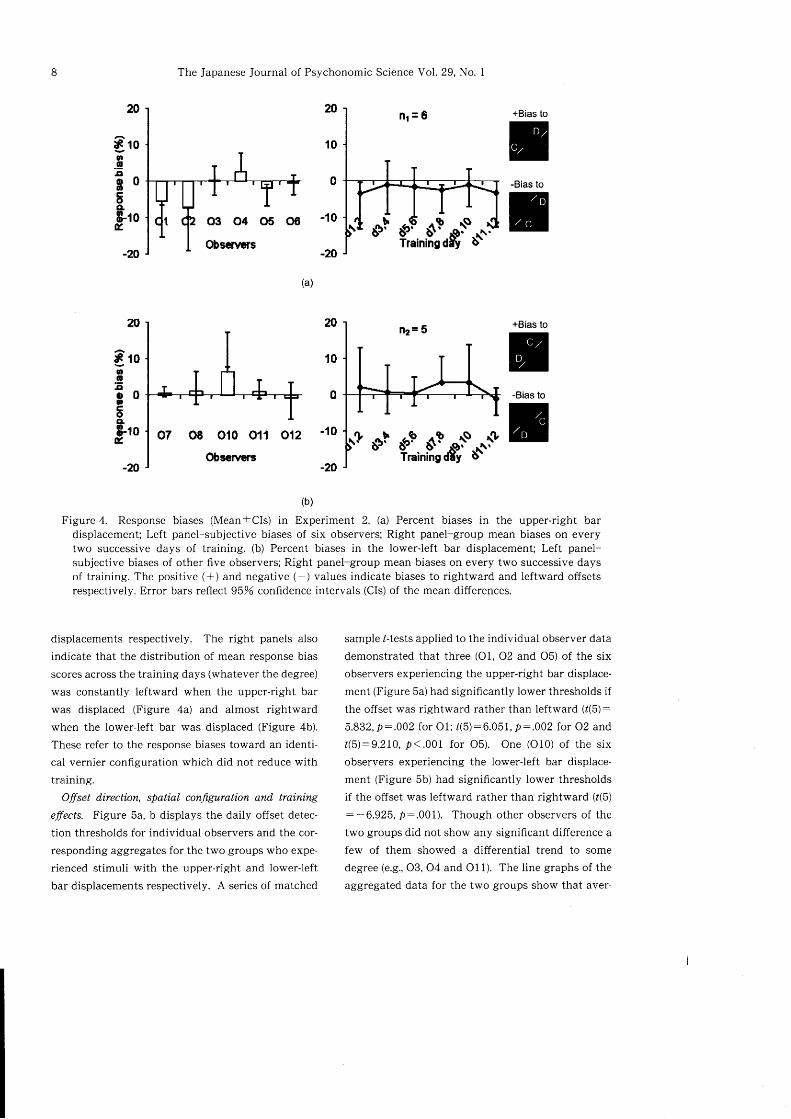
Offset direction, spatial confi,guration and training
effects. Figure 5a, b displays the daily offset detec-
tion thresholds for individual observers and the cor-
responding aggregates for the two groups who expe-
rienced stimuli with the upper-right and lower-left
bar displacements respectively. A series of matched
sample /-tests applied to the individual observer data
demonstrated that three (O1, 02 and 05) of the six
observers experiencing the upper-right bar displace-
ment (Figure 5a)had significantly lower thresholds ifthe offset was rightward rather than leftward (f(5):
5.832,0:.002 for 01; /(5):6.9Ut,p:.002 for 02 and
/(5):9.2f 0, 2<.001 for O5). One (O10) of the six
observers experiencing the lower-left bar displace-
ment (Figure 5b) had significantly lower thresholds
if the offset was leftward rather than rightward (t(5)
:-6.925, P:.001). Though other observers of the
two groups did not show any significant difference a
few of them showed a differential trend to some
degree (e.9., 03, 04 and O11). The line graphs of the
aggregated data for the two groups show that aver-
A. K. M. R. Kanru and Haruyuki Koltua: Perceptual asymmetry in vernier offset discrimination
$soott{J-8200
E''*o€oF
+*g; 2oo
100
0Gr,r-(o.6,9N-O(il!rE!,og=
Training dayE
300
200
100
o
300
2W
100
0
(rltfOcOOC,lr (tl lto!t!tEtlO)-
tl-Tralnlng daY o
t\tt(o@O(\t- rO lf) N -. --TrE'E l'gF
Training day o
(a)
Nt(o€oAt- C4l trfl 1\ '.'-E'T't'iJCD- E-
Trainlng day osssiE:
Tralnlng day o
GITt(oOONJ6.irirj---ttEl!tttol- ttF
Training day o
$tt(0@9(\iBsi;:tl-Training day D
C.l.t(OOOAI- (tl l4l F '-'-!t!ttttlOlr
Training d"T E
$tt(ooost- G! 14! N --'-EttEtl(D- tt-
Training day o
300
M100
0$tt(oooNF(qlLtN----tt!t!ttt(D- !t-
Tralnlng day E
300
200
100
0
*""-fi#. ax}
100
0
dffi*7$ttf(ooost- dl rf! t\ '- '-tt!tttE8=
Trainlrg day o
(b)
$sooH zoo
l-,ooog^F (rlt?(g€Om
-(DlOl\'-'-O!t!tECDr EFTralning day o
(d)(c)
\*
=ffiffi*7
_ O10 30oq1 -r,o't"of,-o) 2oo
100
0Gtt(oooolJriroFj---Etttttldrr E-
Training day E
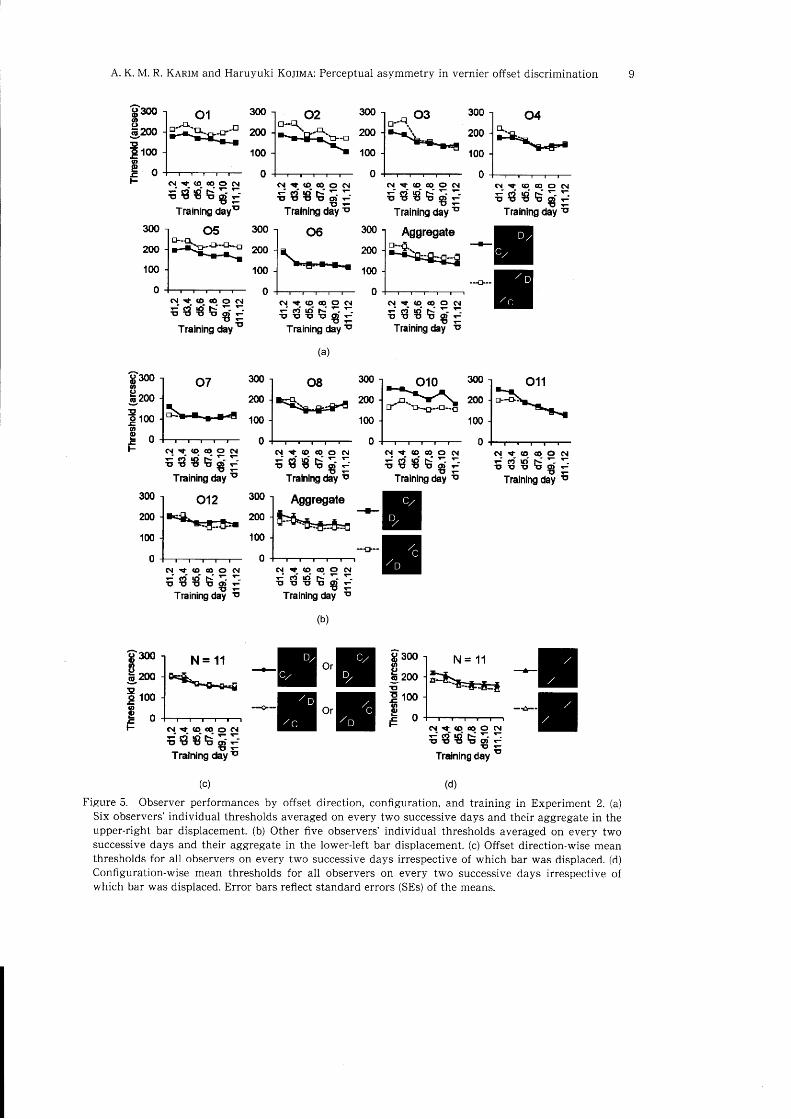
Figure 5. Observer performances by offset direction, conflguration, and training in Experiment 2. (a)
Six observers' individual thresholds averaged on every two successive days and their aggregate in theupper-right bar displacement. (b) Other five observers' individual thresholds averaged on every twosuccessive days and their aggregate in the lower-left bar displacement. (c) Offset direction-wise meanthresholds for all observers on every two successive days irrespective of which bar was displaced. (d)
Configuration-wise mean thresholds for all observers on every two successive days irrespective ofwhich bar was displaced. Error bars reflect standard errors (SEs) of the means.
1 200\+*.*-
1oo
N**.4 1oo
6'sooo(tE2oo
Er*oEoF c{*(ococrGt
- 04l ltl N'-'-t'DAEo)- tt-Tralnlry day u
10 The Japanese Journal of Psychonomic Science Vol. 29, No. 1
age thresholds were lower when the upper-right bar
was displaced to right (Figure 5a; right most last
panel) and the lower-left bar was displaced to left as
compared to the opposite displacements (Figure 5b;
right most last panel). This asymmetry was sig-
nificant in the upper right bar displacement (F(1,5):
10.902, 0:.021) and non-significant in the lower left
bar displacement F(I, 4):1.9I2, b:.239) scenarios.
However, the trends were configurationally identical
irrespective of which bar was displaced. This led us
to plot the grand averages by configuration (Figure
5d) in addition with plotting by offset direction (Fig-
ure 5c), taking training as a common factor.
As in Experiment 1, we analyzed the observers'
threshold data in two-way repeated measures
ANOVA which revealed that the main effect of offset
direction was non-significant (F(1, 10):.611, 2:.453). However, the main effects of both configur-
ation and training were significant (F(1, 10):10.595,
P:.009 for configuration, Greenhouse-Geisser cor-
rected F(2.628, 26.27 8) : 11.862, e : .526,p ( .00 1 for
training). The effect of their interaction was non-
significant (Greenhouse-Geisser corrected F(2.740,
27 ,402): 1.881, e : .548, p:.160). A further analysis
of the training effect done by the post hoc LSD test
revealed that the 5th and 6th days' mean threshold
(M:166.999, SE:8.102) was significantly lower
than the 1st and 2nd days' mean threshold (M:202.065, 5E:7.295,p<.001). This improvement was
maintained, on average, at the 7th and 8th (M:157.974, SE:8.512, p<.001), 9th and l}th (M:155.247, SE:8.590,p<.001) and 1lth and LZth (M:15I.246, SE:7 .425, p <.001) days' follow-ups.
Finally, we examined the configurational diffe-
rences in both pre- and post-training. We considered
the first two days' training as pre-training and the
last two days' training as post-training. The pre-
training average threshold difference between the
two configurations was about 36 arcsec, the diffe-
rence being reduced to 22 arcsec in the post-training
(Figure 5d). Matched sample t-test revealed that
both these mean differences were statistically sig-
nificant (t(10):4.309, p:.002 for pre-training, (t(10)
:2.393, 2 :.038 for post-training).
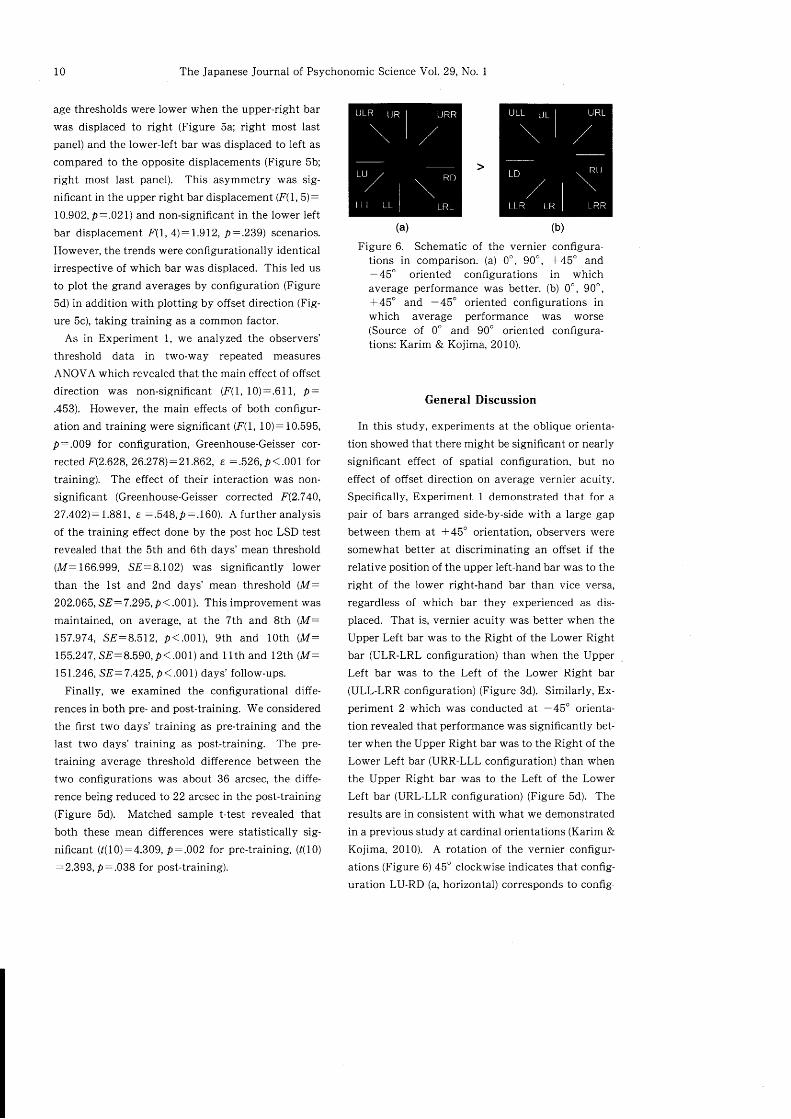
Figure 6. Schematic of the vernier configura-tions in comparison. (a) 0', 90', +45" and
- 45" oriented configurations in whichaverage performance was better. (b) 0', 90",+ 45" and - 45" oriented configurations inwhich average performance was worse(Source of 0" and 90' oriented configura-tions: Karim & Kojima,2010).
General Discussion
In this study, experiments at the oblique orienta-
tion showed that there might be signiflcant or nearly
significant effect of spatial configuration, but no
effect of offset direction on average vernier acuity.
Specifically, Experiment I demonstrated that for a
pair of bars arranged side-by-side with a large gap
between them at * 45" orientation, observers were
somewhat better at discriminating an offset if the
relative position of the upper left-hand bar was to the
right of the lower right-hand bar than vice versa,
regardless of which bar they experienced as dis-
placed. That is, vernier acuity was better when the
Upper Left bar was to the Right of the Lower Right
bar (ULR-LRL configuration) than when the Upper
Left bar was to the Left of the Lower Right bar
(ULL-LRR configuration) (Figure 3d). Similarly, Ex-
periment 2 which was conducted at -45o orienta-
tion revealed that performance was significantly bet-
ter when the Upper Right bar was to the Right of the
Lower Left bar (URR-LLL conflguration) than when
the Upper Right bar was to the Left of the Lower
Left bar (URL-LLR configuration) (Figure 5d). The
results are in consistent with what we demonstrated
in a previous study at cardinal orientations (Karim &
Kojima, 2010). A rotation of the vernier configur-
ations (Figure 6) 45" clockwise indicates that conflg-
uration LU-RD (a, horizontal) corresponds to conflg-
A. K. M. R. KnnIlt and Haruyuki Kolrue: Perceptual asymmetry in vernier offset discrimination 11
urations ULR-LRL (a, *45'), UR-LL (a, vertical), and
URR-LLL (a, -45") directly in mental representa-
tion. Similarly, conflguration LD-RU (b, horizontal)
represents configurations ULL-LRR (b, +45"), UL-
LR (b, vertical), and URL-LLR (b, -45"). Thus there
is no difference between the cardinal and oblique
trends of the configurational asymmetry.
Possible mechanisms of the asymmetry. As we have
excluded observers' guessing bias and response bias
prior to fitting psychometric functions and calculat-
ing thresholds, the asymmetry can be explained by
neither of these variables. The contribution of eye
movement is also unlikely as the stimulus duration
was very brief (100 ms). Nevertheless, if there had
been any eye movements it might not have any role
in vernier acuities (Kessy, 1960), because vernier
lines have internal orientation information and may,
therefore, be less susceptible to orientational or an-
gular noise created by head tilt or eye torsion
(Waugh & Levi, 1993). So, the present results
definitely refer to perceptual bias or preference.
As vernier acuity is accomplished by the activityin orientation tuned neural channels (Campbell &
Kulikowski, 1966;Phillips & Wilson, 1984), such per-
ceptual bias might originate from neural selectivity
for a specific orientation created by the feature offset
or for a specific vernier frame created by the lumi-
nance edges and other surrounding spatial cues. Vis-
ual response properties are thought to develop in
two distinct phases: an experience independent
phase in which the basic neural circuits become es-
tablished and organized into cortical maps, and a
subsequent phase of plasticity in which initial cir-
cuits are elaborated and refined by experience (Crair,
Gillespie, & Stryker, 1998; Hubel & Wiesel, 1963;
Katz & Crowley, 2002; Sengpiel & Kind, 2002). How-
ever, it is not clear in the present study whether the
reported perceptual bias/preference can be attrib-
uted to the first candidate because until today we do
not know any inborn corresponding asymmetry of
neural organizations in the visual cortex. The sec-
ond candidate instead explains the asymmetry better
because most aspects of spatial vision (e.g., vernier
acuity, grating acuity) are quite immature in the
human neonate (Skoczenski & Norcia, 1999)and neu-
ral organization of the human visual system may be
influenced by early visual experience (Freeman,
Mitchell, & Millodot,I972: Freeman & Thibos, 1973;
Mitchell, Freeman, Millodot, & Haegerstrom, 1973).
In our study, when a roughly 50% of the observers
showed more or less better performances in a par-
ticular vernier configuration, 1096 of them (O5 in
Exp.l and 08 in Exp.2) showed fairly an opposite
trend and the remaining 40% did not show any
asymmetry at all (Figure 3a,b; Figure 5a, b). This
might be because the experiential worlds which play
a critical role in visual development (Chapman, Go-
decke, & Bonhoeffer, 1999; Coppola & White, 2004)
are not necessarily equal for all.
The above statistics also remind us of an incidence
of handedness. Annett (1967) reported that the pro-
portions of left-handers, mixed-handers and right-handers are approximately 2-5%, 25.1-3796, and
58.4-71.5%. As is often argued on the causality of
handedness, some kind of genetic factors, evolu-
tional/developmental factors such as language later-
ality, as well as cultural factors such as the prejudice
against left-handed, might be related to perceptual
asymmetry. However, because the present study
lacks in handedness data it is difficult to answer
whether the asymmetric vernier performance can be
associated with handedness or cerebral lateraliza-
tion. The existing literature in visual psychophysics
or visual neurology also cannot explain the phe-
nomenon directly. Nonetheless, we can get impor-
tant clues of the underlying reason from some re-
lated studies (Freimuth & Wapner, 1979; Levy, 1976.,
Mead & Mclaughlin, 1992). These studies have
shown importance of handedness in other visuospa-
tial tasks, with considerable performance variation
being found between dextrals and sinistrals. Spe-
cifically, in a study of aesthetic judgment of pictures
Levy (1976) found that asymmetric pictures judged
to have centers of interest to the right of the center
were preferred over their enantiomorphs (mirror-
reversed pictures), the effect being true for dextrals,
but not for sinistrals. Levy (1976) explained her
findings by the hemispheric activation model which
suggests that differential activation of a hemisphere
produced an attentional orientation bias to the con-
L2 The Japanese Journal of Psychonomic Science Vol. 29, No. I
tralateral visual field (cf. Kinsbourne,l9T4). Assum-
ing that the right hemisphere is more activated than
the left hemisphere when a dextral is engaged in
visuospatial task, she argued that such an atten-
tional bias to the left visual field would make a
symmetrical picture look unbalanced. If, on the
other hand, a picture were asymmetric in the direc-
tion opposite to the attentional bias, the net percep-
tual result would be a state of balance and the aes-
thetic response would be positive. Pictures that have
areas of greater interest or weight in their righthalves are then preferred because their asymmetries
counteract the asymmetry produced by the atten-
tional bias to the left visual fleld. Freimuth and
Wapner (1979), on the other hand, reported that dex-
tral subjects preferred paintings with left-to-right
directional properties. According to them, direc-
tional cues that suggest a left-to-right sequence may
draw attention to the rightward portions of the pic-
ture, but unlike Levy's view such an attentional
draw need not necessarily create the perceptual bal-
ance. Freimuth and Wapner's model can explain the
results of the present study better than does the
model of Levy. In our study, we have shown that a
large part of the observers performed better in the
rightward asymmetry (offset) of the vernier stimuli
at both *45' and -45o orientations. In addition, a
small part of the observers showed an opposite trend.
This led us to assume that for a visuospatial stimulus
suggesting directional cues, visual attention proba-
bly becomes clockwise (left-to-right directional) bi-
ased in the dextrals and anticlockwise (right-to-left
directional) biased in the sinistrals. In line with this
hypothesis, Mclaughlin, Dean, and Stanley (1983)
reported that dextral subjects preferred asymmetric
paintings that contained a rightward position of the
area of major interest and that sinistrals behaved in
an exactly opposite fashion. Similarly, Mead, and
Mclaughlin (1992) demonstrated that paintings con-
taining left-to-right directional cues were preferred
by both dextrals and inverted sinistrals. However,
the phenomenon is still unclear and needs further
investigation to generalize to other visuospatial
stimuli as such as vernier stimuli.
Possible mechanisms of the orientation-inuariance.
By definition, the line vernier features represent cate-
gorical (e.g., above/below, left/right), not coordinate(exact distances) spatial relation (cf. Kosslyn, 1987).
The categorical spatial relations afford invariant ab-
stract spatial relations useful for viewpoint inde-
pendent object recognition and prototypical spatial
location coding (Bullens & Postma, 2008; Jager &
Postma, 2003; Kosslyn, 1987). This invariance is
possibly achieved at some stage(s) of higher level of
cortical processing. Early cortical neurons having
small receptive fields show selectivity for specific
stimulus orientation and motion direction (Hubel &
Wiesel, 1968) and for specific spatial and temporal
frequency of luminance gratings (DeValois, Albrecht,
& Thorell, 1982: Foster, Gaska, Nagler, & Pollen,
1985;Holub & Morton-Gibson, 1981). Higher cortical
neurons, in contrast, have large receptive fields and
respond preferentially to particular shapes, textures
or patterns of complex objects (e.g., David, Hayden, &
Gallant, 2006 Hegd6 & Essen, 2000; Kobatake &
Tanaka, 1994; Logothetis, Pauls, & Poggio, 1995;
Merigan & Pham, 1998; Pasupathy & Connor, 2001;
Sheinberg & Logothetis, 2001; Tamura & Tanaka,
2001). In addition, unlike early visual (lower level)
processing which is orientation-specific in favor of
the cardinal (e.g., Campbell et al., 1966; Furmanski &Engel,2000;Saarinen & Levi, 1995b; Skrandies et al.,
2001: Westheimer & Beard, 1998), late (higher level)
processing is normally orientation-invariant (e.g.,
Biederman & Cooper, 1991; Biederman & Gerhard-
stein, 1993; McMullen & Farah, 1991; Murray, Joli-
coeur, McMullen, & Ingleton, 1993; Takano, 1989;
Tarr & Pinker, 1990). These differential response
properties of lower and higher level cortical neurons
led us to assume two possibilities for the orientation-
invariant configurational preference in our study.
One possibility is that the preference might occur
primarily at early stages of processing the spatial
frame structured by the luminance edges of the ver-
nier bars and other surrounding spatial connections.
Once the preference is thus gained for a specific
configuration the signal is then dispatched to subse-
quent higher stage(s) where it is controlled by orien-
tation-invariant mechanism. Alternatively, the pref-
erence might be directly mediated by configuration-
A. K. M. R. KanIn and Haruyuki Kotlrue: Perceptual asymmetry in vernier offset discrimination 13
seiective higher order processing which is orienta-
tion-invariant. The higher cortical neurons respond
not only to complex objects, but also to simple stim-
uli such as edges and bars (Cadieu, Kouh, Pasupathy,
Connor, Riesenhuber, & Poggio, 2007: Desimone &
Schein, 1987; Desimone, Albright, Gross, & Bruce,
1984; Pollen, Przybyszewski, Rubin, & Foote, 2002)
as in our study. The role of higher cortex to achieve
vernier acuity has also been suggested in previous
studies (c.f., Beard, Levi, & Klein , lgg7: Saarinen &Levi, 1995a,b; Sterken, Toet, & Yap, 1994) claiming
that the neurons on higher levels of processing may
use complex features to discriminate vernier offsets
(Fahle, 2004). Thus, a higher order mechanism is
suggested to operate either directly or indirectly to
achieve conflguration preference invariantly at diffe-
rent orientations.
Learning uernier acuity and configurational asymme-
try. Training improved vernier performance sig-
nificantly, but inter-individual differences were strik-
ing in our study. In the first experiment, for example,
02, 03 and 05 showed remarkable fall of vernier
thresholds in the course of training whereas 01 and
07 did not show any improvement (Figure 3a,b). The
large individual variations were also observed withextended period of training (Figure 5a,b; Exp.2). This
is in agreement with the previous similar kind of
studies (Fahle & Edelman, 1993; Karim & Kojima,
2QIQ; McKee & Westheimer, 1978; Saarinen & Levi,
1995a). For instance, McKee and Westheimer (1978)
reported that after 2000-2500 trials, the range of the
individual decrease in vernier thresholds was from
2% to 70%. An important aspect of the present
findings is that average vernier acuity improved
with training, but configurational differences per-
sisted from the beginning to the end of training
course in both the experiments (Figure 3d; Figure
5d). In addition, we unexpectedly found a littlehigher post-training mean difference than the pre-
training mean difference in Exp.l (not in Exp.2).
These demonstrations make an important difference
from our previous study in which the mean asymme-
try markedly decreased with at least extended period
of training (Karim & Kojima, 2010). This implies
that the asymmetry in oblique orientation is less
sensitive to training than the asymmetry in cardinal
orientation. it can be interpreted by the same mecha-
nism of the oblique effect (Furmanski & Engel, 2000).
That is, a much lower percentage of Vl neurons are
tuned to oblique than to cardinal orientation (Cop-
pola, White, Fitzpatrick, & Purves, 1998; DeValois,
Yund, & Hepler, 1982: Furmanski & Engel, 2000; Li,
Peterson, & Freeman, 2003). In addition, neurons
with oblique preferences exhibit wider orientation
tuning widths than neurons with cardinal prefer-
ences (Kennedy & Orban, 1979: Nelson, Kato, &Bishop, 1977;Orban & Kennedy, 1981;Rose & Blake-
more, I97 4). Thus, the asymmetry might reduce
with training at a slower rate in the oblique than in
the cardinal orientation.
In brief, consistent with our previous study incardinal orientation (Karim & Kojima, 2008, 2010)
the present study demonstrated configuration-specifi
response property in oblique orientation. However,
unlike the previous study we did not find here any
diminishing trend of the average asymmetry withtraining, indicating a cardinal versus oblique orienta-
tion difference in response to training. Though we
do not know clearly about the origin of the asymmet-
ric response, the results advance our understanding
that the relationship between vernier elements even
of simple configuration might be crucial for visual
spatial judgment.
Acknowledgements
This work was supported by the grants from Ka-
nazawa University COE program: Innovative Brain
Science; initiated by the Japan Ministry of Educa-
tion, Culture, Sports, Science and Technology. We
sincerely thank the anonymous reviewers who made
a number of constructive comments to improve the
quality of this paper.
References
Adams, W. J., Graf, E. W., & Ernst, M. O. (2004). Expe-rience can change the 'light-from-above' prior. Na-ture Neuroscience, 7, 1057-1058.
Annett, M. (1967). The binominal distribution ofright, mixed and left handedness. Quarterly Journalof Experimental Psychology, 19, 327-333.
Appelle, S. (1972). Perception and discrimination as a
L4 The Japanese Journal of Psychonomic Science Vol. 29, No. I
function of stimulus orientation: the "obliqueeffect" in man and animals. Psychological Bulletin,78,266-278.
Beard, B. L., Levi, D.M., & Klein, S. A. (1997). Vernieracuity with non-simultaneous targets: the corticalmagnification factor estimated by psychophysics.Vision Research, 37, 325-346.
Biederman, L, & Cooper, E. E. (1991). Evidence forcomplete translational and reflectional invariancein visual object priming. Perception,20, 585-593.
Biederman,I., & Gerhardstein, P. C. (1993). Recogniz-ing depth-rotated objects: evidence and conditionsfor three-dimensional viewpoint invariance. Jour-nal of Experimental Psychology: Human Perceptionand Performance, 19, I | 62-l LBz.
Bouma, H., & Andriessen, J. J. (1968). Perceived orien-tation of isolated line segments. Vision Research, S,
493-507.Bullens, J., & Postma, A. (2008). The development of
categorical and coordinate spatial relations. Cogni-tiue Deueloprlent, 29, 38-47 .
Cadieu, C., Kouh, M., Pasupathy, A., Connor, C. E.,
Riesenhuber, M., & Poggio, T. (2007). A model of V4 shape selectivity and invariance. Journal of Neu-rophysiology, 98, 1 733-1 750.
Campbell, F. W., & Kulikowski, J. J. (1966). Orienta-tional selectivity of the human visual system. Jour-nal of Physiology, 187, 437-445.
Campbell, F. W., Kulikowski, J. J., & Levinson, J.(1966). The effect of orientation on the visual reso-lution of gratings. Journal of Physiology,l87,427-436.
Champion, R. A., & Adams, W. J. (2007). Modificationof the convexity prior but not the light-from-aboveprior in visual search with shaded objects. Journalof Vision, T(13): 10, 1-10.
Chapman, B., Godecke, I., & Bonhoeffer, T. (1999).Development of orientation preference in the mam-malian visual cortex. Journal of Neurobiology, 41,LB-24.
Coppola, D. M., & White, L.E. (2004). Visual experi-ence promotes the isotropic representation of ori-entation preference . Visual Neuroscience, 21,39-5 1 .
Coppola, D. M., White, L. E., Fitzpatrick, D., & Purves,D. (1998). Unequal representation of cardinal andoblique contours in ferret visual cortex. Proceed-ings of the National Academy of Sciences of theUnited States of Amertca, 95, 2621-2623.
Craig, E. A., & Lichtenstein, M. (1953). Visibility-invisibility cycles as a function of stimulus-orientation. American Journal of Psychology, 66,554-563.
Crair, M. C., Gillespie, D. C., & Stryker, M. P. (1998).The role of visual experience in the development ofcolumns in cat visual cortex. Science,279,566-570.
David, S. V., Hayden, B. Y., & Gallant, J. L. (2006).
Spectral receptive field properties explain shapeselectivity in area Y4. Journal of Neurophysiology,96, 3492-3505.
Desimone, R., Albright, T. D., Gross, C. G. & Bruce, C.
(1984). Stimulus-selective properties of inferiortemporal neurons in the macaque./ournal of Neuro,science, 4, 2051-2062.
Desimone, R., & Schein, S. J. (1987). Visual propertiesof neurons in area V4 of the macaque: sensitivityto stimulus form. Journal of Neurophysiology, 57,835-868.
DeValois, R. L., Albrecht, D. G., & Thorell, L. G. (1982).Spatial frequency selectivity of cells in macaquevisual cortex. Vision Research, 22, 545-559.
DeValois, R. L., Yund, E. W., & Hepler, N. (1982). Theorientation and direction selectivity of cells in ma-caque visual cortex. Vision Research, 22, 531-544.
Fahle, M. (2004). Perceptual learning: A case for earlyselection. Journal of Vision,4, 879-890.
Fahle, M., & Edelman, S. (1993). Long-term learningin vernier acuity: effects of stimulus orientation,range and of feedback. Vision Research,33, 397-412.
Foster, K. H., Gaska, J. P., Nagler, M., & Pollen, D. A.(1985). Spatial and temporal frequency selectivityof neurones in visual cortical areas Vl and Y2 otthe macaque monkey. Journal of Physiology,365,331-363.
Freeman, R. D., & Thibos, L. N. (1973). Electrophysio-logical evidence that abnormal visual experiencecan modify the human brain. Science, 180, 876-878.
Freeman, R. D., Mitchell, D. E., & Millodot, M. (1972).A neural effect of partial visual deprivation inhumans. Science, L75, 1384-1386.
Freimuth, M., & Wapner, S. (1979). The influence oflateral organization on the evaluation of paintings.British Journal of Psychology, TS, 21 1-218.
Furmanski, C. S., & Engel, S. A. (2000). An obliqueeffect in human primary visual cortex. Nature Neu-roscience, S,535-536.
Greene, E., Frawley, W., & Swimm, R. (2000).lndivid-ual differences in collinearity judgment as a func-tion of angular position. Perception and Psychophys-ics,62, I440-1458.
Hegd6, J., & Van Essen, D. C. (2000). Selectivity forcomplex shapes in primate visual area Y2. Journalof Neuroscience,20, RC61, 1-6.
Holub, R.4., & Morton-Gibson, M. (1981). Responseof visual cortical neurons of the cat to movingsinusoidal gratings: Response contrast functionsand spatiotemporal interactions. Journal of Neuro-physiology, 46, 1244-1259.
Hubel, D. H., & Wiesel, T. N. (1963). Receptive fields ofcells in striate cortex of very young, visually inex-perienced kittens. Journal of Neurophysiology, 26,
A. K. M. R. Knnru and Haruyuki KolIue: Perceptual asymmetry in vernier offset discrimination 15
994-t002.Hubel, D. H., & Wiesel, T. N. (1968). Receptive fields
and functional architecture of monkey striate cor-tex. Journal of Physiology, L95,215-243.
Jager, G., & Postma, A. (2003). On the hemisphericspecialization for categorical and coordinate spa-
tial relations: a review of the current evidence.Neuropsychologia, 41, 504-b 1 5.
Jastrow, J. (1893). On the judgment of angles andpositions of lines. American Journal of Psychology,
5,214-248.Karim, A. K. M. R., & Kojima, H. (2008). Visual spatial
discrimination: a phenomenon affected by simplestimulus configuration. Proceedings from JPA'08:The 72nd Annual Conuention of the Ja0anese Psycho-
logical A s sociation (p. 50 4). Hokkaido: Sapporo.Karim, A. K. M. R., & Kojima, H. (2010). Configur-
ational asymmetry in vernier offset detection.,4d-uances in Cogni,tiue Psychology, 6, 66-78.
Katz, L. C., & Crowley, J. C. (2002). Development ofcortical circuits: lessons from ocular dominancecolumns. Nature Reuiew s Neuroscience, 3, 3 4-42.
Keesey, U. f. (tgOO). Effects of involuntary eye move-ments on visual acuity, Journal of the O|tical Soci'ety of America, 50, 769-77 4.
Kennedy, H., & Orban, G. A. (1979). Preferences forhorizontal or vertical orientation in cat visual cor-tical neurons [proceedings]. Journal of Physiology,296,6t-62.
Kinsbourne, M. (1974). Direction of gaze and distribu-tion of cerebral thought processes. Neuropsycholo-gia, L2,279-28L
Kobatake, E., & Tanaka, K. (1994). Neuronal selectivi-ties to complex object features in the ventral visualpathway of the macaque cerebral cortex. Journal ofNeurophy sio logy, 7 1, 856-86 7.
Kosslyn, S. M. (1987). Seeing and imagining in thecerebral hemispheres: a computational approach.Psychological Reuieu, 94, I 48-17 5.
Leibowitz, H. W. (1953). Some observations and the-ory on the variation of visual acuity with orienta-tion of the test object. Journal of the O|tical Society
of America, 43, 902-905.Leibowitz, H. W., Meyers, N.4., & Grant, D. A. (1955).
Radial localization of a single stimulus as a func-tion of luminance and duration of exposure. Jour-nal of the Optical Society of America, 45,76-78.
Levy, J. (1976). Lateral dominance and aesthetic pref-erence. Neuropsychologia, 14, 431-445.
Li, 8., Peterson, M. R., & Freeman, R. D. (2003). Obl-ique effect: a neural basis in the visual cortex.
Journal of NeuroDhysiology, 90, 204-217 .
Logothetis, N. K., Pauls, J., & Poggio, T. (1995). Shaperepresentation in the inferior temporal cortex ofmonkeys. Current Biology, 5, 552-563.
Mamassian, P., Jentzsch, L, Bacon, B. A., & Schwein-
berger, S. R. (2003). Neural correlates of shape fromshading. NeuroReport, l4(7), 97l-97 5.
Mckee, S. P., & Westheimer, G. (1978). Improvementin vernier acuity with practice. Perception and Psy-
chophysics, 24, 258-262.Mclaughlin, J. P., Dean, P., & Stanley, P. (1983). Aes-
thetic preference in dextrals and sinistrals. Neurop-sychologia, 21, I 47 -I53.
McMullen, P. A., & Farah, M. J. (1991). Viewer-centred and object-centred representations in therecognition of naturalistic line drawings. Psycho-logical Science, 2, 27 5-27 7
Mead, A. M., & Mclaughlin, J. P. (1992). The roles ofhandedness and stimulus asymmetry in aestheticpreference . Brain and Cognition, 2O, 300-307.
Merigan, W. H., & Pham, H. A. (1998). V4 lesions inmacaques affect both single- and multiple-viewpoint shape discriminations. Visual Neurosci-ence, 15,359-367.
Mitchell, D. E., Freeman, R. D., Millodot, M., & Haeger-strom, G. (1973). Meridional amblyopia: evidencefor modification of the human visual system byearly visual experience. Vision Research, f 3, 535-558.
Murray, J. E., Jolicoeur, P., McMullen, P. A., & Ingle-ton, M. (1993). Orientation-invariant transfer oftraining in the identification of rotated naturalobjects. Memory and Cognition, 21, 604-6 1 0.
Mustillo, P., Francis, E., Oross, S., Fox, R., & Orban, G.
A. (1988). Anistropies in global stereoscopic orien-tation discrimination. Vision Research, 28, 1315-1321.
Nelson, J.I., Kato, H., & Bishop, P.O. (L977). Discrimi-nation of orientation and position disparities bybinocularly activated neurons in cat striate cortex.
Journal of Neurophysiology, 40, 260-283.Orban G. A., & Kennedy, H. (1981). The influence of
eccentricity on receptive field types and orienta-tion selectivity in areas LT and 1B of the cat. BrainResearch, 208, 203-208.
Pasupathy, A., & Connor, C. E. (2001). Shape repre-sentation in area V4: position-specific tuning forboundary conformation. Journal of Neuro?hysiol-ogy,86, 2505-2519.
Phillips, G. C., & Wilson H. R. (1984). Orientation ban-dwidths of spatial mechanisms measured by mask-ing. Journal of the Optical Society of America A, \,226-232.
Pollen, D. A., Przybyszewski, W., Rubin, M.4., &Foote, W. (2002). Spatial receptive field organiza-tion of macaque V4 neurons. Cerebral Cortex, L2,
60 1-6 1 6.
Regan, D., & Price, P. (1986). Periodicity in orienta-tion discrimination and the unconfounding of vis-ual information. Vision Research, 26, 1299-1302.
Rose, D., & Blakemore, C. (197 4). An analysis of orien-
16 The Japanese Journal of Psychonomic Science Vol. 29, No. 1
tation selectivity in the cat's visual cortex. Experi-mental Brain Research, 20, l-17 .
Saarinen, J., & Levi, D. M. (1995a). Perceptual learn-ing in vernier acuity: what is learned ? VisionResearch, 35, 519-527.
Saarinen, J., & Levi, D. M. (1995b). Orientation anisot-ropy in vernier acuity. Vision Research,35, 2449-2461.
Sengpiel, F., & Kind, P. C. (2002). The role of activityin development of the visual system. Current Biol-ogy, 12, R81B-R826.
Sheinberg, D. L., & Logothetis, N. K. (2001). Noticingfamiliar objects in real world scenes: the role oftemporal cortical neurons in natural vision. Journalof Neuroscience, 21, 1 340-1 350.
Sittig, A. C., & De Graaf, J. B. (1994). Orientation de-pendent misalignments in a visual adjustmenttask. Vision Research, 34, 2195-2203.
Skoczenski, A. M., & Norcia, A. M. (1999). Develop-ment of VEP Vernier Acuity and Grating Acuity inHuman Infants. Inuestigatiue Ophthalmology andVisual Science, 40, 24Il-2417 .
Skrandies, W., Jedynak, A., & Fahle, M. (2001). Per-ceptual learning: psychophysical thresholds andelectrical brain topography. International Journal ofPsycho0hysiology, 41, I 19-129.
Sterken, Y., Toet, 4., & Yap, Y. L. (1994). Factorslimiting large-scale localization. Percepti,on, 23,
709-726.Sulzer, R., & Zener, K. (1953). A quantitative analysis
of relations between stimulus determinants andsensitivity of the visual perception of parallelness.American Psychologist, 8, 444.
Sun, J., & Perona, P. (1998). Where is the sun? NatureNeuroscience, 1, 183-1 84.
Takano, Y. (1989). Perception of rotated forms: a
theory of information types. Cognitiue Psychology,21, 1-59.
Tamura, H., & Tanaka, K. (2001). Visual responseproperties of cells in the ventral and dorsal parts ofthe macaque inferotemporal cortex. Cerebral Cor-
tex, 11,384-399.Tarr, M. J., & Pinker, S. (1990). When does human
object recognition use a viewer-centred referenceframe ? Psychological Science, L, 253-256.
Waugh, S. J., & Levi, D. M. (1993). Visibility and ver-nier acuity of separated targets. Vision Research,33, 539-552.
Westheimer, G., & Beard, B. L. (1998). Orientationdependency for foveal line stimuli: detection andintensity discrimination, resolution, orientationdiscrimination and vernier acuity. Vision Research,38,1097-1103.
-Received Oct.7,2009; Accepted July 12,2010-


