Embed Size (px)
Citation preview

Irrigation and Drainage Systems 7: 161-172, 1993 © 1993 Kluwer Academic Publishers. Printed in the Netherlands
Performance of an automatic upstream controlled irrigation system: conveyance efficiencies
M. R I J O 1 & A.B. A L M E I D A 2
1Department of Agricultural Engineering; 2Department of Civil Engineering, Technical University of Lisbon, Tapada da Ajuda, 1399 Lisboa Codex, Portugal
Received 15 October 1992; accepted 2 June 1993
Key words: conveyance efficiencies, flow control, irrigation systems management, performance, upstream control
Abstract. This paper presents a study of conveyance efficiencies in the Sorraia Irrigation Project, Portugal. The Irrigation Project is briefly described and flow measurement techniques are analysed. Results show that efficiencies are higher during week days and normal labour hours and lower during weekends and at night. Water losses are higher than in other similar systems and the main reason is the substitution of the flow rotation method by restricted arranged schedules. An improvement process for saving water and accommodating deliveries to demands is also briefly presented.
I n t r o d u c t i o n
The main purpose o f irrigation systems is to deliver water with equity and max-
imum efficiency, as close as possible to the demand. The delivery schedules
must consider the desired delivery rates, delivery times, dura t ion o f delivery
and the time required for water to travel to the delivery points.
Some years ago, it was though that the best way to improve the per formance
of an irrigation system was to develop on- fa rm water management facilities. However , it soon became clear that an adequate and timely water delivery by the main system is a prerequisite for increasing irrigation per formance (Reddy
1990).
The need of new methods and technologies for opera t ion o f delivery sys-
tems, in order to provide the best use o f water resources, has stimulated several
research projects. In Por tugal , a p rog ram for improvement o f irrigation sys- tems, including their opera t ion and management , started a few years ago. The
Sorraia Irr igat ion Projec t (Fig. 1), an upst ream controlled system, is an ex- ample o f this effort (Rijo 1986; Rijo 1990).
Ups t ream control is one o f the mos t widely used regulation methods for irri-
gat ion canals with rigid delivery rules. As there is no storage capacity in the

162
. • N "~ ]~/ / ( ~ I r n g a t l o n M a n a g e m e n t C e n t e r
O D i s c h a r g e C o n t r o l sec t ion
[ ~ ~ Irva'~:YJ/ ........ Oana, ~ / A
Benav te C a n~~l or r ive r
C o r u c h ~ dato
o r r a i a r lver
sc. -~ 1 : 300000
Fig. 1. Scheme of the Sorraia Irrigation Project canal network.
canals, the water distribution must be predicted and programmed in advance (Cunge & Woolhiser 1975).
In Portugal, social reasons, among others, led to a substitution of the rota- tion method by the restricted prearranged schedules (Replogle 1984): system management then became more complicated and the performance of the con- veyance became poor (Rijo & Pereira 1987). Most of the irrigation canal sys- tems are still empirically operated according to personal judgements. In the particular case study here presented, the system manager does not know the in- flow rates and, in order to be sure that deliveries match demands in all delivery points, he operates the system, most of the time, at full canal capacity so that over-deliveries are common.
A knowledge of the real conveyance efficiencies and water losses is helpful in order to support management and to stimulate the system modernization. This paper presents a performance analysis of the conveyance system of the Sorraia Irrigation Project. This study was made during two irrigation seasons (1987, 1988).
General description of the Sorraia Irrigation Project
The Sorraia Irrigation Project is situated along the narrow alluvial valley of River Sorraia, a tributary of River Tejo, near Lisbon (Fig. 1).
The inflow to the system comes from two large upstream dato reservoirs (Table 1). Water is conveyed by an open lined canal system (main and secon- dary canals). Automatic constant upstream water level AMIL radial gates (Bauzil 1952; Kraatz & Mahajan 1975) provide potential good operating condi- tions for the Neyrpic orifice module intakes to secondary canals, to distribu- taries and to fields.

Table 1. Main characteristics of the Sorraia Irrigation Project.
163
Storage volumes: Maranhäo dam 180.9 × 10⁶ m 3 Montargil dam 142.7 × 10⁶ m 3
Network: Open eanal conveyance system:
Main system 65.2 km Canal Salvaterra 17 km Other canals 30.7 km
Open canal distribution system 98.9 km Low pressure pipe distributors 171.6 km Main open drains and collectors 134.5 km
Regulators: AMIL gates 303 AVIS gares* 85 Modules 567 Outlets to farms 2026
Farmers 2000 Operational and maintenance personnel 90
Total irrigated areas (mean of 1987-1988): Rice 6916 ha Corn 3793 ha Tomato 1304 ha Other crops 2257 ha TOTAL 14270 ha
Canal Salvaterra irrigation area (mean of 1987-1988) 1500 ha
* Outside of canals, immediately upstream of the offtakes, where the water level within canals change very much.
The i r r iga ted areas and the ma in crops are given in Tab le 1.
The sys tem was or ig ina l ly (1959) des igned for a ro t a t i on m e t h o d o f del ivery
wate r to f a rms . However , res t r ic ted a r r anged schedules, wi th f ixed del ivery
ra te and du ra t i on as descr ibed by Replogle (1984), were es tabl ished. W i t h this
new del ivery schedule , the row crops were i r r iga ted dur ing the n o r m a l l abou r
hours and l a b o u r days accord ing to es tabl i shed agreements , wi th the d i tchr ider
in charge o f each d i s t r ibu ta ry . Rice fields were i r r iga ted using a con t inuous
water app l i ca t ion , which wate r was mos t ly app l i ed dur ing o f f l a b o u r hours .
Flow measurements
In o rde r to es tabl ish the i n f low-ou t f l ow ba lance o f the conveyance system, all
inf lows and del ivered ou t f lows were measu red and r eco rded in four canals (at
Mon ta rg i l , F u r a d o u r o , So r r a i a and Sa lva te r ra canals , Fig. 1) dur ing the two
i r r iga t ion seasons.
164
Main system inflows
The main system does not have a f low measuring device at the inlet structures. Thus, the system manager does not know the true inflow rates: the system has been operated according to his qualitative and empirical accumulated ex- perience.
In this study, measurements were made at the two inlet structures for evalua- tion o f the f low rates:
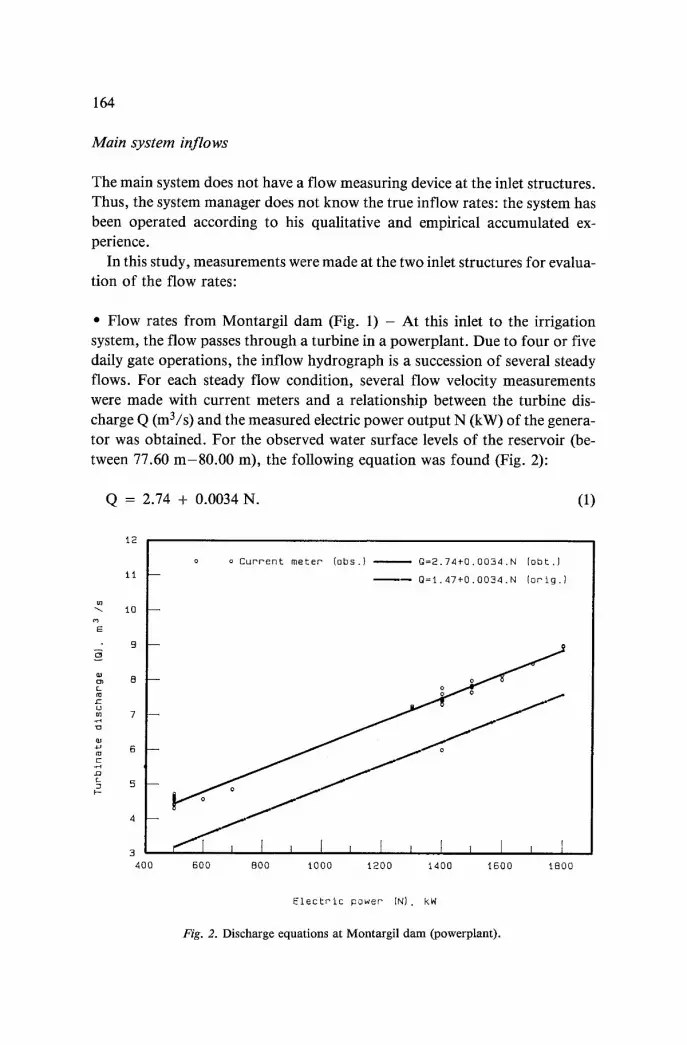
• Flow rates from Montargil dam (Fig. 1) - At this inlet to the irrigation system, the f low passes tbrough a turbine in a powerplant. Due to four or five daily gate operations, the inf low hydrograph is a succession o f several steady flows. For each steady f low condition, several f low velocity measurements were made with current meters and a relationship between the turbine dis- charge Q (m3/s) and the measured electric power output N (kW) of the genera- tor was obtained. For the observed water surface levels o f the reservoir (be- tween 77.60 m - 8 0 . 0 0 m), the fol lowing equation was found (Fig. 2):
Q = 2.74 + 0.0034 N. (1)
~.2
%
g
5 to
c
t l - -
1 0 - -
9 - -
8 - -
7 - -
6 - -
5 - -
4 - -
3
4OO
o o C u r r e n t m e t e r ( o b s . ) Q = 2 . 7 4 + 0 . 0 0 3 4 . N ( o b t . )
Q = I . 4 7 + 0 . 0 0 3 4 , N ( o r i g . )
600 800 t 0 0 0 t 2 0 0 t 4 0 0 1 6 0 0 i S 0 ü
E l e c t r i c p o w e r (N) kW
Fig. 2. Discharge equations at Montargil dam (powerplant).

165
Originally (1959), the equation for the relationship was (Fig. 2):
Q = 1.47 + 0.0034 N. (2)
Equation 2 was obtained when the irrigation system and the power-plant were new. The difference seems to be caused by the decreasing efficiency of the powerplant equipmënt.
• Flow rates from Furadouro diversion dato (Fig. 1) - The second inlet of the main system is at the Furadouro diversion dam (without any storage capacity), where the lined canal begins. The main canal between Maranhäo and Furadouro (Fig. 1) is the natural river, which was not included in this analysis.
At the head of the main canal, there is a sluice gate for which the following discharge equation is valid:
Q = 14.10 a ~fYl - Y2, (3)
where a = gate opening height (m); Yl = upstream water depth (m); Y2 = downstream water depth (m) and Q = discharge (m3/s). The sluice gate is always submerged due to downstream backwater effects.
Flow rates from the main canal and the secondary Salvaterra canal
* Neyrpic orifice modules are used as intake structures to secondary canals, to distributaries, to fields or for non-irrigation deliveries. All orifice modules are manually controlled by the Irrigation Association staff that records the flow and the delivery hours (closing and opening).
* Pumps and siphons - flow rates directly delivered to fields with pumps and siphons were evaluated by measuring discharges using portable RBC flumes (Replogle & Clemmens 1981; Bos et al. 1984).
* Wasteways - water losses were not directly evaluated and outflows at the side channel spillways, gate wasteway turnouts or siphon spillways were not measured.
Conveyance efficiencies
The water flow through an irrigation system, from its source to the crops, can be considered as three operations: conveyance, distribution and field appli- cation.
166
According to ICID standard terms (Bos 1979), conveyance is the movement of water from its source through the main and (sub)lateral or secondary canals or conduits to the tertiary offtakes. Distribution is the movement of water through the tertiary (distributary) and quaternary (farm) canals or conduits to the field inlets.
In this paper, the authors only present the efficiency analysis in the main sys- tem (Montargil, Furadouro and Sorraia canals, Fig. 1) and also in a particular secondary canal that supplies 1500 ha (about 10% of the total irrigated area) (Salvaterra canal, Fig. 1).
The conveyance efficiency (ec) can be defined as the efficiency of canal and conduit networks from the source to the offtakes of the distributary system (tertiary offtakes). It can be expressed as (Bos 1979):
v d + v 2 e c - , (4)
V c + V 1
in which v c -- diverted or pumped volume from the river or reservoir (m3); vd -- delivered volume to the distribution system or to fields (m3); v I -- inflow from other sources (m3); and v 2 = non-irrigation deliveries from conveyance system (m3).
In the present case, the function of the main system is to convey water to secondary canals, in spite of a few direct watet supplies to farms or to distribu- taries. As a main function, the secondary canal will convey water to the distri- bution system, however the direct water supply to farms is also quite im- portant.
In order to take these different aspects into consideration, the conveyance efficiency is split into two parts: the conveyance efficiency of the main canal
(ecm) and the conveyance efficiency of the secondary canal (%1) (Bos & Nugteren 1978).
The conveyance efficiency of the main canal is defined as:
% + v, + v6 (5) e c i l l -
V c + V 1
in which v~ = delivered volume to distributaries or to fields from the main system (m3); v s = delivered volume to secondary canals (m3); and v~ -- non- irrigation deliveries from the main system (m3).
The conveyance efficiency of the particular secondary canal studied by the authors (Salvaterra canal) is expresssed as:
i i I l
Vd + V2 (6 ) ecl - , ,
V s

167
100 -
90
BO
D a i l y P e r . {24 h r )
r 7 7 ~ N i g h t P e r . ( o - 7 h r : 1 9 - 2 4 hrJ
Daylight P e r . ( 7 - 1 9 hr]
u 7 0 - - - -
u~ - - i - - ~ X X - - - - xx . . . . . .
<X X X
50 ; < X , / . , = ./~= XXilI= XX, .,= ~
XX x x ~ / / X X , , - , ~- - - ~ X X - - - - X X , - / i ~ < x ) / / ~
40 × x , ~ , : X X : X ~ / / I ~ - < x ) / / X X I I ~ - - : XX ~_ X~<y//: ' ( X . ~ / / Z
- - X),( ¢- / j ~ ' ( ~ ' ( ~ ' / / ~ ~ < X , ~ : , / / / - - - - X X - - - - X)<F /,-- 4 ' ~ / / ~ ×× . --- -- XX - - X X , z z - - - - X X ¢ / I z X X ~ . ,~____. < X ) I / Z v ' , , ' l F ' , ~ - - - - v ~ ~ / / ~ - - - - X X , . 4 1 - - - - ~ ^ ~ / t / ~
"~o vi,~v ad. JelL AdG S~P M~ M o n t h s
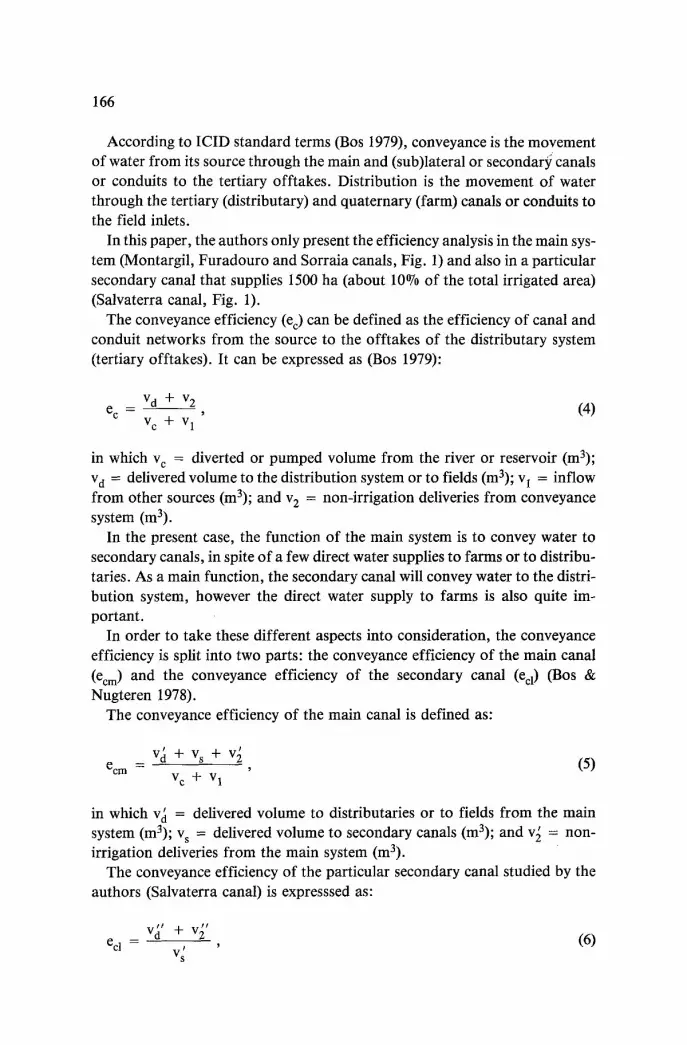
Fig. 3. Conveyance efficiencies of the S~Ivaterra canal (%) for daily, night and daylight periods (mean of 1987-1988).
in which v~' = delivered volume to distributaries or to fields from the lateral (m3); v s = delivered volume to the particular secondary canal (m3); and v~' = non-irrigation deliveries from the lateral (m3).
The water losses are higher in the secondary canal (average 40%) than in the main system (average 34%) (Figs 3, 4). The distribution function is already im- portant in the secondary system and the manager, in order to be sure that the necessary amount of water is available at the right time and at all delivery points, always operates with a surplus volume of water within the canals.
For projects with irrigable areas between 10000 ha-15000 ha (as in this case study) with rotation delivery schedules, the acceptable e c is about 80% (Bos & Nugteren 1978). In Portugal, the irrigation authorities accept, as normal values, losses of 15 -20% (Ramos 1978). As shown, in the present case study, losses are higher than these vales and the main reason seems to be the substitu- tion of the original rotation method by the restricted arranged schedules.
Supposing that the Salvaterra canal can be considered as a representative secondary canal, the global average e c of the system is about 40% (ecrecm, Figs 3, 4), much lower than acceptable. For these canals, losses caused by seepage, leakage, evaporation or other diffusive causes were evaluated at 10% of the inflow (Rijo & Pereira 1987). It can be concluded that approximately 50% of the inflow volumes are management losses from the conveyance system.

168
90
BO
70
6O
5O
4O I MAY
-c_ _-c. ?-i ~c v. %
x x x x x x × x x x x x x x x x x x x x x x x x X X X X X X X X X X X X X X X X X X X X X X X X X X X X X X X X X X X X X X X X X X > ( X X X X X ) < X X X X X > ( X X X X X
I dUN
< X X X X X X
< X X X X X X
~C'C'C'C'C;C;
' C X X X X X X ( X X X X X X <XXXXXX
' ( X X X X X X ( X X X X X X < X X X X X X ( X X X X X X ( X X X X X X ( X X X X X X ( X X X X X X ( X X X X X X ù : , ; . ' : , ' ; . ' : , i C ù - v - « ~ , v v v -~
a l L
Main system
X X X X X ;< >
; 7 ; ~ , : ; ~ ; L ; t ; ;-."-7 ;< ; < ' < ;< >
X X X X X X >
X X X X X X >
~xxxxxx_> X ) , C X X X X > v v . v . v , v v >
-« -.- v -,- Y Y -.
Months
Fig. 4. Conveyance efficiencies of main system (ecm) (mean of daily values for 1987-1988).
In the case study here presented, the excess of water within the irrigation sys- tem are really lost for the river. All irrigation areas are dominated by canals and there are no advantages for the farmers to pump water from the river and there are no pumped volumes from the river into the system.
The daily duration of irrigation is generally 9 hours. This value can be in- creased to 10, 11 or even 12 hours. Assuming the labour hours between 7 h - 19 h (daylight period), Fig. 3 shows that losses are higher during night (0 h - 7 h; 19 h - 2 4 h), when water is only diverted to rice fields (about 50% of the total irrigated lands, Table 1). Daylight e d values are higher in July and August (peak of the irrigation season), but September is the month with higher night ecr Tomato and corn irrigation usually finishes during this month and the area with rice increases, as a percentage of the total irrigated area. For the main system, it seems not to be correct to consider the night and daylight peri- ods, because the water has a long travel time (about 16 hours). However, as shown in Fig. 4, the main system conveyance efficiency is lowest in September because the total irrigated area decreases and the water delivery management is not prepared for that.
Tables 2 and 3 show the overall water demand, the total inflow volume (mean of 1987-1988) and its variation throughout the year, respectively for the Salvaterra canal and the main system. Figures 3 and 4 and Tables 2 and 3 show that higher percentage losses occur with lower flows: night periods, when row crops were not irrigated, and at the beginning and end of the irrigation season,

169
Table 2. Inflow - delivered outflow balance of the Salvaterra canal (mean of 1987-1988).
Inflow volumes (103 m 3) Delivered volumes (103 m 3)
Months Daily per Night per Daylight Daily per Night per Daylight (24 h) (0-7 h; 19-24 h) per (7-19 h) (24 la) (0-7 h; 19-24 h) per (7-19 b)
May 4061.4 2023.6 2037.8 1745 828 917 June 3766.4 1875.6 1890.8 2226.9 1004.1 1222.8 July 5051.6 2414.5 2637 3411.2 1398.9 2012.3 Aug. 5920.7 2859.2 3061.5 3827.5 1572.8 2254.7 Sept. 3067.1 1530.4 1536.7 2065.9 959.2 1106.7
Year 21867.2 10703.3 11163.8 13276.5 5763 7513.5
Table 3. Inflow-delivered outflow balance of main system (mean of 1987-1988).
Months Inflow volumes (103 m 3) Delivered volumes (103 m 3)
June 24134.8 16237.5 July 31141.7 22864.8 August 37163.5 24756.7 September 18752.5 9446.2
Year 111192.5 73305.2
9O
80
70
6o N
40 MON
=
K) K)
K )
K» K ) K~
Oally Per. (24 hr}
Ntght Per. •0-7 hr; 19-24 hr)
Dayllght Per. [7-19 bP)
_--- =--
WÈD THU
z
7g ~-
~X
<5 z
4"> z
TUE FRI MEA
Oay of week
Fig. 5. Weekly distribution of the conveyance efficiencies for the Salvaterra canal (% for daily, night and daylight periods (mean of 1987).

170
t 0 0 - -
9 0
8 0
u
u 7 0
c 60 m
c
u 5 0
4 0
3 0
( I D a i l y P e r . (24 h r )
~- - - -~ Nlght P e r . ( 0 - 7 h r : 1 9 - 2 4 bp}
0 . . . . 0 D a y l i g h t PeP. { ? - i ß hP l
O'O. D P - . 0
• 0 " : .O" "o" "
O
.
ù
ù0
O" • _ O- o •
• 0
Q • . -. • -
" - . 0 " "
6 Il 16 2i
Day 0f month
1 1 26 31
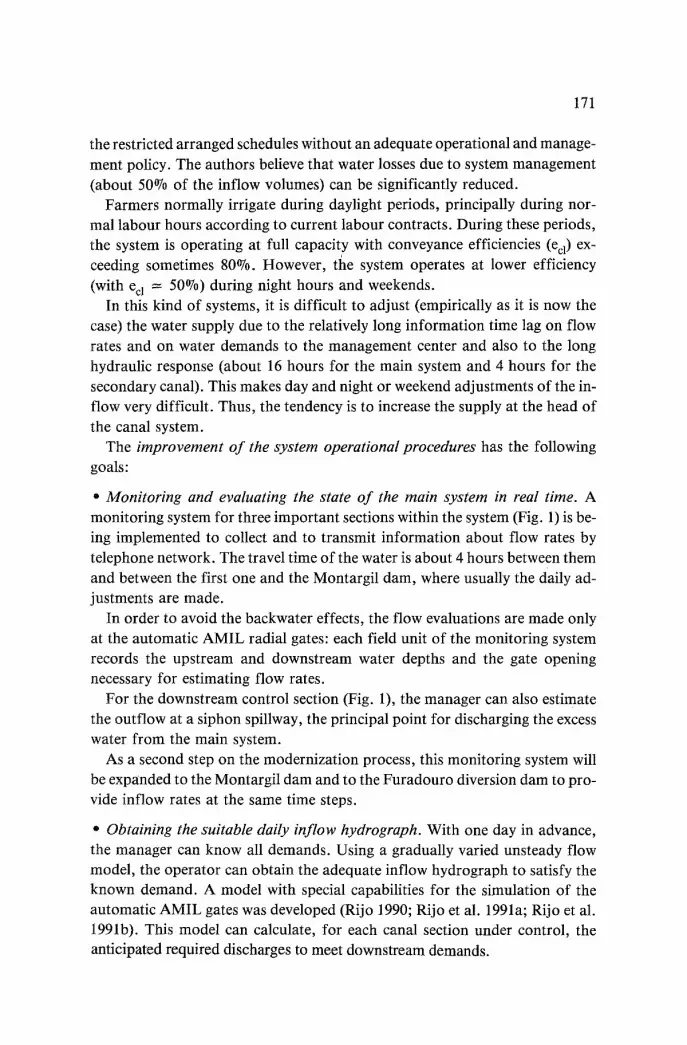
Fig. 6. Conveyance efficiencies of the Salvaterra canal (ecl) for daily, night and daylight periods (August 1988).
when the irrigated areas are increasing or decreasing. There is not a proportion- ate correspondence between irrigated areas and inflow volumes, because the day and night or weekend adjustments are difficult only regarding the empiri- cal experience of the manager.
Daylight efficiencies (ed) are higher during the week days, when the row crops are irrigated (Figs 5, 6). At night, when only rice is irrigated under con- tinuous flow, efficiencies are lower and approximately constant ( = 50%). During the weekends, the two efficiencies (daylight and night periods) are also lower and nearly equal, specially on sundays. On saturday mornings a few row crops are irrigated. The three curves (daylight, daily and night periods) in Fig. 6 approximately coincide during weekends. From this figure, it can also be concluded that daylight efficiencies were above 80% during several days.
Conclusions and improvement of the system operating procedures
The present study is part of a program to improve and modernize the operation and management of the conveyance system of the Sorraia Irrigation Project. Measured conveyance efficiencies are very low and, as indicated, the main rea- son seems to be the substitution of the rotation method of water delivery by
171
the restricted arranged schedules without an adequate operational and manage- ment policy. The authors believe that wate� losses due to system management (about 50% of the inflow volumes) can be significantly reduced.
Farmers normally irrigate during daylight periods, principally during nor- mal labour hours according to current labour contracts. During these periods, the system is operating at full capacity with conveyance efficiencies (ecl) ex- ceeding sometimes 80%. However, the system operates at lower efficiency (with %1 - 50%) during night hours and weekends.
In this kind of systems, it is difficult to adjust (empirically as it is now the case) the water supply due to the relatively long information time lag on flow rates and on watet demands to the management center and also to the long hydraulic response (about 16 hours for the main system and 4 hours for the secondary canal). This makes day and night or weekend adjustments of the in- flow very difficult. Thus, the tendency is to increase the supply at the head of the canal system.
The improvement of the system operational procedures has the following goals:
• Monitoring and evaluating the stare of the main system in real time. A monitoring system for three important sections within the system (Fig. 1) is be- ing implemented to collect and to transmit information about flow rates by telephone network. The travel time of the watet is about 4 hours between them and between the first one and the Montargil dato, where usually the daily ad- justments are made.
In order to avoid the backwater effects, the flow evaluations are made only at the automatic AMIL radial gates: each field unit of the monitoring system records the upstream and downstream water depths and the gare opening necessary for estimating flow rates.
For the downstream control section (Fig. 1), the manager can also estimate the outflow at a siphon spillway, the principal point for discharging the excess water from the main system.
As a second step on the modernization process, this monitoring system will be expanded to the Montargil dam and to the Furadouro diversion dam to pro- vide inflow rates at the same time steps.
• Obtaining the suitable daily inflow hydrograph. With one day in advance, the manager can know all demands. Using a gradually varied unsteady flow model, the operator can obtain the adequate inflow hydrograph to satisfy the known demand. A model with special capabilities for the simulation of the automatic AMIL gares was developed (Rijo 1990; Rijo et al. 1991a; Rijo et al. 1991b). This model can calculate, for each canal section under control, the anticipated required discharges to meet downstream demands.

172
• Correct ing the in f low rates in real t ime. Knowing for each t ime interval the
required and the real discharge for the contro l led sections, the manager can
make gate adjus tments to obta in the requi red inf low rate.
Acknowledgements
This study was p e r f o r m e d in coopera t ion with the Associagäo de Regantes do
Vale do Sorra ia ( I r r igat ion Assoc ia t ion o f the Sorra ia Valley) and part ial ly
f inanced by the I . N . I . C . and J . N . I . C . T . . Facilit ies p rov ided by the Direcgäo
Geral dos Recursos Natura is are also acknowledged.
References
Bauzil V. 1952. Traité d'Irrigation. E. Eyrolles (Ed), Paris. Bos M.G. 1979. Standards for irrigation efficiencies of ICID. Journal oflrrigation andDrainage
Division, ASCE, 105(IR1): 37-43. Bos M.G. & Nugteren J. 1978. On Irrigation Efficiencies, 2nd edition. International Institute for
Land Reclamation and Improvement/ILRI, Wageningen, Netherlands. Bos M.G., Replogle J.A. & Clemmens A.J. 1984. Flow Measuring Flumesfor Open-Channel Sys-
tems. John Wiley & Sons, New York. Cunge J.A. & Woolhiser D.A. 1975. Irrigation systems. In: K. Mahmood & V. Yevjevich (Eds).
Unsteady Flow in Open Channels, Vol. 2 (pp 509-537). Water Resources Publications, Fort Collins, Colorado.
Kraatz D.B. & Mahajan I.K. 1975. Small hydraulic structures. Irrigation andDrainage Paper, No. 26, FAO, Rome.
Ramos A.T. 1978. Operation and Maintenance of the Irrigation System in a Portuguese Hydro- Agricultural Development. 10th ICID Congress, R.54, Q.35, Athens (pp 881-896).
Reddy J.M. 1990. I mproved Local Automatic Control for Scheduled Deliveries. 3rd National Irri- gation Symposium, A.S.A.E., Phoenix (pp 487-494).
Replogle J.A. 1984. Some Environmental Engineering and Social Impacts of Water Delivery Schedules. 12th ICID Congress, R.61, Q.38, Fort Collins (pp 965-978).
Replogle J.A. & Clemmens A.J. 1981. Measuring flumes of simplified construction. Transactions of the ASAE, 197(IR1): 87-102.
Rijo M. 1986. Field applieation of a mathematical model to the Canal Salvaterra (Portuguese). Ms. thesis, IST, Tec. Univ. of Lisbon.
Rijo M. 1990. Mathematical modelling of an irrigation system with upstream control (in Por- tuguese). PhD. thesis, ISA, Tec. Univ, of Lisbon.
Rijo M. & Pereira L.S. 1987. Measuring conveyance efficiencies to improve irrigation water management. Irrigation and Drainage Systems 1(3): 267-276.
Rijo M., Almeida A.B. & Pereira L.S. 1991a. Modelling automatic upstream control with SIM- CAR. In: W.F. Ritter (Ed). Irrigation and Drainage (pp 487-493). ASCE Publications, New-York.
Rijo M., Almeida A.B. & Pereira L.S. 1991b. Simulation of Transient Flows in Irrigation Canals: Automatic AMIL Radial Gates. 24th IAHR Congress, Models and Control Systems for Hydraulic Engineering, Madrid (pp 373-380).