Embed Size (px)
Citation preview

Performance study of classification algorithms for consumer online shopping attitudes and behavior using data mining
Rana Alaa El-Deen Ahmeda, M.Elemam.Shehaba, Shereen Morsya, Nermeen Mekawiea
Arab academy for science and technology(AASTMT), [email protected], [email protected], [email protected], [email protected]
Abstract— The online retail industry is one of the world's largest and fastest growing industries having huge amount of online sales data. This sales data includes information about customer buying history ,goods or services offered for the customers .Hidden relationships in sales data can be discovered from the application of data mining techniques. Data mining is an inter disciplinary promising field that focuses on access of information useful for high level decisions and also include machine learning to help online shopping stores to indentify online customer behavior to recommend for him the appropriate products he/she is interesting to them , because the growing popularity and acceptance of e-commerce platforms, users face an ever increasing burden in actually choosing the right product from the large number of online offers. Thus, techniques for personalization and shopping guides are needed by users. For a pleasant and successful shopping experience, users need to know easily which products to buy with high confidence. In this paper eleven data mining classification techniques will be comparatively tested to find the best classifier fit for consumer online shopping attitudes and behavior according to obtained dataset for big agency of online shopping ,the results shows that decision table classifier and filtered classifier gives the highest accuracy and the lowest accuracy is achieved by classification via clustering and simple cart, also this paper will provide a recommender system based on decision table classifier helping the customer to find the products he/she is searching for in some ecommerce web sites .Recommender system learns from the information about customers and products and provides appropriate personalized recommendations to customers to find the desired products.
Keywords—classification;Data mining; WEKA; Machine learning; online shopping
I. INTRODUCTION Today's online shopping is becoming another shopping channel or pattern for doing shopping because the internet has provided consumers with a platform where they can shop smartly. Consumers are free to explore various alternatives from a wide range and choose the best [1]. Many companies use Internet with the purpose to cut costs and hence reduce the price of the products. It also helps them to reach a larger audience who would require their product. Nowadays, customers use the internet not only to buy the product but also to compare products, prices and find out benefits of buying the product from a particular store.
Online shopping is the process whereby goods and services are bought by consumers from a seller, over the Internet with no intermediary service. It is a form of electronic commerce in which online shop or virtual store evokes the physical analogy of purchasing products or services in a shopping centre. There are many advantages of online shopping. There are no time and location limits in online shopping. This paper is includes eight sections ,the first section starts with a brief introduction , second section introduce data mining and online shopping ,third section discuss some of the related work , fourth section list and explain the selected classifiers algorithms ,fifth section includes a sample of the used data and it's description , sixth section discuss the experimental design methodology and the experimental result by its analysis with the conclusion are explained in the seventh and the eight section respectively [2],[3],[4].
II. DATA MINING AND ONLINE SHOPPING Data mining is crucial for extracting and identifying useful information from a large amount of data that is why retailing companies operate purchase databases in a long way, such that all transactions are stored in arranged order[3] ,[5]. A record-of-transaction database typically contains the transaction date and the products bought in the course of a given transaction. Usually, each record also contains e-shopper ID, particularly when the purchase was made using a credit card or a frequent buyer card. Therefore, the purchasing sequence of an e-shopper in the database that has made repeated purchase can easily be determined. This purchase sequence provides a description of the changes in an e-shopper’s preferences over time ,because a purchase sequence can reveal the changes of e-shopper’s preferences over time[3][6].
III. RELATED WORK The following table give a brief summary of the related work used in data mining in previous researches .
2015 Fifth International Conference on Communication Systems and Network Technologies
978-1-4799-1797-6/15 $31.00 © 2015 IEEE
DOI 10.1109/CSNT.2015.50
1344
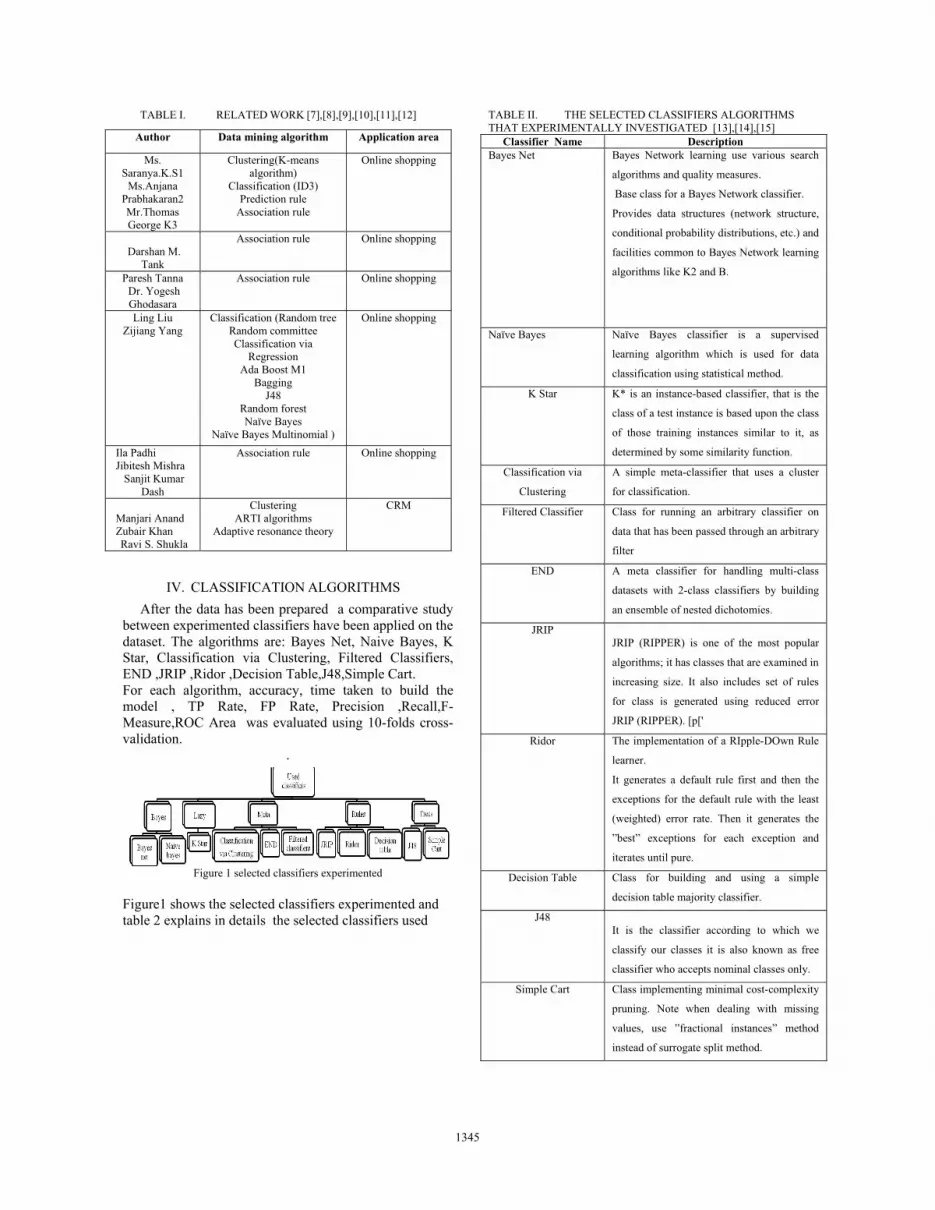
TABLE I. RELATED WORK [7],[8],[9],[10],[11],[12]
Author Data mining algorithm Application area
Ms. Saranya.K.S1
Ms.Anjana Prabhakaran2 Mr.Thomas George K3
Clustering(K-means algorithm)
Classification (ID3) Prediction rule
Association rule
Online shopping
Darshan M.
Tank
Association rule Online shopping
Paresh Tanna Dr. Yogesh Ghodasara
Association rule Online shopping
Ling Liu Zijiang Yang
Classification (Random tree Random committee Classification via
Regression Ada Boost M1
Bagging J48
Random forest Naïve Bayes
Naïve Bayes Multinomial )
Online shopping
Ila Padhi Jibitesh Mishra
Sanjit Kumar Dash
Association rule Online shopping
Manjari Anand Zubair Khan Ravi S. Shukla
Clustering ARTI algorithms
Adaptive resonance theory
CRM
IV. CLASSIFICATION ALGORITHMS After the data has been prepared a comparative study between experimented classifiers have been applied on the dataset. The algorithms are: Bayes Net, Naive Bayes, K Star, Classification via Clustering, Filtered Classifiers, END ,JRIP ,Ridor ,Decision Table,J48,Simple Cart. For each algorithm, accuracy, time taken to build the model , TP Rate, FP Rate, Precision ,Recall,F-Measure,ROC Area was evaluated using 10-folds cross-validation.
.
Figure 1 selected classifiers experimented
Figure1 shows the selected classifiers experimented and table 2 explains in details the selected classifiers used
TABLE II. THE SELECTED CLASSIFIERS ALGORITHMS THAT EXPERIMENTALLY INVESTIGATED [13],[14],[15]
Classifier Name Description Bayes Net Bayes Network learning use various search
algorithms and quality measures.
Base class for a Bayes Network classifier.
Provides data structures (network structure,
conditional probability distributions, etc.) and
facilities common to Bayes Network learning
algorithms like K2 and B.
Naïve Bayes Naïve Bayes classifier is a supervised
learning algorithm which is used for data
classification using statistical method.
K Star K* is an instance-based classifier, that is the
class of a test instance is based upon the class
of those training instances similar to it, as
determined by some similarity function.
Classification via
Clustering
A simple meta-classifier that uses a cluster
for classification.
Filtered Classifier Class for running an arbitrary classifier on
data that has been passed through an arbitrary
filter
END A meta classifier for handling multi-class
datasets with 2-class classifiers by building
an ensemble of nested dichotomies.
JRIP JRIP (RIPPER) is one of the most popular
algorithms; it has classes that are examined in
increasing size. It also includes set of rules
for class is generated using reduced error
JRIP (RIPPER). [p['
Ridor The implementation of a RIpple-DOwn Rule
learner.
It generates a default rule first and then the
exceptions for the default rule with the least
(weighted) error rate. Then it generates the
”best” exceptions for each exception and
iterates until pure.
Decision Table Class for building and using a simple
decision table majority classifier.
J48 It is the classifier according to which we
classify our classes it is also known as free
classifier who accepts nominal classes only.
Simple Cart Class implementing minimal cost-complexity
pruning. Note when dealing with missing
values, use ”fractional instances” method
instead of surrogate split method.
1345
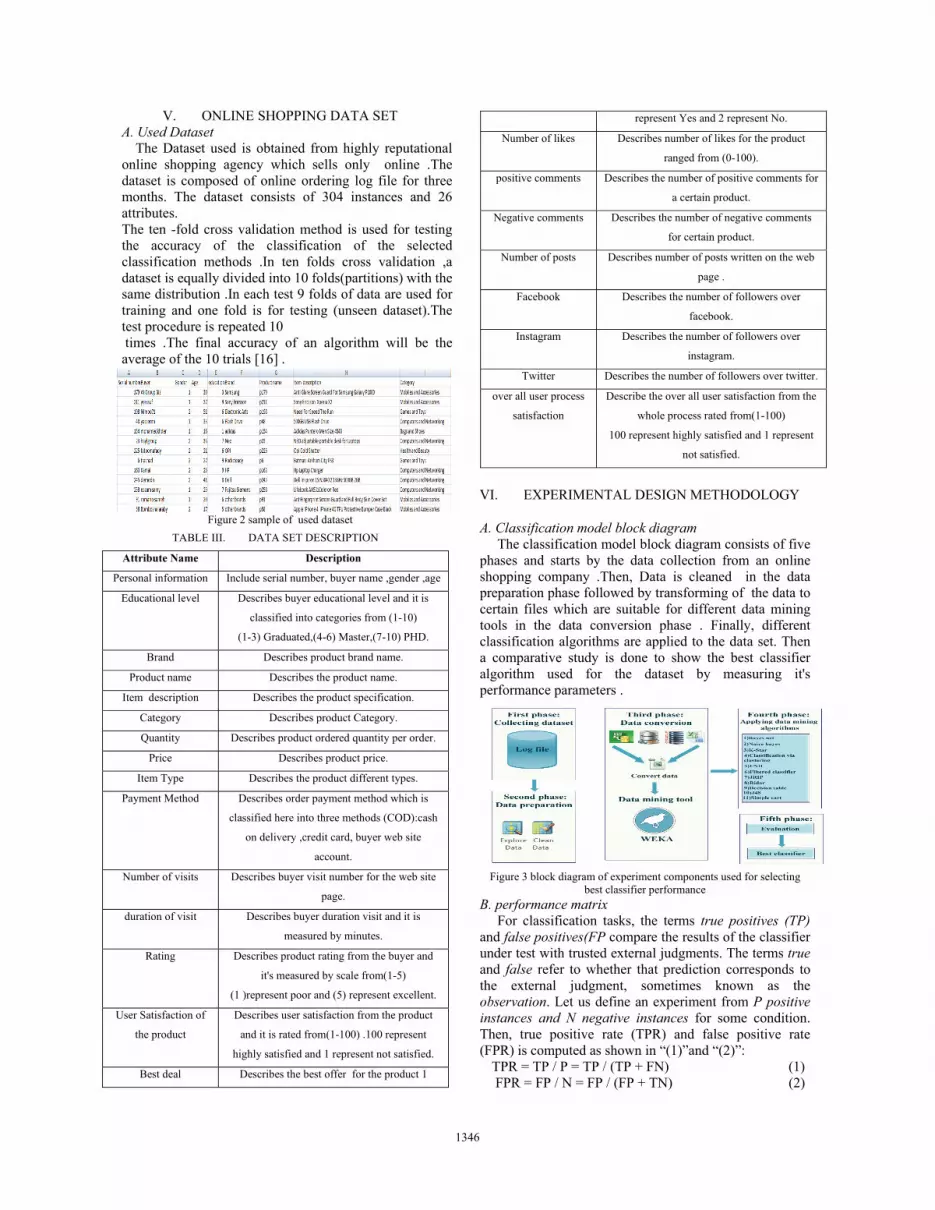
V. ONLINE SHOPPING DATA SET A. Used Dataset The Dataset used is obtained from highly reputational online shopping agency which sells only online .The dataset is composed of online ordering log file for three months. The dataset consists of 304 instances and 26 attributes. The ten -fold cross validation method is used for testing the accuracy of the classification of the selected classification methods .In ten folds cross validation ,a dataset is equally divided into 10 folds(partitions) with the same distribution .In each test 9 folds of data are used for training and one fold is for testing (unseen dataset).The test procedure is repeated 10 times .The final accuracy of an algorithm will be the average of the 10 trials [16] .
Figure 2 sample of used dataset
TABLE III. DATA SET DESCRIPTION
Attribute Name Description
Personal information Include serial number, buyer name ,gender ,age
Educational level Describes buyer educational level and it is
classified into categories from (1-10)
(1-3) Graduated,(4-6) Master,(7-10) PHD.
Brand Describes product brand name.
Product name Describes the product name.
Item description Describes the product specification.
Category Describes product Category.
Quantity Describes product ordered quantity per order.
Price Describes product price.
Item Type Describes the product different types.
Payment Method Describes order payment method which is
classified here into three methods (COD):cash
on delivery ,credit card, buyer web site
account.
Number of visits Describes buyer visit number for the web site
page.
duration of visit Describes buyer duration visit and it is
measured by minutes.
Rating Describes product rating from the buyer and
it's measured by scale from(1-5)
(1 )represent poor and (5) represent excellent.
User Satisfaction of
the product
Describes user satisfaction from the product
and it is rated from(1-100) .100 represent
highly satisfied and 1 represent not satisfied.
Best deal Describes the best offer for the product 1
represent Yes and 2 represent No.
Number of likes Describes number of likes for the product
ranged from (0-100).
positive comments Describes the number of positive comments for
a certain product.
Negative comments Describes the number of negative comments
for certain product.
Number of posts Describes number of posts written on the web
page .
Facebook Describes the number of followers over
facebook.
Instagram Describes the number of followers over
instagram.
Twitter Describes the number of followers over twitter.
over all user process
satisfaction
Describe the over all user satisfaction from the
whole process rated from(1-100)
100 represent highly satisfied and 1 represent
not satisfied.
VI. EXPERIMENTAL DESIGN METHODOLOGY
A. Classification model block diagram The classification model block diagram consists of five phases and starts by the data collection from an online shopping company .Then, Data is cleaned in the data preparation phase followed by transforming of the data to certain files which are suitable for different data mining tools in the data conversion phase . Finally, different classification algorithms are applied to the data set. Then a comparative study is done to show the best classifier algorithm used for the dataset by measuring it's performance parameters .
Figure 3 block diagram of experiment components used for selecting
best classifier performance B. performance matrix For classification tasks, the terms true positives (TP) and false positives(FP compare the results of the classifier under test with trusted external judgments. The terms true and false refer to whether that prediction corresponds to the external judgment, sometimes known as the observation. Let us define an experiment from P positive instances and N negative instances for some condition. Then, true positive rate (TPR) and false positive rate (FPR) is computed as shown in “(1)”and “(2)”: TPR = TP / P = TP / (TP + FN) (1) FPR = FP / N = FP / (FP + TN) (2)
1346
Precision: is the probability that a (randomly selected) retrieved document is relevant. Recall: is the probability that a (randomly selected) relevant document is retrieved in a search. Precision and recall are then defined in “(3)” and “(4)”:
Precision = TP / (TP + FP) (3) Recall = TP / (TP + FN) (4)
F-measure: A measure that combines precision and recall is the harmonic mean of precision and recall, the traditional F-measure or balanced F-score is defined in “(5)” : F = 2 x (Precision x Recall) / (Precision + Recall) (5) Confusion Matrix: also known as a contingency table or an error matrix is a specific table layout that allows visualization of the performance of an algorithm, typically a supervised learning one (in unsupervised learning it is usually called a matching matrix). Each column of the matrix represents the instances in a predicted class, while each row represents the instances in an actual class. The name stems from the fact that it makes it easy to see if the system is confusing two classes (i.e. commonly mislabeling one as another). “Equation (6) we define the classifiers accuracy ”,which is the percentage of predictions that is correct. “Equation (7) we define the mean absolute error”, it is the prediction probability of the correct class, divided by the actual probability of the class and N is the number of classes. Accuracy = (TP + TN) / (TP + TN + FP + FN) (6) Error Rate = (FP + FN) / (TP + TN + FP + FN) (7) Receiver Operating Characteristic (ROC): In signal detection theory, ROC curve is a graphical plot which illustrates the performance of a binary classifier system as its discrimination threshold is varied. It is created by plotting the fraction of true positives out of the total actual positives (TPR = true positive rate) vs. the fraction of false positives out of the total actual negatives (FPR = false positive rate), at various threshold settings. The ROC is also known as a relative operating characteristic curve, because it is a comparison of two operating characteristics (TPR and FPR) as the criterion changes. Precision-Recall Curve (PRC): is a two-dimensional graph where x-axis represents the precision which measures the fraction of instances classified as positive that are truly positive, and y-axis represents the recall which is the same as true positive rate. Precision-recall curves are important to visualize classifier performances. The goal is to observe whether the precision-recall curve is towards the upper right corner of the chart [16].
VII. EXPERIMENTAL RESULTS AND ANALYSIS
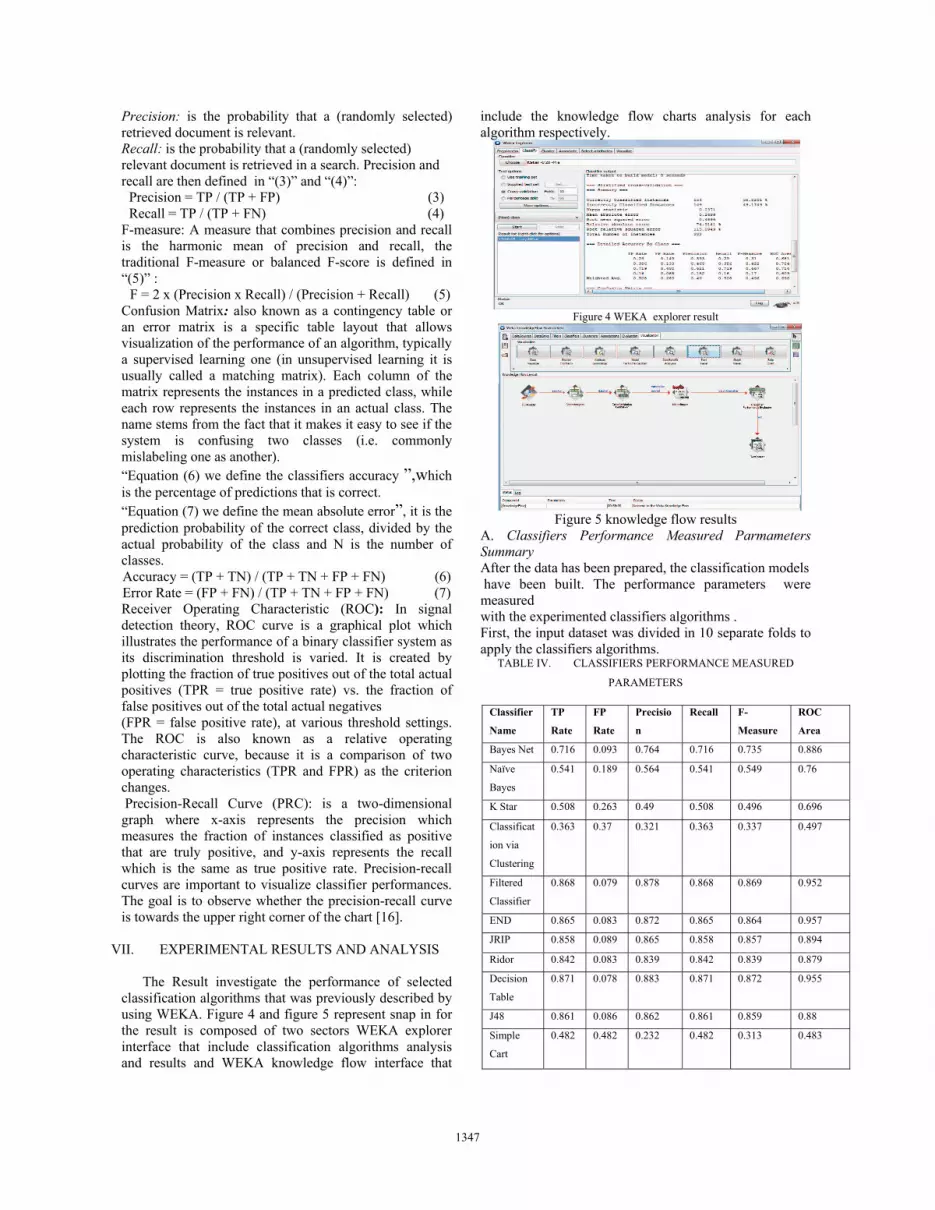
The Result investigate the performance of selected classification algorithms that was previously described by using WEKA. Figure 4 and figure 5 represent snap in for the result is composed of two sectors WEKA explorer interface that include classification algorithms analysis and results and WEKA knowledge flow interface that
include the knowledge flow charts analysis for each algorithm respectively.
Figure 4 WEKA explorer result
Figure 5 knowledge flow results A. Classifiers Performance Measured Parmameters Summary After the data has been prepared, the classification models have been built. The performance parameters were measured with the experimented classifiers algorithms . First, the input dataset was divided in 10 separate folds to apply the classifiers algorithms.
TABLE IV. CLASSIFIERS PERFORMANCE MEASURED
PARAMETERS
Classifier
Name
TP
Rate
FP
Rate
Precisio
n
Recall F-
Measure
ROC
Area
Bayes Net 0.716 0.093 0.764 0.716 0.735 0.886
Naïve
Bayes
0.541 0.189 0.564 0.541 0.549 0.76
K Star 0.508 0.263 0.49 0.508 0.496 0.696
Classificat
ion via
Clustering
0.363 0.37 0.321 0.363 0.337 0.497
Filtered
Classifier
0.868 0.079 0.878 0.868 0.869 0.952
END 0.865 0.083 0.872 0.865 0.864 0.957
JRIP 0.858 0.089 0.865 0.858 0.857 0.894
Ridor 0.842 0.083 0.839 0.842 0.839 0.879
Decision
Table
0.871 0.078 0.883 0.871 0.872 0.955
J48 0.861 0.086 0.862 0.861 0.859 0.88
Simple
Cart
0.482 0.482 0.232 0.482 0.313 0.483
1347
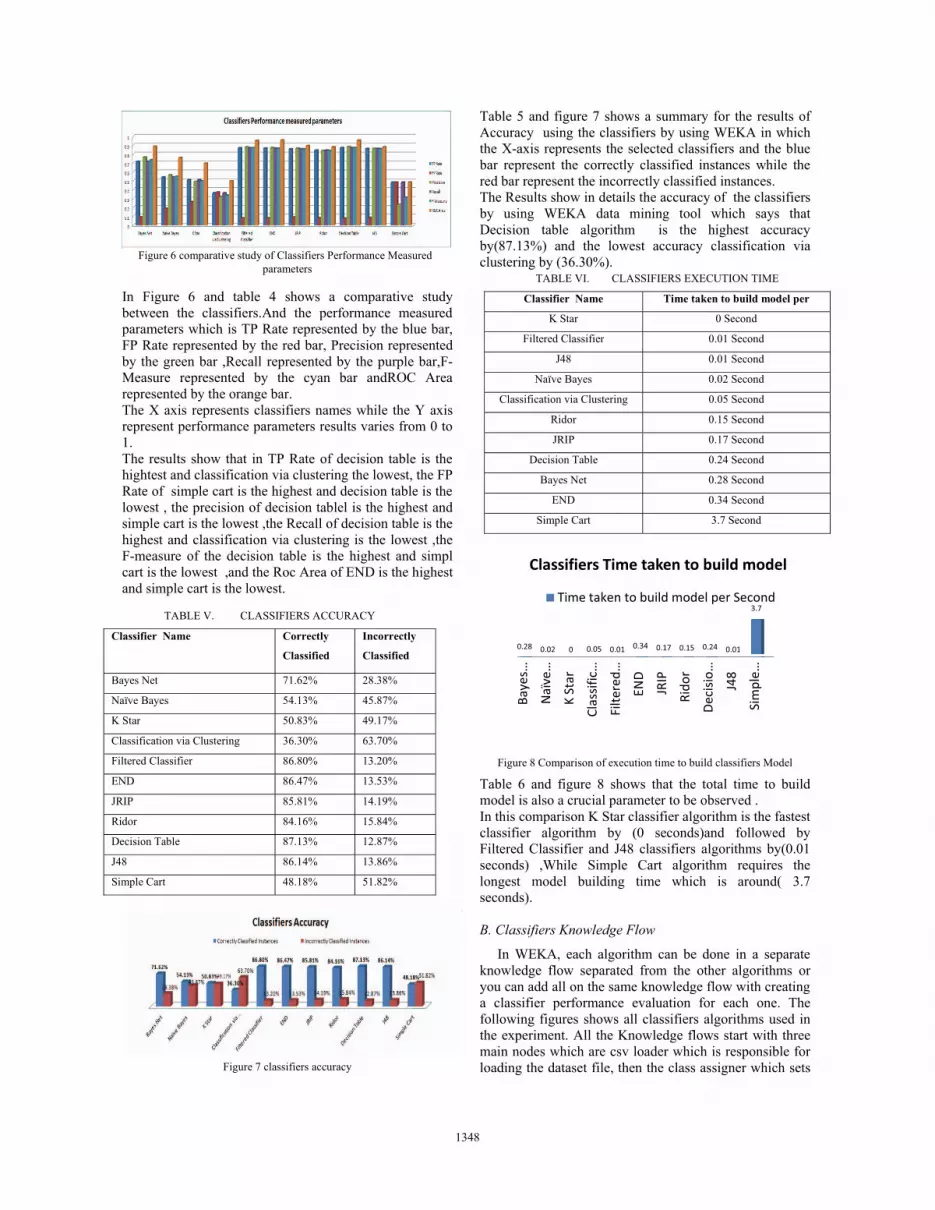
Figure 6 comparative study of Classifiers Performance Measured
parameters
In Figure 6 and table 4 shows a comparative study between the classifiers.And the performance measured parameters which is TP Rate represented by the blue bar, FP Rate represented by the red bar, Precision represented by the green bar ,Recall represented by the purple bar,F-Measure represented by the cyan bar andROC Area represented by the orange bar. The X axis represents classifiers names while the Y axis represent performance parameters results varies from 0 to 1. The results show that in TP Rate of decision table is the hightest and classification via clustering the lowest, the FP Rate of simple cart is the highest and decision table is the lowest , the precision of decision tablel is the highest and simple cart is the lowest ,the Recall of decision table is the highest and classification via clustering is the lowest ,the F-measure of the decision table is the highest and simpl cart is the lowest ,and the Roc Area of END is the highest and simple cart is the lowest.
TABLE V. CLASSIFIERS ACCURACY
Classifier Name Correctly
Classified
Incorrectly
Classified
Bayes Net 71.62% 28.38%
Naïve Bayes 54.13% 45.87%
K Star 50.83% 49.17%
Classification via Clustering 36.30% 63.70%
Filtered Classifier 86.80% 13.20%
END 86.47% 13.53%
JRIP 85.81% 14.19%
Ridor 84.16% 15.84%
Decision Table 87.13% 12.87%
J48 86.14% 13.86%
Simple Cart 48.18% 51.82%
Figure 7 classifiers accuracy
Table 5 and figure 7 shows a summary for the results of Accuracy using the classifiers by using WEKA in which the X-axis represents the selected classifiers and the blue bar represent the correctly classified instances while the red bar represent the incorrectly classified instances. The Results show in details the accuracy of the classifiers by using WEKA data mining tool which says that Decision table algorithm is the highest accuracy by(87.13%) and the lowest accuracy classification via clustering by (36.30%).
TABLE VI. CLASSIFIERS EXECUTION TIME
Classifier Name Time taken to build model per
K Star 0 Second
Filtered Classifier 0.01 Second
J48 0.01 Second
Naïve Bayes 0.02 Second
Classification via Clustering 0.05 Second
Ridor 0.15 Second
JRIP 0.17 Second
Decision Table 0.24 Second
Bayes Net 0.28 Second
END 0.34 Second
Simple Cart 3.7 Second
Figure 8 Comparison of execution time to build classifiers Model
Table 6 and figure 8 shows that the total time to build model is also a crucial parameter to be observed . In this comparison K Star classifier algorithm is the fastest classifier algorithm by (0 seconds)and followed by Filtered Classifier and J48 classifiers algorithms by(0.01 seconds) ,While Simple Cart algorithm requires the longest model building time which is around( 3.7 seconds). B. Classifiers Knowledge Flow
In WEKA, each algorithm can be done in a separate knowledge flow separated from the other algorithms or you can add all on the same knowledge flow with creating a classifier performance evaluation for each one. The following figures shows all classifiers algorithms used in the experiment. All the Knowledge flows start with three main nodes which are csv loader which is responsible for loading the dataset file, then the class assigner which sets
Baye
s …
Naï
ve …
K St
ar
Clas
sific
…
Filte
red …
END
JRIP
Rido
r
Deci
sio…
J48
Sim
ple …
0.28 0.02 0 0.05 0.01 0.34 0.17 0.15 0.24 0.01
3.7
Classifiers Time taken to build model
Time taken to build model per Second
1348

the new class attribute, then the class validation fold maker which separate the testing set from the training set, both sets then are connected to an algorithm.
Figure 9 Selected classifier knowledge flow chart result
VIII. CONCLUSION In this paper, eleven classification algorithm was investigated they included Bayes Net, Naive Bayes, K Star, Classification via Clustering, Filtered Classifiers, END ,JRIP ,Ridor ,DecisionTable,J48 and Simple Cart .Comparative study and analysis related to classification measures included TP Rate, FP Rate, Precision ,Recall,F-Measure,ROC Area ,accuracy and execution time to build the model have computed by different simulation experiments using WEKA tool kit. The experimental results have shown the depending on the nature of their attributes and size the classification techniques on the online shopping dataset. Experimental result show that the decision table gives the best performance and accuracy then the filtered classifier. Decision table provides an accuracy of 87.13% and the total time taken to build the model is at 0.24 Second and filtered classifier with an accuracy of 86.80% and time taken to build the model is at 0.01 Second. The lowest accuracy classification via clustering by (36.30%) with time taken 0.05 Second . Hence, this result can help various online retail shops by selecting the optimal classification algorithm which was decision table suitable to datasets related to the online retail shopping by building a complete recommender model to help the users to identify their needs from the represented product on e-commerce web sites.
REFERENCES
[1]C. Park, “Online shopping behavior model: A literature review and proposed model,” in Advanced Communication Technology, 2009. ICACT 2009. 11th International Conference, 2009.
[2]K. Devkishin, A. Rizvi and V. L. Akre. “Analysis of factors affecting the online shopping behavior of consumers in UAE,” in In Current Trends in Information Technology (CTIT), 2013 International Conference, 2013, pp. 220-225.
[3]M. Rezaul Karim, J. Jo, B. Jeong and H. Choi, “Mining E-Shopper's Purchase Rules by Using Maximal Frequent Patterns: An E-Commerce Perspective, ” in Information Science and Applications (ICISA), 2012 International Conference, 2012, pp. 1-6.
[4]S. Jie, S. Peiji and F. Jiaming, “A Model for adoption of online shopping: A perceived characteristics of Web as a shopping channel view, ” in Service Systems and Service Management, 2007 International Conference, 2007.
[5]D. Burdick, M. Calimlim and J. Gehrke, “GenMax: An Efficient Algorithm for Mining Maximal Frequent Itemsets,” in Data Mining and Knowledge Discovery, 2005.
[6]A. Meenakshi and D. Alagarsamy, “Efficient Storage Reduction of Frequency of Items in Vertical Data Layout ,”International Journal on Computer Science and Engineering, vol. 3, 2011.
[7]S. K.S, A. Prabhakaran and T. George K ,“DECISION SUPPORT SYSTEM FOR CRM IN ONLINE SHOPPING SYSTEM,”.International Journal of Advances in Computer Science and Technology, vol. 3, no. 2, 2014.
[8]D.M.Tank, “Improved Apriori Algorithm for Mining Association Rules,” I.J. Information Technology and Computer Science, 2014 , pp. 15-23.
[9]P. Tanna and Y. Ghodasara,“ Using Apriori with WEKA for Frequent Pattern Mining,”International Journal of Engineering Trends and Technology (IJETT), vol. 12, no. 3, 2015, pp. 127-131.
[10]L. Liu and Z. Yang ,“Improving Online Shopping Experience using Data Mining and Statistical Techniques,” Journal of Convergence Information Technology(JCIT), vol. 8, no. 657, 2013.
[11]I. Padhi, J. Mishra and S. Kumar Dash, “Predicting Missing Items in Shopping Cart using Associative Classification Mining,” International Journal of Computer Applications, vol. 50, no. 14, 2012 , pp. 7-11.
[12]M. Anand, Z. Khan and R. S. Shukla,“ Customer Relationship Management using Adaptive Resonance Theory,” International Journal of Computer Applications, vol. 76, no. 6, 2013 , pp. 43-47.
[13]T. George-Nektarios,“ Weka Classifiers Summary,”www.academia.edu/5167325/Weka_Classifiers_Summary, 2013.
[14]S. Bavisi, J. Mehta and L. Lopes, “A Comparative Study of Different Data Mining Algorithms,” International Journal of Current Engineering and Technology, vol. 4, no. 5, 2014.
[15] Meenakshi and Geetika, “Survey on Classification Methods using WEKA,” International Journal of Computer Applications, vol. 86, no. 18, 2014, pp. 16-19.
[16]A. M. Ragab, A. Y. Noaman, A. S. AL-Ghamdi and A. I. Madbouly, ,“A Comparative Analysis of Classification Algorithms for Students College Enrollment Approval Using Data Mining, ”in Interaction Design in Educational Environment, 2014.
1349


