Embed Size (px)
Citation preview

Nuclear Instruments and Methods in Physics Research A 555 (2005) 270–281
Performances and potentialities of a LaCl3:Ce scintillator
R. Bernabeia,�, P. Bellia, F. Montecchiaa, F. Nozzolia, A. d’Angelob,c, F. Cappellab,A. Incicchittib, D. Prosperib, S. Castellanod,e, R. Cerullid, C.J. Daif, V.I. Tretyakg
aDipartimento di Fisica, Universita di Roma ‘‘Tor Vergata’’, and INFN, Sezione di Roma2, I-00133 Rome, ItalybDipartimento di Fisica, Universita di Roma ‘‘La Sapienza’’ and INFN, Sezione di Roma, I-00185 Rome, ItalycScuola di Specializzazione in FISICA SANITARIA, Universita di Roma ‘‘Tor Vergata’’, I-00133 Rome, Italy
dINFN, Laboratori Nazionali del Gran Sasso – 67010 Assergi (AQ), ItalyeUniversita degli Studi dell’Aquila, I-67000 L’Aquila, Italy
fIHEP, Chinese Academy, P.O. Box 918/3, Beijing 100039, ChinagInstitute for Nuclear Research, MSP 03680 Kiev, Ukraine
Received 26 August 2005; accepted 22 September 2005
Available online 18 October 2005
Abstract
The performances and the potentialities of applications of a LaCl3:Ce scintillator have been investigated deep underground in the
Gran Sasso Laboratory of the I.N.F.N. In particular, the light response, the a=b ratio, the a=b discrimination capability and the
radioactive contaminations have been studied. The results of an experimental search for spontaneous cluster decay in La isotopes are also
presented.
r 2005 Elsevier B.V. All rights reserved.
PACS: 29.40.Mc; 23.60.þe; 23.70.þj
Keywords: LaCl3:Ce crystal scintillator; a=b Ratio; Cluster decay
1. Introduction
A large deal of interest has been devoted by DAMA to
investigate on new kinds of scintillators for various
applications; in particular, the recently developed LaCl3:Ce
scintillator has been considered and its scintillation and
background characteristics have been studied.
In literature several investigations have been carried out
on various LaCl3:Ce prototypes [1–5]. The emission and
excitation characteristics of LaCl3:Ce were measured at ’8K under ultraviolet excitation [6] and in particular, in
Ref. [1] the light response for different Ce concentrations
has been studied. They support for this scintillator a good
linearity with energy (at low energy the maximum
deviation less than 5%) [7] measuring a scintillation light
yield typically of about 49 000 ph=MeV, while the photo-
electron yield is about 70–90% with the respect to NaI(Tl)
[2]. When doped with ’10% Ce the LaCl3 has a fast
principal decay time constant: 26 ns [3], allowing to obtain
a fast time response; a good timing resolution was also
found comparable to that of BaF2 scintillator. In Ref. [2]
the response of a LaCl3:Ce has also been studied as a
function of the temperature (from �65 to 100 �C) showingthe potential interest for applications at high temperature.
The LaCl3:Ce has a maximum emission wavelength at
350 nm and a second peak in the range 420–440 nm
depending on Ce concentration. The density is typically
of order of 3:8 g=cm3 and the refractive index at maxi-
mum emission wavelength ’ 1:9; it is hygroscopic [2] and
due to the high Z of La and Ce atoms it is a good g, b
detector.
All these qualities have gained our attention and in this
paper the results obtained by investigating deep under-
ground (about 3600m w.e.) at the Gran Sasso National
Laboratory of I.N.F.N. the features of a LaCl3:Ce
scintillator produced by Saint Gobain crystals and detectors
are reported.
ARTICLE IN PRESS
www.elsevier.com/locate/nima
0168-9002/$ - see front matter r 2005 Elsevier B.V. All rights reserved.
doi:10.1016/j.nima.2005.09.030
�Corresponding author. Tel.: 390672594542; fax: 390672594542.
E-mail address: [email protected] (R. Bernabei).

The measurements described here have been performed
in the DAMA/R&D apparatus, which is a multipurpose
set-up devoted to tests on detectors’ and PMTs low
background prototypes and to small scale experiments
investigating various processes such as bb decay modes in40Ca, 46Ca, 48Ca, 106Cd, 130Ba, 136Ce, 138Ce, 142Ce [8–13].
Here the light response, the a=b ratio, the a=bdiscrimination capability and the radioactive contamina-
tions have been investigated. Moreover, the energy
distribution of the background, arising from such con-
taminations, has been accounted by a Monte Carlo
simulation based on the EGS4 code [14]. The data have
been then used to investigate some possible cluster decays
in La isotopes.
2. The experimental set-up
The used detector is a LaCl3:(8.5�1.0%)Ce ð25:4�0:2mm in diameter by 25:4� 0:2mm length). It has a
density r ¼ ð3:86� 0:01Þ g=cm3 [15] corresponding to a
mass of ð49:7� 1:3Þ g. The crystal is encapsulated in a
OFHC copper housing 1mm thick; between copper and
crystal there are about 2:5mm of diffuser. The optical
window is made of quartz. The detector is a commercial
crystal and no particular selection of crystal materials has
been pursued; in fact, one of the goal of this work was the
identification of the starting levels of residual contamina-
tions in such a detector.
The crystal scintillator has been viewed by a low
background photomultiplier (PMT) EMI9265-B53/FL
(’ 30% quantum efficiency at 380 nm) through a Tetra-
sil-B light guide (7:6 cm diameter 10 cm long) to even
further reduce the residual contribution from the low
background PMT (see Fig. 1). In order to reduce further
the environmental radioactivity, the voltage divider has
directly been mounted on the flying leads of the PMT over
a teflon disk by using miniaturized SMD capacitors and
resistors, which are soldered by low radioactive lead and
special resin (see Fig. 1).
The experimental configuration has been put inside a
low-radioactivity sealed copper box fulfilled with low
radioactive Cu bricks. It is installed in the center of a
low-radioactivity passive shield of Cu/Pb/Cd-foils/poly-
ethylene/paraffin. The inner copper box is flushed with
high-purity (HP) Nitrogen gas and kept in slightly over-
pressure with the respect to the external environment. Also
the whole shield is sealed and maintained in the HP
Nitrogen atmosphere (see Fig. 2). The low background Cu
and Pb of the passive shield have suitably been etched and
maintained in HP Nitrogen atmosphere until the installa-
tion.
The electronic chain is summarized in Fig. 3.
In particular, three charge ADC channels are acquired
(with a 120 ns gate) to collect energy information in
different energy ranges; moreover, the signals from the
PMT are also recorded by a 160MSa=s Transient Digitizer,
TD, over a time window of 3125 ns.
3. Measured main features of the LaCl3:Ce detector
The light response, the linearity, the energy resolution,
the a=b ratio and the a=b discrimination capability have
been studied. The main radioactive contaminations in the
background have been quantified.
3.1. Calibrations
The energy calibrations have been performed in two
different experimental conditions: (i) crystal directly
coupled to the PMT; (ii) crystal coupled to PMT through
the light guide (since this last one is the experimental
ARTICLE IN PRESS
Fig. 1. Left: schematic view not in scale of the LaCl3:Ce detector. See text. Right: a typical DAMA voltage divider with SMD components; it is mounted
on a teflon disk to be directly connected on the flying leads of the PMT.
Fig. 2. Shield of the DAMA/R&D set-up and the authomatic system to
close it.
R. Bernabei et al. / Nuclear Instruments and Methods in Physics Research A 555 (2005) 270–281 271

condition of the production runs). The measured energy
distributions are shown in Figs. 4 and 5, respectively.
The behaviours of the energy calibrations are shown in
Fig. 6 (a). The energy calibration is ð0:6090�0:0003Þ ch=keV in case (i) and ð0:4061� 0:0006Þ ch=keVin case (ii); thus, the collected light is reduced by about
33% when using that light guide on LaCl3:Ce. More-
over, the energy resolution is in the first case:
s=E ¼ 0:003þ 0:51=ffiffiffiffiffiffiffiffiffiffiffiffiffiffiffi
E½keV �p
, and in the second case:
s=E ¼ 0:004þ 0:59=ffiffiffiffiffiffiffiffiffiffiffiffiffiffiffi
E½keV �p
, respectively; they are
shown in Fig. 6 (b). As example, one gets FWHM=E ¼5:4% at 662 keV g quanta of 137Cs without using light
guide.
By comparing the measured energy calibration spectra
with those obtained by a devoted Monte Carlo full
simulation, the number of photoelectrons/keV has been
derived: 7:2� 1:0 for the first case and 4:8� 1:0 for the
second case, respectively.1
3.2. Pulse shape discrimination capability
The pulse shape discrimination capability between a and
gðbÞ particles has been investigated by studying the pulses
recorded by Transient Digitizer. Various analysis ap-
proaches can be pursued; here we have exploited in
particular the optimal digital filter method [16].
To obtain the numerical characteristic of the LaCl3:Ce
scintillation signal, namely the shape indicator (SI), the
following formula has been applied for each pulse:
SI ¼P
k f ðtkÞ � PðtkÞ, where k identifies the TD time
channel in the time interval 44–200 ns. Moreover, f ðtÞ is
the digitized amplitude of a given signal normalized to its
area. The weight function PðtÞ is defined as:
PðtÞ ¼ f aðtÞ � f gðtÞ, where f aðtÞ and f gðtÞ are the reference
pulse shapes for a particles and g quanta, respectively. In
particular, f aðtÞ has been obtained by averaging about
40 000 individual events in the energy range
1800–2400 keV, where the analysis of the behaviour of
the measured background assures the presence of only a
particles’ events from U and Th chains. To obtain instead
f gðtÞ, about 40 000 individual events of energy around
1500 keV have been averaged; in fact, the events below
1600 keV can be mainly ascribed to b and EC decays of138La (natural abundance: 0.0902%).
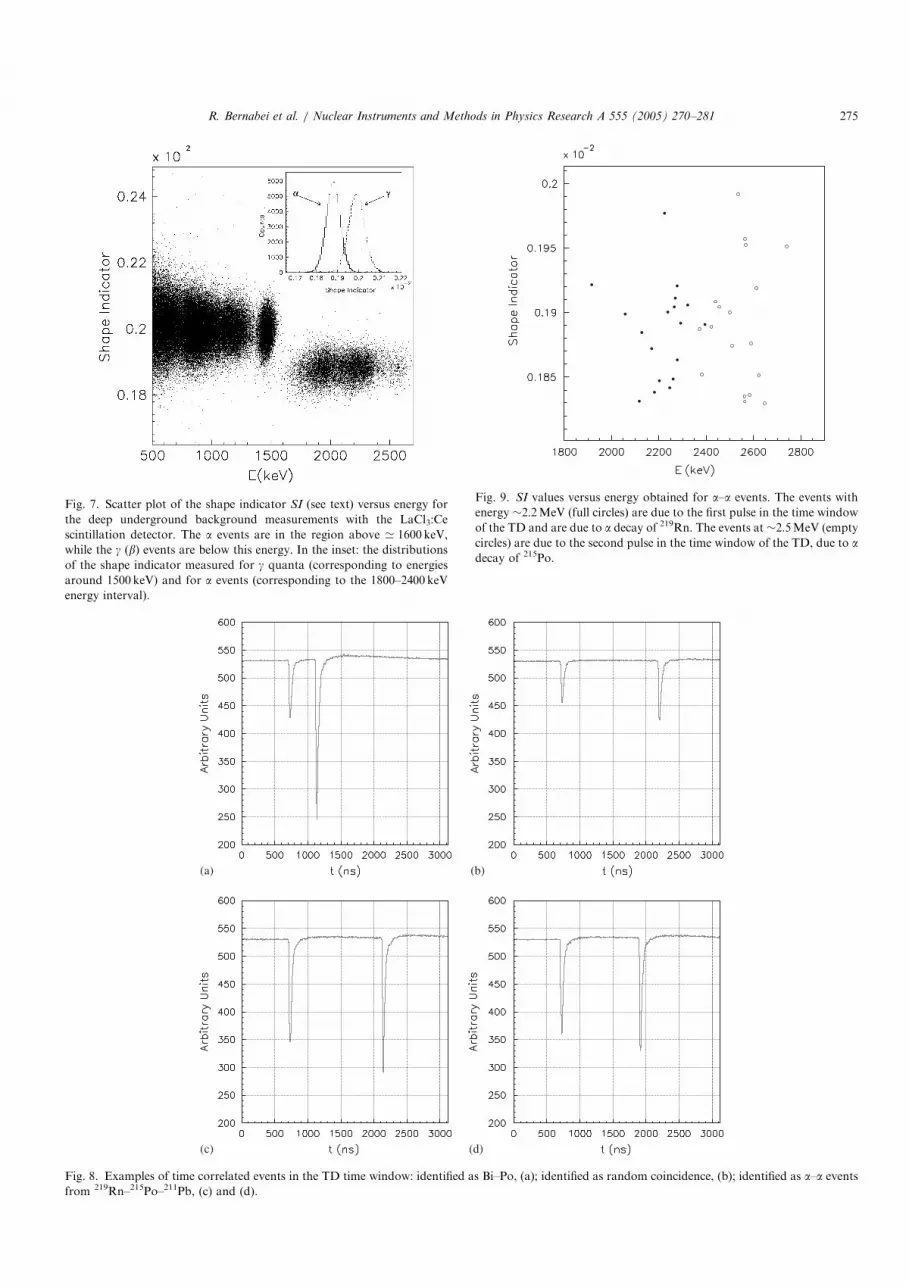
The scatter plot of the shape indicator versus energy for
the deep underground background measurements with the
used LaCl3:Ce crystal is depicted in Fig. 7.
The population of the a events is slightly shifted
relatively to that of the gðbÞ events. As it is visible in the
inset of Fig. 7, the distributions of the shape indicator for
gðbÞ and a events are well described by Gaussian functions.
In particular, we obtain for the reference pulses: SIa ¼1:88� 10�3 with standard deviation sa ¼ 0:03� 10�3 and
for SI g ¼ 1:99� 10�3 with standard deviation
sg ¼ 0:04� 10�3.
The results of this analysis are in substantial agreement
with the possibility of statistical pulse shape discrimination
in LaCl3:Ce as already suggested in Ref. [17].
3.3. Study on correlated events: a–a and Bi–Po events
An analysis of the events time correlated in the TD time
window—for the data collected deep underground during
70:2 h—has been carried out. Examples of double pulses in
the TD time window are shown in Fig. 8.
As first, we have investigated a–a time correlated events
in the TD time window; see Fig. 8 (c) and (d). They can be
produced in particular by a decay of 219Rn into 215Po
followed by 215Po a decay ðT1=2�1:781msÞ into 211Pb
(isotopes of the 235U chain) and can be identified by
applying the shape indicator method.
Note that when considering only a particles the mean
rate measured by the detector is ’ 0:37Hz, i.e.—consider-
ARTICLE IN PRESS
Fig. 3. Scheme of the electronic chain.
1Note that a lower limit on the number of photoelectrons, Nphe, can be
obtained by using the very simple formula: s=EXffiffiffiffiffiffiffiffiffiffi
Nphe
p
=Nphe, which
however does not account for all the factors contributing to the
broadening of the energy resolution such as, for example, a not perfect
uniformity of the detector, the broadening due to the charge distribution
of the pulse of each photoelectron, the light propagation in the specific
detector, etc.
R. Bernabei et al. / Nuclear Instruments and Methods in Physics Research A 555 (2005) 270–281272

ing an effective TD time window of 2400 ns—the expected
a–a random coincidences are 0.03 events/day to be
compared with the measured rate of ð6:2� 1:4Þ events/day.In Fig. 9 the SI values of the two characteristic pulses of
a–a events are shown as a function of the corresponding
energy.2 In particular, the events corresponding to the first
pulse in the time window (full circles) have a mean energy
of ð2:213� 0:026ÞMeV and are due to the 219Rn a decay
(79.4% a of 6:819MeV, 12.9% a of 6:553MeV and 7.5% a
of 6:425MeV). As regards the events corresponding to the
second pulse (empty circles) they have a mean energy of
ð2:537� 0:023ÞMeV and are due to the 215Po a decay
(’ 100% a of 7:386MeV). Thus, from the a–a events it is
possible to derive the a=b ratio by comparing the detected a
energy on the energy scale calibrated with g sources and the
real a energy. In our detector a=b ¼ 0:328� 0:004 for the219Rn peak and 0:343� 0:003 for the 215Po peak; these
values are largely consistent with the value of ð0:33� 0:01Þfor the 214Po a of 7:686MeV given in Ref. [18]. Moreover,
from the analysis of these events, the contamination of235U in the detector can be quantified, considering that the
detection efficiency of a–a events in 2400 ns time window is
9:34� 10�2%.Therefore, an activity of ð66� 16Þ �102 dec=day can be estimated, that is when assuming the235U chain in equilibrium: ð19� 5Þppb of 235U.
Moreover, we have also analyzed the class of the so-
called Bi–Po events. A Bi–Po event from 232Th chain is
given by the b decay of 212Bi into 212Po followed by the212Po a decay ðT1=2�299 nsÞ, while a Bi–Po event from 238U
chain is given by the b decay of 214Bi into 214Po followed by
the 214Po a decay ðT1=2�164msÞ. Also these events can be
identified by studying the pulse information recorded by
the TD: however, considering also in this case an effective
TD time window of 2400 ns, Bi–Po events from 232Th chain
are mostly recorded (see Fig. 8 (a)). In particular, the
detection efficiency is 99.6% for Bi–Po events of 232Th
chain and 1.01% for those of 238U chain. In the exposure of
70:2 h only two b–a events have been identified from the
SI and the energies of the two pulses. Note that in this
case the random coincidences are not negligible, since their
rate is 3:9� 10�6Hz; therefore, in 70:2 h the expected
random coincidences are 0.99. The two events have
ARTICLE IN PRESS
(a) (b)
(c) (d)0
Fig. 4. Energy distributions measured by the LaCl3:Ce detector with the PMT directly coupled to its optical window by using the following g sources:
(a) 137Cs with peak at 662 keV; (b) 241Am with peak at 59:5keV; (c) 22Na with peak at 511 keV (the peak at 1275keV is here out of scale); (d) 133Ba with
peaks at 81keV and �356keV.
2It is worth to note that the detected energy of a particles is given in the
following in keV (or MeV) electron equivalent since it refers to an energy
scale obtained by g sources calibrations.
R. Bernabei et al. / Nuclear Instruments and Methods in Physics Research A 555 (2005) 270–281 273

energies: E1b ¼ 162 keV, E1
a ¼ 1905 keV the first one and
E2b ¼ 1268 keV, E2
a ¼ 3268 keV the second one. The ene-
rgy E2a is high and could be ascribed to a 212Bi–212Po Bi–Po
event with an a of 8785 keV; in this case the a=b ratio is
’ 0:37, suggesting an energy dependence of this quantity
(see also later).
ARTICLE IN PRESS
(a) (b) (c)
(d) (e) (f)
Fig. 5. Energy distributions measured by the LaCl3:Ce detector with the PMT coupled to the optical window of the detector through the light guide by
using the following g sources: (a) 137Cs with peak at 662 keV; (b) 241Am with peak at 59:5 keV; (c) 22Na with peaks at 511 and 1275keV; (d) 228Th with
peaks at 239 and 583keV (sources 228Th set at�10 cm from the detector); (e) 133Ba with peaks at 81 and�356keV, in this case the source was positioned in
a slightly different way than in the other cases; (f) 60Co with peaks at 1173 and 1332keV.
(a) (b)
Fig. 6. (a) Linearity of the LaCl3:Ce crystal, without (upper line) and with (lower line) light guide. The points correspond to the g photopeaks in the Fig. 4
for the calibration without light guide and in Fig. 5 for the calibration with light guide. (b) Behaviours of s=E measured with the LaCl3:Ce detector
without (lower line) and with (upper line) light guide, respectively; in the case with light guide only 7 of the 10 g peaks present in Fig. 5 have been
considered. In fact, for 228Th peaks the source was at �10 cm from detector, while the peak at �356keV from 133Ba is due to the superimposition of more
g’s. In the case without light guide only 4 peaks of Fig. 4 have been taken into account not considering for the same reason the �356keV peak from 133Ba.
R. Bernabei et al. / Nuclear Instruments and Methods in Physics Research A 555 (2005) 270–281274
ARTICLE IN PRESS
Fig. 7. Scatter plot of the shape indicator SI (see text) versus energy for
the deep underground background measurements with the LaCl3:Ce
scintillation detector. The a events are in the region above ’ 1600keV,
while the g (b) events are below this energy. In the inset: the distributions
of the shape indicator measured for g quanta (corresponding to energies
around 1500keV) and for a events (corresponding to the 1800–2400 keV
energy interval).
(a) (b)
(c) (d)
Fig. 8. Examples of time correlated events in the TD time window: identified as Bi–Po, (a); identified as random coincidence, (b); identified as a–a events
from 219Rn–215Po–211Pb, (c) and (d).
Fig. 9. SI values versus energy obtained for a–a events. The events with
energy �2:2MeV (full circles) are due to the first pulse in the time window
of the TD and are due to a decay of 219Rn. The events at�2:5MeV (empty
circles) are due to the second pulse in the time window of the TD, due to a
decay of 215Po.
R. Bernabei et al. / Nuclear Instruments and Methods in Physics Research A 555 (2005) 270–281 275

From the Bi–Po events it is also possible to estimate the238U and 232Th contamination inside the LaCl3:Ce
detector. An upper limit of 4.45 events (90% C.L.) [19]
for the Bi–Po events from both the 238U and 232Th chains
can be set, i.e.:
a212Bi�212Poo1:5 dec=day ð90% C:L:Þ (1)
a214Bi�214Poo150 dec=day ð90% C:L:Þ. (2)
Considering the chains in equilibrium, it results in 232Th
and 238U contaminations,
C232Tho88 ppt ð90% C:L:Þ (3)
C238Uo2:8 ppb ð90% C:L:Þ. (4)
Let us comment the contaminations of 238U with the
respect to 235U in the LaCl3:Ce crystal. Typically,
considering the halflife and the natural abundance of these
two isotopes, the activity of 238U should be about 20 times
larger than that of 235U. This is not the case in LaCl3:Ce as
obtained here and by other authors [20,18,5]; see also later.
4. Further analyses on the LaCl3:Ce radioactive
contaminations
The background spectrum of the LaCl3:Ce crystal
measured deep underground in the low background set-
up is depicted in Fig. 10.
The measured background is fully dominated by the
internal residual contaminants; in particular, as already
mentioned, the events below ’ 1600 keV are mainly due to
the radioactive decays of 138La present in the natural La,
while the events above ’ 1600 keV are due to a particles
mainly from 235U decay chain.
In the analysis of the background, presented in the
following, we have simulated the contribution of each
identified contaminant to the experimental energy spec-
trum by using the EGS4 code [14]; for the a particles it has
been assumed that their whole energies are released inside
the detector.
4.1. Contribution from 235U decay chain
As suggested from the previous analysis on the a–a
events, an important contribution to the measured back-
ground can be ascribed to isotopes from the 235U decay
chain.
As a first step, let us assume this decay chain at
equilibrium and point our attention out on the experi-
mental energy distribution of the a events (see Fig. 11). In
this way, we can ascribe the structure at �2200 keV to the a
decays of 219Rn ðQa ¼ 6950 keVÞ, as already pointed out
also by the previous study on a2a events, and to those of
the 211Bi ðQa ¼ 6750 keVÞ. Moreover, the a=b ratio
estimated above allows to ascribe the peak at �1900 keV
ARTICLE IN PRESS
Fig. 10. Background energy distribution measured by the LaCl3:Ce detector in the low background DAMA/R&D set-up at LNGS. The lowest energy
distribution refers to 493 h of data taking, while the other two regions to 70:2 h.
227Th, 223Ra
219Rn,211Bi
215Po
231Pa absent (see text)
Fig. 11. Comparison between the expected energy distribution by using
the best-fit parameters (dashed line) and the experimental one (continuous
histogram). Here is also shown (light dashed line) the expected distribution
for the a decay of 231Pa in case the same activity for the other isotopes of
the chain is assumed (see text). The absence of this peak in the
experimental data can be explained if the chain is broken between 231Pa
ðT1=2 ¼ 3:276� 104 yrÞ and 227Ac ðT1=2 ¼ 21:8 yrÞ.
R. Bernabei et al. / Nuclear Instruments and Methods in Physics Research A 555 (2005) 270–281276

to the a decays of the 223Ra ðQa ¼ 5980 keVÞ and of 227Th
ðQa ¼ 6150 keVÞ. It is worth to note that in this energy
distribution the expected peak at �2600 keV—see Fig. 9—
from the a decay of 215Po is strongly suppressed ð�85%Þbecause of the short halflife of the 215Po ðT1=2 ’ 1:781msÞwith the respect to the DAQ dead-time; in fact, most of its
decays occur during the DAQ dead time ð�5msÞ after the219Rn decay.
As regards the a decay of 231Pa ðQa ¼ 5150 keVÞ, whichis the third element in the 235U chain, considering the
previous estimates of the a=b ratio, it should induce a peak
at energy �1600 keV. As it can be seen, there is no evidence
for it in the experimental energy spectrum; this can be
explained by abandoning the assumption of chain in
equilibrium and considering that it is broken between231Pa ðT1=2 ¼ 3:276� 104 yrÞ and 227Ac ðT1=2 ¼ 21:8 yrÞ.
Starting from these preliminary considerations, a further
analysis of events due to a contaminations has been
performed by realizing a Monte Carlo simulation of the a
decays of 227Th, 223Ra, 219Rn, 215Po and 211Bi (because of
the above proved absence of 231Pa). The full decay scheme
of each isotope has been considered and for each event the
total energy, E, released in the detector has been calculated.
In particular, for the a particles the a=b ratio has been
written as: a=b ¼ a0 þ a1 � Ea, expliciting its linear depen-
dence on the a deposited energy, Ea.
The expected energy distribution, Sa0;a1;c1;c2;N1;N2ðEÞ, is a
linear combination of the energy distribution obtained by
the previous simulations and is function of 6 parameters.
The a0 and a1 parameters are related to the a=b ratio; the c1and c2 are related to the energy resolution:
s=E ¼ c1 þ c2=ffiffiffiffi
Ep
. The parameter N1 represents the
number of decays due to 227Th (and, therefore, to its
daughters: 223Ra, 219Rn and 211Bi, which are considered at
equilibrium) and N2 is the number of decays due to 215Po
acquired by the DAQ system; we expect N25N1 because
of the DAQ dead time as mentioned above.
The fit has been performed by minimizing in the energy
interval 1600–2800 keV the function:
Z2 ¼X
k
ðSa0;a1;c1;c2;N1;N2ðEkÞ �OkÞ2
Ok
(5)
with the respect to the free parameters a0, a1, c1, c2, N1 and
N2, where Ek is the mean energy in the k bin and Ok the
experimental counts measured in the k bin.
Using the best-fit parameters the energy distribution
shown in Fig. 11 (dashed line) is obtained. The agreement
with the experimental distribution (continuous histogram)
is very good.
Moreover, by using the best-fit value of the parameter
N1 we can estimate the activity of the single components of
the radioactive chain (assumed in equilibrium):
a ¼ N1=Tacq ¼ ð77� 1Þ � 102 dec=day, value that is in
agreement with that previously estimated with the analysis
of the a–a events. Furthermore, from the best-fit values of
the parameters N1 and N2 it follows that only N2=N1
�13% of the 215Po decays is acquired, confirming our
previous estimation. As a by-product, we can also obtain
from the best-fit parameters a0 and a1 the ratio:
a=b ¼ 0:187þ 0:0216� Ea½MeV � (6)
that is valid for a particles with energy Ea between 6 and
7:5MeV and is well in agreement with estimates given
above.
Assuming for the a decay of 231Pa the same activity as
the other isotopes of the chain and using the best-fit
parameters, we obtain the peak at ’ 1550 keV shown in the
same Fig. 11 (light dashed line), which is absent in the
experimental data for the reasons given above. A further
test on the absence of such a peak is given by Fig. 7 where
there is no evidence for a events at energies lower than
1600 keV. It follows that, in our case the 227Ac ðT1=2 ¼21:8 yrÞ can be considered as father isotope of the decay
chain, while there are no traces of decays due to the first
isotopes of the 235U chain.
Let us now put forward some other considerations about
this fact. At first [20] the chemistry of Lanthanides and
Actinides is similar, so the U and Th content in Lanthanide
minerals can be high: as example the Australian monazite,
from which Lantanium can be derived, contains 6.7% of
Th. Moreover, even if the decay chains would originally be
in equilibrium, U and Th would be removed during the
Lanthanide purification, but this procedure is not so
efficient for some of the daughters; thus, a trace of U
and Th can be kept in form of 227Th, 223Ra and daughters
with a similar activity [20].
Moreover, using the value of the activity obtained by the
a contamination analysis, we obtain here for the 227Ac:
C227Ac ¼ ð6:7� 0:3Þ � 10�4 ppt. In the radioactive chain
following 227Ac are also present b decays from 227Ac, 211Pb
and 207Tl which contribute to the energy spectrum below
1600 keV. Assuming the chain in equilibrium after the227Ac, an activity similar as that due to the a decays can be
considered also for these processes. In particular, the
contribution from 227Ac ðQb ¼ 44 keVÞ can be neglected
(events under the used ’ 50 keV threshold). As regards the
b decays of 211Pb and 207Tl, a simulation has allowed to
obtain the expected energy distributions. These distribu-
tions are mainly due to the b decay in the ground state of
the daughter nucleus. In a next section, their contribution
will be taken into account together with that more
consistent of 138La to analyze the whole experimental
energy spectrum below 1600 keV.
4.2. Contribution from 138La
As mentioned above, the energy distribution measured
by the LaCl3:Ce detector below 1600 keV is dominated by
the 138La decays (T1=2 ¼ ð1:05� 0:03Þ � 1011 yr [21]). Our
crystal, ð49:7� 1:3Þ g mass with a Ce concentration of
ð8:5� 1:0Þ%, contains ð1:01� 0:04Þ � 1020 nuclei of 138La;
thus, an activity of ð21:1� 1:4ÞBq can be derived.
ARTICLE IN PRESS
R. Bernabei et al. / Nuclear Instruments and Methods in Physics Research A 555 (2005) 270–281 277

In Fig. 12 the 138La decay scheme is shown. This isotope
in ð66:4� 0:5Þ% of the cases decays by EC in 138Ba, while
in the remaining ð33:6� 0:5Þ% b decays in 138Ce [21].
The expected energy spectrum due to 138La decays has
been simulated with the help of the EGS4 package and of a
dedicated event generator.
The b decay ðQb ¼ 1044 keVÞ in 138Ce is characterized by
a unique emitted b (end-point ¼ 255 keV) followed by a
789 keV deexcitation g from the daughter nucleus. In the
experimental data, the b decay gives rise to the b spectrum
visible below �250 keV when the g escapes the detector and
to the structure between �800 and �1000 keV when the
789 keV g is fully contained. Furthermore, around 600 keV
the Compton edge of the g summed to the b spectrum is
also visible.
As regards the EC process, it is followed by a g of ’1436 keV and X-rays/Auger electrons. In particular, in the
ð63:5� 0:5Þ% an electron from shell K ðEK ’ 38 keVÞ is
involved, in the ð27:7� 0:4Þ% an electron from shell L
ðEL ’ 6 keVÞ and in ð8:86� 0:14Þ% an electron from upper
shells. The EC process produces in the experimental
spectrum the peak at ’ 1500 keV (sum of the 1436 keV g
and X-rays/Auger electrons) with its Compton edge at ’1250 keV and the X-rays/Auger electrons peaks in the low
energy region due to the escape of the 1436 keV g.
A devoted measurement (T ¼ 493 h) has allowed to
point out the peak at ’ 38 keV due to the shell K
deexcitation and part of 6 keV peak due to shell L
deexcitation and shaped by the energy threshold (see
Fig. 10 left).
The peak at ’ 38 keV can also be used to evaluate
the 138La activity in the detector. Using the peak detec-
tion efficiency—accounting also for the branching
ratio—obtained by the simulation: �peak ¼ 0:330� 0:005(the error considers the uncertainties in the decay scheme)
and the number of experimental counts due to the peak
(fit of the experimental data): Npeak ¼ ð1:203� 0:005Þ�107, the resulting activity of 138La is: a138La ¼ Npeak=ð�peak �TÞ ¼ ð20:5� 0:4ÞBq. This result is well in agreement
with the previous estimation from 138La content in the
crystal.
Another determination of the 138La activity can be
obtained analyzing the whole experimental energy spec-
trum below 1600 keV. Here, the expected distribution is
due to the sum of the contributions from b decays of 211Pb
and 207Tl (whose activity has been determined above) and
of that more consistent of 138La. The expected energy
distribution has been fitted to the experimental energy
spectrum in order to estimate the 138La contribution; the
only free parameter is the number of events due to 138La
contribution: N ¼ ð5:23� 0:10Þ � 106 events, thus for an
exposure of T ¼ 70:2 h it results in activity for 138La:
a138La ¼ N=T ¼ ð20:7� 0:4ÞBq, in agreement with the
previous estimates.
Finally, our evaluation of the T1=2 of 138La can be
derived from the measured activity: a138La ¼ ln 2�N138La=T1=2, thus, considering the number of 138La nuclei
in the detector it follows: T1=2 ¼ ln 2�N 138La=a138La ¼ð1:07� 0:06Þ � 1011 yr, well compatible with previous
experimental estimation: T1=2 ¼ ð1:05� 0:03Þ � 1011 yr
[21].
4.3. Conclusions
In conclusion, Fig. 13 shows the comparison between the
experimental energy spectrum (continuous histogram) and
the full simulation contributions (dashed line). A good
agreement has been obtained.
5. An example of application: results on some cluster decay
modes in 138La and 139La
The spontaneous emission of nuclear fragments heavier
than a particles and lighter than the most probable fission
fragments, named cluster decay, was theoretically predicted
in 1980 [23] and experimentally observed for the first time
in 1984 [24,25]. Up to date, spontaneous emissions of
clusters ranging from 14C to 34Si from near 20 translead
nuclei (from 221Fr to 242Cm) have been observed [26,27]. In
all these decays double magic nucleus 208Pb, or nuclei close
to 208Pb, are produced allowing to consider this domain of
cluster decays as ‘‘lead radioactivity’’ [27], analogously to
‘‘a radioactivity’’.
ARTICLE IN PRESS
Fig. 12. Decay scheme of 138La from Ref. [21]. The use of the more recent
scheme in Ref. [22] would give results fully compatible within errors.
Fig. 13. Comparison between the experimental energy distribution
(continuous histogram) and simulation (dashed line) (see text).
R. Bernabei et al. / Nuclear Instruments and Methods in Physics Research A 555 (2005) 270–281278

A new region of parent nuclei, for which cluster
radioactivity can experimentally be observed, was pre-
dicted recently in Ref. [28]: these are the nuclei with Z ¼56� 64 and N ¼ 58� 72; daughter nuclei are close to
double magic 10050 Sn. In Ref. [29] we have already
investigated several possible cluster decays of 127I.
Here we will use the exposure collected deep under-
ground with the LaCl3:Ce detector in order to investigate
some of the possible cluster decay modes in 138La and139La.
It is worth to note that theoretical calculations for the
half-lives of 138La and 139La cluster decays, based on
analytical superasymmetric fission model [30], were pessi-
mistic. Recently, several semiempirical formulae for the
calculation of T1=2 in cluster decays have been proposed
[31–33] with numerical parameters determined by fitting
the known experimental data. However, despite these
formulae work nicely in the region of ‘‘lead radioactivity’’
[27], they give very discrepant results when applied to
cluster decay of 138La or 139La: calculated T1=2 differ by
orders of magnitude (see Table 1). Such a discrepancy gave
us additional motivation for the experimental investigation
of the 138La and 139La cluster decays.
In the present case the 138La and 139La parent nuclei are
incorporated in the LaCl3:Ce detector itself (natural
abundance of 138La and 139La are 0.0902% and
99.9098%, respectively) and the subsequent decays of the
created clusters (which are usually radioactive) are
searched for. In fact, all the nuclides listed in Table 1 are
radioactive with the exception of 48Ca which is unstable to
2b2n decay mode, but with very high T1=2 ’ 4:3� 1019 yr
[35]. Thus, for each considered decay channel, the data
analysis has been realized here searching for the signals
produced in the subsequent decay chain of the nuclides in
the cluster.
In Fig. 14 we show the decay chains just for the three
cluster decay processes analysed in the present paper.
For each process a Monte Carlo estimate of the expected
signal energy distribution has been calculated on the basis
of the EGS4 code [14] and of a dedicated event generator.
It is worth to note that time correlation analyses (as e.g. we
did in Ref. [29]) would not add here more information
because of the lifetimes of the involved nuclides and of the
high background level of the LaCl3:Ce crystal.
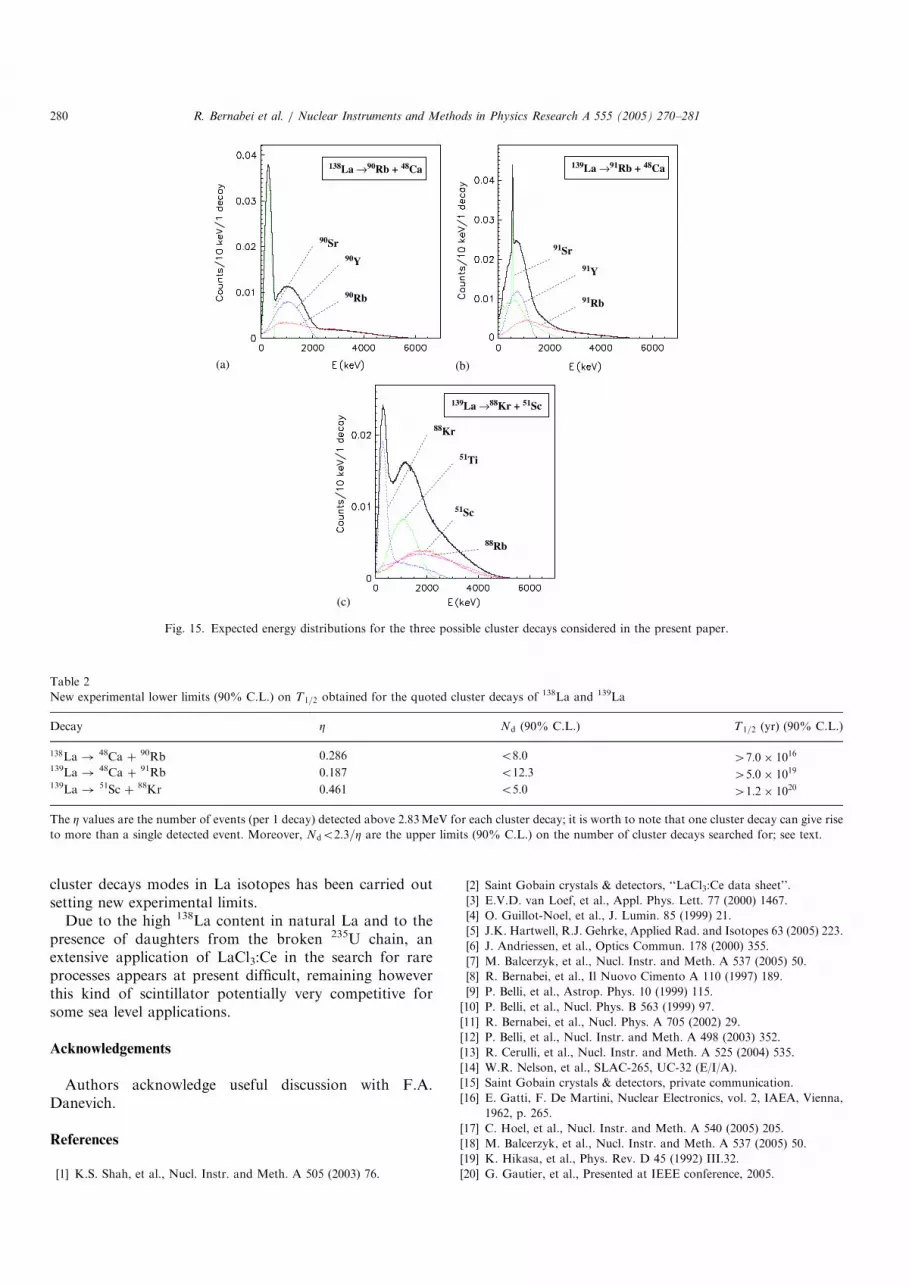
The expected energy distributions are shown in Fig. 15.
As it can be seen, still significant part of the expected
energy distributions in Fig. 15 remains above 2:83MeV,
that is in the region where zero counts have been measured
during 70:2 h; thus, we focus our attention on the energy
region above 2:83MeV. As a consequence, the measured
upper limit on signal events in the considered energy region
is 2.3 counts (90% C.L.), according to the procedure of
Ref. [19] for each considered process. Then, we calculate
the number of events (per 1 decay) detected above
2.83MeV for each cluster decay, Z; it is worth to note that
one cluster decay can give rise to more than a single
detected event. Using the standard formula T1=2 ¼ln 2 ðN � T=Nd Þ with N number of atoms of 138La or of139La, T running time and Ndo2:3=Z number of events
which can be ascribed to the process searched for, one
obtains the results summarized in Table 2.
The obtained limits exclude application of semi-empiri-
cal formulae of Ref. [32] for cluster radioactivity in
investigated nuclear region.
6. Conclusion
The features of a LaCl3:Ce detector have been investi-
gated deep underground for the first time. An investigation
of time correlated events, such as a–a and Bi–Po events,
and a study of the experimental energy distribution have
been carried out and have allowed e.g.: (i) to determine the
a=b light ratio in the used detector; (ii) to investigate the
a=b pulse shape discrimination capability; (iii) to quantify
the main radioactive contaminants of the detector. As an
example of possible application a search for some possible
ARTICLE IN PRESS
Table 1
Possible decay branches for 138La and 139La; in all these cases doubly
magic nucleus 48Ca (or nuclei in neighborhood of 48Ca) is emitted
Decay Q (MeV) T1=2 (yr)
[34] [31] [32] [33]
138La ! 48Ca þ 90Rb 37.05 3:8� 1085 5:5� 1013 4:2� 1044
138La ! 49Ca þ 89Rb 36.48 3:8� 1088 6:7� 1013 1:2� 1046
138La ! 50Sc þ 88Kr 37.70 7:3� 1088 6:8� 105 1:3� 1046
139La ! 48Ca þ 91Rb 34.73 2:2� 1094 3:4� 1017 1:3� 1052
139La ! 50Ca þ 89Rb 34.05 1:0� 1099 1:2� 1017 9:7� 1053
139La ! 51Sc þ 88Kr 35.68 2:6� 1097 1:3� 108 5:7� 1052
139La ! 54Ti þ 85Br 36.97 3:1� 1098 1:7� 10�2 1:3� 1052
139La ! 55V þ 84Se 37.87 7:3� 1098 7:6� 10�12 1:4� 1052
In this paper in particular we evaluate new experimental limits just for the
first, fourth and sixth listed decay processes.
Fig. 14. Decay chains that follow the three cluster decay processes
analysed in the present paper. We remind that 48Ca is unstable to 2b2n
decay mode, but with very high T1=2 ’ 4:3� 1019 yr [35].
R. Bernabei et al. / Nuclear Instruments and Methods in Physics Research A 555 (2005) 270–281 279
cluster decays modes in La isotopes has been carried out
setting new experimental limits.
Due to the high 138La content in natural La and to the
presence of daughters from the broken 235U chain, an
extensive application of LaCl3:Ce in the search for rare
processes appears at present difficult, remaining however
this kind of scintillator potentially very competitive for
some sea level applications.
Acknowledgements
Authors acknowledge useful discussion with F.A.
Danevich.
References
[1] K.S. Shah, et al., Nucl. Instr. and Meth. A 505 (2003) 76.
[2] Saint Gobain crystals & detectors, ‘‘LaCl3:Ce data sheet’’.
[3] E.V.D. van Loef, et al., Appl. Phys. Lett. 77 (2000) 1467.
[4] O. Guillot-Noel, et al., J. Lumin. 85 (1999) 21.
[5] J.K. Hartwell, R.J. Gehrke, Applied Rad. and Isotopes 63 (2005) 223.
[6] J. Andriessen, et al., Optics Commun. 178 (2000) 355.
[7] M. Balcerzyk, et al., Nucl. Instr. and Meth. A 537 (2005) 50.
[8] R. Bernabei, et al., Il Nuovo Cimento A 110 (1997) 189.
[9] P. Belli, et al., Astrop. Phys. 10 (1999) 115.
[10] P. Belli, et al., Nucl. Phys. B 563 (1999) 97.
[11] R. Bernabei, et al., Nucl. Phys. A 705 (2002) 29.
[12] P. Belli, et al., Nucl. Instr. and Meth. A 498 (2003) 352.
[13] R. Cerulli, et al., Nucl. Instr. and Meth. A 525 (2004) 535.
[14] W.R. Nelson, et al., SLAC-265, UC-32 (E/I/A).
[15] Saint Gobain crystals & detectors, private communication.
[16] E. Gatti, F. De Martini, Nuclear Electronics, vol. 2, IAEA, Vienna,
1962, p. 265.
[17] C. Hoel, et al., Nucl. Instr. and Meth. A 540 (2005) 205.
[18] M. Balcerzyk, et al., Nucl. Instr. and Meth. A 537 (2005) 50.
[19] K. Hikasa, et al., Phys. Rev. D 45 (1992) III.32.
[20] G. Gautier, et al., Presented at IEEE conference, 2005.
ARTICLE IN PRESS
Table 2
New experimental lower limits (90% C.L.) on T1=2 obtained for the quoted cluster decays of 138La and 139La
Decay Z Nd (90% C.L.) T1=2 (yr) (90% C.L.)
138La ! 48Ca þ 90Rb 0.286 o8:0 47:0� 1016
139La ! 48Ca þ 91Rb 0.187 o12:3 45:0� 1019
139La ! 51Sc þ 88Kr 0.461 o5:0 41:2� 1020
The Z values are the number of events (per 1 decay) detected above 2:83MeV for each cluster decay; it is worth to note that one cluster decay can give rise
to more than a single detected event. Moreover, Ndo2:3=Z are the upper limits (90% C.L.) on the number of cluster decays searched for; see text.
90Sr
90Y
90Rb
138La →90Rb + 48Ca
(a)
139La →91Rb + 48Ca
139La →88Kr + 51Sc
91Sr
91Y
91Rb
(b)
88Kr
51Ti
51Sc
88Rb
(c)
Fig. 15. Expected energy distributions for the three possible cluster decays considered in the present paper.
R. Bernabei et al. / Nuclear Instruments and Methods in Physics Research A 555 (2005) 270–281280
[21] J.K. Tuli, Nucl. Data Sheets 74 (1995) 349.
[22] A.A. Sonzogni, Nucl. Data Sheets 98 (2003) 515.
[23] A. Sandulescu, et al., Sov. J. Part. Nucl. 11 (1980) 528.
[24] H.J. Rose, G.A. Jones, Nature 307 (1984) 245.
[25] D.V. Aleksandrov, et al., JETP Lett. 40 (1984) 909.
[26] R. Bonetti, A. Guglielmetti, in: W. Greiner, R.K. Gupta (Eds.),
Heavy elements and related new phenomena, vol. 2, World Scientific,
Singapore, 1999, p. 643.
[27] S.P. Tretyakova, et al., Prog. Theor. Phys. Suppl. 146 (2002) 530.
[28] D.N. Poenaru, et al., Phys. Rev. C 47 (1993) 2030.
[29] R. Bernabei, et al., Eur. Phys. J. A 24 (2005) 51.
[30] D.N. Poenaru, et al., Atom. Data Nucl. Data Tables 34 (1986)
423.
[31] D.N. Poenaru, et al., Phys. Rev. C 65 (2002) 054308.
[32] M. Balasubramaniam, et al., Phys. Rev. C 70 (2004) 017301.
[33] Z.Z. Ren, et al., Phys. Rev. C 70 (2004) 034304.
[34] G. Audi, et al., Nucl. Phys. A 729 (2003) 337.
[35] A. Balysh, et al., Phys. Rev. Lett. 77 (1996) 5186.
ARTICLE IN PRESS
R. Bernabei et al. / Nuclear Instruments and Methods in Physics Research A 555 (2005) 270–281 281


