Embed Size (px)
Citation preview
Th
e Ind
ian Jou
rnal of In
du
strial Relation
s Vo
l. 49 N
o. 4
Ap
ril 201
4
A REVIEW OF ECONOMIC & SOCIAL DEVELOPMENT
Vol. 49 No. 4 2014April
Lead Article on
RS C
Jerome Joseph
The Pathology of Performance
Appraisals
ISSN No. 0019-5286
The Indian Journal of Industrial Relations:
a Review of Economic & Social Development
A special (July 2014) issue on
Labor Law Reforms in India
Guest-Editor: Lord Meghnad Desai
Contributors
Arun Maira (Planning Commission) * Ariel B Castro (ILO) * Anil
Verma (University of Toronto) * Amarjeet Kaur (AITUC) * Bruce
E Kaufman (Georia State University) * Debi S Saini (MDI) * Hemal
Shah (American Enterprise Institute) * Jerome Joseph (IIM Ahd)*
Martha Chen (Harvard Kennedy School, Cambridge) * Onkar Sharma
(MoLE) * Tushar Poddar (Goldman Sachs)
For copies contact
A.C. MishraAssistant Manager,
Shri Ram Centre for Industrial Relations, Human Resources, Economic & Social Development,
Unit No. 1078 (F/F), Central Square, Plaza-II, Plot No. 20 Manohar Lal Khurana Marg, (Barahindu Rao), Delhi-110006
Ph. 011- 23635816, Fax: 23635815 E-mail: [email protected] Website:www.srcirhr.com
Special Issues
Affirmative Action (Oct. 08)Guest Editor: Lord Meghnad Desai
Corporate Social Responsibility (Jan. 09)Guest Editor: Mritunjay Athreya
The Global Indian Firm (July 09)Guest Editor: Tarun Khanna
International Industrial Relations (April 10)Guest Editor: Tayo Fashoyin
Beyond GDP (April 2011)Guest Editor : György Széll
Unorganized Workers (Jan. 2013) Guest Editor : Renana Jhabvala
Skill Development (Jan. 2014) Guest Editor : Dilip H.M. Chenoy
Editorial Committee
Abad Ahmed
Andre Bateille
Baldev R. Sharma
Ishwar Dayal
J.S. Sodhi
Meghnad Desai
Rama J. Joshi
Vinay Bharat Ram
Editor
N.K. Nair
The Indian Journal of Industrial RelationsA Review of Economic & Social Development
The Indian Journal of Industrial
Relations: A Review of Economic &
Social Development (IJIR) is devoted to
dissemination of knowledge for effective
management of human resources and
harmonious industrial relations. A quarterly
in English, the journal enjoys high
academic reputation in India and
elsewhere and is widely subscribed by
government institutions, universities and
private sector organizations. A refereed
journal, its readership consists of
academia, policy makers, practicing
managers and student community.
Salient Featuresthl In to its 49 year of uninterrupted
publication and up to date.
l Listed in EBSCO, GALE/ CENGAGE
Learning, JSTOR, Cabell's Directory,
Proquest/ CSA Data Bases
l Research based articles & commu-
nications from eminent persons
l Reviews of latest titles from India and
elsewhere
l Theme based special issue program
with eminent persons as Guest Editors
IJIR online: www.irhrjournal.com
DisclaimerThe views expressed here are of the
authors and not of the publisher. While
care has been taken to ensure the
authenticity of the materials published,
the publisher accepts no responsibility for
their accuracy.
© Shri Ram Centre
All rights reserved. No part of this
publication may be reproduced in any
form or by any means, without written
permission of the publisher.
PERIOD INDIA FOREIGN ($)
(Rs.) (Air Mail)
Single copy 375 30
One Year 1500 100
Three Years 4000 275
Five Years 6500 375
All correspondence on subscription, change of address and non-receipt of copies, etc. should be addressed to A.C. Mishra, Asstt. Manager (Admn.), Shri Ram Centre for Industrial Relations Human Resources, Economic & Soc ia l Deve lopment .
E-mail: [email protected]@gmail.com
Website:www.srcirhr.comPlease quote your Annual Subscription (A.S.) Number in all your correspondence.
Subscription may be sent through Bank Draft in favour of Shri Ram Centre For Industrial Relations & Human Resources.
Unit No. 1078 (F/F), Central Square, Plaza-II, Plot No. 20 Manohar Lal Khurana Marg, (Barahindu Rao), Delhi-110006 Ph. 011- 23635816, Fax: 23635815
The Indian Journal of Industrial RelationsA Review of Economic & Social Development
Published by A.C. Mishra for Shri Ram Centre for Industrial Relations, Human Resources, Economic & Social Development
. Graphic layout and production by M/S Professional Media House, House No. 101, Phase-9, Gali No. 3, Shiv Vihar, Delhi-110094,
Unit No. 1078 (F/F), Central Square, Plaza-II, Plot No. 20 Manohar Lal Khurana Marg, (Barahindu Rao), Delhi-110006
Notes for Contributors
· Manuscripts for publication should be typed in double space, only on one side of the paper and sent in duplicate to the Editor. The Journal prefers to accept soft copies including through e-mail: [email protected]
· Each manuscript should be accompanied by a declaration by the author that the paper has neither been published nor submitted for publication elsewhere.
· Footnotes, typed in double-space, should be numbered serially and placed at the end of the text. Reference to literature cited should be carried within the text in brackets. Reference list, to be placed after footnotes, should be listed alphabetically by author and chronogically for each author. It should be kept as brief as possible.
· Contributors are advised to be brief in introducing the subject and devote most of the paper to the principal theme. The Journal prefers papers based on original data and fresh theoretical insights. References to previous work should be made economically. The Journal does not publish survey of literature comprising lengthy bibliographical references.
· Authors should take care to ensure the accuracy of data and references.
· Authors should always indicate, either in the text or in an enclosed memorandum, the time and place of empirical investigation, the context in which it was done, sponsors if any, and also an outline of the methods used.
· Manuscripts are accepted for publication on the understanding that they are subject to editorial revisions. Proofs will not be sent to the authors.
· Authors will receive one specimen copy of the issue free of charge.
(With effect from July 1, 2013)
Regd. No. 10631/65
Subscription Rates
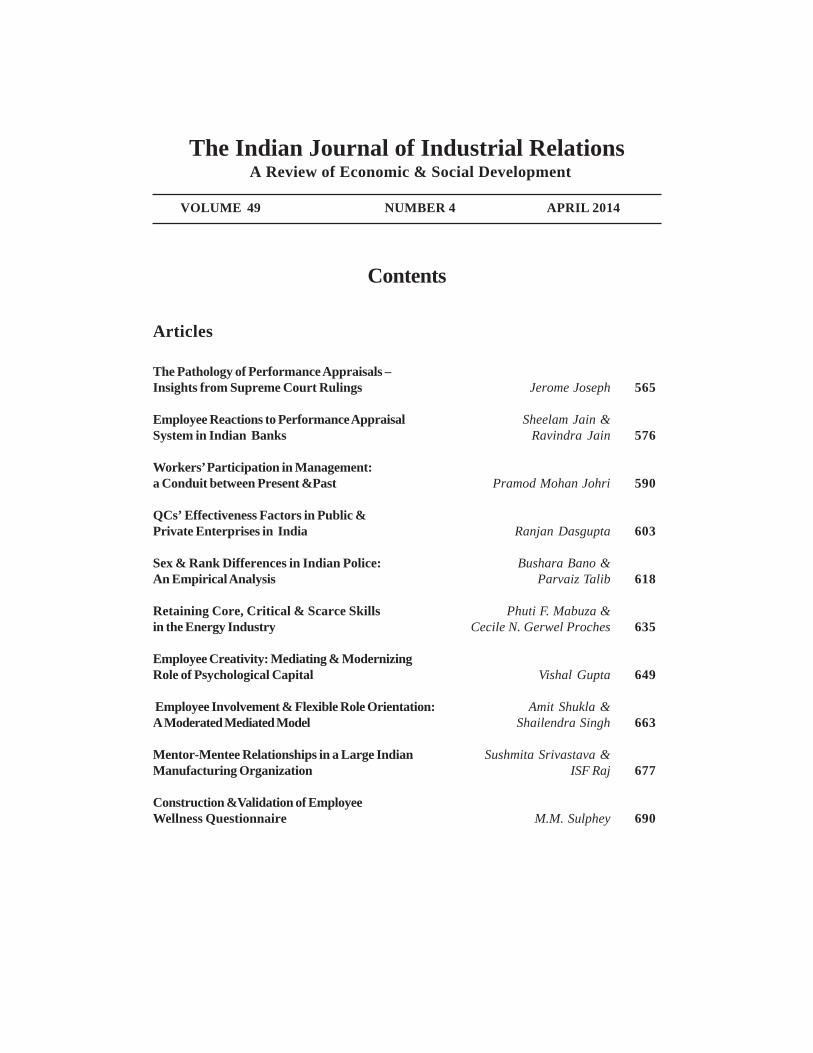
Contents
Articles
The Pathology of Performance Appraisals –Insights from Supreme Court Rulings Jerome Joseph 565
Employee Reactions to Performance Appraisal Sheelam Jain &System in Indian Banks Ravindra Jain 576
Workers’ Participation in Management:a Conduit between Present &Past Pramod Mohan Johri 590
QCs’ Effectiveness Factors in Public &Private Enterprises in India Ranjan Dasgupta 603
Sex & Rank Differences in Indian Police: Bushara Bano &An Empirical Analysis Parvaiz Talib 618
Retaining Core, Critical & Scarce Skills Phuti F. Mabuza &in the Energy Industry Cecile N. Gerwel Proches 635
Employee Creativity: Mediating & ModernizingRole of Psychological Capital Vishal Gupta 649
Employee Involvement & Flexible Role Orientation: Amit Shukla &A Moderated Mediated Model Shailendra Singh 663
Mentor-Mentee Relationships in a Large Indian Sushmita Srivastava &Manufacturing Organization ISF Raj 677
Construction &Validation of EmployeeWellness Questionnaire M.M. Sulphey 690
The Indian Journal of Industrial Relations
VOLUME 49 NUMBER 4 APRIL 2014
A Review of Economic & Social Development
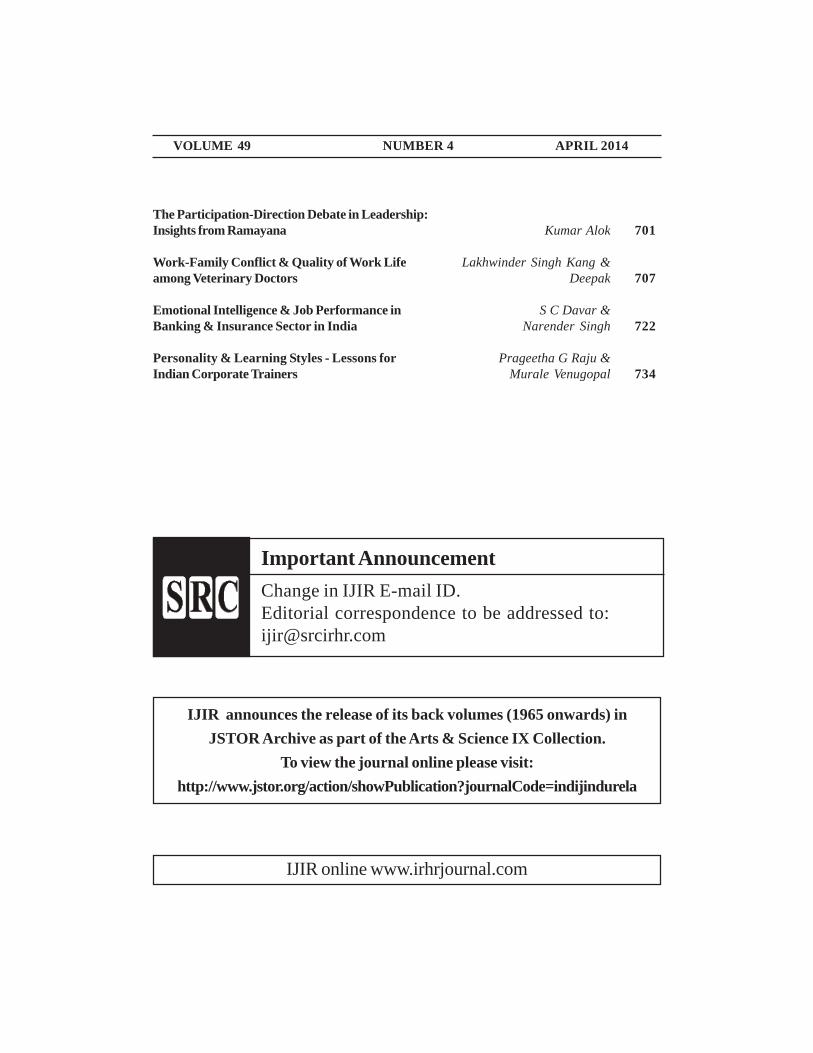
VOLUME 49 NUMBER 4 APRIL 2014
The Participation-Direction Debate in Leadership:Insights from Ramayana Kumar Alok 701
Work-Family Conflict & Quality of Work Life Lakhwinder Singh Kang &among Veterinary Doctors Deepak 707
Emotional Intelligence & Job Performance in S C Davar &Banking & Insurance Sector in India Narender Singh 722
Personality & Learning Styles - Lessons for Prageetha G Raju &Indian Corporate Trainers Murale Venugopal 734
IJIR online www.irhrjournal.com
IJIR announces the release of its back volumes (1965 onwards) inJSTOR Archive as part of the Arts & Science IX Collection.
To view the journal online please visit:http://www.jstor.org/action/showPublication?journalCode=indijindurela
Change in IJIR E-mail ID.Editorial correspondence to be addressed to:[email protected]
Important Announcement
sas
The Pathology of Performance Appraisals – Insights fromSupreme Court Rulings
Jerome Joseph
Based on a study of twenty six SupremeCourt judgments during the previousdecade the author argues that perfor-mance management represents a patho-logical feature of contemporary orga-nizations. It can serve the purpose ofsubjugation as the dissent of employeesis held against them and they are ex-pected to concur to prevailing hierar-chies even if they strongly feel that theorganisation could perform better ifthese hierarchies were democratized. Itis extremely difficult to separate ap-praisals from prevailing political reali-ties which could easily vitiate social re-lationships between employees. By re-inforcing hierarchy, the performancemanagement discourse ensures that al-ternative conceptions of organising arenot allowed to emerge. At a broaderphilosophical level, the performancemanagement discourse is embeddedmore in repressive than democratic con-structions and often ends up strangu-lating the potential and performance ofemployees in organizations.
Introduction
Performance management,like other management practicesespouses that control is necessaryto enable subordinates to achievetheir potential, and that withoutsuch control, production would besub-optimal or abysmally low(Willmott, 1984). Performancemanagement is instrumental ingenerating competition amongemployees, and this sense of com-petition can degenerate into alle-gations of manipulation, lack oftransparency and denial of voice.Issues of denial of voice are seenin the case of Arvind KumarSaxena versus Brij Raj KishoreRanga and others (SupremeCourt, 2005 September 28) wherethe post of Superintending Min-ing Engineer in the Rajasthan CivilServices was to be filled throughan assessment of merit of thecandidates. The procedure for fill-ing the posts was the assessmentof Annual Performance Appraisalreports, and candidates had tohave a rating of ‘very good’ in atleast five of the seven previous
Jerome Joseph is Professor, Personnel & Industrial Relations,Indian Institute of Management Ahmedabad 380015 E-mail:[email protected].
The Indian Journal of Industrial Relations, Vol. 49, No. 4, April 2014 565
Jerome Joseph
566 The Indian Journal of Industrial Relations, Vol. 49, No. 4, April 2014
appraisal reports in order to be consid-ered for promotion. The contention of anaspirant Arun Kumar Kothari was thathe had the requisite rating of ‘very good’in five out of the seven previous apprais-als, and yet he had been overlooked.
He was also not given an adequateopportunity by the appellate tribunal topresent his case, while another aspirantBrij Raj Kishore Ranga had been givensuch an opportunity. The Supreme Court(ibid: 3) attempted to provide voice to ArunKumar Kothari in its judgement – “Wedirect that if Arun Kumar Kothari, the ri-val candidate, is desirous of filing, and files,a counter affidavit in Appeal No. 283/97,within such period as permitted by theTribunal, the Tribunal shall consider suchaffidavit after giving opportunity of filinga rejoinder affidavit to Brij Raj KishoreRanga. Arun Kumar Kothari shall be af-forded an adequate opportunity of mak-ing submissions with regard to the con-tentions urged in Ranga’s Appeal No. 283/97, and thereafter the appeal shall be de-cided in accordance with law, as expedi-tiously as possible …”. In another casethough, the Supreme Court (2005 Novem-ber 22) ruled that adverse remarks neednot necessarily be communicated to em-ployees if stages such as counseling andguidance had not led to an improvementin desired performance. In another case,the Supreme Court (2007 February 12)has allowed the lowering of performanceratings given by a reporting officer by areviewing officer without communicationto an employee, if the performance rat-ings is only one of the elements amongmany other procedural requirements tomake promotion decisions.
Performance management initiatesa politics of stigma, fear and com-petitive tensions.
Performance management initiates apolitics of stigma, fear and competitivetensions where individuals begin to seeeach other as ‘rival candidates’ in thecontext of limited opportunities for ca-reer progression. In this sense, perfor-mance management is a composite of thepractices of management through whichunequal and asymmetrical relationshipsare instituted and reproduced within theenactment of the processes of organiz-ing (Dreyfus & Rabinow, 1986). Theeveryday reality of performance manage-ment can be seen as part of a technol-ogy that induces divisiveness and dis-placements in social relationships in ahierarchically structured career progres-sion (Gordon, 1980).
Performance Management asSubjugation
A Supreme Court (2010 January 12)decision pertaining to the termination ofan employee working as a senior man-ager in a firm allows us to understandseveral possible meanings of the perfor-mance management practice and dis-course. H Omkarappa was given an of-fer to be appointed as Executive Direc-tor (Marketing) by M/s Hindustan PhotoFilms Manufacturing Company in June1998. He accepted the offer and joinedin September 1998. As per the terms ofthe appointment, Omkarappa would beunder probation for a period of one year,
The Pathology of Performance Appraisals
The Indian Journal of Industrial Relations, Vol. 49, No. 4, April 2014 567
and if his performance during this periodwas found to be satisfactory, his appoint-ment would be confirmed, else his pro-bation would be extended or his serviceswould be terminated. At the end of ayear’s service, the company did not findOmkarappa’s performance to be satis-factory and indicated to him that it wasextending his probation by three months.His performance was to be reviewed onOctober 5, 1999 and he was expected toshow concrete results pertaining to im-provement in his performance. Mean-while Omkarappa wrote to the companyon September 20, 1999 pointing out thathis performance during the year of pro-bation had been excellent and there hadbeen no adverse remarks in his servicerecords. In response, a detailed perfor-mance and assessment report had beenprepared on November 25, 1999 andplaced before the Board of Directors onNovember 27, 1999. Following the reso-lution of the board, Omkarappa’s serviceswere terminated on November 29, 1999.Omkarappa’s appeal was on the groundthat the termination was of a stigmaticand punitive nature and therefore an op-portunity should have been given to himto defend his actions before the termina-tion was affected. Since a proper pro-cess of inquiry was not followed, andsince he had not been given an opportu-nity to defend himself, the terminationwas not sustainable in law. Thecompany’s argument was that the deci-sion was not a punitive or stigmatic oneand that deficiencies pertaining to hisperformance had been pointed out to him.It is interesting to note that the letterspertaining to communication of perfor-mance deficiencies as cited in the Su-
preme Court judgement are dated Sep-tember 20, 1999, November 4, 1999 andNovember 8, 1999, all of which are withina couple of months within the termina-tion of Omkarappa. Therefore, the com-munications pertaining to performancedeficiencies may have been the enact-ment of an attempt to ensure the termi-nation of Omkarappa rather than with anyintentions of developmental interventionson the part of higher management. TheSupreme Court, by setting aside the Ma-dras High Court judgement in this regardrefused to see the termination ofOmkarappa as of a punitive or stigmaticnature and therefore ruled in favour ofthe company. It stated that there was noneed for an enquiry to be conducted orfor Omkarappa to be heard before histermination was effected, as this was aninstance of performance deficiency. Fur-ther, the court took cognizance of a let-ter written by Omkarappa just a fortnightbefore his termination, and described itas being rude and intemperate.
Parts of Omkarappa’s letter to theManaging Director are reproduced be-low.
“Sir, I must refer here that unlike myabove explained case, yourself and Direc-tor Finance have joined this company onlyto enjoy better benefits which include sta-tus, good pay, perquisites and other facili-ties … from the beginning of my careerin HPF, I found that I have been re-strained to perform with my full capacityby CMD and DF … affecting my effi-ciency to a great extent … I have beentotally restricted from functioning as EDM,with even small part of my capacity.”
Jerome Joseph
568 The Indian Journal of Industrial Relations, Vol. 49, No. 4, April 2014
The opinion of the Supreme Court isbest summarized in its own words (ibid:paragraph 15) – “If a subordinate officerlike the respondent is in the habit of us-ing an intemperate language against hissuperior like appellant No. 1 the decisiontaken by the appellant company cannotbe said to be in any manner vitiated.” Ina sense such pronouncements ultimatelytend to legitimize the practice of perfor-mance management as subjugation. Theworker’s right to dissent and express herlegitimate and righteous disagreementagainst her ‘superiors’ in passionate butauthentic forms is taken away from her,and her conduct and behavior is thoughtto be objectionable unless she is willingto accept a subjugated existence, andgive up all possibilities of entering intorepresentations to redress injustice. Or-ganizations are not about the reproduc-tion of neat hierarchies where ‘subordi-nates’ must pay constant obeisance totheir ‘superiors’ but they are about find-ing collective solutions to the needs andproblems of society. In order to meetthese needs of society in just and ethicalways, organizational renewal and changeneeds to take place. For such change tooccur, passionate disagreement, dissentand conflicts may be necessary. The sup-pression of conflicts may only reproduceunjust hierarchies rather than bringingabout the necessary change that will re-
new the quest for justice and dignity.There is another problem with perfor-mance management apart from it beingphilosophically anchored against the pos-sibilities of dissent and organisationalchange. It fails to recognise that superi-ors could be incompetent and inadequatein performing their roles. When this is thecase, and when they sit in judgement onthe performance of others, then the per-formance appraisal that is being gener-ated is only likely to reproduce medioc-rity and subservience rather than inde-pendence and excellence. The pedagogyof organisational re-creation on a con-stant basis will have to rely on methodsof dialogue and dissent rather than anyevaluative enactments such as perfor-mance management where hierarchicalexercise of power masquerades as highercapability and superior knowledge.
Townley (2005: 317) articulates themethods through which performancemanagement enacts a culture of subju-gation – “Appraisal operates as a formof panopticon with its anonymous andcontinuous surveillance as seen in the ar-ticulation of a monitoring role … Oftenmonitoring and hierarchical access torecords is introduced under the guise offairness … As a system of surveillance,appraisal, although discontinuous in ac-tion, is rendered permanent in its effects.Its functioning principle is that the indi-vidual never knows whether he or she isunder surveillance or not. It representsthe exercise of control at a distance bothspatially and temporally …” The discur-sive control that performance manage-ment enacts is imprisoning not only forthose who are appraised, but also for
The suppression of conflicts mayonly reproduce unjust hierarchiesrather than bringing about the nec-essary change that will renew thequest for justice and dignity.
The Pathology of Performance Appraisals
The Indian Journal of Industrial Relations, Vol. 49, No. 4, April 2014 569
those who act as appraisers, as they haveto live up to the normality of appraisersand thus engage in evaluative processesthat are implicitly non egalitarian, thusindicating the Foucauldian maxim that su-pervisors are perpetually supervised(Foucault, 1977). It is necessary to re-member that even if performance man-agement is articulated as an objective andneutral exercise, it is not a disembodiedexercise. In the emergence of its embodi-ments in organisational and social locus,it is inevitable that its human enactors willget enmeshed in issues of politics andpower. It is towards these embodimentsof hierarchical politicization that we turnnext.
Performance Management asPolitical Vitiation
Reacting to a scheme for buildingmanagerial competencies, Townley (1999:285) writes – “Reading the document wasa ‘moving’ experience. It prompted a de-gree of anger that for a time, was difficultto explain …” The surveillance saturatedsketch that informs the textuality of a per-formance appraisal has the potential toevoke the same degree of anger. An illus-tration of such a performance appraisalsketch is available in the Supreme Court(2007 February 20) judgement in the S TRamesh versus State of Karnataka andanother case where the court was to de-cide on the issue of expunging the adverseremarks in the confidential records of anIndian Police Service officer, S T Rameshwho was given an overall grading of av-erage for the period between October 16,1996 and March 15, 1997 and several ad-verse remarks were entered in his annual
confidential report. Pertaining to qualityof output, the entry said, “He did not usehis optimum capacity and gave an impres-sion as though his stint in COD was a so-journ.” While analysing this entry pertain-ing to quality of output, it may be useful toremember that in industrial relations par-lance, output does not only mean ‘goodsand services but also structures of advan-tage and disadvantage. These are prop-erly called structures because they are es-tablished features of society which arehard to change’ (Edwards, 2003: 4). Thestructures of performance appraisal areinherently unequal as they provide theability to pass sweeping judgements onthose being appraised. Performance ap-praisals thus give the power to think ofthe optimum ability to which an employeecan deliver and describe the employee incavalier terms such as being on a sojourn.Work is thus reduced to technical unitswhose optimums can be calculated ratherthan being a social and political processof engagement to meet social needs.
In the entry pertaining to knowledgeand sphere of work, the following entrieswere made – “He is knowledgeable inthe profession and its related applicationbut, however his ‘paradigm’ preventedhim from performing better”. The state-ment that the police officer was knowl-edgeable but obstructed by his paradigmis inherently undemocratic, as it offers aview that there can be only one view of
In industrial relations parlance,output does not only mean goodsand services but also structures ofadvantage and disadvantage.
Jerome Joseph
570 The Indian Journal of Industrial Relations, Vol. 49, No. 4, April 2014
what it means to be knowledgeable, thatother dissenting views are not possible.Pertaining to leadership qualities, the ap-praisal states – “He could not appreci-ate the environment and the work cul-ture as defined by the competent author-ity … and this blocked flow of new ideasor new methods of work.” This viewconstructs leadership as merely being afunction of conforming to the culture de-fined by the competent authority andprivileges subordination over creativity.Performance appraisals are thus rein-forcements of the fact that our ‘socialbeing is structured in direct subordina-tion to the will’ (Prashad, 2000: 167) ofentrenched, dominant interests.
The entry pertaining to managementqualities states – “All the managementqualities which very much exist in him,became dormant to the dangerous extentof his not visiting a scene of occurrencein an important case of rape and murderof a young girl student …” And yet it isforgotten that the collective processes ofthe police in bringing to justice thecriminal(s) involved in this despicable actis far more necessary than a hierarchi-cal superior visiting the scene of occur-rence. Perhaps the need would be tostrengthen the grassroots to such an ex-tent that they are able to engage with suchissues of heinous crime in the most ro-bust and urgent manner possible, thansubjecting the grassroots to minute andtotal control. Thus performance apprais-als seek to reinforce a sense of hierar-chy than grassroots democracy. Raffnsoe(2011: 190) comments on the role ofpower in performance development re-views – “In PDR meetings, for example,
people don’t really want to admit thatthere are rules and a power relationshipat play. It’s very soft, something you wantto negotiate together through dialogue.”It is in cases of conflict that the powerrelationships at play emerge explicitly andthe atmosphere of negotiation is shownup to be an irrelevant façade. And thestatements which are a part of Ramesh’sappraisal indicate the depths to whichpower informs the process of assess-ment.
The description pertaining to initia-tive and planning ability states – “On theonly occasion when a group of agitators,after due intimation through handbills,came and squatted outside … he, for rea-sons best known to himself, went out ofthe office around that time and in theprocess, his senior had to defuse the situ-ation.” Thus, what is being reinforced isa standard policing technique of keepingaway from agitations and working to-wards defusing them, rather than engag-ing with them in open, creative and hon-est ways. Gandhi (1927) of course has adifferent view on agitations and believesthat they have the potential to revitalizecommunities and provide them the beliefto sustain their sense of political rights.The cynical purpose that performanceappraisals may serve is also indicated bythe comment on initiative and planningabilities – “His decision making was gov-erned by his ‘paradigm’.” This is almostas if decision making is normally a para-
Performance appraisals seek toreinforce a sense of hierarchy thangrassroots democracy.
The Pathology of Performance Appraisals
The Indian Journal of Industrial Relations, Vol. 49, No. 4, April 2014 571
digm less process and occurs spontane-ously and Ramesh has deviated from thisnormality. Perhaps if the paradigm ofsubordinates is congruent with that oftheir superiors or appraisers, then the dif-ferences in paradigm would not be madevisible. It is necessary that paradigms arenot dogmatically privileged and that theyreflect lived experiences in terms of an-choring them around the premises of jus-tice.
It is only through dissent thatcourse corrections can be intro-duced in time in organisations.
On the issue of communication skills,the evaluation stated – “His presentationof arguments is also good but on a cer-tain occasion; he created an unpleasantscene with the DGP which was totallyavoidable.” Thus communication mustalso represent conformist orientations anddissenting positions are looked down uponfor creating the possibility of unpleasant-ness. Yet dissent is extremely importantfrom the perspective of creating‘civilizational hybridity andcountercultural mentality’ (Rudolph,2006: 17) and it is only through dissentthat course corrections can be introducedin time in organisations. With respect toappraising ability, the performance reportstated – “His evaluation of some of hissubordinates was clouded by some of‘his past experience’ with them else-where”. Through making the vaguecharge of appraisals being clouded, ef-forts are made to raise question marksover the credibility of the employee. Ifthere existed wrongdoing pertaining to
malafide appraisals, then there is a needto point it out in concrete terms and takeappropriate action rather than resort tovague statements. It is appraisals suchas these that articulate management aspathology, as the process of creating dif-ficulties for employees – “most manag-ers create far more obstacles for theirsubordinates than they remove” (Hatch,2011: 206).
In the entry about inter-personal re-lations and teamwork, the appraisalstates – “His professional relationshipwith one of his senior officers wasmarked by cold hostility”. Professionaldisagreements could be expressed instrong or mild terms, the language maybe in the form of an appeal or in the formof harsh critique. From these disagree-ments, renewed introspection mayemerge about how things could be donedifferently in organisations. When chan-nels of disagreement close at a largersocial level, what emerges is fascism andtotalitarianism. In terms of its theoreti-cal extremes, in the political conceptionof organising, it is these totalitarianschemes which are the eventual telos ofintrusive performance managementschemes.
When channels of disagreementclose at a larger social level, whatemerges is fascism and totalitari-anism.
Remarks pertaining to other columnsin the performance appraisal are also in-sightful :
Jerome Joseph
572 The Indian Journal of Industrial Relations, Vol. 49, No. 4, April 2014
“General bearing personality: Anythingbut smiling. Sociability: Prefers to bealoof.
Dedication to duty: Depends on his con-venience.
Attention to details: Yes, but takes hisown time, response time is not fast.
Ability to take a principled stand: It isclouded by his ‘paradigm’”.
These comments indicate the normal-ity pertaining to personal behavior thatappraisals desire to script. The degreeof control that they desire to exerciseover employees is staggering. For in-stance, a smiling personality is expectedas being normal, and aloofness is held asan undesirable attribute of sociability. Interms of personality, a strong assertionof values such as not going back on one’swords or sensitivity and care for otherpeople’s concerns are still not the fea-tures of social relationships that are be-ing emphasized. The comment that dedi-cation to duty exhibited by the employeedepends on his convenience is destruc-tive and damaging rather than being help-ful and developmental. Instead specificsuggestions for how dedication to dutymay be demonstrated in more meaning-ful ways may have been pointed out. Withrespect to attention to details, the com-ment rather than being restricted to theissue under consideration brings in an-other variable such as that of responsetime. The debate about paradigms re-turns in the assessment of ability to takea principled stand. This is especially anentry where dissent and alternativevoices could have been recognised, yetsince the purpose of the appraisal mecha-
nism is oriented towards producing theappropriate individual than in creating therequisite social space for plural and ef-fective ways of functioning, this oppor-tunity is lost. In fact rather than attributesof conformity, it has been suggested thatit is disobedience which may lead togreater productivity – “When we talkabout post-disciplinary society and clo-sures that are opening up, I think we areexaggerating a little bit. Organizations arenot open spaces like that, they are stillquite bureaucratic … But a lot of em-ployees engage with disobedience to beproductive, which is interesting in termsof self-management” (Rennstam, 2011:215).
In the case of the police officer S TRamesh, the Supreme Court ruled theperformance appraisal out of order. Itnoted that Ramesh had an outstandingcareer as a police officer and had re-ceived several appreciations. It was onlyduring these four months that he had re-ceived adverse remarks in his appraisal.The Supreme Court (2007 January 12:9) noted that the comments which hadbeen made as a part of the performanceappraisal were inconsistent and could notwarrant an average rating – “The au-thorities are directed not to treat theappellant’s performance during the pe-riod in question as average”. Perfor-mance appraisals become unhelpful intwo ways. Firstly, they are anchored in aphilosophy of control and can degener-ate in extreme circumstances to repres-sive totalitarianism. Secondly, perfor-mance appraisals can seldom be takenas objective indicators of individual per-formance as they are embedded in reali-
The Pathology of Performance Appraisals
The Indian Journal of Industrial Relations, Vol. 49, No. 4, April 2014 573
ties of organisational politics, and thus thepossibility of political vendetta is foreverpresent. In the case of Badri Nath ver-sus Government of Tamilnadu and oth-ers, the Supreme Court (2000 Septem-ber 29) acknowledged the possibility ofsuch political vendetta. The SupremeCourt noted that “something had funda-mentally gone wrong in the decision mak-ing process in regard to the appellant”(ibid: 9) and these fundamental wrongsemerged from the hostility of senior of-ficers towards the appellant. The issueof vendetta recurs in another SupremeCourt judgement (2006 April 27) D CAggarwal versus State Bank of India andanother, where an inquiry found thatcharges had been falsely fabricatedagainst the appellant to harm his perfor-mance records.
Performance Management as theReinforcement of Hierarchy
Several cases pertaining to perfor-mance management in the Supreme Court(2011 February 23; 2009 November 17;2008 February 22; 2006 November 8; 2006May 9; 2003 September 12; 2000 August28) pertain to the manner in which annualappraisals are to be interpreted when statu-tory provisions exist for promotion accord-ing to the principle of seniority cum merit.A closely associated issue is that of pro-motion and whether an interview alone or
an exam also is required for promotions insome cases, and the relative proportion tobe given to interviews, seniority and othermodes of performance evaluation (SupremeCourt 2011 March 30; 2009 November 24;2008 September 16; 2007 May 15; 2007March 20; 2006 May 12; 2003 May 9). Fol-lowing from a series of cases, the SupremeCourt has stated that when seniority cummerit schemes prevail, then for the pur-poses of promotion, contenders must sat-isfy a reasonable criteria of minimum meritrequirements. Once they have qualified onparameters concerning minimum merit,then among the qualified candidates, pro-motion must occur according to the crite-ria of seniority. While the grammar of hi-erarchy is preserved in these cases on ac-count of privileging the idea of seniority,there are other ways in which hierarchy isreinforced in the performance managementdiscourse. In the case of an air force of-ficer who sought promotion to the post ofAir Marshal (Supreme Court, 2004 Sep-tember 3) the promotion criteria was thatthe employee should have a performancerating of above 7 at least three times in theprevious five years and no rating of lessthan 6. During the years from 1983 to 1988,the performance ratings of the air forceofficer were 7, 7.4, 7.5, 7, 5.3 and 7. Thusdue to his performance being 5.3 in 1987,the air force officer was denied promotion.Thus, even in cases where merit is the solecriteria for making decisions pertaining tocareer, it is again hierarchy which is rein-forced as hierarchical superiors can pre-vent the promotion of meritorious subordi-nates by adversely affecting their perfor-mance records even for a single year. Inthis instance, the air officer, M S Brar’srating for 1987 had been affected because
Performance appraisals can sel-dom be taken as objective indica-tors of individual performance asthey are embedded in realities oforganisational politics.
Jerome Joseph
574 The Indian Journal of Industrial Relations, Vol. 49, No. 4, April 2014
of adverse remarks in his confidential re-port. Further these remarks had not beencommunicated to him, and no opportunityhad been given to ensure that his voice washeard. Promotion was denied to Brar evenafter the adverse remarks were expungedas the performance rating was not revised.In this instance, the Supreme Court di-rected that his voice be given an adequatehearing.
Hierarchy is reiterated by perfor-mance appraisals as superiors decidewhich performance shortcomings are tobe reprimanded and disciplined (SupremeCourt, 2009 March 24; 2007 February 6;2004 April 5), and which can be ignored.The pathology of performance manage-ment lies in the fact that rather than look-ing at organizations as a community or asocial space where conflicts between dif-ferent perspectives are played out beforea collective decision is taken, performancemanagement processes are conceived ashierarchical spaces where vertical mobil-ity is experienced as the exercise of powerto subjugate and marginalize those whodo not toe the line. This hierarchical spaceis defended and reproduced by articulat-ing unrealistic assumptions that objectiveand technical assessments are possible innon political and depersonalized ways.Eventually dominant interests within or-ganizations are reproduced and a normal
subject of the employee is sought to becoercively constructed. Judicial recourseand the jurisprudence of performance ap-praisals alone offer some hope of dignityand justice when confronted with the con-sequences of unfair assessments.
References
Dreyfus, H. & Rabinow, P. (1986), Michel Fou-cault, Beyond Structuralism and Hermeneu-tics. Brighton: Harvester Press.
Edwards, P. (2003), “The Employment Relation-ship and the Field of Industrial Relations”,in P. Edwards (ed) Industrial Relations:Theory and Practice. Oxford: Blackwell.
Foucault, M. (1977), Discipline and Punish: TheBirth of the Prison. London: Allen Lane.
Gandhi, M. K. (1927), The Story of My Experi-ments with Truth, Ahmedabad: NavajivanPublishing House.
Gordon, C. (1980), Power/Knowledge: SelectedInterviews and Other Writings by MichelFoucault. New York: Pantheon Books.
Hatch, M. J. (2011), “Organizing Obstructionsto Manage Organizations Creatively: Re-flecting The Five Obstruction”, ephemera,11(2): 204-11.
Prashad, V. (2000), Untouchable Freedom: A So-cial History of a Dalit Community. NewDelhi: Oxford University Press.
Raffnsoe, S. (2011), “Title missing”, in J. Leth,S. Raffnsoe and P. Holm-Pedersen ‘Trip-ping up the Perfect’, ephemera, 11(2): 189-203.
Rennstam, J. (2011), “Title missing”, in P.Bramming, and M. Gudmand-Hoyer‘Roundtable: Management of Self-Manage-ment’, ephemera, 11(2): 212-24.
Rudolph, L. I. (2006), “Postmodern Gandhi” inL. I. Rudolph and S. H. Rudolph (eds)Postmodern Gandhi and Other Essays:
Performance management pro-cesses are conceived as hierarchi-cal spaces where vertical mobilityis experienced as the exercise ofpower to subjugate and marginalizethose who do not toe the line.
The Pathology of Performance Appraisals
The Indian Journal of Industrial Relations, Vol. 49, No. 4, April 2014 575
Gandhi in the World and at Home. Chicago:University of Chicago Press.
Supreme Court (2011 March 30), Director Gen-eral, Indian Council for Agricultural Re-search and others versus D Sundara Raju.
Supreme Court (2011 February 23), HaryanaState Warehousing Corporation versusJagat Ram and Another.
Supreme Court (2010 January 12), ChaitanyaPrakash and Another versus H.Omkarappa.
Supreme Court (2009 November 24), Rupa RaniRakshit and Others versus JharkhandGramin Bank and Others
Supreme Court (2009 November 17), RajendraKumar Srivastava and Others versusSamyut Kshetriya Gramin Bank andOthers
Supreme Court (2009 March 24), National Avia-tion Company of India Ltd versus S M KKhan
Supreme Court (2008 September 16), K MMishra versus Central Bank of India andothers
Supreme Court (2008 February 22), ChandraPrakash Singh and Others versus Chairman,Purvanchal Gramin Bank and Others
Supreme Court (2007 May 15), S. B. Bhatacharjeeversus S. D. Majumdar and Others
Supreme Court (2007 March 20), Diploma Engi-neers Sangh versus State of U.P. and Others
Supreme Court (2007 February 20), S T Rameshversus State of Karnataka and Another.
Supreme Court (2007 February 12), Union ofIndia and Another versus S K Goel andOthers
Supreme Court (2007 February 6), Lt Col V KPandey versus Union of India and Others
Supreme Court (2006 November 8), BhagwandasTiwari and Others versus Dewas ShajapurKshetriya Gramin Bank and Others.
Supreme Court (2006 May 12), K K Parmar andOthers versus High Court of Gujarat Reg-istrar and Others
Supreme Court (2006 May 9), Hargovind Yadavversus Rewa Sidhi Gramin Bank and Others
Supreme Court (2006 April 27), D C Aggarwalversus State Bank of India and another
Supreme Court (2005 November 22), Union ofIndia and Another versus Major BahadurSingh
Supreme Court (2005 September 28) ArvindKumar Saxena versus Brij Raj KishoreRanga and Others
Supreme Court (2004 September 3) AVM M SBrar versus Union of India and Others
Supreme Court (2004 April 5), Reserve Bank ofIndia and Another versus C L Toora andOthers
Supreme Court (2003 September 12), KSamantaray versus National InsuranceCompany Limited
Supreme Court (2003 May 9), Syed T. A.Naqshbandi and Others versus State ofJammu and Kashmir and Others
Supreme Court (2000 September 29), Badri Nathversus Government of Tamilnadu andOthers
Supreme Court (2000 August 28), Union of Indiaand Others versus Lt Gen Rajendra SinghKadyan and Another
Townley, B. (2005), “Performance Appraisal andthe Emergence of Management”, in C. Greyand H. Willmott (eds) Critical ManagementStudies: A Reader. Oxford: Oxford Univer-sity Press.
Townley, B. (1999), “Nietzsche, Competenciesand Ubermensch: Reflections on Humanand Inhuman Resource Management”, Or-ganization, 6(2): 285-305.
Willmott, H. (1984), “Images and Ideals of Mana-gerial Work: A Critical Examination of Con-ceptual and Empirical Accounts”, Journalof Management Studies, 21: 349-68.
Employee Reactions to Performance Appraisal System inIndian Banks
Sheelam Jain & Ravindra Jain
The present study assesses andcompares the level of Perfor-mance Appraisal (PA) reactionsamong managers of public sec-tor, private sector and foreignbanks operating in India. The PAreactions were measured with re-spect to outcomes in terms of per-formance improvement and em-ployee development; fairness ofPA rating; accuracy of PA rat-ing; providing feedback; ex-plaining rating decisions; andoverall satisfaction with ap-praisal system. The findings sug-gest that although all the sevendimensions of PA reactions werefound at moderate level in thethree banking sectors providingfeedback and explaining ratingdecisions were found at signifi-cantly higher levels in foreignbanks operating in India as com-pared to public sector and pri-vate sector banks.
Introduction
Performance appraisal system (PAS)has been a key organizational process forthe management and the development ofpersonnel (Lee, 1985; Eberhardt &Pooyan, 1988; Baruch & Harel, 1993;Fletcher, 2001; Tizner et al., 2001; Levy& Williams, 2004; Ferris et al., 2008).Fletcher (2001) defines performanceappraisal (PA) more broadly as “activi-ties through which organizations seek toassess employees and develop their com-petence, enhance performance and dis-tribute rewards”. Performance apprais-als are considered to be the most essen-tial element in creating a positive workenvironment and involve a range of at-tributes such as reward, communication,feedback, employee reactions, equity andfairness, trust and acceptance, attitudestowards conflict, and social context(Brown & Heywood, 2005; Elenkov,1998; Erdogan et al., 2001; Fulk et al.,1985; Lawler, 2003; Levy & Williams,2004). Keeping & Levy (2000) arguedthat it is necessary to address employ-ees’ reactions toward their performanceappraisal for many reasons, including (a)the notion that reactions represent a cri-terion of great interest to practitioners
Sheelam Jain (E-mail: [email protected]) isResearch Scholar & Ravindra Jain (E-mail:[email protected]) is Professor, Facultyof Management Studies, Vikram University, Ujjain456010
576 The Indian Journal of Industrial Relations, Vol. 49, No. 4, April 2014
and (b) the fact that reactions have beentheoretically linked to determinants ofappraisal acceptance and success buthave been relatively ignored in research.Earlier researchers have claimed that inorder for performance appraisal to posi-tively influence employee behavior andfuture development, employees must ex-perience positive appraisal reactions toimportant aspects of the appraisal pro-cess (Bernardin & Beatty, 1984; Cardy& Dobbins, 1994; Kuvaas, 2006; Murphy& Cleveland, 1995). Appraisal reactionssuch as satisfaction, acceptability, andmotivation to use feedback, are cited asan important trend in the appraisal re-search during the past ten years (Levy& Williams, 2004).
The domino effect of Liberalization-Privatization-Globalization and the ad-vances in information and communica-tion technology have major HR implica-tions for Indian banking sector as well.This scenario has forced the banking in-dustry in India, which is largely in publicsector, to compete with not only the in-digenous private banks but also with theforeign banks operating in India. Simul-taneously, it is not an easy ride for pri-vate sector and foreign banks to chal-lenge the prima donna status of publicsector banks in India. How well thesechallenges are met will mainly depend onthe extent to which banks leverage theirhuman resources in the context of chang-
ing economic and business environment.Erdogan (2002) suggested that perfor-mance appraisal can make important con-tribution to effective human resourcemanagement, and eventually organiza-tional performance. Employee perfor-mance has, therefore, been identified asa crucial determinant of success in thebanking sector and hence there is a grow-ing interest in the effective managementof employee performance. A number ofobservations have been made in earlierresearch (e.g., Shrivastava & Purang,2012; 2011; Juneja, Shankar &Bhattacharya, 2007; Priyadarshini &Venkatapathy, 2003, etc.) as regards theperformance appraisal practice in thebanking industry, but there is dearth ofstudies which addressed assessment andcomparison of PA reactions among pub-lic and private sector banks and also for-eign banks operating in India. The presentstudy has been an endeavor to addressthis research gap.
Review of Literature
Extant literature has shown thatthere is a critical link between satisfac-tion with appraisal processes and ap-praisal effectiveness (Bernardin &Beatty, 1984; Dobbins, Cardy & Platz-Vieno, 1990). Dipboye & de Pontbriand(1981) showed that employees were moresatisfied and had greater acceptance ofPA when employee development andperformance improvement were empha-sized in it. Jain & Kamble (2005) pointedout that the effectiveness of performanceappraisal system is based on the extentto which the system is HRD oriented.Well structured appraisals should directly
Employees must experience posi-tive appraisal reactions to impor-tant aspects of the appraisal pro-cess .
Employee Reactions to Performance Appraisal System
The Indian Journal of Industrial Relations, Vol. 49, No. 4, April 2014 577
Sheelam Jain & Ravindra Jain
578 The Indian Journal of Industrial Relations, Vol. 49, No. 4, April 2014
relate to noted improvements in any weakareas (Broady-Preston & Steel, 2002).The benefits of an effective appraisalscheme lie in the fact that it leads to im-proved performance throughout the or-ganizations (Fisher, 1996). Studies onemployee’s reactions to appraisals andfeedback (e.g., Taylor, Masterson,Renard, & Tracy, 1998) suggested theoutcome of appraisal in improving em-ployee performance. The perceptions offairness influence the way people think,feel, and act on the job (Bies & Shapiro,1987), thereby influencing positive affec-tive reactions like performance appraisalsatisfaction (Thurston, 2001; Cook &Crossman, 2004). Feedback from the per-formance review should be used as a ba-sis for development and improvement.Research has shown that effective feed-back does improve employee perfor-mance (Latting, 1992). Further, if partici-pants do not perceive the system to befair, the feedback to be accurate, orsources to be credible, then they are morelikely to ignore and not use the feedbackthey receive (Facteau et al., 1998). In anempirical study of 163 BPO employees,Monis & Shreedhara (2010) found thatobjectivity in the appraisals, accuracy ofthe previous appraisals and viewing ap-praisals as a motivating tool have emergedas the significant variables and all thesethree variables are positively associatedwith the satisfaction of the respondentstowards the performance appraisal sys-tem. Employees demonstrate higher levelof commitment when they perceive thatperformance appraisal is associated withemployee development (Lee & Bruvold,2003). In their recent review of PA re-search, Levy & Williams (2004) called for
more field research on the relationshipbetween PA reactions and employee atti-tudes and behavior. They claimed that anappraisal system will be ineffective ifratees (and raters) do not see it as fair,useful, valid, accurate, etc. If ratees aredissatisfied or perceive a system as un-fair, they will be less likely to use evalua-tions as feedback to improve their perfor-mance (Ilgen, Fisher & Taylor, 1979).Jawahar (2006) investigated the potentialpredictors and consequences of satisfac-tion with performance appraisal feedbackand found that satisfaction with rater andprevious performance ratings influenceemployees’ satisfaction with performanceappraisal feedback. Shrivastava & Purang(2012) found that older employees haveperformance expectations that are well set,better clarified, have greater confidencein their raters and feel they are providedmore feedback, rating decision are ex-plained in a fair manner and are treated ina respectable way whereas in the case ofprivate sector bank employees, as age in-creases they do not feel their expectationsare well set and clarified. Measuring ap-praisal effectiveness involves, amongother things, assessing perceptions of oractual rater errors and biases, rating ac-curacy and reactions of raters and rateesabout the PA system in place (Keeping &Levy, 2000). They further claimed thatsatisfaction with performance appraisal isthe most frequently measured appraisalreaction.
An appraisal system will be inef-fective if ratees (and raters) do notsee it as fair, useful, valid, accu-rate, etc.
Employee Reactions to Performance Appraisal System
The Indian Journal of Industrial Relations, Vol. 49, No. 4, April 2014 579
The Study
Based on the review of extant litera-ture, the present study assesses employeereactions to Performance Appraisal Sys-tem (PAS), with respect to: a) outcomesin terms of performance improvementand employee development; b) fairnessof PA rating; c) accuracy of PA rating;d) providing feedback; e) explaining rat-ing decisions; and f) overall satisfactionwith appraisal system. Therefore, themain objectives of the study are: first, tomeasure the levels of employee’s reac-tions to performance appraisal system,and second, to make a comparison be-tween the levels of PA reactions of man-agers belonging to public sector, privatesector and foreign banks operating in In-dia. The field survey for the study wascarried out through a period of six monthsfrom April to September 2013.
The Sample &Data Collection
The study was carried out with asample survey of 318 managers belong-ing to public sector, private sector and for-eign banks operating in India. For the pur-pose, State Bank of India (SBI), Bank ofIndia (BOI), ICICI Bank, HDFC Bank,Axis Bank, Yes Bank, Standard CharteredBank, and Hongkong & Shanghai Bank-ing Corporation (HSBC) have been se-lected. The first two banks represent In-dian public sector banks, next four banksrepresent Indian private sector banks andremaining two banks represent foreignbanks operating in India. The selection ofbranches/ administrative offices for thesurvey was based on convenience sam-pling. For the purpose, three cities, viz.,
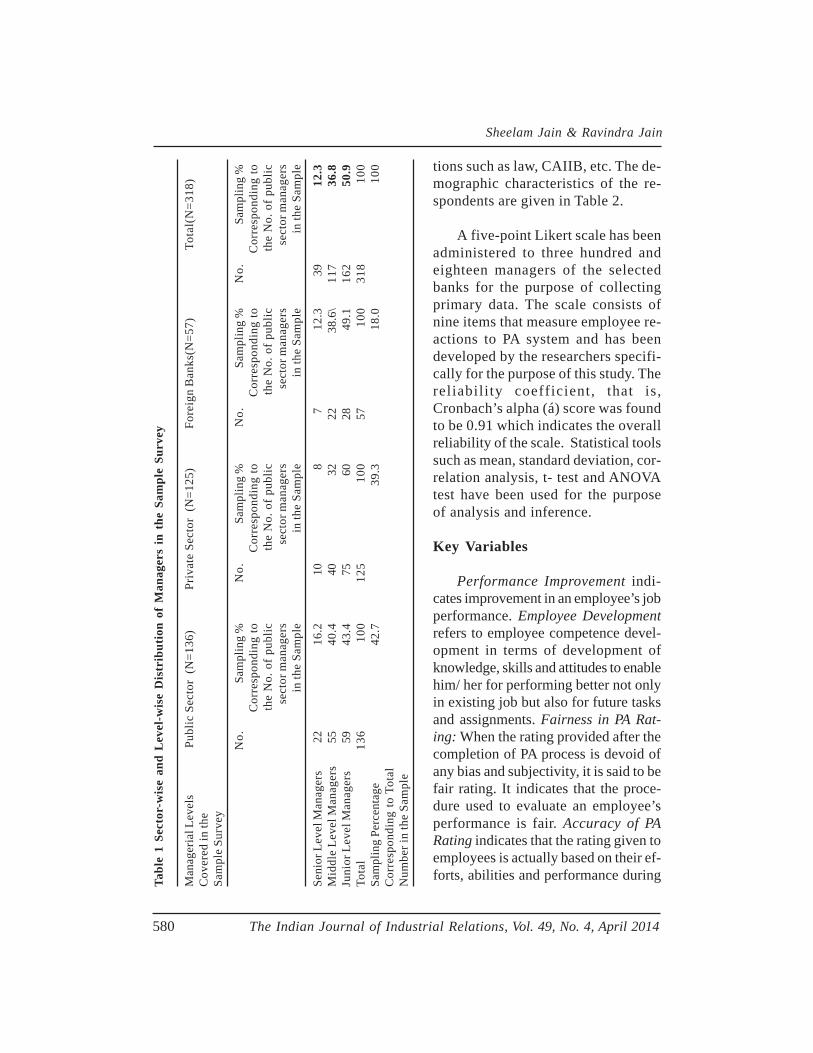
Bhopal, Indore and Ujjain from the stateof Madhya Pradesh have been selected.The three levels of bank managers, viz.,senior managers, middle-level managers,and junior managers working in variousadministrative offices as well as branchesof the chosen banks were selected for thepurpose of the survey. Out of the 318 par-ticipant managers, one hundred and thirtysix (42.7%) were from public sector banks,one hundred and twenty five (39.3%)were from private sector banks and fiftyseven (18%) from foreign banks operat-ing in India. The sample included 12.3%senior level managers, 36.8% middle levelmanagers and 50.9% junior level manag-ers. The coverage of sectors and man-agers are presented in Table 1.
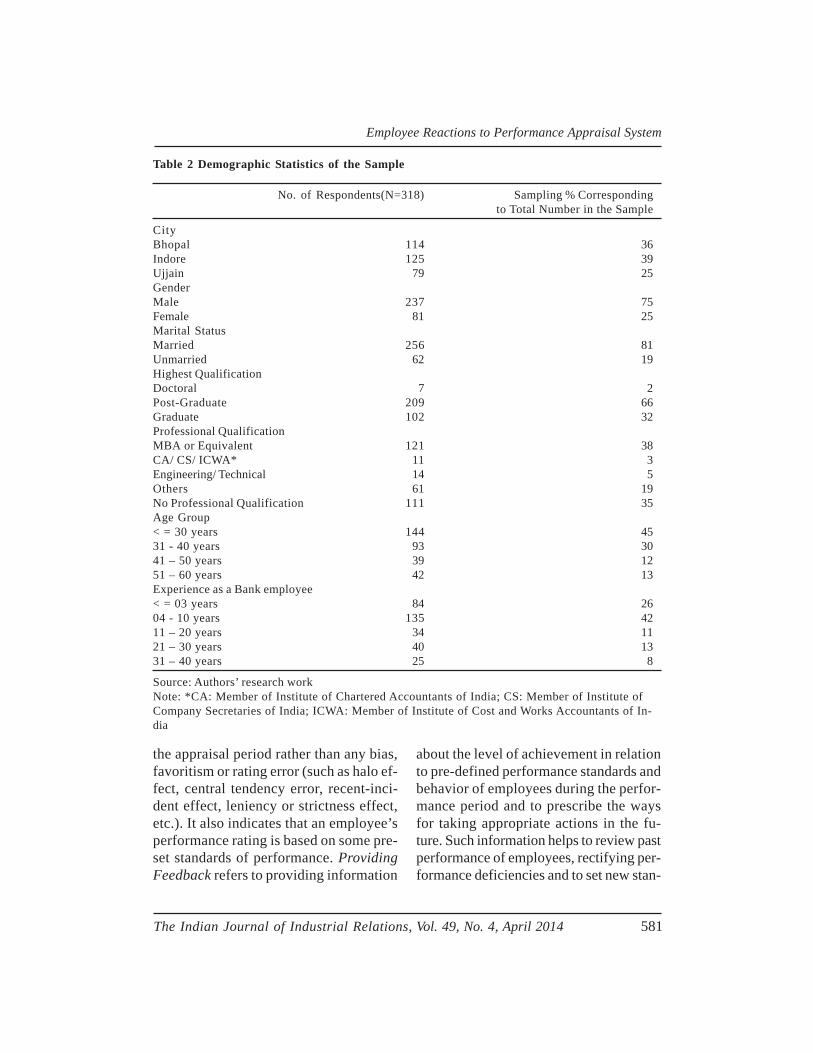
Respondents of the survey repre-sented different age groups, educationaland professional qualifications and expe-rience levels. The average age of themembers of the final sample was 35years and these respondents had totalexperience for an average of 11 years.Seventy-five percent of the selectedmanagers were male and twenty fivepercent were female managers. Eightyone percent of managers were marriedand nineteen percent were unmarried.Thirty two percent of the respondents inthe final sample indicated a graduate de-gree, majority of them (sixty six percent)were holding a post graduate degree andtwo percent were having a doctoral de-gree. Out of the total respondents,around sixty five percent were holdingsome or other professional degree whichincludes, thirty eight percent MBA, threepercent CA/CS/ ICWA, five percent en-gineers, nineteen percent other qualifica-
Sheelam Jain & Ravindra Jain
580 The Indian Journal of Industrial Relations, Vol. 49, No. 4, April 2014
tions such as law, CAIIB, etc. The de-mographic characteristics of the re-spondents are given in Table 2.
A five-point Likert scale has beenadministered to three hundred andeighteen managers of the selectedbanks for the purpose of collectingprimary data. The scale consists ofnine items that measure employee re-actions to PA system and has beendeveloped by the researchers specifi-cally for the purpose of this study. Thereliability coefficient, that is,Cronbach’s alpha (á) score was foundto be 0.91 which indicates the overallreliability of the scale. Statistical toolssuch as mean, standard deviation, cor-relation analysis, t- test and ANOVAtest have been used for the purposeof analysis and inference.
Key Variables
Performance Improvement indi-cates improvement in an employee’s jobperformance. Employee Developmentrefers to employee competence devel-opment in terms of development ofknowledge, skills and attitudes to enablehim/ her for performing better not onlyin existing job but also for future tasksand assignments. Fairness in PA Rat-ing: When the rating provided after thecompletion of PA process is devoid ofany bias and subjectivity, it is said to befair rating. It indicates that the proce-dure used to evaluate an employee’sperformance is fair. Accuracy of PARating indicates that the rating given toemployees is actually based on their ef-forts, abilities and performance duringTa
ble
1 Se
ctor
-wis
e an
d L
evel
-wis
e D
istr
ibut
ion
of M
anag
ers
in t
he S
ampl
e Su
rvey
Man
ager
ial L
evel
sPu
blic
Sec
tor
(N=1
36)
Priv
ate
Sect
or (
N=1
25)
Fore
ign
Ban
ks(N
=57)
Tota
l(N
=318
)C
over
ed in
the
Sam
ple
Surv
ey
No.
Sam
plin
g %
No.
Sam
plin
g %
No.
Sam
plin
g %
No.
Sam
plin
g %
Cor
resp
ondi
ng to
Cor
resp
ondi
ng to
Cor
resp
ondi
ng to
Cor
resp
ondi
ng to
the
No.
of
publ
icth
e N
o. o
f pub
licth
e N
o. o
f pub
licth
e N
o. o
f pub
licse
ctor
man
ager
sse
ctor
man
ager
sse
ctor
man
ager
sse
ctor
man
ager
s in
the
Sam
ple
in th
e Sa
mpl
e in
the
Sam
ple
in th
e Sa
mpl
e
Seni
or L
evel
Man
ager
s22
16.2
108
712
.339
12.3
Mid
dle
Leve
l Man
ager
s55
40.4
4032
2238
.6\
117
36.8
Juni
or L
evel
Man
ager
s59
43.4
7560
2849
.116
250
.9To
tal
136
100
125
100
5710
031
810
0Sa
mpl
ing
Perc
enta
ge42
.739
.318
.010
0C
orre
spon
ding
to T
otal
Num
ber i
n th
e Sa
mpl
e
Employee Reactions to Performance Appraisal System
The Indian Journal of Industrial Relations, Vol. 49, No. 4, April 2014 581
Table 2 Demographic Statistics of the Sample
No. of Respondents(N=318) Sampling % Correspondingto Total Number in the Sample
CityBhopal 114 36Indore 125 39Ujjain 79 25GenderMale 237 75Female 81 25Marital StatusMarried 256 81Unmarried 62 19Highest QualificationDoctoral 7 2Post-Graduate 209 66Graduate 102 32Professional QualificationMBA or Equivalent 121 38CA/ CS/ ICWA* 11 3Engineering/ Technical 14 5Others 61 19No Professional Qualification 111 35Age Group< = 30 years 144 4531 - 40 years 93 3041 – 50 years 39 1251 – 60 years 42 13Experience as a Bank employee< = 03 years 84 2604 - 10 years 135 4211 – 20 years 34 1121 – 30 years 40 1331 – 40 years 25 8
Source: Authors’ research workNote: *CA: Member of Institute of Chartered Accountants of India; CS: Member of Institute ofCompany Secretaries of India; ICWA: Member of Institute of Cost and Works Accountants of In-dia
the appraisal period rather than any bias,favoritism or rating error (such as halo ef-fect, central tendency error, recent-inci-dent effect, leniency or strictness effect,etc.). It also indicates that an employee’sperformance rating is based on some pre-set standards of performance. ProvidingFeedback refers to providing information
about the level of achievement in relationto pre-defined performance standards andbehavior of employees during the perfor-mance period and to prescribe the waysfor taking appropriate actions in the fu-ture. Such information helps to review pastperformance of employees, rectifying per-formance deficiencies and to set new stan-
Sheelam Jain & Ravindra Jain
582 The Indian Journal of Industrial Relations, Vol. 49, No. 4, April 2014
dards of work, if required. ExplainingRating Decisions refers to clear commu-nication and justification of rating decisionsmade as a result of PA process. It involvesopen discussions between the appraiserand employee about the reasons of posi-tive or negative deviations from the pre-set objectives. Overall Satisfaction withPA system indicates overall satisfactionwith performance appraisal system beingpracticed and includes its factors viz.,policy, design, development, implementa-tion and use of appraisal outcomes.
Data Analysis & Findings
The following findings (based on theanalysis of data given in Tables 3 -7) haveemerged.
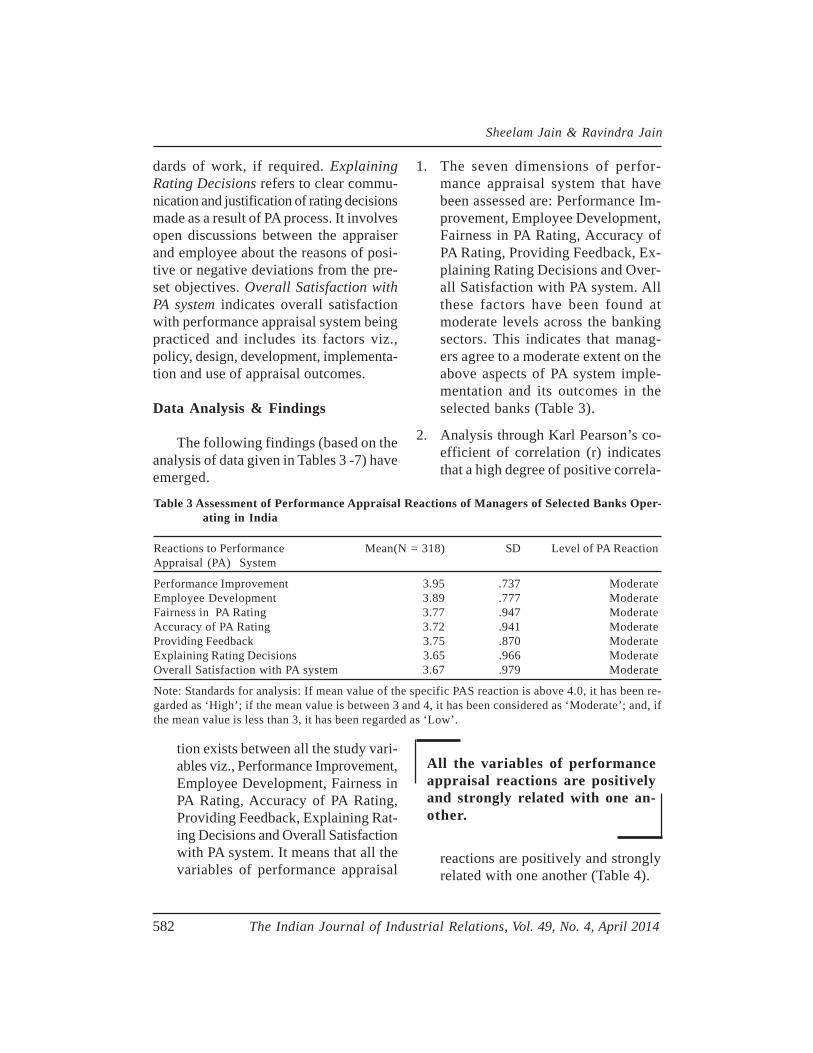
1. The seven dimensions of perfor-mance appraisal system that havebeen assessed are: Performance Im-provement, Employee Development,Fairness in PA Rating, Accuracy ofPA Rating, Providing Feedback, Ex-plaining Rating Decisions and Over-all Satisfaction with PA system. Allthese factors have been found atmoderate levels across the bankingsectors. This indicates that manag-ers agree to a moderate extent on theabove aspects of PA system imple-mentation and its outcomes in theselected banks (Table 3).
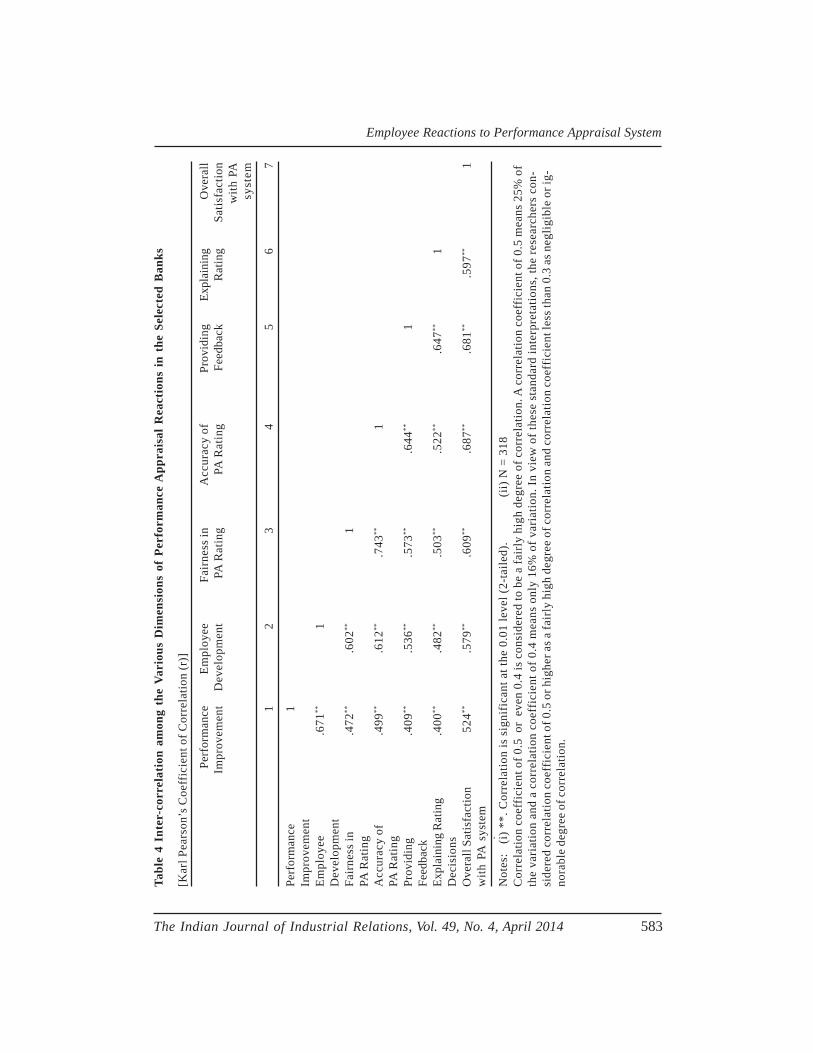
2. Analysis through Karl Pearson’s co-efficient of correlation (r) indicatesthat a high degree of positive correla-
Table 3 Assessment of Performance Appraisal Reactions of Managers of Selected Banks Oper-ating in India
Reactions to Performance Mean(N = 318) SD Level of PA ReactionAppraisal (PA) System
Performance Improvement 3.95 .737 ModerateEmployee Development 3.89 .777 ModerateFairness in PA Rating 3.77 .947 ModerateAccuracy of PA Rating 3.72 .941 ModerateProviding Feedback 3.75 .870 ModerateExplaining Rating Decisions 3.65 .966 ModerateOverall Satisfaction with PA system 3.67 .979 Moderate
Note: Standards for analysis: If mean value of the specific PAS reaction is above 4.0, it has been re-garded as ‘High’; if the mean value is between 3 and 4, it has been considered as ‘Moderate’; and, ifthe mean value is less than 3, it has been regarded as ‘Low’.
tion exists between all the study vari-ables viz., Performance Improvement,Employee Development, Fairness inPA Rating, Accuracy of PA Rating,Providing Feedback, Explaining Rat-ing Decisions and Overall Satisfactionwith PA system. It means that all thevariables of performance appraisal
reactions are positively and stronglyrelated with one another (Table 4).
All the variables of performanceappraisal reactions are positivelyand strongly related with one an-other.
Employee Reactions to Performance Appraisal System
The Indian Journal of Industrial Relations, Vol. 49, No. 4, April 2014 583
Tabl
e 4
Inte
r-co
rrel
atio
n am
ong
the
Vari
ous
Dim
ensi
ons
of P
erfo
rman
ce A
ppra
isal
Rea
ctio
ns i
n th
e Se
lect
ed B
anks
[Kar
l Pea
rson
’s C
oeff
icie
nt o
f Cor
rela
tion
(r)]
Perf
orm
ance
Empl
oyee
Fair
ness
inA
ccur
acy
ofPr
ovid
ing
Expl
aini
ngO
vera
llIm
prov
emen
tD
evel
opm
ent
PA R
atin
gPA
Rat
ing
Feed
back
Rat
ing
Satis
fact
ion
with
PA
syst
em
12
34
56
7
Perf
orm
ance
1Im
prov
emen
tEm
ploy
ee.6
71**
1D
evel
opm
ent
Fair
ness
in.4
72**
.602
**1
PA R
atin
gA
ccur
acy
of.4
99**
.612
**.7
43**
1PA
Rat
ing
Prov
idin
g.4
09**
.536
**.5
73**
.644
**1
Feed
back
Expl
aini
ng R
atin
g.4
00**
.482
**.5
03**
.522
**.6
47**
1D
ecis
ions
Ove
rall
Satis
fact
ion
524**
.579
**.6
09**
.687
**.6
81**
.597
**1
with
PA
sys
tem
.N
otes
: (i
) **.
Cor
rela
tion
is s
igni
fica
nt a
t the
0.0
1 le
vel (
2-ta
iled)
.
(i
i) N
= 3
18C
orre
latio
n co
effi
cien
t of 0
.5 o
r ev
en 0
.4 is
con
side
red
to b
e a
fair
ly h
igh
degr
ee o
f cor
rela
tion.
A c
orre
latio
n co
effi
cien
t of 0
.5 m
eans
25%
of
the
vari
atio
n an
d a
corr
elat
ion
coef
fici
ent o
f 0.4
mea
ns o
nly
16%
of v
aria
tion.
In v
iew
of t
hese
sta
ndar
d in
terp
reta
tions
, the
rese
arch
ers
con-
side
red
corr
elat
ion
coef
fici
ent o
f 0.5
or h
ighe
r as a
fair
ly h
igh
degr
ee o
f cor
rela
tion
and
corr
elat
ion
coef
fici
ent l
ess t
han
0.3
as n
eglig
ible
or i
g-no
rabl
e de
gree
of c
orre
latio
n.
Sheelam Jain & Ravindra Jain
584 The Indian Journal of Industrial Relations, Vol. 49, No. 4, April 2014
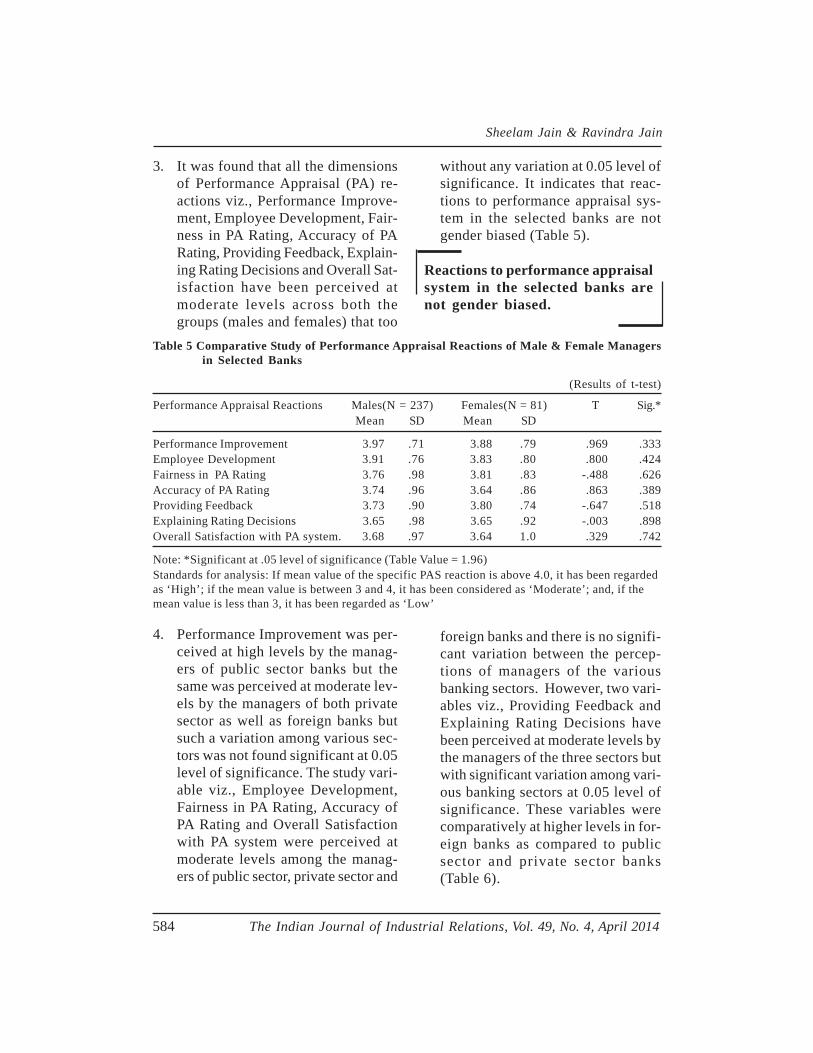
3. It was found that all the dimensionsof Performance Appraisal (PA) re-actions viz., Performance Improve-ment, Employee Development, Fair-ness in PA Rating, Accuracy of PARating, Providing Feedback, Explain-ing Rating Decisions and Overall Sat-isfaction have been perceived atmoderate levels across both thegroups (males and females) that too
without any variation at 0.05 level ofsignificance. It indicates that reac-tions to performance appraisal sys-tem in the selected banks are notgender biased (Table 5).
Reactions to performance appraisalsystem in the selected banks arenot gender biased.
Table 5 Comparative Study of Performance Appraisal Reactions of Male & Female Managersin Selected Banks
(Results of t-test)
Performance Appraisal Reactions Males(N = 237) Females(N = 81) T Sig.*Mean SD Mean SD
Performance Improvement 3.97 .71 3.88 .79 .969 .333Employee Development 3.91 .76 3.83 .80 .800 .424Fairness in PA Rating 3.76 .98 3.81 .83 -.488 .626Accuracy of PA Rating 3.74 .96 3.64 .86 .863 .389Providing Feedback 3.73 .90 3.80 .74 -.647 .518Explaining Rating Decisions 3.65 .98 3.65 .92 -.003 .898Overall Satisfaction with PA system. 3.68 .97 3.64 1.0 .329 .742
Note: *Significant at .05 level of significance (Table Value = 1.96)Standards for analysis: If mean value of the specific PAS reaction is above 4.0, it has been regardedas ‘High’; if the mean value is between 3 and 4, it has been considered as ‘Moderate’; and, if themean value is less than 3, it has been regarded as ‘Low’
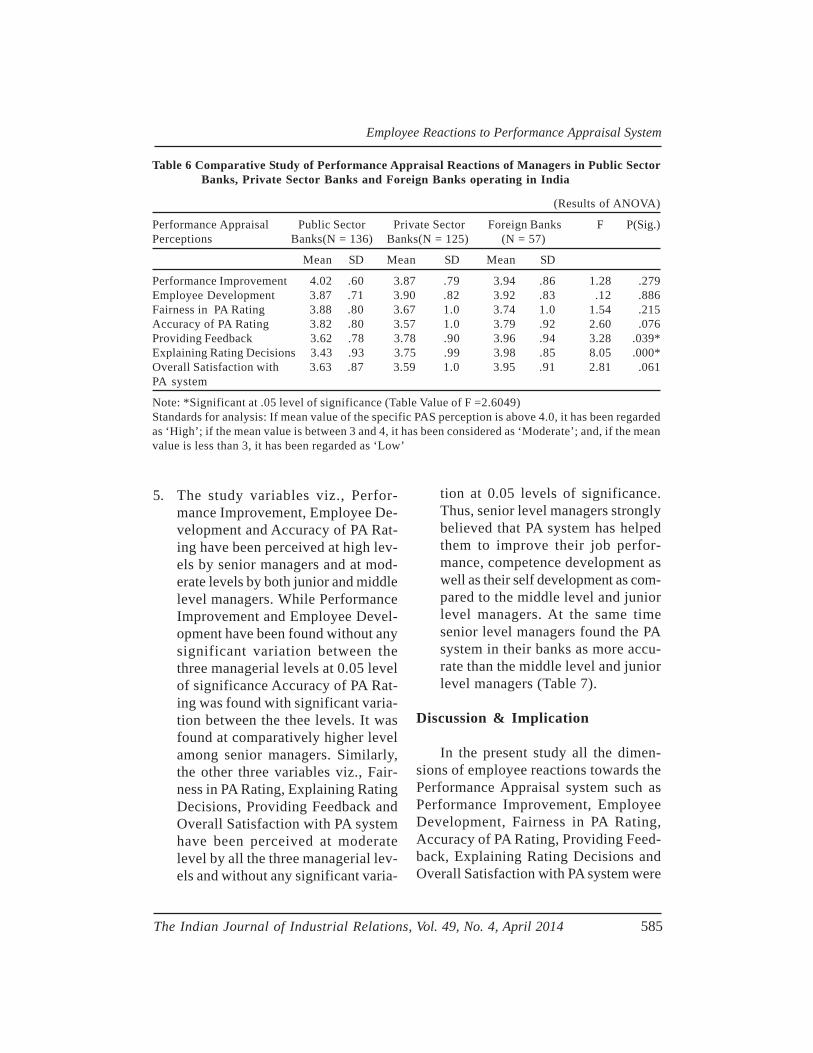
4. Performance Improvement was per-ceived at high levels by the manag-ers of public sector banks but thesame was perceived at moderate lev-els by the managers of both privatesector as well as foreign banks butsuch a variation among various sec-tors was not found significant at 0.05level of significance. The study vari-able viz., Employee Development,Fairness in PA Rating, Accuracy ofPA Rating and Overall Satisfactionwith PA system were perceived atmoderate levels among the manag-ers of public sector, private sector and
foreign banks and there is no signifi-cant variation between the percep-tions of managers of the variousbanking sectors. However, two vari-ables viz., Providing Feedback andExplaining Rating Decisions havebeen perceived at moderate levels bythe managers of the three sectors butwith significant variation among vari-ous banking sectors at 0.05 level ofsignificance. These variables werecomparatively at higher levels in for-eign banks as compared to publicsector and private sector banks(Table 6).
Employee Reactions to Performance Appraisal System
The Indian Journal of Industrial Relations, Vol. 49, No. 4, April 2014 585
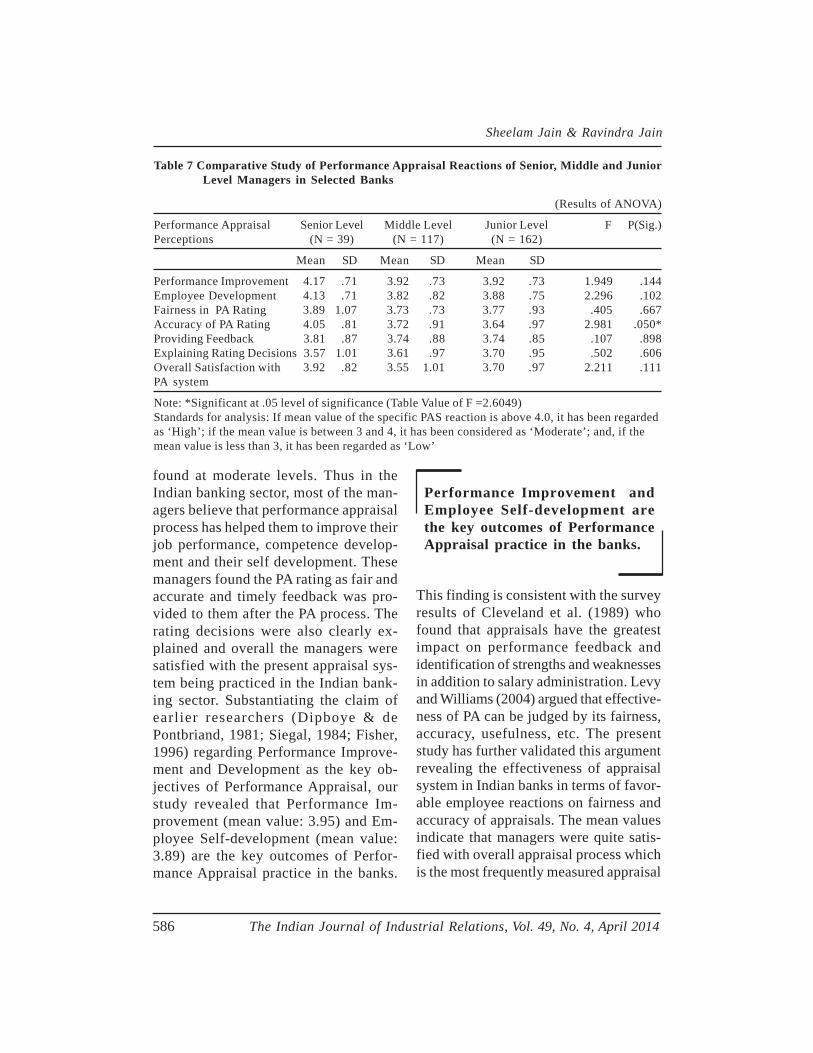
5. The study variables viz., Perfor-mance Improvement, Employee De-velopment and Accuracy of PA Rat-ing have been perceived at high lev-els by senior managers and at mod-erate levels by both junior and middlelevel managers. While PerformanceImprovement and Employee Devel-opment have been found without anysignificant variation between thethree managerial levels at 0.05 levelof significance Accuracy of PA Rat-ing was found with significant varia-tion between the thee levels. It wasfound at comparatively higher levelamong senior managers. Similarly,the other three variables viz., Fair-ness in PA Rating, Explaining RatingDecisions, Providing Feedback andOverall Satisfaction with PA systemhave been perceived at moderatelevel by all the three managerial lev-els and without any significant varia-
tion at 0.05 levels of significance.Thus, senior level managers stronglybelieved that PA system has helpedthem to improve their job perfor-mance, competence development aswell as their self development as com-pared to the middle level and juniorlevel managers. At the same timesenior level managers found the PAsystem in their banks as more accu-rate than the middle level and juniorlevel managers (Table 7).
Discussion & Implication
In the present study all the dimen-sions of employee reactions towards thePerformance Appraisal system such asPerformance Improvement, EmployeeDevelopment, Fairness in PA Rating,Accuracy of PA Rating, Providing Feed-back, Explaining Rating Decisions andOverall Satisfaction with PA system were
Table 6 Comparative Study of Performance Appraisal Reactions of Managers in Public SectorBanks, Private Sector Banks and Foreign Banks operating in India
(Results of ANOVA)
Performance Appraisal Public Sector Private Sector Foreign Banks F P(Sig.)Perceptions Banks(N = 136) Banks(N = 125) (N = 57)
Mean SD Mean SD Mean SD
Performance Improvement 4.02 .60 3.87 .79 3.94 .86 1.28 .279Employee Development 3.87 .71 3.90 .82 3.92 .83 .12 .886Fairness in PA Rating 3.88 .80 3.67 1.0 3.74 1.0 1.54 .215Accuracy of PA Rating 3.82 .80 3.57 1.0 3.79 .92 2.60 .076Providing Feedback 3.62 .78 3.78 .90 3.96 .94 3.28 .039*Explaining Rating Decisions 3.43 .93 3.75 .99 3.98 .85 8.05 .000*Overall Satisfaction with 3.63 .87 3.59 1.0 3.95 .91 2.81 .061PA system
Note: *Significant at .05 level of significance (Table Value of F =2.6049)Standards for analysis: If mean value of the specific PAS perception is above 4.0, it has been regardedas ‘High’; if the mean value is between 3 and 4, it has been considered as ‘Moderate’; and, if the meanvalue is less than 3, it has been regarded as ‘Low’
Sheelam Jain & Ravindra Jain
586 The Indian Journal of Industrial Relations, Vol. 49, No. 4, April 2014
found at moderate levels. Thus in theIndian banking sector, most of the man-agers believe that performance appraisalprocess has helped them to improve theirjob performance, competence develop-ment and their self development. Thesemanagers found the PA rating as fair andaccurate and timely feedback was pro-vided to them after the PA process. Therating decisions were also clearly ex-plained and overall the managers weresatisfied with the present appraisal sys-tem being practiced in the Indian bank-ing sector. Substantiating the claim ofearlier researchers (Dipboye & dePontbriand, 1981; Siegal, 1984; Fisher,1996) regarding Performance Improve-ment and Development as the key ob-jectives of Performance Appraisal, ourstudy revealed that Performance Im-provement (mean value: 3.95) and Em-ployee Self-development (mean value:3.89) are the key outcomes of Perfor-mance Appraisal practice in the banks.
This finding is consistent with the surveyresults of Cleveland et al. (1989) whofound that appraisals have the greatestimpact on performance feedback andidentification of strengths and weaknessesin addition to salary administration. Levyand Williams (2004) argued that effective-ness of PA can be judged by its fairness,accuracy, usefulness, etc. The presentstudy has further validated this argumentrevealing the effectiveness of appraisalsystem in Indian banks in terms of favor-able employee reactions on fairness andaccuracy of appraisals. The mean valuesindicate that managers were quite satis-fied with overall appraisal process whichis the most frequently measured appraisal
Table 7 Comparative Study of Performance Appraisal Reactions of Senior, Middle and JuniorLevel Managers in Selected Banks
(Results of ANOVA)
Performance Appraisal Senior Level Middle Level Junior Level F P(Sig.)Perceptions (N = 39) (N = 117) (N = 162)
Mean SD Mean SD Mean SD
Performance Improvement 4.17 .71 3.92 .73 3.92 .73 1.949 .144Employee Development 4.13 .71 3.82 .82 3.88 .75 2.296 .102Fairness in PA Rating 3.89 1.07 3.73 .73 3.77 .93 .405 .667Accuracy of PA Rating 4.05 .81 3.72 .91 3.64 .97 2.981 .050*Providing Feedback 3.81 .87 3.74 .88 3.74 .85 .107 .898Explaining Rating Decisions 3.57 1.01 3.61 .97 3.70 .95 .502 .606Overall Satisfaction with 3.92 .82 3.55 1.01 3.70 .97 2.211 .111PA system
Note: *Significant at .05 level of significance (Table Value of F =2.6049)Standards for analysis: If mean value of the specific PAS reaction is above 4.0, it has been regardedas ‘High’; if the mean value is between 3 and 4, it has been considered as ‘Moderate’; and, if themean value is less than 3, it has been regarded as ‘Low’
Performance Improvement andEmployee Self-development arethe key outcomes of PerformanceAppraisal practice in the banks.
Employee Reactions to Performance Appraisal System
The Indian Journal of Industrial Relations, Vol. 49, No. 4, April 2014 587
reaction (Keeping & Levy, 2000) thus,indicating further effectiveness of PASystem in Indian banks.
In an empirical study of middle levelmanagers of Indian banks, Shrivastavaand Purang (2011) found that employees’perception of fairness of their appraisalsystem is significantly different betweenthe public sector and private sector banks.Private sector bank employees perceiveperformance appraisal factors, namely,Setting Performance Expectations,Rater’s Confidence, Clarifying Expecta-tions, Providing Feedback, Accuracy ofRating, Seeking Appeals, and ExplainingRating Decisions to be fairer as comparedto public sector bank employees. Ourstudy also found that the perceptions ofprivate sector managers were at higherlevels as compared to public sector man-agers in terms of providing feedback andexplaining rating decisions. However, thepublic sector managers found their ap-praisal system as more accurate than pri-vate sector managers. A fresh insight fromthe present study is the findings as regardsthe perceptions of managers of foreignbanks in India which were not studied sofar in earlier researches.
Our study revealed that PA factorssuch as providing feedback and explain-ing rating decisions are perceived at sig-nificantly higher levels by the managersof foreign banks as compared to those inpublic sector and private sector banks.The reason for such differences could beattributed to the fact that the perfor-mance appraisal process may be inclinedmore towards learning and developmentin foreign banks as against its use prima-
rily for administrative purposes in publicsector banks. Challenges before Indianbanks is to help people feel being treatedfairly and satisfied; as a satisfied em-ployee is a pre-requisite for a satisfiedcustomer (Bhatt, 2012). The most aston-ishing finding in the present study is thecomparatively low scores in the case ofprivate sector banks as regards Perfor-mance Improvement, Fairness and Ac-curacy in PA Rating and Satisfaction withPA System. Such revelations may posean alarming signal for private banks andcould be detrimental to their expansivegrowth plans in the country. A compara-tively better score of foreign banks op-erating in India on Overall Satisfactionof employees with the appraisal systemindicates better PA effectiveness in suchbanks. The effectiveness of any HRDeffort like Performance Appraisal sys-tem depends to a large extent on howsuch effort is being perceived by the em-ployees. Furthermore, employees with apositive view of performance appraisalare more likely to embrace the process,be better motivated and improve theirperformance overall (Lovegrove &Zhang, 2009). The revelations in thepresent research indicate a moderatelevel of employee reactions towards per-formance appraisal, thus pointing to fur-ther scope of improvement in perfor-mance appraisal as a key HRD practice
The effectiveness of any HRD ef-fort like Performance Appraisalsystem depends to a large extenton how such effort is being per-ceived by the employees.
Sheelam Jain & Ravindra Jain
588 The Indian Journal of Industrial Relations, Vol. 49, No. 4, April 2014
in Indian banks. Indian banking is underrevision and in such times of change andchallenge, it has become imperative fortheir HR department to effectively man-age the performance and development ofhuman resources for the achievement ofcompetitive advantage.
Future research should focus onbroadening the study on employee reac-tions to PA system to embrace a widerpopulation covering more geographic lo-cations within the Indian banking envi-ronment and addressing more number ofPA reaction variables. Further investiga-tion is also needed on understanding andcomparing the design, development andimplementation of the appraisal systemamong public sector, private sector andforeign banks operating in India.
References
Baruch, Y. & G. Harel. (1993), “Combining Multi-source Performance Appraisal: An Empiri-cal and Methodological Note”, Public Ad-ministration Quarterly. 17: 96–111.
Bernardin, H.J., & Beatty R.W. (1984), Perfor-mance Appraisal: Assessing Human Perfor-mance at Work. Boston: Kent.
Bhatt, Prachi (2012). “HRD in Emerging Econo-mies - Research Perspectives in IndianBanking”, Indian Journal of IndustrialRelations 47 (4): 665 - 72.
Bies R.J. & Shapiro D.L. (1987), “Voice and Jus-tification: Their Influence on ProceduralFairness Judgements”, Academy of Manage-ment Journal. 31(3): 576-665.
Brown, M. & Heywood, J. S. (2005), “Perfor-mance Appraisal Systems: Determinantsand Change”. British Journal of IndustrialRelations, 43: 659–79.
Cardy, R.L.& Dobbins, G.H. (1994), PerformanceAppraisal: Alternative Perspectives.Cincinatti, OH: South-Western Publishing.
Cleveland, J.N., Murphy, K.R. & Williams, R.E.(1989), “Multiple Uses of PerformanceAppraisal: Prevalence and Correlates”.Journal of Applied Psychology, 74: 130–35.
Cook, J. & Crossman, A. (2004), “Satisfactionwith Performance Appraisal Systems”.Journal of Managerial Psychology, 19 (5):526–41.
Dipboye, R.L. & de Pontbriand, R. (1981), “Cor-relates of Employee Reactions to Perfor-mance Appraisals and Appraisal Systems”,Journal of Applied Psychology, 66: 248-51
Dobbins, G. H., Cardy, R. L. & Platz-Vieno, S. J.(1990),”A Contingency Approach to Ap-praisal Satisfaction: An Initial Investigationof the Joint Effects of Organizational Vari-ables and Appraisal Characteristics”, Jour-nal of Management, 16: 619-32.
Eberhardt, B. J.& A. Pooyan (1988), “The Ef-fects of Appraisal System Redesign on Per-ceptions of and Satisfaction with Perfor-mance Appraisal: A Quasiexperiment”.Journal of Business and Psychology. 32:230–41.
Elenkov, S. F. (1998), “Can American Manage-ment Concepts Work in Russia? A CrossCultural Comparative Study”, CaliforniaManagement Review, 40: 133–56.
Erdogan, B. (2002), “Antecedents and Conse-quences of Justice Perceptions in Perfor-mance Appraisals”, Human Resource Man-agement Review, 12 (4): 555–78.
Erdogan, B., Kraimer, M. L. & Liden, R. C.(2001), “Procedural Justice as a Two Di-mensional Construct”, Journal of AppliedBehavioral Science. 37: 205–22.
Facteau, C.L., Facteau, J.D., Schoel, L.C., Russel,J.E.A. & Poteet, M.L. (1998),”Reactionsof Leaders to 360-Degree Feedback fromSubordinates and Peers”, Leadership Quar-terly. 9: 427–48.
Employee Reactions to Performance Appraisal System
The Indian Journal of Industrial Relations, Vol. 49, No. 4, April 2014 589
Ferris, G. R., P. M. Timothy, K. Basok & M. R.Buckley (2008), “The Performance Evalu-ation Context: Social, Emotional, Cognitive,Political and Relationship Components”.Human Resource Management Review. 18:146–63.
Fisher, M. (1996), Performance Appraisal Build-ing Your Team: The Sunday Times Busi-ness Skills Series, Kogan: 15-17.
Fletcher, C. (2001), “Performance Appraisal andManagement: The Developing ResearchAgenda”, Journal of Occupational and Or-ganizational Psychology. 74: 473–87.
Fulk, J., Brief, A. P. & Barr, S. H. (1985), “Trust-in-Supervisor and Perceived Fairness andAccuracy of Performance Evaluations”.Journal of Business Research,. 13: 301-13.
Ilgen, D.R., Fisher, CD. & Taylor, M.S. (1979),“Consequences of Individual Feedback onBehavior in Organizations”, Journal of Ap-plied Psychology, 64: 349-71
Jain, Ravindra & Kamble’ Sachin (2005), “An As-sessment of Effectiveness of PerformanceAppraisal System in Selected Large andMedium Size Manufacturing Organiza-tions”. Abhigyan. 22(4): 28-39
Jawahar (2006), “Correlates of Satisfaction withPerformance Appraisal Feedback”,. Jour-nal of Labour Research, XXVII (2): 213-36.
Judith Broady-Preston & Lucy Steel (2002),“Employees, Customers and Internal Mar-keting Strategies in LIS, Library Manage-ment”, Library Management, 23 (8/9): 384-93.
Juneja, R., Shankar, A., & Bhattacharya, B.(2007), “Performance Appraisal Systemsin Indian Banks”, Bank Quest, 78 (1): 37–42.
Keeping, L.M. & Levy, P.E. (2000), “PerformanceAppraisal Reactions: Measurement, Mod-eling, and Method Bias”, Journal of Ap-plied Psychology, 85: 708–23.
Kuvaas, Bard (2006). “Performance AppraisalSatisfaction and Employee Outcomes:Mediating and Moderating Roles of WorkMotivation”, International Journal of Hu-man Resource Management,17(3): 504–22.
Latting, J. K. (1992), “Giving Corrective Feed-back: a Decisional Analysis”, Social Work.37(5): 424-31.
Lawler, E. E. (2003), “Reward Practices and Per-formance Management System Effective-ness,” Organizational Dynamics, 32: 396–404
Lee, C. (1985). “Increasing Performance AppraisalEffectiveness: Matching Task Types, Ap-praisal Process, and Rater Training”. Acad-emy of Management Review, 10: 322–31.
Lee, C. H. & Bruvold, N. T. (2003), “CreatingValue for Employees: Investment in Em-ployee Development, The InternationalJournal of Human Resource Management,14(6): 981-1000.
Levy, P.E.& Williams, J.R. (2004). “The SocialContext of Performance Appraisal: A Re-view and Framework for the Future”, Jour-nal of Management, 30: 881–905
Lovegrove, I., & Zhang, Y. (2009), “Performanceappraisal for Chinese state-owned bankingindustry”, Journal of Organizational Trans-formation and Social Change, 6 (3): 189–200,
Monis, H. & Sreedhara, T.N. (2010), “Correlatesof Employee Satisfaction with PerformanceAppraisal System in Foreign MNC BPOsOperating in India”, Annals of the Univer-sity of Petroºani, Economics, 10 (4): 215-24.
Murphy, K. R. & Cleveland, J. N. (1991) Perfor-mance Appraisal: An Organizational Per-spective, Boston: Allyn and Bacon.
Priyadarshini, R. & Venkatapathy, R. (2003), “Im-pact of HRD on Organizational Effective-ness in the Banking Industry”, Prajnan.32(2): 125-47.
Workers’ Participation in Management: a Conduitbetween Present &Past
Pramod Mohan Johri
The paper provides the histori-cal evolution of the concept ofWorkers’ Participation in Man-agement. Workers’ participationIndia has been influenced by theexperience gained from the de-veloped countries after the Sec-ond World War. The grievanceresolution at the shop floor hasrecently been added by amend-ing the Industrial Dispute Act,1947. Though the practice ofWPM has not gained enoughmomentum but in PSUs where theconcept has been adopted hasyielded positive results for in-creasing productivity. The boardlevel participation could not re-ally see the light of the day; how-ever, the bill is pending for con-sideration. The paper gives abroader view of the scheme in theoverall scenario in the develop-ing countries with specific refer-ence to India.
Introduction
“Workers participation in manage-ment is not a new concept; it is as old asthe institution of owners and workers. Onlyits importance has increased and has beenbrought into sharp focus with the indus-trial revolution and the advent of largeenterprises” (Virmani, 1978). In the feu-dal system before the Industrial Revolu-tion, the units were small and there usedto be a joint decision making through con-sultation between the owner and worker.The owner took a paternalistic approachand interest in the employee.
At times interests of workers and ofmanagement clash with each other andeffective discussion becomes essential.Groups representing both sides negoti-ate to derive common ground for findingsolutions for the conflict. Such a com-mon ground can also be prepared throughcooperation, mutual trust and understand-ing of issues between the managementand workers. This can be possible whenboth cooperate jointly to manage issues.Such an understanding and a collabora-tive approach to find a common under-standing is called as workers participa-tion in management.
Pramod Mohan Johri is Chief General Manager(HR & Adm), Goa Shipyard Limited e-mail:[email protected]
590 The Indian Journal of Industrial Relations, Vol. 49, No. 4, April 2014
Some Stylized Facts
Participation of worker in manage-ment would be sufficient to meetthe needs of social justice and dis-tribution.
The roots of modern cry for partici-pation are deep in history. We have comea long way from master- servant rela-tionship to the present stage of partici-pation. Social thinkers like Comte andOmen had advocated the participation ofworkers in management for achieving so-cial and distributive justice. The mostremarkable contribution in this field isdone by Karl Marx who advocated com-plete control of enterprise by workers. Itwas however a distant dream for theworkers to have control over the produc-tion and product under capitalism. Lateron Webb and Cole propagated that par-ticipation of worker in managementwould be sufficient to meet the needs ofsocial justice and distribution. They be-lieved that if the workers are also givenopportunity to participate in the manage-ment process, there would be positivegains for the enterprise through higherproductivity and efficiency. They wantto bridge the divide between the manage-ment and workers in order to bring har-mony in industrial relations.
F. W. Taylor was the first to cham-pion the recognition of the importance ofhuman beings in managing an organiza-tion. Taylor’s work on scientific manage-ment was the first explicit attempt at us-ing in an organization the knowledge thatfor increased productivity the employers
need to make efforts to satisfy workers’needs (Taylor, 1911). The importance ofmaking fuller use of potential of workersthrough management methods waselaborated in the researches carried outby behavioral scientist like Likert (1961)and McGregor (1960). Their analysis wasbased on the assumption that the aver-age worker is willing to accept the re-sponsibility and will respond to the op-portunity of using his intellectual facul-ties in larger measure. The introductionof a more participative management styleand the improvement of job design arereported in several cases to have givengood results in terms of workers attitudesand productivity (ILO, 1976).
In spite of the controversies and con-flicts, Workers Participation in Manage-ment, is being increasingly adopted bothin capitalist and socialist countries par-ticularly in Europe and in the third worldas an ideal form of industrial democracy.Since the conclusion of World War II,more appropriately in the fifties and six-ties, various European countries havebeen experimenting in what may be calledparticipative management. Wertheim(1976) stated that in Europe, there ap-pears as a complement to traditional pat-terns, an attempt to decentralize influ-ence. Efforts towards worker control arelikely to have limited appeal in placessuch as the United States and Britainwhere labor perceives industrial relationsas already fairly decentralized. Jecchinis(1979) explained the experiences of cer-tain successful West European practicesin employee’s participation. He pointedout the establishment of complementaryintuitional arrangements in the existing
Workers’ Participation in Management
The Indian Journal of Industrial Relations, Vol. 49, No. 4, April 2014 591
Pramod Mohan Johri
592 The Indian Journal of Industrial Relations, Vol. 49, No. 4, April 2014
system of labor-management relations inCanada for its success which, at thepresent, is based only on the institutionof collective bargaining.
Alas (2007) made an attempt to study,“The impact of employee participation onjob satisfaction during change process”.He mentioned that “Estonia has suc-ceeded in replacing a planned economywith a free market economy. Still, a lothas to be done to achieve a quality levelcomparable with developed countries inthe European Union. The main problemis: how to change Estonian business or-ganizations even faster than organizationschange in developed countries. To meetthis challenge, we must rely on both thetheories and the experiences of developedcountries”. More recently Kuyea andSulaimonb (2011) examine the relationshipbetween employee involvement in deci-sion making and firms’ performance in themanufacturing sector in Nigeria. The re-sults indicate a statistically significant re-lationship between employee involvementin decision making and firms’ perfor-mance. The study also reveals a signifi-cant difference between the performancesof firms whose employee involvement indecision making is deep and of firmswhose employee involvement in decisionmaking is shallow. The findings also re-veal the involvement of participating firmsin employee involvement in decision mak-ing.
World War Era
It was during the First World War thata need to study the relationship betweenemployer and employee was felt as the
entire United Kingdom faced a challengefor having effective control over the situ-ation as emerged due to the World War,which has adversely affected the indus-trial production. The government ap-pointed a committee to examine the waysand methods for increasing production.This committee was headed by LordWhitley who was then deputed to Indiato lead Royal Commission on Labor inIndia in 1929. Whitley conducted exten-sive studies and had discussions withvarious people connected with industryand labor. He then recommended thatmanagement must consult labor on issuesrelated to production. This would lead togreater involvement and commitment oflabor in promoting industrial production.He suggested that factories and otherworkplaces should form works commit-tees comprising equal representativesfrom both sides. This committee wouldsuggest means to increase productivitythrough workers’ participation.
Whitley’s suggestions were imple-mented by the government and workscommittees were set up in all the facto-ries. Soon, the country witnessed a rapidincrease in production. Workers’ partici-pation in management therefore hadscored a strong point. These works com-mittees continued till the War was overwhen production became normal as therewas no need for excessive industrialgoods. Managements immediately dis-banded the works committees. They weresuccessful when there was a need to in-crease the production or otherwise man-agement did not think it necessary to con-sult labor in issues that were defined asprerogatives of the management. It
Workers’ Participation in Management
The Indian Journal of Industrial Relations, Vol. 49, No. 4, April 2014 593
looked like the workers were used bymanagement in order to achieve its shortterm goals. After disbanding the workscommittees, industrial unrest increasedand the trade union movement grewstronger. However, there was no talk ofconsultation with the workers’ nor wasthere any move of institutional recogni-tion of workers’ participation.
The next major step towards the re-alization of importance of the workerswas felt soon after World War II. Thoughthe War caused havoc in the lives ofpeople, it also led to the questioning ofcertain traditional beliefs. For example,when men went to war, production andfactories had to be managed by some-one in order to meet the increased needscaused by the War. It was then thatwomen started manning the factories andexploring for coal and iron ore in themines. This gave greater confidence towomen that they were proficient to workin these industrial areas. One must re-member that the ILO had earlier passedconvention that prevented women fromworking in factories at night and in work-ing underground in the mines. Similarly,workers too became a part of the move-ment to defend their country against theonslaught of the Nazis. This in turn madeworkers’ feel that they played a positiverole in society and they were not merecogs in the wheels of industry. Thesefactors had important effects on theworking class movement as well as thewomen’s movement in the post War pe-riod. Universal adult suffrage wasgranted in Britain which in turn led tomovements for democratizing the work-place. The argument put forth was that
if workers were competent to elect gov-ernments, why could they not take partin the functioning of their factories? Thisled to a new phase of movement forworkers’ participation in management.The new move was quantitatively differ-ent from that of the works committeesproposed by Whitley. The workers nowdemanded the right to form policies alongwith the management.
If workers were competent toelect governments, why could theynot take part in the functioning oftheir factories?
Post Independence Developments
The need for some form of workerparticipation was felt in the mid-1950sand 1960s, well after Independence, andmore by the government than by theemployers, because of the need for rapidindustrialization. Workers’ participation inmanagement came to India through gov-ernment intervention. There was no urgeamong unions for greater involvement inthe management of industrial enterprises.This is a characteristic feature of mostparticipative schemes in the country, andhad continuing effects on the function-ing of the schemes themselves. The in-troduction of works committees throughthe Industrial Disputes Act in 1947 washailed by many as an encouraging mea-sure for participation. But section 3 ofthis Act states that the works committeeis meant “to promote measures for se-curing and preserving amity and goodrelations between the employer and theworkmen and to that end comment upon
Pramod Mohan Johri
594 The Indian Journal of Industrial Relations, Vol. 49, No. 4, April 2014
matters of their common interest or con-cern and endeavor to compose any ma-terial differences of opinion in respect ofsuch matters.” The objective was clear.The works committee was envisaged asan industrial relations tool to resolve dif-ferences between managements and la-bor. It was not a participative body at all,and was not meant to be so. From thepoint of view of structure, the body hadsome participative affectations. It was tobe introduced in all enterprises with 100or more workmen and composed in sucha way that the number of representativesof workmen was not less than that ofmanagement representatives. The work-ers’ representatives were to be electedfor two years by the workmen of theenterprise, and had to be workers. Theycould in addition be unionists or unionleaders. If there was any doubt about itsnon-participative nature, the successiveclarifications removed them. When jointmanagement councils (JMCs) were pro-posed to be set up in the late 1950s, itwas explained that works committeesshould deal with a small number of is-sues so as not to encroach on the juris-diction of the former or on the sphere ofcollective bargaining. Three lists of is-sues were prepared, one for JMCs, onefor collective bargaining and one forworks committees. Works committeeswere allotted discussions on lighting, ven-tilation, temperature, sanitation, drinkingwater, canteens, dining and rest rooms,medical and health services, safe work-ing conditions, administration of welfarefunds, educational and recreational ac-tivities, and encouragement of thrift andsavings among workers (Sen, 2010: 375).There was some enthusiasm over the
committees initially, but interest declinedas other forums came up. In many en-terprises, workers were particularly ex-cited about the elections associated withthem, and some unions treated the elec-tion exercise as a means of verifyingunion strength and flexing their muscles.The National Commission on Labor, 1969,recommended that the recognized unionbe given the right to nominate worker rep-resentatives to the works committee.However, the committees did serve somepurpose. Even if elections were not heldregularly or the committees did not meetoften, they served as forums for venti-lating workers’ grievances. They arenow redundant in most enterprises.
There was some enthusiasm overthe committees initially, but inter-est declined as other forums cameup.
The first real scheme where somekind of participation was envisaged wasthat proposing joint management coun-cils. The Industrial Policy Resolution of1956 stated that “in a socialist democ-racy, labor is a partner in the commontask of development and should partici-pate in it with enthusiasm ... there shouldbe joint consultation, and workers andtechnicians should, wherever possible, beassociated progressively in management.Enterprises in the public sector have toset the example in this respect” (Sen,2010:375). In 1956, the government sug-gested at the Annual Labor Conferencethat a delegation should go to Europe andstudy how the system worked in coun-tries where many of the joint bodies were
Workers’ Participation in Management
The Indian Journal of Industrial Relations, Vol. 49, No. 4, April 2014 595
still active. The delegation reported backto the Conference and proposed thatJMCs be set up in all establishmentsemploying 500 or more workers. TheConference adopted this recommenda-tion as a resolution in 1958, which there-after became applicable to industrial un-dertakings, since employers and unionswere a party to the resolution. The ThirdPlan desired that the JMCs become anormal feature of the industrial systemand integrate private enterprises into asocialist order. The objectives of theJMCs were to promote warm relationsbetween managements and labor andbuild up trust and understanding, but alsoto increase productivity, secure effectivewelfare and other facilities, to train work-ers to understand and share responsibili-ties, and in general function as a consul-tative body.
It was stated categorically that allmatters for collective bargaining such aswages and allowances were to be ex-cluded, and the creation of new rightsbetween managements and unions wasto be avoided. It was decided that ini-tially JMCs would be set up in 50 selectedenterprises and gradually expanded toothers, using the experience of the first50. But ultimately the total number neverexceeded 140, and even that numbergradually dwindled (Sen, 2010: 376). TheJMCs did get off to a good start in a fewinstances where managements were notaverse to the concept of sharing deci-sion-making with workers and state gov-ernment officials had vision and initiative.But these were few. With the growinginflation of the early and mid-1960s, thecouncils gradually fell into disuse. Ulti-
mately, and very often, the councils dis-cussed relatively inoffensive subjects in-cluding safety and canteen, thus becom-ing glorified works committees. The mainproblem was management reluctance toshare decision-making with workers. Itwas this reluctance which lay at the rootof the failure of the JMCs and the laterschemes (Sheth, 1972).
The JMCs did get off to a goodstart in a few instances where man-agements were not averse to theconcept of sharing decision-mak-ing with workers.
After the JMC experience, the Gov-ernment decided to make a fresh attemptat participation in public sector units(PSUs) at least. It announced in 1971 ascheme for worker directors on PSUboards. One worker director was mademandatory for each PSU, the represen-tative being a nominee of the recognizedunion. Since most of the recognizedunions in the central PSUs were INTUCaffiliates, it became easy to nominate thenational INTUC president or general sec-retary on most boards. The practicebarely survived into the 1990s. In theentire steel industry by then, the loneemployee director was in IISCO, WestBengal.
For the banks, statutory amendmentsin 1973 to the State Bank of India Act1959 and the Banking Regulation Act1969 provided for the appointment of oneworkman (non-executive) director andone non-workman (officer/executive)director in each bank. The working of the
Pramod Mohan Johri
596 The Indian Journal of Industrial Relations, Vol. 49, No. 4, April 2014
scheme was delayed by both manage-ments of various banks and by unions.Unions protested against officer direc-tors, contending that officers were in anycase represented. The controversy con-tinued for many years till it was settledby the Supreme Court in 1989. The mostrepresentative union was to submit apanel of three names, one of which wouldbe approved by the Reserve Bank of In-dia and appointed by the Government.Most of the nominations were placed byeither INTUC or AITUC affiliates, sincethey were in the majority. But few in of-fice workmen or bank staff memberswere appointed to the boards, since unionleadership in many cases was in the handsof retired employees. Ghosh & Gupta(1992) found that while employees fa-vored elected representatives, the unionsfavored nomination by the majority union.
However, the performance and roleexpectations of the nominees provedmajor obstacles to participation in banks.It was found that the top managementenvisaged the role of a worker directoras one of coordination and cooperation.Employees, however, felt that the roleshould additionally involve policy formu-lation, improvement in working conditionsand reduction in unjust treatment of em-ployees. Where the actual performancewas concerned, employee directors rarelyspoke in the board meetings. Employeesfelt their number was too small to makean impact, and in many cases employeedirectors felt intimidated by the presenceof so many non-workmen directors whoall came from social and educationalstrata superior to the workmen (Ghosh& Gupta, 1992: 416).
Years ago, the general secretary ofthe All-India Bank Employees Associa-tion indicated that managements did notreally want participation because agendapapers were sent late, just ahead ofmeetings. But he did concede that par-ticipation at the board level gave employ-ees access to a lot of policy informationas well as the antecedents of such policy.This was found useful by the unions (Sen,1983). But Ghosh and Gupta (1992) foundin their survey that employees were ableto extract improvements in working con-ditions, minimize unjust treatment andsettle many employee problems. In policyformulation, the observation was that thesmaller executive committee of the boardmade the actual decisions without thepresence of employee directors, and eventhe dissent of the latter was usually notrecorded. It can be concluded that theworker director scheme has been par-tially successful.
The worker director scheme hasbeen partially successful.
In 1975, one of the populist measuresadopted by the Government was a 20-point program, and workers’ participationwas one of the points. A new scheme ofshop councils and joint councils was for-mulated in October that year. This wasapplicable to all enterprises in manufac-turing and mining employing 500 or morepeople in the public, private and coop-erative sectors. Accordingly, in 1976, atthe time of the Emergency, the constitu-tion was amended (article 43A of theDirective Principles) to include the intro-duction of workers’ participation as an
Workers’ Participation in Management
The Indian Journal of Industrial Relations, Vol. 49, No. 4, April 2014 597
objective of state policy. The article statesthat the Government shall take steps bysuitable legislation, or in any other way,to secure the participation of employeesin the management of undertakings, es-tablishments or other organizations en-gaged in any industry. In 1977, the ShopCouncils Scheme was extended by a gov-ernment order to service and commer-cial undertakings employing 500 or more(Sen, 2010 : 378). The two-tier schemeprovided for the appointment of shopcouncils in each department or shop ofenterprises, with the management andworkers represented in equal numbers.The former would be nominated by themanagement, and workers’ representa-tives would be from the respective de-partments or shops. The manner of rep-resentation was not specified, though.The recognized union should be consultedon the number of councils and their cov-erage, depending on the number of work-men employed and on the number ofmembers in each council. Once formed,each shop council should function for twoyears and meet at least once a month.The council should be nominated by themanagement and the vice-chairman bythe workers. Decision-making should beby consensus and decisions implementedwithin one month.
The functions of the shop councilswould be to assist the management inachieving production targets, improvingproduction, productivity and efficiency,eliminating wastage, and utilizing capac-ity and manpower to the optimum level.They should specifically identify areas oflow productivity, study absenteeism andrecommend measures for their improve-
ment. The councils should also concernthemselves with safety, working condi-tions, discipline and two-way communi-cation. There would be one joint councilfor a single plant, its constitution beingmuch on the same lines as the shop coun-cils, with the chief executive of the plantas chairman. Any one of the councilmembers could be secretary for the coun-cil, which should meet at least once ev-ery three months. Voting on decisionswas to be avoided. The functions includedoptimum production; efficiency; fixationof targets; matters emanating from thecouncils; inter-shop council matters;training; work schedules and holidays;evaluating suggestions; optimum use ofraw materials and; health, safety andwelfare for the plant as a whole. Theorder did not clarify whether workers orunions would represent employees. Thishad obvious repercussions in intense in-ter-union rivalry. Private and cooperativesector enterprises hardly attempted toimplement the scheme. PSUs did startimplementing the scheme, but most at-tempts came up against the wall of unionrepresentation, especially in multi-unionenterprises. There was also an overlapof issues with works committees andJMCs.
Private and cooperative sector en-terprises hardly attempted toimplement the scheme.
When the Janata Party came topower in 1977, it appointed a committeeunder Labor Minister Ravindra Verma toinvestigate statutory imposition of partici-pation. The Verma Committee in 1978
Pramod Mohan Johri
598 The Indian Journal of Industrial Relations, Vol. 49, No. 4, April 2014
duly recommended a statute on partici-pation. This was hotly contested by em-ployers’ organizations, and the contro-versy led to inevitable delay. The fall ofthe Government in 1979 helped shelve theproposal for statutory participation oncemore. In 1980, the new government pre-empted any move in this regard by ap-pointing the Sachar Committee to go intothe whole question of company gover-nance. Workers’ participation was one ofthe issues. The committee did recom-mend compulsory participation, but witha condition that at least 51 per cent ofthe total employees of an enterprise votesin favor of such participation (Sen, 2010:379).
Unable to make much progress onthese controversies, the Government an-nounced on 31 December 1983 yet an-other scheme for shop councils and plantcouncils. It was billed as a new compre-hensive scheme for workers’ participa-tion in central PSUs, but excluded de-partmental undertakings such as the rail-ways and post and telegraphs. Thisscheme would ordinarily be two-tier, likethe 1975 scheme but, if the Governmentso ordered, could be extended to theboard level, with worker directors.Hence, it could be referred to as a three-tier scheme. It was largely a modifiedversion of the 1975 scheme. The issueswere more comprehensive than in the1975 scheme.
Virmani (1988) found in his investi-gations that the scheme was not evencirculated properly by the public sectorunits (PSUs), and it was left to one ofthe major central union organizations to
circulate it among workers and unions.Bisht (1986) found that in the early 1980s,the three-tier scheme was practiced injust four PSUs and the two-tier schemein eight. His study also indicated that therepresentation system was extremelyvaried. Office bearers of recognizedunions were on the forums in some PSUs,but in others representation was basedon workers’ seniority, sectional represen-tatives from among workers or electedrepresentatives in a few.
The final step in the rather prolongedintroduction of participation was taken in1990, when the new government drafteda Participation of Workers in Manage-ment Bill, and circulated it among cham-bers of commerce and major unions forcomments. The Annual Labor Confer-ence that year had an almost single-pointagenda–statutory participation. Thestructure of the participative scheme andthe issues were no different from thoseof the 1983 scheme. But a major im-provement was that persons represent-ing “the workmen shall be elected by andfrom amongst the workmen of the indus-trial establishments, by secret ballot ornominated by the registered tradeunions.” The term of the councils wasextended to three years and penal provi-sions for non-compliance added, as iscommon to most Acts. Board-level par-ticipation was mandatory, and the num-ber of workmen and non-workmen wouldtogether constitute 25 per cent of the to-tal board strength. This was also an im-provement on the existing worker direc-tor scheme. A monitoring agency to re-view the progress of implementation wasincluded in the Act. This scheme too suf-
Workers’ Participation in Management
The Indian Journal of Industrial Relations, Vol. 49, No. 4, April 2014 599
fered the sad dilemma of its predeces-sors, though, and before it could bepassed, the non-Congress governmentfell. Interestingly, the new Governmentdid not formulate any new schemes onparticipation, although the appropriatenoises on workers’ participation weremade in both the Eighth and Ninth Planapproach documents. Obviously, the eco-nomic developments of 1991 and the neweconomic regime that it ushered in wereincompatible with socialist ideas of work-ers’ participation (Sen, 2010: 381).
Current Scenario
Since then, governments have comeand gone but have generally been eithersilent or inactive in the matter of work-ers’ participation, except marginally. Forinstance, India and the European Union(EU) entered into a Joint Action Plan in2006 for a policy dialogue and coopera-tion in the fields of employment and so-cial policy. In line with this plan, the Min-istry of Labor and Employment signed aMemorandum of Understanding (MoU)with the European Commission tostrengthen dialogue and exchange ofviews and information on issues of com-mon interests within the areas of employ-ment. Social policy such as skills trainingand employment, social security, occupa-tional health and safety, workers’ partici-pation in management and other relevantissues were identified jointly. The struc-tured dialogue was to consist of exchangeof experience, best practice, views andinformation on topics of common inter-est, trends and policy developments re-lated to the above areas. As a part ofthis structured dialogue, it was agreed to
organize a joint seminar on mutually iden-tified issues every year. Accordingly, thefirst seminar on skill development andtraining was held in New Delhi in No-vember 2006. The second seminar onsocial security and social protection washeld in Lisbon, Portugal, in September2007. The third seminar on employmentrelations and resolution of conflicts heldin New Delhi in September 2008, fo-cused on trends in employment relationsand social dialogue, collective bargaining,workers’ participation in managementand challenges, strategies and best prac-tices in labor dispute resolution. However,the background paper for the last semi-nar still cited the history of participationin India up to the time of the 1990 Bill( h t t p : / / l abou r.n i c . i n / l c / Indo -EU/seminarSep22-23-08.pdf).
Government of India after nearly 26years amended the Industrial DisputeAct, 1947 through its Amendment Act,2010, which has now come into forcewith effect from 15.09.2010 vide its No-tification No. S.O. 2278(E) dated15.09.2010. The amendment brought aprovision stating that every industry em-ploying 20 or more workmen is now un-der legal obligation to constitute and havegrievance ventilating machinery in placein the organization to resolve the work-ers dispute at the final level. Earlier itwas not legally essential. The relatedprovisions which were brought in the IDAct in 1984 were enforced.
Conclusion
The effective conditions for workers’participation in management can be
Pramod Mohan Johri
600 The Indian Journal of Industrial Relations, Vol. 49, No. 4, April 2014
viewed from two perspectives: micro aswell as macro. It is difficult to achievemacro-level changes within a short time.But in the present situation, micro-levelchanges would not be difficult to bring.Participative management has basic con-tradictions — in terms of diversity ofgoals and role-conflict among govern-ment, management and union. In the pub-lic sector where government is manag-ing the industry, the schemes of work-ers’ participation in management can befruitfully implemented. But in the privatesector where the contradiction in termsof diversity of goals and role-conflict re-mains, unless the participating groups,namely, employers, managers and work-ers adopt the necessary value orientation,attitude and behavior pattern to under-stand the philosophy of participation,implementation of schemes of workers’participation in management remains aunresolved question.
Facing the urgent problems of ourtime, participative machinery offers im-mense scope simply because it recognizesthe obvious truth that the success or fail-ure of an enterprise depends on thepeople in it. PSUs are now required tomandatorily follow the provisions as en-visaged in the above said directives. It isexpected that this would further give aboost to the scheme.
References
Alas, R. (2007), “The Impact of Employee Par-ticipation on Job Satisfaction during ChangeProcess”, Problems and Perspectives inManagement, 5(4): 28- 33.
Anton, R. (1967), “Workers’ Management andEmployment Relationship”, Indian Jour-nal of Industrial Relations, 3(2): 160-172
Blume, E. (1973), “Management in Yugoslavia,in Thakur C.P. & Seth N.R. (Eds), “Indus-trial Democracy, Some Issues and Experi-ences” SRC, New Delhi.
Bisht, N.S. (1986), Participative Management inIndia, New Delhi: Shree Publishing.
Batt, R. & Appelbaum, E. (1995), “Worker Par-ticipation in Diverse Settings: Does theForm Affect the Outcome, and If So, WhoBenefits”, British Journal of Industrial Re-lations, 33(3): 353–378.
Cotton, J.& Vollrath, A. (1988), “Employee Par-ticipation: Diverse Forms and DifferentOutcomes”. Academy of Management Re-view, 13(1:) 8–22.
Chris, A. J (1979), “Employees Participation inManagement: International Experiences &the prospect for Canada”, Industrial Rela-tions 34(3): 490-515 retrieved from http://id.erudit.org/idedurit/028988ar accessed on31.03.2012
Dhal, M. & Srivastava B. L. (2002),”Trade Union-ism: Perceptions and Attitudes of Work-ers, Managers and Leaders”, Indian Jour-nal of Industrial Relations, 38 (2): 177-98
Das, S., S. Kuruvilla, H. Kwon, S. Kwon, (2005),“Trade Union Growth and Decline in Asia”British journal of Industrial Relations,40(3): 51-73
Dougouliagos, C. (1995), “Worker Participationand Productivity in Labor-Managed andParticipatory Capitalist Firms: a Meta-analysis’. Industrial and Labor RelationsReview, 49(1): 58–77.
Gani, A (1992), “Membership Participation inUnion Activities”, Indian Journal of Indus-trial Relation, 27 (3): 229-36
Ghosh, P.K. & Gupta, P.K. (1992), “Efficacy ofEmployees’ Directors in State Bank ofIndore – A Case Study”, Indian, JournalOf Industrial Relations, 27,( 4): 412–18.
Workers’ Participation in Management
The Indian Journal of Industrial Relations, Vol. 49, No. 4, April 2014 601
Giri, V.V. (1966), Labor Problem in Indian Indus-try, Asia Publishing House, Bombay
ILO (1976), Workers’ Participation in Decisionswithin Undertaking, Labor ManagementRelations Series, No.48
Janardhan, V(2003), “Arguing for Industrial Re-lations: Journey to a Lost World”, Eco-nomic & Political Weekly, 16 (2), 3254-60
Jecchinis, C. A. (1979), “Employees’ Participa-tion In Management: International Experi-ences and the Prospects for Canada” In-dustrial Relations, 34(3): 490-515.
John Z. (1991),” Comparative Industrial Rela-tions in Japan and India”, Indian Journalof Industrial Relations, 26(4), 352-66
Kuyea, O. L.& Sulaimonb, A.H. A. (2011), “Em-ployee Involvement in Decision Making andFirms Performance in the ManufacturingSector in Nigeria”, Serbian Journal of Man-agement, 6 (1):1 – 15.
Kaler, J. (1999), “Understanding Participation”,Journal of Business Ethics, 21 (2/3), 125-35. Retrived from http://www.jstor.org/stable/25074161 accessed on 31.04.2012
Kelly, M. R. (1996), “Participative Structures,Work Organization and Manufacturing Per-formance”, Working Paper, Pittsburgh, PA:Carnegie Mellon University.
Lavakare, S.P. (1977), “Workers’ Participation inManagement” Economic & Political Weekly,12 (9), M22-M24
Likert, R. (1961), New Patterns of Management,New York: McGraw-Hill Book Co. Ltd.
Mcgregor, D. (1960), The Human Side of Enter-prise, New York: McGraw-Hill.
Meyer T. (1990), “WPM in the Federal Republicof Germany: Structure, Consideration &Experience” Indian Journal of IndustrialRelation, 25(4): 372-79
Meyers, C.A.& S. Kannappan, (1970), Indus-trial Relation in India, Asia PublishingHouse, Bombay
Minqi Li (2002),”Workers’ Participation in Man-agement and Firm Performance: Evidencefrom Large and Medium-Sized Chinese In-dustrial Enterprises” Review of RadicalPolitical Economics, 36: 358 retrieved fromhttp://www.sagepublications.com
MacDuffie, J. P. (1991), Beyond Mass Produc-tion: Flexible Production Systems andManufacturing Performance in the WorldAuto Industry. Doctoral thesis, Cambridge,MA: Massachusetts Institute of Technol-ogy.
Martin, D. Hanlon (1985),”Unions, Productiv-ity, and the New Industrial Relations: Stra-tegic Considerations” Economic & Politi-cal Weekly, 15(3): 41-53 retrieved fromhttp://www.jstor.org/stable/25060690
Macduffie, J. P. (1995), “Human ResourceBundles and Manufacturing Performance:Organizational Logic and Flexible Produc-tion Systems in the World Auto Industry”,Industrial and Labor Relations Review,48(2): 197-221 retrieved from http://www.jstor.org/stable/2524483 accessed on04.04.2012
Monnappa, A., (1985), Industrial Relations, TataMac. Graw Hill, New Delhi.
Noronha, E. (1996), “Liberalisation and indus-trial relation”, Economic & Political Review,31(8) 14-20
Noronha, E. (1996),”Liberalization and IndustrialRelations”, Economic and Political Weekly,31 (8), L14-L20
Orpen, C. (1980),”Management Attitudes to In-dustrial Democracy: An International As-sessment”, Management International Re-view, 20(1): 111-25 retrieved from http://www.jstor.org/stable/40245542
Paylee, M.V. (1975), “Workers Participation inManagement: Myth & Reality”, N.V. Pub-lication, New Delhi.
Prakash Arya, P. (1980), “Nature and Extent ofWorkers Participation in Decision Making”,Indian Journal of Industrial Relation, 16(2):45-72
Pramod Mohan Johri
602 The Indian Journal of Industrial Relations, Vol. 49, No. 4, April 2014
Prabhakar, G. (1996),”Union Management Rela-tions in India: Need for a New Approach”,Indian Journal of Industrial Relations, 31(4): 501-09
Pradip K. G. & Mark Van de Vall, (1978), “Work-ers Participation in Management: Appliedto India”, Management International Re-view, 18 (3), 55-68. Retrieved from http://www.jstor.org/stable/40227398, accessedon 24.02.2012.
Ramaswami, U. (1979),”Tradition and Changeamong Industrial Workers”, Economic andPolit ical Weekly , 14 (7/8):367-369+371+373+375-376
Ramaswamy, E. A. (1983),”What Education DoWorkers Need?” Economic and PoliticalWeekly, 18 (9), M4-M5+M7-M9+M11
Ramaswamy, E.A. & Ramaswamy,U. (1981), “In-dustry & Labor-An Introduction” OUP,New Delhi: 263-66
Ramesh, P. S., (1983), “Workers Participation inUnion & Participation correlates” IndianJournal of Industrial Relation, 19 (1): 45-56
Ratna, S. (1983), “Confrontation at UBI”, in Busi-ness Standard, 4 Dec. 2010.
Richard, D. R. & Eliezer, R. (1980), “Participa-tion and Productivity: An Empirical Study”Industrial and Labor Relations Review,33(3): 355-67 retrieved from http:/ /www.jstor.org/stable/2522572 accessed on01.04.2012
Sheth, N.R. (1972.), Joint Management Coun-cils: Problems and Prospects, New Delhi:Shri Ram Centre for Industrial Relations.
Sen, Amartya. (2000), “Work and Rights” Inter-national Labor Review, 139(2): 41-45
Sodhi, J.S. (1993),” New Economic Policy andTheir Impact on Industrial Relations”, In-dian Journal of Industrial Relation ,29(1):31-54
Toscaro D. (1981), “Labor Management Coop-eration & West Germany Co-determina-tion”, Indian Journal of Industrial Relation,12(6), 59-65
Thomas K. Kohler (1986), “Models of WorkersParticipation”, Boston College of Law Re-view, 27(3).
Taylor, F.W.(1911), Scientific Management, NewYork: Harper and Row.
Venkat Ratnam, C.S. (1993), “Impact of NewEconomic Policy on the Role of TradeUnion”, Indian journal of Industrial Rela-tion, 29(1), 57-78
Venkat Ratnam C.S., (1990), “Turnaround Man-agement: Role of Employees and Union”,Economic & Political Weekly, 25 (47),M183-M194
Venkatratnam, C.S., (1993), Industrial Relations:Current Perspective, Allied Publisher, NewDelhi.
Virmani, B. R. (1978), Workers Participation inManagement: Some Experiences and Les-sons, New Delhi: The Macmillan Companyof India Limited.
Wertheim, E.G.(1976), “Worker Participation andIndustrial Relations – The Trend towardDecentralization” Industrial Relations,31(1): 98-111.
Zivan T. (1967) ,”Social Composition of Work-ers’ Councils in Yugoslavia”, Indian Jour-nal of Industrial Relations, 3(1),19-40
sas
QCs’ Effectiveness Factors in Public & PrivateEnterprises in India
Ranjan Dasgupta
The present study was under-taken in three PSUs and twoPSEs from Eastern region to findout the ‘factors’ critical and re-sponsible for QCs’ effectiveness.Both primary and secondarydata were collected in threephases during 2004-09 throughquestionnaire from 236 respon-dents representing 118 sampleQCs. The data so collected wereanalyzed by PCA under FA withrelevant validity analysis.Twenty-one and eleven ‘factors’were extracted by this study ascritical and responsible for QCs’effectiveness in sample PSUs andprivate sector enterprises re-spectively. Although the successand effectiveness measure var-ies between the organizationsand QCs, these ‘factors’ wouldact as the catalyst of QCs’ effec-tiveness in any type of industrialsetting within this region.
Introduction
Major environmental changes in late1980s and early 1990s, such as liberaliza-tion policy, encouraged many Indian or-ganizations to explore and experiment withwork innovations and quality improvementinitiatives in order to improve productivityand quality as well as to satisfy the psy-chological growth needs of people better.One such initiative is the Quality Circles(QCs). Hutchins (1985) observed, “Qual-ity Circles are the most exciting and pro-found approach to have been establishedin the world since the advent of scientificmanagement”. As an approach to partici-pative management, QC philosophy incor-porates the idea that employees at all or-ganizational levels want to be involved indecisions that affect their work, and, thatthose closest to a given job are in the bestposition to evaluate its problems and sug-gest potential solutions. Presently, QCsrepresent the dominant form for involvingemployees in improving manufacturing
Ranjan Dasgupta is Associate Professor, MBADepartment, Institute of Engineering &Management (IEM), Kolkata. e-mail:[email protected]
The Indian Journal of Industrial Relations, Vol. 49, No. 4, April 2014 603
Presently, QCs represent the domi-nant form for involving employeesin improving manufacturing perfor-mance.
Ranjan Dasgupta
604 The Indian Journal of Industrial Relations, Vol. 49, No. 4, April 2014
performance in various types of enter-prises, irrespective of Public Sector Units(PSUs) or Private Sector Enterprises(PSEs), all over India including Kolkataand suburbs.
Though originally developed in theUSA in the 1940s, the QC movementwas formally introduced in Japan wayback in 1962. In India, the QC movementwas started in 1981 in theRamchandrapuram Unit of Bharat HeavyElectricals Ltd. (BHEL) (Udpa, 1986).Since then, QCs have spread to manytypes of organizations all over India. InEastern India, QC movement came intoforce with its successful implementationin Durgapur Steel Plant (DSP), Durgapurin 1991-92. Some other notable PSUsand PSEs from Kolkata and suburbs prac-ticing QC philosophy include NationalThermal Power Corporation (NTPC)Ltd., Farakka; Garden Reach Shipbuild-ers & Engineers (GRSE) Ltd., Kolkata;Exide Industries Ltd. (EXIDE), Haldia;Mitsubishi Chemical PTA India/MCCPTA India Corporation Pvt. Ltd. (MCPI),Haldia; West Bengal State ElectricityBoard (WBSEB), Kolkata; Kolkata PortTrust; etc. But QC’s implementation doesnot guarantee effectiveness. It is there-fore necessary to assess the factors re-sponsible for the effectiveness of this or-ganizational tool individually for PSUsand PSEs and comparatively in betweensuch organizations.
The sample industrial enterprises inand around Kolkata selected for thisstudy include three PSUs (DSP,Durgapur; GRSE Ltd., Kolkata andNTPC Ltd., Farakka) and two PSEs
(EXIDE, Haldia and MCPI, Haldia). Allof them have a history of successful andeffective implementation of QC philoso-phy and QC practices for the last tenyears. Many of the sample QCs have alsobeen working for many years now.
Objectives of the Study
This empirical comparative study hasthe following objectives:
• Determine the criteria for assessingQCs’ effectiveness based on litera-ture survey and develop a model rel-evant for both PSUs and PSEs.
• Use the QCs’ effectiveness model todevelop a questionnaire and conducta survey among the selected PSUsand PSEs in and around Kolkata.
• Extract the factors by using Princi-pal Components Analysis (PCA) un-der Factor Analysis (FA) separatelyfor PSUs and PSEs. This would helpto find out the factors that have beenresponsible for QCs’ effectiveness insuch organizations as studied.
• Compare the model developed withthe separately extracted factors foreffectiveness.
• Recommend the requisite factors in-dispensable for QCs’ effectivenessand suggest necessary steps forsample PSUs and PSEs to developthe QCs and QC movement further.
Methodology
The literature on workers’ participa-tion and QCs was surveyed extensively
QCs’ Effectiveness Factors
The Indian Journal of Industrial Relations, Vol. 49, No. 4, April 2014 605
to develop the QCs’ effectiveness modelrelevant for both PSUs and PSEs oftwenty-five factors. Thereafter, primaryand secondary data were collected from2004 to 2009 in three phases from samplePSUs and PSEs in and around Kolkata,using a range of techniques- focused one-to-one interviews, group interviews, ob-servations, survey questionnaires (bothpilot and final) and verification (or check-ing) of the documentary sources/evi-dence in regard to the QCs in operation.
Based on the primary data collectedand the observations on the prevalentQCs activities in sample PSUs and PSEsin phase I, the questionnaire was devel-oped for pilot survey in phase II. Duringphase II, the pilot survey questionnairewas administered among the QCs’ mem-bers and leaders/deputy leaders (50% ofsample QCs and its members were in-cluded) comprising 118 statements.Thereafter, a thorough analysis of theresponses of pilot survey questionnairewas used to eliminate the less importantstatements for the final questionnairesurvey in Phase III. In Recommendationsof Guilford (1952) have been followedthat at least three statements represent-ing each factor of the QCs’ effective-ness model (as developed initially) shouldbe kept in the final survey questionnairebalanced with reliability estimation.
In phase III, the final questionnaire(comprising 96 statements and other gen-eral questions, totaling 100 questions)survey was conducted among 236 (214from PSUs and 22 from PSEs) respon-dents (representing 118 QCs, i.e., twomembers from each QC, selected on a
stratified basis and as per their availabil-ity) for further investigation and analysisof the QCs’ effectiveness model. Onlythose active QCs which were more thantwo years of age (i.e., the honeymooneffect has gone) and solved at least twoproblems were selected. The question-naire used a 5-point Likert Scale, rang-ing from ‘Strongly Disagree’ (=1) to‘Strongly Agree’ (=5), to obtain primarydata from the respondents. In this study,PCA under FA has been taken to findout the most significant (principal com-ponents) and influential factors as preva-lent separately in sample PSUs and PSEsfor making their QCs effective.
Literature Review
The literature on QCs has beenlargely non-empirical in nature involvingsuccessful and unsuccessful stories fromvaried organizational settings all over theworld. Many formal studies on QCs dealwith selected aspects of their implemen-tation, outcomes and success or failurefactors. This study has focused mainlyon success or failure factors of QCs inthe works of Dale (1984); Dale & Lees(1985); Ingle (1982); Lawler & Mohrman(1985); Mento (1982); Park (1991); Sen(2010); Sillince, Sykes & Singh (1996);Sodhi & Joshi (1995); Udpa (1986);White & Bednar (1983); etc.
In Indian context, QC implementa-tion process and activities in differentorganizations (Dwivedi, 1987; 1987a; Jha,1997; Mathew, 1985; Srinivasan, 1991;Udpa, 1985) and QCs’ effectivenessevaluation in industrial settings (Dwivedi,1987b; Khan, 1986; Vijaya Banu, 2007)
Ranjan Dasgupta
606 The Indian Journal of Industrial Relations, Vol. 49, No. 4, April 2014
were studied. However, no regional studyof this kind in and around Kolkata wasfound. Hence, this study would be oneof pioneering nature within this region.But many of the findings could as wellbe true of other regions or organizationsin India.
The QCs’ Effectiveness Model
In Japan, it has been reported thatonly 40 percent of organizations havingQCs have been able to claim 100 per-cent effectiveness in QCs’ working. Incase of failure, causes must be identi-fied and remedial measures should betaken to reactivate dormant QCs. It isalso imperative for industrial enterprises(including the sample ones) and theirmanagers to know and avoid thesecauses. Also, in case of success, the fac-tors present and responsible should beidentified and standardized. With thisobjective in mind, a model of QCs’ ef-fectiveness factors has been developedfor further investigation and analysis.
The QCs’ effectiveness model[twenty-five factors] includes:
• Top management commitment andsupport
• Organizational requirements and sup-port
• Middle management commitmentand support
• Employees’ attitude and objectives injoining QCs
• Facilitators’ commitment and support
• No resistance from trade union
• QCs members’ commitment and sup-port
• Provision of comprehensive training
• A minimum level of education, skillsand knowledge of QC philosophy
• Main focus on voluntary participationapproach
• Strong group dynamics
• Effective leadership in QCs
• Satisfaction with job and non-job fac-tors in the workplace
• Adequate number of suitable prob-lems/projects for QC
• Selection of simple problems/projectsfor QCs
• Regularity of QCs meetings and QCsactivities
• Free-flowing and effective commu-nication system
• Clear-cut QC objectives and logicalexpectations from QC groups
• Publicity and recognition by manage-ment
• Suitable reward schemes/system
• Maintenance of initial enthusiasm andspirit in spite of age of QC
• Taste of success with existing QCs
• Supportive national, local and socialculture
• Continued presence of key person-nel
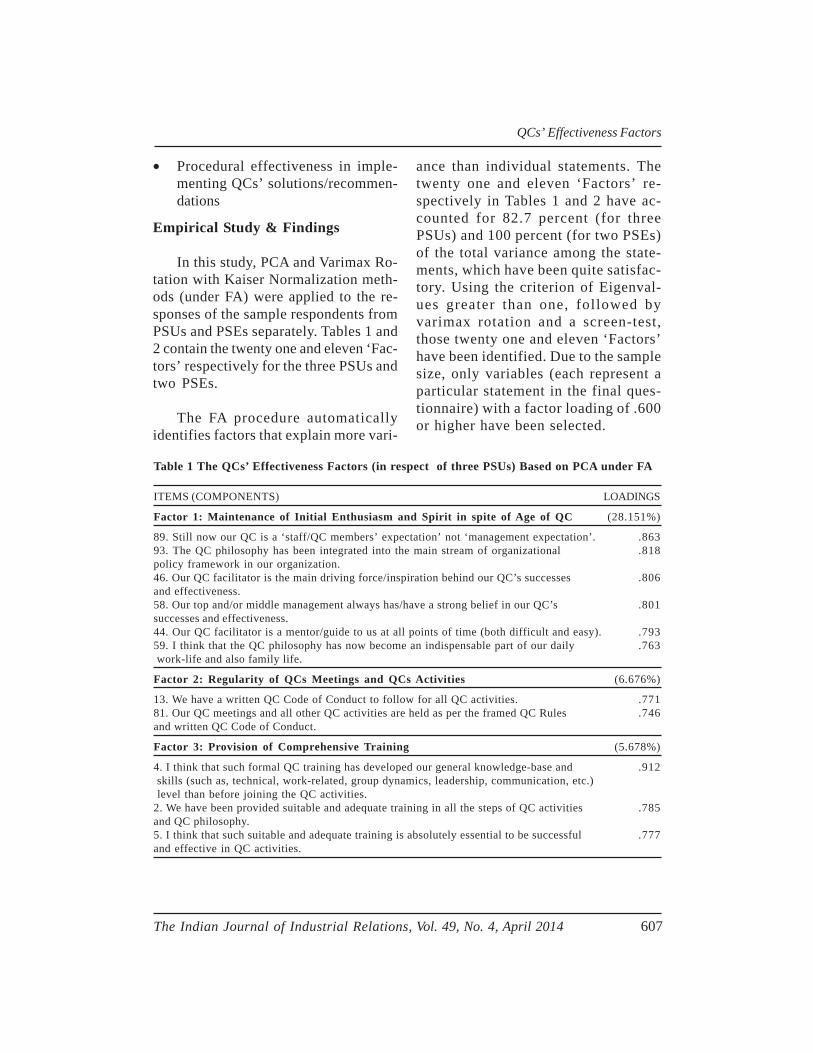
QCs’ Effectiveness Factors
The Indian Journal of Industrial Relations, Vol. 49, No. 4, April 2014 607
• Procedural effectiveness in imple-menting QCs’ solutions/recommen-dations
Empirical Study & Findings
In this study, PCA and Varimax Ro-tation with Kaiser Normalization meth-ods (under FA) were applied to the re-sponses of the sample respondents fromPSUs and PSEs separately. Tables 1 and2 contain the twenty one and eleven ‘Fac-tors’ respectively for the three PSUs andtwo PSEs.
The FA procedure automaticallyidentifies factors that explain more vari-
Table 1 The QCs’ Effectiveness Factors (in respect of three PSUs) Based on PCA under FA
ITEMS (COMPONENTS) LOADINGS
Factor 1: Maintenance of Initial Enthusiasm and Spirit in spite of Age of QC (28.151%)
89. Still now our QC is a ‘staff/QC members’ expectation’ not ‘management expectation’. .86393. The QC philosophy has been integrated into the main stream of organizational .818policy framework in our organization.46. Our QC facilitator is the main driving force/inspiration behind our QC’s successes .806and effectiveness.58. Our top and/or middle management always has/have a strong belief in our QC’s .801successes and effectiveness.44. Our QC facilitator is a mentor/guide to us at all points of time (both difficult and easy). .79359. I think that the QC philosophy has now become an indispensable part of our daily .763 work-life and also family life.
Factor 2: Regularity of QCs Meetings and QCs Activities (6.676%)
13. We have a written QC Code of Conduct to follow for all QC activities. .77181. Our QC meetings and all other QC activities are held as per the framed QC Rules .746and written QC Code of Conduct.
Factor 3: Provision of Comprehensive Training (5.678%)
4. I think that such formal QC training has developed our general knowledge-base and .912 skills (such as, technical, work-related, group dynamics, leadership, communication, etc.) level than before joining the QC activities.2. We have been provided suitable and adequate training in all the steps of QC activities .785and QC philosophy.5. I think that such suitable and adequate training is absolutely essential to be successful .777and effective in QC activities.
ance than individual statements. Thetwenty one and eleven ‘Factors’ re-spectively in Tables 1 and 2 have ac-counted for 82.7 percent (for threePSUs) and 100 percent (for two PSEs)of the total variance among the state-ments, which have been quite satisfac-tory. Using the criterion of Eigenval-ues greater than one, followed byvarimax rotation and a screen-test,those twenty one and eleven ‘Factors’have been identified. Due to the samplesize, only variables (each represent aparticular statement in the final ques-tionnaire) with a factor loading of .600or higher have been selected.
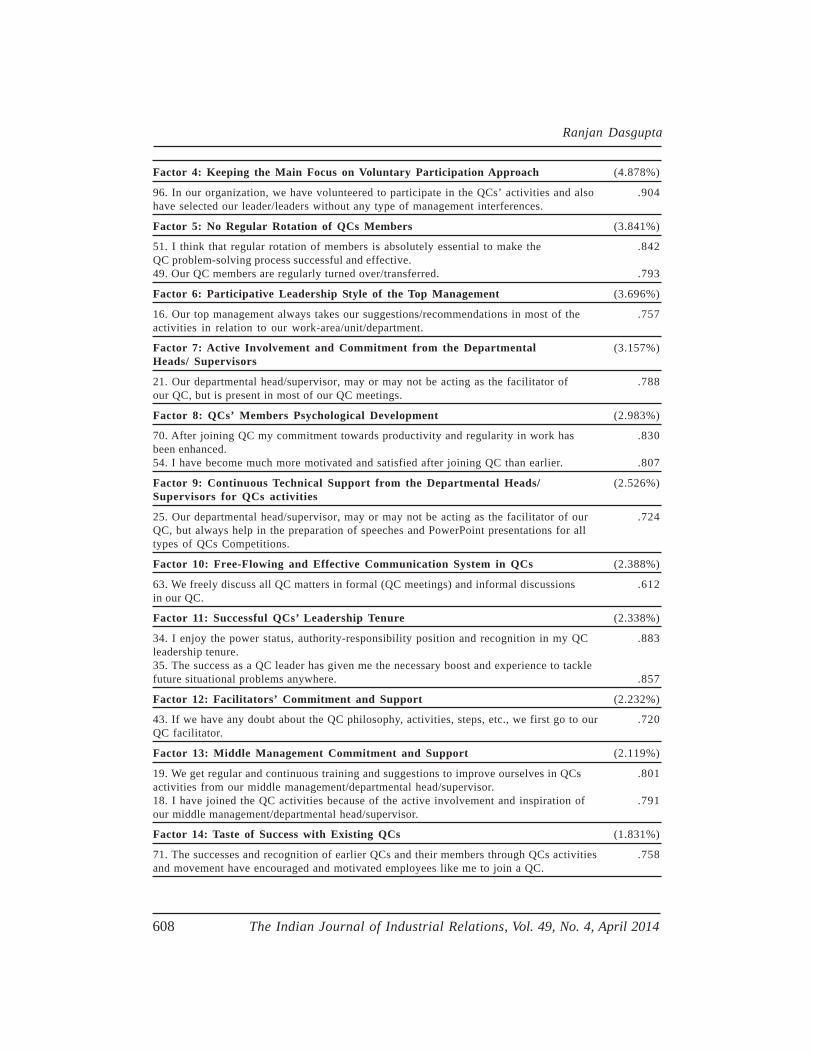
Ranjan Dasgupta
608 The Indian Journal of Industrial Relations, Vol. 49, No. 4, April 2014
Factor 4: Keeping the Main Focus on Voluntary Participation Approach (4.878%)
96. In our organization, we have volunteered to participate in the QCs’ activities and also .904have selected our leader/leaders without any type of management interferences.
Factor 5: No Regular Rotation of QCs Members (3.841%)
51. I think that regular rotation of members is absolutely essential to make the .842QC problem-solving process successful and effective.49. Our QC members are regularly turned over/transferred. .793
Factor 6: Participative Leadership Style of the Top Management (3.696%)
16. Our top management always takes our suggestions/recommendations in most of the .757activities in relation to our work-area/unit/department.
Factor 7: Active Involvement and Commitment from the Departmental (3.157%)Heads/ Supervisors
21. Our departmental head/supervisor, may or may not be acting as the facilitator of .788our QC, but is present in most of our QC meetings.
Factor 8: QCs’ Members Psychological Development (2.983%)
70. After joining QC my commitment towards productivity and regularity in work has .830been enhanced.54. I have become much more motivated and satisfied after joining QC than earlier. .807
Factor 9: Continuous Technical Support from the Departmental Heads/ (2.526%)Supervisors for QCs activities
25. Our departmental head/supervisor, may or may not be acting as the facilitator of our .724QC, but always help in the preparation of speeches and PowerPoint presentations for alltypes of QCs Competitions.
Factor 10: Free-Flowing and Effective Communication System in QCs (2.388%)
63. We freely discuss all QC matters in formal (QC meetings) and informal discussions .612in our QC.
Factor 11: Successful QCs’ Leadership Tenure (2.338%)
34. I enjoy the power status, authority-responsibility position and recognition in my QC .883leadership tenure.35. The success as a QC leader has given me the necessary boost and experience to tacklefuture situational problems anywhere. .857
Factor 12: Facilitators’ Commitment and Support (2.232%)
43. If we have any doubt about the QC philosophy, activities, steps, etc., we first go to our .720QC facilitator.
Factor 13: Middle Management Commitment and Support (2.119%)
19. We get regular and continuous training and suggestions to improve ourselves in QCs .801activities from our middle management/departmental head/supervisor.18. I have joined the QC activities because of the active involvement and inspiration of .791our middle management/departmental head/supervisor.
Factor 14: Taste of Success with Existing QCs (1.831%)
71. The successes and recognition of earlier QCs and their members through QCs activities .758and movement have encouraged and motivated employees like me to join a QC.
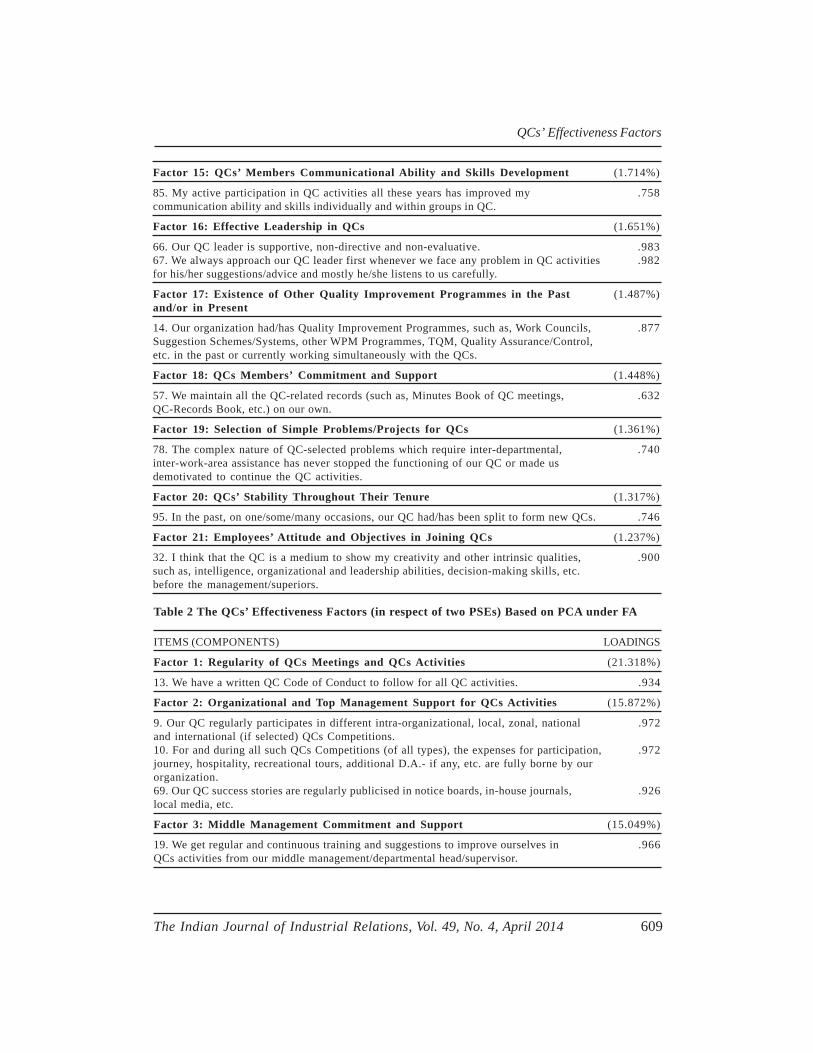
QCs’ Effectiveness Factors
The Indian Journal of Industrial Relations, Vol. 49, No. 4, April 2014 609
Factor 15: QCs’ Members Communicational Ability and Skills Development (1.714%)
85. My active participation in QC activities all these years has improved my .758communication ability and skills individually and within groups in QC.
Factor 16: Effective Leadership in QCs (1.651%)
66. Our QC leader is supportive, non-directive and non-evaluative. .98367. We always approach our QC leader first whenever we face any problem in QC activities .982for his/her suggestions/advice and mostly he/she listens to us carefully.
Factor 17: Existence of Other Quality Improvement Programmes in the Past (1.487%)and/or in Present
14. Our organization had/has Quality Improvement Programmes, such as, Work Councils, .877Suggestion Schemes/Systems, other WPM Programmes, TQM, Quality Assurance/Control,etc. in the past or currently working simultaneously with the QCs.
Factor 18: QCs Members’ Commitment and Support (1.448%)
57. We maintain all the QC-related records (such as, Minutes Book of QC meetings, .632QC-Records Book, etc.) on our own.
Factor 19: Selection of Simple Problems/Projects for QCs (1.361%)
78. The complex nature of QC-selected problems which require inter-departmental, .740inter-work-area assistance has never stopped the functioning of our QC or made usdemotivated to continue the QC activities.
Factor 20: QCs’ Stability Throughout Their Tenure (1.317%)
95. In the past, on one/some/many occasions, our QC had/has been split to form new QCs. .746
Factor 21: Employees’ Attitude and Objectives in Joining QCs (1.237%)
32. I think that the QC is a medium to show my creativity and other intrinsic qualities, .900such as, intelligence, organizational and leadership abilities, decision-making skills, etc.before the management/superiors.
Table 2 The QCs’ Effectiveness Factors (in respect of two PSEs) Based on PCA under FA
ITEMS (COMPONENTS) LOADINGS
Factor 1: Regularity of QCs Meetings and QCs Activities (21.318%)
13. We have a written QC Code of Conduct to follow for all QC activities. .934
Factor 2: Organizational and Top Management Support for QCs Activities (15.872%)
9. Our QC regularly participates in different intra-organizational, local, zonal, national .972and international (if selected) QCs Competitions.10. For and during all such QCs Competitions (of all types), the expenses for participation, .972journey, hospitality, recreational tours, additional D.A.- if any, etc. are fully borne by ourorganization.69. Our QC success stories are regularly publicised in notice boards, in-house journals, .926local media, etc.
Factor 3: Middle Management Commitment and Support (15.049%)
19. We get regular and continuous training and suggestions to improve ourselves in .966QCs activities from our middle management/departmental head/supervisor.
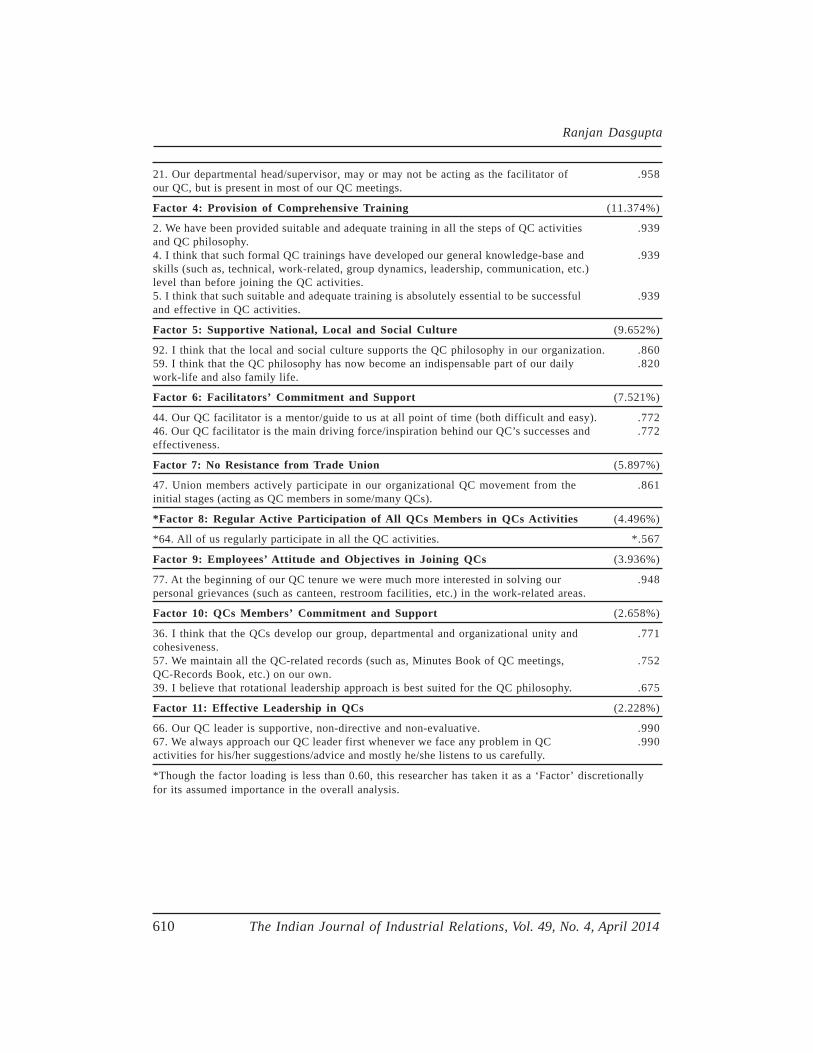
Ranjan Dasgupta
610 The Indian Journal of Industrial Relations, Vol. 49, No. 4, April 2014
21. Our departmental head/supervisor, may or may not be acting as the facilitator of .958our QC, but is present in most of our QC meetings.
Factor 4: Provision of Comprehensive Training (11.374%)
2. We have been provided suitable and adequate training in all the steps of QC activities .939and QC philosophy.4. I think that such formal QC trainings have developed our general knowledge-base and .939skills (such as, technical, work-related, group dynamics, leadership, communication, etc.)level than before joining the QC activities.5. I think that such suitable and adequate training is absolutely essential to be successful .939and effective in QC activities.
Factor 5: Supportive National, Local and Social Culture (9.652%)
92. I think that the local and social culture supports the QC philosophy in our organization. .86059. I think that the QC philosophy has now become an indispensable part of our daily .820work-life and also family life.
Factor 6: Facilitators’ Commitment and Support (7.521%)
44. Our QC facilitator is a mentor/guide to us at all point of time (both difficult and easy). .77246. Our QC facilitator is the main driving force/inspiration behind our QC’s successes and .772effectiveness.
Factor 7: No Resistance from Trade Union (5.897%)
47. Union members actively participate in our organizational QC movement from the .861initial stages (acting as QC members in some/many QCs).
*Factor 8: Regular Active Participation of All QCs Members in QCs Activities (4.496%)
*64. All of us regularly participate in all the QC activities. *.567
Factor 9: Employees’ Attitude and Objectives in Joining QCs (3.936%)
77. At the beginning of our QC tenure we were much more interested in solving our .948personal grievances (such as canteen, restroom facilities, etc.) in the work-related areas.
Factor 10: QCs Members’ Commitment and Support (2.658%)
36. I think that the QCs develop our group, departmental and organizational unity and .771cohesiveness.57. We maintain all the QC-related records (such as, Minutes Book of QC meetings, .752QC-Records Book, etc.) on our own.39. I believe that rotational leadership approach is best suited for the QC philosophy. .675
Factor 11: Effective Leadership in QCs (2.228%)
66. Our QC leader is supportive, non-directive and non-evaluative. .99067. We always approach our QC leader first whenever we face any problem in QC .990activities for his/her suggestions/advice and mostly he/she listens to us carefully.
*Though the factor loading is less than 0.60, this researcher has taken it as a ‘Factor’ discretionallyfor its assumed importance in the overall analysis.
QCs’ Effectiveness Factors
The Indian Journal of Industrial Relations, Vol. 49, No. 4, April 2014 611
With regard to three PSUs, whereemployment is more or less secure, it wasfound that lesser work-pressure, freemind in workplace, independence ofthinking and working, achievement of thebasic needs (as per the different Moti-vation Theories), etc. have promptedgrass-root and middle level workers, aswell as the middle level managers to workwhole-heartedly for the QCs and main-tain the initial enthusiasm and spirit inspite of age of QC [Factor 1 with thehighest variance of 28.15% (Table I)],mainly for the purpose of self and mu-tual development. The PSUs-specificeffectiveness factors, such as, ‘Keepingthe Main Focus on Voluntary Participa-tion Approach’; ‘No Regular Rotation ofQCs Members’; ‘QCs’ Members Psy-chological Development’; ‘Active In-volvement and Commitment from theDepartmental Heads/Supervisors’; ‘Suc-cessful QCs’ Leadership Tenure’; ‘Con-tinuous Technical Support from the De-partmental Heads/Supervisors for QCsactivities’; ‘QCs’ Members Communica-tional Ability and Skills Development’ and‘Free-Flowing and Effective Communi-cation System in QCs’ can be cited asevidence for the above fact.
The sub-factor (representing state-ment no. 89) under Factor 1 with thehighest factor loading of .863 in Table Ipoints towards the fact that QCs havebeen thriving in three PSUs as the mem-bers have been running the whole pro-cess without any type of managementinterference in line with the essence ofthe QC philosophy. The sub-factor (rep-resenting statement no. 93) under Fac-tor 1 with the second highest factor load-
ing of .818 in Table 1 points towards oneof the most critical findings of this re-search (and also a suggestion for otherenterprises to implement it). The QCphilosophy has been integrated into themainstream of organizational policyframework in three PSUs, which makesthe QCs more successful and effectivethan their private counterparts. However,on the basis of observations, it could bepointed out that except DSP, Durgapur,no other sample organization has beenfully successful in this regard till Decem-ber, 2009. The sub-factor (representingstatement no. 59) under Factor 1 with thesixth highest factor loading of .763 inTable I indicates that the QC philosophyhas become an indispensable part of dailywork-life and family life of QCs’ mem-bers. This has made QCs effective inthree PSUs.
The QC philosophy has been inte-grated into the mainstream of or-ganizational policy framework inthree PSUs, which makes the QCsmore successful and effective thantheir private counterparts.
The sub-factors (representing state-ment no. 46 and 44) under Factor 1 withthe third and fifth highest factor loadingsof .806 and .793 respectively in Table Iindicate the importance of the inspira-tional and mentor-role of QCs’ facilita-tors at all times in maintaining the initialenthusiasm and spirit in spite of the ageof QC. Another sub-factor (representingStatement No. 58) under Factor 1 withthe fourth highest factor loading of .801in Table I indicate the strong belief the
Ranjan Dasgupta
612 The Indian Journal of Industrial Relations, Vol. 49, No. 4, April 2014
top and middle management have aboutthe successes and effectiveness of theQCs. This point was clearly observed bythe researcher during his visits to thesample PSUs. The initial failures of manyQCs were ignored and continuous en-couragement was given to QCs for fu-ture improvement. This ultimately causedthe number and stature of the successfuland effective QCs to grow over time.
Another very important factor [Fac-tor 6: Participative Leadership Style ofthe Top Management (Table I)] whichhas been quite unique to PSUs in thisregion was also actually observed in thethree sample PSUs. The sub-factor (rep-resenting statement n. 16) under Factor6 with the highest factor loading of .757in Table I indicates that top managementin the three PSUs has been quite liberalin their leadership style and approachwhich has helped QCs become effectiveand retain stability in the long-term.
Factor 14 (Table I) is labeled asthe ‘Taste of Success with ExistingQCs’ , s ince i t measures the suc-cesses and recognition out of suc-cessful QCs’ efforts which encourageand motivate others to join QCs. Thesub-factor (representing statement no.71) under Factor 14 with the highestfactor loading of .758 in Table I pointsout to the above fact. Some other PSU-specific QCs’ effectiveness factors suchas, ‘Existence of Other Quality Im-provement Programs in the Past and/or in Presen t ’ ; ‘QCs’ S tab i l i tyThroughout Their Tenure’ and ‘Selec-tion of Simple Problems/Projects forQCs’ are pointers to the organizational
and QCs’-specific effectiveness fac-tors for the three sample PSUs.
With regard to the two sample PSEs,along with the common ‘Factors’, someindispensable organization-specific fac-tors were also observed. One such criti-cal factor has been the ‘Supportive Na-tional, Local and Social Culture’ (Factor5, Table 2). The sub-factor (represent-ing statement no. 92) under Factor 5 withthe highest factor loading of .860 in Table2 points to the prevalence of supportivelocal and social culture within this region(i.e., Haldia, as both EXIDE and MCPIare from this region) which has madeQCs effective. Local people have beenvery committed to their work and to anynew intervention or approach. The sub-factor (representing statement no. 59)under Factor 5 with the second highestfactor loading of .820 in Table 2 alsopoints to the commitment and support ofQCs’ members from the two PSEs asthey followed the QC philosophy in theirregular work-life and family life. It wasobvious that they have been getting theactive support of family members in thistask. This is in itself evidence of therightly-named Factor (i.e., Factor 5).
Another very critical factor in the IRscenario of West Bengal and especiallyin Haldia, has been the ‘No Resistancefrom Trade Union’ (Factor 7, Table 2). Thesub-factor (representing statement no. 47)under Factor 7 with the highest factorloading of .861 in Table 2 points to thatthe union members have been activelyparticipating in QCs and in the QC move-ment in the two sample PSEs of this study.It was also found that the QC philosophy
QCs’ Effectiveness Factors
The Indian Journal of Industrial Relations, Vol. 49, No. 4, April 2014 613
had never roused any suspicion or resis-tance from the trade unions of those en-terprises. This helped to make the QCseffective and the movement easy in thosesample PSEs. It was also found that thetop management of these enterprises hadbeen continuously supporting the QCs andtheir members in all regards (Factor 2 with13.703% variance, Table 2) which helpedthem become effective. This allowedQCs’ members to participate regularly inthe QCs’ activities.
QC philosophy had never rousedany suspicion or resistance fromthe trade unions of those enter-prises.
Seven ‘Factors’
• Regularity of QCs Meetings and QCsActivities
• Facilitators’ Commitment and Support
• Provision of Comprehensive Training
• Middle Management Commitmentand Support
• Effective Leadership in QCs
• Employees’ Attitude and Objectivesin Joining QCs
• QCs Members’ Commitment andSupport
These have been found in the sepa-rately extracted ‘Factors’ for the threePSUs and two PSEs respectively(Tables 1&2). So, it can be concludedthat these ‘Factors’ have been the mostindispensable ones for QCs’ effective-
ness in the sample industrial enterprises.It can be seen from Table 3 that most ofthe factors of QCs’ effectiveness modelhave matched (partially or fully) with thatof separately extracted ‘Factors’ for thesample PSUs and PSEs. This itself pointsto the relevance of the model proposedin this study.
The Cronbach Alpha estimate is ap-propriate for the reliability (Henson, 2001).This estimate was found to be .8778 and.6294 for the three sample PSUs and twoPSEs respectively. The standard thumbrule is that the Cronbach Alpha must begreater than .60 to conclude that the scaleis reliable. Thus, in case of total items(statements), the scale has been found tobe reliable in both the cases.
Conclusion
It was found that QCs’ effectivenesswas variable across the sample organiza-tions and QCs. In most of the sample or-ganizations (except DSP and EXIDE), theoverall QC movement shows a decliningmomentum. There is evidence that QCs’effectiveness is conditional on and/or in-fluenced by the overall organizational cul-ture, wider participative structures, man-agement intentions and so on. Also, nei-ther employee loyalty and commitment noremployee satisfaction with QCs has beenuniform even in the same organization.
In two of the sample organizations,i.e., DSP and EXIDE, it was found thatthe members as well as non-members arevery excited and enthusiastic with the QCphilosophy and activities. In some othersample organizations, i.e., NTPC Ltd.,
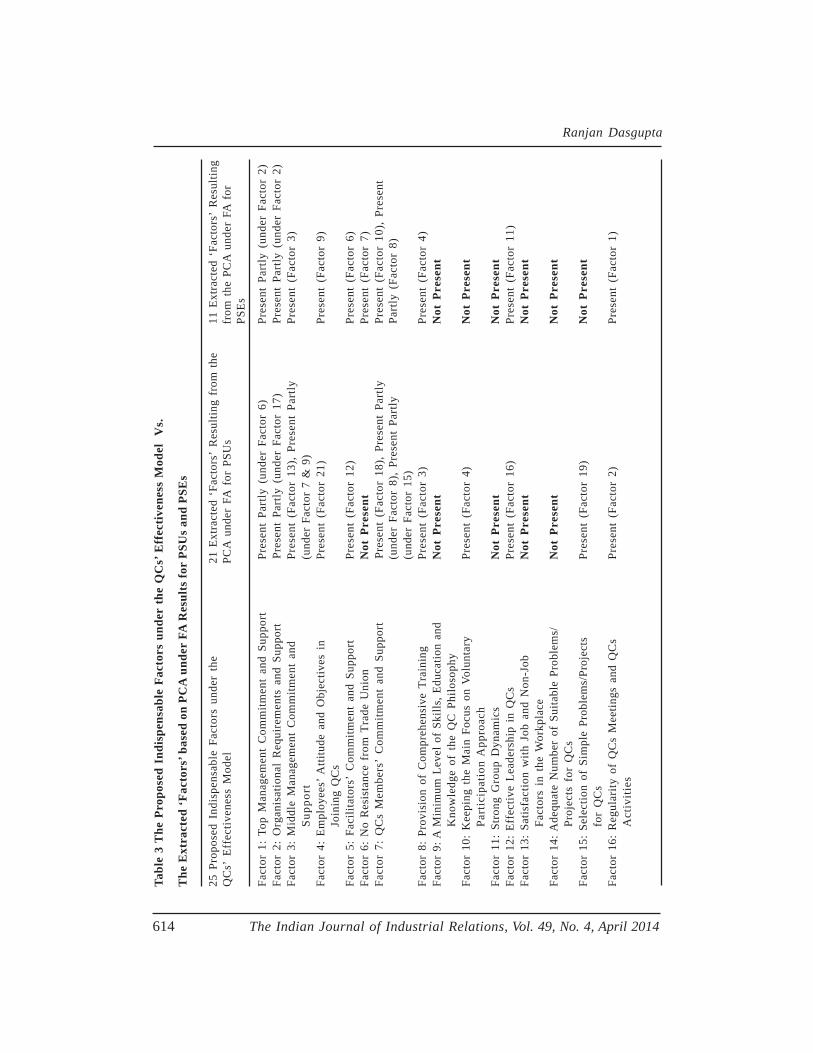
Ranjan Dasgupta
614 The Indian Journal of Industrial Relations, Vol. 49, No. 4, April 2014
Tabl
e 3
The
Pro
pose
d In
disp
ensa
ble
Fact
ors
unde
r th
e Q
Cs’
Eff
ecti
vene
ss M
odel
Vs.
The
Ext
ract
ed ‘F
acto
rs’ b
ased
on
PCA
und
er F
A R
esul
ts fo
r PS
Us
and
PSE
s
25 P
ropo
sed
Indi
spen
sabl
e Fa
ctor
s un
der
the
21 E
xtra
cted
‘Fa
ctor
s’ R
esul
ting
from
the
11 E
xtra
cted
‘Fa
ctor
s’ R
esul
ting
QC
s’ E
ffec
tiven
ess
Mod
elPC
A u
nder
FA
for
PSU
sfr
om t
he P
CA
und
er F
A f
orPS
Es
Fact
or 1
: To
p M
anag
emen
t C
omm
itmen
t an
d Su
ppor
tPr
esen
t Pa
rtly
(un
der
Fact
or 6
)Pr
esen
t Pa
rtly
(un
der
Fact
or 2
)Fa
ctor
2:
Org
anis
atio
nal
Req
uire
men
ts a
nd S
uppo
rtPr
esen
t Pa
rtly
(un
der
Fact
or 1
7)Pr
esen
t Pa
rtly
(un
der
Fact
or 2
)Fa
ctor
3:
Mid
dle
Man
agem
ent
Com
mitm
ent
and
Pres
ent
(Fac
tor
13),
Pres
ent
Part
lyPr
esen
t (F
acto
r 3)
Supp
ort
(und
er F
acto
r 7
& 9
)Fa
ctor
4:
Empl
oyee
s’ A
ttitu
de a
nd O
bjec
tives
in
Pres
ent
(Fac
tor
21)
Pres
ent
(Fac
tor
9)Jo
inin
g Q
Cs
Fact
or 5
: Fa
cilit
ator
s’ C
omm
itmen
t an
d Su
ppor
tPr
esen
t (F
acto
r 12
)Pr
esen
t (F
acto
r 6)
Fact
or 6
: N
o R
esis
tanc
e fr
om T
rade
Uni
onN
ot P
rese
ntPr
esen
t (F
acto
r 7)
Fact
or 7
: Q
Cs
Mem
bers
’ C
omm
itmen
t an
d Su
ppor
tPr
esen
t (F
acto
r 18
), Pr
esen
t Pa
rtly
Pres
ent
(Fac
tor
10),
Pres
ent
(und
er F
acto
r 8)
, Pr
esen
t Pa
rtly
Part
ly (
Fact
or 8
)(u
nder
Fac
tor
15)
Fact
or 8
: Pr
ovis
ion
of C
ompr
ehen
sive
Tra
inin
gPr
esen
t (F
acto
r 3)
Pres
ent
(Fac
tor
4)Fa
ctor
9: A
Min
imum
Lev
el o
f Sk
ills,
Edu
catio
n an
dN
ot P
rese
ntN
ot P
rese
ntK
now
ledg
e of
the
QC
Phi
loso
phy
Fact
or 1
0: K
eepi
ng t
he M
ain
Focu
s on
Vol
unta
ryPr
esen
t (F
acto
r 4)
Not
Pre
sent
Part
icip
atio
n A
ppro
ach
Fact
or 1
1: S
tron
g G
roup
Dyn
amic
sN
ot P
rese
ntN
ot P
rese
ntFa
ctor
12:
Eff
ectiv
e Le
ader
ship
in
QC
sPr
esen
t (F
acto
r 16
)Pr
esen
t (F
acto
r 11
)Fa
ctor
13:
Sat
isfa
ctio
n w
ith J
ob a
nd N
on-J
obN
ot P
rese
ntN
ot P
rese
ntFa
ctor
s in
the
Wor
kpla
ceFa
ctor
14:
Ade
quat
e N
umbe
r of
Sui
tabl
e Pr
oble
ms/
Not
Pre
sent
Not
Pre
sent
Proj
ects
for
QC
sFa
ctor
15:
Sel
ectio
n of
Sim
ple
Prob
lem
s/Pr
ojec
tsPr
esen
t (F
acto
r 19
)N
ot P
rese
ntfo
r Q
Cs
Fact
or 1
6: R
egul
arity
of
QC
s M
eetin
gs a
nd Q
Cs
Pres
ent
(Fac
tor
2)Pr
esen
t (F
acto
r 1)
Act
iviti
es
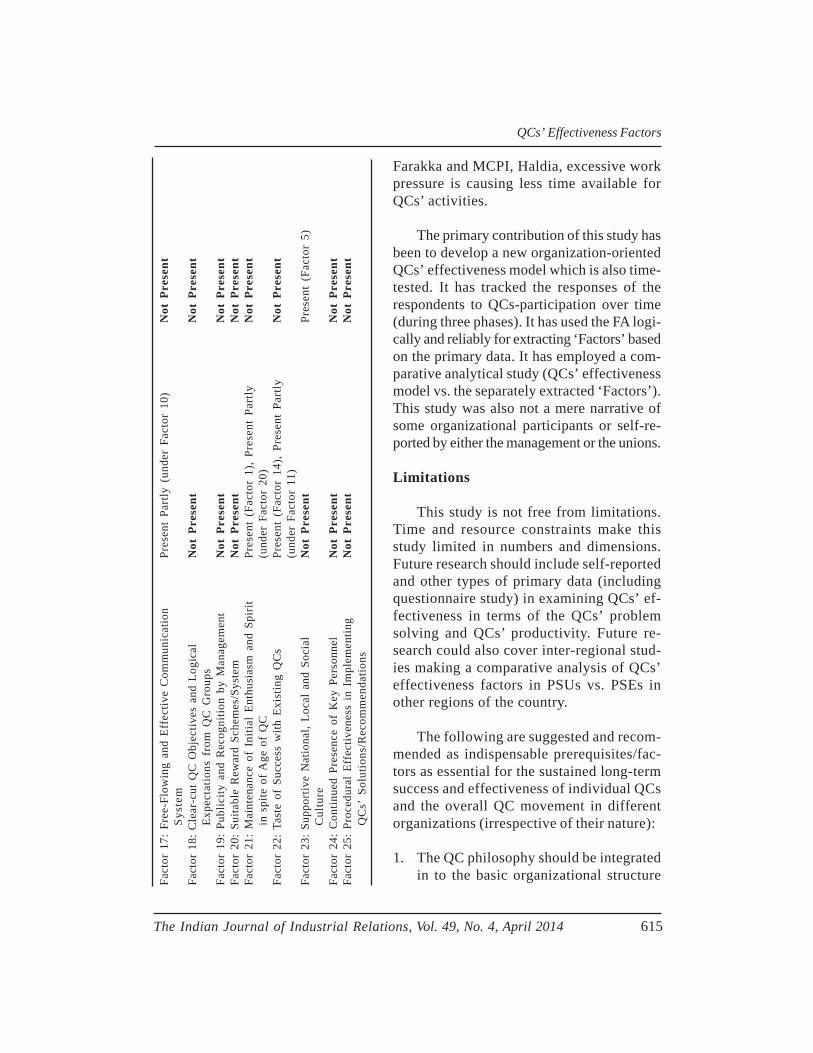
QCs’ Effectiveness Factors
The Indian Journal of Industrial Relations, Vol. 49, No. 4, April 2014 615
Fact
or 1
7: F
ree-
Flow
ing
and
Effe
ctiv
e C
omm
unic
atio
nPr
esen
t Pa
rtly
(un
der
Fact
or 1
0)N
ot P
rese
ntSy
stem
Fact
or 1
8: C
lear
-cut
QC
Obj
ectiv
es a
nd L
ogic
alN
ot P
rese
ntN
ot P
rese
ntEx
pect
atio
ns f
rom
QC
Gro
ups
Fact
or 1
9: P
ublic
ity a
nd R
ecog
nitio
n by
Man
agem
ent
Not
Pre
sent
Not
Pre
sent
Fact
or 2
0: S
uita
ble
Rew
ard
Sche
mes
/Sys
tem
Not
Pre
sent
Not
Pre
sent
Fact
or 2
1: M
aint
enan
ce o
f In
itial
Ent
husi
asm
and
Spi
rit
Pres
ent
(Fac
tor
1),
Pres
ent
Part
lyN
ot P
rese
ntin
spi
te o
f Age
of
QC
(und
er F
acto
r 20
)Fa
ctor
22:
Tas
te o
f Su
cces
s w
ith E
xist
ing
QC
sPr
esen
t (F
acto
r 14
), Pr
esen
t Pa
rtly
Not
Pre
sent
(und
er F
acto
r 11
)Fa
ctor
23:
Sup
port
ive
Nat
iona
l, Lo
cal
and
Soci
alN
ot P
rese
ntPr
esen
t (F
acto
r 5)
Cul
ture
Fact
or 2
4: C
ontin
ued
Pres
ence
of
Key
Per
sonn
elN
ot P
rese
ntN
ot P
rese
ntFa
ctor
25:
Pro
cedu
ral
Effe
ctiv
enes
s in
Im
plem
entin
gN
ot P
rese
ntN
ot P
rese
ntQ
Cs’
Sol
utio
ns/R
ecom
men
datio
ns
Farakka and MCPI, Haldia, excessive workpressure is causing less time available forQCs’ activities.
The primary contribution of this study hasbeen to develop a new organization-orientedQCs’ effectiveness model which is also time-tested. It has tracked the responses of therespondents to QCs-participation over time(during three phases). It has used the FA logi-cally and reliably for extracting ‘Factors’ basedon the primary data. It has employed a com-parative analytical study (QCs’ effectivenessmodel vs. the separately extracted ‘Factors’).This study was also not a mere narrative ofsome organizational participants or self-re-ported by either the management or the unions.
Limitations
This study is not free from limitations.Time and resource constraints make thisstudy limited in numbers and dimensions.Future research should include self-reportedand other types of primary data (includingquestionnaire study) in examining QCs’ ef-fectiveness in terms of the QCs’ problemsolving and QCs’ productivity. Future re-search could also cover inter-regional stud-ies making a comparative analysis of QCs’effectiveness factors in PSUs vs. PSEs inother regions of the country.
The following are suggested and recom-mended as indispensable prerequisites/fac-tors as essential for the sustained long-termsuccess and effectiveness of individual QCsand the overall QC movement in differentorganizations (irrespective of their nature):
1. The QC philosophy should be integratedin to the basic organizational structure
Ranjan Dasgupta
616 The Indian Journal of Industrial Relations, Vol. 49, No. 4, April 2014
and policy framework. Also, the or-ganizations need to capture and fol-low the true spirit of the QC philoso-phy in all regards.
2. The commitment and positive atti-tudes of the immediate boss, actingas facilitator, and the whole-heartedness and drive of the respec-tive QCs’ members are most crucialin making the QCs effective.
3. Prior to the introduction of the QCs,comprehensive training schedulesshould include awareness sessions,skills-development sessions and prac-tical sessions.
4. A separate QC Cell should be devel-oped (possibly under the aegis of theTQM/Quality Control/any other De-partment, as in DSP, Durgapur) to lookafter QC efforts in the organization.
5. QCs’ success and effectivenessshould not be judged only from per-formance in different QCs competi-tions, but, rather from the importanceof the solutions/recommendations forproblems in their respective work-areas. More and more emphasisshould be put on regular visits bymanagement (top and middle) toQCs’ work-areas to verify theprogress of QCs activities and ob-tain necessary feedback from QCsmembers.
6. Lucrative monetary reward schemes/systems based on a percentage of thetotal money saved (post-audit) shouldbe offered to QCs members to moti-vate them further, though, this vio-lates the basic QC philosophy. This
would be much more logical, scien-tific and attractive than the existingone-time ‘Cash Award’ schemes asgenerally prevalent in the samplePSUs and PSEs.
7. The top and especially middle man-agement should be responsible andaccountable for the all-round ar-rangements necessary for QCs’ ef-fectiveness and should show keeninterest and drive to make the QCmovement successful and effectivein the respective organizations.
8. The leadership provided to individualQCs and to organizational QC move-ment is also very critical for and in-fluential in maintaining the initial en-thusiasm and regularity of QCs’meetings and activities for achievingQCs’ effectiveness.
9. All organizations practicing and want-ing to introduce/launch the QC phi-losophy should be focused on improv-ing the QWL and social and family lifeof the QCs members as a priority.
In conclusion, when properly imple-mented in the right industrial culture, QCscould help create a competitive drivequite beyond the experience of anyonewho has not seen them in operation.However, when badly managed, QCsresult in failure, disappointment and cyni-cism and distrust of the concept of QC(Hutchins, 1985) and could become amanagement fad (O’Donnell &O’Donnell, 1984).
References
Dale, B.G. (1984). “Quality Circles in UK Manu-facturing Industry- A State of the Art Sur-
QCs’ Effectiveness Factors
The Indian Journal of Industrial Relations, Vol. 49, No. 4, April 2014 617
vey”, Occasional Paper No. 8402, Univer-sity of Manchester Institute of Science andTechnology (UMIST)
Dale, B.G. & Lees, J. (1985), “Factors WhichInfluence the Success of Quality Circle Pro-grams in the United Kingdom”, Interna-tional Journal of Operations and Produc-tion Management (UK), 5(4): 43-54.
Dwivedi, R.S. (1987), “Quality Control (QC)Circles in an Engineering Enterprise”,Abhigyan, Spring: 53-70.
Dwivedi, R.S. (1987a), “Quality Circles For Effec-tive Performance- A Pioneer Public SectorExperiment”, Prabandh, Jan.-Mar.: 10-28.
Dwivedi, R.S. (1987b), “Effectiveness of Qual-ity Circle and Its Determinants in a LargeIndustrial Organization in India”, IndianJournal of Industrial Relations, 22: 355-68
Guilford, J.P. (1952), “When Not to Factor Ana-lyze”, Psychological Bulletin, 49: 26-37.
Henson, R. K. (2001), “Understanding InternalConsistency Reliability Estimates: A Con-ceptual Primer On Coefficient Alpha”,Measurement and Evaluation in Counsel-ing and Development, 34: 177-89.
Hutchins, D. (1985), Quality Circles Handbook,Pitman, London.
Ingle, S. June, (1982), “How To Avoid QualityCircle Failure in Your Company”, Training& Development Journal, 36(6): 54-59.
Jha, V. (1997), “Quality Circle Implementationin Indian Organization: An AlternativeViewpoint”, Decision, 24 (1-4): 79-92.
Khan, S. (1986), “Quality Circles in India: a Re-view and Assessment of the ParticipativeManagement in Indian Industry”, QualityCircles Journal, 9(3): 51-55.
Lawler, E.E. & Mohrman, S.A. (1985), “QualityCircles After the Fad”, Harvard BusinessReview, 63 (1);65-71.
Mathew, M., (1985), “Quality Circles- Key ToOrganisation Development”, The EconomicTimes. May 23
Mento, A.J., (1982), “Some Motivational Rea-sons Why Quality Circles Work in Organi-zations”, Transactions of the 4th AnnualConference of the International Associationof Quality Circles (IAQC): 75-88.
O’Donnell, M. & O’Donnell, R.J. (1984), “Qual-ity Circles- The Latest Fad Or A Real Win-ner”, Business Horizons, May-June : 48-52.
Park, S.J. (1991), “Estimating Success Rates ofQuality Circle Programs: Public and Pri-vate Experiences”, Public AdministrationQuarterly, Spring :133-46.
Sen, R. (2010), Industrial Relations: Text AndCases, MacMillan, New Delhi.
Sillince, J.A.A., Sykes, G.M.H. & Singh, D.P.,(1996), “Implementation, Problems, Suc-cess and Longevity of Quality Circle Pro-grams- A Study of 95 UK Organizations”,International Journal of Operations & Pro-ductions Management, 16( 4),: 88-111.
Sodhi, J.S., Joshi, R., Chellappa, H.V.V.,Maslamani, S., Kalia, S.A. & Sandhu, H.,(1995), In Search of Participation, Sri RamCentre for Industrial Relations, New Delhi.
Srinivasan, A.V. (1991), “Quality Circle Move-ment In India: A Status Report”, ASCI Jour-nal of Management, 21(1),: 56-75.
Udpa, S.R. (1985), “Quality Circles for DiverseTypes Of Organizations”, The Hindu, Sep-tember 18
Udpa, S.R. (1986), Quality Circles- Progressthrough Participation, Tata McGraw Hill,New Delhi.
Vijaya Banu, C. (2007), “The Effectiveness of Qual-ity Circles at Bharat Heavy Electricals Lim-ited, Tiruchirapalli: A Study”, Icfaian Jour-nal of Management Research, 6(3):31-43.
White, D.D. & Bednar, D.A. (1983), “QualityCircles Procedures & Problems: A Surveyof U.S. Firms”, Proceedings of the AnnualConvention of the Southern ManagementAssociation : 282-84
Sex & Rank Differences in Indian Police: An EmpiricalAnalysis
Bushara Bano & Parvaiz Talib
Law enforcement occupationshave traditionally been domi-nated by males. With more andmore females entering theworkforce across the world andemphasis being placed on equalopportunity hiring, there hasbeen a vast increase in the num-ber of women police personnelworldwide. Obviously, the fe-males will be no less susceptibleto the everyday occupationalstresses than their male counter-parts. The organizational cultureof police department imposes dif-ferent treatment with officers ofdifferent ranks. In order to as-sess the proneness of role stressamong police personnel as pertheir sex and rank, this study wascarried out on a sample of po-lice population. The study indi-cated that stress and sex wereassociated.
Introduction
Fairly large literature on police stresshad been produced since the mid-1970s.These studies focus on issues like inten-sity, prevalence, sources, and conse-quences of stress (Aaron, 2000; He et al.,2005; Lee, 2002). Some studies had con-centrated on the stress of dealing with dan-gerous and violent situations or on factorsexternal to the police department (Morashet al., 2008). But, it is also increasinglyclear that work place problems includingnegative relationships with co-workers andsuperiors, opportunities to determine one’sjob activities and for promotion have alsobeen related to stress in some settings(Brown et al., 1996; Crank et al., 1995;Hurrell, 1995; Kirkcaldy et al., 1995).Coman & Evans (1991) observed thatbecause of the pervasiveness of thesefactors in police organizations, organiza-tional sources of stress are particularly im-portant to them. Brooks and Piquero(1998) also noted that problems in the po-lice organization are more predictive ofstress than are other types of possiblestressors. Finally, Zhao et al. (2000) notedthat police officers’ perceptions of theirwork environment had a significant impacton multiple measures of stress.
Bushara Bano is Assistant Professor, Dept ofBusiness Administration, Anand EngineeringCollege, Agra. E-mail: [email protected] Talib is Professor, Dept of BusinessAdministration, Aligarh Muslim University, Aligarh(email: [email protected])
618 The Indian Journal of Industrial Relations, Vol. 49, No. 4, April 2014
Police work generates its own uniquestresses. Symonds (1970) proposed twogeneral areas of job strain in police-vo-cation i.e. pressure resulting from theunique responsibilities of law enforce-ment and tension arising from the orga-nizational aspects of policing. Stressorswhich had been considered inherent topolice work include physically or psycho-logically threatening events, such as in-progress felony calls, physical attacks,high speed chases, and the death or in-jury of another police officer (Violanti &Aron, 1993). Organizational stressors inpolice work had been related to policies,procedures, shift work, poor or no equip-ment and inadequate support mechanismsfrom superiors (Kroes et al., 1974;Violanti & Aron, 1994). Spielberger et al.(1981) suggested negative encounterswith the public, courts and media as or-ganizational pressures and psychologicalthreats (Ursitti, 2011).
In comparison to other occupations,police work has been identified as oneof society’s most stressful occupations(Alexander, 1999; Anshel, 2000). Theexposure to these stressful conditionscould lead to ill health of police officers.It is important to have a productive andhealthy police service that serves as animportant contributor to the stability andeconomic growth of a country. Thus, itis necessary to investigate possible fac-tors that contribute to work-related wellbeing of the police officers (Mostert &Rothmann, 2006).
Research reported that racism andsexism remained deeply embedded inpolice culture (Martin, 2004; Walker,
1985). For both minority and female of-ficers, the road leading to their full ac-ceptance in police force seemed long anduncertain (Martin, 1991; Steel & Lovrich,1987; Warner, Steel & Lo rich, 1989;Zhao & Lovrich, 1998). The police pro-fession, not unlike other traditional malesex-typed occupations (Haarr & Morash,1999), presented a rather challenging oreven outright hostile work environmentfor women and minority officers. In spiteof the plethora of literature on the rela-tionship between various demographicfactors and job-related stress, there wasa paucity of empirical evidence pertain-ing to the interactive effects of rank andgender on the police stress in India. Thispaper aims to assess this relationship to-wards a sustainable and secure society.
Literature Review
Vander & de Heus (1993) examinedthe difference between male and femaleDutch managers in respect of workstress, social support and strains. Theyreported that although both work and lifesupport were negatively correlated withwork stress, only weak support wasstrongly correlated to each measure ofstrain.
Spielberger & Reheiser (1994) mea-sured perceived psychological severityand anxiety of 30 job stressor events,using men and women as subjects work-
Research reported that racism andsexism remained deeply embed-ded in police culture.
Sex & Rank Differences in Indian Police
The Indian Journal of Industrial Relations, Vol. 49, No. 4, April 2014 619
Bushara Bano & Parvaiz Talib
620 The Indian Journal of Industrial Relations, Vol. 49, No. 4, April 2014
ing in the university and corporate set-tings. The study revealed that overallstress level was similar for men andwomen. However, significant differenceswere reported in perceived severity andfrequency of occurrence of individualstressor events as per gender.
Deb et al. (2006) carried out a studyon 60 Traffic police officers and 68 con-stables from Kolkata police to identifystress among them. The analysis re-vealed that traffic constables were ex-periencing more stress than traffic po-lice officers. Police officers were re-ported stress due to role overload, re-sponsibility for persons, unprofitabilityand strenuous working conditions whileconstables were stressed due to underparticipation, powerlessness, responsi-bility for person and role overload.Kumar (2006) investigated the stressprofiles of police personnel posted in thepolice stations in Hyderabad. The ma-jor stressors affecting the life of policepersonnel were insufficient time forfamily, work overload, accommodationproblem, lack of confidence of superi-ors, no time for intellectual develop-ment, recreation, to keep everyone sat-isfied, risky situations, problem of jobcoordination, lack of clarity in expec-tat ion and coping with superiors .Bhattacharya & Basu (2007) examinedthe relationship of gender and age onthe Distress, Wellness and Organiza-tional Role Stress among professionals.Results of the study reported thatwomen were experiencing greaterwellness and older personnel were ex-periencing more distress. Cardoso &Fernandes (2011) carried out a study on
147 doctors of Goa Medical College toassess the impact of marital status, man-agement level and social support on or-ganizational role stress. The results indi-cated that stress had no relationship withmarital status. However role stress hada negative correlation with level ofmanagement as well as social support.Chaturvedi (2011) investigated the dif-ference in role stress among teachers(both male and female) working in pri-vate and government institutes. The to-tal sample of the study was 180. It wasreported that women employees weremore stressed than their male counter-parts. Age was observed to have a sig-nificant impact on stress level. Bano(2011) undertook a study on 65 policepersonnel of Aligarh to identify majorstressors among them. Findings reportedthat political pressure, lack of time forfamily, negative public image and lowsalary were the primary causes of stressamong police personnel. It also emergedthat stress was significantly more pro-nounced among those police personnelwho were younger, more educated,posted in rural areas and had less workexperience.
Women employees were morestressed than their male counter-parts.
The review of related studies on po-lice stress revealed that women andlower rank police personnel are experi-encing higher political pressure, lack oftime for family, negative public image,inadequate salary, work overload, death/injury of fellow officer on duty, negative
Sex & Rank Differences in Indian Police
The Indian Journal of Industrial Relations, Vol. 49, No. 4, April 2014 621
relationship at workplace, lack of promo-tions, time/job pressure etc than male andhigher rank police officers.
Objectives of the Study
• Investigate the nature and dynamicsof the role stress among police per-sonnel
• Explore the difference, if any, in thequantum and type of stress amongPolice Personnel across sex and rank
• Assess the association between sexand role stress among police person-nel
• Assess the association between rankand role stress among police person-nel
Hypotheses
• Ho1: There is no difference in thenature and intensity of stress (mea-sured through ORS and its ten con-stituent stressors) among police per-sonnel.
• Ho2: There is no difference in quan-tum and type of stress among policepersonnel as per their sex.
• Ho3: There is no association of sexand role stress among police person-nel.
• Ho4: There is no difference in quan-tum and type of stress among policepersonnel as per their rank.
• Ho5: There is no association of rankand role stress among police person-nel.
Research Methodology
The descriptive research design isused in this study. Sample size of thepresent study is 500 police personnel. Thesample for the study was selected fromthe civil and armed police of seven dis-tricts of Uttar Pradesh, namely, Aligarh,Agra, Kannauj, Farrukhabad, Hardoi,Auraiya and Jhansi. Quota and conve-nience sampling were employed for col-lecting the data from police personnel.The stress among personnel was mea-sured through Organizational Role StressScale (ORS). It has ten constituent stres-sors- namely Inter Role Distance (IRD),Role Stagnation (RS), Role ExpectationConflict (REC), Role Erosion (RE), RoleOverload (RO), Role Isolation (RI), Per-sonal Inadequacy (PI), Self Role Dis-tance (SRD), Role Ambiguity (RA) andResource Inadequacy (RIn). The ques-tionnaire was translated into Hindi, theofficial language of Uttar Pradesh police.In order to make suitable for the presentstudy, the scale was refined through itemanalysis (reliability analysis) and factoranalysis (exploratory and confirmatory).
Table 1 summarizes the respondents’characteristics of the sample. The par-ticipants in this study consisted of 439males (87.8%) and 61 females (12.2%).The significant difference between thenumber of male and female participantsis due to very less number of womenpolice in the state police force of thecountry. The BPR&D data (as on01.01.2012) reports that the actualstrength of women police in the countryis 84,479 out of 15.85 lakhs (1.585 mil-lion) of total actual strength of the po-
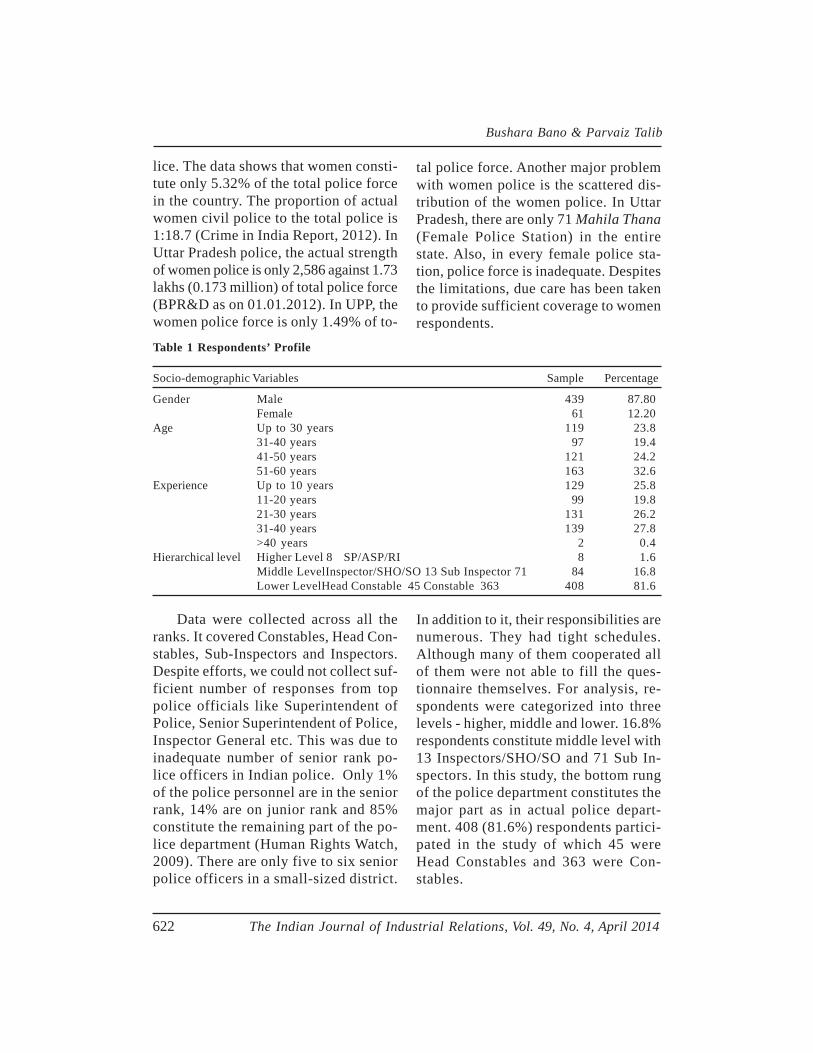
Bushara Bano & Parvaiz Talib
622 The Indian Journal of Industrial Relations, Vol. 49, No. 4, April 2014
lice. The data shows that women consti-tute only 5.32% of the total police forcein the country. The proportion of actualwomen civil police to the total police is1:18.7 (Crime in India Report, 2012). InUttar Pradesh police, the actual strengthof women police is only 2,586 against 1.73lakhs (0.173 million) of total police force(BPR&D as on 01.01.2012). In UPP, thewomen police force is only 1.49% of to-
tal police force. Another major problemwith women police is the scattered dis-tribution of the women police. In UttarPradesh, there are only 71 Mahila Thana(Female Police Station) in the entirestate. Also, in every female police sta-tion, police force is inadequate. Despitesthe limitations, due care has been takento provide sufficient coverage to womenrespondents.
Table 1 Respondents’ Profile
Socio-demographic Variables Sample Percentage
Gender Male 439 87.80Female 61 12.20
Age Up to 30 years 119 23.831-40 years 97 19.441-50 years 121 24.251-60 years 163 32.6
Experience Up to 10 years 129 25.811-20 years 99 19.821-30 years 131 26.231-40 years 139 27.8>40 years 2 0.4
Hierarchical level Higher Level 8 SP/ASP/RI 8 1.6Middle LevelInspector/SHO/SO 13 Sub Inspector 71 84 16.8Lower LevelHead Constable 45 Constable 363 408 81.6
Data were collected across all theranks. It covered Constables, Head Con-stables, Sub-Inspectors and Inspectors.Despite efforts, we could not collect suf-ficient number of responses from toppolice officials like Superintendent ofPolice, Senior Superintendent of Police,Inspector General etc. This was due toinadequate number of senior rank po-lice officers in Indian police. Only 1%of the police personnel are in the seniorrank, 14% are on junior rank and 85%constitute the remaining part of the po-lice department (Human Rights Watch,2009). There are only five to six seniorpolice officers in a small-sized district.
In addition to it, their responsibilities arenumerous. They had tight schedules.Although many of them cooperated allof them were not able to fill the ques-tionnaire themselves. For analysis, re-spondents were categorized into threelevels - higher, middle and lower. 16.8%respondents constitute middle level with13 Inspectors/SHO/SO and 71 Sub In-spectors. In this study, the bottom rungof the police department constitutes themajor part as in actual police depart-ment. 408 (81.6%) respondents partici-pated in the study of which 45 wereHead Constables and 363 were Con-stables.
Sex & Rank Differences in Indian Police
The Indian Journal of Industrial Relations, Vol. 49, No. 4, April 2014 623
Results & Discussion
The data analysis has been carriedout through various statistical techniquessuch as Independent sample t-test,ANOVA test and chi-square test. Thestudy establishes that police personnelare experiencing organizational role stress(Table 2). The mean score for total ORSis 2.11 while the absolute value of ORSis 105.65. This score is fairly high.Around half of the respondents are ex-periencing high medium stress. The levelof stress on seven stressors namely In-ter Role Distance, Role Stagnation, RoleErosion, Role Overload, Role Isolation,Self Role Distance and Resource Inad-equacy is well above the theoretical av-erage of two.
The study establishes that policepersonnel are experiencing orga-nizational role stress.
As far as individual stressors areconcerned, Inter Role Distance (IRD)emerged as the most potent stressor witha mean score of 2.711 (fig. 1). The stan-dard deviation on this account is 0.96.This shows that police personnel are ex-periencing high Inter Role Distance(IRD). Police personnel are often livingaway from their families. Grant of leaveon time is a major cause of concern forthem. Those who are living with theirfamily were found not spending enoughtime with the family due to the nature ofjob. Policing is a 24 hours job. Therefore,demands of the family are often incom-patible with the demands of job. As aresult, families of police personnel usu-
ally get neglected. This conflict betweenthe family’s needs and demands of thejob is a potent cause of stress amongpolice personnel. These results are in linewith the findings of previous studies doneon work-family conflict such as Burke(1988), Burke & Greenglass (1987),Jackson & Maslach (1982), Stephens &Sommer (1995). These studies also re-ported that work-family conflict is themajor reason of stress and burnoutamong police personnel.
Work-family conflict is the majorreason of stress and burnoutamong police personnel.
The second most potent stressor forpolice is Resource Inadequacy (RIn) witha mean value of 2.332. The police per-sonnel experience non-availability of theresources required for performing therole effectively. These resources may bein terms of finance, information, people,material, infrastructure, accommodationand other facilities. They do not havesufficient sources of information. Thetechnology is often outdated.Researcher’s visit to the rural areasbrought out lack of facilities in rural po-lice stations specially. Recently, a news-paper reported that Uttar Pradesh has anoverwhelming vacancy of 60% in its po-lice force against the country average of25% even as it recorded the highest num-ber of crime cases in any state in India(Hindustan Times, 22.04.2012). This re-veals the need for additional police forceat every police station in India. Police iscalled upon to maintain the law and or-der situation on very wide areas with very
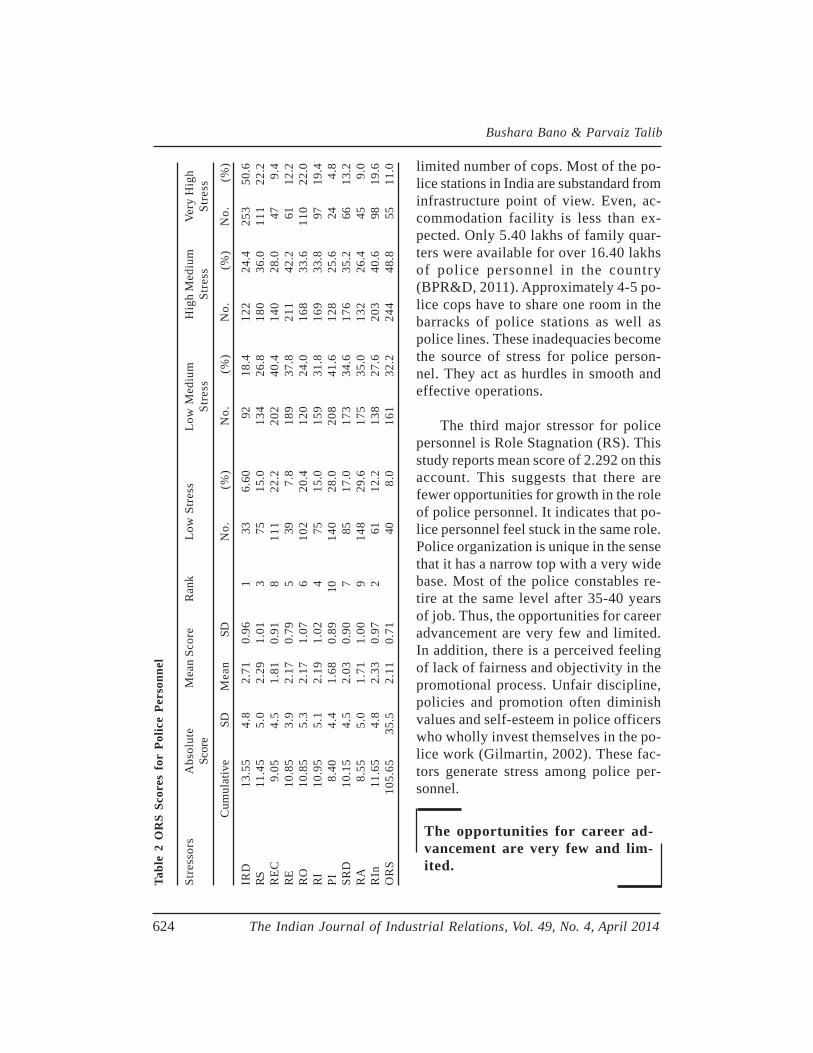
Bushara Bano & Parvaiz Talib
624 The Indian Journal of Industrial Relations, Vol. 49, No. 4, April 2014
Tabl
e 2
OR
S Sc
ores
for
Pol
ice
Pers
onne
l
Stre
ssor
sA
bsol
ute
Mea
n Sc
ore
Ran
kLo
w S
tres
sLo
w M
ediu
mH
igh
Med
ium
Very
Hig
hSc
ore
Stre
ssSt
ress
Stre
ss
Cum
ulat
ive
SDM
ean
SDN
o.(%
)N
o.(%
)N
o.(%
)N
o.(%
)
IRD
13.5
54.
82.
710.
961
336.
6092
18.4
122
24.4
253
50.6
RS11
.45
5.0
2.29
1.01
375
15.0
134
26.8
180
36.0
111
22.2
REC
9.05
4.5
1.81
0.91
811
122
.220
240
.414
028
.047
9.4
RE10
.85
3.9
2.17
0.79
539
7.8
189
37.8
211
42.2
6112
.2R
O10
.85
5.3
2.17
1.07
610
220
.412
024
.016
833
.611
022
.0R
I10
.95
5.1
2.19
1.02
475
15.0
159
31.8
169
33.8
9719
.4PI
8.40
4.4
1.68
0.89
1014
028
.020
841
.612
825
.624
4.8
SRD
10.1
54.
52.
030.
907
8517
.017
334
.617
635
.266
13.2
RA
8.55
5.0
1.71
1.00
914
829
.617
535
.013
226
.445
9.0
RIn
11.6
54.
82.
330.
972
6112
.213
827
.620
340
.698
19.6
OR
S10
5.65
35.5
2.11
0.71
408.
016
132
.224
448
.855
11.0 limited number of cops. Most of the po-
lice stations in India are substandard frominfrastructure point of view. Even, ac-commodation facility is less than ex-pected. Only 5.40 lakhs of family quar-ters were available for over 16.40 lakhsof police personnel in the country(BPR&D, 2011). Approximately 4-5 po-lice cops have to share one room in thebarracks of police stations as well aspolice lines. These inadequacies becomethe source of stress for police person-nel. They act as hurdles in smooth andeffective operations.
The third major stressor for policepersonnel is Role Stagnation (RS). Thisstudy reports mean score of 2.292 on thisaccount. This suggests that there arefewer opportunities for growth in the roleof police personnel. It indicates that po-lice personnel feel stuck in the same role.Police organization is unique in the sensethat it has a narrow top with a very widebase. Most of the police constables re-tire at the same level after 35-40 yearsof job. Thus, the opportunities for careeradvancement are very few and limited.In addition, there is a perceived feelingof lack of fairness and objectivity in thepromotional process. Unfair discipline,policies and promotion often diminishvalues and self-esteem in police officerswho wholly invest themselves in the po-lice work (Gilmartin, 2002). These fac-tors generate stress among police per-sonnel.
The opportunities for career ad-vancement are very few and lim-ited.
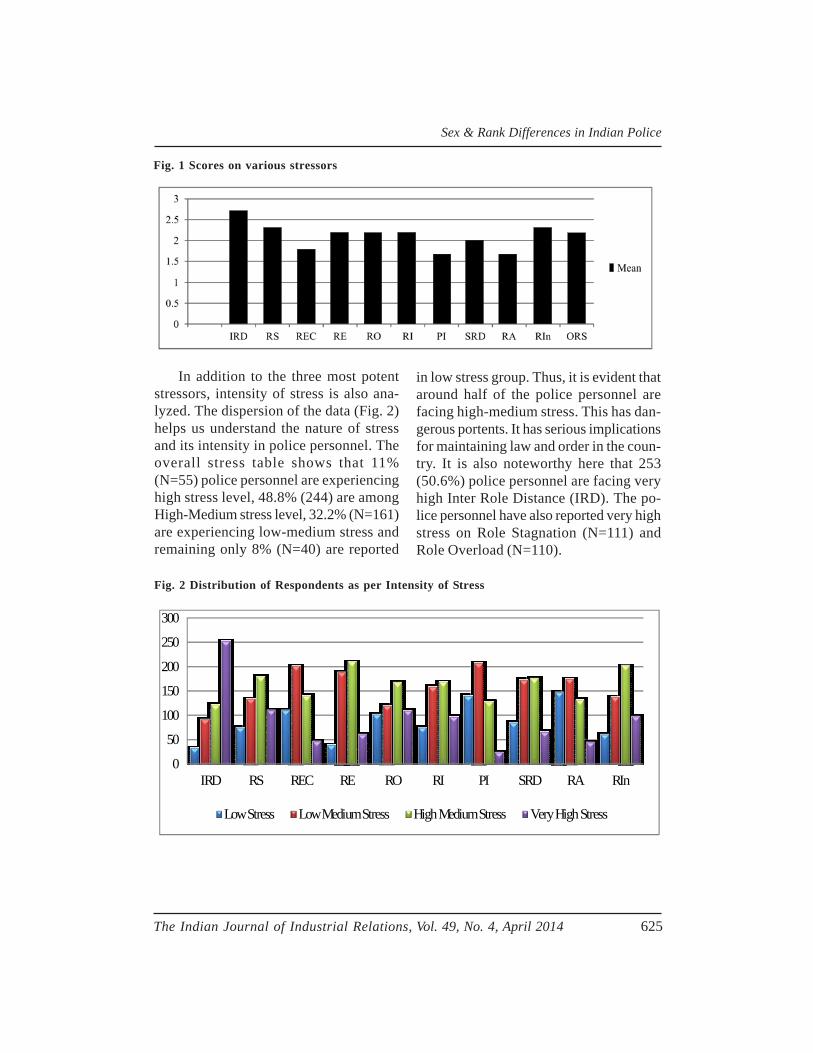
Sex & Rank Differences in Indian Police
The Indian Journal of Industrial Relations, Vol. 49, No. 4, April 2014 625
In addition to the three most potentstressors, intensity of stress is also ana-lyzed. The dispersion of the data (Fig. 2)helps us understand the nature of stressand its intensity in police personnel. Theoverall stress table shows that 11%(N=55) police personnel are experiencinghigh stress level, 48.8% (244) are amongHigh-Medium stress level, 32.2% (N=161)are experiencing low-medium stress andremaining only 8% (N=40) are reported
in low stress group. Thus, it is evident thataround half of the police personnel arefacing high-medium stress. This has dan-gerous portents. It has serious implicationsfor maintaining law and order in the coun-try. It is also noteworthy here that 253(50.6%) police personnel are facing veryhigh Inter Role Distance (IRD). The po-lice personnel have also reported very highstress on Role Stagnation (N=111) andRole Overload (N=110).
Fig. 1 Scores on various stressors
Fig. 2 Distribution of Respondents as per Intensity of Stress
0
50
100
150
200
250
300
IRD RS REC RE RO RI PI SRD RA RIn
Low Stress Low Medium Stress High Medium Stress Very High Stress
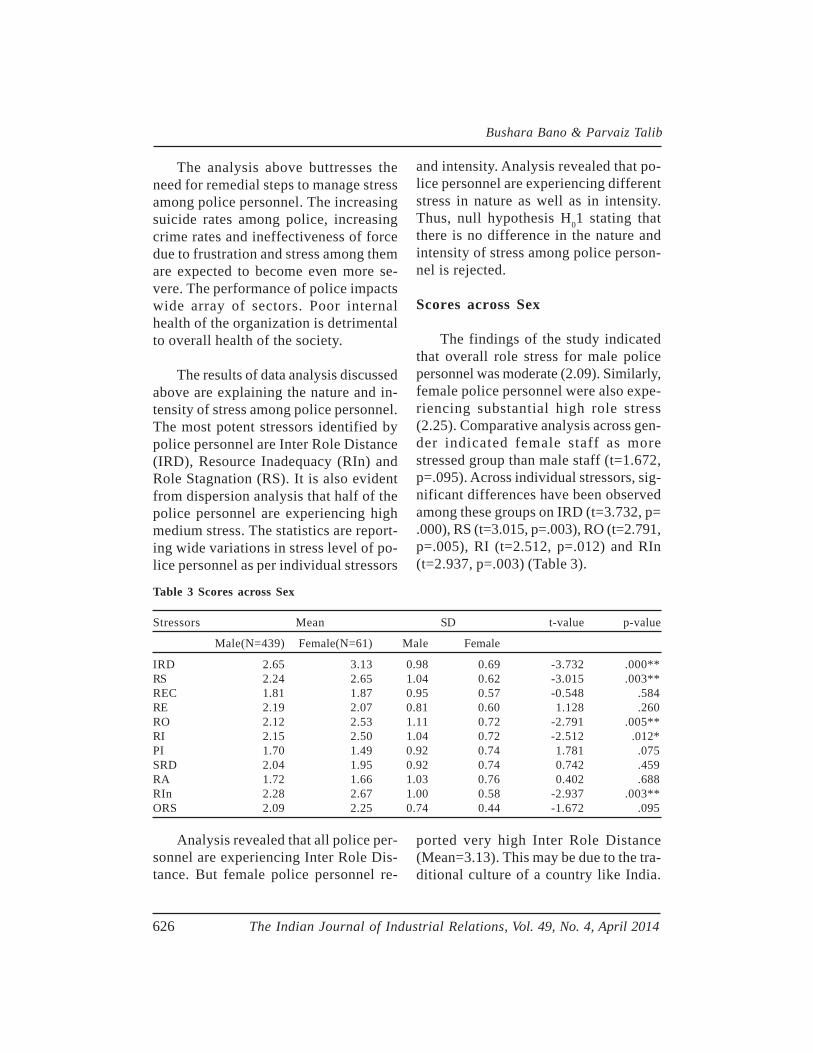
Bushara Bano & Parvaiz Talib
626 The Indian Journal of Industrial Relations, Vol. 49, No. 4, April 2014
The analysis above buttresses theneed for remedial steps to manage stressamong police personnel. The increasingsuicide rates among police, increasingcrime rates and ineffectiveness of forcedue to frustration and stress among themare expected to become even more se-vere. The performance of police impactswide array of sectors. Poor internalhealth of the organization is detrimentalto overall health of the society.
The results of data analysis discussedabove are explaining the nature and in-tensity of stress among police personnel.The most potent stressors identified bypolice personnel are Inter Role Distance(IRD), Resource Inadequacy (RIn) andRole Stagnation (RS). It is also evidentfrom dispersion analysis that half of thepolice personnel are experiencing highmedium stress. The statistics are report-ing wide variations in stress level of po-lice personnel as per individual stressors
and intensity. Analysis revealed that po-lice personnel are experiencing differentstress in nature as well as in intensity.Thus, null hypothesis H01 stating thatthere is no difference in the nature andintensity of stress among police person-nel is rejected.
Scores across Sex
The findings of the study indicatedthat overall role stress for male policepersonnel was moderate (2.09). Similarly,female police personnel were also expe-riencing substantial high role stress(2.25). Comparative analysis across gen-der indicated female staff as morestressed group than male staff (t=1.672,p=.095). Across individual stressors, sig-nificant differences have been observedamong these groups on IRD (t=3.732, p=.000), RS (t=3.015, p=.003), RO (t=2.791,p=.005), RI (t=2.512, p=.012) and RIn(t=2.937, p=.003) (Table 3).
Table 3 Scores across Sex
Stressors Mean SD t-value p-value
Male(N=439) Female(N=61) Male Female
IRD 2.65 3.13 0.98 0.69 -3.732 .000**RS 2.24 2.65 1.04 0.62 -3.015 .003**REC 1.81 1.87 0.95 0.57 -0.548 .584RE 2.19 2.07 0.81 0.60 1.128 .260RO 2.12 2.53 1.11 0.72 -2.791 .005**RI 2.15 2.50 1.04 0.72 -2.512 .012*PI 1.70 1.49 0.92 0.74 1.781 .075SRD 2.04 1.95 0.92 0.74 0.742 .459RA 1.72 1.66 1.03 0.76 0.402 .688RIn 2.28 2.67 1.00 0.58 -2.937 .003**ORS 2.09 2.25 0.74 0.44 -1.672 .095
Analysis revealed that all police per-sonnel are experiencing Inter Role Dis-tance. But female police personnel re-
ported very high Inter Role Distance(Mean=3.13). This may be due to the tra-ditional culture of a country like India.
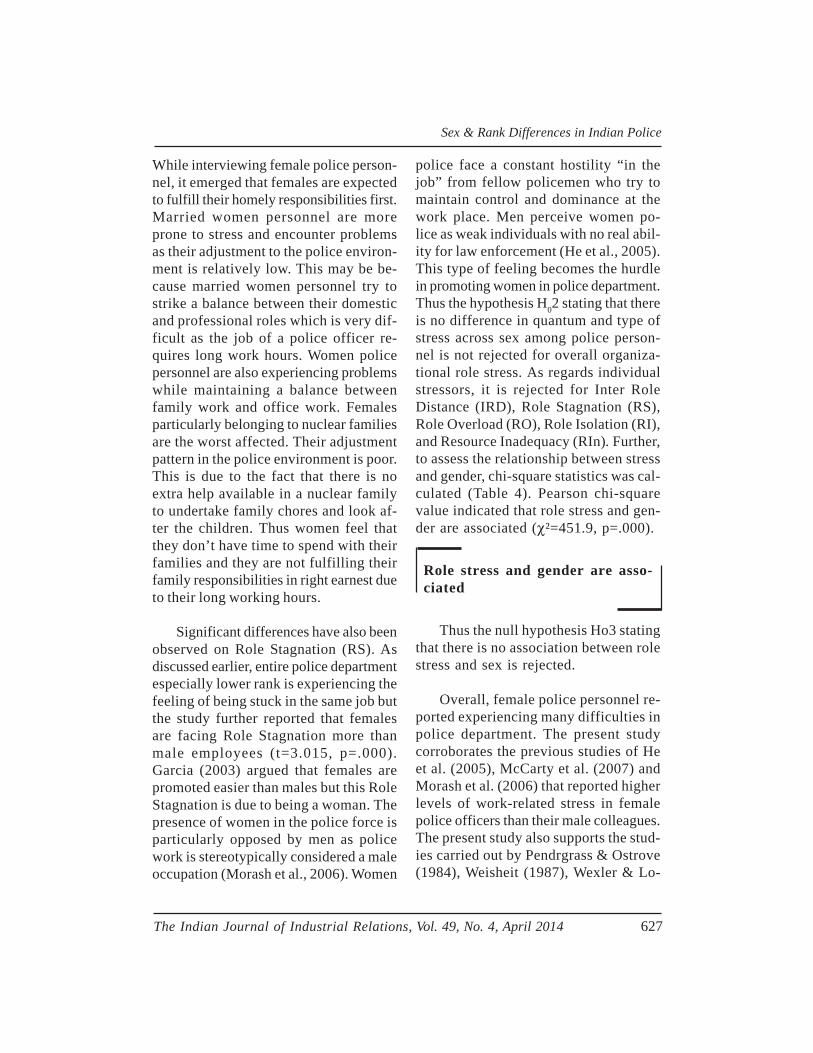
Sex & Rank Differences in Indian Police
The Indian Journal of Industrial Relations, Vol. 49, No. 4, April 2014 627
While interviewing female police person-nel, it emerged that females are expectedto fulfill their homely responsibilities first.Married women personnel are moreprone to stress and encounter problemsas their adjustment to the police environ-ment is relatively low. This may be be-cause married women personnel try tostrike a balance between their domesticand professional roles which is very dif-ficult as the job of a police officer re-quires long work hours. Women policepersonnel are also experiencing problemswhile maintaining a balance betweenfamily work and office work. Femalesparticularly belonging to nuclear familiesare the worst affected. Their adjustmentpattern in the police environment is poor.This is due to the fact that there is noextra help available in a nuclear familyto undertake family chores and look af-ter the children. Thus women feel thatthey don’t have time to spend with theirfamilies and they are not fulfilling theirfamily responsibilities in right earnest dueto their long working hours.
Significant differences have also beenobserved on Role Stagnation (RS). Asdiscussed earlier, entire police departmentespecially lower rank is experiencing thefeeling of being stuck in the same job butthe study further reported that femalesare facing Role Stagnation more thanmale employees (t=3.015, p=.000).Garcia (2003) argued that females arepromoted easier than males but this RoleStagnation is due to being a woman. Thepresence of women in the police force isparticularly opposed by men as policework is stereotypically considered a maleoccupation (Morash et al., 2006). Women
police face a constant hostility “in thejob” from fellow policemen who try tomaintain control and dominance at thework place. Men perceive women po-lice as weak individuals with no real abil-ity for law enforcement (He et al., 2005).This type of feeling becomes the hurdlein promoting women in police department.Thus the hypothesis H02 stating that thereis no difference in quantum and type ofstress across sex among police person-nel is not rejected for overall organiza-tional role stress. As regards individualstressors, it is rejected for Inter RoleDistance (IRD), Role Stagnation (RS),Role Overload (RO), Role Isolation (RI),and Resource Inadequacy (RIn). Further,to assess the relationship between stressand gender, chi-square statistics was cal-culated (Table 4). Pearson chi-squarevalue indicated that role stress and gen-der are associated (χ²=451.9, p=.000).
Role stress and gender are asso-ciated
Thus the null hypothesis Ho3 statingthat there is no association between rolestress and sex is rejected.
Overall, female police personnel re-ported experiencing many difficulties inpolice department. The present studycorroborates the previous studies of Heet al. (2005), McCarty et al. (2007) andMorash et al. (2006) that reported higherlevels of work-related stress in femalepolice officers than their male colleagues.The present study also supports the stud-ies carried out by Pendrgrass & Ostrove(1984), Weisheit (1987), Wexler & Lo-
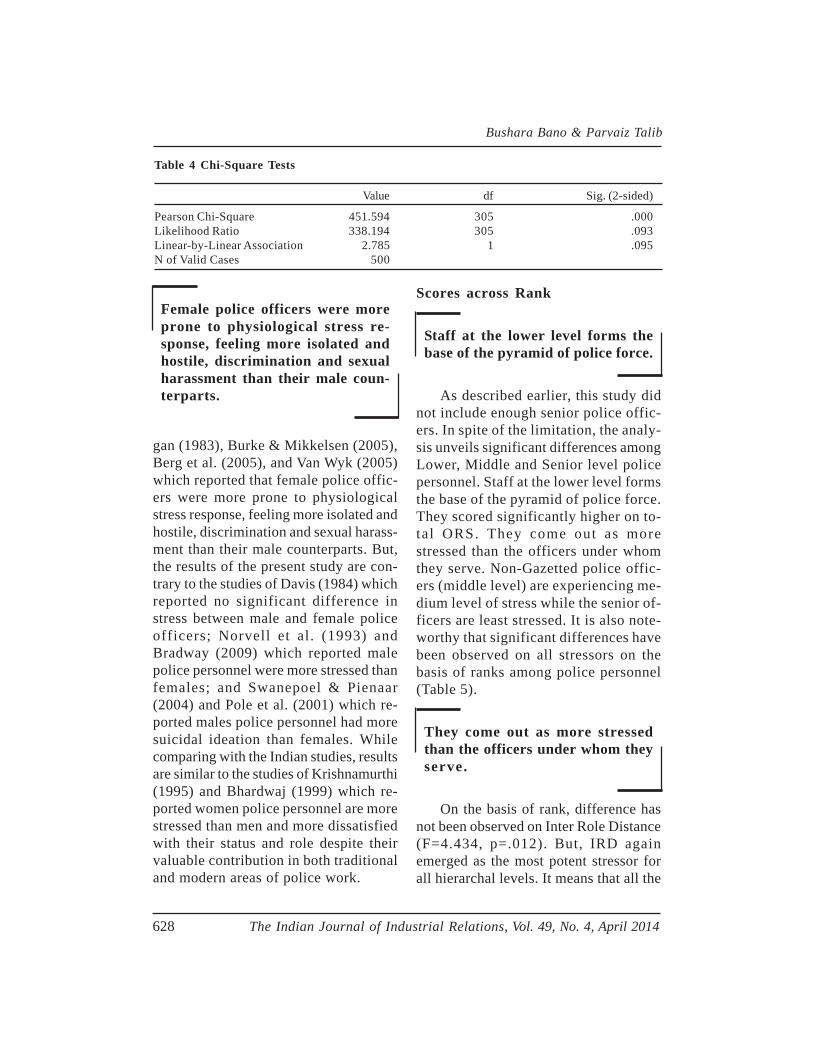
Bushara Bano & Parvaiz Talib
628 The Indian Journal of Industrial Relations, Vol. 49, No. 4, April 2014
Table 4 Chi-Square Tests
Value df Sig. (2-sided)
Pearson Chi-Square 451.594 305 .000Likelihood Ratio 338.194 305 .093Linear-by-Linear Association 2.785 1 .095N of Valid Cases 500
gan (1983), Burke & Mikkelsen (2005),Berg et al. (2005), and Van Wyk (2005)which reported that female police offic-ers were more prone to physiologicalstress response, feeling more isolated andhostile, discrimination and sexual harass-ment than their male counterparts. But,the results of the present study are con-trary to the studies of Davis (1984) whichreported no significant difference instress between male and female policeofficers; Norvell et al. (1993) andBradway (2009) which reported malepolice personnel were more stressed thanfemales; and Swanepoel & Pienaar(2004) and Pole et al. (2001) which re-ported males police personnel had moresuicidal ideation than females. Whilecomparing with the Indian studies, resultsare similar to the studies of Krishnamurthi(1995) and Bhardwaj (1999) which re-ported women police personnel are morestressed than men and more dissatisfiedwith their status and role despite theirvaluable contribution in both traditionaland modern areas of police work.
Scores across Rank
Staff at the lower level forms thebase of the pyramid of police force.
As described earlier, this study didnot include enough senior police offic-ers. In spite of the limitation, the analy-sis unveils significant differences amongLower, Middle and Senior level policepersonnel. Staff at the lower level formsthe base of the pyramid of police force.They scored significantly higher on to-tal ORS. They come out as morestressed than the officers under whomthey serve. Non-Gazetted police offic-ers (middle level) are experiencing me-dium level of stress while the senior of-ficers are least stressed. It is also note-worthy that significant differences havebeen observed on all stressors on thebasis of ranks among police personnel(Table 5).
They come out as more stressedthan the officers under whom theyserve.
On the basis of rank, difference hasnot been observed on Inter Role Distance(F=4.434, p=.012). But, IRD againemerged as the most potent stressor forall hierarchal levels. It means that all the
Female police officers were moreprone to physiological stress re-sponse, feeling more isolated andhostile, discrimination and sexualharassment than their male coun-terparts.
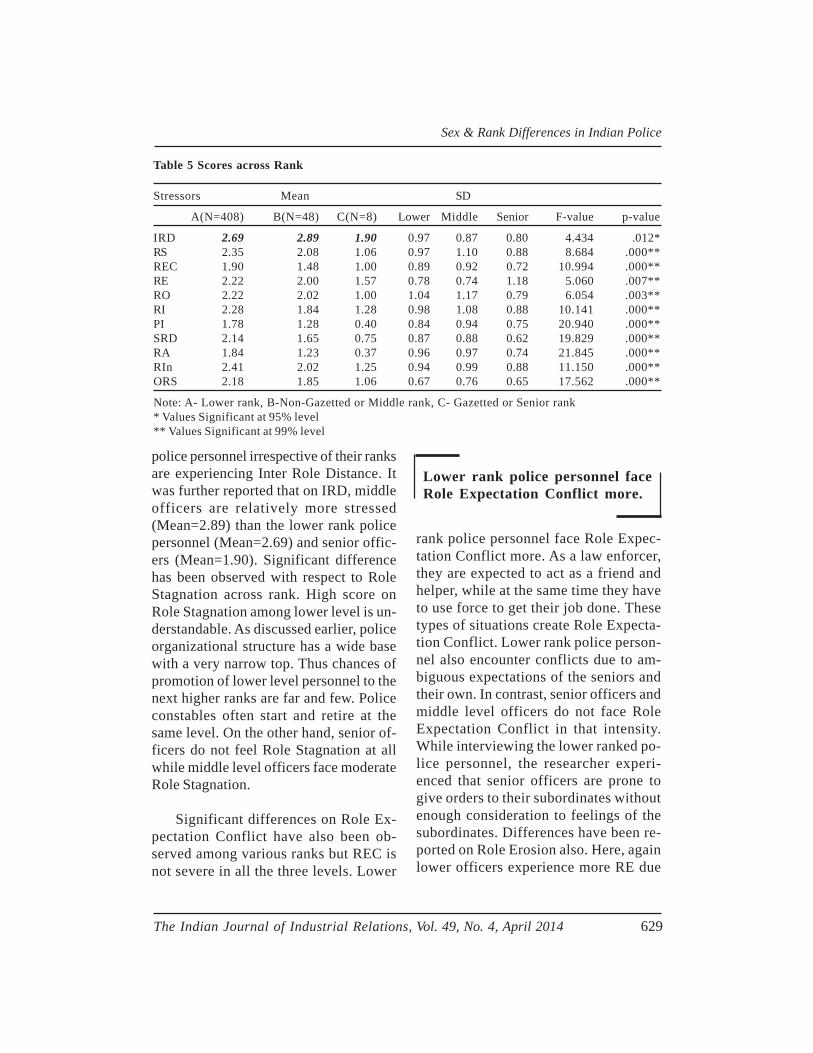
Sex & Rank Differences in Indian Police
The Indian Journal of Industrial Relations, Vol. 49, No. 4, April 2014 629
police personnel irrespective of their ranksare experiencing Inter Role Distance. Itwas further reported that on IRD, middleofficers are relatively more stressed(Mean=2.89) than the lower rank policepersonnel (Mean=2.69) and senior offic-ers (Mean=1.90). Significant differencehas been observed with respect to RoleStagnation across rank. High score onRole Stagnation among lower level is un-derstandable. As discussed earlier, policeorganizational structure has a wide basewith a very narrow top. Thus chances ofpromotion of lower level personnel to thenext higher ranks are far and few. Policeconstables often start and retire at thesame level. On the other hand, senior of-ficers do not feel Role Stagnation at allwhile middle level officers face moderateRole Stagnation.
Significant differences on Role Ex-pectation Conflict have also been ob-served among various ranks but REC isnot severe in all the three levels. Lower
Table 5 Scores across Rank
Stressors Mean SD
A(N=408) B(N=48) C(N=8) Lower Middle Senior F-value p-value
IRD 2.69 2.89 1.90 0.97 0.87 0.80 4.434 .012*RS 2.35 2.08 1.06 0.97 1.10 0.88 8.684 .000**REC 1.90 1.48 1.00 0.89 0.92 0.72 10.994 .000**RE 2.22 2.00 1.57 0.78 0.74 1.18 5.060 .007**RO 2.22 2.02 1.00 1.04 1.17 0.79 6.054 .003**RI 2.28 1.84 1.28 0.98 1.08 0.88 10.141 .000**PI 1.78 1.28 0.40 0.84 0.94 0.75 20.940 .000**SRD 2.14 1.65 0.75 0.87 0.88 0.62 19.829 .000**RA 1.84 1.23 0.37 0.96 0.97 0.74 21.845 .000**RIn 2.41 2.02 1.25 0.94 0.99 0.88 11.150 .000**ORS 2.18 1.85 1.06 0.67 0.76 0.65 17.562 .000**
Note: A- Lower rank, B-Non-Gazetted or Middle rank, C- Gazetted or Senior rank* Values Significant at 95% level** Values Significant at 99% level
rank police personnel face Role Expec-tation Conflict more. As a law enforcer,they are expected to act as a friend andhelper, while at the same time they haveto use force to get their job done. Thesetypes of situations create Role Expecta-tion Conflict. Lower rank police person-nel also encounter conflicts due to am-biguous expectations of the seniors andtheir own. In contrast, senior officers andmiddle level officers do not face RoleExpectation Conflict in that intensity.While interviewing the lower ranked po-lice personnel, the researcher experi-enced that senior officers are prone togive orders to their subordinates withoutenough consideration to feelings of thesubordinates. Differences have been re-ported on Role Erosion also. Here, againlower officers experience more RE due
Lower rank police personnel faceRole Expectation Conflict more.
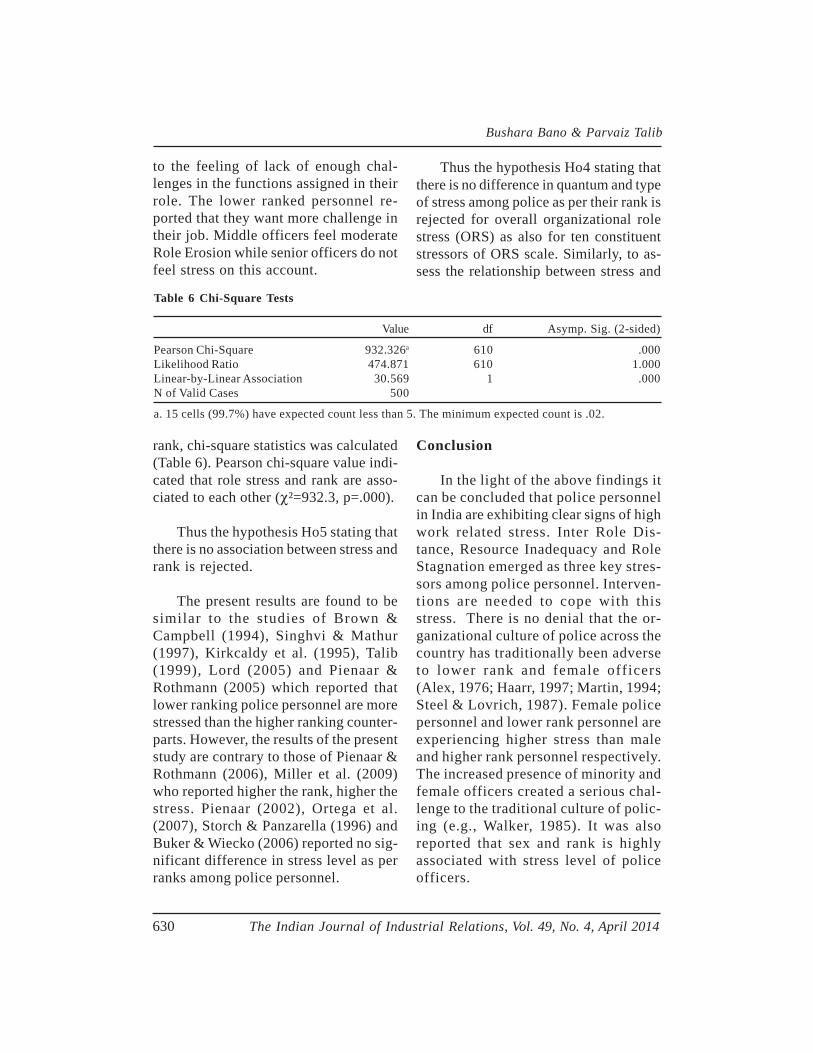
Bushara Bano & Parvaiz Talib
630 The Indian Journal of Industrial Relations, Vol. 49, No. 4, April 2014
to the feeling of lack of enough chal-lenges in the functions assigned in theirrole. The lower ranked personnel re-ported that they want more challenge intheir job. Middle officers feel moderateRole Erosion while senior officers do notfeel stress on this account.
Table 6 Chi-Square Tests
Value df Asymp. Sig. (2-sided)
Pearson Chi-Square 932.326a 610 .000Likelihood Ratio 474.871 610 1.000Linear-by-Linear Association 30.569 1 .000N of Valid Cases 500
a. 15 cells (99.7%) have expected count less than 5. The minimum expected count is .02.
Thus the hypothesis Ho4 stating thatthere is no difference in quantum and typeof stress among police as per their rank isrejected for overall organizational rolestress (ORS) as also for ten constituentstressors of ORS scale. Similarly, to as-sess the relationship between stress and
rank, chi-square statistics was calculated(Table 6). Pearson chi-square value indi-cated that role stress and rank are asso-ciated to each other (χ²=932.3, p=.000).
Thus the hypothesis Ho5 stating thatthere is no association between stress andrank is rejected.
The present results are found to besimilar to the studies of Brown &Campbell (1994), Singhvi & Mathur(1997), Kirkcaldy et al. (1995), Talib(1999), Lord (2005) and Pienaar &Rothmann (2005) which reported thatlower ranking police personnel are morestressed than the higher ranking counter-parts. However, the results of the presentstudy are contrary to those of Pienaar &Rothmann (2006), Miller et al. (2009)who reported higher the rank, higher thestress. Pienaar (2002), Ortega et al.(2007), Storch & Panzarella (1996) andBuker & Wiecko (2006) reported no sig-nificant difference in stress level as perranks among police personnel.
Conclusion
In the light of the above findings itcan be concluded that police personnelin India are exhibiting clear signs of highwork related stress. Inter Role Dis-tance, Resource Inadequacy and RoleStagnation emerged as three key stres-sors among police personnel. Interven-tions are needed to cope with thisstress. There is no denial that the or-ganizational culture of police across thecountry has traditionally been adverseto lower rank and female officers(Alex, 1976; Haarr, 1997; Martin, 1994;Steel & Lovrich, 1987). Female policepersonnel and lower rank personnel areexperiencing higher stress than maleand higher rank personnel respectively.The increased presence of minority andfemale officers created a serious chal-lenge to the traditional culture of polic-ing (e.g., Walker, 1985). It was alsoreported that sex and rank is highlyassociated with stress level of policeofficers.
Sex & Rank Differences in Indian Police
The Indian Journal of Industrial Relations, Vol. 49, No. 4, April 2014 631
Managerial Implications
A stress free police shall ensure ef-fective working of police organizations.This will result in reducing crime rate.Investigation of police stress carried outin the present study is expected to in-crease awareness of the problem espe-cially among the lower rank police per-sonnel. It may become the basis forlaunching interventions to address theproblem of stress among them. The com-bined approach of human relationshipexpertise and human resource manage-ment could help address the issue ofstress among police personnel. The con-clusion of the study largely corroborateswith the existing literature in the area.Police stress influences not only individualofficers and police organizations but so-ciety as a whole. Therefore, it needs tobe managed. The findings of the studybuttress the need for implementing stressmanagement interventions among policepersonnel in India.
References
Alex, N. (1976), New York Cops Talk Back—AStudy of a Beleaguered Minority, NewYork: John Wiley & Sons.
Anshel, M.H. (2000), ”A Conceptual Model andImplications for Coping with StressfulEvents in Police Work”, Criminal JusticeBehavior, 27: 375-400.
Beehr, T. A. & Fenlason, K. (1988), “The Expe-rience and Management of Work RelatedStress”, in G. R. Ferris & K. M. Rowland(Eds.), Human Resources Management:Perspectives and Issues, Boston: Allyn &Bacon.
Berg, A. M., Hem, E., Lau, B., Haseth, K. &Ekeberg, O. (2005), “Stress in the Norwe-
gian Police Service”, Occupational Medi-cine, 55: 113-20.
Bhardwaj, A. (1999), Women in uniform: Emer-gence of Women Police in Delhi. New Delhi,Regency Publications.
Bhattacharya, S. & Basu, J. (2007),” Distress,Wellness and Organizational Role Stressamong IT Professionals: Role of LifeEvents and Coping Resources.,”Journal ofthe Indian Academy of Applied Psychology,33 (2): 169-78.
Bradway, J.H. (2009), “Gender Stress: Differencesin Critical Life Events among Law Enforce-ment Officers”, International Journal ofCriminal Justice Sciences, 4(1): 1-12.
Brown, J.M. & Campbell, E.A. (1994), Stressand Policing: Sources and Strategies, WestSussex, England: John Wiley & Sons.
Brown, J. M., Cooper, C. L. & Kirkcaldy, B.(1996), “Occupational Stress among SeniorPolice Officers”, British Journal of Psychol-ogy, 87: 31-41.
Burke, R.J. & Greenglass, E.R. (1987), “Workand Family”, in C.L. Cooper & I.T.Robertson (eds.), International Review ofIndustrial and Organizational Psychology,New York: John Wiley.
Burke, R. J. & Mikkelsen, A. (2005), “GenderDifferences in Policing: Signs of Progress”,Employee Relations, 27: 425"36.
Chaturvedi, V. (2011), “A Study on Gender Dif-ferences with relation to OccupationalStress among Faculties in ManagementColleges of Private and Government Insti-tutes –A Study with reference to Manage-ment Colleges in NCR”, International Jour-nal of Business Management & EconomicResearch, 2(2): 168-72.
Dangwal, S.P. & Gangopadhyaya, A. (1982),“Alienation and Stress among SubordinateRanks of Police”, Transactions, 35, NationalPolice Academy, Hyderabad.
Deb, S., Chakraboraty, T., Chatterjee, P. &Srivastava, N. (2006), “Stress of Traffic
Bushara Bano & Parvaiz Talib
632 The Indian Journal of Industrial Relations, Vol. 49, No. 4, April 2014
Police Officers and Traffic Constables un-der Kolkata Police: A Comparative Study”,The Indian Police Journal, 53 (4): 50-61.
Davis, J. A. (1984), “Perspectives of police-women in Texas and Oklahoma”, Journalof Police Science and Administration, 12:395-403
Doublet, S. (2000), The Stress Myth., Chester-field, MO: Science & Humanities Press.
Express News (27 December 2011), “Stressedby Family Tragedy, Cop Ends Life”. Pune.Retrieved on 24 March 2012 from http://www.indianexpress.com/news/stressed-by-family-tragedy-cop-ends-life/892488/
French, J. R. P., Caplan, R. D. & Harrison, R. V.(1982), The Mechanisms of Job Stress andStrain, New York, NY: John Wiley & Sons.
Garcia-Zamor, J. (2003), “Workplace Spiritual-ity in the United States and the FormerEast Germany” in R.A. Giacalone & C.L.Jurkiewicz (Eds.), Handbook of WorkplaceSpirituality and Organizational Perfor-mance, New York: M.E. Sharp.
Gibbons, R.M. & Gibbons, B. (2007), ”Occupa-tional Stress in the Cheff Professional”, Int.J. Contemporary Hospitality Management,19: 32-42.
Gilmartin, K. M. (2002), Emotional Survival forLaw Enforcement, Arizona: E-S Press.
Gulle, G., Tredoux, C. & Foster, D. (1998), “In-herent and Organizational Stress in theSAPS: an Empirical Survey in the WesternCape”, South African Journal of Psychol-ogy, 28:129–34.
Haarr, R. N. (1997), “Patterns of Interaction in aPolice Patrol Bureau: Race and Gender Bar-riers to Integration”, Justice Quarterly, 14:53 – 85.
Haarr, R. N. & Morash, M. (1999), “Gender,Race and Strategies of Coping with Occu-pational Stress in Policing”, Justice Quar-terly, 16: 303 – 36
He, N., Zhao, J. & Ren, L. (2005), “Do Race andGender Matter in Police Stress? A Prelimi-nary Assessment of the Interactive Effects”,Journal of Criminal Justice, 33:535-47
Human Rights Watch, Broken System: Dysfunc-tion, Abuse, and Impunity in the IndianPolice, 4 August 2009, 1-56432-518-0, available at: http://www.unhcr.org/refworld/docid/4a793f692.html [accessed30 March 2013]
Jones, R. & Kagee, A. (2005), “Predictors of PostTraumatic Stress Symptoms among SouthAfrican Police Personnel”, South AfricanJournal of Psychology, 35(2): 209 – 24
Kates, A. R. (2005), Editorial Notes: SurvivingStress, Trauma, and Post-Traumatic StressDisorder. Birmingham, AL: CALEA Con-ference, March 16.
Krishnamurthi, L. (1996), “Role Conflicts andTension of Women Police”. The Indian Jour-nal of Social Work, 57(4): 615-29.
Kroes, W.H., Hurrell, J.J. & Margolis, B. L.(1974), “Job Stress in Police Administra-tors”, Journal of Police Science and Ad-ministration, 2: 381-87
Kroes, W.H., Margolis, B.L. & Hurrell, J.J.(1974), “Job Stress in Policemen”, Journalof Police Science and Administration, 2(2):145-55
Kumari, K. & Sharma, S. (1990), “Social Sup-port, Organizational Role Stress and WellBeing: a Study of Medicos”, PsychologicalStudies, 35(3): 163-69.
Kumar, M. (2006), Applications of Psychologi-cal Principles in Maintenance of Law andOrder. Bhopal: Balaji Publications.
Lefkowitz, J. (1975), “Psychological Attributesof Policemen: A Review of Research andOpinion”, Journal of Social Issues, 31(1):3-26.
Lehal, R. (2007), “A Study of Organizational RoleStress and Job Satisfaction among Execu-tives in Punjab”, Indian Management Stud-ies Journal, 11: 67-80
Sex & Rank Differences in Indian Police
The Indian Journal of Industrial Relations, Vol. 49, No. 4, April 2014 633
Martin, S. E. (1994), “Outsider within the Sta-tion House: The Impact of Race and Gen-der on Black Women Police”, Social Prob-lems, 41: 383 – 400.
Martin, B. (2006), “Stress and Personality”, Workand Stress, 11(1):94-100, Retrieved on July02, 2010 from http://psychcentral.com/lib/2006/stress-and-personali ty/MaslachBurnout Inventory.
Mathur, P (1993), “Stress in Police Personnel: APreliminary Survey”, NPA Magazine, 45(2),July-December.
Mathur, P. (1994), “Role Stress in Police Offic-ers: An Exploratory Study”, Indian Jour-nal of Criminology, 22 (1): 9-14.
Mathur P. (1995), “Perceptions of Police Stress:An Empirical Study of Stressors and Cop-ing Response among Police Personnel inIn-dia”, Indian Journal of Criminology, 23(1): 9-19.
Mathur, P. (1999), Stress in Police in India: Rec-ognition, Diagnosis and Coping Strategies,New Delhi: Gyan Publishing House.
Mathur, S. (1997), “Correlates of Role Stress inWorking Women”, in D.M. Pestonjee & U.Pareek (Eds.), Studies in OrganizationalRole Stress and Coping. Jaipur/New Delhi:Rawat Publications.
McCreary, D. R. & Thompson, M. M. (2006),“Development of Two Reliable and ValidMeasures of Stressors in Policing: TheOperational and Organizational PoliceStress Questionnaires”, International Jour-nal of Stress Management, 13: 494-518.
Mishra, P.K. & Bhardwaj, G. (2003). “Evalua-tion of Role Stress in Indian Air TrafficControllers”, Indian Journal of IndustrialRelations, 38 (3): 318-34
Morash, M., Kwak, D. H. & Haarr, R. N.(2006).”Gender Difference in the Predic-tors of Police Stress” International Jour-nal of Police Strategies and Management,29: 541-63.
Morgan, B. (2008), The Relationship betweenthe Big Five Personality Traits and Burn-out in South African University Students,Unpublished Masters Dissertation, Univer-sity of Johannesburg. Retrieved fromhttps:// ujdigispace.uj.ac.za/bitstream/handle/10210/3212/Morgan.pdf? se-quence=1
Mostert, K. & Joubert, A. F. (2005). “Job Stress,Burnout and Coping Strategies in the SouthAfrican Police Service”, Sajems NS, 8(1):39 – 53.
Mostert, K. & Rothmann, S. (2006), “Work-Re-lated Well-being in the South African Po-lice Service”, Journal of Criminal Justice,34: 479–91.
Myendeki, A.N. (2008), Job Stress, Burnout andCoping Strategies of South African PoliceOfficers, Unpublished Master’s Disserta-tion. University of Fort Hare, South Af-rica. Retrieved from http://hdl.handle.net/10353/136.
Norvell, N. K., Hills, H. A. & Murrin, M. R.(1993), “Understanding Stressing, Femaleand Male Law Enforcement Officers”, Psy-chology of Women Quarterly, 17(3): 289-301.
O’Driscoll, M. P. & Cooper, L. C. (1996), “ACritical Incident Analysis of Stress-copingBehaviors at Work”, Stress Medicine, 12:123–28
Pendergrass, V. & Ostrove, N. (1984), “Surveyof Stress in Women in Policing”, Journal ofPolice Science and Administration, 12: 303-09.
Pole, N., Best, S.Z., Weiss, D.S., Metzler, T.,Liberman, A.M., Fagan, J., et al. (2001),“Effects of Gender and Ethnicity on Duty-Related Posttraumatic Stress Symptomsamong Urban Police Officers”, Journal ofNervous and Mental Disorder, 189(7): 442-48.
Schaible, L.M. & Gecas, V. (2010), “The Impactof Emotional Labor and Value Dissonanceon Burnout among Police Officers”, PoliceQuarterly, 13(3): 316-341.
Bushara Bano & Parvaiz Talib
634 The Indian Journal of Industrial Relations, Vol. 49, No. 4, April 2014
Steel, B. S. & Lovrich, N. P. (1987), “Equalityand Efficiency Tradeoffs in Affirmative Ac-tion: Real or Imagined? The Case of Womenin Policing”, Social Science Journal, 24: 53– 70
Swanepoel, C. & Pienaar, J. (2004), “Coping,Stress and Suicide Ideation in the SouthAfrican Police Service in Gauteng Prov-ince”, Acta Criminologica, 17 (2):17-33.
Van Wyk, J. (2005), “Hidden Hazards of Re-sponding to Domestic Disputes”, in H.Copes & M.L. Dantzker (Eds.), Policingand Stress, Upper Saddle River, N.J.:Pearson.
Violanti, J.M. (1996), “Trauma and Stress in Po-lice Work”, in D. Paton, J.M. Violanti (Eds.).Traumatic Stress in Critical Occupations:Recognition, Consequences, and Treatment,Springfield, IL: Charles C. Thomas.
Weisheit, R. (1987), “Women in the State Police:Concerns of Male and Female Officers”,Journal of Police Science and Administra-tion, 15: 137-44.
Wexler, J. G. & Logan, D. D. (1983), “Sources ofStress among Women Police Officers”, Jour-nal of Police Science and Administration,11:46 – 53.
Wright, K. N. & Saylor, W. G. (1991), “Male andFemale Employees’ Perceptions of PrisonWork: Is There a Difference?” Justice Quar-terly, 8: 508-24.
Zhao, J. S., He, N. & Lovrich, N. (2002), “Pre-dicting Five Dimensions of Police OfficerStress: Looking More Deeply into Organi-zational Settings for Sources of PoliceStress”, Police Quarterly, 5: 43-62.
sas
Retaining Core, Critical & Scarce Skills in the EnergyIndustry
Phuti F. Mabuza & Cecile N. Gerwel Proches
An organization within a majorenergy providing industry is fac-ing staff retention challenges. Inspite of their retention strategythat was implemented over thepast three years, employees withcore, critical and scarce skillsare still leaving. The study ex-plored employee motivation theo-ries underlying employee reten-tion in organizations. A qualita-tive study was conducted in or-der to determine factors that in-fluence employees to remain orleave the employer. The findingsrevealed that factors such asleadership style of superiors,ability to exercise control withrespect to decision-making andproblem-solving, and a desirefor career advancement andskills development play a role inretaining specialist staff.
Phuti F. Mabuza is from Eskom ERIC Building,off Lower Germiston Road, Rosherville, 2014.Email: [email protected]. Cecile N. GerwelProches is from Graduate School of Business andLeadership, University of KwaZulu-Natal, WestvilleCampus, 3630.Email: [email protected]
The Indian Journal of Industrial Relations, Vol. 49, No. 4, April 2014 635
Introduction
Employee retention is one of the ma-jor challenges that organizations face to-day. Attracting the best talent is a diffi-cult task, and retaining these employeesis even more difficult. Globalization hasworsened the situation, as employees areboth ready and willing to change jobs andrelocate to any part of the world. Man-agers around the world are concernedabout the retention of skilled employees,and are very conscious of the high rateof employee turnover. Skilled employeesin today’s business are the major differ-entiating factor when determining the suc-cess of a business, making the employeeretention environment very competitive.This is as a result of dependence on theexpertise of these employees to competeeffectively and to gain competitive advan-tage in the market (Samuel & Chipunza,2009).
According to Carr & Jones (2001), thedemand for core, critical and scarce skillsoutnumbers the pool of available talent. Asa result, people in these skill categoriesexperience high levels of stress and theytend to easily resign from their jobs. A waron talent, as reported by Stairs, Galpin &
Phuti F. Mabuza & Cecile N. Gerwel Proches
636 The Indian Journal of Industrial Relations, Vol. 49, No. 4, April 2014
Linley (2006), was predicted to start in2007. Organizations were managing staffretention on a ‘knife edge’. Elaboratestrategies for attracting and retaining tal-ent need to be devised in order for orga-nizations to maintain a competitive edgeand to ensure their long term survival(Stairs et al., 2006).
Employers were slow to compre-hend that the power balance of thework relationship had shifted fromemployer to employee.
In the past, employees leaving theirjobs voluntarily was seldom an occur-rence. However, this is now the norm inthe workplace; a shift which has beenintensified by an increase in job mobility.Changes in the work environment are socomplex that employers were slow tocomprehend that the power balance ofthe work relationship had shifted fromemployer to employee. A new concept,‘employee turnover’ was therefore intro-duced. As a result, a management toolknown as ‘employee retention’ was de-veloped to respond to employee turnover(McKeown, 2002). In response to theemployee turnover challenge, many or-ganizations changed their remunerationpackages to be in line with what similarcompanies in the market were paying.According to McKeown (2002), remu-neration packages alone were not totallyeffective in helping employers to keeptheir employees. In addition to the remu-neration packages, other factors such as,safety and workplace health should beincluded to make the employee happy(McKeown, 2002).
Problem Investigated
The study is focused on a departmentwithin the organization which providesconsulting, advisory, supporting and otherspecialist services in the energy industryin a developing country context. The de-partment comprises predominantly core,scarce, skilled and experienced subjectmatter experts in the engineering envi-ronment, who have acquired a good repu-tation in providing outstanding technologyservices to their customers over time.
According to management, the de-partment is losing its core, critical andscarce skills to the external market ev-ery year. The trends on staff movementwere discussed in various managementmeetings to determine the severity of theproblem. As a result, management iden-tified the loss of skills as one of thedepartment’s high risks. Although a strat-egy has been implemented, the organi-zation still experiences loss of these skillsand it is evident that the strategy has notbeen effective. Recruitment policies andprocesses, as well as the national short-age of specific skills have contributed tothe delay or inability to replace the em-ployees that have left. Lack of skills in-creased the workload for remaining em-ployees, hampering their ability to executethe overall operations plan and broughtabout an undesirable effect on servicedelivery.
Aim of the Research
The main aim of the research is to:a) determine critical factors in respectof employees wanting to remain with the
Retaining Core, Critical & Scarce Skills
The Indian Journal of Industrial Relations, Vol. 49, No. 4, April 2014 637
organization, and b) identify which fac-tors may result in employees wanting toleave the organization. Such a study canlead to recommendations which can beincorporated into the strategy of the or-ganization to retain core, critical andscarce skills.
Literature Review
Organizations hire people from dif-ferent backgrounds and employees de-mand more fulfilling jobs (Mitchell, 1973).Traditional models of motivators reliedsolely on financial rewards, which interms of Maslow’s position, helped em-ployees to achieve their basic needs offood and shelter. In the 1960s and 1970scareer progression emerged as an addi-tional motivator to satisfy the employees’need for achievement, status and recog-nition. For this generation, motivators gobeyond tangible rewards, shifting to in-tangibles like meaning, value fit and theability to make a worthwhile contribution.
Since the current generation of em-ployees has grown up in a world ofchoice and rapid change, they may notstay with one employer for a long time iftheir self-actualization needs are not sat-isfied (Stairs et al, 2006). Managers andorganizational leaders should seek tocomprehend and address employee mo-tivation successfully to be able to leadthe organization (Amabile, 1996). It hasbeen noted that five features which trig-ger recent theories of human motivationare needs, reinforcement, cognition, jobcharacters and emotions (Ramlall, 2004).Three common motivational theories areMaslow’s Needs Hierarchy, Herzberg’s
Two Factors and Vroom’s ExpectancyTheories. Maslow’s theory focuses onindividual needs while Herzberg scruti-nized motivation from the perspectivesof the interaction between the individualand his/her work (Cesare & Sadri,2003). Vroom’s theory proposes thatpeople are driven to behave the waythey do, and produce combinations ofoutcomes that should be desired andexpected.
Maslow developed his Hierarchy ofNeeds theory because he believed thathuman beings desire to become self-ac-tualizing. He held that human potentialbeing underestimated is an unexplainedarea. Human needs can be grouped intoat least five areas, namely: physiological,safety, love, esteem and self-actualiza-tion.
Equity theory stresses the point thatindividuals are not only concerned withtheir own rewards, but also compare theircompensation to what others receive.The Expectancy Model of Motivation, ascited by Ramlall (2004) highlights thecauses of people’s expectations and con-nects effort with performance and jobsatisfaction.
Attitudes of employees towardstheir jobs and work environmentsinfluence their retention.
It has also been acknowledged thatthe attitudes of employees towards theirjobs and work environments influencetheir retention. Job satisfaction is a cata-lyst to employee turnover. Employee
Phuti F. Mabuza & Cecile N. Gerwel Proches
638 The Indian Journal of Industrial Relations, Vol. 49, No. 4, April 2014
motivation is a complex issue and involvesa combination of factors influencing in-dividuals.
According to Mak and Sockel (2001)and Stum (1998) job satisfaction is be-lieved to be an important driver of em-ployee performance. It affects produc-tivity, quality and morale, and hence in-fluences commitment and reduces turn-over and absenteeism. According toBenest (2008), competitive salaries areimportant to employees but are not suf-ficient to retain them. When employeesdo not see the relevance of their job toan organization, they may feel that theydo not belong to the unit. According toStum (1998), in most cases employeeswould like to learn and grow. They alsoexpect employers to give them an oppor-tunity to grow.
Employees may leave an organiza-tion if the reward strategy does not ap-preciate their performance, or lacks con-sideration for skills and experience, orcannot match the compensation systemof the competitors. A meaningful job isthe most powerful motivator of behav-ior. Employees appreciate working in asafe and comfortable environment. Fac-tors such as family responsibilities arealso related to employee retention, be-cause one’s family, community and otherlife activities outside work influence one’sdecision to stay or leave (Hausknecht etal, 2008). Employees can be frustratedand dissatisfied with a workload that isless or more than their capacity (Jan,2010). Certain management styles maycause employees to leave an organiza-tion. Employees also like to be in control
of some aspects of their work and havethe ability to influence the way things aredone.
Research Methodology
This study used qualitative data col-lection methods, namely, open-endedquestionnaires, in-depth unstructured in-terviews and secondary data such as exitinterview materials. This approach en-sured triangulation. Ethical clearance forthe study was obtained. Data collectionoccurred during August-September 2010.Purposive sampling was employed in se-lecting participants for this study. Thismeans purposefully choosing certain el-ements of the population. The key par-ticipants were employees whose skillshave been categorized into core, criticaland scarce. The study invited participa-tion from engineers, technologists tech-nicians, artisans and electricians in theorganization.
The key participants were employ-ees whose skills have been catego-rized into core, critical and scarce.
A total of 28 people completed thequestionnaires, and in-depth interviewswere conducted with two managers andone consultant. Respondents were as-sured about confidentiality and were re-quested to complete informed consentforms before commencing the interviewsor completing the questionnaires. Ques-tions focused on factors which were im-portant for employees and caused themto remain with the organization, whatbenefits they derived from working at the
Retaining Core, Critical & Scarce Skills
The Indian Journal of Industrial Relations, Vol. 49, No. 4, April 2014 639
company, and what factors would causethem to leave. The interpretive inductiveapproach was applied to analyze data.
Leadership Style
Participants reported that they val-ued democratic leadership that allowedthem to operate independently with littleguidance. One participant was quoted assaying, “To be trusted and given the free-dom to work as a professional, to makedecisions, to be self-managed and not tobe micro-managed”. This is consistentwith the study of Stairs et al. (2006) thatemployees would like to be in control ofsome aspects of their work and be ableto influence the way things are done.This is also confirmed by Maslow’sNeeds Theory that people seek fulfill-ment of needs in self-expression, recog-nition, having some voice in job affairs,doing something worthwhile, and de-manding a chance to grow. Bititci,Mendibil, Nudurupati, Garengo andTurner (2006) reported that managementstyle is dictated by the organisation cul-ture.
Participants declared their man-agement to be good and fair.
Participants declared their manage-ment to be good and fair. Moreover, theyproclaimed that management had a ma-ture attitude towards work and allowedemployees the freedom to explore possi-bilities with respect to problems and so-lutions. Mak and Sockel (2001) statedthat if employees perceive that they havesupervisor support, they could be more
satisfied and motivated, with less stressand better performance. Stairs et al.(2006) mentioned that managementshould strive to build positive emotions,harness strengths and drive engagement.
Job Satisfaction
Some participants would like to begiven work that is stimulating, meaning-ful and challenging to enable them tomake a valuable contribution. Other par-ticipants mentioned that the attractivething about working in the environmentwas the opportunity to do different things.This situation was highlighted by Nohria,Groysberg and Lee (2008) who said that,in order to achieve job satisfaction, man-agers and supervisors should design sig-nificant, exciting and stimulating tasks.Employees’ minds should be stimulatedto think widely about the ways in whichthey could contribute to bringing aboutchange in the system. Ramlall (2004)mentioned that employees should begiven additional tasks and difficult ones,perhaps even those normally performedby their seniors or supervisors. There-fore, jobs should be restructured to in-clude thought provoking tasks with moreresponsibility. These authors’ ideas arein line with the Hygiene MotivationTheory that proposed that employeesdefine satisfying encounters in relation tofeatures core to the job content, such asachievement and growth.
Teamwork
Participants indicated favoring anenvironment where teamwork is encour-aged, and also working within a compe-
Phuti F. Mabuza & Cecile N. Gerwel Proches
640 The Indian Journal of Industrial Relations, Vol. 49, No. 4, April 2014
tent team. This was exemplified by oneparticipant who said: “Good team rela-tions, that is, colleagues that are compe-tent and willing to assist in the bigger teamefforts”. Stairs et al. (2006) reported thatemployees need an inclusive organiza-tional culture where the emphasis is onteamwork and co-operation between thegroups. Nohria et al. (2008) suggestedthat the most effective way to unite ateam is to provide a conducive environ-ment that stimulates teamwork, collabo-ration, openness and friendship. It wasthe view of some participants that theorganization has the best or at least verygood specialists in almost all (technical)disciplines of the business. The majorityof the participants said that the advan-tage of being in the environment washaving easy access to human resources,which then helps in making quick deci-sions and drawing conclusions. It hasbeen reported that generally, working ‘in-side’ the organization allows one to ad-dress issues directly and willingly, com-pared to an external consultant, who canonly work on issues that they are askedto investigate.
The most effective way to unite ateam is to provide a conducive en-vironment that stimulates team-work, collaboration, openness andfriendship.
Reward, Recognition &Remuneration
Some participants indicated that theywould like to work in an environmentwhere outputs are appreciated and out-
standing performance is recognized.Ramlall (2004) reported that an employeewill work hard if they are certain of re-ceiving a reward for completing a task.Moreover, Stairs et al. (2006) agreed withRamlall that an employee’s satisfactionlevel rises when they perceive they arebeing fairly rewarded, be it financially ornon-financially. Employees’ decisions towork hard for a reward will therefore bedriven by what they have experienced inthe past in terms of performance andrewards.
It was mentioned that the organiza-tion paid respectable remunerations, butthat these salaries could be better. Otherparticipants pointed out that they wereremunerated well. Some participants re-ported that they prefer a work environ-ment which pays an adequate or high sal-ary to correctly reflect the value of one’sexperience, knowledge and skill, and sala-ries that are above market rates. This re-quires organizations to establish rewardsystems that are perceived to be fair andjust. This is consistent with Herzberg’sMotivator Hygiene Theory that if hygienefactors such as remuneration, job secu-rity and general work environment are notacceptable, employees may become de-motivated. Stairs et al. (2006) noted thattraditional models of motivators relied onfinancial rewards which, in Maslow’sterms, helped employees achieve theirbasic needs.
Stakeholder Involvement
It was clear that some participantsvalued interaction and collaboration withstakeholders of different levels, back-
Retaining Core, Critical & Scarce Skills
The Indian Journal of Industrial Relations, Vol. 49, No. 4, April 2014 641
ground and interest. It pleased them whenthey acted as the middle man betweensenior management and middle technicalstaff, where they ensured that manage-ment priorities and technical require-ments were integrated and aligned. Inaddition to these, they preferred to bemediators between production and re-search, which allowed them to facilitateproduction as well as obtain support forinnovative projects.
Lockwood (2007) found that em-ployee engagement has emerged as acritical driver for organizational achieve-ment, because it affects employee reten-tion, efficiency and loyalty. Therefore itis closely correlated to customer satis-faction, company reputation and overallshareholder value. It has been concludedthat if the employees realize the connec-tion between their job and organizationalstrategy and also understand the impor-tance of their job to the success of theorganization, they would be more en-gaged. Engaged employees are passion-ate about their work, innovative and driveorganizational advancement. Goodman(1971) suggested that employees be in-volved and allowed to participate in theaccomplishment of objectives. Thismeans involvement in decision-makingwhere the outcome involves them.
Engaged employees are passion-ate about their work, innovativeand drive organizational advance-ment.
Participants mentioned that workingin the organization gave them an oppor-
tunity to participate in national activities.They also mentioned that through in-volvement in committees where the de-velopment of technology and technologi-cal changes affecting the organisationwere discussed, they were operating intheir field of expertise and were exposedto a range of new technologies.
It was observed that they made areal contribution to the improvement ofthe company. This was supported by oneparticipant who said that “working at anational level, where I am able to sup-port the network planners in all the re-gions. This keeps me both challenged andmotivated”. They also acknowledged thatthey were able to influence the mediumto long term development of the local in-dustry. In addition to this, they hadgreater opportunities to travel and net-work with specialists around the coun-try. Besides national involvement, theyindicated that they were solving theregion’s technical problems, and in turnacquiring knowledge. It was also high-lighted that they gained experience indeveloping electricity distribution linehardware technology, thereby keeping intouch with new technology. They alsoadmitted that they made decisions andmanaged technology with far reachingconsequences, both in the organisationand in the industry as a whole.
Work Environment
The participants pointed out that inthis environment they were able to workindependently and make decisions to acertain extent. This was supported byone participant who said: “having a cer-
Phuti F. Mabuza & Cecile N. Gerwel Proches
642 The Indian Journal of Industrial Relations, Vol. 49, No. 4, April 2014
tain amount of freedom to manage myactivities to suit my needs”. Many em-ployees would like to have a dedicatedoffice as opposed to a cubicle. One par-ticipant explained why a dedicated officewas needed: “An enabling working envi-ronment that will allow me to do my workeffectively and efficiently”. Stairs et al.(2006) noted that employees appreciateworking in a safe environment and thatthey need a comfortable workstation andsecure parking facilities.
It was indicated by some participantsthat flexible working time or flexible hourswere important characteristics for theirideal work environment. One was quotedas saying: ‘having core hours is fine butbeing unable to shift hours from one dayto the next is restrictive’. In addition tothis, some needed the freedom to workat various office locations and to haveaccess to technology such as 3G connec-tions. Stairs et al. (2006) reported thatemployees need to be supported toachieve a balance between their roleswithin and outside of the work environ-ment to enable them to meet the de-mands placed on them. This means dif-ferent things to different individuals andflexible work practices are proposed toaddress this issue. Hausknecht et al.(2008) agreed with Stairs et al. (2006)and suggested alternative work hours toreduce pressure between competing workand non-work demands.
Participants appreciated the work-life balance opportunities such as flex-ible working times and working fromhome on some days. According to theparticipants, these practices contribute to
the retention of outstanding employees.Others mentioned that the flexibility helpsthem to work independently and takeownership of their work and their owntime management. This was exemplifiedby one participant who said: “I could ne-gotiate flexible hours to suit my personalneeds with a child at school”
Ethical Values &Professionalism
Participants stated that theyneeded to be respected andtrusted, to be given the freedomto work as professionals and tomake decisions.
Participants stated that they neededto be respected and trusted, to be giventhe freedom to work as professionals andto make decisions. They indicated thatthey would like to work in an environ-ment where honesty, integrity, truthful-ness and high morals and ethics werehighly valued. Rucci et al. (1998) statedthat this calls for management to givestaff greater decision-making authority toempower them. Leadership should alsotake responsibility for the culture that willkeep business models working. This wasbelieved to encourage employees to bequick to respond, to become more cre-ative and continually improve their ser-vice to customers.
Image & Caeer Growth
According to some participants, theorganization has a good reputation andimage. They also indicated that they likedto be associated with the organization
Retaining Core, Critical & Scarce Skills
The Indian Journal of Industrial Relations, Vol. 49, No. 4, April 2014 643
because it was seen as a centre of ex-cellence. Other participants would like tohave a clear career path for careergrowth and potential promotion opportu-nities while others would like the careerpath to be coupled with definite careeradvancement. Jan (2010) reported thatif an organization does not consider pro-viding opportunities to employees to ad-vance in their careers, this creates a feel-ing of frustration among them. Stairs etal. (2006) advised that organizationsshould facilitate opportunities for devel-opment and career progression for theiremployees. Benest (2008) also advisedthat this can be achieved by providingappropriate and flexible work challenges,continuous learning, challenging work,assignments which stretch but do notoverwhelm the employee, continual train-ing and development, and competitivepay.
Skills Development
Participants would like to be in anenvironment where there are opportuni-ties for continual professional develop-ment. To some this meant being amongspecialists who have technical knowledgecoupled with years of experience. To oth-ers it meant access to resources, mean-ing money and people to execute work andto keep up with the latest developments.One participant was quoted as saying“what I have realized is that most of thedecision making processes require imme-diate and interactive communications toenable one to solve most engineering prob-lems. Decision making requires extensiveknowledge, which in turn requires experi-ence to solve these problems”.
Stum (1998) reported that, in mostcases, employees would like to learn andgrow. Besides formal learning programs,there should be other learning opportuni-ties like job sharing, task services, con-ferences and expanded responsibilities.It was also recommended that managersshould provide affordable experientiallearning. Most participants confirmed theexistence of opportunities for empower-ment and self-development, depending onwhether they would benefit the depart-ment and the organization. One partici-pant was quoted saying: “what makes thejob worthwhile is the opportunity to learnand take ownership, take on other non-core work for professional growth, thusadvancing my electrical engineering man-agement knowledge and experience”.
Communication
Participants preferred an environ-ment where business matters are com-municated to all to enable them to con-tribute to decisions that are important tothe organization. Rucci et al. (2000) men-tioned that one of the barriers to trust ismisunderstanding and suggested that or-ganizations ensure clear communicationat all times. Stairs et al. (2006) supportedthis by suggesting timely and relevantcommunication that is tailored for func-tions and groups.
Support Services
Participants expressed their dissat-isfaction with poor support business ser-vices and ineffective support policies andinfrastructure, such as HR, buying etc.Sheridan (1992) reported that organiza-
Phuti F. Mabuza & Cecile N. Gerwel Proches
644 The Indian Journal of Industrial Relations, Vol. 49, No. 4, April 2014
tional culture values have an influenceon human resource strategies includingselection, placement policies, promotionand development procedures, and rewardsystems. Nohria et al. (2008) mentionedthat employees acknowledged that man-agers have certain powers to influencethe way in which organizational pro-cesses and policies are implemented, andthat they do have some discretion withintheir area of influence.
Performance ManagementProcesses
Participants raised the concernthat the annual performance ap-praisal methods are highly flawedand do not contribute to qualityoutputs.
Participants raised the concern thatthe annual performance appraisal meth-ods are highly flawed and do not con-tribute to quality outputs. Another causeof concern was perceived inequitabletreatment, lack of transparency, and hon-est and timely feedback by supervisors.To add to this, one participant held theview that the unique and totally over ana-lytical performance review seemed to bedesigned by engineers for engineers. Itwas further alleged that the system mademanagement feel in control to managethe details. Goodman (1971) indicatedthat ratings and evaluations of employ-ees have not been very successful,mainly because they have been used criti-cally, destructively, and with little sounddata to support the evaluation. Within thisnegative attitude towards appraisal,
Goodman (1971) proposed that good per-formance by workers depended on theirself-motivation and the supervisor’s mo-tivation.
Equity theory stresses the point thatindividuals are not only concerned withtheir rewards but also compare theiramount to what others receive. Whenpeople perceive an imbalance, there willbe tension. Fairness or tension providesthe basis for motivation. Nohria et al.(2008) advised the implementation of fair,trustworthy and transparent processes.This would help employees to understandthe rationale behind the decision even ifthey did not agree with some aspects ofthe processes.
Resources & Workload
It was stated by many participantsthat the resources to make a differencewere not always available and the abilityto improve systems and processes to thebenefit of the business was difficult withthe available resources. Moreover, theworkload was too much. One participantshared the same sentiment and said: “Ialso don’t believe we have enough oreven the right staff to handle the demandsand workload in the organization. Thisplaces additional burden and pressure onme”. Jan (2010) reported that employ-ees can become frustrated and dissatis-fied by a workload that is less or morethan their capacity. Mak and Sockel(2001) indicated that in an organizationthat is too demanding and unreliable withits employees’ needs, employee burnoutcould be frequently experienced. Thisburnout is related to work stressors such
Retaining Core, Critical & Scarce Skills
The Indian Journal of Industrial Relations, Vol. 49, No. 4, April 2014 645
as role vagueness, conflict and inad-equate resources.
Too Much Administration
Participants complained that theywere often overwhelmed with adminis-trative work. Despite the wonderful e-systems and processes in place, thereis still a lot of administration work to bedone. One participant elaborated on theissue and said “this is time consumingand prevents us from doing what weactually enjoy doing”. It was evidentthat employees did not understand theimportance of the admin work. Goodman(1971) alluded that only organizationalgoals are often considered and hencesuggested that workers should be helpedto achieve their goals within the organi-zational goals.
Customer Demands
Respondents indicated that some cus-tomers sometimes had no idea what theywanted. It is their feeling that they dealwith customers who sometimes refuse toco-operate and ignore Head Office re-quests or cause problems. Rucci et al.(1998) highlighted that the attitudes ofemployees towards their jobs and thework environment influence employeeretention, and employee customer satis-faction affects financials and more.Therefore, organizations should measureand manage the drivers of employee re-tention and customer satisfaction.Management’s decisions should be cus-tomer-oriented, and their communicationon organization goals and vision shouldbe done effectively.
Repetitive Work
Participants proclaimed that theirexposure to work assignments was onlyin their areas of responsibility. However,after five years, they found that the workwas repetitive, and also that they onlyused a small part of the knowledge theyhad gained at tertiary education level.One participant from management indi-cated that although he was comfortablewith his job, he was getting bored becausehe knew his job inside out. Goodman(1971) advised that supervisors and man-agers should give employees more free-dom and responsibility to direct their ownactivities and accomplish organisationalobjectives. This approach would providean individual with the opportunity to meetegoistic needs, to increase job responsi-bilities and fully utilize their abilities.
Office Environment
Participants indicated that they weredeprived of exposure to the real plantactivities, because they were not beinghands-on every day. The office environ-ment was perceived as not being condu-cive to their development as profession-als, and it would not improve their confi-dence nor speed up their career devel-opment and engineering expertise. Oneparticipant elaborated on this and said“personally, I am still young and ener-getic and prefer an environment that willallow and enable me to perform handson work and apply the basic principlesof engineering”. Deci (1972) suggestedthat in order to motivate employees in-trinsically, supervisors should design in-teresting and challenging tasks and allow
Phuti F. Mabuza & Cecile N. Gerwel Proches
646 The Indian Journal of Industrial Relations, Vol. 49, No. 4, April 2014
employees to participate in decision-mak-ing.
Limited Career Growth
Participants were of the view thatthere was no opportunity forgrowth.
Many participants were concernedthat in many cases there appeared to bea ‘glass ceiling’ in terms of the promo-tion within the organization. Therefore,participants were of the view that therewas no opportunity for growth. In somecases employees’ man-grades (grade ofthe job the person does) were not thesame as their post-grades (grade of thejob profile). Participants also reported thattraining for Engineers-in-training was notenough for them to understand what theircustomers in the business regions do. Jan(2010) stated that if an organization doesnot consider providing opportunities toemployees to advance their career, thenthis will create a feeling of frustrationamong them. Stairs et al. (2006) advisedorganizations to facilitate opportunitiesfor development and career progressionfor employees.
Travelling
One participant mentioned that toomuch travel away from home can be aproblem. This particular participant trav-elled frequently from Durban toJohannesburg. Job descriptions oftenspecify the requirements of a job. In ad-dition to this, management reminds can-didates of the requirements during the
interview and inquires whether a candi-date will be comfortable with the require-ments.
Recruitment
Participants observed that the entrylevel qualifications for the various job lev-els were too high and that suitable per-sons with technical experience could notbe obtained to do the work. A participantexpressed his frustration and said: “It hasa direct effect on me, because we don’tget the right people for doing the workeffectively”. Nohria et al. (2008) high-lighted that employees acknowledgedthat managers have certain powers toinfluence the way in which organizationalprocesses and policies are implemented,and they do have some discretion withintheir area of influence.
Conclusion
It was highlighted that there weremany factors in the organization thatemployees were satisfied with, but whichdid not necessarily mean that they wouldnot leave the department. The studyfound the following factors to be criticalto employees’ decisions to stay or leavethe organization: organizational culture,leadership style and support, autonomy,team work, recognition, remuneration,flexible working hours, challenging work,career and skills development. However,the availability of these factors does notimply satisfaction and no single factor caninfluence employees in favor of the em-ployer. A number of issues were alsohighlighted, such as: the flawed perfor-mance management process, a skills
Retaining Core, Critical & Scarce Skills
The Indian Journal of Industrial Relations, Vol. 49, No. 4, April 2014 647
shortage that led to work overload, un-reasonable customer demands and man-agement not being supportive, limitedcareer growth, the lack of career paths,and unfair reward and recognition prac-tices.
Recommendations
The leadership style of those man-aging the specialists needs to be care-fully considered. Specialist staff re-quires some control in decision-makingand problem-solving, and should be en-couraged to engage in stimulating andchallenging work. Tasks that are repeti-tive need to be reassessed as suchwork can be de-motivating. Specialistsshould not be overloaded with admin-istrative work but should rather be uti-lized for their scarce skills. A balanceshould be sought between companywork which also includes real plantactivity, and participation in work out-side the organization.
Emphasis should be placed on ca-reer advancement and skills develop-ment. As much as the specialists derivesatisfaction from being in charge of theirown work, management should alsostimulate a teamwork approach as thiscan allow for specialists to engage in ideageneration and perhaps start jointprojects. The performance managementsystem needs to be evaluated to ascer-tain the implementation thereof and theremunerat ion and reward systemsshould be considered on an individualand group level. Organizational pro-cesses and policies should facilitate thework of the specialists and specialists
can perhaps be included when decisionsare made regarding the strategy of theorganization and how best to meet cus-tomer demands.
The organization should not try toaddress each factor that may cause em-ployees to resign, but should seek a so-lution that is systematic, which wouldsolve the problem holistically. Employ-ees’ opinions should be explored fre-quently because their environmentchanges rapidly and this impacts eithernegatively or positively on their decisionto leave or stay.
The study noted the challenges of theengineering skills shortage and the diffi-culty in acquiring new employees in thisfield. The factors that influence staff turn-over impact directly on shortage of skills,because the factors that cause people toleave organizations cause it to be unableto attract the people. This impacts nega-tively on businesses because turnoverand shortage of skills causes a decreasein productivity, lack of sustainability, adeclining company image, low morale,and the inability to attract competentpeople.
This study focused on employee per-ceptions. Future research needs to inves-tigate the perceptions of the employerand determine how they would like toretain their employees.
Acknowledgements
All the respondents are thanked forparticipating in the study.
Phuti F. Mabuza & Cecile N. Gerwel Proches
648 The Indian Journal of Industrial Relations, Vol. 49, No. 4, April 2014
References
Amabile, T.M. (1996), The Motivation for Cre-ativity in Organizations. Boston: HarvardBusiness School Publishing.
Benest, F. (2008), “Retaining and Growing Tal-ent: Strategies to Create Organizational‘stickiness”’, Public Management, 90(9):20-25.
Bititci, U.S., Mendibil, K., Nudurupati, S.,Garengo, P. & Turner, T. (2006), “Dynam-ics of Performance Measurement and Or-ganizational Culture”, International Jour-nal of Operations and Production Manage-ment, 26(12): 1325-50.
Carr, C. & Jones, B.M. (2001), “OrganizationalCulture and the Antecedents of Turnoverin High-stress IT jobs”, Paper presented atSeventh Americas Conference on Informa-tion Systems.
Cesare, J.D. & Sadri, G. (2003), “Do All CarrotsLook the Same? Examining the Impact ofCulture on Employee Motivation”, Man-agement Research News, 26(1): 29-40.
Deci, E.L. (1972), “The Effects of Contingentand Non-contingent Rewards and Controlson Intrinsic Motivation”, OrganizationalBehavior and Human Performance, 8: 217-29.
Goodman, C.H. 1971. “Employee Motivation”,Library Trends, 20(1): 39-47.
Hausknecht, J., Rodda, J.M. & Howard, M.J.(2008), “Targeted Employee Retention:Performance-based and Job-related Differ-ences in Reported Reasons for Staying”.CAHRS Working Paper Series, 1-34.
Jan, Z. (2010), Career Development in a LearningOrganization, Islamabad: National Univer-sity of Modern Languages.
Lockwood, N.R. (2007), Leveraging EmployeeEngagement for Competitive Advantage:HR’s Strategic Role. USA: Society for Hu-man Resource Management.
Mak, B.L. & Sockel, H. (2001), “A Confirma-tory Factor Analysis of IS Employee Mo-tivation and Retention”, Information andManagement, 38: 265-76.
McKeown, J.L (2002), Retaining Top Employ-ees, New York: McGraw-Hill.
Mitchell, T.R. (1973), “Motivation and Partici-pation: An Integration”, Academy of Man-agement Journal, 16(4): 670-79.
Nohria, N. Groysberg, B. & Lee, L. (2008), “Em-ployee Motivation: A Powerful New Model”,Harvard Business Review, 7/8: 1-8.
Ramlall, S. (2003), “Managing Employee Reten-tion as a Strategy for Increasing Organiza-tional Competitiveness”, Applied H.R.M.Research, 8(2): 63-72.
Rucci, J.A., Kirn, S.P. & Quinn, R.T. (1998), “TheEmployee-Customer-Profit Chain at Sears”,Harvard Business Review, 76(1): 83-96.
Samuel, M.O. & Chipunza, C. (2009), “EmployeeRetention and Turnover: Using Motiva-tional Variables as a Panacea”, African Jour-nal of Business Management, 3(8): 410-15.
Sheridan, J.E. (1992), “Organizational Cultureand Employee Retention”, Academy ofManagement Journal, 35(5): 1036-56.
Stairs, M., Galpin, M., Page, N. & Linley, A.(2006), “Retention on a Knife Edge: TheRole of Employee Engagement in TalentManagement”, Selection and DevelopmentReview, 22(5): 19-23.
Stum, D.L, (1998), “Five Ingredients for an Em-ployee Retention Formula”, Human Re-source Focus, 75(9), S9-10
sas
Employee Creativity: Mediating & Modernizing Role ofPsychological Capital
Vishal Gupta
The present study develops amulti-level causal frameworklinking HRM practices, positivepsychological capital and em-ployee creativity. The paper de-velops propositions about themediating and moderating roleof psychological capital forHRM-creativity relationship. Thepaper argues that, to provide aconvincing explanation of theassociation between HRM prac-tices and creativity, we need toimprove our theoretical under-standing in three key areas: thenature of HRM, especially therationale for the specific lists ofHR practices; the linkage be-tween HRM practices and em-ployee creativity; and the ‘black-box’ linking HRM practices toemployee creativity.
Introduction
Increasingly turbulent environments,heightened competition and unpredictabletechnological changes have brought to theforefront of management the recognition,development and sustenance of employeecreativity. Creativity is defined as the pro-duction of novel and useful ideas by an in-dividual or by a group of individuals work-ing together and has been found to contrib-ute to organizational innovation, effective-ness and survival (Amabile, 1983; 1996;Shalley, Zhou & Oldham, 2004). Surpris-ingly, the review of literature suggests thatthe impact of human resource management(HRM) practices on employee creativityhas received scant attention from both aca-demicians and practitioners (Shipton, West,Dawson, Birdi & Patterson, 2006; Gupta,2013). Though there have been studies thattested the impact of specific practices oncreativity (e.g., Baer, Oldham &Cummings, 2003; Huang & Lin, 2006;Manolopoulos, 2006; Shalley & Perry-Smith, 2001; Shipton et al., 2006), thesestudies have failed to provide a theoreticalrationale for choosing the HR practices.Moreover, the studies have failed to pro-vide a coherent validation of directionalityof these relationships. Baer et al. (2003:570)
Vishal Gupta is Assistant Professor inOrganizational Behavior at the IndianInstitute of Management Ahmedabad.E-mail: [email protected]
The Indian Journal of Industrial Relations, Vol. 49, No. 4, April 2014 649
Vishal Gupta
650 The Indian Journal of Industrial Relations, Vol. 49, No. 4, April 2014
observed that “Unfortunately, there is littleagreement among scholars concerning thelikely direction of the effects of such re-wards on creativity”. Fewer studies haveconsidered the important role of employ-ees’ perceptions of HR practice used orexamined the more proximal outcomes ofhigh-performance HR practices that mayplay mediating roles in the HR practice–performance relationship (Guest, 2011;Kehoe & Wright, 2013).
If we are to improve our understand-ing of the impact of HRM on creativity,we need a theory about HRM, a theoryabout creativity and a theory about howthey are linked. The present study de-velops a theory about the linkages be-tween HRM practices and employee cre-ativity. In doing so, support has been takenof the componential framework of cre-ativity (Amabile, 1983) consisting of do-main-relevant skills, creativity-relevantskills and task motivation. The secondpart of the study explores the ‘black-box’linking HRM practices and employee cre-ativity. Building on the ideas of positivepsychology, we present positive psycho-logical capital both as a mediating and amoderating variable for the HRM prac-tice-creativity relationship. High-perfor-mance practices enhance the positive ex-changes between the employee and em-ployer, thereby enhancing employee psy-chological capital and creativity.
HRM Practices in the IndianContext
Nature of human resource manage-ment is culture specific (Budhwar &Khatri, 2001). The cultural and eco-
nomic differences may hinder the ac-ceptance and implementation of humanresource practices (Schneider, 1988).North American and Western Europeanorganizations operate in a highly devel-oped legal and regulatory environment.Organizations that operate in India donot have such a well-developed insti-tutional infrastructure for free markettransactions. The country had a sys-tem of state-controlled organizationsuntil 1990s, when the economy of thecountry was finally liberalized. India isdistinct from other countries in termsof its culture (low uncertainty avoid-ance, high power distance, mediumcollectivist orientation, medium mascu-linity, strong long-term orientation)(Hofstede, 2001). A sizeable Indianpopulation has deep-seated belief infatalism and as a result any significantchange in attitudes as well as behav-iors is relatively difficult to accomplish.Taking into account the dominant so-cial norms and values, adopting HRMpractices seen as appropriate in localcontext can be crucial for achievingdesired performance (Björkman &Budhwar, 2007). Table 1 provides a list-ing of the HRM practices included inthe present study along with their defi-nitions and the India-specific researchevidence. Due to the potential of theidentified HRM practices to have anoverall positive influence on employeeperformance, they are referred to ashigh-performance HRM practices inthe present study.
Nature of human resource man-agement is culture specific.
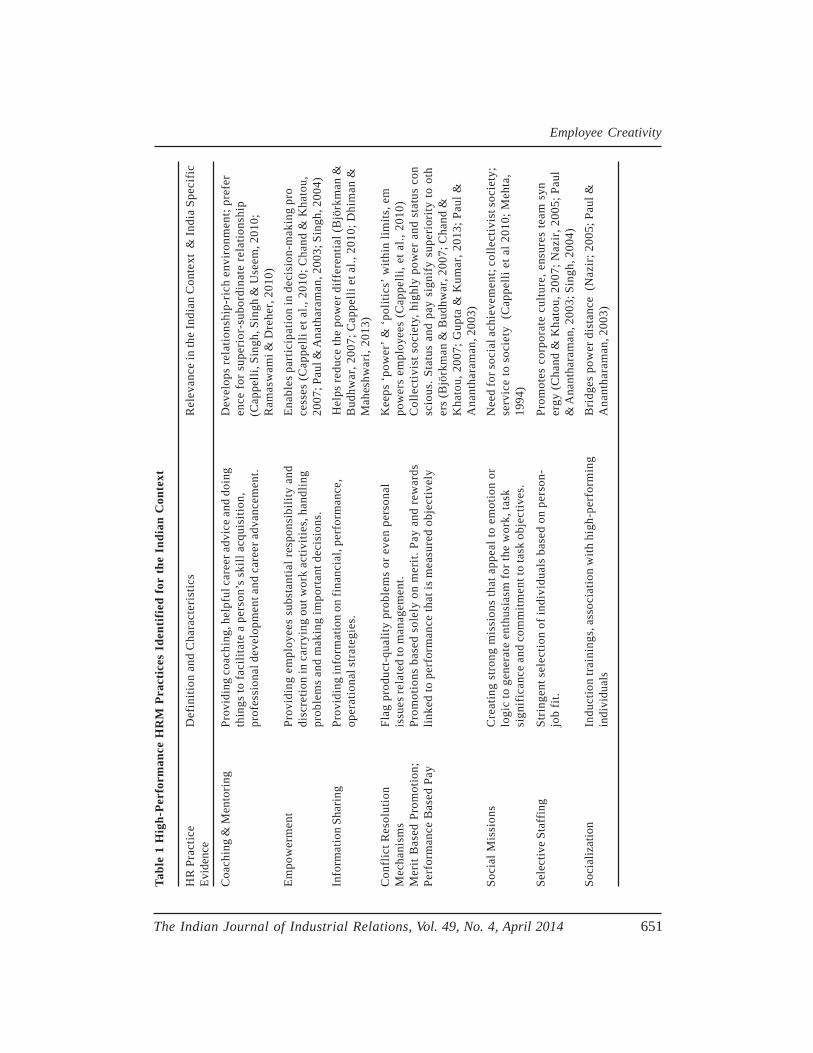
Employee Creativity
The Indian Journal of Industrial Relations, Vol. 49, No. 4, April 2014 651
Tabl
e 1
Hig
h-Pe
rfor
man
ce H
RM
Pra
ctic
es I
dent
ifie
d fo
r th
e In
dian
Con
text
HR
Pra
ctic
eD
efin
ition
and
Cha
ract
eris
tics
Rel
evan
ce in
the
Indi
an C
onte
xt &
Indi
a Sp
ecif
icEv
iden
ce
Coa
chin
g &
Men
tori
ngPr
ovid
ing
coac
hing
, hel
pful
car
eer a
dvic
e an
d do
ing
Dev
elop
s re
latio
nshi
p-ri
ch e
nvir
onm
ent;
pref
erth
ings
to fa
cilit
ate
a pe
rson
’s s
kill
acqu
isiti
on,
ence
for s
uper
ior-
subo
rdin
ate
rela
tions
hip
prof
essi
onal
dev
elop
men
t and
car
eer a
dvan
cem
ent.
(Cap
pelli
, Sin
gh, S
ingh
& U
seem
, 201
0;R
amas
wam
i & D
rehe
r, 20
10)
Empo
wer
men
tPr
ovid
ing
empl
oyee
s su
bsta
ntia
l res
pons
ibili
ty a
ndEn
able
s par
ticip
atio
n in
dec
isio
n-m
akin
g pr
odi
scre
tion
in c
arry
ing
out w
ork
activ
ities
, han
dlin
gce
sses
(Cap
pelli
et a
l., 2
010;
Cha
nd &
Kha
tou,
prob
lem
s an
d m
akin
g im
port
ant d
ecis
ions
.20
07; P
aul &
Ana
thar
aman
, 200
3; S
ingh
, 200
4)In
form
atio
n Sh
arin
gPr
ovid
ing
info
rmat
ion
on fi
nanc
ial,
perf
orm
ance
,H
elps
redu
ce th
e po
wer
dif
fere
ntia
l (B
jörk
man
&op
erat
iona
l str
ateg
ies.
Bud
hwar
, 200
7; C
appe
lli e
t al.,
201
0; D
him
an &
Mah
eshw
ari,
2013
)
Con
flic
t Res
olut
ion
Flag
pro
duct
-qua
lity
prob
lem
s or
eve
n pe
rson
alK
eeps
‘pow
er’ &
‘pol
itics
’ with
in li
mits
, em
Mec
hani
sms
issu
es re
late
d to
man
agem
ent.
pow
ers
empl
oyee
s (C
appe
lli, e
t al.,
201
0)M
erit
Bas
ed P
rom
otio
n;Pr
omot
ions
bas
ed s
olel
y on
mer
it. P
ay a
nd re
war
dsC
olle
ctiv
ist s
ocie
ty, h
ighl
y po
wer
and
sta
tus
con
Perf
orm
ance
Bas
ed P
aylin
ked
to p
erfo
rman
ce th
at is
mea
sure
d ob
ject
ivel
ysc
ious
. Sta
tus
and
pay
sign
ify
supe
rior
ity to
oth
ers
(Bjö
rkm
an &
Bud
hwar
, 200
7; C
hand
&K
hato
u, 2
007;
Gup
ta &
Kum
ar, 2
013;
Pau
l &A
nant
hara
man
, 200
3)So
cial
Mis
sion
sC
reat
ing
stro
ng m
issi
ons
that
app
eal t
o em
otio
n or
Nee
d fo
r soc
ial a
chie
vem
ent;
colle
ctiv
ist s
ocie
ty;
logi
c to
gen
erat
e en
thus
iasm
for t
he w
ork,
task
serv
ice
to s
ocie
ty (
Cap
pelli
et a
l 201
0; M
ehta
,si
gnif
ican
ce a
nd c
omm
itmen
t to
task
obj
ectiv
es.
1994
)
Sele
ctiv
e St
affin
gSt
ring
ent s
elec
tion
of in
divi
dual
s ba
sed
on p
erso
n-Pr
omot
es c
orpo
rate
cul
ture
, ens
ures
team
syn
job
fit.
ergy
(Cha
nd &
Kha
tou,
200
7; N
azir
, 200
5; P
aul
& A
nant
hara
man
, 200
3; S
ingh
, 200
4)So
cial
izat
ion
Indu
ctio
n tr
aini
ngs,
ass
ocia
tion
with
hig
h-pe
rfor
min
gB
ridg
es p
ower
dis
tanc
e (N
azir
; 200
5; P
aul &
indi
vidu
als
Ana
ntha
ram
an, 2
003)
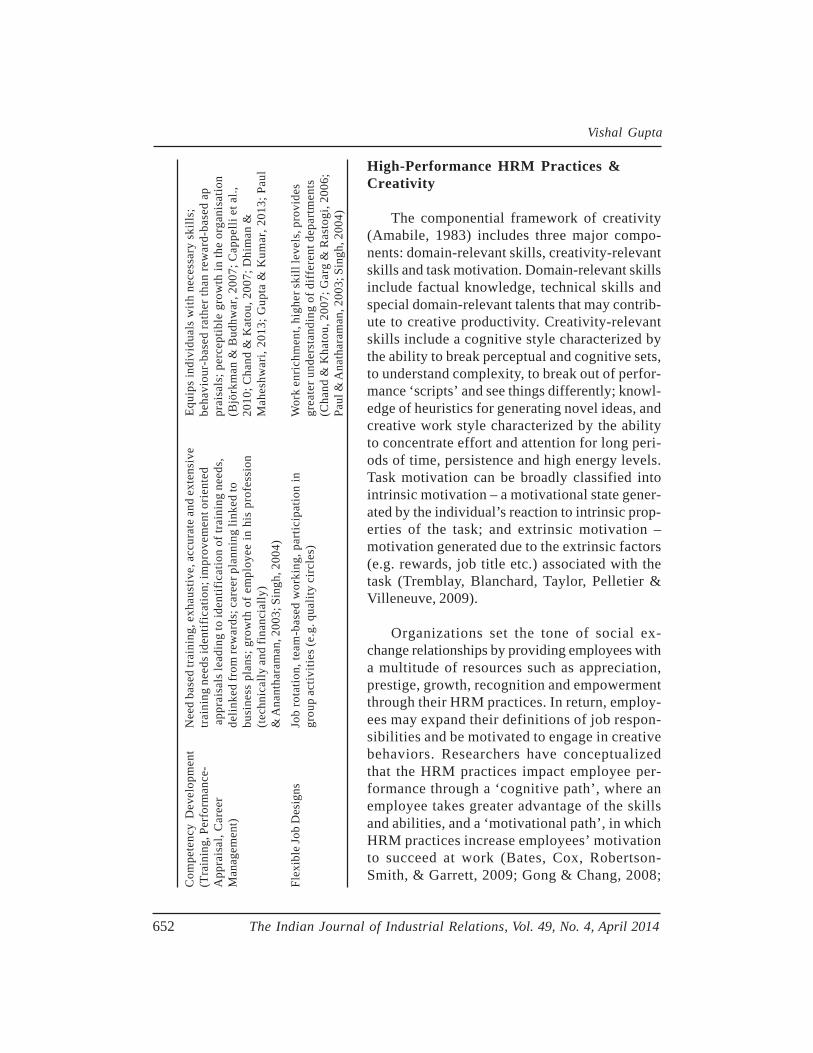
Vishal Gupta
652 The Indian Journal of Industrial Relations, Vol. 49, No. 4, April 2014
Com
pete
ncy
Dev
elop
men
tN
eed
base
d tr
aini
ng, e
xhau
stiv
e, a
ccur
ate
and
exte
nsiv
eEq
uips
indi
vidu
als
with
nec
essa
ry s
kills
;(T
rain
ing,
Per
form
ance
-tr
aini
ng n
eeds
iden
tific
atio
n; im
prov
emen
t ori
ente
dbe
havi
our-
base
d ra
ther
than
rew
ard-
base
d ap
App
rais
al, C
aree
r a
ppra
isal
s lea
ding
to id
entif
icat
ion
of tr
aini
ng n
eeds
,pr
aisa
ls; p
erce
ptib
le g
row
th in
the
orga
nisa
tion
Man
agem
ent)
delin
ked
from
rew
ards
; car
eer p
lann
ing
linke
d to
(Bjö
rkm
an &
Bud
hwar
, 200
7; C
appe
lli e
t al.,
busi
ness
pla
ns; g
row
th o
f em
ploy
ee in
his
pro
fess
ion
2010
; Cha
nd &
Kat
ou, 2
007;
Dhi
man
&(t
echn
ical
ly a
nd fi
nanc
ially
)M
ahes
hwar
i, 20
13; G
upta
& K
umar
, 201
3; P
aul
& A
nant
hara
man
, 200
3; S
ingh
, 200
4)
Flex
ible
Job
Des
igns
Job
rota
tion,
team
-bas
ed w
orki
ng, p
artic
ipat
ion
inW
ork
enri
chm
ent,
high
er sk
ill le
vels
, pro
vide
sgr
oup
activ
ities
(e.g
. qua
lity
circ
les)
grea
ter u
nder
stan
ding
of d
iffe
rent
dep
artm
ents
(Cha
nd &
Kha
tou,
200
7; G
arg
& R
asto
gi, 2
006;
Paul
& A
nath
aram
an, 2
003;
Sin
gh, 2
004)
High-Performance HRM Practices &Creativity
The componential framework of creativity(Amabile, 1983) includes three major compo-nents: domain-relevant skills, creativity-relevantskills and task motivation. Domain-relevant skillsinclude factual knowledge, technical skills andspecial domain-relevant talents that may contrib-ute to creative productivity. Creativity-relevantskills include a cognitive style characterized bythe ability to break perceptual and cognitive sets,to understand complexity, to break out of perfor-mance ‘scripts’ and see things differently; knowl-edge of heuristics for generating novel ideas, andcreative work style characterized by the abilityto concentrate effort and attention for long peri-ods of time, persistence and high energy levels.Task motivation can be broadly classified intointrinsic motivation – a motivational state gener-ated by the individual’s reaction to intrinsic prop-erties of the task; and extrinsic motivation –motivation generated due to the extrinsic factors(e.g. rewards, job title etc.) associated with thetask (Tremblay, Blanchard, Taylor, Pelletier &Villeneuve, 2009).
Organizations set the tone of social ex-change relationships by providing employees witha multitude of resources such as appreciation,prestige, growth, recognition and empowermentthrough their HRM practices. In return, employ-ees may expand their definitions of job respon-sibilities and be motivated to engage in creativebehaviors. Researchers have conceptualizedthat the HRM practices impact employee per-formance through a ‘cognitive path’, where anemployee takes greater advantage of the skillsand abilities, and a ‘motivational path’, in whichHRM practices increase employees’ motivationto succeed at work (Bates, Cox, Robertson-Smith, & Garrett, 2009; Gong & Chang, 2008;
Employee Creativity
The Indian Journal of Industrial Relations, Vol. 49, No. 4, April 2014 653
Vandenberg, Richardson & Eastman,1999).
High-Performance HRM Practices,Task Motivation &Creativity
The mentoring relationships lead todevelopment of positive interpersonal re-lationships, better employee morale, bet-ter career management, and greater com-mitment (Allen, Eby, Poteet, Lentz, &Lima, 2004; Allen & O’Brien, 2006;Horvath, Wasko & Bradley, 2008). Em-powerment maximizes employee’s in-volvement thereby fostering positive workattitudes (Konrad, 2006). Conflict resolu-tion mechanisms help alleviate situationsof perceived injustice or conflicts in thecompany and are likely to maintain a highlevel of motivation (Fey, Björkman &Pavlovskaya, 2000; Morrison & Robinson,1997). Information sharing conveys toemployees that they are trusted and val-ued by the organization (Pfeffer & Veiga,1999). Though extrinsic motivation hasbeen said to be detrimental to creativity(Amabile, 1983), in a scarcity-riddeneconomy like India extrinsic rewards canbe strong motivators of innovative behav-iors for roles that demand creativity as apart of employee’s job description (e.g.,Research and Development work). Pauland Anantharaman (2003) found that com-pensation practices positively affect com-mitment of skilled professional in IndianIT firms. Performance-based compensa-
tion and merit-based promotions have beenfound to influence extrinsic motivation(e.g., Guest, 1997; Manolopoulos, 2006).
India is a collectivist society. Strongmissions that appeal to emotion or logic cangenerate enthusiasm for the work, task sig-nificance, commitment to task objectivesand compliance with requests for coopera-tion and assistance (Cappelli et al., 2010).Stringent selection practices (e.g., followedin Google) influence the employee-job fitand the quality of the workforce (Godard,2004; Guest, 1997; MacDuffie, 1995).Moreover, a selective organization conveysstatus and prestige to those being selected(Gong & Chang, 2008). New-comer so-cialization and selective staffing practicessignal an organization’s intent to establisha long-term exchange relationship with itsemployees. Based on the above arguments,we posit:
P1: High-performance HRM practices(coaching & mentoring, empower-ment, selective staffing, conflict reso-lution mechanisms, new comer so-cialization, competency developmentpractices, merit-based promotions,social missions, flexible job designs)are likely to be positively related toemployee task motivation.
P2: Task motivation will mediate the re-lationship between HRM practicesand employee creativity.
High-Performance HRM Practices&Creativity
Mentors provide access into socialnetworks that include repositories ofknowledge not available through formal
In a scarcity-ridden economy likeIndia extrinsic rewards can bestrong motivators of innovativebehaviors.
Vishal Gupta
654 The Indian Journal of Industrial Relations, Vol. 49, No. 4, April 2014
communication channels (Dreher &Ash, 1990). Entry into these social net-works also provides the protégé with theopportunity to develop knowledge andskills required for being creative at work(Allen et al., 2004). Coaches can alsoinfluence employee’s cognitive and workstyles (creativity-relevant skills) by rolemodeling, evaluation and mastery expe-riences (Shalley & Perry-Smith, 2001).Narrow and rigid job descriptions makeemployees think very narrowly and re-duce their sense of empowerment. Jobrotation improves domain-relevantknowledge by allowing employees to seethe company from multiple roles and per-spectives, forging of strong personal tiesamong organizational members and byenhancing cohesion and teamwork.
Narrow and rigid job descriptionsmake employees think very nar-rowly and reduce their sense ofempowerment.
Selective staffing can be used tochoose employees who are higher ondomain-relevant and creativity-relevantskills (Guest, 1997). Organizations canfocus on screening prior to selection tohire employees based on the task ex-pertise and cognitive skills that are es-sential for creativity. Training can beused to provide educational opportuni-ties that can enhance task domain ex-pertise. Offering training opportunitiesthat can increase individuals’ knowl-edge base and/or their creativity-rel-evant skills should help employees inbecoming more creative at their work(Shalley & Gilson, 2004). Research on
training for creative problem solvinghas shown that it can help in enhanc-ing employees’ divergent thinking(Basudur, Wakabayashi & Graen,1990). Effective performance-basedappraisal can help in identifying thetraining needs and thus aid in improv-ing the domain and creativity-relevantskills. Socialization with highly creativepeople can train employees in creativ-ity related skills (Guest, 1997; Shalley& Perry-Smith, 2001). Socializationprograms can create an ‘esprit decorps,’ a shared experience, an inter-personal or informal network, a com-pany language or jargon, as well asdevelop technica l competencies(Schneider, 1988). Thus, we posit:
P3: High-performance HRM practices(competency development practices,new-comer socialization, selectivestaffing, coaching and mentoring) willbe positively related to employee do-main-relevant skills.
P4: High-performance HRM practices(competency development practices,new-comer socialization, selectivestaffing, coaching and mentoring) willbe positively related to employee cre-ativity-relevant skills.
P5: Employee domain-relevant skills willmediate the relationship betweenhigh-performance HRM practicesand employee creativity.
P6: Employee creativity-relevant skillswill mediate the relationship betweenhigh-performance HRM practicesand employee creativity.
Employee Creativity
The Indian Journal of Industrial Relations, Vol. 49, No. 4, April 2014 655
Mediating Role of PositivePsychological Capital
The composite construct of Psycho-logical Capital has been defined as “anindividual’s positive psychological stateof development characterized by: (1)having confidence (self-efficacy) to takeon and put in the necessary effort to suc-ceed at challenging tasks; (2) making apositive attribution (optimism) about suc-ceeding now and in the future; (3) per-severing toward goals and, when neces-sary, redirecting paths to goals (hope) inorder to succeed; and (4) when beset byproblems and adversity, sustaining andbouncing back and even beyond (resil-ience) to attain success” (Luthans,Youssef, & Avolio, 2007: 3). The fourpositive psychological capacities of con-fidence, hope, optimism, and resilience aremeasurable, open to development and canbe managed through focused interven-tions for more effective work perfor-mance (Luthans et al., 2007; Caza,McCarter, Hargrove & Wad, 2009).
High Performance HRM practicesenhance positive exchanges between theemployee and the employer. High-perfor-mance HRM practices signal to the em-ployees that the organization views themas a strategic resource, invests in theirdevelopment, recognizes their contribu-tion, and cares for their well-being(Chuang & Liao, 2010). This can help increating a positive unit-level climatewhere employees start to feel hopefulabout their future, optimistic about theircareers, resilient and efficacious abouttheir potential and their ability to do wellin their jobs. Moreover, selectively staff-
ing employees based on their levels ofpositive psychological capacities is morelikely to develop a workforce high onthese capacities (Caza et al., 2009).
Self-efficacy can be enhancedthrough empowerment, communication(i.e., sharing useful information and posi-tive feedback), training aimed at enhanc-ing mastery experiences, vicarious posi-tive experiences, positively oriented per-suasion, physiological and psychologicalarousal (Bandura, 1997; Luthans et al.,2007). Use of flexible job designs pro-vide more responsibility, challenge, andempowered personal control over thework thereby enhancing employee’s self-efficacy (Luthans, 2002). Optimism hasbeen shown to be amenable to develop-ment through Schneider’s (2001) three-step process: leniency for the past, ap-preciation for the present and opportu-nity-seeing for the future. Coaching andmentoring, information-sharing, empow-erment, training and development andsocialization practices can be useful indeveloping optimism as they tap the threesteps of Schneider’s optimism develop-ment process. Resilience can be en-hanced using positive emotions, alteringthe perceived level of risk (throughcoaching & mentoring) and fostering self-enhancement and development (throughcompetency development practices)(Avey, Luthans & Jensen, 2009).
Hope can be enhanced by focusingon goal-design acceptance and commit-ment (possible through empowerment),pathways generation (through informa-tion-sharing, mentoring and empower-ment), developing alternate pathways
Vishal Gupta
656 The Indian Journal of Industrial Relations, Vol. 49, No. 4, April 2014
and skill of re-goaling (through traininginterventions) and overcoming obstacles(through coaching and mentoring)(Luthans, 2002; Luthans, Avey, Avolio,Norman & Combs, 2006). Including em-ployees in the goal-setting processes canalso lead to high-hope employees (Lopez,2007). Based on the above arguments,We posit:
P7: High Performance HRM Practices(coaching & mentoring, empower-ment, selective staffing, conflict reso-lution mechanisms, new comer so-cialization, competency developmentpractices, merit-based promotions,social missions ,flexible job designs)will be positively related to employeepsychological capital (self-efficacy,optimism, resilience, hope).
Psychological Capital & Creativity
Creativity is a high-risk activity ascreative pursuits are fretted with risks offailure and ridicule (Janssen, 2004). In-dividuals higher in self-efficacy are morelikely to undertake risky and challengingactivities such as creative task engage-ment (Gupta & Singh, in press;Sweetman, Luthans, Avey & Luthans,2011). Self-efficacious people believe intheir abilities to mobilize the motivationnecessary to successfully perform a spe-cific task (Tierney & Farmer, 2002; Gong,Huang & Farh, 2009). Individuals withhigher levels of hope have the agentic
capacity to set and pursue goals in sucha way that they stay motivated through-out the pursuant process (Luthans et al.,2007; Snyder, 2002; Snyder & Lopez,2005). With high willpower (i.e., takingmotivated action) and high way-power(i.e., generating alternative pathways),those with high hope tend to incorporatea more motivated effort and generatepathways into the mental strategies ofcreative problem solving (Sweetman etal., 2011). Hopeful people deal with ev-eryday obstacles with greater ease andmay even become energized when theyhit a sticky patch to get unstuck. Opti-mistic individuals expect good things tohappen to them leading to significant cog-nitive and behavioral implications (Carver& Scheier, 2003; Avey, Patera & West,2006). Due to an optimistic explanatorystyle, optimists distance themselves fromunfavorable life events and are less likelyto be perturbed by feelings of depression,guilt, self-blame and despair (Youssef &Luthans, 2007; Rego, Sousa, Marques &e Cunha, 2012). Resilient individuals areemotionally stable, have a firm accep-tance of reality, a deep belief often but-tressed by strongly held values that lifeis meaningful and an astounding abilityto improvise and adapt to significantchange (Masten, 2001; Masten & Reed,2005; Gupta & Singh, in press).
There are likely to be synergistic in-teractions between the four psychologi-cal capacities. Employees who embodyhigh levels of overall psychological capi-tal may be stronger performers becauseof the four psychological capacities mani-fested through their cognitions, motiva-tion and ultimately their behaviors than
Creativity is a high-risk activity ascreative pursuits are fretted withrisks of failure and ridicule.
Employee Creativity
The Indian Journal of Industrial Relations, Vol. 49, No. 4, April 2014 657
those who only exhibit hope, or resilience,or optimism, or self-efficacy in a givensituation (Gupta & Singh, in press). Forexample, employees high on self-efficacyare likely to be much more creative be-cause they also have high hope (i.e., theynot only are confident about succeedingat their tasks but also identify alternatepathways to achieve their goals should thecurrent one get blocked). Thus, we posit:
P8: Employee psychological capital willbe positively related to employee cre-ativity.
P9: Employee psychological capital willmediate the relationship betweenhigh-performance work practicesand employee creativity.
Moderating Role of PsychologicalCapital
High-performance work practiceshave been found to be associated with jobstrain and lower pay satisfaction (Ramsay,Scholarios & Harley, 2000), low job satis-faction and self-esteem (Godard, 2001),increased concertive control (Barker,1993), and greater work demands, feel-ings of constant pressure, and stress andnegative spillovers (White et al, 2003).Psychological capital is introduced hereas a possible moderating variable that hasthe potential to mitigate the negative ef-fects of these high-performance workpractices on employee task motivation.
Psychological capital may lead tolower perceived stress, as well aslower intentions to quit.
Higher psychological capital is sig-nificantly related to higher employeewell-being, healthier attitudes towardwork and greater productivity (Cole,Daly & Mak, 2009). Avey et al. (2009)found that psychological capital maylead to lower perceived stress, as wellas lower intentions to quit . Avey,Luthans, Smith & Palmer (2010) foundthat employees’ psychological capitalwas related to psychological well-beingand, importantly, that psychologicalcapital explained additional variance inwell-being measures over time. Individu-als with higher levels of efficacy aremore likely to perceive challenges assurmountable given sufficient competen-cies and effort. Individuals with highhope are more likely to perform betterand survive, are less likely to be emo-tionally exhausted, and thus are morelikely to stay on. Resilient individuals arebetter equipped to deal with the stres-sors as they show greater emotional sta-bility when faced with adversity. (Aveyet al., 2009). We, thus, posit:
P10: Psychological capital will mod-erate the relationship between HRMpractices and employee task motivationsuch that the relationship will be stron-ger when psychological capital is higherthan when it is low.
Fig. 1 presents the conceptualizedmodel.
Discussion
Impact of HRM practices on em-ployee creativity has received scant at-tention from both academicians and
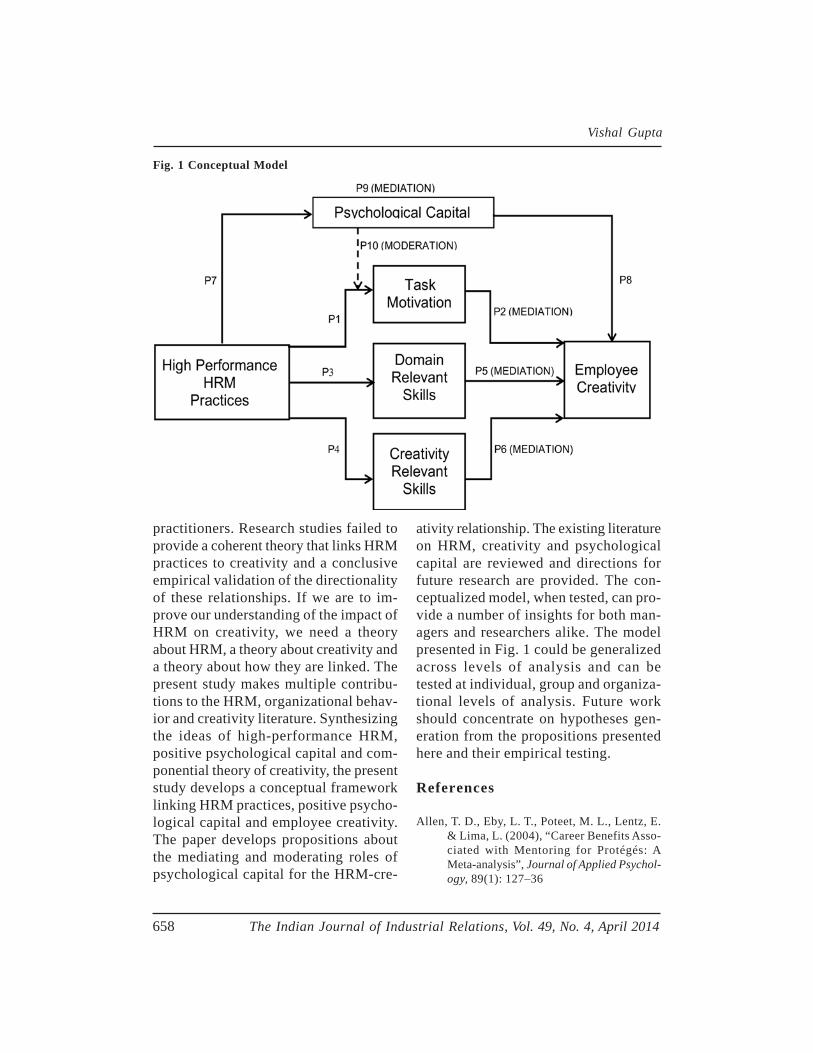
Vishal Gupta
658 The Indian Journal of Industrial Relations, Vol. 49, No. 4, April 2014
Fig. 1 Conceptual Model
practitioners. Research studies failed toprovide a coherent theory that links HRMpractices to creativity and a conclusiveempirical validation of the directionalityof these relationships. If we are to im-prove our understanding of the impact ofHRM on creativity, we need a theoryabout HRM, a theory about creativity anda theory about how they are linked. Thepresent study makes multiple contribu-tions to the HRM, organizational behav-ior and creativity literature. Synthesizingthe ideas of high-performance HRM,positive psychological capital and com-ponential theory of creativity, the presentstudy develops a conceptual frameworklinking HRM practices, positive psycho-logical capital and employee creativity.The paper develops propositions aboutthe mediating and moderating roles ofpsychological capital for the HRM-cre-
ativity relationship. The existing literatureon HRM, creativity and psychologicalcapital are reviewed and directions forfuture research are provided. The con-ceptualized model, when tested, can pro-vide a number of insights for both man-agers and researchers alike. The modelpresented in Fig. 1 could be generalizedacross levels of analysis and can betested at individual, group and organiza-tional levels of analysis. Future workshould concentrate on hypotheses gen-eration from the propositions presentedhere and their empirical testing.
References
Allen, T. D., Eby, L. T., Poteet, M. L., Lentz, E.& Lima, L. (2004), “Career Benefits Asso-ciated with Mentoring for Protégés: AMeta-analysis”, Journal of Applied Psychol-ogy, 89(1): 127–36
Employee Creativity
The Indian Journal of Industrial Relations, Vol. 49, No. 4, April 2014 659
Allen, T. D. & O’Brien, K. E. (2006), “FormalMentoring Programs and OrganizationalAttraction”, Human Resource DevelopmentQuarterly, 17(1): 43-58.
Amabile, T. M. (1983), The Social Psychologyof Creativity, New York: Springer-Verlag.
Amabile, T. M. (1996), Creativity in Context,Boulder, CO: Westview Press.
Àngel, P. O. & Sànchez, L. S. (2009), “R&DManagers’ Adaptation of Frms’ HRM Prac-tices”, R&D Management, 39(3): 271-90
Avey, J. B., Luthans, F., & Jensen, S. M. (2009),“Psychological Capital: A Positive Re-source for Combating Employee Stress andTurnover”, Human Resource Management,48(5): 677- 93.
Avey, J. B., Luthans, F., Smith, R. M. & Palmer,N. F. (2010), “Impact of Positive Psycho-logical Capital on Employee Well-beingover Time”, Journal of Occupational HealthPsychology, 15: 17-28
Avey, J. B., Patera, J. L. & West, B. J. (2006),“The Implications of Positive Psychologi-cal Capital on Employee Absenteeism”,Journal of Leadership & OrganizationalStudies, 13(2): 42-60.
Baer, M., Oldham, G. R. & Cummings, A. (2003),“Rewarding Creativity: When Does it Re-ally Matter”? The Leadership Quarterly,14: 569-86
Barker, J. R. (1993), “Tightening the Iron Cage:Concertive Control in Self-managingTeams”. Administrative Science Quarterly,38: 408–37
Bandura, A. (1997), Self-efficacy: The Exerciseof Control, New York: Freeman
Basudur, M., Wakabayashi, M. & Graen, G. B.(1990), “Individual Problem-solving Stylesand Attitudes toward Divergent ThinkingBefore and After Training”, Creativity Re-search Journal, 3: 22–32
Bates, P., Cox, A., Robertson-Smith, G. & Garrett,R. (2009), High Performance Working: De-veloping a Survey Tool, London, UK
Björkman, I. & Budhwar, P. (2007), “When inRome…? Human Resource Managementand the Performance of Foreign Firms Op-erating in India”, Employee Relations, 29(6):595-610
Budhwar, P. S. & Khatri, N. (2001), “A Com-parative Study of HR Practices in India andBritain”, The International Journal of Hu-man Resource Management, 12: 800-26.
Cappelli, P., Singh, H., Singh, J. V. & Useem, M.(2010), “Leadership Lessons from India:How the Best Indian Companies Drive Per-formance by Investing in People”, HarvardBusiness Review, 88(3): 90-97.
Carver C. S. & Scheier M. F. (2005), “Optimism”,in C. R. Snyder, & S. J. Lopez (Eds.), Hand-book of Positive Psychology, Oxford: Ox-ford University Press.
Caza, A., McCarter, M. W., Hargrove, D. & Wad,S. R. (2009),. “Third Party Effects of Psy-chological Capital: Observer Attributionsand Responses”, Academy of ManagementProceedings: 1-6.
Chand, M. & Katou, A. A. (2007), “The Impactof HRM Practices on Organizational Per-formance in the Indian Hotel Industry”,Employee Relations, 29(6): 576-94
Chuang, C. & Liao, H. (2010), “Strategic HumanResource Management in Service Context:Taking Care of Business by Taking Care ofEmployees and Customers”, PersonnelPsychology, 63(1): 153-96.
Cole, K., Daly, A. & Mak, A. (2009), “Good forthe Soul: The Relationship between Work,Wellbeing and Psychological Capital”, Jour-nal of Socio-Economics, 38: 464-74
Dhiman, A. & Maheshwari, S. (2013), “Perfor-mance Appraisal Politics from AppraiseePerspective: a Study of Antecedents in theIndian Context”, The International Jour-nal of Human Resource Management, 24:1202-35.
Dreher, G. F. & Ash, R. A. (1990), “A Compara-tive Study of Mentoring Among Men and
Vishal Gupta
660 The Indian Journal of Industrial Relations, Vol. 49, No. 4, April 2014
Women in Managerial, Professional, andTechnical Positions”, Journal of AppliedPsychology, 75: 539–46
Fey, C. F., Björkman, I. & Pavlovskaya, A. (2000),“The Effect of Human Resource Practiceson Firm Performance in Russia”, The In-ternational Journal of Human ResourceManagement, 11(1):1-18.
Garg, P. & Rastogi, R. (2006), “New Model ofJob Design: Motivating Employees’ Per-formance”, Journal of Management Devel-opment, 25: 572-87.
Godard, J. (2001), “High Performance and theTransformation of Work. The Implicationsof Alternative Work Practices for the Ex-perience and Outcomes of Work”, Indus-trial and Labor Relations Review, 54(4):776-805.
Godard, J. (2004), “A Critical Assessment of theHigh-Performance Paradigm”, British Jour-nal of Industrial Relations, 42(2): 349-78
Gong, Y. & Chang, S. (2008), “How Do HighPerformance Work Systems (HPWS) Af-fect Collective Organizational CitizenshipBehavior (OCB)? A Collective Social Ex-change Perspective”, Academy of Manage-ment Proceedings: 1-7.
Gong, Y., Huang, J.-C., Farh, J.-L. (2009), “Em-ployee Learning Orientation, Transforma-tional Leadership, and Employee Creativ-ity: The Mediating Role of Employee Cre-ative Self-efficacy”, Academy of Manage-ment Journal, 52(4): 765-78.
Guest, D. (1997), “Human Resource Managementand Performance: a Review and ResearchAgenda”, International Human ResourceManagement, 8(3): 263–76.
Guest, D. (2011), “Human Resource Managementand Performance: Still Searching for SomeAnswers”, Human Resource ManagementJournal, 21: 1-13.
Gupta, V. (2013), “Development of a CausalFramework Linking High PerformanceHRM Practices, Positive Psychological
Capital, Creative Behaviors and Perfor-mance”, IIMA Working Paper Series,WP2013-03-05
Gupta, V. & Kumar, S. (2013), “Impact of Per-formance Appraisal Justice on EmployeeEngagement: A Study of Indian Profession-als”, Employee Relations: The InternationalJournal, 35: 61-78.
Gupta, V. & Singh, S. (in press), “PsychologicalCapital as a Mediator of the Relationshipbetween Leadership and Creative Perfor-mance Behaviors: Empirical Evidence fromthe Indian R&D Sector”, The InternationalJournal of Human Resource Management.
Hofstede, G. (2001), Culture’s Consequences:Comparing Values, Behaviors, Institutions,and Organizations across Nations (2nd ed.).Thousand Oaks CA: Sage.
Horvath, M., Wasko, L. E. & Bradley, J. L. (2008),“The Effect of Formal Mentoring ProgramCharacteristics on Organizational Attrac-tion,” Human Resource Development Quar-terly, 19(4): 323-49
Huang, E. Y. & Lin, S.-C. (2006), “How R&DManagement Practice Affects InnovationPerformance”, Industrial Management &Data Systems, 106 (7): 966-96
James L. R., Choi C. C., Ko C. E., McNeil P. K.,Minton M. K., Wright M. A. & Kim K.(2008), “Organizational and PsychologicalClimate: A Review of Theory and Research.”European Journal of Work and Organiza-tional Psychology, 17: 5–32.
Janssen, O. (2004), “How Fairness PerceptionsMake Innovative Behavior More or LessStressful”, Journal of Organizational Be-havior, 25: 201-15.
Kehoe, R. R. & Wright, P. W. (2013), “The Im-pact of High-Performance Human ResourcePractices on Employees’ Attitudes andBehaviors”, Journal of Management, 39:366-91
Konrad, A. E. (2006), “Engaging Employeesthrough High-Involvement Work Practices”,Ivey Business Journal, March/April: 1-6.
Employee Creativity
The Indian Journal of Industrial Relations, Vol. 49, No. 4, April 2014 661
Lopez, S. (2007), “The Business Case for Instill-ing Hope”, Gallup Management Journal,February:1-6.
Luthans, F. (2002), “Positive Organizational Be-havior: Developing and Managing Psycho-logical Strengths”, Academy of ManagementExecutive, 16(1): 57-72.
Luthans, F., Avey, J. B., Avolio, B. J., Norman, S.M., & Combs, G. M. (2006). Psychologi-cal capital development: Towards a micro-intervention. Journal of OrganizationalBehaviour, 27: 387-393.
Luthans, F., Youssef, C. M. & Avolio, B. J. (2007),Psychological Capital: Developing the Hu-man Competitive Edge. New York: OxfordUniversity Press.
MacDuffie J. P. (1995), “Human ResourceBundles and Manufacturing Performance:Organizational Logic and Flexible Produc-tion Systems in the World Auto Industry”,Industrial and Labor Relations Review,48(2): 197–221.
Manolopoulos, D. (2006), “What Motivates R&DProfessionals? Evidence from Decentral-ized Laboratories in Greece”, The Interna-tional Journal of Human Resource Man-agement, 17(4):616-47.
Masten, A. S. (2001), “Ordinary Magic: Resil-ience Process in Development”; AmericanPsychologist, 56: 227-39.
Masten, A. S. & Reed, M. G. J. (2005), “Resil-ience in Development”, in C. R. Snyder &S. Lopez (Eds.), Handbook of PositivePsychology, Oxford: Oxford UniversityPress.
Mehta, P. (1995), Social Achievement Motiva-tion Needs, Values and Work Organization,New Delhi: Concept Publishing.
Morrison, E. W. & Robinson, S. L. (1997), WhenEmployees Feel Betrayed: A Model of HowPsychological Contract Violations Develop,Academy of Management Review, 22: 226-56.
Nazir, N. A. (2005), “Person-culture Fit andEmployee Commitment in Banks”, Vikalpa,30(3): 39-52.
Paul, A. K. & Anantharaman, R. N. (2004), “In-fluence of HRM Practices on OrganizationalCommitment: A Study among SoftwareProfessionals in India”. Human ResourceDevelopment Quarterly, 15(1): 77-88.
Pfeffer, J. & Veiga, F. (1999), “Putting PeopleFirst for Organizational Success”, Academyof Management Executive, 13(2): 37-48.
Ramaswami, A. & Dreher, G. F. (2010), “Dy-namics of Mentoring Relationships in In-dia: A Qualitative, Exploratory Study”,Human Resource Management, 49: 501-30.
Ramsay, H., Scholarios, D. & Harley, B. (2000),“Employees and High-performance WorkSystems: Testing Inside the Black Box”,British Journal of Industrial Relations,38(4): 501-31.
Rego, A., Sousa, F., Marques, C. & e Cunha, M.P. (2012), “Authentic Leadership Promot-ing Employees’ Psychological Capital andCreativity”, Journal of Business Research,65: 429-37.
Schneider, S. C. (1988), “National vs. CorporateCulture: Implications for Human ResourceManagement”, Human Resource Manage-ment, 27(2): 231-46.
Schneider, S. L. (2001), “In Search of RealisticOptimism’, American Psychologist, 56:250-63
Shalley, C. E. & Gilson, L. L. (2004), “What Lead-ers Need to Know: A Review of Social andContextual Factors that Can Foster orHinder Creativity”, The Leadership Quar-terly, 15: 33-53.
Shalley, C. E. & Perry-Smith, J. E. (2001), “Ef-fects of Social-Psychological Factors onCreative Performance: The Role of Infor-mational and Controlling Expected Evalua-tion and Modeling Experience”, Organiza-tional Behaviors and Human Decision Pro-cesses, 84(1): 1-22.
Vishal Gupta
662 The Indian Journal of Industrial Relations, Vol. 49, No. 4, April 2014
Shalley, C. E., Zhou, J. & Oldman, G. R. (2004),“The Effects of Personal and ContextualCharacteristics on Creativity: WhereShould We Go from Here?” Journal of Man-agement, 30: 933–58
Shipton, H., West, M. A., Dawson, J., Birdi, K.& Patterson, M. (2006), “HRM as a Pre-dictor of Innovation”, Human ResourceManagement Journal, 16, 3-27.
Singh, K. (2004), “Impact of HR Practices onPerceived Firm Performance in India”, AsiaPacific Journal of Human Resources, 42(3):301- 17.
Snyder C. R. (2002), “Hope Theory: Rainbowsin the Mind”, Psychological Inquiry, 13(4):249-76.
Snyder, C. R. & Lopez, S. (2005), Handbook ofPositive Psychology, Oxford: Oxford Uni-versity Press.
Sweetman, D., Luthans, F., Avey, J. B. & Luthans,B. C. (2011), “Relationship between Posi-tive Psychological Capital and CreativePerformance”, Canadian Journal of Admin-istrative Sciences, 28: 4-13.
Tierney, P. & Farmer, S. M. (2002), “CreativeSelf-efficacy: Its Potential Antecedents andRelationship to Creative Performance”,Academy of Management Journal,45(6):1137-48.
Tremblay, M. A., Blanchard, C. M., Taylor, S.,Pelletier, L. G. & Villeneuve, M. (2009),“Work extrinsic and intrinsic motivationscale: Its value for organizational psychol-ogy research”, Canadian Journal of Behav-ioral Sciences, 41: 213-26.
Vandenberg, R. J., Richardson, H. A. & Eastmann,L. J. (1999), “The Impact of High Involve-ment Work Processes on OrganizationalEffectiveness: A Second-order Latent Vari-able Approach.”, Group & OrganizationManagement, 24(3): 300-39
White, M., Hill, S., Mcgovern, P., Mills, C. &Smeaton, D. (2003), “High-PerformanceManagement Practices, Working Hours andWork-life Balance”, British Journal of In-dustrial Relations, 41(2): 175-195
Youssef, C. M. & Luthans, F. (2007), “PositiveOrganizational behavior in the Workplace:The Impact of Hope, Optimism and Resil-ience”, Journal of Management, 33: 774-800.
sas
Employee Involvement & Flexible Role Orientation: AModerated Mediated Model
Amit Shukla & Shailendra Singh
The rising uncertainty and grow-ing competitiveness among mod-ern organizations call for con-certed efforts from all stakehold-ers. It is desirable that employ-ees shun job myopia and adoptgenerous outlook (flexible roleorientation or FRO) while defin-ing their job scope. Present studyempirically examines the role ofparticipative decision making(PDM) and job autonomy in de-veloping FRO in a moderatedmediation model. A questionnairesurvey (N=338) was conductedin a large Indian IT companyand it was found that both PDMand job autonomy were posi-tively related to FRO throughpsychological ownership. Thismediated relationship was fur-ther moderated by role breadthself-efficacy. Theoretical andpractical implications of thesefindings were discussed and fu-ture research possibilities aresuggested.
Introduction
Due to its dynamism, modern workorganizations expect their employees tocontribute more intensively and in a widerspan of activities (Mohrman & Cohen,1995) and abandon the restrictive notion ofjob myopia (Davis & Wacker, 1987). Theidea of ‘concerted efforts by all’ has beenvariously promoted by scholars and findssupport by practitioners as well (Stayer,1990). Today, organizations are willing toallow their educated and technologicallyoriented workforce to involve (Connell,1998) by means of different participatorywork practices (Wright & Boswell, 2002).Among others, High Involvement WorkProcesses or HIWP (Lawler, 1996) is oneof the conceptualizations suggested in theextant literature for these practices. HIWPis expected to promote a sense of controland empowerment and result in many fa-vorable workplace outcomes (Butts et al.,2009), including ‘generous’ outlook towardsone’s role in the organization (Parker et al.,1997; Parker, 2007). Present work is fo-cused on the relationship between HIWPs(particularly participative decision makingor PDM and job autonomy) in the Indiancontext. This is the main objective of thisstudy.
Amit Shukla ([email protected]) & ShailendraSingh ([email protected]) are from the HRM Group,Indian Institute of Management Lucknow
The Indian Journal of Industrial Relations, Vol. 49, No. 4, April 2014 663
Amit Shukla & Shailendra Singh
664 The Indian Journal of Industrial Relations, Vol. 49, No. 4, April 2014
Implementation of involvement prac-tices constitutes only the necessary con-dition for purported organizational ben-efits (Bowen & Lawler, 1992). The fa-vorable outcomes are manifested whenthese practices trigger a psychologicalprocess leading to a sense of participa-tion (Butts et al., 2009; Pierce et al.,1991). Thus, as our second objective, wetested the influence of a couple of vari-ables in shaping the aforementioned re-lationships. Specifically, the roles of psy-chological ownership and role breadthself-efficacy (RBSE) were tested in amoderated mediation model. Results pro-vided some key insights for academicsand practitioners.
Literature Review
The idea of employee participationhas gained widespread recognition andattracted attention during the last twodecades. Modern management theoristsargue against the traditional Tayloristicvision of employees where they are seenas mere passive cost centers and call fora humanistic vision that breeds empow-erment and allows for active participa-tion from employees (Aktouf, 1992).Though different conceptualizations re-lated to employee participation have beenoffered, like HIWP (Lawler, 1992), em-ployee empowerment (Thomas &Velthouse, 1990), psychological empow-erment (Spreitzer, 1995), perceived con-trol (Spector, 1986), yet employee par-ticipation and sharing of responsibilitiesremained the common theme. These con-cepts describe the way in which powerand authority are shared in an organiza-tion between those with and without for-
mal authority. All these concepts arelinked to tangible and intangible outcomesat different levels. For example, HIWPhas sanguine impact on organizationallevel variables like turnover, productivityand financial performance as well as onindividual level variables such as betterskill utilization and higher morale(Vandenberg et al., 1999). The presentstudy focuses on two forms of HIWP:participative decision making (PDM) andjob autonomy at workplace (Lawler,1992). PDM (Bowen & Lawler, 1992)and job autonomy (Liu et al., 2011) arealso suggested as determinants of em-ployee empowerment.
PDM is defined as the “process ofinvolving employees in decisions typicallymade by managers and usually involvesthe cascade of control and decision-mak-ing responsibility from managers to em-ployees” (Russ, 2011). This way, PDMis a collaborative decision making pro-cess and has many positive workplaceoutcomes, such as job satisfaction (Kim,2002), and performance (Wagner, 1994).Cotton et al. (1988) asserted that infor-mal participation and employee owner-ship (forms of participation) were moreeffective in improving productivity andjob satisfaction whereas short term par-ticipation was not effective at all. Glewet al. (1995) posited that PDM also re-sults in favorable employee behavior (asproductivity, turnover, and absenteeism)by affecting their attitude (e.g. commit-ment, job satisfaction).
Apart from PDM, managementscholars also advocated alteration in jobdimensions to create sense of control
Employee Involvement & Flexible Role Orientation
The Indian Journal of Industrial Relations, Vol. 49, No. 4, April 2014 665
(Spector, 1986). Emergence of job char-acteristic model by Hackman andOldham (1976) was one of the success-ful outcomes in this direction. As de-scribed by these scholars, job autonomyis “the degree to which the job providessubstantial freedom, independence, anddiscretion to the individual in schedulingthe work and determining the proceduresto be used in carrying it out” (Hackman& Oldham, 1980:162). Job autonomy isconsidered to be the most important char-acteristic of job design (Breaugh &Becker, 1987), especially for knowledgeworkers (Janz et al., 1997) as in our case.The freedom to choose elements of jobis associated with perceived sense ofcontrol (Rudmin & Berry, 1987; Pierceet al., 2001). Autonomy also cultivatessense of self-determination that intrinsi-cally motivates employee and encouragesself-initiation (Gagne, 2003). Job au-tonomy is also related to employees’ or-ganizational commitment (Bono & Judge,2003) and ‘experienced responsibility’(Parker et al., 2001) that may be relatedto greater ‘concern’ for the organization.
The concept of psychological own-ership belongs to the stable of positiveOB (Avey et al., 2009) and is defined as“a state of mind in which individuals feelas though the target of ownership (ma-terial or immaterial in nature) or a pieceof it is theirs” (Pierce et al., 2001). Lit-erature suggests that psychological own-ership is one of the three main employee-organizational linkages (Sparrow & Coo-per, 2003). It is a malleable entity andcan be developed through three routes(Pierce et al., 2001) namely, (i) by con-trolling the target (ii) by knowing the tar-
get well, and (iii) by investing into thetarget i.e. by directing one’s physical,cognitive and psychic energies.
In today’s era, performance of afixed set of prescribed roles is in-sufficient to gain competitive ad-vantage and flexible role orienta-tion becomes a key requisite.
Flexible role orientation (FRO) isdescribed as the mindset of employeeswherein they feel ownership of outputand take initiatives in solving a broadrange of problems (Parker et al., 1997;Parker, 2000). The concept is linked toemployee’s engagement in broad open-ended and interdependent roles which arenot restricted by “that’s not my job” atti-tude. While highlighting its importance,Parker (2000) suggests that in today’sera, performance of a fixed set of pre-scribed roles is insufficient to gain com-petitive advantage and flexible role ori-entation becomes a key requisite. Parkeret al. (1997) suggested that the competi-tiveness can best be achieved by in-creased responsiveness to the customerdemands (strategic orientation). But thestrategic orientation towards the organi-zation is hardly more than an endorsedset of beliefs and employee needs to de-velop FRO for converting these beliefsinto action. As far as outcomes are con-cerned, FRO was found to be better pre-dictor of performance in comparison toother job attitudes, like job satisfaction(Parker, 2007).
Role breadth self-efficacy (RBSE)refers to self-perceived ability to suc-
Amit Shukla & Shailendra Singh
666 The Indian Journal of Industrial Relations, Vol. 49, No. 4, April 2014
cessfully perform proactive behavior un-der a wide range of organizational con-texts. In terms of Parker (1998:835),“RBSE concerns the extent to whichpeople feel confident that they are ableto carry out a broader and more proac-tive role, beyond traditional prescribedtechnical requirements”. RBSE can bedifferentiated with self-efficacy as theformer is a judgment about capabilityacross a particular set of proactive in-terpersonal and integrative tasks whereasthe latter is a judgment about specific taskcapability (Parker, 2000). RBSE is asso-ciated with proactive behavior and litera-ture shows that it positively relates to andmoderates the relationship withemployee’s initiative taking tendency(Hartog & Belschak, 2012).
Theoretical Framework &Hypotheses
Literature suggests relationship ofHIWP and ownership. According toSashkin (1976), participation influencesorganizational outcomes through sense ofownership (similar to psychological own-ership). Pierce et al. (1991) also sug-gested that various employee ownershipschemes produced benefits if mediatedby psychologically sensed ownership.The linkage has been empirically vali-dated as well (O’Driscoll et al., 2006).Scholars (e.g. Pierce & Rodgers,2004:599) also emphasized the impor-tance of perceived control in job (par-ticularly job autonomy and participation)in developing ownership feelings and pro-vided support as well (Mayhew et al.,2007).
Hence, we expect similar results inthe present settings and propose the fol-lowing hypotheses:
H1(a): PDM will be positively related topsychological ownership.
H1(b): Job autonomy will be positivelyrelated to psychological ownership.
Next, psychological ownership incul-cates feeling of ownership for workplaceproblems (Parker et al., 1997) that leadsto development of role orientation(Parker et al., 2007). Moreover, it isknown that psychological ownership de-velops through suggested routes of ‘gain-ing control’ and ‘knowing the target’(characteristics of job autonomy andPDM), and perception of control andknowledge about work are key precur-sors to FRO (Zammuto & O’Connor,1992; Parker et al., 1997).
Hence, we propose the followinghypotheses:
H2(a): The relationship between PDMand FRO is mediated by psychologi-cal ownership.
H2(b): The relationship between job au-tonomy and FRO is mediated by psy-chological ownership.
Finally, we contend that sense ofownership may not lead to developmentof FRO if employees do not feel capableof performing related and integrativetasks. On the contrary, employees highon role breadth self efficacy (RBSE)would require lesser encouragement totake initiatives (Speier & Frese, 1997) in‘going an extra mile’ while defining their
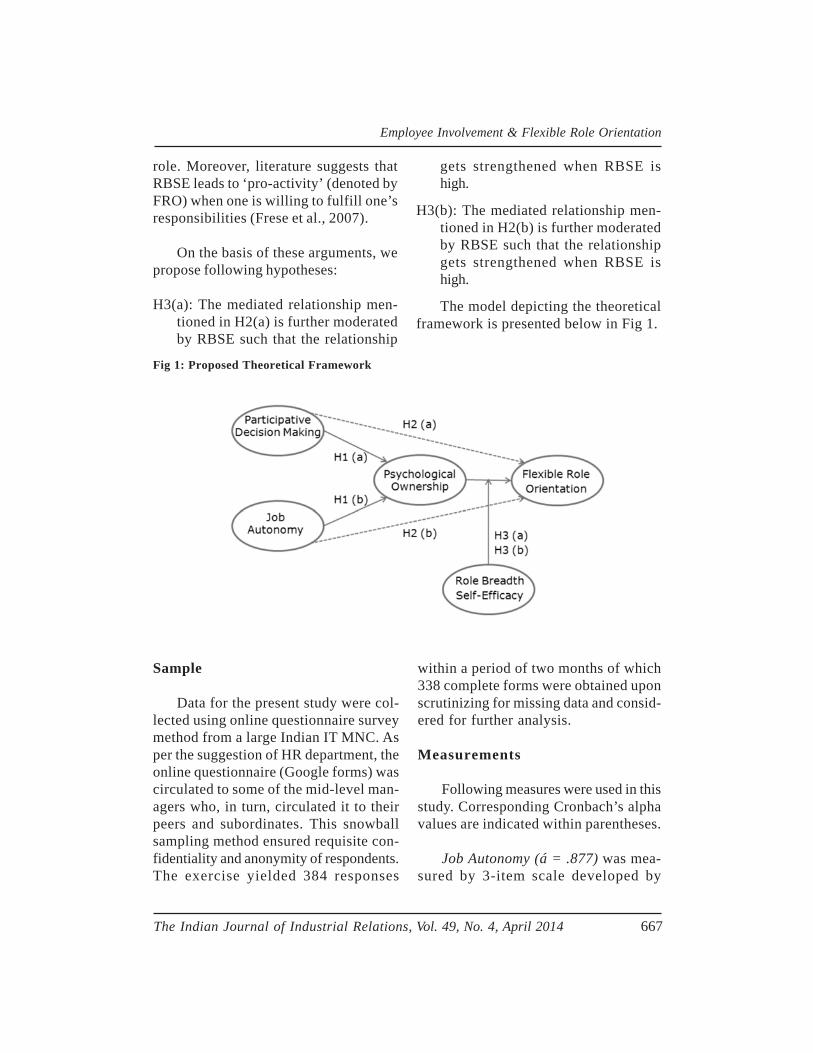
Employee Involvement & Flexible Role Orientation
The Indian Journal of Industrial Relations, Vol. 49, No. 4, April 2014 667
role. Moreover, literature suggests thatRBSE leads to ‘pro-activity’ (denoted byFRO) when one is willing to fulfill one’sresponsibilities (Frese et al., 2007).
On the basis of these arguments, wepropose following hypotheses:
H3(a): The mediated relationship men-tioned in H2(a) is further moderatedby RBSE such that the relationship
gets strengthened when RBSE ishigh.
H3(b): The mediated relationship men-tioned in H2(b) is further moderatedby RBSE such that the relationshipgets strengthened when RBSE ishigh.
The model depicting the theoreticalframework is presented below in Fig 1.
Fig 1: Proposed Theoretical Framework
Sample
Data for the present study were col-lected using online questionnaire surveymethod from a large Indian IT MNC. Asper the suggestion of HR department, theonline questionnaire (Google forms) wascirculated to some of the mid-level man-agers who, in turn, circulated it to theirpeers and subordinates. This snowballsampling method ensured requisite con-fidentiality and anonymity of respondents.The exercise yielded 384 responses
within a period of two months of which338 complete forms were obtained uponscrutinizing for missing data and consid-ered for further analysis.
Measurements
Following measures were used in thisstudy. Corresponding Cronbach’s alphavalues are indicated within parentheses.
Job Autonomy (á = .877) was mea-sured by 3-item scale developed by
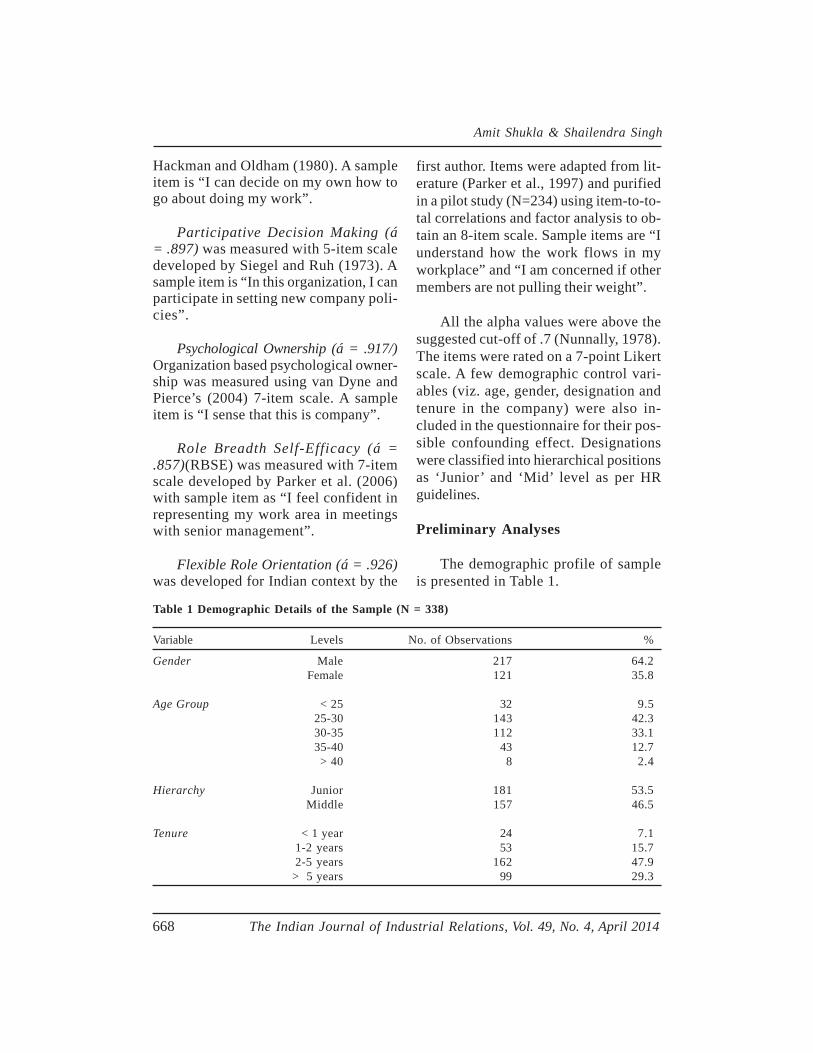
Amit Shukla & Shailendra Singh
668 The Indian Journal of Industrial Relations, Vol. 49, No. 4, April 2014
Hackman and Oldham (1980). A sampleitem is “I can decide on my own how togo about doing my work”.
Participative Decision Making (á= .897) was measured with 5-item scaledeveloped by Siegel and Ruh (1973). Asample item is “In this organization, I canparticipate in setting new company poli-cies”.
Psychological Ownership (á = .917/)Organization based psychological owner-ship was measured using van Dyne andPierce’s (2004) 7-item scale. A sampleitem is “I sense that this is company”.
Role Breadth Self-Efficacy (á =.857)(RBSE) was measured with 7-itemscale developed by Parker et al. (2006)with sample item as “I feel confident inrepresenting my work area in meetingswith senior management”.
Flexible Role Orientation (á = .926)was developed for Indian context by the
first author. Items were adapted from lit-erature (Parker et al., 1997) and purifiedin a pilot study (N=234) using item-to-to-tal correlations and factor analysis to ob-tain an 8-item scale. Sample items are “Iunderstand how the work flows in myworkplace” and “I am concerned if othermembers are not pulling their weight”.
All the alpha values were above thesuggested cut-off of .7 (Nunnally, 1978).The items were rated on a 7-point Likertscale. A few demographic control vari-ables (viz. age, gender, designation andtenure in the company) were also in-cluded in the questionnaire for their pos-sible confounding effect. Designationswere classified into hierarchical positionsas ‘Junior’ and ‘Mid’ level as per HRguidelines.
Preliminary Analyses
The demographic profile of sampleis presented in Table 1.
Table 1 Demographic Details of the Sample (N = 338)
Variable Levels No. of Observations %
Gender Male 217 64.2Female 121 35.8
Age Group < 25 32 9.525-30 143 42.330-35 112 33.135-40 43 12.7> 40 8 2.4
Hierarchy Junior 181 53.5Middle 157 46.5
Tenure < 1 year 24 7.11-2 years 53 15.72-5 years 162 47.9
> 5 years 99 29.3
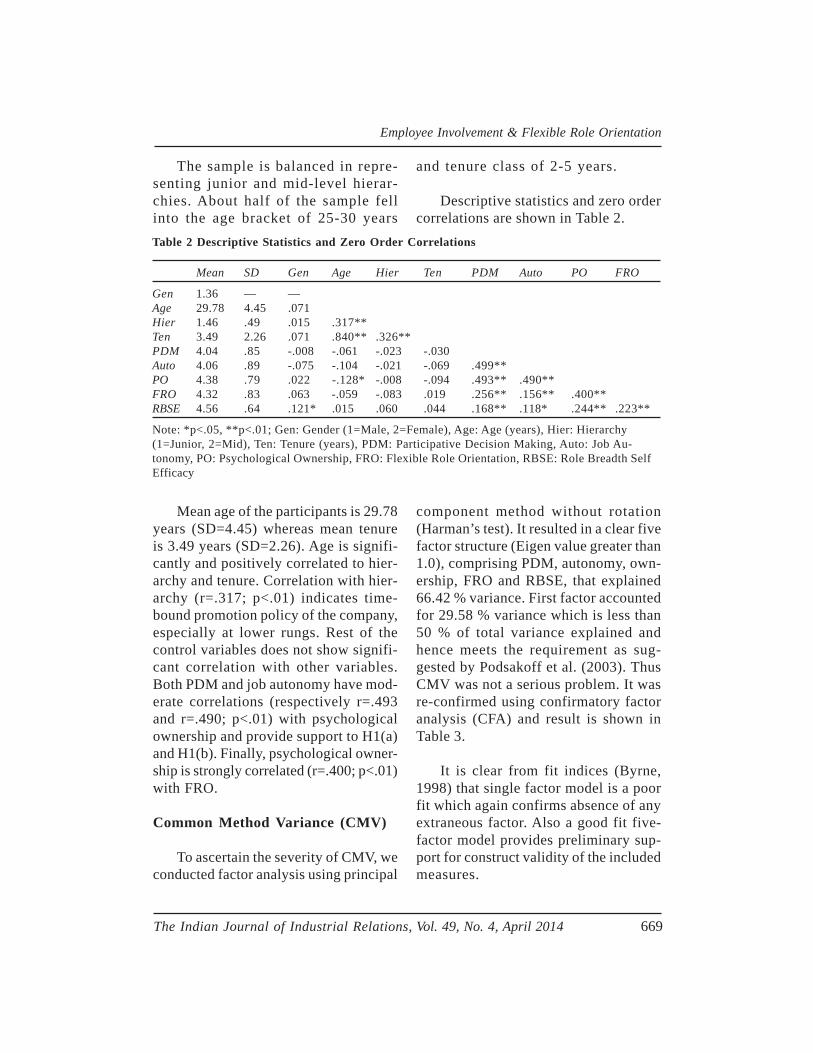
Employee Involvement & Flexible Role Orientation
The Indian Journal of Industrial Relations, Vol. 49, No. 4, April 2014 669
The sample is balanced in repre-senting junior and mid-level hierar-chies. About half of the sample fellinto the age bracket of 25-30 years
and tenure class of 2-5 years.
Descriptive statistics and zero ordercorrelations are shown in Table 2.
Table 2 Descriptive Statistics and Zero Order Correlations
Mean SD Gen Age Hier Ten PDM Auto PO FRO
Gen 1.36 — —Age 29.78 4.45 .071Hier 1.46 .49 .015 .317**Ten 3.49 2.26 .071 .840** .326**PDM 4.04 .85 -.008 -.061 -.023 -.030Auto 4.06 .89 -.075 -.104 -.021 -.069 .499**PO 4.38 .79 .022 -.128* -.008 -.094 .493** .490**FRO 4.32 .83 .063 -.059 -.083 .019 .256** .156** .400**RBSE 4.56 .64 .121* .015 .060 .044 .168** .118* .244** .223**
Note: *p<.05, **p<.01; Gen: Gender (1=Male, 2=Female), Age: Age (years), Hier: Hierarchy(1=Junior, 2=Mid), Ten: Tenure (years), PDM: Participative Decision Making, Auto: Job Au-tonomy, PO: Psychological Ownership, FRO: Flexible Role Orientation, RBSE: Role Breadth SelfEfficacy
Mean age of the participants is 29.78years (SD=4.45) whereas mean tenureis 3.49 years (SD=2.26). Age is signifi-cantly and positively correlated to hier-archy and tenure. Correlation with hier-archy (r=.317; p<.01) indicates time-bound promotion policy of the company,especially at lower rungs. Rest of thecontrol variables does not show signifi-cant correlation with other variables.Both PDM and job autonomy have mod-erate correlations (respectively r=.493and r=.490; p<.01) with psychologicalownership and provide support to H1(a)and H1(b). Finally, psychological owner-ship is strongly correlated (r=.400; p<.01)with FRO.
Common Method Variance (CMV)
To ascertain the severity of CMV, weconducted factor analysis using principal
component method without rotation(Harman’s test). It resulted in a clear fivefactor structure (Eigen value greater than1.0), comprising PDM, autonomy, own-ership, FRO and RBSE, that explained66.42 % variance. First factor accountedfor 29.58 % variance which is less than50 % of total variance explained andhence meets the requirement as sug-gested by Podsakoff et al. (2003). ThusCMV was not a serious problem. It wasre-confirmed using confirmatory factoranalysis (CFA) and result is shown inTable 3.
It is clear from fit indices (Byrne,1998) that single factor model is a poorfit which again confirms absence of anyextraneous factor. Also a good fit five-factor model provides preliminary sup-port for construct validity of the includedmeasures.
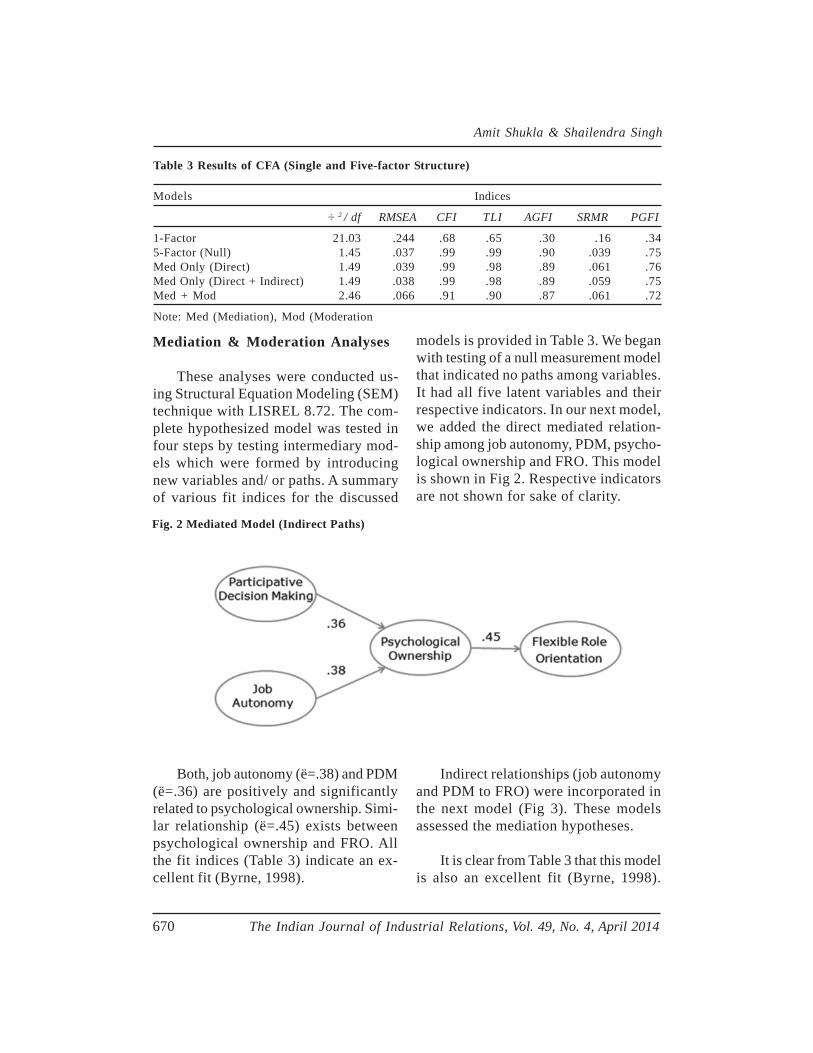
Amit Shukla & Shailendra Singh
670 The Indian Journal of Industrial Relations, Vol. 49, No. 4, April 2014
Table 3 Results of CFA (Single and Five-factor Structure)
Models Indices
÷ 2 / df RMSEA CFI TLI AGFI SRMR PGFI
1-Factor 21.03 .244 .68 .65 .30 .16 .345-Factor (Null) 1.45 .037 .99 .99 .90 .039 .75Med Only (Direct) 1.49 .039 .99 .98 .89 .061 .76Med Only (Direct + Indirect) 1.49 .038 .99 .98 .89 .059 .75Med + Mod 2.46 .066 .91 .90 .87 .061 .72
Note: Med (Mediation), Mod (Moderation
Mediation & Moderation Analyses
These analyses were conducted us-ing Structural Equation Modeling (SEM)technique with LISREL 8.72. The com-plete hypothesized model was tested infour steps by testing intermediary mod-els which were formed by introducingnew variables and/ or paths. A summaryof various fit indices for the discussed
models is provided in Table 3. We beganwith testing of a null measurement modelthat indicated no paths among variables.It had all five latent variables and theirrespective indicators. In our next model,we added the direct mediated relation-ship among job autonomy, PDM, psycho-logical ownership and FRO. This modelis shown in Fig 2. Respective indicatorsare not shown for sake of clarity.
Fig. 2 Mediated Model (Indirect Paths)
Both, job autonomy (ë=.38) and PDM(ë=.36) are positively and significantlyrelated to psychological ownership. Simi-lar relationship (ë=.45) exists betweenpsychological ownership and FRO. Allthe fit indices (Table 3) indicate an ex-cellent fit (Byrne, 1998).
Indirect relationships (job autonomyand PDM to FRO) were incorporated inthe next model (Fig 3). These modelsassessed the mediation hypotheses.
It is clear from Table 3 that this modelis also an excellent fit (Byrne, 1998).
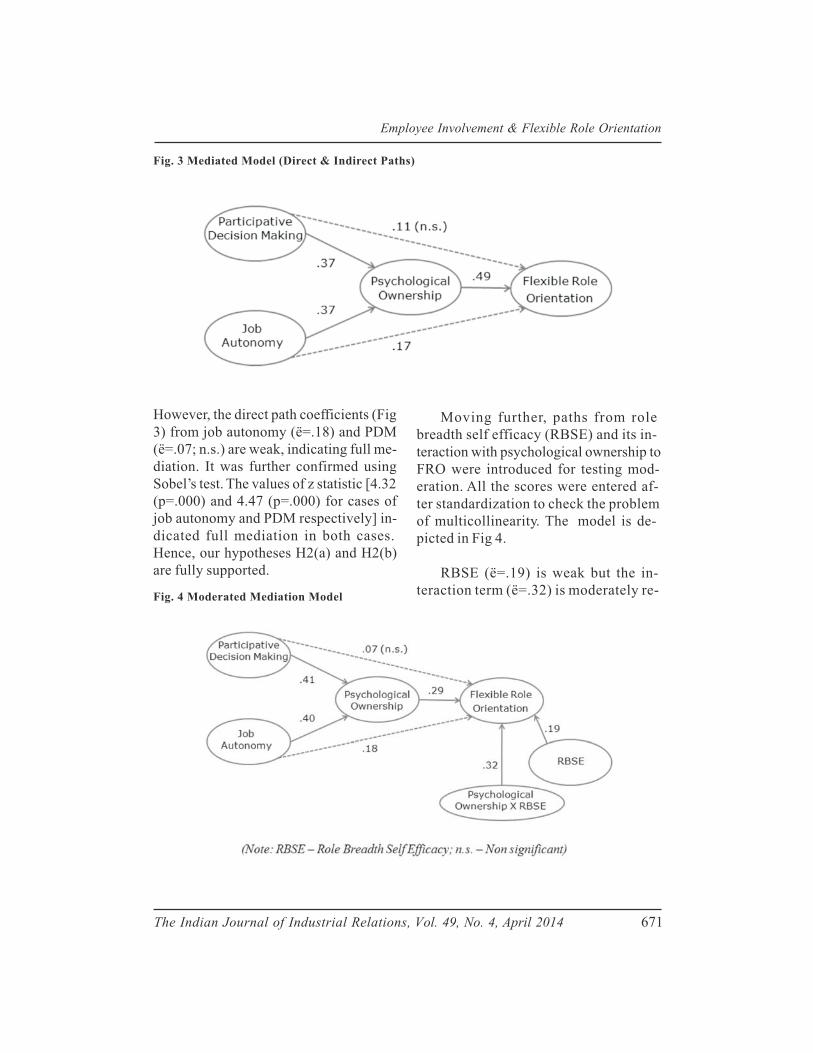
Employee Involvement & Flexible Role Orientation
The Indian Journal of Industrial Relations, Vol. 49, No. 4, April 2014 671
Fig. 3 Mediated Model (Direct & Indirect Paths)
However, the direct path coefficients (Fig
3) from job autonomy (ë=.18) and PDM
(ë=.07; n.s.) are weak, indicating full me-
diation. It was further confirmed using
Sobel’s test. The values of z statistic [4.32
(p=.000) and 4.47 (p=.000) for cases of
job autonomy and PDM respectively] in-
dicated full mediation in both cases.
Hence, our hypotheses H2(a) and H2(b)
are fully supported.
Moving further, paths from role
breadth self efficacy (RBSE) and its in-
teraction with psychological ownership to
FRO were introduced for testing mod-
eration. All the scores were entered af-
ter standardization to check the problem
of multicollinearity. The model is de-
picted in Fig 4.
RBSE (ë=.19) is weak but the in-
teraction term (ë=.32) is moderately re-Fig. 4 Moderated Mediation Model
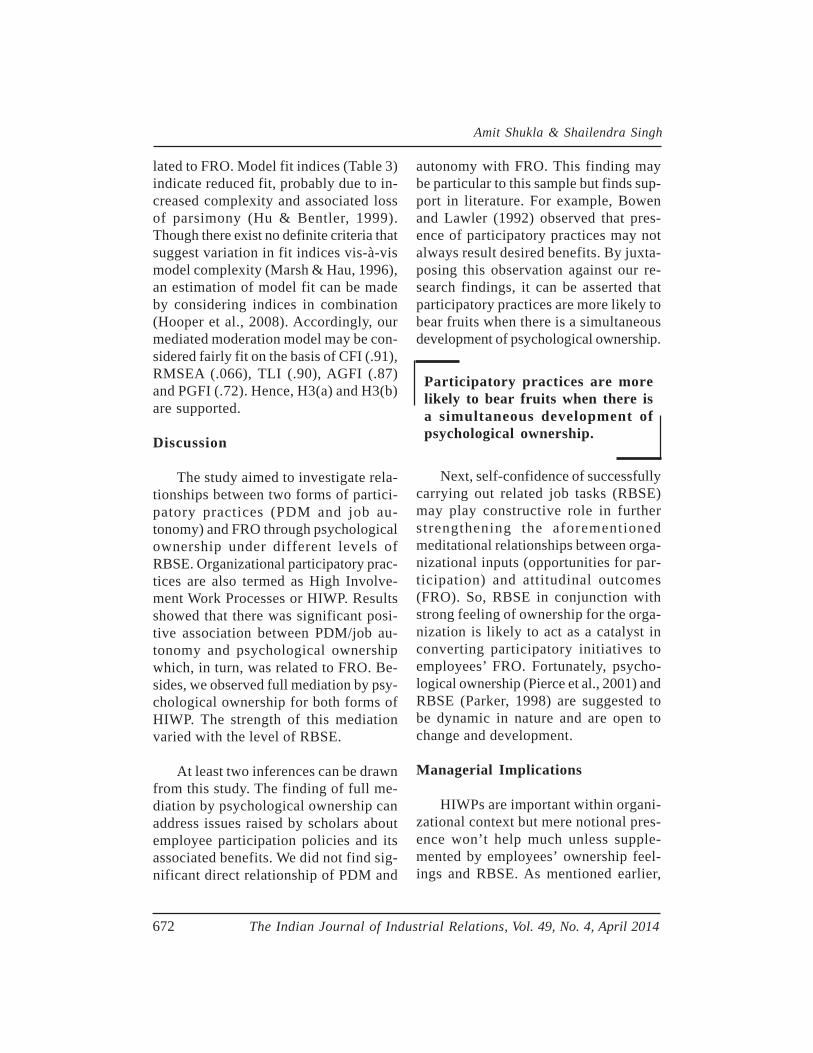
Amit Shukla & Shailendra Singh
672 The Indian Journal of Industrial Relations, Vol. 49, No. 4, April 2014
lated to FRO. Model fit indices (Table 3)indicate reduced fit, probably due to in-creased complexity and associated lossof parsimony (Hu & Bentler, 1999).Though there exist no definite criteria thatsuggest variation in fit indices vis-à-vismodel complexity (Marsh & Hau, 1996),an estimation of model fit can be madeby considering indices in combination(Hooper et al., 2008). Accordingly, ourmediated moderation model may be con-sidered fairly fit on the basis of CFI (.91),RMSEA (.066), TLI (.90), AGFI (.87)and PGFI (.72). Hence, H3(a) and H3(b)are supported.
Discussion
The study aimed to investigate rela-tionships between two forms of partici-patory practices (PDM and job au-tonomy) and FRO through psychologicalownership under different levels ofRBSE. Organizational participatory prac-tices are also termed as High Involve-ment Work Processes or HIWP. Resultsshowed that there was significant posi-tive association between PDM/job au-tonomy and psychological ownershipwhich, in turn, was related to FRO. Be-sides, we observed full mediation by psy-chological ownership for both forms ofHIWP. The strength of this mediationvaried with the level of RBSE.
At least two inferences can be drawnfrom this study. The finding of full me-diation by psychological ownership canaddress issues raised by scholars aboutemployee participation policies and itsassociated benefits. We did not find sig-nificant direct relationship of PDM and
autonomy with FRO. This finding maybe particular to this sample but finds sup-port in literature. For example, Bowenand Lawler (1992) observed that pres-ence of participatory practices may notalways result desired benefits. By juxta-posing this observation against our re-search findings, it can be asserted thatparticipatory practices are more likely tobear fruits when there is a simultaneousdevelopment of psychological ownership.
Participatory practices are morelikely to bear fruits when there isa simultaneous development ofpsychological ownership.
Next, self-confidence of successfullycarrying out related job tasks (RBSE)may play constructive role in furtherstrengthening the aforementionedmeditational relationships between orga-nizational inputs (opportunities for par-ticipation) and attitudinal outcomes(FRO). So, RBSE in conjunction withstrong feeling of ownership for the orga-nization is likely to act as a catalyst inconverting participatory initiatives toemployees’ FRO. Fortunately, psycho-logical ownership (Pierce et al., 2001) andRBSE (Parker, 1998) are suggested tobe dynamic in nature and are open tochange and development.
Managerial Implications
HIWPs are important within organi-zational context but mere notional pres-ence won’t help much unless supple-mented by employees’ ownership feel-ings and RBSE. As mentioned earlier,
Employee Involvement & Flexible Role Orientation
The Indian Journal of Industrial Relations, Vol. 49, No. 4, April 2014 673
psychological ownership can be devel-oped by traversing through three routes(Pierce et al., 2001) of knowing the tar-get better, controlling the target and in-vesting into the target. It can be practi-cally achieved by providing requisitetraining (know), according process own-ership (control) and acknowledging one’scontribution (invest). To strengthenRBSE, management should endeavor toinculcate a culture of learning by expand-ing horizontal (job enlargement) and ver-tical (job enrichment) scope of job. More-over, peripheral knowledge about variousjob facets can be acquired by adoptingpolicy of job rotation. Another way toimprove RBSE is to redesign work so asto provide more opportunities for self-efficacy enhancing experiences, like in-troduction of quality circles (Parker,1998).
Conclusion
The study is first of its kind whereHIWPs are linked with flexible role ori-entation through psychological owner-ship. Additionally the moderating role ofRBSE was investigated. The findings areexpected to pave way towards more suc-cessful implementation of HIWP.
A few alterations would be desirablein follow up studies. Though CMV wasnot a serious problem, future studies maybe conducted using different data collec-tion methods (interviews, paper based)and distribution of predictor and criterionquestionnaires with sufficient time gap inbetween. Follow up studies may test themodel using longitudinal design for mak-ing strong causal interpretations. Finally,
the impact of other forms of HIWP andempowerment (e.g. openness of commu-nication, job enrichment) may also beanalyzed to generate new insights.
References
Aktouf, O. (1992), “Management and Theoriesof Organizations in the 1990s: Toward aCritical Radical Humanism?” Academy ofManagement Review, 17: 407-31.
Avey, J. B., Avolio, B. J., Crossley, C. D. &Luthans, F. (2009), “Psychological Own-ership: Theoretical Extensions, Measure-ment and Relation to Work Outcomes”,Journal of Organizational Behavior, 30:173-91.
Bono, J. E. & Judge, T. A. (2003), “Self-concor-dance at Work: Toward Understanding theMotivational Effects of TransformationalLeaders”, Academy of Management Jour-nal, 46(5): 554-71.
Bowen, D. & Lawler, E. (1992), “The Empower-ment of Service Workers: What, Why, How,and When?”, Sloan Management Review,33: 31-39.
Breaugh, J. A. & Becker, A. S. (1987), “FurtherExamination of the Work Autonomy Scales:Three Studies”, Human Relations, 40(6):381-99.
Butts, M., Vandenberg, R., DeJoy, D., Schaffer,B. & Wilson, M. (2009), “Individual Reac-tions to High Involvement Work Processes:Investigating the Role of Empowerment andPerceived Organizational Support”, Jour-nal of Occupational Health Psychology,14(2): 122-36.
Byrne, B.M. (1998), Structural Equation Model-ing with LISREL, PRELIS and SIMPLIS:Basic Concepts, Applications and Program-ming, New Jersey: Lawrence Erlbaum As-sociates.
Connell, J. (1998), “Soft Skills: The NeglectedFactor in Workplace Participation?”,Labour and Industry, 9(1): 69-90.
Amit Shukla & Shailendra Singh
674 The Indian Journal of Industrial Relations, Vol. 49, No. 4, April 2014
Cotton, J. L., Vollrath, D. A., Froggatt, K. L.,Lengnick-Hall, M. L. & Jennings, K. R.(1988), “Employee Participation: DiverseForms and Different Outcomes”, Academyof Management Review, 13: 8-22.
Davis, L.E. & Wacker, G.J. (1987), “Job Design”,in G. Salvendy (Ed.), Handbook of HumanFactors: 431-45, New York: Wiley.
Frese, M., Garst, H. & Fay, D. (2007), “MakingThings Happen: Reciprocal Relationshipsbetween Work Characteristics and PersonalInitiative in a Four-Wave LongitudinalStructural Equation Model”, Journal ofApplied Psychology, 92(4): 1084-102.
Gagne, M. (2003), “The Role of Autonomy Sup-port and Autonomy Orientation inProsocial Behavior Engagement”, Motiva-tion and Emotion, 27: 199-223.
Glew, D., O’Leary-Kelly, A., Griffin, R. & vanFleet, D. (1995), “Participation in Organi-zations: A Preview of the Issues and Pro-posed Framework for Future Analysis”,Journal of Management, 21(3): 395-421.
Hackman, J. R. & Oldham, G. R. (1976), “Moti-vation through the Design of Work: Test ofa Theory”, Organizational Behavior andHuman Performance, 16: 250-79.
Hackman, J. R. & Oldham, G. R. (1980), WorkRedesign, Reading, MA: Addison Wesley.
Hartog, D. & Belschak, F. (2012), “When DoesTransformational Leadership Enhance Em-ployee Proactive Behavior? The Role ofAutonomy and Role Breadth Self-Efficacy”,Journal of Applied Psychology, 97(1): 194-202.
Hooper, D., Coughlan, J. & Mullen, M. (2008),“Structural Equation Modeling: Guidelinesfor Determining Model Fit”, The ElectronicJournal of Business Research Methods,6(1): 53-60.
Hu, L. & Bentler, P. M. (1999), “Cutoff Criteriafor Fit Indexes in Covariance StructureAnalysis: Conventional Criteria versusNew Alternatives”, Structural EquationModeling, 6: 1-55.
Janz, B. D., Colquitt, J. A. & Noe, R. A. (1997),“Knowledge Worker Team Effectiveness:The Role of Autonomy, Interdependence,Team Development, and Contextual Sup-port Variables”, Personnel Psychology, 50:877-904.
Kim, S. (2002), “Participative Management andJob Satisfaction: Lessons for ManagementLeadership”, Public Administration Review,62: 231-41.
Lawler, E.E. (1992), The Ultimate Advantage:Creating the High Involvement Organiza-tion, San Francisco: Josey-Bass.
Lawler, E.E. (1996), From the Ground Up: SixPrinciples for Building the New Logic Cor-poration, San Francisco: Jossey-Bass.
Liu, D., Zhang, S., Wang, L. & Lee, T. (2011),“The Effects of Autonomy and Empower-ment on Employee Turnover: Test of aMultilevel Model in Teams”, Journal ofApplied Psychology, 96(6): 1305-16.
Marsh, H.W. & Hau, K.T. (1996), “AssessingGoodness of Fit: Is Parsimony AlwaysDesirable?”, The Journal of ExperimentalEducation, 64: 364-90.
Mayhew, M.G., Ashkanasy, N.M., Bramble, T.& Gardner, J. (2007), “A Study of Ante-cedents and Consequences of Psychologi-cal Ownership in Organizational Settings”,The Journal of Social Psychology, 147(5):477-500.
Mohrman, S. & Cohen, S.G. (1995), “WhenPeople Get Out of the Box: New Relation-ships, New Systems”, in A. Howard (Ed.),The Changing Nature of Work: San Fran-cisco: Josey-Bass.
Nunnally, J. C. (1978), Psychometric Theory(2nd ed.), New York: McGraw-Hill.
O’Driscoll, M.P., Pierce, J.L. & Coghlan, A.(2006), “The Psychology of Ownership:Work Environment Structure, Organiza-tional Commitment, and Citizenship Be-havior”, Group and Organization Manage-ment, 31(3): 388-416.
Employee Involvement & Flexible Role Orientation
The Indian Journal of Industrial Relations, Vol. 49, No. 4, April 2014 675
Parker, S. K. (1998), “Role Breadth Self-Efficacy:Relationship with Work Enrichment andother Organizational Practices”, Journal ofApplied Psychology, 83: 835-52.
Parker, S.K. (2000), “From Passive to ProactiveMotivation: The Importance of FlexibleRole Orientations and Role Breadth Self-Efficacy”, Applied Psychology: An Inter-national Review, 49(3): 447-69.
Parker, S.K. (2007), “That is My Job: How Em-ployees’ Role Orientation Affects their JobPerformance”, Human Relations, 60(3):403-34.
Parker, S. K., Wall, T. D. & Cordery, J. L. (2001),“Future Work Design Research and Prac-tice: Towards an Elaborated Model of WorkDesign”, Journal of Occupational and Or-ganizational Psychology, 74(4): 413-40.
Parker, S. K., Wall, T. D. & Jackson, P. R. (1997),“That’s not My Job: Developing FlexibleEmployee Work Orientations”, Academy ofManagement Journal, 40: 899-929.
Parker, S. K., Williams, H. & Turner, N. (2006),“Modeling the Antecedents of ProactiveBehavior at Work”, Journal of Applied Psy-chology, 91: 636-52.
Pierce, J. L., Kostova, T. & Dirks, K. T. (2001),“Toward a Theory of Psychological Own-ership in Organizations”, Academy of Man-agement Review, 26: 298-310.
Pierce, J. L. & Rodgers, L. (2004), “The Psy-chology of Ownership and Worker–OwnerProductivity”, Group & OrganizationManagement, 29: 588-613.
Pierce, J. L., Rubenfeld, S. A. & Morgan, S. (1991),“Employee Ownership: A ConceptualModel of Process and Effects”, Academyof Management Review, 16: 121-44.
Podsakoff, P.M., MacKenzie, S.B., Lee, J.Y. &Podsakoff, N.P. (2003), “Common MethodBiases in Behavioral Research: A CriticalReview of the Literature and RecommendedRemedies”, Journal of Applied Psychology,88(5): 879-903.
Rudmin, F. W. & Berry, J. W. (1987), “Seman-tics of Ownership: A Free-Recall Study ofProperty”, Psychological Record, 37: 257-68.
Russ, T. (2011), “Theory X/Y Assumptions asPredictors of Managers’ Propensity forParticipative Decision Making”, Manage-ment Decision, 49(5): 823-36.
Sashkin, M. (1976), “Changing toward Partici-pative Management Approaches: A Modeland Methods”, Academy of ManagementReview, 1(3): 75-86.
Siegel, A. & Ruh, R. (1973), “Job Involvement,Participation in Decision Making, PersonalBackground and Job Behavior”, Organiza-tional Behavior and Human Performance,9: 318-27.
Sparrow, P. & Cooper, C. (2003), The Employ-ment Relationship: Key Challenges for HR,Oxford: Butterworth-Heinemann.
Spector, P. (1986), “Perceived Control by Em-ployees: A Meta-Analysis of Studies Con-cerning Autonomy and Participation atWork”, Human Relations, 39(11): 1005-16.
Speier, C. & Frese, M. (1997), “Generalized Self-Efficacy as a Mediator and Moderator be-tween Control and Complexity at Work andPersonal Initiative: A Longitudinal Studyin East Germany”, Human Performance,10: 171-92.
Spreitzer, G. (1995), “Psychological Empower-ment in the Workplace: Dimensions, Mea-surement, and Validation”, Academy ofManagement Journal, 38(5): 1442-65.
Stayer, R. (1990), “How I Learned to Let MyWorkers Lead”, Harvard Business Review,68: 66-75, 80-82.
Thomas, K. W. & Velthouse, B. A. (1990), “Cog-nitive Elements of Empowerment: An “In-terpretive” Model of Intrinsic Task Moti-vation”, Academy of Management Review,15: 666-81.
van Dyne, L. & Pierce, J. (2004), “PsychologicalOwnership and Feelings of Possession:
Amit Shukla & Shailendra Singh
676 The Indian Journal of Industrial Relations, Vol. 49, No. 4, April 2014
Three Field Studies Predicting EmployeeAttitudes and Organizational CitizenshipBehavior, Journal of Organizational Behav-ior, 25: 439-59.
Vandenberg, R. J., Richardson, H. A. & Eastman,L. J. (1999), “The Impact of High Involve-ment Work Processes on OrganizationalEffectiveness”, Group and OrganizationManagement, 24: 300-39.
Wagner, J.A. III. (1994), “Participation’s Effectson Performance and Satisfaction: A Recon-sideration of Research Evidence”, Academyof Management Review, 19(2): 312-30.
Wright, P. M. & Boswell, W. R. (2002), “Deseg-regating HRM: A Review and Synthesis ofMicro and Macro Human Resource Man-agement”, Journal of Management, 28: 247-76.
Zammuto, R. F. & O’Connor, E. J. (1992), “Gain-ing Advanced Manufacturing Technologies’Benefits: The Roles of Organization De-sign and Culture”, Academy of Manage-ment Review, 17: 701-28.
Mentor-Mentee Relationships in a Large IndianManufacturing Organization
Sushmita Srivastava & ISF Raj
This article explores the factorsthat impact mentoring relation-ship through a qualitative studyof 88 mentor- mentee pairs in aformal mentoring program in alarge Indian manufacturing or-ganization. The study found thatif the intensity of interaction ishigh, frequency does not play avital role. The mentor- menteepairs have been classified on thebasis of the nature of the rela-tionship on a favorable –unfa-vorable continuum. The orga-nization which has been chosenfor the study is one of the fewcompanies in the country to pro-vide a formal structuredmentoring program. The studyhas practical and theoretical im-plications as factors impactingsuccessful mentoring relation-ship would contribute to futuredesign of mentoring programs asa developmental intervention inIndian organizations.
Introduction
Mentoring relationship is an intensereciprocal interpersonal exchange be-tween a senior experienced individual (thementor) and a less experienced individual(the protégé), characterized by guidance,advice, counsel, feedback, and supportprovided by the mentor for the protégé’spersonal and professional development(Eby, Rhodes & Allen, 2007; Kram, 1985;Fletcher & Ragins, 2007; Kram, 1996).Mentoring enhances employee skills, aidstheir socialization to a new work settingand improves career outcomes formentees. Perceived and actual benefitsof mentoring for mentors include visibil-ity, sense of fulfillment, and having a loyalsupport base (Eby, Durley, Evans &Ragins, 2006; Ragins & Scandura, 1999).
Need for the Paper
Although more than 500 articles onmentoring have been published in man-agement and education literature world-wide during the last 20 years, (Noe,Greenberger & Wang, 2002; Wanberg,Welsh & Hezlett, 2003), there have beenlimited studies of mentoring relationshipin the Indian context. Not many re-
Sushmita Srivastava (e-mail : [email protected]) & ISF Raj (e-mail : [email protected])are from the School of Business & Human Resources,XLRI, Jamshedpur 831001
The Indian Journal of Industrial Relations, Vol. 49, No. 4, April 2014 677
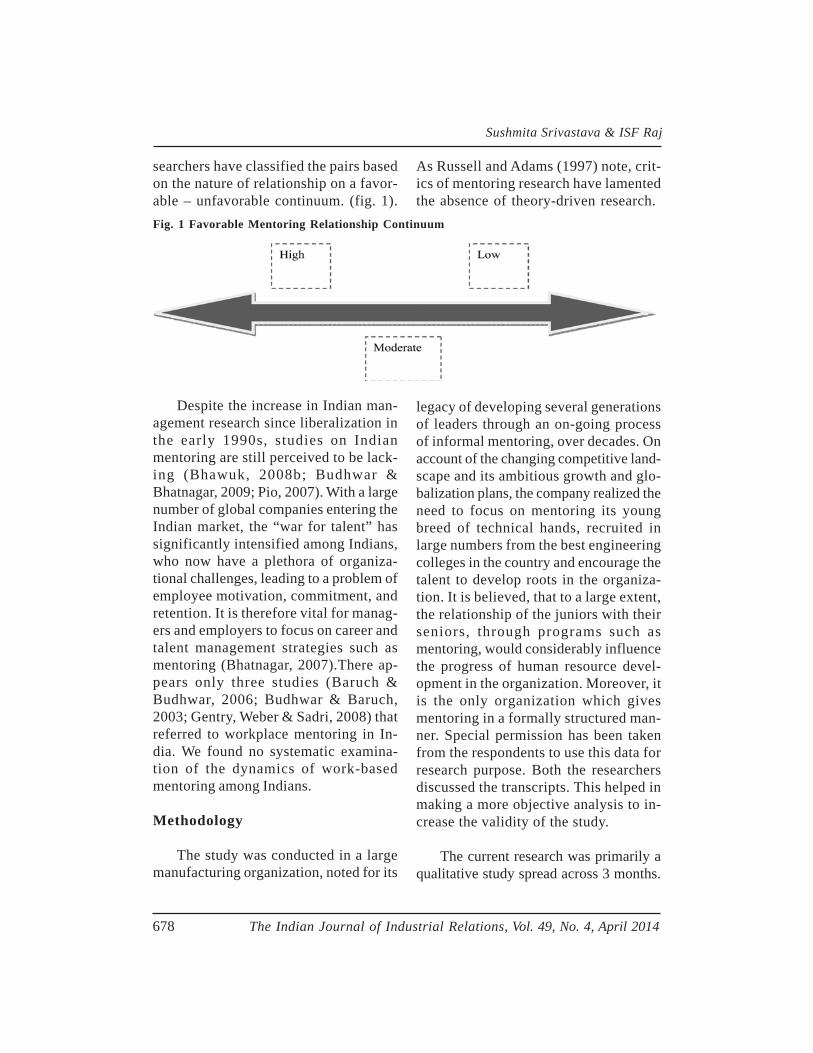
Sushmita Srivastava & ISF Raj
678 The Indian Journal of Industrial Relations, Vol. 49, No. 4, April 2014
searchers have classified the pairs basedon the nature of relationship on a favor-able – unfavorable continuum. (fig. 1).
As Russell and Adams (1997) note, crit-ics of mentoring research have lamentedthe absence of theory-driven research.
Fig. 1 Favorable Mentoring Relationship Continuum
Despite the increase in Indian man-agement research since liberalization inthe early 1990s, studies on Indianmentoring are still perceived to be lack-ing (Bhawuk, 2008b; Budhwar &Bhatnagar, 2009; Pio, 2007). With a largenumber of global companies entering theIndian market, the “war for talent” hassignificantly intensified among Indians,who now have a plethora of organiza-tional challenges, leading to a problem ofemployee motivation, commitment, andretention. It is therefore vital for manag-ers and employers to focus on career andtalent management strategies such asmentoring (Bhatnagar, 2007).There ap-pears only three studies (Baruch &Budhwar, 2006; Budhwar & Baruch,2003; Gentry, Weber & Sadri, 2008) thatreferred to workplace mentoring in In-dia. We found no systematic examina-tion of the dynamics of work-basedmentoring among Indians.
Methodology
The study was conducted in a largemanufacturing organization, noted for its
legacy of developing several generationsof leaders through an on-going processof informal mentoring, over decades. Onaccount of the changing competitive land-scape and its ambitious growth and glo-balization plans, the company realized theneed to focus on mentoring its youngbreed of technical hands, recruited inlarge numbers from the best engineeringcolleges in the country and encourage thetalent to develop roots in the organiza-tion. It is believed, that to a large extent,the relationship of the juniors with theirseniors, through programs such asmentoring, would considerably influencethe progress of human resource devel-opment in the organization. Moreover, itis the only organization which givesmentoring in a formally structured man-ner. Special permission has been takenfrom the respondents to use this data forresearch purpose. Both the researchersdiscussed the transcripts. This helped inmaking a more objective analysis to in-crease the validity of the study.
The current research was primarily aqualitative study spread across 3 months.
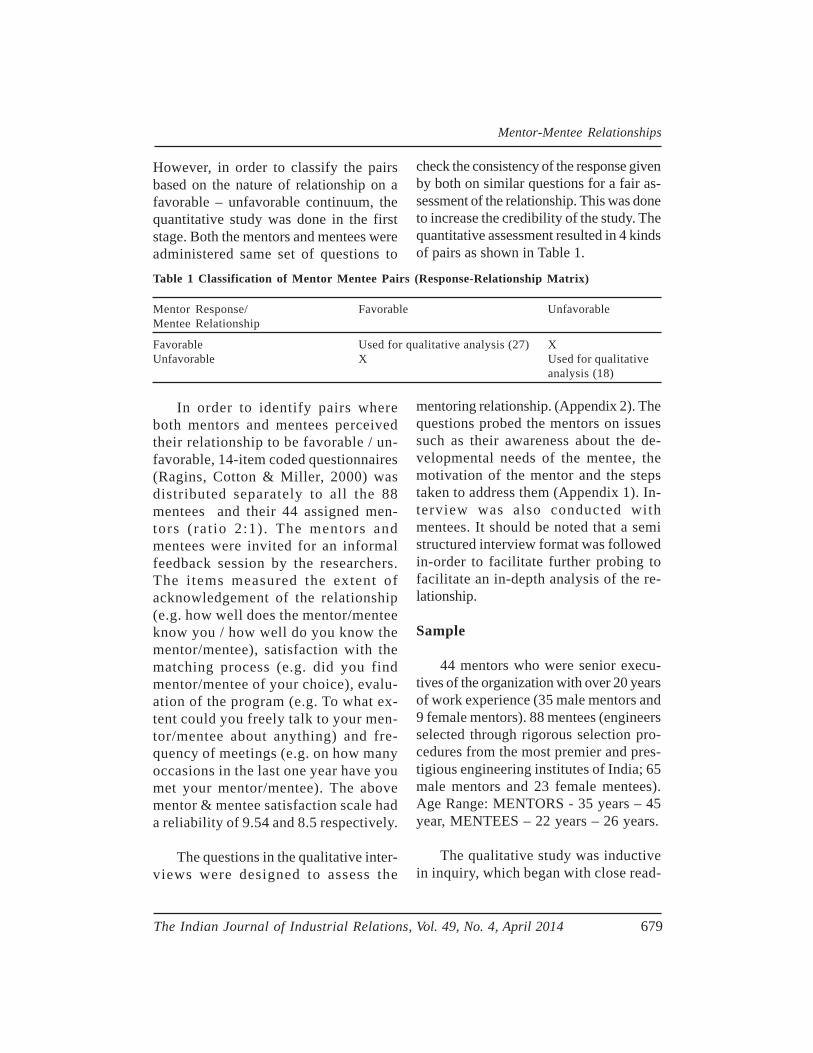
Mentor-Mentee Relationships
The Indian Journal of Industrial Relations, Vol. 49, No. 4, April 2014 679
In order to identify pairs whereboth mentors and mentees perceivedtheir relationship to be favorable / un-favorable, 14-item coded questionnaires(Ragins, Cotton & Miller, 2000) wasdistributed separately to all the 88mentees and their 44 assigned men-tors (rat io 2:1) . The mentors andmentees were invited for an informalfeedback session by the researchers.The i tems measured the extent ofacknowledgement of the relationship(e.g. how well does the mentor/menteeknow you / how well do you know thementor/mentee), satisfaction with thematching process (e.g. did you findmentor/mentee of your choice), evalu-ation of the program (e.g. To what ex-tent could you freely talk to your men-tor/mentee about anything) and fre-quency of meetings (e.g. on how manyoccasions in the last one year have youmet your mentor/mentee). The abovementor & mentee satisfaction scale hada reliability of 9.54 and 8.5 respectively.
The questions in the qualitative inter-views were designed to assess the
mentoring relationship. (Appendix 2). Thequestions probed the mentors on issuessuch as their awareness about the de-velopmental needs of the mentee, themotivation of the mentor and the stepstaken to address them (Appendix 1). In-terview was also conducted withmentees. It should be noted that a semistructured interview format was followedin-order to facilitate further probing tofacilitate an in-depth analysis of the re-lationship.
Sample
44 mentors who were senior execu-tives of the organization with over 20 yearsof work experience (35 male mentors and9 female mentors). 88 mentees (engineersselected through rigorous selection pro-cedures from the most premier and pres-tigious engineering institutes of India; 65male mentors and 23 female mentees).Age Range: MENTORS - 35 years – 45year, MENTEES – 22 years – 26 years.
The qualitative study was inductivein inquiry, which began with close read-
Table 1 Classification of Mentor Mentee Pairs (Response-Relationship Matrix)
Mentor Response/ Favorable UnfavorableMentee Relationship
Favorable Used for qualitative analysis (27) XUnfavorable X Used for qualitative
analysis (18)
However, in order to classify the pairsbased on the nature of relationship on afavorable – unfavorable continuum, thequantitative study was done in the firststage. Both the mentors and mentees wereadministered same set of questions to
check the consistency of the response givenby both on similar questions for a fair as-sessment of the relationship. This was doneto increase the credibility of the study. Thequantitative assessment resulted in 4 kindsof pairs as shown in Table 1.
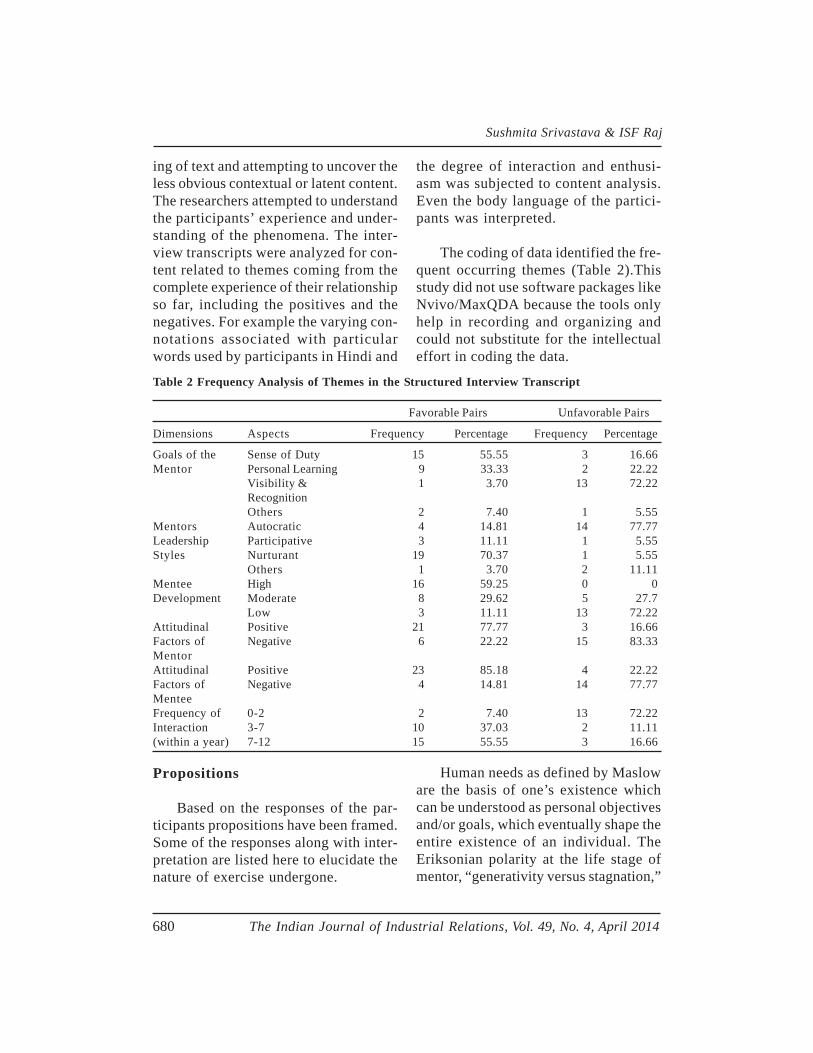
Sushmita Srivastava & ISF Raj
680 The Indian Journal of Industrial Relations, Vol. 49, No. 4, April 2014
Propositions
Based on the responses of the par-ticipants propositions have been framed.Some of the responses along with inter-pretation are listed here to elucidate thenature of exercise undergone.
Human needs as defined by Masloware the basis of one’s existence whichcan be understood as personal objectivesand/or goals, which eventually shape theentire existence of an individual. TheEriksonian polarity at the life stage ofmentor, “generativity versus stagnation,”
Table 2 Frequency Analysis of Themes in the Structured Interview Transcript
Favorable Pairs Unfavorable Pairs
Dimensions Aspects Frequency Percentage Frequency Percentage
Goals of the Sense of Duty 15 55.55 3 16.66Mentor Personal Learning 9 33.33 2 22.22
Visibility & 1 3.70 13 72.22RecognitionOthers 2 7.40 1 5.55
Mentors Autocratic 4 14.81 14 77.77Leadership Participative 3 11.11 1 5.55Styles Nurturant 19 70.37 1 5.55
Others 1 3.70 2 11.11Mentee High 16 59.25 0 0Development Moderate 8 29.62 5 27.7
Low 3 11.11 13 72.22Attitudinal Positive 21 77.77 3 16.66Factors of Negative 6 22.22 15 83.33MentorAttitudinal Positive 23 85.18 4 22.22Factors of Negative 4 14.81 14 77.77MenteeFrequency of 0-2 2 7.40 13 72.22Interaction 3-7 10 37.03 2 11.11(within a year) 7-12 15 55.55 3 16.66
ing of text and attempting to uncover theless obvious contextual or latent content.The researchers attempted to understandthe participants’ experience and under-standing of the phenomena. The inter-view transcripts were analyzed for con-tent related to themes coming from thecomplete experience of their relationshipso far, including the positives and thenegatives. For example the varying con-notations associated with particularwords used by participants in Hindi and
the degree of interaction and enthusi-asm was subjected to content analysis.Even the body language of the partici-pants was interpreted.
The coding of data identified the fre-quent occurring themes (Table 2).Thisstudy did not use software packages likeNvivo/MaxQDA because the tools onlyhelp in recording and organizing andcould not substitute for the intellectualeffort in coding the data.
Mentor-Mentee Relationships
The Indian Journal of Industrial Relations, Vol. 49, No. 4, April 2014 681
suggests the potential value of a mentorrelationship. Through enabling others, themidlife individual satisfies important gen-erative needs (Erikson, 1963; 1968; 1978)and also has the opportunity to reviewand reappraise the past by participatingin a younger adult’s attempts to face thechallenges of early adulthood.
Theme Analysis process suggestedthat there were three main goals of thementor: - Sense of Duty, Personal Learn-ing and Visibility & Recognition. One ofthe mentors said that “It is a part of ourduty to look after them…build long termrelations… they are the managers fortomorrow”. The analysis further revealedthat for around 89% of the mentors inthe favorable pairs goals were morelinked to Sense of Duty and PersonalLearning. On the other hand for around72% of mentors in the unfavorable pairthe goal was more linked to Visibility andRecognition. Another mentor said that “Iwant to be recognized for being a goodmentor…I would have felt better if Iwould have been given a letter formentoring”. Thus, it could be concludedthat the means adopted to achieve thesegoals eventually shape the mentoring re-lationship.
The means adopted to achievethese goals eventually shape thementoring relationship.
Proposition 1: The goals of the mentoraffect the quality and nature ofmentoring relationship.
As to the identification of the domi-
nant leadership style used by mentors intheir relationship with mentees, the re-sults indicate predominance of nurturanttask leadership style. A nurturant leader“cares for his subordinates, shows affec-tion, takes personal interest in their well-being, and above all is committed to theirgrowth.” In the process, there developsa relationship of understanding, warmth,and interdependence, leading to higherproductivity and better growth. An auto-cratic leader demands complete loyalty,unconditional submissiveness and fullcompliance from his subordinates. Theparticipative leader is essentially frater-nal in his interactions. He treats his sub-ordinates as equals though unique in po-tential contributions to the group. (Sinha,1980).
Theme Analysis process suggestedthat there were three main styles adoptedby the mentor: - Autocratic, Participativeand Nurturant. One of the mentees said“He has been like a father to us… hegives us even pocket money to spend, weare like his daughters”. For around 70 %of the mentors in the favorable pairs pre-dominant leadership style was Nurturant.On the other hand for around 78% ofmentors in the unfavorable pair the pre-dominant leadership style was autocratic.One of the autocratic mentors said “Iwant my mentee to meet me every day….”.
Proposition 2: There is a significant rela-tionship between favorable mentoringand mentor’s leadership style.
Mentors who were motivated to ful-fill the needs and expectations of their
Sushmita Srivastava & ISF Raj
682 The Indian Journal of Industrial Relations, Vol. 49, No. 4, April 2014
mentees by using resources within theirreach have experienced a better qualityof mentoring relationship. Their menteesreflected a high degree of affiliation; com-mitment and adoration for the mentor.The mentors having seen such develop-ments in the relation were further moti-vated to devote more attention to the re-lationship.
Those who experienced greaterneed fulfillment enjoyed better re-lationship quality
Patrick et al (2007) also confirm thelink between need fulfillment and qualityof relationship. They recognize 3 basicpsychological needs: autonomy (feeling notcoerced in to one’s actions), competence(feeling capable), and relatedness (feel-ing connected to others). In one of theirstudies the authors used a diary recordingprocedure and tested a model in which theassociation between need fulfillment andrelationship quality was mediated by rela-tionship motivation. Those who experi-enced greater need fulfillment enjoyedbetter relationship quality primarily be-cause of their tendency to have more in-trinsic or autonomous reasons for beingin their relationship. The analysis revealedthat for around 89% of the mentees in thefavorable pairs need fulfillment was mod-erate to high. On the other hand for around72 % of the mentees in the unfavorablepairs need fulfillment was low. One of thementees expressed his satisfaction in thefollowing words: “Wo samjhte hai humarisaari baatien kyonki who bhi UP se hai…(He understands all my feelings, as he isalso from state of Uttar Pradesh)….”.
Proposition 3: The extent of fulfillmentof the needs of the mentee impactedthe quality of the relationship.
Attitudes represent an individual’sdegree of like or dislike for something.They are generally positive or negativeviews of a person, place, thing, or event.They are tendencies or orientations, es-pecially of mind. Attitudes are represen-tations of one’s evaluations, preferencestowards a wide variety of objects. Atti-tudes are based on information (Morgan& King, 2001). Attitudes of mentor andmentee play crucial roles in building theirrelationship. Thus a positively orientedrelation is most likely to stand a betterchance of survival primarily, and secondlythe learning from the relationship alsoexpands. Our analysis revealed that thementor’s relationship with a positive at-titude mentee is more favorable than thatwith a negative attitude mentee. A men-tor who was allocated two mentees withdifferent attitudes said the following abouthis positive attitude mentee “I am alwaysthere with my mentee when he needs methe most”. On the other hand he did nothave the same level of commitment forhis negative attitude mentee. The quoteindicates that even when a similar situa-tion was faced by two mentees the dif-ference in their attitude created a differ-ence in their relationship with the men-tor. The mentor commitment to mentoringrelationship was more when the menteeattitude was positive. Table 2 shows thatin favorable relationships 78% mentorshave positive attitude while 85% menteeshave positive attitude. In unfavorablerelationship 83% mentors have negativeattitude while 78% mentees have nega-tive attitude.
Mentor-Mentee Relationships
The Indian Journal of Industrial Relations, Vol. 49, No. 4, April 2014 683
Proposition 4: The attitudinal dispositioncontributes to the quality of thementoring relationship such that apositively disposed attitude results inmore favorable outcome in thementoring relationship.
Frequency of interaction amongthe mentors and mentees has beenfound to significantly affect and/orimpact the mentoring relationship.
The focus of the current study is notso much on what healthy mentoring re-lationship is. It is more about what mean-ing did people as individuals make ofwhat a healthy mentoring relationshipmeans to them, their attitudes, prepara-tion and factors (both intrinsic and ex-trinsic) which enable effective and/orhealthy mentoring relationships. Amentor’s prior experience of mentoringin any relation as a guide or a counselormay affect the present relationship. Fre-quency of interaction among the mentorsand mentees has been found to signifi-cantly affect and/or impact the mentoringrelationship. Majority of the mentors ex-pressed lack of time hindering their rela-tionship. The number of interaction and/or meeting with the mentor helps onetrace the growth of a mentoring relation-ship. A patterned growth in the mentoringrelationship has been found among allfrequently interacting research partici-pants. In their words, they have de-scribed their relationships, as growingfrom formal interactions that can be ex-plained as the introductory interactions,initial rapport building and/or ice-break-ing sessions followed by informal inter-
actions- discussions about work; how toenhance ones career; different careerprospects; helping the mentees familiar-ize with the organization and also helpthe mentee develop his/her convoy sys-tem within the organization; advice and/or suggestions on projects to do or not todo; how to maximize on the period oftraining. Gradually informal interactionsbecomes their comfort zone, in which oneis able to openly and freely express aboutfamily, friends and sometimes discussareas at a more personal and intimatelevel.
However, our analysis has revealeda rather interesting facet related to fre-quency of interaction. Even in the favor-able pairs some mentors and menteeswere satisfied with less number of inter-actions also if the intensity of interactionswas high.
Proposition 5: The quality of mentoringrelationship is dependent on the fre-quency of interaction between thementor and the mentee. However ifthe need fulfillment of mentee canhappen with less meetings as wellthen frequency is not a major factor.
Frequency of interaction does notplay a significant role if need fulfillmentof mentee can be achieved through lessmeetings also.
Findings & Conclusion
In this research study, we discoveredthat the goals of mentoring could be nu-merous. These can vary from contribut-ing back to the company to interacting
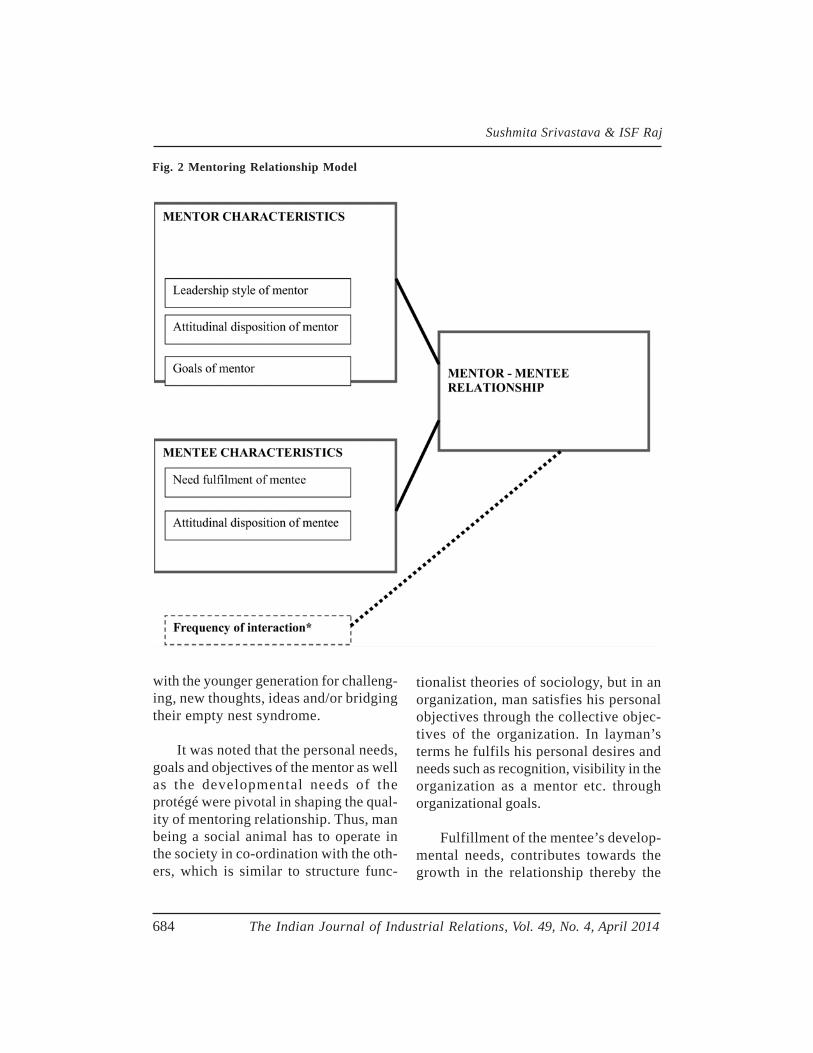
Sushmita Srivastava & ISF Raj
684 The Indian Journal of Industrial Relations, Vol. 49, No. 4, April 2014
with the younger generation for challeng-ing, new thoughts, ideas and/or bridgingtheir empty nest syndrome.
It was noted that the personal needs,goals and objectives of the mentor as wellas the developmental needs of theprotégé were pivotal in shaping the qual-ity of mentoring relationship. Thus, manbeing a social animal has to operate inthe society in co-ordination with the oth-ers, which is similar to structure func-
tionalist theories of sociology, but in anorganization, man satisfies his personalobjectives through the collective objec-tives of the organization. In layman’sterms he fulfils his personal desires andneeds such as recognition, visibility in theorganization as a mentor etc. throughorganizational goals.
Fulfillment of the mentee’s develop-mental needs, contributes towards thegrowth in the relationship thereby the
Fig. 2 Mentoring Relationship Model
Mentor-Mentee Relationships
The Indian Journal of Industrial Relations, Vol. 49, No. 4, April 2014 685
quality of mentoring relationship. Fre-quency of interaction was found to be akey enabler towards understanding ofdevelopmental needs of the protégé.However, if the need fulfillment can hap-pen through less meetings also then fre-quency does not play a major role. Men-tors, who attributed paucity of time ashindrance to mentoring relationships, alsostated that they were unclear on theirroles as mentors, leading us to concludethat unfavorable mentoring relationshipsmay be more an outcome of lack of clar-ity on roles of a mentor and the mentoringprocess, than lack of time. This highlightsthe need for more focused training inter-ventions on mentoring.
Each mentor-mentee relationship isunique. However a unique patternevolved across the pairs interviewed.With “India on growth track in next 15years and people across the spectrumparticipating in the growth process andderiving benefits from it, mentoring re-search has to align with the needs of thecurrent generation by focusing on fac-tors that lead to exponential growth inrelationship building rather than causingmere satisfaction.
Each mentor-mentee relationshipis unique.
Some More Findings
The mentor’s position and careerstage in the organization seems to influ-ence his mentoring relationship, whereinmentors in more influential positionseemed to conceptualize the mentoring
concept from his/her own world view,than mentors in relatively less influentialpositions. One can therefore concludethat mentoring cannot be isolated fromorganizational systems and processes.Therefore, there appears a need to viewmentoring from an HR systems perspec-tive. Mentors might also value the rela-tionship just because the mentee/protégéis from similar socio cultural context ashim/her. We also conclude that one of theindicators for success of formalmentoring relationships is the extent ofprior experiences in informal mentoringrelationships. This could become one ofthe inputs for future selection of men-tors.
Limitations
Mentoring relationship has a widerange of variables, continuously progress-ing and changing across organizations,companies and institutes; however thisstudy could focus only on a ‘single’ com-pany.
Purposive sampling limited the scopeof conducting an exhaustive study anddelivering a rich and varied data. Thestudy was based on mentoring relation-ship at time 1 (eight months) after beingassigned the mentors. However, sincethere was no data collected at time 0,that is, at the start of the relationship, theexact progress/growth trajectory of therelationship could not be traced. This in-hibited a more thorough understanding offactors contributing towards mentoringrelationship. A longitudinal study wouldhave helped us to validate the factors thatcontribute to growth in mentoring rela-
Sushmita Srivastava & ISF Raj
686 The Indian Journal of Industrial Relations, Vol. 49, No. 4, April 2014
tionship with time, although the presentcross sectional study is significant as itexamines both the perspective of thementor and the mentee.
Future Directions
The research being cross-sectional,traced the growth of eight month longrelationship, however, factors impactingmentoring relationship should be studiedthrough a longitudinal method. This studywas a qualitative narrative exploratorystudy; thus, the researchers have at-tempted to quote verbatim. There is aneed now to formulate testable hypoth-eses, based on the phenomena studied toarrive at a theoretical understanding.Each of the variables identified, impact-ing mentoring relationship need to betaken forward for further investigations.
References
Allen, T. A. & Eby, L. T. (2007), The BlackwellHandbook of Mentoring: A Multiple Per-spectives Approach. Malden, MA:Blackwell Publishing.
Allen, T. D. & Poteet, M. L. (1999), “Develop-ing Effective Mentoring Relationships:Strategies from the Mentor’s Viewpoint”,Career Development Quarterly, 48:59-73.
Allen, T. D., Poteet, M. L. & Burroughs, S. M.(1997), “The Mentor’s Perspective: AQualitative Inquiry and Future ResearchAgenda”, Journal of Vocational Behavior,51: 70–89.
Baruch, Y. & Budhwar, P. S. (2006), “A Com-parative Study of Career Practices for Man-agement Staff in Britain and India”. Inter-national Business Review, 15: 84–101.
Bhatnagar, J. (2007), “Talent Management Strat-egy of Employee Engagement in Indian
ITES Employees: Key to Retention”, Em-ployee Relations, 29(6): 640–63.
Bhawuk, D. P. S. (2008), “Globalization and In-digenous Cultures: Homogenization or Dif-ferentiation?” International Journal of In-tercultural Relations, 32(4): 305–17.
Clutterbuck, D. ( 2007), “An International Per-spective on Mentoring”, in B. R. Raginsand K. E. Kram (Eds.), The Handbook ofMentoring at Work: Theory, Research andPractice, Thousand Oaks: Sage.
Eby, L. T. & Lockwood, A. (2005), “Protégés’and Mentors’ Reactions to Participating inFormal Mentoring Programs: A QualitativeInvestigation”, Journal of Vocational Be-havior, 67: 441–58.
Erikson, E. (Ed.) (1978), Adulthood. New York:Norton.
Glaser, B. (1992), Basics of Grounded TheoryAnalysis, Mill Valley, CA: SociologyPress. Glaser, B. & Strauss, A. (1967), TheDiscovery of Grounded Theory, Chicago:Aldine.
Higgins, M. C. (2000), “The More the Merrier?Multiple Developmental Relationships andWork Satisfaction”, Journal of ManagementDevelopment, 19(4):277–96.
Higgins, M. C. & Thomas, D. A. (2001), “Con-stellations and Careers: Towards Under-standing the Effects of Multiple Develop-mental Relationships”, Journal of Organi-zational Behavior, 22:223–47.
Kram, K. E. (1985), Mentoring at Work.Glenview, IL: Scott, Foresman & Com-pany.
Kram, K.E. (1996), “A Relational Approach toCareer Development”, in D.T. Hall (ed.),The Career Is Dead: Long Live the Career.pp. San Francisco: Jossey-Bass Publish-ers.
Krippendorf, K. (2004), Content Analysis: AnIntroduction to Its Methodology, (2nd ed.).Newbury Park, CA: Sage.
Mentor-Mentee Relationships
The Indian Journal of Industrial Relations, Vol. 49, No. 4, April 2014 687
Noe, R. A., Greenberger, D. B. & Wang, S. (2002),“Mentoring: What We Know and WhereWe Might Go”, Research in Personnel andHuman Resources Management, 21, 129–73.
Patrick, H., & C. R. Knee (2007), “The Role ofNeed Fulfillment in Relationship Function-ing & Well-being: a Self-determinationTheory Perspective.” Journal of Personal-ity and Social Psychology 92(3): 434-57.
Ragins, B. R. & Kram, K. E. (2007), Handbookof Mentoring: Theory, Research, and Prac-tice, Thousand Oaks, CA: Sage
Ragins, B. R. & Scandura, T. A. (1999), “Burdenor blessing? Expected Costs and Benefitsof Being a Mentor”, Journal of Organiza-tional Behavior, 20(4):493–509
Ramaswami, A. & Dreher, G. F. (2007), “TheBenefits Associated with WorkplaceMentoring Relationships”, in Allen,Tammy D.; Eby, Lillian T., The Blackwell
Handbook of Mentoring: A Multiple Per-spectives Approach: Malden, MA, US:Blackwell Publishing.
Sinha, J. B. P. (1980), The Nurturant Task Leader,New Delhi: Concept.
Sinha, J. B. P. (1990), “The Salient Indian Valuesand Their Socio-economic Roots”, IndianJournal of Social Science, 3: 477–88.
Suar, D., Tewari, H.R. & Chaturbedi, K. R. (2006),“Subordinates’ Perception of LeadershipStyles and Their Work Behavior”, Psychol-ogy and Developing Societies, 18(1): 95–114.
Wanberg, C. R., Welsh, E. T. & Hezlett, S.A.(2003), “Mentoring Research: A Reviewand Dynamic Process Model”, Research inPersonnel and Human Resource Manage-ment, 22: 39–124.
Weber, R. P. (1990), Basic Content Analysis. (2nded.), Thousand Oaks, CA: Sage Publica-tions.
Appendix 1
Interview Schedule for Mentor• Please recall the last interaction with your mentee .What do you generally discuss with
your mentee?• Are you aware about your mentee’s developmental needs at this point of time?• How have you looked upon your role as a mentor?• Please rate yourself in the scale of 1-10 based on the quality of your relationship. Why
have you given yourself this rating? (justify) What is an ideal rating and how do youthink you can achieve it?
• What has been some of your personal as well as professional benefits derived from thisrelationship?
Interview Schedule of Mentees:
Name: Sex: Age:Educational Qualifications: College/Institute:
• Please elaborate on one of your (positive) interactions with your mentor?• Describe your mentor-mentee relationship?• Why according to you is your relationship; positive and/or negative and/or healthy and/or
not so healthy?• What are your personal and professional expectations from this relationship?• In your future plans, how does your mentor help you achieve and/or affect it?
Sushmita Srivastava & ISF Raj
688 The Indian Journal of Industrial Relations, Vol. 49, No. 4, April 2014
• Any experiences (not so good/good experiences) so far, which you would want to reflectupon?
• What is you unique role as a mentee/protégé that you were playing in the relationship?
Appendix 2 Mentorship Feedback Form (For Mentors)
Dear Mentors,Kindly fill up this brief survey questionnaire by choosing the most suitable option based on yourperception of the MTTs mentoring programYour responses will be kept confidential &will be used entirely for bringing about improvements inthe ongoing mentoring process/program.You may tick “(by dragging the tick) or color the appropriate boxes /save the survey form & mail itback to me please. On a 4 point rating scale mark 4 if you agree to a very great extent, 3 if youagree to a great extent, 2 if you agree to some extent and 1 if you do not agree at all.1. How well do you know your mentee?2. How well does your mentee know you?3. How well do you feel that your mentee understands you as a mentor and your expectationsfrom the relationship?4. To what extent do you feel the mentee recognizes your potential to serve as a mentor to him?5. Are you happy with the mentee selection process?6. Did you find a mentee of your choice?7. What are the chances you feel your mentees assigned to you were personally inclined to beguided and mentored by you personally & professionally?8. Are you happy with the quality of interaction that has taken place so far between you & yourmentee?9. How would you characterize your relationship with your mentee?10. Were you able to focus on personal development of your mentee & yourself in the mentoringrelationship, so far?In the next 3 questions kindly comment on the quality of your mentoring interactions11. “I felt that I could freely talk/relate to my mentee about anything”?12. “I completely trust my mentee”13. “There was a great deal of open communication between my mentee and me”14. On how many occasions in the past one year have you met your mentee?15. Could you state two benefits you felt arising out of this relationship?16. How could we make the mentorship process more effective?17. Your general comments on the mentoring initiatives.
Appendix 3 Mentorship Feedback Form (For Mentees)
Dear Mentees. Please fill up this survey questionnaire by choosing the most suitable option basedon your perception of the mentoring programYou may tick or color the appropriate boxes /save the survey form & mail it back to me([email protected]) please. Your responses will be kept confidential & be used entirely forbringing about improvements in the mentoring process. On a 4 point rating scale mark 4 if youagree to a very great extent, 3 if you agree to a great extent, 2 if you agree to some extent and 1 ifyou do not agree at all.1. How well do you know your mentor?2. How well do you feel that your mentor understands your problem and needs?3. How well does your mentor know you?4. How well do you feel that your mentor recognizes your potential?
Mentor-Mentee Relationships
The Indian Journal of Industrial Relations, Vol. 49, No. 4, April 2014 689
5. Are you happy with the mentor selection process?6. Did you find a mentor of your choice?7. What are the chances you feel your mentor was personally inclined to guide you solve problem at your work?8. Are you happy with the quality of interaction that are taking place between you & your mentor?9. How would you characterize your relationship with your mentor?10. Were you able to focus on your personal development in the mentoring relationship?11.To what extent would you agree to the following three statements?12. I felt that I could freely talk to my mentor about anything?13. I completely trusted my mentor14. There was great deal of open communication between my mentor and me15. On how many occasions in the past one year have you met your mentor?16. Could you state two benefits you felt arising out of this relationship?17. How could we make the mentorship process more effective?18. Your general comments on the mentoring initiatives.
sas
Construction &Validation of Employee WellnessQuestionnaire
M.M. Sulphey
Employee wellness is a poorlydefined concept. It has as manynumbers of definitions as thenumber of experts who have at-tempted to define it . A widerange of dimensions has beenseen used in various tools tomeasure employee wellness.This study has developed a shortscale to assess employeewellness. The ‘EmployeeWellness Questionnaire’ hasbeen developed using the estab-lished procedures and its valid-ity and reliability have also beenassessed. Despite a few limita-tions, the study has presented aplausible structure for the scale.
Introduction
There was a time when most of theeconomies were in the transition phase,human morbidity and mortality weremainly attributed to improper sanitation,poor nutrition, and the lack of immuniza-tion. This situation has undergone a seachange, with infectious and contagiousdiseases being replaced by a wide rangeof lifestyle diseases. Some such diseasesinclude cancer, cardiovascular diseases,hypertension, alcoholism, emphysema,gastrointestinal disorders, and certainother chronic conditions (Ramsey, 1982).Certain others include diabetes mellitus,low back ache, eye diseases, etc. Theeasiest way to deal with such diseases isto implement appropriate employeewellness programs in their place of work.
There is no universally acceptabledefinition for employee wellness.Wellness is badly defined, because thereis little agreement about what the defini-tion should contain (Sieberhagen, Pienaar& Els, 2011). A few available definitionsare presented here. Ardell (1985) de-fines wellness as ’a conscious and delib-erate approach to an advanced state ofphysical, psychological, and spiritual
M.M. Sulphey is Professor, TKM Institute ofManagement, Karuvelil, Kollam, Kerala.E-mail:[email protected]
690 The Indian Journal of Industrial Relations, Vol. 49, No. 4, April 2014
health’. To Gilmore (1979) wellness isthe daily striving for the goal of becom-ing healthier through ongoing assessment,intervention, and reinforcement. Corbin& Pangrazi (2001) define it as ‘a multi-dimensional state of being describing theexistence of positive health in an indi-vidual as exemplified by quality of life anda sense of well-being’.
An entirely different dimension ispresented by Hettler (1984) when hedescribes wellness as an active processthrough which the individual becomesaware of, and makes choices toward, amore successful existence. Corbin,Lindey, Welk & Corbin (2002) describewellness as a person’s state of well-be-ing that contributes to an improved qual-ity of life. The President’s Council onPhysical Fitness and Sports (as quotedin The Journal on Active Aging, 2006)defines wellness as ‘a multidimensionalstate of being describing the existenceof positive health in an individual as ex-emplified by quality of life and a senseof well-being’.
It is also defined as ‘an integratedand dynamic level of functioning ori-ented toward maximizing potential, de-pendent on self-responsibility’. Wellnessinvolves preventive health behaviorscoupled with a shift in thinking and atti-tude. It is thus a comprehensive mind-set of lifelong growth and achievementin the emotional, spiritual, physical, oc-cupational, intellectual, environmental,and social dimensions. Thus throughwellness an individual strives towardhigher levels of functioning for a life-time, keeping complacency and passiv-
ity at bay. Wellness is not a goal to beattained but a continuous process thatneeds to be maintained.
Wellness is not a goal to be at-tained but a continuous processthat needs to be maintained.
It can also be considered as a wayof living, which seeks growth and im-provements in all areas. It involves alifestyle of deliberate choices and self-responsibility that require conscientiousmanagement and meticulous planning.There are many who consider wellnessto be of curing sickness, counting fatgrams, jogging, and measuring body fat.It is much more comprehensive than that.It is a mind-set of personal empower-ment that attempts to approach life withoptimism, confidence, and energy.Wellness is a lifelong quest toward opti-mal functioning. Individuals who strivefor wellness have an exceptional open-ness to experience, and never fear newexperiences and life’s changes. Theywelcome changes, take control of theirlife and face it with creativity and fresh-ness. Studies have shown that living awellness lifestyle has tremendous poten-tial for increasing longevity. Wellness isthus the idea of being aware of, and ac-tively working toward better health. It canbe commented to be ‘making the rest ofyour life the best of your life.’
Wellness is a continuous, active pro-cess which is an ongoing, lifelong effortthat is oriented toward maximizing one’spotential. It is a commitment and deter-mined choice to move toward optimal
Construction &Validation of Employee Wellness Questionnaire
The Indian Journal of Industrial Relations, Vol. 49, No. 4, April 2014 691
M.M. Sulphey
692 The Indian Journal of Industrial Relations, Vol. 49, No. 4, April 2014
well-being. It is a proactive approach toliving, which involves loving, working, andplaying based on values. Wellness is alsosaid to be a self designed lifestyle thatfacilitates optimal health. Overall it isintegration and an appreciation that ev-erything which is done, thought, felt, andbelieved has an impact on the well-be-ing. There is now increasing general in-terest in wellness which has made iteasier for individuals to adopt a wellnesslifestyle.
In management literature the termswellness and well-being are often foundused interchangeably (Martin, Kirkcaldy& Siefen, 2003). According toSieberhagen, Pienaar & Els (2011), theabsence of a universal definition, andconfusion about a preferred term to de-scribe wellness are aspects that pose in-numerable difficulties in developingguidelines for good wellness practices inpresent day organizations.
From the available literature it can beseen that EWPs are intervention strate-gies that are intended to promote the well-being of employees. They could take theform of either curative or preventative innature. The main purpose of a wellnessprogram is to create an awareness ofwellness issues among the employees, tofacilitate personal change and health man-agement among them, and the promotionof a healthy and supportive workplace.
Experiences show that EWPs oftendo not form part of core business struc-tures (Bennett, 1999). This is becauseorganizations fail to realize the extent towhich employee wellness contributes to
organizations’ bottom line. However,according to Dhanesar & Hales (1994)organizations that invests time and re-sources in EWPs, with the focus on be-ing proactive rather than reactive, haveharvested sufficient returns on their in-vestments. Some of the possible returnson investment include lower absenteeism,healthier employees, fewer accidents andlower staff turnover.
In the contemporary world which ismarket-driven, a band of capable andresilient employee would be the mostimportant resource, and fundamental tothe badly needed productivity. The WorldEconomic Forum states that, in Indialifestyle-related illnesses caused due topoor diet, physical inactivity and to a cer-tain level tobacco and alcohol consump-tion accounts for 27% of illnesses amongworking population. India also has thehighest rate of diabetes in the world,presently affecting around 6-8% of thepopulation. Projections indicate that thisis expected to rise to 40% by 2030. It isalso projected that in India, productiveyears of life lost due to cardiovasculardisease is set to double between 2000and 2030. A survey conducted by theWorld Economic Forum in India foundthat one quarter of the firms surveyedlost around 14% of their annual workingdays due to employee sickness. Studiesalso showed that such chronic diseases
One quarter of the firms surveyedlost around 14% of their annualworking days due to employeesickness.
Construction &Validation of Employee Wellness Questionnaire
The Indian Journal of Industrial Relations, Vol. 49, No. 4, April 2014 693
are the prime cause of lost work time inthe working-age population. These canbe avoided only through employeewellness activities.
Towards this, interventions are re-quired to be made to improve healthynutrition, increase in regular physical ac-tivity and avoiding the use of tobacco andharmful alcohol. This is estimated to re-duce by up to 80% ill health and prema-ture deaths caused by chronic diseases.Further, according to World EconomicForum, reducing just one health riskwould increase the employee’s on-the-job productivity by 9% and cut absen-teeism rate by 2%.
EWPs allow employees to takecharge of, and the responsibilityfor, their own well-being.
Organizations in general and IT orga-nizations in particular are aware of theseissues related to employee wellness.There is also increased interest in inte-grating wellness activities with employers’responsibilities (Hillier, Fewell, Cann &Shephard, 2005). This has led to the in-troduction of various programs which in-clude Employee Wellness Programs(EWPs), Employee Assistance Programs(EAPs), etc. EWPs allow employees totake charge of, and the responsibility for,their own well-being (Derr & Lindsay,1999). EWPs include all the activities thatfocus on relieving the stress of employ-ees caused as a result of a host of factorslike personal finances, substance abuse,health problems, career crises and job de-mands (Leiter & Wahlen, 1996).
EWPs has its origin in the older in-dustrial medicine and hygiene programsthat were concerned with first aid andmedical care; occupational and envi-ronmental hazards like toxic compo-nents and noise; and with safety pro-grams the primary stress of which werein accident prevention. Later the oc-cupational safety and health programsexpanded in scope and depth, andevolved in focus. The modern EWPsare intervention strategies intended topromote the overall well-being of em-ployees. They can be either curativeor preventative in nature. Organizationsintroduce EWPs to create awarenessabout wellness issues, to facilitate per-sonal change and health managementand to promote a healthy and support-ive workplace. EWPs include activi-ties that focus on relieving the stressof employees that may be caused dueto aspects like personal finances, sub-stance abuse, health problems, careercrises and job demands (Leiter &Wahlen, 1996).
While EWPs address wellness is-sues at the workplace EAP, accordingto Berridge & Cooper (1994), is a pro-grammatic intervention at the work-place, usually at the level of the indi-vidual employee using behavioral sci-ence knowledge and methods for therecognition and control of certain work-and non work-related problems. EWPsare also described as programs thatcover the identification, assessment,monitoring, referral, counseling, and fol-low-up activities that aim at address-ing employees’ problems (White ,
M.M. Sulphey
694 The Indian Journal of Industrial Relations, Vol. 49, No. 4, April 2014
McDuff, Schwartz, Tiegel & Judge,1996; Zarkin, Bray & Qi, 2000).
Dimensions of Employee Wellness
A review of literature provides thatemployee wellness is seen by differentpeople in varying dimensions. For in-stance while organizations focus mostlyon health, dimensions of wellness andpositive work influences; service provid-ers focus mostly on the recognition of dualbenefits to organizations and employees.Labor unions however focus on anotherdimension – the legal requirements, andoccupational health and safety. In gen-eral, six dimensions of wellness havebeen identified. They include emotional,vocational, physical, spiritual, intellectual,and social.
Six dimensions of wellness includeemotional, vocational, physical,spiritual, intellectual, and social.
Reasons for EWPs
A few reasons why organizations in-troduce EWPs are the following:
1. High levels of stress and the conse-quent absenteeism: Consequent toglobalization, competition has in-creased manifold. This has resultedin increase in incidence of workstress. Work stress can affect thehealth of employees directly. Thiscould ultimately lead to higher levelsof absenteeism and even turnover.
2. To show organizations care: EWPsinduce in the minds of the employ-
ees that they are being cared by theirorganizations.
3. Social responsibility: Many organi-zations introduce EWPs as part ofcorporate social responsibility. In-creasing link is now evidenced be-tween corporate social responsibility,improvements in their value to share-holders and the morale of employees.Organizations now list EWPs as un-der CSR activities. This would alsoenhance the image and prestige ofthe company.
4. To help reduce health care or medi-cal costs: EWPs will help employeesmaintain a healthy mind and body,thereby reducing the incidence ofhealth issues and the consequentcosts associated with it.
5. To increase employee productivity:Since the EWPs address the welfareand morale of employees, it will helpincrease the morale and productiv-ity.
6. To improve retention: As employeesfeel at ease and will be in high spiritsin the organization, since there is ad-equate focus on their well being, re-tention will not be a big issue.
EWPs are now an economic im-perative for corporations, and should beaccorded strategic priority in India.The need for these programs is high-lighted further when viewed against thebackdrop of rising burden of a largenumber of non-communicable diseasesin India. It is estimated that these dis-eases account for around 53% of totaldeaths.
Construction &Validation of Employee Wellness Questionnaire
The Indian Journal of Industrial Relations, Vol. 49, No. 4, April 2014 695
Benefits of EWP for Employees
EWPs provide a number of benefitsto employees. The first and foremostbenefit is that it allows the employees totake charge of, and responsibility for, theirown well-being. It would help the em-ployees in relieving stress that may ariseout of personal finances, substanceabuse, health problems, career crises andjob demands. Further benefits, accord-ing to Renaud, et al (2008) include in-creased mental wellness, energy, resil-ience, life and job satisfaction, reducedstress and depression.
Benefits to the Organization
Through introduction of EWPs em-ployees would be able to derive a host ofbenefits like meeting relevant provisionsof labor legislations, improved industrialrelations, reduced absenteeism, increasedemployee performance and productivity,reduced health care costs, and substan-tial reduction in accidents (Addley,McQuillan & Ruddle, 2001; Goetzel &Ozminkowski, 2008; Hemp, 2004;Makrides, 2004; Shaw, Alfonso, Howat& Corben, 2007; Thogersen-Ntoumani &Fox, 2005).
According to Sieberhagen, Pienaar &Els, (2011) wellness of employees has thecapacity to influence the wellness of theorganization in which he works and viceversa. However, it is difficult to mea-sure the effectiveness of EWPs becausethe measurement ultimately rests on thesubjective perceptions of the organiza-tions. It can be stated that improvingpositive employee outcomes and reduc-
ing negative employee outcomes couldindicate the effectiveness of a EWP.
Elements of Effective EWP
EWPs, which are of importance toany organization, would be effective onlyif it is done in an objective manner. Nor-mally the following elements are sug-gested for an EWP to be effective:
1. Establishing objectives and goals thatare clear
2. Linking the specific programs to thebusiness objectives
3. Communication to and engaging alllevels of employees to such programs
4. Creation of an appropriate environ-ment that is supportive in nature,
5. Lacing the programs with appropri-ate incentives so that desired resultsare achieved
6. Creating a social environment withappropriate norms and providing thenecessary all round support
7. Designing and implementing a pro-gram that is multi component in na-ture and tailored to the specific needsof the organization
A few lifestyle practices identified tohave the capacity to enhance wellnessare:
1. Exercising aerobically at least fourto five times per week.
2. Eliminating all forms of tobacco andalcoholic products.
M.M. Sulphey
696 The Indian Journal of Industrial Relations, Vol. 49, No. 4, April 2014
3. Limiting the quantity of animal fats,cholesterol, trans-fats, and saturatedfats in the diet.
4. Including in the diet a few servingsof fruits and vegetables, and otherhigh-fiber foods and whole grains.
5. Assessing personal stressors andpracticing stress management tech-niques, including maintaining a strongsocial support system.
6. Pursuing and maintaining a healthyweight.
7. Practicing safe sex habits.
8. Balancing work, social, and personaltime, including getting minimum of 6to 7 hours of sleep every night.
The above literature presents theimportance of wellness and its need inthe current fast track work settings. Thepresent study is intended to construct ashort tool to assess employee wellness.
Methodology
This study has followed the frame-work provided by Hinkin (1998) to thedevelopment a psychometrically soundinstrument for employee wellness. Thesteps followed include item development,administration of questionnaire, item re-duction, and scale evaluation. The pro-cedure followed is loose as per theframework of Hinkin (1998).
Item development
In accordance with Hinkin’s (1998)guidelines the initial survey items weredeveloped by specifying the various do-
mains. Items were then developed toasses these domains. Care was takento see that the items developed mea-sured the specified domains. A largenumber of the items were developedthrough this process. Items which weredouble-barreled, poorly worded, incon-sistent with the particular dimension orduplications were either rewritten oreliminated. The content validity of theitems was examined by a panel of judgesworking in a prominent business school.While two items had a two point scale(yes and no), one item had a four pointperiodicity scale (daily, once in a week,sometimes, and never), and the balanceitems were on a three point scale (al-most always, sometimes and never).The questionnaire so developed wasadministered online to 262 IT/ITeS per-sonnel, through Google docs. The par-ticipants of the study included employ-ees from a wide range of backgrounds.The details pertaining to the demograph-ics are presented in Table 1.
Table 1 Demographic Particulars of the Re-spondents
Particulars Number
Gender Male 155Female 107
Marital status Married 128Unmarried 132Divorced 2
Qualification Non graduate 17Graduate 59Prof. graduate 72Professional PG 114
Age < 25 years 8226 – 30 10131 – 35 3936 – 45 3146 < 10
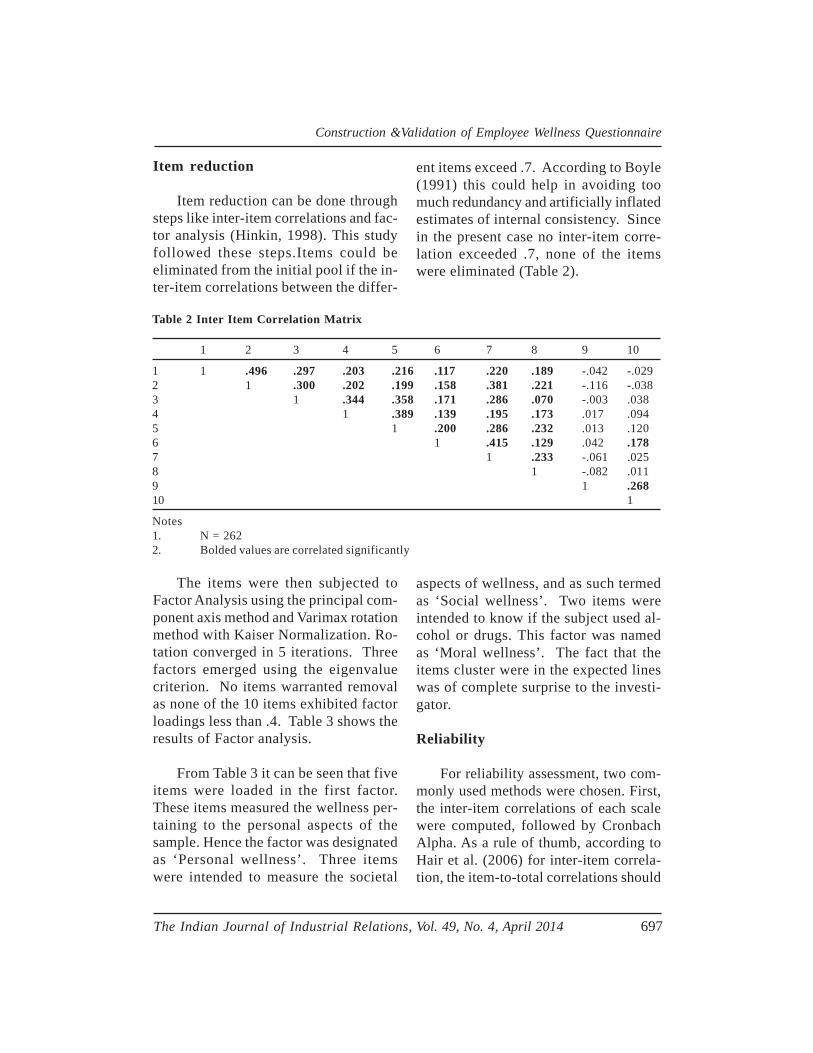
Construction &Validation of Employee Wellness Questionnaire
The Indian Journal of Industrial Relations, Vol. 49, No. 4, April 2014 697
Item reduction
Item reduction can be done throughsteps like inter-item correlations and fac-tor analysis (Hinkin, 1998). This studyfollowed these steps.Items could beeliminated from the initial pool if the in-ter-item correlations between the differ-
Table 2 Inter Item Correlation Matrix
1 2 3 4 5 6 7 8 9 10
1 1 .496 .297 .203 .216 .117 .220 .189 -.042 -.0292 1 .300 .202 .199 .158 .381 .221 -.116 -.0383 1 .344 .358 .171 .286 .070 -.003 .0384 1 .389 .139 .195 .173 .017 .0945 1 .200 .286 .232 .013 .1206 1 .415 .129 .042 .1787 1 .233 -.061 .0258 1 -.082 .0119 1 .26810 1
Notes1. N = 2622. Bolded values are correlated significantly
ent items exceed .7. According to Boyle(1991) this could help in avoiding toomuch redundancy and artificially inflatedestimates of internal consistency. Sincein the present case no inter-item corre-lation exceeded .7, none of the itemswere eliminated (Table 2).
The items were then subjected toFactor Analysis using the principal com-ponent axis method and Varimax rotationmethod with Kaiser Normalization. Ro-tation converged in 5 iterations. Threefactors emerged using the eigenvaluecriterion. No items warranted removalas none of the 10 items exhibited factorloadings less than .4. Table 3 shows theresults of Factor analysis.
From Table 3 it can be seen that fiveitems were loaded in the first factor.These items measured the wellness per-taining to the personal aspects of thesample. Hence the factor was designatedas ‘Personal wellness’. Three itemswere intended to measure the societal
aspects of wellness, and as such termedas ‘Social wellness’. Two items wereintended to know if the subject used al-cohol or drugs. This factor was namedas ‘Moral wellness’. The fact that theitems cluster were in the expected lineswas of complete surprise to the investi-gator.
Reliability
For reliability assessment, two com-monly used methods were chosen. First,the inter-item correlations of each scalewere computed, followed by CronbachAlpha. As a rule of thumb, according toHair et al. (2006) for inter-item correla-tion, the item-to-total correlations should
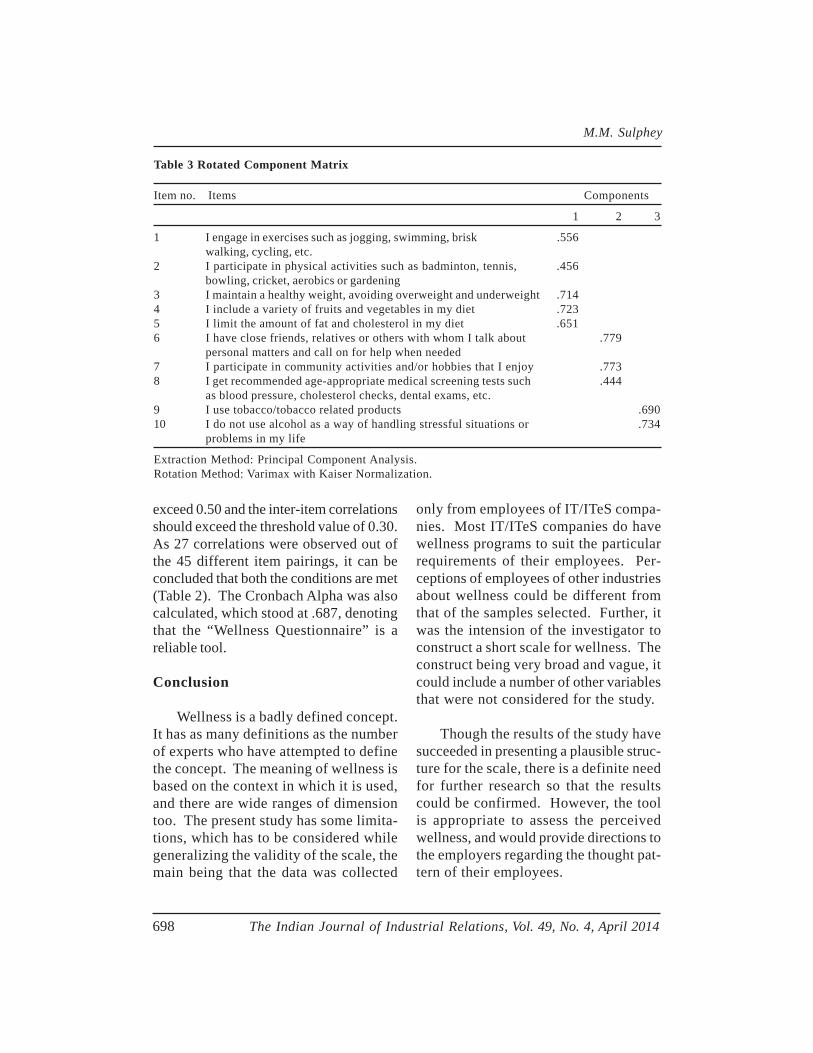
M.M. Sulphey
698 The Indian Journal of Industrial Relations, Vol. 49, No. 4, April 2014
Table 3 Rotated Component Matrix
Item no. Items Components
1 2 3
1 I engage in exercises such as jogging, swimming, brisk .556walking, cycling, etc.
2 I participate in physical activities such as badminton, tennis, .456bowling, cricket, aerobics or gardening
3 I maintain a healthy weight, avoiding overweight and underweight .7144 I include a variety of fruits and vegetables in my diet .7235 I limit the amount of fat and cholesterol in my diet .6516 I have close friends, relatives or others with whom I talk about .779
personal matters and call on for help when needed7 I participate in community activities and/or hobbies that I enjoy .7738 I get recommended age-appropriate medical screening tests such .444
as blood pressure, cholesterol checks, dental exams, etc.9 I use tobacco/tobacco related products .69010 I do not use alcohol as a way of handling stressful situations or .734
problems in my life
Extraction Method: Principal Component Analysis.Rotation Method: Varimax with Kaiser Normalization.
exceed 0.50 and the inter-item correlationsshould exceed the threshold value of 0.30.As 27 correlations were observed out ofthe 45 different item pairings, it can beconcluded that both the conditions are met(Table 2). The Cronbach Alpha was alsocalculated, which stood at .687, denotingthat the “Wellness Questionnaire” is areliable tool.
Conclusion
Wellness is a badly defined concept.It has as many definitions as the numberof experts who have attempted to definethe concept. The meaning of wellness isbased on the context in which it is used,and there are wide ranges of dimensiontoo. The present study has some limita-tions, which has to be considered whilegeneralizing the validity of the scale, themain being that the data was collected
only from employees of IT/ITeS compa-nies. Most IT/ITeS companies do havewellness programs to suit the particularrequirements of their employees. Per-ceptions of employees of other industriesabout wellness could be different fromthat of the samples selected. Further, itwas the intension of the investigator toconstruct a short scale for wellness. Theconstruct being very broad and vague, itcould include a number of other variablesthat were not considered for the study.
Though the results of the study havesucceeded in presenting a plausible struc-ture for the scale, there is a definite needfor further research so that the resultscould be confirmed. However, the toolis appropriate to assess the perceivedwellness, and would provide directions tothe employers regarding the thought pat-tern of their employees.
Construction &Validation of Employee Wellness Questionnaire
The Indian Journal of Industrial Relations, Vol. 49, No. 4, April 2014 699
References
Addley, K., McQuillan, P. & Ruddle, M. (2001),“Creating Healthy Workplaces in North-ern Ireland: Evaluation of a Lifestyle andPhysical Activity Assessment Program”,Occupational Medicine, 51(7):439–49
Ardell, D. (1985), The History and Future ofWellness, Dubuque, IA: Kendall/ Hunt.
Bennet, J. (1999), “Employee Assistance alsoHelps Productivity”, The Argus, BusinessSection, 3, 3.
Berridge, J. & Cooper, C. (1994), “The EmployeeAssistance Program: Its Role in Organiza-tional Coping and Excellence”, PersonnelReview, 23(7): 4–20
Boyle, G. J. (1991), “Does Item HomogeneityIndicate Internal Inconsistency or ItemRedundancy in Psychometric Scales”? Per-sonality and Individual Differences, 12(3):291-94
Corbin, C.B., & Pangrazi, R.P. (2001), “Towarda Uniform Definition of Wellness: A Com-mentary”, President’s Council on PhysicalFitness and Sports Research Digest, 3(15):1–8
Corbin, C.B., Lindsey, R., Welk, G.J. & Corbin,W.R. (2002), Concepts of fitness andwellness: A comprehensive lifestyle ap-proach (4th edn.), New York: McGraw Hill.
Derr, W.D. & Lindsay, G.M. (1999), “EAP andWellness Collaboration”, in J.M. Oher (Ed.),The Employee Assistance Handbook, NewYork: John Wiley & Sons.
Dhanesar, A., & Hales, A. (1994), “From Fitnessto Wellness: A Case Study”, People Dynam-ics, 12(1): 26–31.
Gilmore, G. (1979), “Planning for FamilyWellness”, Health Education, 10:12.
Goetzel, R.Z. & Ozminkowski, R.J. (2008), “TheHealth and Cost Benefits of Work SiteHealth-Promotion Programs”, Annual Re-view of Public Health, 29:303–23.
Hair, J. F., Black, W. C., Anderson, R. E. &Tatham, R. L. (2006), Multivariate DataAnalysis, 6th Edn, Pearson Prentice Hall,New Jersey
Hemp, P. (2004), “Presenteeism: At Work – butOut of It”, Harvard Business Review,82(10): 49–58.
Hettler, B. (1984), “Wellness: Encouraging a Life-time Pursuit of Excellence”, Health Values,8, 15.
Hillier, D., Fewell, F., Cann, W. & Shepard, V.(2005), “Wellness at Work: Enhancing theQuality of Our Working Lives”, Interna-tional Review of Psychiatry, 17(5): 419–31
Hinkin, T. R. (1998), “A Brief Tutorial on theDevelopment of Measures for Use in Sur-vey Questionnaires”, Organizational Re-search Methods, 1: 104-21
Leiter, M.P. & Wahlen, J. (1996), “The Role ofEmployee Assistance Counselors in Ad-dressing Organization Problems”, EmployeeAssistance Quarterly, 12(1): 15–28
Makrides, L. (2004), “The Case for WorkplaceHealth Promotion”, Newsbeat of CACR, 12:1–6
Martin, T., Kirkcaldy, B.D. & Siefen, G.(2003),“Religiosity and Health among GermanAdolescents”, Journal of Managerial Psy-chology, 18(5): 453–70.
Ramsey, J. (1982), Basic Patho-physiology:Modern Stress and the Disease Process.Menlo Park, California: Addison – WesleyPublishing Company.
Renaud, L., Kishchuk, N., Juneau, M., Nigam,A., Tétreault, K. & Leblanc, M. (2008),“Implementation and Outcomes of a Com-prehensive Worksite Health Promotion Pro-gram”, Canadian Journal of Public Health,99(1): 73–77
Sieberhagen, C., Pienaar, J. & Els, C. (2011), “Man-agement of Employee wellness in South Af-rica: Employer, Service Provider and UnionPerspectives”, SA Journal of Human Re-source Management, 9(1), Art. 305
M.M. Sulphey
700 The Indian Journal of Industrial Relations, Vol. 49, No. 4, April 2014
Shaw, G., Alfonso, H., Howat, P.A. & Corben, K.(2007), “Use of Pedometers in a WorkplacePhysical Activity Program”, AustralasianJournal of Podiatric Medicine, 41: 23–28
Sutton, R. I. (1987), “The Process of Organiza-tional death: Disbanding and Reconnecting”,Administrative Science Quarterly, 32: 542-69.
Thøgersen-Ntoumani, C. & Fox, K. (2005),“Physical Activity and Mental Well-being
Typologies in Corporate Employees: AMixed Methods Approach”, Work andStress, 19(1):50–67.
White, R.K., McDuff, D.R., Schwartz, R.P.,Tiegel, S.A. & Judge, C.P. (1996), “NewDevelopments in Employee AssistancePrograms”, Psychiatric Services, 47: 387–91
Zarkin, G.A., Bray, J.W. & Qi, J. (2000), “TheEffect of Employee Assistance ProgramsUse on Healthcare Utilization”, Health Ser-vices Research, 35, 77–100
sas
The Participation-Direction Debate in Leadership:Insights from Ramayana
Kumar Alok
The participation versus direc-tion debate has been an endur-ing one in the leadership litera-ture. Contemporary theoreticalframeworks are used to analyzean episode from the Indian epicRamayana to get insights intothis issue. The analysis pointsout that participation and direc-tion may be effective leaderchoices rather than styles of ef-fective leaders as such. Further,it highlights the need to examinethe role of psychological owner-ship and informational justicerespectively for the participationand direction choices to be ef-fective.
Introduction
“Leadership should be more partici-pative than directive, more enabling thanperforming”
Mary D. Poole
Leadership theorists tend to preferparticipation over direction as an attributeof effective leadership. Participation anddirection refer respectively to high or lowfollower involvement in decision making(Northouse, 2010; Yukl, 1999). Some ofthe theories restrict this general trendwith contingencies. For example, thepath-goal theory suggests that followerswith low technical know-how may pre-fer directive leaders, whereas those withhigh technical know-how may prefer par-ticipative leaders (House, 1996). Never-theless, the underlying belief is that lead-ers preferring participation or directionare different in kind. Yukl (1999) chal-lenged this belief with the assertion thatparticipation and direction are attributesof leader choices rather than leadersthemselves. Leaders may not be effec-tive if they opt for participation or direc-tion as a matter of habit rather than aneed-based choice.
Kumar Alok is Assistant Professor, ChandraguptInstitute of Management Patna. E-mail:[email protected]
The Indian Journal of Industrial Relations, Vol. 49, No. 4, April 2014 701
Kumar Alok
702 The Indian Journal of Industrial Relations, Vol. 49, No. 4, April 2014
There is a lack of strong and consis-tent empirical evidence for the effective-ness of participative leadership (Yukl, 1999;2009). This may mean that participationweakly or moderately influences leadereffectiveness; however, this may also meanthat conceptualizing it as a leader attributeis itself a mistake. The problem may notbe resolved by simply conceptualizing par-ticipation and direction in terms of leaderchoices. It may still not be possible to em-pirically show that these choices signifi-cantly influence leader effectiveness be-cause that may be a function of their ef-fective use rather than the choices as such.Ramayana, the celebrated epic of India,portrays many decision situations that canbe analyzed to gain some insights into thismatter; however, for the purpose of thisarticle, we will focus on one particular epi-sode portrayed in the 17th and 18th chap-ters of the Book 6 (Yuddha Kanda) of theValmiki Ramayana (VR).
The Story in Nutshell
Prince Rama accepted the 14 yearexile to honor his father’s words. Whilein exile, the demon emperor Ravana ab-ducted his wife Sita. Rama resolved toprotect righteousness. He made friend-ship with the monkey emperor Sugrivaand attacked Lanka, the kingdom ofRavana. In the meanwhile, Vibhishana,the youngest of Ravana’s brothers ad-vised him to return Sita to save the coun-try from an impending war; however,Ravana preferred to exile him instead.Vibhishana came to join Rama’s side andconveyed his prayers. When Rama cameto know about it, he asked his advisorsfor their opinion in this regard. Demons
had earned an unblemished reputation forchicanery and Vibhishana was theyounger brother of Ravana himself.Therefore, the question of whether toaccept him as a friend assumed particu-lar significance.
The advisors were generally skepti-cal about Vibhishana’s intentions and sug-gested either to treat him as an enemy orto examine his true intent by variousmeans. Hanuman, the most learned andintelligent of them all, opined that suchsuggestions may be wrong. He suggestedthat Vibhishana may be desirous of gain-ing the kingdom after Ravana. In thatcase, it would be perfectly right for him toapproach Rama given that Rama has al-ready helped Sugriva to gain kingdom.However, Sugriva remained vehementlyagainst accepting Vibhishana. It was clearthat a resolution was not in sight. Finally,Rama gave his firm decision to acceptVibhishana and explained his reasons.
Participation-Direction Debate
This particular episode in Ramayanaproves to be a turning point in the Rama-Ravana war. Lanka was said to be im-pregnable even by gods; however, it be-came vulnerable with insider informationprovided by Vibhishana. The advisorswere well aware that the decision waspotentially a high-impact one – positiveor negative. Rama himself acknowl-edged this by describing it as a difficultdecision while asking for their advice(VR.VI.17.33).
There are a number of questions thatthe reader of this episode may confront.
The Participation-Direction Debate
The Indian Journal of Industrial Relations, Vol. 49, No. 4, April 2014 703
A key argument for participation is thatpeople tend to own the decisions they helpmake (Vroom, 2000). What was the needfor participation in this case? This ques-tion assumes importance given the fact thatRama held his ground independent of theopinions of his advisors. He articulated hisprinciple of accepting someone as a friendwho comes with the offer (VR.VI.18.3).Given this solemn principle, he could havegone ahead with his decision without ac-tually asking anyone.
The need for participation was therefor two reasons. First, Sugriva becamesuspicious of Vibhishana by observing thathe came battle-ready with all his weapons(VR.VI.17.4). His doubt intensified whenVibhishana introduced himself as theyounger brother of Ravana. Sugriva car-ried the message of Vibhishana to Ramaand conveyed his deep suspicions as well.His suspicions were entirely legitimate.Therefore, it was important to examine theissue at length. Second, Sugriva wasRama’s friend and the revered emperor ofthe monkeys. His concerns might be rep-resentative of what others in the army think.He aired his concerns in front of all advi-sors present. His action, though well mean-ing, had the potential to prime negative at-titude toward Vibhishana in their minds aswell. Therefore, it was important to addresshis concerns publicly so that Vibhishanagains wholehearted acceptance from all andsundry.
Does that mean that the participationwas for mere namesake? In other words,did Rama want to merely thrust his viewson others through this exercise? A care-ful reading of the chapters 17 and 18 of
the Book 6 would clarify that it is not so.It was clear to Rama that all advisorshad his well being in mind (VR.VI.17.33).He had two-fold task before him: a) tounderstand the reasons behind negativeattitude toward the offer made byVibhishana and b) to turn such negativeattitudes into positive given his principledstance. None of these two purposescould have been possibly served bythrusting upon his views. However, thesecond purpose required sensegiving onhis part. Sensegiving is a symbolic exer-cise for developing desired meaning con-text and leaders often need to engage init (Gioia & Chittipeddi, 1991; Maitlis &Lawrence, 2007). The leader communi-cates his or her perspective in such amanner that highlights the desired as-pects of the issue at hand. It helps todevelop a meaning-making frameworkfor the target audience so that they cansee things in a favorable light. It workson the basis of trust and legitimacy ratherthan power and authority.
What was the need to understand oth-ers views given the principled stance ofRama? The social identity literature sug-gests people construct their identity in so-cial interactions (Abrams & Hogg, 2004;Hogg, Abrams, Otten & Hinkle, 2004).Moreover, significant relationships as wellas significant collectives such as familiesand social groups constitute parts of theiridentity (Spears, 2002; Turner & Onorato,1999). Social identity processes work insuch manner that people tend to have in-group bias whereby, they view their owncollective category in a positive light and areferent other collective category in a nega-tive light (Boninger, Krosnick & Berent,
Kumar Alok
704 The Indian Journal of Industrial Relations, Vol. 49, No. 4, April 2014
1995; Hogg, Terry, & White, 1995; Pittinsky,2010). At the time, monkeys and demonswere the most important referent catego-ries for each other given the impending war.The natural tendency to view the out-groupwith suspicion must be significantlystrengthened due to animosity. Therefore,suspicion as such could not be a good rea-son for a leader to decide regarding suchan important issue. Once people are al-lowed to articulate their views, it can beeasier to understand whether their concernsare general i.e. an expression of in-groupbias or particular i.e. other issues of sig-nificance. Particular issues might have beenimportant to know to make an informeddecision. The chapter 17 stands testimonyto the fact that the advisors aired concernsout of the general tendency to view theother category with suspicion. Thus it of-fered a good ground for sensegiving effortsof Rama.
Was Rama naïve in taking a prin-cipled stance toward an enemy? The 18th
chapter shows that it was not so. First, itwas uncertain whether Vibhishana wasan enemy though he belonged to thatcategory. Rama indicated at this possi-bility while saying to Sugriva that it wascommon among the kings to have hostilerelatives (VR.VI.18.10-11). Rama alsomentioned that not all brothers are with-out any lust for power (VR.VI.18.15).Second, Rama was fully aware of hisgreat prowess. His prowess was estab-lished beyond doubt on numerous previ-ous occasions. He asserted thatVibhishana was incapable of causing anyharm to him even if he attempts to harmhim (VR.VI.18.22). Sugriva had no rea-son to doubt this because he had been a
witness to Rama’s incomparable prow-ess on previous occasions.
Favorable and unfavorable atti-tudes are two different dimensionswhere people can be simulta-neously low, high or high in oneand low in the other.
Why was it needed for Rama to en-gage in sensegiving? The attitude litera-ture suggests that favorable and unfavor-able attitudes are two different dimensionswhere people can be simultaneously low,high or high in one and low in the other(cf:Pittinsky, 2010) . It was possible forthe monkeys to accept Vibhishana be-cause Rama asked them to; however, thatmight not have alleviated their negativeattitude toward him. Thus Vibhishanamight have felt unwelcome sooner or later.Therefore, Rama engaged in storytellingto emphasize the moral aspect of his de-cision and its sanction by tradition.Storytelling allows meaning-making at dif-ferent levels, whereas, an appeal to tradi-tion bestows much needed legitimacy onthe decision. Thus it was possible for dif-ferent advisors to appreciate Rama’s po-sition from their own stand point.
Rama understood that all the suspi-cions were directed toward the categoryrather than the person. There was noevidence to affirm the categorical suspi-cion. Besides, Hanuman had already ar-ticulated the shortcomings of advices of-fered by the advisors. However, no ar-gument was able to convince Sugriva.Therefore, Rama had to resort to the di-rective way to settle the matter.
The Participation-Direction Debate
The Indian Journal of Industrial Relations, Vol. 49, No. 4, April 2014 705
It is important to note that Rama hadonly moral authority over Sugriva, if at allgiven their friendship. He was famous forconsistency in thoughts, words, and deeds.Rama indicated that he would not forsakevirtue due to any reason. He had alreadypracticed that when accepting his 14 yearexile. Therefore, his assertion of the moralprinciple of protecting those seeking ref-uge (VR.VI.18.33) had credibility. He wenton to say that he would not turn awayRavana himself if he were to come seek-ing refuge (VR.VI.18.34). This showedthat the impending war was indeed to up-hold virtue rather than to take personal re-venge. Priming a higher cause expandedthe cognitive boundaries of the categoriesof friends and enemies. Now those sup-porting virtue were friends irrespective ofwhether they were monkeys or demons.Therefore, the general bias gave way toacceptance and bolstered every one’s faithin Rama’s moral integrity and generosity.Thus Rama was able to take all his advi-sors along with him in this decision.
Priming a higher cause expandedthe cognitive boundaries of thecategories of friends and enemies.
Conclusion
Tales from Ramayana and other ep-ics can be not only an interesting way tostudy philosophy and religion but alsoimportant frameworks for understandingissues of contemporary concern. Theirdepth and richness of description allowsfor multi-level meaning-making. Thesetales can also be analyzed using modernsocial science theories.
The episode discussed above offersthree important insights regarding theparticipation-direction debate in leader-ship. First, it shows that Rama choseparticipation and direction as per theneed. The effectiveness wasn’t inherentin these choices but in their timing andmanner of exercise. Thus rethinking par-ticipation in terms of leader choice andarticulating the contingencies for effec-tiveness may be needed.
Rama chose participation and di-rection as per the need.
Second, it shows that psychologicalownership may be more important thanparticipation as such. Psychological own-ership refers to the feelings of posses-sion – that something is “Mine” (Alok &Israel, 2012; Pierce, Kostova, & Dirks,2001; Van Dyne & Pierce, 2004). Sugrivachallenged Rama out of a deep sense ofownership of the cause and a concernfor Rama’s wellbeing. All the advisorshad mentioned these aspects before say-ing what they had to (e.g. VR.VI.17.34-37). It was not so much a desire to par-ticipate in the decision making but to carefor what they considered as their own.The interplay of psychological ownershipand participation needs to be empiricallyexamined.
Third, informational justice may bean important criterion for effective direc-tion. It refers to the leaders offeringproper explanation of the decisions con-cerning followers (Colquitt, 2001). Ramaoffered considerate explanation of hisdecision with reference to the arguments
Kumar Alok
706 The Indian Journal of Industrial Relations, Vol. 49, No. 4, April 2014
offered by Sugriva and others. He al-lowed them to talk in order to understandthe basis of their concerns. Once it wasclear that the concerns were groundedin mere categorical feelings, he targetedthe category boundaries with his tools ofsensegiving. It helped the advisorschange their atti tude and acceptVibhishana wholeheartedly.
References
Abrams, D. & Hogg, M. A. (2004), “Metatheory:Lessons from Social Identity Research”.Personality and Social Psychology Review,8(2): 98-106.
Alok, K. & Israel, D. (2012), “Authentic Leader-ship and Work Engagement”, Indian Jour-nal of Industrial Relations, 47(3): 498-510.
Boninger, D. S., Krosnick, J. A. & Berent, M. K.(1995), “Origins of Attitude Importance:Self-interest, Social Identification and ValueRelevance”, Journal of Personality and So-cial Psychology, 68(1): 61-80.
Colquitt, J. A. (2001), “On the Dimensionalityof Organizational Justice: A Construct Vali-dation of a Measure”, Journal of AppliedPsychology, 86(3): 386-400.
Gioia, D. A. & Chitt ipeddi, K. (1991),“Sensemaking and Sensegiving in StrategicChange Initiation”, Strategic ManagementJournal, 12(6): 433-48.
Hogg, M. A., Abrams, D., Otten, S. & Hinkle, S.(2004), “The Social Identity Perspective:Intergroup Relations, Self-conception, andSmall Groups”, Small Group Research,35(3): 246-76.
Hogg, M. A., Terry, D. J. & White, K. M. (1995),“A Tale of Two Theories: A CriticalComparision of Identity Theory with So-cial Identity Theory”, Social PsychologyQuarterly, 58(4), 255-69.
House, R. J. (1996), “Path-goal Theory of Lead-ership: Lessons, Legacy, and a Reformu-
lated Theory”, Leadership Quarterly, 7(3):323-52.
Maitlis, S. & Lawrence, T. B. (2007), “Triggersand Enablers of Sensegiving in Organiza-tions”, Academy of Management Review,50(1), 57-84.
Northouse, P. G. (2010), Leadership: Theory andpractice (5 ed.). New Delhi: Sage Publica-tions.
Pierce, J. L., Kostova, T. & Dirks, K. T. (2001),“Toward a Theory of Psychological Own-ership in Organizations”, Academy of Man-agement Review, 26(2): 296-310.
Pittinsky, T. L. (2010), “A Two-dimensionalModel of Intergroup Leadership: The Caseof National Diversity”, American Psy-chologist, 65(3): 194-200.
Spears, R. (2002), “The Interaction between theIndividual and the Collective Self: Self-cat-egorization in Context”, in C. Sedikides &M. B. Brewer (Eds.), Individual Self, Rela-tional Self, Collective Self Hove, UK: Psy-chology Press.
Turner, J. C. & Onorato, R. S. (1999), “SocialIdentity, Personality, and the Self-Concept:A Self-Categorization Perspective”, in T.R. Tyler, R. M. Kramer & O. P. John (Eds.),The Psychology of Social Self, Mahwah,NJ: Lawrence Erlbaum Associates.
Van Dyne, L. & Pierce, J. L. (2004), “Psycho-logical Ownership and Feelings of Posses-sion: Three Field Studies Predicting Em-ployee Attitudes and Organizational Citi-zenship Behavior”, Journal of Organiza-tion Behavior, 25(4): 439-59.
Vroom, V. H. (2000), “Leadership and the Deci-sion-Making Process”, Organizational Dy-namics, 28(4: 82-94.
Yukl, G. (1999), “An Evaluative Essay on Cur-rent Conceptions of Effective Leadership”,European Journal of Work and Organiza-tional Psychology, 8(1): 33-48.
Yukl, G. (2009), Leadership in Organizations (6ed.), Delhi: Pearson.
sas
Work-Family Conflict & Quality of Work Life amongVeterinary Doctors
Lakhwinder Singh Kang & Deepak
This study investigates the rela-tionship between work-familyconflict and QWL by using asample of 322 veterinary doc-tors. QWL depends not onlyupon work place factors but alsoup on non-work life. The studyreveals that a large number ofrespondents have been experi-encing work-family conflict ascompared to family-work con-flict. It was further revealed thatonly work-family conflict vari-able was found to be significantand had negative impact onQWL. The findings of the studysuggest that both types of con-flict affect the QWL of the vet-erinarians but work to familyhas been found more prevalentamong them.
Lakhwinder Singh Kang is Associate Professor,Department of Commerce & Business Management,Guru Nanak Dev University, Amritsar,E-mail: [email protected] Deepak isAssociate Professor, Department of Commerce,GGN Khalsa College, Civil Lines, Ludhiana, E-mail:[email protected]
The Indian Journal of Industrial Relations, Vol. 49, No. 4, April 2014 707
Introduction
Today’s educated workforce expectsmore than just pay from their work. Thedynamic work environment demandsequal importance to both technology andhuman needs, where the individual per-spective play a key role in humanizationof work atmosphere and democratizationof work relations. Such a holistic approachcan contribute to high employee percep-tion of “Quality of Working Life” in anorganization (Anbarasan & Mehta, 2009).The term quality of work life (QWL) canbe conceptualized as a subset of the qual-ity of life as both are closely related toeach other. Work life is an integral partof total life space (Lawler, 1982). Theterm QWL has been defined by variousscholars and management practitionersbut did not find a common definition.Serey’s (2006) work on quality of worklife is quite conclusive and best meets thecontemporary work environment. Thedefinition has been related to a meaning-ful and satisfying work. It includes: (i) anopportunity to exercise one’s talent, ca-pacities and face challenges/situationsthat require independent initiative andself-direction; (ii) an activity thought tobe worthwhile by the individuals involved;
Lakhwinder Singh Kang & Deepak
708 The Indian Journal of Industrial Relations, Vol. 49, No. 4, April 2014
(iii) an activity in which one understandsthe role the individual can play in theachievement of the overall goals; and (iv)a sense of taking pride in what one isdoing and in doing it well. This issue ofmeaningful and satisfying work has beenmerged with the discussions on job sat-isfaction, and believed to be more favor-able to quality of work life. QWL dependsnot only on work place factors but alsoon quality of non-work life and employeespecific attitudes developed over a pe-riod of time. These variables enhance thehuman input at work place and ultimatelyraise the QWL. A perfect QWL in factpromotes the employee well-being andthereby the well-being of the organiza-tion. The present study analyzes theeffect of work family conflict on QWLon account of fluctuating work environ-ment with competing job and family com-mitments.
Work-Family Conflict & QWL
Ideological, political, economic andsocial developments have led to changesin the structure of the labor market andthe industrial landscape more generallyover the last few decades. In turn thesechanges have resulted in reforms at theworkplace that have long since raisedconcerns amongst individuals, familiesand researchers (Allan et al., 2005). Theincrease in the occurrence and impor-tance of work-family issues mirror thechanges witnessed in both family struc-tures and the nature of work in most ofthe developed world (Watson, Buchanan,Cambell & Briggs, 2003). Family is in-deed an important supporter for every-one and probably the family support is
able to provide motivation and strengthto employees to perform better (Azril,2010). But if someone fails to devoteadequate time and attention to one’s fam-ily, may lead to work-family conflict.Greenhaus & Beutell’s (1985) definedwork-family conflict as “a form of inter-role conflict in which the role pressuresfrom work and family domains are mu-tually incompatible in some respect”.This conceptual framework has beenconsistently used by many researchersto study work-family conflict (Gutek,Searle & Klepa, 1991; Frone et al, 1992;Huang, Hammer, Neal & Perrin, 2004)and the same has been used in thepresent study.
Conflict between work and family isbi-directional. Role pressures from workand family can occur simultaneously inboth the directions. That is, excessive roledemands from the work domain (e.g.,hours worked, inflexible work schedules,etc.), can result in work-to-family (W-F)conflict. Similarly, excessive role de-mands from the family domain (e.g.,childcare duties, domestic chores, etc.)can result in family-to-work (F-W) con-flict. Therefore, it is the combined effectof W-F and F-W conflict that ultimatelyresults in the overall level of work-fam-ily conflict experienced by an individual(Greenhaus & Beutell, 1985; Netemeyeret al., 1996; Gutek et al, 1991).
Review of Literature
In early 1960s, researchers had be-gun to study and connect the dots be-tween work and family. Numerous stud-ies on work life thereafter proved that
Work-Family Conflict & Quality of Work Life
The Indian Journal of Industrial Relations, Vol. 49, No. 4, April 2014 709
what happened in the workplace havesignificant impact on individuals and theirfamilies (Lewis & Cooper, 1987; Kossek& Ozeki,1998; Greenhaus & Powell,2006). Sirgy et al. (2001) analyzed thepredictive effect of QWL on satisfactionin non-work life domains, like leisure,family, financial, health, education, friend-ship, neighborhood, community, spiritual,environment, housing, cultural and socialstatus, because satisfaction from one lifedomain tends to spill over to other lifedomains. QWL contributed significantlyto the satisfaction/dissatisfaction in otherlife domains, such as family, leisure, healthand so on.
Satisfaction from one life domaintends to spill over to other lifedomains.
Littlefield (2004) assessed the per-ception of 278 members of dual careerfamilies from 14 organizations related tohealthcare, education, banking, insur-ance, tourism and manufacturing indus-tries in Northern Michigan. The purposewas to examine how supportive membersof dual-career families perceive 18 prac-tices in alleviating work-life conflict. Thestudy suggested that the members of dualcareer families perceive health insuranceand dental insurance as most supportivein alleviating work life conflict. It wasfound that increased satisfaction withQWL programs that helped membersbalance the stress of work-life conflict,may increase productivity, employeemorale and overall corporate productiv-ity. Mott et al. (2004) attempted to iden-tify the variables influencing work life of
1737 actively practicing pharmacists inthe United States. The results revealedthat 48 percent of practicing pharmacistsexperienced work-home conflict leadingto poor quality of work life. Beh (2006)examined career related dimensionswhich were; career satisfaction (9 items),career achievement (13 items) and ca-reer balance (15 items). The sample con-sists of 475 managers from the free tradezones in Malaysia. All these dimensionswere found to be significant and furtherconcluded that balance between workand family deemed to be a very good in-dicator to predict QWL in relation to ca-reer related dimensions.
Che Rose et al. (2006) concludedfrom the data of 475 executives from theelectronic and electrical industry in Ma-laysia that in addition to career satisfac-tion and career achievement, career bal-ance (individuals’ family life) correlatessignificantly with his/her level of qualityof work life. This further suggested thata successful family life carries over intoone’s career and makes one more satis-fied with personal achievements. Khaniet al. (2007) explored how a sample of200 nurses in an Iranian state rate thequality of work life. One of the four subscales used in quality of work life toolwas work life/home life. The findingsfrom the study were consistent with thefindings from a previous study on theacute care nurses by Brooks & Ander-son (2004) in a mid western state. Re-spondents had little energy left afterwork, were unable to balance their workand family lives and stated that rotatingschedules negatively affected their lives.Moreover 76 percent of them were un-
Lakhwinder Singh Kang & Deepak
710 The Indian Journal of Industrial Relations, Vol. 49, No. 4, April 2014
able to balance their work and familylives. Sale & Smoke (2007) attempted toassess the QWL of four employee groups(physicians, nurses, physicists, radiationtherapists) by identifying the problemareas in the cancer centre. These prob-lem areas were articulated as four do-mains that could be measured with ex-isting work place tools; burnout, socialsupport, job satisfaction and work familyconflict. QWL scores were moderate intwo years in consideration but there wereconsiderable variation amongst four em-ployee groups.
Saraji &Dargahi (2006) consideredbalance between work and family life asone of the dimensions to measure thepositive and negative attitudes from QWLof 908 hospital employees in Iran. It wasfound that 82 percent of the workersexpressed dissatisfaction with the bal-ance between the time they spent work-ing and the time they spent with theirfamily and friends. The same feelings ofemployees were endorsed in a study byDargahi and Yazdi (2007). Dhar (2008)conducted a qualitative study with the helpof fifteen bus drivers from four differentPune Municipal Corporation depots. Theobjective of the study was to see howQWL of the drivers could be improvedand ultimately leading to better transportservice to the citizens and a reduction inthe rates of accidents. It was concludedthat QWL initiatives can provide certainpositive experiences for staff, especiallywhen they promote the opportunity tosocialize and build connections with coworkers and help to fulfill employeeneeds for humor and balance. Azril(2010) included individual and family life
as one of the nine aspects of QWL of180 government extension employees toassess its relation with work perfor-mance. It was found that individual andfamily life has been proved to be the high-est contributor to work performanceamongst agriculture extension officers.
Rationale of the Study
The purpose of the present study isto examine the relationship betweenwork-family conflict and quality of worklife of veterinarians who provide techni-cal services, for example; vaccination,disease treatment, controlling differenttypes of outbreaks, providing artificial in-semination for breed improvement andadvising farmers and owners in rearingand maintaining the health status of ani-mals. All the veterinary officers, who actas the promoters of human health in tak-ing the responsibilities for hygienic pro-duction of meat, eggs, milk etc., at manya times, have to be prepared to work inunhygienic conditions without appropri-ate protective clothing. They have towork outdoor in all kinds of weather andtreat the animals or may have to performsurgeries under unsanitary conditions.They are more exposed to fatal infec-tions and physical risks of being bitten,kicked or scratched. In brief, duties ofveterinary officers while providing treat-ment are hard, arduous and tedious due
The work environment in whichveterinarians are working seemsto be leading to work-family con-flict which further affect their QWLadversely.
Work-Family Conflict & Quality of Work Life
The Indian Journal of Industrial Relations, Vol. 49, No. 4, April 2014 711
to objective patients who are non-coop-erative. The work environment in whichveterinarians are working seems to beleading to work-family conflict whichfurther affect their QWL adversely.
Research Methodology
The universe of the study consists of649 veterinary doctors employed byPunjab Government on permanent basisfor the veterinary hospitals/clinics andPunjab Veterinary Vaccine Institute(PVVI), Regional Disease DiagnosticLaboratory (RDDL), farms and semenbanks. In order to collect the sample thequestionnaire was e-mailed to all the vet-erinary officers. A sample of 322 respon-dents was collected partly through per-sonal approach and the rest in monthlymeetings at district level.
Quality of Work Life Scale: QWLhas been measured by considering six lifedomains including; health, happiness, re-lationship with spouse, children and otherimportant people, satisfaction with joband with family. For health and Qualityof relationship with spouse and childrenand with other important people, respon-dents were asked to rate their responseson a three point scale 3, 2 and 1 for‘good’, ‘average’ and ‘poor’ quality.Similarly, happiness and satisfaction withjob and with family were measured on athree point scale 3, 2 and 1 for ‘high’,‘moderate’ and ‘low’ quality. The valueof alpha, a measure of internal consis-tency of the scale is 0.79.
Work-Family Conflict Scale: Thework-family conflict has been measured
with a ten-item scale developed by Guteket al. (1991) and Carlson and Perrewe(1999). The scale has been divided intotwo parts; first part measures the inter-ference of work in family life and sec-ond part assesses interference of familyin work life. The responses were soughton a five point scale 5 for ‘StronglyAgree’, 4 for ‘Agree’, 3 for ‘Undecided’,2 for ‘Disagree’ and 1 for ‘Strongly Dis-agree’.
Results and Discussion
Quality of Work life: For measur-ing QWL of the respondents a singlescore has been calculated for each re-spondent by adding the weights assignedto original responses of the respondentsabout the six dimensions considered formeasuring quality of life among the vet-erinary doctors. The actual range ofscores in the present sample has beencalculated to be 6 to 18 with a mean of2.69 and S.D of 2.03, which indicate su-perior quality of work life being enjoyedby the respondents.
Table1 shows the mean score andstandard deviation of each item of thequality of work life scale which revealsthat the respondents have been found sat-isfied with the variables ‘Good quality ofrelationship with spouse and children’ withthe highest mean value of 2.86. This isbeing followed by ‘quality of relationshipwith other people (who are important foryou)’ with mean value 2.83, ‘Health’ withmean value 2.76, ‘Satisfaction with fam-ily with mean value 2.72, ‘Happiness’ withmean value 2.57 and ‘Satisfaction with job’with mean value 2.43.
Lakhwinder Singh Kang & Deepak
712 The Indian Journal of Industrial Relations, Vol. 49, No. 4, April 2014
Table 1 Quality of Life: Frequencies, Percentage, Mean and Standard Deviation
Variable Good(3) Average(2) Poor(1) Mean Std. Deviation
B1 251 (77.95) 65 (20.19) 6 (1.86) 2.76 0.47B2 188 (58.39) 129 (40.06) 5 (1.55) 2.57 0.53B3-I 282 (87.58) 34 (10.56) 6 (1.86) 2.86 0.40B3-II 273 (84.78) 42 (13.04) 7 (2.18) 2.83 0.43B4-I 168 (52.14) 123 (38.20) 31(9.63) 2.43 0.66B4-II 249 (77.33) 56 (17.39) 17 (5.28) 2.72 0.55
Note:-Figures in Parenthesis indicate the percentage of respondents
In order to find out the number andpercentage of respondents who havebeen experiencing ‘High’, ‘Moderate’ or‘Low’ level of quality of work life, allthe 322 respondents have been distrib-uted according to their mean values andare reported in Table 2. As mentionedin the preceding paragraph, the rangeof mean scores could vary from 1 to 3and thus are interpreted accordingly.Around two percent of the respondentshave been experiencing poor quality ofwork life; around 28 percent of themhave reported moderate level of qualityof work life; and about 70 percent ofthe respondents have indicated a supe-
rior quality of work life. The results re-veal that a very large number of veteri-nary doctors have been enjoying a goodor high level of quality of work life. Theyare government employees with gradeA officers rank, guaranteed good sal-ary, job security and pension schemewhich was applicable till 2004. The levelof satisfaction at the work place doesaffect other life domains and ultimatelyQWL.
The level of satisfaction at thework place does affect other lifedomains and ultimately QWL.
Table 2 Distribution of Respondents according to the Mean Score of Quality of Life
Mean Frequency Percent Cumulative Percent
1.00 2 0.6 0.61.17 2 0.6 1.21.67 1 0.3 1.61.83 3 0.9 2.52.00 6 1.9 4.32.17 13 4 8.42.33 30 9.3 17.72.50 41 12.7 30.42.67 54 16.8 47.22.83 66 20.5 67.73.00 104 32.3 100Total 322 100
Work-Family Conflict: Table 3shows the mean score and standard de-
viation of each item of the work familyconflict scale. The respondents have
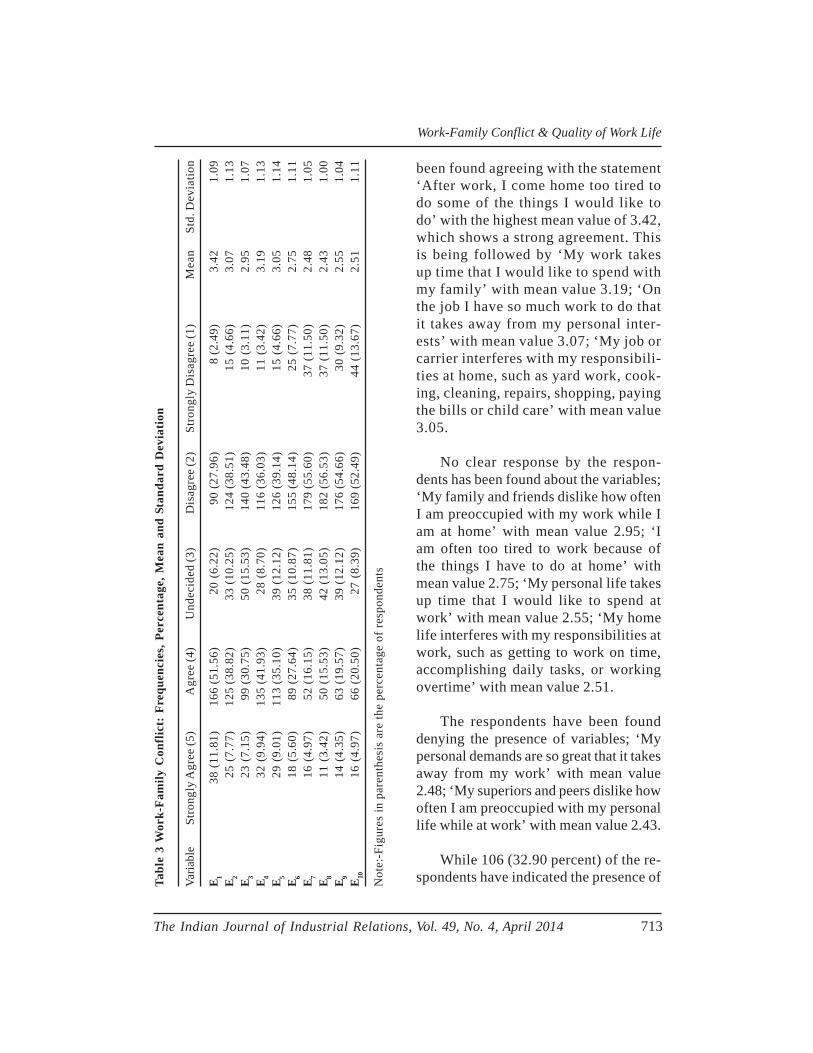
Work-Family Conflict & Quality of Work Life
The Indian Journal of Industrial Relations, Vol. 49, No. 4, April 2014 713
been found agreeing with the statement‘After work, I come home too tired todo some of the things I would like todo’ with the highest mean value of 3.42,which shows a strong agreement. Thisis being followed by ‘My work takesup time that I would like to spend withmy family’ with mean value 3.19; ‘Onthe job I have so much work to do thatit takes away from my personal inter-ests’ with mean value 3.07; ‘My job orcarrier interferes with my responsibili-ties at home, such as yard work, cook-ing, cleaning, repairs, shopping, payingthe bills or child care’ with mean value3.05.
No clear response by the respon-dents has been found about the variables;‘My family and friends dislike how oftenI am preoccupied with my work while Iam at home’ with mean value 2.95; ‘Iam often too tired to work because ofthe things I have to do at home’ withmean value 2.75; ‘My personal life takesup time that I would like to spend atwork’ with mean value 2.55; ‘My homelife interferes with my responsibilities atwork, such as getting to work on time,accomplishing daily tasks, or workingovertime’ with mean value 2.51.
The respondents have been founddenying the presence of variables; ‘Mypersonal demands are so great that it takesaway from my work’ with mean value2.48; ‘My superiors and peers dislike howoften I am preoccupied with my personallife while at work’ with mean value 2.43.
While 106 (32.90 percent) of the re-spondents have indicated the presence ofTa
ble
3 W
ork-
Fam
ily C
onfl
ict:
Fre
quen
cies
, Per
cent
age,
Mea
n an
d St
anda
rd D
evia
tion
Varia
ble
Stro
ngly
Agr
ee (5
)A
gree
(4)
Und
ecid
ed (3
)D
isag
ree
(2)
Stro
ngly
Dis
agre
e (1
)M
ean
Std.
Dev
iatio
n
E 138
(11.
81)
166
(51.
56)
20 (
6.22
)90
(27.
96)
8 (2
.49)
3.42
1.09
E 225
(7.
77)
125
(38.
82)
33 (1
0.25
)12
4 (3
8.51
)15
(4.
66)
3.07
1.13
E 323
(7.
15)
99 (3
0.75
)50
(15.
53)
140
(43.
48)
10 (
3.11
)2.
951.
07E 4
32 (
9.94
)13
5 (4
1.93
)28
(8.
70)
116
(36.
03)
11 (
3.42
)3.
191.
13E 5
29 (
9.01
)11
3 (3
5.10
)39
(12.
12)
126
(39.
14)
15 (
4.66
)3.
051.
14E 6
18 (
5.60
)89
(27.
64)
35 (1
0.87
)15
5 (4
8.14
)25
(7.
77)
2.75
1.11
E 716
(4.
97)
52 (1
6.15
)38
(11.
81)
179
(55.
60)
37 (1
1.50
)2.
481.
05E 8
11 (
3.42
)50
(15.
53)
42 (1
3.05
)18
2 (5
6.53
)37
(11.
50)
2.43
1.00
E 914
(4.
35)
63 (1
9.57
)39
(12.
12)
176
(54.
66)
30 (
9.32
)2.
551.
04E
1016
(4.
97)
66 (2
0.50
)27
(8.
39)
169
(52.
49)
44 (1
3.67
)2.
511.
11
Not
e:-F
igur
es in
par
enth
esis
are
the
perc
enta
ge o
f res
pond
ents
Lakhwinder Singh Kang & Deepak
714 The Indian Journal of Industrial Relations, Vol. 49, No. 4, April 2014
many of these variables, 86 of them(26.70 percent) have been found unde-cided about some of these variables and130 (40.40 percent) have clearly deniedthe presence of some of the variablesexamined. The analysis further revealedthat the mean value of work to familyconflict variables varies from 3.42 to 2.95,which is greater than the range of meanvalue of family to work conflict variables,which varies from 2.75 to 2.43. Themean score for work to family conflictscale was 15.68 with standard deviation4.447 and the mean score for family towork conflict scale was 12.71 with stan-dard deviation 4.421. About 55 percentof the respondents agree with the pres-ence of work to family conflict variableswhereas about 24 percent of respondentsagree with the presence of family to workconflict variables. A large number of re-spondents have been found experiencingwork to family conflict as compared tofamily to work conflict which suggest thatwork to family conflict is more prevalentthan family to work. One reason for thegiven situation seems to be that majorityof the respondents of the present studyare males and needs further probewhether this situation holds true for fe-males also or it is family to work conflictwhich is more prevalent among females.
A large number of respondentshave been found experiencingwork to family conflict as comparedto family to work conflict.
To test whether these scores are sta-tistically significant, paired sample t-testhas been used. The results reported in
Table 4, show that there was a significantdifference between the two scores (t =12.44, d.f. 321, p < 0.0005). It can be con-cluded that there is a significant differ-ence in the work to family and family towork conflict among the respondents.
In order to calculate the effect sizefor paired sample t test, Eta squared hasbeen calculated
= 0.325
According to Cohen (1998) the valueof t = 0.01 indicate small effect, 0.06 in-dicate moderate effect, and 0.14 repre-sent large effect. Given the Eta squaredvalue of 0.325, it can be concluded thatthere was a large effect, with a substan-tial difference in the work to family andfamily to work conflict. The large effectof difference in the work to family andfamily to work conflict supports the con-clusion made earlier that work to familyconflict is more prevalent than family towork conflict. The present situation canbe explained with the help of social iden-tity theory (Stryker ,1968; 1980; 1987;Lobel, 1991; Wiley, 1991; Rothbard &Edwards, 2003) and the associated con-cept of ‘role salience’. Social identitytheory encapsulates a methodical ap-proach to illustrate the relationships be-tween gender, work and family roles,stress, and oneself. An identity can bedefined as “a meaning one attributes tooneself (or others attribute to the person)by virtue of occupying a particular posi-
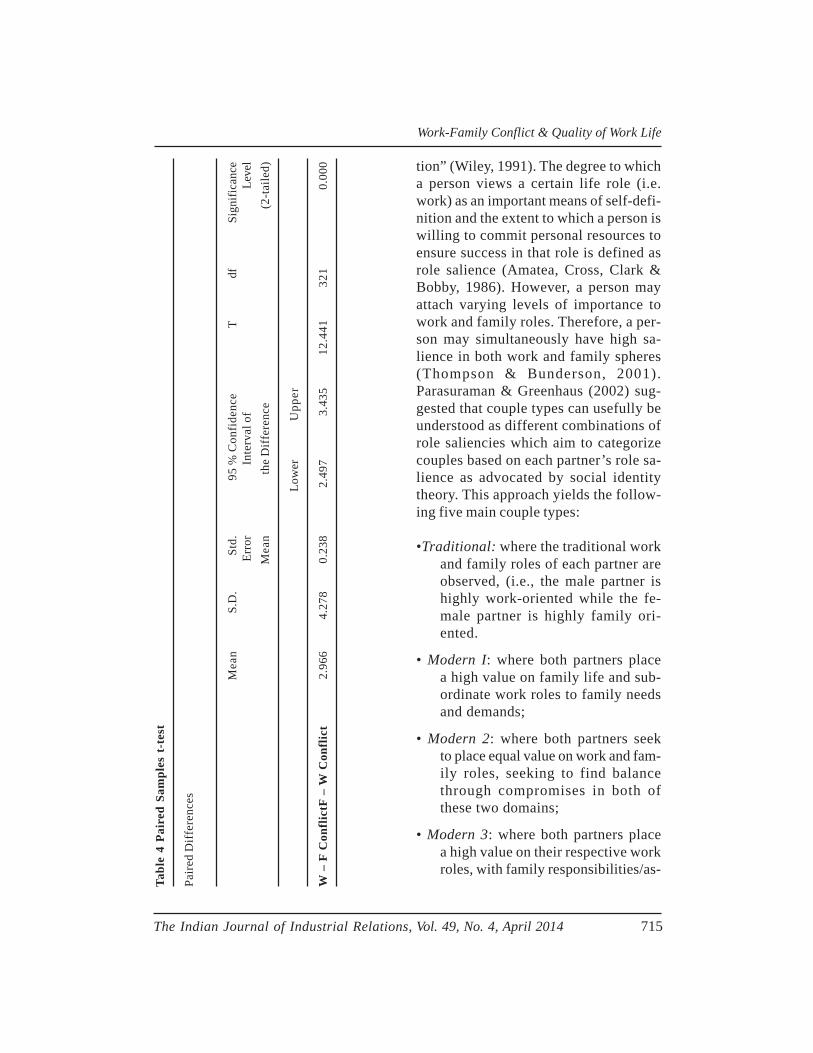
Work-Family Conflict & Quality of Work Life
The Indian Journal of Industrial Relations, Vol. 49, No. 4, April 2014 715
tion” (Wiley, 1991). The degree to whicha person views a certain life role (i.e.work) as an important means of self-defi-nition and the extent to which a person iswilling to commit personal resources toensure success in that role is defined asrole salience (Amatea, Cross, Clark &Bobby, 1986). However, a person mayattach varying levels of importance towork and family roles. Therefore, a per-son may simultaneously have high sa-lience in both work and family spheres(Thompson & Bunderson, 2001).Parasuraman & Greenhaus (2002) sug-gested that couple types can usefully beunderstood as different combinations ofrole saliencies which aim to categorizecouples based on each partner’s role sa-lience as advocated by social identitytheory. This approach yields the follow-ing five main couple types:
•Traditional: where the traditional workand family roles of each partner areobserved, (i.e., the male partner ishighly work-oriented while the fe-male partner is highly family ori-ented.
• Modern I: where both partners placea high value on family life and sub-ordinate work roles to family needsand demands;
• Modern 2: where both partners seekto place equal value on work and fam-ily roles, seeking to find balancethrough compromises in both ofthese two domains;
• Modern 3: where both partners placea high value on their respective workroles, with family responsibilities/as-
Tabl
e 4
Pair
ed S
ampl
es t
-tes
t
Pair
ed D
iffe
renc
es
Mea
nS.
D.
Std.
95
% C
onfi
denc
eT
df S
igni
fican
ceEr
ror
Inte
rval
of
Leve
lM
ean
the
Dif
fere
nce
(2-t
aile
d)
Low
erU
pper
W –
F C
onfl
ictF
– W
Con
flic
t2.
966
4.27
80.
238
2.49
73.
435
12.4
4132
10.
000
Lakhwinder Singh Kang & Deepak
716 The Indian Journal of Industrial Relations, Vol. 49, No. 4, April 2014
pirations subordinate to work and ca-reer goals;
• Modern 4: where traditional work andfamily roles are reversed (i.e., themale partner is highly family-orientedand the female partner is highlywork-oriented.
From the five main couple types; itis possible that the greatest level of con-flict would be experienced by Modern 1and 3 couples where both the husbandand wife are found to possess high andequal orientations toward their family orwork roles. Therefore, couples in whichboth partners are either family (Mod-ern 1) or work (Modern 3) orientedwould experience a lack of time avail-able to perform duties in the oppositelife role. However, studies have foundwork and family domains to be asym-metrically permeable (Rothbard &Edwards, 2003). That is, often individu-als are found to draw from family timeto perform work demands but not viceversa, implying that family boundariesare more flexible than the comparativelyrigid work boundaries.
Regression Analysis
In order to identify the associationof W-F Conflict and F-W Conflict withquality of work life of veterinary doc-tors, correlation analysis has been per-formed (Table 5). Both work to familyconflict and family to work conflicthave negative and significant relation-ship with quality of work life. The cor-relation coefficient of work to familyconflict is bigger (r = - 0.19) than fam-ily to work conflict (r = - 0.12). Allen
et al. (2000) confirmed that conflictbetween work and non-work life is as-sociated with impaired psychologicalwell-being and other negative out-comes. They further emphasized thatproblems associated with family re-sponsibilities are additional resourcesthat may diminish QWL. It was alsoasserted that when an employee hashigher responsibilities there will bemore spill over of negative work out-comes on family life. The demands ofmanaging higher responsibilities atwork and home are also a potentialsource of stress because it allows aspill over to family life thus creating animbalanced working environment.Burke (1998) concluded that the spill-over between work and personal lifehas serious implications on QWL. Ithas also been argued that the conflictrelated to work and personal demandscan lead to negative health outcomesfor employees, and may decrease or-ganizational commitment, job satisfac-tion and increased burn out, which even-tually lead to poor QWL. Aminah(2002) also found that inter-role familyconflict occurs when the accumulateddemand of multiple roles at home andat work becomes too great to managecomfortably. It further suggested thatreducing the level of spill over may helpto reduce the perceived stress and as-sist to maintain some amount of bal-ance between the two environments.
The spill-over between work andpersonal life has serious implica-tions on QWL.
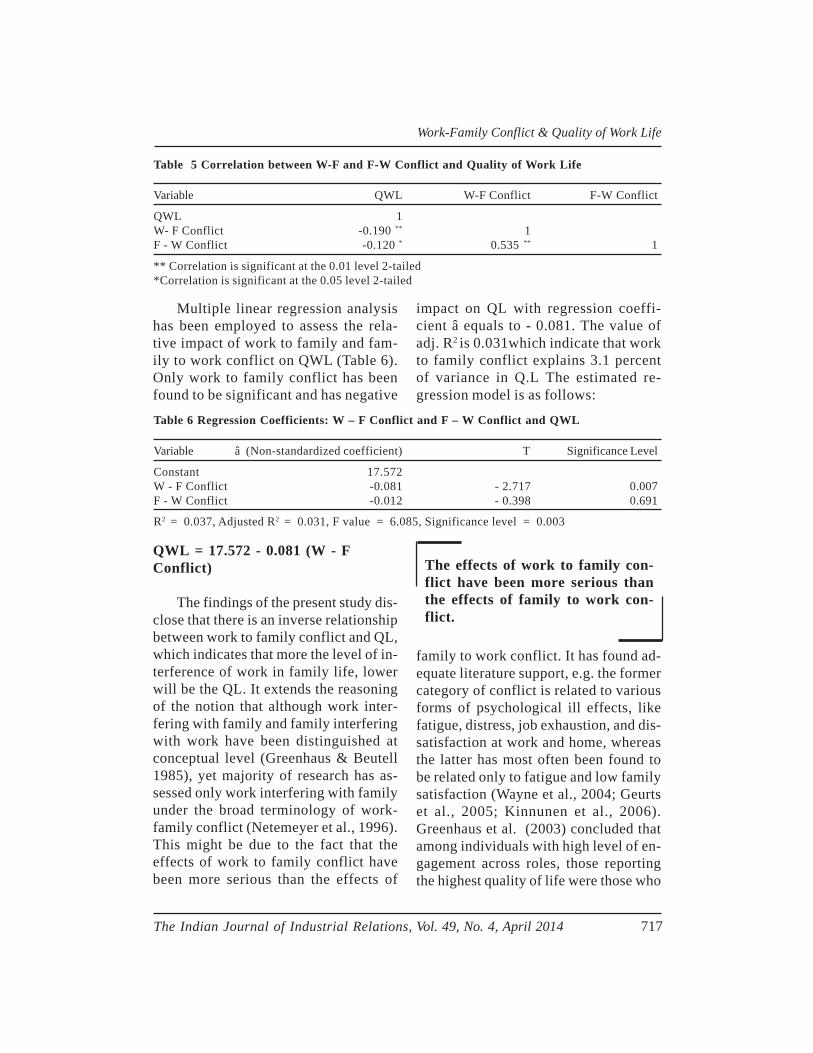
Work-Family Conflict & Quality of Work Life
The Indian Journal of Industrial Relations, Vol. 49, No. 4, April 2014 717
Multiple linear regression analysishas been employed to assess the rela-tive impact of work to family and fam-ily to work conflict on QWL (Table 6).Only work to family conflict has beenfound to be significant and has negative
impact on QL with regression coeffi-cient â equals to - 0.081. The value ofadj. R2 is 0.031which indicate that workto family conflict explains 3.1 percentof variance in Q.L The estimated re-gression model is as follows:
The effects of work to family con-flict have been more serious thanthe effects of family to work con-flict.
Table 6 Regression Coefficients: W – F Conflict and F – W Conflict and QWL
Variable â (Non-standardized coefficient) T Significance Level
Constant 17.572W - F Conflict -0.081 - 2.717 0.007F - W Conflict -0.012 - 0.398 0.691
R2 = 0.037, Adjusted R2 = 0.031, F value = 6.085, Significance level = 0.003
Table 5 Correlation between W-F and F-W Conflict and Quality of Work Life
Variable QWL W-F Conflict F-W Conflict
QWL 1W- F Conflict -0.190 ** 1F - W Conflict -0.120 * 0.535 ** 1
** Correlation is significant at the 0.01 level 2-tailed*Correlation is significant at the 0.05 level 2-tailed
QWL = 17.572 - 0.081 (W - FConflict)
The findings of the present study dis-close that there is an inverse relationshipbetween work to family conflict and QL,which indicates that more the level of in-terference of work in family life, lowerwill be the QL. It extends the reasoningof the notion that although work inter-fering with family and family interferingwith work have been distinguished atconceptual level (Greenhaus & Beutell1985), yet majority of research has as-sessed only work interfering with familyunder the broad terminology of work-family conflict (Netemeyer et al., 1996).This might be due to the fact that theeffects of work to family conflict havebeen more serious than the effects of
family to work conflict. It has found ad-equate literature support, e.g. the formercategory of conflict is related to variousforms of psychological ill effects, likefatigue, distress, job exhaustion, and dis-satisfaction at work and home, whereasthe latter has most often been found tobe related only to fatigue and low familysatisfaction (Wayne et al., 2004; Geurtset al., 2005; Kinnunen et al., 2006).Greenhaus et al. (2003) concluded thatamong individuals with high level of en-gagement across roles, those reportingthe highest quality of life were those who
Lakhwinder Singh Kang & Deepak
718 The Indian Journal of Industrial Relations, Vol. 49, No. 4, April 2014
invested more in the family than in thework role, that is, they showed an imbal-ance in favor of family. In regard to theirlevel of engagement, the equally balancedindividuals scored lower in quality of lifethan those favoring family over work, buthigher than those favoring work overfamily. Thus, those who invested most inwork had the lowest quality of life. Innutshell, it can be concluded that bothforms of conflict have been associatedwith a variety of negative consequencesin both the work and the family domains,such as decreased family and job satis-faction, stress, absenteeism, employeeturnover and reduced work and familyperformance (Allen et al, 2000; Byron,2005; Eby et al., 2005; Poelmans et al,.2005; Stevens et al., 2007).
Conclusions
The study attempts to examine therelationship between work-family conflictand quality of work. The findings of thestudy suggest that both ‘work to family’and ‘family to work’ affect the quality ofwork life of the veterinarian, but ‘workto family’ has been found more preva-lent among them and affecting theirQWL. The findings of the present studywould help the regulatory authorities toframe suitable policies and encourageveterinarians to maintain work-life bal-ance. It also highlights the necessity toexamine the various support mechanismsrequired to maintain a balance betweenwork and family life and a separate studyto examine the nature of conflict whichis prevalent among the women in Indiaand how they manage it.
References
Allan, Cameron, Loudoun, Rebecca & Peetz,David.(2005), “Influences on Work/nonwork Conflict”, Proceedings of 19th Con-ference of Association of Industrial Rela-tions Academics of Australia andNewzealand (AIRAANZ) held at Sydeny,
Allen, D.R. & Rao, T.R. (2000), Analysis of Cus-tomer Satisfaction Data, ASQ QualityPress, Milwaukee,WI.
Amatea, E., Cross, E., Clark, J. & Bobby, C.(1986), “Assessing the Work and FamilyRole Expectations of Career-Oriented Menand Women: The Life Role Salience Scales”,Journal of Marriage and the Family, 48(4):831-38.
Aminah, A. (2002), “Conflict between Work andFamily Roles of Employed Women in Ma-laysia”, in Proceedings of the 17th AnnualConference of the Society for Industrial andOrganizational Psychology, Toronto,Ontario, Canada.
Anbarasan, V. & Mehta, N. (2009), “An Explor-atory Study on Perceived Quality of Work-ing Life among Sales Professionals Em-ployed in Pharmaceutical, Banking, Financeand Insurance Companies in Mumbai’”Abhigyan, 27(1): 70-81.
Azril, Hayrol, M.S., Jegak, U., Asiah, M., AzmanNoor A., Bahaman, A.S., Jamilah, O. &Thomas, K. (2010), “Can Quality of WorkLife Affect Work Performance among Gov-ernment Agriculture Extension Officers? ACase from Malaysia”, Journal of SocialSciences, 6 (1): 64-73.
Beh, Loo see. (2006), “Predicting Quality of WorkLife: The Implications of Career Dimen-sions,” Proceedings of the InternationalConference on Business and Information,Academy of Taiwan Information SystemsResearch, 3 (1).
Brooks B.A.& Anderson M.A. (2005), ‘DefiningQuality of Nursing Work Life’, NursingEconomics, 6: 319-26.
Work-Family Conflict & Quality of Work Life
The Indian Journal of Industrial Relations, Vol. 49, No. 4, April 2014 719
Brooks, B.A. (2004), ‘Quality of Nursing WorkLife in Acute Care’ Journal of Nursing CareQuality, 19: 269-75.
Bruke, R.J., (1998) “Correlations of Job Insecu-rity among Recent Business School Gradu-ates”, Employee Relations, 20/1(2): 92-100.
Byron, K. (2005), “A Meta Analytic Review ofWork Family Conflict and Its Antecedents”,Journal of Vocational Behavior, 67:169-98.
Carlson A.D.S. & Perrewe, P.L. (1999), “TheSocial Support in the Stressor – StrainRelationship. An Examination of WorkFamily Conflict”, Journal of Management,25(4): 513-33.
Cohen, Susan G., Lei, Chang & Gerald E. LedfordJr. (1997), “A Hierarchical Construct ofSelf-Management Leadership and Its Rela-tionship to Quality of Work Life and Per-ceived Work Group Effectiveness”, Person-nel Psychology, 50(2), 275–308.
Dargahi, H.& Sharifi Yazdi, M.K. (2007), “Qual-ity of Work Life in Tehran University ofMedical Sciences Hospitals Clinical Labo-ratories Employees”, Pakistan Journal ofMedical Sciences, 23(4): 630-33.
Davis, L.E. (1983), “Design of New Organiza-tions, The Quality of Working Life and The1980s”, in H. Kolody and H.V.Beinum(Eds). New York, Praeger Publisher
Dhar, L.B. (2008), “Quality of Work Life: A Studyof Municipal Corporation Bus Drivers”,The Journal of International Social Re-search, 1(5): 252-73.
Eby, I. T., Casper, W., Lockwood, A., Bordeaux,C., & Brinkley, I. (2005), “Work and Fam-ily Research in IO/OB; Content Analysisand Review of the Literature (1980-2002)”,Journal of Vocational Behavior, 66: 124-27.
Frone, M.R., Russell, M. and Cooper, M.L.(1992), ‘Antecedents and Outcomes ofWork-Family Conflict: Testing A Model ofthe Work-Family Interface’, Journal ofApplied Psychology, 77: 65-78.
Geurts SAE., Taris TW., Kompiermaj, DikkersJSE.,Van Hooffmlm, Kinnunen UM.(2005),“Work-home Interaction from A Work Psy-chological Perspective: Development andValidation of A New Questionnaire, TheSWING”, Work Stress, 19: 319–39.
Greenhaus, J. & Powell, G. (2003), “When Workand Family Collide: Deciding BetweenCompeting Role Demands”, OrganisationalBehaviour and the Human Decision Pro-cesses, 90 (2): 291-303.
Greenhaus, J. H & Beutell, N. J. (1985), “Sourcesof Conflict Between Work and FamilyRoles”, Academy of Management Review,10: 76-88.
Greenhaus, J. & Powell, G. (2006), “When Workand Family are Allies: A Theory of Work-Family Enrichment”, Academy of Manage-ment Review, 31(1): 72–92.
Gutek, B.A., Searle, S. & Kleps, L. (1991), “Ra-tional Versus Gender Role Explanations forWork Family Conflict”, Journal of AppliedPsychology, 76(4): 560-68.
Heery, Edmund & Noon, Mike (2001), A Dictio-nary of Human Resource Management,Oxford University Press.
Huang, Y., Hammer, L., Neal, M. & Perrin, N.(2004), “The Relationship Between Work-To-Family and Family-To-Work Conflict:A Longitudinal Study”, Journal of Familyand Economic Issues, 25(1): 79-100.
Khani A., Jaafarpour M. & DyrekvandmogadamA. (2007), “Quality of Nursing Work Life”,Journal of Clinical and Diagnostic Re-search, 2(6), 1169-1174.
Kinnunen, U., Feldt, T., Geurts, S. & Pulkkinen,L. (2006), “Types of Work-Family Inter-face: Well-Being Correlates of Negative andPositive Spillover Between Work and Fam-ily, Scand Journal of Psychology, 47:149–62.
Kossek, E.E. & Ozeki, C. (1998), “Work-FamilyConflict, Policies and the Job-Life Satis-faction Relationship: A Review and Direc-tions for Organizational Behavior/Human
Lakhwinder Singh Kang & Deepak
720 The Indian Journal of Industrial Relations, Vol. 49, No. 4, April 2014
Resources Research”, Journal of AppliedPsychology, 83: 139-49.
Lawler, E. E. (1982), “Strategies for Improvingthe Quality of Work Life”, American Psy-chologists, 37: 486-493.
Lewis, S. and Cooper, C.L. (1987), “Stress inTwo Earner Couples and Stage in the LifeCycle”, Journal of Occupational Psychol-ogy, 60: 289-303.
Littlefield, K. L. (2004), “Quality of Work-LifeIssues: The Needs of the Dual-CareerCouple Employee Perceptions of Person-nel Practices: A Study of Rural America aBarometer for Human Resource Managers”,Proceedings of the Academy of Organiza-tional Culture, Communications and Con-flict, New Orleans, 8(1).
Lobel, S. (1991), “Allocation of Investment inWork and Family Roles: Alternative Theo-ries and Implications for Research”, Acad-emy of Management Review, 16(3): 507-521.
Mott , D.A., Doucette, R., Gaither, C.A.,Pedersen, C.A. & Schommer, J.C. (2004),“Pharmacist’s Attitudes towards Work life:Results from a National Survey of Pharma-cists”, Journal of the American Pharma-cists Association, 44(3).
Netemeyer, RG. & Boles, JS.(1996), “Developerand Validation of Work –Family Conflictand Family Work Conflict Scales”, Jour-nal of Applied Psychology, 81:400-410.
Parasuraman, S. & Greenhaus, J. (2002), “To-ward Reducing Some Critical Gaps in Work-Family Research”, Human Resource Man-agement Review, 12(3): 299-312.
Poelmans, S., O’Driscoll, M. and Beham, B.(2005), “An Overview of International Re-search on the Work Family Interface”, In:S. Poelmans (Ed.), Work and Family: AnInternational Research Perspective, 3-46.Mahwah NJ: Lawrence Erlbaum Associates.
Rethinam, Guna Seelan & Ismail, M. (2008),“Constraints of Quality of Work Life: APerspective in Information and Technology
Professional”, European Journal of SocialSciences, 7(1): 58-69.
Rizzo, JR., House, RJ., & Lirtzman, SI. (1970),“Role Conflict and Ambiguity in ComplexOrganizations”, Administrative ScienceQuarterly, 15:150–63.
Robbins, S.P. (1989), Organizational BehaviorConcepts, Controversies and Applications,Prentice Hall of India, New Delhi.
Rothbard, N. & Edwards, J. (2003), “Investmentin Work and Family Roles: A Test of Iden-tity and Utilitarian Motives”, PersonnelPsychology, 56(3): 699-730.
Sale, J.E.M. & Smoke, M. (2007), “MeasuringQuality of Work-Life: A Participatory Ap-proach in a Canadian Cancer Center”, Jour-nal of Cancer Education, 22(1): 62-66.
Saraji, G. Hasl & Dargahi, H. (2006), “Study ofQuality of Work Life”, Iranian Journal ofPublic Health, 35 (4): 8-14.
Serey, T.T (2006), “Choosing A Robust Qualityof Work Life”, Business Forum, 27(2): 7-10.
Sirgy, Joseph M., David Efraty, Phillip Siegel,Dong-Jin Lee (2001), “A New Measure ofQuality of Work Life (Qwl) Based on NeedSatisfaction and Spillover Theories”, So-cial Indicators Research, 55 (3): 241.
Stevens, D P., Minnotte, K.L., Mannon, S.E., andKiger, O.(2007), “Examining the NeglectedSide of Work Family Interface, Anteced-ents of Positive and Negative Family toWork Spillover”, Journal of Family Issues,28(2): 242-262.
Stryker, S. (1968), “Identity Salience and RolePerformance: The Relevance of SymbolicInteraction Theory for Family Research”,Journal of Marriage and the Family, 30(4):558-564.
Stryker, S. (1980), Symbolic Interactionism: ASocial Structural Version, Benjamin/Cummings, Menlo Park, California.
Work-Family Conflict & Quality of Work Life
The Indian Journal of Industrial Relations, Vol. 49, No. 4, April 2014 721
Stryker, S. (1987), “Identity Theory: Develop-ments and Extensions”, In Yardley, K. andHoness, T. (eds.), Self and Identity: Psy-chological Perspectives, Wiley, New York.
Thompson, J. & Bunderson, J. (2001), “Work-Nonwork Conflict and the Phenomenologyof Time: Beyond the Balance Metaphor”,Work and Occupations, 28(1): 17-39.
Watson, I., Buchanan, J., Cambell, I. & Briggs, C.(2003), Fragmented Futures: New Chal-lenges in Working Life, The FederationPress, Annandale: Sydney.
Wayne, JH., Musisca, N.and Fleeson, W. (2004),“Considering the Role of Personality in theWork-Family Experience: Relationships ofthe Big Five to Work-Family Conflict andFacilitation”, Journal of Vocational Behav-ior, 64:108–130.
Wiley, M. (1991), “Gender, Work and Stress: ThePotential Impact of Role-Identity Salienceand Commitment”, Sociological Quarterly,32(4): 495-5
sas
Emotional Intelligence & Job Performance in Banking &Insurance Sector in India
S C Davar & Narender Singh
Inadequate evidence with regardto the direct effect ofemotional intelligence on jobperformance has restricted itsuse as a tool for personnel plan-ning and development.With thehelp of regression analysis, thisstudy establishes that there is adirect relationship between emo-tional intelligence and jobp e r f o r m a n c e . T h e re f o re , w eshould restructure our selectionprocedures in a way that givesdue weightage to emotional in-telligence while hiring employ-ees. A limitation of this study isthat it is confined to bankingand insurance sector enterprisesof India.
Introduction
Until recently, the government andpublic sector undertakings dominated theservice sector in India. During the lasttwo decades, financial sector reformsand other liberalization measures initiatedby the Government of India have in-creased participation by the private sec-tor in the development and delivery ofvarious services. Thus, keen competi-tion among different segments of bank-ing and insurance sector has emerged.Moreover, the competition has resultedin high levels of stress. This may cause ahigh rate of employee turnover. Today,theservice enterprises depend heavily onquality of manpower and hence, we mustgive due weightage to emotional intelli-gence while managing human resources.The recruitment, retention and trainingfunctions need to be redefined. Infact,emotional intelligence has been saidto matter twice as much as IQ i.e. intel-ligence quotient (Goleman, 1998).
Emotional intelligence has beensaid to matter twice as much as IQi.e. intelligence quotient.S C Davar (E-Mail:[email protected]) &.
Narender Singh are from Faculty of Commerce &Management, Kurukshetra University, Kurukshetra
722 The Indian Journal of Industrial Relations, Vol. 49, No. 4, April 2014
The studies abroad e.g. Lagrange&Roodt (2001), Slaski & Cartwright(2002), Sitarenios (1998); Rapisarda(2002), and Donaldo-Feidler & Bond(2004) and in India e.g. Jain & Sinha(2005); Sinha & Jain (2004) suggest thatemotional intelligence improves the or-ganizational effectiveness and organiza-tional commitment or job satisfaction.These measures are expected to have apositive effect on the job performance.For example, Jayan (2006) found higherlevels of emotional-competence for the“high” managerial performers. Further,Bechara, Tranel &Damasio (2000) founda direct (positive) relationship betweenemotional intelligence and performance.Recently, O’Boyle Jr. et al., (2010) con-ducted a meta-analytic study and foundthat emotional intelligence yields predic-tive validity above and beyond the fivefactor model and cognitive ability. Thestudy classified emotional intelligencestudies into three streams and found thatall three streams of emotional intelligenceexhibited substantial relative importancein the presence of FFM and intelligencewhen predicting job performance. But,there are studies which dispute the ex-istence of a direct relationship betweenemotional intelligence and job perfor-mance. However, these studies imbibea number of methodological weak-nesses. The use of non-standardizedmeasures/scales may generate a lowcorrelation between emotional intelli-gence and performance. For example,competencies (influence, achievementorientation, empathy, and achievement-orientation) identified as components ofemotional intelligence by Rapisarda(2002) cannot be construed to reflect
emotional intelligence/competence. Simi-larly, Jayan (2006) utilized a weaker tech-nique namely, uni-variate ANOVA thatfails to abdicate the effects of substan-tial (measurement) errors. Given the limi-tations of these studies, the present studyre-examines the relationship betweenemotional intelligence and the job perfor-mance. A statistically strong technique,i. e, multiple regression analysis has beenused to ascertain the effect, if any, ofemotional intelligence on the job perfor-mance. Its built-in-procedure neutralizesthe measurement error expected in theaforesaid non-standardized domains.
The Sample
The self- report questionnaire wasconstructed and the data was collectedfrom 250 employees working in public-sector banks, private sector banks, co-operative banks and insurance companiesfrom different districts of Haryana(Yamunanangar, Kurukshetra, Panipat,Sonipat, Panchkula, Kaithal and Ambala),Chandigarh, Mohali (Panjab) and Delhiduring 2007 and 2008. The sample iscomposed of employees from coopera-tive banks (14.4 %), insurance (19.2 %),private sector banks (16.4%) and publicsector banks (50%). None the less, dif-ferent categories of employees (clericalworkers:34.8 percent, supervisory staff:24.4%, and managerial staff:40.8%)working in financial undertakingshave been represented in the sample.
The Data &Reliability
The emotional intelligence scales fo-cus mostly on the lifestyle and social in-
Emotional Intelligence & Job Performance
The Indian Journal of Industrial Relations, Vol. 49, No. 4, April 2014 723
S C Davar & Narender Singh
724 The Indian Journal of Industrial Relations, Vol. 49, No. 4, April 2014
telligence of employees i.e. trait theoryor general values and beliefs. Many ofthese have major limitations, SchutteEmotional Intelligence Scale(Schutte etal., 1998) consists of 33 items respondedto on a 5-point Likert scale. A shortcom-ing of the SEIS is that it provides incom-plete coverage of the trait EI domainbecause it is exclusively based on thethree dimensions postulated in the earlySalovey& Mayer (1990) model.
The Multi-factor EI Scale (MEIS)has been developed by Mayer, Saloveyand Caruso (1999) popularly called FourBranches Model. Most of the reliabilitiesof MEIS sub-tests have been foundweak for the Indian sample (Pant&Parkash, 2004:134). Another scale,Mayer, Salovey and Caruso EmotionalIntelligence Test (MSCEIT) has beencriticized for a set of reasons. The meta-analysis examining the relationship be-tween emotional intelligence and job per-formance (O’Boyle et al, 2010) used thethree-stream approach for classifying EIresearch; (1) ability-based models thatuse objective test items; (2) self-reportor peer-report measures based on thefour-branch model of EI; and (3) “mixedmodels” of emotional competencies.Streams 2 and 3 have the largest incre-mental validity beyond cognitive abilityand the Five Factor Model (FFM). Itmeans that ability- based models (MEISand MSCEI etc) do not measure EI ac-curately. Moreover, Ashkanasy& Daus(2005: 441) argue that researchers in thethird stream have developed comprehen-sive measures such as the ECI and theBar-On measures that included socialskills and abilities, whereas the research-
ers in the Mayer–Salovey tradition havedeveloped more narrow measures thatfocus on perceiving emotions, under-standing emotions, and regulating emo-tions.
The present study utilizes self-reportinventory proposed by Bhattacharya,Dutta & Mandal (2004) for the assess-ment of EI (see question-items in Annex-ure I). It may be added that their inven-tory is more or less a compilation of ques-tion items from available Scales on EI,especially Bar-On Emotional QuotientInventory (EQ-i). Bar-On (1997) is oneof the most widely used measures of traitEI in the literature (Mayor, Salovey &Crusco, 2004). The EQ-i is a mixed modelwith 133 items and 15 sub-scales. It rec-ognizes 5 higher-order factors namely,“intrapersonal” skills, “inter-personal”skills, “adaptation”, “stress manage-ment”, and “general mood”. The inven-tory implemented by us includes five cat-egories – negative emotions, positiveemotions, inter personal, intra-personaland emotional facilitation.
Doubts have been expressed byMayor, Salovey & Crusco (2004) aboutEQ-i model for EI. It may be pointedout that EQ-i Scale assesses non-cogni-tive ability and not the IQ. It has a pri-mary focus on the outcome of emotionsrather than the personality differences aspostulated by FFM. This is clear from thefinding by Dawda & Hart (2000) thatcorrelation between measures of fivepersonality factors (Neuroticism, Extro-version, Openness, Agreeableness andConscientiousness) and general EI (de-rived from the Bar-On Emotional Quo-
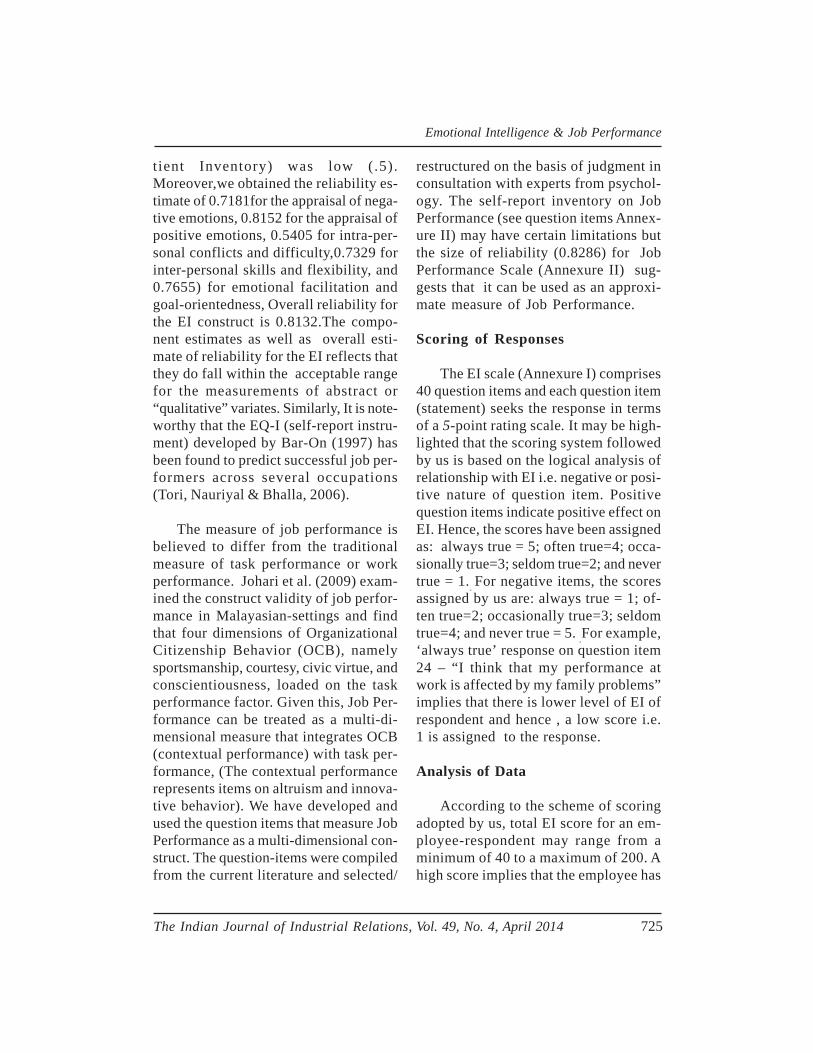
Emotional Intelligence & Job Performance
The Indian Journal of Industrial Relations, Vol. 49, No. 4, April 2014 725
tient Inventory) was low (.5).Moreover,we obtained the reliability es-timate of 0.7181for the appraisal of nega-tive emotions, 0.8152 for the appraisal ofpositive emotions, 0.5405 for intra-per-sonal conflicts and difficulty,0.7329 forinter-personal skills and flexibility, and0.7655) for emotional facilitation andgoal-orientedness, Overall reliability forthe EI construct is 0.8132.The compo-nent estimates as well as overall esti-mate of reliability for the EI reflects thatthey do fall within the acceptable rangefor the measurements of abstract or“qualitative” variates. Similarly, It is note-worthy that the EQ-I (self-report instru-ment) developed by Bar-On (1997) hasbeen found to predict successful job per-formers across several occupations(Tori, Nauriyal & Bhalla, 2006).
The measure of job performance isbelieved to differ from the traditionalmeasure of task performance or workperformance. Johari et al. (2009) exam-ined the construct validity of job perfor-mance in Malayasian-settings and findthat four dimensions of OrganizationalCitizenship Behavior (OCB), namelysportsmanship, courtesy, civic virtue, andconscientiousness, loaded on the taskperformance factor. Given this, Job Per-formance can be treated as a multi-di-mensional measure that integrates OCB(contextual performance) with task per-formance, (The contextual performancerepresents items on altruism and innova-tive behavior). We have developed andused the question items that measure JobPerformance as a multi-dimensional con-struct. The question-items were compiledfrom the current literature and selected/
restructured on the basis of judgment inconsultation with experts from psychol-ogy. The self-report inventory on JobPerformance (see question items Annex-ure II) may have certain limitations butthe size of reliability (0.8286) for JobPerformance Scale (Annexure II) sug-gests that it can be used as an approxi-mate measure of Job Performance.
Scoring of Responses
The EI scale (Annexure I) comprises40 question items and each question item(statement) seeks the response in termsof a 5-point rating scale. It may be high-lighted that the scoring system followedby us is based on the logical analysis ofrelationship with EI i.e. negative or posi-tive nature of question item. Positivequestion items indicate positive effect onEI. Hence, the scores have been assignedas: always true = 5; often true=4; occa-sionally true=3; seldom true=2; and nevertrue = 1.. For negative items, the scoresassigned by us are: always true = 1; of-ten true=2; occasionally true=3; seldomtrue=4; and never true = 5. .For example,‘always true’ response on question item24 – “I think that my performance atwork is affected by my family problems”implies that there is lower level of EI ofrespondent and hence , a low score i.e.1 is assigned to the response.
Analysis of Data
According to the scheme of scoringadopted by us, total EI score for an em-ployee-respondent may range from aminimum of 40 to a maximum of 200. Ahigh score implies that the employee has
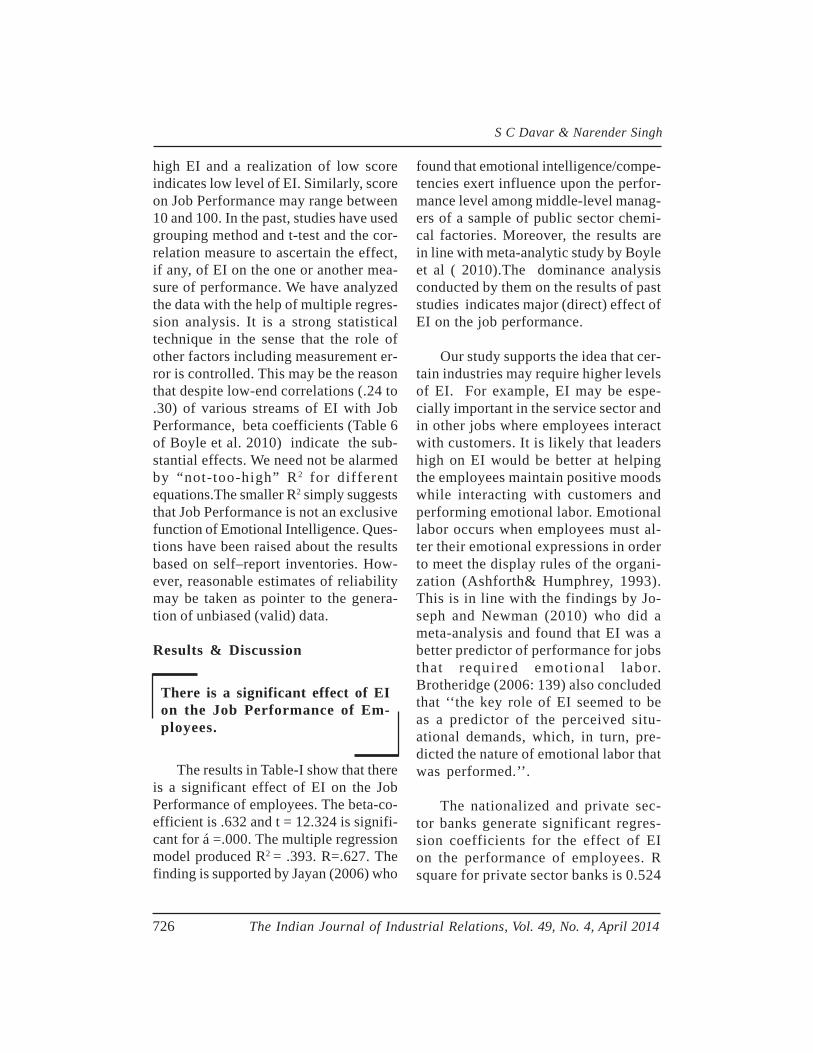
S C Davar & Narender Singh
726 The Indian Journal of Industrial Relations, Vol. 49, No. 4, April 2014
high EI and a realization of low scoreindicates low level of EI. Similarly, scoreon Job Performance may range between10 and 100. In the past, studies have usedgrouping method and t-test and the cor-relation measure to ascertain the effect,if any, of EI on the one or another mea-sure of performance. We have analyzedthe data with the help of multiple regres-sion analysis. It is a strong statisticaltechnique in the sense that the role ofother factors including measurement er-ror is controlled. This may be the reasonthat despite low-end correlations (.24 to.30) of various streams of EI with JobPerformance, beta coefficients (Table 6of Boyle et al. 2010) indicate the sub-stantial effects. We need not be alarmedby “not-too-high” R2 for differentequations.The smaller R2 simply suggeststhat Job Performance is not an exclusivefunction of Emotional Intelligence. Ques-tions have been raised about the resultsbased on self–report inventories. How-ever, reasonable estimates of reliabilitymay be taken as pointer to the genera-tion of unbiased (valid) data.
Results & Discussion
There is a significant effect of EIon the Job Performance of Em-ployees.
The results in Table-I show that thereis a significant effect of EI on the JobPerformance of employees. The beta-co-efficient is .632 and t = 12.324 is signifi-cant for á =.000. The multiple regressionmodel produced R2 = .393. R=.627. Thefinding is supported by Jayan (2006) who
found that emotional intelligence/compe-tencies exert influence upon the perfor-mance level among middle-level manag-ers of a sample of public sector chemi-cal factories. Moreover, the results arein line with meta-analytic study by Boyleet al ( 2010).The dominance analysisconducted by them on the results of paststudies indicates major (direct) effect ofEI on the job performance.
Our study supports the idea that cer-tain industries may require higher levelsof EI. For example, EI may be espe-cially important in the service sector andin other jobs where employees interactwith customers. It is likely that leadershigh on EI would be better at helpingthe employees maintain positive moodswhile interacting with customers andperforming emotional labor. Emotionallabor occurs when employees must al-ter their emotional expressions in orderto meet the display rules of the organi-zation (Ashforth& Humphrey, 1993).This is in line with the findings by Jo-seph and Newman (2010) who did ameta-analysis and found that EI was abetter predictor of performance for jobsthat required emotional labor.Brotheridge (2006: 139) also concludedthat ‘‘the key role of EI seemed to beas a predictor of the perceived situ-ational demands, which, in turn, pre-dicted the nature of emotional labor thatwas performed.’’.
The nationalized and private sec-tor banks generate significant regres-sion coefficients for the effect of EIon the performance of employees. Rsquare for private sector banks is 0.524
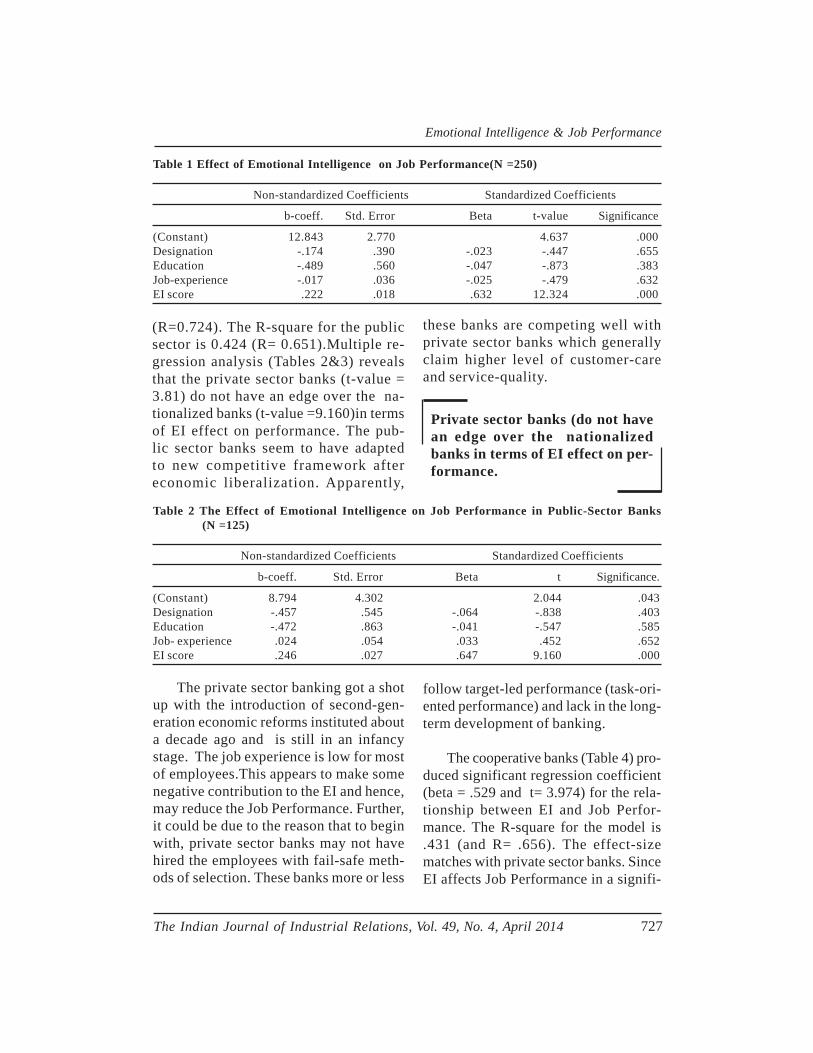
Emotional Intelligence & Job Performance
The Indian Journal of Industrial Relations, Vol. 49, No. 4, April 2014 727
(R=0.724). The R-square for the publicsector is 0.424 (R= 0.651).Multiple re-gression analysis (Tables 2&3) revealsthat the private sector banks (t-value =3.81) do not have an edge over the na-tionalized banks (t-value =9.160)in termsof EI effect on performance. The pub-lic sector banks seem to have adaptedto new competitive framework aftereconomic liberalization. Apparently,
Table 1 Effect of Emotional Intelligence on Job Performance(N =250)
Non-standardized Coefficients Standardized Coefficients
b-coeff. Std. Error Beta t-value Significance
(Constant) 12.843 2.770 4.637 .000Designation -.174 .390 -.023 -.447 .655Education -.489 .560 -.047 -.873 .383Job-experience -.017 .036 -.025 -.479 .632EI score .222 .018 .632 12.324 .000
these banks are competing well withprivate sector banks which generallyclaim higher level of customer-careand service-quality.
Private sector banks (do not havean edge over the nationalizedbanks in terms of EI effect on per-formance.
Table 2 The Effect of Emotional Intelligence on Job Performance in Public-Sector Banks(N =125)
Non-standardized Coefficients Standardized Coefficients
b-coeff. Std. Error Beta t Significance.
(Constant) 8.794 4.302 2.044 .043Designation -.457 .545 -.064 -.838 .403Education -.472 .863 -.041 -.547 .585Job- experience .024 .054 .033 .452 .652EI score .246 .027 .647 9.160 .000
The private sector banking got a shotup with the introduction of second-gen-eration economic reforms instituted abouta decade ago and is still in an infancystage. The job experience is low for mostof employees.This appears to make somenegative contribution to the EI and hence,may reduce the Job Performance. Further,it could be due to the reason that to beginwith, private sector banks may not havehired the employees with fail-safe meth-ods of selection. These banks more or less
follow target-led performance (task-ori-ented performance) and lack in the long-term development of banking.
The cooperative banks (Table 4) pro-duced significant regression coefficient(beta = .529 and t= 3.974) for the rela-tionship between EI and Job Perfor-mance. The R-square for the model is.431 (and R= .656). The effect-sizematches with private sector banks. SinceEI affects Job Performance in a signifi-
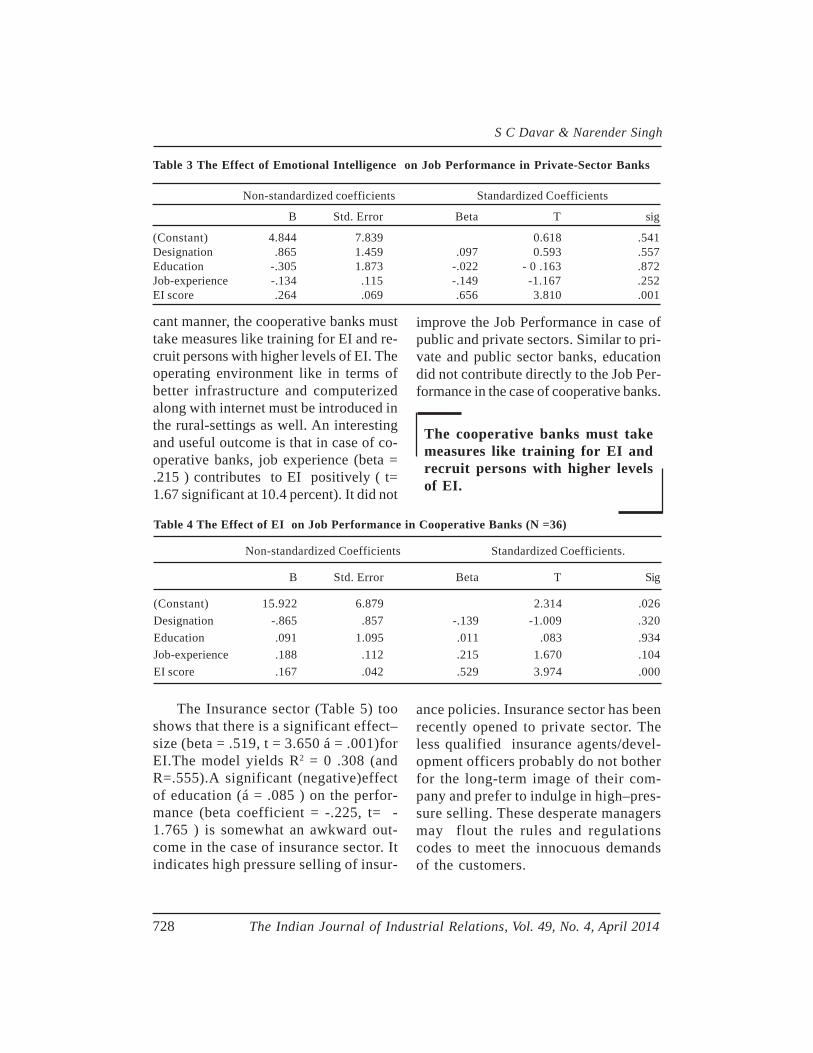
S C Davar & Narender Singh
728 The Indian Journal of Industrial Relations, Vol. 49, No. 4, April 2014
Table 3 The Effect of Emotional Intelligence on Job Performance in Private-Sector Banks
Non-standardized coefficients Standardized Coefficients
B Std. Error Beta T sig
(Constant) 4.844 7.839 0.618 .541Designation .865 1.459 .097 0.593 .557Education -.305 1.873 -.022 - 0 .163 .872Job-experience -.134 .115 -.149 -1.167 .252EI score .264 .069 .656 3.810 .001
cant manner, the cooperative banks musttake measures like training for EI and re-cruit persons with higher levels of EI. Theoperating environment like in terms ofbetter infrastructure and computerizedalong with internet must be introduced inthe rural-settings as well. An interestingand useful outcome is that in case of co-operative banks, job experience (beta =.215 ) contributes to EI positively ( t=1.67 significant at 10.4 percent). It did not
Table 4 The Effect of EI on Job Performance in Cooperative Banks (N =36)
Non-standardized Coefficients Standardized Coefficients.
B Std. Error Beta T Sig
(Constant) 15.922 6.879 2.314 .026Designation -.865 .857 -.139 -1.009 .320Education .091 1.095 .011 .083 .934Job-experience .188 .112 .215 1.670 .104EI score .167 .042 .529 3.974 .000
improve the Job Performance in case ofpublic and private sectors. Similar to pri-vate and public sector banks, educationdid not contribute directly to the Job Per-formance in the case of cooperative banks.
The cooperative banks must takemeasures like training for EI andrecruit persons with higher levelsof EI.
The Insurance sector (Table 5) tooshows that there is a significant effect–size (beta = .519, t = 3.650 á = .001)forEI.The model yields R2 = 0 .308 (andR=.555).A significant (negative)effectof education (á = .085 ) on the perfor-mance (beta coefficient = -.225, t= -1.765 ) is somewhat an awkward out-come in the case of insurance sector. Itindicates high pressure selling of insur-
ance policies. Insurance sector has beenrecently opened to private sector. Theless qualified insurance agents/devel-opment officers probably do not botherfor the long-term image of their com-pany and prefer to indulge in high–pres-sure selling. These desperate managersmay flout the rules and regulationscodes to meet the innocuous demandsof the customers.
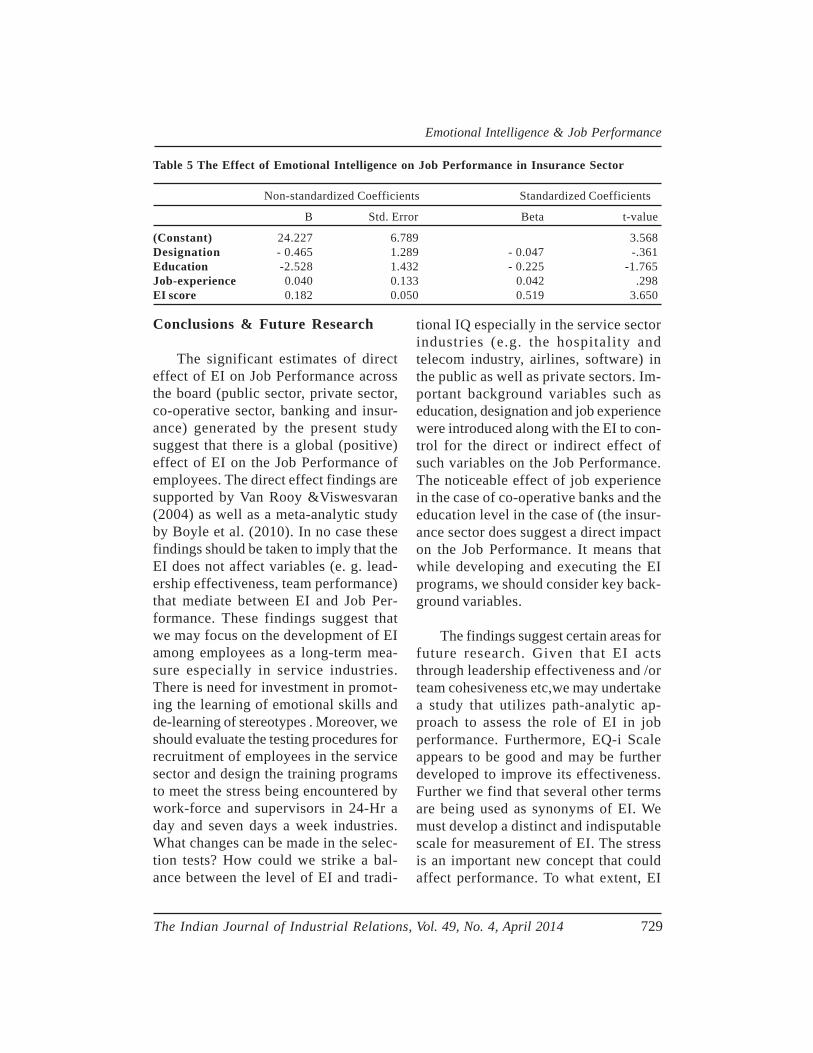
Emotional Intelligence & Job Performance
The Indian Journal of Industrial Relations, Vol. 49, No. 4, April 2014 729
Table 5 The Effect of Emotional Intelligence on Job Performance in Insurance Sector
Non-standardized Coefficients Standardized Coefficients
B Std. Error Beta t-value
(Constant) 24.227 6.789 3.568Designation - 0.465 1.289 - 0.047 -.361Education -2.528 1.432 - 0.225 -1.765Job-experience 0.040 0.133 0.042 .298EI score 0.182 0.050 0.519 3.650
Conclusions & Future Research
The significant estimates of directeffect of EI on Job Performance acrossthe board (public sector, private sector,co-operative sector, banking and insur-ance) generated by the present studysuggest that there is a global (positive)effect of EI on the Job Performance ofemployees. The direct effect findings aresupported by Van Rooy &Viswesvaran(2004) as well as a meta-analytic studyby Boyle et al. (2010). In no case thesefindings should be taken to imply that theEI does not affect variables (e. g. lead-ership effectiveness, team performance)that mediate between EI and Job Per-formance. These findings suggest thatwe may focus on the development of EIamong employees as a long-term mea-sure especially in service industries.There is need for investment in promot-ing the learning of emotional skills andde-learning of stereotypes . Moreover, weshould evaluate the testing procedures forrecruitment of employees in the servicesector and design the training programsto meet the stress being encountered bywork-force and supervisors in 24-Hr aday and seven days a week industries.What changes can be made in the selec-tion tests? How could we strike a bal-ance between the level of EI and tradi-
tional IQ especially in the service sectorindustries (e.g. the hospitality andtelecom industry, airlines, software) inthe public as well as private sectors. Im-portant background variables such aseducation, designation and job experiencewere introduced along with the EI to con-trol for the direct or indirect effect ofsuch variables on the Job Performance.The noticeable effect of job experiencein the case of co-operative banks and theeducation level in the case of (the insur-ance sector does suggest a direct impacton the Job Performance. It means thatwhile developing and executing the EIprograms, we should consider key back-ground variables.
The findings suggest certain areas forfuture research. Given that EI actsthrough leadership effectiveness and /orteam cohesiveness etc,we may undertakea study that utilizes path-analytic ap-proach to assess the role of EI in jobperformance. Furthermore, EQ-i Scaleappears to be good and may be furtherdeveloped to improve its effectiveness.Further we find that several other termsare being used as synonyms of EI. Wemust develop a distinct and indisputablescale for measurement of EI. The stressis an important new concept that couldaffect performance. To what extent, EI
S C Davar & Narender Singh
730 The Indian Journal of Industrial Relations, Vol. 49, No. 4, April 2014
plays its role in managing the stress?.Similarly, to move away from task-ori-ented definition of job, we may developand standardize a different scale formeasurement of Job Performance.Lastly, the regression model for evalua-tion of the role of EI may be postulatedin terms of two factor theory i.e. generalintelligence (IQ) plus specific factor (EI).In our study, we did not control for IQdirectly. We attempted to control for it inthe indirect way i.e. education and jobexperience.
References
Ashkanasy, N. M.&Daus, C. S. (2005), “Rumorsof the Death of EI in Organizational Be-havior Are Vastly Exaggerated”, Journal ofOrganizational Behavior,26, 441–52.
Bar-On, R. (1997), “Development of the Bar-OnEQ-i: a Measure of Emotional and SocialIntelligence”, Paper presented at the 105thAnnual Convention of the American Psy-chological Association in Chicago.
Bechara, A., Tranel, D. &Damasio, A. R. (2000),“Poor Judgment in Spite of High Intellect:Neurological Evidence for EI”. in:Bar-On,R. & Parker, J.D.A.(Eds.), The Handbookof EI, San Francisco: Jossey-Bass.
Bhattacharya, M., Dutta, A. K. &Mandal, M. K.(2004), “Factor Structure of EI in India”,Psychological Studies, 49 (2&3): 42-46.
Dawda, D. & Hart, S.D. (2000), “Assessing EI:Reliability and Validity of the Bar-On Emo-tional Quotient Inventory (EQ-i) in uni-versity students”, Personality and Indi-vidual Difference. 28: 787-812.
Donaldo-fEIdler, E.J & Bond, F.N. (2004), “TheRelative Importance of Psychological Ac-ceptance and EI to Workplace Well be-ing”, British Journal of Guidance and Coun-seling, 32:187-203
Gabriel, Y. & Griffiths, D. S. (2002), “Emotion,Learning and Organizing”, The LearningOrganization, 9 (5)
Goleman, D. (1995), EI: Why It Can Matter MoreThan IQ, London: Bloomsbury.
Ghorbani, N., Singh, M.N., Watson, P.J. ,Davidson, H.K. & Mack, D.A. (2002),“Self-reported EI; Constant Similarity andFunctional Dissimilarity of Higher-orderProcessing in Iran and the US”, Interna-tional Journal of Psychology, 37(5): 297-308.
Jain, A. K. &Sinha, A. K. (2005),”General Healthin Organizations: Relevance of EI, Trustand Organizational Support”, I n t e r n a -tional Journal of Stress Management,12(3):257-73.
Jayan, C. (2006), “Do High Managerial Perform-ers Have High Emotional Competencies”?Journal of the Indian Academy of AppliedPsychology, 32(3): 179-84
Johari , J., Yahya , K. K. & Omar, A.(2009),“Construct Validation of the Job Perfor-mance Measurement: a Case of the Malay-sian Public Service Agencies” , Proceedingsof International Conference on theory andPractice in Performance Measurement andManagement held on 14-17 April 2009Uni-versity of Otago, New Zealand.
Jordan, P. J., Ashkanasy, N. M., &Hartel, C. E. J.(2002), “EI as a Moderator of Emotionaland Behavioral Reactions to JobInsecurity”,Academy of Management Re-view, 27: 361–72
Joseph, D. L. & Newman, D. A. (2010), “EI: AnIntegrative Meta-analysis and CascadingModel”, Journal of Applied P s y c h o l -ogy, 95: 54–78.
Langrange, L. & Roosdt, G. (2001), “Personalityand Cognitive Ability as Predictors of theJob Performance of Insurance S a l ePeople”, SA Journal of Industrial Psychol-ogy, 27(3)
Emotional Intelligence & Job Performance
The Indian Journal of Industrial Relations, Vol. 49, No. 4, April 2014 731
Mayer, J. D., Salovey, P. & Caruso, D. R(1999),”Competing Models of EI”, in J.Sternberg, Handbook of Human Intelli-gence, New York, Cambridge
Mayer, J, D., Salovey, Peter & Caruso, David R.(2004), “EI: Theory, Findings and Implica-tions”, Psychological Inquiry. 1 5 ( 3 ) :197-25.
Mayer, J. D., &Salovey, P. (1997), “What isEI”?in: P. Salovey& D. Sluyter, EmotionalDevelopment and EI: Educational Implica-tions, New York: Basic Books.
O’Boyle Jr., E. Humphrey, R.H., Pollack, J. M.,Hawver, T. H. &Story, P.A. (2011),”TheRelation between EI and Job P e r f o r -mance: A Meta-Analysis”, Journal of Or-ganizational Behavior, 32(5): 788-818.
Pant, Neera& A. Parkash (2004), “Multi-factorEI Scale”, Psychological Studies,128-34.
Rajendran, Diana, Downey, L.A. &StoughC.(2007), “Assessing EI in the Indian Work-place: a Preliminary Reliability S t u d y , ”Electronic Journal of Applied Psychology,3(2): 55-59.
Rapisarda, B. A. (2002), “The Impact of EI onWork Team Cohesiveness and Perfor-mance”, The International Journal ofOrganizational Analysis, 10(4): 363-79.
Salovey, P. & J. Mayer (1990), “EI Imagination”,Cognition and Personality, 9: 185-211.
Schutte, N. S.Malouff, Hall , J. M., Haggerty, L.E., Cooper, D. J., Golden, J. T. (1998),“Development and Validation of a Measureof EI”, Personality and Individual Differ-ences, 25:167-77.
Singh, D. (2003), EI at Work, 2nd Ed., New Delhi:Sage Publications.
Salovey, P. &Mayer, J. D. (1990), “EI”, Imagi-nation, Cognition and Personality, 9: 185-211.
Silaski, M. & S. Cartwright (2002),”Health: Per-formance &EI: An Exploratory Study ofRetail Managers”, Stress and Health. 18:63-68.
Van Rooy, D. L., Viswesvaran, C.&Pluta, P.(2005),”An Evaluation of Construct Valid-ity: What Is This Thing Called EI”, HumanPerformance, 18: 445–62.
Annexure 1 Emotional Intelligence (EI) Scale
I. Appraisal of negative emotions (question item 1-13)
These are negative question items and hence, the response on each item has been assigned scorein the reverse order ie..in terms of : Always true =1;often true=2; occasionally true=3;seldomtrue=4; and never true=5.
1. I get unnecessarily tensed in certain work situation.2. I am stressed even in day-to-day affairs.3. I feel sad in some specific issues.4. I often get depressed.5. I feel that there is no respite from stress.6. I feel helpless in bad moods.7. I cannot get myself out of anxiousness in delibrations with people8. I feel easy in handling conflicts/emotional problems in relationships9. I am out of tune in circumstances that call for my sentiments.10. I repent after I speak where I should not have.11. I am worried about my own problems12. I become thoughtful about those things, people will not care to think13. I over-react on trifles as per other’s belief.
S C Davar & Narender Singh
732 The Indian Journal of Industrial Relations, Vol. 49, No. 4, April 2014
II. Appraisal of positive emotions (14 To 23)
These are positive question-items and hence, the response on each item has been assigned the val-ues: always true = 5;often true=4; occasionally true=3; seldom true=2; and never true=1.
14. I can sense the feelings of others.15. I am quite sensitive to how relationship goes on.16. I pay complement to deserving people.17. I get pleasure in challenges and try to solve them.18. I am satisfied with the performance of my work.19. I enjoy my-self the facts and concepts of my work at my work place.20. I supplement innovative ideas to my organization.21. I can sense whether the new ideas will succeed.22. I prefer brainstorming on a problem to find out a solution for it.23. In my team, I prefer to be the decision-maker.
III Intra-personal conflict & difficulties (24-29)
These are negative question items and hence, the response on each item has been assigned thescore in reverse order i.e. always true =1;often true=2; occasionally true=3;seldom true=4; andnever true=5.
24. I think that my performance at work is affected by my family problems.25. I get frightened when situation changes drastically.26. I feel strained with re-organization in my company.27. I will spare nothing to save myself from bEIng called foolish by my contenders.28. I am concerned for the conflicts between work and family.29 I think the time most critical when people form a different opinion than me.
IV. Inter-personal skills & flexibility (30-35)
These are positive question-items and hence, the response on each item has been assigned the val-ues: always true = 5;often true=4; occasionally true=3; seldom true=2; and never true=1.
30 I do not think I have a non-performing existence.31 I try to keep good relationship with my boss.32 I try to keep good relationship with my subordinates.33 I can easily make acquaintances and friends.34 I am put into distress with the death of a close friend or relative.35 I am ready to mend myself If somebody corrects me.
V. Emotional facilitation and goal-oriented-ness (36 to 40)
These are positive question-items and hence, the response on each item has been assigned thescore values: always true = 5;often true=4; occasionally true=3; seldom true=2; and never true=1..
36 I am fully confident of my ability.37 I can differentiate and compare my feelings.38 I point to the behaviour and not to the man during critical comments.39 I am interested to find out the solution for a problem which I face.40 I know how to make positive emotion last when I experience it.
Emotional Intelligence & Job Performance
The Indian Journal of Industrial Relations, Vol. 49, No. 4, April 2014 733
Annexure II Measure of job performance
These are positive question-items and hence, the response on each item has been assigned thescore values accordingly. Always true =5; Often true=4; Occasionally true =3; Seldom true=2; andNever true=1.
1. I treat all customers fairly with kindness, dignity and respect.2. I demonstrate skills, knowledge and ability needed to perform my work effectively.3. I complete my work in time and in an organized manner.4. I look forward to new ideas/methods to improve productivity.5. I continue to strive for professional improvement.6. I demonstrate effective written and verbal communication skills.7. I adhere to organizational policies and rules8. I complement my co-workers whenever they do some-thingreward-able and thank them
when they do something reward-able and thank them when they come forward to help meout.
9. My co-workers respect me as a part of our work team.10. I enjoy my work.
Annexure III Meaning of Key Terms
(These are simplified versions and in no way indicate technical definitions of the terms and hence,should be understood in liberal terms by the reader)
Emotional Intelligence:Broadly, it reflects the emotional stability (absence of moods), self-control,team-spirit and inter-personal skills. Goleman (1995) defined emotional intelligence as “the capac-ity for recognizing our own feelings and those of others, for motivating ourselves and in ourrelationships”.Mayer and Salovey (1997) conceived it as “the ability to percEIve emotions, inte-grate emotions to facilitate thought, understand emotions, and to regulate emotions to promotepersonal growth”.
Job performance: It is the outcome of efforts by the employee/supervisor/manager to deliver ser-vices to the final customers effectively as a co-worker, supervisor or manager.
Public-sector banks: These are the banks in which there majority of equity share-capital is held bythe Government of India.
Co-operative banks : These are regulated as special banking institutions under the Banking (Regu-lation) Act. 1949 and registered as a co-operative society. Usually, a particular State governmentregulates the business scope, dividend and service conditions such banks.
Private sector banks These are the banks in which the majority holding of equity share-capital isowned by the private individuals and/ or private bodies.
Insurance companies Both public and private sector companies are allowed to operate the insur-ance business. The Insurance and Regulatory Development Authority (IRDA) regulates the insur-ance business of the companies. Public-sector insurance company can be floated by a special Actof the Parliament or by Special Resolution of the parliament. The Insurance Act deals with theregulation of insurance companies and business practices.
sas
Personality & Learning Styles - Lessons for IndianCorporate Trainers
Prageetha G Raju & Murale Venugopal
The study exhibits and estab-lishes the link between Person-ality and Learning to help train-ers improve their training effec-tiveness by comparing the per-sonality types of trainees usingMyers-Briggs Type Indicators(MBTI) with Felder andSilverman’s Index of LearningStyles(ILS); Goley’s LearningPattern (LP) assessment andKiersey Temperament sorter(temperament) are used as a fol-low-up. Results obtained did in-dicate a relation between per-sonality and learning.
Introduction
Learning involves the integratedfunctioning of the total organism- think-ing, feeling, perceiving, and behaving(Kolb, 1984). While the relation betweenpersonality and learning is apparent, cor-porate trainers have not recognized it asa vital factor in corporate training pro-grams. Dubois & Rothwell (2004) indi-cated the importance of using personal-ity in developing corporate training mod-ules. There is a need to recognize howpersonality affects learning, particularlyin the corporate training. Dubois &Rothwell (2004) indicated that corporatetrainers need to address differences inemployee personalities and learning stylesin order to conduct training with effec-tive outcomes because the nature of jobsis getting complex with the advent oftechnology and competition. Also, orga-nizations need new ways to renew andrevitalize them to forestall obsolescencefor the organization and the people in it.Learning is no longer for kids but a cen-tral lifelong task essential for personaldevelopment and career success (Kolb,1984) because to improve the perfor-mance of our employees we need toknow how they learn. Broadly, learning
Prageetha G Raju is Associate Professor of HR &Organizational Behavior at IBS Hyderabad 501203.E-mail: [email protected]. Murale Venugopalis Assistant Professor of HR and OrganizationalBehavior at Amrita School of Business, Kochi,682041. E-mail: [email protected]
734 The Indian Journal of Industrial Relations, Vol. 49, No. 4, April 2014
style refers to the dissimilar approachesto learning. The rationale for identifyingand understanding these styles is that eachstyle involves training methods that arepresumed to allow each individual to learnbest. A study was conducted to deter-mine if MBTI has distinct learning stylesassociated with them and to recommendthe same to corporate trainers.
Problem Background
The current corporate training doesnot take into account the effect of per-sonality and learning on training effective-ness. Also, trainers seek practical solu-tion to improve the effectiveness of train-ing outcomes. The literature bears evi-dence to the effect that those with differ-ent MBTI scores/results had differentlearning styles (Myers et al, 1998); how-ever, most of the research solely reportedpatterns of correlation between a singledichotomy and other variables. In addi-tion, Goley (1982) established learningpreferences, which separated individualsinto four personality groups, which origi-nated from Keirsey’s four temperaments(Keirsey & Bates, 1984). There is no re-search that focused on sixteen personal-ity combinations of MBTI related to vari-ous learning styles. Also, just reporting alearning style for a single dichotomy mightnot address the individual’s learning style(Myers et al, 1998).
Felder and Silverman’s ILS (1988) iscomprehensive and easy to use by cor-porate trainers because it takes into ac-count research from experiential learn-ing theories, personality type theories,behaviorist theories and cognitive learn-
ing studies (Felder &Spurlin, 2005). Notmany studies appeared on MBTI thatspecifically used Felder & Silverman’sILS (1998) except for a study in a schoolin Portugal in 2012 by João Negreiros,Zelia Baptista & Leanda Lee to evaluatehow the choice of teaching method canbe assisted by the knowledge of astudent’s personality type and learningstyle. A study by Komos & Holgard con-ducted MBTI and Kolb’s Learning StyleInventory (LSI) together with the ILS onengineering students to assess learningstyle vis-à-vis personality. Another studyis a class assignment by J J Cohen in2008. The present study, adopts the meth-odology of the above three, but, is con-ducted on corporate trainees in India.Trainers need to believe that “to improvethe performance of our employees weneed to know how they learn”.
To improve the performance of ouremployees we need to know howthey learn.
Research Question
Do ILS learning styles correlate witheach of the sixteen MBTI personalitytypes and do MBTI dichotomies measureagainst the ILS? The objective is to es-tablish links between different MBTIscores having learning styles associatedwith them and suggest corporate train-ers the same.
Methodology
The authors observed: (a) trainingmethods- lectures are predominantly used
Personality & Learning Styles
The Indian Journal of Industrial Relations, Vol. 49, No. 4, April 2014 735
Prageetha G Raju & Murale Venugopal
736 The Indian Journal of Industrial Relations, Vol. 49, No. 4, April 2014
followed by discussions and debates, andsome physical/mental activities; (b) train-ing material- consisted of text with dia-grams, tables and questions of descrip-tive nature at the end of each chapter.The study is conducted in two segments:
Segment 1 is administration of MBTIand ILS instruments on trainees.
Segment 2 is administration of vali-dated and adjusted LP assessment (1982)and Temperament sorter as a follow-up onthree respondents who obtained strongscores in each personality type of MBTIand the assessment format is of Likert type.
130 people were chosen but only 104responses were usable and thus thesample size is 104 participants in trainingprograms from the authors’ networks aswell as friends of friends. The samplingis purely judgemental and snow-balling,though care has been taken to cover asmany industrial sectors.
Information generated by comparingthe 16 MBTI personality types with theirlearning styles vis-à-vis comparing thefour temperaments with their learningstyles, are analyzed using scatter dia-grams to illustrate different coefficientcorrelation of the 16 personality types andtheir ILS scores. The scores of Segment2 are added to Segment 1 results foranalysis through a table comparing tem-peraments with the LP score.
Limitations of the Study
• The number of respondents in thisstudy is not only not large enough to
draw convincing results but also lim-ited to the authors’ network thus doesnot satisfactorily represent all 16 per-sonality types. Also follow-up LPassessment is limited to three fromeach of the MBTI categories whichmay not be reliable.
• Some trainers who give technicaltraining in the area of Engineering,Accounting, Finance, etc felt that thistype of questionnaires are not re-quired for them as it is their knowl-edge that matters and thus the au-thors failed to get the instrument com-pleted.
• This study only wants to establishcorrelation between MBTI and ILSassessments so that it can suggesttrainers to utilize these findings but itdoes not assert that using ILS basedon MBTI would increase training ef-fectiveness.
• Since the study adopted methodologi-cal aspects from three different stud-ies, there may be similarities in somecalculations; demographic informa-tion has not been provided to validateit.
MBTI
Myers Briggs Type Indicator is avalidated assessment tool used at work-place, developed to place individuals inthe best jobs for their personality tem-perament (Myers & Myers, 1995). Ithas four dichotomies that indicate anindividual’s personality preference.These four dichotomies demonstratehow individuals acquire energy, gatherinformation, make decisions, and time
Personality & Learning Styles
The Indian Journal of Industrial Relations, Vol. 49, No. 4, April 2014 737
their decisions. Each area has two op-posite poles and each individual has apersonality preference towards one ofthese extremes (Myers, et al 1998).Myers and Briggs adapted Jung’stheory (1990) for workplace settingbased on his book, “PsychologicalTypes” which describes consistent dif-ferences between psychological func-tion and the affect of introvert/extra-vert attitude on those functions. Heexplained individual personality is dif-ferent based on opposing dichotomiesin function and attitude.
In MBTI, the first focus is function,i.e., how an individual perceives theworld and how he gathers information.An individual with a sensing personality(S) prefers to have information pre-sented in a literal and chronologicalmanner. A person with an intuitive (N)personality prefers to translate literalinformation into possibilities, implica-tions, and associations. Individuals withintuitive personalities look at the big pic-ture and often ignore specific details(Kroeger &Thuesen, 1988) and they caneasily progress to what is implied, andto that which may have potential impli-cations (Quenk, 2000). Another func-tion, thinking (T) tends to use analyticallogic to come to a decision (Kroeger&Thuesen, 1988) and likes to keep emo-tions from clouding the judgement untilthe decision is made. The next functionis feeling (F), which involves makingsubjective decisions based on personallyheld values and are concerned about thepersonal impact of the decision on thepeople around (Keirsey & Bates, 1984).These two dichotomies are based on
functions of information gathering anddecision making and each play a role inan individual’s preferred teaching/learn-ing style.
The next dichotomy is focused onpreferred attitude i.e., how an individualobtains energy and what attitude heshows towards functions. Individualswith an extravert personality (E) prefer-ence would receive energy from the out-side world of people, things, and actionswhile individuals with an introvert per-sonality (I) would receive energy fromreflection, introspection and solitude(Quenk, 2000). But, long periods of soli-tude would exhaust someone with anextravert personality while constant so-cial interaction could exhaust an indi-vidual with an introverted personality(Kroeger &Thuesen, 1988).
The second attitude dichotomy isperceiving (P) through gathering infor-mation or judging (J) for making decisions(Kroeger &Thuesen, 1988) which showsan individual’s attitude towards deadlines,organization, and decision making. Aperson with judging preference preferstheir decision-making to be dominant;they like to plan their work and work theirplan. A person with perceiving person-ality preference continues to collect in-formation, rather than to come to a deci-sion; they enjoy spontaneity and flexibil-ity in their lives.
Since each person has four person-ality preferences, sixteen unique person-ality type codes emerged as typified be-low. Each combination makes each spe-cific preference a little different from
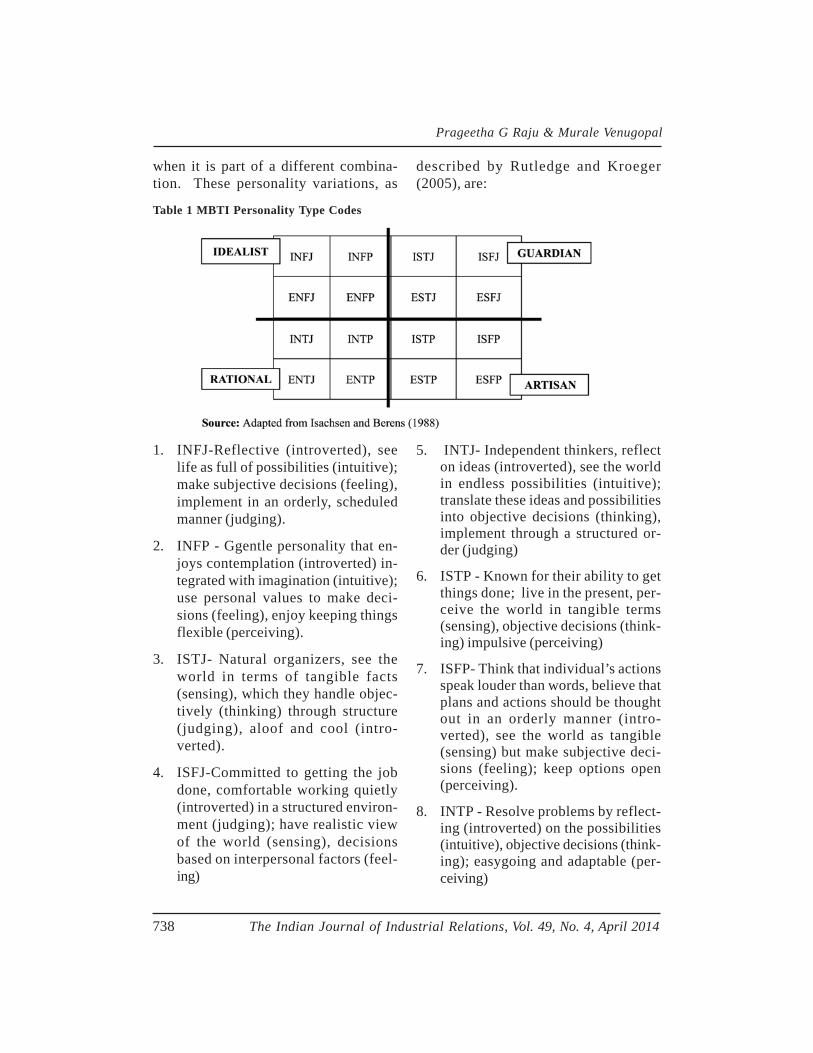
Prageetha G Raju & Murale Venugopal
738 The Indian Journal of Industrial Relations, Vol. 49, No. 4, April 2014
when it is part of a different combina-tion. These personality variations, as
described by Rutledge and Kroeger(2005), are:
Table 1 MBTI Personality Type Codes
1. INFJ-Reflective (introverted), seelife as full of possibilities (intuitive);make subjective decisions (feeling),implement in an orderly, scheduledmanner (judging).
2. INFP - Ggentle personality that en-joys contemplation (introverted) in-tegrated with imagination (intuitive);use personal values to make deci-sions (feeling), enjoy keeping thingsflexible (perceiving).
3. ISTJ- Natural organizers, see theworld in terms of tangible facts(sensing), which they handle objec-tively (thinking) through structure(judging), aloof and cool (intro-verted).
4. ISFJ-Committed to getting the jobdone, comfortable working quietly(introverted) in a structured environ-ment (judging); have realistic viewof the world (sensing), decisionsbased on interpersonal factors (feel-ing)
5. INTJ- Independent thinkers, reflecton ideas (introverted), see the worldin endless possibilities (intuitive);translate these ideas and possibilitiesinto objective decisions (thinking),implement through a structured or-der (judging)
6. ISTP - Known for their ability to getthings done; live in the present, per-ceive the world in tangible terms(sensing), objective decisions (think-ing) impulsive (perceiving)
7. ISFP- Think that individual’s actionsspeak louder than words, believe thatplans and actions should be thoughtout in an orderly manner (intro-verted), see the world as tangible(sensing) but make subjective deci-sions (feeling); keep options open(perceiving).
8. INTP - Resolve problems by reflect-ing (introverted) on the possibilities(intuitive), objective decisions (think-ing); easygoing and adaptable (per-ceiving)
Personality & Learning Styles
The Indian Journal of Industrial Relations, Vol. 49, No. 4, April 2014 739
9. ESTP- Make the most by scanningthe external environment (extra-verted); look at it in a factual andgrounded fashion (sensing); use infor-mation to make objective decisions(thinking) for whatever happens in theimmediate moment (perceiving).
10. ESFP- Enjoy through an outgoingnature (extraverted); realistic outlook(sensing); make subjective decisions(feeling) in a spontaneous manner(perceiving), very flexible.
11. ENFP-People oriented, enjoy socialinteractions (extraverted); search forendless possibilities (intuitive); makedecisions based on their interpersonalinteractions (feeling), while keepingtheir options open (perceiving).
12. ENTP- Enjoy the external world ofpeople (extraverted) and the endlesspossibilities of theoretical connections(intuitive), which in turn are objec-tively filtered (thinking) but not bind-ing; consider new options (perceiving).
13. ESTJ- Natural administrators, outgo-ing and direct manner (extraverted);see the world in a practical and real-istic way (sensing); use informationto make impersonal, analytical deci-sions (thinking), implement them in astructured manner (judging).
14. ESFJ - Trusted friends, interact withothers easily (extraverted), pay closeattention to personal details (sensing),use information in an interpersonalway (feeling) through a scheduledorder (judging).
15. ENFJ-Natural persuaders, sociallyoriented (extraverted), consider the
possibilities (intuitive), make subjec-tive decisions (feeling); use theseattributes in a structured manner(judging) excellent at networking.
16. ENTJ - Natural leaders with peopleoriented skills (extraverted); see con-nections and possibilities (intuitive),analyze objectively (thinking), imple-ment in an organized fashion (judging).
The most dominant function in these16 types is that individual who has themost confidence in using (Myers et al,1998) and is followed in descending or-der by the auxiliary, tertiary, and the in-ferior function.
The first step in determining the domi-nance of functions is to look at the Judg-ing-Perceiving dichotomy (Myers et al,1998), if a person has a judging indicator,then his thinking-feeling dichotomy mightbe extravert and intuitive-sensing indica-tor would be introvert. Likewise, if anindividual has a perceiving indicator, thenthe process reverses and their intuitive-sensing indicator would be extravertedand their thinking-feeling dichotomywould be introvert (Quenk, 2000).
Myers (1998) conducted research ontype indicator preferences and educationand concluded that type theory not onlyis a means for human understanding butalso a catalyst for the realization of hu-man potential. Keirsey (1988) integrateddifferent personality indicators into whathe described as temperament styles.Goley (1982) developed the LP assess-ment using the four temperament stylesto help teachers determine student-learn-ing preferences.
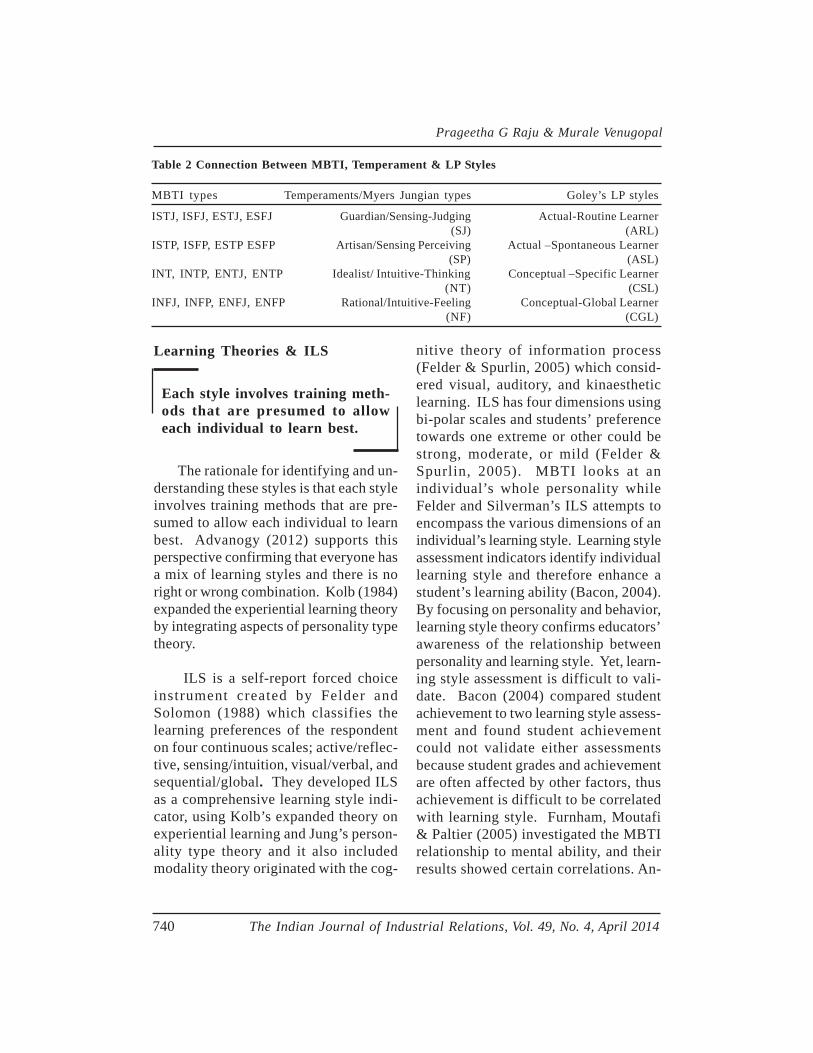
Prageetha G Raju & Murale Venugopal
740 The Indian Journal of Industrial Relations, Vol. 49, No. 4, April 2014
Table 2 Connection Between MBTI, Temperament & LP Styles
MBTI types Temperaments/Myers Jungian types Goley’s LP styles
ISTJ, ISFJ, ESTJ, ESFJ Guardian/Sensing-Judging Actual-Routine Learner(SJ) (ARL)
ISTP, ISFP, ESTP ESFP Artisan/Sensing Perceiving Actual –Spontaneous Learner(SP) (ASL)
INT, INTP, ENTJ, ENTP Idealist/ Intuitive-Thinking Conceptual –Specific Learner(NT) (CSL)
INFJ, INFP, ENFJ, ENFP Rational/Intuitive-Feeling Conceptual-Global Learner(NF) (CGL)
Learning Theories & ILS
Each style involves training meth-ods that are presumed to alloweach individual to learn best.
The rationale for identifying and un-derstanding these styles is that each styleinvolves training methods that are pre-sumed to allow each individual to learnbest. Advanogy (2012) supports thisperspective confirming that everyone hasa mix of learning styles and there is noright or wrong combination. Kolb (1984)expanded the experiential learning theoryby integrating aspects of personality typetheory.
ILS is a self-report forced choiceinstrument created by Felder andSolomon (1988) which classifies thelearning preferences of the respondenton four continuous scales; active/reflec-tive, sensing/intuition, visual/verbal, andsequential/global. They developed ILSas a comprehensive learning style indi-cator, using Kolb’s expanded theory onexperiential learning and Jung’s person-ality type theory and it also includedmodality theory originated with the cog-
nitive theory of information process(Felder & Spurlin, 2005) which consid-ered visual, auditory, and kinaestheticlearning. ILS has four dimensions usingbi-polar scales and students’ preferencetowards one extreme or other could bestrong, moderate, or mild (Felder &Spurlin, 2005). MBTI looks at anindividual’s whole personality whileFelder and Silverman’s ILS attempts toencompass the various dimensions of anindividual’s learning style. Learning styleassessment indicators identify individuallearning style and therefore enhance astudent’s learning ability (Bacon, 2004).By focusing on personality and behavior,learning style theory confirms educators’awareness of the relationship betweenpersonality and learning style. Yet, learn-ing style assessment is difficult to vali-date. Bacon (2004) compared studentachievement to two learning style assess-ment and found student achievementcould not validate either assessmentsbecause student grades and achievementare often affected by other factors, thusachievement is difficult to be correlatedwith learning style. Furnham, Moutafi& Paltier (2005) investigated the MBTIrelationship to mental ability, and theirresults showed certain correlations. An-
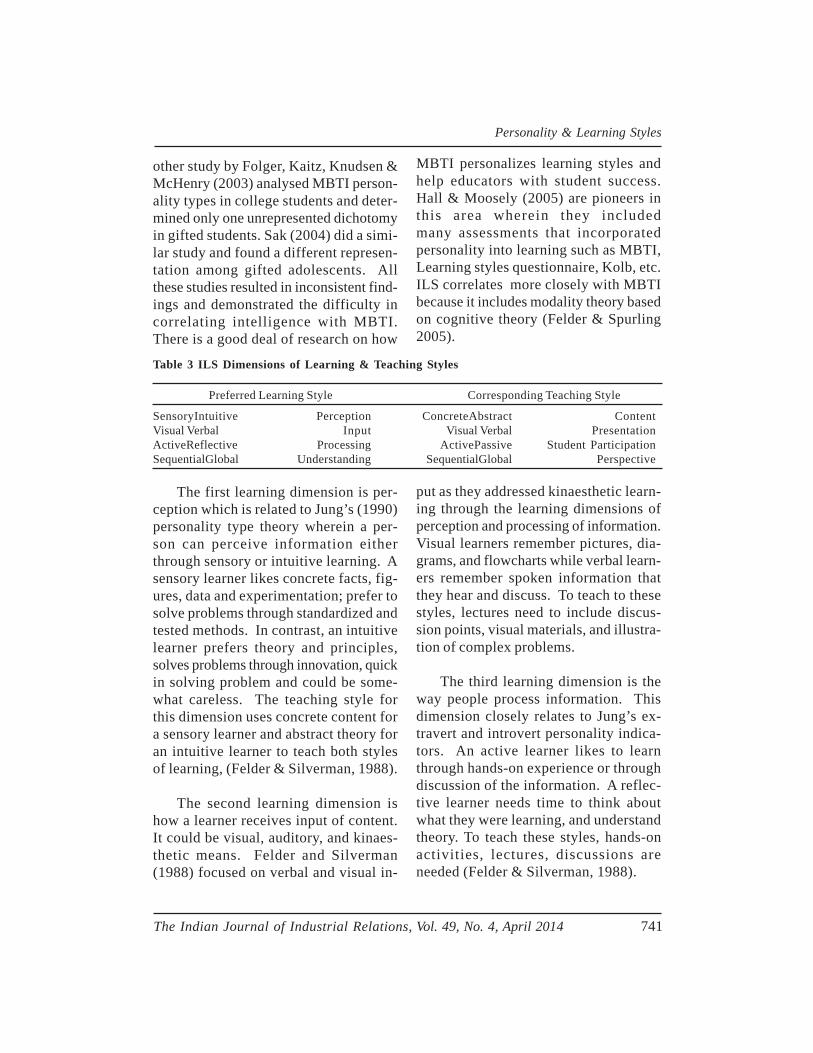
Personality & Learning Styles
The Indian Journal of Industrial Relations, Vol. 49, No. 4, April 2014 741
other study by Folger, Kaitz, Knudsen &McHenry (2003) analysed MBTI person-ality types in college students and deter-mined only one unrepresented dichotomyin gifted students. Sak (2004) did a simi-lar study and found a different represen-tation among gifted adolescents. Allthese studies resulted in inconsistent find-ings and demonstrated the difficulty incorrelating intelligence with MBTI.There is a good deal of research on how
MBTI personalizes learning styles andhelp educators with student success.Hall & Moosely (2005) are pioneers inthis area wherein they includedmany assessments that incorporatedpersonality into learning such as MBTI,Learning styles questionnaire, Kolb, etc.ILS correlates more closely with MBTIbecause it includes modality theory basedon cognitive theory (Felder & Spurling2005).
Table 3 ILS Dimensions of Learning & Teaching Styles
Preferred Learning Style Corresponding Teaching Style
SensoryIntuitive Perception ConcreteAbstract ContentVisual Verbal Input Visual Verbal PresentationActiveReflective Processing ActivePassive Student ParticipationSequentialGlobal Understanding SequentialGlobal Perspective
The first learning dimension is per-ception which is related to Jung’s (1990)personality type theory wherein a per-son can perceive information eitherthrough sensory or intuitive learning. Asensory learner likes concrete facts, fig-ures, data and experimentation; prefer tosolve problems through standardized andtested methods. In contrast, an intuitivelearner prefers theory and principles,solves problems through innovation, quickin solving problem and could be some-what careless. The teaching style forthis dimension uses concrete content fora sensory learner and abstract theory foran intuitive learner to teach both stylesof learning, (Felder & Silverman, 1988).
The second learning dimension ishow a learner receives input of content.It could be visual, auditory, and kinaes-thetic means. Felder and Silverman(1988) focused on verbal and visual in-
put as they addressed kinaesthetic learn-ing through the learning dimensions ofperception and processing of information.Visual learners remember pictures, dia-grams, and flowcharts while verbal learn-ers remember spoken information thatthey hear and discuss. To teach to thesestyles, lectures need to include discus-sion points, visual materials, and illustra-tion of complex problems.
The third learning dimension is theway people process information. Thisdimension closely relates to Jung’s ex-travert and introvert personality indica-tors. An active learner likes to learnthrough hands-on experience or throughdiscussion of the information. A reflec-tive learner needs time to think aboutwhat they were learning, and understandtheory. To teach these styles, hands-onactivities, lectures, discussions areneeded (Felder & Silverman, 1988).
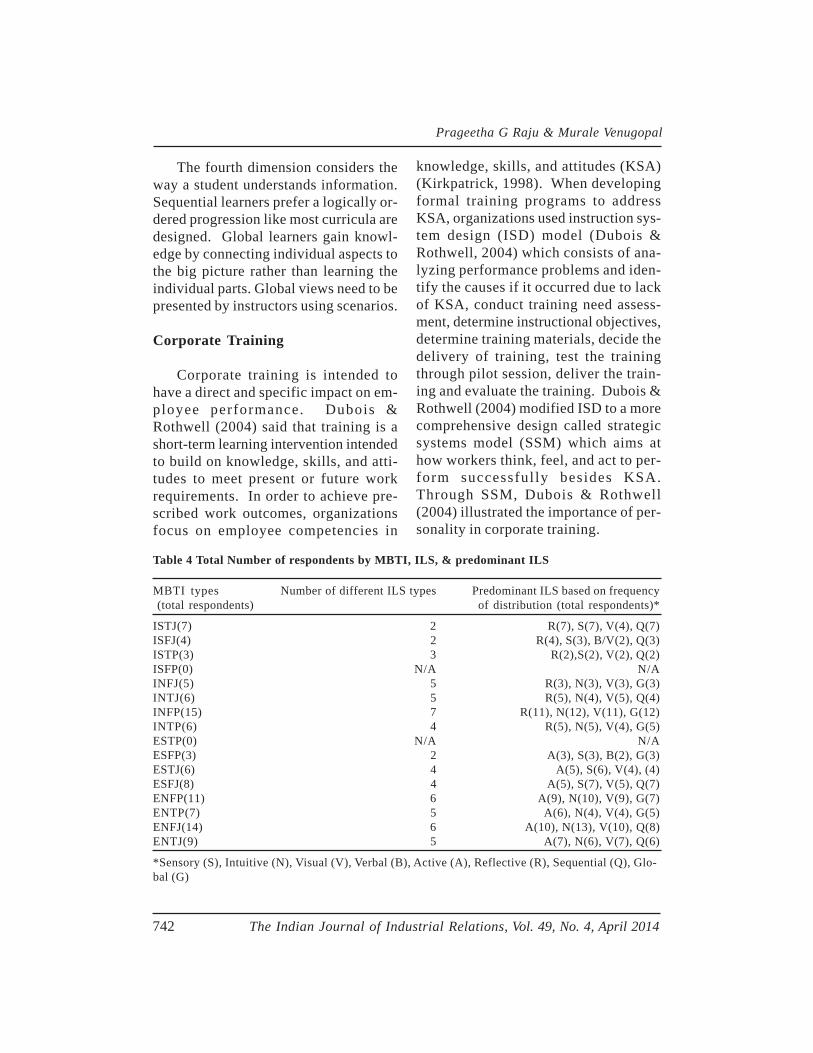
Prageetha G Raju & Murale Venugopal
742 The Indian Journal of Industrial Relations, Vol. 49, No. 4, April 2014
The fourth dimension considers theway a student understands information.Sequential learners prefer a logically or-dered progression like most curricula aredesigned. Global learners gain knowl-edge by connecting individual aspects tothe big picture rather than learning theindividual parts. Global views need to bepresented by instructors using scenarios.
Corporate Training
Corporate training is intended tohave a direct and specific impact on em-ployee performance. Dubois &Rothwell (2004) said that training is ashort-term learning intervention intendedto build on knowledge, skills, and atti-tudes to meet present or future workrequirements. In order to achieve pre-scribed work outcomes, organizationsfocus on employee competencies in
knowledge, skills, and attitudes (KSA)(Kirkpatrick, 1998). When developingformal training programs to addressKSA, organizations used instruction sys-tem design (ISD) model (Dubois &Rothwell, 2004) which consists of ana-lyzing performance problems and iden-tify the causes if it occurred due to lackof KSA, conduct training need assess-ment, determine instructional objectives,determine training materials, decide thedelivery of training, test the trainingthrough pilot session, deliver the train-ing and evaluate the training. Dubois &Rothwell (2004) modified ISD to a morecomprehensive design called strategicsystems model (SSM) which aims athow workers think, feel, and act to per-form successful ly besides KSA.Through SSM, Dubois & Rothwell(2004) illustrated the importance of per-sonality in corporate training.
Table 4 Total Number of respondents by MBTI, ILS, & predominant ILS
MBTI types Number of different ILS types Predominant ILS based on frequency (total respondents) of distribution (total respondents)*
ISTJ(7) 2 R(7), S(7), V(4), Q(7)ISFJ(4) 2 R(4), S(3), B/V(2), Q(3)ISTP(3) 3 R(2),S(2), V(2), Q(2)ISFP(0) N/A N/AINFJ(5) 5 R(3), N(3), V(3), G(3)INTJ(6) 5 R(5), N(4), V(5), Q(4)INFP(15) 7 R(11), N(12), V(11), G(12)INTP(6) 4 R(5), N(5), V(4), G(5)ESTP(0) N/A N/AESFP(3) 2 A(3), S(3), B(2), G(3)ESTJ(6) 4 A(5), S(6), V(4), (4)ESFJ(8) 4 A(5), S(7), V(5), Q(7)ENFP(11) 6 A(9), N(10), V(9), G(7)ENTP(7) 5 A(6), N(4), V(4), G(5)ENFJ(14) 6 A(10), N(13), V(10), Q(8)ENTJ(9) 5 A(7), N(6), V(7), Q(6)
*Sensory (S), Intuitive (N), Visual (V), Verbal (B), Active (A), Reflective (R), Sequential (Q), Glo-bal (G)
Personality & Learning Styles
The Indian Journal of Industrial Relations, Vol. 49, No. 4, April 2014 743
Findings
There is no direct relationship be-tween individual MBTI types ortemperaments with ILS types.
On comparing the distribution of re-sponses, the findings indicated some cor-relation between specific dichotomies ofMBTI, ILS, and LP. However, there isno direct relationship between individualMBTI types or temperaments with ILStypes.
Findings show that there is a predomi-nant ILS type for each of the MBTI typesbased on the frequency distribution of theILS dichotomies. Respondents withMBTI introvert personality scored highas reflective learners in ILS; respondentswith MBTI extravert personality scoredhigh as active learners in ILS. Further-more, respondents with MBTI sensingpersonality are predominantly sensorylearners in ILS and those with MBTI in-tuitive personality are predominantly in-tuitive learners in ILS.
Regarding the correlations betweenthe extroverted/introverted personalitycharacteristic of MBTI and the learningstyles (active/reflective, sensing/intuitive,visual/ verbal, sequential/global), the chi-square values are 0.24, 0.44 and 1.34,1.01 respectively.
Only one of the MBTI personalitiesscored predominantly as a verbal learnerand another split between verbal and vi-sual as per ILS. All the other MBTI
personality types surveyed scored pre-dominantly as visual learners in ILS. Allbut one of the surveyed MBTI types withjudging personality scored high on Se-quential learning of ILS. Likewise, allbut one of the MBTI types with perceiv-ing personality scored high as globallearners. There appears to be no con-nection between MBTI thinking and feel-ing dichotomy to any of the ILS dichoto-mies.
For the personality types of intuitive/sensing of MBTI and the associatedlearning styles from ILS, the chi-squarevalues are: active/passive 0.471; sensi-tive/intuitive 0.49; visual/verbal 3.98 andsequential/global 4.73
Segment1: Correlation betweenTemperaments & ILS Types
When comparing temperaments withtheir associated ILS types, there appearsnot much of direct correlation. MultipleILS types appeared for each of the fourtemperaments. However, the SJ tem-peraments appeared to have a differentpredominant ILS type than the other tem-peraments. Specifically, this differenceis noted in the high frequency of sensoryand sequential ILS dichotomies. In fact,both the sensory and sequential dichoto-mies have a higher percentage frequencyof distribution for the SJ temperamentcompared to any of the other three tem-peraments (Table 5).
There appears some correlation be-tween specific dichotomies. The tem-peraments of NF and NT that include
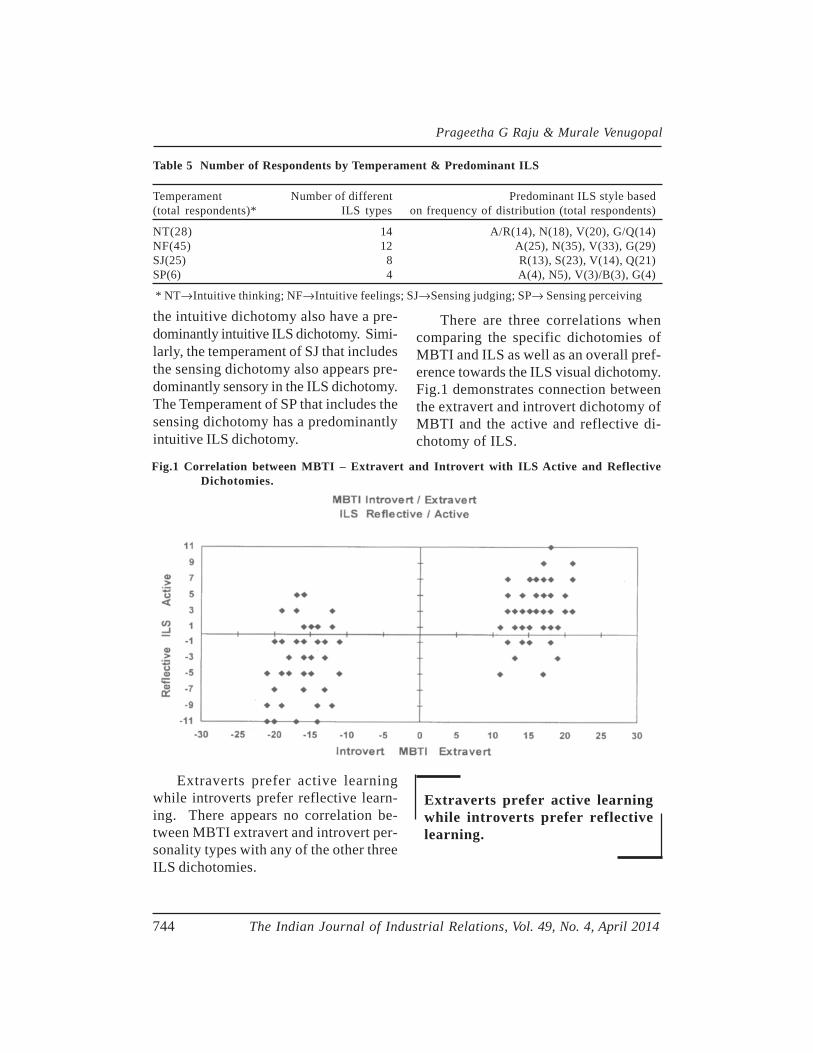
Prageetha G Raju & Murale Venugopal
744 The Indian Journal of Industrial Relations, Vol. 49, No. 4, April 2014
Table 5 Number of Respondents by Temperament & Predominant ILS
Temperament Number of different Predominant ILS style based(total respondents)* ILS types on frequency of distribution (total respondents)
NT(28) 14 A/R(14), N(18), V(20), G/Q(14)NF(45) 12 A(25), N(35), V(33), G(29)SJ(25) 8 R(13), S(23), V(14), Q(21)SP(6) 4 A(4), N5), V(3)/B(3), G(4)
* NT→Intuitive thinking; NF→Intuitive feelings; SJ→Sensing judging; SP→ Sensing perceiving
the intuitive dichotomy also have a pre-dominantly intuitive ILS dichotomy. Simi-larly, the temperament of SJ that includesthe sensing dichotomy also appears pre-dominantly sensory in the ILS dichotomy.The Temperament of SP that includes thesensing dichotomy has a predominantlyintuitive ILS dichotomy.
There are three correlations whencomparing the specific dichotomies ofMBTI and ILS as well as an overall pref-erence towards the ILS visual dichotomy.Fig.1 demonstrates connection betweenthe extravert and introvert dichotomy ofMBTI and the active and reflective di-chotomy of ILS.
Fig.1 Correlation between MBTI – Extravert and Introvert with ILS Active and ReflectiveDichotomies.
Extraverts prefer active learningwhile introverts prefer reflective learn-ing. There appears no correlation be-tween MBTI extravert and introvert per-sonality types with any of the other threeILS dichotomies.
Extraverts prefer active learningwhile introverts prefer reflectivelearning.
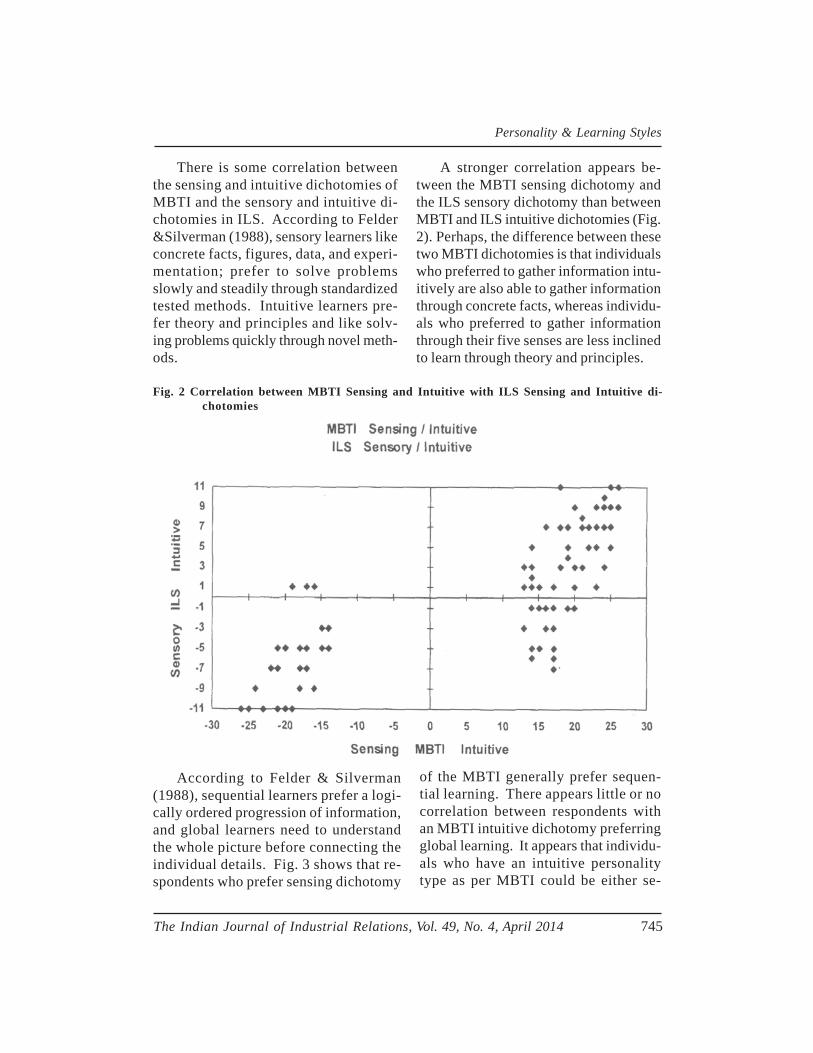
Personality & Learning Styles
The Indian Journal of Industrial Relations, Vol. 49, No. 4, April 2014 745
There is some correlation betweenthe sensing and intuitive dichotomies ofMBTI and the sensory and intuitive di-chotomies in ILS. According to Felder&Silverman (1988), sensory learners likeconcrete facts, figures, data, and experi-mentation; prefer to solve problemsslowly and steadily through standardizedtested methods. Intuitive learners pre-fer theory and principles and like solv-ing problems quickly through novel meth-ods.
A stronger correlation appears be-tween the MBTI sensing dichotomy andthe ILS sensory dichotomy than betweenMBTI and ILS intuitive dichotomies (Fig.2). Perhaps, the difference between thesetwo MBTI dichotomies is that individualswho preferred to gather information intu-itively are also able to gather informationthrough concrete facts, whereas individu-als who preferred to gather informationthrough their five senses are less inclinedto learn through theory and principles.
Fig. 2 Correlation between MBTI Sensing and Intuitive with ILS Sensing and Intuitive di-chotomies
According to Felder & Silverman(1988), sequential learners prefer a logi-cally ordered progression of information,and global learners need to understandthe whole picture before connecting theindividual details. Fig. 3 shows that re-spondents who prefer sensing dichotomy
of the MBTI generally prefer sequen-tial learning. There appears little or nocorrelation between respondents withan MBTI intuitive dichotomy preferringglobal learning. It appears that individu-als who have an intuitive personalitytype as per MBTI could be either se-
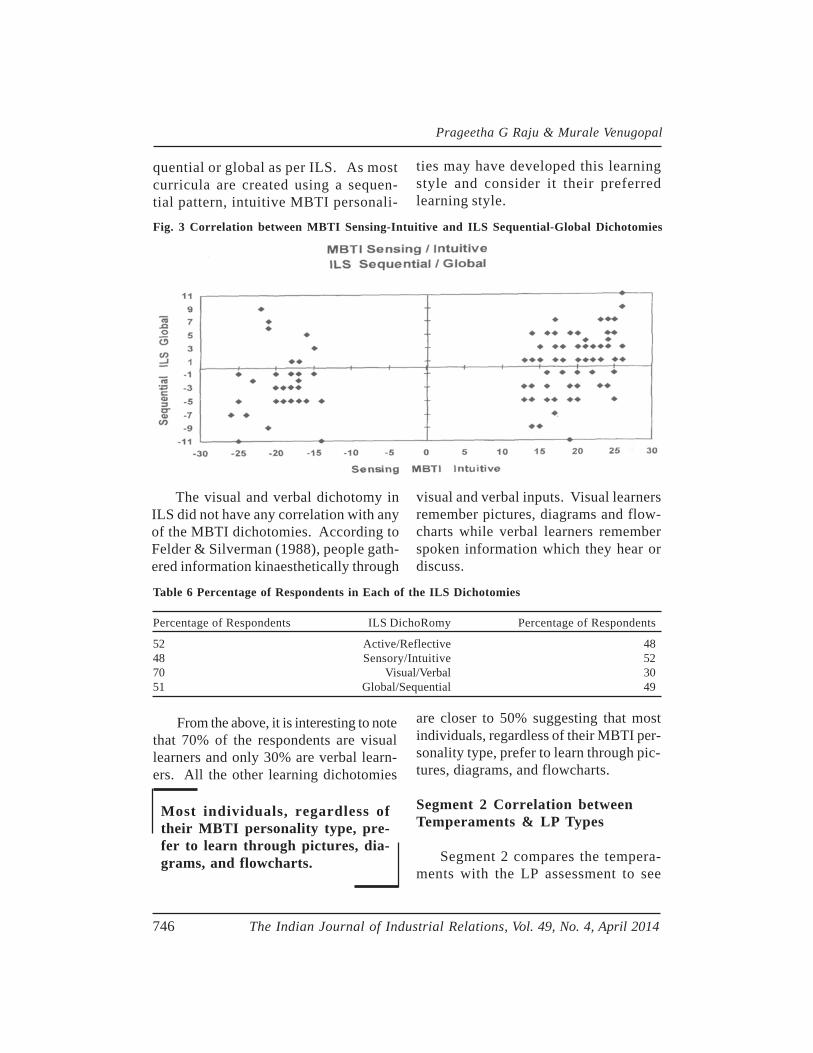
Prageetha G Raju & Murale Venugopal
746 The Indian Journal of Industrial Relations, Vol. 49, No. 4, April 2014
quential or global as per ILS. As mostcurricula are created using a sequen-tial pattern, intuitive MBTI personali-
ties may have developed this learningstyle and consider it their preferredlearning style.
Fig. 3 Correlation between MBTI Sensing-Intuitive and ILS Sequential-Global Dichotomies
The visual and verbal dichotomy inILS did not have any correlation with anyof the MBTI dichotomies. According toFelder & Silverman (1988), people gath-ered information kinaesthetically through
visual and verbal inputs. Visual learnersremember pictures, diagrams and flow-charts while verbal learners rememberspoken information which they hear ordiscuss.
Table 6 Percentage of Respondents in Each of the ILS Dichotomies
Percentage of Respondents ILS DichoRomy Percentage of Respondents
52 Active/Reflective 4848 Sensory/Intuitive 5270 Visual/Verbal 3051 Global/Sequential 49
From the above, it is interesting to notethat 70% of the respondents are visuallearners and only 30% are verbal learn-ers. All the other learning dichotomies
are closer to 50% suggesting that mostindividuals, regardless of their MBTI per-sonality type, prefer to learn through pic-tures, diagrams, and flowcharts.
Segment 2 Correlation betweenTemperaments & LP Types
Segment 2 compares the tempera-ments with the LP assessment to see
Most individuals, regardless oftheir MBTI personality type, pre-fer to learn through pictures, dia-grams, and flowcharts.
Personality & Learning Styles
The Indian Journal of Industrial Relations, Vol. 49, No. 4, April 2014 747
the correlation between them. Most in-dividuals who either have NF tempera-ment or SJ temperament are generallylinked with their associated LP learningstyle. Those individuals who have the
NT or SP temperaments don’t generallyshow a relationship with their associatedLP learning style. Some respondentsscored equally high in two of the LPlearning styles in Table 7 below:
Table 7 Number of Respondents by Temperament and Their LP Assessment
LP ASSESSMENT RATING*
Temperament Total respondents CGL(NF) CSL(NT) ARL(SJ) ASL(SP)
NF 12 10 1 1 0NT 12 7 2.5 0.5 2SJ 10 2 1.5 5.5 1SP 3 1.5 1.5 0 0TOTAL 37 20.5 6.5 7 3
* Expansions in Table 2
A majority of the NF, NT, and half ofthe SP temperaments show preferencefor the CGL (NF) style of learning whilethe SJ temperament prefers the ARL (SJ)learning style. A similar distinction alsoappears in Table 5 wherein the SJ tem-perament appears to have a different pre-dominant ILS type compared to the othertemperaments offering further support tothe idea that individuals who showed apreference for the SJ temperament havespecific learning traits that are differentfrom other temperaments.
Discussion
Study confirms correlation betweenspecific MBTI and ILS dichotomies. Nodirect relationship appeared between the16 distinct MBTI types or the four tem-peraments with the ILS types. The re-searchers followed up with LP assess-ment and it helped define learning stylesand their application for trainers. Al-though, the number of respondents is toosmall to draw any clear-cut evidence, it
offered findings that warrant further ex-ploration. First correlation is between theMBTI extravert and introvert dichotomiesand the ILS active and reflective learn-ers. According to Felder & Silverman(1988), active learners preferred to con-vert information into knowledge throughactive experimentation and enjoyedworking in groups. They indicated thatactive experimentation involved discuss-ing, explaining, or testing information.Conversely, individuals with an introvertMBTI dichotomy are reflective learnersin ILS. Reflective learners preferred toconvert information into knowledgethrough reflective observation by “exam-ining and manipulating the informationintrospectively” and preferred to work bythemselves or work with one other per-son. Since the temperament did not uti-lize this dichotomy, segment two did notsupport or contradict this correlation.This finding suggested that trainersshould use active experimentation/activ-ity based learning for extraverts to usein a group, but at the same time provide
Prageetha G Raju & Murale Venugopal
748 The Indian Journal of Industrial Relations, Vol. 49, No. 4, April 2014
time and instances to reflect such as casestudies or scenario planning activities tointroverts.
Sensory learners preferred “facts,data, and experimentation”.
Second correlation is between MBTIsensing dichotomy and ILS sensorylearner and the ARL (SJ) learning style.In Fig. 2 individuals with a sensing MBTIdichotomy are sensory learners in ILS.According to Felder & Silverman (1988),sensory learners preferred “facts, data,and experimentation.” Sensory learnerstend to be slow and methodical, enjoyeddetails but not complications, and weregood at memorizing facts. Table 7 showsthat individuals with the SJ temperamentgenerally have an ARL (SJ) LP learningstyle. According to Goley (1982), ARL(SJ) learners needed structure with les-sons that were “presented sequentiallyand in increments that make sense” andenjoyed “completing workbooks, pro-grammed learning materials, work sheetsand the like”.
Third correlation is between theMBTI intuitive dichotomy, the ILS intui-tive learner, and the CGL (NF) learningstyle. Fig. 3 shows that most respondentswith the MBTI intuitive dichotomy arealso ILS intuitive learners, although, somescored as sensory learners. According toFelder & Silverman (1988), those whopreferred to learn intuitively preferredprinciples and theory. Intuitive learnersliked innovation; were bored by details,and enjoyed complications. Workingquickly, intuitive learners are sometimes
casual in their work. Table 7 indicatesthat both the NF and NT temperamentsprefer to learn through the CGL (NF)learning style. According to Goley (1982),the CGL (NF) learning style like emo-tionally moving presentations and wantedthe trainer to be enthusiastic; enjoyedsmall group discussions that provided anopportunity for personal interaction;wanted to gain skills and knowledgeabout how to inspire others to be moreconsiderate and useful.
Fourth correlation is between theMBTI sensing dichotomy and the ILSsequential learner, as in fig. 3. Felder &Silverman (1988) found that sequentiallearners solved problems by following alinear reasoning process and generallyare “strong in convergent thinking andanalysis.” Most curricula and coursematerials are developed for sequentiallearners. Fig. 3 shows that there is noconnection between the MBTI intuitivedichotomy and the ILS global learner.Felder & Silverman (1988) showed thatteaching is traditionally leaned towardssequential learning, and this could ex-plain why many respondents with theMBTI intuitive dichotomy preferred ILSsequential learning. Global learners mayhave become skilled at how to learn se-quentially. Table 6 shows that there aremore visual learners compared to ver-bal learners in the ILS assessment.Felder & Silverman (1988) indicated that“visual learners remember best whatthey see picture, diagrams, flow charts,time lines, films, demonstrations” andwill often times forget what was said tothem. This finding suggested that train-ers should include visual materials to il-
Personality & Learning Styles
The Indian Journal of Industrial Relations, Vol. 49, No. 4, April 2014 749
lustrate key points to encourage learn-ing.
The study indicates that trainers neednot be certified as a MBTI administra-tor. However, knowledge of the behav-iors of different personalities and the dif-ferent learning styles would enable themto use different learning methodologies,a variety of resources, to individualizelearning.
Conclusion
Findings indicate personality doesaffect learning style. If trainers are cog-nizant of each trainee’s personality type,they can use a mixture of all learningstyles in training methodologies to in-crease employee learning effectiveness.Study also throws questions like, “If ac-tive learner wants high instructor pres-ence and a passive learner wants lowinstructor presence; how could this issuebe handled”?
Internet makes it difficult to gener-alize human behavior especially with re-spect to learning. Studies which demon-strate link between personality and learn-ing helps identify some hidden patternswhich can determine some rules to learn-ing. Factors that propel candidates tolearn different subjects are a matter ofcontext and a host of related variableswhich have not been considered in thisstudy.
Further research merited largersample to provide a broader view of thecorrelations between certain dichotomiesin MBTI and ILS. Demographic infor-
mation has not been considered whichmay have had a significant impact on thestudy. Also, LP assessment did not showany differences between the MBTI think-ing-feeling dichotomies. Correspond-ingly, the MBTI assessment did not showany correlation with the LP visual-ver-bal dichotomy. It is quite possible thatany other learning style, if used, may showcertain evidences. Study of this kind withthe above mentioned modification mayprovide some interesting insights.
References
Advanogy (2012), “Overview of Learning Styles”Retrieved from www.learning-styles-online.com/overview/
Bacon, D. (2000), “An Examination of TwoLearning Style Measures and Their Asso-ciation with Business Learning” [Electronicversion], Journal of Education for Business,79(4): 205-08
Dubois, D., & Rothwell, W. (2004). “Compe-tency-based or a Traditional Approach toTraining” [Electronic version], Trainingand Development, 58(4): 46-58
Felder, R. M. & Silverman, L. K. (1988), “Learn-ing and Teaching Styles in Engineering Edu-cation”, [Electronic version], EngineeringEducation, 78(7): 674-81.
Felder, R. M. (2002), “Author’s Preface to Learn-ing and Teaching Styles in Engineering Edu-cation”. Retrieved March 15, 2005, fromNorth Carolina State University, RichardFelder: Resources in Science and Engineer-ing Education Website http:/ /www4.ncsu.edu/unity/lockers/users/f/felder/public/Papers/LS-1988.pdf
Felder, R. M. & Spurlin, J. (2005), “Applica-tions, Reliability, and Validity of the Indexof Learning Styles” [Electronic version],International Journal Engineering Educa-tion, 21(1): 103-112.
Prageetha G Raju & Murale Venugopal
750 The Indian Journal of Industrial Relations, Vol. 49, No. 4, April 2014
Folger, W., Kanitz, H., Knudsen, A. & McHenry,S. (2003). “Analysis of MBTI Type Pat-terns in College Scholars” [Electronic ver-sion]. College Student Journal, 37(4): 598-603.
Furnham, A., Moutafi, J. & Paltiel, L. (2005).“Intelligence in Relation to Lung’s Person-ality Types” [Electronic version], Indi-vidual Differences Research, 3(1): 2- 13.
Goley, K. (1982), Learning Patterns and Tem-perament Styles, Fullerton, CA: Mamas-Systems.
Hall, E. & Moseley, D. (2005), “Is There a Rolefor Learning Styles in Personalized [sic]Education and Training” [Electronic ver-sion]? International Journal of LifelongEducation, 24(3): 243-55.
João Negreiros & Zelia Baptista & Leanda Lee(2012), “Personality and Learning StylesSurrounded by W3 Software: The MacaoPortuguese School Case”, Education andInformation Technologies, Online Publica-tion, Springer
Jung, C. G. (1970), “Collective Works of C. G.Jung: The Development of Personality”.(R.F.C. Hull, Trans. 3rd ed., Vol. 17.Bollingen Series XX). New York, NY:Princeton University Press.
Jung, C. G. (1990), “Psychological Types”.(R.F.C. Hull, Trans. 3rd ed., Vol. 6.Bollingen Series XX). New York, NY:Princeton University Press.
Keirsey, D. & Bates, M. (1984), Please Under-stand Me: Character & TemperamentTypes. Del Mar, CA: Gnosology.
Kirkpatrick, D. (1998), Evaluating Training Pro-grams. San Francisco, CA: Berrett- Koehler.
Kolb, D. (1984), Experiential Learning: Experi-ence as the Source of Learning and Devel-opment, Englewood Cliffs, NJ: Prentice-Hall.
Kroeger, 0 & Thuesen, J. M. (1988), Type Talk.New York, NY: Delacorte.
Myers, I. B., McCaulley, M. H., Quenk, N. L. &Hammer, A. L. (1998), MBTI Manual: AGuide to the Development and Use of theMyers-Briggs Type Indicator (3rd ed.), PaloAlto, CA: Consulting Psychologists.
Myers, I. B. & Myers P. B. (1995), Gifts Differ-ing: Understanding Personality Type., PaloAlto, CA: Davies-Black.
Olaf, Isachsen & Linda V. Berens (1988), Work-ing Together: A Personality Centered Ap-proach to Management, 1e, New WorldManagement Press,
Quenk, N. L. (2000), Essential of Myers-BriggsType Indicators Assessment. New York,NY’: John Wiley.
Rutledge, H. & Kroeger, 0. (2005), Myers-BriggsType Indicator Introduction Workbook,Fairfax, VA: OKA, LLC.
Sak, U. (2004), “A Synthesis of Research on Psy-chological Types of Gifted Adolescents”[Electronic version], Journal of SecondaryGifted Education, 15(2): 70-79.


