Embed Size (px)
Citation preview
The Dhaka University Journal of Earth and Environmental Sciences, Vol. 10 (1): 2021
Petrophysical Reservoir Characterization of Habiganj Gas Field, Surma
Basin, Bangladesh
Shamiha Shafinaz Shreya1, Md. Anwar Hossain Bhuiyan1, Shakhawat Hossain1 and Tania Sultana2
1University of Dhaka, Dhaka, Bangladesh 2Reservoir and Data Management Division, Petrobangla, Dhaka, Bangladesh
Manuscript received: 25 April 2021; accepted for publication: 27 August 2021
ABSTRACT: The previous studies on the petrophysical and volumetric analysis of Habiganj gas field were based on
limited well data. As the accuracy of volumetric analysis relies greatly on petrophysical parameters, it is important to
estimate them accurately. In this study we analyzed all eleven wells drilled in the Habiganj field to determine the
petrophysical parameters. Analysis of the well logs revealed two distinct reservoir zones in this field termed as upper
reservoir zone and lower reservoir zone. Stratigraphically, these two reservoir zones are in the Bokabil and Bhuban
Formation of Surma Group. Petrophysical analysis shows significant differences between the two zones in terms of
petrophysical parameters. Porosity in the upper reservoir zone ranges from 12% to 36%, with an average of 28%. This
zone is highly permeable, as indicated by the average permeability of 500 mili Darcy (mD). The average water
saturation in this zone is around 18% suggesting high gas saturation. The lower reservoir zone has an average porosity,
permeability, and water saturation of 12%, 60mD, and 43%, respectively, indicating poor reservoir quality. An analysis
of log motifs indicates that the upper reservoir zone is composed of stacked sands of blocky pattern. The sands in this
interval are clean, as indicated by the lower shale volume of 12-15%. The average thickness of this zone is 230m, and
the presence of this zone in all the drilled wells suggests high lateral continuity. The lower reservoir zone consists of
sand bodies of serrated pattern. The sands have high shale volume and are laterally discontinuous. Overall, the upper
reservoir zone has superior petrophysical properties to the lower reservoir zone. Although the reservoir quality of the
lower reservoir zone is poorer than that of the upper zone, this zone can be considered as the secondary target for
hydrocarbon production. Petrophysical parameters of this study were estimated from all the eleven wells drilled in this
field; hence the values are more accurate. The reported values of the petrophysical parameters in this study are
recommended to use to re-estimate the reserves in Habiganj field.
Keywords: Petrophysical analysis, Reservoir, Well logs, Habiganj gas field, Surma basin
INTRODUCTION
Bangladesh is standing at a critical stage in terms of natural gas reserves. It is necessary to reassess the available resources to comprehend the gravity of this situation. At this stage, efforts to maximize hydrocarbon production from mature hydrocarbon fields like Habiganj Gas Field are much dependent on geological reservoir characterization.
The geological characterization of reservoirs
requires full utilization of all types of data from the
subsurface. These data may include geophysical well
logs, core analyses, mud logs, production histories,
drill-stem, and other test data, pressure data, and
injection profiles. A physical framework for the
reservoir is defined by the most abundant data
(invariably well logs), and cores are carefully
compared to the distribution of lithologies, porosity,
and hydrocarbon-bearing reservoir rock indicated by
well logs (Lake, 2012)
Petrophysical parameter studies are fundamental
for well development and production, as well as for
estimating hydrocarbon reserves in any gas field (Islam
et al., 2014). The determination of reservoir quality
largely depends on the quantitative evaluation of
petrophysical properties (Islam et al., 2006).
Petrophysical studies include lithology, porosity,
permeability, and hydrocarbon saturation assessments
(Sakurai et al., 2002). Previously, some researches were
conducted on petrophysical assessments utilizing well
logs to evaluate the reservoir quality of some gas fields
of Bangladesh (Abdullah Al Fatta et al.; Ahammod et
al., 2014; Hai et al., 2014; Hossain et al., 2015; Hossain
et al., 2021; Islam et al., 2013; Islam et al., 2014; Islam
et al., 2006; Johnson and NUR ALAM, 1991; Samad et
al., 2014; Shofiqul and Nusrat, 2013). These previous
researches were prompted by the fact that Bangladesh’s
gas-bearing reservoirs were given considerable
attention due to their economic significance.
Corresponding author: Md. Anwar Hossain Bhuiyan
Email: [email protected]
DOI: https://doi.org/10.3329/dujees.v10i1.56275
2 Shreya et al.
Habiganj gas field is Bangladesh's second most
productive gas field in terms of GIIP (Gas Initially in
Place) and third in terms of production, after Titas and
Bibiyana Gas Fields. The 1st well ‘Habiganj-1’ was
drilled in 1963. Till 2007, 11 wells have been drilled
at this gas field in total. Now 8 wells are in
production. The GIIP of this field was measured at
3684.0 Bcf. Of this, proved (1P) is 2647.0 Bcf, proved
+ probable (2P) is also 2647.0 Bcf and proved +
probable + possible (3P) is 3096.0 Bcf in amount. The
cumulative production of this field is 2506.84 Bcf till
2019 (Petrobangla, 2019). The remaining reserve is
calculated as 140.16 Bcf (1st January 2020). So, this
gas field can be considered as its matured stage and at
this time, reserve re-estimation, as well as re-
evaluation, is important for further development of
this field. However, no detailed research is done so far
for reevaluation and reappraisal of this field. Few
studies have been conducted on reserve re-estimation
and characterization particularly on Habiganj Gas
Field but those are based on few selected wells of the
field where one reservoir zone had been considered
(Rahman et al., 2017; Shofiqul and Nusrat, 2013).
Thus, it is mandatory to do a research including all the
wells of Habiganj gas field to detect all possible
reservoir zones for a detailed reservoir scenario of the
field. We have therefore considered conducting this
research as a comprehensive study on petrophysical
parameters and reservoir characterization, the
prerequisites for reservoir evaluation.
Based on log data from all eleven wells of the
field, the present study aims to evaluate the
petrophysical features of different reservoir zones of
Habiganj Gas Field. The main objectives of this study
include the analysis of the general behavior of logs,
identifying and evaluating the reservoir zones in the
context of petrophysical properties (porosity,
permeability, hydrocarbon saturation, etc.), and
correlating the reservoir zones. Based on the results, a
comparative analysis among the reservoir zones of
Habiganj Gas Field is depicted for the future
development plan of this field.
GEOLOGY OF THE STUDY AREA
Bengal basin is a productive gas-bearing basin of
South east Asia. Surma basin is a dynamically subsiding
sub-basin of the Bengal Basin situated in the north-
eastern part of Bangladesh (Johnson and Alam, 1991).
Habiganj Gas Field lies in the southern part of the Surma
Basin (Islam et al., 2013; Shofiqul and Nusrat, 2013). A
north-south elongated anticline forms the structure of the
Habiganj Gas Field. It is a simple asymmetrical fold
trending NNW. The structure is expressed by surface
topographic relief and dip reversal of the outcropping
flanks. The structure has a four-way closure without any
significant faulting (Imam, 2005).
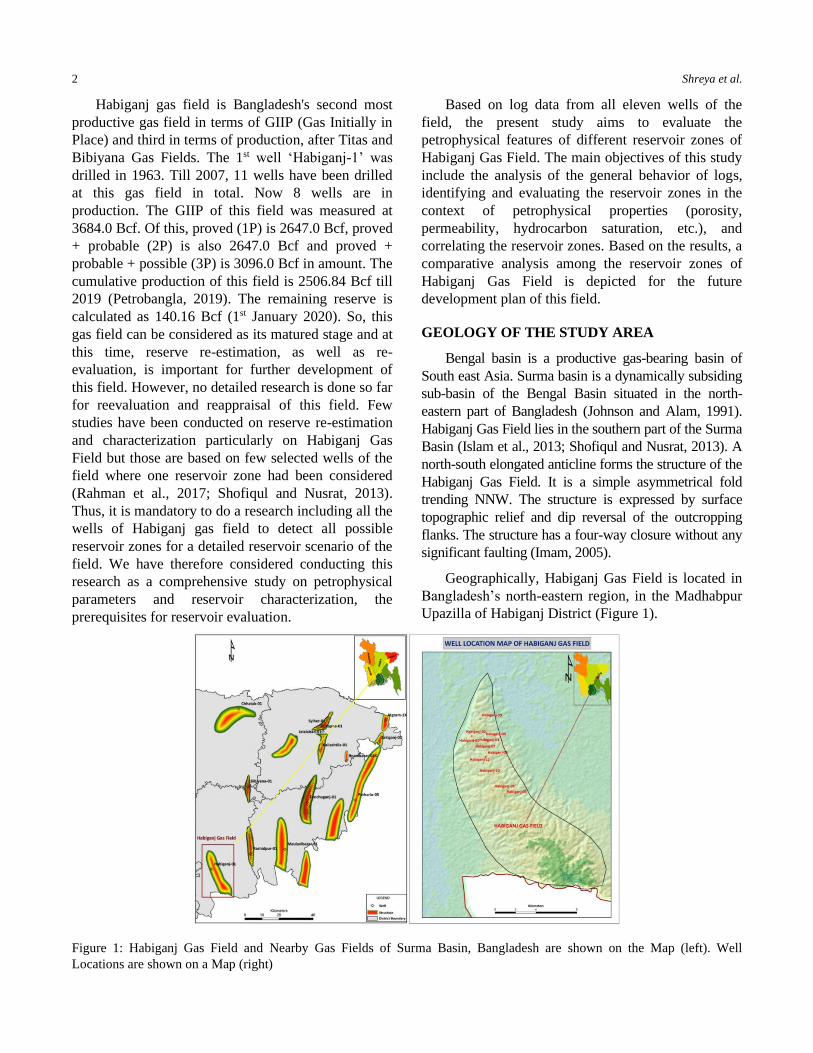
Geographically, Habiganj Gas Field is located in
Bangladesh’s north-eastern region, in the Madhabpur
Upazilla of Habiganj District (Figure 1).
Figure 1: Habiganj Gas Field and Nearby Gas Fields of Surma Basin, Bangladesh are shown on the Map (left). Well
Locations are shown on a Map (right)
Petrophysical Reservoir Characterization of Habiganj Gas Field, Surma Basin, Bangladesh 3
DATA AND METHODS
To achieve the objectives of the present study,
necessary geophysical well log data have been
collected from the Bangladesh Oil, Gas and Mineral
Corporation (Petrobangla) authority and used with
proper permission. The log data of 11 wells of
Habiganj Gas Field include caliper, gamma-ray (GR),
resistivity (deep & shallow), density (RHOB), neutron
porosity (NPHI) logs. Petrel software was used to
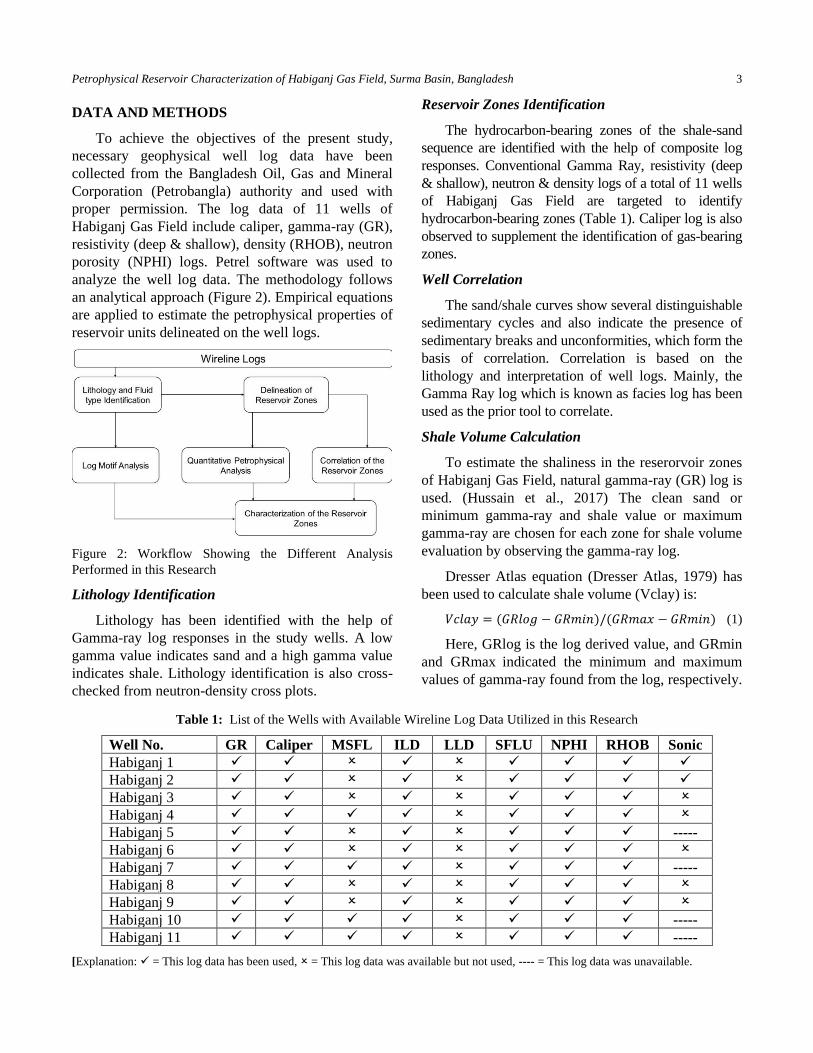
analyze the well log data. The methodology follows
an analytical approach (Figure 2). Empirical equations
are applied to estimate the petrophysical properties of
reservoir units delineated on the well logs.
Figure 2: Workflow Showing the Different Analysis
Performed in this Research
Lithology Identification
Lithology has been identified with the help of
Gamma-ray log responses in the study wells. A low
gamma value indicates sand and a high gamma value
indicates shale. Lithology identification is also cross-
checked from neutron-density cross plots.
Reservoir Zones Identification
The hydrocarbon-bearing zones of the shale-sand
sequence are identified with the help of composite log
responses. Conventional Gamma Ray, resistivity (deep
& shallow), neutron & density logs of a total of 11 wells
of Habiganj Gas Field are targeted to identify
hydrocarbon-bearing zones (Table 1). Caliper log is also
observed to supplement the identification of gas-bearing
zones.
Well Correlation
The sand/shale curves show several distinguishable
sedimentary cycles and also indicate the presence of
sedimentary breaks and unconformities, which form the
basis of correlation. Correlation is based on the
lithology and interpretation of well logs. Mainly, the
Gamma Ray log which is known as facies log has been
used as the prior tool to correlate.
Shale Volume Calculation
To estimate the shaliness in the reserorvoir zones
of Habiganj Gas Field, natural gamma-ray (GR) log is
used. (Hussain et al., 2017) The clean sand or
minimum gamma-ray and shale value or maximum
gamma-ray are chosen for each zone for shale volume
evaluation by observing the gamma-ray log.
Dresser Atlas equation (Dresser Atlas, 1979) has
been used to calculate shale volume (Vclay) is:
𝑉𝑐𝑙𝑎𝑦 = (𝐺𝑅𝑙𝑜𝑔 − 𝐺𝑅𝑚𝑖𝑛)/(𝐺𝑅𝑚𝑎𝑥 − 𝐺𝑅𝑚𝑖𝑛) (1)
Here, GRlog is the log derived value, and GRmin
and GRmax indicated the minimum and maximum
values of gamma-ray found from the log, respectively.
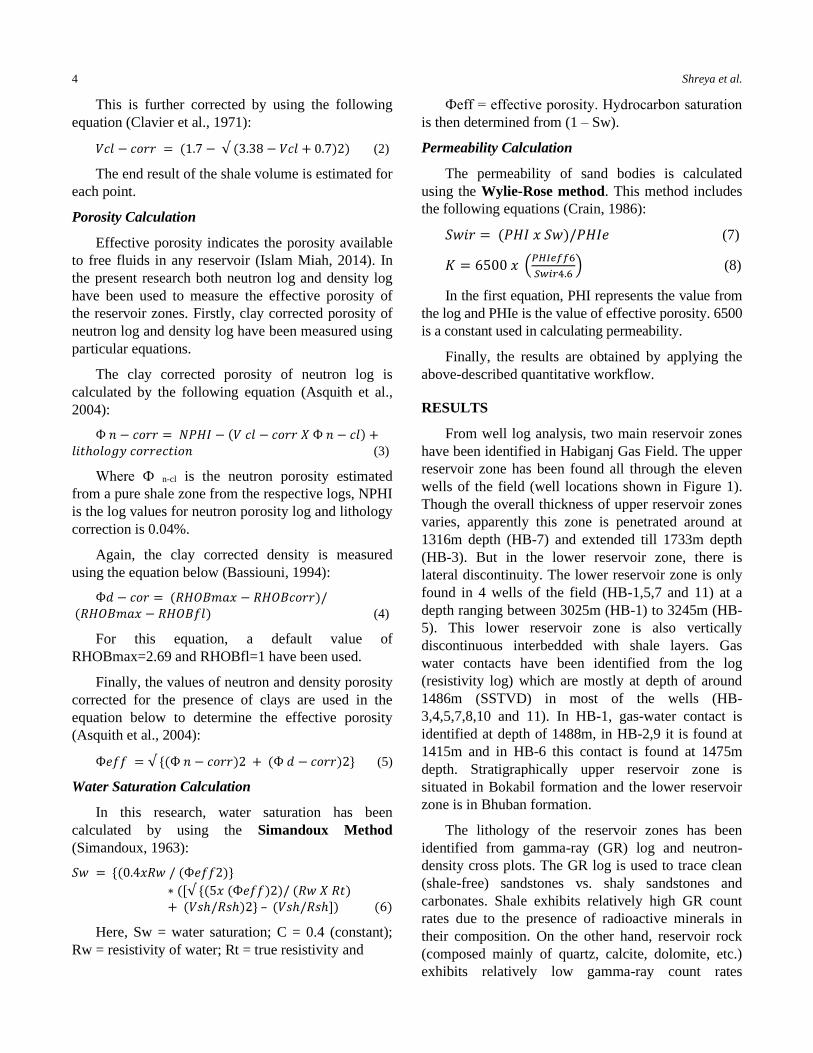
Table 1: List of the Wells with Available Wireline Log Data Utilized in this Research
Well No. GR Caliper MSFL ILD LLD SFLU NPHI RHOB Sonic
Habiganj 1 ✓ ✓ ✓ ✓ ✓ ✓ ✓
Habiganj 2 ✓ ✓ ✓ ✓ ✓ ✓ ✓
Habiganj 3 ✓ ✓ ✓ ✓ ✓ ✓
Habiganj 4 ✓ ✓ ✓ ✓ ✓ ✓ ✓
Habiganj 5 ✓ ✓ ✓ ✓ ✓ ✓ -----
Habiganj 6 ✓ ✓ ✓ ✓ ✓ ✓
Habiganj 7 ✓ ✓ ✓ ✓ ✓ ✓ ✓ -----
Habiganj 8 ✓ ✓ ✓ ✓ ✓ ✓
Habiganj 9 ✓ ✓ ✓ ✓ ✓ ✓
Habiganj 10 ✓ ✓ ✓ ✓ ✓ ✓ ✓ -----
Habiganj 11 ✓ ✓ ✓ ✓ ✓ ✓ ✓ -----
[Explanation: ✓ = This log data has been used, = This log data was available but not used, ---- = This log data was unavailable.
4 Shreya et al.
This is further corrected by using the following
equation (Clavier et al., 1971):
𝑉𝑐𝑙 − 𝑐𝑜𝑟𝑟 = (1.7 − √ (3.38 − 𝑉𝑐𝑙 + 0.7)2) (2)
The end result of the shale volume is estimated for
each point.
Porosity Calculation
Effective porosity indicates the porosity available
to free fluids in any reservoir (Islam Miah, 2014). In
the present research both neutron log and density log
have been used to measure the effective porosity of
the reservoir zones. Firstly, clay corrected porosity of
neutron log and density log have been measured using
particular equations.
The clay corrected porosity of neutron log is
calculated by the following equation (Asquith et al.,
2004):
Ф 𝑛 − 𝑐𝑜𝑟𝑟 = 𝑁𝑃𝐻𝐼 − (𝑉 𝑐𝑙 − 𝑐𝑜𝑟𝑟 𝑋 Ф 𝑛 − 𝑐𝑙) +𝑙𝑖𝑡ℎ𝑜𝑙𝑜𝑔𝑦 𝑐𝑜𝑟𝑟𝑒𝑐𝑡𝑖𝑜𝑛 (3)
Where Ф n-cl is the neutron porosity estimated
from a pure shale zone from the respective logs, NPHI
is the log values for neutron porosity log and lithology
correction is 0.04%.
Again, the clay corrected density is measured
using the equation below (Bassiouni, 1994):
Ф𝑑 − 𝑐𝑜𝑟 = (𝑅𝐻𝑂𝐵𝑚𝑎𝑥 − 𝑅𝐻𝑂𝐵𝑐𝑜𝑟𝑟)/ (𝑅𝐻𝑂𝐵𝑚𝑎𝑥 − 𝑅𝐻𝑂𝐵𝑓𝑙) (4)
For this equation, a default value of
RHOBmax=2.69 and RHOBfl=1 have been used.
Finally, the values of neutron and density porosity
corrected for the presence of clays are used in the
equation below to determine the effective porosity
(Asquith et al., 2004):
Ф𝑒𝑓𝑓 = √ {(Ф 𝑛 − 𝑐𝑜𝑟𝑟)2 + (Ф 𝑑 − 𝑐𝑜𝑟𝑟)2} (5)
Water Saturation Calculation
In this research, water saturation has been
calculated by using the Simandoux Method
(Simandoux, 1963):
𝑆𝑤 = {(0.4𝑥𝑅𝑤 / (Ф𝑒𝑓𝑓2)}
∗ ([√ {(5𝑥 (Ф𝑒𝑓𝑓)2)/ (𝑅𝑤 𝑋 𝑅𝑡)+ (𝑉𝑠ℎ/𝑅𝑠ℎ)2} – (𝑉𝑠ℎ/𝑅𝑠ℎ]) (6)
Here, Sw = water saturation; C = 0.4 (constant);
Rw = resistivity of water; Rt = true resistivity and
Фeff = effective porosity. Hydrocarbon saturation
is then determined from (1 – Sw).
Permeability Calculation
The permeability of sand bodies is calculated
using the Wylie-Rose method. This method includes
the following equations (Crain, 1986):
𝑆𝑤𝑖𝑟 = (𝑃𝐻𝐼 𝑥 𝑆𝑤)/𝑃𝐻𝐼𝑒 (7)
𝐾 = 6500 𝑥 (𝑃𝐻𝐼𝑒𝑓𝑓6
𝑆𝑤𝑖𝑟4.6) (8)
In the first equation, PHI represents the value from
the log and PHIe is the value of effective porosity. 6500
is a constant used in calculating permeability.
Finally, the results are obtained by applying the
above-described quantitative workflow.
RESULTS
From well log analysis, two main reservoir zones
have been identified in Habiganj Gas Field. The upper
reservoir zone has been found all through the eleven
wells of the field (well locations shown in Figure 1).
Though the overall thickness of upper reservoir zones
varies, apparently this zone is penetrated around at
1316m depth (HB-7) and extended till 1733m depth
(HB-3). But in the lower reservoir zone, there is
lateral discontinuity. The lower reservoir zone is only
found in 4 wells of the field (HB-1,5,7 and 11) at a
depth ranging between 3025m (HB-1) to 3245m (HB-
5). This lower reservoir zone is also vertically
discontinuous interbedded with shale layers. Gas
water contacts have been identified from the log
(resistivity log) which are mostly at depth of around
1486m (SSTVD) in most of the wells (HB-
3,4,5,7,8,10 and 11). In HB-1, gas-water contact is
identified at depth of 1488m, in HB-2,9 it is found at
1415m and in HB-6 this contact is found at 1475m
depth. Stratigraphically upper reservoir zone is
situated in Bokabil formation and the lower reservoir
zone is in Bhuban formation.
The lithology of the reservoir zones has been
identified from gamma-ray (GR) log and neutron-
density cross plots. The GR log is used to trace clean
(shale-free) sandstones vs. shaly sandstones and
carbonates. Shale exhibits relatively high GR count
rates due to the presence of radioactive minerals in
their composition. On the other hand, reservoir rock
(composed mainly of quartz, calcite, dolomite, etc.)
exhibits relatively low gamma-ray count rates
Petrophysical Reservoir Characterization of Habiganj Gas Field, Surma Basin, Bangladesh 5
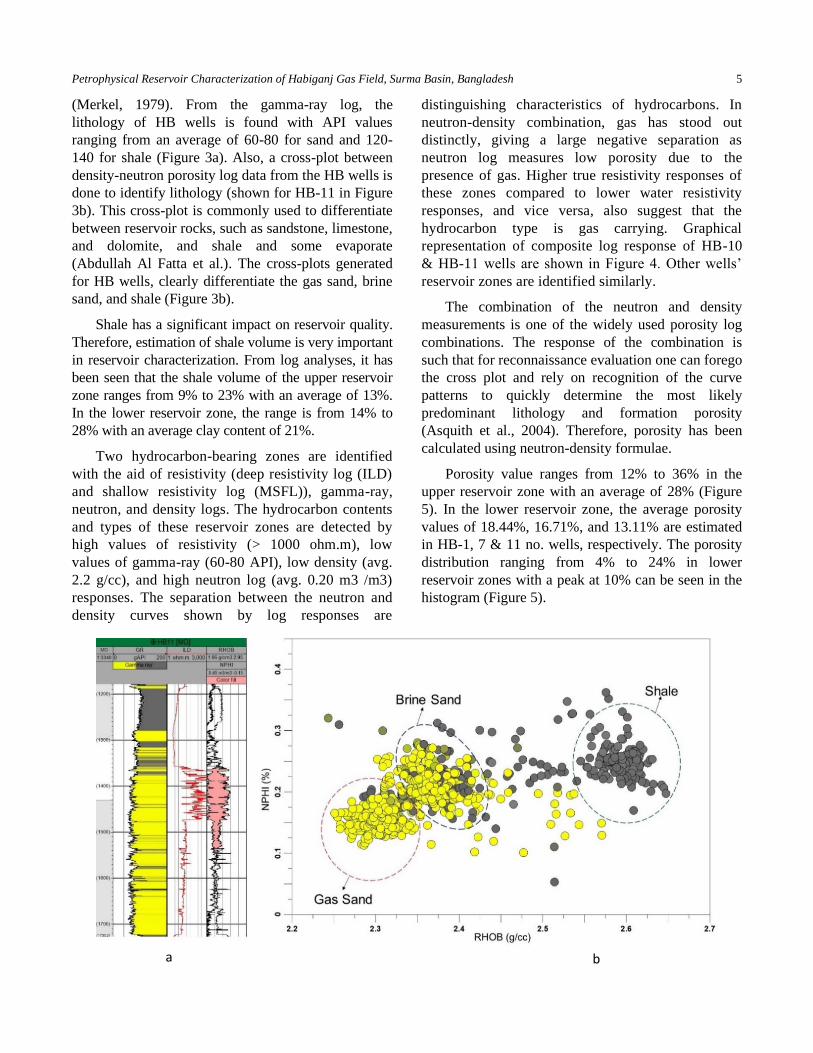
(Merkel, 1979). From the gamma-ray log, the
lithology of HB wells is found with API values
ranging from an average of 60-80 for sand and 120-
140 for shale (Figure 3a). Also, a cross-plot between
density-neutron porosity log data from the HB wells is
done to identify lithology (shown for HB-11 in Figure
3b). This cross-plot is commonly used to differentiate
between reservoir rocks, such as sandstone, limestone,
and dolomite, and shale and some evaporate
(Abdullah Al Fatta et al.). The cross-plots generated
for HB wells, clearly differentiate the gas sand, brine
sand, and shale (Figure 3b).
Shale has a significant impact on reservoir quality.
Therefore, estimation of shale volume is very important
in reservoir characterization. From log analyses, it has
been seen that the shale volume of the upper reservoir
zone ranges from 9% to 23% with an average of 13%.
In the lower reservoir zone, the range is from 14% to
28% with an average clay content of 21%.
Two hydrocarbon-bearing zones are identified
with the aid of resistivity (deep resistivity log (ILD)
and shallow resistivity log (MSFL)), gamma-ray,
neutron, and density logs. The hydrocarbon contents
and types of these reservoir zones are detected by
high values of resistivity (> 1000 ohm.m), low
values of gamma-ray (60-80 API), low density (avg.
2.2 g/cc), and high neutron log (avg. 0.20 m3 /m3)
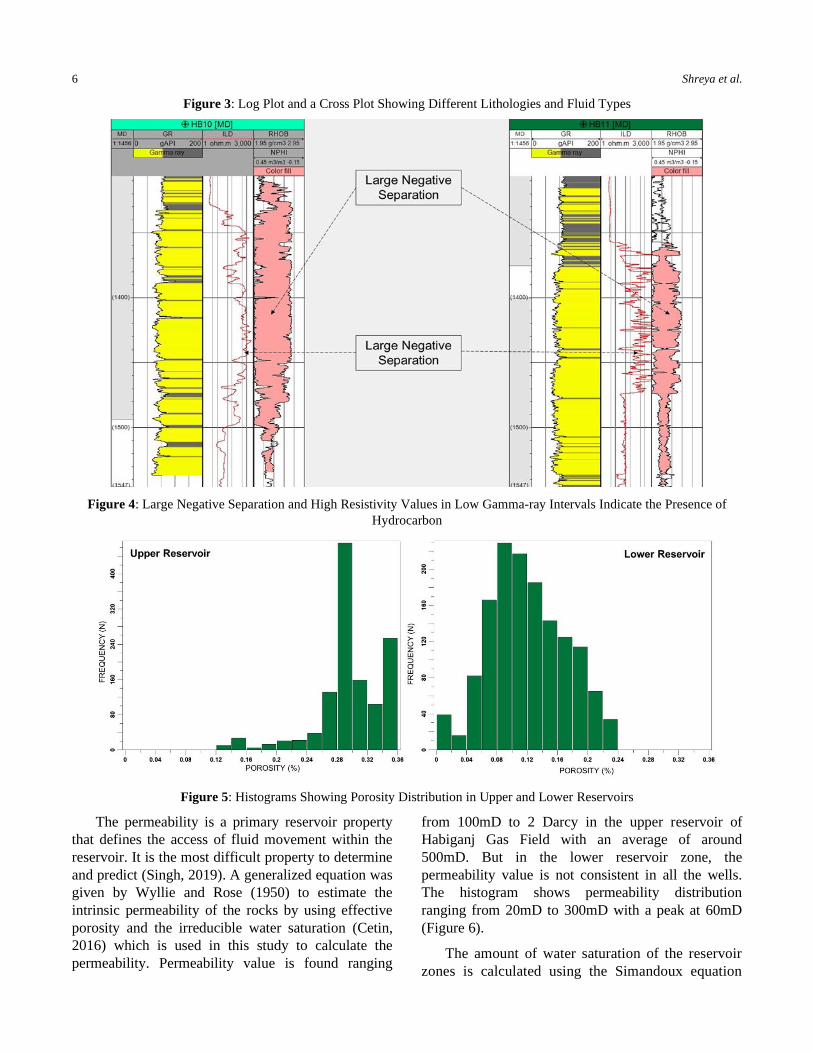
responses. The separation between the neutron and
density curves shown by log responses are
distinguishing characteristics of hydrocarbons. In
neutron-density combination, gas has stood out
distinctly, giving a large negative separation as
neutron log measures low porosity due to the
presence of gas. Higher true resistivity responses of
these zones compared to lower water resistivity
responses, and vice versa, also suggest that the
hydrocarbon type is gas carrying. Graphical
representation of composite log response of HB-10
& HB-11 wells are shown in Figure 4. Other wells’
reservoir zones are identified similarly.
The combination of the neutron and density
measurements is one of the widely used porosity log
combinations. The response of the combination is
such that for reconnaissance evaluation one can forego
the cross plot and rely on recognition of the curve
patterns to quickly determine the most likely
predominant lithology and formation porosity
(Asquith et al., 2004). Therefore, porosity has been
calculated using neutron-density formulae.
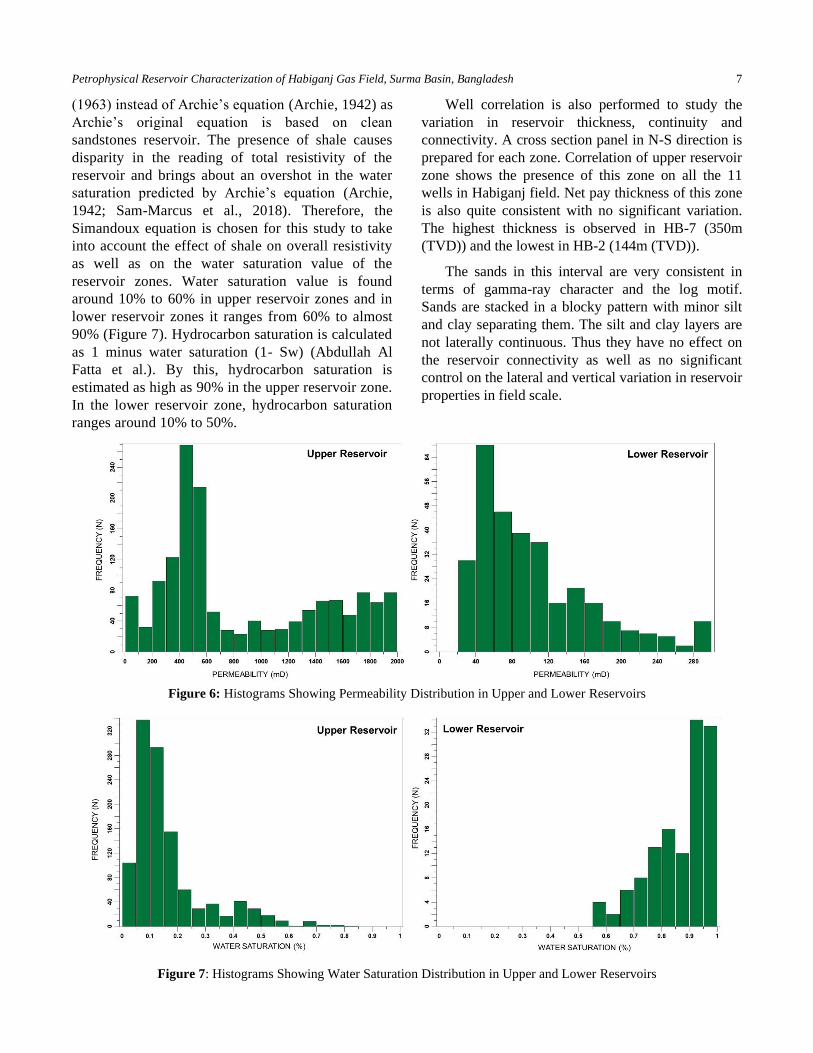
Porosity value ranges from 12% to 36% in the
upper reservoir zone with an average of 28% (Figure
5). In the lower reservoir zone, the average porosity
values of 18.44%, 16.71%, and 13.11% are estimated
in HB-1, 7 & 11 no. wells, respectively. The porosity
distribution ranging from 4% to 24% in lower
reservoir zones with a peak at 10% can be seen in the
histogram (Figure 5).
a b
6 Shreya et al.
Figure 3: Log Plot and a Cross Plot Showing Different Lithologies and Fluid Types
Figure 4: Large Negative Separation and High Resistivity Values in Low Gamma-ray Intervals Indicate the Presence of
Hydrocarbon
Figure 5: Histograms Showing Porosity Distribution in Upper and Lower Reservoirs
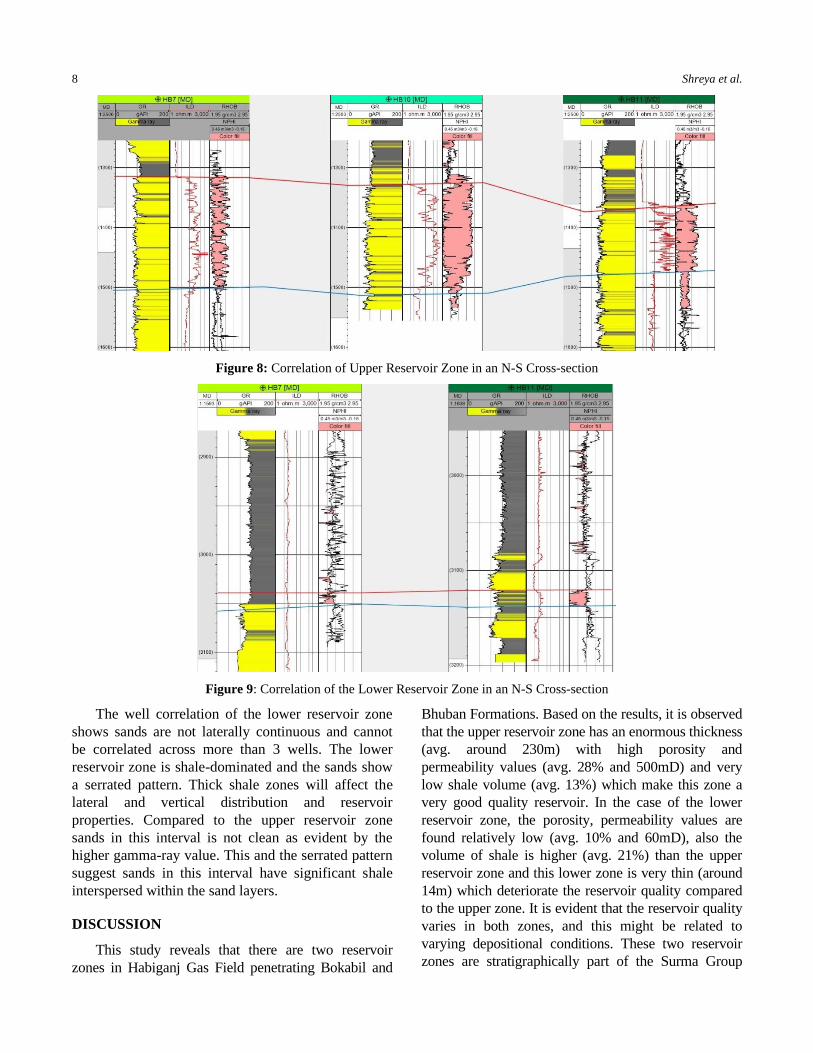
The permeability is a primary reservoir property
that defines the access of fluid movement within the
reservoir. It is the most difficult property to determine
and predict (Singh, 2019). A generalized equation was
given by Wyllie and Rose (1950) to estimate the
intrinsic permeability of the rocks by using effective
porosity and the irreducible water saturation (Cetin,
2016) which is used in this study to calculate the
permeability. Permeability value is found ranging
from 100mD to 2 Darcy in the upper reservoir of
Habiganj Gas Field with an average of around
500mD. But in the lower reservoir zone, the
permeability value is not consistent in all the wells.
The histogram shows permeability distribution
ranging from 20mD to 300mD with a peak at 60mD
(Figure 6).
The amount of water saturation of the reservoir
zones is calculated using the Simandoux equation
Petrophysical Reservoir Characterization of Habiganj Gas Field, Surma Basin, Bangladesh 7
(1963) instead of Archie’s equation (Archie, 1942) as
Archie’s original equation is based on clean
sandstones reservoir. The presence of shale causes
disparity in the reading of total resistivity of the
reservoir and brings about an overshot in the water
saturation predicted by Archie’s equation (Archie,
1942; Sam-Marcus et al., 2018). Therefore, the
Simandoux equation is chosen for this study to take
into account the effect of shale on overall resistivity
as well as on the water saturation value of the
reservoir zones. Water saturation value is found
around 10% to 60% in upper reservoir zones and in
lower reservoir zones it ranges from 60% to almost
90% (Figure 7). Hydrocarbon saturation is calculated
as 1 minus water saturation (1- Sw) (Abdullah Al
Fatta et al.). By this, hydrocarbon saturation is
estimated as high as 90% in the upper reservoir zone.
In the lower reservoir zone, hydrocarbon saturation
ranges around 10% to 50%.
Well correlation is also performed to study the
variation in reservoir thickness, continuity and
connectivity. A cross section panel in N-S direction is
prepared for each zone. Correlation of upper reservoir
zone shows the presence of this zone on all the 11
wells in Habiganj field. Net pay thickness of this zone
is also quite consistent with no significant variation.
The highest thickness is observed in HB-7 (350m
(TVD)) and the lowest in HB-2 (144m (TVD)).
The sands in this interval are very consistent in
terms of gamma-ray character and the log motif.
Sands are stacked in a blocky pattern with minor silt
and clay separating them. The silt and clay layers are
not laterally continuous. Thus they have no effect on
the reservoir connectivity as well as no significant
control on the lateral and vertical variation in reservoir
properties in field scale.
Figure 6: Histograms Showing Permeability Distribution in Upper and Lower Reservoirs
Figure 7: Histograms Showing Water Saturation Distribution in Upper and Lower Reservoirs
8 Shreya et al.
Figure 8: Correlation of Upper Reservoir Zone in an N-S Cross-section
Figure 9: Correlation of the Lower Reservoir Zone in an N-S Cross-section
The well correlation of the lower reservoir zone
shows sands are not laterally continuous and cannot
be correlated across more than 3 wells. The lower
reservoir zone is shale-dominated and the sands show
a serrated pattern. Thick shale zones will affect the
lateral and vertical distribution and reservoir
properties. Compared to the upper reservoir zone
sands in this interval is not clean as evident by the
higher gamma-ray value. This and the serrated pattern
suggest sands in this interval have significant shale
interspersed within the sand layers.
DISCUSSION
This study reveals that there are two reservoir
zones in Habiganj Gas Field penetrating Bokabil and
Bhuban Formations. Based on the results, it is observed
that the upper reservoir zone has an enormous thickness
(avg. around 230m) with high porosity and
permeability values (avg. 28% and 500mD) and very
low shale volume (avg. 13%) which make this zone a
very good quality reservoir. In the case of the lower
reservoir zone, the porosity, permeability values are
found relatively low (avg. 10% and 60mD), also the
volume of shale is higher (avg. 21%) than the upper
reservoir zone and this lower zone is very thin (around
14m) which deteriorate the reservoir quality compared
to the upper zone. It is evident that the reservoir quality
varies in both zones, and this might be related to
varying depositional conditions. These two reservoir
zones are stratigraphically part of the Surma Group
Petrophysical Reservoir Characterization of Habiganj Gas Field, Surma Basin, Bangladesh 9
(Imam, 2005). Traditionally, Surma Group units are
believed to be deposited in fluvio-deltaic to shallow
marine environments (Johnson and Alam, 1991;
Merkel, 1979). It is evident from log analysis that the
upper reservoir zone contains a thicker sand body with
a minor interbedded shale-silty lithology that does not
affect reservoir continuity and connectivity. This
laterally continuous stacked clean sand body with high
poro-perm values is also indicative of the high energy
condition of the deposits which might be braided
fluvial system (Asquith et al., 2004; Singh, 2019). The
lower gas sands are less porous and more clay plugged
than the upper gas sand in the Habiganj field indicating
that they belong to a lower depositional regime which
might be delta front to offshore marine bar deposits.
The laterally discontinuous nature of the lower gas
sands is further proof of their marine depositional
regime as compared to that of the Upper Gas Sand.
The resulting petrophysical properties indicate
that an enhanced production might be favorable with a
little development and/or appraisal efforts in the upper
reservoir zone of Habiganj Gas Field. Although the
reservoir quality of the lower zone of the Habiganj gas
field is poorer than that of the upper zone, this part
can be considered as the secondary target for
hydrocarbon production.
However, this result and interpretation are based
on wireline log data which are one-dimensional. The
well log data sometimes fail to encompass the field-
wide variation of reservoir properties. And most
petrophysical properties used in integrated studies are
obtained through multiple workflows of the
exploration-development portfolio, including data
acquisition, processing, calibration, and interpretation.
Each of these processes has uncertainties that may
affect the result. Also, the equations that have been
used for calculation may vary if some other equations
were being used. Thus, it is suggested that core data of
these wells and seismic data of Habiganj Gas Field
should be incorporated with this study to allow for the
detailed and complementary study of the field which
will reduce inherent uncertainties.
CONCLUSION
Through the present study, we attempt to
comprehend the nature and potentiality of the Habiganj
Gas Field using wireline logs of all the 11 wells of this
field. Lithology and reservoir zones are identified
directly from the log. Effective porosity, permeability,
shale volume, and water saturation are measured using
relevant petrophysical equations. From the calculation,
it has been found out that the average porosity of the
upper reservoir zones is 28%, average permeability is
around 500mD with hydrocarbon saturation values
ranging from 40% to 90%. The average volume of
shale is found at 13% in the upper reservoir zone. And
in lower reservoir zones the average porosity value is
around 10%, permeability value is not consistent in all
wells but in the average value of 60mD, hydrocarbon
saturation is relatively low ranging from 10% to 50%.
The average volume of shale is 21% within this lower
reservoir. Based on the petrophysical analyses, it could
be concluded that the upper reservoir zone is a very
good quality reservoir and the lower reservoir zone is
also potential. The variation between two reservoir
zones might be due to different depositional
environments. The upper reservoir zone is assumed to
be deposited in high energy conditions and the lower
reservoir zone might be deposited in lower energy
conditions. The lower reservoir should be studied more
rigorously with other associated data to reveal its
precise potentiality. However, this study indicates that
the Habiganj Gas Field is a very prospective area in
terms of yet to find hydrocarbons and for further
development. These findings may help in the re-
estimation of gas reserves and may also help to add
reserves to our national gas reserve bucket.
Acknowledgement: The authors are grateful to the
Bangladesh Oil, Gas, and Mineral Corporation (Petrobangla) for
their kind permission, cooperation and access to the relevant data
required for this study. The authors are also grateful to M. A.
Matin Mondol, manager at BAPEX's geophysical division, for
helping to prepare some illustrations for this research paper.
REFERENCES
Abdullah Al Fatta, M., Islam, S., and Farhaduzzaman, M.
(2018). Petrophysical Analysis of Sylhet Gas Field
Using Well Logs and Associated Data from Well
Sylhet, Bangladesh. International Journal of Petroleum
and Petrochemical Engineering, 4(1): 55-69, DOI:
http://dx.doi.org/10.20431/2454-7980.0401007.
Ahammod, S., Hai, M. A., Islam, M. R., and Abu, S.
(2014). Petro-Physical Analysis of Reservoir Rock of
Fenchuganj Gas Field (Well# 03) Using Wireline Log:
American Journal of Engineering Research, Vol.
3(8):37-48
Archie, G. E. (1942). The electrical resistivity log as an aid
in determining some reservoir characteristics:
Transactions of the AIME, 146 (1):54-62.
10 Shreya et al.
Asquith, G. B., Krygowski, D., and Gibson, C. R. (2006).
Basic well log analysis, American Association of
Petroleum Geologists Tulsa: p. 244.
Dresser Atlas (1979). Log interpretation charts: Houston
Dresser Industries: Inc, p. 107.
Bassiouni, Z. (1994). Theory, measurement, and
interpretation of well logs, Henry L. Doherty Memorial
Fund of AIME, Society of Petroleum Engineers. 4,
SPE textbook series
Bateman, R., 1985, Openhole log analysis and formation
analysis. United States: N. p., 1985.
Cetin, M. (2016). A petrophysical evaluation for
permeability of a gas reservoir in the Taranaki Basin,
New Zealand: Michigan Technological University.
Clavier, C., Hoyle, W., and Meunier, D. (1971).
Quantitative interpretation of thermal neutron decay
time logs: part I. Fundamentals and techniques: Journal
of Petroleum Technology, 23(6): 743-755.
Crain, E. R. (1986). Log analysis handbook. United States:
N. p., 1986.
Hai, M. A., Ahammod, S., Faruque, M. O., Hussain, M. A.,
and Ahmed, J. (2014). Identification and determination
of gross thickness of hydrocarbon bearing zone of
Habiganj gas field: Am J Engg Res, 3(8):79-89.
Hossain, A., Hossain, D., and Abdullah, R., 2015,
Structural and stratigraphic interpretation of
geophysical data of the Fenchuganj gas field in the
Surma basin, Bangladesh: Journal of the Geological
Society of India, 86 (2):148-154.
Hossain, M. I. S., Woobaidullah, A., and Rahman, M. J.,
(2021). Reservoir characterization and identification of
new prospect in Srikail gas field using wireline and
seismic data: Journal of Petroleum Exploration and
Production Technology, 11: 2481–2495
Hussain, M., Ahmed, N., Chun, W. Y., Khalid, P.,
Mahmood, A., Ahmad, S. R., and Rasool, U. (2017).
Reservoir characterization of basal sand zone of lower
Goru Formation by petrophysical studies of
geophysical logs: Journal of the Geological Society of
India, 89 (3):331-338.
Imam, B. (2005). Energy Resources of Bangladesh:
University grants commission of Bangladesh, Dhaka.
Islam, A., Habib, M., Islam, M., and Mita, M. (2013).
Interpretation of wireline log data for reservoir
characterization of the Rashidpur Gas Field, Bengal
Basin, Bangladesh: IOSR Journal of Applied Geology
and Geophysics, 1(4): 47-54.
Islam, A., Islam, M. A., Tasnuva, A., Biswas, R. K., and
Jahan, K. (2014). Petrophysical parameter studies for
characterization of gas reservoir of Narsingdi gas field,
Bangladesh: International Journal of Advanced
Geosciences, 2(2):53-58.
Islam, M. A., Islam, M., Latif, M., Mondal, D., and
Mahbub, M. (2006). Petrophysical analysis of shaly-
sand gas reservoir of Titas Gas Field using well logs:
Bangladesh, Journal of Geology, 25: 106-124.
Islam Miah, M. (2014). Formation evaluation using
wireline log data of Bakhrabad gas field. http:/
/lib.buet.ac.bd: 8080 / xmlui/ handle/ 123456789/1460.
Johnson, S. Y., and Alam, A. M.N. (1991). Sedimentation
and tectonics of the Sylhet trough, Bangladesh:
Geological Society of America Bulletin, 103(11):1513-
1527.
Lake, L. (2012). Reservoir characterization, Elsevier.
Merkel, R. H. (1979). Well log formation evaluation,
United States: DOI: https://doi.org/ 10.1306/ CE14453
Petrobangla (2019). Petrobangla Annual Report, 2019.
Rahman, A., Seddique, A. A., Khan, M. H. R., and Rahman,
M. (2017). Present gas reserve estimation using wireline
logging data of Habiganj Gas Field, Bangladesh: Int J
Oil Gas Coal Eng, 5 (4): 44-50.
Sakurai, S., Grimaldo-Suarez, F. M., Aguilera-Gomez, L.
E., Rodriguez-Larios, J. A., Ambrose, W. A., Jennette,
D. C., Holtz, M. H., Dutton, S. P., Wawrzyniec, T. F.,
and Guevara, E. H. (2002). Petrophysical evaluation of
Miocene-Pliocene gas reservoirs: Veracruz and
Macuspana Basins, Mexico, in Proceedings SPWLA
43rd Annual Logging Symposium.
Sam-Marcus, J., Enaworu, E., Rotimi, O. J., and
Seteyeobot, I. (2018). A proposed solution to the
determination of water saturation: using a modelled
equation: Journal of Petroleum Exploration and
Production Technology, 8(4): 1009-1015.
Samad, M. A., Rahman, M. J., and Woobaidullah, A.
(2014). Reservoir characterization of different gas
fields in eastern fold belt of Bangladesh: Unpublished
MS Thesis, University of Dhaka, Bangladesh.
Shofiqul, I. M., and Nusrat, J. L. (2013). Reservoir
characterization of Habiganj gas field: International
Journal of Oil, Gas and Coal Engineering, 1(1): 7-15.
Simandoux, P. (1963). Dielectric measurements on porous
media, application to the measurements of water
saturation: study of behavior of argillaceous
formations: Revue de L’institut Francais du Petrole,
18: 193-215.
Singh, N. (2019). Permeability prediction from wireline
logging and core data: a case study from Assam-
Arakan basin: Journal of Petroleum Exploration and
Production Technology, 9(1): 297-305.


