Embed Size (px)
Citation preview

Pharmacognosy Magazine
ISSN : 0973-1296
Phcog.Net - Bringing Medicinal Plant Researchers Together
Publication of Pharmacognosy Network Worldwide
www.phcog.com
October-December 2015 | Volume 11 | Issue 44 (Supplement 3)
CAB Abstracts, Caspur, Chemical Abstracts, CNKI (China National Knowledge Infrastructure), CSA databases, DOAJ, EBSCO Publishing’s Electronic Databases, Excerpta Medica / EMBASE, Genamics JournalSeek, Google Scholar, Health & Wellness Research Center, Health Reference Center Academic, Hinari, Index Copernicus, Indian Science Abstracts, Journal Citation Reports, National Science Library, OpenJGate, PrimoCentral, ProQuest, PubMed, Pubmed Central, Science Citation Index Expanded, Scimago Journal Ranking, SCOLOAR, SCOPUS, SIIC databases, Summon by Serial Solutions, Ulrich’s International Periodical Directory and Web of Science.
Ph
arm
aco
gn
osy M
ag
azin
e • V
olu
me 1
1 • Issu
e 4
4 (S
up
ple
men
t 3) • O
cto
ber-D
ecem
ber 2
014 • P
ages ***-***
®Impact Factor for 2012: 1.525
Included

S488 © 2015 Pharmacognosy Magazine | Published by Wolters Kluwer - Medknow
Reversed-phase high-performance Liquid Chromatography- ultraviolet Photodiode Array Detector Validated Simultaneous Quantification of six Bioactive Phenolic Acids in Roscoea purpurea Tubers and their In vitro Cytotoxic Potential against Various Cell LinesSharad Srivastava, Ankita Misra, Dharmesh Kumar1, Amit Srivastava, Anil Sood1, AKS Rawat
Pharmacognosy and Ethnopharmacology Division, CSIR‑National Botanical Research Institute, Lucknow, Uttar Pradesh, 1Biotechnology Division, CSIR‑Institute of Himalayan Bioresource Technology, Palampur, Himachal Pradesh, India
ABSTRACTBackground: Roscoea purpurea or Roscoea procera Wall. (Zingiberaceae) is traditionally used for nutrition and in the treatment of various ailments. Objective: Simultaneous reversed‑phase high‑performance liquid chromatography‑ultraviolet (RP‑HPLC) photodiode array detector identification of phenolic acids (PA’s) was carried out in whole extract of tuber and their cytotoxic potential was estimated along with radical scavenging action. Bioactivity guided fractionation was also done to check the response potential against the same assay. Materials and Methods: Identification and method validation was performed on RP‑HPLC column and in vitro assays were used for bioactivity. Results: Protocatechuic acid, syringic acid, ferulic acid, rutin, apigenin, and kaempferol were quantified as 0.774%, 0.064%, 0.265%, 1.125%, 0.128%, and 0.528%, respectively. Validated method for simultaneous determination of PA’s was found to be accurate, reproducible, and linearity was observed between peak area response and concentration. Recovery of identified PA’s was within the acceptable limit of 97.40–104.05%. Significant pharmacological response was observed in whole extract against in vitro cytotoxic assay, that is, Sulforhodamine B assay, however, fractionation results in decreased action potential. Similar pattern of results were observed in the antioxidant assay, as total phenolic content and total flavonoid content were highest in whole extract and decreases with fractionation. Radical scavenging activity was prominent in chloroform fraction, exhibiting IC50 at 0.25 mg/mL. Conclusion: Study, thus, reveals that R. purpurea exhibit significant efficacy in cytotoxic activity with the potentiality of scavenging free radicals due the presence of PA’s as reported through RP‑HPLC.Key words: Cytotoxic activity, phenolic acids, radical scavenging activity, reversed‑phase high‑performance liquid chromatography, Roscoea purpurea
SUMMARY• Proto‑catechuic acid, syringic acid, ferulic acid, rutin, apigenin and kaempferol
were quantified as 0.774, 0.064, 0.265, 1.125, 0.128 and 0.528 %
• Preliminary cytotoxic activity revealed that whole extract of R. purpurea exhibit promising effect and after fractionation the potentiation of action reduces
• The radical scavenging potential of whole extract and fractions are well reflected by TPC, TFC and DPPH assay.
Correspondence: Dr. Sharad Srivastava, Pharmacognosy and Ethnopharmacology Division, CSIR‑National Botanical Research Institute Lucknow ‑ 226 001, Uttar Pradesh, India. E‑mail: [email protected] : 10.4103/0973‑1296.168944
Pharmacogn. Mag.A multifaceted peer reviewed journal in the field of Pharmacognosy and Natural Productswww.phcog.com | www.phcog.net
INTRODUCTIONRoscoea purpurea or Roscoea procera Wall. is a perennial herb of family Zingiberaceae. The species is locally known as Kakoli, Red Gurkha, Dhawanksholika, Karnika, Ksheera, Madhura, Shukla, Svadumansi, Vayasoli and Vaysasha also. R. purpurea is widely available in The Himalayas and is native of Nepal and grown on steepy, grassy hillsides, damp gullies, and stony slopes. R. purpurea is cultivated as an ornamental plant and traditionally in Northern India; fleshy roots are used for the treatment of malaria and urinary infection. In ethnobotanical practice, leaves, roots, and flowers are used for the treatment of diabetic, hypertension, diarrhea, fever, and inflammation. In Nepal, tubers are boiled for edible purpose and also used in traditional veterinary medicine.[1,2] Tubers of Roscoea are major constituent of polyherbal Ayurvedic formulation, “Ashtavarga,” which according to Nighandu Samhita and Indian Metria Medica is like chawanprash having, antioxidant, anti‑aging effect, and elevates overall
health status of a well‑being.[3] Pharmacological reports support the immunomodulatory[4] and antidiabetic activity[5] of R. purpurea tubers.Natural phenolic acids (PA’s) are the class of biologically active compounds possessing one or more ring structure with a variable
ORIGINAL ARTICLE
Cite this article as: Srivastava S, Ankita M, Kumar D, Srivastava A, Sood A, Rawat A. Reversed-phase high-performance liquid chromatography-ultraviolet photodiode array detector validated simultaneous quantification of six bioactive phenolic acids in Roscoea purpurea tubers and their In vitro cytotoxic potential against various cell lines. Phcog Mag 2015;11:488-95.
This is an open access article distributed under the terms of the Creative Commons Attribution‑NonCommercial‑ShareAlike 3.0 License, which allows others to remix, tweak, and build upon the work non‑commercially, as long as the author is credited and the new creations are licensed under the identical terms.
For reprints contact: [email protected]
Access this article onlineWebsite: www.phcog.comQuick Response Code:

SHARAD SRIVASTAVA, et al.: Simultaneous Quantification of Phenols in Roscoea purpurea and their In vitro Cytotoxic Studies
Pharmacognosy Magazine, Oct-Dec 2015, Vol 11, Issue 44 (Supplement 3) S489
number of the hydroxyl group. They are broadly diversified in plants and are one of the major secondary metabolites. PA’s include a class of compounds (flavonoids, flavones, flavanones, tannins, and lignans, etc.), among which flavonoids are the most beneficial and richly available polyphenolic acids/phenolic acids in our diet. Classically, polyphenolic acids have been used as biologically active antioxidants; however, these compounds play several other remarkable activities also, for example antiallergic, anti‑inflammatory, antimutagenic, and modulation of enzyme activities. Several workers have proven the efficacy of PA’s as potent chemotherapeutic and chemoprotective agents.[6‑8] Isolated PA’s, that is, quercetin, kaempferol, caffeic acid, apigenin, (±) catechin, and naringenin, etc., have well established and prominent anti‑cancerous activities.[9‑11] Hence, chemoprevention or chemotherapy via a natural source with fortified radical scavenging activity is always welcomed.As state of art suggested that tubers are effective as anti‑aging, anti‑inflammatory, and have immunomodulatory action, and if focused over the underlying cause of these disorders, free radicals were found as common agents. In addition to this, its traditional use as potential antioxidant further suspect for the presence of bioactive PA’s. Hence, an attempt was made to identify, characterize, and quantify the PA’s present in R. purpurea though reverse phase‑high performance liquid chromatography (RP‑HPLC). As stated above, polyphenolics are emerging source of chemotherapeutic agents, thus, the cytotoxic potential of R. purpurea tubers were evaluated for which scientific data is still lacking. In addition to this activity, guided fractionation was also carried out to determine the potentiation of action on targeted activity. Biologically active nature of identified PA’s was further supported by radical scavenging assay.In summary, the study was conducted with two major objectives, firstly for identification and quantification of PA’s through validated RP‑HPLC‑ultraviolet (UV) photodiode array detector (PDA) developed method in whole extract (A) of species (tuber) and evaluated for preliminary cytotoxic activity. On the basis of results obtained, work was further extended with second objective of activity guided fractionation from tubers with solvents of differential polarity, that is, petroleum ether (B), chloroform (C), acetone (D), alcohol (E), and water (F) fractions as shown in Figure 1 and subjected to in vitro cytotoxic activity. The bioactive nature of identified PA’s was further validated by in vitro antioxidant assay’s, that is, 2,2‑diphenyl‑1‑picrylhydrazyl (DPPH) radical scavenging activity and determination of total PA and flavonoid content.
MATERIALS AND METHODSChemicalsReference standards of protocatechuic acid (97%), syringic acid (≥97%), ferulic acid (≥99%), rutin (≥95%), apigenin (≥95%), kaempferol (≥97%),
ascorbic acid (≥97%), quercetin (≥97%), 1‑1‑diphenyl‑2‑picrylhydrazyl (≥99%, DPPH) and Vinblastine were purchased from Sigma‑Aldrich. HPLC grade solvents viz., acetonitrile, methanol, water, and all other solvents/chemicals (AR grade) were purchased from Merck, Mumbai, India. Ham’s Nutrient Mixtures F‑12 medium, Roswell Park Memorial Institute‑1640 (RPMI‑1640), Dulbecco’s modified Eagle medium (DMEM), heat‑inactivated fetal bovine serum, and antibiotic antimycotic (Ref. No. 15240‑062) were purchased from Invitrogen Bio Services India Pvt. Ltd.
Plant materialFresh tubers of R. purpurea were collected in the month of October to November from the nearby area of Dhanaulti (Phytogeographical zone: Western Himalayas, Altitude: 1705 meter, latitude: 30° 21’ 34.4”, Longitude: 78° 23’ 15.3”), Uttarakhand, India. It was authenticated, and a voucher specimen was deposited in institute’s herbarium (LWG No. 254028).
Preparation of whole extract and bioactivity guided fractionsCollected sample was washed, shade dried, and coarsely powdered (40 mesh). About 5 g of defatted material (with petroleum ether) was macerated with ethyl alcohol at 30 ± 2°C for 24 h, filtered (Whatman No. 1 filter paper) and again macerated with fresh solvent. Extraction was repeated thrice, pooled, and concentrated in a vacuum with rotator evaporator (Buchi Labortechnik, Switzerland). The concentrated extracts were finally lyophilized to obtain ethanol soluble extractive yield (whole extract, A) of 41.85% of dry weight. For activity guided fractionation, about 5 g of powder was successively extracted through maceration (same conditions as above) with solvents in increasing order of polarity, that is, petroleum ether (B), chloroform (C), acetone (D), ethanol (E) and aqueous (F) having fraction yield (%) of 3.38%, 1.47%, 1.23%, 1.90% and 63.15%, respectively.
High-performance liquid chromatography method development and validation for phenolic acids in whole ethanol extract of Roscoea purpurea tuberPreparation of standards and high‑performance liquid chromatography conditionsThe standard stock solutions (1 mg/mL) of protocatechuic acid, syringic acid, ferulic acid, rutin, apigenin and kaempferol were prepared in HPLC grade methanol and stored at 4°C, until used. Working solutions of lower concentration (0.1 mg/mL) were prepared by appropriate dilution of the stock solutions in methanol.Waters RP‑HPLC‑PDA‑2996 (Waters Corporation, Milford, MA, USA) was used for the qualitative and quantitative analysis of analytes. Chromatographic separation was performed on Supelco C18 column (4.6 mm × 50 mm, 5.0 µm,) with C18 guard column in gradient mode with binary mobile phase, duly filtered through 0.22 µm Millipore filter and degassed ultrasonically for 15 min before delivered to column for separation. Data acquisitions were performed using Empower software version 2 (Waters, Milford, MA 01757, USA). The injection volume was 20 µL for standard and sample. Detection was observed at a maximum wavelength of λ285 nm.
Optimization of methodA RP‑HPLC‑PDA‑2996 (Waters, USA) was used for separation of reference compound on Chromatopak C18 column AQ (4.6 mm × 50 mm, 5.0 µm,) using a gradient mode with 0.1% formic acid in water (A) and pure acetonitrile (B) as mobile phases. Separation of analytes was
Figure 1: Diagrammatic representation of experimental study
SHARAD SRIVASTAVA, et al.: Simultaneous Quantification of Phenols in Roscoea purpurea and their In vitro Cytotoxic Studies
S490 Pharmacognosy Magazine, Oct-Dec 2015, Vol 11, Issue 44 (Supplement 3)
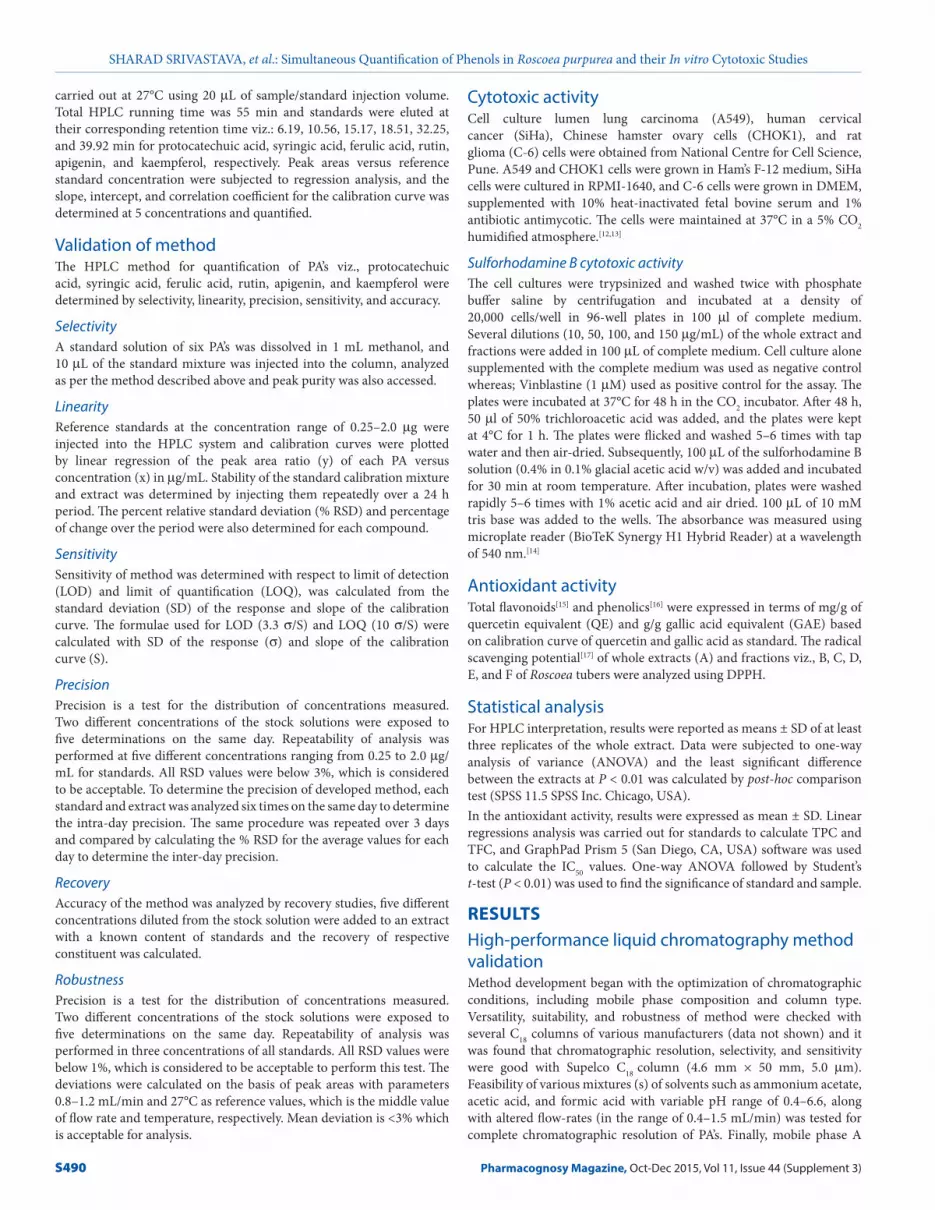
carried out at 27°C using 20 µL of sample/standard injection volume. Total HPLC running time was 55 min and standards were eluted at their corresponding retention time viz.: 6.19, 10.56, 15.17, 18.51, 32.25, and 39.92 min for protocatechuic acid, syringic acid, ferulic acid, rutin, apigenin, and kaempferol, respectively. Peak areas versus reference standard concentration were subjected to regression analysis, and the slope, intercept, and correlation coefficient for the calibration curve was determined at 5 concentrations and quantified.
Validation of methodThe HPLC method for quantification of PA’s viz., protocatechuic acid, syringic acid, ferulic acid, rutin, apigenin, and kaempferol were determined by selectivity, linearity, precision, sensitivity, and accuracy.
SelectivityA standard solution of six PA’s was dissolved in 1 mL methanol, and 10 µL of the standard mixture was injected into the column, analyzed as per the method described above and peak purity was also accessed.
LinearityReference standards at the concentration range of 0.25–2.0 µg were injected into the HPLC system and calibration curves were plotted by linear regression of the peak area ratio (y) of each PA versus concentration (x) in µg/mL. Stability of the standard calibration mixture and extract was determined by injecting them repeatedly over a 24 h period. The percent relative standard deviation (% RSD) and percentage of change over the period were also determined for each compound.
SensitivitySensitivity of method was determined with respect to limit of detection (LOD) and limit of quantification (LOQ), was calculated from the standard deviation (SD) of the response and slope of the calibration curve. The formulae used for LOD (3.3 σ/S) and LOQ (10 σ/S) were calculated with SD of the response (σ) and slope of the calibration curve (S).
PrecisionPrecision is a test for the distribution of concentrations measured. Two different concentrations of the stock solutions were exposed to five determinations on the same day. Repeatability of analysis was performed at five different concentrations ranging from 0.25 to 2.0 µg/mL for standards. All RSD values were below 3%, which is considered to be acceptable. To determine the precision of developed method, each standard and extract was analyzed six times on the same day to determine the intra‑day precision. The same procedure was repeated over 3 days and compared by calculating the % RSD for the average values for each day to determine the inter‑day precision.
RecoveryAccuracy of the method was analyzed by recovery studies, five different concentrations diluted from the stock solution were added to an extract with a known content of standards and the recovery of respective constituent was calculated.
RobustnessPrecision is a test for the distribution of concentrations measured. Two different concentrations of the stock solutions were exposed to five determinations on the same day. Repeatability of analysis was performed in three concentrations of all standards. All RSD values were below 1%, which is considered to be acceptable to perform this test. The deviations were calculated on the basis of peak areas with parameters 0.8–1.2 mL/min and 27°C as reference values, which is the middle value of flow rate and temperature, respectively. Mean deviation is <3% which is acceptable for analysis.
Cytotoxic activityCell culture lumen lung carcinoma (A549), human cervical cancer (SiHa), Chinese hamster ovary cells (CHOK1), and rat glioma (C‑6) cells were obtained from National Centre for Cell Science, Pune. A549 and CHOK1 cells were grown in Ham’s F‑12 medium, SiHa cells were cultured in RPMI‑1640, and C‑6 cells were grown in DMEM, supplemented with 10% heat‑inactivated fetal bovine serum and 1% antibiotic antimycotic. The cells were maintained at 37°C in a 5% CO2 humidified atmosphere.[12,13]
Sulforhodamine B cytotoxic activityThe cell cultures were trypsinized and washed twice with phosphate buffer saline by centrifugation and incubated at a density of 20,000 cells/well in 96‑well plates in 100 µl of complete medium. Several dilutions (10, 50, 100, and 150 µg/mL) of the whole extract and fractions were added in 100 µL of complete medium. Cell culture alone supplemented with the complete medium was used as negative control whereas; Vinblastine (1 µM) used as positive control for the assay. The plates were incubated at 37°C for 48 h in the CO2 incubator. After 48 h, 50 µl of 50% trichloroacetic acid was added, and the plates were kept at 4°C for 1 h. The plates were flicked and washed 5–6 times with tap water and then air‑dried. Subsequently, 100 µL of the sulforhodamine B solution (0.4% in 0.1% glacial acetic acid w/v) was added and incubated for 30 min at room temperature. After incubation, plates were washed rapidly 5–6 times with 1% acetic acid and air dried. 100 µL of 10 mM tris base was added to the wells. The absorbance was measured using microplate reader (BioTeK Synergy H1 Hybrid Reader) at a wavelength of 540 nm.[14]
Antioxidant activityTotal flavonoids[15] and phenolics[16] were expressed in terms of mg/g of quercetin equivalent (QE) and g/g gallic acid equivalent (GAE) based on calibration curve of quercetin and gallic acid as standard. The radical scavenging potential[17] of whole extracts (A) and fractions viz., B, C, D, E, and F of Roscoea tubers were analyzed using DPPH.
Statistical analysisFor HPLC interpretation, results were reported as means ± SD of at least three replicates of the whole extract. Data were subjected to one‑way analysis of variance (ANOVA) and the least significant difference between the extracts at P < 0.01 was calculated by post‑hoc comparison test (SPSS 11.5 SPSS Inc. Chicago, USA).In the antioxidant activity, results were expressed as mean ± SD. Linear regressions analysis was carried out for standards to calculate TPC and TFC, and GraphPad Prism 5 (San Diego, CA, USA) software was used to calculate the IC50 values. One‑way ANOVA followed by Student’s t‑test (P < 0.01) was used to find the significance of standard and sample.
RESULTSHigh-performance liquid chromatography method validationMethod development began with the optimization of chromatographic conditions, including mobile phase composition and column type. Versatility, suitability, and robustness of method were checked with several C18 columns of various manufacturers (data not shown) and it was found that chromatographic resolution, selectivity, and sensitivity were good with Supelco C18 column (4.6 mm × 50 mm, 5.0 µm). Feasibility of various mixtures (s) of solvents such as ammonium acetate, acetic acid, and formic acid with variable pH range of 0.4–6.6, along with altered flow‑rates (in the range of 0.4–1.5 mL/min) was tested for complete chromatographic resolution of PA’s. Finally, mobile phase A

SHARAD SRIVASTAVA, et al.: Simultaneous Quantification of Phenols in Roscoea purpurea and their In vitro Cytotoxic Studies
Pharmacognosy Magazine, Oct-Dec 2015, Vol 11, Issue 44 (Supplement 3) S491
comprising 0.1% formic acid in water and B was pure acetonitrile were selected, and conditions were as follows: Eluent A; eluent B; gradient, 0–30 min (5–25% B) at 0.80 mL/min flow rate, 30–40 min (25–45% B) at 0.90 mL/min flow rate, 45–50 min (50–40% B) at 0.90 mL/min, 45–
50 min (40–20% B) at 1.0 mL/min 50–55 min (20–5% B) at 1.2 mL/min flow rate, and then equilibrated with 8% B for 10 min at 1.0 mL/min flow rate.A typical HPLC chromatogram of the standard and extract is shown in Figures 2 and 3. The identification of PA’s was based on a comparison of retention times and UV spectra of reference standards with the corresponding peaks in the extract [Figure 4]. The retention time (Rt) for standards were obtained according to the optimized method as described in experimental section. Peak purity was accessed by PDA data at λ285 nm and purity factor obtained for extract reveals the presence of pure peak without contamination of other co‑eluting compounds. Quantification of PA compounds ranges from 0.064% to 0.528% [Table 1] in triplicate.The HPLC quantification method for PA’s was validated, and all the included parameters are within the specified limit [Table 2]. The selectivity validation of method is well demonstrated by the excellent separation of analytes in reference mixture and as explained above, the peak purity was also good; it indicates that there is no merging of any unidentified peak with known identified PA (analyte), and thus confirms the selectivity of method. Standard solutions of PA’s in methanol showed a linear correlation between the peak area and concentration, correlation coefficient was found to be satisfactory while plotting of calibration for standards. To estimate the stability, % RSD of standard mixture and extract was calculated and results (not more than 3%) shows that the analytical solutions are stable for duration of 24 h at a temperature of 4ºC in autosampler unit. Value of correlation coefficient for protocatechuic acid, vanillic acid, ferulic acid, apigenin, and kaempferol indicates good linearity [Figure 5]. LOD and LOQ values depict that method is sensitive [Table 2]. A fixed concentration of extract was used to access the precision and accuracy of method, inter and intra‑day RSD (%) indicate the values within the limit range (not more than 5%) as shown in Table 3. Recovery studies of PA’s, as shown in Table 4, vary from 97.40% to 104.05%, respectively. The observed values are within the specified limit (95–105%) and hence the method was found to be accurate, precise, and reproducible. To the best of our knowledge and available literature, this is first reporting on the development of a simple, rapid, and sensitive method on quantification of protocatechuic acid, vanillic acid, ferulic acid, rutin, apigenin, and kaempferol in whole extract of R. purpurea tubers. The outcome supports the evidence that developed method is accurate and reproducible in specified conditions for quantification of targeted PA’s.
Cytotoxic activity of whole extract and fraction (s)In vitro cytotoxicity was carried out against four different cell lines viz., A549, SiHa, CHOK1, and C‑6 cells at 10, 50, 100, and 150 µg/mL,
Figure 4: Ultraviolet spectra of reference standard (a) protocatechuic acid (b) syringic acid (c) ferulic acid (d) rutin (e) apigenin, and (f ) kaempferol in whole extract of Roscoea purpurea rhizome
ba
dc
fe
Figure 2: High-performance liquid chromatography-ultraviolet photodiode array detector chromatograms of standards
Figure 3: High-performance liquid chromatography-ultraviolet photodiode array detector chromatograms of whole extract of Roscoea purpurea rhizome
Table 1: RP-HPLC quantification of phenol acids in whole extract of Roscoea purpurea rhizomes
Standard Retention time (min) Concentration* (%)Proto catechuic acid 6.196 0.077±0.01Syringic acid 10.563 0.064±0.01Ferulic acid 15.173 0.265±0.05Rutin 18.510 1.125±0.01Apigenin 32.252 0.128±0.01Kaempferol 39.926 0.528±0.05
*Values are Mean±S.D. RP‑HPLC: Reverse phase‑ High performance liquid chromatography

SHARAD SRIVASTAVA, et al.: Simultaneous Quantification of Phenols in Roscoea purpurea and their In vitro Cytotoxic Studies
S492 Pharmacognosy Magazine, Oct-Dec 2015, Vol 11, Issue 44 (Supplement 3)
respectively. The percentage of cellular growth inhibition was calculated by measuring the absorbance of respective incubated cells [Table 5]. Potential activity was observed in the whole extracts against the tested cell lines exhibiting IC50 value of <10, 49.5, 83.8, and 141.6 µg/mL against A549, SiHa, C‑6, and CHOK1, respectively. These interesting results, lead to the idea of fractionating the phytomolecules present in the whole extract on the basis of solvent polarity for identification of the nature of molecules responsible for targeted bioactivity. Data reveals that all the tested fractions exhibit dose‑dependent cytotoxicity against the cell lines. Among them fraction B exhibit the highest activity (69.1 ± 0.6 and
60.5 ± 1.5) on SiHa and CHOK‑1 cells at concentration of 100 and 150 µg/mL, respectively, and C showed the highest activity (62.4 ± 1.0) on A549 cells at a concentration of 100 µg/mL. However, the activity against C‑6 cells is similar in B and C fractions [Table 5].The IC50 of tested fractions ranges between < 10 and > 150 µg/mL [Table 6]. In a nutshell, from above preliminary cytotoxic activity, it was observed that whole extract of Roscoea exhibits promising effect and after fractionation, the potentiation of action reduces and variable responsible was observed. The underlying mechanism of action was not clearly known and may be suspected due to the synergistic effect of PA’s with other bioactive metabolites in whole extract. Although fractionation results in segregation of metabolites, and thus the differential response was achieved. Previously, workers had reported the cytotoxic/anti‑cancerous activity of pure PA’s which are identified in the whole extract of Roscoea also. The preventive effect of apigenin in chemotherapy is also established.[18] Further studies in near future will reveal the precise cellular and molecular mechanisms induced by the extract. The inhibitory effect of natural PA’s in carcinogenesis and tumor growth may be through two main mechanisms: (1) Modifying the redox status and (2) interfering with basic cellular functions (cell cycle, apoptosis, inflammation, angiogenesis, invasion, and metastasis) and both the action are mediated through their ability to scavenge the reactive oxygen
Figure 5: Calibration curve of phenolic acids (a) protocatechuic acid (b) syringic acid (c) ferulic acid (d) rutin (e) apigenin, and (f ) kaempferol in whole extract of Roscoea purpurea rhizome
dc
b
f
a
e
Table 2: Validation parameters for HPLC analysis of Protocatechuic acid, Syringic acid, Ferulic acid, Rutin, Apigenin and Kaempferol
Standard* Calibration curve correlation coefficient (r2)
LOD (µg)
LOQ (µg)
Protocatechuic acid y=977338 x+35447 0.9999 0.029 0.097Syringic acid y=4E+06 x ‑ 96038 0.9993 0.067 0.225Ferulic acid y=2E+06 x+241311 0.9995 0.076 0.254Rutin y=571390 x+97.63 0.9988 0.086 0.289Apigenin y=2E+06 x+136560 0.9999 0.028 0.094Kaempferol y=1E+06 x+84378 0.9987 0.090 0.303
*Mean±S.D (n=5). HPLC: High performance liquid chromatography; LOD: Limit of detection; LOQ: Limit of quantification

SHARAD SRIVASTAVA, et al.: Simultaneous Quantification of Phenols in Roscoea purpurea and their In vitro Cytotoxic Studies
Pharmacognosy Magazine, Oct-Dec 2015, Vol 11, Issue 44 (Supplement 3) S493
Table 3: Inter day and Intraday precision table of standard compounds
Standards Inter day precision
(n=5), Mean % RSD
Intraday precision (n=5), Mean % RSD
TRa PA
b Day one Day two Day threeProtocatechuic acid
0.13 0.14 TR1 PA
1 TR2 PA
2 TR3 PA
3
Syringic acid 0.12 0.12 0.22 0.38 0.29 0.46 0.19 0.55Ferulic acid 0.19 0.18 0.25 0.37 0.28 0.41 0.18 0.69Rutin 0.13 0.22 0.29 0.32 0.28 0.47 0.17 0.45Apigenin 0.13 0.13 0.20 0.31 0.27 0.54 0.20 0.87Kaempferol 0.13 0.13 0.20 0.22 0.27 0.67 0.20 0.78
TR: Retention time of analyte; PA: Peak area response; 1Day one, 2Day two, 3Day three
Table 4: Recovery studies (%) of phenol acids in Roscoea purpurea
Amount of Protocatechuic acid in sample (ng)
Calculated amount of Protocatechuic acid (ng)
Analyzed Protocatechuic acid (ng) Recovery (%) RSD%
77 77 78 101.2977 97 99 102.0677 117 119 101.17 2.0977 127 124 97.6377 157 162 103.31Amount of Syringic acid in sample (ng) Calculated amount of Vanillic acid (ng) Analyzed Vanillic acid (ng)64 64 65 101.5664 74 77 98.4864 104 102 104.05 2.7764 154 150 97.4064 194 199 102.57Amount of Ferulic acid in sample (ng) Calculated amount of Ferulic acid (ng) Analyzed Ferulic acid (ng)265 265 269 101.50265 295 299 101.35265 325 333 102.46 1.13265 365 364 99.72265 465 477 102.58Amount of Rutin in sample (ng) Calculated amount of Apigenin (ng) Analyzed amount of Apigenin (ng)1125 1125 1129 100.351125 1525 1520 99.671125 2025 2020 99.75 0.391125 2525 2538 100.511125 3025 3018 99.76Amount of Apigenin in sample (ng) Calculated amount of Kaempferol (ng) Analyzed amount of Kaempferol (ng)128 178 174 99.75128 228 230 100.87128 278 283 101.79 0.72128 328 330 100.60128 378 381 100.79Amount of Kaempferol in sample (ng) Calculated amount of Kaempferol (ng) Analyzed amount of Kaempferol (ng)528 528 531 100.56528 628 629 100.15528 728 732 100.54 0.33528 928 926 99.78528 1028 1033 100.48
species/free radicals at one or other steps of cancer pathology. The study, however, needs to be extended further on SAR and QSAR lineage to depict the mode of action of the compound responsible for same.[19]
Antioxidant potentialPresence of natural phenolic and flavonoid moiety in the plants serves as an indicator of their free radical scavenging activity and quantification of
the same can be useful in accessing the antioxidant capacity of species. Total flavonoid content (TFC) and total phenolic content (TPC) were significantly (P < 0.01) rich in whole extract of Roscoea, that is, 26.78 mg/g QE and 3.03 g/g GAE, respectively. After fractionation, flavonoid content decreases in order of F fraction and then E, D, B, and C fractions having 9.15, 1.71, 1.39, 0.27, and 0.216 mg/g QE, respectively. Phenolic content was also highest in F (0.565 g/g GAE) fraction, followed by D (0.135 g/g GAE), E (0.106 g/g GAE), C (0.100 g/g GAE), and B (0.040 g/g GAE).Bioactive PA’s are the class of compounds that effectively inhibits free radicals because of their scavenging activity and therapeutically beneficial as they are common underlying cause of several disorders viz., cardiovascular, diabetes, aging, arthritis, cancer, and inflammatory disorders, etc.[20] Thus, in order to estimate the radical scavenging effect of the whole extract and fractions, DPPH radical was used. Data show that activity varied considerably among the whole extract and fractions of tubers [Figure 6] when compared to standard reference viz., ascorbic acid, quercetin, and rutin. In standards, maximum inhibition of free radicals was observed in ascorbic acid (77.57%, IC50: 3.86 ± 0.057 µg/mL), followed by quercetin (72.43%, IC50: 5.93 ± 0.115 µg/mL), and rutin (71.48%, IC50: 6.80 ± 0.173 µg/mL). Whole extract exhibits IC50 at 0.925 ± 0.005 mg/mL. Among the Roscoea fractions, inhibition of radicals varies from 5.2% to 83.21% [Figure 6]. Fraction C possesses significant IC50 value at 25 mg/mL [Table 7].

SHARAD SRIVASTAVA, et al.: Simultaneous Quantification of Phenols in Roscoea purpurea and their In vitro Cytotoxic Studies
S494 Pharmacognosy Magazine, Oct-Dec 2015, Vol 11, Issue 44 (Supplement 3)
Figure 6: 2,2-diphenyl-1-picrylhydrazyl radical scavenging activity of Roscoea whole extract and fractions
extracts may be suspected due to the synergistic effect of PA’s with other phytomolecules present in the extracts. However, fractionation leads to segregation of phytochemicals, and thus the activity response reduced prominently. The radical scavenging potential of the whole extract and fractions are well reflected by TPC, TFC, and DPPH assays.The work is novel as this is the first ever report on simultaneous identification and quantification of PA’s in the species, in addition to this cytotoxic potential of identified PA’s was not reported yet. we summarized that R. purpurea (whole extract and fractions) revealed significant efficacy in cytotoxic activity with potentiality of scavenging free radicals due the presence of six bioactive PA’s as reported via RP‑HPLC‑UV PDA validated method.
AcknowledgmentThe authors thankfully acknowledge the Directors of CSIR‑NBRI, Lucknow (UP) and CSIR‑IHBT, Palampur, Himachal Pradesh, India, for continuous support and for providing necessary facilities during the course of the experiment.
Financial support and sponsorship Nil.
Conflicts of interestThere are no conflicts of interest.
REFERENCES1. Handa N. Flora of India; 1980. Available from: http://www.arvindguptatoys.com/arvindgupta/
nimrethanda.pdf. [Last accessed on 2014 Oct 12].
2. Singh G, Rawat GS. Ethnomedicinal survey of Kedarnath wildlife sanctuary in Western
Himalaya, India. Indian J Fundam Appl Life Sci 2011;1:35‑6.
3. Singh AP. Ashtavarga – Rare medicinal plants. Ethnobotanical Lealf 2006;10:104‑8.
4. Sahu MS, Mali PY, Waikar SB, Rangari VD. Evaluation of immunomodulatory potential of
ethanolic extract of Roscoea procera rhizomes in mice. J Pharm Bioallied Sci 2010;2:346‑9.
5. Bairwa R, Basyal D, Srivastav B. Study of antidiabetic and hypolipidemic activity of Roscoea
purpurea (Zingiberaceae). Int J Inst Pharm Life Sci 2012;2:130‑7.
6. Middleton E Jr, Kandaswami C, Theoharides TC. The effects of plant flavonoids on
mammalian cells: Implications for inflammation, heart disease, and cancer. Pharmacol Rev
2000;52:673‑751.
7. Galati G, Teng S, Moridani MY, Chan TS, O’Brien PJ. Cancer chemoprevention and apoptosis
mechanisms induced by dietary polyphenolics. Drug Metabol Drug Interact 2000;17:311‑49.
8. Yang CS, Landau JM, Huang MT, Newmark HL. Inhibition of carcinogenesis by dietary
polyphenolic compounds. Annu Rev Nutr 2000;2:381‑6.
Table 5: Cytotoxicity exhibited by whole extract and fractions of R. purpurea (rhizomes) against different cells by SRB assay
R. purpurea Concentration Cell lines for cyto toxic activity
A549 SiHa C‑6 CHOK1A (μg/ml) 10 51.1±3.6 29.1±2.1 21.9±2.9 20.6±3.4
50 59.0±2.2 50.1±2.3 26.4±4.1 34.3±3.7100 60.1±1.7 63.7±3.1 61.3±1.5 41.6±4.9150 55.5±4.0 68.7±3.1 64.4±4.0 51.7±1.9
B (μg/ml) 10 45.3±3.3 34.4±3.0 21.3±0.6 27.8±4.550 51.8±2.9 53.8±0.4 51.2±2.9 41.6±3.6
100 54.4±0.8 69.1±0.6 57.5±2.4 48.5±4.4150 50.6±3.3 65.9±2.2 60.8±1.0 60.5±1.5
C (μg/ml) 10 47.1±3.4 33.3±4.7 30.7±2.7 29.6±1.950 55.3±0.5 56.9±1.6 62.0±4.6 36.3±2.6
100 48.2±2.9 63.5±1.1 61.8±3.8 39.6±3.1150 39.4±2.3 52.6±1.8 60.4±4.8 43.6±4.9
D (μg/ml) 10 49.3±1.2 25.2±3.6 26.7±2.4 19.7±0.650 59.9±0.8 31.5±2.2 24.9±1.0 26.4±2.0
100 62.4±1.0 35.3±2.3 22.3±1.8 34.4±3.9150 57.3±4.4 40.6±1.3 25.3±4.1 35.8±4.2
E (μg/ml) 10 51.9±1.2 28.4±1.6 26.0±2.1 20.1±2.550 61.9±3.1 33.6±3.7 27.2±1.4 26.8±4.0
100 61.0±2.1 28.1±1.9 21.4±2.0 26.4±0.8150 56.2±3.7 30.7±3.8 22.1±4.8 32.3±2.8
F (μg/ml) 10 51.1±3.5 11.4±3.7 16.6±4.4 12.3±4.650 59.0±2.2 35.8±1.2 20.1±2.3 18.8±1.6
100 60.1±1.3 25.7±2.1 23.5±4.0 22.5±0.6150 55.5±3.8 21.8±3.9 13.8±3.7 26.9±0.5
Vinblastin (μM) 1 67.6±1.3 63.5±1.6 90.5±2.5 60.5±3.1Mean±S.D (n=3). CHOK1: Chinese hamster ovary cells; SRB: Sulforhodamine B
Table 6: IC50 value of whole extract (A) and fractions (B, C, D, E and F) of Roscoea rhizomes against A549, SiHa, C-6 and CHOK1 cells in µg/ml
Cell line* A B C D E FA549 <10 38.9 24.1 12.6 <10 13.4SiHa 49.5 42.2 38.3 >150 >150 >150C‑6 83.8 48.4 34.7 >150 >150 >150CHOK1 141.6 106.2 >150 >150 >150 >150
*Values are mean (n=3)
Table 7: IC50 value of R. purpurea whole extracts and fractions in DPPH radical scavenging assay
R. purpurea IC50 (mg/ml)*Crude extract (A) 0.925±0.005Fraction B 1.25±0.005Fraction C 0.25±0.005Fraction D 0.48±0.005Fraction E 0.77±0.011Fraction F 1.04±0.005
*Values are mean±S.D (n=3). DPPH: 1 1 diphenyl 2 picrylhydrazyl
CONCLUSIONHPLC method developed for simultaneous quantification of six PA’s reveals the presence of protocatechuic acid, syringic acid, ferulic acid, rutin, apigenin, and kaempferol in a concentration range of 0.064–1.125%. It is evident that the developed protocol is accurate and reproducible under specified conditions and can be utilized as a quality control method for quantification of PA’s marker in the species. On the basis of data from preliminary cytotoxic study of whole extract, significant results have been noticed against various cell lines viz., A549, SiHa, CHOK1, and C‑6 cells, and thus may be explored as a source of cytotoxic agent. The observed above activity response of whole

SHARAD SRIVASTAVA, et al.: Simultaneous Quantification of Phenols in Roscoea purpurea and their In vitro Cytotoxic Studies
Pharmacognosy Magazine, Oct-Dec 2015, Vol 11, Issue 44 (Supplement 3) S495
ABOUT AUTHORS
Dr. Sharad Srivastava, is Principal Scientist in Pharmacognosy Division at CSIR‑National Botanical Research Institute; Lucknow, INDIA. He has made significant contributions to quality control of crude drugs/products, chemotaxonomy, bio‑prospection and natural product development and have developed quality parameters of single crude drugs (more than 70 medicinal plants) and also identified biomarkers for their quality control. He has contributed 30 monographs of single herbal drugs in Ayurvedic Pharmacopoeia of India. He has 110 publications in peer reviewed journals, 17 patents and developed some technologies/formulations, few has already been transferred to industry.
Ms. Ankita Misra is working as a Research Associate in Pharmacognosy Division at CSIR‑National Botanical Research Institute; Lucknow, INDIA. She is working in the area of analytical chemistry on medicinal plants, chemotaxonomy, bio‑prospection and natural product developemnt, handling major analytical instruments including HPLC, HPTLC, OPLC and column chromatography for quality control of herbal drugs. She has 11 publications in peer reviewed journals and 1 patent is also to her credit.
Dr. Sharad Srivastava Ms. Ankita Misra
9. Seeram NP, Adams LS, Zhang Y, Lee R, Sand D, Scheuller HS, et al. Blackberry, black
raspberry, blueberry, cranberry, red raspberry, and strawberry extracts inhibit growth and
stimulate apoptosis of human cancer cells in vitro. J Agric Food Chem 2006;54:9329‑39.
10. Damianaki A, Bakogeorgou E, Kampa M, Notas G, Hatzoglou A, Panagiotou S, et al. Potent
inhibitory action of red wine polyphenols on human breast cancer cells. J Cell Biochem
2000;78:429‑41.
11. Kampa M, Hatzoglou A, Notas G, Damianaki A, Bakogeorgou E, Gemetzi C, et al. Wine
antioxidant polyphenols inhibit the proliferation of human prostate cancer cell lines. Nutr
Cancer 2000;37:223‑33.
12. Walia M, Mann TS, Kumar D, Agnihotri VK, Singh B. Chemical composition and in vitro
cytotoxic activity of essential oil of leaves of Malus domestica growing in Western
Himalaya (India). Evid Based Complement Alternat Med 2012;2012:649727.
13. Parashar G, Parashar NC, Capalash N. Curcumin causes promoter hypomethylation and
increased expression of FANCF gene in SiHa cell line. Mol Cell Biochem 2012;365:29‑35.
14. Katoch D, Kumar D, Sharma U, Kumar N, Padwad YS, Lal B, et al. Zephgrabetaine: A new
betaine‑type amaryllidaceae alkaloid from Zephyranthes grandiflora. Nat Prod Commun
2013;8:161‑4.
15. Ordonez AA, Gomez JD, Vattuone MA, Isla MI. Antioxidant activities of Sechium edule (Jacq.)
swart extracts. Food Chem 2006;97:452‑8.
16. Bray HG, Thorpe WV. Analysis of phenolic compounds of interest in metabolism. Methods
Biochem Anal 1954;1:27‑52.
17. Liyana‑Pathirana CM, Shahidi F. Antioxidant activity of commercial soft and hard
wheat (Triticum aestivum L.) as affected by gastric pH conditions. J Agric Food Chem
2005;53:2433‑40.
18. Patel D, Shukla S, Gupta S. Apigenin and cancer chemoprevention: Progress, potential and
promise (review). Int J Oncol 2007;30:233‑45.
19. Dai J, Mumper RJ. Plant phenolics: Extraction, analysis and their antioxidant and anticancer
properties. Molecules 2010;15:7313‑52.
20. Tripathi KD. Essentials of Medical Pharmacology. 4th ed. (reprint). India: Jaypee Brothers
Medical Publishers (P) Ltd.; 2004.