Embed Size (px)
Citation preview

Characterization of binding mechanisms and mobility of
metals and metalloids under the influence of increased
carbon dioxide in mofette soils
Dissertation
zur Erlangung des akademischen Grades
einer Doktorin der Naturwissenschaften (Dr. rer. nat.)
an der Fakultät für Biologie, Chemie und Geowissenschaften
der Universität Bayreuth
vorgelegt von:
Judith Mehlhorn
(MSc. Geoökologie)
geboren in Gera
Bayreuth, November 2018


III
Die vorliegende Arbeit wurde in der Zeit von Oktober 2014 bis November 2018 in Bayreuth am
Lehrstuhl Umweltgeochemie unter Betreuung von Frau Professorin Dr. Britta Planer-Friedrich
angefertigt.
Vollständiger Abdruck der von der Fakultät für Biologie, Chemie und Geowissenschaften der
Universität Bayreuth genehmigten Dissertation zur Erlangung des akademischen Grades einer
Doktorin der Naturwissenschaften (Dr. rer. nat.).
Dissertation eingereicht am: 15.11.2018
Zulassung durch die Promotionskommission: 05.12.2018
Wissenschaftliches Kolloquium: 08.02.2019
Amtierender Dekan: Prof. Dr. Stefan Peiffer
Prüfungsausschuss:
Prof. Dr. Britta Planer-Friedrich (Gutachterin)
Prof. Dr. Thilo Rennert (Gutachter)
Prof. Dr. Martin Obst (Vorsitz)
Prof. Dr. Egbert Matzner


V
ACKNOWLEDGEMENTS
First of all, I would like to thank my doctoral advisor Prof. Dr. Britta Planer-Friedrich for giving me
the opportunity to continue my work on metal(loid)s in mofette soils after my master thesis. I am
sincerely grateful for her constant and intense scientific support, especially, for the numerous helpful
discussions and for the guidance I received during this work. Furthermore, I would like to thank her
for the various opportunities to broaden my scientific horizon, also beyond the topic of my PhD thesis,
by enabling me the participation in sampling campaigns, field trips, and scientific conferences.
I acknowledge financial support from the German Academic Scholarship Foundation for a three-year
PhD stipend and the financial support from University of Bayreuth Graduate School for a three-month
‘Feuerwehrfonds’ as well as for travel grants to the EuCheMS conference 2014 in Istanbul and to the
Goldschmidt Conference 2015 in Prague.
Special thanks also go to my collaborators. For their support with XAS data collection and
interpretation as well as for their helpful contributions to the manuscript on copper in mofettes, I
would like to thank Prof. Dr. Ruben Kretzschmar from ETH Zürich, Prof. Dr. Jon Petter Gustafsson
from SLU Uppsala, my colleague Johannes Besold, and Dr. Juan Lezama Pacheco from Stanford
University. I am grateful to Prof. Dr. Andreas Kappler and Dr. James Byrne from Tübingen University
for conducting Mössbauer spectroscopy and for their helpful contributions to the manuscript on short-
term mobilization processes in mofettes.
Many thanks of course go to all my present and former colleagues from the Environmental
Geochemistry Group, who accompanied me during my PhD. I am especially grateful to Dr. Regina
Lohmayer, Dr. Sinikka Hinrichsen, Dr. Maria Ullrich, Dr. Julia Arndt, Carolin Kerl, Johannes Besold,
Dr. Jörg Schaller, and Dr. Samer Bachmaf for their support and helpful advices as well as for their
interest in my work. Thanks go to Stefan Will for assistance with ICP-MS analyses. I would also like
to thank my supervised bachelor students Rouven Metz and Lukas Gerber as well as my Hiwis Nadja
Knauer, Esther Breuninger, and Kai Jansen for their great cooperation.
I acknowledge helpful discussions with Prof. Dr. Egbert Matzner, Prof. Dr. Martin Obst, and Prof. Dr.
Marcus Horn.
Furthermore, I am sincerely grateful to the numerous people, who contributed to this work by
providing equipment or access to instruments, conducting analyses, or helping with data interpretation,
namely, Dr. Benjamin Gilfedder, Silke Hammer, Martina Rohr, Jutta Eckert, and Heidi Zier from the
Hydrology Department, the staff from the Geo workshop, Dorothea Wiesner and Dr. Tiziana Boffa
Ballaran from BGI, Dr. Oliver Schmidt, Ralf Mertens, and Anita Gossner from ÖMIK, Beate Bojer
from AC III, Dr. Stefan Schwarz and Anna-Maria Dietel from AC II, Manfred Fischer from

Acknowledgements
VI
Geomorphology, Prof. Dr. Ruth Freitag and Nicolas Weithmann from Process Biotechnology, Helga
Rupp, and the staff from SSRL. I also thank Prof. Dr. Andreas Kappler, Dr. Tina Gauger, Wiebke
Ruschmeier, and Dominik Wimmer for providing microbial cultures and for help with their
cultivation. Furthermore, I would like to thank everyone, who participated in the 2014 drilling
campaign in Czech Republic, even if the obtained data were unfortunately not coherent enough to be
included in this thesis. Special thanks go to Dr. Horst Kämpf from the GFZ Potsdam for organizing
this drilling campaign, as well as to Dr. Jörg Schaller and Benedikt Werner for their help with the
collection and stabilization of samples.
For proof-reading, I am thankful to Dr. Regina Lohmayer, Dr. Boris Plüschke, and Dr. Daniel Forberg.
Last but not least, I would like to thank my family, especially my parents and my partner, who always
motivated me and helped me to overcome hard times. Without your support this would not have been
possible.

VII
ABSTRACT
Mofettes are natural exhalation sites of geogenic carbon dioxide (CO2), which mainly occur in
seismically active regions. Soil conditions at such sites are strongly influenced by extreme CO2 partial
pressure. The soil is anoxic up to the surface and CO2 dissolution in pore water causes soil
acidification. Formation of pedogenic iron (oxyhydr)oxides is inhibited and decomposition of organic
material is decelerated in such soils leading to accumulation of poorly degraded soil organic matter
(SOM). These changes in soil conditions can affect metal(loid) binding mechanisms and thus the
mobility of metal(loid)s in soil. Carbon dioxide triggered mobilization may become dangerous if large
amounts of potentially toxic metal(loid)s are mobilized into aquifers, while immobilization can
constitute a risk for plants and soil organisms by limitation of essential trace elements.
The aim of the present thesis was to investigate CO2-induced changes in binding processes and the
mobility of several (trace) metal(loid)s. Besides aluminum (Al), cadmium (Cd), cobalt (Co),
chromium (Cr), nickel (Ni), and zinc (Zn), special attention was payed to the elements iron (Fe),
arsenic (As), manganese (Mn), and copper (Cu). The studied mofette site is located in the Cheb Basin
in northwestern Czech Republic.
In a first study, the spatial distribution of the mentioned metal(loid)s around a main degassing feature
of the mofette site was investigated both for soil and pore water. Sequential extraction of selected soil
samples was used to assign distinct groups of metal(loid) binding. The spatial distribution and
mobility of Fe and As were mainly determined by the presence of Fe (oxyhydr)oxides, which could
form as soon as traces of oxygen were available. Aluminum and Cr were predominantly incorporated
into aluminosilicates and showed almost no mobilization. Depletion around the main degassing center
could be explained by decreased mineral contents due to SOM accumulation. The metals Co, Mn, and
Ni were depleted within the whole CO2-influenced area due to release from increased weathering of
silicates and leaching, following long-term CO2-induced soil acidification. The only elements that
showed enrichment directly in the degassing center were Cd, Cu, and Zn. Effective sequestration of
these chalcophilic metals was attributed to the formation and (co-)precipitation of sulfidic minerals.
The highest metal(loid) pore water concentrations correlated with dissolved organic carbon
concentrations and were observed close to the degassing center for Al, As, Cr, Cu, Fe, and Zn. Due to
anoxic conditions, poorly degraded, easily mobilized SOM accumulates in mofettes. Complexation
with dissolved organic matter (DOM) prevents re-adsorption and leads to increased mobility of these
metal(loid)s.
In a second study, short-term mobilization processes of Fe, As, Mn, and Cu following CO2 intrusion
into a hitherto non-CO2-influenced soil were studied in laboratory batch experiments, using non-CO2-
influenced soil from close vicinity of the mofette. Fast, abiotic mobilization of metal cations (shown

Abstract
VIII
for Mn) occurred due to surface protonation, however, overall mobilization remained low. After
depletion of other electron acceptors, microbially triggered reductive dissolution of Fe
(oxyhydr)oxides began, mobilizing large amounts of Fe and incorporated metal(loid)s like As.
In a last study, Cu mobility was investigated both by studying a transect over the mofette site and by
conducting a Cu-spike experiment with natural, SOM-rich topsoil from this transect. Sorption
isotherms for Cu were determined and Cu solid-phase speciation was investigated using X-ray
absorption spectroscopy. Copper mobility was highest in soils from the transition between oxic
(reference) and anoxic (mofette) conditions, while strong Cu sequestration and high adsorption
coefficients were determined for soil from the degassing center. Solid-phase speciation revealed that
Cu reduction and precipitation of Cu sulfides was the main sequestration process in the permanently
anoxic degassing center. In transition and reference soils, Cu binding to SOM was the dominating
process. The lower degradation state of SOM in the mofettes has a negative effect on SOM stability,
which could be seen by an increasing dissolved-to-solid-phase ratio of organic carbon with increasing
CO2. Thus, also Cu mobility increased with increasing CO2 influence since Cu both complexed with
DOM and solid-phase SOM. Mobility was highest in some meters distance from the degassing center,
where micro-oxic conditions prevented Cu sulfide precipitation.
Overall, both metal(loid) mobilization and immobilization were found to occur in CO2-influenced
soils, necessitating risk assessment with regard to potential ground water contamination or trace
element limitations at such sites. Desorption and mineral dissolution are the main mobilization
processes while sulfide mineral precipitation of chalcophilic metals is the main immobilizing process
in mofette soils. Carbon dioxide influence on these processes is primarily indirect, via soil
acidification and creation of anoxic conditions. Fast metal(loid) mobilization via desorption and
reductive dissolution of Fe (oxyhydr)oxides are dominating processes on a short-term scale. Ongoing
CO2 exhalation will induce further metal(loid) release via silicate weathering and subsequent leaching.
The highest mobilization risk on a long-term scale arises from metal(loid) complexation with DOM,
which can exhibit strongly elevated concentrations close to the degassing center.

IX
ZUSAMMENFASSUNG
Mofetten sind natürliche Austrittsstellen von geogenem Kohlenstoffdioxid (CO2). Sie treten vor allem
in seismisch aktiven Regionen auf. Die extremen CO2-Konzentrationen beeinflussen maßgeblich die
Bodenbedingungen, die um Mofetten herum herrschen. So ist der Boden bis an die Oberfläche
anoxisch und CO2-Lösung im Porenwasser bewirkt eine fortschreitende Bodenversauerung. Die
Bildung pedogener Eisen(oxyhydr)oxide ist in Mofettenböden ebenso gehemmt wie die
Streuzersetzung, was zur Anreicherung von organischer Bodensubstanz (SOM) führt. All diese
Änderungen der Bodenbedingungen können sich maßgeblich auf Bindungsmechanismen und somit
auf die Mobilität von Metall(oid)en auswirken. Eine CO2-induzierte Mobilisierung kann gefährlich
werden, wenn potenziell toxische Metall(oid)e ins Grundwasser gelangen, wohingegen eine
Immobilisierung essenzieller Spurenelemente ein Risiko für Pflanzen und Bodenorganismen darstellt.
Ziel der vorliegenden Arbeit war es, CO2-induzierte Änderungen in den Bindungsmechanismen und
der Mobilität einiger ausgewählter Metal(oid)e zu untersuchen. Neben Aluminium (Al), Cadmium
(Cd), Kobalt (Co), Chrom (Cr), Nickel (Ni) und Zink (Zn) wurde ein besonderes Augenmerk auf die
Elemente Eisen (Fe), Arsen (As), Mangan (Mn) und Kupfer (Cu) gelegt. Das untersuchte
Mofettengebiet befindet sich im Egerbecken im Nordwesten der Tschechischen Republik.
In einer ersten Studie wurde die räumliche Verteilung der genannten Metall(oid)e um eine CO2-
Entgasungsstelle sowohl für die Bodenfestphase als auch im Porenwasser untersucht. Mit Hilfe einer
sequenziellen Extraktion konnten einzelne Fraktionen verschiedenen Bindungsmechanismen
zugeordnet werden. Die räumliche Verteilung der Fe- und As-Gehalte war vor allem an das
Vorhandensein von Eisen(oxyhxdr)oxiden gebunden, welche sich überall dort bilden konnten, wo
Spuren von Sauerstoff verfügbar waren. Aluminium und Cr waren überwiegend in Form von
Aluminosilikaten gebunden und zeigten kaum Mobilisierung. Die niedrigen Gehalte rund um das
Entgasungszentrum waren hauptsächlich auf einen niedrigeren Gesamtmineralgehalt aufgrund der
SOM-Anreicherung zurückzuführen. Die Bodengehalte von Co, Mn und Ni waren im gesamten CO2-
beeinflussten Bereich deutlich erniedrigt. Diese Metalle wurden vermutlich durch die CO2-induzierte
Bodenversauerung und die dadurch deutlich beschleunigte Silikatverwitterung freigesetzt und aus dem
Bereich der Mofette ausgewaschen. Cadmium, Cu und Zn waren die einzigen Elemente, die im
Entgasungszentrum angereichert wurden. Die effektive Festlegung dieser chalkophilen Elemente
konnte auf die Bildung und (Mit-)Fällung von Sulfidmineralen zurückgeführt werden. Die höchsten
Metall(oid)-Konzentrationen im Porenwasser wurden in unmittelbarer Nähe zum Entgasungszentrum
für die Elemente Al, As, Cr, Cu, Fe und Zn beobachtet und korrelierten mit dem gelösten organischen
Kohlenstoff. Aufgrund der anoxischen Bedingungen reichert sich nur gering zersetzte organische
Substanz in den Mofetten an, welche leicht in die Flüssigphase mobilisiert werden kann. Eine

Zusammenfassung
X
Komplexierung der genannten Metall(oid)e mit gelöster organischer Substanz (DOM) kann eine
Adsorption verhindern und die Mobilität der Metall(oid)e erhöhen.
In einer zweiten Studie wurden Kurzzeit-Mobilisierungsprozesse für Fe, As, Mn und Cu untersucht,
die unmittelbar nach einer CO2-Freisetzung in einen bis dahin nicht CO2-beeinflussten Boden
auftreten können. Dafür wurden Batchversuche mit einem CO2-unbeeinflussten Boden aus
unmittelbarer Nähe zur Mofette durchgeführt. Zunächst war die schnelle, abiotische Mobilisierung
von Metallkationen (gezeigt an Mn) durch eine fortschreitende Protonierung der Sorptionsoberflächen
zu beobachten, jedoch war die Gesamtmobilisierung über diesen Prozess recht niedrig. Nach 1 bis
3 Tagen begann eine starke Fe-Mobilisierung durch die mikrobiell getriggerte, reduktive Auflösung
von Eisen(oxyhydr)oxiden, durch die auch inkorporierte Metal(loid)e wie As freigesetzt wurden.
In einer dritten Studie wurde der CO2-Einfluss auf die Mobilität von Cu untersucht. Dafür wurden
Boden- und Porenwasserproben von einem Transekt über die Mofette analysiert und Cu-Spike-
Experimente mit natürlichem, SOM-reichem Oberboden dieses Transekts durchgeführt, um
Sorptionsisothermen zu bestimmen. Des Weiteren wurde die Festphasenspeziierung von Cu mittels
Röntgenabsorptionsspektroskopie bestimmt. Die Cu-Mobilität war im Übergangsbereich zwischen
oxischen (Referenz) und anoxischen (Mofette) Bedingungen am höchsten, wohingegen im
Entgasungszentrum eine starke Cu-Festlegung und sehr hohe Adsorptionskoeffizienten beobachtet
wurden. Anhand der Cu-Festphasenspeziierung konnte gezeigt werden, dass die starke Cu-
Sequestrierung im permanent anoxischen Entgasungszentrum durch eine Cu-Reduktion und die
anschließende Fällung von Sulfidmineralen verursacht wurde. Im Übergangsbereich und im
Referenzboden war Cu überwiegend an SOM gebunden. Ein zunehmendes Verhältnis von gelöstem
organischen Kohlenstoff zu Festphasen-Kohlenstoff mit zunehmendem CO2-Einfluss zeigte, dass sich
der geringere Zersetzungsgrad von SOM in Mofetten negativ auf die SOM-Stabilisierung auswirkt.
Kupfer bindet sowohl an DOM als auch an Festphasen-SOM. Dies bewirkte die beobachtete Zunahme
der Cu-Mobilität mit zunehmendem CO2-Gehalt des Bodens. Die Cu-Mobilität war einige Meter vom
Entgasungszentrum entfernt am höchsten, da hier das Vorhandensein geringer Sauerstoffmengen die
Ausfällung von Cu-Sulfiden verhinderte.
Insgesamt konnte gezeigt werden, dass sowohl Metall(oid)-Mobilisierungs- als auch
Immobilisierungsprozesse in CO2-beeinflussten Böden stattfinden. Potenzielle Risiken hinsichtlich
einer Grundwasserkontamination oder durch die Immobilisierung essenzieller Spurenelemente sollten
an solchen Standorten berücksichtigt werden. Desorption und Mineralauflösung sind Hauptprozesse
bezüglich der Metall(oid)-Mobilisierung in Mofettenböden, während die Fällung chalkophiler Metalle
in Form von Sulfidmineralen einen Hauptimmobilisierungsprozess darstellt. Das CO2 wirkt sich über
die induzierte Bodenversauerung und die anoxischen Bodenbedingungen in erster Linie indirekt auf
diese Prozesse aus. Bei kurzzeitigem CO2-Einfluss ist mit einer schnellen Metall(oid)-Mobilisierung

Zusammenfassung
XI
durch Desorption und Eisen(oxyhydr)oxid-Auflösung zu rechnen. Eine kontinuierliche CO2-
Ausgasung kann durch verstärkte Silikatverwitterung weitere Metall(oid)-Freisetzung
und -Auswaschung bewirken. Das größte langfristige Risiko für eine erhöhte Metall(oid)-Mobilität
stellen die stark erhöhten DOM-Konzentrationen in der Nähe des Entgasungszentrums durch die
mögliche Bildung von Metall(oid)-DOM-Komplexen dar.


XIII
TABLE OF CONTENTS
Acknowledgements ................................................................................................................................ V
Abstract ................................................................................................................................................ VII
Zusammenfassung ................................................................................................................................. IX
Table of contents ................................................................................................................................ XIII
List of Abbreviations ............................................................................................................................ XV
List of Figures ................................................................................................................................... XVII
Extended Summary ................................................................................................................................. 1
1 Introduction ..................................................................................................................................... 1
1.1 Mofettes – special study sites and natural laboratories ........................................................... 1
1.1.1 Geological background, surface appearance, fauna, and flora ........................................ 1
1.1.2 Mofettes as natural laboratories and analogies to leakage from GCS sites ..................... 3
1.1.3 Study site in the Plesná valley (Czech Republic) ............................................................ 4
1.1.4 Carbon dioxide as soil-forming factor ............................................................................. 8
1.2 Influence of carbon dioxide on metal(loid) mobility in soil .................................................. 10
1.2.1 Influence of carbon dioxide induced soil acidification ................................................. 10
1.2.2 Influence of carbon dioxide induced anoxic conditions ................................................ 10
1.2.3 Previous results on metal(loid) mobility at the mofette site studied in this thesis......... 11
1.3 Objectives .............................................................................................................................. 13
2 Methods ......................................................................................................................................... 15
2.1 General practices and analytical methods ............................................................................. 15
2.1.1 Sampling and laboratory practices ................................................................................ 15
2.1.2 Analytical methods with respect to metal(loid)s ........................................................... 15
2.1.3 Methods used for soil and pore water characterization ................................................. 16
2.2 Spatial scale: determination of metal(loid) distribution patterns around a mofette (study 1) 17
2.3 Temporal scale: time dependency of carbon dioxide induced metal(loid) mobilization in soil
(study 2) ............................................................................................................................................. 17
2.4 Case study on copper: sorption behavior and solid-phase speciation of copper in mofettes
(study 3) ............................................................................................................................................. 18

Table of contents
XIV
3 Results and Discussion .................................................................................................................. 19
3.1 Spatial distribution of metal(loid)s around a mofette and implications on soil processes
(study 1) ............................................................................................................................................. 19
3.2 Time and temperature dependency of carbon dioxide induced metal(loid) mobilization in
soil (study 2) ...................................................................................................................................... 21
3.3 Copper mobilization and sequestration in mofettes – the role of redox conditions and soil
organic matter (study 3) .................................................................................................................... 25
4 Conclusion ..................................................................................................................................... 29
References ............................................................................................................................................. 33
Contribution to studies 1 to 3 ................................................................................................................ 41
Appendix: Studies 1 - 3 ......................................................................................................................... 43
STUDY 1: Spatial distribution of metal(loid) depletion and accumulation zones around a natural
carbon dioxide degassing site ................................................................................................................ 45
STUDY 2: Time and temperature dependency of carbon dioxide triggered metal(loid) mobilization in
soil. ........................................................................................................................................................ 75
STUDY 3: Copper mobilization and immobilization along an organic matter and redox gradient –
insights from a mofette site ................................................................................................................. 109
List of publications .............................................................................................................................. 147
Supervised Bachelor theses ................................................................................................................. 149
(Eidesstattliche) Versicherungen und Erklärungen ............................................................................. 151

XV
LIST OF ABBREVIATIONS
CCS carbon capture and storage
DOC dissolved organic carbon
DOM dissolved organic matter
EXAFS extended X-ray absorption fine structure
FTIR Fourier-transform infrared spectroscopy
GCS geologic carbon storage
ICDP International Continental Scientific Drilling Program
ICP-MS inductively coupled plasma mass spectrometry
MLFZ Mariánské Lázně Fault Zone
MPN most probable number
NMR nuclear magnetic resonance
p(CO2) partial pressure of carbon dioxide
PPZ Počatky-Plesná Zone
rS Spearman’s rank correlation coefficient
SEM-EDS scanning electron microscopy energy-dispersive X-ray spectroscopy
SOC soil organic carbon
SOM soil organic matter
SSR soil-to-solution ratio
XANES X-ray absorption near edge structure
XAS X-ray absorption spectroscopy
XRD X-ray powder diffraction


XVII
LIST OF FIGURES
Figure 1. Geological situation at the study site. (a) Geological map of the Ohře Rift (Eger Graben)
System as presented by Bussert et al. (2017). The black cross marks the study site of this thesis. (b)
Conceptual model of the geodynamic situation in northwest Bohemia as presented by Bräuer et al.
(2008) with the three main degassing areas Bublák, Mariánské Lázně, and Karlovy Vary being
supplied from different reservoirs at the crust-mantle boundary. Blue stars mark areas of high
seismicity. Moho = Mohorovičić discontinuity, LAB = lithosphere-asthenosphere boundary, G1 - G4
= granite outcrops. ................................................................................................................................... 5
Figure 2. (a) Aerial image of the study site with mofette sites A and B. (image source:
https://maps.google.de, accessed on: 2 October 2018). (b) Photographs of Site A in summer with detail
from degassing center. (c, d) Photographs of Site B in summer (c) and in late winter (d) with detail
from degassing center. ............................................................................................................................. 6
Figure 3. Processes and properties in mofette soils as presented by Rennert and Pfanz (2016). ......... 10
Figure 4. Conceptual model of metal(loid) binding processes and mobility at a mofette and a non-
CO2-influenced reference site as presented by Mehlhorn et al. (2014). ................................................ 12
Figure 5. Conceptual model comparing short-term (top graph) and long-term (bottom graph) CO2-
induced metal(loid) mobilization (red-framed arrows) and immobilization (blue-framed arrow)
processes. The short-term processes correspond to a temporal change in CO2, i.e., a sudden CO2
release into a hitherto non-CO2-influenced soil as investigated in study 2. The long-term processes
correspond to a change in spatial metal(loid) distribution at a mofette site, in which CO2 exhalation
influenced pedogenesis for at least several decades, going from non-CO2-influenced reference soil
(left) towards the degassing center (right) as investigated in studies 1 and 3. ...................................... 29


1
EXTENDED SUMMARY
1 Introduction
1.1 Mofettes – special study sites and natural laboratories
1.1.1 Geological background, surface appearance, fauna, and flora
Mofettes are defined as natural exhalations of carbon dioxide (CO2) from fissures in the Earth (Oxford
English Dictionary online, 2018a). The word ‘mofette’ originates from the Italian word ‘mofeta’,
which stems from the Latin ‘mefitis’ or ‘mephitis’, meaning ‘a noxious or pestilential emanation,
especially from the Earth’ (Oxford English Dictionary online, 2018a, b). Mofettes occur in areas
influenced by recent volcanic activity, close to tectonic plate boundaries, or at active fault systems
(Irwin and Barnes, 1980). Thereby, the CO2 can have various origins: besides CO2 release from
carbonate containing rocks during metamorphic processes, biogenic respiration and oxidation of
hydrocarbons, large amounts of CO2 can be released from mantle degassing (D’Alessandro, 2006). In
this case, the CO2 originates from magma that has ascended from the Earth’s mantle into the lower
Earth’s crust. Such magma only contains up to 1.5 weight-% of CO2 (D’Alessandro, 2006), however,
due to the decreased pressure in the Earth’s crust and its low solubility, CO2 as well as traces of other
gasses, are released as fluid and can ascend via tectonic faults and fissures into sediments and soils
and, finally, into the atmosphere.
The temperature of the CO2 released in mofettes is lower than 100 °C. This ‘cold’ degassing
distinguishes mofettes from fumaroles, which mainly emit hot water vapor besides volcanic gasses
(Grotzinger and Jordan, 2014). Other forms of volcanic exhalations that can co-occur with mofettes
are solfatara, which mainly emit sulfur gasses, and geysers, which are characterized by periodic
eruptions of hot water (Grotzinger and Jordan, 2014).
Depending on whether the soil is water saturated or not, wet and dry mofettes are distinguished. While
wet mofettes are relatively easily detectable by the gas bubbles ascending through the water, the
degassing might remain unnoticed at dry mofettes. If the CO2 already dissolves in the ground water at
greater depths and then is released together with the water, gaseous mineral springs are formed
(Grotzinger and Jordan, 2014, Pfanz, 2008). However, the difference between wet and dry mofettes is
not consistently defined. Some authors also account degassing of undissolved CO2 in water saturated
soils as dry mofettes and only mineral springs with release of dissolved CO2 as wet mofettes (Rennert
and Pfanz, 2016).

Introduction
2
Degassing rates of CO2 can vary strongly with published rates ranging from 0.1 to
11,900 kg CO2 (m² a)-1
; even a rate of 165,800 kg CO2 (m² a)-1
has been reported for a single spot of a
Czech mofette field (Rennert and Pfanz, 2016 and references therein).
If mofettes are located in small sinks or topographic depressions, CO2 can accumulate under calm
conditions and CO2 lakes may form, which constitute a danger to animals and humans. Such CO2
lakes can develop an own diurnal circle in meteorological conditions as has been shown for the
mofette ‘Il Bossoleto’ in Central Italy (Kies et al., 2015). Various reports exist on tragedies that have
been or might have been caused by CO2 accumulation from mofettes, e.g., 142 persons were killed by
CO2 on the Dieng Plateau, Indonesia, in 1979 (Le Guern et al., 1982), approx. 1700 people died at
Lake Nyos, Cameroon, in 1986 (Baxter et al., 1989), and also some mysterious deaths close to the
Laacher See, Rhineland-Palatinate, Germany, in the 18th and 19
th century might have been linked to
the presence of mofettes (Pfanz, 2008). Thereby, it is not only direct toxicity but rather the
displacement of oxygen by the heavier CO2 that makes inhalation dangerous. Already partial pressures
(p(CO2)) above 0.1 can be lethal to humans and animals and inhalation of p(CO2) above 0.3 leads to
hypoxia, acidosis, and respiratory paralysis, followed by death within only a few breaths of air
(Henderson and Haggard, 1943, Langford, 2005, Stupfel and Le Guern, 1989).
Quite often, dead insects, birds, and smaller mammals can be found around mofettes. Cotrufo et al.
(1999) reported a very limited population of soil fauna in an Italian mofette. Decreased abundancies
and lower diversity of nematode and collembolan fauna in mofettes have also been reported
(Fernández-Montiel et al., 2016, Hohberg et al., 2015, Russell et al., 2011, Yeates et al., 1999).
However, some collembolan and nematode species are able to tolerate extreme CO2 concentrations in
mofette soils, where they might profit from decreased competition or from alternative food resources
(Rennert and Pfanz, 2016, Russell et al., 2011). Even an up to then unknown collembolan species,
Folsomia mofettophil, was discovered in a mofette soil in Czech Republic (Schulz and Potapov, 2010).
Furthermore, an up to now unknown mofettophilic yeast species, Occultifur mephitis was recently
detected in Slovenia (Šibanc et al., 2018), while arbuscular mycorrhizal fungi seem to be negatively
influenced by increased p(CO2) (Maček et al., 2012).
The high CO2 concentrations at mofette sites are not only a risk for animals and fungi but they are also
a challenge for plants. Several studies could show that plant height, root depth, chlorophyll content,
and nutrient supply of plants growing at mofette sites are decreased compared to plants growing at
non-CO2-influenced soils (e.g., Pfanz et al., 2004, 2007, Vodnik et al., 2002). At sites that are not
agriculturally used, a CO2-induced zonation in vegetation develops around mofettes (Pfanz, 2008).
Degassing centers with p(CO2) of almost 1 are generally completely free of vegetation. Plants that can
tolerate the highest CO2 concentrations are species, which are known to grow in wetlands or marshes
and are thus adopted to low oxygen availability in waterlogged soils. Some examples for plant genera,

Introduction
3
which have been identified to tolerate p(CO2) above 0.5, i.e., mofettophilic genera, are Cyperaceae
(sedges) and Juncaceae (rushes) (Pfanz, 2008, Rennert and Pfanz, 2016, Saßmannshausen, 2010).
These species are able to transport oxygen from upper plant parts into their roots via different transport
systems, e.g., via aerenchyma (Jackson and Armstrong, 1999, Vartapetian and Jackson, 1997).
Vegetation changes induced by CO2 facilitate the identification of mofettes in the field whereby the
occurrence of medium tolerant (i.e., mofettovague) and non-CO2-tolerant (i.e., mofettophobic) species,
e.g., Filipendula ulmaria (meadowsweet) and Urtica dioica (common nettle), clearly indicate the
boundaries of CO2 influence (Saßmannshausen, 2010).
1.1.2 Mofettes as natural laboratories and analogies to leakage from GCS sites
Mofettes are very suitable as natural laboratories since they allow to study gradients in soil air p(CO2)
and thus in soil redox conditions within only some meters distance from the degassing center. Thus,
investigation of mofettes can increase general knowledge on processes occurring in other
redoximorphic soils, e.g., wetland and floodplain soils, or soils above landfills or organic contaminant
spills.
Mofettes are also of particular interest regarding their analogy to potential leakages from geologic
carbon storage (GCS) sites. GCS is one possibility that is discussed and practiced with regard to
Carbon Capture and Storage (or Carbon Capture and Sequestration, CCS). The aim of CCS is to
reduce CO2 emissions into the atmosphere by capturing CO2 from industrial production processes and
transporting it to storage sites for final deposition. Different possibilities for carbon storage have been
suggested and tested. Among the most important ones with regard to terrestrial systems are geological
storage and mineral carbonation (IPCC, 2005, Oelkers and Cole, 2008).
For geological storage, CO2 is injected into porous rock formations that are underlying an
impermeable cap rock, e.g., depleted oil reservoirs or sedimentary basins (Benson and Cole, 2008).
GCS projects are in operation in numerous countries, both on pilot-scale and on commercial scale,
with the most well-known one being the Sleipner Project in Norway (Baklid et al., 1996). In Germany,
GCS was studied in a pilot-scale project by the German Research Center for Geosciences
(GeoForschungsZentrum Potsdam). From 2008 to 2013, more than 67,000 t of CO2 were injected into
porous sandstone formations close to Ketzin in Brandenburg (Martens et al., 2014).
Mineral carbonation is considered to be the safest way to sequester CO2 since the gas will react with
cations and form stable minerals such as calcite or magnesite (IPCC, 2005, Oelkers et al., 2008). This
storage technique was and is currently successfully applied in the CarbFix project in Iceland where
more than 95% of the CO2 injected into basaltic rocks was mineralized in less than two years
(Gislason et al., 2010, Matter et al., 2016). Mineral carbonation is thus the most desirable long-term
storage mechanism for CO2 at GCS sites. However, if geological conditions are not as superior as they

Introduction
4
are for example in the basaltic rocks of Iceland, mineralization might take centuries to millennia
(IPCC, 2005). For this long period, the integrity of the cap rock has to be guaranteed.
Under the high pressures present in deep storage reservoirs, the CO2 forms acidic fluids, which might
be able to corrode wellbores or the cap rock (Benson and Cole, 2008, Shukla et al., 2010). An
additional risk arises from seismic events, which could increase the permeability of the cap rock
(IPCC, 2005). If leakage occurs, the CO2 will start to rise along fissures into overlying sediments,
aquifers, the soil, and finally into the atmosphere. Besides the unintended gas emission, CO2-induced
processes can have large effects on groundwater and soil, e.g., the mobilization of potentially toxic
trace metal(loid)s into aquifers used for drinking water supply. Numerous studies on risks arising from
potential leakages of carbon storage sites have been conducted during the last years (Jun et al., 2012,
2013 and references therein). Several authors suggest studying natural CO2 deposits as analogues for
GCS in order to better understand the behavior of CO2 in storage formations but also to investigate the
risks and consequences of potential CO2 leakage into overlying sediments and soils (Lewicki et al.,
2007, Pearce, 2006, Schütze et al., 2012).
Regarding consideration of CCS in Germany, the pilot project near Ketzin officially finished in 2017
and no further projects are planned, yet. However, the Federal Ministry for the Environment, Nature
Conservation and Nuclear Safety mentions CCS as potential possibility in their Climate Action Plan
2050 (BMUB, 2016) and the National Academy of Science and Engineering (acatech) recently
presented a position paper demanding to restore the discussion on CCS potentials in Germany
(acatech, 2018). Thus, the further, in-depth investigation of potential risks arising from CO2 leakage
into soils is still an urgent research need. The investigation of natural analogues like mofettes
represents a relatively simple and low-cost way to explore the long-term influence of CO2 on
sediment, soil, and ground water, as well as on the potential mobilization or immobilization of
metal(loid)s (Lübben and Leven, 2018, Paoletti et al., 2005, Schütze et al., 2012).
1.1.3 Study site in the Plesná valley (Czech Republic)
The mofette site studied for this thesis is located in the floodplain of the river Plesná in Czech
Republic, about 8 km northeast of Františkovy Lázně. The whole area is part of the European
Cenozoic Rift System (Ziegler, 1992) and belongs to the Ohře (or Eger) Rift System, which began to
develop more than 50 million years ago during the Tertiary (Bankwitz et al., 2003, Peterek and
Schunk, 2008). Important parts of the system are the northeast–southwest striking Ohře Rift (or Eger
Graben) and the Cheb Basin, which is a sedimentary basin located at the southwestern end of the Rift
(Figure 1a). The Neogene sediments of the Cheb Basin mainly consist of weathering products from the
magmatic and metamorphic rocks (granites, gneisses, quartzes, mica schists, and phyllites) of the
northwestern Bohemian Massif (Flechsig et al., 2008). Located at the eastern boundary of the Cheb
Basin is the north-northwest–south-southeast striking Mariánské Lázně Fault Zone (MLFZ). Along the

Introduction
5
MLFZ, a vertical movement of up to 400 m was induced during the last 4 million years (Peterek and
Schunk, 2008), which can still be seen in a 50 to 200 m high escarpment. Another active fault zone
that was first described by Bankwitz et al. (2003) is the north–south trending Počatky-Plesná Zone
(PPZ). The river Plesná follows the PPZ for approximately 10 km. Many mofettes can be found along
the floodplain or in the river itself, where CO2 can ascend from underground along the fault structures
and fissures.
Figure 1. Geological situation at the study site. (a) Geological map of the Ohře Rift (Eger Graben) System as
presented by Bussert et al. (2017). The black cross marks the study site of this thesis. (b) Conceptual model of
the geodynamic situation in northwest Bohemia as presented by Bräuer et al. (2008) with the three main
degassing areas Bublák, Mariánské Lázně, and Karlovy Vary being supplied from different reservoirs at the
crust-mantle boundary. Blue stars mark areas of high seismicity. Moho = Mohorovičić discontinuity,
LAB = lithosphere-asthenosphere boundary, G1 - G4 = granite outcrops.
The gas which is released by these mofettes has its origin in magma chambers located in the sub-
crustal Earth’s mantle in approximately 27 to 31 km depth, as indicated by helium (3He/
4He) and
carbon (δ13
CCO2) isotope signatures (Bräuer et al., 2003, Weinlich et al., 1999). Besides the degassing
area in which the studied mofettes are located (called ‘Bublák’ in most publications after the strongest
degassing feature in this area), two more degassing areas exist in northwest Bohemia, one at
Mariánské Lázně and one at Karlovy Vary. Using isotope signatures, Weinlich et al. (1999), later
confirmed by Bräuer et al. (2008), found that these three main degassing sites are probably supplied by
different magma reservoirs (Figure 1b). Besides numerous gas vents in eight mofette fields, more than
100 gaseous mineral springs can be found in these areas (Horálek and Fischer, 2008, Weinlich et al.,
1999). These springs led to the development of the famous spa towns Františkovy Lázně, Mariánské
Lázně, and Karlovy Vary, beginning already in the 14th century.
The two wetland mofettes, which were studied in detail for this thesis, are located close to the locality
Vackovec, between Milhostov and Hartoušov (Figure 2a). All three studies, which were performed
within the scope of this thesis, were conducted at Site A (50°8'43.9" N, 12°27'1.0" E), located in
(a) (b)

Introduction
6
approximately 20 m distance to the river Plesná. Site B (50°8'48.1" N, 12°27'4.6" E) is located in
approximately 80 m distance to the Plesná and was investigated only in study 3.
Figure 2. (a) Aerial image of the study site with mofette sites A and B. (image source: https://maps.google.de,
accessed on: 2 October 2018). (b) Photographs of Site A in summer with detail from degassing center. (c, d)
Photographs of Site B in summer (c) and in late winter (d) with detail from degassing center.
The studied mofettes are not agriculturally used and covered by mofettophilic meadow vegetation
mainly consisting of Eriophorum vaginatum (cotton-grass), Deschampsia cespitosa (hair-grass), and
Calluna vulgaris (heather) (Saßmannshausen, 2010) (Figure 2b-d). In the degassing centers, up to 1 m
deep, flooded depressions are formed, in which the gas ascent can be observed visually by escaping
gas bubbles (Figure 2b, d). The soils in this area of the Cheb Basin developed from fluvial Holocene
and Pleistocene sediments (Flechsig et al., 2008) and have been characterized by Beulig et al. (2016)
as Gleyic Fluvisol for the non-CO2-influenced soil, whereas the mofette soil has been characterized as
Histosol with reductimorphic properties. Based on own observations, the qualifier Hemic could be
added to the Histosol of the mofette site.
Flechsig et al. (2008) studied a mofette field located approximately 1.5 km southeast (‘Hartoušov
mofette’) and found that a small domal hummock of 0.5 m height and 5 m diameter formed above the
degassing centers, which were small, vegetation-free, and sometimes water filled depressions. They
50 m
Site B
Site A
Milhostov
1.0 km
Hartoušov
1.7 km
N
(a)
(d)(c)
(b)

Introduction
7
also observed an updoming of a sediment clay layer which might have been caused by a combination
of strong gas pressure and swelling of smectite minerals. Other major minerals detected in soil and
sediment were quartz, feldspars, micas, illite, kaolinite, and chlorite (Flechsig et al., 2008, Rennert et
al., 2011). In greater depths, pyrite was detected, indicating permanently reducing conditions (Bussert
et al., 2017, Flechsig et al., 2008). The observed accumulation of quartz pebbles close to the degassing
center might indicate an upward transport with the gas flow (Flechsig et al., 2008). While similar
domal hummock structures could also be observed at the mofette sites studied in this thesis (Figure 2b-
d), an accumulation of quartz pebbles was not detected.
Rennert et al. (2011) determined soil air CO2 in 10 to 60 cm depth for the Hartoušov mofette and
found p(CO2) of up to 1 in the degassing center. Generally, degassing patterns at mofette sites were
found to be very heterogeneous due to small scale variations in soil and sediment permeability
(Rennert and Pfanz, 2016 and references therein). Detailed gas flux analysis of the strongest degassing
feature in this area, the mofette ‘Bublák’ located approximately 500 m south of the study site, showed
that CO2 made up 99.7% (Bräuer et al., 2008). Besides CO2, the gas contained 0.2% nitrogen and
traces of argon, helium, and methane. The exact timing of the onset of CO2 exhalation at the study site
and thus the age of the mofettes is unknown, but according to historic maps the gas exhalations have
been known already in 1945 (Saßmannshausen, 2010).
The CO2 ascent at the study site is not only related to the formation of mofettes and gaseous mineral
springs but it is also supposed to provoke earthquake swarms. These are periodically occurring,
intraplate earthquakes, which mostly have magnitudes below 3.5 and occur at focal depths between
4 and 22 km (Horálek and Fischer, 2008). The term ‘earthquake swarm’ was first used by Knett
(1899) and by Credner (1900) and is considered a locus typicus for the West Bohemia/Vogtland
region. The exact processes causing these earthquakes are still under debate but ascending, high
pressure fluids (mixture of pressurized gas and groundwater) are thought to play a key role in
triggering earthquake swarms by interacting with tectonic stress fields in subcritical fault zones
(Fischer et al., 2014, Horálek and Fischer, 2008). Since 1986, earthquake activity is highest at the
Nový Kostel focal zone, which is located at the intersection of the MLFZ and PPZ (Fischer et al.,
2014), about 8 km north of the studied mofette site. Nickschick et al. (2015) recently proposed that the
mofette fields in the Plesná valley are related to two pull-apart basin-like structures that have formed
along the PPZ, facilitating the gas release through the Earth’s crust. Since no gas exhalations were
found around Nový Kostel (Kämpf et al., 2013), it is assumed that less permeable rock units are
blocking the ascending fluids, leading to buildup of overpressure and inducing seismicity (Bräuer et
al., 2003, Nickschick et al., 2015).
According to recently published newspaper articles based on interviews with scientists from the
German Research Center for Geosciences, the earthquake swarms seem to occur in shorter cycles and

Introduction
8
with increased magnitudes (Jähn, 2018, MDR Wissen, 2018). Also, progressive changes in the
isotopic composition of the upstreaming gas have been reported (Bräuer et al., 2008, 2018, Kämpf et
al., 2013), which hints towards an ongoing magmatic process beneath the Cheb Basin.
1.1.4 Carbon dioxide as soil-forming factor
The extreme p(CO2) at mofette sites significantly influences soil conditions and soil development as
recently reviewed by Rennert and Pfanz (2016). In degassing centers, the soil is anoxic up to the
surface and dissolution of CO2 in pore water leads to formation of carbonic acid and thus causes soil
acidification (e.g., Beaubien et al., 2008, Maček et al., 2009, Rennert et al., 2011). In a pre-study for
this thesis, Mehlhorn et al. (2014) found that soil pH in the degassing centers of Sites A and B was
3.8 ± 0.2 compared to 4.1 ± 0.2 in the non-CO2-influenced surrounding soil and that pore water pH
had a significant negative correlation with dissolved CO2 concentrations (rS = -0.8, P < 0.01).
Cation exchange capacity decreases with increasing p(CO2) (Rennert, 2018, Videmšek et al., 2009)
and the weathering of silicate minerals is accelerated at mofette sites due to soil acidification (Rennert
and Pfanz, 2016, Stephens and Hering, 2002). Already more than 100 years ago, Gagel and Stremme
(1909) described kaolinite formation from granite close to a CO2-rich mineral spring. Beaubien et al.
(2008) observed increasing contents of K-feldspar with increasing p(CO2), which they attributed to
weathering of albite, and Blume and Felix-Henningsen (2009) reported transformation of plagioclase
to kaolinite or dickite at natural Reductosols. Around the Hartoušov mofette close to the study site of
this thesis, Flechsig et al. (2008) found increased contents of smectite, probably formed by weathering
of mica, chlorite, and illite. However, for a dry mofette close to Site B, Rennert (2018) could not
detect any systematic CO2 effect on clay mineral composition, which was attributed to the already
acidic parent material and a superimposition of CO2 effects over time.
Furthermore, the formation and maturation of pedogenic iron (Fe), manganese (Mn), and aluminum
(Al) oxides and/or (oxy)hydroxides (hereafter summarized as (oxyhydr)oxides) is inhibited by the
limited supply of oxygen (e.g., Beaubien et al., 2008, Mehlhorn et al., 2014, Rennert et al., 2011,
2012, 2015, 2018). For the Hartoušov mofette field, Rennert et al. (2011) found negative correlations
of p(CO2) and Fe contents and the small amounts of Fe (oxyhydr)oxides detected at increased p(CO2)
were generally of low crystallinity. Determination of Fe solid-phase speciation by X-ray absorption
spectroscopy (XAS) on thin sections of soil samples from spots with a p(CO2) of 1 revealed that most
Fe was present in different clay minerals (smectites, illites, and chlorites) and in form of Fe(II) and
mixed Fe(II)/Fe(III) minerals, e.g., vivianite, siderite, green rust, and magnetite (Rennert et al., 2012).
The Fe(III) (oxyhydr)oxides ferrihydrite and maghemite could only be detected close to a root
channel, where micro-oxic conditions occurred.
Geogenic CO2 does not only influence physical and chemical soil processes but also has a strong
influence on soil fauna (compare section 1.1.1) and microorganisms. The microbial community shows

Introduction
9
a lower diversity and is shifted towards anaerobic, acidophilic taxa, like sulfur-reducing and
acetogenic bacteria or methanogenic archaea (e.g., Beulig et al., 2015, Frerichs et al., 2013, Krauze et
al., 2017, Maček et al., 2009, Oppermann et al., 2010, Šibanc et al., 2014). Due to the anaerobic and
acidic conditions, macro- and mesoscopic eukaryotes like earthworms or moles are absent in mofette
soils, which leads to decreased bioturbation (Cotrufo et al., 1999, Rennert et al., 2011, 2016).
Moreover, litter decomposition is decelerated under anaerobic conditions in mofettes, which causes an
accumulation of soil organic matter (SOM) (e.g., Beaubien et al., 2008, Beulig et al., 2015, Olk et al.,
2006, Rennert et al., 2011, Ross et al., 2000) and sometimes even the previously mentioned growth of
hummocks (Flechsig et al., 2008). Both plants and microbes are able to utilize the exhaled CO2 for
primary production, leading to up to 67% of geogenic carbon in SOM (Beulig et al., 2016, Nowak et
al., 2015).
The composition of the SOM, which is accumulating in mofettes, differs from that of non-CO2-
influenced soils. Due to the decreased carbon turnover, the C/N ratio is increased (e.g., Rennert et al.,
2011, Ross et al., 2000) and sometimes even unaltered plant residues, like roots or pieces of wood, are
preserved within the soil (Flechsig et al., 2008, Rennert and Pfanz, 2016). Further indications for the
accumulation of sparsely degraded SOM are the decreased accumulation of aliphatic carbon and of
SOM of microbial origin in the clay fraction, higher contents of phenolic compounds like lignin, and
the accumulation of particulate organic matter (Rennert et al., 2011, 2015). A smaller extent of
oxidative SOM transformation and a lower abundancy of carboxylic groups was recently described by
Rennert (2018), providing further evidence on the significant influence of geogenic CO2 on SOM
composition. In addition, the interaction of SOM with soil minerals seems to be negatively affected in
mofettes leading to a decreased SOM stabilization by adsorption and inclusion processes (Rennert and
Pfanz, 2015). A significant correlation of exchangeable Al contents and a value indicative for
oxidation and transformation of SOM, determined by diffuse reflectance infrared Fourier transform
spectroscopy, may indicate that Al bridging between SOM and minerals promotes SOM stabilization
in the clay fraction (Rennert, 2018).
Rennert and Pfanz (2016) summarized the soil processes induced by geogenic CO2 in mofettes in the
conceptual model presented in Figure 3. Given the numerous effects on soil processes, they suggested
introducing the qualifier ‘mofettic’ into the World Reference Base for Soil Resources (IUSS Working
Group WRB, 2015) to account for geogenic CO2 as soil-forming factor.

Introduction
10
Figure 3. Processes and properties in mofette soils as presented by Rennert and Pfanz (2016).
1.2 Influence of carbon dioxide on metal(loid) mobility in soil
1.2.1 Influence of carbon dioxide induced soil acidification
The previously mentioned soil acidification, which is induced by CO2 dissolution in soil pore water,
can influence metal(loid) binding mechanisms and mobility in several ways. Weakly bound metal
cations can be replaced by protons, which are formed from carbonic acid dissociation, resulting in
mobilization of these metal(loid)s. Additionally, intensified weathering of minerals, which is induced
by soil acidification, can release adsorbed or incorporated metal(loid)s into the liquid phase. These
processes have been studied in detail with regard to risk assessment at GCS sites and many researcher
groups could prove CO2-induced mobilization of several metal(loid), e.g., Al, arsenic (As), cadmium
(Cd), cobalt (Co), copper (Cu), chromium (Cr), Fe, Mn, nickel (Ni), lead (Pb), and zinc (Zn), by
desorption and mineral dissolution processes (e.g., Jones et al., 2015, Kirsch et al., 2014, Lawter et al.,
2016, Little and Jackson, 2010, Lu et al., 2010, Smyth et al., 2009, Terzi et al., 2014). However, also
re-adsorption of certain metal(loid)s, e.g., shown for As, Cd, Cu, and Zn, or precipitation of new
minerals can occur (e.g., Lawter et al., 2015, Lu et al., 2010, Mickler et al., 2013, Montes-Hernandez
et al., 2013, Shao et al., 2015).
1.2.2 Influence of carbon dioxide induced anoxic conditions
Due to the permanently anoxic conditions, the formation of pedogenic (oxyhxdr)oxides is inhibited in
mofette soils (compare section 1.1.4). This could not only increase the mobility of typical
(oxyhydr)oxide forming metals like Fe, Al, and Mn, but also the mobility of metal(loid)s which are
known to bind to or co-precipitate with these pedogenic minerals.
release into the atmosphere
adapted vegetation
soil surface
leaching of base cations
inhibited formation of
pedogenic oxides
poor crystallinity of
pedogenic oxides
acidification
accelerated silicate
weathering
ascending geogenic CO2
shift of microbial communities
to anaerobic and acidophilic ones
inhibited decomposition of plant residues
diminished stabilization of SOM
by sorption and/or occlusion
diminished bioturbation
accumulation of (particulate)
soil organic matter (SOM)

Introduction
11
A further consequence of the permanently anoxic conditions in mofettes is the previously mentioned
shift in microbial communities. Microbial processes could on the one hand contribute to metal(loid)
mobilization, e.g., by the alteration of existing equilibria or microbially induced dissolution of certain
minerals, like the reductive dissolution of Fe (oxyhydr)oxides (Kirk et al., 2013). On the other hand,
microorganisms can promote mineral precipitation by increasing alkalinity or by direct biological
formation of carbonates (Harvey et al., 2016, Kirk et al., 2013, Lions et al., 2014 and references
therein) and thus contribute to metal(loid) immobilization. From other anoxic soils like wetlands or
floodplain soils, it is known that under sulfur-reducing conditions chalcophilic metal(loid)s, e.g., Cu,
Zn, As, or Fe, can react with microbially produced sulfide and (co-)precipitate in form of sulfidic
minerals (Fulda et al., 2013a, 2013b, Hofacker et al., 2013, Morse and Luther, 1999, Weber et al.,
2009b). This process may also play a role in mofette soils as suggested by Blume and Felix-
Henningsen (2009) and as indicated by the presence of pyrite in deeper sediments of the Hartoušov
mofette (Bussert et al., 2017, Flechsig et al., 2008).
Furthermore, SOM, which accumulates in mofettes due to anoxic conditions, can influence the binding
mechanisms and the mobility of metal(loid)s. Increased contents of solid-phase SOM could provide
potential new sorption sites for metal(loid)s with a high affinity for organic matter and thus contribute
to their immobilization. However, dissolved organic matter (DOM) concentrations might also be
increased in the pore water of mofettes and DOM can compete with metal(loid)s for sorption sites or
mobilize organic matter-affine metal(loid)s by complexation (Kirk, 2004).
1.2.3 Previous results on metal(loid) mobility at the mofette site studied in this thesis
In a pre-study for this thesis, soil contents and pore water concentrations of As, Cu, Fe, Mn, and Ni of
the two mofette sites were compared with nearby, non-CO2-influenced soils (references) (Mehlhorn et
al., 2014). It could be shown that the long-term CO2 ascent in mofette soils influenced metal(loid)
contents considerably (Figure 4). The mofette soils had significantly lower contents of Fe and As
compared to the references and the mobility, i.e., the distribution coefficient between soil solid phase
and pore water, of these elements was increased in the mofettes. This was attributed to the
significantly lower content of poorly crystalline (content reduced by 75%) and well-crystalline Fe
(oxyhydr)oxides (content reduced by 91%).
Besides the CO2-induced increase in As mobility, also changes in As speciation were observed. In
contrast to the references, up to 11% of methylated As and up to 9% of thiolated As could be detected
in mofettes besides arsenite and arsenate. Thereby, the occurrence of methylated As species correlated
with methane concentrations in the pore water. The formation of these As species was thus most
probably related to microbial methane production by methanogenic archaea and to sulfide production
by sulfur-reducing bacteria, which have been shown to predominate in these mofette soils (Beulig et
al., 2015, 2016). Changes in speciation can also influence As mobility, since methylated As species

Introduction
12
are known to be more mobile than arsenate (Bowell, 1994) and thiolated As species are even more
mobile than arsenite (Suess and Planer-Friedrich, 2012).
While the mobilizing effect of geogenic CO2 on Fe and As could clearly be shown in Mehlhorn et al.
(2014), the results for Mn, Ni, and Cu were less clear. Soil Mn contents were slightly decreased in
mofettes compared to reference soils, but also Mn pore water concentrations remained low. The soil
contents of Cu and Ni were relatively equal in mofettes and references (Site A) or showed lower
contents in the upper 60 cm depth and higher contents in deeper soil (Site B) in mofettes compared to
references. Pore water concentrations of Ni and Cu were lower in the mofettes than in the references.
The observed distribution patterns were attributed to a mixture of mobilization and re-adsorption
processes under long-term CO2 influence, with SOM being the main candidate for re-adsorption due to
significantly increased SOM contents in the mofettes (Figure 4). This hypothesis was reinforced by
strong accumulation of Ni, Cu, and also As in a peat lens, which was detected in approximately 2 m
depth at Site A (named ‘site 1’ in Mehlhorn et al. (2014)).
Figure 4. Conceptual model of metal(loid) binding processes and mobility at a mofette and a non-CO2-
influenced reference site as presented by Mehlhorn et al. (2014).
However, the exact processes that caused the distribution patterns observed for Cu, Mn, and Ni could
not be explained entirely. Comparing samples from the degassing center of the mofettes with a p(CO2)
of 1 with non-CO2-influenced reference soils has not been sufficient to completely understand the
mobilization and immobilization processes in mofettes. Therefore, a more detailed investigation of the
transition between permanently anoxic and oxic soil conditions is necessary.
Corg
Fe
As
Mn
Ni Cu
CuNi
partly
oxicCO2
O2
Reference
NiCu
Mn
As
Fe
As
Mn
Ni Cu
CuNi
Mofette
NiCu
Mn
As
Fe
anoxicCO2
CO2
CO2 CO2O2 CH4
Fe
Corg
Fe (hydr)oxides
Organic matter
Solid phase/
in solutionAs/As Net-mobilisation
Net-immobilisation
pH
Fe
Corg
CH4

Introduction
13
In Mehlhorn et al. (2014), also an in situ mobilization experiment was conducted, in which soil from
the reference sites was exposed for approximately one month in the degassing centers of the mofettes.
During this experiment, strong mobilization of all considered metal(loid)s could be observed,
indicating that short-term and long-term processes in mofettes differ significantly and that a more
detailed investigation of the distinct mobilization and immobilization processes is necessary.
1.3 Objectives
The aim of this thesis was to investigate CO2-induced metal(loid) mobilization and sequestration
processes in mofettes. Therefore, it was necessary to determine individual metal(loid) binding
processes and the influence of CO2-induced changes in soil conditions on these binding mechanisms.
The first study focused on the spatial scale of metal(loid) mobilization and immobilization processes,
which should help to understand interdependencies between CO2-induced changes in soil conditions
and metal(loid) distribution under long-term CO2 influence. In the second study, the temporal scale of
CO2-induced, short-term (im)mobilization processes was investigated in more detail using batch
incubations. The third study focused on the behavior of the metal Cu in mofettes, since this element
showed distinct differences compared to the other metal(loid)s investigated in this thesis. A greater
knowledge of the processes occurring in mofettes is not only helpful for a better risk assessment at
GCS sites but it will also increase our understanding of metal(loid) mobilization and immobilization
processes occurring in other redoximorphic soils, like wetlands, floodplains, or contamination sites.
The specific objectives of the three studies presented in this thesis were the following:
(1) to investigate the spatial distribution of metal(loid)s in soil and pore water around a mofette in
order to identify long-term effects of CO2 on metal(loid) binding and mobility (study 1:
Mehlhorn et al. (2019)),
(2) to determine the temporal scale of metal(loid) (im)mobilization processes, which occur after
an hitherto non-CO2-influenced soil was exposed to CO2 (study 2: Mehlhorn et al. (2016)),
(3) to study the temperature dependency of CO2-induced, short-term (im)mobilization processes
and thus the importance of microbial processes (study 2), and
(4) to investigate Cu binding mechanisms and mobility along a CO2 gradient in relation to redox
conditions and SOM composition (study 3: Mehlhorn et al. (2018)).


15
2 Methods
2.1 General practices and analytical methods
2.1.1 Sampling and laboratory practices
During the collection of soil and pore water samples, attention was paid to minimize both the
disturbance of the natural site and the influence of atmospheric oxygen on the samples. Soil samples
were usually collected with an auger or, if larger amounts were required, with a spade, packed into
bags, and either flash-frozen on dry ice or stored under cooled conditions, depending on the planned
analyses or experiments. Collection of pore water samples for studies 1 and 3 was done with pore
water peepers type Hesslein (1976). Oxygen influence on the water samples was minimized by
conducting transport and storage of the peepers in a nitrogen-filled box. In studies 1 and 3, soil air
composition (CO2 and oxygen) at the respective sampling sites was analyzed in approximately
10 to 20 cm depth using a portable gas analyzer (BIOGAS 5000, Geotech). For all experiments and
sample preparations, ultrapure water and reagents of at least analytical degree were used. Oxygen-
sensitive experiments (study 3) were conducted inside an anoxic chamber (Coy, 95%/5%
nitrogen/hydrogen).
For most analyses, the soil samples were freeze-dried, ground, and sieved (nylon, 1 mm mesh size). If
the soil samples were used for analyses of potentially oxygen-sensitive parameters, i.e., for Mössbauer
spectroscopy (study 2), X-ray absorption spectroscopy (XAS), 13
C nuclear magnetic resonance
spectroscopy (NMR), scanning electron microscopy energy-dispersive X-ray spectroscopy (SEM-
EDS; all study 3) or for sequential extraction (study 1), preparation and storage was done inside an
anoxic chamber. In addition, samples were stored under dark conditions to reduce photooxidation
effects.
2.1.2 Analytical methods with respect to metal(loid)s
For the determination of total metal(loid) and sulfur contents, soil samples were digested in aqua regia
using microwave-assisted digestion at 160 °C (MARS Xpress, CEM). Pore water and other liquid
phase samples were stabilized in 0.45% H2O2 and 0.65% HNO3 directly after sampling. Analysis of
total sulfur and metal(loid) concentrations (Al, As, Cd, Co, Cr, Cu, Fe, Mn, Ni, Zn) in soil digests and
in pore water or any other liquid phase samples was conducted by inductively coupled plasma mass
spectrometry (ICP-MS, X-Series 2, Thermo Scientific). All samples were filtered (0.2 µm, cellulose-
acetate) and diluted at least 1:10 before ICP-MS analysis.
In study 1, a five-step sequential extraction procedure according to Fulda et al. (2013a) was conducted
in order to gain information on operationally defined metal(loid) fractions in soil and thus on
dominating binding mechanisms. This sequential extraction is a combination of the methods
established by McGrath et al. (1988), Tessier et al. (1979), and Zeien and Brümmer (1989). The

Methods
16
procedure included the following operationally defined fractions: (1) mobile (soluble and
exchangeable, soluble metal(loid)-SOM complexes), (2) easily mobilizable (specifically adsorbed,
bound to minerals labile at pH 5, and weak metal(loid)-SOM complexes), (3) organically bound (low
affinity), (4) reducible (bound to amorphous and crystalline Fe and Mn (oxyhydr)oxides), (5)
oxidizable (metal sulfides and bound to high affinity sites of SOM). To exclude any reactions induced
by atmospheric oxygen, extraction steps 1 to 3 were conducted inside an anoxic chamber. Total
metal(loid) contents in filtered (0.2 µm, cellulose-acetate) and diluted extracts were determined by
ICP-MS.
In study 3, solid-phase speciation of Cu in natural and Cu-spiked soil samples was investigated using
XAS at the Cu K-edge. Both X-ray absorption near edge structure (XANES) and extended X-ray
absorption fine structure (EXAFS) spectra were collected at beamlines 4-1 and 4-3 of the Stanford
Synchrotron Radiation Light Source (SSRL, Stanford, U.S.A.). Linear combination fitting was
conducted both for normalized XANES and k3-weighted EXAFS sample spectra, using nine published
spectra and one measured spectrum of Cu reference compounds. Details on spectra collection and data
evaluation can be found in study 3. In addition, SEM-EDS data were collected in study 3 in order to
detect any potential Cu-containing precipitates using a Leo Gemini 1530 (Carl Zeiss, Germany) with a
Schottky emitter.
2.1.3 Methods used for soil and pore water characterization
Various other methods were used to characterize soil and pore water parameters, which are relevant
for metal(loid) binding and mobility. The most important methods will briefly be mentioned in this
chapter. Analytical details can be found in the individual studies.
Liquid samples were generally characterized by measuring pH and redox potential directly in solution
or in soil suspensions. Methane and CO2 concentrations were determined by calculating dissolved
concentrations from head space concentrations in septum vials using Henry’s law (Henry, 1803,
Sander, 2015). Therefore, concentrations in the head space were measured with a gas chromatograph
(SRI Instruments 8610C, U.S.) equipped with a methanizer and a flame ionization detector. In studies
1 and 3, additional photometrical analyses were conducted using a multiplate reader (Infinite 200
PRO, Tecan) and the ferrozine assay (Stookey, 1970) for determination of total Fe and ferrous Fe
concentrations (absorbance measured at 570 nm), the methylene blue method (Cline, 1969) for
determination of sulfide concentrations (absorbance measured at 650 nm), and the bathocuproine
method (Maurer et al., 2013, Moffett et al., 1985) for determination of cuprous Cu (absorbance
measured at 492 nm). Total dissolved organic carbon (DOC) and dissolved nitrogen concentrations
were measured in filtered (0.45 µm, polyamide) liquid phase samples using thermo-catalytic oxidation
with a TOC-VCPN Analyzer (Shimadzu). In study 3, DOM was characterized by Fourier-transform

Methods
17
infrared spectroscopy (FTIR) with a Vector 22 spectrometer (Bruker Optik) in transmission mode
using freeze-dried water extracts of soil samples.
Soil samples were generally characterized by measuring soil pH in 0.01 M CaCl2 solution at a soil-to-
solution ratio (SSR) of 1:2.5. In addition, total soil organic carbon (SOC) and nitrogen contents were
determined with a CHN elemental analyzer (Thermo Quest, Flash EA, 1112). In study 2, three soil
samples were analyzed by Mössbauer spectroscopy in order to gain information on Fe mineralogy.
Spectra were collected at 77 K and 5 K using a closed-cycle exchange gas cryostat (Janis cryogenics)
and a constant acceleration drive system (WissEL) in transmission mode with a 57
Co/Rh source. In
study 3, solid-phase SOM of soil samples was characterized by 13
C NMR with an Avance III HD
Spectrometer (Bruker) and soil mineralogy was characterized by X-ray powder diffraction (XRD)
using a Philips X’Pert Pro diffractometer operating in reflection mode with Fe filtered CoKα1
radiation.
2.2 Spatial scale: determination of metal(loid) distribution patterns around a mofette
(study 1)
In the first study of this thesis, the spatial distribution of the metal(loid)s Al, As, Cd, Co, Cr, Cu, Fe,
Mn, Ni, and Zn in soil and pore water around the mofette Site A was determined. Soil samples were
collected along a sampling grid with its center located in the degassing center and its margins in the
non-CO2-influenced area. The samples derived from three depths representing the SOM-rich topsoil
(0 to 5 cm depth), the alternating oxic/anoxic zone (25 to 35 cm), and the hypothetically permanently
water-saturated zone (55 to 65 cm) of the Gleyic Fluvisol in the non-CO2-influenced area. To gain
information on possible metal(loid) binding mechanisms, a five-step sequential extraction according to
Fulda et al. (2013a) was conducted for the soil samples from the east transect. In addition, pore water
samples from 10 to 60 cm depth were collected along the east transect of the sampling grid using pore
water peepers type Hesslein (1976). Spatial distribution patterns of general soil and pore water
parameters as well as total metal(loid) contents were plotted using universal Kriging interpolation.
Calculation of Euclidian distances between normalized distribution patterns allowed to cluster the
investigated metal(loid)s into groups of high similarity. By comparing general soil parameters with
metal(loid) contents and fractionation derived from sequential extraction, conclusions on CO2-induced
long-term processes and on dominant binding mechanisms could be drawn for each individual
metal(loid).
2.3 Temporal scale: time dependency of carbon dioxide induced metal(loid)
mobilization in soil (study 2)
The second study of this thesis focused on the temporal scale of CO2-induced metal(loid) mobilization
processes. Therefore, hitherto non-CO2-influenced soil from 20 to 30 cm depth of Site A (alternating
oxic/anoxic zone) was incubated in triplicate with filtered (0.2 µm, cellulose-acetate) water from the

Methods
18
river Plesná (used as pore water equivalent) in batch reactors and purged with a gas flow of
28 ± 5 mL CO2 min-1
for up to 42 days. For the first experiment, incubation temperature was varied
(16, 22 and 35 °C) while in the second experiment there was a variation in initial soil conditions (fresh
spring soil, stored spring soil, and fresh summer soil). Over the course of the experiment, the liquid
phase was sampled and analyzed for general parameters (pH and redox potential) and for total
concentrations of As, Cu, Fe, and Mn. Metal(loid)-specific mobilization rates could be calculated from
concentration changes observed over time. The amounts of cultivatable heterotrophic aerobic, Fe(III)-
reducing, and sulfate-reducing microorganisms were determined by most probable numbers (MPN).
Differences within the temperature treatments enabled the distinction between abiotic and biotic
processes. Differences within the initial soil conditions helped to elucidate the influence of SOM
content and Fe (oxyhydr)oxide crystallinity, determined by Mössbauer spectroscopy, on metal(loid)
mobilization rates.
2.4 Case study on copper: sorption behavior and solid-phase speciation of copper in
mofettes (study 3)
Study 3 of this thesis focused on Cu, since this element had shown some quite interesting behavior in
Mehlhorn et al. (2014) and in study 2 of this thesis. Besides investigating Cu soil contents and Cu pore
water concentrations with respect to dissolved CO2 along the east transect of Site A, a Cu spike
experiment was conducted. Therefore, SOM-rich topsoil (5 to 15 cm depth) from 4 spots along the
transect of Site A (‘Mofette A’, ‘Transition A1’, ‘Transition A2’, and ‘Reference A’) as well as from
2 spots of Site B (degassing center ‘Mofette B’ and non-CO2-influenced soil ‘Reference B’) were
collected. The homogenized, fresh soil samples were incubated with 5 mM NaCl solution, pH 4.5, as
background electrolyte at a SSR of 1:30 and spiked with up to 11.7 mmol kg-1
CuCl2 solution. Copper
adsorption coefficients (Freundlich and linear coefficients) were calculated for the sorption isotherms,
which could be obtained from this experiment. X-ray absorption spectra (XANES and EXAFS) were
collected at the Cu K-edge for natural and Cu-spiked samples in order to elucidate the solid-phase
speciation of Cu in these samples. In addition, a Cu-loaded soil sample was investigated by SEM-EDS
in order to detect any potential Cu precipitates. The SOM and DOM composition of the respective soil
samples were characterized by 13
C NMR and FTIR, respectively.

19
3 Results and Discussion
3.1 Spatial distribution of metal(loid)s around a mofette and implications on soil
processes (study 1)
The sampling grid of study 1 (Mehlhorn et al., 2019) over Site A covered two degassing features, the
previously studied feature with a p(CO2) of almost 1 in the center of the grid, and a less intense feature
with p(CO2) up to 0.56 in approximately 12 m distance to the northeast. Both the previously
mentioned effects on soil pH (decreasing with increasing p(CO2)) and on SOM content (accumulation
in degassing areas) could be confirmed in study 1.
The three-dimensional spatial distribution patterns of the metal(loid)s Al, As, Cd, Co, Cr, Cu, Fe, Mn,
Ni, and Zn around a main CO2 exhalation of Site A revealed some interesting processes, which were
not detectable by comparing just two spots of the system as done in the pre-study for this thesis
(Mehlhorn et al., 2014). The normalized distribution patterns derived for soil contents of individual
metal(loid)s could be assigned to four clusters of high similarity, which will be considered
individually in the following paragraphs.
The metals Mn, Co, Ni, and Zn showed depletion in almost the whole CO2-influenced area. The only
exception was a slight Zn enrichment in the deepest soil sample from the degassing center. From
sequential extraction and from the negative relationship with SOM contents could be concluded that
these elements were primarily mineral-associated, most probably with clay minerals and other
silicates. High affinity of these metals for soil minerals is in accordance with literature (e.g., Bradl,
2004, McBride, 1989). Long-term CO2 degassing at the mofette site and ongoing soil acidification has
caused mobilization and leaching of Mn, Co, Ni, and Zn by desorption and mineral dissolution
processes. Similar processes have been reported in monitoring or geochemical modelling studies at
GCS sites (e.g., Kharaka et al., 2006, 2010, Wang and Jaffe, 2004, Zheng et al., 2012) as well as in
laboratory batch and column studies on effects of CO2 intrusion into sediments (e.g., Lawter et al.,
2015, 2016, Qafoku et al., 2014, Terzi et al., 2014). In addition, the accumulation of SOM in the
degassing center may have contributed indirectly to the depletion of these elements by a decrease in
total mineral content.
Soil contents of Al and Cr were only decreased directly in the degassing center and showed an inverse
correlation with SOC contents. In addition, less than half of total Cr and less than 30% of total Al
(determined in aqua regia digests) could be extracted during the five-step sequential extraction
procedure indicating that Al and Cr were predominantly present in the residual fraction, i.e.,
incorporated into silicates. Thus, direct CO2-induced depletion by desorption and mineral dissolution
processes must have been way lower for these elements in comparison to Mn, Co, Ni, and Zn.

Results and Discussion
20
However, the accumulation of SOM led to the development of zones of low mineral and thus low Al
and Cr contents directly in the degassing center.
For Fe and As, observations made in Mehlhorn et al. (2014) could be confirmed. Under oxic
conditions, Fe was predominantly present in form of Fe (oxyhydr)oxides and As, which is known to
have a high affinity for Fe (oxyhydr)oxides (e.g., Livesey and Huang, 1981, Manning and Goldberg,
1997), was incorporated in or adsorbed to these pedogenic minerals. Soil contents of As and Fe were
lowest in the degassing areas and in deeper soil, where permanently anoxic conditions largely
inhibited the oxidation of Fe(II) and thus the formation of Fe(III) (oxyhydr)oxides. As soon as traces
of oxygen were available, Fe and As could accumulate, which led to the development of an
enrichment zone in the topsoil located directly between the two degassing areas.
Cadmium and Cu were the only elements that exhibited a strong enrichment directly in the main
degassing feature, most pronounced in the deeper soil. Zinc soil contents were also increased in the
sample originating from 55 to 65 cm depth of the main degassing center. In samples from the center,
the majority of Cd and Cu was extracted in the oxidizable fraction, i.e., metal sulfides and metals
bound to SOM at high affinity sites (Tessier et al., 1979). Both, SOC contents and total soil sulfur
contents were strongly enriched in the degassing center. Thus, considering only the results gained
from solid-phase samples, both sequestration processes could be possible explanations for the Cd, Cu,
and Zn accumulation. Apart from the enrichment in the mofette center, soil contents of Cd and Cu
were highest in the upper soil and their contents were generally increasing with decreasing CO2
influence. The latter implies that outside of the degassing center leaching has also occurred for these
elements.
From cluster analysis of the normalized pore water metal(loid) concentrations, three groups of high
similarity could be distinguished. The first cluster included Mn, Co, Ni, and Cd. The pore water
concentrations of these elements increased with increasing distance from the degassing center, i.e.,
with decreasing CO2 influence. Since for Mn, Co, and Ni both soil contents and pore water
concentrations were increasing with distance, the solid-to-liquid-phase ratio was left more or less
unaltered and no CO2-induced change in metal mobility could be detected. The influence of CO2-
induced changes on the mobility of Mn, Co, and Ni by soil acidification and mineral dissolution seems
to have reached a steady state after decades of CO2 degassing, leaving soil contents and pore water
concentration in quasi-equilibrium. This would also explain the observations in Mehlhorn et al.
(2014), where both pore water and soil were depleted in Mn and Ni in the mofettes compared to the
reference sites.
A second cluster of high similarity in normalized pore water concentrations was formed by Al, Cr, Fe,
and As. These metal(loid)s were especially enriched in 2 to 4 m distance from the main degassing
feature, with concentration hotspots in 10 to 15 cm and in 40 to 60 cm depth. Their pore water

Results and Discussion
21
concentration showed a strong correlation with DOC concentrations, indicating that complexation with
DOM was the main process triggering metal(loid) mobilization in this area. All of these metal(loid)s
are well-known for their affinity towards DOM (e.g., Bauer and Blodau, 2006, Carrillo‐González et
al., 2006, Du Laing et al., 2007, Kalbitz and Wennrich, 1998, Pohlman and McColl, 1988).
Pore water concentrations of Cu and Zn were also increased in some meters distance from the
degassing center, indicating complex formation with DOM, although, these two metals formed an own
cluster of high similarity. The reason for the distinct behavior was most probably that their pore water
concentrations, in contrast to Al, Cr, Fe, and As, were close to detection limit in the degassing center
despite high DOC concentrations. The effective removal of Cu and Zn from solution despite increased
DOM concentrations as well as the presence of up to 1.8 mg L-1
sulfide in the pore water of the
degassing center confirmed the hypothesis of a precipitation of sulfide minerals as effective
sequestration process under permanently anoxic conditions. Copper, Zn, and also Cd are known to
precipitate in form of sulfidic minerals under reducing conditions (Fulda et al., 2013a, 2013b, Kirk,
2004, Weber et al., 2009b).
Concluding from the results of this study, increased metal(loid) mobility at mofette sites could mainly
be observed for those elements with a high affinity to DOM, i.e., Al, As, Cr, Cu, Fe, and Zn. Due to
the accumulation of poorly degraded SOM (compare section 1.1.4), also DOM concentrations are
increased in mofettes. Besides preventing metal(loid) sorption to the soil solid phase by the formation
of metal(loid)-DOM complexes, DOM could also indirectly contribute to increased metal(loid)
mobility by competition for sorption sites (Grafe et al., 2001, 2002, Redman et al., 2002, Theis and
Singer, 1974). The elements Mn, Co, and Ni showed no changes in net-mobility. Long-term, CO2-
induced soil acidification has led to the depletion of these elements within more or less the whole CO2-
influenced area.
Iron and As were the only elements for which a direct, CO2-triggered mobilizing effect could still be
observed after the long-term CO2-influence at this mofette site. This observation was attributed to the
fast kinetics of Fe(II) oxidation and Fe(III) reduction (Kirk, 2004). As soon as traces of oxygen are
available, pedogenic Fe (oxyhydr)oxides can form, but they can also be reductively dissolved again, if
conditions get more reducing. Together with metal(loid) complexation by DOM, this leads to
significantly increased net-mobilities of Fe and As in the mofette center and arises the question on
exact mechanisms and rates of CO2-triggered, short-term mobilization processes.
3.2 Time and temperature dependency of carbon dioxide induced metal(loid)
mobilization in soil (study 2)
In the second study of this thesis (Mehlhorn et al., 2016), the short-term effects on As, Cu, Fe, and Mn
mobility, which follow a sudden CO2 release into a hitherto non-CO2-influenced soil, were studied in

Results and Discussion
22
laboratory experiments and compared to long-term effects at the natural site. Two main processes
could be distinguished in these experiments. Within the first 1 hour to 1 day of incubation with a
constant flow of CO2, fast abiotic mobilization of metal cations, especially pronounced for Mn, was
observed. The mobilization was strongest in the cooled treatments (16 °C), followed by room
temperature (22 °C) treatments, and lowest for the heated treatments (35 °C). This liquid phase
concentration increase must have been caused by abiotic desorption of Mn following sorption site
protonation with protons derived from the dissolution of CO2 and following dissociation of carbonic
acid. Since, according to Henry’s law (Henry, 1803), more CO2 can dissolve at lower temperature,
mobilization rates increased in the order heated < room temperature < cooled. After the initial
mobilization, Mn concentrations remained relatively constant, except for the heated treatments, in
which low amounts of Mn were continuously released until the end of the experiment after 42 days.
The control batches, which were not incubated with CO2, also showed slight Mn mobilization within
1 day, however, significantly lower than the CO2 treatments. This was attributed to desorption
reactions following the mixing of soil with river water.
After an initial lag phase of 1 to 3 days, a strong and continuous Fe mobilization started and liquid
phase Fe concentrations increased almost linearly until the end of the experiment after 42 days. In
contrast to Mn, no Fe mobilization was detected in the non-CO2-incubated controls. The fact that Fe
mobilization followed the order cooled < room temperature < heated treatments already implied that
microbes might have triggered this process. This hypothesis was reinforced by the significant decrease
in redox potential from values above 500 mV down to a minimum of 340 ± 20 mV, which was
observed in the CO2 treatments and which followed the same order as Fe mobilization with regard to
temperature treatment. Additionally, determination of MPNs showed that 4.7∙104 to 1.0∙10
6 MPN mL
-1
of Fe(III)-reducing microorganisms were present in the initial soil. Thus, this second main
mobilization process was attributed to the microbially triggered reductive dissolution of Fe
(oxyhydr)oxides.
In the heated treatments, an up to 111 ± 24 fold increase in liquid phase Fe concentrations could be
observed. This value is much higher than the abiotic mobilization of Mn which only resulted in
2.5 to 3.3 fold concentration increases. For As, significant mobilization was only observed in the
heated treatments and attributed to co-release from Fe (oxyhydr)oxide dissolution. In the cooled and
room temperature treatments, As re-adsorption might have counteracted with any co-release. Also for
Mn, only the heated treatments showed a continuous further mobilization over the course of the
experiment, reaching final concentrations comparable to those of the cooled treatments after 42 days.
This indicated that also some adsorbed or incorporated Mn must have been mobilized during
microbially triggered reductive dissolution of Fe (oxyhydr)oxides.

Results and Discussion
23
Experiment repetitions with sterilized batch incubations were conducted in order to quantify the
microbial influence on metal(loid) mobilization, but unfortunately all tested sterilization methods led
to unintended changes in soil conditions and mobilization reactions, which is a well-known problem in
soil science (Trevors, 1996 and references therein).
To further verify the assumed microbially triggered mobilization process, the influence of SOM
content and Fe mineral crystallinity on CO2 induced metal(loid) mobilization was tested with different
soils in a second experiment. Mössbauer spectroscopy revealed that the main Fe phases in the soil
used for the first batch experiment (fresh spring soil) were goethite, a short range ordered Fe mineral
such as ferrihydrite, and some non-crystalline Fe(II)/Fe(III) phases. Storage of the soil for 11 weeks
under cooled and dark conditions (stored spring soil) significantly increased the crystallinity of the Fe
phases. Another soil sample was taken in summer (fresh summer soil), i.e., during high soil microbial
activity. According to the Mössbauer spectra of this sample, little to no goethite was present and the
majority of the Fe phases were present in form of short range ordered minerals, which might have
been associated with SOM. In comparison to the fresh spring soil, mobilization of all considered
metal(loid)s was decreased in the stored spring soil. In the fresh summer soil, however, mobilization
of Fe and As was both faster and stronger compared to the fresh spring soil. These observations
support the hypothesis of a strong microbial influence on metal(loid) mobilization, whereby the
microbially triggered reductive dissolution of Fe (oxyhydr)oxides was inhibited by the increased
crystallinity of Fe(III) minerals in the stored spring soil. In fresh summer soil, reductive dissolution
was intensified, since Fe(III)-reducing bacteria profited from large amounts of organic matter and
easily available, low crystalline Fe(III) minerals as energy source (Melton et al., 2014).
Following these results of study 2, further test experiments on the effect of CO2 on pure cultures of
Fe(III)-reducing bacteria were conducted (Metz, 2016, unpublished). The acidophilic, facultative
anaerobic bacterium Acidiphilium SJH (A. SJH) was incubated with 5 mM ferrihydite under either an
oxic headspace, a pure nitrogen headspace, or a pure CO2 headspace. The aim of these experiments
was to test, if any CO2-induced effects other than acidification influenced the microbially triggered
reductive dissolution of the ferrihydrite. As expected, only slight Fe mobilization occurred under oxic
conditions as result of co-respiration. Without pH buffering, mobilization was higher in CO2 than in
nitrogen treatments. Dissolution of CO2 in the medium lowered pH significantly (pH 4.2 compared to
5.5 in nitrogen and air treatments), which triggered the proton-consuming reaction of microbial Fe(III)
reduction. When pH was kept constantly low at the optimum pH of A. SJH (pH 3.0), the mobilization
in batches with pure nitrogen and pure CO2 headspace showed no significant differences indicating
that besides acidification no other direct influences of CO2 on the Fe(III) reduction rate of A. SJH exist
in this simplified system. In a natural soil system, however, other effects might play a role, e.g., an
advantage of Fe(III)-reducing bacteria over sulfide reducers at elevated CO2 levels due to the constant
delivery of protons (Kirk et al., 2013).

Results and Discussion
24
Another test experiment, which was conducted following the observations of study 2, was an in situ
mobilization study, similar to the one in Mehlhorn et al. (2014). However, instead of incubating
natural soil, the synthetic Fe (oxyhydr)oxides goethite and ferrihydrite, partially loaded with As or Cu,
were incubated in the degassing center and the non-CO2-influenced reference soil of Site A.
Furthermore, instead of using 0.2 µm membrane for covering the individual compartments, a
polyamide mesh with a pore size of 50 x 50 µm was used to enable microbial colonization. In situ
incubation of natural and As- or Cu-loaded goethite was done during summer for 6.5 weeks. No
metal(loid) mobilization could be observed during this experiment, probably due to the extreme Fe
excess, and the dense, sludge-like structure and high crystallinity of the goethite, making the Fe
(oxyhydr)oxide less available for microbial processes. Therefore, the following in situ mobilization
experiment was conducted with natural and As- or Cu-loaded ferrihydrite coated sand in order to
increase the porosity and the availability for microbes. The in situ mobilization chambers were
exposed at Site A for 2 weeks in spring and for 4 weeks in summer. Again, no mobilization of Fe
could be determined, but some of the adsorbed As and Cu was mobilized, most pronounced in the
summer experiment. However, As mobilization was the same for mofette and reference
(approximately 25% of the initial 216 µg g-1
) and only Cu showed stronger mobilization within the
mofette (62% vs. 12% in the reference of initially 20 µg g-1
), probably caused by stronger desorption
in the low-pH mofette soil. Oppositely to the experiment with natural soil in Mehlhorn et al. (2014),
the incubation of synthetic Fe minerals did neither include any natural soil microbial community nor
any carbon source. Thus, even if some Fe(III)-reducing microbes colonized the ferrihydrite during
incubation, they were lacking a carbon source to reductively dissolve larger amounts of the Fe mineral
and only abiotic desorption of Cu and As could be observed. Same as in the incubations with A. SJH,
the soil system was represented in a too simplified way and processes, which could be observed in the
experiments with natural soil, were not reproducible. Therefore, no further in situ experiments or
experiments with pure microbial cultures were conducted for this thesis; instead, emphasis was put on
the natural mofette site again.
Concluding from the results of study 2 it can be said that on the short-term scale two main CO2-
triggered metal(loid) mobilization processes can be distinguished. Abiotic mobilization of metal
cations (here Mn) due to desorption processes will start immediately upon CO2 intrusion into soil.
However, the overall mobilization by this process was relatively low but might be higher for other
soils. A high risk for strong metal(loid) mobilization arises from mineral dissolution processes,
especially when these reactions are microbially triggered. Large amounts of Fe (and incorporated
metal(loid)s like As and Mn) can be mobilized by microbially triggered reductive dissolution of Fe
(oxyhydr)oxides, as shown for the Fe-rich Gleyic Fluvisol of Site A. However, a direct transfer of
these results to the mofette site is difficult since the incubation of hitherto non-CO2-influenced soil
with CO2 for up to 42 days is hardly comparable with decades of CO2 exhalation at the mofette site. At

Results and Discussion
25
the mofettes, formation of pedogenic Fe (oxyhydr)oxides is inhibited by anoxic conditions or limited
to micro-oxic conditions along root channels (Rennert et al., 2011) or at small elevations (compare the
hummock with elevated Fe and As between two degassing features mentioned in study 1, section 3.1).
Strong metal(loid) mobilization due to CO2-triggered reductive dissolution of Fe (oxyhydr)oxides
might play a major role, if degassing structures are moving or new mofettes are forming and hitherto
non-CO2-influenced soil comes under the influence of CO2. The results of study 2 are especially
relevant with regard to risk assessment at GCS sites, where CO2 leakage could cause metal(loid)
mobilization from soils and sediments into aquifers.
An interesting observation in study 2 was that Cu as only element scarcely showed any CO2-induced
changes in mobility. Almost no differences between treatments and controls or between different
temperature treatments could be observed. Following minor initial mobilization after mixing of soil
and water, which was observed for all elements in all incubations, only the CO2 treatments with fresh
summer soil showed further changes in Cu concentration with continuous immobilization over the
course of the experiment. Since the summer soil was strongly enriched in organic carbon and since Cu
is known to have a high affinity for SOM (McBride et al., 1997, McLaren and Crawford, 1973,
McLaren et al., 1983), this Cu immobilization was attributed to re-adsorption to SOM. However, the
strong decrease in redox potential (from 540 ± 10 to 340 ± 20 mV) and the presence of 2.1∙103 to
4.7∙104 MPN mL
-1 sulfate-reducing microorganisms indicate that also Cu reduction and precipitation
in form of sulfidic minerals could have contributed to the observed Cu sequestration. To further
elucidate the behavior of Cu under increased p(CO2) in mofettes, it was decided to focus on this
specific element for the third study of this thesis.
3.3 Copper mobilization and sequestration in mofettes – the role of redox conditions
and soil organic matter (study 3)
Copper had shown some quite interesting spatial distribution in study 1: Regarding total contents in
SOM-rich topsoil, Cu was both enriched directly in the degassing center and in the non-CO2-
influenced areas, while soil contents were lowest in the transition zones with medium p(CO2). Pore
water concentrations of Cu were highest in the upper 10 to 15 cm of these transition zones, i.e., also
Cu mobility was highest there, especially pronounced in 2 to 4 m distance from the degassing center.
Interestingly, Cu mobility was lowest directly in the degassing center, with pore water concentrations
being close to or even below the limit of detection. These observations indicate that two distinct Cu
binding processes occurred inside and outside of the degassing center and that, in contrast to most
other metal(loid)s considered in studies 1 and 2, CO2 degassing did not simply trigger Cu mobilization
and leaching by soil acidification as might have been expected from studies on pH dependent Cu
sorption in soil (Degryse et al., 2009).

Results and Discussion
26
In order to clarify the distinct Cu binding mechanisms, sorption isotherms were determined in study 3
(Mehlhorn et al., 2018) for four SOM-rich topsoil samples of Site A with increasing soil p(CO2)
(Reference A, Transition A2, Transition A1, and Mofette A) and two samples from Site B (Reference
B and Mofette B).
Copper adsorption was lowest for Transition A1, followed by Transition A2, followed by the two
References A and B, which showed almost similar adsorption isotherms. The isotherms of Mofette A
and B, however, differed completely from the others: while references and transitions showed linear
adsorption isotherms, the Cu adsorption to mofette soils could be fitted best using Freundlich
isotherms. In addition, Cu adsorption was significantly higher for mofettes than for the other soils,
with Mofette A showing the strongest Cu adsorption of all samples.
Since SOM is known to be the predominant binding partner for Cu in oxic soils (Karlsson et al., 2006,
McBride et al., 1997, McLaren and Crawford, 1973, McLaren et al., 1983), both DOM and SOM were
studied in more detail. The Cu sorption isotherms were replotted with respect to total DOC for Cu
concentrations in liquid phase and with respect to total SOC for Cu adsorbed. Interestingly, the
isotherms and linear adsorption coefficients determined for Transitions A1, A2, and Reference A were
almost identical when referred to organic carbon. This indicates that SOM was the dominating binding
partner for Cu in these soils. However, equal amounts of the spiked Cu complexed with DOM as with
solid-phase SOM, resulting in different Cu mobilities in Transitions and References. As expected,
SOC contents increased towards the mofette center with Reference A < Transition A2 < Transition
A1 < Mofette A. However, also the amount of DOC, which was mobilized into the liquid phase during
the course of the experiment, as well as the DOC:SOC ratio increased with increasing SOC. This
indicates that the stability of SOM decreases with increasing p(CO2) as previously reported by Rennert
and Pfanz (2015).
Differences in SOM quality were also detected in this study. Same as observed in other studies (e.g.,
Rennert et al., 2011, Ross et al., 2000) and in study 1 of this thesis, the C/N ratio increased towards the
degassing center, indicating a lower decomposition state of mofettic SOM. While transitions and
references were relatively similar in DOM composition determined by FTIR and in SOM composition
determined by 13
C NMR, both DOM and SOM of the mofette soils showed some distinct differences
from the other soils. The relative fraction of aliphatic carbon in SOM was increased and bands
indicative for aliphatic structures and polypeptides were more pronounced in DOM from mofettes.
Together with longer chain lengths of the aliphatic structures in DOM, as indicated by the ratio of
bands indicative for asymmetric stretching of R−CH3 and R−CH2 (Ibarra et al., 1996), these
observations confirmed the lower degradation state of DOM and SOM in mofettes.
A negative influence of geogenic CO2 on the interaction of SOM with soil minerals and thus on SOM
stabilization due to accumulation of poorly degraded SOM has been first reported by Rennert and

Results and Discussion
27
Pfanz (2015). Sorption isotherms determined in study 3 showed that the decreasing SOM stabilization
with increasing p(CO2) significantly influenced Cu mobility, and regarding results of study 1, also the
mobility of other metal(loid)s with a high affinity for complex formation with DOM. With increasing
p(CO2), the DOC:SOC ratio increased and thus, also Cu mobility increased by formation of Cu-DOM
complexes.
Determination of Cu solid-phase speciation by XAS confirmed the predominance of Cu binding to
SOM for transition and reference soils. Using linear combination fitting, best fits could be achieved
using reference compounds of Cu(II) adsorbed to organic substances. Binding of Cu(II) to SOM (or
DOM) occurs via closely spaced hydroxylic (or amine) and carboxylic groups leading to the formation
of very stable five- to six-membered ring chelates (Karlsson et al., 2006, Manceau and Matynia,
2010). Solid-phase speciation showed that also the spiked Cu predominantly adsorbed to organic
matter and no significant differences in solid-phase speciation could be observed between transitions
and references. This implies that structural changes in SOM composition, e.g., a lower abundance of
carboxylic groups at elevated p(CO2) as recently described by Rennert (2018), did not influence Cu
binding to a detectable extent. Only the DOC:SOC ratio determined Cu mobility in the sorption
experiment of study 3.
In soils from the degassing center, another binding mechanism must have caused the strong Cu
sequestration. This was indicated already by the differing shape of the sorption isotherms and further
confirmed by the fact that Cu adsorption was strong despite high DOC concentrations and a low SOM
degradation state in soil from Mofettes A and B. Copper solid-phase speciation determined by XAS
further confirmed this hypothesis: according to linear combination fitting, 72% of the Cu in Mofette A
was present in form of Cu(I) coordinated via sulfur. Even if no statistically significant distinction
between Cu(I) bound to thiol groups of organic matter and Cu sulfide minerals was possible, it could
be concluded from the strong Cu sequestration despite high DOC concentrations that Cu sulfide
minerals were the dominating Cu compound in Mofette A. Furthermore, one fourth of the spiked
Cu(II) must have been reduced and precipitated in form of Cu sulfide, besides adsorption of Cu(II) to
SOM.
Copper(II) reduction and subsequent precipitation in form of sulfidic minerals is a process that is
known from other anoxic soils, e.g., floodplains, wetlands, or paddy soils (Borch et al., 2009, Fulda et
al., 2013a, 2013b, Weber et al., 2009a). Reduction can appear abiotically, e.g., by reaction with
reduced humic substances (Maurer et al., 2013, Pham et al., 2012) or be triggered by microorganisms
(Hofacker et al., 2015, Sugio et al., 1990). The formed Cu(I) is very reactive, thus, if it is not stabilized
by complexation, e.g., with sulfide, it may disproportionate and form metallic Cu(0) and Cu(II)
(Fenwick, 1926, Sharma and Millero, 1988). With SEM-EDS a small particle of metallic Cu was
detected in a Cu-spiked sample from Mofette A, indicating that precipitation of Cu(0) following Cu(II)
Results and Discussion
28
reduction and disproportionation might also occur in mofettes. However, Cu solid-phase speciation
determined by XAS did not confirm the presence of Cu(0), thus, contributions must have been low.
The detected sulfide concentrations of 1.8 mg L-1
, which could be measured in pore water from the
mofette center, imply that Cu(II) in mofettes is reduced either by microbes or abiotically, complexes
with sulfide, and precipitates in form of sulfidic minerals. This can explain the strong Cu sequestration
observed both in natural soils and in Cu spike experiments. In Mehlhorn et al. (2014), strong Cu
accumulation was observed in a peat lens, which is located in approximately 2 m depth beneath
mofette Site A. Solid-phase speciation of a sample from this peat lens revealed that the majority of the
Cu is present as CuS, i.e., as covellite, reinforcing the hypothesis of Cu sequestration by sulfide
mineral precipitation in mofettes.
Overall, this study helped to clarify the complex processes of Cu mobilization and sequestration
processes along the redox and SOM gradient of a mofette. It could be shown that mofettes serve as
sink for Cu and other chalcophilic elements by formation of or co-precipitation with sulfidic minerals.
The accumulation of Cu, Cd, Zn, and sulfur that was observed in the degassing center of Site A in
study 1 was most probably also caused by metal sulfide precipitation. However, metal sequestration is
only guaranteed under completely anoxic conditions, i.e., directly in the degassing center. In the
surrounding transition area, with low amounts of oxygen available, increased mobility of Cu and other
metal(loid)s due to complexation with DOM has to be expected.

29
4 Conclusion
The aim of this thesis was to investigate the influence of geogenic CO2 exhalations at wetland mofette
sites on the binding mechanisms and the mobility of metal(loid)s in soil. Metal(loid) mobilization and
immobilization processes were explored both on the spatial and temporal scale, differentiating short-
term and long-term processes, and results were put in context with CO2-induced changes in soil
conditions and pedogenesis.
Three main processes, which trigger metal(loid) mobilization and immobilization, could be
distinguished: desorption following surface protonation, mineral dissolution, and precipitation of
sulfidic minerals. The conceptual model developed in a pre-study to this thesis (Figure 4) could be
refined, now separating short-term and long-term processes (Figure 5).
Figure 5. Conceptual model comparing short-term (top graph) and long-term (bottom graph) CO2-induced
metal(loid) mobilization (red-framed arrows) and immobilization (blue-framed arrow) processes. The short-term
processes correspond to a temporal change in CO2, i.e., a sudden CO2 release into a hitherto non-CO2-influenced
soil as investigated in study 2. The long-term processes correspond to a change in spatial metal(loid) distribution
at a mofette site, in which CO2 exhalation influenced pedogenesis for at least several decades, going from non-
CO2-influenced reference soil (left) towards the degassing center (right) as investigated in studies 1 and 3.
Main mobilization processes following CO2 intrusion into a hitherto non-CO2-influenced soil are
desorption of metal cations and the reductive dissolution of pedogenic Fe (oxyhydr)oxides (study 2;
Figure 5, top graph). While desorption of metal cations occurs immediately and overall mobilization is
sh
ort
-te
rm p
roc
ess
es
lon
g-t
erm
pro
ces
ses
Fe(III)
-
-
-
-
Me2+ CO32-
H+H+
Fe2+
Fe(III)
As
As As
oxic anoxic
Me+ -
-
-
-
H+
H+
H+
H+
Me2+
Me+
Me-DOM
complexes
Fe, As
Mn, Co, Ni
Sulfide
precipitation
Mineral weathering
& Leaching
Desorption
Reductive
dissolution
oxic anoxic
REFERENCE MOFETTE
Cu
Zn
Cd

Conclusion
30
comparably low, reductive dissolution of Fe (oxyhydr)oxides as microbially triggered process only
starts after depletion of more favorable electron acceptors, like oxygen or nitrate. However,
significantly larger amounts of Fe and incorporated metal(loid)s are mobilized compared to
mobilization via desorption. The dissolution of CO2 in pore water further accelerates the reductive
dissolution processes by constant supply of protons. Iron(II) oxidation and reductive dissolution of
pedogenic Fe (oxyhydr)oxides are both reactions with fast kinetics due to the catalyzing effect of
microbial activity (Kirk, 2004, Lovley, 1991). These fast kinetics and the small scale heterogeneity of
soil conditions around mofettes lead to an increased As and Fe mobility in close vicinity to the
degassing center of mofettes, which is still apparent after decades of CO2 exhalation (study 1; Figure
5, bottom graph).
The above-mentioned, short-term mobilization processes can constitute a risk if large amounts of toxic
trace elements, like As, are mobilized into aquifers. The extent of mobilization of course depends on
further parameters like soil composition and climatic conditions. For example, dissolution of carbonate
minerals would be a main process expected after CO2 intrusion into limestone containing rocks and
soils (e.g., at the Starzach mofette site in southern Germany (Lübben and Leven, 2018)), but could not
be observed at the site studied for this thesis due to the absence of carbonates in the already relatively
acidic parent material of the soil (sediments from magmatic and metamorphic rocks). Regarding
climate, warmer temperatures would enhance microbially triggered reactions, while cold conditions
would increase the net-mobilization via desorption since more CO2 could dissolve in the pore water.
While reductive dissolution of pedogenic Fe (oxyhydr)oxides is a fast and reversible mineral
dissolution process, weathering of silicates is a much slower, generally non-reversible process and
could thus not be observed in study 2. Investigation of the spatial metal(loid) distribution around a
main degassing feature of a mofette in study 1, however, suggests that mobilization of metal(loid)s
(Mn, Ni, Co, Zn) due to mineral weathering occurred at this site. Increased weathering of silicates
present in soil releases adsorbed and incorporated metal(loid)s into the pore water. In contrast to the
dissolution of Fe (oxyhydr)oxides, silicate weathering is rather triggered by the CO2-induced soil
acidification than by anoxic conditions and microbial processes. Thus, depletion of metal(loid)s
associated with silicates is not limited to the degassing center but occurs in the whole CO2-influenced
area. Moreover, depletion is not limited to the solid phase. The pore water of the mofette site was
likewise depleted in these metals due to continuous leaching, indicating that quasi-equilibrium
between soil and pore water has developed after long-term CO2 influence (study 1).
Aluminum and partly also Cr seem to be less affected by metal(loid) mobilization following silicate
weathering, which can be attributed to the fact that the aluminum octahedral and tetrahedral structures
of aluminosilicates will stay intact for a long time and would only be dissolved in the final step of
aluminosilicate hydrolysis. Furthermore, released Al might precipitate immediately with silicic acid,

Conclusion
31
forming kaolinite, or with water, forming gibbsite (Blume et al., 2016). Most likely, depletion in Al
and Cr around CO2 exhalations is primarily indirectly caused by accumulation of SOM and thus a
decreased soil mineral content while actual mobilization due to silicate weathering remains low.
Accumulation of SOM is also responsible for the increased mobility of numerous metal(loid)s
following long-term CO2-influence in mofettes. Due to the poor decomposition state of the
accumulating SOM, DOM concentrations are strongly increased around CO2 exhalations. Metal(loid)s
with a high affinity for DOM (Al, As, Cr, Cu, Fe, Zn) are complexed by DOM in these zones, which
prevents adsorption or precipitation and thus increases metal(loid) mobility (study 1, study 3).
No evidence for net-immobilization of metal(loid)s by re-adsorption to solid-phase SOM, as
postulated in Mehlhorn et al. (2014), was retrieved in the studies conducted for this thesis, however,
the process might play a role at mofettes on the long-term scale. The net-immobilization in mofettes
observed for Cu in the pre-study was more likely caused by precipitation of sulfidic minerals. Due to
the permanently anoxic conditions in the degassing center of mofettes, Cu(II) is reduced to Cu(I),
complexes with microbially produced sulfide, and precipitates in form of Cu sulfide minerals
(study 3). This process leads to strong Cu accumulation in the degassing center and effectively
sequesters Cu from pore water despite high DOM concentrations. Accumulation of Cd and Zn in the
degassing center suggests that these chalcophilic metals are also sequestered by sulfide formation or
co-precipitation (study 1). Immobilization of these metals may constitute a risk for soil organisms and
plants by limitation of essential trace elements. However, regarding mofettes, the extreme p(CO2),
especially in the degassing center, probably represents the more important limitation for plant growth
and soil organisms.
With the studies conducted for this thesis, main processes causing mobilization and immobilization of
metal(loid)s in soils affected by high p(CO2) in mofettes could be elucidated. The influence of CO2 on
sorption, dissolution, and precipitation processes mainly occurs via CO2-induced soil acidification
and/or (permanently) anoxic soil conditions. Thus, mobilization and immobilization processes are
similar to processes known to occur in other anoxic soils (e.g., wetland or floodplain soils) or during
soil acidification. However, the combination of several influencing factors, e.g., the increased SOM
content and changed SOM composition, the spatial changes in redox conditions, soil and pore water
pH, and microbial community changes, is unique for mofettes, as well as the variety of soil conditions
that can be found within a relatively small area at these sites. Especially, the gradient in redox
conditions from permanently anoxic conditions in the degassing center to oxic conditions within only
several meters distance makes mofette sites a suitable natural laboratory to study metal(loid)
mobilization and immobilization processes.
Regarding risk assessment for GCS sites, it could be shown that on a short-term scale metal(loid)
mobilization via desorption and microbially triggered reductive dissolution of Fe (oxyhydr)oxides and

Conclusion
32
other minerals has to be expected. While these short-term effects can be easily tested for different
types of soil and sediment in laboratory experiments, studies at mofettes, as done for this thesis, help
to estimate the long-term influences of CO2 on soil and metal(loid) mobility, which will be relevant if
a leakage at a GCS site is not detected or cannot be sealed.

33
References
acatech (Ed.), 2018. CCU und CCS – Bausteine für den Klimaschutz in der Industrie; Analyse,
Handlungsoptionen und Empfehlungen. Herbert Utz Verlag, München.
Baklid, A., Korbol, R., Owren, G., 1996. Sleipner Vest CO2 disposal, CO2 injection into a shallow
underground aquifer, SPE Annual Technical Conference and Exhibition. Society of Petroleum
Engineers.
Bankwitz, P., Schneider, G., Kämpf, H., Bankwitz, E., 2003. Structural characteristics of epicentral
areas in Central Europe: study case Cheb Basin (Czech Republic). J. Geodyn., 35(1-2), 5-32.
Bauer, M., Blodau, C., 2006. Mobilization of arsenic by dissolved organic matter from iron oxides,
soils and sediments. Sci. Total Environ., 354(2), 179-190.
Baxter, P.J., Kapila, M., Mfonfu, D., 1989. Lake Nyos disaster, Cameroon, 1986: the medical effects
of large scale emission of carbon dioxide? BMJ, 298(6685), 1437-1441.
Beaubien, S., Ciotoli, G., Coombs, P., Dictor, M.C., Krüger, M., Lombardi, S., Pearce, J., West, J.,
2008. The impact of a naturally occurring CO2 gas vent on the shallow ecosystem and soil
chemistry of a Mediterranean pasture (Latera, Italy). Int. J. Greenh. Gas Control, 2(3), 373-
387.
Benson, S.M., Cole, D.R., 2008. CO2 sequestration in deep sedimentary formations. Elements, 4(5),
325-331.
Beulig, F., Heuer, V.B., Akob, D.M., Viehweger, B., Elvert, M., Herrmann, M., Hinrichs, K.-U.,
Küsel, K., 2015. Carbon flow from volcanic CO2 into soil microbial communities of a wetland
mofette. ISME J., 9(3), 746-759.
Beulig, F., Urich, T., Nowak, M., Trumbore, S.E., Gleixner, G., Gilfillan, G.D., Fjelland, K.E., Küsel,
K., 2016. Altered carbon turnover processes and microbiomes in soils under long-term
extremely high CO2 exposure. Nat. Microbiol., 1, 15025.
Blume, H.-P., Felix-Henningsen, P., 2009. Reductosols: Natural soils and Technosols under reducing
conditions without an aquic moisture regime. J. Plant Nutr. Soil Sci., 172(6), 808-820.
Blume, H.-P., Brümmer, G.W., Fleige, H., Horn, R., Kandeler, E., Kögel-Knabner, I., Kretzschmar,
R., Stahr, K., Wilke, B.-M., 2016. Scheffer/Schachtschabel: Soil Science. Springer-Verlag,
Berlin Heidelberg.
BMUB, 2016. Klimaschutzplan 2050 – Klimapolitische Grundsätze und Ziele der Bundesregierung,
Bundesministerium für Umwelt, Naturschutz, Bau und Reaktorsicherheit.
Borch, T., Kretzschmar, R., Kappler, A., Cappellen, P.V., Ginder-Vogel, M., Voegelin, A., Campbell,
K., 2009. Biogeochemical redox processes and their impact on contaminant dynamics.
Environ. Sci. Technol., 44(1), 15-23.
Bowell, R.J., 1994. Sorption of arsenic by iron oxides and oxyhydroxides in soils. Appl. Geochem.,
9(3), 279-286.
Bradl, H.B., 2004. Adsorption of heavy metal ions on soils and soils constituents. J. Colloid Interface
Sci., 277(1), 1-18.
Bräuer, K., Kämpf, H., Strauch, G., Weise, S.M., 2003. Isotopic evidence (3He/
4He,
13CCO2) of fluid‐
triggered intraplate seismicity. J. Geophys. Res. B: Solid Earth, 108(B2).
Bräuer, K., Kämpf, H., Niedermann, S., Strauch, G., Tesař, J., 2008. Natural laboratory NW Bohemia:
Comprehensive fluid studies between 1992 and 2005 used to trace geodynamic processes.
Geochem. Geophys. Geosyst., 9(4).
Bräuer, K., Kämpf, H., Niedermann, S., Strauch, G., 2018. Monitoring of helium and carbon isotopes
in the western Eger Rift area (Czech Republic): Relationships with the 2014 seismic activity
and indications for recent (2000–2016) magmatic unrest. Chem. Geol., 482, 131-145.
Bussert, R., Kämpf, H., Flechsig, C., Hesse, K., Nickschick, T., Liu, Q., Umlauft, J., Vylita, T.,
Wagner, D., Wonik, T., 2017. Drilling into an active mofette: pilot-hole study of the impact of
CO2-rich mantle-derived fluids on the geo–bio interaction in the western Eger Rift (Czech
Republic). Sci. Dril., 23, 13.
Carrillo‐González, R., Šimůnek, J., Sauve, S., Adriano, D., 2006. Mechanisms and pathways of trace
element mobility in soils. Adv. Agron., 91, 111-178.
Cline, J.D., 1969. Spectrophotometric determination of hydrogen sulfide in natural waters. Limnol.
Oceanogr., 14(3), 454-458.

References
34
Cotrufo, M.F., Raschi, A., Lanini, M., Ineson, P., 1999. Decomposition and nutrient dynamics of
Quercus pubescens leaf litter in a naturally enriched CO2 Mediterranean ecosystem. Funct.
Ecol., 13(3), 343-351.
Credner, H., 1900. Die vogtländischen Erdbebenschwärme während der Zeit des Juli und August
1900. Berichte über die Verhandlungen der Königlich-Sächsischen Gesellschaft der
Wissenschaften zu Leipzig, Mathematisch-Physische Klasse, 52, 153-177.
D’Alessandro, W., 2006. Gas hazard: an often neglected natural risk in volcanic areas. In: Martin-
Duque, J., Brebbia, C., Emmanouloudis, D., Mander, U. (Eds.), Geo-environment and
landscape evolution II: evolution, monitoring, simulation, management and remediation of the
geological environment and landscape. WIT Transactions on Ecology and the Environment,
pp. 10.
Degryse, F., Smolders, E., Parker, D., 2009. Partitioning of metals (Cd, Co, Cu, Ni, Pb, Zn) in soils:
concepts, methodologies, prediction and applications – a review. Eur. J. Soil Sci., 60(4), 590-
612.
Du Laing, G., Vanthuyne, D., Vandecasteele, B., Tack, F., Verloo, M., 2007. Influence of hydrological
regime on pore water metal concentrations in a contaminated sediment-derived soil. Environ.
Pollut., 147(3), 615-625.
Fenwick, F., 1926. The equilibrium between cupric ion, cuprous ion and metallic copper. J. Am.
Chem. Soc., 48(4), 860-870.
Fernández-Montiel, I., Sidrach-Cardona, R., Gabilondo, R., Pedescoll, A., Scheu, S., Bécares, E.,
2016. Soil communities are affected by CO2 belowground emissions at a natural vent in Spain.
Soil Biol. Biochem., 97, 92-98.
Fischer, T., Horálek, J., Hrubcová, P., Vavryčuk, V., Bräuer, K., Kämpf, H., 2014. Intra-continental
earthquake swarms in West-Bohemia and Vogtland: a review. Tectp, 611, 1-27.
Flechsig, C., Bussert, R., Rechner, J., Schütze, C., Kämpf, H., 2008. The Hartoušov mofette field in
the Cheb Basin, western Eger Rift (Czech Republic): a comperative geoelectric,
sedimentologic and soil gas study of a magmatic diffuse CO2-degassing structure. Z. Geol.
Wiss., 36(3), 177-193.
Frerichs, J., Oppermann, B.I., Gwosdz, S., Möller, I., Herrmann, M., Krüger, M., 2013. Microbial
community changes at a terrestrial volcanic CO2 vent induced by soil acidification and
anaerobic microhabitats within the soil column. FEMS Microbiol. Ecol., 84(1), 60-74.
Fulda, B., Voegelin, A., Ehlert, K., Kretzschmar, R., 2013a. Redox transformation, solid phase
speciation and solution dynamics of copper during soil reduction and reoxidation as affected
by sulfate availability. Geochim. Cosmochim. Acta, 123, 385-402.
Fulda, B., Voegelin, A., Kretzschmar, R., 2013b. Redox-controlled changes in cadmium solubility and
solid-phase speciation in a paddy soil as affected by reducible sulfate and copper. Environ.
Sci. Technol., 47(22), 12775-12783.
Gagel, C., Stremme, H., 1909. Ueber einen Fall von Kaolinbildung im Granit durch einen kalten
Säuerling. Centralblatt f. Mineralogie, Abt. A, 427-437.
Gislason, S.R., Wolff-Boenisch, D., Stefansson, A., Oelkers, E.H., Gunnlaugsson, E., Sigurdardottir,
H., Sigfusson, B., Broecker, W.S., Matter, J.M., Stute, M., 2010. Mineral sequestration of
carbon dioxide in basalt: A pre-injection overview of the CarbFix project. Int. J. Greenh. Gas
Control, 4(3), 537-545.
Grafe, M., Eick, M., Grossl, P., 2001. Adsorption of arsenate (V) and arsenite (III) on goethite in the
presence and absence of dissolved organic carbon. Soil Sci. Soc. Am. J., 65(6), 1680-1687.
Grafe, M., Eick, M.J., Grossl, P.R., Saunders, A.M., 2002. Adsorption of arsenate and arsenite on
ferrihydrite in the presence and absence of dissolved organic carbon. J. Environ. Qual., 31(4),
1115-1123.
Grotzinger, J., Jordan, T.H., 2014. Understanding Earth. W. H. Freeman, USA, 3rd edition.
Harvey, O.R., Qafoku, N.P., Cantrell, K.J., Wilkins, M.J., Brown, C.F., 2016. Methanogenesis-
induced pH–Eh shifts drives aqueous metal(loid) mobility in sulfide mineral systems under
CO2 enriched conditions. Geochim. Cosmochim. Acta, 173, 232-245.
Henderson, Y., Haggard, H.W., 1943. Noxious gases. Reinhold Publishing Corporation.

References
35
Henry, W., 1803. III. Experiments on the quantity of gases absorbed by water, at different
temperatures, and under different pressures. Philosophical Transactions of the Royal Society
of London, 93, 29-42 and 274-276.
Hesslein, R.H., 1976. An in situ sampler for close interval pore water studies. Limnol. Oceanogr.,
21(6).
Hofacker, A.F., Voegelin, A., Kaegi, R., Weber, F.-A., Kretzschmar, R., 2013. Temperature-
dependent formation of metallic copper and metal sulfide nanoparticles during flooding of a
contaminated soil. Geochim. Cosmochim. Acta, 103, 316-332.
Hofacker, A.F., Behrens, S., Voegelin, A., Kaegi, R., Lösekann-Behrens, T., Kappler, A.,
Kretzschmar, R., 2015. Clostridium species as metallic copper-forming bacteria in soil under
reducing conditions. Geomicrobiol. J., 32(2), 130-139.
Hohberg, K., Schulz, H.-J., Balkenhol, B., Pilz, M., Thomalla, A., Russell, D.J., Pfanz, H., 2015. Soil
faunal communities from mofette fields: effects of high geogenic carbon dioxide
concentration. Soil Biol. Biochem., 88, 420-429.
Horálek, J., Fischer, T., 2008. Role of crustal fluids in triggering the West Bohemia/Vogtland
earthquake swarms: just what we know (a review). StGG, 52(4), 455.
Ibarra, J., Munoz, E., Moliner, R., 1996. FTIR study of the evolution of coal structure during the
coalification process. Org. Geochem., 24(6), 725-735.
IPCC, 2005. IPCC special report on carbon dioxide capture and storage. Prepared by Working Group
III of the Intergovernmental Panel on Climate Change. Cambridge University Press, United
Kingdom and New York, NY, USA, 442 pp.
Irwin, W.P., Barnes, I., 1980. Tectonic relations of carbon dioxide discharges and earthquakes. J.
Geophys. Res. B: Solid Earth, 85(B6), 3115-3121.
IUSS Working Group WRB, 2015. World Reference Base for Soil Resources 2014, Update 2015,
International soil classification system for naming soils and creating legends for soil maps.
World Soil Resources Reports No. 106. Food and Agriculture Organization of the United
Nations, Rome, Italy, 192 pp.
Jackson, M., Armstrong, W., 1999. Formation of aerenchyma and the processes of plant ventilation in
relation to soil flooding and submergence. Plant Biol., 1(3), 274-287.
Jähn, N., 2018. Erdbeben: Erwacht hier ein Vulkan? , Freie Presse,
https://www.freiepresse.de/vogtland/oberes-vogtland/erdbeben-erwacht-hier-ein-vulkan-
artikel10255812?utm_campaign=Echobox&utm_medium=Social&utm_source=Facebook#Ec
hobox=1531202051. Accessed 4 October 2018.
Jones, D., Beaubien, S., Blackford, J., Foekema, E., Lions, J., De Vittor, C., West, J., Widdicombe, S.,
Hauton, C., Queirós, A., 2015. Developments since 2005 in understanding potential
environmental impacts of CO2 leakage from geological storage. Int. J. Greenh. Gas Control,
40, 350-377.
Jun, Y.-S., Giammar, D.E., Werth, C.J., 2012. Impacts of geochemical reactions on geologic carbon
sequestration. Environ. Sci. Technol., 47(1), 3-8.
Jun, Y.-S., Giammar, D.E., Werth, C.J., Dzombak, D.A., 2013. Environmental and geochemical
aspects of geologic carbon sequestration: a special issue. Environ. Sci. Technol., 47(1), 1-2.
Kalbitz, K., Wennrich, R., 1998. Mobilization of heavy metals and arsenic in polluted wetland soils
and its dependence on dissolved organic matter. Sci. Total Environ., 209(1), 27-39.
Kämpf, H., Bräuer, K., Schumann, J., Hahne, K., Strauch, G., 2013. CO2 discharge in an active, non-
volcanic continental rift area (Czech Republic): Characterisation (δ13
C, 3He/
4He) and
quantification of diffuse and vent CO2 emissions. Chem. Geol., 339(0), 71-83.
Karlsson, T., Persson, P., Skyllberg, U., 2006. Complexation of copper(II) in organic soils and in
dissolved organic matter − EXAFS evidence for chelate ring structures. Environ. Sci.
Technol., 40(8), 2623-2628.
Kharaka, Y.K., Cole, D.R., Hovorka, S.D., Gunter, W.D., Knauss, K.G., Freifeld, B.M., 2006. Gas-
water-rock interactions in Frio Formation following CO2 injection: implications for the storage
of greenhouse gases in sedimentary basins. Geology, 34(7), 577-580.
Kharaka, Y.K., Thordsen, J.J., Kakouros, E., Ambats, G., Herkelrath, W.N., Beers, S.R., Birkholzer,
J.T., Apps, J.A., Spycher, N.F., Zheng, L., Trautz, R.C., Rauch, H.W., Gullickson, K.S., 2010.

References
36
Changes in the chemistry of shallow groundwater related to the 2008 injection of CO2 at the
ZERT field site, Bozeman, Montana. Environ. Earth Sci., 60(2), 273-284.
Kies, A., Hengesch, O., Tosheva, Z., Raschi, A., Pfanz, H., 2015. Diurnal CO2-cycles and temperature
regimes in a natural CO2 gas lake. Int. J. Greenh. Gas Control, 37, 142-145.
Kirk, G., 2004. The biogeochemistry of submerged soils. John Wiley & Sons, England.
Kirk, M.F., Santillan, E.F., Sanford, R.A., Altman, S.J., 2013. CO2-induced shift in microbial activity
affects carbon trapping and water quality in anoxic bioreactors. Geochim. Cosmochim. Acta,
122, 198-208.
Kirsch, K., Navarre-Sitchler, A.K., Wunsch, A., McCray, J.E., 2014. Metal release from sandstones
under experimentally and numerically simulated CO2 leakage conditions. Environ. Sci.
Technol., 48(3), 1436-1442.
Knett, J., 1899. Das erzgebirgische Schwarmbeben zu Hartenberg vom 1. Jänner bis 5. Feber 1824.
Sitzungsber. Dtsch. Naturwiss. Med. Ver. Böhmen Lotos Prague(19), 167-191.
Krauze, P., Kämpf, H., Horn, F., Liu, Q., Voropaev, A., Wagner, D., Alawi, M., 2017.
Microbiological and geochemical survey of CO2-dominated mofette and mineral waters of the
Cheb Basin, Czech Republic. Front. Microbiol., 8, 2446.
Langford, N.J., 2005. Carbon dioxide poisoning. Toxicol. Rev., 24(4), 229-235.
Lawter, A., Qafoku, N., Shao, H., Bacon, D., Brown, C., 2015. Evaluating impacts of CO2 and CH4
gas intrusion into an unconsolidated aquifer: fate of As and Cd. Front. Environ. Sci., 3, 49.
Lawter, A., Qafoku, N.P., Wang, G., Shao, H., Brown, C.F., 2016. Evaluating impacts of CO2
intrusion into an unconsolidated aquifer: I. Experimental data. Int. J. Greenh. Gas Control, 44,
323-333.
Le Guern, F., Tazieff, H., Pierret, R.F., 1982. An example of health hazard: people killed by gas
during a phreatic eruption: Dieng Plateau (Java, Indonesia), February 20th 1979. Bulletin
Volcanologique, 45(2), 153-156.
Lewicki, J.L., Birkholzer, J., Tsang, C.-F., 2007. Natural and industrial analogues for leakage of CO2
from storage reservoirs: identification of features, events, and processes and lessons learned.
Environ. Geol., 52(3), 457-467.
Lions, J., Devau, N., De Lary, L., Dupraz, S., Parmentier, M., Gombert, P., Dictor, M.-C., 2014.
Potential impacts of leakage from CO2 geological storage on geochemical processes
controlling fresh groundwater quality: a review. Int. J. Greenh. Gas Control, 22, 165-175.
Little, M.G., Jackson, R.B., 2010. Potential impacts of leakage from deep CO2 geosequestration on
overlying freshwater aquifers. Environ. Sci. Technol., 44(23), 9225-9232.
Livesey, N., Huang, P., 1981. Adsorption of arsenate by soils and its relation to selected chemical
properties and anions. Soil Sci., 131(2), 88-94.
Lovley, D.R., 1991. Dissimilatory Fe(III) and Mn(IV) reduction. Microbiol. Rev., 55(2), 259-287.
Lu, J., Partin, J.W., Hovorka, S.D., Wong, C., 2010. Potential risks to freshwater resources as a result
of leakage from CO2 geological storage: a batch-reaction experiment. Environ. Earth Sci.,
60(2), 335-348.
Lübben, A., Leven, C., 2018. The Starzach site in Southern Germany: a site with naturally occurring
CO2 emissions recovering from century-long gas mining as a natural analog for a leaking CCS
reservoir. Environ. Earth Sci., 77(8), 316.
Maček, I., Videmšek, U., Kastelec, D., Stopar, D., Vodnik, D., 2009. Geological CO2 affects microbial
respiration rates in Stavešinci mofette soils. Acta Biol. Slov., 52(2), 41-48.
Maček, I., Kastelec, D., Vodnik, D., 2012. Root colonization with arbuscular mycorrhizal fungi and
glomalin-related soil protein (GRSP) concentration in hypoxic soils in natural CO2 springs.
Agr. Food. Sci., 21(1), 62-71.
Manceau, A., Matynia, A., 2010. The nature of Cu bonding to natural organic matter. Geochim.
Cosmochim. Acta, 74(9), 2556-2580.
Manning, B.A., Goldberg, S., 1997. Arsenic (III) and arsenic (V) adsorption on three California soils.
Soil Sci., 162(12), 886-895.
Martens, S., Möller, F., Streibel, M., Liebscher, A., Group, T.K., 2014. Completion of five years of
safe CO2 injection and transition to the post-closure phase at the Ketzin pilot site. Energy
Procedia, 59, 190-197.
References
37
Matter, J.M., Stute, M., Snæbjörnsdottir, S.Ó., Oelkers, E.H., Gislason, S.R., Aradottir, E.S.,
Sigfusson, B., Gunnarsson, I., Sigurdardottir, H., Gunnlaugsson, E., 2016. Rapid carbon
mineralization for permanent disposal of anthropogenic carbon dioxide emissions. Sci.,
352(6291), 1312-1314.
Maurer, F., Christl, I., Fulda, B., Voegelin, A., Kretzschmar, R., 2013. Copper redox transformation
and complexation by reduced and oxidized soil humic acid. 2. Potentiometric titrations and
dialysis cell experiments. Environ. Sci. Technol., 47(19), 10912-10921.
McBride, M., 1989. Reactions controlling heavy metal solubility in soils. Adv. Soil Sci., 1-56.
McBride, M., Sauve, S., Hendershot, W., 1997. Solubility control of Cu, Zn, Cd and Pb in
contaminated soils. Eur. J. Soil Sci., 48(2), 337-346.
McGrath, S.P., Sanders, J.R., Shalaby, M.H., 1988. The effects of soil organic matter levels on soil
solution concentrations and extractabilities of manganese, zinc and copper. Geoderma, 42(2),
177-188.
McLaren, R., Williams, J., Swift, R., 1983. Some observations on the desorption and distribution
behaviour of copper with soil components. Eur. J. Soil Sci., 34(2), 325-331.
McLaren, R.G., Crawford, D.V., 1973. Studies on soil copper II. The specific adsorption of copper by
soils. J. Soil Sci., 24(4), 443-452.
MDR Wissen, 2018. Hinweise auf "Magma-Reservoir" − Vogtland "demnächst" Vulkangebiet MDR
AKTUELL RADIO, 16 July 2018, 07:49 https://www.mdr.de/wissen/umwelt/vogtland-
vulkan-beben-gfz-100.html. Accessed 30 October 2018.
Mehlhorn, J., Beulig, F., Küsel, K., Planer-Friedrich, B., 2014. Carbon dioxide triggered metal(loid)
mobilisation in a mofette. Chem. Geol., 382, 54-66.
Mehlhorn, J., Byrne, J.M., Kappler, A., Planer-Friedrich, B., 2016. Time and temperature dependency
of carbon dioxide triggered metal(loid) mobilization in soil. Appl. Geochem., 74, 122-137.
Mehlhorn, J., Besold, J., Lezama-Pacheco, J.S., Gustafsson, J.P., Kretzschmar, R., Planer-Friedrich,
B., 2018. Copper mobilization and immobilization along an organic matter and redox gradient
– insights from a mofette site. Environ. Sci. Technol., 52(23), 13698-13707.
Mehlhorn, J., Gerber, L.A., Planer-Friedrich, B., 2019. Spatial distribution of metal(loid) depletion
and accumulation zones around a natural carbon dioxide degassing site. Chem. Geol., 509, 64-
76.
Melton, E.D., Swanner, E.D., Behrens, S., Schmidt, C., Kappler, A., 2014. The interplay of
microbially mediated and abiotic reactions in the biogeochemical Fe cycle. Nat. Rev.
Microbiol., 12(12), 797-808.
Metz, R., 2016, unpublished. Influence of CO2 on mobilization of Fe and As by abiotic and
microbially triggered dissolution of ferrihydrite, Bachelor Thesis, University of Bayreuth,
Environmental Geochemistry.
Mickler, P.J., Yang, C., Scanlon, B.R., Reedy, R., Lu, J., 2013. Potential impacts of CO2 leakage on
groundwater chemistry from laboratory batch experiments and field push-pull tests. Environ.
Sci. Technol., 47(18), 10694-10702.
Moffett, J.W., Zika, R.G., Petasne, R.G., 1985. Evaluation of bathocuproine for the spectro-
photometric determination of copper(I) in copper redox studies with applications in studies of
natural waters. Anal. Chim. Acta, 175, 171-179.
Montes-Hernandez, G., Renard, F., Lafay, R., 2013. Experimental assessment of CO2-mineral-toxic
ion interactions in a simplified freshwater aquifer: Implications for CO2 leakage from deep
geological storage. Environ. Sci. Technol., 47(12), 6247-6253.
Morse, J., Luther, G., 1999. Chemical influences on trace metal-sulfide interactions in anoxic
sediments. Geochim. Cosmochim. Acta, 63(19), 3373-3378.
Nickschick, T., Kämpf, H., Flechsig, C., Mrlina, J., Heinicke, J., 2015. CO2 degassing in the
Hartoušov mofette area, western Eger Rift, imaged by CO2 mapping and geoelectrical and
gravity surveys. IJEaS, 104(8), 2107-2129.
Nowak, M., Beulig, F., von Fischer, J., Muhr, J., Küsel, K., Trumbore, S.E., 2015. Autotrophic
fixation of geogenic CO2 by microorganisms contributes to soil organic matter formation and
alters isotope signatures in a wetland mofette. Biogeosciences, 12, 7169-7183.
Oelkers, E.H., Cole, D.R., 2008. Carbon dioxide sequestration a solution to a global problem.
Elements, 4(5), 305-310.

References
38
Oelkers, E.H., Gislason, S.R., Matter, J., 2008. Mineral carbonation of CO2. Elements, 4(5), 333-337.
Olk, D.C., Cassman, K.G., Schmidt-Rohr, K., Anders, M.M., Mao, J.-D., Deenik, J.L., 2006.
Chemical stabilization of soil organic nitrogen by phenolic lignin residues in anaerobic
agroecosystems. Soil Biol. Biochem., 38(11), 3303-3312.
Oppermann, B.I., Michaelis, W., Blumenberg, M., Frerichs, J., Schulz, H.M., Schippers, A., Beaubien,
S.E., Krueger, M., 2010. Soil microbial community changes as a result of long-term exposure
to a natural CO2 vent. Geochim. Cosmochim. Acta, 74(9), 2697-2716.
Oxford English Dictionary online, 2018a. "mofette, n.", Oxford University Press, July 2018,
http://www.oed.com/view/Entry/120708?redirectedFrom=mofette&. Accessed 5 September
2018.
Oxford English Dictionary online, 2018b. "mephitis, n.", Oxford University Press, July 2018,
http://www.oed.com/view/Entry/116592?redirectedFrom=mephitis. Accessed 6 September
2018.
Paoletti, E., Pfanz, H., Raschi, A., 2005. Pros and cons of CO2 springs as experimental sites, Plant
responses to air pollution and global change. Springer, pp. 195-202.
Pearce, J.M., 2006. What can we learn from natural analogues? In: Lombardi, S., Altunina, L.K.,
Beaubien, S.E. (Eds.), Advances in the Geological Storage of Carbon Dioxide. Springer
Netherlands, pp. 127-139.
Peterek, A., Schunk, R., 2008. Zitternde Erde – Die Schwarmbeben in Nordwestböhmen.
Sonderveröffentlichung Bayerisch-Böhmischer Geopark 1/2008.
Pfanz, H., Vodnik, D., Wittmann, C., Aschan, G., Raschi, A., 2004. Plants and Geothermal CO2
Exhalations – Survival in and Adaptation to a High CO2 Environment. Prog. Bot., 65, 499-
538.
Pfanz, H., Vodnik, D., Wittmann, C., Aschan, G., Batic, F., Turk, B., Macek, I., 2007. Photosynthetic
performance (CO2-compensation point, carboxylation efficiency, and net photosynthesis) of
timothy grass (Phleum pratense L.) is affected by elevated carbon dioxide in post-volcanic
mofette areas. Environ. Exp. Bot., 61(1), 41-48.
Pfanz, H., 2008. Mofetten: Kalter Atem schlafender Vulkane. Deutsche Vulkanologische Gesellschaft
e. V., Rheinischer Ver. f. Denkmalpflege u. Landschaftsschutz, Köln.
Pham, A.N., Rose, A.L., Waite, T.D., 2012. Kinetics of Cu(II) reduction by natural organic matter. J.
Phys. Chem. A, 116(25), 6590-6599.
Pohlman, A.A., McColl, J.G., 1988. Soluble organics from forest litter and their role in metal
dissolution. Soil Sci. Soc. Am. J., 52(1), 265-271.
Qafoku, N.P., Lawter, A.R., Shao, H., Wang, G., Brown, C.F., 2014. Evaluating Impacts of CO2 Gas
Intrusion Into a Confined Sandstone aquifer: Experimental Results. Energy Procedia, 63,
3275-3284.
Redman, A.D., Macalady, D.L., Ahmann, D., 2002. Natural organic matter affects arsenic speciation
and sorption onto hematite. Environ. Sci. Technol., 36(13), 2889-2896.
Rennert, T., Eusterhues, K., Pfanz, H., Totsche, K.U., 2011. Influence of geogenic CO2 on mineral and
organic soil constituents on a mofette site in the NW Czech Republic. Eur. J. Soil Sci., 62(4),
572-580.
Rennert, T., Eusterhues, K., Andrade, V.D., Totsche, K.U., 2012. Iron species in soils on a mofette site
studied by Fe K-edge X-ray absorption near-edge spectroscopy. Chem. Geol., 332-333, 116-
123.
Rennert, T., Pfanz, H., 2015. Geogenic CO2 affects stabilization of soil organic matter. Eur. J. Soil
Sci., 66(5), 838-846.
Rennert, T., Pfanz, H., 2016. Hypoxic and acidic—Soils on mofette fields. Geoderma, 280, 73-81.
Rennert, T., 2018. Geogenic CO2 affects inorganic soil properties and the composition of soil organic
matter in physical fractions. Soil Res., 56(4), 396-403.
Ross, D.J., Tate, K.R., Newton, P.C.D., Wilde, R.H., Clark, H., 2000. Carbon and nitrogen pools and
mineralization in a grassland gley soil under elevated carbon dioxide at a natural CO2 spring.
Global Change Biol., 6(7), 779-790.
Russell, D.J., Schulz, H.-J., Hohberg, K., Pfanz, H., 2011. Occurrence of collembolan fauna in mofette
fields (natural carbon-dioxide springs) of the Czech Republic. Soil Org., 83(3), 489-505.
Sander, R., 2015. Compilation of Henry's law constants (version 4.0) for water as solvent. ACP, 15(8).

References
39
Saßmannshausen, F., 2010. Vegetationsökologische Charakterisierung terrestrischer
Mofettenstandorte am Beispiel des west-tschechischen Plesná-Tals (Doctoral Thesis),
University of Duisburg-Essen.
Schulz, H.-J., Potapov, M.B., 2010. A new species of Folsomia from mofette fields of the Northwest
Czechia (Collembola, Isotomidae). Zootaxa, 2553(1), 60-64.
Schütze, C., Sauer, U., Beyer, K., Lamert, H., Bräuer, K., Strauch, G., Flechsig, C., Kämpf, H.,
Dietrich, P., 2012. Natural analogues: a potential approach for developing reliable monitoring
methods to understand subsurface CO2 migration processes. Environ. Earth Sci., 67(2), 411-
423.
Shao, H., Qafoku, N.P., Lawter, A.R., Bowden, M.E., Brown, C.F., 2015. Coupled geochemical
impacts of leaking CO2 and contaminants from subsurface storage reservoirs on groundwater
quality. Environ. Sci. Technol., 49(13), 8202-8209.
Sharma, V.K., Millero, F.J., 1988. Oxidation of copper(I) in seawater. Environ. Sci. Technol., 22(7),
768-771.
Shukla, R., Ranjith, P., Haque, A., Choi, X., 2010. A review of studies on CO2 sequestration and
caprock integrity. Fuel, 89(10), 2651-2664.
Šibanc, N., Dumbrell, A.J., Mandić-Mulec, I., Maček, I., 2014. Impacts of naturally elevated soil CO2
concentrations on communities of soil archaea and bacteria. Soil Biol. Biochem., 68, 348-356.
Šibanc, N., Zalar, P., Schroers, H.-J., Zajc, J., Pontes, A., Sampaio, J.P., Macek, I., 2018. Occultifur
mephitis f.a., sp. nov. and other yeast species from hypoxic and elevated CO2 mofette
environments. Int. J. Syst. Evol. Microbiol., 1-14.
Smyth, R.C., Hovorka, S.D., Lu, J., Romanak, K.D., Partin, J.W., Wong, C., Yang, C., 2009.
Assessing risk to fresh water resources from long term CO2 injection – laboratory and field
studies. Energy Procedia, 1(1), 1957-1964.
Stephens, J.C., Hering, J.G., 2002. Comparative characterization of volcanic ash soils exposed to
decade-long elevated carbon dioxide concentrations at Mammoth Mountain, California.
Chem. Geol., 186(3-4), 301-313.
Stookey, L.L., 1970. Ferrozine – a new spectrophotometric reagent for iron. Anal. Chem., 42(7), 779-
781.
Stupfel, M., Le Guern, F., 1989. Are there biomedical criteria to assess an acute carbon dioxide
intoxication by a volcanic emission? JVGR, 39(2-3), 247-264.
Suess, E., Planer-Friedrich, B., 2012. Thioarsenate formation upon dissolution of orpiment and
arsenopyrite. Chemosphere, 89(11), 1390-1398.
Sugio, T., Tsujita, Y., Inagaki, K., Tano, T., 1990. Reduction of cupric ions with elemental sulfur by
Thiobacillus ferrooxidans. Appl. Environ. Microbiol., 56(3), 693-696.
Terzi, K., Aggelopoulos, C.A., Bountas, I., Tsakiroglou, C.D., 2014. Effects of carbon dioxide on the
mobilization of metals from aquifers. Environ. Sci. Technol., 48(8), 4386-4394.
Tessier, A., Campbell, P.G., Bisson, M., 1979. Sequential extraction procedure for the speciation of
particulate trace metals. Anal. Chem., 51(7), 844-851.
Theis, T.L., Singer, P.C., 1974. Complexation of iron (II) by organic matter and its effect on iron (II)
oxygenation. Environ. Sci. Technol., 8(6), 569-573.
Trevors, J., 1996. Sterilization and inhibition of microbial activity in soil. J. Microbiol. Methods,
26(1), 53-59.
Vartapetian, B.B., Jackson, M.B., 1997. Plant adaptations to anaerobic stress. Ann. Bot., 79(suppl_1),
3-20.
Videmšek, U., Hagn, A., Suhadolc, M., Radl, V., Knicker, H., Schloter, M., Vodnik, D., 2009.
Abundance and diversity of CO2-fixing bacteria in grassland soils close to natural carbon
dioxide springs. Microb. Ecol., 58(1), 1-9.
Vodnik, D., Pfanz, H., Wittmann, C., Macek, I., Kastelec, D., Turk, B., Batic, F., 2002. Photosynthetic
acclimation in plants growing near a carbon dioxide spring. Phyton, 42(3), 239-244.
Wang, S., Jaffe, P.R., 2004. Dissolution of a mineral phase in potable aquifers due to CO2 releases
from deep formations; effect of dissolution kinetics. Energy Convers. Manage., 45(18-19),
2833-2848.
Weber, F.-A., Voegelin, A., Kaegi, R., Kretzschmar, R., 2009a. Contaminant mobilization by metallic
copper and metal sulphide colloids in flooded soil. Nat. Geosci., 2(4), 267-271.

References
40
Weber, F.-A., Voegelin, A., Kretzschmar, R., 2009b. Multi-metal contaminant dynamics in
temporarily flooded soil under sulfate limitation. Geochim. Cosmochim. Acta, 73(19), 5513-
5527.
Weinlich, F., Bräuer, K., Kämpf, H., Strauch, G., Tesař, J., Weise, S., 1999. An active subcontinental
mantle volatile system in the western Eger rift, Central Europe: Gas flux, isotopic (He, C, and
N) and compositional fingerprints. Geochim. Cosmochim. Acta, 63(21), 3653-3671.
Yeates, G.W., Newton, P.C., Ross, D.J., 1999. Response of soil nematode fauna to naturally elevated
CO2 levels influenced by soil pattern. Nematology, 1(3), 285-293.
Zeien, H., Brümmer, G.W., 1989. Chemische Extraktion zur Bestimmung von
Schwermetallbindungsformen in Boden. Mitteilungen der Deutschen Bodenkundlichen
Gesellschaft, 59(1), 505-510.
Zheng, L., Apps, J.A., Spycher, N., Birkholzer, J.T., Kharaka, Y.K., Thordsen, J., Beers, S.R.,
Herkelrath, W.N., Kakouros, E., Trautz, R.C., 2012. Geochemical modeling of changes in
shallow groundwater chemistry observed during the MSU-ZERT CO2 injection experiment.
Int. J. Greenh. Gas Control, 7(0), 202-217.
Ziegler, P.A., 1992. European Cenozoic rift system. Tectp, 208(1-3), 91-111.

41
CONTRIBUTION TO STUDIES 1 TO 3
STUDY 1: Spatial distribution of metal(loid) depletion and accumulation zones around a natural
carbon dioxide degassing site
Judith Mehlhorn 80% development of research concept, field and laboratory work,
analyses and data interpretation, preparation of manuscript
Lukas A. Gerber 10% assistance with laboratory experiments, comments on manuscript
Britta Planer-Friedrich 10% development of research concept, discussion of results,
comments on manuscript
STUDY 2: Time and temperature dependency of carbon dioxide triggered metal(loid)
mobilization in soil
Judith Mehlhorn 80% development of research concept, field and laboratory work,
analyses and data interpretation, preparation of manuscript
James M. Byrne 5% Mössbauer analyses and data interpretation, comments on
manuscript
Andreas Kappler 5% comments on manuscript
Britta Planer-Friedrich 10% development of research concept, discussion of results,
comments on manuscript
STUDY 3: Copper mobilization and immobilization along an organic matter and redox
gradient – insights from a mofette site
Judith Mehlhorn 75% development of research concept, field and laboratory work,
analyses and data interpretation, preparation of manuscript
Johannes Besold 5% assistance with XAS analyses and data interpretation, comments
on manuscript
Juan S. Lezama Pacheco 2.5% assistance with XAS analyses, comments on manuscript
Jon Petter Gustafsson 2.5% assistance with XAS analyses, comments on manuscript
Ruben Kretzschmar 5% assistance with XAS and XRD data interpretation, comments on
manuscript
Britta Planer-Friedrich 10% development of research concept, discussion of results,
comments on manuscript


43
APPENDIX: STUDIES 1 - 3
STUDY 1
Mehlhorn, J., Gerber, L.A., Planer-Friedrich, B. (2018): Spatial distribution of metal(loid) depletion
and accumulation zones around a natural carbon dioxide degassing site. Chemical Geology, 509: 64-
76, DOI: 10.1016/j.chemgeo.2019.01.010.
STUDY 2
Mehlhorn, J., Byrne, J.M., Kappler, A., Planer-Friedrich, B. (2016): Time and temperature
dependency of carbon dioxide triggered metal(loid) mobilization in soil. Applied Geochemistry, 74:
122-137, DOI: 10.1016/j.apgeochem.2016.09.007.
STUDY 3
Mehlhorn, J., Besold, J., Lezama-Pacheco, J.S., Gustafsson, J.P., Kretzschmar, R., Planer-Friedrich, B.
(2018): Copper mobilization and immobilization along an organic matter and redox gradient – insights
from a mofette site. Environmental Science & Technology, 52(23): 13698-13707, DOI:
10.1021/acs.est.8b02668.


45
STUDY 1: Spatial distribution of metal(loid) depletion and accumulation zones
around a natural carbon dioxide degassing site
Judith Mehlhorn, Lukas A. Gerber, Britta Planer-Friedrich
Reprinted with permission from
Chemical Geology 509 (pp. 64 - 76)
Copyright 2019 Elsevier


Contents lists available at ScienceDirect
Chemical Geology
journal homepage: www.elsevier.com/locate/chemgeo
Spatial distribution of metal(loid) depletion and accumulation zones arounda natural carbon dioxide degassing site
Judith Mehlhorn, Lukas A. Gerber, Britta Planer-Friedrich⁎
Environmental Geochemistry, Bayreuth Center for Ecology and Environmental Research (BayCEER), University of Bayreuth, Universitaetsstrasse 30, D-95440 Bayreuth,Germany
A R T I C L E I N F O
Editor: Michael E. Böttcher
Keywords:MofetteIron (oxyhydr)oxidesSulfidic mineralSoil organic matter (SOM)
A B S T R A C T
Long-term influence of geogenic CO2 affects soil conditions and pedogenesis. Mobilization of metals and me-talloids from soil to solution has been reported to occur in natural CO2 degassing sites, so-called mofettes. Wedetermined metal(loid)-specific spatial distribution patterns in soil around a mofette as well as metal(loid) porewater concentrations along a CO2 gradient (0–98% CO2 in soil air). Depletion of Mn, Co, and Ni in soil in themofette center was caused by leaching due to the long-term soil acidification leading to correspondingly lowpore water concentrations and thus indicating no recent influence of CO2 on metal(loid) mobility. Iron and Aswere also depleted in soil within the mofette center where pedogenic Fe (oxyhydr)oxides could not form due toabsence of oxygen. Small-scale variations in redox conditions lead to ongoing Fe cycling and the repeated re-duction of Fe (oxyhydr)oxides resulted in increased Fe and As pore water concentrations at high CO2.Precipitation in form of sulfide minerals caused immobilization and accumulation of Cd, Cu, and Zn directly inthe degassing center. The highest mobilization risk occurred within 2–4m distance from the degassing center,where complexation with dissolved organic matter (DOM) increased the mobility of Al, As, Cr, Cu, Fe, and Zn.Our results show that CO2 as soil-forming factor influences the spatial distribution of metal(loid)s. The highestmetal(loid) mobilization risk after long-term CO2 influence arises from accumulation of scarcely degraded or-ganic matter, which can easily dissolve and form mobile metal(loid)-DOM complexes.
1. Introduction
Research interest in mofettes has strongly increased within the lastyears, among others due to their analogy to leakages from geologiccarbon storage (GCS) sites (Lewicki et al., 2007; Pearce, 2006; Schützeet al., 2012). Mofettes are characterized by diffuse degassing of mainlycarbon dioxide (CO2) as well as traces of other gases like nitrogen ornoble gases (Bräuer et al., 2004). They occur as (post-)volcanic featuresin areas where magma ascends and gases like CO2 are released due tothe decrease in pressure and ascend via tectonic faults to the surface(Irwin and Barnes, 1980). Long-term effects of ascending CO2 on soilproperties and pedogenesis are manifold and have been recently re-viewed by Rennert and Pfanz (2016). They suggest introducing thequalifier “mofettic” into WRB soil classification, since the CO2 acts assoil-forming factor. Dissolution of CO2 in pore water causes soil acid-ification at mofette sites (e.g., Beaubien et al., 2008; Maček et al., 2009;Mehlhorn et al., 2014; Rennert et al., 2011), which affects both abioticand biotic soil processes. Weathering of silicates is accelerated, as re-ported e.g., by Beaubien et al. (2008), Blume and Felix-Henningsen
(2009), and Flechsig et al. (2008). Formation of pedogenic Fe, Mn, andAl (oxyhydr)oxides is decreased in mofettes due to the limited avail-ability of oxygen (Beaubien et al., 2008; Rennert et al., 2011, 2012;Rennert and Pfanz, 2015).
The vegetation on mofettes is dominated by acidophilic and ni-trophobic species (Rennert and Pfanz, 2016; Saßmannshausen, 2010)and microbial communities are shifted towards acidophilic and anae-robic organisms, like sulfur-reducing and acetogenic bacteria or me-thanogenic archaea (Beulig et al., 2015; Frerichs et al., 2013;Oppermann et al., 2010). Both plants and microbes have been reportedto assimilate the geogenic CO2 leading to up to 67% mantle-derivedcarbon in soil organic matter (SOM) of mofettes (Beulig et al., 2016;Nowak et al., 2015). The degradation of SOM is decreased in mofettesdue to anaerobic conditions, absence of macro- and mesoscopic eu-karyotes and the mentioned shifts in microbial community, resulting insignificant SOM accumulation (e.g., Beaubien et al., 2008; Beulig et al.,2015; Olk et al., 2006; Rennert et al., 2011; Ross et al., 2000).
Also, major cations and trace elements in soil are affected by geo-genic CO2. Decreases in cation exchange capacity, exchangeable Ca and
https://doi.org/10.1016/j.chemgeo.2019.01.010Received 3 September 2018; Received in revised form 11 January 2019; Accepted 19 January 2019
⁎ Corresponding author.E-mail address: [email protected] (B. Planer-Friedrich).
Chemical Geology 509 (2019) 64–76
Available online 25 January 20190009-2541/ © 2019 Elsevier B.V. All rights reserved.
T
47
Reprinted with permission from

Mg, and total contents of Al, Mg, and Mn have been recently reportedby Rennert (2018). In a previous study, we compared total soil and porewater contents of several metal(loid)s from a mofette with a non-CO2-influenced reference soil nearby (Mehlhorn et al., 2014). We couldshow that the mobility of Fe and As is increased in mofettes due todecreased Fe (oxyhxdr)oxide contents while, e.g., Cu seems to be im-mobilized in CO2 degassing centers. In a recent study, we identified Cureduction and precipitation in form of sulfide minerals as the mainmechanism for Cu sequestration in mofettes, besides adsorption to SOM(Mehlhorn et al., 2018). For other elements, e.g., Mn and Ni, the net-effect of long-term CO2 influence on mobility remained unclear.
Results from prior studies imply that metal(loid)-specific accumu-lation and depletion zones develop around mofette sites. Most studieson natural CO2 springs or projects on GCS risk assessment either com-pare CO2-influenced and non-CO2-influenced soil or study a lineartransect along a CO2-gradient. To our knowledge, up to now no studieson two- or three-dimensional spatial distribution of (trace) elementsaround natural or anthropogenically caused CO2 degassing sites exist.Determination of metal(loid) distribution patterns can help both tounderstand CO2 influence on metal(loid) binding processes in soil andto evaluate risks arising from CO2-triggered mobilization and im-mobilization.
The aim of this study was to determine spatial distribution of themetal(loids) Al, As, Cd, Co, Cr, Cu, Fe, Mn, Ni, and Zn in a mofette soiland to identify element-specific areas of depletion and accumulation.We used sequential extractions to assign metal(oid)s to different soilfractions and determine the influence of geogenic CO2 on metal(loid)adsorption and binding. By comparing soil and pore water concentra-tions we evaluated the effect of increased CO2 in soil air on net metal(loid) mobility. We hypothesized that long-term CO2 influence will leadto the depletion of metal(loid)s due to surface protonation and mineraldissolution following soil acidification, while metal(loid)s with a highaffinity to SOM or sulfide may accumulate in mofettes.
2. Material and methods
2.1. Site description and sampling
The investigated mofette site is located in Czech Republic, about10 km east of Františkovy Lázně. A detailed site description can befound in Mehlhorn et al. (2014). Soil samples were collected in Sep-tember 2017 at a mofette located in close vicinity to the river Plesná(50°8′43.9″ N, 12°27′1.0″ E) along a sampling grid with its center in themain degassing feature of this mofette. Starting from the center, sam-pling points were located in 2, 4, 8, and 12m distance to the cardinaldirections, and in 6 and 12m distance to the intercardinal directions.Due to the irregular extension of the mofette (determined optically by achange in vegetation from mofette-specific species towards a typicalfloodplain vegetation, see Rennert and Pfanz (2016) andSaßmannshausen (2010)), additional sampling points were located at20mN, NE, and E and at 22mN (sampling grid shown in Fig. 1a). Thegrid design was chosen in order to increase the number of samplesaround the degassing center where we expected to observe the mostinteresting processes. The soils at this site have been characterized as(Hemic) Histosol with reductimorphic properties (reduced Y horizons)for mofette and as Gleyic Fluvisol for non-CO2-influenced surroundingsoil by Beulig et al. (2016). Soil samples were collected with an augerfrom approx. 0–5, 25–35, and 55–65 cm depth and immediately frozenon dry ice. Sampling depths were chosen in order to compare organic-rich topsoil, the alternating oxic-anoxic zone, and the permanentlyanoxic (water saturated) zone with respect to the Fluvisol. Due to re-latively dry weather conditions in the weeks before sampling, ground-water level was below 1m depth at most sampling points. Only in theEastern part of the sampling grid, soil samples were completely watersaturated at 55–65 cm depth. However, visible signs of oxic conditions(orange color of Fe (oxyhydr)oxides) occurred only scarcely below
50 cm depth for all samples. Soil air CO2 was determined with a por-table gas analyzer (BIOGAS 5000, Geotech) in the auger holes in ap-prox. 15–25 cm depth. Only in the degassing center, soil air CO2 had tobe determined in 0–5 cm depth of the auger hole due to water satura-tion.
Pore water samples were collected along the East transect only,using 60 cm long pore water peepers type Hesslein (1976). The peepershad separate compartments from 10 to 60 cm with a 1 cm depth re-solution. Preparation of the peepers followed a previously describedprocedure (Mehlhorn et al., 2014). The peepers were installed next tothe soil sampling points and left to equilibrate for 9 weeks.
2.2. Laboratory analysis
Soil samples were freeze-dried, grinded, and (if larger stones orplant debris were present) sieved (nylon, 1mm mesh size). Samplesfrom the East transect were treated and stored in an anoxic chamber(Coy, 95%/5% nitrogen/hydrogen) for later sequential extraction. SoilpH was determined in 0.01M CaCl2 at a soil-to-solution ratio of 1:2.5(pH meter HQ40d equipped with a PHC101 electrode, Hach). Total Cand N contents were determined with a CHN elemental analyzer(Thermo Quest, Flash EA, 1112). Soil samples were digested in aquaregia at a soil-to-solution ratio of 1:100 (microwave assisted digestionusing a MARS Xpress, CEM). Total concentrations of Al, S, Cr, Mn, Fe,Co, Ni, Cu, Zn, As, and Cd were determined in filtered (0.2 μm, cellu-lose-acetate, CHROMAFIL® Xtra) and 1:10 to 1:5000 diluted extractsusing a quadrupole inductively coupled plasma mass spectrometer (ICP-MS, X-Series2, Thermo Scientific) with matrix-matched calibrations andRh as internal standard.
Carbon dioxide induced changes in metal(loid) binding were in-vestigated by conducting a sequential extraction procedure (SEP) for allsoil samples from the East transect. We used the 5-step SEP described inFulda et al. (2013a) in order to extract the following operationallydefined fractions: F1: mobile (soluble and exchangeable, soluble metal(loid)-SOM complexes), F2: easily mobilizable (specifically adsorbed,bound to minerals labile at pH 5, and weak metal(loid)-SOM com-plexes), F3: organically bound (low affinity), F4: reducible (bound toamorphous and crystalline Fe and Mn (oxyhydr)oxides), and F5: oxi-dizable (metal sulfides and bound to SOM (high affinity)). Details onexact extraction steps can be found in Supporting information (SI), A.1.For extraction, approx. 0.2 g of dried and ground soil were weighed intocentrifuge tubes and the respective amount of extractant was added.Extraction of fractions 1 to 3 was done inside the anoxic chamber withnitrogen purged solutions. The soil samples were washed between theindividual extraction steps to reduce carry-over of residual solution(Fulda et al., 2013a). After extraction, the vials were centrifuged(outside anoxic chamber, 5 min at 4500 g) and the supernatant wasfiltered (0.2 μm, cellulose-acetate, CHROMAFIL® Xtra) and stabilized in0.45% H2O2 and 0.65% HNO3 for total metal(loid) analysis by ICP-MS.
Sampling of pore water peepers was done under atmospheric con-ditions. To reduce oxygen influence on the pore water, the peepers werestored in a nitrogen-filled box and sampled one after the other. Porewater from 5 chambers each was mixed in order to gain sufficientsample volume. Pore water redox potential and pH were determined(pH meter HQ40d equipped with electrodes MTC301 and PHC101,Hach) and the remaining sample was stabilized for the following ana-lyses: 2 mL of unfiltered sample were injected into nitrogen-filledseptum vials and stored at 8 °C overnight for analysis of dissolved CO2
and methane, 8mL were filtered (0.45 μm, polyamide, CHROMAFIL®Xtra) and stored at 8 °C overnight for analysis of total dissolved organiccarbon (DOC) and total dissolved nitrogen (TN), the remaining samplewas filtered (0.2 μm, cellulose-acetate, CHROMAFIL® Xtra) and stabi-lized in 0.45% H2O2 and 0.65% HNO3 for total metal(loid) analysis byICP-MS, in 0.5M HCl for photometric determination of Fe(II) and totalFe, and with 2% (w/v) Zn acetate for photometric sulfide determina-tion.
J. Mehlhorn et al. Chemical Geology 509 (2019) 64–76
6548

Gaseous CO2 and methane concentrations in the head space of theseptum vials were measured by gas chromatography (SRI Instruments8610C, U.S.) using a methanizer and a flame ionization detector.Dissolved concentrations were calculated from head space contentsusing Henry's law (kH,CO2= 0.03344mol L−1 atm−1,kH,CH4= 0.001419mol L−1 atm−1 from Sander (2015)). Dissolved CO2
as well as total Cu pore water concentrations from three depths fromthis sampling have been previously published with respect to Cu se-questration along a SOM and redox gradient in Mehlhorn et al. (2018).Total DOC and TN were determined by thermo-catalytic oxidation witha TOC-VCPN Analyzer (Shimadzu). The ferrozine assay (Stookey, 1970)was used for photometric determination of dissolved Fe(II) and total Feconcentrations and the methylene blue method (Cline, 1969) for de-termination of sulfide concentrations. Absorbance was measured at570 nm for Fe and at 650 nm for sulfide using a multi-plate reader(Infinite 200 PRO, Tecan). Total metal(loid) concentrations (except Fe)were determined in 1:10 or 1:100 diluted pore water samples by ICP-MS. Values below detection limit (LOD) were treated as 0.3·LOD.
2.3. Calculations and statistics
A cluster analysis was conducted on total metal(loid) and S soilcontents as well as on total metal(loid) pore water concentrations inorder to identify similarities between elements. Total soil contents andpore water concentrations were normalized to mean values of 0 and astandard deviation of 1. Clustering was done by calculating theEuclidean distances between element distribution patterns using thesoftware R (R Development Core Team, 2008).
Total metal(loid) and organic carbon (Corg) contents, soil pH, andCO2 distribution patterns were plotted by extrapolating the values be-tween the sampling points from measured values using universal kri-ging interpolation. Spearman's rank correlation was used to calculatecorrelation coefficients (rS) and their significance level (P-value) since
data were not normally distributed. Numbers of variables were n=87for soil data, n= 60 for pore water data and n= 18 for combined soiland pore water data (East transect only).
3. Results and discussion
3.1. Carbon dioxide, soil pH, and soil organic matter
Soil air CO2 content revealed two main degassing centers, one withalmost 100% CO2 in the center and one with up to 56% CO2 in soil airin approx. 12m distance NE (Fig. 1b). Despite the high number ofsampling points, we could not completely cover the heterogeneity ofthis mofette site. Some smaller degassing centers in approx. 3m SW and4m NNE were optically visible but were not covered by our samplinggrid. However, the 87 soil samples collected from 29 sampling pointsdemonstrated well the influence of CO2 degassing on metal(loid) dis-tribution in soil even if some small scale heterogeneity could not berepresented completely.
Soil pH was strongly decreased around CO2 degassing centers(Fig. 1c), most pronounced in the topsoil where soil pH was 3.2–3.7close to the degassing center compared to values up to 5.0 in the non-CO2-influenced soil. A significant negative correlation between log(p(CO2)) (with p(CO2): CO2 partial pressure) and soil pH (rS=−0.55,P < 0.01) could be detected illustrating the acidifying effect of CO2
dissolution that has been observed at this and other mofette sites before(e.g., Beaubien et al., 2008; Maček et al., 2009; Mehlhorn et al., 2014;Rennert et al., 2011).
The frequently reported accumulation of SOM in mofettes (e.g.,Beaubien et al., 2008; Beulig et al., 2015; Mehlhorn et al., 2014; Nowaket al., 2015; Rennert et al., 2011) could also be observed in this studywith Corg contents of 190 g kg−1 in the upper soil and up to 400 g kg−1
in 55–65 cm depth in the degassing center compared to values around20–120 g kg−1 in the non-CO2-influenced surrounding soil (Fig. 1d).
N/S
dis
tanc
e fr
om c
ente
r [m
]N
/S d
ista
nce
from
cen
ter
[m]
W/E distance from center [m]
-10
-5
05101520
0
60
N/S distance [m
]depth [cm
]
3.23.43.63.73.94.14.34.54.64.85.0
pH [-]
-10 -5 0 5 10 15
-10
-5
0
5
10
15
20
0
10
20
30
40
50
60
70
80
90
100CO2 [%]
-10 -5 0 5 10 15
-10
-5
05101520
0
60
N/S distance [m
]depth [cm
]
W/E distance from center [m]
04080120160200240280320360400
Corg [g kg-1]
-10
-5
0
5
10
15
20
5 m N
a b
c d
Fig. 1. (a) Aerial image of the mofettesite with sampling grid (red circles: soilsampling only, blue circles: soil andpore water sampling), image source:https://maps.google.de. (b) CO2 in soilair sampled in approx. 15–25 cm depth.(c) Soil pH determined in 0.01M CaCl2at a soil-to-solution ratio of 1:2.5 forsamples from 0 to 5 cm depth (topgraph) and from 55 to 65 cm depth(bottom graph). (d) Total organiccarbon (Corg) content in samples from 0to 5 cm depth (top graph) and from 55to 65 cm depth (bottom graph). Blackdots mark sampling points, pH andcontents were extrapolated betweenthese points from measured valuesusing universal kriging interpolation.Graphs (a, c) are two-dimensional, (b,d) are three-dimensional. (For inter-pretation of the references to color inthis figure legend, the reader is referredto the web version of this article.)
J. Mehlhorn et al. Chemical Geology 509 (2019) 64–76
6649

While the accumulation pattern in the upper soil was irregular with themain accumulation occurring in some meters distance from the de-gassing center, the strong SOM accumulation in 55–65 cm depth wasclearly confined to the main degassing channel. Patterns of carbon-to-nitrogen ratios were relatively similar to those of total Corg (SI, Fig. A.1)indicating the poorly decomposed nature of the accumulated SOM. Theinfluence of geogenic CO2 on SOM was studied in detail by Rennert andPfanz (2015) and Rennert (2018). Less degraded SOM accumulates,which is reflected e.g., by higher carbon-to-nitrogen ratios (Rennertet al., 2011; Ross et al., 2000), decreased accumulation of aliphaticcarbon or microbial SOM in the clay fraction (Rennert et al., 2011),accumulation of particulate organic matter (Rennert and Pfanz, 2015),as well as changes in SOM functional group abundancies and a lowerdegree of oxidation (Rennert, 2018).
3.2. Distribution patterns of metal(loid) soil contents
3.2.1. Metal(loid) clusteringCluster analysis of normalized soil metal(loid) and sulfur contents
revealed that the elements could be sorted into 4 to 5 groups of similarspatial distribution patterns (Fig. 2). The metals Co and Mn showed thehighest similarity (similarity coefficient s=3.1). Similarity betweenthese elements and Ni and Zn was also high (s < 8.5), thus, we as-signed these four elements into one group. The other three groupsconsisted of Fe and As (s=5.5), Cr and Al (s=5.0), as well as Cu, Cd,and S (s < 9.3). Metal(loid) distribution patterns will be discussedwithin these groups. When discussing metal(loid) depletion or enrich-ment zones, we generally refer to the non-CO2-influenced samples, i.e.,most distanced from the degassing center, as background contents andinterpret higher contents as accumulation and lower contents as de-pletion. For the sake of clarity, we only present the metal(loid) dis-tribution patterns determined in samples from the upper (0–5 cm) andthe lower (55–65 cm) soil depths in the main text. Metal(loid) dis-tribution patterns from 25 to 35 cm depth can be found in SI (Figs.A.3–A.6).
3.2.2. Manganese, cobalt, nickel, and zincThe elements Mn, Co, Ni, and Zn showed a strong depletion in soil
within the whole CO2-influenced area as could be seen by a negativecorrelation with CO2 in soil air (rS=−0.62, −0.78, −0.57, −0.6 forMn, Co, Ni, and Zn, respectively, P < 0.01) and a positive correlationwith distance from degassing center (rS=0.54, 0.67, 0.54, 0.41 for Mn,Co, Ni, and Zn, respectively, P < 0.01). Soil contents only increasedtowards the most distanced, non-CO2-influenced areas (Fig. 3).
Minimum values for 0–5 cm depth in the CO2-influenced area were38mg kg−1 Mn, 2mg kg−1 Co, 13mg kg−1 Ni, and 33mg kg−1 Zncompared to values around 600mg kg−1 Mn, 20mg kg−1 Co,35mg kg−1 Ni, and 150mg kg−1 Zn in the non-CO2-influenced soil.The high metal(loid) contents, especially pronounced for Mn(1881 ± 21mg kg−1, high content confirmed by triplicate digestionand analysis), in 8m distance W (Fig. 3) will be discussed below. Indeeper soil, total contents of these metals were even lower. Only Znshowed an enrichment directly in the degassing center with soil con-tents reaching 158mg kg−1 (Fig. 3d, bottom graph).
Sequential extraction of Mn, Co, Ni, and Zn showed that in non-CO2-influenced soil the majority of these elements was extracted in Fractions4 and 5 (Fig. 4a for Mn, other elements in Fig. A.7, SI). These fractionscan be assigned to metals bound to or present in form of Fe (oxyhydr)oxides (Zeien and Brümmer, 1989) and high-affinity sites of SOM andmetal sulfides (Tessier et al., 1979), respectively. The amount of metalsbound to these fractions in non-CO2-influenced soil showed the stron-gest decrease compared to samples from 55 to 65 cm depth of themofette center (except for Ni, Fig. A.7c, SI), where the largest amountsof metals were extracted in Fraction 1 (mobile fraction (McGrath et al.,1988)). All four metals are known to bind to Fe (oxyhydr)oxides(Dzombak, 1990; Fischer et al., 2007) and decreased contents in theCO2-influenced mofette center fit to the previously observed decreasedcontent of pedogenic Fe (oxyhydr)oxides in mofette soils (Rennertet al., 2011, 2012). Also, all these metals are known to adsorb to SOM(McBride, 1989; Uren, 1993). However, the fact that their contentsdecrease towards the center (Fig. 3) while SOM contents strongly in-crease (Fig. 1d) makes SOM an unlikely binding candidate for thesemetals. Tessier et al. (1979) reported a co-release of silicates likesmectites, chlorites, and mica during extraction of Fraction 5. Thus, it ispossible that Mn, Co, Ni, and Zn released during extraction of Fraction 5were associated with clay minerals and other phyllosilicates which arealso known to serve as binding partners for these metals (Bradl, 2004;McBride, 1989). The total mineral content in the degassing center musthave been decreased due to the accumulation of SOM, thus, also thecontent of mineral-associated Mn, Co, Ni, and Zn should be decreased.However, this cannot be the only explanation since SOM accumulationzones and metal depletion zones differed in their extents. Assumingsilicates to be the main binding partners for Mn, Co, Ni, and Zn, weevaluated the extent of mobilization by calculating the molar ratios ofthese elements with Al. Aluminum was shown to be more or less im-mobile (cf. Section 3.2.4) and therefore used as a reference for silicatecontent. Except for a relative enrichment of Zn and Ni in the degassingcenter in 55–65 cm depth (which will be discussed in Section 3.2.5), the
S
Cu
Cd
Cr Al Fe A
s
Mn
Co
Ni
Zn
24
68
1012
1416
Hei
ght
Fig. 2. Cluster dendrogram of total metal(loid) and S contents in soil samples. Contents were normalized for each element prior to calculation of Euclidean distancesfor clustering. Similarity coefficients can be found in Table A.2, SI.
J. Mehlhorn et al. Chemical Geology 509 (2019) 64–76
6750

distribution patterns of these metal(loid)/Al ratios (Fig. A.10, SI) wererelatively similar to the total contents presented in Fig. 3, indicatingthat leaching of these elements must have occurred. Numerous studieshave shown the mobilization and leaching of cations following soilacidification by CO2. Mobilization can be caused directly by protona-tion of potential cation binding sites or indirectly by increased weath-ering of silicates. A decreased cation exchange capacity in mofette soilcompared to surrounding non-CO2-influenced soil was e.g., reported byVidemšek et al. (2009) and Beaubien et al. (2008). The predominantclay mineral in mofettes close to the one investigated in this study iskaolinite (Bussert et al., 2017; Flechsig et al., 2008; Rennert et al.,2011). However, no direct influence of CO2 on clay mineralogy wasdetected at this mofette site and the kaolinite is assumed to be erodedand transported as debris to this site (Flechsig et al., 2008; Rennert,2018; Rennert et al., 2011). In a prior study, we incubated non-CO2-influenced reference soil, which has been collected close to the mofetteinvestigated in the present study, with CO2 and monitored metal(loid)concentrations in liquid phase over time. We detected fast, abioticmobilization of Mn which we attributed to surface protonation(Mehlhorn et al., 2016). Also several field, laboratory, and chemicalmodelling studies dealing with risk assessment of geologic carbon sto-rage (GCS) have demonstrated the mobilization of metal(loid)s due todesorption and mineral dissolution processes (e.g., Kharaka et al., 2006,2010; Kirsch et al., 2014; Lawter et al., 2016; Qafoku et al., 2014; Wangand Jaffe, 2004; Zheng et al., 2012). The soil contents of these fourmetals showed a significant negative correlation with proton activity{H+} (rS=−0.59, −0.69, −0.66, −0.57 for Mn, Co, Ni, and Zn, re-spectively, P < 0.01), i.e., a positive relationship with soil pH. Besidesthe decreased total contents, also the relative increase of Mn extractedin the mobile fraction (Fraction 1, Fig. 4b) for samples from the CO2-influenced area indicates that increased mineral weathering and deso-rption processes induced by soil acidification and following leachingmust have contributed to depletion of Mn, Co, Ni, and Zn in this mof-ette.
Another parameter influencing the distribution patterns of these
metals could be the occurrence of Mn oxides, which are known to ad-sorb Co, Ni, Zn, and other metals (Post, 1999). In the degassing center,pedogenic Mn oxides cannot form due to the absence of oxygen. Adecreasing content in Mn oxides with increasing CO2 has also beenobserved by Beaubien et al. (2008) and Rennert and Pfanz (2015) foundthat oxalate-extractable Mn contents showed a negative correlationwith CO2 partial pressure. Manganese bound in form of Mn oxideswould have been extracted in Fraction 4 of the SEP used in this study(Fulda et al., 2013a). However, an increase in Mn extracted in Fraction4 with distance was only observed for the deepest sampling depth(Fig. 4a) and did not correspond to trends observed for total Mn contentbut was rather comparable to the patterns observed for Fe (Fig. 4b).Thus, the contribution of pure Mn oxides to total Mn extracted in thisfraction must have been low in comparison to Mn associated with Fe(oxyhydr)oxides. This is in agreement with our prior study, where onlylow contents of Mn oxides were detected by SEP (Mehlhorn et al.,2014).
It remains unclear, whether accumulation of Mn, Co, Ni, and Znleached from the center of the mofette caused the aforementioned en-richment in the eastern, non-CO2-influenced part of the mofette (Fig. 3)or if the high soil contents in this area were caused by natural variationor contamination. Currently, there is no information on the transportregime in this mofette available. Regarding the strong CO2 degassingand the elevated water table in the mofette center, it is quite likely thatgroundwater is transported vertically upwards in areas close to degas-sing channels, while in the non-CO2-influenced area infiltration ofmeteoric water might be the prevailing vertical transport process. Ad-ditionally, a radial lateral transport of the groundwater transportedupwards in the degassing areas might also play a role, distributing theleached elements on a horizontal scale. Due to its location in thefloodplain of river Plesná, a lateral groundwater transport from thevalley slopes towards the river, which would be from (north-)east to(south-)west, could be plausible as well and would support the hy-pothesis of an accumulation of leached Mn, Co, Ni, and Zn in thewestern part of the mofette. Also leaching beyond the studied sampling
-10
-5
05101520
0
60
N/S distance [m
]depth [cm
]
301272243214185156127098069031000
Mn [mg kg-1]
-10 -5 0 5 10 15
-10
-5
05101520
0
60
N/S distance [m
]depth [cm
]
W/E distance from center [m]
1215182023262932343740
Ni [mg kg-1]
a b
c d-10
-5
05101520
0
60
N/S distance [m
]depth [cm
]
036912151821242730
Co [mg kg-1]
-10 -5 0 5 10 15
-10
-5
05101520
0
60N
/S distance [m]
depth [cm]
W/E distance from center [m]
304356698295108121134147160
Zn [mg kg-1]
Fig. 3. Total contents of Mn (a), Co (b), Ni(c), and Zn (d) determined in aqua regia di-gests of soil samples from 0 to 5 (top graphs)and 55–65 cm depth (bottom graphs).Maximum Mn content at 8m East and 0–5 cmdepth is 1881 ± 21mg kg−1 (n= 3). Blackdots mark sampling points, contents wereextrapolated between these points frommeasured concentrations using universalkriging interpolation.
J. Mehlhorn et al. Chemical Geology 509 (2019) 64–76
6851

grid, into the river or deeper groundwater cannot be excluded.
3.2.3. Iron and arsenicIron and As were also depleted within the mofette (significant ne-
gative correlation with CO2, rS=−0.58 and −0.50 for Fe and As, re-spectively, P < 0.01), however, their distribution patterns looked dif-ferent to those of Mn, Co, Ni, and Zn (Fig. 5). In the upper soil, contentswere lowest around the degassing center with 5–7 g kg−1 Fe and25–30mg kg−1 As, but increased to values of 35–40 g kg−1 Fe and70–110mg kg−1 As within only some meters distance. Interestingly, thehighest Fe soil content was detected in a sample from 4mN of the maindegassing center (67 g kg−1), directly between the two degassing areas.Arsenic was also enriched in this sample in comparison to the sur-rounding soil (93mg kg−1). In deeper soil, Fe and As contents de-creased further and also the area of depletion around the degassingcenter increased. Higher contents were only present in> 6m distanceto N, W, and S.
Sequential extraction revealed that most of the Fe and As was ex-tracted in Fraction 4, i.e. in form of or bound to Fe (oxyhydr)oxides(Fig. 4b for Fe, As in Fig. A.8b, SI). This is in line with SEP results fromour previous study (Mehlhorn et al., 2014). Binding in form of Fe(oxyhydr)oxides would also explain the observed Fe and As distribution
a
total Mn/Sum
of fractions [mg kg
-1]
Mn
frac
tion
b
total Fe/Sum of fractions [g kg
-1]
Fe fr
actio
n
c total Al/Sum of fractions [g kg
-1]
Al fr
actio
n
d total Cu/Sum
of fractions [mg kg
-1]
Cu
frac
tion
F1 F2 F3 F4 F5 total content Sum of fractions
0
100
200
300
400
500
600
0%
20%
40%
60%
80%
100%
0
5
10
15
20
25
30
35
0%
20%
40%
60%
80%
100%
0
10
20
30
40
50
0%
20%
40%
60%
80%
100%
0
5
10
15
20
25
30
0%
20%
40%
60%
80%
100%
0 m 2 m 4 m 8 m 12 m18 m 0 m 2 m 4 m 8 m 12 m18 m
0-5 cm depth 55-65 cm depth
Fig. 4. Mn (a), Fe (b), Al (c), and Cu (d) content distribution in different che-mical fractions according to the procedure described in Fulda et al. (2013a) forsoil samples from the East transect. Circles mark total contents determined inaqua regia digests, crosses mark sum of fractions. Sampling depth and distancefrom degassing center are indicated on the x-axis. Data for other elements canbe found in Figs. A.7–A.9, SI.
-10
-5
05101520
0
60
N/S distance [m
]depth [cm
]
07132027344047546067
Fe [g kg-1]
-10 -5 0 5 10 15
-10
-5
05101520
0
60
N/S distance [m
]depth [cm
]
W/E distance from center [m]
1527385061738496107119130
As [mg kg-1]
a
b
Fig. 5. Total contents of Fe (a) and As (b) determined in aqua regia digests ofsoil samples from 0 to 5 cm (top graphs) and 55–65 cm depth (bottom graphs).Black dots mark sampling points, contents were extrapolated between thesepoints from measured concentrations using universal kriging interpolation.
J. Mehlhorn et al. Chemical Geology 509 (2019) 64–76
6952

patterns: typical pedogenic soil Fe (oxyhydr)oxides like goethite or le-pidocrocite cannot form in mofettes due to the absence of oxygen(Rennert et al., 2012). Thus, total soil contents of Fe and also As, whichis known to have a high affinity for Fe (oxyhydr)oxides (e.g., Liveseyand Huang, 1981; Manning and Goldberg, 1997), and also the amountof Fe and As extracted in Fraction 4 (Figs. 4b and A.8b, SI) are de-creased. According to a study from a nearby mofette site by Rennertet al. (2012), the majority of Fe in mofettes was present in different clayminerals and in form of Fe(II) and mixed Fe(II)/Fe(III) minerals, e.g.,vivianite, siderite, green rust, and magnetite. Ferrihydrite was onlydetected close to a root channel, where micro-oxic conditions occurred.The fast precipitation of Fe (oxyhydr)oxides as soon as oxygen isavailable (Kirk, 2004) can explain the observed distribution patterns ofFe and As in the upper soil: within only some meters distance from themain degassing channels CO2 partial pressure in soil air decreases im-mediately and oxygen becomes available. In only 4m distance, oxygenin soil air already reached 14–17% (data not shown), enabling Fe(oxyhydr)oxide formation. The Fe enriched sample taken from 4mNwas located directly between the two degassing areas and additionallyon a small hummock. Iron (and As) that is mobilized elsewhere (e.g., byweathering processes in the deeper sediment) and cannot precipitate inform of Fe (oxyhydr)oxides close to the degassing centers might accu-mulate in this spot due to local oxic conditions. It remains unclear, whyother metals with a high affinity for Fe (oxyhydr)oxides, e.g., Mn, didnot accumulate in this spot as well.
In deeper soil, (micro-)oxic conditions, e.g., along root channels, arescarce. Additionally, groundwater can cause anoxic conditions also inareas of less or no CO2 influence. Thus, the overall contents of Fe and Aswere lower in 55–65 cm depth and higher contents were only found innon-CO2-influenced areas to the N, W, and S, where groundwater levelwas assumingly below 65 cm depth.
3.2.4. Aluminum and chromiumAluminum and Cr were more homogeneously distributed around the
mofette area, especially in the upper soil (0–5 cm depth, Fig. 6) wheremean contents were 35 ± 7 g kg−1 for Al and 38 ± 5mg kg−1 for Cr.Minimum contents of 24–25 g kg−1 Al and 29–32mg kg−1 Cr weredetected in the degassing center and in 2–6m distance to NE and E. Inthe deeper soil (55–65 cm depth) the mean concentrations remainedrelatively similar to the upper soil (35 ± 9 g kg−1 for Al and36 ± 8mg kg−1 for Cr), however, a strong depletion directly in thedegassing center became obvious with contents of 19–22 g kg−1 Al and18–24mg kg−1 Cr. A negative relationship of CO2 partial pressure andAl contents indicating Al depletion in mofettes was also observed byRennert (2018).
Sequential extraction of Al was incomplete, removing only27 ± 3% of the total Al content determined in aqua regia digests(Fig. 4c). Most Al must have been present in the residual fraction, i.e.,most probably in form of aluminosilicates, in which Al(OH)6 octahedralsheets are essential components. Thus, the Al distribution pattern re-presents primarily the phyllosilicate content in the mofette soil, justi-fying the calculation of molar metal(loid)/Al ratios for determination ofleaching and accumulation zones (cf. Sections 3.2.2 and A.2, SI). Wedid not determine the exact mineral content of the soil samples, how-ever, this parameter should have a negative relationship with Corg
content. In the areas, where SOM was accumulated (compare Fig. 1d),i.e. in the degassing center, especially in 55–65 cm depth, the mineralcontent and, thus, Al contents were decreased compared to the sur-rounding soil (Fig. 6). This interdependency is also shown by a sig-nificant negative correlation of Al with Corg (rS=−0.21, P=0.05).The reason for the local Al maximum in 0–5 cm depth and 2m distanceS (61mg kg−1, Fig. 6a, top graph) remains unclear. Since no otherparameter showed an anomaly here, measurement error cannot be ex-cluded.
Due to its chemical similarity, Cr often shows a comparable beha-vior to Al in soils (Bartlett and James, 1988). This is confirmed by the
present study, in which total soil contents of Al and Cr showed a highlysignificant correlation (rS=0.91, P=0) and molar Cr/Al ratios did notshow large variations (Fig. A.11, SI). For Cr, extraction efficiency wasbetter with 45 ± 4% of total Cr being extracted in Fractions 1–5,which probably results from the fact that, compared to Al, a largerfraction of the Cr was present in the hypothetically Fe (oxyhydr)oxidebound fraction (Fraction 4, 24 ± 5% of total Cr content compared to17 ± 5% of total Al, Fig. A.8d, SI).
3.2.5. Copper and cadmiumThe distribution patterns of Cu and Cd differed completely from
those of the other elements. Both metals showed accumulation directlyin the degassing center (Fig. 7a, b). In the upper soil, highest contentswere still located in ≥12m distance from the degassing center (29–39and 0.5–1mg kg−1 versus 14–22 and 0.1–0.4 mg kg−1 close to the de-gassing centers for Cu and Cd, respectively). However, an accumulationin the sampling point located directly in the main degassing center wasdetectable with concentrations reaching 28mg kg−1 Cu and0.6 mg kg−1 Cd. In deeper soil (55–65 cm), the overall concentrationswere lower (approx. 13–22mg kg−1 Cu and 0.1–0.4mg kg−1 Cd) but astrong accumulation in the main degassing center was detected withsoil contents reaching maxima of 33mg kg−1 Cu and 1.9 mg kg−1 Cd.
a
b-10
-5
05101520
0
60
N/S distance [m
]depth [cm
]
17131925323844505662
Al [g kg-1]
-10 -5 0 5 10 15
-10
-5
05101520
0
60
N/S distance [m
]depth [cm
]
W/E distance from center [m]
1519232731353943475155
Cr [mg kg-1]
Fig. 6. Total contents of Al (a) and Cr (b) determined in aqua regia digests ofsoil samples from 0 to 5 cm (top graphs) and 55–65 cm depth (bottom graphs).Black dots mark sampling points, contents were extrapolated between thesepoints from measured concentrations using universal kriging interpolation.
J. Mehlhorn et al. Chemical Geology 509 (2019) 64–76
7053

Sequential extraction revealed that two different binding processesoccurred in the mofette center and the surrounding soil: while forsamples from ≥8m distance from the center Cu was mainly present inFraction 3 (interpreted as organically bound fraction), for samplesoriginating directly from the mofette center the majority of Cu
(93–95%) was extracted in Fraction 5. For Cd, similarly a high share oftotal concentrations (58–79%) was extracted in Fraction 5 for samplesfrom the mofette center while in the surrounding soil most Cd (up to76%) was present in the mobile fraction (Fraction 1, compare SI, Fig.A.9b).
Fraction 5 can be interpreted as metal sulfides or metals bound toSOM at high affinity sites (Tessier et al., 1979). Both sulfur (Fig. 7c) andSOM (Fig. 1d) were enriched in the degassing center, especially pro-nounced in 55–65 cm depth. Thus, both interpretations are possible. Ina recent study, focused on the behavior of Cu along a redox and SOMgradient, we could show by X-ray absorption spectroscopy that most ofthe Cu in the mofette center is present in form of Cu(I) coordinated viasulfur (Mehlhorn et al., 2018). From this and additional results from asorption study, we concluded that Cu is reduced and precipitates inform of Cu sulfides in the degassing center. Same as Cu, Cd is known toform sulfide minerals under sulfur-reducing conditions, e.g., in paddysoils (Fulda et al., 2013b; Weber et al., 2009). Besides precipitation ofmetal sulfides, binding of Cu and Cd to SOM via thiol groups, as pre-viously described in Fulda et al. (2013b,c), could additionally con-tribute to metal accumulation, especially regarding the high SOMcontent and the significant correlation between Corg and total S contents(rS=0.92, P=0).
Besides Cu and Cd, Zn showed an enrichment directly in the de-gassing center with concentrations reaching 158mg kg−1 in 55–65 cmdepth (Fig. 3d). This enrichment was even more obvious when con-sidering the molar Zn/Al ratio and also Ni showed a relative enrichmentin this sample when referred to Al (Fig. A.10a, b, SI). The relative ac-cumulation of Ni could have been caused by an increased adsorption toSOM to which Ni has a high affinity (Uren, 1993), but also a con-tribution of (co-)precipitation of or adsorption to sulfidic mineralscannot be excluded (Di Toro et al., 1992). Zinc is also known to readilyprecipitate in form of sulfide minerals under reducing conditions (Kirk,2004) and according to SEP results up to 49% of Zn were extracted inFraction 5 (metal sulfides and metals bound to SOM at high affinitysites, compare SI, Fig. A.7d). However, the accumulation of Ni and Znwas not as pronounced as for Cu and Cd, which is in line with ob-servations from Weber et al. (2009) who reported a decreasing ten-dency for metal sulfide formation with increasing solubility products(Ni < Cu < Cd < Zn according to Allison et al. (1991)). Flechsiget al. (2008) and Bussert et al. (2017) detected significant amounts ofpyrite in samples from>4m depth in a nearby mofette. In this study,no Fe enrichment was detected in the degassing center, which can beexplained by the even higher solubility products of Fe sulfide mineralscompared to Ni, Cu, Cd, and Zn (Allison et al., 1991).
3.3. Carbon dioxide influence on pore water and metal(loid) mobility
3.3.1. Pore water conditions and microbial influencePore water data were collected along the East transect for 10–60 cm
depth. Dissolved CO2 concentrations were highest directly in the de-gassing center (17–22mM) and decreased to 5 ± 2mM in the non-CO2-influenced reference soil in 18m distance (Fig. 8a). Except for thedegassing center, CO2 concentration also increased with depth. As-suming a saturation or even oversaturation of the pore water with re-gard to CO2 in the degassing center, the expected concentrations wouldhave been even higher (approx. 33mM using the Henry constant fromSander (2015): kH,CO2= 0.03344mol L−1 atm−1). A detailed discus-sion on potential measurement problems can be found in Mehlhornet al. (2018), where CO2 concentrations from three depths have beenpreviously reported with respect to their correlation with Cu con-centrations.
Interestingly, dissolution of CO2 had no significant influence onpore water pH. While for soil pH the acidifying effect of permanent CO2
degassing was clearly visible (Fig. 1c), pore water pH was relativelysimilar over the whole transect with 4.9 ± 0.2 (Fig. 8b). Exceptions arethe pore water samples from 8m distance and 10–35 cm depth which
-10
-5
05101520
0
60
N/S distance [m
]depth [cm
]
1013161922252831343740
Cu [mg kg-1]
-10
-5
05101520
0
60
N/S distance [m
]depth [cm
]0.00.10.20.30.40.50.60.70.80.91.0
Cd [mg kg-1]
a
b
-10 -5 0 5 10 15
-10
-5
05101520
0
60
N/S distance [m
]depth [cm
]
W/E distance from center [m]
0.91.31.72.12.53.03.43.84.24.65.0
S [g kg-1]c
Fig. 7. Total contents of Cu (a), Cd (b), and S (c), determined in aqua regiadigests of soil samples from 0 to 5 cm (top graphs) and 55–65 cm depth (bottomgraphs). Maximum contents in the degassing center in 55–65 cm depth are1.9 mg kg−1 for Cd and 7.4 g kg−1 for S. Black dots mark sampling points,contents were extrapolated between these points from measured concentrationsusing universal kriging interpolation.
J. Mehlhorn et al. Chemical Geology 509 (2019) 64–76
7154

showed a lower pH of 4.5–4.6. The reasons for this pH minimum areunclear, especially since no anomalies of other parameters were ob-served within these samples. Pore water pH in the mofette center iscomparable with observations from our previous study from 2014(4.9 ± 0.1), but it is slightly lower for the non-CO2-influenced re-ference (5.2 ± 0.2 in 2014 study vs. 4.9 ± 0.2 in the present study)(Mehlhorn et al., 2014). While the pore water pH in the degassing
center, thus, seems to be rather stable, it might be influenced by sea-sonal variations in microbial activity in the surrounding non-CO2-in-fluenced soil.
Oppositely to pore water pH, redox potential was strongly influ-enced by CO2 degassing and showed a significant negative correlationwith CO2 concentrations (rS=−0.84, P=0). To facilitate the inter-pretation of redox conditions, pe+pH is presented in Fig. 8c with
E distance from center [m] E distance from center [m] E distance from center [m]
dept
h [c
m]
dept
h [c
m]
dept
h [c
m]
dept
h [c
m]
dept
h [c
m]
dept
h [c
m]
-45
-30
-15
0
01123344556687990
DOC [mg L-1]
0 5 10 15
-45
-30
-15
0
03691214172023
CO2 [mM]
0 5 10 15
0.00.20.50.70.91.11.41.61.8
S2- [mg L-1]
0 5 10 15
059141823273236
Fe [mg L-1]
-45
-30
-15
0
4.04.24.44.64.84.95.15.35.5
pH [-]
047101316192225
S [mg L-1]
0919283847566675
As [µg L-1]
-45
-30
-15
0
67891011121314
pe+pH [-]
088175263350438525613700
Mn [µg L-1]
0.00.40.81.21.62.02.42.83.2
Al [mg L-1]
02571012141719
Co [µg L-1]
0.00.91.82.63.54.45.36.17.0
Cr [µg L-1]
-45
-30
-15
0
0.00.91.72.63.44.35.16.06.8
TN [mg L-1]
037101316202326
Ni [µg L-1]
02571012141719
Cu [µg L-1]
0 5 10 15
-45
-30
-15
0
0.000.020.030.050.070.080.100.110.13
CH4 [mM]
0255075100125150175200
Zn [µg L-1]
0.00.10.20.30.40.50.60.70.8
Cd [mg L-1]
a
b
c
d
e
f
g
h
i
j
k
l
m
n
o
p
q
r
Fig. 8. Chemical data from pore water samples collected with dialysis chambers along the East transect of the mofette site. (a) Dissolved CO2 concentrations, (b) porewater pH, (c) pe+pH, (d) total dissolved organic carbon (DOC), (e) total dissolved nitrogen (TN), (f) dissolved methane concentration, (g) sulfide, (h) total S, (i)total Mn, (j) Co, (k) Ni, (l) Zn, (m) Fe, (n) As, (o) Al, (p) Cr, (q) Cu, and (r) Cd concentrations. Maximum concentrations are 1540 μg L−1 for Mn (i, in 12m distanceand 56–60 cm depth), 24 μg L−1 for Co (j, in 12m distance and 56–60 cm depth), and 1060 μg L−1 for Zn (l, in 4m distance and 21–25 cm depth). Black dots marksampling points, concentrations were extrapolated between these points from measured concentrations using universal kriging interpolation. Black colored areasresult from missing data.
J. Mehlhorn et al. Chemical Geology 509 (2019) 64–76
7255

values< 9 indicating anoxic conditions and 9 < pe+pH < 14 in-dicating suboxic conditions (redox potential (EH) can be found in Fig.A.12, SI). Values in the degassing center reached minima ofpe+pH 6.0, indicating permanently anoxic conditions. They increasedfast with distance from the center and already reached values> 9 in2m distance. Oxic conditions indicated by pe+pH around 14 wereonly detected in> 8m distance and up to 40 cm depth. As expected,pe+pH decreased with depth, except for the degassing center wherevalues of pe+pH 10 were detected below 50 cm depth. The reason forthese relatively high values is unclear since permanently anoxic con-ditions would be expected in this depth.
Interestingly, total DOC concentrations showed no homogeneousincrease or decrease but two hotspots: In 10–20 cm depth in 2m dis-tance from the degassing center as well as in 45–60 cm depth in 4mdistance, DOC concentrations reached 46–89mg L−1 compared to18 ± 9mg L−1 in other pore water samples (Fig. 8d). Rennert andPfanz (2015) could show that the amount of K2SO4-extractable SOM ishigher in mofettes compared to non-CO2-influenced soils. They alsocould show that the interaction of SOM and soil minerals is negativelyaffected by high soil CO2 partial pressures. Thus, particulate organicmatter (POM) accumulates in mofettes, but is not stabilized (Rennertand Pfanz, 2015, 2016). We could also observe that the amount of DOCmobilized in soil batch experiments decreased with distance from thedegassing center (Mehlhorn et al., 2018). A general increase in DOCwith increasing dissolved CO2 concentrations (rS=0.54, P < 0.01)could be observed in this study as well. Formation of these two hotspots(one in the upper soil and one in> 45 cm depth) was probably causedby the comparably high soil Corg contents in these spots, shown by acorrelation of DOC and Corg along the East transect (rS=0.49,P=0.04). The reason for slightly lower concentrations directly in thedegassing center (17 ± 6mg L−1) compared to 2 and 4m distance wasprobably the permanent upwelling of groundwater that transferredDOM towards the surrounding soil.
Dissolved nitrogen concentrations (TN) increased with depth anddecreased with distance from the center with values of 5.4–6mg L−1 inthe center and 0.4–1.5mg L−1 in 18m distance (Fig. 8e). Zones of highDOC concentrations did not correspond with high TN concentrationsindicating that the majority of TN, especially in the degassing center,must have been present as inorganic dissolved species. We did not de-termine N species at the time, but assume that due to the reducingconditions the dominant inorganic N species will be ammonia. Thisassumption is supported by recent observations of Krauze et al. (2017)that nitrite and nitrate concentrations in nearby mofettes were≤0.1mg L−1. However, further speciation analyses are required to
confirm the postulated high ammonia concentrations.In the degassing center, we could detect dissolved methane con-
centrations of up to 0.13mM (for 10–15 cm depth, Fig. 8f). The me-thane originated from methanogenic archaea which have been shownto dominate in mofettes besides acetogenic and sulfur-reducing bacteria(Beaubien et al., 2008; Beulig et al., 2015; Krauze et al., 2017;Oppermann et al., 2010). Outside of the main degassing center, me-thane concentrations decreased to values close to or below LOD. Theconcentrations detected in this study are about 10 times higher than themethane concentrations detected in a previous study (up to 0.014mMin Mehlhorn et al. (2014)), which might result from a longer equili-bration time of the pore water peepers (9 compared to 2 weeks) orcould also indicate a higher microbial activity in fall (September–No-vember 2017) compared to spring (March 2013).
Sulfide concentrations in 10–50 cm depth of the degassing centerwere strongly elevated (up to 1.8mg L−1) compared to the surroundingpore water where concentrations were mostly ≤LOD (Fig. 8g). Thesulfide originates from sulfur-reducing bacteria, which have beenshown to have an increased activity in mofettes compared to non-CO2-influenced soil (Beulig et al., 2016; Frerichs et al., 2013; Oppermannet al., 2010). The presence of sulfide and microbial sulfur-reduction inthe degassing center lends further support to the hypothesized pre-cipitation of Cd, Cu, and Zn sulfides (compare Section 3.2.5).
Total sulfur concentrations in pore water were, oppositely to sulfide,highest in the non-CO2-influenced soil (21 ± 3mg L−1) and decreasedtowards the degassing center (< 3mg L−1) (Fig. 8h). Interestingly,there is a very clear transition between low and high sulfur con-centration in approx. 8m distance. Since DOC and pore water sulfurconcentrations were negatively correlated (rS=−0.51, P < 0.01), themajority of the sulfur must have been present as inorganic species,in> 8m distance most likely as sulfate. Several processes could con-tribute to the observed sudden decrease in sulfur concentrations at<8m distance. The upwelling groundwater from deeper aquifers mightcontain lower total sulfur concentrations than the surroundinggroundwater, which might be more strongly influenced by agriculture.Additionally, sulfate and also sulfide might bind to SOM, leading to theobserved sulfur accumulation in soil from the mofette center. Also, thecontinuous sulfur reduction and following precipitation of sulfide mi-nerals, as described for Cu in Mehlhorn et al. (2018) and postulated forCd and Zn in this study, might lead to sulfur sequestration and removalfrom the liquid phase in the degassing center.
3.3.2. Metal(loid) pore water concentrations and implications on mobilityClustering of normalized metal(loid) pore water concentrations
Fe
As
Cr Al
Mn
Co
Ni
Cd
Cu Zn
24
68
1012
Hei
ght
Fig. 9. Cluster dendrogram of total metal(loid) concentrations in pore water samples. Concentrations were normalized for each element prior to calculation ofEuclidean distances for clustering. Similarity coefficients can be found in Table A.3, SI.
J. Mehlhorn et al. Chemical Geology 509 (2019) 64–76
7356

revealed that the elements could be considered in three groups of highsimilarity: Fe, As, Cr, and Al with similarity coefficients s < 7.4, Mn,Co, Ni, and Cd with s < 7.8, and Cu and Zn with s=9.3 (Fig. 9, si-milarity coefficients s in SI, Table A.3).
The metal(loid)s Fe, As, Cr, and Al correlated significantly with DOCconcentrations (rS=0.71, 0.76, 0.8, and 0.81 for Fe, As, Cr, and Al,respectively, P < 0.01) as could be seen from strongly increased con-centrations in approx. the same two spots (in 10–20 cm depth in 2mdistance and 45–60 cm depth in 4m distance) as DOC concentrations(Fig. 8m–p). All of these elements are known to form complexes withDOM and it has been shown that their mobility in natural soils is largelydetermined by complexation with DOM (e.g., Carrillo-González et al.,2006; Du Laing et al., 2007; Kalbitz and Wennrich, 1998; Pohlman andMcColl, 1988). Recently, Rennert (2018) proposed that exchangeableAl might preferentially interact with SOM in mofettes and, thus, con-tribute to SOM stabilization in mofettes.
Arsenic and especially Fe had the lowest similarity coefficientswithin this group and also their pore water distribution patterns implythat other processes influenced their mobility as well. The two elementswere mainly enriched in 2 and 4m distance from the degassing centerand especially Fe also in 50–60 cm depth over the whole transect whichindicates that also some free, i.e., not DOM-complexed ions must havebeen present in the pore water. The observed zones of high mobility fitwell to our assumptions from soil content distribution patterns and theyconfirm the observations of our prior study (Mehlhorn et al., 2014): themobility of Fe and As is increased in mofettes where no Fe (oxyhydr)oxides could form due to absence of oxygen. This could also be seen byincreased dissolved-to-solid-phase ratios of Fe and As in the mofettecompared to the non-CO2-influenced soil (Fig. 10a–c). In greater depth(> 50 cm), also the non-CO2-influenced soil was anoxic due togroundwater saturation, thus, Fe and As concentrations increased withdepth. The high DOC concentrations close to the degassing center ad-ditionally increased metal(loid) mobility since complex formation withDOM can hinder adsorption and oxidation or compete for sorption sites(Grafe et al., 2001, 2002; Redman et al., 2002; Theis and Singer, 1974).
The highest pore water concentrations of Mn, Co, Ni, and Cd werefound in deeper samples of the non-CO2-influenced soil and
concentrations decreased towards the degassing center (Fig. 8i–k, r).Decreased pore water concentrations in mofette center compared to thenon-CO2-influenced reference soil were already observed for Mn and Niin our prior study (Mehlhorn et al., 2014). In the case of Mn, Co, and Ni(and also for Cd, excluding the degassing center) pore water con-centrations were highest in areas, where soil contents were highest anddissolved-to-solid-phase ratios did not vary much along the Easttransect (Fig. 10a–c). The relatively constant ratios imply that themobility of Mn, Co, and Ni was kinetically controlled and only de-pended on total soil contents. A CO2-triggered increase in mobility, i.e.pore water concentrations, of these elements could, thus, not be de-tected. The frequently observed mobilizing effect of CO2 on metal ca-tions due to surface protonation (e.g., Apps et al., 2010; Kharaka et al.,2010; Qafoku et al., 2014; Zheng et al., 2012), which we also observedfor Mn in non-CO2-influenced soil incubated at 100% CO2 in a priorstudy (Mehlhorn et al., 2016), does not seem to play a major role at thismofette site anymore. One reason probably is that surface protonationand related mobilization of cations is an abiotic and fast process thatcan be observed within hours to days (e.g., Mehlhorn et al., 2016;Qafoku et al., 2014). The natural mofette site has been influenced byCO2 over decades and pedogenesis occurred concurrently (Rennert andPfanz, 2016). CO2-induced, intensified mineral weathering probably ledto an initial mobilization of cations into the pore water. When all mo-bilizable fractions were removed by leaching, only the more inertfractions (e.g., incorporated into silicates) remained. Under long-termconstant CO2-influence, desorption, dissolution, and leaching processeshave thus led to both decreased soil contents and pore water con-centrations of these metals in mofettes.
Equal to Mn, Co, Ni, and Cd, also Zn and Cu had relatively high porewater concentrations in the non-CO2-influenced soil and concentrationsgenerally decreased towards the mofette center (Fig. 8l, q). However,these metals had their highest concentration close to the DOM enrichedzones in 10–20 cm depth in 2 and 4m distance and for Zn also in45–50 cm depth in 4m distance. The pore water concentrations in thesespots reached maxima of 20 μg L−1 for Cu and even 1060 μg L−1 for Zn.This indicates that the pore water concentrations of these two metalswere both influenced by higher total soil contents in the non-CO2-
0.1
1
10
100
1000
0 5 10 15
0.1
1
10
100
1000
0.1
1
10
100
1000
nonot
derreferoitar
dilos/diuqil-C
O2-
]%[
ecnereferdecneulfni
E distance from degassing center [m]
a
b
c
dept
h
distance from degassing center
Fe/A
sm
obiliz
atio
n
Cu/Cd/Zn/Ssequestration
Zones of metal(loid)
mobilization & sequestration
dCu/Zn/Al/Cr mobili-zation by DOM
100% Fe AsMn Co NiZn Cu CdS Al Cr
Mn/Co/Ni leaching
Fig. 10. (a–c) Percentage ratio of metal(loid) andsulfur pore water concentration vs. soil contentalong the East transect referred to non-CO2-influ-enced reference soil in 18m distance (100%) for 3depths: (a) soil sample from 0 to 5 cm depth, re-spective pore water sample from 10 to 20 cm depth(no pore water sample above 10 cm depth avail-able), (b) soil sample from 25 to 35 cm depth, re-spective pore water sample from 25 to 30 cm or30–35 cm depth (depending on the exact soil sam-pling depth), (c) soil sample from 55 to 65 cmdepth, respective pore water sample from 55 to60 cm depth. Values > 100% mean increased net-mobility, values < 100% mean decreased net-mobility. Note the logarithmic scale of y-axis. (d)Conceptual model showing expected zones of in-creased metal(loid) mobility and metal(loid) se-questration along a transect through a mofette.
J. Mehlhorn et al. Chemical Geology 509 (2019) 64–76
7457

influenced soil (like Mn, Co, Ni, and Cd) and by complexation withDOM close to the degassing center (like Al, Cr, Fe, and As). The highaffinity of Zn and Cu to organic matter has been reported in numerousprevious studies (e.g., Flogeac et al., 2004; Hering and Morel, 1988;McBride et al., 1997; McLaren et al., 1983; McLaren and Crawford,1973; Tipping, 2002). It remains unclear what caused the extremelyhigh Zn concentration in 4m distance and 21–25 cm depth (Fig. 8l).Since a reanalysis of this sample was not possible due to limited samplevolume, an analytical error cannot be excluded.
One special observation regarding Cd, Zn, and Cu is that their porewater concentrations directly in the degassing center were decreased tovalues close to or below LOD (Fig. 8l, q, r). These low concentrationsindicate that the precipitation of metal sulfide minerals effectively se-questered Zn, Cu, and Cd from pore water into the solid phase, as couldbe seen by a strong decrease in dissolved-to-solid-phase ratios, espe-cially in the deeper soil (Fig. 10a–c).
4. Conclusions
Pedogenesis under long-term CO2 influence at the studied mofettesite has led to the development of element-specific distribution patternswith some metal(loid)s showing depletion and some showing accu-mulation within the mofette. The results of the present study are ofspecific interest regarding risk assessment of CO2 leakage on potentialmetal(loid) mobilization and contamination of shallow aquifers or, withregard to immobilization, trace metal limitations for microbes or plants.Calculation of dissolved-to-solid ratios for the individual elements al-lowed to identify zones of metal(loid) mobilization and sequestration(Fig. 10a–c) which are summarized in a conceptual model in Fig. 10d.
The only elements, for which a direct CO2-triggered mobilization inmofettes could be identified, are Fe and As. Fe (oxyhydr)oxides cannotform under permanently anoxic conditions or can be rapidly dissolvedif soil conditions become more reducing, leading to an increased mo-bility of Fe and associated As. Soil distribution patterns of these ele-ments are thus primarily determined by oxygen availability. Both Feoxidation and precipitation of (oxyhydr)oxides under oxic conditionsand Fe reduction and (re-)dissolution of (oxyhydr)oxides under anoxicconditions are relatively fast processes (Kirk, 2004). Small-scale and/ortemporal variations of redox conditions as well as the rapidity of Feoxidation/reduction are, besides complexation with DOM, probablymain reasons why an increased Fe and As mobility is still detectable inthe studied mofette even after decades of CO2-influence.
For Mn, Co, and Ni, no change in net-mobility could be identifiedalong the studied CO2-gradient. Their pore water concentrations cor-respond to the total soil contents, which showed depletion within moreor less the whole CO2-influenced area. Mobilization and leaching ofthese elements by CO2-induced, intensified weathering of silicates is –oppositely to Fe oxidation/reduction – generally a non-reversible pro-cess, which led to the removal of all mobilizable fractions and thus toboth decreased metal soil contents and pore water concentrations.Enrichment zones in the west of the mofette site indicate that the lea-ched metals might accumulate again in the non-CO2-influenced soil,however, the exact transport and sequestration processes remain to beinvestigated.
Distribution patterns of the metals Al and Cr are in large parts onlyindirectly influenced by CO2 degassing. The mineral content around thedegassing center is decreased due to the accumulation of SOM, leadingto overall decreased soil contents of these primary mineral-associatedmetals.
Sulfide mineral precipitation leads to strong immobilization, i.e.,low pore water concentrations and accumulation in the solid phase, forthe chalcophilic elements Zn, Cu, and Cd. However, immobilizationonly occurs under permanently anoxic conditions directly in the de-gassing center, where plant growth is rather limited by high CO2 con-centrations than by trace element limitation. Trace element limitationby sulfide mineral precipitation might, however, play a role for
microorganisms, e.g., Zn is an essential trace element for methanogens(Glass and Orphan, 2012).
The overall highest risk for increased metal(loid) mobility arisesfrom increased DOM pore water concentrations in the mofette, whichare caused by the accumulation of scarcely degraded SOM. Metal(loid)swith high tendency for complex formation, in our study Al, Cr, Fe, As,Zn, and Cu, can thus exhibit strongly increased mobilities in mofettes.Other than expected, the highest DOM concentrations are not locateddirectly in the degassing center where upwelling groundwater flushesDOM to the surrounding soil, but in its direct vicinity (2–4m distance).
The results of our study show that geogenic CO2 as soil-formingfactor influences both the mobility and spatial distribution of metal(loids) in soil. Especially the mobilization of potential contaminants byincreased DOM concentrations under moderate CO2 influence can be aproblem at contaminated sites. The transferability of our results toother mofettes or to other sites exhibiting a gradient in redox conditions(e.g., leakages from GCS, organic contaminant spills, or wetlands) re-mains to be tested and should be addressed in future studies.
Acknowledgements
We acknowledge financial support for a PhD stipend to JudithMehlhorn from the German Academic Scholarship Foundation. FromBayreuth University, we thank Ruth Freitag and Nicolas Weithmann(Process Biotechnology) for borrowing the portable gas analyzer,Manfred Fischer (Geomorphology) for borrowing soil auger equipment;from the Hydrology Department we thank Jutta Eckert and MartinaRohr for DOC analysis as well as Benjamin Gilfedder and Silke Hammerfor providing access to GC. For field and lab assistance we are gratefulto Esther Breuninger and Kai Jansen.
Appendix A. Supplementary data
Supplementary data to this article can be found online at https://doi.org/10.1016/j.chemgeo.2019.01.010.
References
Allison, J.D., Brown, D.S., Novo-Gradac, K.J., 1991. MINTEQA2/PRODEFA2, AGeochemical Assessment Model for Environmental Systems: Version 3.0 User'sManual. Environmental Research Laboratory, Office of Research and Development,US Environmental Protection Agency.
Apps, J., Zheng, L., Zhang, Y., Xu, T., Birkholzer, J., 2010. Evaluation of potential changesin groundwater quality in response to CO2 leakage from deep geologic storage.Transp. Porous Media 82 (1), 215–246.
Bartlett, R.J., James, B., 1988. Mobility and bioavailability of chromium in soils. In:Chromium in the Natural and Human Environments. vol. 20. pp. 571.
Beaubien, S., Ciotoli, G., Coombs, P., Dictor, M.C., Krüger, M., Lombardi, S., Pearce, J.,West, J., 2008. The impact of a naturally occurring CO2 gas vent on the shallowecosystem and soil chemistry of a Mediterranean pasture (Latera, Italy). Int. J.Greenhouse Gas Control 2 (3), 373–387.
Beulig, F., Heuer, V.B., Akob, D.M., Viehweger, B., Elvert, M., Herrmann, M., Hinrichs, K.-U., Küsel, K., 2015. Carbon flow from volcanic CO2 into soil microbial communities ofa wetland mofette. ISME J. 9 (3), 746–759.
Beulig, F., Urich, T., Nowak, M., Trumbore, S.E., Gleixner, G., Gilfillan, G.D., Fjelland,K.E., Küsel, K., 2016. Altered carbon turnover processes and microbiomes in soilsunder long-term extremely high CO2 exposure. Nat. Microbiol. 1, 15025.
Blume, H.-P., Felix-Henningsen, P., 2009. Reductosols: natural soils and Technosols underreducing conditions without an aquic moisture regime. J. Plant Nutr. Soil Sci. 172(6), 808–820.
Bradl, H.B., 2004. Adsorption of heavy metal ions on soils and soils constituents. J.Colloid Interface Sci. 277 (1), 1–18.
Bräuer, K., Kämpf, H., Niedermann, S., Strauch, G., Weise, S.M., 2004. Evidence for anitrogen flux directly derived from the European subcontinental mantle in theWestern Eger Rift, central Europe. Geochim. Cosmochim. Acta 68 (23), 4935–4947.
Bussert, R., Kämpf, H., Flechsig, C., Hesse, K., Nickschick, T., Liu, Q., Umlauft, J., Vylita,T., Wagner, D., Wonik, T., 2017. Drilling into an active mofette: pilot-hole study ofthe impact of CO2-rich mantle-derived fluids on the geo–bio interaction in the wes-tern Eger Rift (Czech Republic). Sci. Drill. 23, 13.
Carrillo-González, R., Šimůnek, J., Sauve, S., Adriano, D., 2006. Mechanisms and path-ways of trace element mobility in soils. Adv. Agron. 91, 111–178.
Cline, J.D., 1969. Spectrophotometric determination of hydrogen sulfide in natural wa-ters. Limnol. Oceanogr. 14 (3), 454–458.
Di Toro, D.M., Mahony, J.D., Hansen, D.J., Scott, K.J., Carlson, A.R., Ankley, G.T., 1992.
J. Mehlhorn et al. Chemical Geology 509 (2019) 64–76
7558

Acid volatile sulfide predicts the acute toxicity of cadmium and nickel in sediments.Environ. Sci. Technol. 26 (1), 96–101.
Du Laing, G., Vanthuyne, D., Vandecasteele, B., Tack, F., Verloo, M., 2007. Influence ofhydrological regime on pore water metal concentrations in a contaminated sediment-derived soil. Environ. Pollut. 147 (3), 615–625.
Dzombak, D.A., 1990. Surface Complexation Modeling: Hydrous Ferric Oxide. John Wiley& Sons.
Fischer, L., Brümmer, G.W., Barrow, N.J., 2007. Observations and modelling of the re-actions of 10 metals with goethite: adsorption and diffusion processes. Eur. J. Soil Sci.58 (6), 1304–1315.
Flechsig, C., Bussert, R., Rechner, J., Schütze, C., Kämpf, H., 2008. The Hartoušov mofettefield in the Cheb Basin, western Eger Rift (Czech Republic): a comperative geo-electric, sedimentologic and soil gas study of a magmatic diffuse CO2-degassingstructure. Z. Geol. Wiss. 36 (3), 177–193.
Flogeac, K., Guillon, E., Aplincourt, M., 2004. Surface complexation of copper (II) on soilparticles: EPR and XAFS studies. Environ. Sci. Technol. 38 (11), 3098–3103.
Frerichs, J., Oppermann, B.I., Gwosdz, S., Möller, I., Herrmann, M., Krüger, M., 2013.Microbial community changes at a terrestrial volcanic CO2 vent induced by soilacidification and anaerobic microhabitats within the soil column. FEMS Microbiol.Ecol. 84 (1), 60–74.
Fulda, B., Voegelin, A., Ehlert, K., Kretzschmar, R., 2013a. Redox transformation, solidphase speciation and solution dynamics of copper during soil reduction and reox-idation as affected by sulfate availability. Geochim. Cosmochim. Acta 123, 385–402.
Fulda, B., Voegelin, A., Kretzschmar, R., 2013b. Redox-controlled changes in cadmiumsolubility and solid-phase speciation in a paddy soil as affected by reducible sulfateand copper. Environ. Sci. Technol. 47 (22), 12775–12783.
Fulda, B., Voegelin, A., Maurer, F., Christl, I., Kretzschmar, R., 2013c. Copper redoxtransformation and complexation by reduced and oxidized soil humic acid. 1. X-rayabsorption spectroscopy study. Environ. Sci. Technol. 47 (19), 10903–10911.
Glass, J., Orphan, V., 2012. Trace metal requirements for microbial enzymes involved inthe production and consumption of methane and nitrous oxide. Front. Microbiol.3 (61).
Grafe, M., Eick, M., Grossl, P., 2001. Adsorption of arsenate (V) and arsenite (III) ongoethite in the presence and absence of dissolved organic carbon. Soil Sci. Soc. Am. J.65 (6), 1680–1687.
Grafe, M., Eick, M.J., Grossl, P.R., Saunders, A.M., 2002. Adsorption of arsenate andarsenite on ferrihydrite in the presence and absence of dissolved organic carbon. J.Environ. Qual. 31 (4), 1115–1123.
Hering, J.G., Morel, F.M., 1988. Humic acid complexation of calcium and copper.Environ. Sci. Technol. 22 (10), 1234–1237.
Hesslein, R.H., 1976. An in situ sampler for close interval pore water studies. Limnol.Oceanogr. 21 (6).
Irwin, W.P., Barnes, I., 1980. Tectonic relations of carbon dioxide discharges and earth-quakes. J. Geophys. Res. B: Solid Earth 85 (B6), 3115–3121.
Kalbitz, K., Wennrich, R., 1998. Mobilization of heavy metals and arsenic in pollutedwetland soils and its dependence on dissolved organic matter. Sci. Total Environ. 209(1), 27–39.
Kharaka, Y.K., Cole, D.R., Hovorka, S.D., Gunter, W.D., Knauss, K.G., Freifeld, B.M., 2006.Gas-water-rock interactions in Frio Formation following CO2 injection: implicationsfor the storage of greenhouse gases in sedimentary basins. Geology 34 (7), 577–580.
Kharaka, Y.K., Thordsen, J.J., Kakouros, E., Ambats, G., Herkelrath, W.N., Beers, S.R.,Birkholzer, J.T., Apps, J.A., Spycher, N.F., Zheng, L., Trautz, R.C., Rauch, H.W.,Gullickson, K.S., 2010. Changes in the chemistry of shallow groundwater related tothe 2008 injection of CO2 at the ZERT field site, Bozeman, Montana. Environ. EarthSci. 60 (2), 273–284.
Kirk, G., 2004. The Biogeochemistry of Submerged Soils. John Wiley & Sons, England.Kirsch, K., Navarre-Sitchler, A.K., Wunsch, A., McCray, J.E., 2014. Metal release from
sandstones under experimentally and numerically simulated CO2 leakage conditions.Environ. Sci. Technol. 48 (3), 1436–1442.
Krauze, P., Kämpf, H., Horn, F., Liu, Q., Voropaev, A., Wagner, D., Alawi, M., 2017.Microbiological and geochemical survey of CO2-dominated mofette and mineralwaters of the Cheb Basin, Czech Republic. Front. Microbiol. 8, 2446.
Lawter, A., Qafoku, N.P., Wang, G., Shao, H., Brown, C.F., 2016. Evaluating impacts ofCO2 intrusion into an unconsolidated aquifer: I. Experimental data. Int. J. GreenhouseGas Control 44, 323–333.
Lewicki, J.L., Birkholzer, J., Tsang, C.-F., 2007. Natural and industrial analogues forleakage of CO2 from storage reservoirs: identification of features, events, and pro-cesses and lessons learned. Environ. Geol. 52 (3), 457–467.
Livesey, N., Huang, P., 1981. Adsorption of arsenate by soils and its relation to selectedchemical properties and anions. Soil Sci. 131 (2), 88–94.
Maček, I., Videmšek, U., Kastelec, D., Stopar, D., Vodnik, D., 2009. Geological CO2 affectsmicrobial respiration rates in Stavešinci mofette soils. Acta Biol. Slov. 52 (2), 41–48.
Manning, B.A., Goldberg, S., 1997. Arsenic (III) and arsenic (V) adsorption on threeCalifornia soils. Soil Sci. 162 (12), 886–895.
McBride, M., 1989. Reactions controlling heavy metal solubility in soils. Adv. Soil Sci.1–56.
McBride, M., Sauve, S., Hendershot, W., 1997. Solubility control of Cu, Zn, Cd and Pb incontaminated soils. Eur. J. Soil Sci. 48 (2), 337–346.
McGrath, S.P., Sanders, J.R., Shalaby, M.H., 1988. The effects of soil organic matter levelson soil solution concentrations and extractabilities of manganese, zinc and copper.Geoderma 42 (2), 177–188.
McLaren, R.G., Crawford, D.V., 1973. Studies on soil copper II. The specific adsorption ofcopper by soils. J. Soil Sci. 24 (4), 443–452.
McLaren, R., Williams, J., Swift, R., 1983. Some observations on the desorption anddistribution behaviour of copper with soil components. Eur. J. Soil Sci. 34 (2),
325–331.Mehlhorn, J., Beulig, F., Küsel, K., Planer-Friedrich, B., 2014. Carbon dioxide triggered
metal(loid) mobilisation in a mofette. Chem. Geol. 382, 54–66.Mehlhorn, J., Byrne, J.M., Kappler, A., Planer-Friedrich, B., 2016. Time and temperature
dependency of carbon dioxide triggered metal(loid) mobilization in soil. Appl.Geochem. 74, 122–137.
Mehlhorn, J., Besold, J., Lezama-Pacheco, J.S., Gustafsson, J.P., Kretzschmar, R., Planer-Friedrich, B., 2018. Copper mobilization and immobilization along an organic matterand redox gradient – insights from a mofette site. Environ. Sci. Technol. 52 (23),13698–13707.
Nowak, M., Beulig, F., von Fischer, J., Muhr, J., Küsel, K., Trumbore, S.E., 2015.Autotrophic fixation of geogenic CO2 by microorganisms contributes to soil organicmatter formation and alters isotope signatures in a wetland mofette. Biogeosciences12, 7169–7183.
Olk, D.C., Cassman, K.G., Schmidt-Rohr, K., Anders, M.M., Mao, J.-D., Deenik, J.L., 2006.Chemical stabilization of soil organic nitrogen by phenolic lignin residues in anae-robic agroecosystems. Soil Biol. Biochem. 38 (11), 3303–3312.
Oppermann, B.I., Michaelis, W., Blumenberg, M., Frerichs, J., Schulz, H.M., Schippers, A.,Beaubien, S.E., Krueger, M., 2010. Soil microbial community changes as a result oflong-term exposure to a natural CO2 vent. Geochim. Cosmochim. Acta 74 (9),2697–2716.
Pearce, J.M., 2006. What can we learn from natural analogues? In: Lombardi, S.,Altunina, L.K., Beaubien, S.E. (Eds.), Advances in the Geological Storage of CarbonDioxide. Springer, Netherlands, pp. 127–139.
Pohlman, A.A., McColl, J.G., 1988. Soluble organics from forest litter and their role inmetal dissolution. Soil Sci. Soc. Am. J. 52 (1), 265–271.
Post, J.E., 1999. Manganese oxide minerals: Crystal structures and economic and en-vironmental significance. Proc. Natl. Acad. Sci. U. S. A. 96 (7), 3447–3454.
Qafoku, N.P., Lawter, A.R., Shao, H., Wang, G., Brown, C.F., 2014. Evaluating impacts ofCO2 gas intrusion into a confined sandstone aquifer: experimental results. EnergyProcedia 63, 3275–3284.
R Development Core Team, 2008. R: A Language and Environment for StatisticalComputing. R Foundation for Statistical Computing, Vienna, Austria.
Redman, A.D., Macalady, D.L., Ahmann, D., 2002. Natural organic matter affects arsenicspeciation and sorption onto hematite. Environ. Sci. Technol. 36 (13), 2889–2896.
Rennert, T., 2018. Geogenic CO2 affects inorganic soil properties and the composition ofsoil organic matter in physical fractions. Soil Res. 56 (4), 396–403.
Rennert, T., Pfanz, H., 2015. Geogenic CO2 affects stabilization of soil organic matter.Eur. J. Soil Sci. 66 (5), 838–846.
Rennert, T., Pfanz, H., 2016. Hypoxic and acidic—soils on mofette fields. Geoderma 280,73–81.
Rennert, T., Eusterhues, K., Pfanz, H., Totsche, K.U., 2011. Influence of geogenic CO2 onmineral and organic soil constituents on a mofette site in the NW Czech Republic.Eur. J. Soil Sci. 62 (4), 572–580.
Rennert, T., Eusterhues, K., Andrade, V.D., Totsche, K.U., 2012. Iron species in soils on amofette site studied by Fe K-edge X-ray absorption near-edge spectroscopy. Chem.Geol. 332–333, 116–123.
Ross, D.J., Tate, K.R., Newton, P.C.D., Wilde, R.H., Clark, H., 2000. Carbon and nitrogenpools and mineralization in a grassland gley soil under elevated carbon dioxide at anatural CO2 spring. Glob. Chang. Biol. 6 (7), 779–790.
Sander, R., 2015. Compilation of Henry's law constants (version 4.0) for water as solvent.Atmos. Chem. Phys. 15 (8).
Saßmannshausen, F., 2010. Vegetationsökologische Charakterisierung terrestrischerMofettenstandorte am Beispiel des west-tschechischen Plesná-Tals (Doctoral Thesis).University of Duisburg-Essen.
Schütze, C., Sauer, U., Beyer, K., Lamert, H., Bräuer, K., Strauch, G., Flechsig, C., Kämpf,H., Dietrich, P., 2012. Natural analogues: a potential approach for developing reliablemonitoring methods to understand subsurface CO2 migration processes. Environ.Earth Sci. 67 (2), 411–423.
Stookey, L.L., 1970. Ferrozine – a new spectrophotometric reagent for iron. Anal. Chem.42 (7), 779–781.
Tessier, A., Campbell, P.G., Bisson, M., 1979. Sequential extraction procedure for thespeciation of particulate trace metals. Anal. Chem. 51 (7), 844–851.
Theis, T.L., Singer, P.C., 1974. Complexation of iron (II) by organic matter and its effecton iron (II) oxygenation. Environ. Sci. Technol. 8 (6), 569–573.
Tipping, E., 2002. Cation Binding by Humic Substances. Cambridge University Press,pp. 12.
Uren, N.C., 1993. Forms, reactions and availability of nickel in soils. Adv. Agron. 48,141–203.
Videmšek, U., Hagn, A., Suhadolc, M., Radl, V., Knicker, H., Schloter, M., Vodnik, D.,2009. Abundance and diversity of CO2-fixing bacteria in grassland soils close tonatural carbon dioxide springs. Microb. Ecol. 58 (1), 1–9.
Wang, S., Jaffe, P.R., 2004. Dissolution of a mineral phase in potable aquifers due to CO2
releases from deep formations; effect of dissolution kinetics. Energy Convers. Manag.45 (18–19), 2833–2848.
Weber, F.-A., Voegelin, A., Kretzschmar, R., 2009. Multi-metal contaminant dynamics intemporarily flooded soil under sulfate limitation. Geochim. Cosmochim. Acta 73 (19),5513–5527.
Zeien, H., Brümmer, G.W., 1989. Chemische Extraktion zur Bestimmung vonSchwermetallbindungsformen in Boden. Mitteilungen der DeutschenBodenkundlichen Gesellschaft 59 (1), 505–510.
Zheng, L., Apps, J.A., Spycher, N., Birkholzer, J.T., Kharaka, Y.K., Thordsen, J., Beers,S.R., Herkelrath, W.N., Kakouros, E., Trautz, R.C., 2012. Geochemical modeling ofchanges in shallow groundwater chemistry observed during the MSU-ZERT CO2 in-jection experiment. Int. J. Greenhouse Gas Control 7 (0), 202–217.
J. Mehlhorn et al. Chemical Geology 509 (2019) 64–76
7659


1
A. Supporting Information
Chemical Geology
Spatial distribution of metal(loid) depletion and
accumulation zones around a natural carbon
dioxide degassing site
Judith Mehlhorna, Lukas A. Gerber
a, Britta Planer-Friedrich
a*
a Environmental Geochemistry, Bayreuth Center for Ecology and Environmental Research
(BayCEER), University of Bayreuth, Universitaetsstrasse 30, D-95440 Bayreuth, Germany
* Corresponding author: Tel.: +49 921 55 3999; E-mail address: b.planer-friedrich@uni-
bayreuth.de
(14 pages, 12 figures, 3 tables)
CONTENTS
A.1 Sequential extraction procedure 2
A.2 Additional data from soil samples 3
pH, Corg contents, and C/N ratios 3
Metal(loid) and S contents in 25-35 cm depth 4
Metal(loid) distribution in different chemical fractions 7
Molar metal(loid)/aluminum ratios for Mn, Co, Ni, Zn, and Cr 10
A.3 Similarity coefficients for metal(loid) soil contents and pore water concentrations 12
A.4 Pore water redox potential 13
References 14
61

2
A.1 Sequential extraction procedure
Table A.1
Summary of the 5-step sequential extraction procedure and the operationally defined fractions
according to Fulda et al. (2013). SSR = soil-to-solution ratio in [g mL-1
]. Steps F1 to F3 were
conducted in an anoxic chamber (Coy, 95%/5% nitrogen/hydrogen).
Step Extracting solution Extraction conditions Wash step Hypothetical interpretation
F1a 0.1 M CaCl2 24 h shaking; 23 °C;
SSR 1:25
MQ; 10 min;
SSR 1:12.5
mobile fraction
(soluble and exchangeable,
soluble metal-organic complexes)
F2b 1 M NaOAc (pH 5, adjusted
with HOAc)
24 h shaking; 23 °C;
SSR 1:25
MQ; 10 min;
SSR 1:12.5
easily mobilizable fraction
(specifically adsorbed, bound to
CaCO3 and other minerals labile
at pH 5, weak metal-organic
complexes)
F3c 0.025 M NH4-EDTA (pH
4.6)
90 min shaking; 23 °C;
SSR 1:25
MQ; 10 min;
SSR 1:25
organically bound fraction
(low affinity sites)
1 M NH4OAc (pH 4.6) 10 min shaking; 23 °C;
SSR 1:12.5
F4c 0.1 M ascorbic acid + 0.2 M
NH4Ox/HOx (pH 3.25)
2 h; 96 °C (heat
block); SSR 1:25; dark
MQ; 10 min;
SSR 1:12.5
reducible fraction
(bound to amorphous and
crystalline Fe- and Mn
(oxyhydr)oxides) 0.2 M NH4Ox/HOx (pH
3.25)
10 min shaking; 23 °C;
SSR 1:12.5; dark
F5b 30% H2O2 (pH 2) + 2 M
HNO3
5 mL H2O2 + 3 mL
HNO3; 2 h; 85 °C
(heat block)
oxidizable fraction
(metal sulfides and organically
bound fraction (high affinity
sites))
3 mL H2O2; 3 h; 85 °C
(heat block)
3.2 M NH4OAc (in 20% v/v
HNO3)
5 mL NH4OAc; 30
min; 23 °C
a McGrath et al. (1988)
b Tessier et al. (1979)
c Zeien and Brümmer (1989)
62

3
A.2 Additional data from soil samples
pH, Corg contents, and C/N ratios N
/S d
ista
nc
e f
rom
ce
nte
r [m
]
W/E distance from center [m] W/E distance from center [m]
Fig. A.1. (a) Soil pH determined in 0.01 M CaCl2 at a soil-to-solution ratio of 1:2.5 and (b) total
organic carbon (Corg) content in samples from 25-35 cm depth. Black dots mark sampling points, pH
and Corg contents were extrapolated between these points from measured values using universal
kriging interpolation.
Fig. A.2. C/N ratios in soil samples from 0-5 cm (top graph), 25-35 cm (middle graph), and 55-65 cm
depth (bottom graph). Black dots mark sampling points, contents were extrapolated between these
points from measured concentrations using universal kriging interpolation.
-10 -5 0 5 10 15
-10
-5
0
5
10
15
20
3.2
3.4
3.6
3.7
3.9
4.1
4.3
4.5
4.6
4.8
5.0pH [-]
-10 -5 0 5 10 15
-10
-5
0
5
10
15
20
0
40
80
120
160
200
240
280
320
360
400Corg [g kg-1]
-10 -5 0 5 10 15
-10
-5
0
5
10
15
20
0
30
60
N/S
dis
tan
ce [m
]d
ep
th [c
m]
W/E distance from center [m]
8
10
11
13
15
17
18
20
22
23
25
C/N ratio [-]
a b
63

4
Metal(loid) and S contents in 25-35 cm depth
N/S
dis
tan
ce
fro
m c
en
ter
[m]
N/S
dis
tan
ce
fro
m c
en
ter
[m]
W/E distance from center [m] W/E distance from center [m]
Fig. A.3. Total contents of Mn (a), Co (b), Ni (c), and Zn (d) determined in aqua regia digests of soil
samples from 25-35 cm depth. Black dots mark sampling points, contents were extrapolated between
these points from measured concentrations using universal kriging interpolation.
-10 -5 0 5 10 15
-10
-5
0
5
10
15
20
30
127
224
321
418
515
612
709
806
903
1000Mn [mg kg-1]
-10 -5 0 5 10 15
-10
-5
0
5
10
15
20
0
3
6
9
12
15
18
21
24
27
30Co [mg kg-1]
-10 -5 0 5 10 15
-10
-5
0
5
10
15
20
12
15
18
20
23
26
29
32
34
37
40Ni [mg kg-1]
-10 -5 0 5 10 15
-10
-5
0
5
10
15
20
30
43
56
69
82
95
108
121
134
147
160Zn [mg kg-1]
a b
c d
64

5
N/S
dis
tan
ce
fro
m c
en
ter
[m]
W/E distance from center [m] W/E distance from center [m]
Fig. A.4. Total contents of Fe (a) and As (b) determined in aqua regia digests of soil samples from 25-
35 cm depth. Black dots mark sampling points, contents were extrapolated between these points from
measured concentrations using universal kriging interpolation.
N/S
dis
tan
ce
fro
m c
en
ter
[m]
W/E distance from center [m] W/E distance from center [m]
Fig. A.5. Total contents of Al (a) and Cr (b) determined in aqua regia digests of soil samples from 25-
35 cm depth. Black dots mark sampling points, contents were extrapolated between these points from
measured concentrations using universal kriging interpolation.
-10 -5 0 5 10 15
-10
-5
0
5
10
15
20
0
7
13
20
27
34
40
47
54
60
67Fe [g kg-1]
-10 -5 0 5 10 15
-10
-5
0
5
10
15
20
15
27
38
50
61
73
84
96
107
119
130As [mg kg-1]
-10 -5 0 5 10 15
-10
-5
0
5
10
15
20
1
7
13
19
25
32
38
44
50
56
62Al [g kg-1]
-10 -5 0 5 10 15
-10
-5
0
5
10
15
20
15
19
23
27
31
35
39
43
47
51
55Cr [mg kg-1]
a b
a b
65

6
N/S
dis
tan
ce
fro
m c
en
ter
[m]
N/S
dis
tan
ce
fro
m c
en
ter
[m]
W/E distance from center [m]
W/E distance from center [m]
Fig. A.6. Total contents of Cu (a), Cd (b), and S (c) determined in aqua regia digests of soil samples
from 25-35 cm depth. Maximum Cd content is 1.3 mg kg-1
at 2 m W from degassing center. Black
dots mark sampling points, contents were extrapolated between these points from measured
concentrations using universal kriging interpolation.
-10 -5 0 5 10 15
-10
-5
0
5
10
15
20
10
13
16
19
22
25
28
31
34
37
40Cu [mg kg-1]
-10 -5 0 5 10 15
-10
-5
0
5
10
15
20
0.0
0.1
0.2
0.3
0.4
0.5
0.6
0.7
0.8
0.9
1.0Cd [mg kg-1]
-10 -5 0 5 10 15
-10
-5
0
5
10
15
20
0.9
1.3
1.7
2.1
2.5
3.0
3.4
3.8
4.2
4.6
5.0S [g kg-1]
a b
c
66

7
Metal(loid) distribution in different chemical fractions
a
tota
l Mn
/Su
m o
f fractio
ns
[mg
kg
-1]
Mn
fra
cti
on
b
tota
l Co
/Su
m o
f fractio
ns
[mg
kg
-1]
Co
fra
cti
on
c
tota
l Ni/S
um
of fra
ctio
ns
[mg
kg
-1]
Ni
fracti
on
d
tota
l Zn
/Su
m o
f fractio
ns
[mg
kg
-1]
Zn
fra
cti
on
Fig. A.7. Mn (a), Co (b), Ni (c), and Zn (d) content distribution in different chemical fractions
according the procedure described in Fulda et al. (2013) for soil samples from the East transect.
Circles mark total contents determined in aqua regia digests, crosses mark sum of fractions. Sampling
depth and distance from degassing center is given on x-axis.
0
100
200
300
400
500
600
0%
20%
40%
60%
80%
100%
0
2.5
5
7.5
10
12.5
15
0%
20%
40%
60%
80%
100%
0
5
10
15
20
25
30
35
0%
20%
40%
60%
80%
100%
0
30
60
90
120
150
180
0%
20%
40%
60%
80%
100%
0 m 2 m 4 m 8 m 12 m18 m 0 m 2 m 4 m 8 m 12 m18 m 0 m 2 m 4 m 8 m 12 m18 m
0-5 cm depth 25-35 cm depth 55-65 cm depth
F1 F2 F3 F4 F5 total content Sum of fractions
67
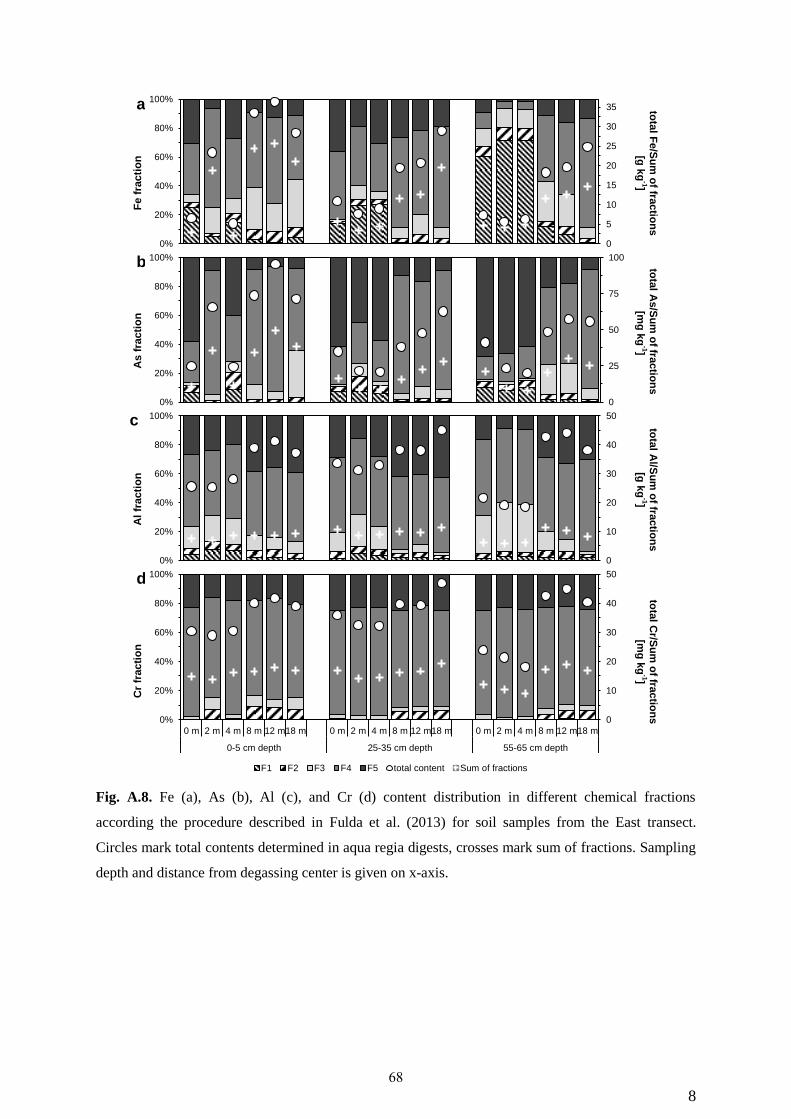
8
a
tota
l Fe/S
um
of fra
ctio
ns
[g k
g-1]
Fe f
racti
on
b
tota
l As/S
um
of fra
ctio
ns
[mg
kg
-1]
As
fra
cti
on
c
tota
l Al/S
um
of fra
ctio
ns
[g k
g-1]
Al
fracti
on
d
tota
l Cr/S
um
of fra
ctio
ns
[mg
kg
-1]
Cr
fracti
on
Fig. A.8. Fe (a), As (b), Al (c), and Cr (d) content distribution in different chemical fractions
according the procedure described in Fulda et al. (2013) for soil samples from the East transect.
Circles mark total contents determined in aqua regia digests, crosses mark sum of fractions. Sampling
depth and distance from degassing center is given on x-axis.
0
5
10
15
20
25
30
35
0%
20%
40%
60%
80%
100%
0
25
50
75
100
0%
20%
40%
60%
80%
100%
0
10
20
30
40
50
0%
20%
40%
60%
80%
100%
0
10
20
30
40
50
0%
20%
40%
60%
80%
100%
0 m 2 m 4 m 8 m 12 m18 m 0 m 2 m 4 m 8 m 12 m18 m 0 m 2 m 4 m 8 m 12 m18 m
0-5 cm depth 25-35 cm depth 55-65 cm depth
F1 F2 F3 F4 F5 total content Sum of fractions
68

9
a
tota
l Cu
/Su
m o
f fractio
ns
[mg
kg
-1] C
u f
racti
on
b
tota
l Cd
/Su
m o
f fractio
ns
[mg
kg
-1] C
d f
racti
on
Fig. A.9. Cu (a) and Cd (b) content distribution in different chemical fractions according the
procedure described in Fulda et al. (2013) for soil samples from the East transect. Circles mark total
contents determined in aqua regia digests, crosses mark sum of fractions. Sampling depth and distance
from degassing center is given on x-axis.
0
5
10
15
20
25
30
0%
20%
40%
60%
80%
100%
0
0.5
1
1.5
2
0%
20%
40%
60%
80%
100%
0 m 2 m 4 m 8 m 12 m18 m 0 m 2 m 4 m 8 m 12 m18 m 0 m 2 m 4 m 8 m 12 m18 m
0-5 cm depth 25-35 cm depth 55-65 cm depth
F1 F2 F3 F4 F5 total content Sum of fractions
69

10
Molar metal(loid)/aluminum ratios for Mn, Co, Ni, Zn, and Cr
Fig. A.10. Molar ratio of soil contents for Mn/Al (a), Co/Al (b), Ni/Al (c), and Zn/Al (d) determined
in aqua regia digests of soil samples from 0-5 cm (top graph), 25-35 cm (middle graph), and 55-65 cm
depth (bottom graph). Maximum Zn/Al ratio is 0.003 in the degassing center. Black dots mark
sampling points, molar ratios were extrapolated between these points using universal kriging
interpolation.
-10 -5 0 5 10 15
-10
-5
0
5
10
15
20
0
30
60
N/S
dis
tan
ce [m
]d
ep
th [c
m]
W/E distance from center [m]
0.0E+00
1.3E-03
2.6E-03
3.9E-03
5.2E-03
6.5E-03
7.8E-03
9.1E-03
1.0E-02
1.2E-02
1.3E-02
Mn:Al [-]
-10 -5 0 5 10 15
-10
-5
0
5
10
15
20
0
30
60
N/S
dis
tan
ce [m
]d
ep
th [c
m]
W/E distance from center [m]
0.0E+00
3.4E-05
6.8E-05
1.0E-04
1.4E-04
1.7E-04
2.0E-04
2.4E-04
2.7E-04
3.1E-04
3.4E-04
Co:Al [-]
-10 -5 0 5 10 15
-10
-5
0
5
10
15
20
0
30
60
N/S
dis
tan
ce [m
]d
ep
th [c
m]
W/E distance from center [m]
0.0E+00
6.0E-05
1.2E-04
1.8E-04
2.4E-04
3.0E-04
3.6E-04
4.2E-04
4.8E-04
5.4E-04
6.0E-04
Ni:Al [-]
-10 -5 0 5 10 15
-10
-5
0
5
10
15
20
0
30
60
N/S
dis
tan
ce [m
]d
ep
th [c
m]
W/E distance from center [m]
0.0E+00
2.0E-04
4.0E-04
6.0E-04
8.0E-04
1.0E-03
1.2E-03
1.4E-03
1.6E-03
1.8E-03
2.0E-03
Zn:Al [-]
a b
c d
70

11
Fig. A.11. Molar ratio of Cr/Al soil contents determined in aqua regia digests of soil samples from 0-
5 cm (top graph), 25-35 cm (middle graph), and 55-65 cm depth (bottom graph). Black dots mark
sampling points, molar ratios were extrapolated between these points using universal kriging
interpolation.
-10 -5 0 5 10 15
-10
-5
0
5
10
15
20
0
30
60
N/S
dis
tan
ce [m
]d
ep
th [c
m]
W/E distance from center [m]
3.0E-04
3.4E-04
3.8E-04
4.1E-04
4.5E-04
4.9E-04
5.3E-04
5.7E-04
6.0E-04
6.4E-04
6.8E-04
Cr:Al [-]
71

12
A.3 Similarity coefficients for metal(loid) soil contents and pore water
concentrations
Table A.2
Similarity matrix for the cluster analysis of normalized soil metal(loid) and S contents.
Fe S Cr Mn Co Ni Cu Zn As Cd Al
Fe 0 15.8 11.2 10.6 9.6 11.0 14.0 10.8 5.5 14.8 12.0
S 0 15.7 14.0 14.8 13.7 9.3 13.8 14.9 8.0 15.0
Cr 0 11.8 10.9 9.1 12.7 10.9 11.3 14.5 5.0
Mn 0 3.1 8.2 12.2 8.5 10.9 11.5 12.6
Co 0 6.4 12.3 7.0 9.9 11.9 12.2
Ni 0 10.1 6.9 10.2 10.9 11.0
Cu 0 12.8 13.1 7.7 13.0
Zn 0 10.4 10.9 12.3
As 0 13.6 12.9
Cd 0 14.6
Al 0
Table A.3
Similarity matrix for the cluster analysis of normalized pore water metal(loid) concentrations.
Fe Cr Mn Co Ni Cu Zn As Cd Al
Fe 0 7.1 9.7 10.2 10.3 12.6 12.1 7.4 12.9 7.2
Cr 0 11.0 10.2 9.3 11.1 11.0 4.9 11.4 2.6
Mn 0 3.5 6.8 10.0 11.6 11.8 7.8 11.7
Co 0 4.5 9.4 11.6 11.3 6.0 11.0
Ni 0 8.1 11.3 10.9 5.3 10.0
Cu 0 9.3 12.0 7.6 11.8
Zn 0 10.9 10.8 11.1
As 0 12.4 5.6
Cd 0 11.9
Al 0
72

13
A.4 Pore water redox potential
E distance from center [m]
de
pth
[cm
]
Fig. A.12. Redox potential (EH) from pore water samples collected with dialysis chambers along the
East transect of the mofette site. Black dots mark sampling points, values were extrapolated between
these points from measured values using universal kriging interpolation.
0 5 10 15
-45
-30
-15
0
0
75
150
225
300
375
450
525
600EH [mV]
73

14
References
Fulda, B., Voegelin, A., Ehlert, K., Kretzschmar, R., 2013. Redox transformation, solid phase
speciation and solution dynamics of copper during soil reduction and reoxidation as
affected by sulfate availability. Geochim. Cosmochim. Acta, 123, 385-402.
McGrath, S.P., Sanders, J.R., Shalaby, M.H., 1988. The effects of soil organic matter levels
on soil solution concentrations and extractabilities of manganese, zinc and copper.
Geoderma, 42(2), 177-188.
Tessier, A., Campbell, P.G., Bisson, M., 1979. Sequential extraction procedure for the
speciation of particulate trace metals. Anal. Chem., 51(7), 844-851.
Zeien, H., Brümmer, G.W., 1989. Chemische Extraktion zur Bestimmung von
Schwermetallbindungsformen in Boden. Mitteilungen der Deutschen
Bodenkundlichen Gesellschaft, 59(1), 505-510.
74

75
STUDY 2: Time and temperature dependency of carbon dioxide triggered
metal(loid) mobilization in soil.
Judith Mehlhorn, James M. Byrne, Andreas Kappler, Britta Planer-Friedrich
Reprinted with permission from
Applied Geochemistry 74 (pp. 122 - 137)
Copyright 2016 Elsevier


Time and temperature dependency of carbon dioxide triggeredmetal(loid) mobilization in soil
Judith Mehlhorn a, James M. Byrne b, Andreas Kappler b, Britta Planer-Friedrich a, *
a University of Bayreuth, Environmental Geochemistry, Bayreuth Center for Ecology and Environmental Research (BayCEER), Universitaetsstrasse 30, D-95440 Bayreuth, Germanyb University of Tuebingen, Geomicrobiology, Center for Applied Geosciences, Sigwartstrasse 10, D-72076 Tuebingen, Germany
a r t i c l e i n f o
Article history:Received 21 June 2016Received in revised form13 September 2016Accepted 16 September 2016Available online 17 September 2016
Keywords:MofetteFluvisolCarbon Capture and Storage (CCS)Microbial iron reductionCzech Republic
a b s t r a c t
Assessing the influence of CO2 on soil and aquifer geochemistry is a task of increasing interest whenconsidering risk assessment for geologic carbon sequestration. Leakage and CO2 ascent can lead to soilacidification and mobilization of potentially toxic metals and metalloids due to desorption or dissolutionreactions. We studied the CO2 influence on an Fe(III) (oxyhydr)oxide rich, gleyic Fluvisol sampled in closevicinity to a Czech mofette site and compared the short-term CO2 influence in laboratory experimentswith observations on long-term influence at the natural site. Six week batch experiments with/withoutCO2 gas flow at 3 different temperatures and monitoring of liquid phase metal(loid) concentrationsrevealed two main short-term mobilization processes. Within 1 h to 1 d after CO2 addition, mobilizationof weakly adsorbed metal cations occurred due to surface protonation, most pronounced for Mn (2.5e3.3fold concentration increase, mobilization rates up to 278 ± 18 mg Mn kgsoil�1 d�1) and strongest at lowtemperatures. However, total metal(loid) mobilization by abiotic desorption was low. After 1e3 d sig-nificant Fe mobilization due to microbially-triggered Fe(III) (oxyhydr)oxide dissolution began andcontinued throughout the experiment (up to 111 ± 24 fold increase or up to 1.9 ± 0.6 mg Fe kgsoil�1 d�1).Rates increased at higher temperature and with a higher content of organic matter. The Fe(III) mineraldissolution was coupled to co-release of incorporated metal(loid)s, shown for As (up to 16 ± 7 fold,11 ± 8 mg As kgsoil�1 d�1). At high organic matter content, re-immobilization due to resorption reactionscould be observed for Cu. The already low pH (4.5e5.0) did not change significantly during Fe(III)reduction due to buffering from sorption and dissolution reactions, but a drop in redox potential (from> þ500 mV to minimum þ340 ± 20 mV) occurred due to oxygen depletion. We conclude that microbialprocesses following CO2 induction into a soil can contribute significantly to metal(loid) mobilization,especially at optimal microbial growth conditions (moderate temperature, high organic carbon content)and should be considered for carbon sequestration monitoring and risk assessment.
© 2016 Elsevier Ltd. All rights reserved.
1. Introduction
The storage of carbon dioxide (CO2) in geological structures(geologic carbon storage, GCS) is a promising option for thereduction of industrial greenhouse gas emissions and currentlytested and practiced in numerous projects all over the world. Eventhough GCS sites are carefully selected in order to guarantee safestorage over centuries, leakage of CO2 can never be completelyruled out and risks for overlying aquifers and soils have to beassessed (IPCC, 2005; Jun et al., 2012, 2013).
One possibility to study long-term influence of CO2 on soils andaquifers is using natural analogues (Lewicki et al., 2007; Pearce,2006; Schütze et al., 2012). Cold, volcanic CO2 exhalation sites,called mofettes, can have CO2 partial pressures (p(CO2)) of up to 1(Br€auer et al., 2004; K€ampf et al., 2007) and thus represent excel-lent sites to study effects on soil and pore water conditions.Dissolution of CO2 in pore water and dissociation of carbonic acidcauses soil acidification and can lead to mobilization of trace ele-ments due to mineral dissolution reactions (Blume and Felix-Henningsen, 2009; Kharaka et al., 2006, 2010; Mehlhorn et al.,2014;Wang and Jaffe, 2004; Zheng et al., 2009, 2012). The influenceof high CO2 partial pressures on iron (Fe) oxides and oxyhydroxides(hereafter summarized as Fe(III) (oxyhydr)oxides) was studied in* Corresponding author.
E-mail address: [email protected] (B. Planer-Friedrich).
Contents lists available at ScienceDirect
Applied Geochemistry
journal homepage: www.elsevier .com/locate/apgeochem
http://dx.doi.org/10.1016/j.apgeochem.2016.09.0070883-2927/© 2016 Elsevier Ltd. All rights reserved.
Applied Geochemistry 74 (2016) 122e137
77
Reprinted with permission from

detail for a Czech grassland mofette site in Rennert et al. (2011,2012). They found that Fe minerals in the mofette were of weakcrystallinity and extractable pedogenic Fe(III) (oxyhydr)oxide con-tent showed a negative correlation with p(CO2). Solid Fe phaseswere dominated by Fe(III) incorporated in silicates and fine grainedFe(II) as well asmixed Fe(II)/Fe(III) mineral phases, while pedogenicFe(III) (oxyhydr)oxides could only be detected along old rootchannels. They concluded that Fe release by weathering of parentmaterial is decreased in the mofettes and the small amount of Fe(II)released from weathering is not re-oxidized to Fe(III) (oxyhydr)oxides due to the absence of oxygen.
The organic matter content in mofettes can be significantlyincreased compared to surrounding sites which are unaffected byCO2. This increase is attributed to decreased decomposition ratesunder anoxic conditions in mofettes (Flechsig et al., 2008; Ma�ceket al., 2009; Rennert et al., 2011; Videm�sek et al., 2009) and anadditional organic matter input from autotrophic microbial carbonfixation of geogenic CO2 (Beulig et al., 2015; Nowak et al., 2015).Furthermore, a shift in microbial community towards anaerobic,acidophilic microorganisms, a lowered microbial diversity as wellas the exclusion of meso- and macroscopic eukaryotes have beenobserved in mofettes, which contributes to organic matter accu-mulation (Beulig et al., 2016; Fern�andez-Montiel et al., 2016;Frerichs et al., 2013; Nowak et al., 2015; Oppermann et al., 2010;�Sibanc et al., 2014). Solid organic matter quality analyzed by 13CNMR did not seem to be affected by geogenic CO2 in a mofette withmoderate p(CO2) (Rennert and Pfanz, 2015) while Fourier-transform infrared spectroscopy on a transect with p(CO2) up to 1revealed detectable changes in organic matter quality withincreased lignin concentrations at higher p(CO2) (Rennert et al.,2011).
Investigations on natural soil and pore water samples from aCzech mofette site conducted by our working group in 2013confirmed the negative correlation of total Fe content in soil andp(CO2) as well as the increased organic matter content in mofettescompared to an adjacent CO2 unaffected reference soil (Mehlhornet al., 2014). We also showed that the reduced content of Fe(III)(oxyhydr)oxides led to an increased mobility of arsenic (As) in themofettes while other elements, especially copper (Cu), showed adecreased net-mobility due to adsorption to organic matter in themofettes.
However, as useful as natural analogues are for assessing thelong-term effects of CO2 on soil and aquifers, they cannot provideany information on time dependencies of the observed (im)mobi-lization processes. Also, other influences on metal(loid) mobiliza-tion, like microbial activity or seasonal effects can hardly be studiedin a quantitativeway at natural sites, since the current state of mostmofettes represents the effects of CO2 influence over decades orcenturies. To further assess the pathway that leads to conditionsfound in mofettes, laboratory batch experiments with controlledCO2 gas purging can help to increase the current knowledge bydistinguishing between different (im)mobilization pathways andbe used to determine mobilization rates. Numerous batch studieson the influence of CO2 on different sediment materials existindicating that mobilization reactions due to desorption or mineraldissolution are the dominating short-term processes following aCO2 intrusion into an aquifer (e.g. Kirsch et al., 2014; Lawter et al.,2016; Little and Jackson, 2010; Smyth et al., 2009). However, alsore-adsorption or formation of secondary minerals can occur andlead to net-immobilization of certain metal(loid)s (e.g. Lawter et al.,2015; Lu et al., 2010; Mickler et al., 2013; Shao et al., 2015). Sig-nificant knowledge gaps still exist on the influence of other relevantgeochemical factors, like redox condition, microbial activity, ormineral composition (Harvey et al., 2012). The microbial influencein particular is not yet completely understood since the effects of
microbial activity on metal(loid) mobility largely depend on thecommunity present in the sediment or soil, which will differsignificantly between different sites. Microbes can either enhancemobilization rates by altering existing equilibria and triggering thedissolution of certain minerals, e.g., the dissolution of Fe(III) (oxy-hydr)oxides (Kirk et al., 2013), or promote mineral precipitation byincreasing alkalinity or direct biological carbonate formation(Harvey et al., 2016; Kirk et al., 2013; Lions et al., 2014 and refer-ences therein).
To further investigate the short-term effects of CO2 intrusion onmetal(loid) mobility, we conducted batch experiments with hith-erto CO2 unaffected soil suspensions from a gleyic Fluvisol in closevicinity to mofettes already studied in Mehlhorn et al. (2014). Theaim of this study was (i) to distinguish between different mobili-zation and immobilization processes by detailed monitoring ofmetal(loid) concentrations during CO2 incubation, (ii) to get qual-itative information about the microbial influence on the (im)mobilization reactions by variation of incubation temperature, and(iii) to determine mobilization rates for certain metal(loid)s underthe conditions prevailing in mofettes, hence, helping to increaseour understanding of the risks arising from potential GCS leakageinto soil and aquifers. Based on the results gained from our study atthe natural mofette site, we hypothesized that mobilization ofmetal cations due to desorption will be the dominating short-termeffect, combined with low total liquid phase concentration in-creases. Further, we expected mobilization of Fe and othermetal(loid)s due to the reductive dissolution of Fe(III) (oxyhydr)oxides, a potentially microbially-triggered process that should beaccelerated by increased incubation temperatures. The mainadvantage of using soil material from close vicinity of mofettes forthe batch experiments is the possibility of direct comparison be-tween experimental results on short-term CO2 influence with re-sults from field studies on long-term effects.
2. Material and methods
2.1. Site description and sampling
Soil and water samples for batch experiments were collected ina mofette area in northwestern Czech Republic. The mofettes arelocated in the flood plain of the river Plesn�a, which follows thenorth-south striking Po�catky-Plesn�a Zone where CO2-rich mantlegasses ascend from a magma chamber in the lower earth crust(Bankwitz et al., 2003). We selected a mofette, already studied inMehlhorn et al. (2014), that is located in direct vicinity of the riverPlesn�a and thus is water saturated all year. Soil samples were nottaken directly from the mofette, but from a “reference site” somemeters away which was selected based on vegetation changes (N50�08043.700 E 12�2701.400, for a more detailed description seeMehlhorn et al. (2014)). Thus, the soil selected for batch experi-ments is similar to the mofette soils but not CO2 influenced. Thefirst sampling took place on March 2nd, 2015. The vegetation androot zone were removed before 1 kg of soil, previously classified asgleyic Fluvisol (Beulig et al., 2016), was taken from a depth between20 and 30 cm and packed in airtight closed plastic bags. Theselected sampling depth was chosen based on results from 2013,where the most pronounced metal(loid) concentration differencesbetween mofette and reference soils were found at approximately25 cm depth. For the batch experiments, we chose river water asgroundwater analogue, since groundwater was not available in theamounts needed. Metal(loid) concentrations in the river waterwere similar to or lower than in natural pore water (see Section 3.1)which justified the usage of river water as analogue for an uncon-taminated aquifer. Two liters of river water were sampled as closeas possible to the soil sampling site (distance approx. 15 m), a few
J. Mehlhorn et al. / Applied Geochemistry 74 (2016) 122e137 123
78

cm below the surface in 1 L-polypropylene bottles without gaseousheadspace. The samples were kept cool during transport to thelaboratory, where the river water was filtered (0.2 mm, cellulose-acetate filter, CHROMAFIL® Xtra) to remove particles and microor-ganisms. Before storage at 8 �C, the head space of the water bottleswas filled with nitrogen and sealed airtight. The soil bags wereopened and closed again in an anoxic COY-glovebox (95% N2, 5% H2)in order to remove oxygen from the gas phase. Afterwards, the bagswere sealed and stored at 8 �C.
The second sampling took place on August 21st, 2015, and wasconducted analogous to the first sampling. Due to the relatively hotand dry summer (average temperature of 19.5 �C in August 2015and 231 mm precipitation between May and August 2015,compared to a 1961e1990 average of 15.7 �C and 272 mm precip-itation in the same time span for the Karlovy Vary region, CHMI(2015)) the soil was exceptionally dry and had a relatively highroot content. We therefore took the soil from a depth of 30e40 cm,where there were less roots and the humidity was slightly higher.Sample preparation in the laboratory was the same as for the firstsampling.
2.2. Batch experiments
We conducted two batch experiments, one with temperaturevariation and one with variation of initial soil conditions. The firstexperiment (Batch Experiment I) started 1 d after the first samplingand lasted 42 d. Three different temperatures were applied to thebatches in order to lower (16 �C) or stimulate (35 �C) microbialactivity compared to room temperature (22 �C) and imitatedifferent seasons. While 16 and 22 �C are typical average soiltemperatures for spring, summer, and fall season in Central Europe(PIK, 2016), the relatively warm 35 �C were chosen to simulatemaximummicrobial activity when soil is exposed to direct sunlighton a warm summer day. Each differently treated set consisted of 7batch reactors: a triplicate of batches with soil andwater phase thatwere not treated with CO2 (controls), a triplicate of batches withsoil and water phase that were treated with CO2 gas flow (treat-ments), and one batch that contained only water and was treatedwith CO2 gas flow (water blank). The batches were prepared in250 mL glass bottles, that were filled with 50 g of fresh soil and75mL of filtered river water (soil:water ratio 1:1.5) or with 75mL offiltered river water only for the water blanks, and stoppered with achlorobutyl septum each. Since the soil appeared to be relativelyhomogenous, there was no further treatment before the beginningof the experiment except for the removal of bigger roots and plantdebris. The batches with CO2 treatment were connected to the CO2gas flow (28 ± 5 mL min�1) with one long needle as gas inlet andone short needle as gas outlet. The batches without CO2 treatmentonly received a short needle to guarantee gas exchange with theatmosphere. One set of samples was placed at room temperature(“RT” 22 ± 1 �C), one set was placed in a thermoelectric cool box(MOBICOOLV26) for cooling (“C” 16 ± 1 �C), and one set was placedin a heated water bath (“H” 35 ± 0.1 �C). All batches were coveredwith aluminum foil to exclude light radiation. After 10 min of gasflow, all batches were shaken softly to mix liquid and solid phase.The mixing was repeated daily during the whole experiment. Gasflowwas controlled dailywith a bubble counter at the outlet needleand needles were exchanged in case of blockage. Sampling of theliquid phase of all batches was conducted 1 h,1, 3, 7, 14, 28, and 42 dafter the start of the experiment. The gas flow was turned off10 min before sampling in order to let bigger particles settle fromthe liquid phase. Between 1.5 and 5 mL of the liquid phase wereremoved from the batch with needle and syringe and filtered(0.2 mm, cellulose-acetate filter, CHROMAFIL® Xtra). Redox poten-tial and pH (WTW pH meter Multi340i equipped with a SenTix pH
electrode and a SenTix ORP redox electrode) were measuredimmediately after sampling to minimize oxygen influence, and1.5 mL of the remaining sample were stabilized with 15 mL of 8 MHNO3 to prevent precipitation and stored at 8 �C until determina-tion of total Fe, Mn, As, and Cu concentrations by inductivelycoupled plasma mass spectrometry (ICP-MS). For the last time step(42 d), an additional 2 mL of sample was stabilized in N2-purgedseptumvials and stored at 8 �C for analysis of dissolved CO2 and CH4by gas chromatography (GC). Each batch was weighed before andafter the experiment for calculation of evaporation loss. For analysisof the solid phase, the remaining supernatant was removed, sam-ples were freeze-dried and ground into a powder. Soil pH wasmeasured in 0.01 M CaCl2 solution (w/v ratio 1:2.5, WTW pHmeterMulti340i equipped with a SenTix pH electrode). Total Fe, As, Mn,and Cu concentrations were determined with ICP-MS, after mi-crowave digestion (MARS Xpress, CEM) with 10 mL aqua regia per100 mg soil sample (program: 20 min heating to 160 �C, 15 minholding, 20 min cooling) in filtered (0.2 mm, cellulose-acetate filter,CHROMAFIL® Xtra) and diluted extracts.
Since the heated batches (“H”) showed the most interestingmobilization processes, this part of the experiment was repeated asecond time (Batch Experiment II). This time, the initial soil con-ditions were varied in order to get more information on the influ-ence of season andmicrobial activity onmobilization processes. Forone set of batches (“H2”), the soil used was the same as for BatchExperiment I (“fresh spring soil”), but this time the soil had beenstored under anoxic and dark conditions at 8 �C for 11 weeks(“stored spring soil”). This long storage increased the crystallinity ofthe Fe(III) (oxyhydr)oxides and thus should have made them lesseasily accessible for microorganisms (see Section 3.2). Experi-mental conditions and sampling were the same as in BatchExperiment I, except that no samples for dissolved CO2 and CH4analysis were taken and that the experiment was finished after41 d. For the other set of batches (“H3”), fresh soil and watersamples were collected from the Czech site in August 2015, 4 dbefore starting the experiment (“fresh summer soil”). Due to therelatively hot summer and the high organic carbon content (espe-cially fine root material that was hardly removable), the microbialactivity was expected to be high compared to the other batches.Experimental setup and sampling were equal to H2. However, dueto the extremely low soil moisture, this part of the experimentlasted only 28 d, since a big part of the added water was absorbedimmediately by soil and less supernatant water for liquid samplingremained.
2.3. Quantification of microbial activity
We determined most probable numbers (MPN) for three sam-ples of the stored spring soil from Batch Experiment II (one initial,one treatment, and one control sample) to quantify the amount ofcultivatable heterotrophic aerobic, Fe(III)-reducing, and sulfate-reducing microorganisms. A detailed description of MPN methodsand results can be found in the Supplementary data, Section S.1.
We also tried to quantify the microbial influence on theobserved processes by conducting additional batch experimentswith sterilized soil. Unfortunately, both sterilization methods used(addition of formaldehyde and steam sterilization) inducedmassive changes in soil properties and already led to abioticmobilization reactions, which made direct comparison with non-sterilized batches impossible. A detailed method description andresults from sterile experiments can be found in Supplementarydata, Section S.2.
Thus, we conducted an additional incubation experiment aim-ing at delivering a proof of principle for the correlation betweenmicrobial activity and Fe release in the soils used for this study. In
J. Mehlhorn et al. / Applied Geochemistry 74 (2016) 122e137124
79

this additional incubation experiment, microbial activity wasquantified by CO2 production, a method that could not be useddirectly in the batch experiments which required specifically CO2addition. Both spring and summer soil were incubated with filteredriver water in 50 mL septum vials at the same ratio as in the batchexperiments but at a smaller scale (10 g soil þ 15 mL water) andpurged with N2 for 1 h to generate anoxic conditions. Afterwards,the bottles were incubated in the dark at 12 �C (thermoelectric coolbox), 21 �C (room temperature), and 35 �C (water bath) for 7 d. As inthe batch experiments, the bottles were shaken daily. At the end ofthe incubation period, 4 mL were removed from the liquid phasewith needle and syringe in an anoxic glovebox, 2 mL were stabi-lized in N2-purged septum vials and stored overnight at 8 �C foranalysis of dissolved CO2, the remaining 2 mL were filtered (0.2 mmcellulose-acetate filter, CHROMAFIL® Xtra), and 1 mL was stabilizedwith 10 mL 8 M HNO3 for total Fe analysis by ICP-MS.
2.4. Laboratory analysis
Total concentrations of Fe, Mn, As, and Cu weremeasured with aquadrupole ICP-MS (X-Series2, Thermo Scientific). Samples fromthe liquid phase were diluted with 0.16 M HNO3, aqua regia digestsfrom soil samples were diluted to a 1:10 dilution deionizedwater:aqua regia. Dilution factors were 1:10 for Mn, As, and Cuanalysis, and between 1:10 and 1:10,000 for Fe analysis. Copperwas measured in standard mode, As was measured in O2 mode asAsOþ, Fe and Mn were measured in KED mode (kinetic energydiscrimination, �2 V for Mn, �3 V for Fe, with a mixture of 93% Heand 7% H2 as collision gas) to avoid polyatomic interferences.Rhodium was added as internal standard and internal driftcorrection was conducted by measuring a mid-range standardevery 10 to 25 samples. We used TMDA-54.4 (National WaterResearch Institute, Environment Canada) as external referencematerial for quality control. A blank correction was conducted forthe aqua regia digests. Calculated limits of detection (LOD) were2.2 ± 4.4 mg L�1 for Fe, 0.03 ± 0.06 mg L�1 for Mn, 0.2 ± 0.1 mg L�1 forAs, and 0.16 ± 0.12 mg L�1 for Cu.
Diluted CO2 and CH4 concentrations were calculated from headspace concentrations in the septum vials using Henry's law.Gaseous head space concentrations were measured with a gaschromatograph (SRI Instruments 8610C, U.S.) equipped with amethanizer and a flame ionization detector.
Since a monitoring of nitrate and dissolved organic carbon(DOC) concentrations over the course of the experiment was notpossible due to limited sample amount, these parameters wereonly determined for the initial river water as well as for the liquidphase directly after mixing with spring and summer soil in order todetermine the amount of nitrate and DOC released from soil.Analysis of DOC was conducted by thermo-catalytic oxidation witha TOC-VCPN Analyzer (Shimadzu) in undiluted, filtered (0.45 mm,nylon, CHROMAFIL® Xtra) samples, which had been stored at 8 �Cfor 5 days. Nitrate was determined with a Spectroquant® quick test(Nitrate Test Photometric, Merck) and a photometer (DR 2800,Hach-Lange), in undiluted, filtered (0.45 mm, nylon, CHROMAFIL®
Xtra) samples, which had been stored frozen until analysis.Three freeze-dried soil samples were investigated using
M€ossbauer spectroscopy including fresh spring soil, stored springsoil, and fresh summer soil, each before incubation. Within ananoxic glovebox (100% N2), samples were prepared for M€ossbauerspectroscopy by loading as dry, ground powders into Plexiglasholders (area 1 cm2). Samples were then transported to theM€ossbauer instrument within airtight bottles which were onlyopened immediately prior to loading into a closed-cycle exchangegas cryostat (Janis cryogenics) to minimize exposure to air. Spectrawere collected at 77 K and 5 K using a constant acceleration drive
system (WissEL) in transmission mode with a 57Co/Rh source. Allspectra were calibrated against a 7 mm thick a-57Fe foil that wasmeasured at room temperature. Analysis was carried out usingRecoil (University of Ottawa) and the Voigt Based Fitting (VBF)routine (Rancourt and Ping, 1991). The half width at half maximum(HWHM) was constrained to 0.131 mm/s during fitting. The samesoil samples were used for determination of oxalate- anddithionite-citrate-extractable pedogenic Fe(III) (oxyhydr)oxides,following the methods according to Schwertmann (1964) andMehra and Jackson (1960), respectively. Total Fe and Aluminium(Al) concentrations in extracts were determined by ICP-MS in �2 VKED mode as described above. Two freeze-dried and ground sam-ples from the initial spring and summer soil were analyzed intriplicate on total carbon and nitrogen content with a CHNelemental analyzer (Thermo Quest, Flash EA, 1112).
2.5. Calculations and statistics
In the differently treated batches (with/without CO2, differenttemperatures) the loss of liquid due to evaporation varied stronglyand measured dissolved concentrations had to be corrected ac-cording to the respective fluid loss. Evaporation was assumed to beconstant over the course of the experiment, so the amount of liquid,remaining in the batches at a certain time step, could be calculatedfrom weight difference before and after the experiment with alinear function, deducting fluid loss due to sampling.
Since data were not normally distributed, the Mann-Whitney-U-test was used to test for significance in differences betweentreatments, Kruskal-Wallis-test was used to test for significanttrends over time, and Spearman's rank correlation was used tocalculate correlation coefficients (rS) and their significance level (P-value) between parameters (a ¼ 0.05). All statistical analyses weredone with R (R Development Core Team, 2008).
3. Results
3.1. Initial soil and water conditions
The physicochemical properties of the river water indicated thatit could be used quite well as an analogue for an uncontaminatedaquifer (Table 1). A comparisonwith the porewater of the referencesite analyzed in Mehlhorn et al. (2014) showed that redox potentialand Cu concentration were almost exactly the same (þ390 mV and3.3 mg Cu L�1 for 30 cm depth in natural porewater) and Fe, Mn, andAs concentrations were even considerably lower (2366 mg Fe L�1,179 mg Mn L�1 and 22 mg As L�1 in natural pore water). Only the pHof 8.6 in the river water was clearly higher compared to naturalpore water (pH of 5.0 in pore water). This, however, did not affectthe experiment, since pH in the batch reactors was mainly deter-mined by soil pH (see Section 3.3). The properties of the watersampled in spring and in summer differed slightly. While redoxpotential and Fe concentration were slightly increased in summer,pH, Mn, and As concentrations were decreased.
Total element contents and pH of the soil used for batch ex-periments (Table 1) were similar to the soil samples from thereference site sampled and analyzed in 2013 (Mehlhorn et al.,2014). Differences between the soil sampled in spring and theone sampled in summer were already optically visible. The organicmatter content, especially pronounced in fine root content, wasclearly increased in the summer soil (total C content of 45 mg g�1
compared to 20 mg g�1 in spring soil) due to the course of vege-tation period. Additionally, the soil wasmore porous and less moist.It is noteworthy that the total soil contents of Fe and As were lowerby 39% and 45%, respectively, in summer soil compared to springsoil. The reduced Fe(III) (oxyhydr)oxide content was already
J. Mehlhorn et al. / Applied Geochemistry 74 (2016) 122e137 125
80
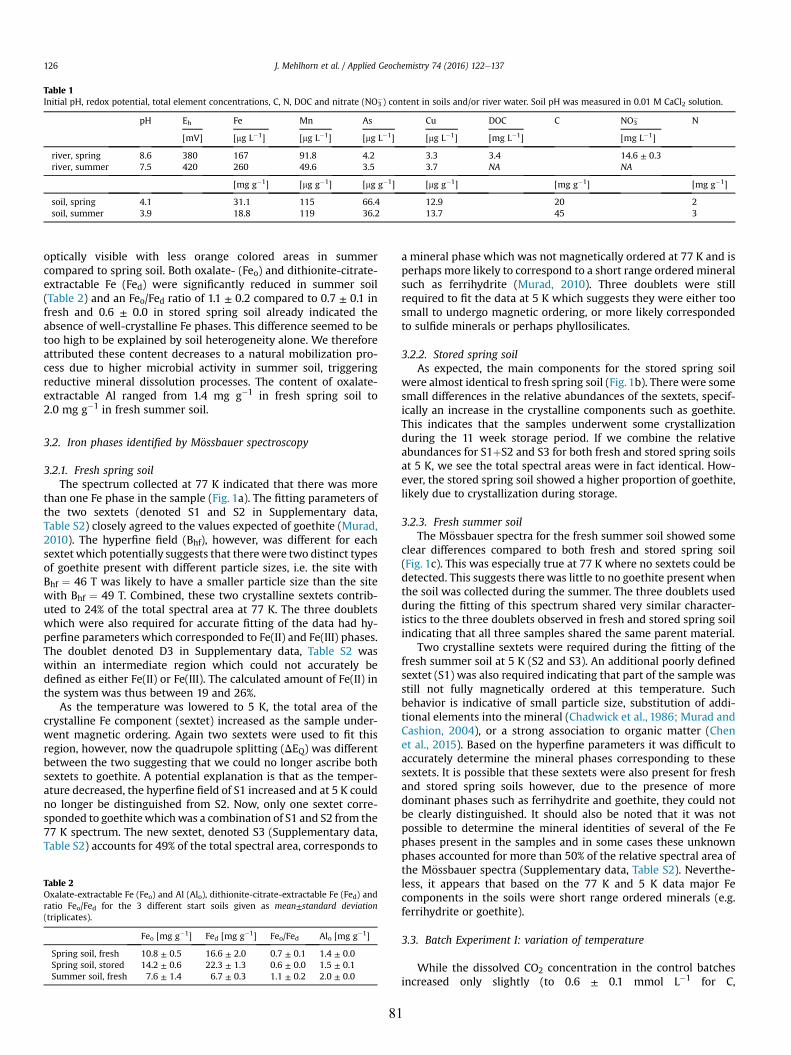
optically visible with less orange colored areas in summercompared to spring soil. Both oxalate- (Feo) and dithionite-citrate-extractable Fe (Fed) were significantly reduced in summer soil(Table 2) and an Feo/Fed ratio of 1.1 ± 0.2 compared to 0.7 ± 0.1 infresh and 0.6 ± 0.0 in stored spring soil already indicated theabsence of well-crystalline Fe phases. This difference seemed to betoo high to be explained by soil heterogeneity alone. We thereforeattributed these content decreases to a natural mobilization pro-cess due to higher microbial activity in summer soil, triggeringreductive mineral dissolution processes. The content of oxalate-extractable Al ranged from 1.4 mg g�1 in fresh spring soil to2.0 mg g�1 in fresh summer soil.
3.2. Iron phases identified by M€ossbauer spectroscopy
3.2.1. Fresh spring soilThe spectrum collected at 77 K indicated that there was more
than one Fe phase in the sample (Fig. 1a). The fitting parameters ofthe two sextets (denoted S1 and S2 in Supplementary data,Table S2) closely agreed to the values expected of goethite (Murad,2010). The hyperfine field (Bhf), however, was different for eachsextet which potentially suggests that therewere two distinct typesof goethite present with different particle sizes, i.e. the site withBhf ¼ 46 T was likely to have a smaller particle size than the sitewith Bhf ¼ 49 T. Combined, these two crystalline sextets contrib-uted to 24% of the total spectral area at 77 K. The three doubletswhich were also required for accurate fitting of the data had hy-perfine parameters which corresponded to Fe(II) and Fe(III) phases.The doublet denoted D3 in Supplementary data, Table S2 waswithin an intermediate region which could not accurately bedefined as either Fe(II) or Fe(III). The calculated amount of Fe(II) inthe system was thus between 19 and 26%.
As the temperature was lowered to 5 K, the total area of thecrystalline Fe component (sextet) increased as the sample under-went magnetic ordering. Again two sextets were used to fit thisregion, however, now the quadrupole splitting (DEQ) was differentbetween the two suggesting that we could no longer ascribe bothsextets to goethite. A potential explanation is that as the temper-ature decreased, the hyperfine field of S1 increased and at 5 K couldno longer be distinguished from S2. Now, only one sextet corre-sponded to goethitewhichwas a combination of S1 and S2 from the77 K spectrum. The new sextet, denoted S3 (Supplementary data,Table S2) accounts for 49% of the total spectral area, corresponds to
a mineral phase which was not magnetically ordered at 77 K and isperhaps more likely to correspond to a short range ordered mineralsuch as ferrihydrite (Murad, 2010). Three doublets were stillrequired to fit the data at 5 K which suggests they were either toosmall to undergo magnetic ordering, or more likely correspondedto sulfide minerals or perhaps phyllosilicates.
3.2.2. Stored spring soilAs expected, the main components for the stored spring soil
were almost identical to fresh spring soil (Fig. 1b). There were somesmall differences in the relative abundances of the sextets, specif-ically an increase in the crystalline components such as goethite.This indicates that the samples underwent some crystallizationduring the 11 week storage period. If we combine the relativeabundances for S1þS2 and S3 for both fresh and stored spring soilsat 5 K, we see the total spectral areas were in fact identical. How-ever, the stored spring soil showed a higher proportion of goethite,likely due to crystallization during storage.
3.2.3. Fresh summer soilThe M€ossbauer spectra for the fresh summer soil showed some
clear differences compared to both fresh and stored spring soil(Fig. 1c). This was especially true at 77 K where no sextets could bedetected. This suggests there was little to no goethite present whenthe soil was collected during the summer. The three doublets usedduring the fitting of this spectrum shared very similar character-istics to the three doublets observed in fresh and stored spring soilindicating that all three samples shared the same parent material.
Two crystalline sextets were required during the fitting of thefresh summer soil at 5 K (S2 and S3). An additional poorly definedsextet (S1) was also required indicating that part of the sample wasstill not fully magnetically ordered at this temperature. Suchbehavior is indicative of small particle size, substitution of addi-tional elements into the mineral (Chadwick et al., 1986; Murad andCashion, 2004), or a strong association to organic matter (Chenet al., 2015). Based on the hyperfine parameters it was difficult toaccurately determine the mineral phases corresponding to thesesextets. It is possible that these sextets were also present for freshand stored spring soils however, due to the presence of moredominant phases such as ferrihydrite and goethite, they could notbe clearly distinguished. It should also be noted that it was notpossible to determine the mineral identities of several of the Fephases present in the samples and in some cases these unknownphases accounted for more than 50% of the relative spectral area ofthe M€ossbauer spectra (Supplementary data, Table S2). Neverthe-less, it appears that based on the 77 K and 5 K data major Fecomponents in the soils were short range ordered minerals (e.g.ferrihydrite or goethite).
3.3. Batch Experiment I: variation of temperature
While the dissolved CO2 concentration in the control batchesincreased only slightly (to 0.6 ± 0.1 mmol L�1 for C,
Table 1Initial pH, redox potential, total element concentrations, C, N, DOC and nitrate (NO3
�) content in soils and/or river water. Soil pH was measured in 0.01 M CaCl2 solution.
pH Eh Fe Mn As Cu DOC C NO3� N
[mV] [mg L�1] [mg L�1] [mg L�1] [mg L�1] [mg L�1] [mg L�1]
river, spring 8.6 380 167 91.8 4.2 3.3 3.4 14.6 ± 0.3river, summer 7.5 420 260 49.6 3.5 3.7 NA NA
[mg g�1] [mg g�1] [mg g�1] [mg g�1] [mg g�1] [mg g�1]
soil, spring 4.1 31.1 115 66.4 12.9 20 2soil, summer 3.9 18.8 119 36.2 13.7 45 3
Table 2Oxalate-extractable Fe (Feo) and Al (Alo), dithionite-citrate-extractable Fe (Fed) andratio Feo/Fed for the 3 different start soils given as mean±standard deviation(triplicates).
Feo [mg g�1] Fed [mg g�1] Feo/Fed Alo [mg g�1]
Spring soil, fresh 10.8 ± 0.5 16.6 ± 2.0 0.7 ± 0.1 1.4 ± 0.0Spring soil, stored 14.2 ± 0.6 22.3 ± 1.3 0.6 ± 0.0 1.5 ± 0.1Summer soil, fresh 7.6 ± 1.4 6.7 ± 0.3 1.1 ± 0.2 2.0 ± 0.0
J. Mehlhorn et al. / Applied Geochemistry 74 (2016) 122e137126
81
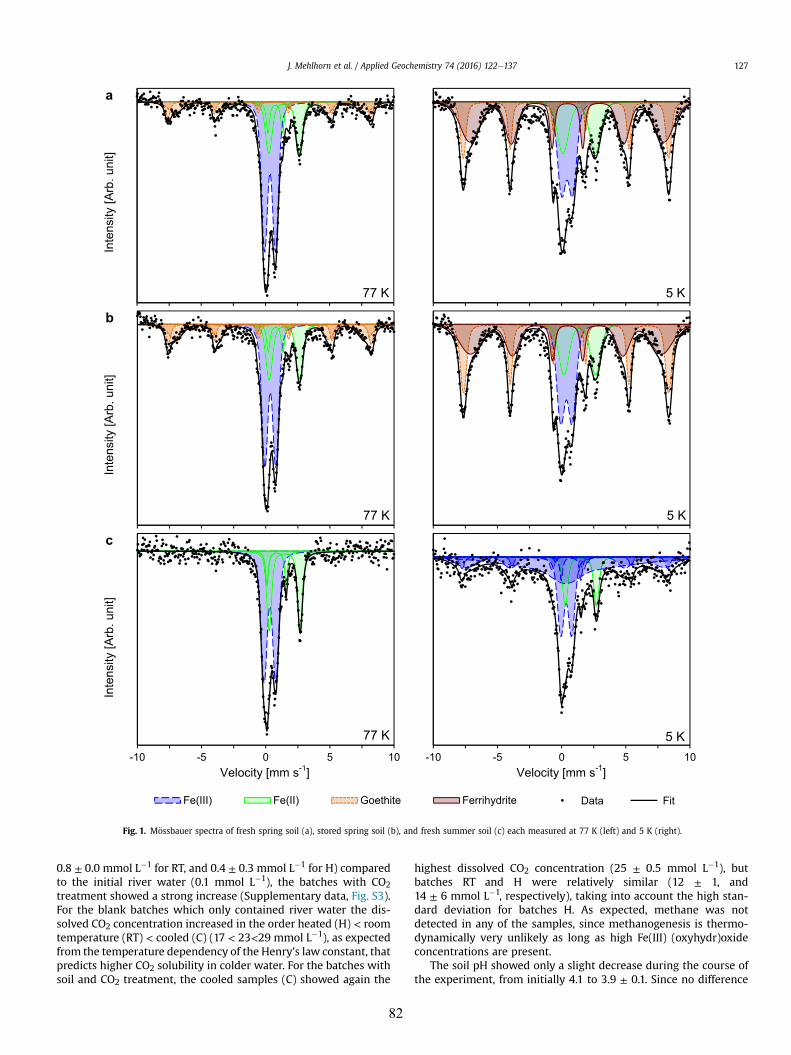
0.8 ± 0.0 mmol L�1 for RT, and 0.4 ± 0.3 mmol L�1 for H) comparedto the initial river water (0.1 mmol L�1), the batches with CO2treatment showed a strong increase (Supplementary data, Fig. S3).For the blank batches which only contained river water the dis-solved CO2 concentration increased in the order heated (H) < roomtemperature (RT) < cooled (C) (17 < 23<29 mmol L�1), as expectedfrom the temperature dependency of the Henry's law constant, thatpredicts higher CO2 solubility in colder water. For the batches withsoil and CO2 treatment, the cooled samples (C) showed again the
highest dissolved CO2 concentration (25 ± 0.5 mmol L�1), butbatches RT and H were relatively similar (12 ± 1, and14 ± 6 mmol L�1, respectively), taking into account the high stan-dard deviation for batches H. As expected, methane was notdetected in any of the samples, since methanogenesis is thermo-dynamically very unlikely as long as high Fe(III) (oxyhydr)oxideconcentrations are present.
The soil pH showed only a slight decrease during the course ofthe experiment, from initially 4.1 to 3.9 ± 0.1. Since no difference
aIn
tens
ity [A
rb. u
nit]
b
Inte
nsity
[Arb
. uni
t]
c
Inte
nsity
[Arb
. uni
t]
Velocity [mm s-1] Velocity [mm s-1]
77 K 5 K
77 K 5 K
-10 -5 0 5 10
77 K-10 -5 0 5 10
5 K
Fe(III) Fe(II) Goethite Ferrihydrite IobsData Fit
Fig. 1. M€ossbauer spectra of fresh spring soil (a), stored spring soil (b), and fresh summer soil (c) each measured at 77 K (left) and 5 K (right).
J. Mehlhorn et al. / Applied Geochemistry 74 (2016) 122e137 127
82

between different temperature treatments or between control andtreatment could be observed, the decrease is probably caused bythe mixing of soil and river water following desorption and disso-lution reactions. The pH of the liquid phase showed a strong initialdecrease both in batches with and without CO2 treatment from 8.6in river water to values between 4.4 and 5.2 within the first 1 h(Fig. 2a) that was caused by mixing with the already acidic soil.After this initial decrease, both controls and treatments remainedat relatively constant pH for batches RT (controls: 4.9 ± 0.1, treat-ments: 4.8 ± 0.1) and C (control: 5.0 ± 0.2, treatments: 4.7 ± 0.1),but heated batches (H) showed a significant decrease (P¼ 0.007) incontrols (from 5.0 ± 0.1 at 1 h to 4.3 ± 0.1 at 42 d) and increase(P ¼ 0.018) in treatments (from 4.5 ± 0.1 at 1 d to 4.8 ± 0.1 at 42 d)over the course of the experiment. Comparison between differenttemperature treatments showed that pH in batches H was signifi-cantly lower than in batches RT (P ¼ 0.0003) and C (P ¼ 0.011),which contradicted the assumption, that higher CO2 dissolution inbatches C would cause a lower pH due to carbonic acid formation.Further processes like redox reactions seemed to buffer pH andprevent a further pH decrease.
After addition of river water to the soil, redox potential in thebatches increased strongly within 1 h, both in controls(from þ380 mV to þ500 ± 10 mV in RT, þ560 ± 10 mV in C,and þ620 ± 0 mV in H) and treatments (to þ560 ± 0 mV inRT, þ570 ± 0 mV in C, and þ610 ± 10 mV in H), probably caused byoxidizing soil constituents (Fig. 2b). During the course of theexperiment, the controls stayed relatively constantatþ570 ± 40 mV for RT,þ590 ± 30 mV for C, andþ570 ± 40 mV forH, while treatments showed a significant decrease, most pro-nounced for batches H (to þ370 ± 10 mV, P ¼ 0.0037), followed byRT (to þ420 ± 10 mV, P ¼ 0.0062) and C (to þ480 ± 20 mV,P ¼ 0.016), leading the soil towards more anoxic conditions. Thedecrease in redox potential hinted towards redox reactions thatreleased reduced species into the pore water, thereby consumedprotons and thus buffered pH, e.g., nitrate reduction and reductivedissolution of Fe(III) (oxyhydr)oxides. The order in redox potentialdecrease with H>RT>C might already be a hint towards strongermicrobial activity at higher temperatures.
Mixing of river water with soil led to an initial concentrationincrease of nitrate (from 14.6 ± 0.3 to 32.8 ± 0.2 mg L�1), DOC (from3.4 to 4.0 mg L�1), and all considered elements in the liquid phasewithin 1 h for both controls and treatments (except Fe treatments,data for As 1 h to 3 d (H) or 7 d (RT, C) are missing due to mea-surement problems) due to mixing with pore water and fastdesorption of weakly bound ions (Fig. 2cef). Calculated concen-tration increase factors X (Table 3) show that an increase in liquidphase concentration (end of experiment vs. river water blank) overthe whole time of the experiment occurred for all elements both incontrols and treatments, except for Fe controls and for As controlsand treatments at batches RT and C. Observations for each indi-vidual element are described in detail as follows.
The highest increases in liquid phase concentrations wereobserved for Fe in CO2 treatments (Table 3, Fig. 2c). After an initial“lag phase” of 1e3 d, inwhich concentrations changed only slightly,the concentration in the treatments increased almost linear frominitially 0.2 mg Fe L�1 to 3.2 ± 1.4 mg L�1 in batches C (19 ± 9 foldincrease), to 5.0 ± 1.6 mg L�1 in RT (30 ± 9 fold increase), and18.4 ± 4.0 mg L�1 in H (111 ± 24 fold increase), while the controlsshowed no significant change of Fe over time and stayed relativelyconstant at 0.2 ± 0.1 mg L�1 for C, 0.1 ± 0.1 mg L�1 for RT, and0.2 ± 0.1 mg L�1 for H.
The mobilization behavior of Mn differed completely from thatof Fe (Fig. 2d). Following the mixing of water and soil, all batchesshowed an increase in dissolvedMn concentration, slightly lower incontrols (from 92 mg L�1 in initial river water to 166 ± 15 mg L�1 in C,
149 ± 12 mg L�1 in RT, and 139 ± 6 mg L�1 in H) compared totreatments (to 213 ± 6 mg L�1 in C, 228 ± 6 mg L�1 in RT, and185 ± 2 mg L�1 in H after 1 h). After this initial mobilization, thecontrols showed only a slight further increase of Mn in liquid phaseconcentration to 203 ± 12 mg L�1 in batches C, 211 ± 15 mg L�1 in RT,and 204 ± 20 mg L�1 in H after 42 d. For the treatments, the strongMn mobilization continued until 1 d with highest initial Mnmobilization for batches C (to 277 ± 12 mg L�1), followed by RT (to262 ± 14 mg L�1), followed by H (to 218 ± 4 mg L�1). For the rest ofthe experiment, the concentration of Mn in C treatments stayedrelatively constant at 292 ± 28 mg L�1, while RT treatments evenshowed a slight Mn re-immobilization to a final concentration onlyslightly above the respective controls (229 ± 27 mg L�1). Only Mn inthe H treatments continuously increased to 262 ± 40 mg L�1 at d 42,but with a very low rate of 1.6 ± 1.3 mg kgsoil�1 d�1 and no significance(P ¼ 0.0868).
Dissolved As concentration decreased in all control batches(from 4.2 mg L�1 in initial river water to 2.5 ± 0.1 mg L�1 in C,2.6 ± 0.1 mg L�1 in RT, and 2.5 ± 0.1 mg L�1 in H) and also in thetreatments for batches C (to 2.6 ± 0.7 mg L�1) and RT (to2.2 ± 0.4 mg L�1) after 42 d (Fig. 2e). However, since a slight Asconcentration decrease at d 28 (to 3.8 ± 0.2 mg L�1) and d 42(3.4 ± 0.2 mg L�1) was also observed in the water blanks (Supple-mentary data, Table S3), part of this As immobilization might beattributed to sensitivity changes during analysis (analysis of d 28and d 42 samples in a separate run). Only the As concentrations inthe heated batches with CO2 exposure differed significantly fromthe related control (P¼ 0.0007) by showing a 1.5 ± 0.3 fold increasein As concentration up to 28 d (to 6.8 ± 1.6 mg L�1) that was,however, not deemed as significant due to high standard variations(P ¼ 0.074).
Copper is the only element where almost no differences be-tween controls and treatments and between different temperaturetreatments could be detected (Fig. 2f). After an initial, immediate(1 h) Cu mobilization in both controls (from 3.3 mg L�1 in initialriver water to 11.1 ± 1.8 mg L�1 in C, 7.9 ± 4.6 mg L�1 in RT, and6.5 ± 1.3 mg L�1 in H) and treatments (to 5.9 ± 0.6 mg L�1 in C,5.7 ± 0.6 mg L�1 in RT, and 6.6 ± 0.7 mg L�1 in H), dissolved Cuconcentrations in the different batches stayed relatively constant atvalues around 5.0e9.0 mg L�1. Only the H treatment differed(P ¼ 0.0369) from the respective control and showed a significant(P ¼ 0.0096) change in Cu over time, with a continuous increase upto 10.9 ± 1.6 mg L�1 until d 14 and a following decrease to7.4 ± 1.0 mg L�1 after 42 d.
Total solid phase contents did not show any change during thecourse of the experiment that was significantly higher than thenatural variation in the soil (Supplementary data, Tables S4 and S5)which is probably due to the high pool of the considered elementsin the soil compared to the small amounts mobilized into liquidphase.
3.4. Batch Experiment II: variation of start soil conditions
Both the batches with stored spring soil (H2) and the ones withfresh summer soil (H3) showed remarkable differences to thebatches with fresh spring soil from Batch Experiment I (for betterdistinction hereafter refered to as H1) despite the similar temper-ature treatment (incubation at 35 �C).
As in Batch Experiment I, mixing of the filtered river water withsoil caused a strong decrease in liquid phase pH for both controlsand treatments (from8.6 to values between 4.4 and 5.1 after 1 h-7 d,Fig. 3a). This initial pH decrease was followed by a slow increase inthe treatments, with the fastest increase in the fresh summer soilH3 (to 4.8 ± 0.1 after 21 d, P ¼ 0.015), followed by the fresh springsoil H1 (to 4.8 ± 0.1 after 42 d, P ¼ 0.018) and slowest for the stored
J. Mehlhorn et al. / Applied Geochemistry 74 (2016) 122e137128
83

spring soil H2 (to 4.6 ± 0.1 after 41 d, P ¼ 0.008). A further increasewas also observed for H3 controls (to 4.7 ± 0.1 after 21 d, P¼ 0.009),
while pH in H2 controls stayed relatively constant (at 4.6 ± 0.1 from7 to 41 d) and H1 controls showed a significant decrease (to
a bpH
Eh
[mV
]
c d
Fe[m
gL-1
]
Mn
[μg
L-1]
e f
As
[μg
L-1]
Cu
[μg
L-1]
time [d] time [d]
4.50
4.75
5.00
5.25
8.50
8.75
4.250 10 20 30 40
300
350
400
450
500
550
600
650
0 10 20 30 40
0
5
10
15
20
0 10 20 30 4050
100
150
200
250
300
350
0 10 20 30 40
0
2
4
6
8
0 10 20 30 400
4
8
12
16
0 10 20 30 40
RT_wo C_wo H_woRT_CO2 C_CO2 H_CO2RT_woRT_CO2
C_woC_CO2
H_woH_CO2
Fig. 2. Changes in liquid phase pH (a), redox potential (b), and total dissolved concentration (evaporation corrected) of Fe (c), Mn (d), As (e), and Cu (f) during Batch Experiment Iwith (solid line) and without (abbreviation “wo”, dashed line) CO2 at room temperature (RT, 22 �C, black squares), cooled (C, 16 �C, blue circles), and heated (H, 35 �C, red triangles)in liquid phase. Data for As for 1 h - 3 d (H) or 7 d (RT, C) are missing due to measurement problems. Single outliers from triplicates had to be removed for the following data points,resulting in duplicates: H_wo_1h for Fe, RT_wo_d28 and H_CO2_d3 for Cu. (For interpretation of the references to colour in this figure legend, the reader is referred to the webversion of this article.)
J. Mehlhorn et al. / Applied Geochemistry 74 (2016) 122e137 129
84

4.3 ± 0.1 at 42 d, P ¼ 0.007). However, pH differences betweencontrols and treatments were not significant. Again, a strong in-crease of redox potential after mixing of soil and river water within1 h was observed (fromþ380 mV in H1 and H2 andþ420 mV in H3to þ620 ± 10 mV in H1, þ550 ± 10 mV in H2, and þ540 ± 10 mV inH3, Fig. 3b). The initial increase was followed by a decrease in CO2treatments, that was strongest for the organic-rich batches H3(to þ340 ± 20 mV after 21 d, P ¼ 0.0058), followed by the freshspring soil H1 (toþ370 ± 10 mV after 42 d, P ¼ 0.0037) followed bythe stored soil H2 (to þ410 ± 20 mV after 41 d, P ¼ 0.0052). Thecontrols remained at significantly higher redox potentials over thecourse of the experiment (betweenþ460 andþ 600mV, P<0.0005).The concentration increases of nitrate (from 14.6 ± 0.3 to49.5 ± 0.3 mg L�1) and DOC (from 3.4 to 6.1 mg L�1) followingmixing of soil and river water were also clearly higher for theorganic rich summer soil compared to spring soil (increase to32.8 ± 0.2 mg L�1 for nitrate and to 4.0 mg L�1 for DOC).
Same as for Batch Experiment I, an initial liquid phase concen-tration increase within 1 h was also observed in this experiment formost of the considered elements (Fig. 3cef). Exceptions were Asand Fe, that showed a slight initial decrease in the batches withsummer soil (H3). Calculated concentration increase factors (X,Table 4) indicated that over the full experiment time (end ofexperiment vs. river water blank) liquid phase concentrations of allelements increased, with Fe and As controls being the onlyexceptions.
Again, the highest increase rates were observed for Fe in CO2treatments, with an average daily mobilization rate (ravg, Table 4) of0.3 ± 0.2 mg kgsoil�1 d�1 for treatments with stored spring soil (H2),0.7 ± 0.1 mg kgsoil�1 d�1 for treatments with fresh spring soil (H1),and 1.9 ± 0.6 mg kgsoil�1 d�1 for treatments with fresh summer soil(H3), while controls stayed relatively constant at 0.28 ± 0.32mg L�1
for batches H1, 0.32 ± 0.42mg L�1 for H2, and 0.24 ± 0.13mg L�1 forH3 (Fig. 3c). However, clear Fe mobilization only began after aninitial lag phase of 3 d for batches H1 and H2 and 1 d for batches H3.Final dissolved Fe concentrations in the treatments were7.95 ± 5.67 mg L�1 after 41 d in batches H2, 18.43 ± 4.03 mg L�1
after 42 d in H1, and 26.33 ± 7.80 mg L�1 after 21 d in H3.The Mn mobilization pattern was similar to Batch Experiment I
with a shift in mobilization rate within the first 24 h (Fig. 3d).Followingmixing of soil and river water, a fast increase in dissolvedMn concentration occurred, again slightly higher in treatments(from 92 mg L�1 to 218 ± 4 mg L�1 for H1, to 206 ± 6 mg L�1 for H2,and from 50 mg L�1 to 185 ± 9 mg L�1 for H3) compared to controls
(to 149 ± 9 mg L�1 for H1, to 153 ± 4 mg L�1 for H2, and to131 ± 3 mg L�1 for H3). But while in the experiment with freshspring soil (H1) the average liquid phase concentration of Mn in thetreatments further increased over the remaining experiment time,even at a very low rate (to 262 ± 40 mg L�1 after 42 d), the treat-ments of H2 and H3 showed a slight re-immobilization of Mn (finalconcentrations of 159 ± 28 mg L�1 after 41 d in H2 and164 ± 10 mg L�1 after 21 d in H3). The Mn concentration of thecontrols stayed relatively constant for the rest of the experiment at160 ± 24 mg L�1 in batches H1, 157 ± 20 mg L�1 in H2, and134 ± 19 mg L�1 in H3. Only the controls of H1 and H2 showed a Mnconcentration increase at the last sampling day (to 204 ± 20 mg L�1
in H1 and 193 ± 16 mg L�1 in H2), leading even to a higher finaldissolved Mn concentration in controls compared to treatments forH2.
Arsenic had shown a 1.5 ± 0.3 fold concentration increase in theliquid phase of the treatments with fresh spring soil (H1), however,after storage of the soil for 11weeks (H2) the repetition of the batchexperiment led to no As mobilization at all (liquid phase As con-centration of 3.55 ± 0.90 mg L�1 over thewhole experiment, Fig. 3e).The same effect was observed for the controls of H1 and H2 whicheven showed a slight immobilization (from 4.2 mg L�1 to2.5 ± 0.1 mg L�1 after 42 d for H1 and to 2.0 ± 0.03 mg L�1 after 41 dfor H2). The extreme As mobilization in treatments with freshsummer soil (H3) was particularly remarkable. Liquid phase Asconcentration increased significantly from 3.5 mg L�1 to55.9 ± 24.7 mg L�1 after 21 d (P¼ 0.0088), despite the high variationbetween the triplicates. The mobilization seemed to occur withinthe first 7 d, while As concentration stayed relatively constant af-terwards. However, this impression is biased by one of the triplicatesamples, that showed an extremely high As mobilization to up to97.6 mg L�1 on day 7, followed by a further decrease to 81.3 mg L�1 onday 21 (compare Supplementary data, Fig. S4). The other 2 treat-ment batches showed a continuous increase over the course of theexperiment. Like Fe mobilization in treatments of H3, liquid phaseconcentration increase of As only started after >1 d and As and Feconcentrations correlated significantly (rS ¼ 0.95, P ¼ 0).
Copper was again the element with the smallest differencesbetween controls and treatments (Fig. 3f). An initial Cu mobiliza-tionwithin 1 h occurred in both controls and treatments, followingthe mixing of filtered river water and soil, that was highest forbatches H3 (from 3.7 mg L�1 to 9.0 ± 0.6 mg L�1, compared to a Cuincrease from 3.4 mg L�1 to 6.6 ± 0.5 mg L�1 in H1 and to6.5 ± 1.6 mg L�1 in H2). Batches with stored spring soil (H2) showeda Cu mobilization over the course of the experiment for both con-trols and treatments. However, the relatively high Cu concentra-tions on days 28 and 41 are probably caused by analysis problems,since the water blank sample without soil showed the same in-crease (Supplementary data, Table S3). Differences between H2controls and treatments were not significant. The batches withfresh summer soil showed a completely different behavior thanbatches H1 and H2 with significant differences between controlsand treatments (P ¼ 0.0304): while the controls stayed relativelyconstant at 9.4 ± 2.2 mg L�1 after initial mobilization, the treatmentsshowed an increase to 10.9 ± 0.1 mg L�1 at day 1, followed by afurther decrease to 6.2 ± 1.1 mg L�1 at day 21. An immobilizationprocess for Cu seemed to have occurred in CO2 treatments.
4. Discussion
4.1. Soil processes following exposure to CO2
When a CO2 outgassing builds up in a redoximorphic Fluvisol,due to the formation of a mofette or leakage from a GCS site, CO2will dissolve in the pore water and form carbonic acid. According to
Table 3Factor X of concentration increase in liquid phase compared to day 0 and averagedaily mobilization rate ravg for Batch Experiment I (3 different temperatures: cooled(C), room temperature (RT), and heated (H)) given as mean ± standard deviation(triplicates).
Element Treatment X-fold initialconcentration [�]
ravg [mg kgsoil�1 d�1]
wo CO2 wo CO2
Fe C 0.5 ± 0.3 19 ± 9 �2.9 ± 1.7 108 ± 51RT 0.6 ± 0.5 30 ± 9 �2.2 ± 2.8 173 ± 56H 0.8 ± 0.5 111 ± 24 �1.2 ± 2.8 652 ± 144
Mn C 2.2 ± 0.1 3.1 ± 0.4 4.0 ± 0.4 6.8 ± 1.4RT 2.3 ± 0.2 2.5 ± 0.3 4.3 ± 0.5 4.9 ± 1.0H 2.2 ± 0.2 2.9 ± 0.4 4.0 ± 0.7 6.1 ± 1.4
As C 0.58 ± 0.03 0.61 ± 0.16 �0.06 ± 0.00 �0.06 ± 0.02RT 0.62 ± 0.02 0.51 ± 0.10 �0.06 ± 0.00 �0.07 ± 0.01H 0.59 ± 0.03 1.45 ± 0.32 �0.06 ± 0.00 0.07 ± 0.05
Cu C 2.1 ± 0.1 2.2 ± 0.1 0.13 ± 0.01 0.15 ± 0.02RT 2.0 ± 0.2 1.9 ± 0.2 0.11 ± 0.02 0.10 ± 0.02H 1.7 ± 0.3 2.2 ± 0.3 0.08 ± 0.04 0.14 ± 0.03
J. Mehlhorn et al. / Applied Geochemistry 74 (2016) 122e137130
85

Henry's Law, more CO2 will dissolve in colder water, as could beverified in Batch Experiment I with different temperature
treatments. However, the dissolution of CO2 did not cause a sig-nificant pH decrease in our experiments as has been observed in
a bpH
Eh
[mV
]
c d
Fe[m
gL-1
]
Mn
[μg
L-1]
e f
As
[μg
L-1]
Cu
[μg
L-1]
time [d] time [d]
4.50
4.75
5.00
5.25
7.00
8.00
9.00
4.250 10 20 30 40
300
350
400
450
500
550
600
650
0 10 20 30 40
0
5
10
15
20
25
30
35
0 10 20 30 400
50
100
150
200
250
300
350
0 10 20 30 40
0
25
50
75
100
0 10 20 30 400
4
8
12
16
0 10 20 30 40
H1_wo H2_wo H3_woH1_CO2 H2_CO2 H3_CO2H1_woH1_CO2
H2_woH2_CO2
H3_woH3_CO2
Fig. 3. Changes in liquid phase pH (a), redox potential (b), and total dissolved concentration (evaporation corrected) of Fe (c), Mn (d), As (e), and Cu (f) during Batch Experiment IIwith (solid line) and without (abbreviation “wo”, dashed line) CO2 at 35 �C with 3 different start soil conditions (H1: fresh spring soil from Batch Experiment I, red triangles, H2:stored spring soil, grey circles, H3: fresh summer soil, dark red squares) in liquid phase. Note the change in scaling after y-axis break in (a); pH data for H2 are missing on 1 d and 3 ddue to electrode calibration problems. Data for As 1 h e 3 d are missing for H1 due to measurement problems. Single outliers from triplicates had to be removed for the followingdata points, resulting in duplicates: H3_wo_d7 for Fe, Mn, and Cu, H2_wo_d41 and H3_wo_d3 for As, H1_CO2_d3 for Cu. (For interpretation of the references to colour in this figurelegend, the reader is referred to the web version of this article.)
J. Mehlhorn et al. / Applied Geochemistry 74 (2016) 122e137 131
86

numerous other batch studies (e.g. Kirsch et al., 2014; Lawter et al.,2015, 2016; Little and Jackson, 2010; Lu et al., 2010; Shao et al.,2015; Smyth et al., 2009). One reason for this is the already acidicFluvisol used in this study. Mixing of river water and soil alonedecreased the liquid phase pH to 4.5e5.0 in both controls andtreatments. These pH values are in accordance with the pore waterpH at the natural mofette site (Beulig et al., 2015; Mehlhorn et al.,2014). Since only slight changes in liquid phase pH occurred overthe course of the experiment, despite the continuous supply of CO2in treatments and therefore a supply of protons, processes thatbuffer pHmust have taken place. At a soil pH of 4.1 or 3.9, the buffersystems of silicates and cation exchange should be depleted andAluminum and Fe(III) (oxyhydr)oxides are defined as the mostimportant buffer systems at pH < 4.2 (Blume et al., 2016). Oxalateextraction indicated the presence of Al (hydr)oxides(1.4e2.0 mg g�1) which might have contributed to buffer reactions.However, a screening of total dissolved Al concentration for 1 h vs.end-of-experiment samples revealed that no significant Al mobi-lization occurred in our experiments (data not shown), thus, Al(hydr)oxides were not dissolved. The initial fast drop in pH couldhave been caused by the rapid mobilization of dissolved organicmatter (DOM) from soil by mixing with river water, indicated byincreased DOC concentrations (increased by 19% after mixing withspring soil and by 81% after mixing with summer soil), initiatingmicrobial processes, as observed in Porsch et al. (2014). Interest-ingly, the lowest liquid phase pH occurred in the heated batches Hwhich contradicts the assumption of a lower CO2 dissolution athigher temperatures. Since the heated, non-CO2-treated controlsetups showed an even further pH decrease over the course of theexperiment, the low pH might be caused by additional CO2 releaseinto the liquid phase from microbial respiration processes or pro-duction of fatty acids frommicrobial fermentation processes whichshould be highest in heated batches where temperature is withinoptimum range of many mesophilic bacteria. Unfortunately, nodirect proof of fatty acid production was possible during this studydue to limited sampling amount, but the presence of fermentingbacteria at the soil sampling site was recently demonstrated byBeulig et al. (2016). The pH increase in H treatments following theinitial decrease might be caused by microbially enhanced protonconsuming reactions like the reductive dissolution of Fe(III) (oxy-hydr)oxides (Lions et al., 2014).
Relatively high redox potentials of þ500 to þ620 mV weremeasured in both controls and CO2-treatments right aftermixing ofsoil and river water. They were caused by the initially relatively
high oxygen content. The redox potential decrease during thecourse of the experiment, which could be observed in the CO2treatments, was most likely caused by microbial consumption ofoxidizing compounds. The anoxic conditions caused by CO2 purgingforced heterotrophic microbes to use electron acceptors with lessand less energy yield. While in the first 3 d, there was probably stilloxygen available for aerobic respiration and the decrease in redoxpotential was relatively fast, the much slower decrease followingday 3 indicates that heterotrophic microorganisms had switched toanother respiration process. This process was most probably mi-crobial Fe(III) reduction to Fe(II) coupled to Fe(III) (oxyhydr)oxidedissolution which is evidenced by the highly significant negativecorrelation between redox potential and dissolved total Fe con-centration calculated with data from all experiments (rS ¼ �0.74,P<10�10). Additionally, fermentation has to be taken into account aspossible microbial process under anoxic conditions that might bothinfluence the pH by production of fatty acids and could alsocontribute indirectly to the reductive dissolution of Fe(III) (oxy-hydr)oxide via electron shuttling (Benz et al., 1998; Kappler et al.,2004). The lowest final redox potentials were achieved in heatedtreatments with þ370 ± 10 mV for batches H1 and þ340 ± 20 mVfor H3. However, these values were still higher than the redoxpotential measured in natural pore water of mofettes(þ270 ± 50 mV and þ310 ± 10 mV), but similar to those measuredin pore water from references (þ360 ± 40 mV and þ390 ± 20 mV)(Mehlhorn et al., 2014). An influence of oxygen on the measuredredox potential could not completely be ruled out, since the mea-surement had to be conducted under atmospheric conditions.However, the observed decrease in redox potential and the simi-larity between lab and field values indicated that artefact effects areprobably negligible.
4.2. Mobility of Fe, Mn, As, and Cu following CO2 exposure
Looking at the mobility of the metal(loid)s considered in thisstudy, experiments with different temperature treatments alloweda clear distinction between two mobilization processes: at first theabiotic desorption of metal cations due to increasingly positivelycharged surfaces or competitionwith DOM released after mixing ofsoil and water phase and later the release of elements due tomicrobially-triggered dissolution of Fe(III) (oxyhydr)oxides and co-release of incorporated elements (Borch et al., 2009). The process ofmobilization via desorption was relatively fast with main mobili-zation occurring within the first 3 d. Cooled treatments showed thehighest mobilization rates, sincemore CO2 was dissolved comparedto warmer batches. The second, microbially-triggered mobilizationprocess did not start until day 3 when all remaining oxygen wasdepleted and the microbes had to switch to the less favorableelectron acceptor Fe(III). The generally higher mobilization rates forheated and organic-rich treatments provide evidence for a micro-bial nature of this process. Observations for the individual elementswill be discussed in detail in the following section.
4.2.1. IronThe results of our study suggest that the dissolution of Fe(III)
(oxyhydr)oxides is the most pronounced mobilization process thatoccurs in an Fe-rich Fluvisol after a CO2 outgassing event. Thedominating Fe phases in the soils used for this study were identi-fied to be goethite and ferrihydrite as well as some non-crystallineFe(II) and Fe(III) phases (Section 3.2). Since we observed signifi-cantly increased Fe mobilization rates at higher incubation tem-peratures (C<RT<H) and an increased mobilization in the organic-rich summer soil (H2<H1<H3), we attributed this release to themicrobially-triggered process of Fe(III) (oxyhydr)oxide reduction(Melton et al., 2014). The presence of Fe(III)-reducing bacteria was
Table 4Factor X of concentration increase in liquid phase compared to day 0 and averagedailymobilization rate ravg for Batch Experiment II (3 different “start” soil conditions,ordered according to mobilization rates: stored spring soil (H2), fresh spring soil(H1), and fresh summer soil (H3)) given as mean ± standard deviation (triplicates).
Element Soil X-fold initialconcentration [�]
ravg [mg kgsoil�1 d�1]
wo CO2 wo CO2
Fe H2 0.7 ± 0.3 48 ± 34 �1.9 ± 1.7 285 ± 207H1 0.8 ± 0.5 111 ± 24 �1.2 ± 2.8 652 ± 144H3 0.5 ± 0.0 101 ± 30 �7.2 ± 0.4 1862 ± 557
Mn H2 2.1 ± 0.2 1.7 ± 0.3 3.7 ± 0.6 2.5 ± 1.0H1 2.2 ± 0.2 2.9 ± 0.4 4.0 ± 0.7 6.1 ± 1.4H3 2.7 ± 0.2 3.3 ± 0.3 4.5 ± 0.5 8.2 ± 1.2
As H2 0.31 ± 0.26 0.61 ± 0.33 �0.08 ± 0.01 �0.06 ± 0.05H1 0.59 ± 0.03 1.45 ± 0.32 �0.06 ± 0.00 0.07 ± 0.05H3 0.96 ± 0.00 15.9 ± 7.0 �0.01 ± 0.00 3.74 ± 1.76
Cu H2 3.6 ± 0.3 2.5 ± 0.3 0.31 ± 0.04 0.19 ± 0.03H1 1.7 ± 0.3 2.2 ± 0.3 0.08 ± 0.04 0.14 ± 0.03H3 2.9 ± 0.4 1.7 ± 0.3 0.38 ± 0.09 0.18 ± 0.08
J. Mehlhorn et al. / Applied Geochemistry 74 (2016) 122e137132
87

proven by determination of most probable numbers (MPN) andrevealed that 4.7$104 to 1.0$106 MPN mL�1 of Fe(III)-reducing mi-croorganisms were present in the spring soil (compare Supple-mentary data, Section S.1). However, no significant change in MPNsof heterotrophic aerobic, Fe(III)-, and sulfate-reducing bacteriacould be detected in spring soil after incubation without/with CO2indicating that the relatively short experiment time of 6 weeks didnot alter the microbial soil community, but only the activity ofcertain microbes, or that the changes were within the error of theMPN method. All attempts to quantify the microbial share onmobilization processes by comparison with data from sterilizedbatches were not successful: both sterilization with formaldehydeand via steam sterilization led to strongly increased mobilizationrates for all considered elements (Supplementary data, Section S.2).Alteration of soil properties due to different sterilizationmethods isa well-known problem (Trevors, 1996 and references therein),especially in organic-rich soils (Berns et al., 2008). We thusconcluded that sterilization of the natural soil used in this studywas not suitable, since soil properties were influenced gravely andno comparability to the unaltered soil was given.
However, to further validate the activity of Fe(III)-reducingbacteria as main factor for Fe mobilization, we conducted ananoxic, 1 week-lasting post-study inwhich we quantified microbialactivity by CO2 production and correlated it with total Fe concen-trations in the liquid phase, incubation temperature, and start soil(see Section 2.3 for detailed method description and Supplemen-tary data, Section S.8 for detailed results). For both soils used(spring and summer soil), we found significant correlations be-tween temperature treatment and CO2 production (for both soils:rS ¼ 0.96, P ¼ 0.0028) as well as between CO2 production and Femobilization (spring soil: rS ¼ 0.94, P ¼ 0.0048; summer soil:rS ¼ 0.83, P ¼ 0.0416). The higher microbial activity in the organic-rich summer soil could also be verified with this experiment: CO2production in the summer soil was 2.4 ± 0.5 times higher comparedto the spring soil and Fe mobilization was up to 9.7 ± 0.7 timeshigher (35 �C) leaving no doubt about the role of Fe(III)-reducingmicrobes on Fe mobilization. An additional factor for increasedmobilization in summer soil was probably also the absence ofcrystalline Fe phases in summer soil and therefore a higher share ofpoorly-crystalline minerals (see Sections 3.1 and 3.2) that are moreeasily accessible for microbes (Cornell and Schwertmann, 2003;Porsch et al., 2014). The significantly decreased Fe mobilization inbatches with stored spring soil (H2) can vice versa be explained byincreased crystallinity of the Fe(III) (oxyhydr)oxides present in soil,as shown for goethite by M€ossbauer spectroscopy and by increasedFed content.
This study provides evidence that a microbially-triggered,reductive dissolution of Fe(III) (oxyhydr)oxides can occur in CO2influenced soils, even if the redox potential is above the generallyassumed threshold of þ150 mV at neutral conditions (Blume et al.,2016). The reason for this is that the energy yield of microbial Fe(III)reduction increases with decreasing pH, since protons areconsumed (Eq. (1)).
4FeðOHÞ3 þ CH2Oþ 8Hþ/4Fe2þ þ CO2 þ 11H2O (1)
While the standard redox potential of Fe(II)/Fe(III) at pH 7is �112 mV for a 1 mM Fe(II) solution, it is increased to þ330 mV atpH 4.5 (Stumm et al., 1996). Kirk et al. (2013) observed that theactivity of Fe(III)-reducing microorganisms surpassed that ofsulfate-reducers at CO2 partial pressures of 1 atm. They contributedthis to increased proton concentrations (accompanied by a loweredpH) due to the dissociation of the carbonic acid formed and thus, athermodynamic advantage of Fe(III)-reducers over sulfate-reducers. MPNs showed that sulfate-reducing bacteria were also
present in the soil used in this study (Supplementary data,Table S1). However, their activity must have been low, since most ofthe sulfur (S) mobilization in the treatments occurred within thefirst day and in the order C>RT>H (Supplementary data, Fig. S5).Thus, S mobilization was most likely caused by desorption re-actions. Only the treatments of H1 (fresh spring soil) and H3 (freshsummer soil) showed a 2.2 ± 0.4 fold and 1.6 ± 0.1 fold concen-tration increase, respectively. However, since these were also thetreatments with the highest Fe mobilization, the correlating Smobilization (H1: rS ¼ 0.97, P ¼ 0; H3: rS ¼ 0.93, P ¼ 1.38$10�9)might also be contributed to a co-release from Fe(III) (oxyhydr)oxide dissolution and not to direct microbial sulfate reduction.
4.2.2. ManganeseA sequential extraction procedure conducted with natural
mofette and reference soil in 2013 detected most of the Mn in thenon-specifically adsorbed fraction or bound to Fe(III) (oxyhydr)oxides, while Mn oxides were not detected (Mehlhorn et al., 2014).This is in good agreement with the mobilization processes weobserved for Mn in the CO2 treatments. Two different processescould be clearly distinguished: within the first 24 h, a fast andstrong Mn mobilization occurred with initial mobilization ratesrinitial increasing in the order H<RT<C (Table 5). This mobilizationwas caused by desorption of weakly bound Mn due to theincreasing competition with protons, that was higher at lowertemperatures, where more CO2 could dissolve. The same patterncould be observed in the controls that were not treated with CO2,but to a significantly lower extent. However, total differences be-tween different temperature treatments were small, thus, an effectof soil heterogeneity cannot completely be ruled out. A further hinttowards an abiotic desorption process was that in Batch Experi-ment II the heated batches showed quite similar initial mobilizationrates (Table 5), despite the different start soil conditions. Similarpatterns of Mn mobilization were also observed in other batch orfield scale CO2 studies (Lawter et al., 2016; Little and Jackson, 2010;Lu et al., 2010; Shao et al., 2015) andmainly attributed to co-releasefrom calcite or dolomite dissolution. This process is unlikely in ourstudy since these minerals are not stable under the acidic soilconditions and abiotic desorption must have been the dominatingMn mobilization process. The fast desorption stopped after atmaximum 3 days when all weakly bound Mn was desorbed. Af-terwards, the dissolved Mn concentration stayed relatively con-stant, or even decreased slightly (compare final mobilization ratesrfinal in Table 5; shift from rinitial to rfinal is designated as “transitionday”). One reason for the slight resorption of Mn could be theproton consumption by microbially-triggered Fe(III) (oxyhydr)ox-ide dissolution, decreasing competition for sorption sites. H1treatments were the only batches, which showed a positive rfinal of1.6 ± 1.3 mg kgsoil�1 d�1, however, with a very high standard variation.The Mn concentrations following day 3 correlated with Fe(rS ¼ 0.71, P ¼ 0.003), which is a hint towards a Mn co-release fromFe(III) (oxyhydr)oxide dissolution that surpassed Mn resorption.Overall, the Mn mobilization in the CO2 treatments was negligiblewhen compared with the controls.
4.2.3. ArsenicSequential extraction in Mehlhorn et al. (2014) revealed that in
reference soils from the Czech sampling site the biggest portion ofAs was adsorbed to or incorporated in poorly crystalline Fe(III)(oxyhydr)oxides. The reductive dissolution of Fe(III) (oxyhydr)ox-ides that we observed in the CO2 treatments of the batch experi-ments should thus have led to an according As co-release. However,such an As co-release could only be observed in the heated treat-ments H1 and H3. In H1 treatments, an As mobilization up to 14 dcould be observed (rinitial ¼ 0.22 ± 0.04 mg kgsoil�1 d�1, Table 5), that
J. Mehlhorn et al. / Applied Geochemistry 74 (2016) 122e137 133
88

correlated significantly with Fe mobilization (rS ¼ 0.78,P ¼ 2.5$10�7). In the fresh summer soil of H3 treatments, the Asmobilization occurred mainly within the first 7 days and wassignificantly higher than in H1 (rinitial ¼ 11 ± 8 mg kgsoil�1 d�1). Here,too, As and Fe concentrations correlated significantly (rS ¼ 0.95,P ¼ 0), but while in batches H1 a 111 ± 24 fold Fe concentrationincrease caused a 1.5 ± 0.3 fold As concentration increase, it was101 ± 30 fold for Fe vs. 16 ± 7 fold for As in batches H3. This almost10 times higher As mobilization in H3 despite a similar total Femobilization could either be caused by a different As content of theFe(III) (oxyhydr)oxides in the start soil or by a differing resorptionbehavior. We would rate differences in As content of Fe(III) (oxy-hydr)oxides as unlikely since both total As and total Fe concentra-tion in the summer soil were decreased in the same order ofmagnitude, by 45 and 39%, respectively, compared to the spring soil(Table 1). This indicates that abiotic resorption of released As topositively charged soil surfaces must have been higher in springcompared to summer soil. Arsenic speciation measurements inpore water from the mofette site in Mehlhorn et al. (2014) revealedthat most of the dissolved As is present as arsenite followed byarsenate. In the study presented here, As speciation analyses werenot successful due to low total As concentrations. However, weassume arsenite and arsenate to be the dominant dissolved Asspecies, since methylation or thiolation and thus the formation ofmethylated As species or thioarsenates seem unlikely because noCH4 formation and no significant S mobilization were observed. Atthe pH values observed in this study, arsenate should be present asnegatively charged H2AsO4
� and arsenite as uncharged H3AsO3(Cullen and Reimer, 1989). Most soil constituents, especially Fe(III)(oxyhydr)oxides, have a net-positive surface charge at the pHvalues measured in this study (e.g. points of zero charge (pHPZC) arearound 7.8e7.9 for ferrihydrite and 7.5e9.5 for goethite (Cornelland Schwertmann, 2003)), thus, the negatively charged arsenatehas a high tendency to adsorb to these positively charged surfaces.Also, arsenite is known to have a high affinity to Fe(III) (oxyhydr)oxides, even at relatively low pH (Dixit and Hering, 2003; Goldbergand Johnston, 2001; Raven et al., 1998). Therefore, resorption toremaining Fe(III) (oxyhydr)oxide surfaces is the most likely re-immobilization process for As in the conducted batch experi-ments. Total Fe(III) (oxyhydr)oxide content in the spring soil wassignificantly higher than in the summer soil, thus, more resorptionsites were available for released As, which could be one factor forthe observed discrepancy in As mobilization. Another reason for adecreased resorption in the fresh summer soil of H3 could be theincreased organic content. Dissolved organic matter and As can be
competitors for soil sorption sites (e.g. Bauer and Blodau, 2006;Redman et al., 2002). It is thus very likely that less As was re-immobilized in H3 since DOM covered most of the positivelycharged surfaces and less free sorption sites were available,resulting in a higher As net-mobilization. Additionally, As mighthave formed colloids or dissolved complexes with DOM and Fe(Bauer and Blodau, 2009; Ritter et al., 2006; Sharma et al., 2010,2011), increasing its mobility in the organic rich summer soil.Competition between As and phosphate or between As and car-bonate should have been of minor importance since no significantphosphorous mobilization was observed (data not shown) andcarbonate was shown to be a weak competitor towards As underincreased p(CO2) by Brechbühl et al. (2012).
In the RT and C batches, no net As-mobilization was observed.Arsenic resorption surpassed the significantly lower release fromFe(III) (oxyhydr)oxide dissolution. The stored spring soil H2 also didnot show any As mobilization in the CO2 treatments. The signifi-cantly decreased dissolution of Fe(III) (oxyhydr)oxides must havereleased less As compared to the fresh spring soil, that could allimmediately resorb to other surfaces, resulting in no net-mobilization.
4.2.4. CopperThe main reason for focusing our study on the element Cu was
that it seemed to be less mobile in natural mofettes compared tothe respective reference sites as shown in Mehlhorn et al. (2014).Within that study, sequential extraction of natural reference soilshowed, that Cu was mainly adsorbed to solid-phase organicmatter or bound to poorly crystalline Fe(III) (oxyhydr)oxides. Asmaller portion was also characterized as non-specifically adsor-bed. In batch experiments of this study, mixing of soil and riverwater caused an immediate Cumobilization in both CO2 treatmentsand controls, which can be contributed to the release of weaklybound Cu. However, no order in mobilization rate according totemperature could be observed as it was for Mn, although themobilization mechanism (competition with protons) should besimilar for these cations. Copper is well known to form dissolvedcomplexes with DOM (Blume et al., 2016), thus, the mixing of liquidand solid phase at the beginning of the experiment mobilized DOMand thereby might have also mobilized Cu through formation ofdissolved Cu-DOM complexes. Unfortunately, we could not proofthe existence of such complexes due to limited sample amount. Atthe moment, we also cannot exclude mobilization of particulatemetallic Cu associated with microorganisms, as observed byHofacker et al. (2015). Following this initial mobilization, Cu
Table 5Initial (rinitial) compared to final daily mobilization rates (rfinal) for Batch Experiment I (3 different temperatures: cooled (C), room temperature (RT), heated (H)) and BatchExperiment II (3 different start soil conditions, ordered according tomobilization rates: stored spring soil (H2), fresh spring soil (H1), and fresh summer soil (H3)) given asmean± standard deviation (triplicates) for elements with a sharp shift in mobilization rate (Mn and As). The “transition day” between initial and final rate was determined opticallyfrom changes in element concentration in liquid phase over time.
Element Treatment Transition day rinitial [mg kgsoil�1 d�1] rfinal [mg kgsoil�1 d�1]
wo CO2 wo CO2
Mn C 1 115 ± 12 278 ± 18 1.3 ± 0.6 0.1 ± 1.1RT 1 109 ± 22 256 ± 23 1.7 ± 0.4 �1.2 ± 0.4H 1 86 ± 13 190 ± 6 2.0 ± 0.4 1.6 ± 1.3
As C 14 0.03 ± 0.01 0.07 ± 0.13 �0.11 ± 0.01 �0.13 ± 0.03RT 14 0.00 ± 0.01 0.05 ± 0.06 �0.09 ± 0.01 �0.13 ± 0.02H 14 0.07 ± 0.02 0.22 ± 0.04 �0.13 ± 0.01 �0.01 ± 0.05
Mn H2 1 92 ± 5 172 ± 10 1.5 ± 0.5 �1.8 ± 1.1H1 1 86 ± 13 190 ± 6 2.0 ± 0.4 1.6 ± 1.3H3 1 122 ± 5 204 ± 14 0.1 ± 0.6 �1.6 ± 0.8
As H2 7 �0.08 ± 0.01 0.07 ± 0.17 �0.08 ± 0.01 �0.09 ± 0.03H1 14 0.07 ± 0.02 0.22 ± 0.04 �0.13 ± 0.01 �0.01 ± 0.05H3 7 0.06 ± 0.04 10.97 ± 8.23 �0.03 ± 0.01 0.12 ± 1.62
J. Mehlhorn et al. / Applied Geochemistry 74 (2016) 122e137134
89

concentrations in both controls and treatments stayed relativelyconstant, indicating that almost no Cu was incorporated into Fe(III)(oxyhydr)oxides or, alternatively, that Cu that was released byFe(III) (oxyhydr)oxide dissolution could resorb immediately toother soil constituents. All these observations gave no hint on thenet-immobilization of Cu that was observed in natural soil inMehlhorn et al. (2014), but the fresh summer soil showed someinteresting differences to all other batch experiments: followingthe initial concentration increase due to mixing of soil and water,the treatments showed a fast concentration decrease between 1and 7 d followed by a slower decrease until the end of the exper-iment while the controls stayed relatively constant at the higherconcentration level. Since the most obvious difference betweenfresh summer soil and spring soil is the higher organic mattercontent, resorption of Cu to solid organic matter could be a likelyexplanation for this decrease. Numerous studies have demon-strated the high affinity of Cu for organic matter (e.g. Brown et al.,2000; Kumpiene et al., 2007; McLaren and Crawford, 1973), how-ever, the effect of CO2 on this process has been unattended. Theresults presented in this study showed that under higher CO2partial pressure, Cu re-adsorption, most probably to solid organicmatter, increased which supports the theory of a Cu net-immobilization in mofettes due to their higher organic mattercontent described in Mehlhorn et al. (2014). One possible expla-nation might be the formation of negatively charged Cu carbonatecomplexes (Cu(CO3)22�) under high CO2 partial pressures that canadsorb to the positively charged surfaces. However, geochemicalmodelling (PHREEQC Version 2.18.00) revealed negatively chargeddissolved Cu carbonate complexes as minor species under theconditions given (data not shown). The formation of solid Cu car-bonate minerals is also unlikely under the given acidic conditions.Another possible explanation already mentioned in Mehlhorn et al.(2014) is that Cu might have profited from the desorption of othercations (e.g. Mn) and attached to sorption sites previously coveredby other elements. To completely clarify the process of Cu immo-bilization under CO2 influence, further studies are required.
4.3. Implications for natural mofettes
The strong Fe mobilization observed in the CO2 treatments ofthis study continued until the end of the experiments and no hintfor approaching equilibrium could be seen. Similar to studies on Femobilization following a flooding event (e.g. Fiedler and Sommer,2004; Meek et al., 1968; Ponnamperuma, 1972), the amount of Femobilized during the course of the experimentwas small comparedto the pool of total Fe available in the soil. It can thus be assumedthat in case of a continuous CO2 release into natural soil the Femobilization would have continued until Fe(III) (oxyhydr)oxidedepletion. Assuming a continuous Fe mobilization with the ratescalculated in Tables 3 and 4 and a total Fe(III) (oxyhydr)oxidecontent of approximately 11 mg g�1 (Table 2), total depletion ofFe(III) (oxyhydr)oxides would have been reached after 280, 170, 46,and 16 years for C, RT, H1, and H3 treatments, respectively. Trans-ferability of the exact rates determined in laboratory studies to thefield is of course limited, because the calculation does not take intoaccount any natural variations, like daily or seasonal changes intemperature or water regime. Nevertheless, they deliver a firstestimate of minimum temperature-dependent time scales. Fe(III)(oxyhydr)oxides are almost completely absent in the center of theCzechmofette site, which is attributed to oxygen absence: Fe that isreleased during weathering cannot precipitate as (oxyhydr)oxides(Rennert et al., 2011, 2012). Since the mofettes in this area haveformed at least decades or even centuries ago, this explanation ismost likely, taking into account a continuous pedogenesis. How-ever, data from our study give evidence that the formation of a new
CO2 outgassing in a soil already rich in Fe(III) (oxyhydr)oxides canalso lead to the microbially-triggered dissolution of Fe(III) (oxy-hydr)oxides, despite the relatively high redox potential, which canbe explained with the thermodynamic advantage of the protonconsuming reduction process (Kirk et al., 2013). Toxic effects of highp(CO2) on the microbial community were not observed in ourstudy, as shown by constant MPNs. Beulig et al. (2016) alsoobserved the ability of themicrobial community from the referencesoil to adapt to short-term (14 d) CO2 exposure. However, CO2toxicity will probably be an issue considering long-term CO2 in-fluence on soils. Over longer time periods, a change in microbialcommunity towards more CO2 tolerant organisms and, afterdepletion of Fe(III) (oxyhydr)oxides, towards other functionalgroups (e.g. methanogens or acetogens, as detected in the center ofthe mofettes by Beulig et al. (2015)), could be expected.
The results of this study also confirmed the hypothesis fromMehlhorn et al. (2014) that the increased As mobility in naturalmofettes is mainly caused by the absence of Fe(III) (oxyhydr)oxides,the most favored binding partner for As in the reference soil. Theyfurther provided some evidence for the hypothesis, that a net-immobilization of Cu occurs in the Czech mofettes, most probablydue to increased resorption to solid organic matter under highp(CO2). The results obtained for Mn did not necessarily help toanswer the knowledge gaps on the Mn balance at the naturalmofette site presented in Mehlhorn et al. (2014). There, both soiland liquid phase concentrations were decreased for Mn whichcontradicts the slight mobilization observed in this study. Oneimportant factor causing this discrepancy might be (reactive)transport of the liquid phase that cannot be taken into account inbatch studies.
5. Conclusions
The results from this study increase our understandingregarding the kinetics and temperature dependency of soil pro-cesses following CO2 intrusion into soil as it might occur during aCO2 leakage from GCS sites or following the formation of a mofette.Within 1 h to 1 d the fast abiotic desorption of weakly bound cat-ions due to competition with protons can be expected to cause apore water concentration increase of some cationic elements.However, mobilization due to desorptionwas relatively small in thesoil used in this study and resorption reactions could cause acomplete re-immobilization over longer time periods. The risk fordrinking water quality from a short-term CO2 influence of <1 d onthe considered soil is thus relatively low. Far more concerning aremicrobially-triggered mobilization processes, such as reductivedissolution of Fe(III) (oxyhydr)oxides in this study, since they tendtomobilize considerably larger amounts of certain elements (in thisstudy especially Fe and As) than abiotic desorption. Higher tem-peratures as well as increased organic matter concentrationsacceleratedmicrobially-triggered Fe(III) (oxyhydr)oxide dissolutionin our experiment. It can thus be assumed that biotically triggeredmobilization processes will be enhanced in warm seasons andslowed down in cold seasons, while it will be the other way aroundfor abiotic mobilization via desorption. This implies that GCS riskassessment should also take into account climatic factors. Ourstudy also showed that pore water Fe concentrations could be agood additional short-termmonitoring tool at sites with high Fe(III)(oxyhydr)oxide contents, where pH is no suitable monitoringparameter due to already low soil pH. However, distinguishing Femobilization caused by CO2 intrusion from natural mobilizationcaused by changes in water regime in redoximorphic soils is diffi-cult, but crucial for risk assessment, thus, the combined effects ofwater regime changes and temperature variations with CO2 gasflow should be subject to further research.
J. Mehlhorn et al. / Applied Geochemistry 74 (2016) 122e137 135
90

Acknowledgements
We acknowledge financial support for a PhD stipend to JudithMehlhorn from the German National Academic Foundation. Wethank Kirsten Küsel (Aquatic Geomicrobiology, Friedrich SchillerUniversity Jena) and Felix Beulig (Department of Bioscience, AarhusUniversity) for motivation to work on the mofettes, Stefan Will forhelp with ICP-MS analyses, Marcus Horn (Ecological Microbiology,University of Bayreuth) for help with MPN and interpretation ofmicrobiological data, Ben Gilfedder and Silke Hammer (Hydrology,University of Bayreuth) for help with GC analysis and Martina Rohr(Hydrology, University of Bayreuth) for DOC analyses and help withnitrate analyses.
Appendix A. Supplementary data
Supplementary data related to this article can be found at http://dx.doi.org/10.1016/j.apgeochem.2016.09.007
References
Bankwitz, P., Schneider, G., K€ampf, H., Bankwitz, E., 2003. Structural characteristicsof epicentral areas in Central Europe: study case Cheb Basin (Czech Republic).J. Geodyn. 35, 5e32.
Bauer, M., Blodau, C., 2006. Mobilization of arsenic by dissolved organic matter fromiron oxides, soils and sediments. Sci. Total Environ. 354, 179e190.
Bauer, M., Blodau, C., 2009. Arsenic distribution in the dissolved, colloidal andparticulate size fraction of experimental solutions rich in dissolved organicmatter and ferric iron. Geochim. Cosmochim. Acta 73, 529e542.
Benz, M., Schink, B., Brune, A., 1998. Humic acid reduction by Propionibacteriumfreudenreichii and other fermenting bacteria. Appl. Environ. Microbiol. 64,4507e4512.
Berns, A., Philipp, H., Narres, H.-D., Burauel, P., Vereecken, H., Tappe, W., 2008. Effectof gamma-sterilization and autoclaving on soil organic matter structure asstudied by solid state NMR, UV and fluorescence spectroscopy. Eur. J. Soil Sci.59, 540e550.
Beulig, F., Heuer, V.B., Akob, D.M., Viehweger, B., Elvert, M., Herrmann, M.,Hinrichs, K.-U., Küsel, K., 2015. Carbon flow from volcanic CO2 into soil micro-bial communities of a wetland mofette. ISME J. 9, 746e759.
Beulig, F., Urich, T., Nowak, M., Trumbore, S.E., Gleixner, G., Gilfillan, G.D.,Fjelland, K.E., Küsel, K., 2016. Altered carbon turnover processes and micro-biomes in soils under long-term extremely high CO2 exposure. Nat. Microbiol. 1,15025.
Blume, H.-P., Brümmer, G.W., Fleige, H., Horn, R., Kandeler, E., K€ogel-Knabner, I.,Kretzschmar, R., Stahr, K., Wilke, B.-M., 2016. Scheffer/Schachtschabel: SoilScience. Springer-Verlag, Berlin Heidelberg.
Blume, H.-P., Felix-Henningsen, P., 2009. Reductosols: natural soils and technosolsunder reducing conditions without an aquic moisture regime. J. Plant Nutr. SoilSci. 172, 808e820.
Borch, T., Kretzschmar, R., Kappler, A., Cappellen, P.V., Ginder-Vogel, M., Voegelin, A.,Campbell, K., 2009. Biogeochemical redox processes and their impact oncontaminant dynamics. Environ. Sci. Technol. 44, 15e23.
Br€auer, K., K€ampf, H., Niedermann, S., Strauch, G., Weise, S.M., 2004. Evidence for anitrogen flux directly derived from the European subcontinental mantle in theWestern Eger Rift, central Europe. Geochim. Cosmochim. Acta 68, 4935e4947.
Brechbühl, Y., Christl, I., Elzinga, E.J., Kretzschmar, R., 2012. Competitive sorption ofcarbonate and arsenic to hematite: combined ATR-FTIR and batch experiments.J. Colloid Interface Sci. 377, 313e321.
Brown, P.A., Gill, S.A., Allen, S.J., 2000. Metal removal from wastewater using peat.Water Res. 34, 3907e3916.
Chadwick, J., Jones, D., Thomas, M., Tatlock, G., Devenish, R., 1986. A M€ossbauerstudy of ferrihydrite and aluminium substituted ferrihydrites. J. Magn. Magn.Mater. 61, 88e100.
Chen, C., Kukkadapu, R., Sparks, D.L., 2015. Influence of coprecipitated organicmatter on Fe2þ(aq)-catalyzed transformation of ferrihydrite: implications forcarbon dynamics. Environ. Sci. Technol. 49, 10927e10936.
CHMI, 2015. Czech Hydrometeorological Institute: Monthly Temperature and Pre-cipitation Data for the Karlovy Vary Region recieved from: http://portal.chmi.cz.
Cornell, R.M., Schwertmann, U., 2003. In: The Iron Oxides: Structure, Properties,Reactions, Occurrences and Uses, second ed. John Wiley & Sons, Weinheim.
Cullen, W.R., Reimer, K.J., 1989. Arsenic speciation in the environment. Chem. Rev.89, 713e764.
Dixit, S., Hering, J.G., 2003. Comparison of arsenic(V) and arsenic(III) sorption ontoiron oxide minerals: implications for arsenic mobility. Environ. Sci. Technol. 37,4182e4189.
Fern�andez-Montiel, I., Sidrach-Cardona, R., Gabilondo, R., Pedescoll, A., Scheu, S.,B�ecares, E., 2016. Soil communities are affected by CO2 belowground emissionsat a natural vent in Spain. Soil Biol. biochem. 97, 92e98.
Fiedler, S., Sommer, M., 2004. Water and redox conditions in wetland soils - theirinfluence on pedogenic oxides and morphology. Soil Sci. Soc. Am. J. 68,326e335.
Flechsig, C., Bussert, R., Rechner, J., Schütze, C., K€ampf, H., 2008. The Hartou�sovmofette field in the Cheb Basin, western Eger Rift (Czech Republic): a com-perative geoelectric, sedimentologic and soil gas study of a magmatic diffuseCO2-degassing structure. Z. Geol. Wiss. 36, 177e193.
Frerichs, J., Oppermann, B.I., Gwosdz, S., M€oller, I., Herrmann, M., Krüger, M., 2013.Microbial community changes at a terrestrial volcanic CO2 vent induced by soilacidification and anaerobic microhabitats within the soil column. FEMSMicrobiol. Ecol. 84, 60e74.
Goldberg, S., Johnston, C.T., 2001. Mechanisms of arsenic adsorption on amorphousoxides evaluated using macroscopic measurements, vibrational spectroscopy,and surface complexation modeling. J. Colloid Interface Sci. 234, 204e216.
Harvey, O.R., Qafoku, N.P., Cantrell, K.J., Lee, G., Amonette, J.E., Brown, C.F., 2012.Geochemical implications of gas leakage associated with geologic CO2 storage -a qualitative review. Environ. Sci. Technol. 47, 23e36.
Harvey, O.R., Qafoku, N.P., Cantrell, K.J., Wilkins, M.J., Brown, C.F., 2016. Methano-genesis-induced pHeEh shifts drives aqueous metal(loid) mobility in sulfidemineral systems under CO2 enriched conditions. Geochim. Cosmochim. Acta173, 232e245.
Hofacker, A.F., Behrens, S., Voegelin, A., Kaegi, R., L€osekann-Behrens, T., Kappler, A.,Kretzschmar, R., 2015. Clostridium species as metallic copper-forming bacteriain soil under reducing conditions. Geomicrobiol. J. 32, 130e139.
IPCC, 2005. In: Metz, B., Davidson, O., De Coninck, H., Loos, M., Meyer, L. (Eds.), IpccSpecial Report on Carbon Dioxide Capture and Storage, p. 442. Prepared byWorking Group III of the Intergovernmental Panel on Climate Change.
Jun, Y.-S., Giammar, D.E., Werth, C.J., 2012. Impacts of geochemical reactions ongeologic carbon sequestration. Environ. Sci. Technol. 47, 3e8.
Jun, Y.-S., Giammar, D.E., Werth, C.J., Dzombak, D.A., 2013. Environmental andgeochemical aspects of geologic carbon sequestration: a special issue. Environ.Sci. Technol. 47, 1e2.
K€ampf, H., Geissler, W.H., Br€auer, K., 2007. Combined gas-geochemical and receiverfunction studies of the Vogtland/NW Bohemia intraplate mantle degassingfield, central Europe. In: Ritter, J.R.R., Christensen, U.R. (Eds.), Mantle Plumes.Springer, Berlin Heidelberg, pp. 127e158.
Kappler, A., Benz, M., Schink, B., Brune, A., 2004. Electron shuttling via humic acidsin microbial iron(III) reduction in a freshwater sediment. FEMS Microbiol. Ecol.47, 85e92.
Kharaka, Y.K., Cole, D.R., Hovorka, S.D., Gunter, W.D., Knauss, K.G., Freifeld, B.M.,2006. Gas-water-rock interactions in Frio Formation following CO2 injection:implications for the storage of greenhouse gases in sedimentary basins. Geol-ogy 34, 577e580.
Kharaka, Y.K., Thordsen, J.J., Kakouros, E., Ambats, G., Herkelrath, W.N., Beers, S.R.,Birkholzer, J.T., Apps, J.A., Spycher, N.F., Zheng, L., Trautz, R.C., Rauch, H.W.,Gullickson, K.S., 2010. Changes in the chemistry of shallow groundwater relatedto the 2008 injection of CO2 at the ZERT field site, Bozeman, Montana. Environ.Earth Sci. 60, 273e284.
Kirk, M.F., Santillan, E.F., Sanford, R.A., Altman, S.J., 2013. CO2-induced shift in mi-crobial activity affects carbon trapping and water quality in anoxic bioreactors.Geochim. Cosmochim. Acta 122, 198e208.
Kirsch, K., Navarre-Sitchler, A.K., Wunsch, A., McCray, J.E., 2014. Metal release fromsandstones under experimentally and numerically simulated CO2 leakageconditions. Environ. Sci. Technol. 48, 1436e1442.
Kumpiene, J., Lagerkvist, A., Maurice, C., 2007. Stabilization of Pb- and Cu-contaminated soil using coal fly ash and peat. Environ. Pollut. 145, 365e373.
Lawter, A., Qafoku, N., Shao, H., Bacon, D., Brown, C., 2015. Evaluating impacts of CO2and CH4 gas intrusion into an unconsolidated aquifer: fate of As and Cd. Front.Environ. Sci. 3, 49.
Lawter, A., Qafoku, N.P., Wang, G., Shao, H., Brown, C.F., 2016. Evaluating impacts ofCO2 intrusion into an unconsolidated aquifer: I. Experimental data. Int. J.Greenh. Gas Control 44, 323e333.
Lewicki, J.L., Birkholzer, J., Tsang, C.-F., 2007. Natural and industrial analogues forleakage of CO2 from storage reservoirs: identification of features, events, andprocesses and lessons learned. Environ. Geol. 52, 457e467.
Lions, J., Devau, N., De Lary, L., Dupraz, S., Parmentier, M., Gombert, P., Dictor, M.-C.,2014. Potential impacts of leakage from CO2 geological storage on geochemicalprocesses controlling fresh groundwater quality: a review. Int. J. Greenh. GasControl 22, 165e175.
Little, M.G., Jackson, R.B., 2010. Potential impacts of leakage from deep CO2 geo-sequestration on overlying freshwater aquifers. Environ. Sci. Technol. 44,9225e9232.
Lu, J., Partin, J.W., Hovorka, S.D., Wong, C., 2010. Potential risks to freshwater re-sources as a result of leakage from CO2 geological storage: a batch-reactionexperiment. Environ. Earth Sci. 60, 335e348.
Ma�cek, I., Videm�sek, U., Kastelec, D., Stopar, D., Vodnik, D., 2009. Geological CO2affects microbial respiration rates in Stave�sinci mofette soils. Acta Biol. Slov. 52,41e48.
McLaren, R.G., Crawford, D.V., 1973. Studies on soil copper II. The specific adsorptionof copper by soils. J. Soil Sci. 24, 443e452.
Meek, B.D., MacKenzie, A., Grass, L., 1968. Effects of organic matter, flooding time,and temperature on the dissolution of iron and manganese from soil in situ. SoilSci. Soc. Am. J. 32, 634e638.
Mehlhorn, J., Beulig, F., Küsel, K., Planer-Friedrich, B., 2014. Carbon dioxide triggeredmetal(loid) mobilisation in a mofette. Chem. Geol. 382, 54e66.
J. Mehlhorn et al. / Applied Geochemistry 74 (2016) 122e137136
91

Mehra, O., Jackson, M., 1960. Iron oxide removal from soils and clays by a dithionite-citrate system buffered with sodium bicarbonate. In: National Conference onClays and Clays Minerals, pp. 317e327.
Melton, E.D., Swanner, E.D., Behrens, S., Schmidt, C., Kappler, A., 2014. The interplayof microbially mediated and abiotic reactions in the biogeochemical Fe cycle.Nat. Rev. Microbiol. 12, 797e808.
Mickler, P.J., Yang, C., Scanlon, B.R., Reedy, R., Lu, J., 2013. Potential impacts of CO2leakage on groundwater chemistry from laboratory batch experiments and fieldpush-pull tests. Environ. Sci. Technol. 47, 10694e10702.
Murad, E., 2010. M€ossbauer spectroscopy of clays, soils and their mineral constit-uents. Clay Miner. 45, 413e430.
Murad, E., Cashion, J., 2004. M€ossbauer Spectroscopy of Environmental Materialsand Their Industrial Utilization. Kluwer Academic Publishers, Dordrecht, theNetherlands.
Nowak, M., Beulig, F., von Fischer, J., Muhr, J., Küsel, K., Trumbore, S.E., 2015.Autotrophic fixation of geogenic CO2 by microorganisms contributes to soilorganic matter formation and alters isotope signatures in a wetland mofette.Biogeosciences 12, 7169e7183.
Oppermann, B.I., Michaelis, W., Blumenberg, M., Frerichs, J., Schulz, H.M.,Schippers, A., Beaubien, S.E., Krueger, M., 2010. Soil microbial communitychanges as a result of long-term exposure to a natural CO2 vent. Geochim.Cosmochim. Acta 74, 2697e2716.
Pearce, J.M., 2006. What can we learn from natural analogues? In: Lombardi, S.,Altunina, L.K., Beaubien, S.E. (Eds.), Advances in the Geological Storage of Car-bon Dioxide. Springer, Netherlands, pp. 127e139.
PIK, 2016. Potsdam Institute for Climate Impact Research: Ground Temperature -Mean Annual Variability recieved from: https://www.pik-potsdam.de/services/klima-wetter-potsdam/klimazeitreihen/bodentemperatur/.
Ponnamperuma, F.N., 1972. The chemistry of submerged soils. Adv. Agron. 24,29e96.
Porsch, K., Rijal, M.L., Borch, T., Troyer, L.D., Behrens, S., Wehland, F., Appel, E.,Kappler, A., 2014. Impact of organic carbon and iron bioavailability on themagnetic susceptibility of soils. Geochim. Cosmochim. Acta 128, 44e57.
R Development Core Team, 2008. R: a Language and Environment for StatisticalComputing. R Foundation for Statistical Computing, Vienna, Austria.
Rancourt, D., Ping, J., 1991. Voigt-based methods for arbitrary-shape static hyperfineparameter distributions in M€ossbauer spectroscopy. Nucl. Instrum. MethodsPhys. Res. Sec. B 58, 85e97.
Raven, K.P., Jain, A., Loeppert, R.H., 1998. Arsenite and arsenate adsorption on fer-rihydrite: kinetics, equilibrium, and adsorption envelopes. Environ. Sci. Technol.32, 344e349.
Redman, A.D., Macalady, D.L., Ahmann, D., 2002. Natural organic matter affectsarsenic speciation and sorption onto hematite. Environ. Sci. Technol. 36,2889e2896.
Rennert, T., Eusterhues, K., Andrade, V.D., Totsche, K.U., 2012. Iron species in soils ona mofette site studied by Fe K-edge X-ray absorption near-edge spectroscopy.Chem. Geol. 332e333, 116e123.
Rennert, T., Eusterhues, K., Pfanz, H., Totsche, K.U., 2011. Influence of geogenic CO2on mineral and organic soil constituents on a mofette site in the NW CzechRepublic. Eur. J. Soil Sci. 62, 572e580.
Rennert, T., Pfanz, H., 2015. Geogenic CO2 affects stabilization of soil organic matter.Eur. J. Soil Sci. 66, 838e846.
Ritter, K., Aiken, G.R., Ranville, J.F., Bauer, M., Macalady, D.L., 2006. Evidence for theaquatic binding of arsenate by natural organic matter-suspended Fe(III). Envi-ron. Sci. Technol. 40, 5380e5387.
Schütze, C., Sauer, U., Beyer, K., Lamert, H., Br€auer, K., Strauch, G., Flechsig, C.,K€ampf, H., Dietrich, P., 2012. Natural analogues: a potential approach fordeveloping reliable monitoring methods to understand subsurface CO2 migra-tion processes. Environ. Earth Sci. 67, 411e423.
Schwertmann, U., 1964. Differenzierung der Eisenoxide des Bodens durch Extra-ktion mit Ammoniumoxalat-L€osung. Z. Pflanzenern€ahr. Düngung Bodenk. 105,194e202.
Shao, H., Qafoku, N.P., Lawter, A.R., Bowden, M.E., Brown, C.F., 2015. Coupledgeochemical impacts of leaking CO2 and contaminants from subsurface storagereservoirs on groundwater quality. Environ. Sci. Technol. 49, 8202e8209.
Sharma, P., Ofner, J., Kappler, A., 2010. Formation of binary and ternary colloids anddissolved complexes of organic matter, Fe and As. Environ. Sci. Technol. 44,4479e4485.
Sharma, P., Rolle, M., Kocar, B., Fendorf, S., Kappler, A., 2011. Influence of naturalorganic matter on As transport and retention. Environ. Sci. Technol. 45,546e553.
�Sibanc, N., Dumbrell, A.J., Mandi�c-Mulec, I., Ma�cek, I., 2014. Impacts of naturallyelevated soil CO2 concentrations on communities of soil archaea and bacteria.Soil Biol. Biochem. 68, 348e356.
Smyth, R.C., Hovorka, S.D., Lu, J., Romanak, K.D., Partin, J.W., Wong, C., Yang, C., 2009.Assessing risk to fresh water resources from long term CO2 injection e labo-ratory and field studies. Energy Procedia 1, 1957e1964.
Stumm, W., Morgan, J.J., Drever, J.I., 1996. In: Aquatic Chemistry: Chemical Equilibriaand Rates in Natural Waters, third ed. John Wiley & Sons, New York.
Trevors, J., 1996. Sterilization and inhibition of microbial activity in soil. J. Microbiol.Methods 26, 53e59.
Videm�sek, U., Hagn, A., Suhadolc, M., Radl, V., Knicker, H., Schloter, M., Vodnik, D.,2009. Abundance and diversity of CO2-fixing bacteria in grassland soils close tonatural carbon dioxide springs. Microb. Ecol. 58, 1e9.
Wang, S., Jaffe, P.R., 2004. Dissolution of a mineral phase in potable aquifers due toCO2 releases from deep formations; effect of dissolution kinetics. EnergyConvers. Manage. 45, 2833e2848.
Zheng, L., Apps, J.A., Spycher, N., Birkholzer, J.T., Kharaka, Y.K., Thordsen, J.,Beers, S.R., Herkelrath, W.N., Kakouros, E., Trautz, R.C., 2012. Geochemicalmodeling of changes in shallow groundwater chemistry observed during theMSU-ZERT CO2 injection experiment. Int. J. Greenh. Gas Control 7, 202e217.
Zheng, L., Apps, J.A., Zhang, Y., Xu, T., Birkholzer, J.T., 2009. On mobilization of leadand arsenic in groundwater in response to CO2 leakage from deep geologicalstorage. Chem. Geol. 268, 281e297.
J. Mehlhorn et al. / Applied Geochemistry 74 (2016) 122e137 137
92

S1
Supplementary data
to “Time and temperature dependency of carbon dioxide triggered metal(loid) mobilization in soil”
Judith Mehlhorn1, James M. Byrne
2, Andreas Kappler
2, Britta Planer-Friedrich
1*
1 University of Bayreuth, Environmental Geochemistry, Bayreuth Center for Ecology and Environmental
Research (BayCEER), Universitaetsstrasse 30, D-95440 Bayreuth, Germany
2 University of Tuebingen, Geomicrobiology, Center for Applied Geosciences, Sigwartstrasse 10, D-72076
Tuebingen, Germany
* Corresponding author: Tel.: +49 921 55 3999; fax: +49 921 55 2334; E-mail address: b.planer-
Content
List of Tables ........................................................................................................................................... 2
List of Figures ......................................................................................................................................... 3
S.1 Determination of most probable numbers (MPN) for cultivatable heterotrophic aerobic, Fe(III)-
reducing, and sulfate-reducing microorganisms ........................................................................... 4
S.2 Batch experiments with sterile controls ........................................................................................ 6
S.3 Results from Mössbauer spectroscopy of three initial soil samples .............................................. 9
S.4 Total dissolved CO2 in Batch Experiment I ................................................................................ 10
S.5 Water blanks for Batch Experiment I and II ............................................................................... 11
S.6 Total soil concentrations in Batch Experiment I and II .............................................................. 12
S.7 Arsenic results for Batch Experiment II with individual graphs ................................................. 13
S.8 Results from additional incubation experiment .......................................................................... 14
S.9 Sulfur results for Batch Experiment I and II ............................................................................... 15
References ............................................................................................................................................. 16
93

S2
List of Tables
Table S1. Most probable number (MPN) values (95 % confidence interval) for cultivatable
heterotrophic aerobes, Fe(III)-reducers, and sulfate-reducers determined for stored spring soil (H2)
before and after Batch Experiment II (incubation at 35 °C for 41 d without (H2_wo) and with CO2
purging (H2_CO2)) and graph (right) with error bars showing 95 % confidence interval for better
comparison. ............................................................................................................................................. 5
Table S2. Hyperfine parameters of Mössbauer spectra from fresh spring soil, stored spring soil, and
fresh summer soil. CS - Center shift, ΔEQ - Quadrupole splitting, ε - quadrupole shift, Bhf - hyperfine
field, Pop. - relative abundance. .............................................................................................................. 9
Table S3. pH, redox potential (Eh), and total dissolved concentration (evaporation corrected) of Fe,
Mn, As, and Cu for water blanks of all batch experiments (single measurements). Missing data are
marked as NA. ....................................................................................................................................... 11
Table S4. Total soil concentrations of Fe, Mn, As, and Cu before (“initial”) and after Batch
Experiment I with incubation of fresh spring soil without (“wo_CO2”) and with CO2 (“CO2”) at 3
different temperatures. Initial concentrations were only measured once, thus the relatively high value
for initial As might have been caused by soil heterogeneity. ................................................................ 12
Table S5. Total soil concentrations of Fe, Mn, As, and Cu before (“initial”) and after Batch
Experiment II with incubation of stored spring soil (H2) and fresh summer soil (H3) without
(“wo_CO2”) and with CO2 (“CO2”) at 35 °C. Initial concentrations were only measured once, thus the
relatively high value for As in initial H2 might have been caused by soil heterogeneity. .................... 12
Table S6. Total amount of CO2 formed and total dissolved Fe concentration after 7 d of incubation of
spring and summer soil at 3 different temperatures from an additional incubation experiment for proof
of microbial Fe(III) reduction. Values are given as range between two replicates. .............................. 14
Table S7. Correlation coefficients rS between incubation temperature, total CO2, and dissolved Fe
concentration for the additional 7 d incubation experiment. Significance level is indicated by stars with
*P<0.05, **P<0.01................................................................................................................................ 14
Table S8. Total dissolved concentration (evaporation corrected) of S for water blanks of all batch
experiments (single measurements). ..................................................................................................... 15
Table S9. Total soil concentrations of S before (“initial”) and after Batch Experiment I with incubation
of fresh spring soil without (“wo_CO2”) and with CO2 (“CO2”) at 3 different temperatures and after
Batch Experiment II with incubation of stored spring soil (H2) and fresh summer soil (H3). ............. 15
94

S3
List of Figures
Fig. S1. Changes in liquid phase pH (a), redox potential (b), and total dissolved concentration
(evaporation corrected) of Fe (c), Mn (d), As (e), and Cu (f) during Batch Experiment II with (solid
line) and without (abbreviation “wo”, dashed line) CO2 for formaldehyde sterilized (S1, non-filled
symbols and black lines) and non-sterilized (H2, filled symbols and grey lines) stored spring soil in
liquid phase. Data on pH are missing on 1 d and 3 d due to electrode calibration problems. Single
outliers from triplicates had to be removed for the following data points, resulting in duplicates:
H2_wo_d41for As and S1_CO2_d7 for Cu. ............................................................................................ 7
Fig. S2. Changes in liquid phase pH (a), redox potential (b), and total dissolved concentration
(evaporation corrected) of Fe (c), Mn (d), As (e), and Cu (f) during Batch Experiment II with (solid
line) and without (abbreviation “wo”, dashed line) CO2 for steam-sterilized (S2, non-filled symbols
and black lines) and non-sterilized (H2, dark red symbols and lines) fresh summer soil in liquid phase.
Single outliers from triplicates had to be removed for the following data points, resulting in duplicates:
H3_wo_d3 for As and H3_wo_d7 for Fe, Mn, and Cu. .......................................................................... 8
Fig. S3. Total dissolved CO2 concentration at the end of Batch Experiment I (fresh spring soil) after
42 d for controls (“wo_CO2”), water blanks (“blank_CO2”,water only), and treatments (“CO2”) at
16 ± 1 °C (C, blue stripes), at 22 ± 1 °C (RT, unfilled), and 35 ± 0.1 °C (H, filled red). ..................... 10
Fig. S4. Changes in total dissolved concentration of As (evaporation corrected) during Batch
Experiment II with (solid line) and without (abbreviation “wo”, dashed line) CO2 at 35 °C with 3
different start soil conditions (H1: fresh spring soil from Batch Experiment I, red triangles, H2: stored
spring soil, grey circles, H3: fresh summer soil, dark red squares) in liquid phase with all triplicates
displayed individually. Data for As 1 h - 3 d are missing for H1 due to measurement problems. One
outlier has been removed in H3_wo_d3. ............................................................................................... 13
Fig. S5. Changes in total dissolved concentration (evaporation corrected) of S with (solid line) and
without (abbreviation “wo”, dashed line) CO2 (a) during Batch Experiment I at room temperature (RT,
22 °C, black squares), cooled (C, 16 °C, blue circles), and heated (H, 35 °C, red triangles) and (b)
during Batch Experiment II with different start soil conditions (H1: fresh spring soil, red triangles; H2:
stored spring soil, grey circles; H3: fresh summer soil, dark red squares) in liquid phase. .................. 15
95

S4
S.1 Determination of most probable numbers (MPN) for cultivatable heterotrophic aerobic,
Fe(III)-reducing, and sulfate-reducing microorganisms
In order to quantify the amount of cultivatable aerobic, Fe(III)-reducing, and sulfate-reducing
microorganisms we determined most probable numbers (MPN) for 3 samples of the stored spring soil:
one initial sample, one treatment (H2_CO2), and one control sample (H2_wo) after Batch
Experiment II. All MPNs were prepared under sterile conditions, using anoxic techniques (Drake et
al., 1996).
The soil water suspensions of the respective batches were well-mixed and 1 mL each was removed
with sterile needle and syringe and injected into a 20 mL glass incubation bottle closed with a butyl
rubber stopper, containing 9 mL sterile saline (NaCl, 0.9 %) and anoxic N2/CO2 (80 %/20 %)
headspace, resulting in a 10-1
dilution. The bottles were left on an orbital shaker for 1 h to guaranty
complete mixing and a further anoxic dilution series up to 10-9
was prepared by transferring 1 mL each
to the next higher dilution. The medium used for MPN determination of heterotrophic aerobes
consisted of 2.7 g L-1
Tryptic Soy Broth (TSB) and 100 mg L-1
Nystatin; pH was adjusted to 5.3 with
HCl and the medium was steam-sterilized in an autoclave (FVS, Integra Biosciences, Germany) at
121 °C before Nystatin addition. Incubation for aerobic MPN was conducted in 96-well plates (Falcon,
Becton Dickinson, Meylan Cedex, France) where 10 times 50 µL of each dilution were added to
150 µL TSB medium each. Well plates were incubated for 4 weeks at room temperature (22 ± 1 °C) in
the dark. Microbial growth was visible from milky cloudiness of the otherwise clear medium. For
MPN of Fe(III)-reducers, a FePPi medium (Caccavo et al., 1994) was used containing 3 g L-1
Fe(III)-
pyrophosphat (Fe4(P2O7)3), 2.5 g L-1
NaHCO3, 1.5 g L-1
NH4Cl, 0.05 g L-1
yeast extract, 0.385 g L-1
D(+)-glucose, 50 mL of a mineral solution (2 g L-1
CaCl2∙2H2O, 2 g L-1
KCl, 12 g L-1
NaH2PO4∙H2O,
2 g L-1
NaCl, 2 g L-1
MgCl2∙6H2O, 2 g L-1
MgSO4∙7H2O, 0.1 g L-1
MnCl2∙4H2O,
0.02 g L-1
NaMoO4∙2H2O), 5 mL of a trace element solution (Drake, 1994), and 5 mL of a vitamin
solution (Drake, 1994). The pH was adjusted to 5.5 with HCl. For MPN of sulfate-reducers, a
modified Postgate medium B (Postgate, 1979) was used containing 0.5 g L-1
KH2PO4, 1 g L-1
NH4Cl,
1 g L-1
CaSO4∙2H2O, 0.5 g L-1
FeSO4∙7H2O, 2 g L-1
MgSO4∙7H2O, 0.1 g L-1
ascorbic acid, 1.2 g L-1
Na-lactate, and 1 g L-1
yeast extract, pH 5.2. Incubation for Fe(III)- and sulfate-reducer MPNs was
conducted in triplicate in anoxic (80 % N2/20 % CO2) and rubber stoppered culture tubes and 1 mL
from each dilution of the tenfold dilution series (10-1
-10-9
) was added to 8 mL of steam-sterilized,
anoxic medium, mixed, and incubated for 4 weeks in the dark at 22 ± 1 °C. Reduction of Fe(III) could
be determined visually by color change of the FePPi medium from yellow to colorless and the
formation of a white precipitate. Sulfate reduction could be determined visually by clouding of the
usually clear SRP medium and formation of black FeS precipitates. Resulting MPN values were
calculated following standard protocols (De Man, 1975). Results can be found in Table S1. Additional
MPNs for formaldehyde sterilized samples showed no microbial growth and confirmed sterility of
these samples (data not shown).
96

S5
Table S1. Most probable number (MPN) values (95 % confidence interval) for cultivatable heterotrophic aerobes, Fe(III)-
reducers, and sulfate-reducers determined for stored spring soil (H2) before and after Batch Experiment II (incubation at
35 °C for 41 d without (H2_wo) and with CO2 purging (H2_CO2)) and graph (right) with error bars showing 95 %
confidence interval for better comparison.
MPN [no. mL-1
]
aerobes Fe(III)-reducers Sulfate-reducers
initial soil 1.2∙105 - 6.5∙10
5 4.7∙10
4 - 1.0∙10
6 3.0∙10
3 - 6.5∙10
4
H2_CO2 2.2∙105 - 1.2∙10
6 4.7∙10
4 - 1.0∙10
6 2.1∙10
3 - 4.7∙10
4
H2_wo 6.0∙104 - 3.2∙10
5 2.1∙10
4 - 4.7∙10
5 6.4∙10
2 - 1.4∙10
4
1.E+00
1.E+02
1.E+04
1.E+06
initial H2_CO2 H2_wo
MN
P [
no
. m
L-1
]
aerobes Fe(III) reducers
sulfate reducers
97

S6
S.2 Batch experiments with sterile controls
We attempted to quantify the influence of microbial activity on the observed mobilization processes
by conducting additional batch experiments with sterilized controls. The first experiment with sterile
batches (“S1”) was conducted parallel to H2 at room temperature (22 ± 1 °C), also with stored spring
soil and water. The batch reactors were prepared the same way as for H2 (50 g soil + 75 mL filtered
river water) and afterwards sterilized by adding 2 mL of a 5 % formaldehyde solution right before the
start of the experiment (method modified after Weir et al., 1996). The second experiment with sterile
batches (“S2”) was conducted parallel to H3, also at 35 °C with fresh summer soil and water. This
time, the batch reactors were closed inside an anoxic COY-glovebox (95 % N2, 5 % H2) and steam-
sterilized in an autoclave (FVS, Integra Biosciences, Germany) at 121 °C one day before the start of
the experiment.
Both sterilization methods caused significant changes in pH and redox potential and led to an abiotic
mobilization of almost all considered elements. Results are shown in comparison to the according non-
sterilized H2 and H3 batches in Fig. S1 and Fig. S2. Formaldehyde as reducing agent caused an
immediate drop in redox potential to values < 400 mV which led to significantly increased Fe and Mn
mobilization over the course of the experiment. A direct comparison with non-sterile samples for the
evaluation of the microbial influence on mobilization processes was thus not possible. However, the
results give evidence that also an abiotic Fe mobilization from Fe(III) (oxyhydr)oxide dissolution can
occur under CO2 treatment. Steam sterilization of the soil led to an immediate mobilization of all
considered elements and a clear drop in redox potential to < 400 mV. Autoclaving is known to cause
changes in soil structure, especially affecting organic matter (Berns et al., 2008), causing collapsing
and aggregation of clay minerals and thereby decreasing soil surface (Lotrario et al., 1995; Trevors,
1996), and inducing changes in solid phase speciation of Fe (Herbert et al., 2005; Wolf et al., 1989).
Thus, also for S2 no comparison with non-sterilized batches in order to quantify microbial influence
was possible.
98

S7
a
b
pH
Eh [
mV
]
c
d
Fe
[m
g L
-1]
Mn
[µ
g L
-1]
e
f
As [
µg
L-1
]
Cu [
µg
L-1
]
time [d] time [d]
Fig. S1. Changes in liquid phase pH (a), redox potential (b), and total dissolved concentration (evaporation corrected) of Fe
(c), Mn (d), As (e), and Cu (f) during Batch Experiment II with (solid line) and without (abbreviation “wo”, dashed line) CO2
for formaldehyde sterilized (S1, non-filled symbols and black lines) and non-sterilized (H2, filled symbols and grey lines)
stored spring soil in liquid phase. Data on pH are missing on 1 d and 3 d due to electrode calibration problems. Single outliers
from triplicates had to be removed for the following data points, resulting in duplicates: H2_wo_d41for As and S1_CO2_d7
for Cu.
4.0
4.5
5.0
5.5
8.0
8.5
0 10 20 30 40
150
250
350
450
550
650
0 10 20 30 40
0
5
10
15
20
25
30
35
0 10 20 30 40
0
200
400
600
800
0 10 20 30 40
0
2
4
6
8
10
0 10 20 30 40
0
4
8
12
16
0 10 20 30 40
H2_CO2 S1_CO2
H2_wo S1_wo
H2_CO2
H2_wo S1_CO2
S1_wo
99

S8
a
b
pH
Eh [
mV
]
c
d
Fe
mg L
-1]
Mn
[µ
g L
-1]
e
f
As [
µg
L-1
]
Cu [
µg
L-1
]
time [d] time [d]
Fig. S2. Changes in liquid phase pH (a), redox potential (b), and total dissolved concentration (evaporation corrected) of Fe
(c), Mn (d), As (e), and Cu (f) during Batch Experiment II with (solid line) and without (abbreviation “wo”, dashed line) CO2
for steam-sterilized (S2, non-filled symbols and black lines) and non-sterilized (H2, dark red symbols and lines) fresh
summer soil in liquid phase. Single outliers from triplicates had to be removed for the following data points, resulting in
duplicates: H3_wo_d3 for As and H3_wo_d7 for Fe, Mn, and Cu.
3.5
4.0
4.5
5.0
5.5
8.0
8.5
0 10 20 30 40
250
300
350
400
450
500
550
600
650
0 10 20 30 40
0
25
50
75
100
0 10 20 30 40
0
100
200
300
400
500
0 10 20 30 40
0
25
50
75
100
0 10 20 30 40
0
10
20
30
40
50
60
70
0 10 20 30 40
H3_CO2 S2_CO2
H3_wo S2_wo
H3_CO2
H3_wo S2_CO2
S2_wo
100

S9
S.3 Results from Mössbauer spectroscopy of three initial soil samples
Table S2. Hyperfine parameters of Mössbauer spectra from fresh spring soil, stored spring soil, and fresh summer soil. CS -
Center shift, ΔEQ - Quadrupole splitting, ε - quadrupole shift, Bhf - hyperfine field, Pop. - relative abundance.
Site Phase CS ΔEQ ε Bhf Pop.
[mm/s] [mm/s] [mm/s] [T] [%]
fresh
sp
rin
g s
oil
77 D1 Fe(III) 0.36 0.85
49.3 ± 1.8
D2 Fe(II) 1.45 2.37
19.3 ± 1.1
D3 Fe(II)? 0.77 1.14
6.9 ± 0.9
S1 Goethite (Fe(III)) 0.48
-0.14 45.9 16.0 ± 2.3
S2 Goethite (Fe(III)) 0.45
-0.14 49.1 8.6 ± 1.6
5 D1 Fe(III) 0.43 0.88
21.8 ± 1.3
D2 Fe(II) 1.36 2.51
16.4 ± 1.4
S1+S2 Goethite (Fe(III)) 0.48
-0.14 49.7 19.4 ± 2.3
S3 Ferrihydrite (Fe(III)) 0.44
-0.02 46.9 42.3 ± 2.6
sto
red
sp
rin
g s
oil
77 D1 Fe(III) 0.36 0.85
44.0 ± 3.7
D2 Fe(II) 1.45 2.37
19.3 ± 1.9
D3 Fe(II)? 0.77 1.14
5.7 ± 1.2
S1 Goethite (Fe(III)) 0.48
-0.14 45.9 20.4 ± 5.2
S2 Goethite (Fe(III)) 0.45
-0.14 49.1 10.6 ± 4.5
5 D1 Fe(III) 0.38 0.91
23.0 ± 1.2
D2 Fe(II) 1.42 2.48
14.8 ± 1.2
S1+S2 Goethite (Fe(III)) 0.48
-0.13 49.7 26.9 ± 2.2
S3 Ferrihydrite (Fe(III)) 0.41
-0.06 46.3 35.3 ± 2.4
fresh
su
mm
er s
oil
77 D1 Fe(III) 0.33 0.91
59.6 ± 2.5
D2 Fe(II) 1.47 2.41
31.3 ± 2.2
D3 Fe(II)? 0.85 1.50
9.2 ± 2.2
5 D1 Fe(III) 0.36 0.84
22.8 ± 7.4
D2 Fe(II) 1.50 2.43
12.2 ± 4.4
D3 Fe(II)? 0.74 1.53
3.8 ± 2.8
S1 Fe(III) 0.82
0.52 28.2 38.0 ± 18.0
S2 Fe(III) 0.39
-0.08 47.9 18.0 ± 10.0
S3 Fe(III) 0.52
-0.27 49.8 5.4 ± 4.4
101

S10
S.4 Total dissolved CO2 in Batch Experiment I
CO
2 [
mm
ol L
-1]
wo_CO2 blank_CO2 CO2
Fig. S3. Total dissolved CO2 concentration at the end of Batch Experiment I (fresh spring soil) after 42 d for controls
(“wo_CO2”), water blanks (“blank_CO2”,water only), and treatments (“CO2”) at 16 ± 1 °C (C, blue stripes), at 22 ± 1 °C
(RT, unfilled), and 35 ± 0.1 °C (H, filled red).
0
4
8
12
16
20
24
28
32C (16 °C)
RT (22 °C)
H (35 °C)
102

S11
S.5 Water blanks for Batch Experiment I and II
Table S3. pH, redox potential (Eh), and total dissolved concentration (evaporation corrected) of Fe, Mn, As, and Cu for water
blanks of all batch experiments (single measurements). Missing data are marked as NA.
time [d] 0 0.04 1 3 7 14 21 28 41 42
pH [-]
C_blank 8.6 4.8 4.8 4.6 4.5 4.6
4.9
4.8
RT_blank 8.6 4.6 5.0 4.9 5.0 5.0
5.1
5.3
H1_blank 8.6 5.2 5.0 5.0 4.9 5.2
5.1
5.2
H2_blank 8.6 5.3 NA NA 4.9 4.8
5.1 5.2
H3_blank 7.5 5.1 5.1 5.1 5.1 5.1 5.1 5.2
Eh [mV]
C_blank 380 560 550 570 580 560
560
550
RT_blank 380 520 510 510 490 500
500
450
H1_blank 380 590 500 470 520 470
470
460
H2_blank 380 500 500 450 470 450
470 460
H3_blank 420 510 480 490 490 430 410 440
Fe [mg L-1
]
C_blank 0.17 0.16 0.15 0.14 0.14 0.15
0.15
0.13
RT_blank 0.17 0.17 0.16 0.15 0.14 0.16
0.16
0.15
H1_blank 0.17 0.16 0.15 0.14 0.16 0.13
0.13
0.13
H2_blank 0.17 0.12 0.10 0.11 0.13 0.15
0.11 0.11
H3_blank 0.26 0.24 0.20 0.18 0.19 0.21 0.22 0.19
Mn [µg L-1
]
C_blank 92 96 99 96 98 96
102
104
RT_blank 92 93 91 90 94 92
96
101
H1_blank 92 97 91 91 96 94
102
101
H2_blank 92 85 84 83 86 95
95 94
H3_blank 50 64 58 58 61 62 63 58
As [µg L-1
]
C_blank 4.2 NA NA NA NA 5.4
3.8
3.6
RT_blank 4.2 NA NA NA NA 5.2
4.1
3.6
H1_blank 4.2 NA NA NA 4.0 4.8
3.6
3.2
H2_blank 4.2 2.5 2.8 NA 3.7 3.9
1.9 1.5
H3_blank 3.5 3.4 3.3 3.5 3.5 3.5 3.1 2.8
Cu [µg L-1
]
C_blank 3.3 12.0 7.4 11.5 5.8 6.7
4.8
6.3
RT_blank 3.3 4.7 17.0 5.8 11.4 5.7
4.0
6.2
H1_blank 3.3 7.2 13.7 9.5 7.9 10.4
6.7
6.9
H2_blank 3.3 4.8 5.5 5.1 4.9 7.5
10.4 7.4
H3_blank 3.7 8.5 7.2 6.5 6.7 6.2 4.5 5.7
103

S12
S.6 Total soil concentrations in Batch Experiment I and II
Table S4. Total soil concentrations of Fe, Mn, As, and Cu before (“initial”) and after Batch Experiment I with incubation of
fresh spring soil without (“wo_CO2”) and with CO2 (“CO2”) at 3 different temperatures. Initial concentrations were only
measured once, thus the relatively high value for initial As might have been caused by soil heterogeneity.
initial C (16 °C) RT (22 °C) H (35 °C)
Fe [mg kg-1
] wo_CO2
31050 30139 ± 3118 26830 ± 1037 28106 ± 1599
CO2 30636 ± 1563 33250 ± 1636 31086 ± 3124
Mn [mg kg-1
] wo_CO2
115 132 ± 5 119 ± 6 123 ± 8
CO2 122 ± 3 118 ± 6 116 ± 5
As [mg kg-1
] wo_CO2
67 41 ± 9 32 ± 4 36 ± 6
CO2 37 ± 4 43 ± 4 41 ± 6
Cu [mg kg-1
] wo_CO2
13 14 ± 0 16 ± 1 15 ± 1
CO2 15 ± 2 16 ± 1 16 ± 1
Table S5. Total soil concentrations of Fe, Mn, As, and Cu before (“initial”) and after Batch Experiment II with incubation of
stored spring soil (H2) and fresh summer soil (H3) without (“wo_CO2”) and with CO2 (“CO2”) at 35 °C. Initial
concentrations were only measured once, thus the relatively high value for As in initial H2 might have been caused by soil
heterogeneity.
initial H2 H2 (35 °C) initial H3 H3 (35 °C)
Fe [mg kg-1
] wo_CO2
34992 29913 ± 3144
18817 18748 ± 540
CO2 28532 ± 1932 18273 ± 238
Mn [mg kg-1
] wo_CO2
128 130 ± 8
119 114 ± 10
CO2 123 ± 7 115 ± 4
As [mg kg-1] wo_CO2
76 44 ± 3
36 30 ± 1
CO2 44 ± 8 31 ± 2
Cu [mg kg-1
] wo_CO2
11 14 ± 0
14 16 ± 1
CO2 14 ± 1 15 ± 1
104

S13
S.7 Arsenic results for Batch Experiment II with individual graphs
As [
µg
L-1
]
time [d]
Fig. S4. Changes in total dissolved concentration of As (evaporation corrected) during Batch Experiment II with (solid line)
and without (abbreviation “wo”, dashed line) CO2 at 35 °C with 3 different start soil conditions (H1: fresh spring soil from
Batch Experiment I, red triangles, H2: stored spring soil, grey circles, H3: fresh summer soil, dark red squares) in liquid
phase with all triplicates displayed individually. Data for As 1 h - 3 d are missing for H1 due to measurement problems. One
outlier has been removed in H3_wo_d3.
0
20
40
60
80
100
0 10 20 30 40
H1_wo H2_wo H3_wo
H1_CO2 H2_CO2 H3_CO2
H1_wo
H1_CO2
H2_wo
H2_CO2
H3_wo
H3_CO2
105

S14
S.8 Results from additional incubation experiment
Table S6. Total amount of CO2 formed and total dissolved Fe concentration after 7 d of incubation of spring and summer soil
at 3 different temperatures from an additional incubation experiment for proof of microbial Fe(III) reduction. Values are
given as range between two replicates.
Soil temp. [°C] CO2 [µmol] Fe [mg L-1
]
spring soil 12 2.5 - 2.6 0.11 - 0.12
21 4.5 - 5.2 0.18 - 0.48
35 7.0 - 9.5 1.47 - 1.67
summer soil 12 5.7 - 6.7 0.07 - 0.17
21 8.3 - 11.1 0.10 - 3.81
35 20.8 - 22.6 14.98 - 15.45
Table S7. Correlation coefficients rS between incubation temperature, total CO2, and dissolved Fe concentration for the
additional 7 d incubation experiment. Significance level is indicated by stars with *P<0.05, **P<0.01.
both soils spring soil summer soil
CO2 [µmol] Fe [µg L-1
] CO2 [µmol] Fe [µg L-1
] CO2 [µmol] Fe [µg L-1
]
temp. [°C] 0.74** 0.80 ** 0.96** 0.96** 0.96** 0.84*
CO2 [µmol] - 0.69 * - 0.94** - 0.83*
106

S15
S.9 Sulfur results for Batch Experiment I and II
a
b
S [
mg
L-1
]
S [
mg
L-1
]
time [d] time [d]
Fig. S5. Changes in total dissolved concentration (evaporation corrected) of S with (solid line) and without (abbreviation
“wo”, dashed line) CO2 (a) during Batch Experiment I at room temperature (RT, 22 °C, black squares), cooled (C, 16 °C,
blue circles), and heated (H, 35 °C, red triangles) and (b) during Batch Experiment II with different start soil conditions (H1:
fresh spring soil, red triangles; H2: stored spring soil, grey circles; H3: fresh summer soil, dark red squares) in liquid phase.
Table S8. Total dissolved concentration (evaporation corrected) of S for water blanks of all batch experiments (single
measurements).
time [d] 0 0.04 1 3 7 14 21 28 41 42
S [mg L-1
]
C_blank 11 10 10 10 10 11 13 14
RT_blank 11 11 11 10 10 11 14 13
H1_blank 11 11 10 10 11 12 13 13
H2_blank 11 12 12 13 13 14 14 13
H3_blank 15 16 15 15 16 17 17 16
Table S9. Total soil concentrations of S before (“initial”) and after Batch Experiment I with incubation of fresh spring soil
without (“wo_CO2”) and with CO2 (“CO2”) at 3 different temperatures and after Batch Experiment II with incubation of
stored spring soil (H2) and fresh summer soil (H3).
S [g kg-1
]
initial
H1
C
(16 °C)
RT
(22 °C)
H1
(35 °C)
initial
H2
H2
(35 °C)
initial
H3
H3
(35 °C)
wo_CO2 2.0
2.1 ± 0.1 2.2 ± 0.1 2.2 ± 0.2 2.5
2.4 ± 0.1 2.6
2.7 ± 0.2
CO2 2.1 ± 0.1 2.3 ± 0.1 2.2 ± 0.1 2.3 ± 0.1 2.7 ± 0.2
5
10
15
20
25
30
0 10 20 30 40
5
10
15
20
25
30
0 10 20 30 40
RT_wo C_wo H_wo
RT_CO2 C_CO2 H_CO2
RT_wo
RT_CO2
C_wo
C_CO2
H_wo
H_CO2
H1_wo H2_wo H3_wo
H1_CO2 H2_CO2 H3_CO2
H1_wo
H1_CO2
H2_wo
H2_CO2
H3_wo
H3_CO2
107

S16
References
Berns, A., Philipp, H., Narres, H.-D., Burauel, P., Vereecken, H., Tappe, W., 2008. Effect of gamma-
sterilization and autoclaving on soil organic matter structure as studied by solid state NMR, UV
and fluorescence spectroscopy. Eur. J. Soil Sci. 59, 540-550.
Caccavo, F., Lonergan, D.J., Lovley, D.R., Davis, M., Stolz, J.F., McInerney, M.J., 1994. Geobacter
sulfurreducens sp. nov., a hydrogen- and acetate-oxidizing dissimilatory metal-reducing
microorganism. Appl. Environ. Microbiol. 60, 3752-3759.
De Man, J., 1975. The probability of most probable numbers. Eur. J. Appl. Microbiol. 1, 67-78.
Drake, H.L., 1994. Acetogenesis, in: Reddy, C.A., Chakrabarty, A.M., Demain, A.L., Tiedje, J.M.
(Eds.), Chapman & Hall Microbiology Series Chapman & Hall, New York.
Drake, H.L., Aumen, N.G., Kuhner, C., Wagner, C., Griesshammer, A., Schmittroth, M., 1996.
Anaerobic microflora of everglades sediments: effects of nutrients on population profiles and
activities. Appl. Environ. Microbiol. 62, 486-493.
Herbert, R.B., Malmström, M., Ebenå, G., Salmon, U., Ferrow, E., Fuchs, M., 2005. Quantification of
abiotic reaction rates in mine tailings: evaluation of treatment methods for eliminating iron- and
sulfur-oxidizing bacteria. Environ. Sci. Technol. 39, 770-777.
Lotrario, J., Stuart, B., Lam, T., Arands, R., O'Connor, O., Kosson, D., 1995. Effects of sterilization
methods on the physical characteristics of soil: implications for sorption isotherm analyses. Bull.
Environ. Contam. Toxicol. 54, 668-675.
Postgate, J.R., 1979. The sulphate-reducing bacteria. Cambridge University Press, Cambridge.
Trevors, J., 1996. Sterilization and inhibition of microbial activity in soil. J. Microbiol. Methods 26,
53-59.
Weir, S.C., Lee, H., Trevors, J.T., 1996. Effect of selected disinfectants on the persistence and
movement of a genetically engineered Pseudomonas sp. in soil. Syst. Appl. Microbiol. 19, 421-
427.
Wolf, D., Dao, T., Scott, H., Lavy, T., 1989. Influence of sterilization methods on selected soil
microbiological, physical, and chemical properties. J. Environ. Qual. 18, 39-44.
108

109
STUDY 3: Copper mobilization and immobilization along an organic matter and
redox gradient – insights from a mofette site
Judith Mehlhorn, Johannes Besold, Juan S. Lezama Pacheco, Jon Petter Gustafsson, Ruben
Kretzschmar, Britta Planer-Friedrich
Reprinted with permission from
Environmental Science & Technology 52(23) (pp. 13698 – 13707)
Copyright 2018 American Chemical Society


www.acs.org
December 4, 2018Volume 52Number 23pubs.acs.org/est
CO2 Exhalations: Natural Laboratories to Study Cu Mobility


Copper Mobilization and Immobilization along an Organic Matterand Redox GradientInsights from a Mofette SiteJudith Mehlhorn,† Johannes Besold,† Juan S. Lezama Pacheco,‡ Jon Petter Gustafsson,§
Ruben Kretzschmar,∥ and Britta Planer-Friedrich*,†
†Environmental Geochemistry, Bayreuth Center for Ecology and Environmental Research (BayCEER), University of Bayreuth,D-95440 Bayreuth, Germany‡Department of Environmental Earth System Science, Stanford University, Stanford, California 94305, United States§Department of Soil and Environment, Swedish University of Agricultural Sciences, 75007 Uppsala, Sweden∥Soil Chemistry Group, Institute of Biogeochemistry and Pollutant Dynamics, ETH Zurich, CHN, CH-8092 Zurich, Switzerland
*S Supporting Information
ABSTRACT: Mofettes (natural geogenic CO2 exhalations) repre-sent excellent sites to study the behavior of Cu in soils and the co-occurrence of different mobilization and immobilization processessince they exhibit both a gradient in redox conditions (oxic topermanently anoxic) and in soil organic matter (SOM; low to highcontents). Soil and pore water samples from an 18 m-transect over amofette showed a complex behavior of Cu, with highest mobility inthe transition between oxic and anoxic conditions. Cu(II) sorptionexperiments on SOM-rich topsoil revealed that Cu mobility underoxic conditions was confined by adsorption to SOM while in theoxygen-free mofette center reduction and precipitation of sulfides wasthe dominating Cu-sequestering process. In transition areas with lowamounts of oxygen (<10%), there was no mineral precipitation, instead high dissolved-to-soil organic carbon ratios stronglyincreased Cu mobility. Our results show that low stability of SOM formed under oxygen-limited conditions leads to increasedCu mobility unless sulfur-reducing conditions cause Cu sequestration by sulfide precipitation. The interplay of these(im)mobilization processes and especially the unexpectedly high mobility under suboxic conditions have to be considered whenassessing Cu mobility along spatial or temporal redox gradients, e.g., at contamination sites or periodically flooded soils.
■ INTRODUCTION
Copper (Cu) is an essential trace element for most livingorganisms since it is an important component in manyenzymes and proteins.1 In higher concentrations, however, itcan become toxic to microorganisms and plants and istherefore considered a contaminant.2
In oxic soils, Cu is primarily present as bivalent Cu(II) andits mobility is mainly controlled by sorption to soil organicmatter (SOM).3−8 Closely spaced carboxylic and hydroxylic(or amine) groups in SOM form very stable five- to six-membered ring chelates with Cu(II) ions.9,10 Cu(II) can alsoadsorb to other soil constituents like clay minerals11,12 and Fe,Mn, or Al (oxyhydr)oxides.13−15 However, SOM seems to bethe preferred binding partner.4,16
Under (temporarily) reducing conditions, e.g., in floodplainsoils or in peatlands, Cu(II) can be reduced to Cu(I) or Cu(0)directly by microorganisms17−20 and abiotically, e.g., byreaction with Fe2+ in solution21 or by redox active functionalgroups in SOM,22−24 which strongly affects Cu solubility.25−27
Metallic Cu(0) can precipitate in reducing soils, as has beenalready observed in early studies for peatlands28,29 and morerecently also in contaminated periodically flooded
soils.20,22,30,31 If microbial sulfate reduction occurs, thenCu(II) can also be reduced by sulfide and precipitate asCu(I) sulfides,32−34 a process that can occur even at lowavailable sulfide concentrations.20,31,35 Dissolved Cu(I) dis-proportionates rapidly into Cu(0) and Cu(II)36,37 unless it isstabilized by complexation with suitable ligands such as sulfideor chloride.38 Recently, it was shown that Cu(I) can also formcomplexes with SOM by coordination to at least one thiolgroup,22,30 a process that was up to then only described forestuarine waters and seawater.39,40
In environments influenced by temporal or spatial gradientsin redox conditions, like periodically flooded soils20,30,35 oranthropogenically influenced soils, (e.g., soils over landfills,organic contaminant spills, leaking pipelines or geologic carbonstorage sites),41,42 the processes described above could coexist.For assessment of Cu mobility in such soils, it is important tounderstand how different sorption and precipitation processes
Received: May 18, 2018Revised: September 5, 2018Accepted: September 10, 2018Published: September 10, 2018
Article
pubs.acs.org/estCite This: Environ. Sci. Technol. 2018, 52, 13698−13707
© 2018 American Chemical Society 13698 DOI: 10.1021/acs.est.8b02668Environ. Sci. Technol. 2018, 52, 13698−13707
113
Reprinted with permission from

interact. Mofettes, which are characterized by degassing ofmainly CO2, represent excellent sites for studying the co-occurrence of Cu mobilizing and immobilizing processes insoils. Mofettes form in volcanic or seismic areas, wheregeogenic CO2 ascends via faults and fissures toward thesurface. Due to their diffuse spatial structure, a permanentgradient in soil conditions can be studied within only somemeters from the mofettes. While the soil is completely anoxicright up to the top in degassing centers with CO2 partialpressures (p(CO2)) of up to almost 1, the CO2 influencedecreases sharply with distance,43,44 leading to a gradient inredox conditions over the mofette area. SOM is accumulatingon mofette sites as a result of decreased decomposition underpermanently anoxic conditions,45−48 creating an additionalgradient in SOM content. Also, SOM composition differsalong mofettes with accumulation of less degraded materialand less interaction of SOM with soil minerals at higherp(CO2).
48−50
In the present study, we evaluated the influence of differentCu sequestering processes on the overall Cu mobility along theredox and SOM gradient of a mofette site. We studied Cudistribution in soil and pore water along a transect over awetland mofette and conducted laboratory experimentsdetermining Cu sorption isotherms for SOM-rich topsoilfrom two mofette sites. The aim of this study was to elucidatethe interplay of the processes causing Cu immobilization(adsorption to SOM, reduction and sulfide precipitation) andmobilization (complexation with dissolved organic matter,DOM) in redoximorphic soils.
■ MATERIALS AND METHODS
Sampling Site. Samples were collected in February andSeptember 2017 from two wetland mofettes (A and B) at a sitein northwestern Czech Republic considered the seismic centerof the Cheb Basin51 (detailed site description in Mehlhorn etal.52). We sampled 18 soil samples over a transect of Site A(former site 252) in 0, 2, 4, 8, 12, and 18 m distance from thedegassing center and from approximately 5−10, 25−35, and55−65 cm depth with an auger and immediately shock-frozethem on dry ice. Beulig et al.53 characterized the mofette soil asa Hemic Histosol with reductimorphic properties due to theinfluence of upstreaming geogenic gas. The surrounding, non-CO2-influenced soil was characterized as a Gleyic Fluvisol.53
From the same spots, we collected pore water samples using 60cm long pore water peepers type Hesslein54 (50 individualchambers with a 1 cm depth resolution located in 10−60 cmdepth). Peeper preparation and recovery after 9 weeks ofequilibration time followed a previously described procedure.52
Pore water from 5 chambers was combined to obtain sufficientsample volume. Samples were filtered (cellulose-acetate, 0.2μm) and stabilized in 0.45% H2O2 and 0.65% HNO3 for totalCu analysis and with 2% (w/v) zinc acetate (Grussing, p.a.) forphotometrical sulfide determination. Additional 2 mL ofunfiltered pore water sample were stabilized in nitrogen-purged septum bottles for analysis of dissolved CO2.For laboratory sorption studies, four additional soil samples
were taken from the transect of Site A: degassing center(“Mofette A”), transition with decreasing CO2 influence(“Transition A1” and “Transition A2,” in approximately 4and 8 m distance), and non-CO2-influenced (“Reference A” inapproximately 18 m distance from Mofette A). Locations werechosen based on vegetation changes as well as p(CO2) andp(O2) in soil air, determined in approximately 10 cm depthwith a portable gas analyzer (BIOGAS 5000, Geotech). Forcomparison, additional samples were taken from the degassingcenter of a second mofette (“Mofette B”) and a non-CO2-influenced reference (“Reference B” in approximately 12 mdistance from Mofette B) (former site 152). If present,vegetation and root mats were removed and approximately300 g of organic-rich topsoil (A/O-horizon, 5−15 cm depth)were sampled into bags and immediately shock-frozen on dryice. Soil samples were stored in a freezer at −20 °C.The sampled soils are generally characterized by decreasing
soil pH, C and S contents, and an increasing C/N ratio withincreasing p(CO2) (Table 1). This is in line with other studiesfrom this site showing a CO2-triggered soil acidification and adecreased C turnover in the mofettes.47,48,52 At Site B, thecontents of C and S were higher in Reference than in Mofette,most likely because its location in a small depression and asmaller distance of Reference B to the CO2-influenced area(approximately 1 m versus >3 m at site A) caused SOMtranslocation from the mofette and accumulation. Thepreviously described negative effect of high p(CO2) inmofettes on the formation of Fe (oxyhydr)oxides48,55−57 isreflected by strongly decreased Fe contents in samples fromdegassing centers and accumulation of Fe in transition zones(Table 1).
Copper Sorption Experiment. All experiments wereconducted in triplicate inside an anaerobic chamber (Coy, 95%N2/5% H2) using nitrogen-purged solutions prepared withultrapure deionized water (Millipore, 18.2 MΩ cm) andchemicals of analytical grade. Soil samples (approximately 300g per sample) were thawed inside the anaerobic chamberovernight and roots and stones were removed by pressing thewell-mixed soil through a nylon sieve (1 mm mesh size). Thewet soil was weighted immediately into centrifuge vials
Table 1. Overview of Selected Physical and Chemical Soil Parameters of the Untreated Soil Used in the Experimentsa,b
Mofette A Transition A1 Transition A2 Reference A Mofette B Reference B
distance (m)c 0 4 8 18 0 12p(CO2) (−)d 0.972 0.556 0.072 0.016 n.d. n.d.p(O2) (−)d 0.000 0.089 0.198 0.205 n.d. n.d.pH (−)e 4.1 ± 0.04 3.7 ± 0.02 4.2 ± 0.03 4.5 ± 0.02 4.0 ± 0.04 4.6 ± 0.01C (g kg−1) 202.0 ± 6.6 190.7 ± 2.5 148.3 ± 0.6 112.3 ± 0.6 127.7 ± 4.5 161.7 ± 2.5C/N ratio (−) 16.7 ± 0.1 15.7 ± 0.1 12.8 ± 0.1 12.7 ± 0.03 16.0 ± 0.6 12.8 ± 0.1Cu (mg kg−1) 23 ± 1 26 ± 1 36 ± 0 33 ± 1 12 ± 0 21 ± 0Fe (mg kg−1) 6847 ± 164 75 697 ± 8,927 60 247 ± 889 30 041 ± 722 6679 ± 414 42 312 ± 1,794S (mg kg−1) 4086 ± 26 3149 ± 141 2981 ± 38 2698 ± 41 2651 ± 29 3052 ± 194
aSamples were taken from approx. 5−15 cm depth. Contents of Cu, Fe, and S were determined in aqua regia digests. bMean ± standard deviation,n = 3. cDistance from degassing center at Mofette A and B, respectively. dPartial pressure of CO2 and O2, respectively.
eMeasured in 0.01 M CaCl2
Environmental Science & Technology Article
DOI: 10.1021/acs.est.8b02668Environ. Sci. Technol. 2018, 52, 13698−13707
13699
114

(equivalent to approximately 0.27 g dry weight) and 8 mL of 5mM NaCl (Merck, p.a.) solution were added as backgroundelectrolyte leading to a soil-to-solution-ratio of approximately1:30. All vials were wrapped in aluminum foil to exclude lightinfluence. Suspensions were well-mixed, pH was adjusted to4.5 ± 0.1 (approximately pore water pH of this mofette site52)using 1 M NaOH or 1 M HCl, and suspensions were pre-equilibrated for 24 h with occasional shaking (permanentshaking might promote colloid formation). Afterward, 0−400μL of 7.87 mM CuCl2 (Grussing, p.a.) stock solution, pH 4.5,were spiked to the suspensions, yielding spike concentrationsof 0, 0.23, 1.16, 2.33, 5.83, and 11.65 mmol kg−1. Thesuspensions were well-mixed and pH was adjusted to 4.5 ± 0.1,then samples were left to equilibrate for 24 h with occasionalshaking. The time required for achieving equilibriumconditions was determined in a kinetic study prior to thisexperiment (see Section S.1, Supporting Information (SI)).After equilibration, pH was measured in soil suspensions, thenvials were centrifuged (5 min at 4500g, outside the glovebox)and the supernatant was removed with needle and syringe,filtered (0.2 μm, cellulose-acetate), and stabilized for total Cuanalysis in 0.45% H2O2 and 0.65% HNO3.Analyses of Collected Samples. The remaining soil from
the sorption experiment and the additional 18 soil samplesfrom Site A were freeze-dried, pestled, and digested in aquaregia (soil-to-solution-ratio 1:100, microwave assisted diges-tion, MARS Xpress, CEM). Total Cu concentrations in filteredand diluted liquid phase samples and aqua regia digests weremeasured with a quadrupole inductively coupled plasma massspectrometer (ICP-MS, X-Series 2, Thermo Scientific) at m/z65 to avoid interferences with ArNa+ at m/z = 63. Aqua regiadigests of the initial soil samples were additionally analyzed fortotal Fe and S concentrations by ICP-MS.Total C and N contents in the initial, freeze-dried and
pestled soil samples were determined with a CHN elementalanalyzer (Thermo Quest, Flash EA, 1112). The amounts oforganic matter mobilized from solid into liquid phase weredetermined in triplicate for samples with highest Cu(II) spike.
Due to limited sample amounts, the Cu sorption experimentwas repeated for these samples, suspensions were centrifuged,and supernatants were filtered (0.45 μm, polyamide) andanalyzed for total dissolved organic carbon (DOC) andnitrogen by thermo-catalytic oxidation with a TOC-VCPNAnalyzer (Shimadzu).Dissolved CO2 concentrations in pore water samples
collected from Site A were calculated from head spaceconcentrations in the septum bottles applying Henry’s law(kH,CO2 = 0.033 44 mol L−1 atm−1 from Sander,58 details inSection S.3, SI). Gaseous head space concentrations weremeasured with a gas chromatograph (SRI Instruments 8610C,U.S.) equipped with a methanizer and a flame ionizationdetector.Sulfide concentrations in pore water samples were
determined photometrically using the methylene bluemethod,59 measuring the absorbance at 650 nm with amultiplate reader (Infinite 200 PRO, Tecan). With the samemethod, we checked for sulfide formation in selected samplesfrom Cu sorption experiment using filtered soil suspensions. Inthe Cu(II)-spiked samples we also checked whether Cu(I)formation occurred, using the bathocuproine method24,60 withabsorbance measured at 492 nm.
Characterization of SOM and Mineral Phases.Characterization of SOM was done for samples from MofetteA, Transition A1, and Reference A by solid-state 13C nuclearmagnetic resonance spectroscopy (NMR, details in SectionS.4, SI). Further, we characterized DOM by Fourier-transforminfrared spectroscopy (FTIR). Extraction of DOM was donewith ultrapure deionized water at a soil-to-solution-ratio of 1:5for 24 h on a horizontal shaker. Absorption band assignmentsare based on Artz et al.61 and Rennert et al.48 Details on FTIRanalysis can be found in Section S.5, SI.Samples from Transition A1 and Reference A were analyzed
by X-ray powder diffraction (XRD) to gain information onmineralogy using a Philips X’Pert Pro diffractometer operatingin reflection mode with Fe filtered CoKα1 radiation, step size
Figure 1. (a) Solid-phase Cu contents on a transect across Site A, going eastward from the degassing center (Mofette A) at 0 m, determined inaqua regia digests from freeze-dried soil samples taken at three depths per sampling point. Crosses mark samples taken for the laboratory sorptionstudy. (b) Corresponding pore water Cu concentrations from three selected depths. Depth 25−35 cm shows mean value with error barsrepresenting minimum and maximum value. (c) Distribution coefficients between Cu solid-phase content and Cu pore water concentration versuspore water CO2 concentrations in the transect over Site A. Note the logarithmic scale of y-axis. Additional information on calculation of dissolvedCO2 concentrations can be found in Section S.3, SI.
Environmental Science & Technology Article
DOI: 10.1021/acs.est.8b02668Environ. Sci. Technol. 2018, 52, 13698−13707
13700
115

0.03° 2θ, range 5−50°, and scan speed of 1.8°/min. Samplespectra can be found in Section S.6, SI.One Cu-loaded sample of Mofette A was analyzed by
scanning electron microscopy energy-dispersive X-ray spec-trometry (SEM-EDS) to detect potential Cu precipitates(details in Section S.7, SI).X-ray Absorption Spectroscopy. Copper K-edge X-ray
absorption near edge structure (XANES) and extended X-rayabsorption fine structure (EXAFS) spectra were collected atbeamlines 4−1 and 4−3 at the Stanford Synchrotron RadiationLightsource (SSRL, Stanford, U.S.A.). Spectra were collectedfor samples from Site A and for one sample from a peat lens atapproximately 2 m depth beneath the degassing center of SiteA (originating from the sampling in February, furtherinformation on physicochemical properties of this peat lenscan be found in Mehlhorn et al.52). We collected XANES onlyfor initial soil samples, XANES and EXAFS for samples withthe highest Cu spike from the sorption experiment and for thepeat lens sample. Sample measurements were performed influorescence mode at 25 K using a 4-element solid-state Si driftdetector (HTA Hitatchi) and a liquid He cryostat at beamline4−3 (samples Transition A1, A2, Reference A, and peat lens)or at 77 K using a 32-element solid-state Ge detector(Canberra) and a liquid nitrogen cryostat (samples MofetteA). The following published spectra were used as referencecompounds: Cu(II)-humic (Cu(II) adsorbed to a soil humicacid solution),30 Cu(II)-malate (Cu(C4H5O5)2(H2O)2),
30
Cu(II)-carboxyl (Cu(II) adsorbed to carboxyl resin Bio-Rex70 (Bio-Rad)),22 Cu(II)-clay (Cu(II) adsorbed to montmor-illonite),30 Cu(I)-thiol (Cu(I) adsorbed to thiol resinAmbersep GT74 (Supelco)),22 Cu(I)-GSH (Cu(I) adsorbedto L-Glutathione),30 Cu1.8S,
20 CuS,30 and Cu(II)-ferrihydrite(30 μM Cu(II) adsorbed to 0.3 mM ferrihydrite,15 kindlyprovided by Charlotta Tiberg, Swedish Geotechnical Institute,Stockholm). Additionally, metallic Cu(0) (Cu foil), measuredin transmission mode, was used as a reference compound.Further details on data collection and evaluation can be foundin Section S.8, SI.
■ RESULTS AND DISCUSSIONNatural Distribution of Solid and Liquid Phase
Copper Along the Mofette-Reference Site Gradient.Compared to the non-CO2-influenced reference in 18 mdistance, Cu soil contents in the degassing center (0 mdistance) were similar or slightly increased while Cu porewater concentrations were decreased (Figure 1a,b). Similartrends were reported previously by Mehlhorn et al.52 whoobserved a relationship (r = 0.59, P < 0.005) between total soilCu and organic carbon (Corg). This observation led to theconclusion that Cu immobilization in mofettes is caused byadsorption to SOM.52 However, Cu data from the transectbetween the two end points Mofette and Reference did notjust show a linear decrease or increase. Copper soil contentsdecreased sharply with increasing distance from the degassingcenter, reaching minima after 2−8 m and then slowlyincreasing again with further distance (Figure 1a). By contrast,Cu pore water concentrations sharply increased with distancereaching (local) maxima at 4 m distance, followed by localminima at 8 m, then slightly increasing again with furtherdistance (Figure 1b). Distribution coefficients between Cu soilcontent and pore water concentration increased with dissolvedCO2, with Cu being strongly shifted toward the solid phase atthe highest CO2 concentrations (Figure 1c). To clarify the
mechanisms that caused this behavior, we determined Cusorption isotherms for soil samples from this mofette site.
Copper Sequestration Potential of Mofette, Tran-sition, and Reference Soil. Copper sorption isotherms ofthe soils measured by batch experiments at pH 4.5 ± 0.1differed strongly between the samples, with highest Cusequestration occurring in mofette centers (Figure 2a).
Isotherms for Mofette A and B were best fitted using aFreundlich isotherm with q = KF × cN (where q is the adsorbedCu content in mol kg−1, c is the dissolved Cu concentration inmol L−1, N is a parameter describing the curvature of theisotherm, KF is the Freundlich coefficient; N = 0.53 and 0.51,KF = 16.7 and 4.6 L kg−1 for Mofette A and B, respectively).Samples from the Transition and Reference sites showed linearadsorption behavior (N = 1; linear adsorption coefficientsKlinear = 963, 1238, 1395, and 1365 L kg−1 for Transition A1,A2, Reference A, and B, respectively). Interestingly, Cuadsorption was lowest at moderate CO2 soil concentrations,i.e., in Transitions A1 (p(CO2) 0.556, p(O2) 0.089) and A2(p(CO2) 0.072, p(O2) 0.198), which at first glance contradictsthe hypothesis of stronger Cu adsorption in soils with higher
Figure 2. (a) Cu sorption isotherms determined at pH 4.5 ± 0.1 at asoil-to-solution-ratio of approximately 1:30 with 5 mM NaCl asbackground electrolyte under anoxic conditions. Initial Cu soilconcentrations are not included. (b) Same Cu sorption isothermsplotted normalized against the DOC concentration for the liquidphase and against total soil Corg for the solid phase. Symbols aremeasured data, dashed lines are calculated isotherms.
Environmental Science & Technology Article
DOI: 10.1021/acs.est.8b02668Environ. Sci. Technol. 2018, 52, 13698−13707
13701
116

SOM content. The two References A and B, however, plottedalmost exactly on the same line.Replotting the isotherms normalized against Corg content in
soil solid phases and DOC concentration in the liquid phases,assuming organic matter to be the dominating binding partnerfor Cu, showed even more pronounced differences betweenmofette centers and all other soils (Figure 2b, Corg and DOCconcentrations in Figure S3, SI). While the difference betweenMofettes A and B became smaller, the isotherms of TransitionsA1, A2, and Reference A even plotted on the same line havingmore or less identical adsorption coefficients (Klinear = 0.291,0.303, and 0.285 kg CDOC (kg Corg)
−1). This observationimplies that Cu adsorption to SOM is the most importantsorption mechanism in all samples outside the mofette centerinvestigated here. Copper sorption followed a linear isotherm,and no saturation occurred at the Cu loadings tested in thisexperiment. Maximum Cu loadings used in this study were well
below literature values of sorption capacities reported forhumic substances (e.g., in Christl and Kretzschmar62 3.1 and2.7 mol kg−1 for humic, and 6.0 and 2.7 mol kg−1 for fulvicacid, for low and high affinity sites, respectively, according tothe NICA-Donnan model). In this study, we did notdistinguish between free and complexed Cu in the liquidphase. Thus, the presence of free Cu2+ in solution cannot beexcluded, especially for samples with high Cu spikes. However,the almost identical sorption isotherms when normalizing Cusorption data to Corg and DOC (Figure 2b) imply that Cu-DOM complexes played a dominant role. Only Reference Bdid not fit to Transitions A1, A2, and Reference A, showing ahigher Klinear (0.925 kg CDOC (kg Corg)
−1) than the other soils.Since Site B was sampled in September while Site A wassampled in February, seasonal differences in DOM quantityand quality (compare Table S1, Figures S3 and S4, SI) might
Figure 3. (a,b) Normalized Cu K-edge XANES spectra and (d,e) k3-weighted EXAFS spectra of Cu reference compounds (a,d) and sample spectra(d,e) with best LCF spectra (symbols). (c,f) Cu redox speciation in samples based on LCF of normalized XANES spectra in the energy range8968−9018 eV (c) and of k3-weighted EXAFS spectra in the k-range 2.5−10 Å−1 (f) (detailed results in Table S4, SI). Individual fractions wereconstrained to values between 0 and 1, the sum of fractions was not constrained. Cu(II)-ferrih = Cu(II)-ferrihydrite, Mof = Mofette, Tra =Transition, Ref = Reference, and Cu = Cu(II)-spiked samples.
Environmental Science & Technology Article
DOI: 10.1021/acs.est.8b02668Environ. Sci. Technol. 2018, 52, 13698−13707
13702
117

contribute to this discrepancy, but further research is neededto elucidate the exact processes.To clarify which processes caused the completely different
Cu sorption behavior in Mofette A and B compared to theother soils, we investigated the Cu solid-phase speciation.Copper Binding to SOM and Mineral Precipitation. As
already expected from their similar sorption behavior, the Cusolid-phase speciation in Transitions A1, A2, and Reference Awas more or less identical. All XANES spectra showed anabsorption maximum around 8988 eV (Figure 3a) indicative ofthe 1s → 4p transition in Cu(II) coordinated to 6 oxygen/nitrogen atoms in a Jahn−Teller-distorted tetragonal config-uration.63 Principal component analysis of both XANES andEXAFS spectra indicated the dominance of one component(>98.7% for XANES, Table S3, SI). The best fits withnormalized sum-squared residuals (NSSR) < 0.2% for XANESand ≤ 3% for EXAFS were achieved with references of Cu(II)adsorbed to organic matter (Cu(II)-humic, Cu(II)-malate,Cu(II)-carboxyl, Figure 3c,f). However, for EXAFS fitting thedifference to linear combination fits (LCF) including otheroxygen/nitrogen-coordinated Cu(II) compounds was not
significant according to the Hamilton test,64,65 (cf. SectionS.8, SI). This confirmed that Cu(II) bound to SOM was thedominating Cu species in natural soil samples from these sitesand that the experimentally spiked Cu(II) was alsopredominantly adsorbed to SOM. The importance of SOMfor Cu(II) sorption in soils is well-known.4,16,66−68 The Cu(II)binding mainly occurs via five- to six-membered ring chelatesformed by closely spaced hydroxylic and carboxylic groups,building an octahedron of oxygen ions around the Cu(II) ion,which geometrically fits perfectly into this structure.9,10 Thefact that the Cu sorption isotherms did not show any evidencefor saturation, even at the highest Cu loadings, shows thatthere were still potential sorption sites on the SOM. Thus,moderate p(CO2) did not affect qualitative SOM compositionin a way that influenced Cu adsorption potential directly. Smallamounts (<17%) of Cu1.8S in LCFs of these samples might bean artifact from radiation-induced Cu reduction, which mainlyoccurred during measurements at beamline 4−3 (details inSection S.8, SI).In Mofette A the Cu solid-phase speciation differed from
that of the other soils: XANES fitting of the initial sample
Figure 4. Organic matter quality: (a,b) FTIR spectra of freeze-dried DOM water extracts from Site A (a) and Site B (b) normalized to the peak at1635 cm−1. A detail from the spectra wavenumber region 1000−1800 cm−1 can be found in Figure S4, SI. (c) 13C NMR spectra of soil fromMofette A, Transition A1, and Reference A with the respective relative contents of organic species derived from integrating areas of 13C NMRspectra.
Environmental Science & Technology Article
DOI: 10.1021/acs.est.8b02668Environ. Sci. Technol. 2018, 52, 13698−13707
13703
118

revealed the presence of 72% sulfur-coordinated Cu(I). Alsothe spiked Cu(II) seems to have been partially reduced,leading to 25% sulfur-coordinated Cu(I) besides Cu(II)binding to oxygen/nitrogen in the Cu-spiked sample (Figure3c). Due to the complex sample matrix, there was nostatistically significant difference between fits including Cu1.8Sor Cu(I)-thiol as reference compound for sulfur-coordinatedCu(I). However, the effective removal of Cu from the liquidphase despite high DOC concentrations (Figure S3, SI)suggests that precipitation of Cu(I) sulfide minerals was moreimportant than Cu(I) adsorption to thiol groups on SOM. Wealso analyzed a peat sample from 2 m depth of Mofette A,which had shown an enrichment with several metal(loid)s,including Cu, in a prior study.52 Linear combination fitting ofXANES and EXAFS spectra now revealed that Cu(II) bindingto SOM was not the dominating Cu sequestering process butthat most Cu was instead present as CuS (covellite, 65%according to XANES LCF, Figure 3c). This can be seen in theXANES spectrum by a shift of the main absorption edge tolower energies around 8982−8984 eV9,63 (Figure 3b).The formation of Cu(I) sulfide minerals requires prior
reduction of Cu(II) and the presence of sulfide.34 We coulddetect free sulfide concentrations of 60 μM in the pore watersample from 10 to 15 cm depth of Mofette A (data notshown). The presence of sulfate-reducing bacteria haspreviously been shown for this mofette site.53,69 Even if wecould neither detect free sulfide nor Cu(I) photometricallyduring the sorption experiment, it is likely that Cu(II)reduction occurred, however, liquid phase concentrationmight have remained low due to fast precipitation. Formationof Cu sulfides has been shown to occur in soils even at lowavailable sulfide levels, which is attributed to the low solubilityof Cu sulfide minerals.20,31,35 We also detected a small metallicCu particle in the Cu-loaded Mofette A sample by SEM-EDS(details in Section S.7, SI). Precipitation of metallic Cu(0) canoccur if aqueous Cu(I) formed by (microbial) reduction ofCu(II) is not stabilized by complexation, e.g., with sulfide, butdisproportionates into Cu(II) and Cu(0).18,20,31,70 However,since LCFs of this sample did not confirm the presence ofmetallic Cu(0), contributions must have been low.A mixture of adsorption and precipitation processes can
explain the differing shape of the sorption isotherms of MofetteA and B in comparison to transitions and references (Figure2), assuming a dominance of Cu reduction and followingprecipitation at low spikes and a mixture of precipitation andadsorption at higher spikes.Effects of Organic Matter Quality on Cu Mobility. To
further clarify the reasons for differing Cu sorption behaviordespite similar XAS solid-phase speciation in soils with low(References) and moderate (Transitions) p(CO2) (Figure 2a),we further investigated organic matter quality, both for DOMand SOM.Differences between FTIR spectra of DOM water extracts
were relatively small (Figure 4a,b). Especially Transition A1,A2, and References A and B followed almost the same line(detailed band assignments in Section S.5, SI). The sameaccounted for SOM, where areal contributions of C in differentfunctional groups determined by 13C NMR for Transition A1and Reference A were almost equal (Figure 4c).Both DOM and SOM, however, differed in samples from
degassing centers (Mofette A and B) compared to transitionsand references. In FTIR spectra of DOM water extracts, bandsindicative of aromatic structures (1720, 1240 cm−1), aliphatic
structures (1450 cm−1), and polypeptides (1550 cm−1) weremore pronounced whereas the band at 1090 cm−1, indicativeof polysaccharides, was less pronounced compared to the othersamples. The ratio of the peak heights at 2960 and 2920 cm−1
(asymmetric stretching of R−CH3 and R−CH2, respectively),which can be used as a measure of aliphatic chain length,71 waslower for Mofette A and B indicating longer aliphatic chainsdue to decreased decomposition.48 Accordingly, we detected ahigher relative fraction of aliphatic C in the 13C NMRspectrum of Mofette A soil in comparison to Transition A1 andReference A (Figure 4c). Rennert et al.48 observedaccumulation of less degraded plant material (alkyl C like inlignin) under higher p(CO2) and less transfer of SOM into theclay fraction. They also showed that microbial formation ofpolysaccharides and polypeptides and their accumulation inthe clay fraction is reduced. A less pronounced shoulderindicative of polysaccharides and more pronounced featuresindicative of aromatic structures such as lignin and of longeraliphatic chain lengths could also be observed in our study inthe FTIR spectra of DOM from mofette centers. Aliphaticcompounds in DOM have a lower binding affinity for Cu72
which may have contributed to lower dissolved Cuconcentrations in mofette samples. Very recently, Rennert73
reported a negative correlation between p(CO2) and theabundance of carboxyl groups in particulate SOM in a transectfrom a mofette site, an observation that could be relevant forCu(II), since carboxylic groups are involved in its complex-ation by SOM.9,10 However, SOM quality differences do notseem to have affected Cu sorption in the concentration rangetested in this study since XAS solid-phase speciation showedthe same mode of Cu(II) binding. Therefore, the stronglyincreased Cu sequestration in mofette centers was likely causedby additional Cu(II) reduction and precipitation as Cu(I)sulfides.Since the qualitative composition of both SOM and DOM in
samples from low to moderate p(CO2) showed no significantdifferences, the observed differences in Klinear for Cu sorption(Figure 2a) must have been exclusively caused by differentratios of dissolved to solid-phase organic matter. Rennert andPfanz49 observed a strong relationship between the amount ofparticulate SOM and p(CO2). From this fact and from thepreviously mentioned decreased accumulation of SOM in theclay fraction they concluded that the reactivity of SOM isdecreased, even under moderate p(CO2), which wouldfacilitate potential release of DOM. Also lower contents ofFe (oxyhydr)oxides and clay minerals (Table 1, Section S.6,SI), which are able to stabilize SOM by surface interactions,74
might contribute to an increasing DOM release with increasingp(CO2).
48,49 This is in line with observations in our sorptionstudy where DOM formation during the experiment as well asDOC:SOC ratio increased in the order: Reference A <Transition A1 < Transition A2 < Mofette A (Figure S3, SI).The reported negative effect of CO2 on the interaction of SOMwith soil minerals48,49 and a resulting higher proportion ofCu(II)-DOM complexes thus explains the observed decreaseof Cu sorption coefficients in the order Reference A >Transition A1 > Transition A2 (Figure 2a). All isothermsplotted on the same line when sorption was normalized againsttotal organic C (Figure 2b). These findings are in line with theobservations of Degryse et al.75 who showed that Cupartitioning between the solid phase and the pore water canbe modeled quite well just using the DOC:SOC ratio innatural soils. The fact that Reference B did not follow the same
Environmental Science & Technology Article
DOI: 10.1021/acs.est.8b02668Environ. Sci. Technol. 2018, 52, 13698−13707
13704
119

adsorption isotherm could indicate a seasonal influence onboth DOM and SOM quality and quantity and, thus, on Cumobility.Implications for Copper Mobility in Mofettes and in
Other Soils. The general assumption that higher SOMcontent increases Cu adsorption also holds true for mofettesoils, but an increased release of DOM under high p(CO2) andthe formation of Cu-DOM complexes can enhance overall Cumobility. Formation of DOM in our experiment might havebeen overestimated compared to natural conditions, wherecation bridging to clay minerals by exchangeable aluminumwas recently proposed to be involved in SOM stabilization.73
Cu adsorption did not seem to be affected by bulk structuralSOM quality, which was rather similar at moderate to lowp(CO2). Differences concerning functional groups, especiallythe recently described reduced content of carboxylic groups inparticulate SOM formed under increased p(CO2),
73 might,however, become relevant at higher Cu loadings or in thepresence of competing divalent cations, since these groups areknown to be the dominant binding site for Cu(II).9
In degassing centers, the formation of Cu(I) mineral phaseslimited Cu mobility rather than adsorption to SOM due to thepermanently anoxic conditions at p(CO2) of almost 1. It islikely that other chalcophilic metal(loid)s (e.g., Cd, Pb, Hg, atincreased sulfide contents also Fe and As) can precipitate inmofettes as well. The presence of pyrite in deeper layers ofmofettes has already been evidenced47,76 and the comparablyhigh As concentrations in the peat lens in 2 m depth ofMofette A observed in Mehlhorn et al.52 might be partlycaused by (co)precipitation of As sulfide minerals33 or bindingvia thiol groups of SOM.77
The estimated potential maximum Cu sequestration alongthe transect from low to high p(CO2), presented in aconceptual model in Figure 5, fits well to the observations
from our field study: lowest Cu soil contents were detected inthe transition zone, where Cu is most mobile (highest porewater Cu concentrations) due to complexation with DOM athigh DOC:SOC ratios (Figure 1, Figure 5). Permanent Cusequestration due to precipitation should, however, have led toeven higher Cu soil contents in the degassing center thanobserved in our study. It is likely that Cu, released byweathering processes in deeper sediment layers and then
transported upward with groundwater flow, is alreadysequestered at greater depths, e.g., in the mentioned, sulfide-rich peat lens, limiting the Cu supply toward the topsoil.However, further research is needed to clarify the influence oftranslocation processes on Cu sequestration.Similar processes influencing Cu mobility might occur at
other sites exhibiting a temporal or spatial redox and/or SOMgradient. A decreased Cu bioavailability due to mineralprecipitation under permanently anoxic conditions, as theymay occur, e.g., in the center of organic contaminant spills orduring flooding of wetland soils, can become a problem forcertain microbes with an essential need for Cu, e.g., formethane-oxidizing bacteria.78 An increased Cu mobility due toCu-DOM complexation may become problematic at Cu-contaminated sites. According to our study, the highest Cumobility can be expected in transition zones or transition timesbetween oxic and permanently anoxic conditions. There, SOMdecomposition and stabilization is slowed down due to limitedoxygen supply and Cu-DOM complexes can form, but suboxicconditions hinder effective Cu sequestration by precipitation ofsulfide minerals. Besides oxygen availability, numerous otherfactors can influence DOC:SOC ratios and sulfide occurrencealong redox gradients, making the assessment of Cu mobility insuch soils a complex issue and necessitating further research oninteractions and influencing processes.
■ ASSOCIATED CONTENT*S Supporting InformationThe Supporting Information is available free of charge on theACS Publications website at DOI: 10.1021/acs.est.8b02668.
Details on kinetics of Cu sorption, pH, DOMmobilization, organic acids in DOM, calculation ofCO2 concentrations,
13C NMR analyses, FTIR analysesof DOM extracts, soil mineralogy determined by XRD,SEM-EDS analyses, SEM image of the Cu(0) particleand corresponding EDS spectra, and additionalinformation on XAS measurements (PDF)
■ AUTHOR INFORMATIONCorresponding Author*Phone: +49 921 55 3999; e-mail: [email protected] (B.P.-F.).ORCIDBritta Planer-Friedrich: 0000-0002-0656-4283NotesThe authors declare no competing financial interest.
■ ACKNOWLEDGMENTSWe acknowledge financial support for a PhD stipend to JudithMehlhorn from the German Academic Scholarship Foundationas well as by a DAAD mobility grant (No. 57315737) fortravels to the U.S.A. We acknowledge the StanfordSynchrotron Radiation Lightsource (SSRL), SLAC NationalAccelerator Laboratory, supported by the U.S. Department ofEnergy, Office of Science, Office of Basic Energy Sciencesunder Contract No. DE-AC02-76SF00515. We are grateful toMatthew Latimer and Eric Nelson for support at beamline 4-3.From University of Bayreuth, we thank Beate Bojer (InorganicChemistry III) for NMR measurements, Dorothea Wiesner(BGI) for help with SEM-EDS, Tiziana Boffa Ballaran (BGI)for XRD measurements, Benjamin Gilfedder and Silke
Figure 5. Conceptual model of Cu behavior in soils under theinfluence of geogenic CO2, going from low (Reference, left) to highsoil CO2 contents (Mofette, right). DOC:SOC = dissolved to solid-phase ratio of organic carbon, pot. max. Cu sequestration = potentialmaximum Cu sequestration including adsorption and precipitationprocesses.
Environmental Science & Technology Article
DOI: 10.1021/acs.est.8b02668Environ. Sci. Technol. 2018, 52, 13698−13707
13705
120

Hammer (Hydrology) for providing access to GC, Heidi Zier(Hydrology) for FTIR measurements, Oliver Schmidt andAnita Gossner (Ecological Microbiology) for organic acidanalysis, Manfred Fischer (Geomorphology), Ruth Freitag andNicolas Weithmann (Process Biotechnology) for borrowingequipment, Nadja Knauer, Esther Breuninger, and LukasGerber for assistance during sampling and experiments. Weacknowledge helpful discussions with Egbert Matzner (SoilEcology) and Martin Obst (Experimental Biogeochemistry).
■ REFERENCES(1) Rubino, J. T.; Franz, K. J. Coordination chemistry of copperproteins: how nature handles a toxic cargo for essential function. J.Inorg. Biochem. 2012, 107 (1), 129−143.(2) Flemming, C.; Trevors, J. Copper toxicity and chemistry in theenvironment: a review. Water, Air, Soil Pollut. 1989, 44 (1−2), 143−158.(3) McBride, M.; Sauve, S.; Hendershot, W. Solubility control of Cu,Zn, Cd and Pb in contaminated soils. Eur. J. Soil Sci. 1997, 48 (2),337−346.(4) McLaren, R. G.; Crawford, D. V. Studies on soil copper II. Thespecific adsorption of copper by soils. J. Soil Sci. 1973, 24 (4), 443−452.(5) McLaren, R.; Williams, J.; Swift, R. Some observations on thedesorption and distribution behaviour of copper with soilcomponents. J. Soil Sci. 1983, 34 (2), 325−331.(6) Hering, J. G.; Morel, F. M. Humic acid complexation of calciumand copper. Environ. Sci. Technol. 1988, 22 (10), 1234−1237.(7) Kinniburgh, D. G.; van Riemsdijk, W. H.; Koopal, L. K.;Borkovec, M.; Benedetti, M. F.; Avena, M. J. Ion binding to naturalorganic matter: competition, heterogeneity, stoichiometry andthermodynamic consistency. Colloids Surf., A 1999, 151 (1), 147−166.(8) Flogeac, K.; Guillon, E.; Aplincourt, M. Surface complexation ofcopper (II) on soil particles: EPR and XAFS studies. Environ. Sci.Technol. 2004, 38 (11), 3098−3103.(9) Manceau, A.; Matynia, A. The nature of Cu bonding to naturalorganic matter. Geochim. Cosmochim. Acta 2010, 74 (9), 2556−2580.(10) Karlsson, T.; Persson, P.; Skyllberg, U. Complexation ofcopper(II) in organic soils and in dissolved organic matter − EXAFSevidence for chelate ring structures. Environ. Sci. Technol. 2006, 40(8), 2623−2628.(11) McBride, M. Reactions controlling heavy metal solubility insoils. In Adv. Soil Sci.; Springer: 1989; pp 1−56.(12) Strawn, D. G.; Palmer, N. E.; Furnare, L. J.; Goodell, C.;Amonette, J. E.; Kukkadapu, R. K. Copper sorption mechanisms onsmectites. Clays Clay Miner. 2004, 52 (3), 321−333.(13) Parkman, R.; Charnock, J.; Bryan, N.; Livens, F.; Vaughan, D.Reactions of copper and cadmium ions in aqueous solution withgoethite, lepidocrocite, mackinawite, and pyrite. Am. Mineral. 1999,84 (3), 407−419.(14) Fischer, L.; Brummer, G. W.; Barrow, N. J. Observations andmodelling of the reactions of 10 metals with goethite: adsorption anddiffusion processes. Eur. J. Soil Sci. 2007, 58 (6), 1304−1315.(15) Tiberg, C.; Sjostedt, C.; Persson, I.; Gustafsson, J. P. Phosphateeffects on copper(II) and lead(II) sorption to ferrihydrite. Geochim.Cosmochim. Acta 2013, 120, 140−157.(16) Strawn, D. G.; Baker, L. L. Speciation of Cu in a contaminatedagricultural soil measured by XAFS, μ-XAFS, and μ-XRF. Environ. Sci.Technol. 2008, 42 (1), 37−42.(17) Sugio, T.; Tsujita, Y.; Inagaki, K.; Tano, T. Reduction of cupricions with elemental sulfur by Thiobacillus ferrooxidans. Appl. Environ.Microbiol. 1990, 56 (3), 693−696.(18) Hofacker, A. F.; Behrens, S.; Voegelin, A.; Kaegi, R.; Losekann-Behrens, T.; Kappler, A.; Kretzschmar, R. Clostridium species asmetallic copper-forming bacteria in soil under reducing conditions.Geomicrobiol. J. 2015, 32 (2), 130−139.
(19) Wakatsuki, T. Metal oxidoreduction by microbial cells. J. Ind.Microbiol. 1995, 14 (2), 169−177.(20) Weber, F.-A.; Voegelin, A.; Kaegi, R.; Kretzschmar, R.Contaminant mobilization by metallic copper and metal sulphidecolloids in flooded soil. Nat. Geosci. 2009, 2 (4), 267−271.(21) Matocha, C.; Karathanasis, A.; Rakshit, S.; Wagner, K.Reduction of copper(II) by iron(II). J. Environ. Qual. 2005, 34 (5),1539−1546.(22) Fulda, B.; Voegelin, A.; Maurer, F.; Christl, I.; Kretzschmar, R.Copper redox transformation and complexation by reduced andoxidized soil humic acid. 1. X-ray absorption spectroscopy study.Environ. Sci. Technol. 2013, 47 (19), 10903−10911.(23) Pham, A. N.; Rose, A. L.; Waite, T. D. Kinetics of Cu(II)reduction by natural organic matter. J. Phys. Chem. A 2012, 116 (25),6590−6599.(24) Maurer, F.; Christl, I.; Fulda, B.; Voegelin, A.; Kretzschmar, R.Copper redox transformation and complexation by reduced andoxidized soil humic acid. 2. Potentiometric titrations and dialysis cellexperiments. Environ. Sci. Technol. 2013, 47 (19), 10912−10921.(25) Borch, T.; Kretzschmar, R.; Kappler, A.; Cappellen, P. V.;Ginder-Vogel, M.; Voegelin, A.; Campbell, K. Biogeochemical redoxprocesses and their impact on contaminant dynamics. Environ. Sci.Technol. 2010, 44 (1), 15−23.(26) Du Laing, G.; Vanthuyne, D.; Vandecasteele, B.; Tack, F.;Verloo, M. Influence of hydrological regime on pore water metalconcentrations in a contaminated sediment-derived soil. Environ.Pollut. 2007, 147 (3), 615−625.(27) Kirk, G. The Biogeochemistry of Submerged Soils; John Wiley &Sons: 2004.(28) Lett, R.; Fletcher, W. Syngenetic sulphide minerals in a copper-rich bog. Miner. Deposita 1980, 15 (1), 61−67.(29) Lovering, T. S. Organic Precipitation of Metallic Copper; USGovernment Printing Office: 1927.(30) Fulda, B.; Voegelin, A.; Ehlert, K.; Kretzschmar, R. Redoxtransformation, solid phase speciation and solution dynamics ofcopper during soil reduction and reoxidation as affected by sulfateavailability. Geochim. Cosmochim. Acta 2013, 123, 385−402.(31) Hofacker, A. F.; Voegelin, A.; Kaegi, R.; Weber, F.-A.;Kretzschmar, R. Temperature-dependent formation of metallic copperand metal sulfide nanoparticles during flooding of a contaminated soil.Geochim. Cosmochim. Acta 2013, 103, 316−332.(32) Pattrick, R.; Mosselmans, J.; Charnock, J.; England, K.; Helz,G.; Garner, C.; Vaughan, D. The structure of amorphous coppersulfide precipitates: An X-ray absorption study. Geochim. Cosmochim.Acta 1997, 61 (10), 2023−2036.(33) Morse, J.; Luther, G. Chemical influences on trace metal-sulfideinteractions in anoxic sediments. Geochim. Cosmochim. Acta 1999, 63(19), 3373−3378.(34) Luther, G. W.; Theberge, S. M.; Rozan, T. F.; Rickard, D.;Rowlands, C.; Oldroyd, A. Aqueous copper sulfide clusters asintermediates during copper sulfide formation. Environ. Sci. Technol.2002, 36 (3), 394−402.(35) Weber, F.-A.; Voegelin, A.; Kretzschmar, R. Multi-metalcontaminant dynamics in temporarily flooded soil under sulfatelimitation. Geochim. Cosmochim. Acta 2009, 73 (19), 5513−5527.(36) Sharma, V. K.; Millero, F. J. Oxidation of copper(I) in seawater.Environ. Sci. Technol. 1988, 22 (7), 768−771.(37) Fenwick, F. The equilibrium between cupric ion, cuprous ionand metallic copper. J. Am. Chem. Soc. 1926, 48 (4), 860−870.(38) Yuan, X.; Pham, A. N.; Xing, G.; Rose, A. L.; Waite, T. D.Effects of pH, chloride, and bicarbonate on Cu(I) oxidation kineticsat circumneutral pH. Environ. Sci. Technol. 2012, 46 (3), 1527−1535.(39) Leal, M. F. C.; Van Den Berg, C. M. Evidence for strongcopper(I) complexation by organic ligands in seawater. Aquat.Geochem. 1998, 4 (1), 49−75.(40) Laglera, L. M.; van den Berg, C. M. Copper complexation bythiol compounds in estuarine waters. Mar. Chem. 2003, 82 (1), 71−89.
Environmental Science & Technology Article
DOI: 10.1021/acs.est.8b02668Environ. Sci. Technol. 2018, 52, 13698−13707
13706
121

(41) Blume, H.-P.; Felix-Henningsen, P. Reductosols: Natural soilsand Technosols under reducing conditions without an aquic moistureregime. J. Plant Nutr. Soil Sci. 2009, 172 (6), 808−820.(42) Lewicki, J. L.; Birkholzer, J.; Tsang, C.-F. Natural and industrialanalogues for leakage of CO2 from storage reservoirs: identification offeatures, events, and processes and lessons learned. Environ. Geol.2007, 52 (3), 457−467.(43) Brauer, K.; Kampf, H.; Niedermann, S.; Strauch, G.; Weise, S.M. Evidence for a nitrogen flux directly derived from the Europeansubcontinental mantle in the Western Eger Rift, central Europe.Geochim. Cosmochim. Acta 2004, 68 (23), 4935−4947.(44) Kampf, H.; Geissler, W. H.; Brauer, K. Combined gas-geochemical and receiver function studies of the Vogtland/NWBohemia intraplate mantle degassing field, central Europe. In MantlePlumes; Ritter, J. R. R., Christensen, U. R., Eds.; Springer: BerlinHeidelberg, 2007; pp 127−158.(45) Macek, I.; Videmsek, U.; Kastelec, D.; Stopar, D.; Vodnik, D.Geological CO2 affects microbial respiration rates in Stavesincimofette soils. Acta Biol. Slov 2009, 52 (2), 41−48.(46) Videmsek, U.; Hagn, A.; Suhadolc, M.; Radl, V.; Knicker, H.;Schloter, M.; Vodnik, D. Abundance and diversity of CO2-fixingbacteria in grassland soils close to natural carbon dioxide springs.Microb. Ecol. 2009, 58 (1), 1−9.(47) Flechsig, C.; Bussert, R.; Rechner, J.; Schutze, C.; Kampf, H.The Hartousov mofette field in the Cheb Basin, western Eger Rift(Czech Republic): a comperative geoelectric, sedimentologic and soilgas study of a magmatic diffuse CO2-degassing structure. Z. Geol. Wiss2008, 36 (3), 177−193.(48) Rennert, T.; Eusterhues, K.; Pfanz, H.; Totsche, K. U. Influenceof geogenic CO2 on mineral and organic soil constituents on amofette site in the NW Czech Republic. Eur. J. Soil Sci. 2011, 62 (4),572−580.(49) Rennert, T.; Pfanz, H. Geogenic CO2 affects stabilization of soilorganic matter. Eur. J. Soil Sci. 2015, 66 (5), 838−846.(50) Ross, D. J.; Tate, K. R.; Newton, P. C. D.; Wilde, R. H.; Clark,H. Carbon and nitrogen pools and mineralization in a grassland gleysoil under elevated carbon dioxide at a natural CO2 spring. GlobalChange Biol. 2000, 6 (7), 779−790.(51) Bankwitz, P.; Schneider, G.; Kampf, H.; Bankwitz, E. Structuralcharacteristics of epicentral areas in Central Europe: study case ChebBasin (Czech Republic). J. Geodyn 2003, 35 (1−2), 5−32.(52) Mehlhorn, J.; Beulig, F.; Kusel, K.; Planer-Friedrich, B. Carbondioxide triggered metal(loid) mobilisation in a mofette. Chem. Geol.2014, 382, 54−66.(53) Beulig, F.; Urich, T.; Nowak, M.; Trumbore, S. E.; Gleixner, G.;Gilfillan, G. D.; Fjelland, K. E.; Kusel, K. Altered carbon turnoverprocesses and microbiomes in soils under long-term extremely highCO2 exposure. Nat. Microbiol 2016, 1, 15025.(54) Hesslein, R. H. An in situ sampler for close interval pore waterstudies. Limnol. Oceanogr. 1976, 21 (6), 912(55) Rennert, T.; Eusterhues, K.; De Andrade, V. D.; Totsche, K. U.Iron species in soils on a mofette site studied by Fe K-edge X-rayabsorption near-edge spectroscopy. Chem. Geol. 2012, 332−333,116−123.(56) Mehlhorn, J.; Byrne, J. M.; Kappler, A.; Planer-Friedrich, B.Time and temperature dependency of carbon dioxide triggeredmetal(loid) mobilization in soil. Appl. Geochem. 2016, 74, 122−137.(57) Beaubien, S.; Ciotoli, G.; Coombs, P.; Dictor, M. C.; Kruger,M.; Lombardi, S.; Pearce, J.; West, J. The impact of a naturallyoccurring CO2 gas vent on the shallow ecosystem and soil chemistryof a Mediterranean pasture (Latera, Italy). Int. J. Greenhouse GasControl 2008, 2 (3), 373−387.(58) Sander, R. Compilation of Henry’s law constants (version 4.0)for water as solvent. Atmos. Chem. Phys. 2015, 15 (8), 4399(59) Cline, J. D. Spectrophotometric determination of hydrogensulfide in natural waters. Limnol. Oceanogr. 1969, 14 (3), 454−458.(60) Moffett, J. W.; Zika, R. G.; Petasne, R. G. Evaluation ofbathocuproine for the spectro-photometric determination of copper-
(I) in copper redox studies with applications in studies of naturalwaters. Anal. Chim. Acta 1985, 175, 171−179.(61) Artz, R. R.; Chapman, S. J.; Robertson, A. H. J.; Potts, J. M.;Laggoun-Defarge, F.; Gogo, S.; Comont, L.; Disnar, J.-R.; Francez, A.-J. FTIR spectroscopy can be used as a screening tool for organicmatter quality in regenerating cutover peatlands. Soil Biol. Biochem.2008, 40 (2), 515−527.(62) Christl, I.; Kretzschmar, R. Relating ion binding by fulvic andhumic acids to chemical composition and molecular size. 1. Protonbinding. Environ. Sci. Technol. 2001, 35 (12), 2505−2511.(63) Kau, L. S.; Spira-Solomon, D. J.; Penner-Hahn, J. E.; Hodgson,K. O.; Solomon, E. I. X-ray absorption edge determination of theoxidation state and coordination number of copper. Application to thetype 3 site in Rhus vernicifera laccase and its reaction with oxygen. J.Am. Chem. Soc. 1987, 109 (21), 6433−6442.(64) Hamilton, W. C. Significance tests on the crystallographic Rfactor. Acta Crystallogr. 1965, 18 (3), 502−510.(65) Calvin, S. XAFS for Everyone; CRC Press: 2013.(66) Brown, P. A.; Gill, S. A.; Allen, S. J. Metal removal fromwastewater using peat. Water Res. 2000, 34 (16), 3907−3916.(67) Kumpiene, J.; Lagerkvist, A.; Maurice, C. Stabilization of Pb-and Cu-contaminated soil using coal fly ash and peat. Environ. Pollut.2007, 145 (1), 365−373.(68) Strawn, D. G.; Baker, L. L. Molecular characterization of copperin soils using X-ray absorption spectroscopy. Environ. Pollut. 2009,157 (10), 2813−2821.(69) Krauze, P.; Kampf, H.; Horn, F.; Liu, Q.; Voropaev, A.;Wagner, D.; Alawi, M. Microbiological and geochemical survey ofCO2-dominated mofette and mineral waters of the Cheb Basin, CzechRepublic. Front. Microbiol. 2017, 8, 2446.(70) Xia, B.; Qiu, H.; Knorr, K.-H.; Blodau, C.; Qiu, R. Occurrenceand fate of colloids and colloid-associated metals in a mining-impacted agricultural soil upon prolonged flooding. J. Hazard. Mater.2018, 348, 56−66.(71) Ibarra, J.; Munoz, E.; Moliner, R. FTIR study of the evolutionof coal structure during the coalification process. Org. Geochem. 1996,24 (6), 725−735.(72) Brooks, M. L.; Meyer, J. S.; McKnight, D. M. Photooxidation ofwetland and riverine dissolved organic matter: altered coppercomplexation and organic composition. Hydrobiologia 2007, 579(1), 95−113.(73) Rennert, T. Geogenic CO2 affects inorganic soil properties andthe composition of soil organic matter in physical fractions. Soil Res.2018, 56 (4), 396−403.(74) Lutzow, M. v.; Kogel-Knabner, I.; Ekschmitt, K.; Matzner, E.;Guggenberger, G.; Marschner, B.; Flessa, H. Stabilization of organicmatter in temperate soils: mechanisms and their relevance underdifferent soil conditions−a review. Eur. J. Soil Sci. 2006, 57 (4), 426−445.(75) Degryse, F.; Smolders, E.; Parker, D. Partitioning of metals(Cd, Co, Cu, Ni, Pb, Zn) in soils: concepts, methodologies,prediction and applications−a review. Eur. J. Soil Sci. 2009, 60 (4),590−612.(76) Bussert, R.; Kampf, H.; Flechsig, C.; Hesse, K.; Nickschick, T.;Liu, Q.; Umlauft, J.; Vylita, T.; Wagner, D.; Wonik, T. Drilling into anactive mofette: pilot-hole study of the impact of CO2-rich mantle-derived fluids on the geo−bio interaction in the western Eger Rift(Czech Republic). Sci. Drill. 2017, 23, 13.(77) Langner, P.; Mikutta, C.; Kretzschmar, R. Arsenic sequestrationby organic sulphur in peat. Nat. Geosci. 2012, 5 (1), 66.(78) Glass, J.; Orphan, V. Trace Metal Requirements for MicrobialEnzymes Involved in the Production and Consumption of Methaneand Nitrous Oxide. Front. Microbiol. 2012, 3, Article 61.
Environmental Science & Technology Article
DOI: 10.1021/acs.est.8b02668Environ. Sci. Technol. 2018, 52, 13698−13707
13707
122

S1
Supporting Information
Environmental Science & Technology
Copper mobilization and immobilization along an organic
matter and redox gradient – insights from a mofette site
Judith Mehlhorn,† Johannes Besold,
† Juan S. Lezama Pacheco,
‡ Jon Petter Gustafsson,
§ Ruben
Kretzschmar,∥ Britta Planer-Friedrich*,†
†Environmental Geochemistry, Bayreuth Center for Ecology and Environmental Research
(BayCEER), University of Bayreuth, D-95440 Bayreuth, Germany
‡Department of Environmental Earth System Science, Stanford University, Stanford, California
94305, United States
§Department of Soil and Environment, Swedish University of Agricultural Sciences, 75007
Uppsala, Sweden
∥Soil Chemistry Group, Institute of Biogeochemistry and Pollutant Dynamics, ETH Zurich,
CHN, CH-8092 Zurich, Switzerland
(23 pages, 7 figures, 4 tables)
CONTENTS
S.1 Kinetic study on copper sorption 2
S.2 Copper sorption isotherm – additional data 5
S.3 Calculation of dissolved CO2 concentrations 8
S.4 13
C nuclear magnetic resonance (NMR) spectroscopy 9
S.5 FTIR spectra of DOM extracts 10
S.6 Soil mineralogy (XRD) 12
S.7 SEM-EDS of Mofette A sample with highest Cu(II)-spike 13
S.8 Information on XAS measurements and copper reference compounds 15
References 21
123

S2
S.1 Kinetic study on copper sorption
Materials and Methods. Only Transition A1 and Reference A were used for the kinetic study.
Soil was thawed overnight inside an anerobic chamber (Coy, 95% N2/5% H2), then sieved and
homogenized by pressing the wet soil through a 1 mm mesh size nylon sieve. The soil was
weighted immediately into PP bottles in triplicate (dry weight equivalent approx. 3.4 g) and
100 mL of 5 mM NaCl (Merck, p.a.), pH 4.5, were added as background electrolyte (approx.
soil-to-solution ratio of approx. 1:30). The suspensions were well-mixed, pH was adjusted to
4.5±0.1 with 1 M NaOH or 1 M HCl, and bottles were left to pre-equilibrate for 24 h with
occasional shaking. Afterwards, 25 mL of the supernatant were removed and stabilized for total
Cu determination by ICP-MS (0.2 µm cellulose-acetate filtration, stabilization in 0.45% H2O2
and 0.65% HNO3) and dissolved organic carbon (DOC) analysis (0.45 µm polyamide filter,
stored frozen till analysis) by thermo-catalytic oxidation with a TOC-VCPN Analyzer (Shimadzu).
The removed supernatant was replaced by 25 mL of a 1.57 mM CuCl2 (Grüssing, p.a.) solution,
pH 4.5, leading to a spike concentration of approx. 11.65 mmol kg-1
. The suspensions were well
mixed and the pH was re-adjusted to 4.5±0.1 with 1 M NaOH or 1 M HCl. In addition to the
triplicate sets of treatments, single soil blank samples (without Cu Spike) and a single chemical
blank (without soil) were prepared. All bottles were wrapped in aluminum foil to exclude light.
Sampling took place after 10 min, 1, 3, 6, 12, 24, 48, 96, 167, and 365 h. First, pH and redox
potential were determined directly in the suspensions. Except for the 10 min sampling, the
bottles were centrifuged (5 min at 4500 g, outside glovebox) and between 2 and 3.5 mL of the
supernatant were removed using needle and syringe. After filtration, the supernatant was
stabilized for total Cu determination by ICP-MS. At the last sampling, additional 8 mL were
stabilized for DOC analysis (stored frozen till analysis) to determine the amount of organic
carbon that was mobilized during the course of the experiment. At 1, 24, and 365 h, we also
tested whether a formation of Cu(I) had occurred during the experiment. We used an UV-vis
spectroscopy method with bathocuproine as colorimetric reagent.1,2
However, no detectable
amounts of Cu(I) could be determined over the course of the kinetic experiment. After the last
sampling, the supernatant was removed completely and the remaining soil was freeze-dried,
grinded, and analyzed on total Cu content after microwave assisted aqua regia digestion (MARS
Xpress, CEM). The amount of Cu adsorbed was calculated from the difference between initial
Cu spike and Cu concentration in solution.
124

S3
Results and Discussion. Sorption equilibrium for both Transition A1 and Reference A was
reached after 24–48 h, with a higher amount of Cu adsorbed in Reference A compared to
Transition A1 (Figure S1a). Interestingly, the amount of Cu adsorbed decreased for Transition
A1 and increased for Reference A during the course of the experiment. Concluding also from the
other results of this study, two different processes seem to have occurred. The strong increase in
dissolved organic carbon (DOC) of Transition A1 indicates that organic matter was mobilized
from the solid phase. This was also optically visible by a strong brownish color of the filtered
samples. Copper that was complexed with organic matter was remobilized by this process too
which explains the observed decrease in Cu adsorbed for Transition A1. DOC increase also
occurred for Reference A but to a way lower extent. However, the observed decrease in redox
potential and increase in pH were stronger in Reference A (end pH: 6.1±0.1, end redox:
220±3 eV) compared to Transition A1 (end pH: 5.4±0.0, end redox: 250±6 eV, Figure S1b).
Copper sorption increases with increasing pH due to decreasing protonation of sorption sites.
Thus, the slow increase in pH could have led to the observed increase in Cu adsorbed. The same
might have occurred in Transition A1 samples, however, the effect of Cu mobilization by DOC
formation must have exceeded this process. Additionally, Cu reduction and precipitation in form
of metallic Cu(0) or Cu sulfides, as observed for Mofette A and B in our sorption isotherm
experiment, might have occurred under more and more reducing conditions in Reference A
samples of the kinetic study as well.
Redox potential decrease and pH and DOC increase were even more pronounced for the soil
blanks (redox potential at the end: -110 and -170 eV, end pH: 6.8 and 6.6, end TOC: 510 and
24 mg L-1
for Mofette and Reference blank, respectively; data not shown). This indicates an
influence of microbial activity (proton consuming processes, like nitrate or Fe reduction), that
was significantly slowed down in the Cu spiked samples due to the toxicity of Cu towards
microorganisms.3,4
Results from the kinetic study indicate that 24 h equilibration time were enough to achieve
equilibrium conditions between solid phase and Cu2+
in solution. Longer equilibration times
would additionally lead to changes in pH and redox potential, which would decrease
comparability between soils.
125

S4
Cu
ad
so
rbed
[m
ol kg
-1]
DO
C [
mg
L-1]
pH
[-]
Eh
[m
V]
time [h]
Figure S1. Results from kinetic study on Cu sorption to Transition A1 and Reference A soil. Experiments
were conducted at pH 4.5±0.1 at a solid-to-solution-ratio of approx. 1:30 with 5 mM NaCl as background
electrolyte under anoxic conditions. Initial Cu soil concentrations are not included. (a) Amount of Cu
adsorbed over time and DOC concentration in liquid phase for 0 and 365 h (bars). (b) Variation of pH and
redox potential (Eh) in soil suspensions over time.
0
150
300
450
600
750
1.05E-02
1.07E-02
1.09E-02
1.11E-02
1.13E-02
1.15E-02(a)
0
200
400
600
800
0
1
2
3
4
5
6
0 50 100 150 200 250 300 350
(b)
Transition A1 Cu ads. Reference A Cu ads.
Transition A1 pH Reference A pH
Transition A1 Eh Reference A Eh
126

S5
S.2 Copper sorption isotherm – additional data
pH in soil suspensions
pH
[-]
Cu spike [mol kg
-1]
Figure S2. pH in soil suspensions after 24 h of equilibration with Cu(II) spike, initially adjusted pH of
4.5±0.1. Experiments were conducted at a solid-to-solution-ratio of approx. 1:30, with 5 mM NaCl as
background electrolyte under anoxic conditions. Error bars represent standard deviation, n=3.
4.00
4.25
4.50
4.75
5.00
0 0.002 0.004 0.006 0.008 0.01
Mofette A Reference ATransition A1 Mofette BTransition A2 Reference B
127

S6
Organic C and N contents
C/N
co
nte
nt
so
il [
%],
C/N
rati
o [
-]
dis
so
lved
org
. C
/N [
mg
L-1],
C/N
rati
o [
-]
Cd
isso
lved/C
so
lid [
kg
L-1]
Figure S3. (a-b) Total organic C and N content and C/N ratio in soil samples of Site A and B. (c-d)
Dissolved organic C (DOC) and N (DN) and C/N ratio determined after equilibration in liquid phase of
soil suspensions that received the highest Cu(II) spike. (e-f) Molar ratio between DOC released into liquid
phase during the isotherm experiment and total organic C in soil samples. Error bars represent standard
deviation, n=3.
0
5
10
15
20
C N C/N ratio
(a)
C N C/N ratio
(b)
0
50
100
150
200
DOC DN C/N ratio
(c)
DOC DN C/N ratio
(d)
0.0000
0.0004
0.0008
0.0012
0.0016
C_dissolved/C_solid
Mofette A
Transition A1
Transition A2
Reference A
(e)
C_dissolved/C_solid
Mofette B
Reference B
(f)
128

S7
Organic Acids in Dissolved Organic Matter
The concentrations of the organic acids succinate, formiate, propionate, lactate, acetate, and
butyrate were measured in single, filtered (0.2 µm, polyamide) liquid phase samples from the Cu
sorption isotherm experiment for each soil. Since Cu might have caused interferences, the
samples were already taken after the pre-equilibration step. Analysis was done with high
performance liquid chromatography (1090 series II with RID detector, Hewlett Packard, Paolo
Alto, USA) as described in Wüst et al.5
From the mentioned organic acids only lactate and acetate were present in low but detectable
amounts (Table S1). Interestingly, we detected high amounts of a compound that according to
retention time might have been ethanol, however, with the detector used, doubtless species
identification was not possible. Differences between Site A and B might result from seasonal
differences: while Site A was sampled directly after snowmelt in February 2017, Site B was
sampled shortly after a relatively warm period in September 2017.
Table S1. Organic acid concentrations in liquid phase samples from Cu sorption isotherm experiment.
The samples were taken after pre-equilibration but before Cu(II) spike addition to avoid Cu interferences.
Lactate [µM] Acetate [µM] Ethanol? [µM]
Mofette A 49 0 2023
Transition A1 55 44 379
Transition A2 48 134 262
Reference A 48 56 246
Mofette B 0 0 334
Reference B 0 192 2457
129

S8
S.3 Calculation of dissolved CO2 concentrations
The CO2 concentrations in pore water samples from Site A were calculated from head space
concentrations in septum bottles using Henry’s law as described in the Materials and Methods
section of the main text. This method worked well for samples from sites with low to moderate
CO2 influence (Transition and Reference) but CO2 concentrations in pore water samples from the
degassing center may have been underestimated due to the built-up of strong overpressure
conditions in septum bottles containing these samples (observed during sampling of headspace
gas phase). It is likely that the pore water in the degassing center was close to saturation or even
oversaturated with regard to CO2 due to permanent CO2 purging, as observed in prior studies.6,7
Calculated concentrations of 18 to 22 mmol CO2 L-1
for samples from the degassing center are
thus lower than expected (CO2 saturation would correspond to approx. 33 mmol L-1
assuming
kH,CO2=0.03344 mol L-1
atm-1
from Sander8). A correction of this potential error was not possible
since the exact overpressure in every individual septum bottle remained unknown. However,
despite this potential error, the overall trend presented in the main text (increasing Cu
distribution coefficients with increasing dissolved CO2 concentrations) remains unaffected.
130

S9
S.4 13C nuclear magnetic resonance (NMR) spectroscopy
Two freeze-dried and pestled soil samples from “Transition A1” and “Reference A” were
analyzed by solid-state 13
C nuclear magnetic resonance spectroscopy (NMR) using an Avance III
HD spectrometer (Bruker) at a B0 field 9.4 T. 13
C{1H} (100.6 MHz) MAS spectra were obtained
using a ramped cross-polarization (CP) experiment, where the nutation frequency nut on the
proton channel was varied linearly by 50%. The samples were spun at 12.5 kHz in a 4 mm MAS
double resonance probe (Bruker). The corresponding nut on the 13
C channel and the contact time
were adjusted to 70 kHz and 3 ms, respectively. During acquisition proton broadband decoupling
was applied using a spinal-64 sequence with nut=70 kHz. 13
C spectra are referenced indirectly
with respect to tetramethylsilane (TMS) using adamantane as secondary reference. Relative
contributions of various C groups were determined by integrating the signal intensity in the
respective areas of chemical shift according to Hoffmann et al.9
131

S10
S.5 FTIR spectra of DOM extracts
FTIR Materials and Methods. The DOM water extracts were filtered (0.45 µm, polyamide),
freeze-dried, mixed with potassium bromide (KBr, Roth) in a ratio of 1:100, pressed into pellets,
and analyzed for FTIR using a Vector 22 spectrometer (Bruker Optik). Measurements were
conducted in transmission mode with a resolution of 2 cm-1
from 4500 to 300 cm-1
, 32 scans per
sample were averaged and background corrected by subtracting the spectrum for pure KBr.
Absorption band assignments are based on Artz et al.10
and Rennert et al.11
Evaluation of FTIR spectra proved difficult since peak areas were partially influenced by
mineral interferences. This made a semi-quantitative data evaluation, e.g. by calculation of
humification indices as in Broder et al.12
or by Lorentz peak fitting as in Rennert et al.11
, highly
prone to errors. Therefore, we focused on differences between spectra concerning the occurrence
and relative height of certain peaks and normalized all spectra to the peak at 1635 cm-1
(aromatic
C=C stretching and asymmetric C-O stretching in COO-), instead of using the mineral derived,
highest peak at approx. 1030 cm-1
(stretching of Si-O), that differed strongly between samples.
FTIR band assignments. Transitions (A1, A2) and References (A, B) showed relatively
similar spectra having main bands at approx. 1720 cm-1
(C=O stretching of carboxylic acids and
aromatic esters), 1635 cm-1
(indicative for aromatics like lignin and aromatic or aliphatic
carboxylates), 1550 cm-1
(carboxylic acids and amides), 1450 cm-1
(C-H deformations in
phenolic and aliphatic structures), 1415 cm-1
(indicative for phenolic and aliphatic structures),
1380 cm-1
(stretching of deprotonated carboxyl or nitrate), 1245 cm-1
(indicative for C-O
stretching and O-H deformation in phenols, like lignin), and 1095 cm-1
(C-O stretching and O-H
deformation of polysaccharides). Spectra from Mofette A and B differed from the other soils:
bands at approx. 1720 and 1240 cm-1
(indicative for lignin), 1450 cm-1
, and 1550 cm-1
were more
pronounced whereas the band at 1095 cm-1
was less pronounced (Figure S4).
132

S11
rela
tive e
xti
nc
tio
n
rela
tive e
xti
nc
tio
n
wave number [cm
-1]
Figure S4. Detail from FTIR spectra of freeze-dried DOM water extracts from Site A (a) and Site B (b)
normalized to the peak at 1635 cm-1
.
0.0
0.5
1.0
1.5
2.0
2.5Mofette A
Transition A1
Transition A2
Reference A
(a)
0.0
0.5
1.0
1.5
2.0
2.5
10001200140016001800
Mofette B
Reference B
(b)
133

S12
S.6 Soil mineralogy (XRD)
X-Ray diffractograms of samples from Transition A1 and Reference A showed similar peaks
(Figure S5), indicating equal mineralogy in both samples, however with an overall higher
mineral content in Reference A. We identified quartz, muscovite, feldspars (albite, anorthite,
orthoclase), and clay minerals (kaolinite, chlorite), confirming results of former mineralogical
analysis from this site.11,13
inte
ns
ity
°2Θ CoKα
Figure S5. X-ray diffractograms of Transition A1 and Reference A.
5 10 15 20 25 30 35 40 45 50
Transition A1
Reference A
134
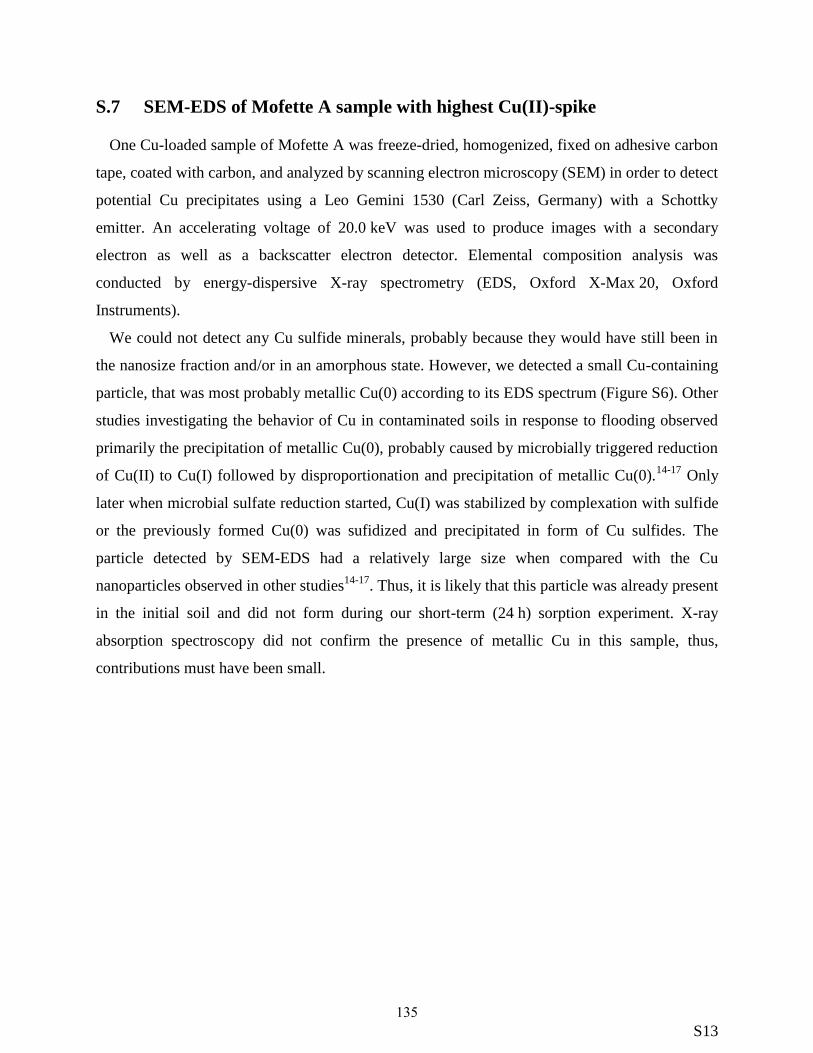
S13
S.7 SEM-EDS of Mofette A sample with highest Cu(II)-spike
One Cu-loaded sample of Mofette A was freeze-dried, homogenized, fixed on adhesive carbon
tape, coated with carbon, and analyzed by scanning electron microscopy (SEM) in order to detect
potential Cu precipitates using a Leo Gemini 1530 (Carl Zeiss, Germany) with a Schottky
emitter. An accelerating voltage of 20.0 keV was used to produce images with a secondary
electron as well as a backscatter electron detector. Elemental composition analysis was
conducted by energy-dispersive X-ray spectrometry (EDS, Oxford X-Max 20, Oxford
Instruments).
We could not detect any Cu sulfide minerals, probably because they would have still been in
the nanosize fraction and/or in an amorphous state. However, we detected a small Cu-containing
particle, that was most probably metallic Cu(0) according to its EDS spectrum (Figure S6). Other
studies investigating the behavior of Cu in contaminated soils in response to flooding observed
primarily the precipitation of metallic Cu(0), probably caused by microbially triggered reduction
of Cu(II) to Cu(I) followed by disproportionation and precipitation of metallic Cu(0).14-17
Only
later when microbial sulfate reduction started, Cu(I) was stabilized by complexation with sulfide
or the previously formed Cu(0) was sufidized and precipitated in form of Cu sulfides. The
particle detected by SEM-EDS had a relatively large size when compared with the Cu
nanoparticles observed in other studies14-17
. Thus, it is likely that this particle was already present
in the initial soil and did not form during our short-term (24 h) sorption experiment. X-ray
absorption spectroscopy did not confirm the presence of metallic Cu in this sample, thus,
contributions must have been small.
135

S14
Figure S6. (a) SEM image of metallic Cu(0) particle in a sample from Mofette A after 24 h of
equilibration with 11.65 mmol kg-1
Cu(II). (b-c) Corresponding semi-quantitative EDS analyses from the
Cu particle and the surrounding matrix. Due to small particle size mineral background in EDS 1 is still
relatively high.
Element wt% at%
Cu K 73.9 45.9 O K 16.2 40.0 Si K 5.1 7.1 Al K 4.5 6.5 K K 0.2 0.3 S K 0.1 0.2 Total 100 100
Element wt% at%
O K 62.7 75.3 Si K 22.0 15.1 Al K 8.2 5.8 K K 5.4 2.7 S K 0.7 0.4 Na K 0.7 0.6 Fe K 0.3 0.1 Total 100 100
(c)
(a)
(b)
(a)
(a)
EDS 1
EDS 2
136

S15
S.8 Information on XAS measurements and copper reference compounds
Sample Preparation. Samples for XAS analysis were freeze-dried, pestled, fixed in sample
holders between Kapton® tape, and stored under anoxic conditions until analysis.
X-ray Absorption Spectroscopy. All spectra were collected at beamlines 4-1 and 4-3 at the
Stanford Synchrotron Radiation Lightsource (SSRL, Stanford, USA). The measurements at
beamline 4-3 (samples Transition A1, A2, Reference A, and peat lens) were performed at about
25 K using a closed cycle He-cryostat. The beamline was equipped with a 4-element solid-state
Si drift detector (HTA Hitatchi). Measurements at beamline 4-1 were done at 77 K using a 32-
element solid-state Ge detector (Canberra) and a liquid nitrogen cryostat (samples from Mofette
A). Detectors were calibrated by setting the first inflection of the K-absorption edge of a metallic
Cu foil to 8979 eV. A combination of Ni and Al filters were used to reduce Fe fluorescence and
scattering contributions. At beamline 4-1, we additionally used Soller slits and the
monochromator was detuned to 70% of maximum intensity to reduce higher order harmonics in
the beam. All sample spectra were collected in fluorescence mode (average of 1–2 scans per
sample for XANES and 4–6 scans per sample for EXAFS, except peat lens: 12 scans), the
metallic Cu foil was measured in transmission mode. In addition, published spectra were used as
references for data analysis. The respective literature references, measurement conditions, and
structural information can be found in Table S2.
XAS Data Processing. All spectra were processed using the software Athena18
and
SixPACK.19
E0 was fixed to 8988 eV. Background correction was performed by subtracting a
first-order polynomial function fit to the pre-edge region (-150 to -40 eV) and subsequently
dividing by a second-order polynomial fit to the post-edge region (80 to 490 eV for XANES; 80
to 700 eV for EXAFS). The background spline was adjusted using the Autobk algorithm
(Rbkg=0.9; k-weight=3; k-range 0.5–14 Å-1
). Spectra were tested for the minimum number of
components by principal component analysis (PCA) based on the empirical indicator function20
and target transform was done for the significant components against the references library using
the program SixPACK.19
SPOIL and chi-squared values as well as visual confirmation were used
to evaluate whether a target was acceptable.20,21
Linear combination fitting (LCF) of the
normalized XANES spectra in the energy range 8968–9018 eV and of the k3-weighted EXAFS
spectra in the k-range 2.5–10 Å-1
was done using the number of significant components
(according to minimum of indicator value: 4 components for XANES and 2 components for
137

S16
EXAFS LCF, Table S3) and reference spectra determined to be acceptable targets. Individual
fractions were constrained to the range 0–1, the sum of fractions was not constrained. The best fit
was chosen based on its normalized sum of squared residuals (NSSR), however, a fit with n
components had to have a NSSR at least 10% lower than the respective fit with n-1 components,
otherwise the fit with fewer components was considered.22
The quality of the combinations
achieved with this method was tested using the Hamilton test23
as described in Calvin24
. As
proposed in Bennett et al.25
we used the ‘information content’ value reported in Athena as
estimate for the value a (half of the lower bound of the number of degrees of freedom of the
closer fit) which is required for the Hamilton test. The ‘information content’ value is the
magnitude of the fitted energy range divided by the core-hole lifetime of the absorption edge18
(28.1 eV in the case of the Cu K-edge). From the LCFs that did not differ significantly according
to the Hamilton test, we chose the fit with the sum of components closest to 100% as best fit.
LCF of both XANES and EXAFS delivered contributions from reference compounds with the
same oxidation state and coordination environment, however, in differing shares. Due to the
better data quality of XANES (more data points, larger dataset), we focused our interpretation on
XANES LCF results. Results from PCA can be found in Table S3, detailed results of LCF in
Table S4.
Radiation Induced Reduction. In all measured samples, however, most pronounced for
samples Transitions A1, A2, and Reference A, we observed radiation induced reduction (RIR)
indicated by an increasing shoulder at 8982–8984 eV in the XANES spectra (exemplarily shown
for Cu-loaded Reference A, Figure S7). This is, where oxygen bound Cu(I) would be expected to
a show a peak resulting from the 1s→4p transition.26,27
We cannot completely exclude that small
amounts of Cu(I) were present in the initial soil samples, however, the height of this shoulder
was increasing from scan to scan due to RIR which implies that Cu(I) in these three samples
might be an artefact. We tried to reduce the effect of RIR on LCF by averaging only 1 to 2 scans
per sample for evaluation of XANES data. Reduction of Cu(II) to Cu(I) due to beam damage has
been observed in other studies as well,28,29
however, the problem mainly occurred when spectra
collection was done at room temperature while our spectra were collected at 25 K. This implies
that some Cu species highly sensitive to RIR must have been present in our samples.
138

S17
Table S2. Structural information and literature references for Cu reference compounds used for LCF of
XANES and EXAFS spectra. RT = room temperature.
compound measurement
information
structural information from literature
coordination distance [Å] reference
Cu metal SSRL beamline 4-1, RT 12 Cu 2.54 Wyckoff30
organic Cu(II)-O/N
Cu(II)-humic spectrum from Fulda et
al.31
, 15 K 4 O/N 1.92–1.95 Karlsson et al.
32
Cu(II)-malate spectrum from Fulda et
al.31
, 15 K 4 O 1.94 Fulda et al.
33
Cu(II)-carboxyl spectrum from Fulda et
al.33
, 15 K 4 O 1.94 Fulda et al.
33
inorganic Cu(II)-O/N
Cu(II)-clay spectrum from Fulda et
al.31
, 77 K 4 O 1.95 Strawn et al.
34
Cu(II)-ferrihydrite spectrum from Tiberg et
al.35
, RT 4 O 1.94–1.95 Tiberg et al.
35
organic Cu(I)-S
Cu(I)-thiol spectrum from Fulda et
al.33
, 15 K 2.9 S 2.24 Fulda et al.
33
Cu(I)-GSH spectrum from Fulda et
al.31
, 77 K
3 S
1 Cu
2.26
2.69 Poger et al.
36
inorganic Cu-S
Cu1.8S spectrum from Weber et
al.15
, RT 3 S 2.30 Weber et al.
15
CuS spectrum from Fulda et
al.31
, 77 K 3.67 S 2.27 Pattrick et al.
37
139

S18
Table S3. Results from principal component analyses (PCA) of 9 normalized sample XANES spectra
(energy range 8968–9018 eV) and 5 k3-weighted sample EXAFS spectra (k-range 2.5–10 Å
-1).
PCA XANES PCA EXAFS
compound Eigenvalue Cum. Var.a IND
b Eigenvalue Cum. Var.
a IND
b
1 1.97 0.987 1.30∙10-4
28.66 0.842 0.149
2 0.02 0.999 1.23∙10-5
4.74 0.981 0.026
3 10-2
0.999 2.88∙10-6
0.35 0.991 0.036
4 <10-2
0.999 1.52∙10-6
0.15 0.996 0.131
5 <10-2
0.999 1.54∙10-6
0.13 1.000 NA
6 <10-2
0.999 1.94∙10-6
7 <10-2
0.999 3.40∙10-6
8 <10-2
0.999 1.02∙10-5
9 <10-2
1.000 NA
acumulative variance
bindicator function
140

S19
Table S4. Comparison between Cu speciation in soil samples based on linear combination fitting (LCF)
of Cu K-edge XANES and EXAFS. Individual fractions were constrained to values between 0 and 1, the
sum of fractions was not constrained.
XANES LCF
Cu(II)-Oa [%] Cu(I)-S
b [%] CuS [%] SUM [%] NSSR
c [%]
Mofette A 23.3
(humic)
72.0
(thiol) - 95.3 1.56
Transition A1 90.8
(humic)
8.4
(Cu1.8S) - 99.2 0.14
Transition A2 83.0
(humic)
16.1
(Cu1.8S) - 99.1 0.09
Reference A 83.0
(humic)
16.7
(Cu1.8S) - 99.7 0.07
Mofette A, Cu 73.4
(humic, clay)
25.1
(thiol) - 98.5 0.06
Transition A1, Cu 97.9
(mal) - - 97.9 0.04
Transition A2, Cu 96.7
(humic, mal)
3.5
(Cu1.8S) - 100.2 0.06
Reference A, Cu 99.1
(humic, mal) - - 99.1 0.08
Mofette A peat 34.9
(humic) - 65.1 100.0 0.10
EXAFS LCF
Cu(II)-Oa [%] Cu(I)-S
b [%] CuS [%] SUM [%] NSSR
c [%]
Mofette A, Cu 61.9
(clay)
23.9
(Cu1.8S) - 85.5 5.6
Transition A1, Cu
94.2
(humic, mal,
carb)
- - 94.2 2.5
Transition A2, Cu 94.2
(humic, carb) - - 94.2 3.0
Reference A, Cu 89.1
(humic, mal) - - 89.1 2.9
Mofette A peat 28.8
(mal) - 84.3 113.1 6.4
ahumic=Cu(II)-humic, mal=Cu(II)-malate, carb=Cu(II)-carboxyl, clay=Cu(II)-clay
bthiol=Cu(I)-thiol, GSH=Cu(I)-GSH
cnormalized sum of squared residuals = ∑i (dataexp – datafit)² / ∑i (dataexp)²
141
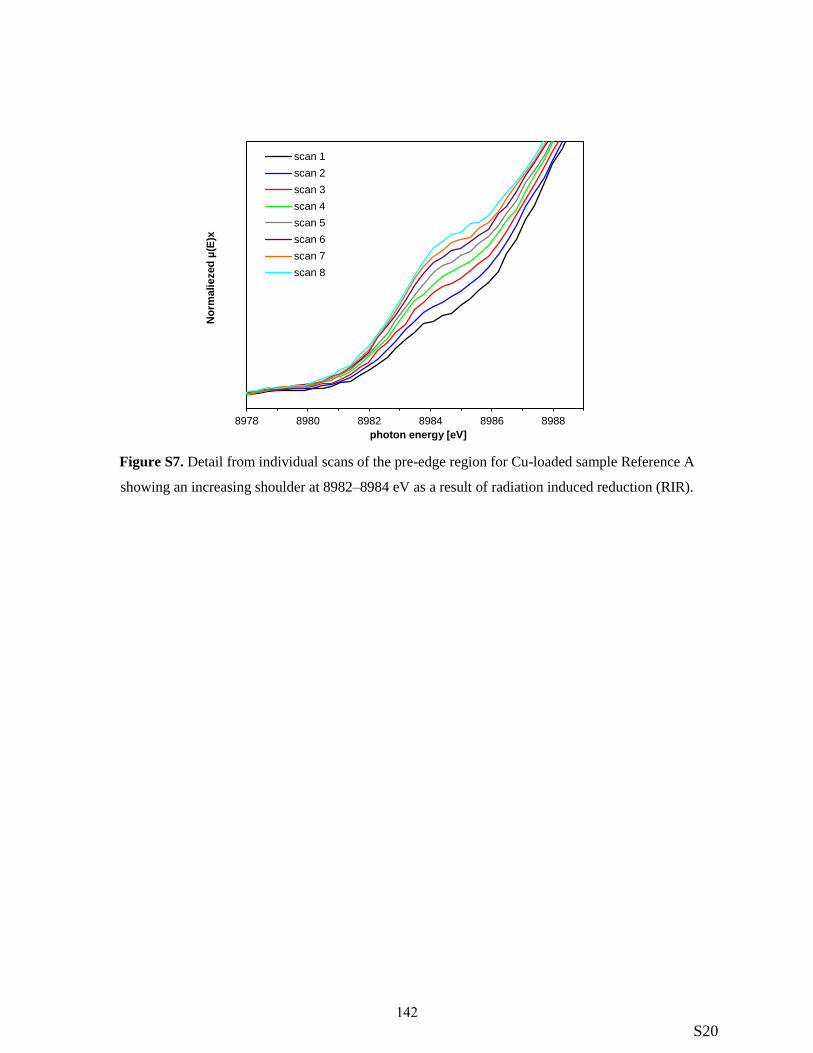
S20
No
rmaliezed
µ(E
)x
photon energy [eV]
Figure S7. Detail from individual scans of the pre-edge region for Cu-loaded sample Reference A
showing an increasing shoulder at 8982–8984 eV as a result of radiation induced reduction (RIR).
8978 8980 8982 8984 8986 8988
scan 1
scan 2
scan 3
scan 4
scan 5
scan 6
scan 7
scan 8
142

S21
References
1. Maurer, F.; Christl, I.; Fulda, B.; Voegelin, A.; Kretzschmar, R., Copper redox
transformation and complexation by reduced and oxidized soil humic acid. 2. Potentiometric
titrations and dialysis cell experiments. Environ. Sci. Technol. 2013, 47, (19), 10912-10921.
2. Moffett, J. W.; Zika, R. G.; Petasne, R. G., Evaluation of bathocuproine for the spectro-
photometric determination of copper(I) in copper redox studies with applications in studies of
natural waters. Anal. Chim. Acta 1985, 175, 171-179.
3. Bååth, E., Effects of heavy metals in soil on microbial processes and populations (a
review). Water, Air, Soil Pollut. 1989, 47, (3-4), 335-379.
4. Flemming, C.; Trevors, J., Copper toxicity and chemistry in the environment: a review.
Water, Air, Soil Pollut. 1989, 44, (1-2), 143-158.
5. Wüst, P. K.; Horn, M. A.; Drake, H. L., In situ hydrogen and nitrous oxide as indicators
of concomitant fermentation and denitrification in the alimentary canal of the earthworm
Lumbricus terrestris. Appl. Environ. Microbiol. 2009, 75, (7), 1852-1859.
6. Beulig, F.; Heuer, V. B.; Akob, D. M.; Viehweger, B.; Elvert, M.; Herrmann, M.;
Hinrichs, K.-U.; Küsel, K., Carbon flow from volcanic CO2 into soil microbial communities of a
wetland mofette. ISME J. 2015, 9, (3), 746-759.
7. Mehlhorn, J.; Beulig, F.; Küsel, K.; Planer-Friedrich, B., Carbon dioxide triggered
metal(loid) mobilisation in a mofette. Chem. Geol. 2014, 382, 54-66.
8. Sander, R., Compilation of Henry's law constants (version 4.0) for water as solvent. ACP
2015, 15, (8).
9. Hoffmann, M.; Mikutta, C.; Kretzschmar, R., Bisulfide reaction with natural organic
matter enhances arsenite sorption: insights from X-ray absorption spectroscopy. Environ. Sci.
Technol. 2012, 46, (21), 11788-11797.
10. Artz, R. R.; Chapman, S. J.; Robertson, A. J.; Potts, J. M.; Laggoun-Défarge, F.; Gogo,
S.; Comont, L.; Disnar, J.-R.; Francez, A.-J., FTIR spectroscopy can be used as a screening tool
for organic matter quality in regenerating cutover peatlands. Soil Biol. Biochem. 2008, 40, (2),
515-527.
11. Rennert, T.; Eusterhues, K.; Pfanz, H.; Totsche, K. U., Influence of geogenic CO2 on
mineral and organic soil constituents on a mofette site in the NW Czech Republic. Eur. J. Soil
Sci. 2011, 62, (4), 572-580.
12. Broder, T.; Blodau, C.; Biester, H.; Knorr, K., Peat decomposition records in three
pristine ombrotrophic bogs in southern Patagonia. Biogeosciences 2012, 9, (4), 1479-1491.
13. Flechsig, C.; Bussert, R.; Rechner, J.; Schütze, C.; Kämpf, H., The Hartoušov mofette
field in the Cheb Basin, western Eger Rift (Czech Republic): a comperative geoelectric,
sedimentologic and soil gas study of a magmatic diffuse CO2-degassing structure. Z. Geol. Wiss.
2008, 36, (3), 177-193.
14. Hofacker, A. F.; Voegelin, A.; Kaegi, R.; Weber, F.-A.; Kretzschmar, R., Temperature-
dependent formation of metallic copper and metal sulfide nanoparticles during flooding of a
contaminated soil. Geochim. Cosmochim. Acta 2013, 103, 316-332.
15. Weber, F.-A.; Voegelin, A.; Kaegi, R.; Kretzschmar, R., Contaminant mobilization by
metallic copper and metal sulphide colloids in flooded soil. Nat. Geosci. 2009, 2, (4), 267-271.
16. Xia, B.; Qiu, H.; Knorr, K.-H.; Blodau, C.; Qiu, R., Occurrence and fate of colloids and
colloid-associated metals in a mining-impacted agricultural soil upon prolonged flooding. J.
Hazard. Mater. 2018, 348, 56-66.
143

S22
17. Hofacker, A. F.; Behrens, S.; Voegelin, A.; Kaegi, R.; Lösekann-Behrens, T.; Kappler,
A.; Kretzschmar, R., Clostridium species as metallic copper-forming bacteria in soil under
reducing conditions. Geomicrobiol. J. 2015, 32, (2), 130-139.
18. Ravel, B.; Newville, M., ATHENA, ARTEMIS, HEPHAESTUS: data analysis for X-ray
absorption spectroscopy using IFEFFIT. J. Synchrotron Rad. 2005, 12, (4), 537-541.
19. Webb, S., SIXpack: a graphical user interface for XAS analysis using IFEFFIT. Phys.
Scr. 2005, 2005, (T115), 1011.
20. Malinowski, E. R., Determination of the number of factors and the experimental error in
a data matrix. Anal. Chem. 1977, 49, (4), 612-617.
21. Beauchemin, S.; Hesterberg, D.; Beauchemin, M., Principal component analysis
approach for modeling sulfur K-XANES spectra of humic acids. Soil Sci. Soc. Am. J. 2002, 66,
(1), 83-91.
22. Jacquat, O.; Voegelin, A.; Kretzschmar, R., Soil properties controlling Zn speciation and
fractionation in contaminated soils. Geochim. Cosmochim. Acta 2009, 73, (18), 5256-5272.
23. Hamilton, W. C., Significance tests on the crystallographic R factor. Acta Crystallogr.
1965, 18, (3), 502-510.
24. Calvin, S., XAFS for Everyone. CRC press: 2013.
25. Bennett, W. W.; Hockmann, K.; Johnston, S. G.; Burton, E. D., Synchrotron X-ray
absorption spectroscopy reveals antimony sequestration by reduced sulfur in a freshwater
wetland sediment. Environ. Chem. 2017, 14, (6), 345-349.
26. Manceau, A.; Matynia, A., The nature of Cu bonding to natural organic matter. Geochim.
Cosmochim. Acta 2010, 74, (9), 2556-2580.
27. Kau, L. S.; Spira-Solomon, D. J.; Penner-Hahn, J. E.; Hodgson, K. O.; Solomon, E. I., X-
ray absorption edge determination of the oxidation state and coordination number of copper.
Application to the type 3 site in Rhus vernicifera laccase and its reaction with oxygen. J. Am.
Chem. Soc. 1987, 109, (21), 6433-6442.
28. Strawn, D. G.; Baker, L. L., Speciation of Cu in a contaminated agricultural soil
measured by XAFS, μ-XAFS, and μ-XRF. Environ. Sci. Technol. 2007, 42, (1), 37-42.
29. Strawn, D. G.; Baker, L. L., Molecular characterization of copper in soils using X-ray
absorption spectroscopy. Environ. Pollut. 2009, 157, (10), 2813-2821.
30. Wyckoff, R. W. G., Crystal structures. Interscience New York: 1960; Vol. 2.
31. Fulda, B.; Voegelin, A.; Ehlert, K.; Kretzschmar, R., Redox transformation, solid phase
speciation and solution dynamics of copper during soil reduction and reoxidation as affected by
sulfate availability. Geochim. Cosmochim. Acta 2013, 123, 385-402.
32. Karlsson, T.; Persson, P.; Skyllberg, U., Complexation of copper(II) in organic soils and
in dissolved organic matter − EXAFS evidence for chelate ring structures. Environ. Sci. Technol.
2006, 40, (8), 2623-2628.
33. Fulda, B.; Voegelin, A.; Maurer, F.; Christl, I.; Kretzschmar, R., Copper redox
transformation and complexation by reduced and oxidized soil humic acid. 1. X-ray absorption
spectroscopy study. Environ. Sci. Technol. 2013, 47, (19), 10903-10911.
34. Strawn, D. G.; Palmer, N. E.; Furnare, L. J.; Goodell, C.; Amonette, J. E.; Kukkadapu, R.
K., Copper sorption mechanisms on smectites. Clays Clay Miner. 2004, 52, (3), 321-333.
35. Tiberg, C.; Sjöstedt, C.; Persson, I.; Gustafsson, J. P., Phosphate effects on copper(II) and
lead(II) sorption to ferrihydrite. Geochim. Cosmochim. Acta 2013, 120, 140-157.
36. Poger, D.; Fillaux, C.; Miras, R.; Crouzy, S.; Delangle, P.; Mintz, E.; Den Auwer, C.;
Ferrand, M., Interplay between glutathione, Atx1 and copper: X-ray absorption spectroscopy
144

S23
determination of Cu(I) environment in an Atx1 dimer. J. Biol. Inorg. Chem. 2008, 13, (8), 1239-
1248.
37. Pattrick, R.; Mosselmans, J.; Charnock, J.; England, K.; Helz, G.; Garner, C.; Vaughan,
D., The structure of amorphous copper sulfide precipitates: An X-ray absorption study. Geochim.
Cosmochim. Acta 1997, 61, (10), 2023-2036.
145


147
LIST OF PUBLICATIONS
The following publications/manuscripts have been published or are submitted during the work on this
thesis:
Mehlhorn, J., Gerber, L.A., Planer-Friedrich, B. (2018): Spatial distribution of metal(loid)
depletion and accumulation zones around a natural carbon dioxide degassing site. Chemical
Geology, 509: 64-76, DOI: 10.1016/j.chemgeo.2019.01.010.
Mehlhorn, J., Besold, J., Lezama-Pacheco, J.S., Gustafsson, J.P., Kretzschmar, R., Planer-
Friedrich, B. (2018): Copper mobilization and immobilization along an organic matter and redox
gradient – insights from a mofette site. Environmental Science & Technology, 52(23): 13698-
13707, DOI: 10.1021/acs.est.8b02668.
Mehlhorn, J., Byrne, J.M., Kappler, A., Planer-Friedrich, B. (2016): Time and temperature
dependency of carbon dioxide triggered metal(loid) mobilization in soil. Applied Geochemistry, 74:
122-137, DOI: 10.1016/j.apgeochem.2016.09.007.
Other publications:
Planer-Friedrich, B., Schaller, J., Wismeth, F., Mehlhorn, J., Hug, S. J. (2018): Monothioarsenate
occurrence in Bangladesh groundwater and its removal by ferrous and zero-valent iron
technologies. Environmental Science & Technology, 52(10): 5931-5939,
DOI: 10.1021/acs.est.8b00948.
Suess, E., Mehlhorn, J., Planer-Friedrich, B. (2015): Anoxic, ethanolic, and cool – An improved
method for thioarsenate preservation in iron-rich waters. Applied Geochemistry, 62: 224-233,
DOI: 10.1016/j.apgeochem.2014.11.017.
Mehlhorn, J., Beulig, F., Küsel, K., Planer-Friedrich, B. (2014): Carbon dioxide triggered
metal(loid) mobilisation in a mofette. Chemical Geology, 382: 54-66,
DOI: 10.1016/j.chemgeo.2014.05.027.


149
SUPERVISED BACHELOR THESES
The following Bachelor theses have been co-supervised during the work on this thesis:
1. Metz, R. (2016): Influence of CO2 on mobilization of Fe and As by abiotic and microbially
triggered dissolution of ferrihydrite, Bachelor Thesis, University of Bayreuth, Environmental
Geochemistry.
Results of this project are included in chapter 3.2 of this thesis.
2. Gerber, L. A. (2018): Räumliche Verteilungsmuster von Metall(oid)en im Bereich einer Mofette,
Bachelor Thesis, University of Bayreuth, Environmental Geochemistry.
Results of this project are included in study 1 of this thesis.


151
(EIDESSTATTLICHE) VERSICHERUNGEN UND ERKLÄRUNGEN
(§ 8 Satz 2 Nr. 3 PromO Fakultät)
Hiermit versichere ich eidesstattlich, dass ich die Arbeit selbstständig verfasst und keine anderen als
die von mir angegebenen Quellen und Hilfsmittel benutzt habe (vgl. Art. 64 Abs. 1 Satz 6 BayHSchG).
(§ 8 Satz 2 Nr. 3 PromO Fakultät)
Hiermit erkläre ich, dass ich die Dissertation nicht bereits zur Erlangung eines akademischen Grades
eingereicht habe und dass ich nicht bereits diese oder eine gleichartige Doktorprüfung endgültig nicht
bestanden habe.
(§ 8 Satz 2 Nr. 4 PromO Fakultät)
Hiermit erkläre ich, dass ich Hilfe von gewerblichen Promotionsberatern bzw. -vermittlern oder
ähnlichen Dienstleistern weder bisher in Anspruch genommen habe noch künftig in Anspruch nehmen
werde.
(§ 8 Satz 2 Nr. 7 PromO Fakultät)
Hiermit erkläre ich mein Einverständnis, dass die elektronische Fassung der Dissertation unter
Wahrung meiner Urheberrechte und des Datenschutzes einer gesonderten Überprüfung unterzogen
werden kann.
(§ 8 Satz 2 Nr. 8 PromO Fakultät)
Hiermit erkläre ich mein Einverständnis, dass bei Verdacht wissenschaftlichen Fehlverhaltens
Ermittlungen durch universitätsinterne Organe der wissenschaftlichen Selbstkontrolle stattfinden
können.
……………………………………………………………………………………….
Ort, Datum, Unterschrift