Embed Size (px)
Citation preview
PHEASANT POPULATION AND HARVEST SUMMARY
for the years
2005 and 2006
STATEWIDE WILDLIFE RESEARCH AND SURVEYS
A Contribution of Pittman-Robertson Funds
Federal Aid in Wildlife Restoration
Grants W-39-R-11, W-39-R-12, and W-39-R-13
Kansas Department of Wildlife and Parks
Mike Hayden Secretary
Prepared by
Randy Rodgers Wildlife Research Biologist
Joe Kramer, Director Mike Mitchener, Chief Fisheries and Wildlife Wildlife Section Division
May 2008
2
PERMISSION TO QUOTE
This progress report may contain information subject to future modification or revision. Persons wishing to quote from this report, for reproduction or reference, should first obtain permission from the Chief of the Wildlife Section, Kansas Department of Wildlife and Parks, 512 SE 25th Avenue, Pratt, KS 67124.
EQUAL OPPORTUNITY STATEMENT
This program receives Federal financial assistance from the U.S. Fish and Wildlife Service. Under Title VI of the Civil Rights Act of 1964, Section 504 of the Rehabilitation Act of 1973, Title II of the Americans with Disabilities Act of 1990, the Age Discrimination Act of 1975, and Title IX of the Education Amendments of 1972, the U.S. Department of the Interior and its bureaus prohibit discrimination on the basis of race, color, national origin, age, disability or sex (in educational programs). If you believe that you have been discriminated against in any program, activity or facility, or if you desire further information, please write to: The U.S. Fish and Wildlife Service Office of Diversity and Civil Rights Programs- External Programs 4040 North Fairfax Drive, Suite 130 Arlington, VA 22203
3
PHEASANT POPULATION AND HARVEST SUMMARY
for the years
2005 and 2006
A Contribution of Pittman-Robertson Funds Federal Aid in Wildlife Restoration
Grants W-39-R-11, W-39-R-12, and W-39-R-13
4
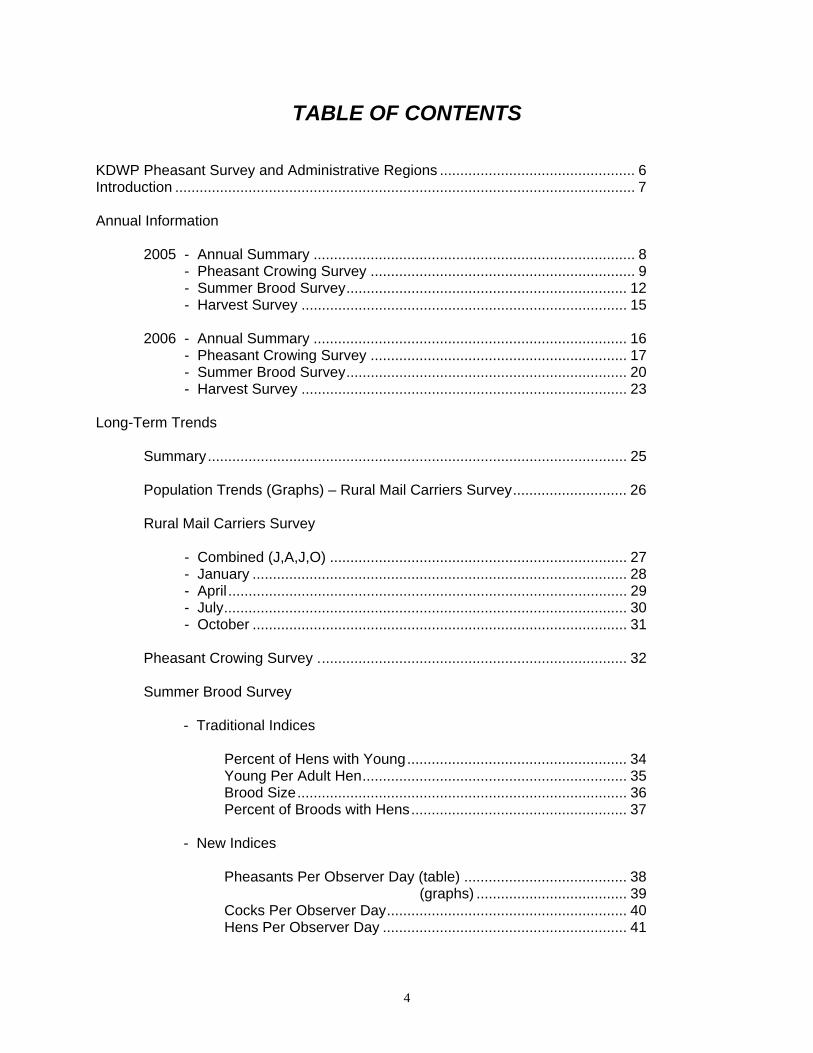
TABLE OF CONTENTS
KDWP Pheasant Survey and Administrative Regions ................................................ 6 Introduction ................................................................................................................. 7 Annual Information
2005 - Annual Summary ............................................................................... 8 - Pheasant Crowing Survey ................................................................. 9 - Summer Brood Survey ..................................................................... 12 - Harvest Survey ................................................................................ 15 2006 - Annual Summary ............................................................................. 16 - Pheasant Crowing Survey ............................................................... 17 - Summer Brood Survey ..................................................................... 20 - Harvest Survey ................................................................................ 23
Long-Term Trends
Summary ....................................................................................................... 25 Population Trends (Graphs) – Rural Mail Carriers Survey ............................ 26 Rural Mail Carriers Survey - Combined (J,A,J,O) ......................................................................... 27 - January ............................................................................................ 28 - April .................................................................................................. 29 - July ................................................................................................... 30 - October ............................................................................................ 31
Pheasant Crowing Survey . ........................................................................... 32 Summer Brood Survey
- Traditional Indices Percent of Hens with Young ...................................................... 34 Young Per Adult Hen ................................................................. 35 Brood Size ................................................................................. 36 Percent of Broods with Hens ..................................................... 37 - New Indices Pheasants Per Observer Day (table) ........................................ 38 (graphs) ..................................... 39 Cocks Per Observer Day ........................................................... 40 Hens Per Observer Day ............................................................ 41
5
Long-Term Trends (cont.)
Young Per Observer Day .......................................................... 42 Broods Per Observer Day ......................................................... 43
Harvest Survey - Statewide Hunting Days and Harvest (Graph) ................................. 44 - Statewide Hunting Activity Indices ................................................... 45 - Regional Hunting Activity Indices ..................................................... 46
Summary of Past Pheasant Hunting Seasons in Kansas ......................................... 49
6
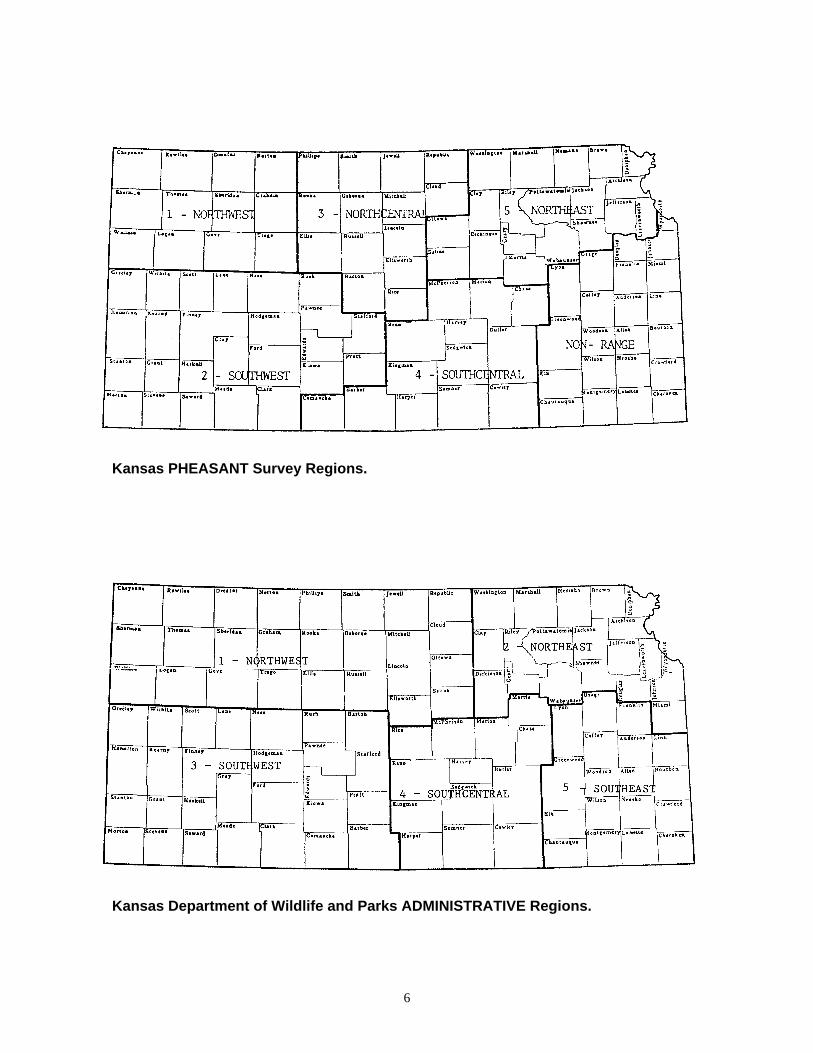
Kansas PHEASANT Survey Regions. Kansas Department of Wildlife and Parks ADMINISTRATIVE Regions.
7
Introduction This report is a compilation of ring-necked pheasant survey data collected by the Kansas Department of Wildlife and Parks (KDWP). It contains pheasant-related segments from Kansas population survey and harvest reports for the years 2005 and 2006 as well as long-term population and harvest trends for Kansas pheasants. Data were derived primarily from (1) Rural Mail Carriers Surveys, (2) the Pheasant Crowing Survey, (3) the Summer Brood Survey, and (4) the Small Game Harvest Survey. These surveys provide three important benefits. They monitor long-term pheasant population trends. Annual surveys also permit reasonable prediction of pheasant population conditions relative to the subsequent hunting season. Such information is widely requested by the media and the public. These ongoing surveys also provide a scientific basis for the development of management recommendations. The Rural Mail Carriers Survey (RMCS) was established in 1962 and is used to estimate long-term changes in population density and distribution and, to a lesser degree, in estimating annual production success. Carriers cooperate by making wildlife counts during the third or fourth week of January, April, and July and during the second week of October. About 400 carriers in Kansas participate in any one survey by counting small game species observed while traveling their normal delivery routes. About 280 of these report information from within Kansas’ pheasant range while traveling between 125,000 and 150,000 miles during each survey period. The Pheasant Crowing Survey (PCS) was first established in 1962 and used 29 survey routes. This survey was discontinued after 1972. The PCS was re-established in 1997 to provide additional long-term population monitoring and uses 63 permanent survey routes scattered throughout the Kansas pheasant range. It is conducted entirely by KDWP personnel in the Fish and Wildlife (FW) and Law Enforcement (LE) divisions. Each route is run once, under good weather conditions, and consists of 11 listening stations placed every 2-miles over the 20-mile course. Between April 25 and May 15, observers count the number of 2-note pheasant crows they hear during a 2-minute interval at each station, beginning 45 minutes before sunrise. The Summer Brood Survey (SBS), begun in 1963, has been conducted to monitor changes in annual production success and hatching chronology. This survey provides one of the state’s best source of information for predicting hunter success in the upcoming season. The survey is conducted by KDWP personnel in the LE and FW divisions. Observations of pheasant, quail, and turkey broods made incidental to normal field duties are recorded during a 6-week period beginning in the third full week of July and ending with the fourth week of August. Traditional indices derived from this survey were ratios of one cohort to another. Most of these ratios eventually proved inadequate as indicators of population productivity or change. In 1986, observers began reporting days in the field for each of the 6 weeks of the survey to permit computation of new indices based on observations per unit effort. The Small Game Harvest Survey (SGHS) was established in 1957 and is used to estimate statewide harvest and hunter activity for a variety of small game species. It has been conducted by mailing a pre-season notification and post-season questionnaires to 5–10 percent of the Kansas residents who held hunting licenses in the previous license year and to non-residents who purchase licenses through a web-based licensing site (INK) contracted by the KDWP. Beginning with the 2006 calendar year, the entire sample was obtained from the Kansas Outdoors Automated Licensing System (KOALS) database which permitted sampling same-year resident and non-resident license buyers. Also, a web-based survey format was initiated, replacing the paper questionnaire (still offered to sample hunters without web access). Typically, 25 to 30 percent of the hunters contacted have returned usable data indicating they hunted small game. This has provided data from between 2,000 and 3,000 small game hunters, representing about 2 to 3 percent of the license holders. Other surveys have been experimentally conducted in the past, but were discontinued for various reasons including: (1) duplication of effort, (2) poor reliability, (3) production of non-essential data, (4) insufficient potential variability, and (5) high cost relative to the value of the information provided. Surveys falling into this category included: (1) Random Hunter Bag Checks, 1961-65; (2) Voluntary Hunter Check Stations, 1963-67; (3) Brood Route Counts, 1961-65; (4) Wing-Leg Envelope Collections, 1962-65; (5) February Sex-Ratio Counts, 1963-68. These data are not addressed in this report. Summaries of research, management projects, or literature reviews relevant to Kansas pheasant populations and performed by the small game staff may also occasionally appear in this report.
8
2005
Kansas Pheasant Summary Weather conditions during the winter of 2004–2005 did not produce any unusual level of stress or mortality, apparently leaving Kansas’ pheasant breeding populations in good shape. For the entire Kansas pheasant range, the April Rural Mail Carriers Survey (RMCS) index increased 14% and the Pheasant Crowing Survey index increased 13% indicating a modest improvement over what was considered a relatively good breeding population in 2004. Good establishment of winter wheat in the fall of 2004 coupled with its early greenup and rapid growth created excellent nesting potential in the spring of 2005. Most green wheat in Kansas was well in excess of the height needed ( > 10 in.) by mid-April to provide good nesting cover. May proved to be unusually dry in much of the state, allowing nesting hens to complete incubation uninterrupted by inclement weather. Although wheat grain yields were seriously reduced when the crop ran out of soil moisture, the vegetative height that the crop had already attained was more than adequate for good nesting concealment. In western Kansas, overall nesting success was probably enhanced by the fact that the wheat stubble remaining from the poor 2004 crop was unusually short. This combination of poor stubble and good green wheat usually results in excellent overall nest success since stubble is often unsafe for nesting due to agricultural operations, whereas green wheat is mostly undisturbed yielding good nest success. Unfortunately, persistent heavy rains in southcentral, part of northcentral, and northeast Kansas prevailed during the first two weeks of June, at the peak of pheasant hatching. Downy chicks are highly vulnerable to chilling during their first two weeks of life and these rains likely produced significant chick mortalities in the affected areas. The negative effect of these poorly-timed rains became clear with results from both the July RMCS and the Summer Brood Survey (SBS). The primary July RMCS indices increased 110% and 82% in the northwest and southwest regions where the early-June rains were moderate, but were little changed or modestly down where the heavy rains occurred. Indices from the SBS also showed strong increases in the northwest (42%) and southwest (47%), but were down further east. This created an unusually sharp contrast in production and fall populations from west to east. A period of extremely hot, windy, and dry conditions took hold in mid-July and probably reduced chick survival throughout the range, as indicated by the small brood sizes recorded throughout the Kansas pheasant range. Fortunately, this period only last 2 weeks and gave way to relatively mild conditions for the remainder of the summer. Habitat conditions were generally good going into the fall, although some areas of below-average cover were present. The 2005–2006 rangewide harvest estimate was 764,000 roosters, a 12% increase over the 2004–2005 season. This increase was primarily driven by stong increases in the northwest (31%) and northcentral (26%) regions, with a more-modest increase (14%) in the southwest. This occurred despite a blizzard that occurred just after Thanksgiving in northwest Kansas during which modest pheasant losses occurred. Wheat establishment conditions in western Kansas were again good in the fall of 2005, but subsequent dry conditions substantially diminished nesting prospects for 2006.
9
KANSAS PHEASANT CROWING SURVEY – 2005
Federal Aid in Wildlife Restoration Grant W-39-R-11
Prepared by: Randy Rodgers, Wildlife Research Biologist The survey period was from April 25 through May 20. The survey was extended 5 days later than the normal May 15 cutoff due to windy weather conditions. Table 1 indicates the results of the 2005 survey and compares them to 2004. Sixty-one of the 63 established routes were assigned for 2005 (routes in Osage and Coffee counties are run only in even-numbered years) and 57 were successfully run. Forty-eight of the routes were completed in both 2004 and 2005 by the same observers. Personnel assigned these surveys are noted in Table 2. The Rangewide PCS index was 16.6 crows per station, 13.3% greater than in 2004. This was a statistically significant change (P = 0.013). Overall, 32 of the 48 comparable routes increased this year and 16 decreased. In the Northwest, 10 of the 12 routes were run and all of those were run by the same observers as in 2004. The overall Northwest PCS index was 23.9 and the 10 routes comparable to 2004 increased by an average of 4.2%, a non-significant change (P = 0.222). Five of these 10 routes increased and 5 decreased. All of the 12 routes in the Northcentral region were run, yielding a PCS index of 19.2. Ten of these routes were run by last year’s observers. The average of those 10 routes increased by 29.0%, which was statistically significant (P = 0.011). Nine of the 10 comparable routes increased over 2004 and 1 decreased. Nine of the 10 routes in the Northeast survey region were successfully run, but only 5 were run by the 2004 observers. The overall PCS index was 7.9. The mean PCS index for the 5 comparable routes did not change from last year (P = 0.446). Of the 5 comparable routes, 2 increased and 3 decreased. In the Southwest, 17 of the 18 routes were successfully run and all of these were run by last year’s observers. The overall PCS index was 19.0 and the 17 comparable routes increased by an average of 10.0%. This change was not statistically significant (P = 0.267). Ten of the 17 comparable routes increased and 7 decreased. All of the 9 routes in the Southcentral survey region were successfully run this spring and, of those, 6 were run by the 2004 observers. This yielded an overall PCS index of 9.4. The PCS index for the 6 comparable routes increased 34.4%, which was statistically significant (P = 0.014). All of the 6 comparable Southcentral routes increased. Overall, the state’s pheasant breeding population continued to improve and was 74% higher than the low levels experienced in the drought years of 2001 to 2003. Significant increases in the PCS indices of the Northcentral and Southcentral region likely reflect the relatively good production that occurred in those areas. The wheat crop, with it’s strong influence on nesting success, in the central portions of the state was relatively good in 2004 and a mild summer created good brood rearing conditions. While the wheat crop was poor in the west last year, exceptionally mild summer conditions appear to have allowed the Northwest and Southwest regions to, at least, remain stable or to slightly increase. Weather conditions during the winter of 2004-05 did not appear to produce any unusual level of stress or mortality, leaving this spring’s breeding population in good shape. This good breeding population, coupled with the good vegetative stature of the 2005 wheat crop suggest good pheasant production potential this year. However, excessive rains that occurred in southcentral Kansas in the first half of June may have reduced production potential in parts of that region.
10
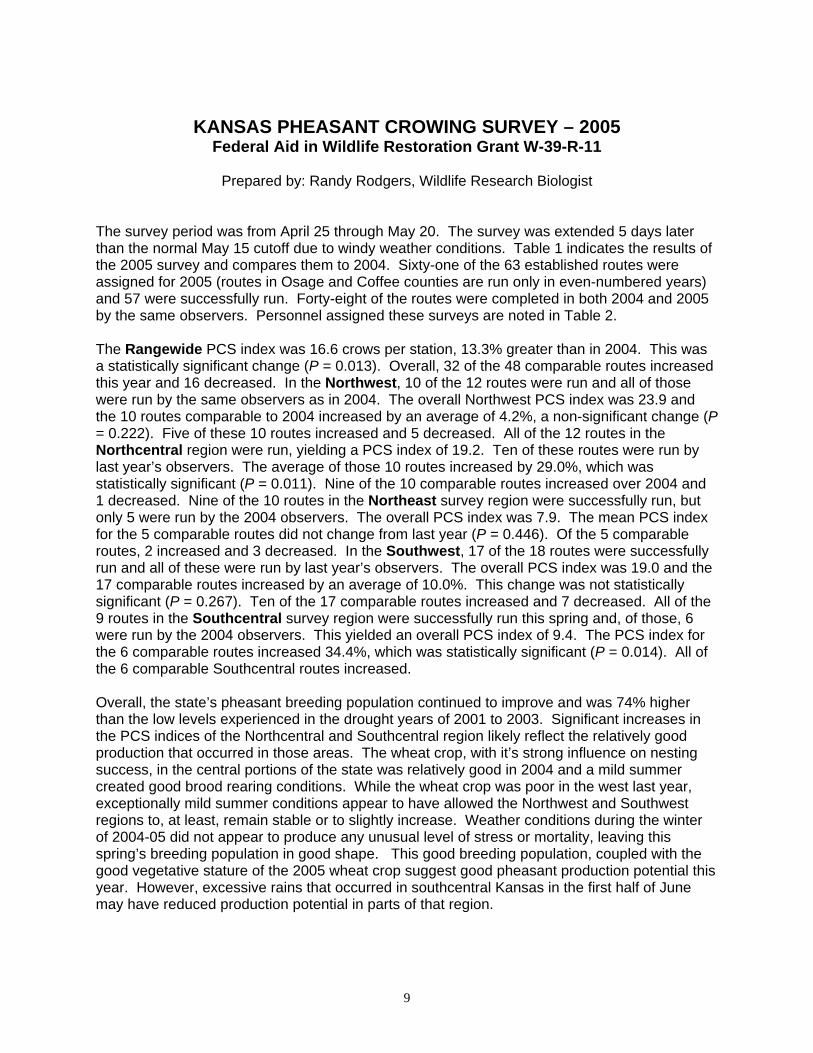
Table 1. Kansas Pheasant Crowing Survey Results – 2005.
2004 2005 1-Year 2004 2005 1-Year Crows Per Crows Per Change Crows Per Crows Per Change Route Station Station (%) Route Station Station (%) Gove NE 13.0 19.5 50 Clark 16.1 17.0 6 Gove SW 15.6 10.5 -33 Edwards 6.6 8.6 32
N Gove-Logan 19.6 18.1 -7 Finney 15.6 23.0 48 O Graham 42.4 40.5 -5 Ford 45.1 37.4 -17 R Logan 23.4 37.3 60 S Gray 40.6 35.8 -12 T Logan SE 6.8 10.6 55 O Hodgeman 12.2 14.9 22 H Norton 37.1 30.5 -18 U Kearny-Hamilton 13.2 15.1 15 W Rawlins-Thomas 15.9 17.6 10 T Morton-Stanton 8.4 10.0 20 E Sheridan 18.0 25.3 40 H Ness-Lane 9.1 7.3 -20 S Sherman 20.6 W Pawnee 26.6 29.6 11 T Thomas E Pawnee (Irrig.) 12.3 10.8 -12
Trego 38.1 29.7 -22 S Pratt 16.5 11.4 -31 T Rush 12.4 Region Mean* 22.8 23.9 (+4) Scott 14.7 29.8 102 Seward-Haskell 10.1 30.3 200 2004 2005 1-Year Stafford-Barton 19.1 11.0 -42 Crows Per Crows Per Change Stevens 16.8 27.1 61 Route Station Station (%) Wichita-Greeley 10.8 4.1 -62
N Barton 12.3 15.6 ~ Region Mean * 17.0 19.0 (+10) O Cloud 8.6 12.5 44 R Ellis 5.0 7.5 49 2004 2005 1-Year T Lincoln 23.0 32.1 40 S Crows Per Crows Per Change H Mitchell 27.8 35.4 27 O Route Station Station (%) C Osborne 28.4 43.0 52 U E Phillips 6.5 T Butler-Marion 2.9 3.6 24 N Republic 23.4 29.8 27 H Comanche 16.4 22.4 37 T Rice 5.7 7.4 28 C Cowley-Sumner 2.5 4.5 ~ R Rooks 14.2 18.4 29 E Harper 5.1 6.6 30 A Russell 8.0 8.8 10 N Kingman-Reno 6.4 8.2 29 L Smith 17.2 13.2 -23 T McPherson 13.4 15.5 ~
R McPhers.-Marion 0.6 Region Mean * 15.8 19.2 (+29) ** A Reno 13.3 18.6 40 L Sedgwick-Harv. 3.3 4.3 32 2004 2005 1-Year Crows Per Crows Per Change Region Mean * 7.9 9.4 (+34) ** Route Station Station (%) S 2004 2-Year
N Brown-Nemaha 3.1 3.5 12 O Crows Per Crows Per Change O Dickinson-Clay 15.2 14.8 -2 U Route Station Station (%) R Jackson-Jeffers. 3.5 3.4 -3 T T Marshall 8.9 9.2 3 H Coffee 0.0 0 H Morris E Osage 0.0 E Ottawa 6.5 17.0 ~ A A Riley 6.4 6.2 -3 S Region Mean * 0.0 S Shawnee 1.5 2.6 ~ T (SE routes run only in even years) T Wabaunsee 0.8 0.9 ~
Washington 7.6 13.9 ~ 2004 2005 1-Year R Crows Per Crows Per Change Region Mean * 5.9 7.9 (0) A Route Station Station (%) N
Routes consist of 11 stations at approx. 2-mile intervals. G Range Mean* 14.9 16.6 (+13) **The listening interval at each station is exactly 2 minutes. E (Excludes SE)
* Means are derived from all completed survey routes in the respective year. Annual change and statistical
Significance are computed only from survey routes completed in both years by the same observer. ** Denotes a significant change (P < 0.10) from previous year (1-tailed P, Wilcoxon Signed Rank Sums Test). ~ Indicates a different observer from previous year.
11
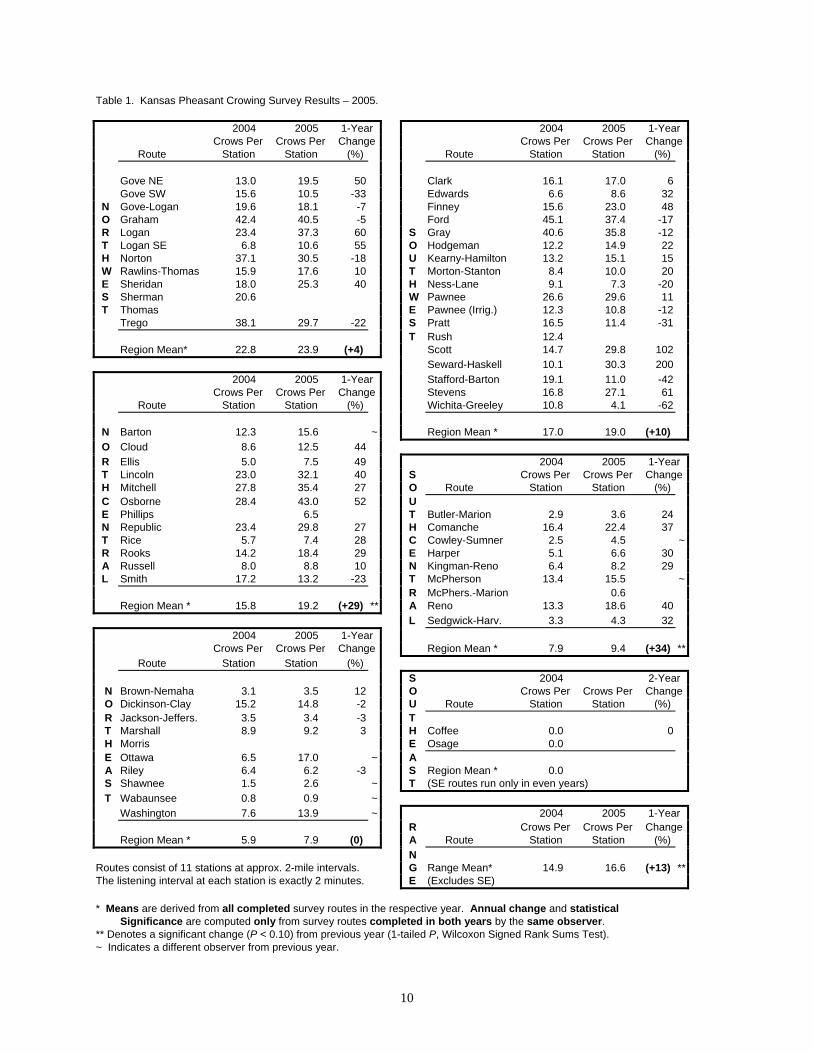
Table 2. Kansas Department of Wildlife and Parks personnel assigned pheasant crowing survey routes – 2005.
Region Route Observer Region Route Observer
NW Gove NE Steve Price SW Clark Jon Zuercher Gove SW Randy Rodgers Edwards Matt Stucker Gove-Logan Randy Rodgers Finney Daryl Fisher Graham Marc Gray Ford Scotty Baugh Logan Matt Bain Gray Lowell Aberson Logan SE Randy Rodgers Hodgeman Craig Curtis Norton Cris Mulder Kearny-Hamilton Mark Sexson Rawlins-Thomas Matt Bain Morton-Stanton B.J. Thurman Sheridan Randy Rodgers Ness-Lane Troy Schroeder Sherman * Mike Hopper Pawnee Charlie Swank Thomas * Benny Young Pawnee (Irrig.) Helen Hands Trego Kent Hensley Pratt Brad Simpson Rush * Brian Hanzlick
NC Barton Gene Scheweis ~ Scott Manuel Torres Cloud Ron Ruthstrom Seward-Haskell Tim Urban Ellis Bruce Taggart Stafford-Barton Charlie Swank Lincoln Aaron Deters Stevens Kraig Schultz Mitchell Mike Nyhoff Wichita-Greeley Daryl Fisher Osborne Toby Marlier Phillips Marc Gray SC Butler-Marion Charlie Cope Republic Rob Unruh Comanche Craig Curtis Rice Steve Adams Cowley-Sumner Kurt Grimm ~ Rooks Mike Zajic Harper Brad Odle Russell Matt Smith Kingman-Reno Troy Smith Smith Ron Ruthstrom McPherson Brent Theede ~ McPhers.-Marion Cliff Peterson
NE Brown-Nemaha Randy Whiteaker Reno Jeff Rue Dickinson-Clay Tom Bowman Sedgwick-Harv. Charlie Cope Jackson-Jeffers. Randy Whiteaker Marshall Keith Salmans SE Coffee ** Bob Culbertson Morris * Roger Applegate Osage ** Matt Peek Ottawa Eli Makings ~ Riley Corey Alderson Shawnee Clint Thornton ~ ~ New Observer Wabaunsee Clint Thornton ~ * Route not completed Washington Tom Bowman ~ ** Southeast routes run only in even years.
12
PHEASANT BROOD SURVEY RESULTS – 2005
Prepared by Randy Rodgers, Wildlife Biologist Dates for the 2005 Summer Brood Survey were from July 17 through August 27. Tables 3 and 4, and Figure 2 summarize the pheasant information collected by Kansas Department of Wildlife and Parks personnel. Temperatures during the first half of the survey period were exceptionally hot, often well exceeding 100° F, with generally dry and windy conditions. Conditions moderated substantially for the second half of the survey period with much cooler temperatures and more frequent precipitation. Exceptionally heavy rains occurred during the last week of the survey period in parts of southcentral Kansas and the southern Flint Hills.
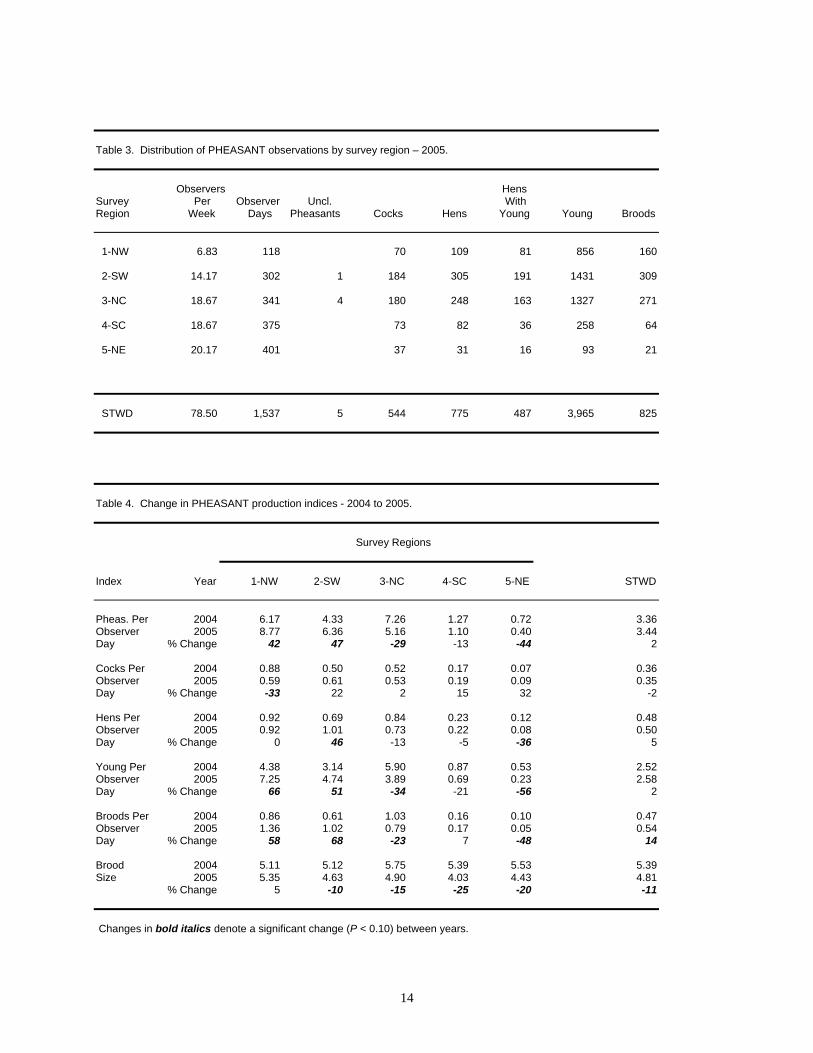
PHEASANT KDWP personnel reported 5,289 pheasants this year, including 3,965 young in 825 broods. In 2004, 4,815 pheasants were reported with 3,609 young in 669 broods. Fifty-seven broods were not classified by age. Adult pheasant observations this year included 544 cocks and 775 hens, compared to 516 cocks and 690 hens in 2004. A weekly average of 78.5 observers spent 1,537 observer-days in the field this year compared to 70.0 and 1,434, respectively, in 2004. The statewide pheasants-per-observer-day index (3.44) increased 2% compared to 2004 which was not statistically significant (P = 0.380). The 2005 index exceeded both the 2000–2004 5-year mean (2.58) and the 1995–2004 10-year mean (2.67). There were, however, very sharp contrasts in this index on a regional basis. Pheasants made very strong gains in western Kansas, but these gains were countered by lower indices in the central and eastern regions. The northwest and southwest survey regions increased significantly, by 42% (P = 0.023) and 47% (P = 0.014), respectively. Nesting conditions in green wheat were particularly good in western Kansas this year. The wheat greened early and attained good height and density by mid-April. A relatively dry May, while negatively affecting wheat grain yields, may actually have helped with pheasant nesting success in the west. In contrast to gains in the west, the northcentral regional index was down 29% (P = 0.014) and the northeast was down 44% (P = 0.023). Both decreases were statistically significant. The southcentral region also trended downward (-13%), but this was not statistically significant (P = 0.232). It was particularly disheartening to see such substantial declines in the northeast, which has seen unusually low, but slowly recovering, pheasant populations for several years. Pheasant production appears to have been best in the northwest survey region where observations of young birds jumped (P = 0.014) by 66% over 2004. This is particularly impressive relative to observations of adult hens which were unchanged from 2004. The 51% increase in young observed (P = 0.014) in the southwest region appeared to be driven more by a substantially improved breeding population, as indicated by a 46% increase (P = 0.014) in the adult hen index over last year. Indices of young birds in the northcentral, southcentral, and northeast survey regions were all lower than adult indices, indicating below-average production. Frequent heavy rains in early June in the central and eastern portions of Kansas’ pheasant range probably account for much of the decline that occurred in these regions. These rains were concurrent with the peak of hatching and likely caused heavy losses among recently-hatched chicks.
13
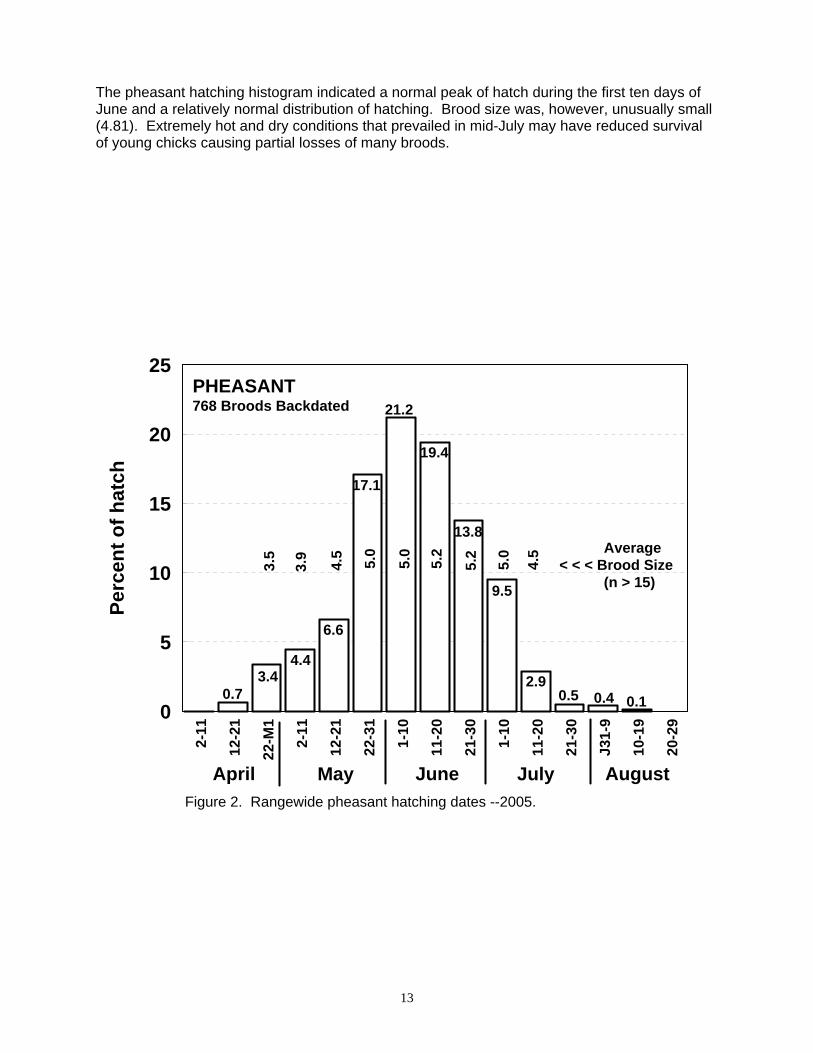
The pheasant hatching histogram indicated a normal peak of hatch during the first ten days of June and a relatively normal distribution of hatching. Brood size was, however, unusually small (4.81). Extremely hot and dry conditions that prevailed in mid-July may have reduced survival of young chicks causing partial losses of many broods.
2 -11
12- 2
1
2 2-M
1
2-11
12-2
1
22-3
1
1-1
0
11-2
0
21-3
0
1-1
0
11-2
0
2 1-3
0
J31 -
9
1 0-1
9
20-2
90
5
10
15
20
25
Perc
ent o
f ha t
ch
PHEASANT
April May June July August
Average< < < Brood Size (n > 15)
Figure 2. Rangewide pheasant hatching dates --2005.
768 Broods Backdated
0.73.4
4.4
6.6
17.1
21.2
19.4
13.8
9.5
2.90.5 0.4 0.1
3.5
3.9
4.5
5.0
5.2
5.0
5.0
5.2
4.5
14
Table 3. Distribution of PHEASANT observations by survey region – 2005. Observers Hens
Survey Per Observer Uncl. With Region Week Days Pheasants Cocks Hens Young Young Broods
1-NW 6.83 118 70 109 81 856 160
2-SW 14.17 302 1 184 305 191 1431 309
3-NC 18.67 341 4 180 248 163 1327 271
4-SC 18.67 375 73 82 36 258 64
5-NE 20.17 401 37 31 16 93 21
STWD 78.50 1,537 5 544 775 487 3,965 825
Table 4. Change in PHEASANT production indices - 2004 to 2005. Survey Regions
Index Year 1-NW 2-SW 3-NC 4-SC 5-NE STWD
Pheas. Per 2004 6.17 4.33 7.26 1.27 0.72 3.36Observer 2005 8.77 6.36 5.16 1.10 0.40 3.44Day % Change 42 47 -29 -13 -44 2
Cocks Per 2004 0.88 0.50 0.52 0.17 0.07 0.36Observer 2005 0.59 0.61 0.53 0.19 0.09 0.35Day % Change -33 22 2 15 32 -2
Hens Per 2004 0.92 0.69 0.84 0.23 0.12 0.48Observer 2005 0.92 1.01 0.73 0.22 0.08 0.50Day % Change 0 46 -13 -5 -36 5
Young Per 2004 4.38 3.14 5.90 0.87 0.53 2.52Observer 2005 7.25 4.74 3.89 0.69 0.23 2.58Day % Change 66 51 -34 -21 -56 2
Broods Per 2004 0.86 0.61 1.03 0.16 0.10 0.47Observer 2005 1.36 1.02 0.79 0.17 0.05 0.54Day % Change 58 68 -23 7 -48 14
Brood 2004 5.11 5.12 5.75 5.39 5.53 5.39Size 2005 5.35 4.63 4.90 4.03 4.43 4.81
% Change 5 -10 -15 -25 -20 -11
Changes in bold italics denote a significant change (P < 0.10) between years.
15
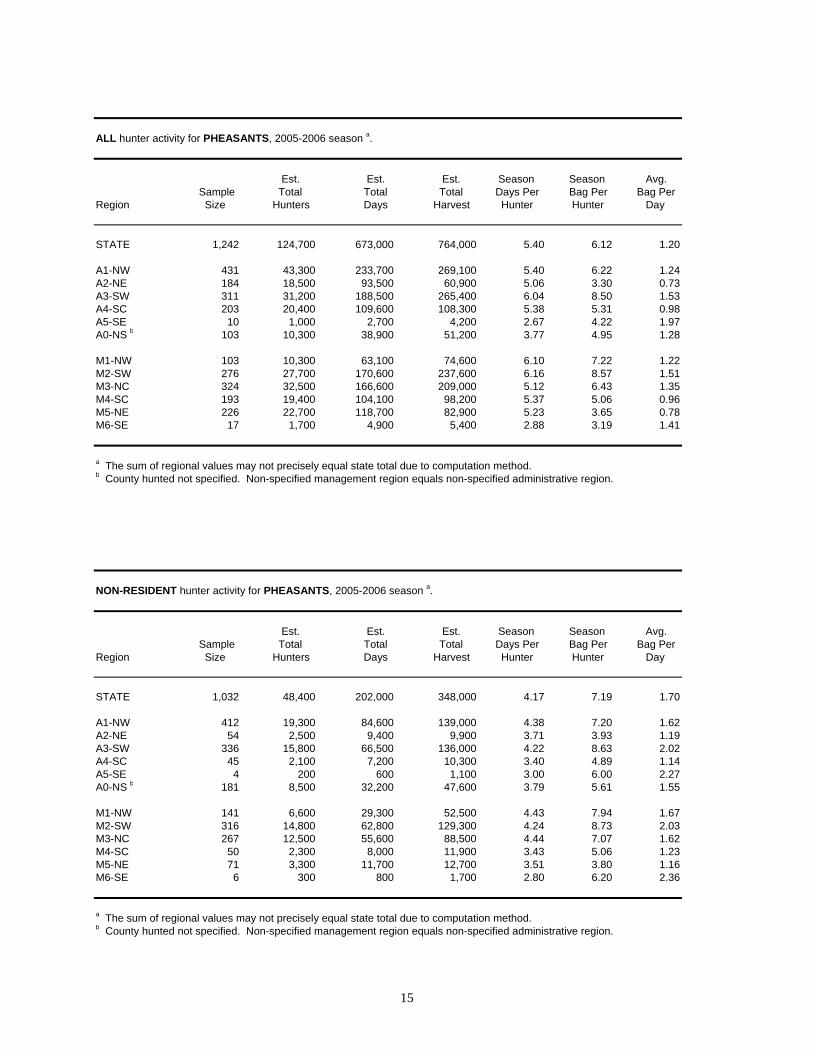
ALL hunter activity for PHEASANTS, 2005-2006 season a.
Est. Est. Est. Season Season Avg. Sample Total Total Total Days Per Bag Per Bag Per
Region Size Hunters Days Harvest Hunter Hunter Day
STATE 1,242 124,700 673,000 764,000 5.40 6.12 1.20
A1-NW 431 43,300 233,700 269,100 5.40 6.22 1.24A2-NE 184 18,500 93,500 60,900 5.06 3.30 0.73A3-SW 311 31,200 188,500 265,400 6.04 8.50 1.53A4-SC 203 20,400 109,600 108,300 5.38 5.31 0.98A5-SE 10 1,000 2,700 4,200 2.67 4.22 1.97A0-NS b 103 10,300 38,900 51,200 3.77 4.95 1.28
M1-NW 103 10,300 63,100 74,600 6.10 7.22 1.22M2-SW 276 27,700 170,600 237,600 6.16 8.57 1.51M3-NC 324 32,500 166,600 209,000 5.12 6.43 1.35M4-SC 193 19,400 104,100 98,200 5.37 5.06 0.96M5-NE 226 22,700 118,700 82,900 5.23 3.65 0.78M6-SE 17 1,700 4,900 5,400 2.88 3.19 1.41
a The sum of regional values may not precisely equal state total due to computation method. b County hunted not specified. Non-specified management region equals non-specified administrative region.
NON-RESIDENT hunter activity for PHEASANTS, 2005-2006 season a.
Est. Est. Est. Season Season Avg. Sample Total Total Total Days Per Bag Per Bag Per
Region Size Hunters Days Harvest Hunter Hunter Day
STATE 1,032 48,400 202,000 348,000 4.17 7.19 1.70
A1-NW 412 19,300 84,600 139,000 4.38 7.20 1.62A2-NE 54 2,500 9,400 9,900 3.71 3.93 1.19A3-SW 336 15,800 66,500 136,000 4.22 8.63 2.02A4-SC 45 2,100 7,200 10,300 3.40 4.89 1.14A5-SE 4 200 600 1,100 3.00 6.00 2.27A0-NS b 181 8,500 32,200 47,600 3.79 5.61 1.55
M1-NW 141 6,600 29,300 52,500 4.43 7.94 1.67M2-SW 316 14,800 62,800 129,300 4.24 8.73 2.03M3-NC 267 12,500 55,600 88,500 4.44 7.07 1.62M4-SC 50 2,300 8,000 11,900 3.43 5.06 1.23M5-NE 71 3,300 11,700 12,700 3.51 3.80 1.16M6-SE 6 300 800 1,700 2.80 6.20 2.36
a The sum of regional values may not precisely equal state total due to computation method. b County hunted not specified. Non-specified management region equals non-specified administrative region.
16
2006
Kansas Pheasant Summary Weather conditions during the winter of 2005–2006 were mild with very little precipitation, leaving western Kansas’ pheasant breeding populations at their highest levels since the onset of drought in 2000. Averaged over the entire Kansas pheasant range, the April Rural Mail Carriers Survey (RMCS) index increased 27%, but this increase was accounted for by large increases in the Northwest (61%) and Southwest (158%) regions, with other regions declining modestly. Excellent 2005 production and good winter survival in western Kansas were also reflected in the Pheasant Crowing Survey (PCS) with 35% and 61% increases recorded in the Northwest and Southwest, respectively. The rangewide PCS index was the highest in 10 years. Unusually dry conditions overwinter persisted through spring and into early August for most of the state. Nesting conditions in green wheat were poor. The wheat greened early but quickly ran out of moisture, resulting in short, thin stands that matured well ahead of normal. This situation was particularly severe in western Kansas where many wheat stands were abandoned. The poor condition of the wheat crop reduced its concealment quality, probably leading to higher nest predation, and likely caused a shift to wheat stubble as many hens’ initial choice for nest placement. Wheat stubble is a dangerous nesting habitat as it is mechanically disturbed during the nesting period, either by tillage or row-crop planting. Early wheat maturity also resulted in wheat harvest occurring 10 to 14 days ahead of normal, sharply reducing the time available for nesting and early brood rearing to safely occur. Unusual numbers of reports of hen or chick destruction were received this year as harvesters lowered their headers and increased combine ground speed to harvest the short, thin stands of wheat. The rangewide Summer Brood Survey (SBS) index decreased 23% compared to 2005 and was down most sharply (-42%) in the southwest, where drought conditions were most severe. One area along the Nebraska border received significant rains in late June, much earlier than most of the state, and experienced relatively good pheasant reproduction. This area, roughly extended from Norton and northern Graham counties eastward through Phillips, northern Rooks, Smith, northern Osborne, and Jewell counties, roughly north of Highway 24. Significant, often heavy rains, occurred statewide in August. These rains substantially improved habitat quality through the remainder of the growing season. This improved habitat set the stage for good overwinter survival. The widespread August rains also provided excellent soil moisture for seeding and early development of the state’s winter wheat crop, creating conditions for potential good recruitment in 2007. The 2006–2007 rangewide harvest estimate was 774,000 roosters. Although this value was slightly greater than the 2005–2006 harvest, this increase was probably due to an improvement in how harvest estimates were obtained. For the first time, we were able to randomly sample non-resident hunters. This improvement was made possible by the new Kansas Automated Outdoors Licensing System (KOALS). In reality, Kansas pheasant hunting proved more difficult in 2006 than in 2005, with the exception of the area in northern Kansas (noted above) where hunting success remained very good. The most severe blizzard and persistent deep-snow conditions in decades hit far western Kansas in the final days of 2006. Snow cover exceeded 2 feet in many areas and persisted through February roughly west of a line from Stevens County in the southwest to Decatur County in northwest Kansas, creating difficult survival conditions for pheasants.
17
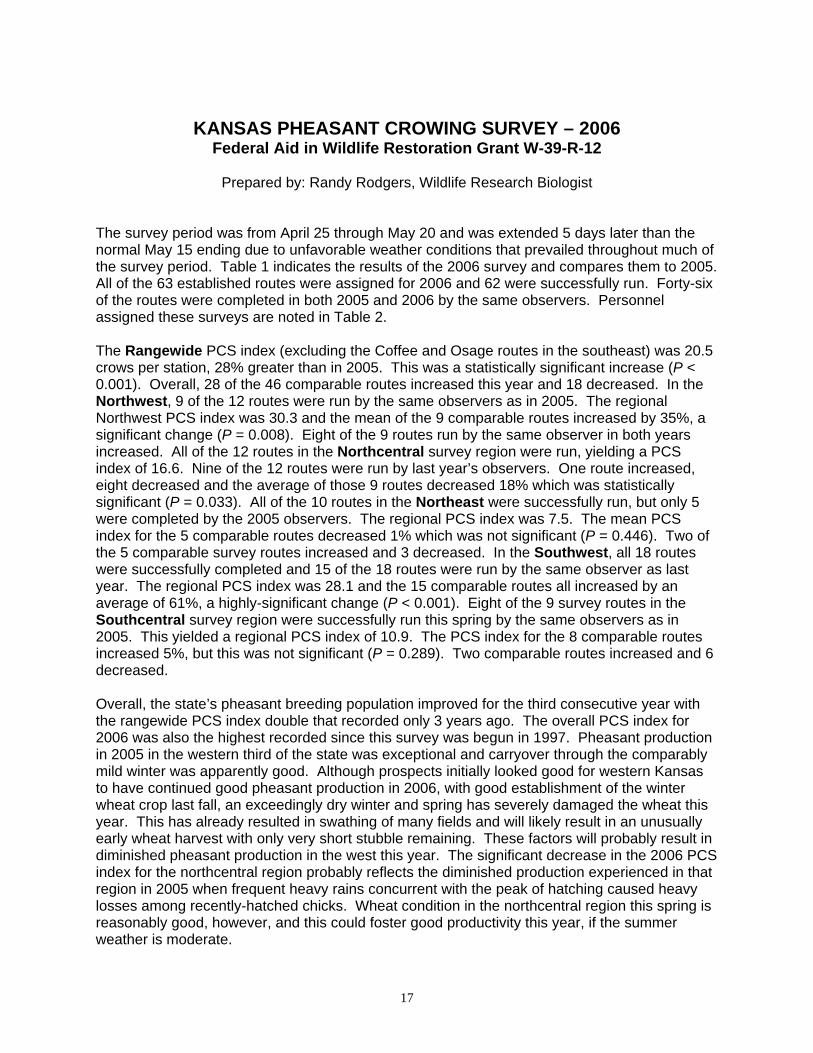
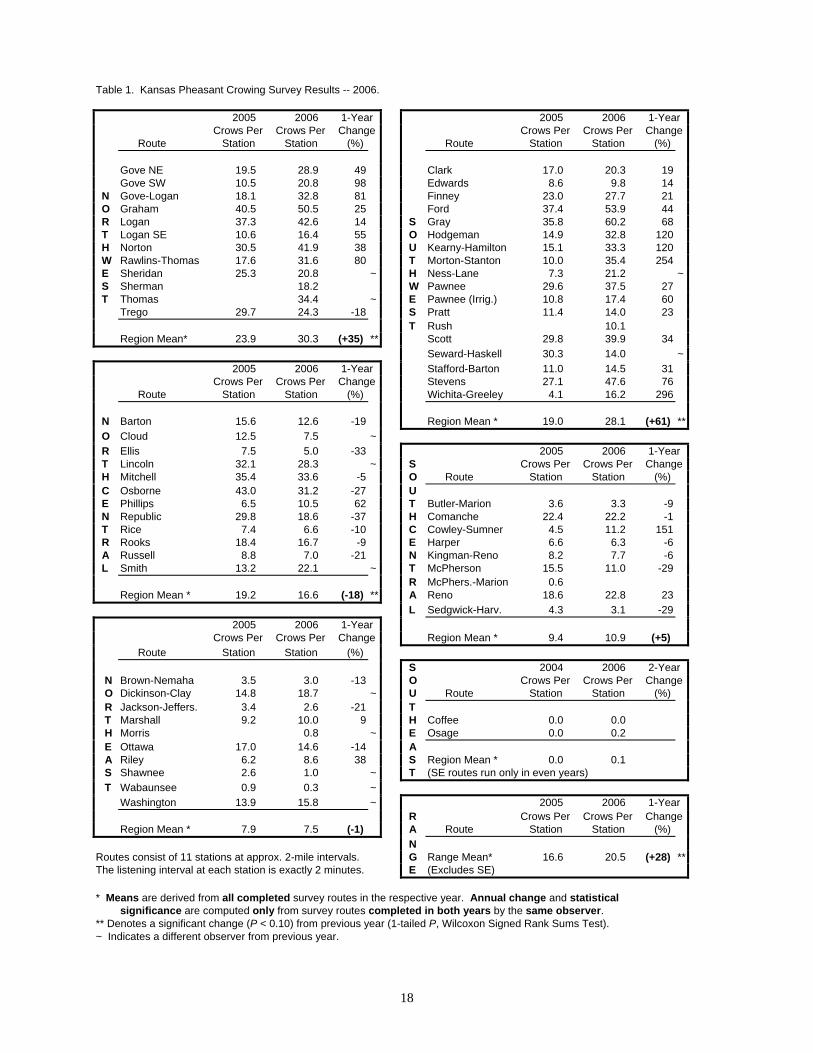
KANSAS PHEASANT CROWING SURVEY – 2006 Federal Aid in Wildlife Restoration Grant W-39-R-12
Prepared by: Randy Rodgers, Wildlife Research Biologist
The survey period was from April 25 through May 20 and was extended 5 days later than the normal May 15 ending due to unfavorable weather conditions that prevailed throughout much of the survey period. Table 1 indicates the results of the 2006 survey and compares them to 2005. All of the 63 established routes were assigned for 2006 and 62 were successfully run. Forty-six of the routes were completed in both 2005 and 2006 by the same observers. Personnel assigned these surveys are noted in Table 2. The Rangewide PCS index (excluding the Coffee and Osage routes in the southeast) was 20.5 crows per station, 28% greater than in 2005. This was a statistically significant increase (P < 0.001). Overall, 28 of the 46 comparable routes increased this year and 18 decreased. In the Northwest, 9 of the 12 routes were run by the same observers as in 2005. The regional Northwest PCS index was 30.3 and the mean of the 9 comparable routes increased by 35%, a significant change (P = 0.008). Eight of the 9 routes run by the same observer in both years increased. All of the 12 routes in the Northcentral survey region were run, yielding a PCS index of 16.6. Nine of the 12 routes were run by last year’s observers. One route increased, eight decreased and the average of those 9 routes decreased 18% which was statistically significant (P = 0.033). All of the 10 routes in the Northeast were successfully run, but only 5 were completed by the 2005 observers. The regional PCS index was 7.5. The mean PCS index for the 5 comparable routes decreased 1% which was not significant (P = 0.446). Two of the 5 comparable survey routes increased and 3 decreased. In the Southwest, all 18 routes were successfully completed and 15 of the 18 routes were run by the same observer as last year. The regional PCS index was 28.1 and the 15 comparable routes all increased by an average of 61%, a highly-significant change (P < 0.001). Eight of the 9 survey routes in the Southcentral survey region were successfully run this spring by the same observers as in 2005. This yielded a regional PCS index of 10.9. The PCS index for the 8 comparable routes increased 5%, but this was not significant (P = 0.289). Two comparable routes increased and 6 decreased. Overall, the state’s pheasant breeding population improved for the third consecutive year with the rangewide PCS index double that recorded only 3 years ago. The overall PCS index for 2006 was also the highest recorded since this survey was begun in 1997. Pheasant production in 2005 in the western third of the state was exceptional and carryover through the comparably mild winter was apparently good. Although prospects initially looked good for western Kansas to have continued good pheasant production in 2006, with good establishment of the winter wheat crop last fall, an exceedingly dry winter and spring has severely damaged the wheat this year. This has already resulted in swathing of many fields and will likely result in an unusually early wheat harvest with only very short stubble remaining. These factors will probably result in diminished pheasant production in the west this year. The significant decrease in the 2006 PCS index for the northcentral region probably reflects the diminished production experienced in that region in 2005 when frequent heavy rains concurrent with the peak of hatching caused heavy losses among recently-hatched chicks. Wheat condition in the northcentral region this spring is reasonably good, however, and this could foster good productivity this year, if the summer weather is moderate.
18
Table 1. Kansas Pheasant Crowing Survey Results -- 2006.
2005 2006 1-Year 2005 2006 1-Year Crows Per Crows Per Change Crows Per Crows Per Change Route Station Station (%) Route Station Station (%) Gove NE 19.5 28.9 49 Clark 17.0 20.3 19 Gove SW 10.5 20.8 98 Edwards 8.6 9.8 14
N Gove-Logan 18.1 32.8 81 Finney 23.0 27.7 21 O Graham 40.5 50.5 25 Ford 37.4 53.9 44 R Logan 37.3 42.6 14 S Gray 35.8 60.2 68 T Logan SE 10.6 16.4 55 O Hodgeman 14.9 32.8 120 H Norton 30.5 41.9 38 U Kearny-Hamilton 15.1 33.3 120 W Rawlins-Thomas 17.6 31.6 80 T Morton-Stanton 10.0 35.4 254 E Sheridan 25.3 20.8 ~ H Ness-Lane 7.3 21.2 ~ S Sherman 18.2 W Pawnee 29.6 37.5 27 T Thomas 34.4 ~ E Pawnee (Irrig.) 10.8 17.4 60
Trego 29.7 24.3 -18 S Pratt 11.4 14.0 23 T Rush 10.1 Region Mean* 23.9 30.3 (+35) ** Scott 29.8 39.9 34 Seward-Haskell 30.3 14.0 ~ 2005 2006 1-Year Stafford-Barton 11.0 14.5 31 Crows Per Crows Per Change Stevens 27.1 47.6 76 Route Station Station (%) Wichita-Greeley 4.1 16.2 296
N Barton 15.6 12.6 -19 Region Mean * 19.0 28.1 (+61) ** O Cloud 12.5 7.5 ~ R Ellis 7.5 5.0 -33 2005 2006 1-Year T Lincoln 32.1 28.3 ~ S Crows Per Crows Per Change H Mitchell 35.4 33.6 -5 O Route Station Station (%) C Osborne 43.0 31.2 -27 U E Phillips 6.5 10.5 62 T Butler-Marion 3.6 3.3 -9 N Republic 29.8 18.6 -37 H Comanche 22.4 22.2 -1 T Rice 7.4 6.6 -10 C Cowley-Sumner 4.5 11.2 151 R Rooks 18.4 16.7 -9 E Harper 6.6 6.3 -6 A Russell 8.8 7.0 -21 N Kingman-Reno 8.2 7.7 -6 L Smith 13.2 22.1 ~ T McPherson 15.5 11.0 -29
R McPhers.-Marion 0.6 Region Mean * 19.2 16.6 (-18) ** A Reno 18.6 22.8 23 L Sedgwick-Harv. 4.3 3.1 -29 2005 2006 1-Year Crows Per Crows Per Change Region Mean * 9.4 10.9 (+5) Route Station Station (%) S 2004 2006 2-Year
N Brown-Nemaha 3.5 3.0 -13 O Crows Per Crows Per Change O Dickinson-Clay 14.8 18.7 ~ U Route Station Station (%) R Jackson-Jeffers. 3.4 2.6 -21 T T Marshall 9.2 10.0 9 H Coffee 0.0 0.0 H Morris 0.8 ~ E Osage 0.0 0.2 E Ottawa 17.0 14.6 -14 A A Riley 6.2 8.6 38 S Region Mean * 0.0 0.1 S Shawnee 2.6 1.0 ~ T (SE routes run only in even years) T Wabaunsee 0.9 0.3 ~
Washington 13.9 15.8 ~ 2005 2006 1-Year R Crows Per Crows Per Change Region Mean * 7.9 7.5 (-1) A Route Station Station (%) N
Routes consist of 11 stations at approx. 2-mile intervals. G Range Mean* 16.6 20.5 (+28) **The listening interval at each station is exactly 2 minutes. E (Excludes SE)
* Means are derived from all completed survey routes in the respective year. Annual change and statistical
significance are computed only from survey routes completed in both years by the same observer. ** Denotes a significant change (P < 0.10) from previous year (1-tailed P, Wilcoxon Signed Rank Sums Test). ~ Indicates a different observer from previous year.
19
Table 2. Kansas Department of Wildlife and Parks personnel assigned pheasant crowing survey routes -- 2006.
Region Route Observer Region Route Observer
NW Gove NE Steve Price SW Clark Jon Zuercher Gove SW Randy Rodgers Edwards Matt Stucker Gove-Logan Randy Rodgers Finney Daryl Fisher Graham Marc Gray Ford Scotty Baugh Logan Matt Bain Gray Lowell Aberson Logan SE Randy Rodgers Hodgeman Craig Curtis Norton Cris Mulder Kearny-Hamilton Mark Sexson Rawlins-Thomas Matt Bain Morton-Stanton B.J. Thurman Sheridan Chris Berens ~ Ness-Lane Randy Rodgers ~ Sherman Mike Hopper Pawnee Charlie Swank Thomas Chris Berens ~ Pawnee (Irrig.) Helen Hands Trego Kent Hensley Pratt Brad Simpson Rush Brian Hanzlick
NC Barton Gene Scheweis Scott Manuel Torres Cloud Aaron Deters ~ Seward-Haskell Aaron Baugh ~ Ellis Bruce Taggart Stafford-Barton Charlie Swank Lincoln Shane Hesting ~ Stevens Kraig Schultz Mitchell Mike Nyhoff Wichita-Greeley Daryl Fisher Osborne Toby Marlier Phillips Marc Gray SC Butler-Marion Charlie Cope Republic Rob Unruh Comanche Craig Curtis Rice Steve Adams Cowley-Sumner Kurt Grimm Rooks Mike Zajic Harper Brad Odle Russell Matt Smith Kingman-Reno Troy Smith Smith Aaron Deters ~ McPherson Brent Theede McPhers.-Marion * Cliff Peterson
NE Brown-Nemaha Randy Whiteaker Reno Jeff Rue Dickinson-Clay Clint Thornton ~ Sedgwick-Harv. Charlie Cope Jackson-Jeffers. Randy Whiteaker Marshall Keith Salmans SE Coffee ** Bob Culbertson Morris Brent Konen Osage ** Matt Peek Ottawa Eli Makings Riley Corey Alderson Shawnee Mike McFadden ~ ~ New Observer Wabaunsee Mike McFadden ~ * Route not completed Washington Clint Thornton ~ ** Southeast routes run only in even years.
20
PHEASANT BROOD SURVEY RESULTS – 2006
Prepared by Randy Rodgers, Wildlife Biologist
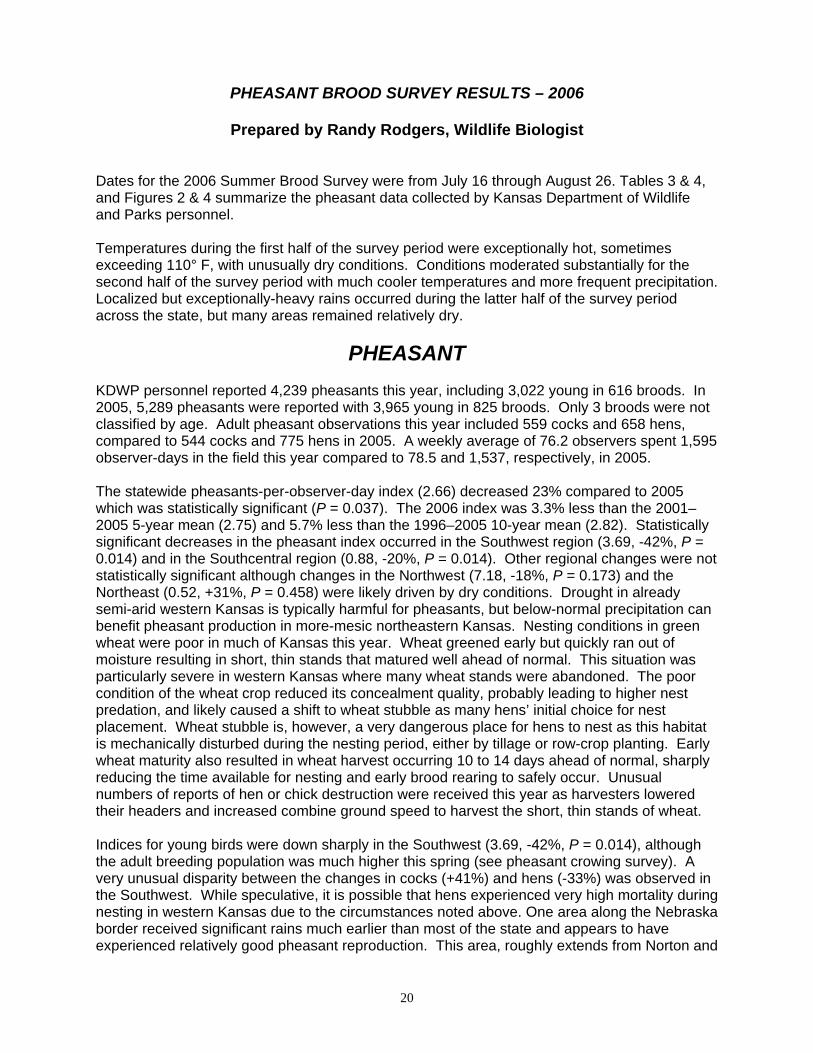
Dates for the 2006 Summer Brood Survey were from July 16 through August 26. Tables 3 & 4, and Figures 2 & 4 summarize the pheasant data collected by Kansas Department of Wildlife and Parks personnel. Temperatures during the first half of the survey period were exceptionally hot, sometimes exceeding 110° F, with unusually dry conditions. Conditions moderated substantially for the second half of the survey period with much cooler temperatures and more frequent precipitation. Localized but exceptionally-heavy rains occurred during the latter half of the survey period across the state, but many areas remained relatively dry.
PHEASANT KDWP personnel reported 4,239 pheasants this year, including 3,022 young in 616 broods. In 2005, 5,289 pheasants were reported with 3,965 young in 825 broods. Only 3 broods were not classified by age. Adult pheasant observations this year included 559 cocks and 658 hens, compared to 544 cocks and 775 hens in 2005. A weekly average of 76.2 observers spent 1,595 observer-days in the field this year compared to 78.5 and 1,537, respectively, in 2005. The statewide pheasants-per-observer-day index (2.66) decreased 23% compared to 2005 which was statistically significant (P = 0.037). The 2006 index was 3.3% less than the 2001–2005 5-year mean (2.75) and 5.7% less than the 1996–2005 10-year mean (2.82). Statistically significant decreases in the pheasant index occurred in the Southwest region (3.69, -42%, P = 0.014) and in the Southcentral region (0.88, -20%, P = 0.014). Other regional changes were not statistically significant although changes in the Northwest (7.18, -18%, P = 0.173) and the Northeast (0.52, +31%, P = 0.458) were likely driven by dry conditions. Drought in already semi-arid western Kansas is typically harmful for pheasants, but below-normal precipitation can benefit pheasant production in more-mesic northeastern Kansas. Nesting conditions in green wheat were poor in much of Kansas this year. Wheat greened early but quickly ran out of moisture resulting in short, thin stands that matured well ahead of normal. This situation was particularly severe in western Kansas where many wheat stands were abandoned. The poor condition of the wheat crop reduced its concealment quality, probably leading to higher nest predation, and likely caused a shift to wheat stubble as many hens’ initial choice for nest placement. Wheat stubble is, however, a very dangerous place for hens to nest as this habitat is mechanically disturbed during the nesting period, either by tillage or row-crop planting. Early wheat maturity also resulted in wheat harvest occurring 10 to 14 days ahead of normal, sharply reducing the time available for nesting and early brood rearing to safely occur. Unusual numbers of reports of hen or chick destruction were received this year as harvesters lowered their headers and increased combine ground speed to harvest the short, thin stands of wheat. Indices for young birds were down sharply in the Southwest (3.69, -42%, P = 0.014), although the adult breeding population was much higher this spring (see pheasant crowing survey). A very unusual disparity between the changes in cocks (+41%) and hens (-33%) was observed in the Southwest. While speculative, it is possible that hens experienced very high mortality during nesting in western Kansas due to the circumstances noted above. One area along the Nebraska border received significant rains much earlier than most of the state and appears to have experienced relatively good pheasant reproduction. This area, roughly extends from Norton and
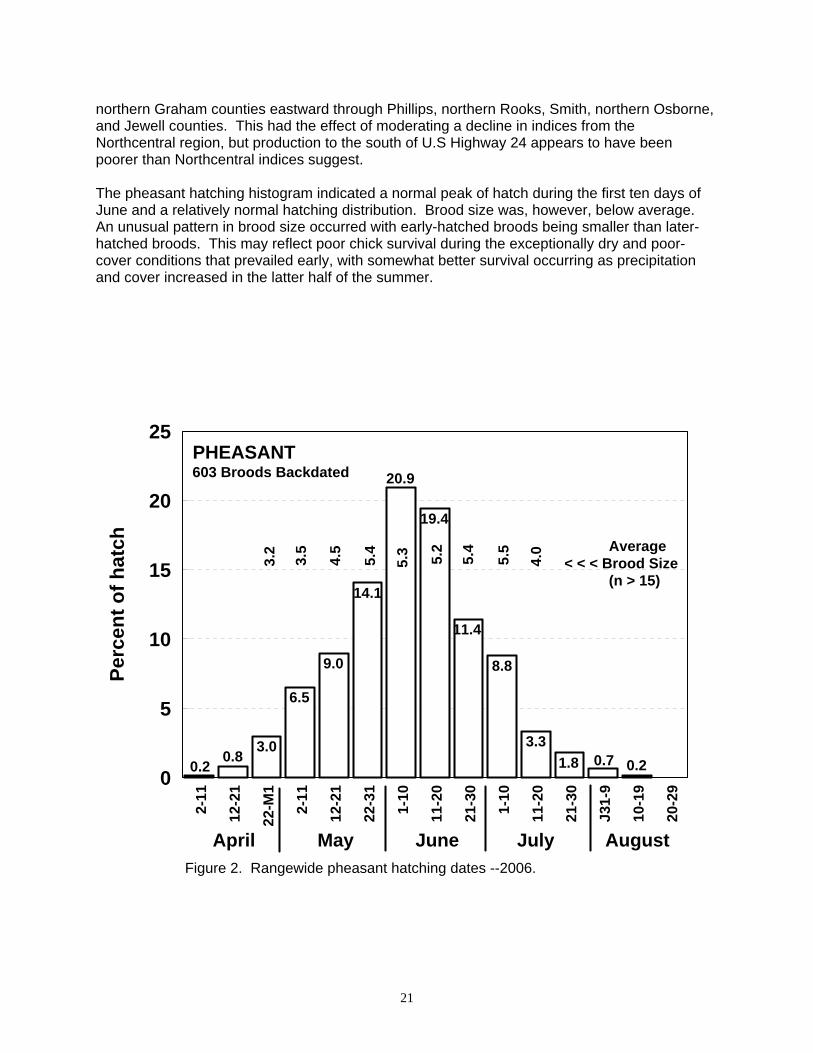
21
northern Graham counties eastward through Phillips, northern Rooks, Smith, northern Osborne, and Jewell counties. This had the effect of moderating a decline in indices from the Northcentral region, but production to the south of U.S Highway 24 appears to have been poorer than Northcentral indices suggest. The pheasant hatching histogram indicated a normal peak of hatch during the first ten days of June and a relatively normal hatching distribution. Brood size was, however, below average. An unusual pattern in brood size occurred with early-hatched broods being smaller than later-hatched broods. This may reflect poor chick survival during the exceptionally dry and poor-cover conditions that prevailed early, with somewhat better survival occurring as precipitation and cover increased in the latter half of the summer.
2 -11
12- 2
1
2 2-M
1
2-11
12-2
1
22-3
1
1-1
0
11-2
0
21-3
0
1-1
0
11-2
0
2 1-3
0
J31 -
9
1 0-1
9
20-2
90
5
10
15
20
25
Perc
ent o
f ha t
ch
PHEASANT
April May June July August
Average< < < Brood Size (n > 15)
Figure 2. Rangewide pheasant hatching dates --2006.
603 Broods Backdated
0.2 0.8 3.0
6.5
9.0
14.1
20.9
19.4
11.4
8.8
3.31.8 0.7 0.2
3.2
3.5
4 .5
5.4
5.3 5.2
5 .4
5.5
4.0
22
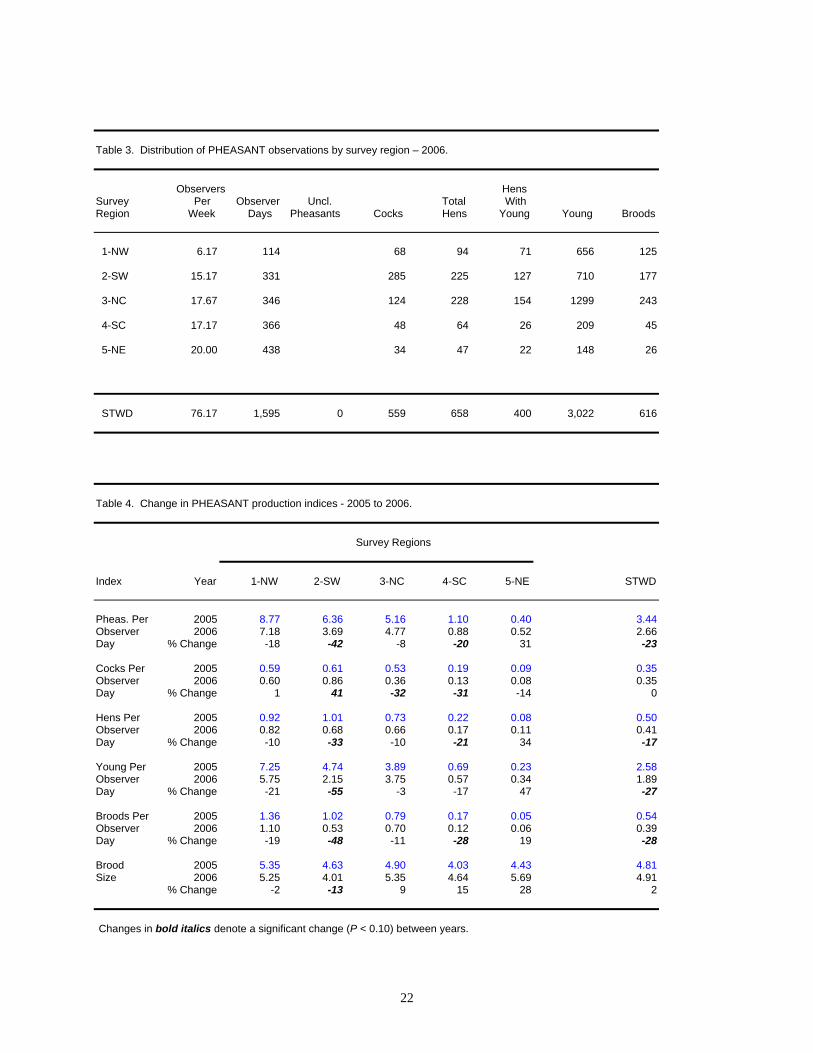
Table 3. Distribution of PHEASANT observations by survey region – 2006. Observers Hens
Survey Per Observer Uncl. Total With Region Week Days Pheasants Cocks Hens Young Young Broods
1-NW 6.17 114 68 94 71 656 125
2-SW 15.17 331 285 225 127 710 177
3-NC 17.67 346 124 228 154 1299 243
4-SC 17.17 366 48 64 26 209 45
5-NE 20.00 438 34 47 22 148 26
STWD 76.17 1,595 0 559 658 400 3,022 616
Table 4. Change in PHEASANT production indices - 2005 to 2006. Survey Regions
Index Year 1-NW 2-SW 3-NC 4-SC 5-NE STWD
Pheas. Per 2005 8.77 6.36 5.16 1.10 0.40 3.44Observer 2006 7.18 3.69 4.77 0.88 0.52 2.66Day % Change -18 -42 -8 -20 31 -23
Cocks Per 2005 0.59 0.61 0.53 0.19 0.09 0.35Observer 2006 0.60 0.86 0.36 0.13 0.08 0.35Day % Change 1 41 -32 -31 -14 0
Hens Per 2005 0.92 1.01 0.73 0.22 0.08 0.50Observer 2006 0.82 0.68 0.66 0.17 0.11 0.41Day % Change -10 -33 -10 -21 34 -17
Young Per 2005 7.25 4.74 3.89 0.69 0.23 2.58Observer 2006 5.75 2.15 3.75 0.57 0.34 1.89Day % Change -21 -55 -3 -17 47 -27
Broods Per 2005 1.36 1.02 0.79 0.17 0.05 0.54Observer 2006 1.10 0.53 0.70 0.12 0.06 0.39Day % Change -19 -48 -11 -28 19 -28
Brood 2005 5.35 4.63 4.90 4.03 4.43 4.81Size 2006 5.25 4.01 5.35 4.64 5.69 4.91
% Change -2 -13 9 15 28 2
Changes in bold italics denote a significant change (P < 0.10) between years.
23
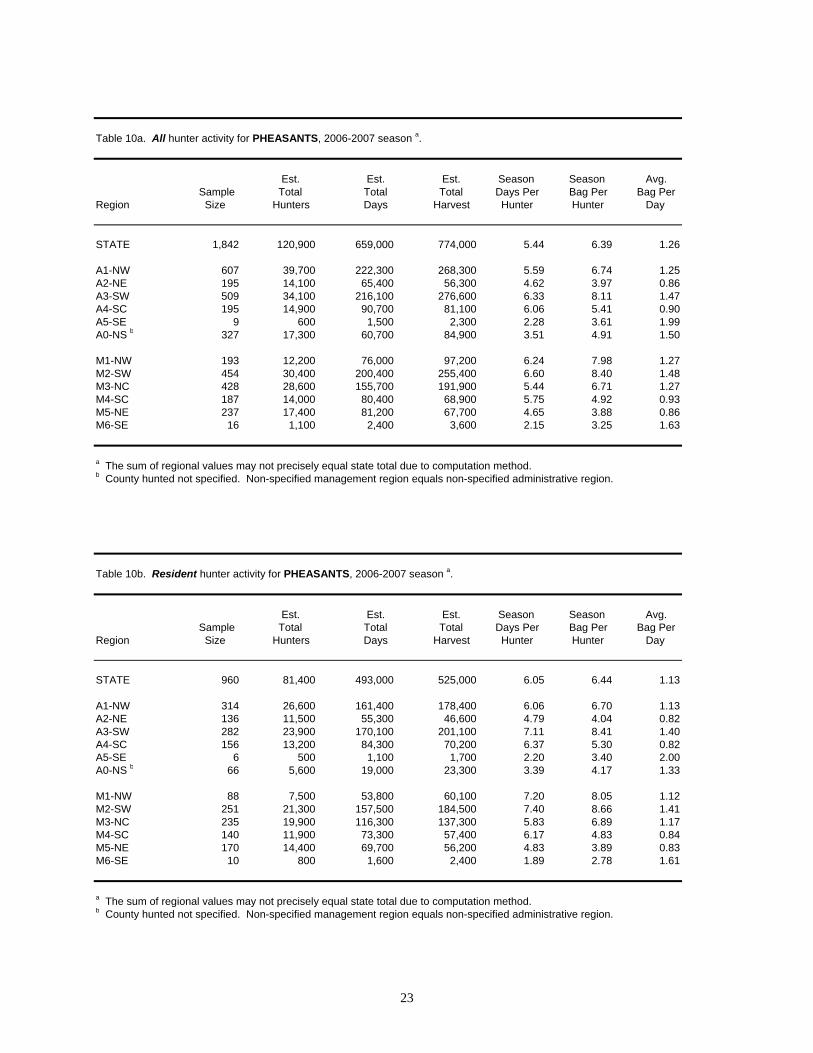
Table 10a. All hunter activity for PHEASANTS, 2006-2007 season a.
Est. Est. Est. Season Season Avg. Sample Total Total Total Days Per Bag Per Bag Per
Region Size Hunters Days Harvest Hunter Hunter Day
STATE 1,842 120,900 659,000 774,000 5.44 6.39 1.26
A1-NW 607 39,700 222,300 268,300 5.59 6.74 1.25A2-NE 195 14,100 65,400 56,300 4.62 3.97 0.86A3-SW 509 34,100 216,100 276,600 6.33 8.11 1.47A4-SC 195 14,900 90,700 81,100 6.06 5.41 0.90A5-SE 9 600 1,500 2,300 2.28 3.61 1.99A0-NS b 327 17,300 60,700 84,900 3.51 4.91 1.50
M1-NW 193 12,200 76,000 97,200 6.24 7.98 1.27M2-SW 454 30,400 200,400 255,400 6.60 8.40 1.48M3-NC 428 28,600 155,700 191,900 5.44 6.71 1.27M4-SC 187 14,000 80,400 68,900 5.75 4.92 0.93M5-NE 237 17,400 81,200 67,700 4.65 3.88 0.86M6-SE 16 1,100 2,400 3,600 2.15 3.25 1.63
a The sum of regional values may not precisely equal state total due to computation method. b County hunted not specified. Non-specified management region equals non-specified administrative region.
Table 10b. Resident hunter activity for PHEASANTS, 2006-2007 season a.
Est. Est. Est. Season Season Avg. Sample Total Total Total Days Per Bag Per Bag Per
Region Size Hunters Days Harvest Hunter Hunter Day
STATE 960 81,400 493,000 525,000 6.05 6.44 1.13
A1-NW 314 26,600 161,400 178,400 6.06 6.70 1.13A2-NE 136 11,500 55,300 46,600 4.79 4.04 0.82A3-SW 282 23,900 170,100 201,100 7.11 8.41 1.40A4-SC 156 13,200 84,300 70,200 6.37 5.30 0.82A5-SE 6 500 1,100 1,700 2.20 3.40 2.00A0-NS b 66 5,600 19,000 23,300 3.39 4.17 1.33
M1-NW 88 7,500 53,800 60,100 7.20 8.05 1.12M2-SW 251 21,300 157,500 184,500 7.40 8.66 1.41M3-NC 235 19,900 116,300 137,300 5.83 6.89 1.17M4-SC 140 11,900 73,300 57,400 6.17 4.83 0.84M5-NE 170 14,400 69,700 56,200 4.83 3.89 0.83M6-SE 10 800 1,600 2,400 1.89 2.78 1.61
a The sum of regional values may not precisely equal state total due to computation method. b County hunted not specified. Non-specified management region equals non-specified administrative region.
24
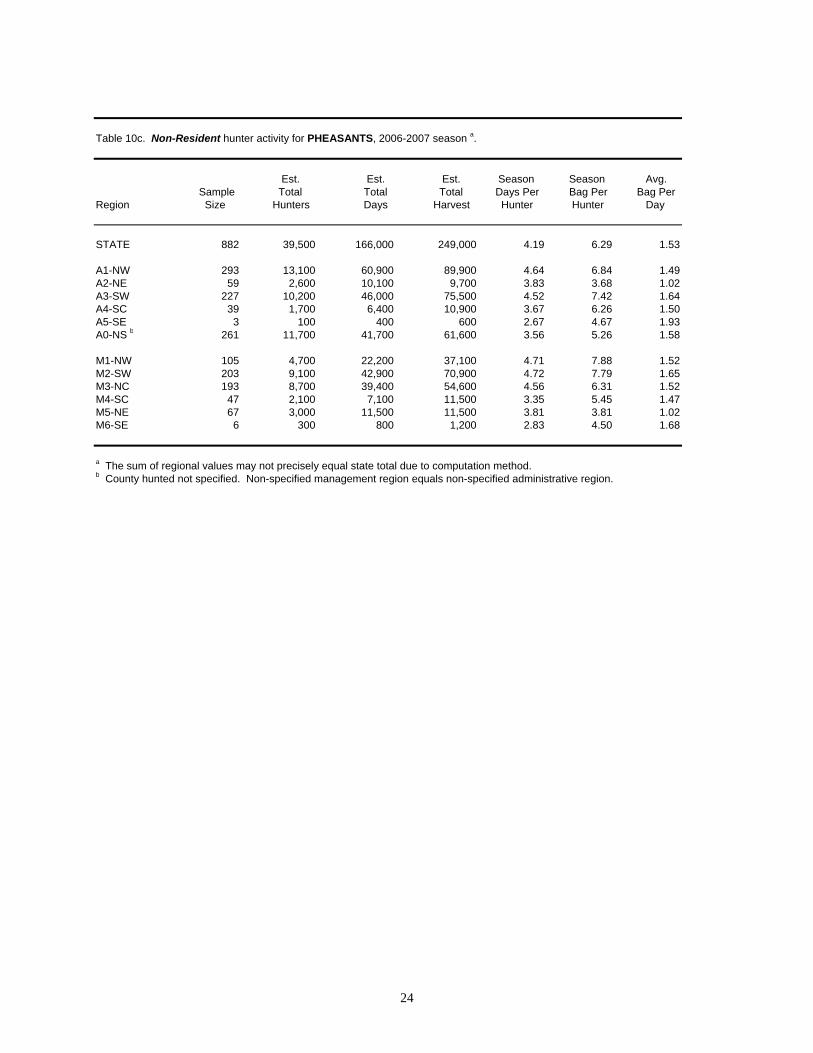
Table 10c. Non-Resident hunter activity for PHEASANTS, 2006-2007 season a.
Est. Est. Est. Season Season Avg. Sample Total Total Total Days Per Bag Per Bag Per
Region Size Hunters Days Harvest Hunter Hunter Day
STATE 882 39,500 166,000 249,000 4.19 6.29 1.53
A1-NW 293 13,100 60,900 89,900 4.64 6.84 1.49A2-NE 59 2,600 10,100 9,700 3.83 3.68 1.02A3-SW 227 10,200 46,000 75,500 4.52 7.42 1.64A4-SC 39 1,700 6,400 10,900 3.67 6.26 1.50A5-SE 3 100 400 600 2.67 4.67 1.93A0-NS b 261 11,700 41,700 61,600 3.56 5.26 1.58
M1-NW 105 4,700 22,200 37,100 4.71 7.88 1.52M2-SW 203 9,100 42,900 70,900 4.72 7.79 1.65M3-NC 193 8,700 39,400 54,600 4.56 6.31 1.52M4-SC 47 2,100 7,100 11,500 3.35 5.45 1.47M5-NE 67 3,000 11,500 11,500 3.81 3.81 1.02M6-SE 6 300 800 1,200 2.83 4.50 1.68
a The sum of regional values may not precisely equal state total due to computation method. b County hunted not specified. Non-specified management region equals non-specified administrative region.
25
Long-Term Trends
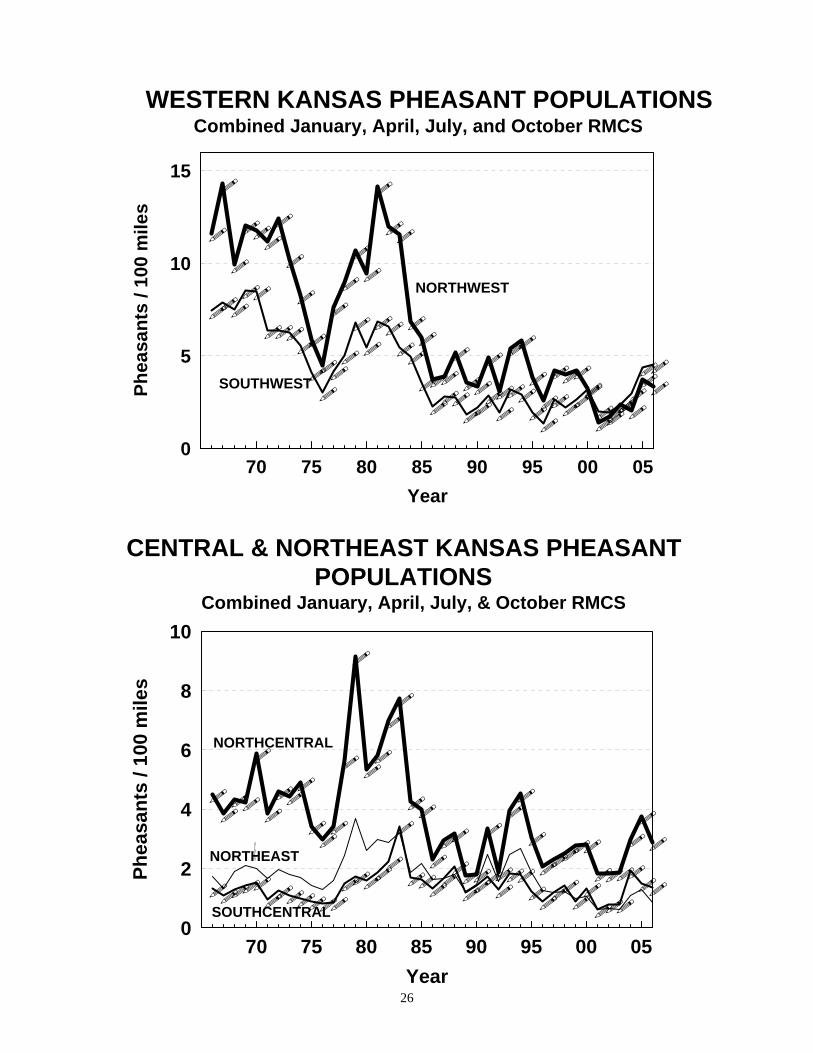
Ring-necked pheasants were first introduced into Kansas with the distribution of 3,000 birds in 84 counties during April of 1906 under the direction of State Fish and Game Warden D. W. Travis. An additional 2,366 pheasants were released between 1907 and 1909. Little record of the species’ early expansion in the state is available except as indicated by the structure of Kansas’ early pheasant seasons. The first season opened in 1917 and lasted 15 days. These earliest seasons continued through 1920. From 1921 through 1931, no pheasant season was held. Pheasant hunting was reopened in 1932 and season length varied from 2 to 7 days in 9 to 21 counties through 1943. The 1940s were apparently a period of substantial growth in Kansas’ pheasant population as hunting was expanded to 47 counties by 1945. Casual accounts indicate Kansas’ pheasant numbers peaked in the 1950s due to favorable cropping systems, but also partially as a result of the Soil Bank program of that time. As Soil Bank acres were gradually returned to crop production in the late 1950s and early 1960s, pheasant numbers began to decline. Kansas initiated its Small Game Harvest Survey in 1957. Population surveys, including the Rural Mail Carriers Survey and the Summer Brood Survey, were begun in 1962 and 1963, respectively, and the Pheasant Crowing Survey, conducted from 1962 to 1972, was re-established in 1997. After the decline associated with the end of the Soil Bank program, Kansas pheasant populations were relatively stable through the early 1970s. This was a time of gradual liberalization in the pheasant season culminating in 1973 when the season structure became essentially the same as that currently used. This gradual increase in pheasant-hunting opportunity fostered a period of slow growth in hunter days and harvest. The early 1970s, however, were a period of all-out crop production in response to an anticipated boom in grain export markets and maximum-production policies of the U.S. Department of Agriculture. Associated with that “fencerow-to-fencerow” crop production, pheasant numbers declined precipitously in western Kansas and, to a smaller degree, in the remainder of Kansas’ range. This decline persisted through 1976. Two events probably played key roles in reversing the pheasant trend for the remainder of the 1970s into the early 1980s. The Arab oil embargo increased the price of fuel that, in turn, reduced the amount of tillage and other weed-control operations in crop fields. Foreign grain markets also diminished, partially as a result of the 1976 embargo on U.S. grain going to the Soviet Union. In combination, these events resulted in a substantial improvement in the quantity and quality of pheasant habitat on Kansas farm lands. During this time, pheasant populations, harvest, and hunter use boomed. An estimated harvest of 1.25 million roosters was taken in 1979, a Kansas record, but even this was eclipsed by the estimated 1.57 million taken in 1982. On the strength of experience and solid scientific evidence that season length and structure with rooster-only hunting had no effect on subsequent breeding success, Kansas stabilized its pheasant-hunting regulations in 1982 (the season opening was advanced 1 week in 2006). The summer of 1983 was exceptionally dry in Kansas and habitat conditions were poor going into what proved to be one of the most severe winters in the state’s history. The pheasant harvest for the 1983-84 season remained a respectable 1.14 million, based on the strength of carryover from the previous year, but a severe decline was underway, particularly in the main pheasant range of western and northcentral Kansas. Since this rapid decline, Kansas’ pheasant populations have fluctuated around a level below the previous low point reached in 1976. Research in Kansas and elsewhere has tied this inability of pheasant populations to recover directly to the high intensity of weed control and declining height of grain stubbles, particularly in western Kansas. Herbicide use in Kansas crop rotations increased dramatically in both intensity and coverage in the 1980s and this trend accelerated in the 1990s. This, along with certain tillage practices, rendered many parts of Kansas much less hospitable to pheasants through the actions of limiting available brood habitat and degrading the amount and quality of winter habitat. Conservation Reserve Program (CRP) grassland, mostly without broadleaved brood habitat, have provided a modest, but critical, buffer against overwhelming pheasant habitat losses in western and central Kansas croplands. Early efforts to improve the diversity and management of Kansas CRP, begun in 1998, have met with significant success and currently offer modest prospects for gradual pheasant population improvement. The severe drought that struck major portions of Kansas’ best pheasant range in 2000 seriously reduced pheasant populations and set back habitat improvement efforts in western Kansas. Drought conditions persisted and became even more intense through 2002, particularly in western Kansas. The state recorded its lowest-ever pheasant harvest in 2001 and the 5th lowest in 2002. Except for portions of far western Kansas, much of the pheasant range received some respite from the drought in 2003 and pheasant numbers recovered well for both the 2003 and 2004 seasons. Recovery continued in 2005, but intense drought in 2006 again set pheasant numbers back.
26
CENTRAL & NORTHEAST KANSAS PHEASANT POPULATIONS
Combined January, April, July, & October RMCS
70 75 80 85 90 95 00 05Year
0
2
4
6
8
10
Phea
s ant
s / 1
00 m
iles
NORTHCENTRAL
NORTHEAST
SOUTHCENTRAL
WESTERN KANSAS PHEASANT POPULATIONSCombined January, April, July, and October RMCS
70 75 80 85 90 95 00 05Year
0
5
10
15Ph
eas a
nts
/ 100
mile
s
NORTHWEST
SOUTHWEST
27
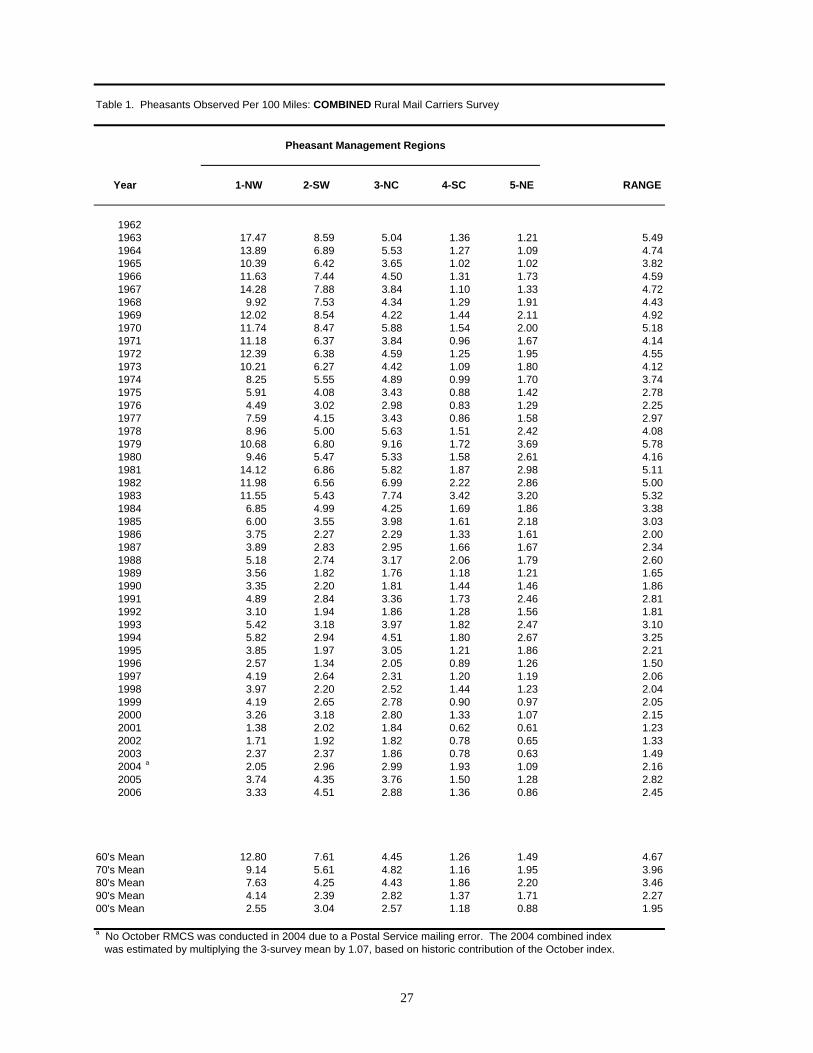
Table 1. Pheasants Observed Per 100 Miles: COMBINED Rural Mail Carriers Survey Pheasant Management Regions
Year 1-NW 2-SW 3-NC 4-SC 5-NE RANGE
1962 1963 17.47 8.59 5.04 1.36 1.21 5.491964 13.89 6.89 5.53 1.27 1.09 4.741965 10.39 6.42 3.65 1.02 1.02 3.821966 11.63 7.44 4.50 1.31 1.73 4.591967 14.28 7.88 3.84 1.10 1.33 4.721968 9.92 7.53 4.34 1.29 1.91 4.431969 12.02 8.54 4.22 1.44 2.11 4.921970 11.74 8.47 5.88 1.54 2.00 5.181971 11.18 6.37 3.84 0.96 1.67 4.141972 12.39 6.38 4.59 1.25 1.95 4.551973 10.21 6.27 4.42 1.09 1.80 4.121974 8.25 5.55 4.89 0.99 1.70 3.741975 5.91 4.08 3.43 0.88 1.42 2.781976 4.49 3.02 2.98 0.83 1.29 2.251977 7.59 4.15 3.43 0.86 1.58 2.971978 8.96 5.00 5.63 1.51 2.42 4.081979 10.68 6.80 9.16 1.72 3.69 5.781980 9.46 5.47 5.33 1.58 2.61 4.161981 14.12 6.86 5.82 1.87 2.98 5.111982 11.98 6.56 6.99 2.22 2.86 5.001983 11.55 5.43 7.74 3.42 3.20 5.321984 6.85 4.99 4.25 1.69 1.86 3.381985 6.00 3.55 3.98 1.61 2.18 3.031986 3.75 2.27 2.29 1.33 1.61 2.001987 3.89 2.83 2.95 1.66 1.67 2.341988 5.18 2.74 3.17 2.06 1.79 2.601989 3.56 1.82 1.76 1.18 1.21 1.651990 3.35 2.20 1.81 1.44 1.46 1.861991 4.89 2.84 3.36 1.73 2.46 2.811992 3.10 1.94 1.86 1.28 1.56 1.811993 5.42 3.18 3.97 1.82 2.47 3.101994 5.82 2.94 4.51 1.80 2.67 3.251995 3.85 1.97 3.05 1.21 1.86 2.211996 2.57 1.34 2.05 0.89 1.26 1.501997 4.19 2.64 2.31 1.20 1.19 2.061998 3.97 2.20 2.52 1.44 1.23 2.041999 4.19 2.65 2.78 0.90 0.97 2.052000 3.26 3.18 2.80 1.33 1.07 2.152001 1.38 2.02 1.84 0.62 0.61 1.232002 1.71 1.92 1.82 0.78 0.65 1.332003 2.37 2.37 1.86 0.78 0.63 1.492004 a 2.05 2.96 2.99 1.93 1.09 2.162005 3.74 4.35 3.76 1.50 1.28 2.822006 3.33 4.51 2.88 1.36 0.86 2.45
60's Mean 12.80 7.61 4.45 1.26 1.49 4.6770's Mean 9.14 5.61 4.82 1.16 1.95 3.9680's Mean 7.63 4.25 4.43 1.86 2.20 3.4690's Mean 4.14 2.39 2.82 1.37 1.71 2.2700's Mean 2.55 3.04 2.57 1.18 0.88 1.95
a No October RMCS was conducted in 2004 due to a Postal Service mailing error. The 2004 combined index was estimated by multiplying the 3-survey mean by 1.07, based on historic contribution of the October index.
28
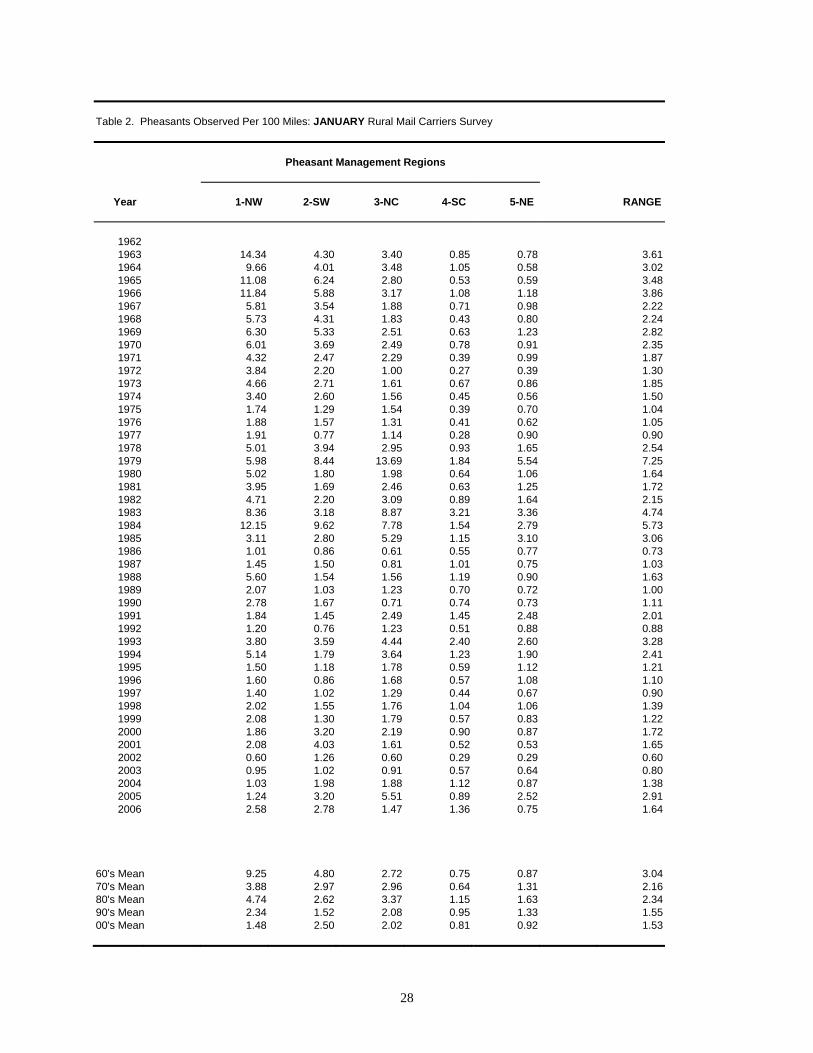
Table 2. Pheasants Observed Per 100 Miles: JANUARY Rural Mail Carriers Survey
Pheasant Management Regions
Year 1-NW 2-SW 3-NC 4-SC 5-NE RANGE
1962 1963 14.34 4.30 3.40 0.85 0.78 3.611964 9.66 4.01 3.48 1.05 0.58 3.021965 11.08 6.24 2.80 0.53 0.59 3.481966 11.84 5.88 3.17 1.08 1.18 3.861967 5.81 3.54 1.88 0.71 0.98 2.221968 5.73 4.31 1.83 0.43 0.80 2.241969 6.30 5.33 2.51 0.63 1.23 2.821970 6.01 3.69 2.49 0.78 0.91 2.351971 4.32 2.47 2.29 0.39 0.99 1.871972 3.84 2.20 1.00 0.27 0.39 1.301973 4.66 2.71 1.61 0.67 0.86 1.851974 3.40 2.60 1.56 0.45 0.56 1.501975 1.74 1.29 1.54 0.39 0.70 1.041976 1.88 1.57 1.31 0.41 0.62 1.051977 1.91 0.77 1.14 0.28 0.90 0.901978 5.01 3.94 2.95 0.93 1.65 2.541979 5.98 8.44 13.69 1.84 5.54 7.251980 5.02 1.80 1.98 0.64 1.06 1.641981 3.95 1.69 2.46 0.63 1.25 1.721982 4.71 2.20 3.09 0.89 1.64 2.151983 8.36 3.18 8.87 3.21 3.36 4.741984 12.15 9.62 7.78 1.54 2.79 5.731985 3.11 2.80 5.29 1.15 3.10 3.061986 1.01 0.86 0.61 0.55 0.77 0.731987 1.45 1.50 0.81 1.01 0.75 1.031988 5.60 1.54 1.56 1.19 0.90 1.631989 2.07 1.03 1.23 0.70 0.72 1.001990 2.78 1.67 0.71 0.74 0.73 1.111991 1.84 1.45 2.49 1.45 2.48 2.011992 1.20 0.76 1.23 0.51 0.88 0.881993 3.80 3.59 4.44 2.40 2.60 3.281994 5.14 1.79 3.64 1.23 1.90 2.411995 1.50 1.18 1.78 0.59 1.12 1.211996 1.60 0.86 1.68 0.57 1.08 1.101997 1.40 1.02 1.29 0.44 0.67 0.901998 2.02 1.55 1.76 1.04 1.06 1.391999 2.08 1.30 1.79 0.57 0.83 1.222000 1.86 3.20 2.19 0.90 0.87 1.722001 2.08 4.03 1.61 0.52 0.53 1.652002 0.60 1.26 0.60 0.29 0.29 0.602003 0.95 1.02 0.91 0.57 0.64 0.802004 1.03 1.98 1.88 1.12 0.87 1.382005 1.24 3.20 5.51 0.89 2.52 2.912006 2.58 2.78 1.47 1.36 0.75 1.64
60's Mean 9.25 4.80 2.72 0.75 0.87 3.0470's Mean 3.88 2.97 2.96 0.64 1.31 2.1680's Mean 4.74 2.62 3.37 1.15 1.63 2.3490's Mean 2.34 1.52 2.08 0.95 1.33 1.5500's Mean 1.48 2.50 2.02 0.81 0.92 1.53
29
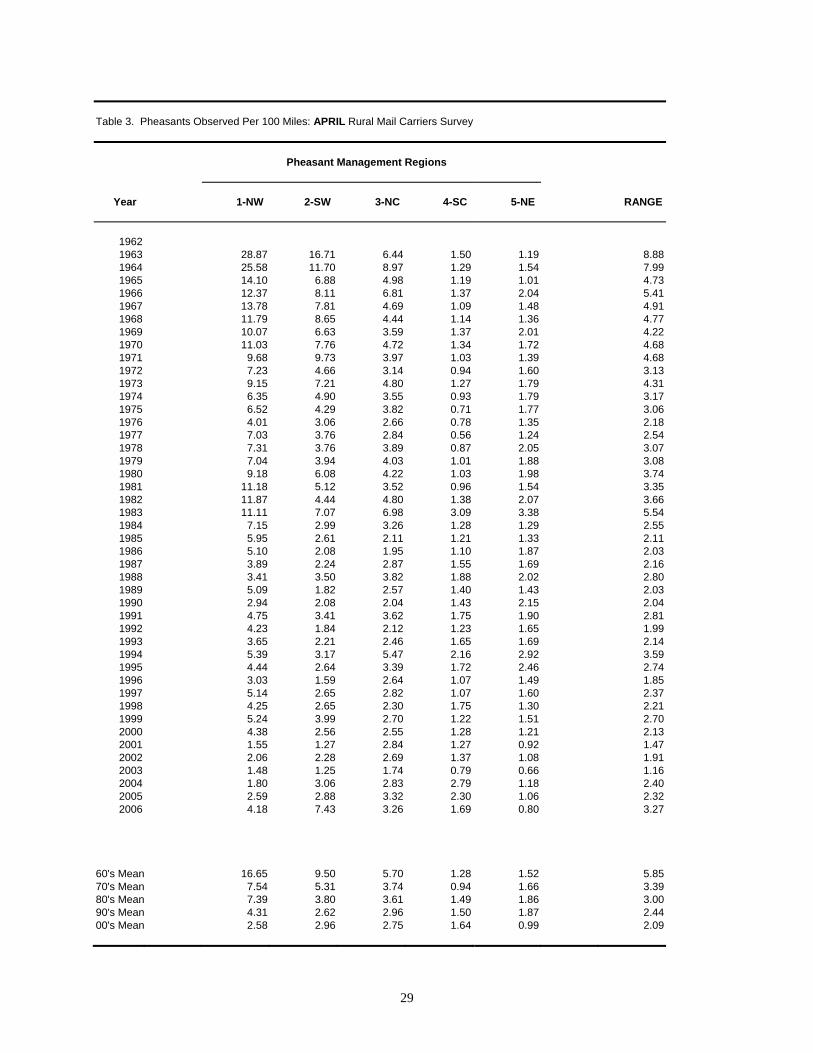
Table 3. Pheasants Observed Per 100 Miles: APRIL Rural Mail Carriers Survey
Pheasant Management Regions
Year 1-NW 2-SW 3-NC 4-SC 5-NE RANGE
1962 1963 28.87 16.71 6.44 1.50 1.19 8.881964 25.58 11.70 8.97 1.29 1.54 7.991965 14.10 6.88 4.98 1.19 1.01 4.731966 12.37 8.11 6.81 1.37 2.04 5.411967 13.78 7.81 4.69 1.09 1.48 4.911968 11.79 8.65 4.44 1.14 1.36 4.771969 10.07 6.63 3.59 1.37 2.01 4.221970 11.03 7.76 4.72 1.34 1.72 4.681971 9.68 9.73 3.97 1.03 1.39 4.681972 7.23 4.66 3.14 0.94 1.60 3.131973 9.15 7.21 4.80 1.27 1.79 4.311974 6.35 4.90 3.55 0.93 1.79 3.171975 6.52 4.29 3.82 0.71 1.77 3.061976 4.01 3.06 2.66 0.78 1.35 2.181977 7.03 3.76 2.84 0.56 1.24 2.541978 7.31 3.76 3.89 0.87 2.05 3.071979 7.04 3.94 4.03 1.01 1.88 3.081980 9.18 6.08 4.22 1.03 1.98 3.741981 11.18 5.12 3.52 0.96 1.54 3.351982 11.87 4.44 4.80 1.38 2.07 3.661983 11.11 7.07 6.98 3.09 3.38 5.541984 7.15 2.99 3.26 1.28 1.29 2.551985 5.95 2.61 2.11 1.21 1.33 2.111986 5.10 2.08 1.95 1.10 1.87 2.031987 3.89 2.24 2.87 1.55 1.69 2.161988 3.41 3.50 3.82 1.88 2.02 2.801989 5.09 1.82 2.57 1.40 1.43 2.031990 2.94 2.08 2.04 1.43 2.15 2.041991 4.75 3.41 3.62 1.75 1.90 2.811992 4.23 1.84 2.12 1.23 1.65 1.991993 3.65 2.21 2.46 1.65 1.69 2.141994 5.39 3.17 5.47 2.16 2.92 3.591995 4.44 2.64 3.39 1.72 2.46 2.741996 3.03 1.59 2.64 1.07 1.49 1.851997 5.14 2.65 2.82 1.07 1.60 2.371998 4.25 2.65 2.30 1.75 1.30 2.211999 5.24 3.99 2.70 1.22 1.51 2.702000 4.38 2.56 2.55 1.28 1.21 2.132001 1.55 1.27 2.84 1.27 0.92 1.472002 2.06 2.28 2.69 1.37 1.08 1.912003 1.48 1.25 1.74 0.79 0.66 1.162004 1.80 3.06 2.83 2.79 1.18 2.402005 2.59 2.88 3.32 2.30 1.06 2.322006 4.18 7.43 3.26 1.69 0.80 3.27
60's Mean 16.65 9.50 5.70 1.28 1.52 5.8570's Mean 7.54 5.31 3.74 0.94 1.66 3.3980's Mean 7.39 3.80 3.61 1.49 1.86 3.0090's Mean 4.31 2.62 2.96 1.50 1.87 2.4400's Mean 2.58 2.96 2.75 1.64 0.99 2.09
30
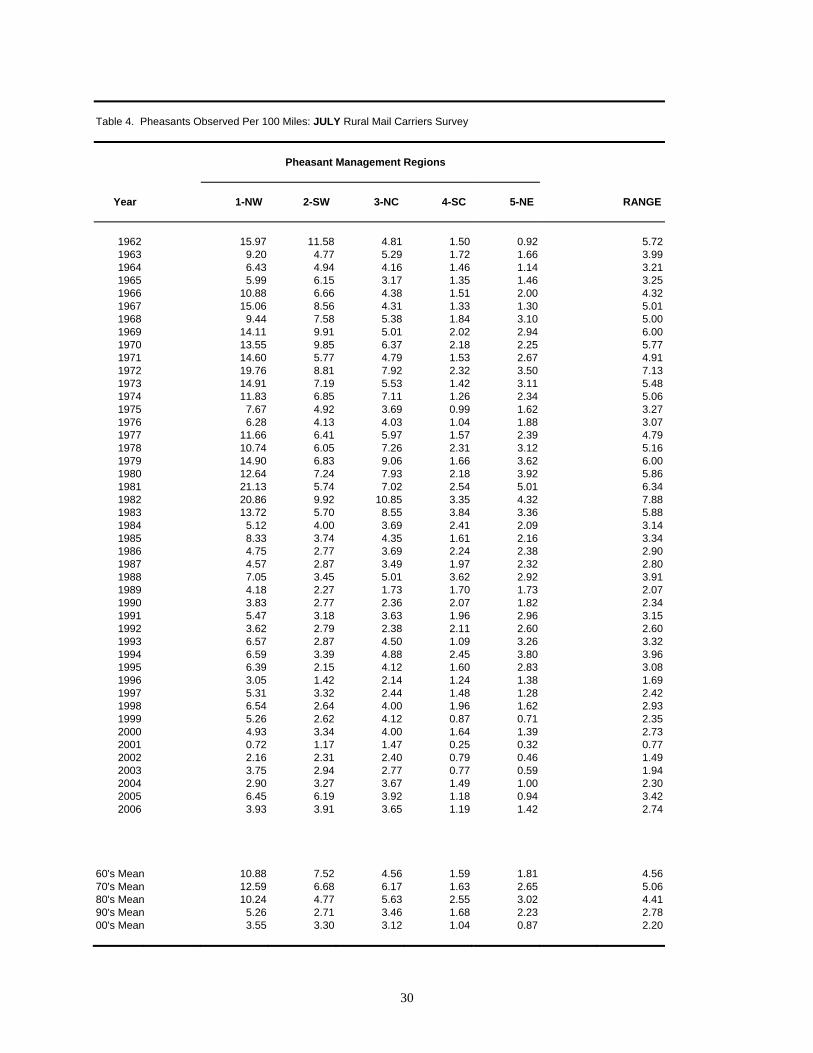
Table 4. Pheasants Observed Per 100 Miles: JULY Rural Mail Carriers Survey
Pheasant Management Regions
Year 1-NW 2-SW 3-NC 4-SC 5-NE RANGE
1962 15.97 11.58 4.81 1.50 0.92 5.721963 9.20 4.77 5.29 1.72 1.66 3.991964 6.43 4.94 4.16 1.46 1.14 3.211965 5.99 6.15 3.17 1.35 1.46 3.251966 10.88 6.66 4.38 1.51 2.00 4.321967 15.06 8.56 4.31 1.33 1.30 5.011968 9.44 7.58 5.38 1.84 3.10 5.001969 14.11 9.91 5.01 2.02 2.94 6.001970 13.55 9.85 6.37 2.18 2.25 5.771971 14.60 5.77 4.79 1.53 2.67 4.911972 19.76 8.81 7.92 2.32 3.50 7.131973 14.91 7.19 5.53 1.42 3.11 5.481974 11.83 6.85 7.11 1.26 2.34 5.061975 7.67 4.92 3.69 0.99 1.62 3.271976 6.28 4.13 4.03 1.04 1.88 3.071977 11.66 6.41 5.97 1.57 2.39 4.791978 10.74 6.05 7.26 2.31 3.12 5.161979 14.90 6.83 9.06 1.66 3.62 6.001980 12.64 7.24 7.93 2.18 3.92 5.861981 21.13 5.74 7.02 2.54 5.01 6.341982 20.86 9.92 10.85 3.35 4.32 7.881983 13.72 5.70 8.55 3.84 3.36 5.881984 5.12 4.00 3.69 2.41 2.09 3.141985 8.33 3.74 4.35 1.61 2.16 3.341986 4.75 2.77 3.69 2.24 2.38 2.901987 4.57 2.87 3.49 1.97 2.32 2.801988 7.05 3.45 5.01 3.62 2.92 3.911989 4.18 2.27 1.73 1.70 1.73 2.071990 3.83 2.77 2.36 2.07 1.82 2.341991 5.47 3.18 3.63 1.96 2.96 3.151992 3.62 2.79 2.38 2.11 2.60 2.601993 6.57 2.87 4.50 1.09 3.26 3.321994 6.59 3.39 4.88 2.45 3.80 3.961995 6.39 2.15 4.12 1.60 2.83 3.081996 3.05 1.42 2.14 1.24 1.38 1.691997 5.31 3.32 2.44 1.48 1.28 2.421998 6.54 2.64 4.00 1.96 1.62 2.931999 5.26 2.62 4.12 0.87 0.71 2.352000 4.93 3.34 4.00 1.64 1.39 2.732001 0.72 1.17 1.47 0.25 0.32 0.772002 2.16 2.31 2.40 0.79 0.46 1.492003 3.75 2.94 2.77 0.77 0.59 1.942004 2.90 3.27 3.67 1.49 1.00 2.302005 6.45 6.19 3.92 1.18 0.94 3.422006 3.93 3.91 3.65 1.19 1.42 2.74
60's Mean 10.88 7.52 4.56 1.59 1.81 4.5670's Mean 12.59 6.68 6.17 1.63 2.65 5.0680's Mean 10.24 4.77 5.63 2.55 3.02 4.4190's Mean 5.26 2.71 3.46 1.68 2.23 2.7800's Mean 3.55 3.30 3.12 1.04 0.87 2.20
31
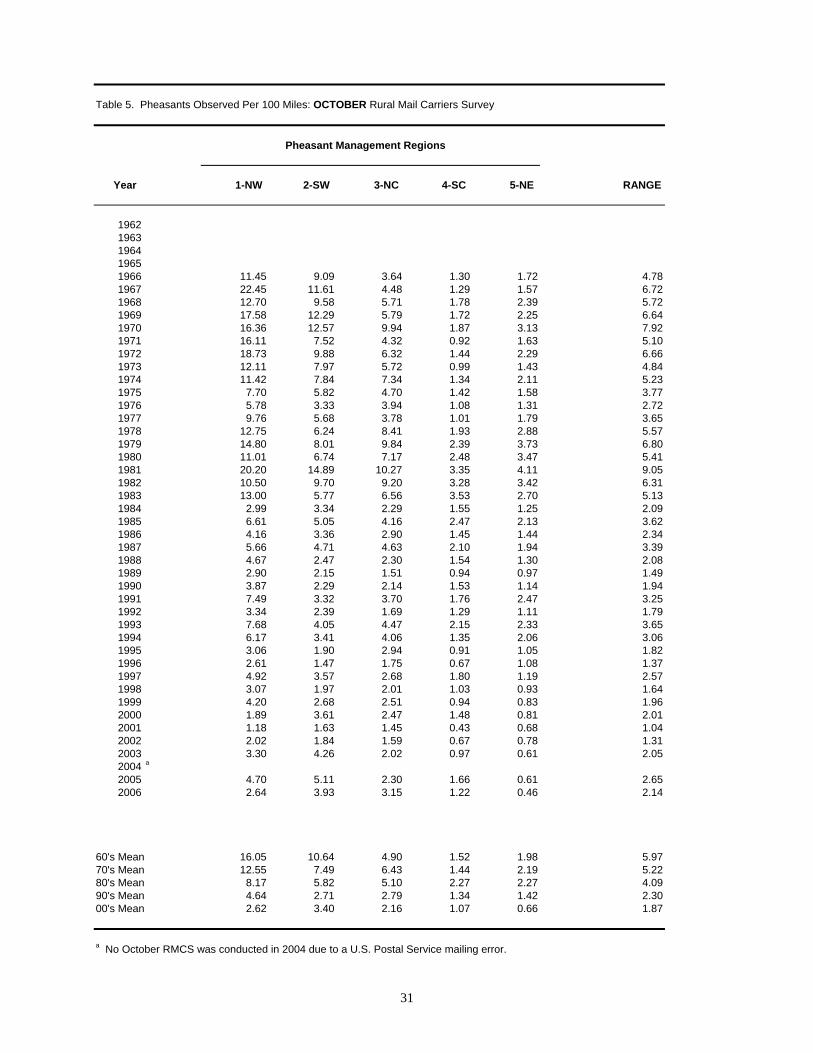
Table 5. Pheasants Observed Per 100 Miles: OCTOBER Rural Mail Carriers Survey Pheasant Management Regions
Year 1-NW 2-SW 3-NC 4-SC 5-NE RANGE
1962 1963 1964 1965 1966 11.45 9.09 3.64 1.30 1.72 4.781967 22.45 11.61 4.48 1.29 1.57 6.721968 12.70 9.58 5.71 1.78 2.39 5.721969 17.58 12.29 5.79 1.72 2.25 6.641970 16.36 12.57 9.94 1.87 3.13 7.921971 16.11 7.52 4.32 0.92 1.63 5.101972 18.73 9.88 6.32 1.44 2.29 6.661973 12.11 7.97 5.72 0.99 1.43 4.841974 11.42 7.84 7.34 1.34 2.11 5.231975 7.70 5.82 4.70 1.42 1.58 3.771976 5.78 3.33 3.94 1.08 1.31 2.721977 9.76 5.68 3.78 1.01 1.79 3.651978 12.75 6.24 8.41 1.93 2.88 5.571979 14.80 8.01 9.84 2.39 3.73 6.801980 11.01 6.74 7.17 2.48 3.47 5.411981 20.20 14.89 10.27 3.35 4.11 9.051982 10.50 9.70 9.20 3.28 3.42 6.311983 13.00 5.77 6.56 3.53 2.70 5.131984 2.99 3.34 2.29 1.55 1.25 2.091985 6.61 5.05 4.16 2.47 2.13 3.621986 4.16 3.36 2.90 1.45 1.44 2.341987 5.66 4.71 4.63 2.10 1.94 3.391988 4.67 2.47 2.30 1.54 1.30 2.081989 2.90 2.15 1.51 0.94 0.97 1.491990 3.87 2.29 2.14 1.53 1.14 1.941991 7.49 3.32 3.70 1.76 2.47 3.251992 3.34 2.39 1.69 1.29 1.11 1.791993 7.68 4.05 4.47 2.15 2.33 3.651994 6.17 3.41 4.06 1.35 2.06 3.061995 3.06 1.90 2.94 0.91 1.05 1.821996 2.61 1.47 1.75 0.67 1.08 1.371997 4.92 3.57 2.68 1.80 1.19 2.571998 3.07 1.97 2.01 1.03 0.93 1.641999 4.20 2.68 2.51 0.94 0.83 1.962000 1.89 3.61 2.47 1.48 0.81 2.012001 1.18 1.63 1.45 0.43 0.68 1.042002 2.02 1.84 1.59 0.67 0.78 1.312003 3.30 4.26 2.02 0.97 0.61 2.052004 a 2005 4.70 5.11 2.30 1.66 0.61 2.652006 2.64 3.93 3.15 1.22 0.46 2.14
60's Mean 16.05 10.64 4.90 1.52 1.98 5.9770's Mean 12.55 7.49 6.43 1.44 2.19 5.2280's Mean 8.17 5.82 5.10 2.27 2.27 4.0990's Mean 4.64 2.71 2.79 1.34 1.42 2.3000's Mean 2.62 3.40 2.16 1.07 0.66 1.87
a No October RMCS was conducted in 2004 due to a U.S. Postal Service mailing error.
32
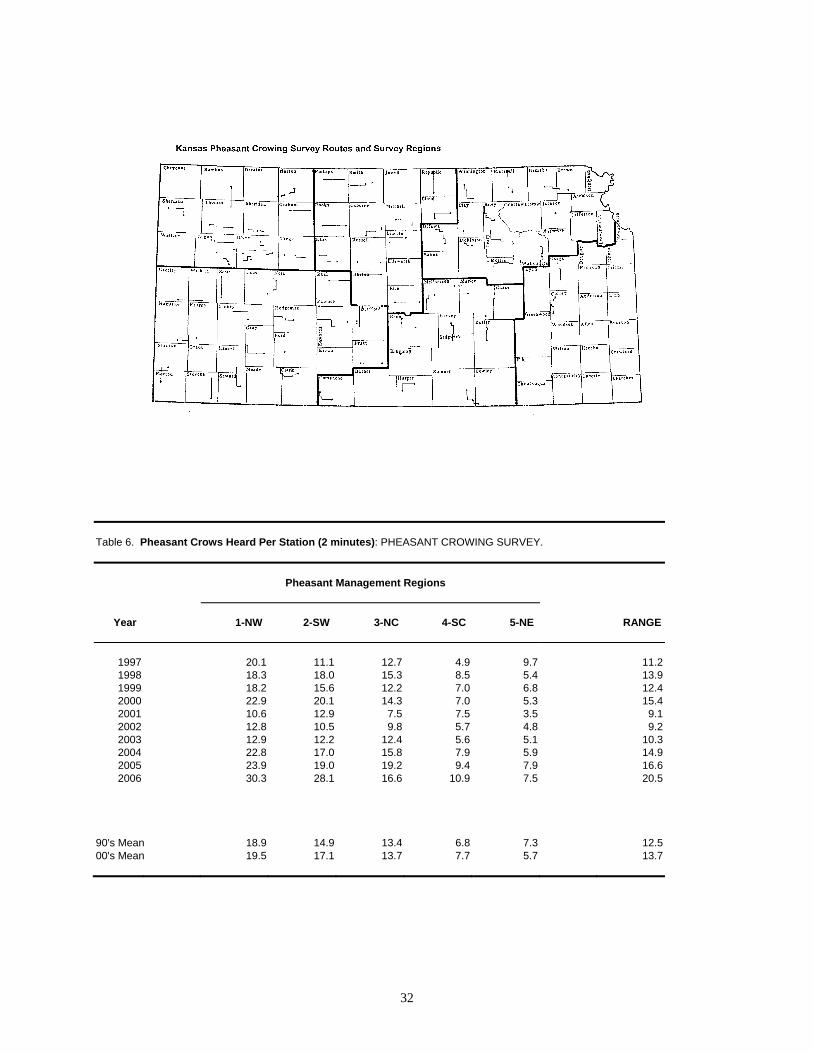
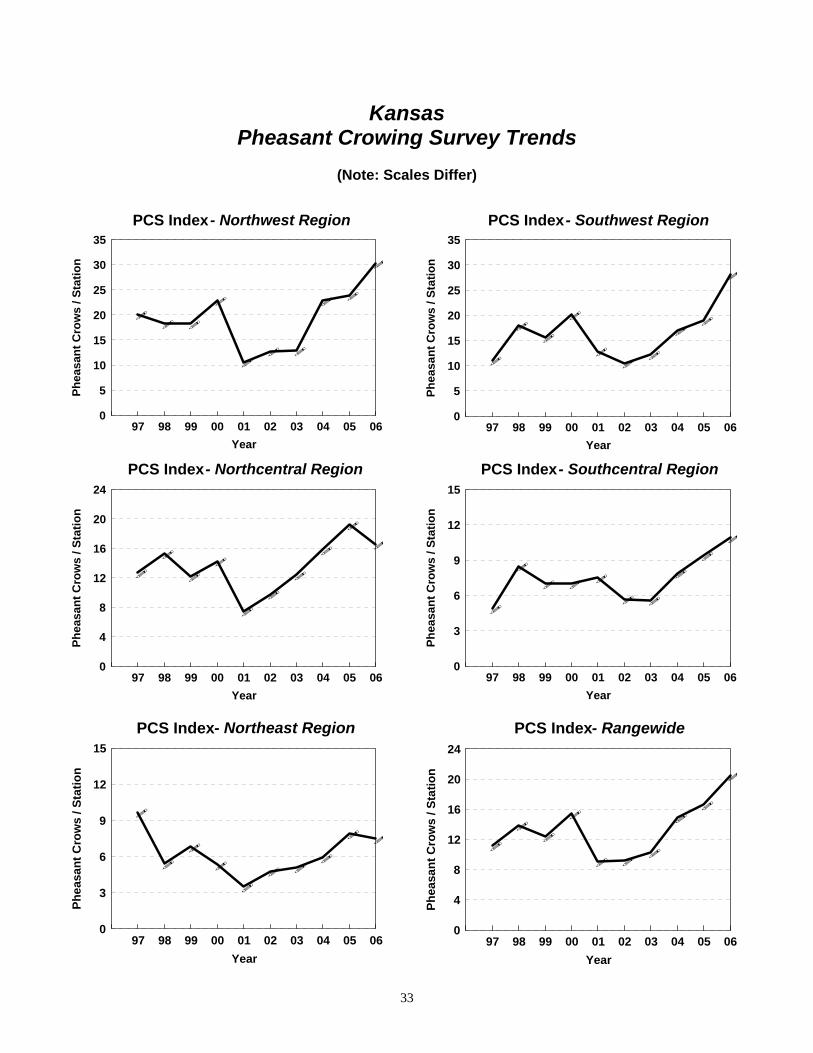
Table 6. Pheasant Crows Heard Per Station (2 minutes): PHEASANT CROWING SURVEY.
Pheasant Management Regions
Year 1-NW 2-SW 3-NC 4-SC 5-NE RANGE
1997 20.1 11.1 12.7 4.9 9.7 11.21998 18.3 18.0 15.3 8.5 5.4 13.91999 18.2 15.6 12.2 7.0 6.8 12.42000 22.9 20.1 14.3 7.0 5.3 15.42001 10.6 12.9 7.5 7.5 3.5 9.12002 12.8 10.5 9.8 5.7 4.8 9.22003 12.9 12.2 12.4 5.6 5.1 10.32004 22.8 17.0 15.8 7.9 5.9 14.92005 23.9 19.0 19.2 9.4 7.9 16.62006 30.3 28.1 16.6 10.9 7.5 20.5
90's Mean 18.9 14.9 13.4 6.8 7.3 12.500's Mean 19.5 17.1 13.7 7.7 5.7 13.7
33
Kansas Pheasant Crowing Survey Trends
(Note: Scales Differ)
PCS Index - Northwest Region
97 98 99 00 01 02 03 04 05 06Year
0
5
10
15
20
25
30
35
Phea
sant
Cro
ws
/ St a
tion
PCS Index - Southwest Region
97 98 99 00 01 02 03 04 05 06Year
0
5
10
15
20
25
30
35
Phea
sant
Cro
ws
/ St a
tion
PCS Index - Northcentral Region
97 98 99 00 01 02 03 04 05 06Year
0
4
8
12
16
20
24
Phea
sant
Cro
ws
/ Sta
tion
PCS Index - Southcentral Region
97 98 99 00 01 02 03 04 05 06Year
0
3
6
9
12
15
Phea
sant
Cro
ws
/ St a
tion
PCS Index - Rangewide
97 98 99 00 01 02 03 04 05 06Year
0
4
8
12
16
20
24
Phea
sant
Cro
ws
/ Sta
tion
PCS Index - Northeast Region
97 98 99 00 01 02 03 04 05 06Year
0
3
6
9
12
15
Phea
san t
Cro
ws
/ Sta
tion
34
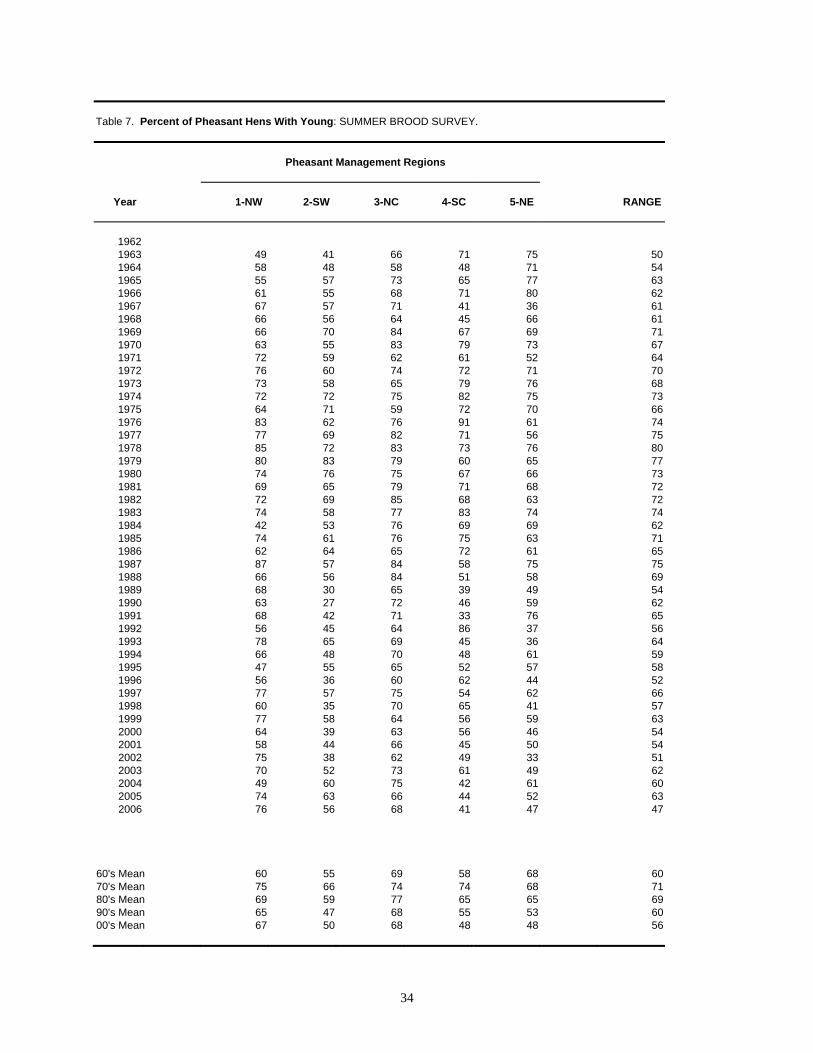
Table 7. Percent of Pheasant Hens With Young: SUMMER BROOD SURVEY.
Pheasant Management Regions
Year 1-NW 2-SW 3-NC 4-SC 5-NE RANGE
1962 1963 49 41 66 71 75 501964 58 48 58 48 71 541965 55 57 73 65 77 631966 61 55 68 71 80 621967 67 57 71 41 36 611968 66 56 64 45 66 611969 66 70 84 67 69 711970 63 55 83 79 73 671971 72 59 62 61 52 641972 76 60 74 72 71 701973 73 58 65 79 76 681974 72 72 75 82 75 731975 64 71 59 72 70 661976 83 62 76 91 61 741977 77 69 82 71 56 751978 85 72 83 73 76 801979 80 83 79 60 65 771980 74 76 75 67 66 731981 69 65 79 71 68 721982 72 69 85 68 63 721983 74 58 77 83 74 741984 42 53 76 69 69 621985 74 61 76 75 63 711986 62 64 65 72 61 651987 87 57 84 58 75 751988 66 56 84 51 58 691989 68 30 65 39 49 541990 63 27 72 46 59 621991 68 42 71 33 76 651992 56 45 64 86 37 561993 78 65 69 45 36 641994 66 48 70 48 61 591995 47 55 65 52 57 581996 56 36 60 62 44 521997 77 57 75 54 62 661998 60 35 70 65 41 571999 77 58 64 56 59 632000 64 39 63 56 46 542001 58 44 66 45 50 542002 75 38 62 49 33 512003 70 52 73 61 49 622004 49 60 75 42 61 602005 74 63 66 44 52 632006 76 56 68 41 47 47
60's Mean 60 55 69 58 68 6070's Mean 75 66 74 74 68 7180's Mean 69 59 77 65 65 6990's Mean 65 47 68 55 53 6000's Mean 67 50 68 48 48 56
35
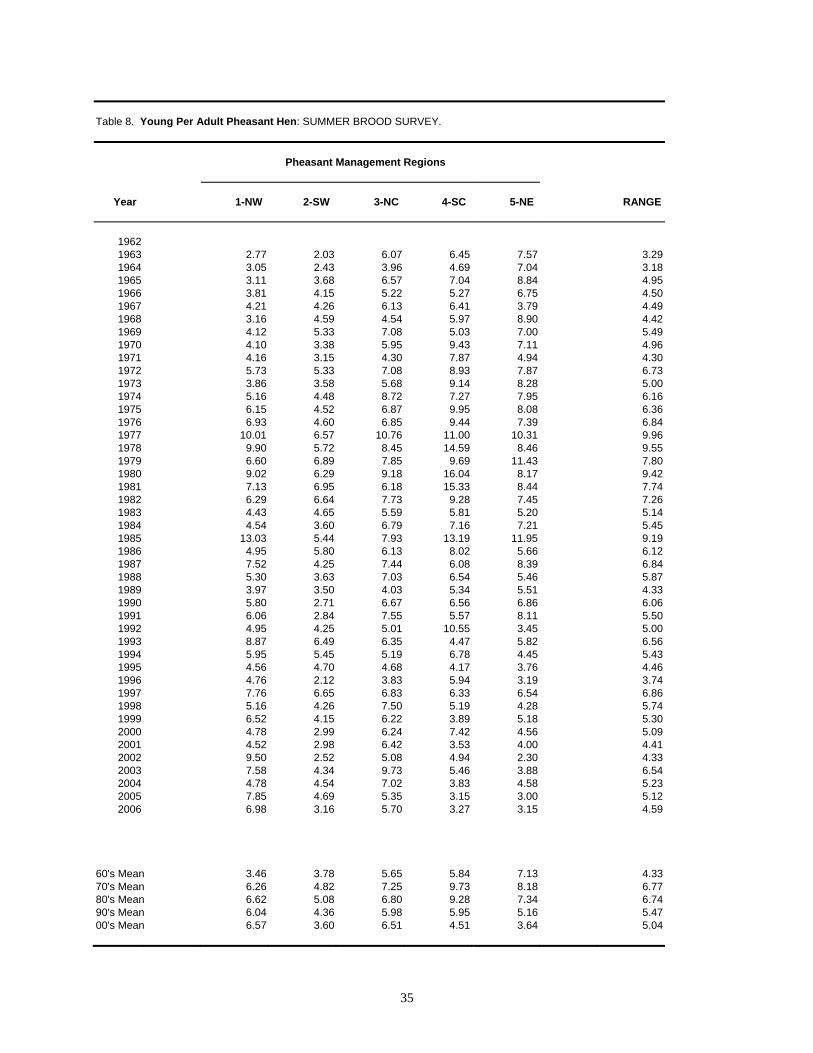
Table 8. Young Per Adult Pheasant Hen: SUMMER BROOD SURVEY.
Pheasant Management Regions
Year 1-NW 2-SW 3-NC 4-SC 5-NE RANGE
1962 1963 2.77 2.03 6.07 6.45 7.57 3.291964 3.05 2.43 3.96 4.69 7.04 3.181965 3.11 3.68 6.57 7.04 8.84 4.951966 3.81 4.15 5.22 5.27 6.75 4.501967 4.21 4.26 6.13 6.41 3.79 4.491968 3.16 4.59 4.54 5.97 8.90 4.421969 4.12 5.33 7.08 5.03 7.00 5.491970 4.10 3.38 5.95 9.43 7.11 4.961971 4.16 3.15 4.30 7.87 4.94 4.301972 5.73 5.33 7.08 8.93 7.87 6.731973 3.86 3.58 5.68 9.14 8.28 5.001974 5.16 4.48 8.72 7.27 7.95 6.161975 6.15 4.52 6.87 9.95 8.08 6.361976 6.93 4.60 6.85 9.44 7.39 6.841977 10.01 6.57 10.76 11.00 10.31 9.961978 9.90 5.72 8.45 14.59 8.46 9.551979 6.60 6.89 7.85 9.69 11.43 7.801980 9.02 6.29 9.18 16.04 8.17 9.421981 7.13 6.95 6.18 15.33 8.44 7.741982 6.29 6.64 7.73 9.28 7.45 7.261983 4.43 4.65 5.59 5.81 5.20 5.141984 4.54 3.60 6.79 7.16 7.21 5.451985 13.03 5.44 7.93 13.19 11.95 9.191986 4.95 5.80 6.13 8.02 5.66 6.121987 7.52 4.25 7.44 6.08 8.39 6.841988 5.30 3.63 7.03 6.54 5.46 5.871989 3.97 3.50 4.03 5.34 5.51 4.331990 5.80 2.71 6.67 6.56 6.86 6.061991 6.06 2.84 7.55 5.57 8.11 5.501992 4.95 4.25 5.01 10.55 3.45 5.001993 8.87 6.49 6.35 4.47 5.82 6.561994 5.95 5.45 5.19 6.78 4.45 5.431995 4.56 4.70 4.68 4.17 3.76 4.461996 4.76 2.12 3.83 5.94 3.19 3.741997 7.76 6.65 6.83 6.33 6.54 6.861998 5.16 4.26 7.50 5.19 4.28 5.741999 6.52 4.15 6.22 3.89 5.18 5.302000 4.78 2.99 6.24 7.42 4.56 5.092001 4.52 2.98 6.42 3.53 4.00 4.412002 9.50 2.52 5.08 4.94 2.30 4.332003 7.58 4.34 9.73 5.46 3.88 6.542004 4.78 4.54 7.02 3.83 4.58 5.232005 7.85 4.69 5.35 3.15 3.00 5.122006 6.98 3.16 5.70 3.27 3.15 4.59
60's Mean 3.46 3.78 5.65 5.84 7.13 4.3370's Mean 6.26 4.82 7.25 9.73 8.18 6.7780's Mean 6.62 5.08 6.80 9.28 7.34 6.7490's Mean 6.04 4.36 5.98 5.95 5.16 5.4700's Mean 6.57 3.60 6.51 4.51 3.64 5.04
36
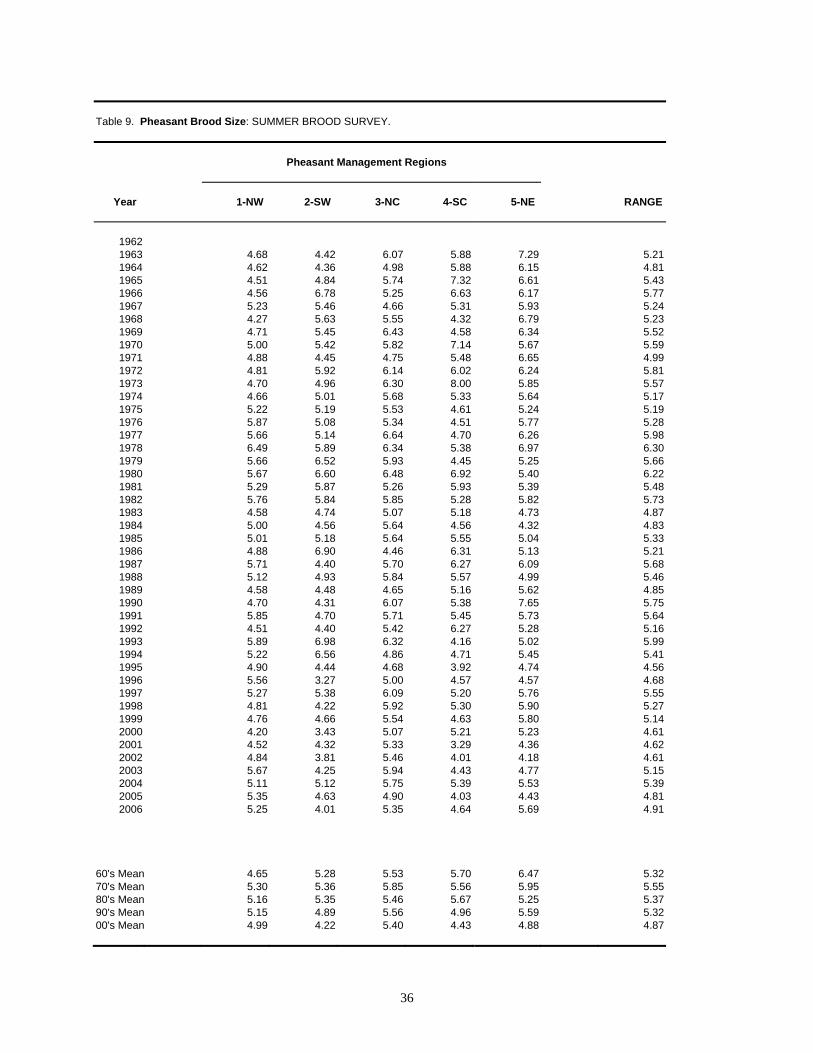
Table 9. Pheasant Brood Size: SUMMER BROOD SURVEY.
Pheasant Management Regions
Year 1-NW 2-SW 3-NC 4-SC 5-NE RANGE
1962 1963 4.68 4.42 6.07 5.88 7.29 5.211964 4.62 4.36 4.98 5.88 6.15 4.811965 4.51 4.84 5.74 7.32 6.61 5.431966 4.56 6.78 5.25 6.63 6.17 5.771967 5.23 5.46 4.66 5.31 5.93 5.241968 4.27 5.63 5.55 4.32 6.79 5.231969 4.71 5.45 6.43 4.58 6.34 5.521970 5.00 5.42 5.82 7.14 5.67 5.591971 4.88 4.45 4.75 5.48 6.65 4.991972 4.81 5.92 6.14 6.02 6.24 5.811973 4.70 4.96 6.30 8.00 5.85 5.571974 4.66 5.01 5.68 5.33 5.64 5.171975 5.22 5.19 5.53 4.61 5.24 5.191976 5.87 5.08 5.34 4.51 5.77 5.281977 5.66 5.14 6.64 4.70 6.26 5.981978 6.49 5.89 6.34 5.38 6.97 6.301979 5.66 6.52 5.93 4.45 5.25 5.661980 5.67 6.60 6.48 6.92 5.40 6.221981 5.29 5.87 5.26 5.93 5.39 5.481982 5.76 5.84 5.85 5.28 5.82 5.731983 4.58 4.74 5.07 5.18 4.73 4.871984 5.00 4.56 5.64 4.56 4.32 4.831985 5.01 5.18 5.64 5.55 5.04 5.331986 4.88 6.90 4.46 6.31 5.13 5.211987 5.71 4.40 5.70 6.27 6.09 5.681988 5.12 4.93 5.84 5.57 4.99 5.461989 4.58 4.48 4.65 5.16 5.62 4.851990 4.70 4.31 6.07 5.38 7.65 5.751991 5.85 4.70 5.71 5.45 5.73 5.641992 4.51 4.40 5.42 6.27 5.28 5.161993 5.89 6.98 6.32 4.16 5.02 5.991994 5.22 6.56 4.86 4.71 5.45 5.411995 4.90 4.44 4.68 3.92 4.74 4.561996 5.56 3.27 5.00 4.57 4.57 4.681997 5.27 5.38 6.09 5.20 5.76 5.551998 4.81 4.22 5.92 5.30 5.90 5.271999 4.76 4.66 5.54 4.63 5.80 5.142000 4.20 3.43 5.07 5.21 5.23 4.612001 4.52 4.32 5.33 3.29 4.36 4.622002 4.84 3.81 5.46 4.01 4.18 4.612003 5.67 4.25 5.94 4.43 4.77 5.152004 5.11 5.12 5.75 5.39 5.53 5.392005 5.35 4.63 4.90 4.03 4.43 4.812006 5.25 4.01 5.35 4.64 5.69 4.91
60's Mean 4.65 5.28 5.53 5.70 6.47 5.3270's Mean 5.30 5.36 5.85 5.56 5.95 5.5580's Mean 5.16 5.35 5.46 5.67 5.25 5.3790's Mean 5.15 4.89 5.56 4.96 5.59 5.3200's Mean 4.99 4.22 5.40 4.43 4.88 4.87
37
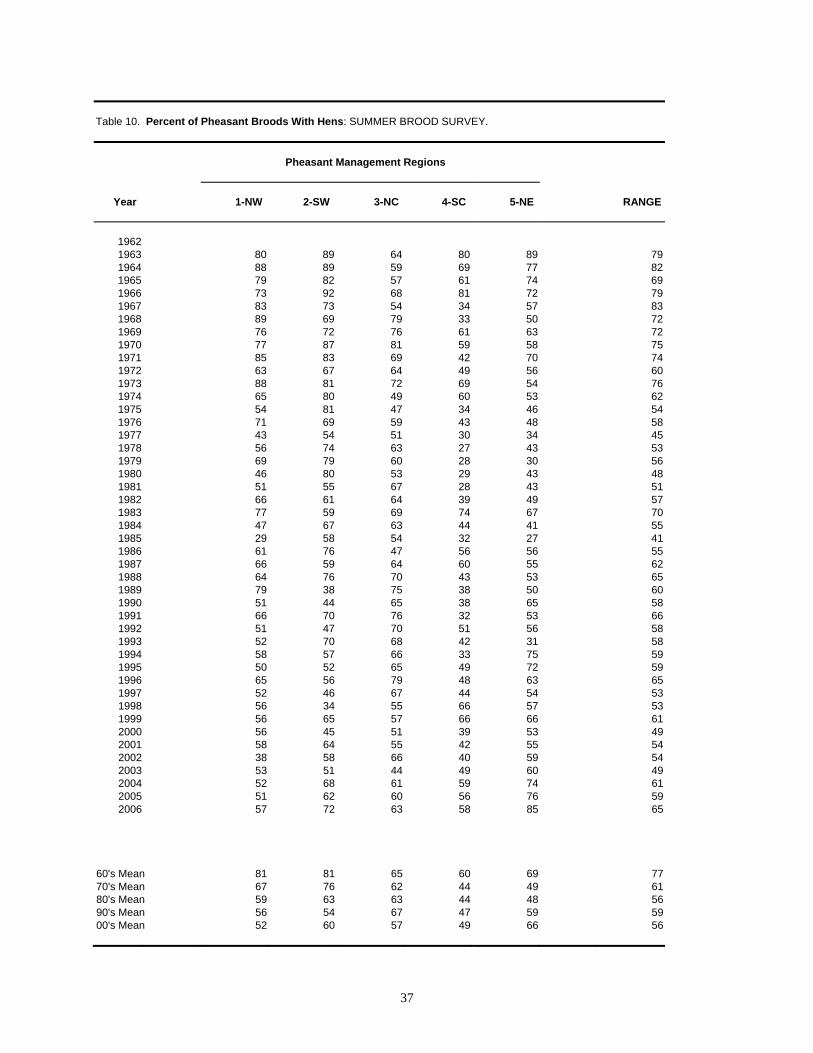
Table 10. Percent of Pheasant Broods With Hens: SUMMER BROOD SURVEY.
Pheasant Management Regions
Year 1-NW 2-SW 3-NC 4-SC 5-NE RANGE
1962 1963 80 89 64 80 89 791964 88 89 59 69 77 821965 79 82 57 61 74 691966 73 92 68 81 72 791967 83 73 54 34 57 831968 89 69 79 33 50 721969 76 72 76 61 63 721970 77 87 81 59 58 751971 85 83 69 42 70 741972 63 67 64 49 56 601973 88 81 72 69 54 761974 65 80 49 60 53 621975 54 81 47 34 46 541976 71 69 59 43 48 581977 43 54 51 30 34 451978 56 74 63 27 43 531979 69 79 60 28 30 561980 46 80 53 29 43 481981 51 55 67 28 43 511982 66 61 64 39 49 571983 77 59 69 74 67 701984 47 67 63 44 41 551985 29 58 54 32 27 411986 61 76 47 56 56 551987 66 59 64 60 55 621988 64 76 70 43 53 651989 79 38 75 38 50 601990 51 44 65 38 65 581991 66 70 76 32 53 661992 51 47 70 51 56 581993 52 70 68 42 31 581994 58 57 66 33 75 591995 50 52 65 49 72 591996 65 56 79 48 63 651997 52 46 67 44 54 531998 56 34 55 66 57 531999 56 65 57 66 66 612000 56 45 51 39 53 492001 58 64 55 42 55 542002 38 58 66 40 59 542003 53 51 44 49 60 492004 52 68 61 59 74 612005 51 62 60 56 76 592006 57 72 63 58 85 65
60's Mean 81 81 65 60 69 7770's Mean 67 76 62 44 49 6180's Mean 59 63 63 44 48 5690's Mean 56 54 67 47 59 5900's Mean 52 60 57 49 66 56
38
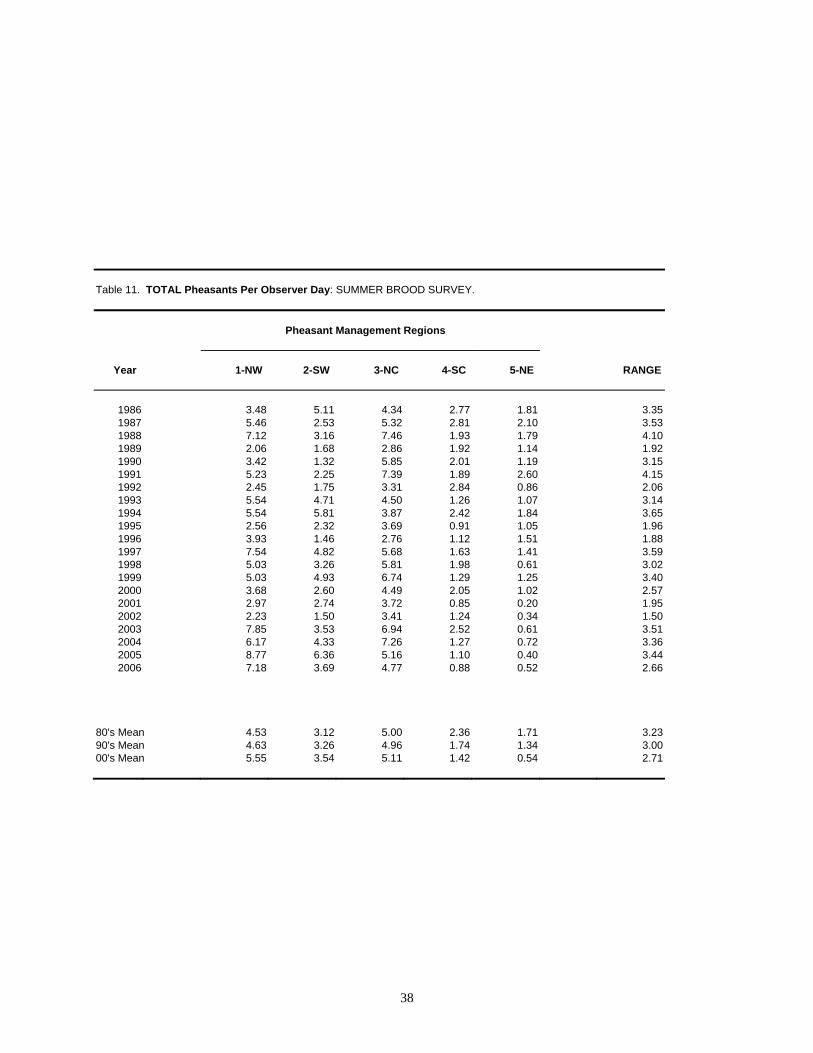
Table 11. TOTAL Pheasants Per Observer Day: SUMMER BROOD SURVEY.
Pheasant Management Regions
Year 1-NW 2-SW 3-NC 4-SC 5-NE RANGE
1986 3.48 5.11 4.34 2.77 1.81 3.351987 5.46 2.53 5.32 2.81 2.10 3.531988 7.12 3.16 7.46 1.93 1.79 4.101989 2.06 1.68 2.86 1.92 1.14 1.921990 3.42 1.32 5.85 2.01 1.19 3.151991 5.23 2.25 7.39 1.89 2.60 4.151992 2.45 1.75 3.31 2.84 0.86 2.061993 5.54 4.71 4.50 1.26 1.07 3.141994 5.54 5.81 3.87 2.42 1.84 3.651995 2.56 2.32 3.69 0.91 1.05 1.961996 3.93 1.46 2.76 1.12 1.51 1.881997 7.54 4.82 5.68 1.63 1.41 3.591998 5.03 3.26 5.81 1.98 0.61 3.021999 5.03 4.93 6.74 1.29 1.25 3.402000 3.68 2.60 4.49 2.05 1.02 2.572001 2.97 2.74 3.72 0.85 0.20 1.952002 2.23 1.50 3.41 1.24 0.34 1.502003 7.85 3.53 6.94 2.52 0.61 3.512004 6.17 4.33 7.26 1.27 0.72 3.362005 8.77 6.36 5.16 1.10 0.40 3.442006 7.18 3.69 4.77 0.88 0.52 2.66
80's Mean 4.53 3.12 5.00 2.36 1.71 3.2390's Mean 4.63 3.26 4.96 1.74 1.34 3.0000's Mean 5.55 3.54 5.11 1.42 0.54 2.71
39
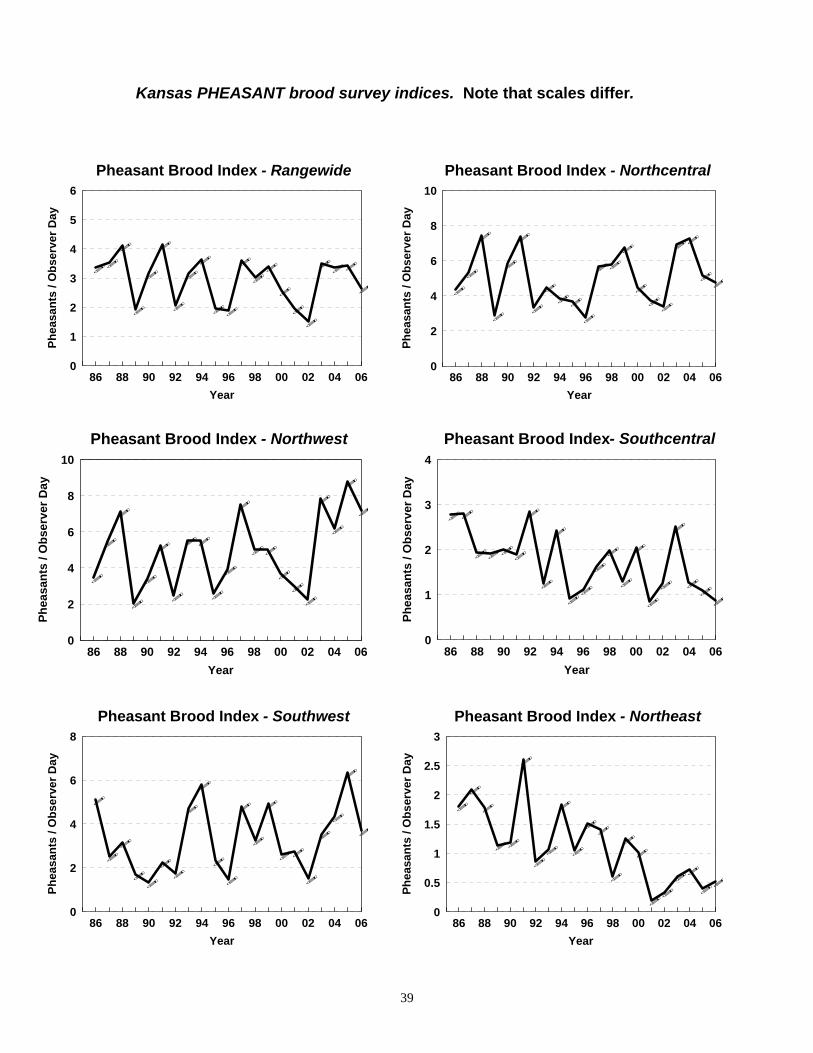
Kansas PHEASANT brood survey indices. Note that scales differ. ++
Pheasant Brood Index - Rangewide
86 88 90 92 94 96 98 00 02 04 06Year
0
1
2
3
4
5
6
Phea
sant
s / O
bser
ver D
a y
Pheasant Brood Index - Northwest
86 88 90 92 94 96 98 00 02 04 06Year
0
2
4
6
8
10
Phea
sant
s / O
bser
ver D
ay
Pheasant Brood Index - Southwest
86 88 90 92 94 96 98 00 02 04 06Year
0
2
4
6
8
Phea
sant
s / O
bser
ver D
a y
Pheasant Brood Index - Northcentral
86 88 90 92 94 96 98 00 02 04 06Year
0
2
4
6
8
10
Phea
s ant
s / O
bser
ver D
ay
Pheasant Brood Index - Southcentral
86 88 90 92 94 96 98 00 02 04 06Year
0
1
2
3
4
Phea
sant
s / O
bse r
ver D
ay
Pheasant Brood Index - Northeast
86 88 90 92 94 96 98 00 02 04 06Year
0
0.5
1
1.5
2
2.5
3
Phea
sant
s / O
bser
ver D
ay
40
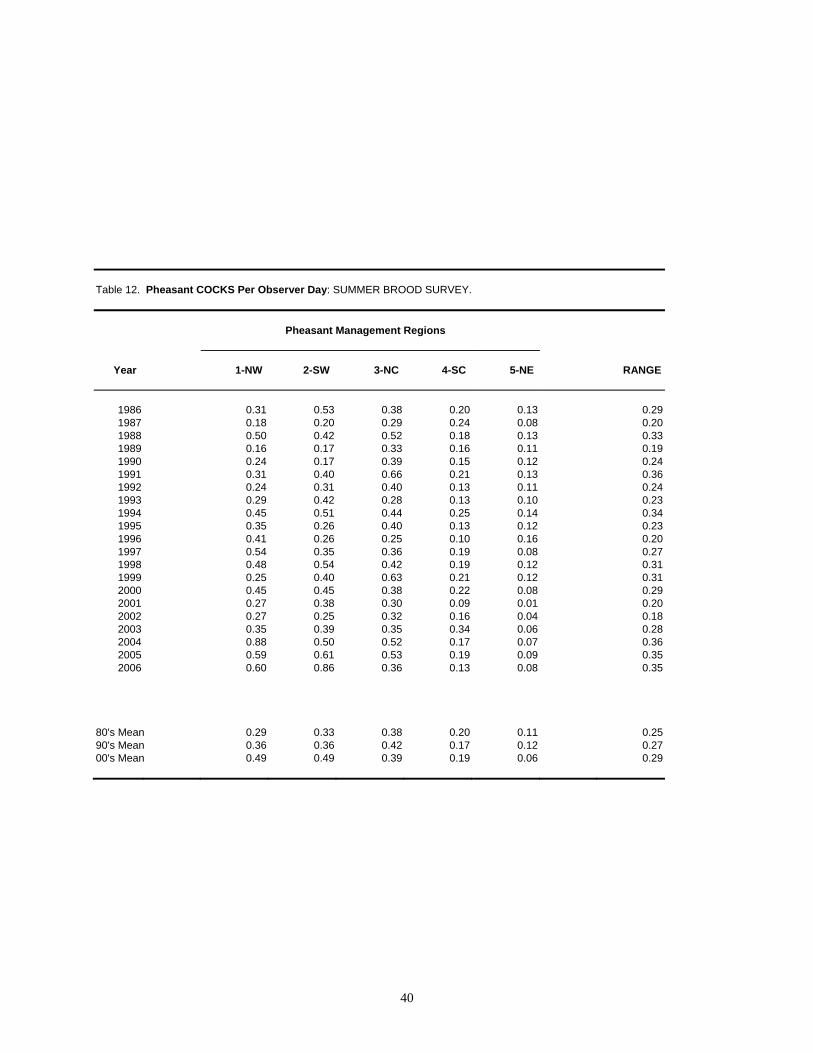
Table 12. Pheasant COCKS Per Observer Day: SUMMER BROOD SURVEY.
Pheasant Management Regions
Year 1-NW 2-SW 3-NC 4-SC 5-NE RANGE
1986 0.31 0.53 0.38 0.20 0.13 0.291987 0.18 0.20 0.29 0.24 0.08 0.201988 0.50 0.42 0.52 0.18 0.13 0.331989 0.16 0.17 0.33 0.16 0.11 0.191990 0.24 0.17 0.39 0.15 0.12 0.241991 0.31 0.40 0.66 0.21 0.13 0.361992 0.24 0.31 0.40 0.13 0.11 0.241993 0.29 0.42 0.28 0.13 0.10 0.231994 0.45 0.51 0.44 0.25 0.14 0.341995 0.35 0.26 0.40 0.13 0.12 0.231996 0.41 0.26 0.25 0.10 0.16 0.201997 0.54 0.35 0.36 0.19 0.08 0.271998 0.48 0.54 0.42 0.19 0.12 0.311999 0.25 0.40 0.63 0.21 0.12 0.312000 0.45 0.45 0.38 0.22 0.08 0.292001 0.27 0.38 0.30 0.09 0.01 0.202002 0.27 0.25 0.32 0.16 0.04 0.182003 0.35 0.39 0.35 0.34 0.06 0.282004 0.88 0.50 0.52 0.17 0.07 0.362005 0.59 0.61 0.53 0.19 0.09 0.352006 0.60 0.86 0.36 0.13 0.08 0.35
80's Mean 0.29 0.33 0.38 0.20 0.11 0.2590's Mean 0.36 0.36 0.42 0.17 0.12 0.2700's Mean 0.49 0.49 0.39 0.19 0.06 0.29
41
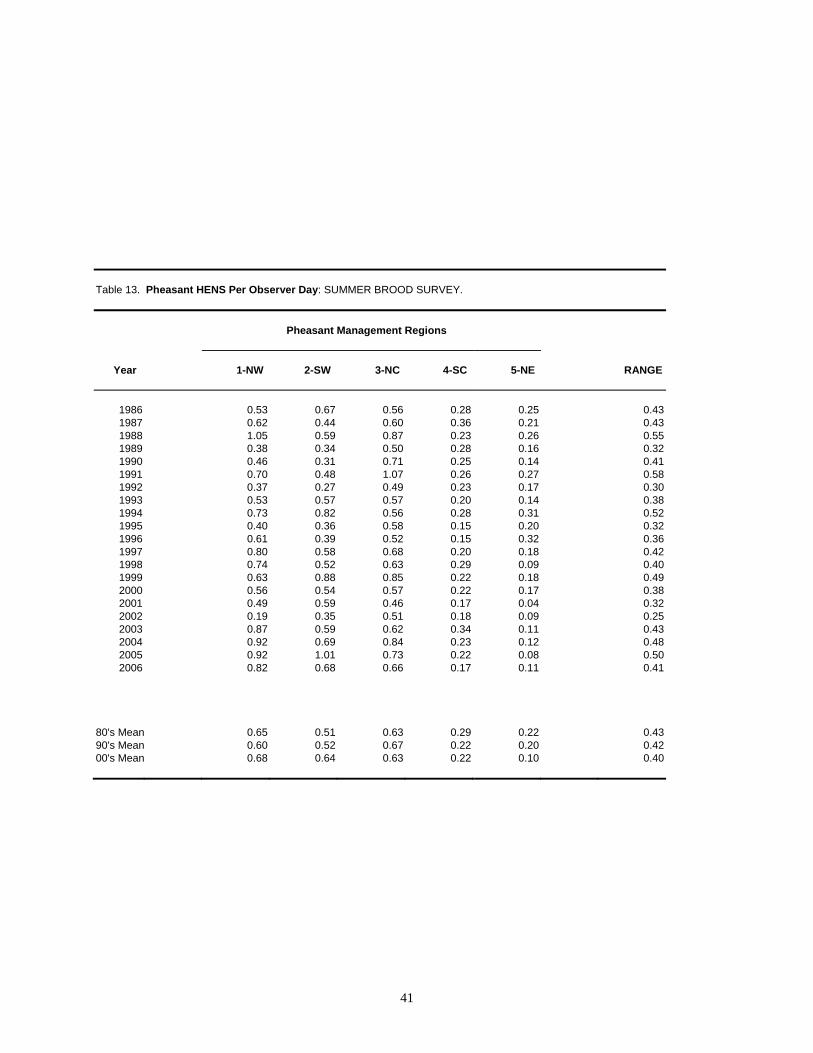
Table 13. Pheasant HENS Per Observer Day: SUMMER BROOD SURVEY.
Pheasant Management Regions
Year 1-NW 2-SW 3-NC 4-SC 5-NE RANGE
1986 0.53 0.67 0.56 0.28 0.25 0.431987 0.62 0.44 0.60 0.36 0.21 0.431988 1.05 0.59 0.87 0.23 0.26 0.551989 0.38 0.34 0.50 0.28 0.16 0.321990 0.46 0.31 0.71 0.25 0.14 0.411991 0.70 0.48 1.07 0.26 0.27 0.581992 0.37 0.27 0.49 0.23 0.17 0.301993 0.53 0.57 0.57 0.20 0.14 0.381994 0.73 0.82 0.56 0.28 0.31 0.521995 0.40 0.36 0.58 0.15 0.20 0.321996 0.61 0.39 0.52 0.15 0.32 0.361997 0.80 0.58 0.68 0.20 0.18 0.421998 0.74 0.52 0.63 0.29 0.09 0.401999 0.63 0.88 0.85 0.22 0.18 0.492000 0.56 0.54 0.57 0.22 0.17 0.382001 0.49 0.59 0.46 0.17 0.04 0.322002 0.19 0.35 0.51 0.18 0.09 0.252003 0.87 0.59 0.62 0.34 0.11 0.432004 0.92 0.69 0.84 0.23 0.12 0.482005 0.92 1.01 0.73 0.22 0.08 0.502006 0.82 0.68 0.66 0.17 0.11 0.41
80's Mean 0.65 0.51 0.63 0.29 0.22 0.4390's Mean 0.60 0.52 0.67 0.22 0.20 0.4200's Mean 0.68 0.64 0.63 0.22 0.10 0.40
42
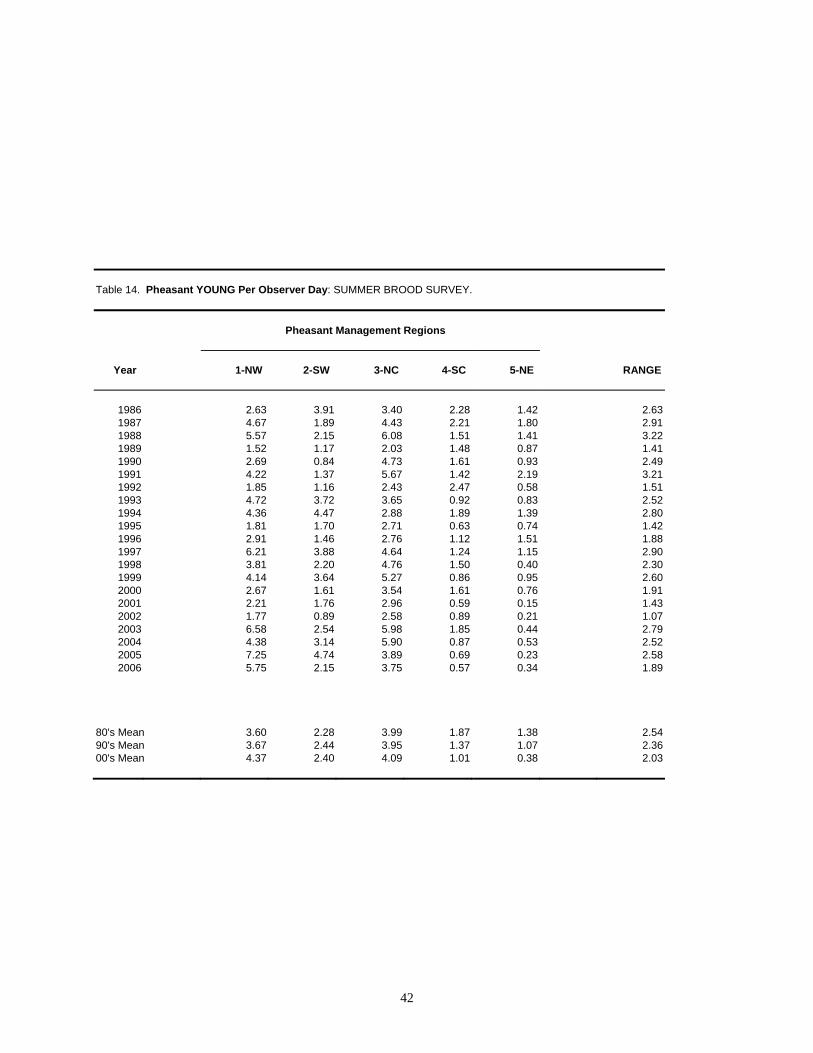
Table 14. Pheasant YOUNG Per Observer Day: SUMMER BROOD SURVEY.
Pheasant Management Regions
Year 1-NW 2-SW 3-NC 4-SC 5-NE RANGE
1986 2.63 3.91 3.40 2.28 1.42 2.631987 4.67 1.89 4.43 2.21 1.80 2.911988 5.57 2.15 6.08 1.51 1.41 3.221989 1.52 1.17 2.03 1.48 0.87 1.411990 2.69 0.84 4.73 1.61 0.93 2.491991 4.22 1.37 5.67 1.42 2.19 3.211992 1.85 1.16 2.43 2.47 0.58 1.511993 4.72 3.72 3.65 0.92 0.83 2.521994 4.36 4.47 2.88 1.89 1.39 2.801995 1.81 1.70 2.71 0.63 0.74 1.421996 2.91 1.46 2.76 1.12 1.51 1.881997 6.21 3.88 4.64 1.24 1.15 2.901998 3.81 2.20 4.76 1.50 0.40 2.301999 4.14 3.64 5.27 0.86 0.95 2.602000 2.67 1.61 3.54 1.61 0.76 1.912001 2.21 1.76 2.96 0.59 0.15 1.432002 1.77 0.89 2.58 0.89 0.21 1.072003 6.58 2.54 5.98 1.85 0.44 2.792004 4.38 3.14 5.90 0.87 0.53 2.522005 7.25 4.74 3.89 0.69 0.23 2.582006 5.75 2.15 3.75 0.57 0.34 1.89
80's Mean 3.60 2.28 3.99 1.87 1.38 2.5490's Mean 3.67 2.44 3.95 1.37 1.07 2.3600's Mean 4.37 2.40 4.09 1.01 0.38 2.03
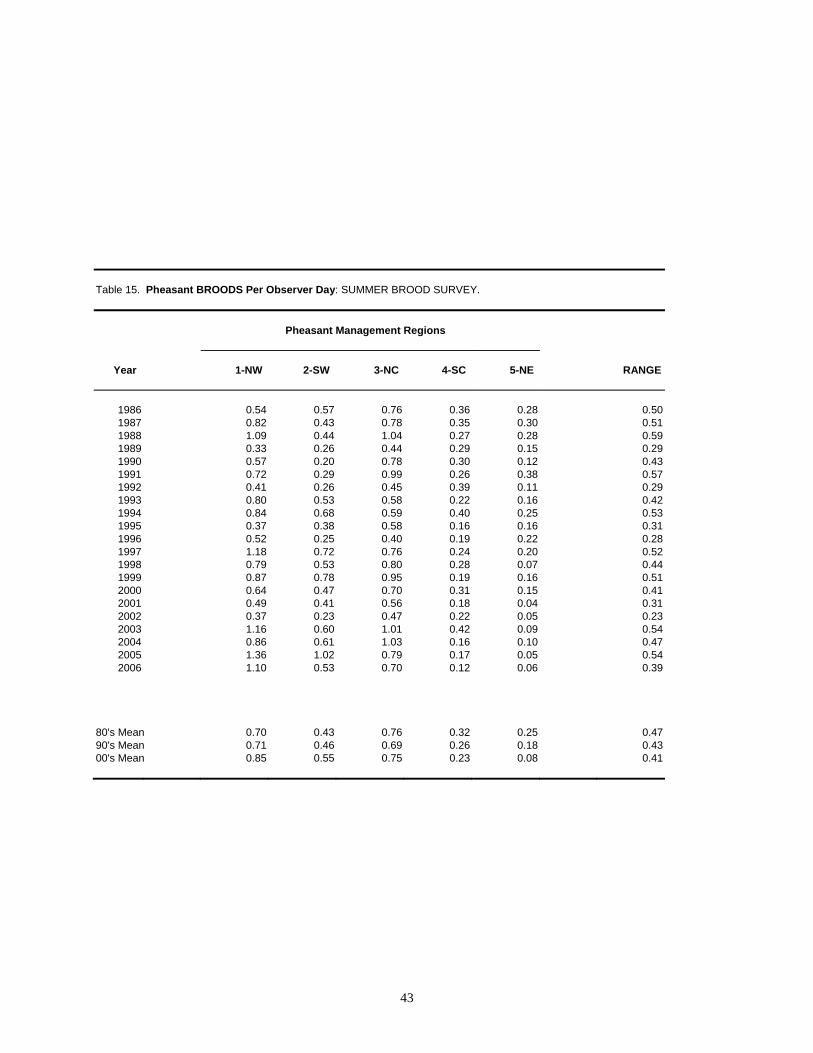
43
Table 15. Pheasant BROODS Per Observer Day: SUMMER BROOD SURVEY.
Pheasant Management Regions
Year 1-NW 2-SW 3-NC 4-SC 5-NE RANGE
1986 0.54 0.57 0.76 0.36 0.28 0.501987 0.82 0.43 0.78 0.35 0.30 0.511988 1.09 0.44 1.04 0.27 0.28 0.591989 0.33 0.26 0.44 0.29 0.15 0.291990 0.57 0.20 0.78 0.30 0.12 0.431991 0.72 0.29 0.99 0.26 0.38 0.571992 0.41 0.26 0.45 0.39 0.11 0.291993 0.80 0.53 0.58 0.22 0.16 0.421994 0.84 0.68 0.59 0.40 0.25 0.531995 0.37 0.38 0.58 0.16 0.16 0.311996 0.52 0.25 0.40 0.19 0.22 0.281997 1.18 0.72 0.76 0.24 0.20 0.521998 0.79 0.53 0.80 0.28 0.07 0.441999 0.87 0.78 0.95 0.19 0.16 0.512000 0.64 0.47 0.70 0.31 0.15 0.412001 0.49 0.41 0.56 0.18 0.04 0.312002 0.37 0.23 0.47 0.22 0.05 0.232003 1.16 0.60 1.01 0.42 0.09 0.542004 0.86 0.61 1.03 0.16 0.10 0.472005 1.36 1.02 0.79 0.17 0.05 0.542006 1.10 0.53 0.70 0.12 0.06 0.39
80's Mean 0.70 0.43 0.76 0.32 0.25 0.4790's Mean 0.71 0.46 0.69 0.26 0.18 0.4300's Mean 0.85 0.55 0.75 0.23 0.08 0.41
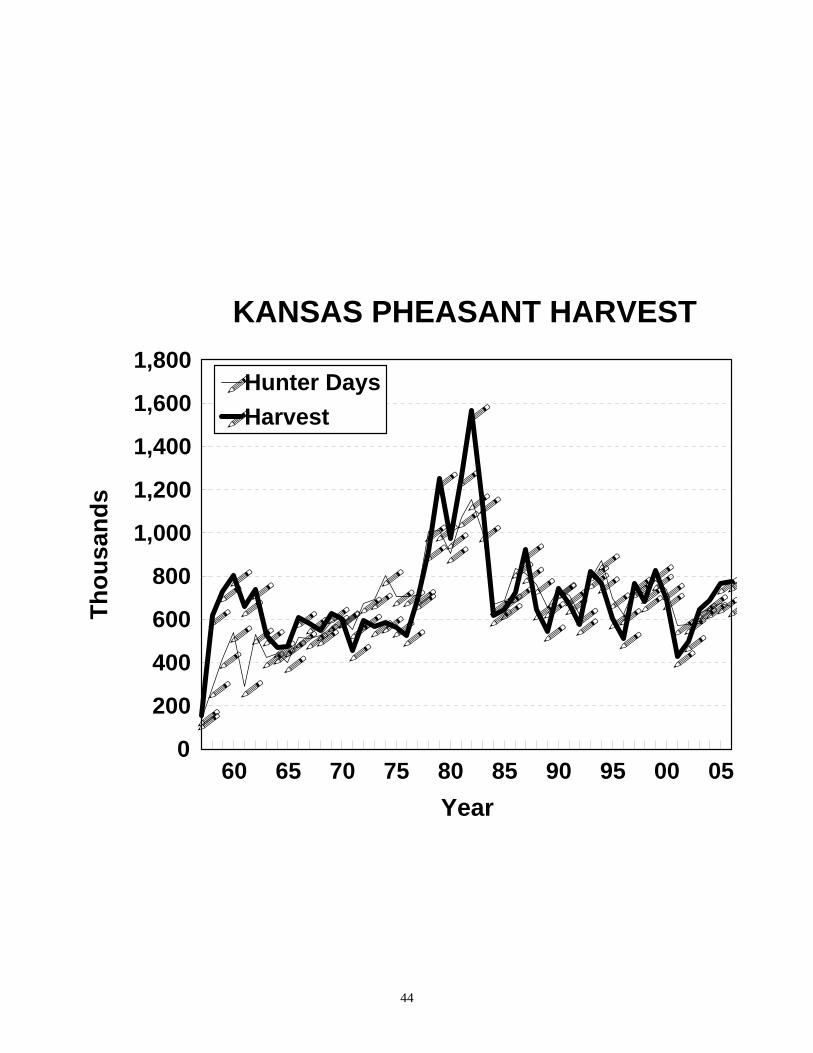
44
KANSAS PHEASANT HARVEST
60 65 70 75 80 85 90 95 00 05Year
0
200
400
600
800
1,000
1,200
1,400
1,600
1,800
Thou
sand
s
Hunter DaysHarvest
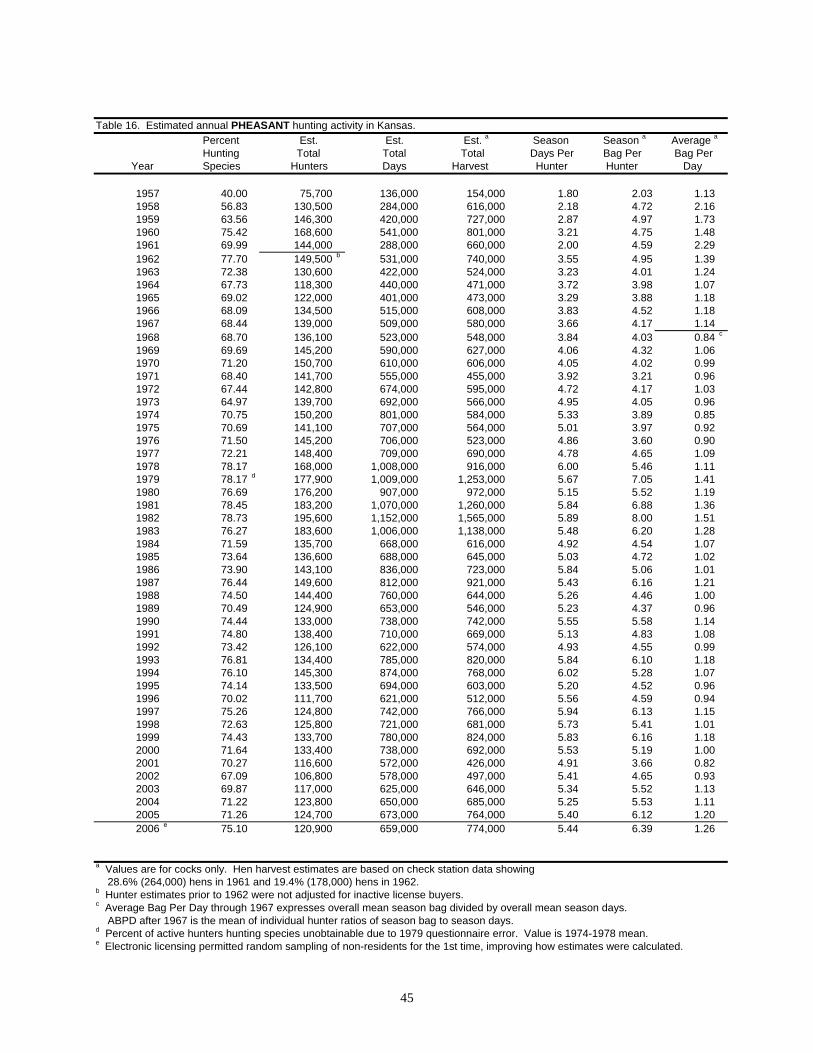
45
Table 16. Estimated annual PHEASANT hunting activity in Kansas.
Percent Est. Est. Est. a Season Season a Average a
Hunting Total Total Total Days Per Bag Per Bag Per Year Species Hunters Days Harvest Hunter Hunter Day
1957 40.00 75,700 136,000 154,000 1.80 2.03 1.131958 56.83 130,500 284,000 616,000 2.18 4.72 2.161959 63.56 146,300 420,000 727,000 2.87 4.97 1.731960 75.42 168,600 541,000 801,000 3.21 4.75 1.481961 69.99 144,000 288,000 660,000 2.00 4.59 2.291962 77.70 149,500 b 531,000 740,000 3.55 4.95 1.391963 72.38 130,600 422,000 524,000 3.23 4.01 1.241964 67.73 118,300 440,000 471,000 3.72 3.98 1.071965 69.02 122,000 401,000 473,000 3.29 3.88 1.181966 68.09 134,500 515,000 608,000 3.83 4.52 1.181967 68.44 139,000 509,000 580,000 3.66 4.17 1.141968 68.70 136,100 523,000 548,000 3.84 4.03 0.84 c
1969 69.69 145,200 590,000 627,000 4.06 4.32 1.061970 71.20 150,700 610,000 606,000 4.05 4.02 0.991971 68.40 141,700 555,000 455,000 3.92 3.21 0.961972 67.44 142,800 674,000 595,000 4.72 4.17 1.031973 64.97 139,700 692,000 566,000 4.95 4.05 0.961974 70.75 150,200 801,000 584,000 5.33 3.89 0.851975 70.69 141,100 707,000 564,000 5.01 3.97 0.921976 71.50 145,200 706,000 523,000 4.86 3.60 0.901977 72.21 148,400 709,000 690,000 4.78 4.65 1.091978 78.17 168,000 1,008,000 916,000 6.00 5.46 1.111979 78.17 d 177,900 1,009,000 1,253,000 5.67 7.05 1.411980 76.69 176,200 907,000 972,000 5.15 5.52 1.191981 78.45 183,200 1,070,000 1,260,000 5.84 6.88 1.361982 78.73 195,600 1,152,000 1,565,000 5.89 8.00 1.511983 76.27 183,600 1,006,000 1,138,000 5.48 6.20 1.281984 71.59 135,700 668,000 616,000 4.92 4.54 1.071985 73.64 136,600 688,000 645,000 5.03 4.72 1.021986 73.90 143,100 836,000 723,000 5.84 5.06 1.011987 76.44 149,600 812,000 921,000 5.43 6.16 1.211988 74.50 144,400 760,000 644,000 5.26 4.46 1.001989 70.49 124,900 653,000 546,000 5.23 4.37 0.961990 74.44 133,000 738,000 742,000 5.55 5.58 1.141991 74.80 138,400 710,000 669,000 5.13 4.83 1.081992 73.42 126,100 622,000 574,000 4.93 4.55 0.991993 76.81 134,400 785,000 820,000 5.84 6.10 1.181994 76.10 145,300 874,000 768,000 6.02 5.28 1.071995 74.14 133,500 694,000 603,000 5.20 4.52 0.961996 70.02 111,700 621,000 512,000 5.56 4.59 0.941997 75.26 124,800 742,000 766,000 5.94 6.13 1.151998 72.63 125,800 721,000 681,000 5.73 5.41 1.011999 74.43 133,700 780,000 824,000 5.83 6.16 1.182000 71.64 133,400 738,000 692,000 5.53 5.19 1.002001 70.27 116,600 572,000 426,000 4.91 3.66 0.822002 67.09 106,800 578,000 497,000 5.41 4.65 0.932003 69.87 117,000 625,000 646,000 5.34 5.52 1.132004 71.22 123,800 650,000 685,000 5.25 5.53 1.112005 71.26 124,700 673,000 764,000 5.40 6.12 1.202006 e 75.10 120,900 659,000 774,000 5.44 6.39 1.26
a Values are for cocks only. Hen harvest estimates are based on check station data showing 28.6% (264,000) hens in 1961 and 19.4% (178,000) hens in 1962. b Hunter estimates prior to 1962 were not adjusted for inactive license buyers. c Average Bag Per Day through 1967 expresses overall mean season bag divided by overall mean season days. ABPD after 1967 is the mean of individual hunter ratios of season bag to season days. d Percent of active hunters hunting species unobtainable due to 1979 questionnaire error. Value is 1974-1978 mean. e Electronic licensing permitted random sampling of non-residents for the 1st time, improving how estimates were calculated.
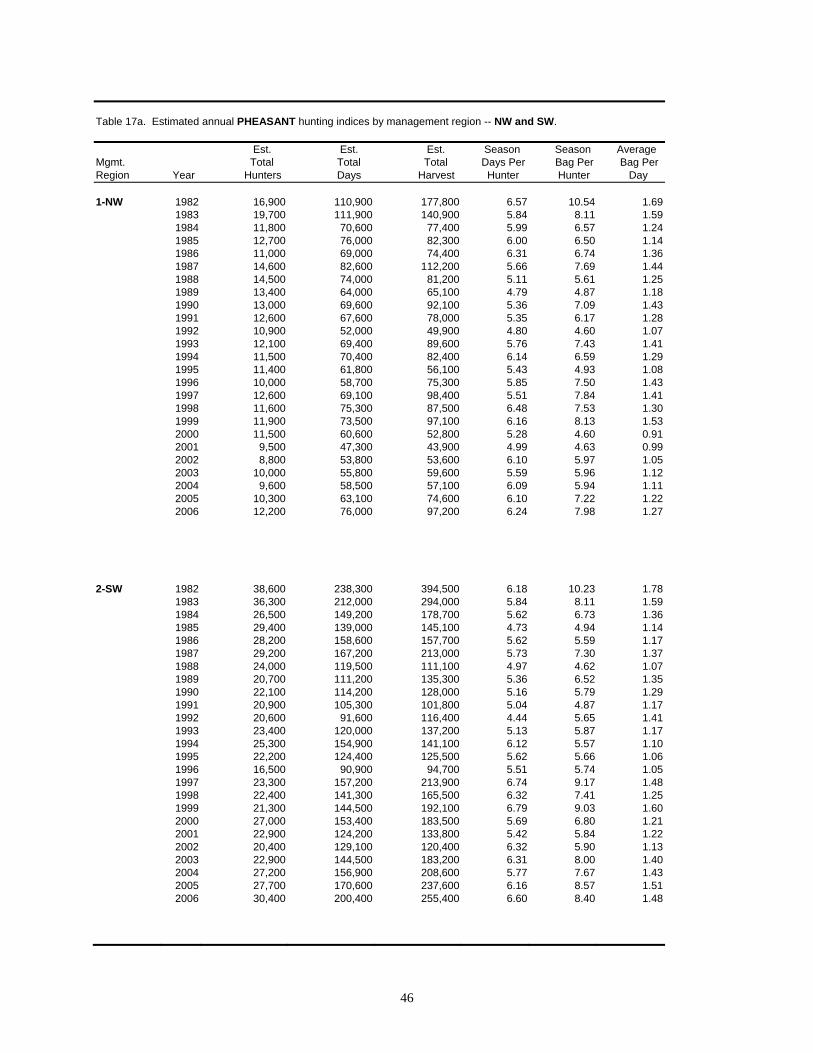
46
Table 17a. Estimated annual PHEASANT hunting indices by management region -- NW and SW.
Est. Est. Est. Season Season Average
Mgmt. Total Total Total Days Per Bag Per Bag Per Region Year Hunters Days Harvest Hunter Hunter Day
1-NW 1982 16,900 110,900 177,800 6.57 10.54 1.69
1983 19,700 111,900 140,900 5.84 8.11 1.59 1984 11,800 70,600 77,400 5.99 6.57 1.24 1985 12,700 76,000 82,300 6.00 6.50 1.14 1986 11,000 69,000 74,400 6.31 6.74 1.36 1987 14,600 82,600 112,200 5.66 7.69 1.44 1988 14,500 74,000 81,200 5.11 5.61 1.25 1989 13,400 64,000 65,100 4.79 4.87 1.18 1990 13,000 69,600 92,100 5.36 7.09 1.43 1991 12,600 67,600 78,000 5.35 6.17 1.28 1992 10,900 52,000 49,900 4.80 4.60 1.07 1993 12,100 69,400 89,600 5.76 7.43 1.41 1994 11,500 70,400 82,400 6.14 6.59 1.29 1995 11,400 61,800 56,100 5.43 4.93 1.08 1996 10,000 58,700 75,300 5.85 7.50 1.43 1997 12,600 69,100 98,400 5.51 7.84 1.41 1998 11,600 75,300 87,500 6.48 7.53 1.30 1999 11,900 73,500 97,100 6.16 8.13 1.53 2000 11,500 60,600 52,800 5.28 4.60 0.91 2001 9,500 47,300 43,900 4.99 4.63 0.99 2002 8,800 53,800 53,600 6.10 5.97 1.05 2003 10,000 55,800 59,600 5.59 5.96 1.12 2004 9,600 58,500 57,100 6.09 5.94 1.11 2005 10,300 63,100 74,600 6.10 7.22 1.22 2006 12,200 76,000 97,200 6.24 7.98 1.27
2-SW 1982 38,600 238,300 394,500 6.18 10.23 1.78 1983 36,300 212,000 294,000 5.84 8.11 1.59 1984 26,500 149,200 178,700 5.62 6.73 1.36 1985 29,400 139,000 145,100 4.73 4.94 1.14 1986 28,200 158,600 157,700 5.62 5.59 1.17 1987 29,200 167,200 213,000 5.73 7.30 1.37 1988 24,000 119,500 111,100 4.97 4.62 1.07 1989 20,700 111,200 135,300 5.36 6.52 1.35 1990 22,100 114,200 128,000 5.16 5.79 1.29 1991 20,900 105,300 101,800 5.04 4.87 1.17 1992 20,600 91,600 116,400 4.44 5.65 1.41 1993 23,400 120,000 137,200 5.13 5.87 1.17 1994 25,300 154,900 141,100 6.12 5.57 1.10 1995 22,200 124,400 125,500 5.62 5.66 1.06 1996 16,500 90,900 94,700 5.51 5.74 1.05 1997 23,300 157,200 213,900 6.74 9.17 1.48 1998 22,400 141,300 165,500 6.32 7.41 1.25 1999 21,300 144,500 192,100 6.79 9.03 1.60 2000 27,000 153,400 183,500 5.69 6.80 1.21 2001 22,900 124,200 133,800 5.42 5.84 1.22 2002 20,400 129,100 120,400 6.32 5.90 1.13 2003 22,900 144,500 183,200 6.31 8.00 1.40 2004 27,200 156,900 208,600 5.77 7.67 1.43 2005 27,700 170,600 237,600 6.16 8.57 1.51 2006 30,400 200,400 255,400 6.60 8.40 1.48
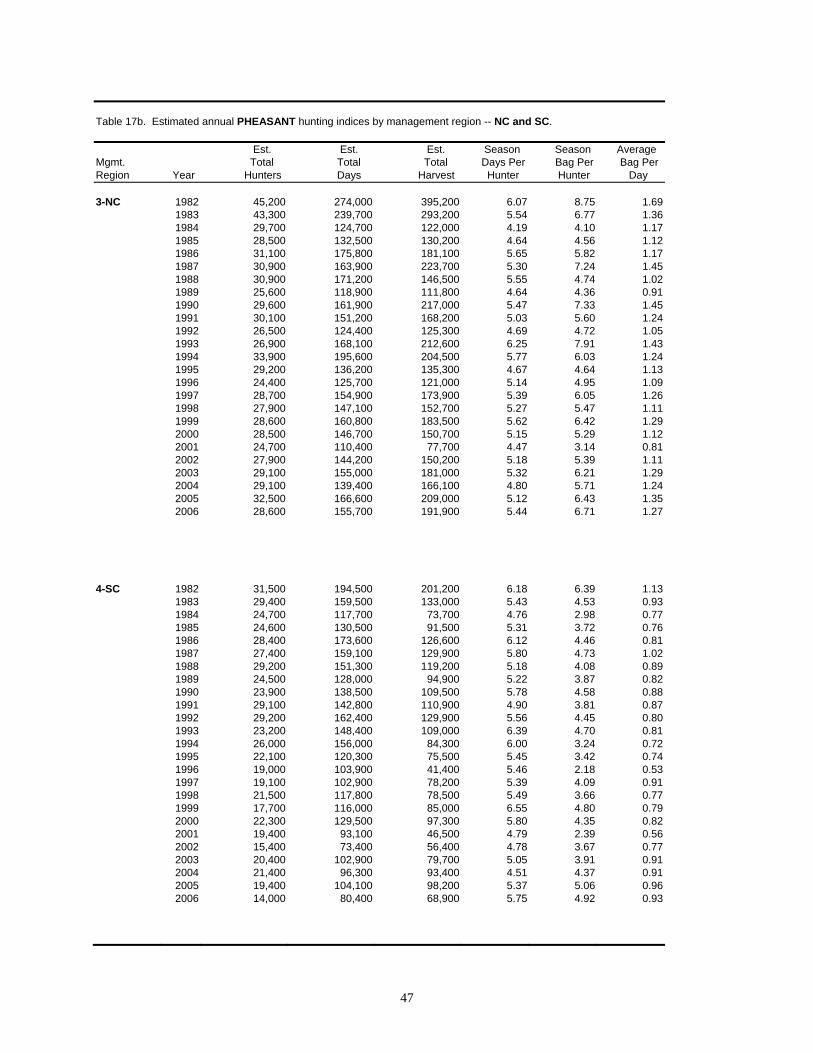
47
Table 17b. Estimated annual PHEASANT hunting indices by management region -- NC and SC.
Est. Est. Est. Season Season Average
Mgmt. Total Total Total Days Per Bag Per Bag Per Region Year Hunters Days Harvest Hunter Hunter Day
3-NC 1982 45,200 274,000 395,200 6.07 8.75 1.69
1983 43,300 239,700 293,200 5.54 6.77 1.36 1984 29,700 124,700 122,000 4.19 4.10 1.17 1985 28,500 132,500 130,200 4.64 4.56 1.12 1986 31,100 175,800 181,100 5.65 5.82 1.17 1987 30,900 163,900 223,700 5.30 7.24 1.45 1988 30,900 171,200 146,500 5.55 4.74 1.02 1989 25,600 118,900 111,800 4.64 4.36 0.91 1990 29,600 161,900 217,000 5.47 7.33 1.45 1991 30,100 151,200 168,200 5.03 5.60 1.24 1992 26,500 124,400 125,300 4.69 4.72 1.05 1993 26,900 168,100 212,600 6.25 7.91 1.43 1994 33,900 195,600 204,500 5.77 6.03 1.24 1995 29,200 136,200 135,300 4.67 4.64 1.13 1996 24,400 125,700 121,000 5.14 4.95 1.09 1997 28,700 154,900 173,900 5.39 6.05 1.26 1998 27,900 147,100 152,700 5.27 5.47 1.11 1999 28,600 160,800 183,500 5.62 6.42 1.29 2000 28,500 146,700 150,700 5.15 5.29 1.12 2001 24,700 110,400 77,700 4.47 3.14 0.81 2002 27,900 144,200 150,200 5.18 5.39 1.11 2003 29,100 155,000 181,000 5.32 6.21 1.29 2004 29,100 139,400 166,100 4.80 5.71 1.24 2005 32,500 166,600 209,000 5.12 6.43 1.35 2006 28,600 155,700 191,900 5.44 6.71 1.27
4-SC 1982 31,500 194,500 201,200 6.18 6.39 1.13 1983 29,400 159,500 133,000 5.43 4.53 0.93 1984 24,700 117,700 73,700 4.76 2.98 0.77 1985 24,600 130,500 91,500 5.31 3.72 0.76 1986 28,400 173,600 126,600 6.12 4.46 0.81 1987 27,400 159,100 129,900 5.80 4.73 1.02 1988 29,200 151,300 119,200 5.18 4.08 0.89 1989 24,500 128,000 94,900 5.22 3.87 0.82 1990 23,900 138,500 109,500 5.78 4.58 0.88 1991 29,100 142,800 110,900 4.90 3.81 0.87 1992 29,200 162,400 129,900 5.56 4.45 0.80 1993 23,200 148,400 109,000 6.39 4.70 0.81 1994 26,000 156,000 84,300 6.00 3.24 0.72 1995 22,100 120,300 75,500 5.45 3.42 0.74 1996 19,000 103,900 41,400 5.46 2.18 0.53 1997 19,100 102,900 78,200 5.39 4.09 0.91 1998 21,500 117,800 78,500 5.49 3.66 0.77 1999 17,700 116,000 85,000 6.55 4.80 0.79 2000 22,300 129,500 97,300 5.80 4.35 0.82 2001 19,400 93,100 46,500 4.79 2.39 0.56 2002 15,400 73,400 56,400 4.78 3.67 0.77 2003 20,400 102,900 79,700 5.05 3.91 0.91 2004 21,400 96,300 93,400 4.51 4.37 0.91 2005 19,400 104,100 98,200 5.37 5.06 0.96 2006 14,000 80,400 68,900 5.75 4.92 0.93
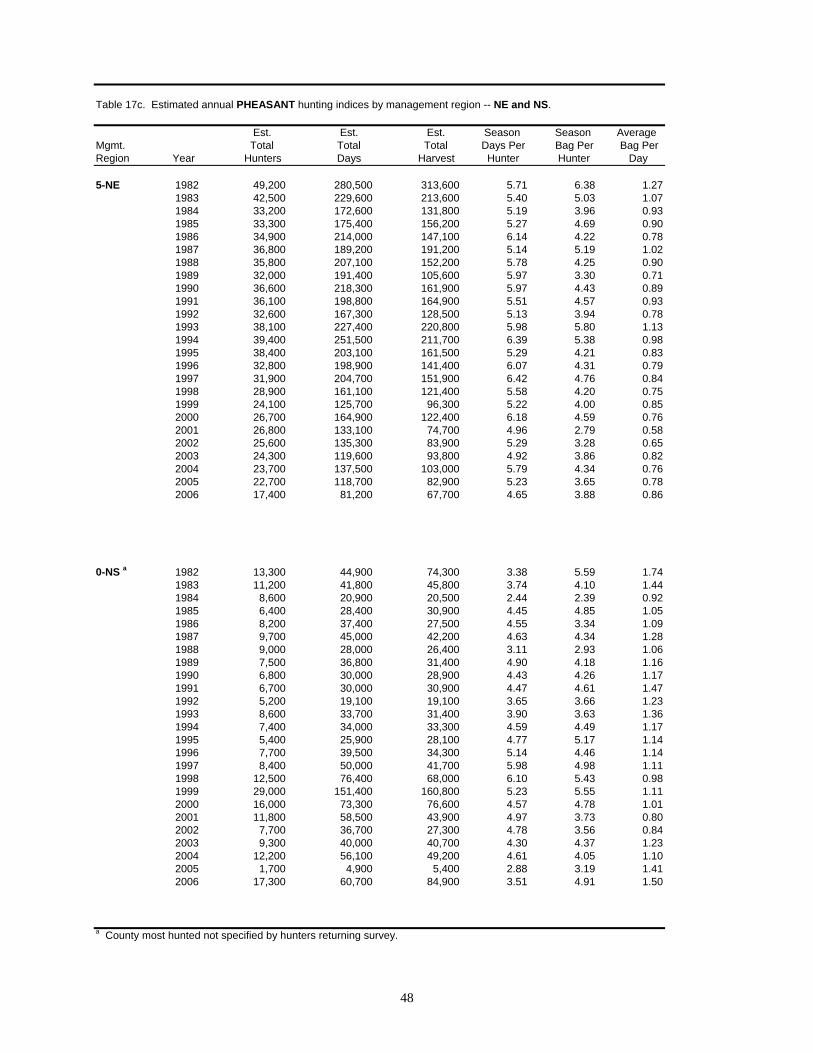
48
Table 17c. Estimated annual PHEASANT hunting indices by management region -- NE and NS. Est. Est. Est. Season Season Average
Mgmt. Total Total Total Days Per Bag Per Bag Per Region Year Hunters Days Harvest Hunter Hunter Day
5-NE 1982 49,200 280,500 313,600 5.71 6.38 1.27
1983 42,500 229,600 213,600 5.40 5.03 1.07 1984 33,200 172,600 131,800 5.19 3.96 0.93 1985 33,300 175,400 156,200 5.27 4.69 0.90 1986 34,900 214,000 147,100 6.14 4.22 0.78 1987 36,800 189,200 191,200 5.14 5.19 1.02 1988 35,800 207,100 152,200 5.78 4.25 0.90 1989 32,000 191,400 105,600 5.97 3.30 0.71 1990 36,600 218,300 161,900 5.97 4.43 0.89 1991 36,100 198,800 164,900 5.51 4.57 0.93 1992 32,600 167,300 128,500 5.13 3.94 0.78 1993 38,100 227,400 220,800 5.98 5.80 1.13 1994 39,400 251,500 211,700 6.39 5.38 0.98 1995 38,400 203,100 161,500 5.29 4.21 0.83 1996 32,800 198,900 141,400 6.07 4.31 0.79 1997 31,900 204,700 151,900 6.42 4.76 0.84 1998 28,900 161,100 121,400 5.58 4.20 0.75 1999 24,100 125,700 96,300 5.22 4.00 0.85 2000 26,700 164,900 122,400 6.18 4.59 0.76 2001 26,800 133,100 74,700 4.96 2.79 0.58 2002 25,600 135,300 83,900 5.29 3.28 0.65 2003 24,300 119,600 93,800 4.92 3.86 0.82 2004 23,700 137,500 103,000 5.79 4.34 0.76 2005 22,700 118,700 82,900 5.23 3.65 0.78 2006 17,400 81,200 67,700 4.65 3.88 0.86
0-NS a 1982 13,300 44,900 74,300 3.38 5.59 1.74 1983 11,200 41,800 45,800 3.74 4.10 1.44 1984 8,600 20,900 20,500 2.44 2.39 0.92 1985 6,400 28,400 30,900 4.45 4.85 1.05 1986 8,200 37,400 27,500 4.55 3.34 1.09 1987 9,700 45,000 42,200 4.63 4.34 1.28 1988 9,000 28,000 26,400 3.11 2.93 1.06 1989 7,500 36,800 31,400 4.90 4.18 1.16 1990 6,800 30,000 28,900 4.43 4.26 1.17 1991 6,700 30,000 30,900 4.47 4.61 1.47 1992 5,200 19,100 19,100 3.65 3.66 1.23 1993 8,600 33,700 31,400 3.90 3.63 1.36 1994 7,400 34,000 33,300 4.59 4.49 1.17 1995 5,400 25,900 28,100 4.77 5.17 1.14 1996 7,700 39,500 34,300 5.14 4.46 1.14 1997 8,400 50,000 41,700 5.98 4.98 1.11 1998 12,500 76,400 68,000 6.10 5.43 0.98 1999 29,000 151,400 160,800 5.23 5.55 1.11 2000 16,000 73,300 76,600 4.57 4.78 1.01 2001 11,800 58,500 43,900 4.97 3.73 0.80 2002 7,700 36,700 27,300 4.78 3.56 0.84 2003 9,300 40,000 40,700 4.30 4.37 1.23 2004 12,200 56,100 49,200 4.61 4.05 1.10 2005 1,700 4,900 5,400 2.88 3.19 1.41 2006 17,300 60,700 84,900 3.51 4.91 1.50
a County most hunted not specified by hunters returning survey.
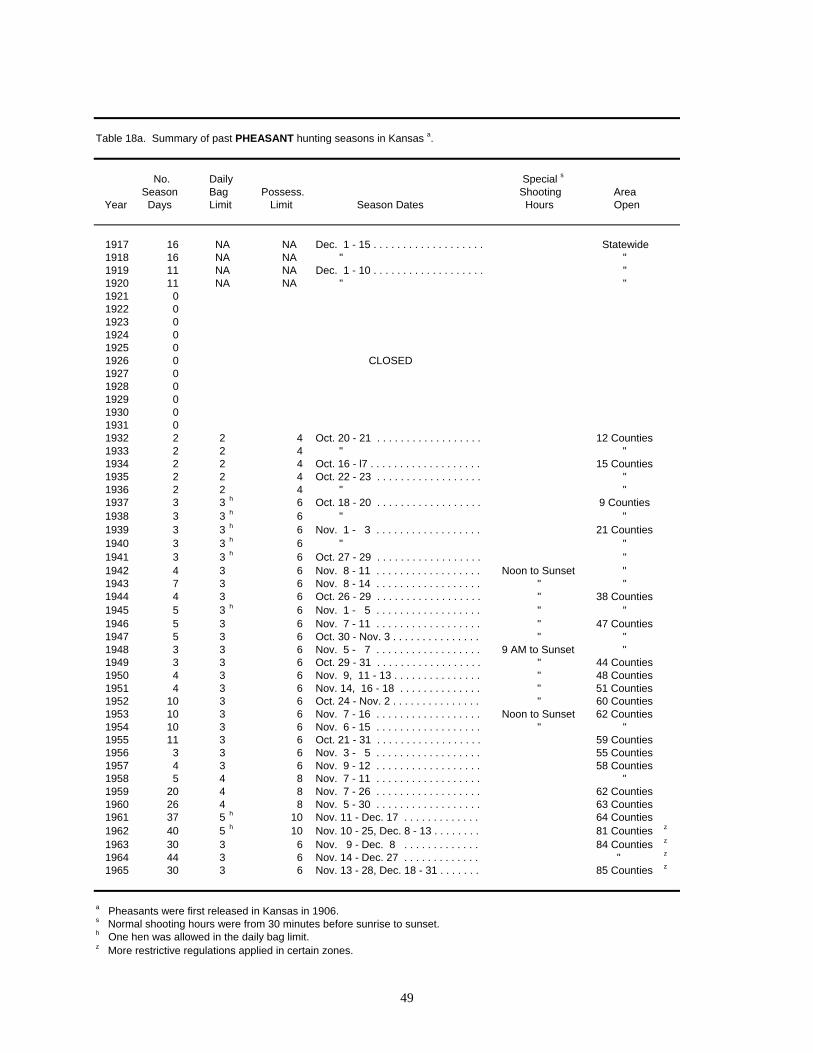
49
Table 18a. Summary of past PHEASANT hunting seasons in Kansas a.
No. Daily Special s
Season Bag Possess. Shooting Area Year Days Limit Limit Season Dates Hours Open
1917 16 NA NA Dec. 1 - 15 . . . . . . . . . . . . . . . . . . . Statewide 1918 16 NA NA " " 1919 11 NA NA Dec. 1 - 10 . . . . . . . . . . . . . . . . . . . " 1920 11 NA NA " " 1921 0 1922 0 1923 0 1924 0 1925 0 1926 0 CLOSED 1927 0 1928 0 1929 0 1930 0 1931 0 1932 2 2 4 Oct. 20 - 21 . . . . . . . . . . . . . . . . . . 12 Counties 1933 2 2 4 " " 1934 2 2 4 Oct. 16 - l7 . . . . . . . . . . . . . . . . . . . 15 Counties 1935 2 2 4 Oct. 22 - 23 . . . . . . . . . . . . . . . . . . " 1936 2 2 4 " " 1937 3 3 h 6 Oct. 18 - 20 . . . . . . . . . . . . . . . . . . 9 Counties 1938 3 3 h 6 " " 1939 3 3 h 6 Nov. 1 - 3 . . . . . . . . . . . . . . . . . . 21 Counties 1940 3 3 h 6 " " 1941 3 3 h 6 Oct. 27 - 29 . . . . . . . . . . . . . . . . . . " 1942 4 3 6 Nov. 8 - 11 . . . . . . . . . . . . . . . . . . Noon to Sunset " 1943 7 3 6 Nov. 8 - 14 . . . . . . . . . . . . . . . . . . " " 1944 4 3 6 Oct. 26 - 29 . . . . . . . . . . . . . . . . . . " 38 Counties 1945 5 3 h 6 Nov. 1 - 5 . . . . . . . . . . . . . . . . . . " " 1946 5 3 6 Nov. 7 - 11 . . . . . . . . . . . . . . . . . . " 47 Counties 1947 5 3 6 Oct. 30 - Nov. 3 . . . . . . . . . . . . . . . " " 1948 3 3 6 Nov. 5 - 7 . . . . . . . . . . . . . . . . . . 9 AM to Sunset " 1949 3 3 6 Oct. 29 - 31 . . . . . . . . . . . . . . . . . . " 44 Counties 1950 4 3 6 Nov. 9, 11 - 13 . . . . . . . . . . . . . . . " 48 Counties 1951 4 3 6 Nov. 14, 16 - 18 . . . . . . . . . . . . . . " 51 Counties 1952 10 3 6 Oct. 24 - Nov. 2 . . . . . . . . . . . . . . . " 60 Counties 1953 10 3 6 Nov. 7 - 16 . . . . . . . . . . . . . . . . . . Noon to Sunset 62 Counties 1954 10 3 6 Nov. 6 - 15 . . . . . . . . . . . . . . . . . . " " 1955 11 3 6 Oct. 21 - 31 . . . . . . . . . . . . . . . . . . 59 Counties 1956 3 3 6 Nov. 3 - 5 . . . . . . . . . . . . . . . . . . 55 Counties 1957 4 3 6 Nov. 9 - 12 . . . . . . . . . . . . . . . . . . 58 Counties 1958 5 4 8 Nov. 7 - 11 . . . . . . . . . . . . . . . . . . " 1959 20 4 8 Nov. 7 - 26 . . . . . . . . . . . . . . . . . . 62 Counties 1960 26 4 8 Nov. 5 - 30 . . . . . . . . . . . . . . . . . . 63 Counties 1961 37 5 h 10 Nov. 11 - Dec. 17 . . . . . . . . . . . . . 64 Counties 1962 40 5 h 10 Nov. 10 - 25, Dec. 8 - 13 . . . . . . . . 81 Counties z
1963 30 3 6 Nov. 9 - Dec. 8 . . . . . . . . . . . . . 84 Counties z
1964 44 3 6 Nov. 14 - Dec. 27 . . . . . . . . . . . . . " z
1965 30 3 6 Nov. 13 - 28, Dec. 18 - 31 . . . . . . . 85 Counties z
a Pheasants were first released in Kansas in 1906. s Normal shooting hours were from 30 minutes before sunrise to sunset. h One hen was allowed in the daily bag limit. z More restrictive regulations applied in certain zones.
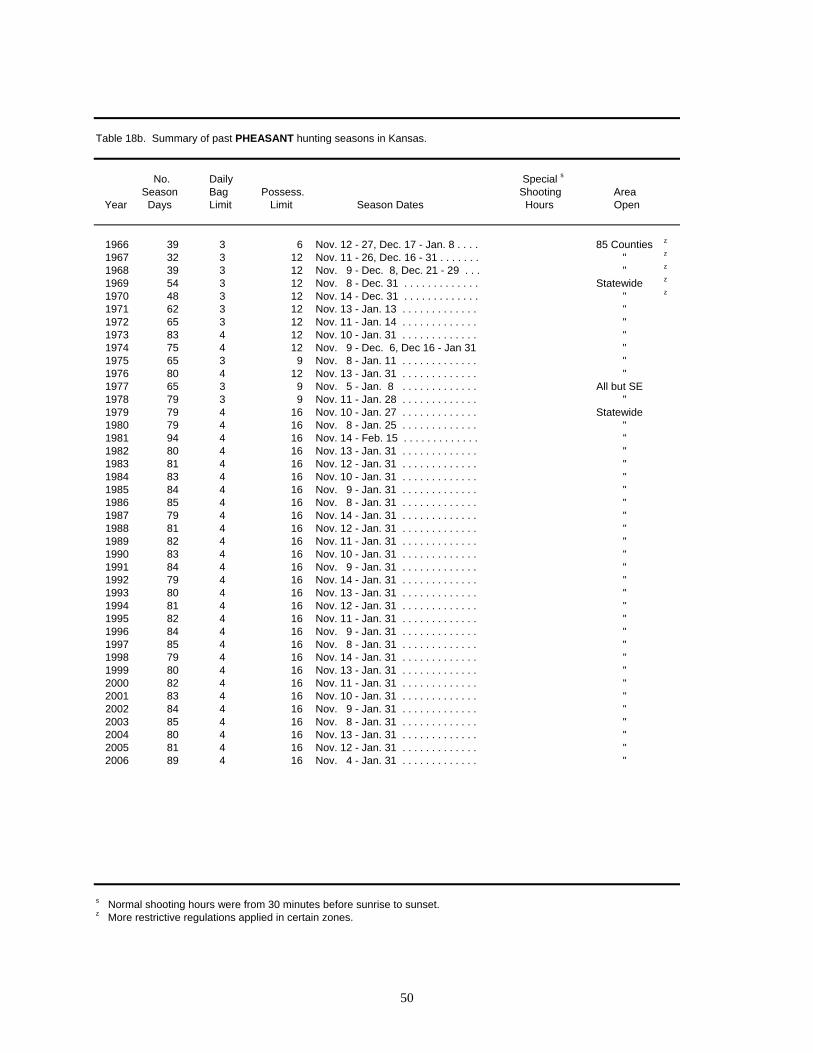
50
Table 18b. Summary of past PHEASANT hunting seasons in Kansas.
No. Daily Special s
Season Bag Possess. Shooting Area Year Days Limit Limit Season Dates Hours Open
1966 39 3 6 Nov. 12 - 27, Dec. 17 - Jan. 8 . . . . 85 Counties z
1967 32 3 12 Nov. 11 - 26, Dec. 16 - 31 . . . . . . . " z
1968 39 3 12 Nov. 9 - Dec. 8, Dec. 21 - 29 . . . " z
1969 54 3 12 Nov. 8 - Dec. 31 . . . . . . . . . . . . . Statewide z
1970 48 3 12 Nov. 14 - Dec. 31 . . . . . . . . . . . . . " z
1971 62 3 12 Nov. 13 - Jan. 13 . . . . . . . . . . . . . " 1972 65 3 12 Nov. 11 - Jan. 14 . . . . . . . . . . . . . " 1973 83 4 12 Nov. 10 - Jan. 31 . . . . . . . . . . . . . " 1974 75 4 12 Nov. 9 - Dec. 6, Dec 16 - Jan 31 " 1975 65 3 9 Nov. 8 - Jan. 11 . . . . . . . . . . . . . " 1976 80 4 12 Nov. 13 - Jan. 31 . . . . . . . . . . . . . " 1977 65 3 9 Nov. 5 - Jan. 8 . . . . . . . . . . . . . All but SE 1978 79 3 9 Nov. 11 - Jan. 28 . . . . . . . . . . . . . " 1979 79 4 16 Nov. 10 - Jan. 27 . . . . . . . . . . . . . Statewide 1980 79 4 16 Nov. 8 - Jan. 25 . . . . . . . . . . . . . " 1981 94 4 16 Nov. 14 - Feb. 15 . . . . . . . . . . . . . " 1982 80 4 16 Nov. 13 - Jan. 31 . . . . . . . . . . . . . " 1983 81 4 16 Nov. 12 - Jan. 31 . . . . . . . . . . . . . " 1984 83 4 16 Nov. 10 - Jan. 31 . . . . . . . . . . . . . " 1985 84 4 16 Nov. 9 - Jan. 31 . . . . . . . . . . . . . " 1986 85 4 16 Nov. 8 - Jan. 31 . . . . . . . . . . . . . " 1987 79 4 16 Nov. 14 - Jan. 31 . . . . . . . . . . . . . " 1988 81 4 16 Nov. 12 - Jan. 31 . . . . . . . . . . . . . " 1989 82 4 16 Nov. 11 - Jan. 31 . . . . . . . . . . . . . " 1990 83 4 16 Nov. 10 - Jan. 31 . . . . . . . . . . . . . " 1991 84 4 16 Nov. 9 - Jan. 31 . . . . . . . . . . . . . " 1992 79 4 16 Nov. 14 - Jan. 31 . . . . . . . . . . . . . " 1993 80 4 16 Nov. 13 - Jan. 31 . . . . . . . . . . . . . " 1994 81 4 16 Nov. 12 - Jan. 31 . . . . . . . . . . . . . " 1995 82 4 16 Nov. 11 - Jan. 31 . . . . . . . . . . . . . " 1996 84 4 16 Nov. 9 - Jan. 31 . . . . . . . . . . . . . " 1997 85 4 16 Nov. 8 - Jan. 31 . . . . . . . . . . . . . " 1998 79 4 16 Nov. 14 - Jan. 31 . . . . . . . . . . . . . " 1999 80 4 16 Nov. 13 - Jan. 31 . . . . . . . . . . . . . " 2000 82 4 16 Nov. 11 - Jan. 31 . . . . . . . . . . . . . " 2001 83 4 16 Nov. 10 - Jan. 31 . . . . . . . . . . . . . " 2002 84 4 16 Nov. 9 - Jan. 31 . . . . . . . . . . . . . " 2003 85 4 16 Nov. 8 - Jan. 31 . . . . . . . . . . . . . " 2004 80 4 16 Nov. 13 - Jan. 31 . . . . . . . . . . . . . " 2005 81 4 16 Nov. 12 - Jan. 31 . . . . . . . . . . . . . " 2006 89 4 16 Nov. 4 - Jan. 31 . . . . . . . . . . . . . "
s Normal shooting hours were from 30 minutes before sunrise to sunset. z More restrictive regulations applied in certain zones.


