Embed Size (px)
Citation preview
ORIGINAL ARTICLE
Photoautotrophic Production of Lipids by Some ChlorellaStrains
Sarote Sirisansaneeyakul & Somruethai Singhasuwan &
Wanna Choorit & Natapas Phoopat & Jose Luis Garcia &
Yusuf Chisti
Received: 30 April 2010 /Accepted: 22 December 2010# Springer Science+Business Media, LLC 2011
Abstract The microalgae Chlorella protothecoides UTEX25, Chlorella sp. TISTR 8991, and Chlorella sp. TISTR8990 were compared for use in the production of biomassand lipids under photoautotrophic conditions. Chlorella sp.TISTR 8990 was shown to be potentially suitable for lipidproduction at 30°C in a culture medium that contained onlyinorganic salts. For Chlorella sp. TISTR 8990 in optimalconditions in a stirred tank photobioreactor, the lipidproductivity was 2.3 mg L−1 h−1 and after 14 days thebiomass contained more than 30% lipids by dry weight. Toattain this, the nitrogen was provided as KNO3 at an initialconcentration of 2.05 gL−1 and chelated ferric iron wasadded at a concentration of 1.2×10⁻⁵ mol L−1 on the ninthday. Under the same conditions in culture tubes (36 mm
outer diameter), the biomass productivity was 2.8-foldgreater than in the photobioreactor (0.125 m in diameter),but the lipid productivity was only 1.2-fold higher. Thus,the average low-light level in the photobioreactor actuallyincreased the biomass specific lipid production compared tothe culture tubes. A light-limited growth model closelyagreed with the experimental profiles of biomass produc-tion, nitrogen consumption, and lipid production in thephotobioreactor.
Keywords Microalgae .Chlorella spp .Chlorellaprotothecoides . Photoautotrophic culture . Lipidproduction . Taguchi method . Batch production model
AbbreviationList of symbolsCN Concentration of potassium nitrate (g L−1)CN0 Initial concentration of potassium nitrate (g L−1)CP Concentration of lipid (g L−1)CX Concentration of biomass (g L−1)CX0 Initial concentration of biomass (g L−1)DOFFactor Degree of freedom of factorsFi Averages of signal-to-noise ratio of factors at
each factor levelFratio F-ratioI0 Incident light level at the surface of the
photobioreactor (μmol m−2 s−1)Ir Local irradiance at radial distance r in the
photobioreactor (μmol m−2 s−1)Ka Light absorption coefficient of the algal bio-
mass (cm2 g−1)Ki Constant in Eq. 4 (μmol m−2 s−1)Ks Saturation constant for light (μmol m−2 s−1)mN Nitrogen consumption constant for maintenance
metabolism (g KNO3g−1 biomass day−1)
S. Sirisansaneeyakul (*)Department of Biotechnology, Faculty of Agro-Industry,Kasetsart University,Bangkok 10900, Thailande-mail: [email protected]
S. Singhasuwan :W. ChooritBiotechnology Program, School of Agricultural Technology,Walailak University,Nakhon Si Thammarat 80161, Thailand
N. PhoopatInstitute of Food Research and Product Development,Kasetsart University,Bangkok 10900, Thailand
J. L. GarciaDepartment of Chemical Engineering, University of Almería,04071 Almería, Spain
Y. ChistiSchool of Engineering, Massey University,Private Bag 11 222,Palmerston North, New Zealand
Mar BiotechnolDOI 10.1007/s10126-010-9355-2
n Number of experimentsqN Biomass specific uptake rate of potassium
nitrate (g g−1 day−1)qP Biomass specific rate of lipid production
(g g−1 day−1)QP Volumetric production rate of lipids
(g L−1 day−1)QX Volumetric production rate of biomass
(mg L−1 h−1)r Radial distance (m)R Radius of the photobioreactor (m)SSError Sum of squares of errorSSFactor Sum of squares of factorsS/N Signal-to-noise ratiot Time (days)T Grand average of signal-to-noise ratioVFactor Variance of a factoryi The observed values of biomass or lipid
concentrations (g L−1)Yopt The expected values of biomass or lipid
concentrations (g L−1)YP/X Lipid yield based on microalgal biomass
(g lipid g−1 biomass)YX/N Biomass yield based on potassium nitrate
(g biomass g−1 KNO3)
Greek lettersα Growth-associated lipid production constant
(g lipid g−1 biomass)β Non-growth-associated lipid production constant
(g lipid g−1 biomass day−1)μr Local specific growth rate at radial position r in the
photobioreactor (day−1)μX Average specific growth rate in the photobioreactor
(day−1)μm Maximum specific growth rate (day−1)
Introduction
Microalgae are a potential source of biofuels (Chisti 2007,2008, 2010a; Mazzuca Sobczuk and Chisti 2010; Mata etal. 2010; Scott et al. 2010) and numerous other products(Molina Grima et al. 1999; Spolaore et al. 2006; Cardozo etal. 2007; García Camacho et al. 2007). Liquid fuels such asbiodiesel, diesel, gasoline, and jet fuel can be producedfrom algal oils, or lipids, using existing technology(Mazzuca Sobczuk and Chisti 2010). Similar renewablefuels can be produced from crops such as oil palm, but onlymicroalgae can realistically provide the quantity of fuel thatis needed to meaningfully displace petroleum-based trans-port fuels (Chisti 2007, 2008).
Photoautotrophic growth of microalgae requires lightand carbon dioxide, but some algae can be grownheterotrophically on organic carbon sources such as glucose(Chen 1996) that must be produced ultimately via photo-synthesis. Many species of algae have been shown toproduce high levels of lipids in photoautotrophic conditions(Banerjee et al. 2002; Scragg et al. 2002; Takagi andKarseno 2006; Chisti 2007; Li et al. 2008; Converti et al.2009; Mandal and Mallick 2009; Mazzuca Sobczuk andChisti 2010; Mata et al. 2010). Photoautotrophic growthusing freely available sunlight and inexpensive carbondioxide is widely used in commercial culture of algae ineither raceway type of open culture systems (Pulz 2001;Spolaore et al. 2006; Chisti 2007) or in closed photo-bioreactors (Molina Grima et al. 1999; Molina et al. 2001;Carvalho et al. 2006; Chisti 2007). Compared to ponds andraceways, photobioreactors are less prone to contaminationfrom unwanted species, allow better control of the cultureconditions, and generally have a much higher productivity(Molina Grima et al. 1999; Chisti 2007).
Factors that affect the oil productivity of algae includethe type of species (Griffiths and Harrison 2009), the natureof the nutrient medium used in growth (Scragg et al. 2002;Takagi and Karseno 2006; Li et al. 2008; Liu et al. 2008),the other growth conditions (e.g., light regime) used, andthe post-growth conditioning of the live cells (MazzucaSobczuk and Chisti 2010). The species-dependent factorsinclude the specific growth rate; the biochemistry of oilproduction (Banerjee et al. 2002); the ability of the cells towithstand the shear forces encountered in a culture system(Chisti 2010b; García Camacho et al. 2001, 2007; MazzucaSobczuk et al. 2006); the algal susceptibility to phenomenasuch as light saturation of growth, photoinhibition, andphotooxidation (Camacho Rubio et al. 2003); the ability ofthe selected species to outcompete the possible contami-nating algae and predators; the susceptibility of the cultureto algal diseases; and the ability of the alga to tolerate theextremes of environmental conditions (e.g., temperature,salinity) that may be encountered during an extended large-scale outdoor culture.
Chlorella is a green freshwater microalga. Species of thegenus Chlorella (e.g., Chlorella emersonii, Chlorellaminutissima, Chlorella protothecoides, Chlorella pyrenoi-dosa, Chlorella sorokiniana, and Chlorella vulgaris) havebeen frequently reported to have a high lipid level in thebiomass and a good volumetric productivity of the lipids(Griffiths and Harrison 2009; Mata et al. 2010), althoughno attempt appears to have been made to compare thevarious strains under optimal conditions for growth or lipidproduction. As in many microalgae (Chisti 2007; Li et al.2008; Mazzuca Sobczuk and Chisti 2010), the lipidproductivity of Chlorella species is affected by the nitrogencontent of the culture medium (Illman et al. 2000; Scragg et
Mar Biotechnol
al. 2002; Converti et al. 2009; Griffiths and Harrison 2009)and by other factors. For example, the concentration offerric iron (Fe3+) in the medium and its time of additionduring culture have been claimed to influence lipidproduction (Liu et al. 2008).
This work compares three Chlorella strains (C. proto-thecoides UTEX 25, Chlorella sp. TISTR 8991, andChlorella sp. TISTR 8990) for production of biomass andlipids under optimal photoautotrophic conditions identifiedusing statistically designed experiments based on theTaguchi method (Roy 1990, 2001). The culture mediumcontained only inorganic salts, and carbon dioxide was thesole source of carbon. The initial concentration of nitrate inthe medium varied. Effects of adding chelated ferric ironand its time of addition on the biomass and lipid productionare reported.
Materials and Methods
Microalgae and Preculture
C. protothecoides UTEX 25 was purchased from theCulture Collection of Algae at the University of Texas,Austin. Chlorella sp. TISTR 8991 was a gift fromSongkhla Rajabhat University, Thailand, and Chlorellasp. TISTR 8990 had been isolated from a freshwaterhabitat at Walailak University, Thailand (Singhasuwan etal. 2009).
Inocula were grown in 50 mL of a basal mediumcontained in a 200-mL microalgal culture tube (32.21 mminternal diameter, 3.89 mm wall thickness) made ofoptically clear glass. The medium contained the followingper liter of deionized water: 2 g KNO3, 1 gKH2PO4, 1 gMgSO4, 2 mg FeSO4, 2.86 mg H3BO3, 1.81 mg MnCl2,0.22 mg ZnSO4, 0.08 mg CuSO4, and 0.021 mg Na2MoO4
(Horikoshi et al. 1981). The tubes were incubated at 30°Cin a chamber equipped with six 18-W daylight fluorescentlamps (Panasonic® Co., Bangkok, Thailand). During thephotoperiod, the light intensity at the surface of tubes was15 klux (260 μmol m−2 s−1). A diurnal cycle of a 16-h photoperiod and 8-h dark was used. The culture tubeswere continuously sparged with air mixed with carbondioxide (1–2% v/v) at a flow rate of 0.67 vvm.
Biomass and Lipid Production
Screening Experiments
Screening studies were conducted in the above specified200-mL culture tubes. Each tube contained 150 mL of theabove referenced basal medium unless otherwise specified.The tubes were inoculated with the microalgal preculture to
obtain an initial optical density of 0.1 measured at 680 nmusing a spectrophotometer (Genesys 20; Sigma-Aldrich, St.Louis, MO, USA) that had been zeroed against a blank ofdeionized water. The culture temperature and the illumina-tion regimen were as specified above for the preculture. Theaeration rate, the initial culture pH, the algal strain, theinitial nitrate concentration, the concentration of ferric iron,and the time when it was added depended on theexperiment. Duplicate samples (3 mL each) were collecteddaily from each tube for the measurement of biomassconcentration, the pH, and the concentration of nitrate.Lipid contents of the biomass were measured in the finalsample that was collected on day 14.
Bioreactor Cultures
A 2-L stirred bioreactor (BioFlo 110; New BrunswickScientific, Edison, NJ, USA) made of borosilicate glasswas used. Eight 18-W vertically oriented daylightfluorescent lamps (Panasonic®) were arranged equidistantapart around the reactor vessel (125 mm in internaldiameter; surrounded by a glass jacket of 175 mm internaldiameter; the vessel and jacket walls were both 3 mmthick). The illuminated surface area of the reactor for aworking volume of 1.6 L was 487 cm2, corresponding to asurface area to volume ratio of 30.4 m−1. The bioreactorvessel contained 1.6 L of the culture medium that hadbeen sterilized by autoclaving the filled vessel at 121°Cfor 30 min. The aforementioned basal medium was usedwith an initial KNO3 concentration of 2.05 gL−1. Thebioreactor was aseptically inoculated with the tubepreculture to an initial optical density of 0.1 as describedabove. The culture vessel was continuously sparged withfilter sterilized (0.45 μm rated membrane filter) air mixedwith carbon dioxide (1–2% v/v) at a flow rate of 1 vvm.The stirring rate was a constant 100 rpm. Two identicalsix-bladed Rushton turbine stirrers (stirrer diameter of41.7 mm) located 65 mm apart on the same shaft wereused. The lower stirrer was located 37 mm above the baseof the photobioreactor vessel. Cultures were grownbatchwise at 30°C for a period of 14 days. Theillumination cycle was as specified above for the pre-culture. Photosynthetically active incident irradiance onthe surface of the photobioreactor was measured using aquantum sensor (model LI-189; LI-COR, Inc., Lincoln,NE, USA). Chelated iron (FeCl3·6H2O/EDTA, molar ratioof 1:1) was added to the culture on the specified day toattain a final bioreactor concentration of 1.2×10⁻⁵ mol L−1
(Liu et al. 2008). The volume of the iron solution added toa culture batch was always 5% of the volume of the batchat any given instance. Samples were taken every 12 h formeasuring the optical density, the pH, the nitrate concen-tration, and the lipid content.
Mar Biotechnol
Analyses
Biomass Concentration
A 3–5 mL sample of the microalgal culture was filteredthrough a preweighed filter paper (47 mm diameter,Whatman GF/C; Whatman Ltd., Maidstone, UK). Thebiomass was washed with distilled water (2×10 mL). Thefilter paper was dried to a constant weight at 107°C in anoven. The dried filter paper was cooled to room tempera-ture in a desiccator and reweighed.
Concentration of KNO3
Residual nitrate in the culture broth was determined bybrucine colorimetric method (ASTM 1976). The resultswere converted to the concentration of KNO3.
Extraction and Measurement of Algal Lipids
A 10–20 mL sample of the microalgal broth was centri-fuged (1,780×g, 10 min). The biomass pellet was recoveredand extracted with chloroform/methanol/water system(1:1:0.9 by volume) as described by Işik et al. (1999).The mass of the lipids extracted was measured gravimet-rically by evaporating the solvent.
The Light Absorption Coefficient
The light absorption coefficient Ka for Chlorella sp. TISTR8990 was determined using a UV spectrophotometer(Genesys 20; Sigma-Aldrich) at a wavelength of 680 nm(Mazzuca Sobczuk and Chisti 2010). The spectrophotom-eter was zeroed with a blank of 0.45 μm filtered freshculture medium. A sample of the algal broth with aprecisely known biomass concentration (determined bygravimetry as above) was serially diluted with the freshmedium to bring the spectrophotometric absorbance in therange of 0 to 0.6. A plot of the absorbance versus thebiomass concentration of any diluted sample gave a straightline that passed through the origin and had the slope=Ka.
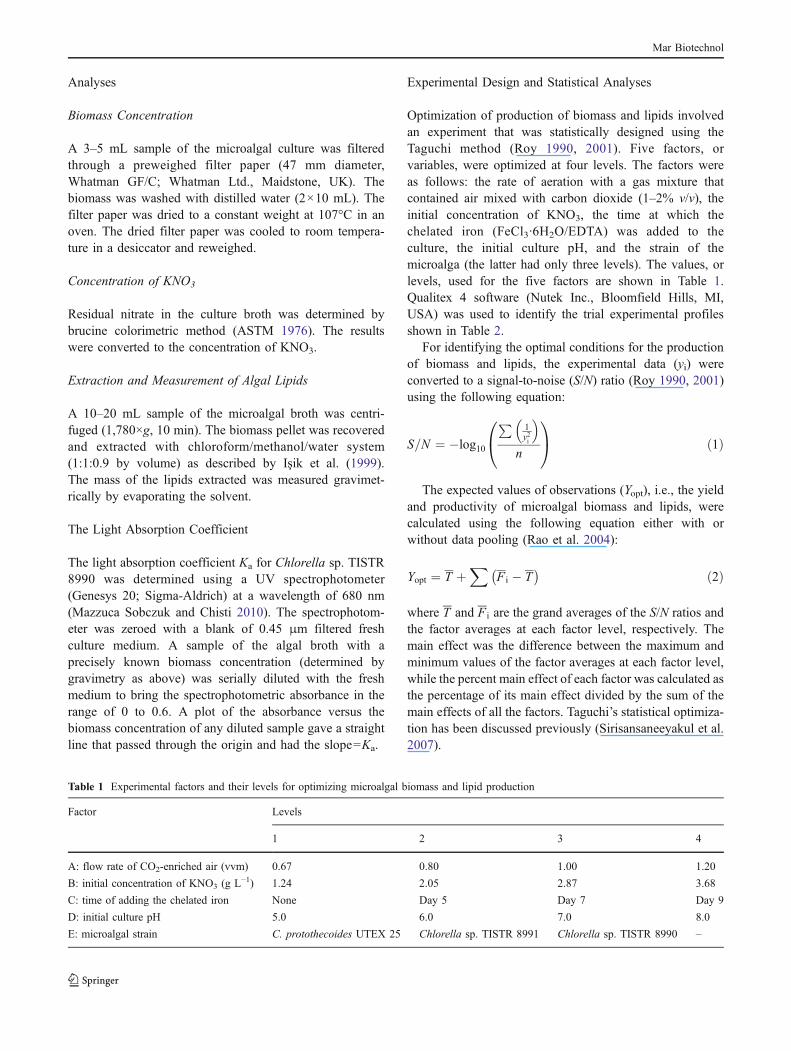
Experimental Design and Statistical Analyses
Optimization of production of biomass and lipids involvedan experiment that was statistically designed using theTaguchi method (Roy 1990, 2001). Five factors, orvariables, were optimized at four levels. The factors wereas follows: the rate of aeration with a gas mixture thatcontained air mixed with carbon dioxide (1–2% v/v), theinitial concentration of KNO3, the time at which thechelated iron (FeCl3·6H2O/EDTA) was added to theculture, the initial culture pH, and the strain of themicroalga (the latter had only three levels). The values, orlevels, used for the five factors are shown in Table 1.Qualitex 4 software (Nutek Inc., Bloomfield Hills, MI,USA) was used to identify the trial experimental profilesshown in Table 2.
For identifying the optimal conditions for the productionof biomass and lipids, the experimental data (yi) wereconverted to a signal-to-noise (S/N) ratio (Roy 1990, 2001)using the following equation:
S=N ¼ �log10
P1y2i
� �n
0@
1A ð1Þ
The expected values of observations (Yopt), i.e., the yieldand productivity of microalgal biomass and lipids, werecalculated using the following equation either with orwithout data pooling (Rao et al. 2004):
Yopt ¼ T þX
F i � T� � ð2Þ
where T and F i are the grand averages of the S/N ratios andthe factor averages at each factor level, respectively. Themain effect was the difference between the maximum andminimum values of the factor averages at each factor level,while the percent main effect of each factor was calculated asthe percentage of its main effect divided by the sum of themain effects of all the factors. Taguchi’s statistical optimiza-tion has been discussed previously (Sirisansaneeyakul et al.2007).
Table 1 Experimental factors and their levels for optimizing microalgal biomass and lipid production
Factor Levels
1 2 3 4
A: flow rate of CO2-enriched air (vvm) 0.67 0.80 1.00 1.20
B: initial concentration of KNO3 (g L−1) 1.24 2.05 2.87 3.68
C: time of adding the chelated iron None Day 5 Day 7 Day 9
D: initial culture pH 5.0 6.0 7.0 8.0
E: microalgal strain C. protothecoides UTEX 25 Chlorella sp. TISTR 8991 Chlorella sp. TISTR 8990 –
Mar Biotechnol
Results and Discussion
Optimization in Culture Tubes
The final concentrations (CX, CP) and the volumetricproductivities (QX, QP) of microalgal biomass and lipidsare shown in Table 3 for the various experiments at thespecified conditions (Tables 1 and 2). Experiments 7, 12, and14 achieved high biomass concentrations (6.3–7.1 gL−1) andlipid concentrations (∼1.1 gL−1) (Table 3). In theseexperiments, the productivities of biomass and lipids werehigh at 0.42–0.48 gL−1 h−1 and ∼3.3 mg L−1 h−1, respec-tively (Table 3). These values were obtained under thefollowing conditions: 0.8–1.2 vvm aeration rate with CO2
supplemented air, 2.05–3.68 gL−1 initial concentration ofKNO3, a single FeCl3/EDTA addition on days 5–9, initialpH 5, and irrespective of the algal strain (C. protothe-coides UTEX 25, Chlorella sp. TISTR 8991, Chlorella sp.TISTR 8990) used. In experiments 7, 12, and 14, thebiomass production results were 6- to 7-fold better than inthe worst case of the 16 experimental runs. Similarly, forthe runs 7, 12, and 14, the lipid production data were ∼5-fold better than in the worst case run among the 16experiments.
Based on the statistical analysis with Qualitex 4, thepercentages of main effect of each factor on the biomassand lipid production are shown in Table 4. The initial pH(factor D) was found to mainly affect the production of
microalgal biomass (main effect ≥35%) and lipids (maineffect >36%). The time of addition of FeCl3/EDTA (factorC) had a main effect of >25% (Table 4). The main effectof the rate of aeration with CO2-supplemented air (factorA) was relatively low at 11–23% (Table 4) probablybecause a low aeration rate of 0.67 vvm was sufficient tosupply the carbon needs and remove the oxygen generatedby photosynthesis. Initial concentration of KNO3 (factorB) had a relatively low main effect (main effect of 10–15%; Table 4) likely because the lowest level tested (i.e.,1.24 gL−1) was already high. Finally, the choice of thespecific algal strain (factor E) of the three Chlorellaspecies had little effect on biomass and lipid production(main effect of <8%; Table 4).
In Table 4, the factor averages at each factor level wereobtained by adding the S/N ratios (CX, CP, QX, or QP) forall the conditions at the level considered and then dividingby the number of data points added (4 for factors A–D, 4 or8 for factor E). The main effect was the difference betweenthe maximum and the minimum values of the factoraverages at each factor level (main effect=max−min),while the percent main effect of each factor was calculatedas the percentage of its main effect divided by the sum ofthe main effects of all the factors; thus, percent maineffect=(main effect×100)/∑ all main effects) (Roy 2001).
The ANOVA results for the various factors affecting thefinal concentrations (CX, CP) of microalgal biomass andlipids and the relevant productivities (QX, QP) are shown inTable 5. All factors except the algal strain had a statisticallysignificant (p<0.01) effect on the production of biomassand lipids, but this could not be clearly discerned using theS/N ratios (Table 5).
Although the analysis of individual S/N ratios did notreveal statistically significant differences among the factorsin influencing the outcome, the factors C and D hadrelatively high percent confidence levels of >64% for thebiomass concentration and >58% for the lipid content.Therefore, the average values of S/N ratios of the pooledfactors were assessed with stepwise pooling of factors Cand D with factors E, B, and A, respectively, until the DOFof the “error” exceeded the DOF of the “total”. Thisincreased the percent confidence levels for both factors Cand D, but only the factor D had a statistically significanteffect with a p<0.05 for the biomass concentration.
Based on an analysis of the average values of the finalconcentrations (CX, CP) and the volumetric productivities(QX, QP) of microalgal biomass and lipids (Table 5), allfactors (A, B, C, D, E) had a statistically significant effect(p<0.01) on biomass concentration/productivity (CX, QX)and the factors A, B, C, and D had a significant effect (p<0.01) on lipid concentration/productivity (CP, QP). Thefactor E had a statistically significant impact on lipidconcentration and productivity (CP, QP) with a p<0.05.
Table 2 The factor levels in the experimental design for optimizingthe production of biomass and lipids
Experiment no. Factora
A B C D E
1 1 1 1 1 1
2 1 2 2 2 2
3 1 3 3 3 3
4 1 4 4 4 1
5 2 1 2 3 1
6 2 2 1 4 3
7 2 3 4 1 2
8 2 4 3 2 1
9 3 1 3 4 2
10 3 2 4 3 1
11 3 3 1 2 1
12 3 4 2 1 3
13 4 1 4 2 3
14 4 2 3 1 1
15 4 3 2 4 1
16 4 4 1 3 2
a See Table 1 for an explanation of the factors A–E
Mar Biotechnol
Tab
le3
Produ
ctionof
microalgalbiom
assandlip
idsin
cultu
retubes
Exp
.CX(g
L−1)
QX(g
L−1
h−1)
CP(g
L−1)
QP(m
gL−1
h−1)
1a2b
Average
S/Nratio
c(dB)
1a2b
Average
S/Nratio
c(dB)
1a2b
Average
S/Nratio
c(dB)
1a2b
Average
S/Nratio
c(dB)
14.1
3.37
3.73
11.32
0.23
0.18
0.2
−13.99
0.62
0.57
0.59
−4.57
1.83
1.68
1.75
4.85
22.37
2.7
2.53
8.02
0.12
0.16
0.14
−17.12
0.49
0.52
0.5
−6.03
1.44
1.53
1.49
3.44
31.3
1.7
1.5
3.29
0.06
0.09
0.07
−23.15
0.26
0.32
0.29
−10.89
0.77
0.95
0.86
−1.42
42.97
2.37
2.67
8.36
0.19
0.15
0.17
−15.79
0.44
0.46
0.45
−7.04
1.3
1.35
1.32
2.44
52.53
2.37
2.45
7.77
0.16
0.13
0.15
−16.79
0.48
0.4
0.44
−7.28
1.41
1.19
1.3
2.20
63.03
3.87
3.45
10.57
0.17
0.22
0.19
−14.56
0.38
0.42
0.4
−7.99
1.13
1.25
1.19
1.48
77.63
6.27
6.95
16.71
0.5
0.4
0.45
−7.08
1.18
1.06
1.12
0.92
3.51
3.14
3.33
10.40
84.1
3.37
3.73
11.32
0.26
0.21
0.24
−12.68
0.76
0.55
0.65
−4.06
2.26
1.62
1.94
5.41
94.9
3.43
4.17
11.99
0.31
0.21
0.26
−12.16
0.93
0.73
0.83
−1.83
2.75
2.17
2.46
7.65
104.63
4.8
4.72
13.47
0.31
0.31
0.31
−10.24
0.77
0.95
0.86
−1.47
2.29
2.82
2.56
8.02
112.37
1.87
2.12
6.33
0.14
0.11
0.13
−18.33
0.44
0.42
0.43
−7.44
1.3
1.24
1.27
2.03
126.73
7.47
7.1
16.99
0.46
0.5
0.48
−6.43
1.05
1.17
1.11
0.85
3.13
3.47
3.3
10.33
134.63
4.9
4.77
13.55
0.3
0.33
0.31
−10.08
0.59
0.79
0.69
−3.57
1.74
2.34
2.04
5.91
146.87
5.73
6.3
15.88
0.46
0.38
0.42
−7.61
1.13
1.06
1.09
0.76
3.35
3.16
3.25
10.23
152.67
3.07
2.87
9.09
0.16
0.19
0.18
−15.08
0.58
0.54
0.56
−5.13
1.71
1.59
1.65
4.34
161.13
1.13
1.13
1.09
0.06
0.06
0.06
−25.19
0.21
0.25
0.23
−13.06
0.61
0.73
0.67
−3.59
a,bDup
licatevalues
cCalculatedusingEq.
1
Mar Biotechnol
The initial pH (factor D) and the time for addition ofchelated iron (factor C) had the highest impact on theproduction of biomass and lipids. To better discern theimpact of the factors C and D on the experiment using theS/N ratios, the other three factors (A, B, and E) were pooled(Rao et al. 2004) for a new analysis of variance (ANOVA).The results shown in Table 6 confirmed that changes in theinitial pH alone could explain the variation in theproduction of biomass (p<0.05).
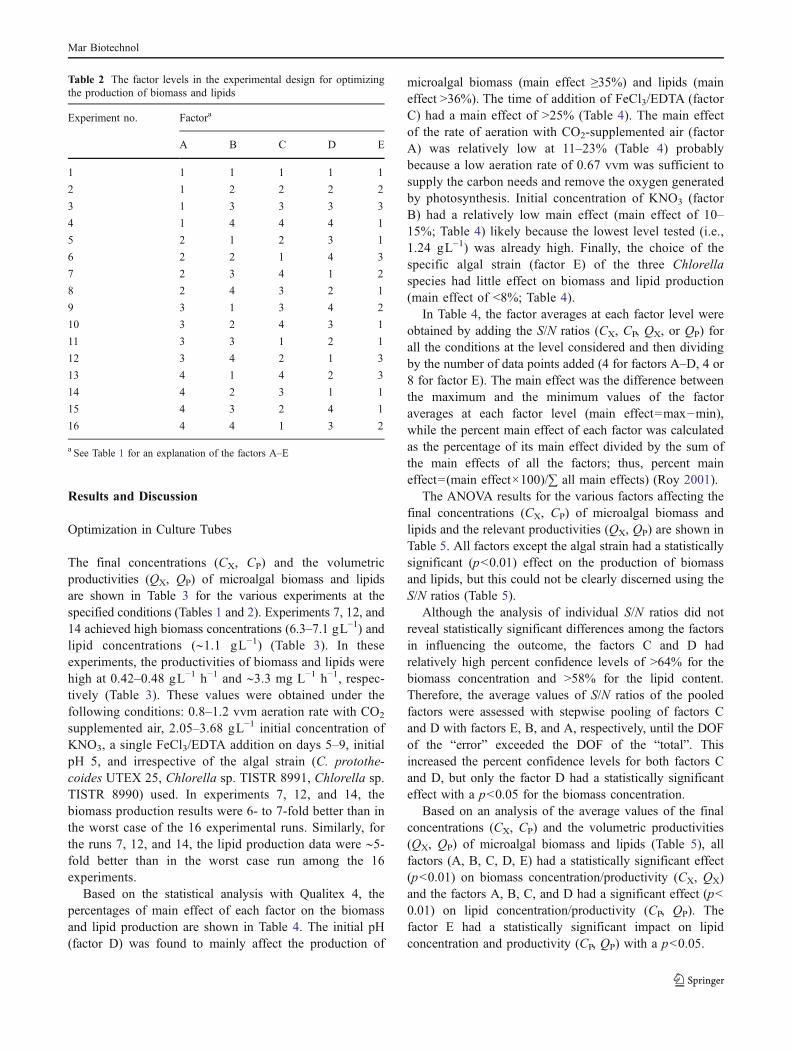
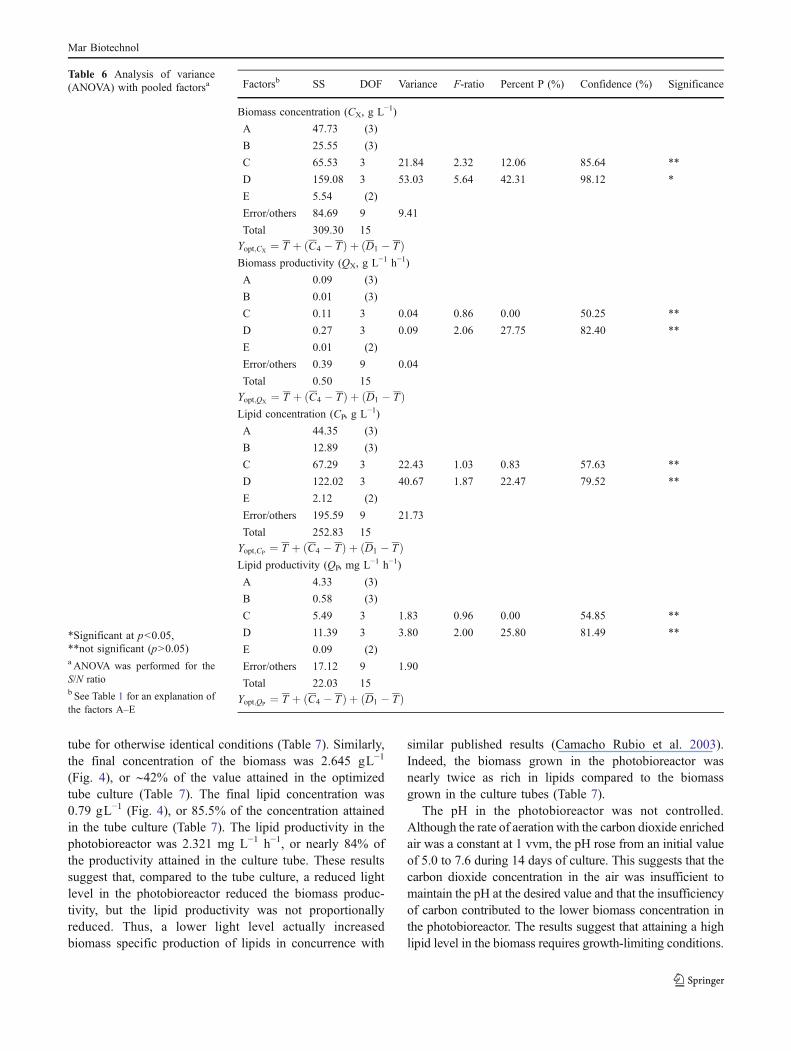
Taguchi method (Roy 2001) uses the signal-to-noise(S/N) ratio (Table 3) as the principal criterion for identifyingthe optimal conditions. High values of the S/N ratio aretaken to indicate optimality (Fig. 1). As expected, under theoptimal conditions (1 vvm aeration rate, A3; 2.05 gL−1
initial concentration of KNO3, B2; FeCl3/EDTA added onday 9, C4; and an initial pH of 5, D1), Chlorella sp. TISTR8990 attained a maximum concentration and productivity ofbiomass (Table 5). Under similar conditions, C. protothe-coides UTEX 25 attained a maximum concentration andproductivity of lipids (Table 5).
Based on the ANOVA results of Table 6, C. protothecoidesUTEX 25 and Chlorella sp. TISTR 8990 were expectedunder the optimal conditions to attain a biomass concentra-tion of 7.843 gL−1 with a productivity of 0.924 gL−1 day−1
(Table 7). The predicted lipid concentration and productivityunder optimal conditions for these algae were 1.198 gL−1
and 3.562 mg L−1 h−1, respectively (Table 7). The predictedvalues were estimated with the assumption that only theinitial pH and the time of addition of the chelated iron werethe main influencing factors.
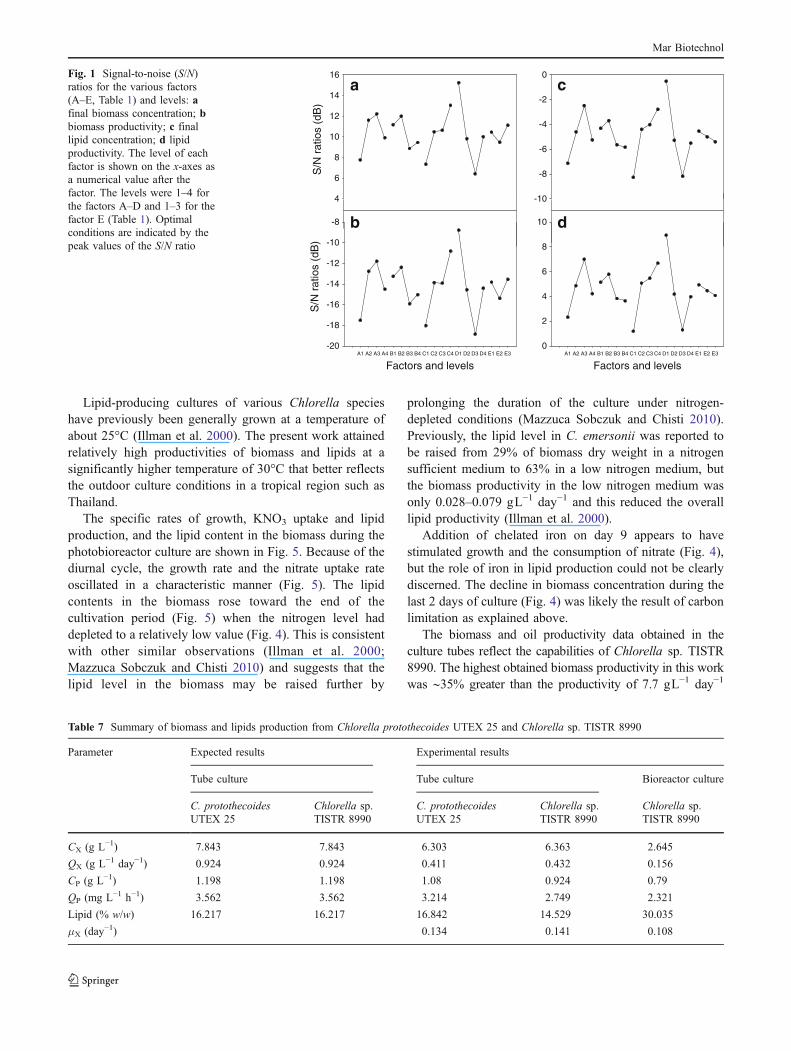
Confirmation runs in culture tubes showed generallycomparable biomass growth and KNO3 consumptionprofiles for C. protothecoides UTEX 25 and Chlorella sp.TISTR 8990 (Fig. 2). The final biomass concentrationsattained in both cases were ∼6.3 gL−1, or about 20% lowerthan the predicted values (Table 7). This may have beendue to the relatively low initial concentration (2.05 gL−1) ofKNO3 in the optimal runs, as the experimental run 12(Table 3) did achieve a biomass concentration of 7.1 gL−1
when the initial KNO3 concentration was 3.68 gL−1. Inculture tubes, nitrate likely limited growth towards the endof the culture as the concentration of KNO3 by day 14 haddeclined to almost nil (Fig. 2). The biomass productivitywas ∼50% compared to the predicted values (Table 7) as alikely consequence of nitrogen depletion. Chlorella culturesare indeed known to have a reduced biomass productivityin low nitrogen media (Illman et al. 2000). The lipidconcentration achieved was ∼1 gL−1 (Table 7), or nearly84% of the predicted value (Table 7). The lipid productiv-ities of C. protothecoides UTEX 25 and Chlorella sp.TISTR 8990 were 90% and 77% of the predicted values,respectively (Table 7). Evidently, C. protothecoides UTEX25 responded more strongly to addition of chelated ironcompared to Chlorella sp. TISTR 8990.
Production of Biomass and Lipids in Photobioreactor
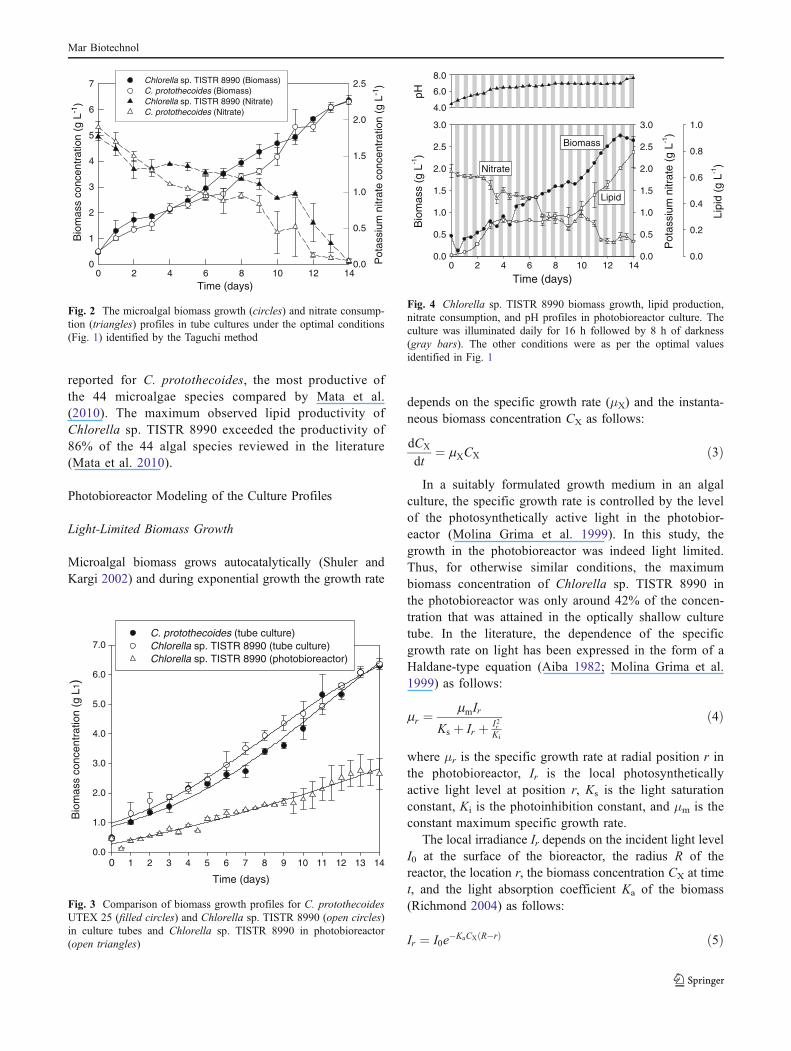
The optimal conditions identified in the culture tubes wereused to grow Chlorella sp. TISTR 8990 in the stirredphotobioreactor. For this study, Chlorella sp. TISTR 8990was preferred to the reference strain C. protothecoidesUTEX 25 because it appeared to better tolerate the outdoorsunlight and temperature conditions that would be unavoid-able in any eventual outdoor cultivation in a tropicallocation such as Thailand. The bioreactor culture wasinevitably different to the tube cultures in having a loweraverage light level as it is nearly impossible to provide thesame average light intensity in high-density algal culturesthat differ significantly in depth. The surface-to-volumeratio of the bioreactor filled to the specified initial volumewas 7-fold lower than for the culture tube.
The culture tube growth profiles of C. protothecoidesUTEX 25 and Chlorella sp. TISTR 8990 were quite
Table 4 Analysis of the factors affecting the microalgal biomass andlipid production
Level Factora
A B C D E
Biomass concentration (CX, g L−1)
1 7.75 11.16 7.33 15.23 10.44
2 11.59 11.98 10.47 9.81 9.45
3 12.20 8.86 10.62 6.40 11.10
4 9.90 9.44 13.02 10.00 –
% Main effect 10.62 14.49 26.39 40.86 7.63
Biomass productivity (QX, g L−1 h−1)
1 −17.51 −13.26 −18.02 −8.78 −13.822 −12.78 −12.38 −13.86 −14.55 −15.393 −11.79 −15.91 −13.90 −18.85 −13.564 −14.49 −15.02 −10.80 −14.40 –
% Main effect 20.17 12.44 25.44 35.48 6.47
Lipid concentration (CP, g L−1)
1 −7.13 −4.31 −8.26 −0.51 −4.532 −4.60 −3.69 −4.40 −5.28 −5.003 −2.47 −5.64 −4.01 −8.18 −5.404 −5.25 −5.83 −2.79 −5.50 –
% Main effect 22.39 10.30 26.31 36.83 4.18
Lipid productivity (QP, mg L−1 h−1)
1 2.33 5.15 1.20 8.95 4.94
2 4.87 5.79 5.08 4.20 4.48
3 7.01 3.84 5.47 1.30 4.07
4 4.22 3.65 6.69 3.98 –
% Main effect 22.46 10.30 26.37 36.72 4.15
a See Table 1 for an explanation of the factors A–E
Mar Biotechnol
comparable (Fig. 3). In the photobioreactor, because oflight limitation, the growth rate and the biomass concen-tration of Chlorella sp. TISTR 8990 were consistently lowcompared to the data obtained in the culture tube (Fig. 3).The specific growth rates and the final lipid content for theprofiles shown in Fig. 3 are given in Table 7. The measureddata are generally consistent with the predictions for tube
cultures for both C. protothecoides UTEX 25 and Chlorellasp. TISTR 8990 (Table 7).
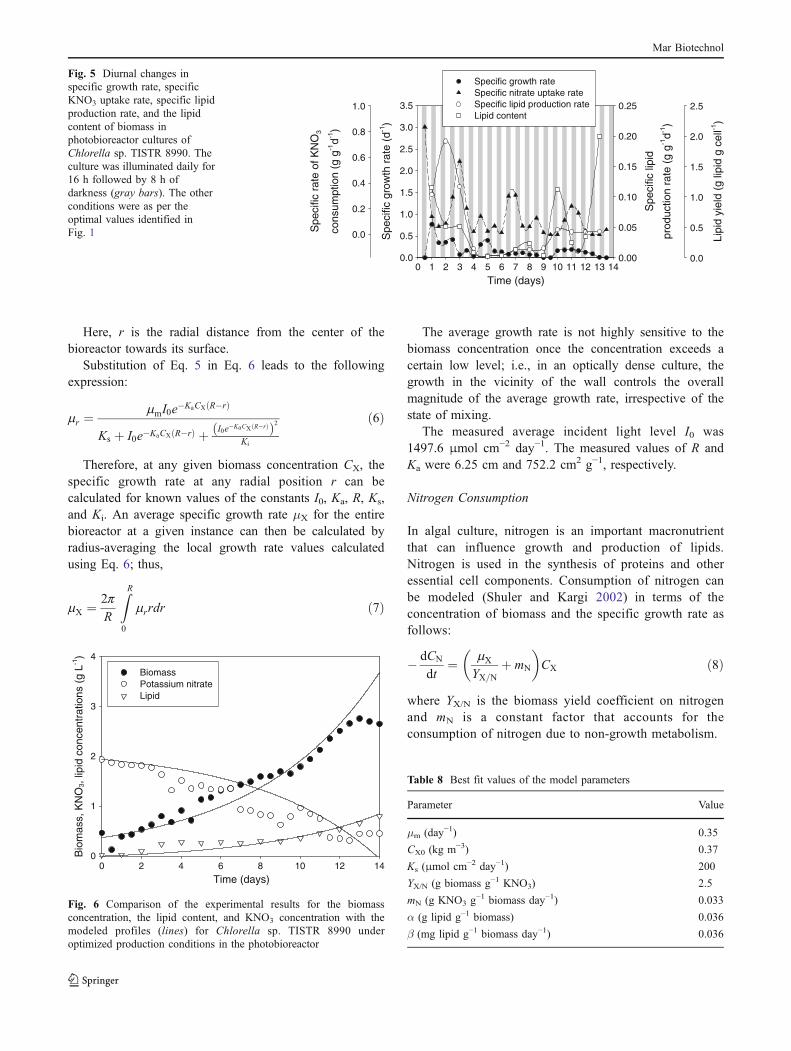
The biomass growth, lipid production, and KNO3
consumption profiles in the photobioreactor are shown inFig. 4. As a consequence of the aforementioned lightlimitation, the specific growth rate in the photobioreactorwas 0.108 h−1, or 76.6% of the value attained in the culture
Table 5 Analysis of variance (ANOVA)a of factors affecting the production of microalgal biomass and lipids
Factorsb SS DOF Variance F-ratio Confidence (%) Significance
Avg S/N ratio Avg S/N ratio Avg S/N ratio Avg S/N ratio Avg S/N ratio Avg S/N ratio
Biomass concentration (CX, g L−1)
A 16.48 47.73 3 3 5.49 15.91 162.44 2.71 100 58.67 * ***
B 3.3 25.55 3 3 1.1 8.52 32.48 1.45 100 46.76 * ***
C 19.07 65.53 3 3 6.36 21.84 187.99 3.73 100 64.02 * ***
D 58.19 159.08 3 3 19.4 53.03 573.56 9.04 100 76.14 * ***
E 2.17 5.54 2 2 1.09 2.77 32.08 0.47 100 28.3 * ***
Error 0.57 5.86 17 1 0.03 5.86
Total 99.79 309.3 31 15
Yopt;CX ¼ T þ ðA3 � TÞ þ ðB2 � TÞ þ ðC4 � TÞ þ ðD1 � TÞ þ ðE3 � TÞBiomass productivity (QX, g L−1 h−1)
A 0.09 75.49 3 3 0.03 25.16 478.16 4.71 100 67.63 * ***
B 0.01 31.15 3 3 0 10.38 73.34 1.94 100 52.49 * ***
C 0.11 105.3 3 3 0.04 35.1 575.55 6.57 100 72.24 * ***
D 0.27 204.42 3 3 0.09 68.14 1383.35 12.75 100 79.76 * ***
E 0.01 8.45 2 2 0 4.23 74.67 0.79 100 37.77 * ***
Error 0 5.34 17 1 0 5.34
Total 0.5 430.15 31 15
Yopt;QX ¼ T þ ðA3 � TÞ þ ðB2 � TÞ þ ðC4 � TÞ þ ðD1 � TÞ þ ðE3 � TÞLipid concentration (CP, g L−1)
A 0.49 44.35 3 3 0.16 14.78 165.95 3.56 100 63.26 * ***
B 0.07 12.89 3 3 0.02 4.3 22.36 1.03 100 39.78 * ***
C 0.62 67.29 3 3 0.21 22.43 210.53 5.39 100 69.59 * ***
D 1.29 122.02 3 3 0.43 40.67 441.64 9.78 100 77.01 * ***
E 0.01 2.12 2 2 0 1.06 5.09 0.25 98.14 18.6 ** ***
Error 0.02 4.16 17 1 0 4.16
Total 2.49 252.83 31 15
Yopt;Cp ¼ T þ ðA3 � TÞ þ ðB2 � TÞ þ ðC4 � TÞ þ ðD1 � TÞ þ ðE3 � TÞLipid productivity (QP, mg L−1 h−1)
A 4.33 44.69 3 3 1.44 14.9 169.62 0.69 100 41.73 * ***
B 0.58 12.86 3 3 0.19 4.29 22.89 0.2 100 10.45 * ***
C 5.49 67.75 3 3 1.83 22.58 214.97 1.04 100 57.95 * ***
D 11.39 121.45 3 3 3.8 40.48 445.81 1.86 100 79.41 * ***
E 0.09 2.09 2 2 0.04 1.04 5.18 0.05 98.25 4.67 ** ***
Error 0.14 195.38 17 9 0.01 21.71
Total 22.03 252.92 31 15
Yopt;Qp ¼ T þ ðA3 � TÞ þ ðB2 � TÞ þ ðC4 � TÞ þ ðD1 � TÞ þ ðE3 � TÞ
*Significant at p<0.01, **significant at p<0.05, ***not significant (p>0.05)a ANOVA was performed for both the average values (Avg) and the S/N ratio (Table 3)b See Table 1 for an explanation of the factors A–E
Mar Biotechnol
tube for otherwise identical conditions (Table 7). Similarly,the final concentration of the biomass was 2.645 gL−1
(Fig. 4), or ∼42% of the value attained in the optimizedtube culture (Table 7). The final lipid concentration was0.79 gL−1 (Fig. 4), or 85.5% of the concentration attainedin the tube culture (Table 7). The lipid productivity in thephotobioreactor was 2.321 mg L−1 h−1, or nearly 84% ofthe productivity attained in the culture tube. These resultssuggest that, compared to the tube culture, a reduced lightlevel in the photobioreactor reduced the biomass produc-tivity, but the lipid productivity was not proportionallyreduced. Thus, a lower light level actually increasedbiomass specific production of lipids in concurrence with
similar published results (Camacho Rubio et al. 2003).Indeed, the biomass grown in the photobioreactor wasnearly twice as rich in lipids compared to the biomassgrown in the culture tubes (Table 7).
The pH in the photobioreactor was not controlled.Although the rate of aeration with the carbon dioxide enrichedair was a constant at 1 vvm, the pH rose from an initial valueof 5.0 to 7.6 during 14 days of culture. This suggests that thecarbon dioxide concentration in the air was insufficient tomaintain the pH at the desired value and that the insufficiencyof carbon contributed to the lower biomass concentration inthe photobioreactor. The results suggest that attaining a highlipid level in the biomass requires growth-limiting conditions.
Factorsb SS DOF Variance F-ratio Percent P (%) Confidence (%) Significance
Biomass concentration (CX, g L−1)
A 47.73 (3)
B 25.55 (3)
C 65.53 3 21.84 2.32 12.06 85.64 **
D 159.08 3 53.03 5.64 42.31 98.12 *
E 5.54 (2)
Error/others 84.69 9 9.41
Total 309.30 15
Yopt;CX ¼ T þ ðC4 � TÞ þ ðD1 � TÞBiomass productivity (QX, g L−1 h−1)
A 0.09 (3)
B 0.01 (3)
C 0.11 3 0.04 0.86 0.00 50.25 **
D 0.27 3 0.09 2.06 27.75 82.40 **
E 0.01 (2)
Error/others 0.39 9 0.04
Total 0.50 15
Yopt;QX ¼ T þ ðC4 � TÞ þ ðD1 � TÞLipid concentration (CP, g L−1)
A 44.35 (3)
B 12.89 (3)
C 67.29 3 22.43 1.03 0.83 57.63 **
D 122.02 3 40.67 1.87 22.47 79.52 **
E 2.12 (2)
Error/others 195.59 9 21.73
Total 252.83 15
Yopt;CP ¼ T þ ðC4 � TÞ þ ðD1 � TÞLipid productivity (QP, mg L−1 h−1)
A 4.33 (3)
B 0.58 (3)
C 5.49 3 1.83 0.96 0.00 54.85 **
D 11.39 3 3.80 2.00 25.80 81.49 **
E 0.09 (2)
Error/others 17.12 9 1.90
Total 22.03 15
Yopt;QP ¼ T þ ðC4 � TÞ þ ðD1 � TÞ
Table 6 Analysis of variance(ANOVA) with pooled factorsa
*Significant at p<0.05,**not significant (p>0.05)a ANOVA was performed for theS/N ratiob See Table 1 for an explanation ofthe factors A–E
Mar Biotechnol
Lipid-producing cultures of various Chlorella specieshave previously been generally grown at a temperature ofabout 25°C (Illman et al. 2000). The present work attainedrelatively high productivities of biomass and lipids at asignificantly higher temperature of 30°C that better reflectsthe outdoor culture conditions in a tropical region such asThailand.
The specific rates of growth, KNO3 uptake and lipidproduction, and the lipid content in the biomass during thephotobioreactor culture are shown in Fig. 5. Because of thediurnal cycle, the growth rate and the nitrate uptake rateoscillated in a characteristic manner (Fig. 5). The lipidcontents in the biomass rose toward the end of thecultivation period (Fig. 5) when the nitrogen level haddepleted to a relatively low value (Fig. 4). This is consistentwith other similar observations (Illman et al. 2000;Mazzuca Sobczuk and Chisti 2010) and suggests that thelipid level in the biomass may be raised further by
prolonging the duration of the culture under nitrogen-depleted conditions (Mazzuca Sobczuk and Chisti 2010).Previously, the lipid level in C. emersonii was reported tobe raised from 29% of biomass dry weight in a nitrogensufficient medium to 63% in a low nitrogen medium, butthe biomass productivity in the low nitrogen medium wasonly 0.028–0.079 gL−1 day−1 and this reduced the overalllipid productivity (Illman et al. 2000).
Addition of chelated iron on day 9 appears to havestimulated growth and the consumption of nitrate (Fig. 4),but the role of iron in lipid production could not be clearlydiscerned. The decline in biomass concentration during thelast 2 days of culture (Fig. 4) was likely the result of carbonlimitation as explained above.
The biomass and oil productivity data obtained in theculture tubes reflect the capabilities of Chlorella sp. TISTR8990. The highest obtained biomass productivity in this workwas ∼35% greater than the productivity of 7.7 gL−1 day−1
Table 7 Summary of biomass and lipids production from Chlorella protothecoides UTEX 25 and Chlorella sp. TISTR 8990
Parameter Expected results Experimental results
Tube culture Tube culture Bioreactor culture
C. protothecoidesUTEX 25
Chlorella sp.TISTR 8990
C. protothecoidesUTEX 25
Chlorella sp.TISTR 8990
Chlorella sp.TISTR 8990
CX (g L−1) 7.843 7.843 6.303 6.363 2.645
QX (g L−1 day−1) 0.924 0.924 0.411 0.432 0.156
CP (g L−1) 1.198 1.198 1.08 0.924 0.79
QP (mg L−1 h−1) 3.562 3.562 3.214 2.749 2.321
Lipid (% w/w) 16.217 16.217 16.842 14.529 30.035
μX (day−1) 0.134 0.141 0.108
a c
db
S/N
rat
ios
(dB
)
4
6
8
10
12
14
16
Factors and levelsA1 A2 A3 A4 B1 B2 B3 B4 C1 C2 3C C4 D1 D2 D3 D4 E1 E2 E3 A1 A2 A3 A4 B1 B2 B3 B4 C1 C2 3C C4 D1 D2 D3 D4 E1 E2 E3
S/N
rat
ios
(dB
)
-20
-18
-16
-14
-12
-10
-8
-10
-8
-6
-4
-2
0
Factors and levels
0
2
4
6
8
10
Fig. 1 Signal-to-noise (S/N)ratios for the various factors(A–E, Table 1) and levels: afinal biomass concentration; bbiomass productivity; c finallipid concentration; d lipidproductivity. The level of eachfactor is shown on the x-axes asa numerical value after thefactor. The levels were 1–4 forthe factors A–D and 1–3 for thefactor E (Table 1). Optimalconditions are indicated by thepeak values of the S/N ratio
Mar Biotechnol
reported for C. protothecoides, the most productive ofthe 44 microalgae species compared by Mata et al.(2010). The maximum observed lipid productivity ofChlorella sp. TISTR 8990 exceeded the productivity of86% of the 44 algal species reviewed in the literature(Mata et al. 2010).
Photobioreactor Modeling of the Culture Profiles
Light-Limited Biomass Growth
Microalgal biomass grows autocatalytically (Shuler andKargi 2002) and during exponential growth the growth rate
depends on the specific growth rate (μX) and the instanta-neous biomass concentration CX as follows:
dCX
dt¼ mXCX ð3Þ
In a suitably formulated growth medium in an algalculture, the specific growth rate is controlled by the levelof the photosynthetically active light in the photobior-eactor (Molina Grima et al. 1999). In this study, thegrowth in the photobioreactor was indeed light limited.Thus, for otherwise similar conditions, the maximumbiomass concentration of Chlorella sp. TISTR 8990 inthe photobioreactor was only around 42% of the concen-tration that was attained in the optically shallow culturetube. In the literature, the dependence of the specificgrowth rate on light has been expressed in the form of aHaldane-type equation (Aiba 1982; Molina Grima et al.1999) as follows:
mr ¼mmIr
Ks þ Ir þ I2rKi
ð4Þ
where μr is the specific growth rate at radial position r inthe photobioreactor, Ir is the local photosyntheticallyactive light level at position r, Ks is the light saturationconstant, Ki is the photoinhibition constant, and μm is theconstant maximum specific growth rate.
The local irradiance Ir depends on the incident light levelI0 at the surface of the bioreactor, the radius R of thereactor, the location r, the biomass concentration CX at timet, and the light absorption coefficient Ka of the biomass(Richmond 2004) as follows:
Ir ¼ I0e�KaCX R�rð Þ ð5Þ
Time (days)0 2 4 6 8 10 12 14
Bio
mas
s (g
L-1
)
0.0
0.5
1.0
1.5
2.0
2.5
3.0
Pot
assi
um n
itrat
e (g
L-1
)
0.0
0.5
1.0
1.5
2.0
2.5
3.0
Lipi
d (g
L-1
)
0.0
0.2
0.4
0.6
0.8
1.0
pH
4.0
6.0
8.0
Biomass
Lipid
Nitrate
Fig. 4 Chlorella sp. TISTR 8990 biomass growth, lipid production,nitrate consumption, and pH profiles in photobioreactor culture. Theculture was illuminated daily for 16 h followed by 8 h of darkness(gray bars). The other conditions were as per the optimal valuesidentified in Fig. 1
Time (days)
0 1 2 3 4 5 6 7 8 9 10 11 12 13 14
Bio
mas
s co
ncen
trat
ion
(g L
1)
0.0
1.0
2.0
3.0
4.0
5.0
6.0
7.0C. protothecoides (tube culture)Chlorella sp. TISTR 8990 (tube culture)Chlorella sp. TISTR 8990 (photobioreactor)
Fig. 3 Comparison of biomass growth profiles for C. protothecoidesUTEX 25 (filled circles) and Chlorella sp. TISTR 8990 (open circles)in culture tubes and Chlorella sp. TISTR 8990 in photobioreactor(open triangles)
Time (days)0 2 4 6 8 10 12 14
Bio
mas
s co
ncen
trat
ion
(g L
-1)
0
1
2
3
4
5
6
7
Pot
assi
um n
itrat
e co
ncen
trat
ion
(g L
-1)
0.0
0.5
1.0
1.5
2.0
2.5Chlorella sp. TISTR 8990 (Biomass)C. protothecoides (Biomass) Chlorella sp. TISTR 8990 (Nitrate) C. protothecoides (Nitrate)
Fig. 2 The microalgal biomass growth (circles) and nitrate consump-tion (triangles) profiles in tube cultures under the optimal conditions(Fig. 1) identified by the Taguchi method
Mar Biotechnol
Here, r is the radial distance from the center of thebioreactor towards its surface.
Substitution of Eq. 5 in Eq. 6 leads to the followingexpression:
mr ¼mmI0e
�KaCX R�rð Þ
Ks þ I0e�KaCX R�rð Þ þ I0e�KaCX R�rð Þð Þ2Ki
ð6Þ
Therefore, at any given biomass concentration CX, thespecific growth rate at any radial position r can becalculated for known values of the constants I0, Ka, R, Ks,and Ki. An average specific growth rate μX for the entirebioreactor at a given instance can then be calculated byradius-averaging the local growth rate values calculatedusing Eq. 6; thus,
mX ¼ 2pR
ZR
0
mrrdr ð7Þ
The average growth rate is not highly sensitive to thebiomass concentration once the concentration exceeds acertain low level; i.e., in an optically dense culture, thegrowth in the vicinity of the wall controls the overallmagnitude of the average growth rate, irrespective of thestate of mixing.
The measured average incident light level I0 was1497.6 μmol cm−2 day−1. The measured values of R andKa were 6.25 cm and 752.2 cm2 g−1, respectively.
Nitrogen Consumption
In algal culture, nitrogen is an important macronutrientthat can influence growth and production of lipids.Nitrogen is used in the synthesis of proteins and otheressential cell components. Consumption of nitrogen canbe modeled (Shuler and Kargi 2002) in terms of theconcentration of biomass and the specific growth rate asfollows:
� dCN
dt¼ mX
YX=Nþ mN
� �CX ð8Þ
where YX/N is the biomass yield coefficient on nitrogenand mN is a constant factor that accounts for theconsumption of nitrogen due to non-growth metabolism.
Time (days)0 1 2 3 4 5 6 7 8 9 10 11 12 13 14
Spe
cific
gro
wth
rat
e (d
-1)
0.0
0.5
1.0
1.5
2.0
2.5
3.0
3.5
Spe
cific
rat
e of
KN
O3
cons
umpt
ion
(g g
-1d-1
)
0.0
0.2
0.4
0.6
0.8
1.0
Spe
cific
lipi
d
prod
uctio
n ra
te (
g g-1
d-1)
0.00
0.05
0.10
0.15
0.20
0.25
Lipi
d yi
eld
(g li
pid
g ce
ll-1)
0.0
0.5
1.0
1.5
2.0
2.5
Specific growth rateSpecific nitrate uptake rateSpecific lipid production rateLipid content
Fig. 5 Diurnal changes inspecific growth rate, specificKNO3 uptake rate, specific lipidproduction rate, and the lipidcontent of biomass inphotobioreactor cultures ofChlorella sp. TISTR 8990. Theculture was illuminated daily for16 h followed by 8 h ofdarkness (gray bars). The otherconditions were as per theoptimal values identified inFig. 1
Table 8 Best fit values of the model parameters
Parameter Value
μm (day−1) 0.35
CX0 (kg m−3) 0.37
Ks (μmol cm−2 day−1) 200
YX/N (g biomass g−1 KNO3) 2.5
mN (g KNO3 g−1 biomass day−1) 0.033
α (g lipid g−1 biomass) 0.036
β (mg lipid g−1 biomass day−1) 0.036
Time (days)0 2 4 6 8 10 12 14
Bio
mas
s, K
NO
3, li
pid
conc
entr
atio
ns (
g L-1
)
0
1
2
3
4
BiomassPotassium nitrateLipid
Fig. 6 Comparison of the experimental results for the biomassconcentration, the lipid content, and KNO3 concentration with themodeled profiles (lines) for Chlorella sp. TISTR 8990 underoptimized production conditions in the photobioreactor
Mar Biotechnol
Lipid Production
In microalgae, lipids are produced both during growth andin the stationary phase. Therefore, the rate of lipidproduction may be related to the biomass concentrationusing the Luedeking–Piret mixed-growth-associated prod-uct formation model (Shuler and Kargi 2002) as follows:
dCP
dt¼ amX þ bð ÞCX ð9Þ
where CP is the total concentration of lipids in the broth attime t, α is the growth-associated lipids constant, μX is thespecific growth rate of biomass, β is the non-growth-associated lipids constant, and CX is the biomass concen-tration at time t. Equation 9 applies only to lipid formationin nutrient sufficient conditions, as in the photobioreactorculture of this work. Compared to nutrient sufficientgrowth, the value of the parameter β can be much highduring nitrogen starvation (Illman et al. 2000; Scragg et al.2002; Converti et al. 2009; Griffiths and Harrison 2009).
The model Eqs. 3, 7, 8, and 9 were fitted to the entireexperimental data (Fig. 6) of the photobioreactor usingMatlab® (version 5.0; The Math-Works, MA, USA) andMicrosoft Excel 2007. The fitting parameters were α, β, Ki,Ks, μm, YX/N, and mN. Although the value of the initialbiomass concentration CX0 was experimentally known(Fig. 6), it was low as in any batch culture at inoculationand, therefore, difficult to measure accurately. Hence, CX0
was used as one of the fitting parameters in the biomassgrowth model. The values of the various model parametersthat produced the fit in Fig. 6 are given in Table 8.
The values of the model parameters (Table 8) areconsistent with expectations. For example, the maximumspecific growth rate (μm) value of 0.35 day−1 is equivalentto a biomass doubling time of ∼2 days, a reasonable value forChlorella, a fast growing alga. The value of Ks, or the lightsaturation constant, is typically <10–20% of the full tropicalsunlight level for most microalgae (Mazzuca Sobczuk et al.2006), but reduces further as a consequence of photo-acclimation (Camacho Rubio et al. 2003) if the alga isgrown under low light for long. The Ks value in this studywas ∼10% of the maximum outdoor tropical sunlight level.
Based on the general molecular formula reported formicroalgae (Chisti 2007), the nitrogen content of dry algalbiomass is typically 6.6% w/w. The YX/N value of 2.5 gbiomass g−1 KNO3 is consistent with this as KNO3 has13.9% w/w nitrogen and, therefore, in terms of nitrogen,YX/N is 18 g biomass g−1 N, or 5.6% nitrogen by weight inthe biomass.
For Chlorella sp. TISTR 8990, the data in Fig. 2 (tubeculture) and Fig. 4 (photobioreactor culture) gave YX/Nvalues of 3.41 and 1.37, respectively. These values were onaverage within about 40% of the model estimated value
from an independent run. In the culture tubes, nearly 2.5-fold more biomass was produced for a given amount ofnitrate than in the photobioreactor. Such variations in YX/Noccur partly because the chlorophyll content of the biomassdepends on the light regimen used in growing it (CamachoRubio et al. 2003). Each mole of chlorophyll contains2 mol of elemental nitrogen and therefore changes inchlorophyll content are directly reflected in the nitrogencontents of the biomass.
Conclusion
C. protothecoides UTEX 25, Chlorella sp. TISTR 8990,and Chlorella sp. TISTR 8991 proved to be equallypromising for the production of algal biomass and oils. Ascompared to C. protothecoides UTEX 25, the new localisolate Chlorella sp. TISTR 8990 was better suited tooutdoor culture in tropical conditions of Thailand and wastherefore the focus of this study. For Chlorella sp. TISTR8990, the maximum biomass and lipid productivitiesattained in culture tubes were 0.432 gL−1 day−1 and2.749 mg L−1 h−1, respectively. The lipid contents in thebiomass were relatively low at 14.5% by dry weight. Thefinal biomass concentration exceeded 6 gL−1. In thephotobioreactor, the biomass and lipid productivitiesreduced to 0.156 gL−1 day−1 and 2.321 mg L−1 h−1,respectively, mainly because of light limitation and possiblysome carbon limitation. Nevertheless, the low-light envi-ronment of the photobioreactor actually increased thebiomass specific lipid production compared to the resultsfor the better illuminated culture tubes. In the photo-bioreactor, the lipid content of the biomass was >30%.The biomass growth, nitrogen consumption, and lipidproduction profiles in the photobioreactor agreed well witha light-limited growth model.
Acknowledgments This work was supported mainly by WalailakUniversity, Thailand. At Kasetsart University, this work was supportedby the Institute of Food Research and Product Development (IFRPD)and the Center of Advanced Studies for Tropical Natural Resources,Kasetsart University Institute for Advanced Studies (KUIAS).
References
Aiba S (1982) Growth kinetics of photosynthetic microorganisms.Adv Biochem Eng 23:85–156
ASTM (1976) Annual Book of ASTM Standards, Part 31, “Water”,Standard D 992-71, 363.
Banerjee A, Sharma R, Chisti Y, Banerjee UC (2002) Botryococcusbraunii: a renewable source of hydrocarbons and other chem-icals. Crit Rev Biotechnol 22:245–279
Camacho Rubio F, García Camacho F, Fernández Sevilla JM, ChistiY, Molina Grima E (2003) A mechanistic model of photosyn-thesis in microalgae. Biotechnol Bioeng 81:459–473
Mar Biotechnol
Cardozo KHM, Guaratini T, Barros MP, Falcão VR, Tonon AP, LopesNP, Campos S, Torres MA, Souza AO, Colepicolo P, Pinto E(2007) Metabolites from algae with economical impact. CompBiochem Physiol C 146:60–78
Carvalho AP, Meireles LA, Malcata FX (2006) Microalgal reactors: areview of enclosed system designs and performances. BiotechnolProg 22:1490–1506
Chen F (1996) High cell density culture of microalgae in heterotrophicgrowth. Trends Biotechnol 14:421–426
Chisti Y (2007) Biodiesel from microalgae. Biotechnol Adv 25:294–306
Chisti Y (2008) Biodiesel from microalgae beats bioethanol. TrendsBiotechnol 26:126–131
Chisti Y (2010a) Fuels from microalgae. Biofuels 1:233–235Chisti Y (2010b) Shear sensitivity. In: Flickinger MC (ed) Encyclo-
pedia of industrial biotechnology, bioprocess, bioseparation andcell technology, vol 7. Wiley, New York, pp 4360–4398
Converti A, Casazza AA, Ortiz EY, Perego P, Borghi MD (2009) Effectof temperature and nitrogen concentration on the growth and lipidcontent of Nannochloropsis oculata and Chlorella vulgaris forbiodiesel production. Chem Eng Process 48:1146–1151
García Camacho F, Molina Grima E, Sánchez Mirón A, GonzálezPascual V, Chisti Y (2001) Carboxymethyl cellulose protectsalgal cells against hydrodynamic stress. Enzyme Microb Technol29:602–610
García Camacho F, Gallardo Rodríguez J, Sánchez Mirón A, CerónGarcía MC, Belarbi EH, Chisti Y, Molina Grima E (2007)Biotechnological significance of toxic marine dinoflagellates.Biotechnol Adv 25:176–194
Griffiths MJ, Harrison STL (2009) Lipid productivity as a keycharacteristic for choosing algal species for biodiesel production.J Appl Phycol 21:493–507
Horikoshi T, Nakajima A, Sakaguchi T (1981) Accumulation ofuranium by Chlorella cells grown under autotrophic, heterotro-phic and mixotrophic culture conditions. Agric Biol Chem 45(3):781–783
Illman AM, Scragg AH, Shales SW (2000) Increase in Chlorellastrains calorific values when grown in low nitrogen medium.Enzyme Microb Technol 27:631–635
Işik O, Sarihana E, Kuşvuran E, Gül Ö, Erbatur O (1999) Comparisonof the fatty acid composition of the freshwater fish larvae Tilapiazillii, the rotifer Brachionus calyciflorus, and the microalgaeScenedesmus abundans, Monoraphidium minitum and Chlorellavulgaris in the algae–rotifer–fish larvae food chains. Aquaculture174:299–311
Li Y, Horsman M, Wang B, Wu N, Christopher QL (2008) Effects ofnitrogen sources on cell growth and lipid accumulation of greenalga Neochloris oleoabundans. Appl Microbiol Biotechnol81:629–636
Liu Z-T, Weng G-C, Zhou B-C (2008) Effect of iron on growth andlipid accumulation in Chlorella vulgaris. Bioresour Technol99:4717–4722
Mandal S, Mallick N (2009) Microalga Scenedesmus obliquus as apotential source for biodiesel production. Appl Microbiol Bio-technol 84:281–291
Mata TM, Martins AA, Caetano NS (2010) Microalgae for biodieselproduction and other applications: a review. Renew SustainEnergy Rev 14:217–232
Mazzuca Sobczuk T, Chisti Y (2010) Potential fuel oils from themicroalga Choricystis minor. J Chem Technol Biotechnol85:100–108
Mazzuca Sobczuk T, García Camacho F, Molina Grima E, Chisti Y(2006) Effects of agitation on the microalgae Phaeodactylumtricornutum and Porphyridium cruentum. Bioprocess BiosystEng 28:243–250
Molina Grima E, Acién Fernández FG, García Camacho F, Chisti Y(1999) Photobioreactors: light regime, mass transfer, and scaleup.J Biotechnol 70:231–247
Molina E, Fernández J, Acién FG, Chisti Y (2001) Tubular photo-bioreactor design for algal cultures. J Biotechnol 92:113–131
Pulz O (2001) Photobioreactors: production systems for phototrophicmicroorganisms. Appl Microbiol Biotechnol 57:287–293
Rao RS, Prakasham RS, Prasad KK, Rajesham S, Sarma PN, Rao LV(2004) Xylitol production by Candida sp.: parameter optimiza-tion using Taguchi approach. Process Biochem 39:951–956
Richmond A (2004) Biological principles of mass cultivation. In:Richmond A (ed) Handbook of microalgal culture: biotechnologyand applied phycology. Blackwell, Oxford, pp 125–177
Roy RK (1990) A primer on the Taguchi method. VNR, New York, p247
Roy RK (2001) Design of experiments using the Taguchi approach.Wiley, Toronto, p 538
Scott SA, Davey MP, Dennis JS, Horst I, Howe CJ, Lea-Smith DJ,Smith AG (2010) Curr Opin Biotechnol 21. doi:10.1016/j.copbio.2010.03.005.
Scragg AH, Illman AM, Carden A, Shales SW (2002) Growth ofmicroalgae with increased calorific values in a tubular bioreactor.Biomass Bioenergy 23:67–73
Shuler ML, Kargi F (2002) Bioprocess engineering. Prentice-Hall,New Jersey, p 553
Singhasuwan S, Choorit W, Phoopat N, Parakulsuksatid P, VanichsriratanaW, Sirisansaneeyakul S (2009) Screening microalgae isolated inThailand for the production of biodiesel. The Proceedings of 47thKasetsart University Annual Conference, vol 8, pp. 386–391,Kasetsart University, Bangkok, Thailand.
Sirisansaneeyakul S, Luangpipat T, Vanichsriratana W, SrinophakunT, Chen HH, Chisti Y (2007) Optimization of lactic acidproduction by immobilized Lactococcus lactis IO-1. J IndMicrobiol Biotechnol 34:381–391
Spolaore P, Joannis-Cassan C, Duran E, Isambert A (2006) Commer-cial applications of microalgae. J Biosci Bioeng 101:87–96
Takagi M, Karseno YT (2006) Effect of salt concentration onintracellular accumulation of lipids and triacylglyceride in marinemicroalgae Dunaliella cells. J Biosci Bioeng 101:223–226
Mar Biotechnol


