Embed Size (px)
Citation preview
1
1
PHOTOCHEMICAL FLOCCULATION OF TERRESTRIAL DISSOLVED ORGANIC 2
MATTER AND IRON 3
4
John R. Helmsa,b*, Jingdong Maoa, Klaus Schmidt-Rohrc, Hussain Abdullaa, and Kenneth Moppera,* 5
6
a. Old Dominion University, Department of Chemistry and Biochemistry, 4541 Hampton Blvd., 7
Norfolk, VA, 23529 8
b. Current address: University of North Carolina Wilmington, Department of Chemistry and 9
Biochemistry, 601 S. College Rd., Wilmington, NC 28403 10
c. Iowa State University, Department of Chemistry, Gilman Hall, Ames, Iowa, 50011 11
12
*Corresponding Authors: email: [email protected]; phone: 757-581-8003; fax: 910-962-3013. 13
email: [email protected]; phone: 757-683-4094; fax: 757-683-5310 14
15
Running Head: Photochemical Flocculation of Organic Matter and Iron 16
17
ABSTRACT: Dissolved organic matter (DOM) rich water samples (Great Dismal Swamp, Virginia) 18 were 0.1-um filtered and UV-irradiated in a solar simulator for 30 days. During the irradiation, pH 19 increased, particulate organic matter (POM) and particulate iron formed. After 30 days, 7.1% of the 20 dissolved organic carbon (DOC) was converted to POC while 75% was remineralized. Approximately 21 87% of the iron was removed from the dissolved phase after 30 days, but iron did not flocculate until a 22 major fraction of DOM was removed by photochemical degradation and flocculation (>10 days); thus, 23 during the initial 10 days, there were sufficient organic ligands present or the pH was low enough to 24 keep iron in solution. Nuclear magnetic resonance and Fourier transform infrared spectroscopies 25 indicated that photochemically flocculated POM was more aliphatic than the residual non-flocculated 26 DOM. Photochemically flocculated POM was also enriched in amide functionality, while carbohydrate-27 like material was resistant to both photochemical degradation and flocculation. Abiotic photochemical 28 flocculation likely removes a significant fraction of terrestrial DOM from the upper water column 29 between headwaters and the ocean ocean, but has been previously ignored. Preliminary evidence 30 suggests that this process may significantly impact the transport of DOM and POM in ocean margin 31 environments including estuaries. 32
2
ABBREVIATIONS 33 34 A- absorbance; optical density 35 a- absorption coefficent 36 a300- absorption coefficient at 300 nm 37 Ads- adsorbed material 38 Arom.- aromatic 39 CDOM- chromophoric (or colored) dissolved organic matter 40 cm- centimeters; 10-2 meters 41 CP- cross polarization 42 CSA- chemical shift anisotropy 43 DIC- dissolved inorganic carbon 44 Diss- dissolved (supernatant fraction of centrifuged samples or the fraction <0.1 µm) 45 DOC- dissolved organic matter 46 DOM- dissolved organic matter 47 DON- dissolved organic nitrogen 48 FTIR- Fourier transform infrared spectroscopy 49 hν- light or photon (shorthand i.e., Planks constant x frequency) 50 l- path length 51 λ- wavelength 52 ln- natural logarithm 53 Me- metal 54 MilliQ- ultrapure deionized water from MilliQ-UV dispenser (Millipore) 55 N/D- not determined 56 NMR- nuclear magnetic resonance spectroscopy 57 PM- particulate material 58 POM- particulate organic matter 59 ppm- chemical shift frequency in parts per milllion (relative to tetramethyl silane standard in delta 60 notation) 61 r2- square of the correlation coefficient 62 S- spectral slope (subscript denotes wavelength interval) 63 SR- spectral slope ratio 64 SUVA254- specific UV absorption at 254 nm 65 tDOM- terrestrial dissolved organic matter 66 TN- total nitrogen 67 TOC- total organic carbon 68 TOSS- total supression of spining sidebands 69 TPPM- two-pulse phase modulation 70
71
3
1. INTRODUCTION 72
Terrestrial dissolved organic matter (tDOM) appears to be efficiently removed in ocean margin 73
environments including coastal zones, estuaries, and buoyant river plumes; yet the physical, chemical, 74
and biological processes that lead to this removal remain poorly understood (Hedges et al., 1997; Del 75
Vecchio and Subramaniam, 2004; Spencer et al., 2009). It has been proposed that significant amounts of 76
riverine DOM are delivered to estuarine, continental shelf, and continental slope sediments by various 77
processes, including: precipitation, co-precipitation, aggregation, coagulation, micelle formation, 78
hydrophobic interactions, adsorption to or encapsulation into pre-existing particles (Stumm and Morgan, 79
1981; Guo et al., 2007). Here, all physico-chemical processes that convert dissolved (<0.1 µm) material 80
to particulate material are referred to as flocculation. Prior studies investigating the role of abiotic 81
flocculation in estuarine biogeochemistry have focused on the influences of salt, mixing, particle 82
interactions, and pH on the solubility, stability, or removal of dissolved and colloidal riverine organic 83
matter (Sholkovitz, 1976; Turner and Rawling, 2001), humic substances (Eckert and Sholkovitz, 1976; 84
Fox, 1983), carbohydrates (Wang et al., 2010), metals (O'melia and Stumm, 1967; Boyle et al., 1977; 85
Sholkovitz, 1978), phosphorus (Forsgren et al., 1996), clay minerals (Black et al., 1965; O'melia and 86
Stumm, 1967), and algal biomass (Sukenik et al., 1988). In spite of the large number of previous 87
studies, the factors resulting in flocculation remain poorly understood. 88
Sondergaard et al. (2003) showed that mixing-induced flocculation caused only a 2-5% decrease 89
in DOC along a salinity gradient of 0-25. In another study based on end-member mixing experiments 90
and estuarine transects, mixing induced flocculation was insufficient to account for the apparent 91
removal (and non-conservative behavior) of humic acids (Fox, 1983). Guo et al. (2007) showed that salt 92
effects alone were not sufficient to significantly alter the chromophoric DOM (CDOM) composition of 93
a river water sample. Flocculation therefore must be accompanied by additional factors, such as 94
adsorption to mineral surfaces, interactions with pre-existing particles, or other uncharacterized 95
processes. 96
In addition to salt effects and mixing-induced flocculation, surface-active materials that collect 97
4
on air bubbles may form particles from DOM upon bubble dissolution (Johnson, 1976) or bursting 98
(Baylor and Sutcliffe, 1963). Surface-active compounds, including polysaccharides, 99
mucopolysaccharides and glycoproteins, may also play a significant role in the formation of organic-100
enriched surface micro-layers (Henrichs and Williams, 1985; Compiano et al., 1993), marine snow 101
(Alldredge and Silver, 1988; Mopper et al., 1995), or mineral/organic aggregates (Kranck and Milligan, 102
1980). 103
Photochemical mineralization of DOM (conversion to inorganic forms) and the decrease in 104
ultraviolet and visible absorption, i.e., photobleaching, have been widely studied (Zepp and 105
Schlotzhauer, 1981; Del Vecchio and Blough, 2002). Photochemical mineralization is a possible 106
removal mechanism for humic acids and colored DOM in estuaries (Stedmon and Markager, 2005; 107
White et al., 2010). However, reports of a link between photochemical alteration of DOM and the 108
flocculation of DOM have received relatively little attention. Thus, little is known about the 109
relationship between these two processes and how photo-induced flocculation may impact processes 110
such as transport and removal of dissolved and particulate materials and pollutants, biological utilization 111
of organic matter and the organic content of coastal sediments. 112
Gao and Zepp (1998) observed that after three days of simulated sunlight exposure, dark-colored 113
particles formed in a 0.22 µm filtered and oxygen saturated Satilla river water sample. They reported 114
that particulate matter accounted for 45% of the iron and about 13% of the organic carbon and 115
speculated that the causes of photochemically induced aggregation are changes to double layer repulsion 116
and van der Waals interactions, from decarboxylation, and/or the loss of DOM’s ability to complex iron 117
leading to formation of polymeric iron oxides. Maurice et al. (2002) and Porcal et al. (2013) observed 118
asimilar phase changes for organic carbon and iron in wetland influenced streams. Von Wachenfeldt et 119
al. (2008) found that light exposure correlated with increases in particulate organic carbon (POC) at the 120
expense of DOC for 5 µm filtered humic lake and mire water samples. Thorn et al. (2010) found that 121
humic and fulvic isolates became decarboxylated, more hydrophobic, much less aromatic, and less 122
soluble after extensive photodegradation. Photochemical flocculation of iron and aluminum has also 123
5
been observed in lakes (Kopáček et al., 2005; Kopáček et al., 2006). The mechanism proposed by 124
Kopáček et al. (2005) proceeds by the iron mediated degradation of organic iron-binding ligands 125
causing release of inorganic iron, which is susceptible to oxidation and/or hydrolysis to form insoluble 126
(hydr)oxides. Dissolved iron in terrestrially dominated waters (and in the open ocean) is dominantly 127
organically complexed (Rue and Bruland, 1995; Powell and Wilson-Finelli, 2003; Laglara and van den 128
Berg, 2009). Additionally, the concentration of carboxyl groups affects the solubility of DOM 129
(VanLoon and Duffy, 2010) and DOM’s ability to form stable complexes with iron (Barbeau, 2006). It 130
is thus anticipated that photochemical decarboxylation of DOM affects solubility of both DOM and 131
iron. Dissolved O2 and photochemically produced reactive oxygen species oxidize free iron (II) to iron 132
(III), leading to the formation of insoluble iron hydroxides (Kuma et al., 1996; Faust and Zepp, 1993) 133
which may prove important when iron binding ligands are actively photodegraded. Iron also participates 134
directly in the degradation of photo-active organic complexes via ligand-metal charge transfer reactions 135
(Faust and Zepp, 1993). 136
The residence time of tDOM within the euphotic zone of the oceans is poorly constrained. Most 137
of the world’s major rivers form large buoyant plumes often becoming entrained in highly stratified 138
surface waters between 30º S and 30º N latitudes (Moore et al., 1986; Dagg et al., 2004). This highlights 139
the importance of photochemical processes because tDOM-containing water masses will receive 140
considerable light exposure upon export to the ocean margins, thus resulting in photodegradation of 141
tDOM and possible photo-flocculation. 142
The present study examines the photochemical changes to DOM composition that result in 143
abiotic flocculation of organic matter in the absence of salt effects, biological interactions, or 144
interactions with pre-existing particles. Conventional and advanced spectroscopic methods were used to 145
characterize both the POM that forms upon light exposure and the DOM that remains in solution in 146
order to gain insights into the flocculation mechanism(s). Our results show that photochemically 147
flocculated particles account for as much as 60% of TOC and CDOM, 25% of total nitrogen, and 87% 148
of total iron remaining after long-term irradiation. POM that forms after 10 days is enriched in aliphatic 149
6
and amide functional groups relative to the remaining DOM, while carbohydrate-like moieties are 150
resistant to both photo-mineralization and photo-flocculation. This study raises new questions regarding 151
both the mechanisms and magnitude with which photochemistry and flocculation affect the export of 152
terrestrial DOM and POM to the oceans and sediments. 153
154
2. MATERIALS AND METHODS 155
2.1 Sample collection 156
Glassware was cleaned with dilute HCl (~1 mol L-1) and rinsed with MilliQ –UV ultrapure grade 157
water (Millipore), referred to below as MilliQ water. Glassware was combusted at 450 ºC (>8 h). 158
Plasticware was cleaned with 0.01 mol L-1 NaOH followed by MilliQ water and dilute HCl and then 159
rinsed with MilliQ water. All containers were rinsed several times with sample prior to filling. Filter 160
capsules (0.1 µm pore size, Whatman PolyCap TF) were rinsed with HPLC grade methanol (Alpha 161
Aesar), flushed with > 20 L of MilliQ water, and conditioned with approximately 1 L of sample prior to 162
use. 163
The water sample used for this irradiation experiment was collected at 76°22' W, 36°36' N from 164
the public boat ramp near the confluence of the Dismal Swamp northwest canal and the Lake 165
Drummond feeder ditch. The waters of the Dismal Swamp are DOC rich and low pH (Minor et al., 166
2006). The water was transported back to the laboratory in a 20 L polyethylene jerrycan. The sample 167
was filtered (within 24 hours of collection) through a pre-cleaned 0.1 µm capsule filter into precleaned 168
and combusted 4 L glass Qorpak bottles with acid rinsed Teflon lined caps. Samples were stored (<48 169
h) at room temperature prior to irradiation. Subsamples were stored at 4-5° C prior to analysis; however, 170
samples were stored at room temperature overnight prior to optical spectroscopic measurements to 171
minimize temperature related artifacts. 172
2.2 Irradiation Experiment 173
Aliquots (450 mL) of the filtered sample were transferred to 550 mL quartz round bottom flasks 174
and placed inside a solar simulator containing UVA340 bulbs (Q-panel). These lamps have a spectral 175
7
output similar to natural sunlight from ~290 to ~365 nm, but under-represent solar irradiance at 176
wavelengths greater than about 365 nm. UVA lamps were chosen because this region of the solar 177
spectrum is quantitatively the most important for the mineralization of dissolved organic carbon at the 178
surface (Vähätalo et al., 2000), though given the greater depth to which longer wavelengths penetrate 179
the water column (Fichot and Miller, 2010), our results do not reflect the degree to which photochemical 180
degradation occurs at depth. The solar simulator is described elsewhere (Minor et al., 2007). The lamps 181
were kept on constantly during the irradiation. Dark controls were wrapped in foil and placed inside the 182
solar simulator. All samples were irradiated at their natural concentration and pH (i.e., not diluted to 183
optically thin conditions or buffered prior to irradiation) in order to collect sufficient organic material 184
for solid-state NMR and FTIR, to approximately simulate surface conditions in humic lakes during 185
seasonal stratification, and to avoid potential contamination and artifactual photochemical and dark 186
reactions. At the end of each irradiation period (10, 20, and 30 days), three irradiated flasks and one 187
dark control flask, were sacrificed for analysis (two dark control flasks were analyzed after 30 days). An 188
additional ~2 L aliquot was stored in a combusted glass qorpak bottle in the dark at 4 ºC. It was sub-189
sampled and analyzed using the same methodology as for the irradiated samples and dark controls. UV-190
visible absorption of the unfractionated refrigerated/dark sample was measured at 0, 10, and 30 days, 191
while the centrifuged refrigerated/dark sample was analyzed at 10 and 30 days. All other analyses of the 192
refrigerated/dark sample were performed at the same time as the 30-day irradiated and dark control 193
samples. 194
A 30 mL aliquot from each flask was set aside for measuring pH, which was measured at room 195
temperature (22º C ±2º) using an Orion ROSS gel filled pH electrode connected to a Fisher Scientific 196
Accumet pH meter 25. The pH meter and electrode were calibrated using NIST traceable buffers of pH 197
= 4, 7, and 10 (EMD Millipore). Measurements were repeated until replicate analyses agreed to within 198
0.03 pH units. 199
During the course of the irradiation, particles formed in all samples except for the dark controls. 200
The particles were separated from the remaining supernatant by centrifugation at 6000 rpm (~9000 g) 201
8
for 15 minutes. For comparison, 15 µL of 50% w/w NaOH (VWR Scientific) was added to one 450 mL 202
flask of un-centrifuged irradiated samples in order to re-dissolve the flocculated and adsorbed DOM. In 203
addition, a sub-sample with particles re-suspended was collected. After emptying the irradiation and 204
control flasks, they were rinsed with MilliQ water to remove remaining solution. One flask was then 205
rinsed with 10 mL of 0.5 mmol L-1 NaOH solution to dissolve wall-adsorbed organic material, while a 206
second flask was rinsed with 0.1 mol L-1 HCl solution to leach adsorbed iron. Adsorbed DOM was 207
collected from the 10-day and 30-day dark control flasks, while adsorbed iron was collected from the 208
20-day and 30-day dark control flasks. As there was insufficient solid material obtained from a single 209
flask to carry out solid state NMR and FTIR analysis, a second 10-day irradiation was performed using 210
5 flasks. The samples from that second 10-day irradiation were centrifuged, as above. The particles were 211
rinsed once with cold (~4ºC) MilliQ water to remove loosely bound DOM. Both dissolved and 212
particulate phases were then freeze-dried. 213
2.3 UV-visible absorption spectroscopy 214
UV-visible absorption spectra (190-900 nm) were measured for all samples and rinses using an 215
Agilent 8453 diode array spectrophotometer with a 1 cm quartz cuvette. MilliQ water was used as the 216
blank. Strongly absorbing samples were diluted with MilliQ water prior to measurement to ensure linear 217
response. Absorbance values were corrected to account for instrument baseline drift, refractive index, 218
and temperature variations according to Green and Blough (1994) and converted to Napierian 219
absorbance coefficients using: 220
(1) 221
where a = absorbance coefficient (m-1), A = absorbance, and l = path length (m). All CDOM UV-visible 222
spectra were assumed to follow an exponential decay approximated by the expression: 223
(2) aλ = aλref e-S(λ-λref) 224
where λ = wavelength (nm), λref = reference wavelength, and S = spectral slope. Spectral slopes were 225
calculated by linear regression of the natural log transformed absorption spectra, and spectral slope ratio 226
!
a = 2.303A / l
9
(SR) was calculated as the ratio of S275-295 to S350-400 (Helms et al., 2008). All samples (dissolved i.e., 227
supernatant centrifuged samples, re-dissolved samples, blanks, and dark controls) were analyzed at 228
similar NaOH concentrations (0.5-0.6 mmol L-1; pH=10.7 ±0.2) to avoid pH and refractive index 229
differences between samples and allow direct comparison. 230
First derivative UV-visible absorption spectra were obtained by fitting absorption data to linear 231
segments over 11 nm intervals and plotting slope vs. wavelength. The process was repeated using first 232
derivative data points in order to produce second derivative spectra. 233
2.4 Dissolved organic carbon 234
Non-purgeable organic carbon was measured using high temperature (720°C) catalytic 235
combustion on a Shimadzu TOC-V-CPH carbon analyzer. Samples were acidified with H3PO4 and 236
sparged with carbon-free air prior to injection. The instrument was calibrated using dried primary 237
standard grade potassium hydrogen phthalate (Alpha Aesar) dissolved in MilliQ water. Measurements 238
of non-purgeable organic carbon for dissolved samples (i.e., centrifuged supernatant) will be referred to 239
as DOC, while measurements of non-fractionated samples will be referred to as total organic carbon 240
(TOC). POC was determined as the difference between TOC and DOC. Total Nitrogen (TN) was also 241
measured using the Shimadzu TOC-V-CPH. Calibration standards were prepared from KNO3 in MilliQ 242
water. 243
2.5 Total iron by atomic absorption spectroscopy 244
Total iron concentration was measured using a Hitachi Z8100 polarized Zeeman flame atomic 245
absorption spectrophotometer equipped with an iron hollow cathode lamp (VWR Scientific). Iron 246
standards were prepared from puris p.a., ACS grade, iron (II) sulfate heptahydrate (Fluka) in 0.01M HCl 247
and ranged in concentration from 0 to 100 µmol L-1. Standards were measured in duplicate and samples 248
were measured in triplicate. Samples were adjusted to pH= 1 using ACS grade concentrated 249
hydrochloric acid (Fisher Scientific). Particulate iron concentrations were determined by comparing the 250
iron concentrations of non-centrifuged (total) and dissolved (centrifuged supernatant) samples. 251
2.6 Solid-state nuclear magnetic resonance spectroscopy 252
10
Freeze-dried DOM and POM samples from the second 10-day irradiation were analyzed by 253
solid-state 13C cross polarization/total sideband suppression (CP-TOSS) NMR at 100 MHz with a 254
Bruker Biospin DSX-400 spectrometer. Experiments were performed using 4-mm rotors at a spinning 255
speed of 6.5 kHz and a cross polarization (CP) time of 1 ms, with a 1H 90o pulse-length of 4.1 µs and a 256
recycle delay of 0.4 s. Four-pulse TOSS (Dixon, 1982) was applied prior to detection, and two-pulse 257
phase-modulated (TPPM) decoupling was used for optimum resolution (Deazevedo et al., 2000). 258
Between 16k and 64k scans were accumulated for each spectrum. 259
In addition to CP-TOSS experiments, spectra showing signals from nonprotonated carbons and 260
mobile groups, like rotating CH3, were generated using 13C CP-TOSS with 40 µs dipolar dephasing 261
(Opella and Frey, 1979; Hatcher, 1987; Mao et al., 2007). Between 32k and 64k scans were averaged 262
for each spectrum with dipolar dephasing. To differentiate the signals of anomeric carbons (O-C-O) 263
from those of aromatic carbons that resonate between 90 and 120 ppm, the aromatic carbon signals were 264
selectively suppressed with a five-pulse 13C chemical-shift anisotropy (CSA) filter (Mao, 2004). 265
Between 32k and 64k scans were performed for each CSA-filtered spectrum. 266
2.7 Fourier transform infrared spectroscopy 267
FTIR spectra were obtained by collecting 200 scans using a Nicolet 370 FTIR spectrometer 268
(DTGS detector) equipped with N2 purge gas generator (Thermo Scientific). Samples were freeze-dried 269
and introduced as KBr disks. The KBr was combusted (24 h, 450 °C) prior to use. The sample and KBr 270
mixtures (1:100 ratio) were homogenized in a glass vial on a grinding mill (Wig-L-Bug) and 271
compressed between two clean, polished iron anvils in a hydraulic press at 20,000 psi to form KBr 272
windows. Spectra were collected with a resolution of 4 cm-1 ±1 and Happ-Genzel apodization. 273
Background scans consisted of a KBr disk prepared as above, except that no sample was added. Second 274
derivative spectra were obtained using the second order Savitzky-Golay method as described in Abdulla 275
et al. (2010). The 1900-1500 cm-1 (carboxyl) region of the spectrum was deconvoluted using Voigt line-276
shape fitting (Griffiths and De Haseth, 2007; Abdulla et al., 2010). Details of the identification and 277
calibration of the deconvoluted peaks are given in Abdulla et al. (2010). 278
11
2.8 Statistical analyses 279
Analytical uncertainty was estimated for UV-visible, DOC, total iron in terms of reproducibility 280
of replicate analyses. Unless otherwise noted, for irradiated samples, three replicate analyses from two 281
flasks (n = 6) were performed and reported below as mean values and one standard deviation. Dark 282
controls were measured at each time point (n=3 from a single flask). Total iron, TOC, and a300 for the 283
unfractionated dark controls were found to be statistically indistinguishable from an unirradiated sample 284
stored at 4 ºC using Student’s t-test (p > 0.1, i.e., a high probability that the null hypothesis pertained 285
and the difference between the dark control and the refrigerated/dark sample was not significant). The 286
values measured for the unfractionated dark controls and refrigerated/dark sample were pooled and Q-287
tested at the 95% confidence level, and the overall mean and standard deviations (n ≥ 10 after removal 288
of outlying values) are reported below as “0-d Total”. Adsorbed material is reported for triplicate 289
analyses from a single flask per time point (n = 3) except in the case of “0-d Ads” which is reported as 290
the overall mean of two dark controls (n=6; 10-day and 30-day dark controls for dissolved iron and 20-291
day and 30-day dark controls for TOC and CDOM). 292
Freeze-dried samples represent combined and homogenized aqueous, particulate, or total (un-293
fractionated) material from multiple flasks (n ≥ 2). The analytical uncertainty of the NMR spectra due to 294
instrumental and environmental noise was estimated by using the signal to noise ratio of each 295
integration region to calculate relative standard deviation. Additional uncertainty arose from the 296
assignment of chemical shift ranges used for integration. The latter was partly alleviated through the 297
consistent application of integration ranges to maintain comparability of the samples and by the use of 298
dipolar dephased or CSA-filtered spectra to differentiate overlapping signals. The analytical uncertainty 299
of the FTIR method was estimated as the standard deviation of individually deconvoluted and integrated 300
triplicate scans of the same sample. For results calculated based on multiple independent methods or by 301
difference from a single method, uncertainties were propagated as one standard deviation according to 302
Harris (2010). 303
304
12
3. RESULTS 305
3.1 pH shift during irradiation 306
As no buffers were added to the water samples prior to or during the irradiation, the pH shifted 307
over the course of the 30 day experiment from ~3.7 to ~5.7 (Fig. 1). The pH of dark controls did not 308
change. While the exclusion of added buffers was necessary to obtain sufficient carbon for solid-state 309
NMR and to avoid artifactual reactions, the gradual increase in pH complicates the interpretation of the 310
iron flocculation mechanism (see 4. Discussion). 311
3.2 Changes in organic matter parameters during irradiation 312
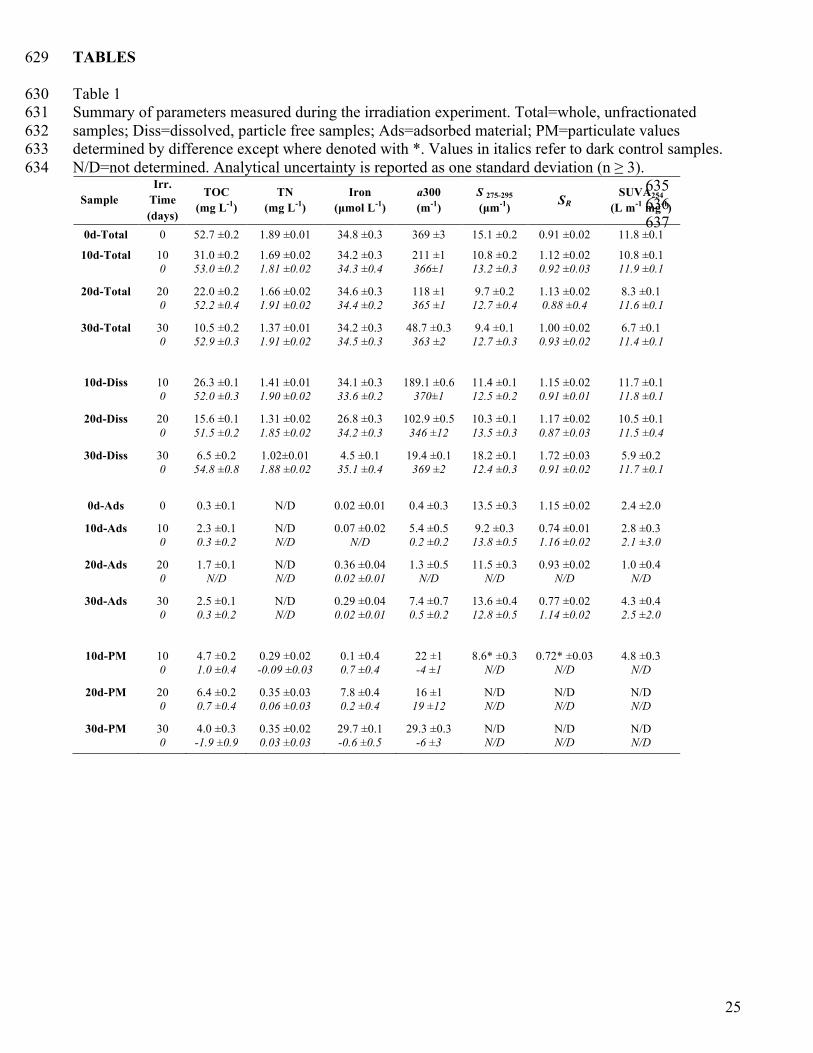
A summary of the parameters measured for each of the samples is given in Table 1. Comparison 313
of these parameters shows that, throughout the course of the irradiation, photo-mineralization and 314
photobleaching caused reductions in both organic matter concentration and absorption at 300 nm 315
(a300). Approximately 41% of the original 52.7 mg L-1 DOC was mineralized during the first 10 days 316
of the irradiation experiment and an additional 9% of initial DOC was converted to POC. The organic 317
carbon remaining after 10 days was ~15% particulate (Table 1; Figs 2a and 3a). After 30 days, 95% of 318
the original a300 and 88% of the original DOC were removed (Table 1). Adsorption to the walls of the 319
quartz flasks was responsible for 2.1% of a300 removal and about 6.5% of DOC removal. Flocculation 320
was responsible for 8.3% of a300 removal and 8.0% of DOC removal. After 30 days irradiation, 38% of 321
the remaining TOC was in the particulate phase, and the particulate phase accounted for ~60% of the 322
remaining absorption at 300 nm (Figs. 2a and 3a). The amount of particulate a300 present after 20 days 323
was 29% lower than it was after 10 days, while the concentration of POC was 36% greater indicating 324
photobleaching of the particles. 325
While up to 15% of the total remaining a300 adsorbed to the walls of the irradiated quartz flasks 326
(Table 1; Fig. 2b), very little wall adsorption (≤0.11% of a300) occurred in the dark control. Wall-327
adsorbed material also exhibited relatively low spectral slope ratios (SR) (Table 1). Likewise, for the 10-328
day irradiated sample, the spectral slope ratio for the isolated re-dissolved particles was low, 0.72 329
(±0.03; Table 1), compared to SR values of 0.91 (±0.02) for the dark control samples, and 1.15 (±0.02) 330
13
for the dissolved material. In fact, all samples containing re-dissolved POM exhibited lower SR values 331
than their particle free counterparts. 332
While the absorption spectra all appear relatively featureless, the derivative spectra show that 333
considerable changes in spectral shape occurred over the course of photobleaching (Figs. 4 and 5). 334
Dissolved and particulate materials exhibit significantly different derivative spectra. Second derivative 335
spectra of dissolved material show minima between 262 and 271 nm and maxima between 285 and 295 336
nm, while particulate spectra show minima between 273 and 290 nm and maxima between 296 and 315 337
nm, which shifted during the irradiation (Figs. 4c, 4f, 4i, 5c, 5f, and 5i). These two trends are consistent 338
with the findings of Helms et al. (2008). Re-dissolution of isolated particles from the 10-d sample and 339
dilution with MilliQ water (data not shown) confirm the low spectral slopes exhibited in the difference 340
spectra (Figs. 4g and 5g), however, the features observed at ~280 nm and ~340 nm in the difference 341
spectrum were less pronounced. 342
DOC normalized absorption or “specific UV absorbance” at 254 nm (SUVA254), which has been 343
shown to correlate well with aromatic content (Weishaar et al., 2003) and carbon normalized lignin 344
yield (Stubbins et al., 2012), are shown in Table 1. SUVA254 values decreased throughout the irradiation 345
indicating photochemical degradation of aromatic material, in agreement with the NMR results 346
(discussed below). The SUVA254 values were generally higher in supernatants than in the unfractionated 347
samples. 348
Total nitrogen in both the dissolved and unfractionated samples decreased during irradiation 349
(Table 1), while particulate nitrogen increased (Table 1; Fig. 2d). The distribution of dissolved and 350
particulate nitrogen is shown in Figs. 2d and 3d. Total nitrogen includes both organic and inorganic 351
forms of nitrogen. Because inorganic forms (e.g., NH4+, NO3
-, NO2-) are highly soluble, particulate 352
nitrogen, determined by subtracting TN values of dissolved samples from TN values of unfractionated 353
samples, must dominantly exist as organic nitrogen. The carbon to nitrogen ratio (C:N) of the DOM 354
decreased linearly from 28 to 6.3 during the irradiation. Particulate C:N was 17 after 10-d, 18 after 20-d 355
14
and 11 after 30-d. The decrease in particulate C:N ratio after 30 days reflects photobleaching of the 356
flocculated material (i.e., preferential loss of carbon; Figs. 2 and 3). 357
3.3 Flocculation of iron during irradiation 358
No detectable flocculation of iron occurred during the first 10 days of irradiation. However, 359
between 10 and 20 days, iron began to flocculate (Figs. 2c and 3c, Table 1) and after 30 days, 87% of 360
the iron was converted to particulate iron. No measurable particle formation occurred in the dark 361
control, and adsorption of iron to the flask wall was negligible (<0.1%). 362
3.4 Spectroscopic characterization of photodegraded DOM and photochemically flocculated POM 363
Solid-state CP-TOSS NMR spectra for the dark control, 10-day irradiated whole sample, 364
supernatant, and particles are shown in Fig. 6 (heavy lines). Photodegradation led to a preferential 365
decrease in the aromatic signal (90-160 ppm), in agreement with the SUVA data (Table 1), a broadening 366
of the carboxyl peak (160-190 ppm) and selective preservation of both O-alkyl (carbohydrate-like) 367
material (60-90 ppm) and aliphatic carbon (0-50 ppm). It is noteworthy that the spectrum of the 368
irradiated organic matter remaining in the dissolved phase upon 10 days of irradiation (Fig. 6c) exhibits 369
pronounced peaks at 35 ppm, 75 ppm, and 175 ppm that are also characteristic of DOM isolated from 370
marine waters (Esteves et al., 2009; Koprivnjak et al., 2009). In comparison with the dissolved material, 371
the flocculated POM from the 10-day irradiated sample (Fig. 4d) contained relatively little aromatic 372
material (90-165 ppm; consistent with SUVA254 results above). It should be noted that this spectrum 373
exhibits two carboxyl peaks, one at ~178 ppm and the other at ~173 ppm. The CP-TOSS spectra were 374
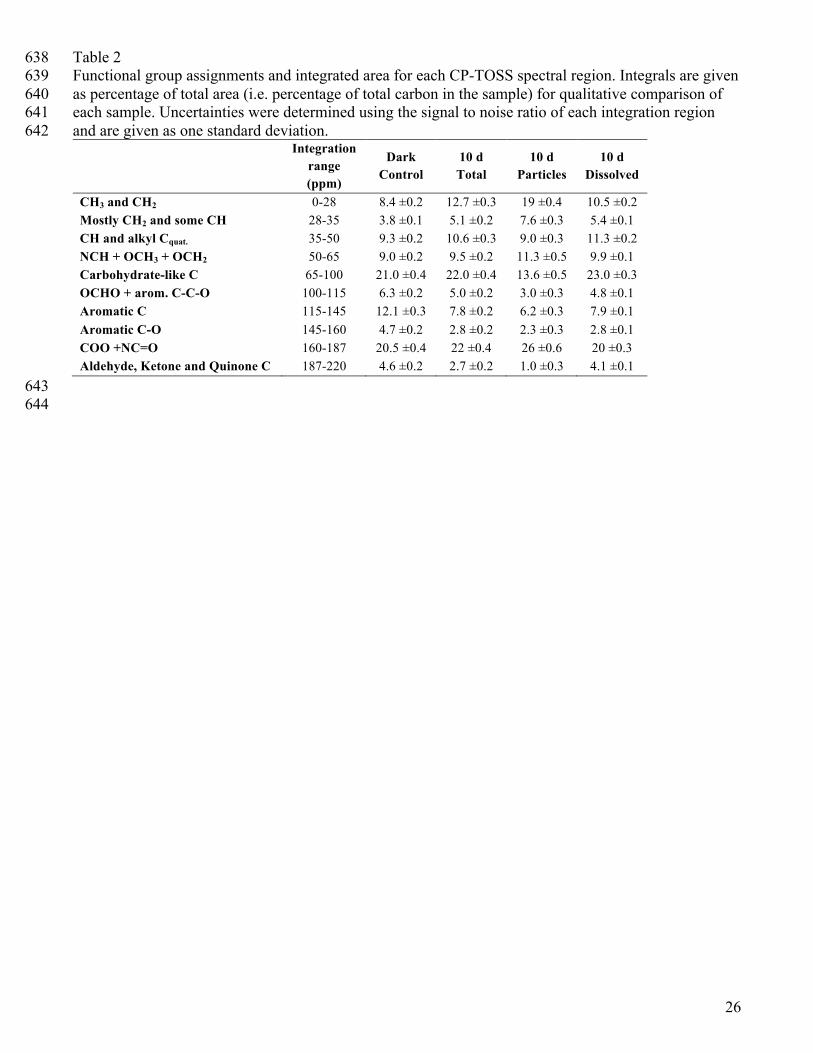
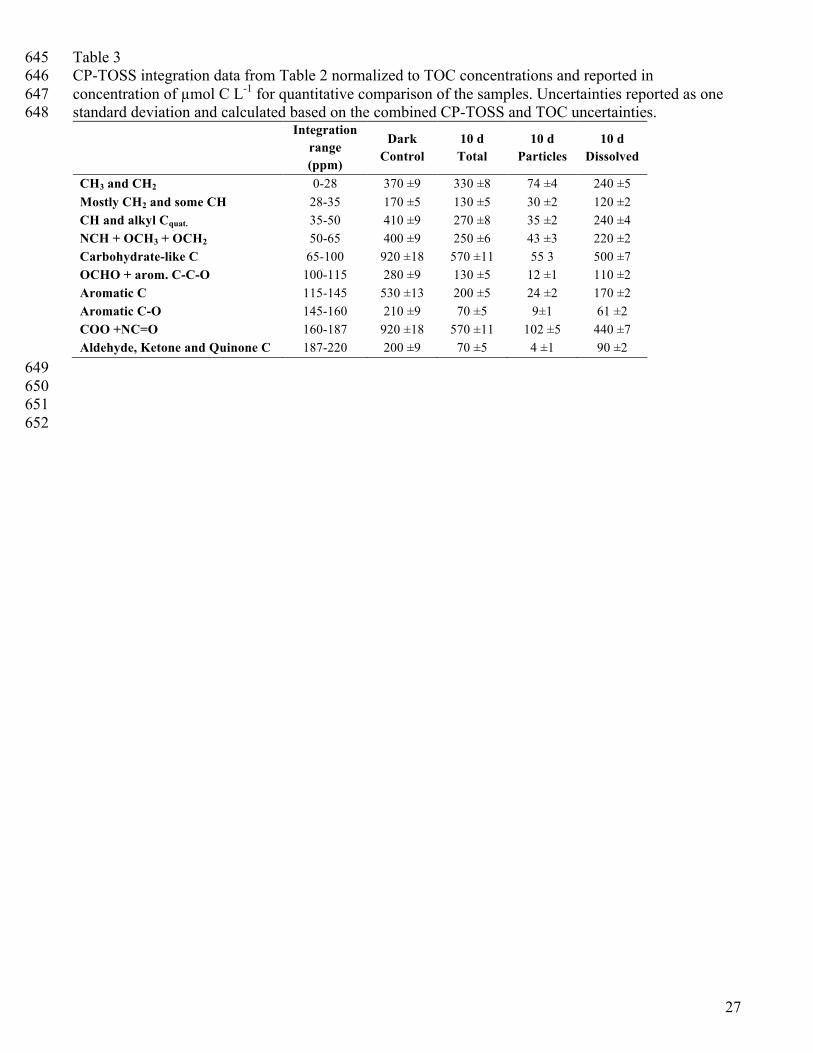
integrated to provide quantitative information, which is given in Table 2. By normalizing the integration 375
data (Table 2) to the TOC concentrations (Table 1), the concentrations of the various carbon classes 376
were estimated in terms of µmol L-1 C, and are given in Tables 3 and 4. 377
The 13C NMR spectra with CSA-filter (Fig. 6 grey lines) show that ~85-88% of carbons detected 378
in the 90-115 ppm region were anomeric, i.e., carbohydrate-like, and carbons with 12-15% aromatic 379
carbons. No CSA-filtered spectrum was collected for the particulate matter sample as the CP-TOSS 380
spectrum contained very little signal in the region where anomeric and aromatic carbon signals overlap. 381
15
CP-TOSS spectra with dipolar dephasing (Fig. 6 narrow lines) show that 80% ±4% of aromatic carbons 382
in the dark control, ~86% ±3% of aromatic carbons in the unfractionated 10-d irradiated sample, ~84% 383
±3% of the aromatic carbons in the 10-d irradiated DOM (supernatant), and ~78% ±5% of the aromatic 384
carbons in the 10-d irradiated POM (flocculated particles) were non-protonated, i.e. substituted ring 385
carbons or carbons in the interior of condensed polyaromatic structures. 386
Insufficient particulate material was available from the 20 and 30 d irradiation time points to 387
carry out NMR analyses. However, FTIR spectra were collected for particulate material from all three 388
irradiation time points and for the dissolved material (supernatant) from the 10-d and 20-d time points 389
(Fig. 7). All DOM FTIR spectra exhibit a prominent peak at 1020-1160 cm-1 (carbohydrate region); 390
however, this peak is not observed in the 10-d POM spectrum and is less prominent in the 20-d and 30-d 391
POM spectra compared to DOM. The carboxyl region (1500-1800 cm-1) of the IR spectrum for the 392
particles that formed during the first ten days (Fig. 7b) is significantly different from that of the 393
corresponding DOM spectra (Fig. 7a). FTIR spectra for particles from the 20-d and 30-d irradations 394
contain major peaks associated with COOH (1720 cm-1), amide (1650 and 1540 cm-1), COO-Fe (1620 395
cm-1), and COO- (1580 cm-1). 396
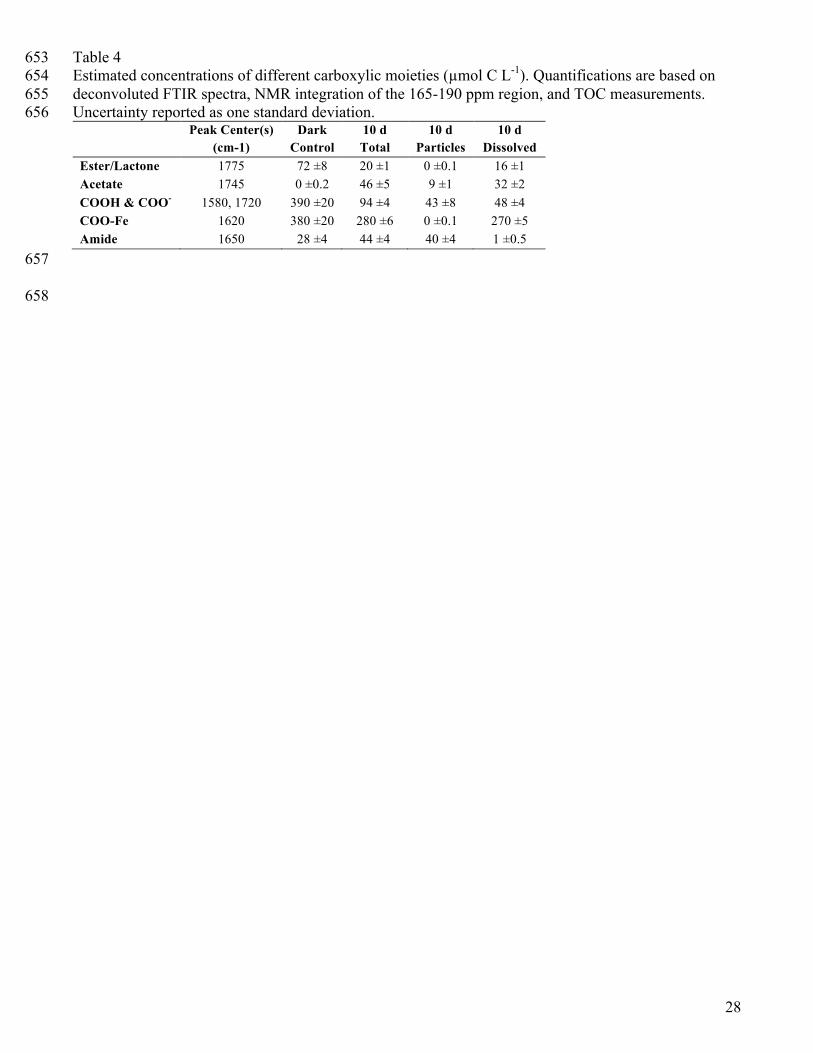
Five main types of carboxyl groups were identified from the deconvoluted second derivative 397
FTIR spectra and their concentrations for the dark control and 10-d irradiated samples were estimated 398
by combining the TOC normalized carboxyl concentration (Table 3) and the areas obtained by 399
deconvolution and integration of the FTIR spectra according to Abdulla et al. (2010). The deconvoluted 400
spectrum revealed primarily acetate groups (1745 cm-1) and amide groups (1650 cm-1, 1540 cm-1, and 401
1261 cm-1) in the particulate spectrum, but no readily observable carboxylate-iron complexes (1620 cm-402
1). This result is consistent with the atomic absorption measurements as no iron flocculation was 403
observed until after the day 10 time point (Figs. 2c and 3c; Table 1). Acetate and amide increased, while 404
the other carboxylate moieties decreased during the irradiation. Nearly all of the amide functionality 405
was present in the particulate phase along with nearly half of the carboxylic acid and carboxylate 406
functionality (Table 4). The partitioning of amide functional groups into the solid phase is consistent 407
16
with the TN results (Table 1; Fig. 2d). Neither esters nor iron associated carboxylate were apparent in 408
the particle phase after 10 days of irradiation. The FTIR spectra for the 20-d and 30-d samples were not 409
deconvoluted due to their low signal to noise ratios and lack of corresponding NMR data. 410
The distribution of the major types of DOM structural moieties after 10 days of irradiation (Fig. 411
8) shows that the most rapidly removed carbons were aromatic. Esters, carboxylic acid/carboxylate 412
groups, and carbonyls were also extensively mineralized. Nearly all of the amide functionality was 413
present in the particulate phase along with a fraction of the aliphatic and O-alkyl or amine carbons. The 414
residual (unaltered, photodegraded, and photoproduced) DOM compounds after 10 days of irradiation 415
were markedly more aliphatic and less aromatic than the dark control. While carboxyl carbons remained 416
relatively constant as a fraction of total DOC (approximately 20%; Table 2), the distribution of 417
carboxylic groups shifted towards primarily metal associated carboxylate, which was present only in the 418
dissolved phase (Table 4; Fig. 8). 419
420
4. DISCUSSION 421
4.1 Chemical composition of DOM and POM 422
The compositional differences between the photo-flocculated POM and the dissolved phase can 423
be summarized as follows: POM after 10 days of irradiation contained no detectable metal associated 424
carboxylate, was less aromatic, less carbohydrate-like, and contained more amide and aliphatic 425
functionality than the corresponding DOM. UV-visible absorption results (Table 1) suggest that photo-426
flocculated POM (10 day sample) has a higher average molecular weight (lower spectral slope and slope 427
ratio) and less aromatic functionality (lower SUVA254) than the DOM remaining in solution. First and 428
second derivative UV-visible spectra (Figs. 4 and 5) indicates that different chromophores were present 429
in the particulate and dissolved phases. These results are supported by the considerable differences 430
between the NMR and FTIR spectra observed for DOM and POM. The C/N ratio of particulate matter 431
decreased during the 10-d to 30-d portion of the irradiation because of the preferential mineralization of 432
carbon. The low C:N ratio of the POM that remained after 30 days of irradiation (11) compared to the 433
17
high DOM C:N ratio of the starting material (28) indicates that photo-flocculation may play an 434
important role in the transport of organic nitrogen from the water column to the sediments, especially in 435
estuaries and coastal waters. 436
The combined use of TOC, NMR, and FTIR to quantify carboxyl functionalities reveals a net 437
increase in amide functionality during the early stages of photolysis (Table 4; Fig. 8), nearly all of 438
which appears in the flocculate (Fig. 5d and Fig. 8). Amides may have formed via the following 439
mechanism: Ammonia that is produced during photolysis of dissolved organic nitrogen (DON) (Bushaw 440
et al., 1996; Stedmon et al., 2007) reacts with esters within DOM to generate alkyl amides (McKee and 441
Hatcher, 2010). Since the results show that amides preferentially accumulate in the POM (Table 4; Fig. 442
8), this process may provide a pathway by which nitrogen is exported from surface waters to sediments. 443
The observed decrease in ester concentration (Table 4) supports this mechanism for amide production. 444
Interestingly, deep ocean DON is largely (up to 76%) in the form of chemically uncharacterized amides 445
that apparently resist both chemical and biological degradation (McCarthy et al., 1997; Aluwihare et al., 446
2005). An abiotic source of amide functionality within DOM would help explain its refractory nature 447
(McKee and Hatcher, 2010). Further work is needed to determine whether this abiotic mechanism also 448
applies to waters with lower DOM concentrations. 449
The results of this study suggest that changes in the concentrations and types of carboxyl groups 450
within DOM play critical roles in photo-flocculation. The signal in the carboxyl region of the NMR 451
spectrum for POM for the 10-day sample is partially split into two peaks that are narrower than the 452
single peak observed for DOM (Fig. 6) suggesting that the carboxyl groups in the flocculate phase 453
represent a less diverse mixture than the bulk dissolved material. The narrower, more resolved bands in 454
the carboxyl region for the particulate phase (Fig. 4, day 10) may also be due to the lack or low content 455
of paramagnetic iron in this sample (Pfeffer et al., 1984). Alternatively, similar peaks observed for 456
riverine DOM samples have been attributed to carbonate (Bianchi et al., 2004), though bicarbonate and 457
carbonate would be expected to resonate at ~161 and ~169 ppm (Gottlieb et al., 1997) while our peak 458
maxima were observed at ~173 and ~178. 459
18
The combined FTIR and NMR results indicate that carboxylic acids, carboxylate groups and 460
metal associated carboxylate groups are mineralized during the first ten days of irradiation (Fig. 8a). In 461
addition, decarboxylation appears to have occurred as indicated by the increase in pH in the irradiated 462
samples (Fig. 1; consistent with Porcal et al., 2013) and the production of dissolved inorganic carbon 463
during UV exposure of Dismal Swamp water (Minor et al., 2006) and similar samples (Porcal et al., 464
2013). NMR evidence presented here, and by Thorn et al. (2010) suggests that photochemical 465
decarboxylation leads to decreased DOM aqueous solubility, which is supported by the higher aliphatic 466
content of the POM relative to the DOM (Table 2), thus facilitating flocculation. Abdulla et al. (2010) 467
showed that carboxylic groups in the >1 kDa fraction of DOM decreased downstream along an estuarine 468
transect. They suggested that this decrease was due to flocculation/adsorption, and/or 469
photodegradation/photo-decarboxylation. In light of the results of the current study, it is reasonable to 470
speculate that a coupled photochemical-flocculation mechanism contributed to this observed estuarine 471
trend. 472
4.2 Mechanism of photo-flocculation 473
The mechanism of photochemical flocculation has not previously been directly investigated. 474
Based on the spectroscopic characterization of the DOM and POM remaining after irradiation, it 475
appears that photo-flocculation occurs by two or more pathways (Fig. 9), and that initial flocculation of 476
organic and inorganic material may not occur simultaneously. The processes in Fig. 9 have been 477
subdivided according to whether they occur prior to the flocculation of iron (Phase I) or after iron 478
begins to flocculate (Phase II). It is important to consider that in higher pH, lower DOC waters such as 479
large lakes, whitewater rivers, and the open ocean, Phase I may have little or no applicability due to the 480
limited solubility of iron and prior photobleaching. The ‘Continuous’ category includes reactions that 481
likely impact the process of photo-flocculation throughout this experiment, while the ‘Competitive’ 482
category includes reactions and processes that compete with or counteract the process of photochemical 483
flocculation. During Phase I, loss of DOM solubility may have occurred as a result of selective 484
photodegradation as a portion of the aromatic, polyhydroxyl and polycarboxyl humic material within the 485
19
DOM matrix becomes more aliphatic and less acidic rendering it more hydrophobic (Gao and Zepp 486
1998; Thorn et al. 2010). An additional possibility involves the degradation of an amphiphilic fraction 487
of the DOM, which leads to the flocculation of pre-existing hydrophobic “core” material and/or 488
sparingly soluble amphiphiles such as hydrophobic peptides. Similar amphiphilic-hydrophobic 489
interactions have been proposed to explain the enhanced solubility of model pollutants by natural 490
organic matter (Chiou et al., 1986; Abdulla et al., 2009), which suggests that the change in bulk DOM 491
polarity may impact the partitioning of aromatic polutants. In either case, a photochemically inert 492
fraction of DOM carbohydrate-like material (NMR signal at ~75ppm and ~100ppm, IR peaks from 997 493
to 1152 cm-1, and little or no UV-visible absorption) survives long-term UV exposure and remains 494
primarily in the dissolved phase. 495
4.3 Role of particles and iron in photo-flocculation of OM 496
Silica particles have been shown to readily adsorb humic substances (Liang et al., 2011), and the 497
adsorption of surface active DOM to minerals and detrital POM has been cited as a possible route for 498
the preservation of organic matter in the sediments (Hedges and Keil, 1995; Henrichs, 1995; Mead and 499
Goñi, 2008). Although the experimental protocol used in the current study excluded pre-existing 500
particulate matter greater than 0.1 µm, the extent to which DOM adsorbed to the walls of the quartz 501
flasks was quantified. Negligible adsorption occurred in the dark control (~0.10% of total a300), while 502
after 20 days of irradiation, 15% of the residual a300 adsorbed to the walls of the irradiated quartz 503
flasks. TN was not measured for the adsorbed material; however, wall adsorption of DON (along with 504
the formation of volatile nitrogen compounds such as ammonia and amines, which would have been lost 505
during freeze drying) may help to explain the observed ~20% decrease in TN during the irradiation 506
experiment (Fig. 4d). The latter show that a fraction of DOM was more susceptible to mineral 507
adsorption, or more strongly adsorbed after photodegradation. This mechanism may be a pathway by 508
which a significant fraction of the tDOM pool is both exported from surface waters to the sediments and 509
subsequently preserved during early diagenesis (Hedges and Keil, 1995; Henrichs, 1995; Mead and 510
Goñi, 2008). If iron flocculated as amorphous hydroxide particles, they may have selectively scavenged 511
20
significant quantities of DOM irrespective of any photochemical changes to the DOM pool (Luider et 512
al., 2003). 513
4.4 Photo-flocculation of iron 514
The role of iron and other metals in the photochemical flocculation of DOM appears to be 515
complex. Both dissolved and particulate forms of iron likely play roles in the photo-flocculation of 516
DOM. Dissolved iron may form metal ion “bridges” between DOM molecules or colloids resulting in 517
aggregation (Verdugo et al., 2004; Orsetti et al., 2010). Polymeric iron (hydr)oxides as well as soluble 518
forms of iron III, have been found to coagulate DOM (Nierop et al., 2002; Pullin et al., 2004; Honghai 519
et al., 2008). Organic metal-binding ligands have been shown to degrade in sunlit surface seawater 520
transforming organically complexed iron to inorganically complexed or colloidal iron on diel time-521
scales (Powell and Wilson-Finelli, 2003; Shank et al., 2006). Thus, photochemically induced 522
flocculation of dissolved and colloidal iron may be driven by photochemical degradation of metal-523
complexing ligands within DOM (Kopáček et al., 2005). 524
Even though photo-flocculation of DOM occurred during the first 10 days of the experiment, all 525
the iron essentially remained in solution (Fig. 3). It either quickly re-cycled back into the dissolved 526
phase by complexation with soluble organic ligands, or it was photo-reduced to iron (II), which is 527
soluble at the experimental pH (Fig. 1). Reduction to iron (II) may have occurred via ligand to metal 528
charge transfer reactions (Faust and Zepp, 1993) resulting in oxidative decarboxylation (Bockman et al. 529
1996; Thorn et al. 2010), which in turn enhanced the hydrophobicity of the residual DOM molecule 530
(Gao and Zepp 1998; Thorn et al. 2010). It is likely that, as the DOM became increasingly mineralized 531
and/or structurally altered, the abundance of ligands and/or electron donors diminished, causing a shift 532
in the speciation of the iron present and allowing less-soluble iron (III) oxyhydroxides to form (Deng 533
and Stumm, 1994). Alternatively or concurrently, iron-binding sites became more abundant in the POM 534
than in the DOM, leading to a transfer of organically complexed iron from the dissolved phase to the 535
particulate phase. Another concurrent possibility is that, as the pH increased during the irradiation (Fig. 536
1), DOM carboxyl groups became progressively deprotonated and thus more readily complexed with 537
21
metals to form insoluble metal DOM complexes via cation bridged aggregates (Nierop et al., 2002) 538
and/or the solubility of iron (III) may simply have decreased as a result of the rising pH (Schwertmann 539
and Murad, 1983; Schwertmann, 1991; Liu and Millero, 2002). More work is needed to determine the 540
degree to which and the conditions under which each of the above are the most important processes. 541
While iron oxidation rates and solubility have been well studied in pure water (King and Farlow, 542
2000), sodium chloride brines (King et al., 1995; Liu and Millero, 1999), and seawater (Liu and Millero, 543
2002), the impact of strong iron (II and III) ligands present in humic-rich and eutrophic freshwater 544
systems (Shapiro, 1964; Emmenegger et al., 1998) make estimating the oxidative lifetime of iron (II) 545
and solubility of iron (III) at sub-neutral pH, based on available literature, problematic. In pure water at 546
pH = 4 and atmospheric equilibrium for example, more than half of the iron initially present would be 547
expected to oxidize and precipitate within 10 days (Morgan and Lahav, 2007); however, under both 548
light and dark experimental conditions, essentially all of the iron remained in solution in Dismal Swamp 549
water samples for a minimum of ten days. Iron is clearly present in the 20 and 30 d irradiated particles 550
(Figs. 3c and 7b), though it is not known whether this association formed primarily in the solution phase 551
through adsorption of DOM to iron (III) oxyhydroxide particles (e.g. Luider et al., 2003) or resulted 552
simply from coincident precipitation. These results suggest that photochemical flocculation and/or the 553
photochemical removal of iron (III)-binding ligands play an important role in the removal of dissolved 554
iron in estuaries and in the transport of riverine iron to the water column and sediments of the ocean 555
margins. 556
4.5 Implications for biogeochemical cycles 557
It should be noted that the POC formation rates of 0.13-0.47 mg C L-1 d-1, reported here, are 558
lower than the rate of 0.50 mg C L-1 d-1 reported by Gao and Zepp (1998) and that all published 559
instances of photochemically mediated DOM flocculation have been reported for high DOC, low pH 560
terrestrial environments with high DOC/TOC ratios. Furthermore, these estimates do not take into 561
account photo-dissolution of the flocculates in the flasks (Table 1; Kieber et al, 2006; Pisani et al., 2011; 562
Porcal et al., 2013) nor possible dilution effects in the environment. It is not yet known if photo-563
22
flocculation affects algal/marine DOM. The need for further investigation in this area of organic matter 564
reactivity is clearly indicated. 565
Photochemically induced flocculation represents a potentially significant source of organic 566
carbon, organic nitrogen, and iron to the sediments (Gao and Zepp, 1998; Scully et al., 2004; Porcal et 567
al., 2013), and thus may impact the geochemical cycling of these elements particularly in estuaries and 568
perhaps in coastal oceanic waters. The abiotic production of amides, which preferentially partition into 569
the particulate phase, may play a role in estuarine N-cycling and may help to explain the presence of 570
biologically refractory carbon and nitrogen in the sediments and deep ocean. Photochemical production 571
of surface-active DOM may significantly contribute to the high rates of organic matter preservation 572
observed in coastal sediments underlying tDOM rich surface waters (Dagg et al. 2004). Preliminary 573
calculations presented in Helms (2012) suggest that as much as 4.5% of terrestrial DOM may photo-574
flocculate before reaching the open ocean, delivering roughly 7.2 x 10¹² g C y-1 to the sediments in 575
marginal environments. Thus, photochemical flocculation may be a quantitatively important removal of 576
tDOM from the water column and may partially explain the apparent disconnect between the large 577
riverine source of tDOM and the low abundance of identifiable terrestrial DOM in the oceans (Hedges 578
et al., 1997). 579
580
ACKNOWLEDGMENTS: The authors would like to thank Aron Stubbins, Patrick G. Hatcher, 581
Richard Zimmerman, and Andrew Wozniak, for helpful discussions and comments about an early draft 582
of this manuscript. The input of three anonymous reviewers was instrumental in improving the quality 583
of this manuscript prior to its publication and is greatly appreciated. This research was supported by 584
NSF grant: OCE-0728634 585
586
23
FIGURE CAPTIONS 587
Fig. 1. pH values of water samples measured at the end of each irradiation time point. 588
Fig. 2. Concentrations of dissolved (gray), particulate (black), and adsorbed (white) material as a 589
function of irradiation time: (a) organic carbon, (b) absorption at 300 nm, (c) total iron by atomic 590
absorption, and (d) total nitrogen. Error bars represent the combined standard deviations of the “total,” 591
“dissolved,” and “adsorbed” terms from which the “particulate” term was calculated. Total nitrogen was 592
not determined for the “adsorbed” material. 593
Fig. 3. Percentage distribution of dissolved (gray), particulate (black), and adsorbed (white) material as 594
a function of irradiation time: (a) organic carbon, (b) absorption at 300 nm, (c) total iron by atomic 595
absorption, and (d) total nitrogen. 596
Fig. 4. (a, d, and g) UV-visible absorption spectra, (b, e, and h) first derivative absorption spectra, and 597
(c, f, and i) second derivative absorption spectra, were obtained for (a, b, and c) total, unfractionated, 598
samples in which flocculated POM was re-dissolved at high pH, (d, e, and f) dissolved samples from 599
which POM was removed, and (g, h, and i) POM obtained by difference. 600
Fig. 5. (a, d, and g) natural log UV-visible absorption spectra, (b, e, and h) first derivative natural log 601
absorption spectra, and (c, f, and i) second derivative natural log absorption spectra, were obtained for 602
(a, b, and c) total samples in which flocculated POM was re-dissolved at high pH, (d, e, and f) dissolved 603
samples from which POM was removed, and (g, h, and i) POM obtained by difference. 604
Fig. 6. Solid-state 13C CP-TOSS NMR spectra (heavy black line) obtained for (a) the dark control 605
sample, (b) the un-fractionated 10 d irradiated sample, (c) dissolved material isolated from the 10 606
d irradiated sample by centrifugation, and (d) the particulate material isolated from the 10 d 607
irradiated sample by centrifugation. Solid-state 13C CP-TOSS NMR spectra with CSA-filter (gray 608
line) and dipolar dephasing (narrow black line) are shown for comparison. The CSA-filtered 609
24
spectra show aliphatic material, while dipolar dephasing shows primarily non-protonated and 610
highly mobile carbons. 611
Fig. 7. FTIR spectra obtained for (a) dissolved organic matter (DOM) and (b) particulate organic matter 612
(POM). Labels to the left of each spectrum refer to the irradiation time point. 613
Fig. 8. Distribution of organic functional groups after 10 days irradiation. “Photolyzed” columns (white) 614
represent organic matter that was completely mineralized or volatilized. “POM” columns (black) 615
represent flocculated organic matter. “DOM” columns (gray) represent organic matter that remained in 616
the dissolved phase after irradiation. Functional group assignments are based on 13C NMR and FTIR 617
spectra. Quantifications are based on TOC measurements normalized to NMR and/or FTIR spectral 618
integrations. Acetate is included in the “COOH/COO-“ category. The carbonyl category refers to 619
aldehydes, ketones, and quinones. 620
Fig. 9. Proposed components of the photochemical flocculation mechanism for organic matter and 621
iron. During “Phase I” organic matter flocculates, but iron does not. During “Phase II” both 622
organic matter and iron flocculate. The transition from Phase I to Phase II during these 623
experiments may have been caused by loss of soluble iron binding ligands, the increase in pH, 624
and/or the build up of iron (III) as the iron photo-reduction rate decreased relative to Fenton’s 625
reaction. Fe(s) represents solid iron oxyhydroxides. The “Continuous” and “Competitive” 626
processes are described in the Discussion. 627
628
25
TABLES 629
Table 1 630 Summary of parameters measured during the irradiation experiment. Total=whole, unfractionated 631 samples; Diss=dissolved, particle free samples; Ads=adsorbed material; PM=particulate values 632 determined by difference except where denoted with *. Values in italics refer to dark control samples. 633 N/D=not determined. Analytical uncertainty is reported as one standard deviation (n ≥ 3). 634
635 636
637 Sample
Irr. Time (days)
TOC (mg L-1)
TN (mg L-1)
Iron (µmol L-1)
a300 (m-1)
S 275-295 (µm-1) SR SUVA254
(L m-1 mg-1)
0d-Total 0 52.7 ±0.2 1.89 ±0.01 34.8 ±0.3 369 ±3 15.1 ±0.2 0.91 ±0.02 11.8 ±0.1
10d-Total 10 31.0 ±0.2 1.69 ±0.02 34.2 ±0.3 211 ±1 10.8 ±0.2 1.12 ±0.02 10.8 ±0.1 0 53.0 ±0.2 1.81 ±0.02 34.3 ±0.4 366±1 13.2 ±0.3 0.92 ±0.03 11.9 ±0.1
20d-Total 20 22.0 ±0.2 1.66 ±0.02 34.6 ±0.3 118 ±1 9.7 ±0.2 1.13 ±0.02 8.3 ±0.1 0 52.2 ±0.4 1.91 ±0.02 34.4 ±0.2 365 ±1 12.7 ±0.4 0.88 ±0.4 11.6 ±0.1
30d-Total 30 10.5 ±0.2 1.37 ±0.01 34.2 ±0.3 48.7 ±0.3 9.4 ±0.1 1.00 ±0.02 6.7 ±0.1 0 52.9 ±0.3 1.91 ±0.02 34.5 ±0.3 363 ±2 12.7 ±0.3 0.93 ±0.02 11.4 ±0.1
10d-Diss 10 26.3 ±0.1 1.41 ±0.01 34.1 ±0.3 189.1 ±0.6 11.4 ±0.1 1.15 ±0.02 11.7 ±0.1 0 52.0 ±0.3 1.90 ±0.02 33.6 ±0.2 370±1 12.5 ±0.2 0.91 ±0.01 11.8 ±0.1
20d-Diss 20 15.6 ±0.1 1.31 ±0.02 26.8 ±0.3 102.9 ±0.5 10.3 ±0.1 1.17 ±0.02 10.5 ±0.1 0 51.5 ±0.2 1.85 ±0.02 34.2 ±0.3 346 ±12 13.5 ±0.3 0.87 ±0.03 11.5 ±0.4
30d-Diss 30 6.5 ±0.2 1.02±0.01 4.5 ±0.1 19.4 ±0.1 18.2 ±0.1 1.72 ±0.03 5.9 ±0.2 0 54.8 ±0.8 1.88 ±0.02 35.1 ±0.4 369 ±2 12.4 ±0.3 0.91 ±0.02 11.7 ±0.1
0d-Ads 0 0.3 ±0.1 N/D 0.02 ±0.01 0.4 ±0.3 13.5 ±0.3 1.15 ±0.02 2.4 ±2.0
10d-Ads 10 2.3 ±0.1 N/D 0.07 ±0.02 5.4 ±0.5 9.2 ±0.3 0.74 ±0.01 2.8 ±0.3 0 0.3 ±0.2 N/D N/D 0.2 ±0.2 13.8 ±0.5 1.16 ±0.02 2.1 ±3.0
20d-Ads 20 1.7 ±0.1 N/D 0.36 ±0.04 1.3 ±0.5 11.5 ±0.3 0.93 ±0.02 1.0 ±0.4 0 N/D N/D 0.02 ±0.01 N/D N/D N/D N/D
30d-Ads 30 2.5 ±0.1 N/D 0.29 ±0.04 7.4 ±0.7 13.6 ±0.4 0.77 ±0.02 4.3 ±0.4 0 0.3 ±0.2 N/D 0.02 ±0.01 0.5 ±0.2 12.8 ±0.5 1.14 ±0.02 2.5 ±2.0
10d-PM 10 4.7 ±0.2 0.29 ±0.02 0.1 ±0.4 22 ±1 8.6* ±0.3 0.72* ±0.03 4.8 ±0.3 0 1.0 ±0.4 -0.09 ±0.03 0.7 ±0.4 -4 ±1 N/D N/D N/D
20d-PM 20 6.4 ±0.2 0.35 ±0.03 7.8 ±0.4 16 ±1 N/D N/D N/D 0 0.7 ±0.4 0.06 ±0.03 0.2 ±0.4 19 ±12 N/D N/D N/D
30d-PM 30 4.0 ±0.3 0.35 ±0.02 29.7 ±0.1 29.3 ±0.3 N/D N/D N/D 0 -1.9 ±0.9 0.03 ±0.03 -0.6 ±0.5 -6 ±3 N/D N/D N/D
26
Table 2 638 Functional group assignments and integrated area for each CP-TOSS spectral region. Integrals are given 639 as percentage of total area (i.e. percentage of total carbon in the sample) for qualitative comparison of 640 each sample. Uncertainties were determined using the signal to noise ratio of each integration region 641 and are given as one standard deviation. 642
Integration
range (ppm)
Dark Control
10 d Total
10 d Particles
10 d Dissolved
CH3 and CH2 0-28 8.4 ±0.2 12.7 ±0.3 19 ±0.4 10.5 ±0.2 Mostly CH2 and some CH 28-35 3.8 ±0.1 5.1 ±0.2 7.6 ±0.3 5.4 ±0.1 CH and alkyl Cquat. 35-50 9.3 ±0.2 10.6 ±0.3 9.0 ±0.3 11.3 ±0.2 NCH + OCH3 + OCH2 50-65 9.0 ±0.2 9.5 ±0.2 11.3 ±0.5 9.9 ±0.1 Carbohydrate-like C 65-100 21.0 ±0.4 22.0 ±0.4 13.6 ±0.5 23.0 ±0.3 OCHO + arom. C-C-O 100-115 6.3 ±0.2 5.0 ±0.2 3.0 ±0.3 4.8 ±0.1 Aromatic C 115-145 12.1 ±0.3 7.8 ±0.2 6.2 ±0.3 7.9 ±0.1 Aromatic C-O 145-160 4.7 ±0.2 2.8 ±0.2 2.3 ±0.3 2.8 ±0.1 COO +NC=O 160-187 20.5 ±0.4 22 ±0.4 26 ±0.6 20 ±0.3 Aldehyde, Ketone and Quinone C 187-220 4.6 ±0.2 2.7 ±0.2 1.0 ±0.3 4.1 ±0.1
643 644
27
Table 3 645 CP-TOSS integration data from Table 2 normalized to TOC concentrations and reported in 646 concentration of µmol C L-1 for quantitative comparison of the samples. Uncertainties reported as one 647 standard deviation and calculated based on the combined CP-TOSS and TOC uncertainties. 648
Integration
range (ppm)
Dark Control
10 d Total
10 d Particles
10 d Dissolved
CH3 and CH2 0-28 370 ±9 330 ±8 74 ±4 240 ±5 Mostly CH2 and some CH 28-35 170 ±5 130 ±5 30 ±2 120 ±2 CH and alkyl Cquat. 35-50 410 ±9 270 ±8 35 ±2 240 ±4 NCH + OCH3 + OCH2 50-65 400 ±9 250 ±6 43 ±3 220 ±2 Carbohydrate-like C 65-100 920 ±18 570 ±11 55 3 500 ±7 OCHO + arom. C-C-O 100-115 280 ±9 130 ±5 12 ±1 110 ±2 Aromatic C 115-145 530 ±13 200 ±5 24 ±2 170 ±2 Aromatic C-O 145-160 210 ±9 70 ±5 9±1 61 ±2 COO +NC=O 160-187 920 ±18 570 ±11 102 ±5 440 ±7 Aldehyde, Ketone and Quinone C 187-220 200 ±9 70 ±5 4 ±1 90 ±2
649 650 651 652
28
Table 4 653 Estimated concentrations of different carboxylic moieties (µmol C L-1). Quantifications are based on 654 deconvoluted FTIR spectra, NMR integration of the 165-190 ppm region, and TOC measurements. 655 Uncertainty reported as one standard deviation. 656
Peak Center(s)
(cm-1) Dark
Control 10 d Total
10 d Particles
10 d Dissolved
Ester/Lactone 1775 72 ±8 20 ±1 0 ±0.1 16 ±1 Acetate 1745 0 ±0.2 46 ±5 9 ±1 32 ±2 COOH & COO- 1580, 1720 390 ±20 94 ±4 43 ±8 48 ±4 COO-Fe 1620 380 ±20 280 ±6 0 ±0.1 270 ±5 Amide 1650 28 ±4 44 ±4 40 ±4 1 ±0.5
657
658
29
REFERENCES 659
Abdulla, H. A. N., Dias, R. F., and Minor, E. C., 2009. Understanding the enhanced aqueous solubility 660 of styrene by terrestrial dissolved organic matter using stable isotope mass balance and FTIR. 661 Org. Geochem. 40, 547-552. 662
Abdulla, H. A. N., Minor, E. C., Dias, R. F., and Hatcher, P. G., 2010. Changes in the compound classes 663 of dissolved organic matter along an estuarine transect: a study using FTIR and 13C-NMR. 664 Geochim. Cosmochim. Acta 74, 3815-3838. 665
Alldredge, A. L. and Silver, M. W., 1988. Characteristics, dynamics and significance of marine snow. 666 Progr. Oceanogr. 20, 41-82. 667
Aluwihare, L. I., Repeta, D. J., Pantoja, S., and Johnson, C. G., 2005. Two chemically distinct pools of 668 organic nitrogen accumulate in the ocean. Science 308, 1007-1010. 669
Barbeau, K., 2006. Photochemistry of organic iron(III) complexing ligands in oceanic systems. 670 Photochem. Photobiol. 82, 1505-1516. 671
Baylor, E. R. and Sutcliffe, W. H., 1963. Dissolved organic matter in sea water as a source of particulate 672 food. Limnol. Oceanogr. 8, 369-371. 673
Bianchi, T. S., Filley, T., Dria, K., and Hatcher, P. G., 2004. Temporal variability in sources of 674 dissolved organic carbon in the lower Mississippi River. Geochim. Cosmochim. Acta 68, 959-675 967. 676
Black, A. P., Birkner, F. B., and Morgan, J. J., 1965. Destabilization of dilute clay suspensions with 677 labeled polymers. J. Am. Water Works Assoc. 57, 1547-1560. 678
Boyle, E. A., Edmond, J. M., and Sholkovitz, E. R., 1977. The mechanism of iron removal in estuaries. 679 Geochim. Cosmochim. Acta 41, 1313-1324. 680
Bushaw, K. L., Zepp, R. G., Tarr, M. A., Schultz-Jander, D., Bourbonniere, R. A., Hodson, R. E., 681 Miller, W. L., Bronk, D. A., and Moran, M. A., 1996. Photochemical release of biologically 682 available nitrogen from aquatic dissolved organic matter. Nature 381, 404-407. 683
Chiou, C. T., Malcolm, R. L., Brinton, T. I., and Kile, D. E., 1986. Water solubility enhancement of 684 some organic pollutants and pesticides by dissolved humic and fulvic acids. Environ. Sci. 685 Technol. 20, 502-508. 686
Compiano, A. M., Romano, J. C., Garabetian, F., Laborde, P., and de la Giraudiere, I., 1993. 687 Monosaccharide composition of particulate hydrolysable sugar fraction in surface microlayers 688 from brackish and marine waters. Mar. Chem. 42, 237-251. 689
Dagg, M., Benner, R., Lohrenz, S., and Lawrence, D., 2004. Transformation of dissolved and particulate 690 materials on continental shelves influenced by large rivers: plume processes. Cont. Shelf Res. 24, 691 833-858. 692
DeAzevedo, E. R., Hu, W.-G., Bonagamba, T. J., and Schmidt-Rohr, K., 2000. Principles of centerband-693 only detection of exchange in solid-state nuclear magnetic resonance, and extension to four-time 694 centerband-only detection of exchange. J. Chem. Phys. 112, 8988-9001. 695
Del Castillo, C. E., Coble, P. G., Morrell, J. M., Lopez, J. M., and Corredor, J. E., 1999. Analysis of the 696 optical properties of the Orinoco River plume by absorption and fluorescence spectroscopy. 697 Mar. Chem. 66, 35-51. 698
Del Vecchio, R. and Blough, N. V., 2002. Photobleaching of chromophoric dissolved organic matter in 699 natural waters: kinetics and modeling. Mar. Chem. 78, 231-253. 700
Del Vecchio, R. and Subramaniam, A., 2004. Influence of the Amazon River on the surface optical 701 properties of the western tropical North Atlantic Ocean. J. Geophys. Res. 109, C11001. 702
Deng, Y. and Stumm, W., 1994. Reactivity of aquatic iron(III) oxyhydroxides - implications for redox 703 cycling of iron in natural waters. Appl. Geochem. 9, 23-36. 704
Dixon, W. T., 1982. Spinning-sideband-free and spinning-sideband-only NMR spectra in spinning 705 samples. J. Chem. Phys. 77, 1800-1809. 706
Eckert, J. M. and Sholkovitz, E. R., 1976. The flocculation of iron, aluminum and humates from river 707 water by electrolytes. Geochim. Cosmochim. Acta 40, 847-848. 708
30
Emmenegger, L., King, D. W., Sigg, L., and Sulzberger, B., 1998. Oxidation kinetics of Fe(II) in a 709 eutrophic Swiss lake. Environ. Sci. Technol. 32, 2990-2996. 710
Esteves, V. I., Otero, M., and Duarte, A. C., 2009. Comparative characterization of humic substances 711 from the open ocean estuarine water and fresh water. Org. Geochem. 40, 942-950. 712
Faust, B. C. and Zepp, R. G., 1993. Photochemistry of aqueous iron (III)-polycarboxylate complexes: 713 roles in the chemistry of atmospheric and surface waters. Environ. Sci. Technol. 27, 2517-2522. 714
Forsgren, G., Jansson, M., and Nilsson, P., 1996. Aggregation and sedimentation of Iron, Phosphorous 715 and organic carbon in experimental mixtures of freshwater and estuarine water. Estuar. Coast. 716 Shelf Sci. 43, 259-268. 717
Fox, L. E., 1983. The removal of dissolved humic acid during estuarine mixing. Estuar. Coast. Shelf 718 Sci. 16, 431-440. 719
Gao, H. Z. and Zepp, R. G., 1998. Factors influencing photoreactions of dissolved organic matter in 720 coastal river of the southern United States. Environ. Sci. Technol. 32, 2940-2946. 721
Gottlieb, H. E., Kotlyar, V., and Nudelman, A., 1997. NMR chemical shifts of common laboratory 722 solvents as trace impurities. J. Org. Chem. 62, 7512-7515. 723
Green, S. A. and Blough, N. V., 1994. Optical absorption and fluorescence properties of chromophoric 724 dissolved organic matter in natural waters. Limnol. Oceanogr. 39, 1903-1916. 725
Griffiths, P. R. and De Haseth, J. A., 2007. Fourier Transform Infrared Spectroscopy. Wiley 726 Interscience, New Jersey. 727
Guo, W., Stedmon, C., Han, Y., Wu, F., Yu, X., and Hu, M., 2007. The conservative and non-728 conservative behavior of chromophoric dissolved organic matter in Chinese estuarine waters. 729 Mar. Chem. 107, 357-366. 730
Harris, D.C., 2010. Quantitative Chemical Analysis, 8th ed. W. H. Freeman and Company, New York. 731 Hatcher, P. G., 1987. Chemical structural studies of natural lignin by dipolar dephasing solid-state 13C 732
nuclear magnetic resonance. Org. Geochem. 11, 31-39. 733 Hedges, J. I. and Keil, R. G., 1995. Sedimentary organic matter preservation: an assesment and 734
speculative synthesis. Mar. Chem. 49, 81-115. 735 Hedges, J. I., Keil, R. G., and Benner, R., 1997. What happens to terrestrial organic matter in the ocean? 736
Org. Geochem. 27, 195-212. 737 Helms, J. R., Stubbins, A., Ritchie, J., Minor, E. C., Kieber, D. J., and Mopper, K., 2008. Absorption 738
spectral slopes and slope ratios as indicators of molecular weight, source, and photobleaching of 739 chromophoric dissolved organic matter. Limnol. Oceanogr. 53, 955-969. 740
Helms, J.R., 2012. Spectroscopic characterization of dissolved organic matter: Insights into 741 composition, photochemical transformation and carbon cycling, Chemistry and Biochemistry. 742 Old Dominion University, Norfolk, VA, p. 228. 743
Henrichs, S. M. and Williams, P. T., 1985. Dissolved and particulate amino acids and carbohydrates in 744 the surface microlayer. Mar. Chem. 17, 141-163. 745
Henrichs, S. M., 1995. Sedimentary organic matter preservation: an assessment and speculative 746 synthesis - a comment. Mar. Chem. 49, 127-136. 747
Honghai, W., Yiying, L., Jiayi, W., Lixuan, Z., Dingcai, Z., and Juan, D., 2008. Surface adsorption of 748 iron oxide minerals for phenol and dissolved organic matter. Earth Sci. Front. 15, 133-141. 749
Johnson, B. D., 1976. Nonliving Organic Particle Formation from Bubble Dissolution. Limnol. 750 Oceanogr. 21, 444-446. 751
Kieber, R. J., Whitehead, R. F., and Skrabal, S. A., 2006. Photochemical production of dissolved 752 organic carbon from resuspended sediments. Limnol. Oceanogr. 51, 2187-2195. 753
King, D. W., Lounsbury, H. A., and Millero, F. J., 1995. Rates and mechanism of Fe(II) oxidation at 754 nanomolar total iron concentrations. Environ. Sci. Technol. 29, 818-824. 755
King, D. W. and Farlow, R., 2000. Role of carbonate speciation on the oxidation of Fe(II) by H2O2. 756 Mar. Chem. 70, 201-209. 757
Kopáček, J., Klemntova, S., and Norton, S., 2005. Photochemical production of ionic and particulate 758 aluminum and iron in lakes. Environ. Sci. Technol. 39, 3656-3662. 759
31
Kopáček, J., Maresova, M., Norton, S., Porcal, P., and Vesely, J., 2006. Photochemical source of metals 760 for sediments. Environ. Sci. Technol. 40, 4455-4459. 761
Koprivnjak, J.-F., Pfromm, P. H., Ingall, E., Vetter, T. A., Schmitt-Kopplin, P., Hertkorn, N., 762 Frommberger, M., Knicker, H., and Perdue, E. M., 2009. Chemical and spectroscopic 763 characterization of marine dissolved organic matter isolated using coupled reverse osmosis-764 electrodialysis. Geochim. Cosmochim. Acta 73, 4215-4231. 765
Kranck, K. and Milligan, T., 1980. Macroflocs: productionof marine snow in the laboratory. Mar. Ecol. 766 Prog. Ser. 3, 19-24. 767
Kuma, K., Nishioka, J., and Matsunaga, K., 1996. Controls on iron(III) hydroxide solubility in seawater: 768 The influence of pH and natural organic chelators. Limnol. Oceanogr. 41, 396-407. 769
Laglara, L. M. and van den Berg, C. M. G., 2009. Evidence for geochemical control of iron by humic 770 substances in seawater. Limnol. Oceanogr. 54, 610-619. 771
Liang, L., Luo, L., and Zhang, S., 2011. Adsorption and desorption of humic and fulvic acids on SiO2 772 particles at nano- and micro-scales. Colloid Surface Physicochem. Eng. Aspects 384, 126-130. 773
Liu, X. and Millero, F. J., 1999. The solubility of ironhydroxide in sodium chloride solutions. Geochim. 774 Cosmochim. Acta 77, 3487-3497. 775
Liu, X. and Millero, F. J., 2002. The solubility of iron in seawater. Mar. Chem. 77, 43-54. 776 Luider, C., Petticrew, E., and Curtis, P. J., 2003. Scavenging of dissolved organic matter (DOM) by 777
amorphous iron hydroxide particles Fe(OH)3(s). Hydrobiologia. 494, 37-41. 778 Mao, J.-D., Tremblay, L., Gagne, J.-P., Kohl, S., Rice, J., and Schmidt-Rohr, K., 2007. Humic acids 779
from particulate organic matter in the Saguenay Fjord and the St. Lawrence Estuary investigated 780 by advanced solid-state NMR. Geochim. Cosmochim. Acta 71, 5483-5499. 781
Mao, J.-D., and Schmidt-Rohr, K, 2004. Separation of aromatic-carbon 13C NMR signals from di-782 oxygen alkyl bands by a chemical-shift-anisotropy filter. Solid State NMR 26, 36-45. 783
Maurice, P. A., Cabaniss, S. E., Drummond, J., Ito, E., 2002. Hydrogeochemical controls on the 784 variations in chemical characteristics of natural organic matter at a small freshwater wetland. 785 Chem. Geol. 187, 59-77. 786
McCarthy, M., Pratum, T., Hedges, J., and Benner, R., 1997. Chemical composition of dissolved 787 organic nitrogen in the ocean. Nature 390, 150-154. 788
McKee, G. A. and Hatcher, P. G., 2010. Alkyl amides in two organic-rich anoxic sediments: A possible 789 new abiotic route for N seqestration. Geochim. Cosmochim. Acta 74, 6436-6450. 790
Mead, R. N. and Goñi, M. A., 2008. Matrix protected organic matter in a river dominated margin: A 791 possible mechanism to sequester terrestrial organic matter? Geochim. Cosmochim. Acta 72, 792 2673-2686. 793
Minor, E. C., Pothen, J., Dalzell, B. J., Abdulla, H., and Mopper, K., 2006. Effects of salinity changes 794 on the photodegradation and ultraviolet-visible absorbance of terrestrial dissolved organic 795 matter. Limnol. Oceanogr. 51, 2181-2186. 796
Minor, E. C., Dalzell, B. J., Stubbins, A., and Mopper, K., 2007. Evaluating the photoalteration of 797 estuarine dissolved organic matter using direct temperature-resolved mass spectrometry and UV-798 visible spectroscopy. Aquat. Sci. 69, 440-455. 799
Moore, W. S., Sarmiento, J. L., and Key, R. M., 1986. Tracing the amazon component of surface 800 Atlantic water using 228Ra, salinity, and silica. J. Geophys. Res. 91, 2574-2580. 801
Mopper, K., Zhou, J., Ramana, K. S., Passow, U., Dam, H. G., and Drapeau, 1995. Role of surface 802 active carbohydrates in the flocculation of a diatom bloom in a mesocosm. Deep-Sea Res. 42, 803 47-73. 804
Morgan, B. and Lahav, O., 2007. The effect of pH on the kinetics of spontaneous Fe(II) oxidation by O2 805 in aqueous solution – basic principles and a simple heuristic description. Chemosphere 68, 2080-806 2084. 807
Nierop, K. G., Jansen, B., and Verstraten, J. M., 2002. Dissolved organic matter, aluminum and iron 808 interactions: precipitation induced by metal/carbon ratio, pH and competition. Sci. Tot. Env. 300, 809 201-211. 810
32
O'Melia, C. R. and Stumm, W., 1967. Aggregation of Silica Despersions by Iron (III). J. Colloid 811 Interface Sci. 23, 437-447. 812
Opella, S. J. and Frey, M. H., 1979. Selection of nonprotonated carbon resonances in solid state nuclear 813 magnetic resonance. J. Am. Chem. Soc. 101, 5854-5856. 814
Orsetti, S., Andrade, E. M., and Molina, F. V., 2010. Modeling ion binding to humic substances: elastic 815 polyelectrolyte network model. Langmuir 26, 3134-3144. 816
Pfeffer, P. E., Gerasimowicz, W. V., and Piotrowsik, E. G., 1984. Effect of paramagnetic Iron on 817 quantitation in carbon- 13 cross polarization magic angle spinning nuclear magnetic resonance 818 spectroscopy of heterogeneous environmental matrices. Anal. Chem. 56, 734-741. 819
Pisani, O., Yamashita, Y., and Jaffe´, R., 2011. Photo-dissolution of flocculent, detrital material in 820 aquatic environments: contributions to the dissolved organic matter pool. Water Res. 45, 3836-821 3844. 822
Porcal, P., Dillon, P. J., and Molot, L. A., 2013. Photochemical production and decomposition of 823 particulate organic carbon in a freshwater stream. Aquat. Sci. DOI: 10.1007/s00027-013-0293-8. 824
Powell, R. and Wilson-Finelli, A., 2003. Photochemical degradation of organic iron complexing ligands 825 in seawater. Aquat. Sci. 65, 367-374. 826
Pullin, M. J., Progress, C. A., and Maurice, P. A., 2004. Effects of photoirradiation on the adsorption of 827 dissolved organic matter ot goethite. Geochim. Cosmochim. Acta 68, 3643-3656. 828
Rue, E.L., Bruland, K.W., 1995. Complexation of iron(III) by natural organic-ligands in the central 829 north pacific as determined by a new competitive ligand equilibration adsorptive cathodic 830 stripping voltammetric method. Mar. Chem. 50, 117-138. 831
Schwertmann, U., 1991. Solubility and oxidation of iron oxides. Plant and Soil 130, 1-25. 832 Schwertmann, U. and Murad, E. 1983. Effect of pH on the formation of goethite and hematite from 833
ferrihydrite. Clays Clay Miner. 31, 277-284. 834 Scully, N.M., Maie, N., Daily, S.K., Boyer, J.N., Jones, R.D., Jaffe´, R., 2004. Early diagenesis of plant-835
derived dissolved organic matter along a wetland, mangrove, estuary ecotone. Limnol. 836 Oceanogr. 49, 1667-1678. 837
Shank, G. C., Whitehead, R. F., Smith, M. L., Skrabal, S. A., and Kieber, R. J., 2006. Photodegradation 838 of storng-copper complexing ligands in organic-rich estuarine waters. Limnol. Oceanogr. 51, 839 884-892. 840
Shapiro, J., 1964. Effect of yellow organic acids on iron and other metals in water. J. Amer. Water 841 Works Assoc. 56, 1062-1082. 842
Sholkovitz, E. R., 1976. Flocculation of dissolved organic and inorganic matter during the mixing of 843 river water and seawater. Geochim. Cosmochim. Acta 40, 831-835. 844
Sholkovitz, E. R., 1978. The flocculation of dissolved Fe, Mn, Al, Cu, Ni, Co and Cd during estuarine 845 mixing. Earth Planet. Sci. Lett. 41, 77-86. 846
Sholkovitz, E. R., Boyle, E. A., and Price, N. B., 1978. The removal of dissolved humic acids and iron 847 during estuarine mixing. Earth Planet. Sci. Lett. 40, 130-136. 848
Sondergaard, M., Stedmon, C. A., and Borch, N. H., 2003. Fate of terrigeneous dissolved organic matter 849 (DOM) in estuaries: agregation and bioavailability. Ophelia 57, 161-176. 850
Spencer, R. G. M., Stubbins, A., Hernes, P. J., Baker, A., Mopper, K., Aufdenkampe, A. K., Dyda, R. 851 Y., Mwamba, V. L., Mangangu, A. M., Wabeakanghanzi, J. N., and Six, J., 2009. Photochemical 852 degradation of dissolved organic matter and dissolved lignin phenols from the Congo River. J. 853 Geophys. Res. 114, G03010. 854
Stedmon, C. A. and Markager, S., 2005. Resolving the variability in dissolved organic matter 855 fluorescence in a temperate estuary and its catchment using PARAFAC analysis. Limnol. 856 Oceanogr. 50, 686-697. 857
Stedmon, C. A., Markager, S., Tranvik, L. J., Kronberk, L., Slatis, T., and Martinsen, W., 2007. 858 Photochemical production of ammonium and transformation of dissolved organic matter in the 859 Baltic Sea. Mar. Chem. 104, 227-204. 860
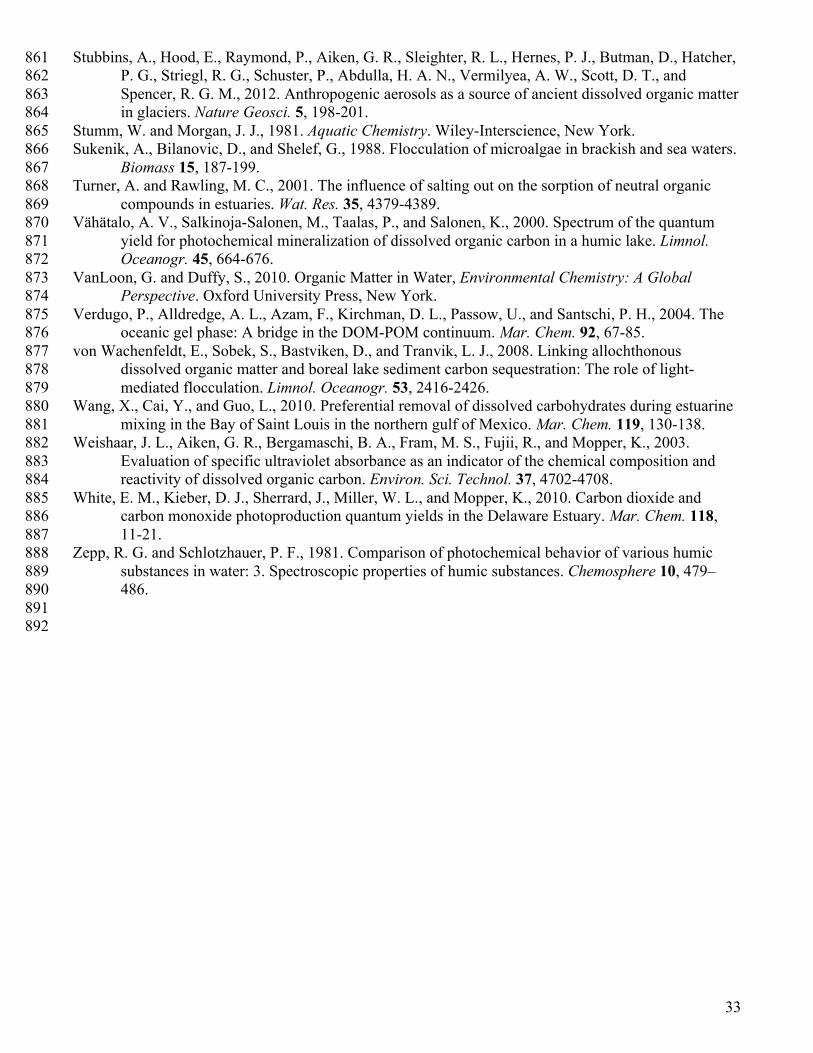
33
Stubbins, A., Hood, E., Raymond, P., Aiken, G. R., Sleighter, R. L., Hernes, P. J., Butman, D., Hatcher, 861 P. G., Striegl, R. G., Schuster, P., Abdulla, H. A. N., Vermilyea, A. W., Scott, D. T., and 862 Spencer, R. G. M., 2012. Anthropogenic aerosols as a source of ancient dissolved organic matter 863 in glaciers. Nature Geosci. 5, 198-201. 864
Stumm, W. and Morgan, J. J., 1981. Aquatic Chemistry. Wiley-Interscience, New York. 865 Sukenik, A., Bilanovic, D., and Shelef, G., 1988. Flocculation of microalgae in brackish and sea waters. 866
Biomass 15, 187-199. 867 Turner, A. and Rawling, M. C., 2001. The influence of salting out on the sorption of neutral organic 868
compounds in estuaries. Wat. Res. 35, 4379-4389. 869 Vähätalo, A. V., Salkinoja-Salonen, M., Taalas, P., and Salonen, K., 2000. Spectrum of the quantum 870
yield for photochemical mineralization of dissolved organic carbon in a humic lake. Limnol. 871 Oceanogr. 45, 664-676. 872
VanLoon, G. and Duffy, S., 2010. Organic Matter in Water, Environmental Chemistry: A Global 873 Perspective. Oxford University Press, New York. 874
Verdugo, P., Alldredge, A. L., Azam, F., Kirchman, D. L., Passow, U., and Santschi, P. H., 2004. The 875 oceanic gel phase: A bridge in the DOM-POM continuum. Mar. Chem. 92, 67-85. 876
von Wachenfeldt, E., Sobek, S., Bastviken, D., and Tranvik, L. J., 2008. Linking allochthonous 877 dissolved organic matter and boreal lake sediment carbon sequestration: The role of light-878 mediated flocculation. Limnol. Oceanogr. 53, 2416-2426. 879
Wang, X., Cai, Y., and Guo, L., 2010. Preferential removal of dissolved carbohydrates during estuarine 880 mixing in the Bay of Saint Louis in the northern gulf of Mexico. Mar. Chem. 119, 130-138. 881
Weishaar, J. L., Aiken, G. R., Bergamaschi, B. A., Fram, M. S., Fujii, R., and Mopper, K., 2003. 882 Evaluation of specific ultraviolet absorbance as an indicator of the chemical composition and 883 reactivity of dissolved organic carbon. Environ. Sci. Technol. 37, 4702-4708. 884
White, E. M., Kieber, D. J., Sherrard, J., Miller, W. L., and Mopper, K., 2010. Carbon dioxide and 885 carbon monoxide photoproduction quantum yields in the Delaware Estuary. Mar. Chem. 118, 886 11-21. 887
Zepp, R. G. and Schlotzhauer, P. F., 1981. Comparison of photochemical behavior of various humic 888 substances in water: 3. Spectroscopic properties of humic substances. Chemosphere 10, 479– 889 486. 890
891 892
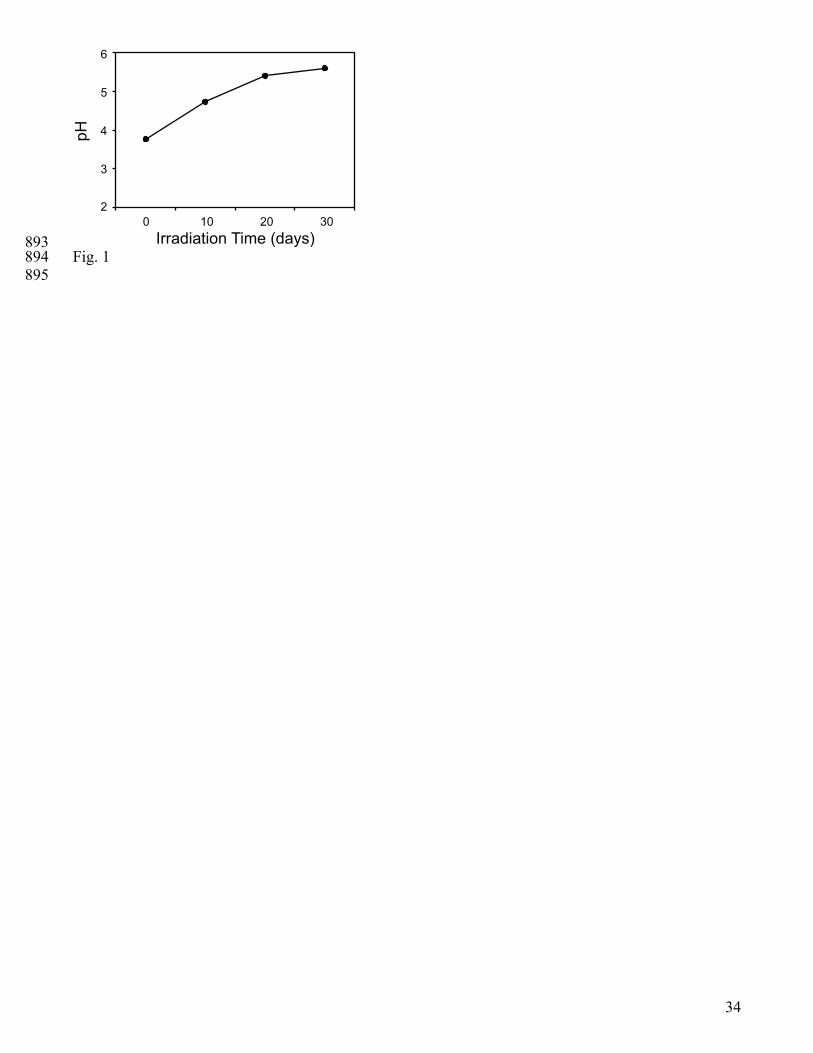
34
893 Fig. 1 894 895
3020100
6
5
4
3
2
Irradiation Time (days)
pH
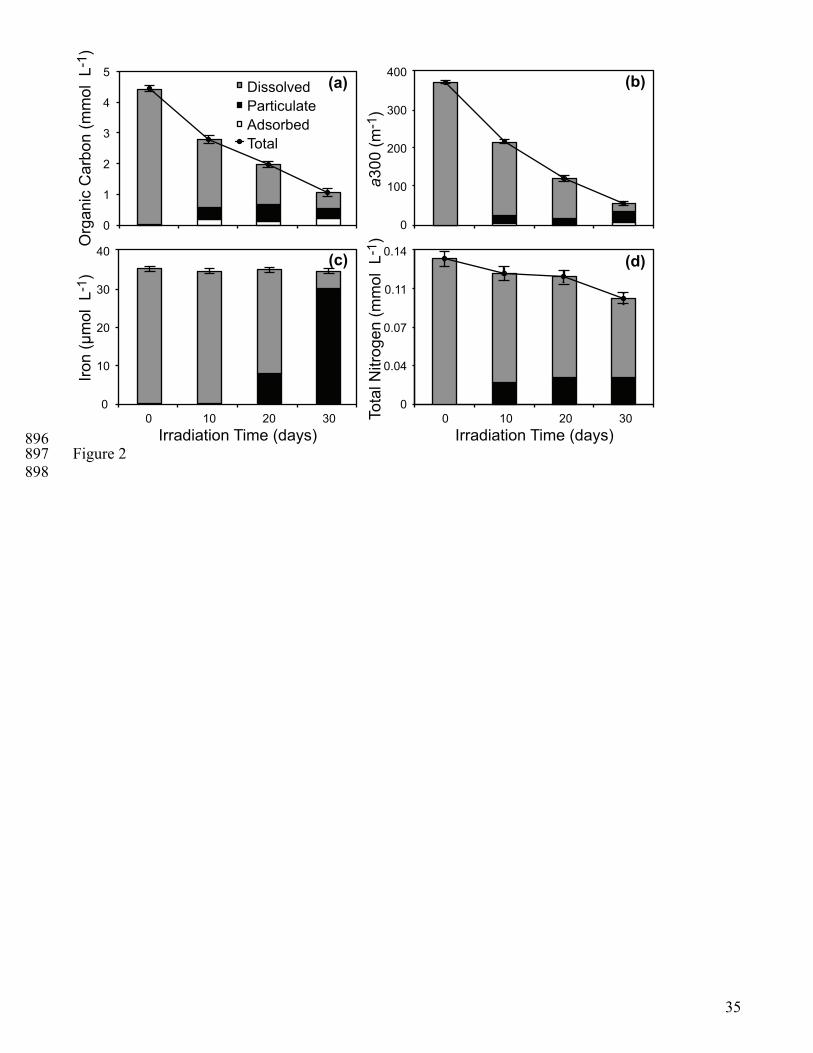
35
896 Figure 2 897 898
Org
anic
Car
bon
(mm
ol L
-1)
5
4
3
2
1
0
DissolvedParticulate
TotalAdsorbed
3020100
40
30
20
10
0
Irradiation Time (days)
Iron
(µm
ol L
-1)
3020100Irradiation Time (days)
a300
(m-1
)
400
300
200
100
0
Tota
l Nitr
ogen
(mm
ol L
-1)
0.14
0.11
0.07
0.04
0
(a)
(c)
(b)
(d)
36
899 Fig. 3 900
Org
anic
Car
bon
100%
75%
50%
25%
0%
3020100Irradiation Time (days)
Iron
3020100Irradiation Time (days)
a300
Tota
l Nitr
ogen
100%
75%
50%
25%
0%
100%
75%
50%
25%
0%
100%
75%
50%
25%
0%
(a)
(c)
(b)
(d)
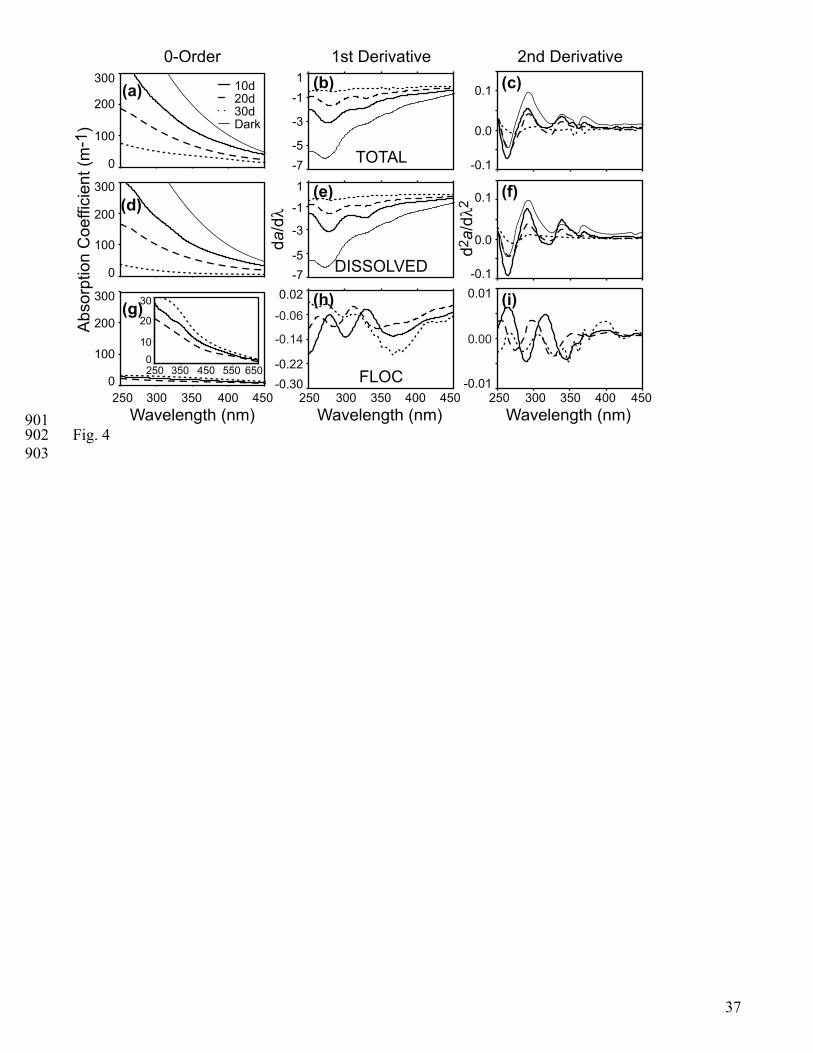
37
901 Fig. 4 902 903
650550450350250
30
20
100
250 300 350 400 450
300
200
100
0
300
200
100
0
300
200
100
0
(g)
(d)
(a) 10d20d30dDark
Wavelength (nm)
Abso
rptio
n C
oeffi
cien
t (m
-1)
0.02-0.06
-0.22-0.30
1-1
-3
-71
-3
-5-7
da/d
!
-5
-1
-0.14
250 300 350 400 450Wavelength (nm)
d2a/
d!2
0.01
-0.01
0.1
0.0
-0.1
0.1
0.0
-0.1
0.00
250 300 350 400 450Wavelength (nm)
(h)
(e)
(b)
(i)
(f)
(c)0-Order 1st Derivative 2nd Derivative
TOTAL
DISSOLVED
FLOC
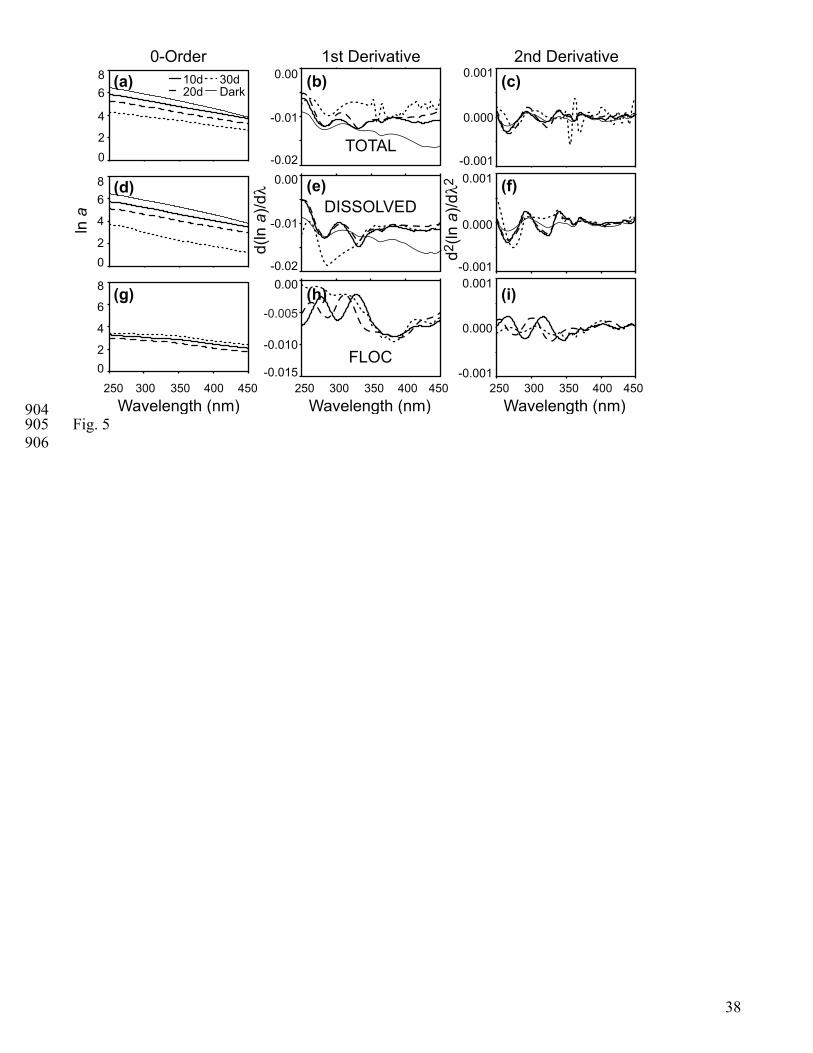
38
904 Fig. 5 905 906
250 300 350 400 450
8
4
20
(g)
(d)
(a) 10d20d
30dDark
Wavelength (nm)
ln a
0.00
-0.010
-0.015
0.00
-0.01
-0.02
d(ln
a)/d
!
-0.005
250 300 350 400 450Wavelength (nm)
d2(ln
a)/d
!2
0.001
0.000
-0.001
250 300 350 400 450Wavelength (nm)
(h)
(e)
(b)
(i)
(f)
(c)6
8
4
20
6
8
4
20
6
0.00
-0.01
-0.02
0.001
0.000
-0.0010.001
0.000
-0.001
0-Order 1st Derivative 2nd Derivative
TOTAL
DISSOLVED
FLOC
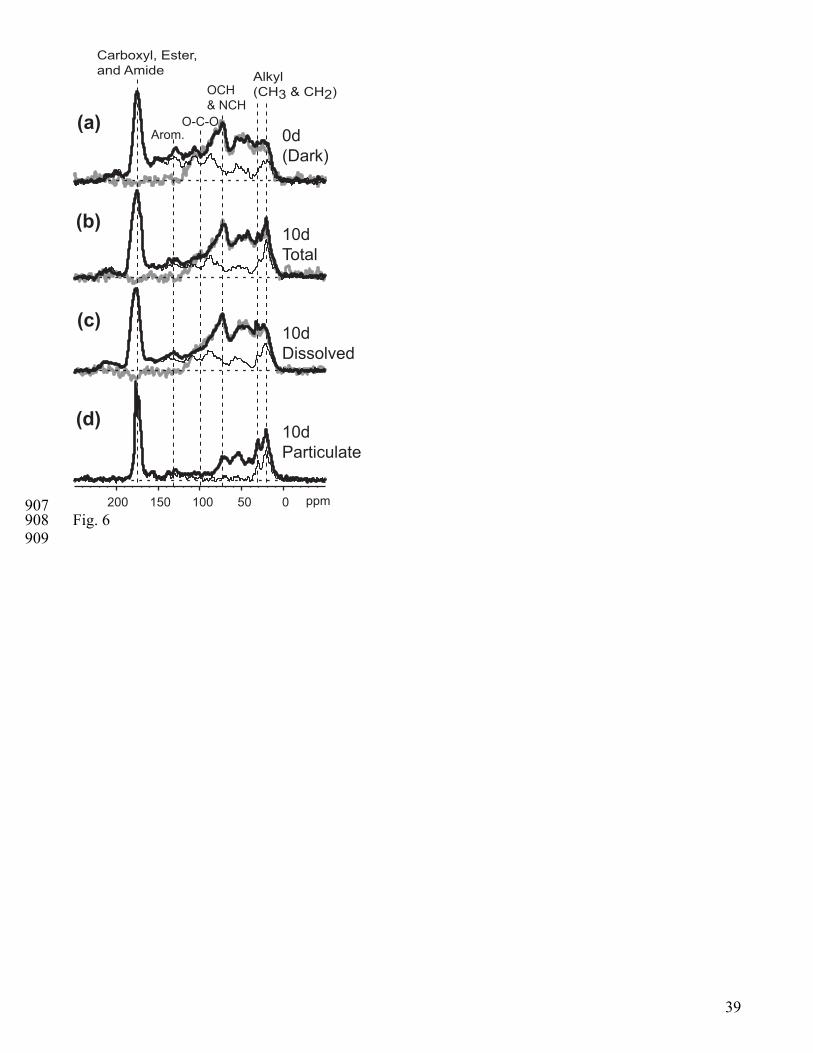
39
907 Fig. 6 908 909
(a)OCH& NCH
Arom.
Alkyl(CH3 & CH2)
200 150 100 50 0 ppm
(b)
(c)
(d)
O-C-O
Carboxyl, Ester,and Amide
0d(Dark)
10dTotal
10dDissolved
10dParticulate
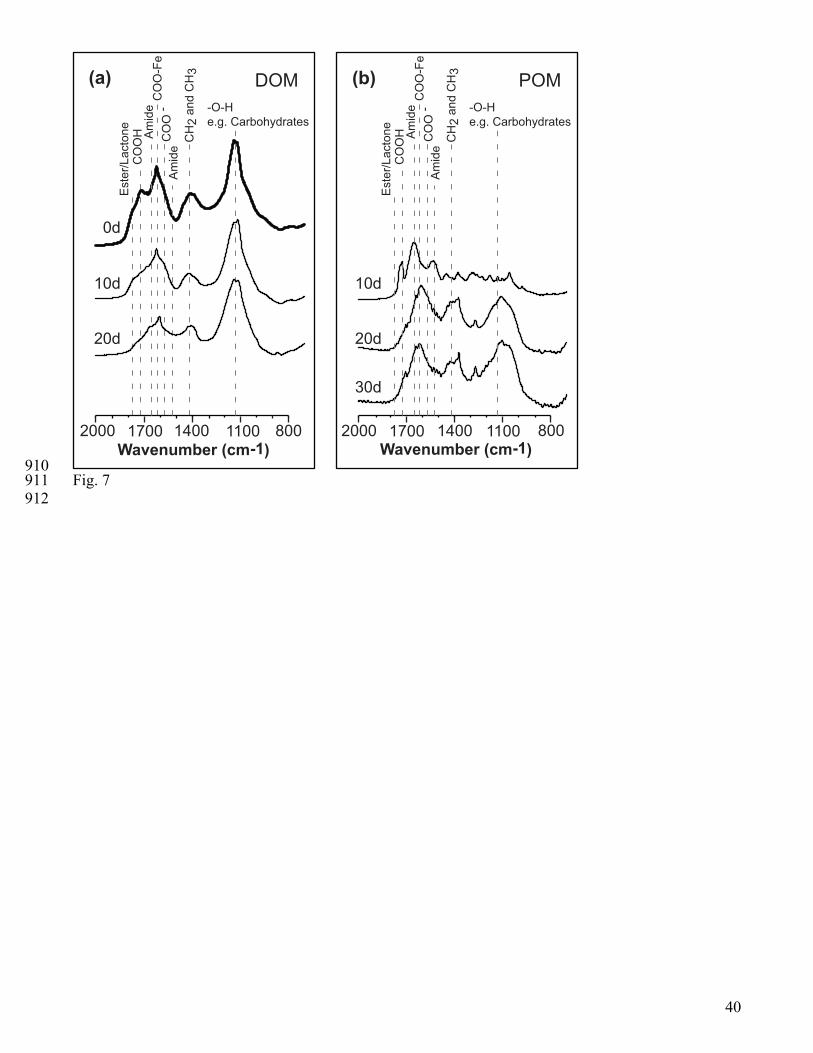
40
910 Fig. 7 911 912
2000 800Wavenumber (cm-1)
1400 2000 800Wavenumber (cm-1)
1400
Este
r/Lac
tone
CO
OH Am
ide
CO
O-F
eC
OO
-Am
ide
CH
2 an
d C
H3
-O-He.g. Carbohydrates
Este
r/Lac
tone
CO
OH Am
ide
CO
O-F
eC
OO
-Am
ide
CH
2 an
d C
H3
-O-He.g. Carbohydrates
0d
10d
20d
10d
20d
30d
(a) (b)
1700 1100 1700 1100
POMDOM
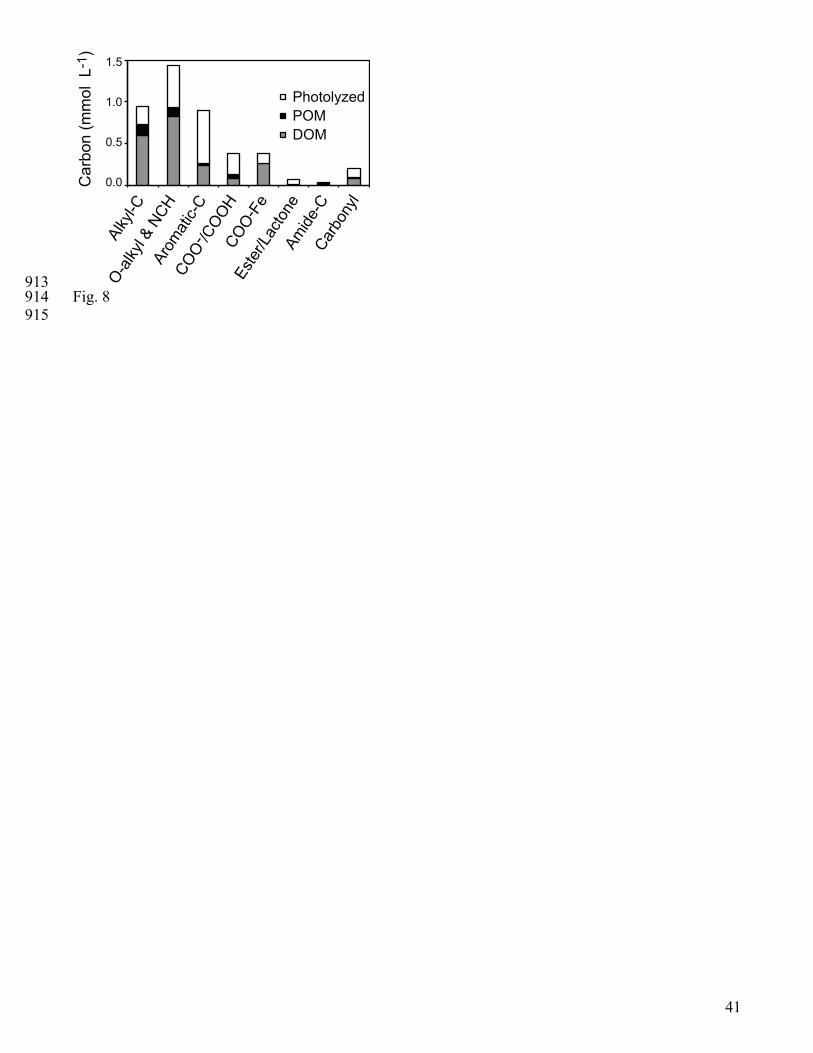
41
913 Fig. 8 914 915
1.5
1.0
0.5
0.0 Car
bon
(mm
ol L
-1)
Alky
l-CO-a
lkyl &
NCH
Arom
atic-C
COO
- /COOH
COO-
FeEs
ter/La
ctone
Amide
-CCa
rbon
yl
PhotolyzedPOMDOM
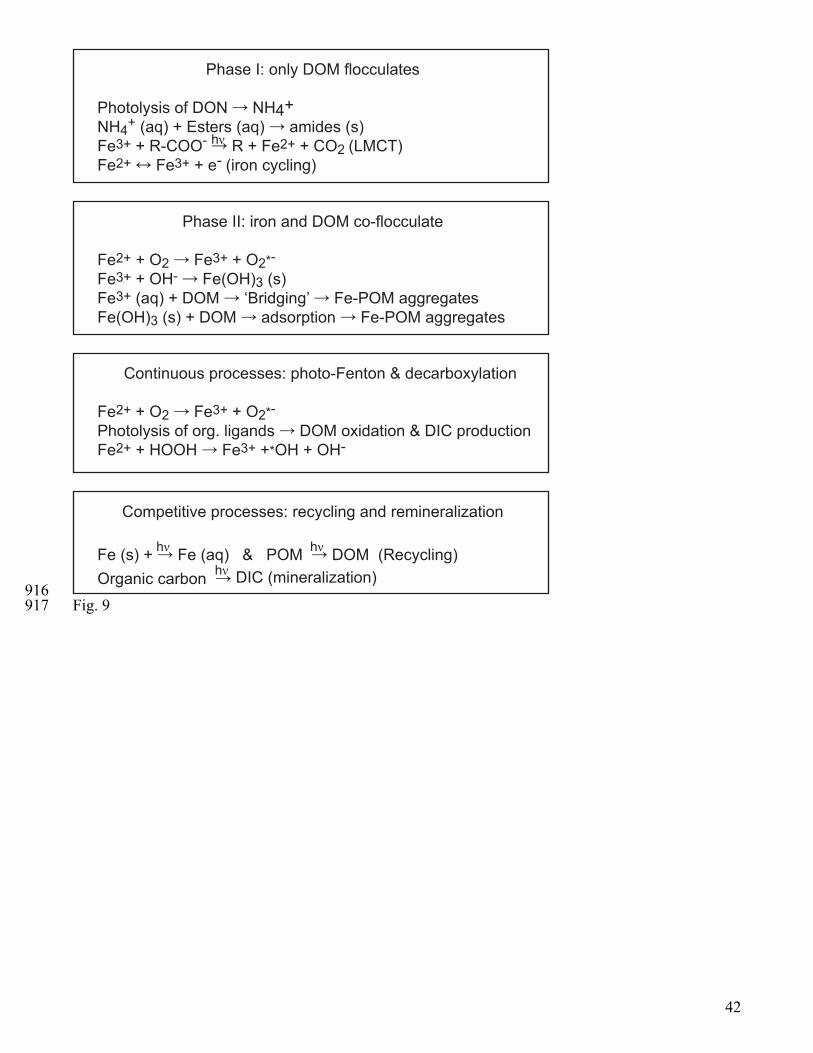
42
916 Fig. 9 917
Phase I: only DOM flocculates
Photolysis of DON ! NH4+NH4+ (aq) + Esters (aq) ! amides (s)Fe3+ + R-COO- ! R + Fe2+ + CO2 (LMCT)Fe2+ " Fe3+ + e- (iron cycling)
Phase II: iron and DOM co-flocculate
Fe2+ + O2 ! Fe3+ + O2*- Fe3+ + OH- ! Fe(OH)3 (s)Fe3+ (aq) + DOM ! ‘Bridging’ ! Fe-POM aggregatesFe(OH)3 (s) + DOM ! adsorption ! Fe-POM aggregates
Continuous processes: photo-Fenton & decarboxylation
Fe2+ + O2 ! Fe3+ + O2*- Photolysis of org. ligands ! DOM oxidation & DIC productionFe2+ + HOOH ! Fe3+ +*OH + OH-
Competitive processes: recycling and remineralization
Fe (s) + ! Fe (aq) & POM ! DOM (Recycling)Organic carbon ! DIC (mineralization)
h# h#
h#
h#


