Embed Size (px)
Citation preview
JPL Publication 97-4
Chemical Kinetics and Photochemical Datafor Use in Stratospheric Modeling
Evaluation Number 12
NASA Panel for Data Evaluation:
W. B. DeMore C. J. HowardS. P. Sander A. R. RavishankaraJet Propulsion Laboratory NOAA Environmental Research Laboratory
D. M. Golden C. E. KolbSRI International Aerodyne Research Inc.
R. F. Hampson M. J. MolinaM. J. Kurylo Massachusetts Institute of TechnologyNational Institute of Standards and Technology
January 15, 1997
NASANational Aeronautics andSpace Administration
Jet Propulsion LaboratoryCalifornia Institute of TechnologyPasadena, California
i i
The research described in this publication was carried out by the Jet PropulsionLaboratory, California Institute of Technology, under a contract with the NationalAeronautics and Space Administration.
Reference herein to any specific commercial product, process, or service by tradename, trademark, manufacturer, or otherwise, does not constitute or imply i t sendorsement by the United States Government or the Jet Propulsion Laboratory,California Institute of Technology.

iii
ABSTRACT
This is the twelfth in a series of evaluated sets of rate constants and photochemical cross sections compiled bythe NASA Panel for Data Evaluation. The primary application of the data is in the modeling of stratosphericprocesses, with particular emphasis on the ozone layer and its possible perturbation by anthropogenic and naturalphenomena. Copies of this evaluation are available from the Jet Propulsion Laboratory, California Institute ofTechnology, Document Distribution, MS 512-110, 4800 Oak Grove Drive, Pasadena, California, 91109.

iv
v
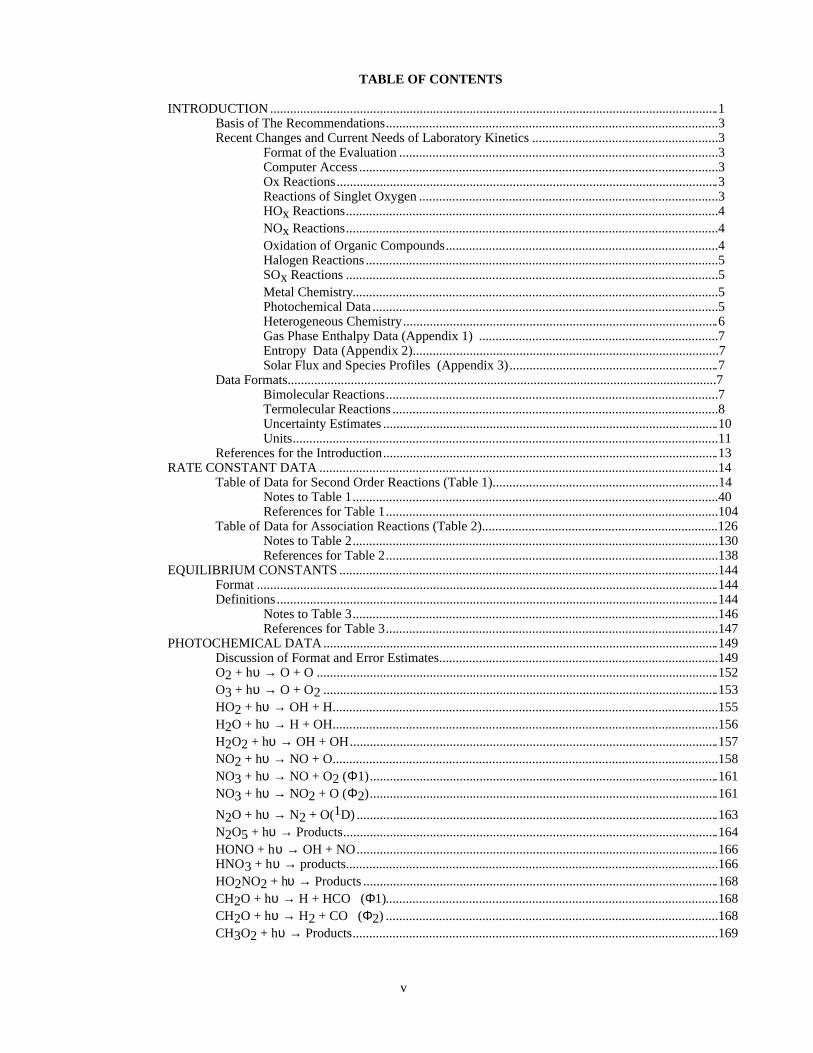
TABLE OF CONTENTS
INTRODUCTION .......................................................................................................................................1Basis of The Recommendations....................................................................................................3Recent Changes and Current Needs of Laboratory Kinetics ........................................................3
Format of the Evaluation ................................................................................................3Computer Access ............................................................................................................3Ox Reactions...................................................................................................................3Reactions of Singlet Oxygen ..........................................................................................3HOx Reactions................................................................................................................4NOx Reactions................................................................................................................4Oxidation of Organic Compounds..................................................................................4Halogen Reactions ..........................................................................................................5SOx Reactions ................................................................................................................5Metal Chemistry..............................................................................................................5Photochemical Data ........................................................................................................5Heterogeneous Chemistry...............................................................................................6Gas Phase Enthalpy Data (Appendix 1) ........................................................................7Entropy Data (Appendix 2)............................................................................................7Solar Flux and Species Profiles (Appendix 3)...............................................................7
Data Formats.................................................................................................................................7Bimolecular Reactions....................................................................................................7Termolecular Reactions ..................................................................................................8Uncertainty Estimates .....................................................................................................10Units................................................................................................................................11
References for the Introduction.....................................................................................................13RATE CONSTANT DATA ........................................................................................................................14
Table of Data for Second Order Reactions (Table 1)....................................................................14Notes to Table 1..............................................................................................................40References for Table 1....................................................................................................104
Table of Data for Association Reactions (Table 2).......................................................................126Notes to Table 2..............................................................................................................130References for Table 2....................................................................................................138
EQUILIBRIUM CONSTANTS ..................................................................................................................144Format ...........................................................................................................................................144Definitions.....................................................................................................................................144
Notes to Table 3..............................................................................................................146References for Table 3....................................................................................................147
PHOTOCHEMICAL DATA.......................................................................................................................149Discussion of Format and Error Estimates....................................................................................149O2 + hυ → O + O .........................................................................................................................152O3 + hυ → O + O2 .......................................................................................................................153HO2 + hυ → OH + H....................................................................................................................155H2O + hυ → H + OH....................................................................................................................156H2O2 + hυ → OH + OH...............................................................................................................157NO2 + hυ → NO + O....................................................................................................................158NO3 + hυ → NO + O2 (Φ1).........................................................................................................161NO3 + hυ → NO2 + O (Φ2).........................................................................................................161
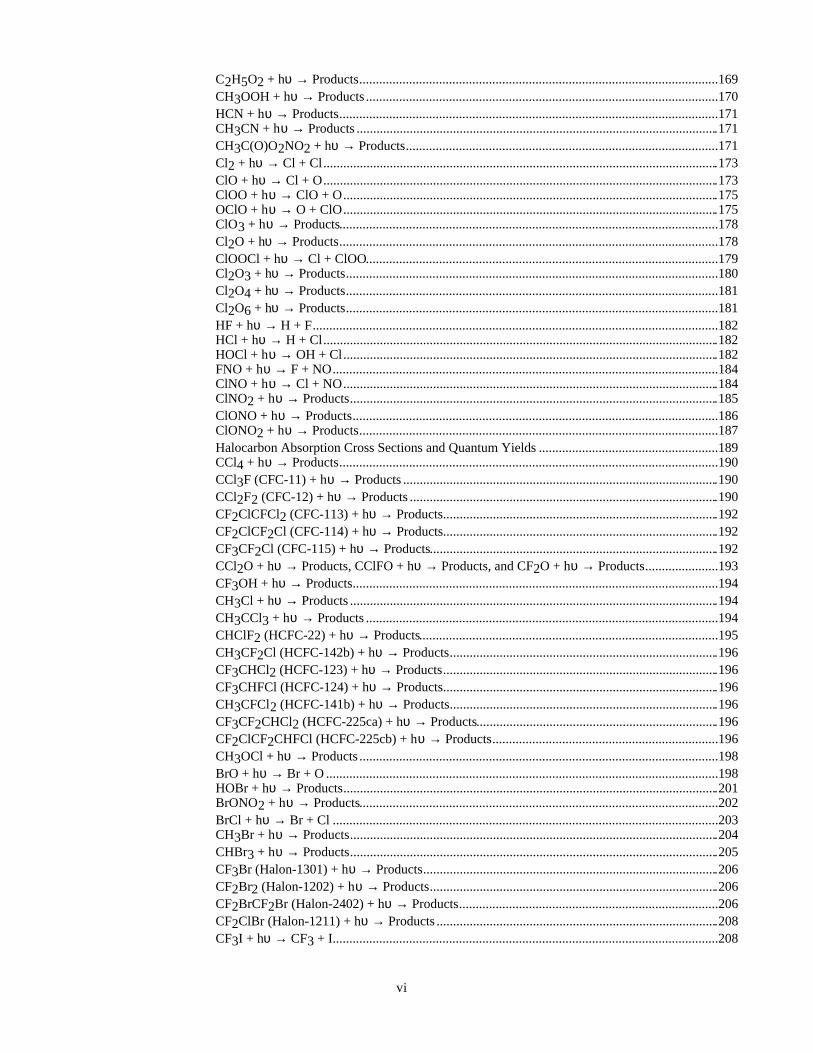
N2O + hυ → N2 + O(1D) .............................................................................................................163N2O5 + hυ → Products.................................................................................................................164HONO + hυ → OH + NO.............................................................................................................166HNO3 + hυ → products................................................................................................................166HO2NO2 + hυ → Products ...........................................................................................................168CH2O + hυ → H + HCO (Φ1)....................................................................................................168CH2O + hυ → H2 + CO (Φ2) ....................................................................................................168CH3O2 + hυ → Products..............................................................................................................169
vi
C2H5O2 + hυ → Products............................................................................................................169CH3OOH + hυ → Products..........................................................................................................170HCN + hυ → Products..................................................................................................................171CH3CN + hυ → Products .............................................................................................................171CH3C(O)O2NO2 + hυ → Products..............................................................................................171Cl2 + hυ → Cl + Cl.......................................................................................................................173ClO + hυ → Cl + O.......................................................................................................................173ClOO + hυ → ClO + O.................................................................................................................175OClO + hυ → O + ClO.................................................................................................................175ClO3 + hυ → Products..................................................................................................................178Cl2O + hυ → Products..................................................................................................................178ClOOCl + hυ → Cl + ClOO..........................................................................................................179Cl2O3 + hυ → Products................................................................................................................180Cl2O4 + hυ → Products................................................................................................................181Cl2O6 + hυ → Products................................................................................................................181HF + hυ → H + F..........................................................................................................................182HCl + hυ → H + Cl.......................................................................................................................182HOCl + hυ → OH + Cl.................................................................................................................182FNO + hυ → F + NO....................................................................................................................184ClNO + hυ → Cl + NO.................................................................................................................184ClNO2 + hυ → Products...............................................................................................................185ClONO + hυ → Products..............................................................................................................186ClONO2 + hυ → Products............................................................................................................187Halocarbon Absorption Cross Sections and Quantum Yields ......................................................189CCl4 + hυ → Products..................................................................................................................190CCl3F (CFC-11) + hυ → Products ...............................................................................................190CCl2F2 (CFC-12) + hυ → Products .............................................................................................190CF2ClCFCl2 (CFC-113) + hυ → Products...................................................................................192CF2ClCF2Cl (CFC-114) + hυ → Products...................................................................................192CF3CF2Cl (CFC-115) + hυ → Products.......................................................................................192CCl2O + hυ → Products, CClFO + hυ → Products, and CF2O + hυ → Products......................193CF3OH + hυ → Products..............................................................................................................194CH3Cl + hυ → Products ...............................................................................................................194CH3CCl3 + hυ → Products ..........................................................................................................194CHClF2 (HCFC-22) + hυ → Products..........................................................................................195CH3CF2Cl (HCFC-142b) + hυ → Products.................................................................................196CF3CHCl2 (HCFC-123) + hυ → Products...................................................................................196CF3CHFCl (HCFC-124) + hυ → Products...................................................................................196CH3CFCl2 (HCFC-141b) + hυ → Products.................................................................................196CF3CF2CHCl2 (HCFC-225ca) + hυ → Products.........................................................................196CF2ClCF2CHFCl (HCFC-225cb) + hυ → Products....................................................................196CH3OCl + hυ → Products............................................................................................................198BrO + hυ → Br + O ......................................................................................................................198HOBr + hυ → Products.................................................................................................................201BrONO2 + hυ → Products............................................................................................................202BrCl + hυ → Br + Cl ....................................................................................................................203CH3Br + hυ → Products...............................................................................................................204CHBr3 + hυ → Products...............................................................................................................205CF3Br (Halon-1301) + hυ → Products.........................................................................................206CF2Br2 (Halon-1202) + hυ → Products.......................................................................................206CF2BrCF2Br (Halon-2402) + hυ → Products..............................................................................206CF2ClBr (Halon-1211) + hυ → Products .....................................................................................208CF3I + hυ → CF3 + I....................................................................................................................208
vii
SO2 + hυ → Products ...................................................................................................................209CS2 + hυ → CS + S......................................................................................................................210OCS + hυ → CO + S ....................................................................................................................210SF6 + hυ → Products...................................................................................................................211NaOH + hυ → Na + OH ...............................................................................................................211NaCl + hυ → Na + Cl ...................................................................................................................211References for Photochemistry Section ........................................................................................212
HETEROGENEOUS CHEMISTRY...........................................................................................................220Surface Types................................................................................................................................220Surface Porosity ............................................................................................................................221Temperature Dependence..............................................................................................................221Solubility Limitations....................................................................................................................221Data Organization .........................................................................................................................221Parameter Definitions....................................................................................................................222
Notes to Table 63............................................................................................................227Notes to Table 64............................................................................................................238Notes to Table 65............................................................................................................249
References for Heterogeneous Section .........................................................................................251APPENDIX 1: GAS PHASE ENTHALPY DATA....................................................................................256APPENDIX 2: GAS PHASE ENTROPY DATA......................................................................................257APPENDIX 3: SOLAR FLUXES AND SPECIES PROFILES ................................................................258
LIST OF TABLES
Table 1. Rate Constants for Second Order Reactions ................................................................................14Table 2. Rate Constants for Association Reactions....................................................................................126Table 3. Equilibrium Constants..................................................................................................................145Table 4. Photochemical Reactions..............................................................................................................150Table 5. Combined Uncertainties for Cross Sections and Quantum Yields...............................................151Table 6. Absorption Cross Sections of O2 Between 205 and 240 nm .......................................................152
Table 7. Absorption Cross Sections of O3 at 273 K ..................................................................................154
Table 8. Quantum Yields, Φ, for Production of O(1D) in the Photolysis of O3........................................155
Table 9. Absorption Cross Sections of HO2..............................................................................................156
Table 10. Absorption Cross Sections of H2O Vapor .................................................................................156
Table 11. Absorption Cross Sections of H2O2 Vapor................................................................................157
Table 12. Mathematical Expression for Absorption Cross Sections of H2O2...........................................158
Table 13. Absorption Cross Sections of NO2............................................................................................159
Table 14. Quantum Yields for NO2 Photolysis..........................................................................................160
Table 15. Absorption Cross Sections of NO3 at 298 K..............................................................................163
Table 16. Mathematical Expression for Absorption Cross Sections of N2O as f(T) .................................164
Table 17. Absorption Cross Sections of N2O at 298 K..............................................................................164
Table 18. Absorption Cross Sections of N2O5..........................................................................................165
Table 19. Absorption Cross Sections of HONO ........................................................................................166Table 20. Absorption Cross Sections and Temperature Coefficients of HNO3 Vapor..............................167
Table 21. Absorption Cross Sections of HO2NO2 Vapor..........................................................................168
Table 22. Absorption Cross Sections and Quantum Yields for Photolysis of CH2O ................................169
Table 23. Absorption Cross Sections of CH3O2 and C2H5O2..................................................................170
Table 24. Absorption Cross Sections of CH3OOH....................................................................................170
Table 25. Absorption Cross Sections of PAN............................................................................................171Table 26. Absorption Cross Sections of Cl2 ..............................................................................................173
Table 27. Absorption Cross Sections of ClOO ..........................................................................................175
viii
Table 28. Absorption Cross Sections of OClO at the Band Peaks .............................................................176Table 29. Absorption Cross Sections of Cl2O............................................................................................178
Table 30. Absorption Cross Sections of ClOOCl at 200-250 K.................................................................180Table 31. Absorption Cross Sections of Cl2O3..........................................................................................181
Table 32. Absorption Cross Sections of Cl2O4..........................................................................................181
Table 33. Absorption Cross Sections of Cl2O6..........................................................................................182
Table 34. Absorption Cross Sections of HCl Vapor ..................................................................................182Table 35. Absorption Cross Sections of HOCl ..........................................................................................183Table 36. Absorption Cross Sections of FNO............................................................................................184Table 37. Absorption Cross Sections of ClNO ..........................................................................................185Table 38. Absorption Cross Sections of ClNO2 ........................................................................................186
Table 39. Absorption Cross Sections of ClONO at 231 K.........................................................................186Table 40. Absorption Cross Sections of ClONO2......................................................................................188
Table 41. Absorption Cross Sections of CCl4............................................................................................190
Table 42. Absorption Cross Sections of CCl3F .........................................................................................191
Table 43. Absorption Cross Sections of CCl2F2 .......................................................................................191
Table 44. Absorption Cross Sections for CF2ClCFCl2, CF2ClCF2Cl and CF3CF2Cl .............................192
Table 45. Absorption Cross Sections of CCl2O, CClFO and CF2O at 298 K...........................................193
Table 46. Absorption Cross Sections of CH3Cl.........................................................................................194
Table 47. Absorption Cross Sections of CH3CCl3....................................................................................195
Table 48. Absorption Cross Sections of CHClF2 ......................................................................................195
Table 49. Absorption Cross Sections of Hydrochlorofluoroethanes at 298 K ...........................................197Table 50. Absorption Cross Sections of CF3CF2CHCl2 and CF2ClCF2CHFCl ......................................197
Table 51 Absorption Cross Sections of CH3OCl......................................................................................198
Table 52. Absorption Cross Sections at the Peak of Various Bands in the Spectrum of BrO ...................199Table 53. Absorption Cross Sections of BrO .............................................................................................199Table 54. Absorption Cross Sections of HOBr ..........................................................................................201Table 55. Absorption Cross Sections of BrONO2......................................................................................202
Table 56. Absorption Cross Sections of BrCl at 298K ..............................................................................203Table 57. Absorption Cross Sections of CH3Br ........................................................................................204
Table 58. Absorption Cross Sections of CHBr3 at 296 K..........................................................................205
Table 59. Absorption Cross Sections of CF2ClBr, CF2Br2, CF3Br, and CF2BrCF2Br at 298 K ............207
Table 60. Absorption Cross Sections of CF3I at 298 K and temperature coefficient B* ..........................209
Table 61. Absorption Cross Sections of OCS ............................................................................................210Table 62. Absorption Cross Sections of NaCl Vapor at 300 K..................................................................211Table 63. Mass Accommodation Coefficients (α)......................................................................................224Table 64. Gas/Surface Reaction Probabilities (γ).......................................................................................233Table 65. Henry's Law Constants for Gas-Liquid Solubilities...................................................................248
ix
LIST OF FIGURES
Figure 1. Symmetric and Asymmetric Error Limits...................................................................................12Figure 2. Absorption Spectrum of NO3 .....................................................................................................162
Figure 3. Absorption Spectrum of ClO ......................................................................................................174Figure 4. Absorption Spectrum of OClO....................................................................................................177Figure 5. Absorption Spectrum of BrO ......................................................................................................200Figure 6. Solar Irradiance ...........................................................................................................................259Figure 7. Solar Flux at Several Altitudes....................................................................................................260Figure 8. Temperature and Density ............................................................................................................261Figure 9. Number Densities of Oxygen and Hydrogen Species.................................................................262Figure 10. Number Densities of Nitrogen Species .....................................................................................263Figure 11. Number Densities of Chlorine Species .....................................................................................264Figure 12. Number Densities of CFCl3, CF2Cl2, and CO.........................................................................265
Figure 13. J-Values for O2 and H2O..........................................................................................................266
Figure 14. Selected J-Values ......................................................................................................................267Figure 15. Selected J-Values ......................................................................................................................268Figure 16. Selected J-Values ......................................................................................................................269
1
INTRODUCTION
The present compilation of kinetic and photochemical data represents the 12th evaluation prepared by theNASA Panel for Data Evaluation. The Panel was established in 1977 by the NASA Upper Atmosphere ResearchProgram Office for the purpose of providing a critical tabulation of the latest kinetic and photochemical data for useby modelers in computer simulations of stratospheric chemistry. The previous publications appeared as follows:
Evaluation Reference
1 NASA RP 1010, Chapter 1 (Hudson [1])
2 JPL Publication 79-27 (DeMore et al. [12])
3 NASA RP 1049, Chapter 1 (Hudson and Reed [2])
4 JPL Publication 81-3 (DeMore et al. [11])
5 JPL Publication 82-57 (DeMore et al. [9])
6 JPL Publication 83-62 (DeMore et al. [10])
7 JPL Publication 85-37 (DeMore et al. [4])
8 JPL Publication 87-41 (DeMore et al. [5])
9 JPL Publication 90-1 (DeMore et al. [6])
10 JPL Publication 92-20 (DeMore et al. [7])
11 JPL Publication 94-26 (DeMore et al. [8])
The present composition of the Panel and the major responsibilities of each member are listed below:
W. B. DeMore, Chairman
D. M. Golden (three-body reactions, equilibrium constants)
R. F. Hampson (halogen chemistry)
C. J. Howard (HOx chemistry, O(1D) reactions, singlet O2, metal chemistry, profiles)
C. E. Kolb (heterogeneous chemistry)
M. J. Kurylo (SOx chemistry)
M. J. Molina (photochemical data)
A. R. Ravishankara (oxidation of organic compounds)
S. P. Sander (NOx chemistry, photochemical data)

2
As shown above, each Panel member concentrates his effort on a given area or type of data. Nevertheless, thefinal recommendations of the Panel represent a consensus of the entire Panel. Each member reviews the basis for allrecommendations, and is cognizant of the final decision in every case. Communications regarding particularreactions may be addressed to the appropriate panel member.
W. B. DeMoreS. P. SanderJet Propulsion Laboratory183-3014800 Oak Grove DrivePasadena, CA [email protected]@ftuvs.jpl.nasa.gov
D. M. GoldenPS-031SRI International333 Ravenswood Ave.Menlo Park, CA [email protected]
R. F. HampsonM. J. KuryloNational Institute of Standards and TechnologyPhysical and Chemical Properties DivisionGaithersburg, MD [email protected]@hq.nasa.gov
C. J. HowardA. R. RavishankaraNOAA-ERL, R/E/AL2325 BroadwayBoulder, CO [email protected]@al.noaa.gov
C. E. KolbAerodyne Research Inc.45 Manning Rd.Billerica, MA [email protected]
M. J. MolinaDepartment of Earth, Atmospheric, and Planetary Sciencesand Department of ChemistryMassachusetts Institute of TechnologyCambridge, MA [email protected]
Copies of this evaluation may be obtained by requesting JPL Publication 97-04 from:
Jet Propulsion LaboratoryCalifornia Institute of TechnologySecondary Distribution, MS 512-1104800 Oak Grove DrivePasadena, CA 91109Telephone: (818) 397-7952
3
BASIS OF THE RECOMMENDATIONS
The recommended rate data and cross sections are based on laboratory measurements. In order to providerecommendations that are as up-to-date as possible, preprints and written private communications are accepted, butonly when it is expected that they will appear as published journal articles. Under no circumstances are rateconstants adjusted to fit observations of stratospheric concentrations. The Panel considers the question ofconsistency of data with expectations based on the theory of reaction kinetics, and when a discrepancy appears toexist this fact is pointed out in the accompanying note. The major use of theoretical extrapolation of data is inconnection with three-body reactions, in which the required pressure or temperature dependence is sometimesunavailable from laboratory measurements, and can be estimated by use of appropriate theoretical treatment. In thecase of important rate constants for which no experimental data are available, the panel may provide estimates of rateconstant parameters based on analogy to similar reactions for which data are available.
RECENT CHANGES AND CURRENT NEEDS OF LABORATORY KINETICS
Format of the Evaluation
Changes or additions to the tables of data are indicated by shading. A new entry is completely shaded, whereasa changed entry is shaded only where the change was made. In some cases only the note has been changed, in whichcase the corresponding note number in the table is shaded. In the Photochemistry section, changed notes areindicated by shading of the note heading.
Each edition of the evaluation is self-contained, and it is not necessary to refer to earlier editions to obtain acomplete set of data.
Appendix 1, listing heats of formation of many atmospheric species, has been updated and expanded. A newentry, Appendix 2, tabulates entropy data for most of these same species. Appendix 3 includes solar flux data aswell as model-generated concentration profiles and J-values for important species in the upper atmosphere.
Computer Access
The contents of the evaluation (exclusive of the figures) are available in computer-readable formats. (In thenear future, electronic versions of the figures will be available.) To maximize transferability to different personalcomputer and workstation/main frame environments, the evaluation will be made available in several differentformats, including Microsoft Word, Rich Text Format (RTF), Postscript, and Adobe Acrobat files. Further detailsare provided in a ‘Readme’ file.
Files may be downloaded from http://remus.jpl.nasa.gov/jpl97/ or may be copied via 'ftp' from the Internethost remus.jpl.nasa.gov. The username is anonymous and the password is the electronic address of the user loggingin. The files are to be found in the /pub/jpl97 subdirectory just below the root directory.
Individuals who want to receive notices when the web page and/or ftp archive are revised should send email [email protected], with the first line of the message being subscribe jpl97-announce.
Questions may be addressed to Mark Allen ([email protected]).
Ox Reactions
The kinetics of the O, O2, and O3 system are relatively well-established. However, the O + O2 + M reactionremains of fundamental importance in atmospheric chemistry. This is because the extent of ozone destruction isdetermined by the relative rates of competing reactions such as O + O3, O + NO2, O + OH, and O + ClO.Additional studies of the ozone-forming reaction, or its relative rate compared to the competing reactions, would beuseful, especially at very low temperatures.
Reactions of Singlet Oxygen
O(1D) ReactionsThe recommended rate coefficients for the O(1D) reactions correspond to the rate of removal of O(1D), which
includes both chemical reactions and physical quenching of the excited O atoms. Details on the branching ratios andproducts are given in the notes.
4
The kinetic energy or hot atom effects of photolytically generated O(1D) are probably not important in theatmosphere, although the literature is rich with studies of these processes and with studies of the dynamics of many
O(1D) reactions. The important atmospheric reactions of O(1D) include: (1) deactivation by major gases, N2 and
O2, which limit the O(1D) steady-state concentrations; (2) reaction with trace gases, e.g., H2O, CH4, and N2O,which generate radicals; and (3) reaction with long-lived trace gases, e.g., HCN, which have relatively slow
atmospheric degradation rates. There are no data for the O(1D) + HCN reaction.
O2 (1∆ and 1∑ )
Fourteen reactions of the (a1∆g) and (b1∑+g) excited states of molecular oxygen are reviewed. These states
are populated via photochemical processes, mainly the UV photolysis of ozone, and the reaction of O(1D) with O2.Over the years they have been proposed as contributors to various reaction schemes in the atmosphere, but as yet nosignificant role in the chemistry of the stratosphere has been demonstrated. The fate of most of these excited speciesis physical quenching by means of energy transfer processes. In the few cases where chemical reaction occurs, it isindicated in the corresponding note.
HO x Reactions
There have been no changes in the database for HOx chemistry since the last evaluation. The HO2 + O3reaction rate coefficient remains one of the most significant uncertainties in the HOx system. High quality data atlow temperatures are needed for this key reaction.
NOx Reactions
There are no significant changes to the recommendations on NOx reactions. The recommendation for theHO2 + NO reaction has been changed and the uncertainty factor reduced to reflect a new direct study of this reactionin the high pressure (several hundred torr) regime. The NH2 + NO and NO + O3 reactions have been re-evaluated,resulting in a significant reduction in the uncertainty factors of both reactions.
Oxidation of Organic Compounds
The major update in this evaluation is the inclusion of the reactions of acetone and alkyl nitrates. In addition,several changes to the recommended values have been made in light of recent data.
The rate coefficient for the reaction of OH with CH4 has been revised very slightly, based on recent work attemperatures close to 200 K. Even though the recommendation is in the form of an Arrhenius expression, the threeparameter expression given in the note may better represent the data and may be preferred in some cases.
There have been direct measurements of the rate coefficients for the reactions of many peroxy radicals withNO, and this data base has been significantly improved. The current recommendations reflect the better database onperoxy radical reactions. The rate coefficient for the reaction of CH3C(O)O2 with NO has been measured directly andis now recommended. This recommended value also leads to a consistency, which was previously absent, in theratio of the rate coefficients for the reactions of CH3C(O)O2 with NO and NO2. Even though there have been manystudies of the reactions between peroxy radicals, the use of only UV absorption to measure the rate coefficients isstill a limiting factor. All peroxy radicals have similar absorption spectra and cross sections. Therefore,deconvolution of the measured absorbances into changes in concentrations of individual reactants is notunambiguous. Use of peroxy radical detection by methods other than UV absorption would be very beneficial.
The reactions of OH with CH3CN and HCN still require further study, because both the rates and mechanismsare uncertain. Studies of larger (>C3) hydrocarbons, especially those containing oxygen, will be of interest inelucidating the hydrocarbon chemistry in the upper troposphere and the lower stratosphere. Such information isneeded to assess the effects of aircraft emissions on ozone and climate as well as the general state of the uppertroposphere.
5
Halogen Reactions
The kinetics database for homogeneous reactions of halogen species has been expanded since the previousevaluation. Rate coefficients for the reaction of OH with sixteen HFCs, HFOCs, and HCFCs have been added,increasing to forty-nine the number of potential alternatives to the fully halogenated CFCs for which rate data forreaction with OH are now included. Rate coefficients for the reaction of chlorine atoms with many of these species
are also included. Rate coefficient data for the reactions of these species with O(1D) are included in the O(1D)section of Table 1. More information on halocarbon degradation mechanisms in the atmosphere can be found inFrancisco and Maricq [13], Wallington et al. [19], and WMO [20]. There have been some changes in therecommendations for reactions included in the previous evaluation, in particular for reactions of OH with HFCs andHCFCs.
SOx Reactions
The database on gas phase atmospheric sulfur chemistry has seen only minor changes in the recommendationsfor the reactions that were included in the previous evaluation. Minor expansion of this section continues in the areaof reactions important in the atmospheric oxidation of reduced sulfur compounds of natural and anthropogenic origin.The database also continues to expand as more information becomes available on halogen atom and halogen oxideradical reactions with a number of the reduced sulfur compounds. Some of these reactions are considered to beimportant in boundary layer chemistry affecting tropospheric polar ozone. Further mechanistic information can beobtained from other reviews such as Tyndall and Ravishankara [18].
Metal Chemistry
Sodium is deposited in the upper atmosphere by meteors along with larger amounts of silicon, magnesium,and iron; comparable amounts of aluminum, nickel, and calcium; and smaller amounts of potassium, chromium,manganese, and other elements. The interest is greatest in the alkali metals because they form the least stable oxidesand thus free atoms can be regenerated through photolysis and reactions with O and O3. The other meteoric elementsare expected to form more stable oxides. A review by Plane [15] describes many aspects of atmospheric metalchemistry.
The total flux of alkali metals through the atmosphere is relatively small, e.g., one or two orders ofmagnitude less than CFCs. Therefore, extremely efficient catalytic cycles are required in order for Na to have asignificant effect on stratospheric chemistry. There are no measurements of metals or metal compounds in thestratosphere which indicate a significant role.
It has been proposed that the highly polar metal compounds may polymerize to form clusters and that thestratospheric concentrations of free metal compounds are too small to play a significant role in the chemistry.
Some studies have shown that the polar species NaO and NaOH associate with abundant gases such as O2 andCO2 with very fast rates in the atmosphere. It has been proposed that reactions of this type will lead to theproduction of clusters with many molecules attached to the sodium compounds. In most cases thermal dissociationis slow, and photolysis competes with the association reactions and limits the cluster concentrations in daylight. Ifatmospheric sodium does form large clusters, it is unlikely that Na species can have a significant role instratospheric ozone chemistry. In order to assess the importance of these processes, data are needed on theassociation rates and the photolysis rates involving the cluster species.
Photochemical Data
The recommendation for the quantum yield values for production of O(1D) in the photolysis of ozone around300 nm (i.e., in the Huggins bands) has been modified to take into account recent work that corroborates thepresence of the "tail" that had been observed in earlier laser experiments. The change incorporates the larger quantumyield values (0.2 - 0.3). Additional measurements for this quantum yield should be carried out as a function oftemperature. For Cl2O2, the small absorption cross sections beyond 320 nm are potentially very important forphotodissociation in the polar stratosphere, and need to be further studied. In addition, the photodissociationquantum yields for ClONO2 at longer wavelengths (around 350 nm) should be further investigated.
6
There are new entries for HOBr and CH3C(O)O2NO2 (PAN, peroxyacetyl nitrate) and significant new workhas been published on the O2 Herzberg continuum, ClOOCl, Cl2O3, and BrONO2. Recent work on ClOOCl hassuggested that cross sections in the long-wavelength tail, where most of the photolysis occurs in the lowerstratosphere, may be significantly smaller than previously thought. Spectral artificats arising from trace impuritiesare especially difficult to identify in this system, leading to large uncertainties in the cross sections in this spectralregion. The situation is similar for HOBr, where a photodissociation study and one spectroscopic study indicate thepresence of absorption features extending well into the visible region, but other spectroscopic studies see noabsorption beyond 400 nm.
Heterogeneous Chemistry
There is no question that heterogeneous processes on the surfaces of polar stratospheric cloud particles play acritical role in the chemistry of the winter and spring polar stratospheres. Furthermore, there is a great deal ofobservational and modeling evidence that heterogeneous reactions on background sulfuric acid aerosols play a veryimportant role in stratospheric processes at both polar and mid-latitudes, particularly when stratospheric sulfatelevels are elevated by major volcanic eruptions.
Polar heterogeneous chemical processes identified to date have a tendency to enhance the destruction ofstratospheric ozone, primarily by converting relatively inactive “reservoir” species HCl and ClONO2 to more activeCl2 and HOCl, which are easily photolyzed to Cl and ClO. In some scenarios the heterogeneous reaction of HOCland N2O5 with HCl may also play an important role in promoting the production of more easily photolyzed species.In addition, interaction with PSC surfaces can remove N2O5 and HNO3 vapor from the polar stratosphere,sequestering nitrogen oxides in the form of condensed phase nitric acid and, thus, reducing the normal mitigatingeffect gaseous NOx can have on ClOx-catalyzed ozone destruction. The net effect of these processes is a majorbuildup of ClOx radicals in PSC-processed polar stratospheric air masses and, particularly over the Antarctic, amassive springtime destruction of stratospheric ozone.
The reaction of stratospheric N2O5 with liquid water in sulfuric acid aerosols to form HNO3 can have asignificant impact on NOx/HNO3 ratios in the lower mid-latitude stratosphere, bringing measured mid-latitude ozonelosses into better agreement with observations. Models suggest that at current mid-latitude ratios of NOx/ClOx thisprocess increases ozone loss by lowering NOx levels and thus reducing the scavenging of ClO by ClONO2formation. The reactions of ClONO2 and BrONO2 with sulfuric acid aerosol may also play a role in denitrification,the release of photolyzable halogen species, and the perturbation of HOx radical levels.
The stratosphere also contains carbonaceous soot from aircraft and rocket exhausts, alumina and other metaloxides from solid propellant rocket exhaust and spacecraft debris, and, possibly, sodium chloride from some volcaniceruptions. There is increasing interest in determining if and when heterogeneous processes on these relatively minorsurfaces can influence stratospheric chemistry.
Heterogeneous processes involving the liquid water droplets and ice crystals found in tropospheric clouds andaircraft contrails and/or the sulfate aerosols found in the free troposphere may have a significant effect on the fluxinto the stratosphere of reactive species from partially oxidized hydrohalocarbons or aircraft exhaust. Propermodeling of these processes will be necessary to assess the atmospheric impact of reducing the use of partiallychlorinated hydrocarbon solvents, replacing CFCs with HCFCs and HFCs, and the evolution of the civil aviationindustry.
The laboratory study of heterogeneous processes relevant to the stratosphere is an immature field incomparison with the measurement of gas phase kinetic and photodissociation parameters. Heterogeneousexperimental techniques are not yet as well developed, and the interpretation of experimental data is significantlymore complex. Nonetheless, over the past several years, a number of experimental groups have made verysignificant progress and data from complementary techniques are increasingly available to help determine when thequantification of heterogeneous kinetic processes has been successfully distinguished from complicating masstransport and surface saturation processes.
However, it is well to remember that quantitative application of laboratory results on heterogeneous processesto the stratosphere is not straightforward. First, there is still a significant level of uncertainty in both the detailedchemical and physical characteristics of the droplet and particle surfaces present in the stratosphere and in howfaithful the laboratory simulation of these surfaces in various experimental configurations may be. Secondly, the
7
proper incorporation of heterogeneous processes into models of stratospheric and upper tropospheric chemistry isvery difficult, and no current models incorporate formation of and reaction on droplet/particle surfaces in a fullycoupled and self-consistent way. A great deal of effort will have to be expended before the modeling community isas adept at incorporating heterogeneous effects as they are in representing gas phase kinetic and photochemicalprocesses.
Gas Phase Enthalpy Data (Appendix 1)
This table lists ∆Hf(298) values for a number of atmospheric species. Most of the heat of formation data aretaken from the IUPAC Evaluation (Atkinson et al. [3]) or the NIST Standard Database 25 [16]. However, some ofthe values may be different from those quoted in these sources, reflecting recent studies that have not yet beenaccepted and incorporated into those publications.
Entropy Data (Appendix 2)
Values for So(298K) are taken mainly from the NIST Standard Database 25 [16], although in a few casesestimates based on structural similarity are included and are identified as such by enclosure in parentheses.
The listings of both enthalpy and entropy data are presented for utility only, and the present evaluation shouldnot be cited as a primary literature reference for thermochemical data.
Solar Flux and Species Profiles (Appendix 3)
A set of two figures representing solar fluxes are included in this evaluation. One figure gives the solar fluxfrom 110 to 600 nm above the atmosphere and the second gives the actinic flux from 180 to 400 nm at five altitudesfrom the surface to 50 km.
A set of nine figures presenting model-calculated altitude profiles for stratospheric temperature, trace speciesconcentrations, and photolysis rate coefficients is given. Some details of the model used to generate the profiles aregiven at the beginning of Appendix 2. The efforts of Peter S. Connell and other members of the LLNL aregratefully acknowledged for providing these profiles.
The data in the eleven figures are presented to provide "order of magnitude" values of important parameters forthe purpose of evaluating stratospheric kinetics and photochemical processes. Since the profiles are sensitive tovariations in season, hour of the day, latitude, and aerosol density, some care must be taken in how they are appliedto specific problems. They are not intended to be standards.
DATA FORMATS
In Table 1 (Rate Constants for Second Order Reactions) the reactions are grouped into the classes Ox, O(1D),Singlet O2, HOx, NOx, Hydrocarbon Reactions, FOx, ClOx, BrOx, IOx, SOx, and metal reactions. The data inTable 2 (Rate Constants for Association Reactions) are presented in the same order as the bimolecular reactions. Thepresentation of photochemical cross section data follows the same sequence.
Bimolecular Reactions
Some of the reactions in Table 1 are actually more complex than simple two-body reactions. To explain thepressure and temperature dependences occasionally seen in reactions of this type, it is necessary to consider thebimolecular class of reactions in terms of two subcategories, direct (concerted) and indirect (nonconcerted) reactions.
A direct or concerted bimolecular reaction is one in which the reactants A and B proceed to products C and Dwithout the intermediate formation of an AB adduct that has appreciable bonding, i.e., no stable A-B molecule
exists, and there is no reaction intermediate other than the transition state of the reaction, (AB)≠.
A + B → (AB)≠ → C + D
The reaction of OH with CH4 forming H2O + CH3 is an example of a reaction of this class.
8
Very useful correlations between the expected structure of the transition state [AB]≠ and the A-Factor of thereaction rate constant can be made, especially in reactions that are constrained to follow a well-defined approach ofthe two reactants in order to minimize energy requirements in the making and breaking of bonds. The rate constantsfor these reactions are well represented by the Arrhenius expression k = A exp(-E/RT) in the 200-300 K temperaturerange. These rate constants are not pressure dependent.
The indirect or nonconcerted class of bimolecular reactions is characterized by a more complex reaction pathinvolving a potential well between reactants and products, leading to a bound adduct (or reaction complex) formedbetween the reactants A and B:
A + B ↔ [AB]* → C + D
The intermediate [AB]* is different from the transition state [AB]≠, in that it is a bound molecule which can,in principle, be isolated. (Of course, transition states are involved in all of the above reactions, both forward andbackward, but are not explicitly shown.) An example of this reaction type is ClO + NO, which normally producesCl + NO2. Reactions of the nonconcerted type can have a more complex temperature dependence and can exhibit apressure dependence if the lifetime of [AB]* is comparable to the rate of collisional deactivation of [AB]*. Thisarises because the relative rate at which [AB]* goes to products C + D vs. reactants A + B is a sensitive function ofits excitation energy. Thus, in reactions of this type, the distinction between the bimolecular and termolecularclassification becomes less meaningful, and it is especially necessary to study such reactions under the temperatureand pressure conditions in which they are to be used in model calculation, or, alternatively, to develop a reliabletheoretical basis for extrapolation of data.
The rate constant tabulation for second-order reactions (Table 1) is given in Arrhenius form: k(T) = A exp((-E/R)(1/T)) and contains the following information:
1. Reaction stoichiometry and products (if known). The pressure dependences are included, whereappropriate.
2. Arrhenius A-factor.
3. Temperature dependence and associated uncertainty ("activation temperature" E/R±∆E/R).
4. Rate constant at 298 K.
5. Uncertainty factor at 298 K.
6. Note giving basis of recommendation and any other pertinent information.
Termolecular Reactions
Rate constants for third order reactions (Table 2) of the type A + B ↔ [AB]* M→ AB are given in the form
ko(T) = ko3 00(T/300)-n cm6 molecule-2 s-1,
(where ko3 00 has been adjusted for air as the third body), together with a recommended value of n. Where
pressure fall-off corrections are necessary, an additional entry gives the limiting high-pressure rate constant in asimilar form:
k∞(T) = k∞3 00 (T/300)-m cm3 molecule-1 s-1.
To obtain the effective second-order rate constant for a given condition of temperature and pressure (altitude),the following formula is used:
9
k(Z) = k(M,T) = 0.6{1 + [log (k (T)[M]/k (T))] }o ∞10
2 -1k (T)[M]o
1 + (k (T)[M]/k (T))o ∞( )
The fixed value 0.6 that appears in this formula fits the data for all listed reactions adequately, although inprinciple this quantity may be different for each reaction, and also temperature dependent.
Thus, a compilation of rate constants of this type requires the stipulation of the four parameters, ko(300), n,k∞(300), and m. These can be found in Table 2. The discussion that follows outlines the general methods we haveused in establishing this table, and the notes to the table discuss specific data sources.
Low-Pressure Limiting Rate Constant [kxo(T) ]
Troe [17] has described a simple method for obtaining low-pressure limiting rate constants. In essence thismethod depends on the definition:
kxo(T) ≡ βxkx
o ,sc(T)
Here sc signifies "strong" collisions, x denotes the bath gas, and βx is an efficiency parameter (0 <β <1),which provides a measure of energy transfer.
The coefficient βx is related to the average energy transferred in a collision with gas x, <∆E>x, via:
βx/(1-βx1/2) = <∆E>x /FEkT
Notice that <∆E> is quite sensitive to β. FE is the correction factor of the energy dependence of the densityof states (a quantity of the order of 1.1 for most species of stratospheric interest).
For some of the reactions of possible stratospheric interest reviewed here, there exist data in the low-pressure
limit (or very close thereto), and we have chosen to evaluate and unify this data by calculating kxo ,sc(T) for the
appropriate bath gas x and computing the value of βx corresponding to the experimental value [Troe [17]]. Acompilation (Patrick and Golden [14]) gives details for many of the reactions considered here.
From the βx values (most of which are for N2, i.e., βN2), we compute <∆E>x according to the above
equation. Values of <∆E>N2 of approximately 0.3-1 kcal mole-1 are generally expected. If multiple data exist, weaverage the values of <∆E>N2 and recommend a rate constant corresponding to the βN2 computed in the equationabove.
Where no data exist we have sometimes estimated the low-pressure rate constant by taking βN2 = 0.3 at T =300 K, a value based on those cases where data exist.
Temperature Dependence of Low-Pressure Limiting Rate Constants: Tn
The value of n recommended here comes from measurements or, in some cases, a calculation of <∆E>N2from the data at 300 K, and a computation of βN2 (200 K) assuming that <∆E>N2 is independent of temperature in
this range. This βN2 (200 K) value is combined with the computed value of kosc (200 K) to give the expected valueof the actual rate constant at 200 K. This latter, in combination with the value at 300 K, yields the value of n.
This procedure can be directly compared with measured values of ko (200 K) when those exist. Unfortunately,very few values at 200 K are available. There are often temperature-dependent studies, but some ambiguity existswhen one attempts to extrapolate these down to 200 K. If data are to be extrapolated beyond the measuredtemperature range, a choice must be made as to the functional form of the temperature dependence. There are twogeneral ways of expressing the temperature dependence of rate constants. Either the Arrhenius expression ko(T) =
10
Aexp(-E/RT) or the form ko(T) = A' T-n is employed. Since neither of these extrapolation techniques is soundlybased, and since they often yield values that differ substantially, we have used the method explained earlier as thebasis of our recommendations.
High-Pressure Limit Rate Constants [k∞ (T)]
High-pressure rate constants can often be obtained experimentally, but those for the relatively small species ofatmospheric importance usually reach the high-pressure limit at inaccessibly high pressures. This leaves twosources of these numbers, the first being guesses based upon some model, and the second being extrapolation of fall-off data up to higher pressures. Stratospheric conditions generally render reactions of interest much closer to thelow-pressure limit and thus are fairly insensitive to the high-pressure value. This means that while the extrapolationis long, and the value of k∞(T) not very accurate, a "reasonable guess" of k∞(T) will then suffice. In some cases wehave declined to guess since the low-pressure limit is effective over the entire range of stratospheric conditions.
Temperature Dependence of High-Pressure Limit Rate Constants: Tm
There are very few data upon which to base a recommendation for values of m. Values in Table 2 are oftenestimated, based on models for the transition state of bond association reactions and whatever data are available.
Uncertainty EstimatesFor second-order rate constants in Table 1, an estimate of the uncertainty at any given temperature may be
obtained from the following expression:
f(T) = f(298) exp ( )-1T
1298R
∆ E
Note that the exponent is an absolute value. An upper or lower bound (corresponding approximately to onestandard deviation) of the rate constant at any temperature T can be obtained by multiplying or dividing the value ofthe rate constant at that temperature by the factor f(T). The quantities f(298) and ∆E/R are, respectively, theuncertainty in the rate constant at 298 K and in the Arrhenius temperature coefficient, as listed in Table 1. Thisapproach is based on the fact that rate constants are almost always known with minimum uncertainty at roomtemperature. The overall uncertainty normally increases at other temperatures, because there are usually fewer dataand it is almost always more difficult to make measurements at other temperatures. It is important to note that theuncertainty at a temperature T cannot be calculated from the expression exp(∆E/RT). The above expression for f(T)must be used to obtain the correct result.
The uncertainty represented by f(T) is normally symmetric; i.e., the rate constant may be greater than or lessthan the central value, k(T), by the factor f(T). In a few cases in Table 1 asymmetric uncertainties are given in thetemperature coefficient. For these cases, the factors by which a rate constant is to be multiplied or divided to obtain,respectively, the upper and lower limits are not equal, except at 298 K where the factor is simply f(298 K). Explicitequations are given below for the case where the temperature dependence is (E/R +a, -b):
For T > 298 K, multiply by the factor
f(298 K)e[a(1/298-1/T)]
and divide by the factor
f(298 K)e[b(1/298-1/T)]
For T < 298 K, multiply by the factor
f(298 K)e[b(1/T-1/298)]
and divide by the factor
11
f(298 K)e[a(1/T-1/298)]
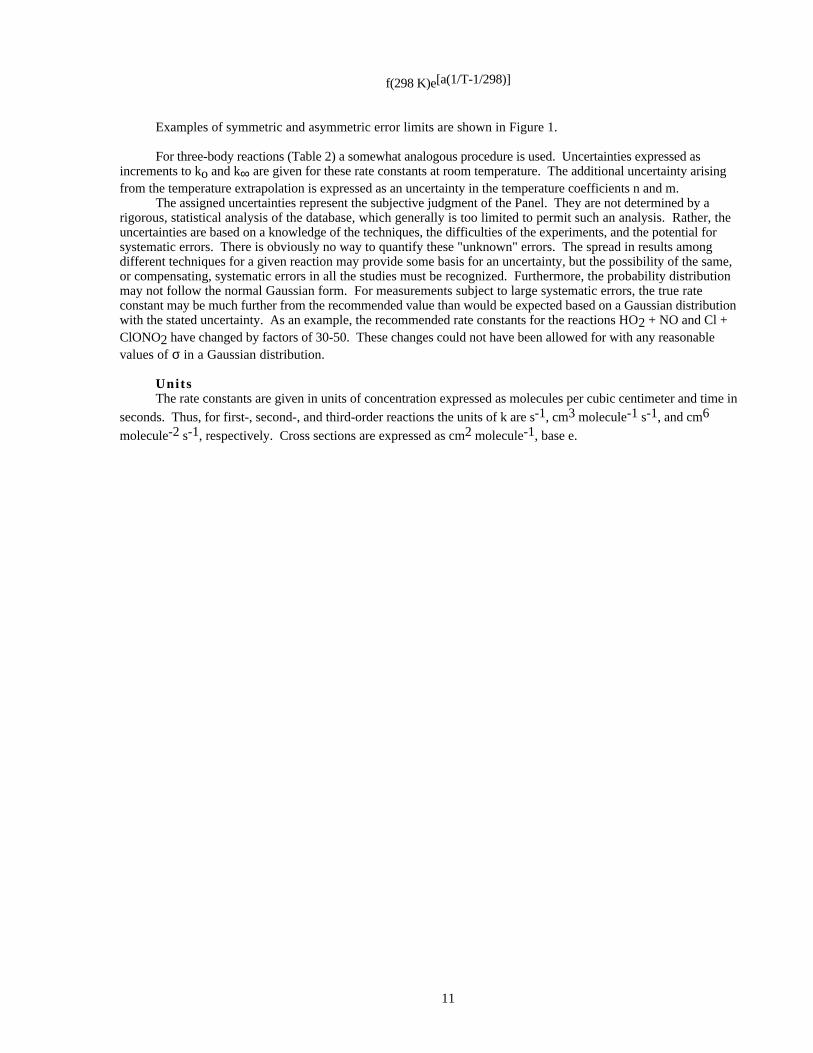
Examples of symmetric and asymmetric error limits are shown in Figure 1.
For three-body reactions (Table 2) a somewhat analogous procedure is used. Uncertainties expressed asincrements to ko and k∞ are given for these rate constants at room temperature. The additional uncertainty arisingfrom the temperature extrapolation is expressed as an uncertainty in the temperature coefficients n and m.
The assigned uncertainties represent the subjective judgment of the Panel. They are not determined by arigorous, statistical analysis of the database, which generally is too limited to permit such an analysis. Rather, theuncertainties are based on a knowledge of the techniques, the difficulties of the experiments, and the potential forsystematic errors. There is obviously no way to quantify these "unknown" errors. The spread in results amongdifferent techniques for a given reaction may provide some basis for an uncertainty, but the possibility of the same,or compensating, systematic errors in all the studies must be recognized. Furthermore, the probability distributionmay not follow the normal Gaussian form. For measurements subject to large systematic errors, the true rateconstant may be much further from the recommended value than would be expected based on a Gaussian distributionwith the stated uncertainty. As an example, the recommended rate constants for the reactions HO2 + NO and Cl +ClONO2 have changed by factors of 30-50. These changes could not have been allowed for with any reasonablevalues of σ in a Gaussian distribution.
UnitsThe rate constants are given in units of concentration expressed as molecules per cubic centimeter and time in
seconds. Thus, for first-, second-, and third-order reactions the units of k are s-1, cm3 molecule-1 s-1, and cm6
molecule-2 s-1, respectively. Cross sections are expressed as cm2 molecule-1, base e.
12
Figure 1. Symmetric and Asymmetric Error Limits
13
References for the Introduction
1 . 1977, "Chlorofluoromethanes and the Stratosphere," NASA Reference Publication 1010, R.D. Hudson, Editor,NASA, Washington, D.C.
2 . 1979, "The Stratosphere: Present and Future," NASA Reference Publication 1049, R.D. Hudson and E.I. Reed,Editors, NASA, Washington, D.C.
3 . Atkinson, R., D.L. Baulch, R.A. Cox, R.F. Hampson, J.A. Kerr, and J. Troe, 1992, J. Phys. Chem. Ref. Data, 21,1125-1568.
4 . DeMore, W.B., D.M. Golden, R.F. Hampson, C.J. Howard, M.J. Kurylo, J.J. Margitan, M.J. Molina, A.R.Ravishankara, and R.T. Watson, 1985, JPL Publication 85-37, Jet Propulsion Laboratory, California Institute ofTechnology, Pasadena, CA.
5 . DeMore, W.B., D.M. Golden, R.F. Hampson, C.J. Howard, M.J. Kurylo, M.J. Molina, A.R. Ravishankara, and S.P.Sander, 1987, JPL Publication 87-41, Jet Propulsion Laboratory, California Institute of Technology, Pasadena,CA.
6 . DeMore, W.B., D.M. Golden, R.F. Hampson, C.J. Howard, M.J. Kurylo, M.J. Molina, A.R. Ravishankara, and S.P.Sander, 1990, JPL Publication 90-1, Jet Propulsion Laboratory, California Institute of Technology, Pasadena, CA.
7 . DeMore, W.B., D.M. Golden, R.F. Hampson, C.J. Howard, M.J. Kurylo, M.J. Molina, A.R. Ravishankara, and S.P.Sander, 1992, JPL Publication 92-20, 10, Jet Propulsion Laboratory, Calif. Inst. of Technology, Pasadena, CA.
8 . DeMore, W.B., D.M. Golden, R.F. Hampson, C.J. Howard, M.J. Kurylo, M.J. Molina, A.R. Ravishankara, and S.P.Sander, 1994, JPL Publication 94-26, 11, Jet Propulsion Laboratory, Calif. Inst. of Technology, Pasadena, CA.
9 . DeMore, W.B., D.M. Golden, R.F. Hampson, C.J. Howard, M.J. Kurylo, M.J. Molina, A.R. Ravishankara, and R.T.Watson, 1982, JPL Publication 82-57, Jet Propulsion Laboratory, California Institute of Technology, Pasadena,CA.
10. DeMore, W.B., D.M. Golden, R.F. Hampson, C.J. Howard, M.J. Kurylo, M.J. Molina, A.R. Ravishankara, and R.T.Watson, 1983, JPL Publication 83-62, Jet Propulsion Laboratory, California Institute of Technology, Pasadena,CA.
11. DeMore, W.B., D.M. Golden, R.F. Hampson, M.J. Kurylo, J.J. Margitan, M.J. Molina, L.J. Stief, and R.T. Watson,1981, JPL Publication 81-3, Jet Propulsion Laboratory, California Institute of Technology, Pasadena, CA.
12. DeMore, W.B., L.J. Stief, F. Kaufman, D.M. Golden, R.F. Hampson, M.J. Kurylo, J.J. Margitan, M.J. Molina, andR.T. Watson, 1979, JPL Publication 79-27, Jet Propulsion Laboratory, California Institute of Technology,Pasadena, CA.
13. Francisco, J.S. and M.M. Maricq, 1995, Advances in Photochemistry, 20, John Wiley, New York, pp. 79-163.14. Patrick, R. and D.M. Golden, 1983, Int. J. Chem. Kinet., 15, 1189-1227.15. Plane, J.M.C., 1991, Int. Rev. Phys. Chem., 10, 55-106.16. Stein, S.E., J.M. Rukkers, and R.L. Brown, 1991, "NIST Standard Reference Database 25," National Institute of
Standards and Technology, Gaithersburg, MD.17. Troe, J., 1977, J. Chem. Phys., 66, 4745.18. Tyndall, G.S. and A.R. Ravishankara, 1991, Int. J. Chem. Kinet., 23, 483-527.19. Wallington, T.J., W.F. Schneider, D.R. Worsnop, O.J. Nielsen, J. Sehested, W.J. DeBruyn, and J.A. Shorter, 1994,
Environ. Sci. Technol., 28, 320A-326A.20. WMO, Scientific Assessment of Ozone Depletion: 1994 , World Meteorological Organization Global Ozone
Research and Monitoring Project, Report No. 37, 1994, Geneva: National Aeronautics and Space Administration.
14
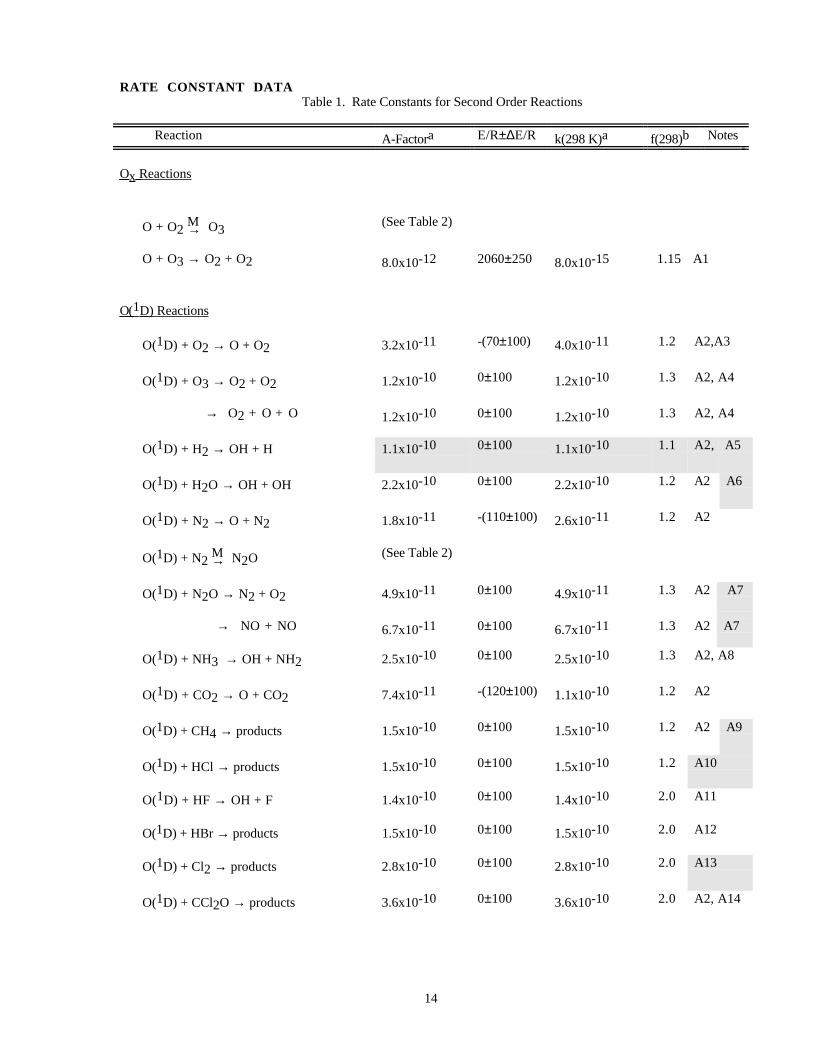
RATE CONSTANT DATATable 1. Rate Constants for Second Order Reactions
Reaction A-Factora E/R±∆E/R k(298 K)a f(298)b Notes
O x Reactions
O + O2 M→ O3(See Table 2)
O + O3 → O2 + O2 8.0x10⁻¹² 2060±250 8.0x10⁻¹⁵ 1.15 A1
O( 1 D) Reactions
O(1D) + O2 → O + O2 3.2x10⁻¹¹ -(70±100) 4.0x10⁻¹¹ 1.2 A2,A3
O(1D) + O3 → O2 + O2 1.2x10⁻¹⁰ 0±100 1.2x10⁻¹⁰ 1.3 A2, A4
→ O2 + O + O 1.2x10⁻¹⁰ 0±100 1.2x10⁻¹⁰ 1.3 A2, A4
O(1D) + H2 → OH + H 1.1x10⁻¹⁰ 0±100 1.1x10⁻¹⁰ 1.1 A2, A5
O(1D) + H2O → OH + OH 2.2x10⁻¹⁰ 0±100 2.2x10⁻¹⁰ 1.2 A2 A6
O(1D) + N2 → O + N2 1.8x10⁻¹¹ -(110±100) 2.6x10⁻¹¹ 1.2 A2
O(1D) + N2 M→ N2O (See Table 2)
O(1D) + N2O → N2 + O2 4.9x10⁻¹¹ 0±100 4.9x10⁻¹¹ 1.3 A2 A7
→ NO + NO 6.7x10⁻¹¹ 0±100 6.7x10⁻¹¹ 1.3 A2 A7
O(1D) + NH3 → OH + NH2 2.5x10⁻¹⁰ 0±100 2.5x10⁻¹⁰ 1.3 A2, A8
O(1D) + CO2 → O + CO2 7.4x10⁻¹¹ -(120±100) 1.1x10⁻¹⁰ 1.2 A2
O(1D) + CH4 → products 1.5x10⁻¹⁰ 0±100 1.5x10⁻¹⁰ 1.2 A2 A9
O(1D) + HCl → products 1.5x10⁻¹⁰ 0±100 1.5x10⁻¹⁰ 1.2 A10
O(1D) + HF → OH + F 1.4x10⁻¹⁰ 0±100 1.4x10⁻¹⁰ 2.0 A11
O(1D) + HBr → products 1.5x10⁻¹⁰ 0±100 1.5x10⁻¹⁰ 2.0 A12
O(1D) + Cl2 → products 2.8x10⁻¹⁰ 0±100 2.8x10⁻¹⁰ 2.0 A13
O(1D) + CCl2O → products 3.6x10⁻¹⁰ 0±100 3.6x10⁻¹⁰ 2.0 A2, A14
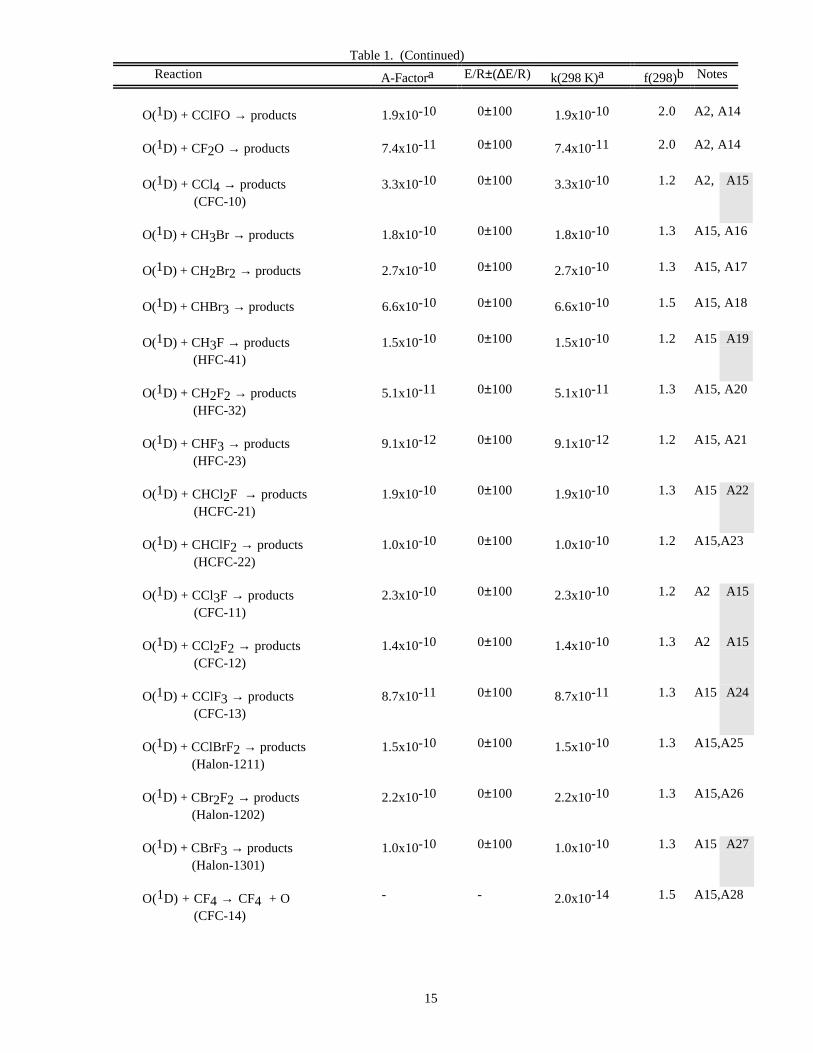
Table 1. (Continued)
Reaction A-Factora E/R±(∆E/R) k(298 K)a f(298)b Notes
15
O(1D) + CClFO → products 1.9x10⁻¹⁰ 0±100 1.9x10⁻¹⁰ 2.0 A2, A14
O(1D) + CF2O → products 7.4x10⁻¹¹ 0±100 7.4x10⁻¹¹ 2.0 A2, A14
O(1D) + CCl4 → products (CFC-10)
3.3x10⁻¹⁰ 0±100 3.3x10⁻¹⁰ 1.2 A2, A15
O(1D) + CH3Br → products 1.8x10⁻¹⁰ 0±100 1.8x10⁻¹⁰ 1.3 A15, A16
O(1D) + CH2Br2 → products 2.7x10⁻¹⁰ 0±100 2.7x10⁻¹⁰ 1.3 A15, A17
O(1D) + CHBr3 → products 6.6x10⁻¹⁰ 0±100 6.6x10⁻¹⁰ 1.5 A15, A18
O(1D) + CH3F → products (HFC-41)
1.5x10⁻¹⁰ 0±100 1.5x10⁻¹⁰ 1.2 A15 A19
O(1D) + CH2F2 → products (HFC-32)
5.1x10⁻¹¹ 0±100 5.1x10⁻¹¹ 1.3 A15, A20
O(1D) + CHF3 → products (HFC-23)
9.1x10⁻¹² 0±100 9.1x10⁻¹² 1.2 A15, A21
O(1D) + CHCl2F → products (HCFC-21)
1.9x10⁻¹⁰ 0±100 1.9x10⁻¹⁰ 1.3 A15 A22
O(1D) + CHClF2 → products (HCFC-22)
1.0x10⁻¹⁰ 0±100 1.0x10⁻¹⁰ 1.2 A15,A23
O(1D) + CCl3F → products (CFC-11)
2.3x10⁻¹⁰ 0±100 2.3x10⁻¹⁰ 1.2 A2 A15
O(1D) + CCl2F2 → products (CFC-12)
1.4x10⁻¹⁰ 0±100 1.4x10⁻¹⁰ 1.3 A2 A15
O(1D) + CClF3 → products (CFC-13)
8.7x10⁻¹¹ 0±100 8.7x10⁻¹¹ 1.3 A15 A24
O(1D) + CClBrF2 → products (Halon-1211)
1.5x10⁻¹⁰ 0±100 1.5x10⁻¹⁰ 1.3 A15,A25
O(1D) + CBr2F2 → products (Halon-1202)
2.2x10⁻¹⁰ 0±100 2.2x10⁻¹⁰ 1.3 A15,A26
O(1D) + CBrF3 → products (Halon-1301)
1.0x10⁻¹⁰ 0±100 1.0x10⁻¹⁰ 1.3 A15 A27
O(1D) + CF4 → CF4 + O (CFC-14)
- - 2.0x10⁻¹⁴ 1.5 A15,A28
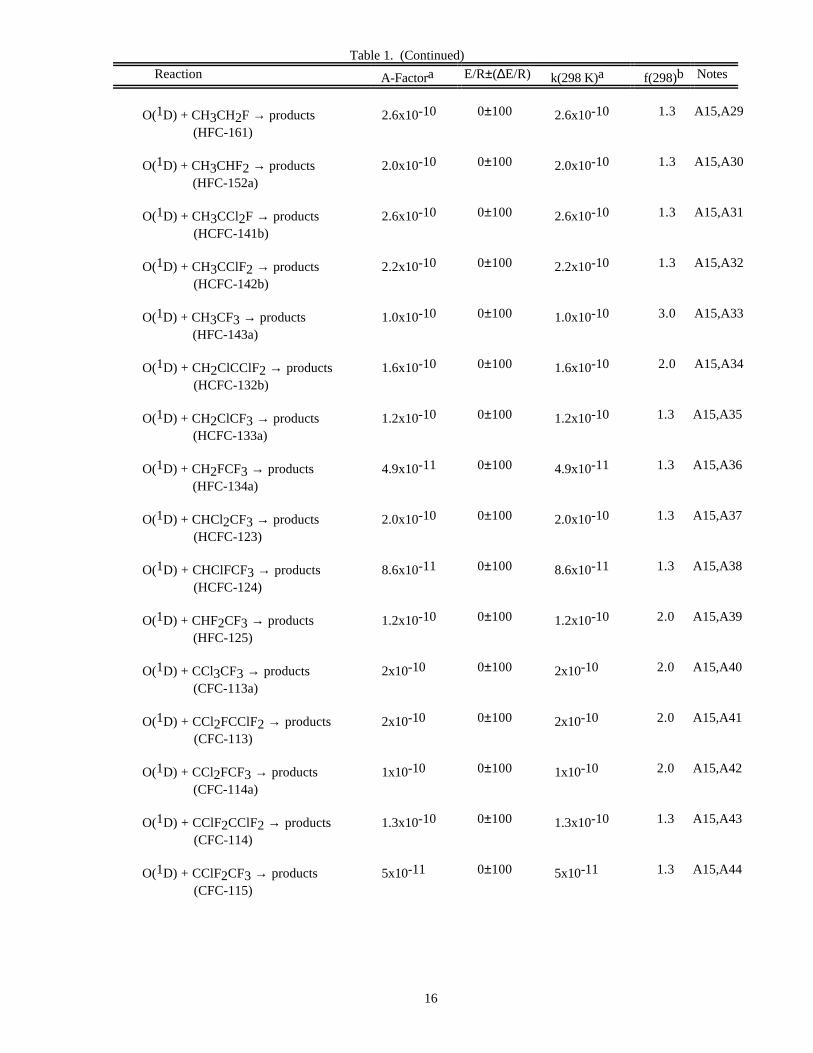
Table 1. (Continued)
Reaction A-Factora E/R±(∆E/R) k(298 K)a f(298)b Notes
16
O(1D) + CH3CH2F → products (HFC-161)
2.6x10⁻¹⁰ 0±100 2.6x10⁻¹⁰ 1.3 A15,A29
O(1D) + CH3CHF2 → products (HFC-152a)
2.0x10⁻¹⁰ 0±100 2.0x10⁻¹⁰ 1.3 A15,A30
O(1D) + CH3CCl2F → products (HCFC-141b)
2.6x10⁻¹⁰ 0±100 2.6x10⁻¹⁰ 1.3 A15,A31
O(1D) + CH3CClF2 → products (HCFC-142b)
2.2x10⁻¹⁰ 0±100 2.2x10⁻¹⁰ 1.3 A15,A32
O(1D) + CH3CF3 → products (HFC-143a)
1.0x10⁻¹⁰ 0±100 1.0x10⁻¹⁰ 3.0 A15,A33
O(1D) + CH2ClCClF2 → products (HCFC-132b)
1.6x10⁻¹⁰ 0±100 1.6x10⁻¹⁰ 2.0 A15,A34
O(1D) + CH2ClCF3 → products (HCFC-133a)
1.2x10⁻¹⁰ 0±100 1.2x10⁻¹⁰ 1.3 A15,A35
O(1D) + CH2FCF3 → products (HFC-134a)
4.9x10⁻¹¹ 0±100 4.9x10⁻¹¹ 1.3 A15,A36
O(1D) + CHCl2CF3 → products (HCFC-123)
2.0x10⁻¹⁰ 0±100 2.0x10⁻¹⁰ 1.3 A15,A37
O(1D) + CHClFCF3 → products (HCFC-124)
8.6x10⁻¹¹ 0±100 8.6x10⁻¹¹ 1.3 A15,A38
O(1D) + CHF2CF3 → products (HFC-125)
1.2x10⁻¹⁰ 0±100 1.2x10⁻¹⁰ 2.0 A15,A39
O(1D) + CCl3CF3 → products (CFC-113a)
2x10⁻¹⁰ 0±100 2x10⁻¹⁰ 2.0 A15,A40
O(1D) + CCl2FCClF2 → products (CFC-113)
2x10⁻¹⁰ 0±100 2x10⁻¹⁰ 2.0 A15,A41
O(1D) + CCl2FCF3 → products (CFC-114a)
1x10⁻¹⁰ 0±100 1x10⁻¹⁰ 2.0 A15,A42
O(1D) + CClF2CClF2 → products (CFC-114)
1.3x10⁻¹⁰ 0±100 1.3x10⁻¹⁰ 1.3 A15,A43
O(1D) + CClF2CF3 → products (CFC-115)
5x10-11 0±100 5x10-11 1.3 A15,A44
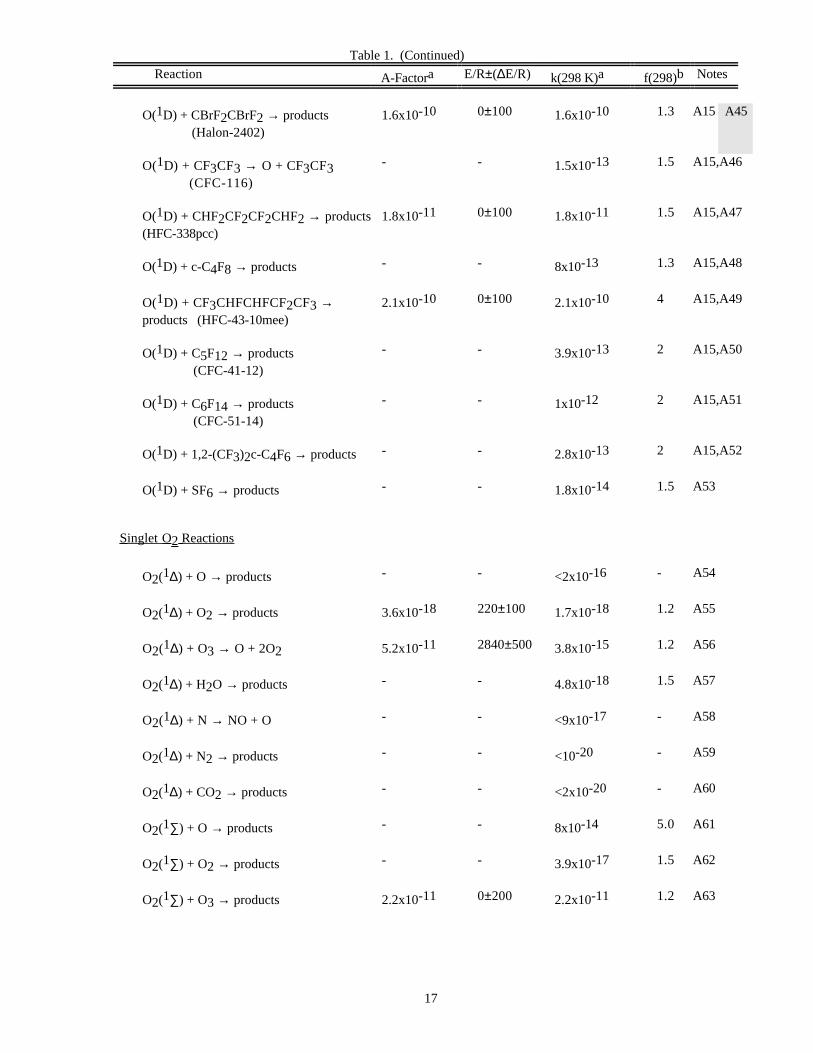
Table 1. (Continued)
Reaction A-Factora E/R±(∆E/R) k(298 K)a f(298)b Notes
17
O(1D) + CBrF2CBrF2 → products (Halon-2402)
1.6x10⁻¹⁰ 0±100 1.6x10⁻¹⁰ 1.3 A15 A45
O(1D) + CF3CF3 → O + CF3CF3 (CFC-116)
- - 1.5x10⁻¹³ 1.5 A15,A46
O(1D) + CHF2CF2CF2CHF2 → products(HFC-338pcc)
1.8x10⁻¹¹ 0±100 1.8x10⁻¹¹ 1.5 A15,A47
O(1D) + c-C4F8 → products - - 8x10-13 1.3 A15,A48
O(1D) + CF3CHFCHFCF2CF3 →products (HFC-43-10mee)
2.1x10⁻¹⁰ 0±100 2.1x10⁻¹⁰ 4 A15,A49
O(1D) + C5F12 → products (CFC-41-12)
- - 3.9x10⁻¹³ 2 A15,A50
O(1D) + C6F14 → products (CFC-51-14)
- - 1x10-12 2 A15,A51
O(1D) + 1,2-(CF3)2c-C4F6 → products - - 2.8x10⁻¹³ 2 A15,A52
O(1D) + SF6 → products - - 1.8x10⁻¹⁴ 1.5 A53
Singlet O 2 Reactions
O2(1∆) + O → products - - <2x10-16 - A54
O2(1∆) + O2 → products 3.6x10⁻¹⁸ 220±100 1.7x10⁻¹⁸ 1.2 A55
O2(1∆) + O3 → O + 2O2 5.2x10⁻¹¹ 2840±500 3.8x10⁻¹⁵ 1.2 A56
O2(1∆) + H2O → products - - 4.8x10⁻¹⁸ 1.5 A57
O2(1∆) + N → NO + O - - <9x10-17 - A58
O2(1∆) + N2 → products - - <10-20 - A59
O2(1∆) + CO2 → products - - <2x10-20 - A60
O2(1∑) + O → products - - 8x10-14 5.0 A61
O2(1∑) + O2 → products - - 3.9x10⁻¹⁷ 1.5 A62
O2(1∑) + O3 → products 2.2x10⁻¹¹ 0±200 2.2x10⁻¹¹ 1.2 A63
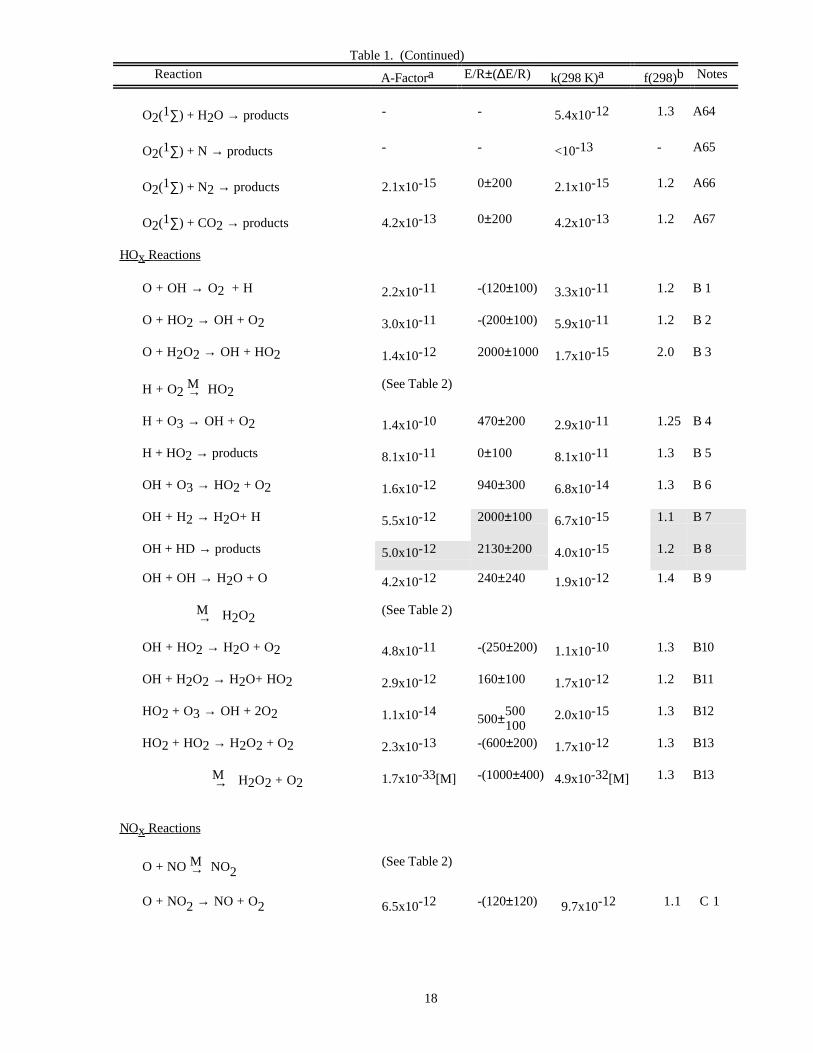
Table 1. (Continued)
Reaction A-Factora E/R±(∆E/R) k(298 K)a f(298)b Notes
18
O2(1∑) + H2O → products - - 5.4x10⁻¹² 1.3 A64
O2(1∑) + N → products - - <10-13 - A65
O2(1∑) + N2 → products 2.1x10⁻¹⁵ 0±200 2.1x10⁻¹⁵ 1.2 A66
O2(1∑) + CO2 → products 4.2x10⁻¹³ 0±200 4.2x10⁻¹³ 1.2 A67
HO x Reactions
O + OH → O2 + H 2.2x10⁻¹¹ -(120±100) 3.3x10⁻¹¹ 1.2 B 1
O + HO2 → OH + O2 3.0x10⁻¹¹ -(200±100) 5.9x10⁻¹¹ 1.2 B 2
O + H2O2 → OH + HO2 1.4x10⁻¹² 2000±1000 1.7x10⁻¹⁵ 2.0 B 3
H + O2 M→ HO2
(See Table 2)
H + O3 → OH + O2 1.4x10⁻¹⁰ 470±200 2.9x10⁻¹¹ 1.25 B 4
H + HO2 → products 8.1x10⁻¹¹ 0±100 8.1x10⁻¹¹ 1.3 B 5
OH + O3 → HO2 + O2 1.6x10⁻¹² 940±300 6.8x10⁻¹⁴ 1.3 B 6
OH + H2 → H2O+ H 5.5x10⁻¹² 2000±100 6.7x10⁻¹⁵ 1.1 B 7
OH + HD → products 5.0x10⁻¹² 2130±200 4.0x10⁻¹⁵ 1.2 B 8
OH + OH → H2O + O 4.2x10⁻¹² 240±240 1.9x10⁻¹² 1.4 B 9
M→ H2O2(See Table 2)
OH + HO2 → H2O + O2 4.8x10⁻¹¹ -(250±200) 1.1x10⁻¹⁰ 1.3 B10
OH + H2O2 → H2O+ HO2 2.9x10⁻¹² 160±100 1.7x10⁻¹² 1.2 B11
HO2 + O3 → OH + 2O2 1.1x10-14500±500
100 2.0x10⁻¹⁵ 1.3 B12
HO2 + HO2 → H2O2 + O2 2.3x10⁻¹³ -(600±200) 1.7x10⁻¹² 1.3 B13
M→ H2O2 + O2 1.7x10⁻³³[M] -(1000±400) 4.9x10⁻³²[M] 1.3 B13
NO x Reactions
O + NO M→ NO2(See Table 2)
O + NO2 → NO + O2 6.5x10⁻¹² -(120±120) 9.7x10⁻¹² 1.1 C 1
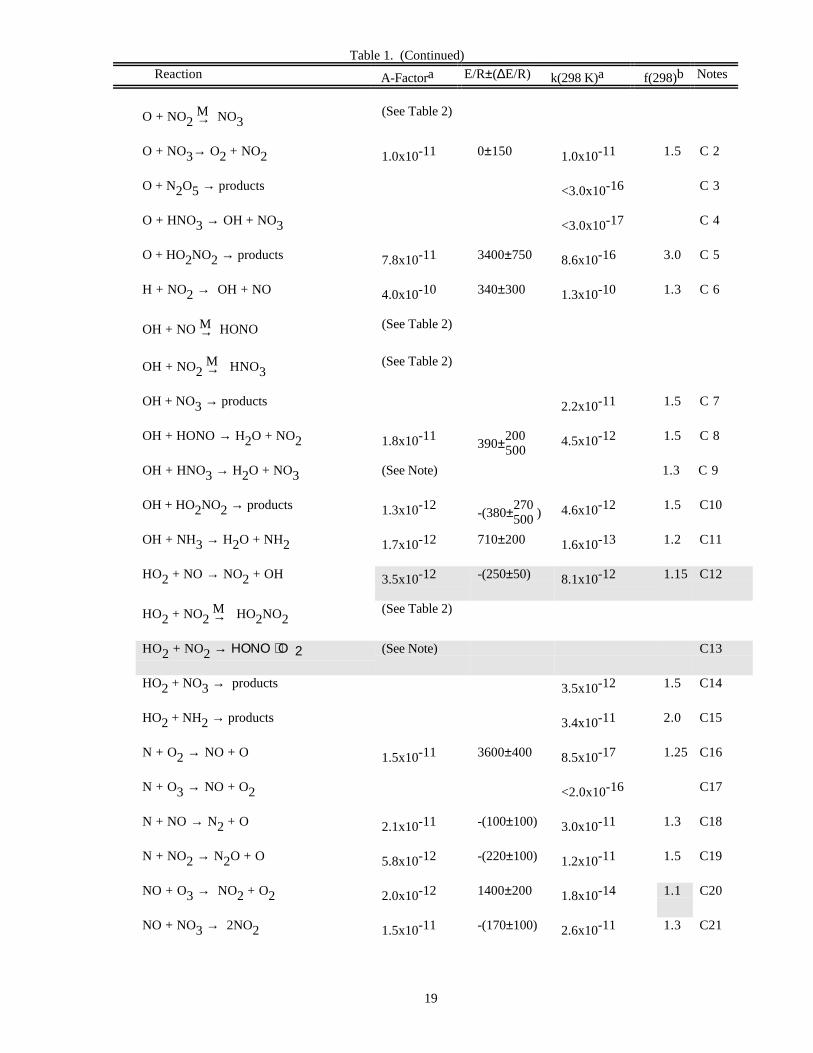
Table 1. (Continued)
Reaction A-Factora E/R±(∆E/R) k(298 K)a f(298)b Notes
19
O + NO2 M→ NO3(See Table 2)
O + NO3→ O2 + NO2 1.0x10⁻¹¹ 0±150 1.0x10⁻¹¹ 1.5 C 2
O + N2O5 → products <3.0x10⁻¹⁶ C 3
O + HNO3 → OH + NO3 <3.0x10⁻¹⁷ C 4
O + HO2NO2 → products 7.8x10⁻¹¹ 3400±750 8.6x10⁻¹⁶ 3.0 C 5
H + NO2 → OH + NO 4.0x10⁻¹⁰ 340±300 1.3x10⁻¹⁰ 1.3 C 6
OH + NO M→ HONO (See Table 2)
OH + NO2 M→ HNO3
(See Table 2)
OH + NO3 → products 2.2x10⁻¹¹ 1.5 C 7
OH + HONO → H2O + NO2 1.8x10-11390±200
500 4.5x10⁻¹² 1.5 C 8
OH + HNO3 → H2O + NO3 (See Note) 1.3 C 9
OH + HO2NO2 → products 1.3x10⁻¹²-(380±270
500 )4.6x10⁻¹² 1.5 C10
OH + NH3 → H2O + NH2 1.7x10⁻¹² 710±200 1.6x10⁻¹³ 1.2 C11
HO2 + NO → NO2 + OH 3.5x10⁻¹² -(250±50) 8.1x10⁻¹² 1.15 C12
HO2 + NO2 M→ HO2NO2(See Table 2)
HO2 + NO2 → ΗΟΝΟ + Ο2 (See Note) C13
HO2 + NO3 → products 3.5x10⁻¹² 1.5 C14
HO2 + NH2 → products 3.4x10⁻¹¹ 2.0 C15
N + O2 → NO + O 1.5x10⁻¹¹ 3600±400 8.5x10⁻¹⁷ 1.25 C16
N + O3 → NO + O2 <2.0x10⁻¹⁶ C17
N + NO → N2 + O 2.1x10⁻¹¹ -(100±100) 3.0x10⁻¹¹ 1.3 C18
N + NO2 → N2O + O 5.8x10⁻¹² -(220±100) 1.2x10⁻¹¹ 1.5 C19
NO + O3 → NO2 + O2 2.0x10⁻¹² 1400±200 1.8x10⁻¹⁴ 1.1 C20
NO + NO3 → 2NO2 1.5x10⁻¹¹ -(170±100) 2.6x10⁻¹¹ 1.3 C21
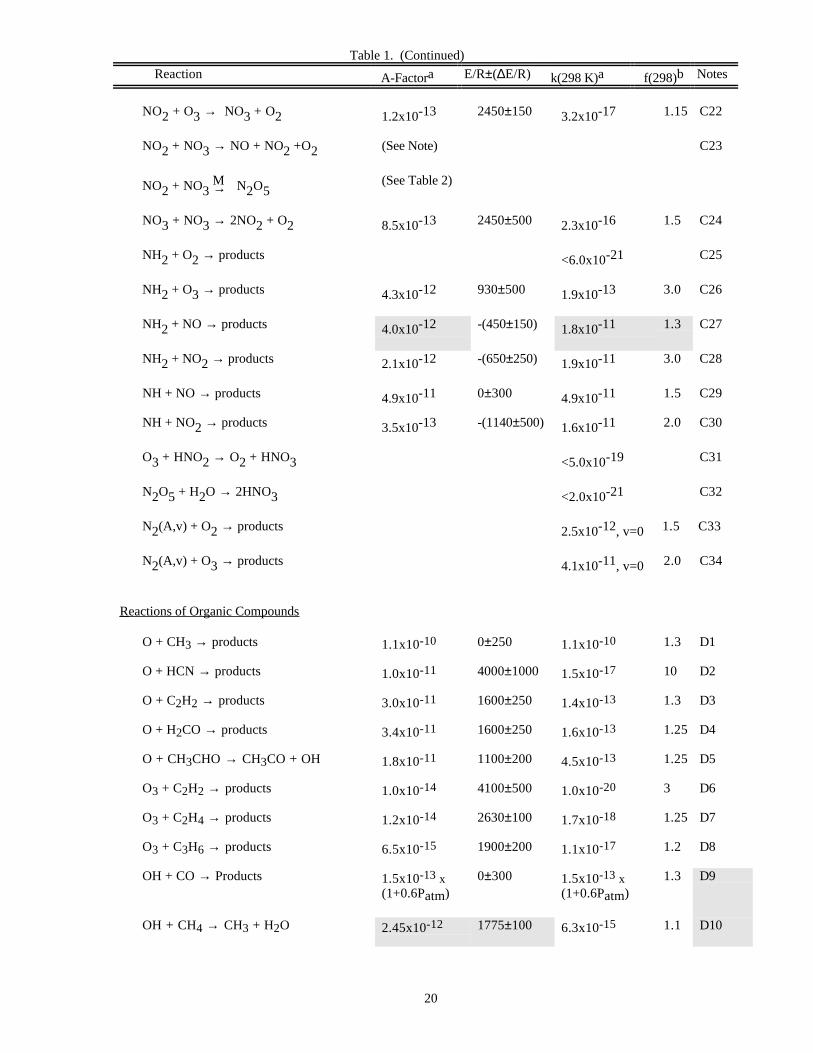
Table 1. (Continued)
Reaction A-Factora E/R±(∆E/R) k(298 K)a f(298)b Notes
20
NO2 + O3 → NO3 + O2 1.2x10⁻¹³ 2450±150 3.2x10⁻¹⁷ 1.15 C22
NO2 + NO3 → NO + NO2 +O2 (See Note) C23
NO2 + NO3 M→ N2O5(See Table 2)
NO3 + NO3 → 2NO2 + O2 8.5x10⁻¹³ 2450±500 2.3x10⁻¹⁶ 1.5 C24
NH2 + O2 → products <6.0x10⁻²¹ C25
NH2 + O3 → products 4.3x10⁻¹² 930±500 1.9x10⁻¹³ 3.0 C26
NH2 + NO → products 4.0x10⁻¹² -(450±150) 1.8x10⁻¹¹ 1.3 C27
NH2 + NO2 → products 2.1x10⁻¹² -(650±250) 1.9x10⁻¹¹ 3.0 C28
NH + NO → products 4.9x10⁻¹¹ 0±300 4.9x10⁻¹¹ 1.5 C29
NH + NO2 → products 3.5x10⁻¹³ -(1140±500) 1.6x10⁻¹¹ 2.0 C30
O3 + HNO2 → O2 + HNO3 <5.0x10⁻¹⁹ C31
N2O5 + H2O → 2HNO3 <2.0x10⁻²¹ C32
N2(A,v) + O2 → products 2.5x10⁻¹², v=0 1.5 C33
N2(A,v) + O3 → products 4.1x10⁻¹¹, v=0 2.0 C34
Reactions of Organic Compounds
O + CH3 → products 1.1x10⁻¹⁰ 0±250 1.1x10⁻¹⁰ 1.3 D1
O + HCN → products 1.0x10⁻¹¹ 4000±1000 1.5x10⁻¹⁷ 10 D2
O + C2H2 → products 3.0x10⁻¹¹ 1600±250 1.4x10⁻¹³ 1.3 D3
O + H2CO → products 3.4x10⁻¹¹ 1600±250 1.6x10⁻¹³ 1.25 D4
O + CH3CHO → CH3CO + OH 1.8x10⁻¹¹ 1100±200 4.5x10⁻¹³ 1.25 D5
O3 + C2H2 → products 1.0x10⁻¹⁴ 4100±500 1.0x10⁻²⁰ 3 D6
O3 + C2H4 → products 1.2x10⁻¹⁴ 2630±100 1.7x10⁻¹⁸ 1.25 D7
O3 + C3H6 → products 6.5x10⁻¹⁵ 1900±200 1.1x10⁻¹⁷ 1.2 D8
OH + CO → Products 1.5x10-13 x(1+0.6Patm)
0±300 1.5x10-13 x(1+0.6Patm)
1.3 D9
OH + CH4 → CH3 + H2O 2.45x10⁻¹² 1775±100 6.3x10⁻¹⁵ 1.1 D10
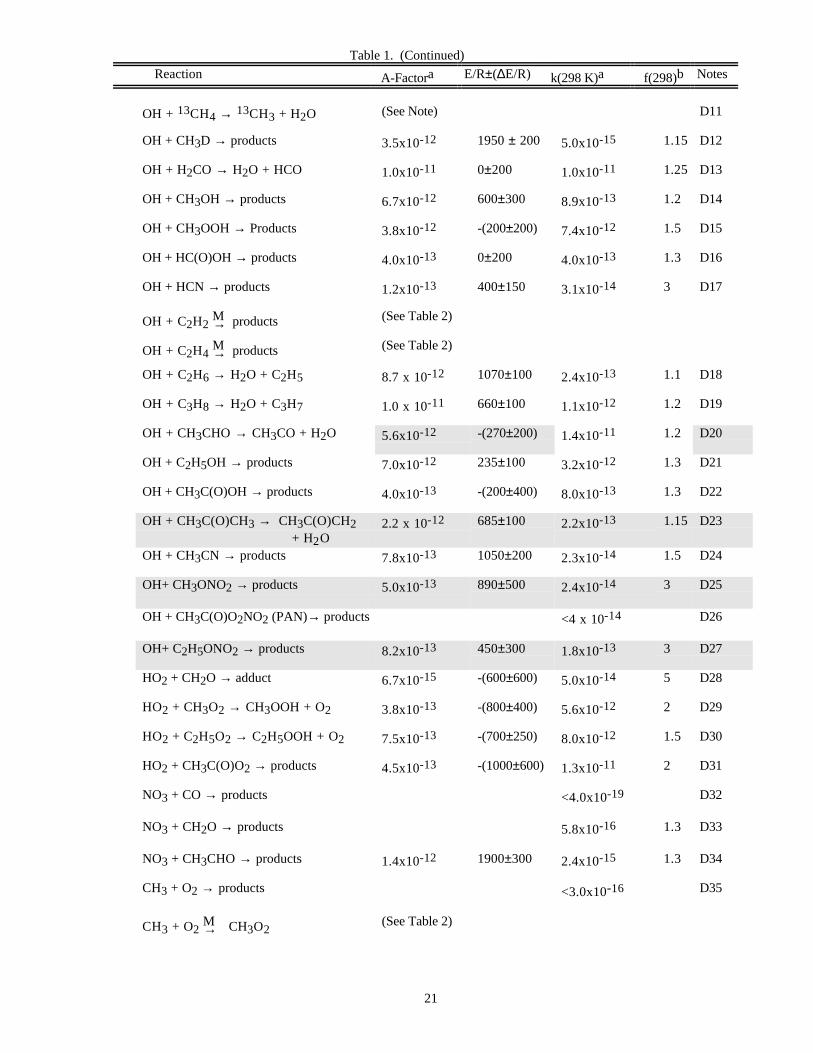
Table 1. (Continued)
Reaction A-Factora E/R±(∆E/R) k(298 K)a f(298)b Notes
21
OH + 13CH4 → 13CH3 + H2O (See Note) D11
OH + CH3D → products 3.5x10⁻¹² 1950 ± 200 5.0x10⁻¹⁵ 1.15 D12
OH + H2CO → H2O + HCO 1.0x10⁻¹¹ 0±200 1.0x10⁻¹¹ 1.25 D13
OH + CH3OH → products 6.7x10⁻¹² 600±300 8.9x10⁻¹³ 1.2 D14
OH + CH3OOH → Products 3.8x10⁻¹² -(200±200) 7.4x10⁻¹² 1.5 D15
OH + HC(O)OH → products 4.0x10⁻¹³ 0±200 4.0x10⁻¹³ 1.3 D16
OH + HCN → products 1.2x10⁻¹³ 400±150 3.1x10⁻¹⁴ 3 D17
OH + C2H2 M→ products (See Table 2)
OH + C2H4 M→ products (See Table 2)
OH + C2H6 → H2O + C2H5 8.7 x 10⁻¹² 1070±100 2.4x10⁻¹³ 1.1 D18
OH + C3H8 → H2O + C3H7 1.0 x 10⁻¹¹ 660±100 1.1x10⁻¹² 1.2 D19
OH + CH3CHO → CH3CO + H2O 5.6x10⁻¹² -(270±200) 1.4x10⁻¹¹ 1.2 D20
OH + C2H5OH → products 7.0x10⁻¹² 235±100 3.2x10⁻¹² 1.3 D21
OH + CH3C(O)OH → products 4.0x10⁻¹³ -(200±400) 8.0x10⁻¹³ 1.3 D22
OH + CH3C(O)CH3 → CH3C(O)CH2 + H2O
2.2 x 10⁻¹² 685±100 2.2x10⁻¹³ 1.15 D23
OH + CH3CN → products 7.8x10⁻¹³ 1050±200 2.3x10⁻¹⁴ 1.5 D24
OH+ CH3ONO2 → products 5.0x10⁻¹³ 890±500 2.4x10⁻¹⁴ 3 D25
OH + CH3C(O)O2NO2 (PAN)→ products <4 x 10-14 D26
OH+ C2H5ONO2 → products 8.2x10⁻¹³ 450±300 1.8x10⁻¹³ 3 D27
HO2 + CH2O → adduct 6.7x10⁻¹⁵ -(600±600) 5.0x10⁻¹⁴ 5 D28
HO2 + CH3O2 → CH3OOH + O2 3.8x10⁻¹³ -(800±400) 5.6x10⁻¹² 2 D29
HO2 + C2H5O2 → C2H5OOH + O2 7.5x10⁻¹³ -(700±250) 8.0x10⁻¹² 1.5 D30
HO2 + CH3C(O)O2 → products 4.5x10⁻¹³ -(1000±600) 1.3x10⁻¹¹ 2 D31
NO3 + CO → products <4.0x10⁻¹⁹ D32
NO3 + CH2O → products 5.8x10⁻¹⁶ 1.3 D33
NO3 + CH3CHO → products 1.4x10⁻¹² 1900±300 2.4x10⁻¹⁵ 1.3 D34
CH3 + O2 → products <3.0x10⁻¹⁶ D35
CH3 + O2 M→ CH3O2(See Table 2)
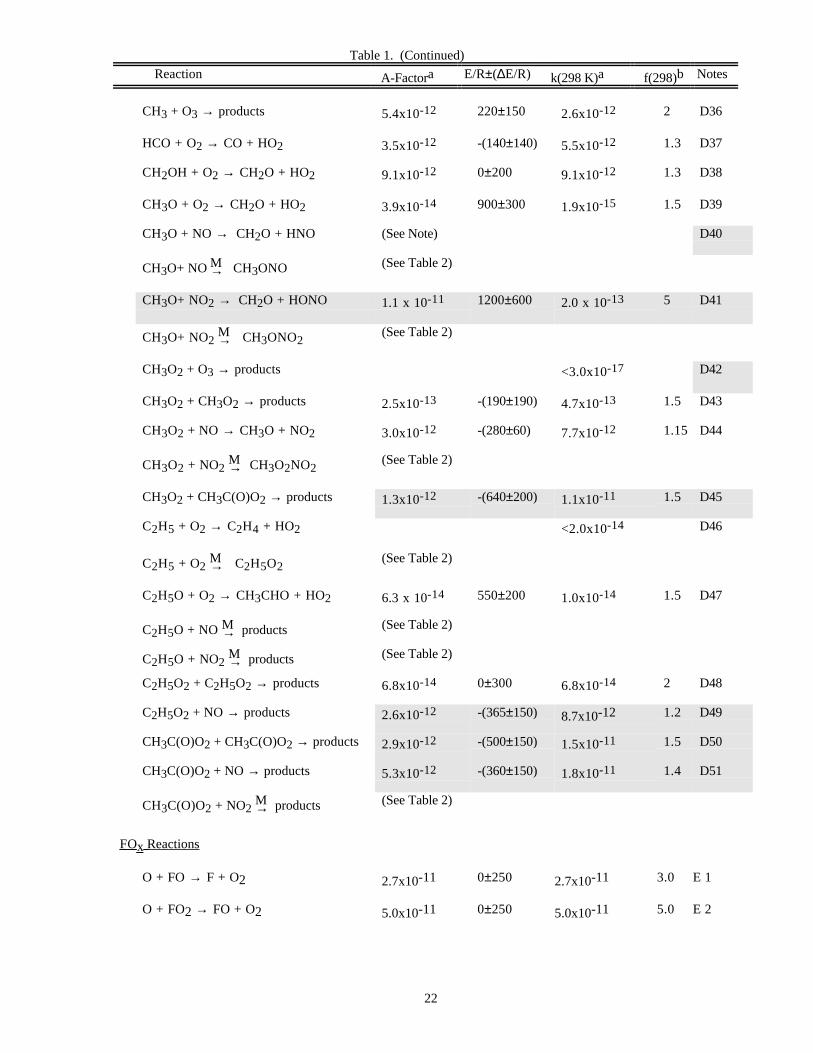
Table 1. (Continued)
Reaction A-Factora E/R±(∆E/R) k(298 K)a f(298)b Notes
22
CH3 + O3 → products 5.4x10⁻¹² 220±150 2.6x10⁻¹² 2 D36
HCO + O2 → CO + HO2 3.5x10⁻¹² -(140±140) 5.5x10⁻¹² 1.3 D37
CH2OH + O2 → CH2O + HO2 9.1x10⁻¹² 0±200 9.1x10⁻¹² 1.3 D38
CH3O + O2 → CH2O + HO2 3.9x10⁻¹⁴ 900±300 1.9x10⁻¹⁵ 1.5 D39
CH3O + NO → CH2O + HNO (See Note) D40
CH3O+ NO M→ CH3ONO (See Table 2)
CH3O+ NO2 → CH2O + HONO 1.1 x 10⁻¹¹ 1200±600 2.0 x 10⁻¹³ 5 D41
CH3O+ NO2 M→ CH3ONO2(See Table 2)
CH3O2 + O3 → products <3.0x10⁻¹⁷ D42
CH3O2 + CH3O2 → products 2.5x10⁻¹³ -(190±190) 4.7x10⁻¹³ 1.5 D43
CH3O2 + NO → CH3O + NO2 3.0x10⁻¹² -(280±60) 7.7x10⁻¹² 1.15 D44
CH3O2 + NO2 M→ CH3O2NO2(See Table 2)
CH3O2 + CH3C(O)O2 → products 1.3x10⁻¹² -(640±200) 1.1x10⁻¹¹ 1.5 D45
C2H5 + O2 → C2H4 + HO2 <2.0x10⁻¹⁴ D46
C2H5 + O2 M→ C2H5O2(See Table 2)
C2H5O + O2 → CH3CHO + HO2 6.3 x 10⁻¹⁴ 550±200 1.0x10⁻¹⁴ 1.5 D47
C2H5O + NO M→ products (See Table 2)
C2H5O + NO2 M→ products (See Table 2)
C2H5O2 + C2H5O2 → products 6.8x10⁻¹⁴ 0±300 6.8x10⁻¹⁴ 2 D48
C2H5O2 + NO → products 2.6x10⁻¹² -(365±150) 8.7x10⁻¹² 1.2 D49
CH3C(O)O2 + CH3C(O)O2 → products 2.9x10⁻¹² -(500±150) 1.5x10⁻¹¹ 1.5 D50
CH3C(O)O2 + NO → products 5.3x10⁻¹² -(360±150) 1.8x10⁻¹¹ 1.4 D51
CH3C(O)O2 + NO2 M→ products (See Table 2)
FO x Reactions
O + FO → F + O2 2.7x10⁻¹¹ 0±250 2.7x10⁻¹¹ 3.0 E 1
O + FO2 → FO + O2 5.0x10⁻¹¹ 0±250 5.0x10⁻¹¹ 5.0 E 2
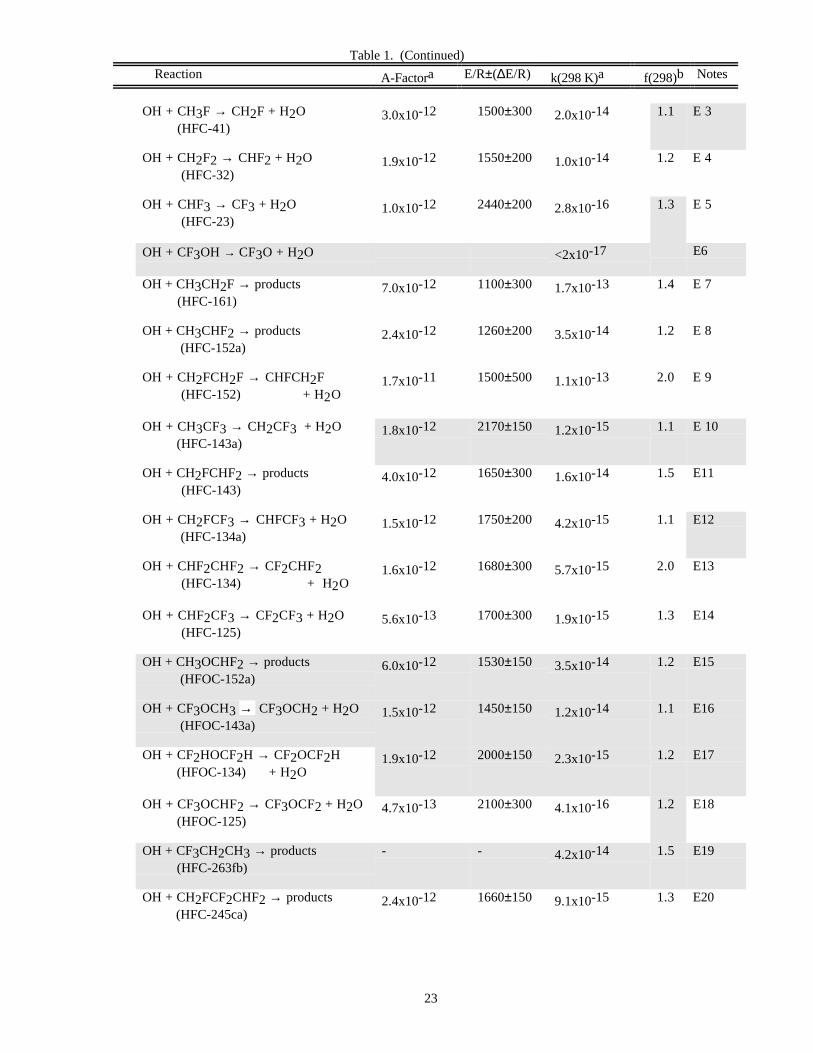
Table 1. (Continued)
Reaction A-Factora E/R±(∆E/R) k(298 K)a f(298)b Notes
23
OH + CH3F → CH2F + H2O (HFC-41)
3.0x10⁻¹² 1500±300 2.0x10⁻¹⁴ 1.1 E 3
OH + CH2F2 → CHF2 + H2O (HFC-32)
1.9x10⁻¹² 1550±200 1.0x10⁻¹⁴ 1.2 E 4
OH + CHF3 → CF3 + H2O (HFC-23)
1.0x10⁻¹² 2440±200 2.8x10⁻¹⁶ 1.3 E 5
OH + CF3OH → CF3O + H2O <2x10-17 E6
OH + CH3CH2F → products (HFC-161)
7.0x10⁻¹² 1100±300 1.7x10⁻¹³ 1.4 E 7
OH + CH3CHF2 → products (HFC-152a)
2.4x10⁻¹² 1260±200 3.5x10⁻¹⁴ 1.2 E 8
OH + CH2FCH2F → CHFCH2F (HFC-152) + H2O
1.7x10⁻¹¹ 1500±500 1.1x10⁻¹³ 2.0 E 9
OH + CH3CF3 → CH2CF3 + H2O (HFC-143a)
1.8x10⁻¹² 2170±150 1.2x10⁻¹⁵ 1.1 E 10
OH + CH2FCHF2 → products (HFC-143)
4.0x10⁻¹² 1650±300 1.6x10⁻¹⁴ 1.5 E11
OH + CH2FCF3 → CHFCF3 + H2O (HFC-134a)
1.5x10⁻¹² 1750±200 4.2x10⁻¹⁵ 1.1 E12
OH + CHF2CHF2 → CF2CHF2 (HFC-134) + H2O
1.6x10⁻¹² 1680±300 5.7x10⁻¹⁵ 2.0 E13
OH + CHF2CF3 → CF2CF3 + H2O (HFC-125)
5.6x10⁻¹³ 1700±300 1.9x10⁻¹⁵ 1.3 E14
OH + CH3OCHF2 → products (HFOC-152a)
6.0x10⁻¹² 1530±150 3.5x10⁻¹⁴ 1.2 E15
OH + CF3OCH3 → CF3OCH2 + H2O (HFOC-143a)
1.5x10⁻¹² 1450±150 1.2x10⁻¹⁴ 1.1 E16
OH + CF2HOCF2H → CF2OCF2H (HFOC-134) + H2O
1.9x10⁻¹² 2000±150 2.3x10⁻¹⁵ 1.2 E17
OH + CF3OCHF2 → CF3OCF2 + H2O (HFOC-125)
4.7x10⁻¹³ 2100±300 4.1x10⁻¹⁶ 1.2 E18
OH + CF3CH2CH3 → products (HFC-263fb)
- - 4.2x10⁻¹⁴ 1.5 E19
OH + CH2FCF2CHF2 → products (HFC-245ca)
2.4x10⁻¹² 1660±150 9.1x10⁻¹⁵ 1.3 E20
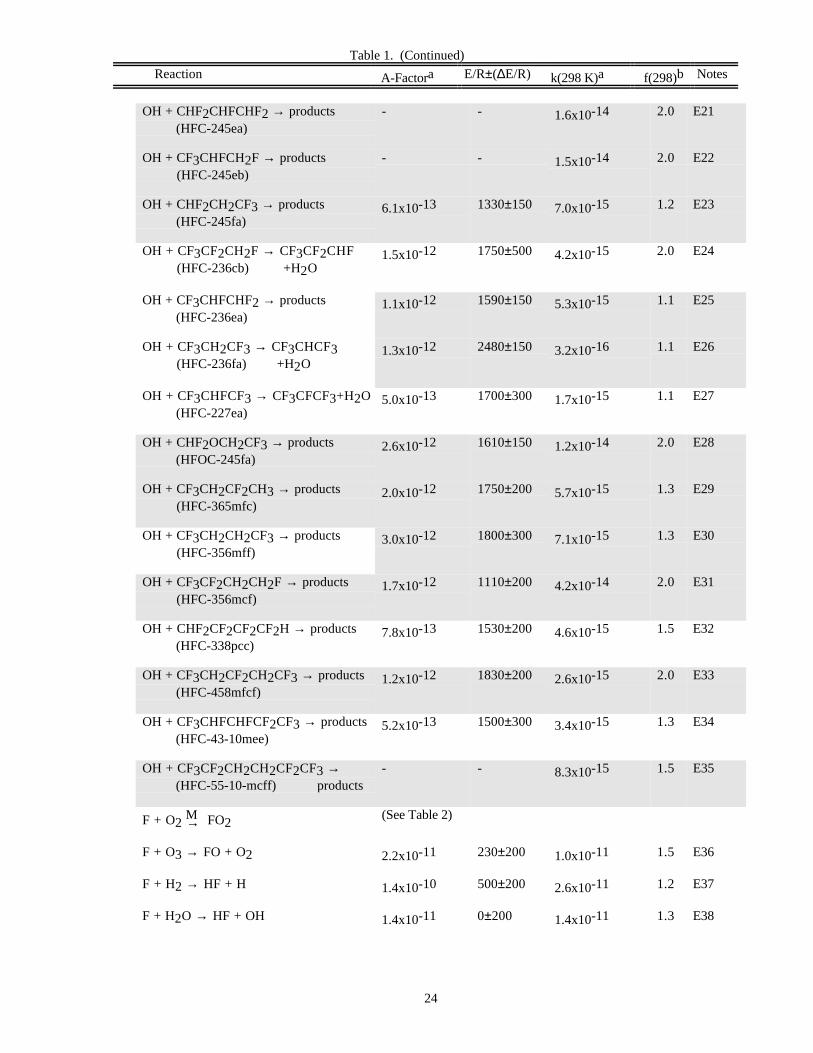
Table 1. (Continued)
Reaction A-Factora E/R±(∆E/R) k(298 K)a f(298)b Notes
24
OH + CHF2CHFCHF2 → products (HFC-245ea)
- - 1.6x10⁻¹⁴ 2.0 E21
OH + CF3CHFCH2F → products (HFC-245eb)
- - 1.5x10⁻¹⁴ 2.0 E22
OH + CHF2CH2CF3 → products (HFC-245fa)
6.1x10⁻¹³ 1330±150 7.0x10⁻¹⁵ 1.2 E23
OH + CF3CF2CH2F → CF3CF2CHF (HFC-236cb) +H2O
1.5x10⁻¹² 1750±500 4.2x10⁻¹⁵ 2.0 E24
OH + CF3CHFCHF2 → products (HFC-236ea)
1.1x10⁻¹² 1590±150 5.3x10⁻¹⁵ 1.1 E25
OH + CF3CH2CF3 → CF3CHCF3 (HFC-236fa) +H2O
1.3x10⁻¹² 2480±150 3.2x10⁻¹⁶ 1.1 E26
OH + CF3CHFCF3 → CF3CFCF3+H2O (HFC-227ea)
5.0x10⁻¹³ 1700±300 1.7x10⁻¹⁵ 1.1 E27
OH + CHF2OCH2CF3 → products (HFOC-245fa)
2.6x10⁻¹² 1610±150 1.2x10⁻¹⁴ 2.0 E28
OH + CF3CH2CF2CH3 → products (HFC-365mfc)
2.0x10⁻¹² 1750±200 5.7x10⁻¹⁵ 1.3 E29
OH + CF3CH2CH2CF3 → products (HFC-356mff)
3.0x10⁻¹² 1800±300 7.1x10⁻¹⁵ 1.3 E30
OH + CF3CF2CH2CH2F → products (HFC-356mcf)
1.7x10⁻¹² 1110±200 4.2x10⁻¹⁴ 2.0 E31
OH + CHF2CF2CF2CF2H → products (HFC-338pcc)
7.8x10⁻¹³ 1530±200 4.6x10⁻¹⁵ 1.5 E32
OH + CF3CH2CF2CH2CF3 → products (HFC-458mfcf)
1.2x10⁻¹² 1830±200 2.6x10⁻¹⁵ 2.0 E33
OH + CF3CHFCHFCF2CF3 → products (HFC-43-10mee)
5.2x10⁻¹³ 1500±300 3.4x10⁻¹⁵ 1.3 E34
OH + CF3CF2CH2CH2CF2CF3 → (HFC-55-10-mcff) products
- - 8.3x10⁻¹⁵ 1.5 E35
F + O2 M→ FO2(See Table 2)
F + O3 → FO + O2 2.2x10⁻¹¹ 230±200 1.0x10⁻¹¹ 1.5 E36
F + H2 → HF + H 1.4x10⁻¹⁰ 500±200 2.6x10⁻¹¹ 1.2 E37
F + H2O → HF + OH 1.4x10⁻¹¹ 0±200 1.4x10⁻¹¹ 1.3 E38
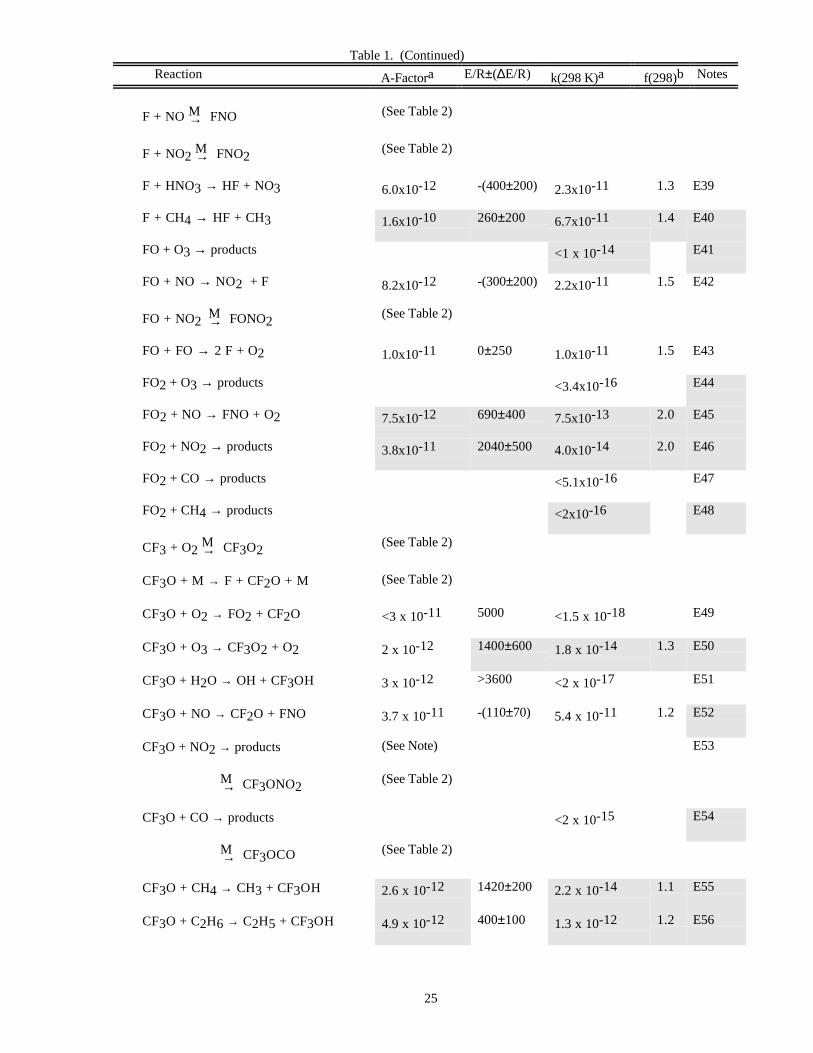
Table 1. (Continued)
Reaction A-Factora E/R±(∆E/R) k(298 K)a f(298)b Notes
25
F + NO M→ FNO (See Table 2)
F + NO2 M→ FNO2(See Table 2)
F + HNO3 → HF + NO3 6.0x10⁻¹² -(400±200) 2.3x10⁻¹¹ 1.3 E39
F + CH4 → HF + CH3 1.6x10⁻¹⁰ 260±200 6.7x10⁻¹¹ 1.4 E40
FO + O3 → products <1 x 10-14 E41
FO + NO → NO2 + F 8.2x10⁻¹² -(300±200) 2.2x10⁻¹¹ 1.5 E42
FO + NO2 M→ FONO2(See Table 2)
FO + FO → 2 F + O2 1.0x10⁻¹¹ 0±250 1.0x10⁻¹¹ 1.5 E43
FO2 + O3 → products <3.4x10⁻¹⁶ E44
FO2 + NO → FNO + O2 7.5x10⁻¹² 690±400 7.5x10⁻¹³ 2.0 E45
FO2 + NO2 → products 3.8x10⁻¹¹ 2040±500 4.0x10⁻¹⁴ 2.0 E46
FO2 + CO → products <5.1x10⁻¹⁶ E47
FO2 + CH4 → products <2x10-16 E48
CF3 + O2 M→ CF3O2(See Table 2)
CF3O + M → F + CF2O + M (See Table 2)
CF3O + O2 → FO2 + CF2O <3 x 10-11 5000 <1.5 x 10⁻¹⁸ E49
CF3O + O3 → CF3O2 + O2 2 x 10-12 1400±600 1.8 x 10⁻¹⁴ 1.3 E50
CF3O + H2O → OH + CF3OH 3 x 10-12 >3600 <2 x 10-17 E51
CF3O + NO → CF2O + FNO 3.7 x 10⁻¹¹ -(110±70) 5.4 x 10⁻¹¹ 1.2 E52
CF3O + NO2 → products (See Note) E53
M→ CF3ONO2(See Table 2)
CF3O + CO → products <2 x 10-15 E54
M→ CF3OCO (See Table 2)
CF3O + CH4 → CH3 + CF3OH 2.6 x 10⁻¹² 1420±200 2.2 x 10⁻¹⁴ 1.1 E55
CF3O + C2H6 → C2H5 + CF3OH 4.9 x 10⁻¹² 400±100 1.3 x 10⁻¹² 1.2 E56
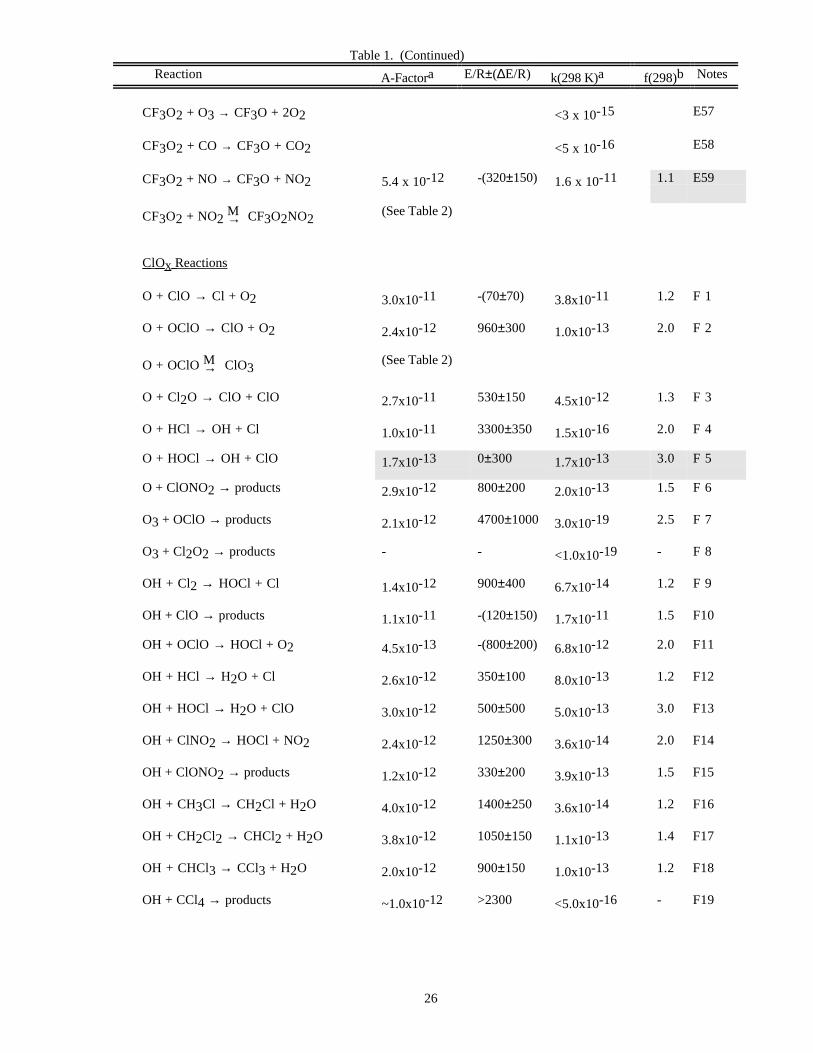
Table 1. (Continued)
Reaction A-Factora E/R±(∆E/R) k(298 K)a f(298)b Notes
26
CF3O2 + O3 → CF3O + 2O2 <3 x 10-15 E57
CF3O2 + CO → CF3O + CO2 <5 x 10-16 E58
CF3O2 + NO → CF3O + NO2 5.4 x 10⁻¹² -(320±150) 1.6 x 10⁻¹¹ 1.1 E59
CF3O2 + NO2 M→ CF3O2NO2(See Table 2)
ClO x Reactions
O + ClO → Cl + O2 3.0x10⁻¹¹ -(70±70) 3.8x10⁻¹¹ 1.2 F 1
O + OClO → ClO + O2 2.4x10⁻¹² 960±300 1.0x10⁻¹³ 2.0 F 2
O + OClO M→ ClO3(See Table 2)
O + Cl2O → ClO + ClO 2.7x10⁻¹¹ 530±150 4.5x10⁻¹² 1.3 F 3
O + HCl → OH + Cl 1.0x10⁻¹¹ 3300±350 1.5x10⁻¹⁶ 2.0 F 4
O + HOCl → OH + ClO 1.7x10⁻¹³ 0±300 1.7x10⁻¹³ 3.0 F 5
O + ClONO2 → products 2.9x10⁻¹² 800±200 2.0x10⁻¹³ 1.5 F 6
O3 + OClO → products 2.1x10⁻¹² 4700±1000 3.0x10⁻¹⁹ 2.5 F 7
O3 + Cl2O2 → products - - <1.0x10⁻¹⁹ - F 8
OH + Cl2 → HOCl + Cl 1.4x10⁻¹² 900±400 6.7x10⁻¹⁴ 1.2 F 9
OH + ClO → products 1.1x10⁻¹¹ -(120±150) 1.7x10⁻¹¹ 1.5 F10
OH + OClO → HOCl + O2 4.5x10⁻¹³ -(800±200) 6.8x10⁻¹² 2.0 F11
OH + HCl → H2O + Cl 2.6x10⁻¹² 350±100 8.0x10⁻¹³ 1.2 F12
OH + HOCl → H2O + ClO 3.0x10⁻¹² 500±500 5.0x10⁻¹³ 3.0 F13
OH + ClNO2 → HOCl + NO2 2.4x10⁻¹² 1250±300 3.6x10⁻¹⁴ 2.0 F14
OH + ClONO2 → products 1.2x10⁻¹² 330±200 3.9x10⁻¹³ 1.5 F15
OH + CH3Cl → CH2Cl + H2O 4.0x10⁻¹² 1400±250 3.6x10⁻¹⁴ 1.2 F16
OH + CH2Cl2 → CHCl2 + H2O 3.8x10⁻¹² 1050±150 1.1x10⁻¹³ 1.4 F17
OH + CHCl3 → CCl3 + H2O 2.0x10⁻¹² 900±150 1.0x10⁻¹³ 1.2 F18
OH + CCl4 → products ~1.0x10⁻¹² >2300 <5.0x10⁻¹⁶ - F19
Table 1. (Continued)
Reaction A-Factora E/R±(∆E/R) k(298 K)a f(298)b Notes
27
OH + CFCl3 → products (CFC-11)
~1.0x10⁻¹² >3700 <5.0x10⁻¹⁸ - F20
OH + CF2Cl2 → products (CFC-12)
~1.0x10⁻¹² >3600 <6.0x10⁻¹⁸ - F21
OH + CH2ClF → CHClF + H2O (HCFC-31)
2.8x10⁻¹² 1270±200 3.9x10⁻¹⁴ 1.2 F22
OH + CHFCl2 → CFCl2 + H2O (HCFC-21)
1.7x10⁻¹² 1250±150 2.6x10⁻¹⁴ 1.2 F23
OH + CHF2Cl → CF2Cl + H2O (HCFC-22)
1.0x10⁻¹² 1600±150 4.7x10⁻¹⁵ 1.1 F24
OH + CH3OCl → products 2.4x10⁻¹² 360±200 7.2x10⁻¹³ 3.0 F25
OH + CH3CCl3 → CH2CCl3 + H2O (HCC-140)
1.8x10⁻¹² 1550±150 1.0x10⁻¹⁴ 1.1 F26
OH + C2HCl3 → products 4.9x10⁻¹³ -(450±200) 2.2x10⁻¹² 1.25 F27
OH + C2Cl4 → products 9.4x10⁻¹² 1200±200 1.7x10⁻¹³ 1.25 F28
OH + CCl3CHO → H2O + CCl3CO 8.2x10⁻¹² 600±300 1.1x10⁻¹² 1.5 F29
OH + CH3CFCl2 → CH2CFCl2 + H2O (HCFC-141b)
1.7x10⁻¹² 1700±150 5.7x10⁻¹⁵ 1.2 F30
OH + CH3CF2Cl → CH2CF2Cl + H2O (HCFC-142b)
1.3x10⁻¹² 1800±150 3.1x10⁻¹⁵ 1.2 F31
OH + CH2ClCF2Cl → CHClCF2Cl (HCFC-132b) + H2O
3.6x10⁻¹² 1600±400 1.7x10⁻¹⁴ 2.0 F32
OH + CHCl2CF2Cl → CCl2CF2Cl (HCFC-122) + H2O
1.0x10⁻¹² 900±150 4.9x10⁻¹⁴ 1.2 F33
OH + CHFClCFCl2 → CFClCFCl2 (HCFC-122a) + H2O
1.0x10⁻¹² 1250±150 1.5x10⁻¹⁴ 1.1 F34
OH + CH2ClCF3 → CHClCF3 + H2O (HCFC-133a)
5.2x10⁻¹³ 1100±300 1.3x10⁻¹⁴ 1.3 F35
OH + CHCl2CF3 → CCl2CF3 + H2O (HCFC-123)
7.0x10⁻¹³ 900±150 3.4x10⁻¹⁴ 1.2 F36
OH + CHFClCF2Cl → CFClCF2Cl (HCFC-123a) + H2O
9.2x10⁻¹³ 1280±150 1.3x10⁻¹⁴ 1.2 F37
OH + CHFClCF3 → CFClCF3 + H2O (HCFC-124)
8.0x10⁻¹³ 1350±150 8.6x10⁻¹⁵ 1.2 F38
Table 1. (Continued)
Reaction A-Factora E/R±(∆E/R) k(298 K)a f(298)b Notes
28
OH + CH3CF2CFCl2 → products (HCFC-243cc)
7.7x10⁻¹³ 1700±300 2.6x10⁻¹⁵ 2.0 F39
OH + CF3CF2CHCl2 → products (HCFC-225ca)
1.0x10⁻¹² 1100±200 2.5x10⁻¹⁴ 1.3 F40
OH + CF2ClCF2CHFCl → products (HCFC-225cb)
5.5x10⁻¹³ 1250±200 8.3x10⁻¹⁵ 1.3 F41
HO2 + Cl → HCl + O2 1.8x10⁻¹¹ -(170±200) 3.2x10⁻¹¹ 1.5 F42
→ OH + ClO 4.1x10⁻¹¹ 450±200 9.1x10⁻¹² 2.0 F42
HO2 + ClO → HOCl + O2 4.8x10⁻¹³-(700±250
700 )5.0x10⁻¹² 1.4 F43
H2O + ClONO2 → products - - <2.0x10⁻²¹ - F44
NO + OClO → NO2 + ClO 2.5x10⁻¹² 600±300 3.4x10⁻¹³ 2.0 F45
NO + Cl2O2 → products - - <2.0x10⁻¹⁴ - F46
NO3 + OClO M→ O2ClONO2(See Table 2)
NO3 + HCl → HNO3 + Cl - - <5.0x10⁻¹⁷ - F47
HO2NO2 + HCl → products - - <1.0x10⁻²¹ - F48
Cl + O2 M→ ClOO (See Table 2)
Cl + O3 → ClO + O2 2.9x10⁻¹¹ 260±100 1.2x10⁻¹¹ 1.15 F49
Cl + H2 → HCl + H 3.7x10⁻¹¹ 2300±200 1.6x10⁻¹⁴ 1.25 F50
Cl + H2O2 → HCl + HO2 1.1x10⁻¹¹ 980±500 4.1x10⁻¹³ 1.5 F51
Cl + NO M→ NOCl (See Table 2)
Cl + NO2 M→ ClONO (ClNO2) (See Table 2)
Cl + NO3 → ClO + NO2 2.4x10⁻¹¹ 0±400 2.4x10⁻¹¹ 1.5 F52
Cl + N2O → ClO + N2 (See Note) F53
Cl + HNO3 → products - - <2.0x10⁻¹⁶ - F54
Cl + CO M→ ClCO (See Table 2)
Cl + CH4 → HCl + CH3 1.1x10⁻¹¹ 1400±150 1.0x10⁻¹³ 1.1 F55
Cl + CH3D → products - - 7.4x10⁻¹⁴ 2.0 F56
Table 1. (Continued)
Reaction A-Factora E/R±(∆E/R) k(298 K)a f(298)b Notes
29
Cl + H2CO → HCl + HCO 8.1x10⁻¹¹ 30±100 7.3x10⁻¹¹ 1.15 F57
Cl + CH3O2 → products - - 1.6x10⁻¹⁰ 1.5 F58
Cl + CH3OH → CH2OH + HCl 5.4x10⁻¹¹ 0±250 5.4x10⁻¹¹ 1.5 F59
Cl + C2H2 M→ ClC2H2(See Table 2)
Cl + C2H4 M→ ClC2H4(See Table 2)
Cl + C2H6 → HCl + C2H5 7.7x10⁻¹¹ 90±90 5.7x10⁻¹¹ 1.1 F60
Cl + C2H5O2 → ClO + C2H5O - - 7.4x10⁻¹¹ 2.0 F61
→ HCl + C2H4O2 - - 7.7x10⁻¹¹ 2.0 F61
Cl + CH3CN → products 1.6x10⁻¹¹ 2140±300 1.2x10⁻¹⁴ 2.0 F62
Cl + CH3CO3NO2 → products - - <1x10-14 F63
Cl + C3H8 → HCl + C3H7 1.2x10⁻¹⁰ -(40±250) 1.4x10⁻¹⁰ 1.3 F64
Cl + OClO → ClO + ClO 3.4x10⁻¹¹ -(160±200) 5.8x10⁻¹¹ 1.25 F65
Cl + ClOO → Cl2 + O2 2.3x10⁻¹⁰ 0±250 2.3x10⁻¹⁰ 3.0 F66
→ ClO + ClO 1.2x10⁻¹¹ 0±250 1.2x10⁻¹¹ 3.0 F66
Cl + Cl2O → Cl2 + ClO 6.2x10⁻¹¹ -(130±130) 9.6x10⁻¹¹ 1.2 F67
Cl + Cl2O2 → products - - 1.0x10⁻¹⁰ 2.0 F68
Cl + HOCl → products 2.5x10⁻¹² 130±250 1.6x10⁻¹² 1.5 F69
Cl + ClNO → NO + Cl2 5.8x10⁻¹¹ -(100±200) 8.1x10⁻¹¹ 1.5 F70
Cl + ClONO2 → products 6.5x10⁻¹² -(135±50) 1.0x10⁻¹¹ 1.2 F71
Cl + CH3Cl → CH2Cl + HCl 3.2x10⁻¹¹ 1250±200 4.8x10⁻¹³ 1.2 F72
Cl + CH2Cl2 → HCl + CHCl2 3.1x10⁻¹¹ 1350±500 3.3x10⁻¹³ 1.5 F73
Cl + CHCl3 → HCl + CCl3 8.2x10⁻¹² 1325±300 9.6x10⁻¹⁴ 1.3 F74
Cl + CH3F → HCl + CH2F (HFC-41)
2.0x10⁻¹¹ 1200±500 3.5x10⁻¹³ 1.3 F75
Cl + CH2F2 → HCl + CHF2 (HFC-32)
1.2x10⁻¹¹ 1630±500 5.0x10⁻¹⁴ 1.5 F76
Cl + CF3H → HCl + CF3 (HFC-23)
- - 3.0x10⁻¹⁸ 5.0 F77
Table 1. (Continued)
Reaction A-Factora E/R±(∆E/R) k(298 K)a f(298)b Notes
30
Cl + CH2FCl → HCl + CHFCl (HCFC-31)
1.2x10⁻¹¹ 1390±500 1.1x10⁻¹³ 2.0 F78
Cl + CHFCl2 → HCl + CFCl2 (HCFC-21)
5.5x10⁻¹² 1675±200 2.0x10⁻¹⁴ 1.3 F79
Cl + CHF2Cl → HCl + CF2Cl (HCFC-22)
5.9x10⁻¹² 2430±200 1.7x10⁻¹⁵ 1.3 F80
Cl + CH3CCl3 → CH2CCl3 + HCl 2.8x10⁻¹² 1790±400 7.0x10⁻¹⁵ 2.0 F81
Cl + CH3CH2F → HCl + CH3CHF (HFC-161)
1.8x10⁻¹¹ 290±500 6.8x10⁻¹² 3.0 F82
→ HCl + CH2CH2F 1.4x10⁻¹¹ 880±500 7.3x10⁻¹³ 3.0 F82
Cl + CH3CHF2 → HCl + CH3CF2 (HFC-152a)
6.4x10⁻¹² 950±500 2.6x10⁻¹³ 1.3 F83
→ HCl + CH2CHF2 7.2x10⁻¹² 2390±500 2.4x10⁻¹⁵ 3.0 F83
Cl + CH2FCH2F → HCl + CHFCH2F (HFC-152)
2.6x10⁻¹¹ 1060±500 7.5x10⁻¹³ 3.0 F84
Cl + CH3CFCl2 → HCl + CH2CFCl2 (HCFC-141b)
1.8x10⁻¹² 2000±300 2.2x10⁻¹⁵ 1.2 F85
Cl + CH3CF2Cl → HCl + CH2CF2Cl (HCFC-142b)
1.4x10⁻¹² 2420±500 4.2x10⁻¹⁶ 1.2 F86
Cl + CH3CF3 → HCl + CH2CF3 (HFC-143a)
1.2x10⁻¹¹ 3880±500 2.6x10⁻¹⁷ 5.0 F87
Cl + CH2FCHF2 → HCl + CH2FCF2 (HFC-143)
5.5x10⁻¹² 1610±500 2.5x10⁻¹⁴ 3.0 F88
→ HCl + CHFCHF2 7.7x10⁻¹² 1720±500 2.4x10⁻¹⁴ 3.0 F88
Cl + CH2ClCF3 → HCl + CHClCF3 (HCFC-133a)
1.8x10⁻¹² 1710±500 5.9x10⁻¹⁵ 3.0 F89
Cl + CH2FCF3 → HCl + CHFCF3 (HFC-134a)
- - 1.5x10⁻¹⁵ 1.2 F90
Cl + CHF2CHF2 → HCl + CF2CHF2 (HCF-134)
7.5x10⁻¹² 2430±500 2.2x10⁻¹⁵ 1.5 F91
Cl + CHCl2CF3 → HCl + CCl2CF3 (HCFC-123)
4.4x10⁻¹² 1750±500 1.2x10⁻¹⁴ 1.3 F92
Cl + CHFClCF3 → HCl + CFClCF3 (HCFC-124)
1.1x10⁻¹² 1800±500 2.7x10⁻¹⁵ 1.3 F93
Cl + CHF2CF3 → HCl + CF2CF3 (HFC-125)
- - 2.4x10⁻¹⁶ 1.3 F94
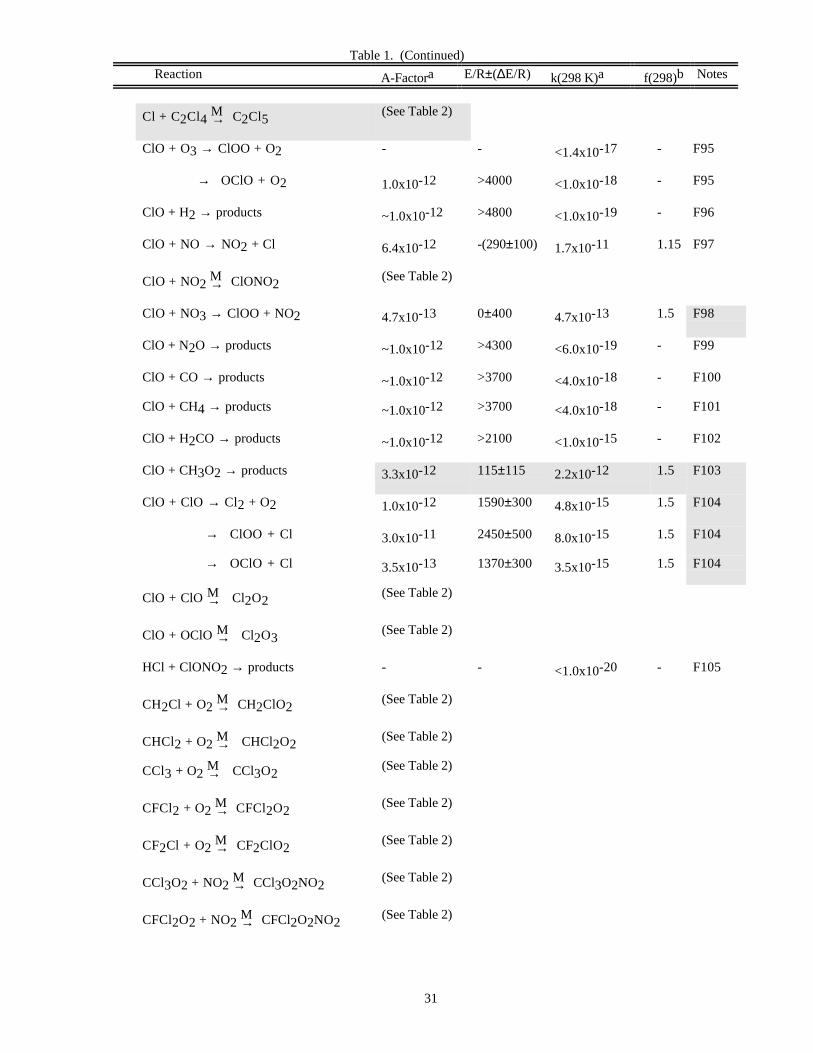
Table 1. (Continued)
Reaction A-Factora E/R±(∆E/R) k(298 K)a f(298)b Notes
31
Cl + C2Cl4 M→ C2Cl5(See Table 2)
ClO + O3 → ClOO + O2 - - <1.4x10⁻¹⁷ - F95
→ OClO + O2 1.0x10⁻¹² >4000 <1.0x10⁻¹⁸ - F95
ClO + H2 → products ~1.0x10⁻¹² >4800 <1.0x10⁻¹⁹ - F96
ClO + NO → NO2 + Cl 6.4x10⁻¹² -(290±100) 1.7x10⁻¹¹ 1.15 F97
ClO + NO2 M→ ClONO2(See Table 2)
ClO + NO3 → ClOO + NO2 4.7x10⁻¹³ 0±400 4.7x10⁻¹³ 1.5 F98
ClO + N2O → products ~1.0x10⁻¹² >4300 <6.0x10⁻¹⁹ - F99
ClO + CO → products ~1.0x10⁻¹² >3700 <4.0x10⁻¹⁸ - F100
ClO + CH4 → products ~1.0x10⁻¹² >3700 <4.0x10⁻¹⁸ - F101
ClO + H2CO → products ~1.0x10⁻¹² >2100 <1.0x10⁻¹⁵ - F102
ClO + CH3O2 → products 3.3x10⁻¹² 115±115 2.2x10⁻¹² 1.5 F103
ClO + ClO → Cl2 + O2 1.0x10⁻¹² 1590±300 4.8x10⁻¹⁵ 1.5 F104
→ ClOO + Cl 3.0x10⁻¹¹ 2450±500 8.0x10⁻¹⁵ 1.5 F104
→ OClO + Cl 3.5x10⁻¹³ 1370±300 3.5x10⁻¹⁵ 1.5 F104
ClO + ClO M→ Cl2O2(See Table 2)
ClO + OClO M→ Cl2O3(See Table 2)
HCl + ClONO2 → products - - <1.0x10⁻²⁰ - F105
CH2Cl + O2 M→ CH2ClO2(See Table 2)
CHCl2 + O2 M→ CHCl2O2(See Table 2)
CCl3 + O2 M→ CCl3O2(See Table 2)
CFCl2 + O2 M→ CFCl2O2
(See Table 2)
CF2Cl + O2 M→ CF2ClO2(See Table 2)
CCl3O2 + NO2 M→ CCl3O2NO2(See Table 2)
CFCl2O2 + NO2 M→ CFCl2O2NO2(See Table 2)
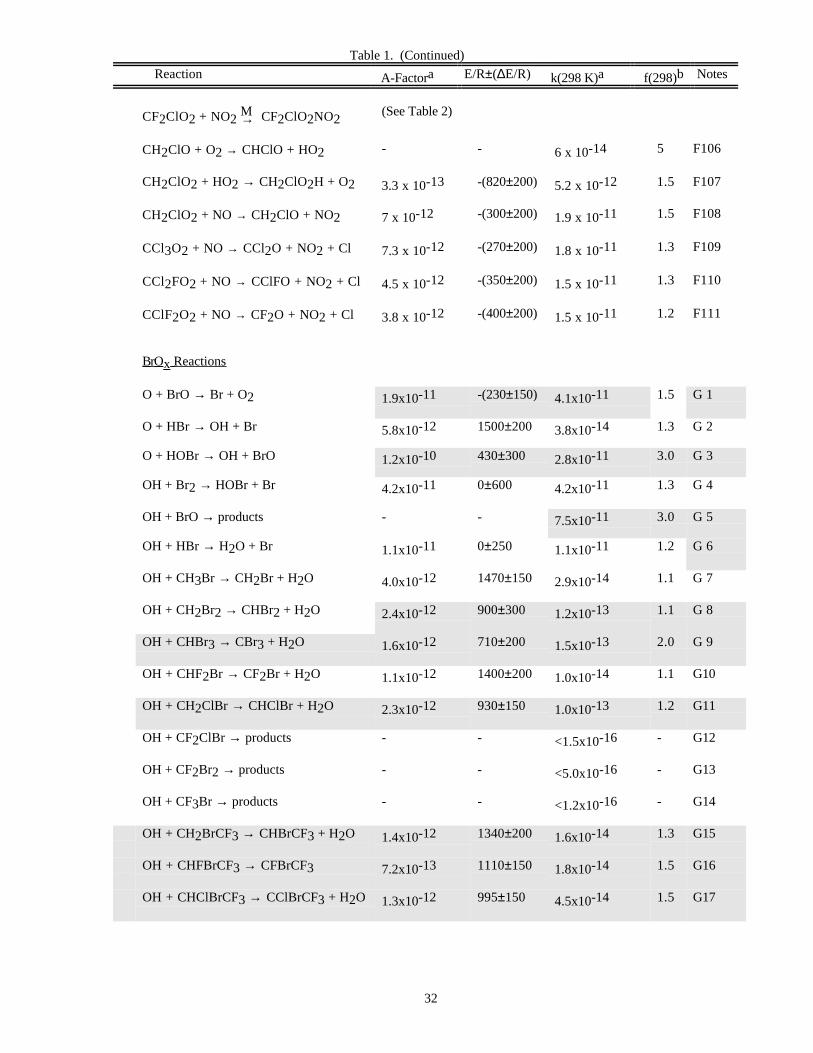
Table 1. (Continued)
Reaction A-Factora E/R±(∆E/R) k(298 K)a f(298)b Notes
32
CF2ClO2 + NO2 M→ CF2ClO2NO2(See Table 2)
CH2ClO + O2 → CHClO + HO2 - - 6 x 10-14 5 F106
CH2ClO2 + HO2 → CH2ClO2H + O2 3.3 x 10⁻¹³ -(820±200) 5.2 x 10⁻¹² 1.5 F107
CH2ClO2 + NO → CH2ClO + NO2 7 x 10-12 -(300±200) 1.9 x 10⁻¹¹ 1.5 F108
CCl3O2 + NO → CCl2O + NO2 + Cl 7.3 x 10⁻¹² -(270±200) 1.8 x 10⁻¹¹ 1.3 F109
CCl2FO2 + NO → CClFO + NO2 + Cl 4.5 x 10⁻¹² -(350±200) 1.5 x 10⁻¹¹ 1.3 F110
CClF2O2 + NO → CF2O + NO2 + Cl 3.8 x 10⁻¹² -(400±200) 1.5 x 10⁻¹¹ 1.2 F111
BrO x Reactions
O + BrO → Br + O2 1.9x10⁻¹¹ -(230±150) 4.1x10⁻¹¹ 1.5 G 1
O + HBr → OH + Br 5.8x10⁻¹² 1500±200 3.8x10⁻¹⁴ 1.3 G 2
O + HOBr → OH + BrO 1.2x10⁻¹⁰ 430±300 2.8x10⁻¹¹ 3.0 G 3
OH + Br2 → HOBr + Br 4.2x10⁻¹¹ 0±600 4.2x10⁻¹¹ 1.3 G 4
OH + BrO → products - - 7.5x10⁻¹¹ 3.0 G 5
OH + HBr → H2O + Br 1.1x10⁻¹¹ 0±250 1.1x10⁻¹¹ 1.2 G 6
OH + CH3Br → CH2Br + H2O 4.0x10⁻¹² 1470±150 2.9x10⁻¹⁴ 1.1 G 7
OH + CH2Br2 → CHBr2 + H2O 2.4x10⁻¹² 900±300 1.2x10⁻¹³ 1.1 G 8
OH + CHBr3 → CBr3 + H2O 1.6x10⁻¹² 710±200 1.5x10⁻¹³ 2.0 G 9
OH + CHF2Br → CF2Br + H2O 1.1x10⁻¹² 1400±200 1.0x10⁻¹⁴ 1.1 G10
OH + CH2ClBr → CHClBr + H2O 2.3x10⁻¹² 930±150 1.0x10⁻¹³ 1.2 G11
OH + CF2ClBr → products - - <1.5x10⁻¹⁶ - G12
OH + CF2Br2 → products - - <5.0x10⁻¹⁶ - G13
OH + CF3Br → products - - <1.2x10⁻¹⁶ - G14
OH + CH2BrCF3 → CHBrCF3 + H2O 1.4x10⁻¹² 1340±200 1.6x10⁻¹⁴ 1.3 G15
OH + CHFBrCF3 → CFBrCF3 7.2x10⁻¹³ 1110±150 1.8x10⁻¹⁴ 1.5 G16
OH + CHClBrCF3 → CClBrCF3 + H2O 1.3x10⁻¹² 995±150 4.5x10⁻¹⁴ 1.5 G17
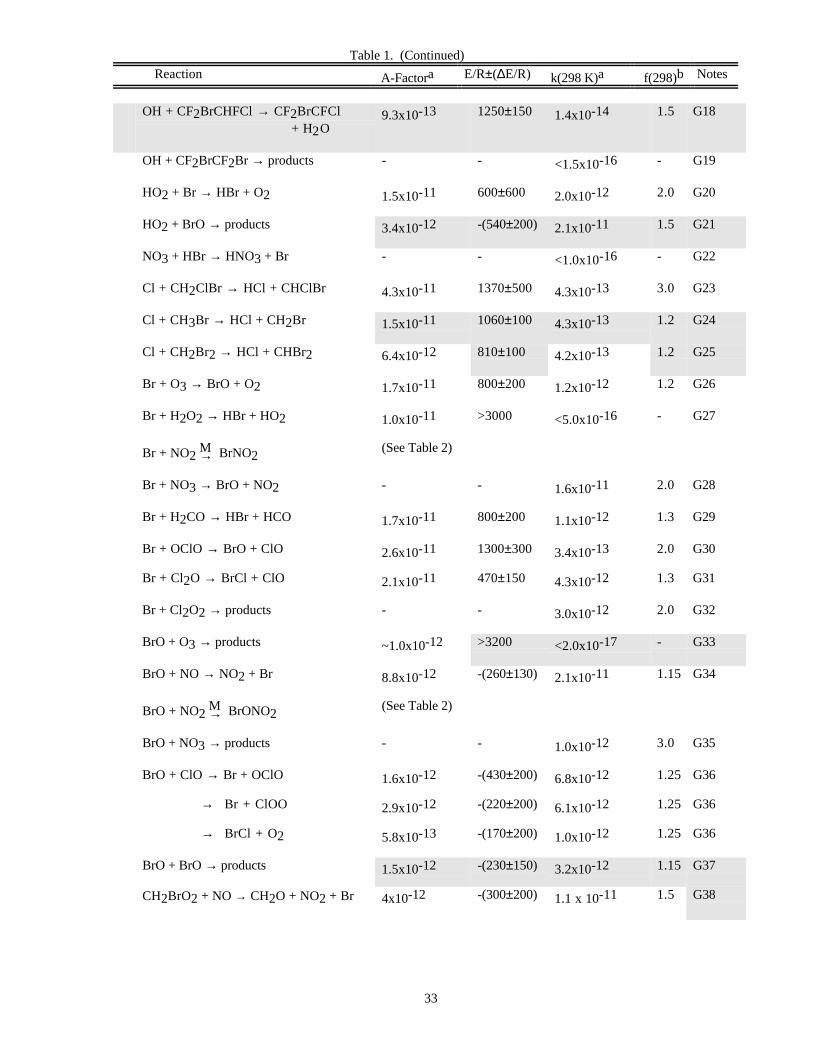
Table 1. (Continued)
Reaction A-Factora E/R±(∆E/R) k(298 K)a f(298)b Notes
33
OH + CF2BrCHFCl → CF2BrCFCl + H2O
9.3x10⁻¹³ 1250±150 1.4x10⁻¹⁴ 1.5 G18
OH + CF2BrCF2Br → products - - <1.5x10⁻¹⁶ - G19
HO2 + Br → HBr + O2 1.5x10⁻¹¹ 600±600 2.0x10⁻¹² 2.0 G20
HO2 + BrO → products 3.4x10⁻¹² -(540±200) 2.1x10⁻¹¹ 1.5 G21
NO3 + HBr → HNO3 + Br - - <1.0x10⁻¹⁶ - G22
Cl + CH2ClBr → HCl + CHClBr 4.3x10⁻¹¹ 1370±500 4.3x10⁻¹³ 3.0 G23
Cl + CH3Br → HCl + CH2Br 1.5x10⁻¹¹ 1060±100 4.3x10⁻¹³ 1.2 G24
Cl + CH2Br2 → HCl + CHBr2 6.4x10⁻¹² 810±100 4.2x10⁻¹³ 1.2 G25
Br + O3 → BrO + O2 1.7x10⁻¹¹ 800±200 1.2x10⁻¹² 1.2 G26
Br + H2O2 → HBr + HO2 1.0x10⁻¹¹ >3000 <5.0x10⁻¹⁶ - G27
Br + NO2 M→ BrNO2(See Table 2)
Br + NO3 → BrO + NO2 - - 1.6x10⁻¹¹ 2.0 G28
Br + H2CO → HBr + HCO 1.7x10⁻¹¹ 800±200 1.1x10⁻¹² 1.3 G29
Br + OClO → BrO + ClO 2.6x10⁻¹¹ 1300±300 3.4x10⁻¹³ 2.0 G30
Br + Cl2O → BrCl + ClO 2.1x10⁻¹¹ 470±150 4.3x10⁻¹² 1.3 G31
Br + Cl2O2 → products - - 3.0x10⁻¹² 2.0 G32
BrO + O3 → products ~1.0x10⁻¹² >3200 <2.0x10⁻¹⁷ - G33
BrO + NO → NO2 + Br 8.8x10⁻¹² -(260±130) 2.1x10⁻¹¹ 1.15 G34
BrO + NO2 M→ BrONO2(See Table 2)
BrO + NO3 → products - - 1.0x10⁻¹² 3.0 G35
BrO + ClO → Br + OClO 1.6x10⁻¹² -(430±200) 6.8x10⁻¹² 1.25 G36
→ Br + ClOO 2.9x10⁻¹² -(220±200) 6.1x10⁻¹² 1.25 G36
→ BrCl + O2 5.8x10⁻¹³ -(170±200) 1.0x10⁻¹² 1.25 G36
BrO + BrO → products 1.5x10⁻¹² -(230±150) 3.2x10⁻¹² 1.15 G37
CH2BrO2 + NO → CH2O + NO2 + Br 4x10-12 -(300±200) 1.1 x 10⁻¹¹ 1.5 G38
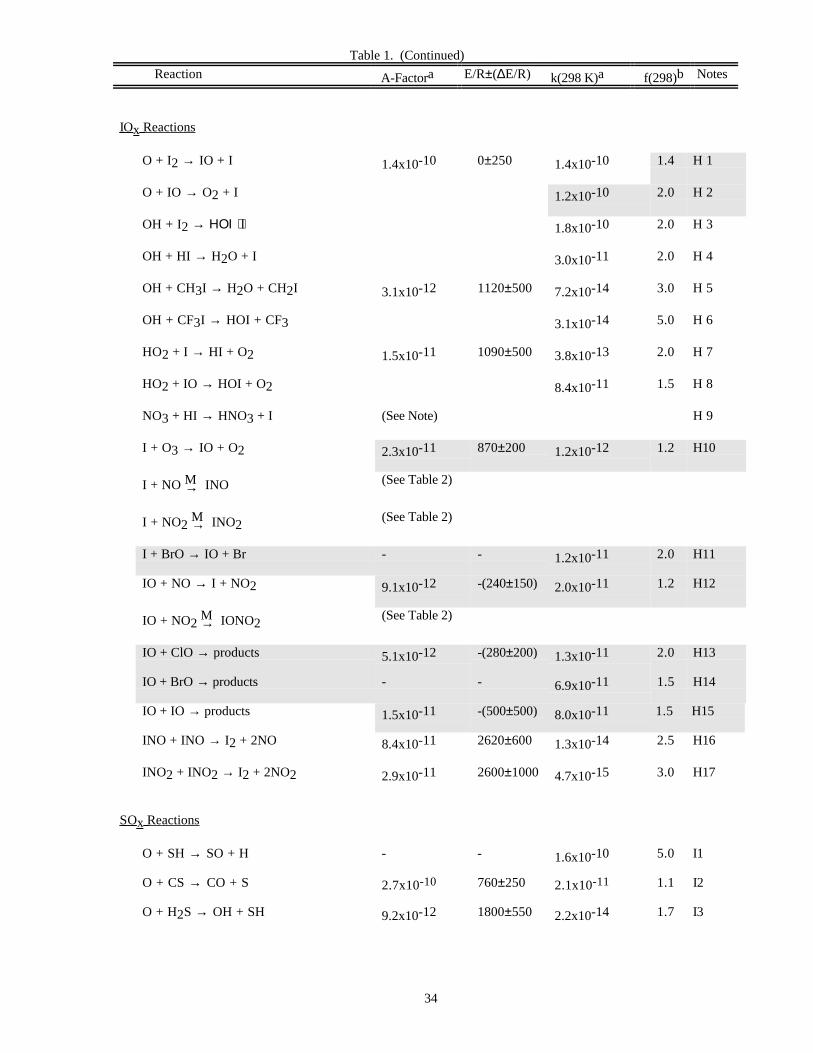
Table 1. (Continued)
Reaction A-Factora E/R±(∆E/R) k(298 K)a f(298)b Notes
34
IO x Reactions
O + I2 → IO + I 1.4x10⁻¹⁰ 0±250 1.4x10⁻¹⁰ 1.4 H 1
O + IO → O2 + I 1.2x10⁻¹⁰ 2.0 H 2
OH + I2 → ΗΟΙ + Ι 1.8x10⁻¹⁰ 2.0 H 3
OH + HI → H2O + I 3.0x10⁻¹¹ 2.0 H 4
OH + CH3I → H2O + CH2I 3.1x10⁻¹² 1120±500 7.2x10⁻¹⁴ 3.0 H 5
OH + CF3I → HOI + CF3 3.1x10⁻¹⁴ 5.0 H 6
HO2 + I → HI + O2 1.5x10⁻¹¹ 1090±500 3.8x10⁻¹³ 2.0 H 7
HO2 + IO → HOI + O2 8.4x10⁻¹¹ 1.5 H 8
NO3 + HI → HNO3 + I (See Note) H 9
I + O3 → IO + O2 2.3x10⁻¹¹ 870±200 1.2x10⁻¹² 1.2 H10
I + NO M→ INO (See Table 2)
I + NO2 M→ INO2(See Table 2)
I + BrO → IO + Br - - 1.2x10⁻¹¹ 2.0 H11
IO + NO → I + NO2 9.1x10⁻¹² -(240±150) 2.0x10⁻¹¹ 1.2 H12
IO + NO2 M→ IONO2(See Table 2)
IO + ClO → products 5.1x10⁻¹² -(280±200) 1.3x10⁻¹¹ 2.0 H13
IO + BrO → products - - 6.9x10⁻¹¹ 1.5 H14
IO + IO → products 1.5x10⁻¹¹ -(500±500) 8.0x10⁻¹¹ 1.5 H15
INO + INO → I2 + 2NO 8.4x10⁻¹¹ 2620±600 1.3x10⁻¹⁴ 2.5 H16
INO2 + INO2 → I2 + 2NO2 2.9x10⁻¹¹ 2600±1000 4.7x10⁻¹⁵ 3.0 H17
SO x Reactions
O + SH → SO + H - - 1.6x10⁻¹⁰ 5.0 I1
O + CS → CO + S 2.7x10⁻¹⁰ 760±250 2.1x10⁻¹¹ 1.1 I2
O + H2S → OH + SH 9.2x10⁻¹² 1800±550 2.2x10⁻¹⁴ 1.7 I3
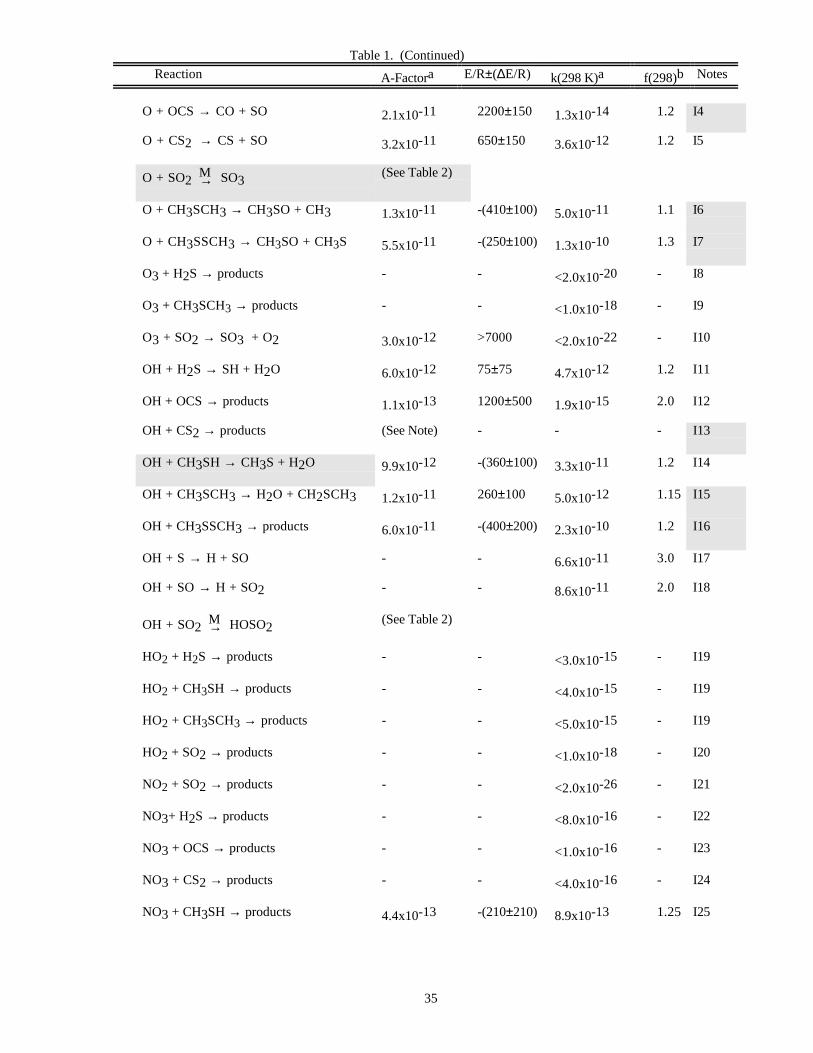
Table 1. (Continued)
Reaction A-Factora E/R±(∆E/R) k(298 K)a f(298)b Notes
35
O + OCS → CO + SO 2.1x10⁻¹¹ 2200±150 1.3x10⁻¹⁴ 1.2 I4
O + CS2 → CS + SO 3.2x10⁻¹¹ 650±150 3.6x10⁻¹² 1.2 I5
O + SO2 M→ SO3(See Table 2)
O + CH3SCH3 → CH3SO + CH3 1.3x10⁻¹¹ -(410±100) 5.0x10⁻¹¹ 1.1 I6
O + CH3SSCH3 → CH3SO + CH3S 5.5x10⁻¹¹ -(250±100) 1.3x10⁻¹⁰ 1.3 I7
O3 + H2S → products - - <2.0x10⁻²⁰ - I8
O3 + CH3SCH3 → products - - <1.0x10⁻¹⁸ - I9
O3 + SO2 → SO3 + O2 3.0x10⁻¹² >7000 <2.0x10⁻²² - I10
OH + H2S → SH + H2O 6.0x10⁻¹² 75±75 4.7x10⁻¹² 1.2 I11
OH + OCS → products 1.1x10⁻¹³ 1200±500 1.9x10⁻¹⁵ 2.0 I12
OH + CS2 → products (See Note) - - - I13
OH + CH3SH → CH3S + H2O 9.9x10⁻¹² -(360±100) 3.3x10⁻¹¹ 1.2 I14
OH + CH3SCH3 → H2O + CH2SCH3 1.2x10⁻¹¹ 260±100 5.0x10⁻¹² 1.15 I15
OH + CH3SSCH3 → products 6.0x10⁻¹¹ -(400±200) 2.3x10⁻¹⁰ 1.2 I16
OH + S → H + SO - - 6.6x10⁻¹¹ 3.0 I17
OH + SO → H + SO2 - - 8.6x10⁻¹¹ 2.0 I18
OH + SO2 M→ HOSO2(See Table 2)
HO2 + H2S → products - - <3.0x10⁻¹⁵ - I19
HO2 + CH3SH → products - - <4.0x10⁻¹⁵ - I19
HO2 + CH3SCH3 → products - - <5.0x10⁻¹⁵ - I19
HO2 + SO2 → products - - <1.0x10⁻¹⁸ - I20
NO2 + SO2 → products - - <2.0x10⁻²⁶ - I21
NO3+ H2S → products - - <8.0x10⁻¹⁶ - I22
NO3 + OCS → products - - <1.0x10⁻¹⁶ - I23
NO3 + CS2 → products - - <4.0x10⁻¹⁶ - I24
NO3 + CH3SH → products 4.4x10⁻¹³ -(210±210) 8.9x10⁻¹³ 1.25 I25
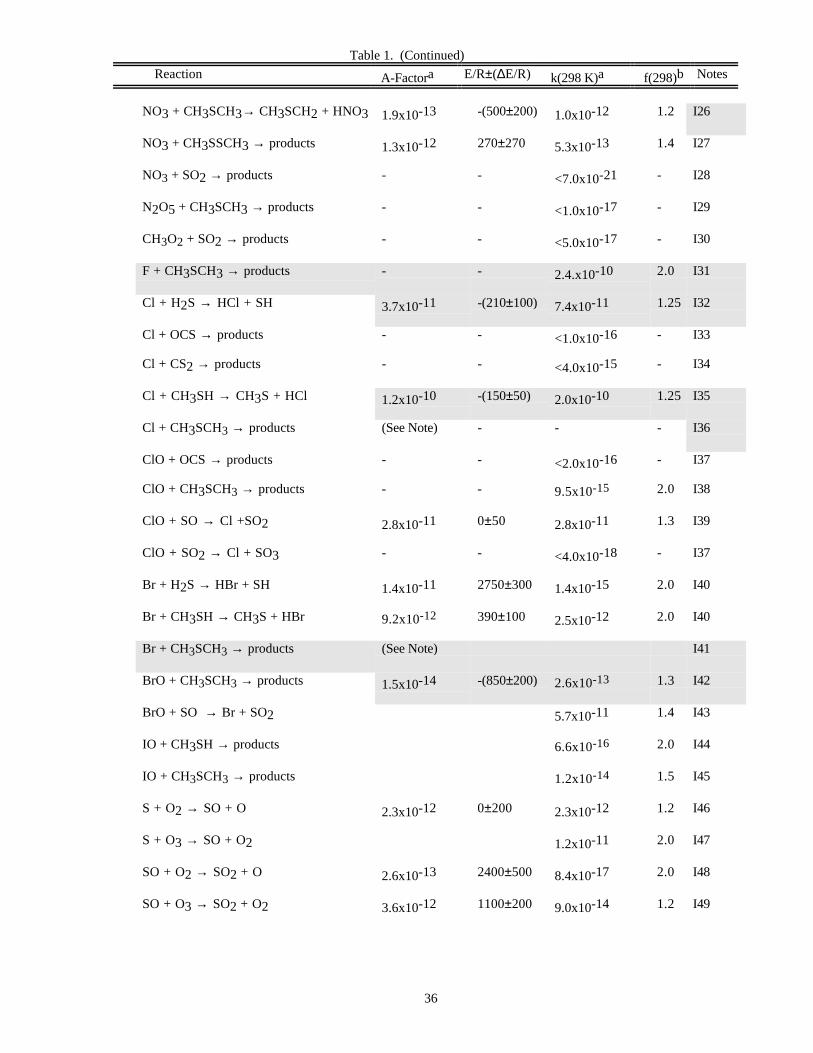
Table 1. (Continued)
Reaction A-Factora E/R±(∆E/R) k(298 K)a f(298)b Notes
36
NO3 + CH3SCH3→ CH3SCH2 + HNO3 1.9x10⁻¹³ -(500±200) 1.0x10⁻¹² 1.2 I26
NO3 + CH3SSCH3 → products 1.3x10⁻¹² 270±270 5.3x10⁻¹³ 1.4 I27
NO3 + SO2 → products - - <7.0x10⁻²¹ - I28
N2O5 + CH3SCH3 → products - - <1.0x10⁻¹⁷ - I29
CH3O2 + SO2 → products - - <5.0x10⁻¹⁷ - I30
F + CH3SCH3 → products - - 2.4.x10-10 2.0 I31
Cl + H2S → HCl + SH 3.7x10⁻¹¹ -(210±100) 7.4x10⁻¹¹ 1.25 I32
Cl + OCS → products - - <1.0x10⁻¹⁶ - I33
Cl + CS2 → products - - <4.0x10⁻¹⁵ - I34
Cl + CH3SH → CH3S + HCl 1.2x10⁻¹⁰ -(150±50) 2.0x10⁻¹⁰ 1.25 I35
Cl + CH3SCH3 → products (See Note) - - - I36
ClO + OCS → products - - <2.0x10⁻¹⁶ - I37
ClO + CH3SCH3 → products - - 9.5x10⁻¹⁵ 2.0 I38
ClO + SO → Cl +SO2 2.8x10⁻¹¹ 0±50 2.8x10⁻¹¹ 1.3 I39
ClO + SO2 → Cl + SO3 - - <4.0x10⁻¹⁸ - I37
Br + H2S → HBr + SH 1.4x10⁻¹¹ 2750±300 1.4x10⁻¹⁵ 2.0 I40
Br + CH3SH → CH3S + HBr 9.2x10⁻¹² 390±100 2.5x10⁻¹² 2.0 I40
Br + CH3SCH3 → products (See Note) I41
BrO + CH3SCH3 → products 1.5x10⁻¹⁴ -(850±200) 2.6x10⁻¹³ 1.3 I42
BrO + SO → Br + SO2 5.7x10⁻¹¹ 1.4 I43
IO + CH3SH → products 6.6x10⁻¹⁶ 2.0 I44
IO + CH3SCH3 → products 1.2x10⁻¹⁴ 1.5 I45
S + O2 → SO + O 2.3x10⁻¹² 0±200 2.3x10⁻¹² 1.2 I46
S + O3 → SO + O2 1.2x10⁻¹¹ 2.0 I47
SO + O2 → SO2 + O 2.6x10⁻¹³ 2400±500 8.4x10⁻¹⁷ 2.0 I48
SO + O3 → SO2 + O2 3.6x10⁻¹² 1100±200 9.0x10⁻¹⁴ 1.2 I49
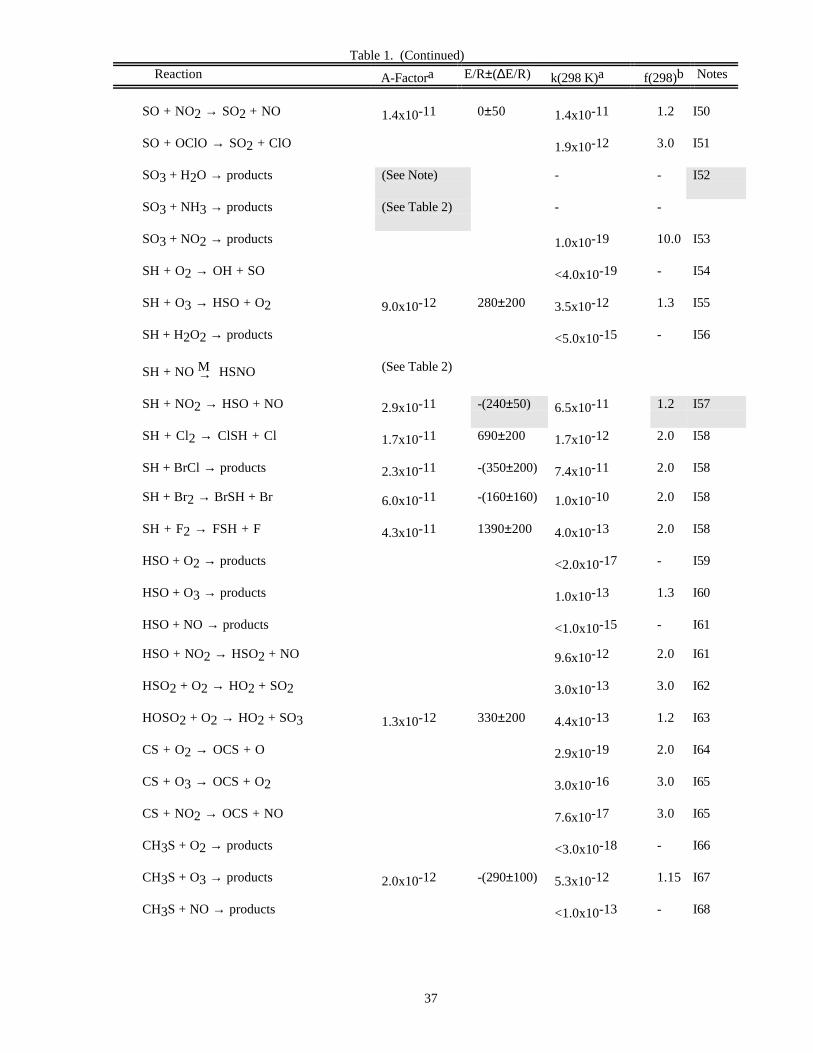
Table 1. (Continued)
Reaction A-Factora E/R±(∆E/R) k(298 K)a f(298)b Notes
37
SO + NO2 → SO2 + NO 1.4x10⁻¹¹ 0±50 1.4x10⁻¹¹ 1.2 I50
SO + OClO → SO2 + ClO 1.9x10⁻¹² 3.0 I51
SO3 + H2O → products (See Note) - - I52
SO3 + NH3 → products (See Table 2) - -
SO3 + NO2 → products 1.0x10⁻¹⁹ 10.0 I53
SH + O2 → OH + SO <4.0x10⁻¹⁹ - I54
SH + O3 → HSO + O2 9.0x10⁻¹² 280±200 3.5x10⁻¹² 1.3 I55
SH + H2O2 → products <5.0x10⁻¹⁵ - I56
SH + NO M→ HSNO (See Table 2)
SH + NO2 → HSO + NO 2.9x10⁻¹¹ -(240±50) 6.5x10⁻¹¹ 1.2 I57
SH + Cl2 → ClSH + Cl 1.7x10⁻¹¹ 690±200 1.7x10⁻¹² 2.0 I58
SH + BrCl → products 2.3x10⁻¹¹ -(350±200) 7.4x10⁻¹¹ 2.0 I58
SH + Br2 → BrSH + Br 6.0x10⁻¹¹ -(160±160) 1.0x10⁻¹⁰ 2.0 I58
SH + F2 → FSH + F 4.3x10⁻¹¹ 1390±200 4.0x10⁻¹³ 2.0 I58
HSO + O2 → products <2.0x10⁻¹⁷ - I59
HSO + O3 → products 1.0x10⁻¹³ 1.3 I60
HSO + NO → products <1.0x10⁻¹⁵ - I61
HSO + NO2 → HSO2 + NO 9.6x10⁻¹² 2.0 I61
HSO2 + O2 → HO2 + SO2 3.0x10⁻¹³ 3.0 I62
HOSO2 + O2 → HO2 + SO3 1.3x10⁻¹² 330±200 4.4x10⁻¹³ 1.2 I63
CS + O2 → OCS + O 2.9x10⁻¹⁹ 2.0 I64
CS + O3 → OCS + O2 3.0x10⁻¹⁶ 3.0 I65
CS + NO2 → OCS + NO 7.6x10⁻¹⁷ 3.0 I65
CH3S + O2 → products <3.0x10⁻¹⁸ - I66
CH3S + O3 → products 2.0x10⁻¹² -(290±100) 5.3x10⁻¹² 1.15 I67
CH3S + NO → products <1.0x10⁻¹³ - I68
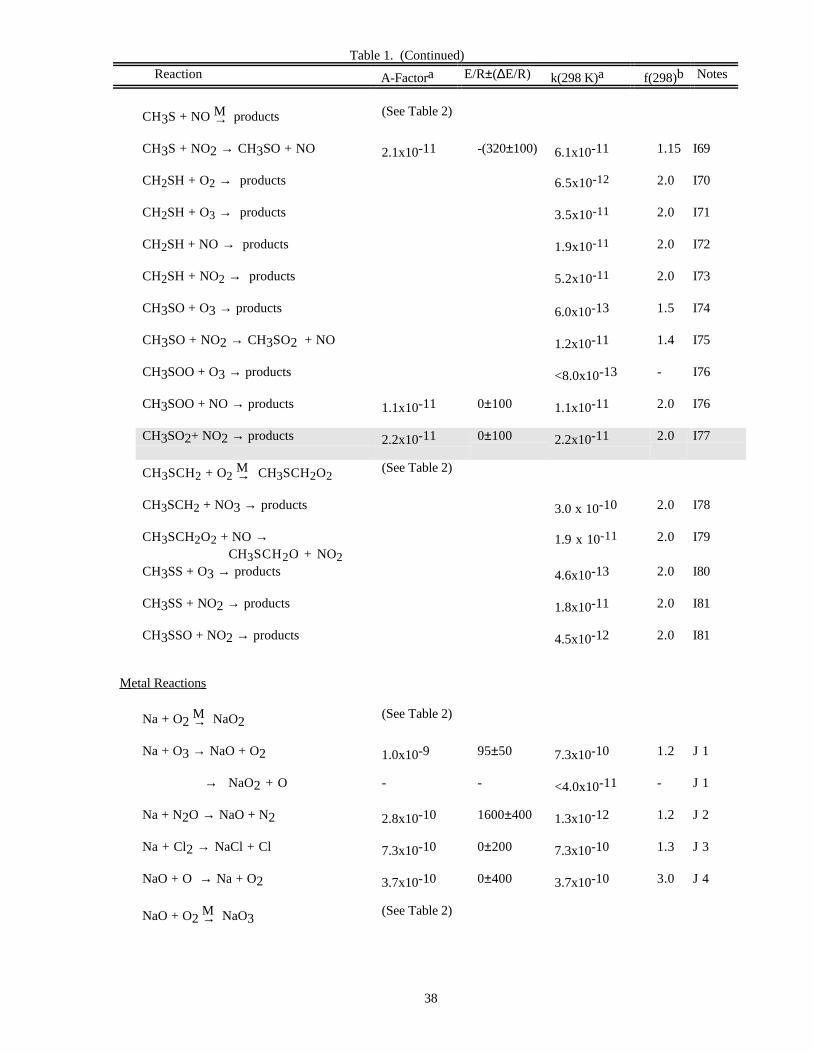
Table 1. (Continued)
Reaction A-Factora E/R±(∆E/R) k(298 K)a f(298)b Notes
38
CH3S + NO M→ products (See Table 2)
CH3S + NO2 → CH3SO + NO 2.1x10⁻¹¹ -(320±100) 6.1x10⁻¹¹ 1.15 I69
CH2SH + O2 → products 6.5x10⁻¹² 2.0 I70
CH2SH + O3 → products 3.5x10⁻¹¹ 2.0 I71
CH2SH + NO → products 1.9x10⁻¹¹ 2.0 I72
CH2SH + NO2 → products 5.2x10⁻¹¹ 2.0 I73
CH3SO + O3 → products 6.0x10⁻¹³ 1.5 I74
CH3SO + NO2 → CH3SO2 + NO 1.2x10⁻¹¹ 1.4 I75
CH3SOO + O3 → products <8.0x10⁻¹³ - I76
CH3SOO + NO → products 1.1x10⁻¹¹ 0±100 1.1x10⁻¹¹ 2.0 I76
CH3SO2+ NO2 → products 2.2x10⁻¹¹ 0±100 2.2x10⁻¹¹ 2.0 I77
CH3SCH2 + O2 M→ CH3SCH2O2(See Table 2)
CH3SCH2 + NO3 → products 3.0 x 10⁻¹⁰ 2.0 I78
CH3SCH2O2 + NO → CH3SCH2O + NO2
1.9 x 10⁻¹¹ 2.0 I79
CH3SS + O3 → products 4.6x10⁻¹³ 2.0 I80
CH3SS + NO2 → products 1.8x10⁻¹¹ 2.0 I81
CH3SSO + NO2 → products 4.5x10⁻¹² 2.0 I81
Metal Reactions
Na + O2 M→ NaO2(See Table 2)
Na + O3 → NaO + O2 1.0x10⁻⁹ 95±50 7.3x10⁻¹⁰ 1.2 J 1
→ NaO2 + O - - <4.0x10⁻¹¹ - J 1
Na + N2O → NaO + N2 2.8x10⁻¹⁰ 1600±400 1.3x10⁻¹² 1.2 J 2
Na + Cl2 → NaCl + Cl 7.3x10⁻¹⁰ 0±200 7.3x10⁻¹⁰ 1.3 J 3
NaO + O → Na + O2 3.7x10⁻¹⁰ 0±400 3.7x10⁻¹⁰ 3.0 J 4
NaO + O2 M→ NaO3(See Table 2)
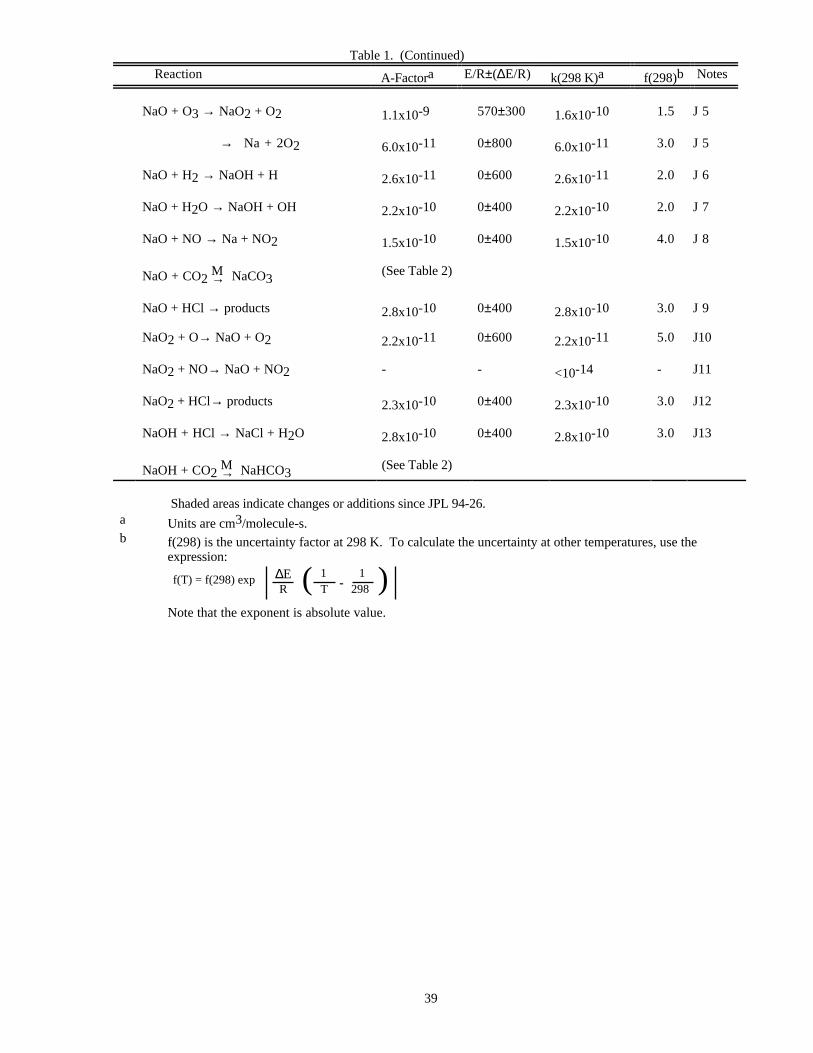
Table 1. (Continued)
Reaction A-Factora E/R±(∆E/R) k(298 K)a f(298)b Notes
39
NaO + O3 → NaO2 + O2 1.1x10⁻⁹ 570±300 1.6x10⁻¹⁰ 1.5 J 5
→ Na + 2O2 6.0x10⁻¹¹ 0±800 6.0x10⁻¹¹ 3.0 J 5
NaO + H2 → NaOH + H 2.6x10⁻¹¹ 0±600 2.6x10⁻¹¹ 2.0 J 6
NaO + H2O → NaOH + OH 2.2x10⁻¹⁰ 0±400 2.2x10⁻¹⁰ 2.0 J 7
NaO + NO → Na + NO2 1.5x10⁻¹⁰ 0±400 1.5x10⁻¹⁰ 4.0 J 8
NaO + CO2 M→ NaCO3(See Table 2)
NaO + HCl → products 2.8x10⁻¹⁰ 0±400 2.8x10⁻¹⁰ 3.0 J 9
NaO2 + O→ NaO + O2 2.2x10⁻¹¹ 0±600 2.2x10⁻¹¹ 5.0 J10
NaO2 + NO→ NaO + NO2 - - <10-14 - J11
NaO2 + HCl→ products 2.3x10⁻¹⁰ 0±400 2.3x10⁻¹⁰ 3.0 J12
NaOH + HCl → NaCl + H2O 2.8x10⁻¹⁰ 0±400 2.8x10⁻¹⁰ 3.0 J13
NaOH + CO2 M→ NaHCO3
(See Table 2)
Shaded areas indicate changes or additions since JPL 94-26.a Units are cm3/molecule-s.b f(298) is the uncertainty factor at 298 K. To calculate the uncertainty at other temperatures, use the
expression:
f(T) = f(298) exp ( )-1T
1298R
∆E
Note that the exponent is absolute value.
40
Notes to Table 1
A1. O + O3. The recommended rate expression is from Wine et al. [1260] and is a linear least squares fit of alldata (unweighted) from Davis et al. [313], McCrumb and Kaufman [772], West et al. [1239], Arnold andComes [29], and Wine et al. [1260].
A2. O(1D) Reactions. The rate constants are for the disappearance of O(1D), which includes physical quenching ordeactivation. Where information is available, product yields are given. The rate constant recommendations arebased on averages of the absolute rate constant measurements reported by Streit et al. [1088], Davidson et al.[306] and Davidson et al. [305] for N2O, H2O, CH4, H2, N2, O2, O3, CCl4, CFCl3, CF2Cl2, NH3, andCO2; by Amimoto et al. [17], Amimoto et al. [16], and Force and Wiesenfeld [392, 393] for N2O, H2O,CH4, N2, H2, O2, O3, CO2, CCl4, CFCl3, CF2Cl2, and CF4; by Wine and Ravishankara [1261-1263] forN2O, H2O, N2, H2, O3, CO2 and CF2O; by Brock and Watson (private communication, 1980) for N2, O2and CO2; by Lee and Slanger [677, 678] for H2O and O2; by Gericke and Comes [414] for H2O; and by Shiand Barker [1020] for N2 and CO2, and Talukdar and Ravishankara [1120] for H2. The weight of the evidencefrom these studies indicates that the results of Heidner and Husain [475], Heidner et al. [476] and Fletcher andHusain [386, 387] contain a systematic error. For the critical atmospheric reactants, such as N2O, H2O, andCH4, the recommended absolute rate constants are in good agreement with the previous relative measurementswhen compared with N2 as the reference reactant. A similar comparison with O2 as the reference reactantgives somewhat poorer agreement.
A3. O(1D) + O2. The deactivation of O(1D) by O2 leads to the production of O2(1∑) with an efficiency of
80±20%: Noxon [873], Biedenkapp and Bair [112], Snelling [1061], and Lee and Slanger [677]. The O2(1∑)is produced in the v=0, 1, and 2 vibrational levels in the amounts 60%, 40%, and <3%, Gauthier and Snelling[411] and Lee and Slanger [677].
A4. O(1D) + O3. The branching result for reaction of O(1D) with O3 to give O2 + O2 or O2 + O + O is fromDavenport et al. [300]. This is supported by measurements of Amimoto et al. [17] who reported that on
average one ground state O is produced per O(1D) reaction with O3. It seems unlikely that this could result
from 100% quenching of the O(1D) by O3.
A5. O(1D) + H2. Wine and Ravishankara [1262] have determined the yield of O(3P) is <4.9%. The majorproducts are H + OH. Koppe et al. [628] report a 2.7 times larger rate coefficient at a kinetic energy of0.12eV. This does not agree with the observations of Davidson et al. [306], who reported that k is independent
of temperature (200-350K) and Matsumi et al. [767] who report no change in k when hot O(1D) is moderatedwith Ar.
A6. O(1D) + H2O. Measurements of the O2 + H2 product yield were made by Zellner et al. [1301] (1 +0.5 or
-1)% and by Glinski and Birks [428] (0.6 +0.7 or -0.6)%. That the yield of O(3P) from O(1D) + H2O isreported to be <(4.9±3.2)% by Wine and Ravishankara [1722] and (2±1)% by Takahashi et al. [1109].
A7. O(1D) + N2O. The branching ratio for the reaction of O(1D) with N2O to give N2 + O2 or NO + NO is anaverage of the values reported by Davidson et al. [303]; Volltrauer et al. [1185]; Marx et al. [765] and Lam etal. [654], with a spread in R=k(NO + NO)/k(Total) = 0.52 - 0.62. Cantrell et al. [185] reported a measurementof R=0.57 and an analysis of all measurements from 1957-1994 leads them to recommend a value ofR=0.61±0.06, where the uncertainty indicates their 95% confidence interval. The recommended branching ratioagrees well with earlier measurements of the quantum yield from N2O photolysis (Calvert and Pitts [177]).
The O(1D) translational energy and temperature dependence effects are not clearly resolved. Wine and
Ravishankara [1262] have determined that the yield of O(3P) from O(1D) + N2O is <4.0%. The uncertaintyfor this reaction includes factors for both the overall rate coefficient and the branching ratio. A direct
measurement by Greenblatt and Ravishankara [437] of the NO yield from the O(1D) + N2O reaction in the
presence of airlike mixtures agrees very well with the value predicted using the recommended O(1D) rate
41
constants for N2, O2, and N2O and the O(1D) + N2O product branching ratio. These authors suggest thattheir results support the recommendations and reduce the uncertainty in the collected rate parameters by over afactor of two.
A8. O(1D) + NH3. Sanders et al. [991] have detected the products NH(a1∆) and OH formed in the reaction. They
report that the yield of NH(a1∆) is in the range 3-15% of the amount of OH detected.
A9. O(1D) + CH4. The reaction products are (a) CH3 + OH, (b) CH3O or CH2OH + H and (c) CH2O + H2. Linand DeMore [718] analyzed the final products of N2O/CH4 photolysis mixtures and concluded that (a)accounted for about 90% and that CH2O and H2 (c) accounted for about 9%. Addison et al. [8] reported an OHyield of 80%. Casavecchia et al. [189] used a molecular beam experiment to observe H and CH3O (orCH2OH) products. They reported that the yield of H2 was <25% of the yield of H from (b). Satyapal et al.[996] observed the production of H atoms in a pulsed laser experiment and reported a yield of H of (25±8)%.
Matsumi et al. [767] measured the yields of H and O(3P) in low pressure gas mixtures and reported the yield
of H was (15±3)% and the yield of O(3P) was <5%. Wine and Ravishankara [1262] reported that the yield of
O(3P) was <4.3%. Takahashi et al. [1109] reported that the O(3P) yield is <1%. We recommend thefollowing branching ratios: (a) (75±15)%, (b) (20±7)%, (c) (5±5)%.
A10. O(1D) + HCl. The recommendation is the average of measurements by Davidson et al. [306] and Wine et al.
[1270]. Product studies by the latter indicate: O(3P) + HCl (9±5)%; H + ClO (24±5)%; and OH + Cl
(67±10)%. Takahashi et al. [1109] report the O(3P) yield is (15±4)%.
A11. O(1D) + HF. Rate coefficient and product yield measured by Wine et al. (1984, private communication). The
O(3P) yield is less than 4%.
A12. O(1D) + HBr. Rate coefficient and products measured by Wine et al. [1270]. Product yields: HBr + O(3P)(20±7)%, H + BrO <4.5%, and OH + Br (80±12)%.
A13. O(1D) + Cl2. Rate coefficient and O(3P) product were measured by Wine et al. [1258], who reported Cl2 +
O(3P) (25±10)%. Takahashi et al. [1109] reported that the ClO yield is (74±15)%, in excellent agreement.An indirect study by Freudenstein and Biedenkapp [396] is in reasonable agreement on the yield of ClO.
A14. O(1D) + COCl2, COClF and COF2. For the reactions of O(1D) with COCl2 and COClF the recommendedrate constants are derived from data of Fletcher and Husain [388]. For consistency, the recommended valuesfor these rate constants were derived using a scaling factor (0.5) which corrects for the difference between rate
constants from the Husain laboratory and the recommendations for other O(1D) rate constants in this table.The recommendation for COF2 is from the data of Wine and Ravishankara [1263]. Their result is preferredover the value of Fletcher and Husain [388] because it appears to follow the pattern of decreased reactivitywith increased fluorine substitution observed for other halocarbons. These reactions have been studied only at
298 K. Based on consideration of similar O(1D) reactions, it is assumed that E/R equals zero, and thereforethe value shown for the A-factor has been set equal to k(298 K).
A15. O(1D) + halocarbons. The halocarbon rate constants are for the total disappearance of O(1D) and probablyinclude physical quenching. Products of the reactive channels may include CX3O + X, CX2O + X2 (or 2X),and CX3 + XO, where X = H, F, Cl, or Br in various combinations. Bromine, chlorine and hydrogen aremore easily displaced than fluorine from halocarbons. Some values have been reported for the fractions of the
total rate of disappearance of O(1D) proceeding through physical quenching and reactive channels. For CCl4:quenching = (14±6)% and reaction = (86±6)% (Force and Wiesenfeld [393]), ClO yield = (90±19)% (Takahashiet al. [1109]; for CFCl3: quenching = (25±10)%, ClO formation = (60±15)% (Donovan, privatecommunication, 1980), ClO yield = (88±18)% (Takahashi et al.); for CF2Cl2: quenching = (14±7)% andreaction = (86±14)% (Force and Wiesenfeld [393]), quenching = (20±10)%, ClO formation = (55±15)%(Donovan), quenching =(19±5)% and ClO formation =(87±18%) (Takahashi et al.)
42
A16. O(1D) + CH3Br. The recommendation is based on data from Thompson and Ravishankara [1127]. They
report that the yield of O(3P) from physical quenching is 0±7%.
A17. O(1D) + CH2Br2. The recommendation is based on data from Thompson and Ravishankara [1127]. They
report that the yield of O(3P) from physical quenching is (5±7)%.
A18. O(1D) + CHBr3. The recommendation is based on data from Thompson and Ravishankara [1127]. The rate
coefficient is somewhat large compared to analogous compounds. They report that the yield of O(3P) fromphysical quenching is (32±8)%.
A19. O(1D) + CH3F (HFC-41). The recommendation is the average of measurements of Force and Wiesenfeld
[393] and Schmoltner et al. [1005]. The O(3P) product yield was reported to be (25±3)% by Force andWiesenfeld, (11±5)% by Schmoltner et al., and (19±5)% by Takahashi et al. [1109]. Burks and Lin [163]reported observing vibrationally excited HF as a product. Park and Wiesenfeld [895] observed OH.
A20. O(1D) + CH2F2 (HFC-32). The recommendation is based upon the measurement of Schmoltner et al.
[1005], who reported that the yield of O(3P) is (70±11)%. Green and Wayne [435] measured the loss of
CH2F2 relative to the loss of N2O. Their value when combined with our recommendation for O(1D) + N2Oyields a rate coefficient for reactive loss of CH2F2 that is about three times the result of Schmoltner et al.Burks and Lin [163] reported observing vibrationally excited HF as a product.
A21. O(1D) + CHF3 (HFC-23). The recommendation is the average of measurements of Force and Wiesenfeld
[393] and Schmoltner et al. [1005]. The O(3P) product yield was reported to be (77±15)% by Force andWiesenfeld and (102±3)% by Schmoltner et al. Although physical quenching is the dominant process,detectable yields of vibrationally excited HF have been reported by Burks and Lin [163] and Aker et al. [14],which indicate the formation of HF + CF2O products.
A22. O(1D) + CHCl2F (HCFC-21). The recommendation is based upon the measurement by Davidson et al.[305] of the total rate coefficient (physical quenching and reaction). Takahashi et al. [1109] report the yield ofClO is (74±15)%.
A23. O(1D) + CHClF2 (HCFC-22). The recommendation is based upon the measurements by Davidson et al.[305] and Warren et al. [1222] of the total rate coefficient. A measurement of the rate of reaction (halocarbonremoval) relative to the rate of reaction with N2O by Green and Wayne [435] agrees very well with this value
when the O(1D) + N2O recommendation is used to obtain an absolute value. A relative measurement byAtkinson et al. [39] gives a rate coefficient about a factor of two higher. Addison et al. [8] reported the
following product yields: ClO (55±10)%, CF2 (45±10)%, O(3P) (28 +10 or -15)%, and OH 5%, where the
O(3P) comes from a branch yielding CF2 and HCl. Warren et al. [1222] also report a yield of O(3P) of(28±6)%, which they interpret as the product of physical quenching.
A24. O(1D) + CClF3 (CFC-13). The recommendation is based on the measurement by Ravishankara et al.[951]
who report (31±10)% physical quenching. Takahashi et al. [1109] report the yields of O(3P) (16±5)% andClO (85±18)%.
A25. O(1D) + CClBrF2 (Halon 1211). The recommendation is based on data from Thompson and Ravishankara
[1127]. They report that the yield of O(3P) from physical quenching is (36±4)%.
A26. O(1D) + CBr2F2 (Halon 1202). The recommendation is based on data from Thompson and Ravishankara
[1127]. They report that the yield of O(3P) from physical quenching is (54±6)%.
43
A27. O(1D) + CBrF3 (Halon 1301). The recommendation is based on data from Thompson and Ravishankara
[1127]. They report that the yield of O(3P) from physical quenching is (59±8)%. Lorenzen-Schmidt et al.[728] measured the Halon removal rate relative to the N2O removal rate and report that the rate coefficient for
the Halon destruction path is (4.0±0.4)x10-11, which is in excellent agreement with Thompson andRavishankara.
A28. O(1D) + CF4 (CFC-14). The recommendation is based upon the measurement by Ravishankara et al. [951],who report (92±8)% physical quenching. Force and Wiesenfeld [393] measured a quenching rate coefficientabout 10 times larger. Shi and Barker [1020] report an upper limit that is consistent with therecommendation. The small rate coefficient for this reaction makes it vulnerable to interference from reactantimpurities. For this reason the recommendation should probably be considered an upper limit.
A29. O(1D) + CH3CH2F (HFC 161). The recommendation is based on data from Schmoltner et al. [1005]. They
report that the yield of O(3P) from physical quenching is (18±5)%.
A30. O(1D) + CH3CHF2 (HFC-152a). The recommendation is based on the measurements of Warren et al.[1222], who report (54±7)% physical quenching.
A31. O(1D) + CH3CCl2F (HCFC-141b). The recommendation is based upon the measurement of Warren et al.[1222], who report (31±5)% physical quenching.
A32. O(1D) + CH3CClF2 (HCFC-142b). The recommendation is based upon the measurement of Warren et al.[1222], who report (26±5)% physical quenching. This agrees very well with Green and Wayne [435], whomeasured the loss of CH3CF2Cl relative to the loss of N2O, when the recommendation for N2O is used.
A33. O(1D) + CH3CF3 (HFC-143a). The recommendation is based upon the relative rate measurement of Greenand Wayne [435], who measured the loss of CH3CF3 relative to the loss of N2O. The recommendation forN2O is used to obtain the value given. It is assumed that there is no physical quenching, although thereported physical quenching by CH2FCF3 and CH3CHF2 suggests some quenching is possible.
A34. O(1D) + CH2ClCClF2 (HCFC-132b). The recommendation is based upon the relative rate measurement ofGreen and Wayne [435], who measured the loss of CH2ClCF2Cl relative to the loss of N2O. Therecommendation for N2O is used to obtain the value given. It is assumed that there is no physical quenching.
A35. O(1D) + CH2ClCF3 (HCFC-133a). The recommendation is based upon the measurement of Warren et al.[1222], who report (20±5)% physical quenching. This agrees with Green and Wayne [435] who measured theloss of CH2ClCF3 relative to the loss of N2O, when the recommendation for N2O is used.
A36. O(1D) + CH2FCF3 (HFC-134a). The recommendation is based on the measurement of Warren et al. [1222]who report (94+6/-1)% physical quenching. The predominance of physical quenching is surprising,
considering the presence of C-H bonds, which are usually reactive toward O(1D) .
A37. O(1D) + CHCl2CF3 (HCFC-123). The recommendation is based upon measurements by Warren et al.[1222]. The relative rate measurement of Green and Wayne [435], who measured the loss of CHCl2CF3relative to the loss of N2O, agrees well with the recommendation when the recommendation for N2O is used.Warren et al. report (21±8)% physical quenching.
A38. O(1D) + CHClFCF3 (HCFC-124). The recommendation is based upon the measurement of Warren et al.[1222], who report (31±10)% physical quenching.
44
A39. O(1D) + CHF2CF3 (HFC-125). The recommendation is based upon the measurement of Warren et al.[1222], who report (85+15/-22)% physical quenching. Green and Wayne [435] measured the loss ofCHF2CF3 relative to the loss of N2O and report a loss corresponding to about 40% of the recommended ratecoefficient. This reaction is much faster than one would predict by analogy to similar compounds, such asCH2FCF3.
A40. O(1D) + CCl3CF3 (CFC-113a). The recommendation is an estimate based on analogy to similarcompounds.
A41. O(1D) + CCl2FCClF2 (CFC-113). The recommendation is an estimate based on analogy to similarcompounds.
A42. O(1D) + CCl2FCF3 (CFC-114a). The recommendation is an estimate based on analogy to similarcompounds.
A43. O(1D) + CClF2CClF2 (CFC-114). The recommendation is based on the measurement by Ravishankara etal. [951], who report (25±9)% physical quenching.
A44. O(1D) + CClF2CF3 (CFC-115). The recommendation is based on the measurement by Ravishankara etal.[951], who report (70±7)% physical quenching.
A45. O(1D) + CBrF2CBrF2 (Halon 2402). The recommendation is based on data from Thompson and
Ravishankara [1127]. They report that the yield of O(3P) from physical quenching is (25±7)%. Lorenzen-Schmidt et al. [728] measured the Halon removal rate relative to the N2O removal rate and report that the rate
coefficient for the Halon destruction path is (8.8±1.2)x10-11, in fair agreement with the result of Thompsonand Ravishankara.
A46. O(1D) + C2F6 (CFC-116). The recommendation is based on a measurement by Ravishankara et al. [951],who report (85±15)% physical quenching. The small rate coefficient for this reaction makes it vulnerable tointerference from reactant impurities. For this reason the recommendation should probably be considered anupper limit.
A47. O(1D) + CHF2CF2CF2CHF2 (HFC 338 pcc). The recommendation is based on data from Schmoltner et
al. [1005]. They report that the yield of O(3P) from physical quenching is (97±9)%.
A48. O(1D) + c-C4F8. The recommendation for perfluorocyclobutane is based upon the measurement byRavishankara et al. [951], who report (100+0/-15)% physical quenching. The small rate coefficient for thisreaction makes it vulnerable to interference from reactant impurities. For this reason the recommendationshould probably be considered an upper limit.
A49. O(1D) + CF3CHFCHFCF2CF3 (HFC 43-10 mee). The recommendation is based on data from Schmoltneret al. [1005]. The rate coefficients for this compound and CHF2CF3 do not follow the reactivity trend of
other HFCs. Schmoltner et al. report that the yield of O(3P) from physical quenching is (91±4)%.
A50. O(1D) + C5F12 (CFC 41-12). The recommendation is based on data from Ravishankara et al. [951]. They
report that the yield of O(3P) from physical quenching is (79±12)%.
A51. O(1D) + C6F14 (CFC 51-14). The recommendation is based on data from Ravishankara et al. [951]. They
report that the yield of O(3P) from physical quenching is (75±9)%.
45
A52. O(1D) + 1,2-(CF3)2c-C4F6. The recommendation is based on data from Ravishankara et al. [951]. They
report that the yield of O(3P) from physical quenching is (84±16)%.
A53. O(1D) + SF6. The recommendation is based upon measurements by Ravishankara et al. [951] who report(32±10)% physical quenching. The small rate coefficient for this reaction makes it vulnerable to interferencefrom reactant impurities. For this reason the recommendation should probably be considered an upper limit.
A54. O2(1∆) + O. The recommendation is based on the upper limit reported by Clark and Wayne [219].
A55. O2(1∆) + O2. The recommendation is the average of eight room temperature measurements: Steer et al.[1073], Findlay and Snelling [379], Borrell et al. [131], Leiss et al. [682], Tachibana and Phelps [1103],Billington and Borrell [118], Raja et al. [942], and Wildt et al. [1251]. The temperature dependence is derivedfrom the data of Findlay and Snelling and Billington and Borrell. Several other less direct measurements ofthe rate coefficient agree with the recommendation, including Clark and Wayne [218], Findlay et al. [378], andMcLaren et al. [774]. Wildt et al. [1252] report observations of weak emissions in the near IR due tocollision-induced radiation. Wildt et al. [1253] give rate coefficients for this process.
A56. O2(1∆) + O3. The recommendation is the average of the room temperature measurements of Clark et al.[217], Findlay and Snelling [380], Becker et al. [92], and Collins et al. [256]. Several less directmeasurements agree well with the recommendation (McNeal and Cook [775], Wayne and Pitts [1235], andArnold and Comes [30]). The temperature dependence is from Findlay and Snelling and Becker et al., whoagree very well, although both covered a relatively small temperature range. An earlier study by Clark et al.covered a much larger range, and found a much smaller temperature coefficient. The reason for thisdiscrepancy is not clear. The yield of O + 2O2 products appears to be close to unity, based on many studiesof the quantum yield of O3 destruction near the peak of the Hartley band. For example, measurements of thenumber of O3 molecules destroyed per photon absorbed: Von Ellenrieder et al. [1186], Ravishankara et al.[957], Lissi and Heicklen [722], and references cited therein and measurements of O3 loss and O atomtemporal profiles in pulsed experiments Klais et al. [614] and Arnold and Comes [30]. Anderson et al. [26]
report that the rate coefficient for atom exchange between O2(1∆) and O3 is < 5x10-16 at 300K.
A57. O2(1∆) + H2O. The recommendation is the average of the measurements reported by Becker et al. [91] andFindlay and Snelling [379]. An earlier study by Clark and Wayne [218] reported a value about three timeslarger.
A58. O2(1∆) + N. The recommendation is an upper limit based upon the measurement reported by Westenberg et
al. [1246], who used ESR to detect O2(X3∑ and a1∆), O(3P) and N(4S) with a discharge flow reactor. They
used an excess of O2(1∆) and measured the decay of N and the appearance of O at 195 and 300 K. They
observed that the reaction of N with O2(1∆) is somewhat slower than its reaction with O2(3∑). Therecommended rate constant value for the latter provides the basis for the recommendation. Clark and Wayne
[219, 220] and Schmidt and Schiff [1002] reported observations of an O2(1∆) reaction with N that is about 30
times faster than the recommended limit. Schmidt and Schiff attribute the observed loss of O2(1∆) in excessN to a rapid energy exchange with some constituent in discharged nitrogen, other than N.
A59. O2(1∆) + N2. The recommendation is based upon the measurements by Findlay et al. [378] and Becker et al.[91]. Other studies obtained higher values for an upper limit: Clark and Wayne [218] and Steer et al. [1073].
A60. O2(1∆) + CO2. The recommendation is based on the measurements reported by Findlay and Snelling [379]and Leiss et al. [682]. Upper limit rate coefficients reported by Becker et al. [91], McLaren et al. [774], andSingh et al. [1039] are consistent with the recommendation.
A61. O2(1∑) + O. The recommendation is based on the measurement reported by Slanger and Black [1053].
46
A62. O2(1∑) + O2. The recommendation is the average of values reported by Martin et al. [763], Lawton et al.[664], and Lawton and Phelps [665], who are in excellent agreement. Measurements by Thomas and Thrush[1126], Chatha et al. [202], and Knickelbein et al. [620] are in reasonable agreement with the
recommendation. Knickelbein et al. report an approximate unit yield of O2(1∆) product.
A63. O2(1∑) + O3. The recommendation is based upon the room temperature measurements of Gilpin et al. [422],Slanger and Black [1053], Choo and Leu [215], and Shi and Barker [1020]. Measurements by Snelling[1061], Amimoto and Wiesenfeld [18], Ogren et al. [875], and Turnipseed et al. [1163] are in very goodagreement with the recommendation. The temperature dependence is derived from the results of Choo andLeu. The yield of O + 2O2 products is reported to be (70±20)% by Slanger and Black and Amimoto andWiesenfeld.
A64. O2(1∑) + H2O. The recommendation is the average of room temperature measurements reported by Stuhl andNiki [1092], Filseth et al. [377], Wildt et al. [1251], and Shi and Barker [1020]. These data cover a range ofabout a factor of two. Measurements reported by O'Brien and Myers [874], Derwent and Thrush [334], andThomas and Thrush [1126] are in good agreement with the recommendation. Wildt et al. [1251] report that
the yield of O2(1∆) ≥ 90%.
A65. O2(1∑) + N. The recommendation is based on the limit reported by Slanger and Black [1053].
A66. O2(1∑) + N2. The recommendation is the average of measurements reported by Izod and Wayne [546], Stuhland Welge [1095], Filseth et al. [377], Martin et al. [763], Kohse-Höinghaus and Stuhl [625], Choo and Leu[215], Wildt et al. [1251], and Shi and Barker [1020]. Less direct measurements reported by Noxon [873],Myers and O'Brien [821], and Chatha et al. [202] are consistent with the recommendation. Kohse-Höinghausand Stuhl observed no significant temperature dependence over the range 203-349 K.
A67. O2(1∑) +CO2. The recommendation is the average of measurements reported by Filseth et al. [377],Davidson et al. [304], Avilés et al. [49], Muller and Houston [818], Choo and Leu [215], Wildt et al. [1251],and Shi and Barker [1020] at room temperature. The temperature dependence is from the work of Choo and
Leu. Muller and Houston and Singh and Setser [1040] give evidence that O2(1∆) is a product. Wildt et al.
report that the yield of O2(1∆) ≥ 90%.
B1. O + OH. The rate constant for O + OH is a fit to three temperature dependence studies: Westenberg et al.[1245], Lewis and Watson [703], and Howard and Smith [514]. This recommendation is consistent withearlier work near room temperature as reviewed by Lewis and Watson [703] and with the measurements ofBrune et al. [148]. The ratio k(O + HO2)/k(O + OH) measured by Keyser [600] agrees with the rate constantsrecommended here.
B2. O + HO2. The recommendation for the O + HO2 reaction rate constant is the average of five studies at roomtemperature (Keyser [599], Sridharan et al. [1064], Ravishankara et al. [957], Brune et al. [148] and Nicovichand Wine [848]) fitted to the temperature dependence given by Keyser [599] and Nicovich and Wine [848].Earlier studies by Hack et al. [449] and Burrows et al. [164, 167] are not considered, because the OH + H2O2reaction was important in these studies and the value used for its rate constant in their analyses has beenshown to be in error. Data from Lii et al. [713] are not used, because they are based on only four experimentsand involve a curve fitting procedure that appears to be insensitive to the desired rate constant. Data fromRavishankara et al. [957] at 298 K show no dependence on pressure between 10 and 500 torr N2. The ratiok(O + HO2)/k(O + OH) measured by Keyser [600] agrees with the rate constants recommended here.Sridharan et al. [1062] showed that the reaction products correspond to abstraction of an oxygen atom from
HO2 by the O reactant. Keyser et al. [604] reported <1% O2 (b1∑) yield.
B3. O + H2O2. There are two direct studies of the O + H2O2 reaction: Davis et al. [314] and Wine et al. [1260].The recommended value is a fit to the combined data. Wine et al. suggest that the earlier measurements maybe too high because of secondary chemistry. The A-factor for both data sets is quite low compared to similar
47
atom-molecule reactions. An indirect measurement of the E/R by Roscoe [972] is consistent with therecommendation.
B4. H + O3. The recommendation is an average of the results of Lee et al. [670] and Keyser [595], which are inexcellent agreement over the 200-400 K range. An earlier study by Clyne and Monkhouse [238] is in verygood agreement on the T dependence in the range 300-560 K but lies about 60% below the recommendedvalues. Although we have no reason not to believe the Clyne and Monkhouse values, we prefer the twostudies that are in excellent agreement, especially since they were carried out over the T range of interest.Results by Finlayson-Pitts and Kleindienst [384] agree well with the present recommendations. Reports of achannel forming HO2 + O (Finlayson-Pitts and Kleindienst [384]: ~25%, and Force and Wiesenfeld [392]:~40%) have been contradicted by other studies (Howard and Finlayson-Pitts [513]: <3%; Washida et al.[1225]: <6%; Finlayson-Pitts et al. [385]: <2%; and Dodonov et al. [348]: <0.3%). Secondary chemistry isbelieved to be responsible for the observed O-atoms in this system. Washida et al. [1226] measured a lowlimit (<0.1%) for the production of singlet molecular oxygen in the reaction H + O3.
B5. H + HO2. There are five studies of this reaction: Hack et al. [453], Hack et al. [451], Thrush and Wilkinson[1133], Sridharan et al. [1064] and Keyser [602]. Related early work and combustion studies are referenced inthe Sridharan et al. paper. All five studies used discharge flow systems. It is difficult to obtain a directmeasurement of the rate constant for this reaction because both reactants are radicals and the products OH andO are very reactive toward the HO2 reactant. The recommendation is based on the data of Sridharan et al. andKeyser because their measurements were the most direct and required the fewest corrections. The other
measurements, (5.0±1.3) x 10-11 cm3 molecule-1 s-1 by Thrush and Wilkinson [1133] and (4.65±1)x 10-11
by Hack et al. [451] are in reasonable agreement with the recommended value. Three of the studies reportedthe product channels: (a) 2OH, (b) H2O + O, and (c) H2 + O2. Hack et al. [453] ka/k = 0.69, kb/k = 0.02,and kc/k = 0.29; Sridharan et al. [1064] ka/k = 0.87±0.04, kb/k = 0.02±0.02, kc/k = 0.09±.045; and Keyser[602] ka/k = 0.90±0.04, kb/k = 0.02±0.02, and kc/k = 0.08±0.04. Hislop and Wayne [491], Keyser et al.
[604], and Michelangeli et al. [801] reported on the yield of O2 (b1∑) formed in channel (c) as (2.8±1.3) x
10-4, <8 x 10⁻³, and <2.1 x 10⁻² respectively of the total reactions. Keyser found the rate coefficient andproduct yields to be independent of temperature for 245 < T < 300 K.
B6. OH + O3. The recommendation for the OH + O3 rate constant is based on the room temperaturemeasurements of Kurylo [636] and Zahniser and Howard [1292] and the temperature dependence studies ofAnderson and Kaufman [23], Ravishankara et al. [955] and Smith et al. [1056]. Kurylo's value was adjustedby -8% to correct for an error in the ozone concentration measurement (Hampson and Garvin [460]). The
Anderson and Kaufman rate constants were normalized to k = 6.2 x 10⁻¹⁴ cm3 molecule-1 s-1 at 295 K assuggested by Chang and Kaufman [198].
B7. OH + H2. The OH + H2 reaction has been the subject of numerous studies (see Ravishankara et al. [949] fora review of experimental and theoretical work). The recommendation is fixed to the average of nine studies at298 K: Greiner [439], Stuhl and Niki [1094], Westenberg and de Haas [1242], Smith and Zellner [1058],Atkinson et al. [41], Overend et al. [890], Tully and Ravishankara [1153], Zellner and Steinert [1300], andRavishankara et al. [949]. Results reported by Talukdar et al. [1116] are in excellect agreement.
B8. OH + HD. The recommendation is based on direct measurements made by Talukdar et al. [1116] using pulsedphotolysis-laser induced fluorescence over the temperature range 248-418K. The recommendation is inexcellent agreement with the ratio k(OH + H2)/k(OH + HD) = 1.65±0.05 at 298K reported by Ehhalt et al.[363] when combined with the recommended k(OH + H2).
B9. OH + OH. The recommendation for the OH + OH reaction is the average of six measurements near 298 K:Westenberg and de Haas [1243], McKenzie et al. [773], Clyne and Down [227], Trainor and von Rosenberg[1140], Farquharson and Smith [371], and Wagner and Zellner [1188]. The rate constants for these studies all
fall between (1.4 and 2.3) x 10-12 cm3 molecule-1 s-1. The temperature dependence is from Wagner andZellner, who reported rate constants for the range T = 250-580 K.
B10. OH + HO2. A study by Keyser [603] appears to resolve a discrepancy between low-pressure discharge flow
experiments that all gave rate coefficients near 7 x 10-11 cm3 molecule-1 s-1 : Keyser [598], Thrush and
48
Wilkinson [1132], Sridharan et al. [1063, 1065], Temps and Wagner [1123], and Rozenshtein et al. [976], and
atmospheric pressure studies that gave rate coefficients near 11 x 10-11: Lii et al. [712], Hochanadel et al.[498], DeMore [323], Cox et al. [268], Burrows et al. [166], and Kurylo et al. [644]. Laboratorymeasurements using a discharge flow experiment and a chemical model analysis of the results by Keyser [603]demonstrate that the previous discharge flow measurements were probably subject to interference from smallamounts of O and H. In the presence of excess HO2 these atoms generate OH and result in a rate coefficientmeasurement that falls below the true value. The temperature dependence is from Keyser [603], who covered
the range 254 to 382 K. A flow tube study by Schwab et al. [1009] reported k = (8.0 +3/-4) x 10-11, inagreement with the recommendation. These workers measured the concentrations of HO2, OH, O, and H andused a computer model of the relevant reactions to test for interference. A flow tube study by Dransfeld and
Wagner [355] employing an isotope labelled 18OH reactant obtained k = (11±2) x 10-11 in good agreementwith the recommendation. They attributed about half of the reactive events to isotope scrambling because
control experiments with 16 OH gave k = 6 x 10-11. It should be noted that their control experiments weresubject to the errors described by Keyser [603] due to the presence of small amounts of H and O, whereas their18OH measurements were not. Kurylo et al. [644] found no evidence of significant scrambling in isotopestudies of the OH and HO2 reaction. An additional careful study of the reaction temperature dependence wouldbe useful. Hippler and Troe [489] have analysed data for this reaction at temperatures up to 1250K.
B11. OH + H2O2. The recommendation is a fit to the temperature dependence studies of Keyser [596], Sridharan etal. [1066], Wine et al. [1265], Kurylo et al. [648], and Vaghjiani et al. [1174]. The data from these studieshave been revised to account for the H2O2 UV absorption cross section recommendations in this evaluation.The first two references contain a discussion of some possible reasons for the discrepancies with earlier workand an assessment of the impact of the new value on other kinetic studies. All of these measurements agreequite well and overlap one another. Measurements by Lamb et al. [655] agree at room temperature butindicate a quite different temperature dependence with k increasing slightly with decreasing temperature. Theirdata were not incorporated in the fit. A measurement at room temperature by Marinelli and Johnston [757]agrees well with the recommendation. Hippler and Troe [489] have analysed data for this reaction attemperatures up to 1250K.
B12. HO2 + O3. There are four studies of this reaction using flow tube reactors: Zahniser and Howard [1292] at245 to 365 K, Manzanares et al. [747] at 298 K, Sinha et al. [1049] at 243 to 413 K, and Wang et al. [1220]at 233 to 400 K. The data of Sinha et al. were given somewhat greater weight in the evaluation because thisstudy did not employ an OH radical scavenger. The other studies fall close to the recommendation. All of thetemperature dependence studies show some curvature in the Arrhenius plot with the E/R decreasing at lowertemperature. The recommendation incorporates only data at temperatures less than 300 K; it is not valid for T> 300 K and is uncertain at T < 230 K, where there are no data. Zahniser and Nelson (privatecommunication, 1991) observe curvature in the Arrhenius plot at low temperatures. High-quality lowtemperature data are needed for this reaction. Early studies using the HO2 + HO2 reaction as a reference(Simonaitis and Heicklen [1033]; DeMore and Tschuikow-Roux [332]) give results that fall below therecommendation by factors of about 2 and 1.5, respectively. The more recent study by DeMore [321] agrees
with the recommendation. The mechanism of the reaction has been studied using 18O labelled HO2 by Sinhaet al. [1049], who reported that the reaction occurs 75±10% via H atom transfer at 297K and by Nelson andZahniser [828], who reported branching ratios for H transfer vs O transfer over the range 226-355K. Theyreport that the H atom transfer decreases from 94±5% at 226±11K to 88±5% at 355±8K.
B13. HO2 + HO2. Two separate expressions are given for the rate constant for the HO2 + HO2 reaction. Theeffective rate constant is given by the sum of these two equations. This reaction has been shown to have apressure-independent bimolecular component and a pressure-dependent termolecular component. Bothcomponents have negative temperature coefficients. The bimolecular expression is obtained from data of Coxand Burrows [267], Thrush and Tyndall [1129, 1130], Kircher and Sander [607], Takacs and Howard [1107,1108], Sander [982] and Kurylo et al. [650]. Data of Rozenshtein et al. [976] are consistent with the lowpressure recommendation, but they report no change in k with pressure up to 1 atm. Results of Thrush andWilkinson [1131] and Dobis and Benson [346] are inconsistent with the recommendation. The termolecularexpression is obtained from data of Sander et al. [986], Simonaitis and Heicklen [1037], and Kurylo et al.[650] at room temperature and Kircher and Sander [607] for the temperature dependence. This equation appliesto M = air. On this reaction system there is general agreement among investigators on the following aspectsof the reaction at high pressure (P ~1 atm): (a) the HO2 UV absorption cross section: Paukert and Johnston
49
[902], Cox and Burrows [267], Hochanadel et al. [498], Sander et al. [986], Kurylo et al. [652], and Crowleyet al. [288]; (b) the rate constant at 300K: Paukert and Johnston [902], Hamilton and Lii [458], Cox andBurrows [267], Lii et al. [711], Tsuchiya and Nakamura [1145], Sander et al. [986], Simonaitis and Heicklen[1037], Kurylo et al. [650], Andersson et al. [27], and Crowley et al. [288] (all values fall in the range (2.5 to
4.7) x 10-12 cm3 molecule-1 s-1); (c) the rate constant temperature dependence: Cox and Burrows [267], Liiet al. [711], and Kircher and Sander [607]; (d) the rate constant water vapor dependence: Hamilton [457],Hochanadel et al. [497], Hamilton and Lii [458], Cox and Burrows [267], DeMore [321], Lii et al. [714],Sander et al. [986], and Andersson et al. [27]; (e) the H/D isotope effect: Hamilton and Lii [458] and Sanderet al. [986]; and (f) the formation H2O2 + O2 as the major products at 300 K: Su et al. [1098], Niki et al.[865], Sander et al. [986], and Simonaitis and Heicklen [1037]. Sahetchian et al. [980, 981] give evidence forthe formation of a small amount of H2 (~10%) at temperatures near 500 K, but Baldwin et al. [55] and Ingold[541] give evidence that the yield must be much less. Glinski and Birks [428] report an upper limit of 1% H2yield at a total pressure of about 50 torr and 298 K, but their experiment may have interference from wallreactions. A smaller limit to H2 production (0.01%) was later determined in the same laboratory (Stephens etal. [1077]). For systems containing water vapor, the multiplicative factor given by Lii et al. [714] and
Kircher and Sander [607] can be used: 1 + 1.4 x 10⁻²¹ [H2O] exp(2200/T). Lightfoot et al. [709] reportedatmospheric pressure measurements over the temperature range 298-777 K that are in agreement with therecommended value at room temperature but indicate an upward curvature in the Arrhenius plot at elevatedtemperature. A high temperature study by Hippler et al. [490] confirms the strong curvature.
C1. O + NO2. k(298 K) is based on the results of Davis et al. [309], Slanger et al. [1054], Bemand et al. [105],
Ongstad and Birks [880] and Geers-Muller and Stuhl [412]. The recommendation for E/R is from Davis et al.,Ongstad and Birks, and Geers-Muller and Stuhl with the A-factor adjusted to give the recommended k(298)value.
C2. O + NO3. Based on the study of Graham and Johnston [433] at 298 K and 329 K. While limited in
temperature range, the data indicate no temperature dependence. Furthermore, by analogy with the reaction ofO with NO2, it is assumed that this rate constant is independent of temperature. Clearly, temperature-
dependence studies are needed.
C3. O + N2O5. Based on Kaiser and Japar [582].
C4. O + HNO3. The upper limit reported by Chapman and Wayne [200] is accepted.
C5. O + HO2NO2. The recommended value is based on the study of Chang et al. [199]. The large uncertainty in
E/R and k at 298 K are due to the fact that the recommendation is based on a single study.
C6. H + NO2. The recommended value of k298 is derived from the studies of Wagner et al. [1190], Bemand and
Clyne [103], Clyne and Monkhouse [238], Michael et al. [796] and Ko and Fontijn [624]. The temperaturedependence is from the studies of Wagner et al. and Ko and Fontijn. The data from Wategaonkar and Setser[1229] and Agrawalla et al. [13] were not considered.
C7. OH + NO3. The recommendation is derived from an average of the results of Boodaghians et al. [128],
Mellouki et al. [782], Becker et al. [88] and Mellouki et al. [785]. There are no temperature dependence data.The reaction products are probably HO2 + NO2.
C8. OH + HONO. The recommended rate expression is derived from the work of Jenkin and Cox [557], whichsupersedes the earlier room temperature study of Cox et al. [275]. Recent results from the Ravishankaragroup [161] suggest that the reaction may have a small negative temperature dependence.
C9. OH + HNO3. The intensive study of this reaction over the past few years has significantly reduced many of
the apparent discrepancies among (a) the early studies yielding a low, temperature-independent rate constant(Smith and Zellner [1059] and Margitan et al. [751]); (b) more recent work (mostly flash photolysis) with ak(298) approximately 40% larger, and a strong negative T dependence below room temperature (Wine et al.[1264]; Kurylo et al. [642]; Margitan and Watson [752]; Marinelli and Johnston [757]; Ravishankara et al.
50
[946]; Jourdain et al. [579]; C. A. Smith et al. [1056]; Jolly et al. [573] (298 K); Stachnik et al. [1068]); and(c) recent discharge low studies yielding the lower value for k(298 K) but showing substantial negative Tdependence (Devolder et al. [335]; Connell and Howard [260]). Major features of the data are (1) a strongnegative T dependence below room temperature, (2) a much weaker temperature dependence above roomtemperature, possibly leveling off around 500 K, and (3) small, measurable pressure dependence whichbecomes greater at low temperature. The pressure dependence has been determined by Margitan and Watson[752] over the ranges 20-100 torr and 225-298 K and by Stachnik et al. [1068] at pressures of 10, 60, and 730torr at 298 K. The two studies are in excellent agreement. Their "low pressure limit" agrees well with the
average k(298 K) = 1.0 x 10⁻¹³ cm3 molec-1 s-1 derived from the four low pressure discharge flow studies.The value measured for pressures typical of the other flash photolysis studies (20-50 torr) also agrees well.The two pressure-dependence studies indicate that the high pressure limit is approximately 50% greater thanthe low pressure limit at 298 K, and about a factor of 2 greater at 240 K. Thus, over the narrow pressureranges explored in most flash photolysis studies, the P dependence can be represented by combining a lowpressure (bimolecular) limit, ko, with a Lindemann-Hinshelwood expression for the P dependence:
k = 7.2x10 exp(785/T)k = 4.1x10 exp(1440/T) k = 1.9x10 exp(725/T)
k(M,T) = k + witho
k
k [M]3k [M]3
2
{-15-16-33
0231 +
The coefficients k3 and k2 are the termolecular and high pressure limits for the "association" channel. The
value of k at high pressures is the sum ko + k2. The weak pressure dependence and weak T dependence above
300 K explain many of the apparent discrepancies for all the data (including the 1975 studies), except for a fewminor features which are probably due to the normally encountered experimental scatter. The Smith andZellner flash photolysis values are low compared to other flash systems (closer to the flow studies), althoughthe difference is not unusual (~30%). Conversely, the Jourdain et al. flow study is high relative to the otherones. The Connell and Howard T dependence (below 300 K) is significantly weaker than the other studies.The failure of Smith et al. to observe a pressure effect between 50 and 760 torr, even at 240 K, is in sharpconflict with the effect seen by Stachnik et al. over the same range in a much more detailed study. Jolly et al.also could not detect a pressure dependence between 1 torr (M = HNO3) and 600 torr (M = SF6) at 298 K.
Nelson et al. [833], Jourdain et al. and Ravishankara et al. have all shown that within experimental error theyield of NO3 (per OH removed) is unity at 298 K, with similar results at 250 K (Ravishankara et al.).
C10. OH + HO2NO2. The recommendation for both k at 298 K and the Arrhenius expression is based upon the
data of Trevor et al. [1141], Barnes et al. [61], C. A. Smith et al. [1056] and Barnes et al. [63]. Trevor et al.studied this reaction over the temperature range 246-324 K and reported a temperature invariant value of 4.0 x
10-12 cm3 molecule-1 s-1, although a weighted least squares fit to their data yields an Arrhenius expressionwith an E/R value of (193±193) K. In contrast, Smith et al. studied the reaction over the temperature range240-300 K and observed a negative temperature dependence with an E/R value of -(650±30) K. The earlyBarnes et al. study [61] was carried out only at room temperature and 1 torr total pressure while their mostrecent study was performed in the pressure range 1-300 torr N2 and temperature range 268-295 K with no rate
constant variation being observed. In addition, k298 derived in Barnes et al. [61] was revised upward in the
later study from 4.1 x 10⁻¹² to 5.0 x 10⁻¹² due to a change in the rate constant for the reference reaction. Thevalues of k at 298 K from the four studies are in excellent agreement. An unweighted least squares fit to thedata from the above-mentioned studies yields the recommended Arrhenius expression. The less precise valuefor k at 298 K reported by Littlejohn and Johnston [723] is in fair agreement with the recommended value.The error limits on the recommended E/R are sufficient to encompass the results of both Trevor et al. andSmith et al. It should be noted that the values of k at 220 K deduced from the two studies differ by a factor of2. Clearly, additional studies of k as a function of temperature and the identification of the reaction productsare needed.
C11. OH + NH3. The recommended value at 298 K is the average of the values reported by Stuhl [1090], Smith
and Zellner [1059], Perry et al. [909], Silver and Kolb [1024], Stephens [1076] and Diau et al. [338]. Thevalues reported by Pagsberg et al. [891] and Cox et al. [274] were not considered because these studiesinvolved the analysis of a complex mechanism and the results are well outside the error limits implied by theabove six direct studies. The results of Kurylo [636] and Hack et al. [447] were not considered because oftheir large discrepancies with the other direct studies (factors of 3.9 and 1.6 at room temperature, respectively).
51
Because the Arrhenius plot displays considerable curvature, the temperature dependence is based only on thedata below 300 K, i.e., the studies of Smith and Zellner [1059] and Diau et al. [338], and the A-factor hasbeen selected to fit the recommended room temperature value.
C12. HO2 +NO. The recommendation for HO2 + NO is based on the average of eight measurements of the rate
constant at room temperature and below: Howard and Evenson [512], Leu [689], Howard [509], Glaschick-Schimpf et al. [423], Hack et al. [450], Thrush and Wilkinson [1132] and Jemi-Alade Thrush [554], andSeeley et al. [1012]. All of these are in quite good agreement. The results of Imamura and Washida [540]were not considered due to the relatively large uncertainty limits reported in this study. An earlier study,Burrows et al. [164] has been disregarded because of an error in the reference rate constant, k(OH + H2O2).
The room temperature study of Rozenshtein et al. [976] has also been disregarded due to an inadequatetreatment of possible secondary reactions. The recommended Arrhenius parameters are obtained from a fit toall the data. The recommended value of k(298) is obtained from the Arrhenius line.
C13. HO2 + NO2 . Tyndall et al. [1165] obtained an upper limit to the rate coefficient of 5x10-16 cm3
molecule-1 s-1 based on static photolysis experiments with FTIR analysis at 296 K and 760 Torr of N2.
C14. HO2 + NO3. The recommendation for k298 is based on a weighted average of the data of Hall et al. [455],
Mellouki et al. [782], Becker et al. [88] and Mellouki et al. [785]. There are insufficient data on which to basethe temperature dependence of the rate coefficient. The measured branching ratios for the OH + NO2 + O2channel range from 0.57 to 1.0. The most direct measurement is derived from the study of Mellouki et al.
[785], which obtained a value of 1.0 +0.0/-0.3 at 298 K.
C15. HO2 + NH2. There is a fairly good agreement on the value of k at 298 K between the direct study of
Kurasawa and Lesclaux [634] and the relative studies of Cheskis and Sarkisov [212] and Pagsberg et al. [891].The recommended value is the average of the values reported in these three studies. The identity of theproducts is not known; however, Kurasawa and Lesclaux suggest that the most probable reaction channelsgive either NH3 + O2 or HNO + H2O as products.
C16. N + O2. The recommended expression is derived from a least squares fit to the data of Kistiakowsky and
Volpi [610], Wilson [1254], Becker et al. [90], Westenberg et al. [1246], Clark and Wayne [220], Winkler etal. [1273] and Barnett et al. [71]. k(298 K) is derived from the Arrhenius expression and is in excellentagreement with the average of all of the room temperature determinations.
C17. N + O3. The recommendation is based on the results of Barnett et al. [71]. The value of (1.0±0.2) x 10-16
cm3 molecule-1 s-1 reported by Barnett et al. should probably be considered an upper limit rather than adetermination. The low values reported by Barnett et al., Stief et al. [1086] and Garvin and Broida [410] castdoubt on the much faster rates reported by Phillips and Schiff [914], and Chen and Taylor [208].
C18. N + NO. The recommended temperature dependence is based on the discharge flow-resonance fluorescencestudies of Wennberg and Anderson [1238], and the discharge flow-resonance fluorescence and flash photolysis-resonance fluorescence studies of Lee et al. [671]. There is relatively poor agreement between these studies andthe results of Clyne and McDermid [235], Kistiakowsky and Volpi [611], Herron [482], Phillips and Schiff[914], Lin et al. [716], Ishikawa et al. [543], Sugawara et al. [1099], Cheah and Clyne [203], Husain andSlater [530], Clyne and Ono [242], Brunning and Clyne [149] and Jeoung et al. [568].
C19. N + NO2. The recommendation for k298 is from the discharge flow-resonance fluorescence study of
Wennberg and Anderson [1238]. The latter study had significantly better sensitivity for N(4S) than thedischarge flow-resonance fluorescence study of Clyne and Ono [242], which obtained a value about four timessmaller. The results of Husain and Slater [530] and Clyne and McDermid [235] are not considered. Thetemperature dependence is obtained from the study of Wennberg and Anderson. In the latter study, atomicoxygen was shown to be the principal reaction product, in agreement with Clyne and McDermid. A recent

52
study by Iwata et al. [544] suggested an upper limit of 3.3 x 10⁻¹³ cm3 molecule-1 s-1 for the corresponding
reaction involving N(2D) and N(2P) atoms (sum of all reaction channels).
C20. NO + O3. The recommended Arrhenius expression is a least squares fit to the data reported by Birks et al.
[120], Lippmann et al. [721], Ray and Watson [963], Michael et al. [790] and Borders and Birks [130] at andbelow room temperature, with the data at closely spaced temperatures reported in Lippmann et al. and Bordersand Birks being grouped together so that these five studies are weighted equally. This expression fits all thedata within the temperature range 195-304 K reported in these five studies to within 20%. Only the databetween 195 and 304 K were used to derive the recommended Arrhenius expression, due to the observed non-linear Arrhenius behavior (Clyne et al. [244], Clough and Thrush [223], Birks et al., Michael et al. andBorders and Birks). Clough and Thrush, Birks et al., Schurath et al. [1008], and Michael et al. have allreported individual Arrhenius parameters for each of the two primary reaction channels. The range of valuesfor k at stratospheric temperatures is somewhat larger than would be expected for such an easy reaction tostudy. The measurements of Stedman and Niki [1071] and Bemand et al. [105] at 298 K are in excellentagreement with the recommended value of k at 298 K.
C21. NO + NO3. The recommendation is based on the studies of Hammer et al. [459], Sander and Kircher [985]
and Tyndall et al. [1166], which are in excellent agreement.
C22. NO2 + O3. The recommended expression is derived from a least squares fit to the data of Davis et al. [312],
Graham and Johnston [432], Huie and Herron [524], and Cox and Coker [269]. The data of Verhees andAdema [1177] and Stedman and Niki [1071] were not considered because of systematic discrepancies with theother studies.
C23. NO2 + NO3. The existence of the reaction channel forming NO + NO2 + O2 has not been firmly
established. However, studies of N2O5 thermal decomposition that monitor NO2 (Daniels and Johnston
[298]; Johnston and Tao [571]; Cantrell et al. [183]) and NO (Hjorth et al. [492], and Cantrell et al. [186])require reaction(s) that decompose NO3 into NO = O2. The rate constant from the first three studies is
obtained from the product kKeq, where Keq is the equilibrium constant for NO2 + NO3 = N2O5, while for the
latter two studies the rate constant is obtained from the ratio k/k(NO + NO3), where k(NO + NO3) is the rate
constant for the reaction NO + NO3 → 2NO2. Using Keq and k(NO + NO3) from this evaluation, the rate
expression that best fits the data from all five studies is 4.5 x 10⁻¹⁴ exp (-1260/T) cm3 molecule-1 s-1 withan overall uncertainty factor of 2.
C24. NO3 + NO3. . The recommendation for k(298) is from the studies of Graham and Johnston [433] and Biggs
et al. [116]. The temperature dependence is from Graham and Johnston.
C25. NH2 + O2. This reaction has several product channels which are energetically possible, including NO + H2O
and HNO + OH. With the exception of the studies of Hack et al. [446] and Jayanty et al. [552] and severalstudies at high temperature, there is no evidence for a reaction. The following upper limits have been
measured (cm3 molecule-1 s-1): 3 x 10-18 (Lesclaux and Demissy [684]), 8 x 10-15 (Pagsberg et al. [891]),
1.5 x 10⁻¹⁷ (Cheskis and Sarkisov [212]), 3 x 10-18 (Lozovsky et al. [735]), 1 x 10-17 (Patrick and Golden
[901]) and 7.7 x 10⁻¹⁸ (Michael et al. [792]) and 6 x 10-21 (Tyndall et al. [1167]). The recommendation isbased on the study of Tyndall et al., which was sensitive to reaction paths leading to the products NO, NO2and N2O. The reaction forming NH2O2 cannot be ruled out, but is apparently not important in the
atmosphere.
C26. NH2 + O3. There is poor agreement among the recent studies of Cheskis et al. [211], k(298) = 1.5 x 10⁻¹³
cm3 s-1, Patrick and Golden [901], k(298) = 3.25 x 10⁻¹³ cm3 s--1, Hack et al. [445], 1.84 x 10⁻¹³ cm3
s-1, Bulatov et al. [154], 1.2 x 10⁻¹³ cm3 s-1, and Kurasawa and Lesclaux [635], 0.63 x 10⁻¹³ cm3 s-1. Thevery low value of Kurasawa and Lesclaux may be due to regeneration of NH2 from secondary reactions (see
53
Patrick and Golden), and it is disregarded here. The discharge flow value of Hack et al. is nearly a factor oftwo less than the recent Patrick and Golden flash photolysis value. The large discrepancy between Bulatov etal. and Patrick and Golden eludes explanation. The recommendation is the k(298) average of these fourstudies, and E/R is an average of Patrick and Golden (1151 K) with Hack et al. (710 K).
C27. NH2 + NO. The recommended value for k at 298 K is the average of the values reported by Lesclaux et al.
[686], Hancock et al. [461], Sarkisov et al. [995], Stief et al. [1084], Andresen et al. [28] Whyte and Phillips[1247], Dreier and Wolfrum [357], Atakan et al. [33], Wolf et al. [1274], Diau et al. [336] and Imamura andWashida [540]. The results of Gordon et al. [429], Gehring et al. [413], Hack et al. [452] and Silver and Kolb[1025] were not considered because they lie at least 2 standard deviations from the average of the previous
group. The results tend to separate into two groups. The flash photolysis results average 1.8 x 10⁻¹¹ cm3
molecule-1 s-1 (except for the pulse radiolysis study of Gordon et al.), while those obtained using the
discharge flow technique average 0.9 x 10⁻¹¹ cm3 molecule-1 s-1. The apparent discrepancy cannot be duesimply to a pressure effect as the pressure ranges of the flash photolysis and discharge flow studies overlappedand none of the studies observed a pressure dependence for k. Whyte and Phillips have suggested that thedifference may be due to decomposition of the adduct NH2NO, which occurs on the timescale of the flowexperiments, but not the flash experiments. There have been many studies of the temperature dependence butmost have investigated the regime of interest to combustion and only two have gone below room temperature(Hack et al. from 209-505 K and Stief et al. from 216-480 K. Each study reported k to decrease withincreasing temperature The recommended temperature dependence is taken from a fit of to the Stief et al. dataat room temperature and below. The reaction proceeds along a complex potential energy surface, whichresults in product branching ratios that are strongly dependent on temperature. Ab initio calculations byWalch [1193] show the existence of four saddle points in the potential surface leading to N2 + H2O without areaction barrier. Elimination to form OH + HN2 can occur at any point along the surface. While results fromearly studies on the branching ratio for OH formation different significantly, the most recent studies (Hall etal., Dolson [350], Silver and Kolb [1028], Atakan et al., Stephens et al. [1075], Park and Lin [896]) agree ona value around 0.1 at 300 K, with N2+H2O making up the balance.
C28. NH2 + NO2. There have been four studies of this reaction (Hack et al. [452]; Kurasawa and Lesclaux [633];
Whyte and Phillips [1247]; and Xiang et al. [1282]). There is very poor agreement among these studies both
for k at 298 K (factor of 2.3) and for the temperature dependence of k (T-3.0 and T-1.3). The recommendedvalues of k at 298 K and the temperature dependence of k are averages of the results reported in these fourstudies. Hack et al. have shown that the predominant reaction channel (>95%) produces N2O + H2O. Just as
for the NH2 + NO reaction, the data for this reaction seem to indicate a factor of two discrepancy between
flow and flash techniques, although the data base is much smaller.
C29. NH + NO. The recommendation is derived from the room temperature results of Hansen et al. [464], Cox etal. [264] and Harrison et al. [466]. The temperature dependence is from Harrison et al.
C30. NH + NO2. The recommendation is derived from the temperature-dependence study of Harrison et al. [466].
C31. O3 + HNO2. Based on Kaiser and Japar [581] and Streit et al. [1089].
C32. N2O5 + H2O. The recommended value at 298 K is based on the studies of Tuazon et al. [1148], Atkinson et
al. [47] and Hjorth et al. [493]. Sverdrup et al. [1101] obtained an upper limit that is a factor of four smallerthan that obtained in the other studies, but the higher upper limit is recommended because of the difficulty ofdistinguishing between homogeneous and heterogeneous processes in the experiment. See Table 59 forheterogeneous rate data for this reaction.
C33. N2(A,v) + O2. . Rate constants for the overall reaction for the v=0, 1 and 2 vibrational levels of N2(A) have
been made by Dreyer et al. [358], Zipf [1312], Piper et al. [915], Iannuzzi and Kaufman [538], Thomas andKaufman [1125] and De Sousa et al. [318]. The results of these studies are in relatively good agreement. The
recommended values are (2.5±0.4), (4.0±0.6) and (4.5±0.6) (x10-12 cm3 molecule-1 s-1), from the work ofDe Sousa et al. The only temperature dependence data are from De Sousa et al., who obtained
54
k(T,v)=k(v,298K)(T/300)0.55 for v=0,1,2. The observation of high N2O production initially reported by Zipf
[1312] has not been reproduced by other groups, and the branching ratio for this channel is probably less than0.02 (Iannuzzi et al. [537], Black et al. [123], De Sousa et al. [318], Fraser and Piper [394]). The branchingratios for the other channels are poorly established, although there is strong evidence for the formation of both
O(3P) and O2(B3∑u-).
C34. N2(A,v) + O3. . The only study is that of Bohmer and Hack [127], who obtained 298K rate constants of
4.1±1.0, 4.1±1.2, 8.0±2.3, and 10±3.0 (x10-11 cm3 molecule-1 s-1) for the v=0-3 vibrational levels ofN2(A), respectively. This study determined that the NO channel accounts for about 20% of the reaction
products.
D1. O + CH3. The recommended k(298 K) is the weighted average of three measurements by Washida and Bayes[1227], Washida [1224], and Plumb and Ryan [920]. The E/R value is based on the results of Washida andBayes [1227], who found k to be independent of temperature between 259 and 341 K.
D2. O + HCN. Because it is a very slow reaction, there are no studies of this reaction below 450 K. Davies andThrush [307] studied this reaction between 469 and 574 K while Perry and Melius [911] studied it between540 and 900 K. Results of Perry and Melius are in agreement with those of Davies and Thrush. Ourrecommendation is based on these two studies. The higher-temperature (T>1000 K) combustion-relatedstudies [Roth et al. [973], Szekely et al. [1102], and Louge and Hanson [729]] have not been considered.This reaction has two reaction pathways: O + HCN → H + NCO, ∆H = -2 kcal/mol (ka); and O + HCN →CO + NH (kb), ∆H = -36 kcal/mol. The branching ratio ka/kb for these two channels has been measured tobe ~2 at T = 860 K. The branching ratio at lower temperatures, which is likely to vary significantly withtemperature, is unknown.
D3. O + C2H2. The value at 298 K is an average of ten measurements [Arrington et al. [31], Sullivan andWarneck [1100], Brown and Thrush [146], Hoyermann et al. [515, 516], Westenberg and deHaas [1240],James and Glass [549], Stuhl and Niki [1093], Westenberg and deHaas [1244], and Aleksandrov et al. [15]].There is reasonably good agreement among these studies. Arrington et al. [31] did not observe a temperaturedependence, an observation that was later shown to be erroneous by Westenberg and deHaas [1240].Westenberg and deHaas [1240], Hoyermann et al. [516] and Aleksandrov et al. [15] are the only authors, whohave measured the temperature dependence below 500 K. Westenberg and deHaas observed a curved Arrheniusplot at temperatures higher than 450 K. In the range 194-450 K, Arrhenius behavior provides an adequatedescription and the E/R obtained by a fit of the data from these three groups in this temperature range isrecommended. The A-factor was calculated to reproduce k(298 K). This reaction can have two sets ofproducts, i.e., C2HO + H or CH2 + CO. Under molecular beam conditions C2HO has been shown to be themajor product. The study by Aleksandrov et al. using a discharge flow-resonance fluorescence method (underundefined pressure conditions) indicates that the C2HO + H channel contributes no more than 7% to the netreaction at 298 K, while a similar study by Vinckier et al. [1183] suggests that both CH2 and C2HO areformed.
D4. O + H2CO. The recommended values for A, E/R and k(298 K) are the averages of those determined byKlemm [616] (250 to 498 K) using flash photolysis-resonance fluorescence, by Klemm et al. [617] (298 to748 K) using discharge flow-resonance fluorescence, and Chang and Barker [195] (296 to 436 K) usingdischarge flow-mass spectrometry techniques. All three studies are in good agreement. The k(298 K) value isalso consistent with the results of Niki et al. [861], Herron and Penzhorn [484], and Mack and Thrush [737].Although the mechanism for O + H2CO has been considered to be the abstraction reaction yielding OH +HCO, Chang and Barker suggest that an additional channel yielding H + HCO2 may be occurring to theextent of 30% of the total reaction. This conclusion is based on an observation of CO2 as a product of thereaction under conditions where reactions such as O + HCO → H + CO2 and O + HCO → OH + COapparently do not occur. This interesting suggestion needs independent confirmation.
D5. O + CH3CHO. The recommended k(298 K) is the average of three measurements by Cadle and Powers[173], Mack and Thrush [738], and Singleton et al. [1043], which are in good agreement. Cadle and Powersand Singleton et al. studied this reaction as a function of temperature between 298 and 475 K and obtained
55
very similar Arrhenius parameters. The recommended E/R value was obtained by considering both sets ofdata. This reaction is known to proceed via H-atom abstraction [Mack and Thrush [738], Avery andCvetanovic [48], and Singleton et al. [1043]].
D6. O3 + C2H2. The database for this reaction is not well established. Room temperature measurements (Cadleand Schadt [174]; DeMore [319]; DeMore [320]; Stedman and Niki [1070]; Pate et al. [899]; and Atkinson andAschmann [34]) disagree by as much as an order of magnitude. It is probable that secondary reactionsinvolving destruction of ozone by radical products resulted in erroneously high values for the rate constants inseveral of the previous measurements. The present recommendation for k(298 K) is based on the roomtemperature value of Atkinson and Aschmann [34], which is the lowest value obtained and therefore perhaps
the most accurate. The temperature dependence is estimated, based on an assumed A-factor of 1.0 x 10⁻¹⁴
cm3 s-1 similar to that for the O3 + C2H4 reaction and corresponding to the expected 5-membered ringstructure for the transition state (DeMore [319, 320]). Further studies, particularly of the temperaturedependence, are needed. Major products in the gas phase reaction are CO, CO2, and HCOOH, and chemically-activated formic anhydride has been proposed as an intermediate of the reaction (DeMore [320], and DeMoreand Lin [330]). The anhydride intermediates in several alkyne ozonations have been isolated in lowtemperature solvent experiments (DeMore and Lin [330]).
D7. O3 + C2H4. The rate constant of this reaction is well established over a large temperature range, 178 to360 K. Our recommendation is based on the data of DeMore [319], Stedman et al. [1072], Herron and Huie[483], Japar et al. [550, 551], Toby et al. [1135], Su et al. [1097], Adeniji et al. [9], Kan et al. [587],Atkinson et al. [36], and Bahta et al. [52].
D8. O3 + C3H6. The rate constant of this reaction is well established over the temperature range 185 to 360 K.The present recommendation is based largely on the data of Herron and Huie [483], in the temperature range235-362 K. (Note that a typographical error in Table 2 of that paper improperly lists the lowest temperatureas 250 K, rather than the correct value, 235 K.) The recommended Arrhenius expression agrees within 25%with the low temperature (185-195 K) data of DeMore [319], and is consistent with, but slightly lower (about40%) than the data of Adeniji et al. [9] in the temperature range 260-294 K. Room temperature measurementsof Cox and Penkett [281], Stedman et al. [1072], Japar et al. [550, 551], and Atkinson et al. [36] are in goodagreement (10% or better) with the recommendation.
D9. OH + CO. The recommendation allows for an increase in k with pressure. The zero pressure value wasderived by averaging direct low pressure determinations [those listed in Baulch et al. [86] and the valuesreported by Dreier and Wolfrum [356], Husain et al. [528], Ravishankara and Thompson [952],Paraskevopoulos and Irwin [893], Hofzumahaus and Stuhl [499]. The results of Jonah et al. [574] are toohigh and were not included. An increase in k with pressure has been observed by a large number ofinvestigators [Overend and Paraskevopoulos [889], Perry et al. [910], Chan et al. [194], Biermann et al. [114],Cox et al. [275], Butler et al. [172], Paraskevopoulos and Irwin [892, 893], DeMore [324], Hofzumahaus andStuhl [499], Hynes et al. [535]. In addition, Niki et al. [869] have measured k relative to OH + C2H4 in oneatmosphere of air by following CO2 production using FTIR. The recommended 298 K value was obtained byusing a weighted nonlinear least squares analysis of all pressure-dependent data in N2 [Paraskevopoulos andIrwin [893], DeMore [324], Hofzumahaus and Stuhl [499], and Hynes et al. [535]] as well as those in air[Niki et al. [870], Hynes et al. [535], to the form k = (A+BP)/(C+DP), where P is pressure in atmospheres.The data were best fit with D = 0 and therefore a linear form is recommended. Previous controversy regardingthe effect of small amounts of O2 (Biermann et al. [114]) has been resolved and is attributed to secondaryreactions [DeMore [324], Hofzumahaus and Stuhl [499]]. The results of Butler et al. [172] have to be re-evaluated in the light of refinements in the rate coefficient for the OH + H2O2 reaction. The corrected ratecoefficient is in approximate agreement with the recommended value. Currently, there are no indications tosuggest that the presence of O2 has any effect on the rate coefficient other than as a third body. The E/Rvalue in the pressure range 50-760 torr has been shown to be essentially zero between 220 and 298 K byHynes et al. [535]. Further substantiation of the temperature independence of k at 1 atm. may be worthwhile.Beno et al. [106] observe an enhancement of k with water vapor, which is in conflict with the flashphotolysis studies; e.g., Ravishankara and Thompson [952], Paraskevopoulos and Irwin [893], and Hynes etal. [535]. The uncertainty factor is for 1 atm. of air.
56
The bimolecular channel yields H + CO2 while the addition leads to HOCO. In the presence of O2, theHOCO intermediate is converted to HO2 + CO2 (DeMore [324], Miyoshi et al. [803]). Miyoshi et al. report
a rate constant for the reaction of HOCO with O2 of ~1.5 x 10⁻¹² cm3 molecule-1 s-1 at 298 K). Therefore,for atmospheric purposes, the products can be taken to be HO2 and CO2.
D10. OH + CH4. This reaction has been extensively studied. The most recent data are from Vaghjiani andRavishankara [1173], Saunders et al. [997], Finlayson-Pitts et al. [383], Dunlop and Tully [360] ,Mellouki et al. [788], and Gierczak et al. [419], who measured the absolute rate coefficients for this reactionusing discharge flow and pulsed photolysis techniques. Sharkey and Smith [1019] have reported a high
value (7.7 x 10⁻¹⁵ cm3 molecule-1 s-1) for k(298 K), and this value has not been considered here. Thecurrent recommendation for k(298) was derived from the results of Vaghjiani and Ravishankara, Dunlop andTully, Saunders et al., Mellouki et al., Finlayson-Pitts et al., and Gierczak et al. The temperature dependenceof this rate coefficient has been measured by Vaghjiani and Ravishankara (223-420 K), Dunlop and Tully(above 298 K), Finlayson-Pitts et al. (278-378 K), and Mellouki et al. (233-343 K). Gierczak et al haveextended the measurements of k to 195 K, and it appears that the rate coefficient does not strictly follow anArrhenius expression. The recommended E/R was obtained from these results using data below 300 K. Amore accurate representation of the rate constant as a function of temperature is obtained by using the three-
parameter expression: k = 2.80x10⁻¹⁴ T0.667 exp(-1575/T). This three-parameter fit may be preferred forlower stratosphere and upper troposphere calculations.
D11. OH + 13CH4 . This reaction has been studied relative to the OH + CH4 reaction, since the ratio of the ratecoefficients is the quantity needed for quantifying methane sources. Rust and Stevens [977], Davidson et al.[302], and Cantrell et al. [187] have measured k12/k13 at 298 K to be 1.003, 1.010, and 1.0055,respectively. Cantrell et al.'s data supersede the results of Davidson et al. The recommended value of 1.005 ±0.002 is based on the results of Rust and Stevens and Cantrell et al. Cantrell et al. find k12/k13 to beindependent of temperature between 273 and 353 K.
D12. OH + CH3D. The rate coefficient for this reaction has been measured between 249 and 422 K using a pulsedlaser photolysis-laser induced fluorescence system by Gierczak et al. [418]. The recommended values of k(298) and E/R are from this study. The recommendation agrees within about 10% at 298 K with the rateconstant measured by DeMore [328] in a relative rate study over the temperature range 298 - 360 K. Thedifference, while small in an absolute sense, is nevertheless significant for the isotopic fractionation ofatmospheric CH3D and CH4 by OH. An earlier result of Gordon and Mulac at 416 K [430] is in goodagreement with the extrapolated data of both of these determinations. However, that measurement has not beenexplicitly included in this recommendation because the experiments were carried out at higher temperatures andtherefore are less applicable to the atmosphere. The rate coefficients for the reactions of OH with otherdeuterated methanes have also been measured. (Dunlop and Tully [360], Gierczak et al. [1116], Gordon andMulac [430]).
D13. OH + H2CO. The value for k(298 K) is the average of those determined by Atkinson and Pitts [44], Stief etal. [1085], Temps and Wagner [1124], and Zabarnick et al. [1286]. The value reported by Morris and Niki[814] agrees within the stated uncertainty. There are two relative values that are not in agreement with therecommendations. The value of Niki et al. [863] relative to OH + C2H4 is higher, while the value of Smith[1060] relative to OH + OH is lower. The latter data are also at variance with the negligible temperaturedependence observed in the two flash photolysis studies. The combined data set suggests E/R = 0. Theabstraction reaction shown in the table is the major channel [Temps and Wagner [1124], Niki et al. [869]];other channels may contribute to a small extent (Horowitz et al. [507]).
D14. OH + CH3OH. The recommended value for k(298 K) is the average of seven direct studies [Overend andParaskevopoulos [888], Ravishankara and Davis [944], Hagele et al. [454], Meier et al. [776], Greenhill andO'Grady [438], Wallington and Kurylo [1211], and Hess and Tully [486]]. Indirect measurements byCampbell et al. [178], Barnes et al. [62], Tuazon et al. [1149] and Klopffer et al. [619] are in good agreementwith the recommended value. The temperature dependence of k has been measured by Hagele et al., Meier etal., Greenhill and O'Grady, Wallington and Kurylo, and Hess and Tully. The recommended value of E/R wascalculated using the results obtained in the temperature range of 240 to 400 K by Greenhill and O'Grady [438]and Wallington and Kurylo [1211], the only investigators who have measured k below 298 K. Hess andTully report a curved Arrhenius plot over the temperature range 298 - 1000 K, while Meier et al. do not
57
observe such a curvature. This reaction has two pathways: abstraction of the H-atom from the methyl groupor from the OH group. The results of Hagele et al., Meier et al., and Hess and Tully suggest that Habstraction from the methyl group is the dominant channel below room temperature.
D15. OH + CH3OOH. The recommended value for k(298 K) is the average of the rate coefficients measured byNiki et al. [868] and Vaghjiani and Ravishankara [1172], which differ by nearly a factor of two. Niki et al.
measured the rate coefficient relative to that for OH with C2H4 (= 8.0 x 10⁻¹² cm3 molecule-1 s-1) bymonitoring CH3OOH disappearance using an FTIR system. Vaghjiani and Ravishankara monitored the
disappearance of OH, OD, and 18OH in excess CH3OOH in a pulsed photolysis-LIF system. They measuredk between 203 and 423 K and report a negative activation energy with E/R = -190 K; the recommended E/R isbased on their results. The reaction of OH with CH3OOH occurs via abstraction of H from the oxygen end toproduce the CH3OO radical and from the CH3 group to produce the CH2OOH radical, as originally proposedby Niki et al. and confirmed by Vaghjiani and Ravishankara. CH2OOH is unstable and falls apart to CH2Oand OH within a few microseconds. The possible reaction of CH2OOH with O2 is unimportant underatmospheric conditions (Vaghjiani and Ravishankara). The recommended branching ratios are,
OH + CH3OOH → CH3O2 + H2O (a) 70%
OH + CH3OOH → CH2OOH + H2O (b) 30%,
(from Vaghjiani and Ravishankara) and are nearly independent of temperature.
D16. OH + HC(O)OH. The recommended value of k(298 K) is the average of those measured by Zetzsch and Stuhl[1303], Wine et al. [1255], Jolly et al. [572], Dagaut et al. [297], and Singleton et al. [1048]. Thetemperature dependence of k has been studied by Wine et al., who observed a very small negative activationenergy and by Singleton et al., who observed k to be essentially independent of T. The recommendedtemperature dependence is based on these two studies.
Wine et al. found the rate coefficient for the OH + HC(O)OH reaction to be the same as that for OH +DC(O)OH reaction. Jolly et al. found the formic acid dimer to be unreactive toward OH, i.e., abstraction ofthe H atom attached to C was not the major pathway for the reaction. A comprehensive study of Singletonet al. showed that reactivity of HC(O)OH is essentially the same as that of DC(O)OH, but DC(O)OD reactsmuch slower than HC(O)OH and DC(O)OH. These observations show that the reaction proceeds viaabstraction of the acidic H atom. Wine et al. and Jolly et al. also found that H atoms are produced in thereaction, which is consistent with the formation of HC(O)O, which would rapidly fall apart to CO2 and H.End product studies are also consistent with the formation of CO2 and H2O in this reaction (Singleton et al.[1048]). The products of this reaction would be mostly HC(O)O and H2O. The fate of HC(O)O in theatmosphere will be to give HO2 either directly via reaction with O2 or via thermal decomposition to H atom,which adds to O2.
Wine et al. have suggested that, in the atmosphere, the formic acid could be hydrogen bonded to a watermolecule and its reactivity with OH could be lowered because the hydrogen bonded water would obstruct theabstraction of the H atom. This suggestion needs to be checked.
D17. OH + HCN. This reaction is pressure dependent. The recommended value is the high pressure limitmeasured by Fritz et al. [401] using a laser photolysis-resonance fluorescence apparatus. Phillips [913]studied this reaction using a discharge flow apparatus at low pressures and found the rate coefficient to havereached the high pressure limit at ~10 torr at 298 K. Fritz et al.'s results contradict this finding. They agreewith Phillip's measured value, within a factor of two, at 7 torr, but they find k to increase further withpressure. The products of the reaction are unknown.
D18. OH + C2H6. There are nineteen studies of this reaction at 298 K [Greiner [440], Howard and Evenson[510], Overend et al. [890], Lee and Tang [673], Leu [689], Tully et al. [1154], Jeong et al. [565], Tully et al.[1152], Nielsen et al. [856], Zabarnick et al. [1286], Wallington et al. [1213], Smith et al. [1056], Baulch etal. [85], Bourmada et al. [135], Abbatt et al. [1], Schiffman et al. [999], Talukdar et al. [1118], Sharkey andSmith [1019] and Anderson and Stephens [24]]. The recommended value is obtained by averaging the resultsof the recent investigations by Tully et al., Wallington et al., Abbatt et al., Schiffman et al., Talukdar et al.
58
and Anderson and Stephens. The results of Sharkey and Smith are approximately 20% higher than thoserecommended here. When the measurements were not carried out at exactly 298 K, we have recalculated kusing an E/R of 1070 K. The temperature dependence of the rate coefficient below 298 K has been measuredonly by Jeong et al., Wallington et al., Talukdar et al. and Anderson and Stephens. The last three studies arein good agreement. The recommended E/R is obtained from an analysis of the data of these three studies.The ratio of the rate coefficients for OH reactions with C2H6 and C3H8 has been measured by Finlayson-Pitts[383]. Our recommendations are in reasonable agreement with this ratio. Crowley et al. [287] have measuredk at 247, 294, and 303 K, and the results are in agreement with the recommendations.
D19. OH + C3H8. There are many measurements of the rate coefficients at 298 K. In this evaluation we haveconsidered only the direct measurements [Greiner [440], Tully et al. [1154], Droege and Tully [359], Schmidtet al. [1003], Baulch et al. [85], Bradley et al. [138], Abbatt et al. [1], Schiffman et al. [999], Talukdar et al.[1118], Anderson and Stephens [24] and Mellouki et al. [788]]. The 298 K value is the average of these tenstudies. Greiner, Tully et al. [1151], Droege and Tully, Talukdar et al. and Mellouki et al. have measured thetemperature dependence of this reaction. The recommended E/R was obtained from a linear least squaresanalysis of the data of Droege and Tully below 400 K and the data of Talukdar et al., Anderson and Stephens,and Mellouki et al. The A-factor was adjusted to reproduce k(298 K). This reaction has two possiblechannels, i.e., abstraction of the primary and the secondary H-atom. Therefore, non-Arrhenius behavior isexhibited over a wide temperature range, as shown by Tully et al. and Droege and Tully. The branching ratioswere estimated from the latter study:
kprimary = 6.3 x 10⁻¹² exp(-1050/T) cm3 molecule-1 s-1
ksecondary = 6.3 x 10⁻¹² exp(-580/T) cm3 molecule-1 s-1
These numbers are in reasonable agreement with the older data of Greiner. The ratio of the rate coefficients forOH reactions with C2H6 and C3H8 has been measured by Finlayson-Pitts et al. [383]. Our recommendationsare in reasonable agreement with this ratio.
D20. OH + CH3CHO. There are six measurements of this rate coefficient at 298 K [Morris et al. [816], Niki etal. [863], Atkinson and Pitts [44], Kerr and Sheppard [592], Semmes et al. [1018], and Michael et al. [791]].The recommended value of k(298 K) is the average of these measurements. Atkinson and Pitts, Semmes etal., and Michael et al. measured the temperature dependence of this rate coefficient and found it to exhibit anegative temperature dependence. The recommended E/R is the average value of these studies. The A-factorhas been adjusted to yield the recommended value of k(298 K).
D21. OH + C2H5OH. The recommended value for k(298 K) is the average of those reported by Campbell et al.[178], Overend and Paraskevopoulos [888], Ravishankara and Davis [944], Cox and Goldstone [279], Kerr andStocker [593], Wallington and Kurylo [1211], and Hess and Tully [485]. The value reported by Meier et al.is nearly a factor of two lower than that recommended here. The recommended value of E/R was obtained byusing the data of Wallington and Kurylo, and Hess and Tully. The A-factor has been adjusted to yield therecommended value of k(298 K). At atmospheric temperatures, H-atom abstraction from the CH2 group isthe dominant channel [Meier et al. [777], Hess and Tully [485]], leading to CH3CHO and HO2.
D22. OH + CH3C(O)OH. The recommended k(298K) is the average of the values obtained by Dagaut et al. [297]and Singleton et al. [1047]. The earlier results of Zetzsch and Stuhl [1303] are lower than these values, butwithin the uncertainty of the recommended value. The temperature dependence has been studied by Dagaut etal., who observe a very slight increase in k with temperature between 298 and 440 K and by Singleton et al.,who observe a significant decrease with increase in temperature between 298 and 446 K. Further, Singleton etal. observe that the Arrhenius plot is curved. While Dagaut et al. observed that the acetic acid dimer reactstwice as fast as the monomer, Singleton et al. found the dimer to be essentially unreactive toward OH! Thelatter observations are consistent with the mechanism for the OH + HC(O)OH reaction, which is discussed inthe note for that reaction. It is also consistent with the decrease in reactivity upon D substitution on thecarboxylic site and no change upon substitution on the methyl group (Singleton et al. [1047]. Thus, there issome uncertainty as to the T dependence and the reaction mechanism. Here we recommend a slightly negativeT dependence, but with an uncertainty that encompasses both the studies. The A factor and E/R suggest thatthis reaction may not be a simple metathesis reaction. Based on the analogy with OH + HC(O)OH reactionand the evidence of Singleton et al., the products are expected to be mostly CH3C(O)O + H2O. In theatmosphere, CH3C(O)O is expected to give CH3 + CO2.
59
D23. OH + CH3C(O)CH3. The rate coefficient for this reaction has been measured at temperatures close to 298 Kby Cox et al. [277], Zetzsch [1302], Chiorboli et al. [214], Kerr and Stocker [593], Wallington and Kurylo[1212], and Bauerle et al.[84] The 298 K value was derived from the results of Zetzsch, Kerr and Stocker,
Wallington and Kurylo, and Bauerle et al. Cox reported only an upper limit of <5 x 10-13 cm3 molecule-1
s-1, which is consistent with this recommendation. The primary aim of Chiorboli et al. was to examine theatmospheric degradation of styrene, which produces acetone. They employed a relative rate measurement andreported a value of k(298 K) that is almost 3 times faster than the recommended value. Because of possiblecomplications in their system, we have not included their results in arriving at the recommended value. OnlyWallington and Kurylo and Bauerle et al. have reported k as a function of temperature; both these studiesdirectly measured the rate constant using the pulsed photolysis method. Their results are in good agreement,and the recommended temperature dependence is based on these two studies.
D24. OH + CH3CN. This rate coefficient has been measured as a function of temperature by Harris et al. [465]between 298 and 424 K, Kurylo and Knable [645] between 250 and 363 K, Rhasa [968] between 295 and 520K, and Hynes and Wine [533] between 256 and 388 K. In addition, the 298 K value has been measured byPoulet et al. [927]. The 298 K results of Harris et al. are in disagreement with all other measurements andtherefore have not been included. The recommended 298 K value is a weighted average of all other studies.The temperature dependence was computed using the results of Kurylo and Knable, the lower temperaturevalues (i.e., 295-391 K) of Rhasa, and the data of Hynes and Wine. Three points are worth noting: (a) Rhasaobserved a curved Arrhenius plot even in the temperature range of 295 to 520 K, and therefore extrapolation ofthe recommended expression could lead to large errors; (b) Hynes and Wine observed a pressure dependentincrease of k(298 K) that levels off at about 1 atmosphere, and this observation is contradictory to the resultsof other investigations; (c) Hynes and Wine have carried out extensive pressure, temperature, O2concentration, and isotope variations in this reaction. Hynes and Wine postulate that the reaction proceeds viaaddition as well as abstraction pathways. They observe OH regeneration in the presence of O2. Therecommended k(298 K) and E/R are applicable for only lower tropospheric conditions. Because of theunresolved questions of pressure dependence and reaction mechanism, the recommended value may not beapplicable under upper tropospheric and stratospheric conditions.
D25. OH + CH3ONO2. The rate coefficient for this reaction at 298 K has been measured by Kerr and Stocker[593], Nielsen et al. [858], Gaffney et al. [404], and Talukdar et al. [1117]. Nielsen et al. used both a relativerate technique and a direct method (the pulsed radiolysis-UV absorption method) to measure this rate constant,while Kerr used only a relative rate method. The results of Kerr and Stocker and of Nielsen et al. are a factorof ten higher than those of Gaffney et al. and Talukdar et al. Gaffney et al. carried out a flow tubemeasurement while Talukdar et al. used the pulsed photolysis method. There are no obvious reasons for thereported differences. Talukdar et al. have carried out a large number of checks to see if the difference could bedue to the regeneration of OH via secondary reactions, effects of bath gas pressure, and formation of an adductthat could undergo further reaction in the presence of oxygen. They concluded that none of these factorsaffected their measured value. The lower value of Talukdar et al. could not be due to the presence of reactiveimpurities. Further, their measured temperature dependence of the rate constant, variation of the rate constantwith the length of the hydrocarbon chain (i.e., in CH3ONO2, C2H5ONO2, and C3H7ONO2), variation with
isotopic substitution in the hydroxyl radical (OH, 18OH and OD) and methyl nitrate (CH3ONO2 and
CD3ONO2) are all consistent with this reaction proceeding via an H-atom abstraction pathway. Lastly, the
values measured by Talukdar et al. and Gaffney et al. are consistent with the predictions of Atkinson andAschmann[ 1989], who assumed an H-atom abstraction pathway. However, it is very puzzling that therelative rate measurements of both Kerr and Stocker and of Nielsen et al. are so different; the large uncertaintyreflects this concern. Measurements of this rate constant will be very beneficial.
The temperature dependence of the rate coefficient has been measured by Nielsen et al, and by Talukdar et al.While Nielsen et al. report a negative activation energy, Talukdar et al. report a positive value. Because of theextensive tests carried out by Talukdar et al., as noted above, the temperature dependence measured by them arerecommended here, with a large uncertainty. A thorough investigation of the temperature dependence of thisreaction and the identification of the products of the reaction are needed.
60
D26. OH + CH3C(O)O2NO2 (PAN). This reaction has been studied by four groups, Winer et al. [1271],Wallington et al. [1198], Tsalkani et al. [1142], and Talukdar et al. [1115]. Winer et al. obtained only anupper limit for the rate coefficient. Tsalkani et al. noted that their system was very ill-behaved and obtained avalue of k(298 K) that is a factor of ~2 lower than that obtained by Wallington et al. The pulsed photolysisstudy of Wallington et al. yielded consistent results, but PAN was not directly measured and photodissociationof H2O in the vacuum UV, where PAN absorbs strongly, was used as the OH source. The recent study ofTalukdar et al. [1115] yielded much lower rate coefficients. These investigators measured the PANconcentration directly in their system, minimized secondary reactions due to the photodissociation of PAN,and carried out extensive tests for decomposition of PAN, impurities, and secondary reactions. Therecommended upper limit is a factor two higher than the highest value measured by Talukdar et al. at 298 Kand at 272 K. The quoted upper limit is expected to be valid at all atmospheric temperatures. The productsof the reaction are not known. Further measurements of the rate coefficients and information on the reactionpathways are needed.
D27. OH + C2H5ONO2. The rate constant for this reaction at 298 K has been measured by Kerr and Stocker[593], Nielsen et al. [858], and Talukdar et al. [1117]. As in the case of the reaction of OH with CH3ONO2,
the results of Kerr and Stocker and of Nielsen et al. are larger (by a factor of 3) than those of Talukdar et al.The reasons for the differences are not clear. Because of the exhaustive tests carried out (see the note for theOH + CH3ONO2 reaction), the values of Talukdar et al. are recommended, with a large uncertainty. Nielsen
et al. and Talukdar et al. have measured the rate constant as a function of temperature. While Talukdar et al.observe a small positive activation energy, Nielsen et al. report a negative activation energy. Talukdar et al.note that the rate coefficient for this reaction does not strictly follow Arrhenius behavior, consistent with theabstraction of both the primary and the secondary H atoms. The recommended value was obtained by fittingthe rate coefficients measured by Talukdar et al. at T≤ 298 K. The large uncertainty reflects the discrepanciesbetween the results of Talukdar et al. and of Nielsen et al. A thorough investigation of this reaction is needed.
D28. HO2 + CH2O. There is sufficient evidence to suggest that HO2 adds to CH2O [Su et al. [1096, 1098],Veyret et al. [1180], Zabel et al. [1288], Barnes et al. [67], and Veyret et al. [1179]]. The recommendedk(298 K) is the average of values obtained by Su et al. [1096], Veyret et al. [1180], and Veyret et al. [1179].The temperature dependence observed by Veyret et al. [1179] is recommended. The value reported by Barnes etal. at 273 K is consistent with this recommendation. The adduct HO2•CH2O seems to isomerize toHOCH2OO reasonably rapidly and reversibly. There is a great deal of discrepancy between measured values ofthe equilibrium constants for this reaction.
D29. HO2 + CH3O2. The rate coefficient at 298 K has been measured by Cox and Tyndall [285, 286], Moortgatet al. [810], McAdam et al. [770], Kurylo et al. [643], Jenkin et al. [559], and Lightfoot et al. [710]. In allthe studies, except that of Jenkin et al., both CH3O2 and HO2 have been monitored via UV absorption.Jenkin et al. used IR absorption of HO2 and UV absorption of CH3O2 to obtain the rate constants. Becauseof overlapping absorption spectra of CH3O2 and HO2 and the unavoidable occurrence of the CH3O2 +CH3O2 and HO2 + HO2 reactions along with the CH3O2 + HO2 reaction, the extraction of the ratecoefficient requires modelling of the system and reliance on the UV cross sections of both CH3O2 and HO2.The agreement among the values of k obtained by all these groups is not very good. Part of the difference isdefinitely due to different values of the UV cross sections used in various studies. Contribution fromsecondary reactions may also be partly responsible for the differences. Unfortunately, it is not feasible tocorrect the reported values to a common set of cross sections. Therefore, the average of rate coefficients fromCox and Tyndall, Moortgat et al., McAdam et al., Kurylo and Wallington, Jenkin et al., and Lightfoot et al.are used to obtain the recommended value. Cox and Tyndall, Dagaut et al. [296], and Lightfoot et al. havemeasured the temperature dependence of this rate coefficient. The recommended E/R was obtained by plottingln (k(T)/k298) vs 1/T from these studies. This method looks for only the E/R value in each data set. The A-
factor was calculated to reproduce k(298 K). The studies by the above groups have indicated that this reactionis not affected by pressure or nature of the buffer gas. Jenkin et al. suggest that a substantial fraction of thereaction may yield H2O + CH2O + O2 rather than CH3OOH + O2. The lower value of k measured bymonitoring CH3OOH formation by Moortgat et al. and Kan et al. [586] is consistent with the occurrence ofthe second channel and the lower value of k measured when CH3OOH product yield is monitored. However,the recent work of Wallington [1194] indicates that CH3OOH is the dominant (>92%), if not the only,
61
product. Further work on measurement of k without reliance on UV absorption cross sections and branchingratios where CH2O is monitored is needed.
D30. HO2 + C2H5O2. The recommended value is the weighted average of those measured by Cattell et al. [192],Dagaut et al. [295], Fenter et al. [376], and Maricq and Szente [754]. In all experiments the rate coefficientwas obtained by modeling the reaction system. Also, the calculated rate coefficients depended on the UVabsorption cross sections of both C2H5O2 and HO2. The absorption cross section of C2H5O2 is not well-defined. The value reported by Dagaut et al. would be ~30% higher if the cross sections used by Maricq andSzente were used. The recommended E/R is that measured by Dagaut et al., Fenter et al., and Maricq andSzente. Wallington and Japar [1210] have shown that C2H5O2H and O2 are the only products of thisreaction.
D31. HO2 + CH3C(O)O2. The recommendation is based on Moortgat et al. [812], the only measurement of thisrate coefficient. They measured UV absorption at 210 and 260 nm as a function of time in a flash photolysissystem and fitted the observed 210 and 260 nm absorption temporal profiles to a set of reactions involvingCH3C(O)O2, CH3O2, and HO2. The recommended temperature dependence is also from this study. The ratecoefficient obtained in such a measurement is dependent on the UV absorption cross sections of all theabsorbers and all their reactions. Hence, any change in these parameters can change the calculated ratecoefficient. The recommended k and E/R are consistent with those for similar peroxy radical reactions.Moortgat et al. report two possible channels for this reaction:
CH3C(O)O2 + HO2 → CH3C(O)OOH + O2 (a)
CH3C(O)O2 + HO2 → CH3C(O)OH + O3 (b)
At 298 K, Niki et al. [870] measured kb/k to be 0.25 which agrees reasonably with 0.33 measured byMoortgat et al. Horie and Moortgat [504] report the temperature dependence of the branching ratio to be ka/kb= 330 exp(-1430/T).
D32. NO3 + CO. The upper limit is based on the results of Hjorth et al. [494], who monitored isotopically
labeled CO loss in the presence of NO3 by FTIR. Burrows et al. [168] obtained an upper limit of 4 x 10-16
cm3 molecule-1 s-1, which is consistent with the Hjorth et al. study. Products are expected to be NO2 +CO2, if the reaction occurs.
D33. NO3 + CH2O. There are three measurements of this rate coefficient at 298 K: Atkinson et al. [46], Cantrell
et al. [188], and Hjorth et al. [495]. The value reported by Atkinson et al. [46], k = (3.23 ± 0.26) x 10-16
cm3 molecule-1 s-1, is corrected to 5.8 x 10⁻¹⁶ cm3 molecule-1 s-1 to account for the different value of theequilibrium constant for the NO3 + NO2 ↔ N2O5 reaction that was measured subsequent to this study by thesame group using the same apparatus. This correction is in accordance with their suggestion [Tuazon et al.
[1150]]. The values reported by Cantrell et al. and Hjorth et al., k = 6.3 x 10⁻¹⁶ cm3 molecule-1 s-1 and
(5.4±1.1) x 10-16 cm3 molecule-1 s-1, respectively, are in good agreement with the corrected value ofAtkinson et al. The recommended value is the average of these three studies. Cantrell et al. have goodevidence to suggest that HNO3 and CHO are the products of this reaction. The temperature dependence of thisrate coefficient is unknown, but comparison with the analogous NO3 + CH3CHO reaction suggests a largeE/R.
D34. NO3 + CH3CHO. There are four measurements of this rate constant: Morris and Niki [815], Atkinson etal. [46], Cantrell et al. [182], and Dlugokencky and Howard [341]. The value reported by Atkinson et al.
[46], k = (1.34±0.28) x 10-15 cm3 molecule-1 s-1, is corrected to 2.4 x 10⁻¹⁵ cm3 molecule-1 s-1 asdiscussed for the NO3 + H2CO reaction above and as suggested by Tuazon et al. [1150]. The recommendedvalue is the average of the values obtained by Atkinson et al., Cantrell et al., and Dlugokencky and Howard.The results of Morris and Niki agree with the recommended value when their original data is re-analyzed usinga more recent value for the equilibrium constant for the reaction NO2 + NO3 ↔ N2O5 as shown byDlugokencky and Howard. Dlugokencky and Howard have studied the temperature dependence of this reaction.
62
Their measured value of E/R is recommended. The A-factor has been calculated to yield the k(298K)recommended here. Morris and Niki, and Cantrell et al. observed the formation of HNO3 and PAN in theirstudies, which strongly suggests that HNO3 and CH3CO are the products of this reaction.
D35. CH3 + O2. This bimolecular reaction is not expected to be important based on the results of Baldwin and
Golden [54], who found k < 5 x 10-17 cm3 molecule-1 s-1 for temperatures up to 1200 K. Klais et al. [613]
failed to detect OH (via CH3 + O2 → CH2O + OH) at 368 K and placed an upper limit of 3 x 10-16 cm3
molecule-1 s-1 for this rate coefficient. Bhaskaran et al. [109] measured k = 1x10-11 exp (-12,900/T) cm3
molecule-1 s-1 for 1800 < T < 2200 K. The latter two studies thus support the results of Baldwin andGolden. Studies by Selzer and Bayes [1017] and Plumb and Ryan [920] confirm the low value for this ratecoefficient. Previous studies of Washida and Bayes [1227] are superseded by those of Selzer and Bayes.
Plumb and Ryan have placed an upper limit of 3 x 10-16 cm3 molecule-1 s-1 based on their inability to findHCHO in their experiments. A study by Zellner and Ewig [1298] suggests that this reaction is important atcombustion temperature but is unimportant for the atmosphere.
D36. CH3 + O3. The recommended A-factor and E/R are those obtained from the results of Ogryzlo et al. [876].The results of Simonaitis and Heicklen [1034], based on an analysis of a complex system, are not used.Washida et al. [1226] used O + C2H4 as the source of CH3. Studies on O + C2H4 reaction (Schmoltner etal. [1004], Kleinermanns and Luntz [615], Hunziker et al. [525], and Inoue and Akimoto [542]) have shownthis reaction to be a poor source of CH3. Therefore, the results of Washida et al. are also not used.
D37. HCO + O2. The value of k(298 K) is the average of the determinations by Washida et al. [1228], Shibuya etal. [1022], Veyret and Lesclaux [1178], and Langford and Moore [659]. There are three measurements of kwhere HCO was monitored via the intracavity dye laser absorption technique (Reilly et al. [964], Nadtochenkoet al. [822], and Gill et al. [420]). Even though there is excellent agreement between these three studies, theyyield consistently lower values than those obtained by other techniques. There are several possible reasons forthis discrepancy: (a) The relationship between HCO concentration and laser attenuation in an intracavityabsorption experiment might not be linear, (b) there could have been depletion of O2 in the static systemsthat were used (as suggested by Veyret and Lesclaux), and (c) these experiments were designed more for thestudy of photochemistry than kinetics. Therefore, these values are not included in obtaining the recommendedvalue. The recommended temperature dependence is essentially identical to that measured by Veyret andLesclaux. We have expressed the temperature dependence in an Arrhenius form even though Veyret and
Lesclaux preferred a Tn form (k = 5.5 x 10⁻¹¹ T-(0.4±0.3) cm3 molecule-1 s-1).
D38. CH2OH + O2. The rate coefficient was first measured directly by Radford [938] by detecting the HO2 productin a laser magnetic resonance spectrometer. The wall loss of CH2OH could have introduced a large error inthis measurement. Radford also showed that the previous measurement of Avramenko and Kolesnikova [50]
was in error. Wang et al. [1218] measured a value of 1.4 x 10⁻¹² cm3 molecule-1 s-1 by detecting the HO2product. Recently, Dobe et al. [344], Grotheer et al. [442], Payne et al. [904], Grotheer et al. [443] and
Nesbitt et al. [840] have measured k(298 K) to be close to 1.0 x 10⁻¹¹ cm3 molecule-1 s-1 under conditionswhere wall losses are small. This reaction appears to exhibit a very complex temperature dependence. Basedon the recent data of Grotheer et al. [443] and Nesbitt et al. [840], k appears to increase from 200 K toapproximately 250 K in an Arrhenius fashion, levels off at approximately 300 K, decreases from 300 to 500K, and finally increases as temperature is increased. This complex temperature dependence is believed to bedue to the formation of a CH2(OH)•O2 adduct which can isomerize to CH2O•HO2 or decompose to reactants.The CH2O•HO2 isomer can also decompose to CH2O and HO2 or reform the original adduct. Attemperatures less than 250 K, the data of Nesbitt et al. suggests an E/R value of ~1700 K. For atmosphericpurposes, the value E/R = 0 is appropriate.
D39. CH3O + O2. The recommended value for k(298 K) is the average of those reported by Lorenz et al. [727]and Wantuck et al. [1221]. The recommended E/R was obtained using the results of Gutman et al. [444] (413to 608 K), Lorenz et al. [727] (298 to 450 K), and Wantuck et al. [1221] (298 to 498 K). These investigatorshave measured k directly under pseudo-first order conditions by following CH3O via laser inducedfluorescence. Wantuck et al. measured k up to 973 K and found the Arrhenius plot to be curved; only theirlower temperature data are used in the fit to obtain E/R. The A factor has been adjusted to reproduce the
63
recommended k(298 K). The previous high temperature measurements [Barker et al. [58] and Batt andRobinson [82]] are in reasonable agreement with the derived expression. This value is consistent with the298 K results of Cox et al. [276], obtained from an end product analysis study, and with the upper limitmeasured by Sanders et al. [992]. The A-factor appears low for a hydrogen atom transfer reaction. Thereaction may be more complicated than a simple abstraction. At 298 K, the products of this reaction are HO2and CH2O, as shown by Niki et al. [866].
D40. CH3O + NO. The reaction of CH3O with NO proceeds mainly via addition to form CH3ONO (Batt et al.[81], Wiebe and Heicklen [1250], Frost and Smith [402], and Ohmori et al. [877]). However, a fraction of theenergized CH3ONO adducts decompose to CH2O + HNO, and appear to be a bimolecular channel. Thisreaction has been investigated recently by direct detection of CH3O via laser-induced fluorescence [Zellner[1296]; Frost and Smith [402]; Ohmori et al. [877]]. The previous end-product studies (Batt et al. [81],Wiebe and Heicklen [1250]) are generally consistent with this conclusion. Since the fraction of the CH3ONOadduct that falls apart to CH2O + HNO decreases with increases in pressure and decreases in temperature, it is
not possible to derive a "bimolecular" rate coefficient. A value of k < 8x10-12 cm3 molecule-1 s-1 can bededuced from the work of Frost and Smith [402] and Ohmori et al.[877] for lower atmospheric conditions.
D41. CH3O + NO2. The reaction of CH3O with NO2 proceeds mainly via the formation of CH3ONO2.
However, a fraction of the energized adducts fall apart to yield CH2O + HNO2. The bimolecular rate
coefficient reported here is for the fraction of the reaction that yields CH2O and HNO2. It is not meant to
represent a bimolecular metathesis reaction. The recommended value was derived from the study ofMcCaulley et al.[771] and is discussed in the section on association reactions.
D42. CH3O2 + O3. There are no direct laboratory studies of this reaction. The quoted upper limit is based on theevidence obtained by Simonaitis and Heicklen [1034]. A much lower upper limit has been deduced byMonks et al. [808] by observing the decay of the peroxy radical in a remote clean troposphere at night.
D43. CH3O2 + CH3O2. This reaction has been studied at 298 K by Hochanadel et al. [496], Parkes [897],Anastasi et al. [21], Kan et al. [588], Sanhueza et al. [994], Cox and Tyndall [286], Sander and Watson [988],Basco and Parmar [80], McAdam et al. [770], Kurylo and Wallington [651], Jenkin et al. [559], Lightfoot etal. [708], and Simon et al. [1030]. All the above determinations used UV absorption techniques to monitorCH3O2 and hence measured k/σ, where σ is the absorption cross section for CH3O2 at the monitoredwavelength. Therefore, the derived value of k critically depends on the value of σ that is used. Even thoughthere is good agreement among the measured values of k/σ, there are large discrepancies (approximately afactor of 2) among the values of σ measured by Hochanadel et al., Parkes, Sander and Watson, Adachi et al.[6], McAdam et al., Kurylo et al. [652], and Simon et al. To obtain the recommended k value at 298 K, an
average value of σ at 250 nm, 4.0 x 10⁻¹⁸ cm2 (obtained by averaging the results of Sander and Watson,Kurylo and Wallington as amended in Dagaut and Kurylo [294], Lightfoot et al., and Jenkin et al.) waschosen. The value of k(298 K) was derived using this value of σ and the weighted average value of k/σ at250 nm measured by Cox and Tyndall, Jenkin et al., Sander and Watson, McAdam et al., Kurylo andWallington, Lightfoot et al., and Simon et al. The recommended temperature dependence was calculated byusing the results of Sander and Watson, Kurylo and Wallington, Lightfoot et al. (at temperatures between 228and 420 K), and Jenkin and Cox [558], using a value of σ independent of T. It has been recently shown byLightfoot and Jemi-Alade [707] that σ is essentially invariant with temperature. It is not clear whether theabove procedure of recalculating k using an average value of σ is valid. Therefore, the quoted error limitsencompass the values of k calculated by various authors. This reaction has four possible sets of products,i.e.,
CH3O2 + CH3O2 → 2CH3O + O2 ka ; ka/k = 0.3 at 298 KCH3O2 + CH3O2 → CH2O + CH3OH + O2 kb ; kb/k = 0.6 at 298 KCH3O2 + CH3O2 → CH3OOCH3 + O2 kc ; kc/k = 0.1 at 298 KCH3O2 + CH3O2 → CH3OOH + CH2O2 kd ; kd/k = 0.0 at 298 K
FTIR studies by Kan et al. [586] and Niki et al. [866] are in reasonable agreement on the branching ratios at298 K; ka/k ~ 0.35, kb/k ~ 0.55. The recent study by Lightfoot et al. also yields ka/k ≅ 0.35 while Horie etal. [503] obtain 0.30. The last two groups see a large decrease of ka/k with decreasing temperature, which
64
may be expressed as (ka/k) = 1/[1 + {exp(1130/T)}/19]. The results of Ballod et al. [57] are in fair agreementwith this trend. Channel (d) was suggested by Nangia and Benson [824], but there are no experimental datato suggest its occurrence [Khursan et al. [605]]. Because of the existence of multiple pathways, thetemperature dependence of k may be complex. Further work is required on both the temperature dependenceand the variation of branching ratios with temperature. It should be noted that the recommended value of kdepends on the branching ratios used for correcting for secondary reactions.
D44. CH3O2 + NO. The value of k(298 K) was derived from the results of Sander and Watson [987] ,Ravishankara et al. [949], Cox and Tyndall [286] , Plumb et al. [923], Simonaitis and Heicklen [1036] ,Zellner et al. [1299] and Villalta et al. [1181]. Values lower by more than a factor of two have been reportedby Adachi and Basco [4] and Simonaitis and Heicklen [1035]. The former direct study was probably in errorbecause of interference by CH3ONO formation. The results of Simonaitis and Heicklen [1035] and Plumb etal. [922] are assumed to be superseded by their more recent values. Masaki et al. [766]report a value of
(1.12±0.14) x 10-11, which was measured using a flow tube equipped with a photoionization massspectrometer. They encountered complications due to detection of other products and deduced that the lower
limit for the rate constant was 9.8 x 10⁻¹². Even though this lower limit overlaps the recommended value,it was not used in deriving the recommendation. Ravishankara et al., Simonaitis and Heicklen, and Villaltaet al. have measured the temperature dependence of k over limited temperature ranges. The recommended A-factor and E/R were obtained by a weighted least squares analysis of the data from these three studies.Ravishankara et al. find that the reaction channel leading to NO2 accounts for at least 80% of the reaction.Zellner et al. have measured the yield of CH3O to be 1.0±0.2. These results, in conjunction with the indirectevidence obtained by Pate et al. [900], confirm that NO2 formation is the major reaction path, at least at lowpressures.
D45. CH3O2 + CH3C(O)O2. The reaction has been investigated by Addison et al. [7], Moortgat et al. [810], andMoortgat et al. [811] and Maricq and Szente [755] using UV absorption in conjunction with investigations ofthe CH3C(O)O2 self-reaction. The rate coefficient obtained by Addison et al. is a factor of ~5 lower thanthose measured by Moortgat et al. [810]. It is believed that this lower value is due to the use of low UVabsorption cross sections, which were poorly known at the time of this study [Moortgat et al. [811]]. Therecommended value is derived from Moortgat et al. and Maricq and Szente. The temperature dependence of khas been studied by Moortgat et al. [811] and more extensively by Maricq and Szente. The recommendedvalue is derived from these studies.
The reaction has two pathways:
CH3C(O)O2 + CH3O2 → CH3C(O)O + CH3O + O2 (a)
→ CH3C(O)OH + CH2O + O2 (b)
Horie and Moortgat [504] have measured the branching between these two channels to be ka/kb= 2.2 x 10⁶
exp(-3820/T). This report is expected to supersede the earlier branching ratio given by Moortgat et al. [811].Roehl et al. [971] report that ka/kb = 0.9 at 298 K. However, Maricq and Szente show evidence that onlychannel b is operative below 298 K. Further work on the branching ratios for the products are needed.
D46. C2H5 + O2. This is a complex reaction that involves the formation of an C2H5O2 adduct, which can eitherbe stabilized by collisions or fall apart to HO2 and C2H4 (Wagner et al. [1187], Bozzelli and Dean [137], andKaiser et al. [583]). The fraction of the energized adducts that fall apart to give HO2 and C2H4 will decreasewith increasing pressure and decreasing temperature, i.e., as the C2H5O2 formation increases. The C2H4formation channel cannot be separated from the addition reaction. Yet, we recommend a conservative upperlimit as a guide to the extent of this reaction. This upper limit is applicable only for lower atmosphericpressure and temperature conditions.
D47. C2H5O + O2. The recommendation is based on the pulsed laser photolysis studies of Gutman et al. [444]and Hartmann et al. [467]. In both these studies, removal of C2H5O in an excess of O2 was directlymonitored via laser induced fluorescence. Gutman et al. measured k at only two temperatures, while
65
Hartmann et al. measured k at 5 temperatures between 295 and 411 K. The E/R is from Hartmann et al. The298 K value deduced from an indirect study by Zabarnick and Heicklen [1285] is in reasonable agreement withthe recommended value.
D48. C2H5O2 + C2H5O2. k(298 K) has been studied by Adachi et al. [5], Anastasi et al. [22], Munk et al. [819],Cattell et al. [192], Anastasi et al. [20], Wallington et al. [1204], Bauer et al. [83], and Fenter et al. [376].All the above determinations used only UV absorption to monitor C2H5O2 and hence measured k/σ, where σis the absorption cross section of C2H5O2 at the monitoring wavelength. These investigators also measuredthe σ that was used in evaluating the rate coefficient. There are large discrepancies in the measured values ofσ. For this evaluation, we have used the cross sections recommended here and recalculated the values of kfrom each investigation. The recommended k is based on the results of Cattell et al., Wallington et al., Baueret al., and Fenter et al. In all these experiments the observed rate coefficient is higher than the true ratecoefficient because of secondary reactions involving HO2. HO2 is formed by the reaction of CH3CH2O withO2 and it reacts with C2H5O2 to enhance the observed rate coefficient (see Wallington et al. [1205] orLightfoot et al. [706] for further discussion). Based on product branching ratios discussed below, whichdetermine the magnitude of the necessary correction, the recommended rate coefficient is 0.6 times the averageobserved rate coefficient. The recommended value of E/R was obtained from the results of Anastasi et al.,Wallington et al., Anastasi et al., Cattell et al., Bauer et al. and Fenter et al. The observed products (Niki etal. [867]), suggest that at 298K the channel to yield 2 C2H5O + O2 accounts for about 60% of the reaction;the channel to yield CH3CHO + C2H5OH + O2 accounts for about 40% of the reaction; and the channel toyield C2H5O2C2H5 + O2 accounts for less than 5% of the reaction. These branching ratios were used aboveto obtain the true rate coefficient from the observed rate coefficient.
D49. C2H5O2 + NO. The recommended k(298) is obtained from the results of Plumb et al. [924], Sehested et al.[1015], Daele et al. [293], Eberhard and Howard [361], and Maricq and Szente [755]. The value reported byAdachi and Basco [4], which is a factor of three lower than the recommended value, was not used. The ratecoefficient for the CH3O2 + NO reaction measured by Basco and co-workers [Adachi et al. [5]], using thesame apparatus, is also much lower than the value recommended here. The recommended temperaturedependence is derived from Eberhardt and Howard and Maricq and Szente, which are in good agreement.
D50. CH3C(O)O2 + CH3C(O)O2. This reaction has been studied by Addison et al. [7], Basco and Parmar [80],Moortgat et al. [811] Maricq and Szente [755], and Roehl et al. [971], using UV absorption techniques. Therecommended value is obtained from the data of Moortgat et al., Maricq and Szente, and Roehl et al. Aspointed out by Moortgat et al., the six times lower value of k obtained by Addison et al. is likely due to theuse of incorrect UV absorption cross sections for the peroxyradical. The k obtained by Basco and Parmar is~2 times lower than the recommended value. This discrepancy is possibly due to neglecting the UVabsorption of CH3O2 and other stable products in their data analysis [Moortgat et al., Maricq and Szente].The recommended temperature dependence was calculated from the data of Moortgat et al. and Maricq andSzente. Addison et al. reported the formation of O3, which was attributed to the reaction channel whichproduces CH3C(O)OCH3C(O) + O3. Moortgat et al. place an upper limit of 2% for this channel. The mainproducts of this reaction appear to be CH3C(O)O + O2. The CH3C(O)O radicals rapidly decompose to giveCH3 and CO2.
D51. CH3C(O)O2 + NO. This rate coefficient has been directly measured as a function of temperature by Villaltaetal. [1182] and Maricq and Szente [755], using flow tube-chemical ionization mass spectrometry and laserphotolysis-UV/IR absorption spectroscopy, respectively. The agreement between the two groups isreasonable. The precision of the data of Villalta et al was excellent. The k(298) and the Arrhenius parameterswere derived from these two studies. The earlier investigations of this reaction were relative to that for theaddition reaction of CH3C(O)O2 with NO2 [Cox et al. [270], Cox and Roffey [282] , Hendry and Kenley[480], Kirchner et al. [608], and Tuazon et al. [1146]]. The current recommendations for the reactions ofCH3C(O)O2 with NO and NO2 are consistent with the ratio of these two rate constants measured by Zabel etal. [1287]. Hence, our recommendations are consistent with the rate coefficient for the thermal decompositionof PAN as recommended here. The products of the reaction are probably CH3C(O)O and NO2.
66
E1. O + FO. The recommended value is based on results of the room temperature study of Bedzhanyan et al.[101] The temperature dependence of the rate constant is expected to be small, as it is for the analogous ClOreaction.
E2. O + FO2. No experimental data. The rate constant for such a radical-atom process is expected to approachthe gas collision frequency, and is not expected to exhibit a strong temperature dependence.
E3. OH + CH3F (HFC-41). Relative rate data of DeMore [329] are in good agreement with the JPL 94-26recommendation, which is based on results of Hsu and DeMore [519], Schmoltner et al. [1005], Nip et al[872], and Howard and Evenson [511].
E4. OH + CH2F2 (HFC-32). The preferred rate expression is derived from the results of Schmoltner et al. [1005]and Hsu and DeMore [519] and from the data of Jeong and Kaufman [567], Talukdar et al. [1114] below 400 Kand the room temperature data of Howard and Evenson [511] and Nip et al. [872].
E5. OH + CHF3 (HFC-23). The recommended value is based on the absolute rate measurements by Schmoltneret al. [1005] , the relative rate measurements of Hsu and DeMore [519], the room temperature points ofHoward and Evenson [511], and the 387 K and 410 K points of Jeong and Kaufman [567].
E6. OH + CF3OH. New Entry. There are no measurements of the rate coefficient of this reaction. The
recommendation is based upon the recommended limit for the reverse reaction rate coefficient and an estimatedequilibrium constant. The thermochemistry of CF3O and CF3OH are taken from ab initio calculations
(Montgomery et al. [809] and Schneider and Wallington [1006]) and laboratory measurements (Huey et al.
[523]) to estimate ∆G°298 (OH + CF3OH ↔ CF3O + H2O) to be about (+2±4) kcal mol-1. In considering
the large uncertainty in the free energy change, the estimated rate coefficient limit is based on theassumption that the reaction is approximately thermoneutral.
E7. OH + CH3CH2F (HFC-161). The recommended value is based on a fit to the temperature dependent data ofHsu and DeMore [519] and Schmoltner et al. [1005] and the room temperature result of Nip et al. [872].Singleton et al. [1045] determined that 85 ± 3% of the abstraction by OH is from the fluorine substitutedmethyl group.
E8. OH + CH3CHF2 (HFC-152a). The relative rate data of Hsu and DeMore [519] agree with previous absolutedata at high temperatures, but at lower temperatures fall below those data. However, Zellner (privatecommunication, 1993) reports an absolute value for k (293 K) that is in good agreement with the relative ratedata at that temperature. The recommended temperature dependence is from Hsu and DeMore. Roomtemperature value averages these new results with those of Nielsen [852], Gierczak et al. [416], Liu et al.[724], Howard and Evenson [510], Handwerk and Zellner [463], and Nip et al. [872].
E9. OH + CH2FCH2F (HFC-152). The preferred rate expression is derived by fitting an estimated temperaturedependence to the room temperature data of Martin and Paraskevopoulos [762].
E10. OH + CH3CF3 (HFC-143a). The recommended rate expression is based on temperature-dependent data fromHsu and DeMore [519], Orkin et al. [881], and Talukdar et al. [1114], all of which are in good agreement.
E11. OH + CH2FCHF2 (HFC-143). The preferred rate expression is based on results of the relative rate study ofBarry et al. [76] normalized to the value of the rate constant for the reference reaction (OH + CH3CCl3)recommended in this evaluation. The room temperature value of Martin and Paraskevopoulos [762] is in goodagreement. The significantly higher values reported by Clyne and Holt [231] were not considered.
E12. OH + CH2FCF3 (HFC-134a). Absolute rate constant measurements by Orkin and Khamaganov [883] are ingood agreement with previous data such as that of Gierczak et al. [416] and Liu et al. [724]. Relative ratemeasurements of DeMore [327], referenced to CH4, CH3CCl3, and HFC-125, yield a rate constant that isslightly lower (10-20%) than these absolute measurements, but with approximately the same temperaturedependence. Leu and Lee [687] report absolute rate constant measurements that are in excellent agreementwith the relative rate measurements. The recommended value averages results of the new studies with those ofearlier studies of Gierczak et al. [416] above 243 K, Liu et al. [724], the 270 K data of Zhang et al. [1304] and
67
the room temperature data of Martin and Paraskevopoulos [762]. The data of Jeong et al. [565], Brown et al.[144], and Clyne and Holt [231] were not considered. Data of Bednarek et al. [96] at 298 K are in goodagreement with the recommendation.
E13. OH + CHF2CHF2 (HFC-134). The preferred rate expression is based on results of the relative rate study ofDeMore [327]. The room temperature value of Clyne and Holt [231] is in good agreement.
E14. OH + CHF2CF3 (HFC-125). The preferred rate expression is derived from the temperature dependence data ofTalukdar et al. [1114] and the room temperature data of Martin and Paraskevopoulos [762] and DeMore [327].
E15. OH + CH3OCHF2 (HFOC-152a). Based on data of Orkin et al. [884].
E16. OH + CF3OCH3 (HFOC-143a). Based on data of Hsu and DeMore [520] and Orkin et al. [884], which are inexcellent agreement.
E17. OH + CF2HOCF2H (HFOC-134). Temperature-dependent expression based on the results of Hsu andDeMore [520]. The significantly higher measurements of Garland et al. [407] were not used in derivation ofthe preferred value.
E18. OH + CF3OCF2H (HFOC-125). Recommended value is based on results of the relative rate study of Hsu andDeMore [520]. The room temperature result of Zhang et al. [1308] is significantly higher.
E19. OH + CF3CH2CH3 (HFC-263fb). Based on room temperature measurement of Nelson et al. [831].
E20. OH + CHF2CF2CH2F (HFC-245ca). The absolute rate constant results of Zhang et al. [1306] are about40% higher at 298 K than the relative rate data (Hsu and DeMore [519]) but show a similar T-dependence.The recommended value averages results of these studies.
E21. OH + CHF2CHFCHF2 (HFC-245ea). Based on room temperature measurement of Nelson et al. [831].
E22. OH + CF3CHFCH2F (HFC-245eb). Based on room temperature measurement of Nelson et al. [831].
E23. OH + CHF2CH2CF3 (HFC-245fa). The recommended room temperature value is the mean of the valuesreported by Orkin et al. [881] and Nelson et al. [831], which are in good agreement. The temperaturedependence is from Orkin et al. The A-factor from that study has been adjusted to fit the recommended roomtemperature value.
E24. OH + CF3CF2CH2F (HFC-236cb). The preferred rate expression given is that for the reaction of OH withCF3CH2F (HFC-134a). These reactions are expected to have very similar Arrhenius parameters. Thisestimate is preferred over the results reported by Garland et al. [407], the only published experimental study.The A-factor reported in that study is much lower than expected.
E25. OH + CF3CHFCHF2 (HFC-236ea). Recommended value is based on the temperature-dependence data of Hsuand DeMore [519] by the relative rate method and the absolute study of Nelson et al. [831] at roomtemperature, which are in good agreement. The significantly higher values of Garland et al. [407] and Zhanget al. [1306] were not used.
E26. OH + CF3CH2CF3 (HFC-236fa). Recommended value is based on results of the relative rate study of Hsuand DeMore [519] and the absolute rate study of Gierczak et al. [417]. The significantly higher results ofNelson et al. [831] and of Garland and Nelson [408], which superseded the earlier results of Garland et al.[408], were not used.
E27. OH + CF3CHFCF3 (HFC-227ea). Data of Nelson et al. [830], Zellner et al. [1297], and Zhang et al. [1306]are in good agreement for this compound. Relative rate studies of Hsu and DeMore [519] are in goodagreement with the absolute studies. Recommended value is an average.
E28. OH + CHF2OCH2CF3 (HFOC-245fa). Based on data of Orkin et al. [884].
68
E29. OH + CF3CH2CF2CH3 (HFC-365-mfc). There are data for this reaction by Mellouki et al. [789] and Barryet al. [74]. The recommended Arrhenius expression is from the relative rate study of Barry et al., normalizedto the reference rate constant (OH + CH3CCl3) recommended in this evaluation.
E30. OH + CF3CH2CH2CF3 (HFC-356mff). Recommended value is based on the room temperature measurementof Nelson et al.[831], and the temperature-dependent data of Zhang et al. [1306].
E31. OH + CF3CF2CH2CH2F (HFC-356mcf). Based on Nelson et al. [831].
E32. OH + CHF2CF2CF2CF2H (HFC-338pcc). Recommended value is based on results of Schmoltner et al.[1005] and Zhang et al. [1307].
E33. OH + CF3CH2CF2CH2CF3 (HFC-458mfcf). Based on Nelson et al. [831].
E34. OH + CF3CHFCHFCF2CF3. (HFC-43-10mee). Data of Schmoltner et al. [1005] and Zhang et al. [1307]are in reasonable agreement at 298 K and show similar Arrhenius parameters. Recommended value averageresults of these studies.
E35. OH + CF3CF2CH2CH2CF2CF3 (HFC-55-10mcff). Based on Nelson et al. [831]. As expected, the rateconstant is similar to that for CF3CH2CH2CF3.
E36. F + O3. The recommended value is based on results of the room temperature study of Bedzhanyan et al. [100]and the temperature-dependent study of Wagner et al. [1191]. The value appears to be quite reasonable in viewof the well-known reactivity of atomic chlorine with O3.
E37. F + H2. The value of k at 298 K seems to be well established with the results reported by Zhitneva andPshezhetskii [1311], Heidner et al. [473, 474], Wurzberg and Houston [1281], Dodonov et al. [347], Clyne etal. [236], Bozzelli [136], Igoshin et al. [539], Clyne and Hodgson [229] and Stevens et al. [1080] being in
excellent agreement (range of k being 2.3-3.0 x 10⁻¹¹ cm3 molecule-1 s-1). The preferred value at 298 K istaken to be the mean of the values reported in these references. Values of E/R range from 433-595 K (Heidneret al.; Wurzberg and Houston; Igoshin et al.; and Stevens et al.). The preferred value of E/R is derived from afit to the data in these studies. The A-factor was chosen to fit the recommended room temperature value.
E38. F + H2O. The recommended temperature-independent value is based on results reported in the study byStevens et al. [1080] over the temperature range 240-373 K using a discharge flow system with chemicalconversion of fluorine atoms to deuterium atoms and detection of the latter by resonanace fluorescence. Thisvalue is in excellent agreement with the room temperature results of Frost et al. [403] and Walther andWagner [1215]. The latter authors in a limited temperature-dependent study reported an E/R value of 400 K.Although these data have not been included in the derivation of the preferred value, with the exception of theone low temperature data point, they are encompassed within the indicated uncertainty limits.
E39. F + HNO3. The recommendation is based on results of the temperature-dependent study of Wine et al. [1269]and the room temperature results of Mellouki et al. [781], Rahman et al. [940] and Becker et al. [87]. Thevalues at room temperature are in good agreement. The study of Wine et al. [1269] was over the temperaturerange 260-373 K. Below 320 K the data were fitted with the Arrhenius expression recommended here, whereasat higher temperatures a temperature-independent value was found, suggesting the occurrence of differentmechanisms in the two temperature regimes.
E40. F + CH4. The recommended room temperature value is the mean of the results of Wagner et al. [1189],Clyne et al. [236], Kompa and Wanner [627], Foon and Reid [391], Fasano and Nogar [373], and Persky et al.[912]. The temperature dependence is that reported by Persky et al. in a competitive study using the reactionF + D2 as the reference reaction. These results are preferred over the temperature dependences reported in theearlier studies of Wagner et al. and Foon and Reid.
E41. FO + O3. Recommended upper limit is based on the results of Li et al. [704] in a study using a dischargeflow-mass spectrometric technique. FO was produced in the reaction of F atoms with excess O3. No
69
appreciable decay of FO, and only a small increase in FO2, was detected, allowing an upper limit to the rate
constant of 1 x 10-14 cm3 molecule-1s-1 to be derived. A two orders of magnitude higher upper limit wasderived by Sehested et al. [1016]. A lower value of the upper limit was derived by Colussi and Grela [258]from a re-analysis of data on the quantum yields for ozone destruction in F2/O3 mixtures reported by Starricoet al. [1069]. The results of the recent, more direct, study of Li et al. [704] are preferred over the earlierresults of Starrico et al. There are two possible pathways which are exothermic, resulting in the production ofF + 2O2 or FO2 + O2.
E42. FO + NO. The recommended value is based on results of the temperature-dependent study of Bedzhanyan etal. [99] and the value reported by Ray and Watson [962] for k at 298 K using the discharge flow-massspectrometric technique.
E43. FO + FO. The recommended value is based on the results of Bedzhanyan et al. [98] and Clyne and Watson[248]. Wagner et al. [1191], in a less direct study, report a higher value. The results of Bedzhanyan et al.indicate the predominant reaction channel is that to produce 2F + O2.
E44. FO2 + O3. Recommended value is based on results of Sehested et al. [1016]. A higher upper limit has beenreported by Li et al. [704].
E45. FO2 + NO. Recommended values are based on results of Li et al. [704], the only temperature-dependentstudy. The room temperature value is nearly a factor of 2 less than the previous recommendation, which wasbased on the results of Sehested et al. [1016].
E46. FO2 + NO2. Recommended values are based on results of Li et al. [704], the only temperature-dependentstudy. The room temperature value is a factor of 2.5 less than the previous recommendation, which was basedon the results of Sehested et al. [1016]. This discrepancy might be attributable to a small NO impurity in theNO2 sample used in the Sehested et al. study.
E47. FO2 + CO. Recommended value is based on results of Sehested et al. [1016], the only published study ofthis reaction.
E48. FO2 + CH4. Recommended value is based on results of Li et al. [704]. This upper limit is a factor of 20less than the previously recommended upper limit, which was based on the results of Sehested et al. [1016].
E49. CF3O + O2. The recommendation is based upon the results of Turnipseed et al. [1157] who reported
k(373K) ≤ 4 x 10-17. Assuming an E/R of 5000K, which is equal to the reaction endothermicity, yields therecommended A and k(298) limits. By comparison to other reactions involving abstraction by O2 the Afactor is likely to be much smaller.
E50. CF3O + O3. The recommendation is based on the average of room temperature measurements reported by
Turnipseed et al. [1157], Wallington and Ball [1201] , and Bourbon et al. [132]. Turnipseed et al. andBourbon et al. made direct measurements using LIF detection of CF3O with pulsed photolysis and flow tube
reactors, respectively. Wallington and Ball used a competetive reaction scheme with IR absorption detectionand CF3O + CH4 as the reference reaction. The recommended A factor is estimated by comparison to other
CF3O reactions, and the E/R is calculated to give the recommended k(298). Upper limits reported by Maricq
and Szente [753], Nielsen and Sehested [857], and Wallington et al. [1208] are consistent with the k(298)recommendation. Measurements reported by Fockenberg et al. [389] and Meller and Moortgat [778] gave ratecoefficients about an order of magnitude less than the recommended value. Although the reason for thisdiscrepancy is not known, both studies appear to have the possibility of significant secondary chemistry.The reaction products have not been observed.
E51. CF3O + H2O. The recommendation is based upon the measurement k(381) ≤ 2 x 10-16 reported byTurnipseed et al. [1155]. The A factor is estimated and the E/R is calculated to fit k(381). The limits k =
(0.2-40) x 10-17 at 296±2K given by Wallington et al. [1209] are consistent with the recommendation.
70
E52. CF3O + NO. The recommendation is based upon the room temperature rate coefficients reported by Sehestedand Nielsen [1014], Turnipseed et al. [1157], and Jensen et al. [562] which are in very good agreement. Anearlier low value given by Bevilacqua et al. [108] is superseded by Jensen et al. The temperature-dependence isderived from measurements by Turnipseed (233-360K) and Jensen et al. (231-393K). Room temperatureresults from Bourbon et al. [133] and Bhatnagar and Carr [110] and a temperature dependence study by Dibbleet al. [339] are in good agreement with the recommendation. The reaction products have been reported byChen et al. [206] Bevilacqua et al. [108], Bhatnagar and Carr and Dibble et al.
E53. CF3O + NO2. There are no published measurements of the rate coefficient for this reaction. The reactionproducts have been reported by Chen et al. [205] who used photolysis of CF3NO to prepare CF3O2 andsubsequently CF3O in 700 torr of air at 297±2K. They considered two product channels: (a) CF3ONO2obtained via three-body recombination and (b) CF2O + FNO2 obtained via fluorine transfer. Products fromboth channels were observed and found to be thermally stable in their reactor. They report ka/(ka + kb) ≥90% and kb/(ka + kb) ≤ 10%, thus the formation of CF3ONO2 is the dominant channel at 700 torr and297K.
E54. CF3O + CO. The kinetics of this reaction were studied by Turnipseed et al. [1155], who used pulsed laserphotolysis with pulsed laser-induced fluorescence detection and a flow tube reactor with chemical ionizationdetection to obtain data at temperatures from 233 to 332 K and at pressures from 0.8 to about 300 torr in Heand at about 300 torr in SF6. The reaction was found to be predominantly a three-body recombination,presumably producing CF3OCO as described in Table 2. The bimolecular reaction has at least two productchannels: (a) CF2O + CFO and (b) CF3 + CO2. The recommended bimolecular rate coefficient limit isderived from the low pressure results of Turnipseed et al., where the reaction was in the fall-off region. Their
low pressure data indicate that kb < 4 x 10-16 cm3 molecule-1 s-1 at 298K. The fate of the CF3OCO adductis uncertain, and it may lead to the regeneration of CF3 or CF3O radicals in the atmosphere. Wallington andBall [1202] report a yield of (96±8)% CO2 at one atmosphere and (296±2)K.
E55. CF3O + CH4. The absolute rate coefficients reported by Saathoff and Zellner [979], Barone et al. [72], Jensenet al. [562], Bourbon et al. [134], and Bednarek et al. [97] at room temperature are in excellent agreement.Kelly et al. [590] used a relative method with FTIR detection to determine the ratio k(CF3O + CH4)/k(CF3O+ C2H6) = R = 0.01±0.001 at 298±2K. This does not agree with the ratio of our recommended values,which is 0.017. A relative rate measurement reported by Chen et al. [207] using FTIR methods also gives alow result for the rate coefficient. A relative rate measurement reported by Wallington and Ball [1202], R =0.0152±0.0023 at 296K, is in good agreement with the recommended rate coefficients. The temperaturedependence is from the data of Barone et al. (247-360K), Jensen et al. (231-385 K), and Bednarek et al. (235-401K), who agree very well. Measurements at higher temperatures by Bourbon et al. (296-573K) gave ahigher E/R (1606K). The k(298) is the average of the three absolute studies. The CF3OH product wasobserved by Jensen et al. and Bevilacqua et al. [108].
E56. CF3O + C2H6. The room temperature recommendation is based on results reported by Saathoff and Zellner[979], Barone et al. [72], and Bourbon et al. [134]. These workers are in excellent agreement. Chen et al.[207] measured the rate coefficient relative to that for the CF3O + NO reaction in 700 torr of air at 297 K.Their ratio is in good agreement with the values recommended in this evaluation. Kelly et al. [590] used arelative method with FTIR detection to determine the ratio k(CF3O + CH4)/k(CF3O + C2H6) = 0.01±0.001at 298±2K. This does not agree with the ratio of our recommended values, which is 0.017. A relative ratemeasurement reported by Wallington and Ball [1202], R = 0.0152±0.0023 at 296k is in good agreement withthe recommended rate coefficients. The temperature dependence is from the work of Barone et al., who studiedthe reaction over the temperature range from 233 to 360 K. Measurements by Bourbon et al. (295-573k) gavea higher E/R (642K). The products are inferred by analogy to other reactions of CF3O with organiccompounds.
E57. CF3O2 + O3. The recommended upper limit is given by the measurements reported by Ravishankara et al.[953] who used chemical ionization detection of CF3O2 with a flow tube reactor. No measurable reactionwas observed in their study. The less direct studies of Nielsen and Sehested [857], Maricq and Szente [753]and Turnipseed et al. [1157] all report somewhat larger upper limits to the rate coefficient. An observable
71
reaction was reported in an indirect measurement by Meller and Moortgat [778]. Their result for the CF3O +O3 reaction is not consistent with the value recommended above. Their study may have interference fromunknown reactions. The products are assumed to be CF3O + 2O2.
E58. CF3O2 + CO. The recommended upper limit is reported by Turnipseed et al. [1155] who used chemicalionization mass spectrometric detection of CF3OO with a flow tube reactor at 296K. This result is at oddswith an earlier study by Czarnowski and Schumacher [291], who deduced a "fast reaction" when they observedthe thermal decomposition of CF3OOOCF3 to accelerate in the presence of CO at 315-343K. It is possiblethat the reaction of CF3O with CO could account for their observations.
E59. CF3O2 + NO. The recommendation is an average of the room temperature rate coefficients reported by Plumband Ryan [921], Dognon et al. [349], Peeters et al. [906], Bevilacqua et al. [108], Sehested and Nielsen[1014], Turnipseed et al. [1157], Bourbon et al. [133], and Bhatnagar and Carr [110], all of whom are inexcellent agreement. The temperature dependence is derived from the results of Dognon et al. Several studieshave confirmed the identity of the products.
F1. O + ClO. Recently there have been five studies of this rate constant over an extended temperature range usinga variety of techniques: Leu [692]; Margitan [749]; Schwab et al. [1010]; Ongstad and Birks [880]; andNicovich et al. [850]. The recommended value is based on a least squares fit to the data reported in thesestudies and in the earlier studies of Zahniser and Kaufman [1293] and Ongstad and Birks [879]. Valuesreported in the early studies of Bemand et al. [104] and Clyne and Nip [240] are significantly higher and were
not used in deriving the recommended value. Leu and Yung [701] were unable to detect O2(1∑) or O2(1∆) and
set upper limits to the branching ratios for their production of 4.4 x 10⁻⁴ and 2.5 x 10⁻² respectively.
F2. O + OClO. The recommended value is based on results of the DF-RF study of Gleason et al. [426]. Over thetemperature range from 400 K down to 240 K their data are well fitted by this Arrhenius expression, but atlower temperatures down to 200 K their data show an abrupt change to a negative temperature dependence. At200 K the value measured is a factor of 3 higher than that calculated from the Arrhenius expression. Similarresults were obtained in a recent study (Toohey, Avallone, and Anderson, private communication). Over thetemperature range 413 - 273 K their data showed a temperature dependence very similar to that reported byGleason et al. over the same temperature range. Moreover, as the temperature was lowered further their rateconstant values also levelled off and then increased at the lowest temperature. Their rate constant values werenearly 50% lower than the values of Gleason et al. from 400 K down to 273 K and 30% lower at 253 K.Colussi [257], using a laser flash photolysis - resonance fluorescence technique over an extended pressurerange, reported a value of the bimolecular rate coefficient at room temperature 50% higher than therecommended value. Colussi et al. [259] extended these measurements down to 248 K; in contrast to thepositive temperature dependence over this temperature range reported by Gleason et al., these authors report anegative temperature dependence. The bimolecular rate constants reported by Colussi et al. are not directlymeasured but are derived quantities which are consistent with fall-off curves fitted to the experimental data overthe pressure range 20 - 600 torr. It appears that the experiments of Bemand et al. [104], were complicated bysecondary chemistry. The results of Colussi and Colussi et al. over an extended pressure range demonstratethe importance of the termolecular reaction O + OClO + M → ClO3 + M (see entry for this reaction in Table2). It should be noted that the termolecular rate constants derived by Gleason et al. on the basis of their lowtemperature data are not consistent with the termolecular rate constant expression recommended in thisevaluation (factor of 3 difference). The recommended expression is based on the results of Colussi [257] andColussi et al. [259].
F3. O + Cl2O. Recommended value is based on the results of Stevens and Anderson [1079] and Miziolek andMolina [804], which are in good agreement. The significantly lower values of Wecker et al. [1236] are notincluded, nor are earlier results by Basco and Dogra [79] and Freeman and Phillips [395] due to data analysisdifficulties in both studies.
F4. O + HCl. Fair agreement exists between the results of Brown and Smith [147], Wong and Belles [1275],Ravishankara et al. [950], Hack et al. [448] and Singleton and Cvetanovic [1042] at 300 K (some of thevalues for k(300 K) were obtained by extrapolation of the experimentally determined Arrhenius expressions),but these are a factor of ~7 lower than that of Balakhnin et al. [53]. Unfortunately, the values reported forE/R are in complete disagreement, ranging from 2260-3755 K. The preferred value was based on the results
72
reported by Brown and Smith, Wong and Belles, Ravishankara et al., Hack et al. and Singleton andCvetanovic, but not on those reported by Balakhnin et al.
F5. O + HOCl. Recommended value is based on results of Schindler et al. [1001]. In this study the rate constantwas found to be practically independent of temperature in the range 213-298 K. Product analysis indicated thatCl atom abstraction is the predominant primary reaction channel.
F6. O + ClONO2. The results reported by Molina et al. [806] and Kurylo [637] are in good agreement, and thesedata have been used to derive the preferred Arrhenius expression. The value reported by Ravishankara et al.[945] at 245 K is a factor of 2 greater than those from the other studies, and this may possibly be attributed to(a) secondary kinetic complications, (b) the presence of NO2 as a reactive impurity in the ClONO2, or (c)formation of reactive photolytic products. None of the studies reported identification of the reaction products.The room temperature result of Adler-Golden and Wiesenfeld [10] is in good agreement with the recommendedvalue.
F7. O3 + OClO. The recommended value is based on results over the temperature range 262-296 K reported byWongdontri-Stuper et al. [1276]. Within the indicated uncertainty limits it also encompasses the somewhatlower room temperature result of Birks et al. [119].
F8. O3 + Cl2O2. The recommended upper limit is that determined by DeMore and Tschuikow-Roux [333]. Itrefers to a temperature of 195 K, and while the reaction possibly could be faster at higher temperatures, thevalue of the rate at the higher temperatures would be of no significance because of the thermal decompositionof the dimer.
F9. OH + Cl2. The recommended room temperature value is the average of the results reported by Boodaghians etal. [129], Loewenstein and Anderson [725], Ravishankara et al. [947], and Leu and Lin [697]. Thetemperature dependence is from Boodaghians et al. Loewenstein and Anderson determined that the exclusiveproducts are Cl + HOCl.
F10. OH + ClO. The recommended value is based on a fit to the 219-373 K data of Hills and Howard [488], the243-298 K data of Burrows et al. [169], and the 298 K data of Poulet et al. [931]. Data reported in the studiesof Ravishankara et al. [947], and Leu and Lin [697] were not used in deriving the recommended value becausein these studies the concentration of ClO was not determined directly. The results of Burrows et al. aretemperature-independent, while those of Hills and Howard show a slight negative temperature dependence.The fraction of total reaction yielding HO2 + Cl as products has been determined by Leu and Lin (>0.65);Burrows et al. (0.85±0.2); Hills and Howard (0.86±0.14); and Poulet et al. (0.98±0.12). The latest studygives an upper limit of 0.14 for the branching ratio to give HCl + O2 as products. Even though uncertaintiesin all studies allow for the HCl yield to be zero, none of the current measurements can exclude a small, butatmospherically significant, yield of HCl. Quantification of the HCl yield, especially at temperatures close to200 K, is needed.
F11. OH + OClO. The recommended value is that reported by Poulet et al. [935], the only reported study of thisrate constant, using a discharge flow system in which OH decay was measured by LIF or EPR over thetemperature range 293-473 K. Product HOCl was detected by modulated molecular beam mass spectrometry.The branching ratio for the channel to produce HOCl + O2 was determined to be close to unity, butexperimental uncertainty would allow it to be as low as 0.80.
F12. OH + HCl. The recommended value is based on a least squares fit to the data reported in the studies byMolina et al. [807], Keyser [601], and Ravishankara et al. [959]. In these studies particular attention was paidto the determination of the absolute concentration of HCl by UV and IR spectrophotometry. Earlier studiesby Takacs and Glass [1106], Zahniser et al. [1294], Smith and Zellner [1058], Ravishankara et al. [950], Hacket al. [448], Husain et al. [528], Cannon et al. [179], Husain et al. [529], and Smith and Williams [1057] hadreported somewhat lower room temperature values. Results of a low temperature study by Sharkey and Smith[1019] are in good agreement with this recommendation down to 216 K but are significantly higher at 178 Kand 138 K.
F13. OH + HOCl. In the only reported study of this system Ennis and Birks [367] reported the value of this rate
constant at room temperature to lie in the range (1.7 - 9.5) x 10-13 cm3 molecule-1 s-1. A temperature-
73
dependent expression has been estimated by choosing a pre-exponential factor by analogy with the OH +H2O2 reaction and selecting the midpoint of the experimental range for the room temperature rate constant.The large uncertainty factor is needed to encompass the entire range.
F14. OH + ClNO2. The recommended value is based on results of the direct study of Ganske et al. [405, 406]using the discharge flow-resonance fluorescence technique. Mass spectrometric studies showed HOCl to bethe major chlorine-containing product, with no evidence for a channel to produce HONO2 + Cl.
F15. OH + ClONO2. The results reported by Zahniser et al. [1291] and Ravishankara et al. [945] are in goodagreement at ~245 K (within 25%), considering the difficulties associated with handling ClONO2. Thepreferred value is that of Zahniser et al. Neither study reported any data on the reaction products.
F16. OH + CH3Cl. The recommended expression averages the relative rate data of Hsu and DeMore with theabsolute rate data below 400 K from the studies of Taylor et al. [1122], Jeong and Kaufman [567], Davis etal. [311], Perry et al. [908] and the room temperature data of Howard and Evenson [511] and Paraskevopouloset al. [894].
F17. OH + CH2Cl2. The relative rate data of Hsu and DeMore [518] lie below the data from absolute rate studies,although only slightly below that of Davis et al. [311]. The recommended expression averages this relativerate data with the absolute rate data below 400 K from the studies of Taylor et al. [1122], Davis et al. [311],and Jeong and Kaufman [567], and the room temperature data of Perry et al. [908] and Howard and Evenson[511].
F18. OH + CHCl3. There have been two recent studies of this reaction rate - the relative rate study of Hsu andDeMore [518] and the absolute rate study of Taylor et al. [1122], which superseded Taylor et al. [1121]. Bothstudies report a lower activation energy than that reported in the earlier studies. The new data reconcile theproblem with respect to transition state theory pointed out by Cohen and Benson [254] and Cohen andWestberg [255] for the previous data for this reaction (Davis et al. [311], Jeong and Kaufman [567], andTaylor et al. [1121]). The recommended expression averages the relative rate data of Hsu and DeMore with theabsolute rate data below 400 K from the studies of Taylor et al. [1122], Jeong and Kaufman [567] and Daviset al. [311], and the room temperature data of Howard and Evenson [511].
F19. OH + CCl4. The recommended upper limit at room temperature is based on the upper limit reported in thecompetitive study by Cox et al. [272]. The value given there has been increased by a factor of four to allowfor uncertainties in the number of NO molecules oxidized. The recommendation is compatible with the lesssensitive upper limits reported by Howard and Evenson [511] and Clyne and Holt [230]. None of theseinvestigators reported any evidence for reaction between these species. The A-factor was estimated and a lowerlimit for E/R was derived.
F20. OH + CFCl3. The A-factor was estimated, and a lower limit was derived for E/R by using the upper limitreported for the rate constant by Chang and Kaufman [196] at about 480 K. This expression is quitecompatible with the upper limits reported by Atkinson et al. [41], Howard and Evenson [511], Cox et al.[272] and Clyne and Holt [230]. None of the investigators reported any evidence for reaction.
F21. OH + CF2Cl2. The A-factor was estimated, and a lower limit was derived for E/R by using the upper limitreported for the rate constant by Chang and Kaufman [196] at about 480 K. This expression is quitecompatible with the upper limits reported by Atkinson et al. [41], Howard and Evenson [511], Cox et al.[272] and Clyne and Holt [230]. None of the investigators reported any evidence for reaction.
F22. OH + CH2FCl (HCFC-31). The recommended Arrhenius expression includes the data of DeMore [329] alongwith the room temperature data of Howard and Evenson [511] and Paraskevopoulos et al. [894], and thetemperature dependence data of Watson et al. [1231], Handwerk and Zellner [463] and Jeong and Kaufman[567] below 400 K.
F23. OH + CHFCl2 (HCFC-21). Absolute rate coefficient data for this reaction have been reported by Howard andEvenson [511], Perry et al. [908], Watson et al. [1231], Chang and Kaufman [197], Clyne and Holt [231],Paraskevopoulos et al. [894] and Jeong and Kaufman [567]. New data are now available from Fang et al.[370] and DeMore (1997, to be published). The preferred Arrhenius expression fits the latter two sets of data.
74
F24. OH + CHF2Cl (HCFC-22). Results for this compound show very good agreement among both absolute andrelative rate constant measurements. The recommended Arrhenius expression fits the results of Orkin andKhamaganov [883], Hsu and DeMore [519], and Fang et al. [370] along with the earlier results reported byHoward and Evenson [511], Atkinson et al. [41], Watson et al. [1231], Chang and Kaufman [197], Handwerkand Zellner [463], Paraskevopoulos et al. [894] and Jeong and Kaufman [567].
F25. OH + CH3OCl. Recommended value is based on results of Crowley et al. [287], the only reported study ofthis reaction.
F26. OH + CH3CCl3. The k(298K) recommendation is based on absolute rate studies of Talukdar et al. [1119] andFinlayson-Pitts et al. [382], and a relative rate study (CH4 as reference) of DeMore [326]. The temperaturedependence is that of Talukdar et al. [1119]. These studies indicate both a lower k(298K) and E/R than wasreported in earlier studies: Nelson et al. [835], Jeong and Kaufman [566], and Kurylo et al. [640]. Recentmeasurements by Jiang et al. [569] and Lancar et al. [657] yield rate constants that are slightly higher at 298K than this recommendation.
F27. OH + C2HCl3. The preferred value at 298 K is a mean of the values reported by Howard [508] and Changand Kaufman [197]. The value derived from a relative rate coefficient study by Winer et al. [1272] is a factorof ~2 greater than the other values and is not considered in deriving the preferred value at 298 K. TheArrhenius parameters are based on those reported by Chang and Kaufman (the A-factor is reduced to yield thepreferred value at 298 K). Kirchner et al. [609] report a room temperature rate constant and Arrheniusparameters in reasonable agreement with the recommended values.
F28. OH + C2Cl4. The preferred value at 298 K is a mean of the value reported by Howard [508] and Chang andKaufman [197]. The value reported by Winer et al. [1272], which is more than a factor of 10 greater, isrejected. The preferred Arrhenius parameters are those of Chang and Kaufman. Kirchner et al. [609] report aroom temperature rate constant in good agreement with the recommended value and Arrhenius parameters inreasonable agreement with the recommended values.
F29. OH + CCl3CHO. The recommended room temperature value is that reported by Barry et al. [75] in acomprehensive study using three independent techniques. The temperature dependence is that reported by Dobeet al. [342].
F30. OH + CH3CFCl2 (HCFC-141b). Both absolute and relative rate measurements are in excellent agreement forthis compound, and the data are linear over a wide temperature range. The recommended value averages resultsof the studies of Huder and DeMore [522] and Lancar et al. [657] with those of the earlier studies of Zhang etal. [1304], Liu et al. [724] at 330 K and above, and Talukdar et al. [1114] above 253 K. The temperature-dependence data of Brown et al. [144] were not considered because the relatively large rate constants andArrhenius curvature are suggestive of sample impurities.
F31. OH + CH3CF2Cl (HCFC-142b). The recommended rate expression is derived from a fit to the temperature-dependence data of Gierczak et al. [416], Liu et al. [724], Watson et al. [1231], Handwerk and Zellner [463],the 270 K data of Zhang et al. [1304] and the room temperature data of Howard and Evenson [510],Paraskevopoulos et al. [894] and Mors et al. [817]. The data from Brown et al. [144] and Clyne and Holt[231] were not included in the fit.
F32. OH + CH2ClCF2Cl (HCFC-132b). The recommended rate expression was derived from the data of Watson etal. [1233], which were corrected by these authors for the presence of alkene impurities. The data of Jeong etal. [565], indicating substantially faster rate constants, may have been affected by such impurities; hence theywere not included in deriving the recommendation.
F33. OH + CHCl2CF2Cl (HCFC-122). Based on the data of Orkin and Khamaganov [883] and DeMore [329],which are in good agreement.
F34. OH + CHFClCFCl2 (HCFC-122a). Fit to data of Hsu and DeMore [519] and Orkin (privatecommunication), which are in good agreement.
75
F35. OH + CH2ClCF3 (HCFC-133a). The temperature dependence of the preferred rate expression was derivedfrom the data of Handwerk and Zellner [463]. The recommended value of k298 is the average of the values ofHoward and Evenson [510] and Handwerk and Zellner [463] adjusted to 298 K.
F36. OH + CHCl2CF3 (HCFC-123). The relative rate constant measurements of Hsu and DeMore [519], usingHFC-152a as a reference compound, are in good agreement with the Zellner (private communication, 1993)value, but somewhat lower than most of the previous absolute data. The recommended value averages resultsof the new studies with the earlier temperature-dependence data below 400 K of Nielsen [852], Gierczak et al.[416], Liu et al. [724], Watson et al. [1233], and the room temperature data of Howard and Evenson [510].
F37. OH + CHFClCF2Cl (HCFC-123a). Based on the data of Orkin and Khamaganov [883].
F38. OH + CHFClCF3 (HCFC-124). The relative rate measurements of Hsu and DeMore [519], using both HFC-134 and CH4 as reference compounds, are somewhat lower (about 30% at 298 K) than the absolutemeasurements, with a slightly greater temperature dependence. The recommended rate expression averagesresults of this new study with those of the earlier studies of Gierczak et al. [416], Watson et al. [1233], andthe room temperature data of Howard and Evenson [510].
F39. OH + CH3CF2CFCl2 (HCFC-243cc). The preferred rate expression is derived from the temperature-dependence data of Nelson et al. [829]. The recommended value of k298 is obtained from the temperaturedependence expression.
F40. OH + CF3CF2CHCl2 (HCFC-225ca). The preferred rate expression is derived from reanalysis of the finalpublished temperature-dependence data of Nelson et al. [829] and Zhang et al. [1305].
F41. OH + CF2ClCF2CHFCl (HCFC-225cb). The preferred rate expression is derived from the temperature-dependence data of Nelson et al. [829] and Zhang et al. [1305].
F42. HO2 + Cl. The recommendations for the two reaction channels are based upon the results by Lee and Howard[679] using a discharge flow system with laser magnetic resonance detection of HO2, OH, and ClO. The total
rate constant is temperature independent with a value of (4.2±0.7) x 10-11 cm3 molecule-1 s-1 over thetemperature range 250-420 K. This value for the total rate constant is in agreement with the results ofindirect studies relative to Cl + H2O2 [Leu and DeMore [693], Poulet et al. [933], Burrows et al. [164]] or toCl + H2 [Cox [265]]. The contribution of the reaction channel producing OH + ClO (21% at roomtemperature) is much higher than the upper limit reported by Burrows et al. (1% of total reaction). Cattell andCox [193], using a molecular modulation-UV absorption technique over the pressure range 50-760 torr, reportresults in good agreement with those of Lee and Howard both for the overall rate constant and for the relativecontribution of the two reaction channels. A study by Dobis and Benson [346] reports a total rate constant ingood agreement with this recommendation but a much lower contribution (5±3%) of the channel producingOH + ClO. The rate constant for the channel producing ClO + OH can be combined with that for the reactionClO + OH > Cl + HO2 to give an equilibrium constant from which a value of the heat of formation of HO2at 298 K of 3.0 kcal/mol can be derived.
F43. HO2 + ClO. There have now been five studies of this rate constant. Three were low pressure discharge flowstudies, each using a different experimental detection technique (Reimann and Kaufman, [965]; Stimpfle et al.[1087]; Leck et al. [668]), and two were molecular modulation studies; at one atmosphere (Burrows and Cox[165]), and over the pressure range 50-760 torr (Cattell and Cox [193]). The 298 K values reported, in units of
10-12 cm3 molecule-1 s-1, are: 3.8±0.5 (Reimann and Kaufman), 6.3±1.3 (Stimpfle et al.), 4.5±0.9 (Leck etal.), 5.4 (Burrows and Cox), and 6.2±1.5 (Cattell and Cox). The recommended value is the mean of thesevalues. The study of Cattell and Cox over an extended pressure range, when combined with results of the lowpressure discharge flow studies, seems to indicate that this reaction exhibits no pressure dependence at roomtemperature. The only temperature-dependence study (Stimpfle et al.) resulted in a nonlinear Arrhenius
behavior. The data were best described by a four parameter equation of the form k = Ae-B/T + CTn, possiblysuggesting that two different mechanisms may be occurring. The expression forwarded by Stimpfle et al. was
3.3 x 10⁻¹¹ exp(-850/T) + 4.5 x 10⁻¹² (T/300)-3.7. Two possible preferred values can be suggested for thetemperature dependence of k: (a) an expression of the form suggested by Stimpfle et al., but where the values
76
of A and C are adjusted to yield a value of 5.0 x 10⁻¹² at 298 K, or (b) a simple Arrhenius expression which
fits the data obtained at and below 300 K (normalized to 5.0 x 10⁻¹² at 298 K). The latter form is preferred.The two most probable pairs of reaction products are, (1) HOCl + O2 and (2) HCl + O3. Leu [691] and Lecket al. used mass spectrometric detection of ozone to place upper limits of 1.5% (298 K) and 3.0% (248 K);and 2.0% (298 K), respectively, on k2/k. Burrows and Cox report an upper limit of 0.3% for k2/k at 300 K.Finkbeiner et al. [381], using matrix-isolation/FTIR spectroscopy, studied product formation between 210 and300 K at 700 Torr. HOCl was observed as the dominant product (> 95% at all temperatures). The branchingratio values for k2/k were determined to be <1% at 300 K and 270 K, 2±1% at 240 K, and 5±2% at 210 K.No evidence for any other product channel was found.
F44. H2O + ClONO2. This recommendation is based on the upper limits to the homogeneous bimolecular rateconstant reported by Atkinson et al. [47], and by Hatakeyama and Leu [470, 471]. Atkinson et al. observedby FTIR analysis the decay of ClONO2 in the presence of H2O in large-volume (2500 and 5800 liters) Teflonor Teflon-coated chambers. Their observed decay rate gives an upper limit to the homogeneous gas phase rateconstant, and they conclude that the decay observed is due to heterogeneous processes. Hatakeyama and Leu,using a static photolysis system with FTIR analysis, derive a similar upper limit. Rowland et al. [974]concluded that the decay they observed resulted from rapid heterogeneous processes. The homogeneousreaction is too slow to have any significant effect on atmospheric chemistry.
F45. NO + OClO. The Arrhenius expression was estimated based on 298 K data reported by Bemand, Clyne andWatson [104].
F46. NO + Cl2O2. The recommended upper limit is that determined by Friedl (private communication) in a studyusing a DF-MS technique.
F47. NO3 + HCl. The recommended upper limit is that reported by Mellouki et al. [783] in a study using DF-EPR techniques. This upper limit shows that this reaction is of negligible importance in stratosphericchemistry. Somewhat lower upper limits have been reported by Cantrell et al. [184] and Canosa-Mas et al.[181]; the latter study also reports Arrhenius parameters at higher temperatures (333-473 K).
F48. HO2NO2 + HCl. This upper limit is based on results of static photolysis-FTIR experiments reported by Leuet al. [696].
F49. Cl + O3. The results reported for k(298 K) by Watson et al. [1232], Zahniser et al. [1295], Kurylo and Braun[641] and Clyne and Nip [241] are in good agreement, and have been used to determine the preferred value atthis temperature. The values reported by Leu and DeMore [693] (due to the wide error limits) and Clyne andWatson [247] (the value is inexplicably high) are not considered. The four Arrhenius expressions are in fairagreement within the temperature range 205-300 K. In this temperature range, the rate constants at anyparticular temperature agree to within 30-40%. Although the values of the activation energy obtained byWatson et al. and Kurylo and Braun are in excellent agreement, the value of k in the study of Kurylo andBraun is consistently (~17%) lower than that of Watson et al. This may suggest a systematic underestimateof the rate constant, as the values from the other three agree so well at 298 K. A more disturbing difference isthe scatter in the values reported for the activation energy (338-831 cal/mol). However, there is no reason toprefer any one set of data to any other; therefore, the preferred Arrhenius expression shown above was obtainedby computing the mean of the four results between 205 and 298 K. Inclusion of higher temperature (466 K)
experimental data would yield the following Arrhenius expression: k = (3.4±1.0) x 10-11 exp(-310±76/T).Results of the study by Nicovich et al. [845] show non-Arrhenius behavior over the temperature range 189-385 K. These results are in good agreement with the present recommendation above about 250 K, but atlower temperatures they are faster than the recommendation, although still within its stated uncertainty downto about 220 K. Results of Seeley et al. [1011] using the turbulent flow tube technique are in excellentagreement with the recommendation at room temperature but 20% higher than the recommendation at 220 K.DeMore [325] directly determined the ratio k(Cl + O3)/k(Cl + CH4) at 197-217 K to be within 15% of thatcalculated from the absolute rate constant values recommended here.
Vanderzanden and Birks [1176] have interpreted their observation of oxygen atoms in this system as evidence
for some production (0.1-0.5%) of O2 (1∑+g ) in this reaction. The possible production of singlet molecular
oxygen in this reaction has also been discussed by DeMore [322], in connection with the Cl2 photosensitized
77
decomposition of ozone. However Choo and Leu [216] were unable to detect O2(1∑) or O2(1∆) in the Cl +
O3 system and set upper limits to the branching ratios for their production of 5 x 10⁻⁴ and 2.5 x 10⁻²,respectively. They suggested two possible mechanisms for the observed production of oxygen atoms,involving reactions of vibrationally excited ClO radicals with O3 or with Cl atoms, respectively. Burkholderet al. [160], in a study of infrared line intensities of the ClO radical, present evidence in support of the secondmechanism. In their experiments with excess Cl atoms, the vibrationally excited ClO radicals produced in theCl + O3 reaction can react with Cl atoms to give Cl2 and oxygen atoms, which can then remove additionalClO radicals. These authors point out the possibility for systematic error from assuming a 1:1 stoichiometryfor [Cl)]:[O3]o when using the Cl + O3 reaction as a quantitative source of ClO radicals for kinetic andspectroscopic studies.
F50. Cl + H2. This Arrhenius expression is based on the data below 300 K reported by Watson et al. [1230], Leeet al. [669], Miller and Gordon [802], and Kita and Stedman [612]. The results of these studies are inexcellent agreement below 300 K; the data at higher temperatures are in somewhat poorer agreement. Theresults of Watson et al., Miller and Gordon, and Kita and Stedman agree well (after extrapolation) with theresults of Benson et al. [107] and Steiner and Rideal [1074] at higher temperatures. For a discussion of thelarge body of rate data at high temperatures, see the review by Baulch et al. [86][86]. The room temperaturevalue of Kumaran et al. [632], in a study primarily at high temperatures, is in excellent agreement with thisrecommendation. Miller and Gordon and Kita and Stedman also measured the rate of the reverse reaction, andfound the ratio to be in good agreement with equilibrium constant data.
F51. Cl + H2O2. The absolute rate coefficients determined at ~298 K by Watson et al. [1232], Leu and DeMore
[693], Michael et al. [800], Poulet et al. [933] and Keyser [597] range in value from (3.6-6.2) x 10-13. Thestudies of Michael et al., Keyser, and Poulet et al. are presently considered to be the most reliable. Thepreferred value for the Arrhenius expression is taken to be that reported by Keyser. The A-factor reported byMichael et al. is considerably lower than that expected from theoretical considerations and may possibly beattributed to decomposition of H2O2 at temperatures above 300 K. The data of Michael et al. at and below300 K are in good agreement with the Arrhenius expression reported by Keyser. More data are required beforethe Arrhenius parameters can be considered to be well-established. Heneghan and Benson [481], using massspectrometry, confirmed that this reaction proceeds only by the abstraction mechanism giving HCl and HO2as products.
F52. Cl + NO3. The recommended value at room temperature is based on the discharge flow-EPR study ofMellouki et al. [781] and the discharge flow-mass spectrometric study of Becker et al. [89]. The results ofthese direct absolute rate studies are preferred over results of the earlier relative rate studies of Cox et al. [266],Burrows et al. [168], and Cox et al. [278], in all of which NO3 was monitored in the photolysis of Cl2-ClONO2-N2 mixtures. Complications in the chemistry of the earlier systems probably contributed to thespread in reported values. This radical-radical reaction is expected to have negligible temperature dependence,which is consistent with the results from the study of Cox et al. [278] in which the complications must havebeen temperature independent.
F53. Cl + N2O. This rate coefficient has been determined in a study of the halogen-catalyzed decomposition of
nitrous oxide at about 1000 K by Kaufman et al. [589]. The largest value reported was 10-17 cm3 molecule-1
s-1, with an activation energy of 34 kcal/mol. Extrapolation of these results to low temperature shows thatthis reaction cannot be of any significance in atmospheric chemistry.
F54. Cl + HNO3. The recommended upper limit at room temperature is that reported in the study of Wine et al.[1269], in which long-path laser absorption spectroscopy was used to look for the appearance of NO3following the pulsed laser photolysis of Cl2-HNO3 mixtures with no evidence for NO3 production wasobserved. In the same study a less sensitive upper limit was derived from monitoring Cl atom decay byresonance fluorescence. A less sensitive upper limit was also found in the discharge flow-EPR study ofZagogianni et al. [1289]. Higher values obtained in earlier studies [Leu and DeMore [693], Kurylo et al.[649], and Clark et al. [221]] as well as the higher temperature results of Poulet et al. [933] are not used.
78
F55. Cl + CH4. The values reported from the thirteen absolute rate coefficient studies for k at 298 K fall in the
range (0.99 to 1.48) x 10-13, with a mean value of 1.15 x 10⁻¹³. However, based upon the stated confidencelimits reported in each study, the range of values far exceeds that to be expected. A preferred average value of
1.0 x l0-13 can be determined from the absolute rate coefficient studies for k at 298 K by giving equal weightto the values reported in Lin et al. [719], Watson et al. [1232], Manning and Kurylo [745]; Whytock et al.[1248], Zahniser et al. [1290], Michael and Lee [793], Keyser [594], and Ravishankara and Wine [954]. Thevalues derived for k at 298 K from the competitive chlorination studies of Pritchard et al. [936], Knox [621],
Pritchard et al. [937], Knox and Nelson [623], and Lin et al. [719] range from (0.95-1.13) x l0-13, with an
average value of 1.02 x l0-13. The preferred value of 1.0 x l0-13 was obtained by taking a mean value fromthe most reliable absolute and relative rate coefficient studies.
There have been nine absolute studies of the temperature dependence of k. In general, the agreement betweenmost of these studies can be considered to be quite good. However, for a meaningful analysis of the reportedstudies it is best to discuss them in terms of two distinct temperature regions: (a) below 300 K, and (b) above300 K. Three resonance fluorescence studies have been performed over the temperature range 200 to 500 K[Whytock et al. [1248], Zahniser et al. [1290] and Keyser [594]], and in each case a strong nonlinearArrhenius behavior was observed. Ravishankara and Wine [954] also noted nonlinear Arrhenius behavior overa more limited temperature range. This behavior tends to explain partially the large variance in the values ofE/R reported between those other investigators who mainly studied this reaction below 300 K [Watson et al.[1232] and Manning and Kurylo [745]] and those who only studied it above 300 K [Clyne and Walker [246],Poulet et al. [932], and Lin et al. [719]]. The agreement between all studies below 300 K is good, with
values of (a) E/R ranging from 1229-1320 K, and (b) k(230 K) ranging from (2.64-3.32) x 10-14. The mean
of the two discharge flow values [Zahniser et al. [1290] and Keyser [594]] is 2.67 x 10⁻¹⁴, while the meanof the flash photolysis values [Watson et al. [1232], Manning and Kurylo [745], Whytock et al. [1248], and
Ravishankara and Wine [954]] is 3.22 x 10⁻¹⁴ at 230 K. There have not been any absolute studies atstratospheric temperatures other than those which utilized the resonance fluorescence technique. Ravishankaraand Wine [954] have suggested that the results obtained using the discharge flow and competitive chlorination
techniques may be in error at the lower temperatures (<240 K) due to a non-equilibration of the 2P1/2 and2P3/2 states of atomic chlorine. Ravishankara and Wine observed that at temperatures below 240 K theapparent bimolecular rate constant was dependent upon the chemical composition of the reaction mixture; i.e.,if the mixture did not contain an efficient spin equilibrator, e.g., Ar or CCl4, the bimolecular rate constantdecreased at high CH4 concentrations. The chemical composition in each of the flash photolysis studiescontained an efficient spin equilibrator, whereas this was not the case in the discharge flow studies. However,the reactor walls in the discharge flow studies could have been expected to have acted as an efficient spinequilibrator. Consequently, until the hypothesis of Ravishankara and Wine is proven it is assumed that thedischarge flow and competitive chlorination results are reliable.
Above 300 K the three resonance fluorescence studies reported (a) "averaged" values of E/R ranging from
1530-1623 K, and (b) values for k(500 K) ranging from (7.74-8.76) x 10-13. Three mass spectrometricstudies have been performed above 300 K with E/R values ranging from 1409-1790 K. The data of Poulet etal. [932] are sparse and scattered; those of Clyne and Walker [246] show too strong a temperature dependence(compared to all other absolute and competitive studies) and k(298 K) is ~20% higher than the preferred valueat 298 K. The data of Lin et al. [719] are in fair agreement with the resonance fluorescence results.
The competitive chlorination results differ from those obtained from the absolute studies in that linearArrhenius behavior is observed. This difference is the major discrepancy between the two types of
experiments. The values of E/R range from 1503 to 1530 K, and k(230 K) from (2.11-2.54) x 10-14 with a
mean value of 2.27 x 10⁻¹⁴. It can be seen from the above discussion that the average values at 230 K are:
3.19 x 10⁻¹⁴ (flash photolysis), 2.67 x 10⁻¹⁴ (discharge flow), and 2.27 x 10⁻¹⁴ (competitive chlorination).These differences increase at lower temperatures. Until the hypothesis of Ravishankara and Wine [954] is re-examined, the preferred Arrhenius expression attempts to best fit the results obtained between 200 and 300 K
from all sources. The average value of k at 298 K is 1.04 x 10⁻¹³, and at 230 K is 2.71 x 10⁻¹⁴ (this is asimple mean of the three average values). The preferred Arrhenius expression yields values similar to thoseobtained in the discharge flow-resonance fluorescence studies. If only flash photolysis-resonance fluorescence
results are used then an alternate expression of 6.4 x 10⁻¹² (exp(-1200/T)) can be obtained (k(298 K) = 1.07 x
79
10-13, and k(230 K) = 3.19 x 10⁻¹⁴). The room temperature result of Beichert et al. [102] is in goodagreement with the recommendation. The results of Seeley et al. [1011], using the turbulent flow tubetechnique, are in excellent agreement with the recommendation at room temperature but 20% higher than therecommendation at 200 K.
F56. Cl + CH3D. Recommended value is based on results of Wallington and Hurley [1207].
F57. Cl + H2CO. The results from five of the six published studies [Michael et al. [798], Anderson and Kurylo[25], Niki et al. [862], Fasano and Nogar [372] and Poulet et al. [928]] are in good agreement at ~298 K, butare ~50% greater than the value reported by Foon et al. [390]. The preferred value at 298 K was obtained bycombining the absolute values reported by Michael et al., Anderson and Kurylo, and Fasano and Nogar, withthe values obtained by combining the ratio of k(Cl + H2CO)/k(Cl + C2H6) reported by Niki et al. (1.3±0.1)
and by Poulet et al. (1.16±0.12) with the preferred value of 5.7 x 10⁻¹¹ for k(Cl + C2H6) at 298 K. Thepreferred value of E/R was obtained from a least squares fit to all the data reported in Michael et al. and inAnderson and Kurylo. The A-factor was adjusted to yield the preferred value at 298 K.
F58. Cl + CH3O2. Recommended value is based on results of Maricq et al. [756], Jungkamp et al. [580], andDaele and Poulet [292]. All three studies agree that this overall reaction is very fast. However, there is adiscrepancy in the reported values of the branching ratios for the two pathways producing ClO + CH3O (a)and HCl + CH2O2 (b). The branching ratio for the reaction channels producing HCl + CH2O2 (b) has beenreported to be 50% by both Maricq et al. [756] and Jungkamp et al., but has been reported to be 90% by Daeleand Poulet. Because of this large discrepancy no branching ratios are recommended.
F59. Cl + CH3OH. This recommendation is based on results of the absolute rate studies of Michael et al. [797]Payne et al. [904], Dobe et al. [343] and results obtained in the competitive chlorination studies ofWallington et al. [1214], Lightfoot et al. [710] and Nelson et al. [834]. The temperature independence of therate constant was reported by Michael et al. and Lightfoot et al. Product analysis and isotopic substitutionhave established that the reaction mechanism consists of abstraction of a hydrogen atom from the methylgroup rather than from the hydroxyl group. See Radford [938], Radford et al. [939], Meier et al. [776], andPayne et al. [904]. This reaction has been used as a source of CH2OH and as a source of HO2 by the reactionof CH2OH with O2.
F60. Cl + C2H6. The absolute rate coefficients reported in all four studies [Davis et al. [308], Manning andKurylo [745], Lewis et al. [702], and Ray et al. [961]] are in good agreement at 298 K. The value reported by
Davis et al. was probably overestimated by ~10% (the authors assumed that If was proportional to [Cl]0.9,whereas a linear relationship between If and [Cl] probably held under their experimental conditions). Thepreferred value at 298 K was taken to be a simple mean of the four values (the value reported by Davis et al.
was reduced by 10%), i.e., 5.7 x 10⁻¹¹. The two values reported for E/R are in good agreement; E/R = 61 K(Manning and Kurylo) and E/R = 130 K (Lewis et al.). A simple least squares fit to all the data wouldunfairly weight the data of Lewis et al. due to the larger temperature range covered. Therefore, the preferred
value of 7.7 x 10⁻¹¹ exp(-90/T) is an expression which best fits the data of Lewis et al. and Manning andKurylo between 220 and 350 K. The recent temperature-dependent results of Dobis and Benson [345] androom temperature results of Kaiser et al. [584], Hooshiyar and Niki [502] and Beichert et al. [102] are in goodagreement with the recommendation.
F61. Cl + C2H5O2. Recommended value is based on results of Maricq et al. [756].
F62. Cl + CH3CN. The recommendation is based on results of the study of Tyndall et al. [1168]. The results ofthis study, using both relative and absolute methods and measured over a wide range of experimentalconditions are preferred over the results of earlier studies of Kurylo and Knable [645], Poulet et al. [927], andOlbregts et al. [878]. Product studies reported by Tyndall et al. show that reaction proceeds predominantly byhydrogen atom abstraction.
F63. Cl + CH3CO3NO2 (PAN). The recommended value is based on results of the relative rate study ofWallington et al. [1195]. In this study no reaction of PAN was observed in the presence of Cl atoms. Theseresults are preferred over the results of the direct study of Tsalkani et al. [1142] using a discharge flow system
80
with EPR detection of Cl atom decay (in which study the authors reported a rate constant of (3.7±1.7) x 10-13
cm3 molecule-1 s-1). In both studies the major impurity in the PAN samples would be the alkane solvent.The presence of 0.1% tridecane in the PAN sample used by Tsalkani et al. could account for the observed Clatom decay; however, solvent impurities in the PAN sample would be of no consequence in the relative ratestudy of Wallington et al.
F64. Cl + C3H8. The recommended room temperature value is the mean of results of the competitive chlorinationstudies of Pritchard et al. [937], Knox and Nelson [623], Atkinson and Aschmann [35], Wallington et al.[1214], and Hooshiyar and Niki [502], and the absolute rate studies of Lewis et al. [702] and Beichert et al.[102]. The temperature dependence is from Lewis et al. The A-factor from that study has been adjustedslightly to fit the recommended room temperature value.
F65. Cl + OClO. The data of Toohey [1136] are in good agreement with the results of Bemand et al. [104] atroom temperature, and the recommended value at room temperature is the mean of the values reported in thesetwo studies. The slight negative temperature dependence reported by Toohey [1136] is accepted but with errorlimits that encompass the temperature independence reported in the earlier study.
F66. Cl + ClOO. The recommended value is based on the results of studies by Mauldin et al. [768] and Baer et al.[51], in which ClOO was formed by the pulsed photolysis of Cl2/O2 mixtures and its overall loss rate wasmonitored by UV absorption. In both studies k was found to be independent of temperature. These results arepreferred over the results of the earlier, indirect studies of Johnston et al. [570], Cox et al. [273], and Ashfordet al. [32]. The earlier studies did show that the predominant reaction pathway is that yielding Cl2 + O2 asproducts. From the branching ratio data of Cox et al., Ashford et al., and Nicholas and Norrish [841], it canbe estimated that this reaction channel constitutes 95% of the overall reaction with ClO + ClO the products ofthe minor (5%) reaction channel.
F67. Cl + Cl2O. The preferred value was determined from results of the temperature-dependent study of Stevensand Anderson [1079] and the results of two independent absolute rate coefficient studies reported by Ray et al.[961], which used the discharge flow-resonance fluorescence and discharge flow-mass spectrometric techniques.This value has been confirmed by Burrows and Cox [165], who determined the ratio k(Cl + Cl2O)/k(Cl + H2)= 6900 in modulated photolysis experiments. The earlier value reported by Basco and Dogra [77] has beenrejected.
F68. Cl + Cl2O2. The recommended value is that determined by Friedl (private communication) in a study using aDF-MS technique. It is in agreement with the value reported by Cox and Hayman [280] in a study using astatic photolysis technique with photodiode array UV spectroscopy.
F69. Cl + HOCl. This recommendation is based on results over the temperature range 243-365 K reported byCook et al. [261] and the room temperature result of Vogt and Schindler [1184]. There is a significantdiscrepancy in the reported values of the product branching ratios. Ennis and Birks [366] reported that themajor reaction channel is that to give the products Cl2 + OH with a yield of 91±6%, whereas Vogt andSchindler report this yield to be 24±11%, with the major reaction channel giving HCl + ClO as products.
F70. Cl + ClNO. The discharge flow-resonance fluorescence study of Abbatt et al. [3] provides the first reliabledata on the temperature dependence. The laser photolysis-LMR study of Chasovnikov et al. [201] providesrate data for each Cl atom spin state, and they attribute the low value reported by Nelson and Johnston [832]
in a laser flash photolysis-resonance fluorescence study to reaction of the Cl 2P1/2 state. Adsorption anddecomposition of ClNO on the walls of their static system may account for the very low value of Grimleyand Houston [441]. The results of Clyne and Cruse [226] in a discharge flow-resonance fluorescence study aresignificantly lower than all recent results. The recommended value at room temperature is the mean of thevalues reported by Abbatt et al. [3], Chasovnikov et al. [201], Nesbitt et al. [839], and Kita and Stedman[612]. The recommended temperature dependence is from the study of Abbatt et al. [3].
F71. Cl + ClONO2. Recommended value is based on the results of Yokelson et al. [1284] and those of Margitan[748]. These results are in excellent agreement; the slightly higher values of Kurylo et al. [646] areencompassed within the stated uncertainties. Yokelson et al. report that at 298 K, more than 95% of thisreaction proceeds by the reaction channel giving Cl2 + NO3 as products.
81
F72. Cl + CH3Cl. The recommended room temperature value is the mean of results of the absolute rate studies ofManning and Kurylo [745] and Beichert et al. [102] and the relative rate study of Wallington et al. [1195].The temperature dependence is from Manning and Kurylo. The A-factor from that study has been adjustedslightly to fit the recommended room temperature value. The results reported by Clyne and Walker [246] andManning and Kurylo [745] are in good agreement at 298 K. However, the value of the activation energymeasured by Manning and Kurylo is significantly lower than that measured by Clyne and Walker. Bothgroups of workers measured the rate constant for the Cl + CH4 and, similarly, the activation energy measuredby Manning and Kurylo was significantly lower than that measured by Clyne and Walker. It is suggested thatthe discharge flow-mass spectrometric technique used by Clyne and Walker was in this case subject to asystematic error, and that the flash photolysis results of Manning and Kurylo provide the basis for therecommended rate constant.
F73. Cl + CH2Cl2. The recommended value is based on results of the relative rate study of Tschuikow-Roux et al.[1143] normalized to the value of the rate constant for the reference reaction (Cl + CH4) recommended in thisevaluation. The room temperature value is in good agreement with results of the relative rate study of Niki etal. [864] and the absolute rate study of Beichert et al. [102]. The higher results of Clyne and Walker [246]were not used.
F74. Cl + CHCl3. There have been three recent studies of this reaction. In the studies of Beichert et al. [102] byan absolute technique and Brahan et al. [139] by a relative technique, room temperature values about 50%greater than the previous recommendation, which was based on the relative study of Knox [622], werereported. Talhaoui et al. [1111] in a temperature-dependent absolute rate study by the discharge flow-massspectrometric technique reported a room temperature value in excellent agreement with the previousrecommendation. The recommended room temperature value is the mean of the values reported in the studiesof Knox , Beichert et al. , Brahan et al. and Talhaoui et al. The temperature dependence is from Talhaoui etal. and Knox. The A-factor has been fitted to the recommended room temperature value.
F75. Cl + CH3F (HFC-41). The recommended value is based on results of the temperature-dependent relative ratestudy of Tschuikow-Roux et al. [1143] and the relative rate studies of Tuazon et al. [1147] and Wallington etal. [1203] at room temperature. The results of the absolute rate study of Manning and Kurylo [745] are ingood agreement at room temperature but show a weaker temperature dependence, which is encompassed withinthe error limits.
F76. Cl + CH2F2 (HFC-32). The recommended room temperature value is the mean of results of the relative ratestudies of Tschuikow-Roux et al. [1144] and of Nielsen et al. [853], both normalized to the value of the rateconstant for the reference reaction (Cl + CH4) recommended in this evaluation. The temperature dependence isfrom Tschuikow-Roux et al. The A-factor from that study has been adjusted to fit the recommended roomtemperature value.
F77. Cl + CF3H (HFC-23). Recommended value is based on results of Coomber and Whittle [262].
F78. Cl + CH2FCl (HCFC-31). The recommended value is based on the room temperature results of Tuazon et al.[1147] and the temperature dependence reported by Tschuikow-Roux et al. [1143], normalized to the value ofthe rate constant for the reference reaction (Cl + CH4) recommended in this evaluation.
F79. Cl + CHFCl2 (HCFC-21). The recommended room temperature value is the mean of results of the relativerate study of Tuazon et al. [1147] and the absolute rate study of Talhaoui et al. [1111]. The temperaturedependence is from Talhaoui et al. The A-factor from that study has been adjusted to fit the recommendedroom temperature value. These results are preferred over the earlier results of Glavas and Heicklen [424].
F80. Cl + CHF2Cl (HCFC-22). The recommended room temperature value is the mean of results of the relativerate studies of Tuazon et al. [1147] and the absolute rate studies of Sawerysyn et al. [998] and Talhaoui et al.[1111]. The temperature dependence is from Talhaoui et al. The A-factor from that study has been adjusted tofit the recommended room temperature value.
F81. Cl + CH3CCl3. Recommended value is based on results of the absolute rate study of Talhaoui et al. [1112].It is consistent with the previous recommendation, which was a much higher upper limit reported by Wine et
82
al. [1266] in a study in which it was concluded that a reactive impurity accounted for a significant fraction ofthe Cl atom removal. The value reported by Platz et al. [919] is in agreement with the recommendation.
F82. Cl + CH3CH2F (HFC-161). The recommended values for the two reaction channels are based on results ofthe relative rate study of Tschuikow-Roux et al. [1144], normalized to the value of the rate constant for thereference reaction (Cl + CH4) recommended in this evaluation.
F83. Cl + CH3CHF2 (HFC-152a). The recommended values for the two reaction channels are based on results ofthe relative rate study of Yano and Tschuikow-Roux [1283], normalized to the value of the rate constant forthe reference reaction (Cl + C2H6) recommended in this evaluation. The overall rate constant value is in goodagreement with results of the room temperature relative rate studies of Wallington and Hurley [1207], andTuazon et al. [1147].
F84. Cl + CH2FCH2F (HFC-152). The recommended value is based on results of the relative rate study of Yanoand Tschuikow-Roux [1283], normalized to the value of the rate constant for the reference reaction (Cl +C2H6) recommended in this evaluation.
F85. Cl + CH3CFCl2 (HCFC-141b). The recommended value is based on results of absolute rate studies ofTalhaoui et al. [1112] by the discharge flow - mass spectrometric technique and Warren and Ravishankara[1223] by the pulsed photolysis-resonance fluorescence technique and the relative rate studies of Wallingtonand Hurley [1207] and Tuazon et al. [1147].
F86. Cl + CH3CF2Cl (HCFC-142b). The recommended room temperature value is based on results of the relativerate studies of Wallington and Hurley [1207], and Tuazon et al. [1147], and the absolute rate study of Talhaouiet al. [1112]. The temperature dependence is from Talhaoui et al. The A-factor from that study has beenadjusted to fit the recommended room temperature value.
F87. Cl + CH3CF3 (HFC-143a). The recommended value is based on results of the relative rate study ofTschuikow-Roux et al. [1144], normalized to the value of the rate constant for the reference reaction (Cl +CH4) recommended in this evaluation.
F88. Cl + CH2FCHF2 (HFC-143). The recommended values for the two reaction channels are based on results ofthe relative rate study of Tschuikow-Roux et al. [1144] normalized to the value of the rate constant for thereference reaction (Cl + CH4) recommended in this evaluation.
F89. Cl + CH2ClCF3 (HCFC-133a). The recommended value is based on results of the direct study of Jourdain etal. [576] using the discharge flow-mass spectrometric technique to monitor the decay of the HCFC in thepresence of a large excess of Cl atoms. The A-factor is lower than expected.
F90. Cl + CH2FCF3 (HFC-134a). The recommended value is based on results of the relative rate studies ofWallington and Hurley [1207], and Tuazon et al. [1147], and the absolute rate study of Sawerysyn et al. [998].
F91. Cl + CHF2CHF2 (HFC-134). The recommended value is based on results of the relative rate study ofNielsen et al. [854] and that of Yano and Tschuikow-Roux [1283], normalized to the value of the rate constantfor the reference reaction (Cl + C2H6) recommended in this evaluation.
F92. Cl + CHCl2CF3 (HCFC-123). The recommended value is based on results of the temperature-dependentstudy of Warren and Ravishankara [1223] using the pulsed photolysis-resonance fluorescence technique, andthe relative rate studies of Wallington and Hurley [1207] and Tuazon et al. [1147] at room temperature.
F93. Cl + CHFClCF3 (HCFC-124). The recommended value is based on results of the temperature-dependentstudy of Warren and Ravishankara [1223] using the pulsed photolysis-resonance fluorescence technique and therelative rate study of Tuazon et al. [1147] at room temperature. The A-factor is lower than expected.
F94. Cl + CHF2CF3 (HFC-125). Recommended value is based on results of the relative rate studies of Tuazon etal. [1147] and Sehested et al. [1013].
83
F95. ClO + O3. There are two possible channels for this reaction: ClO + O3 → ClOO + O2 (k1); and ClO + O3→ OClO + O2 (k2). The recommended upper limit for k1 at 298 K is based on results of the recent study by
Stevens and Anderson [1078]. These authors also report that k1 = (4±2) x 10-16 cm3 molecule-1 s-1 at 413
K. These data can be combined to derive the Arrhenius parameters A = 2 x 10-12 cm3 molecule-1 s-1 andE/R > 3600 K. The upper limit for k2 is based on results reported by DeMore et al. [331] and Wongdontri-Stuper et al. [1276]; the Arrhenius parameters for k2 were estimated.
F96. ClO + H2. The Arrhenius expression was estimated based on the ~600 K data of Walker (reported in Clyneand Watson [247]).
F97. ClO + NO. The absolute rate coefficients determined in the four discharge flow-mass spectrometric studies[Clyne and Watson [247], Leu and DeMore [695], Ray and Watson [962] and Clyne and MacRobert [232]] andthe discharge flow laser magnetic resonance study of Lee et al. [680] are in excellent agreement at 298 K, andare averaged to yield the preferred value. The value reported by Zahniser and Kaufman [1293] from acompetitive study is not used in the derivation of the preferred value as it is about 33% higher. Themagnitudes of the temperature dependences reported by Leu and DeMore [695] and Lee et al. are in excellentagreement. Although the E/R value reported by Zahniser and Kaufman [1293] is in fair agreement with theother values, it is not considered as it is dependent upon the E/R value assumed for the Cl + O3 reaction. TheArrhenius expression was derived from a least squares fit to the data reported by Clyne and Watson, Leu andDeMore, Ray and Watson, Clyne and MacRobert, and Lee et al.
F98. ClO + NO3. The recommended value is based on results reported by Cox et al. [266], Cox et al. [278] Biggset al. [117], and Kukui et al. [629]. Biggs et al. report the rate constant to be independent of temperature,consistent with the results of Cox et al. [278]. This recent study of Kukui et al. supersedes the earlier studyof Becker et al. [89] from the same laboratory, which had indicated the major products to be OClO + NO2.There is now agreement among all studies that the major reaction channel forms ClOO + NO2 (see Biggs etal. [117] Cox et al. [278], and Kukui et al. From a study of the OClO/NO3 system Friedl et al. [400]conclude that at 220 K the formation of ClOO + NO2 is favored.
F99. ClO + N2O. The Arrhenius expression was estimated based on the ~600 K data of Walker (reported in Clyneand Watson [247]).
F100.ClO + CO. The Arrhenius expression was estimated based on the ~600 K data of Walker (reported in Clyneand Watson [247]).
F101.ClO + CH4. The Arrhenius expression was estimated based on the ~600 K data of Walker (reported in Clyneand Watson [247]).
F102.ClO + H2CO. Poulet et al. [934] have reported an upper limit of 10-15 cm3 molecule-1 s-1 for k at 298 Kusing the discharge flow-EPR technique.
F103.ClO + CH3O2. The recommended expressions for the overall rate constant is based on the results of Helleiset al. [477]. It is consistent with the room temperature measurements of Simon et al. [1031] and Kenner etal. [591]. The results of Kukui et al. [631] for the overall reaction are in agreement with the recommendationat room temperature, but these values show a slight negative temperature dependence in contrast with theslight positive temperature dependence recommended here. There is general agreement that the only importantreaction channels are the two channels resulting in the production of ClOO + CH3O (a) and CH3OCl + O2(b). However, there is severe disagreement on their relative importance; at room temperature reaction channel(a) is reported to be the major channel by Helleis et al. [477], Simon et al. [1031], Kukui et al. and Helleis etal. [478] but it is reported to be the minor channel by Biggs et al. [115] and Daele and Poulet [292]. Becauseof this large discrepancy, no branching ratios are recommended. The branching ratio studies that go down tolow temperatures (Helleis et al. [477], Kukui et al. , and Helleis et al. [478]) report that reaction channels (a)and (b) are both significant down to lower polar stratospheric temperatures.
F104.ClO + ClO. There are three bimolecular channels for this reaction: ClO + ClO → Cl2 + O2 (k1); ClO +ClO → ClOO + Cl (k2); and ClO + ClO → OClO + Cl (k3). The recommended values for the individual
84
reaction channels are from the study of Nickolaisen et al. [842]. This study, using a flash photolysis/longpath ultraviolet absorption technique, is the most comprehensive study of this system, covering a wide rangeof temperature and pressure. These results are preferred over the results of earlier studies of the totalbimolecular rate coefficient at low pressures by Clyne and Coxon [224], Clyne and White [251], and Clyne etal. [237], and those of other studies reported by Hayman et al. [472], Cox and Derwent [271], Simon et al.[1032], Horowitz et al. [505], and Horowitz et al. [506]. The room temperature branching ratio are k1:k2:k3= 0.29:0.50:0.21. The reaction exhibits both bimolecular and termolecular reaction channels (see entry inTable 2). The termolecular reaction dominates at pressures higher than about 10 torr. The equilibriumconstant for formation of the Cl2O2 dimer is given in Table 3.
F105.HCl + ClONO2. Results of four studies of the kinetics of this system have been published, in which the
following upper limits to the homogeneous bimolecular rate constant were reported: 1 x 10-19 cm3
molecule-1 s-1 by a static wall-less long-path UV absorption technique and a steady-state flow FTIR technique
(Molina et al. [805]); 5 x 10-18 using a flow reactor with FTIR analysis (Friedl et al. [398]); and 8.4 x 10⁻²¹
using a static photolysis system with FTIR analysis (Hatakeyama and Leu [470] and Leu et al. [696]), and 1.5
x 10-19 by FTIR analysis of the decay of ClONO2 in the presence of HCl in large-volume (2500 and 5800liters) Teflon or Teflon-coated chambers (Atkinson et al. [38]). Earlier, Birks et al. [119] had reported a higherupper limit. All studies found this reaction to be catalyzed by surfaces. The differences in the reported upperlimits can be accounted for in terms of the very different reactor characteristics and detection sensitivities ofthe various studies. The homogeneous reaction is too slow to have any significant effect on atmosphericchemistry.
F106. CH2ClO + O2. The CH2ClO radical is reported to be resistant to unimolecular dissociation into Cl +CH2O products, according to chain reaction/product analysis studies by Sanhueza and Heicklen [993] and Nikiet al. [864] and kinetics studies by Catoire et al. [191]. The recommendation is based on the work of Kaiserand Wallington [585] who studied the competition between reaction with O2 and HCl elimination in acomplex photochemical reaction system using FTIR detection of stable products. The recommendation is afactor of 5 higher than estimated using the empirical relationship given by Atkinson and Carter [40]. The fateof CH2ClO in the atmosphere is this reaction with O2.
F107. CH2ClO2 + HO2. The recommendation is based on the measurement reported by Catoire et al. [191], whoused pulsed photolysis with UV absorption detection at 1 atm pressure and 251- 588 K.
F108. CH2ClO2 + NO. The recommendation is based on the value reported by Sehested et al. [1015], who usedpulsed radiolysis and UV absorption detection of NO2 to measure the rate coefficient. The temperaturedependence is estimated by analogy to similar RO2 + NO reactions.
F109. CCl3O2 + NO. The recommendation is based upon the measurements of Ryan and Plumb [978] andDognon et al. [349], who agree well at room temperature. The temperature dependence is derived from thedata of Dognon et al., who covered the temperature range 228-413 K. The CCl3O primary product of thereaction of CCl3O2 with NO decomposes rapidly to eliminate Cl, according to Lesclaux et al. [685].
F110. CCl2FO2 + NO. The recommendation is based on the measurements made by Dognon et al. [349] usingpulsed photolysis with mass spectrometry detection at 1-10 torr and 228-413 K. These results supersede theearlier study of Lesclaux and Caralp [683]. The CCl2FO radical primary product of the CCl2FO2 + NOreaction is reported by Lesclaux et al.[685] and Wu and Carr [1280] to rapidly decompose to eliminate Cl andto give the products indicated.
F111. CClF2O2 + NO. The recommendation is based on the measurements made by Dognon et al. [349], whoused pulsed photolysis with mass spectrometry detection at 1-10 torr and 228-413 K, and Sehested et al.[1015], who used pulsed radiolysis with UV absorption detection of the NO2 product at one atm and 298K.Wu and Carr [1280] observed the CClF2O radical primary product to rapidly dissociate to CF2O and Cl.
85
G1. O + BrO. The preferred value is based on the value reported by Thorn et al. [1128] using a dual laser flashphotolysis/long path absorption/resonance fluorescence technique. Clyne et al. [239] reported a valueapproximately 40% lower.
G2. O + HBr. Results of the flash photolysis-resonance fluorescence study of Nava et al. [825] for 221-455 K andthe laser flash photolysis-resonance fluorescence study of Nicovich and Wine [849] for 250-402 K provide theonly data at stratospheric temperatures. Results reported include those of Singleton and Cvetanovic [1041] for298-554 K by a phase-shift technique, and discharge flow results of Brown and Smith [147] for 267-430 K andTakacs and Glass [1104] at 298 K. The preferred value is based on the results of Nava et al., as well as thoseof Nicovich and Wine and those of Singleton and Cvetanovic over the same temperature range, since theseresults are less subject to complications due to secondary chemistry than are the results using discharge flowtechniques. The uncertainty at 298 K has been set to encompass these latter results.
G3. O + HOBr. Recommended room temperature value is the mean of results of Monks et al. [1128] and Kukuiet al. [630]. The temperature dependence is from Nesbitt et al. [838]. The A-factor from that study has beenadjusted to fit the recommended room temperature value. Kukui et al. determined that the Br atom abstractionchannel is the only pathway at room temperature.
G4. OH + Br2. The recommended room temperature value is the average of the values reported by Boodaghians etal. [129], Loewenstein and Anderson [725], and Poulet et al. [929]. The temperature independence is fromBoodaghians et al. Loewenstein and Anderson determined that the exclusive products are Br + HOBr.
G5. OH + BrO. Recommended room temperature value is that reported by Bogan et al. [126]. This study, usingdischarge flow reactor techniques and beam sampling mass spectrometry, is the only experimentalmeasurement of this rate constant. Because of the difficulty of analyzing the data, we assign a largeuncertainty factor. The authors suggest that the reaction proceeds by recombination to form vibrationallyexcited HOOBr that dissociates to Br + HO2.
G6. OH + HBr. The preferred value at room temperature is the average of the values reported by Ravishankara etal. [956] using FP-RF, by Jourdain et al. [578] using DF-DPR, by Cannon et al. [179] using FP-LIF, and byRavishankara et al. [958] using LFP-RF and LFP-LIF techniques. In this latest study the HBr concentrationwas directly measured in-situ in the slow flow system by UV absorption. The rate constant determined in thisre-investigation is identical to the value recommended here. The data of Ravishankara et al. [956] show nodependence on temperature over the range 249-416 K. Values reported by Takacs and Glass [1105] and byHusain et al. [528] are a factor of 2 lower and were not included in the derivation of the preferred value. Databy Sims et al. [1038] are in good agreement with the reommendation at 298 K but show a negativetemperature dependence at lower temperatures.
G7. OH + CH3Br. The recommended value averages results of Hsu and DeMore [518], Chichinin et al. [213],Mellouki et al. [787] and Zhang et al. [1309]. The results of these extensive studies are in excellentagreement and are preferred over the higher values reported in the earlier studies of Davis et al. [311] andHoward and Evenson [511].
G8. OH + CH2Br2. Recommended value is based on results of Mellouki et al. [787], DeMore [329], and Orlandoet al. [887], all of which are in excellent agreement.
G9. OH + CHBr3. Arrhenius expression from DeMore [329]. Results of Orkin et al. [884] are higher by a factorof 2 but have a similar temperature dependence.
G10. OH + CHF2Br. The recommended value is a fit to the data of Talukdar et al. [1113], Orkin and Khamaganov[882] and Hsu and DeMore [519], all of which are in excellent agreement. These data are preferred over theconsistently higher results reported by Brown et al. [143].
G11. OH + CH2ClBr. Arrhenius expression fit to data of DeMore [329] and Orkin et al. [885], which are in goodagreement.
G12. OH + CF2ClBr. The recommended upper limit at room temperature is the upper limit reported by Burkholderet al. [162] in a study using pulsed photolysis-LIF and DF-LMR techniques. A less sensitive upper limit wasreported by Clyne and Holt [230].
86
G13. OH + CF2Br2. The recommended upper limit at room temperature is the upper limit reported by Burkholderet al. [162] in a study using pulsed photolysis-LIF and DF-LMR techniques.
G14. OH + CF3Br. The recommended upper limit at room temperature is the upper limit reported by Burkholder etal. [162] in a study using pulsed photolysis-LIF and DF-LMR techniques. A less sensitive upper limit wasreported by Le Bras and Combourieu [666]. The upper limit of Orkin and Khamaganov [882] is in agreement.
G15. OH + CH2BrCF3. Fit to the data of Nelson et al. [830] and Orkin and Khamaganov [882], which are inreasonable agreement.
G16. OH + CHFBrCF3. Based on data of Orkin and Khamaganov [882].
G17. OH + CHClBrCF3. Based on data of Orkin and Khamaganov [882].
G18. OH + CF2BrCHFCl. Based on DeMore [329].
G19. OH + CF2BrCF2Br. The recommended upper limit at room temperature is the upper limit reported byBurkholder et al. [162] in a study using pulsed photolysis-LIF and DF-LMR techniques. The upper limit ofOrkin and Khamaganov [882] is in agreement.
G20. HO2 + Br. This recommendation is based on results obtained over the 260-390 K temperature range in thestudy by Toohey et al. [1138], using a discharge flow system with LMR detection of HO2 decay in excess Br.The room temperature value reported in this study is a factor of 3 higher than that reported by Poulet et al.[930] using LIF and MS techniques and is an order of magnitude larger than the value of Posey et al. [925].The uncertainty in E/R is set to encompass the value E/R = O, as it is for other radical-radical reactions. Thevalue determined by Laverdet et al. [663] using DF-EPR techniques is in good agreement with thisrecommendation. The reactions of Br atoms with H2O2, HCHO, and HO2 are all slower than thecorresponding reactions of Cl atoms by one to two orders of magnitude.
G21. HO2 + BrO. The recommendation is based on results of the temperature-dependent studies of Larichev et al.[660], Elrod et al. ([365], and Li et al. [705]. The studies of Larichev et al. and Elrod et al. were done underpseudo-first-order conditions with excess HO2; the study of Li et al. was done under pseudo-first-orderconditions with either HO2 or BrO in excess. The recommended room temperature value is the mean of thevalues reported in these studies, with the values of Li et al. under both conditions included. These studies allreport a similar negative temperature dependence. The room temperature value of Bridier et al. [142], whichwas not obtained under pseudo-first-order decay conditions, was not included in derivation of therecommendation. Larichev et al. have determined an upper limit of 1.5% for production of HBr and O3.From a study of the reverse reaction above room temperature, Mellouki et al. [786] determined byextrapolation that the yield of HBr + O3 is an insignificant fraction (<0.01%) of the total reaction down to200 K.
G22. NO3 + HBr. The recommended upper limit is the upper limit reported by Mellouki et al. [783] in a studyusing DF-EPR techniques. This upper limit shows that this reaction is of negligible importance instratospheric chemistry. Canosa-Mas et al. [181] reported a value that is consistent, within experimentalerror, with the upper limit of Mellouki et al.
G23. Cl + CH2ClBr. Recommended value is based on results of Tschuikow-Roux et al. [1143] normalized to thevalue of the rate constant for the reference reaction (Cl + CH4) recommended in this evaluation.
G24. Cl + CH3Br. Recommended value is based on results of the absolute rate studies of Gierczak et al. [415] andOrlando et al. [887]. Results of these studies are in excellent agreement. Results of the relative rate studyTschuikow-Roux et al. [1143] were not used in derivation of the recommended value.
G25. Cl + CH2Br2. Recommended value is based on results of the absolute rate studies of Gierczak et al. [415] andOrlando et al. [887]. Results of these studies are in excellent agreement. Results of the relative rate study ofTschuikow-Roux et al. [1143] were not used in derivation of the recommended value.
87
G26. Br + O3. The results reported for k(298 K) by Clyne and Watson [249], Leu and DeMore [694], Michael etal. [794], Michael and Payne [799], and Toohey et al. [1139] are in excellent agreement. The preferred valueat 298 K is derived by taking a simple mean of these five values. The temperature dependences reported for kby Leu and DeMore and by Toohey et al. are in good agreement, but they can only be considered to be in fairagreement with those reported by Michael et al. and Michael and Payne. The preferred value was synthesizedto best fit all the data reported from these five studies. The results of Nicovich et al. [845] are in excellentagreement with this recommendation.
G27. Br + H2O2. The recommended upper limit to the value of the rate constant at room temperature is based onresults reported in the study by Toohey et al. [1138] using a discharge flow-resonance fluorescence/lasermagnetic resonance technique. Their upper limit determined over the temperature range 298-378 K isconsistent with less sensitive upper limits determined by Leu [690] and Posey et al. [925] using the dischargeflow-mass spectrometric technique. The much higher value reported by Heneghan and Benson [481] mayresult from the presence of excited Br atoms in the very low pressure reactor. The pre-exponential factor waschosen to be consistent with that for the Cl + H2O2 rate constant, and the E/R value was fitted to the upperlimit at 298 K. Mellouki et al. [786] have measured the rate of the reverse reaction.
G28. Br + NO3. The recommended value is that reported by Mellouki et al. [783] in a study using DF-DPRtechniques.
G29. Br + H2CO. There have been two studies of this rate constant as a function of temperature: Nava et al. [827],using the flash photolysis-resonance fluorescence technique, and Poulet et al. [928], using the discharge flow-mass spectrometric technique. These results are in reasonably good agreement. The Arrhenius expression wasderived from a least squares fit to the data reported in these two studies. The higher room temperature value ofLe Bras et al. [667], using the discharge flow-EPR technique, has been shown to be in error due to secondarychemistry (Poulet et al.).
G30. Br + OClO. The recommended value at room temperature is the mean of the values reported by Clyne andWatson [250] and Toohey [1136]. In the study of Clyne and Watson, correction for the effect of the rapidreverse reaction was required. The temperature dependence reported by Toohey [1136] is accepted but withincreased error limits.
G31. Br + Cl2O. The recommended value is based on results reported by Stevens and Anderson [1079] and bySander and Friedl [984], which are in good agreement.
G32. Br + Cl2O2. The recommended value is that determined by Friedl (private communication) in a study using aDF-MS technique.
G33. BrO + O3. There have been two recent studies of this reaction. Rattigan et al. [943] report an overall rate
constant of ~10-17 cm3 molecule-1s-1 over the temperature range 318-343 K. Rowley et al. [975] report a
room temperature upper limit of 2x10-17 cm3 molecule-1s-1. Both papers report a value of ~2x10-18 cm3
molecule-1 s-1 for the channel to produce OBrO + O2. The recommended upper limit of 2 x 10-17 cm3
molecule-1s-1 is a factor of 2.5 less than the previously recommended upper limit of 5 x 10-17, which wasbased on Mauldin et al. [769]. The pre-exponential factor was estimated, and E/R was calculated.
G34. BrO + NO. The results of the three low pressure mass spectrometric studies (Clyne and Watson [249]; Rayand Watson [962]; Leu [688]) and the high pressure UV absorption study (Watson et al. [1234]), which allused pseudo first-order conditions, are in excellent agreement at 298 K and are thought to be much morereliable than the earlier low pressure UV absorption study (Clyne and Cruse [225]). The results of the twotemperature-dependence studies are in good agreement and both show a small negative temperature dependence.The preferred Arrhenius expression was derived from a least squares fit to all the data reported in the four recentstudies. By combining the data reported by Watson et al. with those from the three mass spectrometricstudies, it can be shown that this reaction does not exhibit any observable pressure dependence between 1 and700 torr total pressure. The temperature dependences of k for the analogous ClO and HO2 reactions are alsonegative and are similar in magnitude.
88
G35. BrO + NO3. The recommended value is the geometric mean of the lower and upper limits reported byMellouki et al. [783] in a study using DF-DPR techniques. These reported limits are encompassed within theindicated uncertainty limits.
G36. BrO + ClO. Friedl and Sander [399], using DF/MS techniques, measured the overall rate constant over thetemperature range 220-400 K and also over this temperature range determined directly branching ratios for thereaction channels producing BrCl and OClO. The same authors in a separate study using flash photolysis-ultraviolet absorption techniques (Sander and Friedl [984]) determined the overall rate constant over thetemperature range 220-400 K and pressure range 50-750 torr and also determined at 220 K and 298 K thebranching ratio for OClO production. The results by these two independent techniques are in excellentagreement, with the overall rate constant showing a negative temperature dependence. Toohey and Anderson[1137], using DF/RF/LMR techniques, reported room temperature values of the overall rate constant and thebranching ratio for OClO production. They also found evidence for the direct production of BrCl in avibrationally excited π state. Poulet et al. [926], using DF/MS techniques, reported room temperature valuesof the overall rate constant and branching ratios for OClO and BrCl production. Overall room temperature rateconstant values reported also include those from the DF/MS study of Clyne and Watson [250] and the verylow value derived in the flash photolysis study of Basco and Dogra [78] using a different interpretation of thereaction mechanism. The recommended Arrhenius expressions for the individual reaction channels are takenfrom the study of Friedl and Sander [399]. This study and the study of Turnipseed et al. [1160] contain themost comprehensive sets of rate constant and branching ratio data. The overall rate constants reported in thesetwo studies are in good agreement (20%) at room temperature and in excellent agreement at stratospherictemperatures. Both studies report that OClO production by channel (1) accounts for 60% of the overallreaction at 200 K. Both studies report a BrCl yield by channel (3) of about 8%, relatively independent oftemperature. The recommended expressions are consistent with the body of data from all studies except thoseof Hills et al. [487] and Basco and Dogra [78].
G37. BrO + BrO. Measurements of the overall rate constant can be divided into categories - those in which BrOwas monitored by UV absorption and those in which BrO was monitored by mass spectrometer. Gilles et al.[421] have re-analyzed the results of the UV absorption studies and scaled the reported values of the rateconstant to the UV absorption cross sections reported in their paper. When scaled in this manner, the roomtemperature rate constant values reported in the UV absorption studies (Sander and Watson [990], Mauldin etal. [769], Bridier et al. [142], Rowley et al. [975], Laszlo et al. [661], and Gilles et al.) come into very goodagreement among themselves and also with results of the mass spectrometric studies of Clyne and Watson[249] and Lancar et al. [656]. This provides the basis for the reommended room temperature value. Thetemperature dependence is based on results of Sander and Watson, Turnipseed et al. [1159] and Gilles et al.
There are two possible bimolecular channels for this reaction: BrO + BrO → 2Br + O2 (k1) and BrO + BrO→ Br2 + O2 (k2). The partitioning of the total rate constant into its two components, k1 and k2, has beenmeasured at room temperature by Sander and Watson [990], Turnipseed et al. [1159] and Lancar et al. [656],by Jaffe and Mainquist [548] from 258 to 333 K, by Cox et al. [284] from 278 to 348 K and by Mauldin etal. [769] from 220 to 298 K. All are in agreement that k1/k = 0.85±0.03 at 298 K. From the values of k1/k= 0.85 at 298 K (all studies) and 0.68 at 220 K (Mauldin et al. and Cox et al. extrapolated), one can derive thetemperature dependent expression k1/k = 1.60 exp(-190/T). From the recommended Arrhenius expression forthe overall rate constant k = k1 + k2 and the expression for the branching ratio k1/k, one can derive the
following Arrhenius expressions for the individual reaction channels: k1 = 2.4x10⁻¹² exp(40/T) cm3
molecule-1s-1 and k2 = 2.8x10⁻¹⁴ exp(860/T) cm3 molecule-1s-1.
G38. CH2BrO2 + NO. The recommendation is based on the 298 K measurement of Sehested et al. [1015], whoused pulsed radiolysis with UV absorption detection of the NO2 product formation rate. The temperaturedependence is estimated based on analogy to similar RO2 + NO reactions. The CH2BrO product has beenshown to undergo rapid unimolecular decomposition to yield CH2O + Br by Chen et al. [204] and Orlando etal. [886] The domination of this channel over the reaction of CH2BrO with O2 is consistent with the fate ofother alkoxy radicals (Chen et al. and Orlando et al.), but contradicts the easrlier result of Nielson et al. [855].
H1. O + I2. Based on the room temperature data of Ray and Watson [962] and Laszlo et al. [662]. The molecularbeam study of Parrish and Herschbach [898] suggests a zero activation energy, consistent with the near gaskinetic value of k at 298 K.
89
H2. O + IO. Based on results of Laszlo et al. [662], the only reported study of this rate constant. This value wasderived from modeling a system in which the concentrations of I2 and IO were monitored simultaneously.This rate constant is a factor of 4 greater than the values for the corresponding reactions of O with ClO andBrO.
H3. OH + I2. Based on the data of Loewenstein and Anderson [726] and Jenkin et al. [555].
H4. OH + HI. Based on the data of Lancar et al. [658] and MacLeod et al. [740].
H5. OH + CH3I. Based on the data of Brown et al. [145], the only reported study of this reaction.
H6. OH + CF3I. The recommended value is based on results of the discharge flow/resonance fluorescence study ofBrown et al. [145]. The value reported in this study is preferred over the much higher value (factor of 4)reported by Garraway and Donovan [409], using flash photolysis with time-resolved absorption photometry.The Garraway and Donovan value is encompassed within the stated uncertainty.
H7. HO2 + I. Based on the data of Jenkin et al. [561], the only reported study of this reaction.
H8. HO2 + IO. The recommended value is the average of the values reported by Jenkin et al. [560] and Maguin etal. [743].
H9. NO3 + HI. No recommendation is given, based on the potential for severe complications resulting fromsecondary chemistry in the only reported study of the reaction (Lancar et al. [658]).
H10. I + O3. Based on the room temperature data of Jenkin and Cox [556] and Sander [983], and the temperaturedependent data of Buben et al. [152] and Turnipseed et al. [1162].
H11. I + BrO. Based on results of Laszlo et al. [661], the only reported study of this rate constant. This value wasderived from modeling the simultaneous decay of BrO and IO in a Br2/I2/N2O system.
H12. IO + NO. Based on the data of Ray and Watson [962], Daykin and Wine [317], Buben et al. [153], andTurnipseed et al. [1162].
H13. IO + ClO. Based on results of Turnipseed et al. [1161], the only reported study of this reaction. Theseauthors also reported the product yield for channel(s) yielding an I atom to be 0.8 ± 0.2.
H14. IO + BrO. Based primarily on results of Laszlo et al. [661]. Gilles et al. [421] reported the following
Arrhenius expression for non-iodine atom producing channels: 2.5 x 10⁻¹¹ exp (260/T) cm3
molecule-1s-1. They also reported a branching ratio of <0.35 for channels producing I atoms. From their
data they could constrain the value of the overall rate constant to be: 6 x 10-11 < k < 10 x 10-11 cm3
molecule-1s-1, the range of which is consistent with the results of Laszlo et al.
H15. IO + IO. Changed from the previous recommendation, which was based on the results of Sander [983]. Inthat study, over the temperature range 250-373 K, a negative temperature dependence was reported for theoverall rate constant and for the absorption cross section at 427.2 nm. In the recent study of Harwood et al.[468], the overall rate constant and the absorption cross section were found to be independent of temperaturefrom 253 to 320 K. The recommended room temperature value is the average of the values reported bySander, Harwood et al., and Laszlo et al. [662]. The recommended temperaure dependence is the average of thevalues reported by Sander and by Harwood et al., with an uncertainty sufficient to encompass the two reportedvalues. The A-factor has been fitted to the recommended room temperature rate constant and the recommendedtemperature dependence. The overall rate constant for the decay of IO in the absence of ozone has been foundto be independent of pressure by Sander, Laszlo et al., and Harwood et al. A comparison of the overall rateobserved in excess ozone to that in the absence of ozone was interpreted by Sander and by Harwood et al. toimply that formation of the dimer I2O2 is the dominant reaction channel in the IO self-reaction.
H16. INO + INO. Based on the data of Van den Bergh and Troe [1175].
90
H17. INO2 + INO2. Based on the data of Van den Bergh and Troe [1175].
I1. O + SH. This recommendation accepts the results of Cupitt and Glass [289]. The large uncertainty reflectsthe absence of any confirming investigation.
I2. O + CS. The room temperature recommendation is an average of the rate constants determined by Slagle etal. [1052], Bida et al. [111], Lilenfeld and Richardson [715], and Hancock and Smith [462]. The temperaturedependence is that of Lilenfeld and Richardson, with the A-factor adjusted to yield the recommended value ofk(298 K).
I3. O + H2S. This recommendation is derived from an unweighted least squares fit of the data of Singleton et al.[1044] and Whytock et al. [1249]. The results of Slagle et al. [1050] show very good agreement for E/R inthe temperature region of overlap (300 - 500 K) but lie systematically higher at every temperature. Theuncertainty factor at 298 K has been chosen to encompass the room temperature rate constant values of Slagleet al. [1050] and Hollinden et al. [500]. Other than the 263 K data point of Whytock et al. and the 281 Kpoint of Slagle et al., the main body of rate constant data below 298 K comes from the study of Hollinden etal., which indicates a dramatic change in E/R in this temperature region. Thus, ∆E/R was set to account forthese observations. Such a nonlinearity in the Arrhenius plot might indicate a change in the reactionmechanism from abstraction (as written) to addition. An addition channel (resulting in H atom displacement)has been proposed by Slagle et al. [1050], Singleton et al. [1044], and Singleton et al. [1046]. In the lattertwo studies, an upper limit of 20% was placed on the displacement channel. Direct observations of productHSO was made in the reactive scattering experiments of Clemo et al. [222] and Davidson et al. [301]. Athreshold energy of 3.3 kcal/mole was observed (similar to the activation energy measured in earlier studies),suggesting the importance of this direct displacement channel. Addition products from this reaction have beenseen in a matrix by Smardzewski and Lin [1055]. Further kinetic studies in the 200 - 300 K temperaturerange, as well as quantitative direct mechanistic information, could clarify these issues. However, thisreaction is thought to be of limited importance in stratospheric chemistry.
I4. O + OCS. The value of k(298 K) is the average of the determinations by Westenberg and de Haas [1241],Klemm and Stief [618], Wei and Timmons [1237], Manning et al. [746], and Breckenridge and Miller [141].The recommended value of E/R is the average value taken from the first three listed studies. Hsu et al. [517]report that this reaction proceeds exclusively by a stripping mechanism. The vibrational and rotational statedistributions in the SO and CO products have been reported by Chen et al. [209] and Nickolaisen et al. [843]respectively.
I5. O + CS2. The value of k(298 K) is an average of the rate constants determined by Wei and Timmons[1237], Westenberg and de Haas [1241], Slagle et al. [1051], Callear and Smith [176], Callear and Hedges[175], Homann et al. [501], and Graham and Gutman [431]. The E/R value is an average of thedeterminations by Wei and Timmons and Graham and Gutman. The ∆E/R has been set to encompass thelimited temperature data of Westenberg and de Haas. The principal reaction products are thought to be CS +SO. However, Hsu et al. [517] report that 1.4% of the reaction at 298 K proceeds through a channel yieldingCO + S2 and calculate a rate constant for the overall process in agreement with that recommended. Grahamand Gutman [431] have found that 9.6% of the reaction proceeds to yield OCS + S at room temperature.Using time-resolved diode laser spectroscopy, Cooper and Hershberger [263] determined the branching ratiosfor the CO and OCS producing channels to be (3.0±1.0)% and (8.5±1.0)% respectively.
I6. O + CH3SCH3. This recommendation is based on a fit of the data from Nip et al. [871], Lee et al. [676],and Lee et al. [675]. Product studies by Cvetanovic et al. [290] indicate that the reaction proceeds almostentirely by addition followed by rapid fragmentation to the products as written. Pavanaja et al. [903]
examined the pressure and reactant ratio dependencies of OH(A2∑+
) and SO2(3B,
1B) emissions in this
reaction system. Their observations are consistent with initial product formation as written, followed bysecondary generation of both OH and SO2.
I7. O + CH3SSCH3. This recommendation averages the 298 K rate constants of Nip et al. [871] and Lee et al.[672], which differ by nearly a factor of 2. The temperature dependence is that of Nip et al.; Lee et al. havingreported no temperature dependence over the limited range of 270-329K. The A-factor has been adjusted toyield the recommended (averaged) value of k(298K). Product studies by Cvetanovic et al. [290] indicate thatthe reaction proceeds mainly by addition followed by rapid fragmentation to the products as written. Pavanaja
91
et al. [903] examined the pressure and reactant ratio dependencies of OH(A2∑+
) and SO2(3B,
1B) emissions in
this reaction system. Their observations are consistent with initial product formation as written, followed bysecondary generation of both OH and SO2.
I8. O3 + H2S. This upper limit was determined by Becker et al. [93] from measurements of the rates of SO2production and O3 consumption. The heterogeneous reaction between H2S and O3 is far more efficient inmost laboratory systems.
I9. O3 + CH3SCH3. This rate constant upper limit is based on the measurements of Martinez and Herron[764], which represent the only reported study of this reaction.
I10. SO2 + O3. This recommendation is based on the limited data of Davis et al. [312] at 300 K and 360 K in astopped flow investigation using mass spectrometric and UV spectroscopic detection.
I11. OH + H2S. The values of k(298 K) and E/R are derived from a composite unweighted least squares fit to theindividual data points of Perry et al. [909], Cox and Sheppard [283], Wine et al. [1257], Leu and Smith [700],Michael et al. [795], Lin [717], Lin et al. [720], Barnes et al. [60], and Lafage et al. [653]. The studies ofLeu and Smith [700], Lin et al. [720], Lin [717], and Lafage et al. [653] show a slight parabolic temperaturedependence of k with a minimum occurring near room temperature. However, with the error limits stated inthis evaluation, all data are fit reasonably well by an Arrhenius expression. Lafage et al. and Michael et al.discuss the results in terms of a two-channel reaction scheme involving direct H atom abstraction and complex(adduct) formation. Lafage et al. analyzed their results above room temperature to yield an apparent E/R =400K for the abstraction channel, in good agreement with the E/R value determined above room temperatureby Westenberg and de Haas [1243]. The results of these latter workers lie systematically higher (by about70%), presumably due to secondary reactions. The room temperature value measured by Stuhl [1091] lies justoutside the 2σ error limit set for k(298 K).
I12. OH + OCS. The value of k(298 K) is an average of the determinations by Wahner and Ravishankara [1192]and Cheng and Lee [210]. The room temperature rate constants from these studies are a factor of 3 higher thanthe earlier determination by Leu and Smith [698]. As discussed in the later studies, this difference may be dueto an overcorrection of the Leu and Smith data to account for OH reaction with H2S impurities and also topossible regeneration of OH. Nevertheless, the uncertainty factor at 298 K has been set to encompass theearlier study within 2σ. The work by Wahner and Ravishankara [1192] supersedes the study of Ravishankaraet al. [948], which minimized complications due to secondary and/or excited state reactions that presumablywere interfering with the experiments of Atkinson et al. [43] and of Kurylo [639]. The upper limit for k(298K) reported by Cox and Sheppard [283] is too insensitive to permit comparison with the more recent studies.The room temperature measurements of Wahner and Ravishankara demonstrate the lack of an effect of totalpressure (or O2 partial pressure) on the rate constant and are supported by the more limited pressure and O2studies of Cheng and Lee. The recommendation for E/R is based on the study of Cheng and Lee whodetermined a value considerably lower than reported by Leu and Smith, although this difference may be due inpart to the earlier mentioned overcorrection of the data by the latter authors.
Product observations by Leu and Smith indicate that SH is a primary product of this reaction and tentativelyconfirm the suggestion of Kurylo and Laufer [647] that the predominant reaction pathway is to produce SH +CO2 through a complex (adduct) mechanism similar to that observed for the OH + CS2 reaction. However,the absence of an O2/pressure effect for OH + OCS is in marked contrast with the strong dependence seen instudies of OH + CS2 (see note for the latter reaction).
Experiments by Greenblatt and Howard [436] have shown that oxygen atom exchange in the reaction of 18OH
with OCS is relatively unimportant, leading to an upper limit of 1 x 10-15 being set on the rate constant ofthe exchange reaction.
I13. OH + CS2. There is a consensus of experimental evidence that this reaction proceeds very slowly as a direct
bimolecular process. Wine et al. [1267] set an upper limit on k(298 K) of 1.5 x 10⁻¹⁵ cm3 molecule-1 s-1.A consistent upper limit is also reported by Iyer and Rowland [545] for the rate of direct product of OCS,suggesting that OCS and SH are primary products of the bimolecular process. This mechanistic interpretation
92
is further supported by the studies of Leu and Smith [699] and of Biermann et al. [113], which set somewhathigher upper limits on k(298 K). The more rapid reaction rates measured by Atkinson et al. [43], Kurylo[639], and Cox and Sheppard [283] may be attributable to severe complications arising from excited state andsecondary chemistry in their photolytic systems. The Cox and Sheppard study in particular may have beenaffected by the reaction of electronically excited CS2 (produced via the 350 nm photolysis) with O2 (in theone-atmosphere synthetic air mixture) as well as by the accelerating effect of O2 on the OH + CS2 reactionitself, which has been observed by other workers as summarized below. The possible importance ofelectronically excited CS2 reactions in the tropospheric oxidation of CS2 to OCS has been discussed by Wineet al. [1256].
An accelerating effect of O2 on the OH + CS2 reaction rate has been observed by Jones et al. [575], Barnes etal. [66], and Hynes et al. [534], along with a near unity product yield for SO2 and OCS. In the latter twostudies the effective bimolecular rate constant was found to be a function of total pressure (O2 + N2), andexhibited an appreciably negative temperature dependence. These observations are consistent with theformation of a long-lived adduct as postulated by Kurylo [639] and Kurylo and Laufer [647] followed by itsreaction with O2:
kaOH + CS2 + M ↔ HOCS2 + M
kb
kcHOCS2 + O2 → Products
Hynes et al. [534], Murrells et al. [820], Becker et al. [94], and Bulatov et al. [155] directly observed theapproach to equilibrium in this reversible adduct formation. In the Hynes et al. study, the equilibriumconstant was measured as a function of temperature, and the heat of formation of HOCS2 was calculated (-27.4 kcal/mole). A rearrangement of this adduct followed by dissociation into OCS and SH corresponds tothe bimolecular (low k) channel referred to earlier. Hynes et al. [534] measured the rate constant for this
process in the absence of O2 (at approximately one atmosphere of N2) to be < 8 x 10-16 cm3 molecule-1 s-1.Hynes et al. [534], Murrells et al. [820], and Diau and Lee [337] agree quite well on the value of kc, with an
average value of 2.9 x 10⁻¹⁴ being reported independent of temperature and pressure. Diau and Lee also report
the rate constants for the reactions of the adduct (CS2OH) with NO and NO2 to be 7.3 x 10⁻¹³ and 4.2 x 10-
11 respectively.
The effective second order rate constant for CS2 or OH removal in the above reaction scheme can be expressedas
1/keff = (kb/kakc)(1/PO2) + (1/ka)(1/PM)
where PO2 is the partial pressure of O2 and PM equals PO2 + PN2. The validity of this expression requiresthat ka and kb are invariant with the PO2/PN2 ratio. A 1/k vs 1/PO2 plot of the data of Jones et al. [575]taken at atmospheric pressure exhibits marked curvature, suggesting a more complex mechanistic involvementof O2, whereas the data of Barnes et al. [66] and Hynes et al. [534] are more satisfactorily represented by thisanalytical expression. Nevertheless, while the qualitative features of the data from all three laboratories agree,there are some quantitative inconsistencies. First, under similar conditions of O2 and N2 pressures, theBarnes et al. rate constants lie approximately 60% higher than those of Jones et al. and up to a factor of 2higher than those derived by Hynes et al. Secondly, two fits each of both the Barnes et al. and Hynes et al.data can be made: one at fixed PM and varying PO2, and the other at fixed PO2 and varying PM (i.e., varyingadded N2). Within each data set, rate constants calculated from both fits agree reasonably well for molefractions of O2 near 0.2 (equivalent to air) but disagree by more than a factor of 2 for measurements in a pureO2 system. Finally, the temperature dependence (from 264 - 293 K) of the keff values from Barnes et al.varies systematically from an E/R of -1300 K for experiments in pure O2 (at 700 torr total pressure) to -2900 K for experiments in a 50 torr O2 plus 650 torr N2 mixture. An Arrhenius fit of the Hynes et al. data
93
(from 251 - 348 K) recorded in synthetic air at 690 torr yields an E/R = -3300 K, although the data showmarked curvature over the temperature range of study. These observations suggest that ka and kb may not beindependent of the identity of M. For this reason, we limit our recommendation to air mixtures (i.e.,PO2/PN2 = 0.25) at atmospheric pressure. Since most CS2 is oxidized within the atmospheric boundarylayer, such restriction does not limit the applicability of this recommendation in atmospheric modeling.
The present recommendation accepts the measurements of Hynes et al. [534], which appear to be the mostsensitive of the three investigations. Thus, k(298 K) is derived from the Arrhenius fit of the data near roomtemperature.
k(298 K) = 1.2 x 10⁻¹² cm3 molecule-1 s-1
The uncertainty factor, f(298) = 1.5, encompasses the results of Barnes et al. [66] within 2σ. To computevalues of k below 298 K, we have accepted the analysis of Hynes et al.
k(T) = {1.25 x 10⁻¹⁶ exp(4550/T)}/{T + 1.81 x 10⁻³ exp(3400/T)}
This recommendation is only valid for one atmosphere pressure of air. It is interesting to note thatmeasurements by Hynes et al. [534] at approximately 250 K and 700 torr total pressure result in keff valuesthat are independent of the amount of O2 for partial pressures between 145 - 680 torr. This suggests that theadduct is quite stable with respect to dissociation into the reactants (OH + CS2) at this low temperature andthe that effective rate constant for reactant removal approaches the elementary rate constant for adductformation.
From a mechanistic viewpoint, the primary products of reaction c determine the products of CS2 oxidation inair. Lovejoy et al. [732] have shown that the yields of both HO2 and SO2 are equal and near unity. Togetherwith the earlier mentioned unity yield of OCS, these observations suggest that the oxidation equation
OH + CS2 + 2O2 → OCS + HO2 + SO2
describes this atmospheric system. Further insight is provided by the mechanistic study of Stickel et al.[1081], who observe OCS and CO product yields of (0.83±0.08) and (0.16±0.03) respectively. The resultsfrom this study are interpreted to imply that OCS and CO are formed either as primary products of theCS2OH + O2 reaction or as products of a secondary reaction between a primary product and O2. These sameauthors report an SO2 yield of (1.15±0.10), with the results suggesting that only about 75% of the SO2formed as a prompt product, with the remainder generated via a slow reaction of SO (generated as a promptproduct of the CS2OH + O2 reaction) with O2. Insight into the specific reaction pathways can be gleanedfrom the study of Lovejoy et al. [731] in which kc for the reaction of DOCS2 + O2 was found to be the sameas that for HOCS2, indicating that simple H atom abstraction is not the likely process. Rather, HO2production most likely involves complex formation followed by HO2 elimination. Lovejoy et al. [733]
found that the 18
O atom in the 18
OH reactant is transferred predominantly (90 ± 20)% to the SO2 product.These findings are consistent with an S-O bonded CS2-OH adduct and preservation of the S-O bond in thesteps leading to SO2 formation. Additional work involving direct intermediate observations would be helpfulin elucidating this reaction mechanism.
I14. OH + CH3SH. This recommendation is based on a composite fit to the data of Atkinson et al. [42], Wine etal. [1257], Wine et al. [1268], and Hynes and Wine [532], which are in excellent agreement. The results fromthe relative rate study of Barnes et al. [60] are in agreement with this recommendation and indicate that thehigher value of Cox and Sheppard [283] is due to complications resulting from the presence of O2 and NO intheir reaction system. MacLeod et al. [741, 742] and Lee and Tang [674] obtained rate constants at 298Kapproximately 50% lower than recommended here. These authors also obtained lower values for theethanethiol reaction in comparison with results from studies upon which the methanethiol recommendation ismade. Wine et al. [1268] present evidence that this reaction proceeds via adduct formation to produce a speciesthat is thermally stable over the temperature range and time scales of the kinetic measurements. Tyndall andRavishankara [1169] have determined the yield of CH3S (via laser-induced fluorescence) to be unity, indicating
94
that any adduct must be short lived (less than 100 µs). Longer lifetimes would have led to anomalies in theOH decay kinetics used for the rate constant determinations. Hynes and Wine [532] failed to observe anyeffect of O2 on the rate constant.
I15. OH + CH3SCH3. This recommendation is based on the results of Hynes et al. [536], Wine et al. [1257],Hsu et al. [521], Abbatt et al. [2], and Barone et al.[73]. The earlier higher rate constant values of Atkinsonet al. [43] and Kurylo [638] are presumably due to reactive impurities, while those of MacLeod et al. [742]were most likely overestimated because of heterogeneous reactions. Absolute determinations lower than thoserecommended were obtained by Martin et al. [760], Wallington et al. [1197], and Nielsen et al. [860]. Whilethe reasons for these differences are not readily apparent, these results are encompassed within the 2σ errorlimits of the 298K recommendation. Hynes et al. have demonstrated the importance of a second reactionchannel involving addition of OH to dimethyl sulfide (approximately 30% in 1 atmosphere of air at 298K).More recently, Hynes et al. and Barone et al. have examined the reaction mechanism in more detail using fullydeuterated DMS. Both groups report similar rate constants for the bimolecular (non-adduct-forming) rateconstant and adduct bond strengths (13.0 and 10.1 kcal/mole - Hynes et al.; 10.2 and 10.7 kcal/mole - Baroneet al.) from second and third law calculations, respectively. Values of the rate constant for the reaction of the
adduct with O2 were also nearly identical (0.8 x 10⁻¹²
cm3 molec
-1 s
-1 from Hynes et al., and 1.0 x 10
-12
cm3 molec
-1 s
-1 from Barone et al for both DMS and d
6-DMS) independent of pressure and temperature.
The recommendation given here is for the abstraction reaction only. Confirmation of the products as writtenis obtained from the study of Stickel et al. [1083] who determined an HDO product yield of (0.84±0.15) forthe OD + CH3SCH3. Further mechanistic insight comes from the studies of Barnes et al. [69, 70] and
Turnipseed et al. [1158] who find that the abstraction product, CH3SCH2, leads predominantly to CH3Sunder atmospheric conditions. Barnes et al. measure a 0.7% yield of OCS under low NOx conditions, whichthey attribute to further oxidation of CH3S. Both Barnes et al. and Turnipseed et al. find a significant (20-30%) yield of dimethyl sulfoxide, apparently produced via the reaction of the DMS-OH adduct with O2. Zhaoet al. [1310] determined an upper yield of 0.07 for CH3 elimination in the OD + CH3SCH3 reaction system.
Due to the rapid decomposition of a DMS-OH adduct, only the direct abstraction channel is measured in theabsence of O2. The reaction of the adduct with O2, as quantified most recently by Hynes et al. and Barone etal., is responsible for the majority of the products formed in the atmospheric oxidation of DMS. An increasein the observed rate constant (kobs) with increasing O2 concentration has clearly been observed by Hynes etal. [536], Wallington et al. [1197], Barnes et al. [59], Nielsen et al. [860], Barone et al. [73], and Hynes et al.[531]. This O2 effect has been suggested as an explanation for the higher rate constants obtained in many of
the earlier relative rate studies. Hynes et al. give the following expression for the observed rate constant inone atmosphere of air:
kobs = {T exp(-234/T) + 8.46 x 10⁻¹⁰
exp(7230/T) + 2.68 x 10⁻¹⁰
exp(7810/T)}/
{1.04 x 10¹¹
T + 88.1 exp(7460/T)}
This expression was derived empirically from the analysis of a complex data set, which also yielded a value ofthe rate constant for reaction of the adduct with O2 that was a factor of 4 larger than the values derived byHynes et al. [531] and Barone et al. [73] and appeared to be both pressure and temperature dependent. Theeffect of these revisions in the adduct + O2 rate constant on the kobs expression is not easily ascertained.
I16. OH + CH3SSCH3. This recommendation is based on the temperature-dependent studies of Wine et al.[1257] and Abbatt et al. [2] and the room temperature relative rate study of Cox and Sheppard [283]. Domineand Ravishankara [352] have observed both CH3S (via laser-induced fluorescence) and CH3SOH (viaphotoionization mass spectrometry) as products of this reaction. At 298 K, the yield of CH3S alone wasquantified at approximately 30%. An FTIR product study of the photooxidation of dimethyl disulfide byBarnes et al. [68] presents evidence that oxidation of the CH3SOH product is the principal source of themethane sulfonic acid observed.
95
I17. OH + S. This recommendation is based on the study by Jourdain et al. [577]. Their measured value fork(298 K) compares favorably with the recommended value of k(O + OH) when one considers the slightlygreater exothermicity of the present reaction.
I18. OH + SO. The value recommended for k(298 K) is an average of the determinations by Fair and Thrush[368] and Jourdain et al. [577]. Both sets of data have been corrected using the present recommendation forthe O + OH reaction.
I19. HO2 + H2S, HO2 + CH3SH, HO2 + CH3SCH3. These upper limits are taken from the discharge flowlaser magnetic resonance study of Mellouki and Ravishankara [784]. The H2S value disagrees with the rateconstant reported by Bulatov et al. [159] by approximately three orders of magnitude. The reason for thisdifference is not readily apparent. However, the recommended upper limit is consistent with the values forCH3SH and CH3SCH3, which respectively agree with upper limits from the work of Barnes et al. [60] andNiki (reported as a private communication in the Mellouki and Ravishankara paper).
I20. HO2 + SO2. This upper limit is based on the atmospheric pressure study of Graham et al. [434]. A lowpressure laser magnetic resonance study by Burrows et al. [164] places a somewhat higher upper limit on
k(298 K) of 4 x 10-17 (determined relative to OH + H2O2). Their limit is based on the assumption that theproducts are OH and SO3. The weight of evidence from both studies suggests an error in the earlierdetermination by Payne et al. [905].
I21. NO2 + SO2. This recommendation is based on the study of Penzhorn and Canosa [907] using secondderivative UV spectroscopy. While these authors actually report a measured value for k(298 K), theirobservations of strong heterogeneous and water vapor catalyzed effects prompt us to accept their measurementas an upper limit. This value is approximately two orders of magnitude lower than that for a dark reactionobserved by Jaffe and Klein [547], much of which may have been due to heterogeneous processes. Penzhornand Canosa suggest that the products of this reaction are NO + SO3.
I22. NO3 + H2S. This recommendation accepts the upper limit set by Dlugokencky and Howard [340] based onexperiments in which NO3 loss was followed in the presence of large concentrations of H2S. Less sensitiveupper limits for the rate constant have been reported by Wallington et al. [1199] and Cantrell et al. [184].
I23. NO3 + OCS. This upper limit is based on the relative rate data of MacLeod et al. [739].
I24. NO3 + CS2. This upper limit is based on the study of Burrows et al. [168]. A somewhat higher upperlimit was derived in the relative rate data of MacLeod et al. [739].
I25. NO3 + CH3SH. The recommended values are derived from a composite fit to the data of Wallington et al.[1199], Rahman et al. [940], and Dlugokencky and Howard [340]. The room temperature rate constant derivedin the relative rate experiments of MacLeod et al. [739] is in good agreement with the recommended value.The suite of investigations shows the rate constant to be pressure independent over the range 1 - 700 torr.Dlugokencky and Howard place an upper limit of 5% on the production of NO2 via this reaction at lowpressure. Based on the product distribution observed in their investigation, Jensen et al. [564] propose areaction mechanism initiated by abstraction of the hydrogen atom from the SH group, possibly afterformation of an initial adduct as suggested by Wallington et al. and Dlugokencky and Howard.
I26. NO3 + CH3SCH3. The recommended values are derived from a composite fit to the data of Wallington et al.[1199], Tyndall et al. [1164], and Dlugokencky and Howard [340]. The relative rate study of Atkinson et al.[45] yields a rate constant at room temperature in good agreement with that recommended. The experimentaldata from all investigations demonstrate the pressure independence of the rate constant over the range 1 - 740torr. Room temperature investigations by Daykin and Wine [316] and Wallington et al. [1200] are also inagreement with the recommended value. Jensen et al. [563] propose a mechanism that involves hydrogenabstraction as the first step to explain their observed product distribution. In a later study, Jensen et al. [564]measured a kinetic isotope effect for the rate constant for CH3SCH3 vs. that for CD3SCD3 of kH/kD =(3.8±0.6), providing further confirmation of such abstraction. Butkovskaya and Le Bras [170] utilizedchemical titration of the primary radical produced from NO3 + CH3SCH3 in a discharge flow mass
96
spectrometer system to show that the reaction produces predominantly CH3SCH2 + HNO3. An upper limitof 2% was placed on the reaction channel yielding CH3 + CH3SONO2.
I27. NO3 + CH3SSCH3. The recommended values were derived from a composite fit to the data of Wallington etal. [1199] and Dlugokencky and Howard [340]. The investigation by Atkinson et al. [37] indicates that therelative rate technique cannot be considered as yielding reliable rate data for this reaction due to chemicalcomplexities. Thus, the much lower room temperature results from the study of MacLeod et al. [739] can beconsidered to be erroneous. Based on their observations of intermediate and end products, Jensen et al. [564]proposed a reaction mechanism in which the initial addition of NO3 to one of the sulfur atoms results information of CH3S + CH3SO + NO2.
I28. NO3 + SO2. This recommended upper limit for k(298 K) is based on the study by Daubendiek and Calvert[299]. Considerably higher upper limits have been derived by Burrows et al. [168], Wallington et al. [1199],Canosa-Mas et al. [180], and Dlugokencky and Howard [340].
I29. N2O5 + CH3SCH3. This recommendation is based on the value estimated by Tyndall and Ravishankara[1171] from the study by Atkinson et al. [45].
I30. CH3O2 + SO2. This recommendation accepts the results from the study of Sander and Watson [989], whichis believed to be the most appropriate for stratospheric modeling purposes. These authors conductedexperiments using much lower CH3O2 concentrations than employed in the earlier investigations of Sanhuezaet al. [994] and Kan et al. [588], both of which resulted in k(298 K) values approximately 100 times greater.A later report by Kan et al. [587] postulates that these differences are due to the reactive removal of theCH3O2SO2 adduct at high CH3O2 concentrations prior to its reversible decomposition into CH3O2 andSO2. They suggest that such behavior of CH3O2SO2 or its equilibrated adduct with O2 (CH3O2SO2O2)would be expected in the studies yielding high k values, while decomposition of CH3O2SO2 into reactantswould dominate in the Sander and Watson experiments. It does not appear likely that such secondary reactionsinvolving CH3O2, NO, or other radical species would be rapid enough, if they occur under normalstratospheric conditions to compete with the adduct decomposition. This interpretation, unfortunately, doesnot explain the high rate constant derived by Cocks et al. [253] under conditions of low [CH3O2].
I31. F + CH3SCH3. This recommendation is based on the discharge flow mass spectrometric study byButkovskaya et al. [171]. The uncertainty placed on this recommendation has been increased over thatestimated by the authors to reflect the lack of any confirming investigations. Titration of the primary organicradical products indicated that the reaction proceeds via two channels to produce HF + CH3SCH2 and CH3 +CH3SF with a branching ratio of approximately 0.8/0.2 respectively.
I32. Cl + H2S. This recommendation is based on the study by Nicovich et al. [847], who conducted an elaboratestudy with attention to sources of possible systematic error. The rate constant at 298K is in good agreementwith that determined by Nesbitt and Leone [836], who refined the data of Braithwaite and Leone [140], but issignificantly greater than the values reported by Clyne and Ono [243], Clyne et al. [234], and Nava et al.[826]. The small, but clearly observed, negative activation energy determined by Nicovich et al. contrastswith the lack of a temperature dependence observed by Nava et al.. In fact, at the lowest temperature ofoverlap, the results from these two studies differ by 50%. Nevertheless, the Nicovich et al. study yieldsconsistent results for both H2S and CH3SH as well as for D2S and CD3SD. While the reason for thesedifferences remains to be determined, the full range of reported values is encompassed within the 2σ errorlimits recommended. Lu et al. [736] also measured a temperature-independent rate constant but report a valueat 298K, about 40% greater than that of Nicovich et al. However, the presence of 4000 torr of CF3Cl bathgas in the Lu et al may suggest a slight pressure dependence of the reaction, although Nicovich et al.observed no pressure dependence for pressures ranging up to 600 torr with N2.
I33. Cl + OCS. This upper limit is based on the minimum detectable decrease in atomic chlorine measured byEibling and Kaufman [364]. Based on the observation of product SCl, these authors set a lower limit on
k(298 K) of 10-18 for this reaction channel. Considerably higher upper limits on k(298 K) were determinedin the studies of Clyne et al. [234] and Nava et al. [826].
97
I34. Cl + CS2. This upper limit for the overall reaction is based on determinations by Nicovich et al. [846] andWallington et al. [1196]. The first authors confirm that the reaction proceeds via reversible adduct formationas suggested by Martin et al. [758]. The much larger rate constant values determined by Martin et al. maypossibly be attributed to reactive impurities in the CS2 sample. Nicovich et al. set an upper limit on the rate
constant for the adduct (CS2Cl) reacting with O2 of 2.5 x 10⁻¹⁶ at room temperature.
I35. Cl + CH3SH. This recommendation is based on the results of Nicovich et al. [847], who used laserphotolysis with resonance fluorescence detection to study the reactions of Cl with H2S, D2S, CH3SH, andCD3SD. The room temperature determination by Nesbitt and Leone [836] is in good agreement with thevalue recommended. The k(298K) value from the study by Mellouki et al. [780] is nearly a factor of 2 lower.However, the low sensitivity of EPR detection of Cl atoms did not permit these latter authors to conduct aprecise determination of k under pseudo-first-order conditions, and a more complex analysis of experimentsconducted under second-order conditions was required. Nesbitt and Leone [837] report that less than 2% of thereaction occurs via abstraction of an H atom from the CH3 group.
I36. Cl + CH3SCH3. Stickel et al. [1082] have used laser photolysis resonance fluorescence to measure that rateconstant between 240-421K, over the pressure range of 3-700 torr. The rate constant is near collisional but
increases with increasing pressure from a low pressure limit of 1.8x10⁻¹⁰
to a value of 3.3x10⁻¹⁰
at 700 torr.The yield of HCl at 297K, measured by diode laser spectroscopy, decreased from near unity at low pressureto a value of approximately 0.5 at 203 torr, suggesting that stabilization of a (CH3)2SCl adduct becomescompetitive with hydrogen atom abstraction with increasing pressure. These investigators also observed anegative temperature dependence for the reaction. Butkovskaya et al. [171] conducted a discharge flow massspectrometric study at 298K, in which they determined that the reaction proceeds to form HCl + CH3SCH2almost exclusively at 1 torr total pressure. The sum of all other possible channels was estimated at less than3%. Zhao et al. [1310] used laser photolysis coupled with CH3 detection by time-resolved tunable diode laserabsorption spectroscopy to determine an upper limit for CH3 elimination at 298K and pressures between 10-30 torr. Room temperature measurements by Nielsen et al. [859] at 740 torr and Kinnison et al. [606] at 760torr agree quite well with the results of Stickel et al. Kinnison et al. also observed the rate constant to
increase from 3.6 x 10⁻¹⁰
to 4.2 x 10⁻¹⁰
cm3 molec
-1 s
-1 when the bath gas was changed from pure N2 to
synthetic air, suggesting that the (CH3)2SCl adduct reacts with O2.
I37. ClO + OCS; ClO + SO2. These recommendations are based on the discharge flow mass spectrometric dataof Eibling and Kaufman [364]. The upper limit on k(298 K) for ClO + OCS was set from the minimumdetectable decrease in ClO. No products were observed. The upper limit on k(298 K) for ClO + SO2 is basedon the authors’ estimate of their SO3 detection limit. The upper limit for this same reaction based on theminimum detectable decrease in ClO was not used due to the potential problem of ClO reformation from theCl + O3 source reaction.
I38. ClO + CH3SCH3. This recommendation is based on the study by Barnes et al. [64] using discharge flowmass spectrometry. The authors prefer the present value of the rate constant to one a factor of 4 higher, whichthey determined in an earlier version of their apparatus. The uncertainty factor reflects the absence of anyconfirming investigations.
I39. ClO + SO. The value of k(298 K) is an average of the determinations by Clyne and MacRobert [233] andBrunning and Stief [150]. The temperature independence is taken from the latter study with the A-factorrecalculated to fit the k(298 K) recommendation.
I40. Br + H2S, Br + CH3SH. These recommendations are based on the study by Nicovich et al. [844] whomeasured both the forward and reverse reactions by time-resolved resonance fluorescence detection of Br atoms.The uncertainties placed on these recommendations have been increased over those estimated by the authors toreflect the absence of any confirming investigations.
I41. Br + CH3SCH3. Wine et al. [1259] used laser photolysis resonance fluorescence to study reversible adductformation in the Br + CH3SCH3 reaction system over the temperature range 260 - 310K from which they
98
derive a (CH3)2S-Br bond strength of 14.5 ± 1.2 kcal mole-1
. Above 375K, adduct decomposition is so rapidthat the addition channel is effectively negligible. Extrapolation of these data to conditions typical of thespringtime Arctic boundary layer (760 torr, 230 - 270K) leads these authors to suggest that under such
conditions, the addition of Br to CH3SCH3 proceeds with a rate constant of approximately 1.3 x 10⁻¹⁰
cm3
molecule-1
s-1
. Researchers from the same laboratory (Jefferson et al. [553]) studied the abstraction reactionover the temperature range 386 - 604K. These authors observed the reactants to be in equilibrium with theproducts HBr + CH3SCH2 and determined Arrhenius expressions for the forward and reverse reactions
respectively of 9.0 x 10⁻¹¹
exp(-2386/T) cm3 molec
-1 s
-1 and 8.6 x 10
-13 exp(836/T) cm
3 molec
-1 s
-1.
Analysis of the equilibrium data also permitted determination of the heat of formation of CH3SCH2 (seeAppendix 1).
I42. BrO + CH3SCH3. This recommendation is based on the discharge flow mass spectrometric study byBedjanian et al. [95], performed at 1 torr over the temperature range 233-320K. The rate constant at 298K isnearly identical to that derived by Barnes et al. [64], using a similar experimental system. Bedjanian et al.also determined a near unity yield for the production of dimethylsulfoxide and suggest that the reactionproceeds via production of an adduct that decomposes into the sulfoxide and bromine atoms.
I43. BrO + SO. This recommendation is based on the measurements of Brunning and Stief [151] performed underboth excess BrO and excess SO conditions. The rate constant is supported by the lower limit assigned byClyne and MacRobert [233] from measurements of SO2 production.
I44. IO + CH3SH. The value of k(298K) comes from the study by Maguin et al. [744] using discharge flowmass spectrometry. The investigators establish a branching ratio near unity for the production of HOI. Theuncertainty factor reflects the absence of any confirming investigations.
I45. IO + CH3SCH3. This recommendation comes from the studies by Daykin and Wine [315] using laserphotolysis absorption spectroscopy and by Maguin et al. [744] and Barnes et al. [64] using discharge flow
mass spectroscopy. These groups obtained rate constants of ≤ 3.5 x 10⁻¹⁴, 1.5 x 10⁻¹⁴, and 8.8x10⁻¹⁵
respectively. The last two studies supersede earlier, less direct measurements by the same groups, which
resulted in rate constants of 1.5 x 10⁻¹¹ (Martin et al. [759]) and 3.0 x 10⁻¹¹ (Barnes et al. [65]).
I46. S + O2. This recommendation is based primarily on the study of Davis et al. [310]. Modest agreement at298 K is found in the studies of Fair and Thrush [368], Fair et al. [369], Donovan and Little [354], and Clyneand Townsend [245]. The study by Clyne and Whitefield [252], which indicates a slightly negative E/Rbetween 300 and 400 K, is encompassed by the assigned uncertainty limits.
I47. S + O3. This recommendation accepts the only available experimental data of Clyne and Townsend [245].In this study the authors measure a value of the rate constant for S + O2 in reasonable agreement with thatrecommended above.
I48. SO + O2. This recommendation is based on the low temperature measurements of Black et al. [124, 125].The room temperature value accepts the results of the more recent paper as recommended by the authors. Theuncertainties cited reflect the need for further confirmation and the fact that these results lie significantlyhigher than an extrapolation of the higher temperature data of Homann et al. [501]. A room temperatureupper limit on k set by Breckenridge and Miller [141] is consistent with the Black et al. data.
I49. SO + O3. The value of k(298 K) is an average of the determinations by Halstead and Thrush [456],Robertshaw and Smith [970], and Black et al. [124, 125] using widely different techniques. The value of E/Ris an average of the values reported by Halstead and Thrush and Black et al. [124], with the A-factorrecalculated to fit the recommendation for k(298 K).
I50. SO + NO2. The value of k(298 K) is an average of the determinations by Clyne and MacRobert [232], Blacket al. [125], and Brunning and Stief [150], which agree quite well with the rate constant calculated from therelative rate measurements of Clyne et al. [228]. The Arrhenius parameters are taken from Brunning andStief.
99
I51. SO + OClO. This recommendation is based on the room temperature study by Clyne and MacRobert [233].The uncertainty reflects the absence of any confirming investigation.
I52. SO3 + H2O. Several research groups have attempted to quantify the rate of sulfuric acid formation via this
reaction in the gas phase. Reiner and Arnold [966] placed an upper limit of 2.4 x 10⁻¹⁵
cm3 molec
-1 s
-1 on
the rate constant, slightly lower than that determined by Wang et al. [1219]. The inability to cite the resultsas other than an upper limit is due to the difficulty in excluding all heterogeneous effects from theexperiments. The higher rate constant reported earlier by Castleman et al. [190] may have resulted from anunderestimation of the effects of such heterogeneous reactions. Subsequently, Reiner and Arnold [967] soughtto improve their rate constant determination by more detailed quantification of heterogeneous contributions.
They derived a value of 1.2 x 10⁻¹⁵
cm3 molec
-1 s
-1, independent of pressure (from 31-260 mbar of synthetic
air). Evidence was also obtained that H2SO4 was, indeed, the product of the reaction.
Kolb et al. [626] attempted to measure the gas phase reaction using a turbulent flow reactor designed tominimize wall effects. Their results, when analyzed as representing a bimolecular reaction, support a rate
constant between (1 - 7) x 10-15
cm3 molec
-1 s
-1. However, a more considered analysis of the data indicated
that the gas phase reaction was second order in water vapor. The reaction rate was also observed to increase asthe temperature was lowered from 333K to 243K. These observations, together with calculations byMorokuma and Mugurama [813], led the latter authors to suggest that SO3 consumption likely involved its
reaction with the water dimer or the reaction of SO3.H2O + H2O, leading to the formation of sulfuric acid.
A laminar flow reactor study by Lovejoy et al. [730] over the temperature range 256 - 360K also revealed SO3loss to be second order in water concentration and independent of pressure (from 20 to 80 torr of N2 at 300K).These latter authors measured a strong negative temperature dependence for the rate constant and a significantkinetic isotope effect (kH2O ≈ 2kD2O), leading them to describe the reaction as proceeding via the rapidassociation between SO3 and H2O followed by a slower reaction between the adduct and water to form sulfuric
acid. Lovejoy at al.’s measurement of a -13 kcal mol-1
“activation” energy was viewed as energeticallyinconsistent with the SO3 + water dimer reaction mechanism since it would require a large negative activationenergy for the SO3 + (H2O)2 step. The first order expression for SO3 loss derived by these authors is 2.26 x
10-43
T exp(6544/T) [H2O]2 and is recommended here.
I53. SO3 + NO2. This recommendation is based on the study of Penzhorn and Canosa [907] using secondderivative UV spectroscopy. These authors observe the production of a white aerosol, which they interpret tobe the adduct NSO5. This claim is supported by ESCA spectra.
I54. SH + O2. This upper limit for k(298 K) is based on the study by Stachnik and Molina [1067] utilizing
experiments sensitive to the production of OH. Somewhat higher upper limits of 1.0 x 10⁻¹⁷ and 1.5 x
10-17 were assigned by Friedl et al. [397] and Wang et al. [1217] respectively from the detection sensitivitiesfor OH detection and SH decay respectively. An even higher upper limit by Black [121], based on the lack ofSH decay, may have been complicated by SH regeneration. Much less sensitive upper limits have beencalculated by Tiee et al. [1134], Nielsen [851], and Cupitt and Glass [289]. Stachnik and Molina [1067] also
report a somewhat higher upper limit (< 1.0 x 10⁻¹⁸) for the rate constant for the sum of the two SH + O2reaction channels (producing OH + SO and H + SO2).
I55. SH + O3. The value for k(298 K) is an average of the determinations by Friedl et al. [397] (laser-inducedfluorescence detection of SH), Schonle et al. [1007] (mass spectrometric detection of reactant SH and productHSO) as revised by Schindler and Benter [1000], and Wang and Howard [1216] (laser magnetic resonancedetection of SH). The temperature dependence is from Wang and Howard with the A-factor calculated to agreewith the recommended value for k(298 K). ∆E/R reflects the fact that the temperature dependence comes frommeasurements above room temperature and, thus, extrapolation to lower temperatures may be subject toadditional uncertainties. Wang and Howard report observing a minor reaction channel that produces H + SO +O2.
100
I56. SH + H2O2. This recommended upper limit for k(298 K) is based on the study of Friedl et al. [397]. Theirvalue is calculated from the lack of SH decay (measured by laser-induced fluorescence) and the lack of OHproduction (measured by resonance fluorescence). The three possible product channels yield: H2S + HO2,HSOH + OH, and HSO + H2O.
I57. SH + NO2. This recommendation is based on the measurements of Wang et al. [1217]. These authorssuggest that the lower values of k(298 K) reported by Black [121], Friedl et al. [397], and Bulatov et al. [156]are due to SH regeneration from the H2S source compound. In the study by Stachnik and Molina [1067],attempts were made at minimizing such regeneration, and the reported value of k(298 K) was significantlyhigher than that from the earlier studies, but still 30% lower than that measured by Wang et al., who used twoindependent SH source reactions. A slightly higher rate constant measured by Schonle et al. [1007], asrevised by Schindler and Benter [1000], has not been recommended due to the somewhat more limited databasefor their determination. The reaction as written represents the most exothermic channel. In fact, HSO hasbeen detected as a product by Leu and Smith [700], Bulatov et al. [156], Schonle et al. [1007], and Wang etal. [1217]. The absence of a primary deuterium isotope effect, as observed by Wang et al. [1217], coupledwith the large magnitude of the rate constant suggests that the (four-center intermediate) channels producingSO + HNO and OH + SNO are of minor importance. No evidence for a three-body combination reaction wasfound by either Black [121] or Friedl et al. [397]. Based on a pressure independence of the rate constant
between 30 - 300 torr, Black set an upper limit of 7.0 x 10⁻³¹ for the termolecular rate constant. Similarly,Stachnik and Molina [1067] saw no change in decay rate between 100 and 730 torr with O2 (although theseO2 experiments were designed primarily to limit SH regeneration). The recommendation given here issupported by the recent discharge flow laser-induced fluorescence study of the SD + NO2 reaction by Fenter
and Anderson [375]. These investigators report a rate constant at 298K of 6.8 x 10⁻¹¹
cm3 molec
-1 s
-1,
which compares favorably with the value of 7.1 x 10⁻¹¹
cm3 molec
-1 s
-1 determined in the Wang et al. of
the same reaction. Fenter and Anderson also obtained an E/R value of -210 K, very similar to the -237 Kvalue derived by Wang et al. for the SH reaction.
I58. SH + Cl2; SH + BrCl; SH + Br2; SH + F2. The recommendations for these reactions are derived from thedata of Fenter and Anderson [374] for the SD radical. The uncertainties have been increased over thoseestimated by the investigators to reflect the absence of any confirming investigations and the influence of thesecondary isotope effect. For the BrCl reaction, the channel producing ClSD + Br was found to be described
by the rate expression k = 2.3 x 10⁻¹¹ exp(100/T).
I59. HSO + O2. This recommendation is based on the study by Lovejoy et al. [734], who employed lasermagnetic resonance monitoring of HSO in a discharge flow system. The upper limit thus derived fork(298 K) is nearly two orders of magnitude lower than measured by Bulatov et al. [158].
I60. HSO + O3. This recommendation is based on the determinations by Friedl et al. [397] and Wang andHoward [1216]. In the first study, performed at higher O3 concentrations, greater quantities of HSO wereproduced in the flow tube and SH approached a steady state due to its generation via HSO + O3. The rateconstant for this reaction was thus determined relative to SH + O3 from measurements of the steady state SHconcentration as a function of the initial SH concentration. In the second study, the rate constant and itsbranching ratio were measured at two temperatures. At room temperature, the overall rate constant is inexcellent agreement with that of Friedl et al. More recently, Lee et al. [681] determined a room temperature
rate constant of 4.7 x 10⁻¹⁴ for the sum of all reaction channels not producing HS. This value isapproximately 30% greater than that measured by Wang and Howard for the same channels. Lee et al. derivean Arrhenius activation energy of 1120K for these channels from data between 273-423K, in agreement withthe more limited temperature data of Wang and Howard.
The lack of an isotope effect when SD was employed in the Friedl et al. study suggests that the products ofthe HSO + O3 reaction are SH + 2O2 (analogous to those for HO2 + O3). However, Wang and Howardfound that only 70% of the reaction leads to HS formation. In addition, their observations of HO2 productionin the presence of O2 suggests the existence of a reaction channel producing HSO2 + O2 followed by HSO2+ O2 → HO2 + SO2. At the present time, no recommendation is given for the product channels. Further
101
mechanistic work is suggested, since it is important to understand whether this reaction in the atmosphereleads to HS regeneration or to oxidation of the sulfur.
I61. HSO + NO; HSO + NO2. The recommendations for these reactions are based on the study by Lovejoy et al.[734] in which laser magnetic resonance was used to monitor HSO in a discharge flow system. Their upperlimit for the NO reaction is a factor of 25 lower than the rate constant measured by Bulatov et al. [157] usingintracavity laser absorption at pressures between 10 and 100 torr. Since it is unlikely that this reaction rateundergoes a factor of 25 increase between 1 torr (the pressure of the Lovejoy et al. work) and 10 torr, thehigher rate constant may be due to secondary chemistry associated with the HSO production methodsemployed.
The recommendation for the NO2 reaction is a factor of 2 higher than the rate constant reported by Bulatov etal. [156]. Lovejoy et al. have attributed this difference to HSO regeneration under the experimental conditionsused by Bulatov et al. [156]. The product assignment for this reaction is discussed in the note for the HSO2+ O2 reaction.
I62. HSO2 + O2. This recommendation is based on the rate of HO2 formation measured by Lovejoy et al. [734]upon addition of O2 to the HSO + NO2 reaction system. While HSO2 was not observed directly, aconsideration of the mechanistic possibilities for HSO + NO2, coupled with measurements of the HO2production rate at various O2 pressures, led these authors to suggest that HSO2 is both a major product of theHSO + NO2 reaction and a precursor for HO2 via reaction with O2.
I63. HOSO2 + O2. This recommendation is based on the studies of Gleason et al. [427] and Gleason and Howard[425] in which the HOSO2 reactant was monitored using a chemical ionization mass spectrometric technique.Gleason and Howard conducted their measurements over the 297-423 K temperature range in the onlytemperature dependence investigation. Thus, ∆E/R has been increased from their quoted limits to account forthe potential uncertainties in extrapolating their data to sub-ambient temperatures. The value of k(298 K)derives further support from the studies of Margitan [750] and Martin et al. [761], both of whom usedmodeling fits of OH radical decays in the OH + SO2 + M reaction system in the presence of O2 and NO. Inthis latter analysis, the HOSO2 reacts with O2, yielding HO2, which subsequently regenerates OH through itsreaction with NO. The infrared spectrum of HOSO2 has been recorded in low temperature matrix isolationexperiments by Hashimoto et al. [469] and Nagase et al. [823]. Mass spectrometric detection of HOSO2 inthe gas phase has also been reported by Egsgaard et al. [362].
I64. CS + O2. The recommendation given for k(298 K) is based on the work of Black et al. [123] using laser-induced fluorescence to monitor CS. This value agrees with the somewhat less precise determination byRichardson [969] using OCS formation rates. The latter author presents evidence that this reaction channeldominates over the one producing SO + CO by more than a factor of 10. Measurements by Richardson at293 K and 495 K yield an E/R of 1860 K. However, use of this activation energy with the recommended
value of k(298 K) results in an unusually low Arrhenius A-factor of 1.5 x 10⁻¹⁶. In view of this, norecommendation is given for the temperature dependence.
I65. CS + O3; CS + NO2. The k(298 K) recommendations for both reactions accept the results of Black et al.[123], who used laser-induced fluorescence to monitor the CS reactant in a room temperature experiment. Theuncertainty factors reflect the absence of any confirming measurements.
I66. CH3S + O2. This upper limit is based on the study by Tyndall and Ravishankara [1170]. Somewhat higherupper limits were derived in the earlier studies of Balla et al. [56] and Black and Jusinski [122].
I67. CH3S + O3. This recommendation is based on the temperature-dependent study of Turnipseed et al. [1156]and the room temperature determinations of Tyndall and Ravishankara [1169] and Domine et al. [353].Domine et al. measured the yield of CH3SO to be 15% at low pressure and used this value to revise thecorrections applied in the Tyndall and Ravishankara investigation to account for CH3S regeneration byCH3SO + O3. A failure to observe significant reaction in the study by Black and Jusinski [122] is interpretedas due to rapid regeneration of CH3S in their system. The value of ∆E/R has been set larger than that derivedby Turnipseed et al. to reflect the existence of only one temperature dependence investigation.
102
I68. CH3S + NO. The upper limit for the bimolecular reaction between CH3S and NO is based on estimates byBalla et al. [56], who conducted a temperature dependence study of the termolecular reaction.
I69. CH3S + NO2. This recommendation is based on the temperature dependent data of Turnipseed et al. [1156]and the room temperature results of Tyndall and Ravishankara [1170]. The room temperature value of Domineet al. [351] is encompassed by the recommended uncertainty factor. The value of ∆E/R has been set largerthan that derived by Turnipseed et al. to reflect the existence of only one temperature dependence investigation.An earlier study by Balla et al. [56] yielded a room temperature rate constant nearly a factor of two higher thanthe present recommendation, which may be attributed to secondary reactions at higher radical concentrations.Tyndall and Ravishankara determined the NO yield to be (80 ± 20)%. Together with the unity yield ofCH3SO obtained by Domine et al., this implies that the primary reaction channel is as written.
I70. CH2SH + O2. This recommendis the ation average of the rate constant obtained by Rahman et al. [941] ina fast flow mass spectrometer system and that from Anastasi et al. [19] using a pulse radiolysis kineticabsorption apparatus. The value of Anastasi et al. is nearly twice that of Rahman et al. It is difficult atpresent to indicate a preference for the results of one study over the other, and the value of f(298) has beenchosen to reflect this uncertainty. Since this is a fast bimolecular reaction, one would expect the products tobe HO2 + CH2S, by analogy with the reaction between CH2OH and O2.
I71. CH2SH + O3. The value of k(298K) comes from the study by Rahman et al. [941] using fast flow massspectrometry. The uncertainty factor reflects the absence of any confirming investigations.
I72. CH2SH + NO. The value of k(298K) comes from the study by Anastasi et al. [19] using a pulse radiolysiskinetic absorption apparatus. The uncertainty factor reflects the absence of any confirming investigations.
I73. CH2SH + NO2. This recommendation averages the rate constant obtained by Rahman et al. [941] in a fastflow mass spectrometer system with that from Anastasi et al. [19], using a pulse radiolysis kinetic absorptionapparatus. The value of Rahman et al. is nearly twice that of Anastasi et al. It is difficult at present toindicate a preference for the results of one study over the other, and the value of f(298) has been chosen toreflect this uncertainty.
I74. CH3SO + O3. This recommendation is based on the study by Domine et al. [353]. It is supported by thestudy of Tyndall and Ravishankara [1169], in which the rate constant was derived from a complex analysis ofthe CH3S + O3 reaction system. Domine et al. place the direct yield of CH2SO at approximately 10% andthat of CH3S at 13% at low pressure.
I75. CH3SO + NO2. This recommendation is based on the direct measurements of Domine et al. [351]. Theresults are supported by somewhat less direct measurements of Tyndall and Ravishankara [1170] and Melloukiet al. [779].
I76. CH3SOO + O3, CH3SOO + NO, CH3SOO + NO2. These recommendations are based on the experimentsof Turnipseed et al. [1156] in which CH3S was monitored by LIF in equilibrium with CH3SOO. The upperlimit for the O3 reaction was determined from experiments at 227K. The results for the NO and NO2reactions were independent of temperature over the ranges 227-256K and 227-246K, respectively. Theuncertainties placed on these recommendations have been increased over those estimated by the authors toreflect the absence of any confirming investigations.
I77. CH3SO2 + NO2. This recommendation is based on the study by Ray et al. [960] using a discharge flowreactor equipped with laser-induced fluorescence and mass spectrometric detection. The CH3SO2 was producedby the sequential oxidation of CH3S and CH3SO by NO2 and is to be differentiated from the weakly boundadduct, CH3SOO, formed by the reaction of CH3S with O2 at low temperature (Turnipseed et al [1156]). Theuncertainty limit on the rate constant has been increased over that given by the authors to reflect the absenceof any confirming investigation. However, some additional support for this recommendation does come fromthe study of the CH3S + NO2 reaction by Tyndall and Ravishankara [1170]. These authors observedfluorescence from a product species tentatively identified as CH3SO2, produced by the reaction of CH3SOwith NO2. Computer simulation of the rise and fall of the fluorescence signal yielded an approximate rate
103
constant value for the reaction CH3SO2 + NO2 of 7.0 x 10⁻¹²
cm3 molec
-1 s
-1. However, an unambiguous
differentiation between the production and disappearance rate constants was not possible.
I78. CH3SCH2 + NO3. This recommendation is based on the experiments of Butkovskaya and Le Bras [170].The uncertainty factor reflects the absence of any confirming investigation.
I79. CH3SCH2O2 + NO. This recommendation is based on the experiments of Wallington et al. [1206]. Theuncertainty factor reflects the absence of any confirming investigation.
I80. CH3SS + O3. This recommendation is based on the discharge flow photoionization mass spectroscopy studyby Domine et al. [353]. The uncertainty factor reflects the absence of any confirming investigations. Therate constant ratio for the reactions of CH3SS with O3 and NO2 is consistent with the rate constant ration forthe corresponding CH3S reactions.
I81. CH3SS + NO2; CH3SSO + NO2. These recommendations are based on the discharge flow photoionizationmass spectroscopy study by Domine et al. [351]. The rate constant ratio for these two reactions agrees withthat observed for other RS/RSO radicals with NO2. The assigned uncertainties reflect this agreement butacknowledge the absence of any confirming investigation. In the Domine et al. study, CH3SSO was producedby reacting away all CH3SS with high NO2 concentrations. Thus, as expected, O atom transfer may be theprimary channel in the CH3SS reaction.
J1. Na + O3. The recommendation is based on the measurements of Ager et al. [12], Worsnop et al. [1277] ascorrected in Worsnop et al. [1278], and Plane et al. [917]. The data of Worsnop et al. supersede earlier workfrom that laboratory (Silver and Kolb [1026]). Measurements made by Husain et al. [527] at 500 K aresomewhat lower, probably because they did not recognize that secondary chemistry, NaO + O3 → Na + 2O2,interferes with the rate coefficient measurement. The temperature dependence is from results of Worsnop et al.[1278] (214-294 K) and Plane et al. [917] (208-377K). Ager et al. [12] estimate that the NaO2 + O product
channel is ≤5%. Evidence that the NaO product is in the 2Σ+ excited electronic state was reported by Shi etal. [1021] and Wright et al. [1279].
J2. Na + N2O. The recommendation incorporates the data of Husain and Marshall [526], Ager et al. [12], Planeand Rajasekhar [918], and Worsnop et al. [1278]. Silver and Kolb [1026] measured a rate coefficient at 295 Kthat is lower and is superseded by Worsnop et al. [1278]. Helmer and Plane [479] report a measurement at300K in excellent agreement with the recommendation. Earlier, less direct studies are discussed by Ager et al.[12]. The NaO product does not react significantly with N2O at room temperature [k (for Na + N2 + O2
products) ≤10-16 and k (for NaO2 + N2 products) ≤2 x 10-15 Ager et al.]. Wright et al. [1279] used UV
photoelectron spectroscopy to determine the product NaO is formed predominantly in the excited 2Σ+ state.
J3. Na + Cl2. Two measurements of the rate coefficient for this reaction are in excellent agreement: Silver[1023] and Talcott et al. [1110]. The recommended value is the average of these room temperature results.
J4. NaO + O. The recommendation is based on a measurement at 573 K by Plane and Husain [916]. They
reported that ≤1% of the Na product is in the 32P excited state.
J5. NaO + O3. This reaction was studied by Silver and Kolb [1026], Ager et al. [12], and Plane et al. [917], whoagree on the rate coefficient and branching ratio. This agreement may be fortuitous because Silver and Kolbused an indirect method and an analysis based on their rate coefficient for the Na + O3 reaction, which is about1/2 of the recommended value. Ager et al. employed a somewhat more direct measurement, but the study iscomplicated by a chain reaction mechanism in the Na/O3 system. Plane et al. reported rate coefficientmeasurements for the NaO2 + O2 product channel over the temperature range 207-377K using pulsedphotolysis LIF methods. The recommendation for that channel is based on all three studies, and therecommendation for the Na + 2O2 channel is based upon the results of Silver and Kolb and Ager et al. Thelatter reaction channel may also have a significant temperature dependence.
104
J6. NaO + H2. The recommendation is based on a measurement by Ager and Howard [11]. They also reported a
significant Na + H2O product channel and that a small fraction of the Na from this channel is in the 32Pexcited state.
J7. NaO + H2O. The recommendation is based on a measurement by Ager and Howard [11].
J8. NaO + NO. The recommendation is based on an indirect measurement reported by Ager et al. [12].
J9. NaO + HCl. There is only one indirect measurement of the rate coefficient for this reaction, that from thestudy by Silver et al. [1029]. They indicate that the products are NaCl and OH, although some NaOH and Clproduction is not ruled out.
J10. NaO2 + O. The recommendation is based on a flow tube study at 300K by Helmer and Plane [479].
J11. NaO2 + NO. This reaction is endothermic. The upper limit recommended is from an experimental study byAger et al. [12].
J12. NaO2 + HCl. The recommendation is based on a measurement reported by Silver and Kolb [1027]. Theyindicated that the products are NaCl + HO2, but NaOOH + Cl may be possible products.
J13. NaOH + HCl. The recommendation is based on the study by Silver et al. [1029], which is the only publishedstudy of this reaction.
References for Table 1
1 . Abbatt, J.P.D., K.L. Demerjian, and J.G. Anderson, 1990, J. Phys. Chem., 94, 4566-4575.2 . Abbatt, J.P.D., F.F. Fentner, and J.G. Anderson, 1992, J. Phys. Chem., 96, 1780-1785.3 . Abbatt, J.P.D., D.W. Toohey, F.F. Fenter, P.S. Stevens, W.H. Brune, and J.G. Anderson, 1989, J. Phys. Chem.,
93, 1022-1029.4 . Adachi, H. and N. Basco, 1979, Chem. Phys. Lett., 63, 490.5 . Adachi, H., N. Basco, and D.G.L. James, 1979, Int. J. Chem. Kinet., 11, 1211-1229.6 . Adachi, H., N. Basco, and D.G.L. James, 1980, Int. J. Chem. Kinet., 12, 949.7 . Addison, M.C., J.P. Burrows, R.A. Cox, and R. Patrick, 1980, Chem. Phys. Lett., 73, 283.8 . Addison, M.C., R.J. Donovan, and J. Garraway, 1979, J. Chem. Soc. Faraday Disc., 67, 286-296.9 . Adeniji, S.A., J.A. Kerr, and M.R. Williams, 1981, Int. J. Chem. Kinet., 13, 209.10. Adler-Golden, S.M. and J.R. Wiesenfeld, 1981, Chem. Phys. Lett., 82, 281.11. Ager, J.W., III and C.J. Howard, 1987, J. Chem. Phys., 87, 921-925.12. Ager, J.W., III, C.L. Talcott, and C.J. Howard, 1986, J. Chem. Phys., 85, 5584-5592.13. Agrawalla, B.S., A.S. Manocha, and D.W. Setser, 1981, J. Phys. Chem., 85, 2873-2877.14. Aker, P.M., B.I. Niefer, J.J. Sloan, and H. Heydtmann, 1987, J. Chem. Phys., 87, 203-209.15. Aleksandrov, E.N., V.S. Arutyunov, and S.N. Kozlov, 1981, Kinetics and Catalysis, 22, 391-394.16. Amimoto, S.T., A.P. Force, R.G. Gulotty Jr., and J.R. Wiesenfeld, 1979, J. Chem. Phys., 71, 3640-3647.17. Amimoto, S.T., A.P. Force, and J.R. Wiesenfeld, 1978, Chem. Phys. Lett., 60, 40-43.18. Amimoto, S.T. and J.R. Wiesenfeld, 1980, J. Chem. Phys., 72, 3899-3903.19. Anastasi, C., M. Broomfield, O.J. Nielsen, and P. Pagsberg, 1992, J. Phys. Chem., 96, 696-701.20. Anastasi, C., M.J. Brown, D.B. Smith, and D.J. Waddington, paper presented at the Joint French and Italian
sections of the Combustion Institute, 1987, Amalfi, Italy.21. Anastasi, C., I.W.M. Smith, and D.A. Parkes, 1978, J. Chem. Soc. Faraday Trans. 1, 74, 1693-1701.22. Anastasi, C., D.J. Waddington, and A. Woolley, 1983, J. Chem. Soc. Faraday Trans., 79, 505-516.23. Anderson, J.G. and F. Kaufman, 1973, Chem. Phys. Lett., 19, 483-486.24. Anderson, L.G. and R.D. Stephens, 1994, personal communication.25. Anderson, P.C. and M.J. Kurylo, 1979, J. Phys. Chem., 83, 2055.26. Anderson, S.M., J. Morton, K. Mauersberger, Y.L. Yung, and W.B. DeMore, 1992, Chem. Phys. Lett., 189, 581-
585.27. Andersson, B.Y., R.A. Cox, and M.E. Jenkin, 1988, Int. J. Chem. Kinetics, 20, 283-295.28. Andresen, P., A. Jacobs, C. Kleinermanns, and J. Wolfrum, 1982, 19th Symp. (Intl.) Combustion, pp. 11.29. Arnold, I. and F.J. Comes, 1979, Chem. Phys., 42, 231.30. Arnold, I. and F.J. Comes, 1980, Chem. Phys., 47, 125-130.31. Arrington, C.A., W. Brennen, G.P. Glass, J.V. Michael, and H. Niki, 1965, J. Chem. Phys., 43, 525.32. Ashford, R.D., N. Basco, and J.E. Hunt, 1978, Int. J. Chem. Kinet., 10, 1233-1244.33. Atakan, B.A. Jacobs, M. Wahl, R. Weller, and J. Wolfrum, 1989, Chem. Phys. Lett., 155, 609-613.34. Atkinson, R. and S.M. Aschmann, 1984, Int. J. Chem. Kinet., 16, 259.
105
35. Atkinson, R. and S.M. Aschmann, 1985, Int. J. Chem. Kinet., 17, 33-41.36. Atkinson, R., S.M. Aschmann, D.R. Fitz, A.M. Winer, and J.N. Pitts Jr., 1982, Int. J. Chem. Kinet., 14, 13.37. Atkinson, R., S.M. Aschmann, and J.N. Pitts Jr., 1988, J. Geophys. Res., 93, 7125-7126.38. Atkinson, R., S.M. Aschmann, E.C. Tuazon, M.A. Goodman, and A.M. Winer, 1987, J. Atmos. Chem., 5, 83-90.39. Atkinson, R., G.M. Breuer, and J.N. Pitts Jr., 1976, J. Geophys. Res., 81, 5765-5770.40. Atkinson, R. and W.P.L. Carter, 1991, J. Atmos. Chem., 13, 195-210.41. Atkinson, R., D.A. Hansen, and J.N. Pitts Jr., 1975, J. Chem. Phys., 63, 1703-1706.42. Atkinson, R., R.A. Perry, and J.N. Pitts Jr., 1977, J. Chem. Phys., 66, 1578.43. Atkinson, R., R.A. Perry, and J.N. Pitts Jr., 1978, Chem. Phys. Lett., 54, 14.44. Atkinson, R. and J.N. Pitts Jr., 1978, J. Chem. Phys., 68, 3581.45. Atkinson, R., J.N. Pitts Jr., and S.M. Aschmann, 1984, J. Phys. Chem., 88, 1584.46. Atkinson, R., C.N. Plum, W.P.L. Carter, A.M. Winer, and J.N. Pitts Jr., 1984, J. Phys. Chem., 88, 1210-1215.47. Atkinson, R., R.C. Tuazon, H. Macleod, S.M. Aschmann, and A.M. Winer, 1986, Geophys. Res. Lett., 13, 117-
120.48. Avery, H.E. and R.J. Cvetanovic, 1965, J. Chem. Phys., 43, 3727-3733.49. Aviles, R.G., D.F. Muller, and P.L. Houston, 1980, Appl. Phys. Lett., 37, 358-360.50. Avramenko, L.I. and R.V. Kolesnikova, 1961, Bull. Acad. Sci. USSR, Div. Chem. Sci., 545.51. Baer, S., H. Hippler, R. Rahn, M. Siefke, N. Seitzinger, and J. Troe, 1991, J. Chem. Phys., 95, 6463-6470.52. Bahta, A., R. Simonaitis, and J. Heicklen, 1984, Int. J. Chem. Kinet., 16, 1227.53. Balakhnin, V.P., V.I. Egorov, and E.I. Intezarova, 1971, Kinetics and Catalysis , 12, 299.54. Baldwin, A.C. and D.M. Golden, 1978, Chem. Phys. Lett., 55, 350.55. Baldwin, R.R., C.E. Dean, M.R. Honeyman, and R.W. Walker, 1984, J. Chem. Soc. Faraday Trans. 1, 80, 3187-
3194.56. Balla, R.J., H.H. Nelson, and J.R. McDonald, 1986, Chem. Phys., 109, 101.57. Ballod, A.P., A.I. Poroikova, T.A. Titarchuk, and V.N. Khabarov, 1989, Kinetics and Catalysis, 30, 476-483.58. Barker, J.R., S.W. Benson, and D.M. Golden, 1977, Int. J. Chem. Kinet., 9, 31.59. Barnes, I., V. Bastian, and K.H. Becker, 1988, Int. J. Chem. Kinet., 20, 415-431.60. Barnes, I., V. Bastian, K.H. Becker, E.H. Fink, and W. Nelsen, 1986, J. Atmos. Chem., 4, 445-466.61. Barnes, I., V. Bastian, K.H. Becker, E.H. Fink, and F. Zabel, 1981, Chem. Phys. Lett. , 83, 459-464.62. Barnes, I., V. Bastian, K.H. Becker, E.H. Fink, and F. Zabel, 1982, Atmos. Environ., 16, 545.63. Barnes, I., V. Bastian, K.H. Becker, E.H. Fink, and F. Zabel, 1986, Chem. Phys. Lett., 123, 28-32.64. Barnes, I., V. Bastian, K.H. Becker, and R.D. Overath, 1991, Int. J. Chem. Kinet., 23, 579-591.65. Barnes, I., K.H. Becker, P. Carlier, and G. Mouvier, 1987, Int. J. Chem. Kinet., 19, 489-501.66. Barnes, I., K.H. Becker, E.H. Fink, A. Reimer, F. Zabel, and H. Niki, 1983, Int. J. Chem. Kinet., 15, 631-645.67. Barnes, I., K.H. Becker, E.H. Fink, A. Reimer, F. Zabel, and H. Niki, 1985, Chem. Phys. Lett., 115, 1.68. Barnes, I., K.H. Becker, and N. Mihalopoulas, 1994, J. Atmos. Chem., 18, 267-289.69. Barnes, I., K.H. Becker, and I. Patroescu, 1994, Geophys. Res. Lett., 21, 2389-2392.70. Barnes, I., K.H. Becker, and I. Patroescu, 1996, Atmos. Environ., 30, 1805-1814.71. Barnett, A.J., G. Marston, and R.P. Wayne, 1987, J. Chem. Soc. Faraday Trans. 2, 83, 1453-1463.72. Barone, S.B., A.A. Turnipseed, and A.R. Ravishankara, 1994, J. Phys. Chem., 98, 4602-4608.73. Barone, S.B., A.A. Turnipseed, and A.R. Ravishankara, 1996, J. Phys. Chem., 100, 14694-14702.74. Barry, J., G. Locke, S. D., H. Sidebottom, J. Treacy, C. Clerbeaux, and R. Colin, 1996, to be published.75. Barry, J., et al., 1994, Chem. Phys. Lett., 221, 353-358.76. Barry, J., H. Sidebottom, J. Treacy, and J. Franklin, 1995, Int. J. Chem. Kinet., 27, 27-36.77. Basco, N. and S.K. Dogra, 1971, Proc. Roy. Soc. A., 323, 401.78. Basco, N. and S.K. Dogra, 1971, Proc. Roy. Soc. A., 323, 417.79. Basco, N. and S.K. Dogra, 1971, Proc. Roy. Soc. A., 323, 29.80. Basco, N. and S.S. Parmar, 1985, Int. J. Chem. Kinet., 17, 891.81. Batt, L., R.T. Milne, and R.D. McCulloch, 1977, Int. J. Chem. Kinet., 9, 567-587.82. Batt, L. and G.N. Robinson, 1979, Int. J. Chem. Kinet., 11, 1045.83. Bauer, D., J.N. Crowley, and G.K. Moortgat, 1992, J. Photochem and Photobiol., A65, 329-344.84. Bauerle, S., F. Battin-LeClerc, T. Gierczak, and A.R. Ravishankara, 1997, Manuscript in preparation.85. Baulch, D.L., I.M. Campbell, and S.M. Saunders, 1985, J. Chem. Soc. Faraday Trans. 1, 81, 259-263.86. Baulch, D.L., R.A. Cox, R.F. Hampson Jr., J.A. Kerr, J. Troe, and R.T. Watson, 1980, J. Phys. Chem. Ref. Data, 9,
295-471.87. Becker, E., T. Benter, R. Kampf, R.N. Schindler, and U. Wille, 1991, Ber. Bunsenges. Phys. Chem., 95, 1168-
1173.88. Becker, E., M.M. Rahman, and R.N. Schindler, 1992, Ber. Bunsenges. Phys. Chem., 96, 776-783.89. Becker, E., U. Wille, M.M. Rahman, and R.H. Schindler, 1991, Ber. Bunsenges. Phys. Chem., 95, 1173-1179.90. Becker, K.H., W. Groth, and D. Kley, 1969, Z. Naturforsch, A24, 1280.91. Becker, K.H., W. Groth, and U. Schurath, 1971, Chem. Phys. Lett., 8, 259-262.92. Becker, K.H., W. Groth, and U. Schurath, 1972, Chem. Phys. Lett., 14, 489-492.93. Becker, K.H., M.A. Inocencio, and U. Schurath, 1975, Int. J. Chem. Kinet., Symp. No. 1, 205-220.94. Becker, K.H., W. Nelsen, Y. Su, and K. Wirtz, 1990, Chem. Phys. Lett., 168, 559-563.95. Bedjanian, Y., G. Poulet, and G. Le Bras, 1996, Int. J. Chem. Kinet, 28, 383-389.
106
96. Bednarek, G., M. Breil, A. Hoffman, J.P. Kohlman, V. Mors, and R. Zellner, 1996, Ber. Bunsenges. Phys. Chem.,100, 528-539.
97. Bednarek, G., J.P. Kohlmann, H. Saathoff, and R. Zellner, 1995, Z, Phys. Chem., 188, 1-15.98. Bedzhanyan, Y.R., E.M. Markin, and Y.M. Gershenzon, 1993, Kinetics and Catalysis, 33, 601-606.99. Bedzhanyan, Y.R., E.M. Markin, and Y.M. Gershenzon, 1993, Kinetics and Catalysis, 34, 1-3.100. Bedzhanyan, Y.R., E.M. Markin, and Y.M. Gershenzon, 1993, Kinetics and Catalysis, 33, 594-601.101. Bedzhanyan, Y.R., E.M. Markin, G.G. Politenkova, and Y.M. Gershenzon, 1993, Kinetics and Catalysis, 33, 797-
801.102. Beichert, P., J.L. Wingen, R. Vogt, M.J. Ezell, M. Ragains, R. Neavyn, and B.J. Finlayson-Pitts, 1995, J. Phys.
Chem., 99, 13156-13162.103. Bemand, P.P. and M.A.A. Clyne, 1977, J. Chem. Soc. Faraday Trans. 2, 73, 394.104. Bemand, P.P., M.A.A. Clyne, and R.T. Watson, 1973, J. Chem. Soc. Faraday Trans. 1, 69, 1356.105. Bemand, P.P., M.A.A. Clyne, and R.T. Watson, 1974, J. Chem. Soc. Faraday Trans. 2, 70, 564.106. Beno, M.F., C.D. Jonah, and W.A. Mulac, 1985, Int. J. Chem. Kinet., 17, 1091-1101.107. Benson, S.W., F.R. Cruickshank, and R. Shaw, 1969, Int. J. Chem. Kinet., 1, 29.108. Bevilacqua, T.J., D.R. Hanson, and C.J. Howard, 1993, J. Phys. Chem., 97, 3750-3757.109. Bhaskaran, K.A., P. Frank, and T. Just, 1979, 12th International Shock Tube Symposium, Jerusalem.110. Bhatnagar, A. and R.W. Carr, 1994, Chem. Phys. Lett., 231, 454-459.111. Bida, G.T., W.H. Breckenridge, and W.S. Kolln, 1976, J. Chem. Phys., 64, 3296.112. Biedenkapp, D. and E.J. Bair, 1970, J. Chem. Phys., 52, 6119-6125.113. Biermann, H.W., G.W. Harris, and J.N. Pitts Jr., 1982, J. Phys. Chem., 86, 2958-2964.114. Biermann, H.W., C. Zetzsch, and F. Stuhl, 1978, Ber. Bunsenges Phys. Chem., 82, 633.115. Biggs, P., C.E. Canosa-Mas, J.-M. Fracheboud, D.E. Shallcross, and R.P. Wayne, 1995, Geophys. Res. Lett., 22,
1221-1224.116. Biggs, P., C.E. Canosa-Mas, P.S. Monks, R.P. Wayne, T. Benter, and R.N. Schindler, 1993, Int. J. Chem. Kinet.,
25, 805-817.117. Biggs, P., M.H. Harwood, A.D. Parr, and R.P. Wayne, 1991, J. Phys. Chem., 97, 7746-7751.118. Billington, A.P. and P. Borrell, 1986, J. Chem. Soc. Faraday Trans. 2, 82, 963-970.119. Birks, J.W., B. Shoemaker, T.J. Leck, R.A. Borders, and L.J. Hart, 1977, J. Chem. Phys., 66, 4591.120. Birks, J.W., B. Shoemaker, T.J. Leck, and D.M. Hinton, 1976, J. Chem. Phys., 65, 5181.121. Black, G., 1984, J. Chem. Phys., 80, 1103-1107.122. Black, G. and L.E. Jusinski, 1986, J. Chem. Soc. Faraday Trans. 2, 86, 2143.123. Black, G., L.E. Jusinski, and T.G. Slanger, 1983, Chem. Phys. Lett., 102, 64-68.124. Black, G., R.L. Sharpless, and T.G. Slanger, 1982, Chem. Phys. Lett., 93, 598-602.125. Black, G., R.L. Sharpless, and T.G. Slanger, 1982, Chem. Phys. Lett., 90, 55-58.126. Bogan, D.J., R.P. Thorn, F.L. Nesbitt, and L.J. Stief, 1996, J. Phys. Chem., 100, 14383-14389.127. Bohmer, E. and W. Hack, 1991, Ber. Bunsenges. Phys. Chem., 95, 1688-1690.128. Boodaghians, R.B., C.E. Canosa-Mas, P.J. Carpenter, and R.P. Wayne, 1988, J. Chem. Soc. Faraday Trans. 2, 84,
931-948.129. Boodaghians, R.B., I.W. Hall, and R.P. Wayne, 1987, J. Chem. Soc. Faraday Trans. 2, 83, 529-538.130. Borders, R.A. and J.W. Birks, 1982, J. Phys. Chem., 86, 3295-3302.131. Borrell, P., P.M. Borrell, and M.D. Pedley, 1977, Chem. Phys. Lett., 51, 300-302.132. Bourbon, C., M. Brioukov, and P. Devolder, 1996, C.A. Acad. Sci. Paris, 322, 181-188.133. Bourbon, C., M. Brioukov, B. Hanoune, J.P. Sawerysyn, and P. Devolder, 1996, Chem. Phys. Lett., 254, 203-212.134. Bourbon, C., C. Fittschen, J.P. Sawerysyn, and P. Devolder, 1995, J. Phys. Chem., 99, 15102-15107.135. Bourmada, N., C. Lafage, and P. Devolder, 1987, Chem. Phys. Lett., 136, 209-214.136. Bozzelli, J.W., Ph.D. Thesis , 1973, Dept. of Chemistry, Princeton University, (Diss. Abstr. Int. B 34(2) 608).137. Bozzelli, J.W. and A.M. Dean, 1990, J. Phys. Chem., 94, 3313-3317.138. Bradley, J.N., W. Hack, K. Hoyermann, and H.G. Wagner, 1973, J. Chem. Soc. Faraday Trans. 1, 69, 1889.139. Brahan, K.M., A.D. Hewitt, G.D. Boone, and S.A. Hewitt, 1996, Int. J. Chem. Kinet., 28, 397-404.140. Braithwaite, M. and S.R. Leone, 1978, J. Chem. Phys., 69, 839-845.141. Breckenridge, W.H. and T.A. Miller, 1972, J. Chem. Phys., 56, 465.142. Bridier, I., B. Veyret, and R. Lesclaux, 1993, Chem. Phys. Lett., 201, 563-568.143. Brown, A.C., C.E. Canosa-Mas, A.D. Parr, K. Rothwell, and R.P. Wayne, 1990, Nature, 347, 541-543.144. Brown, A.C., C.E. Canosa-Mas, A.D. Parr, and R.P. Wayne, 1990, Atmos. Environ., 24A, 2499-2511.145. Brown, A.C., C.E. Canosa-Mas, and R.P. Wayne, 1990, Atmos. Environ., 24A, 361-367.146. Brown, A.C. and B.A. Thrush, 1967, Trans. Faraday Soc., 63, 630.147. Brown, R.D. and I.W.M. Smith, 1975, Int. J. Chem. Kinet., 7, 301.148. Brune, W.H., J.J. Schwab, and J.G. Anderson, 1983, J. Phys. Chem., 87, 4503-4514.149. Brunning, J. and M.A.A. Clyne, 1984, J. Chem. Soc. Faraday Trans 2, 80, 1001-1014.150. Brunning, J. and L.J. Stief, 1986, J. Chem. Phys., 84, 4371-4377.151. Brunning, J. and L.J. Stief, 1986, J. Chem. Phys., 85, 2591.152. Buben, S.N., I.K. Larin, N.A. Messineva, and E.M. Trofimova, 1990, Khim. Fiz., 9, 116-126.153. Buben, S.N., I.K. Larin, N.A. Messineva, and E.M. Trofimova, 1991,154. Bulatov, V.P., A.A. Buloyan, S.G. Cheskis, M.Z. Kozliner, O.M. Sarkisov, and A.I. Trostin, 1980, Chem. Phys.
Lett., 74, 288.
107
155. Bulatov, V.P., S.G. Cheskis, A.A. Iogensen, P.V. Kulakov, O.M. Sarkisov, and E. Hassinen, 1988, Chem. Phys.Lett., 153, 258-262.
156. Bulatov, V.P., M.Z. Kozliner, and O.M. Sarkisov, 1984, Khim. Fiz., 3, 1300-1305.157. Bulatov, V.P., M.Z. Kozliner, and O.M. Sarkisov, 1985, Khimi Fiz., 4, 1353.158. Bulatov, V.P., O.M. Sarkisov, M.Z. Kozliner, and V.G. Ergorov, 1986, Khim. Fiz., 5, 1031.159. Bulatov, V.P., S.I. Vereschchuk, F.N. Dzegilenko, O.M. Sarkisov, and V.N. Khabarov, 1990, Khim. Fiz., 9, 1214.160. Burkholder, J.B., P.D. Hammer, C.J. Howard, and A. Goldman, 1989, J. Geophys. Res., 94, 2225-2234.161. Burkholder, J.B., A. Mellouki, R. Talukdar, and A.R. Ravishankara, 1994, Int. J. Chem. Kinet., 24, 711-725.162. Burkholder, J.B., R.R. Wilson, T. Gierczak, R. Talukdar, S.A. McKeen, J.J. Orlando, G.L. Vaghjiani, and A.R.
Ravishankara, 1991, J. Geophys. Res., 96, 5025-5043.163. Burks, T.L. and M.C. Lin, 1981, Int. J. Chem. Kinet., 13, 13977-13999.164. Burrows, J.P., D.I. Cliff, G.W. Harris, B.A. Thrush, and J.P.T. Wilkinson, 1979, Proc. Roy. Soc. (London), A368,
463-481.165. Burrows, J.P. and R.A. Cox, 1981, J. Chem. Soc. Faraday Trans. 1, 77, 2465.166. Burrows, J.P., R.A. Cox, and R.G. Derwent, 1981, J. Photochem., 16, 147-168.167. Burrows, J.P., G.W. Harris, and B.A. Thrush, 1977, Nature, 267, 233-234.168. Burrows, J.P., G.S. Tyndall, and G.K. Moortgat, 1985, J. Phys. Chem., 89, 4848-4856.169. Burrows, J.P., T.J. Wallington, and R.P. Wayne, 1984, J. Chem. Soc. Faraday Trans. 2, 80, 957-971.170. Butkovskaya, N.I. and G. Le Bras, 1994, J. Phys. Chem., 98, 2582-2591.171. Butkovskaya, N.I., G. Poulet, and G. Le Bras, 1995, J. Phys. Chem., 99, 4536-4543.172. Butler, R., I.J. Solomon, and A. Snelson, 1978, Chem. Phys. Lett., 54, 19.173. Cadle, R.D. and J.W. Powers, 1967, J. Phys. Chem., 71, 1702-1706.174. Cadle, R.D. and C. Schadt, 1953, J. Phys. Chem., 21, 163.175. Callear, A.B. and R.E.M. Hedges, 1970, Trans. Faraday Soc., 66, 605.176. Callear, A.B. and I.W.M. Smith, 1967, Nature, 213, 382.177. Calvert, J.G. and J.N. Pitts, 1966, Photochemistry, John Wiley & Sons, Inc., New York, pp. 783.178. Campbell, I.M., D.F. McLaughlin, and B.J. Handy, 1976, Chem. Phys. Lett., 38, 362-64.179. Cannon, B.D., J.S. Robertshaw, I.W.M. Smith, and M.D. Williams, 1984, Chem. Phys. Lett., 105, 380-385.180. Canosa-Mas, C., S.J. Smith, S. Toby, and R.P. Wayne, 1988, J. Chem. Soc. Faraday Trans. 2, 84, 247-262.181. Canosa-Mas, C.E., S.J. Smith, S. Toby, and R.P. Wayne, 1989, J. Chem. Soc. Faraday Trans. 2, 85, 709-725.182. Cantrell, C.A., J.A. Davidson, K.L. Busarow, and J.G. Calvert, 1986, J. Geophys. Res., 91, 5347-5353.183. Cantrell, C.A., J.A. Davidson, A.H. McDaniel, R.E. Shetter, and J.G. Calvert, 1988, J. Chem. Phys., 88, 4997-
5006.184. Cantrell, C.A., J.A. Davidson, R.E. Shetter, B.A. Anderson, and J.G. Calvert, 1987, J. Phys. Chem., 91, 6017-
6021.185. Cantrell, C.A., R.E. Shetter, and J.G. Calvert, 1994, J. Geophys. Res., 99, 3739-3743.186. Cantrell, C.A., R.E. Shetter, A.H. McDaniel, and J.G. Calvert, 1990, J. Geophys. Res., 95, 20531-20537.187. Cantrell, C.A., R.E. Shetter, A.J. McDaniel, J.G. Calvert, J.A. Davidson, D.C. Lowe, S.C. Tyler, R.J. Cicerone, and
J.P. Greenberg, 1990, J. Geophys. Res., 95, 22455-22462.188. Cantrell, C.A., W.R. Stockwell, L.G. Anderson, K.L. Busarow, D. Perner, A. Schmeltekopf, J.G. Calvert, and H.S.
Johnston, 1985, J. Phys. Chem., 89, 139-146.189. Casavecchia, P., R.J. Buss, S.J. Sibener, and Y.T. Lee, 1980, J. Chem. Phys., 73, 6351-6352.190. Castleman, A.W., R.E. Davis, H.R. Munkelwitz, I.N. Tang, and W.P. Wood, 1975, Int. J. Chem. Kinet., Symp. 1,
629.191. Catoire, V., R. Lesclaux, P.D. Lightfoot, and M.-T. Rayez, 1994, J. Phys. Chem., 98, 2889-2898.192. Cattell, F.C., J. Cavanagh, R.A. Cox, and M.E. Jenkin, 1986, J. Chem. Soc. Faraday Trans. 2, 82, 1999-2018.193. Cattell, F.C. and R.A. Cox, 1986, J. Chem. Soc. Faraday Trans. 2, 82, 1413-1426.194. Chan, W.H., W.M. Uselman, J.G. Calvert, and J.H. Shaw, 1977, Chem. Phys. Lett., 45, 240.195. Chang, J.S. and J.R. Barker, 1979, J. Phys. Chem., 83, 3059.196. Chang, J.S. and F. Kaufman, 1977, Geophys. Res. Lett., 4, 192-194.197. Chang, J.S. and F. Kaufman, 1977, J. Chem. Phys., 66, 4989.198. Chang, J.S. and F. Kaufman, 1978, J. Phys. Chem., 82, 1683-1686.199. Chang, J.S., P.L. Trevor, and J.R. Barker, 1981, Int. J. Chem. Kinet., 13, 1151-1161.200. Chapman, C.J. and R.P. Wayne, 1974, Int. J. Chem. Kinet., 6, 617-630.201. Chasovnikov, S.A., A.I. Chichinin, and L.N. Krasnoperov, 1987, Chem. Phys., 116, 91-99.202. Chatha, J.P.S., P.K. Arora, N. Raja, P.B. Kulkarni, and K.G. Vohra, 1979, Int. J. Chem. Kinetics, 11, 175-185.203. Cheah, C.T. and M.A.A. Clyne, 1980, J. Chem. Soc. Faraday Trans., 76, 1543.204. Chen, J., V. Catoire, and H. Niki, 1995, Chem. Phys. Lett, 245, 519-528.205. Chen, J., V. Young, T. Zhu, and H. Niki, 1993, J. Phys. Chem., 97, 11696-11698.206. Chen, J., T. Zhu, and H. Niki, 1992, J. Phys. Chem., 96, 6115-6117.207. Chen, J., T. Zhu, H. Niki, and G.J. Mains, 1992, Geophys. Res. Lett., 19, 2215-2218.208. Chen, M.C. and H.A. Taylor, 1961, J. Chem. Phys., 34, 1344-1347.209. Chen, X., F. Wu, and B.R. Weiner, 1995, Chem. Phys. Lett., 247, 313-320.210. Cheng, B.-M. and Y.-P. Lee, 1986, Int. J. Chem. Kinet., 18, 1303-1314.211. Cheskis, S.G., A.A. Iogansen, O.M. Sarkisov, and A.A. Titov, 1985, Chem. Phys. Lett., 120, 45-49.212. Cheskis, S.G. and O.M. Sarkisov, 1979, Chem. Phys. Lett., 62, 72.
108
213. Chichinin, A., S. Teton, G. Le Bras, and G. Poulet, 1994, J. Atmos. Chem, 18, 239-245.214. Chiorboli, C., C.A. Bignozzi, A. Maldotti, P.F. Giardini, A. Rossi, and V. Carassiti, 1983, Int. J. Chem. Kinet.,
15, 579-586.215. Choo, K.Y. and M.-T. Leu, 1985, Int. J. Chem. Kinetics, 17, 1155-1167.216. Choo, K.Y. and M.T. Leu, 1985, J. Phys. Chem., 89, 4832-4837.217. Clark, I.D., I.T.N. Jones, and R.P. Wayne, 1970, Proc. Roy. Soc. Lond. A., 317, 407-416.218. Clark, I.D. and R.P. Wayne, 1969, Proc. Roy. Soc. Lond. A., 314, 111-127.219. Clark, I.D. and R.P. Wayne, 1969, Chem. Phys. Lett., 3, 405-407.220. Clark, I.D. and R.P. Wayne, 1970, Proc. Roy. Soc. London. A., 316, 539-550.221. Clark, R.H., D. Husain, and J.Y. Jezequel, 1982, J. Photochem., 18, 39-46.222. Clemo, A.R., F.E. Davidson, G.L. Duncan, and R. Grice, 1981, Chem. Phys. Lett., 84, 509-511.223. Clough, P.N. and B.A. Thrush, 1967, Trans. Faraday Soc., 63, 915.224. Clyne, M.A.A. and J.A. Coxon, 1968, Proc. Roy. Soc. A, 303, 207-231.225. Clyne, M.A.A. and H.W. Cruse, 1970, Trans. Faraday Soc., 66, 2227.226. Clyne, M.A.A. and H.W. Cruse, 1972, J. Chem. Soc. Faraday Trans. 2, 68, 1281.227. Clyne, M.A.A. and S. Down, 1974, J. Chem. Soc. Faraday Trans. 2, 70, 253-266.228. Clyne, M.A.A., C.J. Halstead, and B.A. Thrush, 1966, Proc. Soc. London Ser. A., 295, 355.229. Clyne, M.A.A. and A. Hodgson, 1985, J. Chem. Soc. Faraday Trans. 2, 81, 443-455.230. Clyne, M.A.A. and P.M. Holt, 1979, J. Chem. Soc. Faraday Trans. 2, 75, 569-581.231. Clyne, M.A.A. and P.M. Holt, 1979, J. Chem. Soc. Faraday Trans. 2, 75, 582-591.232. Clyne, M.A.A. and A.J. MacRobert, 1980, Int. J. Chem. Kinet., 12, 79-96.233. Clyne, M.A.A. and A.J. MacRobert, 1981, Int. J. Chem. Kinet., 13, 187-197.234. Clyne, M.A.A., A.J. MacRobert, T.P. Murrells, and L.J. Stief, 1984, J. Chem. Soc. Faraday Trans. 2, 80, 877-886.235. Clyne, M.A.A. and I.S. McDermid, 1975, J. Chem. Soc. Faraday Trans. 1, 71, 2189.236. Clyne, M.A.A., D.J. McKenney, and R.F. Walker, 1973, Can. J. Chem., 51, 3596.237. Clyne, M.A.A., D.J. McKenney, and R.T. Watson, 1975, Chem. Soc. Faraday Trans. 1, 71, 322-335.238. Clyne, M.A.A. and P. Monkhouse, 1977, J. Chem. Soc. Faraday Trans. 2, 73, 298-309.239. Clyne, M.A.A., P.B. Monkhouse, and L.W. Townsend, 1976, Int. J. Chem. Kinet., 8, 425.240. Clyne, M.A.A. and W.S. Nip, 1976, J. Chem. Soc. Faraday Trans. 1, 72, 2211.241. Clyne, M.A.A. and W.S. Nip, 1976, J. Chem. Soc. Faraday Trans. 2, 72, 838.242. Clyne, M.A.A. and Y. Ono, 1982, Chem. Phys., 69, 381-388.243. Clyne, M.A.A. and Y. Ono, 1983, Chem. Phys. Lett., 94, 597-602.244. Clyne, M.A.A., B.A. Thrush, and R.P. Wayne, 1964, Trans. Faraday Soc., 60, 359.245. Clyne, M.A.A. and L.W. Townsend, 1975, Int. J. Chem. Kinet., Symp. 1, 73-84.246. Clyne, M.A.A. and R.F. Walker, 1973, J. Chem. Soc. Faraday Trans. 1, 69, 1547.247. Clyne, M.A.A. and R.T. Watson, 1974, J. Chem. Soc. Faraday Trans. 1, 70, 2250.248. Clyne, M.A.A. and R.T. Watson, 1974, J. Chem. Soc. Faraday Trans. 1, 70, 1109.249. Clyne, M.A.A. and R.T. Watson, 1975, J. Chem. Soc. Faraday Trans. 1, 71, 336.250. Clyne, M.A.A. and R.T. Watson, 1977, J. Chem. Soc. Faraday Trans. 1, 73, 1169.251. Clyne, M.A.A. and I.F. White, 1971, Trans. Faraday Soc., 67, 2068-2076.252. Clyne, M.A.A. and P.D. Whitefield, 1979, J. Chem. Soc. Faraday Trans. 2, 75, 1327.253. Cocks, A.T., R.P. Fernanado, and I.S. Fletcher, 1986, Atmos. Environ., 20, 2359-2366.254. Cohen, N. and S.W. Benson, 1987, J. Phys. Chem., 91, 162-170.255. Cohen, N. and K.R. Westberg, 1991, J. Phys. Chem. Ref. Data , 20, 1211-1311.256. Collins, R.J., D. Husain, and R.J. Donovan, 1973, J. Chem. Soc. Faraday Trans. 2, 69, 145-157.257. Colussi, A.J., 1990, J. Phys. Chem., 94, 8922-8926.258. Colussi, A.J. and M.A. Grela, 1994, Chem. Phys. Lett., 229, 134-138.259. Colussi, A.J., S.P. Sander, and R.R. Friedl, 1992, J. Phys.Chem., 96, 4442-4445.260. Connell, P.S. and C.J. Howard, 1985, Int. J. Chem. Kinet., 17, 17.261. Cook, J.L., C.A. Ennis, T.J. Leck, and J.W. Birks, 1981, J. Chem. Phys., 74, 545.262. Coomber, J.W. and E. Whittle, 1966, Trans. Faraday Soc., 62, 2183-2190.263. Cooper, W.F. and J.F. Hershberger, 1992, J. Phys. Chem., 96, 5405-5410.264. Cox, J.W., H.H. Nelson, and J.R. McDonald, 1985, Chem. Phys., 96, 175.265. Cox, R.A., 1980, Int. J. Chem. Kinet., 12, 649.266. Cox, R.A., R.A. Barton, E. Ljungstrum, and D.W. Stocker, 1984, Chem. Phys. Lett., 108, 228-232.267. Cox, R.A. and J.P. Burrows, 1979, J. Phys. Chem., 83, 2560-2568.268. Cox, R.A., J.P. Burrows, and T.J. Wallington, 1981, Chem. Phys. Lett., 84, 217-221.269. Cox, R.A. and G.B. Coker, 1983, J. Atmos. Chem., 1, 53.270. Cox, R.A., R. Derwent, P.M. Holt, and J.A. Kerr, 1976, J. Chem. Soc. Faraday Trans I, 72, 2061-2075.271. Cox, R.A. and R.G. Derwent, 1979, J. Chem. Soc. Far. Trans. 1, 75, 1635-1647.272. Cox, R.A., R.G. Derwent, A.E.J. Egg1eton, and J.E. Lovelock, 1976, Atmos. Environ., 10, 305.273. Cox, R.A., R.G. Derwent, A.E.J. Eggleton, and H.J. Read, 1979, J. Chem. Soc. Faraday Trans. I, 75, 1648-1666.274. Cox, R.A., R.G. Derwent, and P.M. Holt, 1975, Chemosphere, 4, 201.275. Cox, R.A., R.G. Derwent, and P.M. Holt, 1976, J. Chem. Soc. Faraday Trans. 1, 72, 2031.276. Cox, R.A., R.G. Derwent, S.V. Kearsey, L. Batt, and K.G. Patrick, 1980, J. Photochem., 13, 149.277. Cox, R.A., R.G. Derwent, and M.R. Williams, 1980, Environ. Sci. and Technol., 14, 57-61.
109
278. Cox, R.A., M. Fowles, D. Moulton, and R.P. Wayne, 1987, J. Phys. Chem., 91, 3361-3365.279. Cox, R.A. and A. Goldstone, 1982, Proceedings of the 2nd European Symposium on the "Physico-Chemical
Behaviour of the Atmospheric Pollutants", D. Reidel Publishing Co., Varese, Italy, pp. 112-119.280. Cox, R.A. and G.D. Hayman, 1988, Nature, 332, 796-800.281. Cox, R.A. and S.A. Penkett, 1972, J. Chem. Soc., Faraday Trans. 1, 68, 1735.282. Cox, R.A. and J.J. Roffey, 1977, Environ. Sci. Technol., 11, 900.283. Cox, R.A. and D. Sheppard, 1980, Nature, 284, 330-331.284. Cox, R.A., D.W. Sheppard, and M.P. Stevens, 1982, J. Photochem., 19, 189-207.285. Cox, R.A. and G. Tyndall, 1979, Chem. Phys. Lett., 65, 357.286. Cox, R.A. and G.S. Tyndall, 1980, J. Chem. Soc. Faraday Trans. 2, 76, 153.287. Crowley, J.N., P. Campuzano-Jost, and G.K. Moortgat, 1996, J. Phys. Chem., 100, 3601-3606.288. Crowley, J.N., F.G. Simon, J.P. Burrows, G.K. Moortgat, M.E. Jenkin, and R.A. Cox, 1991, J. Photochem. and
Photobiol. A: Chem., 60, 1-10.289. Cupitt, L.T. and G.P. Glass, 1975, Int. J. Chem. Kinet., Symp. 1, 39-50.290. Cvetanovic, R.J., D.L. Singleton, and R.S. Irwin, 1981, J. Am. Chem. Soc., 103, 3530.291. Czarnowski, J. and H.J. Schumacher, 1981, Int. J. Chem. Kinet., 13, 639-649.292. Daele, V. and G. Poulet, 1996, J. Chim. Phys., 93, 1081-1099.293. Daele, V., A. Ray, I. Vassali, G. Poulet, and G. Le Bras, 1995, Int. J. Chem. Kinet., 27, 1121-1133.294. Dagaut, P. and M.J. Kurylo, 1990, J. Photochem. and Photobiol. A:Chem., 51, 133.295. Dagaut, P., T.J. Wallington, and M.J. Kurylo, 1988, J. Phys. Chem., 92, 3836-3839.296. Dagaut, P., T.J. Wallington, and M.J. Kurylo, 1988, J. Phys. Chem., 92, 3833-3836.297. Dagaut, P., T.J. Wallington, R. Liu, and M.J. Kurylo, 1988, Int. J. Chem. Kinet., 20, 331-338.298. Daniels, F. and E.H. Johnston, 1921, J. Am. Chem. Soc., 43, 53.299. Daubendiek, R.L. and J.G. Calvert, 1975, Environ. Lett., 8, 103.300. Davenport, J.E., B. Ridley, H.I. Schiff, and K.H. Welge, 1972, J. Chem. Soc. Faraday Discussion, 53, 230-231.301. Davidson, F.E., A.R. Clemo, G.L. Duncan, R.J. Browett, J.H. Hobson, and R. Grice, 1982, Molec. Phys., 46, 33-
40.302. Davidson, J.A., C.A. Cantrell, S.C. Tyler, R.E. Shetter, R.J. Cicerone, and J.G. Calvert, 1987, J. Geophys. Res.,
92, 2195-2199.303. Davidson, J.A., C.J. Howard, H.I. Schiff, and F.C. Fehsenfeld, 1979, J. Chem. Phys., 70, 1697-1704.304. Davidson, J.A., K.E. Kear, and E.W. Abrahamson, 1972/1973, J. Photochem., 1, 307-316.305. Davidson, J.A., H.I. Schiff, T.J. Brown, and C.J. Howard, 1978, J. Chem. Phys., 69, 4277-4279.306. Davidson, J.A., H.I. Schiff, G.E. Streit, J.R. McAfee, A.L. Schmeltekopf, and C.J. Howard, 1977, J. Chem. Phys.,
67, 5021-5025.307. Davies, P.B. and B.A. Thrush, 1968, Trans. Far. Soc., 64, 1836.308. Davis, D.D., W. Braun, and A.M. Bass, 1970, Int. J. Chem. Kinet., 2, 101.309. Davis, D.D., J.T. Herron, and R.E. Huie, 1973, J. Chem. Phys., 58, 530.310. Davis, D.D., R.B. Klemm, and M. Pilling, 1972, Int. J. Chem. Kinet., 4, 367-382.311. Davis, D.D., G. Machado, B. Conaway, Y. Oh, and R.T. Watson, 1976, J. Chem. Phys., 65, 1268.312. Davis, D.D., J. Prusazcyk, M. Dwyer, and P. Kim, 1974, J. Phys. Chem., 78, 1775-1779.313. Davis, D.D., W. Wong, and J. Lephardt, 1973, Chem. Phys. Lett., 22, 273-278.314. Davis, D.D., W. Wong, and R. Schiff, 1974, J. Phys. Chem., 78, 463-464.315. Daykin, E.P. and P.H. Wine, 1990, J. Geophys. Res., 95, 18547-18553.316. Daykin, E.P. and P.H. Wine, 1990, Int. J. Chem. Kinet., 22, 1083-1094.317. Daykin, E.P. and P.H. Wine, 1990, J. Phys. Chem., 94, 4528-4535.318. De Sousa, A.R., M. Touzeau, and M. Petitdidier, 1985, Chem. Phys. Lett., 121, 423-428.319. DeMore, W.B., 1969, Int. J. Chem. Kinet., 1, 209-220.320. DeMore, W.B., 1971, Int. J. Chem. Kinet., 3, 161-173.321. DeMore, W.B., 1979, J. Phys. Chem., 83, 1113-1118.322. DeMore, W.B., paper presented at the 182nd National Meeting of the American Chemical Society, 1981, New
York.323. DeMore, W.B., 1982, J. Phys. Chem, 86, 121-126.324. DeMore, W.B., 1984, Int. J. Chem. Kinet., 16, 1187-1200.325. DeMore, W.B., 1991, J. Geophys. Res., 96, 4995-5000.326. DeMore, W.B., 1992, Geophys. Res. Lett., 19, 1367-1370.327. DeMore, W.B., 1993, Geophys. Res. Lett., 20, 1359-1362.328. DeMore, W.B., 1993, J. Phys. Chem., 97, 8564-8566.329. DeMore, W.B., 1996, J. Phys. Chem., 100, 5813-5820.330. DeMore, W.B. and C.L. Lin, 1973, J. Org. Chem., 38, 985-989.331. DeMore, W.B., C.L. Lin, and S. Jaffe, paper presented at the 12th Informal Conference on Photochemistry, 1976,
NBS, 287-289.332. DeMore, W.B. and E. Tschuikow-Roux, 1974, J. Phys. Chem., 78, 1447-1451.333. DeMore, W.B. and E. Tschuikow-Roux, 1990, J. Phys. Chem., 94, 5856-5860.334. Derwent, R.G. and B.A. Thrush, 1971, Trans. Faraday Soc., 67, 2036-2043.335. Devolder, P., M. Carlier, J.F. Pauwels, and L.R. Sochet, 1984, Chem. Phys. Lett., 111, 94-99.336. Diau, E.W., T. Yu, M.A.G. Wagner, and M.C. Lin, 1994, J. Phys. Chem., 98, 4034-4042.
110
337. Diau, E.W.-G. and Y.-P. Lee, 1991, J. Phys. Chem., 95, 7726-7732.338. Diau, E.W.-G., T.-L. Tso, and Y.-P. Lee, 1990, J. Phys. Chem., 94, 5261-5265.339. Dibble, T.S., M.M. Maricq, J.J. Szente, and J.S. Francisco, 1995, J. Phys. Chem., 99, 17394-17402.340. Dlugokencky, E.J. and C.J. Howard, 1988, J. Phys. Chem., 92, 1188-1193.341. Dlugokencky, E.J. and C.J. Howard, 1989, J. Phys. Chem., 93, 1091-1096.342. Dobe, S., L.A. Khachatryan, and T. Berces, 1989, Ber. Bunsenges. Phys. Chem., 93, 847-852.343. Dobe, S., M. Otting, F. Temps, H.G. Wagner, and H. Ziemer, 1993, Ber. Bunsenges. Phys. Chem., 97, 877-884.344. Dobe, S., F. Temps, T. Bohland, and H.G. Wagner, 1985, Z. Naturforsch., 40a, 1289-1298.345. Dobis, O. and S.W. Benson, 1991, J. Am. Chem. Soc., 113, 6377-6386.346. Dobis, O. and S.W. Benson, 1993, J. Am. Chem. Soc., 115, 8798-8809.347. Dodonov, A.F., G.K. Lavrovskaya, I.I. Morozov, and V.L. Tal'rose, 1971, Dokl. Adak. Nauk USSR, 1971, Vol.
198, 622: Dokl. Phys. Chem. (Engl. Trans.), 198, 440-442.348. Dodonov, A.F., V.V. Zelenov, A.S. Kukui, and E.A.P.V.L. Tal'Rose, 1985, Khim. Fiz., 4, 1335-1343.349. Dognon, A.M., F. Caralp, and R. Lesclaux, 1985, J. Chim. Phys. Phys.-Chim. Biol., 82, 349-352.350. Dolson, D.A., 1986, J. Phys. Chem., 90, 6714-6718.351. Domine, F., T.P. Murrells, and C.J. Howard, 1990, J. Phys. Chem., 94, 5839-5847.352. Domine, F. and A.R. Ravishankara, 1992, Int. J. Chem. Kinet., 24, 943-951.353. Domine, F., A.R. Ravishankara, and C.J. Howard, 1992, J. Phys. Chem., 96, 2171-2178.354. Donovan, R.J. and D.J. Little, 1972, Chem. Phys. Lett., 13, 488.355. Dransfeld, P. and H.G. Wagner, 1986, Z. Naturforsch., 42a, 471-476.356. Dreier, T. and J. Wolfrum, 1980, 18th International Symposium on Combustion, The Combustion Institute, pp.
801-809.357. Dreier, T. and J. Wolfrum, paper presented at the 20th International Symposium on Combustion, 1984, The
Combustion Institute, 695-702.358. Dreyer, J.W., D. Perner, and C.R. Roy, 1974, J. Chem. Phys., 61, 3164.359. Droege, A.T. and F.P. Tully, 1986, J. Phys. Chem., 90, 1949-1954.360. Dunlop, J.R. and F.P. Tully, 1993, J. Phys. Chem., 97, 11148-11150.361. Eberhard, J. and C.J. Howard, 1996, Int. J. Chem. Kinet., 28, 731-740.362. Egsgaard, H., L. Carlson, H. Florencio, T. Drewello, and H. Schwarz, 1988, Chem. Phys. Lett., 148, 537-540.363. Ehhalt, D.H., J.A. Davidson, C.A. Cantrell, I. Friedman, and S. Tyler, 1989, J. Geophys. Res., 94, 9831-9836.364. Eibling, R.E. and M. Kaufman, 1983, Atmos. Environ., 17, 429-431.365. Elrod, M.J., R.F. Meads, J.B. Lipson, J.V. Seeley, and M.J. Molina, 1996, J. Phys. Chem., 100, 5808-5812.366. Ennis, C.A. and J.W. Birks, 1985, J. Phys. Chem., 89, 186-191.367. Ennis, C.A. and J.W. Birks, 1988, J. Phys. Chem., 93, 1119-1126.368. Fair, R.W. and B.A. Thrush, 1969, Trans. Faraday Soc., 65, 1557.369. Fair, R.W., A. van Roodaelaar, and O.P. Strausz, 1971, Can. J. Chem., 49, 1659.370. Fang, T.D., P.H. Taylor, and B. Dellinger, 1996, J. Phys. Chem., 100, 4048-4054.371. Farquharson, G.K. and R.H. Smith, 1980, Aust. J. Chem., 33, 1425-1435.372. Fasano, D.M. and N.S. Nogar, 1981, Int. J. Chem. Kinet., 13, 325.373. Fasano, D.M. and N.S. Nogar, 1982, Chem. Phys. Lett., 92, 411-414.374. Fenter, F.F. and J.G. Anderson, 1991, J. Phys. Chem., 95, 3172-3180.375. Fenter, F.F. and J.G. Anderson, 1994, Int. J. Chem. Kinet., 26, 801-812.376. Fenter, F.F., V. Catoire, R. Lesclaux, and P.D. Lightfoot, 1993, J. Phys. Chem., 97, 3530-3538.377. Filseth, S.V., A. Zia, and K.H. Welge, 1970, J. Chem. Phys., 52, 5502-5510.378. Findlay, F.D., C.J. Fortin, and D.R. Snelling, 1969, Chem. Phys. Lett., 3, 204-206.379. Findlay, F.D. and D.R. Snelling, 1971, J. Chem. Phys., 55, 545-551.380. Findlay, F.D. and D.R. Snelling, 1971, J. Chem. Phys., 54, 2750-2755.381. Finkbeiner, M., J.N. Crowley, O. Horie, R. Muller, G.K. Moortgat, and P.J. Crutzen, 1995, J. Phys. Chem., 99,
16264-16275.382. Finlayson-Pitts, B.J., M.J. Ezell, T.M. Jayaweera, H.N. Berko, and C.C. Lai, 1992, Geophys. Res. Lett., 19, 1371-
1374.383. Finlayson-Pitts, B.J., S.K. Hernandez, and H.N. Berko, 1993, J. Phys. Chem., 97, 1172-1177.384. Finlayson-Pitts, B.J. and T.E. Kleindienst, 1979, J. Chem. Phys., 70, 4804-4806.385. Finlayson-Pitts, B.J., T.E. Kleindienst, J.J. Ezell, and D.W. Toohey, 1981, J. Chem. Phys., 74, 4533-4543.386. Fletcher, I.S. and D. Husain, 1976, J. Phys. Chem., 80, 1837-1840.387. Fletcher, I.S. and D. Husain, 1976, Can. J. Chem., 54, 1765-1770.388. Fletcher, I.S. and D. Husain, 1978, J. Photochem., 8, 355-361.389. Fockenberg, C., H. Saathoff, and R. Zellner, 1994, Chem. Phys. Lett., 218, 21-28.390. Foon, R., G. Le Bras, and J. Combourieu, 1979, C.R. Acad. Sci. Paris, Series C 288, 241.391. Foon, R. and G.P. Reid, 1971, Trans. Faraday Soc., 67, 3513.392. Force, A.P. and J.R. Wiesenfeld, 1981, J. Chem. Phys., 74, 1718-1723.393. Force, A.P. and J.R. Wiesenfeld, 1981, J. Phys. Chem., 85, 782-785.394. Fraser, M.E. and L.G. Piper, 1989, J. Phys. Chem., 93, 1107-1111.395. Freeman, C.G. and L.F. Phillips, 1968, J. Phys. Chem., 72, 3025.396. Freudenstein, K. and D. Biedenkapp, 1976, Ber. Bunsenges. Phys. Chem., 80, 42-48.397. Friedl, R.R., W.H. Brune, and J.G. Anderson, 1985, J. Phys. Chem., 89, 5505-5510.
111
398. Friedl, R.R., J.H. Goble, and S.P. Sander, 1986, Geophys. Res. Lett., 13, 1351-1354.399. Friedl, R.R. and S.P. Sander, 1989, J. Phys. Chem., 93, 4756-4764.400. Friedl, R.R., S.P. Sander, and Y.L. Yung, 1992, J. Phys. Chem., 96, 7490-7493.401. Fritz, B., K. Lorenz, W. Steinert, and R. Zellner, 1984, Oxidation Communications, 6, 363-370.402. Frost, M.J. and I.W.M. Smith, 1990, J. Chem. Soc. Farad. Trans., 86, 1757-1762.403. Frost, R.J., D.S. Green, M.K. Osborn, and I.W.M. Smith, 1986, Int. J. Chem. Kinet., 18, 885-898.404. Gaffney, J.S., R. Fajer, G.I. Senum, and J.H. Lee, 1986, Int. J. Chem. Kinet., 18, 399-407.405. Ganske, J.A., H.N. Berko, M.J. Ezell, and B.J. Finlayson-Pitts, 1992, J. Phys. Chem., 96, 2568-2572.406. Ganske, J.A., M.J. Ezell, H.N. Berko, and B.J. Finlayson-Pitts, 1991, Chem. Phys. Lett., 179, 204-210.407. Garland, N.L., L.J. Medhurst, and H.H. Nelson, 1993, J. Geophys. Res. D., 98, 23107-23111.408. Garland, N.L. and H.H. Nelson, 1996, Chem. Phys. Lett., 248, 296-300.409. Garraway, J. and R.J. Donovan, 1979, J. Chem. Soc. Chem. Commun., 1108.410. Garvin, D. and H.P. Broida, paper presented at the 9th Symposium on Combustion, 1963, The Combustion
Institute, 678.411. Gauthier, M.J.E. and D.R. Snelling, 1974, Can. J. Chem., 52, 4007-4015.412. Geers-Muller, R. and F. Stuhl, 1987, Chem. Phys. Lett., 135, 263-268.413. Gehring, M., K. Hoyermann, H. Sahaeke, and J. Wolfrum, paper presented at the 14th Int. Symposium on
Combustion, 1973, The Combustion Institute, 99.414. Gericke, K.-H. and F.J. Comes, 1981, Chem. Phys. Lett., 81, 218-222.415. Gierczak, T., L. Goldfarb, D. Sueper, and A.R. Ravishankara, 1994, Int. J. Chem. Kinet., 26, 719-728.416. Gierczak, T., R. Talukdar, G.L. Vaghjiani, E.R. Lovejoy, and A.R. Ravishankara, 1991, J. Geophys. Res., 96,
5001-5011.417. Gierczak, T., R.K. Talukdar, J.B. Burkholder, R.W. Portmann, J.S. Daniel, S. Solomon, and A.R. Ravishankara,
1996, J. Geophys. Res., 101, 12905-12911.418. Gierczak, T., R.K. Talukdar, and A.R. Ravishankara, 1997, J. Phys. Chem., in press.419. Gierczak, T., S. Talukdar, S. Herndon, G.L. Vaghjiani, and A.R. Ravishankara, 1997, J. Phys. Chem., in press.420. Gill, R.J., W.D. Johnson, and G.H. Atkinson, 1981, Chem. Phys., 58, 29.421. Gilles, M.K., A.A. Turnipseed, J.B. Burkholder, A.R. Ravishankara, and S. Solomon, 1996, manuscript.422. Gilpin, R., H.I. Schiff, and K.H. Welge, 1971, J. Chem. Phys., 55, 1087-1093.423. Glaschick-Schimpf, I., A. Leiss, P.B. Monkhouse, U. Schurath, K.H. Becker, and E.H. Fink, 1979, Chem. Phys.
Lett., 67, 318-323.424. Glavas, S. and J. Heicklen, 1985, J. Photochem., 31, 21-28.425. Gleason, J.F. and C.J. Howard, 1988, J. Phys. Chem., 92, 3414-3417.426. Gleason, J.F., F.L. Nesbitt, and L.J. Stief, 1994, J. Phys. Chem., 98, 126-131.427. Gleason, J.F., A. Sinha, and C.J. Howard, 1987, J. Phys. Chem., 91, 719-724.428. Glinski, R.J. and J.W. Birks, 1985, J. Phys. Chem., 89 90, 3449-3453 342.429. Gordon, S., W. Mulac, and P. Nangia, 1971, J. Phys. Chem., 75 , 2087.430. Gordon, S. and W.A. Mulac, 1975, Int. J. Chem. Kinet., Symp. 1, 289-299.431. Graham, R.A. and D.J. Gutman, 1977, J. Phys. Chem., 81, 207.432. Graham, R.A. and H.S. Johnston, 1974, J. Chem. Phys., 60, 4628.433. Graham, R.A. and H.S. Johnston, 1978, J. Phys. Chem., 82, 254-268.434. Graham, R.A., A.M. Winer, R. Atkinson, and J.N. Pitts Jr., 1979, J. Phys. Chem., 83, 1563.435. Green, R.G. and R.P. Wayne, 1976/77, J. Photochem., 6, 371-374.436. Greenblatt, G.D. and C.J. Howard, 1989, J. Phys. Chem., 93, 1035-1042.437. Greenblatt, G.D. and A.R. Ravishankara, 1990, J. Geophys. Res., 95, 3539-3547.438. Greenhill, P.G. and B.V. O'Grady, 1986, Aust. J. Chem., 39, 1775-1787.439. Greiner, N.R., 1969, J. Chem. Phys., 51, 5049-5051.440. Greiner, N.R., 1970, J. Chem. Phys., 53, 1284-1285.441. Grimley, A.J. and P.L. Houston, 1980, J. Chem. Phys., 72, 1471-1475.442. Grotheer, H.H., G. Riekert, U. Meier, and T. Just, 1985, Ber. Bunsenges. Phys. Chem., 89, 187-191.443. Grotheer, H.H., G. Riekert, D. Walter, and T. Just, 1988, J. Phys. Chem., 92, 4028.444. Gutman, D., N. Sanders, and J.E. Butler, 1982, J. Phys. Chem., 86, 66.445. Hack, W., O. Horie, and H.G. Wagner, 1981, Ber. Bunsenges. Phys. Chem., 85, 72.446. Hack, W., O. Horie, and H.G. Wagner, 1982, J. Phys. Chem., 86, 765.447. Hack, W., K. Hoyermann, and H.G. Wagner, 1974, Ber. Bunsenges. Phys. Chem., 78, 386.448. Hack, W., G. Mex, and H.G. Wagner, 1977, Ber. Bunsenges. Phys. Chem., 81, 677-684.449. Hack, W., A.W. Preuss, F. Temps, and H.G. Wagner, 1979, Ber. Bunsenges. Phys. Chem., 83, 1275-1279.450. Hack, W., A.W. Preuss, F. Temps, H.G. Wagner, and K. Hoyermann, 1980, Int. J. Chem. Kinet., 12, 851-860.451. Hack, W., A.W. Preuss, H.G. Wagner, and K. Hoyermann, 1979, Ber. Bunsenges. Phys. Chem., 83, 212-217.452. Hack, W., H. Schacke, M. Schroter, and H.G. Wagner, paper presented at the 17th International Symposium on
Combustion, 1979.453. Hack, W., H.G. Wagner, and K. Hoyermann, 1978, Ber. Bunsenges. Phys. Chem., 82, 713-719.454. Hagele, J., K. Lorenz, D. Rhasa, and R. Zellner, 1983, Ber. Bunsenges. Phys. Chem., 87, 1023-1026.455. Hall, I.W., R.P. Wayne, R.A. Cox, M.E. Jenkin, and G.D. Hayman, 1988, J. Phys. Chem., 92, 5049-5054.456. Halstead, C.J. and B.A. Thrush, 1966, Proc. Roy. Soc. London, Ser. A 295, 380.457. Hamilton, E.J., Jr., 1975, J. Chem. Phys., 63, 3682-3683.
112
458. Hamilton, E.J., Jr. and R.-R. Lii, 1977, Int. J. Chem. Kinet., 9, 875-885.459. Hammer, P.D., E.J. Dlugokencky, and C.J. Howard, 1986, J. Phys. Chem., 90, 2491-2496.460. Hampson, R.F., Jr. and D. Garvin, 1977, Reaction Rate and Photochemical Data for Atmospheric Chemistry, SP-
513, National Bureau of Standards, Washington, D.C., pp. 33.461. Hancock, G., W. Lange, M. Lenzi, and K.H. Welge, 1975, Chem. Phys. Lett., 33, 168.462. Hancock, G. and I.W.M. Smith, 1971, Trans. Faraday Soc., 67, 2586.463. Handwerk, V. and R. Zellner, 1978, Ber. Bunsenges. Phys. Chem., 82, 1161-1166.464. Hansen, I., K. Hoinghaus, C. Zetzsch, and F. Stuhl, 1976, Chem. Phys. Lett., 42, 370-372.465. Harris, G.W., T.E. Kleindienst, and J.N. Pitts Jr., 1981, Chem. Phys. Lett., 80, 479-483.466. Harrison, J.A., A.R. Whyte, and L.F. Phillips, 1986, Chem. Phys. Lett., 129, 346-352.467. Hartmann, D., J. Karthauser, J.P. Sawerysyn, and R. Zellner, 1990, Ber. Bunsenges. Phys. Chem., 94, 639-645.468. Harwood, M.H., J.B. Burkholder, M. Hunter, R.W. Fox, and A.R. Ravishankara, 1997, J. Phys. Chem. A, 101,
853-863.469. Hashimoto, S., G. Inoue, and H. Akimoto, 1984, Chem. Phys. Lett., 107, 198-202.470. Hatakeyama, S. and M.T. Leu, 1986, Geophys. Res. Lett., 13, 1343-1346.471. Hatakeyama, S. and M.T. Leu, 1989, J. Phys. Chem., 93, 5784-5789.472. Hayman, G.D., J.M. Davies, and R.A. Cox, 1986, Geophys. Res. Lett., 13, 1347-1350.473. Heidner, R.F., J.F. Bott, C.E. Gardner, and J.E. Melzer, 1979, J. Chem. Phys., 70, 4509.474. Heidner, R.F., J.F. Bott, C.E. Gardner, and J.E. Melzer, 1980, J. Chem. Phys., 72, 4815.475. Heidner, R.F., III and D. Husain, 1973, Int. J. Chem. Kinet., 5, 819-831.476. Heidner, R.F., III , D. Husain, and J.R. Weisenfeld, 1973, J. Chem. Soc. Faraday Trans. 2, 69, 927-938.477. Helleis, F., J.N. Crowley, and G.K. Moortgat, 1993, J. Phys. Chem., 97, 11464-11473.478. Helleis, F., J.N. Crowley, and G.K. Moortgat, 1994, Geophys. Res. Lett., 21, 1795-1798.479. Helmer, M. and J.M.C. Plane, 1993, J. Geophys. Res., 98, 23207-23222.480. Hendry, D.G. and R.A. Kenley, 1977, J. Amer. Chem. Soc., 99, 3198-99.481. Heneghan, S.P. and S.W. Benson, 1983, Int. J. Chem. Kinet., 15, 1311-1319.482. Herron, J.T., 1961, J. Chem. Phys., 35, 1138.483. Herron, J.T. and R.E. Huie, 1974, J. Phys. Chem., 78, 2085.484. Herron, J.T. and R.D. Penzhorn, 1969, J. Phys. Chem., 73, 191.485. Hess, W.P. and F.P. Tully, 1988, Chem. Phys. Lett., 152, 183-189.486. Hess, W.P. and F.P. Tully, 1989, J. Phys. Chem., 93, 1944-1947.487. Hills, A.J., R.J. Cicerone, J.G. Calvert, and J.W. Birks, 1988, J. Phys. Chem., 92, 1853-1858.488. Hills, A.J. and C.J. Howard, 1984, J. Chem. Phys., 81, 4458-4465.489. Hippler, H. and J. Troe, 1992, Chem. Phys. Lett., 192, 333-337.490. Hippler, H., J. Troe, and J. Willner, 1990, J. Chem. Phys., 93, 1755-1760.491. Hislop, J.R. and R.P. Wayne, 1977, J. Chem. Soc. Faraday Trans. 2, 73, 506-516.492. Hjorth, J., F. Cappellani, C.J. Nielsen, and G. Restelli, 1989, J. Phys. Chem., 93, 5458-5461.493. Hjorth, J., G. Ottobrini, F. Cappellani, and G. Restelli, 1987, J. Phys. Chem., 91, 1565-1568.494. Hjorth, J., G. Ottobrini, and G. Restelli, 1986, Int. J. Chem. Kinet., 18, 819-828.495. Hjorth, J., G. Ottobrini, and G. Restelli, 1988, J. Phys. Chem., 92, 2669.496. Hochanadel, C.J., J.A. Ghormley, J.W. Boyle, and P.J. Ogren, 1977, J. Phys. Chem., 81, 3.497. Hochanadel, C.J., J.A. Ghormley, and P.J. Ogren, 1972, J. Chem. Phys., 56, 4426-4432.498. Hochanadel, C.J., T.J. Sworski, and P.J. Ogren, 1980, J. Phys. Chem., 84, 3274-3277.499. Hofzumahaus, A. and F. Stuhl, 1984, Ber. Bunsenges Phys. Chem., 88, 557-561.500. Hollinden, G.A., M.J. Kurylo, and R.B. Timmons, 1970, J. Phys. Chem., 74, 988-991.501. Homann, K.H., G. Krome, and H.G. Wagner, 1968, Ber. Bunsenges. Phys. Chem., 72, 998.502. Hooshiyar, P.A. and H. Niki, 1995, Int. J. Chem. Kinet., 27, 1197-1206.503. Horie, O., J.N. Crowley, and G.K. Moortgat, 1990, J. Phys. Chem., 94, 8198-8203.504. Horie, O. and G.K. Moortgat, 1992, J. Chem. Soc. Faraday Trans., 88, 3305-3312.505. Horowitz, A., D. Bauer, J.N. Crowley, and G.K. Moortgat, 1993, Geophys. Res. Lett., 20, 1423-1426.506. Horowitz, A., J.N. Crowley, and G.K. Moortgat, 1994, J. Phys. Chem., 98, 11924-11930.507. Horowitz, A., F. Su, and J.G. Calvert, 1978, Int. J. Chem. Kinet., 10, 1099.508. Howard, C.J., 1976, J. Chem. Phys., 65, 4771.509. Howard, C.J., 1979, J. Chem. Phys., 71, 2352-2359.510. Howard, C.J. and K.M. Evenson, 1976, J. Chem. Phys., 64, 4303.511. Howard, C.J. and K.M. Evenson, 1976, J. Chem. Phys., 64, 197.512. Howard, C.J. and K.M. Evenson, 1977, Geophys. Res. Lett., 4, 437-440.513. Howard, C.J. and B.J. Finlayson-Pitts, 1980, J. Chem. Phys., 72, 3842-3843.514. Howard, M.J. and I.W.M. Smith, 1981, J. Chem. Soc. Faraday Trans. 2, 77, 997-1008.515. Hoyermann, K., H.G. Wagner, and J. Wolfrum, 1967, Z. Phys. Chem., 55, 72.516. Hoyermann, K., H.G. Wagner, and J. Wolfrum, 1969, Z. Phys. Chem., 63, 193.517. Hsu, D.S.Y., W.M. Shaub, T.L. Burks, and M.C. Lin, 1979, Chem Phys., 44, 143-150.518. Hsu, K.J. and W.B. DeMore, 1994, Geophys. Res. Lett., 21, 805-808.519. Hsu, K.J. and W.B. DeMore, 1995, J. Phys. Chem., 99, 1235-1244.520. Hsu, K.J. and W.B. DeMore, 1995, J. Phys. Chem., 99, 11141-11930.521. Hsu, Y.-C., D.-S. Chen, and Y.-P. Lee, 1987, Int. J. Chem. Kinet., 19 , 1073-1082.
113
522. Huder, K.J. and W.B. DeMore, 1993, Geophys. Res. Lett., 20, 1575-1577.523. Huey, L.G., E.J. Dunlea, and C.J. Howard, 1996, J. Phys. Chem, 100, 6504-6508.524. Huie, R.E. and J.T. Herron, 1974, Chem. Phys. Lett., 27, 411.525. Hunziker, H.E., H. Kneppe, and H.R. Wendt, 1981, J. Photochem., 17, 377.526. Husain, D. and P. Marshall, 1985, Combust. and Flame, 60, 81-87.527. Husain, D., P. Marshall, and J.M.C. Plane, 1985, J. Chem. Soc. Chem. Comm., 1216-1218.528. Husain, D., J.M.C. Plane, and N.K.H. Slater, 1981, J. Chem. Soc. Faraday Trans. 2, 77, 1949.529. Husain, D., J.M.C. Plane, and C.C. Xiang, 1984, J. Chem. Soc. Faraday Trans. 2, 80, 713-728.530. Husain, D. and N.K.H. Slater, 1980, J. Chem. Soc. Faraday Trans. 2, 76, 606-619.531. Hynes, A.J., R.B. Stocker, A.J. Pounds, T. Mckay, J.D. Bradshaw, J.M. Nicovich, and P.H. Wine, 1995, J. Phys.
Chem., 99, 16967-16975.532. Hynes, A.J. and P.H. Wine, 1987, J. Phys. Chem., 91, 3672.533. Hynes, A.J. and P.H. Wine, 1991, J. Phys. Chem., 95, 1232-1240.534. Hynes, A.J., P.H. Wine, and J.M. Nicovich, 1988, J. Phys. Chem., 92, 3846-3852.535. Hynes, A.J., P.H. Wine, and A.R. Ravishankara, 1986, J. Geophys. Res., 91, 815-820.536. Hynes, A.J., P.H. Wine, and D.H. Semmes, 1986, J. Phys. Chem., 90, 4148-4156.537. Iannuzzi, M.P., J.B. Jeffries, and F. Kaufman, 1982, Chem. Phys. Lett., 87, 570-574.538. Iannuzzi, M.P. and F. Kaufman, 1981, J. Phys. Chem., 85, 2163.539. Igoshin, V.I., L.V. Kulakov, and A.I. Nikitin, 1974, Sov. J. Quant. Electron., 3, 306.540. Imamura, T. and N. Washida, 1995, Laser Chem., 16, 43-51.541. Ingold, K.U., 1988, J. Phys. Chem., 92, 4568-4569.542. Inoue, G. and H. Akimoto, 1981, J. Chem. Phys., 84, 425-433.543. Ishikawa, Y., K. Sugawara, and S. Sato, Abstracts of Papers , Vol. 1. 1979, ACS/CSJ Chemical Congress.544. Iwata, R., R.A. Ferrieri, and A.P. Wolf, 1986, J. Phys. Chem., 90, 6722-6726.545. Iyer, R.S. and F.S. Rowland, 1980, Geophys. Res. Lett., 7, 797-800.546. Izod, T.P.J. and R.P. Wayne, 1968 , Proc. Roy. Soc. A, 308, 81-94.547. Jaffe, S. and F.S. Klein, 1966, Trans. Faraday Soc., 62, 2150-2157.548. Jaffe, S. and W.K. Mainquist, 1980, J. Phys. Chem, 84, 3277.549. James, G.S. and G.P. Glass, 1970, J. Chem. Phys., 50, 2268.550. Japar, S.M., C.H. Wu, and H. Niki, 1974, J. Phys. Chem., 78, 2318.551. Japar, S.M., C.H. Wu, and H. Niki, 1976, J. Phys. Chem., 80, 2057.552. Jayanty, R.K.M., R. Simonaitis, and J. Heicklen, 1976, J. Phys. Chem., 80, 443.553. Jefferson, A., J.M. Nicovich, and P.H. Wine, 1994, J. Phys. Chem., 98, 7128-7135.554. Jemi-Alade, A.A. and B.A. Thrush, 1990, J. Chem. Soc. Faraday Trans. 2, 86, 3355-3363.555. Jenkin, M.E., K.C. Clemitshaw, and R.A. Cox, 1984, J. Chem. Soc. Faraday Trans. 2, 80, 1633-1641.556. Jenkin, M.E. and R.A. Cox, 1985, J. Phys. Chem., 89, 192-199.557. Jenkin, M.E. and R.A. Cox, 1987, Chem. Phys. Lett., 137, 548-552.558. Jenkin, M.E. and R.A. Cox, 1991, J. Phys. Chem., 95, 3229.559. Jenkin, M.E., R.A. Cox, G. Hayman, and L.J. Whyte, 1988, J. Chem. Soc. Faraday Trans. 2, 84, 913.560. Jenkin, M.E., R.A. Cox, and G.D. Hayman, 1991, Chem. Phys. Lett., 177, 272-278.561. Jenkin, M.E., R.A. Cox, A. Mellouki, G. Le Bras, and G. Poulet, 1990, J. Phys. Chem., 94, 2927-2934.562. Jensen, N.R., D.R. Hanson, and C.J. Howard, 1994, J. Phys. Chem., 98, 8574-8579.563. Jensen, N.R., J. Hjorth, C. Lohse, H. Skov, and G. Restelli, 1991, Atmos. Environ., 24A, 1897-1904.564. Jensen, N.R., J. Hjorth, C. Lohse, H. Skov, and G. Restelli, 1992, J. Atmos. Chem., 14, 95-108.565. Jeong, K.M., K.J. Hsu, J.B. Jeffries, and F. Kaufman, 1984, J. Phys. Chem., 88, 1222-1226.566. Jeong, K.M. and F. Kaufman, 1979, Geophys. Res. Lett., 6, 757-759.567. Jeong, K.M. and F. Kaufman, 1982, J. Phys. Chem., 86, 1808-1815.568. Jeoung, S.C., K.Y. Choo, and S.W. Benson, 1991, J. Phys. Chem., 95, 7282-7290.569. Jiang, Z., P.H. Taylor, and B. Dellinger, 1992, J. Phys. Chem., 96, 8961-8964.570. Johnston, H.S., E.D. Morris Jr., and J. Van den Bogaerde, 1969, J. Am. Chem. Soc., 91, 7712.571. Johnston, H.S. and Y.-S. Tao, 1951, J. Am. Chem Soc., 73, 2948.572. Jolly, G.S., D.J. McKenney, D.L. Singleton, G. Paraskevopoulos, and A.R. Bossard, 1986, J. Phys. Chem., 90,
6557-6562.573. Jolly, G.S., G. Paraskevopoulos, and D.L. Singleton, 1985, Chem. Phys. Lett., 117, 132-137.574. Jonah, C.D., W.A. Mulac, and P. Zeglinski, 1984, J. Phys. Chem., 88, 4100-4104.575. Jones, B.M.R., J.P. Burrows, R.A. Cox, and S.A. Penkett, 1982, Chem. Phys. Lett., 88, 372-376.576. Jourdain, J.L., G. Le Bras, and J. Combourieu, 1978, J. Chim. Phys., 75, 318-323.577. Jourdain, J.L., G. Le Bras, and J. Combourieu, 1979, Int. J. Chem. Kinet., 11, 569-577.578. Jourdain, J.L., G. Le Bras, and J. Combourieu, 1981, Chem. Phys. Lett., 78, 483.579. Jourdain, J.L., G. Poulet, and G. Le Bras, 1982, J. Chem. Phys., 76, 5827-5833.580. Jungkamp, T.P., A. Kukui, and R.N. Schindler, 1995, Ber. Bunsenges. Phys. Chem., 99, 1057-1066.581. Kaiser, E.W. and S.M. Japar, 1977, Chem. Phys. Lett., 52, 121.582. Kaiser, E.W. and S.M. Japar, 1978, Chem. Phys. Lett., 54, 265.583. Kaiser, E.W., I.M. Lorkovic, and T.J. Wallington, 1990, J. Phys. Chem., 94, 3352-3354.584. Kaiser, E.W., L. Rimai, E. Schwab, and E.C. Lim, 1992, J. Phys. Chem., 96, 303-306.585. Kaiser, E.W. and T.J. Wallington, 1994, J. Phys. Chem., 98, 5679-5685.
114
586. Kan, C.S., J.G. Calvert, and J.H. Shaw, 1980, J. Phys. Chem., 84, 3411.587. Kan, C.S., J.G. Calvert, and J.H. Shaw, 1981, J. Phys. Chem., 85, 1126-1132.588. Kan, C.S., R.D. McQuigg, M.R. Whitbeck, and J.G. Calvert, 1979, Int. J. Chem. Kinet., 11, 921.589. Kaufman, F., N.J. Gerri, and D.A. Pascale, 1956, J. Chem. Phys., 24, 32-34.590. Kelly, C., J. Treacy, H.W. Sidebottom, and O.J. Nielsen, 1993, Chem. Phys. Lett., 207, 498-503.591. Kenner, R.D., K.R. Ryan, and I.C. Plumb, 1993, Geophys. Res. Lett., 20, 1571-1574.592. Kerr, J.A. and D.W. Sheppard, 1981, Environ. Sci. and Technol., 15, 960.593. Kerr, J.A. and D.W. Stocker, 1986, J. Atmos. Chem., 4, 253-262.594. Keyser, L.F., 1978, J. Chem. Phys., 69, 214.595. Keyser, L.F., 1979, J. Phys. Chem., 83, 645-648.596. Keyser, L.F., 1980, J. Phys. Chem., 84 , 1659-1663.597. Keyser, L.F., 1980, J. Phys. Chem., 84, 11-14.598. Keyser, L.F., 1981, J. Phys. Chem., 85, 3667-3673.599. Keyser, L.F., 1982, J. Phys. Chem., 86, 3439-3446.600. Keyser, L.F., 1983, J. Phys. Chem., 87, 837-841.601. Keyser, L.F., 1984, J. Phys. Chem., 88, 4750-4758.602. Keyser, L.F., 1986, J. Phys. Chem., 90, 2994-3003.603. Keyser, L.F., 1988, J. Phys. Chem., 92, 1193-1200.604. Keyser, L.F., K.Y. Choo, and M.T. Leu, 1985, Int. J. Chem. Kinet., 17, 1169-1185.605. Khursan, S.L., V.S. Martem'yanov, and E.T. Denisov, 1990, Kinet. and Catal. (translation from Russian), 31, 899-
907.606. Kinnison, D.J., W. Mengon, and J.A. Kerr, 1996, J. Chem. Soc. Faraday Trans., 92, 369-372.607. Kircher, C.C. and S.P. Sander, 1984, J. Phys. Chem., 88, 2082-91.608. Kirchner, F., F. Zabel, and K.H. Becker, 1990, Ber. Bunsenges. Phys. Chem., 94, 1379-1382.609. Kirchner, K., D. Helf, P. Ott, and S. Vogt, 1990, Ber. Bunsenges. Phys. Chem., 94, 77-83.610. Kistiakowsky, G.B. and G.G. Volpi, 1957, J. Chem. Phys., 27, 1141-1149.611. Kistiakowsky, G.B. and G.G. Volpi, 1958, J. Chem. Phys., 28, 665.612. Kita, D. and D.H. Stedman, 1982, J. Chem. Soc. Faraday Trans. 2, 78, 1249-1259.613. Klais, O., P.C. Anderson, A.H. Laufer, and M.J. Kurylo, 1979, Chem. Phys. Lett., 66, 598.614. Klais, O., A.H. Laufer, and M.J. Kurylo, 1980, J. Chem. Phys., 73, 2696-2699.615. Kleinermanns, K. and A.C. Luntz, 1981, J. Phys. Chem., 85, 1966.616. Klemm, R.B., 1979, J. Chem. Phys., 71, 1987.617. Klemm, R.B., E.G. Skolnik, and J.V. Michael, 1980, J. Chem. Phys., 72, 1256.618. Klemm, R.B. and L.J. Stief, 1974, J. Chem. Phys., 61, 4900.619. Klopffer, W., R. Frank, E.G. Kohl, and F. Haag, 1986, Chemiker-Zeitung, 110, 57-61.620. Knickelbein, M.B., K.L. Marsh, O.E. Ulrich, and G.E. Busch, 1987, J. Chem. Phys., 87, 2392-2393.621. Knox, J.H., 1955, Chemistry and Industry, 1631.622. Knox, J.H., 1962, Trans. Faraday Soc., 58, 275.623. Knox, J.H. and R.L. Nelson, 1959, Trans. Far. Soc., 55, 937.624. Ko, T. and A. Fontijn, 1991, J. Phys. Chem., 95, 3984-3987.625. Kohse-Höinghaus, K. and F. Stuhl, 1980, J. Chem. Phys., 72, 3720-3726.626. Kolb, C.E., J.T. Jayne, D.R. Worsnop, M.J. Molina, R.F. Meads, and A.A. Viggiano, 1994, J. Am. Chem. Soc.,
116, 10314-10315.627. Kompa, K.L. and J. Wanner, 1972, Chem. Phys. Lett., 12, 560.628. Koppe, S., T. Laurent, P.D. Naik, H.-R. Volpp, J. Wolfrum, T. Arusi-Parpar, I. Bar, and S. Rosenwaks, 1993, Chem.
Phys. Lett., 214, 546-552.629. Kukui, A., T.P.W. Jungkamp, and R.N. Schindler, 1994, Ber. Bunsenges. Phys. Chem., 98, 1619-1621.630. Kukui, A., U. Kirchner, T. Benter, and R.N. Schindler, 1996, Ber. Bunsenges. Phys. Chem., 100, 455-461.631. Kukui, A.S., T.P.W. Jungkamp, and R.N. Schindler, 1994, Ber. Bunsenges. Phys. Chem., 98, 1298-1302.632. Kumaran, S.S., K.P. Lim, and J.V. Michael, 1994, J. Chem. Phys., 101, 9487-9498.633. Kurasawa, H. and R. Lesclaux, 1979, Chem. Phys. Lett., 66, 602.634. Kurasawa, H. and R. Lesclaux, paper presented at the 14th Informal Photochemistry Conference, 1980, Newport
Beach, CA.635. Kurasawa, H. and R. Lesclaux, 1980, Chem. Phys. Lett., 72, 437.636. Kurylo, M.J., 1973, Chem. Phys. Lett., 23, 467-471.637. Kurylo, M.J., 1977, Chem. Phys. Lett., 49, 467.638. Kurylo, M.J., 1978, Chem. Phys. Lett., 58, 233.639. Kurylo, M.J., 1978, Chem. Phys. Lett., 58, 238-242.640. Kurylo, M.J., P.C. Anderson, and O. Klais, 1979, Geophys. Res. Lett., 6, 760-762.641. Kurylo, M.J. and W. Braun, 1976, Chem. Phys. Lett., 37, 232.642. Kurylo, M.J., K.D. Cornett, and J.L. Murphy, 1982, J. Geophys. Res., 87, 3081-3085.643. Kurylo, M.J., P. Dagaut, T.J. Wallington, and D.M. Neuman, 1987, Chem. Phys. Lett., 139, 513-518.644. Kurylo, M.J., O. Klais, and A.H. Laufer, 1981, J. Phys. Chem., 85, 3674-3678.645. Kurylo, M.J. and G.L. Knable, 1984, J. Phys. Chem., 88, 3305-3308.646. Kurylo, M.J., G.L. Knable, and J.L. Murphy, 1983, Chem. Phys. Lett., 95, 9-12.647. Kurylo, M.J. and A.H. Laufer, 1979, J. Chem. Phys., 70, 2032-2033.
115
648. Kurylo, M.J., J.L. Murphy, G.S. Haller, and K.D. Cornett, 1982, Int. J. Chem. Kinet, 14, 1149-1161.649. Kurylo, M.J., J.L. Murphy, and G.L. Knable, 1983, Chem. Phys. Lett., 94, 281-284.650. Kurylo, M.J., P.A. Ouellette, and A.H. Laufer, 1986, J. Phys. Chem., 90, 437-440.651. Kurylo, M.J. and T.J. Wallington, 1987, Chem. Phys. Lett., 138, 543-547.652. Kurylo, M.J., T.J. Wallington, and P.A. Ouellette, 1987, J. Photochem., 39, 201-215.653. Lafage, C., J.-F. Pauwels, M. Carlier, and P. Devolder, 1987, J. Chem. Soc. Faraday Trans. 2, 83, 731-739.654. Lam, L., D.R. Hastie, B.A. Ridley, and H.I. Schiff, 1981, J. Photochem., 15, 119-130.655. Lamb, J.J., L.T. Molina, C.A. Smith, and M.J. Molina, 1983, J. Phys. Chem., 87, 4467-4470.656. Lancar, I., G. Laverdet, G. Le Bras, and G. Poulet, 1991, Int. J. Chem. Kinet., 23, 37-45.657. Lancar, I., G. Le Bras, and G. Poulet, 1993, J. Chim. Physique, 90, 1897-1908.658. Lancar, I., A. Mellouki, and G. Poulet, 1991, Chem. Phys. Lett., 177, 554-558.659. Langford, A.O. and C.B. Moore, 1984, J. Chem. Phys., 80, 4211-4221.660. Larichev, M., F. Maguin, G. Le Bras, and G. Poulet, 1995, J. Phys. Chem., 99, 15911-15918.661. Laszlo, B., R.E. Huie, M.J. Kurylo, and A.W. Miziolek, 1997, J. Geophys. Res., 102, 1523-1532.662. Laszlo, B., M.J. Kurylo, and R.E. Huie, 1995, J. Phys. Chem., 99, 11701-11707.663. Laverdet, G., G. Le Bras, A. Mellouki, and G. Poulet, 1990, Chem. Phys. Lett., 172, 430-434.664. Lawton, S.A., S.E. Novick, H.P. Broida, and A.V. Phelps, 1977, J. Chem. Phys., 66, 1381-1382.665. Lawton, S.A. and A.V. Phelps, 1978, J. Chem. Phys., 69, 1055-1068.666. Le Bras, G. and J. Combourieu, 1978, Int. J. Chem. Kinet., 10, 1205-1213.667. Le Bras, G., R. Foon, and J. Combourieu, 1980, Chem. Phys. Lett., 73, 357.668. Leck, T.J., J.E. Cook, and J.W. Birks, 1980, J. Chem. Phys., 72, 2364-2373.669. Lee, J.H., J.V. Michael, W.A. Payne Jr., and L.J. Stief, 1977, J. Chem. Soc. Faraday Trans. 1, 73, 1530-1536.670. Lee, J.H., J.V. Michael, W.A. Payne Jr., and L.J. Stief, 1978, J. Chem. Phys., 69, 350-353.671. Lee, J.H., J.V. Michael, W.A. Payne Jr., and L.J. Stief, 1978, J. Chem. Phys., 69, 3069-3076.672. Lee, J.H. and I.N. Tang, 1980, J. Chem. Phys., 72, 5718-5720.673. Lee, J.H. and I.N. Tang, 1982, J. Chem. Phys., 77, 4459-63.674. Lee, J.H. and I.N. Tang, 1983, J. Chem. Phys., 78, 6646.675. Lee, J.H., I.N. Tang, and R.B. Klemm, 1980, J. Chem. Phys., 72, 1793-1796.676. Lee, J.H., R.B. Timmons, and L.J. Stief, 1976, J. Chem. Phys., 64, 300-305.677. Lee, L.C. and T.G. Slanger, 1978, J. Chem. Phys., 69, 4053-4060.678. Lee, L.C. and T.G. Slanger, 1979, Geophys. Res. Lett., 6, 165-166.679. Lee, Y.-P. and C.J. Howard, 1982, J. Chem. Phys., 77 , 756-763.680. Lee, Y.-P., R.M. Stimpfle, R.A. Perry, J.A. Mucha, K.M. Evenson, D.A. Jennings, and C.J. Howard, 1982, Int. J.
Chem. Kinet., 14, 711-732.681. Lee, Y.-Y., Y.-P. Lee, and N.S. Wang, 1994, J. Chem. Phys., 100, 387-392.682. Leiss, A., U. Schurath, K.H. Becker, and E.H. Fink, 1978, J. Photochem., 8, 211-214.683. Lesclaux, R. and F. Caralp, 1984, Int. J. Chem. Kinet., 16, 1117-1128.684. Lesclaux, R. and M. Demissy, 1977, Nouv. J. Chim., 1, 443.685. Lesclaux, R., A.M. Dognon, and F. Caralp, 1987, J. Photochem. and Photobiol., A41, 1-11.686. Lesclaux, R., P.V. Khe, P. Dezauzier, and J.C. Soulignac, 1975, Chem. Phys. Lett., 35, 493.687. Leu, G.-H. and Y.-P. Lee, 1994, J. Chin. Chem. Soc., 41, 645-649.688. Leu, M.T., 1979, Chem. Phys. Lett., 61, 275-279.689. Leu, M.T., 1979, J. Chem. Phys., 70, 1662-1666.690. Leu, M.T., 1980, Chem. Phys. Lett., 69, 37-39.691. Leu, M.T., 1980, Geophys. Res. Lett., 7, 173-175.692. Leu, M.T., 1984, J. Phys. Chem., 88, 1394-1398.693. Leu, M.T. and W.B. DeMore, 1976, Chem. Phys. Lett., 41, 121-124.694. Leu, M.T. and W.B. DeMore, 1977, Chem. Phys. Lett., 48, 317.695. Leu, M.T. and W.B. DeMore, 1978, J. Phys. Chem., 82, 2049.696. Leu, M.T., S. Hatkeyama, and K.J. Hsu, 1989, J. Phys. Chem., 93, 5778-5784.697. Leu, M.T. and C.L. Lin, 1979, Geophys. Res. Lett., 6, 425-428.698. Leu, M.T. and R.H. Smith, 1981, J. Phys. Chem., 85, 2570-2575.699. Leu, M.T. and R.H. Smith, 1982, J. Phys. Chem., 86, 958-961.700. Leu, M.T. and R.H. Smith, 1982, J. Phys. Chem., 86, 73-81.701. Leu, M.T. and Y.L. Yung, 1987, Geophys. Res. Lett., 14, 949-952.702. Lewis, R.S., S.P. Sander, S. Wagner, and R.T. Watson, 1980, J. Phys. Chem., 84, 2009-2015.703. Lewis, R.S. and R.T. Watson, 1980, J. Phys. Chem., 84, 3495-3503.704. Li, Z., R.R. Friedl, and S.P. Sander, 1995, J. Phys. Chem., 99, 13445-13451.705. Li, Z., R.R. Friedl, and S.P. Sander, 1997, J. Chem. Soc. Farad. Trans., submitted.706. Lightfoot, P.D., R.A. Cox, J.N. Crowley, M. Destriau, G.D. Hayman, M.E. Jenkin, G.K. Moortgat, and F. Zabel,
1992, Atmos. Environ., 26A, 1805-1961.707. Lightfoot, P.D. and A.A. Jemi-Alade, 1991, J.Photochem. and Photobiol. A: Chem., 59, 1-10.708. Lightfoot, P.D., R. Lesclaux, and B. Veyret, 1990, J. Phys. Chem., 94, 700-707.709. Lightfoot, P.D., B. Veyret, and R. Lesclaux, 1988, Chem. Phys. Lett., 150, 120-126.710. Lightfoot, P.D., B. Veyret, and R. Lesclaux, 1990, J. Phys. Chem., 94, 708-714.711. Lii, R.-R., R.A. Gorse Jr., M.C. Sauer Jr., and S. Gordon, 1979, J. Phys. Chem., 83, 1803-1804.
116
712. Lii, R.-R., R.A. Gorse Jr., M.C. Sauer Jr., and S. Gordon, 1980, J. Phys. Chem., 84, 819-821.713. Lii, R.-R., M.C. Sauer Jr., and S. Gordon, 1980, J. Phys. Chem., 84, 817-819.714. Lii, R.-R., M.C. Sauer Jr., and S. Gordon, 1981, J. Phys. Chem., 85, 2833-2834.715. Lilenfeld, H.V. and R.J. Richardson, 1977, J. Chem. Phys., 67, 3991.716. Lin, C.-L., D.A. Parkes, and F. Kaufman, 1970, J. Chem. Phys., 53, 3896-3900.717. Lin, C.L., 1982, Int. J. Chem. Kinet., 14, 593-598.718. Lin, C.L. and W.B. DeMore, 1973, J. Phys. Chem., 77 , 863-869.719. Lin, C.L., M.T. Leu, and W.B. DeMore, 1978, J. Phys. Chem., 82, 1772.720. Lin, Y.-L., N.-S. Wang, and Y.-P. Lee, 1985, Int. J. Chem. Kinet., 17, 1201-1214.721. Lippmann, H.H., B. Jesser, and U. Schurath, 1980, Int. J. Chem. Kinet., 12, 547-554.722. Lissi, E. and J. Heicklen, 1972, J. Photochem., 1, 39-68.723. Littlejohn, D. and H.S. Johnston, 1980, EOS, 61, 966.724. Liu, R., R.E. Huie, and M.J. Kurylo, 1990, J. Phys. Chem., 94, 3247-3249.725. Loewenstein, L.M. and J.G. Anderson, 1984, J. Phys. Chem., 88, 6277-6286.726. Loewenstein, L.M. and J.G. Anderson, 1985, J. Phys. Chem., 89, 5371-5379.727. Lorenz, K., D. Rhasa, R. Zellner, and B. Fritz, 1985, Ber. Bunsenges. Phys. Chem., 89, 341-342.728. Lorenzen-Schmidt, H., R. Weller, and O. Schrems, 1994, Ber. Bunsenges. Phys. Chem., 98, 1622-1629.729. Louge, M.Y. and R.K. Hanson, 1984, Twentieth Symposium (International) on Combustion, 665-672.730. Lovejoy, E.R., D.R. Hanson, and L.G. Huey, 1996, J. Phys. Chem., 100, 19911-19916.731. Lovejoy, E.R., K.S. Kroeger, and A.R. Ravishankara, 1990, Chem. Phys. Lett., 167, 183-187.732. Lovejoy, E.R., T.P. Murrells, A.R. Ravishankara, and C.J. Howard, 1990, J. Phys. Chem., 94, 2386-2393.733. Lovejoy, E.R., A.R. Ravishankara, and C.J. Howard, 1994, Int. J. Chem. Kinet., 26, 551-560.734. Lovejoy, E.R., N.S. Wang, and C.J. Howard, 1987, J. Phys. Chem., 91, 5749-5755.735. Lozovsky, V.A., M.A. Ioffe, and O.M. Sarkisov, 1984, Chem. Phys. Lett., 110, 651-654.736. Lu, E.C.C., R.S. Iyer, and F.S. Rowland, 1986, J. Phys. Chem., 90, 1988-1990.737. Mack, G.P.R. and B. Thrush, 1973, J. Chem. Soc. Faraday Trans. 1, 69, 208.738. Mack, G.P.R. and B. Thrush, 1974, J. Chem. Soc. Faraday Trans. 1, 70, 173-186.739. MacLeod, H., S.M. Aschmann, R. Atkinson, E.C. Tuazon, J.A. Sweetman, A.M. Winer, and J.N. Pitts Jr., 1986, J.
Geophys. Res., 91, 5338.740. MacLeod, H., C. Balestra, J.L. Jourdain, G. Laverdet, and G. Le Bras, 1990, Int. J. Chem. Kinet., 22, 1167-1176.741. MacLeod, H., J.L. Jourdain, G. Poulet, and G. Le Bras, 1984, Atmos. Environ., 18, 2621.742. MacLeod, H., G. Poulet, and G. Le Bras, 1983, J. Chim. Phys., 80, 287.743. Maguin, F., G. Laverdet, G. Le Bras, and G. Poulet, 1992, J. Phys. Chem., 96, 1775-1780.744. Maguin, F., A. Mellouki, G. Laverdet, G. Poulet, and G. Le Bras, 1991, Int. J. Chem. Kinet., 23, 237-245.745. Manning, R. and M.J. Kurylo, 1977, J. Phys. Chem., 81, 291.746. Manning, R.G., W. Braun, and M.J. Kurylo, 1976, J. Chem. Phys., 65, 2609.747. Manzanares, E.R., M. Suto, L.C. Lee, and D. Coffey, 1986, J. Chem. Phys., 85, 5027-5034.748. Margitan, J.J., 1983, J. Phys. Chem., 87, 674-679.749. Margitan, J.J., 1984, J. Phys. Chem., 88, 3638-3643.750. Margitan, J.J., 1984, J. Phys. Chem., 88, 3314-3318.751. Margitan, J.J., F. Kaufman, and J.G. Anderson, 1975, Int. J. Chem. Kinet., Symp. No. 1, 281.752. Margitan, J.J. and R.T. Watson, 1982, J. Phys. Chem., 86, 3819-3824.753. Maricq, M.M. and J.J. Szente, 1993, Chem. Phys. Lett., 213, 449-456.754. Maricq, M.M. and J.J. Szente, 1994, J. Phys. Chem., 98, 2078-2082.755. Maricq, M.M. and J.J. Szente, 1996, J. Phys. Chem., 100, 12374.756. Maricq, M.M., J.J. Szente, E.W. Kaiser, and J. Shi, 1994, J. Phys. Chem., 98, 2083-2089.757. Marinelli, W.J. and H.S. Johnston, 1982, J. Chem. Phys., 77, 1225-1234.758. Martin, D., I. Barnes, and K.H. Becker, 1987, Chem. Phys. Lett., 140, 195.759. Martin, D., J.L. Jourdain, G. Laverdet, and G. Le Bras, 1987, Int. J. Chem. Kinet., 19, 503-512.760. Martin, D., J.L. Jourdain, and G. Le Bras, 1985, Int. J. Chem. Kinet., 17, 1247.761. Martin, D., J.L. Jourdain, and G. Le Bras, 1986, J. Phys. Chem., 90, 4143-4147.762. Martin, J.-P. and G. Paraskevopoulos, 1983, Can. J. Chem., 61, 861-865.763. Martin, L.R., R.B. Cohen, and J.F. Schatz, 1976, Chem. Phys. Lett., 41, 394-396.764. Martinez, R.I. and J.T. Herron, 1978, Int. J. Chem. Kinet., 10, 433.765. Marx, W., F. Bahe, and U. Schurath, 1979, Ber. Bunsenges. Phys. Chem., 83, 225-230.766. Masaki, A., N. Tsunashima, and N. Washida, 1994, Chem. Phys. Lett., 218, 523-528.767. Matsumi, Y., K. Tonokura, Y. Inagaki, and M. Kawasaki, 1993, J. Phys. Chem., 97, 6816-6821.768. Mauldin, R.L., III, J.B. Burkholder, and A.R. Ravishankara, 1992, J. Phys. Chem., 96, 2582-2588.769. Mauldin, R.L., III, A. Wahner, and A.R. Ravishankara, 1993, J. Phys. Chem., 97, 7585-7596.770. McAdam, K., B. Veyret, and R. Lesclaux, 1987, Chem. Phys. Lett., 133, 39-44.771. McCaulley, J.A., S.M. Anderson, J.B. Jeffries, and F. Kaufman, 1985, Chem Phys. Lett., 115, 180.772. McCrumb, J.L. and F. Kaufman, 1972, J. Chem. Phys., 57, 1270-1276.773. McKenzie, A., M.F.R. Mulcahy, and J.R. Steven, 1973, J. Chem. Phys., 59, 3244-3254.774. McLaren, I.A., N.W. Morris, and R.P. Wayne, 1981, J. Photochem., 16, 311-319.775. McNeal, R.J. and G.R. Cook, 1967, J. Chem. Phys., 47, 5385-5389.776. Meier, U., H.H. Grotheer, and T. Just, 1984, Chem. Phys. Lett., 106, 97-101.
117
777. Meier, U., H.H. Grotheer, G. Riekert, and T. Just, 1985, Chem. Phys. Lett., 115, 221-225.778. Meller, R. and G.K. Moortgat, 1995, J. Photochem. Photobio. A: Chem., 86, 15-25.779. Mellouki, A., J.L. Jourdain, and G. Le Bras, 1988, Chem. Phys. Lett., 148, 231-236.780. Mellouki, A., G. Laverdet, L. Jourdain, and G. Poulet, 1989, Int. J. Chem. Kinet., 21, 1161-1172.781. Mellouki, A., G. Le Bras, and G. Poulet, 1987, J. Phys. Chem., 91, 5760-5764.782. Mellouki, A., G. Le Bras, and G. Poulet, 1988, J. Phys. Chem., 92, 2229-2234.783. Mellouki, A., G. Poulet, G. Le Bras, R. Singer, J.P. Burrows, and G.K. Moortgat, 1989, J. Phys. Chem., 93, 8017-
8021.784. Mellouki, A. and A.R. Ravishankara, 1994, Int. J. Chem. Kinet., 26, 355-365.785. Mellouki, A., R.K. Talukdar, A.M.R.P. Bopegedera, and C.J. Howard, 1993, Int. J. Chem. Kinet., 25, 25-39.786. Mellouki, A., R.K. Talukdar, and C.J. Howard, 1994, J. Geophys. Res., 99, 22949-22954.787. Mellouki, A., R.K. Talukdar, A.-M. Schmoltner, T. Gierczak, M.J. Mills, S. Soloman, and A.R. Ravishankara,
1992, Geophys. Res. Lett., 19, 2059-2062.788. Mellouki, A., S. Teton, G. Laverdet, A. Quilgars, and G. Le Bras, 1994, J. Chem. Physique, 91, 473-487.789. Mellouki, A., S. Teton, and G. Le Bras, 1995, Geophys. Res. Lett., 22, 389-392.790. Michael, J.V., J.E. Allen Jr., and W.D. Brobst, 1981, J. Phys. Chem., 85, 4109.791. Michael, J.V., D.G. Keil, and R.B. Klemm, 1985, J. Chem. Phys., 83 , 1630-1636.792. Michael, J.V., R.B. Klemm, W.D. Brobst, S.R. Bosco, and D.F. Nava, 1985, J. Phys. Chem., 89, 3335-3337.793. Michael, J.V. and J.H. Lee, 1977, Chem. Phys. Lett., 51, 303.794. Michael, J.V., J.H. Lee, W.A. Payne, and L.J. Stief, 1978, J. Chem. Phys., 68, 4093.795. Michael, J.V., D.F. Nava, W. Brobst, R.P. Borkowski, and L.J. Stief, 1982, J. Phys. Chem., 86, 81-84.796. Michael, J.V., D.F. Nava, W.A. Payne, J.H. Lee, and L.J. Stief, 1979, J. Phys. Chem., 83, 2818.797. Michael, J.V., D.F. Nava, W.A. Payne, and L.J. Stief, 1979, J. Chem. Phys., 70, 3652.798. Michael, J.V., D.F. Nava, W.A. Payne, and L.J. Stief, 1979, J. Chem. Phys., 70, 1147.799. Michael, J.V. and W.A. Payne, 1979, Int. J. Chem. Kinet., 11, 799.800. Michael, J.V., D.A. Whytock, J.H. Lee, W.A. Payne, and L.J. Stief, 1977, J. Chem. Phys., 67, 3533.801. Michelangeli, D.V., K.-Y. Choo, and M.T. Leu, 1988, Int. J. Chem. Kinet., 20, 915-938.802. Miller, J.C. and R.J. Gordon, 1981, J. Chem. Phys., 75, 5305.803. Miyoshi, A., H. Matsui, and N. Washida, 1994, J. Chem. Phys., 100, 3532-3539.804. Miziolek, A.W. and M.J. Molina, 1978, J. Phys. Chem., 82, 1769.805. Molina, L.T., M.J. Molina, R.A. Stachnik, and R.D. Tom, 1985, J. Phys. Chem., 89, 3779-3781.806. Molina, L.T., J.E. Spencer, and M.J. Molina, 1977, Chem. Phys. Lett., 45, 158-162.807. Molina, M.J., L.T. Molina, and C.A. Smith, 1984, Int. J. Chem. Kinet., 16, 1151-1160.808. Monks, P.S., L.J. Carpenter, S.A. Penkett, G. Ayers, and P. Gregory, 1996, Geophys. Res. Lett., 23, 535.809. Montgomery, J.A., H.H. Michels, and J.S. Francisco, 1994, Chem. Phys. Lett., 220, 391-396.810. Moortgat, G.K., J.P. Burrows, W. Schneider, G.S. Tyndall, and R.A. Cox, 1986, Proceedings of the 4th European
Symposium on Physico-Chemical Behavior of Atmospheric Pollutants, Stresa, Sept. 23-25, 271-281.811. Moortgat, G.K., B. Veyret, and R. Lesclaux, 1989, J. Phys. Chem., 93, 2362-2368.812. Moortgat, G.K., B. Veyret, and R. Lesclaux, 1989, Chem. Phys. Lett., 160, 443-447.813. Morokuma, K. and C. Mugurama, 1994, J. Am. Chem. Soc., 116, 10316-10317.814. Morris, E.D., Jr. and H. Niki, 1971, J. Chem. Phys., 55, 1991-1992.815. Morris, E.D. and H. Niki, 1974, J. Phys. Chem., 78, 1337-1338.816. Morris, E.D., D.H. Stedman, and H. Niki, 1971, J. Am. Chem. Soc., 93, 3570.817. Mors, V., A. Hoffman, W. Malms, and R. Zellner, 1996, Ber. Bunsenges, Phys. Chem., 100, 540-552.818. Muller, D.F. and P.L. Houston, 1981, J. Phys. Chem., 85, 3563-3565.819. Munk, J., P. Pagsberg, E. Ratajczak, and A. Sillesen, 1986, J. Phys. Chem., 90, 2752-2757.820. Murrells, T.P., E.R. Lovejoy, and A.R. Ravishankara, 1990, J. Phys. Chem., 94, 2381-2386.821. Myers, G.H. and R.J. O'Brien Jr., 1970, Ann. N.Y. Acad. Sci., 171, 224-225.822. Nadtochenko, V.A., O.M. Sarkisov, and V.I. Vedeneev, 1979, Doklady Akademii Nauk SSSR, 244, 152.823. Nagase, S., S. Hashimoto, and H. Akimoto, 1988, J. Phys. Chem., 92, 641-644.824. Nangia, P.S. and S.W. Benson, 1980, Int. J. Chem. Kinet., 12, 43.825. Nava, D.F., S.R. Bosco, and L.J. Stief, 1983, J. Chem. Phys., 78, 2443-2448.826. Nava, D.F., W.D. Brobst, and L.J. Stief, 1985, J. Phys. Chem., 89, 4703-4707.827. Nava, D.F., J.V. Michael, and L.J. Stief, 1981, J. Phys. Chem., 85, 1896.828. Nelson, D.D., Jr. and M.S. Zahniser, 1994, J. Phys. Chem., 98, 2101-2104.829. Nelson, D.D., Jr., M.S. Zahniser, and C.E. Kolb, 1992, J. Phys. Chem., 96, 249-253.830. Nelson, D.D., Jr., M.S. Zahniser, and C.E. Kolb, 1993, Geophys. Res. Lett., 20, 197-200.831. Nelson, D.D., M.S. Zahniser, C.E. Kolb, and H. Magid, 1995, J. Phys. Chem., 99, 16301-16306.832. Nelson, H.H. and H.S. Johnston, 1981, J. Phys. Chem., 85, 3891.833. Nelson, H.H., J. Marinelli, and H.S. Johnston, 1981, Chem. Phys. Lett., 78 , 495-499.834. Nelson, L., O. Rattigan, R. Neavyn, H. Sidebottom, J. Treacy, and O.J. Nielsen, 1990, Int. J. Chem. Kinet., 22,
1111-1126.835. Nelson, L., I. Shanahan, H.W. Sidebottom, J. Treacy, and O.J. Nielsen, 1990, Int. J. Chem. Kinet., 22, 577-590.836. Nesbitt, D.J. and S.R. Leone, 1980, J. Chem. Phys., 72, 1722-1732.837. Nesbitt, D.J. and S.R. Leone, 1981, J. Chem. Phys., 75, 4949.838. Nesbitt, F.L., P.S. Monks, W.A. Payne, L.J. Stief, and R. Toumi, 1995, Geophys. Res. Lett., 22, 827-830.
118
839. Nesbitt, F.L., D.F. Nava, W.A. Payne, and L.J. Stief, 1987, J. Phys. Chem., 91, 5337-5340.840. Nesbitt, F.L., W.A. Payne, and L.J. Stief, 1988, J. Phys. Chem., 92, 4030-4032.841. Nicholas, J.E. and R.G.W. Norrish, 1968, Proc. Roy. Soc. A, 307, 391.842. Nickolaisen, S.L., R.R. Friedl, and S.P. Sander, 1994, J. Phys. Chem., 98, 155-169.843. Nickolaisen, S.L., D.W. Veney, and H.E. Cartland, 1994, J. Chem. Phys., 100, 4925-4931.844. Nicovich, J.M., K.D. Kreutter, C.A. van Dijk, and P.H. Wine, 1992, J. Phys. Chem., 96, 2518-2528.845. Nicovich, J.M., K.D. Kreutter, and P.H. Wine, 1990, Int. J Chem. Kinet., 22, 399-414.846. Nicovich, J.M., C.J. Shackelford, and P.H. Wine, 1990, J. Phys. Chem., 94, 2896-2903.847. Nicovich, J.M., S. Wang, and P.H. Wine, 1995, Int. J. Chem. Kinet., 27, 359-368.848. Nicovich, J.M. and P.H. Wine, 1987, J. Phys. Chem., 91, 5118-5123.849. Nicovich, J.M. and P.H. Wine, 1990, Int. J. Chem. Kinet., 22, 379-397.850. Nicovich, J.M., P.H. Wine, and A.R. Ravishankara, 1988, J. Chem. Phys., 89, 5670-5679.851. Nielsen, O.J., 1979, "Chemical Kinetics in the Gas Phase Pulse Radiolysis of Hydrogen Sulfide Systems", No.
Riso-M-2216, Riso National Laboratory.852. Nielsen, O.J., 1991, Chem. Phys. Lett., 187, 286-290.853. Nielsen, O.J., T. Ellermann, E. Bartkiewicz, T.J. Wallington, and M.D. Hurley, 1992, Chem. Phys. Lett., 192, 82-
88.854. Nielsen, O.J., T. Ellermann, J. Sehested, and T.J. Wallington, 1992, J. Phys. Chem., 96, 10875-10879.855. Nielsen, O.J., J. Munk, G. Locke, and T.J. Wallington, 1991, J. Phys. Chem., 95, 8714-8719.856. Nielsen, O.J., J. Munk, P. Pagsberg, and A. Sillesen, 1986, Chem. Phys. Lett., 128, 168-171.857. Nielsen, O.J. and J. Sehested, 1993, Chem. Phys. Lett., 213, 433-441.858. Nielsen, O.J., H.W. Sidebottom, M. Donlon, and J. Treacy, 1991, Chem. Phys. Lett., 178, 163-170.859. Nielsen, O.J., H.W. Sidebottom, L. Nelson, O. Rattigan, J.J. Treacy, and D.J. O'Farrell, 1990, Int. J. Chem. Kinet.,
22, 603-612.860. Nielsen, O.J., H.W. Sidebottom, L. Nelson, J.J. Treacy, and D.J. O'Farrell, 1989, Int. J. Chem. Kinet., 21, 1101-
1112.861. Niki, H., E.E. Daby, and B. Weinstock, 1969, Twelfth Symposium (International) on Combustion, The Combustion
Institute, pp. 277.862. Niki, H., P.D. Maker, L.P. Breitenbach, and C.M. Savage, 1978, Chem. Phys. Lett., 57, 596.863. Niki, H., P.D. Maker, C.M. Savage, and L.P. Breitenbach, 1978, J. Phys. Chem., 82, 132.864. Niki, H., P.D. Maker, C.M. Savage, and L.P. Breitenbach, 1980, Int. J. Chem. Kinet., 12, 1001-1012.865. Niki, H., P.D. Maker, C.M. Savage, and L.P. Breitenbach, 1980, Chem. Phys. Lett., 73, 43-46.866. Niki, H., P.D. Maker, C.M. Savage, and L.P. Breitenbach, 1981, J. Phys. Chem., 85, 877.867. Niki, H., P.D. Maker, C.M. Savage, and L.P. Breitenbach, 1982, J. Phys. Chem., 86, 3825.868. Niki, H., P.D. Maker, C.M. Savage, and L.P. Breitenbach, 1983, J. Phys. Chem., 87, 2190-2193.869. Niki, H., P.D. Maker, C.M. Savage, and L.P. Breitenbach, 1984, J. Phys. Chem., 88, 2116-2119.870. Niki, H., P.D. Maker, C.M. Savage, and L.P. Breitenbach, 1985, J. Phys. Chem., 89, 588.871. Nip, W.S., D.L. Singleton, and R.J. Cvetanovic, 1981, J. Am. Chem. Soc., 103, 3526.872. Nip, W.S., D.L. Singleton, R. Overend, and G. Paraskevopoulos, 1979, J. Phys. Chem., 83, 2440-2443.873. Noxon, J.F., 1970, J. Chem. Phys., 52, 1852-1873.874. O'Brien, R.J., Jr. and G.H. Myers, 1970, J. Chem. Phys., 53, 3832-3835.875. Ogren, P.J., T.J. Sworski, C.J. Hochanadel, and J.M. Cassel, 1982, J. Phys. Chem., 86, 238-242.876. Ogryzlo, E.A., R. Paltenghi, and K.D. Bayes, 1981, Int. J. Chem. Kinet., 13, 667-675.877. Ohmori, K., K. Yamasaki, and H. Matsui, 1993, Bull. Chem. Soc. Jpn., 66, 51-56.878. Olbregts, J., G. Brasseur, and E.J. Arijs, 1984, J. Photochem., 24, 315-322.879. Ongstad, A.P. and J.W. Birks, 1984, J. Chem. Phys., 81, 3922-3930.880. Ongstad, A.P. and J.W. Birks, 1986, J. Chem. Phys., 85, 3359-3368.881. Orkin, V.L., R.E. Huie, and M.J. Kurylo, 1996, J. Phys. Chem., 100, 8907-8912.882. Orkin, V.L. and V.G. Khamaganov, 1993, J. Atmos. Chem., 16, 169-178.883. Orkin, V.L. and V.G. Khamaganov, 1993, J. Atmos. Chem., 16, 157-167.884. Orkin, V.L., V.G. Khamaganov, A.G. Guschin, R.E. Huie, and M.J. Kurylo, paper presented at the International
Symposium on Gas Kinetics, 1994, Dublin.885. Orkin, V.L., V.G. Khamaganov, A.G. Guschin, R.E. Huie, and M.J. Kurylo, 1997, J. Phys. Chem. A, 101, 174-
178.886. Orlando, J.J., G.S. Tyndall, and T.J. Wallington, 1996, J. Phys. Chem., 100, 7026-7033.887. Orlando, J.J., G.S. Tyndall, T.J. Wallington, and M. Dill, 1996, Int. J. Chem. Kinet., 28, 433-442.888. Overend, R. and G. Paraskevopoulos, 1978, J. Phys. Chem., 82, 1329-1333.889. Overend, R.P. and G. Paraskevopoulos, 1977, Chem. Phys. Lett., 49, 109.890. Overend, R.P., G. Paraskevopoulos, and R.J. Cvetanovic, 1975, Canad. J. Chem., 53, 3374-3382.891. Pagsberg, P.B., J. Erikson, and H.C. Christensen, 1979, J. Phys. Chem., 83, 582.892. Paraskevopoulos, G. and R.S. Irwin, paper presented at the XV Informal Conference on Photochemistry, 1982,
Stanford, CA.893. Paraskevopoulos, G. and R.S. Irwin, 1984, J. Chem. Phys., 80, 259-266.894. Paraskevopoulos, G., D.L. Singleton, and R.S. Irwin, 1981, J. Phys. Chem., 85, 561.895. Park, C.R. and J.R. Wiesenfeld, 1991, Chem. Phys. Lett., 186, 170-176.896. Park, J. and M.C. Lin, 1996, J. Phys. Chem., 100, 3317-3319.
119
897. Parkes, D.A., 1977, Int. J. Chem. Kinet., 9, 451.898. Parrish, D.D. and D.R. Herschbach, 1973, J. Am. Chem. Soc., 95, 6133.899. Pate, C.T., R. Atkinson, and J.N. Pitts Jr., 1976, J. Environ. Sci. Health, A11, 1.900. Pate, C.T., B.J. Finlayson, and J.N. Pitts Jr., 1974, J. Am. Chem. Soc., 96, 6554.901. Patrick, R. and D.M. Golden, 1984, J. Phys. Chem., 88, 491-495.902. Paukert, T.T. and H.S. Johnston, 1972, J. Chem. Phys., 56, 2824-2838.903. Pavanaja, U.B., H.P. Upadhyaya, A.V. Sapre, K.V.S.R. Rao, and J.P. Mittal, 1994, J. Chem. Soc. Faraday. Trans.,
90, 825-829.904. Payne, W.A., J. Brunning, M.B. Mitchell, and L.J. Stief, 1988, Int. J. Chem. Kinet., 20, 63-74.905. Payne, W.A., L.J. Stief, and D.D. Davis, 1973, J. Am. Chem. Soc., 95, 7614.906. Peeters, J., J. Vertommen, and I. Langhans, 1992, Ber. Bunsenges. Phys. Chem., 96, 431-436.907. Penzhorn, R.D. and C.E. Canosa, 1983, Ber. Bunsenges. Phys. Chem., 87, 648-654.908. Perry, R.A., R. Atkinson, and J.N. Pitts Jr., 1976, J. Chem. Phys., 64, 1618.909. Perry, R.A., R. Atkinson, and J.N. Pitts Jr., 1976, J. Chem. Phys., 64, 3237.910. Perry, R.A., R. Atkinson, and J.N. Pitts Jr., 1977, J. Chem. Phys., 67, 5577.911. Perry, R.A. and C.F. Melius, 1984, Twentieth Symposium (International) on Combustion, The Combustion
Institute, pp. 639-646.912. Persky, A., 1996, J. Phys. Chem., 100, 689-693.913. Phillips, L.F., 1978, Chem. Phys. Lett., 57, 538-539.914. Phillips, L.F. and H.I. Schiff, 1962, J. Chem. Phys., 36, 1509-1517.915. Piper, L.G., G.E. Caledonia, and J.P. Konnealy, 1981, J. Chem. Phys., 74, 2888.916. Plane, J.M.C. and D. Husain, 1986, J. Chem. Soc. Faraday 2, 82, 2047-2052.917. Plane, J.M.C., C.-F. Nien, M.R. Allen, and M. Helmer, 1993, J. Phys. Chem., 97, 4459-4467.918. Plane, J.M.C. and B. Rajasekhar, 1989, J. Phys. Chem., 93, 3135-3140.919. Platz, J., O.J. Nielson, J. Sehested, and T.J. Wallington, 1995, J. Phys. Chem., 99, 6570-6579.920. Plumb, I.C. and K.R. Ryan, 1982, Int. J. Chem. Kinet., 14, 861-874.921. Plumb, I.C. and K.R. Ryan, 1982 , Chem. Phys. Lett., 92, 236-238.922. Plumb, I.C., K.R. Ryan, J.R. Steven, and M.F.R. Mulcahy, 1979, Chem. Phys. Lett., 63, 255.923. Plumb, I.C., K.R. Ryan, J.R. Steven, and M.F.R. Mulcahy, 1981, J. Phys. Chem., 85, 3136.924. Plumb, I.C., K.R. Ryan, J.R. Steven, and M.F.R. Mulcahy, 1982, Int. J. Chem. Kinet., 14, 183.925. Posey, J., J. Sherwell, and M. Kaufman, 1981, Chem. Phys. Lett., 77, 476-479.926. Poulet, G., I.T. Lancar, G. Laverdet, and G. Le Bras, 1990, J. Phys. Chem., 94, 278-284.927. Poulet, G., G. Laverdet, J.L. Jourdain, and G. Le Bras, 1984, J. Phys. Chem., 88, 6259-6263.928. Poulet, G., G. Laverdet, and G. Le Bras, 1981, J. Phys. Chem., 85, 1892.929. Poulet, G., G. Laverdet, and G. Le Bras, 1983, Chem. Phys. Lett., 94, 129-132.930. Poulet, G., G. Laverdet, and G. Le Bras, 1984, J. Chem. Phys., 80, 1922-1928.931. Poulet, G., G. Laverdet, and G. Le Bras, 1986, J. Phys. Chem., 90, 159-165.932. Poulet, G., G. Le Bras, and J. Combourieu, 1974, J. Chim. Physique, 71, 101.933. Poulet, G., G. Le Bras, and J. Combourieu, 1978, J. Chem. Phys., 69, 767.934. Poulet, G., G. Le Bras, and J. Combourieu, 1980, Geophys. Res. Lett., 7, 413-414.935. Poulet, G., H. Zagogianni, and G. Le Bras, 1986, Int. J. Chem. Kinet., 18, 847-859.936. Pritchard, H.O., J.B. Pyke, and A.F. Trotman-Dickenson, 1954, J. Amer. Chem. Soc., 76, 1201.937. Pritchard, H.O., J.B. Pyke, and A.F. Trotman-Dickenson, 1955, J. Amer. Chem. Soc., 77, 2629.938. Radford, H.E., 1980, Chem. Phys. Lett., 71, 195.939. Radford, H.E., K.M. Evenson, and D.A. Jennings, 1981, Chem. Phys. Lett., 78, 589.940. Rahman, M.M., E. Becker, T. Benter, and R.N. Schindler, 1988, Ber. Bunsenges. Phys. Chem., 92, 91-100.941. Rahman, M.M., E. Becker, U. Wille, and R.N. Schindler, 1992, Ber. Bunsenges. Phys. Chem., 96, 783-787.942. Raja, N., P.K. Arora, and J.P.S. Chatha, 1986, Int. J. Chem. Kinetics, 18, 505-512.943. Rattigan, O.V., R.A. Cox, and R.L. Jones, 1995, J. Chem. Soc. Faraday Soc. Trans., 91, 4189-4197.944. Ravishankara, A.R. and D.D. Davis, 1978, J. Phys. Chem., 82, 2852-2853.945. Ravishankara, A.R., D.D. Davis, G. Smith, G. Tesi, and J. Spencer, 1977, Geophys. Res. Lett., 4, 7.946. Ravishankara, A.R., F.L. Eisele, and P.H. Wine, 1982, J. Phys. Chem., 86, 1854-1958.947. Ravishankara, A.R., F.L. Eisele, and P.H. Wine, 1983, J. Chem. Phys., 78, 1140-1144.948. Ravishankara, A.R., N.M. Kreutter, R.C. Shah, and P.H. Wine, 1980, Geophys. Res. Lett., 7, 861-864.949. Ravishankara, A.R., J.M. Nicovich, R.L. Thompson, and F.P. Tully, 1981, J. Phys. Chem., 85, 2498-2503.950. Ravishankara, A.R., G.J. Smith, R.T. Watson, and D.D. Davis, 1977, J. Phys. Chem., 81, 2220.951. Ravishankara, A.R., S. Solomon, A.A. Turnipseed, and R.F. Warren, 1993, Science, 259, 194-199.952. Ravishankara, A.R. and R.L. Thompson, 1983, Chem. Phys. Lett., 99, 377.953. Ravishankara, A.R., A.A. Turnipseed, N.R. Jensen, S. Barone, M. Mills, C.J. Howard, and S. Solomon, 1994,
Science, 263, 71-75.954. Ravishankara, A.R. and P.H. Wine, 1980, J. Chem. Phys., 72, 25-30.955. Ravishankara, A.R., P.H. Wine, and A.O. Langford, 1979, J. Chem. Phys., 70, 984-989.956. Ravishankara, A.R., P.H. Wine, and A.O. Langford, 1979, Chem. Phys. Lett., 63, 479.957. Ravishankara, A.R., P.H. Wine, and J.M. Nicovich, 1983, J. Chem. Phys., 78, 6629-6639.958. Ravishankara, A.R., P.H. Wine, and J.R. Wells, 1985, J. Chem. Phys., 83, 447-448.959. Ravishankara, A.R., P.H. Wine, J.R. Wells, and R.L. Thompson, 1985, Int. J. Chem. Kinet., 17, 1281-1297.
120
960. Ray, A., I. Vassalli, G. Laverdet, and G. Le Bras, 1996, J. Phys. Chem., 100, 8895-8900.961. Ray, G.W., L.F. Keyser, and R.T. Watson, 1980, J. Phys. Chem., 84, 1674-1681.962. Ray, G.W. and R.T. Watson, 1981, J. Phys. Chem., 85, 2955-2960.963. Ray, G.W. and R.T. Watson, 1981, J. Phys. Chem., 85 , 1673-1676.964. Reilly, J.D., J.H. Clark, C.B. Moore, and G.C. Pimentel, 1978, J. Chem. Phys., 69, 4381.965. Reimann, B. and F. Kaufman, 1978, J. Chem. Phys., 69, 2925.966. Reiner, T. and F. Arnold, 1993, Geophys. Res. Lett., 20, 2659-2662.967. Reiner, T. and F. Arnold, 1994, J. Chem. Phys., 101, 7399-7407.968. Rhasa, D., 1983, Diplomarbeit, Univ. of Gottingen, FRG.969. Richardson, R.J., 1975, J. Phys. Chem., 79, 1153-1158.970. Robertshaw, J.S. and I.W.M. Smith, 1980, Int. J. Chem. Kinet., 12, 729.971. Roehl, C.M., D. Bauer, and G.K. Moortgat, 1996, J. Phys. Chem., 100, 4038-4047.972. Roscoe, J.M., 1982, Int. J. Chem. Kinet., 14, 471-478.973. Roth, P., R. Lohr, and H.D. Hermanns, 1980, Ber. Bunsenges. Phys. Chem., 84, 835-840.974. Rowland, F.S., H. Sato, H. Khwaja, and S.M. Elliott, 1986, J. Phys. Chem., 90, 1985 -1988.975. Rowley, D.M., M.H. Harwood, R.A. Freshwater, and R.L. Jones, 1996, J. Phys. Chem., 100, 3020-3029.976. Rozenshtein, V.B., Y.M. Gershenzon, S.O. Il'in, and O.P. Kishkovitch, 1984, Chem. Phys. Lett., 112, 473-478.977. Rust, F. and C.M. Stevens, 1980, Int. J. Chem. Kinet., 12, 371-377.978. Ryan, K.R. and I.C. Plumb, 1984, Int. J. Chem. Kinet., 16, 591-602.979. Saathoff, H. and R. Zellner, 1993, Chem. Phys. Lett., 206, 349-354.980. Sahetchian, K.A., A. Heiss, and R. Rigny, 1982, Can. J. Chem., 60, 2896-2902.981. Sahetchian, K.A., A. Heiss, and R. Rigny, 1987, J. Phys. Chem., 91, 2382-2386.982. Sander, S.P., 1984, J. Phys. Chem., 88, 6018-6021.983. Sander, S.P., 1986, J. Phys. Chem., 90, 2194-2199.984. Sander, S.P. and R.R. Friedl, 1989, J. Phys. Chem., 93, 4764-4771.985. Sander, S.P. and C.C. Kircher, 1986, Chem. Phys. Lett., 126, 149-152.986. Sander, S.P., M. Peterson, R.T. Watson, and R. Patrick, 1982, J. Phys. Chem., 86, 1236-1240.987. Sander, S.P. and R.T. Watson, 1980, J. Phys. Chem., 84, 1664.988. Sander, S.P. and R.T. Watson, 1981, J. Phys. Chem., 85, 2960.989. Sander, S.P. and R.T. Watson, 1981, Chem. Phys. Lett., 77, 473-475.990. Sander, S.P. and R.T. Watson, 1981, J. Phys. Chem., 85, 4000.991. Sanders, N.D., J.E. Butler, and J.R. McDonald, 1980, J. Chem. Phys., 73, 5381-5383.992. Sanders, N.D., J.E. Butler, L.R. Pasternack, and J.R. McDonald, 1980, Chem. Phys., 48, 203.993. Sanhueza, E. and J. Heicklen, 1975, J. Phys. Chem., 79, 7-11.994. Sanhueza, E., R. Simonaitis, and J. Heicklen, 1979, Int. J. Chem. Kinet., 11, 907.995. Sarkisov, O.M., S.G. Cheskis, and E.A. Sviridenkov, 1978, Bull. Acad. Sci. USSR Chem., Ser. 27, 2336.996. Satyapal, S., J. Park, R. Bersohn, and B. Katz, 1989, J. Chem. Phys., 91, 6873-6879.997. Saunders, S.M., K.J. Hughes, M.J. Pilling, D.L. Baulch, and P.I. Smurthwaite, paper presented at the Optical
Methods in Atmospheric Chemistry, 1992, 1715, Berlin SPIE, 88-89.998. Sawerysyn, J.P., A. Talhaoui, B. Meriaux, and P. Devolder, 1992, Chem. Phys. Lett., 198, 197-199.999. Schiffman, A., D.D. Nelson, M.S. Robinson, and D.J. Nesbitt, 1991, J. Phys. Chem., 95, 2629-2636.1000. Schindler, R.N. and T. Benter, 1988, Ber. Bunsenges. Phys. Chem., 92, 558.1001. Schindler, R.N., J. Dethlefs, and M. Schmidt, 1996, Ber. Bunsenges. Phys. Chem., 100, 1242-1249.1002. Schmidt, C. and H.I. Schiff, 1973, Chem. Phys. Lett., 23, 339-342.1003. Schmidt, V., G.Y. Zhu, K.H. Becker, and E.H. Fink, 1985, Ber. Bunsenges. Phys. Chem., 89, 321.1004. Schmoltner, A.-M., P.M. Chu, R.J. Brudzynski, and Y.T. Lee, 1989, J. Chem. Phys., 91, 6926-6936.1005. Schmoltner, A.M., R.K. Talukdar, R.F. Warren, A. Mellouki, L. Goldfarb, T. Gierczak, S.A. McKeen, and A.R.
Ravishankara, 1993, J. Phys. Chem., 97, 8976-8982.1006. Schneider, W.F. and T.J. Wallington, 1994, J. Phys. Chem., 98, 7448-7451.1007. Schonle, G., M.M. Rahman, and R.N. Schindler, 1987, Ber. Bunsenges. Phys. Chem., 91, 66-75.1008. Schurath, U., H.H. Lippmann, and B. Jesser, 1981, Ber. Bunsenges. Phys. Chem., 85, 807-813.1009. Schwab, J.J., W.H. Brune, and J.G. Anderson, 1989, J. Phys. Chem., 93, 1030-1035.1010. Schwab, J.J., D.W. Toohey, W.H. Brune, and J.G. Anderson, 1984, J. Geophys. Res., 89, 9581-9587.1011. Seeley, J.V., J.T. Jayne, and M.J. Molina, 1996, J. Phys. Chem., 100, 4019-4025.1012. Seeley, J.V., R.F. Meads, M.J. Elrod, and M.J. Molina, 1996, J. Phys. Chem., 100, 4026-4031.1013. Sehested, J., T. Ellermann, O.J. Nielsen, T.J. Wallington, and M.D. Hurley, 1993, Int. J. Chem. Kinet., 25, 701-
717.1014. Sehested, J. and O.J. Nielsen, 1993, Chem. Phys. Lett., 206, 369-375.1015. Sehested, J., O.J. Nielsen, and T.J. Wallington, 1993, Chem. Phys. Lett., 213, 457-464.1016. Sehested, J., K. Sehested, O.J. Nielsen, and T.J. Wallington, 1994, J. Phys. Chem., 98, 6731-6739.1017. Selzer, E.A. and K.D. Bayes, 1983, J. Phys. Chem., 87, 392-394.1018. Semmes, D.H., A.R. Ravishankara, C.A. Gump-Perkins, and P.H. Wine, 1985, Int. J. Chem. Kinet., 17, 303-313.1019. Sharkey, P. and I.W.M. Smith, 1993, J. Chem. Soc. Faraday Trans., 89, 631-638.1020. Shi, J. and J.R. Barker, 1990, Int. J. Chem. Kinetics, 20, 1283-1301.1021. Shi, X., D.R. Herschbach, D.R. Worsnop, and C.E. Kolb, 1993, J. Phys. Chem., 97, 2113-2122.1022. Shibuya, K., T. Ebatu, K. Obi, and I. Tanaka, 1977, J. Phys. Chem., 81, 2292.
121
1023. Silver, J.A., 1986, J. Chem. Phys., 84, 4718-4720.1024. Silver, J.A. and C.E. Kolb, 1980, Chem. Phys. Lett., 75, 191.1025. Silver, J.A. and C.E. Kolb, 1982, J. Phys. Chem., 86, 3240-3246.1026. Silver, J.A. and C.E. Kolb, 1986, J. Phys. Chem., 90, 3263-3266.1027. Silver, J.A. and C.E. Kolb, 1986, J. Phys. Chem., 90, 3267-3269.1028. Silver, J.A. and C.E. Kolb, 1987, J. Phys. Chem., 91, 3713-3714.1029. Silver, J.A., A.D. Stanton, M.S. Zahniser, and C.E. Kolb, 1984, J. Phys. Chem., 88, 3123-3129.1030. Simon, F.-G., W. Schneider, and G.K. Moortgat, 1990, Int. J. Chem. Kinet., 22, 791-813.1031. Simon, F.G., J.P. Burrows, W. Schneider, G.K. Moortgat, and P.J. Crutzen, 1989, J. Phys. Chem., 93, 7807-7813.1032. Simon, F.G., W. Schneider, G.K. Moortgat, and J.P. Burrows, 1990, J. Photochem. Photobiol., A55, 1-23.1033. Simonaitis, R. and J. Heicklen, 1973, J. Phys. Chem, 77, 1932-1935.1034. Simonaitis, R. and J. Heicklen, 1975, J. Phys. Chem., 79, 298.1035. Simonaitis, R. and J. Heicklen, 1979, Chem. Phys. Lett., 65, 361.1036. Simonaitis, R. and J. Heicklen, 1981, J. Phys. Chem., 85 , 2946.1037. Simonaitis, R. and J. Heicklen, 1982, J. Phys. Chem., 86, 3416-3418.1038. Sims, I.R., I.W.M. Smith, D.C. Clary, P. Bocherel, and B.R. Rowe, 1994, J. Chem. Phys., 101, 1748-1751.1039. Singh, J.P., J. Bachar, D.W. Setser, and S. Rosenwaks, 1985, J. Phys. Chem., 89, 5347-5353.1040. Singh, J.P. and D.W. Setser, 1985, J. Phys. Chem., 89, 5353-5358.1041. Singleton, D.L. and R.J. Cvetanovic, 1978, Can. J. Chem., 56, 2934.1042. Singleton, D.L. and R.J. Cvetanovic, 1981, Int. J. Chem. Kinet., 13, 945.1043. Singleton, D.L., R.S. Irwin, and R.J. Cvetanovic, 1977, Can. J. Chem., 55, 3321-3327.1044. Singleton, D.L., R.S. Irwin, W.S. Nip, and R.J. Cvetanovic, 1979, J. Phys. Chem., 83, 2195-2200.1045. Singleton, D.L., G. Paraskevopoulos, and R.S. Irwin, 1980, J. Phys. Chem., 84 , 2339-2343.1046. Singleton, D.L., G. Paraskevopoulos, and R.S. Irwin, 1982, J. Phys. Chem., 86, 2605-2609.1047. Singleton, D.L., G. Paraskevopoulos, and R.S. Irwin, 1989, J. Am. Chem. Soc., 111, 5248-5251.1048. Singleton, D.L., G. Paraskevopoulos, R.S. Irwin, G.S. Jolly, and D.J. McKenney, 1988, J. Am. Chem. Soc., 110,
7786-7790.1049. Sinha, A., E.R. Lovejoy, and C.J. Howard, 1987, J. Chem. Phys., 87, 2122-2128.1050. Slagle, I.R., F. Baiocchi, and D. Gutman, 1978, J. Phys. Chem., 82 , 1333.1051. Slagle, I.R., J.R. Gilbert, and D. Gutman, 1974, J. Chem. Phys., 61, 704.1052. Slagle, I.R., R.E. Graham, J.R. Gilbert, and D. Gutman, 1975, Chem. Phys. Lett., 32, 184.1053. Slanger, T.G. and G. Black, 1979, J. Chem. Phys., 70, 3434-3438.1054. Slanger, T.G., B.J. Wood, and G. Black, 1973, Int. J. Chem. Kinet., 5, 615.1055. Smardzewski, R.R. and M.C. Lin, 1977, J. Chem. Phys., 66, 3197-3204.1056. Smith, C.A., L.T. Molina, J.J. Lamb, and M.J. Molina, 1984, Int. J. Chem. Kinet., 16, 41-45.1057. Smith, I.W.M. and M.D. Williams, 1986, J. Chem. Soc. Faraday Trans. 2, 82, 1043-1055.1058. Smith, I.W.M. and R. Zellner, 1974, J. Chem. Soc. Faraday Trans. 2, 70, 1045-1056.1059. Smith, I.W.M. and R. Zellner, 1975, Int. J. Chem. Kinet., Symp. 1, 341.1060. Smith, R.H., 1978, Int. J. Chem. Kinet., 10, 519.1061. Snelling, D.R., 1974, Can. J. Chem., 52, 257-270.1062. Sridharan, U.C., F.S. Klein, and F. Kaufman, 1985, J. Chem. Phys., 82, 592-593.1063. Sridharan, U.C., L.X. Qiu, and F. Kaufman, 1981, J. Phys. Chem., 85, 3361-3363.1064. Sridharan, U.C., L.X. Qiu, and F. Kaufman, 1982, J. Phys. Chem., 86, 4569-4574.1065. Sridharan, U.C., L.X. Qiu, and F. Kaufman, 1984, J. Phys. Chem., 88, 1281-1282.1066. Sridharan, U.C., B. Reimann, and F. Kaufman, 1980, J. Chem. Phys., 73 , 1286-1293.1067. Stachnik, R.A. and M.J. Molina, 1987, J. Phys. Chem., 91, 4603.1068. Stachnik, R.A., M.J. Molina, and L.T. Molina, 1986, J. Phys. Chem., 90, 2777-2780.1069. Staricco, E.H., S.E. Sicre, and H.J. Schumacher, 1962, Z. Phys. Chem. N.F., 31, 385.1070. Stedman, D.H. and H. Niki, 1973, Environ. Lett., 4, 303.1071. Stedman, D.H. and H. Niki, 1973, J. Phys. Chem., 77, 2604.1072. Stedman, D.H., C.H. Wu, and H. Niki, 1973, J. Phys. Chem., 77, 2511.1073. Steer, R.P., R.A. Ackerman, and J.N. Pitts Jr., 1969, J. Chem. Phys., 51, 843-844.1074. Steiner, H. and E.K. Rideal, 1939, Proc. Roy. Soc. (London) Sec. A., 173, 503.1075. Stephens, J.W., C.L. Morter, S.K. Farhat, G.P. Glass, and R.F. Curl, 1993, J. Phys. Chem., 97, 8944-8951.1076. Stephens, R.D., 1984, J. Phys. Chem., 88, 3308-3313.1077. Stephens, S.L., J.W. Birks, and R.J. Glinski, 1989, J. Phys. Chem., 93, 8384-8385.1078. Stevens, P.S. and J.G. Anderson, 1990, Geophys. Res. Lett., 17, 1287-1290.1079. Stevens, P.S. and J.G. Anderson, 1992, J. Phys. Chem., 96, 1708-1718.1080. Stevens, P.S., W.H. Brune, and J.G. Anderson, 1989, J. Phys. Chem., 93, 4068-4079.1081. Stickel, R.E., M. Chin, E.P. Daykin, A.J. Hynes, P.H. Wine, and T.J. Wallington, 1993, J. Phys. Chem., 97,
13653-13661.1082. Stickel, R.E., J.M. Nicovich, S. Wang, Z. Zhao, and P.H. Wine, 1992, J. Phys. Chem., 96, 9875-9883.1083. Stickel, R.E., Z. Zhao, and P.H. Wine, 1993, Chem. Phys. Lett., 212, 312-318.1084. Stief, L.J., W.D. Brobst, D.F. Nava, R.P. Borkowski, and J.V. Michael, 1982, J. Chem. Soc. Faraday Trans. 2, 78,
1391-1401.1085. Stief, L.J., D.F. Nava, W.A. Payne, and J.V. Michael, 1980, J. Chem. Phys., 73, 2254-2258.
122
1086. Stief, L.J., W.A. Payne, J.H. Lee, and J.V. Michael, 1979, J. Chem. Phys., 70, 5241-5243.1087. Stimpfle, R., R. Perry, and C.J. Howard, 1979, J. Chem. Phys., 71, 5183-5190.1088. Streit, G.E., C.J. Howard, A.L. Schmeltekopf, J.A. Davidson, and H.I. Schiff, 1976, J. Chem. Phys., 65, 4761-
4764.1089. Streit, G.E., J.S. Wells, F.C. Fehsenfeld, and C.J. Howard, 1979, J. Chem. Phys., 70, 3439-3443.1090. Stuhl, F., 1973, J. Chem. Phys., 59, 635.1091. Stuhl, F., 1974, Ber. Bunsenges. Phys. Chem., 78, 230.1092. Stuhl, F. and H. Niki, 1970, Chem. Phys. Lett., 7, 473-474.1093. Stuhl, F. and H. Niki, 1971, J. Chem. Phys., 55, 3954-3957.1094. Stuhl, F. and H. Niki, 1972, J. Chem. Phys., 57, 3671-3677.1095. Stuhl, F. and K.H. Welge, 1969, Can. J. Chem., 47, 1870-1871.1096. Su, F., J.G. Calvert, and J.H. Shaw, 1979, J. Phys. Chem., 83, 3185-3191.1097. Su, F., J.G. Calvert, and J.H. Shaw, 1980, J. Phys. Chem., 84, 239.1098. Su, F., J.G. Calvert, J.H. Shaw, H. Niki, P.D. Maker, C.M. Savage, and L.D. Breitenbach, 1979, Chem. Phys. Lett.,
65, 221-225.1099. Sugawara, K., Y. Ishikawa, and S. Sato, 1980, Bull. Chem. Soc. Japan, 53, 3159.1100. Sullivan, J.O. and P. Warneck, 1965, J. Phys. Chem., 69, 1749.1101. Sverdrup, G.M., C.W. Spicer, and G.F. Ward, 1987, Int. J. Chem. Kinet., 19, 191-205.1102. Szekely, A., R.K. Hanson, and C. Bowman, 1984, Twentieth Symposium (International) on Combustion, The
Combustion Institute, pp. 647-654.1103. Tachibana, K. and A.V. Phelps, 1981, J. Chem. Phys., 75, 3315-3320.1104. Takacs, G.A. and G.P. Glass, 1973, J. Phys. Chem., 77, 1182.1105. Takacs, G.A. and G.P. Glass, 1973, J. Phys. Chem., 77, 1060.1106. Takacs, G.A. and G.P. Glass, 1973, J. Phys. Chem., 77, 1948.1107. Takacs, G.A. and C.J. Howard, 1984, J. Phys. Chem., 88, 2110.1108. Takacs, G.A. and C.J. Howard, 1986, J. Phys. Chem., 90, 687-690.1109. Takahashi, K., R. Wada, Y. Matsumi, and M. Kawasaki, 1996, J. Phys. Chem., 100, 10145-10149.1110. Talcott, C.L., J.W. Ager III, and C.J. Howard, 1986, J. Chem. Phys., 84, 6161-6169.1111. Talhaoui, A., B. Louis, B. Meriaux, P. Devolder, and J.P. Sawerysyn, 1996, J. Phys. Chem., 100, 2107-2113.1112. Talhaoui, A., F. Louis, P. Devolder, B. Meriaux, J.P. Sawerysyn, M.T. Rayez, and J.C. Rayez, 1996, J. Phys.
Chem., 100, 13531-13538.1113. Talukdar, R., A. Mellouki, T. Gierczak, J.B. Burkholder, S.A. McKeen, and A.R. Ravishankara, 1991, Science,
252, 693-695.1114. Talukdar, R., A. Mellouki, T. Gierczak, J.B. Burkholder, S.A. McKeen, and A.R. Ravishankara, 1991, J. Phys.
Chem., 95, 5815-5821.1115. Talukdar, R.K., J.B. Burkholder, A.-M. Schmoltner, J.M. Roberts, R. Wilson, and A.R. Ravishankara, 1995, J.
Geophys. Res., 100, 14163-14173.1116. Talukdar, R.K., T. Gierczak, L. Goldfarb, Y. Rudich, B.S. Madhava Rao, and A.R. Ravishankara, 1996, J. Phys.
Chem., 100, 3037-3043.1117. Talukdar, R.K., S. Herndon, J.B. Burkholder, J.M. Roberts, and A.R. Ravishankara, 1997, Trans. Faraday. Soc.,
manuscript in preparation.1118. Talukdar, R.K., A. Mellouki, T. Gierczak, S. Barone, S.-Y. Chiang, and A.R. Ravishankara, 1994, Int. J. Chem.
Kinet., 26, 973-990.1119. Talukdar, R.K., A. Mellouki, A.-M. Schmoltner, T. Watson, S. Montzka, and A.R. Ravishankara, 1992, Science,
257, 227-230.1120. Talukdar, R.K. and A.R. Ravishankara, 1996, Chem. Phys. Lett., 253, 177-183.1121. Taylor, P.H., J.A. D'Angelo, M.C. Martin, J.H. Kasner, and B. Dellinger, 1989, Int. J. Chem. Kinet., 21, 829-846.1122. Taylor, P.H., Z. Jiang, and B. Dellinger, 1993, Int. J. Chem. Kinet., 25, 9-23.1123. Temps, F. and H.G. Wagner, 1982, Ber. Bunsenges. Phys. Chem., 86, 119.1124. Temps, F. and H.G. Wagner, 1984, Ber. Bunsenges Phys. Chem., 88, 415.1125. Thomas, J.W. and F. Kaufman, 1985, J. Chem. Phys., 83, 2900-2903.1126. Thomas, R.G.O. and B.A. Thrush, 1975, J. Chem. Soc. Faraday Trans. 2, 71, 664-667.1127. Thompson, J.E. and A.R. Ravishankara, 1993, Int. J. Chem. Kinet., 25, 479-487.1128. Thorn, R.P., J.M. Conkhite, J.M. Nicovich, and P.H. Wine, 1995, J. Chem. Phys., 102, 4131-4142.1129. Thrush, B.A. and G.S. Tyndall, 1982, J. Chem. Soc. Faraday 2, 78, 1469-1475.1130. Thrush, B.A. and G.S. Tyndall, 1982, Chem. Phys. Lett., 92, 232-235.1131. Thrush, B.A. and J.P.T. Wilkinson, 1979, Chem. Phys. Lett., 66, 441-443.1132. Thrush, B.A. and J.P.T. Wilkinson, 1981, Chem. Phys. Lett., 81, 1-3.1133. Thrush, B.A. and J.P.T. Wilkinson, 1981, Chem. Phys. Lett., 84, 17-19.1134. Tiee, J.J., F.B. Wampler, R.C. Oldenborg, and W.W. Rice, 1981, Chem. Phys. Lett., 82, 80-84.1135. Toby, F.S., S. Toby, and H.E. O'Neal, 1976, Int. J. Chem. Kinet., 8, 25.1136. Toohey, D.W., 1988, Ph. D. Thesis, "Kinetic and Mechanistic Studies of Reactions of Bromine and Chlorine
Species Important in the Earth's Stratosphere", Harvard University.1137. Toohey, D.W. and J.G. Anderson, 1988, J. Phys. Chem., 92, 1705-1708.1138. Toohey, D.W., W.H. Brune, and J.G. Anderson, 1987, J. Phys. Chem., 91, 1215-1222.1139. Toohey, D.W., W.H. Brune, and J.G. Anderson, 1988, Int. J. Chem. Kinet., 20, 131-144.
123
1140. Trainor, D.W. and C.W. von Rosenberg Jr., 1974, J. Chem. Phys., 61, 1010-1015.1141. Trevor, P.L., G. Black, and J.R. Barker, 1982, J. Phys. Chem., 86, 1661.1142. Tsalkani, N., A. Mellouki, G. Poulet, G. Toupance, and G. Le Bras, 1988, J. Atmos. Chem., 7, 409-419.1143. Tschuikow-Roux, E., F. Faraji, S. Paddison, J. Niedzielski, and K. Miyokawa, 1988, J. Phys. Chem., 92, 1488-
1495.1144. Tschuikow-Roux, E., T. Yano, and J. Niedzielski, 1985, J. Chem. Phys., 82 , 65-74.1145. Tsuchiya, S. and T. Nakamura, 1979, Bull. Chem. Soc. Japan, 52, 1527-1528.1146. Tuazon, E., W.P.L. Carter, and R. Atkinson, 1991, J. Phys. Chem., 95, 2434-2437.1147. Tuazon, E.C., R. Atkinson, and S.B. Corchnoy, 1992, Int. J. Chem. Kinet., 24, 639-648.1148. Tuazon, E.C., R. Atkinson, C.N. Plum, A.M. Winer, and J.N. Pitts, 1983, Geophys. Res. Lett., 10, 953-956.1149. Tuazon, E.C., W.P.L. Carter, R. Atkinson, and J.N. Pitts Jr., 1983, Int. J. Chem. Kinet., 15, 619-629.1150. Tuazon, E.C., E. Sanhueza, R. Atkinson, W.P.L. Carter, A.M. Winer, and J.N. Pitts Jr., 1984, J. Phys. Chem., 88,
3095-3098.1151. Tully, F.P., 1983, Chem. Phys. Lett., 96, 148-153.1152. Tully, F.P., A, T. Droege, M.L. Koszykowski, and C.F. Melius, 1986, J. Phys. Chem., 90, 691-698.1153. Tully, F.P. and A.R. Ravishankara, 1980, J. Phys. Chem., 84, 3126-3130.1154. Tully, F.P., A.R. Ravishankara, and K. Carr, 1983, Inter. J. Chem. Kinet., 15, 1111-1118.1155. Turnipseed, A.A., S.B. Barone, N.R. Jensen, D.R. Hanson, C.J. Howard, and A.R. Ravishankara, 1995, J. Phys.
Chem., 99, 6000-6009.1156. Turnipseed, A.A., S.B. Barone, and A.R. Ravishankara, 1993, J. Phys. Chem., 97, 5926-5934.1157. Turnipseed, A.A., S.B. Barone, and A.R. Ravishankara, 1994, J. Phys. Chem., 98, 4594-4601.1158. Turnipseed, A.A., S.B. Barone, and A.R. Ravishankara, 1996, J. Phys. Chem., 100, 14703-14713.1159. Turnipseed, A.A., J.W. Birks, and J.G. Calvert, 1990, J. Phys. Chem., 94, 7477-7482.1160. Turnipseed, A.A., J.W. Birks, and J.G. Calvert, 1991, J. Phys. Chem., 95, 4356-4364.1161. Turnipseed, A.A., M.K. Gilles, J.B. Burkholder, and A.R. Ravishankara, manuscript.1162. Turnipseed, A.A., M.K. Gilles, J.B. Burkholder, and A.R. Ravishankara, 1995, Chem. Phys. Lett., 242, 427-434.1163. Turnipseed, A.A., G.L. Vaghjiani, T. Gierczak, J.E. Thompson, and A.R. Ravishankara, 1991, J. Chem. Phys., 95,
3244-3251.1164. Tyndall, G.S., J.P. Burrows, W. Schneider, and G.K. Moortgat, 1986, Chem. Phys. Lett., 130, 463-466.1165. Tyndall, G.S., J.J. Orlando, and J.G. Calvert, 1995, Environ. Sci. Technol., 29, 202-206.1166. Tyndall, G.S., J.J. Orlando, C.A. Cantrell, R.E. Shetter, and J.G. Calvert, 1991, J. Phys. Chem., 95, 4381-4386.1167. Tyndall, G.S., J.J. Orlando, K.E. Nickerson, C.A. Cantrell, and J.G. Calvert, 1991, J. Geophys. Res., 96, 20761-
20768.1168. Tyndall, G.S., J.J. Orlando, T.J. Wallington, J. Sehested, and O.J. Nielsen, 1996, J. Phys. Chem., 100, 660-668.1169. Tyndall, G.S. and A.R. Ravishankara, 1989, J. Phys. Chem., 93, 4707-4710.1170. Tyndall, G.S. and A.R. Ravishankara, 1989, J. Phys. Chem., 93, 2426-2435.1171. Tyndall, G.S. and A.R. Ravishankara, 1991, Int. J. Chem. Kinet., 23, 483-527.1172. Vaghjiani, G.L. and A.R. Ravishankara, 1989, J. Phys. Chem., 93, 1948.1173. Vaghjiani, G.L. and A.R. Ravishankara, 1991, Nature, 350, 406-409.1174. Vaghjiani, G.L., A.R. Ravishankara, and N. Cohen, 1989, J. Phys. Chem., 93, 7833-7837.1175. Van den Bergh, H. and J. Troe, 1976, J. Chem. Phys., 64, 736-742.1176. Vanderzanden, J.W. and J.W. Birks, 1982, Chem. Phys. Lett., 88, 109-114.1177. Verhees, P.W.C. and E.H. Adema, 1985, J. Atmos. Chem., 2, 387.1178. Veyret, B. and R. Lesclaux, 1981, J. Phys. Chem., 85, 1918.1179. Veyret, B., R. Lesclaux, M.-T. Rayez, J.-C. Rayez, R.A. Cox, and G.K. Moortgat, 1989, J. Phys. Chem., 93, 2368-
2374.1180. Veyret, B., J.C. Rayez, and R. Lesclaux, 1982, J. Phys. Chem., 86, 3424-3430.1181. Villalta, P.W., L.G. Huey, and C.J. Howard, 1995, J. Phys. Chem., 99, 12829-12834.1182. Villalta, P.W., E.R. Lovejoy, and D.R. Hanson, 1996, Geophys. Res. Lett., 23, 1765-1768.1183. Vinckier, C., M. Schaekers, and J. Peeters, 1985, J. Phys. Chem., 89, 508-512.1184. Vogt, R. and R.N. Schindler, 1993, Ber. Bunsenges. Phys. Chem., 97, 819-829.1185. Volltrauer, H.N., W. Felder, R.J. Pirkle, and A. Fontijn, 1979, J. Photochem., 11, 173-181.1186. Von Ellenrieder, G., E. Castellano, and H.J. Schumacher, 1971, Chem. Phys. Lett., 9, 152-156.1187. Wagner, A.F., I.R. Slagle, D. Sarzynski, and D. Gutman, 1990, J. Phys. Chem., 94, 1853-1864.1188. Wagner, G. and R. Zellner, 1981, Ber. Bunsenges. Phys. Chem., 85, 1122-1128.1189. Wagner, H.G., J. Warnatz, and C. Zetzsch, 1971, Anales Assoc. Quim. Argentina, 59, 169-177.1190. Wagner, H.G., U. Welzbacher, and R. Zellner, 1976, Ber Bunsenges. Phys. Chem., 80, 1023-1027.1191. Wagner, H.G., C. Zetzsch, and J. Warnatz, 1972, Ber. Bunsenges. Phys. Chem., 76, 526.1192. Wahner, A. and A.R. Ravishankara, 1987, J. Geophys. Res., 92, 2189-2194.1193. Walch, S.P., 1993, J. Chem. Phys., 99, 5295-5300.1194. Wallington, T.J., 1991, J. Chem. Soc. Faraday Trans., 87, 2379-2382.1195. Wallington, T.J., J.M. Andino, J.C. Ball, and S.M. Japar, 1990, J. Atmos. Chem., 10, 301-313.1196. Wallington, T.J., J.M. Andino, A.R. Potts, and P.H. Wine, 1991, Chem. Phys. Lett., 176, 103-108.1197. Wallington, T.J., R. Atkinson, E.C. Tuazon, and S.M. Aschmann, 1986, Int. J. Chem. Kinet., 18, 837-846.1198. Wallington, T.J., R. Atkinson, and A.M. Winer, 1984, Geophys. Res. Lett., 11, 861-864.1199. Wallington, T.J., R. Atkinson, A.M. Winer, and J.N. Pitts Jr., 1986, J. Phys. Chem., 90, 5393-5396.
124
1200. Wallington, T.J., R. Atkinson, A.M. Winer, and J.N. Pitts Jr., 1986, J. Phys. Chem., 90, 4640-4644.1201. Wallington, T.J. and J.C. Ball, 1995, Chem. Phys. Lett., 234, 187-194.1202. Wallington, T.J. and J.C. Ball, 1995, J. Phys. Chem., 99, 3201-3205.1203. Wallington, T.J., J.C. Ball, O.J. Nielsen, and E. Bartkiewicz, 1992, J. Phys. Chem., 96, 1241-1246.1204. Wallington, T.J., P. Dagaut, and M.J. Kurylo, 1988, J. Photochem. Photobiol. A: Chemistry, 42, 173-185.1205. Wallington, T.J., P. Dagaut, and M.J. Kurylo, 1992, Chem. Rev., 92, 667-710.1206. Wallington, T.J., T. Ellermann, and O.J. Nielsen, 1993, J. Phys. Chem., 97, 8442-8449.1207. Wallington, T.J. and M.D. Hurley, 1992, Chem. Phys. Lett., 189, 437-442.1208. Wallington, T.J., M.D. Hurley, and W.F. Schneider, 1993, Chem. Phys. Lett., 213, 442-448.1209. Wallington, T.J., M.D. Hurley, W.F. Schneider, J. Sehested, and O.J. Nielsen, 1993, J. Phys. Chem., 97, 7606-
7611.1210. Wallington, T.J. and S.M. Japar, 1990, Chem. Phys. Lett., 166, 495-499.1211. Wallington, T.J. and M.J. Kurylo, 1987, Int. J. Chem. Kinet., 19, 1015-1023.1212. Wallington, T.J. and M.J. Kurylo, 1987, J. Phys. Chem., 91, 5050-5054.1213. Wallington, T.J., D.M. Neuman, and M.J. Kurylo, 1987, Int. J. Chem. Kinet., 19, 725-739.1214. Wallington, T.J., L.M. Skewes, W.O. Siegl, C.H. Wu, and S.M. Japar, 1988, Int. J. Chem. Kinet., 20, 867-875.1215. Walther, C.-D. and H.G. Wagner, 1983, Ber. Bunsenges. Phys. Chem., 87, 403-409.1216. Wang, N.S. and C.J. Howard, 1990, J. Phys. Chem., 94, 8787-8794.1217. Wang, N.S., E.R. Lovejoy, and C.J. Howard, 1987, J. Phys. Chem., 91, 5743-5749.1218. Wang, W.C., M. Suto, and L.C. Lee, 1984, J. Chem. Phys., 81, 3122-3126.1219. Wang, X., Y.G. Jin, M. Suto, and L.C. Lee, 1988, J. Chem. Phys., 89, 4853-4860.1220. Wang, X., M. Suto, and L.C. Lee, 1988, J. Chem. Phys., 88 , 896-899.1221. Wantuck, P.J., R.C. Oldenberg, S.L. Baughcum, and K.R. Winn, 1987, J. Phys. Chem., 91, 4653.1222. Warren, R., T. Gierczak, and A.R. Ravishankara, 1991, Chem. Phys. Lett., 183, 403-409.1223. Warren, R.F. and A.R. Ravishankara, 1993, Int. J. Chem. Kinet., 25, 833-844.1224. Washida, N., 1980, J. Chem. Phys., 73, 1665.1225. Washida, N., H. Akimoto, and M. Okuda, 1980, J. Chem. Phys., 72, 5781-5783.1226. Washida, N., H. Akimoto, and M. Okuda, 1980, Bull. Chem. Soc. Japan, 53, 3496-3503.1227. Washida, N. and K.D. Bayes, 1976, Int. J. Chem. Kinet., 8, 777.1228. Washida, N., R.J. Martinez, and K.D. Bayes, 1974, Z. Naturforsch., 29A, 251.1229. Wategaonkar, S.J. and D.W. Setser, 1989, J. Chem. Phys., 90, 251-264.1230. Watson, R.T., E.S. Machado, R.L. Schiff, S. Fischer, and D.D. Davis, 1975, Proceedings of the 4th CIAP
Conference, DOT-TSC-OST-75-38, Dept. of Transportation Washington D.C, Cambridge, MA.1231. Watson, R.T., G. Machado, B.C. Conaway, S. Wagner, and D.D. Davis, 1977, J. Phys. Chem., 81, 256.1232. Watson, R.T., G. Machado, S. Fischer, and D.D. Davis, 1976, J. Chem. Phys., 65, 2126.1233. Watson, R.T., A.R. Ravishankara, G. Machado, S. Wagner, and D.D. Davis, 1979, Int. J. Chem. Kinet., 11, 187-
197.1234. Watson, R.T., S.P. Sander, and Y.L. Yung, 1979, J. Phys. Chem., 83, 2936.1235. Wayne, R.P. and J.N. Pitts Jr., 1969, J. Chem. Phys., 50, 3644-3645.1236. Wecker, D., R. Johanssen, and R.N. Schindler, 1982, Ber. Bunsenges. Phys. Chem., 86, 532-538.1237. Wei, C.N. and R.B. Timmons, 1975, J. Chem. Phys., 62, 3240.1238. Wennberg, P.O., J.G. Anderson, and D.K. Weisenstein, 1994, J. Geophys. Res., 99, 18839-18846.1239. West, G.A., R.E. Weston Jr., and G.W. Flynn, 1978, Chem. Phys. Lett., 56, 429.1240. Westenberg, A.A. and N. de Haas, 1969, J. Phys. Chem., 73, 1181.1241. Westenberg, A.A. and N. de Haas, 1969, J. Chem. Phys., 50, 707-709.1242. Westenberg, A.A. and N. de Haas, 1973, J. Chem. Phys., 58, 4061-4065.1243. Westenberg, A.A. and N. de Haas, 1973, J. Chem. Phys., 58, 4066-4071.1244. Westenberg, A.A. and N. de Haas, 1977, J. Chem. Phys., 66, 4900.1245. Westenberg, A.A., N. de Haas, and J.M. Roscoe, 1970, J. Phys. Chem., 74, 3431.1246. Westenberg, A.A., J.M. Roscoe, and N. de Haas, 1970, Chem. Phys. Lett., 7, 597-599.1247. Whyte, A.R. and L.F. Phillips, 1983, Chem. Phys. Lett., 102, 451-454.1248. Whytock, D.A., J.H. Lee, J.V. Michael, W.A. Payne, and L.J. Stief, 1977, J. Chem. Phys., 66, 2690.1249. Whytock, D.A., R.B. Timmons, J.H. Lee, J.V. Michael, W.A. Payne, and L.J. Stief, 1976, J. Chem. Phys., 65,
2052-2055.1250. Wiebe, H.A. and J. Heicklen, 1973, J. Am. Chem. Soc., 95, 1-7.1251. Wildt, J., G. Bednarek, E.H. Fink, and R.P. Wayne, 1988, Chem. Phys., 122, 463-470.1252. Wildt, J., E.H. Fink, P. Biggs, and R.P. Wayne, 1989, Chem. Phys., 139, 401-407.1253. Wildt, J., E.H. Fink, P. Biggs, R.P. Wayne, and A.F. Vilesov, 1992, Chem. Phys., 159, 127-140.1254. Wilson, W.E., 1967, J. Chem. Phys., 46, 2017-2018.1255. Wine, P.H., R.J. Astalos, and R.L. Mauldin III, 1985, J. Phys. Chem., 89, 2620-2624.1256. Wine, P.H., W.L. Chameides, and A.R. Ravishankara, 1981, Geophys. Res. Lett., 8 , 543-546.1257. Wine, P.H., N.M. Kreutter, C.A. Gump, and A.R. Ravishankara, 1981, J. Phys. Chem., 85, 2660-2665.1258. Wine, P.H., J.M. Nicovich, and A.R. Ravishankara, 1985, J. Phys. Chem., 89, 3914-3918.1259. Wine, P.H., J.M. Nicovich, R.E. Stickel, Z. Zhao, C.J. Shackelford, K.D. Kreutter, E.P. Daykin, and S. Wang, The
Tropospheric Chemistry of Ozone in the Polar Regions , NATO ASI, eds. H. Niki and K.H. Becker. Vol. 17. 1993,Berlin: Springer-Verlag. 385-395.
125
1260. Wine, P.H., J.M. Nicovich, R.J. Thompson, and A.R. Ravishankara, 1983, J. Phys. Chem., 87, 3948-3954.1261. Wine, P.H. and A.R. Ravishankara, 1981, Chem. Phys. Lett., 77, 103-109.1262. Wine, P.H. and A.R. Ravishankara, 1982, Chem. Phys., 69, 365-373.1263. Wine, P.H. and A.R. Ravishankara, 1983, Chem. Phys. Lett., 96, 129-132.1264. Wine, P.H., A.R. Ravishankara, N.M. Kreutter, R.C. Shah, J.M. Nicovich, R.L. Thompson, and D.J. Wuebbles,
1981, J. Geophys. Res., 86, 1105-1112.1265. Wine, P.H., D.H. Semmes, and A.R. Ravishankara, 1981, J. Chem. Phys., 75, 4390-4395.1266. Wine, P.H., D.H. Semmes, and A.R. Ravishankara, 1982, Chem. Phys. Lett., 90, 128-132.1267. Wine, P.H., R.C. Shah, and A.R. Ravishankara, 1980, J. Phys. Chem., 84, 2499-2503.1268. Wine, P.H., R.J. Thompson, and D.H. Semmes, 1984, Int. J. Chem. Kinet., 16, 1623.1269. Wine, P.H., J.R. Wells, and J.M. Nicovich, 1988, J. Phys. Chem., 92, 2223-2228.1270. Wine, P.H., J.R. Wells, and A.R. Ravishankara, 1986, J. Chem. Phys., 84, 1349-1354.1271. Winer, A.M., A.C. Lloyd, K.R. Darnall, R. Atkinson, and J.N. Pitts Jr., 1977, Chem. Phys. Lett., 51, 221-226.1272. Winer, A.M., A.C. Lloyd, K.R. Darnall, and J.N. Pitts Jr., 1976, J. Phys. Chem., 80, 1635.1273. Winkler, I.C., R.A. Stachnik, J.I. Steinfeld, and S.M. Miller, 1986, J. Chem. Phys., 85, 890.1274. Wolf, M., D.L. Yang, and J.L. Durant, 1994, J. Photochem. Photobiol. A: Chem., 80, 85-93.1275. Wong, E.L. and F.R. Belles, 1971, NASA TN D-6495, NASA, Washington, D. C.1276. Wongdontri-Stuper, W., R.K.M. Jayanty, R. Simonaitis, and J. Heicklen, 1979, J. Photochem., 10, 163.1277. Worsnop, D.R., M.S. Zahniser, and C.E. Kolb, 1991, J. Phys. Chem., 95, 3960-3964.1278. Worsnop, D.R., M.S. Zahniser, and C.E. Kolb, 1992, J. Phys. Chem., 96, 9088.1279. Wright, T.G., A.M. Ellis, and J.M. Dyke, 1993, J. Chem. Phys., 98, 2891-2907.1280. Wu, F. and R.W. Carr, 1992, J. Phys. Chem., 96, 1743-1748.1281. Wurzburg, E. and P.L. Houston, 1980, J. Chem. Phys., 72, 4811.1282. Xiang, T., L. M, Torres, and W.A. Guillory, 1985, J. Chem. Phys., 83, 1623-1629.1283. Yano, T. and E. Tschuikow-Roux, 1986, J. Photochem., 32, 25-37.1284. Yokelson, R.J., J.B. Burkholder, L. Goldfarb, R.W. Fox, M.K. Gilles, and A.R. Ravishankara, 1995, J. Phys.
Chem., 99, 13976-13983.1285. Zabarnick, S. and J. Heicklen, 1985, Int. J. Chem. Kinet., 17, 455-476.1286. Zabarnick, S., J. W, Fleming, and M.C. Lin, 1988, Int. J. Chem. Kinet., 20, 117-129.1287. Zabel, F., A. Reimer, K.H. Becker, and E.H. Fink, 1989, J. Phys. Chem., 93, 5500-5507.1288. Zabel, F., K.A. Sahetchian, and C. Chachaty, 1987, Chem. Phys. Lett., 134, 433.1289. Zagogianni, H., A. Mellouki, and G. Poulet, 1987, C. R. Acad. Sci. Paris, Series II 304, 573-578.1290. Zahniser, M.S., B.M. Berquist, and F. Kaufman, 1978, Int. J. Chem. Kinet., 10, 15.1291. Zahniser, M.S., J. Chang, and F. Kaufman, 1977, J. Chem. Phys., 67, 997.1292. Zahniser, M.S. and C.J. Howard, 1980, J. Chem. Phys., 73, 1620-1626.1293. Zahniser, M.S. and F. Kaufman, 1977, J. Chem. Phys., 66, 3673.1294. Zahniser, M.S., F. Kaufman, and J.G. Anderson, 1974, Chem. Phys. Lett., 27, 507.1295. Zahniser, M.S., F. Kaufman, and J.G. Anderson, 1976, Chem. Phys. Lett., 37, 226.1296. Zellner, R., 1987, J. Chem. Phys., 84, 403.1297. Zellner, R., G. Bednarek, A. Hoffmann, J.P. Kohlmann, V. Mors, and H. Saathoff, 1994, Ber. Bunsenges. Phys.
Chem., 98, 141-146.1298. Zellner, R. and F. Ewig, 1988, J. Phys Chem., 92, 2971.1299. Zellner, R., B. Fritz, and K. Lorenz, 1986, J. Atmos. Chem., 4, 241-251.1300. Zellner, R. and W. Steinert, 1981, Chem. Phys. Lett., 81, 568-572.1301. Zellner, R., G. Wagner, and B. Himme, 1980, J. Phys. Chem., 84, 3196-3198.1302. Zetzsch, C., paper presented at the 7th International Symposium on Gas Kinetics, 1982, Goettingen, Germany.1303. Zetzsch, C. and F. Stuhl, 1982, Proceedings of the 2nd European Symposium on the Physico-Chemical Behaviour of
Atmospheric Pollutants, D. Reidel Publishing Co., Dordrecht, Holland, pp. 129-137.1304. Zhang, Z., R.E. Huie, and M.J. Kurylo, 1992, J. Phys. Chem., 96, 1533-1535.1305. Zhang, Z., R. Liu, R.E. Huie, and M.J. Kurylo, 1991, Geophys. Res. Lett., 18, 5-7.1306. Zhang, Z., S. Padmaja, R.D. Saini, R.E. Huie, and M.J. Kurylo, 1994, J. Phys. Chem., 98, 4312-4315.1307. Zhang, Z., R.D. Saini, M.J. Kurylo, and R.E. Huie, 1992, Chem. Phys. Lett., 200, 230-234.1308. Zhang, Z., R.D. Saini, M.J. Kurylo, and R.E. Huie, 1992, J. Phys. Chem., 96, 9301-9304.1309. Zhang, Z., R.D. Saini, M.J. Kurylo, and R.E. Huie, 1992, Geophys. Res. Lett., 19, 2413-2416.1310. Zhao, Z., R.E. Stickel, and P.H. Wine, 1996, Chem. Phys. Lett., 251, 59-66.1311. Zhitneva, G.P. and S.Y. Pshezhetskii, 1978, Kinetika i Kataliz, 19, 296.1312. Zipf, E.C., 1980, Nature (London), 287, 523-525.
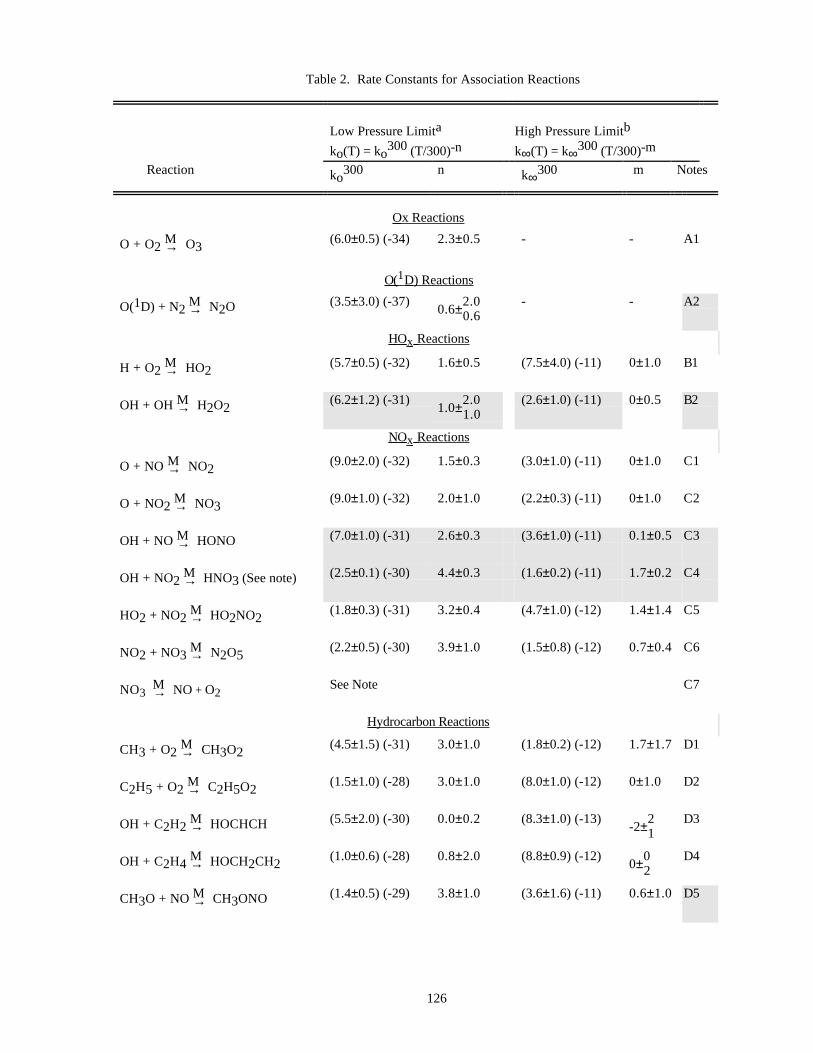
126
Table 2. Rate Constants for Association Reactions
Low Pressure Limita High Pressure Limitb
ko(T) = ko300 (T/300)-n k∞(T) = k∞300 (T/300)-m
Reaction ko300 n k∞300 m Notes
Ox Reactions
O + O2 M→ O3(6.0±0.5) (-34) 2.3±0.5 - - A1
O( 1 D) Reactions
O(1D) + N2 M→ N2O (3.5±3.0) (-37)0.6±2.0
0.6 - - A2
HO x Reactions
H + O2 M→ HO2(5.7±0.5) (-32) 1.6±0.5 (7.5±4.0) (-11) 0±1.0 B1
OH + OH M→ H2O2(6.2±1.2) (-31)
1.0±2.01.0
(2.6±1.0) (-11) 0±0.5 B2
NO x Reactions
O + NO M→ NO2(9.0±2.0) (-32) 1.5±0.3 (3.0±1.0) (-11) 0±1.0 C1
O + NO2 M→ NO3(9.0±1.0) (-32) 2.0±1.0 (2.2±0.3) (-11) 0±1.0 C2
OH + NO M→ HONO (7.0±1.0) (-31) 2.6±0.3 (3.6±1.0) (-11) 0.1±0.5 C3
OH + NO2 M→ HNO3 (See note) (2.5±0.1) (-30) 4.4±0.3 (1.6±0.2) (-11) 1.7±0.2 C4
HO2 + NO2 M→ HO2NO2(1.8±0.3) (-31) 3.2±0.4 (4.7±1.0) (-12) 1.4±1.4 C5
NO2 + NO3 M→ N2O5(2.2±0.5) (-30) 3.9±1.0 (1.5±0.8) (-12) 0.7±0.4 C6
NO3 M→ NO + O2See Note C7
Hydrocarbon Reactions
CH3 + O2 M→ CH3O2(4.5±1.5) (-31) 3.0±1.0 (1.8±0.2) (-12) 1.7±1.7 D1
C2H5 + O2 M→ C2H5O2(1.5±1.0) (-28) 3.0±1.0 (8.0±1.0) (-12) 0±1.0 D2
OH + C2H2 M→ HOCHCH (5.5±2.0) (-30) 0.0±0.2 (8.3±1.0) (-13)
-2±21
D3
OH + C2H4 M→ HOCH2CH2
(1.0±0.6) (-28) 0.8±2.0 (8.8±0.9) (-12)0±0
2 D4
CH3O + NO M→ CH3ONO (1.4±0.5) (-29) 3.8±1.0 (3.6±1.6) (-11) 0.6±1.0 D5
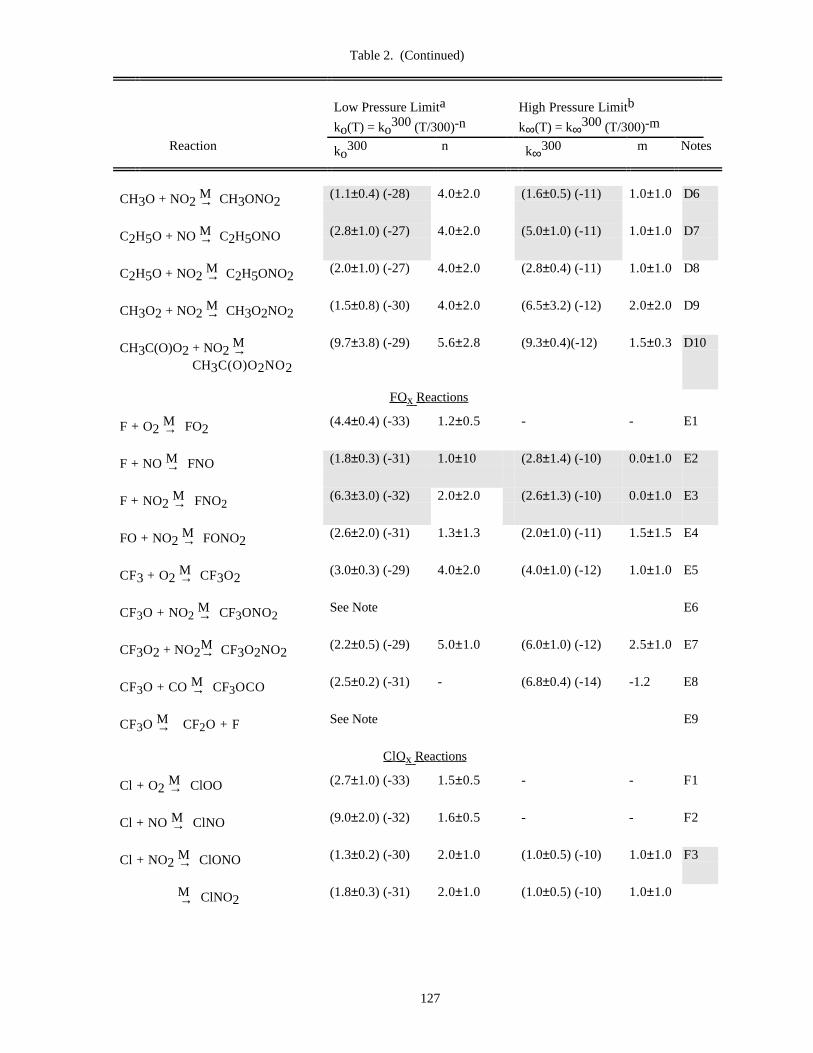
Table 2. (Continued)
Low Pressure Limita High Pressure Limitb
ko(T) = ko300 (T/300)-n k∞(T) = k∞300 (T/300)-m
Reaction ko300 n k∞300 m Notes
127
CH3O + NO2 M→ CH3ONO2
(1.1±0.4) (-28) 4.0±2.0 (1.6±0.5) (-11) 1.0±1.0 D6
C2H5O + NO M→ C2H5ONO (2.8±1.0) (-27) 4.0±2.0 (5.0±1.0) (-11) 1.0±1.0 D7
C2H5O + NO2 M→ C2H5ONO2
(2.0±1.0) (-27) 4.0±2.0 (2.8±0.4) (-11) 1.0±1.0 D8
CH3O2 + NO2 M→ CH3O2NO2
(1.5±0.8) (-30) 4.0±2.0 (6.5±3.2) (-12) 2.0±2.0 D9
CH3C(O)O2 + NO2 M→ CH3C(O)O2NO2
(9.7±3.8) (-29) 5.6±2.8 (9.3±0.4)(-12) 1.5±0.3 D10
FO x Reactions
F + O2 M→ FO2(4.4±0.4) (-33) 1.2±0.5 - - E1
F + NO M→ FNO (1.8±0.3) (-31) 1.0±10 (2.8±1.4) (-10) 0.0±1.0 E2
F + NO2 M→ FNO2(6.3±3.0) (-32) 2.0±2.0 (2.6±1.3) (-10) 0.0±1.0 E3
FO + NO2 M→ FONO2(2.6±2.0) (-31) 1.3±1.3 (2.0±1.0) (-11) 1.5±1.5 E4
CF3 + O2 M→ CF3O2
(3.0±0.3) (-29) 4.0±2.0 (4.0±1.0) (-12) 1.0±1.0 E5
CF3O + NO2 M→ CF3ONO2See Note E6
CF3O2 + NO2M→ CF3O2NO2
(2.2±0.5) (-29) 5.0±1.0 (6.0±1.0) (-12) 2.5±1.0 E7
CF3O + CO M→ CF3OCO (2.5±0.2) (-31) - (6.8±0.4) (-14) -1.2 E8
CF3O M→ CF2O + F See Note E9
ClO x Reactions
Cl + O2 M→ ClOO (2.7±1.0) (-33) 1.5±0.5 - - F1
Cl + NO M→ ClNO (9.0±2.0) (-32) 1.6±0.5 - - F2
Cl + NO2 M→ ClONO (1.3±0.2) (-30) 2.0±1.0 (1.0±0.5) (-10) 1.0±1.0 F3
M→ ClNO2(1.8±0.3) (-31) 2.0±1.0 (1.0±0.5) (-10) 1.0±1.0
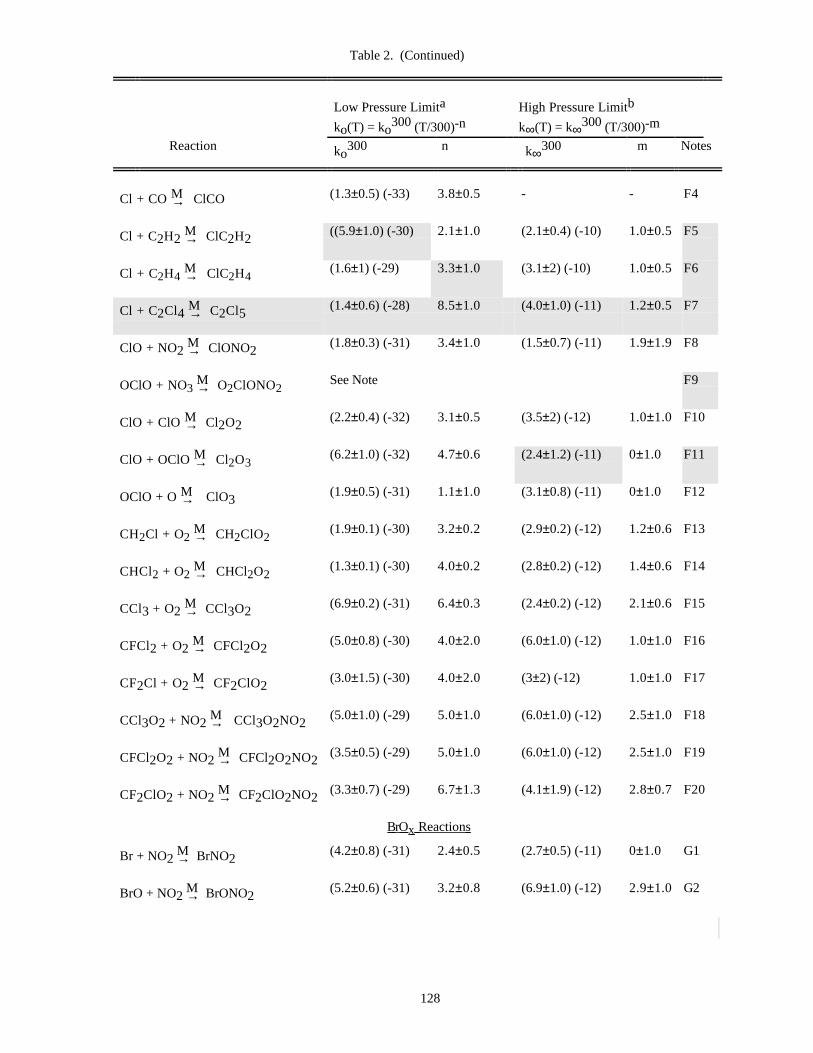
Table 2. (Continued)
Low Pressure Limita High Pressure Limitb
ko(T) = ko300 (T/300)-n k∞(T) = k∞300 (T/300)-m
Reaction ko300 n k∞300 m Notes
128
Cl + CO M→ ClCO (1.3±0.5) (-33) 3.8±0.5 - - F4
Cl + C2H2 M→ ClC2H2((5.9±1.0) (-30) 2.1±1.0 (2.1±0.4) (-10) 1.0±0.5 F5
Cl + C2H4 M→ ClC2H4(1.6±1) (-29) 3.3±1.0 (3.1±2) (-10) 1.0±0.5 F6
Cl + C2Cl4 M→ C2Cl5(1.4±0.6) (-28) 8.5±1.0 (4.0±1.0) (-11) 1.2±0.5 F7
ClO + NO2 M→ ClONO2(1.8±0.3) (-31) 3.4±1.0 (1.5±0.7) (-11) 1.9±1.9 F8
OClO + NO3 M→ O2ClONO2See Note F9
ClO + ClO M→ Cl2O2(2.2±0.4) (-32) 3.1±0.5 (3.5±2) (-12) 1.0±1.0 F10
ClO + OClO M→ Cl2O3(6.2±1.0) (-32) 4.7±0.6 (2.4±1.2) (-11) 0±1.0 F11
OClO + O M→ ClO3(1.9±0.5) (-31) 1.1±1.0 (3.1±0.8) (-11) 0±1.0 F12
CH2Cl + O2 M→ CH2ClO2(1.9±0.1) (-30) 3.2±0.2 (2.9±0.2) (-12) 1.2±0.6 F13
CHCl2 + O2 M→ CHCl2O2(1.3±0.1) (-30) 4.0±0.2 (2.8±0.2) (-12) 1.4±0.6 F14
CCl3 + O2 M→ CCl3O2
(6.9±0.2) (-31) 6.4±0.3 (2.4±0.2) (-12) 2.1±0.6 F15
CFCl2 + O2 M→ CFCl2O2
(5.0±0.8) (-30) 4.0±2.0 (6.0±1.0) (-12) 1.0±1.0 F16
CF2Cl + O2 M→ CF2ClO2
(3.0±1.5) (-30) 4.0±2.0 (3±2) (-12) 1.0±1.0 F17
CCl3O2 + NO2 M→ CCl3O2NO2
(5.0±1.0) (-29) 5.0±1.0 (6.0±1.0) (-12) 2.5±1.0 F18
CFCl2O2 + NO2 M→ CFCl2O2NO2(3.5±0.5) (-29) 5.0±1.0 (6.0±1.0) (-12) 2.5±1.0 F19
CF2ClO2 + NO2 M→ CF2ClO2NO2(3.3±0.7) (-29) 6.7±1.3 (4.1±1.9) (-12) 2.8±0.7 F20
BrO x Reactions
Br + NO2 M→ BrNO2
(4.2±0.8) (-31) 2.4±0.5 (2.7±0.5) (-11) 0±1.0 G1
BrO + NO2 M→ BrONO2(5.2±0.6) (-31) 3.2±0.8 (6.9±1.0) (-12) 2.9±1.0 G2
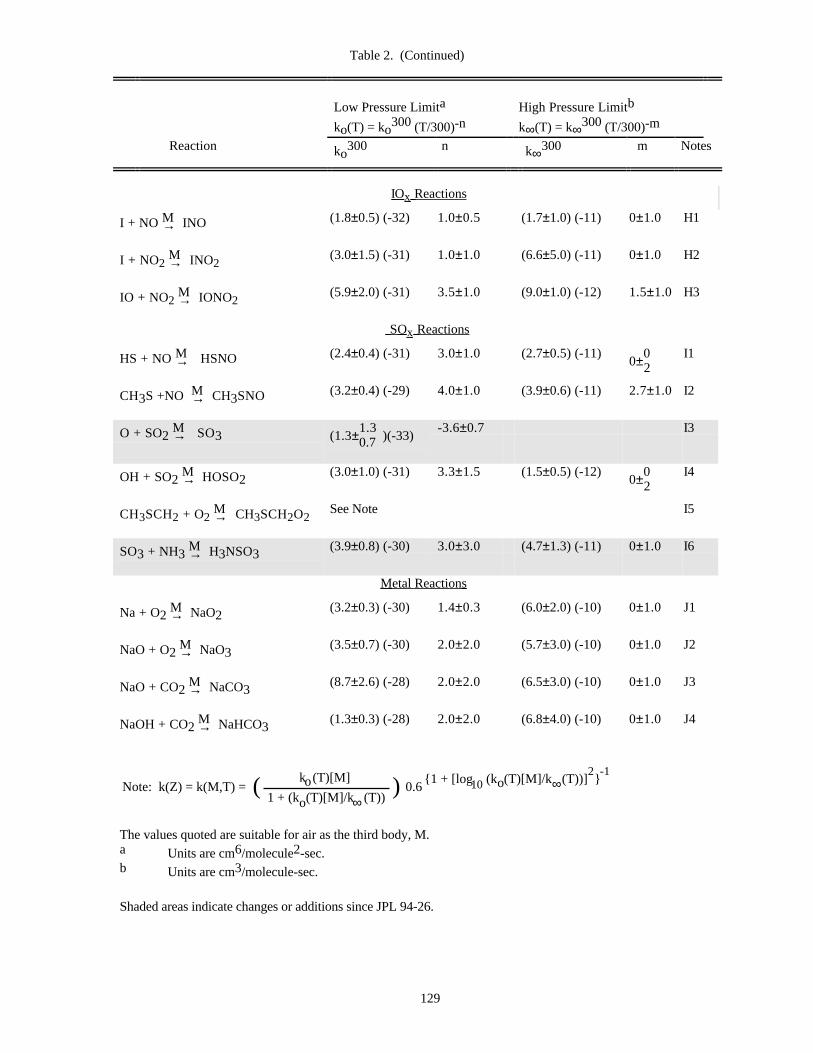
Table 2. (Continued)
Low Pressure Limita High Pressure Limitb
ko(T) = ko300 (T/300)-n k∞(T) = k∞300 (T/300)-m
Reaction ko300 n k∞300 m Notes
129
IO x Reactions
I + NO M→ INO (1.8±0.5) (-32) 1.0±0.5 (1.7±1.0) (-11) 0±1.0 H1
I + NO2 M→ INO2(3.0±1.5) (-31) 1.0±1.0 (6.6±5.0) (-11) 0±1.0 H2
IO + NO2 M→ IONO2(5.9±2.0) (-31) 3.5±1.0 (9.0±1.0) (-12) 1.5±1.0 H3
SO x Reactions
HS + NO M→ HSNO (2.4±0.4) (-31) 3.0±1.0 (2.7±0.5) (-11)0±0
2 I1
CH3S +NO M→ CH3SNO (3.2±0.4) (-29) 4.0±1.0 (3.9±0.6) (-11) 2.7±1.0 I2
O + SO2 M→ SO3 (1.3±1.3
0.7 )(-33)-3.6±0.7 I3
OH + SO2 M→ HOSO2
(3.0±1.0) (-31) 3.3±1.5 (1.5±0.5) (-12)0±0
2 I4
CH3SCH2 + O2 M→ CH3SCH2O2See Note I5
SO3 + NH3 M→ H3NSO3(3.9±0.8) (-30) 3.0±3.0 (4.7±1.3) (-11) 0±1.0 I6
Metal Reactions
Na + O2 M→ NaO2(3.2±0.3) (-30) 1.4±0.3 (6.0±2.0) (-10) 0±1.0 J1
NaO + O2 M→ NaO3(3.5±0.7) (-30) 2.0±2.0 (5.7±3.0) (-10) 0±1.0 J2
NaO + CO2 M→ NaCO3(8.7±2.6) (-28) 2.0±2.0 (6.5±3.0) (-10) 0±1.0 J3
NaOH + CO2 M→ NaHCO3(1.3±0.3) (-28) 2.0±2.0 (6.8±4.0) (-10) 0±1.0 J4
Note: k(Z) = k(M,T) = 0.6{1 + [log (k (T)[M]/k (T))] }o ∞10
2 -1k (T)[M]o1 + (k (T)[M]/k (T))o ∞
( )
The values quoted are suitable for air as the third body, M.a Units are cm6/molecule2-sec.b Units are cm3/molecule-sec.
Shaded areas indicate changes or additions since JPL 94-26.
130
Notes to Table 2
A1. O + O2. Low pressure limit and T dependence are an average of Klais, Anderson, and Kurylo [119] and Lin
and Leu [141]. The result is in agreement with most previous work (see references therein) and with the studyof Hippler et al. [98]. Kaye [114] has calculated isotope effects for this reaction, using methods similar tothose discussed in the Introduction; Troe [223], Patrick and Golden [178]. Croce de Cobos and Troe [63] arein agreement with earlier work. Rawlins et al. [190] report values in Ar between 80 and 150K thatextrapolate to agreement with the recommended values.
A2. O(1D) + N2. Low pressure limit from Kajimoto and Cvetanovic [113]. The T dependence is obtained by
assuming a constant β. The rate constant is extremely low in this special system due to electronic curve
crossing. Maric and Burrows [148] extract (8.8±3.3)x10-37 cm6s-1 from a study of the photolysis ofsynthetic air, in agreement with the recommended value within mutual error limits.
B1. H + O2. Kurylo [125], Wong and Davis [250] and Hsu et al. [104] are averaged to obtain the low pressure
limiting value at 300K. The first two studies include T dependence, as does a study by Hsu et al. [103]. The
recommended value is chosen with constant <∆E>N2 ~.05 kcal mol-1. This very low number reflects
rotational effects. The high pressure limit is from Cobos et al. [51]. The temperature dependence isestimated. Cobos et al. [51] estimate m = -0.6, which is within our uncertainty. High temperaturemeasurements in Ar by Pirraglia et al. [182] are in good agreement. Measurements in the range298<T/K<750 by Carleton et al. [44] agree within error limits.
B2. OH + OH. Recommended values are from fits of measurements by Zellner et al. [257] in N2, and byForster et al. [85] in 1-150 kbar He scaled to N2. We find that these two data sets agree, in contrast to theconclusion of Forster et al., which is a result of not scaling their He data to correspond to N2. A study byFagerstrom et al. [81] in 85-1000 mbar SF6 gives slightly different values. A pressure independent
bimolecular channel to H2O + O with a rate 1.9 x 10⁻¹² is observed (see Table 1). The temperaturedependence of ko takes into account both Zellner et al. and Fagerstrom et al.. The unsymmetrical error limitsin ko (298) take into account contributions from H + OH → H2O. Trainor and von Rosenberg [222] report
a value at 300K that is lower by a factor of 2.7.
C1. O + NO. Low pressure limit and n from direct measurements of Schieferstein et al. [202] and their re-analysisof the data of Whytock et al. [246]. Error limits encompass other studies. High pressure limit and m fromBaulch et al. [23] and Baulch et al. [22], slightly modified. Shock tube measurements by Yarwood et al.[253] in argon from 300-1300K are consistent with these values.
C2. O + NO2. Values of rate constants and temperature dependences from the evaluation of Baulch et al. [23].They use Fc = 0.8 to fit the measured data at 298 K, but our value of Fc = 0.6 gives a similar result. In asupplementary review, Baulch et al. [22] suggest a slight temperature dependence for Fc, which would causetheir suggested value to rise to Fc = 0.85 at 200 K.
C3. OH + NO. The low pressure limit rate constant has been reported by Anderson and Kaufman [6], Stuhl andNiki [220], Morley and Smith [157], Westenberg and de Haas [245], Anderson et al. [7], Howard and Evenson[102], Harris and Wayne [95], Atkinson et al. [14], Overend et al. [170], Anastasi and Smith [5], Burrows etal. [39] and Atkinson and Smith [11]. The general agreement is good, and the recommended values of boththe rate constant and the temperature dependence are weighted averages. Studies by Sharkey et al. [207] andDonahue et al. [78] in the transition regime between low and high pressure limits are in agreement and serveto reduce the uncertainty. These latter studies yield a value for the high pressure limiting rate constant inagreement with the results of Forster et al. [85], whose study reached pressures of 100 bar in He. Thetemperature dependence of the high pressure limiting rate constant is from the data of Anastasi and Smith [5]
131
and Sharkey et al. (Both cis- and trans- HONO are expected to be formed.) A study by Zabarnick [254] isnoted.
C4. OH + NO2. Both the low pressure limit and the high pressure limiting rate constants are from a fit to the
data (at effective nitrogen densities less than 5x10¹⁹ molecules/cm3) of Anderson et al. [7], Howard andEvenson [102], Anastasi and Smith [4], Wine et al. [248], Burrows et al. [39], Robertshaw and Smith [193],Erler et al. [80] and Dohahue et al. [78]. Data of Forster et al [85] appear to be systematically too high. TheForster et al. results and those of Robertshaw and Smith [193], who have measured k in up to 8.6atmospheres of CF4, suggest that k∞ might be higher than suggested here (~50%). This disagreement might
also be due to other causes (i.e., the failure of the simplified fall-off expression as suggested by Donahue etal., isomer formation, or involvement of excited electronic states). Burkholder et al. [35] have shown that
HONO2 is the only isomer formed (yield - .75±.25.10 ) and the fit to the data used here assumes that only this
isomer is formed. The temperature dependence of both limiting rate constants is from the data of Wine et al.[248] and Anastasi and Smith [4] and is consistent with Smith and Golden [215] and Patrick and Golden[178]. The recommendation here fits all data over the range of atmospheric interest.
C5. HO2 + NO2. Kurylo and Ouellette [126] have remeasured the 300K range constants. Kurylo and Ouellette
[127] have also remeasured the temperature dependence. The recommended values are taken from this latterreference wherein their data were combined with that of Sander and Peterson [199]. The recommended ko(300K) is consistent with Howard [101]. Other studies by Simonaitis and Heicklen [210] and Cox and Patrick[61] are in reasonable agreement with the recommendation.
C6. NO2 + NO3. Data with N2 as the bath gas from Kircher et al. [118], Smith et al. [213], Burrows et al. [38],
and Wallington et al. [235] were used to obtain k300ο and k
300∞ . A study by Orlando et al. [168] is in
excellent agreement. The values of n and m are from Kircher et al. [118] and Orlando et al. [168]. Valuesfrom Croce de Cobos et al. [62] are excluded due to arguments given by Orlando et al. [168], who point outthat a reanalysis of these data using better values for the rate constant for NO3 + NO → 2NO2 yields anegative value for NO2 + NO3 + M. The study of Fowles et al. [86] is noted, but not used. Johnston et al.
[106] have reviewed this reaction.
A study of the reverse reaction has been carried out by Cantrell et al. [40]. These data are in excellentagreement with those obtained by Connell and Johnston [54] and Viggiano et al. [230]. The equilibriumconstant recommended in Table 3 is taken from Cantrell et al. [40], who computed it from the ratio of the rateconstant of Orlando et al. [168] and their rate constants for the reverse reaction.
C7. O2 + NO. Johnston et al. [106] and Davidson et al. [69] have suggested significant thermal decompositionof NO3. This has been disputed by Russell et al. [194]. Davis et al. [71] claim that the barrier to thermal
dissociation is 47.3 kcal mol-1. This would seem to rule out such a process in the atmosphere.
D1. CH3 + O2. Low pressure limit from Selzer and Bayes [205]. (These workers determined the rate constants asa function of pressure in N2, Ar, O2, and He. Only the N2 points were used directly in the evaluation, but
the others are consistent.) Plumb and Ryan [184] report a value in He which is consistent within error limitswith the work of Selzer and Bayes. Pilling and Smith [181] have measured this process in Ar (32-490 torr).Their low pressure limiting rate constant is consistent with this evaluation, but their high pressure value is alittle low. Cobos et al. [50] have made measurements in Ar and N2 from 0.25 to 150 atmospheres. They
report parameters somewhat different than recommended here, but their data are reproduced well by therecommended values. The work of Laguna and Baughcum [128] seems to be in the fall-off region. Results ofPratt and Wood [186] in Ar are consistent with this recommendation, although the measurements are indirect.Their T dependence is within our estimate. As can be seen from Patrick and Golden [178], the above valueleads to a very small β, ~.02, and thus temperature dependence is hard to calculate. The suggested value
132
accommodates the values of Keiffer et al. [115], who measure the process in Ar between 20 and 600 torr andin the range 334 ≤ T/K ≤ 582. Ryan and Plumb [197] suggest that the same type of calculation as employedby Patrick and Golden yields a reasonable value of β. We have not been able to reproduce their results. Thehigh pressure rate constant fits the data of Cobos et al. [50]. The temperature dependence is an estimate.(Data of van den Bergh and Callear [229], Hochanadel et al. [99], Basco et al. [21], Washida and Bayes [244],Laufer and Bass [130], and Washida [243] are also considered.) The fit to Keiffer et al. [115] is very good,suggesting that the temperature dependence for the high pressure limit is also reasonable. Kaiser [109] hasdetermined values in reasonable agreement (±30%) with the recommended values.
D2. C2H5 + O2. A relative rate study by Kaiser et al. [111] yields k∞ = (9.2 ± 0.9) x 10-12 cm3 molecule-1s-1
and ko = (6.5 ± 2.0) x 10-29 cm6 molecule-2s-1 in He at 298K and pressures between 3 and 1500 torr.
Their k∞ agrees with the value calculated by Wagner et al. [232] (k∞ = 7 x 10-12 cm3 molecule-1s-1) using
variational RRKM theory. The extrapolation to the low pressure limit is difficult due to the complex
potential energy surface, but agrees with a Patrick and Golden-type calculation [178] using ∆Hoo = 32.4 kcal
mol-1. The recommended values use the calculated temperature dependence and a 2.5 times higher rateconstant for air as the bath gas.
D3. OH + C2H2. The rate constant for this complex process has been re-examined by Smith et al. [214] in the
temperature range from 228 to 1400 K, and in the pressure range 1 to 760 torr. Their analysis, which is castin similar terms to those used here, is the source of the rate constants and temperature dependences at bothlimits. The negative value of m reflects the fact that their analysis includes a 1.2 kcal/mol barrier for theaddition of OH to C2H2. The data analyzed include those of Pastrana and Carr [177], Perry et al. [179],
Michael et al. [154], and Perry and Williamson [180]. Other data of Wilson and Westenberg [247], Breen andGlass [30], Smith and Zellner [218], and Davis et al. [70] were not included. Studies by Liu et al. [142] andLai et al. [129] are in general agreement with the recommendation. Calculations of ko via the methods of
Patrick and Golden [178] yield values compatible with those of Smith et al. [214].
D4. OH + C2H4. Experimental data of Tully [225], Davis et al. [70], Howard [100], Greiner [92], Morris et al.
[158], and Overend and Paraskevopoulos [169] in helium, Atkinson et al. [15] in argon, and Lloyd et al. [143]and Cox [56] and Klein et al. [120] in nitrogen/oxygen mixtures, have been considered in the evaluation.This well-studied reaction is considerably more complex than most others in this table. The parametersrecommended here fit exactly the same curve proposed by Klein et al. [120] at 298 K. An error in the kovalue has been corrected from the previous evaluation. Discrepancies remain and the effect of multiple productchannels is not well understood. Kuo and Lee [124] report very strong temperature dependence for the lowpressure limit (n=4). Calculations of the type in Patrick and Golden [178] yield the recommended value. Thehigh pressure limit temperature dependence has been determined by several workers. Almost all obtainnegative activation energies, the Zellner and Lorenz [258] value being equivalent to m = +0.8 over the range(296 < T/K < 524) at about 1 atmosphere. Although this could theoretically arise as a result of reversibility,the equilibrium constant is too high for this possibility. If there is a product channel that proceeds with a lowbarrier via a tight transition state, a complex rate constant may yield the observed behavior. The actualaddition process (OH + C2H4) may even have a small positive barrier. The recommended limits encompass
the reported values. A new high temperature measurement has been reported by Diau and Lee [75].
D5. CH3O + NO. The recommended values are taken from the results of Frost and Smith [88] in argon.
Temperature dependences are from their higher temperature results. The low pressure rate constant isconsistent with the measurement of McCaulley et al. [152] and Daele et al. [64] in helium and half the valuefrom Troe-type calculations. A bimolecular (chemical activation) path also exists, forming HNO + CH2O
(Frost and Smith [88]). Studies by Ohmori et al. [166] and Dobé et al. [77] are in general agreement withFrost and Smith with respect to both the addition and bimolecular pathways. (See the note in Table 1 for thebimolecular pathway.)
133
D6. CH3O + NO2. Recommended values at 298K from the study of Frost and Smith [89] in argon (corrected by
Frost and Smith [90] and that of Biggs et al [25] in He. Low pressure results agree within a factor of twowith the measurements of McCaulley et al. [151] in helium. A bimolecular (chemical activation) pathway isalso observed. Temperature dependences are estimated.
D7 C2H5O + NO. High pressure data at 298K in Ar from Frost and Smith [88] and low pressure measurementsin He by Daele et el. [65] are scaled to N2 and fit with an expression summing the bimolecular and
termolecular channels. The low pressure value agrees with theory. The bimolecular channel with an
estimated rate of about 10-12 needs to be verified by direct studies. The temperature dependence is estimated.
D8. C2H5O + NO2. High pressure rate constant at 298K from Frost and Smith [89]. Other values estimated
from similar reactions.
D9. CH3O2 + NO2. Parameters from a reasonable fit to the temperature- and pressure-dependent data in Sanderand Watson [201] and Ravishankara et al. [187]. These references report Fc = 0.4, and their parameters are a
somewhat better fit at all temperatures than those recommended here. We do not adopt them since they arenot much better in the stratospheric range, and they would require both a change in our Fc = 0.6 format andthe adoption of a quite large negative activation energy for k∞. A study of the reverse reaction by Zabel et al.[255] also uses Fc = 0.4. The values recommended herein, taken with the value of the equilibrium constant inTable 3, fit the data in Zabel et al. [255] very well. Destriau and Troe [74] have fit the above data with k∞independent of temperature and Fc = 0.36. Bridier et al. [32] are in good agreement with this recommendation
at one atmosphere and 298K.
D10. CH3C(O)O2 + NO2. The recommended parameters are from the data of Bridier et al. [31], who report in the
format represented here, but using Fc = 0.3. Their values are: k300o = (2.7 ± 1.5) x 10-28, k
300∞ = (12.1 ±
2.0) x 10-12, with n = 7.1 ±1.7 and m= 0.9 ± 0.15. Studies of the decomposition of CH3C(O)O2NO2[PAN] by Roberts and Bertman [192], Grosjean et al. [93], and Orlando et al. [167] are in accord with Bridieret al. [31]. In the former study it was shown that PAN decomposition yields only peroxyacetyl radical andNO2; no methyl nitrate.
E1. F + O2. A study by Pagsberg et al. [174] reports ko in argon = 4.38 x 10⁻³³ (T/300)-1.2. This is in good
agreement with earlier values of Smith and Wrigley [217], Smith and Wrigley [216], Shamonina and Kotov[206], Arutyunov et al. [9] and slightly lower than the values of Chen et al. [47] and Chegodaev et al. [46].Wallington and Nielsen [241], Wallington et al. [240] and Ellerman et al. [79] confirm the value of Pagsberget al. [174]. Lyman and Holland [145] report a slightly lower value in Ar at 298K. We assume that ßAr =ßN2 at all temperatures. Pagsberg et al. [174], also determined the equilibrium constant and thus ∆Hf (FO2).See F + O2, Table 3. A calculation such as described in Patrick and Golden [178], using the new value
yields: ko = 1.06 x 10⁻³³ (T/300)-1.5 using ßN2 = 0.3 (i.e., <∆E> = 2kJ mol-1). This is not good
agreement.
E2. F + NO. A study by Pagsberg et al [172], taking into account data from Zetzsch [259], Skolnik et al. [211],Kim et al. [117], Pagsberg et al. [173] and Wallington et al. [238], reports rate constants for this reaction inseveral bath gases. Converting their values to the form used in this compilation yields the recommendedparameters.
E3. F + NO2. A study by Pagsberg et al. [171], taking into account the experimental data of Fasano and Nogar
[82] and Zetzsch [259], was used to determine both the high and low pressure limits at 300 K. Convertingtheir values to the form used in this compilation yields the recommended parameters. Treatment of the datafor this system requires knowledge of the relative stabilities of FNO2 and FONO. Patrick and Golden [178]assumed that the difference between these would be the same as between the ClNO2 isomers. Theoretical work
134
by Dixon and Christie [76], Lee and Rice [133] and Amos et al. [3] indicates that FNO2 is 35-40 kcal mol-1
more stable than FONO, and therefore the measured rate refers to FNO2 formation. The value of n = 2 is from
Patrick and Golden, but consistent with Pagsberg et al.. The value of m is a rough estimate from similarreactions, but is also consistent with Pagsberg et al..
E4. FO + NO2. Low pressure limit from strong collision calculation and ß = 0.33. T dependence from resultant
<∆E> = .523 kcal mol-1. High pressure limit and T dependence estimated. A theoretical study by Rayezand Destriau [191] indicates that the product is the single isomer FONO2. Bedzhanyan et al. [24] report a
value extracted from a complex mixture of bath gases.
E5. CF3 + O2. Caralp et al. [42] have measured the rate constant in N2 between 1 and 10 torr. This supplants
the value from Caralp and Lesclaux [41]. Kaiser et al. [112] have extended the pressure range to 580 torr.They both recommend different parameters, but the data are well represented by the currently recommendedvalues. Data of Ryan and Plumb [196] are in agreement.
E6. CF3O + NO2. There are no published measurements of the rate coefficient for this reaction. The reactionproducts have been reported by Chen et al. [48], who used photolysis of CF3NO to prepare CF3O2 andsubsequently CF3O in 700 torr of air at 297 + 2K. They considered two product channels: (a) CF3ONO2obtained via three-body recombination and (b) CF2O + FNO2 obtained via fluorine transfer. Both productswere observed and found to be thermally stable in their reactor. They report ka/(ka+kb) > 90% and kb/(ka+kb)< 10%, thus the formation of CF3ONO2 is the dominant channel at 700 torr and 297 K.
E7. CF3O2 + NO2. Based on experiments in O2 of Caralp et al. [43], who suggest a somewhat different fitting
procedure, but the values recommended here fit the data just as well. Destriau and Troe [74] use yet a differentfitting procedure that does not represent the data quite as well as that recommended here. Reverse rate data aregiven by Köppenkastrop and Zabel [122].
E8. CF3O + CO. Values taken from Turnipseed et al. [226]. The numbers were obtained for Ar as the bath gasand are assumed to hold for N2 as well. The temperature dependence of the high pressure rate constant wasdetermined over the range 233<T/K<332 in SF6. No temperature dependence of the low pressure limiting rate
constant was reported. Wallington and Ball [236] report values in good agreement with Turnipseed et al.
E9. CF3O + M. The activation energy for thermal decomposition of CF3O to CF2O + F has been reported to
be 31 kcal mol-1 by Kennedy and Levy [116]. Thermochemical data yield ∆Ho(298) = 23 kcal mol-1. This
implies an intrinsic barrier of about 8 kcal mol-1 to elimination of F from CF3O. Electronic structure
calculations by Li and Francisco [140] support this observation. Adopting the A-factor for unimolecular
dissociation, A = 3 x 10¹⁴ s-1 and E = 31 kcal mol-1 from Kennedy and Levy, k∞(298) is about 6 x 10⁻⁹s-1.This corresponds to a lifetime of about 6 years; therefore, thermal decomposition of CF3O is unimportant
throughout the atmosphere.
F1. Cl + O2. Nicovich et al. [161] measure k=(9 ± 3) x 10-33 cm6 molecule-2s-1 at T = 187 ± 6K in O2.Using the methods described in Patrick and Golden [178], but adjusting the thermochemistry of ClO2 such
that So2 98 = 64.3 cal mol-1 K-1 and ∆Hf,298 = 23.3 ± 0.6 kcal mol-1 (Cl + O2, Table 3). We calculate
5.4 x 10⁻³³ cm6 molecule-2 s-1 at T = 185K, with collisional efficiency of the bath gas taken from the
formula [ß/(1-ß1/2)] = <∆E>/FEkT and <∆E> ~ 0.5 kcal mol-1 (i.e., ß185 = .42 and ß300 = .30). Since O2may be particularly efficient for this process, we use this calculation with broader error limits. The value from
the calculation at 300K (i.e., 2.7 x 10⁻³³ cm6 molec-2 s-1) compares with an older value of Nicholas and
Norrish [159] of 1.7 x 10⁻³³ in an N2 + O2 mixture. The temperature dependence is from the calculation.
135
Baer et al. [16] report a value at 298 K in good agreement with the value recommended here, but thetemperature dependence is strikingly different, as noted by the authors.
F2. Cl + NO. Low pressure limit from Lee et al. [132], Clark et al. [49], Ashmore and Spencer [10], andRavishankara et al. [188]. Temperature dependence from Lee et al. [132] and Clark et al. [49].
F3. Cl + NO2. Low pressure limit and T dependence from Leu [138]. (Assuming similar T dependence in N2and He.) Leu [138] confirms the observation of Niki et al. [164] that both ClONO and ClNO2 are formed,
with the former dominating. This has been explained by Chang et al. [45], with detailed calculations inPatrick and Golden [178]. The temperature dependence is as predicted in Patrick and Golden [178]. Leu'sresults are in excellent agreement with those reported in Ravishankara et al. [189]. The latter work extends to200 torr, and the high pressure limit was chosen to fit these measurements. The temperature dependence ofthe high pressure limit is estimated. A turbulent flow study by Seeley et al. [204] that extends results to 250torr of Ar is in agreement with earlier work.
F4. Cl + CO. From Nicovich et al. [162], who measured the process in N2 for 185 ≤ T/K ≤ 260.
F5. Cl + C2H2. The recommended values are taken from the work of Kaiser [108] and Kaiser and Wallington
[110], which extends the pressure range to 0.3-6000 torr. The data are in reasonable agreement with earliermeasurements of Brunning and Stief [33] and Wallington et al. [234], although the derived temperaturedependence is much less than obtained by Brunning and Stief [33]. These values are compatible with earlierstudies of Poulet et al. [185], Atkinson and Aschmann [12], Lee and Rowland [131] and Wallington et al.[242]. Using FTIR, Zhu et al. [260] reported branching of 16% and 84% to the trans and cis adduct isomers,respectively, at 700 torr N2 and 295K.
F6. Cl + C2H4. Values at 300K are from Wallington et al. [234]. A study by Kaiser and Wallington [110]
extends the pressure range to 0.3-6000 torr and is compatible with earlier studies. Temperature dependence istaken from Kaiser and Wallington. Values are in reasonable agreement with earlier studies.
F7 Cl + C2Cl4. New Entry. Recommendation is from the flash photolysis study of Nicovich et al. [163] doneat 231-390 K in 3-700 torr N2.
F8. ClO + NO2. Several independent low pressure determinations (Zahniser et al. [256]; Birks et al. [27]; Leu etal. [139]; Lee et al. [135]) of the rate of ClO disappearance via the ClO + NO2 + M reaction are in excellent
agreement and give an average ko(300) near 1.8 x 10⁻³¹ cm6 s-1. No product identification was carried out,and it was assumed that the reaction gave chlorine nitrate, ClONO2. In contrast, direct measurements of therate of thermal decomposition of ClONO2 (Knauth [121]; Schonle et al. [203]; and Anderson and Fahey [8]),
when combined with the accepted thermochemistry give a value lower by a factor of 3. It is concluded that
earlier measurements of the heat of formation are incorrect,and so the value 5.5 kcal mol-1 evaluated from thekinetics by Anderson and Fahey [8] is accepted. Earlier explanations to the effect that the low pressure ClOdisappearance studies measured not only a reaction forming ClONO2, but also another channel forming anisomer, such as OClNO2, ClOONO, or OClONO (Chang et al. [45]; Molina et al. [155]) are obviated by the
above and the work of Margitan [146], Cox et al. [57], and Burrows et al. [37], which indicates that there areno isomers of ClONO2 formed. Wallington and Cox [237] confirm current values but are unable to explain
the effect of OClO observed by both Molina et al. [155] and themselves. A theoretical study by Rayez andDestriau [191] supports the idea of a single isomer being the product. The high pressure limit rate constantsand their temperature dependence are from the model of Smith and Golden [215]. The recommended rateconstants fit measured rate data for the disappearance of reactants (Cox and Lewis [60]; Dasch et al. [68]).Data from Handwerk and Zellner [94] indicate a slightly lower k∞.
136
F9. OClO + NO3. Friedl et al. [87], studied this system at 1 ≤ P/torr ≤ 5 for Helium and 220 ≤ T/K ≤ 298.
They deduced values for the rate constant consistent with their data of ko ~ 10-31 and k∞ ~ 10-11. They also
suggest a value for the equilibrium constant: K/cm3 molecule-1 = 1 x 10-28 exp (9300/T). However, Boyd etal. [29] have raised the question of possible heterogeneous effects in this system, and further work is needed.
F10. ClO + ClO. The recommendation is based on data from Sander et al. (194 - 247 K) [198], Nickolaisen et al.(260 - 390 K) [160], and Trolier et al. (200 - 263 K) [224]. The latter data have been corrected for the effect ofCl2 as third body, as suggested by Nickolaisen et al. With this adjustment all the data are in goodagreement. The ko value for N2 is not in accord with a Patrick and Golden-type calculation. This may be due
to uncertainty in the ClOOCl thermochemistry, which is based on the equilibrium constants reported byNickolaisen et al. and Cox and Hayman [59]. Other previous rate constant measurements, such as those ofHayman et al. [96], Cox and Derwent [58], Basco and Hunt [20], Walker [233], and Johnston et al. [107],
range from 1-5 x 10-32 cm6 s-1, with N2 or O2 as third bodies. The major dimerization product is chlorine
peroxide (Birk et al. [26], DeMore and Tschuikow-Roux [73], Slanina and Uhlik [212], Stanton et al. [219]and Lee et al. [134]).
F11. ClO + OClO. Corrected from the entry in 94-26, which had an error in k∞. Data are from Burkholder et al.
[36], who measured the rate constant in N2 at 200 ≤ T/K ≤ 260 and densities from (1.1-10.9) x 1018
molecules cm-3. They also measured the equilibrium constant. Parr et al. [176] also report a value for therate constant in reasonable agreement with the recommendation.
F12. O + OClO. The recommendation is based on data of Colussi et al. [53] and Colussi [52], who measured thepressure dependence between 248 and 312K. Their results are consistent with calculations. A zero pressure
rate constant of (1.6 ± 0.4) x 10-13 cm3 s-1 is reported for the chemical activation channel producing ClO +
O2, and their value of ∆Hof (ClO3) = 52 kcal mol-1 is derived at 298K. A low pressure study by Gleason et
al. [91] suggests a direct abstraction as well. See Table 1.
F13. CH2Cl + O2. Measured by Fenter et al. [83] over the range 298 ≤ T/K ≤ 448 and 1 ≤ P/torr ≤ 760 in
nitrogen. Two different techniques were employed: laser photolysis/photoionization mass spectrometry inthe range 1-10 torr and laser photolysis/UV absorption for the range 20-760 torr.
F14. CHCl2 + O2. Measured by Fenter et al. [83] over the range 298 ≤ T/K ≤ 383 and 1 ≤ P/Torr ≤ 760 in
nitrogen. Two different techniques were employed: laser photolysis/photoionization mass spectrometry in therange 1-10 torr and laser photolysis/UV absorption for the range 20-760 torr. A study by Nottingham et al.[165], in He, is in agreement.
F15. CCl3 + O2. Fenter et al. [84] present new data for this reaction. They combine these new data with those of
Danis et al. [67] to determine the recommended rate parameters. Experimental data of Ryan and Plumb [197]have been considered in the evaluation. A study by Nottingham et al. [165], in He, is in agreement. A
Patrick and Golden-type calculation using the thermochemistry of Russell et al. [195] yields k300 o =
1.5x10⁻³⁰, with ß = 0.3. A value of k300∞ = 5x10-12 has been reported by Cooper et al. [55].
F16. CFCl2 + O2. Values for both low and high pressure limits at 300K are from Caralp and Lesclaux [41].
Temperature dependences are rough estimates based on calculations and similar reactions.
F17. CF2Cl + O2. Values estimated from other reactions in this series.
137
F18. CCl3O2 + NO2. Based on experiments in O2 of Caralp et al. [43], who suggest a somewhat different fitting
procedure, but the values recommended here fit the data as well. Destriau and Troe [74] use yet a differentfitting procedure that does not represent the data quite as well as that recommended herein. Reverse rate dataare given by Köppenkastrop and Zabel [122].
F19. CFCl2O2 + NO2. Based on experiments in O2 of Caralp et al. [43], who suggest a somewhat different
fitting procedure, but the values recommended here fit the data as well. Destriau and Troe [74] use yet adifferent fitting procedure that does not represent the data quite as well as that recommended herein. Reverserate data are given by Köppenkastrop and Zabel [122].
F20. CF2ClO2 + NO2. A study by Wu and Carr [251] supersedes the earlier work of Moore and Carr [156] and is
recommended here. Reverse rate data are given by Köppenkastrop and Zabel [122] and Xiong and Carr [252].
G1. Br+NO2. The recommended values are from a study by Kreutter et al. [123]. Their ko value agrees with the
measurement of Mellouki et al. [153] at 300K. A Patrick and Golden-type calculation using the knownstructure of the more stable BrNO2 isomer and the measured equilibrium by Kreutter et al. [123] underpredictsko by an order of magnitude. Participation by other electronic states and isomers such as BrONO merits
further consideration, in keeping with the chlorine analog.
G2. BrO + NO2. Values from a study by Thorn et al. [221] that is in excellent agreement with Sander et al. [200]
are recommended. Danis et al. [66] give slightly lower values for the low pressure limiting rate constant anda smaller temperature dependence as well. A theoretical study by Rayez and Destriau [191] suggests that thebond dissociation energy in BrONO2 is higher than that in ClONO2, thus rationalizing the relative values of
the low pressure limiting rate constants for these two processes.
H1. I + NO. Evaluation taken from IUPAC [105]. The data is from van den Bergh et al. [227] and Basco andHunt [19]. Although IUPAC recommends Fc = 0.75, any differences will be insignificant, since this reaction
is in the low pressure limit under atmospheric conditions.
H2. I + NO2. Evaluation taken from IUPAC [105]. The data is from van den Bergh et al. [227], Mellouki et al.[153], Buben et al. [34] and van den Bergh and Troe [228]. IUPAC uses Fc = 0.63, which is the same as theuniversal value adopted here of Fc = 0.6. (No evidence of possible isomers [INO2 or IONO] is reported.)
H3. IO + NO2. Data taken from Daykin and Wine [72]. They suggest ko = 7.7 x 10⁻³¹ (T/300)-5.0, k∞ = 1.5
x 10-11 and Fc = 0.4. The values recommended here fit the data as well.
I1. HS + NO. Data and analysis are from the work of Black et al. [28]. The temperature dependence of k hasbeen estimated.
I2. CH3S + NO. The recommended values are from the study by Balla et al. [17] at 296K in nitrogen.
Temperature dependences are derived from the higher temperature results of the same study.
I3 O + SO2. New Entry. The recommendation is taken from Atkinson et al. [13] and was transformed to the
format used herein.
I4. OH + SO2. Values of the rate constant as a function of pressure at 298 K from Leu [137], Paraskevopoulos
et al. [175], and Wine et al. [249]. The value of the low pressure limit is from Leu [137], corrected for fall-off. The high pressure limit is from a fit to all the data. The value of n comes from the above data combinedwith calculations such as those of Patrick and Golden [178], except that the heat of formation of HOSO2 is
raised by 4 kcal mol-1, as suggested by the work of Margitan [147]. The value of m is estimated. This isnot a radical-radical reaction and is unlikely to have a positive value of m. The limit of m = -2 corresponds to
138
a real activation energy of ~1 kcal mol-1. Earlier data listed in Baulch et al. [23] and Baulch et al. [22] arenoted. Work of Martin et al. [150], Barnes et al. [18], and Lee et al. [136] confirm the current evaluation.
I5. CH3SCH2 + O2 . Wallington et al. [239] have employed a pulse radiolysis technique, allowing the
derivation of k = 5.7 ± 0.4 x 10⁻¹² in 992 mbar of SF6 at room temperature.
I6 SO3 + NH3. New Entry. (Moved from Table 1). Recommendation is from Lovejoy and Hanson [144], whostudied this reaction from 10-400 torr N2 at 295 K. They observe that the adduct isomerizes rapidly to
sulfamic acid and clusters efficiently with itself and sulfuric acid. Observed sulfamic acid dimerization rate
constant exceeds 5 x 10-11. Measurements of Shen et al. [208] made at 1-2 torr He are much higher thanthose of Lovejoy and Hanson. Temperature dependences are rough estimates.
J1. Na + O2. A study by Plane and Rajasekhar [183] finds ko = (2.9 ± 0.7) x 10-30 at 300 K with n = 1.30 ±.04. They also estimate k∞ to be about 6 x 10⁻¹⁰, with a small positive temperature dependence. Another
study by Helmer and Plane [97] yields ko = (3.1 ±0.2) x 10-30 at 300K with n = 1.52±0.27. The
recommended values are taken from these studies. They are consistent with values measured by Marshall etal. [149] at 600K and those measured by Vinckier et al. [231] at higher temperature. The ko value is about
60% higher than that of Silver et al. [209].
J2. NaO + O2. Ager and Howard [1] have measured the low pressure limit at room temperature in several bathgases. Their value in N2 is used in the recommendation. They performed a Troe calculation, as per Patrick
and Golden [178], to obtain collision efficiency and temperature dependence. They obtained a high pressurelimit rate constant by use of a simple model. The temperature dependence is estimated.
J3. NaO + CO2. Ager and Howard [1] have measured the rate constant for this process in the "fall-off" regime.
Their lowest pressures are very close to the low pressure limit. The temperature dependence is an estimate.Ager and Howard calculate the high pressure rate constant from a simple model. The temperature dependenceis an estimate.
J4. NaOH + CO2. Ager and Howard [2] have measured the low pressure limiting rate constant. The temperature
dependence is an estimate. Ager and Howard have calculated the high pressure limit using a simple model.The temperature dependence is an estimate.
References for Table 2
1 . Ager, J.W., III and C.J. Howard, 1986, Geophys. Res. Lett., 13, 1395-1398.2 . Ager, J.W., III and C.J. Howard, 1987, J. Geophys. Res., 92, 6675-6678.3 . Amos, R.D., C.W. Murray, and N.C. Handy, 1993, Chem. Phys. Lett., 202, 489-494.4 . Anastasi, C. and I.W.M. Smith, 1976, J. Chem. Soc. Faraday Trans. 2, 72, 1459-1468.5 . Anastasi, C. and I.W.M. Smith, 1978, J. Chem. Soc. Faraday Trans. 2, 74, 1056.6 . Anderson, J.G. and F. Kaufman, 1972, Chem. Phys. Lett., 16, 375-379.7 . Anderson, J.G., J.J. Margitan, and F. Kaufman, 1974, J. Chem. Phys., 60, 3310.8 . Anderson, L.C. and D.W. Fahey, 1990, J. Phys. Chem., 94, 644-652.9 . Arutyunov, V.S., L.S. Popov, and A.M. Chaikin, 1976, Kinet. Katal., 17, 286.10. Ashmore, P.G. and M.S. Spencer, 1959, Trans. Faraday Soc., 55, 1868.11. Atkinson, D.B. and M.A. Smith, 1994, J. Phys. Chem., 98, 5797-5800.12. Atkinson, R. and S.M. Aschmann, 1985, Int. J. Chem. Kinet., 17, 33-41.13. Atkinson, R., D.L. Baulch, R.A. Cox, R.F. Hampson, J.A. Kerr, and J. Troe, 1992, J. Phys. Chem. Ref. Data, 21,
1125-1568.14. Atkinson, R., D.A. Hansen, and J.N. Pitts Jr., 1975, J. Chem. Phys., 62, 3284-3288.
139
15. Atkinson, R., R.A. Perry, and J.N. Pitts Jr., 1977, J. Chem. Phys., 66, 1197.16. Baer, S., H. Hippler, R. Rahn, M. Siefke, N. Seitzinger, and J. Troe, 1991, J. Chem. Phys., 95, 6463-6470.17. Balla, R.J., H.H. Nelson, and J.R. McDonald, 1986, Chem. Phys., 109, 101.18. Barnes, I., V. Bastian, K.H. Becker, E.H. Fink, and W. Nelsen, 1986, J. Atmos. Chem., 4, 445-466.19. Basco, N. and J.E. Hunt, 1978, Int. J. Chem Kinet., 10, 733-743.20. Basco, N. and J.E. Hunt, 1979, Int. J. Chem. Kinet., 11, 649.21. Basco, N., D.G.L. James, and F.C. James, 1972, Int. J. Chem. Kinet. , 4, 129.22. Baulch, D.L., R.A. Cox, P.J. Crutzen, R.F. Hampson Jr., J.A. Kerr, J. Troe, and R.T. Watson, 1982, J. Phys. Chem.
Ref. Data, 11, 327-496.23. Baulch, D.L., R.A. Cox, R.F. Hampson Jr., J.A. Kerr, J. Troe, and R.T. Watson, 1980, J. Phys. Chem. Ref. Data, 9,
295-471.24. Bedzhanyan, Y.R., E.M. Markin, and Y.M. Gershenzon, 1993, Kinetics and Catalysis, 34, 190-193.25. Biggs, P., C.E. Canosa-Mas, J.M. Fracheboud, D.E. Shallcross, R.P. Wayne, and F. Caralp, 1993, J. Chem. Soc.
Faraday Trans., 89, 4163-4169.26. Birk, M., R.R. Friedl, E.A. Cohen, H.M. Pickett, and S.P. Sander, 1989, J. Chem. Phys., 91, 6588-6597.27. Birks, J.W., B. Shoemaker, T.J. Leck, R.A. Borders, and L.J. Hart, 1977, J. Chem. Phys., 66, 4591.28. Black, G., R. Patrick, L.E. Jusinski, and T.G. Slanger, 1984, J. Chem. Phys., 80, 4065.29. Boyd, A.A., G. Marston, and R.P. Wayne, 1996, J. Phys. Chem., 100, 130-137.30. Breen, J.E. and G.P. Glass, 1971, Int. J. Chem. Kinet., 3, 145.31. Bridier, I., F. Caralp, H. Loirat, R. Lesclaux, B. Veyret, K.H. Becker, A. Reimer, and F. Zabel, 1991, J. Phys.
Chem., 95, 3594-3600.32. Bridier, I., R. Lesclaux, and B. Veyret, 1992, Chem. Phys. Lett., 191, 259-263.33. Brunning, J. and L.J. Stief, 1985, J. Chem. Phys., 83, 1005-1009.34. Buben, S.N., I.K. Larin, N.A. Messineva, and E.M. Trofimova, 1990, Kinetika i Kataliz, 31, 973.35. Burkholder, J.B., P.D. Hammer, and C.J. Howard, 1987, J. Phys. Chem., 91, 2136-2144.36. Burkholder, J.B., R.L. Mauldin, R.J. Yokelson, S. Solomon, and A.R. Ravishankara, 1993, J. Phys. Chem., 97,
7597-7605.37. Burrows, J.P., D.W.T. Griffith, G.K. Moortgat, and G.S. Tyndall, 1985, J. Phys. Chem., 89, 266-271.38. Burrows, J.P., G.S. Tyndall, and G.K. Moortgat, 1985, J. Phys. Chem., 89, 4848-4856.39. Burrows, J.P., T.J. Wallington, and R.P. Wayne, 1983, J. Chem. Soc. Faraday Trans. 2, 79, 111-122.40. Cantrell, C.A., R.E. Shetter, J.G. Calvert, G.S. Tyndall, and J.J. Orlando, 1993, J. Phys. Chem., 97, 9141-9148.41. Caralp, F. and R. Lesclaux, 1983, Chem. Phys. Lett., 102, 54-58.42. Caralp, F., R. Lesclaux, and A.M. Dognon, 1986, Chem. Phys. Lett., 129, 433-438.43. Caralp, F., R. Lesclaux, M.T. Rayez, J.-C. Rayez, and W. Forst, 1988, J. Chem. Soc. Faraday Trans. 2, 84, 569-
585.44. Carleton, K.J., W.J. Kessler, and W.J. Marinelli, 1993, J. Phys. Chem., 97, 6412-6417.45. Chang, J.S., A.C. Baldwin, and D.M. Golden, 1979, Chem. Phys., 71, 2021.46. Chegodaev, P.P. and V.I. Tubikov, 1973, Dokl. Akad. Nauk. SSSR, 210, 647.47. Chen, H.L., D.W. Trainor, R.E. Center, and W.T. Fyfe, 1977, J. Chem. Phys., 66, 5513.48. Chen, J., V. Young, T. Zhu, and H. Niki, 1993, J. Phys. Chem., 97, 11696-11698.49. Clark, T.C., M.A.A. Clyne, and D.H. Stedman, 1966, Trans. Faraday Soc., 62, 3354.50. Cobos, C.J., H. Hippler, K. Luther, A.R. Ravishankara, and J. Troe, 1985, J. Phys. Chem., 89, 4332-4338.51. Cobos, C.J., H. Hippler, and J. Troe, 1985, J. Phys. Chem., 89, 342-349.52. Colussi, A.J., 1990, J. Phys. Chem., 94, 8922-8926.53. Colussi, A.J., S.P. Sander, and R.R. Friedl, 1992, J. Phys.Chem., 96, 4442-4445.54. Connell, P.S. and H.S. Johnston, 1979, Geophys. Res. Lett., 6, 553.55. Cooper, R., J.B. Cumming, S. Gordon, and W.A. Mulac, 1980, Radiat. Phys. Chem., 16, 169.56. Cox, R.A., 1975, Int. J. Chem. Kinet. Symp., 1, 379.57. Cox, R.A., J.P. Burrows, and G.B. Coker, 1984, Int. J. Chem. Kinet., 16, 445-67.58. Cox, R.A. and R.G. Derwent, 1979, J. Chem. Soc. Far. Trans. 1, 75, 1635-1647.59. Cox, R.A. and G.D. Hayman, 1988, Nature, 332, 796-800.60. Cox, R.A. and R. Lewis, 1979, J. Chem. Soc. Faraday Trans. 1, 75, 2649.61. Cox, R.A. and R. Patrick, 1979, Int. J. Chem. Kinet., 11, 635.62. Croce de Cobos, A.E., H. Hippler, and J. Troe, 1984, J. Phys. Chem., 88, 5083-5086.
140
63. Croce de Cobos, A.E. and J. Troe, 1984, Int. J. Chem. Kinet., 16, 1519-1530.64. Daele, V., G. Laverdet, G. Le Bras, and G. Poulet, 1995, J. Phys. Chem., 99, 1470-1477.65. Daele, V., A. Ray, I. Vassali, G. Poulet, and G. Le Bras, 1995, Int. J. Chem. Kinet., 27, 1121-1133.66. Danis, F., F. Caralp, J. Masanet, and R. Lesclaux, 1990, Chem. Phys. Lett., 167, 450.67. Danis, F., F. Caralp, M. Rayez, and R. Lesclaux, 1991, J. Phys. Chem., 95, 7300-7307.68. Dasch, W., K.-H. Sternberg, and R.N. Schindler, 1981, Ber. Bunsenges. Phys. Chem., 85, 611.69. Davidson, J.A., C.A. Cantrell, R.E. Shetter, A.H. McDaniel, and J.G. Calvert, 1990, J. Geophys. Res., 95, 13963-
13969.70. Davis, D.D., S. Fischer, R. Schiff, R.T. Watson, and W. Bollinger, 1975, J. Chem. Phys., 63, 1707.71. Davis, H.F., B. Kim, H.S. Johnston, and Y.T. Lee, 1993, J. Phys. Chem., 97, 2172-2180.72. Daykin, E.P. and P.H. Wine, 1990, J. Phys. Chem. , 94, 4528-4535.73. DeMore, W.B. and E. Tschuikow-Roux, 1990, J. Phys. Chem., 94, 5856-5860.74. Destriau, M. and J. Troe, 1990, Int. J. Chem. Kinet., 22, 915-934.75. Diau, E.W.-G. and Y.-P. Lee, 1992, J. Chem. Phys., 96, 377-386.76. Dixon, D.A. and K.O. Christie, 1992, J. Phys. Chem., 95, 1018-1021.77. Dobe, S., G. Lendvay, I. Szilagyi, and T. Berces, 1994, Int. J. Chem. Kinet., 26, 887-901.78. Donahue, N.M., M.K. Dubey, R. Mohrschladt, K. Demerjian, and J.G. Anderson, 1996, Accepted by J. Geophys.
Res.79. Ellerman, T., J. Sehested, O.J. Nielson, P. Pagsberg, and T.J. Wallington, 1994, Chem. Phys. Lett., 218, 287-294.80. Erler, K., D. Field, R. Zellner, and I.W.M. Smith, 1977, Ber. Bunsenges. Phys. Chem., 81, 22.81. Fagerstrom, K., A. Lund, G. Mahmound, J.T. Jodkowski, and E. Ratajczak, 1994, Chem. Phys. Lett., 224, 43-50.82. Fasano, D.M. and N.S. Nogar, 1983, J. Chem. Phys., 78, 6688-6694.83. Fenter, F.F., P.D. Lightfoot, F. Caralp, R. Lesclaux, J.T. Niranen, and D. Gutman, 1993, J. Phys. Chem., 97, 4695-
4703.84. Fenter, F.F., P.D. Lightfoot, J.T. Niranen, and D. Gutman, 1993, J. Phys. Chem., 97, 5313-5320.85. Forster, R., M. Frost, H.F. Hamann, H. Hippler, Schlepegreli, and J. Troe, 1996, J. Chem. Phys., 103, 2949-2958.86. Fowles, M., D.N. Mitchell, J.W.L. Morgan, and R.P. Wayne, 1982, J. Chem. Soc. Faraday Trans. 2, 78, 1239-
1248.87. Friedl, R.R., S.P. Sander, and Y.L. Yung, 1992, J. Phys. Chem., 96, 7490-7493.88. Frost, M.J. and I.W.M. Smith, 1990, J. Chem. Soc. Farad. Trans., 86, 1757-1762.89. Frost, M.J. and I.W.M. Smith, 1990, J. Chem. Soc. Farad. Trans., 86, 1751-1756.90. Frost, M.J. and I.W.M. Smith, 1993, J. Chem. Soc. Faraday Trans, 89, 4251.91. Gleason, J.F., F.L. Nesbitt, and L.J. Stief, 1994, J. Phys. Chem., 98, 126-131.92. Greiner, N.R., 1970, J. Chem. Phys., 53, 1284-1285.93. Grosjean, D., E. Grosjean, and E.L. Williams, 1994, J. Air and Waste Manage. Assoc., 44, 391-396.94. Handwerk, V. and R. Zellner, 1984, Ber. Bunsenges. Phys. Chem., 88, 405.95. Harris, G.W. and R.P. Wayne, 1975, J. Chem. Soc. Faraday Trans. 1, 71, 610.96. Hayman, G.D., J.M. Davies, and R.A. Cox, 1986, Geophys. Res. Lett., 13, 1347-1350.97. Helmer, M. and J.M.C. Plane, 1993, J. Geophys. Res., 98, 23207-23222.98. Hippler, H., R. Rahn, and J. Troe, 1990, J. Chem. Phys., 93, 6560.99. Hochanadel, C.J., J.A. Ghormley, J.W. Boyle, and P.J. Ogren, 1977, J. Phys. Chem., 81, 3.100. Howard, C.J., 1976, J. Chem. Phys., 65, 4771.101. Howard, C.J., 1977, J. Chem. Phys., 67, 5258.102. Howard, C.J. and K.M. Evenson, 1974, J. Chem. Phys., 61, 1943.103. Hsu, K.J., S.M. Anderson, J.L. Durant, and F. Kaufman, 1989, J. Phys. Chem., 93, 1018.104. Hsu, K.J., J.L. Durant, and F. Kaufman, 1987, J. Phys. Chem., 91, 1895-1899.105. IUPAC, 1992, J. Phys. Chem. Ref. Data, 21, 1125-1568.106. Johnston, H.S., C.A. Cantrell, and J.G. Calvert, 1986, J. Geophys. Res., 91, 5159-5172.107. Johnston, H.S., E.D. Morris Jr., and J. Van den Bogaerde, 1969, J. Am. Chem. Soc., 91, 7712.108. Kaiser, E.W., 1992, Int. J. Chem. Kinet., 24, 179-189.109. Kaiser, E.W., 1993, J. Phys. Chem., 97, 11681-11688.110. Kaiser, E.W. and T.J. Wallington, 1996, J. Phys. Chem., 100, 4111-4119.111. Kaiser, E.W., T.J. Wallington, and J.M. Andino, 1990, Chem. Phys. Lett., 168, 309.112. Kaiser, E.W., T.J. Wallington, and M.D. Hurley, 1995, Int. J. Chem. Kinet., 27, 205-218.
141
113. Kajimoto, O. and R.J. Cvetanovic, 1976, J. Chem. Phys., 64, 1005.114. Kaye, J.A., 1986, J. Geophys. Res., 91, 7865-7874.115. Keiffer, M., M.J. Pilling, and M.J.C. Smith, 1987, J. Phys. Chem., 91, 6028-6034.116. Kennedy, R.C. and J.B. Levy, 1972, J. Phys. Chem., 76, 3480-3488.117. Kim, P., D.I. MacLean, and W.G. Valence, 1980, J. Phys. Chem., 84, 1806.118. Kircher, C.C., J.J. Margitan, and S.P. Sander, 1984, J. Phys. Chem., 88, 4370-4375.119. Klais, O., P.C. Anderson, and M.J. Kurylo, 1980, Int. J. Chem. Kinet., 12, 469.120. Klein, T., I. Barnes, K.H. Becker, E.H. Fink, and F. Zabel, 1984, J. Phys. Chem., 88, 5020-5025.121. Knauth, H.D., 1978, Ber. Bunsenges. Phys. Chem., 82, 212.122. Köppenkastrop, D. and F. Zabel, 1991, Int. J. Chem. Kinet., 23, 1-15.123. Kreutter, K.D., J.M. Nicovich, and P.H. Wine, 1991, J. Phys. Chem., 95, 4020.124. Kuo, C.H. and Y.P. Lee, 1991, J. Phys. Chem., 95, 1253.125. Kurylo, M.J., 1972, J. Phys. Chem., 76, 3518.126. Kurylo, M.J. and P.A. Ouellette, 1986, J. Phys. Chem., 90, 441-444.127. Kurylo, M.J. and P.A. Ouellette, 1987, J. Phys. Chem., 91, 3365-3368.128. Laguna, G.A. and S.L. Baughcum, 1982, Chem. Phys. Lett., 88, 568-71.129. Lai, L.-H., Y.-C. Hsu, and Y.-P. Lee, 1992, J. Chem. Phys., 97, 3092-3099.130. Laufer, A.H. and A.M. Bass, 1975, Int. J. Chem. Kinet., 7, 639.131. Lee, F.S.C. and F.S. Rowland, 1977, J. Phys. Chem., 81, 684.132. Lee, J.H., J.V. Michael, W.A. Payne Jr., and L.J. Stief, 1978, J. Chem. Phys., 68, 5410-5413.133. Lee, T.J. and J.E. Rice, 1992, J. Chem. Phys., 97, 4223-4232.134. Lee, T.J., C.M. Rohlfing, and J.E. Rice, 1992, J. Chem. Phys., 97, 6593-6605.135. Lee, Y.-P., R.M. Stimpfle, R.A. Perry, J.A. Mucha, K.M. Evenson, D.A. Jennings, and C.J. Howard, 1982, Int. J.
Chem. Kinet., 14, 711-732.136. Lee, Y.-Y., W.C. Kao, and Y.-P. Lee, 1990, J. Phys. Chem., 94, 4535.137. Leu, M.T., 1982, J. Phys. Chem., 86, 4558.138. Leu, M.T., 1984, Int. J. Chem. Kinet., 16, 1311-1320.139. Leu, M.T., C.L. Lin, and W.B. DeMore, 1977, J. Phys. Chem., 81, 190.140. Li, Z. and J.S. Francisco, 1989, J. Am. Chem. Soc., 111, 5660-5667.141. Lin, C.L. and M.T. Leu, 1982, Int. J. Chem. Kinet., 14, 417.142. Liu, A., W.A. Mulac, and C.D. Jonah, 1988, J. Phys. Chem., 92, 5942-5945.143. Lloyd, A.C., K.R. Darnall, A.M. Winer, and J.N. Pitts Jr., 1976, J. Phys. Chem., 80, 789.144. Lovejoy, E.R. and D.R. Hanson, 1996, J. Phys. Chem., 100, 4459-4465.145. Lyman, J. and R. Holland, 1988, J. Phys. Chem., 92, 7232-7241.146. Margitan, J.J., 1983, J. Geophys. Res., 88, 5416-5420.147. Margitan, J.J., 1984, J. Phys. Chem., 88, 3314-3318.148. Maric, D. and J.P. Burrows, 1992, J.Photochem. Photobiol. A: Chem., 66, 291-312.149. Marshall, P., A.S. Narayan, and A. Fontijn, 1990, J. Phys. Chem., 94, 2998.150. Martin, D., J.L. Jourdain, and G. Le Bras, 1986, J. Phys. Chem., 90, 4143-4147.151. McCaulley, J.A., S.M. Anderson, J.B. Jeffries, and F. Kaufman, 1985, Chem Phys. Lett., 115, 180.152. McCaulley, J.A., A.M. Moyle, M.F. Golde, S.M. Anderson, and F. Kaufman, 1990, J. Chem Soc. Farad. Trans., 86,
4001-4009.153. Mellouki, A., G. Laverdet, J.L. Jourdain, and G. Poulet, 1989, Int. J. Chem. Kinet., 21, 1161.154. Michael, J.V., D.F. Nava, R.P. Borkowski, W.A. Payne, and L.J. Stief, 1980, J. Chem. Phys., 73, 6108.155. Molina, M.J., L.T. Molina, and T. Ishiwata, 1980, J. Phys. Chem., 84, 3100.156. Moore, S.B. and R.W. Carr, 1990, J. Phys. Chem., 94, 1393.157. Morley, C. and I.W.M. Smith, 1972, J. Chem. Soc. Faraday Trans., 68, 1016.158. Morris, E.D., D.H. Stedman, and H. Niki, 1971, J. Am. Chem. Soc., 93, 3570.159. Nicholas, J.E. and R.G.W. Norrish, 1968, Proc. Roy. Soc. A, 307, 391.160. Nickolaisen, S.L., R.R. Friedl, and S.P. Sander, 1994, J. Phys. Chem., 98, 155-169.161. Nicovich, J.M., K.D. Kreutter, C.J. Shackelford, and P.H. Wine, 1991, Chem. Phys. Lett., 179, 367-373.162. Nicovich, J.M., K.D. Kreutter, and P.H. Wine, 1990, J. Chem. Phys., 92, 3539-3544.163. Nicovoch, J.M., S. Wang, M.L. McKee, and P.H. Wine, 1996, J. Phys. Chem., 100, 680-688.164. Niki, H., P.D. Maker, C.M. Savage, and L.P. Breitenbach, 1978, Chem. Phys. Lett., 59, 78.
142
165. Nottingham, W.C., R.N. Rudolph, K.P. Andrews, J.H. Moore, and J.A. Tossell, 1994, Int. J. Chem. Kinet., 26,749-756.
166. Ohmori, K., K. Yamasaki, and H. Matsui, 1993, Bull. Chem. Soc. Jpn., 66, 51-56.167. Orlando, J.J., G.S. Tyndall, and J.G. Calvert, 1992, Atmos. Environ., 26A, 3111-3118.168. Orlando, J.J., G.S. Tyndall, C.A. Cantrell, and J.G. Calvert, 1991, J. Chem. Soc. Far. Trans., 87, 2345-2349.169. Overend, R.P. and G. Paraskevopoulos, 1977, J. Chem. Phys., 67, 674.170. Overend, R.P., G. Paraskevopoulos, and C. Black, 1976, J. Chem. Phys., 64, 4149.171. Pagsberg, p., A. Sillesen, J.T. Jodowski, and E. Ratajczak, 1996, Chem. Phys. Lett., 252, 165-171.172. Pagsberg, P., A. Sillesen, J.T. Jodowski, and E. Ratajczak, 1996, Chem. Phys. Lett., 249, 358-364.173. Pagsberg, P., B. Sztuba, E. Ratajczak, and A. Sillesen, 1991, Acta Chem. Scand., 45, 329.174. Pagsberg, P.B., E. Ratajczak, A. Sillesen, and J.T. Jodkowski, 1987, Chem. Phys. Lett., 141, 88-94.175. Paraskevopoulos, G., D.L. Singleton, and R.S. Irwin, 1983, Chem. Phys. Lett., 100, 83-87.176. Parr, A.D., R.P. Wayne, G.D. Hayman, M.E. Jenkin, and R.A. Cox, 1990, Geophys. Res. Lett., 17, 2357-2360.177. Pastrana, A.V. and R.W. Carr Jr., 1974, Int. J. Chem. Kinet., 6, 587.178. Patrick, R. and D.M. Golden, 1983, Int. J. Chem. Kinet., 15, 1189-1227.179. Perry, R.A., R. Atkinson, and J.N. Pitts Jr., 1977, J. Chem. Phys., 67, 5577.180. Perry, R.A. and D. Williamson, 1982, Chem. Phys. Lett., 93, 331-334.181. Pilling, M.J. and M.J.C. Smith, 1985, J. Phys. Chem., 89, 4713-4720.182. Pirraglia, A.N., J.V. Michael, J.W. Sutherland, and R.B. Klemm, 1989, J. Phys. Chem., 93, 282-291.183. Plane, J.M.C. and B. Rajasekhar, 1989, J. Phys. Chem., 93, 3135-3140.184. Plumb, I.C. and K.R. Ryan, 1982, Int. J. Chem. Kinet., 14, 861-874.185. Poulet, G., J. Barassin, G. Le Bras, and J. Combourieu, 1973, Bull. Soc. Chim. Fr., 1, 1.186. Pratt, G.L. and S.W. Wood, 1984, J. Chem. Soc. Faraday Trans. 1, 80, 3419-3427.187. Ravishankara, A.R., F.L. Eisele, and P.H. Wine, 1980, J. Chem. Phys., 73, 3743.188. Ravishankara, A.R., G. Smith, and D.D. Davis, paper presented at the 13th Informal Photochemistry Conference,
1978, Clearwater Beach, Florida .189. Ravishankara, A.R., G.J. Smith, and D.D. Davis, 1988, Int. J. Chem. Kinet., 20, 811-814.190. Rawlins, W.T., G.E. Caledonia, and R.A. Armstrong, 1987, J. Chem. Phys., 87, 5209-5213.191. Rayez, M.T. and M. Destriau, 1993, Chem. Phys. Lett., 206, 278-284.192. Roberts, J.M. and S.B. Bertman, 1992, Int. J. Chem. Kinet., 24, 297-307.193. Robertshaw, J.S. and I.W.M. Smith, 1982, J. Phys. Chem., 86, 785.194. Russell, A.G., G.R. Cass, and J.H. Seinfeld, 1986, Environ. Sci. Technol., 20, 1167-1172.195. Russell, J.J., J.A. Setula, D. Gutman, F. Danis, F.Caralp, P.D. Lightfoot, R. Lesclaux, C.F. Melius, and S.M.
Senkan, 1990, J. Phys. Chem., 94, 3277-3283.196. Ryan, K.R. and I.C. Plumb, 1982, J. Phys. Chem., 86, 4678-4683.197. Ryan, K.R. and I.C. Plumb, 1984, Int. J. Chem. Kinet., 16, 591-602.198. Sander, S.P., R.P. Friedl, and Y.L. Yung, 1989, Science, 245, 1095-1098.199. Sander, S.P. and M. Peterson, 1984, J. Phys. Chem., 88, 1566-1571.200. Sander, S.P., G.W. Ray, and R.T. Watson, 1981, J. Phys. Chem., 85, 199.201. Sander, S.P. and R.T. Watson, 1980, J. Phys. Chem. , 84, 1664.202. Schieferstein, M., K. Kohse-Höinghaus, and F. Stuhl, 1983, Ber. Bunsenges. Phys. Chem., 87, 361-366.203. Schonle, G., H.D. Knauth, and R.N. Schindler, 1979, J. Phys. Chem., 83, 3297.204. Seeley, J.V., J.T. Jayne, and M.J. Molina, 1996, J. Phys. Chem., 100, 4019-4025.205. Selzer, E.A. and K.D. Bayes, 1983, J. Phys. Chem., 87, 392-394.206. Shamonina, N.F. and A.G. Kotov, 1979, Kinet. i Kataliz., 20, 233.207. Sharkey, P., I.R. Sims, I.W.M. Smith, P. Bocherl, and B.R. Rowe, 1994, J. Chem. Soc. Far. Trans., 90, 3609-
3616.208. Shen, G., M. Suto, and L.C. Lee, 1990, J. Geophys. Res., 95, 13981-13984.209. Silver, J.A., M.S. Zahniser, A.C. Stanton, and C.E. Kolb, 1984, 20th International Symposium on Combustion,
Pittsburgh, PA, pp. 605-612.210. Simonaitis, R. and J. Heicklen, 1978, Int. J. Chem. Kinet., 10, 67-87.211. Skolnik, E.D., M.G. Veysey, M.G. Ahmed, and W.E. Jones, 1975, Can. J. Chem., 53, 3188.212. Slanina, Z. and F. Uhlik, 1991, Chem. Phys. Lett., 182, 51-56.213. Smith, C.A., A.R. Ravishankara, and P.H. Wine, 1985, J. Phys. Chem., 89, 1423-1427.
143
214. Smith, G.P., P.W. Fairchild, and D.R. Crosley, 1984, J. Chem. Phys., 81, 2667.215. Smith, G.P. and D.M. Golden, 1978, Int. J. Chem. Kinet., 10, 489.216. Smith, I.W.M. and D.J. Wrig1ey, 1981, Chem. Phys., 63, 321.217. Smith, I.W.M. and D.J. Wrigley, 1980, Chem. Phys. Lett., 70, 481.218. Smith, I.W.M. and R. Zellner, 1973, J. Chem. Soc. Faraday Trans. 2, 69, 1617.219. Stanton, J.F., C.M.L. Rittby, R.J. Bartlett, and D.W. Toohey, 1991, J. Phys. Chem., 95, 2107-2110.220. Stuhl, F. and H. Niki, 1972, J. Chem. Phys., 57, 3677-3679.221. Thorn, R.P., E.P. Daykin, and P.H. Wine, 1993, Int J. Chem. Kinet., 25, 521-537.222. Trainor, D.W. and C.W. von Rosenberg Jr., 1974, J. Chem. Phys., 61, 1010-1015.223. Troe, J., 1977, J. Chem. Phys., 66, 4745.224. Trolier, M., R.L. Mauldin III, and A.R. Ravishankara, 1990, J. Phys. Chem., 94, 4896-4907.225. Tully, F.P., 1983, Chem. Phys. Lett., 96, 148-153.226. Turnipseed, A.A., S.B. Barone, N.R. Jensen, D.R. Hanson, C.J. Howard, and A.R. Ravishankara, 1995, J. Phys.
Chem., 99, 6000-6009.227. Van den Bergh, H., N. Benoit-Guyot, and J. Troe, 1977, Int. J. Chem Kinet., 9, 223-234.228. Van den Bergh, H. and J. Troe, 1976, J. Chem. Phys., 64, 736-742.229. Van den Bergh, H.E. and A.B. Callear, 1971, Trans. Faraday Soc., 67, 2017.230. Viggiano, A.A., J.A. Davidson, F.C. Fehsenfeld, and E.E. Ferguson, 1981, J. Chem. Phys., 74, 6113.231. Vinckier, C., A. Dumoulin, and S. DeJaegere, 1991, J. Chem. Soc. Faraday Trans., 87, 1075-1081.232. Wagner, A.F., I.R. Slagle, D. Sarzynski, and D. Gutman, 1990, J. Phys. Chem., 94, 1853-1864.233. Walker, R.W., 1972, Ph.D. Thesis, Queen Mary College University of London.234. Wallington, T.J., J.M. Andino, I.M. Lorkovic, E.W. Kaiser, and G. Marston, 1990, J. Phys. Chem., 94, 3644-
3648.235. Wallington, T.J., R. Atkinson, A.M. Winer, and J.N. Pitts Jr., 1987, Int. J. Chem. Kinet., 19, 243-249.236. Wallington, T.J. and J.C. Ball, 1995, J. Phys. Chem., 99, 3201-3205.237. Wallington, T.J. and R.A. Cox, 1986, J. Chem. Soc. Faraday Trans. 2, 82, 275-289.238. Wallington, T.J., T. Ellerman, O.J. Nielsen, and J. Sehested, 1994, J. Phys. Chem., 98, 2346.239. Wallington, T.J., T. Ellermann, and O.J. Nielsen, 1993, J. Phys. Chem., 97, 8442-8449.240. Wallington, T.J., M.M. Mariq, T. Ellerman, and O.J. Nielsen, 1992, J. Phys. Chem., 96, 982-986.241. Wallington, T.J. and O.J. Nielsen, 1991, Int. J. Chem. Kinet., 23, 785-798.242. Wallington, T.J., L.M. Skewes, and W.O. Siegl, 1988, J. Photochem. Photobiol. A, 45, 167.243. Washida, N., 1980, J. Chem. Phys., 73, 1665.244. Washida, N. and K.D. Bayes, 1976, Int. J. Chem. Kinet., 8, 777.245. Westenberg, A.A. and N. de Haas, 1972, J. Chem. Phys., 57, 5375-5378.246. Whytock, D.A., J.V. Michael, and W.A. Payne, 1976, Chem. Phys. Lett., 42, 466-471.247. Wilson, W.E. and A.A. Westenberg, 1967, 11th Symposium on Combustion, The Combustion Institute,
Pittsburgh, pp. 1143.248. Wine, P.H., N.M. Kreutter, and A.R. Ravishankara, 1979, J. Phys. Chem., 83, 3191.249. Wine, P.H., R.J. Thompson, A.R. Ravishankara, D.H. Semmes, C.A. Gump, A. Torabi, and J.M. Nicovich, 1984, J.
Phys. Chem., 88, 2095.250. Wong, W.D. and D. Davis, 1974, Int. J. Chem. Kinet., 6, 401.251. Wu, F. and R.W. Carr, 1991, Int. J. Chem. Kinet., 23, 701-715.252. Xiong, J.Q. and R.W. Carr, 1994, J. Phys. Chem., 98, 9811-9822.253. Yarwood, G., J.W. Sutherland, M.A. Wickramaaratchi, and R.B. Klemm, 1991, J. Phys. Chem., 95, 8771-8775.254. Zabarnick, S., 1993, Chem Phys., 171, 265-273.255. Zabel, F., A. Reimer, K.H. Becker, and E.H. Fink, 1989, J. Phys. Chem., 93, 5500-5507.256. Zahniser, M.S., J. Chang, and F. Kaufman, 1977, J. Chem. Phys., 67, 997.257. Zellner, R., F. Ewig, R. Paschke, and G. Wagner, 1988, J. Phys. Chem., 92, 4184-4190.258. Zellner, R. and K. Lorenz, 1984, J. Phys. Chem., 88, 984-989.259. Zetzsch, C., paper presented at the European Symposium on Combustion, 1973, Academic Press, 35.260. Zhu, T., G. Yarwood, J. Chen, and H. Niki, 1994, J. Phys. Chem., 98, 5065-5067.
144
EQUILIBRIUM CONSTANTS
Format
Some of the three-body reactions in Table 2 form products which are thermally unstable at atmospherictemperatures. In such cases the thermal decomposition reaction may compete with other loss processes, such asphotodissociation or radical attack. Table 3 lists the equilibrium constants, K(T), for several reactions which mayfall into this category. The table has three column entries, the first two being the parameters A and B which can beused to express K(T):
K(T)/cm3 molecule-1 = A exp(B/T) (200 < T < 300 K)
The third column entry in Table 3 is the calculated value of K at 298 K.
The data sources for K(T) are described in the individual notes to Table 3.
Defini t ions
When values of the heats of formation and entropies of all species are known at the temperature T, we notethat:
10log [K(T) / 3cm −1molecule ] = To∆S
2.303R−
∆ ToH
2.303RT+ 10log (T) − 21.87
Where the superscript "o" refers to a standard state of one atmosphere. In some cases K values were calculated fromthis equation, using thermochemical data. In other cases the K values were calculated directly from kinetic data forthe forward and reverse reactions. When available, JANAF values were used for the equilibrium constants. Thefollowing equations were then used to calculate the parameters A and B:
B/oK = 2.303 log10(K200/K300) x [(300 x 200)/(300-200)]
B/oK = 1382 log10 (K200/K300)
log10 A = log10 K(T) - B/2.303 T
The relationships between the parameters A and B and the quantities ∆So(298K) and ∆Ho(298K) are as follows:
A = (eR'T/Nav) exp(∆So/R) = 3.7 x 10⁻²² T exp(∆So/R)
Β = −∆Ηο/R - T(K)
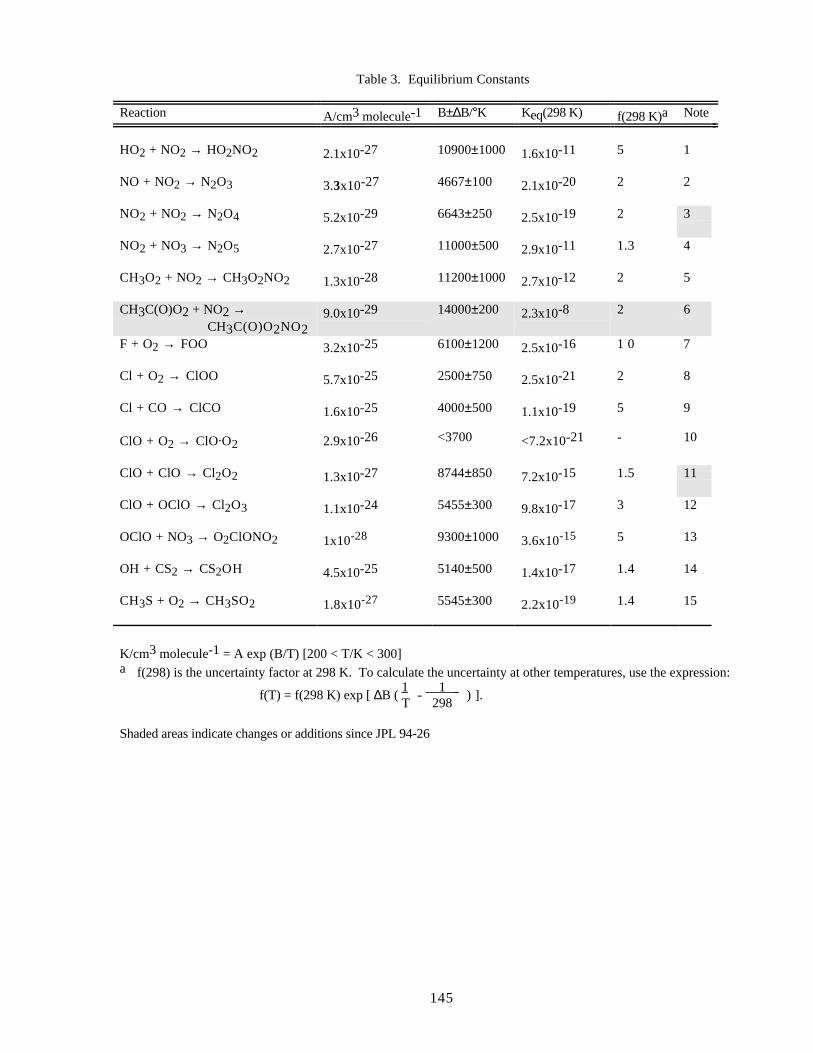
145
Table 3. Equilibrium Constants
Reaction A/cm3 molecule-1 B±∆B/°K Keq(298 K) f(298 K)a Note
HO2 + NO2 → HO2NO2 2.1x10⁻²⁷ 10900±1000 1.6x10⁻¹¹ 5 1
NO + NO2 → N2O3 3.3x10⁻²⁷ 4667±100 2.1x10⁻²⁰ 2 2
NO2 + NO2 → N2O4 5.2x10⁻²⁹ 6643±250 2.5x10⁻¹⁹ 2 3
NO2 + NO3 → N2O5 2.7x10⁻²⁷ 11000±500 2.9x10⁻¹¹ 1.3 4
CH3O2 + NO2 → CH3O2NO2 1.3x10⁻²⁸ 11200±1000 2.7x10⁻¹² 2 5
CH3C(O)O2 + NO2 → CH3C(O)O2NO2
9.0x10⁻²⁹ 14000±200 2.3x10⁻⁸ 2 6
F + O2 → FOO 3.2x10⁻²⁵ 6100±1200 2.5x10⁻¹⁶ 1 0 7
Cl + O2 → ClOO 5.7x10⁻²⁵ 2500±750 2.5x10⁻²¹ 2 8
Cl + CO → ClCO 1.6x10⁻²⁵ 4000±500 1.1x10⁻¹⁹ 5 9
ClO + O2 → ClO.O2 2.9x10⁻²⁶ <3700 <7.2x10⁻²¹ - 10
ClO + ClO → Cl2O2 1.3x10⁻²⁷ 8744±850 7.2x10⁻¹⁵ 1.5 11
ClO + OClO → Cl2O3 1.1x10⁻²⁴ 5455±300 9.8x10⁻¹⁷ 3 12
OClO + NO3 → O2ClONO2 1x10-28 9300±1000 3.6x10⁻¹⁵ 5 13
OH + CS2 → CS2OH 4.5x10⁻²⁵ 5140±500 1.4x10⁻¹⁷ 1.4 14
CH3S + O2 → CH3SO2 1.8x10⁻²⁷ 5545±300 2.2x10⁻¹⁹ 1.4 15
K/cm3 molecule-1 = A exp (B/T) [200 < T/K < 300]a f(298) is the uncertainty factor at 298 K. To calculate the uncertainty at other temperatures, use the expression:
f(T) = f(298 K) exp [ ∆B ( 1T
- 1 298
) ].
Shaded areas indicate changes or additions since JPL 94-26
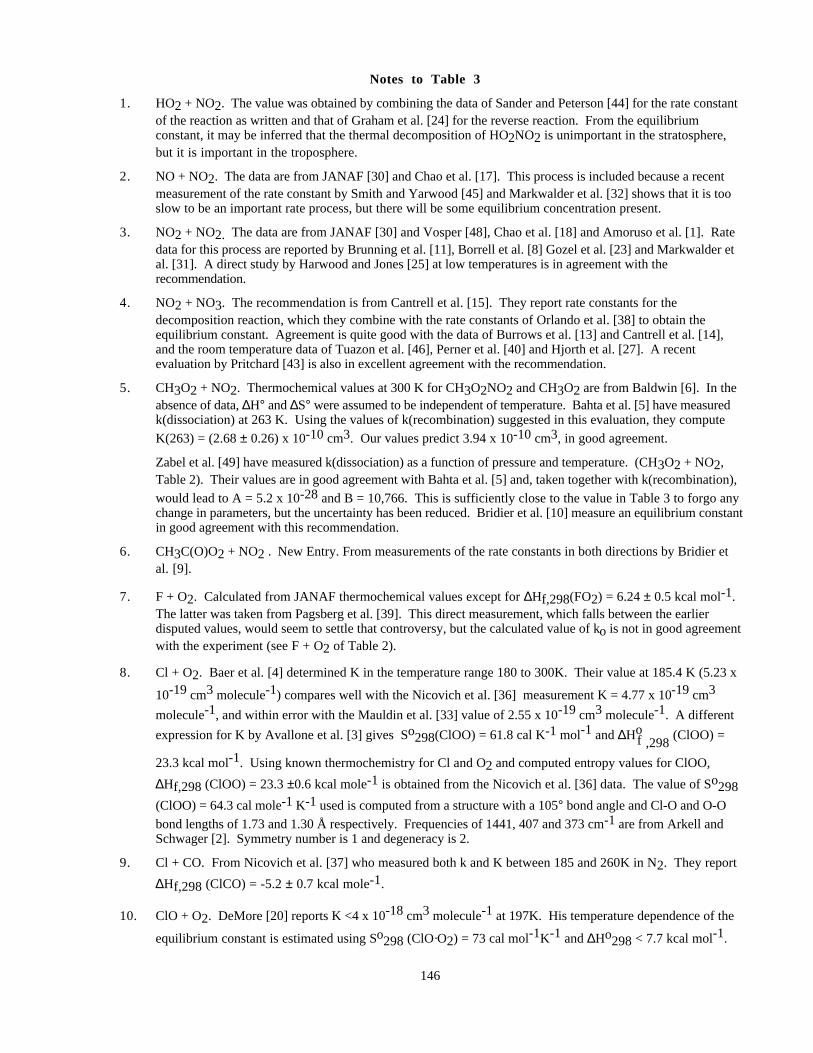
146
Notes to Table 3
1. HO2 + NO2. The value was obtained by combining the data of Sander and Peterson [44] for the rate constantof the reaction as written and that of Graham et al. [24] for the reverse reaction. From the equilibriumconstant, it may be inferred that the thermal decomposition of HO2NO2 is unimportant in the stratosphere,but it is important in the troposphere.
2. NO + NO2. The data are from JANAF [30] and Chao et al. [17]. This process is included because a recentmeasurement of the rate constant by Smith and Yarwood [45] and Markwalder et al. [32] shows that it is tooslow to be an important rate process, but there will be some equilibrium concentration present.
3. NO2 + NO2. The data are from JANAF [30] and Vosper [48], Chao et al. [18] and Amoruso et al. [1]. Ratedata for this process are reported by Brunning et al. [11], Borrell et al. [8] Gozel et al. [23] and Markwalder etal. [31]. A direct study by Harwood and Jones [25] at low temperatures is in agreement with therecommendation.
4. NO2 + NO3. The recommendation is from Cantrell et al. [15]. They report rate constants for thedecomposition reaction, which they combine with the rate constants of Orlando et al. [38] to obtain theequilibrium constant. Agreement is quite good with the data of Burrows et al. [13] and Cantrell et al. [14],and the room temperature data of Tuazon et al. [46], Perner et al. [40] and Hjorth et al. [27]. A recentevaluation by Pritchard [43] is also in excellent agreement with the recommendation.
5. CH3O2 + NO2. Thermochemical values at 300 K for CH3O2NO2 and CH3O2 are from Baldwin [6]. In theabsence of data, ∆H° and ∆S° were assumed to be independent of temperature. Bahta et al. [5] have measuredk(dissociation) at 263 K. Using the values of k(recombination) suggested in this evaluation, they compute
K(263) = (2.68 ± 0.26) x 10-10 cm3. Our values predict 3.94 x 10⁻¹⁰ cm3, in good agreement.
Zabel et al. [49] have measured k(dissociation) as a function of pressure and temperature. (CH3O2 + NO2,Table 2). Their values are in good agreement with Bahta et al. [5] and, taken together with k(recombination),
would lead to A = 5.2 x 10⁻²⁸ and B = 10,766. This is sufficiently close to the value in Table 3 to forgo anychange in parameters, but the uncertainty has been reduced. Bridier et al. [10] measure an equilibrium constantin good agreement with this recommendation.
6. CH3C(O)O2 + NO2 . New Entry. From measurements of the rate constants in both directions by Bridier etal. [9].
7. F + O2. Calculated from JANAF thermochemical values except for ∆Hf,298(FO2) = 6.24 ± 0.5 kcal mol-1.The latter was taken from Pagsberg et al. [39]. This direct measurement, which falls between the earlierdisputed values, would seem to settle that controversy, but the calculated value of ko is not in good agreementwith the experiment (see F + O2 of Table 2).
8. Cl + O2. Baer et al. [4] determined K in the temperature range 180 to 300K. Their value at 185.4 K (5.23 x
10-19 cm3 molecule-1) compares well with the Nicovich et al. [36] measurement K = 4.77 x 10⁻¹⁹ cm3
molecule-1, and within error with the Mauldin et al. [33] value of 2.55 x 10⁻¹⁹ cm3 molecule-1. A different
expression for K by Avallone et al. [3] gives So298(ClOO) = 61.8 cal K-1 mol-1 and ∆Hof ,298
(ClOO) =
23.3 kcal mol-1. Using known thermochemistry for Cl and O2 and computed entropy values for ClOO,
∆Hf,298 (ClOO) = 23.3 ±0.6 kcal mole-1 is obtained from the Nicovich et al. [36] data. The value of So298
(ClOO) = 64.3 cal mole-1 K-1 used is computed from a structure with a 105° bond angle and Cl-O and O-O
bond lengths of 1.73 and 1.30 Å respectively. Frequencies of 1441, 407 and 373 cm-1 are from Arkell andSchwager [2]. Symmetry number is 1 and degeneracy is 2.
9. Cl + CO. From Nicovich et al. [37] who measured both k and K between 185 and 260K in N2. They report
∆Hf,298 (ClCO) = -5.2 ± 0.7 kcal mole-1.
10. ClO + O2. DeMore [20] reports K <4 x 10-18 cm3 molecule-1 at 197K. His temperature dependence of the
equilibrium constant is estimated using So298 (ClO·O2) = 73 cal mol-1K-1 and ∆Ho298 < 7.7 kcal mol-1.
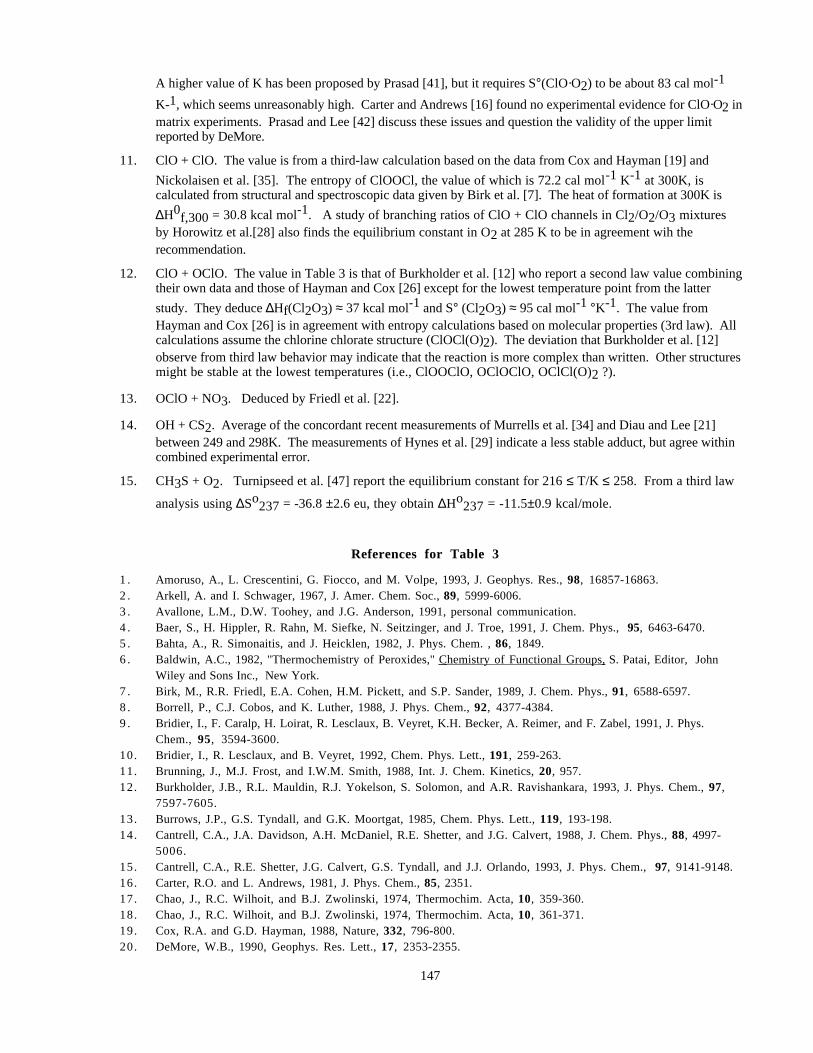
147
A higher value of K has been proposed by Prasad [41], but it requires S°(ClO·O2) to be about 83 cal mol-1
K-1, which seems unreasonably high. Carter and Andrews [16] found no experimental evidence for ClO·O2 inmatrix experiments. Prasad and Lee [42] discuss these issues and question the validity of the upper limitreported by DeMore.
11. ClO + ClO. The value is from a third-law calculation based on the data from Cox and Hayman [19] and
Nickolaisen et al. [35]. The entropy of ClOOCl, the value of which is 72.2 cal mol-1 K-1 at 300K, iscalculated from structural and spectroscopic data given by Birk et al. [7]. The heat of formation at 300K is
∆H0f,300 = 30.8 kcal mol-1. A study of branching ratios of ClO + ClO channels in Cl2/O2/O3 mixtures
by Horowitz et al.[28] also finds the equilibrium constant in O2 at 285 K to be in agreement wih therecommendation.
12. ClO + OClO. The value in Table 3 is that of Burkholder et al. [12] who report a second law value combiningtheir own data and those of Hayman and Cox [26] except for the lowest temperature point from the latter
study. They deduce ∆Hf(Cl2O3) ≈ 37 kcal mol-1 and S° (Cl2O3) ≈ 95 cal mol-1 °K-1. The value fromHayman and Cox [26] is in agreement with entropy calculations based on molecular properties (3rd law). Allcalculations assume the chlorine chlorate structure (ClOCl(O)2). The deviation that Burkholder et al. [12]observe from third law behavior may indicate that the reaction is more complex than written. Other structuresmight be stable at the lowest temperatures (i.e., ClOOClO, OClOClO, OClCl(O)2 ?).
13. OClO + NO3. Deduced by Friedl et al. [22].
14. OH + CS2. Average of the concordant recent measurements of Murrells et al. [34] and Diau and Lee [21]between 249 and 298K. The measurements of Hynes et al. [29] indicate a less stable adduct, but agree withincombined experimental error.
15. CH3S + O2. Turnipseed et al. [47] report the equilibrium constant for 216 ≤ T/K ≤ 258. From a third law
analysis using ∆So237 = -36.8 ±2.6 eu, they obtain ∆Ho
237 = -11.5±0.9 kcal/mole.
References for Table 3
1 . Amoruso, A., L. Crescentini, G. Fiocco, and M. Volpe, 1993, J. Geophys. Res., 98, 16857-16863.2 . Arkell, A. and I. Schwager, 1967, J. Amer. Chem. Soc., 89, 5999-6006.3 . Avallone, L.M., D.W. Toohey, and J.G. Anderson, 1991, personal communication.4 . Baer, S., H. Hippler, R. Rahn, M. Siefke, N. Seitzinger, and J. Troe, 1991, J. Chem. Phys., 95, 6463-6470.5 . Bahta, A., R. Simonaitis, and J. Heicklen, 1982, J. Phys. Chem. , 86, 1849.6 . Baldwin, A.C., 1982, "Thermochemistry of Peroxides," Chemistry of Functional Groups, S. Patai, Editor, John
Wiley and Sons Inc., New York.7 . Birk, M., R.R. Friedl, E.A. Cohen, H.M. Pickett, and S.P. Sander, 1989, J. Chem. Phys., 91, 6588-6597.8 . Borrell, P., C.J. Cobos, and K. Luther, 1988, J. Phys. Chem., 92, 4377-4384.9 . Bridier, I., F. Caralp, H. Loirat, R. Lesclaux, B. Veyret, K.H. Becker, A. Reimer, and F. Zabel, 1991, J. Phys.
Chem., 95, 3594-3600.10. Bridier, I., R. Lesclaux, and B. Veyret, 1992, Chem. Phys. Lett., 191, 259-263.11. Brunning, J., M.J. Frost, and I.W.M. Smith, 1988, Int. J. Chem. Kinetics, 20, 957.12. Burkholder, J.B., R.L. Mauldin, R.J. Yokelson, S. Solomon, and A.R. Ravishankara, 1993, J. Phys. Chem., 97,
7597-7605.13. Burrows, J.P., G.S. Tyndall, and G.K. Moortgat, 1985, Chem. Phys. Lett., 119, 193-198.14. Cantrell, C.A., J.A. Davidson, A.H. McDaniel, R.E. Shetter, and J.G. Calvert, 1988, J. Chem. Phys., 88, 4997-
5006.15. Cantrell, C.A., R.E. Shetter, J.G. Calvert, G.S. Tyndall, and J.J. Orlando, 1993, J. Phys. Chem., 97, 9141-9148.16. Carter, R.O. and L. Andrews, 1981, J. Phys. Chem., 85, 2351.17. Chao, J., R.C. Wilhoit, and B.J. Zwolinski, 1974, Thermochim. Acta, 10, 359-360.18. Chao, J., R.C. Wilhoit, and B.J. Zwolinski, 1974, Thermochim. Acta, 10, 361-371.19. Cox, R.A. and G.D. Hayman, 1988, Nature, 332, 796-800.20. DeMore, W.B., 1990, Geophys. Res. Lett., 17, 2353-2355.
148
21. Diau, E.W.-G. and Y.-P. Lee, 1991, J. Phys. Chem., 95, 379.22. Friedl, R.R., S.P. Sander, and Y.L. Yung, 1992, J. Phys. Chem., 96, 7490-7493.23. Gozel, P., B. Calpani, and H. van den Bergh, 1984, Isrl. J. Chem., 24, 210.24. Graham, R.A., A.M. Winer, and J.N. Pitts Jr., 1977, Chem. Phys. Lett., 51, 215.25. Harwood, M.H. and R.L. Jones, 1994, J. Geophys. Res., 99, 22995-22964.26. Hayman, G.D. and R.A. Cox, 1989, Chem. Phys. Lett., 155, 1-7.27. Hjorth, J., J. Nothholt, and G. Restelli, 1992, Int. J. Chem. Kinet., 24, 51-65.28. Horowitz, A., J.N. Crowley, and G.K. Moortgat, 1994, J. Phys. Chem., 98, 11924-11930.29. Hynes, A.J., P.H. Wine, and J.M. Nicovich, 1988, J. Phys. Chem., 92, 3846-3852.30. JANAF, JANAF Thermochemical Tables , Third ed. 1985, National Bureau of Standards.31. Markwalder, B., P. Gozel, and H. van den Bergh, 1992, J. Chem. Phys., 97, 5472-5479.32. Markwalder, B., P. Gozel, and H. van den Bergh, 1993, J. Phys. Chem., 97, 5260-5265.33. Mauldin, R.L., III, J.B. Burkholder, and A.R. Ravishankara, 1992, J. Phys. Chem., 96, 2582-2588.34. Murrells, T.P., E.R. Lovejoy, and A.R. Ravishankara, 1990, J. Phys. Chem., 94, 2381-2386.35. Nickolaisen, S.L., R.R. Friedl, and S.P. Sander, 1994, J. Phys. Chem., 98, 155-169.36. Nicovich, J.M., K.D. Kreutter, C.J. Shackelford, and P.H. Wine, 1991, Chem. Phys. Lett., 179, 367-373.37. Nicovich, J.M., K.D. Kreutter, and P.H. Wine, 1990, J. Chem. Phys., 92, 3539-3544.38. Orlando, J.J., G.S. Tyndall, C.A. Cantrell, and J.G. Calvert, 1991, J. Chem. Soc. Far. Trans., 87, 2345-2349.39. Pagsberg, P.B., E. Ratajczak, A. Sillesen, and J.T. Jodkowski, 1987, Chem. Phys. Lett., 141, 88-94.40. Perner, D., A. Schmeltekopf, R.H. Winkler, H.S. Johnston, J.G. Calvert, C.A. Cantrell, and W.R. Stockwell, 1985,
J. Geophys. Res., 90, 3807-3812.41. Prasad, S.S., 1980, Nature, 285, 152.42. Prasad, S.S. and T.J. Lee, 1994, J. Geophys. Res., 99, 8225-8230.43. Pritchard, H.O., 1994, Int. J. Chem. Kinet., 26, 61-72.44. Sander, S.P. and M. Peterson, 1984, J. Phys. Chem., 88, 1566-1571.45. Smith, I.W.M. and G. Yarwood, 1986, Chem. Phys. Lett., 130, 24-28.46. Tuazon, E.C., E. Sanhueza, R. Atkinson, W.P.L. Carter, A.M. Winer, and J.N. Pitts Jr., 1984, J. Phys. Chem., 88,
3095-3098.47. Turnipseed, A.A., S.B. Baron, and A.R. Ravishankara, 1992, J. Phys. Chem., 96, 7502-7505.48. Vosper, A.J., 1970, J. Chem. Soc. A, 1970, 625.49. Zabel, F., A. Reimer, K.H. Becker, and E.H. Fink, 1989, J. Phys. Chem., 93, 5500-5507.
149
PHOTOCHEMICAL DATA
Discussion of Format and Error Estimates
In Table 4 we present a list of photochemical reactions considered to be of stratospheric interest. Theabsorption cross sections of O2 and O3 largely determine the extent of penetration of solar radiation into thestratosphere and troposphere. Some comments and references to these cross sections are presented in the text, butonly a sample of the data is listed here. (See, for example, WMO Report No. 11 [1]; WMO Report No. 16 [330])The photodissociation of NO in the O2 Schumann-Runge band spectral range is another important process requiringspecial treatment and is not discussed in this evaluation (see, for example, Frederick and Hudson [92]; Allen andFrederick [3]; WMO Report No. 11 [1], and Minschwaner and Siskind [195]).
For some other species having highly structured spectra, such as CS2 and SO2, some comments are given inthe text, but the photochemical data are not presented. The species CH2O, NO2, NO3, ClO, BrO, and OClO alsohave complicated spectra, but in view of their importance for atmospheric chemistry a sample of the data is presentedin the evaluation; for more detailed information on their high-resolution spectra and temperature dependence, thereader is referred to the original literature.
Table 5 gives recommended reliability factors for some of the more important photochemical reactions. Thesefactors represent the combined uncertainty in cross sections and quantum yields, taking into consideration theatmospherically important wavelength regions, and they refer to the total dissociation rate regardless of product
identity. The exception is O(1D) production from photolysis of O3: the reliability factor applies to the quantumyield at the indicated wavelengths.
The error estimates are not rigorous numbers resulting from a detailed error propagation analysis of statisticalmanipulations of the different sets of literature values; they merely represent a consensus among the panel membersas to the reliability of the data for atmospheric photodissociation calculations, taking into account the difficulty ofthe measurements, the agreement among the results reported by various groups, etc.
The absorption cross sections are defined by the following expression of Beer's Law:
I = Ioexp(-σnl),
where Io and I are the incident and transmitted light intensity, respectively; σ is the absorption cross section in cm2
molecule-1; n is the concentration in molecule cm-3; and l is the pathlength in cm. The cross sections are roomtemperature values at the specific wavelengths listed in the table, and the expected photodissociation quantum yieldsare unity, unless otherwise stated.
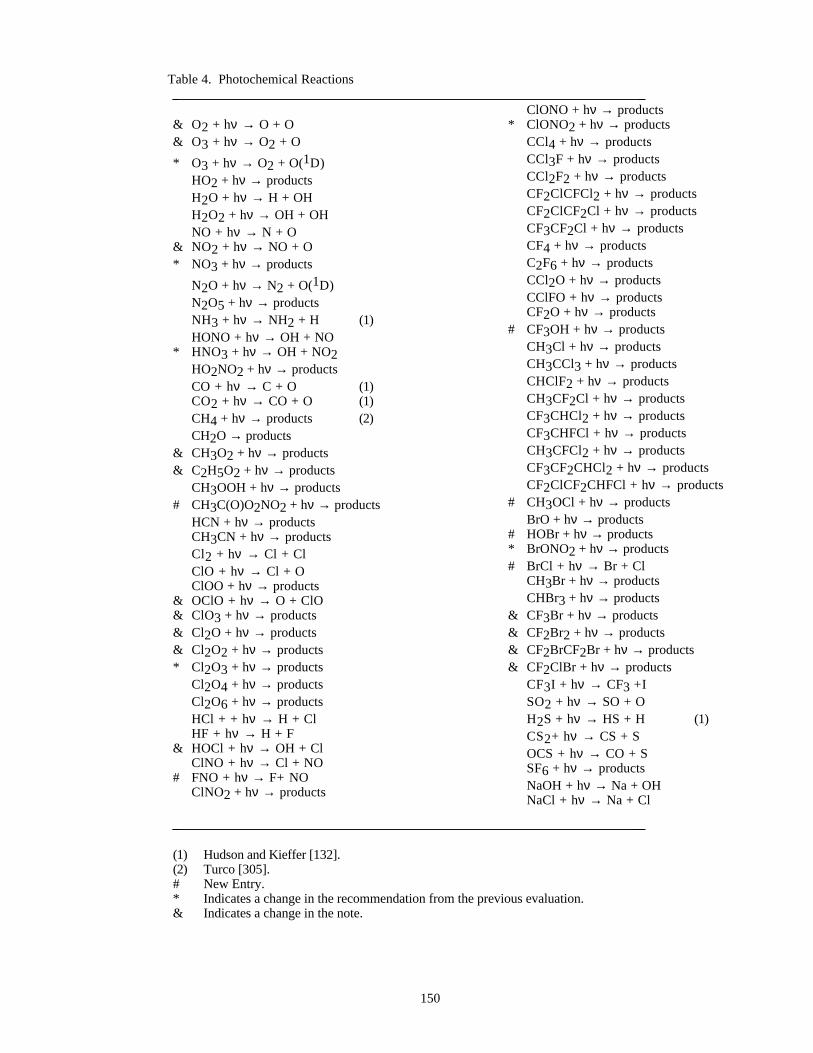
150
Table 4. Photochemical Reactions _______________________________________________________________________
& O2 + hν → O + O& O3 + hν → O2 + O
* O3 + hν → O2 + O(1D)HO2 + hν → productsH2O + hν → H + OHH2O2 + hν → OH + OHNO + hν → N + O
& NO2 + hν → NO + O* NO3 + hν → products
N2O + hν → N2 + O(1D)N2O5 + hν → productsNH3 + hν → NH2 + H (1)HONO + hν → OH + NO
* HNO3 + hν → OH + NO2HO2NO2 + hν → productsCO + hν → C + O (1)CO2 + hν → CO + O (1)CH4 + hν → products (2)CH2O → products
& CH3O2 + hν → products& C2H5O2 + hν → products
CH3OOH + hν → products# CH3C(O)O2NO2 + hν → products
HCN + hν → productsCH3CN + hν → productsCl2 + hν → Cl + ClClO + hν → Cl + OClOO + hν → products
& OClO + hν → O + ClO& ClO3 + hν → products& Cl2O + hν → products& Cl2O2 + hν → products* Cl2O3 + hν → products
Cl2O4 + hν → productsCl2O6 + hν → productsHCl + + hν → H + ClHF + hν → H + F
& HOCl + hν → OH + ClClNO + hν → Cl + NO
# FNO + hν → F+ NOClNO2 + hν → products
ClONO + hν → products* ClONO2 + hν → products
CCl4 + hν → productsCCl3F + hν → productsCCl2F2 + hν → productsCF2ClCFCl2 + hν → productsCF2ClCF2Cl + hν → productsCF3CF2Cl + hν → productsCF4 + hν → productsC2F6 + hν → productsCCl2O + hν → productsCClFO + hν → productsCF2O + hν → products
# CF3OH + hν → productsCH3Cl + hν → productsCH3CCl3 + hν → productsCHClF2 + hν → productsCH3CF2Cl + hν → productsCF3CHCl2 + hν → productsCF3CHFCl + hν → productsCH3CFCl2 + hν → productsCF3CF2CHCl2 + hν → productsCF2ClCF2CHFCl + hν → products
# CH3OCl + hν → productsBrO + hν → products
# HOBr + hν → products* BrONO2 + hν → products# BrCl + hν → Br + Cl
CH3Br + hν → productsCHBr3 + hν → products
& CF3Br + hν → products& CF2Br2 + hν → products& CF2BrCF2Br + hν → products& CF2ClBr + hν → products
CF3I + hν → CF3 +ISO2 + hν → SO + OH2S + hν → HS + H (1)CS2+ hν → CS + SOCS + hν → CO + SSF6 + hν → productsNaOH + hν → Na + OHNaCl + hν → Na + Cl
_______________________________________________________________________
(1) Hudson and Kieffer [132].(2) Turco [305].# New Entry.* Indicates a change in the recommendation from the previous evaluation.& Indicates a change in the note.
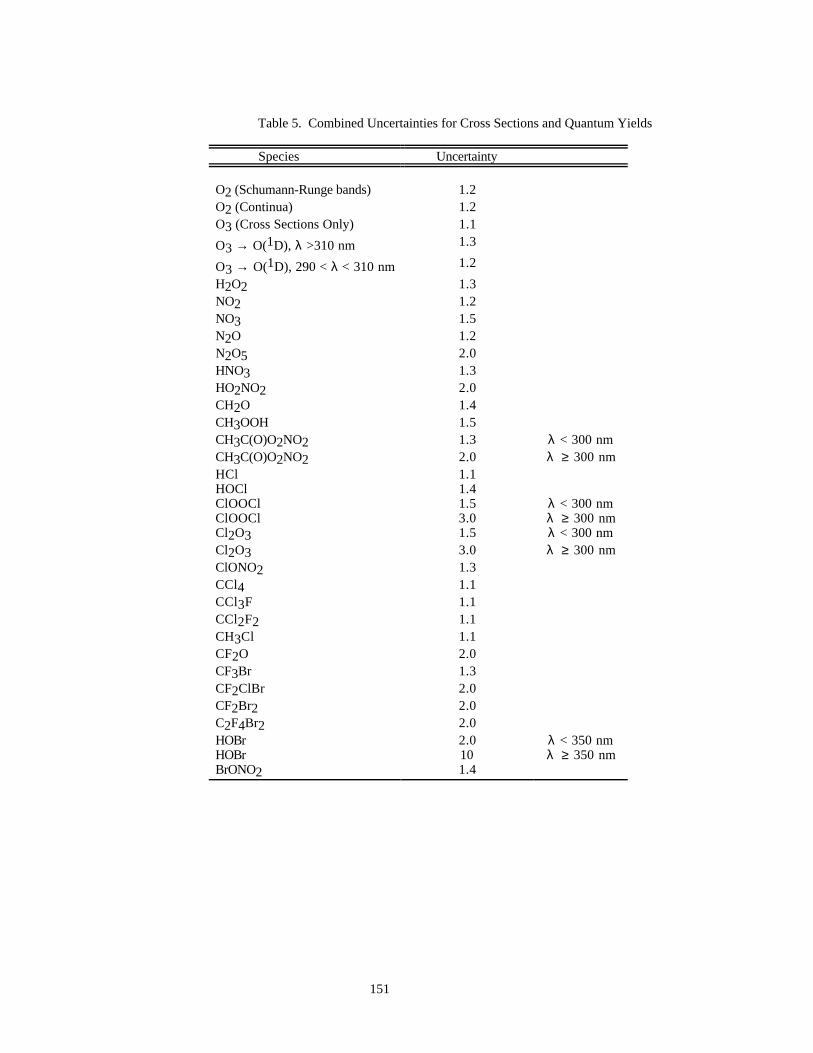
151
Table 5. Combined Uncertainties for Cross Sections and Quantum Yields
Species Uncertainty
O2 (Schumann-Runge bands) 1.2O2 (Continua) 1.2O3 (Cross Sections Only) 1.1
O3 → O(1D), λ >310 nm 1.3
O3 → O(1D), 290 < λ < 310 nm 1.2
H2O2 1.3NO2 1.2NO3 1.5N2O 1.2N2O5 2.0HNO3 1.3HO2NO2 2.0CH2O 1.4CH3OOH 1.5CH3C(O)O2NO2 1.3 λ < 300 nmCH3C(O)O2NO2 2.0 λ ≥ 300 nmHCl 1.1HOCl 1.4ClOOCl 1.5 λ < 300 nmClOOCl 3.0 λ ≥ 300 nmCl2O3 1.5 λ < 300 nmCl2O3 3.0 λ ≥ 300 nmClONO2 1.3CCl4 1.1CCl3F 1.1CCl2F2 1.1CH3Cl 1.1CF2O 2.0CF3Br 1.3CF2ClBr 2.0CF2Br2 2.0C2F4Br2 2.0HOBr 2.0 λ < 350 nmHOBr 10 λ ≥ 350 nmBrONO2 1.4
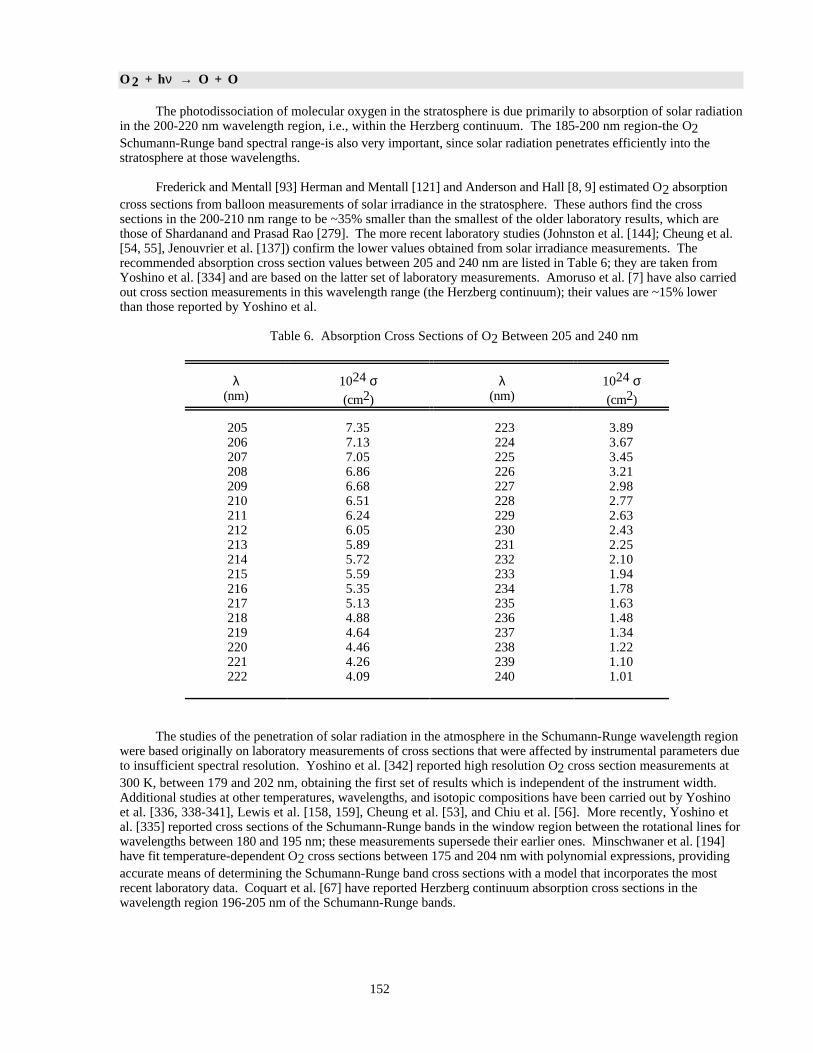
152
O 2 + hν → O + O
The photodissociation of molecular oxygen in the stratosphere is due primarily to absorption of solar radiationin the 200-220 nm wavelength region, i.e., within the Herzberg continuum. The 185-200 nm region-the O2Schumann-Runge band spectral range-is also very important, since solar radiation penetrates efficiently into thestratosphere at those wavelengths.
Frederick and Mentall [93] Herman and Mentall [121] and Anderson and Hall [8, 9] estimated O2 absorptioncross sections from balloon measurements of solar irradiance in the stratosphere. These authors find the crosssections in the 200-210 nm range to be ~35% smaller than the smallest of the older laboratory results, which arethose of Shardanand and Prasad Rao [279]. The more recent laboratory studies (Johnston et al. [144]; Cheung et al.[54, 55], Jenouvrier et al. [137]) confirm the lower values obtained from solar irradiance measurements. Therecommended absorption cross section values between 205 and 240 nm are listed in Table 6; they are taken fromYoshino et al. [334] and are based on the latter set of laboratory measurements. Amoruso et al. [7] have also carriedout cross section measurements in this wavelength range (the Herzberg continuum); their values are ~15% lowerthan those reported by Yoshino et al.
Table 6. Absorption Cross Sections of O2 Between 205 and 240 nm
λ(nm)
1024 σ(cm2)
λ(nm)
1024 σ(cm2)
205 7.35 223 3.89206 7.13 224 3.67207 7.05 225 3.45208 6.86 226 3.21209 6.68 227 2.98210 6.51 228 2.77211 6.24 229 2.63212 6.05 230 2.43213 5.89 231 2.25214 5.72 232 2.10215 5.59 233 1.94216 5.35 234 1.78217 5.13 235 1.63218 4.88 236 1.48219 4.64 237 1.34220 4.46 238 1.22221 4.26 239 1.10222 4.09 240 1.01
The studies of the penetration of solar radiation in the atmosphere in the Schumann-Runge wavelength regionwere based originally on laboratory measurements of cross sections that were affected by instrumental parameters dueto insufficient spectral resolution. Yoshino et al. [342] reported high resolution O2 cross section measurements at300 K, between 179 and 202 nm, obtaining the first set of results which is independent of the instrument width.Additional studies at other temperatures, wavelengths, and isotopic compositions have been carried out by Yoshinoet al. [336, 338-341], Lewis et al. [158, 159], Cheung et al. [53], and Chiu et al. [56]. More recently, Yoshino etal. [335] reported cross sections of the Schumann-Runge bands in the window region between the rotational lines forwavelengths between 180 and 195 nm; these measurements supersede their earlier ones. Minschwaner et al. [194]have fit temperature-dependent O2 cross sections between 175 and 204 nm with polynomial expressions, providingaccurate means of determining the Schumann-Runge band cross sections with a model that incorporates the mostrecent laboratory data. Coquart et al. [67] have reported Herzberg continuum absorption cross sections in thewavelength region 196-205 nm of the Schumann-Runge bands.
153
For parameterizations of the O2 absorption in the Schumann-Runge bands used in atmospheric modelingcalculations, see, e.g., the review in WMO Report No. 16 [330]. More recent work by Murtagh [220], Nicolet andKennes, [229] and Minschwaner et al. [194] incorporates results of the later laboratory measurements into efficientschemes for computing broad-band transmission and photolysis rates. Transmission values obtained by Murtagh[220] agree well with the WMO [330] recommendations, although the high-resolution calculations of Minschwanerand Salawitch differ with the WMO values by as much as 10 - 20% at some wavelengths.
In view of the quality of the high-resolution laboratory measurements, the primary source of uncertainty inmodeling O2 photolysis in the Schumann-Runge bands (other than the issue of absolute solar irradiance) has shiftedto the choice of broadband parameterization.
O 3 + hν → O + O2
The O3 absorption cross sections and their temperature dependence have been measured by several groups. Anearlier review is presented in WMO Report No. 16 [330]; this reference should be consulted to obtain data foratmospheric modeling calculations. Table 7 lists merely a sample of the data taken from this review, namely the273 K cross section values averaged over the wavelength intervals commonly employed in modeling calculations,except for the wavelength range 185 to 225 nm, where the present recommendation incorporates the averaged valuesfrom the work of Molina and Molina [206]; the older values were based on the work of Inn and Tanaka [136]. Morerecently, Daumont et al. [79] and Brion et al. [30] reported ozone absorption cross section measurements between195 and 345 nm, in the temperature range 200 - 300 K; and Yoshino et al. [337] measured the cross sections in the185 to 254 nm wavelength range at 195, 228, and 295 K; the results of these studies yield values in very goodagreement with those reported by Molina and Molina [206]. Cacciani et al. [46] reported measurements of the ozonecross sections in the wavelength range from 339 to 355 nm, in reasonable agreement with the presentrecommendation; the same group has measured also the cross sections in the 590-610 nm region, at 230 K and at299 K (Amoruso et al. [5]). The temperature effect on the cross sections is negligible for wavelengths shorter than
~260 nm. Recent work by Mauersberger et al. [181, 182] yields a value of 1137 x 10-20 cm2 for the cross sectionat 253.7 nm, the mercury line wavelength; it is about 1% smaller than the commonly accepted value of 1147 x
10-20 cm2 reported by Hearn [119]; about 2% smaller than the value obtained by Molina and Molina [206], 1157 x
10-20 cm2; and 0.5% larger than the value obtained by Daumont et al. [79]. The reason for the small discrepancy,which appears to be beyond experimental precision, is unclear.
Malicet et al. [170] report cross section measurements in the 195-345 nm range, at temperatures between 218and 295 K, with a spectral bandwidth of 0.01-0.02 nm.; the results are in good agreement with the recommendedvalues. Their data are presented in graphical form, and are also available on floppy disks.
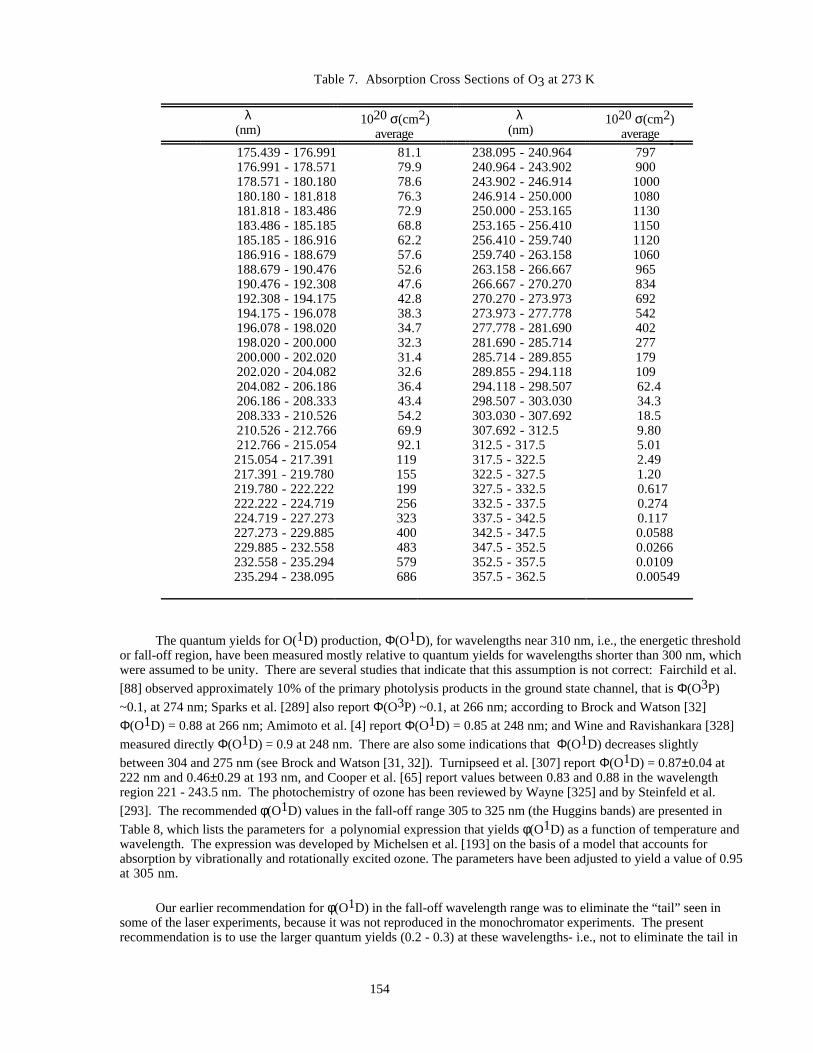
154
Table 7. Absorption Cross Sections of O3 at 273 K
λ(nm)
1020 σ(cm2)average
λ(nm)
1020 σ(cm2)average
175.439 - 176.991 81.1 238.095 - 240.964 797176.991 - 178.571 79.9 240.964 - 243.902 900178.571 - 180.180 78.6 243.902 - 246.914 1000180.180 - 181.818 76.3 246.914 - 250.000 1080181.818 - 183.486 72.9 250.000 - 253.165 1130183.486 - 185.185 68.8 253.165 - 256.410 1150185.185 - 186.916 62.2 256.410 - 259.740 1120186.916 - 188.679 57.6 259.740 - 263.158 1060188.679 - 190.476 52.6 263.158 - 266.667 965190.476 - 192.308 47.6 266.667 - 270.270 834192.308 - 194.175 42.8 270.270 - 273.973 692194.175 - 196.078 38.3 273.973 - 277.778 542196.078 - 198.020 34.7 277.778 - 281.690 402198.020 - 200.000 32.3 281.690 - 285.714 277200.000 - 202.020 31.4 285.714 - 289.855 179202.020 - 204.082 32.6 289.855 - 294.118 109204.082 - 206.186 36.4 294.118 - 298.507 62.4206.186 - 208.333 43.4 298.507 - 303.030 34.3208.333 - 210.526 54.2 303.030 - 307.692 18.5210.526 - 212.766 69.9 307.692 - 312.5 9.80212.766 - 215.054 92.1 312.5 - 317.5 5.01215.054 - 217.391 119 317.5 - 322.5 2.49217.391 - 219.780 155 322.5 - 327.5 1.20219.780 - 222.222 199 327.5 - 332.5 0.617222.222 - 224.719 256 332.5 - 337.5 0.274224.719 - 227.273 323 337.5 - 342.5 0.117227.273 - 229.885 400 342.5 - 347.5 0.0588229.885 - 232.558 483 347.5 - 352.5 0.0266232.558 - 235.294 579 352.5 - 357.5 0.0109235.294 - 238.095 686 357.5 - 362.5 0.00549
The quantum yields for O(1D) production, Φ(O1D), for wavelengths near 310 nm, i.e., the energetic thresholdor fall-off region, have been measured mostly relative to quantum yields for wavelengths shorter than 300 nm, whichwere assumed to be unity. There are several studies that indicate that this assumption is not correct: Fairchild et al.
[88] observed approximately 10% of the primary photolysis products in the ground state channel, that is Φ(O3P)
~0.1, at 274 nm; Sparks et al. [289] also report Φ(O3P) ~0.1, at 266 nm; according to Brock and Watson [32]
Φ(O1D) = 0.88 at 266 nm; Amimoto et al. [4] report Φ(O1D) = 0.85 at 248 nm; and Wine and Ravishankara [328]
measured directly Φ(O1D) = 0.9 at 248 nm. There are also some indications that Φ(O1D) decreases slightly
between 304 and 275 nm (see Brock and Watson [31, 32]). Turnipseed et al. [307] report Φ(O1D) = 0.87±0.04 at222 nm and 0.46±0.29 at 193 nm, and Cooper et al. [65] report values between 0.83 and 0.88 in the wavelengthregion 221 - 243.5 nm. The photochemistry of ozone has been reviewed by Wayne [325] and by Steinfeld et al.
[293]. The recommended φ(O1D) values in the fall-off range 305 to 325 nm (the Huggins bands) are presented in
Table 8, which lists the parameters for a polynomial expression that yields φ(O1D) as a function of temperature andwavelength. The expression was developed by Michelsen et al. [193] on the basis of a model that accounts forabsorption by vibrationally and rotationally excited ozone. The parameters have been adjusted to yield a value of 0.95at 305 nm.
Our earlier recommendation for φ(O1D) in the fall-off wavelength range was to eliminate the “tail” seen insome of the laser experiments, because it was not reproduced in the monochromator experiments. The presentrecommendation is to use the larger quantum yields (0.2 - 0.3) at these wavelengths- i.e., not to eliminate the tail in
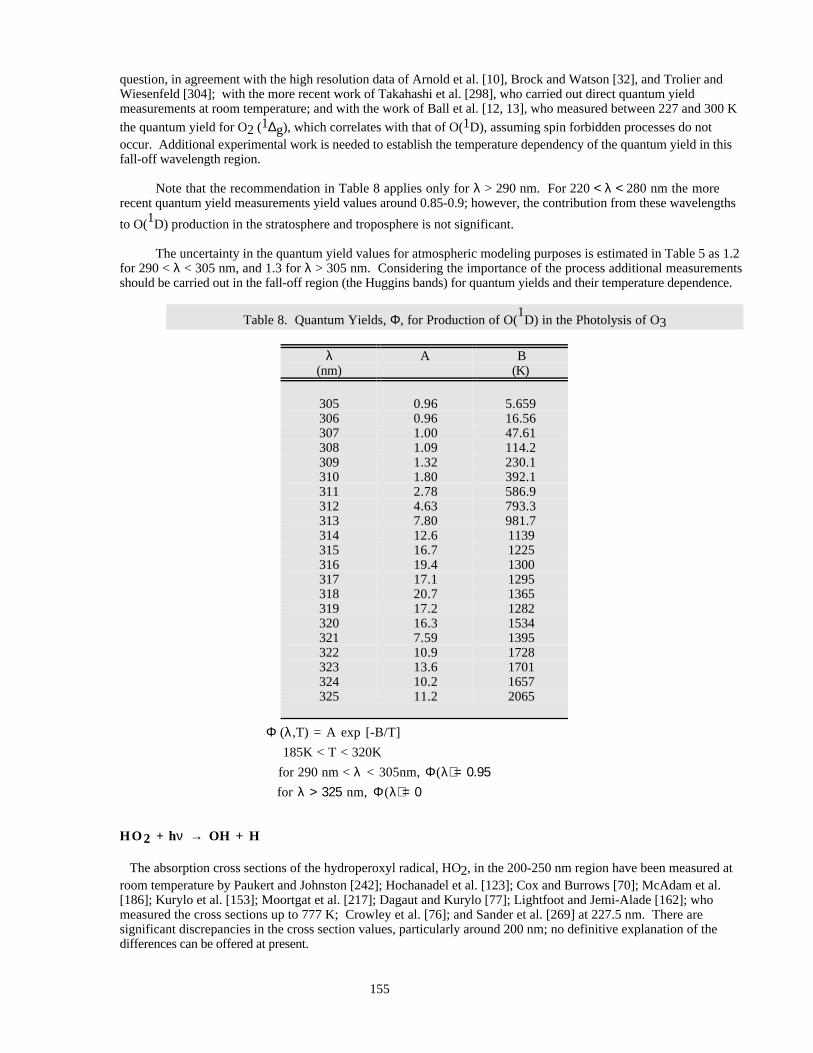
155
question, in agreement with the high resolution data of Arnold et al. [10], Brock and Watson [32], and Trolier andWiesenfeld [304]; with the more recent work of Takahashi et al. [298], who carried out direct quantum yieldmeasurements at room temperature; and with the work of Ball et al. [12, 13], who measured between 227 and 300 K
the quantum yield for O2 (1∆g), which correlates with that of O(1D), assuming spin forbidden processes do notoccur. Additional experimental work is needed to establish the temperature dependency of the quantum yield in thisfall-off wavelength region.
Note that the recommendation in Table 8 applies only for λ > 290 nm. For 220 < λ < 280 nm the morerecent quantum yield measurements yield values around 0.85-0.9; however, the contribution from these wavelengths
to O(1D) production in the stratosphere and troposphere is not significant.
The uncertainty in the quantum yield values for atmospheric modeling purposes is estimated in Table 5 as 1.2for 290 < λ < 305 nm, and 1.3 for λ > 305 nm. Considering the importance of the process additional measurementsshould be carried out in the fall-off region (the Huggins bands) for quantum yields and their temperature dependence.
Table 8. Quantum Yields, Φ, for Production of O(1D) in the Photolysis of O3
λ(nm)
A B(K)
305 0.96 5.659306 0.96 16.56307 1.00 47.61308 1.09 114.2309 1.32 230.1310 1.80 392.1311 2.78 586.9312 4.63 793.3313 7.80 981.7314 12.6 1139315 16.7 1225316 19.4 1300317 17.1 1295318 20.7 1365319 17.2 1282320 16.3 1534321 7.59 1395322 10.9 1728323 13.6 1701324 10.2 1657325 11.2 2065
Φ (λ ,T) = A exp [-B/T]
185K < T < 320K
for 290 nm < λ < 305nm, Φ(λ) = 0.95 for λ > 325 nm, Φ(λ) = 0
HO 2 + hν → OH + H
The absorption cross sections of the hydroperoxyl radical, HO2, in the 200-250 nm region have been measured atroom temperature by Paukert and Johnston [242]; Hochanadel et al. [123]; Cox and Burrows [70]; McAdam et al.[186]; Kurylo et al. [153]; Moortgat et al. [217]; Dagaut and Kurylo [77]; Lightfoot and Jemi-Alade [162]; whomeasured the cross sections up to 777 K; Crowley et al. [76]; and Sander et al. [269] at 227.5 nm. There aresignificant discrepancies in the cross section values, particularly around 200 nm; no definitive explanation of thedifferences can be offered at present.
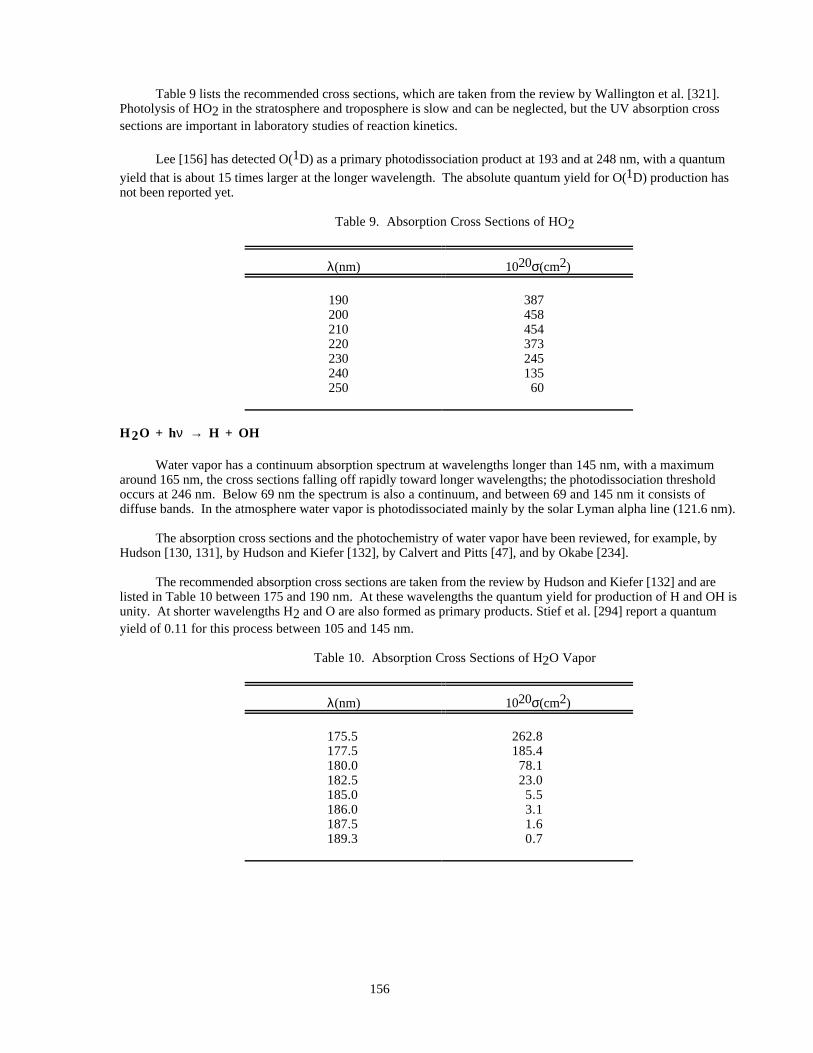
156
Table 9 lists the recommended cross sections, which are taken from the review by Wallington et al. [321].Photolysis of HO2 in the stratosphere and troposphere is slow and can be neglected, but the UV absorption crosssections are important in laboratory studies of reaction kinetics.
Lee [156] has detected O(1D) as a primary photodissociation product at 193 and at 248 nm, with a quantum
yield that is about 15 times larger at the longer wavelength. The absolute quantum yield for O(1D) production hasnot been reported yet.
Table 9. Absorption Cross Sections of HO2
λ(nm) 1020σ(cm2)
190 387200 458210 454220 373230 245240 135250 60
H 2O + hν → H + OH
Water vapor has a continuum absorption spectrum at wavelengths longer than 145 nm, with a maximumaround 165 nm, the cross sections falling off rapidly toward longer wavelengths; the photodissociation thresholdoccurs at 246 nm. Below 69 nm the spectrum is also a continuum, and between 69 and 145 nm it consists ofdiffuse bands. In the atmosphere water vapor is photodissociated mainly by the solar Lyman alpha line (121.6 nm).
The absorption cross sections and the photochemistry of water vapor have been reviewed, for example, byHudson [130, 131], by Hudson and Kiefer [132], by Calvert and Pitts [47], and by Okabe [234].
The recommended absorption cross sections are taken from the review by Hudson and Kiefer [132] and arelisted in Table 10 between 175 and 190 nm. At these wavelengths the quantum yield for production of H and OH isunity. At shorter wavelengths H2 and O are also formed as primary products. Stief et al. [294] report a quantumyield of 0.11 for this process between 105 and 145 nm.
Table 10. Absorption Cross Sections of H2O Vapor
λ(nm) 1020σ(cm2)
175.5 262.8177.5 185.4180.0 78.1182.5 23.0185.0 5.5186.0 3.1187.5 1.6189.3 0.7
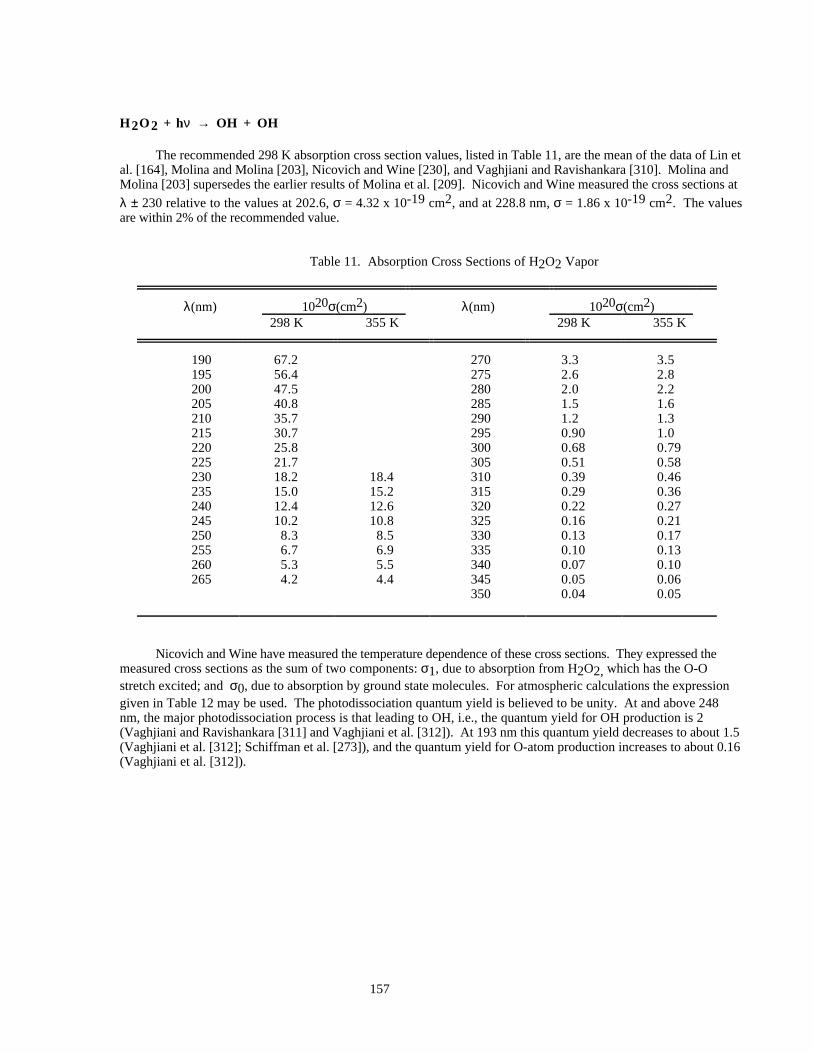
157
H 2O2 + hν → OH + OH
The recommended 298 K absorption cross section values, listed in Table 11, are the mean of the data of Lin etal. [164], Molina and Molina [203], Nicovich and Wine [230], and Vaghjiani and Ravishankara [310]. Molina andMolina [203] supersedes the earlier results of Molina et al. [209]. Nicovich and Wine measured the cross sections at
λ ± 230 relative to the values at 202.6, σ = 4.32 x 10⁻¹⁹ cm2, and at 228.8 nm, σ = 1.86 x 10⁻¹⁹ cm2. The valuesare within 2% of the recommended value.
Table 11. Absorption Cross Sections of H2O2 Vapor
λ(nm) 1020σ(cm2) λ(nm) 1020σ(cm2)298 K 355 K 298 K 355 K
190 67.2 270 3.3 3.5195 56.4 275 2.6 2.8200 47.5 280 2.0 2.2205 40.8 285 1.5 1.6210 35.7 290 1.2 1.3215 30.7 295 0.90 1.0220 25.8 300 0.68 0.79225 21.7 305 0.51 0.58230 18.2 18.4 310 0.39 0.46235 15.0 15.2 315 0.29 0.36240 12.4 12.6 320 0.22 0.27245 10.2 10.8 325 0.16 0.21250 8.3 8.5 330 0.13 0.17255 6.7 6.9 335 0.10 0.13260 5.3 5.5 340 0.07 0.10265 4.2 4.4 345 0.05 0.06
350 0.04 0.05
Nicovich and Wine have measured the temperature dependence of these cross sections. They expressed themeasured cross sections as the sum of two components: σ1, due to absorption from H2O2, which has the O-Ostretch excited; and σ0, due to absorption by ground state molecules. For atmospheric calculations the expressiongiven in Table 12 may be used. The photodissociation quantum yield is believed to be unity. At and above 248nm, the major photodissociation process is that leading to OH, i.e., the quantum yield for OH production is 2(Vaghjiani and Ravishankara [311] and Vaghjiani et al. [312]). At 193 nm this quantum yield decreases to about 1.5(Vaghjiani et al. [312]; Schiffman et al. [273]), and the quantum yield for O-atom production increases to about 0.16(Vaghjiani et al. [312]).
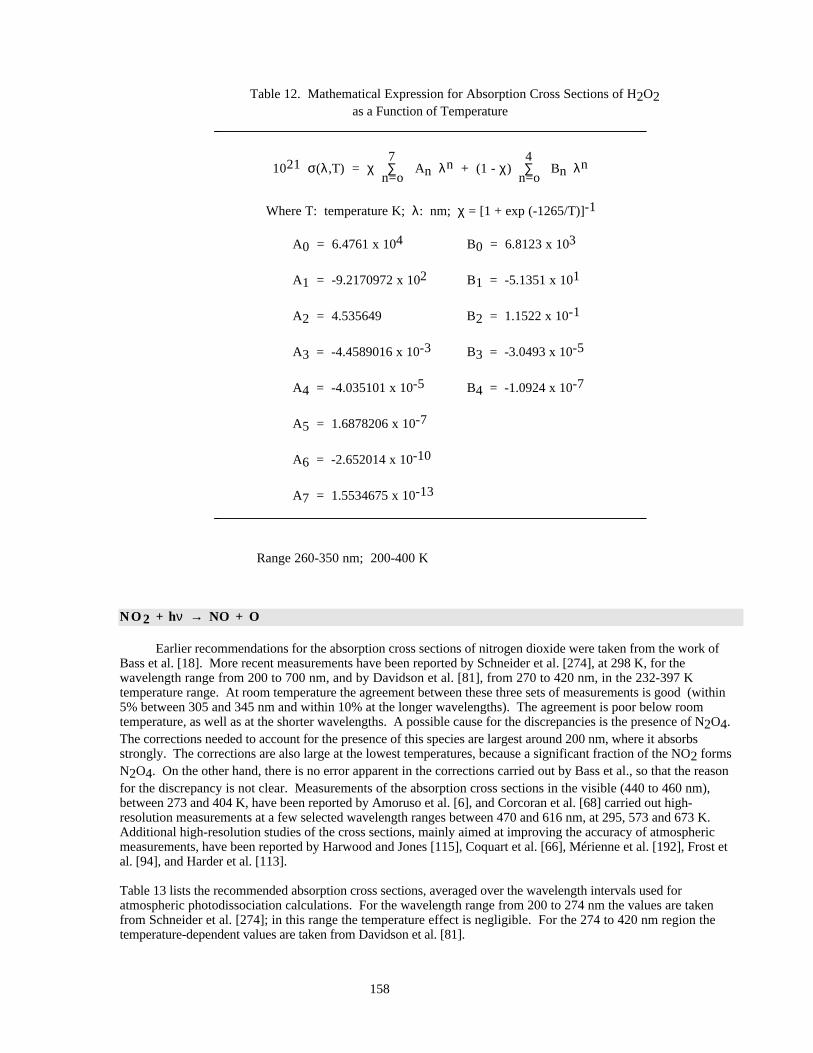
158
Table 12. Mathematical Expression for Absorption Cross Sections of H2O2as a Function of Temperature
_________________________________________________________________
1021 σ(λ,T) = χ 7∑
n=o An λn + (1 - χ)
4∑
n=o Bn λn
Where T: temperature K; λ: nm; χ = [1 + exp (-1265/T)]-1
A0 = 6.4761 x 10⁴ B0 = 6.8123 x 10³
A1 = -9.2170972 x 10² B1 = -5.1351 x 101
A2 = 4.535649 B2 = 1.1522 x 10⁻¹
A3 = -4.4589016 x 10⁻³ B3 = -3.0493 x 10⁻⁵
A4 = -4.035101 x 10⁻⁵ B4 = -1.0924 x 10⁻⁷
A5 = 1.6878206 x 10⁻⁷
A6 = -2.652014 x 10⁻¹⁰
A7 = 1.5534675 x 10⁻¹³
_________________________________________________________________
Range 260-350 nm; 200-400 K
NO2 + hν → NO + O
Earlier recommendations for the absorption cross sections of nitrogen dioxide were taken from the work ofBass et al. [18]. More recent measurements have been reported by Schneider et al. [274], at 298 K, for thewavelength range from 200 to 700 nm, and by Davidson et al. [81], from 270 to 420 nm, in the 232-397 Ktemperature range. At room temperature the agreement between these three sets of measurements is good (within5% between 305 and 345 nm and within 10% at the longer wavelengths). The agreement is poor below roomtemperature, as well as at the shorter wavelengths. A possible cause for the discrepancies is the presence of N2O4.The corrections needed to account for the presence of this species are largest around 200 nm, where it absorbsstrongly. The corrections are also large at the lowest temperatures, because a significant fraction of the NO2 formsN2O4. On the other hand, there is no error apparent in the corrections carried out by Bass et al., so that the reasonfor the discrepancy is not clear. Measurements of the absorption cross sections in the visible (440 to 460 nm),between 273 and 404 K, have been reported by Amoruso et al. [6], and Corcoran et al. [68] carried out high-resolution measurements at a few selected wavelength ranges between 470 and 616 nm, at 295, 573 and 673 K.Additional high-resolution studies of the cross sections, mainly aimed at improving the accuracy of atmosphericmeasurements, have been reported by Harwood and Jones [115], Coquart et al. [66], Mérienne et al. [192], Frost etal. [94], and Harder et al. [113].
Table 13 lists the recommended absorption cross sections, averaged over the wavelength intervals used foratmospheric photodissociation calculations. For the wavelength range from 200 to 274 nm the values are takenfrom Schneider et al. [274]; in this range the temperature effect is negligible. For the 274 to 420 nm region thetemperature-dependent values are taken from Davidson et al. [81].
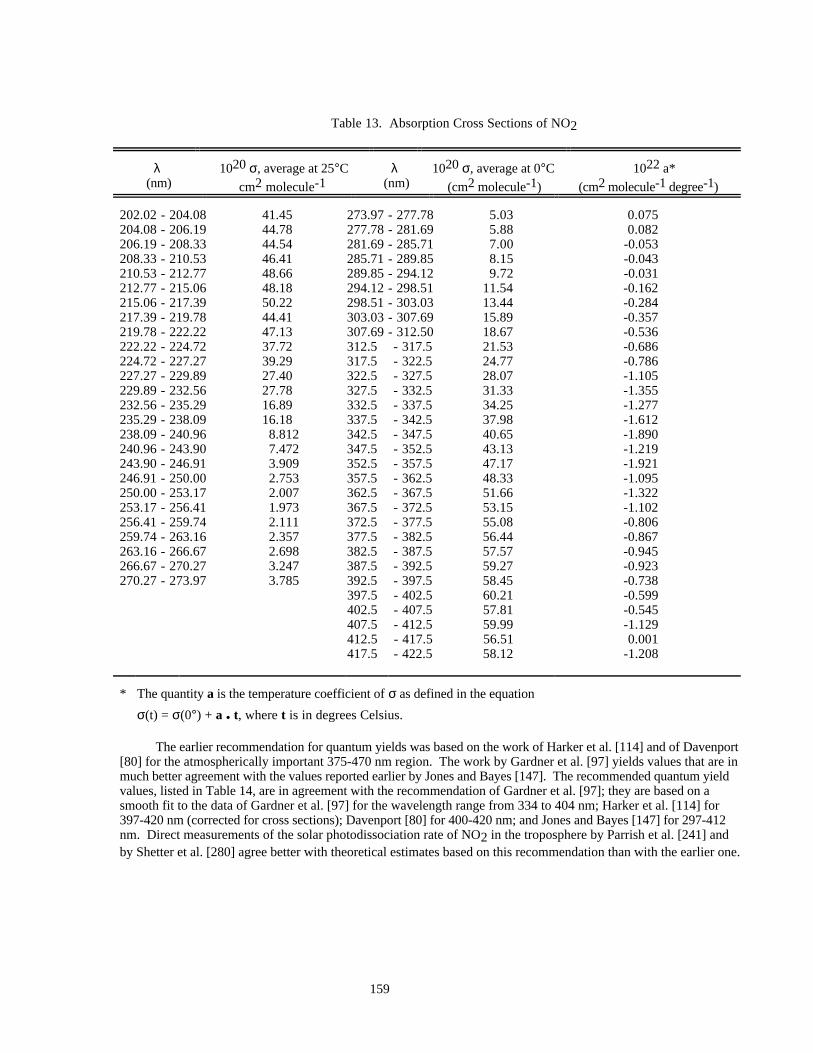
159
Table 13. Absorption Cross Sections of NO2
λ 1020 σ, average at 25°C λ 1020 σ, average at 0°C 1022 a*(nm) cm2 molecule-1 (nm) (cm2 molecule-1) (cm2 molecule-1 degree-1)
202.02 - 204.08 41.45 273.97 - 277.78 5.03 0.075204.08 - 206.19 44.78 277.78 - 281.69 5.88 0.082206.19 - 208.33 44.54 281.69 - 285.71 7.00 -0.053208.33 - 210.53 46.41 285.71 - 289.85 8.15 -0.043210.53 - 212.77 48.66 289.85 - 294.12 9.72 -0.031212.77 - 215.06 48.18 294.12 - 298.51 11.54 -0.162215.06 - 217.39 50.22 298.51 - 303.03 13.44 -0.284217.39 - 219.78 44.41 303.03 - 307.69 15.89 -0.357219.78 - 222.22 47.13 307.69 - 312.50 18.67 -0.536222.22 - 224.72 37.72 312.5 - 317.5 21.53 -0.686224.72 - 227.27 39.29 317.5 - 322.5 24.77 -0.786227.27 - 229.89 27.40 322.5 - 327.5 28.07 -1.105229.89 - 232.56 27.78 327.5 - 332.5 31.33 -1.355232.56 - 235.29 16.89 332.5 - 337.5 34.25 -1.277235.29 - 238.09 16.18 337.5 - 342.5 37.98 -1.612238.09 - 240.96 8.812 342.5 - 347.5 40.65 -1.890240.96 - 243.90 7.472 347.5 - 352.5 43.13 -1.219243.90 - 246.91 3.909 352.5 - 357.5 47.17 -1.921246.91 - 250.00 2.753 357.5 - 362.5 48.33 -1.095250.00 - 253.17 2.007 362.5 - 367.5 51.66 -1.322253.17 - 256.41 1.973 367.5 - 372.5 53.15 -1.102256.41 - 259.74 2.111 372.5 - 377.5 55.08 -0.806259.74 - 263.16 2.357 377.5 - 382.5 56.44 -0.867263.16 - 266.67 2.698 382.5 - 387.5 57.57 -0.945266.67 - 270.27 3.247 387.5 - 392.5 59.27 -0.923270.27 - 273.97 3.785 392.5 - 397.5 58.45 -0.738
397.5 - 402.5 60.21 -0.599402.5 - 407.5 57.81 -0.545407.5 - 412.5 59.99 -1.129412.5 - 417.5 56.51 0.001417.5 - 422.5 58.12 -1.208
* The quantity a is the temperature coefficient of σ as defined in the equation
σ(t) = σ(0°) + a • t, where t is in degrees Celsius.
The earlier recommendation for quantum yields was based on the work of Harker et al. [114] and of Davenport[80] for the atmospherically important 375-470 nm region. The work by Gardner et al. [97] yields values that are inmuch better agreement with the values reported earlier by Jones and Bayes [147]. The recommended quantum yieldvalues, listed in Table 14, are in agreement with the recommendation of Gardner et al. [97]; they are based on asmooth fit to the data of Gardner et al. [97] for the wavelength range from 334 to 404 nm; Harker et al. [114] for397-420 nm (corrected for cross sections); Davenport [80] for 400-420 nm; and Jones and Bayes [147] for 297-412nm. Direct measurements of the solar photodissociation rate of NO2 in the troposphere by Parrish et al. [241] andby Shetter et al. [280] agree better with theoretical estimates based on this recommendation than with the earlier one.
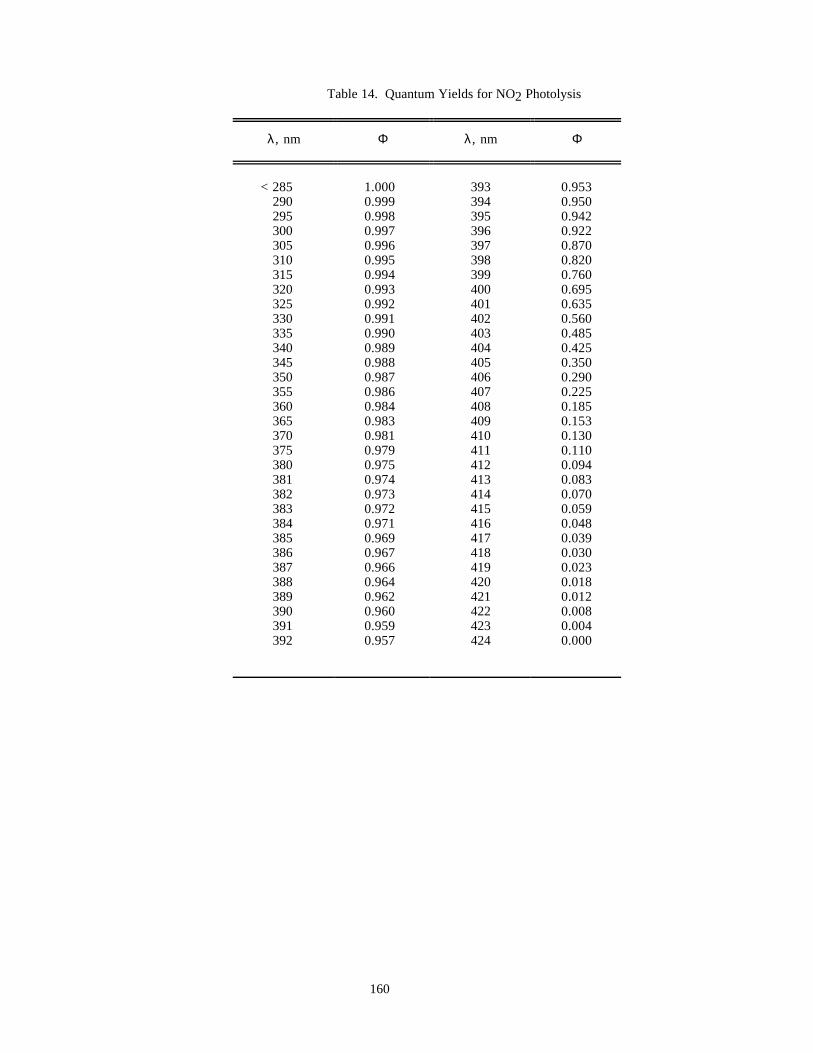
160
Table 14. Quantum Yields for NO2 Photolysis
λ , nm Φ λ, nm Φ
< 285 1.000 393 0.953290 0.999 394 0.950295 0.998 395 0.942300 0.997 396 0.922305 0.996 397 0.870310 0.995 398 0.820315 0.994 399 0.760320 0.993 400 0.695325 0.992 401 0.635330 0.991 402 0.560335 0.990 403 0.485340 0.989 404 0.425345 0.988 405 0.350350 0.987 406 0.290355 0.986 407 0.225360 0.984 408 0.185365 0.983 409 0.153370 0.981 410 0.130375 0.979 411 0.110380 0.975 412 0.094381 0.974 413 0.083382 0.973 414 0.070383 0.972 415 0.059384 0.971 416 0.048385 0.969 417 0.039386 0.967 418 0.030387 0.966 419 0.023388 0.964 420 0.018389 0.962 421 0.012390 0.960 422 0.008391 0.959 423 0.004392 0.957 424 0.000
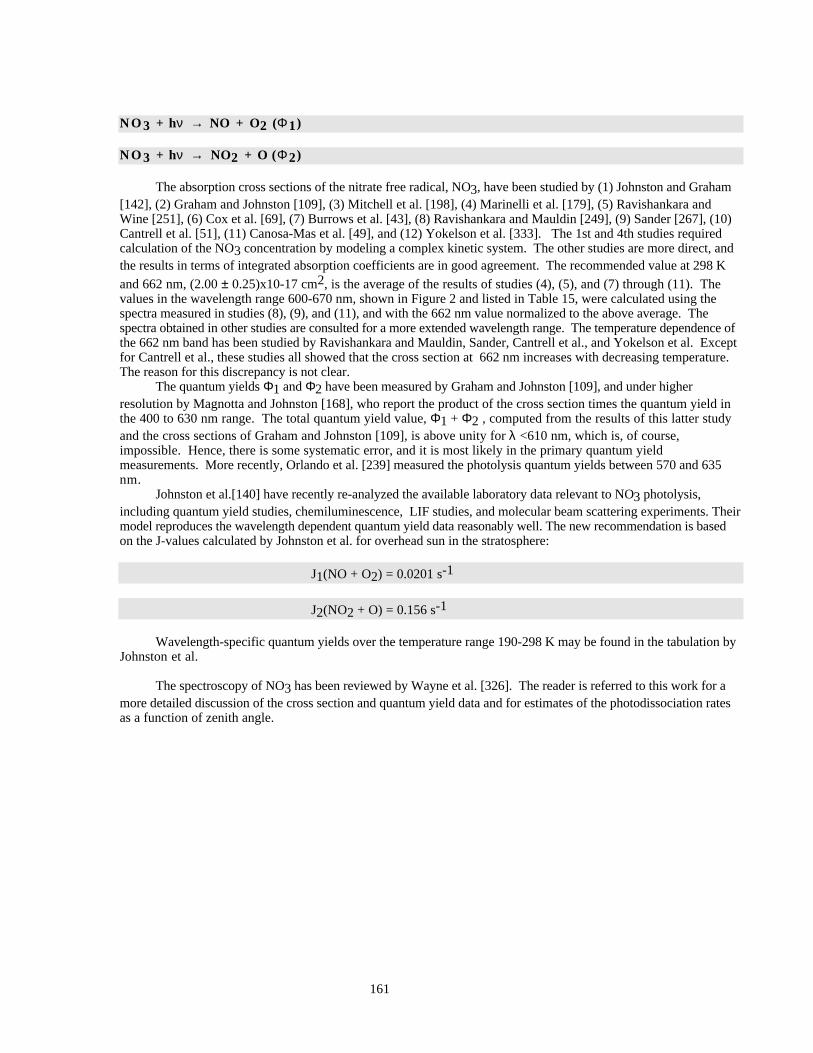
161
NO3 + hν → NO + O2 (Φ1)
NO3 + hν → NO2 + O (Φ2)
The absorption cross sections of the nitrate free radical, NO3, have been studied by (1) Johnston and Graham[142], (2) Graham and Johnston [109], (3) Mitchell et al. [198], (4) Marinelli et al. [179], (5) Ravishankara andWine [251], (6) Cox et al. [69], (7) Burrows et al. [43], (8) Ravishankara and Mauldin [249], (9) Sander [267], (10)Cantrell et al. [51], (11) Canosa-Mas et al. [49], and (12) Yokelson et al. [333]. The 1st and 4th studies requiredcalculation of the NO3 concentration by modeling a complex kinetic system. The other studies are more direct, andthe results in terms of integrated absorption coefficients are in good agreement. The recommended value at 298 K
and 662 nm, (2.00 ± 0.25)x10-17 cm2, is the average of the results of studies (4), (5), and (7) through (11). Thevalues in the wavelength range 600-670 nm, shown in Figure 2 and listed in Table 15, were calculated using thespectra measured in studies (8), (9), and (11), and with the 662 nm value normalized to the above average. Thespectra obtained in other studies are consulted for a more extended wavelength range. The temperature dependence ofthe 662 nm band has been studied by Ravishankara and Mauldin, Sander, Cantrell et al., and Yokelson et al. Exceptfor Cantrell et al., these studies all showed that the cross section at 662 nm increases with decreasing temperature.The reason for this discrepancy is not clear.
The quantum yields Φ1 and Φ2 have been measured by Graham and Johnston [109], and under higherresolution by Magnotta and Johnston [168], who report the product of the cross section times the quantum yield inthe 400 to 630 nm range. The total quantum yield value, Φ1 + Φ2 , computed from the results of this latter studyand the cross sections of Graham and Johnston [109], is above unity for λ <610 nm, which is, of course,impossible. Hence, there is some systematic error, and it is most likely in the primary quantum yieldmeasurements. More recently, Orlando et al. [239] measured the photolysis quantum yields between 570 and 635nm.
Johnston et al.[140] have recently re-analyzed the available laboratory data relevant to NO3 photolysis,including quantum yield studies, chemiluminescence, LIF studies, and molecular beam scattering experiments. Theirmodel reproduces the wavelength dependent quantum yield data reasonably well. The new recommendation is basedon the J-values calculated by Johnston et al. for overhead sun in the stratosphere:
J1(NO + O2) = 0.0201 s-1
J2(NO2 + O) = 0.156 s-1
Wavelength-specific quantum yields over the temperature range 190-298 K may be found in the tabulation byJohnston et al.
The spectroscopy of NO3 has been reviewed by Wayne et al. [326]. The reader is referred to this work for amore detailed discussion of the cross section and quantum yield data and for estimates of the photodissociation ratesas a function of zenith angle.
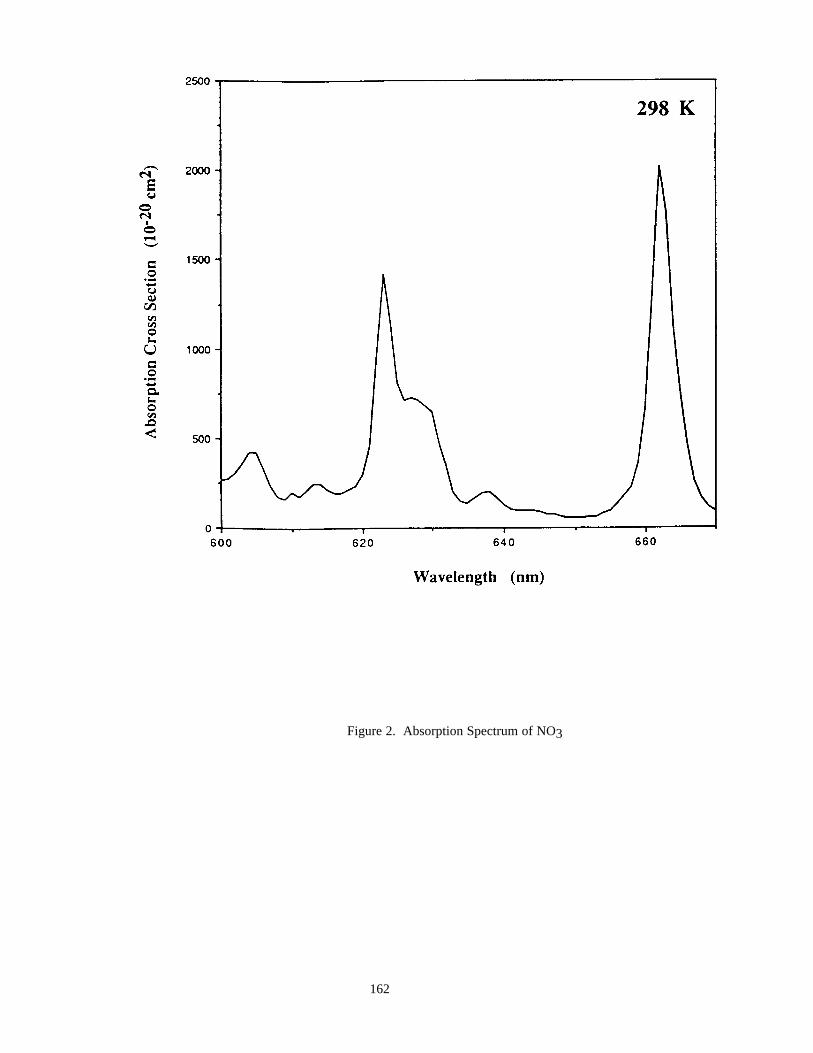
162
Figure 2. Absorption Spectrum of NO3
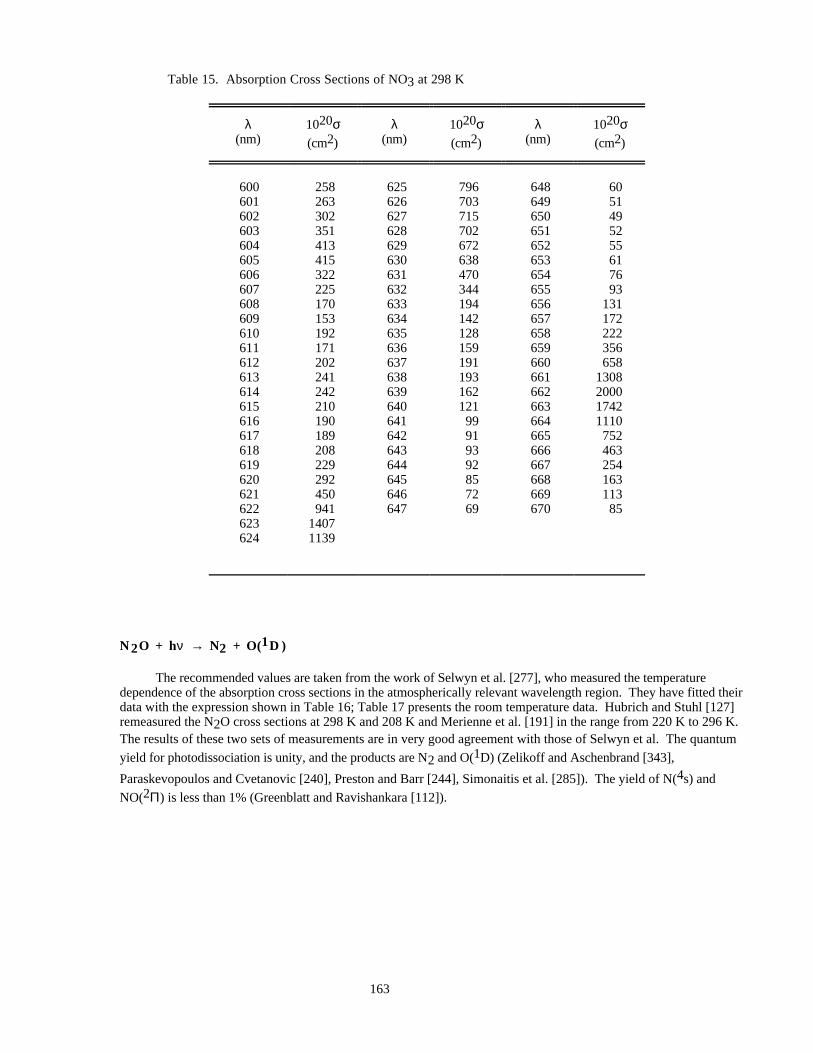
163
Table 15. Absorption Cross Sections of NO3 at 298 K
λ(nm)
1020σ(cm2)
λ(nm)
1020σ(cm2)
λ(nm)
1020σ(cm2)
600 258 625 796 648 60601 263 626 703 649 51602 302 627 715 650 49603 351 628 702 651 52604 413 629 672 652 55605 415 630 638 653 61606 322 631 470 654 76607 225 632 344 655 93608 170 633 194 656 131609 153 634 142 657 172610 192 635 128 658 222611 171 636 159 659 356612 202 637 191 660 658613 241 638 193 661 1308614 242 639 162 662 2000615 210 640 121 663 1742616 190 641 99 664 1110617 189 642 91 665 752618 208 643 93 666 463619 229 644 92 667 254620 292 645 85 668 163621 450 646 72 669 113622 941 647 69 670 85623 1407624 1139
N2O + hν → N2 + O(1D )
The recommended values are taken from the work of Selwyn et al. [277], who measured the temperaturedependence of the absorption cross sections in the atmospherically relevant wavelength region. They have fitted theirdata with the expression shown in Table 16; Table 17 presents the room temperature data. Hubrich and Stuhl [127]remeasured the N2O cross sections at 298 K and 208 K and Merienne et al. [191] in the range from 220 K to 296 K.The results of these two sets of measurements are in very good agreement with those of Selwyn et al. The quantum
yield for photodissociation is unity, and the products are N2 and O(1D) (Zelikoff and Aschenbrand [343],
Paraskevopoulos and Cvetanovic [240], Preston and Barr [244], Simonaitis et al. [285]). The yield of N(4s) and
NO(2Π) is less than 1% (Greenblatt and Ravishankara [112]).
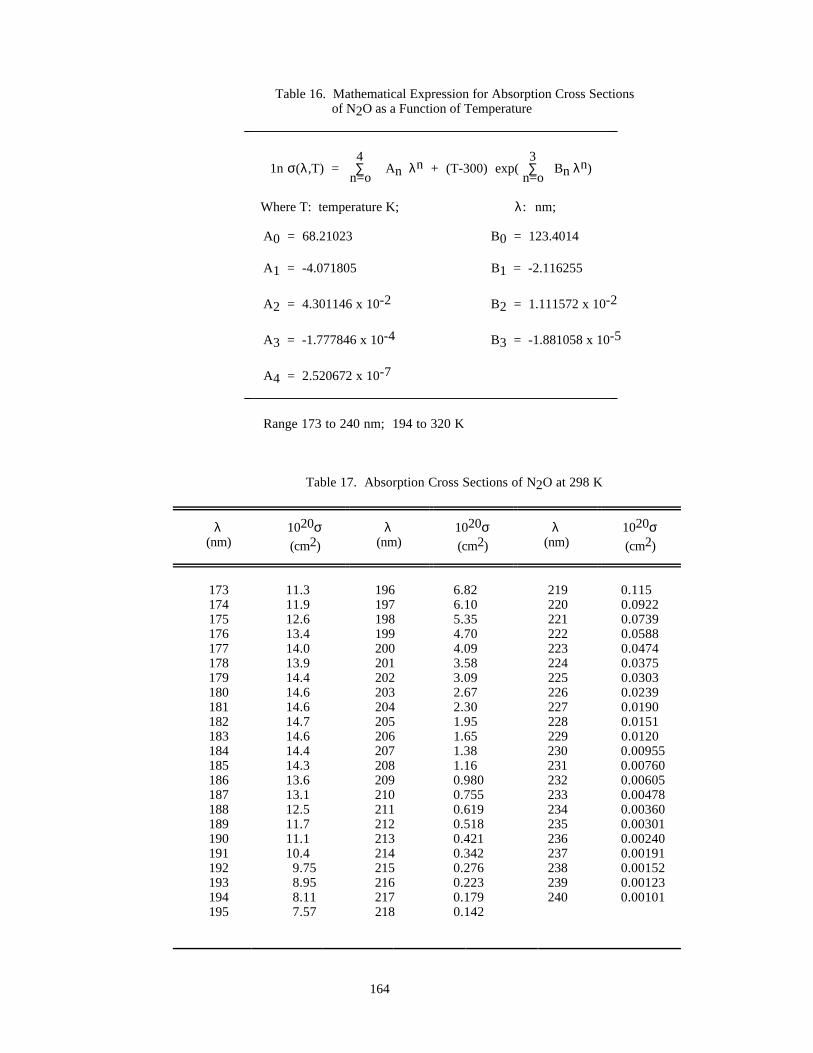
164
Table 16. Mathematical Expression for Absorption Cross Sections of N2O as a Function of Temperature
________________________________________________________
1n σ(λ,T) = 4∑
n=o An λn + (T-300) exp(
3∑
n=o Bn λn)
Where T: temperature K; λ : nm;
A0 = 68.21023 B0 = 123.4014
A1 = -4.071805 B1 = -2.116255
A2 = 4.301146 x 10⁻² B2 = 1.111572 x 10⁻²
A3 = -1.777846 x 10⁻⁴ B3 = -1.881058 x 10⁻⁵
A4 = 2.520672 x 10⁻⁷
________________________________________________________
Range 173 to 240 nm; 194 to 320 K
Table 17. Absorption Cross Sections of N2O at 298 K
λ(nm)
1020σ(cm2)
λ(nm)
1020σ(cm2)
λ(nm)
1020σ(cm2)
173 11.3 196 6.82 219 0.115174 11.9 197 6.10 220 0.0922175 12.6 198 5.35 221 0.0739176 13.4 199 4.70 222 0.0588177 14.0 200 4.09 223 0.0474178 13.9 201 3.58 224 0.0375179 14.4 202 3.09 225 0.0303180 14.6 203 2.67 226 0.0239181 14.6 204 2.30 227 0.0190182 14.7 205 1.95 228 0.0151183 14.6 206 1.65 229 0.0120184 14.4 207 1.38 230 0.00955185 14.3 208 1.16 231 0.00760186 13.6 209 0.980 232 0.00605187 13.1 210 0.755 233 0.00478188 12.5 211 0.619 234 0.00360189 11.7 212 0.518 235 0.00301190 11.1 213 0.421 236 0.00240191 10.4 214 0.342 237 0.00191192 9.75 215 0.276 238 0.00152193 8.95 216 0.223 239 0.00123194 8.11 217 0.179 240 0.00101195 7.57 218 0.142
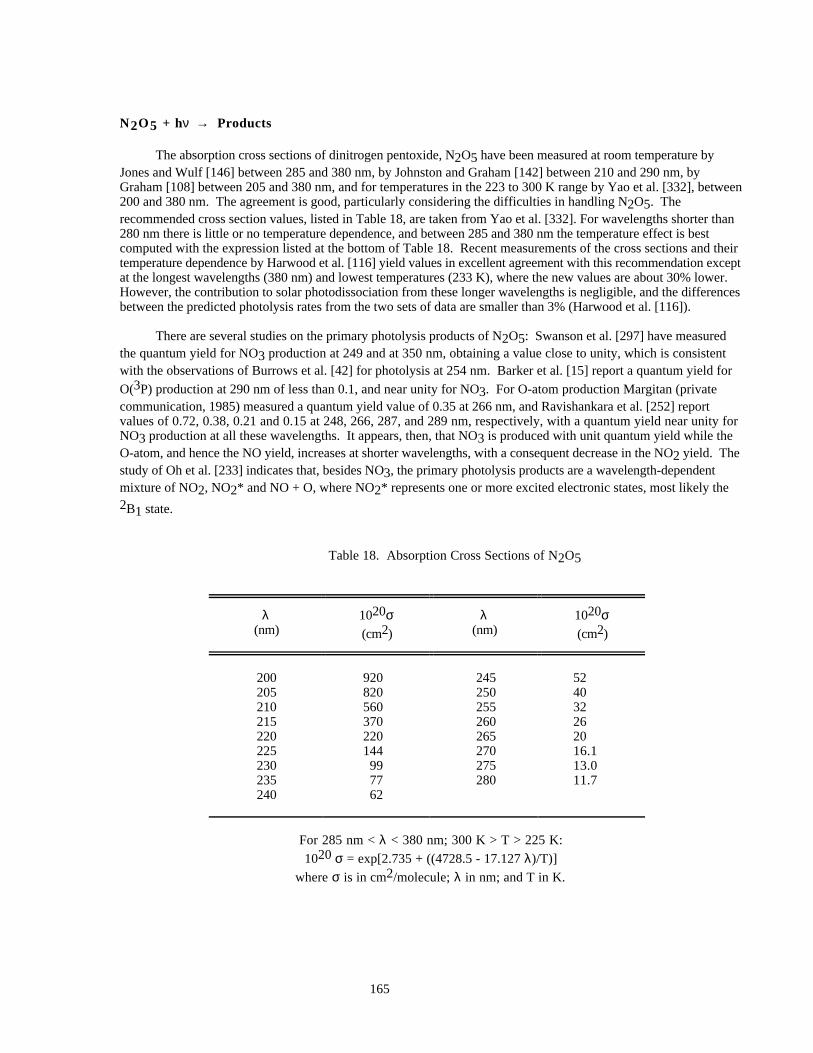
165
N2O5 + hν → Products
The absorption cross sections of dinitrogen pentoxide, N2O5 have been measured at room temperature byJones and Wulf [146] between 285 and 380 nm, by Johnston and Graham [142] between 210 and 290 nm, byGraham [108] between 205 and 380 nm, and for temperatures in the 223 to 300 K range by Yao et al. [332], between200 and 380 nm. The agreement is good, particularly considering the difficulties in handling N2O5. Therecommended cross section values, listed in Table 18, are taken from Yao et al. [332]. For wavelengths shorter than280 nm there is little or no temperature dependence, and between 285 and 380 nm the temperature effect is bestcomputed with the expression listed at the bottom of Table 18. Recent measurements of the cross sections and theirtemperature dependence by Harwood et al. [116] yield values in excellent agreement with this recommendation exceptat the longest wavelengths (380 nm) and lowest temperatures (233 K), where the new values are about 30% lower.However, the contribution to solar photodissociation from these longer wavelengths is negligible, and the differencesbetween the predicted photolysis rates from the two sets of data are smaller than 3% (Harwood et al. [116]).
There are several studies on the primary photolysis products of N2O5: Swanson et al. [297] have measuredthe quantum yield for NO3 production at 249 and at 350 nm, obtaining a value close to unity, which is consistentwith the observations of Burrows et al. [42] for photolysis at 254 nm. Barker et al. [15] report a quantum yield for
O(3P) production at 290 nm of less than 0.1, and near unity for NO3. For O-atom production Margitan (privatecommunication, 1985) measured a quantum yield value of 0.35 at 266 nm, and Ravishankara et al. [252] reportvalues of 0.72, 0.38, 0.21 and 0.15 at 248, 266, 287, and 289 nm, respectively, with a quantum yield near unity forNO3 production at all these wavelengths. It appears, then, that NO3 is produced with unit quantum yield while theO-atom, and hence the NO yield, increases at shorter wavelengths, with a consequent decrease in the NO2 yield. Thestudy of Oh et al. [233] indicates that, besides NO3, the primary photolysis products are a wavelength-dependentmixture of NO2, NO2* and NO + O, where NO2* represents one or more excited electronic states, most likely the2B1 state.
Table 18. Absorption Cross Sections of N2O5
λ(nm)
1020σ(cm2)
λ(nm)
1020σ(cm2)
200 920 245 52205 820 250 40210 560 255 32215 370 260 26220 220 265 20225 144 270 16.1230 99 275 13.0235 77 280 11.7240 62
For 285 nm < λ < 380 nm; 300 K > T > 225 K:
1020 σ = exp[2.735 + ((4728.5 - 17.127 λ)/T)]
where σ is in cm2/molecule; λ in nm; and T in K.
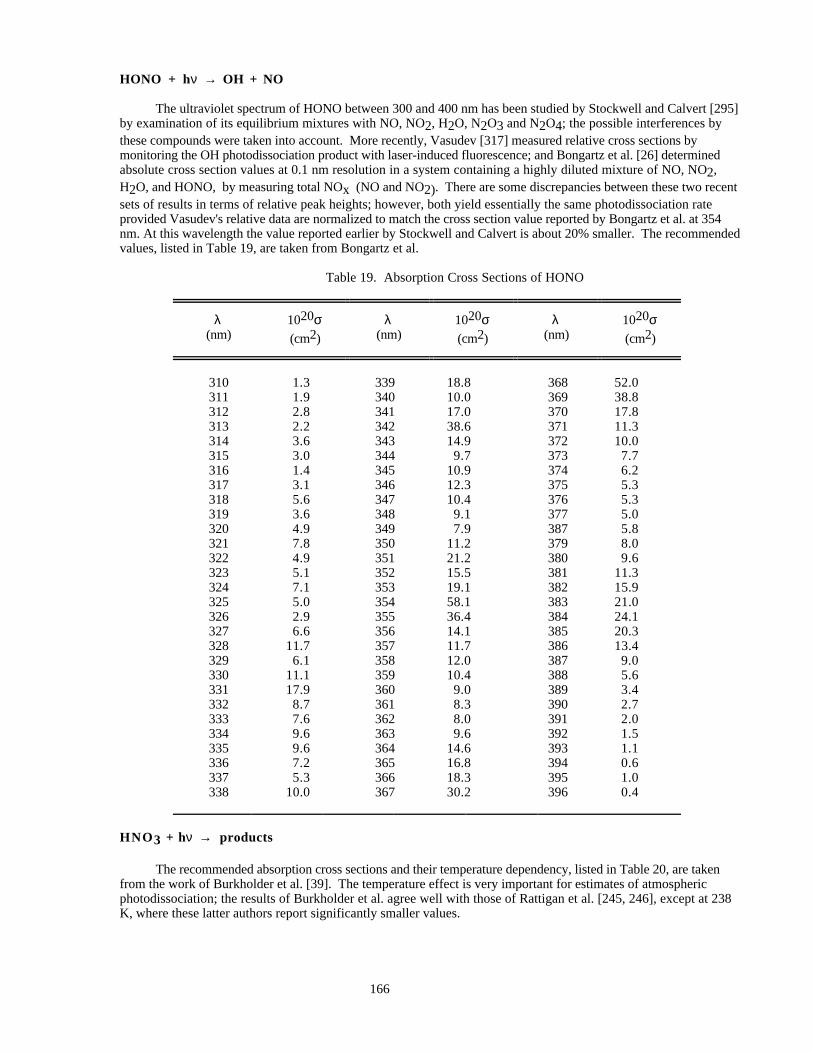
166
HONO + hν → OH + NO
The ultraviolet spectrum of HONO between 300 and 400 nm has been studied by Stockwell and Calvert [295]by examination of its equilibrium mixtures with NO, NO2, H2O, N2O3 and N2O4; the possible interferences bythese compounds were taken into account. More recently, Vasudev [317] measured relative cross sections bymonitoring the OH photodissociation product with laser-induced fluorescence; and Bongartz et al. [26] determinedabsolute cross section values at 0.1 nm resolution in a system containing a highly diluted mixture of NO, NO2,H2O, and HONO, by measuring total NOx (NO and NO2). There are some discrepancies between these two recentsets of results in terms of relative peak heights; however, both yield essentially the same photodissociation rateprovided Vasudev's relative data are normalized to match the cross section value reported by Bongartz et al. at 354nm. At this wavelength the value reported earlier by Stockwell and Calvert is about 20% smaller. The recommendedvalues, listed in Table 19, are taken from Bongartz et al.
Table 19. Absorption Cross Sections of HONO
λ(nm)
1020σ(cm2)
λ(nm)
1020σ(cm2)
λ(nm)
1020σ(cm2)
310 1.3 339 18.8 368 52.0311 1.9 340 10.0 369 38.8312 2.8 341 17.0 370 17.8313 2.2 342 38.6 371 11.3314 3.6 343 14.9 372 10.0315 3.0 344 9.7 373 7.7316 1.4 345 10.9 374 6.2317 3.1 346 12.3 375 5.3318 5.6 347 10.4 376 5.3319 3.6 348 9.1 377 5.0320 4.9 349 7.9 387 5.8321 7.8 350 11.2 379 8.0322 4.9 351 21.2 380 9.6323 5.1 352 15.5 381 11.3324 7.1 353 19.1 382 15.9325 5.0 354 58.1 383 21.0326 2.9 355 36.4 384 24.1327 6.6 356 14.1 385 20.3328 11.7 357 11.7 386 13.4329 6.1 358 12.0 387 9.0330 11.1 359 10.4 388 5.6331 17.9 360 9.0 389 3.4332 8.7 361 8.3 390 2.7333 7.6 362 8.0 391 2.0334 9.6 363 9.6 392 1.5335 9.6 364 14.6 393 1.1336 7.2 365 16.8 394 0.6337 5.3 366 18.3 395 1.0338 10.0 367 30.2 396 0.4
HNO 3 + hν → products
The recommended absorption cross sections and their temperature dependency, listed in Table 20, are takenfrom the work of Burkholder et al. [39]. The temperature effect is very important for estimates of atmosphericphotodissociation; the results of Burkholder et al. agree well with those of Rattigan et al. [245, 246], except at 238K, where these latter authors report significantly smaller values.
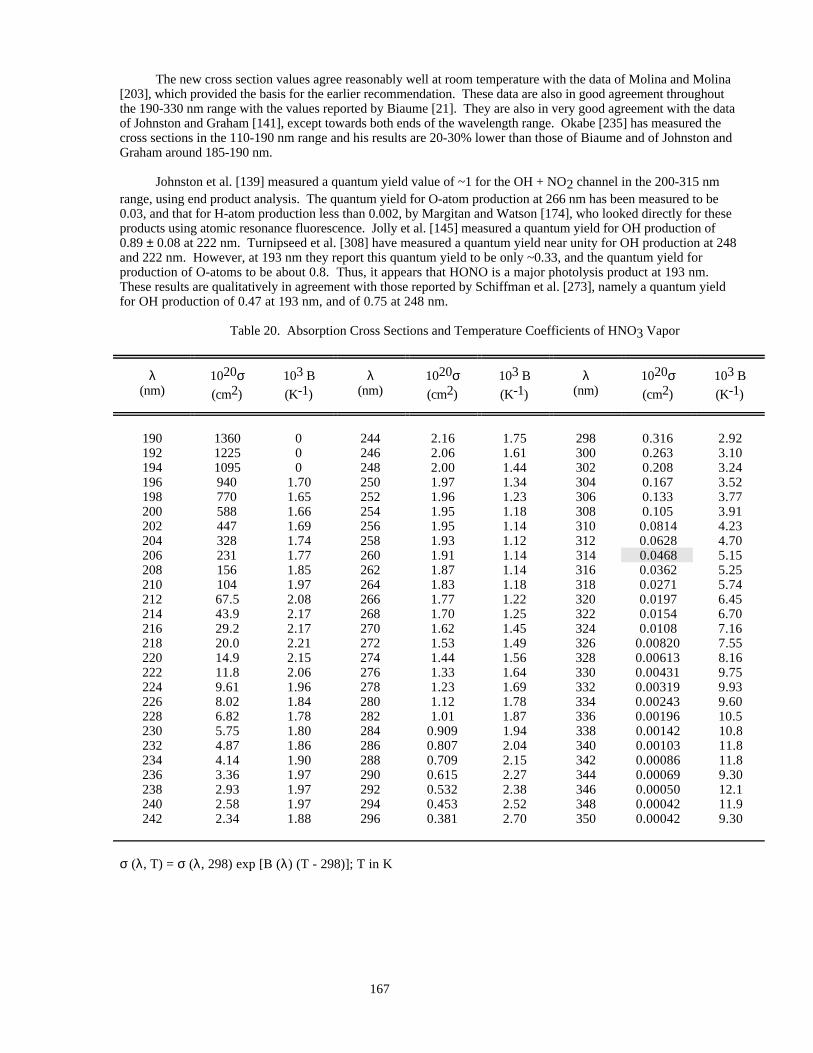
167
The new cross section values agree reasonably well at room temperature with the data of Molina and Molina[203], which provided the basis for the earlier recommendation. These data are also in good agreement throughoutthe 190-330 nm range with the values reported by Biaume [21]. They are also in very good agreement with the dataof Johnston and Graham [141], except towards both ends of the wavelength range. Okabe [235] has measured thecross sections in the 110-190 nm range and his results are 20-30% lower than those of Biaume and of Johnston andGraham around 185-190 nm.
Johnston et al. [139] measured a quantum yield value of ~1 for the OH + NO2 channel in the 200-315 nmrange, using end product analysis. The quantum yield for O-atom production at 266 nm has been measured to be0.03, and that for H-atom production less than 0.002, by Margitan and Watson [174], who looked directly for theseproducts using atomic resonance fluorescence. Jolly et al. [145] measured a quantum yield for OH production of0.89 ± 0.08 at 222 nm. Turnipseed et al. [308] have measured a quantum yield near unity for OH production at 248and 222 nm. However, at 193 nm they report this quantum yield to be only ~0.33, and the quantum yield forproduction of O-atoms to be about 0.8. Thus, it appears that HONO is a major photolysis product at 193 nm.These results are qualitatively in agreement with those reported by Schiffman et al. [273], namely a quantum yieldfor OH production of 0.47 at 193 nm, and of 0.75 at 248 nm.
Table 20. Absorption Cross Sections and Temperature Coefficients of HNO3 Vapor
λ(nm)
1020σ(cm2)
103 B
(K-1)
λ(nm)
1020σ(cm2)
103 B
(K-1)
λ(nm)
1020σ(cm2)
103 B
(K-1)
190 1360 0 244 2.16 1.75 298 0.316 2.92192 1225 0 246 2.06 1.61 300 0.263 3.10194 1095 0 248 2.00 1.44 302 0.208 3.24196 940 1.70 250 1.97 1.34 304 0.167 3.52198 770 1.65 252 1.96 1.23 306 0.133 3.77200 588 1.66 254 1.95 1.18 308 0.105 3.91202 447 1.69 256 1.95 1.14 310 0.0814 4.23204 328 1.74 258 1.93 1.12 312 0.0628 4.70206 231 1.77 260 1.91 1.14 314 0.0468 5.15208 156 1.85 262 1.87 1.14 316 0.0362 5.25210 104 1.97 264 1.83 1.18 318 0.0271 5.74212 67.5 2.08 266 1.77 1.22 320 0.0197 6.45214 43.9 2.17 268 1.70 1.25 322 0.0154 6.70216 29.2 2.17 270 1.62 1.45 324 0.0108 7.16218 20.0 2.21 272 1.53 1.49 326 0.00820 7.55220 14.9 2.15 274 1.44 1.56 328 0.00613 8.16222 11.8 2.06 276 1.33 1.64 330 0.00431 9.75224 9.61 1.96 278 1.23 1.69 332 0.00319 9.93226 8.02 1.84 280 1.12 1.78 334 0.00243 9.60228 6.82 1.78 282 1.01 1.87 336 0.00196 10.5230 5.75 1.80 284 0.909 1.94 338 0.00142 10.8232 4.87 1.86 286 0.807 2.04 340 0.00103 11.8234 4.14 1.90 288 0.709 2.15 342 0.00086 11.8236 3.36 1.97 290 0.615 2.27 344 0.00069 9.30238 2.93 1.97 292 0.532 2.38 346 0.00050 12.1240 2.58 1.97 294 0.453 2.52 348 0.00042 11.9242 2.34 1.88 296 0.381 2.70 350 0.00042 9.30
σ (λ, T) = σ (λ, 298) exp [B (λ) (T - 298)]; T in K
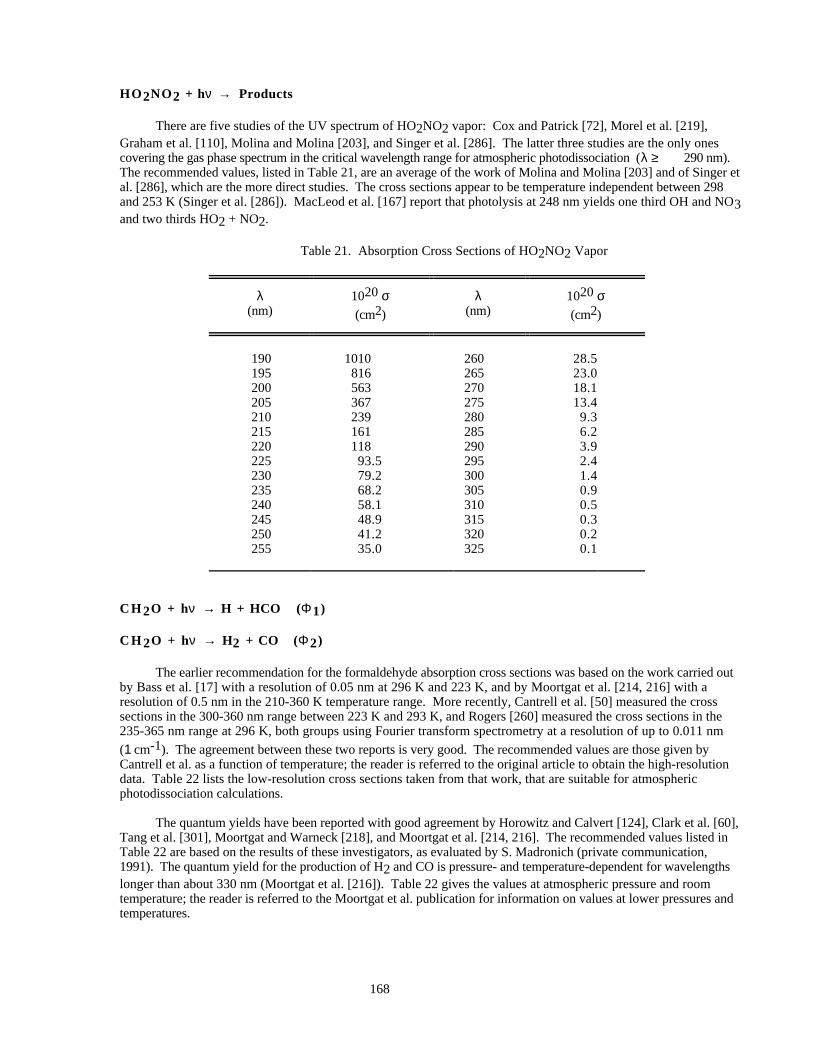
168
HO 2NO2 + hν → Products
There are five studies of the UV spectrum of HO2NO2 vapor: Cox and Patrick [72], Morel et al. [219],Graham et al. [110], Molina and Molina [203], and Singer et al. [286]. The latter three studies are the only onescovering the gas phase spectrum in the critical wavelength range for atmospheric photodissociation (λ ≥ 290 nm).The recommended values, listed in Table 21, are an average of the work of Molina and Molina [203] and of Singer etal. [286], which are the more direct studies. The cross sections appear to be temperature independent between 298and 253 K (Singer et al. [286]). MacLeod et al. [167] report that photolysis at 248 nm yields one third OH and NO3and two thirds HO2 + NO2.
Table 21. Absorption Cross Sections of HO2NO2 Vapor
λ(nm)
1020 σ(cm2)
λ(nm)
1020 σ(cm2)
190 1010 260 28.5195 816 265 23.0200 563 270 18.1205 367 275 13.4210 239 280 9.3215 161 285 6.2220 118 290 3.9225 93.5 295 2.4230 79.2 300 1.4235 68.2 305 0.9240 58.1 310 0.5245 48.9 315 0.3250 41.2 320 0.2255 35.0 325 0.1
CH 2O + hν → H + HCO (Φ1)
CH 2O + hν → H2 + CO (Φ2)
The earlier recommendation for the formaldehyde absorption cross sections was based on the work carried outby Bass et al. [17] with a resolution of 0.05 nm at 296 K and 223 K, and by Moortgat et al. [214, 216] with aresolution of 0.5 nm in the 210-360 K temperature range. More recently, Cantrell et al. [50] measured the crosssections in the 300-360 nm range between 223 K and 293 K, and Rogers [260] measured the cross sections in the235-365 nm range at 296 K, both groups using Fourier transform spectrometry at a resolution of up to 0.011 nm
(1 cm-1). The agreement between these two reports is very good. The recommended values are those given byCantrell et al. as a function of temperature; the reader is referred to the original article to obtain the high-resolutiondata. Table 22 lists the low-resolution cross sections taken from that work, that are suitable for atmosphericphotodissociation calculations.
The quantum yields have been reported with good agreement by Horowitz and Calvert [124], Clark et al. [60],Tang et al. [301], Moortgat and Warneck [218], and Moortgat et al. [214, 216]. The recommended values listed inTable 22 are based on the results of these investigators, as evaluated by S. Madronich (private communication,1991). The quantum yield for the production of H2 and CO is pressure- and temperature-dependent for wavelengthslonger than about 330 nm (Moortgat et al. [216]). Table 22 gives the values at atmospheric pressure and roomtemperature; the reader is referred to the Moortgat et al. publication for information on values at lower pressures andtemperatures.
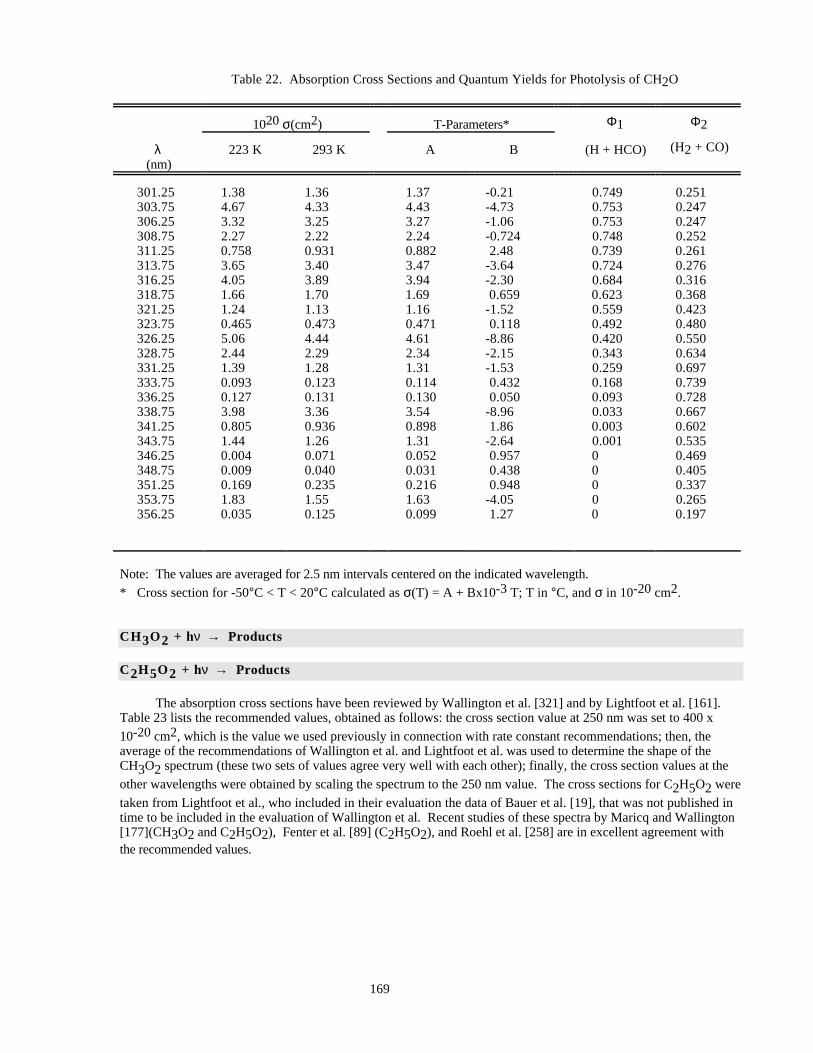
169
Table 22. Absorption Cross Sections and Quantum Yields for Photolysis of CH2O
1020 σ(cm2) T-Parameters* Φ1 Φ2
λ(nm)
223 K 293 K A B (H + HCO) (H2 + CO)
301.25 1.38 1.36 1.37 -0.21 0.749 0.251303.75 4.67 4.33 4.43 -4.73 0.753 0.247306.25 3.32 3.25 3.27 -1.06 0.753 0.247308.75 2.27 2.22 2.24 -0.724 0.748 0.252311.25 0.758 0.931 0.882 2.48 0.739 0.261313.75 3.65 3.40 3.47 -3.64 0.724 0.276316.25 4.05 3.89 3.94 -2.30 0.684 0.316318.75 1.66 1.70 1.69 0.659 0.623 0.368321.25 1.24 1.13 1.16 -1.52 0.559 0.423323.75 0.465 0.473 0.471 0.118 0.492 0.480326.25 5.06 4.44 4.61 -8.86 0.420 0.550328.75 2.44 2.29 2.34 -2.15 0.343 0.634331.25 1.39 1.28 1.31 -1.53 0.259 0.697333.75 0.093 0.123 0.114 0.432 0.168 0.739336.25 0.127 0.131 0.130 0.050 0.093 0.728338.75 3.98 3.36 3.54 -8.96 0.033 0.667341.25 0.805 0.936 0.898 1.86 0.003 0.602343.75 1.44 1.26 1.31 -2.64 0.001 0.535346.25 0.004 0.071 0.052 0.957 0 0.469348.75 0.009 0.040 0.031 0.438 0 0.405351.25 0.169 0.235 0.216 0.948 0 0.337353.75 1.83 1.55 1.63 -4.05 0 0.265356.25 0.035 0.125 0.099 1.27 0 0.197
Note: The values are averaged for 2.5 nm intervals centered on the indicated wavelength.
* Cross section for -50°C < T < 20°C calculated as σ(T) = A + Bx10-3 T; T in °C, and σ in 10-20 cm2.
CH 3O2 + hν → Products
C2H 5O2 + hν → Products
The absorption cross sections have been reviewed by Wallington et al. [321] and by Lightfoot et al. [161].Table 23 lists the recommended values, obtained as follows: the cross section value at 250 nm was set to 400 x
10-20 cm2, which is the value we used previously in connection with rate constant recommendations; then, theaverage of the recommendations of Wallington et al. and Lightfoot et al. was used to determine the shape of theCH3O2 spectrum (these two sets of values agree very well with each other); finally, the cross section values at the
other wavelengths were obtained by scaling the spectrum to the 250 nm value. The cross sections for C2H5O2 were
taken from Lightfoot et al., who included in their evaluation the data of Bauer et al. [19], that was not published intime to be included in the evaluation of Wallington et al. Recent studies of these spectra by Maricq and Wallington[177](CH3O2 and C2H5O2), Fenter et al. [89] (C2H5O2), and Roehl et al. [258] are in excellent agreement withthe recommended values.
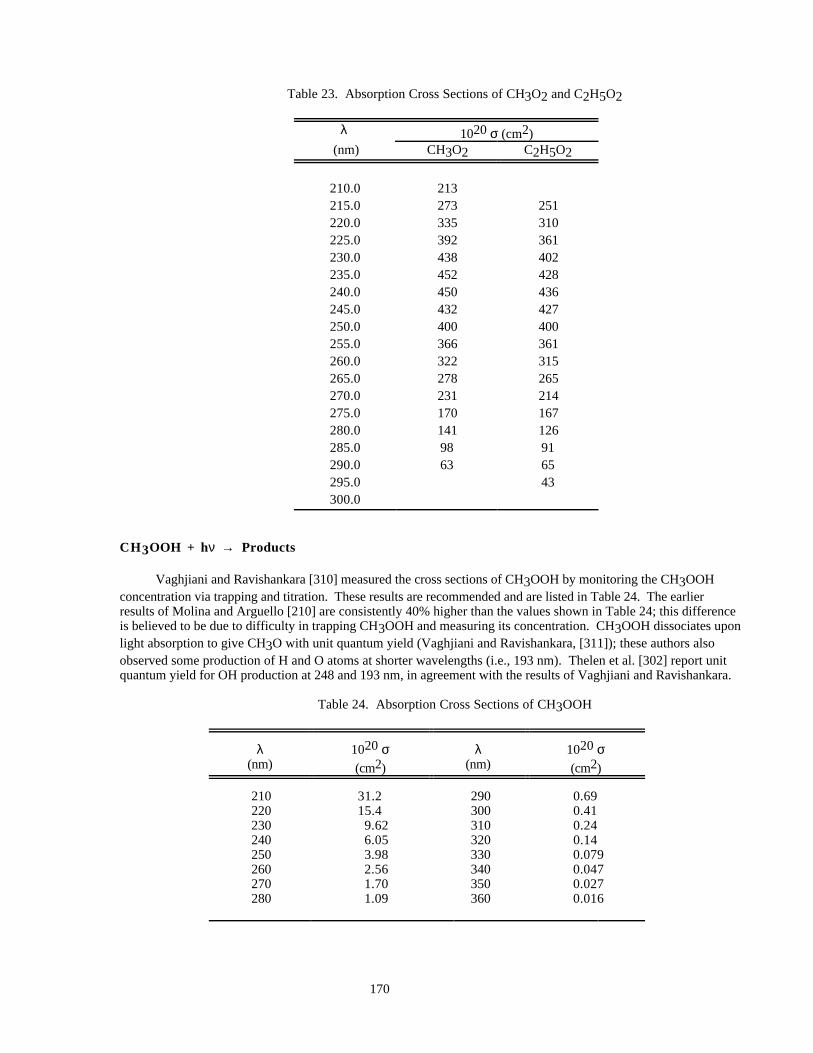
170
Table 23. Absorption Cross Sections of CH3O2 and C2H5O2
λ 1020 σ (cm2) (nm) CH3O2 C2H5O2
210.0 213215.0 273 251220.0 335 310225.0 392 361230.0 438 402235.0 452 428240.0 450 436245.0 432 427250.0 400 400255.0 366 361260.0 322 315265.0 278 265270.0 231 214275.0 170 167280.0 141 126285.0 98 91290.0 63 65295.0 43300.0
CH 3OOH + hν → Products
Vaghjiani and Ravishankara [310] measured the cross sections of CH3OOH by monitoring the CH3OOHconcentration via trapping and titration. These results are recommended and are listed in Table 24. The earlierresults of Molina and Arguello [210] are consistently 40% higher than the values shown in Table 24; this differenceis believed to be due to difficulty in trapping CH3OOH and measuring its concentration. CH3OOH dissociates uponlight absorption to give CH3O with unit quantum yield (Vaghjiani and Ravishankara, [311]); these authors alsoobserved some production of H and O atoms at shorter wavelengths (i.e., 193 nm). Thelen et al. [302] report unitquantum yield for OH production at 248 and 193 nm, in agreement with the results of Vaghjiani and Ravishankara.
Table 24. Absorption Cross Sections of CH3OOH
λ(nm)
1020 σ(cm2)
λ(nm)
1020 σ(cm2)
210 31.2 290 0.69220 15.4 300 0.41230 9.62 310 0.24240 6.05 320 0.14250 3.98 330 0.079260 2.56 340 0.047270 1.70 350 0.027280 1.09 360 0.016
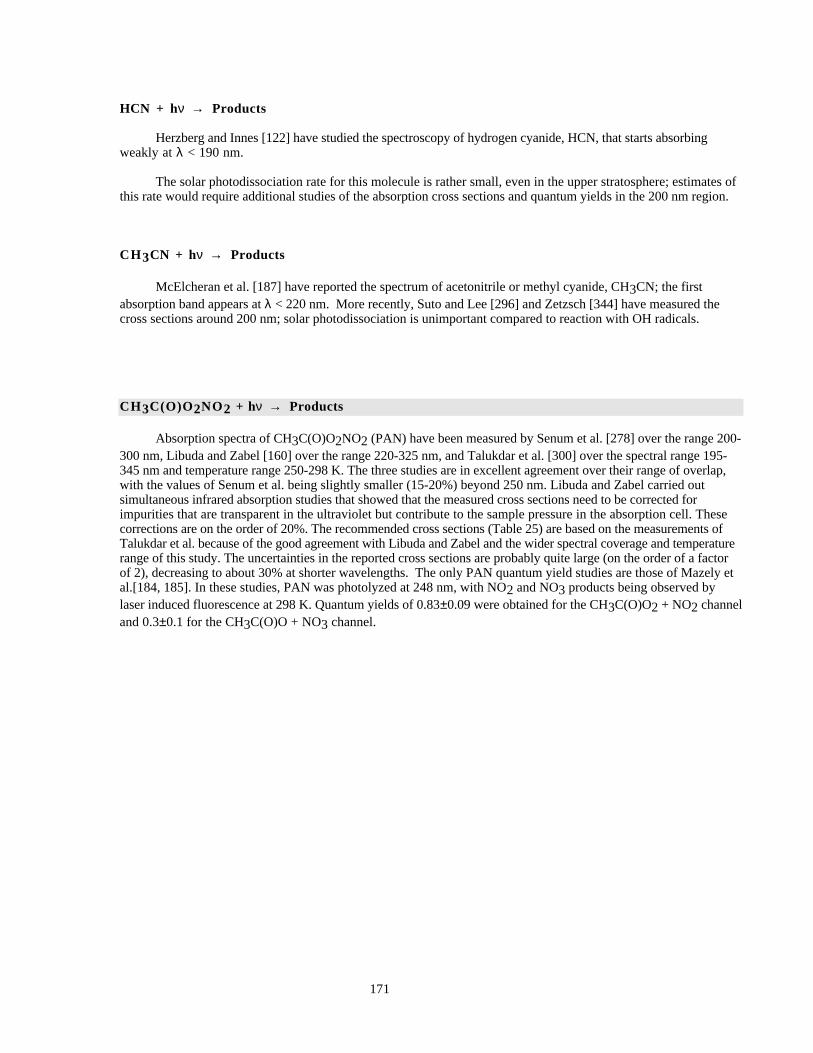
171
HCN + hν → Products
Herzberg and Innes [122] have studied the spectroscopy of hydrogen cyanide, HCN, that starts absorbingweakly at λ < 190 nm.
The solar photodissociation rate for this molecule is rather small, even in the upper stratosphere; estimates ofthis rate would require additional studies of the absorption cross sections and quantum yields in the 200 nm region.
CH 3CN + hν → Products
McElcheran et al. [187] have reported the spectrum of acetonitrile or methyl cyanide, CH3CN; the firstabsorption band appears at λ < 220 nm. More recently, Suto and Lee [296] and Zetzsch [344] have measured thecross sections around 200 nm; solar photodissociation is unimportant compared to reaction with OH radicals.
CH 3C(O)O2NO2 + hν → Products
Absorption spectra of CH3C(O)O2NO2 (PAN) have been measured by Senum et al. [278] over the range 200-300 nm, Libuda and Zabel [160] over the range 220-325 nm, and Talukdar et al. [300] over the spectral range 195-345 nm and temperature range 250-298 K. The three studies are in excellent agreement over their range of overlap,with the values of Senum et al. being slightly smaller (15-20%) beyond 250 nm. Libuda and Zabel carried outsimultaneous infrared absorption studies that showed that the measured cross sections need to be corrected forimpurities that are transparent in the ultraviolet but contribute to the sample pressure in the absorption cell. Thesecorrections are on the order of 20%. The recommended cross sections (Table 25) are based on the measurements ofTalukdar et al. because of the good agreement with Libuda and Zabel and the wider spectral coverage and temperaturerange of this study. The uncertainties in the reported cross sections are probably quite large (on the order of a factorof 2), decreasing to about 30% at shorter wavelengths. The only PAN quantum yield studies are those of Mazely etal.[184, 185]. In these studies, PAN was photolyzed at 248 nm, with NO2 and NO3 products being observed bylaser induced fluorescence at 298 K. Quantum yields of 0.83±0.09 were obtained for the CH3C(O)O2 + NO2 channeland 0.3±0.1 for the CH3C(O)O + NO3 channel.
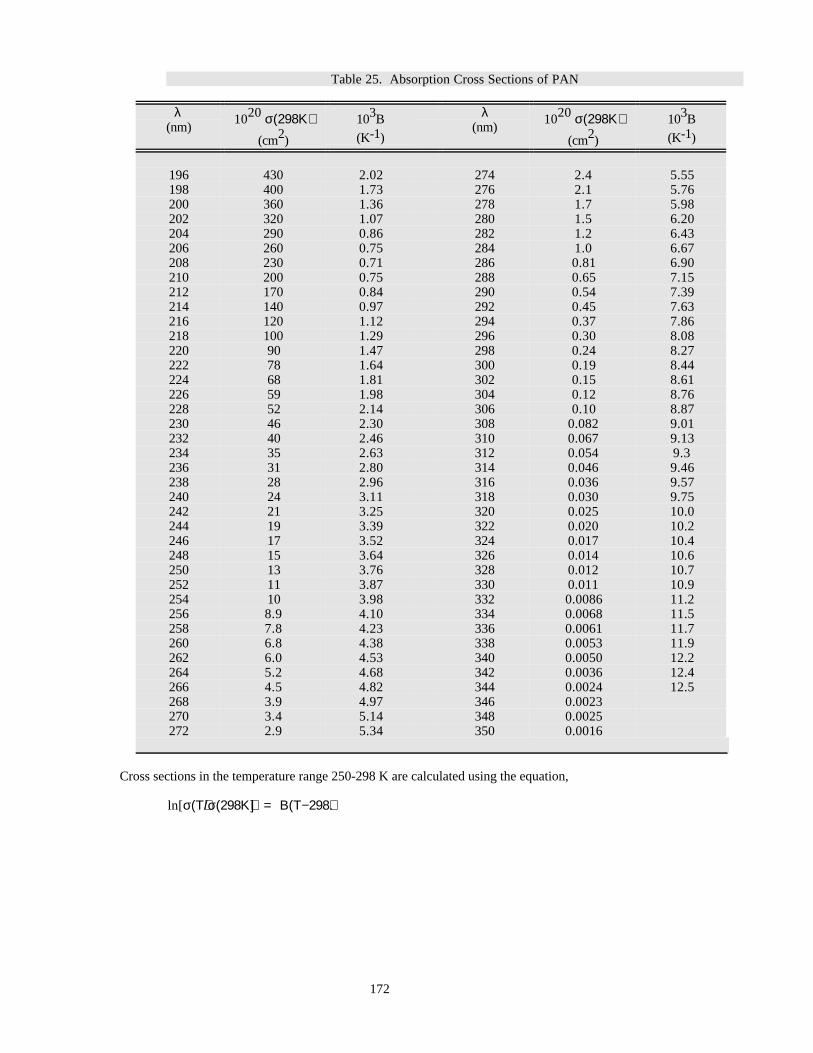
172
Table 25. Absorption Cross Sections of PAN
λ(nm)
1020 σ(298Κ)(cm2)
103B
(K-1)
λ(nm)
1020 σ(298Κ)(cm2)
103B
(K-1)
196 430 2.02 274 2.4 5.55198 400 1.73 276 2.1 5.76200 360 1.36 278 1.7 5.98202 320 1.07 280 1.5 6.20204 290 0.86 282 1.2 6.43206 260 0.75 284 1.0 6.67208 230 0.71 286 0.81 6.90210 200 0.75 288 0.65 7.15212 170 0.84 290 0.54 7.39214 140 0.97 292 0.45 7.63216 120 1.12 294 0.37 7.86218 100 1.29 296 0.30 8.08220 90 1.47 298 0.24 8.27222 78 1.64 300 0.19 8.44224 68 1.81 302 0.15 8.61226 59 1.98 304 0.12 8.76228 52 2.14 306 0.10 8.87230 46 2.30 308 0.082 9.01232 40 2.46 310 0.067 9.13234 35 2.63 312 0.054 9.3236 31 2.80 314 0.046 9.46238 28 2.96 316 0.036 9.57240 24 3.11 318 0.030 9.75242 21 3.25 320 0.025 10.0244 19 3.39 322 0.020 10.2246 17 3.52 324 0.017 10.4248 15 3.64 326 0.014 10.6250 13 3.76 328 0.012 10.7252 11 3.87 330 0.011 10.9254 10 3.98 332 0.0086 11.2256 8.9 4.10 334 0.0068 11.5258 7.8 4.23 336 0.0061 11.7260 6.8 4.38 338 0.0053 11.9262 6.0 4.53 340 0.0050 12.2264 5.2 4.68 342 0.0036 12.4266 4.5 4.82 344 0.0024 12.5268 3.9 4.97 346 0.0023270 3.4 5.14 348 0.0025272 2.9 5.34 350 0.0016
Cross sections in the temperature range 250-298 K are calculated using the equation,
ln[σ(Τ)/σ(298Κ)] = Β(Τ−298).
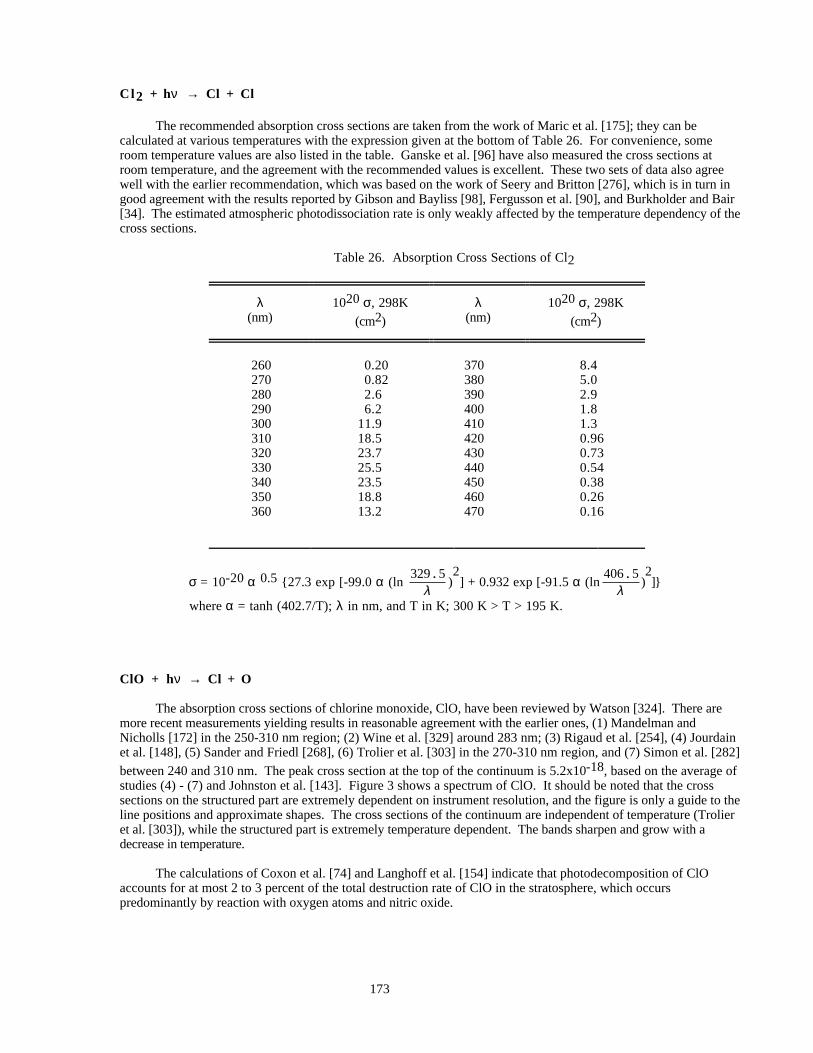
173
Cl 2 + hν → Cl + Cl
The recommended absorption cross sections are taken from the work of Maric et al. [175]; they can becalculated at various temperatures with the expression given at the bottom of Table 26. For convenience, someroom temperature values are also listed in the table. Ganske et al. [96] have also measured the cross sections atroom temperature, and the agreement with the recommended values is excellent. These two sets of data also agreewell with the earlier recommendation, which was based on the work of Seery and Britton [276], which is in turn ingood agreement with the results reported by Gibson and Bayliss [98], Fergusson et al. [90], and Burkholder and Bair[34]. The estimated atmospheric photodissociation rate is only weakly affected by the temperature dependency of thecross sections.
Table 26. Absorption Cross Sections of Cl2
λ(nm)
1020 σ, 298K
(cm2)
λ(nm)
1020 σ, 298K
(cm2)
260 0.20 370 8.4270 0.82 380 5.0280 2.6 390 2.9290 6.2 400 1.8300 11.9 410 1.3310 18.5 420 0.96320 23.7 430 0.73330 25.5 440 0.54340 23.5 450 0.38350 18.8 460 0.26360 13.2 470 0.16
σ = 10-20 α 0.5 {27.3 exp [-99.0 α (ln
329. 5λ )
2] + 0.932 exp [-91.5 α (ln
406. 5λ )
2]}
where α = tanh (402.7/T); λ in nm, and T in K; 300 K > T > 195 K.
ClO + hν → Cl + O
The absorption cross sections of chlorine monoxide, ClO, have been reviewed by Watson [324]. There aremore recent measurements yielding results in reasonable agreement with the earlier ones, (1) Mandelman andNicholls [172] in the 250-310 nm region; (2) Wine et al. [329] around 283 nm; (3) Rigaud et al. [254], (4) Jourdainet al. [148], (5) Sander and Friedl [268], (6) Trolier et al. [303] in the 270-310 nm region, and (7) Simon et al. [282]
between 240 and 310 nm. The peak cross section at the top of the continuum is 5.2x10⁻¹⁸, based on the average ofstudies (4) - (7) and Johnston et al. [143]. Figure 3 shows a spectrum of ClO. It should be noted that the crosssections on the structured part are extremely dependent on instrument resolution, and the figure is only a guide to theline positions and approximate shapes. The cross sections of the continuum are independent of temperature (Trolieret al. [303]), while the structured part is extremely temperature dependent. The bands sharpen and grow with adecrease in temperature.
The calculations of Coxon et al. [74] and Langhoff et al. [154] indicate that photodecomposition of ClOaccounts for at most 2 to 3 percent of the total destruction rate of ClO in the stratosphere, which occurspredominantly by reaction with oxygen atoms and nitric oxide.
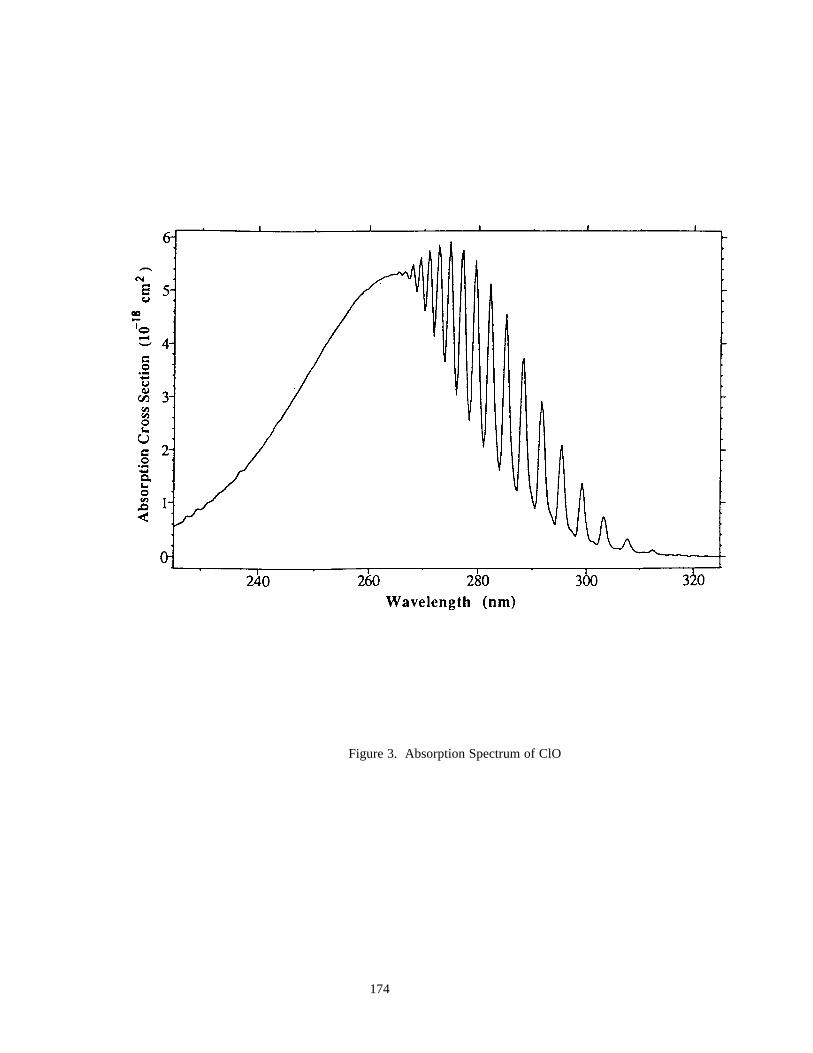
174
Figure 3. Absorption Spectrum of ClO
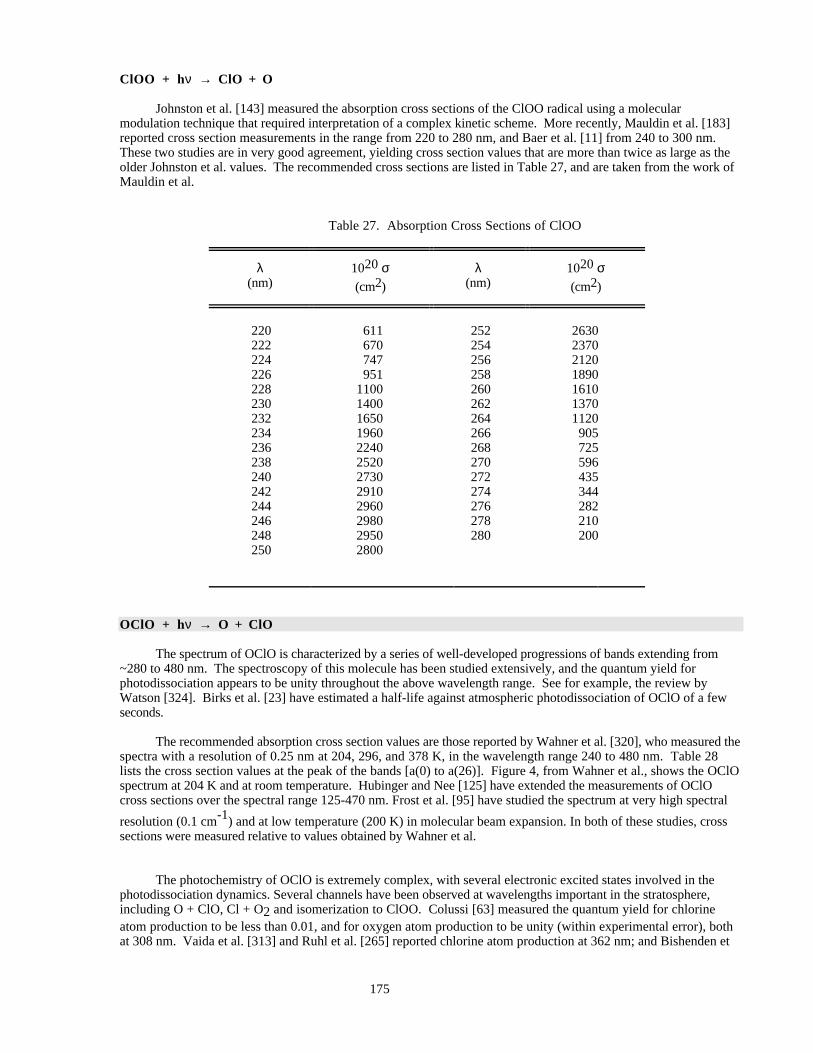
175
ClOO + hν → ClO + O
Johnston et al. [143] measured the absorption cross sections of the ClOO radical using a molecularmodulation technique that required interpretation of a complex kinetic scheme. More recently, Mauldin et al. [183]reported cross section measurements in the range from 220 to 280 nm, and Baer et al. [11] from 240 to 300 nm.These two studies are in very good agreement, yielding cross section values that are more than twice as large as theolder Johnston et al. values. The recommended cross sections are listed in Table 27, and are taken from the work ofMauldin et al.
Table 27. Absorption Cross Sections of ClOO
λ(nm)
1020 σ(cm2)
λ(nm)
1020 σ(cm2)
220 611 252 2630222 670 254 2370224 747 256 2120226 951 258 1890228 1100 260 1610230 1400 262 1370232 1650 264 1120234 1960 266 905236 2240 268 725238 2520 270 596240 2730 272 435242 2910 274 344244 2960 276 282246 2980 278 210248 2950 280 200250 2800
OClO + hν → O + ClO
The spectrum of OClO is characterized by a series of well-developed progressions of bands extending from~280 to 480 nm. The spectroscopy of this molecule has been studied extensively, and the quantum yield forphotodissociation appears to be unity throughout the above wavelength range. See for example, the review byWatson [324]. Birks et al. [23] have estimated a half-life against atmospheric photodissociation of OClO of a fewseconds.
The recommended absorption cross section values are those reported by Wahner et al. [320], who measured thespectra with a resolution of 0.25 nm at 204, 296, and 378 K, in the wavelength range 240 to 480 nm. Table 28lists the cross section values at the peak of the bands [a(0) to a(26)]. Figure 4, from Wahner et al., shows the OClOspectrum at 204 K and at room temperature. Hubinger and Nee [125] have extended the measurements of OClOcross sections over the spectral range 125-470 nm. Frost et al. [95] have studied the spectrum at very high spectral
resolution (0.1 cm-1) and at low temperature (200 K) in molecular beam expansion. In both of these studies, crosssections were measured relative to values obtained by Wahner et al.
The photochemistry of OClO is extremely complex, with several electronic excited states involved in thephotodissociation dynamics. Several channels have been observed at wavelengths important in the stratosphere,including O + ClO, Cl + O2 and isomerization to ClOO. Colussi [63] measured the quantum yield for chlorineatom production to be less than 0.01, and for oxygen atom production to be unity (within experimental error), bothat 308 nm. Vaida et al. [313] and Ruhl et al. [265] reported chlorine atom production at 362 nm; and Bishenden et
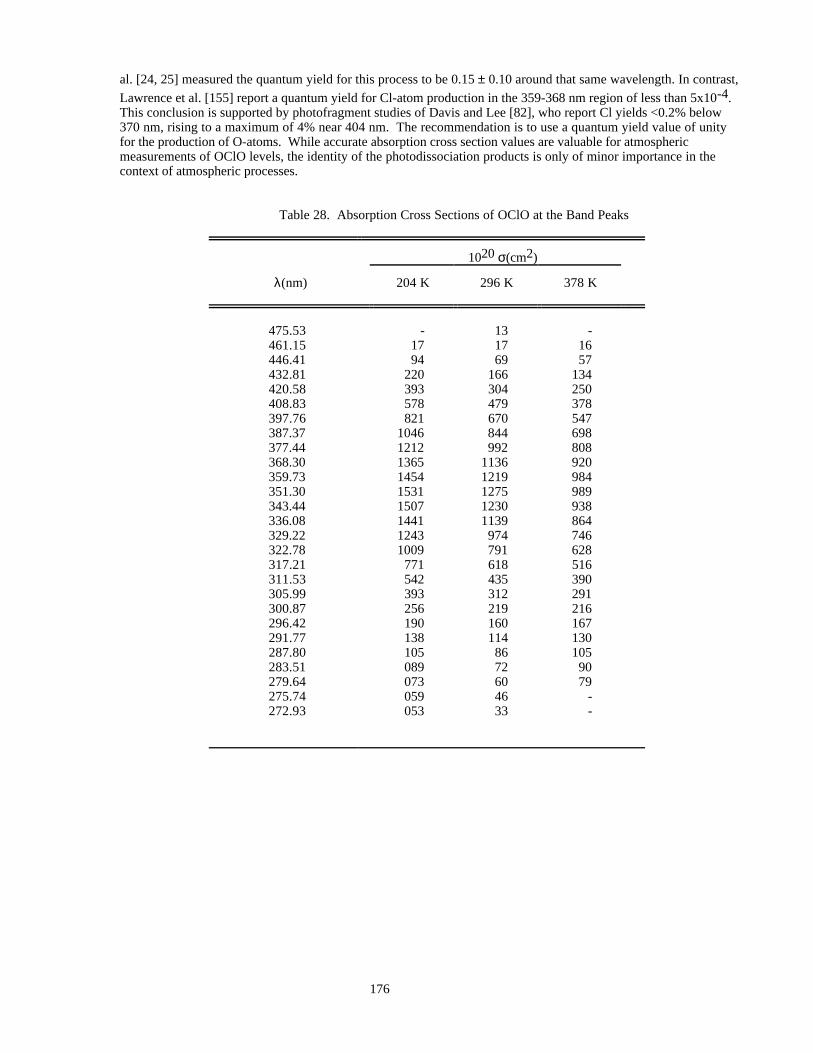
176
al. [24, 25] measured the quantum yield for this process to be 0.15 ± 0.10 around that same wavelength. In contrast,
Lawrence et al. [155] report a quantum yield for Cl-atom production in the 359-368 nm region of less than 5x10⁻⁴.This conclusion is supported by photofragment studies of Davis and Lee [82], who report Cl yields <0.2% below370 nm, rising to a maximum of 4% near 404 nm. The recommendation is to use a quantum yield value of unityfor the production of O-atoms. While accurate absorption cross section values are valuable for atmosphericmeasurements of OClO levels, the identity of the photodissociation products is only of minor importance in thecontext of atmospheric processes.
Table 28. Absorption Cross Sections of OClO at the Band Peaks
1020 σ(cm2)
λ(nm) 204 K 296 K 378 K
475.53 - 13 -461.15 17 17 16446.41 94 69 57432.81 220 166 134420.58 393 304 250408.83 578 479 378397.76 821 670 547387.37 1046 844 698377.44 1212 992 808368.30 1365 1136 920359.73 1454 1219 984351.30 1531 1275 989343.44 1507 1230 938336.08 1441 1139 864329.22 1243 974 746322.78 1009 791 628317.21 771 618 516311.53 542 435 390305.99 393 312 291300.87 256 219 216296.42 190 160 167291.77 138 114 130287.80 105 86 105283.51 089 72 90279.64 073 60 79275.74 059 46 -272.93 053 33 -
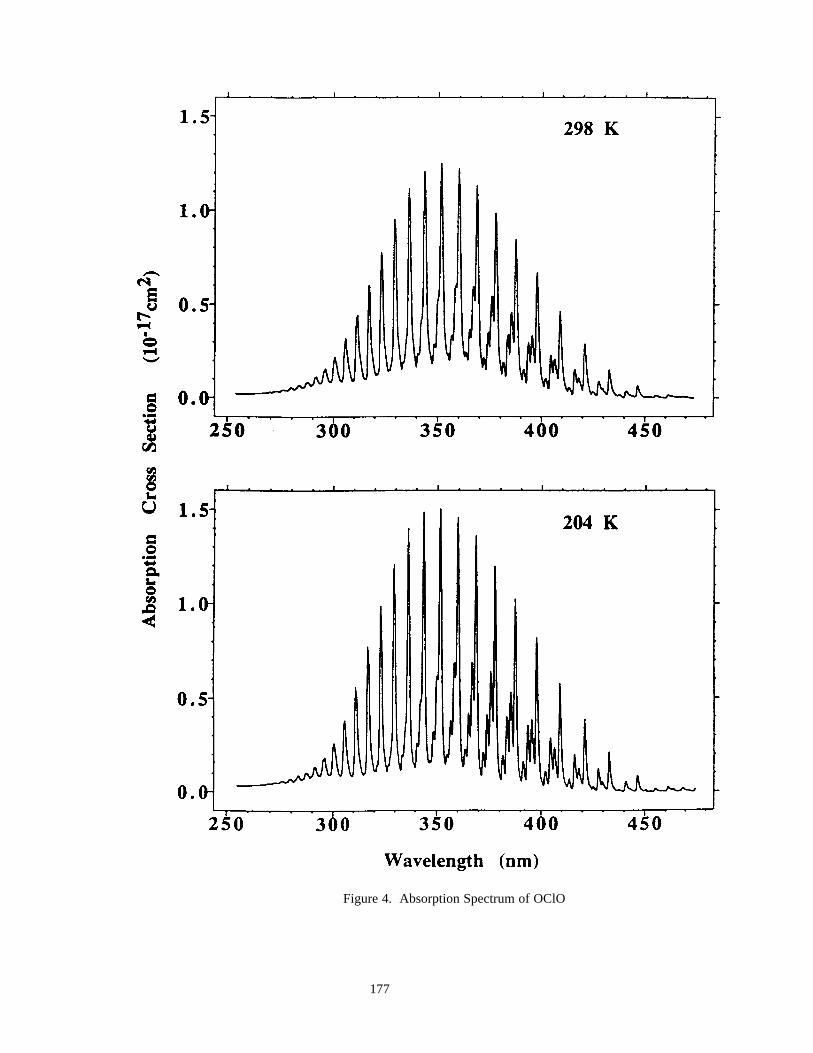
177
Figure 4. Absorption Spectrum of OClO
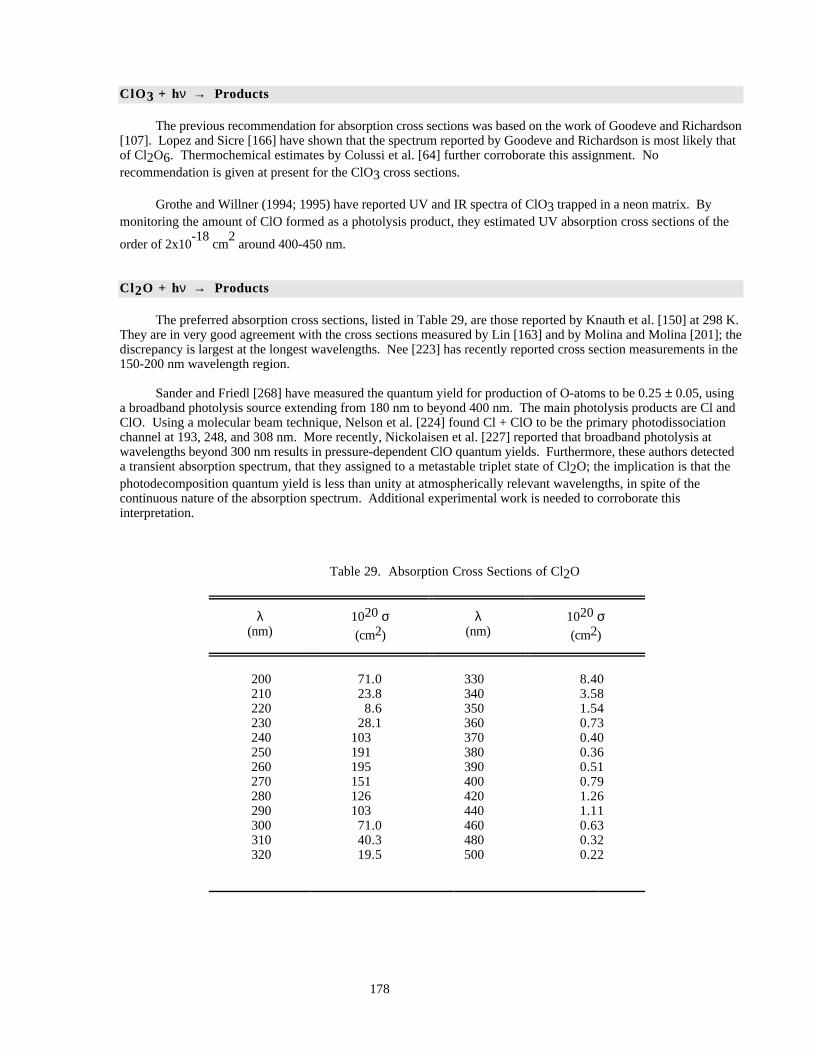
178
ClO 3 + hν → Products
The previous recommendation for absorption cross sections was based on the work of Goodeve and Richardson[107]. Lopez and Sicre [166] have shown that the spectrum reported by Goodeve and Richardson is most likely thatof Cl2O6. Thermochemical estimates by Colussi et al. [64] further corroborate this assignment. Norecommendation is given at present for the ClO3 cross sections.
Grothe and Willner (1994; 1995) have reported UV and IR spectra of ClO3 trapped in a neon matrix. Bymonitoring the amount of ClO formed as a photolysis product, they estimated UV absorption cross sections of the
order of 2x10-18
cm2 around 400-450 nm.
Cl2O + hν → Products
The preferred absorption cross sections, listed in Table 29, are those reported by Knauth et al. [150] at 298 K.They are in very good agreement with the cross sections measured by Lin [163] and by Molina and Molina [201]; thediscrepancy is largest at the longest wavelengths. Nee [223] has recently reported cross section measurements in the150-200 nm wavelength region.
Sander and Friedl [268] have measured the quantum yield for production of O-atoms to be 0.25 ± 0.05, usinga broadband photolysis source extending from 180 nm to beyond 400 nm. The main photolysis products are Cl andClO. Using a molecular beam technique, Nelson et al. [224] found Cl + ClO to be the primary photodissociationchannel at 193, 248, and 308 nm. More recently, Nickolaisen et al. [227] reported that broadband photolysis atwavelengths beyond 300 nm results in pressure-dependent ClO quantum yields. Furthermore, these authors detecteda transient absorption spectrum, that they assigned to a metastable triplet state of Cl2O; the implication is that thephotodecomposition quantum yield is less than unity at atmospherically relevant wavelengths, in spite of thecontinuous nature of the absorption spectrum. Additional experimental work is needed to corroborate thisinterpretation.
Table 29. Absorption Cross Sections of Cl2O
λ(nm)
1020 σ(cm2)
λ(nm)
1020 σ(cm2)
200 71.0 330 8.40210 23.8 340 3.58220 8.6 350 1.54230 28.1 360 0.73240 103 370 0.40250 191 380 0.36260 195 390 0.51270 151 400 0.79280 126 420 1.26290 103 440 1.11300 71.0 460 0.63310 40.3 480 0.32320 19.5 500 0.22
179
ClOOCl + hν → Cl + ClOO
Recommended absorption cross sections in the wavelength range 190-450 nm for ClOOCl are listed in Table30. The values for the wavelength range 200 - 360 nm are the average of experimental results reported by Cox andHayman [71], DeMore and Tschuikow-Roux [83], Permien et al.[243], and Burkholder et al. [36]. For the 190 −200 nm range the data are from DeMore and Tschuikow-Roux, these being the only data available in that range. Dataat wavelengths greater than 360 nm were obtained from a linear extrapolation of the logarithm of the cross sections,
using the expression log[1020σ(cm2)] = -0.01915 x λ(nm) + 7.589. For λ > 360 nm the extrapolated data areconsidered to be more reliable than the experimental measurements because of the very small dimer cross sections inthis region. While the results of Cox and Hayman, DeMore and Tschuikow-Roux, Permien et al., and Burkholder etal. are in good agreement at wavelengths below 250 nm, there are significant discrepancies at longer wavelengths,which may be attributed to uncertainties in the spectral subtraction of impurities such as Cl2O, Cl2 and Cl2O3.Huder and DeMore [129] measured ClOOCl cross sections over the 190-310 nm range using a method thatminimized the corrections required for impurities such as Cl2O. The cross sections from this study are significantlysmaller (up to a factor of 2) than the current recommendation, particularly when extrapolated beyond 400 nmAdditional measurements are needed, particularly at the longer wavelengths, to validate the results of Huder andDeMore.
These studies also indicate that only one stable species is produced in the recombination reaction of ClO withitself, and that this species is dichlorine peroxide, ClOOCl, rather than ClOClO. Using submillimeter wavespectroscopy, Birk et al. [22] have further established the structure of the recombination product to be ClOOCl.These observations are in agreement with the results of quantum mechanical calculations (McGrath et al. [189, 190];Jensen and Odershede [138]; Stanton et al. [292]). The experiments of Cox and Hayman [71] indicate that the mainphotodissociation products at 253.7 nm are Cl and ClOO. Molina et al. [211] measured the quantum yield φ for thischannel to be unity at 308 nm, with no ClO detectable as a product, with an experimental uncertainty in φ of about± 25%. These results are also supported by quantum mechanical calculations (Stanton et al. [292]; Stanton andBartlett [291]). In contrast, Eberstein [85] suggested a quantum yield of unity for the production of two ClOradicals, based merely on an analogy with the photolysis of H2O2 at shorter wavelengths. For atmosphericphotodissociation calculations the recommended quantum yield value is based on the work of Molina et al. [211],i.e., a quantum yield of unity for the Cl + ClOO channel.
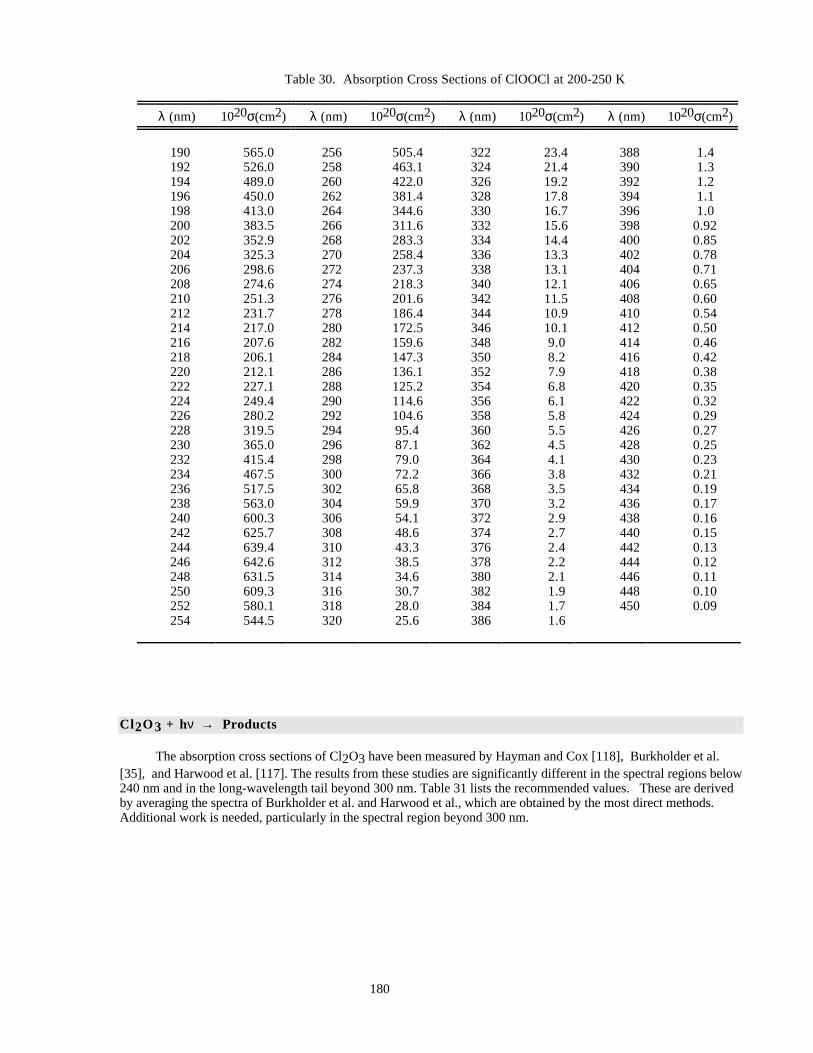
180
Table 30. Absorption Cross Sections of ClOOCl at 200-250 K
λ (nm) 1020σ(cm2) λ (nm) 1020σ(cm2) λ (nm) 1020σ(cm2) λ (nm) 1020σ(cm2)
190 565.0 256 505.4 322 23.4 388 1.4192 526.0 258 463.1 324 21.4 390 1.3194 489.0 260 422.0 326 19.2 392 1.2196 450.0 262 381.4 328 17.8 394 1.1198 413.0 264 344.6 330 16.7 396 1.0200 383.5 266 311.6 332 15.6 398 0.92202 352.9 268 283.3 334 14.4 400 0.85204 325.3 270 258.4 336 13.3 402 0.78206 298.6 272 237.3 338 13.1 404 0.71208 274.6 274 218.3 340 12.1 406 0.65210 251.3 276 201.6 342 11.5 408 0.60212 231.7 278 186.4 344 10.9 410 0.54214 217.0 280 172.5 346 10.1 412 0.50216 207.6 282 159.6 348 9.0 414 0.46218 206.1 284 147.3 350 8.2 416 0.42220 212.1 286 136.1 352 7.9 418 0.38222 227.1 288 125.2 354 6.8 420 0.35224 249.4 290 114.6 356 6.1 422 0.32226 280.2 292 104.6 358 5.8 424 0.29228 319.5 294 95.4 360 5.5 426 0.27230 365.0 296 87.1 362 4.5 428 0.25232 415.4 298 79.0 364 4.1 430 0.23234 467.5 300 72.2 366 3.8 432 0.21236 517.5 302 65.8 368 3.5 434 0.19238 563.0 304 59.9 370 3.2 436 0.17240 600.3 306 54.1 372 2.9 438 0.16242 625.7 308 48.6 374 2.7 440 0.15244 639.4 310 43.3 376 2.4 442 0.13246 642.6 312 38.5 378 2.2 444 0.12248 631.5 314 34.6 380 2.1 446 0.11250 609.3 316 30.7 382 1.9 448 0.10252 580.1 318 28.0 384 1.7 450 0.09254 544.5 320 25.6 386 1.6
Cl2O3 + hν → Products
The absorption cross sections of Cl2O3 have been measured by Hayman and Cox [118], Burkholder et al.[35], and Harwood et al. [117]. The results from these studies are significantly different in the spectral regions below240 nm and in the long-wavelength tail beyond 300 nm. Table 31 lists the recommended values. These are derivedby averaging the spectra of Burkholder et al. and Harwood et al., which are obtained by the most direct methods.Additional work is needed, particularly in the spectral region beyond 300 nm.
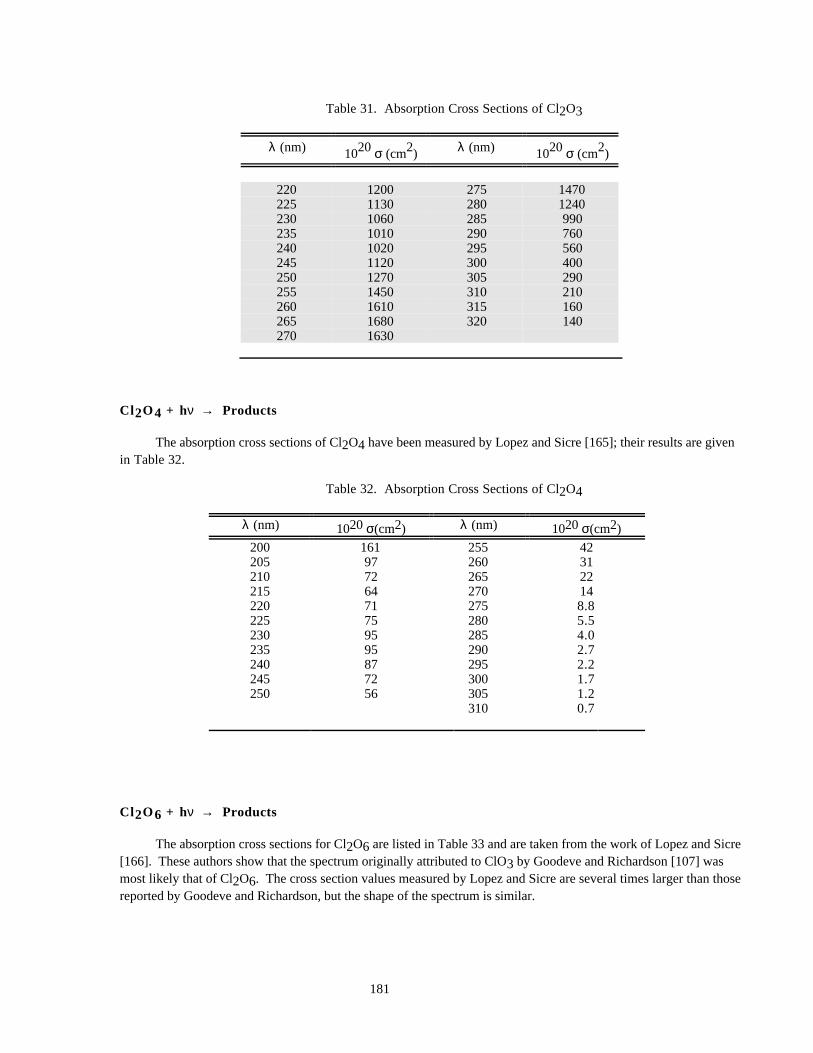
181
Table 31. Absorption Cross Sections of Cl2O3
λ (nm) 1020 σ (cm2) λ (nm) 1020 σ (cm2)
220 1200 275 1470225 1130 280 1240230 1060 285 990235 1010 290 760240 1020 295 560245 1120 300 400250 1270 305 290255 1450 310 210260 1610 315 160265 1680 320 140270 1630
Cl2O4 + hν → Products
The absorption cross sections of Cl2O4 have been measured by Lopez and Sicre [165]; their results are givenin Table 32.
Table 32. Absorption Cross Sections of Cl2O4
λ (nm) 1020 σ(cm2) λ (nm) 1020 σ(cm2)
200 161 255 42205 97 260 31210 72 265 22215 64 270 14220 71 275 8.8225 75 280 5.5230 95 285 4.0235 95 290 2.7240 87 295 2.2245 72 300 1.7250 56 305 1.2
310 0.7
Cl2O6 + hν → Products
The absorption cross sections for Cl2O6 are listed in Table 33 and are taken from the work of Lopez and Sicre[166]. These authors show that the spectrum originally attributed to ClO3 by Goodeve and Richardson [107] wasmost likely that of Cl2O6. The cross section values measured by Lopez and Sicre are several times larger than thosereported by Goodeve and Richardson, but the shape of the spectrum is similar.
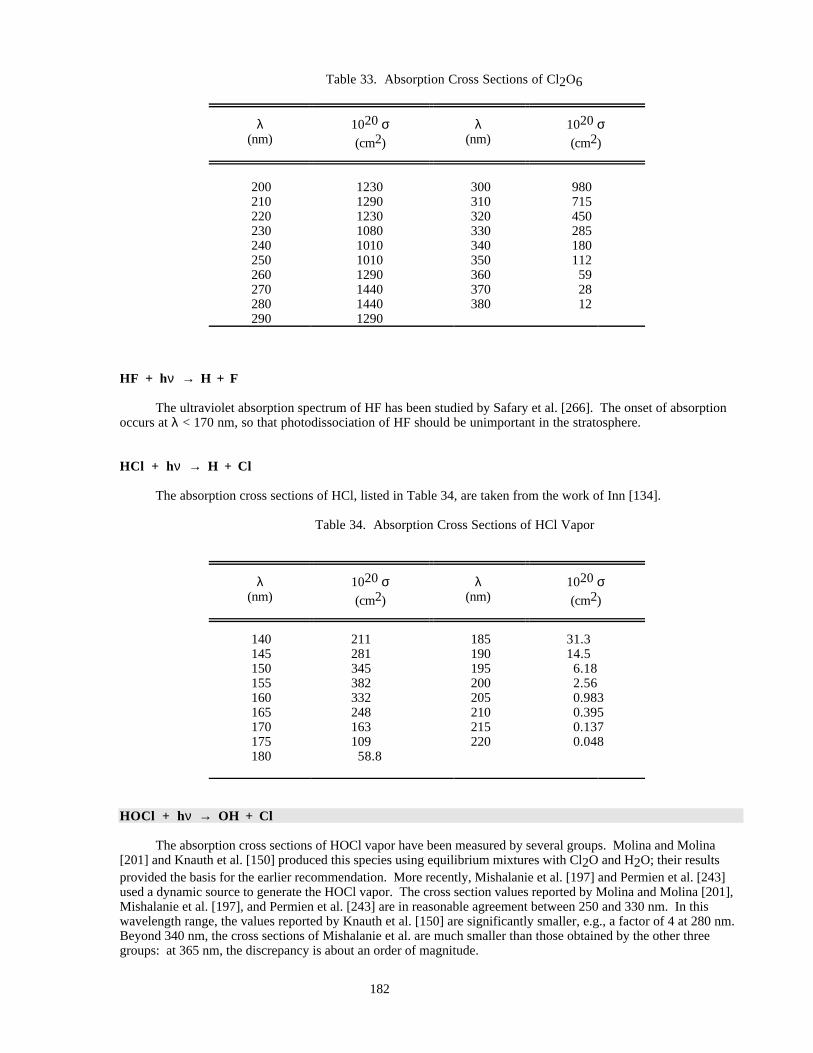
182
Table 33. Absorption Cross Sections of Cl2O6
λ(nm)
1020 σ(cm2)
λ(nm)
1020 σ(cm2)
200 1230 300 980210 1290 310 715220 1230 320 450230 1080 330 285240 1010 340 180250 1010 350 112260 1290 360 59270 1440 370 28280 1440 380 12290 1290
HF + hν → H + F
The ultraviolet absorption spectrum of HF has been studied by Safary et al. [266]. The onset of absorptionoccurs at λ < 170 nm, so that photodissociation of HF should be unimportant in the stratosphere.
HCl + hν → H + Cl
The absorption cross sections of HCl, listed in Table 34, are taken from the work of Inn [134].
Table 34. Absorption Cross Sections of HCl Vapor
λ(nm)
1020 σ(cm2)
λ(nm)
1020 σ(cm2)
140 211 185 31.3145 281 190 14.5150 345 195 6.18155 382 200 2.56160 332 205 0.983165 248 210 0.395170 163 215 0.137175 109 220 0.048180 58.8
HOCl + hν → OH + Cl
The absorption cross sections of HOCl vapor have been measured by several groups. Molina and Molina[201] and Knauth et al. [150] produced this species using equilibrium mixtures with Cl2O and H2O; their resultsprovided the basis for the earlier recommendation. More recently, Mishalanie et al. [197] and Permien et al. [243]used a dynamic source to generate the HOCl vapor. The cross section values reported by Molina and Molina [201],Mishalanie et al. [197], and Permien et al. [243] are in reasonable agreement between 250 and 330 nm. In thiswavelength range, the values reported by Knauth et al. [150] are significantly smaller, e.g., a factor of 4 at 280 nm.Beyond 340 nm, the cross sections of Mishalanie et al. are much smaller than those obtained by the other threegroups: at 365 nm, the discrepancy is about an order of magnitude.
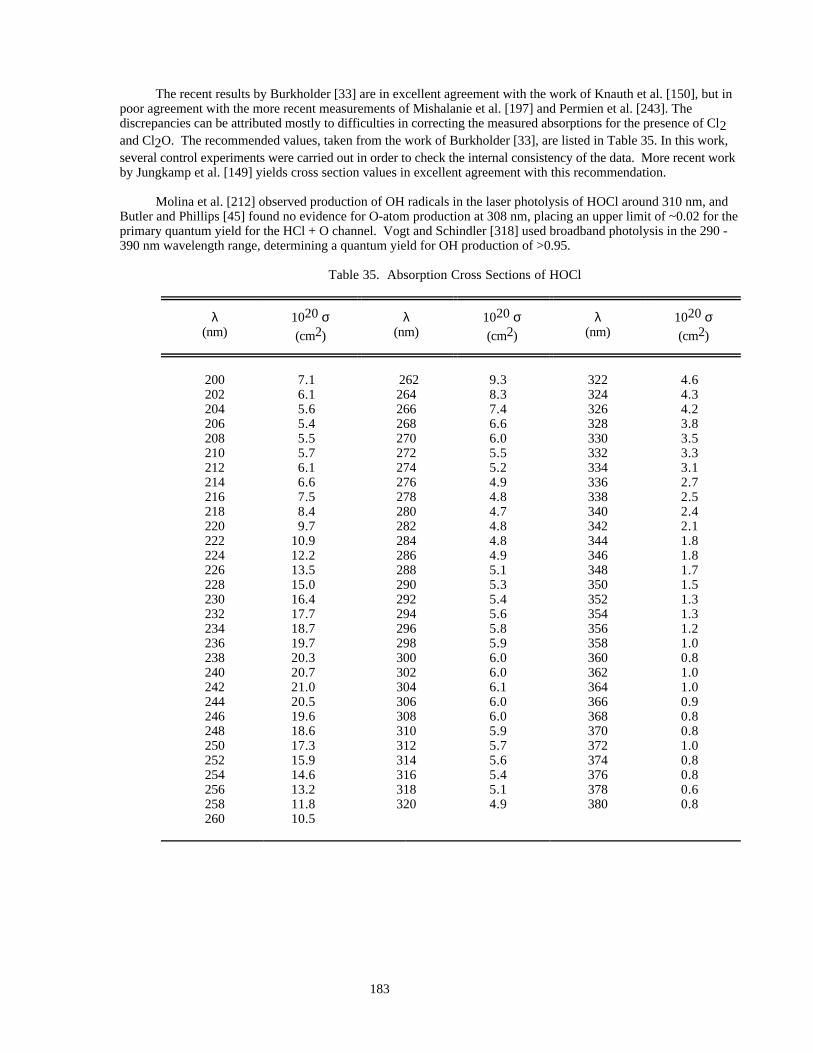
183
The recent results by Burkholder [33] are in excellent agreement with the work of Knauth et al. [150], but inpoor agreement with the more recent measurements of Mishalanie et al. [197] and Permien et al. [243]. Thediscrepancies can be attributed mostly to difficulties in correcting the measured absorptions for the presence of Cl2and Cl2O. The recommended values, taken from the work of Burkholder [33], are listed in Table 35. In this work,several control experiments were carried out in order to check the internal consistency of the data. More recent workby Jungkamp et al. [149] yields cross section values in excellent agreement with this recommendation.
Molina et al. [212] observed production of OH radicals in the laser photolysis of HOCl around 310 nm, andButler and Phillips [45] found no evidence for O-atom production at 308 nm, placing an upper limit of ~0.02 for theprimary quantum yield for the HCl + O channel. Vogt and Schindler [318] used broadband photolysis in the 290 -390 nm wavelength range, determining a quantum yield for OH production of >0.95.
Table 35. Absorption Cross Sections of HOCl
λ(nm)
1020 σ(cm2)
λ(nm)
1020 σ(cm2)
λ(nm)
1020 σ(cm2)
200 7.1 262 9.3 322 4.6202 6.1 264 8.3 324 4.3204 5.6 266 7.4 326 4.2206 5.4 268 6.6 328 3.8208 5.5 270 6.0 330 3.5210 5.7 272 5.5 332 3.3212 6.1 274 5.2 334 3.1214 6.6 276 4.9 336 2.7216 7.5 278 4.8 338 2.5218 8.4 280 4.7 340 2.4220 9.7 282 4.8 342 2.1222 10.9 284 4.8 344 1.8224 12.2 286 4.9 346 1.8226 13.5 288 5.1 348 1.7228 15.0 290 5.3 350 1.5230 16.4 292 5.4 352 1.3232 17.7 294 5.6 354 1.3234 18.7 296 5.8 356 1.2236 19.7 298 5.9 358 1.0238 20.3 300 6.0 360 0.8240 20.7 302 6.0 362 1.0242 21.0 304 6.1 364 1.0244 20.5 306 6.0 366 0.9246 19.6 308 6.0 368 0.8248 18.6 310 5.9 370 0.8250 17.3 312 5.7 372 1.0252 15.9 314 5.6 374 0.8254 14.6 316 5.4 376 0.8256 13.2 318 5.1 378 0.6258 11.8 320 4.9 380 0.8260 10.5
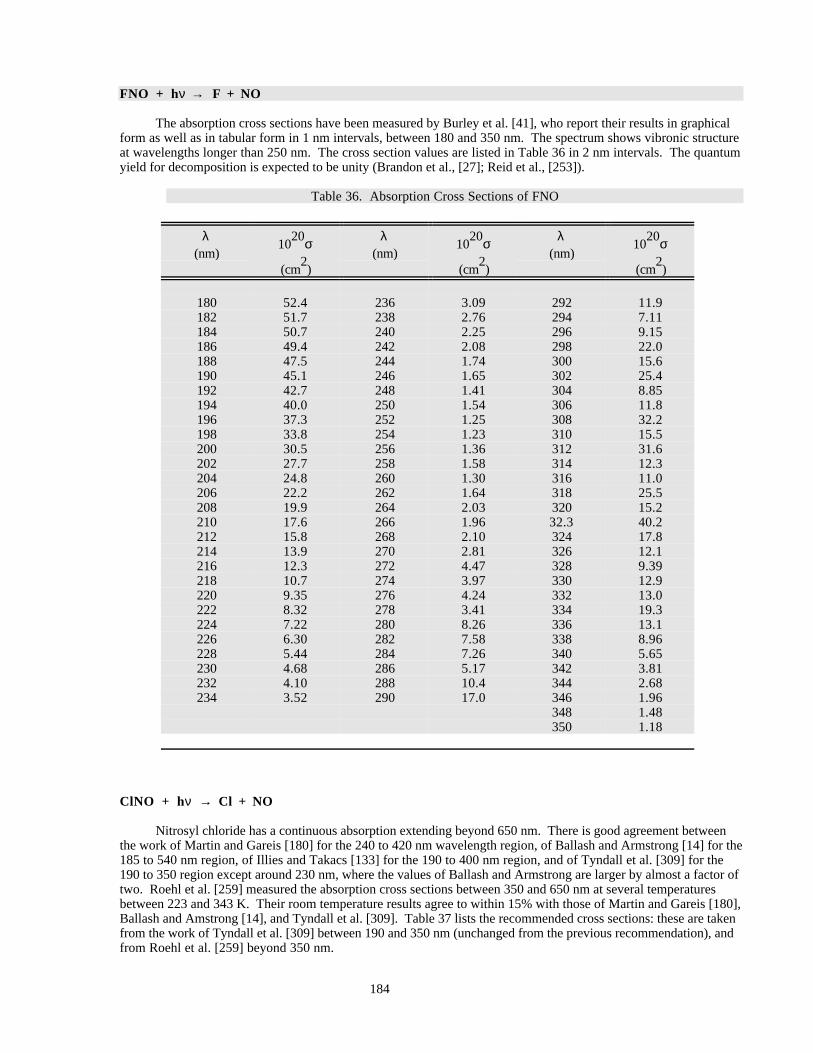
184
FNO + hν → F + NO
The absorption cross sections have been measured by Burley et al. [41], who report their results in graphicalform as well as in tabular form in 1 nm intervals, between 180 and 350 nm. The spectrum shows vibronic structureat wavelengths longer than 250 nm. The cross section values are listed in Table 36 in 2 nm intervals. The quantumyield for decomposition is expected to be unity (Brandon et al., [27]; Reid et al., [253]).
Table 36. Absorption Cross Sections of FNO
λ(nm)
1020σ
(cm2)
λ(nm)
1020σ
(cm2)
λ(nm)
1020σ
(cm2)
180 52.4 236 3.09 292 11.9182 51.7 238 2.76 294 7.11184 50.7 240 2.25 296 9.15186 49.4 242 2.08 298 22.0188 47.5 244 1.74 300 15.6190 45.1 246 1.65 302 25.4192 42.7 248 1.41 304 8.85194 40.0 250 1.54 306 11.8196 37.3 252 1.25 308 32.2198 33.8 254 1.23 310 15.5200 30.5 256 1.36 312 31.6202 27.7 258 1.58 314 12.3204 24.8 260 1.30 316 11.0206 22.2 262 1.64 318 25.5208 19.9 264 2.03 320 15.2210 17.6 266 1.96 32.3 40.2212 15.8 268 2.10 324 17.8214 13.9 270 2.81 326 12.1216 12.3 272 4.47 328 9.39218 10.7 274 3.97 330 12.9220 9.35 276 4.24 332 13.0222 8.32 278 3.41 334 19.3224 7.22 280 8.26 336 13.1226 6.30 282 7.58 338 8.96228 5.44 284 7.26 340 5.65230 4.68 286 5.17 342 3.81232 4.10 288 10.4 344 2.68234 3.52 290 17.0 346 1.96
348 1.48350 1.18
ClNO + hν → Cl + NO
Nitrosyl chloride has a continuous absorption extending beyond 650 nm. There is good agreement betweenthe work of Martin and Gareis [180] for the 240 to 420 nm wavelength region, of Ballash and Armstrong [14] for the185 to 540 nm region, of Illies and Takacs [133] for the 190 to 400 nm region, and of Tyndall et al. [309] for the190 to 350 region except around 230 nm, where the values of Ballash and Armstrong are larger by almost a factor oftwo. Roehl et al. [259] measured the absorption cross sections between 350 and 650 nm at several temperaturesbetween 223 and 343 K. Their room temperature results agree to within 15% with those of Martin and Gareis [180],Ballash and Amstrong [14], and Tyndall et al. [309]. Table 37 lists the recommended cross sections: these are takenfrom the work of Tyndall et al. [309] between 190 and 350 nm (unchanged from the previous recommendation), andfrom Roehl et al. [259] beyond 350 nm.
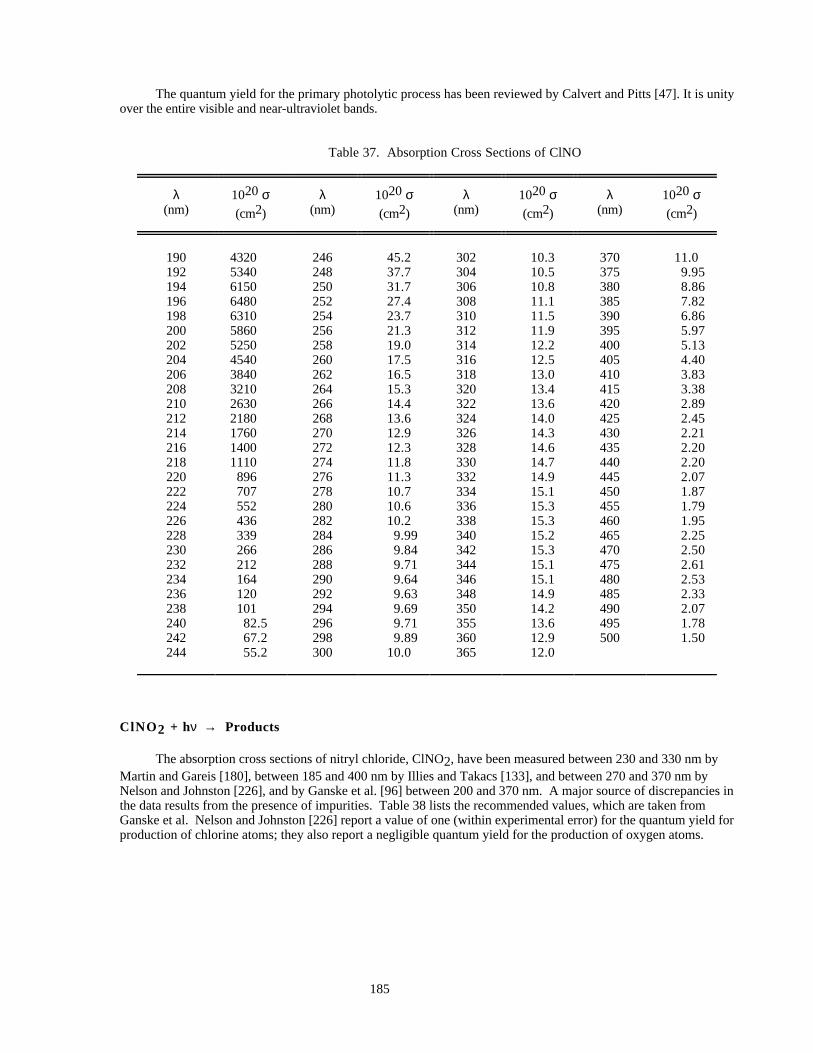
185
The quantum yield for the primary photolytic process has been reviewed by Calvert and Pitts [47]. It is unityover the entire visible and near-ultraviolet bands.
Table 37. Absorption Cross Sections of ClNO
λ(nm)
1020 σ(cm2)
λ(nm)
1020 σ(cm2)
λ(nm)
1020 σ(cm2)
λ(nm)
1020 σ(cm2)
190 4320 246 45.2 302 10.3 370 11.0192 5340 248 37.7 304 10.5 375 9.95194 6150 250 31.7 306 10.8 380 8.86196 6480 252 27.4 308 11.1 385 7.82198 6310 254 23.7 310 11.5 390 6.86200 5860 256 21.3 312 11.9 395 5.97202 5250 258 19.0 314 12.2 400 5.13204 4540 260 17.5 316 12.5 405 4.40206 3840 262 16.5 318 13.0 410 3.83208 3210 264 15.3 320 13.4 415 3.38210 2630 266 14.4 322 13.6 420 2.89212 2180 268 13.6 324 14.0 425 2.45214 1760 270 12.9 326 14.3 430 2.21216 1400 272 12.3 328 14.6 435 2.20218 1110 274 11.8 330 14.7 440 2.20220 896 276 11.3 332 14.9 445 2.07222 707 278 10.7 334 15.1 450 1.87224 552 280 10.6 336 15.3 455 1.79226 436 282 10.2 338 15.3 460 1.95228 339 284 9.99 340 15.2 465 2.25230 266 286 9.84 342 15.3 470 2.50232 212 288 9.71 344 15.1 475 2.61234 164 290 9.64 346 15.1 480 2.53236 120 292 9.63 348 14.9 485 2.33238 101 294 9.69 350 14.2 490 2.07240 82.5 296 9.71 355 13.6 495 1.78242 67.2 298 9.89 360 12.9 500 1.50244 55.2 300 10.0 365 12.0
ClNO 2 + hν → Products
The absorption cross sections of nitryl chloride, ClNO2, have been measured between 230 and 330 nm byMartin and Gareis [180], between 185 and 400 nm by Illies and Takacs [133], and between 270 and 370 nm byNelson and Johnston [226], and by Ganske et al. [96] between 200 and 370 nm. A major source of discrepancies inthe data results from the presence of impurities. Table 38 lists the recommended values, which are taken fromGanske et al. Nelson and Johnston [226] report a value of one (within experimental error) for the quantum yield forproduction of chlorine atoms; they also report a negligible quantum yield for the production of oxygen atoms.
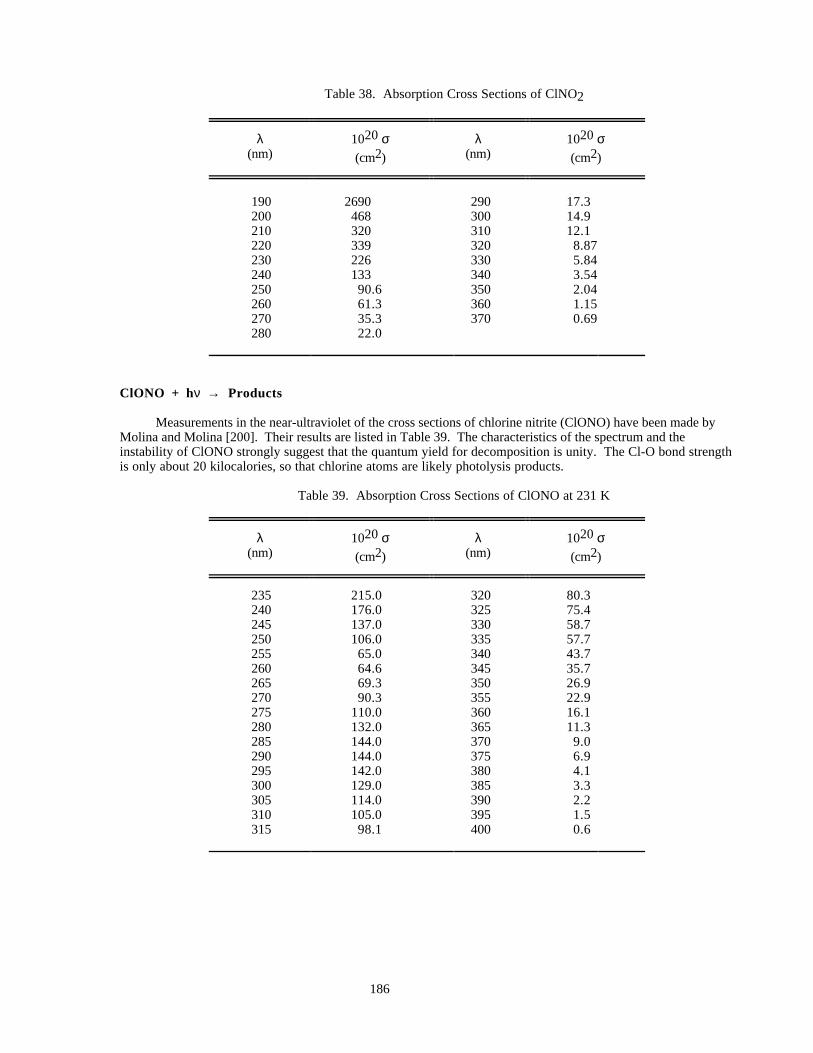
186
Table 38. Absorption Cross Sections of ClNO2
λ(nm)
1020 σ(cm2)
λ(nm)
1020 σ(cm2)
190 2690 290 17.3200 468 300 14.9210 320 310 12.1220 339 320 8.87230 226 330 5.84240 133 340 3.54250 90.6 350 2.04260 61.3 360 1.15270 35.3 370 0.69280 22.0
ClONO + hν → Products
Measurements in the near-ultraviolet of the cross sections of chlorine nitrite (ClONO) have been made byMolina and Molina [200]. Their results are listed in Table 39. The characteristics of the spectrum and theinstability of ClONO strongly suggest that the quantum yield for decomposition is unity. The Cl-O bond strengthis only about 20 kilocalories, so that chlorine atoms are likely photolysis products.
Table 39. Absorption Cross Sections of ClONO at 231 K
λ(nm)
1020 σ(cm2)
λ(nm)
1020 σ(cm2)
235 215.0 320 80.3240 176.0 325 75.4245 137.0 330 58.7250 106.0 335 57.7255 65.0 340 43.7260 64.6 345 35.7265 69.3 350 26.9270 90.3 355 22.9275 110.0 360 16.1280 132.0 365 11.3285 144.0 370 9.0290 144.0 375 6.9295 142.0 380 4.1300 129.0 385 3.3305 114.0 390 2.2310 105.0 395 1.5315 98.1 400 0.6
187
ClONO 2 + hν → Products
The recommended cross sections are taken from the work of Burkholder et al. [38]; the values are listed inTable 40, together with the parameters needed to compute their temperature dependency. These values are in verygood agreement with those reported by Molina and Molina [202], which provided the basis for the previousrecommendation, and which supersedes the earlier work of Rowland, Spencer, and Molina [263].
The identity of the primary photolytic fragments has been investigated by several groups. Smith et al. [287]report O + ClONO as the most likely products, using end product analysis and steady-state photolysis. The resultsof Chang et al. [52], who employed the "Very Low Pressure Photolysis" (VLPPh) technique, indicate that theproducts are Cl + NO3. Adler-Golden and Wiesenfeld [2], using a flash photolysis atomic absorption technique, findO-atoms to be the predominant photolysis product and report a quantum yield for Cl-atom production of less than4%. Marinelli and Johnston [178] report a quantum yield for NO3 production at 249 nm between 0.45 and 0.85,with a most likely value of 0.55; they monitored NO3 by tunable dye-laser absorption at 662 nm. Margitan [173]used atomic resonance fluorescence detection of O- and Cl-atoms and found the quantum yield at 266 and at 355 nmto be 0.9 ± 0.1 for Cl-atom production and ~0.1 for O-atom production, with no discernible difference at the twowavelengths. These results were confirmed by Knauth and Schindler [151], who used end-product analysis to inferthe quantum yields. Burrows et al. [44] report also Cl and NO3 as the photolysis products at 254 nm, with aquantum yield of unity within experimental error. In contrast, Nikolaisen et al. [228] report relative branching ratiosof 0.44 for production of ClO and NO2 and 0.56 for production of Cl and NO3 at wavelengths beyond 300 nm.Minton et al. [196], Nelson et al. [225], and Moore et al. [213] measured comparable yields for these two channels at193, 248 and 308 nm, using a molecular beam technique.
The recommended quantum yield values for production of Cl + NO3 (φ1) and ClO + NO2 (φ2) are given atthe bottom of Table 40 and are based on the work of Nelson et al. [225], Moore et al. [213], Nickolaisen et al.[228], and Ravishankara [248]. For wavelengths shorter than 308 nm the value of φ1 is 0.6, and for φ2 it is 0.4.For longer wavelengths φ1 increases linearly to 0.9 at 350 nm, with the corresponding decrease in φ2 to 0.1. Thereis no evidence for production of O + ClONO in the more recent work; the production of O-atoms reported in some ofthe earlier studies might have resulted from decomposition of excited NO3.
Recent work by Nickolaisen et al. [228] indicates that the photodissociation quantum yield is less than unityat wavelengths longer than about 330 nm, because of the formation of a long-lived intermediate that might bequenched under atmospheric conditions (a situation analogous to that of Cl2O). Additional work is needed to addressthese issues, which have potentially important atmospheric consequences.
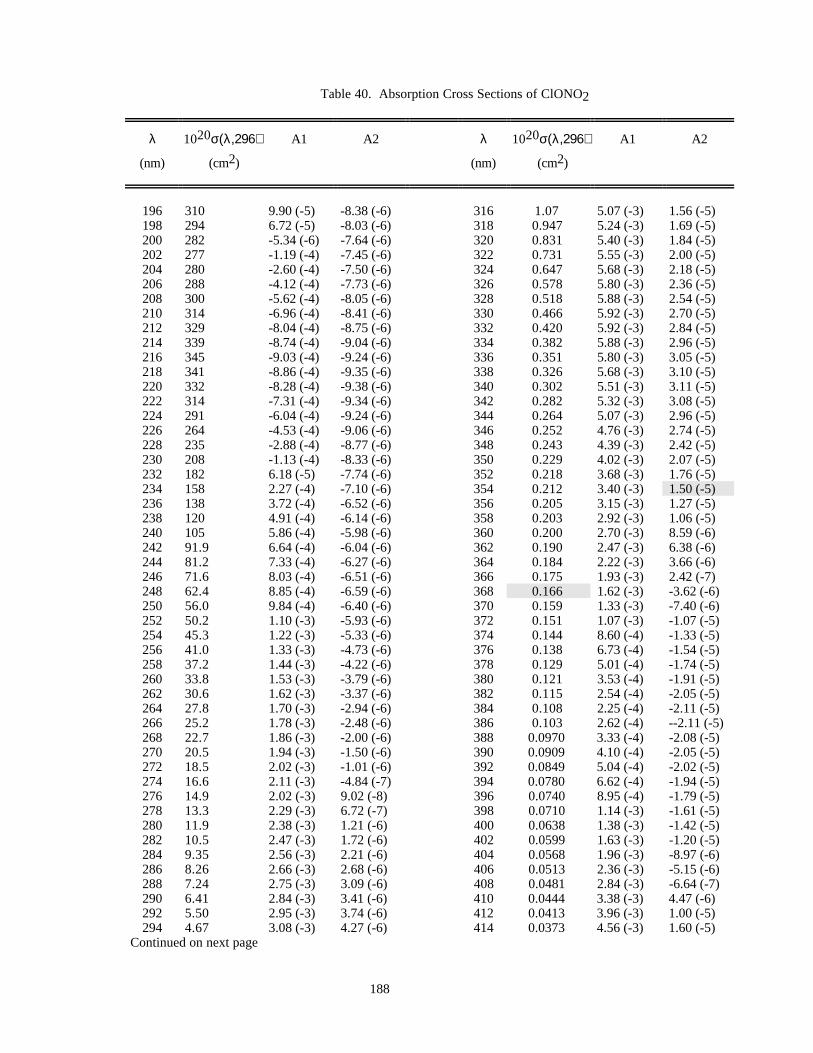
188
Table 40. Absorption Cross Sections of ClONO2
λ
(nm)
1020σ(λ,296)
(cm2)
A1 A2 λ
(nm)
1020σ(λ,296)
(cm2)
A1 A2
196 310 9.90 (-5) -8.38 (-6) 316 1.07 5.07 (-3) 1.56 (-5)198 294 6.72 (-5) -8.03 (-6) 318 0.947 5.24 (-3) 1.69 (-5)200 282 -5.34 (-6) -7.64 (-6) 320 0.831 5.40 (-3) 1.84 (-5)202 277 -1.19 (-4) -7.45 (-6) 322 0.731 5.55 (-3) 2.00 (-5)204 280 -2.60 (-4) -7.50 (-6) 324 0.647 5.68 (-3) 2.18 (-5)206 288 -4.12 (-4) -7.73 (-6) 326 0.578 5.80 (-3) 2.36 (-5)208 300 -5.62 (-4) -8.05 (-6) 328 0.518 5.88 (-3) 2.54 (-5)210 314 -6.96 (-4) -8.41 (-6) 330 0.466 5.92 (-3) 2.70 (-5)212 329 -8.04 (-4) -8.75 (-6) 332 0.420 5.92 (-3) 2.84 (-5)214 339 -8.74 (-4) -9.04 (-6) 334 0.382 5.88 (-3) 2.96 (-5)216 345 -9.03 (-4) -9.24 (-6) 336 0.351 5.80 (-3) 3.05 (-5)218 341 -8.86 (-4) -9.35 (-6) 338 0.326 5.68 (-3) 3.10 (-5)220 332 -8.28 (-4) -9.38 (-6) 340 0.302 5.51 (-3) 3.11 (-5)222 314 -7.31 (-4) -9.34 (-6) 342 0.282 5.32 (-3) 3.08 (-5)224 291 -6.04 (-4) -9.24 (-6) 344 0.264 5.07 (-3) 2.96 (-5)226 264 -4.53 (-4) -9.06 (-6) 346 0.252 4.76 (-3) 2.74 (-5)228 235 -2.88 (-4) -8.77 (-6) 348 0.243 4.39 (-3) 2.42 (-5)230 208 -1.13 (-4) -8.33 (-6) 350 0.229 4.02 (-3) 2.07 (-5)232 182 6.18 (-5) -7.74 (-6) 352 0.218 3.68 (-3) 1.76 (-5)234 158 2.27 (-4) -7.10 (-6) 354 0.212 3.40 (-3) 1.50 (-5)236 138 3.72 (-4) -6.52 (-6) 356 0.205 3.15 (-3) 1.27 (-5)238 120 4.91 (-4) -6.14 (-6) 358 0.203 2.92 (-3) 1.06 (-5)240 105 5.86 (-4) -5.98 (-6) 360 0.200 2.70 (-3) 8.59 (-6)242 91.9 6.64 (-4) -6.04 (-6) 362 0.190 2.47 (-3) 6.38 (-6)244 81.2 7.33 (-4) -6.27 (-6) 364 0.184 2.22 (-3) 3.66 (-6)246 71.6 8.03 (-4) -6.51 (-6) 366 0.175 1.93 (-3) 2.42 (-7)248 62.4 8.85 (-4) -6.59 (-6) 368 0.166 1.62 (-3) -3.62 (-6)250 56.0 9.84 (-4) -6.40 (-6) 370 0.159 1.33 (-3) -7.40 (-6)252 50.2 1.10 (-3) -5.93 (-6) 372 0.151 1.07 (-3) -1.07 (-5)254 45.3 1.22 (-3) -5.33 (-6) 374 0.144 8.60 (-4) -1.33 (-5)256 41.0 1.33 (-3) -4.73 (-6) 376 0.138 6.73 (-4) -1.54 (-5)258 37.2 1.44 (-3) -4.22 (-6) 378 0.129 5.01 (-4) -1.74 (-5)260 33.8 1.53 (-3) -3.79 (-6) 380 0.121 3.53 (-4) -1.91 (-5)262 30.6 1.62 (-3) -3.37 (-6) 382 0.115 2.54 (-4) -2.05 (-5)264 27.8 1.70 (-3) -2.94 (-6) 384 0.108 2.25 (-4) -2.11 (-5)266 25.2 1.78 (-3) -2.48 (-6) 386 0.103 2.62 (-4) --2.11 (-5)268 22.7 1.86 (-3) -2.00 (-6) 388 0.0970 3.33 (-4) -2.08 (-5)270 20.5 1.94 (-3) -1.50 (-6) 390 0.0909 4.10 (-4) -2.05 (-5)272 18.5 2.02 (-3) -1.01 (-6) 392 0.0849 5.04 (-4) -2.02 (-5)274 16.6 2.11 (-3) -4.84 (-7) 394 0.0780 6.62 (-4) -1.94 (-5)276 14.9 2.02 (-3) 9.02 (-8) 396 0.0740 8.95 (-4) -1.79 (-5)278 13.3 2.29 (-3) 6.72 (-7) 398 0.0710 1.14 (-3) -1.61 (-5)280 11.9 2.38 (-3) 1.21 (-6) 400 0.0638 1.38 (-3) -1.42 (-5)282 10.5 2.47 (-3) 1.72 (-6) 402 0.0599 1.63 (-3) -1.20 (-5)284 9.35 2.56 (-3) 2.21 (-6) 404 0.0568 1.96 (-3) -8.97 (-6)286 8.26 2.66 (-3) 2.68 (-6) 406 0.0513 2.36 (-3) -5.15 (-6)288 7.24 2.75 (-3) 3.09 (-6) 408 0.0481 2.84 (-3) -6.64 (-7)290 6.41 2.84 (-3) 3.41 (-6) 410 0.0444 3.38 (-3) 4.47 (-6)292 5.50 2.95 (-3) 3.74 (-6) 412 0.0413 3.96 (-3) 1.00 (-5)294 4.67 3.08 (-3) 4.27 (-6) 414 0.0373 4.56 (-3) 1.60 (-5)
Continued on next page
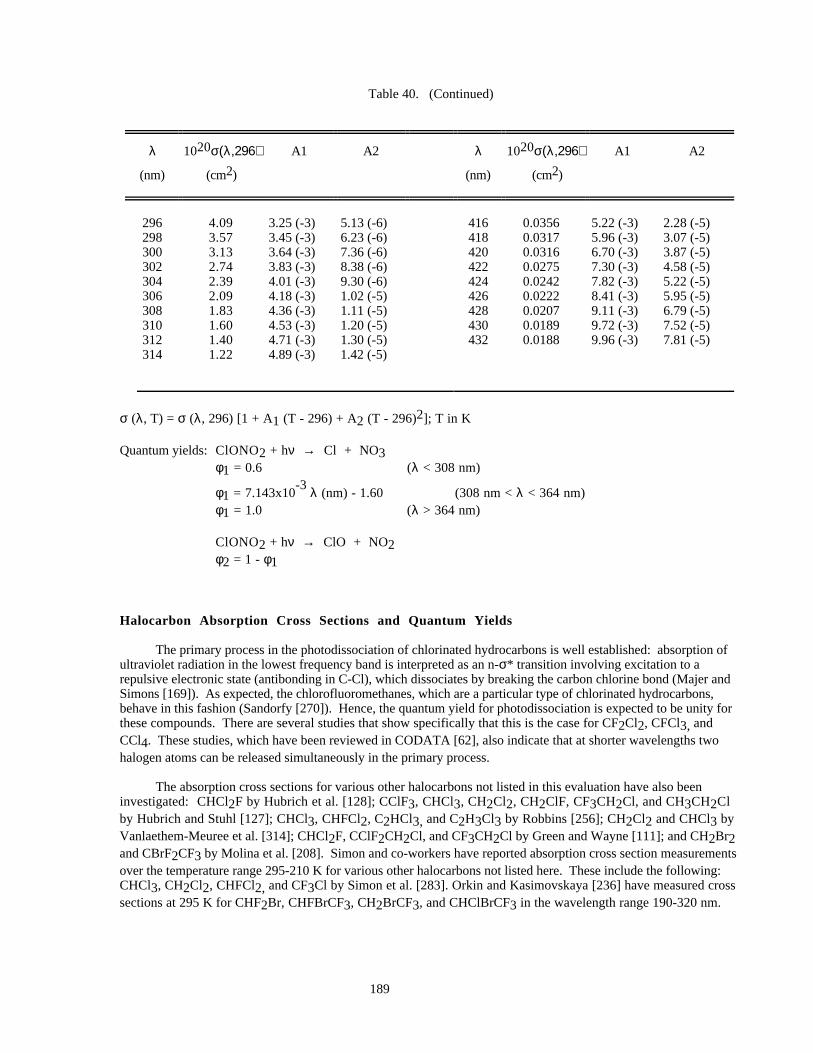
189
Table 40. (Continued)
λ
(nm)
1020σ(λ,296)
(cm2)
A1 A2 λ
(nm)
1020σ(λ,296)
(cm2)
A1 A2
296 4.09 3.25 (-3) 5.13 (-6) 416 0.0356 5.22 (-3) 2.28 (-5)298 3.57 3.45 (-3) 6.23 (-6) 418 0.0317 5.96 (-3) 3.07 (-5)300 3.13 3.64 (-3) 7.36 (-6) 420 0.0316 6.70 (-3) 3.87 (-5)302 2.74 3.83 (-3) 8.38 (-6) 422 0.0275 7.30 (-3) 4.58 (-5)304 2.39 4.01 (-3) 9.30 (-6) 424 0.0242 7.82 (-3) 5.22 (-5)306 2.09 4.18 (-3) 1.02 (-5) 426 0.0222 8.41 (-3) 5.95 (-5)308 1.83 4.36 (-3) 1.11 (-5) 428 0.0207 9.11 (-3) 6.79 (-5)310 1.60 4.53 (-3) 1.20 (-5) 430 0.0189 9.72 (-3) 7.52 (-5)312 1.40 4.71 (-3) 1.30 (-5) 432 0.0188 9.96 (-3) 7.81 (-5)314 1.22 4.89 (-3) 1.42 (-5)
σ (λ, T) = σ (λ, 296) [1 + A1 (T - 296) + A2 (T - 296)2]; T in K
Quantum yields:ClONO2 + hν → Cl + NO3φ1 = 0.6 (λ < 308 nm)
φ1 = 7.143x10⁻³
λ (nm) - 1.60 (308 nm < λ < 364 nm)φ1 = 1.0 (λ > 364 nm)
ClONO2 + hν → ClO + NO2φ2 = 1 - φ1
Halocarbon Absorption Cross Sections and Quantum Yields
The primary process in the photodissociation of chlorinated hydrocarbons is well established: absorption ofultraviolet radiation in the lowest frequency band is interpreted as an n-σ* transition involving excitation to arepulsive electronic state (antibonding in C-Cl), which dissociates by breaking the carbon chlorine bond (Majer andSimons [169]). As expected, the chlorofluoromethanes, which are a particular type of chlorinated hydrocarbons,behave in this fashion (Sandorfy [270]). Hence, the quantum yield for photodissociation is expected to be unity forthese compounds. There are several studies that show specifically that this is the case for CF2Cl2, CFCl3, andCCl4. These studies, which have been reviewed in CODATA [62], also indicate that at shorter wavelengths twohalogen atoms can be released simultaneously in the primary process.
The absorption cross sections for various other halocarbons not listed in this evaluation have also beeninvestigated: CHCl2F by Hubrich et al. [128]; CClF3, CHCl3, CH2Cl2, CH2ClF, CF3CH2Cl, and CH3CH2Clby Hubrich and Stuhl [127]; CHCl3, CHFCl2, C2HCl3, and C2H3Cl3 by Robbins [256]; CH2Cl2 and CHCl3 byVanlaethem-Meuree et al. [314]; CHCl2F, CClF2CH2Cl, and CF3CH2Cl by Green and Wayne [111]; and CH2Br2and CBrF2CF3 by Molina et al. [208]. Simon and co-workers have reported absorption cross section measurementsover the temperature range 295-210 K for various other halocarbons not listed here. These include the following:CHCl3, CH2Cl2, CHFCl2, and CF3Cl by Simon et al. [283]. Orkin and Kasimovskaya [236] have measured crosssections at 295 K for CHF2Br, CHFBrCF3, CH2BrCF3, and CHClBrCF3 in the wavelength range 190-320 nm.
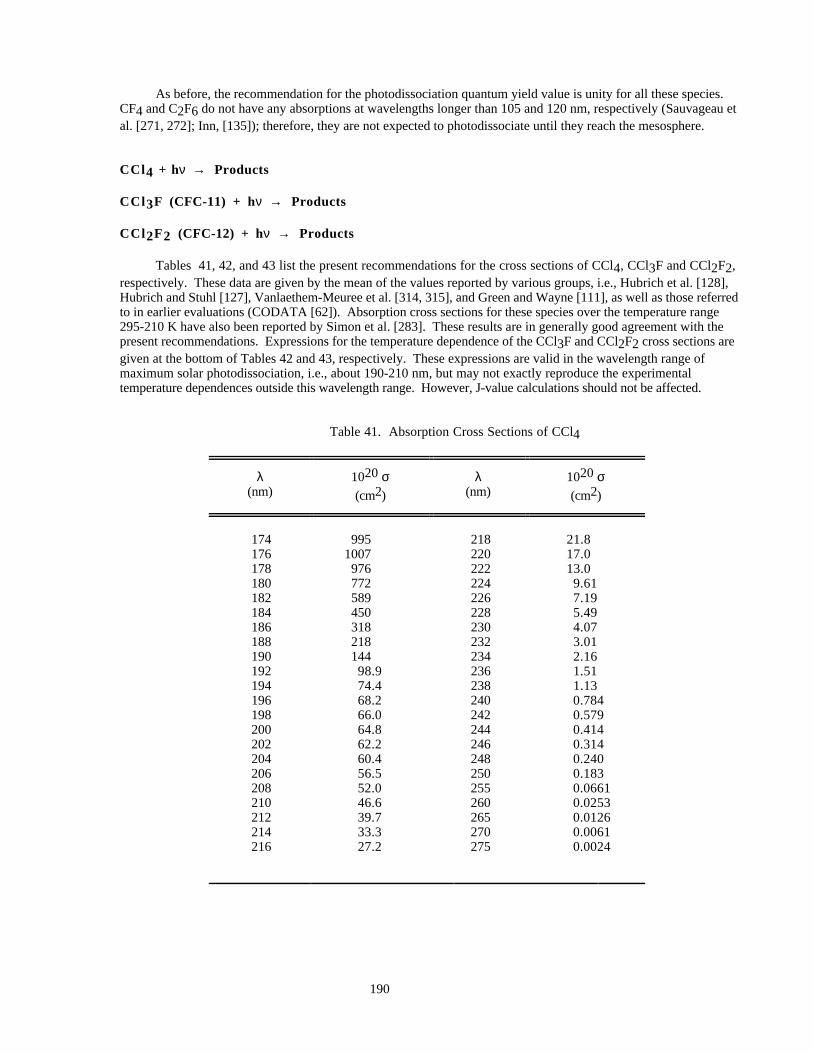
190
As before, the recommendation for the photodissociation quantum yield value is unity for all these species.CF4 and C2F6 do not have any absorptions at wavelengths longer than 105 and 120 nm, respectively (Sauvageau etal. [271, 272]; Inn, [135]); therefore, they are not expected to photodissociate until they reach the mesosphere.
CCl 4 + hν → Products
CCl 3F (CFC-11) + hν → Products
CCl 2F2 (CFC-12) + hν → Products
Tables 41, 42, and 43 list the present recommendations for the cross sections of CCl4, CCl3F and CCl2F2,respectively. These data are given by the mean of the values reported by various groups, i.e., Hubrich et al. [128],Hubrich and Stuhl [127], Vanlaethem-Meuree et al. [314, 315], and Green and Wayne [111], as well as those referredto in earlier evaluations (CODATA [62]). Absorption cross sections for these species over the temperature range295-210 K have also been reported by Simon et al. [283]. These results are in generally good agreement with thepresent recommendations. Expressions for the temperature dependence of the CCl3F and CCl2F2 cross sections aregiven at the bottom of Tables 42 and 43, respectively. These expressions are valid in the wavelength range ofmaximum solar photodissociation, i.e., about 190-210 nm, but may not exactly reproduce the experimentaltemperature dependences outside this wavelength range. However, J-value calculations should not be affected.
Table 41. Absorption Cross Sections of CCl4
λ(nm)
1020 σ(cm2)
λ(nm)
1020 σ(cm2)
174 995 218 21.8176 1007 220 17.0178 976 222 13.0180 772 224 9.61182 589 226 7.19184 450 228 5.49186 318 230 4.07188 218 232 3.01190 144 234 2.16192 98.9 236 1.51194 74.4 238 1.13196 68.2 240 0.784198 66.0 242 0.579200 64.8 244 0.414202 62.2 246 0.314204 60.4 248 0.240206 56.5 250 0.183208 52.0 255 0.0661210 46.6 260 0.0253212 39.7 265 0.0126214 33.3 270 0.0061216 27.2 275 0.0024
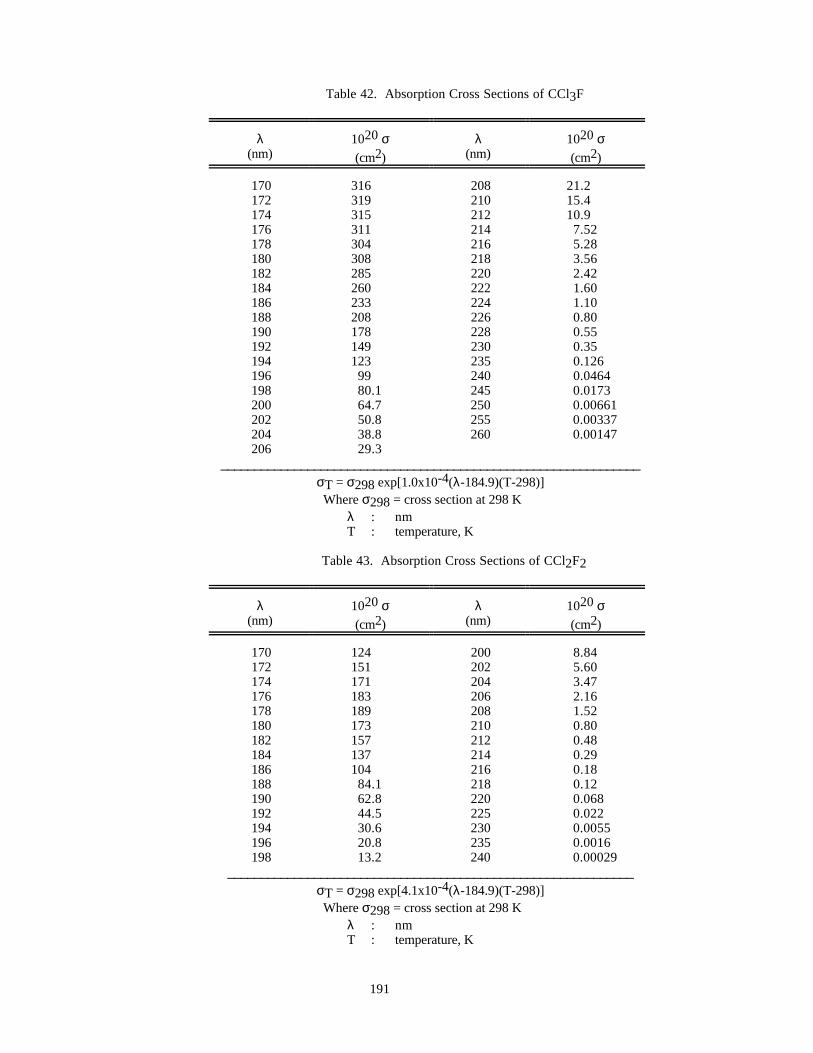
191
Table 42. Absorption Cross Sections of CCl3F
λ(nm)
1020 σ(cm2)
λ(nm)
1020 σ(cm2)
170 316 208 21.2172 319 210 15.4174 315 212 10.9176 311 214 7.52178 304 216 5.28180 308 218 3.56182 285 220 2.42184 260 222 1.60186 233 224 1.10188 208 226 0.80190 178 228 0.55192 149 230 0.35194 123 235 0.126196 99 240 0.0464198 80.1 245 0.0173200 64.7 250 0.00661202 50.8 255 0.00337204 38.8 260 0.00147206 29.3
_______________________________________________________________σT = σ298 exp[1.0x10⁻⁴(λ-184.9)(T-298)]Where σ298 = cross section at 298 K
λ : nmT : temperature, K
Table 43. Absorption Cross Sections of CCl2F2
λ(nm)
1020 σ(cm2)
λ(nm)
1020 σ(cm2)
170 124 200 8.84172 151 202 5.60174 171 204 3.47176 183 206 2.16178 189 208 1.52180 173 210 0.80182 157 212 0.48184 137 214 0.29186 104 216 0.18188 84.1 218 0.12190 62.8 220 0.068192 44.5 225 0.022194 30.6 230 0.0055196 20.8 235 0.0016198 13.2 240 0.00029
_____________________________________________________________σT = σ298 exp[4.1x10⁻⁴(λ-184.9)(T-298)]Where σ298 = cross section at 298 K
λ : nmT : temperature, K
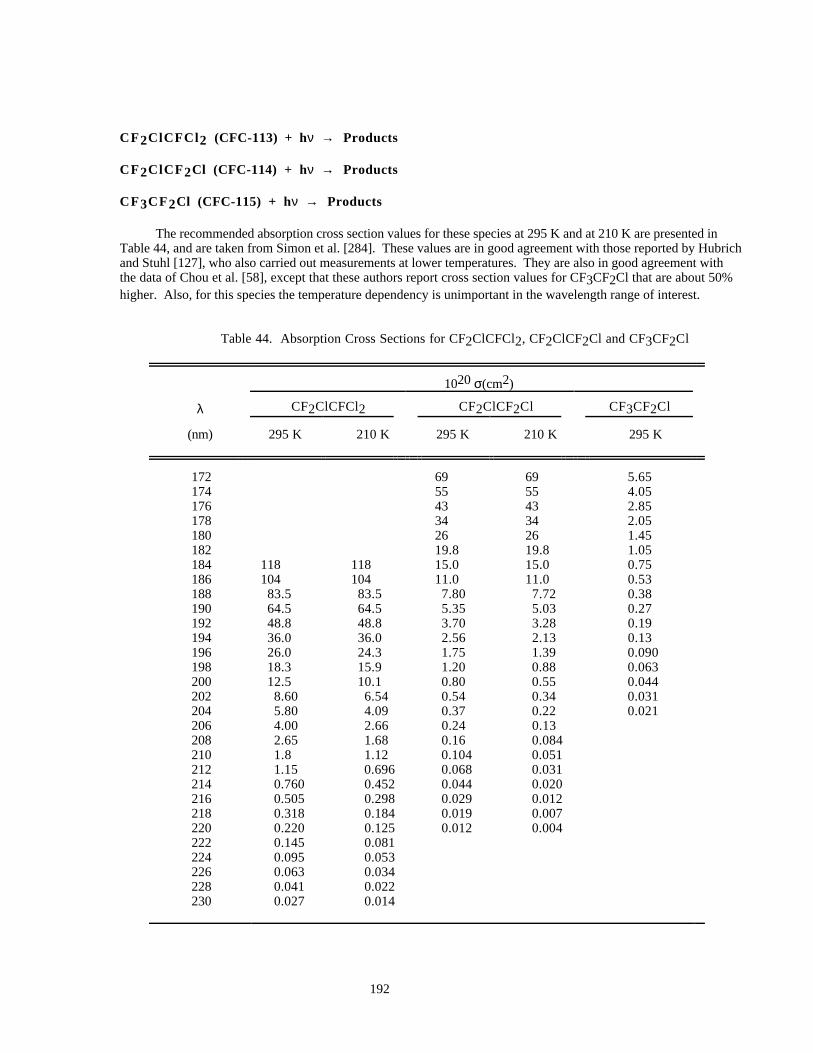
192
CF2ClCFCl 2 (CFC-113) + hν → Products
CF2ClCF 2Cl (CFC-114) + hν → Products
CF3CF2Cl (CFC-115) + hν → Products
The recommended absorption cross section values for these species at 295 K and at 210 K are presented inTable 44, and are taken from Simon et al. [284]. These values are in good agreement with those reported by Hubrichand Stuhl [127], who also carried out measurements at lower temperatures. They are also in good agreement withthe data of Chou et al. [58], except that these authors report cross section values for CF3CF2Cl that are about 50%higher. Also, for this species the temperature dependency is unimportant in the wavelength range of interest.
Table 44. Absorption Cross Sections for CF2ClCFCl2, CF2ClCF2Cl and CF3CF2Cl
1020 σ(cm2)
λ CF2ClCFCl2 CF2ClCF2Cl CF3CF2Cl
(nm) 295 K 210 K 295 K 210 K 295 K
172 69 69 5.65174 55 55 4.05176 43 43 2.85178 34 34 2.05180 26 26 1.45182 19.8 19.8 1.05184 118 118 15.0 15.0 0.75186 104 104 11.0 11.0 0.53188 83.5 83.5 7.80 7.72 0.38190 64.5 64.5 5.35 5.03 0.27192 48.8 48.8 3.70 3.28 0.19194 36.0 36.0 2.56 2.13 0.13196 26.0 24.3 1.75 1.39 0.090198 18.3 15.9 1.20 0.88 0.063200 12.5 10.1 0.80 0.55 0.044202 8.60 6.54 0.54 0.34 0.031204 5.80 4.09 0.37 0.22 0.021206 4.00 2.66 0.24 0.13208 2.65 1.68 0.16 0.084210 1.8 1.12 0.104 0.051212 1.15 0.696 0.068 0.031214 0.760 0.452 0.044 0.020216 0.505 0.298 0.029 0.012218 0.318 0.184 0.019 0.007220 0.220 0.125 0.012 0.004222 0.145 0.081224 0.095 0.053226 0.063 0.034228 0.041 0.022230 0.027 0.014
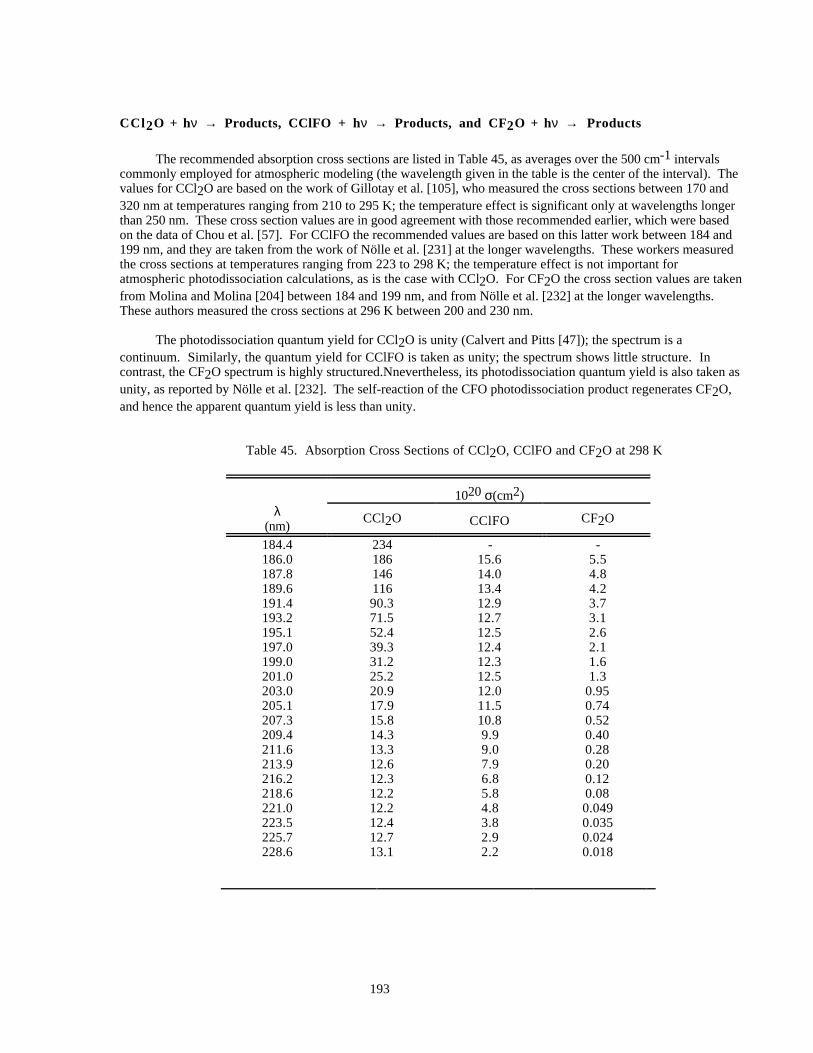
193
CCl 2O + hν → Products, CClFO + hν → Products, and CF2O + hν → Products
The recommended absorption cross sections are listed in Table 45, as averages over the 500 cm-1 intervalscommonly employed for atmospheric modeling (the wavelength given in the table is the center of the interval). Thevalues for CCl2O are based on the work of Gillotay et al. [105], who measured the cross sections between 170 and320 nm at temperatures ranging from 210 to 295 K; the temperature effect is significant only at wavelengths longerthan 250 nm. These cross section values are in good agreement with those recommended earlier, which were basedon the data of Chou et al. [57]. For CClFO the recommended values are based on this latter work between 184 and199 nm, and they are taken from the work of Nölle et al. [231] at the longer wavelengths. These workers measuredthe cross sections at temperatures ranging from 223 to 298 K; the temperature effect is not important foratmospheric photodissociation calculations, as is the case with CCl2O. For CF2O the cross section values are takenfrom Molina and Molina [204] between 184 and 199 nm, and from Nölle et al. [232] at the longer wavelengths.These authors measured the cross sections at 296 K between 200 and 230 nm.
The photodissociation quantum yield for CCl2O is unity (Calvert and Pitts [47]); the spectrum is acontinuum. Similarly, the quantum yield for CClFO is taken as unity; the spectrum shows little structure. Incontrast, the CF2O spectrum is highly structured.Nnevertheless, its photodissociation quantum yield is also taken asunity, as reported by Nölle et al. [232]. The self-reaction of the CFO photodissociation product regenerates CF2O,and hence the apparent quantum yield is less than unity.
Table 45. Absorption Cross Sections of CCl2O, CClFO and CF2O at 298 K
1020 σ(cm2)λ
(nm)CCl2O CClFO CF2O
184.4 234 - -186.0 186 15.6 5.5187.8 146 14.0 4.8189.6 116 13.4 4.2191.4 90.3 12.9 3.7193.2 71.5 12.7 3.1195.1 52.4 12.5 2.6197.0 39.3 12.4 2.1199.0 31.2 12.3 1.6201.0 25.2 12.5 1.3203.0 20.9 12.0 0.95205.1 17.9 11.5 0.74207.3 15.8 10.8 0.52209.4 14.3 9.9 0.40211.6 13.3 9.0 0.28213.9 12.6 7.9 0.20216.2 12.3 6.8 0.12218.6 12.2 5.8 0.08221.0 12.2 4.8 0.049223.5 12.4 3.8 0.035225.7 12.7 2.9 0.024228.6 13.1 2.2 0.018
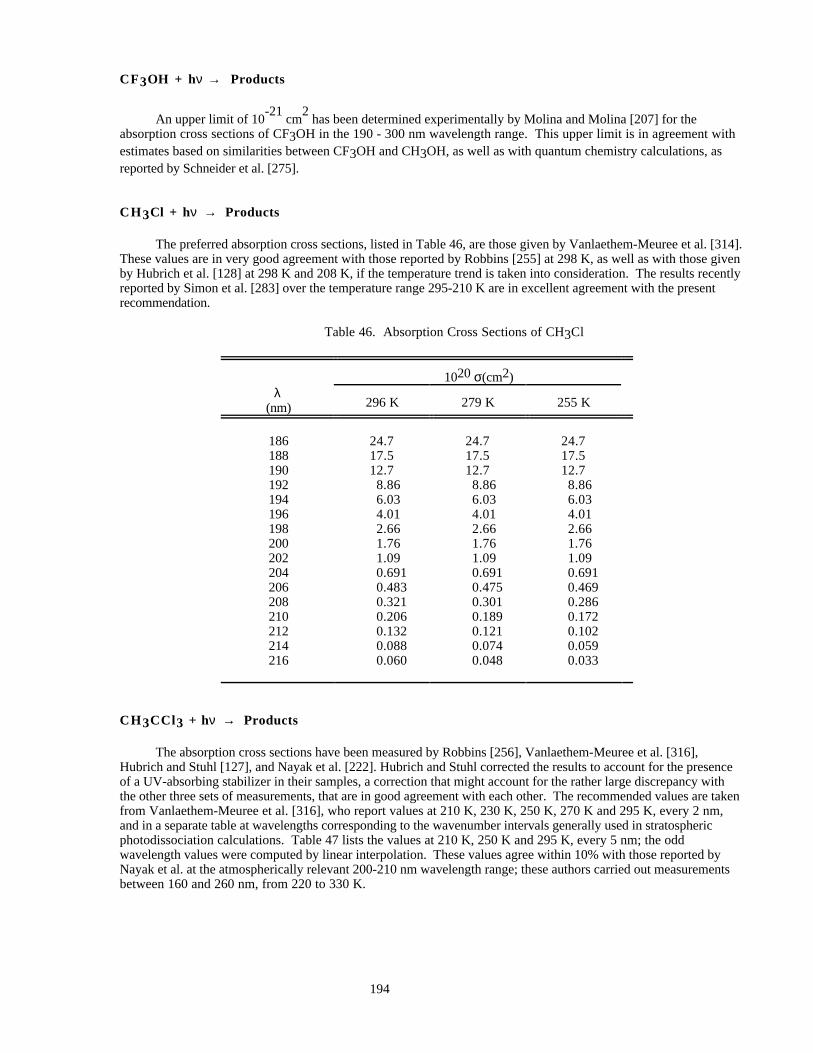
194
CF3OH + hν → Products
An upper limit of 10-21
cm2 has been determined experimentally by Molina and Molina [207] for the
absorption cross sections of CF3OH in the 190 - 300 nm wavelength range. This upper limit is in agreement withestimates based on similarities between CF3OH and CH3OH, as well as with quantum chemistry calculations, asreported by Schneider et al. [275].
CH 3Cl + hν → Products
The preferred absorption cross sections, listed in Table 46, are those given by Vanlaethem-Meuree et al. [314].These values are in very good agreement with those reported by Robbins [255] at 298 K, as well as with those givenby Hubrich et al. [128] at 298 K and 208 K, if the temperature trend is taken into consideration. The results recentlyreported by Simon et al. [283] over the temperature range 295-210 K are in excellent agreement with the presentrecommendation.
Table 46. Absorption Cross Sections of CH3Cl
1020 σ(cm2)λ
(nm) 296 K 279 K 255 K
186 24.7 24.7 24.7188 17.5 17.5 17.5190 12.7 12.7 12.7192 8.86 8.86 8.86194 6.03 6.03 6.03196 4.01 4.01 4.01198 2.66 2.66 2.66200 1.76 1.76 1.76202 1.09 1.09 1.09204 0.691 0.691 0.691206 0.483 0.475 0.469208 0.321 0.301 0.286210 0.206 0.189 0.172212 0.132 0.121 0.102214 0.088 0.074 0.059216 0.060 0.048 0.033
CH 3CCl 3 + hν → Products
The absorption cross sections have been measured by Robbins [256], Vanlaethem-Meuree et al. [316],Hubrich and Stuhl [127], and Nayak et al. [222]. Hubrich and Stuhl corrected the results to account for the presenceof a UV-absorbing stabilizer in their samples, a correction that might account for the rather large discrepancy withthe other three sets of measurements, that are in good agreement with each other. The recommended values are takenfrom Vanlaethem-Meuree et al. [316], who report values at 210 K, 230 K, 250 K, 270 K and 295 K, every 2 nm,and in a separate table at wavelengths corresponding to the wavenumber intervals generally used in stratosphericphotodissociation calculations. Table 47 lists the values at 210 K, 250 K and 295 K, every 5 nm; the oddwavelength values were computed by linear interpolation. These values agree within 10% with those reported byNayak et al. at the atmospherically relevant 200-210 nm wavelength range; these authors carried out measurementsbetween 160 and 260 nm, from 220 to 330 K.
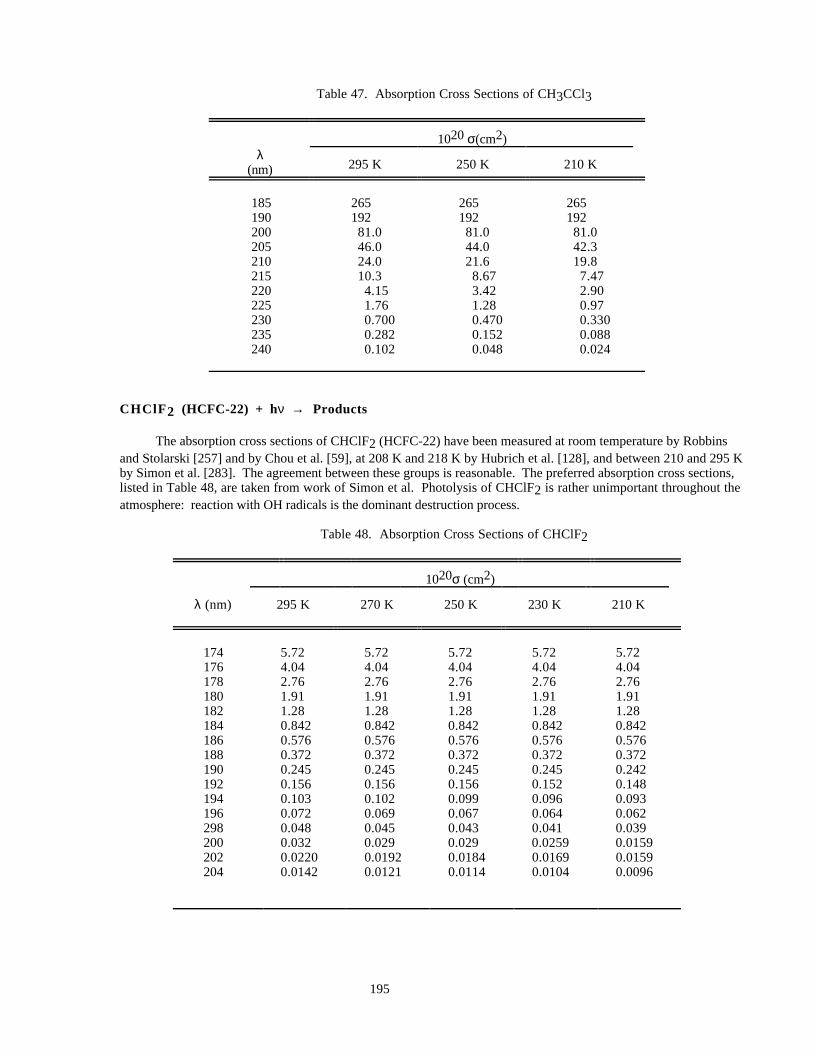
195
Table 47. Absorption Cross Sections of CH3CCl3
1020 σ(cm2)λ
(nm) 295 K 250 K 210 K
185 265 265 265190 192 192 192200 81.0 81.0 81.0205 46.0 44.0 42.3210 24.0 21.6 19.8215 10.3 8.67 7.47220 4.15 3.42 2.90225 1.76 1.28 0.97230 0.700 0.470 0.330235 0.282 0.152 0.088240 0.102 0.048 0.024
CHClF 2 (HCFC-22) + hν → Products
The absorption cross sections of CHClF2 (HCFC-22) have been measured at room temperature by Robbinsand Stolarski [257] and by Chou et al. [59], at 208 K and 218 K by Hubrich et al. [128], and between 210 and 295 Kby Simon et al. [283]. The agreement between these groups is reasonable. The preferred absorption cross sections,listed in Table 48, are taken from work of Simon et al. Photolysis of CHClF2 is rather unimportant throughout theatmosphere: reaction with OH radicals is the dominant destruction process.
Table 48. Absorption Cross Sections of CHClF2
1020σ (cm2)
λ (nm) 295 K 270 K 250 K 230 K 210 K
174 5.72 5.72 5.72 5.72 5.72176 4.04 4.04 4.04 4.04 4.04178 2.76 2.76 2.76 2.76 2.76180 1.91 1.91 1.91 1.91 1.91182 1.28 1.28 1.28 1.28 1.28184 0.842 0.842 0.842 0.842 0.842186 0.576 0.576 0.576 0.576 0.576188 0.372 0.372 0.372 0.372 0.372190 0.245 0.245 0.245 0.245 0.242192 0.156 0.156 0.156 0.152 0.148194 0.103 0.102 0.099 0.096 0.093196 0.072 0.069 0.067 0.064 0.062298 0.048 0.045 0.043 0.041 0.039200 0.032 0.029 0.029 0.0259 0.0159202 0.0220 0.0192 0.0184 0.0169 0.0159204 0.0142 0.0121 0.0114 0.0104 0.0096
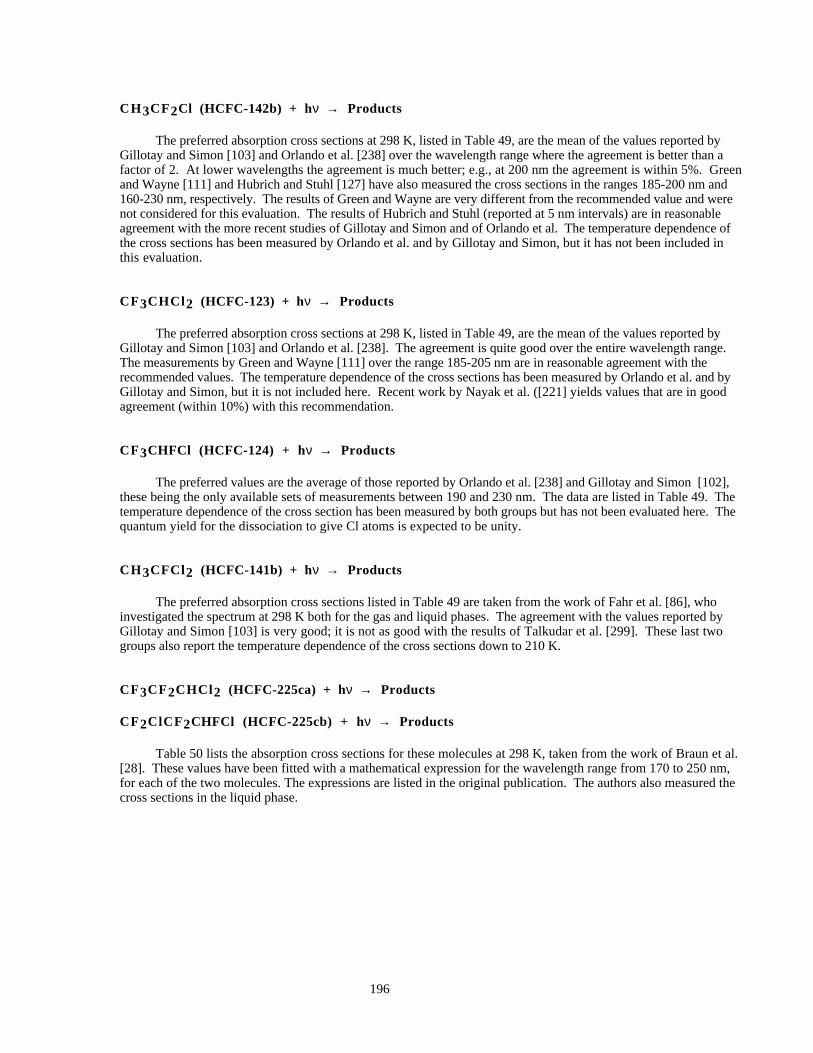
196
CH 3CF2Cl (HCFC-142b) + hν → Products
The preferred absorption cross sections at 298 K, listed in Table 49, are the mean of the values reported byGillotay and Simon [103] and Orlando et al. [238] over the wavelength range where the agreement is better than afactor of 2. At lower wavelengths the agreement is much better; e.g., at 200 nm the agreement is within 5%. Greenand Wayne [111] and Hubrich and Stuhl [127] have also measured the cross sections in the ranges 185-200 nm and160-230 nm, respectively. The results of Green and Wayne are very different from the recommended value and werenot considered for this evaluation. The results of Hubrich and Stuhl (reported at 5 nm intervals) are in reasonableagreement with the more recent studies of Gillotay and Simon and of Orlando et al. The temperature dependence ofthe cross sections has been measured by Orlando et al. and by Gillotay and Simon, but it has not been included inthis evaluation.
CF3CHCl 2 (HCFC-123) + hν → Products
The preferred absorption cross sections at 298 K, listed in Table 49, are the mean of the values reported byGillotay and Simon [103] and Orlando et al. [238]. The agreement is quite good over the entire wavelength range.The measurements by Green and Wayne [111] over the range 185-205 nm are in reasonable agreement with therecommended values. The temperature dependence of the cross sections has been measured by Orlando et al. and byGillotay and Simon, but it is not included here. Recent work by Nayak et al. ([221] yields values that are in goodagreement (within 10%) with this recommendation.
CF3CHFCl (HCFC-124) + hν → Products
The preferred values are the average of those reported by Orlando et al. [238] and Gillotay and Simon [102],these being the only available sets of measurements between 190 and 230 nm. The data are listed in Table 49. Thetemperature dependence of the cross section has been measured by both groups but has not been evaluated here. Thequantum yield for the dissociation to give Cl atoms is expected to be unity.
CH 3CFCl 2 (HCFC-141b) + hν → Products
The preferred absorption cross sections listed in Table 49 are taken from the work of Fahr et al. [86], whoinvestigated the spectrum at 298 K both for the gas and liquid phases. The agreement with the values reported byGillotay and Simon [103] is very good; it is not as good with the results of Talkudar et al. [299]. These last twogroups also report the temperature dependence of the cross sections down to 210 K.
CF3CF2CHCl 2 (HCFC-225ca) + hν → Products
CF2ClCF 2CHFCl (HCFC-225cb) + hν → Products
Table 50 lists the absorption cross sections for these molecules at 298 K, taken from the work of Braun et al.[28]. These values have been fitted with a mathematical expression for the wavelength range from 170 to 250 nm,for each of the two molecules. The expressions are listed in the original publication. The authors also measured thecross sections in the liquid phase.
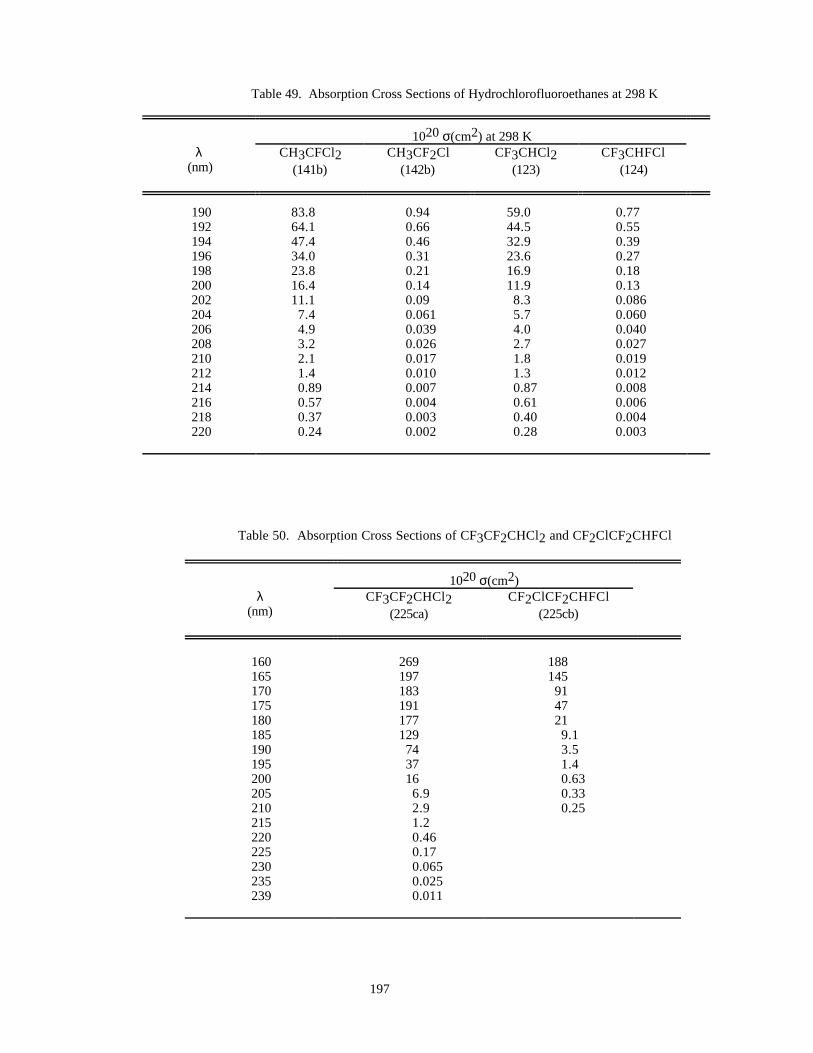
197
Table 49. Absorption Cross Sections of Hydrochlorofluoroethanes at 298 K
1020 σ(cm2) at 298 Kλ
(nm)CH3CFCl2
(141b)CH3CF2Cl
(142b)CF3CHCl2
(123)CF3CHFCl
(124)
190 83.8 0.94 59.0 0.77192 64.1 0.66 44.5 0.55194 47.4 0.46 32.9 0.39196 34.0 0.31 23.6 0.27198 23.8 0.21 16.9 0.18200 16.4 0.14 11.9 0.13202 11.1 0.09 8.3 0.086204 7.4 0.061 5.7 0.060206 4.9 0.039 4.0 0.040208 3.2 0.026 2.7 0.027210 2.1 0.017 1.8 0.019212 1.4 0.010 1.3 0.012214 0.89 0.007 0.87 0.008216 0.57 0.004 0.61 0.006218 0.37 0.003 0.40 0.004220 0.24 0.002 0.28 0.003
Table 50. Absorption Cross Sections of CF3CF2CHCl2 and CF2ClCF2CHFCl
1020 σ(cm2)λ
(nm)CF3CF2CHCl2
(225ca)CF2ClCF2CHFCl
(225cb)
160 269 188165 197 145170 183 91175 191 47180 177 21185 129 9.1190 74 3.5195 37 1.4200 16 0.63205 6.9 0.33210 2.9 0.25215 1.2220 0.46225 0.17230 0.065235 0.025239 0.011
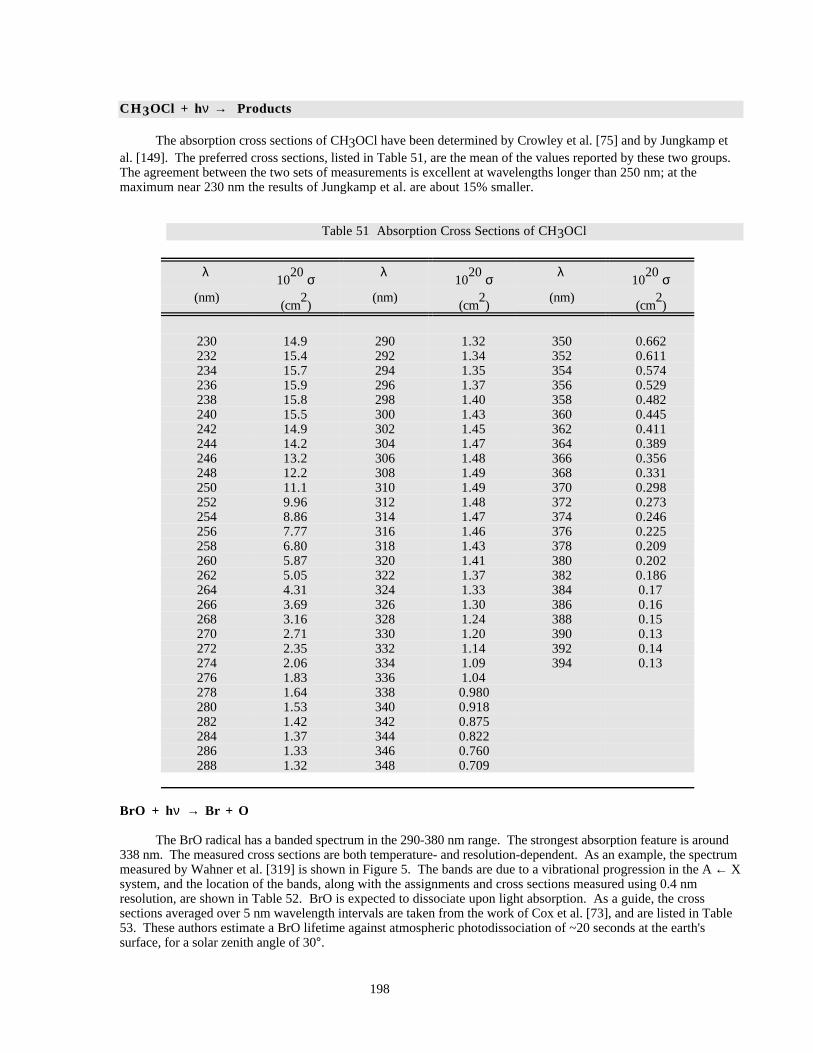
198
CH 3OCl + hν → Products
The absorption cross sections of CH3OCl have been determined by Crowley et al. [75] and by Jungkamp etal. [149]. The preferred cross sections, listed in Table 51, are the mean of the values reported by these two groups.The agreement between the two sets of measurements is excellent at wavelengths longer than 250 nm; at themaximum near 230 nm the results of Jungkamp et al. are about 15% smaller.
Table 51 Absorption Cross Sections of CH3OCl
λ10
20 σ λ10
20 σ λ10
20 σ(nm)
(cm2)
(nm)(cm
2)
(nm)(cm
2)
230 14.9 290 1.32 350 0.662232 15.4 292 1.34 352 0.611234 15.7 294 1.35 354 0.574236 15.9 296 1.37 356 0.529238 15.8 298 1.40 358 0.482240 15.5 300 1.43 360 0.445242 14.9 302 1.45 362 0.411244 14.2 304 1.47 364 0.389246 13.2 306 1.48 366 0.356248 12.2 308 1.49 368 0.331250 11.1 310 1.49 370 0.298252 9.96 312 1.48 372 0.273254 8.86 314 1.47 374 0.246256 7.77 316 1.46 376 0.225258 6.80 318 1.43 378 0.209260 5.87 320 1.41 380 0.202262 5.05 322 1.37 382 0.186264 4.31 324 1.33 384 0.17266 3.69 326 1.30 386 0.16268 3.16 328 1.24 388 0.15270 2.71 330 1.20 390 0.13272 2.35 332 1.14 392 0.14274 2.06 334 1.09 394 0.13276 1.83 336 1.04278 1.64 338 0.980280 1.53 340 0.918282 1.42 342 0.875284 1.37 344 0.822286 1.33 346 0.760288 1.32 348 0.709
BrO + hν → Br + O
The BrO radical has a banded spectrum in the 290-380 nm range. The strongest absorption feature is around338 nm. The measured cross sections are both temperature- and resolution-dependent. As an example, the spectrummeasured by Wahner et al. [319] is shown in Figure 5. The bands are due to a vibrational progression in the A ← Xsystem, and the location of the bands, along with the assignments and cross sections measured using 0.4 nmresolution, are shown in Table 52. BrO is expected to dissociate upon light absorption. As a guide, the crosssections averaged over 5 nm wavelength intervals are taken from the work of Cox et al. [73], and are listed in Table53. These authors estimate a BrO lifetime against atmospheric photodissociation of ~20 seconds at the earth'ssurface, for a solar zenith angle of 30°.
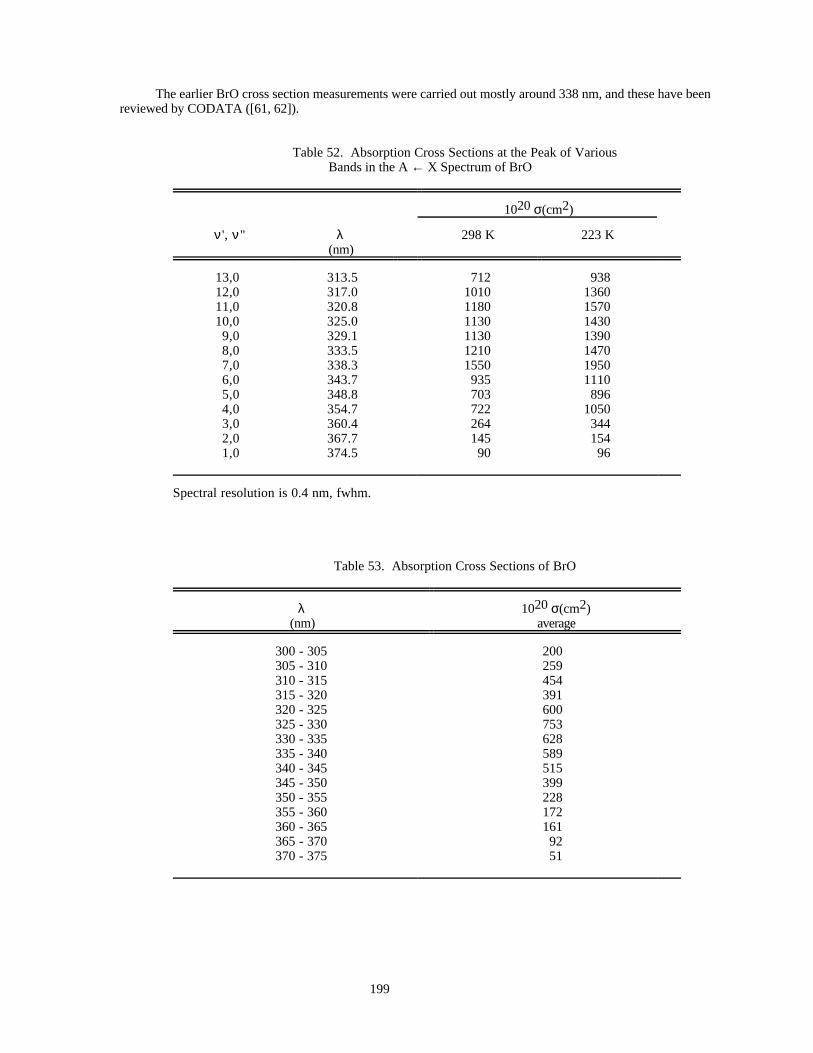
199
The earlier BrO cross section measurements were carried out mostly around 338 nm, and these have beenreviewed by CODATA ([61, 62]).
Table 52. Absorption Cross Sections at the Peak of VariousBands in the A ← X Spectrum of BrO
1020 σ(cm2)
ν ', ν" λ(nm)
298 K 223 K
13,0 313.5 712 93812,0 317.0 1010 136011,0 320.8 1180 157010,0 325.0 1130 14309,0 329.1 1130 13908,0 333.5 1210 14707,0 338.3 1550 19506,0 343.7 935 11105,0 348.8 703 8964,0 354.7 722 10503,0 360.4 264 3442,0 367.7 145 1541,0 374.5 90 96
Spectral resolution is 0.4 nm, fwhm.
Table 53. Absorption Cross Sections of BrO
λ(nm)
1020 σ(cm2)average
300 - 305 200305 - 310 259310 - 315 454315 - 320 391320 - 325 600325 - 330 753330 - 335 628335 - 340 589340 - 345 515345 - 350 399350 - 355 228355 - 360 172360 - 365 161365 - 370 92370 - 375 51
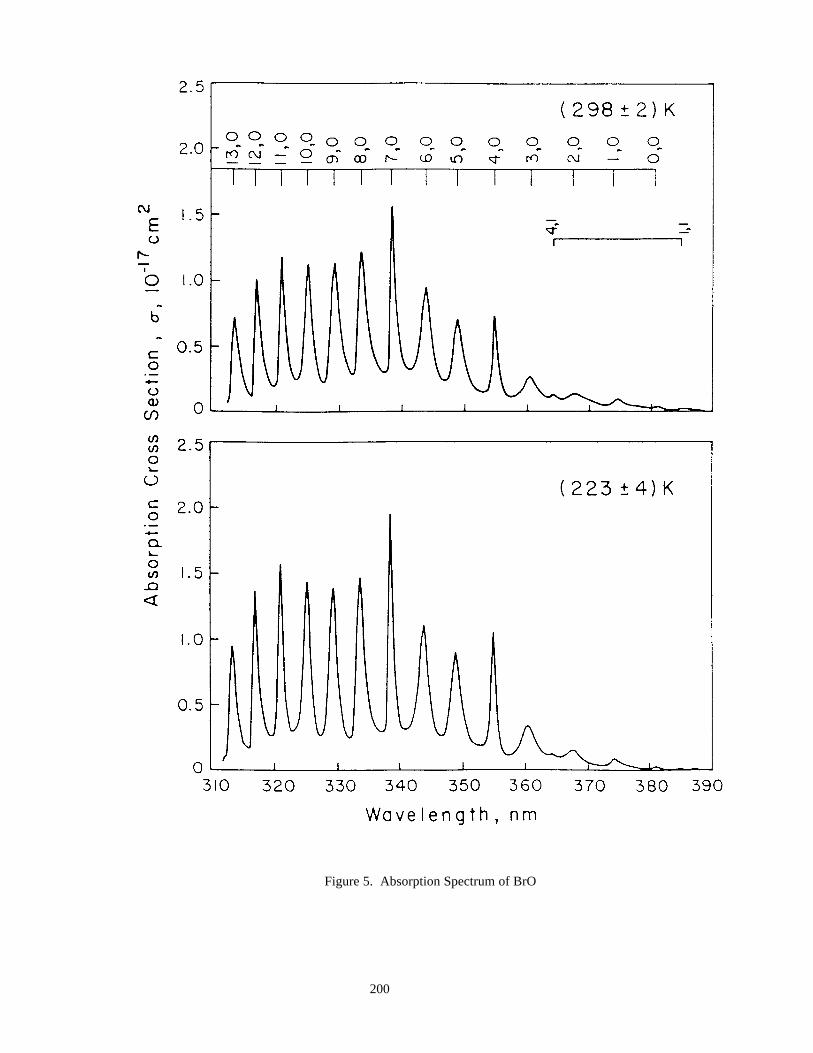
200
Figure 5. Absorption Spectrum of BrO
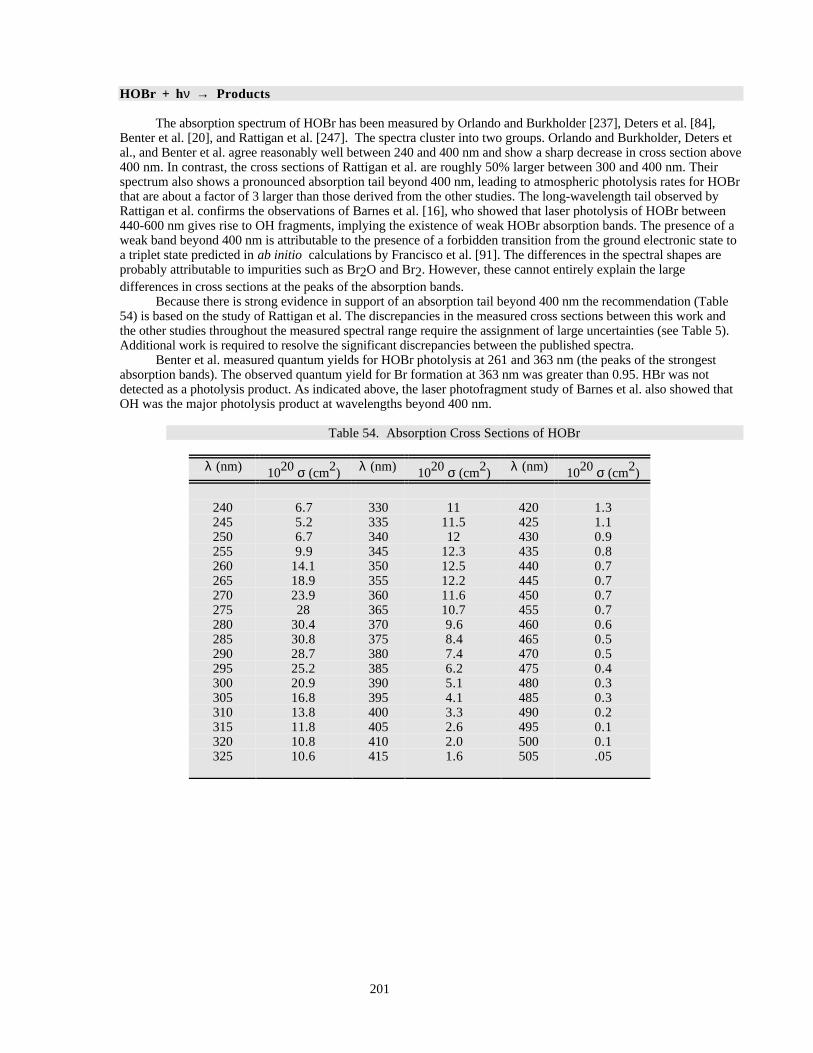
201
HOBr + hν → Products
The absorption spectrum of HOBr has been measured by Orlando and Burkholder [237], Deters et al. [84],Benter et al. [20], and Rattigan et al. [247]. The spectra cluster into two groups. Orlando and Burkholder, Deters etal., and Benter et al. agree reasonably well between 240 and 400 nm and show a sharp decrease in cross section above400 nm. In contrast, the cross sections of Rattigan et al. are roughly 50% larger between 300 and 400 nm. Theirspectrum also shows a pronounced absorption tail beyond 400 nm, leading to atmospheric photolysis rates for HOBrthat are about a factor of 3 larger than those derived from the other studies. The long-wavelength tail observed byRattigan et al. confirms the observations of Barnes et al. [16], who showed that laser photolysis of HOBr between440-600 nm gives rise to OH fragments, implying the existence of weak HOBr absorption bands. The presence of aweak band beyond 400 nm is attributable to the presence of a forbidden transition from the ground electronic state toa triplet state predicted in ab initio calculations by Francisco et al. [91]. The differences in the spectral shapes areprobably attributable to impurities such as Br2O and Br2. However, these cannot entirely explain the largedifferences in cross sections at the peaks of the absorption bands.
Because there is strong evidence in support of an absorption tail beyond 400 nm the recommendation (Table54) is based on the study of Rattigan et al. The discrepancies in the measured cross sections between this work andthe other studies throughout the measured spectral range require the assignment of large uncertainties (see Table 5).Additional work is required to resolve the significant discrepancies between the published spectra.
Benter et al. measured quantum yields for HOBr photolysis at 261 and 363 nm (the peaks of the strongestabsorption bands). The observed quantum yield for Br formation at 363 nm was greater than 0.95. HBr was notdetected as a photolysis product. As indicated above, the laser photofragment study of Barnes et al. also showed thatOH was the major photolysis product at wavelengths beyond 400 nm.
Table 54. Absorption Cross Sections of HOBr
λ (nm) 1020 σ (cm2) λ (nm) 1020 σ (cm2) λ (nm) 1020 σ (cm2)
240 6.7 330 11 420 1.3245 5.2 335 11.5 425 1.1250 6.7 340 12 430 0.9255 9.9 345 12.3 435 0.8260 14.1 350 12.5 440 0.7265 18.9 355 12.2 445 0.7270 23.9 360 11.6 450 0.7275 28 365 10.7 455 0.7280 30.4 370 9.6 460 0.6285 30.8 375 8.4 465 0.5290 28.7 380 7.4 470 0.5295 25.2 385 6.2 475 0.4300 20.9 390 5.1 480 0.3305 16.8 395 4.1 485 0.3310 13.8 400 3.3 490 0.2315 11.8 405 2.6 495 0.1320 10.8 410 2.0 500 0.1325 10.6 415 1.6 505 .05
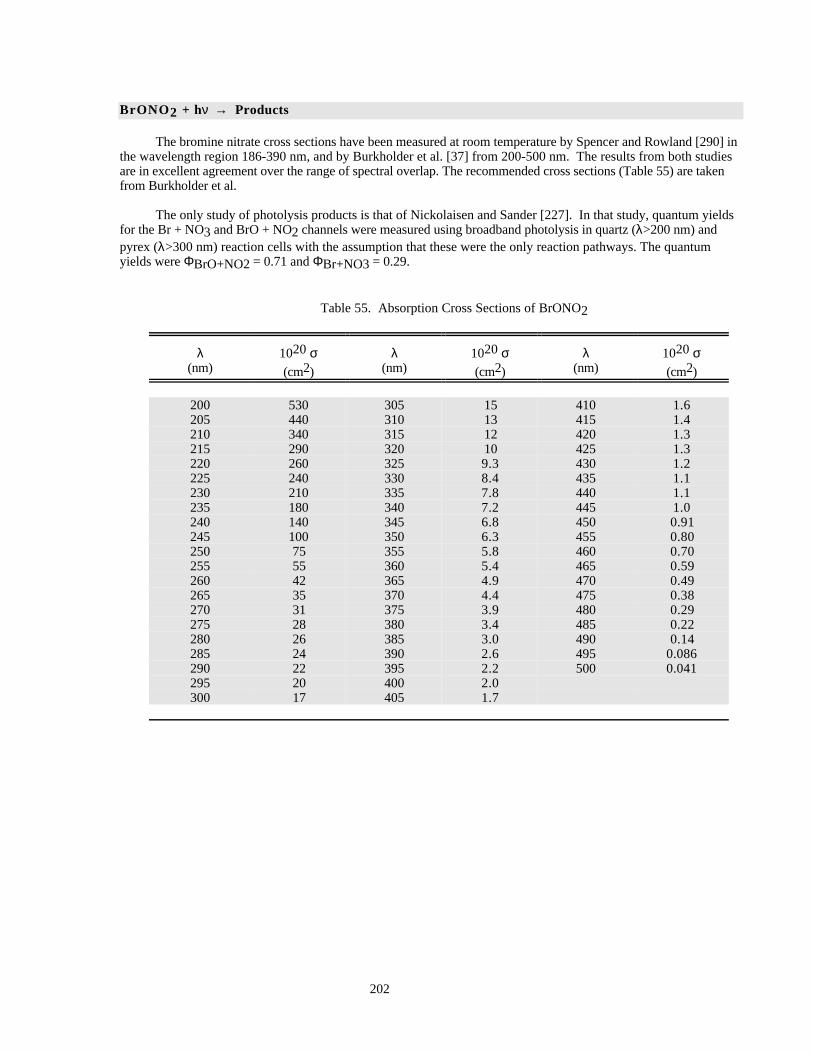
202
BrONO 2 + hν → Products
The bromine nitrate cross sections have been measured at room temperature by Spencer and Rowland [290] inthe wavelength region 186-390 nm, and by Burkholder et al. [37] from 200-500 nm. The results from both studiesare in excellent agreement over the range of spectral overlap. The recommended cross sections (Table 55) are takenfrom Burkholder et al.
The only study of photolysis products is that of Nickolaisen and Sander [227]. In that study, quantum yieldsfor the Br + NO3 and BrO + NO2 channels were measured using broadband photolysis in quartz (λ>200 nm) andpyrex (λ>300 nm) reaction cells with the assumption that these were the only reaction pathways. The quantumyields were ΦBrO+NO2 = 0.71 and ΦBr+NO3 = 0.29.
Table 55. Absorption Cross Sections of BrONO2
λ(nm)
1020 σ(cm2)
λ(nm)
1020 σ(cm2)
λ(nm)
1020 σ(cm2)
200 530 305 15 410 1.6205 440 310 13 415 1.4210 340 315 12 420 1.3215 290 320 10 425 1.3220 260 325 9.3 430 1.2225 240 330 8.4 435 1.1230 210 335 7.8 440 1.1235 180 340 7.2 445 1.0240 140 345 6.8 450 0.91245 100 350 6.3 455 0.80250 75 355 5.8 460 0.70255 55 360 5.4 465 0.59260 42 365 4.9 470 0.49265 35 370 4.4 475 0.38270 31 375 3.9 480 0.29275 28 380 3.4 485 0.22280 26 385 3.0 490 0.14285 24 390 2.6 495 0.086290 22 395 2.2 500 0.041295 20 400 2.0300 17 405 1.7
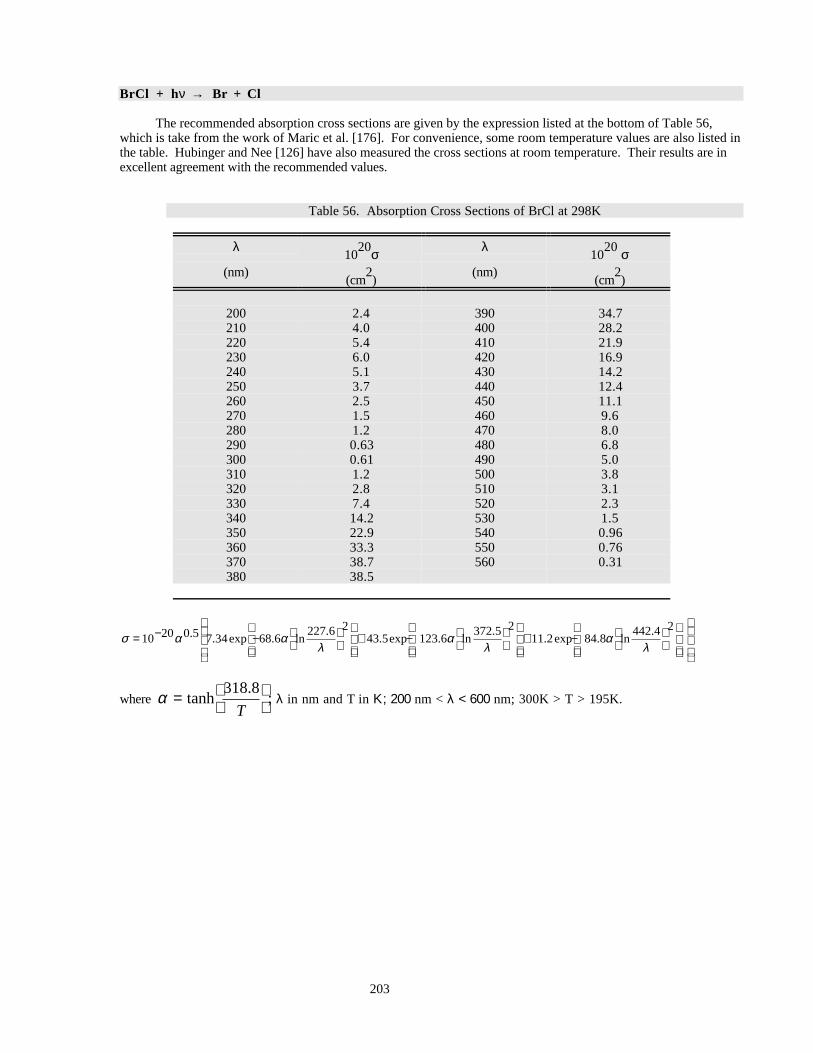
203
BrCl + hν → Br + Cl
The recommended absorption cross sections are given by the expression listed at the bottom of Table 56,which is take from the work of Maric et al. [176]. For convenience, some room temperature values are also listed inthe table. Hubinger and Nee [126] have also measured the cross sections at room temperature. Their results are inexcellent agreement with the recommended values.
Table 56. Absorption Cross Sections of BrCl at 298K
λ10
20σ λ10
20 σ(nm)
(cm2)
(nm)(cm
2)
200 2.4 390 34.7210 4.0 400 28.2220 5.4 410 21.9230 6.0 420 16.9240 5.1 430 14.2250 3.7 440 12.4260 2.5 450 11.1270 1.5 460 9.6280 1.2 470 8.0290 0.63 480 6.8300 0.61 490 5.0310 1.2 500 3.8320 2.8 510 3.1330 7.4 520 2.3340 14.2 530 1.5350 22.9 540 0.96360 33.3 550 0.76370 38.7 560 0.31380 38.5
σ α αλ
αλ
αλ
= − −
+ −
+ −
10 20 0 5 7 34 68 6
227 6 243 5 123 6
372 5 211 2 84 8
442 4 2. . exp . ln
.. exp . ln
.. exp . ln
.
where α =
tanh
.;
318 8
T λ in nm and T in Κ; 200 nm < λ < 600 nm; 300K > T > 195K.
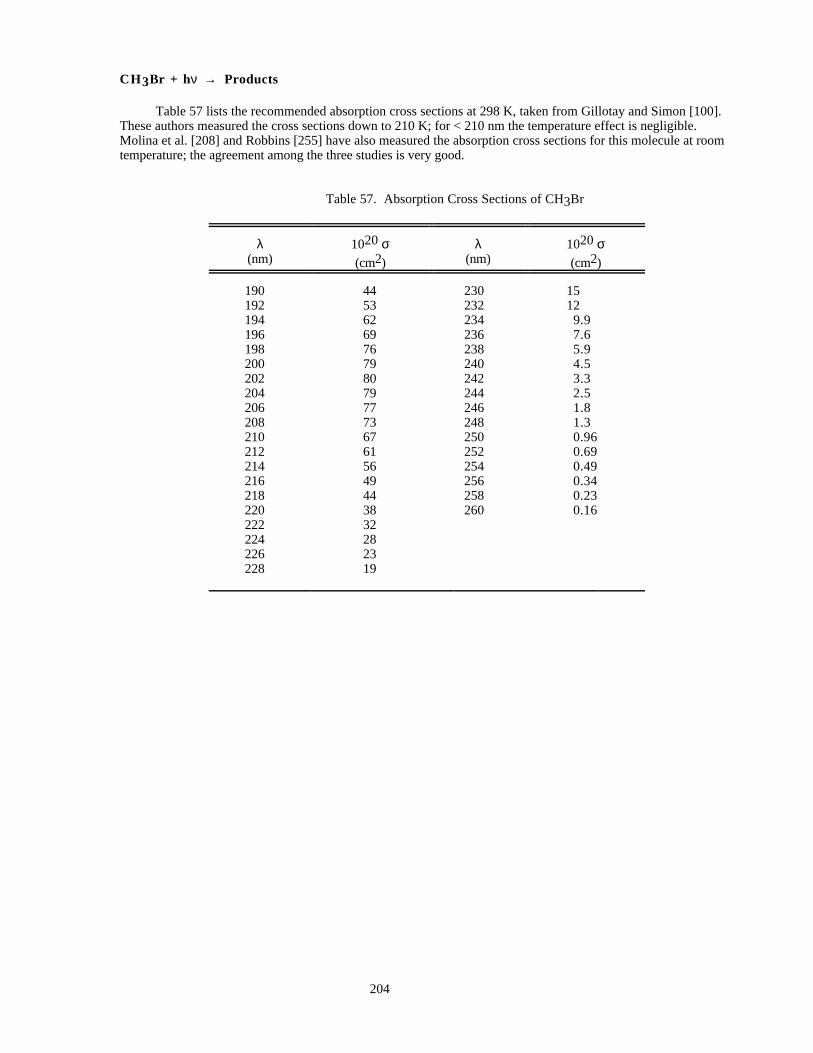
204
CH 3Br + hν → Products
Table 57 lists the recommended absorption cross sections at 298 K, taken from Gillotay and Simon [100].These authors measured the cross sections down to 210 K; for < 210 nm the temperature effect is negligible.Molina et al. [208] and Robbins [255] have also measured the absorption cross sections for this molecule at roomtemperature; the agreement among the three studies is very good.
Table 57. Absorption Cross Sections of CH3Br
λ(nm)
1020 σ(cm2)
λ(nm)
1020 σ(cm2)
190 44 230 15192 53 232 12194 62 234 9.9196 69 236 7.6198 76 238 5.9200 79 240 4.5202 80 242 3.3204 79 244 2.5206 77 246 1.8208 73 248 1.3210 67 250 0.96212 61 252 0.69214 56 254 0.49216 49 256 0.34218 44 258 0.23220 38 260 0.16222 32224 28226 23228 19
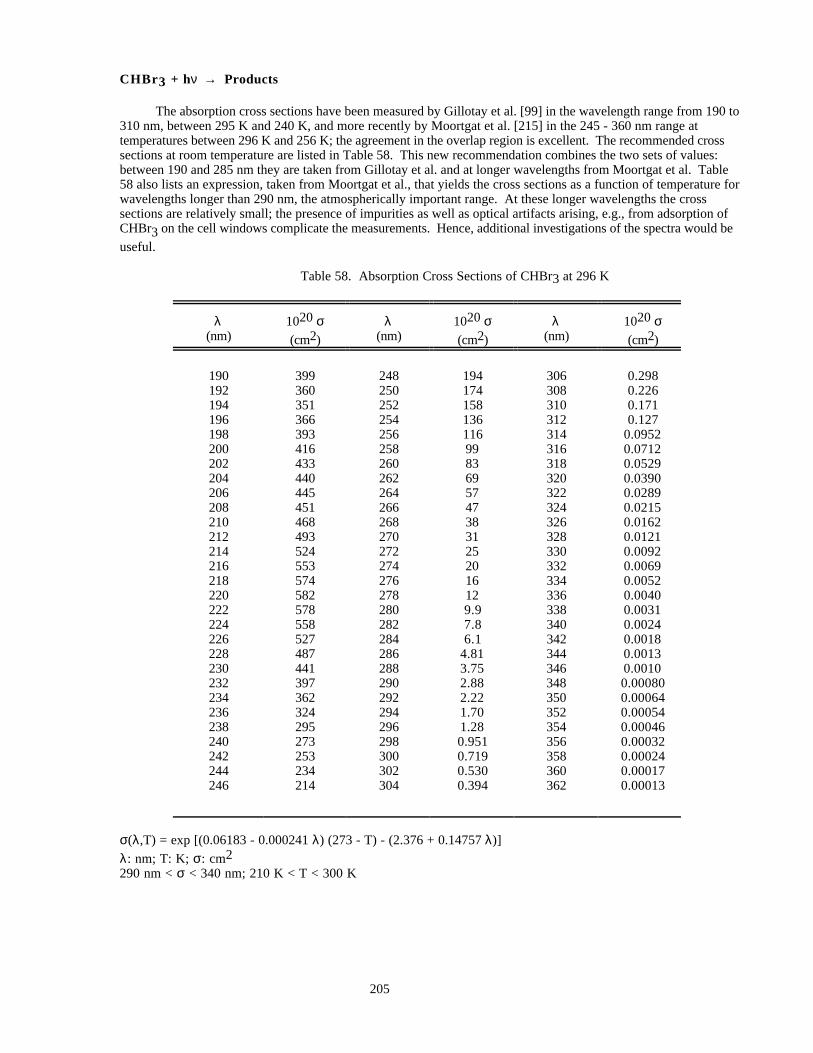
205
CHBr 3 + hν → Products
The absorption cross sections have been measured by Gillotay et al. [99] in the wavelength range from 190 to310 nm, between 295 K and 240 K, and more recently by Moortgat et al. [215] in the 245 - 360 nm range attemperatures between 296 K and 256 K; the agreement in the overlap region is excellent. The recommended crosssections at room temperature are listed in Table 58. This new recommendation combines the two sets of values:between 190 and 285 nm they are taken from Gillotay et al. and at longer wavelengths from Moortgat et al. Table58 also lists an expression, taken from Moortgat et al., that yields the cross sections as a function of temperature forwavelengths longer than 290 nm, the atmospherically important range. At these longer wavelengths the crosssections are relatively small; the presence of impurities as well as optical artifacts arising, e.g., from adsorption ofCHBr3 on the cell windows complicate the measurements. Hence, additional investigations of the spectra would be
useful.
Table 58. Absorption Cross Sections of CHBr3 at 296 K
λ(nm)
1020 σ(cm2)
λ(nm)
1020 σ(cm2)
λ(nm)
1020 σ(cm2)
190 399 248 194 306 0.298192 360 250 174 308 0.226194 351 252 158 310 0.171196 366 254 136 312 0.127198 393 256 116 314 0.0952200 416 258 99 316 0.0712202 433 260 83 318 0.0529204 440 262 69 320 0.0390206 445 264 57 322 0.0289208 451 266 47 324 0.0215210 468 268 38 326 0.0162212 493 270 31 328 0.0121214 524 272 25 330 0.0092216 553 274 20 332 0.0069218 574 276 16 334 0.0052220 582 278 12 336 0.0040222 578 280 9.9 338 0.0031224 558 282 7.8 340 0.0024226 527 284 6.1 342 0.0018228 487 286 4.81 344 0.0013230 441 288 3.75 346 0.0010232 397 290 2.88 348 0.00080234 362 292 2.22 350 0.00064236 324 294 1.70 352 0.00054238 295 296 1.28 354 0.00046240 273 298 0.951 356 0.00032242 253 300 0.719 358 0.00024244 234 302 0.530 360 0.00017246 214 304 0.394 362 0.00013
σ(λ,T) = exp [(0.06183 - 0.000241 λ) (273 - T) - (2.376 + 0.14757 λ)]
λ: nm; T: K; σ: cm2
290 nm < σ < 340 nm; 210 K < T < 300 K
206
CF3Br (Halon-1301) + hν → Products
The preferred absorption cross sections at 298 K, listed in Table 59, are the mean of the values reported byGillotay and Simon [101] at 2 nm intervals and Burkholder et al. [40] at 1 nm intervals over the wavelength rangewhere the agreement is acceptable, i.e., better than 70%. At longer wavelengths Burkholder et al. [40] measurelarger values than those reported by Gillotay and Simon. Molina et al. [208] have also measured these crosssections, which agree better with Gillotay and Simon. However, the agreement in the wavelength range 190-230 nmamong the three studies is excellent. More recently, Orkin and Kasimovskaya [236] measured the cross sections atroom temperature; their results are in good agreement with the recommended values over the wavelength regionrelevant for atmospheric photodissociation, i.e., ~ 200-220 nm. The temperature dependence of the cross sectionshas been measured by Gillotay and Simon as well as Burkholder et al. [40]. The agreement between these twostudies is poor. We have not evaluated the temperature dependence of the cross sections, and the readers are referredto the original publications for this information. For all the bromofluoromethanes, photolysis is expected to cleavethe C-Br bond with unit quantum efficiency. Orkin and Kasimovskaya measured the cross sections in thewavelength range 190-320 nm, at 295 K; their results agree with the recommendation.
CF2Br 2 (Halon-1202) + hν → Products
The preferred absorption cross sections at 298 K, listed in Table 59, are the mean of the values reported byGillotay and Simon [101] at 2 nm intervals and Burkholder et al. [40] at 1 nm intervals over the wavelength rangewhere the agreement is no more than a factor of 2. At wavelengths longer than ~250 nm, Burkholder et al. [40]measured cross sections larger than those reported by Gillotay and Simon [101] and Molina et al. [208]. Thediscrepancy increases with wavelength and is more than a factor of 2 beyond 280 nm. However, the agreementbetween all three measurements is acceptable below 250 nm. The values of Molina et al. agree with those ofGillotay and Simon over the entire range of wavelengths. The temperature dependence of the cross sections has beenmeasured by Gillotay and Simon as well as Burkholder et al. [40]. The agreement between these two studies is poor.Orkin and Kasimovskaya [236] measured the cross sections in the wavelength range 190-320 nm at 295 K; theirresults agree with the recommended values.
The quantum yield for the dissociation of CF2Br2 has been measured to be unity at 206, 248 and 308 nm byMolina and Molina [205], independent of pressure, in contrast to an earlier report by Walton [323] that the quantumyield at 265 nm decreases from unity when the system pressure is raised to 50 torr of CO2. Orkin andKasimovskaya [236] measured the cross sections in the wavelength range 190-320 nm, at 295 K; their results agreewith the recommendation.
CF2BrCF 2Br (Halon-2402) + hν → Products
The preferred absorption cross sections at 298 K, listed in Table 59, are the mean of the values reported byGillotay et al. [104] at 2 nm intervals and Burkholder et al. [40] at 1 nm intervals over the wavelength range wherethe agreement is acceptable, i.e., ~70%. At longer wavelengths, Burkholder et al. [40] measured larger cross sectionsthan those measured by Gillotay et al. Molina et al. [208] have also measured these cross sections, and they agreewith the results of Gillotay et al. at longer wavelengths. The agreement between the three studies at wavelengthsshorter than 250 nm is good. The results of Robbins [256] and of Orkin and Kasimovskaya [236] are in goodagreement with the recommended values.
The temperature dependence of the cross sections has been measured by Gillotay et al. and Burkholder et al.The agreement between the two studies is poor at longer wavelengths. We have not evaluated the temperaturedependence of the cross section, and the readers are referred to the investigators for the information. Orkin andKasimovskaya measured the cross sections in the wavelength range 190-320 nm, at 295 K; their results agree withthe recommendation.
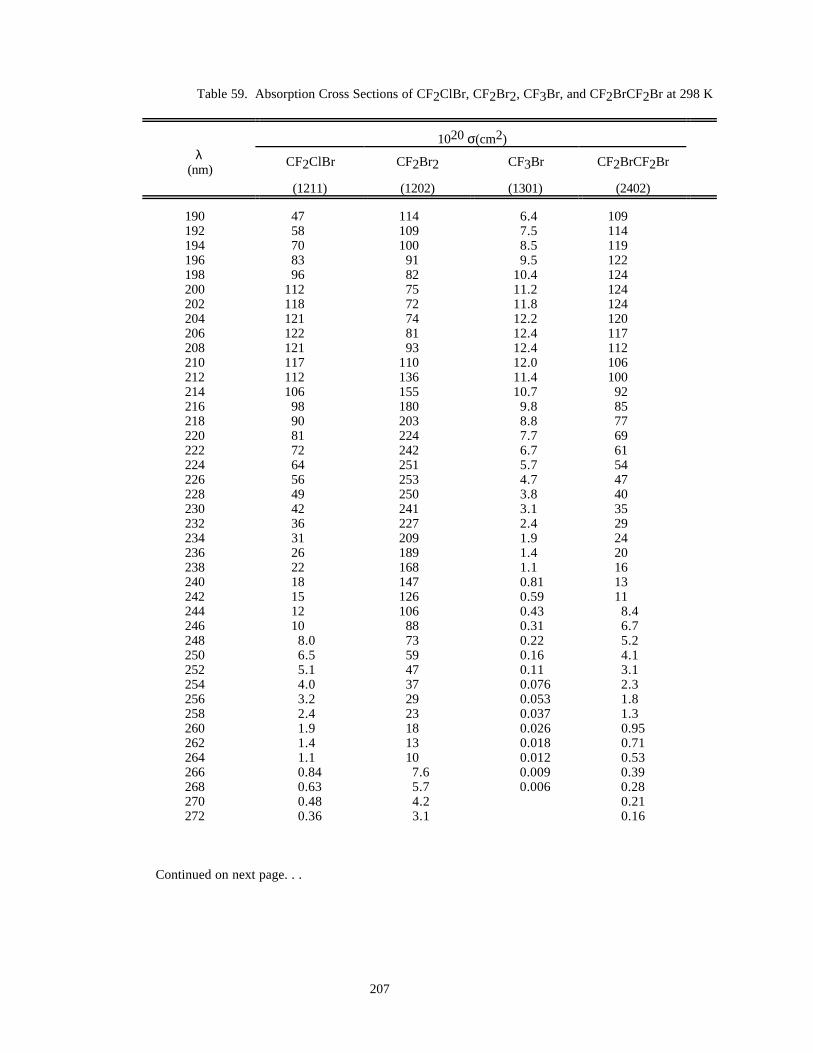
207
Table 59. Absorption Cross Sections of CF2ClBr, CF2Br2, CF3Br, and CF2BrCF2Br at 298 K
1020 σ(cm2)λ
(nm)CF2ClBr
(1211)
CF2Br2
(1202)
CF3Br
(1301)
CF2BrCF2Br
(2402)
190 47 114 6.4 109192 58 109 7.5 114194 70 100 8.5 119196 83 91 9.5 122198 96 82 10.4 124200 112 75 11.2 124202 118 72 11.8 124204 121 74 12.2 120206 122 81 12.4 117208 121 93 12.4 112210 117 110 12.0 106212 112 136 11.4 100214 106 155 10.7 92216 98 180 9.8 85218 90 203 8.8 77220 81 224 7.7 69222 72 242 6.7 61224 64 251 5.7 54226 56 253 4.7 47228 49 250 3.8 40230 42 241 3.1 35232 36 227 2.4 29234 31 209 1.9 24236 26 189 1.4 20238 22 168 1.1 16240 18 147 0.81 13242 15 126 0.59 11244 12 106 0.43 8.4246 10 88 0.31 6.7248 8.0 73 0.22 5.2250 6.5 59 0.16 4.1252 5.1 47 0.11 3.1254 4.0 37 0.076 2.3256 3.2 29 0.053 1.8258 2.4 23 0.037 1.3260 1.9 18 0.026 0.95262 1.4 13 0.018 0.71264 1.1 10 0.012 0.53266 0.84 7.6 0.009 0.39268 0.63 5.7 0.006 0.28270 0.48 4.2 0.21272 0.36 3.1 0.16
Continued on next page. . .
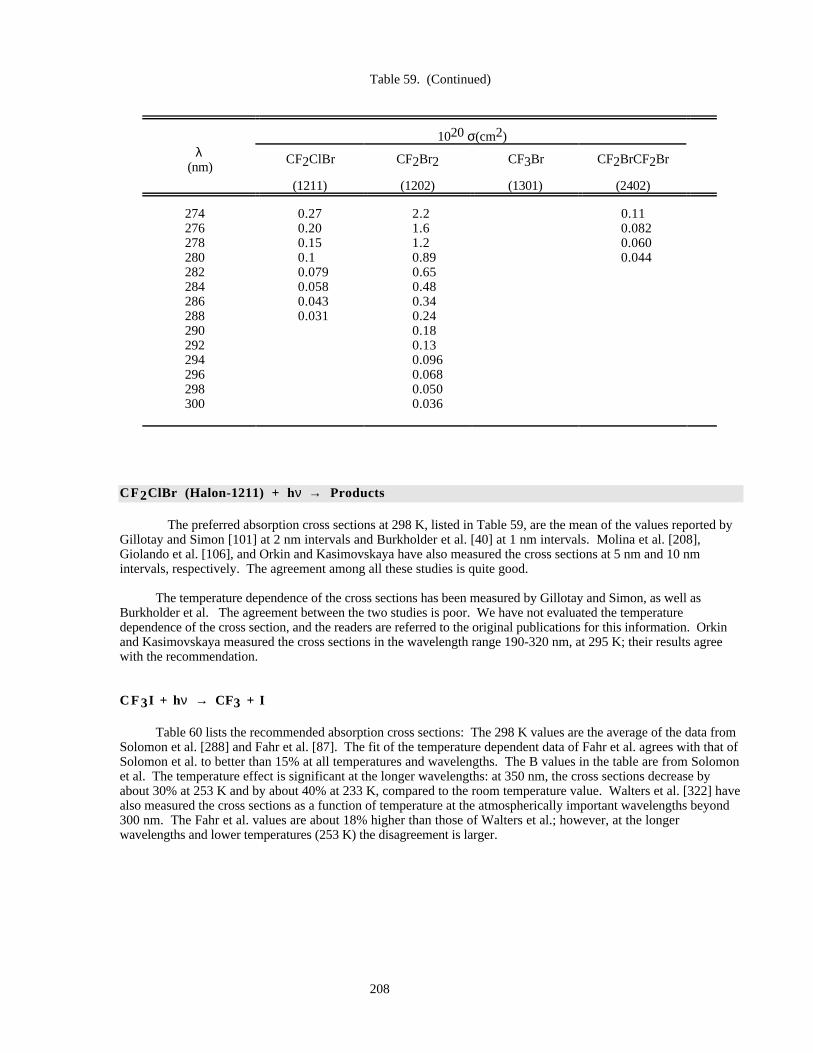
208
Table 59. (Continued)
1020 σ(cm2)λ
(nm)CF2ClBr
(1211)
CF2Br2
(1202)
CF3Br
(1301)
CF2BrCF2Br
(2402)
274 0.27 2.2 0.11276 0.20 1.6 0.082278 0.15 1.2 0.060280 0.1 0.89 0.044282 0.079 0.65284 0.058 0.48286 0.043 0.34288 0.031 0.24290 0.18292 0.13294 0.096296 0.068298 0.050300 0.036
CF2ClBr (Halon-1211) + hν → Products
The preferred absorption cross sections at 298 K, listed in Table 59, are the mean of the values reported byGillotay and Simon [101] at 2 nm intervals and Burkholder et al. [40] at 1 nm intervals. Molina et al. [208],Giolando et al. [106], and Orkin and Kasimovskaya have also measured the cross sections at 5 nm and 10 nmintervals, respectively. The agreement among all these studies is quite good.
The temperature dependence of the cross sections has been measured by Gillotay and Simon, as well asBurkholder et al. The agreement between the two studies is poor. We have not evaluated the temperaturedependence of the cross section, and the readers are referred to the original publications for this information. Orkinand Kasimovskaya measured the cross sections in the wavelength range 190-320 nm, at 295 K; their results agreewith the recommendation.
CF3I + hν → CF3 + I
Table 60 lists the recommended absorption cross sections: The 298 K values are the average of the data fromSolomon et al. [288] and Fahr et al. [87]. The fit of the temperature dependent data of Fahr et al. agrees with that ofSolomon et al. to better than 15% at all temperatures and wavelengths. The B values in the table are from Solomonet al. The temperature effect is significant at the longer wavelengths: at 350 nm, the cross sections decrease byabout 30% at 253 K and by about 40% at 233 K, compared to the room temperature value. Walters et al. [322] havealso measured the cross sections as a function of temperature at the atmospherically important wavelengths beyond300 nm. The Fahr et al. values are about 18% higher than those of Walters et al.; however, at the longerwavelengths and lower temperatures (253 K) the disagreement is larger.
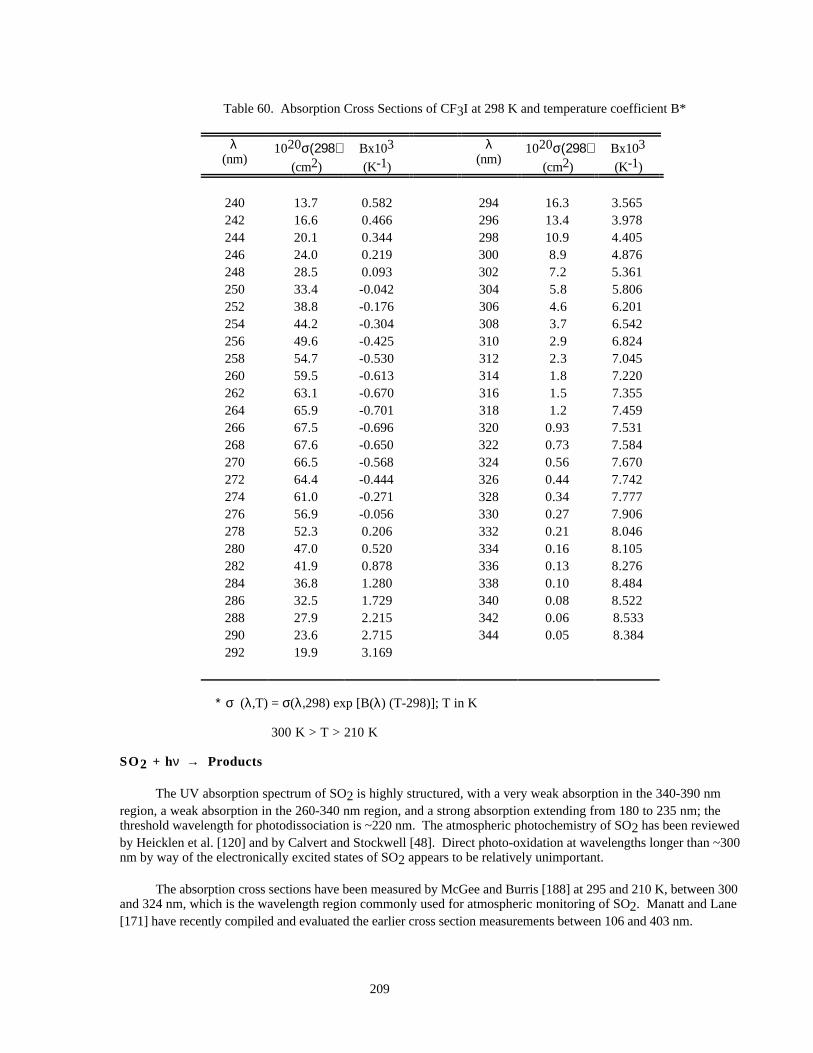
209
Table 60. Absorption Cross Sections of CF3I at 298 K and temperature coefficient B*
λ(nm)
1020σ(298)(cm2)
Bx103
(K-1)
λ(nm)
1020σ(298)(cm2)
Bx103
(K-1)
240 13.7 0.582 294 16.3 3.565242 16.6 0.466 296 13.4 3.978244 20.1 0.344 298 10.9 4.405246 24.0 0.219 300 8.9 4.876248 28.5 0.093 302 7.2 5.361250 33.4 -0.042 304 5.8 5.806252 38.8 -0.176 306 4.6 6.201254 44.2 -0.304 308 3.7 6.542256 49.6 -0.425 310 2.9 6.824258 54.7 -0.530 312 2.3 7.045260 59.5 -0.613 314 1.8 7.220262 63.1 -0.670 316 1.5 7.355264 65.9 -0.701 318 1.2 7.459266 67.5 -0.696 320 0.93 7.531268 67.6 -0.650 322 0.73 7.584270 66.5 -0.568 324 0.56 7.670272 64.4 -0.444 326 0.44 7.742274 61.0 -0.271 328 0.34 7.777276 56.9 -0.056 330 0.27 7.906278 52.3 0.206 332 0.21 8.046280 47.0 0.520 334 0.16 8.105282 41.9 0.878 336 0.13 8.276284 36.8 1.280 338 0.10 8.484286 32.5 1.729 340 0.08 8.522288 27.9 2.215 342 0.06 8.533290 23.6 2.715 344 0.05 8.384292 19.9 3.169
∗ σ (λ,T) = σ(λ,298) exp [B(λ) (T-298)]; T in K
300 K > T > 210 K
SO2 + hν → Products
The UV absorption spectrum of SO2 is highly structured, with a very weak absorption in the 340-390 nmregion, a weak absorption in the 260-340 nm region, and a strong absorption extending from 180 to 235 nm; thethreshold wavelength for photodissociation is ~220 nm. The atmospheric photochemistry of SO2 has been reviewedby Heicklen et al. [120] and by Calvert and Stockwell [48]. Direct photo-oxidation at wavelengths longer than ~300nm by way of the electronically excited states of SO2 appears to be relatively unimportant.
The absorption cross sections have been measured by McGee and Burris [188] at 295 and 210 K, between 300and 324 nm, which is the wavelength region commonly used for atmospheric monitoring of SO2. Manatt and Lane[171] have recently compiled and evaluated the earlier cross section measurements between 106 and 403 nm.
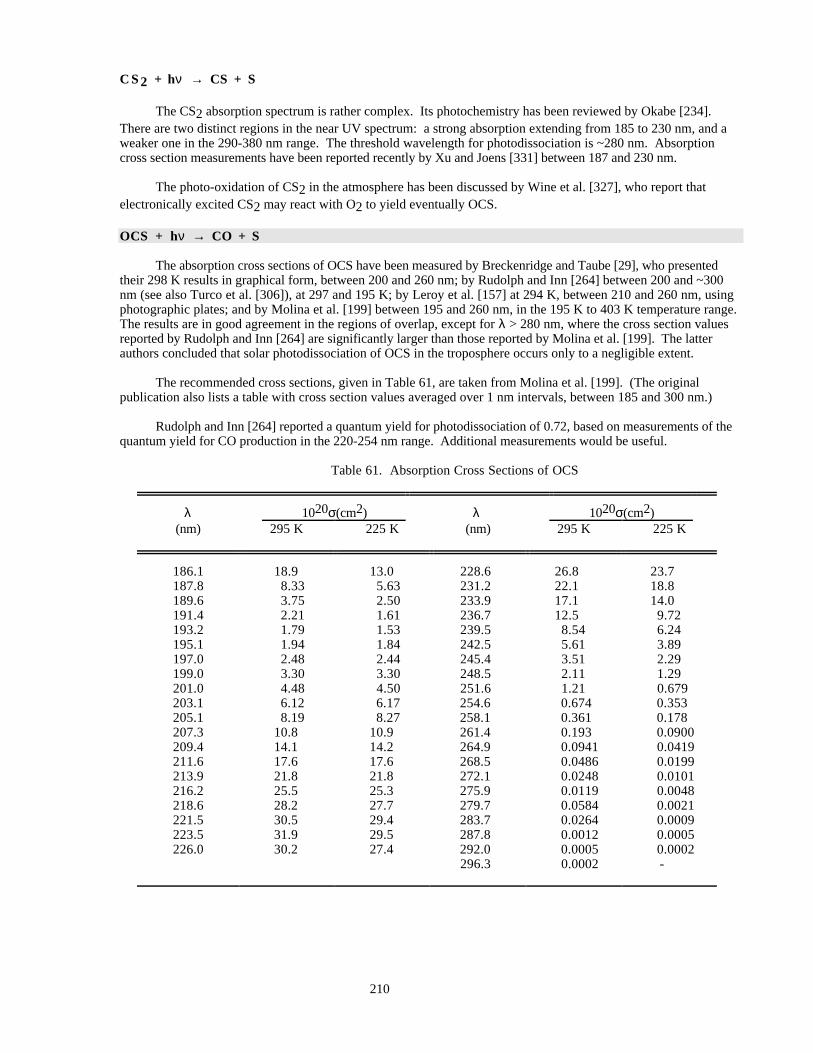
210
C S2 + hν → CS + S
The CS2 absorption spectrum is rather complex. Its photochemistry has been reviewed by Okabe [234].There are two distinct regions in the near UV spectrum: a strong absorption extending from 185 to 230 nm, and aweaker one in the 290-380 nm range. The threshold wavelength for photodissociation is ~280 nm. Absorptioncross section measurements have been reported recently by Xu and Joens [331] between 187 and 230 nm.
The photo-oxidation of CS2 in the atmosphere has been discussed by Wine et al. [327], who report thatelectronically excited CS2 may react with O2 to yield eventually OCS.
OCS + hν → CO + S
The absorption cross sections of OCS have been measured by Breckenridge and Taube [29], who presentedtheir 298 K results in graphical form, between 200 and 260 nm; by Rudolph and Inn [264] between 200 and ~300nm (see also Turco et al. [306]), at 297 and 195 K; by Leroy et al. [157] at 294 K, between 210 and 260 nm, usingphotographic plates; and by Molina et al. [199] between 195 and 260 nm, in the 195 K to 403 K temperature range.The results are in good agreement in the regions of overlap, except for λ > 280 nm, where the cross section valuesreported by Rudolph and Inn [264] are significantly larger than those reported by Molina et al. [199]. The latterauthors concluded that solar photodissociation of OCS in the troposphere occurs only to a negligible extent.
The recommended cross sections, given in Table 61, are taken from Molina et al. [199]. (The originalpublication also lists a table with cross section values averaged over 1 nm intervals, between 185 and 300 nm.)
Rudolph and Inn [264] reported a quantum yield for photodissociation of 0.72, based on measurements of thequantum yield for CO production in the 220-254 nm range. Additional measurements would be useful.
Table 61. Absorption Cross Sections of OCS
λ 1020σ(cm2) λ 1020σ(cm2)(nm) 295 K 225 K (nm) 295 K 225 K
186.1 18.9 13.0 228.6 26.8 23.7187.8 8.33 5.63 231.2 22.1 18.8189.6 3.75 2.50 233.9 17.1 14.0191.4 2.21 1.61 236.7 12.5 9.72193.2 1.79 1.53 239.5 8.54 6.24195.1 1.94 1.84 242.5 5.61 3.89197.0 2.48 2.44 245.4 3.51 2.29199.0 3.30 3.30 248.5 2.11 1.29201.0 4.48 4.50 251.6 1.21 0.679203.1 6.12 6.17 254.6 0.674 0.353205.1 8.19 8.27 258.1 0.361 0.178207.3 10.8 10.9 261.4 0.193 0.0900209.4 14.1 14.2 264.9 0.0941 0.0419211.6 17.6 17.6 268.5 0.0486 0.0199213.9 21.8 21.8 272.1 0.0248 0.0101216.2 25.5 25.3 275.9 0.0119 0.0048218.6 28.2 27.7 279.7 0.0584 0.0021221.5 30.5 29.4 283.7 0.0264 0.0009223.5 31.9 29.5 287.8 0.0012 0.0005226.0 30.2 27.4 292.0 0.0005 0.0002
296.3 0.0002 -
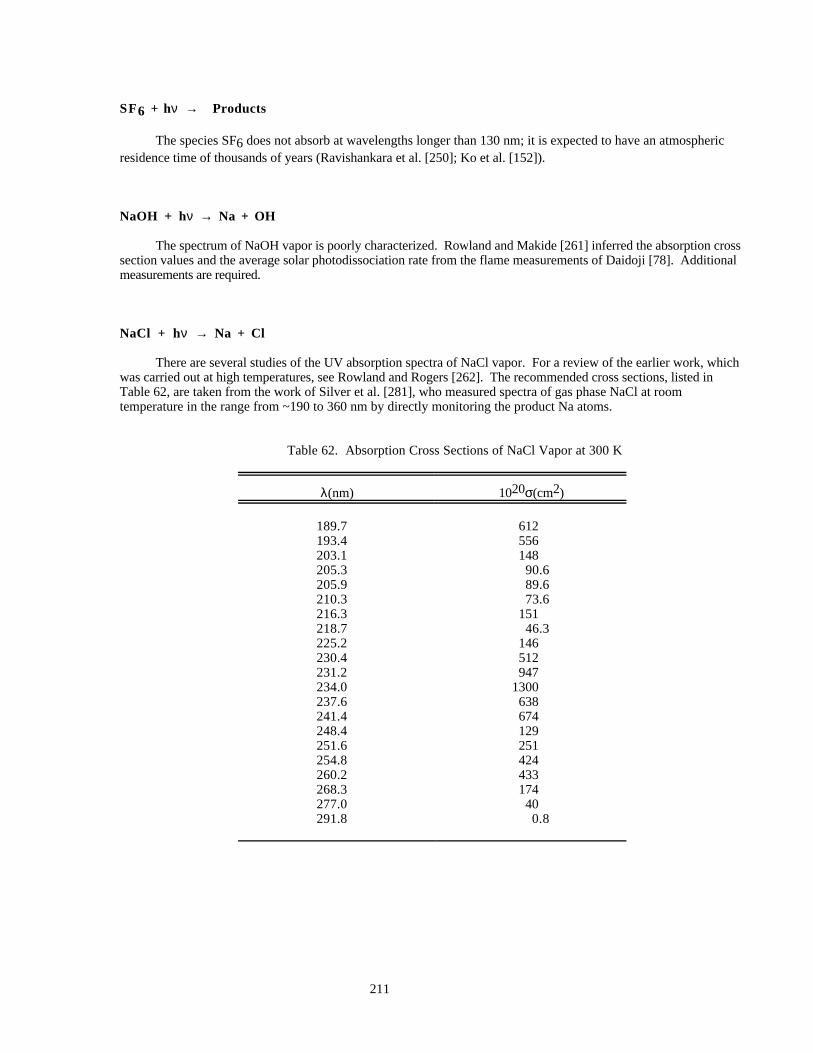
211
SF6 + hν → Products
The species SF6 does not absorb at wavelengths longer than 130 nm; it is expected to have an atmosphericresidence time of thousands of years (Ravishankara et al. [250]; Ko et al. [152]).
NaOH + hν → Na + OH
The spectrum of NaOH vapor is poorly characterized. Rowland and Makide [261] inferred the absorption crosssection values and the average solar photodissociation rate from the flame measurements of Daidoji [78]. Additionalmeasurements are required.
NaCl + hν → Na + Cl
There are several studies of the UV absorption spectra of NaCl vapor. For a review of the earlier work, whichwas carried out at high temperatures, see Rowland and Rogers [262]. The recommended cross sections, listed inTable 62, are taken from the work of Silver et al. [281], who measured spectra of gas phase NaCl at roomtemperature in the range from ~190 to 360 nm by directly monitoring the product Na atoms.
Table 62. Absorption Cross Sections of NaCl Vapor at 300 K
λ(nm) 1020σ(cm2)
189.7 612193.4 556203.1 148205.3 90.6205.9 89.6210.3 73.6216.3 151218.7 46.3225.2 146230.4 512231.2 947234.0 1300237.6 638241.4 674248.4 129251.6 251254.8 424260.2 433268.3 174277.0 40291.8 0.8
212
References for Photochemistry Section
1 . The Stratosphere 1981: Theory and Measurements , World Meteorological Organization Global Ozone Research andMonitoring Project, Report No. 11; see NASA-TM-84125, 1982, National Aeronautics and Space Administration.
2 . Adler-Golden, S.M. and J.R. Wiesenfeld, 1981, Chem. Phys. Lett., 82, 281.3 . Allen, M. and J.E. Frederick, 1982, J. Atmos. Sci., 39, 2066-2075.4 . Amimoto, S.T., A.P. Force, J.R. Wiesenfeld, and R.H. Young, 1980, J. Chem. Phys., 73, 1244-1247.5 . Amoruso, A., M. Cacciani, A. DiSarra, and G. Fiocco, 1990, J. Geophys. Res., 95, 20565.6 . Amoruso, A., L. Crescentini, G. Fiocco, and M. Volpe, 1993, J. Geophys. Res., 98, 16857-16863.7 . Amoruso, A., L. Crescentini, M. Silvia Cola, and G. Fiocco, 1996, J. Quant. Spectrosc. Radiat. Transfer, 56, 145-
152.8 . Anderson, G.P. and L.A. Hall, 1983, J. Geophys. Res., 88, 6801-6806.9 . Anderson, G.P. and L.A. Hall, 1986, J. Geophys. Res., 91, 14509-14514.10. Arnold, I., F.J. Comes, and G.K. Moortgat, 1977, Chem. Phys., 24, 211-217.11. Baer, S., H. Hippler, R. Rahn, M. Siefke, N. Seitzinger, and J. Troe, 1991, J. Chem. Phys., 95, 6463-6470.12. Ball, S.M., G. Hancock, I.J. Murphy, and S.P. Rayner, 1993, Geophys. Res. Lett., 20, 2063-2066.13. Ball, S.M., G. Hancock, and F. Winterbottom, 1995, Faraday Discuss., 100, 215.14. Ballash, N.M. and D.A. Armstrong, 1974, Spectrochim Acta, 30A, 941-944.15. Barker, J.R., L. Brouwer, R. Patrick, M.J. Rossi, P.L. Trevor, and D.M. Golden, 1985, Int. J. Chem. Kinet., 17,
991-1006.16. Barnes, R.J., M. Lock, J. Coleman, and A. Sinha, 1996, J. Phys. Chem., 100, 453-457.17. Bass, A.M., L.C. Glasgow, C. Miller, J.P. Jesson, and S.L. Filken, 1980, Planet. Space Sci., 28, 675.18. Bass, A.M., A.E. Ledford, and A.H. Laufer, 1976, J. Res. NBS, 80A, 143-166.19. Bauer, D., J.N. Crowley, and G.K. Moortgat, 1992, J. Photochem. and Photobiol., A65, 3530-3538.20. Benter, T., C. Feldmann, U. Kirchner, M. Schmidt, S. Schmidt, and R.N. Schindler, 1995, Ber. Bunsenges. Phys.
Chem., 99, 1144-1147.21. Biaume, F., 1973, J. Photochem., 2, 139.22. Birk, M., R.R. Friedl, E.A. Cohen, H.M. Pickett, and S.P. Sander, 1989, J. Chem. Phys., 91, 6588-6597.23. Birks, J.W., B. Shoemaker, T.J. Leck, R.A. Borders, and L.J. Hart, 1977, J. Chem. Phys., 66, 4591.24. Bishenden, E., J. Haddock, and D.J. Donaldson, 1991, J. Phys. Chem., 95, 2113.25. Bishenden, E., J. Haddock, and D.J. Donaldson, 1992, J. Phys. Chem., 96, 6513.26. Bongartz, A., J. Kames, F. Welter, and U. Schurath, 1991, J. Phys. Chem., 95, 1076-1082.27. Brandon, J.T., S.A. Reid, D.C. Robie, and H. Reisler, 1992, J. Chem. Phys., 97, 5246.28. Braun, M., A. Fahr, R. Klein, M.J. Kurylo, and R.E. Huie, 1991, J. Geophys. Res., 96, 13009.29. Breckenridge, W. and H.H. Taube, 1970, J. Chem. Phys., 52, 1713-1715.30. Brion, J., A. Chakir, D. Daumont, J. Malicet, and C. Parisse, 1993, Chem. Phys. Lett., 213, 610-612.31. Brock, J.C. and R.T. Watson, 1980, Chem. Phys., 46, 477-484.32. Brock, J.C. and R.T. Watson, 1980, Chem. Phys. Lett., 71, 371-375.33. Burkholder, J.B., 1993, J. Geophys. Res., 98, 2963-2974.34. Burkholder, J.B. and E.J. Bair, 1983, J. Phys. Chem., 87, 1859-1863.35. Burkholder, J.B., R.L. Mauldin, R.J. Yokelson, S. Solomon, and A.R. Ravishankara, 1993, J. Phys. Chem., 97,
7597-7605.36. Burkholder, J.B., J.J. Orlando, and C.J. Howard, 1990, J. Phys. Chem., 94, 687-695.37. Burkholder, J.B., A.R. Ravishankara, and S. Solomon, 1995, J. Geophys. Res., 100, 16793-16800.38. Burkholder, J.B., R.K. Talukdar, and A.R. Ravishankara, 1994, Geophys. Res. Lett., 21, 585-588.39. Burkholder, J.B., R.K. Talukdar, A.R. Ravishankara, and S. Solomon, 1993, J. Geophys. Res., 98, 22937-22948.40. Burkholder, J.B., R.R. Wilson, T. Gierczak, R. Talukdar, S.A. McKeen, J.J. Orlando, G.L. Vaghjiani, and A.R.
Ravishankara, 1991, J. Geophys. Res., 96, 5025-5043.41. Burley, J.D., C.E. Miller, and H.S. Johnston, 1993, J. Molec. Spec, 158, 377-391.42. Burrows, J.P., G.S. Tyndall, and G.K. Moortgat, paper presented at the 16th Informal Conf. on Photochemistry,
1984, Boston.43. Burrows, J.P., G.S. Tyndall, and G.K. Moortgat, 1985, J. Phys. Chem., 89, 4848-4856.44. Burrows, J.P., G.S. Tyndall, and G.K. Moortgat, 1988, J. Phys. Chem., 92, 4340-4348.45. Butler, P.J.D. and L.F. Phillips, 1983, J. Phys. Chem., 87, 183-184.
213
46. Cacciani, M., A.D. Sarra, G. Fiocco, and A. Amoruso, 1989, J. Geophys. Res., 94, 8485-8490.47. Calvert, J.G. and J.N. Pitts, Photochemistry, 1966, New York: John Wiley & Sons, Inc., pp. 230-231.48. Calvert, J.G. and W.R. Stockwell, 1983, Acid Precipitation: SO 2 , NO, NO 2 Oxidation Mechanisms: Atmospheric
Considerations, Ann Arbor Sci. Publishers, Ann Arbor, Michigan.49. Canosa-Mas, C.E., M. Fowles, P.J. Houghton, and R.P. Wayne, 1987, J. Chem. Soc. Faraday Trans. 2, 83, 1465.50. Cantrell, C.A., J.A. Davidson, A.H. McDaniel, R.E. Shetter, and J.G. Calvert, 1990, J. Phys. Chem., 94, 3902-
3908.51. Cantrell, C.A., J.A. Davidson, R.E. Shetter, B.A. Anderson, and J.G. Calvert, 1987, J. Phys. Chem., 91, 5858-
5863.52. Chang, J.S., J.R. Barker, J.E. Davenport, and D.M. Golden, 1979, Chem. Phys. Lett., 60, 385-390.53. Cheung, A.S.C., K. Yoshino, J.R. Esmond, S.S.L. Chiu, D.E. Freeman, and W.H. Parkinson, 1990, J. Chem. Phys.,
92, 842-849.54. Cheung, A.S.C., K. Yoshino, W.H. Parkinson, and D.E. Freeman, 1984, Geophys. Res. Lett., 11, 580-582.55. Cheung, A.S.C., K. Yoshino, W.H. Parkinson, S.L. Guberman, and D.E. Freeman, 1986, Planet. Space Sci., 34,
1007-1021.56. Chiu, S.S.L., A.S.C. Cheung, K. Yoshino, J.R. Esmond, D.E. Freeman, and W.H. Parkinson, 1990, J. Chem. Phys.,
93, 5539-5543.57. Chou, C.C., G. Crescentini, H. Vera-Ruiz, W.S. Smith, and F.S. Rowland, paper presented at the 173rd American
Chemical Society Meeting, 1977, New Orleans, LA.58. Chou, C.C., R.J. Milstein, W.S. Smith, H. Vera-Ruiz, M.J. Molina, and F.S. Rowland, 1978, J. Phys. Chem., 82,
1 .59. Chou, C.C., H. Vera-Ruiz, K. Moe, and F.S. Rowland, 1976, unpublished results.60. Clark, J.H., C.B. Moore, and N.S. Nogar, 1978, J. Chem. Phys., 68, 1264-1271.61. CODATA, 1980, J. Phys. Chem. Ref. Data, 9, 295-471.62. CODATA, 1982, J. Phys. Chem. Ref. Data, 11, 327-496.63. Colussi, A.J., 1990, J. Phys. Chem., 94, 8922-8926.64. Colussi, A.J., S.P. Sander, and R.R. Friedl, 1992, J. Phys.Chem., 96, 4442-4445.65. Cooper, I.A., P.J. Neill, and J.R. Wiesenfeld, 1993, J. Geophys. Res., 98, 12795-12800.66. Coquart, B., A. Jenouvier, and M.F. Merienne, 1995, J. Atm. Chem, 21, 251-261.67. Coquart, B., M.F. Merienne, and A. Jenouvrier, 1990, Planet. Space Sci., 38, 287.68. Corcoran, T.C., E.J. Beiting, and M.O. Mitchell, 1992, J. Molecular Spectroscopy, 154, 119-128.69. Cox, R.A., R.A. Barton, E. Ljungstrum, and D.W. Stocker, 1984, Chem. Phys. Lett., 108, 228-232.70. Cox, R.A. and J.P. Burrows, 1979, J. Phys. Chem., 83, 2560-2568.71. Cox, R.A. and G.D. Hayman, 1988, Nature, 332, 796-800.72. Cox, R.A. and R. Patrick, 1979, Int. J. Chem. Kinet., 11, 635.73. Cox, R.A., D.W. Sheppard, and M.P. Stevens, 1982, J. Photochem., 19, 189-207.74. Coxon, J.A., W.E. Jones, and D.A. Ramsey, paper presented at the 12th International Symposium on Free Radicals,
1976, Laguna Beach, California.75. Crowley, J.N., R. Helleis, R. Muller, G.K. Moortgat, P.J. Crutzen, and J.J. Orlando, 1994, J. Geophys. Res., 99,
20683-20688.76. Crowley, J.N., F.G. Simon, J.P. Burrows, G.K. Moortgat, M.E. Jenkin, and R.A. Cox, 1991, J. Photochem. and
Photobiol. A: Chem., 60, 1-10.77. Dagaut, P. and M.J. Kurylo, 1990, J. Photochem. and Photobiol. A:Chem., 51, 133.78. Daidoji, H., 1979, Bunseki Kagaku, 28, 77.79. Daumont, D., J. Brion, J. Charbonnier, and J. Malicet, 1992, J. Atmos. Chem., 15, 145-155.80. Davenport, J.E., 1978, Report No. FAA-EQ-78-14, Federal Aviation Administration, Washington, DC.81. Davidson, J.A., C.A. Cantrell, A.H. McDaniel, R.E. Shetter, S. Madronich, and J.G. Calvert, 1988, J. Geophys.
Res., 93, 7105-7112.82. Davis, H.F. and Y.T. Lee, 1992, J. Phys. Chem., 96, 5681-5684.83. DeMore, W.B. and E. Tschuikow-Roux, 1990, J. Phys. Chem., 94, 5856-5860.84. Deters, B., J.P. Burrows, S. Himmelmann, and C. Blindauer, 1996, Ann. Geophysicae, 14, 468-475.85. Eberstein, I.J., 1990, Geophys. Res. Lett., 17, 721-724.86. Fahr, A., W. Braun, and M.J. Kurylo, 1993, J. Geophys. Res., 98, 20467-20472.87. Fahr, A., A.K. Nayak, and R. Huie, 1995, Chem. Phys., 199, 275-284.88. Fairchild, C.E., E.J. Stone, and G.M. Lawrence, 1978, J. Chem. Phys., 69, 3632-3638.
214
89. Fenter, F.F., V. Catoire, R. Lesclaux, and P.D. Lightfoot, 1993, J. Phys. Chem., 97, 3530-3538.90. Fergusson, W.C., L. Slotin, and W.G. Style, 1936, Trans. Far. Soc., 32, 956.91. Francisco, J.S., M.R. Hand, and I.H. Williams, 1996, J. Phys. Chem., 100, 9250-9253.92. Frederick, J.E. and R.D. Hudson, 1979, J. Atmos. Sci., 36, 737-745.93. Frederick, J.E. and J.E. Mentall, 1982, Geophys. Res. Lett., 9, 461-464.94. Frost, G.J., L.M. Goss, and V. Vaida, 1996, J. Geophys. Res, 101, 3869-3877.95. Frost, G.J., L.M. Goss, and V. Vaida, 1996, J. Geophys. Res., 101, 3879-3884.96. Ganske, J.A., H.N. Berko, and B.J. Finlayson-Pitts, 1992, J. Geophys. Res., 97, 7651-7656.97. Gardner, E.P., P.D. Sperry, and J.G. Calvert, 1987, J. Geophys. Res., 92, 6642-6652.98. Gibson, G.E. and N.S. Bayliss, 1933, Phys. Rev., 44, 188.99. Gillotay, D., A. Jenouvrier, B. Coquart, M.F. Merienne, and P.C. Simon, 1989, Planet. Space Sci., 37, 1127-1140.100. Gillotay, D. and P.C. Simon, 1988, Annales Geophysicae, 6, 211-215.101. Gillotay, D. and P.C. Simon, 1989, J. Atmos. Chem., 8, 41-62.102. Gillotay, D. and P.C. Simon, 1991, J. Atmos. Chem., 13, 289-299.103. Gillotay, D. and P.C. Simon, 1991, J. Atmos. Chem., 12, 269-285.104. Gillotay, D., P.C. Simon, and L. Dierickx, 1988, Aeronomica Acta, A335, 1-25.105. Gillotay, D., P.C. Simon, and L. Dierickx, 1993, Aeronomica Acta, A368, 1-15.106. Giolando, D.M., G.B. Fazekas, W.D. Taylor, and G.A. Takacs, 1980, J. Photochem., 14, 335.107. Goodeve, C.F. and F.D. Richardson, 1937, Trans. Faraday. Soc., 33, 453-457.108. Graham, R.A., 1975, Ph. D. Thesis, "Photochemistry of NO3 and the Kinetics of the N2O5-O3 System", University
of California, Berkeley, CA.109. Graham, R.A. and H.S. Johnston, 1978, J. Phys. Chem., 82, 254-268.110. Graham, R.A., A.M. Winer, and J.N. Pitts Jr., 1978, Geophys. Res. Lett., 5, 909.111. Green, R.G. and R.P. Wayne, 1976/77, J. Photochem., 6, 375-377.112. Greenblatt, G.D. and A.R. Ravishankara, 1990, J. Geophys. Res., 95, 3539-3547.113. Harder, J.W., J.W. Brault, P.V. Johnston, and G.H. Mount, 1996, J. Geophys. Res., submitted.114. Harker, A.B., W. Ho, and J.J. Ratto, 1977, Chem. Phys. Lett., 50, 394-397.115. Harwood, M.H. and R.L. Jones, 1994, J. Geophys. Res., 99, 22995-22964.116. Harwood, M.H., R.L. Jones, R.A. Cox, E. Lutman, and O.V. Rattigan, 1993, J. Photochem. Photobiol. A: Chem.,
73, 167-175.117. Harwood, M.H., D.M. Rowley, R.A. Freshwater, R.A. Cox, and R.L. Jones, 1995, J. Chem. Soc. Faraday Trans, 91,
3027-3032.118. Hayman, G.D. and R.A. Cox, 1989, Chem. Phys. Lett., 155, 1-7.119. Hearn, A.G., 1961, Proc. Phys. Soc. London, 78, 932-940.120. Heicklen, J., N. Kelly, and K. Partymiller, 1980, Rev. Chem. Intermediates, 3, 315-404.121. Herman, J.R. and J.E. Mentall, 1982, J. Geophys. Res., 87, 8967-8975.122. Herzberg, G. and K.K. Innes, 1957, Canad. J. Phys., 35, 842.123. Hochanadel, C.J., J.A. Ghormley, and P.J. Ogren, 1972, J. Chem. Phys., 56, 4426-4432.124. Horowitz, A. and J.G. Calvert, 1978, Int. J. Chem. Kinet., 10, 805.125. Hubinger, S. and J.B. Nee, 1994, Chem. Phys., 181, 247-257.126. Hubinger, S. and J.B. Nee, 1995, J. Photochem. and Photobiol. A: Chem., 85, 1-7.127. Hubrich, C. and F. Stuhl, 1980, J. Photochem., 12, 93-107.128. Hubrich, C., C. Zetzsch, and F. Stuhl, 1977, Ber. Bunsenges. Phys. Chem., 81, 437-442.129. Huder, K.J. and W.B. DeMore, 1995, J. Phys. Chem., 99, 3905-3908.130. Hudson, R.D., 1971, Reviews of Geophysics and Space Physics, 9, 305-399.131. Hudson, R.D., 1974, Canad. J. Chem., 52, 1465-1478.132. Hudson, R.D. and L.J. Kieffer, 1975, "Absorption Cross Sections of Stratospheric Molecules," The Natural
Stratosphere of 1974, Monograph 1, CIAP, pp. (5-156)-(5-194).133. Illies, A.J. and G.A. Takacs, 1976, J. Photochem., 6, 35-42.134. Inn, E.C.Y., 1975, J. Atmos. Sci., 32, 2375.135. Inn, E.C.Y., 1980, J. Geophys. Res., 85, 7493.136. Inn, E.C.Y. and Y. Tanaka, 1953, J. Opt. Soc. Am., 43, 870-873.137. Jenouvrier, A., B. Coquart, and M.F. Merienne, 1986, J. Quant. Spectros. Radiat. Transfer, 36, 349-354.138. Jensen, F. and J. Oddershede, 1990, J. Phys. Chem., 94, 2235.139. Johnston, H.S., S. Chang, and G. Whitten, 1974, J. Phys. Chem., 78, 1-7.
215
140. Johnston, H.S., H.F. Davis, and Y.T. Lee, 1996, J. Phys. Chem., 100, 4713-4723.141. Johnston, H.S. and R. Graham, 1973, J. Chem. Phys., 77, 62.142. Johnston, H.S. and R. Graham, 1974, Canad. J. Chem., 52, 1415-1423.143. Johnston, H.S., E.D. Morris Jr., and J. Van den Bogaerde, 1969, J. Am. Chem. Soc., 91, 7712.144. Johnston, H.S., M. Paige, and F. Yao, 1984, J. Geophys. Res., 89, 661.145. Jolly, G.S., D.L. Singleton, D.J. McKenney, and G. Paraskevopoulos, 1986, J. Chem. Phys., 84, 6662-6667.146. Jones, E.L. and O.R. Wulf, 1937, J. Chem. Phys., 5, 873.147. Jones, I.T.N. and K. Bayes, 1973, J. Chem. Phys., 59, 4836-4844.148. Jourdain, J.L., G. Le Bras, G. Poulet, J. Combourieu, P. Rigaud, and B. LeRoy, 1978, Chem. Phys. Lett., 57, 109.149. Jungkamp, T.P.W., U. Kirchner, M. Schmidt, and R.N. Schindler, 1995, J. Photochem. Photobiol. A: Chemistry,
99, 1-999.150. Knauth, H.D., H. Alberti, and H. Clausen, 1979, J. Phys. Chem., 83, 1604-1612.151. Knauth, H.D. and R.N. Schindler, 1983, Z. Naturforsch., 38a, 893.152. Ko, M.K.W., D.S. Nien, W.C. Wang, G. Shia, A. Goldman, F.J. Murcray, D.G. Murcray, and C.P. Rinsland, 1993, J.
Geophys. Res., 98, 10499-10507.153. Kurylo, M.J., T.J. Wallington, and P.A. Ouellette, 1987, J. Photochem., 39, 201-215.154. Langhoff, S.R., L. Jaffe, and J.O. Arnold, 1977, J. Quant. Spectrosc. Radiat. Transfer, 18, 227.155. Lawrence, W.G., K.C. Clemitshaw, and V.A. Apkarian, 1990, J. Geophys. Res., 95, 18591.156. Lee, L.C., 1982, J. Chem. Phys., 76, 4909-4915.157. Leroy, B., G. Le Bras, and P. Rigaud, 1981, Ann. Geophys., 37, 297-302.158. Lewis, B.R., L. Berzins, and J.H. Carver, 1986, J. Quant. Spectrosc. Radiat. Transfer, 36, 209-232.159. Lewis, B.R., L. Berzins, J.H. Carver, and S.T. Gibson, 1986, J. Quant. Spectrosc. Radiat. Transfer, 36, 187-207.160. Libuda, H.G. and F. Zabel, 1995, Ber. Bunsenges. Phys. Chem., 99, 1205-1213.161. Lightfoot, P.D., R.A. Cox, J.N. Crowley, M. Destriau, G.D. Hayman, M.E. Jenkin, G.K. Moortgat, and F. Zabel,
1992, Atmos. Environ., 26A, 1805-1961.162. Lightfoot, P.D. and A.A. Jemi-Alade, 1991, J.Photochem. and Photobiol. A: Chem., 59, 1-10.163. Lin, C.L., 1976, J. Chem. Eng. Data, 21, 411.164. Lin, C.L., N.K. Rohatgi, and W.B. DeMore, 1978, Geophys. Res. Lett., 5, 113-115.165. Lopez, M.I. and J.E. Sicre, 1988, J. Phys. Chem., 92, 563-564.166. Lopez, M.I. and J.E. Sicre, 1990, J. Phys. Chem., 94, 3860-3863.167. MacLeod, H., G.P. Smith, and D.M. Golden, 1988, J. Geophys. Res., 93, 3813-3823.168. Magnotta, F. and H.S. Johnston, 1980, Geophys. Res. Lett., 7, 769-772.169. Majer, J.R. and J.P. Simons, 1964, "Photochemical Processes in Halogenated Compounds," Advances in
Photochemistry, 2, Interscience, pp. 137-181.170. Malicet, J., D. Daumont, J. Charbonnier, C. Parisse, A. Chakir, and J. Brion, 1995, J. Atm. Chem, 21, 263-273.171. Manatt, S.L. and A.L. Lane, 1993, J. Quant. Spectrosc. Radiat. Transfer, 50, 267-276.172. Mandelman, M. and R.W. Nicholls, 1977, J. Quant. Spectrosc. Radiat. Trans., 17, 483.173. Margitan, J.J., 1983, J. Phys. Chem., 87, 674-679.174. Margitan, J.J. and R.T. Watson, 1982, J. Phys. Chem., 86, 3819-3824.175. Maric, D., J.P. Burrows, R. Meller, and G.K. Moortgat, 1993, J. Photochem. Photobiol. A Chem., 70, 205-214.176. Maric, D., J.P. Burrows, and G.K. Moortgat, 1994, J. Photochem. Photobiol A: Chem., 83, 179-192.177. Maricq, M.M. and T.J. Wallington, 1992, J. Phys. Chem., 96, 982-986.178. Marinelli, W.J. and H.S. Johnston, 1982, Chem. Phys. Lett., 93, 127-132.179. Marinelli, W.J., D.M. Swanson, and H.S. Johnston, 1982, J. Chem. Phys., 76, 2864-2870.180. Martin, H. and R. Gareis, 1956, Z. Elektrochemie, 60, 959-964.181. Mauersberger, K., J. Barnes, D. Hanson, and J. Morton, 1986, Geophys. Res. Lett., 13, 671-673.182. Mauersberger, K., D. Hanson, J. Barnes, and J. Morton, 1987, J. Geophys. Res., 92, 8480-8482.183. Mauldin, R.L., III, J.B. Burkholder, and A.R. Ravishankara, 1992, J. Phys. Chem., 96, 2582-2588.184. Mazely, T.L., R.R. Friedl, and S.P. Sander, 1995, J. Phys. Chem., 99, 8162-8169.185. Mazely, T.L., S.P. Sander, and R.R. Friedl, 1997, Manuscript in preparation.186. McAdam, K., B. Veyret, and R. Lesclaux, 1987, Chem. Phys. Lett., 133, 39-44.187. McElcheran, D.E., M.H.J. Wijnen, and E.W.R. Steacie, 1958, Can. J. Chem., 36, 321.188. McGee, T.J. and J. Burris, 1987, J. Quant. Spectrosc. Radiat. Trans., 37, 165-182.189. McGrath, M.P., K.C. Clemitshaw, F.S. Rowland, and W.J. Hehre, 1988, Geophys. Res. Lett., 15, 883-886.190. McGrath, M.P., K.C. Clemitshaw, F.S. Rowland, and W.J. Hehre, 1990, J. Phys. Chem., 94, 6126.
216
191. Merienne, M.F., B. Coquart, and A. Jenouvrier, 1990, Planet. Space Sci., 38, 617-625.192. Merienne, M.F., A. Jenouvrier, and B. Coquart, 1995, J. Atm. Chem, 20, 281-297.193. Michelsen, H.A., R.J. Salawitch, P.O. Wennberg, and J.G. Anderson, 1994, Geophys. Res. Lett., 21, 2227-2230.194. Minschwaner, K., G.P. Anderson, L.A. Hall, and K. Yoshino, 1992, J. Geophys. Res., 97, 10103-10108.195. Minschwaner, K. and D.E. Siskind, 1993, J. Geophys. Res., 98, 20401-20412.196. Minton, T.K., C.M. Nelson, T.A. Moore, and M. Okumura, 1992, Science, 258, 1342-1345.197. Mishalanie, E.A., J.C. Rutkowski, R.S. Hutte, and J.W. Birks, 1986, J. Phys. Chem., 90, 5578-5584.198. Mitchell, D.N., R.P. Wayne, P.J. Allen, R.P. Harrison, and R.J. Twin, 1980, J. Chem. Soc. Faraday Trans. 2, 76,
785.199. Molina, L.T., J.J. Lamb, and M.J. Molina, 1981, Geophys. Res. Lett., 8, 1008.200. Molina, L.T. and M.J. Molina, 1977, Geophys. Res. Lett., 4, 83-86.201. Molina, L.T. and M.J. Molina, 1978, J. Phys. Chem., 82, 2410-2414.202. Molina, L.T. and M.J. Molina, 1979, J. Photochem., 11, 139-144.203. Molina, L.T. and M.J. Molina, 1981, J. Photochem., 15, 97.204. Molina, L.T. and M.J. Molina, paper presented at the 182nd American Chemical Society National Meeting, 1982,
New York.205. Molina, L.T. and M.J. Molina, 1983, J. Phys. Chem., 87, 1306.206. Molina, L.T. and M.J. Molina, 1986, J. Geophys. Res., 91, 14,501-14,508.207. Molina, L.T. and M.J. Molina, 1996, Geophys. Res. Lett., 23, 563-565.208. Molina, L.T., M.J. Molina, and F.S. Rowland, 1982, J. Phys. Chem., 86, 2672-2676.209. Molina, L.T., S.D. Schinke, and M.J. Molina, 1977, Geophys. Res. Lett., 4, 580-582.210. Molina, M.J. and G. Arguello, 1979, Geophys. Res. Lett., 6, 953-955.211. Molina, M.J., A.J. Colussi, L.T. Molina, R.N. Schindler, and T.L. Tso, 1990, Chem. Phys. Lett., 173, 310.212. Molina, M.J., T. Ishiwata, and L.T. Molina, 1980, J. Phys. Chem., 84, 821-826.213. Moore, T.A., M. Okumura, M. Tagawa, and T.K. Minton, 1995, Faraday Discuss, 100, 295-307.214. Moortgat, G.K., W. Klippel, K.H. Mobius, W. Seiler, and P. Warneck, 1980, Report No. FAA-EE-80-47, Federal
Aviation Administration, Washington, DC.215. Moortgat, G.K., R. Meller, and W. Schneider, 1993, "Temperature dependence (256-296K) of the absorption cross-
sections of bromoform in the wavelength range 285-360 nm," The Tropospheric Chemistry of Ozone in the Polar Regions, H. Niki and K.H. Becker, Editors, Springer-Verlag, Berlin, pp. 359-369.
216. Moortgat, G.K., W. Seiler, and P. Warneck, 1983, J. Chem. Phys., 78, 1185-1190.217. Moortgat, G.K., B. Veyret, and R. Lesclaux, 1989, J. Phys. Chem., 93, 2362-2368.218. Moortgat, G.K. and P. Warneck, 1979, J. Chem. Phys., 70, 3639-3651.219. Morel, O., R. Simonaitis, and J. Heicklen, 1980, Chem. Phys. Lett., 73, 38.220. Murtagh, D.P., 1988, Planet. Space Sci., 36, 819-828.221. Nayak, A.K., T.J. Buckley, M.J. Kurylo, and A. Fahr, 1996, J. Geophys. Res., 101, 9055-9062.222. Nayak, A.K., M.J. Kurylo, and A. Fahr, 1995, J. Geophys. Res, 100, 11185-11189.223. Nee, J.B., 1991, J. Quant. Spectrosc. Radiat. Transfer, 46, 55.224. Nelson, C.M., T.A. Moore, and M. Okumura, 1994, J. Chem. Phys., 100, 8055-8064.225. Nelson, C.M., T.A. Moore, M. Okumura, and T.K. Minton, 1996, Chem. Phys, 2248, 287-307.226. Nelson, H.H. and H.S. Johnston, 1981, J. Phys. Chem., 85, 3891.227. Nickolaisen, S.L. and S.P. Sander, 1996, Manuscript in preparation.228. Nickolaisen, S.L., S.P. Sander, and R.R. Friedl, 1996, J. Phys. Chem., 100, 10165.229. Nicolet, M. and R. Kennes, 1989, Planet. Space Sci., 37, 459-491.230. Nicovich, J.M. and P.H. Wine, 1988, J. Geophys. Res., 93, 2417.231. Nolle, A., H. Heydtmann, R. Meller, and G.K. Moortgat, 1993, Geophys. Res. Lett., 20, 707-710.232. Nölle, A., H. Heydtmann, R. Meller, W. Schneider, and G.K. Moortgat, 1992, Geophys. Res. Lett., 19, 281-284.233. Oh, D., W. Sisk, A. Young, and H. Johnston, 1986, J. Chem. Phys., 85, 7146-7158.234. Okabe, H., 1978, Photochemistry of Small Molecules, John Wiley and Sons Inc., New York, pp. 217.235. Okabe, H., 1980, J. Chem. Phys., 72, 6642.236. Orkin, V.L. and E.E. Kasimovskaya, 1995, J. Atm. Chem, 21, 1-11.237. Orlando, J.J. and J.B. Burkholder, 1995, J. Phys. Chem., 99, 1143-1150.238. Orlando, J.J., J.B. Burkholder, S.A. McKeen, and A.R. Ravishankara, 1991, J. Geophys. Res., 96, 5013-5023.239. Orlando, J.J., G.S. Tyndall, G.K. Moortgat, and J.G. Calvert, 1993, J. Phys. Chem., 97, 10996-11000.240. Paraskevopoulos, G. and R.J. Cvetanovic, 1969, J. Am. Chem. Soc., 91, 7572.
217
241. Parrish, D.D., P.C. Murphy, D.L. Albritton, and F.C. Fehsenfeld, 1983, Atmos. Environ., 17, 1365.242. Paukert, T.T. and H.S. Johnston, 1972, J. Chem. Phys., 56, 2824-2838.243. Permien, T., R. Vogt, and R.N. Schindler, 1988, "Mechanisms of Gas Phase-Liquid Phase Chemical
Transformations," Air Pollution Report #17, R.A. Cox, Editor, Environmental Research Program of the CEC.,Brussels.
244. Preston, K.F. and R.F. Barr, 1971, J. Chem. Phys., 54, 3347-3348.245. Rattigan, O., E. Lutman, R.L. Jones, and R.A. Cox, 1992, J. Photochem. Photobiol. A: Chem., 66, 313-326.246. Rattigan, O., E. Lutman, R.L. Jones, R.A. Cox, K. Clemitshaw, and J. Williams, 1992, J. Photochem. Photobiol.
A: Chem., 69, 125-126.247. Rattigan, O.V., D.J. Lary, R.L. Jones, and R.A. Cox, 1996, J. Geophys. Res., 101, 23021-23033.248. Ravishankara, A.R., 1995, Faraday Discuss, 100, 335.249. Ravishankara, A.R. and R.L. Mauldin, 1986, J. Geophys. Res., 91, 8709-8712.250. Ravishankara, A.R., S. Solomon, A.A. Turnipseed, and R.F. Warren, 1993, Science, 259, 194-199.251. Ravishankara, A.R. and P.H. Wine, 1983, Chem. Phys. Lett., 101, 73.252. Ravishankara, A.R., P.H. Wine, C.A. Smith, P.E. Barbone, and A. Torabi, 1986, J. Geophys. Res., 91, 5355-5360.253. Reid, S.A., J.T. Brandon, and H. Reisler, 1993, J. Phys. Chem., 97, 540.254. Rigaud, P., B. Leroy, G. Le Bras, G. Poulet, J.L. Jourdain, and J. Combourieu, 1977, Chem. Phys. Lett., 46, 161.255. Robbins, D.E., 1976, Geophys. Res. Lett., 3, 213-216. See also Erratum, GRL, 1976, Vol. 3, p. 757.256. Robbins, D.E., paper presented at the International Conference on Problems Related to the Stratosphere, 1977,
Pasadena, California Jet Propulsion Laboratory, California Institute of Technology.257. Robbins, D.E. and R.S. Stolarski, 1976, Geophys. Rev. Lett., 3, 603-606.258. Roehl, C.M., D. Bauer, and G.K. Moortgat, 1996, J. Phys. Chem., 100, 4038-4047.259. Roehl, C.M., J.J. Orlando, and J.G. Calvert, 1992, J. Photochem. Photobiol. A: Chem., 69, 1-5.260. Rogers, J.D., 1990, J. Phys. Chem., 94, 4011-4015.261. Rowland, F.S. and Y. Makide, 1982, Geophys. Res. Lett., 9, 473.262. Rowland, F.S. and P.J. Rogers, 1982, Proc. Natl. Acad. Sci. USA, 79, 2737.263. Rowland, F.S., J.E. Spencer, and M.J. Molina, 1976, J. Phys. Chem., 80, 2711-2713.264. Rudolph, R.N. and E.C.Y. Inn, 1981, J. Geophys. Res., 86, 9891.265. Ruhl, E., A. Jefferson, and V. Vaida, 1990, J. Phys. Chem., 94, 2990.266. Safary, E., J. Romand, and B. Vodar, 1951, J. Chem. Phys., 19, 379.267. Sander, S.P., 1986, J. Phys. Chem., 90, 4135-4142.268. Sander, S.P. and R.R. Friedl, 1989, J. Phys. Chem., 93, 4764-4771.269. Sander, S.P., M. Peterson, R.T. Watson, and R. Patrick, 1982, J. Phys. Chem., 86, 1236-1240.270. Sandorfy, C., 1976, Atmos. Environ., 10, 343-351.271. Sauvageau, P., J. Doucet, R. Gilbert, and C. Sandorfy, 1974, J. Chem. Phys., 61, 391.272. Sauvageau, P., R. Gilbert, P.P. Berlow, and C. Sandorfy, 1973, J. Chem. Phys., 59, 762.273. Schiffman, A., D.D. Nelson Jr., and D.J. Nesbitt, 1993, J. Chem. Phys., 98, 6935-6946.274. Schneider, W., G.K. Moortgat, J.P. Burrows, and G.5. Tyndall, 1987, J. Photochem. Photobiol., 40, 195-217.275. Schneider, W.F., T.J. Wallington, K. Minschwaner, and E.A. Stahlberg, 1995, Environ. Sci. Technol., 29, 247.276. Seery, D.J. and D. Britton, 1964, J. Phys. Chem., 68, 2263.277. Selwyn, G., J. Podolske, and H.S. Johnston, 1977, Geophys. Res. Lett., 4, 427-430.278. Senum, G.I., Y.-N. Lee, and J.S. Gaffney, 1984, J. Phys. Chem., 88, 1269-1270.279. Shardanand and A.D.P. Rao, 1977, J. Quant. Spectrosc. Radiat. Transfer, 17, 433-439.280. Shetter, R.E., J.A. Davidson, C.A. Cantrell, N.J. Burzynski, and J.G. Calvert, 1988, J. Geophys. Res., 93, 7113-
7118.281. Silver, J.A., D.R. Worsnop, A. Freedman, and C.E. Kolb, 1986, J. Chem. Phys., 84, 4378-4384.282. Simon, F.G., W. Schneider, G.K. Moortgat, and J.P. Burrows, 1990, J. Photochem. Photobiol., A55, 1-23.283. Simon, P.C., D. Gillotay, N. Vanlaethem-Meuree, and J. Wisemberg, 1988, J. Atmos. Chem., 7, 107-135.284. Simon, P.C., D. Gillotay, N. Vanlaethem-Meuree, and J. Wisemberg, 1988, Annales Geophysicae, 6, 239-248.285. Simonaitis, R., R.I. Greenberg, and J. Heicklen, 1972, Int. J. Chem. Kinet., 4, 497.286. Singer, R.J., J.N. Crowley, J.P. Burrows, W. Schneider, and G.K. Moortgat, 1989, J. Photochem. Photobiol., 48,
17-32.287. Smith, W.S., C.C. Chou, and F.S. Rowland, 1977, Geophys. Res. Lett., 4, 517-519.288. Solomon, S., J.B. Burkholder, A.R. Ravishankara, and R.R. Garcia, 1994, J. Geophys. Res., 99, 20929-20935.289. Sparks, R.K., L.R. Carlson, K. Shobatake, M.L. Kowalczyk, and Y.T. Lee, 1980, J. Chem. Phys., 72, 1401-1402.
218
290. Spencer, J.E. and F.S. Rowland, 1978, J. Phys. Chem., 82, 7-10.291. Stanton, J.F. and R.J. Bartlett, 1993, J. Phys. Chem., 98, 9335-9339.292. Stanton, J.F., C.M.L. Rittby, R.J. Bartlett, and D.W. Toohey, 1991, J. Phys. Chem., 95, 2107-2110.293. Steinfeld, J.I., S.M. Adler-Golden, and J.W. Gallagher, 1987, J. Phys. Chem. Ref. Data, 16, 911-951.294. Stief, L.J., W.A. Payne, and R.B. Klemm, 1975, J. Chem. Phys., 62, 4000-4008.295. Stockwell, W.R. and J.G. Calvert, 1978, J. Photochem., 8, 193-203.296. Suto, M. and L.C. Lee, 1985, J. Geophys. Res., 90, 13037-13040.297. Swanson, D., B. Kan, and H.S. Johnston, 1984, J. Phys. Chem., 88, 3115.298. Takahashi, K., Y. Matsumi, and M. Kawasaki, 1996, J. Phys. Chem., 100, 4084-4089.299. Talukdar, R., A. Mellouki, T. Gierczak, J.B. Burkholder, S.A. McKeen, and A.R. Ravishankara, 1991, J. Phys.
Chem., 95, 5815-5821.300. Talukdar, R.K., J.B. Burkholder, A.-M. Schmoltner, J.M. Roberts, R. Wilson, and A.R. Ravishankara, 1995, J.
Geophys. Res., 100, 14163-14173.301. Tang, K.Y., P.W. Fairchild, and E.K.C. Lee, 1979, J. Phys. Chem., 83, 569.302. Thelen, M.-A., P. Felder, and J.R. Huber, 1993, Chem. Phys. Lett., 213, 275-281.303. Trolier, M., R.L. Mauldin III, and A.R. Ravishankara, 1990, J. Phys. Chem., 94, 4896-4907.304. Trolier, M. and J.R. Wiesenfeld, 1988, J. Geophys. Res., 93, 7119-7124.305. Turco, R.P., 1975, Geophys. Surveys, 2, 153-192.306. Turco, R.P., R.J. Cicerone, E.C.Y. Inn, and L.A. Capone, 1981, J. Geophys. Res., 86, 5373.307. Turnipseed, A.A., G.L. Vaghjiani, T. Gierczak, J.E. Thompson, and A.R. Ravishankara, 1991, J. Chem. Phys., 95,
3244-3251.308. Turnipseed, A.A., G.L. Vaghjiani, J.E. Thompson, and A.R. Ravishankara, 1992, J. Chem. Phys., 96, 5887.309. Tyndall, G.S., K.M. Stedman, W. Schneider, J.P. Burrows, and G.K. Moortgat, 1987, J. Photochem., 36, 133-139.310. Vaghjiani, G.L. and A.R. Ravishankara, 1989, J. Geophys. Res., 94, 3487-3492.311. Vaghjiani, G.L. and A.R. Ravishankara, 1990, J. Chem. Phys., 92, 996.312. Vaghjiani, G.L., A.A. Turnipseed, R.F. Warren, and A.R. Ravishankara, 1992, J. Chem. Phys., 96, 5878.313. Vaida, V., S. Solomon, E.C. Richards, E. Ruhl, and A. Jefferson, 1989, Nature, 342, 405.314. Vanlaethem-Meuree, N., J. Wisemberg, and P.C. Simon, 1978, Bull. Acad. Roy. Belgique Cl. Sci., 64, 31.315. Vanlaethem-Meuree, N., J. Wisemberg, and P.C. Simon, 1978, Bull. Acad. Roy. Belgique Cl. Sci., 64, 42.316. Vanlaethem-Meuree, N., J. Wisemberg, and P.C. Simon, 1979, Geophys. Res. Lett., 6, 451-454.317. Vasudev, R., 1990, Geophys. Res. Lett., 17, 2153-2155.318. Vogt, R. and R.N. Schindler, 1992, J. Photochem. Photobiol. A: Chem., 66, 133-140.319. Wahner, A., A.R. Ravishankara, S.P. Sander, and R.R. Friedl, 1988, Chem. Phys. Lett., 152, 507.320. Wahner, A., G.S. Tyndall, and A.R. Ravishankara, 1987, J. Phys. Chem., 91, 2734-2738.321. Wallington, T.J., P. Dagaut, and M.J. Kurylo, 1992, Chem. Rev., 92, 667-710.322. Walters, E.A., M. Gupta, J.T. Clay, D.D. Baldyga, J.R. Smith, and K. Glidden, 1994, personal communication.323. Walton, J.C., 1972, J. Chem. Soc. Farad. Trans., 68, 1559.324. Watson, R.T., 1977, J. Phys. Chem. Ref. Data, 6, 871-917.325. Wayne, R.P., 1987, Atm. Environ., 21, 1683-1694.326. Wayne, R.P., I. Barnes, J.P. Burrows, C.E. Canosa-Mas, J. Hjorth, G. Le Bras, G.K. Moortgat, D. Perner, G. Poulet,
G. Restelli, and H. Sidebottom, 1991, Atmos. Environ., 25A, 1-203.327. Wine, P.H., W.L. Chameides, and A.R. Ravishankara, 1981, Geophys. Res. Lett., 8, 543-546.328. Wine, P.H. and A.R. Ravishankara, 1982, Chem. Phys., 69, 365-373.329. Wine, P.H., A.R. Ravishankara, D.L. Philen, D.D. Davis, and R.T. Watson, 1977, Chem. Phys. Lett., 50, 101.330. WMO, Atmospheric Ozone: 1985 , World Meteorological Organization Global Ozone Research and Monitoring
Project, Report No. 16, 1986, Geneva: National Aeronautics and Space Administration.331. Xu, H. and J.A. Joens, 1993, Geophys. Res. Lett., 20, 1035-1037.332. Yao, F., I. Wilson, and H. Johnston, 1982, J. Phys. Chem., 86, 3611.333. Yokelson, R.J., J.B. Burkholder, R.W. Fox, R.K. Talukdar, and A.R. Ravishankara, 1994, J. Phys. Chem., 98,
13144-13150.334. Yoshino, K., A.S.C. Cheung, J.R. Esmond, W.H. Parkinson, D.E. Freeman, S.L. Guberman, A. Jenouvrier, B.
Coquart, and M.F. Merienne, 1988, Planet. Space Sci., 36, 1469-1475.335. Yoshino, K., J.R. Esmond, A.S.-C. Cheung, D.E. Freeman, and W.H. Parkinson, 1992, Planet. Space Sci., 40, 185-
192.
219
336. Yoshino, K., J.R. Esmond, A.S.C. Cheung, D.E. Freeman, and W.H. Parkinson, 1990, J. Geophys. Res., 95,11743.
337. Yoshino, K., J.R. Esmond, D.E. Freeman, and W.H. Parkinson, 1993, J. Geophys. Res., 98, 5205-5211.338. Yoshino, K., D.E. Freeman, J.R. Esmond, R.S. Friedman, and W.H. Parkinson, 1988, Planet. Space Sci., 36, 1201-
1210.339. Yoshino, K., D.E. Freeman, J.R. Esmond, R.S. Friedman, and W.H. Parkinson, 1989, Planet. Space Sci., 37, 419-
426.340. Yoshino, K., D.E. Freeman, J.R. Esmond, and W.H. Parkinson, 1987, Planet. Space Sci., 35, 1067-1075.341. Yoshino, K., D.E. Freeman, and W.H. Parkinson, 1984, J. Phys. Chem. Ref. Data, 13, 207-227.342. Yoshino, K., D.F. Freeman, J.R. Esmond, and W.H. Parkinson, 1983, Planet. Space Sci., 31, 339-353.343. Zelikoff, M. and L.M. Aschenbrand, 1954, J. Chem. Phys., 22, 1685-1687.344. Zetzsch, C., 1989, Proceedings of the International Ozone Symposium 1988, R. Bojkov and P. Fabian, Editors,
Deepak, Hampton, VA.
220
HETEROGENEOUS CHEMISTRY
We have evaluated and tabulated the currently available information on heterogeneous stratosphericprocesses. In addition, because of the increasing level of interest in tropospheric processes with a direct bearing onthe fluxes of reactive species into the stratosphere, such as heterogeneous loss processes for partially oxidizeddegradation products of hydrohalocarbons and heterogeneous contrail and cloud processing of exhaust species fromaircraft, we have included kinetic data for selected heterogeneous interactions relevant to modeling cloud droplet andaqueous aerosol chemistry in the free troposphere. However, both stratospheric and tropospheric heterogeneouschemistry are relatively new and rapidly developing fields, and further results can be expected to change ourquantitative and even our qualitative understanding on a regular basis. The complexity is compounded by thedifficulty of characterizing the chemical and physical properties of atmospheric heterogeneous surfaces and thenreproducing suitable simulations in the laboratory [99].
Surface Types
To a first approximation there are three major types of surfaces believed to be present at significant levels inthe stratosphere. They are: 1) Type I - polar stratospheric clouds (PSCs), nominally composed of nitric acidtrihydrate (HNO3 • 3H2O); 2) crystals of relatively pure water ice, designated as Type II PSCs because they form atlower temperatures than Type I and are believed to be nucleated by Type I (similar surfaces may form as contrailsbehind high-altitude aircraft under some stratospheric conditions); and 3) sulfuric acid aerosol, which is nominally aliquid phase surface generally composed of 60 - 80 weight percent H2SO4 and, concomitantly, 40-20 weight percentH2O. While PSCs, as their name suggests, are formed primarily in the cold winter stratosphere at high latitudes,sulfuric acid aerosol is present year round at all latitudes and may influence stratospheric chemistry on a global basis,particularly after large injections of volcanic sulfur episodically increase their abundance and surface area. There isalso increasing evidence that ternary H2SO4/HNO3/H2O liquid solutions may play a significant role in PSCformation.
In addition to the major stratospheric surface types noted above, several other types of heterogeneoussurfaces are found in the stratosphere and may play a significant role in some stratospheric processes. For instance,recent laboratory work has indicated that nitric acid dihydrate (NAD) may play an important role in the nucleation ofType I PSCs (Worsnop et al. [180]; Fox et al. [44]) and that mixtures of solid nitric acid hydrates and sulfuric acidtetrahydrate (SAT) (Molina et al. [122]; Zhang et al. [188]) and/or a more complex sulfuric acid/nitric acid hydrate(Fox et al. [44]) may also be key to understanding Type I PSC nucleation and evolution. Analyses of the range ofatmospheric conditions possible in the polar stratosphere have also led to interest in solid SAT surfaces and possiblyother forms of frozen sulfuric acid aerosols (Toon et al. [164]; Middlebrook et al. [117]), as well as liquid sulfuricacid aerosols significantly more dilute than the 60-80 weight percent normally present at lower latitudes (Wolff andMulvaney [179]; Hofmann and Oltmans [77]; Toon et al. [164]). Some modeling studies also suggest that certaintypes of major volcanic eruptions transport significant levels of sodium chloride into the stratosphere (Michelangeliet al. [116]), so studies of stratospheric trace species interacting with solid NaCl or similar salts, as well as saltsolutions, have also been included. Finally, aircraft and rocket exhausts contribute small but measurable amounts ofcarbonaceous soot (Pueschel et al. [133]) and aluminized solid propellant rocket exhausts and spacecraft debrisproduce increasing levels of alumina (Al2O3) and similar metal oxide particles (Zolensky et al. [189]) in thestratosphere. In the free troposphere the primary heterogeneous surfaces of interest are liquid or solid water (clouddroplets, contrails) or aqueous sulfate solutions representative of background aerosols.
The detailed composition and morphology of each surface type are uncertain and probably subject to asignificant range of natural variability. Certain chemical and physical properties of these surfaces, such as theirability to absorb and/or solvate HCl and HNO3, are known to be strongly dependent on their detailed chemicalcomposition. Moreover, most heterogeneous processes studied under laboratory conditions (and in some casesproceeding under stratospheric conditions) can change the chemical composition of the surface in ways thatsignificantly affect the kinetic or thermodynamic processes of interest. Thus, a careful analysis of the time-dependentnature of the active surface is required in the evaluation of measured uptake kinetics experiments. Experimentaltechniques which allow the measurement of mass accommodation or surface reaction kinetics with high timeresolution and/or with low trace gas fluxes are often more credible in establishing that measured kinetic parametersare not seriously compromised by surface saturation or changing surface chemical composition.
The measured kinetic uptake parameters, mass accommodation coefficients, and surface reactionprobabilities are separately documented for relevant atmospheric trace gas species for the major and, where available,the minor stratospheric surfaces noted above. Since these parameters can vary significantly with surface composition(e.g., the H2SO4/H2O ratio for sulfate aerosol or the HNO3/H2O ratio for Type I PSC) the dependence of theseparameters on surface composition is reviewed where sufficient data are available. Furthermore, data are also
221
compiled for liquid water for several reasons. First, this surface is one asymptote of the H2SO4/H2O aerosol con-tinuum; second, the interactions of some trace species with liquid water and water ice (Type II PSC) surfaces areoften similar; and third, the uptake of some trace species by water surfaces in the troposphere can play a key role inunderstanding their tropospheric chemical lifetimes and, thus, the fraction that may be transported into thestratosphere.
Surface Porosity
The experimental techniques utilized to measure mass accommodation, heterogeneous reaction, and otheruptake coefficients generally require knowledge of the surface area under study. For solid surfaces, and mostparticularly for water and acid ice surfaces formed in situ, the determination of how the molecular scale ice surfacediffers from the geometrical surface of the supporting substrate is not easy. Keyser, Leu, and coworkers haveinvestigated the structure of water and nitric acid ice films prepared under conditions similar to those used in theirflow reactor for uptake studies (Keyser et al. [97]; Keyser and Leu [95]; Keyser and Leu [94]). They havedemonstrated that ice films grown in situ from the vapor can have a considerably larger available surface than thatrepresented by the geometry of the substrate; they have also developed a simple model to attempt to correctmeasured uptake rates for this effect (Keyser et al. [97]; Keyser et al. [96]). This model predicts that correction fac-tors are largest for small uptake coefficients and thick films. The application of the model to experimental uptakedata remains controversial (Keyser et al. [96]; Hanson and Ravishakara [71]; Kolb et al. [99]). Some experimentersprefer to attempt growing ice surfaces as smooth as possible and to demonstrate that their measured uptake co-efficients are only weakly dependent on surface thickness (Hanson and Ravishankara, [68]). Similar issues arise foruptake experiments performed on powered, fused and single crystal salt or oxide surfaces (Fenter et al.[41]; Hanning-Lee et al. [57]). The degree to which measured uptake parameters must be corrected for porosity effects will remainin some doubt until a method is devised for accurately determining the effective surface area for the surfaces actuallyused in uptake studies. Most studies evaluated in this review assume that the effective ice or salt surface area is thegeometrical area.
Temperature Dependence
A number of laboratory studies have shown that mass accommodation coefficients and, to some extent,surface reaction probabilities can be temperature dependent. While these dependencies have not been characterized formany systems of interest, temperature effects on kinetic data are noted where available. More work that fullyseparates heterogeneous kinetic temperature effects from temperature controlled surface composition is obviouslyneeded.
Solubility Limitations
Experimental data on the uptake of some trace gases by various stratospherically relevant surfaces can beshown to be governed by solubility limitations rather than kinetic processes. In these cases properly analyzed datacan yield measurements of trace gas solubility parameters relevant to stratospheric conditions. In general, suchparameters can be strongly dependent on both condensed phase composition and temperature. Such parameters maybe very important in stratospheric models, since they can govern the availability of a reactant for a bimolecularheterogeneous process (e.g., the concentration of HCl available for the HCl + ClONO2 reaction on sulfuric acidaerosols) or the gas/condensed phase partitioning of a heterogeneous reaction product (e.g., the HNO3 formed by thereaction of N2O5 on sulfuric acid aerosols).
Data Organization
Data for trace gas heterogenous interactions with relevant condensed phase surfaces are tabulated in Tables63, 64, and 65. These are organized into:
Table 63 - Mass Accommodation CoefficientsTable 64 - Surface Reaction ProbabilitiesTable 65 - Solubility Data
222
Parameter Definitions
Mass accommodation coefficients ( α ), represent the probability of reversible uptake of a gaseous species colliding with the condensed surface of interest. For liquid surfaces this process is associated with interfacial (gas-to-liquid) transport and is generally followed by bulk liquid phase solvation. Examples include: simple surfaceabsorption, absorption followed by ionic dissociation and solvation (e.g., HCl + nH2O ↔ H+(aq) + Cl- (aq)), and
absorption followed by a reversible chemical reaction with a condensed phase substituent (e.g., SO2 + H2O ↔ H+ +
HSO3- or CH2O + H2O ↔ CH2(OH)2).The term "sticking coefficient" is often used for mass accommodation on solid surfaces where physisorption
or chemisorption takes the place of true interfacial mass transport.Processes involving liquid surfaces are subject to Henry’s law, which limits the fractional uptake of a gas
phase species into a liquid. If the gas phase species is simply solvated, a physical Henry’s law constraint holds; ifthe gas phase species reacts with a condensed phase substituent, as in the sulfur dioxide or formaldehyde hydrolysiscases noted above, a “chemically modified” or “effective” Henry’s law constraint holds (Clegg and Brimblecombe[26]; Schwartz [149]; Watson et al. [174]). Henry's law constants relate the equilibrium concentration of a species in the gas phase to the concentration of the same species in a liquid phase, and they have, in this report, units of M
atm -1. These are tabulated for liquid surfaces in Table 65. Effective Henry's law constants are designated H*, whilesimple physical Henry's law constants are represented by H. Effective Henry's law constants are also employed torepresent decreased trace gas solubilities in moderate ionic strength acid or salt solutions with the use of a Setchenowcoefficient formulation which relates H* to the concentration of the acid or salt [81]. It is presently unclear whether“surface solubility” effects govern the uptake on nominally solid water ice or HNO3/H2O ice surfaces in a manneranalogous to bulk solubility effects for liquid substrates.
For some trace species on some surfaces, experimental data suggest that mass accommodation coefficientsuntainted by experimental saturation limitations have been obtained. These are tabulated in Table 63. In other casesexperimental data can be shown to be subject to Henry’s law constraints, and Henry’s law constants, or at least theirupper limits, can be determined. Some experimental data sets are insufficient to determine if measured “uptake”coefficients are true accommodation coefficients or if the measurement values are lower limits compromised bysaturation effects. These are currently tabulated, with suitable caveats, in Table 63.
Surface reaction probabilities ( γ ) are kinetic values for generally irreversible reactive uptake of trace gas species on condensed surfaces. Such processes may not be rate limited by Henry’s law constraints; however, thefate of the uptake reaction products may be subject to saturation limitations. For example, N2O5 has been shown toreact with sulfuric acid aerosol surfaces. However, if the H2SO4/H2O ratio is too high, the product HNO3 will beinsoluble, and a large fraction will be expelled back into the gas phase. Surface reaction probabilities forsubstantially irreversible processes are presented in Table 64. Reaction products are identified where known. .
The total experimental uptake coefficient measured in laboratory heterogeneous kinetic experiments are alsooften symbolized by the symbol γ. In those cases where surface and/or bulk reaction dominate the uptake, the total
uptake coefficient (γtotal) and reactive uptake coefficient (γrxn) may well be identical. More formally, for caseswhere bulk liquid phase reaction is facile and there are no gas phase diffusion constraints, the total uptake coefficient
can be approximated in terms of γrxn and γsol as [99]:
1
γtotal
= 1α
+ 1
γsol
+ γrxn
where
γsol
= 4HRT
π1 / 2 c
D
t
1 / 2
and
223
γ rxn = 4HRT
c Dkrxn( )1/2
where t is the time the trace gas is exposed to the liquid surface, R is the gas constant, D is the liquid phase diffusion
coefficient, and c is the mean trace gas molecular speed. In the limit of low solubility or long exposure time γsolbecomes negligible and:
1γ
total
= 1α
+ 1
γrxn
.
Discussion of how to use this approach to model chemical reactions in liquid stratospheric aerosols can befound in Hanson et al. [74] and Kolb et al. [99]. Note that these formulations are approximate. In cases whereseparate terms are competitive, more rigorous solution of kinetic differential operations may be appropriate.
For solid surfaces, bulk diffusion is generally too slow to allow bulk solubility or bulk kinetic processes todominate uptake. For solids, reactive uptake is driven by chemisorption/chemical reaction at the interface, a process
that can also influence trace gas uptake on liquids. In these cases surface reaction (γsurf) occurs in parallel, ratherthan in series with mass accommodation, thus:
γtotal
= γsurf
+ 1α
+ 1
γ sol + γ rxn
−1
Examples where this more complex situation holds for liquid surfaces can be found in Hu et al. [78] and Jayne etal.[88]. In such cases γ may be significantly larger than α.
The data in Tables 63 and 64 are organized by trace gas species, since some systematic variation may beexpected for surface accommodation or reaction as the surface composition and/or phase is varied. Data presented forone surface may be judged for “reasonableness” by comparing with data for a “similar” surface. In some cases it isnot yet clear if surface uptake is truly reversible (accommodation) or irreversibly reactive in nature. In such cases theavailable uptake coefficients are generally tabulated in Table 63 as accommodation coefficients, a judgment yhat willbe subject to change if more definitive data become available.
Where a specific evaluated value for an accommodation coefficient or reaction probability has been obtained,an estimated uncertainty factor is also tabulated. However, when the data evaluation yielded only a lower or upperlimit, no uncertainty factor can be reliably estimated and none is presented.
Description of and reference citations to many of the laboratory techniques used to obtain the data in thefollowing three tables can be found in Kolb et al. [99].
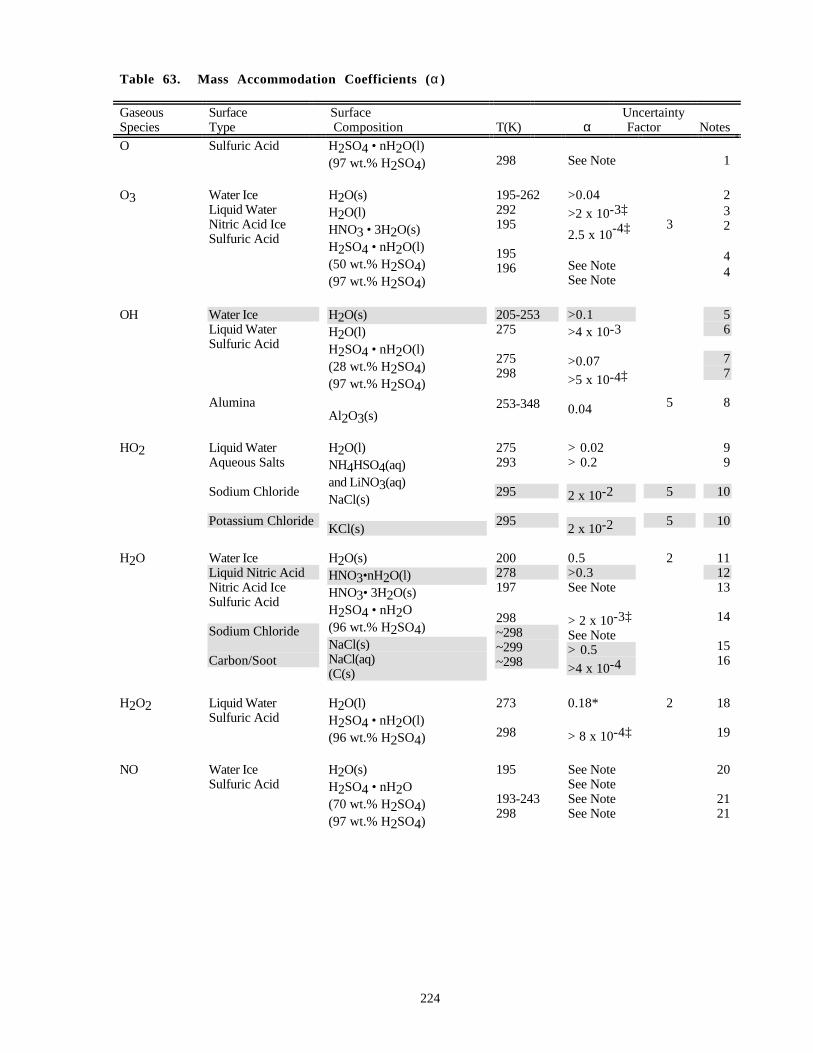
224
Table 63. Mass Accommodation Coefficients (α )
GaseousSpecies
SurfaceType
Surface Composition T(K) α
Uncertainty Factor Notes
O Sulfuric Acid H2SO4 • nH2O(l)(97 wt.% H2SO4) 298 See Note 1
O3 Water IceLiquid WaterNitric Acid IceSulfuric Acid
H2O(s)H2O(l)HNO3 • 3H2O(s)H2SO4 • nH2O(l)(50 wt.% H2SO4)(97 wt.% H2SO4)
195-262292195
195196
>0.04
>2 x 10⁻³‡
2.5 x 10⁻⁴‡
See NoteSee Note
3
232
44
OH Water IceLiquid WaterSulfuric Acid
Alumina
H2O(s)H2O(l)H2SO4 • nH2O(l)(28 wt.% H2SO4)(97 wt.% H2SO4)
Al2O3(s)
205-253275
275298
253-348
>0.1>4 x 10⁻³
>0.07
>5 x 10⁻⁴‡
0.04 5
56
77
8
HO2 Liquid WaterAqueous Salts
Sodium Chloride
Potassium Chloride
H2O(l)NH4HSO4(aq)and LiNO3(aq)NaCl(s)
KCl(s)
275293
295
295
> 0.02> 0.2
2 x 10⁻²
2 x 10⁻²
5
5
99
10
10
H2O Water IceLiquid Nitric AcidNitric Acid IceSulfuric Acid
Sodium Chloride
Carbon/Soot
H2O(s)HNO3•nH2O(l)HNO3• 3H2O(s)H2SO4 • nH2O(96 wt.% H2SO4)NaCl(s)NaCl(aq)(C(s)
200278197
298~298~299~298
0.5>0.3See Note
> 2 x 10⁻³‡
See Note> 0.5
>4 x 10⁻⁴
2 111213
14
1516
H2O2 Liquid WaterSulfuric Acid
H2O(l)H2SO4 • nH2O(l)(96 wt.% H2SO4)
273
298
0.18*
> 8 x 10⁻⁴‡
2 18
19
NO Water IceSulfuric Acid
H2O(s)H2SO4 • nH2O(70 wt.% H2SO4)(97 wt.% H2SO4)
195
193-243298
See NoteSee NoteSee NoteSee Note
20
21 21
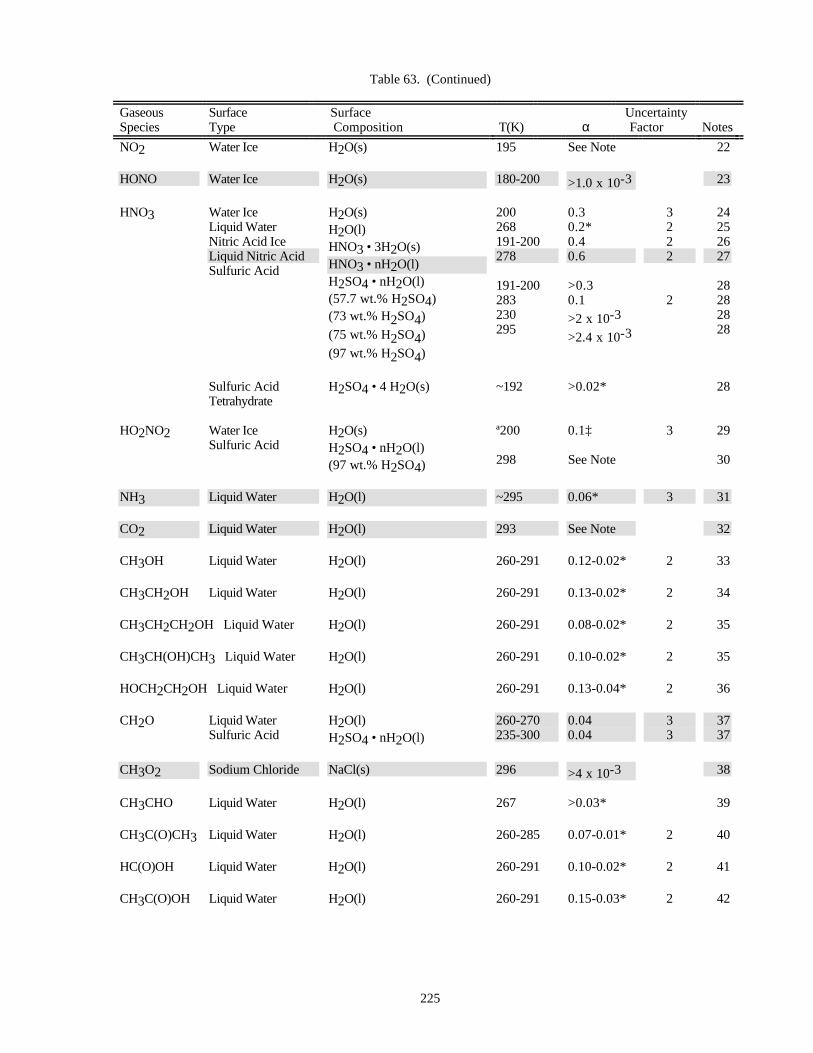
225
Table 63. (Continued)
GaseousSpecies
SurfaceType
Surface Composition T(K) α
Uncertainty Factor Notes
NO2 Water Ice H2O(s) 195 See Note 22
HONO Water Ice H2O(s) 180-200 >1.0 x 10⁻³ 23
HNO3 Water IceLiquid WaterNitric Acid IceLiquid Nitric AcidSulfuric Acid
H2O(s)H2O(l)HNO3 • 3H2O(s)HNO3 • nH2O(l)H2SO4 • nH2O(l)(57.7 wt.% H2SO4)(73 wt.% H2SO4)
(75 wt.% H2SO4)
(97 wt.% H2SO4)
200268191-200278
191-200283230295
0.30.2*0.40.6
>0.30.1
>2 x 10⁻³
>2.4 x 10⁻³
3222
2
24252627
28282828
Sulfuric AcidTetrahydrate
H2SO4 • 4 H2O(s) ~192 >0.02* 28
HO2NO2 Water IceSulfuric Acid
H2O(s)H2SO4 • nH2O(l)(97 wt.% H2SO4)
ª200
298
0.1‡
See Note
3 29
30
NH3 Liquid Water H2O(l) ~295 0.06* 3 31
CO2 Liquid Water H2O(l) 293 See Note 32
CH3OH Liquid Water H2O(l) 260-291 0.12-0.02* 2 33
CH3CH2OH Liquid Water H2O(l) 260-291 0.13-0.02* 2 34
CH3CH2CH2OH Liquid Water H2O(l) 260-291 0.08-0.02* 2 35
CH3CH(OH)CH3 Liquid Water H2O(l) 260-291 0.10-0.02* 2 35
HOCH2CH2OH Liquid Water H2O(l) 260-291 0.13-0.04* 2 36
CH2O Liquid WaterSulfuric Acid
H2O(l)H2SO4 • nH2O(l)
260-270235-300
0.040.04
33
3737
CH3O2 Sodium Chloride NaCl(s) 296 >4 x 10⁻³ 38
CH3CHO Liquid Water H2O(l) 267 >0.03* 39
CH3C(O)CH3 Liquid Water H2O(l) 260-285 0.07-0.01* 2 40
HC(O)OH Liquid Water H2O(l) 260-291 0.10-0.02* 2 41
CH3C(O)OH Liquid Water H2O(l) 260-291 0.15-0.03* 2 42
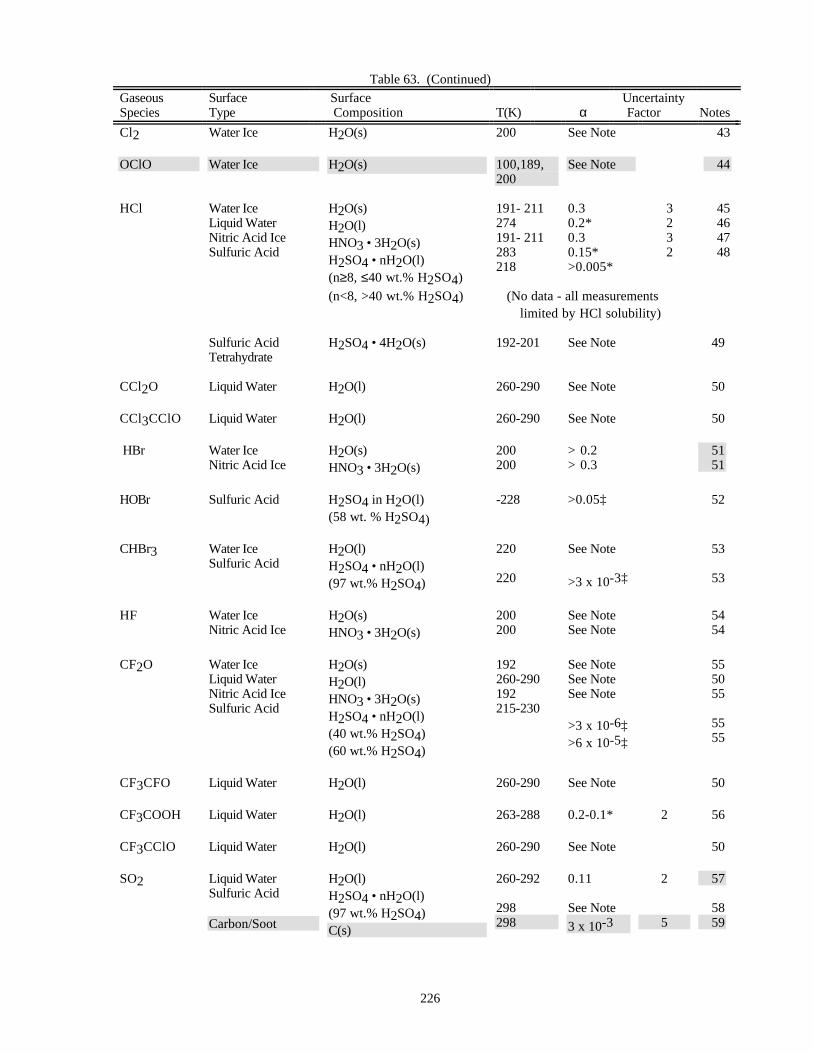
226
Table 63. (Continued)
GaseousSpecies
SurfaceType
Surface Composition T(K) α
Uncertainty Factor Notes
Cl2 Water Ice H2O(s) 200 See Note 43
OClO Water Ice H2O(s) 100,189,200
See Note 44
HCl Water IceLiquid WaterNitric Acid IceSulfuric Acid
H2O(s)H2O(l)HNO3 • 3H2O(s)H2SO4 • nH2O(l)(n≥8, ≤40 wt.% H2SO4)
191- 211274191- 211283218
0.30.2*0.30.15*>0.005*
3232
45464748
(n<8, >40 wt.% H2SO4) (No data - all measurements limited by HCl solubility)
Sulfuric AcidTetrahydrate
H2SO4 • 4H2O(s) 192-201 See Note 49
CCl2O Liquid Water H2O(l) 260-290 See Note 50
CCl3CClO Liquid Water H2O(l) 260-290 See Note 50
HBr Water IceNitric Acid Ice
H2O(s)HNO3 • 3H2O(s)
200200
> 0.2> 0.3
5151
HOBr Sulfuric Acid H2SO4 in H2O(l)(58 wt. % H2SO4)
-228 >0.05‡ 52
CHBr3 Water IceSulfuric Acid
H2O(l)H2SO4 • nH2O(l)(97 wt.% H2SO4)
220
220
See Note
>3 x 10⁻³‡
53
53
HF Water IceNitric Acid Ice
H2O(s)HNO3 • 3H2O(s)
200200
See NoteSee Note
5454
CF2O Water IceLiquid WaterNitric Acid IceSulfuric Acid
H2O(s)H2O(l)HNO3 • 3H2O(s)H2SO4 • nH2O(l)(40 wt.% H2SO4)(60 wt.% H2SO4)
192260-290192215-230
See NoteSee NoteSee Note
>3 x 10⁻⁶‡>6 x 10⁻⁵‡
555055
5555
CF3CFO Liquid Water H2O(l) 260-290 See Note 50
CF3COOH Liquid Water H2O(l) 263-288 0.2-0.1* 2 56
CF3CClO Liquid Water H2O(l) 260-290 See Note 50
SO2 Liquid WaterSulfuric Acid
Carbon/Soot
H2O(l)H2SO4 • nH2O(l)(97 wt.% H2SO4)C(s)
260-292
298298
0.11
See Note
3 x 10⁻³
2
5
57
5859
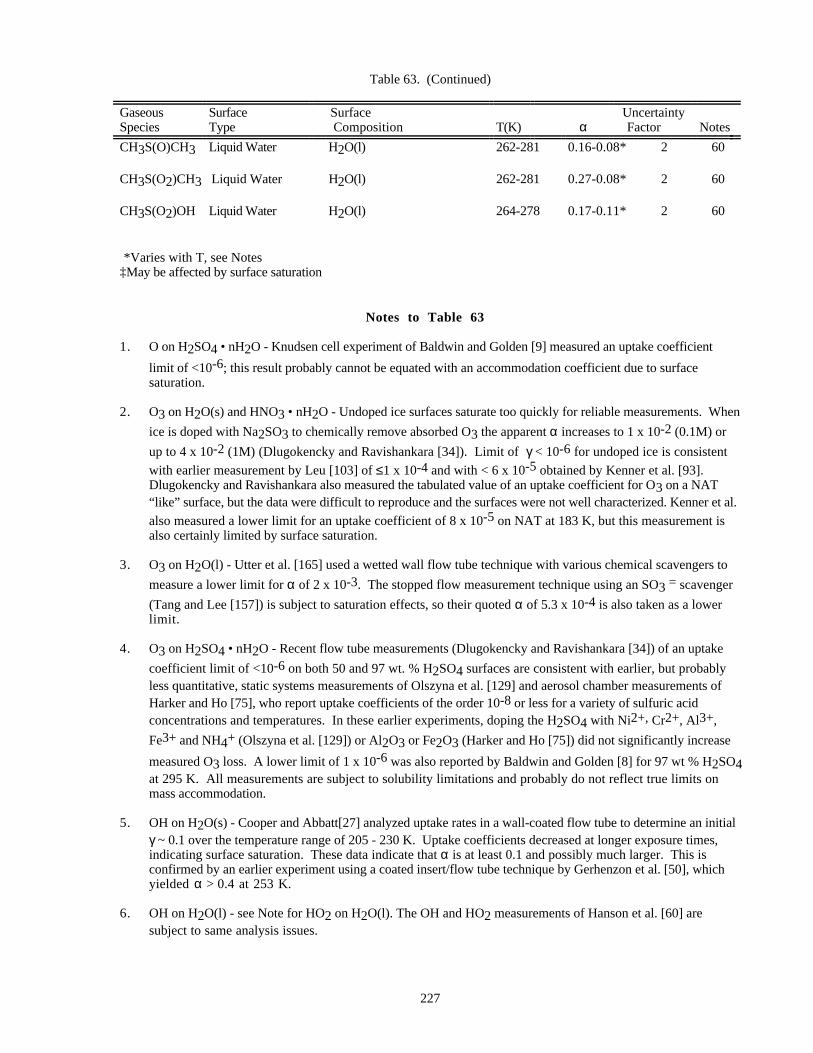
227
Table 63. (Continued)
GaseousSpecies
SurfaceType
Surface Composition T(K) α
Uncertainty Factor Notes
CH3S(O)CH3 Liquid Water H2O(l) 262-281 0.16-0.08* 2 60
CH3S(O2)CH3 Liquid Water H2O(l) 262-281 0.27-0.08* 2 60
CH3S(O2)OH Liquid Water H2O(l) 264-278 0.17-0.11* 2 60
*Varies with T, see Notes‡May be affected by surface saturation
Notes to Table 63
1. O on H2SO4 • nH2O - Knudsen cell experiment of Baldwin and Golden [9] measured an uptake coefficient
limit of <10-6; this result probably cannot be equated with an accommodation coefficient due to surfacesaturation.
2. O3 on H2O(s) and HNO3 • nH2O - Undoped ice surfaces saturate too quickly for reliable measurements. When
ice is doped with Na2SO3 to chemically remove absorbed O3 the apparent α increases to 1 x 10⁻² (0.1M) or
up to 4 x 10⁻² (1M) (Dlugokencky and Ravishankara [34]). Limit of γ < 10-6 for undoped ice is consistent
with earlier measurement by Leu [103] of ≤1 x 10⁻⁴ and with < 6 x 10⁻⁵ obtained by Kenner et al. [93].Dlugokencky and Ravishankara also measured the tabulated value of an uptake coefficient for O3 on a NAT“like” surface, but the data were difficult to reproduce and the surfaces were not well characterized. Kenner et al.
also measured a lower limit for an uptake coefficient of 8 x 10⁻⁵ on NAT at 183 K, but this measurement isalso certainly limited by surface saturation.
3. O3 on H2O(l) - Utter et al. [165] used a wetted wall flow tube technique with various chemical scavengers to
measure a lower limit for α of 2 x 10⁻³. The stopped flow measurement technique using an SO3 = scavenger
(Tang and Lee [157]) is subject to saturation effects, so their quoted α of 5.3 x 10⁻⁴ is also taken as a lowerlimit.
4. O3 on H2SO4 • nH2O - Recent flow tube measurements (Dlugokencky and Ravishankara [34]) of an uptake
coefficient limit of <10-6 on both 50 and 97 wt. % H2SO4 surfaces are consistent with earlier, but probablyless quantitative, static systems measurements of Olszyna et al. [129] and aerosol chamber measurements ofHarker and Ho [75], who report uptake coefficients of the order 10-8 or less for a variety of sulfuric acidconcentrations and temperatures. In these earlier experiments, doping the H2SO4 with Ni2+, Cr2+, Al3+,
Fe3+ and NH4+ (Olszyna et al. [129]) or Al2O3 or Fe2O3 (Harker and Ho [75]) did not significantly increase
measured O3 loss. A lower limit of 1 x 10⁻⁶ was also reported by Baldwin and Golden [8] for 97 wt % H2SO4at 295 K. All measurements are subject to solubility limitations and probably do not reflect true limits onmass accommodation.
5. OH on H2O(s) - Cooper and Abbatt[27] analyzed uptake rates in a wall-coated flow tube to determine an initialγ ~ 0.1 over the temperature range of 205 - 230 K. Uptake coefficients decreased at longer exposure times,indicating surface saturation. These data indicate that α is at least 0.1 and possibly much larger. This isconfirmed by an earlier experiment using a coated insert/flow tube technique by Gerhenzon et al. [50], whichyielded α > 0.4 at 253 K.
6. OH on H2O(l) - see Note for HO2 on H2O(l). The OH and HO2 measurements of Hanson et al. [60] aresubject to same analysis issues.
228
7. OH on H2SO4•nH2O - See Note for HO2 on H2O(l) for measurement (28 wt.% H2SO4) by Hanson et al.[60] and Note for O on H2SO4 for measurement (97 wt. % H2SO4) by Baldwin and Golden [9].
8. OH on Al2O3(s) - Measured value is from flow tube experiment with native oxide on aluminum as the activesurface. An uptake coefficient of 0.4 ± 0.2 independent of temperature over the range of 253-348 K wasmeasured (Gershenzon et al. [50]).
9. HO2 on H2O(l) - Determination of α in liquid-wall flow tube (Hanson et al. [60]) is dependent on gas-phasediffusion corrections; measured limit (α >0.02) is consistent with α = 1. In the aqueous salt aerosolmeasurements of Mozurkewich et al. [125], HO2 was chemically scavenged by Cu++ from added CuSO4 toavoid Henry’s law constraints; the measured limit of >0.2 is also consistent with α =1.
10. HO2 on NaCl(s) and KCl(s) - Measured values of γ = 1.8 x 10⁻² for KCl and 1.6 x 10⁻² for NaCl, both at 295
K by Gersherzon et al.[52] supplementing an earlier value of γ - 8 x 10⁻³ measured by Gersherzon and Purmal[51], results have not been calibrated with a competitive technique.
11. H2O on H2O(s) - Measurements are available from Leu [104] giving 0.3 (+0.7, -0.1) at 200 K and Haynes etal. [76] (1.06 ± 0.1 to 0.65 ± 0.08) from 20 to 185 K. Brown et al.[18] used molecular beam reflectiontechniques to measure a value of α = 0.99 ± 0.03 between 85 and 150 K and optical interference methods toobtain α = 0.97 ± 0.10 between 97 and 145 K.
12. H2O on HNO3/H2O(l) - Rudolf and Wagner[147] used aerosol expansion chamber techniques to illustrate thaton liquid water/nitric acid aerosols α is greater than 0.3 and is consistent with 1.0 at 278 K.
13. H2O on HNO3•nH2O(s) - Middlebrook et al. [118] measured an uptake coefficient of .002 for water vapor co-depositing with nitric acid over NAT at 197 K.
14. H2O on H2SO4 • nH2O - Baldwin and Golden [8] measured γ ~2 x 10⁻³, which is almost certainly affected bysurface saturation. See Note 15 for H2O2 on H2SO4 • nH2O.
15. H2O on NaCl(s) - Fenter et al.[40] used Knudsen cell/mass spectrometry methods to measure γ < 2 x 10⁴ forH2O(g) uptake on NaCl powders, an observation confirmed by Beichert and Finlayson-Pitts[13], who found γ< 1 x 10⁻⁵. However, Dai et al.[28] used FTIR spectroscopy on NaCl crystallite films at 240 and 296 K todetermine that a water adlayer does adhere to dry salt and that a small fraction of surface sites (< 1%) cause H2Odissociation. It is likely that the measurements of Fenter et al. and Beichert and Finlayson-Pitts were affectedby surface saturation.
16. H2O on NaCl(aq) - Fung et al.[46] used Mie resonance scattering techniques to quantify aqueous NaCl dropletgrowth (5.8 to 7.8 µm), yielding fitted values of α > 0.5 and consistent with 1.0.
17. H2O on C(s) - Rogaski et al.[142] used initial Knudsen cell uptake measurements to estimate α = (4 ±2) x
10-4 for H2O vapor on amorphous carbon at 298 K. Pretreatment of the carbon surface with gaseous O3,NO2, and SO2 made little change in α. However, pretreatment with HNO3 and H2SO4 increased uptake
coefficients dramatically to (11 ±1) x 10-3 and (27 ±1) x 10-3, respectively.
18. H2O2 on H2O(l) - Measured accommodation coefficient (Worsnop et al. [181]) has a strong negative temper-ature dependence over the measured range of 260-292 K, with α = 0.3 at 260 K decreasing to 0.1 at 292 K.
19. H2O2 on H2SO4•nH2O - Knudsen cell uptake measurements are subject to surface saturation, thus uptake
coefficient value of 7.8 x 10⁻⁴ quoted by Baldwin and Golden [8] is almost certainly a lower limit for α. This
effect is probably also responsible for the lack of measured uptake (γ <10-6) for NO, NO2, SO2, Cl2, andother species reported in this reference and Baldwin and Golden [9].
229
20. NO on H2O(s) - NO data (Leu [103], Saastad et al. [148]) subject to same concerns as NO2. See Note forNO2 on H2O(s).
21. NO on H2SO4•nH2O - See Notes for H2O2 on H2SO4 • nH2SO4 and NO2 on H2SO4 • nH2O. NO issubject to the same concerns as NO2 for both reported measurements (Saastad et al. [148]; Baldwin and Golden[8]).
22. NO2 on H2O(s) - In the absence of a chemical sink, Leu [103] measured no sustained uptake of NO2 on ice
yielding an apparent α ≤1 x 10⁻⁴. Saastad et al. [148] measured a lower limit of 5 x 10⁻⁵ for temperaturesbetween 193 and 243 K. However these values are probably influenced by surface saturation.
23. HONO on H2O(s) - Fenter and Rossi[42] measured reversible uptake on water ice between 180 and 200 K
using a Knudsen cell technique. An initial uptake coefficient of 1 x 10- 3 suggests that α equals or exceedsthis value.
24. HNO3 on H2O(s) - Leu [104] reports 0.3 (+0.7, -0.1). Some additional uncertainty is introduced by effectiveice surface area in fast-flow measurement (see Keyser et al. [97]). Hanson [58] measured an uptake coefficientof > 0.3 at 191.5 and 200 K.
25. HNO3 on H2O(l) - Measured α has a strong negative temperature dependence varying from 0.19 ± 0.02 at 268K to 0.07 ± 0.02 at 293 K (Van Doren et al. [167]). Ponche et al. [132] measured an accommodationcoefficient of 0.05 ± 0.01 at 297 K.
26. HNO3 on HNO3 • nH2O(s) - Hanson [58] measured uptake coefficients of > 0.3 and >0.2 on NAT surfaces at191 K and 200 K, respectively. Middlebrook et al. [118] measured an uptake coefficient of 0.7 on NAT at 197K under conditions where both nitric acid and water vapor were co-depositing.
27. HNO3 on HNO3 • nH2O(l) - Rudolf and Wagner used aerosol expansion chamber techniques to deduce that αfor HNO3 on 278 K H2O/HNO3 droplets is > 0.3 and probably close to 1. The consistency of this value withsmaller (~0.2) values measured for uptake on pure water by Van Doren et al. [167] is unclear, since themechanism of co-condensation is unknown and the composition of the surface in the aerosol expansionchamber experiments may be kinetically controlled and has not been well determined.
28. HNO3 on H2SO4•nH2O and H2SO4 • 4H2O(s) - Initial uptake at 73 wt. % H2SO4 allows a measurement ofα = 0.11 ± 0.01 at 283 K (Van Doren et al. [167]). This value is expected to increase at lower temperatures,in a manner similar to H2O(1) uptake (Van Doren et al. [166]). Total HNO3 uptake is subject to Henry’s lawsolubility constraints, even at stratospheric temperatures (Reihs et al. [135]). Solubility limitations alsoaffected the earlier “sticking coefficient” measurements of Tolbert et al. [161] for 75 wt % H2SO4 at 230 K.Hanson [58] measured an uptake coefficient of >0.3 for frozen 57.7 wt. % sulfuric acid at 191.5 and 200 K.
Baldwin and Golden [8] reported a lower limit of 2.4 x 10⁻⁴ on 97 wt. % H2SO4 at 295 K, also reflectingsolubility limits. Iraci et al. [83] monitored nitric acid trihydrate growth on sulfuric acid tetrahydrate withinfrared techniques, measuring HNO3 uptake coefficient limits of >0.03 at 192.5 K and >0.08 at 192 K. Thesemeasurements involved co-deposition of water vapor.
29. HO2NO2 on H2O(s) - Li et al. [106] measured an uptake coefficient of 0.15 ±0.10; uptake may be limited bysurface saturation.
30. HO2NO2 on H2SO4•nH2O(l) - Baldwin and Golden measured γ = 2.7 x 10⁻⁵, which is probably solubilitylimited; see Note 15 for H2O2 on H2SO4 • nH2O.
31. NH3 on H2O(l) - Ponche et al. [132] used a droplet train technique to obtain α = (9.7 ±0.9) x 10-2 at 290 K,
and Bongartz et al.[16] used a liquid jet technique to obtain α = 4.0 (+3.0, - 0.05) x 10-2. Earlier levitateddroplet evaporation experiments [158] on NH4Cl obtained a larger evaporation coefficient of α = 0.29 ±0.03,which is discounted because of the indirect nature of the experiment.
230
32. CO2 on H2O(l) - Noyes et al.[128] used a dynamic stirring technique to monitor pressure decreases in a closed
cylinder. They inferred α = (5.5±0.5) x 10- 8 at 293 K. This technique is uncalibrated against more widelyused procedures and probably suffers from surface saturation effects. Measured α is probably many orders ofmagnitude too small.
33. CH3OH on H2O(l) - Jayne et al. [86] measured uptake from 260-291 K and derived accommodation coefficients
fitting α/(1-α) = exp(-∆G‡obs/RT), where ∆G‡obs = -8.0 kcal/mol + 34.9 cal mol-1 K–1 T(K).
34. CH3CH2OH on H2O(l) - Jayne et al. [86] measured uptake from 260-291 K and derived accommodation
coefficients fitting α/(1-α) = exp(-∆G‡obs/RT), where ∆G‡obs = -11.0 kcal/mol + 46.2 cal mol-1 K-1 T(K).Similar, but somewhat larger values were reported for chloro-, bromo-, and iodo-ethanols.
35. CH3CH2CH2OH and CH3CH(OH)CH3 on H2O(l) - Jayne et al. [86] measured uptake coefficients between
260 and 291 K and derived accommodation coefficients fitting α/(1-α) = exp (-∆G‡obs/RT), where ∆G‡obs =
- 9.2 kcal mol-1 + 40.9 cal mol-1 K-1 T(K) for 1-propanol and -9.1 kcal mol-1 + 43.0 cal mol-1 K-1 T(K) for2-propanol. Similar data for t-butanol were also reported.
36. HOCH2CH2OH on H2O(l) - Jayne et al. [86] measured uptake coefficients for ethylene gycol between 260 and
291 K and derived accommodation coefficients fitting α/(1-α) = exp(-∆G‡obs/RT), where ∆G‡obs =
- 5.3 kcal mol-1 + 24.5 cal mol-1 K-1 T(K).
37. CH2O + H2O(l), H2 SO4 • mHNO3 • nH2O(l) - Jayne et al.[88] report uptake measurements for 0 - 85 wt %H2SO4 and 0 - 54 wt% HNO3 over a temperature range of 241 - 300 K. Measured uptake coefficients vary
from 0.0027 - 0.027, increasing with H+ activity (Jayne et al ([88]; Tolbert et al., [160]), and with increasingpH above 7 (Jayne et al., [87]). Reversible uptake is solubility limited through reactions to form H2C(OH)2and CH3O.+ Model of uptake kinetics (Jayne et al., [88]) consistent with α = 0.04 ± 0.01 for all
compositions. A chemisorbed surface complex dominates uptake at 10 - 20 wt % H2SO4, and CH3O+
formation dominates above 20 wt % (Tolbert et al., [94/1564]; Jayne et al.[88]). These chemical mechanismsallow γ to greatly exceed α for strong acid and basic solutions. A full uptake model for acid solutions ispresented in Jayne et al. [88], and for basic solutions in Jayne et al. [87].
38. CH3O2 + NaCl(s) - Gershenzon et al.[52] measured the uptake of CH3O2 on crystalline NaCl(s) in a central
rod flow apparatus. They determined a value of γ = (4 ±1) x 10-3 at 296 K, suggesting that α ≥ 4 x 10⁻³.
39. CH3CHO on H2O(l) - Jayne et al. [87] measured a lower accommodation coefficient limit of > 0.03 at 267 K.Uptake can be limited by Henry's law and hydrolysis kinetics effects - see reference.
40. CH3C(O)CH3 on H2O(l) - Duan et al. [36] measured uptake between 260 and 285 K, deriving α = 0.066 at thelower temperature and 0.013 at the higher, with several values measured in between. Measured values fit
α /(1-α) = exp(-∆G‡obs/RT), where ∆G‡obs = -12.7 kcal/mol + 53.6 cal mol-1 K-1 T(K).
41. HC(O)OH on H2O(l) - Jayne et al. [86] measured uptake coefficients for formic acid between 260 and 291 K
and derived accommodation coefficients fitting α/(1-α) = exp(-∆G‡obs/RT), where ∆G‡obs = -7.9 kcal mol-1
+ 34.9 cal mol-1 K-1 T(K).
42. CH3C(O)OH on H2O(l) - Jayne et al. [86] measured uptake coefficients for acetic acid between 260 and
291 K and derived an accommodation coefficient fitting α/(1-α) = exp(-∆G‡obs/RT), where ∆G‡obs =
- 8.1 kcal mol-1 + 34.9 cal mol-1 K-1 T(K).
231
43. Cl2 on H2O(s) - Measurement of Leu [104] yielded a limit of <1 x 10⁻⁴ for Cl2 and is subject to same concern
as NO2 (see note 18). A similar limit of < 5 x 10⁻⁵ has been measured by Kenner et al. [93], which is alsoprobably limited by surface saturation.
44. OClO + H2O(s) - Brown et al.[19] and Graham et al.[56] used complementary ultra high-vacuum (UHV) andcoated-wall flow tube techniques to show sub-monolayer reversible absorption of OClO on water ice at 100 K(UVH) and 189 and 200 K (flow tube). No kinetic data are available at stratospheric temperatures but the massaccommodation coefficient for 100 K ice surfaces is near unity, with values of 0.8 ± 0.2 reported foramorphous ice and 0.6 ±0.2 for crystalline ice [56].
45. HCl on H2O(s) - Leu [104] (0.4; +0.6, -0.2) and Hanson and Ravishankara, [66] (α ≥ 0.3) are in reasonableagreement at stratospheric ice temperatures. More recently, a great deal of experimental effort (Abbatt et al. [4],Koehler et al. [98], Chu et al. [25], Graham and Roberts [54], Graham and Roberts[55]; Rieley et al.[136]) hasgone into understanding the uptake of HCl by ice surfaces. Rieley et al. measured α = 0.95±0.05 at 80 - 120K. Water ice at stratospheric temperatures can take up a large fraction of a monolayer even at HCl partialpressures typical of the stratosphere. Both the thermodynamic and spectroscopic properties of this absorbedHCl indicate that it has dissociated to ions, forms ionic hydrates, and is highly reactive. These experimentalresults contrast with initial theoretical calculations that predicted undissociated HCl hydrogen bonded to the icesurface and a very small adsorption probability at stratospheric temperatures (Kroes and Clary [100]); morerecent simulations result in higher adsorption energies and theoretical accommodation coefficients of one for190 K surfaces [Wang and Clary [173]]. Recent molecular dynamics calculations by Gertner and Hynes[53]also show that ionic absorption is thermodynamically favorable by about 5 kcal/mole. At HCl partialpressures significantly above those typical of the stratosphere, a liquid surface layer forms on the ice, greatlyenhancing the total amount of HCl that the surface can absorb.
46. HCl on H2O(1) - Recommendation is based on Van Doren et al. [166]. Measured α’s decrease from 0.18±0.02 at 274 K to 0.064 ±0.01 at 294 K, demonstrating a strong negative temperature dependence. Tang andMunkelwitz [158] have measured a larger (0.45 ±0.4) HCl evaporation coefficient for an aqueous NH4Cldroplet at 299 K.
47. HCl on HNO3 • nH2O - There was previously severe disagreement between Hanson and Ravishankara [66](α≥0.3) for NAT (54 wt. % HNO3), and Leu and coworkers (Moore et al. [123], Leu et al. [105]).However, subsequent experiments at lower HCl concentrations by Leu and coworkers (Chu et al. [25]) as wellas Abbatt and Molina [5] are generally consistent with Hanson and Ravishankara. In particular, Abbatt andMolina [5] report a large uptake coefficient (α >0.2). The measurements of Hanson and Ravishankara areconsistent with α = 1. The experiments at stratospherically representative HCl concentrations show thatHNO3 rich NAT surfaces adsorb significantly less HCl than H2O rich surfaces.
48. HCl on H2SO4•nH2O - Measurements by Watson et al. [174] at 284 K show α = 0.15±0.01 independent of nfor n ≥ 8. Experimental uptake and, therefore, apparent α falls off for n ≤8 (≥40 wt. % H2SO4). Thisbehavior is also observed at stratospheric temperature (218 K) by Hanson and Ravishankara [66]. More recentmeasurements by Robinson et al. (to be published) extend mass accommodation measurements to lowertemperatures, yielding significantly higher values. Solubility constraints also controlled earlier low temperatureuptake measurements of Tolbert et al. [161]. A review of the most recent solubility data is presented in Table60.
49. HCl on H2SO4 • 4H2O(s) - Uptake is a strong function of temperature and water vapor partial pressure(relative humidity) (Zhang et al. [188]), both of which affect adsorbed surface water.
50. Halocarbonyls on H2O(l) - Uptake is limited by Henry's law solubility and hydrolysis rate constants (De Bruynet al. and George et al. [47, 49]. See Table 60.
51. HBr on H2O(s) and HNO3 • nH2O - Hanson and Ravishankara [67, 69] have reported large uptake coefficientsfor HBr on 200 K ice and NAT. Lower limits of >0.3 and >0.2 for ice are reported in the two referencedpublications, respectively, and a limit of >0.3 is reported for NAT. No surface saturation was observed,leading to the supposition that HBr, like HCl, dissociates to ions on ice surfaces at stratospheric temperatures.Abbatt [1] measured an uptake coefficient lower limit of >0.03 on water ice at 228 K in agreement with
232
Hanson and Ravishankara. Rieley et al. measured an α of 1.0 ± 0.05 for water ice at 80 - 120K and Chu andHeron[23] report equilibrium HBr coverages for ice at 188 and 195 K.
52. HOBr on H2SO4 • nH2O(l) - Abbatt [1] measured an uptake coefficient of 0.06 ±(0.02) by measuring HOBrgas phase loss at 228 K. This result may well be a lower limit due to surface saturation effects.
53. CHBr3 on H2O(s) and H2SO4•nH2O(l) - Hanson and Ravishankara [69] investigated the uptake of bromoformon ice and 58 wt.% sulfuric acid at 220 K. No uptake on ice was observed, with a measured uptake coefficient
of <6 x 10⁻⁵. Reversible uptake by the sulfuric acid surface was observed with an initial uptake coefficient of
>3 x 10⁻³; both measurements are probably limited by surface saturation.
54. HF on H2O(s) and HNO3 • nH2O(s) - Hanson and Ravishankara [67] attempted to measure the uptake of HFby 200 K water ice and NAT surfaces but were unable to observe measurable adsorption. They surmise that,unlike HCl and HBr, HF does not dissociate to ions on ice or NAT surfaces at 200 K. Lack of measurableuptake is probably due to surface saturation.
55. CF2O on H2O(s), HNO3 • nH2O and H2SO4 • nH2O - Uptake coefficient measurements by Hanson andRavishankara [64] on stratospheric surfaces are probably subject to surface and/or bulk saturation effects and
may not represent accommodation coefficient measurements, particularly the lower limits of >3 x 10⁻⁶ reportedfor water and nitric acid ices.
56. CF3COOH on H2O(l) - Hu et al. [79] measured mass accommodation coefficients for five haloacetic acids,including trifluoroacetic acid (TFA); the others were mono-, di-, trichloro-, and chlorodifluoro-acetic acids. Alldisplayed a negative temperature dependence and values for α of about 0.1 at 273 K.
57. SO2 on H2O(1) - Measured α of 0.11 ± 0.02 has no significant temperature variation over a temperature rangeof 260 - 292 K (Worsnop et al. [181]). Ponche et al. [132] measured 0.13 ± 0.01 at 298 K, in agreementwith the earlier measurement. Shimono and Koda[151] estimated an α of 0.2 at 293.5 K from analysis of pH-dependent uptake coefficients in a novel liquid impingement technique that has not been calibrated with othergases. Donaldson et al. ([35]) have used second harmonic generation spectroscopy to detect a chemisorbed SO2surface species which was predicted from earlier uptake measurements by Jayne et al.[85]; this surface complexmay play a role in SO2 heterogeneous reactions on aqueous surfaces.
58. SO2 on H2SO4 • nH2O. See Note for H2O2 on H2SO4 • nH2O.
59. SO2 on C(s) - Initial and longer-term uptake Knudsen cell values of Rogaski et al. yielded γ = 3(±1) x 10-3
for room temperature amorphous carbon, suggesting α ~ 3 x 10⁻³ since no reaction products were observablewith gas phase mass spectrometry.
60. CH3S(O)CH3, CH3S(O2)CH3 and CH3S(O2)OH on H2O(l) - De Bruyn et al. [32] measured uptake overthe temperature range ~262-281 K and derived accommodation coefficients fitting α / (1 - α) =
exp(-∆G‡obs/RT), where ∆G‡obs = - 0.12 kcal mol-1 + 23.1 cal mol-1 K-1 T(K) for dimethylsulfoxide,
-10.7 kcal mol-1 + 43.0 cal mol-1 K-1 T(K) for dimethylsulfone and -3.50 kcal mol-1 + 16.7 cal mol-1 K-1
T(K) for methanesulfonic acid.
233
Table 64. Gas/Surface Reaction Probabilities (γ)
GaseousSpecies
SurfaceType
Surface Composition T(K) γ
Uncertainty Factor Notes
O3 + Surface → Products
O3 AluminaCarbon/SootSodium Chloride
Al2O3(s)C(s)NaCl(s)
210-300≈300≈300
See Note
3 x 10⁻³
>2 x 15-10
20121
OH + Surface → Products
OH Water IceHydrochloric AcidNitric Acid IceSulfuric AcidSodium Chloride
H2O(s)HCl • nH2O(l)HNO3 • 3HzO(s)H2SO4 • nH2O(l)NaCl(s)
205-230220200-228200-298245-339
>0.01>0.2>0.2>0.2
1.2 x 10⁻⁵
exp 1750/T
3
34567
HO2 + Surface → Products
Water IceSulfuric Acid
H2O(s)H2SO4 • nH2O(l)(28 wt %)(55 wt %)(80-96 wt %)
223
275223243
0.025
.0.07>0.05>0.2
3 88
2NO2 + H2O(l) → HONO + HNO3
NO2 Liquid Water H2O(l) See Note 9Sulfuric Acid H2SO4 • nH2O See Note 10
NO2 + C(s) → Products
NO2 Carbon/Soot C(s) See Note 11
2NO2 + NaCl(s) → ClNO + NaNO3
NO2 Sodium Chloride NaCl(s) 298 See Note 12
NO3 + H2O(l) → HNO3 + OH
NO3 Liquid Water H2O(l) 273 2 x 10⁻⁴ 20 13
234
Table 64. Continued
GaseousSpecies
SurfaceType
Surface Composition T(K) γ
Uncertainty Factor Notes
N2O5 + H2O → 2HNO3
N2O5 Water IceLiquid WaterNitric Acid IceSulfuric Acid
Sulfuric AcidMonohydrate
Sulfuric AcidTetrahydrateTernary Acid
H2O(s)H2O(l)HNO3 • 3H2O(s)H2SO4 • nH2O(l)
H2SO4 • H2O(s)
H2SO4 • 4H2O(s)
H2SO4 • nHNO3 •nH2O(l)
195-200260-295200195-300
200-300
195-207
195-218
0.010.05*
3 x 10-4
≈0.1
See Note
0.006
See Note
323
See Note
3
2
14151617
18
19
17
N2O5 + HCl(s) → ClNO2 + HNO3
N2O5 Water IceNitric Acid Ice
Sulfuric AcidMonohydrate
H2O(s) • HCl(s)HNO3 • 3H2O(s) •HCl(s)
H2SO4 • H2O(s)
190-220200
195
0.030.003
<1 x 10⁻⁴
See Note2
2021
22
N2O5 + NaCl(s) → ClNO2 + NaNO3(s)
N2O5 Sodium Chloride NaCl(s)NaCl(aq)
-300 5 x 10⁻⁴
>0.02
20 2323
N2O5 + HBr(s) → BrNO2 + HNO3
N2O5 Nitric Acid Ice HNO3 • 3H2O(s) 200 0.005 10 24
N2O5 + MBr(s) → Products
N2O5 Sodium BromidePotassium Bromide
NaBr(s)KBr(s)
~300~300 4 x 10⁻³
See Note10
2525
HONO + H2O → Products
HONO Liquid Water H2O(l) 247-297 0.04 5 26
HONO + H2SO4 → Products
HONO Sulfuric Acid H2SO4(l) 180-200 See Note 27
HONO + HCl → ClNO + H2O
HONO Water Ice H2O(s) 180-200 0.05 3 28
235
Table 64. Continued
GaseousSpecies
SurfaceType
Surface Composition T(K) γ
Uncertainty Factor Notes
HONO + NaCl → Products
HONO Sodium Chloride NaCl(s) ~300 <1 x 10⁻⁴ 29
HNO3 + C(s) → Products
HNO3 Carbon/Soot C(s) 190-440 0.04 5 30
HNO3 + NaX(s) → HX + NaNO3
HNO3 Sodium ChlorideSodium BromidePotassium ChloridePotassium Bromide
NaCl(s)NaBr(s)KCl(s)KBr(s)
295-298~290~290~290
0.020.020.020.02
3101010
31313131
NH3 + H2SO4 → NH4HSO4
NH3 Sulfuric Acid H2SO4 • nH2O 288-300 0.4 2.5 32
CH3C(O)O2 + H2O → CH3C(O)OH + HO2
CH3C(O)O2 Liquid WaterSulfuric Acid
H2O(l)H2SO4 • nH2O(84 wt % H2SO4)(51 wt % H2SO4)(71 wt % H2SO4)
225
246223298
4 x 10⁻³
3 x 10⁻³
1 x 10⁻³
1 x 10⁻³
3
333
3333
Cl + Surface → Products
Cl Sulfuric Acid H2SO4 • nH2O(l) 221-296 2 x 10⁻⁴ 10 34
Cl2 + HBr(s) → BrCl + HCl
Cl2 Water Ice • HBr(s) H2O(s) 200 >0.2 35
Cl2 + KBr(s) → BrCl + KCl(s)
Cl2 Potassium Bromide KBr(s) ~295 >0.1 36
Cl2 + NaX (aq) → ClX + NaCl (aq)
Cl2 Aqueous SodiumBromideAqueous SodiumIodine
NaBr(aq)
NaI(aq)
See Note
See Note
37
37
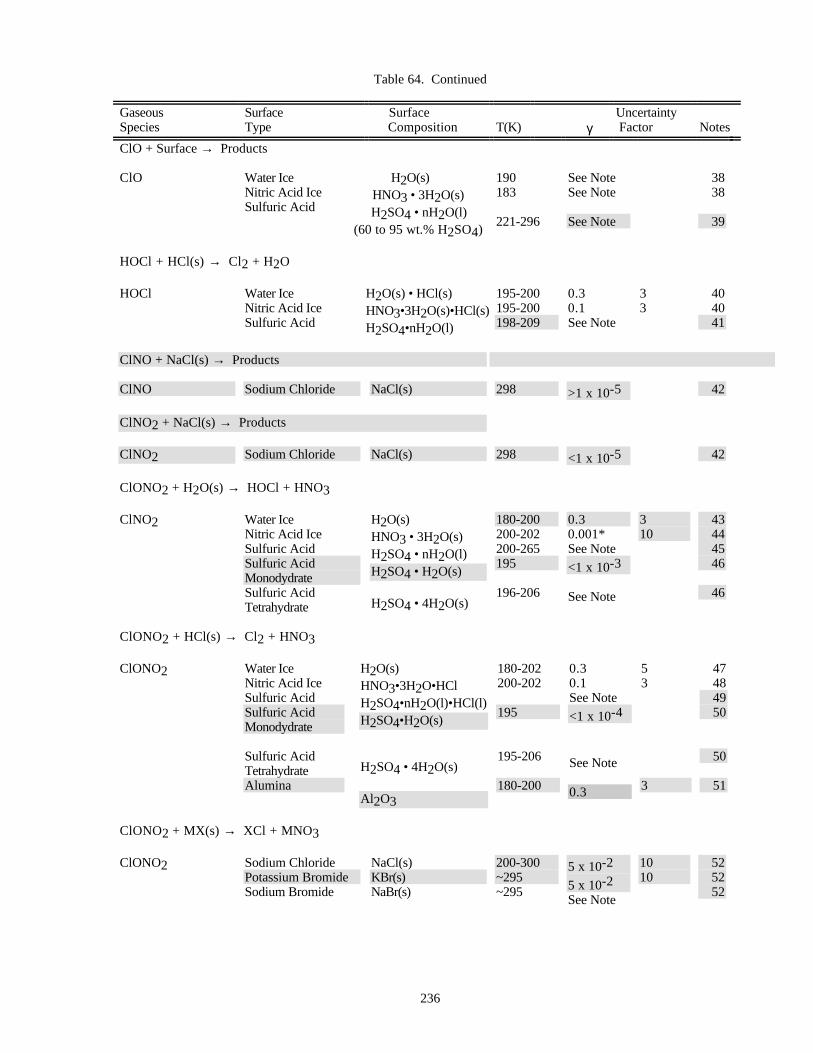
236
Table 64. Continued
GaseousSpecies
SurfaceType
Surface Composition T(K) γ
Uncertainty Factor Notes
ClO + Surface → Products
ClO Water IceNitric Acid IceSulfuric Acid
H2O(s)HNO3 • 3H2O(s)H2SO4 • nH2O(l)
(60 to 95 wt.% H2SO4)
190183
221-296
See NoteSee Note
See Note
3838
39
HOCl + HCl(s) → Cl2 + H2O
HOCl Water IceNitric Acid IceSulfuric Acid
H2O(s) • HCl(s)HNO3•3H2O(s)•HCl(s)H2SO4•nH2O(l)
195-200195-200198-209
0.30.1See Note
33
404041
ClNO + NaCl(s) → Products
ClNO Sodium Chloride NaCl(s) 298 >1 x 10⁻⁵ 42
ClNO2 + NaCl(s) → Products
ClNO2 Sodium Chloride NaCl(s) 298 <1 x 10⁻⁵ 42
ClONO2 + H2O(s) → HOCl + HNO3
ClNO2 Water IceNitric Acid IceSulfuric AcidSulfuric AcidMonodydrateSulfuric AcidTetrahydrate
H2O(s)HNO3 • 3H2O(s)H2SO4 • nH2O(l)H2SO4 • H2O(s)
H2SO4 • 4H2O(s)
180-200200-202200-265195
196-206
0.30.001*See Note
<1 x 10⁻³
See Note
310
43444546
46
ClONO2 + HCl(s) → Cl2 + HNO3
ClONO2 Water IceNitric Acid IceSulfuric AcidSulfuric AcidMonodydrate
Sulfuric AcidTetrahydrateAlumina
H2O(s)HNO3•3H2O•HClH2SO4•nH2O(l)•HCl(l)H2SO4•H2O(s)
H2SO4 • 4H2O(s)
Al2O3
180-202200-202
195
195-206
180-200
0.30.1See Note
<1 x 10⁻⁴
See Note
0.3
53
3
47484950
50
51
ClONO2 + MX(s) → XCl + MNO3
ClONO2 Sodium ChloridePotassium BromideSodium Bromide
NaCl(s)KBr(s)NaBr(s)
200-300~295~295
5 x 10⁻²
5 x 10⁻²
See Note
1010
525252
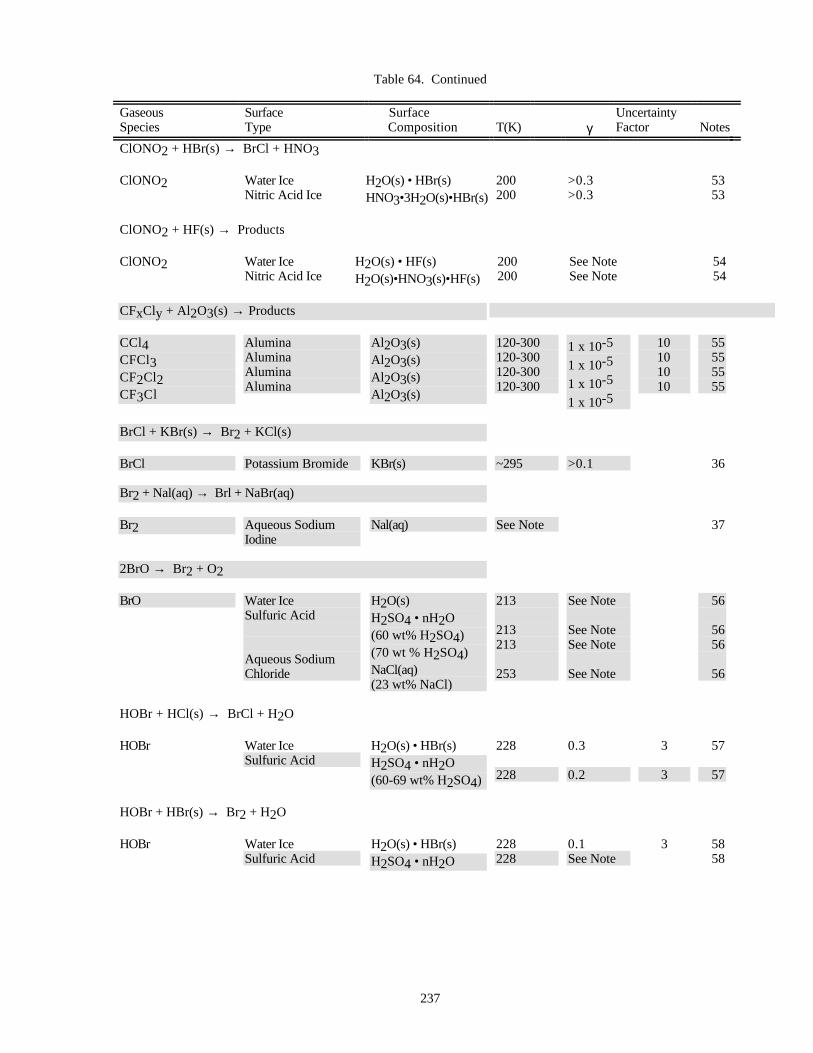
237
Table 64. Continued
GaseousSpecies
SurfaceType
Surface Composition T(K) γ
UncertaintyFactor Notes
ClONO2 + HBr(s) → BrCl + HNO3
ClONO2 Water IceNitric Acid Ice
H2O(s) • HBr(s)HNO3•3H2O(s)•HBr(s)
200200
>0.3>0.3
5353
ClONO2 + HF(s) → Products
ClONO2 Water IceNitric Acid Ice
H2O(s) • HF(s)H2O(s)•HNO3(s)•HF(s)
200200
See NoteSee Note
5454
CFxCly + Al2O3(s) → Products
CCl4CFCl3CF2Cl2CF3Cl
AluminaAluminaAluminaAlumina
Al2O3(s)Al2O3(s)Al2O3(s)Al2O3(s)
120-300120-300120-300120-300
1 x 10⁻⁵
1 x 10⁻⁵
1 x 10⁻⁵
1 x 10⁻⁵
10101010
55555555
BrCl + KBr(s) → Br2 + KCl(s)
BrCl Potassium Bromide KBr(s) ~295 >0.1 36
Br2 + Nal(aq) → Brl + NaBr(aq)
Br2 Aqueous SodiumIodine
Nal(aq) See Note 37
2BrO → Br2 + O2
BrO Water IceSulfuric Acid
Aqueous SodiumChloride
H2O(s)H2SO4 • nH2O(60 wt% H2SO4)(70 wt % H2SO4)NaCl(aq)(23 wt% NaCl)
213
213213
253
See Note
See NoteSee Note
See Note
56
5656
56
HOBr + HCl(s) → BrCl + H2O
HOBr Water IceSulfuric Acid
H2O(s) • HBr(s)H2SO4 • nH2O(60-69 wt% H2SO4)
228
228
0.3
0.2
3
3
57
57
HOBr + HBr(s) → Br2 + H2O
HOBr Water IceSulfuric Acid
H2O(s) • HBr(s)H2SO4 • nH2O
228228
0.1See Note
3 5858
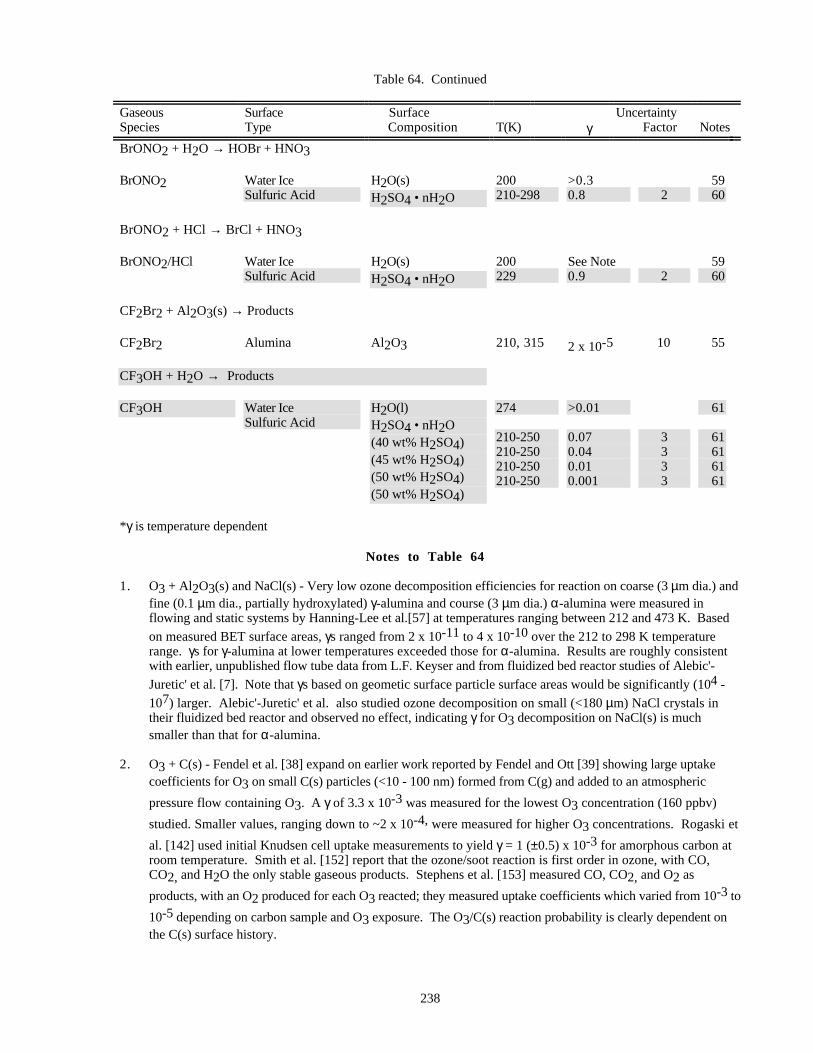
238
Table 64. Continued
GaseousSpecies
SurfaceType
Surface Composition T(K) γ
Uncertainty Factor Notes
BrONO2 + H2O → HOBr + HNO3
BrONO2 Water IceSulfuric Acid
H2O(s)H2SO4 • nH2O
200210-298
>0.30.8 2
5960
BrONO2 + HCl → BrCl + HNO3
BrONO2/HCl Water IceSulfuric Acid
H2O(s)H2SO4 • nH2O
200229
See Note0.9 2
5960
CF2Br2 + Al2O3(s) → Products
CF2Br2 Alumina Al2O3 210, 315 2 x 10⁻⁵ 10 55
CF3OH + H2O → Products
CF3OH Water IceSulfuric Acid
H2O(l)H2SO4 • nH2O(40 wt% H2SO4)(45 wt% H2SO4)(50 wt% H2SO4)(50 wt% H2SO4)
274
210-250210-250210-250210-250
>0.01
0.070.040.010.001
3333
61
61616161
*γ is temperature dependent
Notes to Table 64
1. O3 + Al2O3(s) and NaCl(s) - Very low ozone decomposition efficiencies for reaction on coarse (3 µm dia.) andfine (0.1 µm dia., partially hydroxylated) γ-alumina and course (3 µm dia.) α-alumina were measured inflowing and static systems by Hanning-Lee et al.[57] at temperatures ranging between 212 and 473 K. Based
on measured BET surface areas, γs ranged from 2 x 10-11 to 4 x 10⁻¹⁰ over the 212 to 298 K temperaturerange. γs for γ-alumina at lower temperatures exceeded those for α-alumina. Results are roughly consistentwith earlier, unpublished flow tube data from L.F. Keyser and from fluidized bed reactor studies of Alebic'-
Juretic' et al. [7]. Note that γs based on geometic surface particle surface areas would be significantly (104 -
107) larger. Alebic'-Juretic' et al. also studied ozone decomposition on small (<180 µm) NaCl crystals intheir fluidized bed reactor and observed no effect, indicating γ for O3 decomposition on NaCl(s) is muchsmaller than that for α-alumina.
2. O3 + C(s) - Fendel et al. [38] expand on earlier work reported by Fendel and Ott [39] showing large uptakecoefficients for O3 on small C(s) particles (<10 - 100 nm) formed from C(g) and added to an atmospheric
pressure flow containing O3. A γ of 3.3 x 10⁻³ was measured for the lowest O3 concentration (160 ppbv)
studied. Smaller values, ranging down to ~2 x 10⁻⁴, were measured for higher O3 concentrations. Rogaski et
al. [142] used initial Knudsen cell uptake measurements to yield γ = 1 (±0.5) x 10-3 for amorphous carbon atroom temperature. Smith et al. [152] report that the ozone/soot reaction is first order in ozone, with CO,CO2, and H2O the only stable gaseous products. Stephens et al. [153] measured CO, CO2, and O2 as
products, with an O2 produced for each O3 reacted; they measured uptake coefficients which varied from 10-3 to
10-5 depending on carbon sample and O3 exposure. The O3/C(s) reaction probability is clearly dependent onthe C(s) surface history.
239
3. OH + H2O(s) - Cooper and Abbatt [27] measured initial irreversible OH uptake coefficients of ~ 0.1 for waterice between 205 - 230 K; these decayed to γ = 0.03 ±0.02 after repeated exposure to OH. Self reaction to formH2O or H2O2 was indicated by the lack of observable gas phase products despite observation of first order OHloss.
4. OH + HCl • nH2O(l) - Cooper and Abbatt [27] demonstrated significant enhancement of OH uptake(to γ > 0.2) after HCl doping of 220 K ice surfaces sufficient to melt the surface layer. It is unclear whether
OH is lost to self-reaction or reaction with hydrated Cl- ions.
5. OH + HNO3 • 3H2O - Cooper and Abbatt [27] measured γ > 0.2 for nitric acid doped ice surfaces underconditions suitable for NAT formation at 200 and 228 K. Increase over pure ice uptake rates is probably due toHNO3 + OH → H2O + NO3 reaction.
6. OH + H2SO4 • nH2O - Lower limits of 0.2 for uptake coefficients on 45-65 wt % H2SO4 between 220 and230 K and for 96 wt % H2SO4 at 230 and 298 K by Cooper and Abbatt [27] are consistent with a lower limitof 0.07 on 28 wt % H2SO4 at 275 K in similar experiments by Hanson et al. [60] and a probable surface
saturated value of (4.9 ±0.5) x 10-4 from Knudsen cell measurements by Baldwin and Golden [9] and anestimate of γ = 1 on ~96 wt % H2SO4 at 298 K by Gerhenzon et al. [50] using a coated insert flow tube
technique. Uptake is probably reactive with OH + HSO4- → H2O + SO4- the hypothesized process.
7. OH + NaCl(s) - Ivanov et al. [84] used a fast flow reactor with a central salt coated rod to measure
heterogeneous loss of OH between 245 and 339 K. Their fit for NaCl(s) yielded γ = (1.2 ±0.7) x 10-5
exp[(1750 ±200)/T]. Similar data for NH4NO3 yielded γ - (1.4 ±0.5) x 10-4 exp [(1000 ±100)]. Since uptakewas irreversible, it is assumed that the loss was self-reaction.
8. HO2 on H2O(s) and H2SO4 • nH2O(l) - Uptake of HO2 on ice and super-cooled 55 wt % sulfuric acid at223 K has been demonstrated to be limited by HO2 surface saturation by Cooper and Abbatt [27]. They arguethat self-reaction, presumably 2HO2 → H2O2 + O2 is limiting measured uptake coefficients of 0.025 ±0.005for ice and 0.055 ±0.020 for 55 wt % H2SO4. However, Gersherzon et al. [52] measured γ > 0.2 for 80 and96 wt % H2SO4 at 243 K and Hanson et al. [60] measured a lower limit for 28 wt % H2SO4 at 275 K of0.07. However, large gas phase diffusion corrections mean this value is consistent with γ = 1.
9. NO2 + H2O(1) - Value for γ of (6.3 ± 0.7) x 10-4 at 273 K (Tang and Lee, [157]) was achieved by chemical
consumption of NO2 by SO3=; their stopped-flow measurement was probably still affected by surfacesaturation, leading to the measurement of a lower limit. Ponche et al. [132] measured an uptake coefficient of
1.5 (±0.6) x 10-3 at 298 K, which was also probably subject to saturation limitations. Mertes and
Wahner[115] used a liquid jet technique to measure a lower limit of γ ≥ 2 x 10⁻⁴ at 278 K, and they observedpartial conversion of the absorbed NO2 to HONO. Msibi et al. [127] used a cylindrical/annular flow reactor to
derive g = (8.7 ±0.6) x 10-5 on pH = 7 deionized water surfaces and (4.2 ± 0.9) x 10-4 on pH = 9.3 wetascorbate surfaces; it seems likely that these results are also subject to surface saturation given the gas/surface
interaction times involved in the experiment. Data are consistent with an α ≥ 1 x 10⁻³ for 278 - 298 K and aliquid phase second-order hydrolysis of NO2 to HONO and HNO3 which depends on temperature and pH.However, the interplay between accommodation, possible surface reaction, and bulk reaction may be complex.
10. NO2 + H2SO4•nH2O - Saastad et al. [148] measured a lower limit of 5 x 10⁻⁵ for an uptake coefficient on 70wt % H2SO4 between 193 and 243 K. Baldwin and Golden [8] measured an uptake coefficient limit of <1.0 x
10-6 on 96 wt. % H2SO4. See Note 15 for H2O2 on H2SO4 • nH2O. Both measurements were probablylimited by surface saturation.
11. NO2 + C(S) - Tabor et al. [156] extended their previously published study (Tabor et al. [155]) to three types ofamorphous carbon particles exposed to NO2 in a low pressure Knudsen cell reactor. All three types of C(s)
particles were reported to show initial γ values of (5.1 ±1.7), (8.3 ±2.7), and (5.7 ±1.3) x 10- 2, compared
240
with (4.8 ± 0.6) x 10- 2 reported in Tabor et al., all assuming a geometrical surface area for the bulk C(s)powder. NO was observed as a product from all samples, and some samples evolved CO, CO2, and a massspectrometric peak consistent with NO3 or N2O5 upon thermal desorption. The amount of NO evolved variedwidely with the type of C(s) particle. Co-deposition of H2O vapor had no major effect on NO2 uptake. Onthe other hand, room temperature Knudsen cell studies of amorphous carbon by Rogaski et al. report an initialγ of 0.11 ±0.04, although γ for longer times agrees reasonably well with Tabor et al.[156]. However, 13NO2uptake studies with suspended small aerosol particles of graphitic or amorphous carbon by Kalberer et al. [90]measured uptake coefficients between (0.3 ±0.19) x 10-4 and (4.0 ±1.0) x 10-4. NO was determined to be theprincipal gaseous product observed in these studies, and first-order absorbed NO2 reaction rates of (4 to 9) x
10-4 s-1 were obtained. The large discrepancy between these measured uptake rates may be due to the difficultyof properly specifying the reactive surface area for bulk powders and the time-dependent nature of reactiveuptake.
12. NO2 + NaCl(s), NaBr(s) - Vogt and Finlayson-Pitts [170, 172] used diffuse reflectance infrared spectroscopy tostudy the reaction of NO2 with NaCl(s) at 298 K, and Vogt et al.[169] used the same technique to study NO2 +NaBr(s) at 298 K. Both reactions were shown to be approximately second order in NO2. Assuming that
adsorbed N2O4 is the reactant leads to γ = (1.3 ±0.6) x 10-4 for NaCl(s) and 2 (+4, -1.3) x 10-4 for NaBr(s).
Peters and Ewing [131] measured reactive uptake for single-crystal NaCl(100) surfaces and observed both NO3-
(c) and ClNO products. The value of γ(N2O4) measured by Peters and Ewing at 298 K was only (1.3 ±0.3) x
10-6. They noted that small amounts of water vapor (9.5 mbar) cause γ to increase by two orders ofmagnitude.
13. NO3 + H2O(l) - Rudich et al. [145, 146] used wetted-wall flow tube techniques to measure uptake coefficientsfor NO3 on pure water and aqueous NaCl, NaBr, NaI, and NaNO2 solutions. These studies were extended toother aqueous solutions by Imamura et al.[82]. Uptake on pure water was consistent with reaction of NO3 to
produce HNO3 and OH. Uptake coefficients with solutions containing I- , Cl- , Br - , NO2- and other anions
were larger and scaled with anion concentration, indicating electon transfer reactions to produce NO3- . The γof (2.0 ±1.0 x 10- 4) at 273 K determined for pure water by Rudich et al. is significantly lower than the lowerlimit of 2.5 x 10⁻³ quoted by Mihelcic et al. [119]. A detailed analysis of uptake coefficients for KI aqueoussolutions indicated that the NO3 mass accommodation coefficient is >0.04[146].
14. N2O5 + H2O(s) - Leu [103] and Hanson and Ravishankara [63] have measured nearly identical values of 0.28(±0.11) and 0.24 (±30%) near 200 K. Hanson and Ravishankara [68] presented new and re-analyzed data as afunction of ice thickness, with a value of ~0.008 for the thinnest ice sample, rising to ~0.022 for the thickest.Quinlan et al. [134] have measured a lower limit for γ on fresh ice surfaces of 0.03 at 188 K.
15. N2O5 + H2O(l) - Reaction on liquid water has a negative temperature dependence. Van Doren et al. [166]measured γ’s of 0.057 ±0.003 at 271 K and 0.036 ±0.004 at 282 K. Mozurkewich and Calvert [124] studied γon NH3/H2SO4/H2O aerosols. For their most water-rich aerosols (RH = 76%) they measured γs of 0.10±0.02 at 274 and 0.039 ±0.012 at 293 K. George et al. [48] use droplet train/ion chromotography techniquesto measure γs of (3.0 ±0.2) x 10- 2 (262 K), (2.9 ±1.2) x 10-2 (267 K), 2.0 ±0.2) x 10-2 (273 K), (1.6 ±0.8)x 10-2 (276 K), and (1.3 ±0.8) x 10-2 (277 K). Msibi et al.[126]] measured a smaller γ of 2.5 x 10⁻³ forwater adsorbed on a denuder flow tube well under 66-96% relative humidity conditions at room temperature.
16. N2O5 + HNO3 • 3H2O(s) - Hanson and Ravishankara [63] have measured γ = 0.0006 (±30%) at 200 K. Theypresented re-analyzed and additional data as a function of ice thickness (Hanson and Ravishankara [68]), deriving
a value of 3 x 10⁻⁴ for the thinnest NAT covered ice layer, with values up to three times higher for thickerNAT-covered ice layers. This is in very poor agreement with γ = 0.015 (±0.006) reported by Quinlan et al.[134]. This latter measurement may have been biased by a super-cooled nitric acid surface rather than NAT.
17. N2O5 + H2SO4 • nH2O(l) - This reaction has been intensively studied between 195 and 296 K for a wide rangeof H2SO4 wt % values using four complementary experimental techniques. Data are available from aerosolflow tube studies (Fried et al. [45], Hanson and Lovejoy [61], and Lovejoy and Hanson [108]), coated wall flow
241
tube studies (Hanson and Ravishankara [66], Zhang et al. [186]), stirred Knudsen cell studies (Williams et al.[178], Manion et al. [111]) and droplet train studies (Van Doren et al. [166], Robinson et al. [141]). Allstudies have yielded γs between ~0.05 and 0.20 with modest dependence on surface H2SO4 wt % andtemperature. Aerosol flow tube studies at higher N2O5 exposure and the ternary H2SO4/HNO3/H2O studies ofZhang et al. both illustrate that significant levels of HNO3 in the H2SO4/H2O solutions will reduce γmeasurably; this fact explains some of the scatter in aerosol flow tube studies [45, 61, 108]. The effect of 5.0x 10⁻⁷ torr HNO3 for γ (N2O5) as a function of temperature at two water vapor concentrations are plotted inZhang et al.; the decrease in γ is greatest at low temperatures, approaching a factor of 2-5 between 200 and 195K.
Robinson et al. have binned the data believed to be free of suspected HNO3 dilution and surface saturationeffects from the studies cited above into groups with similar H2SO4 concentration, and they have fit atemperature-dependent uptake model, taking into account temperature and composition dependence of theeffective Henry's Law constant, liquid phase diffusion coefficient, and the liquid phase hydrolysis rate constant.The hydrolysis reaction was treated by modeling two reaction channels, a direct hydrolysis process dominatingreaction at low H2SO4 concentrations with a reaction rate proportional to water activity, and a proton-catalyzed
reaction with a rate proportional to H+ activity, which dominates at higher acid concentrations. Aparameterized fit for 30 to 80 wt % H2SO4 to the uptake model gives
γ = k0 + k1/T + k2/T, where ki = ∑ aij (wt% H2SO4)j, j = 0 to 3
i = 0, j: -11.548 0.65252 -0.013183 0.000081293i = 1, j: 5521.6 -316.68 6.4268 -0.039527i = 2, j: -587410 34601 -712.3 4.3833
18. N2O5 + H2SO4 • H2O(s) - Zhang et al. [185] used coated flow tube techniques to measure the uptake of N2O5on solid sulfuric acid monohydrate over a temperature range of 200 to 225 K. The measurement values of γwere significantly higher at 200 K (γ ~ 1 x 10⁻³) than at 225 K (γ ~10-4) and were well fit by log γ = [4.78 -0.0386 T(K)]. Acid rich H2SO4 • H2O surfaces had a lower γ than water rich surfaces (log γ = 0.162 - 0.789x log ρH2O] where ρH2O is their experimental water vapor partial pressure.
19. N2O5 on H2SO4 • 4H2O(s) - Hanson and Ravishankara [71] studied N2O5 uptake by frozen 57.5 and 60 wt% H2SO4 as a function of temperature and relative humidity. The 57.5 wt % surface was not sensitive torelative humidity and was slightly more reactive (γ = 0.008 vs 0.005) at 205 K than at 195 K. Reactionprobabilities on the 60 wt % surface dropped off with temperature and relative humidity.
20. N2O5 + HCl on H2O(s) - Leu [103] measured γ = 0.028 (±0.011) at 195 K, while Tolbert et al. [162]
measured a lower limit of 1 x 10⁻³ at 185 K. These experiments were done at high HCl levels probablyleading to a liquid water/acid surface solution (Abbatt et al. [4]). The reaction probability may be much smalleron HCl/H2O ice surfaces characteristic of the stratosphere.
21. N2O5 + HCl on HNO3 • 3H2O(s) - Hanson and Ravishankara [63] measured γ = 0.0032 (±30%) near 200 K.
22. N2O5 + HCl on H2SO4 • H2O(s) - Zhang et al. [185] saw no increase in N2O5 uptake on sulfuric acid
monohydrate at 195 K upon exposure to HCl, setting γ < 10-4.
23. N2O5 + NaCl (s,aq) - Using FTIR analysis, Livingston and Finlayson-Pitts [107] have demonstrated that
N2O5 reacts with crystalline NaCl to form NaNO3(s), and they report γ > 2.5 x 10⁻³ at 298 K. However,
Leu et al.[102] used flow tube/mass spectrometric techniques to obtain γ < 1 x 10⁻⁴ for dry salt at 223 and296 K; they also noted that exposing salt surfaces to small amounts of H2O vapor increased γ significantly.
Fenter et al.[41] measured γ = (5.0 ±0.2) x 10-4 on fused salt surfaces at room temperature, assuming thegeometrical surface area is the only surface accessed. Msibi et al. [126] measured NO3- deposition on an
annular flow reactor to determine γ = 1 x 10⁻³ for salt surfaces between 45 and 96% relative humidity at room
242
temperature, rising to γ = 1.5 x 10⁻² at 96/97% relative humidity, but they argue that most of the uptake isdue to reaction with H2O. On aqeous NaCl solutions, Zetzsch, Behnke, and co-workers [11, 12, 182] havestudied the reaction of N2O5 with aqueous NaCl aerosols in an aerosol chamber. The relative yields of ClNO2and HNO3 rise with the NaCl concentration. A reaction probability of ~0.03 is measured with a 50% ClNO2yield at the deliquescence point (Zetsch and Behnke). This picture is confirmed by droplet uptake studies on 1M NaCl solutions reported by George et al. [48] which confirm that uptake on salt solutions in the 263 - 278K temperature range is larger than that on pure water droplets.
24. N2O5 + HBr on HNO3 • 3H2O(s) - This reaction, yielding γ ~0.005, was investigated on NAT surfaces near200 K by Hanson and Ravishankara [67]. Under some conditions a much higher reaction coefficient of ~0.04was observed.
25. N2O5 + MBr - Finlayson-Pitts et al. [43] used FTIR techniques to demonstrate that BrNO2(ads) is a majorproduct of the N2O5(g) + NaBr(s) reaction. However, Fenter et al. [41] failed to measure gas phase evolutionof BrNO2 using Knudsen cell/mass spectrometry techniques, detecting Br2(g) instead. They propose that
BrNO2 reacts with KBr(s) to yield KNO2(s) + Br2(g). A γ of (4.0 ±2.0) x 10-3 at room temperature wasdetermined for fused KBr surfaces with well-defined surface areas.
26. HONO + H2O(l) - Bongartz et al. [15] present uptake measurements by two independent techniques, the liquidjet technique of Schurath and co-workers and the droplet train/flow tube technique of Mirabel and co-workers(Ponche et al. [132]). With a surface temperature of ~245 K the droplet train techniques yielded 0.045<γ<0.09,while the liquid jet operating with a surface temperature of 297 K obtained 0.03<γ< 0.15. Mertes and Wahnerused a liquid jet technique to measure 4 x 10- 3 < γ < 4 x 10⁻² at 278 K. Since HONO uptake by liquidwater probably involved hydrolysis, an increase in Henry's law solubility with decreasing temperature may beoffset by a decreasing hydrolysis rate constant, leaving the uptake coefficient's temperature trend uncertain.Measured uptake coefficients will not correspond to the mass accommodation coefficient.
27. HONO + H2SO4 • nH2O(l) - Zhang et al.[187] measured uptake coefficients for HONO on sulfuric acid that
increased from (1.6 ±0.1) x 10-2 for 65.3 wt % H2SO4 (214 K) to (9.1 ±1.6) x 10-2 for 73 wt % H2SO4(226 K). Fenter and Rossi[42] measured uptake coefficients rising from 1.8 x 10⁻⁴ for 55 wt % H2SO4 (220
K) to 3.1 x 10⁻¹ for 95 wt % H2SO4 (220 K and 273 K). In general, the values measured by Zhang et al. are afactor of 2 to 5 higher than those of Fenter et al. for comparable acid concentrations. Since the reactionprobably depends on both temperature and acid concentration and since the data scatter is high in bothexperiments, further independent data will be required to define γ as a function of acid concentration andtemperature. These data are generally consistent with the effective Henry's law constant measurements ofBecker et al. [10] who illustrate that HONO solubility decreases exponentially with H2SO4 concentration until~53 wt %, at which point reaction to form nitrosyl sulfuric acid increases H* dramatically as H2SO4concentration increases.
28. HONO + HCl + H2O(s) - Knudsen cell uptake studies for HONO/HCl co-deposited on ice (180-200 K) and forHONO on 0.1 to 10 m HCl frozen solutions (~190 K) by Fenter and Rossi showed HONO uptake coefficientsin the 0.02 to 0.12 range as long as surface HCl concentrations significantly exceed HONO concentrations.ClNO was evolved quantitatively with HONO consumption.
29. HONO + NaCl(s) - Diffuse reflectance experiments by Vogt and Finlayson-Pitt [171] on room temperatureNaCl(s) and Knudsen cell uptake experiments by Fenter and Rossi on room temperature NaCl(s) and frozen 0.1M NaCl aqueous solutions, all failed to show HONO uptake. The latter results yield γ < 1 x 10⁻⁴.
30. HNO3 + C(s) - Knudsen cell/mass spectrometry measurements by Rogaski et al. yielded γ = 3.8 (±0.8) x 10-2
on one type of amorphous carbon over a temperature range of 190-440 K. Gas phase NO and NO2 equivalentto ~2/3 of the HNO3 uptake were observed as reaction products.
31. HNO3 + NaX(s)/KX(s) - Vogt and Finlayson - Pitts [170, 172] used diffuse infrared reflectance spectroscopy tocharacterize the process. There was absorption of HNO3, but no reaction was observed on completely dryNaCl(s); however, NaNO3 forms in the presence of very low (well below the deliquescence point) levels of
243
H2O(g). Using XPS spectroscopy to identify surface products and a dry HNO3 source, Laux et al. [101]
(also see Vogt et al.) measured γ = (4 ±2) x 10-4 at 298K. Fenter et al. [40] measured the room temperatureuptake of HNO3 on solid powders of NaCl, NaBr, KCl, KBr, and NaNO3, using Knudsen cell/massspectrometry techniques. They saw similar uptake for all surfaces, including unreactive NaNO3, and
recommend γ = (2.8 ±0.3) x 10-2 for all salts. HCl or HBr was produced with ~100% yield from the halidesurfaces. There is some concern about the effective surface area of the powders used by Fenter et al. (see Leu etal.[102]). Fenter et al. report new HNO3 data to support their argument that "sticky" gases such as HNO3cannot penetrate below the top surface layer of the powders used in their experiments. Leu et al. used flowtube/mass spectrometry techniques to measure γ = (1.3 ±0.4) x 10-2 at 296 K and γ > 8 x 10⁻³ at 223 K,both in the presence of low levels of H2O(g). They determined that uptake at 296 K was reactive, producingHCl but that at 223 K reaction was suppressed and uptake was largely absorptive. Beichert and Finlayson-Pitts [13] measured γ = (1.4 ±0.6) x 10-2 at 298 K with a Knudsen cell technique, and, using D2O,demonstrated that chemisorbed water, presumably retained on defect sites, was crucial for NaNO3 formation.This suggests that low levels of defect-retained water are responsible for the small uptake values measured byLaux et al.
32. NH3 + H2SO4 • nH2O - Robbins and Cadle [137], Huntzicker et al. [80], McMurry et al. [114], and Daumeret al. [30] all studied NH3 uptake by sulfuric acid aerosols in near room temperature flow reactors (T = 281 -300 K). Uptake coefficients varied between 0.1 and 0.5. Rubel and Gentry [144] used levitated H3PO4 aciddroplets to show that heterogeneous reaction does control the initial NH3 uptake on strong acid solutions.Both Rubel and Gentry and Däumer et al. also explored the effect of organic surface coatings.
33 CH3 C(O)O2 + H2O(l) and H2SO4 • nH2O - Villalta et al. [168] used wetted-wall flow tube techniques to
measure γ = 4.3 (+ 2.4 /-1.5) x 10-3 for water at 274 ± 3K. They also measured uptake for 34 wt % H2SO4at 246 K (γ = (2.7 ±1.5) x 10-3), 51 wt % at 273 K (γ = (0.9 ±0.5) x 10-3), and 71 wt % at 298 K (γ = (1.4±0.7) x 10-3). They suggest that products subsequent to hydrolysis are HO2 and CH3C(O)OH.
34. Cl + H2SO4 • nH2O - Measured reaction probability (Martin et al. [113]) varies between 3 x 10⁻⁵ and 7 x 10⁻⁴
as H2O and T co-vary. Reaction product is claimed to be HCl.
35. Cl2+HBr + H2O(s) - Hanson and Ravishankara [67] measured a reaction probability of >0.2 on water ice near200 K. BrCl was not detected, presumably due to rapid reaction with excess HBr.
36. Cl2 and BrCl + KBr(s) - Caloz et al. measured γ > 0.1 for reactive uptake of Cl2 and BrCl on KBr(s) in a roomtemperature Knudsen cell experiment.
37. Cl2 and Br2 + NaBr(aq) and NaI(aq) - Hu et al.,[78] measured large uptake coefficients for Cl2 on dilute aqueousdroplets of NaBr and NaI solutions and Br2 on NaI solutions using a droplet train technique. Reaction wasdemonstrated to proceed through both a chemisorbed surface complex and normal bulk solution second-orderkinetics. Second-order bulk reaction rate constants near the diffusion limit and consistent with bulk-phasekinetic measurements were obtained between 263 and 293 K.
38. ClO + H2O(s) and HNO3 • nH2O - Proposed reaction (Leu [103]) is 2 ClO → Cl2 + O2; reactive uptakemay depend on ClO surface coverage, which in turn may depend on gas phase ClO concentrations. Kenner et
al. [93] measured reaction probabilities of (8 ±2) x 10-5 for ice at 183 K which is far lower than the limit of
>1 x 10⁻³ obtained by Leu et al. [103]. Abbatt [3], using nearly the same low levels of ClO as Kenner et al.,
obtained γ < 1 x 10⁻⁵ at 213 K. The difference may lie in the level of ClO or other adsorbable reactivespecies present. The lower value of Abbatt is probably closer to the expected reactivity under stratospheric
conditions. Kenner et al. also measured a reaction probability limit of < (8 ±4) x 10-5 for NAT at 183 K.
39. ClO + H2SO4 • nH2O - Measured reaction probability (Martin et al. [113]) varies between 2 x 10⁻⁵ and 2 x
10-4 as H2O content is varied by changing wall temperature. Reaction product is claimed to be HCl, not Cl2.
Abbatt[3] measured γ < 1 x 10⁻⁵ for 60 and 70 wt % H2SO4 at 213 K.
244
40. HOCl + HCl + H2O(s) and HNO3 • 3H2O(s) - Hanson and Ravishankara [66] and Abbatt and Molina [5] haveinvestigated the HOCl + HCl reaction on water ice and NAT-like surfaces, and Chu et al. [24] studied water ice.Product yield measurements support the identification of Cl2 and H2O as the sole products. The high reactionprobabilities measured indicate that this reaction may play a significant role in release of reactive chlorine fromthe HCl reservoir. The reaction probability on NAT-like surfaces falls off dramatically (a factor of 10) onwater-poor (HNO3-rich) surfaces (Abbatt and Molina). The measured yield of product Cl2 is 0.87 ±0.20(Abbatt and Molina [5]).
41. HOCl + HCl + H2SO4 • nH2O - This process has been studied in coated flow tubes near 200 K by Zhanget al. [184] and Hanson and Ravishankara [70]. Both studies measured large γs for [HCl] > [HOCl]. Hanson
and Ravishankara [70] deduced a second-order reaction rate constant of ~1 x 10⁵ M-1 s-1 in 59.6 wt % H2SO4at 201-205 K. A model of this and related sulfuric acid aerosol reactions tailored to stratospheric conditions has
been published by Hanson et al. [74]. Zhang et al. held the water vapor partial pressure at 3.8 x 10⁻⁴ torr andshowed γ increased by a factor of 50 as the temperature was lowered from 209 to 198 K, showing that thereaction rate is strongly dependent on water activity.
42. ClNO and ClNO2 + NaCl(s) - Using a Knudsen cell technique Beichart and Finlayson-Pitts set upper limits of
γ < ~10-5 for reaction uptake of ClNO and ClNO2 on NaCl(s) powders at 298 K.
43. ClONO2 + H2O(s) - Measurement of γ = 0.3 (+0.7, -0.1) (Hanson and Ravishankara [65]) significantlyexceeds previous measurements of Molina et al. [121], Tolbert et al. [163], Leu [104] and Moore et al. [123]and subsequent measurements by Chu et al. [24] and Zhang et al. [183]. Previous measurements were probablyimpeded by NAT formation on surface (Hanson and Ravishankara, [66], Chu et al.). Lower levels ofClONO2(g) used by Hanson and Ravishankara [63] minimized this surface saturation problem. Also, usinglower ClONO2 concentrations, Zhang et al. obtained a reaction probability of 0.08 ± 0.02 at 195 K, in fairagreement with the range of 0.03 to 0.13 measured by Chu et al. More recent Knudsen cell measurements at180 and 200 K by Oppliger et al.,[130] showed initial uptake gs in the 0.2 to 0.4 range. Reaction products areHNO3 and HOCl. All of the HNO3 and much of the HOCl is retained on the surface under polar stratospheric
conditions (Hanson and Ravishankara). Hanson [59] deposited ClONO2 on H218O enriched ice and detected
H18OCl showing the Cl-ONO2 bond is broken during reaction on ice at 191 K.
44. ClONO2 + HNO3 • nH2O - Hanson and Ravishankara [63, 65] report a value of 0.006 for ClONO2 reactionwith the water on NAT (HNO3 • 3H2O). However, these authors present re-analyzed and new data with γ ≈0.001 in Hanson and Ravishankara [68]. Similar experiments (Moore et al. [123], Leu et al. [105]) report alarger value 0.02 ±0.01 which falls very rapidly as slight excesses of H2O above the 3/1 H2O/HNO3 ratio for
NAT are removed. They measure γ of less than 10-6 for slightly water poor “NAT” surfaces. Theinconsistency between Hanson and Ravishankara [63, 65] and the JPL group (Moore et al. [123]; Leu et al.,[105]) has not been resolved. Hanson and Ravishankara [66] report that γ for this reaction increases by a factorof 4 as the surface temperature increases from 191 to 211 K.
45. ClONO2 + H2SO4 • nH2O(l) - Results from wetted-wall flow tube (Hanson and Ravishankara, [72]) Knudsencell reactor (Manion et al. [111], Williams et al., [178], aerosol flow tube (Hanson and Lovejoy [141]), anddroplet train uptake experiments (Robinson et al., 96/63) supplement older wetted-wall flow tube (Hanson andRavishankara [66]) and Knudsen cell measurements (Rossi et al. [143], Tolbert et al. [161]). Although earlierKnudsen cell measurements probably suffered from surface saturation, more recent results compare well withthose from other techniques. Results are now available over a temperature range of 200-265 K and a H2SO4concentration range of 39 to 75 wt.%. Measured γ values depend strongly on H2SO4 concentration and varymodestly with temperature, with a trend to somewhat higher values for the 210 - 220 temperature range,
reflecting the temperature dependence of Hkhyd1/2 and the liquid phase diffusion coefficient for ClONO2 andthe rates of the direct- and proton-catalyzed hydrolysis reactions, which are proportional to the activity of H2O
and the activity of H+, respectively. (Robinson et al., [141]).
245
Robinson et al. have binned the data believed to be free of suspected HNO3 dilution and surface saturationeffects from the studies cited above into groups with similar H2SO4 concentration and they have fit atemperature-dependent uptake model, taking into account temperature and composition dependence of theeffective Henry's Law constant, liquid phase diffusion coefficient, and the liquid phase hydrolysis rate constant.The hydrolysis reaction was treated by modeling two reaction channels, a direct hydrolysis process dominatingreaction at low H2SO4 concentrations with a reaction rate proportional to water activity, and a proton-catalyzed
reaction with a rate proportional to H+ activity, which dominates at higher acid concentrations. Aparameterized fit to the uptake for 30-80 wt % H2SO4 model gives:
γ = k0 + k1/T + k2/T, where ki = ∑ aij (wt% H2SO4)j, j = 0 to 3
i = 0, j: -10.855 -0.12764 0.0087648 -0.00010047i = 1, j: 4349.6 44.544 -3.8043 0.043465i = 2, j: -454140 -3061.2 376.53 -4.7098
46. ClONO2 + H2SO4 • H2O(s) and H2SO4 • 4H2O(s) - Measurements by Hanson and Ravishankara [71] andZhang et al. [183] demonstrate that the reaction probability on the tetrahydrate is a strong function of bothtemperature and relative humidity, both of which affect the level of adsorbed H2O. Both groups covered thetemperature range of 192-205 K. The reaction is slowest at higher temperatures and lower relative humidities.
Zhang et al. [183] have parameterized their data in the form of log γ = a1 + a2 log x + a3 log2 x; for 195 Kand x = water partial pressure in torr: a1 = 10.12, a2 = 5.75 and a3 = 0.62; for a water partial pressure of 3.4
x 10-4 torr and x = T(K) between 182 and 206: a1 = 318.67, a2 =-3.13 and a3 = 0.0076. Zhang et al.[186]
have also measured a low value of γ ∼ 2 x 10⁻⁴ on sulfuric acid monohydrate at 195 K.
47. ClONO2 + HCl + H2O(s) - Reaction probabilities of 0.27 (+0.73, -0.13) (Leu [104]) and 0.05 to 0.1 (Molinaet al. [121]) have been reported near 200 K. Abbatt et al. [4], Abbatt and Molina [5], and Hanson andRavishankara [65] report that a portion of the reaction may be due to HOCl + HCl → Cl2 + H2O, with HOClformed from ClONO2 + H2O(s) → HOCl + HNO3(s). Hanson and Ravishankara [63] see no enhancement ofthe ClONO2 reaction probability when H2O(s) is doped with HCl. Their preferred value is γ = 0.3, but this isconsistent with γ = 1. Using a Knudsen cell technique and looking at initial uptake, Oppliger et al. [130]measured γ = 0.7 at 180 K and 0.2 at 200 K with HCl in excess.
48. ClONO2 + HCl + HNO3 • 3H2O - Measurements by Hanson and Ravishankara [63, 66], Leu and co-workers(Moore et al. [123], Leu et al. [105]), and Abbatt and Molina [6] confirm a high γ. Work by Hanson andRavishankara indicates that reaction probabilities on nitric acid dihydrate (NAD) are similar to those on NAT.The most recent NAT studies (Abbatt and Molina [6]) show a strong fall-off with relative humidity from γ>0.2 at 90% RH to 0.002 at 20% RH, indicating the necessity of sufficient water to solvate reactants.
49. ClONO2 + HCl + H2SO4 • nH2O - Hanson and Ravishankara [65] estimated that low temperature solubilitylimits for HCl in H2SO4 • nH2O (> 60 wt.% H2SO4) would restrict the ClONO2 + HCl reaction bydemonstrating that HCl vapor has a minimal effect on ClONO2 uptake on 60-75 wt.% H2SO4 surfaces.Tolbert et al. [161] also noted no measurable enhancement of ClONO2 loss on a 65 wt.% H2SO4 surface at210 K when the surface is exposed to HCl, but the reaction products do change to include Cl2. However,subsequent work (Hanson and Ravishankara [72]) has led to a re-evaluation of the process as a second-order
liquid phase reaction between Cl- and ClONO2, which they estimate to proceed at a diffusion limited rate of 1-3
x 107 M-1 s-1 near 200 K. Re-analysis of H* for HCl in cold concentrated H2SO4 (see next table) may makethis process important even for 60-70 wt% H2SO4. Additional measurements by Zhang et al.[184] and Elrodet al. [37] show substantial agreement with Hanson and Ravishankara [72] and illustrate the strong dependenceof γ on HCl solubility, which, in turn, depends on water activity. Both Zhang et al. and Elrod et al. examinedthe effect of HNO3 on the reaction and found no significant change. Hanson and Lovejoy used an aerosol flowtube method to measure a reacto-diffusive length, l, of 0.009 ± 0.005 for 60 wt % H2SO4 at 250 K. This is afactor of 4 smaller than l for ClONO2 hydrolysis on the same aerosol, showing a significantly enhancedreaction rate for these conditions. Sulfuric acid surfaces with less than ∼ 60 wt.% H2SO4 also have sufficient
246
water to absorb significant levels of HCl. Wolff and Mulvaney [179], Hofmann and Oltmans [77], and Toon etal. [164] have suggested that such water-rich H2SO4 aerosols may form under polar stratospheric conditions.
50. ClONO2+HCl + H2SO4 • H2O(s) and H2SO4 • 4H2O(s) - This reaction has been studied by Hanson andRavishankara [71] and Zhang et al. [183]. The reaction probability is strongly dependent on thethermodynamic state of the SAT surface, which is controlled by the temperature and the water vapor partial
pressure. At a water vapor pressure of 5.6 x 10⁻⁴ torr the measured γ drops by over two orders of magnitudeas the SAT surface temperature rises from 195 to 206 K. The results from the two groups are in qualitativeagreement, but sample different H2O and HCl partial pressures. Zhang et al. have parameterized their data as a
function of water partial pressure (at 195 K) and for temperature (both at an HCl partial pressure of 4 to 8 x 10-
7 torr) in the form log γ = a1 + a2 log x + a3 (log x)2. For H2O partial pressure, a1 = 5.25, a2 = 1.91, anda3 = 0.0; for T(K), a1 = 175.74, a2 = -1.59, and a3 = 0.0035. Care must be taken in extrapolating either dataset to lower HCl concentrations. Zhang et al. [186] measured no enhancement of ClONO2 uptake on sulfuric
acid monohydrate at 195 K with (2 - 8) x 10-7 torr of HCl present, implying γ < 1 x 10⁻⁴.
51. ClONO2 + HCl + Al2O3(s) - Molina et al. [120] used flow tube techniques to measure γ = 0.020 ±0.005 onα−alumina at 195 - 230 K with stratospheric (5 ppmV) water vapor levels. Measured γ was independent of Tand was affected very little by 5 ppbv HNO3 vapor. The same γ was measured for a Pyrex surface, indicatingthe absorbed water and not the inorganic substrate hosted the reaction.
52. ClONO2 + MX(s) - Finlayson-Pitts and co-workers have shown that ClONO2 reacts with crystalline NaCl(Finlayson-Pitts et al. [43]) and NaBr (Berko et al. [14]) to produce Cl2 and BrCl, respectively. Timonen et al.
[159] have measured the reaction rate for ClONO2 with dry and slightly wet (water vapor pressure 5 x 10⁻⁵ -
3 x 10⁻⁴ torr) NaCl at temperatures of 225 and 296 K. Reaction probabilities were analyzed as γ = 4 - 7 x
10-3 and were independent of temperature and water vapor pressure within experimental error. The Cl2 yield ondry NaCl was 1.0 ±0.2. Caloz et al. [20] used a room temperature Knudsen cell technique to measure γ = 0.23±0.06 for NaCl(s) and γ = 0.35 ±0.06 for KBr(s). They argue that the surface corrections imposed by Timonenet al. were too large. Caloz et al. measured quantitative yields of Cl2 and BrCl products.
53. ClONO2+HBr + H2O(s) and HNO3 • nH2O(s) - This reaction was studied by Hanson and Ravishankara [67] onwater ice and NAT near 200 K. A diffusion-limited reaction probability of >0.3 was observed.
54. ClONO2+HF + H2O(s) and HNO3 • nH2O(s) - Hanson and Ravishankara [67] were not able to observe thisreaction on water ice and NAT surfaces near 200 K.
55. CFxCl(4-x ) (x=0-3) and CF2Br2 + Al2O3(s) - Robinson et al. [139] reported dissociative uptake of CF2Cl2
and CF2Br2 on α-alumina surfaces at 210 and 315 K. Reaction probabilities of about 1 x 10⁻³ at 210 K weremeasured by monitoring the amounts of surface species bonded to the Al2O3 substrate. A re-analysis(Robinson et al. [140]) lowered this value by about a factor of 50. Moderate surface dosage with water vapor didnot quench the reaction. In addition, Dai et al. [29] and Robinson et al. [138] studied dissociativechemisorption of CF3Cl, CF2Cl2, CFCl3, and CCl4 on dehydroxylated γ-alumina powders. The obtained
reactive uptake probabilities ranging from 0.4 x 10⁻⁵ for CFCl3 to 1.0 x 10⁻⁵ for CFCl3 over a temperaturerange of 120 to 300 K. HCl and halomethyl radicals were observed as desorption products. Loss of theseproducts may point to somewhat higher γs, since they were measured by integrating halogen bound to Al2O3substrates.
56. BrO + H2O(s) + H2O(s) and H2SO4 • nH2O(l) and NaCl(aq) - Abbatt [3] used a coated flow tube technique tomeasure heterogeneous uptake on water ice, 60 and 70 wt % H2SO4 at 213 K, and 23 wt % aqueous NaCl at
253 K. He obtained γ(ice) = (1.0 ±0.4) x 10-3, γ (60 wt % H2SO4) = (7 ±2) x 10- 4, γ (70 wt % H2SO4) =
(5 ±2) x 10- 4 and γ (23 wt % NaCl) < 3 x 10⁻³. He observed product Br2, indicating BrO self-reaction onboth water ice and sulfuric acid solutions. Since reaction rate will depend on BrO concentrations, norecommendation is made for an atmospheric rate.
247
57. HOBr + HCl + H2O(s) and H2SO4 • nH2O - Abbatt [1] measured γ = 0.25 (+0.10/-0.05) for this reaction onice at 228 K. The BrCl product was observed by mass spectrometry. Abbatt[2] measured γs of ~ 0.1 to 0.2
for [HCl] > 1 x 1012 cm-3 over 68.8 wt % H2SO4 at 228 K; yielding an estimated kII = 1.4 x 10⁵ M-1 s-1
with a factor of 2 uncertainty. Hanson and Ravishankara[73] also measured γ = 0.2 [+0.2, - 0.1] for 60 wt %H2SO4 at 210 K.
58. HOBr + HBr + H2O(s) and H2SO4 • nH2O - Abbatt [1] measured γ = 0.12±(0.03) on ice at 228 K. The Br2
product was observed by mass spectrometry. Abbatt [2] measured γ = 0.25 for [HBr] = 1 x 1012 cm-3 over
68.8 wt % H2SO4 at 228 K; yielding to an estimated kII > 5 x 10⁴ M-1 s-1.
59. BrONO2 and BrONO2+HCl + H2O(s) - Hanson and Ravishankara [68] investigated these reactions in an ice-coated flow reactor at 200 (±10) K. The reaction of BrONO2 with H2O(s) proceeded at a rate indistinguishablefrom the gas phase diffusion limit, implying that the reaction probability may be as high as one; the productBrNO(g) was observed. Depositing HCl and BrONO2 on ice led to rapid production of BrCl. This may havebeen produced directly through reaction of BrONO2 with adsorbed HCl or, indirectly, through production ofHOBr in the BrONO2/ice reaction, followed by reaction of HOBr + HCl. No kinetic parameters for BrClproduction were given.
60. BrONO2 and BrONO2 + HCl + H2SO4 • nH2O - Hanson and co-workers ([62, 73]) used both coated flow tubeand aerosol flow tube techniques to show that the reaction of BrONO2 with 45-70 wt % H2SO4 is extremelyfacile at temperatures from 210 to 298 K. Hanson and Ravishankara [73] measured γs of 0.5 (+ 0.5, - 0.25)(45 wt % H2SO4, 210 K, 0.4 (+0.6, -0.2) (60 wt %, 210 K) , and 0.3 (+ 0.7, -0.1 (70 wt %, 220 K) in acoated-wall flow tube experiment. Hanson et al. [62] measured γ ~ 0.8 (20 to 40% error) for submicronaerosols at temperatures between 249 and 298 K and H2SO4 concentrations of 45 to 70 wt %; they did observea sharp fall off in γ for H2SO4 concentrations between 73 and 83 wt %. Addition of excess HCl to 229 K 40and 60 wt % H2SO4 aerosols caused an increase in γ to 1.0 and 0.9, respectively.
61. CF3OH + H2O + H2O(l) and H2SO4 • nH2O(l) - Lovejoy et al. [109] used both wetted-wall and aerosol flowtube techniques to measure reactive uptake of CF3OH on water at 274 K and 39 - 60 wt % H2SO4 at varioustemperatures between 206 and 250 K. γs showed a strong dependence on water activity. Aerosol uptakestudies yielded reacto-diffusive lengths, l, of > 0.4 µm for 40 wt % H2SO4 and 1.0 µm for 50 wt % H2SO4,both at 250 K. Recommended γ's were estimated by averaging bulk uptake measurements at similar H2SO4concentrations and ignoring temperature effects on water activity.
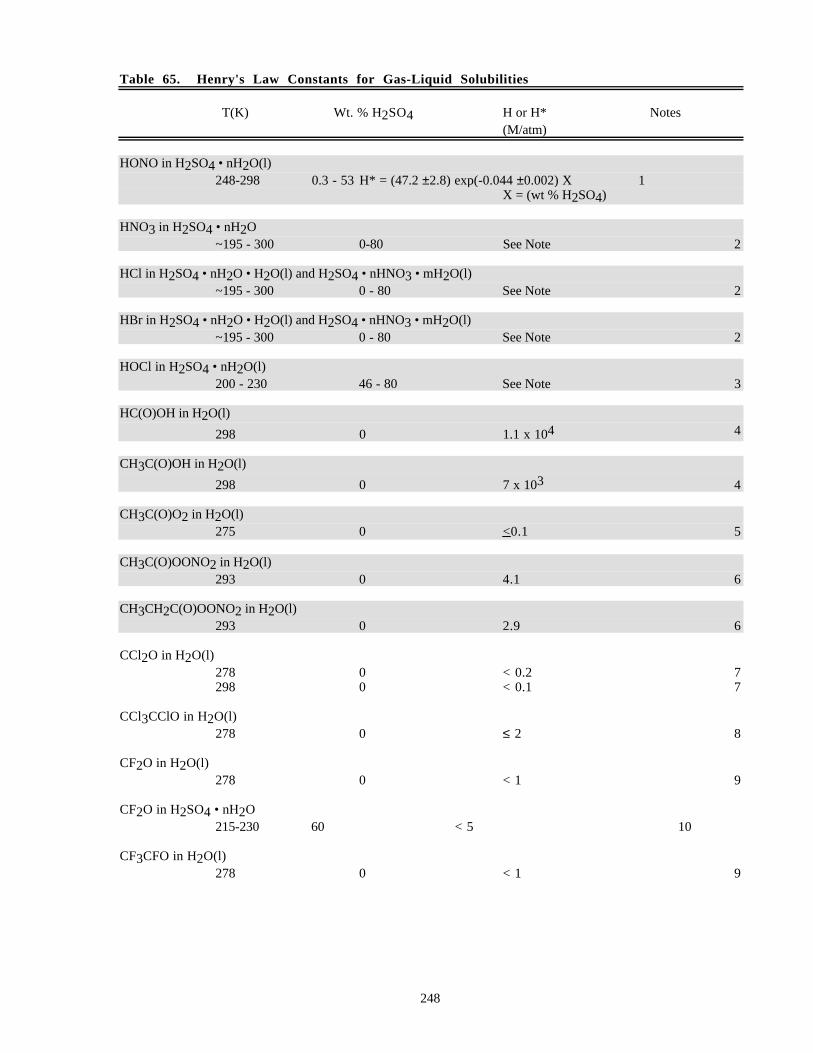
248
Table 65. Henry's Law Constants for Gas-Liquid Solubilities
T(K) Wt. % H2SO4 H or H* Notes(M/atm)
HONO in H2SO4 • nH2O(l)248-298 0.3 - 53 H* = (47.2 ±2.8) exp(-0.044 ±0.002) X 1
X = (wt % H2SO4)
HNO3 in H2SO4 • nH2O~195 - 300 0-80 See Note 2
HCl in H2SO4 • nH2O • H2O(l) and H2SO4 • nHNO3 • mH2O(l)~195 - 300 0 - 80 See Note 2
HBr in H2SO4 • nH2O • H2O(l) and H2SO4 • nHNO3 • mH2O(l)~195 - 300 0 - 80 See Note 2
HOCl in H2SO4 • nH2O(l)200 - 230 46 - 80 See Note 3
HC(O)OH in H2O(l)
298 0 1.1 x 10⁴ 4
CH3C(O)OH in H2O(l)
298 0 7 x 10³ 4
CH3C(O)O2 in H2O(l)275 0 < 0.1 5
CH3C(O)OONO2 in H2O(l)293 0 4.1 6
CH3CH2C(O)OONO2 in H2O(l)293 0 2.9 6
CCl2O in H2O(l)278 0 < 0.2 7298 0 < 0.1 7
CCl3CClO in H2O(l)278 0 ≤ 2 8
CF2O in H2O(l)278 0 < 1 9
CF2O in H2SO4 • nH2O215-230 60 < 5 10
CF3CFO in H2O(l)278 0 < 1 9
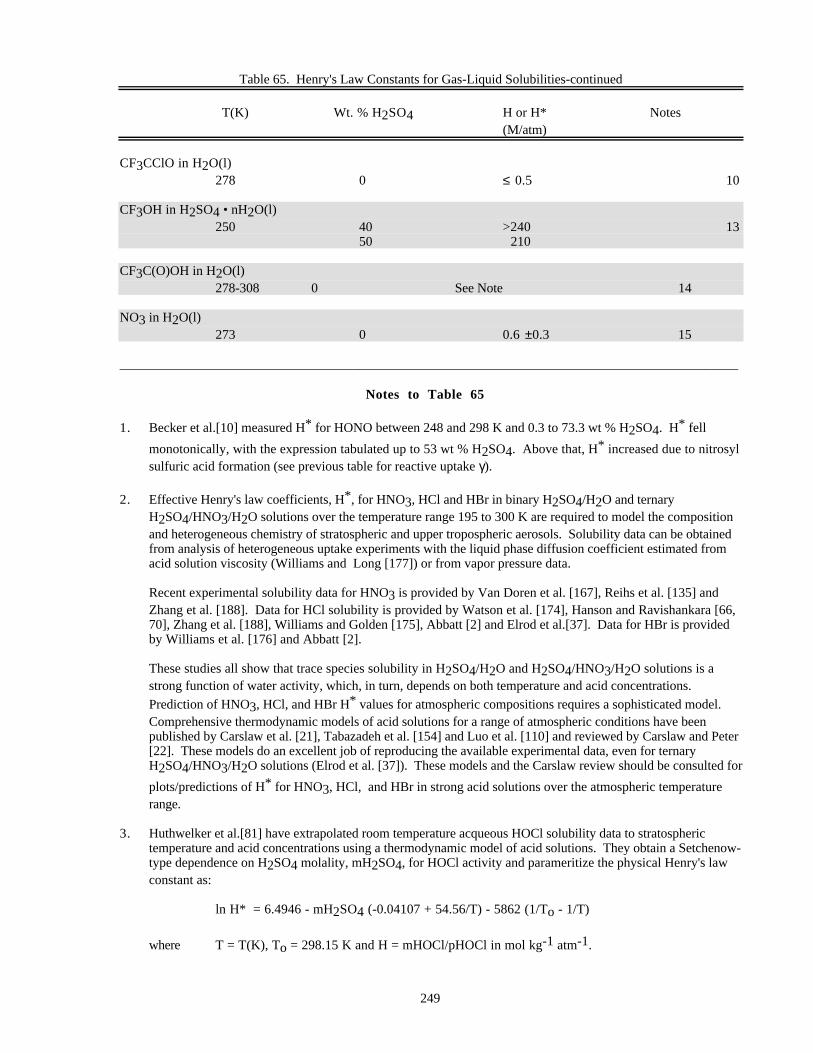
249
Table 65. Henry's Law Constants for Gas-Liquid Solubilities-continued
T(K) Wt. % H2SO4 H or H* Notes(M/atm)
CF3CClO in H2O(l)278 0 ≤ 0.5 10
CF3OH in H2SO4 • nH2O(l)250 40 >240 13
50 210
CF3C(O)OH in H2O(l)278-308 0 See Note 14
NO3 in H2O(l)273 0 0.6 ±0.3 15
_____________________________________________________________________________________________
Notes to Table 65
1. Becker et al.[10] measured H* for HONO between 248 and 298 K and 0.3 to 73.3 wt % H2SO4. H* fell
monotonically, with the expression tabulated up to 53 wt % H2SO4. Above that, H* increased due to nitrosylsulfuric acid formation (see previous table for reactive uptake γ).
2. Effective Henry's law coefficients, H* , for HNO3, HCl and HBr in binary H2SO4/H2O and ternaryH2SO4/HNO3/H2O solutions over the temperature range 195 to 300 K are required to model the compositionand heterogeneous chemistry of stratospheric and upper tropospheric aerosols. Solubility data can be obtainedfrom analysis of heterogeneous uptake experiments with the liquid phase diffusion coefficient estimated fromacid solution viscosity (Williams and Long [177]) or from vapor pressure data.
Recent experimental solubility data for HNO3 is provided by Van Doren et al. [167], Reihs et al. [135] andZhang et al. [188]. Data for HCl solubility is provided by Watson et al. [174], Hanson and Ravishankara [66,70], Zhang et al. [188], Williams and Golden [175], Abbatt [2] and Elrod et al.[37]. Data for HBr is providedby Williams et al. [176] and Abbatt [2].
These studies all show that trace species solubility in H2SO4/H2O and H2SO4/HNO3/H2O solutions is astrong function of water activity, which, in turn, depends on both temperature and acid concentrations.
Prediction of HNO3, HCl, and HBr H* values for atmospheric compositions requires a sophisticated model.Comprehensive thermodynamic models of acid solutions for a range of atmospheric conditions have beenpublished by Carslaw et al. [21], Tabazadeh et al. [154] and Luo et al. [110] and reviewed by Carslaw and Peter[22]. These models do an excellent job of reproducing the available experimental data, even for ternaryH2SO4/HNO3/H2O solutions (Elrod et al. [37]). These models and the Carslaw review should be consulted for
plots/predictions of H* for HNO3, HCl, and HBr in strong acid solutions over the atmospheric temperaturerange.
3. Huthwelker et al.[81] have extrapolated room temperature acqueous HOCl solubility data to stratospherictemperature and acid concentrations using a thermodynamic model of acid solutions. They obtain a Setchenow-type dependence on H2SO4 molality, mH2SO4, for HOCl activity and parameritize the physical Henry's lawconstant as:
ln H* = 6.4946 - mH2SO4 (-0.04107 + 54.56/T) - 5862 (1/To - 1/T)
where T = T(K), To = 298.15 K and H = mHOCl/pHOCl in mol kg-1 atm-1.
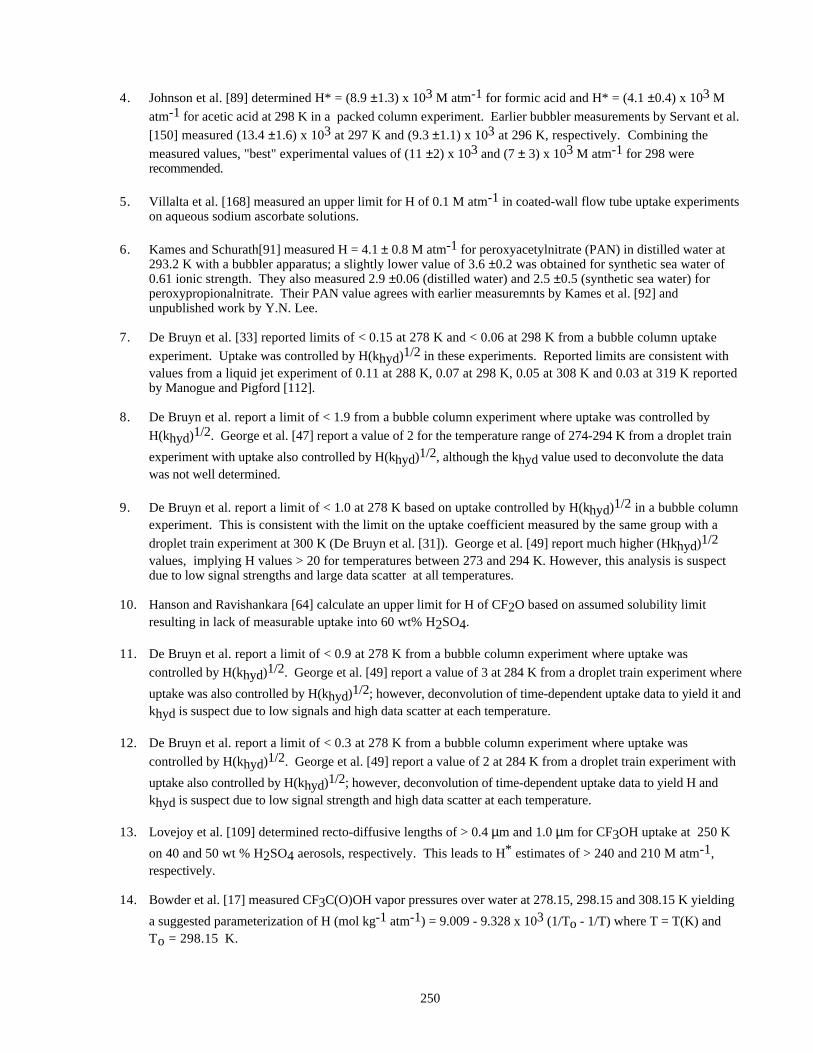
250
4. Johnson et al. [89] determined H* = (8.9 ±1.3) x 103 M atm-1 for formic acid and H* = (4.1 ±0.4) x 103 M
atm-1 for acetic acid at 298 K in a packed column experiment. Earlier bubbler measurements by Servant et al.
[150] measured (13.4 ±1.6) x 103 at 297 K and (9.3 ±1.1) x 103 at 296 K, respectively. Combining the
measured values, "best" experimental values of (11 ±2) x 103 and (7 ± 3) x 103 M atm-1 for 298 wererecommended.
5. Villalta et al. [168] measured an upper limit for H of 0.1 M atm-1 in coated-wall flow tube uptake experimentson aqueous sodium ascorbate solutions.
6. Kames and Schurath[91] measured H = 4.1 ± 0.8 M atm-1 for peroxyacetylnitrate (PAN) in distilled water at293.2 K with a bubbler apparatus; a slightly lower value of 3.6 ±0.2 was obtained for synthetic sea water of0.61 ionic strength. They also measured 2.9 ±0.06 (distilled water) and 2.5 ±0.5 (synthetic sea water) forperoxypropionalnitrate. Their PAN value agrees with earlier measuremnts by Kames et al. [92] andunpublished work by Y.N. Lee.
7. De Bruyn et al. [33] reported limits of < 0.15 at 278 K and < 0.06 at 298 K from a bubble column uptake
experiment. Uptake was controlled by H(khyd)1/2 in these experiments. Reported limits are consistent withvalues from a liquid jet experiment of 0.11 at 288 K, 0.07 at 298 K, 0.05 at 308 K and 0.03 at 319 K reportedby Manogue and Pigford [112].
8. De Bruyn et al. report a limit of < 1.9 from a bubble column experiment where uptake was controlled by
H(khyd)1/2. George et al. [47] report a value of 2 for the temperature range of 274-294 K from a droplet train
experiment with uptake also controlled by H(khyd)1/2, although the khyd value used to deconvolute the datawas not well determined.
9. De Bruyn et al. report a limit of < 1.0 at 278 K based on uptake controlled by H(khyd)1/2 in a bubble columnexperiment. This is consistent with the limit on the uptake coefficient measured by the same group with a
droplet train experiment at 300 K (De Bruyn et al. [31]). George et al. [49] report much higher (Hkhyd)1/2
values, implying H values > 20 for temperatures between 273 and 294 K. However, this analysis is suspectdue to low signal strengths and large data scatter at all temperatures.
10. Hanson and Ravishankara [64] calculate an upper limit for H of CF2O based on assumed solubility limitresulting in lack of measurable uptake into 60 wt% H2SO4.
11. De Bruyn et al. report a limit of < 0.9 at 278 K from a bubble column experiment where uptake was
controlled by H(khyd)1/2. George et al. [49] report a value of 3 at 284 K from a droplet train experiment where
uptake was also controlled by H(khyd)1/2; however, deconvolution of time-dependent uptake data to yield it andkhyd is suspect due to low signals and high data scatter at each temperature.
12. De Bruyn et al. report a limit of < 0.3 at 278 K from a bubble column experiment where uptake was
controlled by H(khyd)1/2. George et al. [49] report a value of 2 at 284 K from a droplet train experiment with
uptake also controlled by H(khyd)1/2; however, deconvolution of time-dependent uptake data to yield H andkhyd is suspect due to low signal strength and high data scatter at each temperature.
13. Lovejoy et al. [109] determined recto-diffusive lengths of > 0.4 µm and 1.0 µm for CF3OH uptake at 250 K
on 40 and 50 wt % H2SO4 aerosols, respectively. This leads to H* estimates of > 240 and 210 M atm-1,respectively.
14. Bowder et al. [17] measured CF3C(O)OH vapor pressures over water at 278.15, 298.15 and 308.15 K yielding
a suggested parameterization of H (mol kg-1 atm-1) = 9.009 - 9.328 x 10³ (1/To - 1/T) where T = T(K) andTo = 298.15 K.
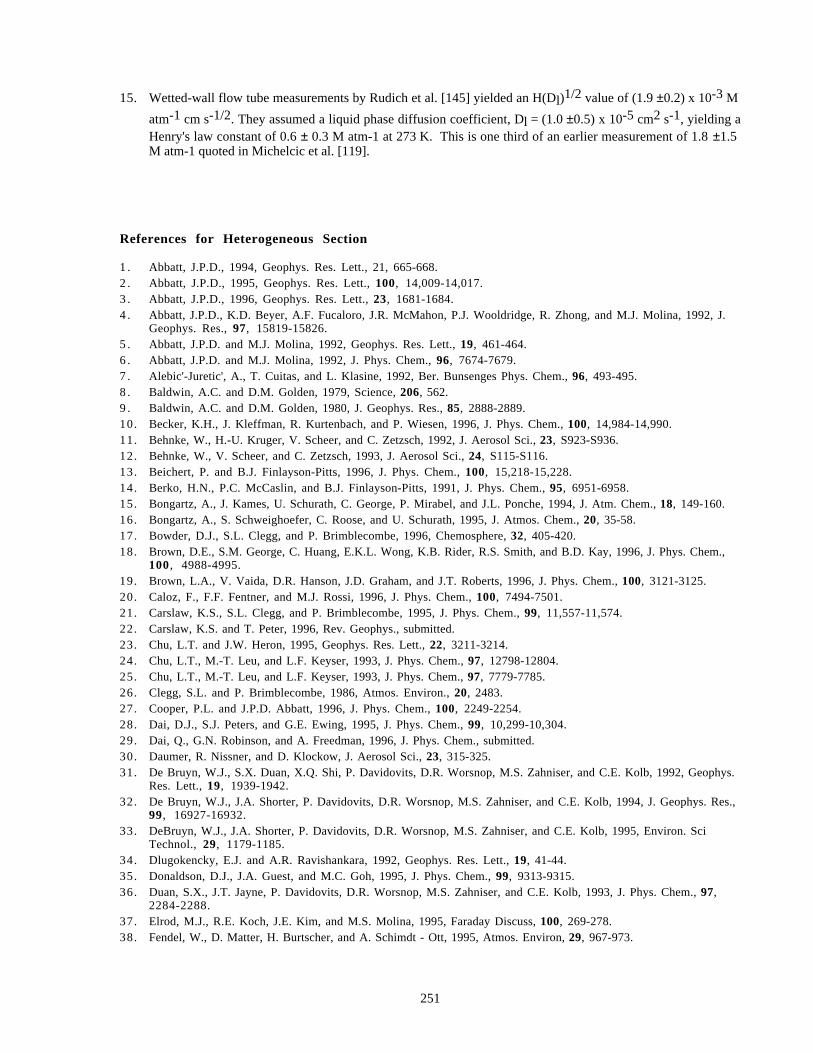
251
15. Wetted-wall flow tube measurements by Rudich et al. [145] yielded an H(Dl)1/2 value of (1.9 ±0.2) x 10-3 M
atm-1 cm s-1/2. They assumed a liquid phase diffusion coefficient, Dl = (1.0 ±0.5) x 10-5 cm2 s-1, yielding aHenry's law constant of 0.6 ± 0.3 M atm-1 at 273 K. This is one third of an earlier measurement of 1.8 ±1.5M atm-1 quoted in Michelcic et al. [119].
References for Heterogeneous Section
1 . Abbatt, J.P.D., 1994, Geophys. Res. Lett., 21, 665-668.2 . Abbatt, J.P.D., 1995, Geophys. Res. Lett., 100, 14,009-14,017.3 . Abbatt, J.P.D., 1996, Geophys. Res. Lett., 23, 1681-1684.4 . Abbatt, J.P.D., K.D. Beyer, A.F. Fucaloro, J.R. McMahon, P.J. Wooldridge, R. Zhong, and M.J. Molina, 1992, J.
Geophys. Res., 97, 15819-15826.5 . Abbatt, J.P.D. and M.J. Molina, 1992, Geophys. Res. Lett., 19, 461-464.6 . Abbatt, J.P.D. and M.J. Molina, 1992, J. Phys. Chem., 96, 7674-7679.7 . Alebic'-Juretic', A., T. Cuitas, and L. Klasine, 1992, Ber. Bunsenges Phys. Chem., 96, 493-495.8 . Baldwin, A.C. and D.M. Golden, 1979, Science, 206, 562.9 . Baldwin, A.C. and D.M. Golden, 1980, J. Geophys. Res., 85, 2888-2889.10. Becker, K.H., J. Kleffman, R. Kurtenbach, and P. Wiesen, 1996, J. Phys. Chem., 100, 14,984-14,990.11. Behnke, W., H.-U. Kruger, V. Scheer, and C. Zetzsch, 1992, J. Aerosol Sci., 23, S923-S936.12. Behnke, W., V. Scheer, and C. Zetzsch, 1993, J. Aerosol Sci., 24, S115-S116.13. Beichert, P. and B.J. Finlayson-Pitts, 1996, J. Phys. Chem., 100, 15,218-15,228.14. Berko, H.N., P.C. McCaslin, and B.J. Finlayson-Pitts, 1991, J. Phys. Chem., 95, 6951-6958.15. Bongartz, A., J. Kames, U. Schurath, C. George, P. Mirabel, and J.L. Ponche, 1994, J. Atm. Chem., 18, 149-160.16. Bongartz, A., S. Schweighoefer, C. Roose, and U. Schurath, 1995, J. Atmos. Chem., 20, 35-58.17. Bowder, D.J., S.L. Clegg, and P. Brimblecombe, 1996, Chemosphere, 32, 405-420.18. Brown, D.E., S.M. George, C. Huang, E.K.L. Wong, K.B. Rider, R.S. Smith, and B.D. Kay, 1996, J. Phys. Chem.,
100, 4988-4995.19. Brown, L.A., V. Vaida, D.R. Hanson, J.D. Graham, and J.T. Roberts, 1996, J. Phys. Chem., 100, 3121-3125.20. Caloz, F., F.F. Fentner, and M.J. Rossi, 1996, J. Phys. Chem., 100, 7494-7501.21. Carslaw, K.S., S.L. Clegg, and P. Brimblecombe, 1995, J. Phys. Chem., 99, 11,557-11,574.22. Carslaw, K.S. and T. Peter, 1996, Rev. Geophys., submitted.23. Chu, L.T. and J.W. Heron, 1995, Geophys. Res. Lett., 22, 3211-3214.24. Chu, L.T., M.-T. Leu, and L.F. Keyser, 1993, J. Phys. Chem., 97, 12798-12804.25. Chu, L.T., M.-T. Leu, and L.F. Keyser, 1993, J. Phys. Chem., 97, 7779-7785.26. Clegg, S.L. and P. Brimblecombe, 1986, Atmos. Environ., 20, 2483.27. Cooper, P.L. and J.P.D. Abbatt, 1996, J. Phys. Chem., 100, 2249-2254.28. Dai, D.J., S.J. Peters, and G.E. Ewing, 1995, J. Phys. Chem., 99, 10,299-10,304.29. Dai, Q., G.N. Robinson, and A. Freedman, 1996, J. Phys. Chem., submitted.30. Daumer, R. Nissner, and D. Klockow, J. Aerosol Sci., 23, 315-325.31. De Bruyn, W.J., S.X. Duan, X.Q. Shi, P. Davidovits, D.R. Worsnop, M.S. Zahniser, and C.E. Kolb, 1992, Geophys.
Res. Lett., 19, 1939-1942.32. De Bruyn, W.J., J.A. Shorter, P. Davidovits, D.R. Worsnop, M.S. Zahniser, and C.E. Kolb, 1994, J. Geophys. Res.,
99, 16927-16932.33. DeBruyn, W.J., J.A. Shorter, P. Davidovits, D.R. Worsnop, M.S. Zahniser, and C.E. Kolb, 1995, Environ. Sci
Technol., 29, 1179-1185.34. Dlugokencky, E.J. and A.R. Ravishankara, 1992, Geophys. Res. Lett., 19, 41-44.35. Donaldson, D.J., J.A. Guest, and M.C. Goh, 1995, J. Phys. Chem., 99, 9313-9315.36. Duan, S.X., J.T. Jayne, P. Davidovits, D.R. Worsnop, M.S. Zahniser, and C.E. Kolb, 1993, J. Phys. Chem., 97,
2284-2288.37. Elrod, M.J., R.E. Koch, J.E. Kim, and M.S. Molina, 1995, Faraday Discuss, 100, 269-278.38. Fendel, W., D. Matter, H. Burtscher, and A. Schimdt - Ott, 1995, Atmos. Environ, 29, 967-973.
252
39. Fendel, W. and A.S. Ott, 1993, J. Aerosol Sci., 24, S317-S318.40. Fenter, F.F., F. Caloz, and M.J. Rossi, 1994, J. Phys. Chem., 98, 9801-9810.41. Fenter, F.F., F. Caloz, and M.J. Rossi, 1996, J. Phys. Chem., 100, 1008-1019.42. Fenter, F.F. and M.J. Rossi, 1996, J. Phys. Chem., 100, 13765-13775.43. Finlayson-Pitts, B.J., M.J. Ezell, and J.N. Pitts Jr., 1989, Nature, 337, 241-244.44. Fox, L.E., D.R. Worsnop, M.S. Zahniser, and S.C. Wofsy, 1994, Science, 267, 351-355.45. Fried, A., B.E. Henry, J.G. Calvert, and M. Mozukewich, 1994, J. Geophys. Res., 99, 3517-3532.46. Fung, K.N., I.N. Tang, and H.R. Munkelwitz, 1987, Appl. Optics, 26, 1282-1287.47. George, C., J. Lagrange, P. Lagrange, P. Mirabel, C. Pallares, and J.L. Ponche, 1994, J. Geophys. Res., 99, 1255-
1262.48. George, C., J.L. Ponche, P. Mirabel, W. Behnke, V. Sheer, and C. Zetzsch, 1994, J. Phys. Chem., 98, 8780-8784.49. George, C., J.Y. Saison, J.L. Ponche, and P. Mirabel, 1994, J. Phys. Chem., 98, 10857-10862.50. Gershenzon, Y.M., A.V. Ivanov, S.I. Kucheryavyi, and V.B. Rozenshtein, 1986, Kinet. Katal., 27, 1069-1074.51. Gershenzon, Y.M. and A.P. Purmal, 1990, Russ. Chem. Rev., 59, 1007-1023.52. Gersherzon, V.M., V.M. Grigorieva, A.V. Ivanov, and R.G. Remorov, 1995, Faraday Discuss, 100, 83-100.53. Gertner, B.J. and J.T. Hynes, 1996, Science, 271, 1563-1566.54. Graham, J.D. and J.T. Roberts, 1994, J. Phys. Chem., 98, 5974-5983.55. Graham, J.D. and J.T. Roberts, 1995, Geophys. Res. Lett., 22, 251-254.56. Graham, J.D., J.T. Roberts, L.A. Brown, and V. Vaida, 1996, J. Phys. Chem., 100, 3115-3120.57. Hanning-Lee, M.A., B.B. Brady, L.R. Martin, and J.A. Syage, 1996, Geophys. Res. Lett., 23, 1961-1964.58. Hanson, D.R., 1992, Geophys. Res. Lett., 19, 2063-2066.59. Hanson, D.R., 1995, J. Phys. Chem., 99, 13,059-13,061.60. Hanson, D.R., J.B. Burkholder, C.J. Howard, and A.R. Ravishankara, 1992, J. Phys. Chem., 96, 4979-4985.61. Hanson, D.R. and E.R. Lovejoy, 1994, Geophys. Res. Lett., 21, 2401-2404.62. Hanson, D.R. and E.R. Lovejoy, 1995, Science, 267, 1326-1329.63. Hanson, D.R. and A.R. Ravishankara, 1991, J. Geophys. Res., 96, 5081-5090.64. Hanson, D.R. and A.R. Ravishankara, 1991, Geophys. Res. Lett., 18, 1699-1701.65. Hanson, D.R. and A.R. Ravishankara, 1991, J. Geophys. Res., 96, 17307-17314.66. Hanson, D.R. and A.R. Ravishankara, 1992, J. Phys. Chem., 96, 2682-2691.67. Hanson, D.R. and A.R. Ravishankara, 1992, J. Phys. Chem., 96, 9441-9446.68. Hanson, D.R. and A.R. Ravishankara, 1993, J. Phys. Chem., 97, 2802-2803.69. Hanson, D.R. and A.R. Ravishankara, 1993, The Tropospheric Chemistry of Ozone in the Polar Regions, H. Niki and
K.H. Becker, Editors, NATO, pp. 17281-17290.70. Hanson, D.R. and A.R. Ravishankara, 1993, J. Phys. Chem., 97, 12309-12319.71. Hanson, D.R. and A.R. Ravishankara, 1993, J. Geophys. Res., 98, 22931-22936.72. Hanson, D.R. and A.R. Ravishankara, 1994, J. Phys. Chem., 98, 5728-5735.73. Hanson, D.R. and A.R. Ravishankara, 1995, Geophys. Res. Lett., 22, 385-388.74. Hanson, D.R., A.R. Ravishankara, and S. Solomon, 1994, J. Geophys. Res., 99, 3615-3629.75. Harker, A.B. and W.W. Ho, 1979, Atmos. Environ., 13, 1005-1010.76. Haynes, D.R., N.J. Tro, and S.M. George, 1992, J. Phys. Chem., 96, 8502-8509.77. Hofmann, D.J. and S.J. Oltmans, 1992, Geophys. Res. Lett., 22, 2211-2214.78. Hu, J.H., Q. Shi, P. Davidovits, D.R. Worsnop, M.S. Zahniser, and C.E. Kolb, 1995, J. Phys. Chem., 99, 8768-
8776.79. Hu, J.H., J.A. Shorter, P. Davidovits, D.R. Worsnop, M.S. Zahniser, and C.E. Kolb, 1993, J. Phys. Chem., 97,
11037-11042.80. Huntzicker, J.J., R.A. Cary, and C.-S. Ling, 1980, Environ. Sci. Technol., 14, 819-824.81. Huthwelker, T., T. Peter, B.P. Juo, S.L. Clegg, K.S. Carshlaw, and P. Brimblecombe, 1995, J. Atmos. Chem., 21,
81-95.82. Imamura, T., Y. Rudich, R.K. Talukdar, R.W. Fox, and A.R. Ravishankara, 1996, J. Phys. Chem., submitted.83. Iraci, L.T., A.M. Middlebrook, M.A. Wilson, and M.A. Tolbert, 1994, Geophys. Res. Lett., 21, 867-870.84. Ivanov, A.V., Y.M. Gersherzon, F. Gratpanche, P. Devolder, and J.-P. Saverysyn, 1996, Am. Geophys., 14, 659-
664.85. Jayne, J.T., P. Davidovits, D.R. Worsnop, M.S. Zahniser, and C.E. Kolb, 1990, J. Phys. Chem., 94, 6041-6048.86. Jayne, J.T., S.X. Duan, P. Davidovits, D.R. Worsnop, M.S. Zahniser, and C.E. Kolb, 1991, J. Phys. Chem., 95,
6329-6336.
253
87. Jayne, J.T., S.X. Duan, P. Davidovits, D.R. Worsnop, M.S. Zahniser, and C.E. Kolb, 1992, J. Phys. Chem., 96,5452-5460.
88. Jayne, J.T., D.R. Worsnop, C.E. Kolb, E. Swartz, and P. Davidovits, 1996, J. Phys. Chem., 100, 8015-8022.89. Johnson, B.J., E.A. Betterton, and D. Craig, 1996, J. Atmos. Chem., 24, 113-119.90. Kalberer, M., K. Tubor, M. Ammann, Y. Parrat, E. Weingartner, D. Piguet, E. Rossler, D.T. Just, A. Jurles, H.W.
Gaaggeler, and V. Baltersperger, 1996, J. Phys. Chem., 100, 15,487-45,493.91. Kames, J. and U. Schurath, 1995, J. Atmos. Chem., 21, 151-164.92. Kames, J., S. Schweighoefer, and U. Schurath, 1991, J. Atmos. Chem., 12, 169-180.93. Kenner, R.D., I.C. Plumb, and K.R. Ryan, 1993, Geophys. Res. Lett., 20, 193-196.94. Keyser, L.F. and M.-T. Leu, 1993, J. Colloid Interface Sci., 155, 137-145.95. Keyser, L.F. and M.-T. Leu, 1993, Micros. Res. Technol., 25, 434-438.96. Keyser, L.F., M.-T. Leu, and S.B. Moore, 1993, J. Phys. Chem., 97, 2800-2801.97. Keyser, L.F., S.B. Moore, and M.T. Leu, 1991, J. Phys. Chem., 95, 5496-5502.98. Koehler, B.G., L.S. McNeill, A.M. Middlebrook, and M.A. Tolbert, 1993, J. Geophys. Res., 98, 10563-10571.99. Kolb, C.E., D.R. Worsnop, M.S. Zahniser, P. Davidovits, L.F. Keyser, M.-T. Leu, M.J. Molina, D.R. Hanson, A.R.
Ravishankara, L.R. Williams, and M.A. Tolbert, 1994, "Progress and Problems in Atmospheric Chemistry," Adv. Phys. Chem. Series, 3, J.R. Barker, Editor, , pp. 771-875.
100. Kroes, G.-J. and D.C. Clary, 1992, J. Phys. Chem., 96, 7079-7088.101. Laux, J.M., J.C. Hemminger, and B.J. Finlayson-Pitts, 1994, Geophys. Res. Lett., 21, 1623-1626.102. Leu, M.-T., R.S. Timonen, L.F. Keyser, and Y.L. Yung, 1995, J. Phys. Chem., 99, 13,203-13,212.103. Leu, M.T., 1988, Geophys. Res. Lett., 15, 851-854.104. Leu, M.T., 1988, Geophys. Res. Lett., 15, 17-20.105. Leu, M.T., S.B. Moore, and L.F. Keyser, 1991, J. Phys. Chem., 95, 7763-7771.106. Li, Z., R.R. Friedl, S.B. Moore, and S.P. Sander, 1996, J. Geophys. Res., 101, 6795-6802.107. Livingston, F.E. and B.J. Finlayson-Pitts, 1991, Geophys. Res. Lett., 18, 17-20.108. Lovejoy, E.R. and D.R. Hanson, 1995, J. Phys. Chem., 99, 2080-2087.109. Lovejoy, E.R., L.G. Huey, and D.R. Hanson, 1995, J. Geophys. Res., 100, 18,775-18,780.110. Luo, B., K.S. Carslaw, T. Peter, and S.L. Clegg, 1995, Geophys. Res. Lett., 22, 247-250.111. Manion, J.A., C.M. Fittschen, D.M. Golden, L.R. Williams, and M.A. Tolbert, 1994, Israel J. Chem., 34, 355-363.112. Manogue, W.H. and R.L. Pigford, 1960, A.I.Ch.E.J., 6, 494-500.113. Martin, L.R., H.S. Judeikis, and M. Wun, 1980, J. Geophys. Res., 85, 5511-5518.114. McMurry, P.H., H. Takano, and G.R. Anderson, 1983, Environ. Sci. Technol., 17, 347-357.115. Mertes, S. and A. Wahner, 1995, J. Phys. Chem., 99, 14,000-14,006.116. Michelangeli, D.V., M. Allen, and Y.L. Yung, 1991, Geophys. Res. Lett., 18, 673-676.117. Middlebrook, A.M., L.T. Iraci, L.S. McNeil, B.G. Koehler, M.A. Wilson, O.W. Saastad, and M.A. Tolbert, 1993, J.
Geophys. Res., 98, 20473-20481.118. Middlebrook, A.M., B.G. Koehler, L.S. McNeill, and M.A. Tolbert, 1992, Geophys. Res. Lett., 19, 2417-2420.119. Mihelcic, D., D. Klemp, P. Msgen, H.W. Ptz, and A. Volz-Thomas, 1993, J. Atmos. Chem., 16, 313-335.120. Molina, M.J., R.F. Meads, D.D. Spencer, and L.T. Molina, 1996, Geophys. Res. Lett., submitted.121. Molina, M.J., T.L. Tso, L.T. Molina, and F.C. Wang, 1987, Science, 238, 1253-1259.122. Molina, M.J., R. Zhang, P.J. Woolridge, J.R. McMahon, J.E. Kim, H.Y. Chang, and K.D. Beyer, 1993, Science,
261, 1418-1423.123. Moore, S.B., L.F. Keyser, M.T. Leu, R.P. Turco, and R.H. Smith, 1990, Nature, 345, 333-335.124. Mozurkewich, M. and J. Calvert, 1988, J. Geophys. Res., 93, 889-896.125. Mozurkewich, M., P.H. McMurray, A. Gupta, and J.G. Calvert, 1987, J. Geophys. Res., 92, 4163-4170.126. Msibi, I.M., Y. Li, J.P. Shi, and R.M. Harrison, 1994, J. Phys. Chem., 18, 291-300.127. Msibi, I.M., J.P. Shi, and R.M. Harrison, 1993, J. Atmos. Chem., 17,339-17,351.128. Noyes, R.M., M.B. Rubin, and P.G. Bowers, 1996, J. Phys. Chem., 100, 4167-4172.129. Olszyna, K., R.D. Cadle, and R.G. dePena, 1979, J. Geophys. Res., 84, 1771-1775.130. Oppliger, R., A. Allanic, and M.J. Rossi, 1996, J. Phys. Chem., submitted.131. Peters, S.J. and G.E. Ewing, 1996, J. Phys. Chem., 100, 14,093-14,102.132. Ponche, J.L., C. George, and P. Mirabel, 1993, J. Atmos. Chem., 16, 1-21.133. Pueschel, R.F., D.F. Blake, A.G. Suetsinger, A.D.A. Hansen, S. Verma, and K. Kato, 1992, Geophys. Res. Lett., 19,
1659-1662.134. Quinlan, M.A., C.M. Reihs, D.M. Golden, and M.A. Tolbert, 1990, J. Phys. Chem., 94, 3255-3260.135. Reihs, C.M., D.M. Golden, and M.A. Tolbert, 1990, J. Geophys. Res., 95, 16,545-16,550.
254
136. Rieley, H., H.D. Aslin, and S. Haq, 1995, J. Chem. Soc. Faraday Trans., 91, 2349-2351.137. Robbins, R.C. and R.D. Cadle, 1958, J. Phys. Chem., 62, 469-471.138. Robinson, G.N., Q. Dai, and A. Freedman, 1996, J. Phys. Chem., submitted.139. Robinson, G.N., A. Freedman, C.E. Kolb, and D.R. Worsnop, 1994, Geophys. Res. Lett., 21, 377-380.140. Robinson, G.N., A. Freedman, C.E. Kolb, and D.R. Worsnop, 1996, Geophys. Res. Lett., 23, 317.141. Robinson, G.N., D.R. Worsnop, J.T. Jayne, C.E. Kolb, and P. Davidovits, 1996, J. Geophys. Res., 102, 3583-
3601.142. Rogaski, C.A., D.M. Golden, and L.R. Williams, 1996, Geophys. Res. Lett., 24, 381-384.143. Rossi, M.J., R. Malhotra, and D.M. Golden, 1987, Geophys. Res. Lett., 14, 127-130.144. Rubel, G.O. and J.W. Gentry, 1984, J. Aerosol Sci., 15, 661-671.145. Rudich, Y., R.K. Talukdar, R.W. Fox, and A.R. Ravishankara, 1996, J. Geophys. Res., 101, 21,023-21,031.146. Rudich, Y., R.K. Talukdar, T. Imamura, R.W. Fox, and A.R. Ravishankara, 1996, Chem. Phys. Lett., 261, 467-473.147. Rudolf, R. and P.E. Wagner, 1994, J. AerosolSci, 25, 597-598.148. Saastad, O.W., T. Ellerman, and C.J. Nielson, 1993, Geophys. Res. Lett., 20, 1191-1193.149. Schwartz, S.E., 1988, Atmos. Environ., 22, 2331.150. Servant, J., G. Koundio, B. Cross, and R. Delmas, 1991, J. Atmos. Chem., 12, 367-380.151. Shimono, A. and S. Koda, 1996, J. Phys. Chem., 100, 10,269-10,276.152. Smith, D.M., W.F. Welch, J.A. Jassim, A.R. Chughtai, and D.H. Stedman, 1988, Appl. Spectros., 42, 1473-1482.153. Stephens, S., M.J. Rossi, and D.M. Golden, 1986, Int. J. Chem. Kinetics, 18, 1133-1149.154. Tabazadeh, A., R.P. Turco, and M.Z. Jacobson, 1994, J. Geophys. Res., 99, 12,897-12,914.155. Tabor, K., L. Gutzwiller, and M.J. Rossi, 1993, Geophys. Res. Lett., 20, 1431-1434.156. Tabor, K., L. Gutzwiller, and M.J. Rossi, 1994, J. Phys. Chem., 98, 6172-7186.157. Tang, I.N. and J.H. Lee, 1987, The Chemistry of Acid Rain, G.E. Gordon and R.W. Johnson, Editors, Am. Chem.
Soc. Symp. Series, pp. 109-117.158. Tang, I.N. and H.R. Munkelwitz, 1989, J. Colloid Interface Sci., 128, 289-295.159. Timonen, R.S., L.T. Chu, M.-T. Leu, and L.F. Keyser, 1994, J. Phys. Chem., 98, 9509-9517.160. Tolbert, M.A., J. Praff, I. Jayaweera, and M.J. Prather, 1993, J. Geophys. Res., 98, 2957-2962.161. Tolbert, M.A., M.J. Rossi, and D.M. Golden, 1988, Geophys. Res. Lett., 15, 847-850.162. Tolbert, M.A., M.J. Rossi, and D.M. Golden, 1988, Science, 240, 1018-1021.163. Tolbert, M.A., M.J. Rossi, R. Malhotra, and D.M. Golden, 1987, Science, 238, 1258-1260.164. Toon, O., et al., 1993, Science, 261, 1136-1140.165. Utter, R.G., J.B. Burkholder, C.J. Howard, and A.R. Ravishankara, 1992, J. Phys. Chem., 96, 4973-4978.166. Van Doren, J.M., L.R. Watson, P. Davidovits, D.R. Worsnop, M.S. Zahniser, and C.E. Kolb, 1990, J. Phys. Chem.,
94, 3265-3269.167. Van Doren, J.M., L.R. Watson, P. Davidovits, D.R. Worsnop, M.S. Zahniser, and C.E. Kolb, 1991, J. Phys. Chem.,
95, 1684-1689.168. Villalta, P.W., E.R. Lovejoy, and D.R. Hanson, 1996, Geophys. Res. Lett., 23, 1765-1768.169. Vogt, R., Elliott, C., Allen, H.C., Laux, J.M., J.C. Hemminger, and B.J. Finlayson-Pitts, 1996, Atmos. Environ,
30, 1729-1737.170. Vogt, R. and B. Finlayson-Pitts, 1994, J. Phys. Chem., 98, 3747-3755.171. Vogt, R. and B.F. Finlayson-Pitts, 1994, Geophys. Res. Lett., 21, 2291-2294.172. Vogt, R. and B.J. Finlayson-Pitts, 1995, J. Phys. Chem., 99, 13,052.173. Wang, L. and D.C. Clary, 1996, J. Chem. Phys., 104, 5663-5673.174. Watson, L.R., J.M.V. Doren, P. Davidovits, D.R. Worsnop, M.S. Zahniser, and C.E. Kolb, 1990, J. Geophys. Res.,
95, 5631-5638.175. Williams, L.R. and D.M. Golden, 1993, Geophys. Res. Lett., 20, 2227-2230.176. Williams, L.R., D.M. Golden, and D.L. Huestis, 1995, J. Geophys. Res., 100, 7329-7335.177. Williams, L.R. and F.S. Long, 1995, J. Phys. Chem., 99, 3748-3751.178. Williams, L.R., J.A. Manion, D.M. Golden, and M.A. Tolbert, 1994, J. Appl. Meteor., 33, 785-790.179. Wolff, E.W. and R. Mulvaney, 1991, Geophys. Res. Lett., 18, 1007-1010.180. Worsnop, D.R., L.E. Fox, M.S. Zahniser, and S.C. Wofsy, 1993, Science, 259, 71-74.181. Worsnop, D.R., M.S. Zahniser, C.E. Kolb, J.A. Gardner, L.R. Watson, J.M.V. Doren, J.T. Jayne, and P. Davidovits,
1989, J. Phys. Chem., 93, 1159-1172.182. Zetzsch, C. and W. Behnke, 1992, Ber. Bunsenges. Phys. Chem., 96, 488-493.183. Zhang, R., J.T. Jayne, and M.J. Molina, 1994, J. Phys. Chem., 98, 867-874.184. Zhang, R., M.-T. Leu, and L.F. Keyser, 1994, J. Phys. Chem., 98, 13,563-13,574.

255
185. Zhang, R., M.-T. Leu, and L.F. Keyser, 1995, Geophys. Res. Lett., 22, 1493-1496.186. Zhang, R., M.-T. Leu, and L.F. Keyser, 1995, J. Geophys. Res., 100, 18,845-18,854.187. Zhang, R., M.-T. Leu, and L.F. Keyser, 1996, J. Phys. Chem., 100, 339-345.188. Zhang, R., P.J. Wooldridge, and M.J. Molina, 1993, J. Phys. Chem., 97, 8541-8548.189. Zolensky, M.E., D.S. McKay, and L.A. Kaczor, 1989, J. Geophys. Res., 94, 1047-1056.
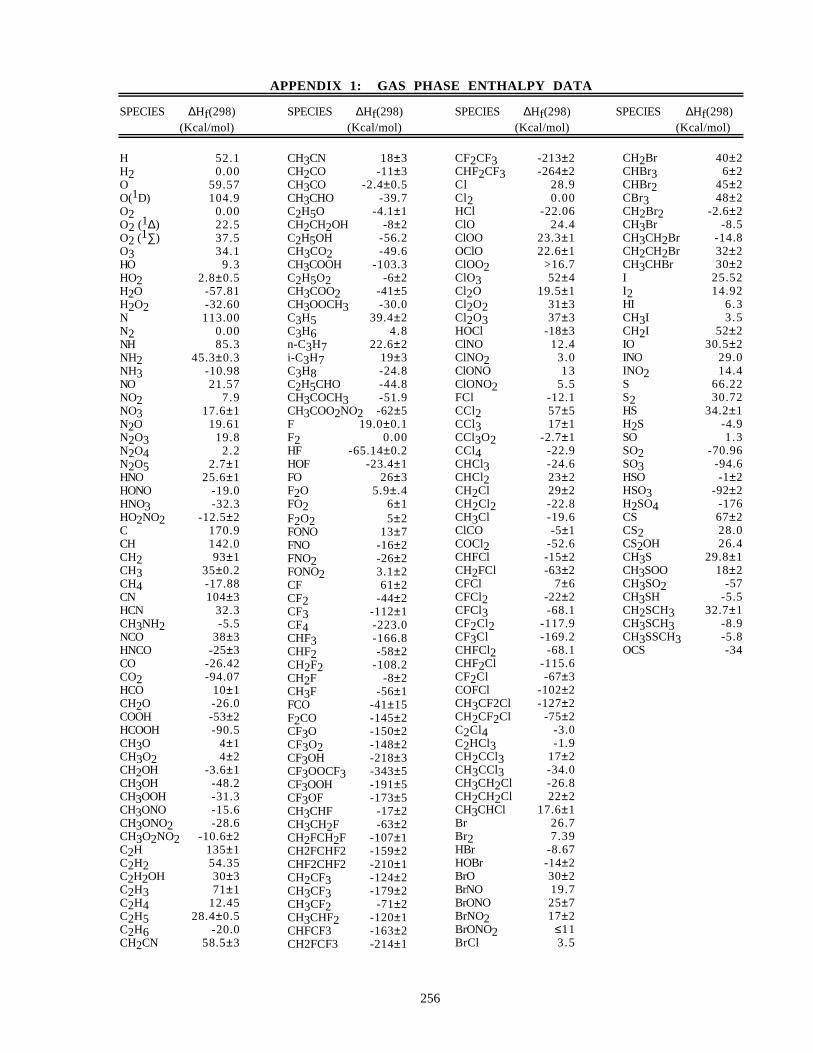
256
APPENDIX 1: GAS PHASE ENTHALPY DATA
SPECIES ∆Hf(298) SPECIES ∆Hf(298) SPECIES ∆Hf(298) SPECIES ∆Hf(298)(Kcal/mol) (Kcal/mol) (Kcal/mol) (Kcal/mol)
H 52.1H2 0.00O 59.57O(1D) 104.9O2 0.00O2 (1∆) 22.5O2 (1∑) 37.5O3 34.1HO 9.3HO2 2.8±0.5H2O -57.81H2O2 -32.60N 113.00N2 0.00NH 85.3NH2 45.3±0.3NH3 -10.98NO 21.57NO2 7.9NO3 17.6±1N2O 19.61N2O3 19.8N2O4 2.2N2O5 2.7±1HNO 25.6±1HONO -19.0HNO3 -32.3HO2NO2 -12.5±2C 170.9CH 142.0CH2 93±1CH3 35±0.2CH4 -17.88CN 104±3HCN 32.3CH3NH2 -5.5NCO 38±3HNCO -25±3CO -26.42CO2 -94.07HCO 10±1CH2O -26.0COOH -53±2HCOOH -90.5CH3O 4±1CH3O2 4±2CH2OH -3.6±1CH3OH -48.2CH3OOH -31.3CH3ONO -15.6CH3ONO2 -28.6CH3O2NO2 -10.6±2C2H 135±1C2H2 54.35C2H2OH 30±3C2H3 71±1C2H4 12.45C2H5 28.4±0.5C2H6 -20.0CH2CN 58.5±3
CH3CN 18±3CH2CO -11±3CH3CO -2.4±0.5CH3CHO -39.7C2H5O -4.1±1CH2CH2OH -8±2C2H5OH -56.2CH3CO2 -49.6CH3COOH -103.3C2H5O2 -6±2CH3COO2 -41±5CH3OOCH3 -30.0C3H5 39.4±2C3H6 4.8n-C3H7 22.6±2i-C3H7 19±3C3H8 -24.8C2H5CHO -44.8CH3COCH3 -51.9CH3COO2NO2 -62±5F 19.0±0.1F2 0.00HF -65.14±0.2HOF -23.4±1FO 26±3F2O 5.9±.4FO2 6±1F2O2 5±2FONO 13±7FNO -16±2FNO2 -26±2FONO2 3.1±2CF 61±2CF2 -44±2CF3 -112±1CF4 -223.0CHF3 -166.8CHF2 -58±2CH2F2 -108.2CH2F -8±2CH3F -56±1FCO -41±15F2CO -145±2CF3O -150±2CF3O2 -148±2CF3OH -218±3CF3OOCF3 -343±5CF3OOH -191±5CF3OF -173±5CH3CHF -17±2CH3CH2F -63±2CH2FCH2F -107±1CH2FCHF2 -159±2CHF2CHF2 -210±1CH2CF3 -124±2CH3CF3 -179±2CH3CF2 -71±2CH3CHF2 -120±1CHFCF3 -163±2CH2FCF3 -214±1
CF2CF3 -213±2CHF2CF3 -264±2Cl 28.9Cl2 0.00HCl -22.06ClO 24.4ClOO 23.3±1OClO 22.6±1ClOO2 >16.7ClO3 52±4Cl2O 19.5±1Cl2O2 31±3Cl2O3 37±3HOCl -18±3ClNO 12.4ClNO2 3.0ClONO 13ClONO2 5.5FCl -12.1CCl2 57±5CCl3 17±1CCl3O2 -2.7±1CCl4 -22.9CHCl3 -24.6CHCl2 23±2CH2Cl 29±2CH2Cl2 -22.8CH3Cl -19.6ClCO -5±1COCl2 -52.6CHFCl -15±2CH2FCl -63±2CFCl 7±6CFCl2 -22±2CFCl3 -68.1CF2Cl2 -117.9CF3Cl -169.2CHFCl2 -68.1CHF2Cl -115.6CF2Cl -67±3COFCl -102±2CH3CF2Cl -127±2CH2CF2Cl -75±2C2Cl4 -3.0C2HCl3 -1.9CH2CCl3 17±2CH3CCl3 -34.0CH3CH2Cl -26.8CH2CH2Cl 22±2CH3CHCl 17.6±1Br 26.7Br2 7.39HBr -8.67HOBr -14±2BrO 30±2BrNO 19.7BrONO 25±7BrNO2 17±2BrONO2 ≤11BrCl 3.5
CH2Br 40±2CHBr3 6±2CHBr2 45±2CBr3 48±2CH2Br2 -2.6±2CH3Br -8.5CH3CH2Br -14.8CH2CH2Br 32±2CH3CHBr 30±2I 25.52I2 14.92HI 6.3CH3I 3.5CH2I 52±2IO 30.5±2INO 29.0INO2 14.4S 66.22S2 30.72HS 34.2±1H2S -4.9SO 1.3SO2 -70.96SO3 -94.6HSO -1±2HSO3 -92±2H2SO4 -176CS 67±2CS2 28.0CS2OH 26.4CH3S 29.8±1CH3SOO 18±2CH3SO2 -57CH3SH -5.5CH2SCH3 32.7±1CH3SCH3 -8.9CH3SSCH3 -5.8OCS -34
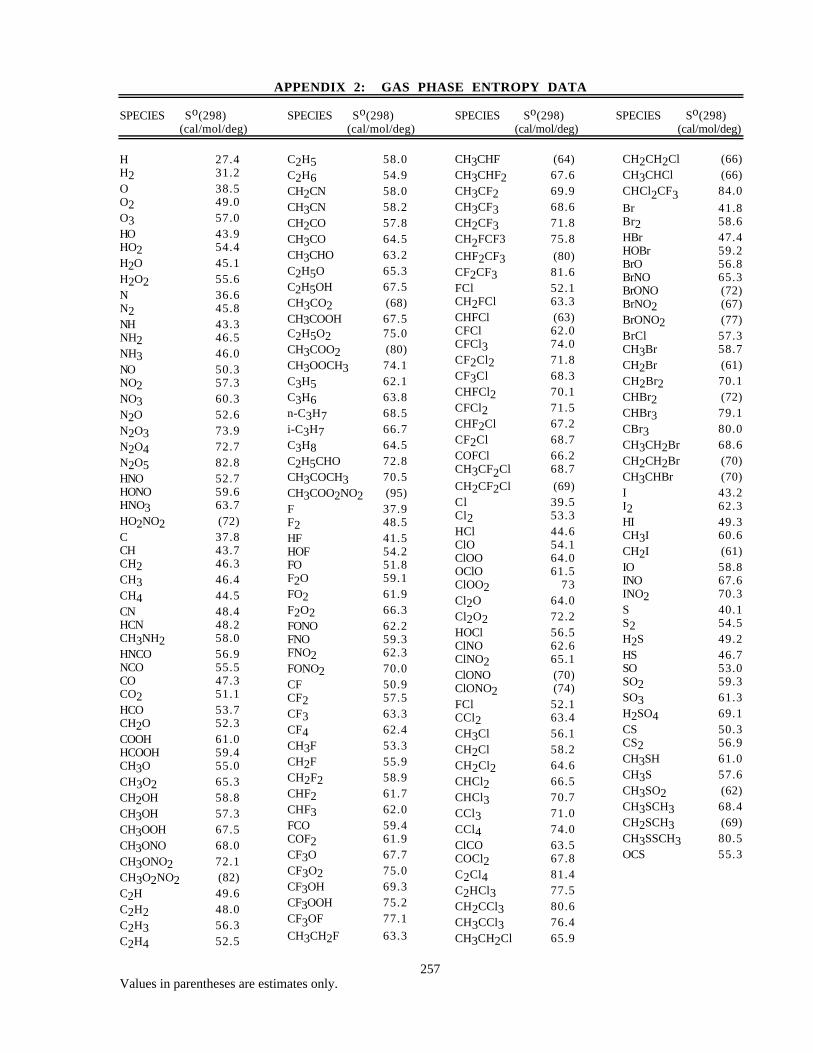
Values in parentheses are estimates only.257
APPENDIX 2: GAS PHASE ENTROPY DATA
SPECIES So(298) SPECIES So(298) SPECIES So(298) SPECIES So(298)(cal/mol/deg) (cal/mol/deg) (cal/mol/deg) (cal/mol/deg)
H 27.4H2 31.2O 38.5O2 49.0O3 57.0HO 43.9HO2 54.4H2O 45.1H2O2 55.6N 36.6N2 45.8NH 43.3NH2 46.5NH3 46.0NO 50.3NO2 57.3NO3 60.3N2O 52.6N2O3 73.9N2O4 72.7N2O5 82.8HNO 52.7HONO 59.6HNO3 63.7HO2NO2 (72)C 37.8CH 43.7CH2 46.3CH3 46.4CH4 44.5CN 48.4HCN 48.2CH3NH2 58.0HNCO 56.9NCO 55.5CO 47.3CO2 51.1HCO 53.7CH2O 52.3COOH 61.0HCOOH 59.4CH3O 55.0CH3O2 65.3CH2OH 58.8CH3OH 57.3CH3OOH 67.5CH3ONO 68.0CH3ONO2 72.1CH3O2NO2 (82)C2H 49.6C2H2 48.0C2H3 56.3C2H4 52.5
C2H5 58.0C2H6 54.9CH2CN 58.0CH3CN 58.2CH2CO 57.8CH3CO 64.5CH3CHO 63.2C2H5O 65.3C2H5OH 67.5CH3CO2 (68)CH3COOH 67.5C2H5O2 75.0CH3COO2 (80)CH3OOCH3 74.1C3H5 62.1C3H6 63.8n-C3H7 68.5i-C3H7 66.7C3H8 64.5C2H5CHO 72.8CH3COCH3 70.5CH3COO2NO2 (95)F 37.9F2 48.5HF 41.5HOF 54.2FO 51.8F2O 59.1FO2 61.9F2O2 66.3FONO 62.2FNO 59.3FNO2 62.3FONO2 70.0CF 50.9CF2 57.5CF3 63.3CF4 62.4CH3F 53.3CH2F 55.9CH2F2 58.9CHF2 61.7CHF3 62.0FCO 59.4COF2 61.9CF3O 67.7CF3O2 75.0CF3OH 69.3CF3OOH 75.2CF3OF 77.1
CH3CH2F 63.3
CH3CHF (64)CH3CHF2 67.6CH3CF2 69.9CH3CF3 68.6CH2CF3 71.8CH2FCF3 75.8
CHF2CF3 (80)CF2CF3 81.6FCl 52.1CH2FCl 63.3CHFCl (63)CFCl 62.0CFCl3 74.0CF2Cl2 71.8CF3Cl 68.3CHFCl2 70.1CFCl2 71.5CHF2Cl 67.2CF2Cl 68.7COFCl 66.2CH3CF2Cl 68.7
CH2CF2Cl (69)Cl 39.5Cl2 53.3HCl 44.6ClO 54.1ClOO 64.0OClO 61.5ClOO2 73Cl2O 64.0Cl2O2 72.2HOCl 56.5ClNO 62.6ClNO2 65.1ClONO (70)ClONO2 (74)FCl 52.1CCl2 63.4CH3Cl 56.1CH2Cl 58.2CH2Cl2 64.6CHCl2 66.5CHCl3 70.7CCl3 71.0CCl4 74.0ClCO 63.5COCl2 67.8C2Cl4 81.4C2HCl3 77.5CH2CCl3 80.6CH3CCl3 76.4CH3CH2Cl 65.9
CH2CH2Cl (66)CH3CHCl (66)CHCl2CF3 84.0
Br 41.8Br2 58.6HBr 47.4HOBr 59.2BrO 56.8BrNO 65.3BrONO (72)BrNO2 (67)BrONO2 (77)BrCl 57.3CH3Br 58.7CH2Br (61)CH2Br2 70.1CHBr2 (72)CHBr3 79.1CBr3 80.0CH3CH2Br 68.6CH2CH2Br (70)CH3CHBr (70)I 43.2I2 62.3HI 49.3CH3I 60.6CH2I (61)IO 58.8INO 67.6INO2 70.3S 40.1S2 54.5H2S 49.2HS 46.7SO 53.0SO2 59.3SO3 61.3H2SO4 69.1CS 50.3CS2 56.9CH3SH 61.0CH3S 57.6CH3SO2 (62)CH3SCH3 68.4CH2SCH3 (69)CH3SSCH3 80.5OCS 55.3
258
APPENDIX 3: SOLAR FLUXES AND SPECIES PROFILES
Figures 6 and 7 show data for solar irradiances and fluxes. These were provided by KennethMinschwaner. The solar irradiances are from measurements by the Solar Ultraviolet Spectral IrradianceMonitor (SUSIM) for λ ≤ 400 nm (VanHoosier et al. [6]), and by Neckel and Labs [5] for 400 < λ ≤ 600nm. The SUSIM measurements are spectrally degraded to 2 nm full width half-maximum to correspond tothe resolution of the Neckel and Labs data. Additionally, a normalization factor that varies linearly from1.17 at 400 nm to 1.0 at 440 nm has been applied to the Neckel and Labs irradiances in order to matchSUSIM values at 400 nm. Irradiances from 110 to 120 nm are based on measurements by Mount andRottman [4] and Woods and Rottman [8]. Values below 110 nm are not plotted.
The solar fluxes are computed from the sum of the direct, attenuated solar beam plus angularlyintegrated scattered radiation. Fluxes at 0, 20, 30, 40, and 50 km are based on the solar irradiances,assuming a solar zenith angle of 30° and the U.S. Standard Atmosphere (1976). Molecular and aerosolscattering are taken into account; the latter process is appropriate for "moderate volcanic" conditions (Fennet al. [2]). The surface albedo is 0.3. Ozone cross sections follow the recommendations herein; oxygencross sections in the Herzberg continuum are taken from Yoshino et al. [9]; Schumann-Runge bandabsorption is determined using the high-resolution treatment of Minschwaner et al. [3], with fluxesspectrally degraded to 1.0 nm resolution.
The species and "J" value profiles presented in Figures 8-16 were provided by Peter Connell. Theywere generated by the LLNL 2-D model of the troposphere and stratosphere. The temperature profile is aninterpolation to climatological values. Surface source gas boundary conditions are those for the year 1990,as reported in chapter 6 of the WMO/UNEP report [7]. The equatorial tropopause source gas mixing ratiosare: total chlorine 3.4 ppb, total fluorine 1.6 ppb, total bromine 18 ppt, methane 1.67 ppm, and nitrousoxide 309 ppb. The kinetic parameters used were consistent, to the extent possible, with the currentrecommendations. Representations of sulfate aerosol and polar stratospheric heterogeneous processeswhich were included are hydrolysis of nitrogen pentoxide and chlorine and bromine nitrate and reaction ofhydrogen chloride with chlorine nitrate and hypochlorous acid. The model run represents a periodicsteady-state atmosphere with 1990 surface abundances of source gases.
The "J" values were calculated with a clear sky, two-stream radiative transfer model with
wavelength binning of 5 nm above 310 nm and 500 cm-1 below. Surface reflectance includes the effect ofaverage cloudiness on the albedo. Oxygen cross sections in the Schumann-Runge region were calculatedby the method of Allen and Frederick [1], corrected for the Herzberg continuum values of Yoshino et al.[9].
The fluxes and profiles are given to provide "order of magnitude" values of important photochemicalparameters. They are not intended to be standards or recommended values.
References
1. Allen, M. and J.E. Frederick, 1982, J. Atmos. Sci., 39, 2066-2075.2. Fenn, W.R., S.A. Clough, W.O. Gallery, R.E. Good, F.X. Kneizys, J.D. Mill, L.S. Rothman, E.P. Shettle, and
F.E. Volz, 1985, "Optical and Infrared Properties of the Atmosphere," Handbook of Geophysics and the Space Environment, Chapter 18, A.S. Jursa, Editor, Air Force Geophysics Laboratory, Bedford, MA.
3. Minschwaner, K., G.P. Anderson, L.A. Hall, and K. Yoshino, 1992, J. Geophys. Res., 97, 10103-10108.4. Mount, G.H. and G.J. Rottman, 1985, J. Geophys. Res., 90, 13031-13036.5. Neckel, H. and D. Labs, 1984, Solar Physics, 90, 205-258.6. VanHoosier, M.E., J.-D.F. Bartoe, G.E. Brueckner, and D.K. Prinz, 1988, Astro. Lett. and Communications, 27,
163-168.7. WMO, Scientific Assessment of Ozone Depletion: 1994 , World Meteorological Organization Global Ozone
Research and Monitoring Project, Report No. 37, 1994, Geneva: National Aeronautics and SpaceAdministration.
8. Woods, T.N. and G.J. Rottman, 1990, J. Geophys. Res., 95, 6227-6236.9. Yoshino, K., A.S.C. Cheung, J.R. Esmond, W.H. Parkinson, D.E. Freeman, S.L. Guberman, A. Jenouvrier, B.
Coquart, and M.F. Merienne, 1988, Planet. Space Sci., 36, 1469-1475.
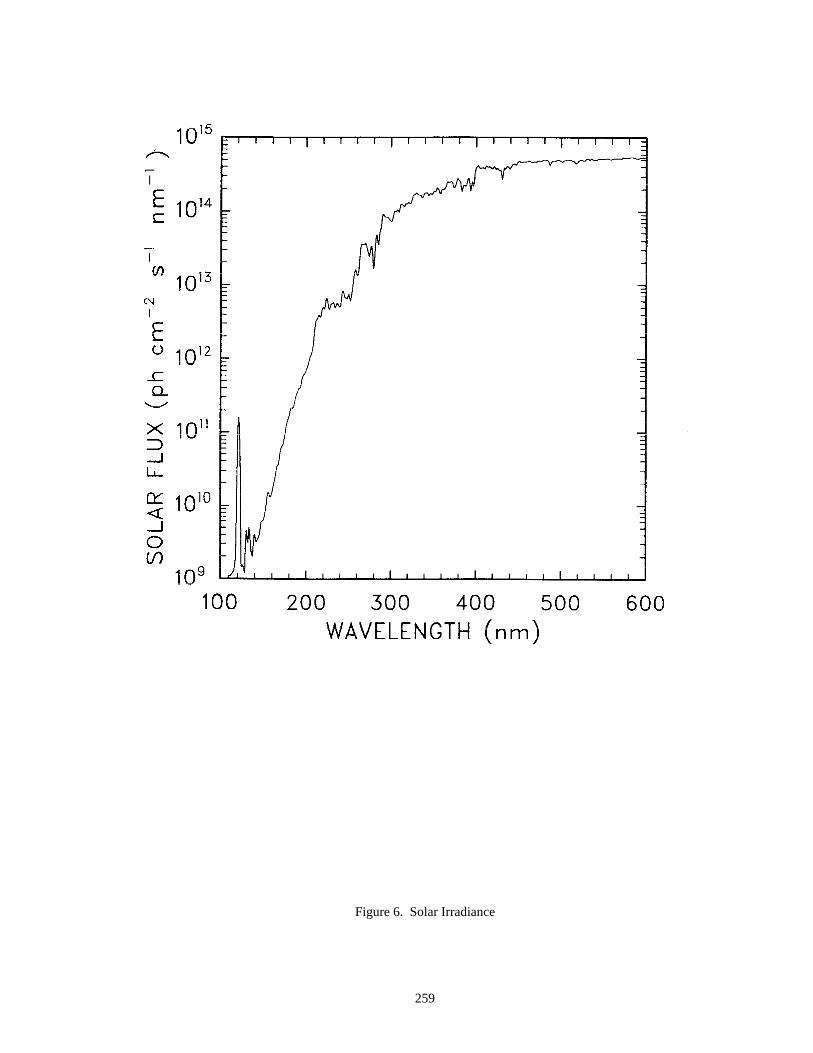
259
Figure 6. Solar Irradiance
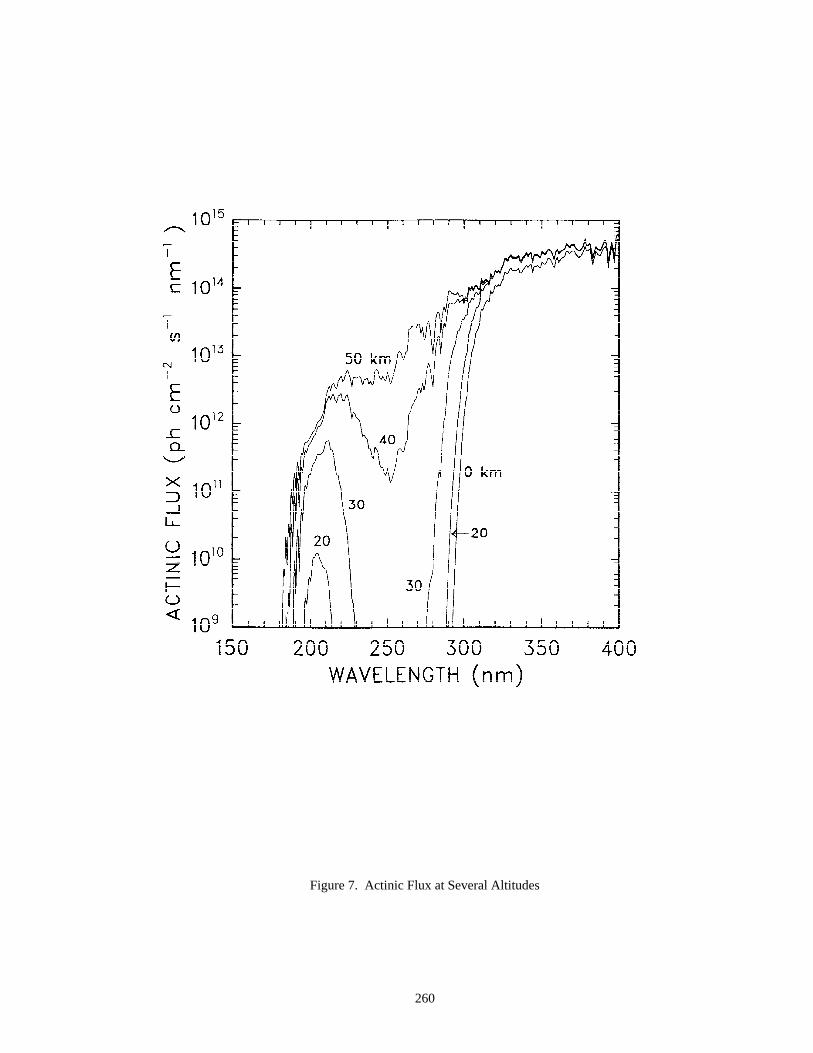
260
Figure 7. Actinic Flux at Several Altitudes
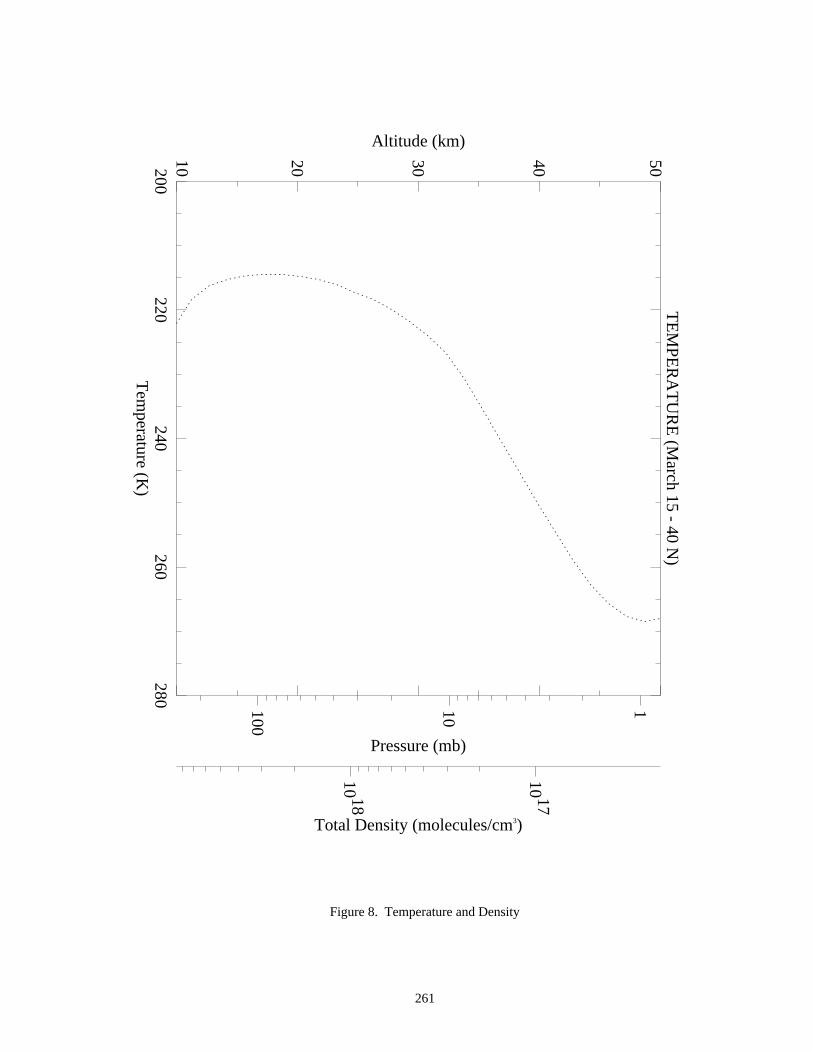
261
TE
MPE
RA
TU
RE
(March 15 - 40 N
)
200220
240260
280T
emperature (K
)
10 20 30 40 50Altitude (km)
100
10 1
Pressure (mb)
10 18
10 17
Total Density (molecules/cm3)
Figure 8. Temperature and Density
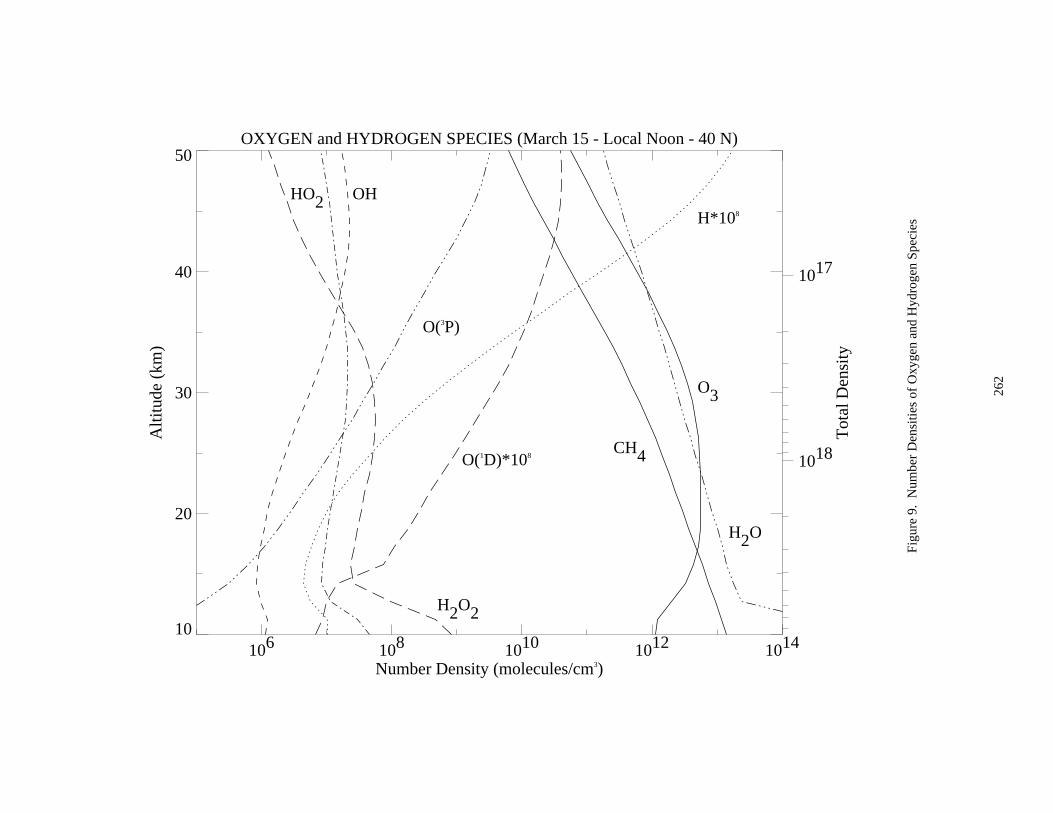
262
OXYGEN and HYDROGEN SPECIES (March 15 - Local Noon - 40 N)
106 108 1010 1012 1014
Number Density (molecules/cm3)
10
20
30
40
50A
ltitu
de (
km)
1018
1017
Tot
al D
ensi
ty
O(3P)
O(1D)*108
O3
H*108
OHHO2
H2O
H2O2
CH4
Fig
ure
9. N
umbe
r D
ensi
ties
of O
xyge
n an
d H
ydro
gen
Spe
cies
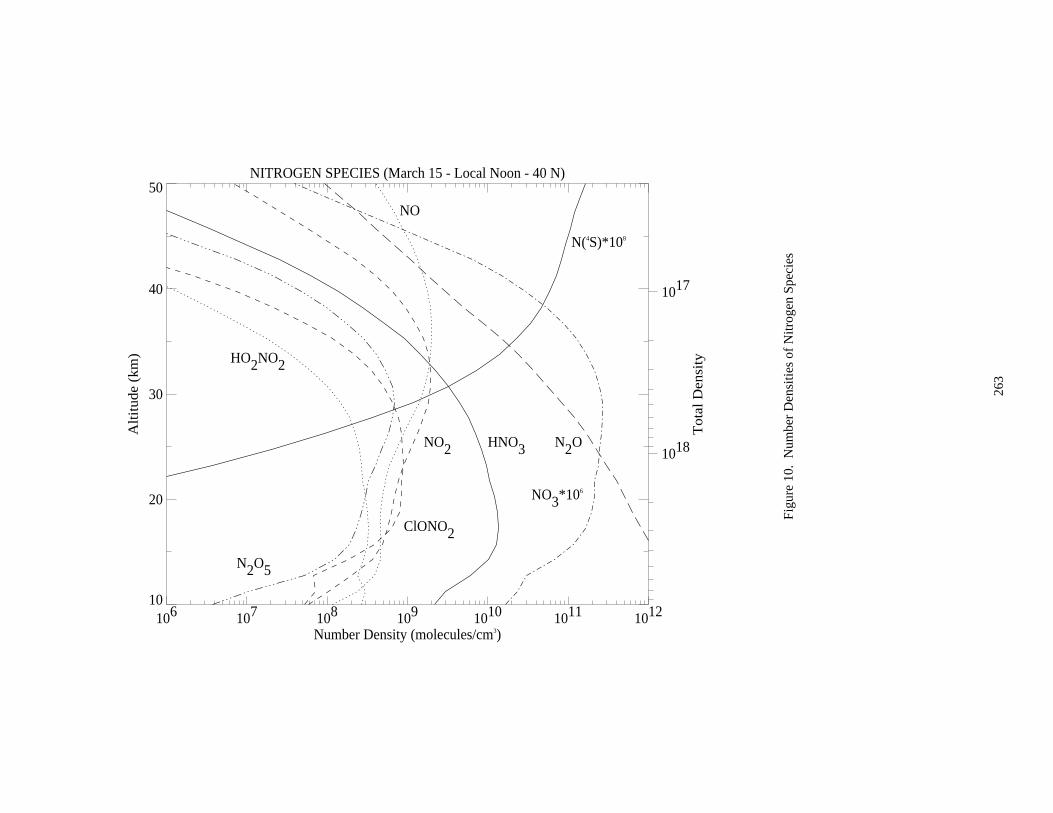
263
NITROGEN SPECIES (March 15 - Local Noon - 40 N)
106 107 108 109 1010 1011 1012
Number Density (molecules/cm3)
10
20
30
40
50
Alt
itud
e (k
m)
1018
1017
Tot
al D
ensi
ty
N(4S)*108
NO
NO2
NO3*106
N2O5
N2OHNO3
HO2NO2
ClONO2
Fig
ure
10.
Num
ber
Den
sitie
s of
Nitr
ogen
Spe
cies
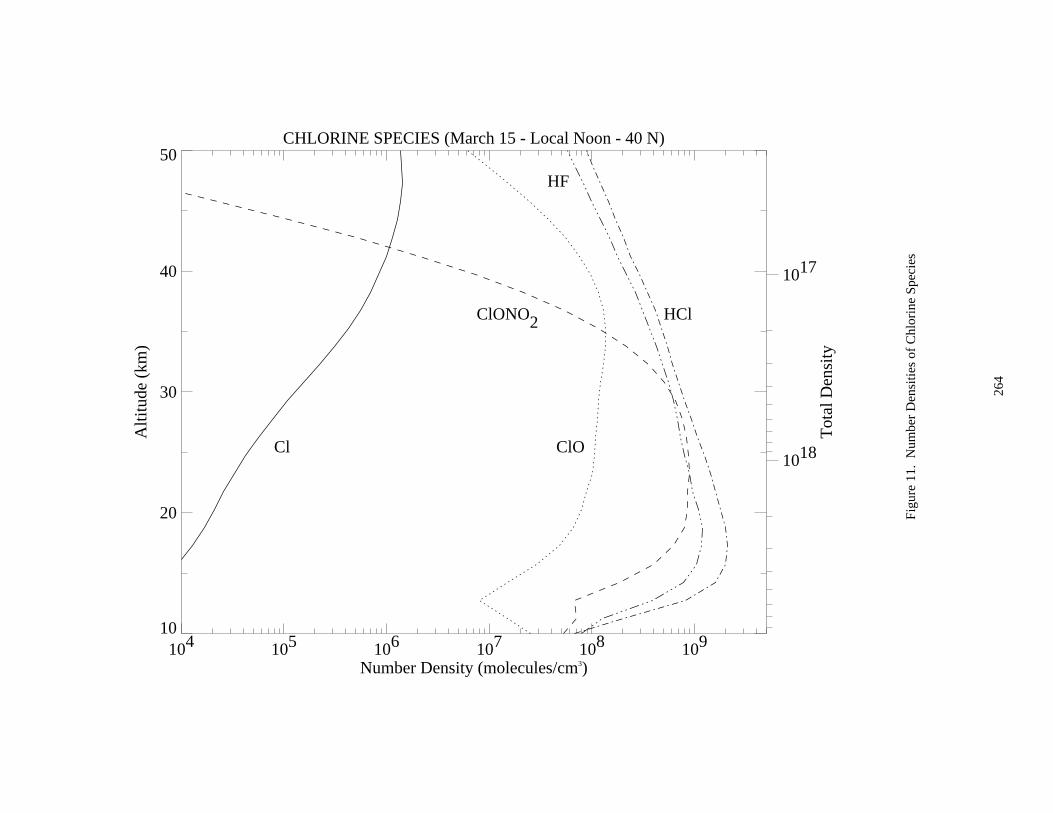
264
CHLORINE SPECIES (March 15 - Local Noon - 40 N)
104 105 106 107 108 109
Number Density (molecules/cm3)
10
20
30
40
50A
ltitu
de (
km)
1018
1017
Tot
al D
ensi
ty
Cl ClO
ClONO2 HCl
HF
Fig
ure
11.
Num
ber
Den
sitie
s of
Chl
orin
e S
peci
es
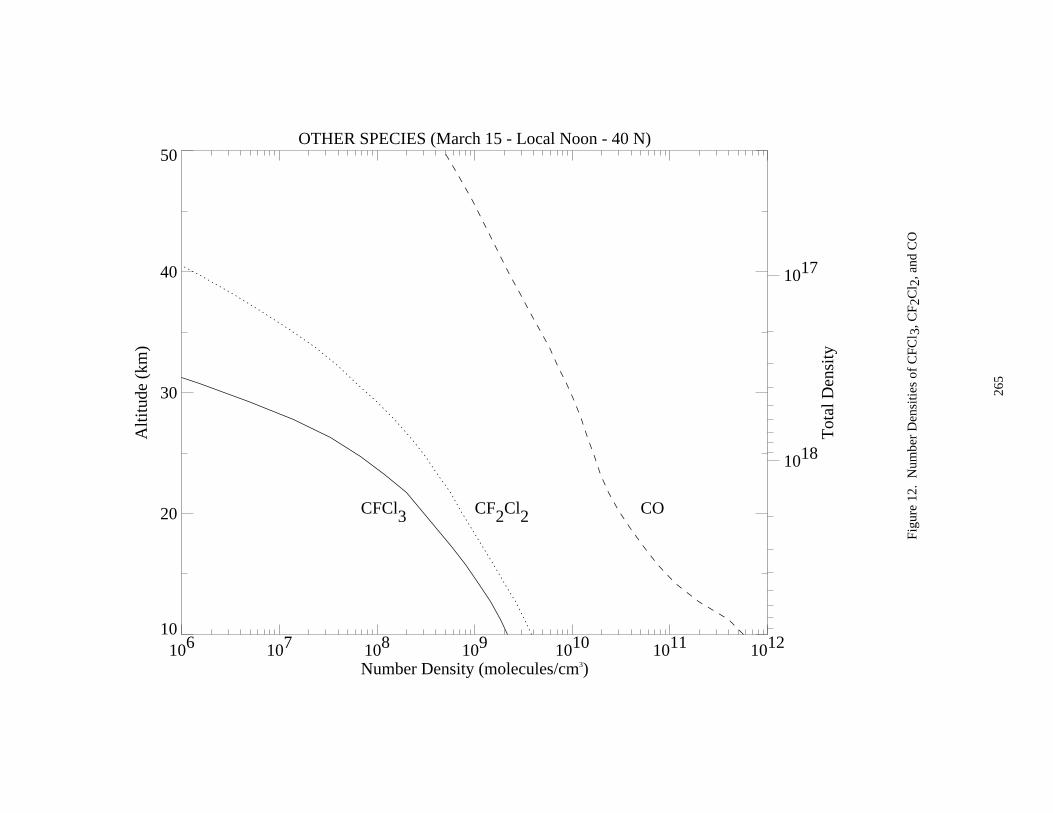
265
OTHER SPECIES (March 15 - Local Noon - 40 N)
106 107 108 109 1010 1011 1012
Number Density (molecules/cm3)
10
20
30
40
50A
ltitu
de (
km)
1018
1017
Tot
al D
ensi
ty
CFCl3 CF2Cl2 CO
Fig
ure
12.
Num
ber
Den
sitie
s of
CF
Cl
3, C
F 2C
l 2, a
nd C
O
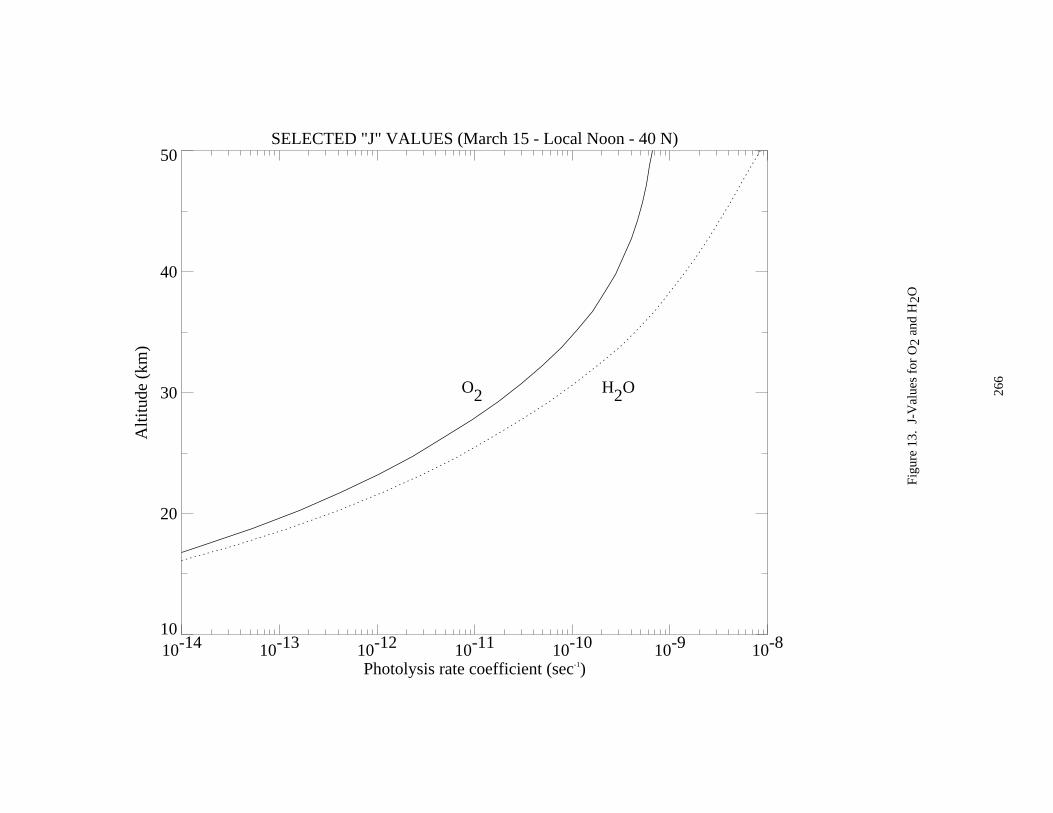
266
SELECTED "J" VALUES (March 15 - Local Noon - 40 N)
10-14 10-13 10-12 10-11 10-10 10-9 10-8
Photolysis rate coefficient (sec-1)
10
20
30
40
50A
ltitu
de (
km)
O2 H2O
Fig
ure
13.
J-V
alue
s fo
r O 2
and
H 2O
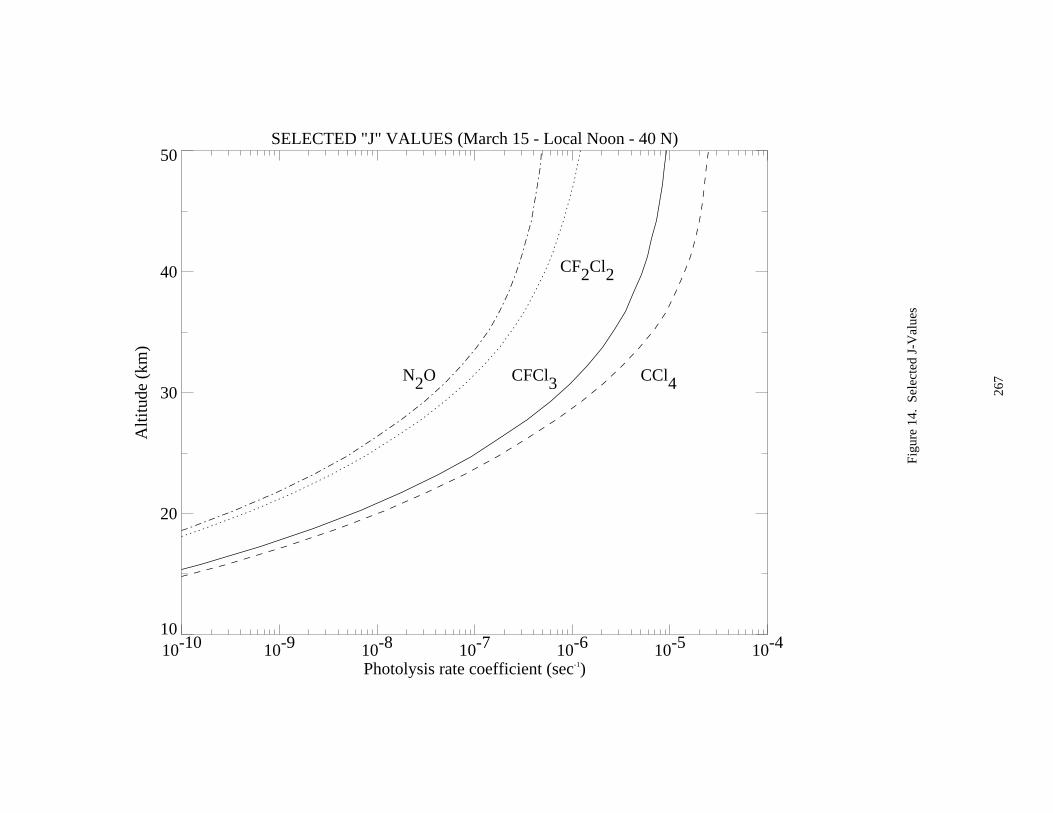
267
SELECTED "J" VALUES (March 15 - Local Noon - 40 N)
10-10 10-9 10-8 10-7 10-6 10-5 10-4
Photolysis rate coefficient (sec-1)
10
20
30
40
50A
ltitu
de (
km)
CFCl3
CF2Cl2
CCl4N2O
Fig
ure
14.
Sel
ecte
d J-
Val
ues
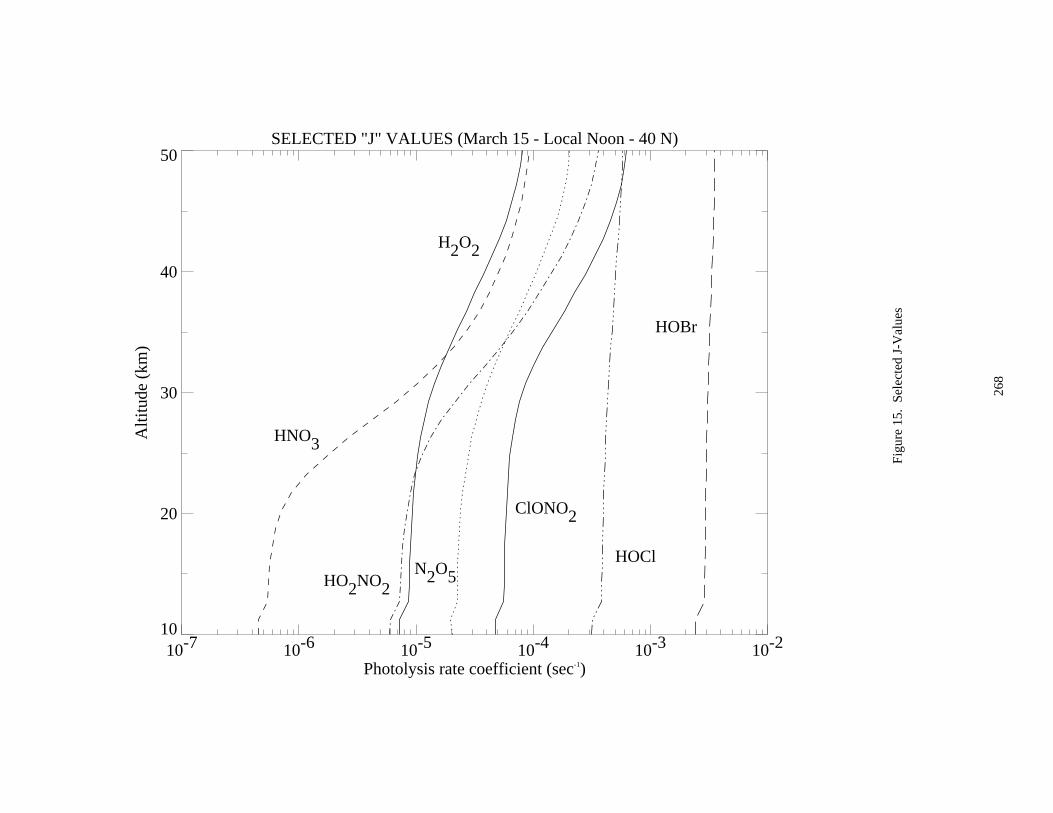
268
SELECTED "J" VALUES (March 15 - Local Noon - 40 N)
10-7 10-6 10-5 10-4 10-3 10-2
Photolysis rate coefficient (sec-1)
10
20
30
40
50A
ltitu
de (
km)
H2O2
N2O5
HNO3
HO2NO2
HOCl
HOBr
ClONO2
Fig
ure
15.
Sel
ecte
d J-
Val
ues
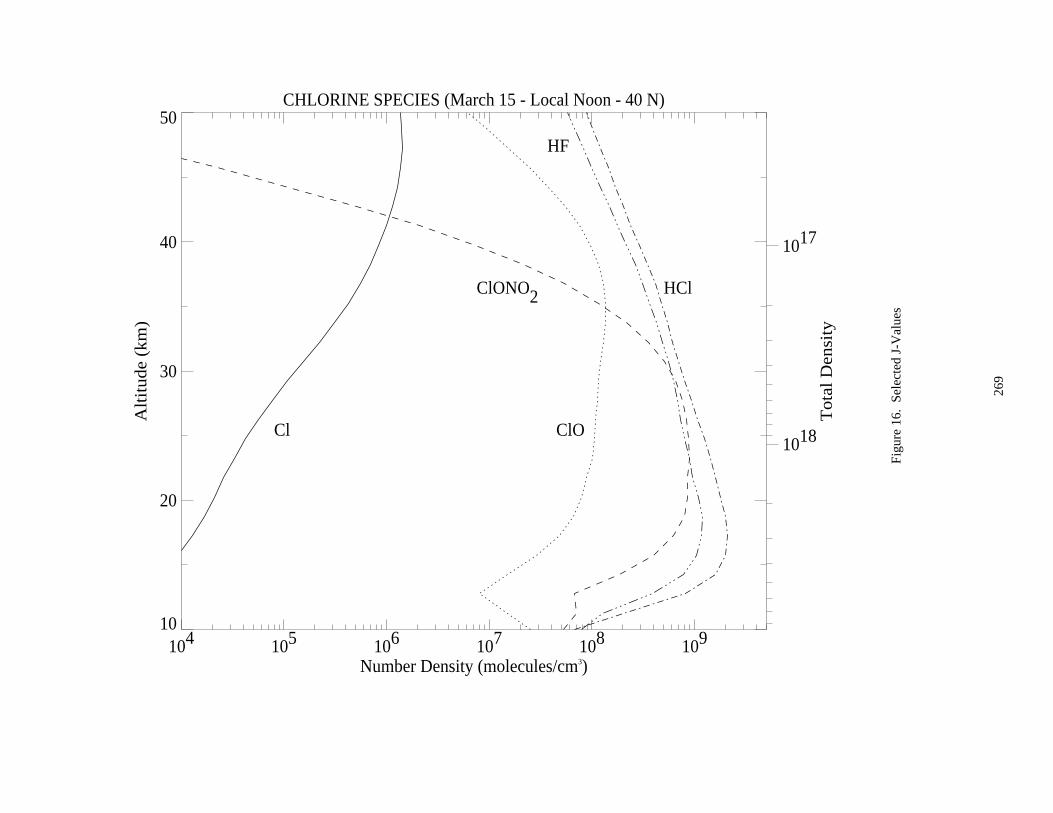
269
CHLORINE SPECIES (March 15 - Local Noon - 40 N)
104 105 106 107 108 109
Number Density (molecules/cm3)
10
20
30
40
50A
ltit
ude
(km
)
1018
1017
Tot
al D
ensi
ty
Cl ClO
ClONO2 HCl
HF
Fig
ure
16.
Sel
ecte
d J-
Val
ues


