Embed Size (px)
Citation preview

DOI: 10.1002/asia.200700351
Photodissociation of CH2I2 and Subsequent Electron Transfer in Solution
Ken-ichi Saitow,*[a] Yukito Naitoh,[b] Keisuke Tominaga,[a, b] and Keitaro Yoshihara*[a, b]
Introduction
Photochemical reactions in the condensed phase, in compar-ison with those in the gas phase, often give different kinetics
and dynamics owing to continual interactions with solventmolecules.[1–4] In the case of photodissociation, solventcaging causes geminate recombination between photofrag-ments[5–8] and further induces a secondary reaction between
Abstract: We studied photoinduced re-actions of diiodomethane (CH2I2) uponexcitation at 268 nm in acetonitrile andhexane by subpicosecond–nanosecondtransient absorption spectroscopy. Thetransient spectra involve two absorp-tion bands centered at around 400 (in-tense) and 540 nm (weak). The transi-ents probed over the range 340–740 nmshow common time profiles consistingof a fast rise (<200 fs), a fast decayACHTUNGTRENNUNG(�500 fs), and a slow rise. The two fastcomponents were independent ofsolute concentration, whereas the slowrise became faster (7–50 ps) when theconcentration in both solutions was in-creased. We assigned the fast compo-nents to the generation of a CH2I radi-cal by direct dissociation of the photo-excited CH2I2 and its disappearance bysubsequent primary geminate recombi-nation. The concentration-dependent
slow rise produced the absorptionbands centered at 400 and 540 nm. Theformer consists of different time-de-pendent bands at 385 and 430 nm. Theband near 430 nm grew first and wasassigned to a charge-transfer (CT)complex, CH2I2
d+ ···Id�, formed by aphotofragment I atom and the soluteCH2I2 molecule. The CT complex isfollowed by full electron transfer,which then develops the band of theion pair CH2I2
+ ···I� at 385 nm on thepicosecond timescale. On the nanosec-ond scale, I3
� was generated afterdecay of the ion pair. The reactionscheme and kinetics were elucidated by
the time-resolved absorption spectraand the reaction rate equations. We as-cribed concentration-dependent dy-namics to the CT-complex formation inpre-existing aggregates of CH2I2 andanalyzed how solutes are aggregated ata given bulk concentration by evaluat-ing a relative local concentration.Whereas the local concentration inhexane monotonically increased as afunction of the bulk concentration, thatin acetonitrile gradually became satu-rated. The number of CH2I2 moleculesthat can participate in CT-complex for-mation has an upper limit that dependson the size of aggregation or spatial re-striction in the neighboring region ofthe initially photoexcited CH2I2. Suchconditions were achieved at lower con-centrations in acetonitrile than inhexane.
Keywords: charge transfer · elec-tron transfer · femtochemistry ·
photochemistry · reactive inter-mediates
[a] Prof. Dr. K.-i. Saitow,+ Prof. Dr. K. Tominaga,+++
Prof. Dr. K. Yoshihara++++
The Graduate University for Advanced StudiesMyodaiji, Okazaki 444-8585 (Japan)E-mail : [email protected]
[b] Dr. Y. Naitoh,++ Prof. Dr. K. Tominaga,+++ Prof. Dr. K. Yoshihara++++
Institute for Molecular ScienceMyodaiji, Okazaki 444-8585 (Japan)
[+] Present address: Natural Science Center for Basic Research andDevelopment (N-BARD)Hiroshima UniversityKagamiyama, Higashi-Hiroshima 739-8526 (Japan)Fax: (+81)82-424-7487and
Department of ChemistryGraduate School of ScienceHiroshima UniversityKagamiyama, Higashi-Hiroshima 739-8526 (Japan)andPRESTO, JST, 4-1-8, Honcho KawaguchiSaitama 332-0012 (Japan)
[++] National Institute of Information and Communications Technology588-2 Iwaoka, Iwaoka-cho, Kobe 651-2492 (Japan)
[+++] Molecular Photoscience Research CenterKobe University, Nada, Kobe 657-8501 (Japan)andCREST, JST, Nada, Kobe 657-8501 (Japan)
[++++] Toyota Physical and Chemical Research InstituteNagakute, Aichi 480-1192 (Japan)Fax: (+81)561-63-6302
696 F 2008 Wiley-VCH Verlag GmbH&Co. KGaA, Weinheim Chem. Asian J. 2008, 3, 696 – 709
FULL PAPERS

the photofragment and solute or solvent molecules.[9–14] Asmall simple molecule as a reactant could provide an ad-vantage for evaluating microscopic details of solute–solventinteractions by minimizing interference from competing in-tramolecular pathways.[5–18] Alkyl halides show characteristicphotochemical reactions in the condensed phase, whichoffer different photoproducts in contrast to that in the gasphase. Photolyzed halogen fragments are well-known as ac-tivated atoms to form charge–transfer (CT) complexes withsolvent or solute molecules[9–12] or to give other products byhydrogen abstraction[13] or electron-transfer reactions.[14]
Polyhalomethanes in the condensed phase are typical ex-amples of the alkyl halides mentioned above, and many re-action pathways and assignments of products have been re-ported over the last 40 years.[19–44] Neat CCl4 was most ex-tensively studied, and transient absorption bands at around335 and 500 nm were commonly observed by the excitationsources of ultraviolet, pulsed-electron beam, and g-ray.[19–25]
These bands were assigned to various products, that is,CCl2,
[19] CCl4+ ,[20] CCl3
+ ,[21] solvent-separated CCl3+Cl�,[22,23]
and ion-pair complex CCl4+ ···Cl�.[24] Through a subnanosec-
ond transient absorption experiment and ab initio calcula-tions, BIhler assigned the UV and visible bands to CCl4
+
and the CT complex of CCl3+ , respectively.[25]
For the photolysis of halomethanes in low-temperaturematrices, it is known that UV irradiation gives a transientproduct as a “color center”, which causes an intense andbroad absorption band in the UV/Vis region. As for polyha-lomethanes in a 3-methylpentane (3MP) matrix, Simons andco-workers found a color center upon UV irradiation.[26a,b]
They assigned it to a trapped electron and suggested thecharacteristic reaction for its formation in contrast to theirstudies in the gas phase.[26c,d] They also observed generationof trihalide ions, for example, I3
�, by warming the coloredmatrices.[26b] These characteristic reactions were ascribed tothe photoexcitation of a polyhalomethane cluster in matri-ces.Many investigators studied diiodomethane (CH2I2) and
reported absorption spectra of transient products in low-temperature matrices by UV[26a,b,27a,28] and VUV[29] irradia-tions. UV irradiation at around 300 nm in 3MP matrix pro-duced broad absorption bands at around 385 (intense) and570 nm (weak). The former was assigned to CH2I2
+ .[27a] Theabsorption intensity showed a sublinear concentration de-pendence, which suggests interaction of solutes in formingCH2I2
+ . The band at 370 nm in an Ar matrix was identifiedas CH2I2
+ by photoelectron spectroscopy.[29]
Another assignment for this broad absorption band ataround 370 nm was proposed to be an isomerization toCH2–I–I as a result of difference absorption spectra in theIR region and ab initio calculations.[28] Bond formation be-tween the halogen of the CH2–I radical and the I radicalafter photodissociation was suggested as a reaction mecha-nism.For reference, we briefly introduce the well-defined stud-
ies of photoexcited CH2I2 in the gas phase.[45–56] The UV ab-sorption band, which lies between 200 and 350 nm, is as-
signed to four or five n!s* transitions[45–49] (Figure 1). UVexcitation (<5 eV) induces photodissociation to the CH2Iradical and I atom. A flash photolysis experiment showedgeneration of the CH2I radical, the ground state I (2P3/2),and the spin–orbit excited state I* (2P1/2) fragments.[45] Opto-acoustic[46] and IR emission[47] experiments showed that theexcitation of the first B1 band is correlated with productionof only I, whereas the excitation of the second B1 band iscorrelated with both I and I*. The branching ratios I*/I werereported to be 0 upon excitation to the first B1, 0.57 to thesecond B1, and 0.91 to the A1 states.
[46] Anisotropic parame-ters of fragments upon excitation at 310[49] , 266,[50] and304 nm[51] revealed that the photoexcited CH2I2 causesdirect dissociation, and the dissociation process is very fast.The lifetime of the first dissociative state of CH2I2 was theo-retically calculated to be very short (<80[54] and <8 fs[55])owing to the direct dissociation.Femtosecond time-resolved investigations of CH2I2 in so-
lution at room temperature have been conducted by severalresearchers since 1993.[34–38] Schwarts et al. observed the ul-trafast formation of CH2I radical at 620 nm by the photodis-sociation of CH2I2 upon excitation of the B1 state at 310 nmin solution.[34] The transient absorption profiles indicated afast rise, a fast decay, and a successive slow rise. The fastrise was assigned to the formation of CH2I radical by directdissociation. The fast decay with a time constant of 350 fswas assigned to disappearance of the CH2I radical by pri-mary geminate recombination in a solvent cage. The slowrise was assigned to a vibrational relaxation of the CH2I rad-ical. We observed similar time profiles at 400 nm upon exci-tation at 268 nm in acetonitrile (CH3CN).
[35] We assignedthe fast rise and decay components to the instantaneous for-mation and decay of the CH2I radical, but the slow rise com-
Figure 1. Static absorption spectra of CH2I2 in a) acetonitrile andb) hexane. Spectra are deconvoluted into a sum of four Gaussian bands(dashed lines). These bands are assigned to the electronic excited B1, B1,and A1 states.
[46] Arrows indicate the excitation wavelength used in thefemtosecond transient absorption measurements.
Chem. Asian J. 2008, 3, 696 – 709 F 2008 Wiley-VCH Verlag GmbH&Co. KGaA, Weinheim www.chemasianj.org 697

ponent to a CT complex between the solute and the photo-fragment iodine. Tarnovsky et al. reported a similar transientabsorption upon excitation of the B1 state at 310 nm in ace-tonitrile.[36] They suggested the dynamics to be the electroni-cally excited CH2I2 molecule, which stayed for 350 fs in a re-pulsive state, and slower photodissociation (0.35–1 ps) wasproposed. The slow-rise component was considered to bedue to the isomer CH2–I–I. Kwok and Phillips studied theresonance Raman spectra upon excitation at the B1 stateand showed that the single C�I bond of CH2I2 was rapidlylengthened in 10–20 fs.[37a] The transient resonance Ramanspectra showed overtone progressions, which were suggestedto be the I–I stretching mode of isomer CH2–I–I.
[37b,c] Thesame authors observed a similar progression in the photo-product of CH3I in solution, but it was identified to the I–Istretching mode of CH3–I–I complex formed by “soluteCH3I and fragment I”.[37d] Several studies on the reaction dy-namics of CH2I2 were recently conducted by time-resolvedexperiments,[38–41] that is, transient absorptions in solutio-n[38]and supercritical fluids[40] and time-resolved X-ray dif-fraction in solution.[41] In these studies, interactions of frag-ments between CH2I and I were investigated, and successiveprocesses after the photodissociation were discussed for theformation of isomer CH2–I–I.The present study examines the photoinduced reactions
of CH2I2 in acetonitrile and hexane by using subpicosecondand nanosecond transient absorption spectroscopy at roomtemperature. The transients produced upon excitation at268 nm were probed from 340 to 740 nm. Time-resolved ab-sorption spectra at around 340 nm were obtained from ab-sorption immediately after photoexcitation (�1 ps) and cor-respond to the reported CH2I radical in the gas phase.[39, 56]
The slow-rise components were observed at all probedwavelengths, and the time constants were found to be signif-icantly dependent on the concentration of CH2I2. The analy-sis of time-resolved absorption spectra and kinetics indicatethat a CT complex, CH2I2
d+ ···Id�, is formed between thephotofragment I atom and the solute CH2I2. We discuss thisprocess on the basis of the concentration dependence of theslow-rise component and suggest that the reaction occurs inan environment of pre-existing solute aggregates.
Results and Discussion
Absorption Spectra of CH2I2 in solution
The static absorption spectra of CH2I2 in acetonitrile andhexane are shown in Figure 1. The spectra can be brokendown into the sum of four Gaussian functions in the gasphase, as shown by the dashed lines. Each band has a similarbandwidth to that in the gas phase.[48a] This coincidence sug-gests that the initial process at the Franck–Condon excitedregion is nearly equivalent to that in the gas phase, which isoften described by the direct (ultrafast) dissociation.[45–55]
The peak positions underwent a blue shift by 1000 cm�1 inacetonitrile and a red shift by 700 cm�1 in hexane relative tothat in the gas phase. Such shifts are commonly observed in
alkyl halides dissolved in solvents.[57,58] The excitation wave-length at 268 nm for CH2I2 corresponds mainly to the B1
state in acetonitrile and to both the B1 and A1 states inhexane.
Dynamics of Transient Absorptions Observed in the
Subpicosecond and Picosecond Regions
Figure 2 displays the transient absorptions in acetonitrileprobed at several different wavelengths, from the UV to thenear-IR region, within 5 ps. The insets show the absorptionswithin 50 ps. The transient absorptions observed in hexaneare shown in Figure 3. All time profiles gave common char-acteristics: a fast rise, a fast decay, and a slow rise. As listedin Table 1, the best-fit time constants were obtained by fit-ting the time profiles with three exponential functions con-voluted with the instrumental response function. The twofast time constants in acetonitrile are almost same as thosein hexane within experimental error.[59]
Figure 4 shows the pump-power dependence of the transi-ent absorptions at 500-fs and 20-ps delay times, probed at400 nm in acetonitrile. The data indicate that the absorban-ces of the fast and slow rises are linearly proportional to thepump power. As a result, the transient dynamics seem tooccur by a one-photon process. Taking into account excita-tion to the state of direct dissociation, we assigned the fastrise to generation of the CH2I radical. The assignment is ra-tionalized by the time-resolved absorption spectra in the
Figure 2. Transient absorption signals probed at eight different wave-lengths for photoproducts of CH2I2 within 5 ps in acetonitrile. Insets: sig-nals within 50 ps. The solid lines represent the best-fit results obtained bythe three exponentials convoluted with the instrument response function.
698 www.chemasianj.org F 2008 Wiley-VCH Verlag GmbH&Co. KGaA, Weinheim Chem. Asian J. 2008, 3, 696 – 709
FULL PAPERSK.-i. Saitow, K. Yoshihara et al.

subpicosecond region, because we recognized the absorptionband of the CH2I radical centered at 340 nm in the spectra,as described later. Thus, the CH2I radical is generated im-mediately after photoexcitation, and the absorption rises in-stantaneously (Figure 2). Subsequently, the transient absorp-tion decays, and the CH2I radical disappears with a timeconstant of less than 500 fs. The most plausible mechanismfor the disappearance of the CH2I radical is primary gemi-nate recombination.Transient absorptions in the picosecond region were re-
corded as a function of solute concentration in both acetoni-trile and hexane. The pump-probe signals within 5 ps in ace-tonitrile probed at 400 and 580 nm are shown in Figure 5,
Table 1. Best-fit time constants of transient absorptions for photoprod-ucts of CH2I2 in acetonitrile and hexane.
Solvent l
[nm]t1 (fast rise)[fs]
t2 (fast decay)[fs]
t3 (slow rise)[ps]
CH3CN 360 190�110 510�120 10.1�0.6380 210�100 450�110 13.9�0.7400 200�90 440�120 7.3�0.6420 200�100 430�140 6.8�0.5440 210�90 410�150 6.2�0.6460 180�110 430�140 3.5�0.3480 190�90 460�160 3.1�0.5500 220�110 510�170 3.1�0.3520 210�120 450�130 6.7�0.4540 220�100 440�130 9.2�1.0560 200�110 480�150 7.2�0.8580 210�120 490�160 6.5�0.4620 200�120 420�120 5.1�0.5640 200�110 440�110 4.9�2.0680 190�100 480�120 4.6�1.5740 210�120 460�140 4.3�2.0
Hexane[a] 360 –[b] –[b] 17�1.7380 – – 30�3.0400 150�80[c] 620�200[c] 13�1.2420 – – 7.6�0.6440 – – 5.5�1.5460 – – 4.9�2.0
[a] At longer wavelengths than 480 nm, transient absorptions were tooweak to detect in hexane. [b] Fast components of transient absorptionwere not determined in hexane by artifacts arising from solvent. [c] Timeconstants for fast-rise and decay components at 400 nm in hexane wereroughly obtained by subtracting artifacts of solvent from data of solutionobtained under the same experimental conditions.
Figure 4. Pump-power dependence of the transient absorption signalsprobed at 400 nm in acetonitrile. *=20 ps,*=500 fs.
Figure 3. Transient absorption signals probed at six different wavelengthsfor photoproducts of CH2I2 within 50 ps in hexane. The solid lines repre-sent the best-fit results obtained by the exponential function convolutedwith the instrument response function. The dashed line is due to the sol-vent-induced artifacts.
Figure 5. Transient absorption signals probed at a) 400 nm and b) 580 nmfor photoproducts of CH2I2 within 5 ps at different concentrations in ace-tonitrile. In a), *=6.2O10�3, ~=2.5O10�3, &=1.2O10�3, ^=3.1O10�4m. In b), *=1.2O10�2, ~=6.2O10�3, &=4.3O10�3, ^=2.5O10�3m.The solid lines represent the best-fit results obtained by the exponentialfunction.
Chem. Asian J. 2008, 3, 696 – 709 F 2008 Wiley-VCH Verlag GmbH&Co. KGaA, Weinheim www.chemasianj.org 699
Photodissociation and Electron Transfer of CH2I2

and those within 50 ps at 400 nm in acetonitrile and hexaneare shown in Figure 6. The fast rise and decay componentsat both red and blue bands are independent of the solute
concentrations chosen in this experiment. On the otherhand, the slow signal rises depend significantly on concen-tration in both solutions. These results seem to indicate thatthe slow rise does not arise from a photofragment, but re-flects a solute-induced process. The time constants of thesecomponents are listed in Tables 2 and 3.
Transient Absorption Spectra on the Nanosecond Timescale
To assign the slow rise, we performed nanosecond transientabsorption experiments with solutions in acetonitrile,hexane, and CH2Cl2. In Figure 7a, the solid line is the transi-ent absorption spectrum of photoproducts in acetonitrile.The static absorption spectrum of the product by UV pho-tolysis of CH2I2 in 3MP matrix at 77 K[27a] is shown by thedotted line. The spectrum in the nanosecond region is ingood agreement with that in the 3MP matrix. Figure 7bshows the transient spectra recorded in hexane and CH2Cl2.These results indicate that similar transient absorptionbands are formed in these solutions at room temperatureand in the low-temperature matrices.[26, 27a,28] Mohan et al. as-signed the blue band to CH2I2
+ and explained that its for-mation was caused by electron transfer between two photo-excited CH2I2 molecules.[27a] This reaction scheme, however,cannot be accepted in the present study, because the slow-
rise component showed a linear pump-power dependence(Figure 4).As shown in Figure 8, the time profiles of the transient
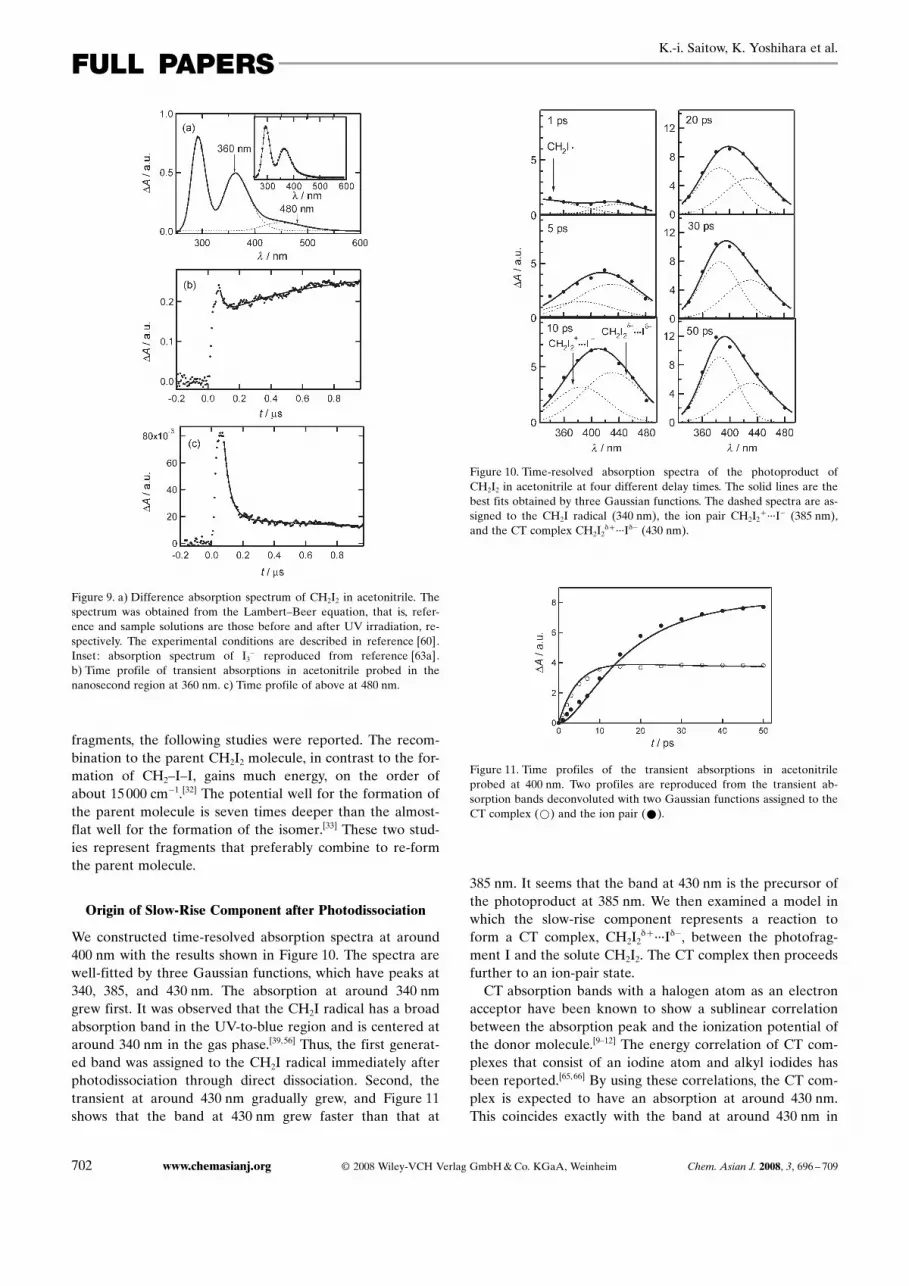
photoproducts probed at 400 and 580 nm consist of a risewithin a pulse width of about 30 ns and an exponentialdecay with a time constant of about 100 ns. By using solu-tions before and after UV irradiation at 268 nm, a differenceabsorption spectrum was recorded (Figure 9a).[60] The spec-trum in acetonitrile shows two bands in the UV and visibleregions. Notably, the UV band is identical to the absorptionspectrum of I3
� as shown in the inset,[61] and the visible bandat around 460 nm is identical to the spectrum of I2 in aceto-nitrile. As a result, these bands are assigned to I3
� and I2, re-spectively.To examine further the formation of the final photoprod-
ucts of I3� and I2, the transient absorptions were recorded
(Figure 9b and c). The transient probed at 480 nm decayedwith time constants of about 50 and 650 ns. The transient ab-sorption at 360 nm decayed with a time constant of about50 ns and rose with one of about 600 ns. As the time con-stant of the rise component at 360 nm is similar to that ofthe second decay at 480 nm, the appearance of I3
� seems to
Figure 6. Transient absorption signals probed at 400 nm for photoprod-ucts of CH2I2 within 50 ps in a) acetonitrile and b) hexane. The soluteconcentration is 3.1O10�4–1.2O10�2m. The solid lines represent the best-fit data obtained by the exponential function. The dashed lines are thesignals from the neat solvents.
Table 2. Best-fit time constants of transient absorptions for photoprod-ucts of CH2I2 probed at 400 nm as a function of solute concentration.
Solvent Conc.[m]
t1 (fast rise)[fs]
t2 (fast decay)[fs]
t3 (slow rise)[ps]
CH3CN 3.1O10�4 180�110 480�200 12.8�1.86.2O10�4 190�100 500�190 11.5�1.21.2 O10�3 250�150 540�200 10.8�0.81.8 O10�3 170�110 520�260 9.8�1.02.5 O10�3 200�100 400�130 9.1�0.66.2 O10�3 160�120 450�200 7.4�0.39.3 O10�3 210�100 530�240 7.2�0.61.2 O10�2 170�110 490�240 7.1�0.5
Hexane[a] 1.2 O10�3 –[b] –[b] 51�31.8 O10�3 – – 36�22.5 O10�3 – – 30�16.2 O10�3 – – 20�19.3 O10�3 – – 15�11.2 O10�2 – – 13�1
[a] At concentrations lower than 1O10�3m, transient absorption was tooweak to detect in hexane. [b] Fast-rise and decay components in hexanecould not be determined by artifacts of neat hexane.
Table 3. Best-fit time constants of transient absorptions for photoprod-ucts of CH2I2 probed at 580 nm as a function of solute concentration inacetonitrile.
Conc.[m][a]
t1 (fast rise)[fs]
t2 (fast decay)[fs]
t3 (slow rise)[ps]
1.2O10�3 –[a] –[a] 9.7�1.72.5O10�3 180�100 460�170 8.5�0.74.3 O10�3 220�120 430�160 8.1�0.66.2 O10�3 190�110 440�140 7.7�0.69.3 O10�3 210�100 480�130 7.4�0.41.2 O10�2 200�120 460�160 6.7�0.4
[a] At solute concentrations lower than 1.2O10�3m, transient absorptionwas too weak to detect.
700 www.chemasianj.org F 2008 Wiley-VCH Verlag GmbH&Co. KGaA, Weinheim Chem. Asian J. 2008, 3, 696 – 709
FULL PAPERSK.-i. Saitow, K. Yoshihara et al.

be correlated to the decay of I2. We consider that I3� is gen-
erated by a reaction between I2 and I� through diffusion andequilibration processes in solution. It has been shown thatthe I3
� ion is generated through I2+ I�QI3� by dissolving I2
and KI in polar solvents.[62] The ion I3� exists stably, and the
stability of I3� was observed in the resonance Raman spectra
of I3� and I2.
[63] The observation of I3� and I2 was previously
reported by warming the UV-irradiated matrix of CH2I2.[26b]
Transient Photoproducts Observed at Around 400 nm
By UV excitation, we observed two transient absorptionbands centered at around 400 and 540 nm at room tempera-ture. Similar absorption spectra at around 400 nm were re-ported by VUV excitation,[29] g-ray[27b] irradiation of low-temperature matrices, and pulse radiolysis in solution.[30]
From the experiment of the direct photoionization of CH2I2upon excitation at 105 nm in Ar matrix at 15 K, the absorp-tion spectrum of CH2I2
+ was observed at around 370 nm,which was identified by photoelectron spectroscopy to bethe electronic transition A !X of CH2I2
+ .[29] This assign-ment is in accordance with the result of nanosecond transi-ent electroconductivity measurements.[30] In the presentstudy, the absorption band at around 380 nm was obtained
by pico- and nanosecond transient absorption spectroscopy,and the photoproduct was generated by a one-photon pro-cess. The concentration-dependent slow rise indicates thatthe products that gave the band at around 400 nm are relat-ed to solute–solute interactions.Simons and co-workers proposed that the absorption
bands are associated with electrons trapped in clusters ofpolyhalomethane molecules in 3MP matrix.[26a,b] They sug-gested that the trapped electron is formed by electron trans-fer by tunneling between Rydberg orbitals of adjacent mole-cules.[26a] If trapped electrons were to be generated, the ejec-tion of the electron should be much faster than the photo-dissociation. In the present study, the absorption at around400 nm developed with time constants of 7–50 ps, dependingon the solute concentration. This time range seems to be toolong for electron ejection via the Rydberg state before thefast photodissociation process, which was calculated to be 8–80 fs in the gas[54,55] and solution states.[37a]
Another model was reported to be the isomer CH2–I–Iformed by the reaction between CH2I and I fragments afterphotodissociation.[28] As this isomerizaion is given by asingle molecular process, the reaction should be independ-ent of solute concentration. However, as shown in Figures 5and 6, the slow-rise component depends significantly onsolute concentration and becomes faster with increasingconcentration. As for other reactions between CH2I and I
Figure 7. Nanosecond transient absorption spectra for the photoproductof CH2I2 immediately after excitation with an XeCl excimer laser. a) Thesolid circles (*) and line (left vertical axis) are the transient absorptionsignals and fitting curve obtained by two Gaussian functions in acetoni-trile at 293 K, respectively. The dashed line (right vertical axis) representsthe static absorption spectrum of CH2I2
+ in 3MP matrix at 77 K repro-duced from reference [27a]. b) The solid triangles (~) and squares (&)are the transient spectra of the product in CH2Cl2 and hexane, respective-ly. The solid lines are the fitting curves obtained by two Gaussian func-tions.
Figure 8. Time profiles of transient absorptions probed in the nanosecondregion a) at 400 nm in acetonitrile, b) at 400 nm in hexane, c) at 580 nmin acetonitrile, and d) at 580 nm in hexane.
Chem. Asian J. 2008, 3, 696 – 709 F 2008 Wiley-VCH Verlag GmbH&Co. KGaA, Weinheim www.chemasianj.org 701
Photodissociation and Electron Transfer of CH2I2
fragments, the following studies were reported. The recom-bination to the parent CH2I2 molecule, in contrast to the for-mation of CH2–I–I, gains much energy, on the order ofabout 15000 cm�1.[32] The potential well for the formation ofthe parent molecule is seven times deeper than the almost-flat well for the formation of the isomer.[33] These two stud-ies represent fragments that preferably combine to re-formthe parent molecule.
Origin of Slow-Rise Component after Photodissociation
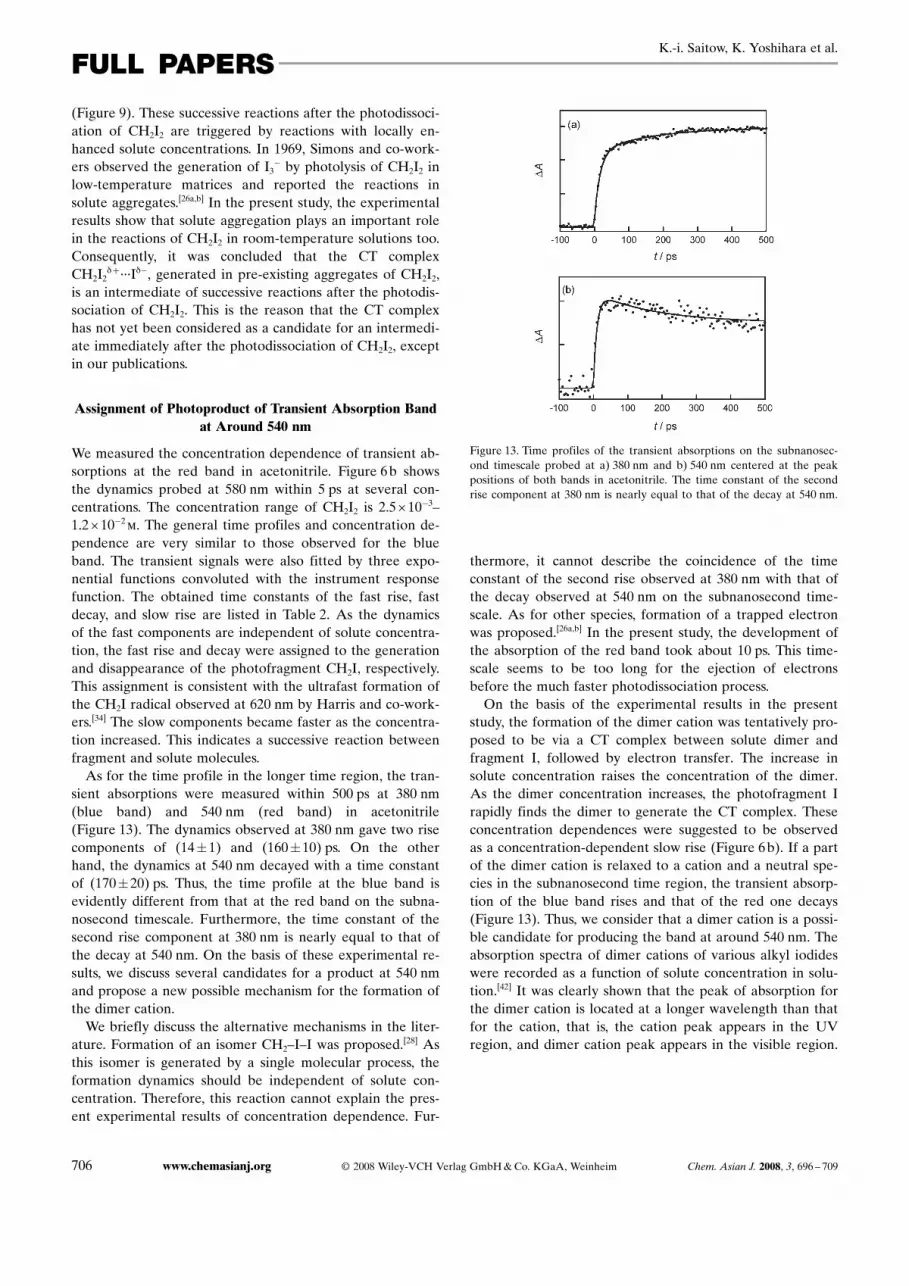
We constructed time-resolved absorption spectra at around400 nm with the results shown in Figure 10. The spectra arewell-fitted by three Gaussian functions, which have peaks at340, 385, and 430 nm. The absorption at around 340 nmgrew first. It was observed that the CH2I radical has a broadabsorption band in the UV-to-blue region and is centered ataround 340 nm in the gas phase.[39,56] Thus, the first generat-ed band was assigned to the CH2I radical immediately afterphotodissociation through direct dissociation. Second, thetransient at around 430 nm gradually grew, and Figure 11shows that the band at 430 nm grew faster than that at
385 nm. It seems that the band at 430 nm is the precursor ofthe photoproduct at 385 nm. We then examined a model inwhich the slow-rise component represents a reaction toform a CT complex, CH2I2
d+ ···Id�, between the photofrag-ment I and the solute CH2I2. The CT complex then proceedsfurther to an ion-pair state.CT absorption bands with a halogen atom as an electron
acceptor have been known to show a sublinear correlationbetween the absorption peak and the ionization potential ofthe donor molecule.[9–12] The energy correlation of CT com-plexes that consist of an iodine atom and alkyl iodides hasbeen reported.[65,66] By using these correlations, the CT com-plex is expected to have an absorption at around 430 nm.This coincides exactly with the band at around 430 nm in
Figure 9. a) Difference absorption spectrum of CH2I2 in acetonitrile. Thespectrum was obtained from the Lambert–Beer equation, that is, refer-ence and sample solutions are those before and after UV irradiation, re-spectively. The experimental conditions are described in reference [60].Inset: absorption spectrum of I3
� reproduced from reference [63a].b) Time profile of transient absorptions in acetonitrile probed in thenanosecond region at 360 nm. c) Time profile of above at 480 nm.
Figure 10. Time-resolved absorption spectra of the photoproduct ofCH2I2 in acetonitrile at four different delay times. The solid lines are thebest fits obtained by three Gaussian functions. The dashed spectra are as-signed to the CH2I radical (340 nm), the ion pair CH2I2
+ ···I� (385 nm),and the CT complex CH2I2
d+ ···Id� (430 nm).
Figure 11. Time profiles of the transient absorptions in acetonitrileprobed at 400 nm. Two profiles are reproduced from the transient ab-sorption bands deconvoluted with two Gaussian functions assigned to theCT complex (*) and the ion pair (*).
702 www.chemasianj.org F 2008 Wiley-VCH Verlag GmbH&Co. KGaA, Weinheim Chem. Asian J. 2008, 3, 696 – 709
FULL PAPERSK.-i. Saitow, K. Yoshihara et al.
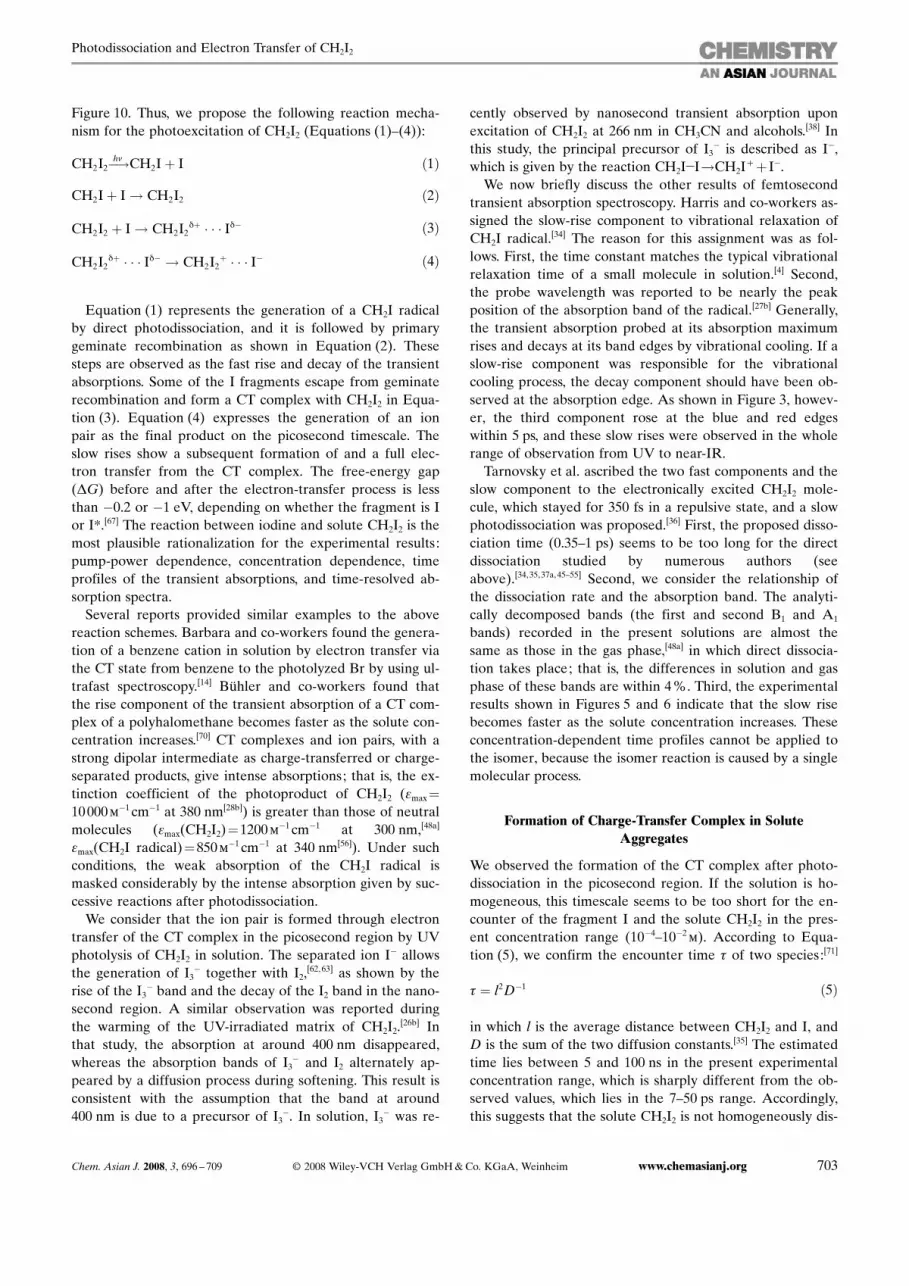
Figure 10. Thus, we propose the following reaction mecha-nism for the photoexcitation of CH2I2 (Equations (1)–(4)):
CH2I2hn�!CH2Iþ I ð1Þ
CH2Iþ I! CH2I2 ð2Þ
CH2I2 þ I! CH2I2dþ Id� ð3Þ
CH2I2dþ Id� ! CH2I2
þ I� ð4Þ
Equation (1) represents the generation of a CH2I radicalby direct photodissociation, and it is followed by primarygeminate recombination as shown in Equation (2). Thesesteps are observed as the fast rise and decay of the transientabsorptions. Some of the I fragments escape from geminaterecombination and form a CT complex with CH2I2 in Equa-tion (3). Equation (4) expresses the generation of an ionpair as the final product on the picosecond timescale. Theslow rises show a subsequent formation of and a full elec-tron transfer from the CT complex. The free-energy gap(DG) before and after the electron-transfer process is lessthan �0.2 or �1 eV, depending on whether the fragment is Ior I*.[67] The reaction between iodine and solute CH2I2 is themost plausible rationalization for the experimental results:pump-power dependence, concentration dependence, timeprofiles of the transient absorptions, and time-resolved ab-sorption spectra.Several reports provided similar examples to the above
reaction schemes. Barbara and co-workers found the genera-tion of a benzene cation in solution by electron transfer viathe CT state from benzene to the photolyzed Br by using ul-trafast spectroscopy.[14] BIhler and co-workers found thatthe rise component of the transient absorption of a CT com-plex of a polyhalomethane becomes faster as the solute con-centration increases.[70] CT complexes and ion pairs, with astrong dipolar intermediate as charge-transferred or charge-separated products, give intense absorptions; that is, the ex-tinction coefficient of the photoproduct of CH2I2 (emax=
10000m�1cm�1 at 380 nm[28b]) is greater than those of neutralmolecules (emax ACHTUNGTRENNUNG(CH2I2)=1200m�1cm�1 at 300 nm,[48a]
emax(CH2I radical)=850m�1cm�1 at 340 nm[56]). Under suchconditions, the weak absorption of the CH2I radical ismasked considerably by the intense absorption given by suc-cessive reactions after photodissociation.We consider that the ion pair is formed through electron
transfer of the CT complex in the picosecond region by UVphotolysis of CH2I2 in solution. The separated ion I� allowsthe generation of I3
� together with I2,[62, 63] as shown by the
rise of the I3� band and the decay of the I2 band in the nano-
second region. A similar observation was reported duringthe warming of the UV-irradiated matrix of CH2I2.
[26b] Inthat study, the absorption at around 400 nm disappeared,whereas the absorption bands of I3
� and I2 alternately ap-peared by a diffusion process during softening. This result isconsistent with the assumption that the band at around400 nm is due to a precursor of I3
�. In solution, I3� was re-
cently observed by nanosecond transient absorption uponexcitation of CH2I2 at 266 nm in CH3CN and alcohols.[38] Inthis study, the principal precursor of I3
� is described as I�,which is given by the reaction CH2I�I!CH2I
++ I�.
We now briefly discuss the other results of femtosecondtransient absorption spectroscopy. Harris and co-workers as-signed the slow-rise component to vibrational relaxation ofCH2I radical.
[34] The reason for this assignment was as fol-lows. First, the time constant matches the typical vibrationalrelaxation time of a small molecule in solution.[4] Second,the probe wavelength was reported to be nearly the peakposition of the absorption band of the radical.[27b] Generally,the transient absorption probed at its absorption maximumrises and decays at its band edges by vibrational cooling. If aslow-rise component was responsible for the vibrationalcooling process, the decay component should have been ob-served at the absorption edge. As shown in Figure 3, howev-er, the third component rose at the blue and red edgeswithin 5 ps, and these slow rises were observed in the wholerange of observation from UV to near-IR.Tarnovsky et al. ascribed the two fast components and the
slow component to the electronically excited CH2I2 mole-cule, which stayed for 350 fs in a repulsive state, and a slowphotodissociation was proposed.[36] First, the proposed disso-ciation time (0.35–1 ps) seems to be too long for the directdissociation studied by numerous authors (seeabove).[34,35,37a,45–55] Second, we consider the relationship ofthe dissociation rate and the absorption band. The analyti-cally decomposed bands (the first and second B1 and A1
bands) recorded in the present solutions are almost thesame as those in the gas phase,[48a] in which direct dissocia-tion takes place; that is, the differences in solution and gasphase of these bands are within 4%. Third, the experimentalresults shown in Figures 5 and 6 indicate that the slow risebecomes faster as the solute concentration increases. Theseconcentration-dependent time profiles cannot be applied tothe isomer, because the isomer reaction is caused by a singlemolecular process.
Formation of Charge-Transfer Complex in Solute
Aggregates
We observed the formation of the CT complex after photo-dissociation in the picosecond region. If the solution is ho-mogeneous, this timescale seems to be too short for the en-counter of the fragment I and the solute CH2I2 in the pres-ent concentration range (10�4–10�2m). According to Equa-tion (5), we confirm the encounter time t of two species:[71]
t ¼ l2D�1 ð5Þ
in which l is the average distance between CH2I2 and I, andD is the sum of the two diffusion constants.[35] The estimatedtime lies between 5 and 100 ns in the present experimentalconcentration range, which is sharply different from the ob-served values, which lies in the 7–50 ps range. Accordingly,this suggests that the solute CH2I2 is not homogeneously dis-
Chem. Asian J. 2008, 3, 696 – 709 F 2008 Wiley-VCH Verlag GmbH&Co. KGaA, Weinheim www.chemasianj.org 703
Photodissociation and Electron Transfer of CH2I2

solved in solution. The inhomogeneity of the solute mole-cules is generally driven by strong solute–solute interactions.We now describe the intrinsic and specific properties of
CH2I2. It is known that the van der Waals energy is formu-lated by Equation (6):[72]
W ¼A
12pD0¼ 2g ð6Þ
in which W is the van der Waals energy, A is the Hamakerconstant, D0 is the contact intermolecular distance, and g isthe surface energy. Notably, the g value of CH2I2 is the larg-est among 450 organic liquids:[73, 74] gACHTUNGTRENNUNG(CH2I2)=67, gACHTUNGTRENNUNG(H2O)=73 mJm�2 at 298 K. Furthermore, the vaporization energywas also reported to be large: DHvapACHTUNGTRENNUNG(CH2I2)=45.6 kJmol�1[75] at 298 K, which is similar to that for water,DHvapACHTUNGTRENNUNG(H2O)=45.0 kJmol�1. In other words, the CH2I2 mole-cule has strong intermolecular interactions. These strong in-teractions seem to play an important role in forming thestructure of CH2I2 in solution. In fact, the structure aroundCH2I2 solute was investigated by Raman spectroscopy, and avery large spectral shift (20 cm�1) of the C–H stretching ofCH2I2 was observed when the concentration of CH2I2 wasincreased.[64] In that study, the aggregation tendency ofCH2I2 solute was clear at room temperature, because theevaluated microscopic concentration became higher thanthe macroscopic one. Another specific feature of CH2I2 wasreported in terms of the solubility of polyhalomethanes. Ac-cording to the Hildebrand parameter, the CH2I2 molecule issaid to be the most insoluble solute in various polyhalo-ACHTUNGTRENNUNGmethanes.[26a] We observed “phase separation” in concen-trated solutions of CH2I2, for example, when the concentra-tion of CH2I2 was greater than 0.1m in hexane.On the basis of the following five reasons, we introduce
the aggregation of CH2I2 to explain the fast formation of theCT complex. First, the fragment I readily finds a partnerCH2I2 in aggregates within a few tens of picoseconds.Second, the aggregation of CH2I2 in solution at room tem-perature is indicated by Raman spectroscopy.[64] Third, it hasbeen suggested that the formation of CH2I2
+ in matrix isdue to solute interactions with a sublinear dependence ofabsorbance on concentration.[27a] Fourth, the CH2I2 moleculeis the most insoluble solute in various polyhalomethanes.[26a]
Fifth, the very large van der Waals energy of CH2I2 is infavor of aggregate formation.
Kinetics of Sequential Reactions After Photodissociation
Figure 11 shows two time profiles in acetonitrile at 400 nm.These were reproduced from the time-resolved absorptionbands analyzed by two Gaussian functions (Figure 10) andwere assigned to the CT complex and the ion-pair complex.It is clear that the former is formed faster than the latter.We analyzed the kinetics for CT-complex formation and theelectron-transfer process as follows (Equation (7)):
CH2I2 þ I k1�! CH2I2
dþ Id�k2
k�2
�! � CH2I2þ I� k3
�! ð7Þ
in which k1, k2, k�2, and k3 represent each reaction rate con-stant. In this scheme, photodissociation and geminate re-combination are not included, because these processes arecompleted within a few hundred femtoseconds, and the in-fluence on CT-complex formation and later processes isminute. We introduced the back reaction of the electrontransfer, because the transient absorption of the CT complexshowed a small decay component in the time range of obser-vation regardless of the rise of the CH2I2
+ ···I� band. This be-havior indicates that formation of the ion pair from the CTcomplex may cause a back reaction in the above scheme.We analyzed the reaction in Equation (7) by solving the
following rate equations (Equations (8)–10):
d½I dt¼ �k1½CH2I2 ½I ð8Þ
d½CH2Idþ2 I
d�
dt¼
k1½CH2I2 ½I � k2½CH2Idþ2 I
d� þ k�2½CH2Iþ2 I
�
ð9Þ
d½CH2Iþ2 I
�
dt¼
k2½CH2Idþ2 I
d� � k�2½CH2Iþ2 I
� � k3½CH2Iþ2 I
�
ð10Þ
Under the present experimental conditions, such asphoton flux and solute concentration, the pump pulse of268 nm excited CH2I2 by less than 1% in the irradiatedvolume. This means that the number of ground-state mole-cules is much greater than the number of fragments I. Ac-cordingly, the CT-complex formation can be safely approxi-mated to a pseudo-first-order reaction. Here, we introduce alocal concentration [CH2I2]L, which reflects the number ofCH2I2 molecules around the photofragment I, instead of themacroscopic bulk concentration [CH2I2] (see next section).In Equation (10), the first two terms proceed in the picosec-ond time region. On the other hand, the third term takesseveral tens of nanoseconds. As the former two terms are solarge that the third term can be neglected, the above rateequations can be safely reduced to the following (Equa-tions (11)–(13)):
d½I dt¼ �k01½I ð11Þ
d½CH2Idþ2 I
d�
dt¼ k01½I � k2½CH2I
dþ2 I
d� þ k�2½CH2Iþ2 I
�
ð12Þ
d½CH2Iþ2 I
�
dt¼ k2½CH2I
dþ2 I
d� � k�2½CH2Iþ2 I
�
ð13Þ
in which k1’ is defined as k1ACHTUNGTRENNUNG[CH2I2]L.
704 www.chemasianj.org F 2008 Wiley-VCH Verlag GmbH&Co. KGaA, Weinheim Chem. Asian J. 2008, 3, 696 – 709
FULL PAPERSK.-i. Saitow, K. Yoshihara et al.

To solve the above rate equations, we use the matrixmethod.[76] The results are as follows (Equations (14)–(16)):
½I t ¼ ½I 0 expð�k01tÞ ð14Þ
½CH2Idþ2 I
d� t ¼
½I 0
�
k�2k2 þ k�2
þk�2 � k
01
k01 � k2 � k�2expð�k01tÞ
þk01k2 expf�ðk2 þ k�2Þtgðk2 þ k�2Þðk
01 � k2 � k�2Þ
�
ð15Þ
½CH2Iþ2 I
� t ¼
½I 0
�
k2k2 þ k�2
þk2
k01 � k2 � k�2expð�k01tÞ
�k01k2 expf�ðk2 þ k�2Þtgðk2 þ k�2Þðk
01 � k2 � k�2Þ
�
ð16Þ
Using Equations (15) and (16), we fitted the time profilesof the transient absorptions for the slow-rise component at aconcentration of 10�2m. As shown in Figure 11, the experi-mental results are in good agreement with the above kinet-ics, that is, the kinetics of the CT complex and ion pair areconsistent with the above reaction scheme. We obtained therate constants k1’= (2.4�0.3)O1011, k2=7.0O109, and k�2=
5.8O1010 s�1. As the rate constant k1’ is much greater than k2and k�2, the CT-complex formation is the major process inthe reaction in Equation (7).
Difference in Macroscopic Bulk Concentration and
Microscopic Local Concentration in Two Typical Solutions
In both acetonitrile and hexane, the slow-rise component ofthe transient absorption becomes faster nonlinearly as theCH2I2 concentration increases. In other words, although thetime constant in hexane is about five times greater than thatin acetonitrile at 10�4m, the difference decreases at higherconcentrations. Here, we mention that the aggregate corre-sponds to an ensemble of solute molecules of an undefinednumber, unlike a specific dimer. If only a dimer was respon-sible for the CT-complex formation, the formation ratecould have been exclusively determined independent of thesolute concentration. The degree of aggregation or locallyenhanced concentration makes the formation of the CTcomplex faster. We consider that these features representhow solutes are aggregated at a given concentration in ace-tonitrile and hexane.To investigate aggregation, the local concentration
[CH2I2]L is estimated in the following manner. The transientabsorption bands of the CT complex and ion pair overlap asshown in Figure 11. First, the signal intensity at 400 nm,I ACHTUNGTRENNUNG(t,400), is described as in Equation (17):
Iðt,400Þ¼ ICTðt, 400Þ þ IIPðt, 400Þ
¼ eCTð400Þ½CH2Idþ2 I
d� t þ eIPð400Þ½CH2Iþ2 I
�
ð17Þ
in which eCTACHTUNGTRENNUNG(400) and eIP ACHTUNGTRENNUNG(400) are the extinction coefficientsof the CT complex and ion pair, respectively. By using[CH2I2
d+ ···Id�]t and [CH2I2+ ···I�]t given by Equations (15)
and (16) and the signal intensities in Figure 11, the ratio ofthe extinction coefficient at 400 nm, eIP ACHTUNGTRENNUNG(400)/eCTACHTUNGTRENNUNG(400), wasestimated to be a constant value of around 14 in the presenttime region. Second, we assume the three rate constants, k1,k2, and k�2, determined in the above section, to be constantindependent of bulk concentration and solvent. Third, thetime profiles of the transient absorptions at the several bulkconcentrations are fitted by Equation (17). As a result, thefitting parameter in Equation (17) is the only local concen-tration [CH2I2]L, because all the rate constants except for k1’are defined to be concentration independent. As we cannotobtain the absolute value of k1, the local concentrations thusevaluated become relative values.Figure 12 shows the local concentration [CH2I2]L as a
function of the bulk concentration in both solutions. Thelocal concentration in acetonitrile increased steeply with an
increase in macroscopic bulk concentration and becameACHTUNGTRENNUNGsaturated at a relatively low bulk concentration. On theother hand, in hexane the local concentration increased mo-notonically and did not reach a plateau within the presentrange of experimental concentrations. As the local concen-tration increases, the effective number of CH2I2 moleculeswith which the photofragment I can generate a CT complexincreases. Such a condition is established at a lower concen-tration in acetonitrile than in hexane. This means that theaggregate does not grow to more than a given size in aceto-nitrile, whereas it continues to develop in hexane. In fact, inconcentrated solutions of hexane, phase separation takesplace, but it does not occur at the higher concentrations inacetonitrile. The aggregation of CH2I2 solute can be stabi-lized by the polarization effect of solvent molecules.In conclusion, we determined that the CT complex
CH2I2d+ ···Id�, generated in pre-existing aggregates of CH2I2,
plays an important role in reactions of CH2I2 in solution andlow-temperature matrices. The CT complex corresponds toa precursor of I3
�, whose product is given by I� and I2
Figure 12. Evaluated local concentration of CH2I2 as a function of bulkconcentration in acetonitrile (*) and hexane (*).
Chem. Asian J. 2008, 3, 696 – 709 F 2008 Wiley-VCH Verlag GmbH&Co. KGaA, Weinheim www.chemasianj.org 705
Photodissociation and Electron Transfer of CH2I2
(Figure 9). These successive reactions after the photodissoci-ation of CH2I2 are triggered by reactions with locally en-hanced solute concentrations. In 1969, Simons and co-work-ers observed the generation of I3
� by photolysis of CH2I2 inlow-temperature matrices and reported the reactions insolute aggregates.[26a,b] In the present study, the experimentalresults show that solute aggregation plays an important rolein the reactions of CH2I2 in room-temperature solutions too.Consequently, it was concluded that the CT complexCH2I2
d+ ···Id�, generated in pre-existing aggregates of CH2I2,is an intermediate of successive reactions after the photodis-sociation of CH2I2. This is the reason that the CT complexhas not yet been considered as a candidate for an intermedi-ate immediately after the photodissociation of CH2I2, exceptin our publications.
Assignment of Photoproduct of Transient Absorption Band
at Around 540 nm
We measured the concentration dependence of transient ab-sorptions at the red band in acetonitrile. Figure 6b showsthe dynamics probed at 580 nm within 5 ps at several con-centrations. The concentration range of CH2I2 is 2.5O10
�3–1.2O10�2m. The general time profiles and concentration de-pendence are very similar to those observed for the blueband. The transient signals were also fitted by three expo-nential functions convoluted with the instrument responsefunction. The obtained time constants of the fast rise, fastdecay, and slow rise are listed in Table 2. As the dynamicsof the fast components are independent of solute concentra-tion, the fast rise and decay were assigned to the generationand disappearance of the photofragment CH2I, respectively.This assignment is consistent with the ultrafast formation ofthe CH2I radical observed at 620 nm by Harris and co-work-ers.[34] The slow components became faster as the concentra-tion increased. This indicates a successive reaction betweenfragment and solute molecules.As for the time profile in the longer time region, the tran-
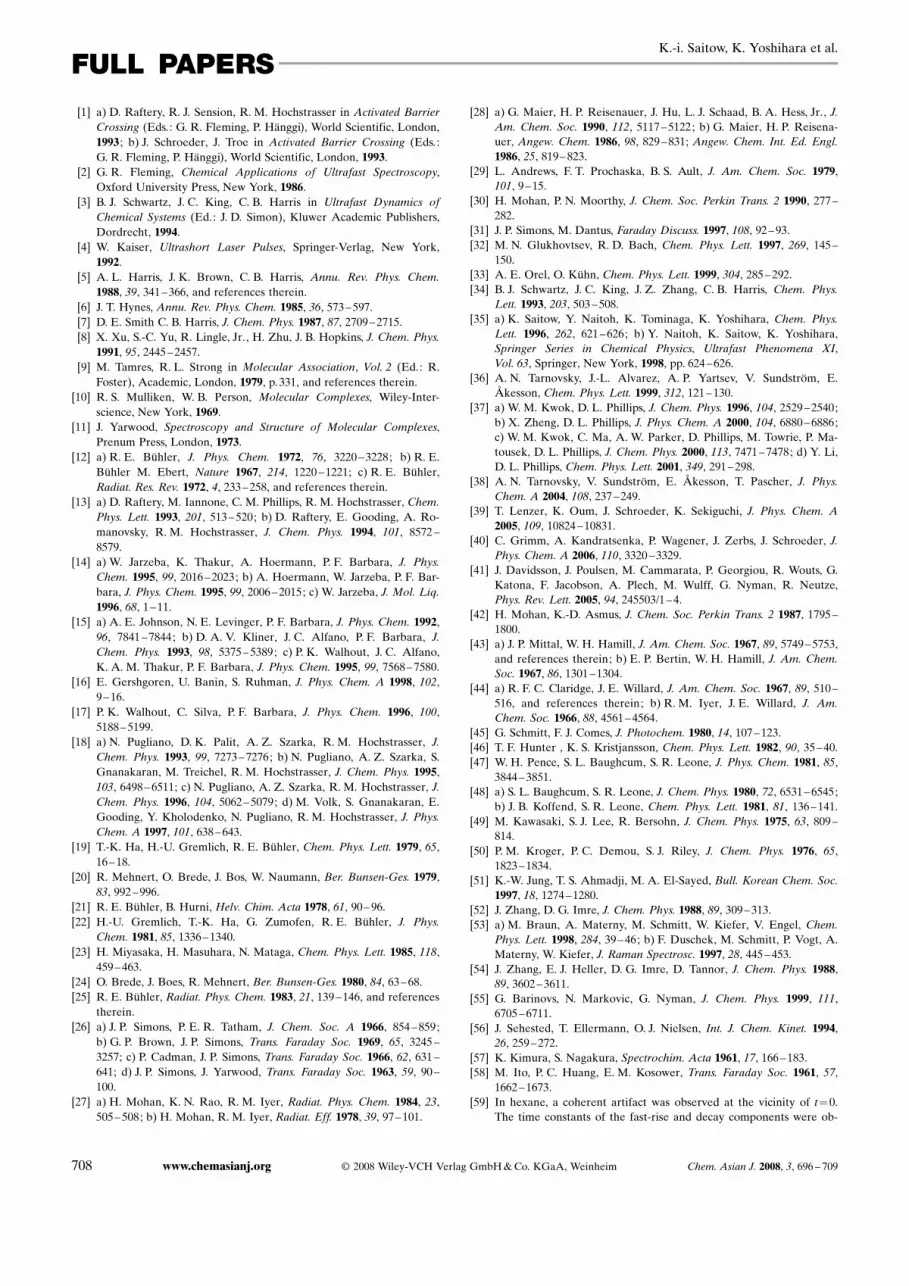
sient absorptions were measured within 500 ps at 380 nm(blue band) and 540 nm (red band) in acetonitrile(Figure 13). The dynamics observed at 380 nm gave two risecomponents of (14�1) and (160�10) ps. On the otherhand, the dynamics at 540 nm decayed with a time constantof (170�20) ps. Thus, the time profile at the blue band isevidently different from that at the red band on the subna-nosecond timescale. Furthermore, the time constant of thesecond rise component at 380 nm is nearly equal to that ofthe decay at 540 nm. On the basis of these experimental re-sults, we discuss several candidates for a product at 540 nmand propose a new possible mechanism for the formation ofthe dimer cation.We briefly discuss the alternative mechanisms in the liter-
ature. Formation of an isomer CH2–I–I was proposed.[28] As
this isomer is generated by a single molecular process, theformation dynamics should be independent of solute con-centration. Therefore, this reaction cannot explain the pres-ent experimental results of concentration dependence. Fur-
thermore, it cannot describe the coincidence of the timeconstant of the second rise observed at 380 nm with that ofthe decay observed at 540 nm on the subnanosecond time-scale. As for other species, formation of a trapped electronwas proposed.[26a,b] In the present study, the development ofthe absorption of the red band took about 10 ps. This time-scale seems to be too long for the ejection of electronsbefore the much faster photodissociation process.On the basis of the experimental results in the present
study, the formation of the dimer cation was tentatively pro-posed to be via a CT complex between solute dimer andfragment I, followed by electron transfer. The increase insolute concentration raises the concentration of the dimer.As the dimer concentration increases, the photofragment Irapidly finds the dimer to generate the CT complex. Theseconcentration dependences were suggested to be observedas a concentration-dependent slow rise (Figure 6b). If a partof the dimer cation is relaxed to a cation and a neutral spe-cies in the subnanosecond time region, the transient absorp-tion of the blue band rises and that of the red one decays(Figure 13). Thus, we consider that a dimer cation is a possi-ble candidate for producing the band at around 540 nm. Theabsorption spectra of dimer cations of various alkyl iodideswere recorded as a function of solute concentration in solu-tion.[42] It was clearly shown that the peak of absorption forthe dimer cation is located at a longer wavelength than thatfor the cation, that is, the cation peak appears in the UVregion, and dimer cation peak appears in the visible region.
Figure 13. Time profiles of the transient absorptions on the subnanosec-ond timescale probed at a) 380 nm and b) 540 nm centered at the peakpositions of both bands in acetonitrile. The time constant of the secondrise component at 380 nm is nearly equal to that of the decay at 540 nm.
706 www.chemasianj.org F 2008 Wiley-VCH Verlag GmbH&Co. KGaA, Weinheim Chem. Asian J. 2008, 3, 696 – 709
FULL PAPERSK.-i. Saitow, K. Yoshihara et al.

Conclusions
The photoinduced reaction dynamics of CH2I2 in acetonitrileand hexane have been studied by time-resolved absorptionspectroscopy from the subpicosecond to the nanosecondtimescale over a wide wavelength region. The transient ab-sorptions consist of three time components. A fast rise(t�200 fs) and fast decay (�500 fs) at around 400 nm wereassigned to the generation of a CH2I radical by direct photo-dissociation of CH2I2 and disappearance by primary gemi-nate recombination, respectively. A concentration-depen-dent slow rise with time constants of 7–50 ps was observedat 400 nm. It was assigned to the formation of a CT complex(CH2I2
d+ ···Id�) between CH2I2 and photofragment I based onthe concentration-dependent time-resolved absorption spec-tra in the picosecond region. This process was followed by afull electron transfer from CH2I2 to I to generate an ion-paircomplex. The kinetics were analyzed by sequential forma-tion of a CT complex and an ion-pair complex. In thisscheme, a significant role for solute aggregation was pro-posed. We analyzed the results of the concentration-depen-dent slow rise by using rate constants to investigate the localstructure around the CT complex, and the difference be-tween macroscopic and microscopic concentrations was rep-resented in both solutions. The analysis proposed that onlyCH2I2 in the neighboring region of initially photoexcitedCH2I2 participates in CT-complex formation. Such a condi-tion is more readily achieved at lower concentrations in ace-tonitrile than in hexane.We also observed that the photoproduct gave an absorp-
tion band at around 540 nm. This band had a similar timeprofile to the blue band in the sense that the slow-rise com-ponent became faster with increasing concentration. We ten-tatively assigned this transient to a charge-separated speciesof the dimer cation and I�. It was considered that CH2I2solute interactions strongly influence the chemical processesafter photoexcitation. Our results show that, even in solu-tion at room temperature, the pre-existing solute aggregatesgovern the early dynamics.
Experimental Section
Subpicosecond Transient Absorption Spectrometer and Its Experimental
Procedures
The optical configurations for the UV subpicosecond transient absorptionspectrometer are described elsewhere.[35, 77, 78] Briefly, the light source wasbased on a regenerative amplified Ti/sapphire laser. A Ti/sapphire oscilla-tor (Clark-MXR NJA-4) pumped by a position-stabilized Ar ion laser(Spectra Physics BeamLok 2060) produced an optical pulse width of 70 fswith an average power of 400 mW at 800 nm. The output pulse of the os-cillator was temporally chirped by a stretcher and its energy per pulsewas regeneratively amplified by a CW Q-switched intracavity-doubledNd/YAG laser (Clark MXR ORC-1000) with 8-W output. With a pulsecompressor, we finally obtained an amplified pulse with a pulse energy of900 mJ at 800 nm with a pulse width of 120 fs at a repetition rate of 1 kHz(Clark MXR CPA-1000).
The fundamental output pulse was used to generate both a third harmon-ic (268 nm) as a pump pulse and a white-light continuum as a probe
pulse. The fundamental pulse was passed through a BBO (b-bariumborate) crystal (type I, thickness 1 mm) to generate a second harmonic(400 nm). After the second harmonic pulse was separated with a dichroicmirror, the polarization was rotated by a half-wave plate. The second har-monic and fundamental pulses were mixed on another BBO crystal(type I, thickness 0.5 mm) to generate a third harmonic pulse. This waspassed through a pair of prisms to compensate for its group velocity dis-persion and was separated from the fundamental and second harmonicpulses. The white-light continuum was generated by focusing the funda-mental or the second harmonic pulse onto a quartz flow cell containingD2O with a path length of 10 mm. The available wavelength regions forthe probe light with the second harmonic and fundamental pulses were340–600 and 500–900 nm, respectively. The configuration of linear polari-zation between the pump and the probe pulses was set to be the magicangle.
The pump pulse was loosely focused onto a quartz sample flow cell witha path length of 1 mm, and the energy in front of the cell was about10 mJ. For the probe and reference pulses, the most stable part of thewhite-light continuum, selected by focusing it onto a pin hole, was usedas the spatially stable part. The probed wavelength was selected with asuitable interference filter (Andover, full width at half maximum=10 nm). The probe and reference pulses were detected by Si pin photodi-odes. These signals were processed by two boxcar integrators (StanfordResearch Systems SR250) and sent to an analogue processor (StanfordResearch Systems SR235) to normalize the fluctuations of the white-lightcontinuum on every laser shot. Finally, the normalized signals were pro-cessed by a third boxcar integrator operating in toggle mode. We wereable to obtain directly absorbance changes by chopping pump pulses onevery other shot. The absorbance change at a certain time delay on acomputer-controlled stage was accumulated in a computer. The presenttransient absorption spectrometer allowed us to detect an absorbancechange of DOD=1O10�4. The instrument response assumed with aGaussian function was estimated to be 550 fs from the instantaneous riseof the excited-state absorption or instantaneous bleach for rhodamine 6Gin ethanol and p-terphenyl in cyclohexane, depending on the probe wave-length.
Nanosecond Flash Photolysis
Transient absorption signals on the nanosecond timescale were measuredby a system described elsewhere.[79] Briefly, pump and probe pulses wereobtained from an XeCl excimer laser (308 nm; Lambda Physik EMG 101MSC) and a xenon flash lamp (EG&G FX279U), respectively. The twopulses were triggered by a pulse generator (Hewlett Packard 8015A) at1 Hz. Synchronization between the pump and probe pulses was carriedout by a delay generator (Stanford Research Systems DG535). Theprobe beam that passed through a sample cell was directed onto a mono-chromator (Ritsu MC 10N) equipped with a photodiode. Signals wereamplified with a fast amplifier (Stanford Research System SR445), pro-cessed with a programmable digitizer (Tektronix 7612D), and accumulat-ed in a computer.
Samples
CH2I2 (Tokyo Kasei, >99%), hexane, acetonitrile, and dichloromethane(CH2Cl2 ; Wako, HPLC grade) were used as obtained. Sample solutionswere flowed through a tube attached to a bottle of solution to ensure afresh sample on every laser shot. Air was removed from the solutions bybubbling argon gas, and the solutions were replaced at intervals of a fewhours to avoid degradation by laser irradiation.
Acknowledgements
We thank Prof. M. Kotani and Mr. H. Kobayashi for use of the nanosec-ond absorption spectrometer. This work was supported in part by aGrant-in-Aid for Scientific Research on New Programs (06NP0301) andPriority Areas in the chemistry of small many-body systems by the Minis-try of Education, Culture, Sports, Science, and Technology of Japan.
Chem. Asian J. 2008, 3, 696 – 709 F 2008 Wiley-VCH Verlag GmbH&Co. KGaA, Weinheim www.chemasianj.org 707
Photodissociation and Electron Transfer of CH2I2
[1] a) D. Raftery, R. J. Sension, R. M. Hochstrasser in Activated BarrierCrossing (Eds.: G. R. Fleming, P. HTnggi), World Scientific, London,1993 ; b) J. Schroeder, J. Troe in Activated Barrier Crossing (Eds.:G. R. Fleming, P. HTnggi), World Scientific, London, 1993.
[2] G. R. Fleming, Chemical Applications of Ultrafast Spectroscopy,Oxford University Press, New York, 1986.
[3] B. J. Schwartz, J. C. King, C. B. Harris in Ultrafast Dynamics of
Chemical Systems (Ed.: J. D. Simon), Kluwer Academic Publishers,Dordrecht, 1994.
[4] W. Kaiser, Ultrashort Laser Pulses, Springer-Verlag, New York,1992.
[5] A. L. Harris, J. K. Brown, C. B. Harris, Annu. Rev. Phys. Chem.1988, 39, 341–366, and references therein.
[6] J. T. Hynes, Annu. Rev. Phys. Chem. 1985, 36, 573–597.[7] D. E. Smith C. B. Harris, J. Chem. Phys. 1987, 87, 2709–2715.[8] X. Xu, S.-C. Yu, R. Lingle, Jr., H. Zhu, J. B. Hopkins, J. Chem. Phys.
1991, 95, 2445–2457.[9] M. Tamres, R. L. Strong in Molecular Association, Vol. 2 (Ed.: R.
Foster), Academic, London, 1979, p.331, and references therein.[10] R. S. Mulliken, W. B. Person, Molecular Complexes, Wiley-Inter-
science, New York, 1969.[11] J. Yarwood, Spectroscopy and Structure of Molecular Complexes,
Prenum Press, London, 1973.[12] a) R. E. BIhler, J. Phys. Chem. 1972, 76, 3220–3228; b) R. E.
BIhler M. Ebert, Nature 1967, 214, 1220–1221; c) R. E. BIhler,Radiat. Res. Rev. 1972, 4, 233–258, and references therein.
[13] a) D. Raftery, M. Iannone, C. M. Phillips, R. M. Hochstrasser, Chem.Phys. Lett. 1993, 201, 513–520; b) D. Raftery, E. Gooding, A. Ro-manovsky, R. M. Hochstrasser, J. Chem. Phys. 1994, 101, 8572–8579.
[14] a) W. Jarzeba, K. Thakur, A. Hoermann, P. F. Barbara, J. Phys.Chem. 1995, 99, 2016–2023; b) A. Hoermann, W. Jarzeba, P. F. Bar-bara, J. Phys. Chem. 1995, 99, 2006–2015; c) W. Jarzeba, J. Mol. Liq.1996, 68, 1–11.
[15] a) A. E. Johnson, N. E. Levinger, P. F. Barbara, J. Phys. Chem. 1992,96, 7841–7844; b) D. A. V. Kliner, J. C. Alfano, P. F. Barbara, J.Chem. Phys. 1993, 98, 5375–5389; c) P. K. Walhout, J. C. Alfano,K. A. M. Thakur, P. F. Barbara, J. Phys. Chem. 1995, 99, 7568–7580.
[16] E. Gershgoren, U. Banin, S. Ruhman, J. Phys. Chem. A 1998, 102,9–16.
[17] P. K. Walhout, C. Silva, P. F. Barbara, J. Phys. Chem. 1996, 100,5188–5199.
[18] a) N. Pugliano, D. K. Palit, A. Z. Szarka, R. M. Hochstrasser, J.Chem. Phys. 1993, 99, 7273–7276; b) N. Pugliano, A. Z. Szarka, S.Gnanakaran, M. Treichel, R. M. Hochstrasser, J. Chem. Phys. 1995,103, 6498–6511; c) N. Pugliano, A. Z. Szarka, R. M. Hochstrasser, J.Chem. Phys. 1996, 104, 5062–5079; d) M. Volk, S. Gnanakaran, E.Gooding, Y. Kholodenko, N. Pugliano, R. M. Hochstrasser, J. Phys.Chem. A 1997, 101, 638–643.
[19] T.-K. Ha, H.-U. Gremlich, R. E. BIhler, Chem. Phys. Lett. 1979, 65,16–18.
[20] R. Mehnert, O. Brede, J. Bos, W. Naumann, Ber. Bunsen-Ges. 1979,83, 992–996.
[21] R. E. BIhler, B. Hurni, Helv. Chim. Acta 1978, 61, 90–96.[22] H.-U. Gremlich, T.-K. Ha, G. Zumofen, R. E. BIhler, J. Phys.
Chem. 1981, 85, 1336–1340.[23] H. Miyasaka, H. Masuhara, N. Mataga, Chem. Phys. Lett. 1985, 118,
459–463.[24] O. Brede, J. Boes, R. Mehnert, Ber. Bunsen-Ges. 1980, 84, 63–68.[25] R. E. BIhler, Radiat. Phys. Chem. 1983, 21, 139–146, and references
therein.[26] a) J. P. Simons, P. E. R. Tatham, J. Chem. Soc. A 1966, 854–859;
b) G. P. Brown, J. P. Simons, Trans. Faraday Soc. 1969, 65, 3245–3257; c) P. Cadman, J. P. Simons, Trans. Faraday Soc. 1966, 62, 631–641; d) J. P. Simons, J. Yarwood, Trans. Faraday Soc. 1963, 59, 90–100.
[27] a) H. Mohan, K. N. Rao, R. M. Iyer, Radiat. Phys. Chem. 1984, 23,505–508; b) H. Mohan, R. M. Iyer, Radiat. Eff. 1978, 39, 97–101.
[28] a) G. Maier, H. P. Reisenauer, J. Hu, L. J. Schaad, B. A. Hess, Jr., J.Am. Chem. Soc. 1990, 112, 5117–5122; b) G. Maier, H. P. Reisena-uer, Angew. Chem. 1986, 98, 829–831; Angew. Chem. Int. Ed. Engl.1986, 25, 819–823.
[29] L. Andrews, F. T. Prochaska, B. S. Ault, J. Am. Chem. Soc. 1979,101, 9–15.
[30] H. Mohan, P. N. Moorthy, J. Chem. Soc. Perkin Trans. 2 1990, 277–282.
[31] J. P. Simons, M. Dantus, Faraday Discuss. 1997, 108, 92–93.[32] M. N. Glukhovtsev, R. D. Bach, Chem. Phys. Lett. 1997, 269, 145–
150.[33] A. E. Orel, O. KIhn, Chem. Phys. Lett. 1999, 304, 285–292.[34] B. J. Schwartz, J. C. King, J. Z. Zhang, C. B. Harris, Chem. Phys.
Lett. 1993, 203, 503–508.[35] a) K. Saitow, Y. Naitoh, K. Tominaga, K. Yoshihara, Chem. Phys.
Lett. 1996, 262, 621–626; b) Y. Naitoh, K. Saitow, K. Yoshihara,Springer Series in Chemical Physics, Ultrafast Phenomena XI,Vol. 63, Springer, New York, 1998, pp. 624–626.
[36] A. N. Tarnovsky, J.-L. Alvarez, A. P. Yartsev, V. Sundstrçm, E.Wkesson, Chem. Phys. Lett. 1999, 312, 121–130.
[37] a) W. M. Kwok, D. L. Phillips, J. Chem. Phys. 1996, 104, 2529–2540;b) X. Zheng, D. L. Phillips, J. Phys. Chem. A 2000, 104, 6880–6886;c) W. M. Kwok, C. Ma, A. W. Parker, D. Phillips, M. Towrie, P. Ma-tousek, D. L. Phillips, J. Chem. Phys. 2000, 113, 7471–7478; d) Y. Li,D. L. Phillips, Chem. Phys. Lett. 2001, 349, 291–298.
[38] A. N. Tarnovsky, V. Sundstrçm, E. Wkesson, T. Pascher, J. Phys.Chem. A 2004, 108, 237–249.
[39] T. Lenzer, K. Oum, J. Schroeder, K. Sekiguchi, J. Phys. Chem. A2005, 109, 10824–10831.
[40] C. Grimm, A. Kandratsenka, P. Wagener, J. Zerbs, J. Schroeder, J.Phys. Chem. A 2006, 110, 3320–3329.
[41] J. Davidsson, J. Poulsen, M. Cammarata, P. Georgiou, R. Wouts, G.Katona, F. Jacobson, A. Plech, M. Wulff, G. Nyman, R. Neutze,Phys. Rev. Lett. 2005, 94, 245503/1–4.
[42] H. Mohan, K.-D. Asmus, J. Chem. Soc. Perkin Trans. 2 1987, 1795–1800.
[43] a) J. P. Mittal, W. H. Hamill, J. Am. Chem. Soc. 1967, 89, 5749–5753,and references therein; b) E. P. Bertin, W. H. Hamill, J. Am. Chem.Soc. 1967, 86, 1301–1304.
[44] a) R. F. C. Claridge, J. E. Willard, J. Am. Chem. Soc. 1967, 89, 510–516, and references therein; b) R. M. Iyer, J. E. Willard, J. Am.Chem. Soc. 1966, 88, 4561–4564.
[45] G. Schmitt, F. J. Comes, J. Photochem. 1980, 14, 107–123.[46] T. F. Hunter , K. S. Kristjansson, Chem. Phys. Lett. 1982, 90, 35–40.[47] W. H. Pence, S. L. Baughcum, S. R. Leone, J. Phys. Chem. 1981, 85,
3844–3851.[48] a) S. L. Baughcum, S. R. Leone, J. Chem. Phys. 1980, 72, 6531–6545;
b) J. B. Koffend, S. R. Leone, Chem. Phys. Lett. 1981, 81, 136–141.[49] M. Kawasaki, S. J. Lee, R. Bersohn, J. Chem. Phys. 1975, 63, 809–
814.[50] P. M. Kroger, P. C. Demou, S. J. Riley, J. Chem. Phys. 1976, 65,
1823–1834.[51] K.-W. Jung, T. S. Ahmadji, M. A. El-Sayed, Bull. Korean Chem. Soc.
1997, 18, 1274–1280.[52] J. Zhang, D. G. Imre, J. Chem. Phys. 1988, 89, 309–313.[53] a) M. Braun, A. Materny, M. Schmitt, W. Kiefer, V. Engel, Chem.
Phys. Lett. 1998, 284, 39–46; b) F. Duschek, M. Schmitt, P. Vogt, A.Materny, W. Kiefer, J. Raman Spectrosc. 1997, 28, 445–453.
[54] J. Zhang, E. J. Heller, D. G. Imre, D. Tannor, J. Chem. Phys. 1988,89, 3602–3611.
[55] G. Barinovs, N. Markovic, G. Nyman, J. Chem. Phys. 1999, 111,6705–6711.
[56] J. Sehested, T. Ellermann, O. J. Nielsen, Int. J. Chem. Kinet. 1994,26, 259–272.
[57] K. Kimura, S. Nagakura, Spectrochim. Acta 1961, 17, 166–183.[58] M. Ito, P. C. Huang, E. M. Kosower, Trans. Faraday Soc. 1961, 57,
1662–1673.[59] In hexane, a coherent artifact was observed at the vicinity of t=0.
The time constants of the fast-rise and decay components were ob-
708 www.chemasianj.org F 2008 Wiley-VCH Verlag GmbH&Co. KGaA, Weinheim Chem. Asian J. 2008, 3, 696 – 709
FULL PAPERSK.-i. Saitow, K. Yoshihara et al.

tained by subtracting the artifact of neat solvent from the solutiondata. This phenomenon has never been observed in acetonitrile inthe present and previous studies.[35, 77]
[60] The photolyzed solution for the recording of the difference spec-trum was prepared by irradiating at 268 nm the sample solution in aquartz cell with a thickness of 1 mm in 5 min.
[61] W. Gabes, D. J. Stufkens, Spectrochim. Acta Part A 1974, 30, 1835–1841.
[62] A. I. Popov, Halogen Chemistry, Vol. 1 (Ed.: V. Gutmann), Academ-ic Press, New York, 1967.
[63] a) W. Kiefer, H. J. Bernstein, Chem. Phys. Lett. 1972, 16, 5–9; b) K.Kaya, N. Mikami, Y. Udagawa, M. Mitsuo, Chem. Phys. Lett. 1972,16, 151–153.
[64] G. Moser, A. Asenbaum, G. Doge, J. Chem. Phys. 1993, 99, 9389–9393.
[65] R. E. BIhler, J. Phys. Chem. 1972, 76, 3220–3228.[66] a) R. L. Strong, J. A. Kaye, J. Am. Chem. Soc. 1976, 98, 5460–5464;
b) R. L. Strong, F. J. Venditti, Jr., Chem. Phys. Lett. 1977, 46, 546–550.
[67] The free-energy gap DG before and after electron transfer was esti-mated by the following equation:[69] DG= Ip�EA+P++P��Eint, inwhich Ip is the ionization potential of the donor (CH2I2 : 9.52 eV),EA is the electron affinity of the acceptor (I atom: 3.1 eV), P+ andP� are the polarization energies (CH2I2
+ : �2.7 eV; I� : �3.5 eV) ob-tained from reference [68], and Eint is the sum of the internal ener-gies of CH2I2 and fragment I or I*. The internal energy of fragmentI or I* was estimated from the sum of the translational energy ofthe recoiling fragment I or I* after photodissociation by referring tovalues from references [50] and [51] and the energy of the spin-ex-cited state of I*.
[68] I. Messing, J. Jortner, Chem. Phys. 1977, 24, 183–189.[69] R. A. Marcus, J. Chem. Phys. 1956, 24, 966–978.[70] J. L. Gebicki, A. S. Domazou, T.-K. Ha, G. Cirelli, R. E. BIhler, J.
Phys. Chem. 1994, 98, 9570–9576.[71] J. T. Hynes, R. Kapral, G. M. Torrie, J. Chem. Phys. 1980, 72, 177–
188.[72] J. N. Israelachvili, Intermolecular and Surface Forces, Academic
Press, New York, 1985.[73] J. J. Jasper, J. Phys. Chem. Ref. Data 1972, 1, 841–1009.[74] Due to its largest surface energy among molecular liquids, neat
liquid CH2I2 is the most popular system for measuring the contactangle of a liquid droplet on solid surfaces.
[75] A. S. Carson, P. G. Laye, J. B. Pedley, A. M. Welsby, J. S. Chickos, S.Hosseini, J. Chem. Thermodyn. 1994, 26, 1103–1109.
[76] J. I. Steinfeld, J. S. Francisco, W. L. Hase, Chemical Kinetics and Dy-namics, Prentice Hall, New Jersey, 1989.
[77] a) K. Ohta, Y. Naitoh, K. Saitow, K. Tominaga, N. Hirota, K. Yoshi-hara, Chem. Phys. Lett. 1996, 256, 629–634; b) K. Ohta, Y. Naitoh,K. Tominaga, N. Hirota, K. Yoshihara, J. Phys. Chem. A 1998, 102,35–44; c) K. Ohta, Y. Naitoh, K. Tominaga, K. Yoshihara, J. Phys.Chem. A 2001, 105, 3973–3980.
[78] Y. Inokuchi, Y. Naitoh, K. Ohashi, K. Saitow, K. Yoshihara, N.Nishi, Chem. Phys. Lett. 1997, 269, 298–304.
[79] a) K. Saitow, K. Endo, R. Katoh, M. Kotani, Chem. Phys. Lett. 1994,229, 323–327; b) K. Saitow, R. Matsumura, R. Katoh, M. Kotani,Mol. Cryst. Liq. Cryst. 1996, 277, 125–133.
Received: October 24, 2007Revised: January 4, 2007
Chem. Asian J. 2008, 3, 696 – 709 F 2008 Wiley-VCH Verlag GmbH&Co. KGaA, Weinheim www.chemasianj.org 709
Photodissociation and Electron Transfer of CH2I2


![Photodissociation of N[sub 2]O: Energy partitioning](https://img.pdfslide.net/doc/110x75/63549429acf89cc34703bc94/photodissociation-of-nsub-2o-energy-partitioning.jpg)


