Embed Size (px)
Citation preview
ORIGINAL PAPER
Physical and Compaction Behaviour of Clay Soil–Fly AshMixtures
B. A. Mir • A. Sridharan
Received: 12 January 2012 / Accepted: 5 March 2013
� Springer Science+Business Media Dordrecht 2013
Abstract At present, nearly 100 million tonnes of fly
ash is being generated annually in India posing serious
health and environmental problems. To control these
problems, the most commonly used method is addition
of fly ash as a stabilizing agent usually used in
combination with soils. In the present study, high-
calcium (ASTM Class C—Neyveli fly) and low-
calcium (ASTM Class F—Badarpur fly ash) fly ashes
in different proportions by weight (10, 20, 40, 60 and
80 %) were added to a highly expansive soil [known as
black cotton (BC) soil] from India. Laboratory tests
involved determination of physical properties, compac-
tion characteristics and swell potential. The test results
show that the consistency limits, compaction character-
istics and swelling potential of expansive soil–fly ash
mixtures are significantly modified and improved. It is
seen that 40 % fly ash content is the optimum quantity to
improve the plasticity characteristics of BC soil. The fly
ashes exhibit low dry unit weight compared to BC soil.
With the addition of fly ash to BC soil the maximum dry
unit weight (cdmax) of the soil–fly ash mixtures
decreases with increase in optimum moisture content
(OMC), which can be mainly attributed to the improve-
ment in gradation of the fly ash. It is also observed that
10 % of Neyveli fly ash is the optimum amount required
to minimize the swell potential compared to 40 % of
Badarpur fly ash. Therefore, the main objective of the
study was to study the effect of fly ashes on the physical,
compaction, and swelling potential of BC soils, and bulk
utilization of industrial waste by-product without
adversely affecting the environment.
Keywords Expansive soil � Fly ash � Self-pozzolanic �Swell potential
1 Introduction
Coal continues to be one of the primary sourcesof energy
in India and the present generation of fly ash is more than
150 million tones per year posing serious disposal and
environmental problems. Thus, the coal-based thermal
power plants not only in India, but also all over the world
face a serious problem of handling and disposal of ash
generated. In India, this problem is particularly sensitive
and complex due to the high ash content (30–45 %) of
A. Sridharan—Formerly Professor of Civil Engineering, Indian
Institute of science Bangalore-560 012.
B. A. Mir (&)
Department of Civil Engineering, National Institute
of Technology, Srinagar 190 006, J&K, India
e-mail: [email protected]; [email protected];
A. Sridharan
Indian National Science Academy, New Delhi, India
e-mail: [email protected];
123
Geotech Geol Eng
DOI 10.1007/s10706-013-9632-8
coal. The safe disposal of these ashes without affecting
the environment and the large area involved are of major
concern. Therefore, it is important to find alternative uses
for fly ash so that their bulk disposal without adverse
environmental effects becomes possible.
There are numerous possible ways by which fly ash
can be utilized (Raymond 1961; Uppal and Dhawn
1968; Amos and Wright 1972; Digioia and Nuzzo
1972; Joshi and Nagaraj 1987; Toth et al. 1988;
Ramme et al. 1994; Larimore 1996; Mir and Pandian
2003; Nalbantoglu 2004; Edil et al. 2006; Phanikumar
and Sharma 2004; Tastan et al. 2011). The bulk
utilization in geotechnical applications includes
embankments/dykes, as back fill material, as base
material, as soil stabilization material and in water
retaining structures. For stabilization of soil with fly
ash in most of the occasions, soil needs to be mixed and
compacted with fly ash. Furthermore, the use of fly ash
as an additive results in a stabilized soil of less
shrinkage in comparison with soft soils treated with
lime or cement alone (Natt and Joshi 1984; Hausman
1990). BC soils undergo significant volumetric
changes when subjected to changes in water content
and have caused considerable damage to structures
built above them (Katti 1979; Suba Rao 2000). The
properties of BC soils may be improved by means of
chemical stabilization. Among various chemical sta-
bilizing agents, lime, fly ash and cement are most
widely and commonly used for the stabilization of the
BC soils (Singh 1996). Fly ash contains siliceous and
aluminous materials (pozzolans) and also certain
amount of lime. When mixed with black cotton soils,
it reacts chemically and forms cementitious com-
pounds. The presence of free lime and inert particles in
fly ash suggests that it can be used for stabilization of
expansive soils (Indraratna et al. 1991).
The pozzolanic fly ash (ASTM Class C) with self-
hardening properties is most advantageous in ground
improvement. Ferguson (1993) studied the feasibility
of using Class C fly ash from Kansas Power and Light
Jeffrey Energy Centre for the stabilization of subgrade
materials. It was noted that an addition of fly ash
altered the physical and compaction characteristics of
both granular and cohesive materials.
Fly ashes are predominantly silt-sized with some
sand-sized particles (e.g. Sherwood and Ryley 1966;
Sridharan et al. 1997; Mir 2001). In most of the
stabilization techniques, fly ash is invariably mixed
with soil and compacted. The physical and engineering
properties of black cotton soil are significantly
improved by the addition of fly ash (Mir 2001).
Sivapullaiah et al. (1996) studied the effect of fly ash
on the index properties of BC soils from Karnataka,
India and reported that the addition of fly ash decreased
the liquid limit of these soils. Pandian et al. (1998)
studied in detail the wide variation in specific gravity
of Indian fly ashes. Gray and Lin (1972) reported that
the specific gravity of fly ash depends on a variety of
factors such as gradation, particle shape, chemical
composition, etc. Sridharan et al. (2001) and Pandian
and Mir (2002) reported that the compaction curves of
fly ashes resemble those of cohesionless soils and the
change in water content does not have significant effect
on the dry unit weight. Moulton (1978) reported that
natural soils have 1–5 % air voids at maximum dry unit
weight, whereas the same for fly ash is 5–15 %. The
higher void ratio tends to limit the build up of pore
pressures during compaction and thus allowing fly ash
to be compacted over a large range of water contents
(Toth et al. 1988; Sridharan et al. 2001). Further, fly
ash being a silty non-cohesive material, can be
compacted efficiently with rubber tired rollers during
construction. Yudbhir and Honjo (1991) reported that
fly ash with high carbon content provided lower
maximum dry density and higher optimum moisture
content values, but the dry unit weight of fly ash
increases with an increase in iron content. Due to their
low unit weight and high shear strength, the potential
use of fly ash in the construction of embankments has
been discussed by Sridharan et al. (1998).
Fly ash can be considered as a beneficial and
economical material for ground improvement, where
long-term settlements due to self-weight are also of
concern (Indraratna et al. 1991). Fly ash has been very
effective to reduce swell potential of BC soils
(Nalbantoglu 2004; Phanikumar and Sharma 2007).
Prakash and Sridharan (2009) reported that fly ash has
advantageous properties such as low specific gravity,
lower compressibility, higher rate of consolidation,
high volume stability, water insensitiveness to com-
paction and pozzolanic reactivity.
The effect of addition of fly ash to soil on different
parameters such as consistency limits (Sivapullaiah
et al. 1996), maximum dry density and optimum
moisture content (Sridharan et al. 2001), swell
potential (Cokca 2001) show that these properties
are improved considerably. Further for each parameter
there exist an optimum value of fly ash at which most
Geotech Geol Eng
123
desirable value is obtained. Therefore, the major
objective of this study was to investigate the effect of
high and low calcium fly ashes on the physical,
compaction characteristics, and swelling potential of
Indian black cotton soil.
2 Material Properties and Methods
2.1 Material Properties
2.1.1 Black Cotton Soil
In India, black cotton soils cover extensive areas in the
states of Karnataka, Maharashtra, Andhra Pradesh,
Madhya Pradesh, Gujarat and Tamil Nadu accounting
for almost one-fifth of the surficial deposits. In the
present investigation, black cotton soil was collected
from Davangere District of Karnataka State of India.
The BC soil was chosen for this study because it
possesses low strength and inherent high swelling and
shrinkage characteristics.
The natural soil samples were oven-dried and
pulverized to pass through 425 lm sieve before testing.
2.1.2 Fly Ashes
Two fly ashes, namely Badarpur fly ash (Class F—
pozzolanic fly ash from Badarpur thermal power station
(Uttar Pradesh State), and Neyveli fly ash (Class C—
pozzolanic fly ash with cementitious properties from
Neyveli thermal power station Tamil Nadu State) were
used for this study as they represent the extreme cases
based on calcium content among many Indian fly ashes.
Class F fly ash [with SiO2 ? AlO3 ? Fe2O3 [70 %—(ASTM C 618-89)] is normally produced from
burning anthratic or bituminous coal. It has pozzolanic
properties, but little or no cementious properties. Class
C fly ash [with SiO2 ? AlO3 ? Fe2O3 [ 50 %—
(ASTM C 618-89)] is normally produced from burning
lignite or sub-bituminous coal and in addition to having
pozzolanic properties, it also has cementitious proper-
ties. Class C fly ashes have more a glassy structure
(calcium aluminate) and minor constituents of crystal-
line compounds, which are highly reactive. Therefore,
Class C fly ashes are more reactive than Class F fly
ashes.
The chemical analysis shows Neyveli fly ash to
contain 9 % CaO while 0.5 % CaO is present in
Badarpur fly ash. Therefore, commercially available
hydrated lime (8.5 %) was used as an additive to
Badarpur fly ash to make it at par with Neyveli fly ash in
terms of lime content. The SiO2 ? Al2O3 values for BC
soil and Neyveli fly ash are comparable (73 and 77 %)
whereas the same for Badarpur fly ash is high (90 %).
2.2 Experimental Methods
Laboratory tests were carried out on the BC soil and
the two fly ashes, which include particle size analysis,
chemical analysis, specific gravity, Atterberg limits,
Proctor compaction tests, free swell and consolidation
tests by following standard laboratory procedures. The
physical and chemical properties of materials used are
listed in Table 1.
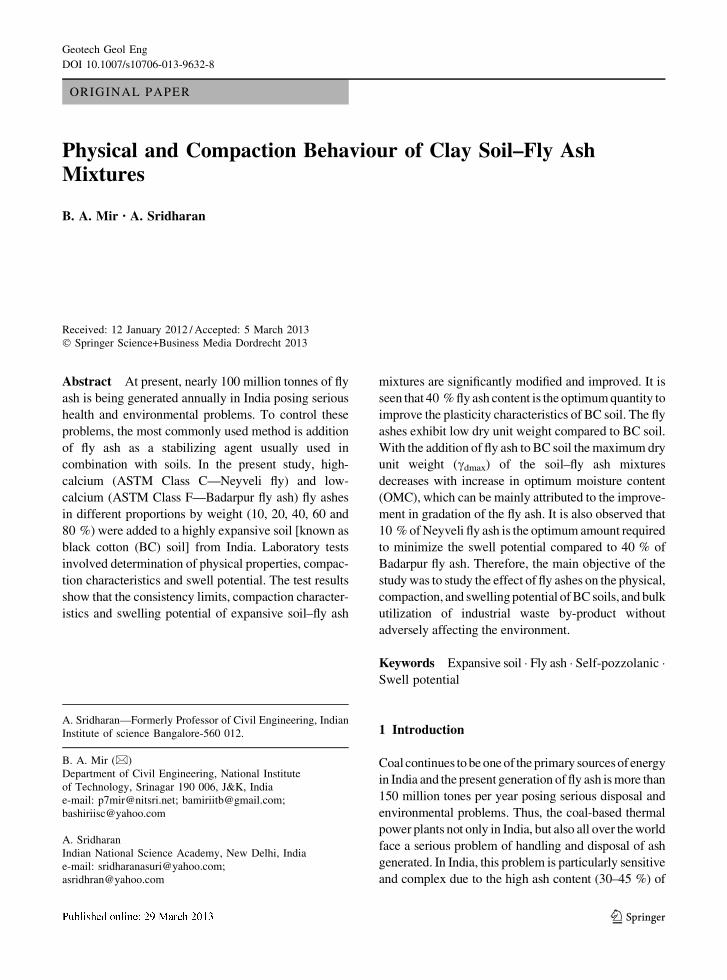
2.2.1 Particle Size Analysis
The particle size distribution curves for BC soil and fly
ashes (ASTM D 422-63, 2007) are shown in Fig. 1.
Particle size distribution analysis revealed that the BC
soil contained about 60 % clay size particles (\2 lm),
and that fly ashes are mainly a silt size. The grain size
distribution curves for Badarpur fly ash and Neyveli fly
ash are poorly graded sandy silt (SM) of uniform size.
2.2.2 Chemical Analysis
The chemical analysis of BC soil and fly ashes were
performed in accordance with ASTM C311. The
chemical composition of BC soil and the two fly ashes
(Neyveli and Badarpur fly ashes) is given in Table 1.
The main constituents of the BC soil and both fly ashes
are silica (as SiO2), alumina (as A12O3), and iron oxide
(as Fe2O3). The SiO2 ? A12O3 ? Fe2O3 fraction of
the both fly ashes is more than 80 % of its total content,
which can be classified as a silica-aluminous fly ashes.
The chemical analysis shows Neyveli fly ash to contain
9 % CaO and Badarpur fly ash to contain 0.5 % CaO.
The main constituent of the clay mineral of BC soil is
montmorillonite. According to ASTM C 618 classifi-
cation, only Neyveli fly ash can be classified as Class C
fly ash and Badarpur fly ash falls under Class F.
2.2.3 Specific Gravity
The specific gravity of BC soil and fly ashes were in
accordance with ASTM D854-92. The specific
Geotech Geol Eng
123
gravities of black cotton soil, Badarpur fly ash and
Neyveli fly ash are 2.71, 2.18 and 2.64 respectively. It
is noted that the specific gravity of fly ashes vary
significantly compared to natural soils. The specific
gravity of most fly ashes is low compared to soils
because of the presence of cenospheres (Pandian et al.
1998). The generally low specific gravity of fly ash
resulting in low unit weight as compared to soils is an
attractive property for its use (such as a backfill
material for retaining walls, as embankment material)
in geotechnical engineering applications (Sridharan
et al. 1998). Since the specific gravities of the fly ashes
vary over a wide range (i.e., 2.18–2.64), the specific
gravity of the soil–fly ash mixtures will also vary
Fig. 1 Particle size
distribution curves for BC
soil and fly ashes
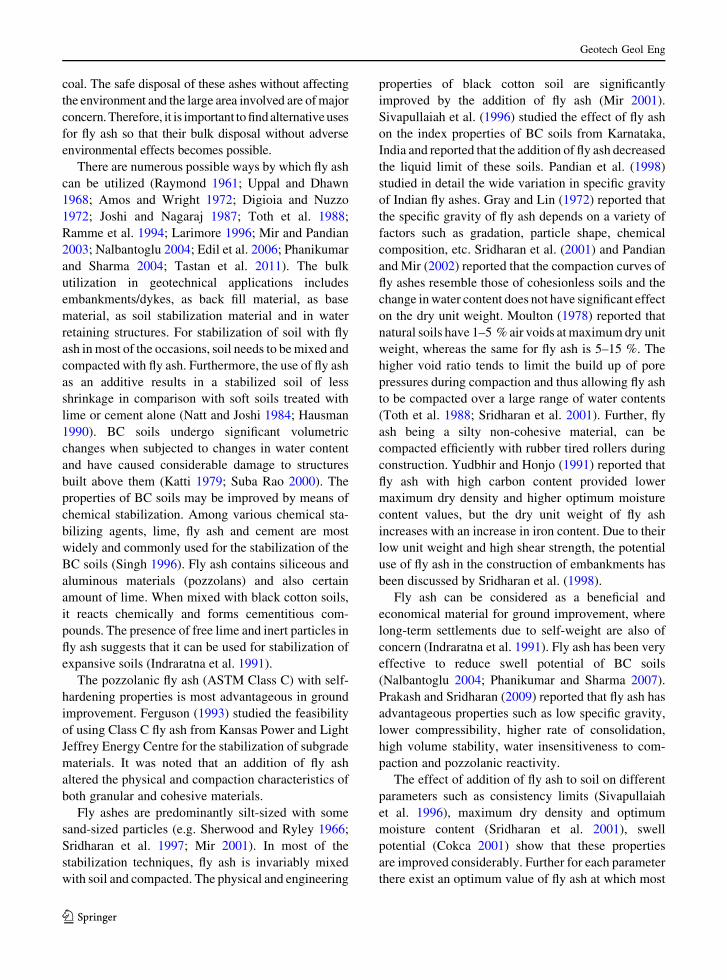
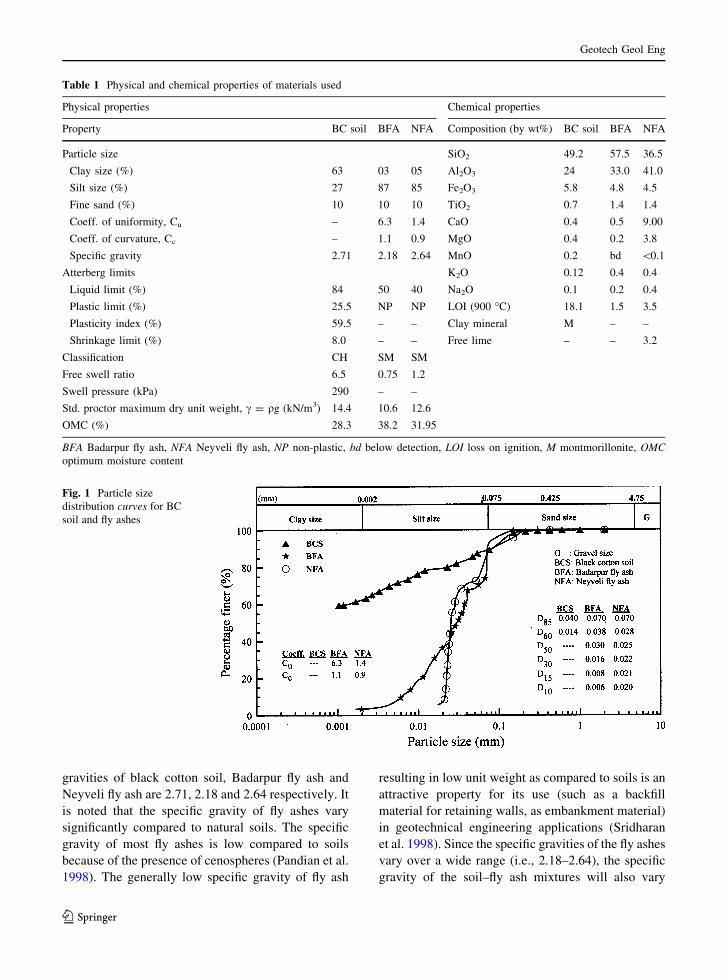
Table 1 Physical and chemical properties of materials used
Physical properties Chemical properties
Property BC soil BFA NFA Composition (by wt%) BC soil BFA NFA
Particle size SiO2 49.2 57.5 36.5
Clay size (%) 63 03 05 Al2O3 24 33.0 41.0
Silt size (%) 27 87 85 Fe2O3 5.8 4.8 4.5
Fine sand (%) 10 10 10 TiO2 0.7 1.4 1.4
Coeff. of uniformity, Cu – 6.3 1.4 CaO 0.4 0.5 9.00
Coeff. of curvature, Cc – 1.1 0.9 MgO 0.4 0.2 3.8
Specific gravity 2.71 2.18 2.64 MnO 0.2 bd \0.1
Atterberg limits K2O 0.12 0.4 0.4
Liquid limit (%) 84 50 40 Na2O 0.1 0.2 0.4
Plastic limit (%) 25.5 NP NP LOI (900 �C) 18.1 1.5 3.5
Plasticity index (%) 59.5 – – Clay mineral M – –
Shrinkage limit (%) 8.0 – – Free lime – – 3.2
Classification CH SM SM
Free swell ratio 6.5 0.75 1.2
Swell pressure (kPa) 290 – –
Std. proctor maximum dry unit weight, c = qg (kN/m3) 14.4 10.6 12.6
OMC (%) 28.3 38.2 31.95
BFA Badarpur fly ash, NFA Neyveli fly ash, NP non-plastic, bd below detection, LOI loss on ignition, M montmorillonite, OMCoptimum moisture content
Geotech Geol Eng
123
between 2.18 and 2.71. The specific gravity of soil–fly
ash mixtures is calculated in proportion of ratios of
soil–fly ash mixtures. For example, for BC soil–
Badarpur fly ash ratio of 80:20, the specific gravity of
this soil–fly ash mixture is calculated as:
Gmix ¼ GBC soil � 0:8þ GBFA � 0:2¼ 2:71� 0:8þ 2:18� 0:2 ¼ 2:604 ð1Þ
Similarly, the specific gravity of other samples of
soil–fly ash mixtures is calculated in the same manner
(see Table 2).
2.2.4 Consistency Limit Tests
Consistency limits such as liquid limit, plastic limit and
shrinkage limits for the BC soil and fly ashes were
determined in accordance with ASTM D4318-98 and
ASTM D 427-93. The liquid limit of BC soil, Badarpur
fly ash and Neyveli fly ash are 84, 50 and 40 %,
respectively. The BC soil may be classified as clay with
high liquid limit (CH) from its plasticity chart. The fly
ashes exhibit liquid limits due to their fabric and not due
to plasticity characteristics. Since fly ashes are essentially
silt sized and non-plastic, plastic limit and shrinkage limit
of fly ashes alone cannot be determined easily.
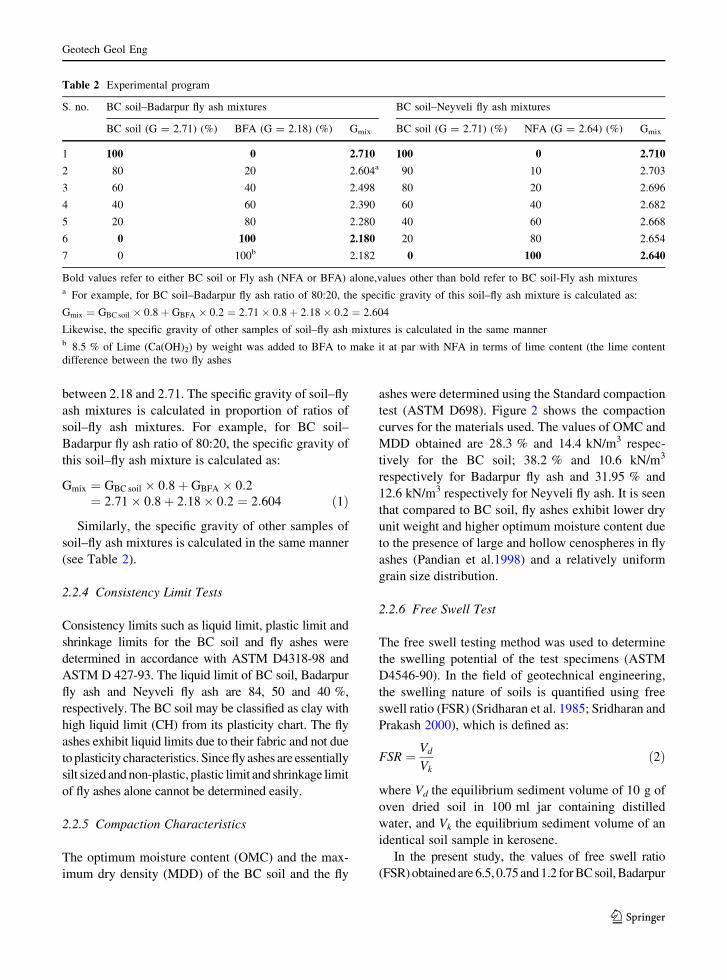
2.2.5 Compaction Characteristics
The optimum moisture content (OMC) and the max-
imum dry density (MDD) of the BC soil and the fly
ashes were determined using the Standard compaction
test (ASTM D698). Figure 2 shows the compaction
curves for the materials used. The values of OMC and
MDD obtained are 28.3 % and 14.4 kN/m3 respec-
tively for the BC soil; 38.2 % and 10.6 kN/m3
respectively for Badarpur fly ash and 31.95 % and
12.6 kN/m3 respectively for Neyveli fly ash. It is seen
that compared to BC soil, fly ashes exhibit lower dry
unit weight and higher optimum moisture content due
to the presence of large and hollow cenospheres in fly
ashes (Pandian et al.1998) and a relatively uniform
grain size distribution.
2.2.6 Free Swell Test
The free swell testing method was used to determine
the swelling potential of the test specimens (ASTM
D4546-90). In the field of geotechnical engineering,
the swelling nature of soils is quantified using free
swell ratio (FSR) (Sridharan et al. 1985; Sridharan and
Prakash 2000), which is defined as:
FSR ¼ Vd
Vkð2Þ
where Vd the equilibrium sediment volume of 10 g of
oven dried soil in 100 ml jar containing distilled
water, and Vk the equilibrium sediment volume of an
identical soil sample in kerosene.
In the present study, the values of free swell ratio
(FSR) obtained are 6.5, 0.75 and 1.2 for BC soil, Badarpur
Table 2 Experimental program
S. no. BC soil–Badarpur fly ash mixtures BC soil–Neyveli fly ash mixtures
BC soil (G = 2.71) (%) BFA (G = 2.18) (%) Gmix BC soil (G = 2.71) (%) NFA (G = 2.64) (%) Gmix
1 100 0 2.710 100 0 2.710
2 80 20 2.604a 90 10 2.703
3 60 40 2.498 80 20 2.696
4 40 60 2.390 60 40 2.682
5 20 80 2.280 40 60 2.668
6 0 100 2.180 20 80 2.654
7 0 100b 2.182 0 100 2.640
Bold values refer to either BC soil or Fly ash (NFA or BFA) alone,values other than bold refer to BC soil-Fly ash mixturesa For example, for BC soil–Badarpur fly ash ratio of 80:20, the specific gravity of this soil–fly ash mixture is calculated as:
Gmix ¼ GBC soil � 0:8þ GBFA � 0:2 ¼ 2:71� 0:8þ 2:18� 0:2 ¼ 2:604
Likewise, the specific gravity of other samples of soil–fly ash mixtures is calculated in the same mannerb 8.5 % of Lime (Ca(OH)2) by weight was added to BFA to make it at par with NFA in terms of lime content (the lime content
difference between the two fly ashes
Geotech Geol Eng
123
fly ash and Neyveli fly ash respectively. It is seen that fly
ashes have very low values of FSR indicating negligible
degree of expansivity or swell potential.
2.2.7 One Dimensional Compression Test
The swelling potential [dH/Ho, (Ho = initial height of
specimen)] and swelling pressure of the BC soil were
determined using one dimensional compression tests
(ASTM D4546-90). The specimens were inundated
with water and allowed to swell against a seating
pressure of 6.25 kPa. The dial gauge readings were
recorded until the specimen reached a constant
swollen height (dH = Dial gauge Divn. 9 0.002).
After equilibrium was attained, a pressure increment
ratio of 1 was used for next pressure applications (up to
800 kPa). Each pressure increment was maintained for
24 h and dial gauge readings were recorded during
consolidation process with time. Addition of fly ash to
BC soil decreases the free swell index, swell potential
and swell pressure. There is a considerable reduction
in the swelling potential as the amount of fly ash-added
increases. With duration of curing, swelling potential/
pressure further decreases. It has been observed that
10 % of Neyveli fly ash (Class C fly ash) is the
optimum amount required to minimize the swell
potential compared to 40 % of Badarpur fly ash (Class
F fly ash).
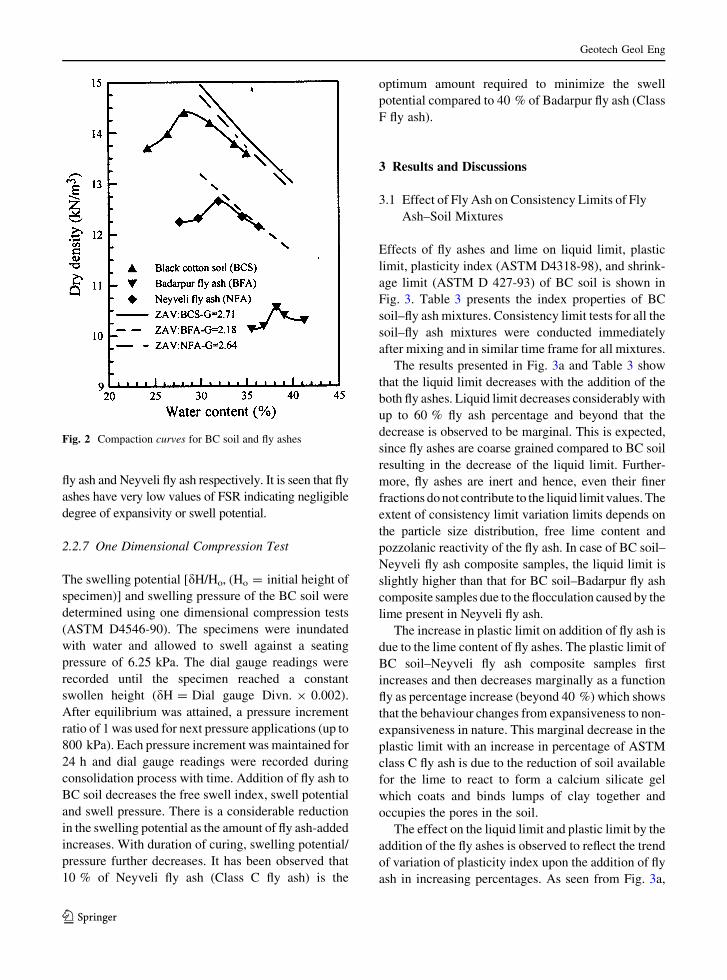
3 Results and Discussions
3.1 Effect of Fly Ash on Consistency Limits of Fly
Ash–Soil Mixtures
Effects of fly ashes and lime on liquid limit, plastic
limit, plasticity index (ASTM D4318-98), and shrink-
age limit (ASTM D 427-93) of BC soil is shown in
Fig. 3. Table 3 presents the index properties of BC
soil–fly ash mixtures. Consistency limit tests for all the
soil–fly ash mixtures were conducted immediately
after mixing and in similar time frame for all mixtures.
The results presented in Fig. 3a and Table 3 show
that the liquid limit decreases with the addition of the
both fly ashes. Liquid limit decreases considerably with
up to 60 % fly ash percentage and beyond that the
decrease is observed to be marginal. This is expected,
since fly ashes are coarse grained compared to BC soil
resulting in the decrease of the liquid limit. Further-
more, fly ashes are inert and hence, even their finer
fractions do not contribute to the liquid limit values. The
extent of consistency limit variation limits depends on
the particle size distribution, free lime content and
pozzolanic reactivity of the fly ash. In case of BC soil–
Neyveli fly ash composite samples, the liquid limit is
slightly higher than that for BC soil–Badarpur fly ash
composite samples due to the flocculation caused by the
lime present in Neyveli fly ash.
The increase in plastic limit on addition of fly ash is
due to the lime content of fly ashes. The plastic limit of
BC soil–Neyveli fly ash composite samples first
increases and then decreases marginally as a function
fly as percentage increase (beyond 40 %) which shows
that the behaviour changes from expansiveness to non-
expansiveness in nature. This marginal decrease in the
plastic limit with an increase in percentage of ASTM
class C fly ash is due to the reduction of soil available
for the lime to react to form a calcium silicate gel
which coats and binds lumps of clay together and
occupies the pores in the soil.
The effect on the liquid limit and plastic limit by the
addition of the fly ashes is observed to reflect the trend
of variation of plasticity index upon the addition of fly
ash in increasing percentages. As seen from Fig. 3a,
Fig. 2 Compaction curves for BC soil and fly ashes
Geotech Geol Eng
123
the addition of the fly ashes decreases the plasticity
index of the soil samples. The decrease is found to be
more with the increase in the quantities of fly ash up to
40 % and then the trend of decrease is nominal with
further increase in the percentages of fly ash. It can be
seen that the BC soil becomes non-plastic upon
addition of about 80 % fly ash. The test results show
that addition of 20 % of Badarpur fly ash and 10 % of
Neyveli fly ash has changed the classification of BC
soil from CH to MH, MH-ML respectively. Hence, fly
ash can be used as an admixture to reduce the
associated problems posed by the swelling soils like
BC soils.
The value of shrinkage limit is used for under-
standing the swelling and shrinkage properties of
cohesive soils. Shrinkage limit is important for
stabilized fly ash used as liners. Cracking can lead to
the development of secondary permeability. Shrink-
age cracking also plays an important role if fly ash is
used in rigid pavements. The test results presented in
Fig. 3b and Table 3 show that the shrinkage limit of
the resulting BC soil–fly ash mixture increases mainly
due to the flocculation of clay particles caused by the
free lime present in the fly ash and also due to the
substitution of finer particles of black cotton soil by
relatively coarser fly ash particles. Addition of 20 %
fly ash with BC soil enhances the shrinkage limit of the
soil samples from 8 to 48 % for BC soil–Badarpur fly
ash composite samples and from 8 to 38 % for BC
soil–Neyveli fly ash composite samples (Table 3).
Since fly ashes are silt sized and non-plastic, plastic
limit and shrinkage limit of fly ashes alone could not
be determined.
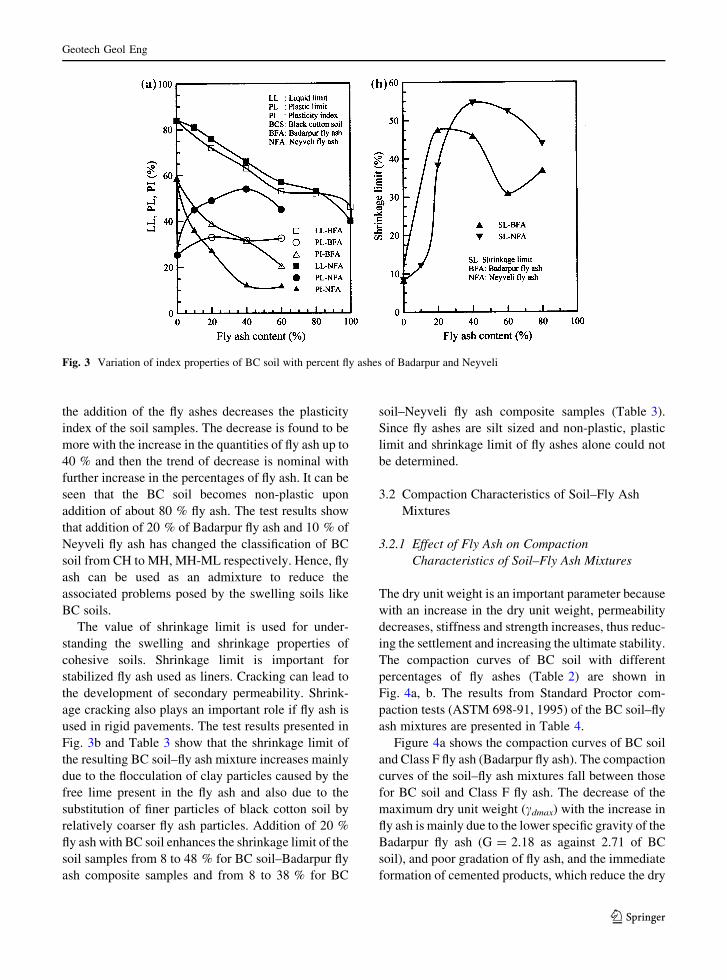
3.2 Compaction Characteristics of Soil–Fly Ash
Mixtures
3.2.1 Effect of Fly Ash on Compaction
Characteristics of Soil–Fly Ash Mixtures
The dry unit weight is an important parameter because
with an increase in the dry unit weight, permeability
decreases, stiffness and strength increases, thus reduc-
ing the settlement and increasing the ultimate stability.
The compaction curves of BC soil with different
percentages of fly ashes (Table 2) are shown in
Fig. 4a, b. The results from Standard Proctor com-
paction tests (ASTM 698-91, 1995) of the BC soil–fly
ash mixtures are presented in Table 4.
Figure 4a shows the compaction curves of BC soil
and Class F fly ash (Badarpur fly ash). The compaction
curves of the soil–fly ash mixtures fall between those
for BC soil and Class F fly ash. The decrease of the
maximum dry unit weight (cdmax) with the increase in
fly ash is mainly due to the lower specific gravity of the
Badarpur fly ash (G = 2.18 as against 2.71 of BC
soil), and poor gradation of fly ash, and the immediate
formation of cemented products, which reduce the dry
Fig. 3 Variation of index properties of BC soil with percent fly ashes of Badarpur and Neyveli
Geotech Geol Eng
123
unit weight of the treated soil (Lees et al. 1982; Bell
1996). The reduced dry unit weight reduces the swell
shrinkage potential of the compacted expansive soils
(Du et al. 1999). The increase in optimum moisture
content (OMC) with an increase in the fly ash content
is due to poor gradation of fly ash, and presence of
broken hollow spheres in fly ash. Figure 4a also shows
that with the addition of small amount of BC soil to the
fly ash, cdmax of the composite sample increases with a
decrease in OMC. The increase in cdmax can be mainly
attributed to the improvement in gradation of the fly
ash and increase in the specific gravity of soil–fly ash
composite sample.
Figure 4b shows the compaction curves of BC soil
and Class F fly ash (Neyveli fly ash). The compaction
curves of the soil–fly ash mixtures fall between those for
BC soil and Class C fly ash. The compaction curves in
between represent the soil and fly ash mixed in different
proportions. It may be noted that the specific gravity of
the two materials are almost of the same order (NFA:
2.64 as against 2.71 of BC soil). Because of the
increased resistance offered by the fly ash, which is a
coarser and uniformly graded material, cdmax obtained
is lesser than the cdmax of BC soil. Since the water
contents of fly ash and soil are different (i.e., 32 % for
Neyveli fly ash as compared to 28 % for BC soil), OMC
Table 3 Index properties of BC soil–fly ash mixtures
BC soil–Badarpur fly ash mixtures BC soil–Neyveli fly ash mixtures
BC soil–fly ash mixes Index properties BC soil–fly ash mixes Index properties
BC soil (%) BFA (%) LL (%) PL (%) PI (%) SL (%) BC soil (%) NFA (%) LL (%) PL (%) PI (%) SL (%)
100 0 84.0 25.4 58.6 8.3 100 0 84.0 25.4 58.6 8.3
80 20 72.0 33.0 39.0 47.5 90 10 81.0 45.0 36.0 12.1
60 40 63.0 31.6 31.4 46.0 80 20 76.0 49.0 27.0 38.2
40 60 53.0 32.5 20.5 30.9 60 40 66.0 54.0 12.0 54.6
20 80 52.0 NP – 36.9 40 60 56.5 45.0 11.5 52.4
0 100 50.0 NP – – 20 80 53.0 NP – 43.9
0 100 46.0 NP – 38.0 0 100 40.0 NP – –
8.5 % of lime was added to Badarpur fly ash (lime content = 0.5 %) to make it at par with Neyveli fly ash (lime content = 9 %) in
terms of lime content (Mir 2001)
BC soil black cotton soil, BFA Badarpur fly ash, NFA Neyveli fly ash, NP non-plastic, LL liquid limit, PL plastic limit, PI plasticity
index, SL shrinkage limit
Fig. 4 Proctor’s
compaction curves for BC
soil and fly ash mixtures
Geotech Geol Eng
123
increases with increase in fly ash content. The increase
in optimum moisture content is probably on account of
additional water held within the flocs resulting from
flocculation due to lime and the fly ash reaction.
3.2.2 Normalized Dry Unit Weight: Water Content
Plots for Soil–Fly Ash Mixtures
Since the specific gravity of fly ashes varies over a wide
range (i.e., 2.18–2.64), it is not possible to compare the
compaction characteristics of fly ashes with those of
natural soils. To compare the degree of compaction for
fly ashes, and soil–fly ash mixtures, and to account for
the widely varying specific gravities of fly ashes, it is
essential to replot the conventional dry unit weight–
water content relationship in the form of normalized
dry unit weight-normalized water content relationship
(Sridharan et al. 2001; Pandian and Mir 2002).
The conventional unit weight–water content is
modified in terms of normalized dry unit weight (cdn)
and normalized water content (wn). The Normalized dry
unit weight and water content are computed as below:
Normalized dry unit weight ðkN=m3Þ; cdn ¼ cd
Gstd
Gm
ð3Þ
Normalized water content; wn ¼ wGm
Gstdð4Þ
where cd dry unit weight of given material (kN/m3),
w water content corresponding to dry unit weight of a
given material, Gm specific gravity of a given material,
Gstd the standard value of specific gravity with respect
to which the plots are normalized.
A specific gravity of 2.65, a typical value of most
soils, has been adopted as the standard specific gravity
in this investigation.
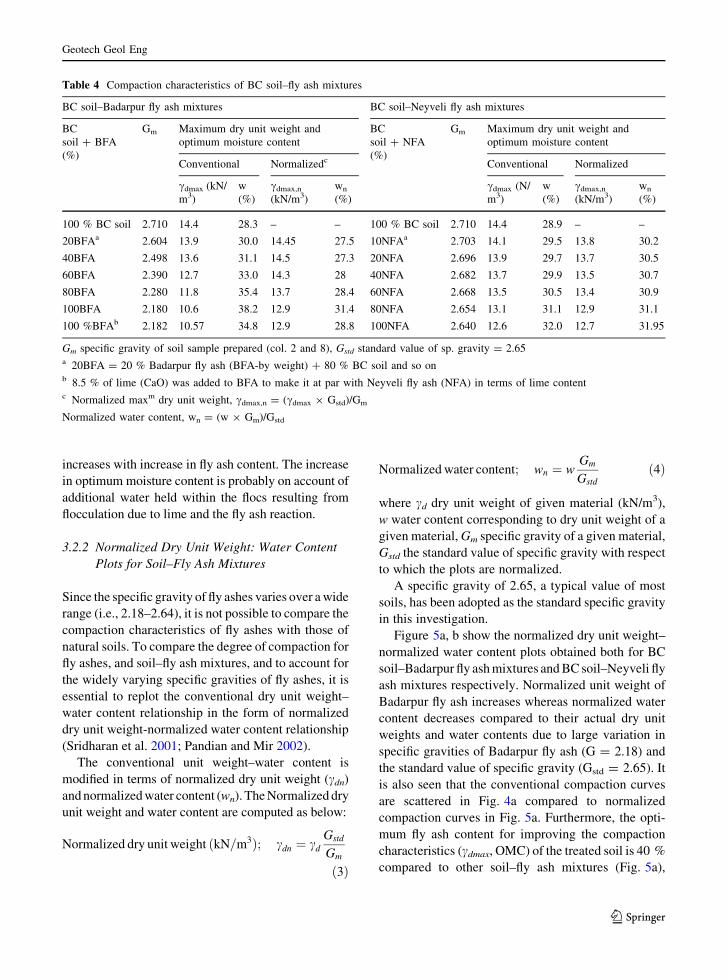
Figure 5a, b show the normalized dry unit weight–
normalized water content plots obtained both for BC
soil–Badarpur fly ash mixtures and BC soil–Neyveli fly
ash mixtures respectively. Normalized unit weight of
Badarpur fly ash increases whereas normalized water
content decreases compared to their actual dry unit
weights and water contents due to large variation in
specific gravities of Badarpur fly ash (G = 2.18) and
the standard value of specific gravity (Gstd = 2.65). It
is also seen that the conventional compaction curves
are scattered in Fig. 4a compared to normalized
compaction curves in Fig. 5a. Furthermore, the opti-
mum fly ash content for improving the compaction
characteristics (cdmax, OMC) of the treated soil is 40 %
compared to other soil–fly ash mixtures (Fig. 5a),
Table 4 Compaction characteristics of BC soil–fly ash mixtures
BC soil–Badarpur fly ash mixtures BC soil–Neyveli fly ash mixtures
BC
soil ? BFA
(%)
Gm Maximum dry unit weight and
optimum moisture content
BC
soil ? NFA
(%)
Gm Maximum dry unit weight and
optimum moisture content
Conventional Normalizedc Conventional Normalized
cdmax (kN/
m3)
w
(%)
cdmax,n
(kN/m3)
wn
(%)
cdmax (N/
m3)
w
(%)
cdmax,n
(kN/m3)
wn
(%)
100 % BC soil 2.710 14.4 28.3 – – 100 % BC soil 2.710 14.4 28.9 – –
20BFAa 2.604 13.9 30.0 14.45 27.5 10NFAa 2.703 14.1 29.5 13.8 30.2
40BFA 2.498 13.6 31.1 14.5 27.3 20NFA 2.696 13.9 29.7 13.7 30.5
60BFA 2.390 12.7 33.0 14.3 28 40NFA 2.682 13.7 29.9 13.5 30.7
80BFA 2.280 11.8 35.4 13.7 28.4 60NFA 2.668 13.5 30.5 13.4 30.9
100BFA 2.180 10.6 38.2 12.9 31.4 80NFA 2.654 13.1 31.1 12.9 31.1
100 %BFAb 2.182 10.57 34.8 12.9 28.8 100NFA 2.640 12.6 32.0 12.7 31.95
Gm specific gravity of soil sample prepared (col. 2 and 8), Gstd standard value of sp. gravity = 2.65a 20BFA = 20 % Badarpur fly ash (BFA-by weight) ? 80 % BC soil and so onb 8.5 % of lime (CaO) was added to BFA to make it at par with Neyveli fly ash (NFA) in terms of lime contentc Normalized maxm dry unit weight, cdmax,n = (cdmax 9 Gstd)/Gm
Normalized water content, wn = (w 9 Gm)/Gstd
Geotech Geol Eng
123
which is at par with BC soil. Kate (2005) has shown
that the quantity of fly ash up to optimum content can
induce pozzolanic reaction and cemented materials
effectively contributing to shear strength increase,
while the additional quantity of fly ash acts as
unbonded silt particles, which has neither appreciable
friction nor cohesion, causing decrease in strength. In
the case of BC soil–Neyveli fly ash mixtures, there is
not much variation in their compaction behaviour since
the specific gravity of the two materials are almost of
the same order (NFA: 2.64 as against 2.71 of BC soil).
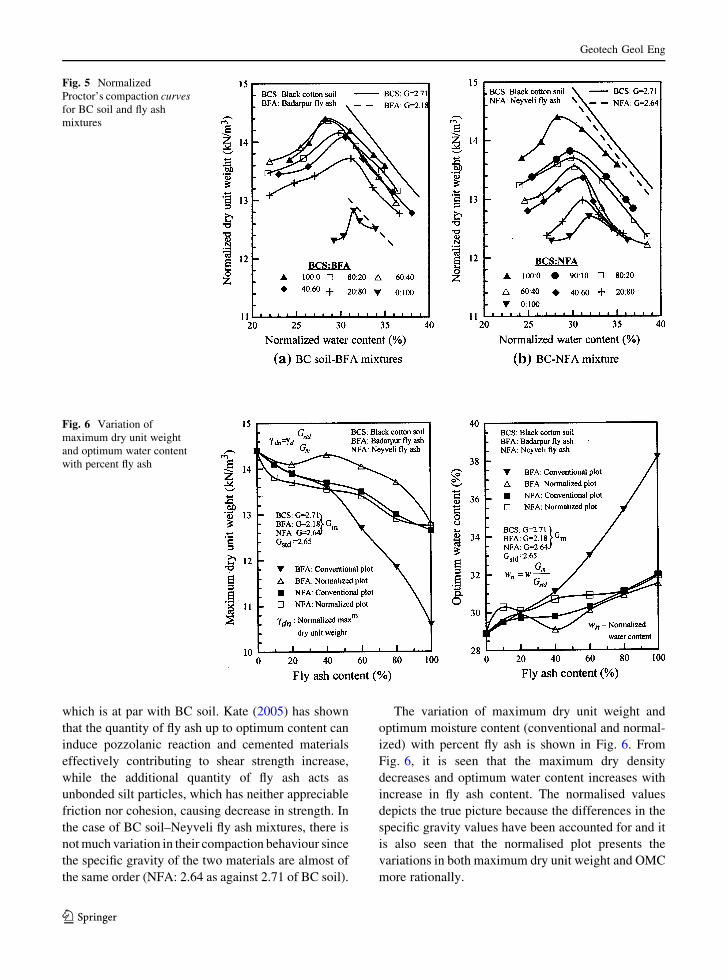
The variation of maximum dry unit weight and
optimum moisture content (conventional and normal-
ized) with percent fly ash is shown in Fig. 6. From
Fig. 6, it is seen that the maximum dry density
decreases and optimum water content increases with
increase in fly ash content. The normalised values
depicts the true picture because the differences in the
specific gravity values have been accounted for and it
is also seen that the normalised plot presents the
variations in both maximum dry unit weight and OMC
more rationally.
Fig. 5 Normalized
Proctor’s compaction curvesfor BC soil and fly ash
mixtures
Fig. 6 Variation of
maximum dry unit weight
and optimum water content
with percent fly ash
Geotech Geol Eng
123
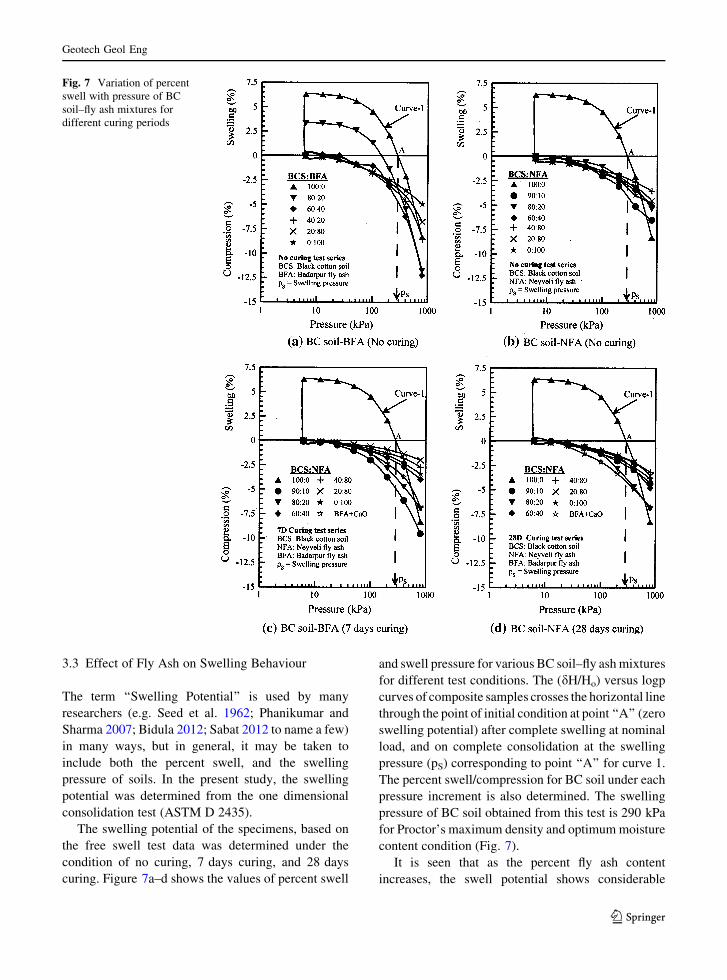
3.3 Effect of Fly Ash on Swelling Behaviour
The term ‘‘Swelling Potential’’ is used by many
researchers (e.g. Seed et al. 1962; Phanikumar and
Sharma 2007; Bidula 2012; Sabat 2012 to name a few)
in many ways, but in general, it may be taken to
include both the percent swell, and the swelling
pressure of soils. In the present study, the swelling
potential was determined from the one dimensional
consolidation test (ASTM D 2435).
The swelling potential of the specimens, based on
the free swell test data was determined under the
condition of no curing, 7 days curing, and 28 days
curing. Figure 7a–d shows the values of percent swell
and swell pressure for various BC soil–fly ash mixtures
for different test conditions. The (dH/Ho) versus logp
curves of composite samples crosses the horizontal line
through the point of initial condition at point ‘‘A’’ (zero
swelling potential) after complete swelling at nominal
load, and on complete consolidation at the swelling
pressure (pS) corresponding to point ‘‘A’’ for curve 1.
The percent swell/compression for BC soil under each
pressure increment is also determined. The swelling
pressure of BC soil obtained from this test is 290 kPa
for Proctor’s maximum density and optimum moisture
content condition (Fig. 7).
It is seen that as the percent fly ash content
increases, the swell potential shows considerable
Fig. 7 Variation of percent
swell with pressure of BC
soil–fly ash mixtures for
different curing periods
Geotech Geol Eng
123
decrease. The interaction between clay particles that is
necessary for swelling is reduced quite effectively by
the addition of non-plastic fly ash particles. It is also
observed that with an increase in the curing time, both
swelling as well as compression potential is reduced
(Fig. 7b–d). The decrease in swelling potential due to
curing can be attributed to the time-dependent pozzo-
lanic and self-hardening properties (formation of
cementitious compounds) of fly ashes. Fly ashes have
potential to provide multivalent cations (Ca2?, Al3?,
Fe3?, etc.), which promote flocculation of clay
particles by cation exchange. Therefore, the surface
area and water affinity of the samples decreases, which
result in the reduction of swelling potential and
swelling pressure.
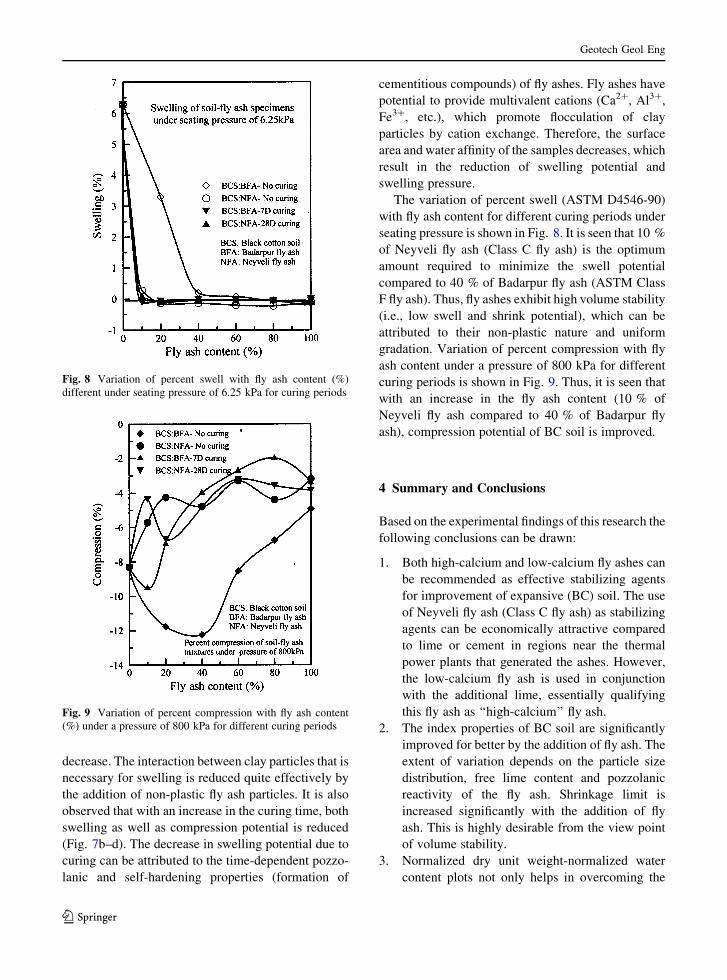
The variation of percent swell (ASTM D4546-90)
with fly ash content for different curing periods under
seating pressure is shown in Fig. 8. It is seen that 10 %
of Neyveli fly ash (Class C fly ash) is the optimum
amount required to minimize the swell potential
compared to 40 % of Badarpur fly ash (ASTM Class
F fly ash). Thus, fly ashes exhibit high volume stability
(i.e., low swell and shrink potential), which can be
attributed to their non-plastic nature and uniform
gradation. Variation of percent compression with fly
ash content under a pressure of 800 kPa for different
curing periods is shown in Fig. 9. Thus, it is seen that
with an increase in the fly ash content (10 % of
Neyveli fly ash compared to 40 % of Badarpur fly
ash), compression potential of BC soil is improved.
4 Summary and Conclusions
Based on the experimental findings of this research the
following conclusions can be drawn:
1. Both high-calcium and low-calcium fly ashes can
be recommended as effective stabilizing agents
for improvement of expansive (BC) soil. The use
of Neyveli fly ash (Class C fly ash) as stabilizing
agents can be economically attractive compared
to lime or cement in regions near the thermal
power plants that generated the ashes. However,
the low-calcium fly ash is used in conjunction
with the additional lime, essentially qualifying
this fly ash as ‘‘high-calcium’’ fly ash.
2. The index properties of BC soil are significantly
improved for better by the addition of fly ash. The
extent of variation depends on the particle size
distribution, free lime content and pozzolanic
reactivity of the fly ash. Shrinkage limit is
increased significantly with the addition of fly
ash. This is highly desirable from the view point
of volume stability.
3. Normalized dry unit weight-normalized water
content plots not only helps in overcoming the
Fig. 8 Variation of percent swell with fly ash content (%)
different under seating pressure of 6.25 kPa for curing periods
Fig. 9 Variation of percent compression with fly ash content
(%) under a pressure of 800 kPa for different curing periods
Geotech Geol Eng
123
effect of widely varying specific gravity, but also
facilitates proper comparison of the compaction
characteristics of fly ashes with those of soils
without any change in the shape of the compac-
tion curves.
4. Addition of fly ash to BC soil decreases the free
swell index, swell potential and swell pressure.
There is a considerable reduction in the swelling
potential as the amount of fly ash-added increases.
With duration of curing, swelling potential/
pressure further decreases. It has been observed
that 10 % of Neyveli fly ash (Class C fly ash) is the
optimum amount required to minimize the swell
potential compared to 40 % of Badarpur fly ash
(Class F fly ash).
5. Compressibility characteristics of the expansive
soil are improved with the addition of fly ash.
These further improve with curing of the com-
pacted BC soil–fly ash mixtures.
6. Recycling/utilization of fly has the advantage of
using an industrial waste by-product without
adversely affecting the environment or potential
land use with in addition fly ash proves to be an
effective admixture for improving the soil engi-
neering behaviour considerably.
Acknowledgments The investigation reported in this paper
forms a part of the research at IISc Bangalore. The support and
assistance is gratefully acknowledged. Thanks are due to
Faculty of Geotechnical Engg. Division and supporting staff
of the Soil Mechanics laboratory and the office staff of Civil
Engineering Department for their timely help during the course
of investigation. The Authors thank the ‘‘unknown referees’’
whose comments were extremely useful and enhanced the
quality of their paper.
References
Amos, DF, Wright JD (1972) The effect of soil fly ash on soil
physical characteristics. In: Proceedings of third mineral
waste utilisation symposium, Chicago, pp 95–104
ASTM C 311-94b (1995) Standard test methods for sampling
and testing fly ash or natural pozzolanas for use as a mineral
admixture in portland cement concrete. Annual book of
ASTM standards, American Society for Testing and
Materials, Philadelphia, sec. 4, vol 04-02, pp 187–193.
www.astm.org
ASTM D 422-63 (1995) Standard test method for particle size
analysis of soils. Annual book of ASTM standards,
American Society for Testing and Materials, Philadelphia,
sec. 4, vol 04-08, pp 10–16. www.astm.org
ASTM C 618-89. Standard specification for coal fly ash and raw
or calcined natural pozzolan for use in concrete. Annual
book of ASTM standards, American Society for Testing
and Materials, Philadelphia. www.astm.org
ASTM D 854-92 (1995) Standard test method for specific
gravity of soils. Annual book of ASTM Standards. Amer-
ican Society for Testing and Materials, Philadelphia, vol
04.08, pp 80–83
ASTM D4318-98. Standard test methods for liquid limit, plastic
limit, and plasticity index of soils. Annual book of ASTM
standards, American Society for Testing and Materials,
Philadelphia. www.astm.org
ASTM D 427-93. Standard test method for shrinkage factors of
soils by the mercury method. Annual book of ASTM
standards, American Society for Testing and Materials,
Philadelphia. www.astm.org
ASTM D698-91. Standard test methods for laboratory com-
paction characteristics of soil using standard effort. Annual
book of ASTM standards, American Society for Testing
and Materials, Philadelphia. www.astm.org
ASTM D4546-90. Standard test methods for one-dimensional
swell or settlement potential of cohesive soils. Annual book
of ASTM standards, American Society for Testing and
Materials, Philadelphia. www.astm.org
ASTM D 2435. Test method for one-dimensional consolidation
properties of soils. Annual book of ASTM Standards,
American Society for Testing and Materials, Philadelphia,
vol. 04.08. www.astm.org
Bell FG (1996) Lime stabilization of clay minerals and soils.
Eng Geol 42:223–237
Bidula B (2012) Geo-engineering properties of expansive soil
stabilized with fly ash. EJGE 17(J):1339–1353
Cokca E (2001) Use of class C fly ash for the stabilization of an
expansive soil. J Geotech Geoenviron Eng ASCE
127(7):568–573
Digioia AM Jr, Nuzzo WL (1972) Fly ash as structural fill.
J Power Div ASCE 98(1):77–92
Du YJ, Li SL, Hayashi S (1999) Swelling-shrinkage properties
and soil improvement of compacted expansive soil, Ning-
Lian highway, China. Eng Geol 53:351–358
Edil TB, Acosta HA, Benson CH (2006) Stabilizing soft fine-
grained soils with fly ash. J Mater Civ Eng 18(2):283–294
Ferguson G (1993) Use of self-cementing fly ashes as a soil-
stabilizing agent. In: Proceedings of session on fly ash for
soil improvement, ASCE Geotechnical Special Publication
36, pp 1–14
Gray DH, Lin YK (1972) Engineering properties of compacted
fly ash. J Soil Mech Found Div 98(4):361–380
Hausman MR (1990) Engineering principles of ground modi-
fication. McGraw-Hill, New York
Indraratna B, Nutalaya P, Kuganenthira N (1991) Stabilization
of a dispersive soil by blending with fly ash. Q J Eng Geol
Hydrogeol 24(3):275–290
Joshi CR, Nagaraj TS (1987) Fly ash utilization for soil
improvement. In: Proceedings of environmental geotech-
nics and problematic soils and rocks. A. A. Balkema,
Rotterdam, The Netherlands, pp 15–24
Kate JM (2005) Strength and volume change behaviour of
expansive soils treated with fly ash. Geo Frontiers 2005,
ASCE, Geotechnical Special Publication
Geotech Geol Eng
123
Katti RK (1979) Search for solutions to problems in black cotton
soils. Indian Geotech J, 1st IGS Annual Lecture (Dec
1978), vol 9, no. 1, pp 1–80
Larimore CL (1996) Ash utilization in highways. Georgia
Demonstration Project Research Project 2422-4, Southern
Company Services for Electric Power Research Institute,
Palo Alto, CA
Lees G, Abdelkader MO, Hamdani SK (1982) Effect of the clay
fraction on some mechanical properties of lime–soil mix-
tures. J Inst Highw Eng 11:3–9
Mir BA (2001) The effect of fly ash on the engineering prop-
erties of black cotton soils. M. E. thesis, Department of
Civil Engineering, IISc, Bangalore
Mir BA, Pandian NS (2003) Fly ash—as an engineered con-
struction material. In: Proceedings of international con-
ference on construction technology (CONTEC), 13–15 Oct
2003, University Malaysia Sabah, Malaysia, pp 57–68
Moulton KL (1978) Technology and utilization of power plant
ash in structural fills and embankments. West Virginia
University, pp 791–806
Nalbantoglu Z (2004) Effectiveness of class C fly ash as an
expansive soil stabilizer. Constr Build Mater 18:377–381
Natt GS, Joshi RC (1984) Properties of cement and lime–fly ash
stabilized aggregate. Transport Research Record 998.
Transport Research Board, National Research Council,
pp 32–40
Pandian NS, Mir BA (2002) Compaction behaviour of fly ash–
BC soil mixes. In: Proceedings of Indian geotechnical
conference, 2002, N. I. T. Allahabad, pp 261–264
Pandian NS, Rajasekhar C, Sridharan A (1998) Studies of the
specific gravity of some Indian coal ashes. J Test Eval
26(03):177–186
Phanikumar BR, Sharma RS (2004) Effect of fly ash on engi-
neering properties of expansive soil. J Geotech Geoenviron
Eng 130(7):764–767
Phanikumar BR, Sharma RS (2007) Volume change behaviour
of fly ash-stabilized clays. J Mater Civ Eng 19(1):67–74
Prakash K, Sridharan A (2009) Beneficial properties of cal ashes
and effective solid waste management. Pract Period Hazard
Toxic Radioact Waste Manag ASCE 13(4):239–248
Ramme BW, Naik TR, Kolbeck HJ (1994) Use of fly ash slurry
for underground facility construction. J Constr Build Mater
8(1):63–67
Suba Rao KS (2000) Swell-shrink behaviour of expansive
soils—geotechnical challenges. Indian Geotech J 30(1):
1–68
Raymond S (1961) Pulverized fuel ash as embankment material.
Proc Inst Civ Eng (London) 19:515–536
Sabat AK (2012) Statistical models for prediction of swelling
pressure of a stabilized expansive soil. EJGE 17(G):
837–846
Seed HB, Woodward RJ, Lundgren R (1962) Prediction of
swelling potential of compacted clays. J SMFE Div ASCE
88(SM3):53–87
Sherwood PT, Ryley MD (1966) The use of stabilized pulver-
ized fuel ash in road construction. RRL, Ministry of
Transport, UK, report no. 49, pp 1–44
Singh DN (1996) Influence of chemical constituents on fly ash
characteristics. In: Proceedings of Indian geotechnical
conference, Madras, vol 1, pp 227–230
Sivapullaiah PV, Prashant JP, Sridharan A (1996) Effect of fly
ash on the index properties of BC soil. Soils Found
36(1):97–103
Sridharan A, Prakash K (2000) Classification procedures for
expansive soils. Proc Inst Civ Eng (UK) 143:235–240
Sridharan A, Rao SM, Murthy NS (1985) Free swell index of
soils: a need for redefinition. Indian Geotech J 15(2):94–99
Sridharan A, Prashanth PJ, Sivapullaiah PV (1997) Effect of fly
ash on the unconfined compressive strength of black cotton
soil. In: Proceedings of ground improvement, Thomas
Telford, London, UK, vol 1, pp 169–175
Sridharan A, Pandian NS, Srinivasa PR (1998) Fly ash as con-
struction material in embankments. 4th international
symposium on environmental geotechnology and global
sustainable development, Aug 9–13, Boston, MA, USA
Sridharan A, Pandian NS, Srinavas S (2001) Compaction
behaviour of Indian coal ashes. In: Proceedings ground
improvement, Thomas Telford, UK, vol 5, pp 13–22
Tastan EO, Edil TB, Craig HB, Aydilek AH (2011) Stabilization
of organic soils with fly ash. J Geotech Geoenviron Eng
137(9):819–833
Toth PS, Chan HT, Cragg CB (1988) Coal ash as a structural fill
with special reference to Ontario experience. Can Geotech
J 25(4):694–704
Uppal HL, Dhawn PK (1968) A resume on the use of fly ash in
soil stabilization. Central Road Research Institute, pp 1–12
Yudhbir, Honjo Y (1991) Applications of geotechnical engi-
neering of environmental control. Theme lecture 5, 9 ARC,
Bangkok, Thailand, vol 2, pp 431–469
Geotech Geol Eng
123


