Embed Size (px)
Citation preview
�����������������
Citation: Loke, C.H.; Adam, M.S.;
Nordin, R.; Abdullah, N.F.;
Abu-Samah, A. Physical Distancing
Device with Edge Computing for
COVID-19 (PADDIE-C19). Sensors
2022, 22, 279. https://doi.org/
10.3390/s22010279
Academic Editors: Mario
Martínez-Zarzuela, David González
Ortega and Yuh-Shyan Chen
Received: 22 October 2021
Accepted: 22 December 2021
Published: 30 December 2021
Publisher’s Note: MDPI stays neutral
with regard to jurisdictional claims in
published maps and institutional affil-
iations.
Copyright: © 2021 by the authors.
Licensee MDPI, Basel, Switzerland.
This article is an open access article
distributed under the terms and
conditions of the Creative Commons
Attribution (CC BY) license (https://
creativecommons.org/licenses/by/
4.0/).
sensors
Article
Physical Distancing Device with Edge Computing forCOVID-19 (PADDIE-C19)Chun Hoe Loke, Mohammed Sani Adam , Rosdiadee Nordin * , Nor Fadzilah Abdullahand Asma Abu-Samah
Department of Electrical, Electronics and Systems Engineering, Faculty of Engineering and Built Environment,Universiti Kebangsaan Malaysia, Bangi 43600, Selangor, Malaysia; [email protected] (C.H.L.);[email protected] (M.S.A.); [email protected] (N.F.A.); [email protected] (A.A.-S.)* Correspondence: [email protected]
Abstract: The most effective methods of preventing COVID-19 infection include maintaining physicaldistancing and wearing a face mask while in close contact with people in public places. However,densely populated areas have a greater incidence of COVID-19 dissemination, which is causedby people who do not comply with standard operating procedures (SOPs). This paper presents aprototype called PADDIE-C19 (Physical Distancing Device with Edge Computing for COVID-19)to implement the physical distancing monitoring based on a low-cost edge computing device. ThePADDIE-C19 provides real-time results and responses, as well as notifications and warnings toanyone who violates the 1-m physical distance rule. In addition, PADDIE-C19 includes temperaturescreening using an MLX90614 thermometer and ultrasonic sensors to restrict the number of people onspecified premises. The Neural Network Processor (KPU) in Grove Artificial Intelligence HardwareAttached on Top (AI HAT), an edge computing unit, is used to accelerate the neural network modelon person detection and achieve up to 18 frames per second (FPS). The results show that the accuracyof person detection with Grove AI HAT could achieve 74.65% and the average absolute error betweenmeasured and actual physical distance is 8.95 cm. Furthermore, the accuracy of the MLX90614thermometer is guaranteed to have less than 0.5 ◦C value difference from the more common Fluke59 thermometer. Experimental results also proved that when cloud computing is compared to edgecomputing, the Grove AI HAT achieves the average performance of 18 FPS for a person detector(kmodel) with an average 56 ms execution time in different networks, regardless of the networkconnection type or speed.
Keywords: COVID-19; computer vision; edge computing; thermometer; physical distancing
1. Introduction
Public health and the global economy are under threat from the COVID-19 pandemic.As of 15 November 2021, there were 251 million confirmed cases and 5 million deaths fromthe COVID-19 outbreak [1]. Currently, the most effective infection prevention methods arephysical distancing, wearing a face mask, and frequent handwashing [2]. The Malaysiangovernment’s early response to the outbreak is to implement the Movement Control Order(MCO) at the national level to restrict the movement and gathering of people throughoutthe country, including social, cultural, and religious activities [3]. Besides that, governmentand private sectors cooperate in body temperature inspection and quarantine enforcementoperations in all locations to prevent the spread of COVID-19. However, the critical issue isthat it is not easy to implement strong and effective control measures on humans. Peoplestill need to address needs such as obtaining food from outside homes, working to coverliving costs, and socializing with individuals or family members. The Ministry of HealthMalaysia’s concern is that individuals do not take the standard operation procedures (SOP)compliance seriously and lack understanding of COVID-19 disease transmission [4]. In this
Sensors 2022, 22, 279. https://doi.org/10.3390/s22010279 https://www.mdpi.com/journal/sensors
Sensors 2022, 22, 279 2 of 17
context, intelligent and automated systems capable of operating 24 h a day to combat thepandemic transmission are critical for long-term economic and public health interests.
Edge computing is a concept that has been widely adopted in the healthcare industryto minimize the cost, energy, and workload of medical personnel [5,6]. Many types ofInternet of Things (IoT) components have been proposed, including Radio FrequencyIdentification (RFID) and Bluetooth technology, magnetic field, infrared, camera and lidarsensors. These components play an important role in physical distancing monitoring viaedge computing concept [7–13]. At the moment, physical distancing monitoring is primarilybased on three technologies: wireless communication, electromagnetics, and computervision. A Bluetooth-based wireless communication has been used to determine the distancebetween individuals based on the strength of the Received Signal Strength Indicator (RSSI)signal in [8]. Singapore has a “Tracetogether” application based on Bluetooth technologythat enables close contacts of COVID-19 patients to be located [14]. The limitation ofthe application is that users have to download the existing application and then activateBluetooth at all times in public places. Additionally, the most popular application of deeplearning in this context is to detect physical distance using a camera [12]. However, suchdetection techniques are dependent on the camera location, computing power, and imageprocessing capabilities.
Prevention is better than cure to break the chain of infection and combat the COVID-19pandemic. The purpose of this study is to build a Physical Distancing Device with EdgeComputing for COVID-19 (PADDIE-C19) system to prevent infection based on the conceptof edge computing. The three main functions of PADDIE-C19 are: (i) to identify andmonitor physical distances using computer vision, (ii) forehead temperature checking,and (iii) to limit the number of people in each room or enclosed area through a countersystem that detects people entering/leaving a premise. The edge computing unit cancollect image and temperature data from sensors for processing at the edge without relyingon the internet network. Furthermore, the edge computing system can provide real-timeresults and responses, as well as notifications and warnings to anyone who violates the1-m physical distance rule or has a forehead temperature greater than 37.2 ◦C.
The following are the main contributions of this paper:
• A PADDIE-C19 prototype based on Raspberry-pi Grove Artificial Intelligence Hard-ware Attached on Top (Grove AI HAT) with edge computing capability to recognizeand classify humans based on image processing. The performance of the persondetector system implemented on the Grove AI HAT, Raspberry Pi 4 and Google Colabplatform on different mobile networks was evaluated and compared based on framesper second (FPS) and execution time to compare the performance between edge andcloud computing approaches.
• A physical distance monitoring algorithm and implementation technique to operatein low-energy edge computing devices that provide physical distance guidance tothe public.
• An accurate sensor platform design for forehead temperature measurement and personcounting to manage the flow of visitors in public spaces.
The remainder of this research work is organized as follows. The problem backgroundis demonstrated in Section 2 and the relevant works are discussed in Section 3. The PADDIE-C19 prototype physical distance monitoring algorithm and implementation technique withedge computing are comprehensively discussed in Section 4. The dataset used in thisstudy for training and testing purposes is presented in Section 5. Furthermore, a detaileddiscussion and analysis on the FPS comparison between edge and cloud, execution time indifferent networks, the performance of person detector, distance test, comparison betweenthe MLX90614 and Fluke 59 thermometer, and the person counter are discussed in thissection. The concluding remarks and potential future research plans are provided inSection 6.
Sensors 2022, 22, 279 3 of 17
2. Problem Background
Many individuals are unaware or do not have the right knowledge of the serious-ness of COVID-19 for individual health and its impact on society. On a cross-sectionalsurvey to measure the level of awareness, views, and behaviours of the Malaysian publictoward COVID-19, only 51.2% of participants were reported to wear face masks while outin public [15]. Inconsistent instructions and guidelines from the authorities also createfeelings of panic and emotional stress, further reducing the society’s adherence to SOPs forpandemic prevention and physical distancing measures. Aside from psychological reasons,the cultural, economic, and geographical factors can create issues in addressing publicviolations with movement control orders enforcement. For example, in less than a week inDecember 2020, the police force in Selangor, Malaysia, issued 606 fines for those who failedto comply with the SOPs [16].
COVID-19 has changed the lives of the people since the MCO was implemented [15].The government cannot permanently restrict people’s movement because it significantlyinfluences the people’s way of life and the country’s economic sector. Although theflexibility of movement is given in the new life norms, SOPs often fail to be adhered toby the public, such as physical distancing, wearing a face mask, and registration processwhen entering the premises. Besides, MCO has placed high economic pressure on thelow-income group. People require income from employment to meet their basic needsof food. Furthermore, the concept of working from home cannot be implemented in themanufacturing and service sectors. Moreover, large-scale gatherings such as religiousactivities and weddings can be considered to have serious cultural consequences if they arenot conducted.
To fight the spreading of COVID-19, the Malaysian government has created an ap-plication, “MySejahtera” that records the entry of visitors into a facility [14]. However,a small percentage of citizens, particularly the elderly, do not own a smartphone. Theapplication relies on QR code as user input, and is unusable for those without handphones.The application’s functionality is also limited to areas with consistent internet coverage.Furthermore, the government and employers are experiencing a shortage of officers andstaff responsible for ensuring that people are physically separated at least one meter inpublic places at all times.
This article aims to create a COVID-19 monitoring system based on the concepts ofedge computing, computer vision and the Internet of Things. An automated monitoringsystem called PADDIE-C19 has been designed to maintain the recommended safe physicaldistance between crowds in factories, schools, restaurants, and ceremonies to confine thespread of COVID-19. A person detection model is trained based on the transfer learningmethod and is used to measure physical distances via camera. Meanwhile, an infraredthermometer is used to detect the individual’s forehead temperature at the entrance toidentify people with symptoms of COVID-19 infection. Last but not least, the number ofpeople in any room or enclosed location is also limited by using a visitor counting systembased on an ultrasonic sensor.
3. Related Works
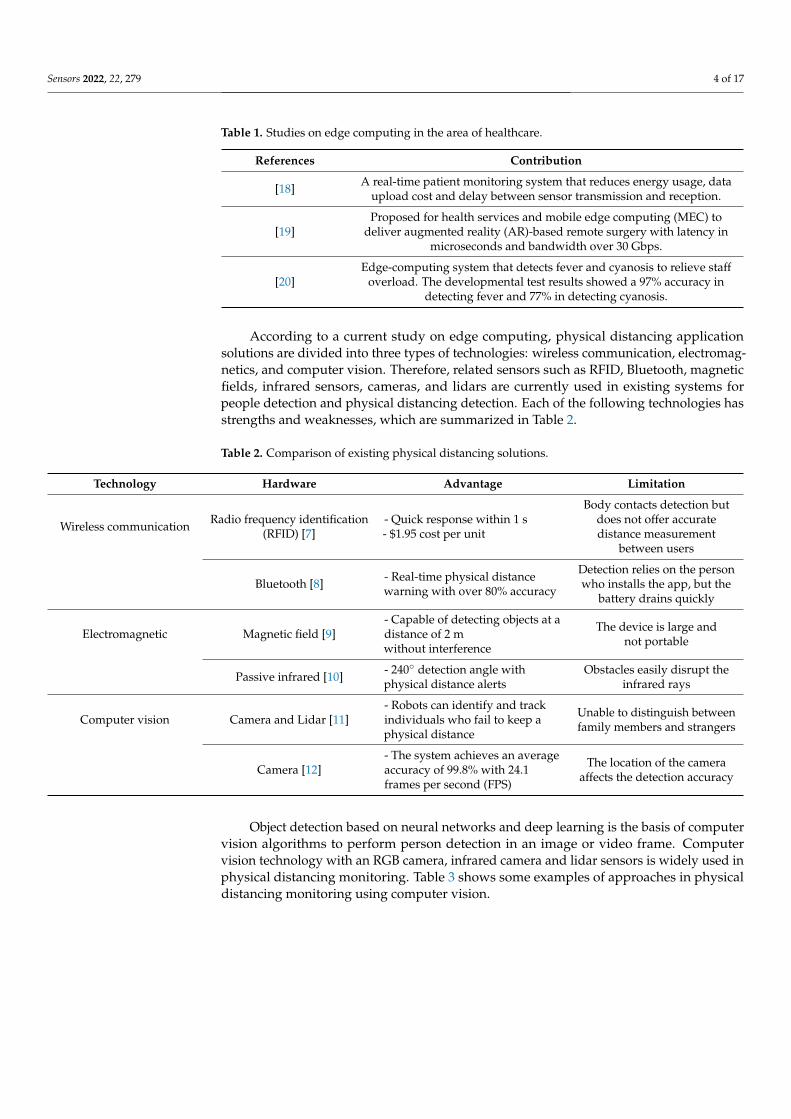
The COVID-19 pandemic has impacted hospitals worldwide, causing many non-emergency services and treatments, such as cancer, hypertension, and diabetes, to bedelayed [17]. This is due to a shortage of healthcare workers to handle COVID-19 patients.Nevertheless, medical equipment with edge computing capability for patient monitoringcan help to reduce the load on medical systems. Several studies in Table 1 demonstrate therole of edge computing in healthcare and the COVID-19 pandemic.
Sensors 2022, 22, 279 4 of 17
Table 1. Studies on edge computing in the area of healthcare.
References Contribution
[18] A real-time patient monitoring system that reduces energy usage, dataupload cost and delay between sensor transmission and reception.
[19]Proposed for health services and mobile edge computing (MEC) to
deliver augmented reality (AR)-based remote surgery with latency inmicroseconds and bandwidth over 30 Gbps.
[20]Edge-computing system that detects fever and cyanosis to relieve staff
overload. The developmental test results showed a 97% accuracy indetecting fever and 77% in detecting cyanosis.
According to a current study on edge computing, physical distancing applicationsolutions are divided into three types of technologies: wireless communication, electromag-netics, and computer vision. Therefore, related sensors such as RFID, Bluetooth, magneticfields, infrared sensors, cameras, and lidars are currently used in existing systems forpeople detection and physical distancing detection. Each of the following technologies hasstrengths and weaknesses, which are summarized in Table 2.
Table 2. Comparison of existing physical distancing solutions.
Technology Hardware Advantage Limitation
Wireless communication Radio frequency identification(RFID) [7]
- Quick response within 1 s- $1.95 cost per unit
Body contacts detection butdoes not offer accuratedistance measurement
between users
Bluetooth [8] - Real-time physical distancewarning with over 80% accuracy
Detection relies on the personwho installs the app, but the
battery drains quickly
Electromagnetic Magnetic field [9]- Capable of detecting objects at adistance of 2 mwithout interference
The device is large andnot portable
Passive infrared [10] - 240◦ detection angle withphysical distance alerts
Obstacles easily disrupt theinfrared rays
Computer vision Camera and Lidar [11]- Robots can identify and trackindividuals who fail to keep aphysical distance
Unable to distinguish betweenfamily members and strangers
Camera [12]- The system achieves an averageaccuracy of 99.8% with 24.1frames per second (FPS)
The location of the cameraaffects the detection accuracy
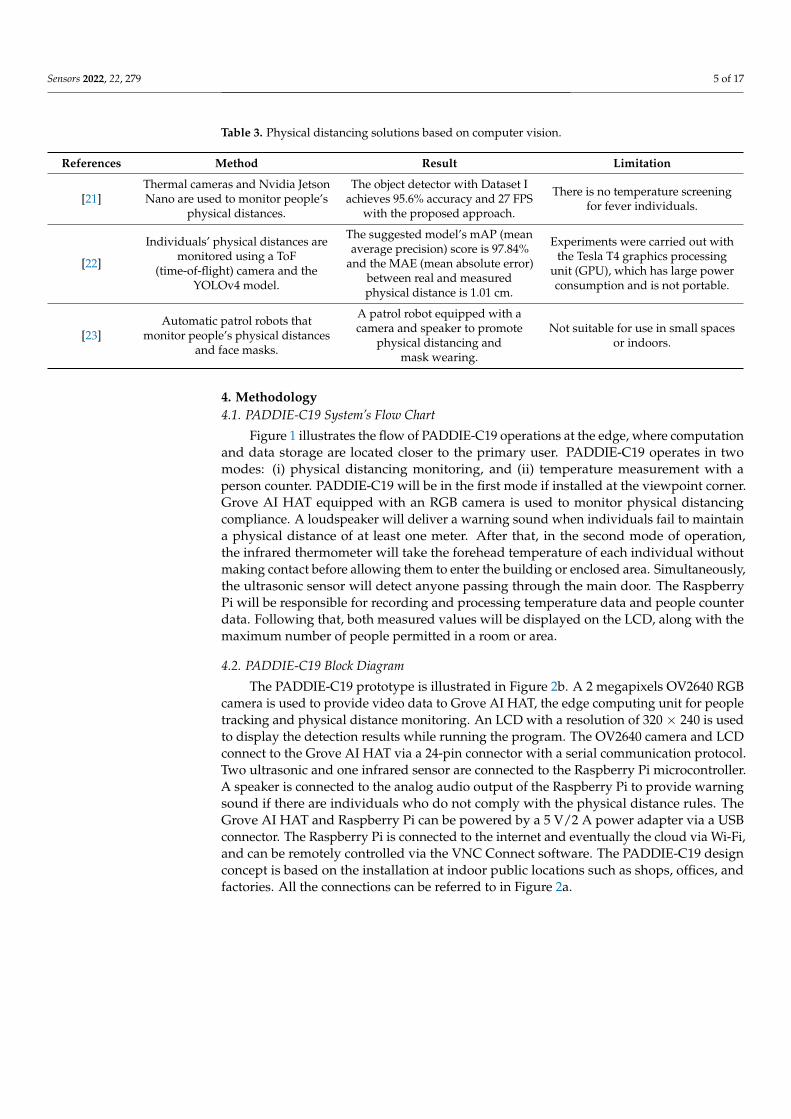
Object detection based on neural networks and deep learning is the basis of computervision algorithms to perform person detection in an image or video frame. Computervision technology with an RGB camera, infrared camera and lidar sensors is widely used inphysical distancing monitoring. Table 3 shows some examples of approaches in physicaldistancing monitoring using computer vision.
Sensors 2022, 22, 279 5 of 17
Table 3. Physical distancing solutions based on computer vision.
References Method Result Limitation
[21]Thermal cameras and Nvidia JetsonNano are used to monitor people’s
physical distances.
The object detector with Dataset Iachieves 95.6% accuracy and 27 FPS
with the proposed approach.
There is no temperature screeningfor fever individuals.
[22]
Individuals’ physical distances aremonitored using a ToF
(time-of-flight) camera and theYOLOv4 model.
The suggested model’s mAP (meanaverage precision) score is 97.84%
and the MAE (mean absolute error)between real and measuredphysical distance is 1.01 cm.
Experiments were carried out withthe Tesla T4 graphics processing
unit (GPU), which has large powerconsumption and is not portable.
[23]Automatic patrol robots that
monitor people’s physical distancesand face masks.
A patrol robot equipped with acamera and speaker to promote
physical distancing andmask wearing.
Not suitable for use in small spacesor indoors.
4. Methodology4.1. PADDIE-C19 System’s Flow Chart
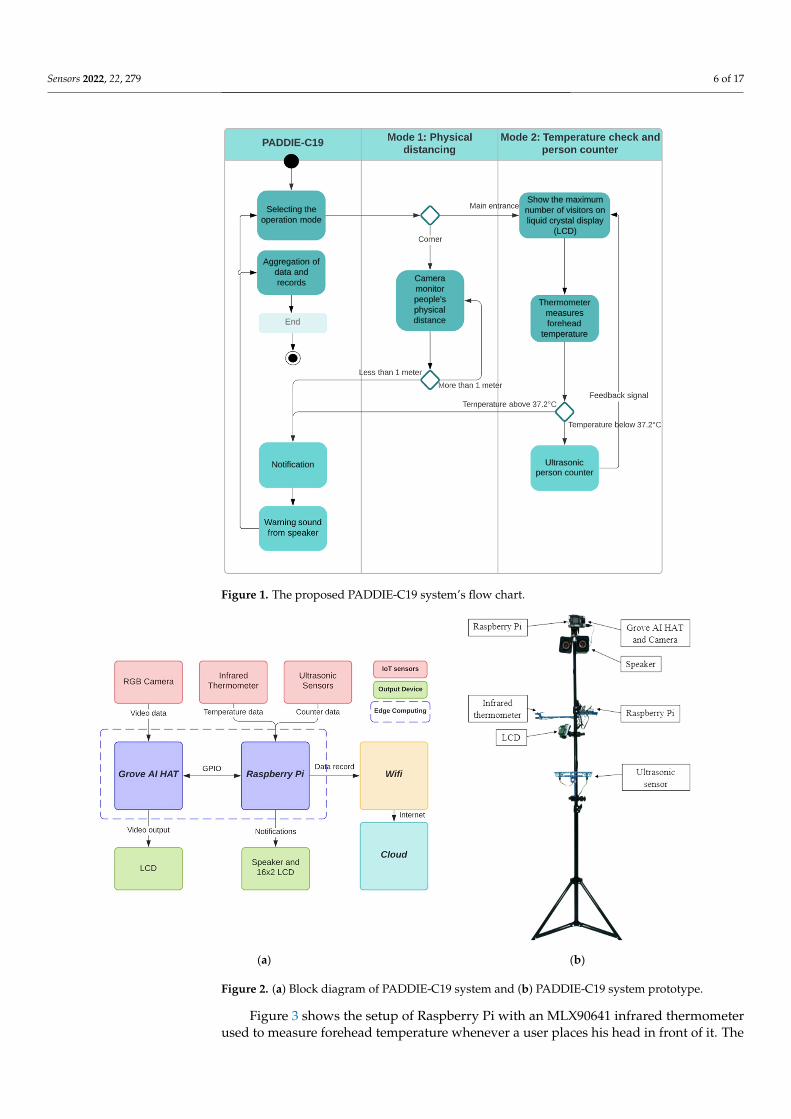
Figure 1 illustrates the flow of PADDIE-C19 operations at the edge, where computationand data storage are located closer to the primary user. PADDIE-C19 operates in twomodes: (i) physical distancing monitoring, and (ii) temperature measurement with aperson counter. PADDIE-C19 will be in the first mode if installed at the viewpoint corner.Grove AI HAT equipped with an RGB camera is used to monitor physical distancingcompliance. A loudspeaker will deliver a warning sound when individuals fail to maintaina physical distance of at least one meter. After that, in the second mode of operation,the infrared thermometer will take the forehead temperature of each individual withoutmaking contact before allowing them to enter the building or enclosed area. Simultaneously,the ultrasonic sensor will detect anyone passing through the main door. The RaspberryPi will be responsible for recording and processing temperature data and people counterdata. Following that, both measured values will be displayed on the LCD, along with themaximum number of people permitted in a room or area.
4.2. PADDIE-C19 Block Diagram
The PADDIE-C19 prototype is illustrated in Figure 2b. A 2 megapixels OV2640 RGBcamera is used to provide video data to Grove AI HAT, the edge computing unit for peopletracking and physical distance monitoring. An LCD with a resolution of 320 × 240 is usedto display the detection results while running the program. The OV2640 camera and LCDconnect to the Grove AI HAT via a 24-pin connector with a serial communication protocol.Two ultrasonic and one infrared sensor are connected to the Raspberry Pi microcontroller.A speaker is connected to the analog audio output of the Raspberry Pi to provide warningsound if there are individuals who do not comply with the physical distance rules. TheGrove AI HAT and Raspberry Pi can be powered by a 5 V/2 A power adapter via a USBconnector. The Raspberry Pi is connected to the internet and eventually the cloud via Wi-Fi,and can be remotely controlled via the VNC Connect software. The PADDIE-C19 designconcept is based on the installation at indoor public locations such as shops, offices, andfactories. All the connections can be referred to in Figure 2a.
Sensors 2022, 22, 279 6 of 17Sensors 2022, 22, x FOR PROOFREADING 6 of 18
Figure 1. The proposed PADDIE-C19 system’s flow chart.
4.2. PADDIE-C19 Block Diagram The PADDIE-C19 prototype is illustrated in Figure 2b. A 2 megapixels OV2640 RGB
camera is used to provide video data to Grove AI HAT, the edge computing unit for peo-ple tracking and physical distance monitoring. An LCD with a resolution of 320 × 240 is used to display the detection results while running the program. The OV2640 camera and LCD connect to the Grove AI HAT via a 24-pin connector with a serial communication protocol. Two ultrasonic and one infrared sensor are connected to the Raspberry Pi mi-crocontroller. A speaker is connected to the analog audio output of the Raspberry Pi to provide warning sound if there are individuals who do not comply with the physical dis-tance rules. The Grove AI HAT and Raspberry Pi can be powered by a 5 V/2 A power adapter via a USB connector. The Raspberry Pi is connected to the internet and eventually the cloud via Wi-Fi, and can be remotely controlled via the VNC Connect software. The PADDIE-C19 design concept is based on the installation at indoor public locations such as shops, offices, and factories. All the connections can be referred to in Figure 2a.
Figure 1. The proposed PADDIE-C19 system’s flow chart.
Sensors 2022, 22, x FOR PROOFREADING 7 of 18
(a) (b)
Figure 2. (a) Block diagram of PADDIE-C19 system and (b) PADDIE-C19 system prototype.
Figure 3 shows the setup of Raspberry Pi with an MLX90641 infrared thermometer used to measure forehead temperature whenever a user places his head in front of it. The forehead distance from the infrared thermometer can be calculated using an infrared sen-sor. This is due to the fact that each type of thermometer has a unique distance-to-spot ratio. As a result, temperature taking is permitted only at a distance of 3 to 5 cm for the MLX90614 thermometer to obtain an accurate forehead temperature reading. The infrared camera connects to the Raspberry Pi via the I2C protocol. The buzzer will emit a signal sound when the temperature is successfully measured. Furthermore, two ultrasonic sen-sors were used to detect people moving in and out of the premises from a distance. If the first sensor detects the obstacle ahead of time, the number of people recorded will be in-creased by one. The recorded number of people will be reduced by one if the second sen-sor detects the obstacle ahead of time. Algorithm 1 describes the physical distancing mon-itoring system that consists of two functions.
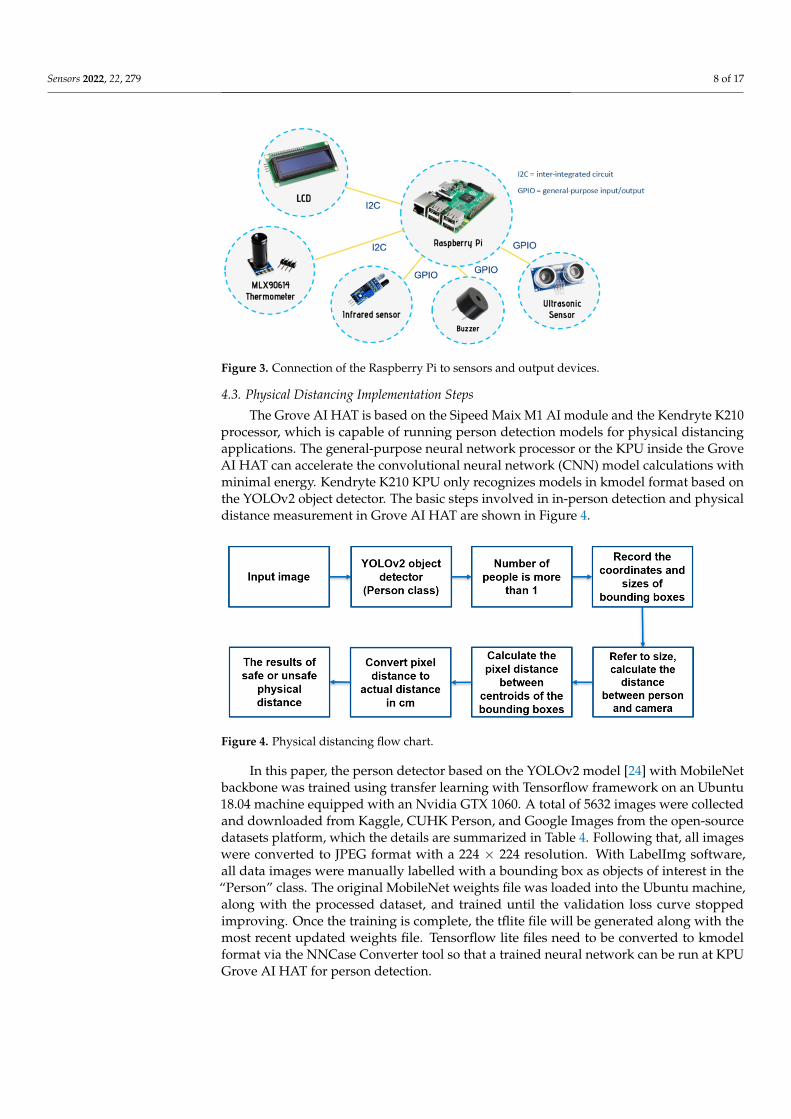
Figure 3. Connection of the Raspberry Pi to sensors and output devices.
Figure 2. (a) Block diagram of PADDIE-C19 system and (b) PADDIE-C19 system prototype.
Figure 3 shows the setup of Raspberry Pi with an MLX90641 infrared thermometerused to measure forehead temperature whenever a user places his head in front of it. The
Sensors 2022, 22, 279 7 of 17
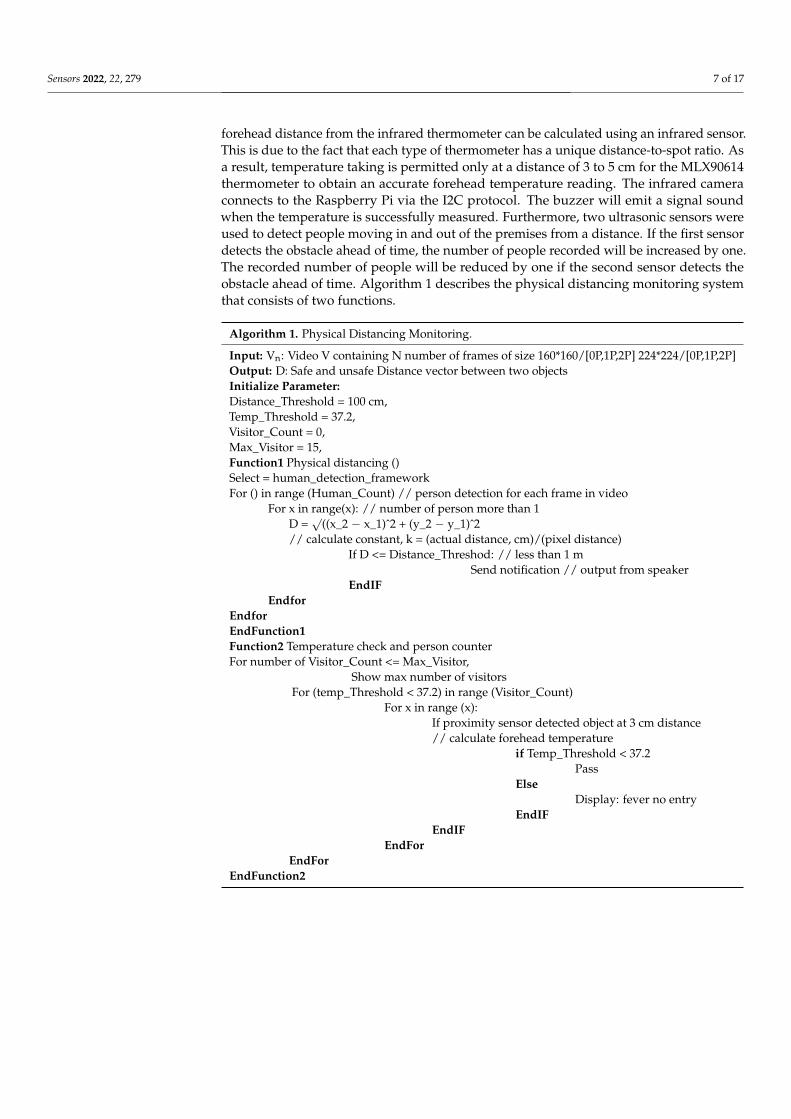
forehead distance from the infrared thermometer can be calculated using an infrared sensor.This is due to the fact that each type of thermometer has a unique distance-to-spot ratio. Asa result, temperature taking is permitted only at a distance of 3 to 5 cm for the MLX90614thermometer to obtain an accurate forehead temperature reading. The infrared cameraconnects to the Raspberry Pi via the I2C protocol. The buzzer will emit a signal soundwhen the temperature is successfully measured. Furthermore, two ultrasonic sensors wereused to detect people moving in and out of the premises from a distance. If the first sensordetects the obstacle ahead of time, the number of people recorded will be increased by one.The recorded number of people will be reduced by one if the second sensor detects theobstacle ahead of time. Algorithm 1 describes the physical distancing monitoring systemthat consists of two functions.
Algorithm 1. Physical Distancing Monitoring.
Input: Vn: Video V containing N number of frames of size 160*160/[0P,1P,2P] 224*224/[0P,1P,2P]Output: D: Safe and unsafe Distance vector between two objectsInitialize Parameter:Distance_Threshold = 100 cm,Temp_Threshold = 37.2,Visitor_Count = 0,Max_Visitor = 15,Function1 Physical distancing ()Select = human_detection_frameworkFor () in range (Human_Count) // person detection for each frame in video
For x in range(x): // number of person more than 1D =√
((x_2 − x_1)ˆ2 + (y_2 − y_1)ˆ2// calculate constant, k = (actual distance, cm)/(pixel distance)
If D <= Distance_Threshod: // less than 1 mSend notification // output from speaker
EndIFEndfor
EndforEndFunction1Function2 Temperature check and person counterFor number of Visitor_Count <= Max_Visitor,
Show max number of visitorsFor (temp_Threshold < 37.2) in range (Visitor_Count)
For x in range (x):If proximity sensor detected object at 3 cm distance// calculate forehead temperature
if Temp_Threshold < 37.2Pass
ElseDisplay: fever no entry
EndIFEndIF
EndForEndFor
EndFunction2
Sensors 2022, 22, 279 8 of 17
Sensors 2022, 22, x FOR PROOFREADING 7 of 18
(a) (b)
Figure 2. (a) Block diagram of PADDIE-C19 system and (b) PADDIE-C19 system prototype.
Figure 3 shows the setup of Raspberry Pi with an MLX90641 infrared thermometer used to measure forehead temperature whenever a user places his head in front of it. The forehead distance from the infrared thermometer can be calculated using an infrared sen-sor. This is due to the fact that each type of thermometer has a unique distance-to-spot ratio. As a result, temperature taking is permitted only at a distance of 3 to 5 cm for the MLX90614 thermometer to obtain an accurate forehead temperature reading. The infrared camera connects to the Raspberry Pi via the I2C protocol. The buzzer will emit a signal sound when the temperature is successfully measured. Furthermore, two ultrasonic sen-sors were used to detect people moving in and out of the premises from a distance. If the first sensor detects the obstacle ahead of time, the number of people recorded will be in-creased by one. The recorded number of people will be reduced by one if the second sen-sor detects the obstacle ahead of time. Algorithm 1 describes the physical distancing mon-itoring system that consists of two functions.
Figure 3. Connection of the Raspberry Pi to sensors and output devices. Figure 3. Connection of the Raspberry Pi to sensors and output devices.
4.3. Physical Distancing Implementation Steps
The Grove AI HAT is based on the Sipeed Maix M1 AI module and the Kendryte K210processor, which is capable of running person detection models for physical distancingapplications. The general-purpose neural network processor or the KPU inside the GroveAI HAT can accelerate the convolutional neural network (CNN) model calculations withminimal energy. Kendryte K210 KPU only recognizes models in kmodel format based onthe YOLOv2 object detector. The basic steps involved in in-person detection and physicaldistance measurement in Grove AI HAT are shown in Figure 4.
Sensors 2022, 22, x FOR PROOFREADING 9 of 18
based on the YOLOv2 object detector. The basic steps involved in in-person detection and physical distance measurement in Grove AI HAT are shown in Figure 4.
Figure 4. Physical distancing flow chart.
In this paper, the person detector based on the YOLOv2 model [24] with MobileNet backbone was trained using transfer learning with Tensorflow framework on an Ubuntu 18.04 machine equipped with an Nvidia GTX 1060. A total of 5632 images were collected and downloaded from Kaggle, CUHK Person, and Google Images from the open-source datasets platform, which the details are summarized in Table 4. Following that, all images were converted to JPEG format with a 224 × 224 resolution. With LabelImg software, all data images were manually labelled with a bounding box as objects of interest in the “Per-son” class. The original MobileNet weights file was loaded into the Ubuntu machine, along with the processed dataset, and trained until the validation loss curve stopped im-proving. Once the training is complete, the tflite file will be generated along with the most recent updated weights file. Tensorflow lite files need to be converted to kmodel format via the NNCase Converter tool so that a trained neural network can be run at KPU Grove AI HAT for person detection.
Table 4. Datasets description.
Class Sources Size Description Person Kaggle Dataset 785 A person was walking on the road.
CUHK Person Dataset 3840 Walking pedestrians at a various angle.
Google Open Images 1007 Randomly sampled person from differ-
ent backgrounds.
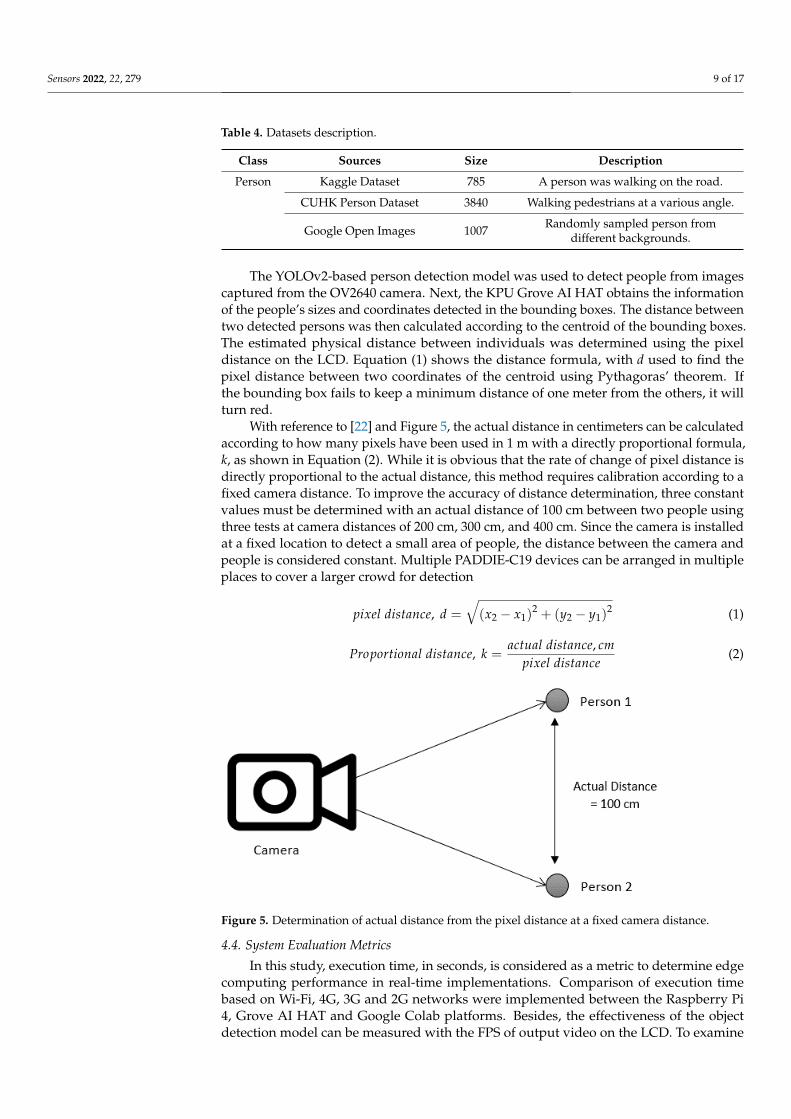
The YOLOv2-based person detection model was used to detect people from images captured from the OV2640 camera. Next, the KPU Grove AI HAT obtains the information of the people’s sizes and coordinates detected in the bounding boxes. The distance be-tween two detected persons was then calculated according to the centroid of the bounding boxes. The estimated physical distance between individuals was determined using the pixel distance on the LCD. Equation (1) shows the distance formula, with d used to find the pixel distance between two coordinates of the centroid using Pythagoras’ theorem. If the bounding box fails to keep a minimum distance of one meter from the others, it will turn red.
With reference to [22] and Figure 5, the actual distance in centimeters can be calcu-lated according to how many pixels have been used in 1 m with a directly proportional formula, k, as shown in Equation (2). While it is obvious that the rate of change of pixel distance is directly proportional to the actual distance, this method requires calibration according to a fixed camera distance. To improve the accuracy of distance determination, three constant values must be determined with an actual distance of 100 cm between two
Figure 4. Physical distancing flow chart.
In this paper, the person detector based on the YOLOv2 model [24] with MobileNetbackbone was trained using transfer learning with Tensorflow framework on an Ubuntu18.04 machine equipped with an Nvidia GTX 1060. A total of 5632 images were collectedand downloaded from Kaggle, CUHK Person, and Google Images from the open-sourcedatasets platform, which the details are summarized in Table 4. Following that, all imageswere converted to JPEG format with a 224 × 224 resolution. With LabelImg software,all data images were manually labelled with a bounding box as objects of interest in the“Person” class. The original MobileNet weights file was loaded into the Ubuntu machine,along with the processed dataset, and trained until the validation loss curve stoppedimproving. Once the training is complete, the tflite file will be generated along with themost recent updated weights file. Tensorflow lite files need to be converted to kmodelformat via the NNCase Converter tool so that a trained neural network can be run at KPUGrove AI HAT for person detection.
Sensors 2022, 22, 279 9 of 17
Table 4. Datasets description.
Class Sources Size Description
Person Kaggle Dataset 785 A person was walking on the road.
CUHK Person Dataset 3840 Walking pedestrians at a various angle.
Google Open Images 1007 Randomly sampled person fromdifferent backgrounds.
The YOLOv2-based person detection model was used to detect people from imagescaptured from the OV2640 camera. Next, the KPU Grove AI HAT obtains the informationof the people’s sizes and coordinates detected in the bounding boxes. The distance betweentwo detected persons was then calculated according to the centroid of the bounding boxes.The estimated physical distance between individuals was determined using the pixeldistance on the LCD. Equation (1) shows the distance formula, with d used to find thepixel distance between two coordinates of the centroid using Pythagoras’ theorem. Ifthe bounding box fails to keep a minimum distance of one meter from the others, it willturn red.
With reference to [22] and Figure 5, the actual distance in centimeters can be calculatedaccording to how many pixels have been used in 1 m with a directly proportional formula,k, as shown in Equation (2). While it is obvious that the rate of change of pixel distance isdirectly proportional to the actual distance, this method requires calibration according to afixed camera distance. To improve the accuracy of distance determination, three constantvalues must be determined with an actual distance of 100 cm between two people usingthree tests at camera distances of 200 cm, 300 cm, and 400 cm. Since the camera is installedat a fixed location to detect a small area of people, the distance between the camera andpeople is considered constant. Multiple PADDIE-C19 devices can be arranged in multipleplaces to cover a larger crowd for detection
pixel distance, d =
√(x2 − x1)
2 + (y2 − y1)2 (1)
Proportional distance, k =actual distance, cm
pixel distance(2)
Sensors 2022, 22, x FOR PROOFREADING 10 of 18
people using three tests at camera distances of 200 cm, 300 cm, and 400 cm. Since the cam-era is installed at a fixed location to detect a small area of people, the distance between the camera and people is considered constant. Multiple PADDIE-C19 devices can be arranged in multiple places to cover a larger crowd for detection 𝑝𝑖𝑥𝑒𝑙 𝑑𝑖𝑠𝑡𝑎𝑛𝑐𝑒, 𝑑 = 𝑥 − 𝑥 + 𝑦 − 𝑦 (1)
𝑃𝑟𝑜𝑝𝑜𝑟𝑡𝑖𝑜𝑛𝑎𝑙 𝑑𝑖𝑠𝑡𝑎𝑛𝑐𝑒, 𝑘 = 𝑎𝑐𝑡𝑢𝑎𝑙 𝑑𝑖𝑠𝑡𝑎𝑛𝑐𝑒, 𝑐𝑚𝑝𝑖𝑥𝑒𝑙 𝑑𝑖𝑠𝑡𝑎𝑛𝑐𝑒 (2)
Figure 5. Determination of actual distance from the pixel distance at a fixed camera distance.
4.4. System Evaluation Metrics In this study, execution time, in seconds, is considered as a metric to determine edge
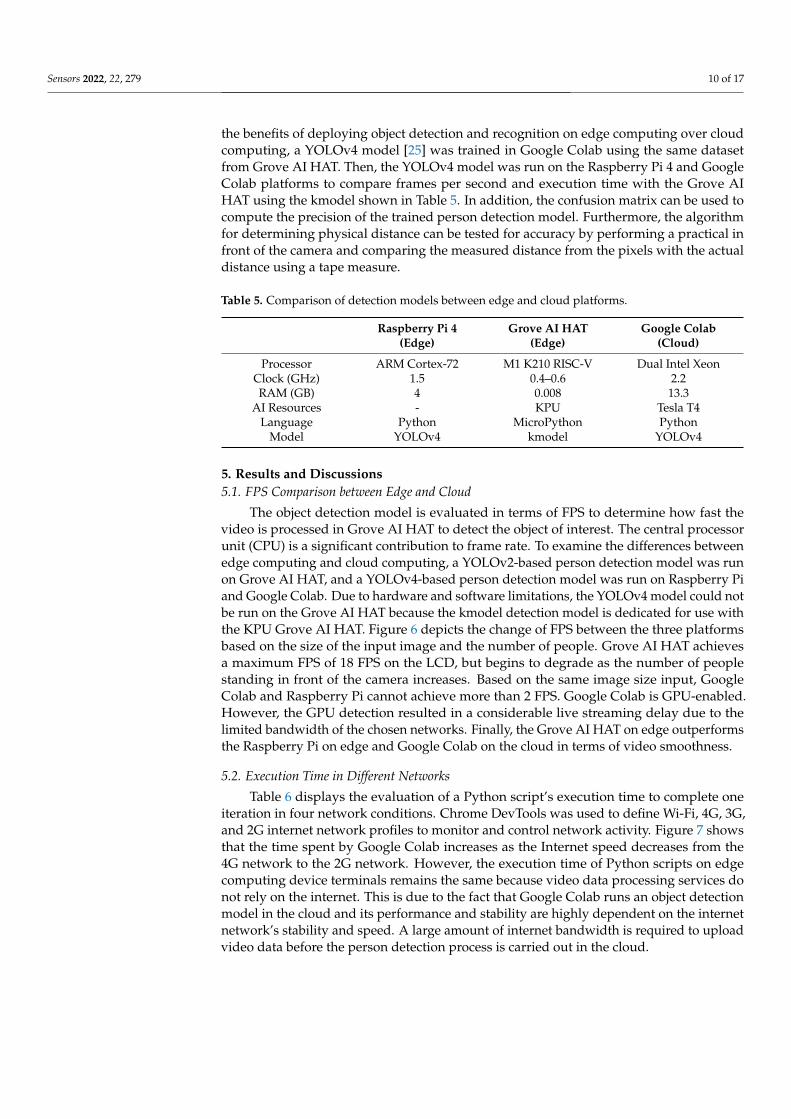
computing performance in real-time implementations. Comparison of execution time based on Wi-Fi, 4G, 3G and 2G networks were implemented between the Raspberry Pi 4, Grove AI HAT and Google Colab platforms. Besides, the effectiveness of the object detec-tion model can be measured with the FPS of output video on the LCD. To examine the benefits of deploying object detection and recognition on edge computing over cloud com-puting, a YOLOv4 model [25] was trained in Google Colab using the same dataset from Grove AI HAT. Then, the YOLOv4 model was run on the Raspberry Pi 4 and Google Colab platforms to compare frames per second and execution time with the Grove AI HAT using the kmodel shown in Table 5. In addition, the confusion matrix can be used to compute the precision of the trained person detection model. Furthermore, the algorithm for deter-mining physical distance can be tested for accuracy by performing a practical in front of the camera and comparing the measured distance from the pixels with the actual distance using a tape measure.
Table 5. Comparison of detection models between edge and cloud platforms.
Raspberry Pi 4 (Edge) Grove AI HAT (Edge) Google Colab (Cloud) Processor ARM Cortex-72 M1 K210 RISC-V Dual Intel Xeon
Clock (GHz) 1.5 0.4–0.6 2.2 RAM (GB) 4 0.008 13.3
AI Resources - KPU Tesla T4 Language Python MicroPython Python
Model YOLOv4 kmodel YOLOv4
Figure 5. Determination of actual distance from the pixel distance at a fixed camera distance.
4.4. System Evaluation Metrics
In this study, execution time, in seconds, is considered as a metric to determine edgecomputing performance in real-time implementations. Comparison of execution timebased on Wi-Fi, 4G, 3G and 2G networks were implemented between the Raspberry Pi4, Grove AI HAT and Google Colab platforms. Besides, the effectiveness of the objectdetection model can be measured with the FPS of output video on the LCD. To examine
Sensors 2022, 22, 279 10 of 17
the benefits of deploying object detection and recognition on edge computing over cloudcomputing, a YOLOv4 model [25] was trained in Google Colab using the same datasetfrom Grove AI HAT. Then, the YOLOv4 model was run on the Raspberry Pi 4 and GoogleColab platforms to compare frames per second and execution time with the Grove AIHAT using the kmodel shown in Table 5. In addition, the confusion matrix can be used tocompute the precision of the trained person detection model. Furthermore, the algorithmfor determining physical distance can be tested for accuracy by performing a practical infront of the camera and comparing the measured distance from the pixels with the actualdistance using a tape measure.
Table 5. Comparison of detection models between edge and cloud platforms.
Raspberry Pi 4(Edge)
Grove AI HAT(Edge)
Google Colab(Cloud)
Processor ARM Cortex-72 M1 K210 RISC-V Dual Intel XeonClock (GHz) 1.5 0.4–0.6 2.2RAM (GB) 4 0.008 13.3
AI Resources - KPU Tesla T4Language Python MicroPython Python
Model YOLOv4 kmodel YOLOv4
5. Results and Discussions5.1. FPS Comparison between Edge and Cloud
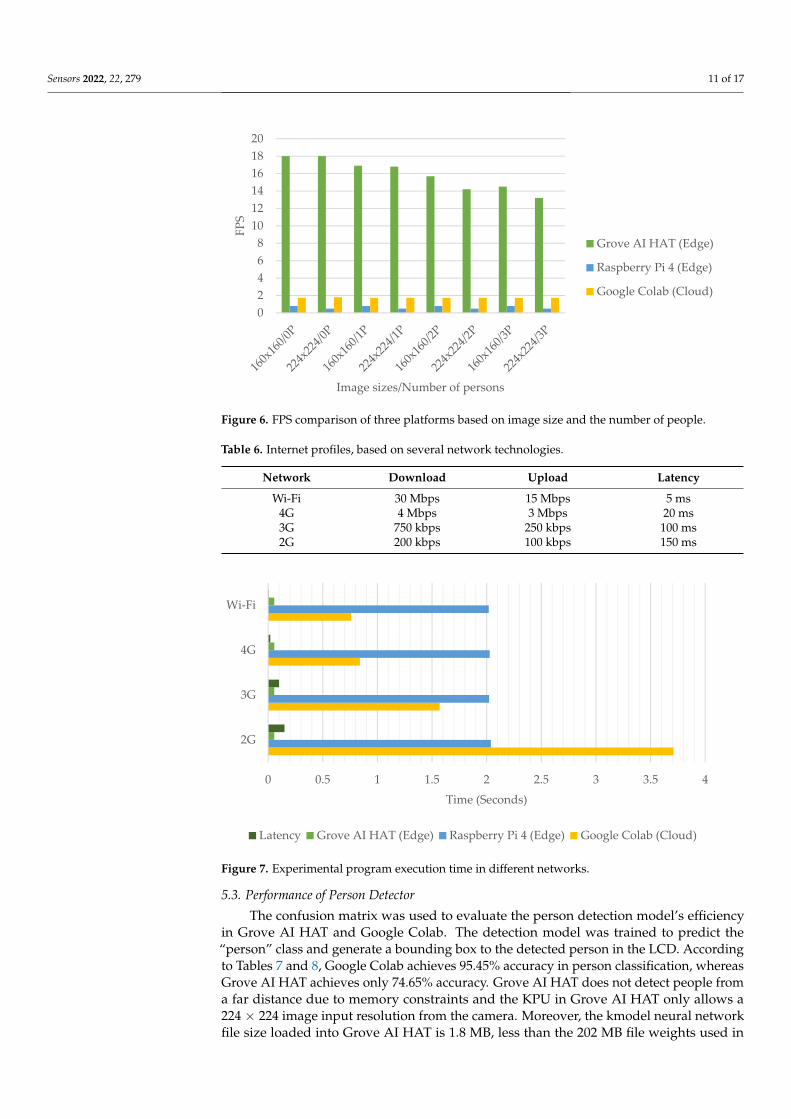
The object detection model is evaluated in terms of FPS to determine how fast thevideo is processed in Grove AI HAT to detect the object of interest. The central processorunit (CPU) is a significant contribution to frame rate. To examine the differences betweenedge computing and cloud computing, a YOLOv2-based person detection model was runon Grove AI HAT, and a YOLOv4-based person detection model was run on Raspberry Piand Google Colab. Due to hardware and software limitations, the YOLOv4 model could notbe run on the Grove AI HAT because the kmodel detection model is dedicated for use withthe KPU Grove AI HAT. Figure 6 depicts the change of FPS between the three platformsbased on the size of the input image and the number of people. Grove AI HAT achievesa maximum FPS of 18 FPS on the LCD, but begins to degrade as the number of peoplestanding in front of the camera increases. Based on the same image size input, GoogleColab and Raspberry Pi cannot achieve more than 2 FPS. Google Colab is GPU-enabled.However, the GPU detection resulted in a considerable live streaming delay due to thelimited bandwidth of the chosen networks. Finally, the Grove AI HAT on edge outperformsthe Raspberry Pi on edge and Google Colab on the cloud in terms of video smoothness.
5.2. Execution Time in Different Networks
Table 6 displays the evaluation of a Python script’s execution time to complete oneiteration in four network conditions. Chrome DevTools was used to define Wi-Fi, 4G, 3G,and 2G internet network profiles to monitor and control network activity. Figure 7 showsthat the time spent by Google Colab increases as the Internet speed decreases from the4G network to the 2G network. However, the execution time of Python scripts on edgecomputing device terminals remains the same because video data processing services donot rely on the internet. This is due to the fact that Google Colab runs an object detectionmodel in the cloud and its performance and stability are highly dependent on the internetnetwork’s stability and speed. A large amount of internet bandwidth is required to uploadvideo data before the person detection process is carried out in the cloud.
Sensors 2022, 22, 279 11 of 17
Sensors 2022, 22, x FOR PROOFREADING 11 of 18
5. Results and Discussions 5.1. FPS Comparison between Edge and Cloud
The object detection model is evaluated in terms of FPS to determine how fast the video is processed in Grove AI HAT to detect the object of interest. The central processor unit (CPU) is a significant contribution to frame rate. To examine the differences between edge computing and cloud computing, a YOLOv2-based person detection model was run on Grove AI HAT, and a YOLOv4-based person detection model was run on Raspberry Pi and Google Colab. Due to hardware and software limitations, the YOLOv4 model could not be run on the Grove AI HAT because the kmodel detection model is dedicated for use with the KPU Grove AI HAT. Figure 6 depicts the change of FPS between the three plat-forms based on the size of the input image and the number of people. Grove AI HAT achieves a maximum FPS of 18 FPS on the LCD, but begins to degrade as the number of people standing in front of the camera increases. Based on the same image size input, Google Colab and Raspberry Pi cannot achieve more than 2 FPS. Google Colab is GPU-enabled. However, the GPU detection resulted in a considerable live streaming delay due to the limited bandwidth of the chosen networks. Finally, the Grove AI HAT on edge out-performs the Raspberry Pi on edge and Google Colab on the cloud in terms of video smoothness.
Figure 6. FPS comparison of three platforms based on image size and the number of people.
5.2. Execution Time in Different Networks Table 6 displays the evaluation of a Python script’s execution time to complete one
iteration in four network conditions. Chrome DevTools was used to define Wi-Fi, 4G, 3G, and 2G internet network profiles to monitor and control network activity. Figure 7 shows that the time spent by Google Colab increases as the Internet speed decreases from the 4G network to the 2G network. However, the execution time of Python scripts on edge com-puting device terminals remains the same because video data processing services do not rely on the internet. This is due to the fact that Google Colab runs an object detection model in the cloud and its performance and stability are highly dependent on the internet network’s stability and speed. A large amount of internet bandwidth is required to upload video data before the person detection process is carried out in the cloud.
02468
101214161820
FPS
Image sizes/Number of persons
Grove AI HAT (Edge)
Raspberry Pi 4 (Edge)
Google Colab (Cloud)
Figure 6. FPS comparison of three platforms based on image size and the number of people.
Table 6. Internet profiles, based on several network technologies.
Network Download Upload Latency
Wi-Fi 30 Mbps 15 Mbps 5 ms4G 4 Mbps 3 Mbps 20 ms3G 750 kbps 250 kbps 100 ms2G 200 kbps 100 kbps 150 ms
Sensors 2022, 22, x FOR PROOFREADING 12 of 18
Table 6. Internet profiles, based on several network technologies.
Network Download Upload Latency Wi-Fi 30 Mbps 15 Mbps 5 ms
4G 4 Mbps 3 Mbps 20 ms 3G 750 kbps 250 kbps 100 ms 2G 200 kbps 100 kbps 150 ms
Figure 7. Experimental program execution time in different networks.
5.3. Performance of Person Detector The confusion matrix was used to evaluate the person detection model’s efficiency in
Grove AI HAT and Google Colab. The detection model was trained to predict the “per-son” class and generate a bounding box to the detected person in the LCD. According to Tables 7 and 8, Google Colab achieves 95.45% accuracy in person classification, whereas Grove AI HAT achieves only 74.65% accuracy. Grove AI HAT does not detect people from a far distance due to memory constraints and the KPU in Grove AI HAT only allows a 224 × 224 image input resolution from the camera. Moreover, the kmodel neural network file size loaded into Grove AI HAT is 1.8 MB, less than the 202 MB file weights used in YOLOv4. Because of their low hardware performance requirements, small neural net-works are ideal for edge devices, but they can also produce lower accuracy values.
Table 7. Accuracy of the person detector with Grove AI HAT.
Grove AI HAT Confusion Matrix Predicted Class Person No person Recall
Actual class Person 32 12 0.7273 No person 6 21 0.7778
Precision 0.8421 0.6364 Accuracy = 0.7465
0 0.5 1 1.5 2 2.5 3 3.5 4
2G
3G
4G
Wi-Fi
Time (Seconds)
Latency Grove AI HAT (Edge) Raspberry Pi 4 (Edge) Google Colab (Cloud)
Figure 7. Experimental program execution time in different networks.
5.3. Performance of Person Detector
The confusion matrix was used to evaluate the person detection model’s efficiencyin Grove AI HAT and Google Colab. The detection model was trained to predict the“person” class and generate a bounding box to the detected person in the LCD. Accordingto Tables 7 and 8, Google Colab achieves 95.45% accuracy in person classification, whereasGrove AI HAT achieves only 74.65% accuracy. Grove AI HAT does not detect people froma far distance due to memory constraints and the KPU in Grove AI HAT only allows a224 × 224 image input resolution from the camera. Moreover, the kmodel neural networkfile size loaded into Grove AI HAT is 1.8 MB, less than the 202 MB file weights used in
Sensors 2022, 22, 279 12 of 17
YOLOv4. Because of their low hardware performance requirements, small neural networksare ideal for edge devices, but they can also produce lower accuracy values.
Table 7. Accuracy of the person detector with Grove AI HAT.
Grove AI HAT Confusion Matrix
Predicted Class
Person No person Recall
Actual classPerson 32 12 0.7273
No person 6 21 0.7778Precision 0.8421 0.6364 Accuracy = 0.7465
Table 8. Accuracy of the person detector with Google Colab.
Google Colab Confusion Matrix
Predicted Class
Person No person Recall
Actual classPerson 38 1 0.9744
No person 2 25 0.9259Precision 0.95 0.9615 Accuracy = 0.9545
5.4. Distance Test
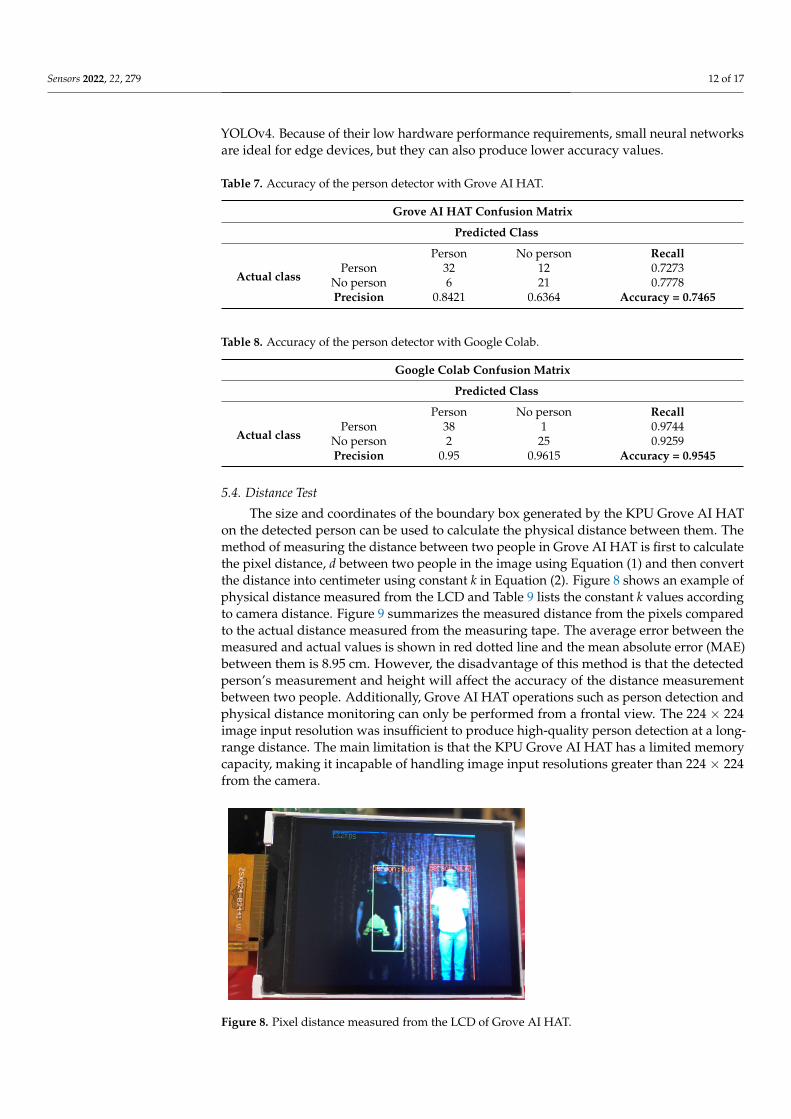
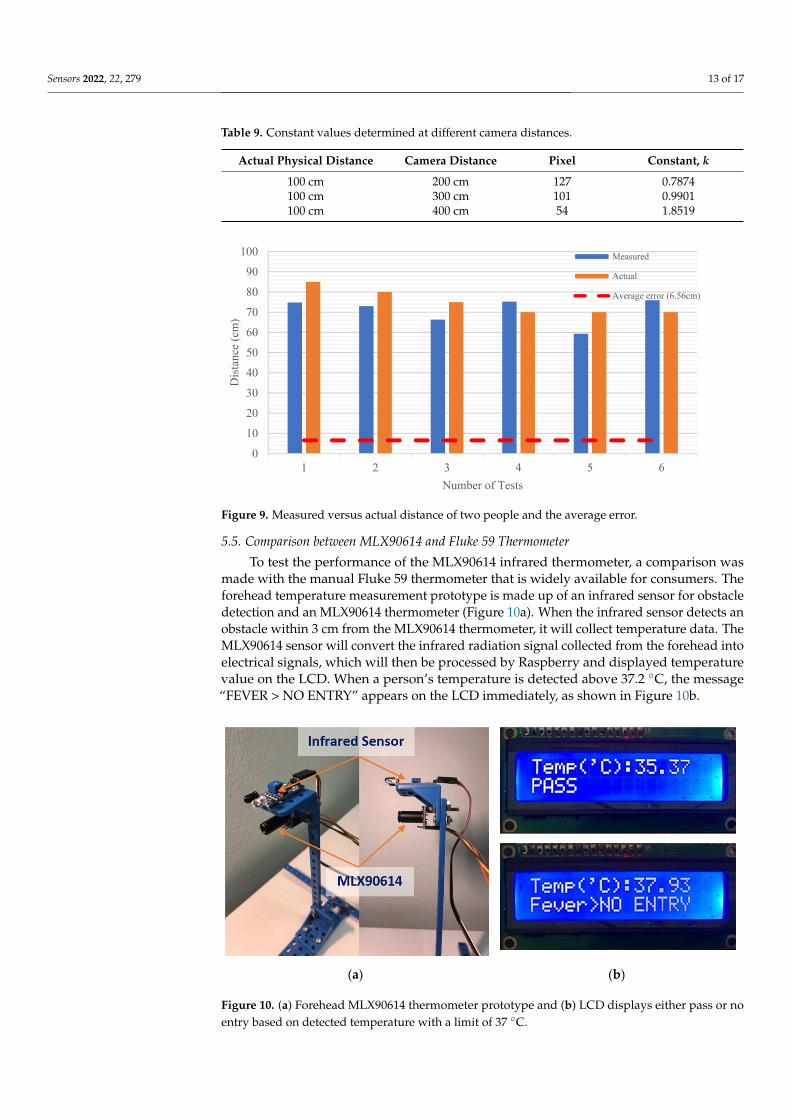
The size and coordinates of the boundary box generated by the KPU Grove AI HATon the detected person can be used to calculate the physical distance between them. Themethod of measuring the distance between two people in Grove AI HAT is first to calculatethe pixel distance, d between two people in the image using Equation (1) and then convertthe distance into centimeter using constant k in Equation (2). Figure 8 shows an example ofphysical distance measured from the LCD and Table 9 lists the constant k values accordingto camera distance. Figure 9 summarizes the measured distance from the pixels comparedto the actual distance measured from the measuring tape. The average error between themeasured and actual values is shown in red dotted line and the mean absolute error (MAE)between them is 8.95 cm. However, the disadvantage of this method is that the detectedperson’s measurement and height will affect the accuracy of the distance measurementbetween two people. Additionally, Grove AI HAT operations such as person detection andphysical distance monitoring can only be performed from a frontal view. The 224 × 224image input resolution was insufficient to produce high-quality person detection at a long-range distance. The main limitation is that the KPU Grove AI HAT has a limited memorycapacity, making it incapable of handling image input resolutions greater than 224 × 224from the camera.
Sensors 2022, 22, x FOR PROOFREADING 13 of 18
Table 8. Accuracy of the person detector with Google Colab.
Google Colab Confusion Matrix Predicted Class Person No person Recall
Actual class Person 38 1 0.9744 No person 2 25 0.9259
Precision 0.95 0.9615 Accuracy = 0.9545
5.4. Distance Test The size and coordinates of the boundary box generated by the KPU Grove AI HAT
on the detected person can be used to calculate the physical distance between them. The method of measuring the distance between two people in Grove AI HAT is first to calcu-late the pixel distance, d between two people in the image using Equation (1) and then convert the distance into centimeter using constant k in Equation (2). Figure 8 shows an example of physical distance measured from the LCD and Table 9 lists the constant k val-ues according to camera distance. Figure 9 summarizes the measured distance from the pixels compared to the actual distance measured from the measuring tape. The average error between the measured and actual values is shown in red dotted line and the mean absolute error (MAE) between them is 8.95 cm. However, the disadvantage of this method is that the detected person’s measurement and height will affect the accuracy of the dis-tance measurement between two people. Additionally, Grove AI HAT operations such as person detection and physical distance monitoring can only be performed from a frontal view. The 224 × 224 image input resolution was insufficient to produce high-quality per-son detection at a long-range distance. The main limitation is that the KPU Grove AI HAT has a limited memory capacity, making it incapable of handling image input resolutions greater than 224 × 224 from the camera.
Figure 8. Pixel distance measured from the LCD of Grove AI HAT.
Table 9. Constant values determined at different camera distances.
Actual Physical Distance Camera Distance Pixel Constant, k 100 cm 200 cm 127 0.7874 100 cm 300 cm 101 0.9901 100 cm 400 cm 54 1.8519
Figure 8. Pixel distance measured from the LCD of Grove AI HAT.
Sensors 2022, 22, 279 13 of 17
Table 9. Constant values determined at different camera distances.
Actual Physical Distance Camera Distance Pixel Constant, k
100 cm 200 cm 127 0.7874100 cm 300 cm 101 0.9901100 cm 400 cm 54 1.8519
Sensors 2022, 22, x FOR PROOFREADING 14 of 18
Figure 9. Measured versus actual distance of two people and the average error.
5.5. Comparison between MLX90614 and Fluke 59 Thermometer To test the performance of the MLX90614 infrared thermometer, a comparison was
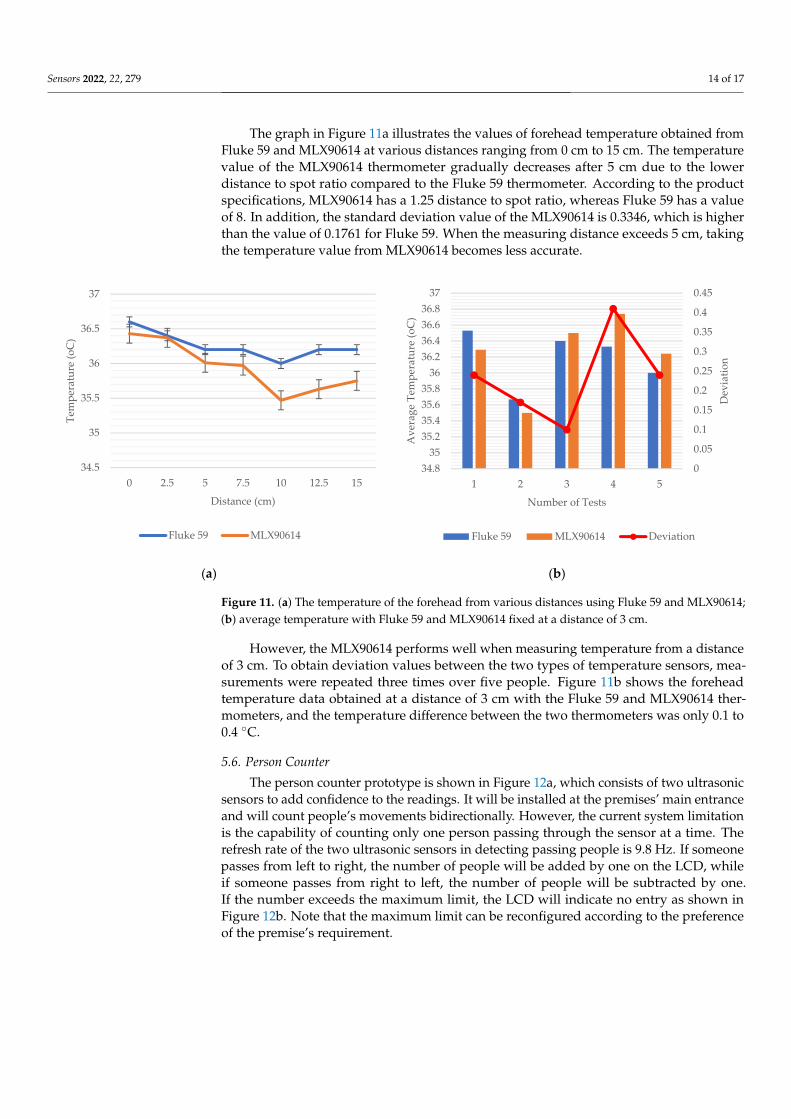
made with the manual Fluke 59 thermometer that is widely available for consumers. The forehead temperature measurement prototype is made up of an infrared sensor for obsta-cle detection and an MLX90614 thermometer (Figure 10a). When the infrared sensor de-tects an obstacle within 3 cm from the MLX90614 thermometer, it will collect temperature data. The MLX90614 sensor will convert the infrared radiation signal collected from the forehead into electrical signals, which will then be processed by Raspberry and displayed temperature value on the LCD. When a person’s temperature is detected above 37.2 °C, the message “FEVER > NO ENTRY” appears on the LCD immediately, as shown in Figure 10b.
(a) (b)
Figure 10. (a) Forehead MLX90614 thermometer prototype and (b) LCD displays either pass or no entry based on detected temperature with a limit of 37 °C.
The graph in Figure 11a illustrates the values of forehead temperature obtained from Fluke 59 and MLX90614 at various distances ranging from 0 cm to 15 cm. The temperature value of the MLX90614 thermometer gradually decreases after 5 cm due to the lower dis-tance to spot ratio compared to the Fluke 59 thermometer. According to the product spec-ifications, MLX90614 has a 1.25 distance to spot ratio, whereas Fluke 59 has a value of 8. In addition, the standard deviation value of the MLX90614 is 0.3346, which is higher than
0
10
20
30
40
50
60
70
80
90
100
1 2 3 4 5 6
Dist
ance
(cm
)
Number of Tests
Measured
Actual
Average error (6.56cm)
Figure 9. Measured versus actual distance of two people and the average error.
5.5. Comparison between MLX90614 and Fluke 59 Thermometer
To test the performance of the MLX90614 infrared thermometer, a comparison wasmade with the manual Fluke 59 thermometer that is widely available for consumers. Theforehead temperature measurement prototype is made up of an infrared sensor for obstacledetection and an MLX90614 thermometer (Figure 10a). When the infrared sensor detects anobstacle within 3 cm from the MLX90614 thermometer, it will collect temperature data. TheMLX90614 sensor will convert the infrared radiation signal collected from the forehead intoelectrical signals, which will then be processed by Raspberry and displayed temperaturevalue on the LCD. When a person’s temperature is detected above 37.2 ◦C, the message“FEVER > NO ENTRY” appears on the LCD immediately, as shown in Figure 10b.
Sensors 2022, 22, x FOR PROOFREADING 14 of 18
Figure 9. Measured versus actual distance of two people and the average error.
5.5. Comparison between MLX90614 and Fluke 59 Thermometer To test the performance of the MLX90614 infrared thermometer, a comparison was
made with the manual Fluke 59 thermometer that is widely available for consumers. The forehead temperature measurement prototype is made up of an infrared sensor for obsta-cle detection and an MLX90614 thermometer (Figure 10a). When the infrared sensor de-tects an obstacle within 3 cm from the MLX90614 thermometer, it will collect temperature data. The MLX90614 sensor will convert the infrared radiation signal collected from the forehead into electrical signals, which will then be processed by Raspberry and displayed temperature value on the LCD. When a person’s temperature is detected above 37.2 °C, the message “FEVER > NO ENTRY” appears on the LCD immediately, as shown in Figure 10b.
(a) (b)
Figure 10. (a) Forehead MLX90614 thermometer prototype and (b) LCD displays either pass or no entry based on detected temperature with a limit of 37 °C.
The graph in Figure 11a illustrates the values of forehead temperature obtained from Fluke 59 and MLX90614 at various distances ranging from 0 cm to 15 cm. The temperature value of the MLX90614 thermometer gradually decreases after 5 cm due to the lower dis-tance to spot ratio compared to the Fluke 59 thermometer. According to the product spec-ifications, MLX90614 has a 1.25 distance to spot ratio, whereas Fluke 59 has a value of 8. In addition, the standard deviation value of the MLX90614 is 0.3346, which is higher than
0
10
20
30
40
50
60
70
80
90
100
1 2 3 4 5 6
Dist
ance
(cm
)
Number of Tests
Measured
Actual
Average error (6.56cm)
Figure 10. (a) Forehead MLX90614 thermometer prototype and (b) LCD displays either pass or noentry based on detected temperature with a limit of 37 ◦C.
Sensors 2022, 22, 279 14 of 17
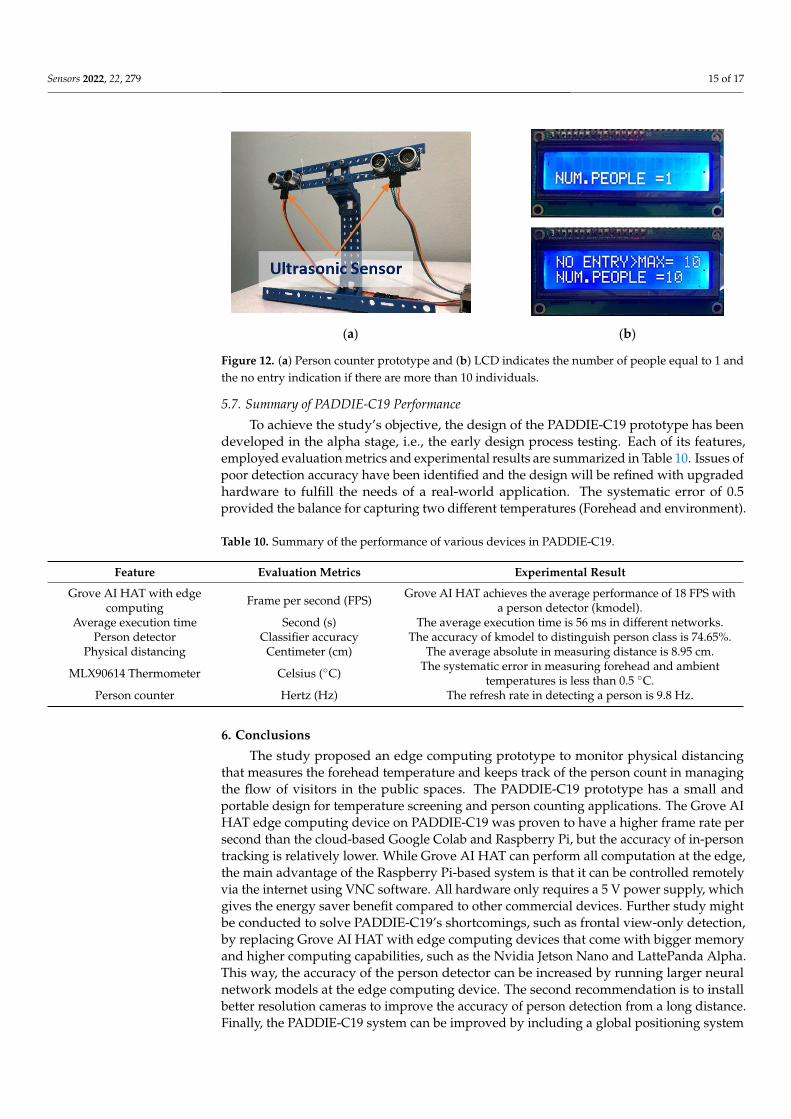
The graph in Figure 11a illustrates the values of forehead temperature obtained fromFluke 59 and MLX90614 at various distances ranging from 0 cm to 15 cm. The temperaturevalue of the MLX90614 thermometer gradually decreases after 5 cm due to the lowerdistance to spot ratio compared to the Fluke 59 thermometer. According to the productspecifications, MLX90614 has a 1.25 distance to spot ratio, whereas Fluke 59 has a valueof 8. In addition, the standard deviation value of the MLX90614 is 0.3346, which is higherthan the value of 0.1761 for Fluke 59. When the measuring distance exceeds 5 cm, takingthe temperature value from MLX90614 becomes less accurate.
Sensors 2022, 22, x FOR PROOFREADING 15 of 18
the value of 0.1761 for Fluke 59. When the measuring distance exceeds 5 cm, taking the temperature value from MLX90614 becomes less accurate.
(a) (b)
Figure 11. (a) The temperature of the forehead from various distances using Fluke 59 and MLX90614; (b) average temperature with Fluke 59 and MLX90614 fixed at a distance of 3 cm.
However, the MLX90614 performs well when measuring temperature from a dis-tance of 3 cm. To obtain deviation values between the two types of temperature sensors, measurements were repeated three times over five people. Figure 11b shows the forehead temperature data obtained at a distance of 3 cm with the Fluke 59 and MLX90614 ther-mometers, and the temperature difference between the two thermometers was only 0.1 to 0.4 °C.
5.6. Person Counter The person counter prototype is shown in Figure 12a, which consists of two ultra-
sonic sensors to add confidence to the readings. It will be installed at the premises’ main entrance and will count people’s movements bidirectionally. However, the current system limitation is the capability of counting only one person passing through the sensor at a time. The refresh rate of the two ultrasonic sensors in detecting passing people is 9.8 Hz. If someone passes from left to right, the number of people will be added by one on the LCD, while if someone passes from right to left, the number of people will be subtracted by one. If the number exceeds the maximum limit, the LCD will indicate no entry as shown in Figure 12b. Note that the maximum limit can be reconfigured according to the preference of the premise’s requirement.
34.5
35
35.5
36
36.5
37
0 2.5 5 7.5 10 12.5 15
Tem
pera
ture
(oC
)
Distance (cm)
Fluke 59 MLX90614
0
0.05
0.1
0.15
0.2
0.25
0.3
0.35
0.4
0.45
34.835
35.235.435.635.8
3636.236.436.636.8
37
1 2 3 4 5
Dev
iatio
n
Ave
rage
Tem
pera
ture
(oC
)
Number of Tests
Fluke 59 MLX90614 Deviation
Figure 11. (a) The temperature of the forehead from various distances using Fluke 59 and MLX90614;(b) average temperature with Fluke 59 and MLX90614 fixed at a distance of 3 cm.
However, the MLX90614 performs well when measuring temperature from a distanceof 3 cm. To obtain deviation values between the two types of temperature sensors, mea-surements were repeated three times over five people. Figure 11b shows the foreheadtemperature data obtained at a distance of 3 cm with the Fluke 59 and MLX90614 ther-mometers, and the temperature difference between the two thermometers was only 0.1 to0.4 ◦C.
5.6. Person Counter
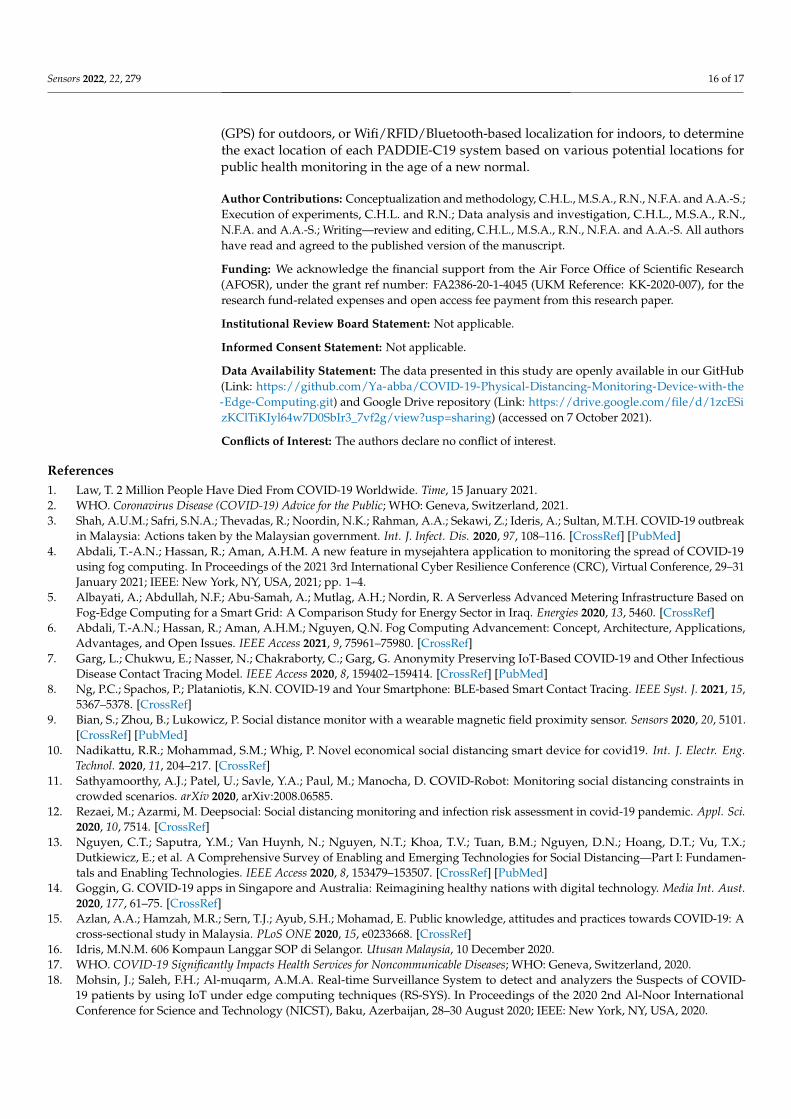
The person counter prototype is shown in Figure 12a, which consists of two ultrasonicsensors to add confidence to the readings. It will be installed at the premises’ main entranceand will count people’s movements bidirectionally. However, the current system limitationis the capability of counting only one person passing through the sensor at a time. Therefresh rate of the two ultrasonic sensors in detecting passing people is 9.8 Hz. If someonepasses from left to right, the number of people will be added by one on the LCD, whileif someone passes from right to left, the number of people will be subtracted by one.If the number exceeds the maximum limit, the LCD will indicate no entry as shown inFigure 12b. Note that the maximum limit can be reconfigured according to the preferenceof the premise’s requirement.
Sensors 2022, 22, 279 15 of 17Sensors 2022, 22, x FOR PROOFREADING 16 of 18
(a) (b)
Figure 12. (a) Person counter prototype and (b) LCD indicates the number of people equal to 1 and the no entry indication if there are more than 10 individuals.
5.7. Summary of PADDIE-C19 Performance To achieve the study’s objective, the design of the PADDIE-C19 prototype has been
developed in the alpha stage, i.e., the early design process testing. Each of its features, employed evaluation metrics and experimental results are summarized in Table 10. Issues of poor detection accuracy have been identified and the design will be refined with up-graded hardware to fulfill the needs of a real-world application. The systematic error of 0.5 provided the balance for capturing two different temperatures (Forehead and environ-ment).
Table 10. Summary of the performance of various devices in PADDIE-C19.
Feature Evaluation Metrics Experimental Result
Grove AI HAT with edge computing Frame per second (FPS) Grove AI HAT achieves the average performance of 18 FPS with a person
detector (kmodel).
Average execution time Second (s) The average execution time is 56 ms in
different networks.
Person detector Classifier accuracy The accuracy of kmodel to distinguish person class is 74.65%.
Physical distancing Centimeter (cm) The average absolute in measuring dis-tance is 8.95 cm.
MLX90614 Thermometer Celsius (°C) The systematic error in measuring
forehead and ambient temperatures is less than 0.5 °C.
Person counter Hertz (Hz) The refresh rate in detecting a person is 9.8 Hz.
6. Conclusions The study proposed an edge computing prototype to monitor physical distancing
that measures the forehead temperature and keeps track of the person count in managing the flow of visitors in the public spaces. The PADDIE-C19 prototype has a small and port-able design for temperature screening and person counting applications. The Grove AI HAT edge computing device on PADDIE-C19 was proven to have a higher frame rate per second than the cloud-based Google Colab and Raspberry Pi, but the accuracy of in-per-son tracking is relatively lower. While Grove AI HAT can perform all computation at the edge, the main advantage of the Raspberry Pi-based system is that it can be controlled remotely via the internet using VNC software. All hardware only requires a 5 V power
Figure 12. (a) Person counter prototype and (b) LCD indicates the number of people equal to 1 andthe no entry indication if there are more than 10 individuals.
5.7. Summary of PADDIE-C19 Performance
To achieve the study’s objective, the design of the PADDIE-C19 prototype has beendeveloped in the alpha stage, i.e., the early design process testing. Each of its features,employed evaluation metrics and experimental results are summarized in Table 10. Issues ofpoor detection accuracy have been identified and the design will be refined with upgradedhardware to fulfill the needs of a real-world application. The systematic error of 0.5provided the balance for capturing two different temperatures (Forehead and environment).
Table 10. Summary of the performance of various devices in PADDIE-C19.
Feature Evaluation Metrics Experimental Result
Grove AI HAT with edgecomputing Frame per second (FPS) Grove AI HAT achieves the average performance of 18 FPS with
a person detector (kmodel).Average execution time Second (s) The average execution time is 56 ms in different networks.
Person detector Classifier accuracy The accuracy of kmodel to distinguish person class is 74.65%.Physical distancing Centimeter (cm) The average absolute in measuring distance is 8.95 cm.
MLX90614 Thermometer Celsius (◦C) The systematic error in measuring forehead and ambienttemperatures is less than 0.5 ◦C.
Person counter Hertz (Hz) The refresh rate in detecting a person is 9.8 Hz.
6. Conclusions
The study proposed an edge computing prototype to monitor physical distancingthat measures the forehead temperature and keeps track of the person count in managingthe flow of visitors in the public spaces. The PADDIE-C19 prototype has a small andportable design for temperature screening and person counting applications. The Grove AIHAT edge computing device on PADDIE-C19 was proven to have a higher frame rate persecond than the cloud-based Google Colab and Raspberry Pi, but the accuracy of in-persontracking is relatively lower. While Grove AI HAT can perform all computation at the edge,the main advantage of the Raspberry Pi-based system is that it can be controlled remotelyvia the internet using VNC software. All hardware only requires a 5 V power supply, whichgives the energy saver benefit compared to other commercial devices. Further study mightbe conducted to solve PADDIE-C19’s shortcomings, such as frontal view-only detection,by replacing Grove AI HAT with edge computing devices that come with bigger memoryand higher computing capabilities, such as the Nvidia Jetson Nano and LattePanda Alpha.This way, the accuracy of the person detector can be increased by running larger neuralnetwork models at the edge computing device. The second recommendation is to installbetter resolution cameras to improve the accuracy of person detection from a long distance.Finally, the PADDIE-C19 system can be improved by including a global positioning system
Sensors 2022, 22, 279 16 of 17
(GPS) for outdoors, or Wifi/RFID/Bluetooth-based localization for indoors, to determinethe exact location of each PADDIE-C19 system based on various potential locations forpublic health monitoring in the age of a new normal.
Author Contributions: Conceptualization and methodology, C.H.L., M.S.A., R.N., N.F.A. and A.A.-S.;Execution of experiments, C.H.L. and R.N.; Data analysis and investigation, C.H.L., M.S.A., R.N.,N.F.A. and A.A.-S.; Writing—review and editing, C.H.L., M.S.A., R.N., N.F.A. and A.A.-S. All authorshave read and agreed to the published version of the manuscript.
Funding: We acknowledge the financial support from the Air Force Office of Scientific Research(AFOSR), under the grant ref number: FA2386-20-1-4045 (UKM Reference: KK-2020-007), for theresearch fund-related expenses and open access fee payment from this research paper.
Institutional Review Board Statement: Not applicable.
Informed Consent Statement: Not applicable.
Data Availability Statement: The data presented in this study are openly available in our GitHub(Link: https://github.com/Ya-abba/COVID-19-Physical-Distancing-Monitoring-Device-with-the-Edge-Computing.git) and Google Drive repository (Link: https://drive.google.com/file/d/1zcESizKClTiKIyl64w7D0SbIr3_7vf2g/view?usp=sharing) (accessed on 7 October 2021).
Conflicts of Interest: The authors declare no conflict of interest.
References1. Law, T. 2 Million People Have Died From COVID-19 Worldwide. Time, 15 January 2021.2. WHO. Coronavirus Disease (COVID-19) Advice for the Public; WHO: Geneva, Switzerland, 2021.3. Shah, A.U.M.; Safri, S.N.A.; Thevadas, R.; Noordin, N.K.; Rahman, A.A.; Sekawi, Z.; Ideris, A.; Sultan, M.T.H. COVID-19 outbreak
in Malaysia: Actions taken by the Malaysian government. Int. J. Infect. Dis. 2020, 97, 108–116. [CrossRef] [PubMed]4. Abdali, T.-A.N.; Hassan, R.; Aman, A.H.M. A new feature in mysejahtera application to monitoring the spread of COVID-19
using fog computing. In Proceedings of the 2021 3rd International Cyber Resilience Conference (CRC), Virtual Conference, 29–31January 2021; IEEE: New York, NY, USA, 2021; pp. 1–4.
5. Albayati, A.; Abdullah, N.F.; Abu-Samah, A.; Mutlag, A.H.; Nordin, R. A Serverless Advanced Metering Infrastructure Based onFog-Edge Computing for a Smart Grid: A Comparison Study for Energy Sector in Iraq. Energies 2020, 13, 5460. [CrossRef]
6. Abdali, T.-A.N.; Hassan, R.; Aman, A.H.M.; Nguyen, Q.N. Fog Computing Advancement: Concept, Architecture, Applications,Advantages, and Open Issues. IEEE Access 2021, 9, 75961–75980. [CrossRef]
7. Garg, L.; Chukwu, E.; Nasser, N.; Chakraborty, C.; Garg, G. Anonymity Preserving IoT-Based COVID-19 and Other InfectiousDisease Contact Tracing Model. IEEE Access 2020, 8, 159402–159414. [CrossRef] [PubMed]
8. Ng, P.C.; Spachos, P.; Plataniotis, K.N. COVID-19 and Your Smartphone: BLE-based Smart Contact Tracing. IEEE Syst. J. 2021, 15,5367–5378. [CrossRef]
9. Bian, S.; Zhou, B.; Lukowicz, P. Social distance monitor with a wearable magnetic field proximity sensor. Sensors 2020, 20, 5101.[CrossRef] [PubMed]
10. Nadikattu, R.R.; Mohammad, S.M.; Whig, P. Novel economical social distancing smart device for covid19. Int. J. Electr. Eng.Technol. 2020, 11, 204–217. [CrossRef]
11. Sathyamoorthy, A.J.; Patel, U.; Savle, Y.A.; Paul, M.; Manocha, D. COVID-Robot: Monitoring social distancing constraints incrowded scenarios. arXiv 2020, arXiv:2008.06585.
12. Rezaei, M.; Azarmi, M. Deepsocial: Social distancing monitoring and infection risk assessment in covid-19 pandemic. Appl. Sci.2020, 10, 7514. [CrossRef]
13. Nguyen, C.T.; Saputra, Y.M.; Van Huynh, N.; Nguyen, N.T.; Khoa, T.V.; Tuan, B.M.; Nguyen, D.N.; Hoang, D.T.; Vu, T.X.;Dutkiewicz, E.; et al. A Comprehensive Survey of Enabling and Emerging Technologies for Social Distancing—Part I: Fundamen-tals and Enabling Technologies. IEEE Access 2020, 8, 153479–153507. [CrossRef] [PubMed]
14. Goggin, G. COVID-19 apps in Singapore and Australia: Reimagining healthy nations with digital technology. Media Int. Aust.2020, 177, 61–75. [CrossRef]
15. Azlan, A.A.; Hamzah, M.R.; Sern, T.J.; Ayub, S.H.; Mohamad, E. Public knowledge, attitudes and practices towards COVID-19: Across-sectional study in Malaysia. PLoS ONE 2020, 15, e0233668. [CrossRef]
16. Idris, M.N.M. 606 Kompaun Langgar SOP di Selangor. Utusan Malaysia, 10 December 2020.17. WHO. COVID-19 Significantly Impacts Health Services for Noncommunicable Diseases; WHO: Geneva, Switzerland, 2020.18. Mohsin, J.; Saleh, F.H.; Al-muqarm, A.M.A. Real-time Surveillance System to detect and analyzers the Suspects of COVID-
19 patients by using IoT under edge computing techniques (RS-SYS). In Proceedings of the 2020 2nd Al-Noor InternationalConference for Science and Technology (NICST), Baku, Azerbaijan, 28–30 August 2020; IEEE: New York, NY, USA, 2020.

Sensors 2022, 22, 279 17 of 17
19. Ranaweera, P.S.; Liyanage, M.; Jurcut, A.D. Novel MEC based Approaches for Smart Hospitals to Combat COVID-19 Pandemic.IEEE Consum. Electron. Mag. 2020, 10, 80–91. [CrossRef]
20. Hegde, C.; Jiang, Z.; Suresha, P.B.; Zelko, J.; Seyedi, S.; Smith, M.; Wright, D.; Kamaleswaran, R.; Reyna, M.; Clifford, G.AutoTriage—An Open Source Edge Computing Raspberry Pi-based Clinical Screening System. medRxiv 2020, 1–13. [CrossRef]
21. Saponara, S.; Elhanashi, A.; Gagliardi, A. Implementing a real-time, AI-based, people detection and social distancing measuringsystem for Covid-19. J. Real-Time Image Process. 2021, 18, 1937–1947. [CrossRef] [PubMed]
22. Rahim, A.; Maqbool, A.; Rana, T. Monitoring social distancing under various low light conditions with deep learning and a singlemotionless time of flight camera. PLoS ONE 2021, 16, e0247440. [CrossRef] [PubMed]
23. Shen, Y.; Guo, D.; Long, F.; Mateos, L.A.; Ding, H.; Xiu, Z.; Hellman, R.B.; King, A.; Chen, S.; Zhang, C.; et al. Robots underCOVID-19 Pandemic: A Comprehensive Survey. IEEE Access 2021, 9, 1590–1615. [CrossRef]
24. Redmon, J.; Farhadi, A. YOLO9000: Better, faster, stronger. In Proceedings of the IEEE Conference on Computer Vision andPattern Recognition, Honolulu, HI, USA, 21–26 July 2017; pp. 7263–7271.
25. Bochkovskiy, A.; Wang, C.-Y.; Liao, H.-Y.M. Yolov4: Optimal speed and accuracy of object detection. arXiv 2020, arXiv:2004.10934.


