Embed Size (px)
Citation preview

1
MINIREVIEWS
Physical Properties of Biopolymers Assessed by Optical Tweezers: Analyses of Folding and Refolding of Bacterial Pili Magnus Andersson,[a] Ove Axner,[a] Fredrik Almqvist,[b] Bernt Eric Uhlin,[c] and Erik Fällman*[a]
Bacterial adhesion to surfaces mediated by specific adhesion organelles that promote infections, as exemplified by the pili of uropathogenic E. coli, has been studied mostly at the level of cell-cell interactions and thereby reflected the averaged behavior of multiple pili. The role of the pili rod structure per se has therefore only been estimated from the outcome of experiments involving large number of organelles at the same time. It has, however, lately become clear that the biomechanical behavior of the pili shafts play an important although hitherto a rather unrecognized role in the adhesion process. It has, for example, been observed that shafts from two different strains, even though they are similar in their structure, impose large differences in the ability of the bacterium to adhere to its host tissue. However, in order to identify all properties of pili structures that are of importance in the adhesion process, the biomechanical properties of
pili need to be assessed at the single molecule level. Due to the low force range of these structures it has until recently not been possible to obtain such information. However, with the development of force measuring optical tweezers (FMOT), with force resolution in the low pN range, it has lately become possible to assess forces mediated by individual pili on single living bacteria in real time. FMOT allows for a more or less detailed mapping of the biomechanical properties of individual pili shafts, in particular those that are associated with their elongation and contraction under stress. This review presents the FMOT technique, the biological model system, and results from assessment of the biomechanical properties of bacterial pili. The information retrieved is in the end also compared with that obtained by AFM.
Introduction
Despite much progress in our understanding of how microbial cells are functioning, our means to prevent and cure infections are far from adequate. The diseases due to bacterial infections continue to be major reasons for morbidity and mortality worldwide. The widespread bacterial resistance to currently used antibiotics is a ubiquitous and rapidly growing problem in our society that needs to be addressed by appropriate means with urgency. It is a general consensus that the development of new drugs requires identification of new targets in bacteria. The characterization of bacterial factors and mechanisms specifically promoting infection has opened new possibilities for such developments. There are common themes with respect to the mechanisms and role of many bacterial virulence factors (e.g. toxins, adherence factors, etc) found in different bacterial species. The adhesion of bacterial pathogens to surfaces in host tissue is regarded as an initial, and crucial, step in case of most infections. It is therefore an attractive and highly relevant approach to look for new means to interfere with the adhesion mechanisms that are present in the pathogenic bacteria.
1.1 Adhesion to host surfaces by Gram-negative pathogenic bacteria
Among the different adhesion mechanisms found in bacteria, the adhesive surface organelles known as pili or fimbriae that often are found on Gram-negative species are to date the best characterized. In particular, the pili mediating receptor specific adherence of Escherichia coli to surfaces on mammalian cells
and tissues have been studied in detail. Both the extraintestinal E. coli pathogenic (ExPEC) variants and the intestinal pathogenic variants (e.g. the enterotoxigenic E. coli, ETEC) are commonly equipped with pili adhesion systems promoting their efficient colonization and establishment of infections. The ExPEC causing urinary tract infections (UTI) are also referred to as UPEC (urinary tract pathogenic E. coli) and have become a paradigm for studies of the mechanisms and molecular details behind receptor specific adhesion and host interactions.
1.2 UPEC
UPEC is by far the most common reason behind UTI and thereby also a medically very important infectious agent.[1] In the case of UPEC the specific adhesion is known to occur through stereo specific interaction by a particular pilus component, the adhesin
[a] Mr. M. Andersson, Prof. O. Axner, Dr. E. Fällman Department of Physics Umeå University SE-901 87 Umeå Sweden Fax: (+46) 90-786-6673 E-mail: [email protected]
[b] Prof. F. Almqvist Department of Organic Chemistry Umeå University SE-901 87 Umeå Sweden
[c] Prof. B. E. Uhlin Department of Molecular Biology SE-901 87 Umeå Sweden

2
protein, and carbohydrate receptor molecules that are part of glycolipids or glycoproteins on the host cells. The biogenesis of the pili organelles is a complex process involving a number of steps and proteins occurring in the bacterial cytoplasm, in the periplasmic space, and at the membranes. Pathogenic bacteria often carry multiple genetic determinants for adhesion systems that are allowing interaction with different receptors and they commonly contain genes also for different cytotoxic proteins that are expressed under the conditions when bacteria adhere. Genomic sequencing of E. coli clinical isolates has revealed that these pathogens are carrying multiple such gene clusters that presumably provide selective advantages for the bacteria in the different niches of infection.[2, 3] As the causative agent of UTI, E. coli may occur in either of the different locations throughout the urinary tract. UPEC are found in bladder infections (cystitis), in pyelonephritis, as well as in asymptomatic bacteriuria. The different niches will impose different biophysical/biomechanical constraints on the interactions between bacterial components and the host surface components. However, not much is known about these aspects and there is a need for analyses of such, e.g. the bacterial pili assemblies are adapted to different physical environments, in addition to the variation in receptor specificity suited for a particular niche.
Until recently the knowledge of the biomechanical function of the adhesion organelles was based merely on information obtained from static observations, i.e., electron micrographs, atomic force microscopy (AFM) pictures and crystallographic data. It has provided the basis for a rather good understanding about the structural features of the pili systems but only given a hint of the potential dynamic functions of such structures.
1.3 Biogenesis of pili and the role of pilicides
Many different species of pathogenic bacteria use the so-called chaperone/usher pathway defined from the studies of UPEC for the assembly of the adhesive pili/fimbriae.[4] The Pap pili of UPEC are serving as the model system for this pathway and the genetic and biochemical analyses have revealed a number of molecular details.
Pili consist of a number of repeating protein subunits (PapA, E, F, G, H and K in the case of P pili) and they are assembled by a donor strand exchange reaction whereby every subunit donates its amino terminal extension to complete the immunoglobulin (Ig)-like fold of its neighbor, thus forming a non-covalent immunoglobulin-like polymer, arranged in a helical structure.[5] The absence of the C-terminal beta strand makes folding of the subunit dependent upon the periplasmic chaperone (e. g. PapD) that is comprised of two Ig-like domains. The chaperone transiently donates its edge beta strand to complete the Ig fold of the subunit and the chaperone-subunit complexes are then targeted to outer membrane assembly sites called ushers (e. g. PapC) that form channels in the outer membrane where the donor strand exchange reaction takes place, driving the translocation of the growing fiber[4] (Fig. 1). The chaperones are therefore essential for the folding, stabilization and transport of the subunits and chaperone-deficient or dysfunctional strains are unable to assemble pili.[6-9] The chaperones and ushers that make up these molecular machines are all highly homologous with highly conserved active surfaces.
Recently, rationally designed small drug-like compounds, termed pilicides, that inhibit this assembly process have been developed and their detailed mechanism of action has been studied.[10, 11] Data from NMR spectroscopy, crystallography, surface plasmon resonance studies and genetics support that
these pilicides inhibit the formation of the essential ternary complex between the usher and the chaperone-subunit co-complex. This results in selective inhibition of the chaperone-usher pathway and, consequently, in non-piliated bacteria that retain similar growth properties as untreated controls. The effect is dose dependent and lower doses of pilicides do not result in completely non-piliated bacteria but instead a larger fraction of moderately piliated bacteria are seen, without altering the functional properties of the pilus rod.[12] This implies that pilicides can be used as chemical tools to modulate or regulate the chaperone usher pathway (See section 6.3).
Figure 1. The upper left shows an AFM image of a bacterium, HB101/pPAP5, expressing P pili and the schematic illustration above describes the biogenesis and assembly of pili by the chaperone usher pathway. The black bar in the AFM image is representing a length of 2 µm.
1.4 Justifications for studies of pili by force spectroscopic techniques
Recent studies have indicated that the adhesion systems with the adhesin protein at the pilus tip may act as rather dynamic biomechanical machineries. It has for instance been found that the adhesin of type 1 pili are of catch bond type[13] (and similar indications have recently appeared also for P pili)[14], which implies that the strength of a bond increases as the applied force is increased up to a threshold force. It has also been shown that the efficiency of this catch bond is affected by the pilus shaft.[15] In addition, it has been found that the elongation and contraction properties of the pili (including their unfolding and refolding processes) are of importance for the dynamic function of the adhesion system of a bacterium. These properties make it also possible for pili with a distribution of lengths to be elongated to dissimilar degrees when exposed to an external shear-force action, which, in turn, makes it possible for a bacterium to distribute an external force over a number of pili without exposing an individual pilus to a large force. All this suggests that the biomechanical function of the pili is of great importance for the bacterial ability to initiate and establish an infection process. These aspects also serve as strong incentive for further assessment of the structural dynamics and the biomechanical function of bacterial attachment organelles.
As mentioned above, static pictures of the pili structure can be obtained from conventional microscopy studies, e.g. using AFM or electron microscopy, and from crystallographic data,
Folded rod
PapH
PapC
Unfolded rod
PapG
PapK
Cytoplasmic Membrane
D
D D
PapE
PapF
D
PapA
KE
G
AA
PeriplasmD
D
DD
D
A
Outer Membrane

3
using X-ray diffraction. However, to get information about the dynamic, in vivo-like, action of the adhesion organelle, the biomechanical function of pili has to be probed by studies under stress. Such studies have been performed by analyses of bacteria under flow. This type of measurements will not, however, give any detailed information about the function of an individual pilus, but rather an averaged ensemble behavior of all the pili involved. In order to assess in detail the function of an individual adhesion system of a given bacterial cell, the elongation and contraction properties of pili need to be assessed under controlled conditions by an appropriately sensitive force measuring technique addressing one pilus at a time. This minireview addresses the physical properties of individual pili on single bacterial cells, in particular their elongation, unfolding and refolding properties, assessed by Optical Tweezers.
2 Force Measuring Systems for Single Molecule Force Spectroscopy
2.1 Techniques for measurements of forces in biological systems
Thanks to the advances in development of modern force measuring techniques during the last decades, various types of forces and interactions in biological systems can nowadays be monitored with good accuracy. With the growing number of techniques developed, scientists cannot only assess forces and interaction strengths in biological system, but also manipulate single biological objects, including individual macromolecules, under controlled conditions. This implies that properties of individual biomolecules can nowadays be assessed without the configurational averaging that always takes place in bulk experiments.
The most common force measuring techniques of today are AFM and force measuring optical tweezers (FMOT). Whereas the former uses a mechanical cantilever to probe the interaction with the sample, as is further discussed below, the latter relies on a small bead that is held in the focal region of laser light, which acts as an optical trap. This difference provides the two techniques with somewhat dissimilar properties of which the most important is that FMOT can assess weaker forces than AFM.
The fundamental property that sets the resolution of a measurement system is the inherent noise. A force transducer that relies on a harmonic potential with a given stiffness, κ , gives rise to a linearly restoring force, tF , through tF xκ= Δ , where xΔ is the displacement from the equilibrium position of the force transducer (the bead). A trapped particle is therefore prevented from long-range diffusion by the restoring force of the trap. The confined particle will instead wiggle in the trap with an average amplitude that depends on the strength of the trap as well as the Brownian motion. More precisely, the position of the particle will be Gaussian distributed[16] with a standard deviation, xσ , given by,
/x kTσ κ= . (1)
Since the force is related to the displacement through the stiffness, the corresponding standard deviation for the measured force, Fσ , becomes
F x kTσ κσ κ= = . (2)
Inasmuch as the former depends on the square root of the inverse of the stiffness whereas the latter scales with the square root of κ , this shows that a force measurement system cannot simultaneously be optimized for both maximum position and force resolution (i.e., simultaneously minimum xσ and Fσ ).
The cantilever used in AFM has a significantly larger stiffness than the optical trap in FMOT (~10 nN/µm vs. ~100 pN/µm). This explains why FMOT outperforms AFM when it comes to force resolution (although AFM beats FMOT regarding position measurements). AFM can typically measure forces from a few pN and upwards, into the nN regime,[17] whereas FMOT can assess forces from within the sub-pN range into the hundreds of pN range.[18] Since many types of forces in biological systems are in the pN or tens of pN range, e.g. those of entropic origin and those from non-covalent bonds, FMOT is often more suitable than AFM for studies of forces in biological systems. The FMOT technique has also, by its ability to manipulate individual biological objects, the additional specific advantage over AFM that it can be used to actively isolate a single molecule and thereby simplify the system under investigation significantly. This implies that many types of non-specific interaction can be eliminated that otherwise would compromise the analysis.
2.2 Force measuring optical tweezers - FMOT
Optical tweezers are scientific instruments that use a focused laser beam to trap small objects, particles as well as biological objects, in its focus. The basic principles of optical trapping and the first stable three-dimensional trap, based upon counter propagating beams, were established in the early 1970s by Arthur Ashkin.[19, 20] A few years later the first single gradient trap was completed and the optical tweezers technique as we know it today was born.[21] Since then, numerous groups worldwide have constructed and developed sensitive and user friendly tweezers systems for both optical manipulation and force measurements.[22]
The trap provides an attractive force (typically on the order of picoNewton, pN) on micrometer sized dielectrical particles (primarily non-absorbing particles with an index of refraction larger than that of the surrounding) that confines the particles in the focal region, which is schematically illustrated in Fig. 2A & B. When an external force is applied to a trapped particle, as is schematically depicted in Fig. 2C, its position in the trap will shift, due to force balance, a distance /extF κ , where extF is the externally applied force. For force measurement applications, the bead thus acts both as a handle for the tweezers and a force transducer. All this implies that particles can be manipulated with nanometer precision in three dimensions under fully controlled conditions by moving the trap, and forces on individual biomolecules can be measured with sub-pN accuracy by monitoring the shift of a the position of the bead in the trap.
Figure 2. The principle for trapping an object with optical tweezers. tF represents the force from the trap whereas extF indicates an external force, e.g. that from a biological system. The force of the trap is in general related to the shift of the position of the bead in the trap through tF xκ= Δ .
A B C Ft Ft FtFext

4
Access to a single molecule manipulation and force measuring technique with such properties has opened up several new important areas of study in the field of biosciences. The optical tweezers society has in particular expanded the applicability of the FMOT technique to areas encompassing assessments of minute forces and various types of interaction in biological systems. This has implied that the FMOT technique allows for tests of physical models describing biomolecules in a way that never before has been achieved. It is possible, for example, to observe the action of tiny molecular motors and study the activity of a single enzyme on biological molecules.[23] It is also possible to directly investigate the ligand-receptor interactions,[24] or study the folding and unfolding of large biomolecules, e.g. DNA[25, 26] and pili,[27-31] and from such measurements determine interaction energies. In summary, single molecular optical tweezers measurements have generated new information about various types of interaction processes between individual molecules, which is essential for the understanding of the complex mechanisms that are involved in real biological processes.
3 Instrumentation and Methodology
3.1 Experimental setup
Although FMOT equipment can be constructed in a variety of ways, they all share one common feature; the monitoring of the position of a bead that is held by optical tweezers and simultaneously attached to the system under study.[22] The FMOT system used for most of the studies presented here makes use of a separate probe laser for monitoring of the position of the trapped bead. The instrumentation is schematically depicted in Fig. 3 and described in some detail elsewhere. [32-34]
Figure 3. A schematic illustration of the optical tweezers setup used by the authors. A Nd:YVO4 laser is used for trapping whereas a fiber-coupled HeNe laser is used for probing the position of the object. The defection of the probe laser is monitored on a PSD detector placed on top of the microscope.
3.2 Bacterial strains, growth conditions, and specimen preparation
To avoid possible interference of other similar (i.e., fimbrial) surface structures, P pili and type 1 pili were expressed by the otherwise afimbriated E. coli strain HB101 from the plasmid pPAP5 and pPKL4, respectively. The E. coli strain HB101/pPAP5 carries the entire pap gene cluster on the vector pBR322 and expresses normal P pili[35] and the E. coli strain HB101/pPKL4
expresses functional type 1 pili.[36] The bacteria were cultured on trypticase soy agar at 37°C and the expression of functional pili was assessed by hemagglutination assays.[28]
The biological model system has been described in some detail previously.[30] In short, 9 µm polystyrene beads are first firmly attached to a microscope slide by the following procedure. A solution containing well diluted 9 µm beads is dropped on a washed and cleaned regular coverslip, which subsequently is placed in an oven at 55° C for 60 min. The immobilized beads are then covered with a water solution of Poly-L-Lysine, placed in an incubator at 37° C for 60 min, and finally rinsed in deionized water (MilliQ). The sample, in which the measurements are performed, consists of a 25 μL drop of 1 x PBS containing a few suspended bacteria and 3.2 µm beads.
3.3 Mounting and calibration procedure
An individual free-floating bacterium is trapped by the optical tweezers (run at low power, i.e., a few tenth of mW at the sample) and firmly mounted on a 9 µm (large) bead. As is schematically shown in Fig. 4A, a small bead is then trapped by the optical tweezers with normal power and brought to a position close to the bacterium where it is properly aligned (the bacterium and the trapped bead are aligned along the translation direction of the piezo stage).
Figure 4. Procedure for mounting and measurement of the force response of a single pilus. The large bead is immobilized to the cover slide which in turn is controlled via a piezo stage. A free-floating bacterium is trapped by the optical tweezers and firmly mounted on the large bead (procedure not illustrated). A free-floating small bead is then trapped by the optical tweezers (panel A) and brought into contact with the bacterium (panel B) in a controlled way to allow for attachment of pili. Measurements are then performed by moving the cover slip back and forth while measuring the corresponding force-elongation response (panel C).
A force measuring calibration procedure, based upon Brownian motion, is then used to calibrate the stiffness of the trap before each new set of measurements (procedure not shown).[33] The technique is based upon the fact that a bead in a medium experiences random forces due to thermal fluctuations, which gives rise to a random movement (so called Brownian motion). The optical trap restricts, however, the movements that have the largest amplitudes, i.e., the low frequencies. A power spectrum of a particle in a trap brings therefore information about the quality as well as the stiffness of the trap. It has been found that the stiffness of the trap in the authors’ laboratory varies in general less than a few percent over the course of a day, and less in between consecutive measurements, which shows that the system has good stability and reproducibility.
After this calibration procedure, the small bead, to which the pili adhere non-covalently and non-specifically through hydrophobic interaction, is then brought close to the bacterium in order to achieve attachment between a few pili and the bead (Fig. 4B). The data acquisition is started and the piezo stage is set in
A B C

5
motion in order to provide a controlled elongation of the pilus/pili under study (Fig. 4C).
3.4 Measurement procedure
A typical bacterium expresses a multitude of pili that together form a sophisticated adhesion mechanism optimized for distributing external shear forces. A measurement in which the probing object is simply brought in close contact to the investigated bacteria will therefore in most cases give rise to the formation of multiple bonds, as is shown by the upper trace in Fig. 5A. Multi-pili responses will limit the amount of information that can be assessed from the system since they will not give a sufficiently detailed picture of the fundamental interactions in the system. In addition, since the highest measurable force is limited by the strength of the optical trap (a few hundred pN) the system is only capable of measuring the simultaneous response of a limited number of pili. We have therefore developed a method for probing a single pilus response.
Figure 5. Panel A shows by the black line the elongation first of two pili where one detaches from the bead and the remaining response is only from a single pilus. The direction of the movement is then reversed, whereby the pilus is refolding, which is illustrated by the grey line. Panel B shows in turn a second elongation and contraction cycle of the same pilus.
Any elongation showing multiple pili attachments are pursued until all pili except one has detached. For the example in Fig. 5A, a single pilus response is obtained after about 2 µm of elongation, at which the response shows a steady force at around 28 pN (see further discussion below). After an elongation of about 3.3 µm, the direction of the movement is reversed, as is shown by the grey line. At the point where the remaining pilus is completely relaxed (at ~0.4 μm in this particular case) the contraction is stopped. Most often no other pilus reattaches although the small bead is in close proximity to the bacterium. The remaining pilus can then be elongated and contracted several times, providing a number of measurement cycles from the same individual pilus, of which one is shown in Fig. 5B.
4 A Biomechanical Model of Bonds
4.1 Bonds, energy landscape, and forces
In the world of macromolecules, a bond can be described in terms of an energy landscape, which is a representation of its energy-length dependence. As is schematically illustrated by the upper curve in Fig. 6, such a landscape has, in most cases, at least two minima, representing the bond being “closed” and “opened” (referred to as state A and B), respectively, and an intermediate local maximum, called the transition state (denoted by T). A closed bond can open, and thus elongate, only if it, somehow, “passes” this transition state. The energy of the transition state ( ATVΔ in Fig. 6) thereby represents the activation energy for bond opening.
Figure 6. Schematic energy landscape diagram of the interactions between neighboring PapA units elongated along the long axis of the PapA rod (the reaction coordinate, denoted by x). The state A represents the closed layer-to-layer bond of the helical structure of the PapA rod whereas state B symbolizes the head-to-tail interaction that makes up the backbone of the PapA rod. The position of the maximum of the energy landscape curve between the states A and B is referred to as the transition state, and is denoted by T. The uppermost curve represents the energy landscape for a PapA rod not exposed to any force, whereas the lower refers to the case when the PapA rod is exposed to a force equal to the unfolding force of the quaternary structure of the PapA rod, UFF . The bond length, ATxΔ , represents the distance from the minimum of state A to the transition state, whereas TBxΔ is the distance from the transition state to the minimum of state B. ABxΔ represents the total elongation of the layer-to-layer bonds along the reaction coordinate when it opens.
Due to the thermal energy, every bond will vibrate and each vibration oscillation can be seen as an attempt to open. The vibration frequency can therefore be seen as an attempt rate. The bond opening rate can, in general, be written as a product of this attempt rate and an Arrhenius factor encompassing the activation energy, ATVΔ . A typical attempt rate for a bond in a liquid is around 109 – 1010 Hz whereas the activation energy can range from several tens of kT (where k is the Boltzmann constant and T the temperature) to virtually zero, representing various bond strengths.[37]
An opened bond can subsequently close. This takes place with a rate given by the product of the attempt rate and an Arrhenius factor encompassing the difference in energy between the transition state and the open state ( AT ABV VΔ − Δ in Fig. 6).
ABxΔ
ABΔV
A B
Energy
UFF F=
0F =
x
ATxΔ TBxΔ
TBATΔV

6
When a force is applied to a bond (often called stress in the world of biophysics), the activation energy for bond opening is lowered by an amount equal to the product of the force and the bond length (the latter given by the distance from the closed state to the transition state), i.e., from ATVΔ to AT ATV F xΔ − Δ in Fig. 6. The activation energy for bond closure is increased an amount equal to the product of the force and the length between the transition state and the open state, thus from AT ABV VΔ − Δ to
AT AB TBV V F xΔ − Δ + Δ .[38] This can be envisioned as if the energy landscape is tilted with a slope given by the force, as is illustrated by the lower curve in Fig. 6. Applying a force to a bond alters therefore the activation barriers and thereby the bond opening and closure rates, which in turn affects the fate of the bond. This is the basis for force spectroscopy of bonds.
When the force transducer has been moved a distance ΔL , the force in the system will increase as a consequence of the finite stiffness of the force transducer as κΔL . When the distance is increased with a given speed, L , a single bond will be exposed to a linearly increasing force, given by κL , referred to as the loading rate, whereby it will open at a certain force. However, due to the statistical properties of thermodynamics, a single bond, exposed to repeated elongations under a given loading rate, will open at a distribution of forces where the peak position of this distribution is called the bond strength.[37, 39] Since a bond exposed to a constant elongation speed will experience a progressively increased probability for opening, and the integrated history of such a time dependent opening probability will determine the fate of the bond, the bond strength of a single bond will, in turn, critically depend on how fast the force is applied. It can be shown that, under a set of fairly normal conditions, the strength of a single bond is proportional to the logarithm of the loading rate with a slope set by the bond length.
In contrast, if a macromolecule consists of several bonds that are arranged in a sequential configuration, the width of the bond opening distribution is decreased by a force stabilizing process and all bonds will open in succession at more or less the same force, thus giving rise to a force plateau in the force-elongation
response.[30] As is discussed further below, the value of this force depends on the elongation speed; it is fairly independent of the elongation speed for low speeds, but proportional to the logarithm of the elongation speed for higher.
4.2 The elongation and contraction of a helixlike polymer exposed to stress
Due to its structure, a pilus has an intricate force-elongation response that differs from that of a single bond as well as those of many other types of biopolymer. It can still though be understood in terms of the general bond opening and closure properties of a single bond or a chain bonds given above. As is shown in Fig. 5B, not only does it show a constant unfolding force for a substantial part of its elongation (referred to as region II), but it also shows a soft wave-like force-elongation region for longer elongations (region III).
The constant force-elongation response in region II is a direct result of the quaternary structure of the pilus. Since each layer of the quaternary structure consists of slightly more than 3 subunits, there are also ~3 layer-to-layer bonds per turn.[40] When a pilus is exposed to a force, each bond within the rod will therefore experience only one third of the applied force. On the other hand, the bond connecting the outermost unit in the folded part of the rod will experience a significantly higher force, virtually the entire force mediated by the pilus. This implies that the outermost layer-to-layer bond of the rod will open significantly more often than a bond in the interior. Moreover, the initiation of an unfolding of the rod from an interior position requires at least three bonds to open simultaneously. Since a bond only spends a short time in its open state before it closes, this is a rather unlikely event. Both these effects lead to a sequential bond breaking of the layer-to-layer bonds of the quaternary structure of the rod, as shown in Fig. 7, sometimes referred to as a zipper like unfolding.
.
Figure 7. Schematic illustration of a pilus that is partly unfolded. The head-to-tail bond that is composed by the donor strand interaction and holds consecutive subunits together is marked with a red arc whereas the layer-to-layer bond located between subunits in consecutive layers and holds the rod together is illustrated by a white and red dots combined with a red line. Open layer-to-layer bonds are illustrated with a black dashed line.
In contrast, the soft wave-like force-elongation behavior in region III originates from a stochastic opening of individual head-to-tail bonds in pili, which has already been linearized by a preceding elongation. The particular shape of this region is therefore governed by both properties of the individual bonds and entropy
As is further discussed below, when an individual pilus elongates and contracts at a low speeds, the force-contraction response is fully reversible, whereas hysteresis appears for higher speeds.
In order to extract detailed information about the pili and their biophysical properties from various types of measurements, appropriate theoretical models of the elongation and contraction of pili exposed to stress (in particular their unfolding and refolding properties) are needed.
7
4.3 Rate theory for unfolding and refolding of a helixlike polymer
The net opening rate of the outermost bond in a helixlike polymer exposed to a force, F , defined as the number of times the bond opens per unit time, ( )AB
netk F , can, for the case of the layer-to-layer bond in the folded part of the rod, be written as
( ) ( ) ( )AB AB BA= −netk F k F k F , (3)
where ABk and BAk are the bond opening and closure rates under the exposed stress, respectively. The latter rates can be expressed as[38]
/( ) ATthAB AB
F x kTk F k e Δ= , (4)
and
( ) /( ) AB TBthBA AB
V F x kTk F k e Δ − Δ= , (5)
where thABk is the thermal bond opening rate in the absence of
force, which, in turn, is given by a product of an attempt rate and an Arrhenius factor encompassing the activation energy, i.e., the energy difference between the closed and the transition state,
ATVΔ . ATxΔ and TBxΔ are the distances between the closed state A and the transition state T, and between the transition state T and the open state B, respectively, where the former often is referred to as the bond length.
The bond opening rate of region II, defined as the number of bonds that open per unit time in region II (in the presence of a force), /BdN dt , where BN is the number of open layer-to-layer bonds, is identical to the net opening rate of the outermost bond,
( )ABnetk F . This implies that the bond opening rate can be
expressed as a rate-equation according to
( ) ( ),BAB BA
dN k F k Fdt
= − (6)
Due to the experimental procedure, the force in the system, F , can be related to the forced elongation speed of the pili, L , and the bond opening rate according to
BAB
dNdF L xdt dt
κ⎛ ⎞= − Δ⎜ ⎟⎝ ⎠
. (7)
Information about the force-elongation-speed-behavior of a helixlike polymer unfolding at a constant force can be obtained by solving Eq. (7) for a given elongation speed with / 0dF dt = . Equation (7) shows first of all that unfolding at a constant force implies that the bond opening rate, /BdN dt , is fully given by the elongation speed, / ABL xΔ . This rate is referred to as the forced bond opening rate. Solving Eq. (7) under such conditions gives rise to a force-elongation-speed-behavior that is schematically illustrated in Fig. 8.
Figure 8. Schematic illustration of the force response of a helixlike biopolymer as a function of elongation speed.
As can be seen from the figure, for low speeds, up to a so-called corner velocity, *L , the force depends only weakly on the elongation speed.[30] For such elongation speeds, there is a balance between the bond opening and the bond closure rates, both being larger than the forced bond opening rate; in particular the bond closure rate is larger than the forced bond opening rate, i.e., ( ) />BA Bk F dN dt . This implies that each bond will open and close several times at a rate referred to as the balance rate,
( ) ( ) balAB BA ABk F k F k= = , before the neighboring bond starts to open.
Measurements performed under such conditions are therefore referred to as being done at equilibrium or under steady-state conditions and the force depends only weakly on the elongation speed (it is, in fact, often considered to be speed independent). Under such conditions the Eqs (6) and (7) give rise to an expression for the steady-state unfolding force of a helixlike polymer (a pilus in its elongation region II), UFF , that reads
/UF AB ABF V x= Δ Δ , (8)
where ABxΔ is the bond opening length, defined as AT TBx xΔ + Δ . [29]
For higher elongation speeds, those above *L , on the other hand, the forced bond opening rate becomes larger than the bond closure rate, / ( )>B BAdN dt k F . When this takes place, there is no balance between the opening and closure rates. The closure rate can therefore be neglected in comparison with the forced bond opening rate, whereby the bond opening rate, ABk , becomes in balance with elongation speed, / ABL xΔ . Solving Eq. (7) under these conditions gives rise to an expression that relates the unfolding force to the elongation speed in an logarithmic manner, viz. as
( ) ln⎛ ⎞
= ⎜ ⎟⎜ ⎟Δ Δ⎝ ⎠UF th
AT AB AB
kT LF Lx k x
. (9)
Force measurements made under this condition is commonly referred to as dynamic force spectroscopy (DFS).
The advantage with DFS measurements is that it is possible to assess values to physical entities that cannot be addressed by measurements under steady-state conditions, most importantly
ATxΔ and thABk .[30, 41, 42] As is described below, this method has
therefore been used for assessment of ATxΔ and thABk in P pili.
However, due to the low corner velocity of type 1 pili (see further discussion below), DFS is not suitable (for practical purposes) for assessment of the dynamic parameters of type 1 pili. These parameters can instead preferably be assessed by an alternative technique, which is built upon the monitoring of the decay in force that follows when the elongation to which the pilus is exposed is suddenly halted.
An expression for the unfolding force from an elongated pilus when its elongating is suddenly halted can be derived from the Eqs (6) and (7) under the condition that L = 0. Equation (7) then states that / /UF B ABdF dt dN dt x κ= − Δ . This implies that it is possible to write an expression for the time dependent unfolding force that reads,
( ) ( )( )/ ( ) /UF AT AB UF TBUF thAB AB
F t x kT V F x kTdF tx k e e
dtκ Δ Δ − Δ= −Δ − . (10)
At high forces the refolding rate can again be neglected[30] and Eq. (10) becomes a separable differential equation from which an analytical expression of the decaying unfolding force can be derived,
( ) ´ /ln AT
thAB AT AB
UFAT
F x kT x x kkTF t e tkTx
κ− Δ⎡ ⎤Δ Δ= − +⎢ ⎥Δ ⎣ ⎦
. (11)
F
Log ( L ) Log ( L *)

8
F ′ is here the initial force at the time when the elongation is halted whereas t is the time thereafter. This expression thus describes the force-time response of a helixlike biopolymer when the applied elongation is suddenly halted. The actual form of Eq. (10) is shown below as fits to measurements.
4.4 Rate theory for elongation and contraction of a linear polymer
The elongation of the linearized pili, in which the pili reside in Region III, differs from that of a helixlike structure in the respect that all bonds have the same probability to open and close, irrespectively of the state of the nearest neighbors. Region III is therefore governed by a set of random transitions from state B to C. This is the reason why it is strongly affected by entropy and has a soft wave-like form, which sometime is referred to as entropic softening.
The bond opening rate in the linearized configuration (region III), can be described by the rate equation,
( ) ( )CB BC C CB
dNN k F N k F
dt= − , (12)
where the bond opening and closure rates are similar to those defined in Eq. (6), with the only exception being that the rates refer to the opening and closure of the head-to-tail bond. The force response under steady-state conditions becomes in this case
ln TOT BAB
AB BC B
N NV kTFx x N
⎛ ⎞−Δ= + ⎜ ⎟Δ Δ ⎝ ⎠
, (13)
where we have used the fact that C TOT BN N N= − , where TOTN is the total numbers of units in the rod.
Since the length of the pilus can be related to the number of units in each state ( AN , BN , and CN , respectively), BN can be expressed in terms of the length of the pili, L , and thereby the elongation. This provides an expression for the force-elongation behavior of pili in region III under steady-state conditions. Although not explicitly evident from the derivation given above, the expression given in Eq. (13) includes the effect of entropy.
Inasmuch as all bonds are involved in the length regulation of region III and not just the outermost bond of the folded part of the rod (as is the case for region II), the dynamic region is entered whenever / ( )BC C CBL x N k FΔ > . Since 1CN , and in most cases ~103, the onset of the dynamic response in region III takes place at a significantly higher speed than in region II. Region III is therefore in its steady-state region for all practical elongation speeds. This implies that energy landscape parameters such as,
BTxΔ and BTVΔ for the head-to-tail bond cannot readily be assessed.
4.5 Principal behavior of elongation of a single pilus
As was illustrated above, the rate equations for bond opening and closure, i.e., the Eqs (6), (7) and (12), can, together with the Bell’s equations for unfolding and refolding, Eqs (4) and (5), be solved analytically under steady-state conditions, giving rise to the Eqs (8) and (13). This behavior is illustrated in Fig. 9.
Figure 9. A numerical simulation of the rate equations for elongation of a pilus under steady-state conditions.
However, it is not as simple to illustrate the force-elongation behavior under general conditions, in particular not for elongation speeds in proximity of the corner velocity. The reason is that analytical solutions can only be found under steady-state conditions or if the refolding rate is neglected, which are good approximations when *L L and *L L , respectively. Under such conditions, the force-elongation behavior of a helixlike polymer is given either by Eq. (8) or Eq. (9). The dynamic response when the refolding rate cannot be neglected has though no analytical solution and needs therefore to be solved numerically, e.g. by numerical integration.
4.6 Monte Carlo simulation of pili
An alternative way of solving the Eqs (6), (7) and (12) is to make use of Monte Carlo simulations. Such simulations provide in general a powerful tool for simulation of stochastic variations in biopolymers under diverse conditions. We have shown that such simulations reproduce the unfolding well under all kind of conditions (steady-state as well as dynamic) for all regions.[43]
MC simulations have the advantages that they allow, by their probabilistic approach, bond opening and closure for a distribution of forces around the one that corresponds to the transition energy. They also provide information of how the polymer rod, by its unfolding capability, is capable of decreasing the load on the adhesin.[17, 43] Finally, MC simulations can also provide a way to incorporate alternative interaction mechanisms, e.g. multiple bonds or transitions or other geometries, in an efficient way without significantly altering the complexity of the solving procedure.
5 Results
5.1 Typical force-elongation responses of P and type 1 pili on E. coli bacteria
The biophysical properties of both P and type 1 pili have recently been assessed in some detail by the authors using FMOT.[28-31, 33,
34, 44] Figure 10 shows a typical force-elongation response of these two pili for an elongation speed of 0.1 µm/s, with the black and grey curves representing elongation and contraction, respectively. As is discussed further below, the short curves inserted in panel A represent sections of elongation responses taken at higher elongation speeds.

9
Figure 10. Panel A and B shows typical single pili response from a P and a type 1 pili, respectively, for an elongation speed of 0.1 µm/s. The single pilus response in Panel A was facilitated through the use of Pilicides, which reduced the number of pili expressed by the bacterium. On the other hand, the single pilus response in panel B was achieved through the method described in section 3.4. The inserted data lines between 1 and 2 μm in panel A shows three DFS measurement of the quaternary structure under 0.74, 5.7, 42.7 μm/s. This data is replotted from ref.[30]
The plateau in region II for P pili, with almost identical force values for unfolding and refolding (28 ± 2 pN), agrees well with the predicted shape of the force-elongation behavior for unfolding of a helixlike structure under steady-state conditions given by Eq. (8). The behavior of type 1 pili, on the other hand, with dissimilar plateau values for unfolding and refolding, shows instead the predicted unfolding response of a helixlike polymer under dynamic conditions, given by Eq. (9). Region III for both pili agrees well with the predicted shape for the elongation of a linear polymer under steady-state conditions, given by Eq. (13). By fitting the model equations to curves like those in Fig. 10, many of the model parameters, e.g. ABVΔ , BCVΔ , ABxΔ , BCxΔ , can be assigned values for the two types of pili.
There are two features that cannot be explained by the simple theory given above. The first is the dip in force that appears during contraction following the transition from region III and II. This dip is caused by a lack of a nucleation kernel for the formation of a first layer in the quaternary structure. Occasionally, also other dips in the contraction data can occur, as for example is the case at around 1.5 μm for the P pilus (Fig. 10A). As is further discussed below, such dips are not reproducible and are considered to originate from sporadic misfoldings not described by the models.
The second feature is the ability of type 1 pili to refold its quaternary structure at two different force levels, ~30 and ~25 pN, respectively, which is illustrated by the gray curve in Fig. 10B. This suggests that type 1 pili can refold into two dissimilar helixlike configurations.
5.2 Dynamic force-elongation response
As was alluded to above, not all model parameters can be assessed by elongation and contraction studies under steady-state conditions. However, studies of the dynamic response
provide a possibility to assess a few of the missing entities, primarily the bond lengths, ATxΔ , and the thermal bond opening rates, th
ABk . As was alluded to above, and as can be seen in Fig. 10, for
an elongation speed of 0.1 μm/s, the response of both types of pili indicate steady-state conditions in region I and III (the black unfolding and grey refolding curves are overlapping and show no hysteresis). Also the elongation/contraction of P pili in region II takes place under steady-state conditions, whereas that of type 1 pili indicates non-equilibrium conditions (the unfolding and refolding curves are shifted about ~15 pN).
As was discussed above, although bonds in a helixlike polymer opens under steady-state conditions for elongation speeds below a certain corner velocity, the bonds can show dynamic behavior if exposed to a higher elongation speed. The data curves inserted in Fig. 10A between 1 and 2 μm, which represents elongations of the quaternary structure of P pili under three higher elongation speeds; 0.74, 5.7, 43 μm/s respectively, illustrate this phenomenon. Such DFS measurements thus show that also P pili can unfold its quaternary structure under non-equilibrium conditions, although this requires higher elongation speeds than for type 1 pili.
Figure 11 shows a compilation of some typical force-elongation speed data for type 1 pili (triangles) and P pili (filled circles) from measurements such as those shown in Fig. 10, presented as the unfolding force of region II vs. the elongation speed in a lin – log plot.
Figure 11 Unfolding force in region II of type 1 pili (triangles) and P pili (filled circles) vs. elongation speed. The data for P pili is replotted from Fig. 5 in ref. [30]. The dashed lines represent the low and high elongation speed asymptotes, given by the Eqs (8) and (9), respectively. The intercept of the two asymptotes represents the corner velocity, *L , whereas the intercept of the high elongation speed asymptote with the x-axis gives an entity, 0L , that provides a value for the thermal bond opening rate, th
ABk .
For each type of pili, the data gather in two regions, following two asymptotes; one that is virtually constant (for low elongation speeds) and one that is linear in a lin – log plot (thus showing an logarithmic behavior) for large elongation speeds. All this is in agreement with the theoretical predictions given in Fig. 8 above. The two asymptotes meet at an elongation speed given by the corner velocity. Bonds exposed to elongation speeds below the corner velocity thus open under steady-state conditions, under a more or less constant force, as was predicted by Eq. (8), whereas those exposed to higher elongation speeds open under dynamic conditions, with an unfolding force that increases with elongation speed, in agreement with Eq. (9). Studies such as these support the model given above and indicate that the corner velocity for the type 1 and P pili are significantly different, around 6 and 400 nm/s, respectively.
Studies of the dynamic response that follows a sudden halt in elongation reveal that the force relaxes to the steady-state force according to Eq. (11) for both types of pili, although with
10
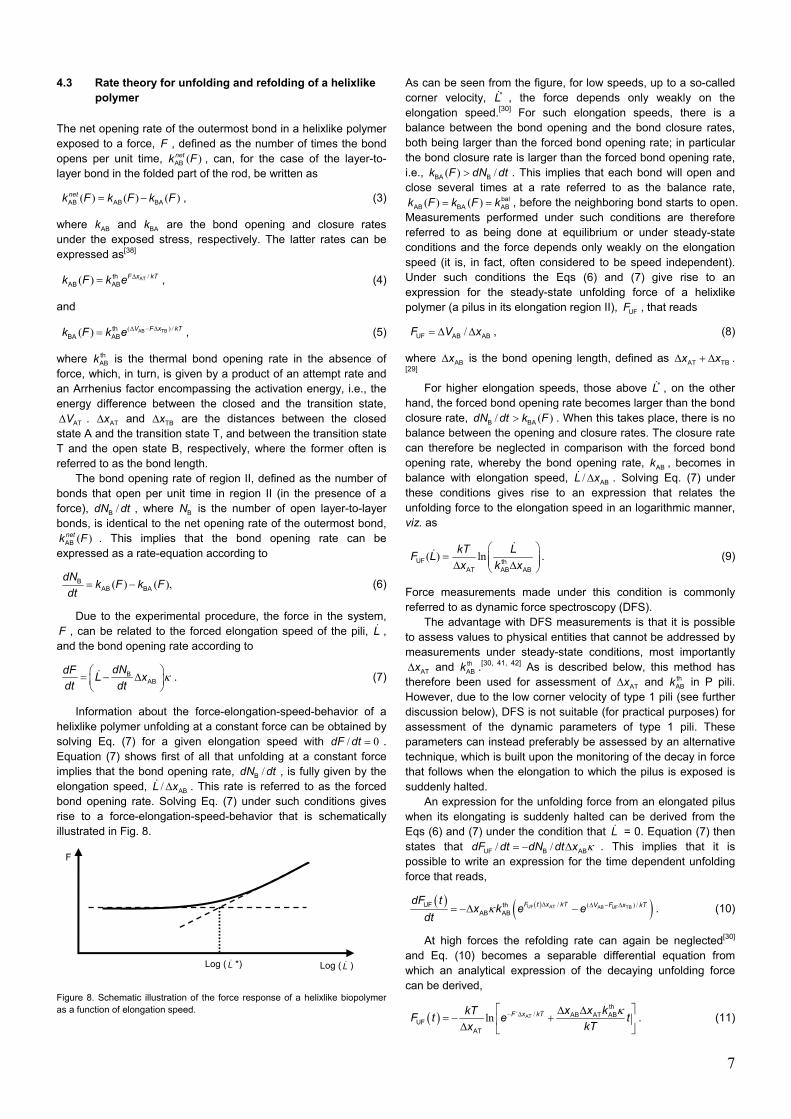
significantly dissimilar speeds. One such example is given in Fig. 12 in which data from the two types of pili is shown together with fits based upon Eq. (11).
Figure 12. The data shows the decaying force response of P and type 1 pili after a initial dynamic responding force of 50 pN. As seen in the figure, P pili reach the steady-state force after a fraction of a second whereas type 1 pili reach it after ~9 s.
Curves such as those given in Figs 11 and 12 can then serve the purpose of assessing values of the bond length and the thermal bond opening rate, i.e., ATxΔ and th
ABk , for the layer-to-layer bond of the two types of pili. It was found that these take the values of 0.76 nm and 0.8 Hz for P pili. The same entities take values of 0.59 nm and 0.016 Hz for type 1 pili.
5.3 A summary of the model parameters assessed
The bond parameters that have been assessed for P and type 1 pili by force measuring techniques are summarized in Table 1. In addition to measurements performed by the authors, [28-31, 33, 34, 44,
45] the table includes also parameters for the type 1 pili assessed by Miller et al.[17] and Forero et al.[46] using force measuring AFM. Note though that some of their values have been recalculated to make a comparison possible with results obtained from our works. For example, Miller et al. reported a value of 17 kT for ATVΔ with an attempt rate of 106 Hz, which, for consistency, has been recalculated to 26 kT with an attempt rate of 1010 Hz.
Table 1. Bond parameters for type1 and P pili of E. coli
Parameters[a] Type 1 Type 1 Type 1 P pili
The authors’ assessments[a]
Miller[17] Forero[46] The authors’ assessments[a]
UFF (pN) 30 ± 2 60[b] 22 28 ± 2
ABxΔ (nm) 5 ± 0.3 3.5 ± 0.1
ATxΔ (nm) 0.59 ± 0.06 0.2 0.26 ±
0.01
0.76 ± 0.11
thABk (Hz) 0.016 ± 0.009 0.05 0.5 0.8 ± 0.5
balABk (Hz) 1.2 ± 0.9 0.8 2.2 120 ± 75
ABVΔ (kT) 37 ± 2 16[c] 25 24 ± 1
ATVΔ (kT) 27 ± 2 26[c] 29 23 ± 1
*L (nm/s) 6 400
[a] Refs [28-31, 33, 34, 44, 45]. [b] Measured at 1-3 µm/s, which is according to our measurements not at steady-state. [c] At an attempt rate of 1010 Hz.
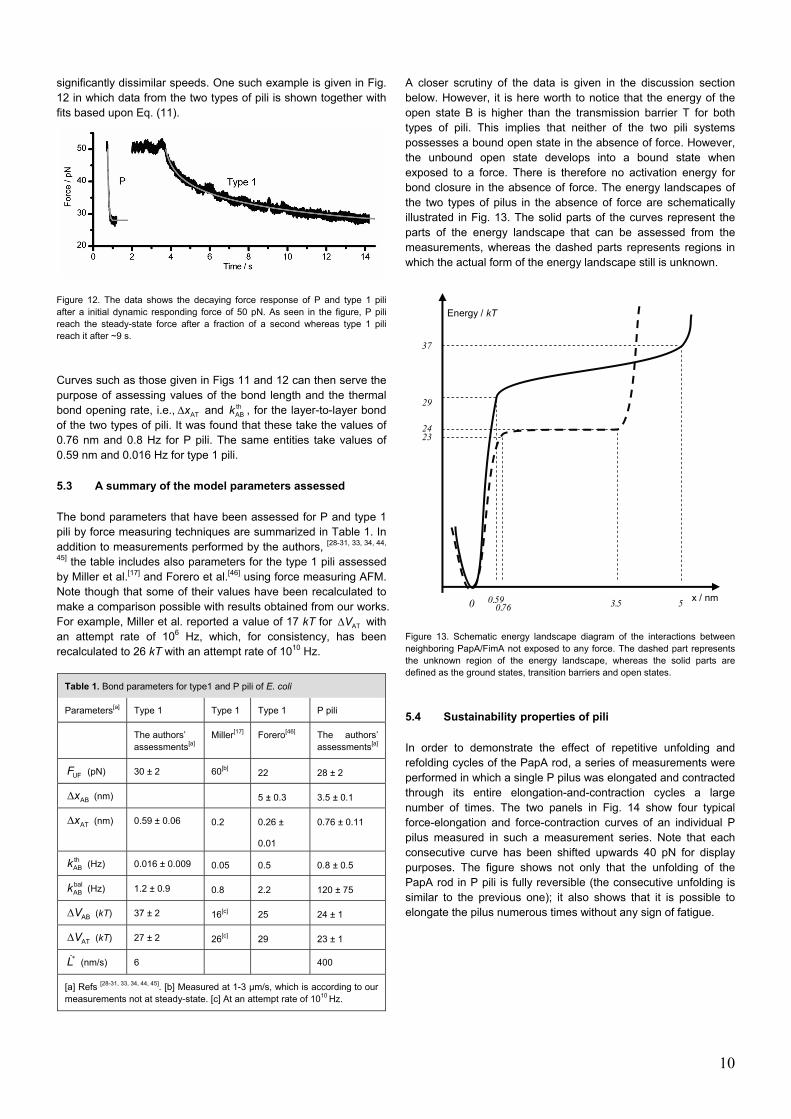
A closer scrutiny of the data is given in the discussion section below. However, it is here worth to notice that the energy of the open state B is higher than the transmission barrier T for both types of pili. This implies that neither of the two pili systems possesses a bound open state in the absence of force. However, the unbound open state develops into a bound state when exposed to a force. There is therefore no activation energy for bond closure in the absence of force. The energy landscapes of the two types of pilus in the absence of force are schematically illustrated in Fig. 13. The solid parts of the curves represent the parts of the energy landscape that can be assessed from the measurements, whereas the dashed parts represents regions in which the actual form of the energy landscape still is unknown.
Figure 13. Schematic energy landscape diagram of the interactions between neighboring PapA/FimA not exposed to any force. The dashed part represents the unknown region of the energy landscape, whereas the solid parts are defined as the ground states, transition barriers and open states.
5.4 Sustainability properties of pili
In order to demonstrate the effect of repetitive unfolding and refolding cycles of the PapA rod, a series of measurements were performed in which a single P pilus was elongated and contracted through its entire elongation-and-contraction cycles a large number of times. The two panels in Fig. 14 show four typical force-elongation and force-contraction curves of an individual P pilus measured in such a measurement series. Note that each consecutive curve has been shifted upwards 40 pN for display purposes. The figure shows not only that the unfolding of the PapA rod in P pili is fully reversible (the consecutive unfolding is similar to the previous one); it also shows that it is possible to elongate the pilus numerous times without any sign of fatigue.
23
Energy / kT
x / nm
24
29
37
0 .0 59.076 .35 5

11
Figure 14. Four typical force-elongation and force-contraction curves of an individual P pilus monitored in such a measurement series. Note that each consecutive curve has been shifted upwards 40 pN for display purposes. The panels shows data from a series of measurement on the same pilus over a total time of >45 min. Panel A) represents data from a single pilus elongated four times in a row, whereas panel B) shows the refolding. The only difference between the unfolding/refolding is the dips, which originates from failure to refold in the absence of a nucleation kernel. A slightly lower constant level is also present in panel B. Data replotted from ref. [34]
5.5 The Influence of pH and salinity on pili
The pH and salinity level of the urinary tract vary normally over a broad range of values. There is, however, very little known about the influence of these parameters on the ability of the bacteria to sustain the natural cleaning action caused by the shear forces from the urine flow. It is therefore of interest to study how the biomechanical properties of the pili are affected by changes in pH and salt concentration.
Preliminary investigations on the influence of pH and salinity on the refolding properties of P pili have been performed at both high and low pH in combination of high and low salinity levels, indicate that the refolding, i.e., the capability to contract after a given unfolding, depends strongly on both the pH and the salinity of the sample buffer.
Figure 15 shows a force-elongation curve of P pili at pH 9.25, which is just above the normal range of pH in the urine (which is 4.5 - 8). A comparison of measurements performed under normal pH levels, e.g. those shown in Figs 5B, 9A and 10A,
Figure 15. Unfolding and refolding sequence of a P pilus at pH 9.25 with normal salinity. The refolding data show an increased number of misfoldings. Similar force curves are obtained at normal pH in conditions with high salinity, e.g. pH 6.5 and 0.6 mol/l PBS (4 x PBS). The force data were collected at an unfolding and refolding speed of 0.1 µm/s.
shows that contraction at this high pH gives rise to significantly more misfoldings than at ordinary pH.
pH levels just under the normal range, i.e., at pH 4.1 (data not shown) showed a refolding sequence similar to that of normal pH. At very low levels, pH <3.5, there were, however, a drastic change in both the unfolding and refolding curve. At this level the entire quaternary structure seemed to be disintegrated. This is illustrated in Fig. 16, which shows an elongation sequence of a P pilus at pH 3.1.
Figure 16. Unfolding and refolding sequence of a P pilus at pH 3.1 assessed at an unfolding and refolding speed of 0.1 µm/s. At this pH level there is no sign of reformation of the helixlike structure. This particular force measurement was collected at a low force constant (0.1 pN/nm) wherefore the force response is nonlinear above 60 pN. The estimated force response is marked wit the dashed line.
The force-elongation response at high salinity, e.g. pH 6.5 and 0.6 mol/l PBS (data not shown) was found to be similar to that for high pH (Fig. 15). These preliminary studies show that the number of misfoldings increases with both pH and salinity. Low salinity levels do not, however, seem to affect the refolding capability of the pilus.
These preliminary results show clearly that both pH and salinity affect the capability of the pilus to refold, which possibly also influences the pilus’ ability to sustain repeated cleaning action from the urine flow. Although it remains to be tested, it is also feasible that this has an implication on the function of a catch bond.
6 Discussion
The theoretical treatment above provides a biomechanical model that can describe and well reproduce the elongation and contraction behavior of individual bacterial pili exposed to stress and measured by FMOT. Measurements from two types of pili structures, expressed by UPEC, have been presented and evaluated using the theoretical model, and relevant model parameters have been assessed. The model parameters of the two different pili structures are below discussed and compared to those assessed with AFM.
6.1 Comparison of pili
Measurements of the unfolding force of the quaternary structure of two types of pili for a static elongation have shown that the steady-state unfolding forces of P and type 1 pili are comparable, 28 ± 2 pN and 30 ± 2 pN, respectively. The unfolding force of type 1 pilus has previously been assessed to 60 pN by Miller et al. [17] However, their measurement was performed for an elongation speed of 1-3 µm/s. A direct comparison of these unfolding forces

12
can, however, not be made, since they are not all performed under steady-state conditions (i.e., below the corner velocity *L which is 6 nm/s for type 1 pili).[44] However, according to our model, primarily Eq. (9), and the parameters assessed, it is possible to conclude that a measurement at an elongation speed of 1 µm/s should result in a force of ~65 pN. We thus find that the measurements made with FMOT are in reasonable agreement with those made with AFM.
It is known from scanning transmission electron microscopy, that that P and type 1 pili have structural similarities.[47] The bond lengths of the quaternary structure, ATxΔ , assessed by DFS measurements to 0.59 ± 0.06 nm for type 1 pili[44] and 0.76 ± 0.11 nm for P pili[30], support these conclusions. The value of the bond length of type 1 pili assessed by FMOT, was, however, found to be larger than that estimated from AFM studies (0.26 ± 0.01).[46] We have presently no explanation to this discrepancy.
The thermal bond opening rate for type 1 pili, thABk , was
assessed to 0.016 ± 0.009 Hz, which is significantly lower than what was found for P pili, 0.8 ± 0.5 Hz.[30] Since the thermal bond opening rate, th
ABk , can be written as exp( / )ATV kTν −Δ , where ν is the attempt rate, differences in thermal bond opening rates indicate, under the condition that the attempt rates are similar, dissimilar activation energies. It can be concluded that the lower thermal rate of type 1 pili corresponds to a ATVΔ that is 4 kT higher than that of P pili. This implies that a layer-to-layer bond in a type 1 pilus is bound harder than in P pili.
The barrier height ATVΔ of the two different pili was assessed to 23 kT for P and 27 kT for type 1 pili assuming an attempt rate of 1010 Hz. The value for type 1 pili is comparable with those found by others, 26 kT (recalculated from 17 kT with an attempt rate of 106) by Miller et al.[17] and 29 kT reported by Forero et al.[46] It is, however, not only the height of the transition barrier that has an effect upon how a pilus reacts to stress, also the bond length affects the bond functioning. The type 1 pili energy landscape is in agreement with a hypothesis that a bond with a sharp potential can hold a high force for a short time whereas a bond with a soft potential can hold a small force for a long time. Therefore, the steeper and higher transition barrier implies that unfolding is more unlikely and that the rate of unfolding is slower in type 1 than in P pili at a particular force, i.e., a higher force is required to unfold the type 1 pili than in case of the Pap pili at a given speed.
The steeper potential of type 1 pili may be considered a consequence of that the structure has evolved to support higher forces during shorter time events, which would correlate with the irregular urine flow in the bladder and the urethra as compared to the more constant urine flow in the upper urinary tracts. It is therefore possible that the much stiffer bond potential for type 1 pili is optimized for a fast shock damping effect.
A consequence of the higher transmission barrier, ATVΔ , and the short bond length, ATxΔ , of the layer-to-layer bond of type 1 pili is that the opening/closing rate in region II under balanced conditions, bal
ABk , is low. Our analysis indicates a rate of 1.2 Hz, whereas Forero et al. assessed it to 2.2 Hz using AFM in a force feedback mode.[46] Both these values are much lower than the balance rate of P pili (120 Hz), which is in line with the fact that the bond opening energy of P pili is lower. This in turn agrees well with the fact that the P pilus reaches its stationary force balance much faster than type 1 pili, as was shown in Fig. 12.
The good agreement between the values of the thermal bond opening rate and the bond opening length for P pili obtained from relaxation fits, and the previously assessed values from DFS measurements, shows that the model correctly describes the
unfolding of the quaternary structure and that it is justified to use Eq. (10) as a model of force relaxation.
The bond opening energy of the layer-to-layer bonds of both P and type 1 pili, ABVΔ , which were assessed to 24 kT and 37 kT respectively, were found to be larger than those of the transition barriers, ATVΔ , 23 kT and 27 kT, respectively. This implies that neither type 1 pili nor P pili possesses a bound unfolded state in the absence of force, as was illustrated by Fig. 13. Therefore, whenever a bond has opened spontaneously, it will close with the attempt rate. This implies in turn that none of the structures will be found in an unfolded state unless an external force is applied. Therefore, static images of unfolded pili are most likely a result of the treatment during preparation.
The specific bond strength of pili has been assessed with FMOT. Lugmaier et al. [48] found recently that an adhesin of P pili PapG binds to a glycolipid galabiose receptor with a force of 49 pN and has a bond length of 0.7 ± 0.15 nm. In another study the specific adhesin of type 1 pili, FimH, that binds to mannose presenting surfaces was found to be only 1.7 pN.[49] This value, however, is questionable since a bond with a length of ~0.7 nm would experience a thermal force of ~6 pN. Thermal fluctuations and urine flow would spontaneously disassociate such a weak bond. On the other hand, it has been shown that the FimH-1M bond lifetime, assessed with force feedback AFM and flow chamber experiments, is highest at 40 pN.[46] This suggests that the bond strength of FimH is ~40 pN under physical conditions, which supports the value reported by Lugmaier et al.[48]
6.2 Studies made possible by optical tweezers
The soft stiffness of the optical trap provides optical tweezers with a better force resolution than AFM systems. Consequently, small variations in the force, <10 pN, that are hidden in the noise of the AFM data, are clearly revealed by optical tweezers. As an example, the last part of the force-elongation response of type 1 pili measured with optical tweezers, clearly shows the linearized phase transition as a distinct wave with an inclining plateau at ~65 pN, i.e., at the same level as for P pili. This part is not seen in the response data collected in AFM measurements because of their higher loading rates.[17, 46] Furthermore, the high force resolution of FMOT makes possible a convenient decaying force measuring procedure of a pilus that has been elongated into a dynamic region. This particular method provides a fast and swift way of assessing the bond transition distance and the thermal rate of a polymer. Moreover, since only one measurement is needed, in comparison to the multitude of measurements needed in DFS at a variety of elongation speeds, the analysis of the data is evaluated much faster.
In addition, the use of FMOT reveals by the two different refolding forces two alternative configurations of type 1 pili. An example of a reconfiguration in a single pilus is seen at ~7.5 μm in Fig. 10B, in which the force is changed by ~5 pN. Such a reconfiguration is only observed occasionally but when it takes place it is often permanent and extends until the whole pili structure is refolded. A possible explanation of this behavior is that type 1 pili has the possibility to reassemble the structure in two different ways, one in which all interactions are aligned and another in which the units do not refold to the original orientation. The configuration of each subunit is, in turn, set by the orientation of its neighbor, which would explain why it remains through the whole refolding sequence. This alternative configuration has, however, not been observed for P pili.
On the other hand, the dip in the refolding force curves of ~15 pN at the transition from region III to II is found for both P and

13
type 1 pili. This dip is a clear indication that the refolding process requires the formation of a nucleation kernel to start. Such a nucleation kernel can only be formed at a lower force level, which implies that pili must have a large amount of slack before the formation of the first layer-to-layer bond can take place. In our P pili measurements dips were also sometimes found in the middle of the refolding sequences and their number increased with refolding speed. Such dips have been attributed to spurious misfoldings. These misfoldings are, however, seldom found in refolding sequences of type 1 pili. The hypothetical explanation is that the quaternary structure of the type 1 pilus is mediated by more than one binding site whereas that of the P pili is mediated by a single site. If one site in P pili is blocked the folding would be interrupted and require the formation of a new nucleation kernel. Type 1 pili, on the other hand, would only misfold if all sites are blocked at the same time, which presumably is less likely. Small dips in force (< 5 pN) are, however, frequently seen and they are attributed to a blockage of one of the sites that does not necessarily require reformation of the nucleation kernel.
6.3 Chemical tools
Pilicides as a chemical tool that controls the number of pili expressed by a bacterium have a number of possible application areas. Bacterial adhesion most often appears to be a multivalent interaction with receptors on host/target surfaces. The UPEC typically expose pili in the order of hundreds of copies distributed over the bacterial cell. With the ability to reduce the number of pili it might be possible to study the role of pili from quantitative viewpoints, e.g. how many pili per bacterial cell are required for biofilm formation or for a bacterium to adhere to a host cell. Is there a certain number of pili required for establishment of an infection? Moreover the use of pilicides to control the number of pili expressed by the bacterium opens up a possibility to study the correlation between the ability of the bacterium to withstand the rinsing action of the urine flow and the number of pili expressed. Pilicides will also provide us with the additional opportunity to study shear forces on a single pilus level.
Another area where the chemical tool is valuable is in the characterization of the specific adhesion of the adhesion organelle. A bacterium expressing a multitude of pili normally interacts by several simultaneous adherence events on the target surface, as is illustrated in Fig. 5A. The methodology for single molecule force spectroscopy described in paragraph 3.4 is, however, not easily applicable to specific adhesion measurements. The reason is that the specific receptor binding has a probability to break already at low forces. This implies, in turn, that a proper assessment of the bond strength requires a single pilus attachment already from the start of the elongation. In addition, a proper assessment of the adhesion force requires a multitude of measurements at a variety of loading rates so as to assess the mean value of the force. Multi-pili-interactions, which are found in most of the measurements, would therefore render a number of measurements obsolete and in turn require a very large number of measurements in order to achieve the number of measurements required for proper statistic analysis. On the other hand, by the use of pilicides as a chemical tool, the number of pili can be reduced and that should improve the possibility to get single pili attachments in repeated experiments.
To date no small molecules have been identified that disrupt or substantially affect already formed pili. As shown in paragraph 5.5, the salinity and pH clearly have an influence on the pili properties. Experiments performed in a similar way can elucidate how small molecules can affect pili in shear-force-like situations,
mimicked by the optical tweezers. Such studies are now under way in our laboratories and we take advantage of pilicide treated bacteria to study shear forces on a single pilus level.
6.4 Outlook
Our characterization of the biomechanical properties of pili shows clearly that the FMOT technique is an excellent tool for assessment of physical properties of biopolymers.
A wider characterization of the dynamic properties of single pili in combination with an assessment of the function of an assembly of pili, as, for example, the study by Duncan et al.[15] where it was shown that the fimbriae itself affects the adhesion ability of the bacteria, can make it possible to point out specific properties of the pili that are of importance for the pili to sustain the rinsing action. These properties can then serve as potential new targets for development of ant-adhesive drugs.
The studies performed on fimbriae expressed by UPEC are just one example of an applicability area of the FMOT technique. The technique and the model system used in this study are directly applicable also to characterization of a variety of other biopolymers.
Acknowledgements
We are grateful to Dr. Veronica Åberg for her work on pilicides and Monica Persson for technical assistance in atomic force microscopy analyses. This work was supported by the Swedish Research Council and performed within the Umeå Centre for Microbial Research (UCMR). Economical support for the construction of a force measuring optical tweezers system from the Kempe foundation and from Magnus Bergvall’s foundation is acknowledged. The Knut and Alice Wallenberg foundation is acknowledged for financial support to FA and for the AFM equipment (to BEU).
Keywords: fibers •microscopy • uropathogenic E. coli • mechanical properties• energy landscape
[1] W. E. Stamm and S. R. Norrby, J. Infect. Dis., 2001, 183, S1-S4. [2] R. A. Welch, V. Burland, G. Plunkett, P. Redford, P. Roesch, D. Rasko,
E. L. Buckles, S. R. Liou, A. Boutin, J. Hackett, D. Stroud, G. F. Mayhew, D. J. Rose, S. Zhou, D. C. Schwartz, N. T. Perna, H. L. T. Mobley, M. S. Donnenberg and F. R. Blattner, Proc. Nat. Acad. Sci. USA., 2002, 99, 17020-17024.
[3] E. Brzuszkiewicz, H. Bruggemann, H. Liesegang, M. Emmerth, T. Oschlager, G. Nagy, K. Albermann, C. Wagner, C. Buchrieser, L. Emody, G. Gottschalk, J. Hackert and U. Dobrindt, Proc. Nat. Acad. Sci. USA., 2006, 103, 12879-12884.
[4] S. J. Hultgren, S. Abraham, M. Caparon, P. Falk, J. W. Stgeme and S. Normark, Cell, 1993, 73, 887-901.
[5] F. G. Sauer, J. S. Pinkner, G. Waksman and S. J. Hultgren, Cell, 2002, 111, 543-551.
[6] M. J. Kuehn, D. J. Ogg, J. Kihlberg, L. N. Slonim, K. Flemmer, T. Bergfors and S. J. Hultgren, Science, 1993, 262, 1234-1241.
[7] P. Klemm, Res. Microbiol., 1992, 143, 831-838. [8] F. Lindberg, J. M. Tennent, S. J. Hultgren, B. Lund and S. Normark, J.
Bacteriol., 1989, 171, 6052-6058. [9] D. L. Hung, S. D. Knight and S. J. Hultgren, Mol. Microbiol., 1999, 31,
773-783. [10] J. S. Pinkner, H. Remaut, F. Buelens, E. Miller, V. Aberg, N. Pemberton,
M. Hedenstrom, A. Larsson, P. Seed, G. Waksman, S. J. Hultgren and F. Almqvist, Proc. Nat. Acad. Sci. USA., 2006, 103, 17897-17902.
14
[11] V. Åberg and F. Almqvist, Organic and Biomolecular Chemistry, 2007, 5, 1827-1834 (Emerging Area article) Ref. cited therein.
[12] V. Åberg, E. Fällman, O. Axner, B. E. Uhlin, S. J. Hultgren and F. Almqvist, Mol. Biosyst., 2007, 3, 214-218.
[13] W. E. Thomas, E. Trintchina, M. Forero, V. Vogel and E. V. Sokurenko, Cell, 2002, 109, 913-923.
[14] L. M. Nilsson, W. E. Thomas, E. Trintchina, V. Vogel and E. V. Sokurenko, J. Biol. Chem., 2006, 281, 16656-16663.
[15] M. J. Duncan, E. L. Mann, M. S. Cohen, I. Ofek, N. Sharon and S. N. Abraham, J. Biol. Chem., 2005, 280, 37707-37716.
[16] F. Rief, Fundamentals of statistical and thermal physics, McGraw-Hill, New York, 1965.
[17] E. Miller, T. I. Garcia, S. Hultgren and A. Oberhauser, Biophys. J., 2006, 91, 3848-3856.
[18] A. Rohrbach, Opt. Express, 2005, 13, 9695-9701. [19] A. Ashkin, Phys. Rev. Lett., 1970, 24, 156-159. [20] A. Ashkin, Appl. Phys. Lett., 1971, 19, 283-285. [21] A. Ashkin, J. M. Dziedzic, J. E. Bjorkholm and S. Chu, Opt. Lett., 1986,
11, 288-290. [22] M. J. Lang and S. M. Block, American Journal of Physics, 2003, 71, 201-
215. [23] A. D. Rowe, M. C. Leake, H. Morgan and R. M. Berry, J. Modern Opt.,
2003, 50, 1539-1554. [24] D. Leckband, Annu. Rev. Biophys. Biomem., 2000, 29, 1-26. [25] M. D. Wang, H. Yin, R. Landick, J. Gelles and S. M. Block, Biophys. J.,
1997, 72, 1335-1346. [26] C. Bustamante, Z. Bryant and S. B. Smith, Nature, 2003, 421, 423-427. [27] S. B. Smith, Y. J. Cui and C. Bustamante, Science, 1996, 271, 795-799. [28] J. Jass, S. Schedin, E. Fällman, J. Ohlsson, U. Nilsson, B. E. Uhlin and
O. Axner, Biophys. J., 2004, 87, 4271-4283. [29] M. Andersson, E. Fällman, B. E. Uhlin and O. Axner, Biophys. J., 2006,
90, 1521-1534. [30] M. Andersson, E. Fällman, B. E. Uhlin and O. Axner, Biophys. J., 2006,
91, 2717-2725. [31] E. Fällman, S. Schedin, J. Jass, B. E. Uhlin and O. Axner, EMBO Rep.,
2005, 6, 52–56. [32] E. Fällman and O. Axner, Appl. Opt., 1997, 36, 2107-2113. [33] E. Fällman, S. Schedin, J. Jass, M. Andersson, B. E. Uhlin and O. Axner,
Biosens. Bioelectron., 2004, 19, 1429-1437. [34] M. Andersson, E. Fällman, B. E. Uhlin and O. Axner, SPIE, 2006, 6088,
286-295. [35] F. P. Lindberg, B. Lund and S. Normark, EMBO J., 1984, 3, 1167-1173. [36] E. V. Sokurenko, H. S. Courtney, S. N. Abraham, P. Klemm and D. L.
Hasty, Infect. Immun., 1992, 60, 4709-4719. [37] E. Evans, Annu. Rev. Biophys. Biomem., 2001, 30, 105-128. [38] M. G. Bell, Science, 1978, 200, 618-627. [39] E. Evans and K. Ritchie, Biophys. J., 1999, 76, 2439-2447. [40] E. Bullitt and L. Makowski, Nature, 1995, 373, 164 -167. [41] R. Merkel, P. Nassoy, A. Leung, K. Ritchie and E. Evans, Nature, 1999,
397, 50-53. [42] T. Strunz, K. Oroszlan, I. Schumakovitch, H. J. Guntherodt and M.
Hegner, Biophys. J., 2000, 79, 1206-1212. [43] O. Björnham, O. Axner and M. Andersson, European Biophysics Journal,
2007, In press. [44] M. Andersson, B. E. Uhlin and E. Fällman, Biophys. J., 2007, 93, doi:
10.1529/biophysj.107.110643. [45] M. Andersson, E. Fällman, B. E. Uhlin and O. Axner, SPIE, 2006, 6088,
326-337. [46] M. Forero, O. Yakovenko, E. V. Sokurenko, W. E. Thomas and V. Vogel,
PLoS Biology, 2006, 4, 1509-1516. [47] E. Hahn, P. Wild, U. Hermanns, P. Sebbel, R. Glockshuber, M. Haner, N.
Taschner, P. Burkhard, U. Aebi and S. A. Muller, J. Mol. Biol., 2002, 323, 845-857.
[48] R. A. Lugmaier, S. Schedin, F. Kuhner and M. Benoit, European Biophysics Journal, 2007, DOI:10.1007/s00249-00007-00183-x.
[49] M. N. Liang, S. P. Smith, S. J. Metallo, I. S. Choi, M. Prentiss and G. M. Whitesides, PNAS, 2000, 97, 13092-13096.
Received: ((will be filled in by the editorial staff)) Published online: ((will be filled in by the editorial staff)


