Embed Size (px)
Citation preview

Physical properties of upper oceanic crust: Ocean Drilling Program
Hole 801C and the waning of hydrothermal circulation
Richard D. Jarrard,1 Lewis J. Abrams,2 Robert Pockalny,3 Roger L. Larson,3
and Tetsuro Hirono4
Received 19 December 2001; revised 4 September 2002; accepted 26 November 2002; published 8 April 2003.
[1] The hydrologic evolution of oceanic crust, from vigorous hydrothermal circulationin young, permeable volcanic crust to reduced circulation in old, cooler crust, causes acorresponding evolution of geophysical properties. Ocean Drilling Program (ODP) Hole801C, which obtained the world’s oldest section of in situ, normal oceanic crust,provides the opportunity to examine relationships among hydrologic properties (porosity,permeability, fluid flow), crustal alteration, and geophysical properties, at both core plugand downhole log scales. Within these upper crustal basalts, fluid flux in zones withhigh porosity and associated high permeability fosters alteration, particularly hydration.Consequently, porosity is correlated with both permeability and a variety of hydrationindicators. Porosity-dependent alteration is also seen at the log scale: potassiumenrichment is strongly proportional to porosity. We extend the crustal alteration patternsobserved at Hole 801C to a global examination of how physical properties of upperoceanic crust change as a function of age based on global data sets of Deep Sea DrillingProject and ODP core physical properties and downhole logs. Increasing crustal ageentails macroporosity reduction and large-scale velocity increase, despite intergranularvelocity decrease with little microporosity change. The changes in macroporosity andvelocity are significant for pillows but minor for flows. Matrix densities provide thestrongest demonstration of systematic age-dependent alteration. On the basis of observeddecreases in matrix density that are proportional to the logarithm of age, approximatelyhalf of all intergranular-scale crustal alteration occurs after the first 10–15 Myr.Apparently, crustal alteration continues, at a decreasing rate, throughout the lifetime ofoceanic crust. INDEX TERMS: 3015 Marine Geology and Geophysics: Heat flow (benthic) and
hydrothermal processes; 7220 Seismology: Oceanic crust; 3035 Marine Geology and Geophysics: Midocean
ridge processes; 5102 Physical Properties of Rocks: Acoustic properties; 8135 Tectonophysics: Evolution of
the Earth: Hydrothermal systems (8424); KEYWORDS: Ocean Drilling Program, basalt, oceanic crust,
logging
Citation: Jarrard, R. D., L. J. Abrams, R. Pockalny, R. L. Larson, and T. Hirono, Physical properties of upper oceanic crust: Ocean
Drilling Program Hole 801C and the waning of hydrothermal circulation, J. Geophys. Res., 108(B4), 2188,
doi:10.1029/2001JB001727, 2003.
1. Introduction
[2] An elegant conceptual model describes the hydrologicand geophysical evolution of oceanic crust. Hydrothermalcirculation is vigorous in newly created oceanic crust,resulting in black smokers on the seafloor and alterationof the upper kilometer of crust. Alteration minerals fill
macroporosity (cracks and interpillow voids), causingincreased velocities and densities, decreased porosity andpermeability, and oxidation of magnetic minerals [e.g.,Jacobson, 1992]. Hydrothermal circulation on ridge flanksis damped by a relatively impermeable sediment cover[Anderson and Hobart, 1976], decreased crustal permeabil-ity, and decreased thermal buoyancy forces [Anderson et al.,1977]. Nevertheless, circulation on flanks is responsible for�70% of the advective heat loss from oceanic crust [Steinand Stein, 1994] and substantial geochemical exchange withseawater [Mottl and Wheat, 1994; Elderfield and Schultz,1996].[3] To decipher the interactions among hydrogeology,
structure, and physical properties in the aging of oceaniccrust, we must examine at least four typical end-membersituations: young crust created at slow and fast spreadingrates and old crust created at slow and fast spreading rates.
JOURNAL OF GEOPHYSICAL RESEARCH, VOL. 108, NO. B4, 2188, doi:10.1029/2001JB001727, 2003
1Department of Geology and Geophysics, University of Utah, Salt LakeCity, Utah, USA.
2University of North Carolina at Wilmington, Center for MarineScience, Wilmington, North Carolina, USA.
3Graduate School of Oceanography, University of Rhode Island,Narragansett, Rhode Island, USA.
4Department of Earth and Planetary Sciences, Tokyo Institute ofTechnology, Maguro, Japan.
Copyright 2003 by the American Geophysical Union.0148-0227/03/2001JB001727$09.00
EPM 5 - 1

The first three of these situations were partly addressed atHoles 395A (young and slow), 504B (young and moderateto fast), and 418A (old and slow). Legs 129 and 185 drilledthe fourth end-member: Hole 801C, located in the PigafettaBasin at 18�38.50N, 156�21.60E, northwest Pacific Ocean(Figure 1). Hole 801C contained the oldest in situ oceaniccrust that has been sampled to date: 166.8 ± 4.5 Ma[Pringle, 1992]; its biostratigraphic [Bartolini and Larson,2001] and radiometric basement ages closely match itspredicted age on the basis of extrapolating magnetic anom-aly isochrons. This crust was created at a half spreading rateof 70–80 mm/yr [Abrams et al., 1992; Bartolini andLarson, 2001], close to the fastest rate (90 mm/yr) that isobserved at currently active spreading centers. Leg 185 alsodrilled a second example of this fourth end-member: Site1149 (Figure 1). Unfortunately, basement at Site 1149 couldnot be logged, but its core-based geophysical data areanalyzed in this paper.[4] In the first half of this paper, we analyze physical
properties, both core and downhole logs, of the tholeiites atHole 801C, in order to complete the characterization ofoceanic crustal end-members. These specific questions areaddressed for Hole 801C:1. What is the porosity structure (intergranular, intraflow,
and interflow) of the upper crust, and how is it related toalteration?2. What is the relationship of alteration to the velocity
structure of old crust of fast spreading origin? Are theobservations consistent with predictions of the standardmodel of geophysical aging of oceanic crust?3. Do the physical properties of these basalts provide
clues to their hydrothermal circulation history?[5] In the second half of this paper, we extend the crustal
alteration patterns observed at Hole 801C to a globalexamination of how the physical properties of upper oceaniccrust change as a function of age. Basalt coring and loggingby Deep Sea Drilling Project (DSDP) and Ocean DrillingProgram (ODP) provide abundant information on physicalproperties of upper oceanic crust, despite generally lowbasement core recoveries and rare basement logging [Gold-berg, 1997]. These data, acquired and published over aperiod of three decades, have not been combined in asystematic study. Johnson and Semyan [1994] have com-
piled and analyzed physical properties of basalt cores, andtwo studies [Carlson and Herrick, 1990; Moos et al., 1990]have compared results from the three deepest-penetrationsites (Holes 395A, 418A, and 504B). This paper focusesonly on the top 300 m of basalt, thereby permitting us todocument and compare temporal changes among 4 times asmany logged sites (Figure 1). Many basalt sites have coresbut not logs, so some of our additional indicators of geo-physical aging of oceanic crust are entirely core based.
2. Data
2.1. Site 801
2.1.1. Coring and Logging[6] In contrast to all previous sites drilled in the northwest
Pacific, Site 801 succeeded in penetrating mid-Cretaceousvolcanics and obtaining a first-time view of the remnantJurassic Pacific plate. Beneath a 192-m-thick section ofMiddle Cretaceous volcaniclastics and beneath an apparentunconformity lies an uninterrupted section of Valanginian toBathonian (130–165 Ma) deep-sea pelagic sediments. Thebasal Bathonian sediments are interbedded with the upper-most basalts. Seismic stratigraphy of this portion of thePigafetta Basin indicates that Site 801 is located on normaloceanic crust, free from intersecting faults [Abrams et al.,1992, 1993].[7] During ODP Leg 129, Holes 801B and 801C pene-
trated the upper 131 m of Jurassic basement, with 20 m ofoverlap between the two holes [Shipboard Scientific Party,1990c]. Most of these basalts are thin flows and some arepillows. A fossilized iron-rich hydrothermal sedimentdeposit was found �60 m below the uppermost basalts.Above this hydrothermal deposit are alkalic basalts, whichare probably sills [Shipboard Scientific Party, 2000a; J. C.Alt, personal communication, 2002] and are �10 Myryounger [Pringle, 1992] than the mid-ocean ridge basalt(MORB) tholeiites from below the deposit [Floyd andCastillo, 1992]. All recovered samples are affected bylow-grade and highly variable, anoxic submarine alteration,the intensity of which appears to be unrelated to increasingdepth or lithology [Alt et al., 1992]. The most highly alteredbasalts are directly above and below the hydrothermalsediment deposit. The cooling unit just below the hydro-
Figure 1. Locations of DSDP and ODP sites with significant penetrations into normal oceanic crust andwith either downhole logging (Table 2) or core physical properties (Table 3).
EPM 5 - 2 JARRARD ET AL.: PHYSICAL PROPERTIES OF OCEANIC CRUST

thermal deposit is highly fractured and extremely altered,with a late, oxidative type of alteration that is suggestive ofproximity to a hydrothermal system [Alt et al., 1992].[8] Although Hole 801C was drilled during Leg 129, no
downhole experiments were undertaken in the hole at thattime. ODP Leg 144 returned to this site and completed bothpacker [Larson et al., 1993] and logging [Jarrard et al.,1995] measurements. A complete suite of in situ geophys-ical logs was obtained through the upper 100 m of basalt,including velocity, density, neutron porosity, resistivity,three-component magnetometer, geochemistry, and Forma-tion MicroScanner1 logs. ODP Leg 185 returned to thishole and deepened it by 339.3 m for a total of 474 mpenetration onto oceanic crust [Shipboard Scientific Party,2000a]. Recovered cores consisted almost entirely ofMORB tholeiites, both flows and pillows, with rare hyalo-clastites and sediments plus a second hydrothermal unit
(Figure 2). Downhole logging extended from a bridge at70–90 m above total depth, up to the bottom of casing at483 m below seafloor (mbsf). This includes the zonepreviously logged on Leg 144. Nearly the same suite oflogs was run as on Leg 144, except that geochemicallogging was confined to the spectral gamma tool. Resistiv-ity logging on Leg 185 used the dual laterolog rather thandual induction tool.[9] Physical properties of the upper hydrothermal zone and
overlying alkali basalts have been presented and analyzedpreviously [Busch et al., 1992;Wallick et al., 1992; Larson etal., 1993; Jarrard et al., 1995] and are not presented here.Our analyses focus on the tholeiitic section, first encounteredon Leg 129 but mostly cored and logged during Leg 185.2.1.2. Core Measurements of Physical Properties[10] Busch et al. [1992] and Wallick et al. [1992] meas-
ured core-based physical properties of upper Hole 801C
Figure 2. Edited density, velocity, and apparent formation factor logs from Hole 801C tholeiites,compared with core plug measurements. Note the consistency of core and log measurements for velocityand density, but not for apparent formation factor. Extrusive units are from Shipboard Scientific Party[2000a].
JARRARD ET AL.: PHYSICAL PROPERTIES OF OCEANIC CRUST EPM 5 - 3
basalts. These measurements included index properties(bulk density, matrix (or grain) density, porosity) and Pwave velocity at atmospheric pressure. Wallick et al. [1992]also measured velocity versus pressure. Our analysesexclude the data of Wallick et al. [1992], because ofincomplete removal of interstitial water during drying[Jarrard et al., 1995]. Leg 185 basalt physical propertiessampling used a much closer sample spacing than at anyprevious deep crustal site: approximately three samples percore. At each horizon, a wedge-shaped sample was taken forindex properties [Shipboard Scientific Party, 2000a] and anadjacent cube was cut for three-axis measurement of veloc-ity [Shipboard Scientific Party, 2000a], resistivity and X-raycomputed tomography (CT) imaging [Hirono and Abrams,2002]. An additional 235 measurements of horizontal Pwave velocity were made on split cores.[11] Alteration of the Leg 185 basalt cubes was estimated
with light absorption spectroscopy (LAS). LAS measuresthe spectrum of light reflected from a rock surface. Light isabsorbed by minerals at and near the rock surface due toboth electronic and vibrational processes [Clark et al., 1990;Clark, 1995]. Types of identifiable minerals depend on thefrequency band of the instrument. We use the FieldSpec ProFR Portable Spectroradiometer1 because of its wide band-width (350–2500 nm). At near-infrared wavelengths (950–2500 nm), normal modes of characteristic vibrations of OHbonds occur; diagnostic absorption bands for water, Mg-OH, Al-OH, and Fe-OH are evident.[12] LAS has not previously been used as a technique for
basalt analysis, yet it has several advantages over traditionalDSDP/ODP analytical techniques: measurements take onlyseconds and are nondestructive, and LAS is particularlysensitive to hydration and smectite concentration, both ofwhich have presented challenges to interlaboratory meas-urement consistency. The volumetrically dominant mineralsin these basalts are pyroxene and plagioclase. Plagioclase isspectrally featureless and therefore undetectable by LAS.The dominant spectral signature in these basalts is frompigeonite, the pyroxene. Montmorillonites, with an OHabsorption band at 1400 nm and a strong water absorptionband at 1930 nm, can be detected at concentrations of only afew percent [Vanden Berg and Jarrard, 2002]. Troughdepths at these two wavelengths, each normalized to adja-cent wavelengths outside the absorption band, are highlycorrelated (R = 0.882), so we combine them into a singlemeasure of relative abundance of montmorillonite amongthe Leg 185 basalts. Pore water has the same OH and waterabsorption bands as hydration minerals, so it is important touse LAS only on thoroughly dried samples. To assurecomplete drying, we evacuated the samples for 24 hoursat a vacuum pressure of 9–11 Pa.[13] Permeabilities of 13 of these cube samples were
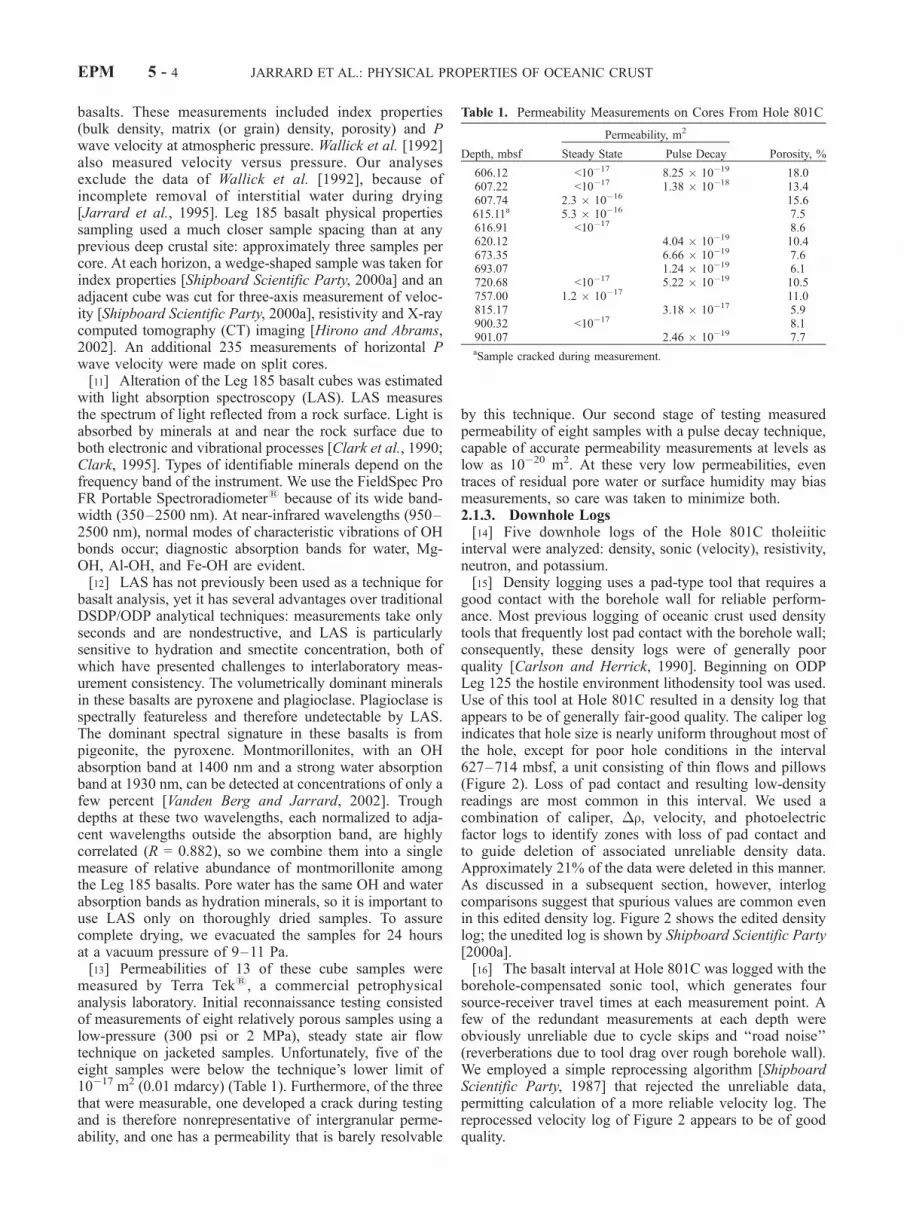
measured by Terra Tek1, a commercial petrophysicalanalysis laboratory. Initial reconnaissance testing consistedof measurements of eight relatively porous samples using alow-pressure (300 psi or 2 MPa), steady state air flowtechnique on jacketed samples. Unfortunately, five of theeight samples were below the technique’s lower limit of10�17 m2 (0.01 mdarcy) (Table 1). Furthermore, of the threethat were measurable, one developed a crack during testingand is therefore nonrepresentative of intergranular perme-ability, and one has a permeability that is barely resolvable
by this technique. Our second stage of testing measuredpermeability of eight samples with a pulse decay technique,capable of accurate permeability measurements at levels aslow as 10�20 m2. At these very low permeabilities, eventraces of residual pore water or surface humidity may biasmeasurements, so care was taken to minimize both.2.1.3. Downhole Logs[14] Five downhole logs of the Hole 801C tholeiitic
interval were analyzed: density, sonic (velocity), resistivity,neutron, and potassium.[15] Density logging uses a pad-type tool that requires a
good contact with the borehole wall for reliable perform-ance. Most previous logging of oceanic crust used densitytools that frequently lost pad contact with the borehole wall;consequently, these density logs were of generally poorquality [Carlson and Herrick, 1990]. Beginning on ODPLeg 125 the hostile environment lithodensity tool was used.Use of this tool at Hole 801C resulted in a density log thatappears to be of generally fair-good quality. The caliper logindicates that hole size is nearly uniform throughout most ofthe hole, except for poor hole conditions in the interval627–714 mbsf, a unit consisting of thin flows and pillows(Figure 2). Loss of pad contact and resulting low-densityreadings are most common in this interval. We used acombination of caliper, �r, velocity, and photoelectricfactor logs to identify zones with loss of pad contact andto guide deletion of associated unreliable density data.Approximately 21% of the data were deleted in this manner.As discussed in a subsequent section, however, interlogcomparisons suggest that spurious values are common evenin this edited density log. Figure 2 shows the edited densitylog; the unedited log is shown by Shipboard Scientific Party[2000a].[16] The basalt interval at Hole 801C was logged with the
borehole-compensated sonic tool, which generates foursource-receiver travel times at each measurement point. Afew of the redundant measurements at each depth wereobviously unreliable due to cycle skips and ‘‘road noise’’(reverberations due to tool drag over rough borehole wall).We employed a simple reprocessing algorithm [ShipboardScientific Party, 1987] that rejected the unreliable data,permitting calculation of a more reliable velocity log. Thereprocessed velocity log of Figure 2 appears to be of goodquality.
Table 1. Permeability Measurements on Cores From Hole 801C
Depth, mbsf
Permeability, m2
Porosity, %Steady State Pulse Decay
606.12 <10�17 8.25 � 10�19 18.0607.22 <10�17 1.38 � 10�18 13.4607.74 2.3 � 10�16 15.6615.11a 5.3 � 10�16 7.5616.91 <10�17 8.6620.12 4.04 � 10�19 10.4673.35 6.66 � 10�19 7.6693.07 1.24 � 10�19 6.1720.68 <10�17 5.22 � 10�19 10.5757.00 1.2 � 10�17 11.0815.17 3.18 � 10�17 5.9900.32 <10�17 8.1901.07 2.46 � 10�19 7.7aSample cracked during measurement.
EPM 5 - 4 JARRARD ET AL.: PHYSICAL PROPERTIES OF OCEANIC CRUST

[17] Leg 185 resistivity logging of Hole 801C [ShipboardScientific Party, 2000a] used the dual laterolog, which hastwo depths of penetration (shallow and deep). This toolprovides superior accuracy to the dual induction tool (usedon Leg 144) in high-resistivity formations such as somebasalts, because dual-induction response saturates at resis-tivities near �2000 � m. In general, resistivity logs have thehighest signal-to-noise ratio of any log obtained in ODP.The shallower-penetration logs are, however, sensitive tochanges in hole size: In enlarged portions of the hole, theyunderestimate formation resistivity. Consequently, we con-fine our analyses to the deep-resistivity log, which has adepth of penetration so great that it is insensitive to hole sizevariations.[18] Rock resistivity depends mainly on resistivity of the
formation fluid, which is a function of both salinity andtemperature. Apparent formation factor, the ratio of rockresistivity to fluid resistivity, removes this effect. We con-verted core-based resistivities to apparent formation factors,assuming a fluid resistivity of 0.2 � m (seawater salinityand room temperature of 21�C). Assuming seawater salinityand the temperatures measured within the borehole at thetime of logging [Shipboard Scientific Party, 2000a], logresistivities were converted to apparent formation factors(Figure 2). Because the time between logging and cessationof drilling is small compared to the time spent drilling andcirculating drilling fluids, we suspect that near-boreholetemperatures are similar to those measured within theborehole. If the zone reached by the deep resistivity toolattained equilibrium temperature by the time of logging,then temperatures are �10� higher than we assumed andformation factors are �25% lower than we calculated. Thisuncertainty is relatively small, compared to the 2 orders ofmagnitude variations in formation factor observed withinthe logged interval.[19] An alternative approach to Leg 185 formation tem-
peratures is to compare the upper part of the Leg 185resistivity log to the log obtained on Leg 144. If the duallaterolog and induction tools have identical log responses,then the ratio of these logs can be converted to a log oftemperature change. We found, however, that the differ-ences between these two logs were too great to be attribut-able to temperature change; tool response is probablyresponsible.[20] ODP neutron porosity logs consistently overestimate
the porosity of basalts [Anderson et al., 1985; Broglia andMoos, 1988; Lysne, 1989; Moos, 1990]. Broglia and Ellis[1990] utilized logs from five sites to analyze the relativecontributions of several factors to this systematic bias. Theyconcluded that the most important factor is the ODPtechnique of running the neutron porosity tool withoutappropriate eccentralization. At the one site (Site 735) thatwas logged with a bowspring-eccentralized neutron tool,this bias was absent. Although neutron tools are ‘‘compen-sated’’ in the sense of applying some correction for toolstandoff from the borehole wall, Broglia and Ellis [1990]found that this compensation is insufficient for correction ofneutron logs that lack eccentralization.[21] The Hole 801C neutron logs run on Legs 144 and
185 were corrected for standoff. Jarrard et al. [1995]compared Leg 144 density-based porosity to neutron poros-ity and found that the neutron tool overestimated porosity
by 5–25%. A similar cross plot for the Leg 185 logs (notshown) exhibits a nearly identical pattern to that for Leg144. This discrepancy, which is higher than those identifiedby Broglia and Ellis [1990] in other ODP crustal sites,probably results from a combination of interlayer water inalteration minerals and calibration to limestone matrixdensity rather than to basalt matrix density. Broglia andEllis [1990] corrected neutron logs from several crustal sitesfor both effects. For Hole 801C, however, too few H2O
+
analyses are available for alteration correction, which com-promises the usefulness of the Hole 801C neutron logs.
2.2. Other Sites
[22] From the DSDP and ODP Initial Reports and theirassociated CD-ROM databases, we have extracted fourtypes of data: velocity logs, core plug velocities, core indexproperties (bulk density, matrix density, and porosity), andcore-based identification of volcanic style.[23] From �1200 sites drilled by DSDP and ODP, we
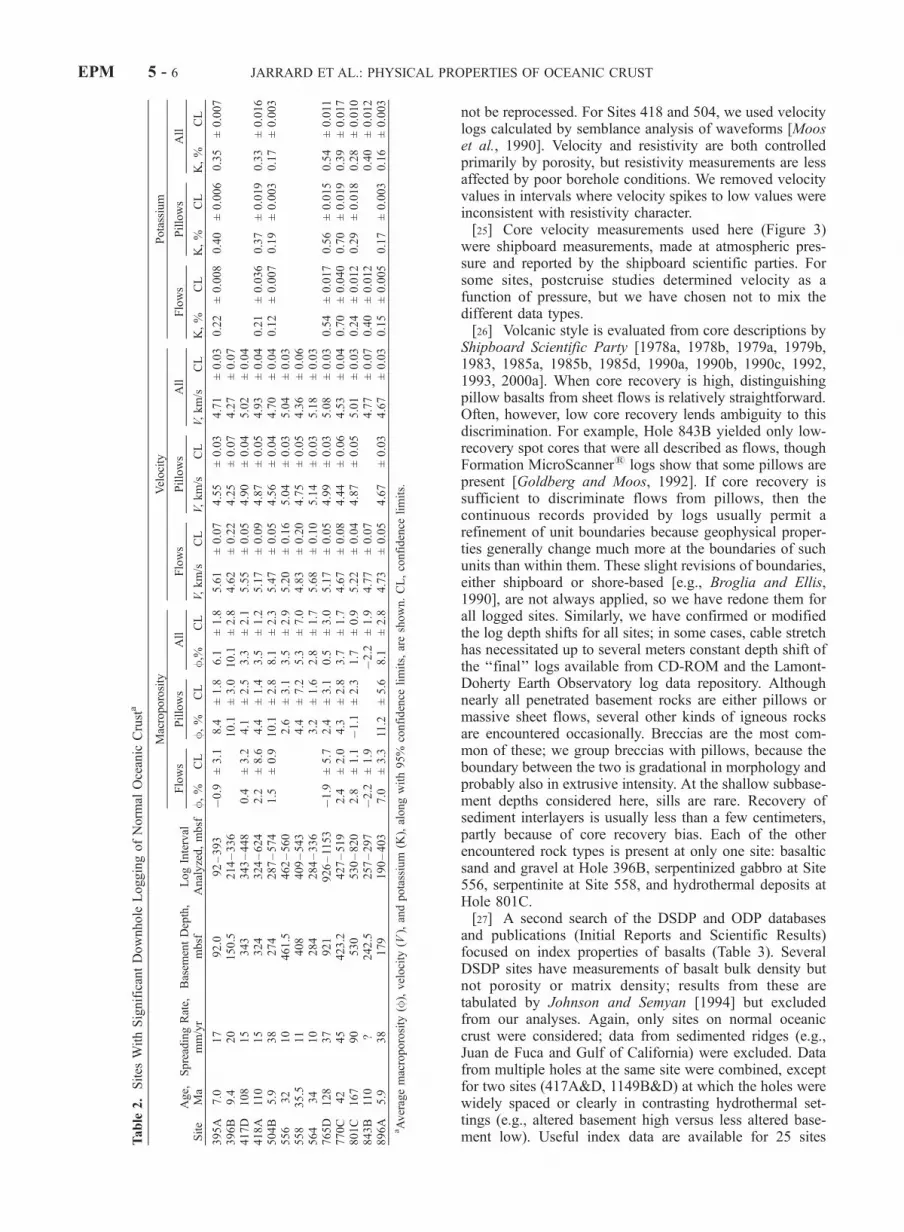
selected those that fulfill the following criteria: (1) velocitylogging of at least 40 m of basement and (2) basementcomposed of normal oceanic crust formed in an open oceanenvironment. This second criterion excluded sites on crustformed by back arc spreading, oceanic plateau or seamountvolcanism, or at a heavily sedimented spreading center; allthree environments are likely to differ from normal oceaniccrust in both volcanic style (especially proportion of intru-sives versus extrusives) and in hydrothermal alteration.Thirteen holes met both criteria: 395A, 396B, 417D,418A, 504B, 556, 558, 564, 765D, 770C, 801C, 843B,and 896A (Table 2 and Figure 1). Basement logs for thesesites [Kirkpatrick, 1978; Salisbury et al., 1979; Cann andVon Herzen, 1983; Hill and Cande, 1985; Broglia andMoos, 1988; Moos, 1990; Jarrard and Broglia, 1991;Goldberg and Moos, 1992; Jarrard et al., 1995; ShipboardScientific Party, 1978a, 1978b, 1979a, 1979b, 1983, 1985a,1985b, 1985d, 1990a, 1990b, 1990c, 1993, 1998, 2000a]vary in length, from a minimum of 41 m at Site 843 to 1827m at Hole 504B. Most sites have 90–200 m of velocity log(Figure 3), and only three (395A, 418A, and 504B) havemore than 300 m. We confined our analyses to the top 300m of basement, thereby preventing our intersite compari-sons from being biased by intrasite velocity gradients.Except for a possible velocity gradient within the top 30m of basement, no systematic depth-dependent changes invelocity are evident within the top 300 m of basement(Figure 3).[24] Most DSDP and ODP velocity logging has utilized
the Schlumberger borehole-compensated sonic tool, whichdetermines P wave travel time by a first-break thresholdingcriterion: the first energy exceeding a preset threshold isassumed to be that of the initial P wave peak [e.g., Serra,1984]. Raw velocity logs for basalts generally have manyunreliable intervals, because cycle skips and ‘‘road noise’’(reverberations due to tool drag over rough borehole wall)induce failure of the threshold technique. For most sites, weemployed a simple reprocessing algorithm [Shipboard Sci-entific Party, 1987] that we have developed to take advant-age of redundancy of measurements, reject the unreliabledata, and use retained data to calculate a more reliablevelocity log. Original first-break travel time logs were notavailable for Sites 396 and 417, so their velocity logs could
JARRARD ET AL.: PHYSICAL PROPERTIES OF OCEANIC CRUST EPM 5 - 5
not be reprocessed. For Sites 418 and 504, we used velocitylogs calculated by semblance analysis of waveforms [Mooset al., 1990]. Velocity and resistivity are both controlledprimarily by porosity, but resistivity measurements are lessaffected by poor borehole conditions. We removed velocityvalues in intervals where velocity spikes to low values wereinconsistent with resistivity character.[25] Core velocity measurements used here (Figure 3)
were shipboard measurements, made at atmospheric pres-sure and reported by the shipboard scientific parties. Forsome sites, postcruise studies determined velocity as afunction of pressure, but we have chosen not to mix thedifferent data types.[26] Volcanic style is evaluated from core descriptions by
Shipboard Scientific Party [1978a, 1978b, 1979a, 1979b,1983, 1985a, 1985b, 1985d, 1990a, 1990b, 1990c, 1992,1993, 2000a]. When core recovery is high, distinguishingpillow basalts from sheet flows is relatively straightforward.Often, however, low core recovery lends ambiguity to thisdiscrimination. For example, Hole 843B yielded only low-recovery spot cores that were all described as flows, thoughFormation MicroScanner1 logs show that some pillows arepresent [Goldberg and Moos, 1992]. If core recovery issufficient to discriminate flows from pillows, then thecontinuous records provided by logs usually permit arefinement of unit boundaries because geophysical proper-ties generally change much more at the boundaries of suchunits than within them. These slight revisions of boundaries,either shipboard or shore-based [e.g., Broglia and Ellis,1990], are not always applied, so we have redone them forall logged sites. Similarly, we have confirmed or modifiedthe log depth shifts for all sites; in some cases, cable stretchhas necessitated up to several meters constant depth shift ofthe ‘‘final’’ logs available from CD-ROM and the Lamont-Doherty Earth Observatory log data repository. Althoughnearly all penetrated basement rocks are either pillows ormassive sheet flows, several other kinds of igneous rocksare encountered occasionally. Breccias are the most com-mon of these; we group breccias with pillows, because theboundary between the two is gradational in morphology andprobably also in extrusive intensity. At the shallow subbase-ment depths considered here, sills are rare. Recovery ofsediment interlayers is usually less than a few centimeters,partly because of core recovery bias. Each of the otherencountered rock types is present at only one site: basalticsand and gravel at Hole 396B, serpentinized gabbro at Site556, serpentinite at Site 558, and hydrothermal deposits atHole 801C.[27] A second search of the DSDP and ODP databases
and publications (Initial Reports and Scientific Results)focused on index properties of basalts (Table 3). SeveralDSDP sites have measurements of basalt bulk density butnot porosity or matrix density; results from these aretabulated by Johnson and Semyan [1994] but excludedfrom our analyses. Again, only sites on normal oceaniccrust were considered; data from sedimented ridges (e.g.,Juan de Fuca and Gulf of California) were excluded. Datafrom multiple holes at the same site were combined, exceptfor two sites (417A&D, 1149B&D) at which the holes werewidely spaced or clearly in contrasting hydrothermal set-tings (e.g., altered basement high versus less altered base-ment low). Useful index data are available for 25 sitesT
able
2.Sites
WithSignificantDownhole
LoggingofNorm
alOceanic
Crusta
Site
Age,
Ma
SpreadingRate,
mm/yr
Basem
entDepth,
mbsf
LogInterval
Analyzed,mbsf
Macroporosity
Velocity
Potassium
Flows
Pillows
All
Flows
Pillows
All
Flows
Pillows
All
f,%
CL
f,%
CL
f,%
CL
V,km/s
CL
V,km/s
CL
V,km/s
CL
K,%
CL
K,%
CL
K,%
CL
395A
7.0
17
92.0
92–393
�0.9
±3.1
8.4
±1.8
6.1
±1.8
5.61
±0.07
4.55
±0.03
4.71
±0.03
0.22
±0.008
0.40
±0.006
0.35
±0.007
396B
9.4
20
150.5
214–336
10.1
±3.0
10.1
±2.8
4.62
±0.22
4.25
±0.07
4.27
±0.07
417D
108
15
343
343–448
0.4
±3.2
4.1
±2.5
3.3
±2.1
5.55
±0.05
4.90
±0.04
5.02
±0.04
418A
110
15
324
324–624
2.2
±8.6
4.4
±1.4
3.5
±1.2
5.17
±0.09
4.87
±0.05
4.93
±0.04
0.21
±0.036
0.37
±0.019
0.33
±0.016
504B
5.9
38
274
287–574
1.5
±0.9
10.1
±2.8
8.1
±2.3
5.47
±0.05
4.56
±0.04
4.70
±0.04
0.12
±0.007
0.19
±0.003
0.17
±0.003
556
32
10
461.5
462–560
2.6
±3.1
3.5
±2.9
5.20
±0.16
5.04
±0.03
5.04
±0.03
558
35.5
11
408
409–543
4.4
±7.2
5.3
±7.0
4.83
±0.20
4.75
±0.05
4.36
±0.06
564
34
10
284
284–336
3.2
±1.6
2.8
±1.7
5.68
±0.10
5.14
±0.03
5.18
±0.03
765D
128
37
921
926–1153
�1.9
±5.7
2.4
±3.1
0.5
±3.0
5.17
±0.05
4.99
±0.03
5.08
±0.03
0.54
±0.017
0.56
±0.015
0.54
±0.011
770C
42
45
423.2
427–519
2.4
±2.0
4.3
±2.8
3.7
±1.7
4.67
±0.08
4.44
±0.06
4.53
±0.04
0.70
±0.040
0.70
±0.019
0.39
±0.017
801C
167
90
530
530–820
2.8
±1.1
�1.1
±2.3
1.7
±0.9
5.22
±0.04
4.87
±0.05
5.01
±0.03
0.24
±0.012
0.29
±0.018
0.28
±0.010
843B
110
?242.5
257–297
�2.2
±1.9
�2.2
±1.9
4.77
±0.07
4.77
±0.07
0.40
±0.012
0.40
±0.012
896A
5.9
38
179
190–403
7.0
±3.3
11.2
±5.6
8.1
±2.8
4.73
±0.05
4.67
±0.03
4.67
±0.03
0.15
±0.005
0.17
±0.003
0.16
±0.003
aAveragemacroporosity
(f),velocity
(V),andpotassium
(K),alongwith95%
confidence
limits,areshown.CL,confidence
limits.
EPM 5 - 6 JARRARD ET AL.: PHYSICAL PROPERTIES OF OCEANIC CRUST

(Table 3 and Figure 1), almost double the number of siteswith velocity logs (Table 2).
3. Site 801 Analysis
3.1. Permeability
[28] Permeability is the architect of the crust’s hydro-thermal systems. Nearly all measurements of the perme-ability of upper oceanic crust are averages for portions of aborehole tens to hundreds of meters in extent. Fisher [1998]provides an excellent review and synthesis of these bulkpermeability measurements and their implications. Thislarge-scale crustal permeability is a critical control onhydrothermal circulation patterns and associated heat flux
because the volumetrically dominant flux is channelizedwithin the most permeable zones, particularly large openfractures [Fisher, 1998; Fisher and Becker, 2000].[29] Bulk permeabilities for the top 1200 m of oceanic
crust suggest two main layers: the top �500 m has per-meabilities of �10�14
�10�13 m2, and the next 700 m haspermeabilities of �10�17 m2 [Fisher, 1998]. These bulkpermeabilities are all from <8 Ma crust. A single measure-ment from older crust is that at Hole 801C, where testing ofa 93-m interval indicated a bulk permeability of �8 �
10�14 m2; more likely, flow is confined to an 18-m hydro-thermal zone at the top of the tholeiites, and bulk perme-ability is accordingly higher, �4 � 10�13 m2 [Larson et al.,1993]. Drilling-induced temperature anomalies measured on
Figure 3. P wave velocity logs, reprocessed and edited, and measurements of core plug velocity, for the13 DSDP and ODP sites of this study. Sites are plotted in order from youngest (504B) to oldest (801C), tographically demonstrate the general pattern of increasing agreement of the two types of data withincreasing age. The horizontal scale on all plots is velocity, ranging from 3 km/s at each left margin to 7km/s at each right margin. All plots extend to 300 m subbasement, the maximum depth of these analyses.
JARRARD ET AL.: PHYSICAL PROPERTIES OF OCEANIC CRUST EPM 5 - 7

Leg 185 clearly delineate this high-permeability zone, aswell as a thinner permeable zone at 705–712 mbsf [Ship-board Scientific Party, 2000a]. This deeper zone is veryporous, with the lowest formation factors and velocities ofthe entire tholeiitic interval (Figure 2).[30] Bulk permeability measurements cannot address the
problem of intergranular-scale permeability and the associ-ated fluid flow that is responsible for pervasive intergranu-lar-scale crustal alteration. Intergranular permeabilities ofmost rocks are controlled by pore geometry, which in turn isdependent on porosity and lithology. This dependencecommonly results in a linear relationship between porosityand ln(permeability) for all rocks from the same formation[Nelson, 1994]. Very few core plug measurements of basaltpermeability have been undertaken. Young basalts fromDSDP Leg 70 (0.5–2.7 Ma) and Hole 504B (5.9 Ma) havepermeabilities of mostly 10�20 to 10�18 m2 that are weaklydependent on porosity [Karato, 1983a, 1983b]. Permeabil-ities of 110 Ma crust at Holes 417D and 418A are generally10�21 to 10�17 m2 [Johnson, 1979a; Hamano, 1979] andmoderately correlated with porosity. These intergranularpermeabilities are �3–8 orders of magnitude lower thanbulk permeabilities for the upper layer, which in turn areless than regional-scale permeabilities [Fisher et al., 1994;Fisher and Becker, 2000]. Other basalt permeability meas-urements may not be representative of open ocean crust:Juan de Fuca sedimented ridge [Christensen and Ramana-nantoandro, 1988], Tonga-Kermadec [Christensen andRamananantoandro, 1988], and Arctic Ocean [Aksyuk etal., 1992].[31] Our samples from Hole 801C (Table 1), along with
mostly lower-porosity samples from other sites on normaloceanic crust [Johnson, 1979a; Hamano, 1979; Karato,1983a, 1983b], exhibit a linear relation between porosityand ln(permeability) (Figure 4a). Compared to typical
trends for sedimentary rocks, however, the basalt scatter ismuch higher and permeabilities are lower by �3 orders ofmagnitude. Both differences are attributable to the isolationof most vesicles from available flow paths. The relationshipbetween permeability and porosity, though noisy, indicatesthat porosity can be used as an indirect indicator of perme-ability and therefore of relative fluid flux. Permeabilitycontrols alteration by determining water-rock ratio. Con-sequently, measurements of LAS-based alteration index forHole 801C are correlated with both permeability (Figure 4b)and porosity (Figure 5c). On the basis of our small samplefrom Hole 801C, alteration does not appear to cause a majorchange in the porosity/permeability relation.[32] On the basis of the freshness of most non-801C
samples in Figure 4a and the regression trend of Figure4b, the minimum permeability for sufficient water-rock ratioto generate significant alteration is �10�19 m2, whichoccurs at a porosity of �5%. Flows, with porosities ofmostly <5%, consequently undergo much less alterationthan more porous pillows. However, these threshold per-meability and porosity values are only generalizations,because water-rock ratio and alteration depend not onlyon local intergranular permeability but also on proximity tohigh-permeability cracks.
3.2. Alteration
[33] Basalt physical properties at the centimeter scalemeasured in core plugs may differ from those at the meterscale measured by logs, because of differences in type ofporosity and in alteration history. At plug scale, porosityconsists mainly of vesicles and microcracks, whereas log-scale porosity also includes fractures. At plug scale, alter-ation converts glass, olivine, and plagioclase mainly to clayminerals, thereby decreasing matrix density and matrixvelocity. Porosity may increase due to this hydration, or
Table 3. Average Index Properties of Basalts for Sites on Normal Oceanic Crust, With 95% Confidence Limits
Site Hole Age, MaMatrix Densityf > 5%, g/cm3 95% CL
Matrix Density,g/cm3 95% CL Porosity, % 95% CL
Bulk Density,g/cm3 95% CL
332 A&B 3.5 2.963 ± 0.015 2.942 ± 0.016 7.36 ± 1.02 2.800 ± 0.018333 A 3.5 2.974 ± 0.015 2.974 ± 0.015 11.13 ± 3.72 2.754 ± 0.085334 8.9 2.992 ± 0.032 4.75 ± 3.13 2.897 ± 0.088395 &A 7.0 2.954 ± 0.018 2.955 ± 0.010 5.27 ± 0.58 2.852 ± 0.016396 B 9.4 2.847 ± 0.086 2.855 ± 0.030 5.51 ± 1.33 2.752 ± 0.039409 2.4 2.970 ± 0.022 2.970 ± 0.022 16.27 ± 0.96 2.650 ± 0.028410 &A 9 2.903 ± 0.035 2.903 ± 0.035 23.43 ± 2.05 2.456 ± 0.038412 A 1.6 3.010 ± 0.013 3.005 ± 0.011 5.31 ± 0.76 2.897 ± 0.013417 A 108 2.835 ± 0.028 2.852 ± 0.026 8.50 ± 3.59 2.698 ± 0.081417 D 108 2.924 ± 0.018 2.925 ± 0.013 6.67 ± 0.90 2.796 ± 0.022418 A 110 2.878 ± 0.017 2.899 ± 0.016 8.36 ± 1.70 2.742 ± 0.042470 A 15 2.940 ± 0.050 2.958 ± 0.019 4.71 ± 1.33 2.865 ± 0.037504 B 5.9 2.981 ± 0.007 2.987 ± 0.005 5.34 ± 0.43 2.881 ± 0.011505 B 4 2.988 ± 0.033 2.986 ± 0.023 6.15 ± 1.48 2.864 ± 0.038543 A 80 2.893 ± 0.100 2.898 ± 0.052 5.77 ± 1.50 2.788 ± 0.072556 32 2.955 ± 0.040 2.947 ± 0.027 6.77 ± 2.41 2.814 ± 0.055559 32 2.947 ± 0.092 2.938 ± 0.080 12.23 ± 5.06 2.701 ± 0.128562 16 2.970 ± 0.034 2.960 ± 0.026 5.05 ± 1.52 2.863 ± 0.029564 34 3.005 ± 0.024 2.995 ± 0.023 7.79 ± 2.18 2.839 ± 0.029597 C 28.5 3.103 ± 0.019 3.53 ± 1.60 3.030 ± 0.033648 B 0 2.999 ± 0.041 2.998 ± 0.015 5.03 ± 0.76 2.897 ± 0.023765 C&D 128 2.835 ± 0.031 2.867 ± 0.016 4.02 ± 0.64 2.792 ± 0.023770 B&C 42 2.839 ± 0.042 2.845 ± 0.025 5.34 ± 0.79 2.747 ± 0.031801 C 167 2.880 ± 0.021 2.900 ± 0.016 7.56 ± 0.89 2.759 ± 0.026896 A 5.9 2.936 ± 0.016 2.948 ± 0.009 5.73 ± 1.14 2.842 ± 0.0271149 B 132 2.796 ± 0.074 2.796 ± 0.074 10.27 ± 4.69 2.616 ± 0.1341149 D 132 2.829 ± 0.027 2.832 ± 0.026 8.27 ± 1.50 2.682 ± 0.038
EPM 5 - 8 JARRARD ET AL.: PHYSICAL PROPERTIES OF OCEANIC CRUST

decrease due to precipitation of carbonates or zeolites. Atlog scale and larger, porosity is thought to decrease due tofilling of cracks and interpillow voids by alteration miner-als, carbonates, quartz/chalcedony, or Fe-oxyhydroxides.[34] Basalt core descriptions provide only a subjective
description of variations in alteration. The H2O+ of basalts,
as measured by CHN analyzer, does provide a semiquanti-tative measure of the extent of alteration-induced hydration[Alt et al., 1992]. Typical H2O
+ contents of 3–6 wt % forthe upper extrusives contrast with initial MORB H2O
+ ofonly 0.12 wt % in fluid inclusions [Sobolev and Chaussi-don, 1996]. For the portion of Hole 801C cored during Leg129, the index property measurements of Busch et al.[1992] were paired with geochemical analyses of Alt et al.[1992], permitting demonstration of a close correlationbetween increasing hydration (greater H2O
+) and decreasesin velocity, matrix density, and matrix velocity [Busch et al.,
1992; Jarrard et al., 1995]. An association between alter-ation and porosity was also evident, probably because oftwo factors: (1) alteration increases porosity and (2) highporosity promotes alteration because of high permeabilityand therefore enhanced fluid flow. Figure 5b confirms thatmatrix densities of Hole 801C tholeiites decrease withincreasing porosity, although the relationship is weaker thanwas observed for the short tholeiite interval cored duringLeg 129.[35] CHN-based hydration measurements were not avail-
able for the Leg 185 index property samples, so wedetermined relative variations in hydration with LAS. Fig-ure 5a shows that matrix density for these basalts is onlysubtly correlated with LAS-based hydration, in contrast tothe much better association between matrix density andhydration for the shorter interval analyzed by Jarrard et al.[1995]. Increasing hydration is associated with increasingporosity (Figure 5c), with a higher correlation (R = 0.69)than observed by Jarrard et al. [1995].
3.3. Density
[36] Formation bulk density (rb) depends on fractionalporosity (f), matrix (or grain) density (rma), and fluiddensity (rf), according to the relationship rb = rma (1 � f) +rff. Matrix density is the average density of the mineralsforming the solid part of the rock, including any alterationminerals. This definition and an analogous one for matrixvelocity are universal in physical properties analyses but notlog analyses. Many log interpretations, particularly hydro-carbon-related ones, confine matrix density and matrixvelocity to the ‘‘clean’’ portion of a rock, often withcorrections for any clay content. Fractional porosity isgenerally much more variable than matrix density and fluiddensity. Thus the density log is a relatively straightforwardporosity log, and both rma and rf often can be assumed to beconstant. For upper crustal basalts, however, matrix densityoften decreases with increasing porosity, because of greateralteration in the more porous and therefore more permeablerocks. This pattern has been observed in several otherstudies [Hamano, 1979; Christensen et al., 1980; Carlsonand Herrick, 1990; Jarrard and Broglia, 1991], includingprior analyses of the upper basalts from Hole 801C [Buschet al., 1992; Jarrard et al., 1995]. Jarrard et al. [1995]modified the equation above to include this effect, based onthe upper 801C basalts, and we used their equation toconvert the new Hole 801C density log into a porosity log.
3.4. Velocity
[37] Porosity is the most important variable controllingboth density and velocity in the 801C basalts. This commoncontrol imparts a strong correlation between density andvelocity, routinely noted for individual sites and summar-ized for core plugs from multiple sites by Busch et al.[1992]. Figures 6a and 6b compare velocities to densitiesfor the Hole 801C tholeiites on the basis of core and logdata.[38] The relation between density and velocity can be
predicted on the basis of a combination of the theoreticaldensity equation above and the Wyllie et al. [1956] equa-tion: V �1 = (1 � f)/Vma + f/Vf, where V is whole rockcompressional wave velocity, f is fractional porosity, Vma ismatrix velocity, and Vf is pore fluid velocity. This equation
Figure 4. (a) Relationship between permeability andporosity for core plugs from Hole 801C (Table 1), comparedto published data for young crustal sites (Hole 504B andLeg 170) [Karato, 1983a, 1983b] and old crustal sites(Holes 417D and 418A) [Hamano, 1979; Johnson, 1979a].(b) Relationship between permeability and LAS-basedalteration intensity for core plugs from Hole 801C.
JARRARD ET AL.: PHYSICAL PROPERTIES OF OCEANIC CRUST EPM 5 - 9

is only an empirical approximation; theoretical equations[e.g., Gassmann, 1951; Kuster and Toksoz, 1974] requireelastic moduli that are rarely measured. Matrix velocities forbasalts [e.g., Serra, 1986] vary due to changes in alterationand composition (particularly proportion of mafic minerals).The Site 801 basalts cored during Leg 129 have a zero-porosity matrix velocity of 6.5–6.8 km/s [Jarrard et al.,1995], whereas those cored during Leg 185 have a matrixvelocity of 6.0–6.3 km/s.[39] Assuming a matrix velocity of 6.3 km/s and matrix
density of 3.0 g/cm3, the predicted relationship betweenvelocity and density at Site 801 is shown by a curve onFigures 6a and 6b. This curve fits the lowest-porosity coreand log data reasonably well, but it systematically mis-matches higher-porosity data. We attribute this mismatch toporosity-dependent variations in matrix density and matrixvelocity, caused by increased alteration at higher porosities.Jarrard et al. [1995] noted a similar pattern for core plugdata from upper 801C. They found, in contrast, that apredicted curve incorporating regression-based porosity-dependent matrix densities and matrix velocities fit not onlythe 801C core plug data but also the synthesis by Busch et
al. [1992] of core plug measurements from various sites.Figures 6a and 6b confirm that this pattern holds throughoutthe deepened tholeiitic interval at 801C. The pattern holdsfor both core and log data, despite differences in type ofporosity.[40] Several other studies have examined the relationship
between basalt porosity and velocity, based on core or logdata. Those that have examined variations in matrix velocityhave noted reduced matrix velocities at high porosity,attributed to alteration [Carlson and Herrick, 1990; Jarrardand Broglia, 1991]. A velocity/porosity cross plot for Hole801C (not shown) indicates that low-alteration samples(based on LAS) are only subtly higher in velocity, by�200 m/s, than more altered samples.
3.5. Formation Factor
[41] The deep and shallow laterologs differ not only indepth of penetration but also in overall current geometry:the shallow measurement path is predominantly vertical andthe deep path is more horizontal. Pezard and Anderson[1989] and later Pezard et al. [1996] used this distinction toidentify basalt intervals at Hole 504B with dominantly
Figure 5. Relationships among porosity, alteration (based on light absorption spectroscopy, or LAS),matrix density, and apparent formation factor, based on core plug measurements for tholeiites from Hole801C. In general, higher porosities promote hydration reactions generating clays, thereby increasingLAS-based alteration intensity and lowering matrix density and formation factor. Solid dots: basalts; opencircles: interpillow material.
EPM 5 - 10 JARRARD ET AL.: PHYSICAL PROPERTIES OF OCEANIC CRUST

horizontal (Rdeep < Rshallow) or vertical (Rdeep > Rshallow)fractures, and a similar approach has been used at nearbyHole 896A [de Larouziere et al., 1996]. Comparison of thedeep and shallow laterologs for Hole 801C tholeiites showsgenerally very close agreement [Shipboard Scientific Party,2000a]. A cross plot, not shown here, indicates a nonlinearrelationship: Shallow resistivity is systematically lower than
deep resistivity at the highest and lowest resistivities. Thisbehavior implies that differences in tool response (internalcalibrations?) overwhelm any possible influence of resistiv-ity anisotropy on the logs.[42] Our analyses use formation factor (F = Ro/Rw) rather
than the resistivity log (Ro), thereby removing the influenceof variations in fluid resistivity (Rw). If clays have a minor
Figure 6. (left) Core-based and (right) log-based relationships among velocity, bulk density, andapparent formation factor for Hole 801C tholeiites. Log porosities are calculated from the bulk densitylog. Also shown for comparison to the data of Figures 6a and 6b are predicted relationships assumingeither constant matrix values or porosity-dependent matrix values. Note that porosity-dependent matrixvalues give the most successful prediction of observed variations. Open circles: basalts; crosses:interpillow material.
JARRARD ET AL.: PHYSICAL PROPERTIES OF OCEANIC CRUST EPM 5 - 11

contribution to formation factor, then F is related to frac-tional porosity by the Archie [1942] equation, as generalizedby Winsauer and McCardell [1953]: F = a f�m. Surfaceconduction on clays can have a significant effect on basaltresistivity, particularly at elevated temperatures [Olhoeft,1981]. Consequently, calculations of porosity from resistiv-ity for Hole 504B are based on log-based estimates of bothpore fluid and clay conduction [Pezard, 1990; Pezard et al.,1996]. At Sites 768 and 770, in contrast, clay conductionwas detectable but small enough to neglect without sub-stantially biasing porosity determination [Jarrard andSchaar, 1991]. Our analyses for Hole 801C do not includeestimates of clay conduction, so we calculate apparentformation factors rather than intrinsic, clay-free formationfactors.[43] Creation of hydrous minerals during alteration is
expected to decrease both apparent formation factor andmatrix density. As previously mentioned, this process isoften most advanced in the highest-porosity, most perme-able zones. The combination of high pore fluid conductionand high clay conduction in porous, altered zones generatesa correlation between apparent formation factor and matrixdensity, as seen in Figure 5d.[44] Several previous studies of basalt cores or logs have
used a cross plot of either apparent or intrinsic formationfactor versus porosity to estimate a and m. For example,Pezard [1990] found from cores at Hole 504B that F = 10f�1. For core and log data from Sites 768 and 770,estimates of a range from 2.2 to 6.5, and estimates of mrange from 1.2 to 1.6 [Jarrard and Schaar, 1991]. For thevery old crust of Hole 418A, Broglia and Moos [1988]found from logs that F = 11.5 f�1.85 in the uppermostaltered interval, and F = 29.5 f�1.16 in the lower portion ofthat site. Similarly, the three major lithostratigraphic sub-divisions (alkalic basalts, hydrothermal zone, and tholeiiticbasalts) of Hole 801C have subtly different relationsbetween apparent formation factor and porosity [Jarrardet al., 1995]. For the tholeiites, the highest-porosity rocksindicate a linear trend with a of �4–10, but low-porosityzones exhibit little apparent correlation of formation factorto porosity, probably because of porosity errors.[45] Figures 6c and 6d compare Hole 801C apparent
formation factors to porosity for both core plug and logdata. Compared to the close relationship between theseparameters shown by core data, log data have high scatter.We attribute this scatter to porosity errors, as was the casefor Leg 144 logs, due to inadequate contact of the densitytool pad with the borehole wall. If equilibrium temperatureshad been assumed for the calculation of apparent formationfactors from resistivities, rather than assuming some for-mation cooling by drilling circulation, the pattern in Figure6d would be offset slightly upward; this uncertainty is minorin comparison to the range of formation factors and theirscatter. For the core data, linear regression indicates that F =2.6 f�2.1, within the range of relationships observed at otherbasalt sites. The log-based pattern, though high in scatter,appears to be systematically offset to the left of the core-based pattern (lower porosities for a given formation factor).[46] Figures 6e and 6f compare apparent formation fac-
tors to velocity, for both core plug and log data. Becauseboth depend on porosity, a positive correlation is expected.Both core plug and log data do show a good correlation
between these parameters. Comparison of the two trendsindicates generally lower formation factors, for a givenvelocity, for log data than for core data. Velocity differencebetween in situ and laboratory pressures is unlikely to beresponsible for this offset between trends, because reboundhere is small [Wallick et al., 1992] and reduces both velocityand formation factor.[47] The cross plots of Figure 6 indicate that apparent
formation factor is the geophysical property that differs mostbetween core and log scales. This conclusion is confirmedby overlays of core and log measurements for velocity,density, and formation factor versus depth (Figure 2).Apparent formation factors are lower for logs than for coreplugs. Either subvertical cracks (which are low resistivitybut not seen by velocity logs) or crack filling by clays(which are conductive yet increase velocity) may explainthis difference.[48] The relationships among log-based velocity, forma-
tion factor, and density seen in Figure 6 differ substantiallyin data scatter. Velocity is much better correlated withformation factor than either of these parameters is correlatedwith density. Comparison of depth plots of the three logs(Figure 2) confirms this conclusion. We attribute the densitydiscrepancies to artifacts within the density log, caused bypoor pad contact. Although the Hole 801C density log isone of the best quality density logs obtained by either DSDPor ODP from oceanic crust, its reliability is marginal.Fortunately, velocity and resistivity logs are just as sensitiveto porosity variations as is the density log, and they havemuch higher signal-to-noise ratios than does density loggingin basalts.[49] Velocity/formation factor relationships for oceanic
basalts have not been analyzed previously, but some poros-ity/formation factor log analyses have used sonic-basedporosities because density-based porosities were poor orunavailable [Jarrard and Broglia, 1991; de Larouziere etal., 1996]. At log scale, the velocity/formation factorrelation may depend on alteration intensity [de Larouziereet al., 1996]. For Hole 801C core plugs, however, the leastand most altered samples lie along the same velocity/formation factor trend.
3.6. Potassium Enrichment
[50] Is the plug-based correlation between alteration andporosity (Figure 5c) also evident in the continuous recordsavailable from in situ logs? We investigated this question bycomparing log measurements of velocity and potassium(Figure 7).[51] The potassium content of altered basalts is often an
order of magnitude higher than that of fresh basalts, due topotassium absorption from seawater during low-temperaturealteration [Hart, 1969]. Potassium-rich saponite and cela-donite are commonly formed during low-temperature dia-genesis [e.g., Alt and Honnorez, 1984]. Consequently,Broglia and Moos [1988] found that both the potassiumlog and total gamma ray log at Hole 418A were highlycorrelated with qualitative ratings of core alteration, andboth indicate variation in content of potassium-rich alter-ation minerals at that site. A relationship between gammaray and either velocity, resistivity, or fracture intensity logshas been observed at Holes 395A [Moos, 1990], 765D[Shipboard Scientific Party, 1990a], and 896A [de Larou-
EPM 5 - 12 JARRARD ET AL.: PHYSICAL PROPERTIES OF OCEANIC CRUST

ziere et al., 1996], but Sites 768 and 770 exhibit only asubtle association between alteration indicators and potas-sium [Jarrard and Broglia, 1991].[52] For the alkali basalts and upper tholeiites drilled at
Site 801 during Leg 129, a cross plot of K2O versus H2O+ is
a moderately successful alteration indicator [Alt et al.,1992]; primary compositional variations among the alkalicbasalts and potassium-free alteration minerals degrade therelationship. Jarrard et al. [1995] concluded that Th/K ratiowas superior to total potassium in detecting alteration-induced potassium enrichment among the upper tholeiites;it too was nondiagnostic among the alkalic basalts. Com-parison of the Th/K log to the porosity and velocity logssuggested that greater alteration is correlated with bothgreater porosity and lower velocity. Leg 185 tholeiite coringdemonstrates a strong correlation between patent alterationin the core, K2O concentration based on atomic absorptionand XRF and high gamma ray counts measured both incores on the multisensor track and in situ with downholelogs [Shipboard Scientific Party, 2000a]. For example, azone at �530 mbsf with K2O >2 wt % is celadonite-rich,and a K2O minimum at �720 mbsf has abundant fresh glass[Shipboard Scientific Party, 2000a]. Average K2O fromdownhole logs is slightly higher than that from cores[Shipboard Scientific Party, 2000a], probably because ofhigher core recovery in fresh, massive units than in inter-pillow material and highly altered zones.[53] Figure 7, which overlays potassium and velocity logs
versus depth for the Hole 801C tholeiites, demonstrates thatpotassium variations are closely linked to porosity changes.We use velocity as a porosity indicator, rather than density,because of density log errors discussed above. The lowestobserved potassium contents, �0.06–0.1 wt%, are compa-rable to values typical of unalteredMORB tholeiites [Spivackand Staudigel, 1994; Hart et al., 1999; Shipboard ScientificParty, 2000a], indicating that the most massive, low-porosityunits are minimally altered. Potassium maxima of �1%
imply a high proportion of potassium-bearing alterationminerals; such zones are less likely to be recovered by coring.This strong log-based correlation between porosity andpotassium-bearing alteration minerals is consistent with acore-based correlation for the upper tholeiites [Busch et al.,1992] and our core-based correlations between porosity andhydrous minerals. Although the log-based pattern could begenerated by fluid flow and associated precipitation either incracks or at an intergranular scale, the core-based patternsrequire intergranular flow and alteration.
3.7. Synthesis
[54] Hole 801C tholeiites demonstrate the relationshipsamong hydrologic properties, geophysical properties, andcrustal alteration (Figure 8a). At an intergranular scale, highporosity generates permeability that promotes fluid flux andresulting alteration (Figure 8a). Alteration, in turn, mayincrease intergranular porosity and permeability (Figure 8a).Greater alteration, as indicated byH2O
+ [Jarrard et al., 1995]or LAS, is associated with both greater porosity (Figure 5c)and permeability (Figure 4b). Alteration also reduces matrixdensities andmatrix velocities by up to 10%. The relationshipbetween velocity and density is best fit by a model in whichhigher porosities are associated with alteration-inducedreductions in matrix velocity and matrix density (Figure 6a).[55] Whereas plugs reveal intergranular patterns, coring
misses cracks and crack filling that potentially control macro-porosity and large-scale velocity [Hyndman and Drury,1976]. Log analysis, in contrast, allows us to determinewhether the laboratory sample-scale observations also holdat the interflow scale. Our comparison of Hole 801C logvelocity to density shows a pattern (Figure 6b) that agreeswith core data (Figure 5a). In contrast, the relationship of logformation factor to velocity is offset from that seen at theintergranular scale (Figures 6e and 6f), possibly because ofconductive clays in cracks. The potassium log confirms thatgreatest alteration is correlated with highest porosities andlowest velocities (Figure 7). The net effect is that the mostaltered zones remain lower in velocity than the lower-porosity, lower-permeability, unaltered zones. An extremeexample is at 711 mbsf (Figures 2 and 7): this probable crackstill has the highest permeability, lowest velocity, and lowestformation factor within the tholeiites, yet it has the mosthydrous minerals (based on the potassium log).[56] These observations at Hole 801C lead to the following
tentative predicted effects of age-dependent crustal alterationon evolution of geophysical properties: (1) ongoing alter-ation causes significant decreases in intergranular (core plug)matrix density, matrix velocity, bulk density, and velocity,possibly accompanied by subtle increase in intergranularporosity; (2) alteration reduces macroporosity; (3) the alter-ation impact on log-scale velocity involves the competingeffects of fracture filling and intergranular velocity reduction;(4) alteration increases potassium, at both core and log scales;and (5) these patterns will be more evident in pillows than inflows because of permeability differences.
4. Temporal Variations in Physical Properties ofUpper Oceanic Crust
[57] The evolution of hydrothermal circulation is wellestablished qualitatively. Hydrothermal circulation is most
Figure 7. Comparison of velocity and potassium logs forHole 801C tholeiites. The strong inverse correlationbetween these logs indicates that precipitation of potas-sium-bearing clays and celadonite occurs mainly in the mostporous (lowest-velocity) zones. See color version of thisfigure at back of this issue.
JARRARD ET AL.: PHYSICAL PROPERTIES OF OCEANIC CRUST EPM 5 - 13

vigorous and extends deepest into the oceanic crust at theridge axis, where thermally induced buoyancy forces arehighest [Humphris, 1995; Fisher, 1998]. If early sedimen-tation is substantial, hydrothermal circulation is isolatedfrom seawater and higher in temperature [Fehn and Cathles,1986; Davis et al., 1992; Humphris, 1995]. Hydrothermalcirculation continues within ridge flanks for at least tens ofmillions of years [e.g., Anderson et al., 1977; Fisher et al.,1990]. Off-axis waning of hydrothermal circulation iscaused by decrease in crustal heat, accumulation of arelatively low-permeability sediment cover, and decrease
in crustal permeability due to crustal alteration [Anderson etal., 1977; Stein and Stein, 1994]. Of these three mechanismsby which hydrothermal circulation is reduced with time anddistance from the ridge, crustal alteration has received themost attention, perhaps because only it can account for theage dependence of upper crustal velocities [Schreiber andFox, 1976, 1977]. Honnorez [1981], Thompson [1991], andAlt [1995] provided comprehensive reviews of low-temper-ature crustal alteration processes. Alteration minerals even-tually fill cracks and interpillow voids, thereby reducingporosity and permeability and increasing velocity (Figure8b). This model suggests that hydrothermal circulation isultimately self-limiting. It is, however, opposite to thepattern observed at Hole 801C (Figure 8a) in a fundamentalrespect: greater alteration at Hole 801C is associated withhigh porosity and low velocity. This contradiction may beonly apparent: the highest-porosity zones probably experi-ence the most alteration and associated porosity reduction,yet they remain more porous than fresher, more massiveintervals.[58] Of the many associations that are expected to result
from crustal aging, some are only assumed rather thandirectly observed (Figure 8c), and others have beenobserved only in young crust. The correlation betweengreater alteration and greater velocity, assumed to be presentat the multiflow scale (Figure 8c), has only been demon-strated at one site, Hole 418A [Broglia and Moos, 1988].Alteration, though extremely heterogeneous, certainly doesgenerally increase with crustal age very near the ridge crest,and abundance of crack-filling carbonate veins is higher inold crust than in 8 Ma crust [Alt and Teagle, 1999]. Hole504B provides direct evidence for alteration-induced per-meability reduction [Anderson and Zoback, 1982; Andersonet al., 1985; Becker, 1989]. Bulk permeability decreasessystematically with crustal age, for the first 8 Myr [Fisherand Becker, 2000], but packer experiments at Hole 801Cfound some of the highest crustal permeability everobserved [Larson et al., 1993]. To evaluate both the gen-erality of Hole 801C observations and the inferred patternsof crustal aging, it is necessary to undertake a globalexamination of temporal variations in physical propertiesof upper oceanic crust.
4.1. Previous Evidence for Timing of Waning ofHydrothermal Circulation
[59] The temporal evolution of hydrothermal circulationin oceanic crust is an outstanding problem. Different geo-physical techniques suggest that ridge flank hydrothermalcirculation terminates at �5–10 Ma, >10 Ma, �10–40 Ma,�65 Ma, �100 Ma, or beyond the Cretaceous.[60] Global data syntheses of upper crustal seismic veloc-
ities [Grevemeyer and Weigel, 1996; Carlson, 1998] indi-cate that velocities increase approximately linearly with thelogarithm of time from �0.1 Ma to �5–10 Ma, but changesafter that are subtle or absent. Grevemeyer et al. [1999]demonstrate this systematic increase within a single 0–8 Maheat flow and seismic velocity transect on the west flank ofthe East Pacific Rise.[61] Bulk permeabilities decrease exponentially from 1 to
8 Ma and may continue to decrease, though subsequentchanges are undetermined [Fisher and Becker, 2000]. Mostof these permeability data are from sedimented ridges,
Figure 8. Flowcharts of the interrelations among hydro-logic and geophysical parameters during the aging andalteration of oceanic crust. (a) Observed pattern at Hole801C, based on core plug measurements. (b) Generallyaccepted ‘‘standard model.’’ (c) Expected relationships atthe interflow scale, based on the standard model; some linkshave been observationally verified, whereas others are onlyassumed. Note that alteration increases large-scale velocitiesby reducing macroporosity, whereas it decreases intergra-nular velocity. Modified from Jarrard et al. [1995].
EPM 5 - 14 JARRARD ET AL.: PHYSICAL PROPERTIES OF OCEANIC CRUST

which may have alteration histories that are not representa-tive of open ocean crust.[62] Dating of alteration minerals within upper oceanic
crust suggests that alteration terminates by �10–40 Ma[Peterson et al., 1986; Gallahan and Duncan, 1994; Hart etal., 1994]. Most of these dates are <15 Myr younger thanthe age of surrounding crust, but some indicate that for-mation of alteration minerals continues for �40 Myr [Gal-lahan and Duncan, 1994].[63] The global heat flow synthesis of Stein and Stein
[1994] shows that the heat flow deficit (theoretical minusobserved) gradually decreases with age, disappearing atabout 65 Ma. The deficit indicates advection via opencirculation between seawater and the crust, with narrowunsampled zones of upwelling heat loss. Beyond 65 Ma,heat flow is dominantly conductive. The sealing agedepends primarily on crustal age and only secondarily onsediment thickness, implying that it is caused mainly bydecreased crustal permeability and/or reduced temperaturecontrast [Stein and Stein, 1994; Stein et al., 1995]. Inde-pendent evidence of hydrothermal circulation in 15–70 Macrust comes from geochemical gradients within pore fluidsof equatorial Pacific sediments [Baker et al., 1991].[64] Velocities and densities of basalt core plugs decrease
as crust ages, until �100 Ma [Johnson and Semyan, 1994].This analysis of global DSDP (and minor ODP) data fromthe top 50 m of oceanic crust confirmed the much earlierChristensen and Salisbury [1973] velocity results for theuppermost 1–2 m of basalts.[65] Hydrothermal circulation may terminate beyond the
Cretaceous, if at all, based on heterogeneity within someregional heat flow surveys on Cretaceous crust [e.g.,Embley et al., 1983; Noel and Hounslow, 1988]. Averageheat flow in these regions is conductive, but variationswithin each region suggest hydrothermal circulation. Ifglobal heat flow data are binned by crustal age, percentagestandard deviation decreases systematically with age, evenwithin the Mesozoic [Stein and Stein, 1994]. This obser-vation indicates that waning hydrothermal circulation isstill present in some old crust [Stein and Stein, 1994].Although heat flow data cannot unambiguously determinewhether this hydrothermal circulation in old crust is closedcell (no interchange with seawater) or slow open cell[Fisher, 1998], the two differ crucially in geochemicalmass balance. For closed cell fluid flow, precipitationequals solution, and crustal geophysical properties maybe unchanged by ongoing alteration.[66] These conflicting indications of when off-axis hydro-
thermal circulation wanes have been partially reconciled.Apparently, any crustal alteration that may occur beyond�5–10 Ma is so subtle that some geophysical methods maybe incapable of resolving it. Fisher and Becker [2000]suggest that the rapid initial increase in velocity anddecrease in permeability are not necessarily incompatiblewith heat flow evidence for persistence of open cell con-vection to �65 Ma. They hypothesize that hydrothermalcirculation continues to 65 Ma, in localized channels withinthe crust that are too small a percentage of total upper crustfor significant effects on average crustal velocity. If the heatflow evidence for continued fluid flow could be coupledwith a demonstration of the magnitude of ongoing crustalalteration, estimates of global geochemical fluxes into the
oceans [Kadko et al., 1995; Elderfield and Schultz, 1996]and subduction zones could be refined. Sections 4.2–4.5synthesize core, log, and seismic refraction evidence ofwhether physical properties of upper oceanic crust continueto evolve beyond �5 Ma.
4.2. Crustal Velocity Versus Age
[67] Houtz and Ewing [1976] first demonstrated thatsonobuoy refraction velocities for layer 2A increase system-atically with increasing crustal age. This observation wasattributed to lowering of uppermost crustal macroporosityby hydrothermal alteration products (Figure 8b). Subse-quent refraction experiments using improved techniquesdemonstrate that seismic velocities of the upper oceaniccrust increase rapidly for the first 5–8 Myr, from an averageof 2.3 km/s at the spreading center to 4.3–4.4 km/s at 5–10Ma [Grevemeyer and Weigel, 1996; Carlson, 1998]. Veloc-ity modeling suggests that the large near-ridge velocityincreases may be accomplished by changing the shape ofpore spaces via secondary mineralization with relativelysmall overall porosity reduction [Wilkens et al., 1991; Shaw,1994; Moos and Marion, 1994]. Beyond 10 Ma, no sig-nificant change in upper crustal velocity is evident.[68] The uppermost layer of the seismic modeling studies,
which is �200–500 m thick, is the portion of oceanic crustthat exhibits the greatest age-dependent change [White,1984]. Thus the depth interval of the DSDP and ODP sitesshould provide a sensitive barometer of crustal aging for allcrustal ages. Figure 9 plots average velocity versus loga-rithm of crustal age, based on averaging each of the 13velocity logs in Figure 3. The velocity averages shown areactually based on averaging transit times (the inverse ofvelocity) rather than velocity because the seismic methodsimilarly averages transit times rather than velocities. The95% confidence limits shown are optimistic, because theassumption that each log value is independent is invalid indepth series. Intersite variation is high because of localvariations in degree of alteration, initial porosity, andvolcanic style.[69] Average velocity for the flows ranges from 4.6 to 5.7
km/s, with no age dependence of velocity evident (Figure 9).We attribute this lack of age dependence to initial porositiesand permeabilities too low for significant fluid flow andassociated macroporosity reduction. Average velocity forthe pillows appears to be 4.25–4.7 km/s initially, increasingwith age to 4.8–5.0 km/s. Scatter at intermediate agesencompasses nearly the full range of observed velocities,precluding detection of any changes after 30 Ma. Overallaverage velocity, like pillow velocity, is initially 4.2–4.7km/s and increases with age to 5.0–5.1 km/s. This changeappears to continue beyond 30 Ma, but the evidence is notcompelling. Because pillows are generally much moreabundant than flows, the patterns for pillows and totalbasalts are mostly similar. Hole 504B (the youngest site),however, has many high-velocity flows and so is anom-alously fast in total average velocity.[70] The age dependence of total average velocity shown
here (Figure 9) extends the already well-established agedependence of uppermost crustal velocities for <5–10 Myrbased on seismic studies [Houtz and Ewing, 1976; White,1984; Grevemeyer and Weigel, 1996, 1997; Carlson, 1998;Grevemeyer et al., 1999]. Individual seismic studies, though
JARRARD ET AL.: PHYSICAL PROPERTIES OF OCEANIC CRUST EPM 5 - 15

subject to dip and other analytical uncertainties, are bothmore abundant and average larger basement volumes thanthe individual sites of this study. Nevertheless, the logs ofthis study augment the seismic results in two critical ways.First, this study is able to link velocity change to volcanicstyle and macroporosity reduction. Second, the logs appearto indicate systematic velocity increase for the time period6–167 Ma. Linear regression of log results for this timeperiod indicates that average upper crustal velocityincreases by �0.5 km/s, from �4.5 to 5.0 km/s (Figure 9).Regression of Carlson’s [1998] compiled seismic results forthis period suggests slightly lower velocities than the logresults but a similar velocity increase versus age. However,scatter is much higher for the seismic results than for log dataand the apparent increase in seismic velocity is not signifi-cant at the 95% confidence level. Consequently, Carlson[1998] concluded that rapid velocity change is limited to thefirst 5–10 Myr and that no significant increase is detectedbeyond that age.[71] Upper crustal velocities appear to be scale-depend-
ent, decreasing from core plug to log to seismic scale. Core
plug velocities are higher than log velocities (Figure 3)because interpillow porosity and cracks are seen only by thelogs. Velocity logs indicate slightly higher velocities, by�0.2–0.3 km/s, than the seismic results, as describedabove. This difference is likely to be open fracture porosityin large, near-vertical fractures and normal faults, seen bythe seismic experiments but not by vertical logs.[72] Crustal age and velocity are positively correlated at
the multiflow scale, but inversely correlated at the plug scale.Christensen and Salisbury [1972, 1973] first observed thatcore samples from the uppermost 2 m of oceanic crusttypically exhibit a velocity decrease associated withincreasing crustal age. Low-temperature alteration breaksdown glass, olivine, and feldspar, and replaces them withclay minerals that are lower in matrix velocity and density.Potassium, sodium, and water are absorbed from seawater;calcium, silicon, and iron are given off, and the netgeochemical flux is out of the basalt [e.g., Hart, 1973],thereby increasing porosity at an intergranular scale. Theplug-based relation of greater alteration inducing lowervelocity apparently is competing with alteration-inducedcrack filling and large-scale velocity increase. Conse-quently, core and log velocities converge as crust ages(Figure 3). This age-dependent convergence is examined insection 4.3.
4.3. Macroporosity Versus Age
[73] Plugs reveal intergranular patterns, but they tend tomiss cracks and crack-filling that potentially are majorcontrols on large-scale velocity [Hyndman and Drury,1976; Anderson and Zoback, 1983]. Estimation of crackporosity and its effect on large-scale physical propertiesusing incomplete core recovery is difficult [Johnson,1979b]. This crack filling may be more important tolarge-scale crustal velocity than the opposing intergranulareffects of alteration. If much of basalt porosity is in the formof large-scale voids and fractures that are not sampled by10-cm3 core plugs, then comparison of core and logmeasurements has the potential of detecting this macro-porosity. We use velocity logs rather than density logs formacroporosity detection because even the best density logshave abundant artifacts due to tool sensitivity to boreholeirregularities (e.g., compare the Hole 801C density, velocity,and formation factor logs in Figure 2). Comparisons of coreand log velocities are degraded, however, by low corerecovery and nonrepresentative core recovery. Core recov-ery in basalts varies from �10% to 80%, and the coringprocess can bias basalt core recovery toward fresher, lessaltered basalts. This reduced recovery leads to 0.5–9.0 m ofdepth uncertainty in attempts to match core and log meas-urements for the same depth.[74] Many studies have compared basalt core and log
velocities at individual sites. Such comparisons at severalyounger sites [Kirkpatrick, 1978; Moos et al., 1990; Jarrardand Broglia, 1991] concluded that macroporosity missed bythe plugs caused lower velocity and density values for logsthan for plugs. For old sites, in contrast, the standard modelpredicts that macroporosity is reduced or absent and there-fore that plug and log velocities will be similar. Thisprediction is confirmed at Holes 765D [Shipboard ScientificParty, 1990a] and 801C (Figure 2), refuted at Hole 417D[Salisbury et al., 1979], and dominantly refuted at Hole
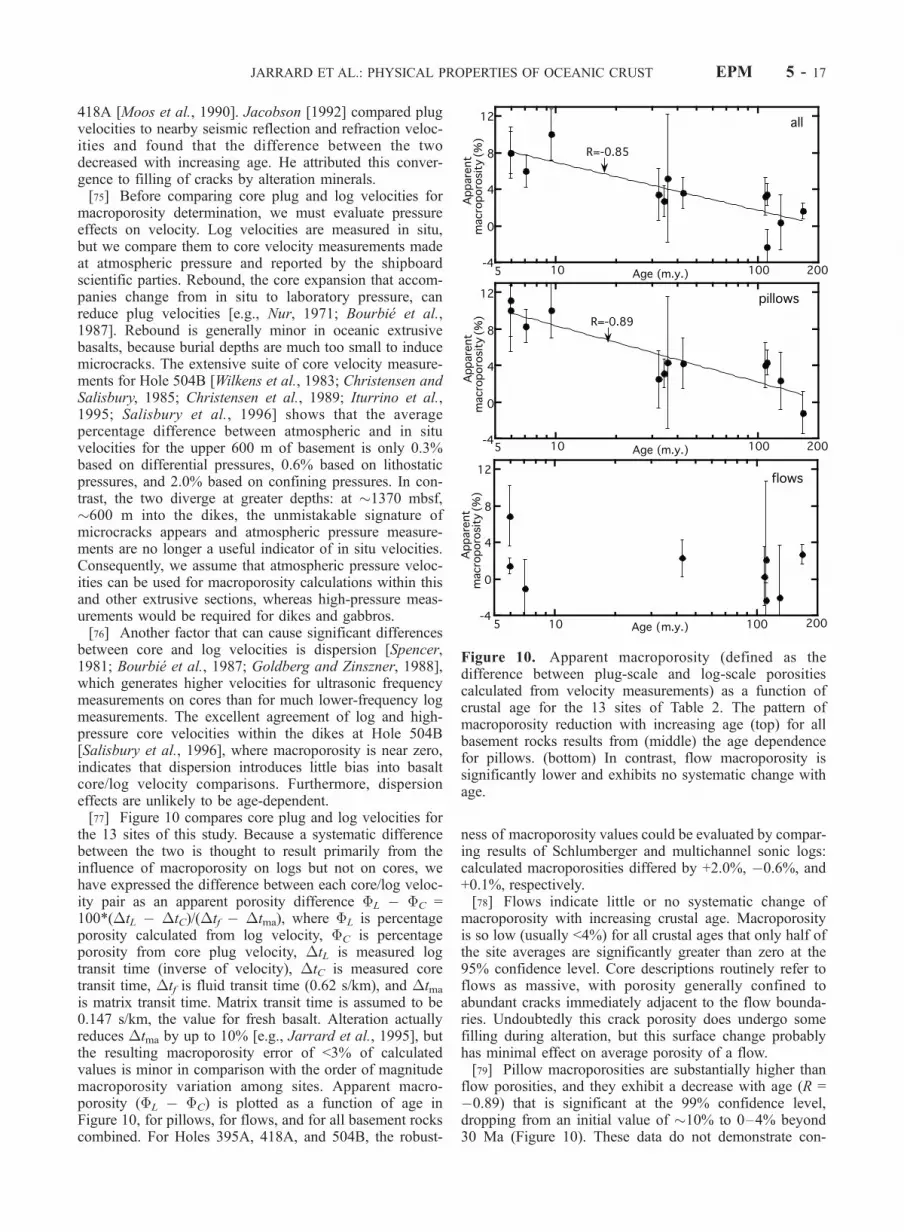
Figure 9. Log-based velocity as a function of crustal age,for the 13 sites of Table 2, compared to the seismic velocitysynthesis of Carlson [1998]. The moderate log-based trendtoward velocity increase with increasing age (top) for totalbasement rocks results from (middle) the age dependencefor pillows. (bottom) In contrast, flows exhibit no age-dependent change.
EPM 5 - 16 JARRARD ET AL.: PHYSICAL PROPERTIES OF OCEANIC CRUST
418A [Moos et al., 1990]. Jacobson [1992] compared plugvelocities to nearby seismic reflection and refraction veloc-ities and found that the difference between the twodecreased with increasing age. He attributed this conver-gence to filling of cracks by alteration minerals.[75] Before comparing core plug and log velocities for
macroporosity determination, we must evaluate pressureeffects on velocity. Log velocities are measured in situ,but we compare them to core velocity measurements madeat atmospheric pressure and reported by the shipboardscientific parties. Rebound, the core expansion that accom-panies change from in situ to laboratory pressure, canreduce plug velocities [e.g., Nur, 1971; Bourbie et al.,1987]. Rebound is generally minor in oceanic extrusivebasalts, because burial depths are much too small to inducemicrocracks. The extensive suite of core velocity measure-ments for Hole 504B [Wilkens et al., 1983; Christensen andSalisbury, 1985; Christensen et al., 1989; Iturrino et al.,1995; Salisbury et al., 1996] shows that the averagepercentage difference between atmospheric and in situvelocities for the upper 600 m of basement is only 0.3%based on differential pressures, 0.6% based on lithostaticpressures, and 2.0% based on confining pressures. In con-trast, the two diverge at greater depths: at �1370 mbsf,�600 m into the dikes, the unmistakable signature ofmicrocracks appears and atmospheric pressure measure-ments are no longer a useful indicator of in situ velocities.Consequently, we assume that atmospheric pressure veloc-ities can be used for macroporosity calculations within thisand other extrusive sections, whereas high-pressure meas-urements would be required for dikes and gabbros.[76] Another factor that can cause significant differences
between core and log velocities is dispersion [Spencer,1981; Bourbie et al., 1987; Goldberg and Zinszner, 1988],which generates higher velocities for ultrasonic frequencymeasurements on cores than for much lower-frequency logmeasurements. The excellent agreement of log and high-pressure core velocities within the dikes at Hole 504B[Salisbury et al., 1996], where macroporosity is near zero,indicates that dispersion introduces little bias into basaltcore/log velocity comparisons. Furthermore, dispersioneffects are unlikely to be age-dependent.[77] Figure 10 compares core plug and log velocities for
the 13 sites of this study. Because a systematic differencebetween the two is thought to result primarily from theinfluence of macroporosity on logs but not on cores, wehave expressed the difference between each core/log veloc-ity pair as an apparent porosity difference �L � �C =100*(�tL � �tC)/(�tf � �tma), where �L is percentageporosity calculated from log velocity, �C is percentageporosity from core plug velocity, �tL is measured logtransit time (inverse of velocity), �tC is measured coretransit time, �tf is fluid transit time (0.62 s/km), and �tma
is matrix transit time. Matrix transit time is assumed to be0.147 s/km, the value for fresh basalt. Alteration actuallyreduces �tma by up to 10% [e.g., Jarrard et al., 1995], butthe resulting macroporosity error of <3% of calculatedvalues is minor in comparison with the order of magnitudemacroporosity variation among sites. Apparent macro-porosity (�L � �C) is plotted as a function of age inFigure 10, for pillows, for flows, and for all basement rockscombined. For Holes 395A, 418A, and 504B, the robust-
ness of macroporosity values could be evaluated by compar-ing results of Schlumberger and multichannel sonic logs:calculated macroporosities differed by +2.0%, �0.6%, and+0.1%, respectively.[78] Flows indicate little or no systematic change of
macroporosity with increasing crustal age. Macroporosityis so low (usually <4%) for all crustal ages that only half ofthe site averages are significantly greater than zero at the95% confidence level. Core descriptions routinely refer toflows as massive, with porosity generally confined toabundant cracks immediately adjacent to the flow bounda-ries. Undoubtedly this crack porosity does undergo somefilling during alteration, but this surface change probablyhas minimal effect on average porosity of a flow.[79] Pillow macroporosities are substantially higher than
flow porosities, and they exhibit a decrease with age (R =�0.89) that is significant at the 99% confidence level,dropping from an initial value of �10% to 0–4% beyond30 Ma (Figure 10). These data do not demonstrate con-
Figure 10. Apparent macroporosity (defined as thedifference between plug-scale and log-scale porositiescalculated from velocity measurements) as a function ofcrustal age for the 13 sites of Table 2. The pattern ofmacroporosity reduction with increasing age (top) for allbasement rocks results from (middle) the age dependencefor pillows. (bottom) In contrast, flow macroporosity issignificantly lower and exhibits no systematic change withage.
JARRARD ET AL.: PHYSICAL PROPERTIES OF OCEANIC CRUST EPM 5 - 17

vincingly that porosity reduction continues beyond 30 Ma,though the two oldest sites have the lowest pillow macro-porosities. The pattern of total macroporosities is verysimilar to that from pillows, because pillows are thedominant component at most sites. Total macroporositiesalso exhibit a decrease with increasing age (R = �0.85)that is significant at the 99% confidence level, and thisdecrease appears to persist rather than wane at 30 Ma.Initial macroporosities of 8–10% eventually are reduced tonear zero. This pattern is a strong confirmation of thestandard model, which predicts age-dependent macro-porosity reduction.[80] For the 13 sites of Table 2, core plug velocities
exhibit an inverse correlation with logarithm of age that issignificant at the 95% confidence level, both for total basalts(R = �0.57) and for pillows (R = �0.68). Core plugvelocities of flows are not significantly correlated withlogarithm of age (R = �0.26). Temporal increase in overalllarge-scale velocity due to fracture and void filling occursdespite alteration-induced decrease in core plug velocity.We conclude that the gradual convergence of core and logvelocities (Figure 3) is not simply a macroporosity decrease(Figure 10) but a combination of fracture and void filling(increased log velocity) and decreased core plug velocity.Consequently, the age dependence of apparent macroporos-ity (Figure 10) is stronger than that for either log velocity(Figure 9) or core plug velocity, despite depth and volumemismatches inherent in comparing log and core plug veloc-ities to calculate macroporosity.
4.4. Potassium Versus Age
[81] Low-temperature crustal alteration processes includeoxidation, hydration, and alkali fixation. The latter twogenerate clay minerals, the most abundant alteration prod-ucts [e.g., Donnelly et al., 1979; Gillis and Robinson, 1988;Alt and Honnorez, 1984; Alt et al., 1986]. Consequently,altered basalts are generally higher in potassium thanunaltered basalts [Hart, 1969; Hart et al., 1974]. The extentand timing of alteration-induced potassium enrichment ofoceanic crust has implications for the potassium budgets ofthe ocean and subduction zones. Available data, however,have been generally sparse and nonrepresentative. Mostmajor element analyses of DSDP and ODP basalts selectthe least altered samples, because the geochemical objectiveis original composition rather than alteration-inducedchanges. Basalt core recovery is biased toward less alteredmaterials, with underrepresentation of hyaloclastites andinterpillow alteration minerals.[82] Spectral gamma ray logs, which provide continuous
records of potassium concentration, offer additional per-spectives on alteration-induced potassium enrichment. Thepotassium log at Hole 418A is highly correlated withqualitative ratings of core alteration [Broglia and Moos,1988], whereas potassium logs for Sites 768 and 770 areweakly correlated with alteration indicators [Jarrard andBroglia, 1991]. We interpreted the strong inverse correlationbetween potassium and velocity logs within Hole 801Ctholeiites (Figure 7) as indicating production of high-Kclays and celadonite primarily in the most porous andtherefore most permeable zones, possibly augmented byalteration-induced increase in intergranular porosity anddecrease in matrix velocity.
[83] Only seven of the 13 logged basement sites innormal oceanic crust (Table 2) have potassium logs. DSDPlogging used a total gamma ray tool, whereas ODP logginghas routinely employed spectral gamma ray logging; for-tunately, several DSDP basement sites have been revisitedby ODP and logged with newer tools such as spectralgamma ray. Among these seven sites, average log-basedpotassium content is strongly correlated with average core-based matrix density (R = �0.86; significant at 95%confidence level) (Figure 11). This correlation demonstratesthat alteration of upper oceanic crust entails potassiumenrichment. In contrast, the high-temperature alteration ofdeeper oceanic crust that occurs at the ridge crest depletespotassium [Elderfield and Schultz, 1996; Kadko et al.,1995].[84] The few normal crustal sites with potassium logs
may indicate that old (>100 Ma) sites are higher inpotassium than young (6–7 Ma) sites (Figure 12), but thecorrelation (R = 0.47) is not statistically significant, andpotassium-depleted magmas affect the values for two of theyoungest sites (504 and 896) [Alt et al., 1996]. Potassiumcontent of pillows is usually slightly higher than that offlows from the same site (Figure 12 and Table 2), asexpected because of the greater permeability and alterationof pillows. The highest-potassium site is highly altered Site770, which is backarc-trapped crust of intermediate age.The correlation without the extreme value at Site 770 ismuch greater: R = 0.64 for all units, R = 0.65 for flows, andR = 0.58 for pillows.
4.5. Core Alteration, Bulk Density, Porosity, andMatrix Density Versus Age
[85] Basalt core descriptions routinely include subjectiverankings of alteration intensity. Criteria differ from leg toleg, and no systematic pattern of increasing alteration rankwith increasing age is evident. Progressive CO2 enrichmentof oceanic crust has been quantified by analysis of fiveDSDP and ODP sites [Staudigel et al., 1996; Alt and Teagle,1999]. Alt and Teagle [1999] used these results to demon-
Figure 11. Relationship between core-based matrix den-sity and log-based potassium for sites of Table 2. Hydration,the dominant type of crustal alteration, lowers matrixdensity and absorbs potassium from seawater. Solid dotsindicate individual sites.
EPM 5 - 18 JARRARD ET AL.: PHYSICAL PROPERTIES OF OCEANIC CRUST

strate that carbonate precipitation in veins continues beyondthe 6 Ma age of Sites 504 and 896, resulting in enrichmentof total CO2 content of the upper extrusive section.[86] Johnson and Semyan [1994] examined the possibil-
ity of age-dependent changes in velocity, porosity, anddensity, based on a compilation of core plug measurementsfrom DSDP and ODP basalts. Far more drill holes intobasalt had velocity (65 holes) or density (50 holes) data thanporosity data (25 holes), and only two of these, includingSite 801, were ODP sites. Johnson and Semyan [1994]found that average velocity and bulk density decreasedsystematically from 0 to 100 Ma, but data older than 100Myr were inexplicably highly scattered and often higherthan the trend for younger crust. Porosities exhibited apossible increase with age, but the change was not statisti-cally significant. Note that these patterns of age-dependentchange at the plug scale are the opposite of those seen at logscale (e.g., Figures 9 and 10).[87] Johnson and Semyan [1994] also compiled averages
of iron oxidation ratio and of H2O+ from major element
analyses. They found that oxidation occurs mainly withinthe first 5 Myr and exhibits no detectable increase beyond20 Ma. Zhou et al. [2001] measured oxidation state of
titanomagnetites in 97 MORB samples and demonstratedthat small grains exhibit a strong linear pattern of increas-ing oxidation with logarithm of age. Their independentdata confirm the findings of Johnson and Semyan [1994]:age-dependent oxidation is clearest for 0.1–5 Ma and isnot resolved beyond �10–30 Ma. The H2O
+ compilationof Johnson and Semyan [1994] confirms earlier indica-tions [Hart, 1970, 1973; Donnelly et al., 1979; Muehlen-bachs, 1979] that hydration increases with increasing age.Unfortunately, the timing of this change is ill-determined:H2O
+ correlates better with linear age (significant at 95%confidence level) than with logarithm of age (not signifi-cant), whereas oxidation correlates better with logarithmof age (significant at 99% confidence level) than withlinear age (not significant). Both velocity and densitydecrease with increasing H2O
+ (both significant at 99%confidence level) [Johnson and Semyan, 1994], probablybecause of the combination of porosity-dependent alter-ation and alteration-induced decrease in matrix density andmatrix velocity.[88] Dating of alteration minerals, particularly celadonite,
commonly yields ages 8–16 Myr younger than the age ofthe crust [Peterson et al., 1986; Gallahan and Duncan,1994; Hart et al., 1994]. The comprehensive dating ofceladonites within the Troodos ophiolite indicates that halfof these alteration minerals formed more than 12 Myr afterthe crust, and alteration continued for at least 40 Myr[Gallahan and Duncan, 1994], particularly in the morepermeable units. However, discrepancies between Rb/Srand K/Ar ages and between core and outcrop ages suggestthat these durations could be overestimates [Booij et al.,1995]. Furthermore, ophiolite alteration is nonrepresenta-tive: it is generally more intense, with much higher fluidflux, than normal crustal alteration [Alt and Teagle, 2000].[89] Our compilation of temporal changes in core plug
physical properties draws on almost the same DSDP andODP databases as those used by Johnson and Semyan[1994]; only five additional ODP basalt sites have obtainedsignificant penetration of normal oceanic crust and associ-ated index property measurements. Both compilations areconfined to normal, open ocean oceanic crust. Johnson andSemyan [1994] also excluded sites with anomalous depths,whereas we exclude data from off-axis volcanism andsedimented ridges. They included sites with any basementpenetration and data from only the top 50 m of basement.We only include sites with >40 m of basement penetration,in order to obtain a more representative crustal sample, andwe average results from the top 300 m of basement. Theirminimum number of measurements per site was two, butours is five, again to obtain a more representative sample.They considered multiple holes at a site as independentsamples and calculated an average for each, whereas wecombine data from adjacent holes, except in rare caseswhere the holes were drilled into different hydrothermalenvironments (e.g., topographic high versus saddle). Bothcompilations are subject to similar biases: preferential corerecovery and changing measurement techniques. For exam-ple, incomplete drying biases matrix densities and porositiesdownward [Jarrard and Broglia, 1991; Jarrard et al.,1995], whereas the routine technique of drying samplesby heating to 100�–110�C biases them upward by drivingoff interlayer water from clays.
Figure 12. Potassium as a function of crustal age, for theseven sites of Table 2 that have spectral gamma ray logging.Age-dependent crustal alteration may cause progressivepotassium enrichment, but the pattern is not statisticallysignificant.
JARRARD ET AL.: PHYSICAL PROPERTIES OF OCEANIC CRUST EPM 5 - 19

[90] Unlike Johnson and Semyan [1994], we have notcompiled core plug velocities, except for logged sites asdescribed earlier. Our major focus is on matrix density, notcompiled by them, because our analyses of Site 801 andother basalt sites led us to hypothesize that matrix densitymeasurements may provide sensitive and abundant indica-tors of crustal hydration. Figure 13 shows variations of bulkdensity, matrix density, and porosity as a function of age,based on site averages of core plug analyses (Table 3).[91] No systematic change in porosity is evident, prob-
ably because of the competing effects of porosity filling byalteration minerals and porosity generation during alterationof minerals such as olivine. This observation at the plugscale does not imply lack of age-dependent decrease inmacroporosity.[92] Bulk densities may decrease with increasing age (R =
0.22; not statistically significant) (Figure 13). The correla-tion is much higher (R = 0.41, significant at 95% confidencelevel) if low-porosity, low-density Site 410 is excluded. Thedensity decrease appears to continue throughout the
sampled age range of 0–167 Ma. This observation isconsistent with the systematic decrease found by Johnsonand Semyan [1994] for 0–100 Ma, but their observations ofanomalously high scatter and high densities beyond 100 Maare not confirmed by these data. The oldest three points onthis plot are new data from ODP Leg 185: Hole 801C, Hole1149B, and Hole 1149D. The pattern of bulk densitydecrease without systematic porosity change implies thatthe source of density decrease is matrix density.[93] Matrix density exhibits a strong pattern (R = �0.57;
significant at 99% confidence level) of decrease withincreasing age (Figure 13). The simplest interpretation ofthis pattern is that matrix density continues to decrease, at arate proportional to logarithm of age, throughout the period0–167 Ma. However, data scatter in the time period 10–70Ma is high, and the hypothesis of no change beyond about40–60 Ma cannot be rejected. Index property sampling atSite 597, which has an anomalously high average matrixdensity (Table 3), is described as concentrating on a massiveflow [Shipboard Scientific Party, 1985c]; excluding thispoint raises the correlation coefficient to �0.70.[94] The matrix density plot of Figure 13 fails to remove a
major source of variance: Intersite variations in basaltporosity affect permeability and therefore degree of alter-ation. Massive flows are usually much less altered thanporous pillows, and several studies of individual sites havefound a correlation between increasing porosity anddecreasing matrix density [e.g., Christensen et al., 1980;Carlson and Herrick, 1990; Jarrard and Broglia, 1991;Busch et al., 1992; Jarrard et al., 1995]. Figure 14 plotssite-average matrix densities for porosities of <5%, 5–10%,10–15%, and >15%. Sites less than 10 Myr old exhibit littleor no evidence of porosity-dependent reduction in matrixdensity, for these grouped data. The same may be true for15–42 Ma sites, but near absence of porosities greater than10% limits resolution in this time bracket. Older sites, 80–167 Ma, have matrix densities that clearly decrease withincreasing porosity; among these are Leg 185 Holes 801C,1149B, and 1149D.[95] To reduce the influence of porosity on the pattern of
matrix density change due to crustal aging, we confine theaveraging of matrix densities to samples with a porosity of>5% (Figure 15). Most massive flows, which are tooimpermeable to share in progressive alteration of oceaniccrust, are thereby excluded. The pattern is quite similar tothat for all porosities, but the dependence on logarithm ofage is stronger (R = �0.72). The hypothesis of negligiblecrustal alteration beyond 10 Ma [Carlson, 1998; Greve-meyer et al., 1999] can be rejected at the 99% confidencelevel (R = �0.73 among sites >10 Ma).
4.6. Local Heterogeneity
[96] Superimposed on the age-dependent trends in log-scale velocity (Figure 9), macroporosity (Figure 10), potas-sium (Figure 12), density (Figure 13), and matrix density(Figures 13 and 15) is substantial local heterogeneity. Thisheterogeneity, evident as scatter on these plots, is partic-ularly evident at intermediate ages. Alteration appears tooccur earlier at some sites than others, though eventually allare altered (Figures 9 and 13). Most of our 15–40 Ma pointscome from Leg 82 drilling in an area of the North Atlanticwhere both alteration and geophysical properties are clearly
Figure 13. Bulk density, porosity, and matrix density as afunction of crustal age based on core index propertymeasurements for the sites of Table 3. The weak pattern ofgradual density decrease results from systematic decrease inmatrix density, not from porosity increase. Arrows asso-ciated with the youngest site indicate that its actual age isless than shown; its true age of 0.0 Ma cannot be plotted ona logarithmic scale nor be used in the regressions.
EPM 5 - 20 JARRARD ET AL.: PHYSICAL PROPERTIES OF OCEANIC CRUST

heterogeneous. ODP Leg 187, which obtained basementpenetration of 7–67 m at 13 sites south of Australia, is notincluded in our figures because no logging or physicalproperties measurements were undertaken. Visual coredescriptions of basalt alteration for these sites, ranging from14 to 28 Ma, show high intersite heterogeneity and nocorrelation between alteration and crustal age [ShipboardScientific Party, 2001]. The complexity of both vertical andhorizontal variations in alteration intensity is best docu-mented in ophiolites, particularly the Troodos ophiolite[Gillis and Robinson, 1988, 1990]. Basement topographyoften controls the geometry of hydrothermal circulation,concentrating outflow at topographic highs [Fisher et al.,
1990, 1994]. This pattern is evident for paired holes onadjacent topographic highs and saddles, at 417A/417D/418A and at 504B/896A [Donnelly et al., 1979; ShipboardScientific Party, 1993; Alt et al., 1996].[97] Heterogeneity of crustal alteration intensity hampers
efforts to determine the pattern of waning hydrothermalcirculation. Lack of logged sites prior to 6 Ma is not aserious disadvantage, because ample seismic experimentsdemonstrate the rapid velocity increase between 0 and about5–10 Ma [Carlson, 1998; Grevemeyer et al., 1999]. Paucityof logged sites with ages between 15 and 100 Ma isparticularly unfortunate: changes in velocity (Figure 9),macroporosity (Figure 10), and potassium (Figure 12)within this time interval are poorly determined, and onlymacroporosity suggests that upper crust of this age issystematically less altered than crust >100 Ma. Fortunately,this time interval is better represented by index propertymeasurements. Matrix densities of high-porosity basaltsprovide the most comprehensive demonstration that crustalalteration continues, albeit at a decreasing rate, throughoutthe period 0–167 Ma, corresponding to virtually the entirerange of extant oceanic crust.
4.7. Rejuvenation of Hydrothermal Circulation atthe Outer Rise?
[98] The geochemical signature of age-dependent crustalalteration can provide an essential starting point for calcu-lations of geochemical mass balances associated with sub-duction. Implicit to such calculations, however, is theassumption that normal oceanic crust is not modified bythe subduction process itself. This assumption may beinvalid.[99] The flexure of lithosphere prior to subduction gen-
erates an outer rise. Extension at the top of the lithospherecauses normal faulting, horst-and-graben topography [Lud-wig et al., 1966], and associated seismicity with tensionalfocal mechanisms [Stauder, 1968; Isacks et al., 1968;Christensen and Ruff, 1988]. These phenomena implydevelopment and opening of near-vertical cracks. Withinocean basins, off-ridge open cell hydrothermal circulationappears to be limited largely by vertical permeability;horizontal permeability is still relatively high [Fisher andBecker, 2000]. Normal faulting at the outer rise mightrejuvenate hydrothermal circulation by generating verticalpermeability, particularly when combined with the strong
Figure 14. Relationships between porosity and matrixdensity based on core index property measurements for thesites of Table 3. High porosity permits increased fluid flowand resulting increased alteration, but this effect is onlyevident at older sites. See color version of this figure at backof this issue.
Figure 15. Matrix density as a function of crustal age,based on core index property measurements for the sites ofTable 3. Because alteration is generally most intense inmore porous basalts (Figure 14), site-average matrix densityis calculated for samples with porosities of >5%.
JARRARD ET AL.: PHYSICAL PROPERTIES OF OCEANIC CRUST EPM 5 - 21

topographic gradient from the crest of the outer rise to thetrench floor. Strain cycling induced by cyclic seismicflexure may also contribute to fluid flow [Silver et al.,2000]. The very low heat flows measured immediatelyseaward of the Costa Rica and Peru trenches may beattributable to this mechanism [Langseth and Silver, 1996;Silver et al., 2000].[100] In addition to deepening Hole 801C, ODP Leg 185
drilled a deep crustal site on the outer rise of the Izu-BoninTrench (Figure 1). Holes 1149B and 1149D, though widelyspaced for holes from the same site, both encounteredseverely altered basalts. Indeed, the two lowest matrixdensities on Figure 15 are these 132 Ma holes. Geochemicalgradients in interstitial waters just above basement at Site1149 demonstrate that fluids are currently circulating withinthis crust and, by geochemical mass balance, that this crustis still undergoing alteration [Shipboard Scientific Party,2000b]. Historic seismicity on the Izu-Bonin outer rise istensional [Christensen and Ruff, 1988; Kao and Chen,1996]. Figure 16 shows that the crust surrounding Site1149 is cut by abundant normal faults, as is typical forouter rises.[101] This correlation of crustal extension and faulting
with extreme alteration and active hydrothermal flow maybe coincidental. Alternatively, it may suggest that Site 1149is representative of the final alteration state of subductingnormal oceanic crust. If so, estimates of geochemical massbalance at subduction zones need to incorporate the effectsof hydrothermal rejuvenation within oceanic crust immedi-ately seaward of the trench axis. Matrix densities for Site1149 imply �25–30% more hydration than is predicted by
the regression trend of Figure 15, but scatter from the trendis high. Unfortunately, no other crustal sites have beendrilled on flexural outer rises. Additional heat flow surveysmight resolve this uncertainty, by testing the generality ofthe pattern seen offshore Costa Rica by Langseth and Silver[1996].
5. Conclusions
[102] ODP Hole 801C, which obtained the world’s oldestsection of in situ, normal oceanic crust, provides theopportunity to examine relationships among hydrologicproperties (porosity, permeability, fluid flow), crustal alter-ation, and geophysical properties, at both core plug anddownhole log scales [Busch et al., 1992; Jarrard et al.,1995]. Within these upper crustal basalts, higher porosity isresponsible for higher permeability and therefore higherfluid flow rates. High fluid flux, in turn, fosters alteration,particularly the hydration reactions that generate clays.Consequently, porosity is well correlated with both LAS-based hydration intensity (significant at 99% confidencelevel; Figure 5c) and matrix density (significant at 99%confidence level; Figure 5b). Because clay minerals are�20% lower in matrix density than the original basaltconstituents, hydration substantially reduces matrix density;this effect is also demonstrated by the correlation betweenmatrix density and LAS-based hydration (significant at 99%confidence level; Figure 5a).[103] Geophysical properties such as formation factor are
impacted by this enhanced alteration in high-porosity zones,resulting in a correlation between core plug formation factor
Figure 16. MCS line 39, an east-west line recorded during Conrad Cruise 2005, illustrating theproximity of Site 1149 to the Izu-Bonin Trench and the numerous normal faults cutting the sediment andupper crust of the Pacific plate landward of the outer rise.
EPM 5 - 22 JARRARD ET AL.: PHYSICAL PROPERTIES OF OCEANIC CRUST

and matrix density (significant at 99% confidence level;Figure 5d). Porosity-dependent alteration is also seen at thelog scale: the excellent character match between potassiumand velocity logs (Figure 7) demonstrates that potassiumenrichment is proportional to porosity. Core plug resultsindicate that hydration not only reduces density by reducingmatrix density, but also reduces velocity by reducing matrixvelocity. These combined effects are evident on velocity/density cross plots, for both core plug (Figure 6a) and log(Figure 6b) data.[104] The similarity of core plug and log patterns at 801C
is significant, because the core plugs indicate intergranular-scale properties, whereas the logs also respond to macro-porosity. The log-based relationships of velocity to potas-sium (Figure 7) and of velocity to bulk density (Figure 6b)could result from either intergranular-scale alteration orhydration of cracks and interpillow voids. These two alter-ation scales cannot be isolated from the Hole 801C dataalone; a global examination of temporal changes in hydro-logic, alteration, and geophysical properties is needed.[105] To examine the evolution of physical properties for
normal oceanic crust, we used global data sets of DSDP andODP core physical properties and downhole logs (Figure 1and Tables 2 and 3). These core and log data suggest thatcrustal alteration continues, at a decreasing rate, throughoutthe lifetime of oceanic crust. Crustal aging is accompaniedby increased hydration, increased log-scale velocity, anddecreased macroporosity.[106] Matrix densities provide the strongest demonstra-
tion of systematic increase in alteration versus logarithm oftime (Figure 13). If variance associated with porosity-dependent alteration is reduced by confining the matrixdensity analysis to porosities greater than 5% (Figure 15),the ongoing evolution of matrix density is statisticallysignificant not only for the complete age interval but alsobeyond 10 Ma (99% confidence level) and beyond 30 Ma(95% confidence level).[107] Large-scale velocity of the upper oceanic crust
increases with age. Seismic experiments demonstrate asystematic increase of average velocity from �2.3 km/s atthe spreading center to 4.3–4.4 km/s at 5–10 Ma [Greve-meyer and Weigel, 1996; Carlson, 1998]. Beyond �5–10Ma, in contrast, seismic velocities detect no significant agedependence [Carlson, 1998], but DSDP and ODP logvelocities for pillows indicate that crustal velocity increasecontinues (Figure 9; significant at 95% confidence level).Both velocity increases are attributed to decrease in macro-porosity; the former may be more rapid because of velocitysensitivity to initial change in pore aspect ratio. This gradualincrease in large-scale velocity occurs despite systematicvelocity decrease at the intergranular scale, as indicated bycore plug velocities for 0–100 Ma [Christensen and Salis-bury, 1973; Johnson and Semyan, 1994] and for the 13logged basement sites. Precipitation in cracks and interpil-low voids must be dominant over intergranular-scale alter-ation in controlling the evolution of large-scale crustalvelocity.[108] Macroporosity can be estimated based on the differ-
ence between log and core plug velocity at the same depth.Macroporosity decreases with increasing crustal age, with alogarithm of age dependence that is evident in overall siteaverages (significant at 99% confidence level; Figure 10)
but even better demonstrated among the pillow basalts(significant at 99% confidence level; Figure 10). Thissystematic macroporosity decrease contrasts with theabsence of significant age-dependent porosity changeamong core plugs, based on the compilations of Johnsonand Semyan [1994] and Figure 13.[109] The time-dependent alteration of upper oceanic crust,
aswell as associated changes in geophysical properties, can belocally overwhelmed by two sources of variance: local top-ography, which controls hydrothermal circulation intensity,and initial permeability, which is sensitive to porosity andtherefore also to volcanic style. Flows are generally muchmore massive and impermeable than pillows, so they aremuch less subject to alteration. Consequently, systematic age-dependent changes in log-scale velocity, core plug velocity,and macroporosity are much stronger for pillows (significantat 95%, 95%, and 99%confidence level, respectively) than forflows (none is significant). The observation of intense inter-granular alteration of pillows and flow margins, despiteintergranular permeabilities that are more than 4 orders ofmagnitude lower than the fracture and interpillow permeabil-ities measured by packers, requires that fluid flow and attend-ant alteration can proceed even at these exceedingly lowpermeabilities. The lower limit for fluid flow and associatedalteration appears to be�10�19m2, based on the observationthat lower intergranular permeabilities are encounteredmostly in fresh, massive basalts with porosities of <5%[Karato, 1983a, 1983b; Johnson, 1979a; Hamano, 1979].Supporting evidence for this permeability threshold comesfrom the lackofmatrix density reduction for porosities of <5%(Figure 13) and the lack of age dependence for both velocityand macroporosity of massive flows (Figures 9 and 10).[110] Examples of ongoing hydrothermal circulation in
very old crust, such as the present-day flow within basementat Site 1149 [Shipboard Scientific Party, 2000b], microbialalteration patterns within Hole 801C [Shipboard ScientificParty, 2000a], and local heat flow anomalies in severalregions [e.g., Embley et al., 1983; Noel and Hounslow,1988], do not appear to be confined to isolated instances.Persistence of detectable hydrothermal circulation through-out the lifetime of oceanic crust is suggested by age-dependent change in heat flow variance [Stein and Stein,1994], velocity logs, macroporosity data, and matrix den-sities. This conclusion is not incompatible with previousresults suggesting lack of detectable change in seismicvelocity beyond 5–10 Ma [Carlson, 1998], preponderanceof alteration mineral ages < 40 Ma [e.g., Gallahan andDuncan, 1994], and convergence of theoretical andobserved heat flows at 65 Ma [Stein and Stein, 1994].The majority of velocity change and alteration is relativelyyoung, and termination of the heat flow deficit signifies areduction of advection to a level minor in comparison toconduction, rather than an ending of hydrothermal flow[Anderson and Skilbeck, 1981; Jacobson, 1992; Stein andStein, 1994]. On the basis of observed decreases in matrixdensity that are proportional to the logarithm of age (Figures13 and 15), approximately half of all intergranular-scalecrustal alteration occurs after the first 10–15 Myr.
[111] Acknowledgments. This project was made possible by the dataacquisition efforts of shipboard scientific parties, operations managers, andparticularly the logging scientists of a dozen DSDP and ODP legs. Also
JARRARD ET AL.: PHYSICAL PROPERTIES OF OCEANIC CRUST EPM 5 - 23

important to the success of this project was the availability of log and coredata, on CD-ROM and at the Web sites of ODP Logging Services andJANUS. We sincerely thank the Co-Chief Scientists and Shipboard Scien-tific Party of Leg 185 for making Hole 801C a solidly determined end-member for evolution of upper oceanic crust. We appreciate constructivereviews by J. C. Alt, C. Broglia, and D. Goldberg. This research usedsamples and data provided by ODP. ODP is sponsored by the U.S. NationalScience Foundation and participating countries under management of JointOceanographic Institutions, Inc. Funding for this project was provided toAbrams, Pockalny, and Larson by the U.S. Science Support Program.
ReferencesAbrams, L. J., R. L. Larson, T. H. Shipley, and Y. Lancelot, The seismicstratigraphy and sedimentary history of the East Mariana and PigafettaBasins of the western Pacific, Proc. Ocean Drill. Program Sci. Results,129, 551–569, 1992.
Abrams, L. J., R. L. Larson, T. H. Shipley, and Y. Lancelot, Cretaceousvolcanic sequences and Jurassic crust in the East Mariana and PigafettaBasins of the western Pacific, in The Mesozoic Pacific: Geology, Tec-tonics, and Volcanism, Geophys. Monogr. Ser., vol. 77, edited by M.Pringle and W. Sager, pp. 77–101, AGU, Washington, D. C., 1993.
Aksyuk, A. M., V. M. Vitovtova, A. A. Pustovoy, G. S. Kharin, and V. M.Shmonov, The permeability of oceanic basalts and some questions of theformation of hydrothermal springs in the rift zone of the Atlantic Ocean,Oceanology, Engl. Transl., 32, 778–784, 1992.
Alt, J. C., Subseafloor processes in mid-ocean ridge hydrothermal systems,in Seafloor Hydrothermal Systems: Physical, Chemical, Biological, andGeological Interactions, Geophys. Monogr. Ser., vol. 91, edited by S. E.Humphris et al., pp. 85–114, AGU, Washington, D. C., 1995.
Alt, J. C., and J. Honnorez, Alteration of the upper oceanic crust, Deep SeaDrilling Project Site 417: Mineralogy and chemistry, Contrib. Mineral.Petrol., 87, 149–169, 1984.
Alt, J. C., and D. A. H. Teagle, The uptake of carbon during alteration ofocean crust, Geochim. Cosmochim. Acta, 63, 1527–1535, 1999.
Alt, J. C., and D. A. H. Teagle, Hydrothermal alteration and fluid fluxes inophiolites and ocean crust, in Ophiolites and Oceanic Crust: New In-sights from Field Studies and the Ocean Drilling Program, edited byY. Dilek, E. M. Moores, D. Elthon, and A. Nicolas, Spec. Pap. Geol. Soc.Am., 349, 273–282, 2000.
Alt, J. C., J. Honnorez, C. Laverne, and R. Emmermann, Hydrothermalalteration of a 1-km section through the upper oceanic crust, Deep SeaDrilling Project Hole 504B: Mineralogy, chemistry and evolution ofseawater-basalt interactions, J. Geophys. Res., 91, 10,309–10,335,1986.
Alt, J. C., C. France-Lanord, P. A. Floyd, P. Castillo, and A. Galy, Low-temperature hydrothermal alteration of Jurassic ocean crust, Site 801,Proc. Ocean Drill. Program Sci. Results, 129, 415–427, 1992.
Alt, J. C., D. A. H. Teagle, C. Laverne, A. Vanko, W. Bach, J. Honnorez,K. Becker, M. Ayadi, and P. A. Pezard, Ridge-flank alteration of upperoceanic crust in the eastern Pacific: Synthesis of results for volcanicrocks of Holes 504B and 896A, Proc. Ocean Drill. Program Sci. Re-sults, 148, 435–450, 1996.
Anderson, R. N., and M. A. Hobart, The relation between heat flow, sedi-ment thickness, and age in the eastern Pacific, J. Geophys. Res., 81,2968–2989, 1976.
Anderson, R. N., and J. N. Skilbeck, Oceanic heat flow, in The Seas, vol. 7,The Oceanic Lithosphere, edited by C. Emiliani, pp. 489–523, Wiley-Interscience, New York, 1981.
Anderson, R. N., and M. D. Zoback, Permeability, underpressures andconvection in the oceanic crust near the Costa Rica Rift, eastern equator-ial Pacific, J. Geophys. Res., 87, 2860–2868, 1982.
Anderson, R. N., and M. D. Zoback, The implications of fracture and voiddistribution from bore-hole televiewer imagery for the seismic velocity ofthe upper oceanic crust at Deep Sea Drilling Project Holes 501 and 504B,Initial Rep. Deep Sea Drill. Proj., 69, 255–270, 1983.
Anderson, R. N., M. G. Langseth, and J. G. Sclater, The mechanisms ofheat transfer through the floor of the Indian Ocean, J. Geophys. Res., 82,3391–3409, 1977.
Anderson, R. N., H. O’Malley, and R. L. Newmark, Use of geophysicallogs for quantitative determination of fracturing, alteration, and lithostra-tigraphy in the upper oceanic crust, DSDP Holes 504B and 556, InitialRep. Deep Sea Drill. Proj., 83, 443–478, 1985.
Archie, G. E., The electrical resistivity log as an aid in determining somereservoir characteristics, J. Pet. Technol., 5, 1–8, 1942.
Baker, P. A., P. M. Stout, M. Kastner, and H. Elderfield, Large-scale lateraladvection of seawater through oceanic crust in the central equatorialPacific, Earth Planet. Sci. Lett., 105, 522–533, 1991.
Bartolini, A., and R. L. Larson, Pacific microplate and the Pangea super-continent in the Early to Middle Jurassic, Geology, 29, 735–738, 2001.
Becker, K., Measurements of the permeability of the sheeted dikes in Hole504B, ODP Leg 111, Proc. Ocean Drill. Program Sci. Results, 111, 317–325, 1989.
Booij, E., W. E. Gallahan, and H. Staudigel, Ion-exchange experiments andRb/Sr dating on celadonites from the Troodos Ophiolite, Cyprus, Chem.Geol., 126, 155–167, 1995.
Bourbie, T., O. Coussy, and B. Zinszner, Acoustics of Porous Media, 334pp., Educ. Technol., Paris, 1987.
Broglia, C., and D. Ellis, Effect of alteration, formation absorption, andstandoff on the response of the thermal neutron porosity log in gabbrosand basalts: Examples from Deep Sea Drilling Project-Ocean DrillingProgram sites, J. Geophys. Res., 95, 9171–9188, 1990.
Broglia, C., and D. Moos, In-situ structure and properties of 110-Ma crustfrom geophysical logs in DSDP Hole 418A, Proc. Ocean Drill. ProgramSci. Results, 102, 29–47, 1988.
Busch, W. H., P. R. Castillo, P. A. Floyd, and G. Cameron, Effects of altera-tion on physical properties of basalts from the Pigafetta and East MarianaBasins, Proc. Ocean Drill. Program Sci. Results, 129, 485–499, 1992.
Cann, J. R., and R. P. Von Herzen, Downhole logging at DSDP Sites 501,504, and 505, near the Costa Rica Rift, Initial Rep. Deep Sea Drill. Proj.,69, 281–299, 1983.
Carlson, R. L., Seismic velocities in the uppermost oceanic crust: Agedependence and the fate of layer 2A, J. Geophys. Res., 103, 7069–7077, 1998.
Carlson, R. L., and C. N. Herrick, Densities and porosities in the oceaniccrust and their variations with depth and age, J. Geophys. Res., 95,9153–9170, 1990.
Christensen, N. I., and R. Ramananantoandro, Permeability of the oceaniccrust based on experimental studies of basalt permeability at elevatedpressures, Tectonophysics, 149, 181–186, 1988.
Christensen, D. H., and L. J. Ruff, Seismic coupling and outer rise earth-quakes, J. Geophys. Res., 93, 13,421–13,444, 1988.
Christensen, N. I., and M. H. Salisbury, Sea floor spreading, progressivealteration of layer 2 basalts, and associated changes in seismic velocities,Earth Planet. Sci. Lett., 15, 367–375, 1972.
Christensen, N. I., and M. H. Salisbury, Velocities, elastic moduli andweathering-age relations for Pacific layer 2 basalts, Earth Planet. Sci.Lett., 19, 461–470, 1973.
Christensen, N. I., and M. H. Salisbury, Seismic velocities, densities andporosities of layer 2B and layer 2C basalts from Hole 504B, Initial Rep.Deep Sea Drill. Proj., 83, 367–370, 1985.
Christensen, N. I., S. C. Blair, R. H. Wilkens, and M. H. Salisbury, Com-pressional wave velocities, densities and porosities of basalts from Holes417A, 417D and 418A, Initial Rep. Deep Sea Drill. Proj., 51–53, Part 2,1467–1471, 1980.
Christensen, N. I., W. W. Wepfer, and R. D. Baud, Seismic properties ofsheeted dikes from Hole 504B, ODP Leg 111, Proc. Ocean Drill. Pro-gram Sci. Results, 111, 171–176, 1989.
Clark, R. N., Reflectance spectra, in A Handbook of Physical Constants:Rock Physics and Phase Relations, AGU Ref. Shelf Ser., vol. 3, edited byT. J. Ahrens, pp. 178–188, AGU, Washington, D.C., 1995.
Clark, R. N., T. V. V. King, M. Klejwa, G. Swayze, and N. Vergo, Highresolution reflectance spectroscopy of minerals, J. Geophys. Res., 95,12,653–12,680, 1990.
Davis, E. E., et al., Flank Flux: An experiment to study the nature ofhydrothermal circulation in young oceanic crust, Can. J. Earth Sci., 29,925–952, 1992.
de Larouziere, F. D., P. A. Pezard, M. Ayadi, and K. Becker, Downholemeasurements and electrical images in Hole 896A, Costa Rica Rift, Proc.Ocean Drill. Program Sci. Results, 148, 375–388, 1996.
Donnelly, T. W., R. A. Pritchard, R. Emmermann, and H. Puchelt, Theaging of oceanic crust: Synthesis of the mineralogical and chemical re-sults of Deep Sea Drilling Proj., Legs 51 through 53, Initial Rep. DeepSea Drill. Proj., 51–53, Part 2, 1563–1577, 1979.
Elderfield, H., and A. Schultz, Mid-ocean ridge hydrothermal fluxes andthe chemical composition of the ocean, Annu. Rev. Earth Planet. Sci., 24,191–224, 1996.
Embley, R. W., M. A. Hobart, R. N. Anderson, and D. Abbott, Anomalousheat flow in the northwest Atlantic: A case for continued hydrothermalcirculation in 80-m.y. crust, J. Geophys. Res., 88, 1067–1074, 1983.
Fehn, U., and L. M. Cathles, The influence of plate movement on theevolution of hydrothermal convection cells in the oceanic crust, Tecto-nophysics, 125, 289–312, 1986.
Fisher, A. T., Permeability within basaltic oceanic crust, Rev. Geophys., 36,143–182, 1998.
Fisher, A. T., and K. Becker, Channelized fluid flow in oceanic crustreconciles heat-flow and permeability data, Nature, 403, 71–74, 2000.
Fisher, A., K. Becker, T. N. Narasimhan, M. Langseth, and M. Mottl,Passive, off-axis convection on the southern flank of the Costa Rica Rift,J. Geophys. Res., 95, 9343–9370, 1990.
EPM 5 - 24 JARRARD ET AL.: PHYSICAL PROPERTIES OF OCEANIC CRUST

Fisher, A. T., K. Becker, and T. N. Narasimhan, Off-axis hydrothermalcirculation: Parametric tests of a refined model of processes at DeepSea Drilling Project/Ocean Drilling Program Site 504, J. Geophys.Res., 99, 3097–3121, 1994.
Floyd, P. A., and P. R. Castillo, Geochemistry and petrogenesis of Jurassicocean crust basalts, Site 801, Proc. Ocean Drill. Program Sci. Results,129, 361–388, 1992.
Gallahan, W. E., and R. A. Duncan, Spatial and temporal variability incrystallization of celadonites within the Troodos ophiolite, Cyprus: Im-plications for low-temperature alteration of the oceanic crust, J. Geophys.Res., 99, 3147–3161, 1994.
Gassmann, F., Elastic waves through a packing of spheres, Geophysics, 16,673–685, 1951.
Gillis, K., and P. T. Robinson, Distribution of alteration zones in the upperoceanic crust, Geology, 16, 262–266, 1988.
Gillis, K., and P. T. Robinson, Patterns and processes of alteration in thelavas and dikes of the Troodos ophiolite Cyprus, J. Geophys. Res., 95,21,523–21,548, 1990.
Goldberg, D., The role of downhole measurements in marine geology andgeophysics, Rev. Geophys., 35, 315–342, 1997.
Goldberg, D., and D. Moos, Physical properties of 110 Ma oceanic crust atSite OSN-1: Implications for emplacement of a borehole seismometer,Geophys. Res. Lett., 19, 757–760, 1992.
Goldberg, D., and B. Zinszner, Acoustic properties of alterred peridotite atSite 637 from laboratory and sonic waveform data, Proc. Ocean Drill.Program Sci. Results, 103, 269–276, 1988.
Grevemeyer, I., and W. Weigel, Seismic velocities of the uppermost igneouscrust versus age, Geophys. J. Int., 124, 631–635, 1996.
Grevemeyer, I., and W. Weigel, Increase of seismic velocities in upperigneous crust: The ‘‘superfast’’ spreading East Pacific Rise at 14�14’S,Geophys. Res. Lett., 24, 217–220, 1997.
Grevemeyer, I., N. Kaul, H. Villinger, and W. Weigel, Hydrothermal activityand the evolution of seismic properties of upper oceanic crust, J. Geophys.Res., 104, 5069–5079, 1999.
Hamano, Y., Physical properties of basalts from Holes 417D and 418A,Initial Rep. Deep Sea Drill. Proj., 51–53, Part 2, 1457–1466, 1979.
Hart, S. R., K, Rb, Cs contents, and K/Rb, K/Cs ratios of fresh and alteredsubmarine basalts, Earth Planet. Sci. Lett., 6, 295–303, 1969.
Hart, R. A., Chemical exchange between sea water and deep ocean basalts,Earth Planet. Sci. Lett., 9, 269–279, 1970.
Hart, R. A., A model for chemical exchange in the basalt-seawater systemof oceanic layer II, Can. J. Earth Sci., 10, 799–816, 1973.
Hart, S. R., A. J. Erlank, and E. J. D. Kable, Sea floor basalt alteration:Some chemical and Sr isotopic effects, Contrib. Mineral. Petrol., 44,219–230, 1974.
Hart, S. R., J. Blusztajn, H. J. B. Dick, and J. R. Lawrence, Fluid circulationin the oceanic crust: Contrast between volcanic and plutonic regimes,J. Geophys. Res., 99, 3163–3173, 1994.
Hart, S. R., J. Blusztajn, H. J. B. Dick, P. S. Meyer, and K. Muehlenbachs,The fingerprint of seawater circulation in a 500-meter section of oceancrust gabbros, Geochim. Cosmochim. Acta, 63, 4059–4080, 1999.
Hill, I. A., and S. C. Cande, Downhole logging and laboratory physicalproperties measurements, Initial Rep. Deep Sea Drill. Proj., 82, 351–360, 1985.
Hirono, T., and L. J. Abrams, Electrical resistivity and X-ray computedtomography measurements of sedimentary and igneous units from Hole801C and Site 1149, Proc. Ocean Drill. Program Sci. Results, 185[on-line], 2002. (Available at http://www-odp.tamu.edu/publications/185_SR/005/005.htm)
Honnorez, J., The aging of the oceanic crust at low temperature, in The Sea,vol. 7, edited by C. Emiliani, pp. 525–587, Wiley-Interscience, NewYork, 1981.
Houtz, R., and J. Ewing, Upper crustal structure as a function of plate age,J. Geophys. Res., 81, 2490–2498, 1976.
Humphris, S. E., Hydrothermal processes at mid-ocean ridges, U.S. Natl.Rep. Int. Union Geod. Geophys., 1991–1994, Rev. Geophys., 33, 71–80,1995.
Hyndman, R. D., and M. J. Drury, The physical properties of oceanicbasement rocks from deep drilling on the Mid-Atlantic Ridge, J. Geo-phys. Res., 81, 4042–4052, 1976.
Isacks, B., J. Oliver, and L. R. Sykes, Seismology and the new globaltectonics, J. Geophys. Res., 73, 5855–5899, 1968.
Iturrino, G. J., N. I. Christensen, K. Becker, L. O. Boldreel, P. K. H. Harvey,and P. Pezard, Physical properties and elastic constants of upper crustalrocks from core-log measurements in Hole 504B, Proc. Ocean Drill.Program Sci. Results, 137/140, 273–292, 1995.
Jacobson, R. S., Impact of crustal evolution on changes of the seismicproperties of the uppermost ocean crust, Rev. Geophys., 30, 23–42, 1992.
Jarrard, R. D., and C. Broglia, Geophysical properties of oceanic crust at Sites768 and 770, Proc. Ocean Drill. Program Sci. Results, 124, 75–90, 1991.
Jarrard, R. D., and R. Schaar, Electrical properties of basalts from Sites 768and 770, Proc. Ocean Drill. Program Sci. Results, 124, 91–104, 1991.
Jarrard, R. D., R. L. Larson, A. T. Fisher, and L. J. Abrams, Geophysicalaging of oceanic crust: Evidence from Hole 801C, Proc. Ocean Drill.Program Sci. Results, 144, 649–663, 1995.
Johnson, D. M., Fluid permeability of oceanic basalts, Initial Rep. Deep SeaDrill. Proj., 51–53, Part 2, 1473–1477, 1979a.
Johnson, D. M., Crack distribution in the upper oceanic crust and its effectsupon seismic velocity, seismic structure, formation permeability, andfluid circulation, Initial Rep. Deep Sea Drill. Proj., 51–53, Part 2,1479–1490, 1979b.
Johnson, H. P., and S. W. Semyan, Age variation in the physical proper-ties of oceanic basalts: Implications for crustal formation and evolution,J. Geophys. Res., 99, 3123–3134, 1994.
Kadko, D., J. Baross, and J. C. Alt, The magnitude and global implicationsof hydrothermal flux, in Seafloor Hydrothermal Systems: Physical, Che-mical, Biological, and Geological Interactions, Geophys. Monogr. Ser.,vol. 91, edited by S. E. Humphris et al., pp. 446–466, AGU, Washington,D. C., 1995.
Kao, H., and W.-P. Chen, Seismicity in the outer rise-forearc region andconfiguration of the subducting lithosphere with special reference to theJapan Trench, J. Geophys. Res., 101, 27,811–27,831, 1996.
Karato, S., Physical properties of basalts from Deep Sea Drilling ProjectHole 504B, Initial Rep. Deep Sea Drill. Proj., 69, 687–695, 1983a.
Karato, S., Physical properties of basalts from the Galapagos, Leg 70,Initial Rep. Deep Sea Drill. Proj., 70, 423–428, 1983b.
Kirkpatrick, R. J., Results of downhole geophysical logging Hole 396B,DSDP Leg 146, Initial Rep. Deep Sea Drill. Proj., 46, 401–407, 1978.
Kuster, G. T., and M. N. Toksoz, Velocity and attenuation of seismic wavesin two-phase media, part I, Theoretical formulation, part II, Experimentalresults, Geophysics, 39, 587–607, 1974.
Langseth, M. G., and E. A. Silver, The Nicoya convergent margin: A regionof exceptionally low heat flow, J. Geophys. Res., 23, 891–894, 1996.
Larson, R. L., A. T. Fisher, R. D. Jarrard, and K. Becker, Highly permeableand layered Jurassic oceanic crust in the western Pacific, Earth Planet.Sci. Lett., 119, 71–83, 1993.
Ludwig, W. J., et al., Sediments and structure of the Japan trench,J. Geophys. Res., 71, 2121–2137, 1966.
Lysne, P., Investigation of neutron-porosity uncertainties: Ocean DrillingProgram Hole 642E, Proc. Ocean Drill. Program Sci. Results, 104, 973–977, 1989.
Moos, D., Petrophysical results from logging in DSDPHole 395A, ODP Leg109, Proc. Ocean Drill. Program Sci. Results, 106/109, 237–253, 1990.
Moos, D., and D. Marion, Morphology of extrusive basalts and its relation-ship to seismic velocities in the shallow oceanic crust, J. Geophys. Res.,99, 2985–2994, 1994.
Moos, D., P. Pezard, and M. Lovell, Elastic wave velocities within oceaniclayer 2 from sonic full waveform logs in Deep Sea Drilling Project Holes395A, 418A, and 504B, J. Geophys. Res., 95, 9189–9207, 1990.
Mottl, M. J., and C. G. Wheat, Hydrothermal circulation through mid-oceanridge flanks: Fluxes of heat and magnesium, Geochim. Cosmochim. Acta,58, 2225–2237, 1994.
Muehlenbachs, K., The alteration and aging of the basaltic layer of the seafloor: Oxygen isotope evidence from DSDP/IPOD Legs 51, 52, and 53,Initial Rep. Deep Sea Drill. Proj., 51–53, Part 2, 1159–1167, 1979.
Nelson, P. H., Permeability-porosity relationships in sedimentary rocks, LogAnal., 35(3), 38–62, 1994.
Noel, M., and M. W. Hounslow, Heat flow evidence for hydrothermalconvection in Cretaceous crust of the Madiera Abyssal Plain, Earth Pla-net. Sci. Lett., 90, 77–86, 1988.
Nur, A., Effects of stress on velocity anisotropy in rocks with cracks,J. Geophys. Res., 76, 2022–2034, 1971.
Olhoeft, G. R., Electrical properties of rocks, in Physical Properties ofRocks and Minerals, edited by Y. S. Touloukian, W. R. Judd, and R. F.Roy, pp. 257–330, McGraw-Hill New York, 1981.
Peterson, C., R. Duncan, and K. F. Scheidegger, Sequence and longevity ofbasalt alteration in Deep Sea Drilling Project Site 597, Initial Rep. DeepSea Drill. Proj., 92, 509–515, 1986.
Pezard, P. A., Electrical properties of mid-ocean ridge basalt and implica-tions for the structure of the upper oceanic crust at Hole 504B, J. Geo-phys. Res., 95, 9237–9264, 1990.
Pezard, P. A., and R. N. Anderson, Morphology and alteration of the upperoceanic crust from in situ electrical experiments in DSDP/ODP Hole504B, Proc. Ocean Drill. Program Sci. Results, 111, 133–146, 1989.
Pezard, P. A., K. Becker, A. Revil, M. Ayadi, and P. K. Harvey, Fractures,porosity, and stress in the dolerites of Hole 504B, Costa Rica Rift, Proc.Ocean Drill. Program Sci. Results, 148, 317–329, 1996.
Pringle, M. S., Radiometric ages of basaltic basement recovered at Sites800, 801, and 802, ODP Leg 129, western Pacific Ocean, Proc. OceanDrill. Program Sci. Results, 129, 389–404, 1992.
JARRARD ET AL.: PHYSICAL PROPERTIES OF OCEANIC CRUST EPM 5 - 25

Salisbury, M. H., T. W. Donnely, and J. Francheteau, Geophysical loggingin Deep Sea Drilling Project Hole 417D, Initial Rep. Deep Sea Drill.Proj., 51–53, Part 1, 705–713, 1979.
Salisbury, M. H., N. I. Christensen, and R. H. Wilkens, Nature of the Layer2/3 transition from a comparison of laboratory and logging velocities andpetrology at the base of Hole 504B, Proc. Ocean Drill. Program Sci.Results, 148, 409–414, 1996.
Schreiber, E., and P. J. Fox, Compressional wave velocities and mineralogyof fresh basalts from the FAMOUS area and the Oceanographer Fracturezone and the texture of layer 2A of the oceanic crust, J. Geophys. Res.,81, 4071–4076, 1976.
Schreiber, E., and P. J. Fox, Density and P-wave velocity of rocks from theFAMOUS region and their implication to the structure of the oceaniccrust, Geol. Soc. Am. Bull., 88, 600–608, 1977.
Serra, O., Fundamentals of Well Log Interpretation, vol. 1, The Acquisitionof Logging Data, Elsevier Sci., New York, 1984.
Serra, O., Fundamentals of Well Log Interpretation, vol. 2, The Interpreta-tion of Logging Data, Elsevier Sci., New York, 1986.
Shaw, P., Age variations of oceanic crust Poisson’s ratio: Inversion and aporosity inversion model, J. Geophys. Res., 99, 3057–3066, 1994.
Shipboard Scientific Party, Site 395, Initial Rep. Deep Sea Drill. Proj., 45,131–264, 1978a.
Shipboard Scientific Party, Site 396, Initial Rep. Deep Sea Drill. Proj., 46,15–86, 1978b.
Shipboard Scientific Party, Site 417, Initial Rep. Deep Sea Drill. Proj., 51–53, Part 1, 23–350, 1979a.
Shipboard Scientific Party, Site 418, Initial Rep. Deep Sea Drill. Proj., 51–53, Part 1, 351–626, 1979b.
Shipboard Scientific Party, 501 and 504: Sediments and ocean crust in anarea of high heat flow on the southern flank of the Costa Rica Rift, InitialRep. Deep Sea Drill. Proj., 69, 31–173, 1983.
Shipboard Scientific Party, Site 556, Initial Rep. Deep Sea Drill. Proj., 82,61–113, 1985a.
Shipboard Scientific Party, Site 558, Initial Rep. Deep Sea Drill. Proj., 82,127–214, 1985b.
Shipboard Scientific Party, Site 562, Initial Rep. Deep Sea Drill. Proj., 82,255–278, 1985c.
Shipboard Scientific Party, Site 564, Initial Rep. Deep Sea Drill. Proj., 82,325–348, 1985d.
Shipboard Scientific Party, Site 645, Proc. Ocean Drill. Program InitialRep., 104, 61–418, 1987.
Shipboard Scientific Party, Site 765, Proc. Ocean Drill. Program InitialRep., 123, 63–267, 1990a.
Shipboard Scientific Party, Site 770, Proc. Ocean Drill. Program InitialRep., 124, 343–397, 1990b.
Shipboard Scientific Party, Site 801, Proc. Ocean Drill. Program InitialRep., 129, 91–170, 1990c.
Shipboard Scientific Party, Site 843, Proc. Ocean Drill. Program InitialRep., 136, 65–99, 1992.
Shipboard Scientific Party, Site 896, Proc. Ocean Drill. Program InitialRep., 148, 123–192, 1993.
Shipboard Scientific Party, Site 395, Proc. Ocean Drill. Program InitialRep., 174B, 13–23, 1998.
Shipboard Scientific Party, Site 801, Proc. Ocean Drill. Program InitialRep., 185, 1–222, 2000a.
Shipboard Scientific Party, Site 1149, Proc. Ocean Drill. Program InitialRep., 185, 1–190, 2000b.
Shipboard Scientific Party, Leg 187, Proc. Ocean Drill. Program InitialRep., 187, 1–49, 2001.
Silver, E., M. Kastner, A. Fisher, J. Morris, and D. Saffer, Fluid flow pathsin the Middle America Trench and Costa Rica margin, Geology, 28, 679–682, 2000.
Sobolev, A. V., and M. Chaussidon, H2O concentrations in primary meltsfrom supra-subduction zones and midocean ridges—Implications for
H2O storage and recycling in the mantle, Earth Planet. Sci. Lett., 137,45–55, 1996.
Spencer, J. W., Stress relaxation at low frequencies in fluid-saturated rocks:Attenuation and modulus dispersion, J. Geophys. Res., 86, 1803–1812,1981.
Spivack, A. J., and H. Staudigel, Low-temperature alteration of the upperoceanic crust and the alkalinity budget of seawater, Chem. Geol., 115,239–247, 1994.
Stauder, W., Mechanism of the Rat Island earthquake sequence of February4, 1965, with relation to island arcs and sea floor spreading, J. Geophys.Res., 73, 3847–3858, 1968.
Staudigel, H., T. Plank, B. White, and H.-U. Schmincke, Geochemicalfluxes during seafloor alteration of the basaltic upper oceanic crust;DSDP sites 417 and 418, in Subduction Top to Bottom, Geophys.Monogr. Ser., vol. 96, edited by G. E. Bebout et al., pp. 19–38, AGU,Washington, D. C., 1996.
Stein, C. A., and S. Stein, Constraints on hydrothermal heat flux throughthe oceanic lithosphere from global heat flow, J. Geophys. Res., 99,3081–3095, 1994.
Stein, C. A., S. Stein, and A. M. Pelayo, Heat flow and hydrothermalcirculation, in Seafloor Hydrothermal Systems: Physical, Chemical, Bio-logical, and Geological Interactions, Geophys. Monogr. Ser., vol. 91,edited by S. E. Humphris et al., pp. 425 –445, AGU, Washington,D. C., 1995.
Thompson, G., Metamorphic and hydrothermal processes: Basalt-seawaterinteraction, in Oceanic Basalts, edited by P. A. Floyd, pp. 148–173, VanNostrand Reinhold, New York, 1991.
Vanden Berg, M. D., and R. D. Jarrard, Determination of equatorial Pacificmineralogy using light absorption spectroscopy, Proc. Ocean Drill. Pro-gram Initial Rep., 199, [CD-ROM], 1–20, 2002.
Wallick, B. P., N. I. Christensen, and D. M. Ballotti, High-pressure velocitymeasurements of Jurassic basalt, Leg 129, Proc. Ocean Drill. ProgramSci. Results, 129, 501–506, 1992.
White, R. S., Atlantic oceanic crust: Seismic structure of a slow spreadingridge, in Ophiolites and Oceanic Lithosphere, edited by I. G. Gass, S. J.Lippard, and A. W. Shelton, Spec. Publ. Geol. Soc. London, 13, 34–44,1984.
Wilkens, R. H., N. I. Christensen, and L. Slater, High-pressure seismicstudies of Leg 69 and 70 basalts, Initial Rep. Deep Sea Drill. Proj., 69,683–686, 1983.
Wilkens, R. H., G. J. Fryer, and J. Karsten, Evolution of porosity and seismicstructure of upper oceanic crust: Importance of aspect ratios, J. Geophys.Res., 96, 17,981–17,995, 1991.
Winsauer, W. O., and W. M. McCardell, Ionic double-layer conductivity inreservoir rocks, Trans. Am. Inst. Min. Metall. Pet. Eng., 198, 129–134,1953.
Wyllie, M. R. J., A. R. Gregory, and G. H. F. Gardner, Elastic wavevelocities in heterogeneous and porous media, Geophysics, 21, 41–70,1956.
Zhou, W., R. Vander Voo, D. R. Peacor, D. Wang, and Y. Zhang, Low-temperature oxidation in MORB of titanomagnetite to titanomaghemite:A gradual process with implications for marine magnetic anomaly am-plitudes, J. Geophys. Res., 106, 6409–6421, 2001.
�����������������������
L. J. Abrams, University of North Carolina at Wilmington, Center forMarine Science, One M. K. Moss Lane, Wilmington, NC 28409, USA.T. Hirono, Department of Earth and Planetary Sciences, Tokyo Institute
of Technology, Maguro 152-8551, Japan.R. D. Jarrard, Department of Geology and Geophysics, University of
Utah, 717 WBB - 135 S. 1460 East, Salt Lake City, UT 84112-0111, USA.([email protected])R. L. Larson and R. Pockalny, Graduate School of Oceanography,
University of Rhode Island, Narragansett, RI 02882, USA.
EPM 5 - 26 JARRARD ET AL.: PHYSICAL PROPERTIES OF OCEANIC CRUST

Figure 14. Relationships between porosity and matrixdensity based on core index property measurements for thesites of Table 3. High porosity permits increased fluid flowand resulting increased alteration, but this effect is onlyevident at older sites.
Figure 7. Comparison of velocity and potassium logs forHole 801C tholeiites. The strong inverse correlationbetween these logs indicates that precipitation of potas-sium-bearing clays and celadonite occurs mainly in the mostporous (lowest-velocity) zones.
JARRARD ET AL.: PHYSICAL PROPERTIES OF OCEANIC CRUST
EPM 5 - 13 and EPM 5 - 21


