Embed Size (px)
Citation preview
UNIVERSITY OF NAIROBI
Physicochemical Characterization of Honey from Selected Counties in Kenya
By
Evalyne Jepkorir Rotich, BSc (Analytical Chemistry)
A Research Thesis submitted to The University of Nairobi in partial fulfillment of the
requirements for the award of degree of Master of Science in Nuclear Science.
@2019

iii
DEDICATION
I would like to dedicate this thesis to my late parents; Albert and Mary, who died young but will
never be forgotten, my guardians; Rtd Major Bartai and Rose Bartai, who have always supported
me and cheered me on, in my studies and in life from a very tender age until now. I love you all
so much.
iv
ACKNOWLEDMENT I would like to acknowledge and thank my two supervisors; Mr Michael J. Mangala and Prof John
M. Onyari for their guidance and support.
Many thanks go to the Director and staff of National Beekeeping Institute, for permission to carry
out part of my research in their laboratories and for laboratory assistance in the analysis of honey
samples.
Lastly, I thank the staff members of Institute of Nuclear Science and Technology, the University
of Nairobi and Radiation Protection Board of Kenya and my classmates for their encouragement
and assistance to do better, always.
v
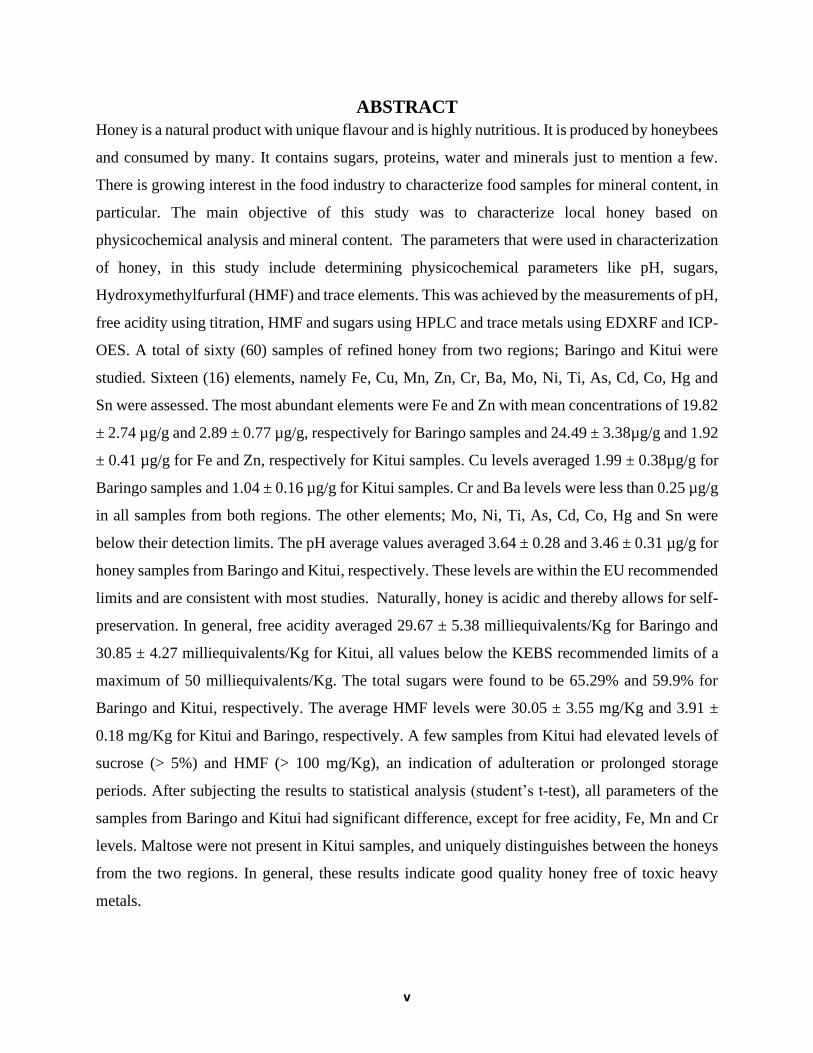
ABSTRACT
Honey is a natural product with unique flavour and is highly nutritious. It is produced by honeybees
and consumed by many. It contains sugars, proteins, water and minerals just to mention a few.
There is growing interest in the food industry to characterize food samples for mineral content, in
particular. The main objective of this study was to characterize local honey based on
physicochemical analysis and mineral content. The parameters that were used in characterization
of honey, in this study include determining physicochemical parameters like pH, sugars,
Hydroxymethylfurfural (HMF) and trace elements. This was achieved by the measurements of pH,
free acidity using titration, HMF and sugars using HPLC and trace metals using EDXRF and ICP-
OES. A total of sixty (60) samples of refined honey from two regions; Baringo and Kitui were
studied. Sixteen (16) elements, namely Fe, Cu, Mn, Zn, Cr, Ba, Mo, Ni, Ti, As, Cd, Co, Hg and
Sn were assessed. The most abundant elements were Fe and Zn with mean concentrations of 19.82
± 2.74 µg/g and 2.89 ± 0.77 µg/g, respectively for Baringo samples and 24.49 ± 3.38µg/g and 1.92
± 0.41 µg/g for Fe and Zn, respectively for Kitui samples. Cu levels averaged 1.99 ± 0.38µg/g for
Baringo samples and 1.04 ± 0.16 µg/g for Kitui samples. Cr and Ba levels were less than 0.25 µg/g
in all samples from both regions. The other elements; Mo, Ni, Ti, As, Cd, Co, Hg and Sn were
below their detection limits. The pH average values averaged 3.64 ± 0.28 and 3.46 ± 0.31 µg/g for
honey samples from Baringo and Kitui, respectively. These levels are within the EU recommended
limits and are consistent with most studies. Naturally, honey is acidic and thereby allows for self-
preservation. In general, free acidity averaged 29.67 ± 5.38 milliequivalents/Kg for Baringo and
30.85 ± 4.27 milliequivalents/Kg for Kitui, all values below the KEBS recommended limits of a
maximum of 50 milliequivalents/Kg. The total sugars were found to be 65.29% and 59.9% for
Baringo and Kitui, respectively. The average HMF levels were 30.05 ± 3.55 mg/Kg and 3.91 ±
0.18 mg/Kg for Kitui and Baringo, respectively. A few samples from Kitui had elevated levels of
sucrose (> 5%) and HMF (> 100 mg/Kg), an indication of adulteration or prolonged storage
periods. After subjecting the results to statistical analysis (student’s t-test), all parameters of the
samples from Baringo and Kitui had significant difference, except for free acidity, Fe, Mn and Cr
levels. Maltose were not present in Kitui samples, and uniquely distinguishes between the honeys
from the two regions. In general, these results indicate good quality honey free of toxic heavy
metals.
vi
Table of Contents
DEDICATION ............................................................................................................................... iii
ACKNOWLEDMENT .................................................................................................................. iv
ABSTRACT .................................................................................................................................... v
LIST OF ABBREVIATIONS AND ACRONYMS ...................................................................... ix
LIST OF FIGURES ....................................................................................................................... xi
LIST OF TABLES ........................................................................................................................ xii
CHAPTER ONE: INTRODUCTION ............................................................................................. 1
1.1 Introduction ...................................................................................................................... 1
1.2 Problem statement ............................................................................................................ 5
1.3 Main objective .................................................................................................................. 5
1.4 Specific objectives........................................................................................................... 5
1.5 Justification, Scope and Limitation .................................................................................. 6
CHAPTER TWO: LITERATURE REVIEW ................................................................................. 7
2.1 Introduction ...................................................................................................................... 7
2.2 The Composition of Honey .............................................................................................. 8
2.2.1 Review of Studies on Trace Elements Content in Honey ......................................... 9
2.3 Spectrometric Methods used to characterize honey for quality ..................................... 10
2.3.1 Principles of ED-XRF for Trace Elements Analysis .............................................. 12
2.3.2 Principles of HPLC for Analysis of Organic Compounds ..................................... 13
2.3.3 Principles of ICP-OES ............................................................................................ 15
2.3.4 Other Complimentary Methods used in Honey Quality test: Carbon Isotope Ratio
Analysis for Honey ................................................................................................................ 16
2.4 Regulations on Honey Production in Kenya ................................................................. 16
2.5 Honey Health and Nutrition ........................................................................................... 18
CHAPTER THREE: MATERIALS AND METHODS ............................................................... 19
3.1 Description of the Sampling Area and Sampling. .......................................................... 19
3.2 Sample Preparation ........................................................................................................ 21
3.3 Sample analysis .............................................................................................................. 22
3.3.1 Determination of Trace Element Content with EDXRF ......................................... 22
3.3.2 Determination of Trace Element Content with ICP – OES .................................... 23
vii
3.3.3 Determination of pH and Free Acidity .................................................................. 25
3.3.4 Determination of HMF and sugars ......................................................................... 25
3.4 Quality Compliance of Measurements and Statistical Analysis .................................... 27
CHAPTER FOUR: RESULTS AND DISCUSSION ................................................................... 28
4.1 Introduction .................................................................................................................... 28
4.2 Physicochemical Parameters of Honey Samples ........................................................... 28
4.3 pH Content in Honey Samples .......................................................................................... 29
4.4 Free Acidity in Honey Samples .................................................................................... 31
4.5 Sugar Measurements in Honey Samples ........................................................................ 33
4.6 Hydroxymethylfurfural (HMF) ...................................................................................... 35
4.7 Trace Elements of Honey from Baringo and Kitui ........................................................ 37
4.7.1 Iron (Fe) ................................................................................................................. 40
4.7.2 Manganese (Mn) ..................................................................................................... 40
4.7.3 Copper (Cu) ............................................................................................................ 41
4.7.4 Zinc (Zn) ................................................................................................................. 41
4.7.5 Chromium (Cr)....................................................................................................... 41
4.7.6 Barium (Ba) ............................................................................................................ 42
4.7.7 Strontium (Sr) ......................................................................................................... 42
4.7.8 Rubidium (Rb) ........................................................................................................ 42
4.7.9 Other Trace Elements ............................................................................................. 43
4.8 Statistical Analysis ......................................................................................................... 43
CHAPTER FIVE: RECOMMENDATIONS AND CONCLUSIONS ......................................... 44
5.1 Conclusions .................................................................................................................... 44
5.2 Recommendations ......................................................................................................... 45
References ..................................................................................................................................... 46
Appendix 1: pH Measurements for Baringo samples ............................................................... 50
Appendix 2: pH Values for Kitui Samples................................................................................ 51
Appendix 3: Free Acidity Measurement for Baringo samples .................................................. 52
Appendix 4: Free Acidity Measurements for Kitui Samples .................................................... 53
Appendix 5: Sugar Measurements for Baringo Samples .......................................................... 54
Appendix 6: Sugar Measurements for Kitui Samples ............................................................... 55
viii
Appendix 7: Sugar Chromatogram ........................................................................................... 56
Appendix 8: HMF Baringo Samples ......................................................................................... 57
Appendix 9: HMF Kitui Samples ............................................................................................. 58
Appendix 10: HMF Chromatogram .......................................................................................... 59
Appendix 11: Trace Element Concentration for Baringo Samples ........................................... 60
Appendix 12: Trace Element Concentration for Kitui Samples ............................................... 61
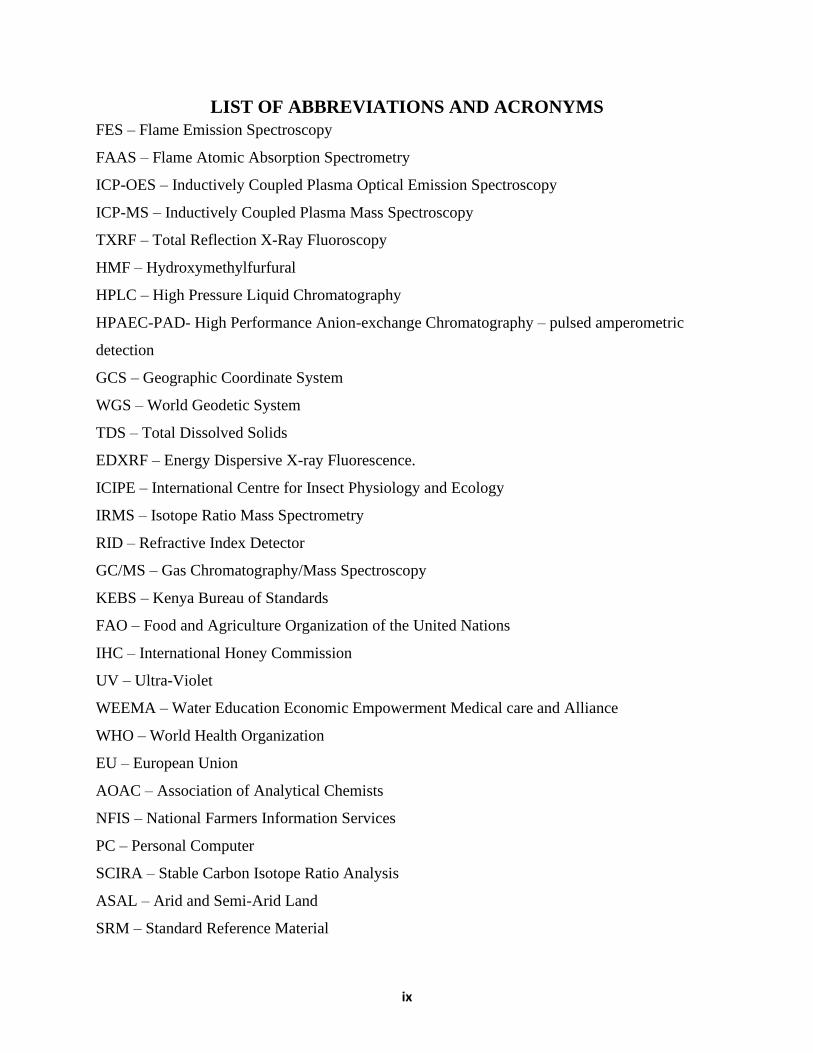
ix
LIST OF ABBREVIATIONS AND ACRONYMS
FES – Flame Emission Spectroscopy
FAAS – Flame Atomic Absorption Spectrometry
ICP-OES – Inductively Coupled Plasma Optical Emission Spectroscopy
ICP-MS – Inductively Coupled Plasma Mass Spectroscopy
TXRF – Total Reflection X-Ray Fluoroscopy
HMF – Hydroxymethylfurfural
HPLC – High Pressure Liquid Chromatography
HPAEC-PAD- High Performance Anion-exchange Chromatography – pulsed amperometric
detection
GCS – Geographic Coordinate System
WGS – World Geodetic System
TDS – Total Dissolved Solids
EDXRF – Energy Dispersive X-ray Fluorescence.
ICIPE – International Centre for Insect Physiology and Ecology
IRMS – Isotope Ratio Mass Spectrometry
RID – Refractive Index Detector
GC/MS – Gas Chromatography/Mass Spectroscopy
KEBS – Kenya Bureau of Standards
FAO – Food and Agriculture Organization of the United Nations
IHC – International Honey Commission
UV – Ultra-Violet
WEEMA – Water Education Economic Empowerment Medical care and Alliance
WHO – World Health Organization
EU – European Union
AOAC – Association of Analytical Chemists
NFIS – National Farmers Information Services
PC – Personal Computer
SCIRA – Stable Carbon Isotope Ratio Analysis
ASAL – Arid and Semi-Arid Land
SRM – Standard Reference Material

x
GDP – Gross Domestic Product
XRF – X-ray Fluorescence
IPGRI – International Plant Genetic Resources Institute
KHC – Kenya Honey Council
KS – Kenyan Standard
EAS – East African Standard

xi
LIST OF FIGURES
Figure 2.1: The basic components of the EDXF spectrometer and its geometry… ..................... 13
Figure 2.2: Components of HPLC ................................................................................................ 14
Figure 2.3: Energy Level Diagram showing energy transitions of atoms .................................... 15
Figure 3.1: Sampling points of Baringo county ............................................................................ 20
Figure 3.2: Sampling points of Kitui County................................................................................ 20
Figure 3.3: The EDXRF spectrometer at the Institute of Nuclear Science and Technology ........ 22
Figure 3.4: ICP-OES Spectrometer at Kenya Bureau of Standards.............................................. 24
Figure 3.5: The HPLC equipment at Beekeeping Institute for analysis of sugars and HMF ....... 25
Figure 4.1: pH for Baringo honey samples. .................................................................................. 30
Figure 4.2: pH for Kitui honey samples........................................................................................ 30
Figure 4.3: Free acidity in Baringo samples. ................................................................................ 32
Figure 4.4: Free acidity in Kitui samples ...................................................................................... 32
Figure 4.5: Sugar content for Baringo honey samples .................................................................. 34
Figure 4.6: Sugar content for Kitui honey samples ...................................................................... 34
Figure 4.7: HMF levels in Baringo samples ................................................................................. 36
Figure 4.8: HMF levels for Kitui samples .................................................................................... 36
Figure 4.9: Variation of HMF levels for Baringo and Kitui samples ........................................... 37
Figure 4.10: Trace elements in Baringo honey samples ............................................................... 38
Figure 4.11: Trace elements in Kitui honey samples .................................................................... 39
Figure 4.12: Trace elements for Baringo and Kitui honey samples ............................................. 39
xii
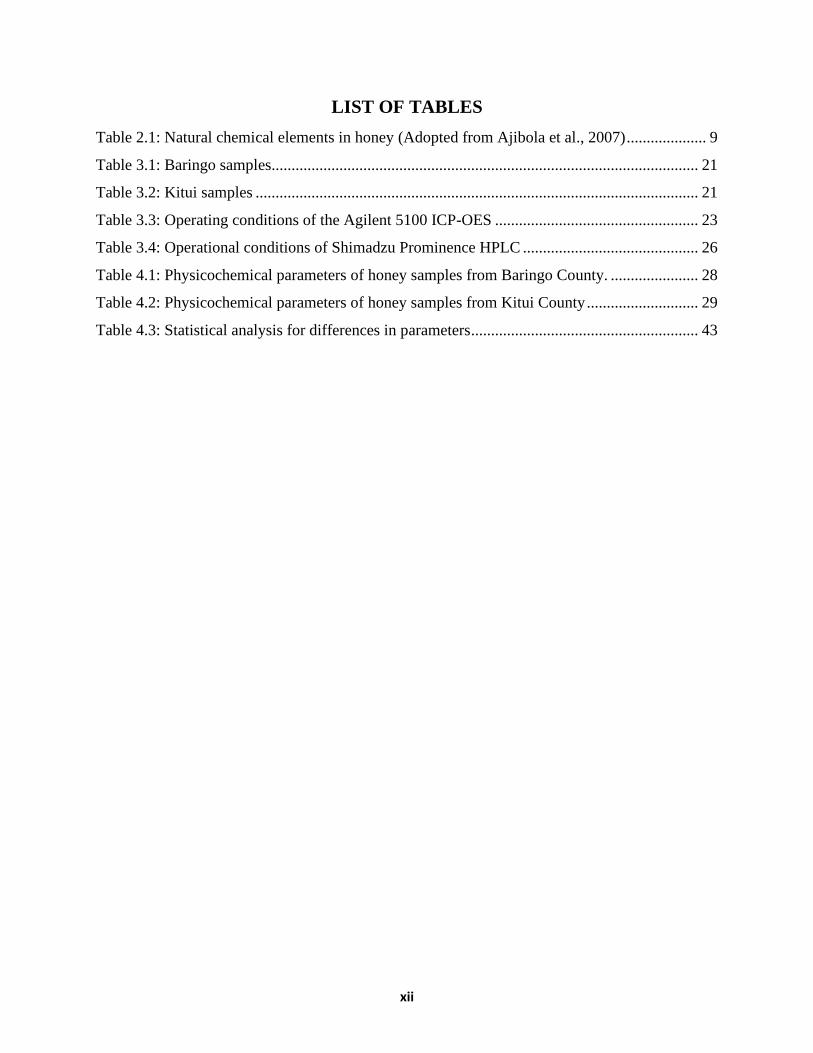
LIST OF TABLES
Table 2.1: Natural chemical elements in honey (Adopted from Ajibola et al., 2007) .................... 9
Table 3.1: Baringo samples........................................................................................................... 21
Table 3.2: Kitui samples ............................................................................................................... 21
Table 3.3: Operating conditions of the Agilent 5100 ICP-OES ................................................... 23
Table 3.4: Operational conditions of Shimadzu Prominence HPLC ............................................ 26
Table 4.1: Physicochemical parameters of honey samples from Baringo County. ...................... 28
Table 4.2: Physicochemical parameters of honey samples from Kitui County ............................ 29
Table 4.3: Statistical analysis for differences in parameters ......................................................... 43
1
CHAPTER ONE
INTRODUCTION
1.1 Introduction
In Kenya, honey production is an economic activity that is practiced by most farmers in the rural.
It does not require a lot of investment as other food crop farming except for occasional beehive
maintenance. About 80% of Kenya’s land has the potential to produce honey (Muli, Munguti, &
Raina, 2007) and there is a high demand for honey products worldwide and locally.
In order to create awareness of the economic benefits of bee keeping and their products, the Kenya
Honey Council provides a forum for stakeholders in the beekeeping industry, to safeguard and to
promote their interests and expand their growth. Specifically, these include; diversity and
availability of bee flora, potential for commercial honey production, introduction to new
technologies (like the modern hives and equipment), access to financing and marketing.
However, some of the weaknesses that beekeepers experience includes; limited local research
studies, awareness of modern bee management practices and lack of enthusiasm for most farmers.
Other challenges include, absconding and migration nature of bees from their habitats, which is
mainly caused by human activities; deforestation, construction, pest control through spraying using
toxic chemicals etc (Le Conte & Navajas, 2008). Differences in climatic conditions greatly affect
the apiculture and agricultural sector in general. Honey can be found in both dry and wetlands
depending on the types of bees prevalent in the area.
Worldwide, honey has been used as a biological monitor of the environmental air quality for
pollution. For example, air quality can be indirectly investigated by physicochemical analysis of
honey for mineral content for; toxic heavy metals, pH and conductivity levels. Since these heavy
metals cannot be destroyed or be degraded, they can enter into the human body following ingestion
(Afzal, et al., 2014). Therefore, it is essential to determine the amount of trace metals that are in
honey. Agricultural diversity is an important component for food security in general. In most parts
2
of Kenya, agricultural diversity is practiced through crop production and livestock keeping, to
increase productivity.
Most often, honey is sometimes used instead of sugar as a source for minerals supplement. For
diets that are mainly based on carbohydrates and fats, are said to contribute to diseases like obesity,
heart diseases, diabetes and other various types of cancers that are on the rise all over the world
(Mouillé, Charrondière, & Burlingame, 2006). Other honey parameters, such as sugars, minerals,
volatile compounds, flavonoids and organic acids have been used for characterization of honey.
Some of the techniques employed include; Flame Atomic Absorption Spectrometry, Flame
Emission Spectrometry, Inductively Coupled Plasma-Mass Spectrometry, Inductively Coupled
Plasma-Optical Emission Spectrometry, Total Reflection X-ray Fluorescence, Ion
Chromatography, amongst others.
The mineral content in honey can be used to identify its botanical and geographical origin as well.
The amount of minerals in honey brings out the different colours in honey and they vary from light
to very dark colours. Schuette & Remy, 1932, and his colleagues suggested a connection between
the amount of minerals and the degree of honey pigmentation which was later confirmed by other
scientists. White & Doner, 1978 confirmed that honey with light colour had lower mineral content
compared to honey with dark colour which had a higher mineral content. Furthermore, all these
parameters depend on the climate and the types of vegetation. The amount of moisture content is
linked to the degree of maturity of honey and the climatic conditions; abnormal values may be an
indication of honey adulteration. However, all these factors highly depend on the processing
techniques, botanical origin of the sample and the storage conditions. Honeys from different
regions indicate differences in mineral contents in their compositions.
Honey production capacity varies widely from one country to another, for example, China
produces 170,000 tonnes, the highest production yields while Argentina produces 45,500 tonnes
(Oliveira, et al., 2015). According to the WEEMA, 2016, Ethiopia is the largest producer of honey
in Africa; followed by Tanzania, while Kenya is ranked third. Kenya has a high consumption of
honey and some honey dealers import it from Tanzania when the demand cannot be met locally.
Generally, the highest importers of honey in the world are mainly United States, Germany, Japan,
United Kingdom and France (Oliveira, et al., 2015).
3
Honey residue is a worldwide concern since it affects the quality of honey. Honey residue is the
substances that remains after processing and act as a contaminant. Some of these residues include
radioactive material, heavy metals and antibiotics. The main sources of these residues are from
beekeeping practices and the environment. However, contamination from heavy metals results
from traffic and industrial pollution while antibiotics and pesticides result from agricultural
practices. Honey therefore is a bio-indicator of environmental pollution (Zane, Maris, Vita, &
Arturs, 2013).
Honey is an important nutrition in children; whose daily dietary intake is essential to improve their
immune system and to ensure a steady growth. The total mineral content in honey is low but is
significant, if consumed frequently. Major elements in honey like sodium plays an important role
in maintaining the optimum blood pressure and proper functioning of the kidney, nerves and the
muscles. Magnesium is also important since it acts as a cofactor for enzymes in which most of
them have antioxidant properties. Lack of magnesium contributes to aging and other disorders
related to aging. Trace elements are useful only in certain levels above which, they become toxic
to the body since the body cannot get rid of them anymore (Solayman, et al., 2015).
Research shows that some of the bee products contain vitamins, healthy fats and minerals. All
these come from the royal jelly, bee venom, propolis and the pollen (Wamwangi, 2012). These bee
products can be used for disease treatment and to improve nutritional regulations and health. The
pollen is rich in protein and can therefore be a good source for nutritional requirements. Propolis
contains essential oils, beeswax, some resins and some pollen and it can also be a very good source
of nutritious substances. Propolis also contains minerals, bioflavonoid and amino acids (Shahram,
Yarsan, Erici, Tumer, & Demirbas, 2012).
Honey has been characterized based on its physical, biological or chemical properties. The
physicochemical parameters that have been used for characterization include; water content, pH,
free acidity, ash content or mineral content and electrical conductivity (Kebede, P.A, &
Gebrekidan, 2011). For determination of botanical origin of honey, electrical conductivity is used.
The electrical conductivity measured, is mostly related to the other contents of honey which
include the proteins, mineral salts and organic acids and is, extremely useful when it comes to
differentiating the floral origins of the honey (Soares, Soares, Pires, Novaes, & Junio, 2008). The
amounts of ash content in honey is highly dependent on the composition of nectar and the main
4
plants that this nectar comes from. Consequently, the variation in ash content has been related
qualitatively to the different geographical and botanical origins of honey. For honey that is
generated from plant nectar, the total ash content must be less than 0.06% but for honeys generated
from honeydew, it should be less than 1% (Bogdanov & Martin, Harmonised Methods of the
European Honey Commission, 1997).
In general, most of the natural honeys are highly saturated with sugars like glucose and fructose
and have low pH values which are in the range of 3.2 to 4.5. This pH range is acidic and can be
attributed to organic acids like acetic acid, gluconic acid and ascorbic acid which inhibit bacteria
growth and allows honey to have a longer shelf life. Fermentation of honey depends on the
moisture content and in turn depends on the season when the honey is harvested and the degree of
maturity of the honey in the hive. The higher the moisture content, the faster honey will ferment
and granulate, and this fermentation process lowers the quality (Equar, Abraha, Lemma, & Amare,
2015). The level of moisture in honey also depends on how it is handled during processing and
harvesting.
The minerals in honey are highly stable and are very useful in classifying honey, they also show a
relationship to the soil where the vegetation containing the nectar is grown. Approximately 7 km2
radius has been considered as the distance where most bees forage to look for nectar. In general,
the mineral contents of honey ranges between 0.1% to 1.0% and this value varies widely depending
on the climatic conditions, extraction techniques used and botanical origin of nectar (Zane, Maris,
Vita, & Arturs, 2013).
This study focused on areas in Kitui and Baringo counties where honey is extensively produced.
These two counties were chosen for the study, because they are the top honey producing counties
in Kenya and contribute substantially to the total amount of honey that is harvested in Kenya.
Kitui County is located in the former Eastern Province and it is semi-arid while Baringo County
is in the former Rift Valley Province.
In both counties, honey production is a valuable economic commodity and it contributes
significantly to creation of employment, food security and poverty reduction.
5
The government of Kenya, through its strategic development projects for emerging livestock and
apiculture, has identified honey production as key for economic growth and is working towards;
training of bee farmers and in provision of better beehives among other efforts. Accordingly,
Kenya produced an average of 25,000 metric tonnes annually from 2 million beehives. In Kenya,
beekeeping is an integral part of the livestock farming and contributes to more than 10% GDP,
beekeeping contributes to more than 2% of this GDP (Wambua, Musimba, & Muli, 2016)
(Ministry of Agriculture, 2019).
1.2 Problem statement
In Kenya, most honey quality is compromised through adulterations, through addition of food
syrup and commercial sweeteners.
This study will enable the characterization of honey from selected parts of two counties of Kenya
that produce honey. This includes Baringo county and Kitui county which are some of the counties
in Kenya that have high production capacities of honey.
Most research on honey in Kenya has been focusing on physicochemical properties of honey.
However, trace elements and mineral content aspect has not been considered for quality evaluation.
This study enables for a combination of both aspects to characterize the honey from these two
regions.
The main beneficiaries of this study are the consumers of honey and the Apiculture industry and
trade.
1.3 Main objective
Characterization of honey based on physicochemical analysis and trace element content
1.4 Specific objectives
a) To determine the variations of physicochemical properties and trace elements in
different honey samples from two regions, Baringo and Kitui counties;
b) To evaluate the honey quality and nutritional requirements for compliance with local
and international standards;
6
c) To determine heavy metal residues in the honey samples that are a potential risk to
human health.
1.5 Justification, Scope and Limitation
Although research on characterization of honey has been done in many other countries, there is
need for getting such information on Kenyan honey especially so, from honey producing counties.
Kitui and Baringo counties produce high amounts of honey locally. It is therefore important to
know the properties and characteristics of this honey so that its quality can be maintained or even
improved. This can greatly increase the market share for honey from both these places, locally and
internationally.
There is need for labeling of the amounts of trace elements in Kenyan honey and other
physicochemical parameters for purposes of food nutritional labeling and trade requirements.
The legislation on honey production in Kenya needs to be revised to include the levels of the
various honey quality indicators, as a basic requirement for the international market requirements
and consequently for improvement of trade.
In this study, most of the honey samples used were purchased from the roadside vendors and as
such, honey samples could not be categorized in terms of types; unifloral, multifloral or honeydew.
7
CHAPTER TWO
LITERATURE REVIEW
2.1 Introduction
Human beings have consumed honey since time immemorial. Honey is popularly used as food and
for medicine, culturally, in most local traditions. Other users of honey and its products include; the
textile industry that uses wax, the cosmetic industry and dairy farmers. China, Turkey, Argentina,
USA, Ukraine, Russia, India, Mexico, Iran, Brazil and Ethiopia just to mention a few, are some of
the countries that produce large quantities of honey. Worldwide, honey has been identified as an
economic source for many with an estimated production capacity of about 1.2 million tonnes of
honey produced annually (Shahram, et al., 2012).
Current globalization of honey market involves nearly 150 countries and some of the honey dealers
have coined a phrase “the money is in the honey”. This makes honey a very important economic
commodity.
However, the consumers are sometimes mainly confronted with challenges presented with the
quality of these products, which are subjected to instances of frequent alterations. Some of the
factors that lead to adulteration of honey by dealers are economic issues; to satisfy high demands
for honey and in some cases, extreme weather conditions. This can happen, for example, when
there is not enough nectar at a particular season and the bees are fed on sugar syrup or commercial
sweeteners.
Honey has been accepted and is used as medicine and food for a very long time by mankind. Egypt
was one of the first nations to practice beekeeping. Both ancient and modern civilizations use
honey as a remedy for various ailments; wounds, burns, diabetes, ulcers, cataracts etc. These
traditional uses of honey have been validated by many researchers worldwide (Liyanage &
Horadugoda, 2017). In some of the Kenyan traditions, honey has been used for wine making and
in traditional brew and as payment for bride price.
8
2.2 The Composition of Honey
Different honeys contain unique combination of elements and properties because of the variety of
nectar sources in the geographical location of production, climate of area of production and
processing and storage methods (I. Turhan, Karhan, Gurel, & Tavukcuoglu, 2008). The mineral
content in honey is affected by the geographical origin (Bogdanov, et al., 2014).
The minerals in honey have nutritional significance for the human body; vitamins like folic acid,
vitamin K, vitamin C, thiamine, niacin, riboflavin among others. However, most of these vitamins
are lost at extreme heating conditions above 40ºC. It is therefore advisable not to heat honey at
high temperatures during processing.
Naturally, honey can be preserved for a long time because it contains acids that contribute to its
stability against micro-organisms and its flavour. The volatile components also contribute towards
the aroma and flavour. Some of the volatiles in honey are acetaldehyde, formaldehyde, acetone,
diacetyl among others (Liyanage & Horadugoda, 2017). Upon storage for a longer period of time,
there is increase in alcohol contents such as pentanol, 2-methyl-1-butanol, n-propanol and 3-
methyl-1-1-butanol due to fermentation. This may be products of hydrolysis of esters or they may
arise from the corresponding amino acids.
Nectar is the primary source of minor elements in the soil that are transported through the plant
and find its way in honey (Hernandez, Fraga, Jimenez, & Arias, 2005) (Equar, et al., 2015). There
are external and internal factors that influence the production of nectar; the size of the flower, the
age of the flower and its maturity on the plant, the nectary surface and the species and variety or
cultivated species to which the plant belongs (Stihi, Chelarescu, Duliu, & Toma, 2015). The
external factors include use of fertilizers and the type of soil, soil humidity, the temperature and
the direction of wind and the time of day or the time of year.
Other factors that affect the components in honey include, beekeeping techniques, extraction and
processing by the beekeeper or the commercial producer and the changes induced by the conditions
of storage. Processing of honey at high temperatures destroys some of the significant nutritional
components like the vitamins and the volatiles. If heavy metals are present in high amounts in the
honey, then it can be harmful to human health. This is because heavy metals cannot be destroyed,
and they are non-biodegradable.
9
2.2.1 Review of Studies on Trace Elements Content in Honey
The minerals in honey vary according to the geographical and botanical origin. The essential trace
elements in honey are desirable because of their nutritional value. On the other hand, heavy metals
in higher levels are not beneficial because of their toxicity. However, some of these heavy metals
are very important when it comes to maintaining metabolism in the human body. Examples of such
heavy metals include Zn, Cu and Se (Shahram, et al., 2012).
Kebede et al., 2011 reported that Ethiopian honey samples showed the presence of elements such
as Cd, Cu, Cr, Co, Ni, Fe, Mn and Zn. Among the elements investigated, Cd, Cr and Co had the
lowest concentration while Fe and Cu had the highest concentration. Table 2.1 shows the typical
natural chemical element composition present in honey.
Table 2.1: Natural chemical elements in honey. Adopted from (Ajibola, Idowu, Oyefuga, &
Iquot, 2007)
Element Amount (mg 100g-1) Element Amount (mg 100g-1)
Potassium (K) 40 - 3500 Rubidium (Rb) 0.04 - 3.5
Iodide (I) 10 - 100 Strontium (Sr) 0.04 - 0.35
Calcium (Ca) 3 - 31 Iron (Fe) 0.03 - 4
Phosphorus (P) 2 - 15 Manganese (Mn) 0.02 - 2
Sodium (Na) 1.6 - 17 Copper (Cu) 0.02 - 0.6
Sulphur (S) 0.7 - 26 Arsenic (As) 0.014 - 0.026
Magnesium (Mg) 0.7 - 13 Aluminium (Al) 0.01 - 2.4
Chlorine (Cl) 0.4 - 56 Barium (Ba) 0.01 - 0.08
Fluoride (F) 0.4 - 1.34 Chromium (Cr) 0.01 - 0.03
Bromine (Br) 0.4 - 1.3 Selenium (Se) 0.002 - 0.01
Lithium (Li) 0.225 - 1.56 Lead (Pb) 0.001 - 0.03
Cobalt (Co) 0.1 - 0.35 Vanadium (V) 0 - 0.013
Zinc (Zn) 0.05 - 2 Nickel (Ni) 0 - 0.051
Zirconium (Zr) 0.05-0.8 Molybdenum (Mo) 0-0.004
Boron (B) 0.05-0.3 Cadmium (Cd) 0-0.001
Silicon (Si) 0.05-24
10
Cantarelli, Pellerano, Marchevsky, & Camina, 2008, did a study on the chemical composition and
trace elements of Argentine honey. They used ICP-OES for the analysis of trace elements and
found Fe, Al, Mn, Zn, Cu, Ca, Mg, Na, K among other essential elements. The highest
concentration was from K, Ca, Na and Mg, followed by Fe and Zn. Mn and Cu had the lowest
concentration.
Boukka, Belouali, & Hakkou, 2008, determined some of the major and minor elements present in
honey from Morocco. They found that the most abundant elements were K, Zn, Ca, Mn, Mg and
Fe. They also checked the honey for heavy metals; Cd and Pb. They detected these two heavy
metals in some of the samples, but they were below the maximum limits according to the European
standards.
A study was done to determine the trace elements in raw honey and processed honey, in Kitui and
Nyeri, by Wamwangi, 2012 and he found that raw honey had a lower level of Fe than processed
honey.
2.3 Spectrometric Methods used to characterize honey for quality
Determination of metals in foodstuffs that are rich in sugar presents a challenge in analytical
procedures because of interference that arise from the matrix (Ioannidu, Zachariadis, Anthemidis,
& Stratis, 2004).
Chemical elements in honey can be determined using several techniques. The techniques that are
commonly used are; flame atomic absorption spectrometry, flame emission spectrometry; and
inductively coupled plasma mass spectrometry and inductively coupled plasma optical emission
spectrometry. In some situations, precipitation titrations and acid titrations are used to determine
Ag and Ca, respectively (Skoog, West, & Holler, Fundamentals of Analytical Chemistry 7th
Edition, 1996).
Some other methods include; Total Reflection X-ray Fluorescence Spectrometry (Enrich,
Boeykens, Caracciolo, Custo, & Vazquez, 2006), Spectrophotometric Analysis (Afzal, et al., 2014)
and Infrared Spectroscopy Analysis (Lidija, Nikola, Dragan, & Domagoj, 2014). In most of these
techniques, preparation of honey samples requires acid digestion before analysis.
11
High Performance Anion-exchange Chromatography – pulsed amperometric detection (HPAEC-
PAD) has been used to detect adulterated honey products as well as floral origin characterization
(Christophe, Julio, Clement, & Daniel, 2003). The use of this method has embraced pattern
recognition procedures to characterize honey samples. The pattern recognition uses full sugar
profiles of honey and mathematical and statistical techniques in order to identify possible
adulteration by non-reducing sugars. Most of these methods incorporate other techniques so as to
get chemically relevant information. Chemometric tools like Principal Component Analysis have
been employed in some of the cases.
The principle of the TXRF method is based on the measurement of absorbed radiation at specific
wavelengths which corresponds to the mineral of interest. Calibration of measurement instruments
and the use of relevant working standards is very important in order to get accurate and reliable
data.
There is a big challenge when it comes to analysis of minerals in honey. This is mainly because of
the complex organic matter of the matrix in honey (Ajibola, Idowu, Oyefuga, & Iquot, 2007).
Other quality indicators of honey that are based on physicochemical analysis include: Total acidity,
the higher the acidity the earlier the fermentation of honey. Acidity is mainly caused by factors
such as nectar sources, organic acid variation, and enzyme activity of sugars, the bacterial activity
and the mineral content present in honey. To ensure a longer shelf life of honey, there is need to
keep moisture content low to avoid early fermentation. Therefore, honey should be capped when
harvested and moisture content kept below 20% (Kebede, P.A, & Gebrekidan, 2011). Some
common physical methods used to determine moisture content include; tilting the honey container,
dip a stick in the honey container and observe how it flows and pour honey in the water in a glass
to observe whether it flows in a straight or wavy line. An Abbey refractometer is used to precisely
determine the moisture content (Kebede, et al., 2011).
The most common tool for investigating HMF and sugars is HPLC. Content of HMF
(Hydroxymethylfurfural) is the main quality indicator especially on honey freshness and excess
heating. Fresh honey may not contain hydroxymethylfurfural but the amount increases with
storage time, storage temperature and the pH of honey. Sugar content includes reducing sugars
like fructose and glucose as the main sugars in honey. Some reducing sugars (sucrose and maltose)
12
are also present in small amounts, usually 5% or below. A high amount of non-reducing sugars
indicates adulteration or bees feeding on sugar syrup (Zappala, Fallico, Arena, & Verzera, 2004).
Honey parameters like flavour contributes to the uniqueness of honey. The flavour and aroma of
honey can be affected by poor processing procedures, over smoking at harvest time, poor storage
conditions and packaging materials. Ripeness of honey is associated by proline. The amount of
proline present in honey is directly related to the ripeness of honey. As proline content reduces,
the quality of honey also reduces. On the other hand, Fiehe reaction is the test mainly done to
detect the presence of commercial sugar and the elimination of nutritional properties due to heating
above 40ºC (Zappala et al., 2004). Diastase activity utilizes the enzymes present in honey. The
enzyme amylase is important in detecting heating in processed honey. This enzyme is thermally
unstable and therefore it indicates freshness and overheating. Furthermore, Lund reaction is mainly
done to determine substances that naturally precipitate. Natural honey should be able to precipitate
after some time of storage. Adulterated ones may not precipitate or if they do it is not as much as
natural one.
Mineral content or ash present in honey is a criterion for the determination of botanical origin.
However, it is much replaced by electrical conductivity which is now accepted as a worldwide
standard. Water insoluble solids content generally measures the cleanliness of honey. Some of the
substances that are not soluble in water include wax and any other foreign material that is insoluble
in water (Bogdanov et al; 2014, Cantarelli et al; 2008).
2.3.1 Principles of ED-XRF for Trace Elements Analysis
ED-XRF spectrometry use X-ray fluorescence emission to identify and quantify the elements that
are present in the sample. The principle of the energy-dispersive-X-ray-fluorescence is that, the
atoms present in the sample (which can be in the form of powder, solid or liquid) are excited by
interacting with incident X-rays emitted from the X-ray tube. In some cases, if increased sensitivity
is required, polarization of the radiation of excitation can be done by the use of particular targets
placed between the sample and the X-ray tube or other geometries may be considered such as the
TXRF (Van Grieken & Markowicz, 2001). The intensity of radiation for each signal in the
spectrum is unique for each element constituent and is also proportional to amount of the analyte
13
in the sample. X-ray fluorescence is suitable for determining metal elements in their various
composition levels.
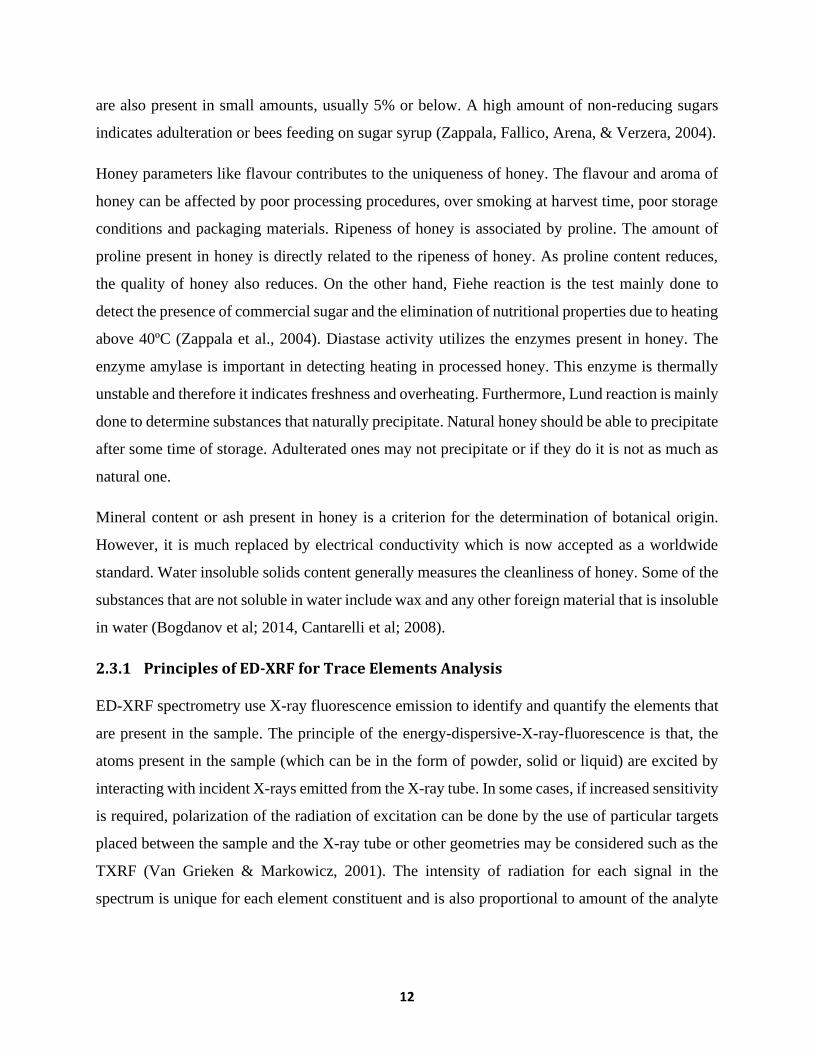
As shown in figure 2.1, the x-ray tube irradiates the sample directly, then the x-ray fluorescence
coming out of the sample is measured with the energy dispersive detector. The detector directly
measures the energies of the fluorescence radiation. Apart from the x-ray fluorescence from the
sample, some scattered radiation might also reach the detector and form the background noise
which makes it difficult to measure low concentrations of analytes (Brouwer, 2010). For such
situations, lower concentration analytes are given a longer counting times or other sampling
preparation techniques are used prior to the analysis.
Figure 2.1: The basic components of the EDXF spectrometer and its geometry.
(Adapted from Van Grieken et al., 2001).
2.3.2 Principles of HPLC for Analysis of Organic Compounds
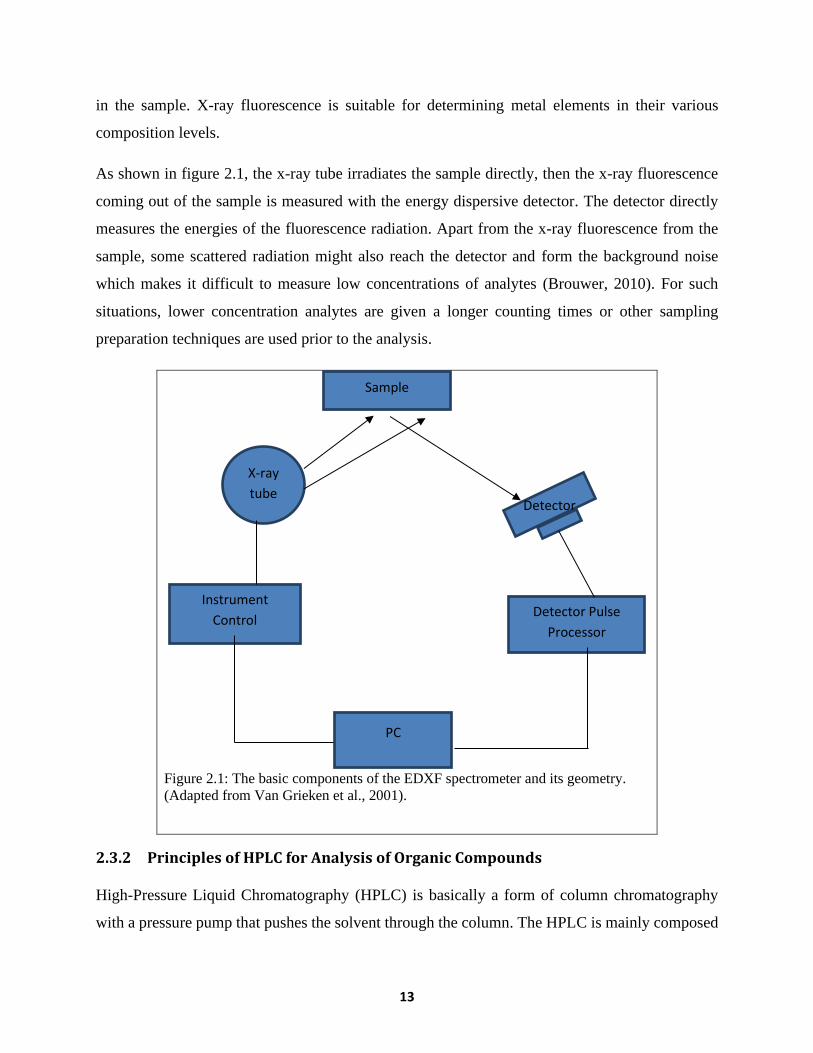
High-Pressure Liquid Chromatography (HPLC) is basically a form of column chromatography
with a pressure pump that pushes the solvent through the column. The HPLC is mainly composed
X-ray
tube Detector
Instrument
Control Detector Pulse
Processor
PC
Sample
14
of the solvent reservoir, stationary and mobile phases, the high-pressure pump (of up to 400atm),
the column, the injector system and the detector system. The main aim of HPLC is to separate,
identify and to quantify compounds that are dissolved in a liquid solvent (Skoog, Holler, & Crouch,
Principles of Instrumental Analysis 6th Edition, 2007). There are five main components of a HPLC
and they are shown in figure 2.2.
The use of small amount of sample during analysis using HPLC enables the interaction of the small
particles and the stationary phase. This leads to a better separation of the mixture and therefore
improved sensitivity. The separation technique of HPLC is also very efficient and relatively fast.
Analysis of sugars and HMF using HPLC is done using different absorption wavelengths of UV
absorption. HMF absorbs UV rays well between 266nm and 330nm but mostly 285nm is used
because of the quality of the spectrum formed at this wavelength. The spectrum will show many
other flavonoids and that is where the retention time comes in for the identification of the HMF
peak (Zappala et al., 2004). As for sugars, the peaks are seen well at wavelengths between 245nm
and 254nm. Depending on the detector on the instrument, the retention times will vary slightly but
fructose will be first, then glucose, then sucrose and finally maltose. This is the reason why it is
important to give time to the analyte to elute and in the case of HPLC such time can be up to 20
minutes (Skoog et al., 2007).
Figure 2.2: Components of HPLC
15
2.3.3 Principles of ICP-OES
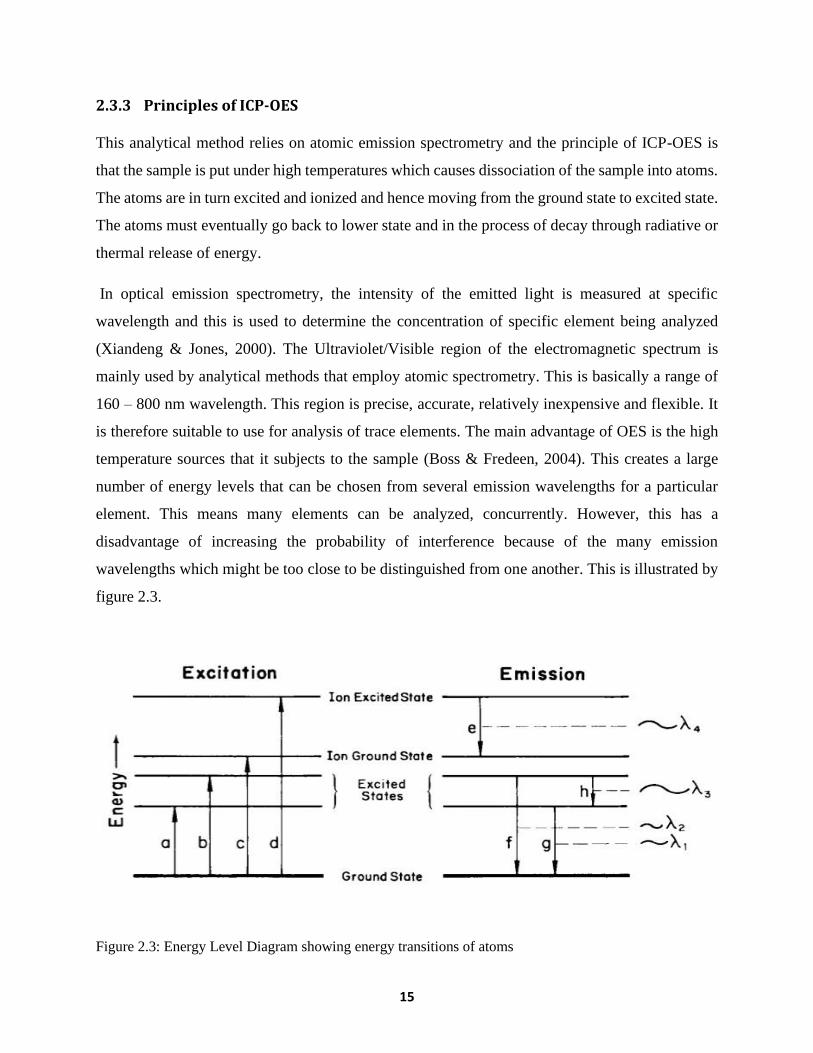
This analytical method relies on atomic emission spectrometry and the principle of ICP-OES is
that the sample is put under high temperatures which causes dissociation of the sample into atoms.
The atoms are in turn excited and ionized and hence moving from the ground state to excited state.
The atoms must eventually go back to lower state and in the process of decay through radiative or
thermal release of energy.
In optical emission spectrometry, the intensity of the emitted light is measured at specific
wavelength and this is used to determine the concentration of specific element being analyzed
(Xiandeng & Jones, 2000). The Ultraviolet/Visible region of the electromagnetic spectrum is
mainly used by analytical methods that employ atomic spectrometry. This is basically a range of
160 – 800 nm wavelength. This region is precise, accurate, relatively inexpensive and flexible. It
is therefore suitable to use for analysis of trace elements. The main advantage of OES is the high
temperature sources that it subjects to the sample (Boss & Fredeen, 2004). This creates a large
number of energy levels that can be chosen from several emission wavelengths for a particular
element. This means many elements can be analyzed, concurrently. However, this has a
disadvantage of increasing the probability of interference because of the many emission
wavelengths which might be too close to be distinguished from one another. This is illustrated by
figure 2.3.
Figure 2.3: Energy Level Diagram showing energy transitions of atoms
16
2.3.4 Other Complimentary Methods used in Honey Quality test: Carbon Isotope
Ratio Analysis for Honey
A very powerful analytical tool that uses stable carbon isotope ratio analysis for detecting
adulterated honey is Isotope Ratio Mass Spectroscopy (IRMS). It can detect honey that has been
adulterated using syrups of low cost which usually show sugar profiles that are very identical to
natural honey (Gilberto, et al., 2008). These sugars may only be detected by the common
physicochemical techniques when they are above 13%. However, other techniques like the Gas
Chromatography/Mass Spectroscopy (GC/MS) can detect as low adulteration as 0.01%.
IRMS is a special technique whose measurement of changes in natural abundance of stable
isotopes of Carbon (the stable isotopes mainly 13C and 12C) are accurate and precise. The ratios of
the carbon isotopes are determined in relation to a reference gas that is calibrated using accepted
international standards. The carbon isotope ratio analysis was used by Gilberto et al., 2008 to do
physicochemical evaluation of Brazilian honey. The study showed that five out of twenty-one
samples of honey were adulterated when physicochemical analyses alone were done. However, by
analysing 12C/13C ratios, it was determined that up-to half of the samples were adulterated with C4
sugars which gave a range of 12.45% to 25.15% which is above the 7% international limit
(Gilberto, et al., 2008).
2.4 Regulations on Honey Production in Kenya
In the 53rd report of the Joint FAO/WHO expert committee on food additives. The Expert
committee established a maximum level of 2 mg kg-1 for Pb and 1 mg kg-1 for Cd and Hg, except
where there is a good reason for establishing a higher or a lower maximum level. The committee
also confirmed that it would include limits for arsenic (As) only when the source from which the
additive is prepared, or the nature of the manufacturing method showed that such a limit was
necessary.
Labeling food systems and packages of honey for example should include information on the
product’s floral or vegetable origin and regional or topographical origin (Enrique, et al., 2014).
The European Union has described the general and specific definitions of the contents of honey
and its characteristics and they include acidity, humidity, sugar content, hydroxymethylfurfural,
17
diastase activity and electrical conductivity. It is therefore important that the characterization of
honey is done so as to provide this information to the consumers and for trade.
Legislation plays a very big role in regulation of foods for public consumption and minimize on
potential contaminants or substances that can harm the human health. In Kenya, legislation on
honey is found in Cap 254 Food, Drugs and Chemical Substances (General) Regulations, 1978),
Part VII Section 88. It states that honey shall be the food derived solely from the nectar of flowers
and other sweet exudation of plants by bees; it shall contain not less than 60% invert sugar and
shall contain no more than 20% moisture, 8% sucrose and 1% ash.
These requirements might not necessarily cover all specifics for adulterations, but the limits
imposed to moisture and sugar contents are adequate to discriminate the adulterated honey
products, nevertheless. Furthermore, sugars can also be categorized further to differentiate
between pure honey and adulterated honey. However, these regulations need to be more specific
to include these categories and their limits.
Honey can be adulterated using cheaper sweeteners like sugar syrups and molasses which are
inverted by enzymes or acids from sugar beet, corn, sugar cane and other natural origin syrups
such as maple (Blanka & Lenka, 2015). From an economic point of view, honey adulteration brings
unfair competition to the market. This might destabilize the market which is not good for business.
Adulteration of honey was first encountered in the world market in the 1970s. This was also the
time when the industry introduced high-fructose corn syrup into the market. The main components
of honey are sugars which make up to the range of 60 – 77.8%. Fructose and glucose are the most
dominant and account for 85–95% of the total sugars. Glucose to fructose ratio in the honey largely
depends on the nectar sources. Generally, the average fructose to glucose ratio is normally 1.2:1.
At normal temperatures, honey contains glucose at highly saturated levels. However, when the
temperature and water content is reduced, crystallization of the glucose can take place. In its dry
weight, honey contains approximately 1% sucrose. The moisture content of honey is normally
between 12.4% and 24.5%. Fermentation will start when the moisture content of honey drops
below 17% (Blanka & Lenka, 2015).
The National Beekeeping Institute, Lenana is a government institution that offers many services
to the public and the farmers. These services include quality analysis of honey and other hive
18
products, production of bee equipment, marketing and utilization of the products, training of the
beekeepers and bee management and investigation (World, 2018).The Institute plays a very big
role in encouraging the farmers to practice beekeeping and supporting them on the modern
equipment to use so as to improve the yield and also to train them on the good practices of
beekeeping.
2.5 Honey Health and Nutrition
A large part of honey is made up of carbohydrates, but it also contains enzymes, amino acids,
proteins, minerals, vitamins, taste building compounds, polyphenols and aroma compounds. The
sugars in honey are the main building compounds because of their sweet nature, the more the
amount of fructose, and the sweeter the honey. Polyphenols have antioxidant properties due to the
presence of flavonoids such as luteolin, quercetin, galangin, apigenin, kaempferol, chrysin etc. The
aroma compounds are responsible for the honey flavour which is very important when it comes to
industries that manufacture foods with honey as an ingredient (Bogdanov, Jurendic, Sieber, &
Gallman, 2008). The functional properties of honey and its high amount of carbohydrates makes
it an ideal source of strength and vitality for athletes and other sport groups. Most of the honey
properties that promote health are only achieved by using high amounts of honey like 50 to 80 g
per intake.
Human health is a very important aspect of life and recently a branch of medicine called apitherapy
has been developed and it uses honey and other bee products as ingredients in the medicine against
a number of diseases (Bogdanov, et al., 2008).
The minerals in honey have nutritional significance for the human body; vitamins like folic acid,
vitamin K, vitamin C, thiamine, niacin, riboflavin among others. However, most of these vitamins
are lost at extreme heating conditions above 40ºC.
The minerals in honey vary according to the geographical and botanical origin. The essential trace
elements in honey are desirable because of their nutritional value. On the other hand, heavy metals
in higher levels are toxic (Shahram, et al., 2012).
19
CHAPTER THREE
MATERIALS AND METHODS
3.1 Description of the Sampling Area and Sampling.
Baringo County borders Turkana County and West Pokot County to the North, Samburu County
and Laikipia County to the East, Nakuru County and Kericho County to the South, Uasin-Gishu
County to the South West and Elgeyo-Marakwet County to the west. It has six sub-counties. The
County has an area of 11,015 square kilometers. This study focused on Marigat and Koibatek sub-
counties.
Kitui County borders Machakos County and Makueni County to the west, Tana River County to
the east, Taita Taveta County to the south, Embu and Tharaka Nithi counties to the North. It covers
an area of 20,501.6 square kilometers. The county has 16 sub-counties. This study focused on Kitui
central, Matinyani, Mwingi Central and Mwingi East.
Thirty honey samples each weighing approximately 100 g, were collected, specifically from,
Marigat and Koibatek sub-counties and Kitui central, Matinyani, Mwingi central and Mwingi east
sub-counties. The sampling was done in May 2018 for Baringo samples and in June 2018 for Kitui
samples. The sampling was only limited to roadside vendors.
Specifically, Baringo samples were obtained from; Esageri, Molo River, Muserechi and Ravine
Junction and those from Kitui were collected at; at Kalundu market, Kitui animal market and Kitui
town.
Figure 3.1 and 3.2 show the sampling points for Baringo and Kitui.
20
Figure 3.1: Sampling points: Baringo county
Figure 3.2: Sampling points: Kitui County
21
The table 3.1 and 3.2 indicates the sampling points in this study and how they were labelled for
identification.
Table 3.1: Baringo samples n=30
Esageri Muserechi Molo River Junction a Junction b Junction c
Esageri 1 Muserechi 1 Molo River 1 Junction 401 Junction 411 Junction 421
Esageri 2 Muserechi 2 Molo River 2 Junction 402 Junction 412 Junction 422
Esageri 3 Muserechi 3 Molo River 3 Junction 403 Junction 413 Junction 423
Esageri 4 Muserechi 4 Junction 404 Junction 414 Junction 424
Esageri 5 Muserechi 5 Junction 415 Junction 425
Muserechi 6 Junction 416
Junction 417
Table 3.2: Kitui samples n=30
Mbusyani Road Open Market Kibwezi-Kitui Road Kitui Town
Kitui 101 Kitui 201 Kitui 301 Kitui 401
Kitui 102 Kitui 202 Kitui 302 Kitui 402
Kitui 103 Kitui 203 Kitui 303 Kitui 403
Kitui 104 Kitui 204 Kitui 304 Kitui 404
Kitui 105 Kitui 205 Kitui 305 Kitui 405
Kitui 206 Kitui 406
Kitui 207 Kitui 407
Kitui 208 Kitui 408
Kitui 209 Kitui 409
Kitui 210 Kitui 410
3.2 Sample Preparation
All the glassware and containers that were used for sample preparation were soaked in detergent
and 10% nitric acid solution for 24 hours. The glassware was then rinsed in pure water and dried.
All the honey was shaken for homogeneity before sample preparation and analysis.
For environmental control, reagents and standards were prepared using concentrated acids and
they were done in a fume chamber. During digestion, the microwave digester’s exhaust unit was
22
directed at the fume chamber at all times and the unit of extraction was on throughout the period
of analysis.
3.3 Sample analysis
3.3.1 Determination of Trace Element Content with EDXRF
Approximately 5 g of honey of each honey sample was accurately weighed into an XRF cup, the
top was covered using a mylar foil. Then the sample was placed on the sample holder for EDXRF
irradiation for 1000 seconds. Prior to measurements, calibration curve was prepared for use from
pure elements of interest of standards in the liquid form to quantify the trace metals in the honey
samples.
The Amptek EDXRF Kit used for analysis of heavy metals in this study, contains the X-ray tube,
X-ray analysis software, the spectrometer with signal processor and detector and a sample chamber
with safety features such as safety interlocks and radiation shielding.
For this study, the spectrometer consisted of a lithium-silicon drift detector, an x-ray tube made of
silver and it was operated at 30 keV maximum energy and 80 µA current. Each sample was
analyzed in triplicate (figure 3.3).
Figure 3.3: The EDXRF spectrometer at the Institute of Nuclear Science and Technology
23
3.3.2 Determination of Trace Element Content with ICP – OES
An Agilent 5100 ICP-OES spectrometer, which is available at Kenya Bureau of Standards was
used to determine trace elements in this study (figure 3.4). Prior to measurements, the spectrometer
was optimized for geometry of measurements using the Agilent ICP Expert software.
Approximately 0.5g of homogenized honey sample was accurately weighed into a Teflon tube to
be digested in the microwave. 6mL of Conc. HNO3 and 3mL of H2O2 were added to the sample
and then left for 30 minutes in the fume hood. The vessel was well capped and digested in the
microwave oven for 30 minutes at various temperatures according to the procedures. This was then
transferred to the sample holder for analysis (Boukka, Belouali, & Hakkou, 2008).
The peaks corresponding to each of the element of interest were determined at different
wavelengths, from which the concentration of the element in the sample was determined as shown
in table 3.3. All the samples were analysed in duplicates.
Table 3.3: Operating conditions of the Agilent 5100 ICP-OES
Analyte Wavelength
(nm)
Read
time (s)
View Nebulizer
Ba 455.403 5 Axial Concentric
Cr 267.716 5 Axial Concentric
Al 396.152 5 Axial Concentric
Ca 396.847 5 Axial Concentric
Pb 220.353 5 Axial Concentric
Cu 327.395 5 Axial Concentric
Mg 279.553 5 Axial Concentric
Fe 238.204 5 Axial Concentric
Ni 231.604 5 Axial Concentric
K 766.491 5 Axial Concentric
Mo 202.032 5 Axial Concentric
P 213.618 5 Axial Concentric
Zn 213.611 5 Axial Concentric
24
Na 589.593 5 Axial Concentric
Ag 328.068 5 Axial Concentric
Ti 190.794 5 Axial Concentric
Si 251.611 5 Axial Concentric
Sn 189.925 5 Axial Concentric
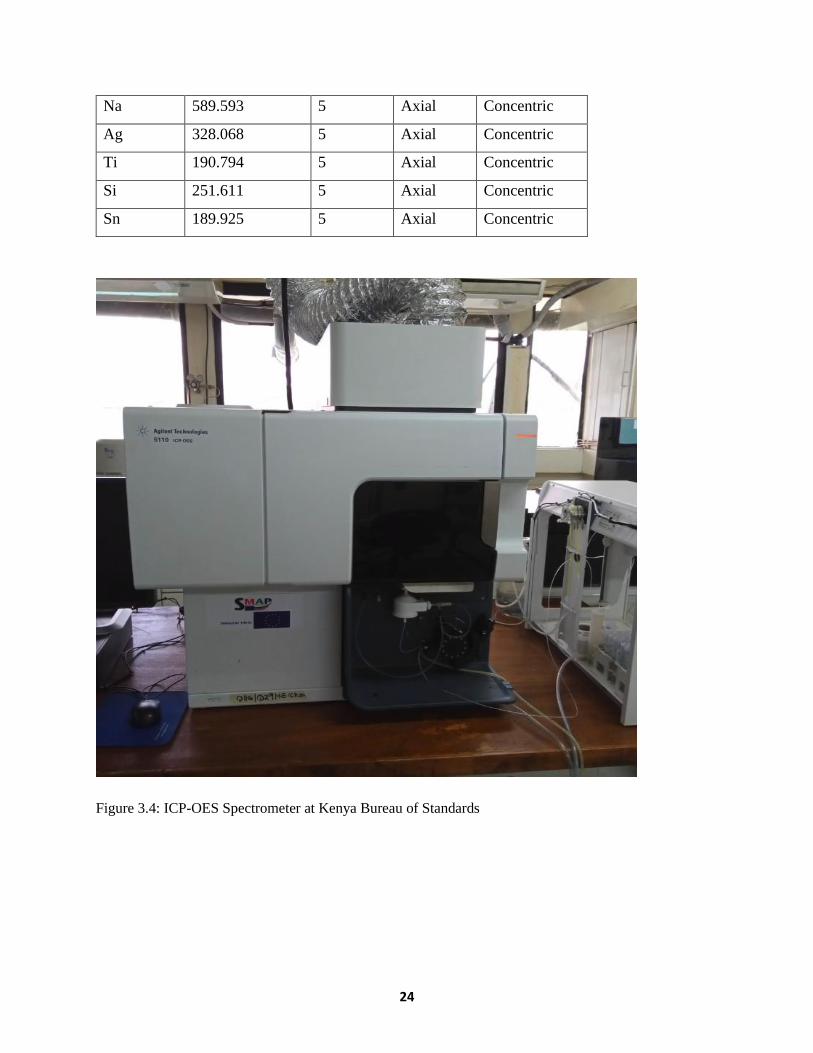
Figure 3.4: ICP-OES Spectrometer at Kenya Bureau of Standards
25
3.3.3 Determination of pH and Free Acidity
The bench top model HI-2210, Hanna Instruments Digital pH meter was used for pH
measurements. It was well calibrated using the buffer 4, buffer 7 and buffer 9 solutions. 0.1M
NaOH was prepared prior to measurements (Chemists, 1999).
10 g of honey was measured using a well calibrated digital weighing scale. It was then diluted in
75 ml of distilled water, stirred well and the pH readings recorded.
The solution was titrated with 0.1M NaOH to a pH of 8.3. The volume for NaOH used was
recorded for determining the free acidity (Chemists, 1999).
3.3.4 Determination of HMF and sugars
5 g of honey was measured using a digital balance. It was then diluted into 100 ml of double
distilled water, the solution was filtered through 0.45 µm filters and approximately 10 µl of the
filtrate was immediately injected into the HPLC. It was run for 10 minutes then the process
repeated for duplicate samples.
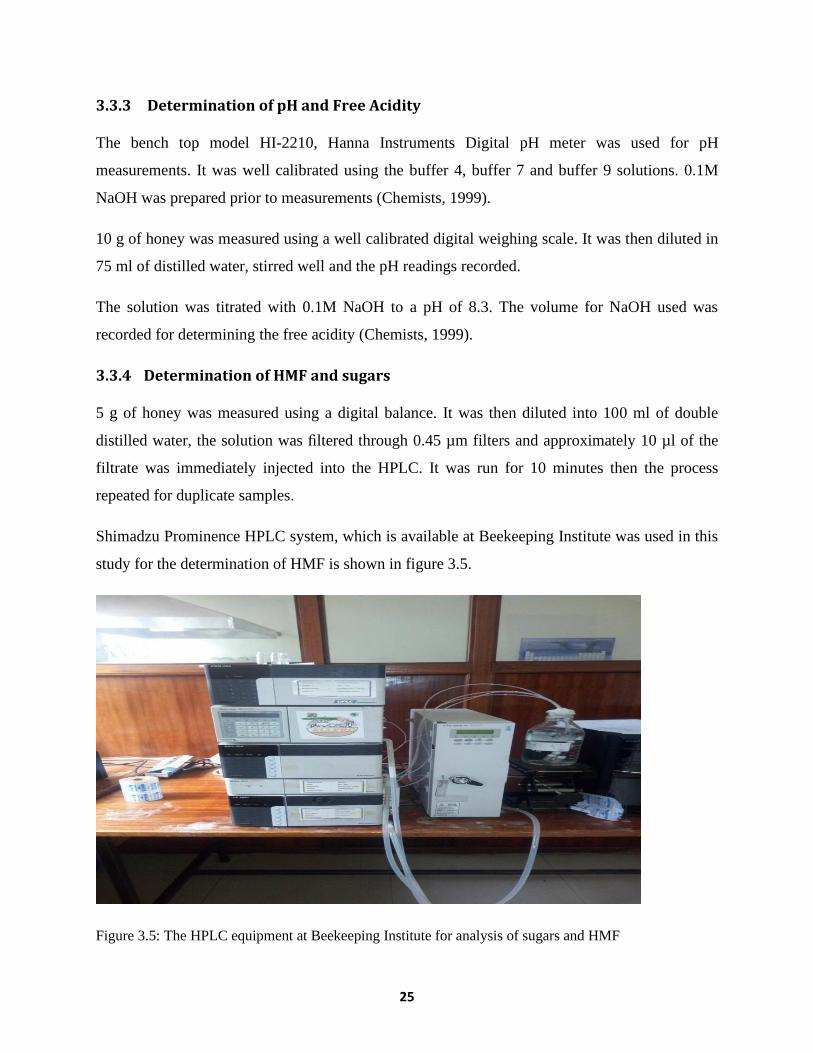
Shimadzu Prominence HPLC system, which is available at Beekeeping Institute was used in this
study for the determination of HMF is shown in figure 3.5.
Figure 3.5: The HPLC equipment at Beekeeping Institute for analysis of sugars and HMF
26
For determining HMF, the HPLC spectrometer was reconfigured with SPD-20A detector and the
operating conditions optimized for use. Prior to measurements, the system was calibrated using
analytical grade standard HMF. The amount of HMF was determined from the peak areas
determined using LC Solution software. For determination of sugars; fructose, sucrose, glucose
and maltose, the Shimadzu Prominence HPLC system with detector RID-10A was used. The
operational conditions of the HPLC were optimized for measurement of sugars as shown in table
3.4.
Prior to sugar measurements, various sugar standards were prepared in the following proportions;
fructose; 2%, glucose; 1.5%, sucrose; 0.25% and maltose; 0.15%. The mixture was dissolved with
distilled water to 100 ml or in a beaker and left overnight in the refrigerator. The standard solution
was run every morning prior to the measurements.
5g of honey was measured using a digital balance. It was then diluted into 100 ml of double
distilled water, the solution was filtered through 0.45 µm filters and approximately 10 µl of the
filtrate was immediately injected into the HPLC. It was run for 10 minutes then the process
repeated for duplicate samples.
Peaks corresponding to fructose, glucose, sucrose and maltose were identified and quantified for
the analyte composition using the standards (Bogdanov, et al., 2014)
Table 3.4: Operational conditions of Shimadzu Prominence HPLC
Flow rate 0.6ml/min
Cell temperature 40ºC
Column Temperature 80ºC
Mobile phase Water
Analysis time per sample 20 min
Column Shim-pack, SPR-Ca (250 mm L ×7.8 mm I.D, 8 µm)
Detection RID-10A
The Sugar content was calculated using the formula:
27
𝐶𝑖 = (𝐴𝑠𝑎𝑚𝑝𝑙𝑒
𝐴𝑠𝑡𝑎𝑛𝑑𝑎𝑟𝑑)𝑋 (
𝐶𝑠𝑡𝑎𝑛𝑑𝑎𝑟𝑑
𝑊𝑠𝑎𝑚𝑝𝑙𝑒)𝑋100……………………………………………Eqn 3.1
Where,
Ci = percentage concentration of sugars
𝐴𝑠𝑎𝑚𝑝𝑙𝑒= Area of the analyte in the sample
𝐴𝑠𝑡𝑎𝑛𝑑𝑎𝑟𝑑= Area of the analyte in the standard
𝐶𝑠𝑡𝑎𝑛𝑑𝑎𝑟𝑑= Concentration of the analyte in the standard
𝑊𝑠𝑎𝑚𝑝𝑙𝑒 = Weight of the sample
3.4 Quality Compliance of Measurements and Statistical Analysis
It is important that the obtained results are compared to the standards established locally and
internationally for compliance.
Statistical analysis for the parameters analyzed in this study were done using the Student’s t-test
for comparison of the means (Montgomery & Runger, 2011). Student’s t-test was used to compare
the two-independent means of the honey sample distribution to sought information of whether
there was a significant difference between the two data sets of Baringo and Kitui. A two-sample t
test was suitable for this study because it compared the means or averages. By using this method
of data analysis, a value was generated as tcal and a table is used to get ttab (Bluman, 2009). When
the absolute t-value was greater than the tabulated value (tcal > ttab), it indicated that there was a
significant difference between the two data sets (Pirk, et al., 2013).
28
CHAPTER FOUR
RESULTS AND DISCUSSION
4.1 Introduction
This section summarizes the results of measurements of physicochemical properties of honey
samples from the areas of Baringo and Kitui.
4.2 Physicochemical Parameters of Honey Samples
Table 4.1 and 4.2 show the results of physicochemical parameters of honey samples from Baringo
and Kitui counties respectively. Summarized tables were generated from the data in the appendix
1 – 12.
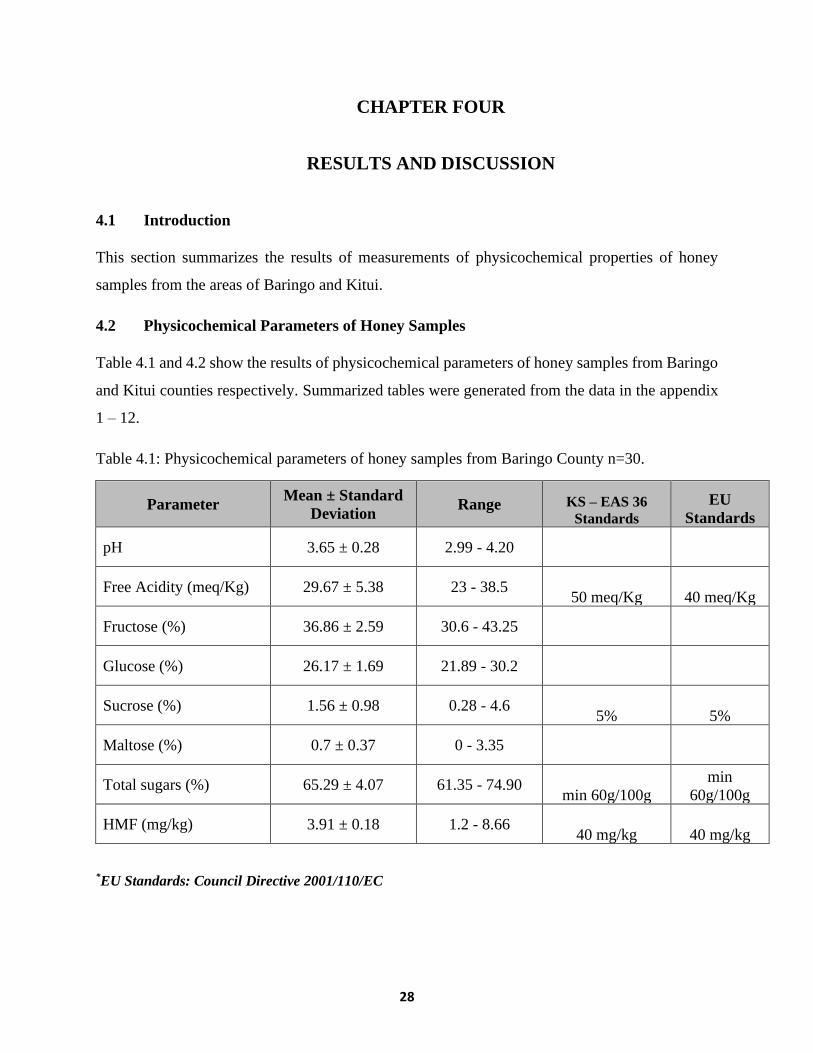
Table 4.1: Physicochemical parameters of honey samples from Baringo County n=30.
Parameter Mean ± Standard
Deviation Range KS – EAS 36
Standards
EU
Standards
pH 3.65 ± 0.28 2.99 - 4.20
Free Acidity (meq/Kg) 29.67 ± 5.38 23 - 38.5 50 meq/Kg 40 meq/Kg
Fructose (%) 36.86 ± 2.59 30.6 - 43.25
Glucose (%) 26.17 ± 1.69 21.89 - 30.2
Sucrose (%) 1.56 ± 0.98 0.28 - 4.6 5% 5%
Maltose (%) 0.7 ± 0.37 0 - 3.35
Total sugars (%) 65.29 ± 4.07 61.35 - 74.90 min 60g/100g
min
60g/100g
HMF (mg/kg) 3.91 ± 0.18 1.2 - 8.66 40 mg/kg 40 mg/kg
*EU Standards: Council Directive 2001/110/EC
29
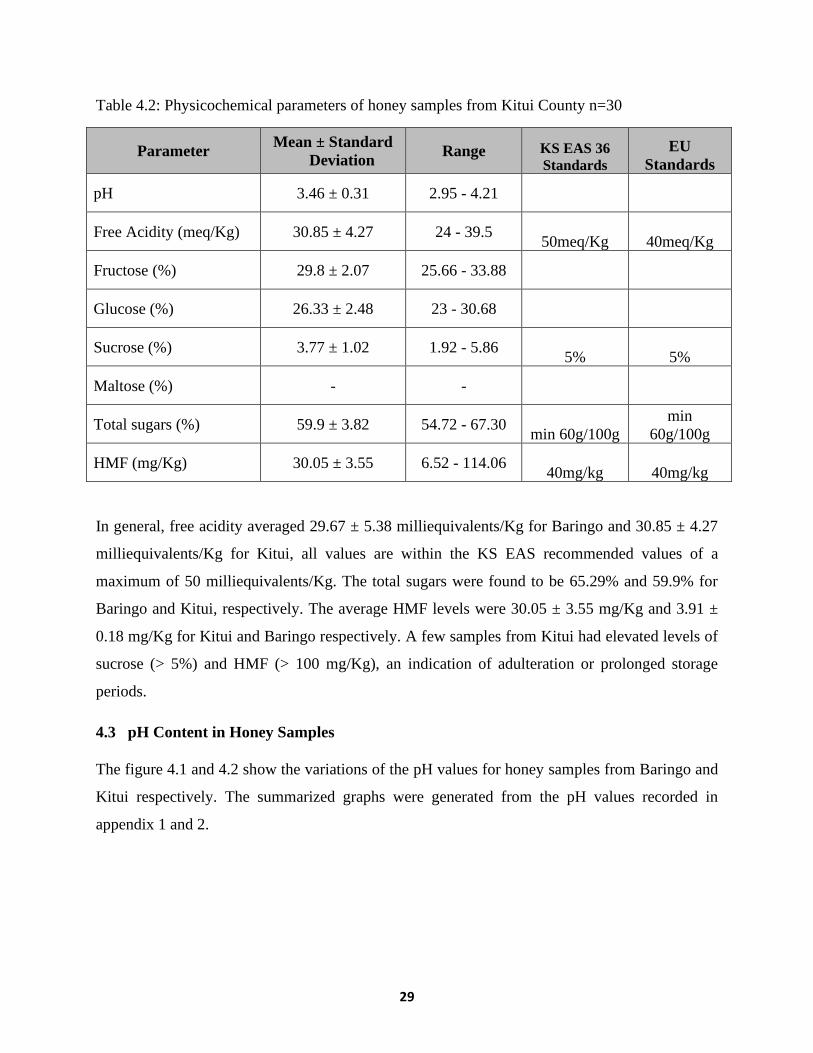
Table 4.2: Physicochemical parameters of honey samples from Kitui County n=30
Parameter Mean ± Standard
Deviation Range KS EAS 36
Standards
EU
Standards
pH 3.46 ± 0.31 2.95 - 4.21
Free Acidity (meq/Kg) 30.85 ± 4.27 24 - 39.5 50meq/Kg 40meq/Kg
Fructose (%) 29.8 ± 2.07 25.66 - 33.88
Glucose (%) 26.33 ± 2.48 23 - 30.68
Sucrose (%) 3.77 ± 1.02 1.92 - 5.86 5% 5%
Maltose (%) - -
Total sugars (%) 59.9 ± 3.82 54.72 - 67.30 min 60g/100g
min
60g/100g
HMF (mg/Kg) 30.05 ± 3.55 6.52 - 114.06 40mg/kg 40mg/kg
In general, free acidity averaged 29.67 ± 5.38 milliequivalents/Kg for Baringo and 30.85 ± 4.27
milliequivalents/Kg for Kitui, all values are within the KS EAS recommended values of a
maximum of 50 milliequivalents/Kg. The total sugars were found to be 65.29% and 59.9% for
Baringo and Kitui, respectively. The average HMF levels were 30.05 ± 3.55 mg/Kg and 3.91 ±
0.18 mg/Kg for Kitui and Baringo respectively. A few samples from Kitui had elevated levels of
sucrose (> 5%) and HMF (> 100 mg/Kg), an indication of adulteration or prolonged storage
periods.
4.3 pH Content in Honey Samples
The figure 4.1 and 4.2 show the variations of the pH values for honey samples from Baringo and
Kitui respectively. The summarized graphs were generated from the pH values recorded in
appendix 1 and 2.
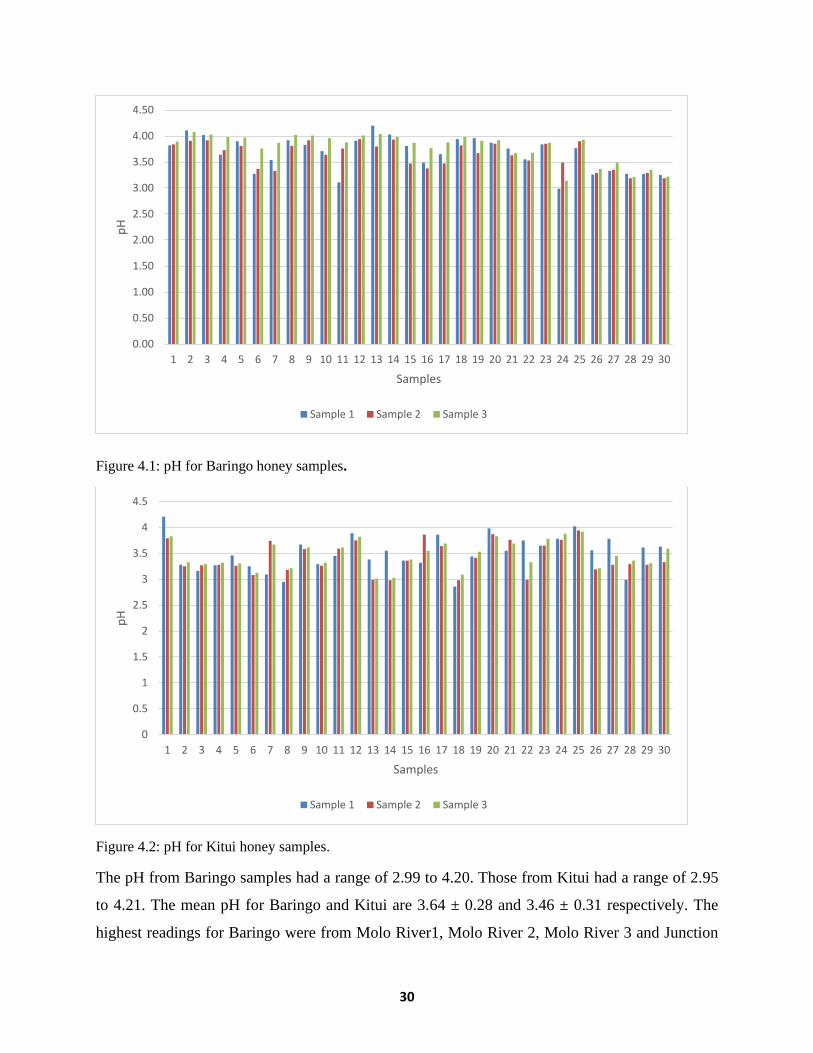
30
Figure 4.1: pH for Baringo honey samples.
Figure 4.2: pH for Kitui honey samples.
The pH from Baringo samples had a range of 2.99 to 4.20. Those from Kitui had a range of 2.95
to 4.21. The mean pH for Baringo and Kitui are 3.64 ± 0.28 and 3.46 ± 0.31 respectively. The
highest readings for Baringo were from Molo River1, Molo River 2, Molo River 3 and Junction
0.00
0.50
1.00
1.50
2.00
2.50
3.00
3.50
4.00
4.50
1 2 3 4 5 6 7 8 9 10 11 12 13 14 15 16 17 18 19 20 21 22 23 24 25 26 27 28 29 30
pH
Samples
Sample 1 Sample 2 Sample 3
0
0.5
1
1.5
2
2.5
3
3.5
4
4.5
1 2 3 4 5 6 7 8 9 10 11 12 13 14 15 16 17 18 19 20 21 22 23 24 25 26 27 28 29 30
pH
Samples
Sample 1 Sample 2 Sample 3
31
402 which had a pH of 4.02, 4.2, 4.03 and 4.11, respectively. The lowest levels of pH were from
Muserechi 4 which had a pH of 2.99.
For Kitui samples, the highest pH measurements were recorded in Kitui 401 with a pH value of
4.21 and Kitui 105 with a pH value of 4.02. The lowest values correspond to Kitui 208, Kitui 408
and Kitui 303 samples with pH 2.86, 2.95 and 2.99, respectively.
Enrique, et al., 2014, characterized Argentine honey based on their quality parameters and mineral
content and they found the mean pH of unifloral honey to be 4.12 ± 0.21 and for multifloral honey
to be 3.81 ± 0.27. The honey from Kitui and Baringo are more likely to be multifloral according
to these classifications. Nganga, Onditi, Gachanja, & Ngumba, 2013, also did some studies on
physicochemical parameters of honey and they found pH in the range of 3.82 to 4.43. In Ethiopia,
Kebede, et al., 2011, analyzed honey and they found a pH range of 3.82 to 4.45.
4.4 Free Acidity in Honey Samples
In honey, acidity occurs because of the different organic acids present in natural honey. With the
different nectar sources used by bees and the activity of the enzymes like glucose oxidase, there is
formation of gluconic acid which contributes to the formation of acids in honey. Furthermore,
during ripening of the honey, there is the action of bacteria and the minerals that are present in the
honey composition (Stihi, et al., 2015). Free acidity of honey is a very important quality indicator.
Fermentation of honey leads to increased acidity. Natural honey has varying amounts of free
acidity but the maximum value set by the Codex Alimentarius is 40 milliequivalents/Kg. This
value was revised to 50 milliequivalents/Kg to cater for the honeys which have an elevated amount
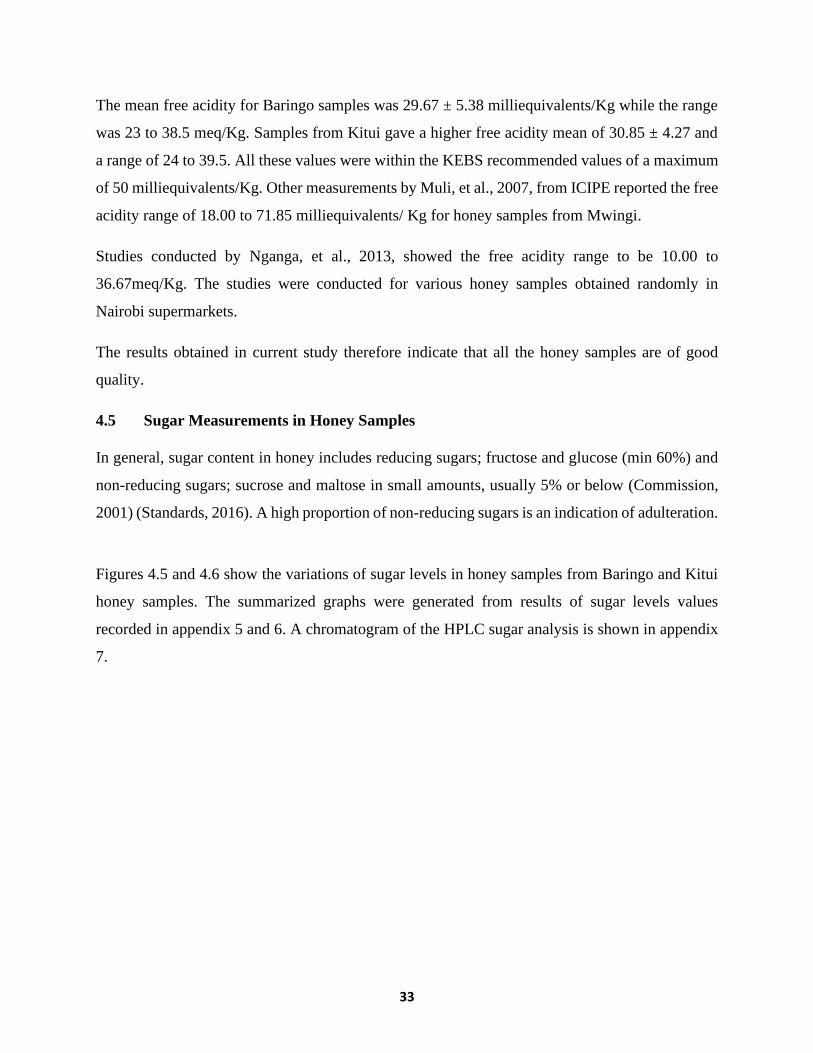
of natural acidity. Figure 4.3 and 4.4 show the content of free acidity in honey samples for Baringo
and Kitui. The graphs were generated from the data in appendix 3 and 4.
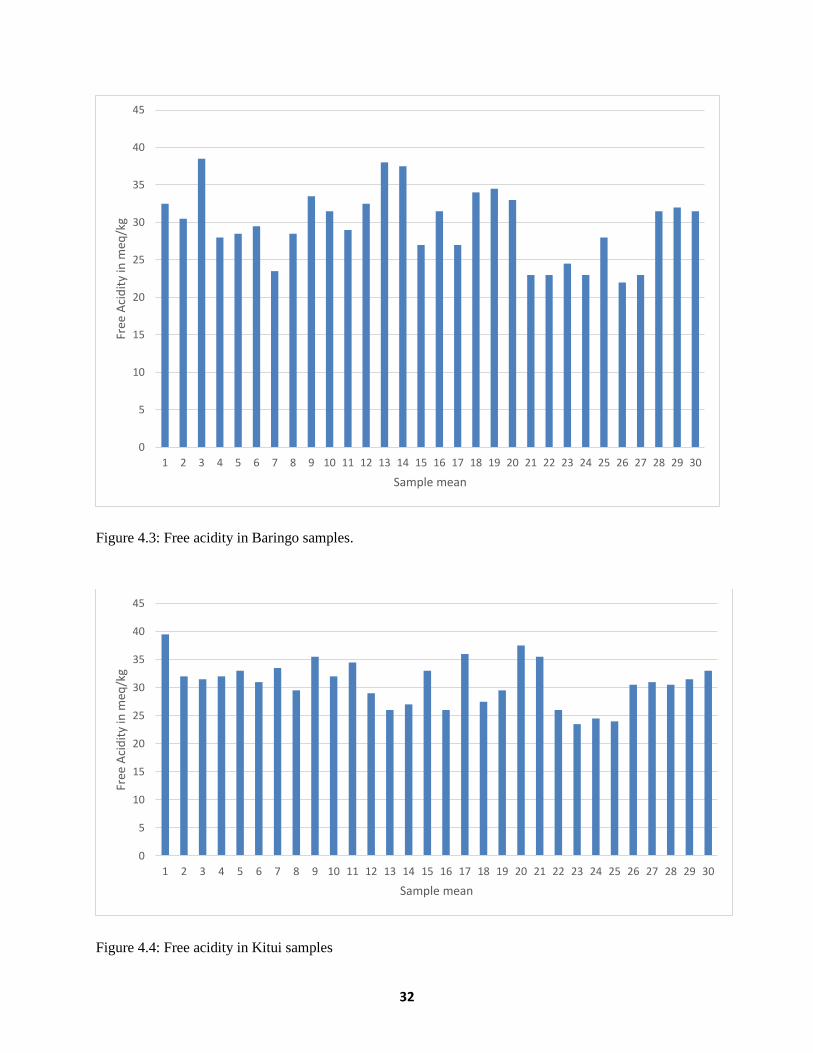
32
Figure 4.3: Free acidity in Baringo samples.
Figure 4.4: Free acidity in Kitui samples
0
5
10
15
20
25
30
35
40
45
1 2 3 4 5 6 7 8 9 10 11 12 13 14 15 16 17 18 19 20 21 22 23 24 25 26 27 28 29 30
Free
Aci
dit
y in
meq
/kg
Sample mean
0
5
10
15
20
25
30
35
40
45
1 2 3 4 5 6 7 8 9 10 11 12 13 14 15 16 17 18 19 20 21 22 23 24 25 26 27 28 29 30
Free
Aci
dit
y in
meq
/kg
Sample mean
33
The mean free acidity for Baringo samples was 29.67 ± 5.38 milliequivalents/Kg while the range
was 23 to 38.5 meq/Kg. Samples from Kitui gave a higher free acidity mean of 30.85 ± 4.27 and
a range of 24 to 39.5. All these values were within the KEBS recommended values of a maximum
of 50 milliequivalents/Kg. Other measurements by Muli, et al., 2007, from ICIPE reported the free
acidity range of 18.00 to 71.85 milliequivalents/ Kg for honey samples from Mwingi.
Studies conducted by Nganga, et al., 2013, showed the free acidity range to be 10.00 to
36.67meq/Kg. The studies were conducted for various honey samples obtained randomly in
Nairobi supermarkets.
The results obtained in current study therefore indicate that all the honey samples are of good
quality.
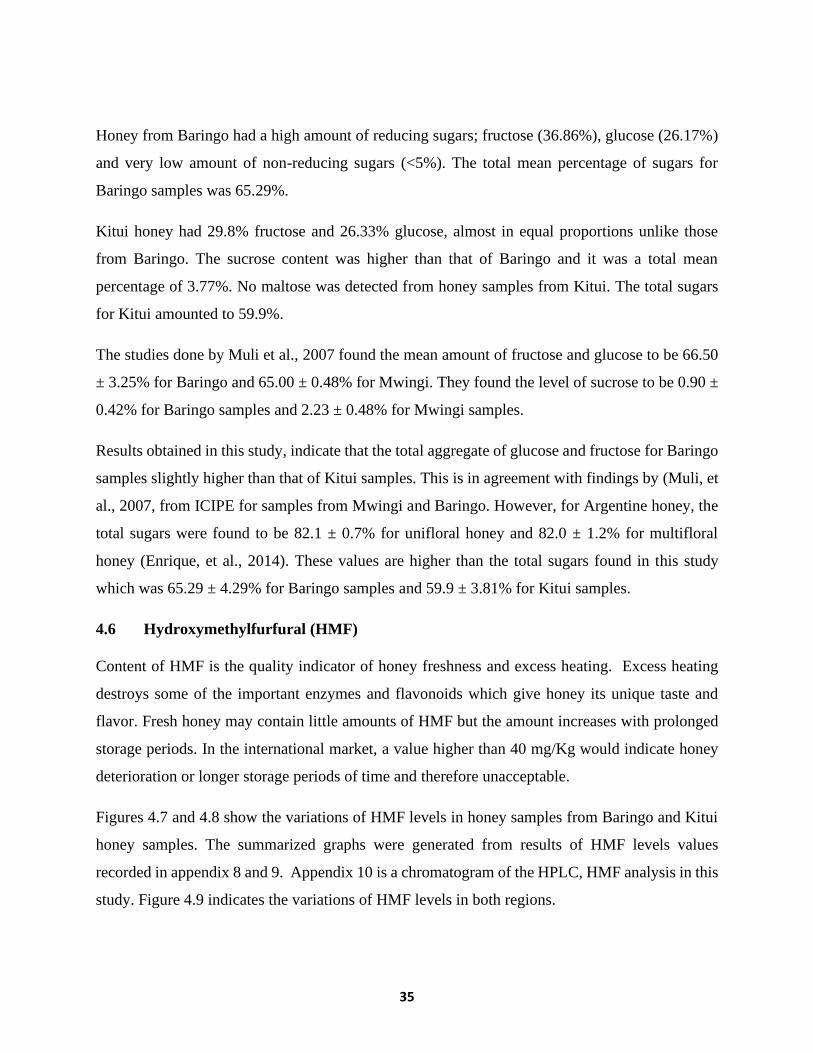
4.5 Sugar Measurements in Honey Samples
In general, sugar content in honey includes reducing sugars; fructose and glucose (min 60%) and
non-reducing sugars; sucrose and maltose in small amounts, usually 5% or below (Commission,
2001) (Standards, 2016). A high proportion of non-reducing sugars is an indication of adulteration.
Figures 4.5 and 4.6 show the variations of sugar levels in honey samples from Baringo and Kitui
honey samples. The summarized graphs were generated from results of sugar levels values
recorded in appendix 5 and 6. A chromatogram of the HPLC sugar analysis is shown in appendix
7.
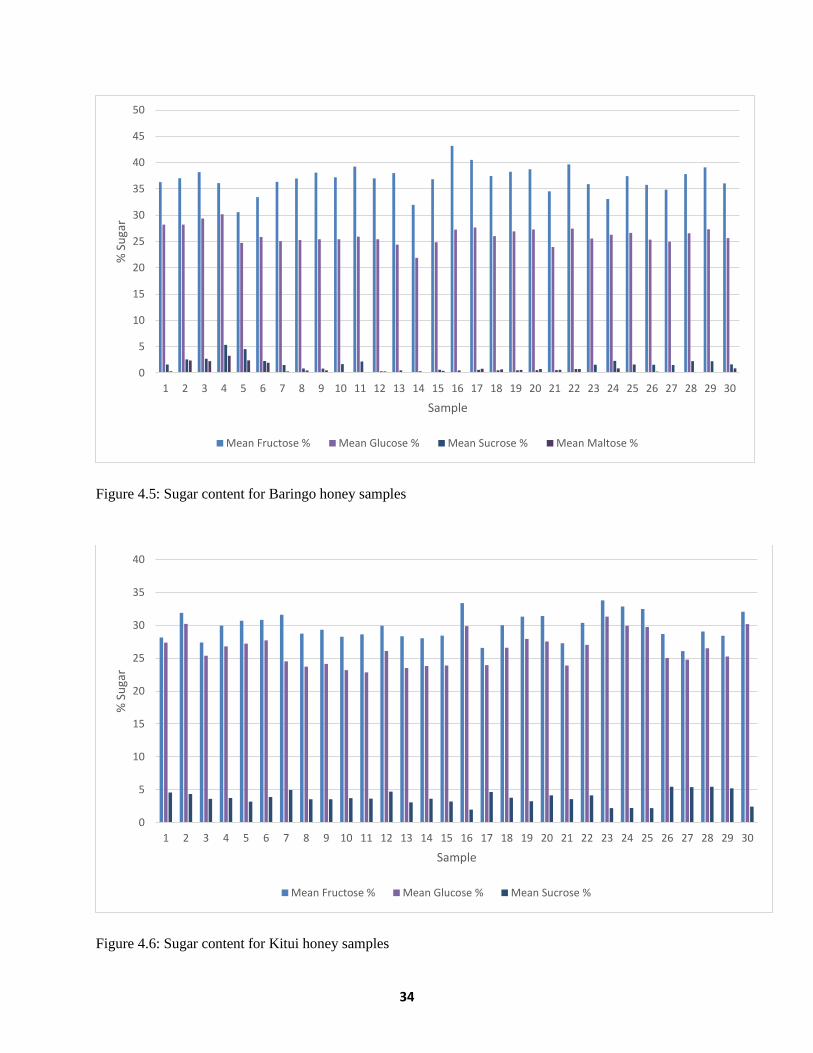
34
Figure 4.5: Sugar content for Baringo honey samples
Figure 4.6: Sugar content for Kitui honey samples
0
5
10
15
20
25
30
35
40
45
50
1 2 3 4 5 6 7 8 9 10 11 12 13 14 15 16 17 18 19 20 21 22 23 24 25 26 27 28 29 30
% S
uga
r
Sample
Mean Fructose % Mean Glucose % Mean Sucrose % Mean Maltose %
0
5
10
15
20
25
30
35
40
1 2 3 4 5 6 7 8 9 10 11 12 13 14 15 16 17 18 19 20 21 22 23 24 25 26 27 28 29 30
% S
uga
r
Sample
Mean Fructose % Mean Glucose % Mean Sucrose %
35
Honey from Baringo had a high amount of reducing sugars; fructose (36.86%), glucose (26.17%)
and very low amount of non-reducing sugars (<5%). The total mean percentage of sugars for
Baringo samples was 65.29%.
Kitui honey had 29.8% fructose and 26.33% glucose, almost in equal proportions unlike those
from Baringo. The sucrose content was higher than that of Baringo and it was a total mean
percentage of 3.77%. No maltose was detected from honey samples from Kitui. The total sugars
for Kitui amounted to 59.9%.
The studies done by Muli et al., 2007 found the mean amount of fructose and glucose to be 66.50
± 3.25% for Baringo and 65.00 ± 0.48% for Mwingi. They found the level of sucrose to be 0.90 ±
0.42% for Baringo samples and 2.23 ± 0.48% for Mwingi samples.
Results obtained in this study, indicate that the total aggregate of glucose and fructose for Baringo
samples slightly higher than that of Kitui samples. This is in agreement with findings by (Muli, et
al., 2007, from ICIPE for samples from Mwingi and Baringo. However, for Argentine honey, the
total sugars were found to be 82.1 ± 0.7% for unifloral honey and 82.0 ± 1.2% for multifloral
honey (Enrique, et al., 2014). These values are higher than the total sugars found in this study
which was 65.29 ± 4.29% for Baringo samples and 59.9 ± 3.81% for Kitui samples.
4.6 Hydroxymethylfurfural (HMF)
Content of HMF is the quality indicator of honey freshness and excess heating. Excess heating
destroys some of the important enzymes and flavonoids which give honey its unique taste and
flavor. Fresh honey may contain little amounts of HMF but the amount increases with prolonged
storage periods. In the international market, a value higher than 40 mg/Kg would indicate honey
deterioration or longer storage periods of time and therefore unacceptable.
Figures 4.7 and 4.8 show the variations of HMF levels in honey samples from Baringo and Kitui
honey samples. The summarized graphs were generated from results of HMF levels values
recorded in appendix 8 and 9. Appendix 10 is a chromatogram of the HPLC, HMF analysis in this
study. Figure 4.9 indicates the variations of HMF levels in both regions.
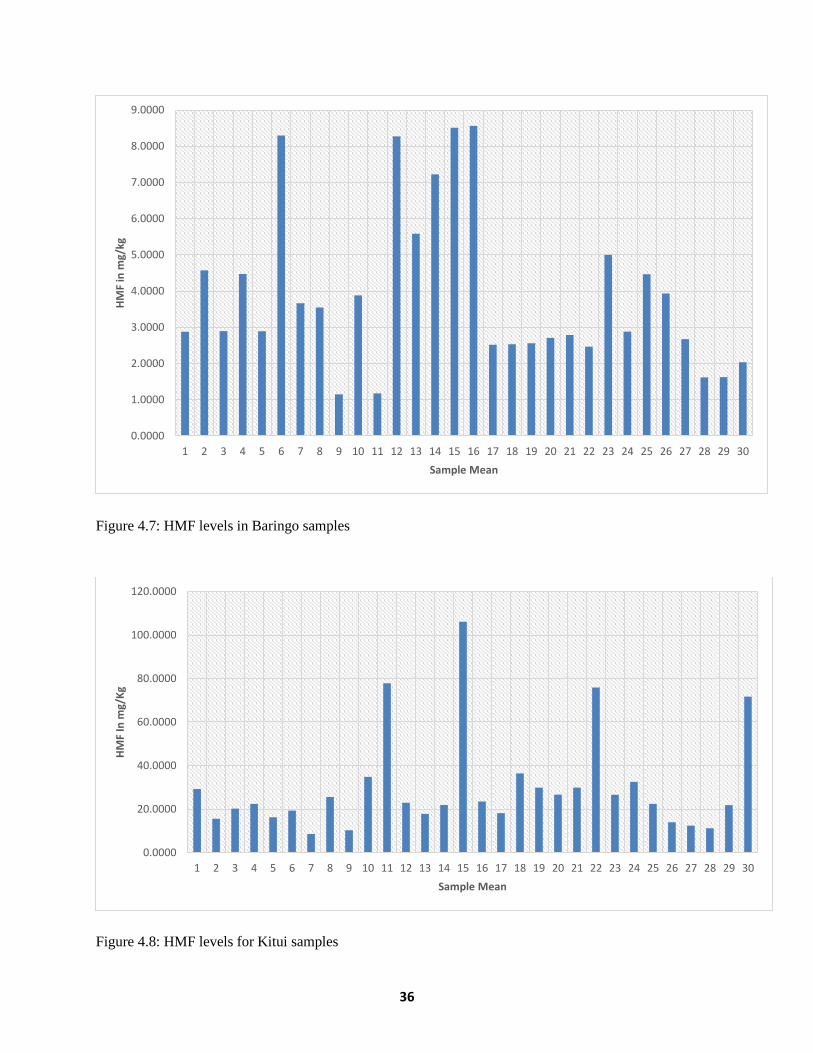
36
Figure 4.7: HMF levels in Baringo samples
Figure 4.8: HMF levels for Kitui samples
0.0000
1.0000
2.0000
3.0000
4.0000
5.0000
6.0000
7.0000
8.0000
9.0000
1 2 3 4 5 6 7 8 9 10 11 12 13 14 15 16 17 18 19 20 21 22 23 24 25 26 27 28 29 30
HM
F in
mg/
kg
Sample Mean
0.0000
20.0000
40.0000
60.0000
80.0000
100.0000
120.0000
1 2 3 4 5 6 7 8 9 10 11 12 13 14 15 16 17 18 19 20 21 22 23 24 25 26 27 28 29 30
HM
F In
mg/
Kg
Sample Mean
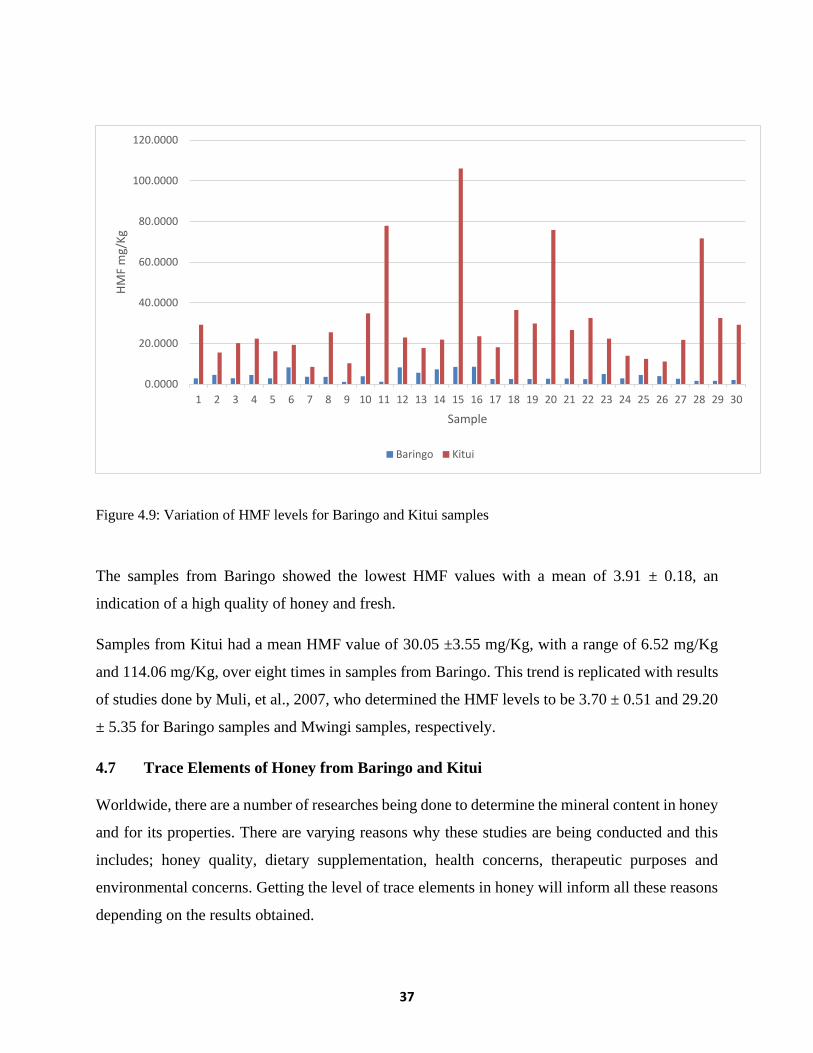
37
Figure 4.9: Variation of HMF levels for Baringo and Kitui samples
The samples from Baringo showed the lowest HMF values with a mean of 3.91 ± 0.18, an
indication of a high quality of honey and fresh.
Samples from Kitui had a mean HMF value of 30.05 ±3.55 mg/Kg, with a range of 6.52 mg/Kg
and 114.06 mg/Kg, over eight times in samples from Baringo. This trend is replicated with results
of studies done by Muli, et al., 2007, who determined the HMF levels to be 3.70 ± 0.51 and 29.20
± 5.35 for Baringo samples and Mwingi samples, respectively.
4.7 Trace Elements of Honey from Baringo and Kitui
Worldwide, there are a number of researches being done to determine the mineral content in honey
and for its properties. There are varying reasons why these studies are being conducted and this
includes; honey quality, dietary supplementation, health concerns, therapeutic purposes and
environmental concerns. Getting the level of trace elements in honey will inform all these reasons
depending on the results obtained.
0.0000
20.0000
40.0000
60.0000
80.0000
100.0000
120.0000
1 2 3 4 5 6 7 8 9 10 11 12 13 14 15 16 17 18 19 20 21 22 23 24 25 26 27 28 29 30
HM
F m
g/K
g
Sample
Baringo Kitui
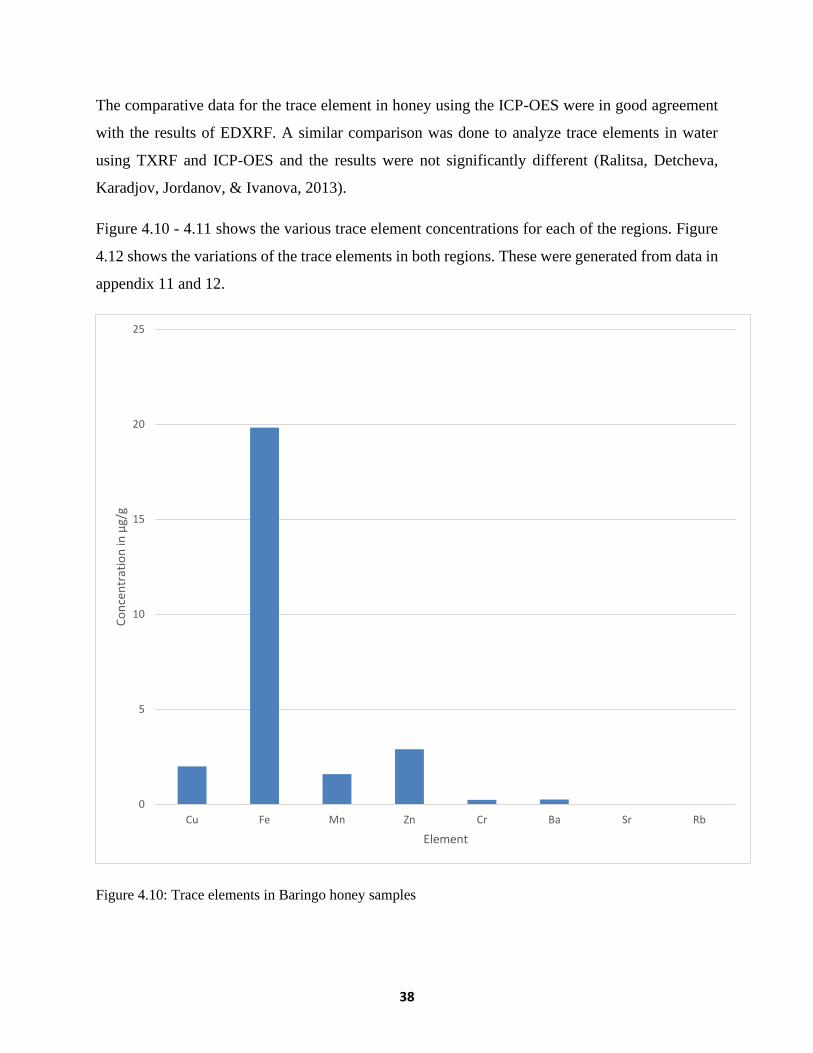
38
The comparative data for the trace element in honey using the ICP-OES were in good agreement
with the results of EDXRF. A similar comparison was done to analyze trace elements in water
using TXRF and ICP-OES and the results were not significantly different (Ralitsa, Detcheva,
Karadjov, Jordanov, & Ivanova, 2013).
Figure 4.10 - 4.11 shows the various trace element concentrations for each of the regions. Figure
4.12 shows the variations of the trace elements in both regions. These were generated from data in
appendix 11 and 12.
Figure 4.10: Trace elements in Baringo honey samples
0
5
10
15
20
25
Cu Fe Mn Zn Cr Ba Sr Rb
Co
nce
ntr
atio
n in
µg/
g
Element
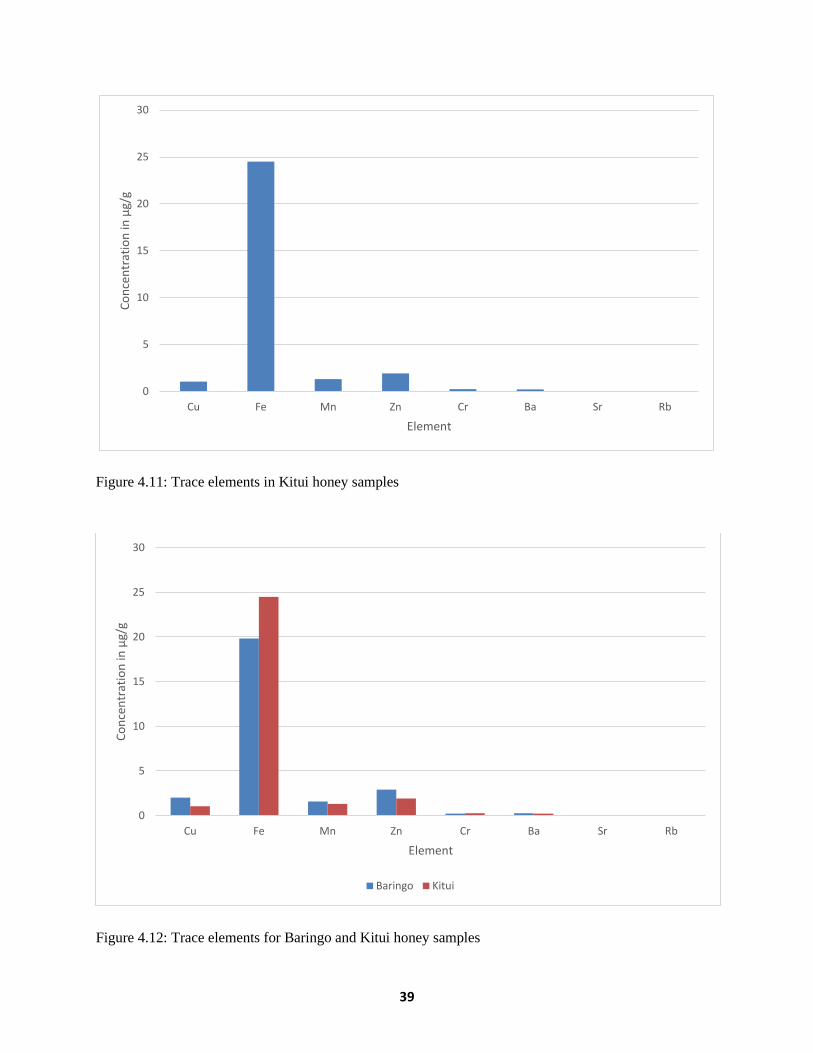
39
Figure 4.11: Trace elements in Kitui honey samples
Figure 4.12: Trace elements for Baringo and Kitui honey samples
0
5
10
15
20
25
30
Cu Fe Mn Zn Cr Ba Sr Rb
Co
nce
ntr
atio
n in
µg/
g
Element
0
5
10
15
20
25
30
Cu Fe Mn Zn Cr Ba Sr Rb
Co
nce
ntr
atio
n in
µg/
g
Element
Baringo Kitui
40
4.7.1 Iron (Fe)
Iron was one of the most prominent metals of all the trace elements and it was present in all the
honey samples studied. For Baringo samples, the average amount for Fe was 19.82 ± 2.74 µg/g.
This average value is a bit lower than that of Kitui samples. The maximum and the minimum levels
of Iron for Baringo samples were found to be 82.78 µg/g (Molo River 1) and 5.2 µg/g (Junction
413) respectively. For Kitui samples, Fe was detected in all the samples and it was the most
prevalent metal. The average amount of Iron for Kitui samples was 24.49 ± 3.38 µg/g which is a
bit higher than the value for Baringo samples. The highest amount for Iron was 97.63µg/g and the
lowest amount was 6.45 µg/g. These samples were Kitui 404 and Kitui 405 respectively. Studies
done by Wamwangi, 2012, showed the amount of Fe to be ranging from 8.6 µg/g to 15.6 µg/g.
The mean was 10.7 µg/g. The study was done to determine the trace elements in raw honey and
processed honey and Wamwangi, 2012, found that raw honey had a lower level of Fe than
processed honey.
Fredes & Montenegro, 2006, determined heavy elements in Chilean honey using ICP-OES and
found the amount of iron to be 3.13 ± 1.44 µg/g. This is a bit lower than the results of this study.
Enrique, et al., 2014, found Fe level in Argentine honey to be 3.57 µg/g which is also lower than
the levels found in this study.
4.7.2 Manganese (Mn)
All honey samples studied showed presence of Mn. The average amount of Manganese for Baringo
samples was found to be 1.58 ± 0.22 µg/g which is slightly higher than that of Kitui samples which
had a mean of 1.30 ± 0.52 µg/g. The range was between 12.32 µg/g and 0.45 µg/g. This value is
slightly lower compared to Argentine honey determined by Marcelo et al., 2014 which was found
to be 2.61 µg/g.
Unlike samples from Baringo which showed Mn in all the samples, Kitui had four sample whose
Mn levels were below detection. The mean levels for manganese was found to be 1.30 ± 0.52µg/g.
The range was 0 ppm to2.87 µg/g. This is because some few samples had very low levels of Mn
that were below the detection limit. Wamwangi, 2012, did some studies on Kitui honey and it was
determined to have a mean of 7.8 ± 2.3 ppm for Mn. This value is slightly higher than the one
found in this study.
41
4.7.3 Copper (Cu)
Copper showed wide variation from one sample to another and in some cases no copper was
detected. The average amount of copper of 1.99 ± 0.38 µg/g obtained for Baringo samples was
slightly higher than that of Kitui honey samples. The concentration levels for copper ranged from
0ppm to 5.89 µg/g. Overall, the mean value of copper (1.99 ± 0.38 µg/g) was higher compared to
a mean of 0.29 µg/g for Argentine honey done by Enrique, et al., 2014.
The average value for copper for Kitui samples was 1.04 ± 0.16 µg/g. The range was 0 µg/g to
7.19 µg/g. This value is a lower compared to the findings of Wamwangi, 2012, who did some
studies on Kitui raw and processed honey and found a mean of 10.3 µg/g for Cu and a range of 7.7
µg/g to 14.5 µg/g.
4.7.4 Zinc (Zn)
Zinc was prevalent and showed variations amongst the samples. The mean levels of zinc for
Baringo samples were 2.89 ± 0.77 µg/g, these values are higher than those of Kitui. The maximum
level of Zinc for Baringo samples was 17.40 µg/g and the minimum value was 0.31 µg/g. The
mean was slightly higher than those of Argentine honey by Enrique, et al., 2014 who found a mean
of 1.17 µg/g.
Zn was also detected in most of the samples from Kitui and the mean was found to be 1.92 ± 0.41
µg/g. The average value was lower than the value in Baringo samples. The range was between 0
µg/g and 11.50 µg/g. Some studies were done for trace elements of Kitui honey by Wamwangi,
2012 and the mean for Zinc was 6.3 µg/g. The range was 3.5 µg/g to 13.8 µg/g. These values are
slightly higher than the findings of this study.
4.7.5 Chromium (Cr)
For Baringo samples, the levels of Chromium were at an average of 0.22 ± 0.07 µg/g and a range
of 0ppm to 1.29 µg/g. On average, the levels of this metal were almost the same as those of Kitui
samples. Enrique, et al., 2014 found a mean of 0.03 ± 0.02 µg/g for Cr. This is a bit lower compared
to the results of this study for Chromium.
For Kitui samples, the average value of Chromium was found to be 0.25 ± 0.09 µg/g which was
almost the same as that of Baringo. The maximum and minimum values were 0 µg/g and 0.49 µg/g
42
respectively. The maximum value was found to be higher (about twice) compared to that of
Baringo. Fredes & Montenegro, 2006, found Chilean honey to have the mean for Cr to be 0.07 ±
0.03 µg/g. Enrique, et al., 2014 found a lower mean of 0.03 ± 0.02 µg/g. These values are lower
compared to what was found in this study.
4.7.6 Barium (Ba)
Barium had an average of 0.25 ± 0.09 µg/g for Baringo samples and a range of 0 µg/g to 0.85 µg/g.
The average value was almost the same as that of Kitui samples. Studies done by Batista, et al.,
2012 for Brazilian honey found a mean value for Ba as 374 ± 440 ng/g.
Kitui samples showed a lower average value of 0.22 ± 0.08 µg/g and a range of 0 µg/g to 0.59
µg/g. Studies done on Brazilian honey by Batista, et al., 2012, found a mean value for Ba as 374
± 440 ng/g.
4.7.7 Strontium (Sr)
The highest amount of Strontium in honey samples from Baringo was 0.12 µg/g. Most of the
samples, however, did not indicate any amounts of Sr at all. Studies done by (Fredes &
Montenegro, 2006) found mean levels of Sr in Chilean honey to be 2.39 ± 5.26 mg/Kg and the
range was between 0.01 and 23.06 mg/Kg. This value is higher than the those of this study.
For Kitui samples, the amount of Sr highly varied from one sample to another. Most of the samples
had 0 µg/g for Strontium but the maximum value was at 0.23 µg/g. Some studies done on the
elements of Chilean honey by Fredes & Montenegro, 2006, found a higher value for Sr with a
mean of 2.36 ± 5.33 µg/g.
4.7.8 Rubidium (Rb)
The range of Rubidium for Baringo samples was 0 ppm to 0.15 µg/g. However, Rb was not
detected in majority of the samples.
The highest value for Rubidium from Kitui samples was at 0.18 µg/g. Most of the other samples
did not show detectable amounts of Rb. Wamwangi, 2012, did some analysis on raw honey for
Kitui and found a range of 1.5 µg/g to 3.7 µg/g and a mean of 2.6 µg/g which is slightly higher
than the ones found in this study.
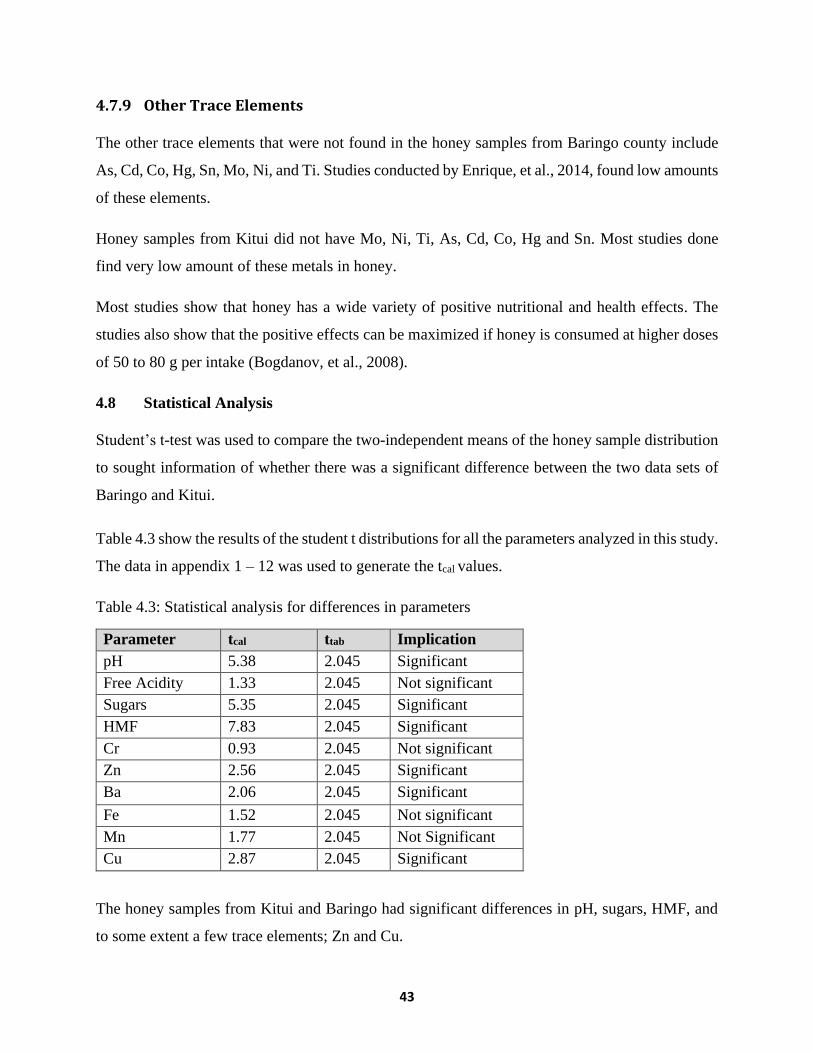
43
4.7.9 Other Trace Elements
The other trace elements that were not found in the honey samples from Baringo county include
As, Cd, Co, Hg, Sn, Mo, Ni, and Ti. Studies conducted by Enrique, et al., 2014, found low amounts
of these elements.
Honey samples from Kitui did not have Mo, Ni, Ti, As, Cd, Co, Hg and Sn. Most studies done
find very low amount of these metals in honey.
Most studies show that honey has a wide variety of positive nutritional and health effects. The
studies also show that the positive effects can be maximized if honey is consumed at higher doses
of 50 to 80 g per intake (Bogdanov, et al., 2008).
4.8 Statistical Analysis
Student’s t-test was used to compare the two-independent means of the honey sample distribution
to sought information of whether there was a significant difference between the two data sets of
Baringo and Kitui.
Table 4.3 show the results of the student t distributions for all the parameters analyzed in this study.
The data in appendix 1 – 12 was used to generate the tcal values.
Table 4.3: Statistical analysis for differences in parameters
Parameter tcal ttab Implication
pH 5.38 2.045 Significant
Free Acidity 1.33 2.045 Not significant
Sugars 5.35 2.045 Significant
HMF 7.83 2.045 Significant
Cr 0.93 2.045 Not significant
Zn 2.56 2.045 Significant
Ba 2.06 2.045 Significant
Fe 1.52 2.045 Not significant
Mn 1.77 2.045 Not Significant
Cu 2.87 2.045 Significant
The honey samples from Kitui and Baringo had significant differences in pH, sugars, HMF, and
to some extent a few trace elements; Zn and Cu.
44
CHAPTER FIVE
RECOMMENDATIONS AND CONCLUSIONS
5.1 Conclusions
The total sum of glucose and fructose proportions in nectar-based honey should not be less than
60 g/100g according to the codex Alimentarius, 1999. As for honey dew honey, it should not be
less than 45 g/100g. The honey samples from Baringo had a total of 63.13% for glucose and
fructose but samples from Kitui had results averaging 56.13% for the sum of two sugars. This
indicates that Kitui honey may be a result of blended nectar honey and honeydew honey in origin.
Some other samples from Kitui had sucrose levels higher than 5% which is above the
recommended level. This is an indication of deliberate adulteration also indicated by higher HMF
levels (> 100 mg/Kg). Samples from Baringo had very low levels of sucrose (mean 1.56%) and
HMF (mean 3.91 mg/Kg), therefore, of high quality.
The mean pH for Baringo was 3.65 ± 0.28 and that of Kitui samples was 3.46 ± 0.31. The variations
in pH may be due to the different flower species in the regions and therefore making some samples
more acidic than others.
The following elements As, Cd, Hg, Co, Sn, Mo, Ni, Ti and Pb were not present in both honey
samples of Baringo and Kitui. The other metals including; Cu, Zn, Ba, Mn, Cr, Fe, Sr and Rb were
present in both samples from Kitui and Baringo. The samples from Baringo had an average of 1.99
± 0.38 µg/g for Copper, 19.82 ± 2.74 µg/g for Iron, 1.58± 0.22 µg/g for Manganese, 2.89 ± 0.77
µg/g for Zinc, 0.22 ± 0.07 µg/g for Chromium and 0.25 ± 0.09µg/g for Barium. While those from
Kitui samples, the average values were 1.04 ± 0.16 µg/g for copper, 24.49 ± 3.38 µg/g for Iron,
1.30 ± 0.52 µg/g for Manganese, 1.92 ± 0.41 µg/g for Zinc, 0.25 ± 0.08 µg/g for Chromium and
0.22 ± 0.08 µg/g for Barium. Statistics show that there is a significant difference in all the
parameters analyzed except free acidity, Fe, Mn and Cr which did not have significant differences.
This may be explained by the fact that both Baringo and Kitui have almost the same climatic and
vegetation conditions; semi-arid. The honey from both regions are not contaminated by potential
farming activities like insecticides or heavy traffic and industries.
45
5.2 Recommendations
1) There is need for the apiculture industry to harmonize all the honey processing processes,
promote food labelling of apiculture products.
2) Research needs to be done on both honey and soil where the vegetation containing the
nectar grows so as to compare between the minerals in honey and in the soil to see whether
there is a relationship between them. This is because the metals or other contaminants can
be taken up from the soil, water or use of fertilizers.
3) There is need to do more research on the heavy metals of honey from the urban areas and
its surroundings in order to determine the level of pollution from industrialization and
heavy traffic.
46
References
Afzal, S., Farzana, S., Imdad, U., Salah, U.-D. K., Usman, A., & Thomas, M. (2014).
Spectrophotometric Determination of Trace Elements in Various Honey Samples,
Collected from Different Environments. Food and Nutrition Research, 532 - 538.
Ajibola, A., Idowu, G., Oyefuga, O., & Iquot, I. (2007). Improvement of some Haematological
Parameters in Albino Rats with Pure Natural Honey. Journal of Biological Science
Research, 67 - 69.
Batista, Silva, d., Rocha, Rodriguez, Berretta-Silva, Gomez, . . . Barbosa, F. (2012). Multi-
Element Determination in Brazilian Honey Samples by Inductively Coupled Plasma
Mass Spectrometry and Estimation of Geographic Origin with Data Mining Techniques.
Food Research International, 209 - 215.
Blanka, Z., & Lenka, V. (2015). Adulteration of honey and available methods for detection.
Acta. Vet. Brno, 85 - 102.
Bluman, A. (2009). Elementary Statistics: A Step by Step Approach 7th Edition. New York:
McGrow Hill Inc.
Bogdanov, S., & Martin, P. (1997). Harmonised Methods of the European Honey Commission.
Apidologie, Vol 28.
Bogdanov, S., Jurendic, T., Sieber, R., & Gallman, P. (2008). Honey for Nutrition and Health: A
Review . American Journal of the College of Nutrition, 677 - 689.
Bogdanov, S., Lullman, C., Martin, P., Von der hor, W., Russman, H., & Vorworl, G. (2014).
Honey Quality, Methods of Analysis and International Regulatory Standards.
International Honey Commission , Vol 80.
Boss, C., & Fredeen, K. (2004). Concepts, Instrumentation and Techniques in Inductively
Coupled Plasma Optical Emission Spectrometry. 3rd Edition. Shelton: Perkin Elmer Inc.
Boukka, M., Belouali, H., & Hakkou, A. (2008). Determination of some Major and Minor
Elements in the East of Morocco Honey through Inductively Coupled Plasma Optical
Emission Spectroscopy. Apiacta, 17 - 24.
Brouwer, P. (2010). Theory of XRF: Getting Acquainted with the Principles. Lelyweg:
PANalytical B.V.
Cantarelli, M., Pellerano, R., Marchevsky, E., & Camina, J. (2008). Quality of Honey from
Argentina: Study of Chemical Composition and Trace Elements . Food and Nutrition
Research, 532 - 538.
47
Chemists, A. o. (1999). Official Methods of Analysis. 15th Edition. Arlington: Association of
Analytical Chemists Inc.
Christophe, C., Julio, M., Clement, M.-C., & Daniel, C.-B. (2003). Honey Characterization and
Adulteration Detection by Pattern Recognition Applied on HPAEC-PAD Profiles.
Journal of Agricultural Food Chemistry , 3234 - 3242.
Commission, E. (2001). Council Directive 2001/110/EC. Official Journal of European
Communities , 47 - 52.
Enrich, C., Boeykens, S., Caracciolo, N., Custo, G., & Vazquez, C. (2006). Honey
Characterization by Total X-ray Fluorescence: Evaluatio of Environmental Quality and
Risk for the Human Health. Wiley InterScience, 215 - 220.
Enrique, M., Finoia, M., Fontana, L., Mele, G., Botre, F., & Lavicoli, I. (2014). Characterization
of Argentine Honeys on the Basis of their Mineral Content and some Typical Quality
Parameters. Chemistry Central Journal, 44 - 46.
Equar, G., Abraha, B., Lemma, H., & Amare, S. (2015). Physicochemical Characteristics of
Honey from Debre-Nazret Kobelle of Tigray Region, Ethiopia. World Applied Science
Journal, 1806 - 1814.
Fredes, C., & Montenegro, G. (2006). Heavy Metals and other Trace Elements Content in
Chilean Honey. Cien. Inv. Agr, 50 - 58.
Gilberto, P., Rodriguez, L., De Jong, D., Favaro, R., Ykosawa, C., & Marchini, J. (2008).
Brazilian Honey Samples Evaluated by Physicochemical and Carbon Isotope Ratio
Analysis. Journal of Apicultural Research, 87 - 88.
Hernandez, O., Fraga, J., Jimenez, A., & Arias, J. (2005). Characterization of Honey from the
Canary Islands: Determination of Mineral Content by Atomic Absorption
Spectrophotometry. Food Chemistry, 449 - 458.
I. Turhan, N. T., Karhan, M., Gurel, F., & Tavukcuoglu, R. (2008). Quality of Honeys
Influenced by Thermal Treatment. LWT - Food Science and Technology, 1396 - 1399.
Ioannidu, M., Zachariadis, G., Anthemidis, A., & Stratis, J. (2004). Direct Determination of
Toxic Trace Metals in Honey and Sugars using Inductively Coupled Plasma Atomic
Emission Spectrometry. Talanta, 65 - 82.
Kebede, N., P.A, S., & Gebrekidan, M. (2011). Physicochemical Analysis of Tigray Honey: An
Attempt to Determine Major Quality Markers of Honey. Bull. Chem. Soc. Ethiopia, 127 -
133.
48
Le Conte, Y., & Navajas, M. (2008). Climate Change: Impact on oney Bee Populations and
Diseases . Rev.Sci. Tech, 499 - 510.
Lidija, S., Nikola, B., Dragan, B., & Domagoj, B. (2014). Application of Infrared Spectroscopy
in Honey Analysis . Agric. Conspec. Sci, Vol 76.
Liyanage, A., & Horadugoda, H. (2017). Health Benefits and Traditional uses of Honey. Journal
of Apitherapy, Vol 2.
Ministry of Agriculture, L. F. (2019). Kenya Livestock Policy Draft. Nairobi: Kenya Government
Press.
Montgomery, D., & Runger, G. (2011). Applied Statistics and Proability for Engineers. Arizona:
Arizona State University.
Mouillé, B., Charrondière, R., & Burlingame, B. (2006). Contribution of Plant Genetic
Resources to Health and Dietary Diversity. Geneva: Food Agriculture Organization of
the UN.
Muli, E., Munguti, A., & Raina, S. (2007). Quality of Honey Harvested and Processed using
Traditional Methods in Rural Areas in Kenya. Acta. Vet. Brno, 315 - 320.
Nganga, F., Onditi, A., Gachanja, A., & Ngumba, E. (2013). Physicochemical Analysis of Honey
in the Kenya Retail Market. Food Science and Quality Management, Vol 12.
Oliveira, R., Teixera, E., Francisco, E., Da Silva, C., Adam, C., De Almeida, E., & Filho, V.
(2015). Determination of Trace Elementsin Honey from Different Regions in Rio de
Janeiro State (Brazil) by Total Reflection X-ray Fluorescence . Environmental
Monitoring, 187 - 196.
Pirk, C., Joachim, D. M., Kramer, M., Murray, T., Nazzi, F., Shutler, D., . . . Coby, v. D. (2013).
Statistical Guidelines for apis mellifera Research. Journal of Apicultural Research, 52 -
58.
Ralitsa, G., Detcheva, A., Karadjov, M., Jordanov, J., & Ivanova, E. (2013). Total Reflection X-
ray Fluorescence Analysis of Trace Elements in Bulgarian Bottled Mineral Waters of
Low and High Mineral Content. Journal of Environmental Analytical Chemistry, 1043 -
1051.
Schuette, H., & Remy, K. (1932). Degree of Pigmentation and its Probable Relationship to the
Mineral Constituents of Honey . American Chemical Society, 2909 - 2913.
Shahram, S., Yarsan, E., Erici, H., Tumer, I., & Demirbas, M. (2012). Determination of Metal
Contents of Honey Samples from Orimieh in Iran. Kafkas Univ Vet Fak Derg, 281 - 284.
49
Skoog, D., Holler, J., & Crouch, S. (2007). Principles of Instrumental Analysis 6th Edition.
California: Belmont.
Skoog, D., West, D., & Holler, F. (1996). Fundamentals of Analytical Chemistry 7th Edition.
Connecticut: Thomson Inc.
Soares, J., Soares, N., Pires, M., Novaes, S., & Junio, J. (2008). Honey Classification from Semi-
Arid, Atlantic and Transitional Forest Zones in Bahia, Brazil. Brazilian Chemical
Society, 502 - 508.
Solayman, Islam, A., Sudip, P., Ali, Y., Khalil, I., Alam, N., & Hua Gan, S. (2015).
Physicochemical Properties, Minerals, Trace Elements and Heavy Metals in Honey of
Different Origins. Food Science and Food Safety, 1537 - 1541.
Standards, K. B. (2016). KS EAS 36 Honey - Specification. Nairobi: Kenya Government Press.
Stihi, C., Chelarescu, E., Duliu, O., & Toma, L. (2015). Characterization of Romanian Honey
using Physicochemical Parameters and the Elemental Content Determination by
Analytical Techniques. Romanian Reports on Physics, 362 - 369.
Van Grieken, R., & Markowicz, A. (2001). Handbook of X-ray Spectrometry. New York: CRC
Press.
Wambua, B., Musimba, N., & Muli, E. (2016). Socioeconomic Analysis of Beekeeping
Technologies in Kenya: A Case Study of Kitui County. International Journal of
Education and Research, 2411 - 2441.
Wamwangi, M. D. (2012). Teace Element Analysis of Pollen, Honey and Bee Tissue by Energy
Dispersive X-ray Fluorescence (EDXRF) and Total Reflection X-ray Fluorescence
(TXRF) Techniques. Library ICT Kenyatta University, 4 - 10.
White, J., & Doner, L. (1978). Honey Composition and Properties. Association of Analytical
Chemists, 746 - 750.
World, B. (2018). Kenya Agricultural Productivity Program. Washington DC: World Bank.
Xiandeng, H., & Jones, B. (2000). Inductively Coupled Plasma Optical Emission Spectrometry.
Encyclopedia of Analytical Chemistry, 9468 - 9485.
Zane, V.-G., Maris, K., Vita, R., & Arturs, V. (2013). Potentially Toxic Metals in Honey from
Latvia: Is There a Connection with Botanical Origin. Recent Reseraches in Environment,
Energy and Sustainability, 158 - 1
Zappala, M., Fallico, B., Arena, E., & Verzera, A. (2004). Methods for the Determination of
Honey: A Comparison . Food Control, 273 - 277.
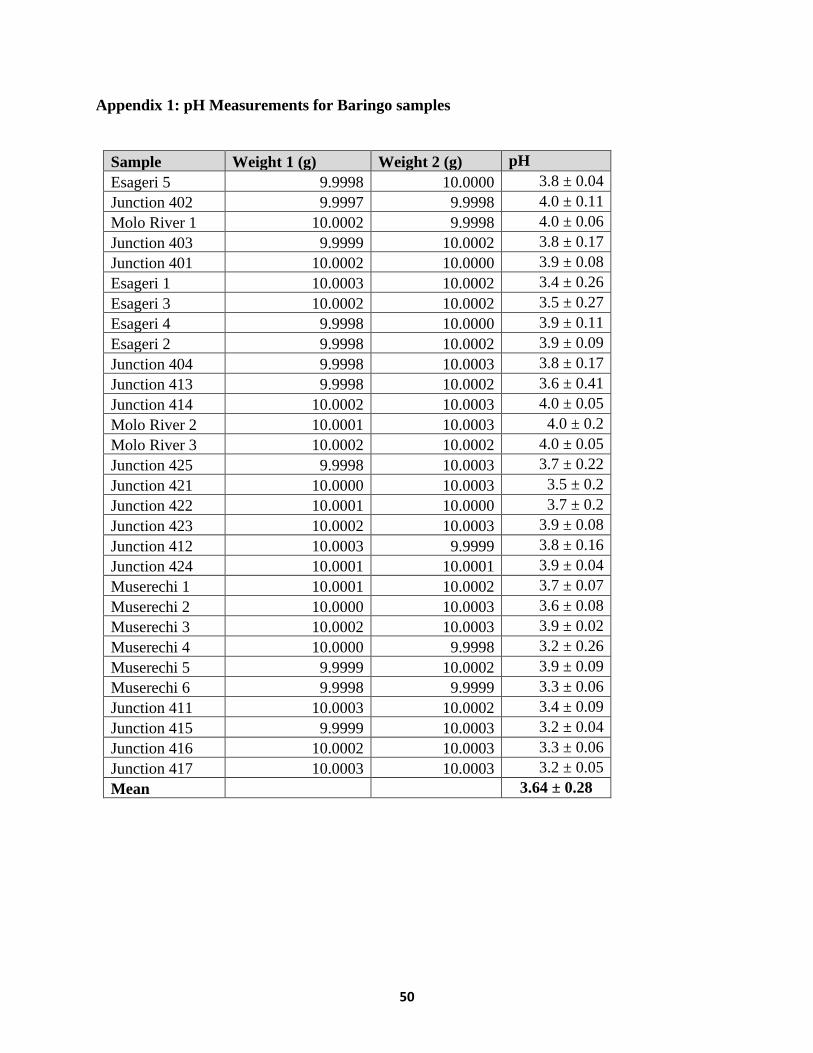
50
Appendix 1: pH Measurements for Baringo samples
Sample Weight 1 (g) Weight 2 (g) pH
Esageri 5 9.9998 10.0000 3.8 ± 0.04
Junction 402 9.9997 9.9998 4.0 ± 0.11
Molo River 1 10.0002 9.9998 4.0 ± 0.06
Junction 403 9.9999 10.0002 3.8 ± 0.17
Junction 401 10.0002 10.0000 3.9 ± 0.08
Esageri 1 10.0003 10.0002 3.4 ± 0.26
Esageri 3 10.0002 10.0002 3.5 ± 0.27
Esageri 4 9.9998 10.0000 3.9 ± 0.11
Esageri 2 9.9998 10.0002 3.9 ± 0.09
Junction 404 9.9998 10.0003 3.8 ± 0.17
Junction 413 9.9998 10.0002 3.6 ± 0.41
Junction 414 10.0002 10.0003 4.0 ± 0.05
Molo River 2 10.0001 10.0003 4.0 ± 0.2
Molo River 3 10.0002 10.0002 4.0 ± 0.05
Junction 425 9.9998 10.0003 3.7 ± 0.22
Junction 421 10.0000 10.0003 3.5 ± 0.2
Junction 422 10.0001 10.0000 3.7 ± 0.2
Junction 423 10.0002 10.0003 3.9 ± 0.08
Junction 412 10.0003 9.9999 3.8 ± 0.16
Junction 424 10.0001 10.0001 3.9 ± 0.04
Muserechi 1 10.0001 10.0002 3.7 ± 0.07
Muserechi 2 10.0000 10.0003 3.6 ± 0.08
Muserechi 3 10.0002 10.0003 3.9 ± 0.02
Muserechi 4 10.0000 9.9998 3.2 ± 0.26
Muserechi 5 9.9999 10.0002 3.9 ± 0.09
Muserechi 6 9.9998 9.9999 3.3 ± 0.06
Junction 411 10.0003 10.0002 3.4 ± 0.09
Junction 415 9.9999 10.0003 3.2 ± 0.04
Junction 416 10.0002 10.0003 3.3 ± 0.06
Junction 417 10.0003 10.0003 3.2 ± 0.05
Mean 3.64 ± 0.28
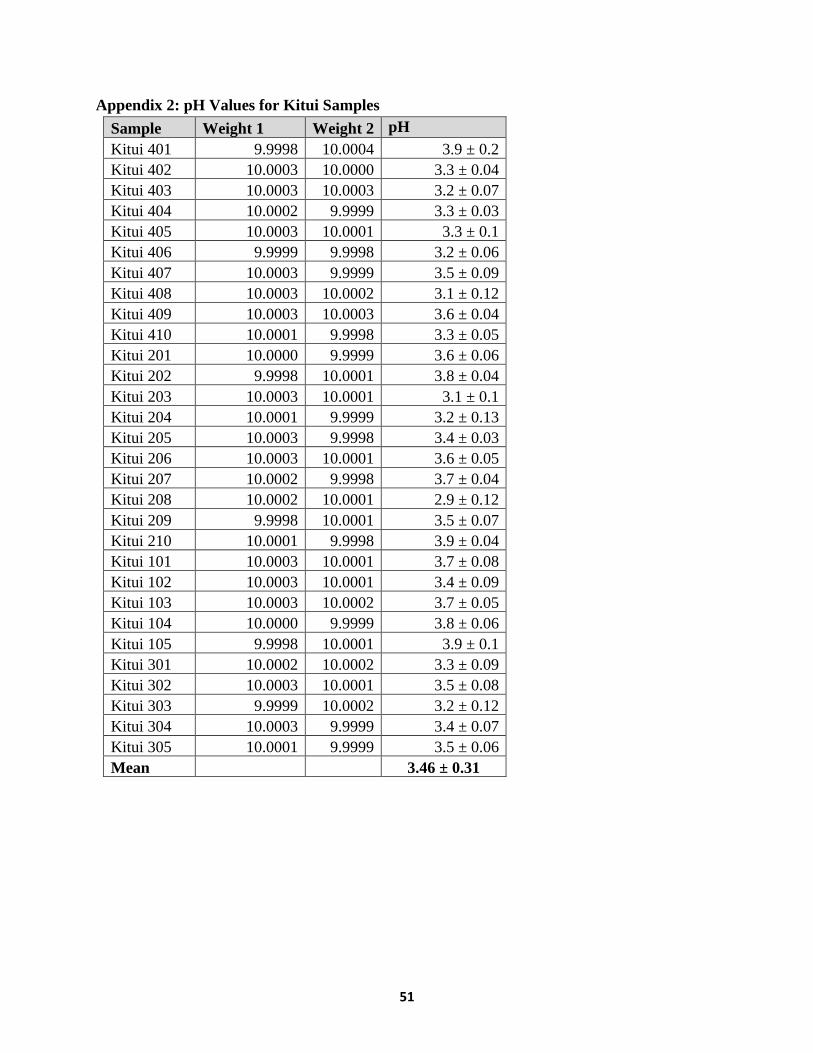
51
Appendix 2: pH Values for Kitui Samples
Sample Weight 1 Weight 2 pH
Kitui 401 9.9998 10.0004 3.9 ± 0.2
Kitui 402 10.0003 10.0000 3.3 ± 0.04
Kitui 403 10.0003 10.0003 3.2 ± 0.07
Kitui 404 10.0002 9.9999 3.3 ± 0.03
Kitui 405 10.0003 10.0001 3.3 ± 0.1
Kitui 406 9.9999 9.9998 3.2 ± 0.06
Kitui 407 10.0003 9.9999 3.5 ± 0.09
Kitui 408 10.0003 10.0002 3.1 ± 0.12
Kitui 409 10.0003 10.0003 3.6 ± 0.04
Kitui 410 10.0001 9.9998 3.3 ± 0.05
Kitui 201 10.0000 9.9999 3.6 ± 0.06
Kitui 202 9.9998 10.0001 3.8 ± 0.04
Kitui 203 10.0003 10.0001 3.1 ± 0.1
Kitui 204 10.0001 9.9999 3.2 ± 0.13
Kitui 205 10.0003 9.9998 3.4 ± 0.03
Kitui 206 10.0003 10.0001 3.6 ± 0.05
Kitui 207 10.0002 9.9998 3.7 ± 0.04
Kitui 208 10.0002 10.0001 2.9 ± 0.12
Kitui 209 9.9998 10.0001 3.5 ± 0.07
Kitui 210 10.0001 9.9998 3.9 ± 0.04
Kitui 101 10.0003 10.0001 3.7 ± 0.08
Kitui 102 10.0003 10.0001 3.4 ± 0.09
Kitui 103 10.0003 10.0002 3.7 ± 0.05
Kitui 104 10.0000 9.9999 3.8 ± 0.06
Kitui 105 9.9998 10.0001 3.9 ± 0.1
Kitui 301 10.0002 10.0002 3.3 ± 0.09
Kitui 302 10.0003 10.0001 3.5 ± 0.08
Kitui 303 9.9999 10.0002 3.2 ± 0.12
Kitui 304 10.0003 9.9999 3.4 ± 0.07
Kitui 305 10.0001 9.9999 3.5 ± 0.06
Mean 3.46 ± 0.31
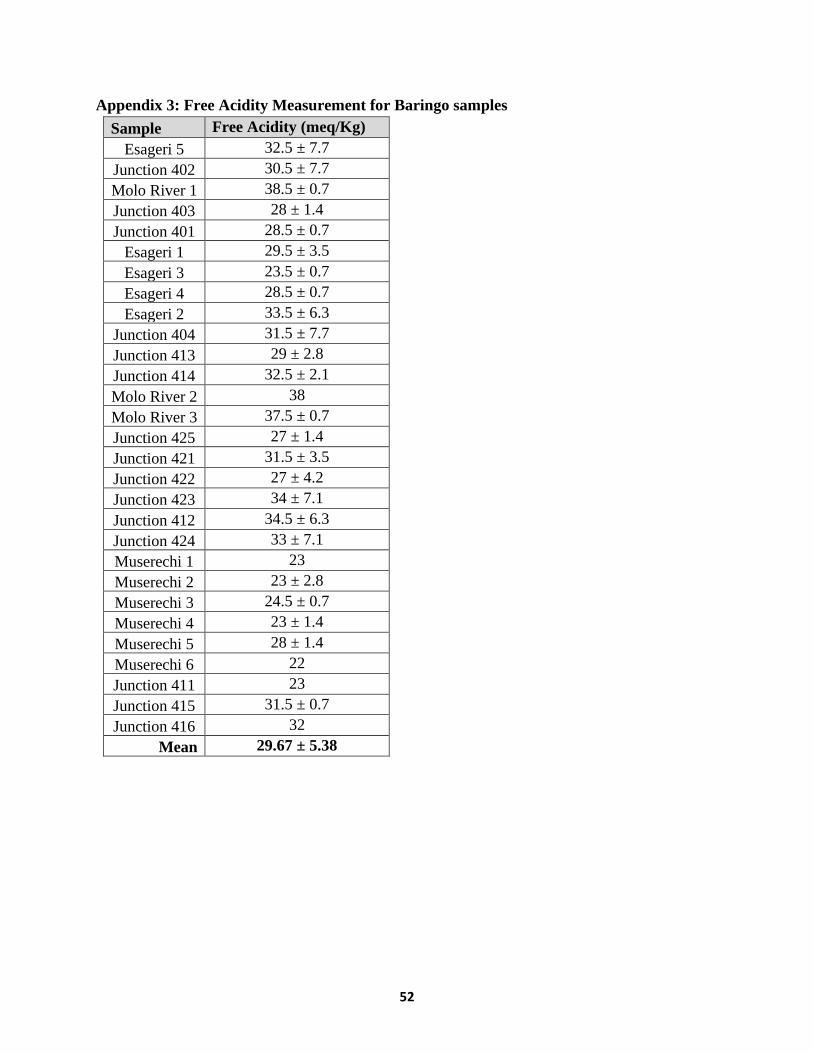
52
Appendix 3: Free Acidity Measurement for Baringo samples
Sample Free Acidity (meq/Kg)
Esageri 5 32.5 ± 7.7
Junction 402 30.5 ± 7.7
Molo River 1 38.5 ± 0.7
Junction 403 28 ± 1.4
Junction 401 28.5 ± 0.7
Esageri 1 29.5 ± 3.5
Esageri 3 23.5 ± 0.7
Esageri 4 28.5 ± 0.7
Esageri 2 33.5 ± 6.3
Junction 404 31.5 ± 7.7
Junction 413 29 ± 2.8
Junction 414 32.5 ± 2.1
Molo River 2 38
Molo River 3 37.5 ± 0.7
Junction 425 27 ± 1.4
Junction 421 31.5 ± 3.5
Junction 422 27 ± 4.2
Junction 423 34 ± 7.1
Junction 412 34.5 ± 6.3
Junction 424 33 ± 7.1
Muserechi 1 23
Muserechi 2 23 ± 2.8
Muserechi 3 24.5 ± 0.7
Muserechi 4 23 ± 1.4
Muserechi 5 28 ± 1.4
Muserechi 6 22
Junction 411 23
Junction 415 31.5 ± 0.7
Junction 416 32
Mean 29.67 ± 5.38
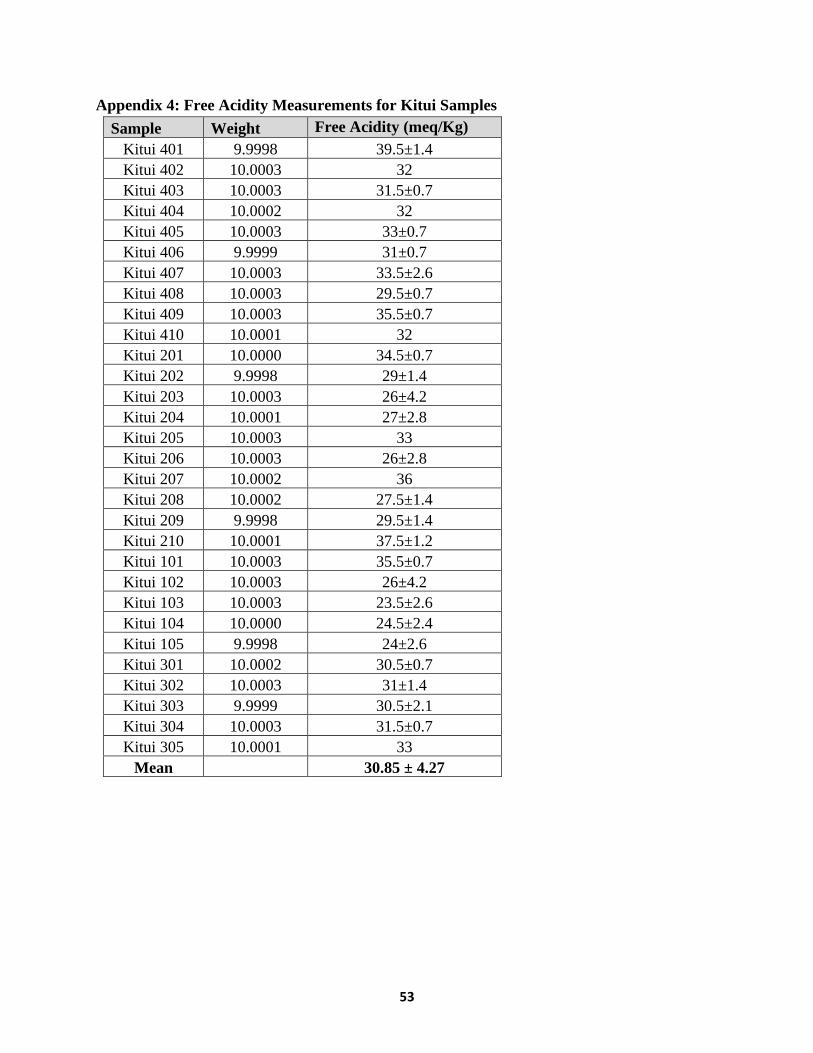
53
Appendix 4: Free Acidity Measurements for Kitui Samples
Sample Weight Free Acidity (meq/Kg)
Kitui 401 9.9998 39.5±1.4
Kitui 402 10.0003 32
Kitui 403 10.0003 31.5±0.7
Kitui 404 10.0002 32
Kitui 405 10.0003 33±0.7
Kitui 406 9.9999 31±0.7
Kitui 407 10.0003 33.5±2.6
Kitui 408 10.0003 29.5±0.7
Kitui 409 10.0003 35.5±0.7
Kitui 410 10.0001 32
Kitui 201 10.0000 34.5±0.7
Kitui 202 9.9998 29±1.4
Kitui 203 10.0003 26±4.2
Kitui 204 10.0001 27±2.8
Kitui 205 10.0003 33
Kitui 206 10.0003 26±2.8
Kitui 207 10.0002 36
Kitui 208 10.0002 27.5±1.4
Kitui 209 9.9998 29.5±1.4
Kitui 210 10.0001 37.5±1.2
Kitui 101 10.0003 35.5±0.7
Kitui 102 10.0003 26±4.2
Kitui 103 10.0003 23.5±2.6
Kitui 104 10.0000 24.5±2.4
Kitui 105 9.9998 24±2.6
Kitui 301 10.0002 30.5±0.7
Kitui 302 10.0003 31±1.4
Kitui 303 9.9999 30.5±2.1
Kitui 304 10.0003 31.5±0.7
Kitui 305 10.0001 33
Mean 30.85 ± 4.27
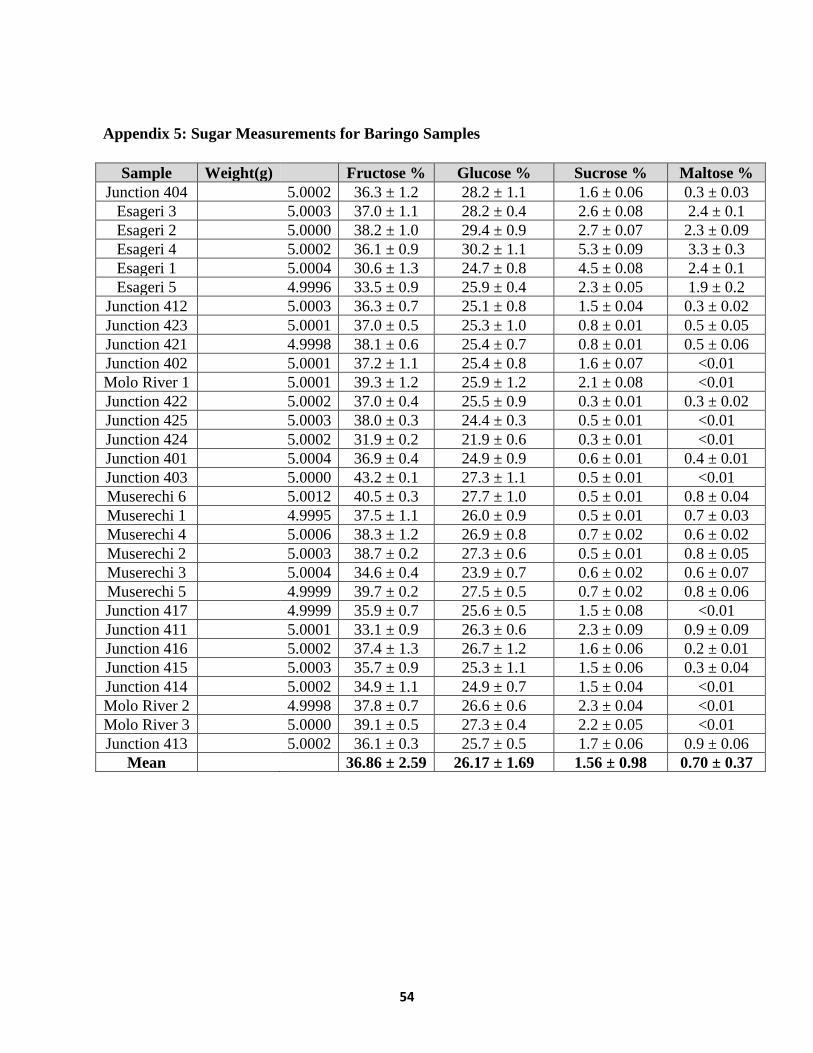
54
Appendix 5: Sugar Measurements for Baringo Samples
Sample Weight(g) Fructose % Glucose % Sucrose % Maltose %
Junction 404 5.0002 36.3 ± 1.2 28.2 ± 1.1 1.6 ± 0.06 0.3 ± 0.03
Esageri 3 5.0003 37.0 ± 1.1 28.2 ± 0.4 2.6 ± 0.08 2.4 ± 0.1
Esageri 2 5.0000 38.2 ± 1.0 29.4 ± 0.9 2.7 ± 0.07 2.3 ± 0.09
Esageri 4 5.0002 36.1 ± 0.9 30.2 ± 1.1 5.3 ± 0.09 3.3 ± 0.3
Esageri 1 5.0004 30.6 ± 1.3 24.7 ± 0.8 4.5 ± 0.08 2.4 ± 0.1
Esageri 5 4.9996 33.5 ± 0.9 25.9 ± 0.4 2.3 ± 0.05 1.9 ± 0.2
Junction 412 5.0003 36.3 ± 0.7 25.1 ± 0.8 1.5 ± 0.04 0.3 ± 0.02
Junction 423 5.0001 37.0 ± 0.5 25.3 ± 1.0 0.8 ± 0.01 0.5 ± 0.05
Junction 421 4.9998 38.1 ± 0.6 25.4 ± 0.7 0.8 ± 0.01 0.5 ± 0.06
Junction 402 5.0001 37.2 ± 1.1 25.4 ± 0.8 1.6 ± 0.07 <0.01
Molo River 1 5.0001 39.3 ± 1.2 25.9 ± 1.2 2.1 ± 0.08 <0.01
Junction 422 5.0002 37.0 ± 0.4 25.5 ± 0.9 0.3 ± 0.01 0.3 ± 0.02
Junction 425 5.0003 38.0 ± 0.3 24.4 ± 0.3 0.5 ± 0.01 <0.01
Junction 424 5.0002 31.9 ± 0.2 21.9 ± 0.6 0.3 ± 0.01 <0.01
Junction 401 5.0004 36.9 ± 0.4 24.9 ± 0.9 0.6 ± 0.01 0.4 ± 0.01
Junction 403 5.0000 43.2 ± 0.1 27.3 ± 1.1 0.5 ± 0.01 <0.01
Muserechi 6 5.0012 40.5 ± 0.3 27.7 ± 1.0 0.5 ± 0.01 0.8 ± 0.04
Muserechi 1 4.9995 37.5 ± 1.1 26.0 ± 0.9 0.5 ± 0.01 0.7 ± 0.03
Muserechi 4 5.0006 38.3 ± 1.2 26.9 ± 0.8 0.7 ± 0.02 0.6 ± 0.02
Muserechi 2 5.0003 38.7 ± 0.2 27.3 ± 0.6 0.5 ± 0.01 0.8 ± 0.05
Muserechi 3 5.0004 34.6 ± 0.4 23.9 ± 0.7 0.6 ± 0.02 0.6 ± 0.07
Muserechi 5 4.9999 39.7 ± 0.2 27.5 ± 0.5 0.7 ± 0.02 0.8 ± 0.06
Junction 417 4.9999 35.9 ± 0.7 25.6 ± 0.5 1.5 ± 0.08 <0.01
Junction 411 5.0001 33.1 ± 0.9 26.3 ± 0.6 2.3 ± 0.09 0.9 ± 0.09
Junction 416 5.0002 37.4 ± 1.3 26.7 ± 1.2 1.6 ± 0.06 0.2 ± 0.01
Junction 415 5.0003 35.7 ± 0.9 25.3 ± 1.1 1.5 ± 0.06 0.3 ± 0.04
Junction 414 5.0002 34.9 ± 1.1 24.9 ± 0.7 1.5 ± 0.04 <0.01
Molo River 2 4.9998 37.8 ± 0.7 26.6 ± 0.6 2.3 ± 0.04 <0.01
Molo River 3 5.0000 39.1 ± 0.5 27.3 ± 0.4 2.2 ± 0.05 <0.01
Junction 413 5.0002 36.1 ± 0.3 25.7 ± 0.5 1.7 ± 0.06 0.9 ± 0.06
Mean 36.86 ± 2.59 26.17 ± 1.69 1.56 ± 0.98 0.70 ± 0.37
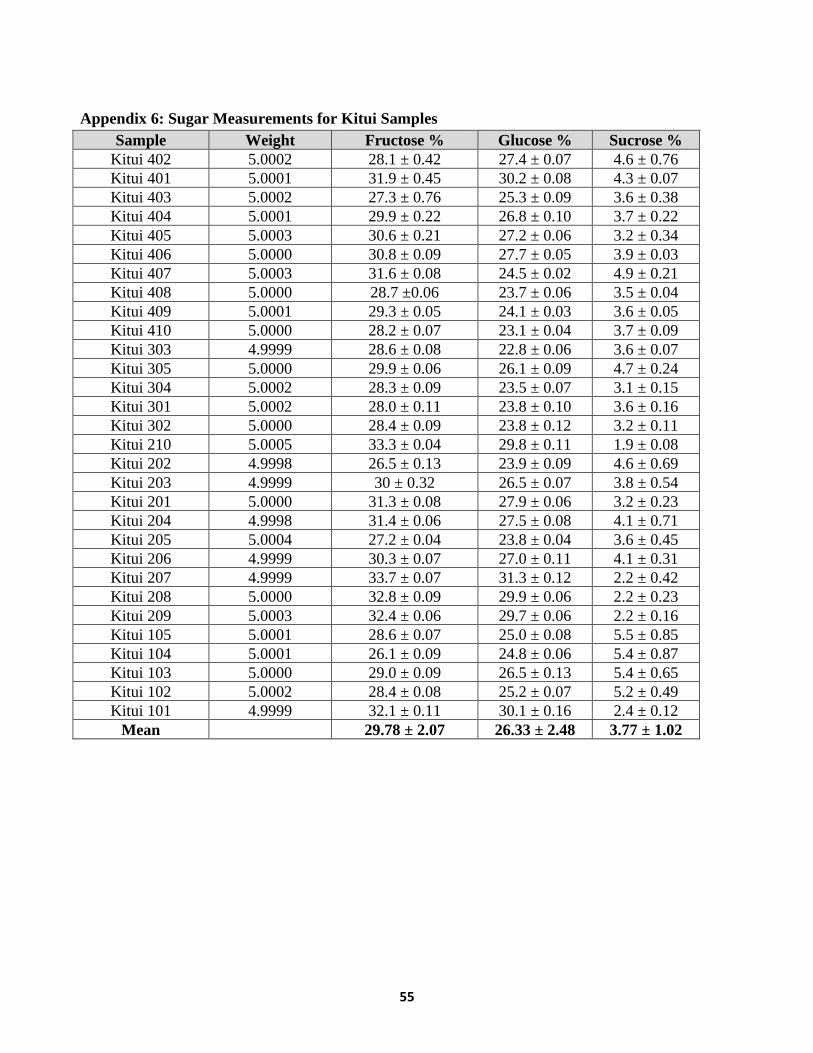
55
Appendix 6: Sugar Measurements for Kitui Samples
Sample Weight Fructose % Glucose % Sucrose %
Kitui 402 5.0002 28.1 ± 0.42 27.4 ± 0.07 4.6 ± 0.76
Kitui 401 5.0001 31.9 ± 0.45 30.2 ± 0.08 4.3 ± 0.07
Kitui 403 5.0002 27.3 ± 0.76 25.3 ± 0.09 3.6 ± 0.38
Kitui 404 5.0001 29.9 ± 0.22 26.8 ± 0.10 3.7 ± 0.22
Kitui 405 5.0003 30.6 ± 0.21 27.2 ± 0.06 3.2 ± 0.34
Kitui 406 5.0000 30.8 ± 0.09 27.7 ± 0.05 3.9 ± 0.03
Kitui 407 5.0003 31.6 ± 0.08 24.5 ± 0.02 4.9 ± 0.21
Kitui 408 5.0000 28.7 ±0.06 23.7 ± 0.06 3.5 ± 0.04
Kitui 409 5.0001 29.3 ± 0.05 24.1 ± 0.03 3.6 ± 0.05
Kitui 410 5.0000 28.2 ± 0.07 23.1 ± 0.04 3.7 ± 0.09
Kitui 303 4.9999 28.6 ± 0.08 22.8 ± 0.06 3.6 ± 0.07
Kitui 305 5.0000 29.9 ± 0.06 26.1 ± 0.09 4.7 ± 0.24
Kitui 304 5.0002 28.3 ± 0.09 23.5 ± 0.07 3.1 ± 0.15
Kitui 301 5.0002 28.0 ± 0.11 23.8 ± 0.10 3.6 ± 0.16
Kitui 302 5.0000 28.4 ± 0.09 23.8 ± 0.12 3.2 ± 0.11
Kitui 210 5.0005 33.3 ± 0.04 29.8 ± 0.11 1.9 ± 0.08
Kitui 202 4.9998 26.5 ± 0.13 23.9 ± 0.09 4.6 ± 0.69
Kitui 203 4.9999 30 ± 0.32 26.5 ± 0.07 3.8 ± 0.54
Kitui 201 5.0000 31.3 ± 0.08 27.9 ± 0.06 3.2 ± 0.23
Kitui 204 4.9998 31.4 ± 0.06 27.5 ± 0.08 4.1 ± 0.71
Kitui 205 5.0004 27.2 ± 0.04 23.8 ± 0.04 3.6 ± 0.45
Kitui 206 4.9999 30.3 ± 0.07 27.0 ± 0.11 4.1 ± 0.31
Kitui 207 4.9999 33.7 ± 0.07 31.3 ± 0.12 2.2 ± 0.42
Kitui 208 5.0000 32.8 ± 0.09 29.9 ± 0.06 2.2 ± 0.23
Kitui 209 5.0003 32.4 ± 0.06 29.7 ± 0.06 2.2 ± 0.16
Kitui 105 5.0001 28.6 ± 0.07 25.0 ± 0.08 5.5 ± 0.85
Kitui 104 5.0001 26.1 ± 0.09 24.8 ± 0.06 5.4 ± 0.87
Kitui 103 5.0000 29.0 ± 0.09 26.5 ± 0.13 5.4 ± 0.65
Kitui 102 5.0002 28.4 ± 0.08 25.2 ± 0.07 5.2 ± 0.49
Kitui 101 4.9999 32.1 ± 0.11 30.1 ± 0.16 2.4 ± 0.12
Mean 29.78 ± 2.07 26.33 ± 2.48 3.77 ± 1.02
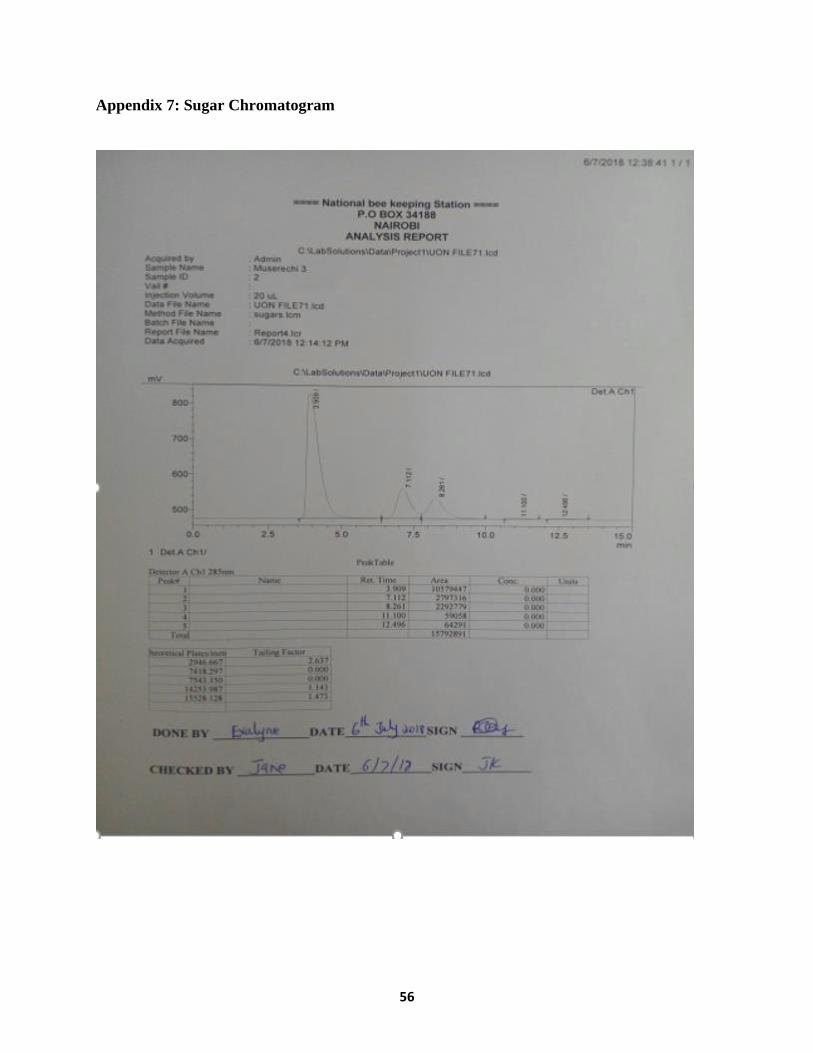
56
Appendix 7: Sugar Chromatogram
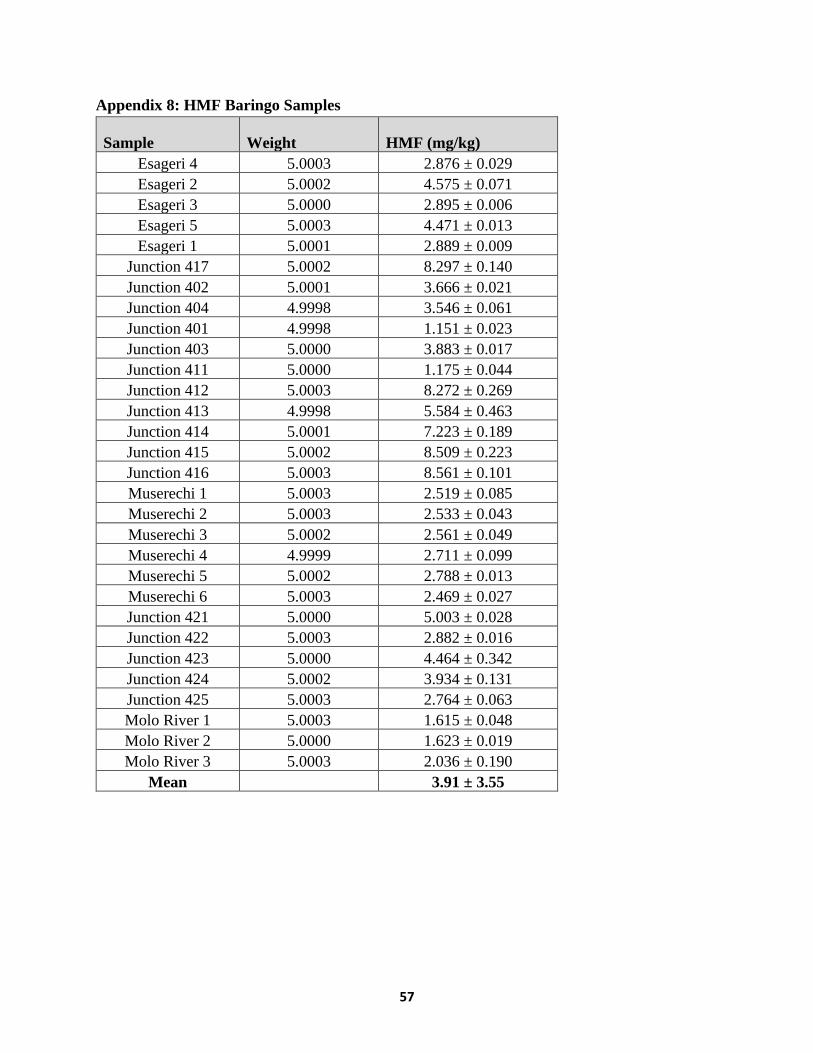
57
Appendix 8: HMF Baringo Samples
Sample Weight HMF (mg/kg)
Esageri 4 5.0003 2.876 ± 0.029
Esageri 2 5.0002 4.575 ± 0.071
Esageri 3 5.0000 2.895 ± 0.006
Esageri 5 5.0003 4.471 ± 0.013
Esageri 1 5.0001 2.889 ± 0.009
Junction 417 5.0002 8.297 ± 0.140
Junction 402 5.0001 3.666 ± 0.021
Junction 404 4.9998 3.546 ± 0.061
Junction 401 4.9998 1.151 ± 0.023
Junction 403 5.0000 3.883 ± 0.017
Junction 411 5.0000 1.175 ± 0.044
Junction 412 5.0003 8.272 ± 0.269
Junction 413 4.9998 5.584 ± 0.463
Junction 414 5.0001 7.223 ± 0.189
Junction 415 5.0002 8.509 ± 0.223
Junction 416 5.0003 8.561 ± 0.101
Muserechi 1 5.0003 2.519 ± 0.085
Muserechi 2 5.0003 2.533 ± 0.043
Muserechi 3 5.0002 2.561 ± 0.049
Muserechi 4 4.9999 2.711 ± 0.099
Muserechi 5 5.0002 2.788 ± 0.013
Muserechi 6 5.0003 2.469 ± 0.027
Junction 421 5.0000 5.003 ± 0.028
Junction 422 5.0003 2.882 ± 0.016
Junction 423 5.0000 4.464 ± 0.342
Junction 424 5.0002 3.934 ± 0.131
Junction 425 5.0003 2.764 ± 0.063
Molo River 1 5.0003 1.615 ± 0.048
Molo River 2 5.0000 1.623 ± 0.019
Molo River 3 5.0003 2.036 ± 0.190
Mean 3.91 ± 3.55
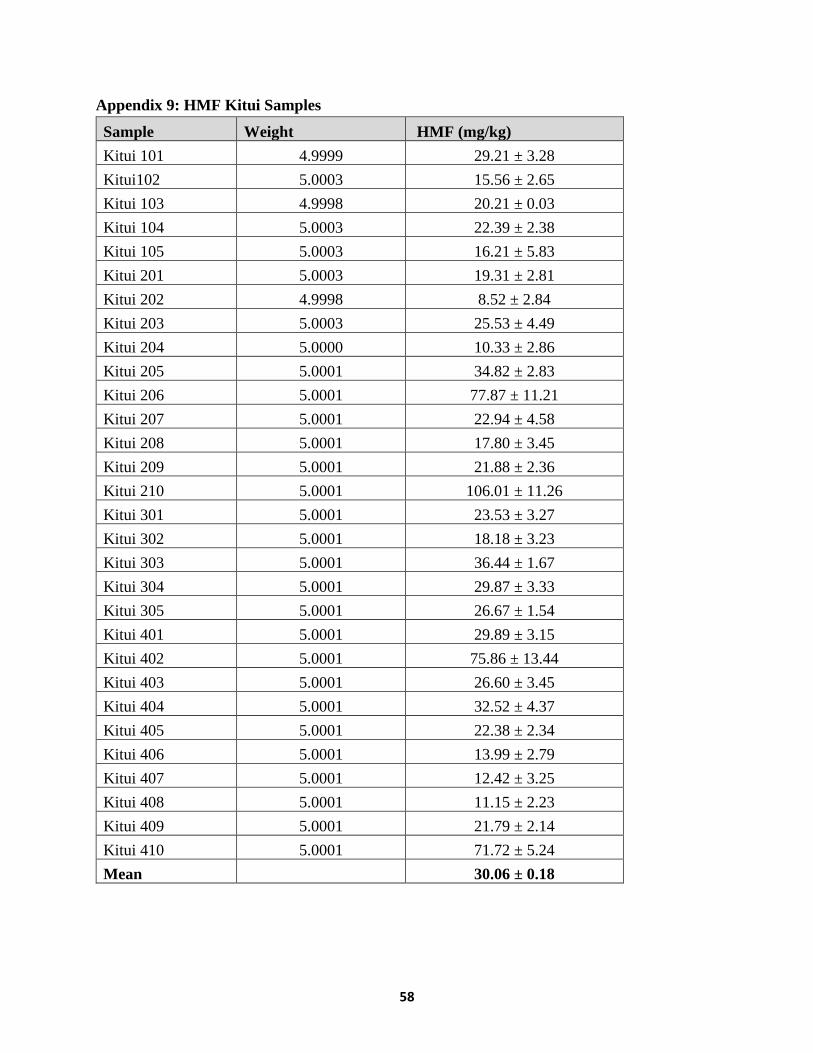
58
Appendix 9: HMF Kitui Samples
Sample Weight HMF (mg/kg)
Kitui 101 4.9999 29.21 ± 3.28
Kitui102 5.0003 15.56 ± 2.65
Kitui 103 4.9998 20.21 ± 0.03
Kitui 104 5.0003 22.39 ± 2.38
Kitui 105 5.0003 16.21 ± 5.83
Kitui 201 5.0003 19.31 ± 2.81
Kitui 202 4.9998 8.52 ± 2.84
Kitui 203 5.0003 25.53 ± 4.49
Kitui 204 5.0000 10.33 ± 2.86
Kitui 205 5.0001 34.82 ± 2.83
Kitui 206 5.0001 77.87 ± 11.21
Kitui 207 5.0001 22.94 ± 4.58
Kitui 208 5.0001 17.80 ± 3.45
Kitui 209 5.0001 21.88 ± 2.36
Kitui 210 5.0001 106.01 ± 11.26
Kitui 301 5.0001 23.53 ± 3.27
Kitui 302 5.0001 18.18 ± 3.23
Kitui 303 5.0001 36.44 ± 1.67
Kitui 304 5.0001 29.87 ± 3.33
Kitui 305 5.0001 26.67 ± 1.54
Kitui 401 5.0001 29.89 ± 3.15
Kitui 402 5.0001 75.86 ± 13.44
Kitui 403 5.0001 26.60 ± 3.45
Kitui 404 5.0001 32.52 ± 4.37
Kitui 405 5.0001 22.38 ± 2.34
Kitui 406 5.0001 13.99 ± 2.79
Kitui 407 5.0001 12.42 ± 3.25
Kitui 408 5.0001 11.15 ± 2.23
Kitui 409 5.0001 21.79 ± 2.14
Kitui 410 5.0001 71.72 ± 5.24
Mean 30.06 ± 0.18
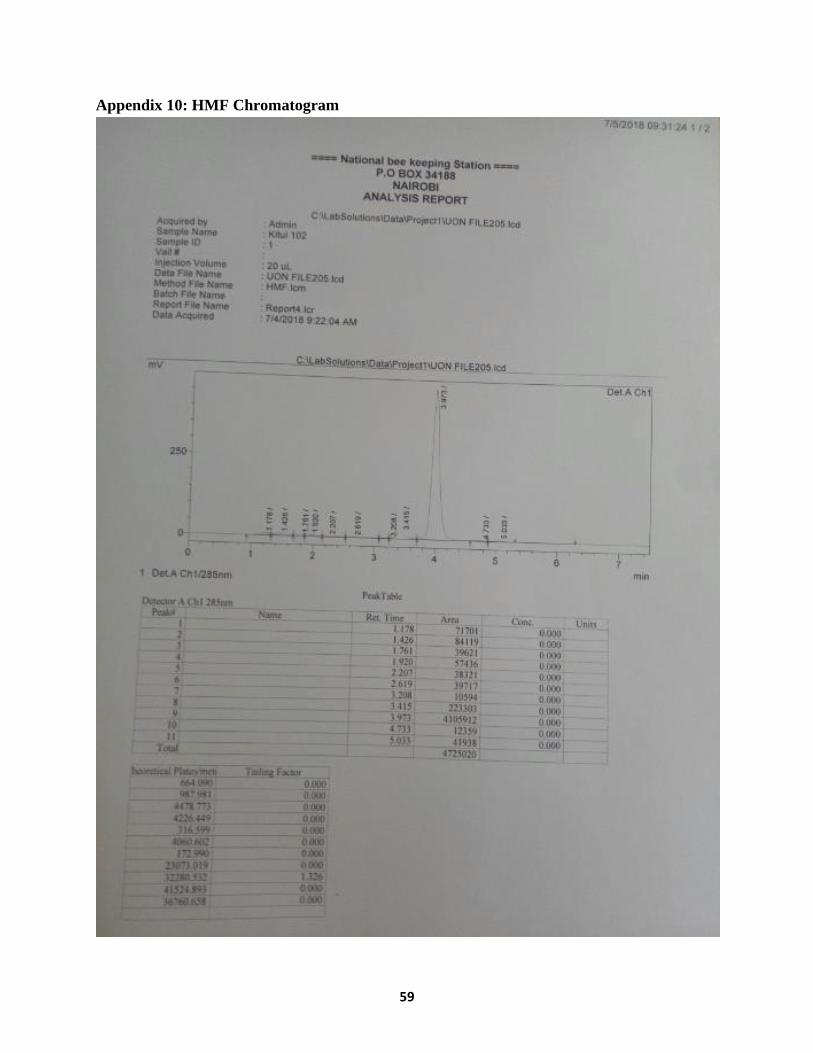
59
Appendix 10: HMF Chromatogram
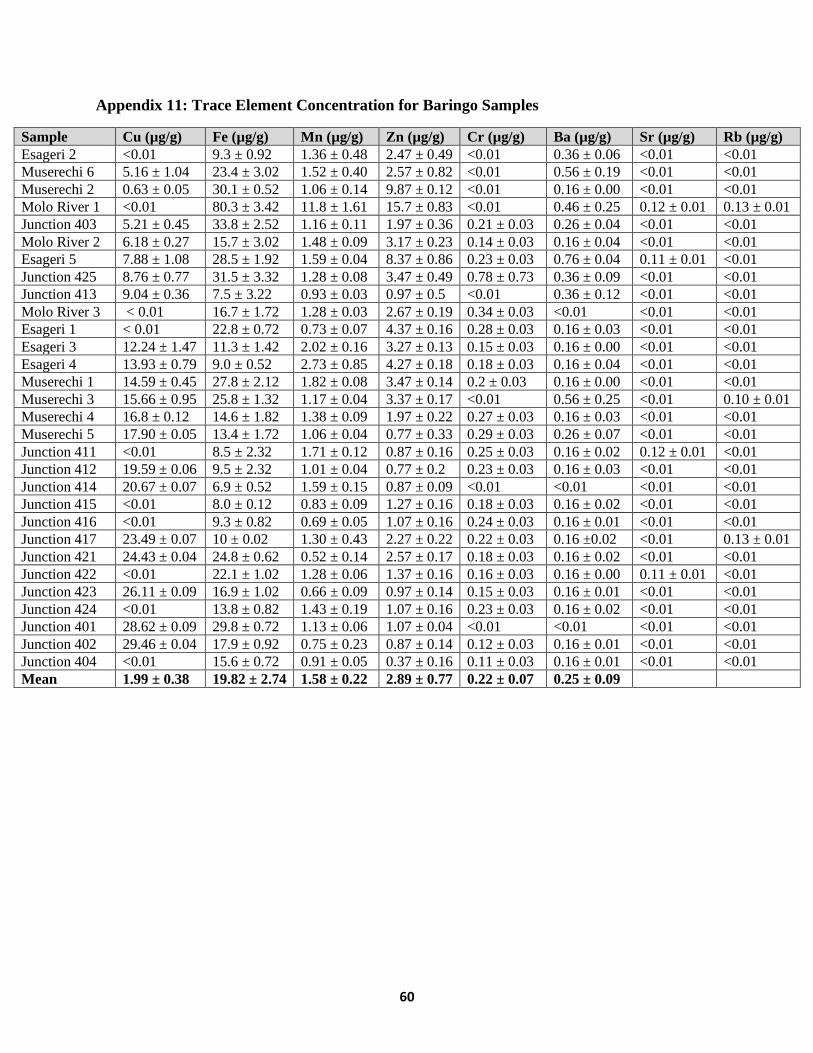
60
Appendix 11: Trace Element Concentration for Baringo Samples
Sample Cu (µg/g) Fe (µg/g) Mn (µg/g) Zn (µg/g) Cr (µg/g) Ba (µg/g) Sr (µg/g) Rb (µg/g)
Esageri 2 <0.01 9.3 ± 0.92 1.36 ± 0.48 2.47 ± 0.49 <0.01 0.36 ± 0.06 <0.01 <0.01
Muserechi 6 5.16 ± 1.04 23.4 ± 3.02 1.52 ± 0.40 2.57 ± 0.82 <0.01 0.56 ± 0.19 <0.01 <0.01
Muserechi 2 0.63 ± 0.05 30.1 ± 0.52 1.06 ± 0.14 9.87 ± 0.12 <0.01 0.16 ± 0.00 <0.01 <0.01
Molo River 1 <0.01 80.3 ± 3.42 11.8 ± 1.61 15.7 ± 0.83 <0.01 0.46 ± 0.25 0.12 ± 0.01 0.13 ± 0.01
Junction 403 5.21 ± 0.45 33.8 ± 2.52 1.16 ± 0.11 1.97 ± 0.36 0.21 ± 0.03 0.26 ± 0.04 <0.01 <0.01
Molo River 2 6.18 ± 0.27 15.7 ± 3.02 1.48 ± 0.09 3.17 ± 0.23 0.14 ± 0.03 0.16 ± 0.04 <0.01 <0.01
Esageri 5 7.88 ± 1.08 28.5 ± 1.92 1.59 ± 0.04 8.37 ± 0.86 0.23 ± 0.03 0.76 ± 0.04 0.11 ± 0.01 <0.01
Junction 425 8.76 ± 0.77 31.5 ± 3.32 1.28 ± 0.08 3.47 ± 0.49 0.78 ± 0.73 0.36 ± 0.09 <0.01 <0.01
Junction 413 9.04 ± 0.36 7.5 ± 3.22 0.93 ± 0.03 0.97 ± 0.5 <0.01 0.36 ± 0.12 <0.01 <0.01
Molo River 3 < 0.01 16.7 ± 1.72 1.28 ± 0.03 2.67 ± 0.19 0.34 ± 0.03 <0.01 <0.01 <0.01
Esageri 1 < 0.01 22.8 ± 0.72 0.73 ± 0.07 4.37 ± 0.16 0.28 ± 0.03 0.16 ± 0.03 <0.01 <0.01
Esageri 3 12.24 ± 1.47 11.3 ± 1.42 2.02 ± 0.16 3.27 ± 0.13 0.15 ± 0.03 0.16 ± 0.00 <0.01 <0.01
Esageri 4 13.93 ± 0.79 9.0 ± 0.52 2.73 ± 0.85 4.27 ± 0.18 0.18 ± 0.03 0.16 ± 0.04 <0.01 <0.01
Muserechi 1 14.59 ± 0.45 27.8 ± 2.12 1.82 ± 0.08 3.47 ± 0.14 0.2 ± 0.03 0.16 ± 0.00 <0.01 <0.01
Muserechi 3 15.66 ± 0.95 25.8 ± 1.32 1.17 ± 0.04 3.37 ± 0.17 <0.01 0.56 ± 0.25 <0.01 0.10 ± 0.01
Muserechi 4 16.8 ± 0.12 14.6 ± 1.82 1.38 ± 0.09 1.97 ± 0.22 0.27 ± 0.03 0.16 ± 0.03 <0.01 <0.01
Muserechi 5 17.90 ± 0.05 13.4 ± 1.72 1.06 ± 0.04 0.77 ± 0.33 0.29 ± 0.03 0.26 ± 0.07 <0.01 <0.01
Junction 411 <0.01 8.5 ± 2.32 1.71 ± 0.12 0.87 ± 0.16 0.25 ± 0.03 0.16 ± 0.02 0.12 ± 0.01 <0.01
Junction 412 19.59 ± 0.06 9.5 ± 2.32 1.01 ± 0.04 0.77 ± 0.2 0.23 ± 0.03 0.16 ± 0.03 <0.01 <0.01
Junction 414 20.67 ± 0.07 6.9 ± 0.52 1.59 ± 0.15 0.87 ± 0.09 <0.01 <0.01 <0.01 <0.01
Junction 415 <0.01 8.0 ± 0.12 0.83 ± 0.09 1.27 ± 0.16 0.18 ± 0.03 0.16 ± 0.02 <0.01 <0.01
Junction 416 <0.01 9.3 ± 0.82 0.69 ± 0.05 1.07 ± 0.16 0.24 ± 0.03 0.16 ± 0.01 <0.01 <0.01
Junction 417 23.49 ± 0.07 10 ± 0.02 1.30 ± 0.43 2.27 ± 0.22 0.22 ± 0.03 0.16 ±0.02 <0.01 0.13 ± 0.01
Junction 421 24.43 ± 0.04 24.8 ± 0.62 0.52 ± 0.14 2.57 ± 0.17 0.18 ± 0.03 0.16 ± 0.02 <0.01 <0.01
Junction 422 <0.01 22.1 ± 1.02 1.28 ± 0.06 1.37 ± 0.16 0.16 ± 0.03 0.16 ± 0.00 0.11 ± 0.01 <0.01
Junction 423 26.11 ± 0.09 16.9 ± 1.02 0.66 ± 0.09 0.97 ± 0.14 0.15 ± 0.03 0.16 ± 0.01 <0.01 <0.01
Junction 424 <0.01 13.8 ± 0.82 1.43 ± 0.19 1.07 ± 0.16 0.23 ± 0.03 0.16 ± 0.02 <0.01 <0.01
Junction 401 28.62 ± 0.09 29.8 ± 0.72 1.13 ± 0.06 1.07 ± 0.04 <0.01 <0.01 <0.01 <0.01
Junction 402 29.46 ± 0.04 17.9 ± 0.92 0.75 ± 0.23 0.87 ± 0.14 0.12 ± 0.03 0.16 ± 0.01 <0.01 <0.01
Junction 404 <0.01 15.6 ± 0.72 0.91 ± 0.05 0.37 ± 0.16 0.11 ± 0.03 0.16 ± 0.01 <0.01 <0.01
Mean 1.99 ± 0.38 19.82 ± 2.74 1.58 ± 0.22 2.89 ± 0.77 0.22 ± 0.07 0.25 ± 0.09
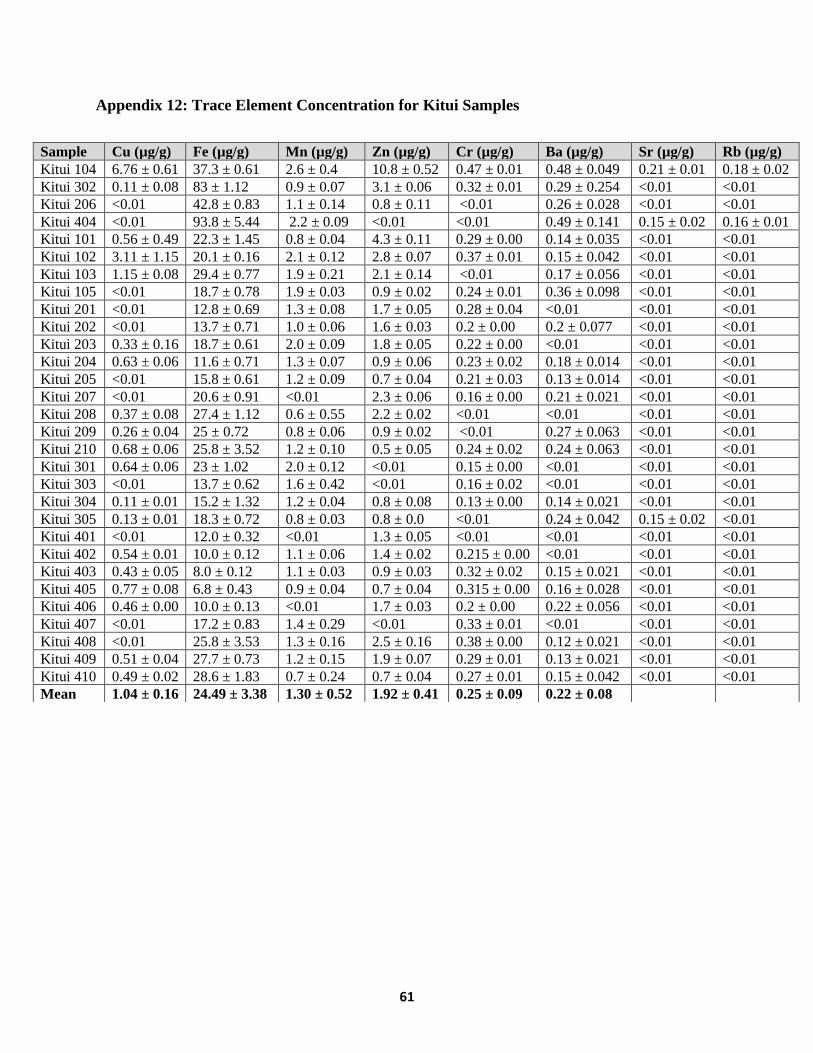
61
Appendix 12: Trace Element Concentration for Kitui Samples
Sample Cu (µg/g) Fe (µg/g) Mn (µg/g) Zn (µg/g) Cr (µg/g) Ba (µg/g) Sr (µg/g) Rb (µg/g)
Kitui 104 6.76 ± 0.61 37.3 ± 0.61 2.6 ± 0.4 10.8 ± 0.52 0.47 ± 0.01 0.48 ± 0.049 0.21 ± 0.01 0.18 ± 0.02
Kitui 302 0.11 ± 0.08 83 ± 1.12 0.9 ± 0.07 3.1 ± 0.06 0.32 ± 0.01 0.29 ± 0.254 <0.01 <0.01
Kitui 206 <0.01 42.8 ± 0.83 1.1 ± 0.14 0.8 ± 0.11 <0.01 0.26 ± 0.028 <0.01 <0.01
Kitui 404 <0.01 93.8 ± 5.44 2.2 ± 0.09 <0.01 <0.01 0.49 ± 0.141 0.15 ± 0.02 0.16 ± 0.01
Kitui 101 0.56 ± 0.49 22.3 ± 1.45 0.8 ± 0.04 4.3 ± 0.11 0.29 ± 0.00 0.14 ± 0.035 <0.01 <0.01
Kitui 102 3.11 ± 1.15 20.1 ± 0.16 2.1 ± 0.12 2.8 ± 0.07 0.37 ± 0.01 0.15 ± 0.042 <0.01 <0.01
Kitui 103 1.15 ± 0.08 29.4 ± 0.77 1.9 ± 0.21 2.1 ± 0.14 <0.01 0.17 ± 0.056 <0.01 <0.01
Kitui 105 <0.01 18.7 ± 0.78 1.9 ± 0.03 0.9 ± 0.02 0.24 ± 0.01 0.36 ± 0.098 <0.01 <0.01
Kitui 201 <0.01 12.8 ± 0.69 1.3 ± 0.08 1.7 ± 0.05 0.28 ± 0.04 <0.01 <0.01 <0.01
Kitui 202 <0.01 13.7 ± 0.71 1.0 ± 0.06 1.6 ± 0.03 0.2 ± 0.00 0.2 ± 0.077 <0.01 <0.01
Kitui 203 0.33 ± 0.16 18.7 ± 0.61 2.0 ± 0.09 1.8 ± 0.05 0.22 ± 0.00 <0.01 <0.01 <0.01
Kitui 204 0.63 ± 0.06 11.6 ± 0.71 1.3 ± 0.07 0.9 ± 0.06 0.23 ± 0.02 0.18 ± 0.014 <0.01 <0.01
Kitui 205 <0.01 15.8 ± 0.61 1.2 ± 0.09 0.7 ± 0.04 0.21 ± 0.03 0.13 ± 0.014 <0.01 <0.01
Kitui 207 <0.01 20.6 ± 0.91 <0.01 2.3 ± 0.06 0.16 ± 0.00 0.21 ± 0.021 <0.01 <0.01
Kitui 208 0.37 ± 0.08 27.4 ± 1.12 0.6 ± 0.55 2.2 ± 0.02 <0.01 <0.01 <0.01 <0.01
Kitui 209 0.26 ± 0.04 25 ± 0.72 0.8 ± 0.06 0.9 ± 0.02 <0.01 0.27 ± 0.063 <0.01 <0.01
Kitui 210 0.68 ± 0.06 25.8 ± 3.52 1.2 ± 0.10 0.5 ± 0.05 0.24 ± 0.02 0.24 ± 0.063 <0.01 <0.01
Kitui 301 0.64 ± 0.06 23 ± 1.02 2.0 ± 0.12 <0.01 0.15 ± 0.00 <0.01 <0.01 <0.01
Kitui 303 <0.01 13.7 ± 0.62 1.6 ± 0.42 <0.01 0.16 ± 0.02 <0.01 <0.01 <0.01
Kitui 304 0.11 ± 0.01 15.2 ± 1.32 1.2 ± 0.04 0.8 ± 0.08 0.13 ± 0.00 0.14 ± 0.021 <0.01 <0.01
Kitui 305 0.13 ± 0.01 18.3 ± 0.72 0.8 ± 0.03 0.8 ± 0.0 <0.01 0.24 ± 0.042 0.15 ± 0.02 <0.01
Kitui 401 <0.01 12.0 ± 0.32 <0.01 1.3 ± 0.05 <0.01 <0.01 <0.01 <0.01
Kitui 402 0.54 ± 0.01 10.0 ± 0.12 1.1 ± 0.06 1.4 ± 0.02 0.215 ± 0.00 <0.01 <0.01 <0.01
Kitui 403 0.43 ± 0.05 8.0 ± 0.12 1.1 ± 0.03 0.9 ± 0.03 0.32 ± 0.02 0.15 ± 0.021 <0.01 <0.01
Kitui 405 0.77 ± 0.08 6.8 ± 0.43 0.9 ± 0.04 0.7 ± 0.04 0.315 ± 0.00 0.16 ± 0.028 <0.01 <0.01
Kitui 406 0.46 ± 0.00 10.0 ± 0.13 <0.01 1.7 ± 0.03 0.2 ± 0.00 0.22 ± 0.056 <0.01 <0.01
Kitui 407 <0.01 17.2 ± 0.83 1.4 ± 0.29 <0.01 0.33 ± 0.01 <0.01 <0.01 <0.01
Kitui 408 <0.01 25.8 ± 3.53 1.3 ± 0.16 2.5 ± 0.16 0.38 ± 0.00 0.12 ± 0.021 <0.01 <0.01
Kitui 409 0.51 ± 0.04 27.7 ± 0.73 1.2 ± 0.15 1.9 ± 0.07 0.29 ± 0.01 0.13 ± 0.021 <0.01 <0.01
Kitui 410 0.49 ± 0.02 28.6 ± 1.83 0.7 ± 0.24 0.7 ± 0.04 0.27 ± 0.01 0.15 ± 0.042 <0.01 <0.01
Mean 1.04 ± 0.16 24.49 ± 3.38 1.30 ± 0.52 1.92 ± 0.41 0.25 ± 0.09 0.22 ± 0.08


