Embed Size (px)
Citation preview

Physics aspects of safety assurance
in high dose rate brachytherapy:
quality control testing and
implementation of dosimetry audit
by
Antony Lee Palmer
Submitted for the degree of Doctor of Philosophy in Physics
Department of Physics University of Surrey January 2015 ©Antony Lee Palmer 2015

ii

i
Contents
Abstract vii
Acknowledgments ix
List of Figures xi
List of Tables xv
List of Abbreviations xvii
CHAPTER 1 Introduction and Overview
1.1 Introduction 2
1.1.1 Brachytherapy 2
1.1.2 Requirements for Accuracy of Dose Delivery 2
1.1.3 Quality Control, Dosimetry Audits and Treatment Errors 3
1.2 Research Questions and Objectives 4
1.3 Summary of Thesis 5
1.4 List of Publications and Presentations Arising from this Work 7
1.4.1 Quality Control and Accuracy of Brachytherapy 7
1.4.2 Dosimeters for Brachytherapy Audit 8
1.4.3 Radiochromic Film Methodology 8
1.4.4 Brachytherapy Audit 9
1.4.5 Monte Carlo Calculations 10
1.4.6 Miscellaneous Publications Relating to PhD Work 10
CHAPTER 2 Theory
2.1 High Dose Rate (HDR) Brachytherapy Equipment 12
2.2 HDR Brachytherapy Dose Distribution Measurement 12
2.2.1 Review of Contemporary Dosimetry Systems for Brachytherapy 13
2.2.2 Optical Fibre Dosimetry 15
2.2.3 Radiochromic Film Dosimetry 15
2.2.4 Radiochromic Plastic Dosimetry 17

ii
2.3 Brachytherapy Audit 17
2.3.1 Definition of Audit and the Need for Dosimetric Audit in Radiotherapy 17
2.3.2 The Need for Dosimetric Audit in Brachytherapy 19
2.4 Monte Carlo MCNP5 Simulation 20
2.4.1 The Monte Carlo Method 20
2.4.2 MCNP5 Applied to Brachytherapy 20
2.4.3 MCNP5 Input and Output Files 21
CHAPTER 3 Quality Control of High Dose Rate (HDR) Brachytherapy
Treatment Equipment
3.1 The Need to Review Quality Control and Commissioning Procedures
and Establish Performance Requirements 24
3.1.1 Quality Control Testing of HDR Brachytherapy Systems 24
3.1.2 Commissioning of HDR Brachytherapy Systems 25
3.1.3 Performance Requirements: Effect of Simulated Source Position Errors 26
3.2 Methodology 26
3.2.1 Survey of Quality Control Practices in the United Kingdom (UK) 26
3.2.2 HDR Treatment Unit Commissioning Tests, Dwell Position and Transit Dose 26
3.2.3 Treatment Planning Study to Determine the Effect of Simulated Source Position Errors 28
3.3 Results 28
3.3.1 UK Survey: Brachytherapy Equipment Profile and Physics Processes 28
3.3.2 UK Survey: Quality Control Testing 32
3.3.3 Commissioning and QC of HDR Treatment Units 33
3.3.3.1 Source Movement Profile 44
3.3.3.2 Transit Dosimetry 45
3.3.3.3 Dwell Position Accuracy with Transfer Tube Curvature 48
3.3.4 Treatment Planning Study of Simulated Source Position Errors 49
3.4 Discussion and Conclusions 54
3.4.1 UK Survey 54
3.4.2 Treatment Unit Commissioning and QC: Dwell Position Accuracy and Transit Dose 55
3.4.3 Equipment Performance Requirements 55
3.4.4 Future Directions for Quality Control Testing of HDR Brachytherapy 56

iii
CHAPTER 4 Candidate Dosimeters for Brachytherapy Applicator
Dosimetry Audit
4.1 Requirements of Dosimetry Systems for Brachytherapy Audit 60
4.2 Methodology 61
4.2.1 Dosimetry Systems 61
4.2.1.1 Doped Silica Glass Optical Fibres 61
4.2.1.2 Radiochromic Film 62
4.2.1.3 Solid Radiochromic Polymer 63
4.2.2 Test Objects and Irradiation Conditions 63
4.3 Results 65
4.3.1 Initial Processing and Calibration of Dosimeters 65
4.3.2 Isolated Source Radial Dose Measurements 66
4.3.3 Dose Distribution Measurements for Multi-Dwell Treatment Plans 68
4.3.4 Uncertainty Analysis 71
4.4 Discussion and Conclusions 73
4.4.1 Doped Silica Glass Optical Fibres 73
4.4.2 Radiochromic Film 74
4.4.3 Solid Radiochromic Polymer 74
4.4.4 Dosimetric and Practical Considerations for Dosimetry System Choice 75
4.4.5 Selection of Dosimeter 76
CHAPTER 5 Development of Radiochromic Film Dosimetry for
Brachytherapy Audit
5.1 Objectives for the Development and Evaluation of Film Dosimetry for
Brachytherapy 78
5.2 Methodology 80
5.2.1 Film Dosimetry Equipment, Calibration and Scanning 80
5.2.2 Investigation of Film Dosimetry Performance Parameters
and Evaluation of Triple-Channel Dosimetry 83
5.2.3 Validation of Film Dosimetry Response to HDR Brachytherapy Sources 87
5.3 Results 87
5.3.1 Film Calibration, Scanning and Processing 87

iv
5.3.2 Calibration Function Linear-Scaling 90
5.3.3 Post-Irradiation Film Darkening 91
5.3.4 Lateral Position of Film on Scanner 92
5.3.5 Film Surface Perturbation 95
5.3.6 Film Active Layer Thickness 96
5.3.7 The Effect of Film Curvature at Scanning 96
5.3.8 Film Measurement and Validation of Radial Dose from an Ir-192 HDR
Brachytherapy Source 100
5.3.9 Film Measurement and Validation of Radial Dose from a Co-60 HDR
Brachytherapy Source 100
5.4 Discussion and Conclusions 103
5.4.1 Dosimeter Performance Characteristics 103
5.4.2 Use of Radiochromic Film Dosimetry for Brachytherapy Dosimetric Audit 105
CHAPTER 6 Development of an ‘End to End’ Brachytherapy Dosimetric
Audit using Radiochromic Film
6.1 Review and Evaluation of Previous Brachytherapy Dosimetric Audits 108
6.2 Objectives for a Dosimetric Audit in Brachytherapy 109
6.3 Methodology 112
6.3.1 Design of an Audit Phantom 112
6.3.2 ‘End to End’ Audit Procedure Development 113
6.3.3 Sensitivity to Simulated Errors 113
6.4 Results 113
6.4.1 BRachytherapy Applicator Dosimetry (BRAD) Phantom Design 113
6.4.2 ‘End to End’ Audit Procedure 116
6.4.3 Film Dosimetry and Data Analysis Procedure 119
6.4.4 Sensitivity to Simulated Errors 121
6.4.5 BRAD Audit Uncertainty Budget 121
6.5 Discussion and Conclusions 123

v
CHAPTER 7 Monte Carlo Simulations for the Brachytherapy Film
Dosimetry Audit
7.1 Objectives for MCNP5 Simulations 128
7.2 Methodology 128
7.2.1 MCNP5 Input Files 128
7.2.2 MCNP5 Validation of Implementation 130
7.2.3 Phantom Scatter: Spherical Scatter Volume with Point Source 131
7.2.4 Effect of the Presence of EBT3 Film on Measured Dose 133
7.2.5 Applicator Attenuation 134
7.3 Results 136
7.3.1 Validation 136
7.3.2 Phantom Scatter 137
7.3.3 Film Dosimetry Dose Perturbation 137
7.3.4 Applicator Attenuation 141
7.4 Conclusions and Discussion 142
CHAPTER 8 ‘End to End’ Audit of Clinical Brachytherapy Dosimetry
in the United Kingdom
8.1 Objectives for the UK Brachytherapy Audit 144
8.2 Methodology 144
8.2.1 Establishment of a Working Party of the Institute of Physics and Engineering in
Medicine (IPEM) 144
8.2.2 Brachytherapy Applicator Dosimetry ‘End to End’ Audit Methodology 144
8.2.3 Data Analysis 145
8.2.4 Schedule of Audits 146
8.3 Results 147
8.3.1 Point A Dose Measurement for Cervix Treatment Applicators 147
8.3.2 Dose Distribution Measurement for Cervix Treatment Applicators 151
8.3.3 Review of Physics Procedures for HDR Brachytherapy Treatment 154
8.3.4 Results Requiring Further Investigation 156
8.3.4.1 Library Applicator Misalignment 156
8.3.4.2 Prescription Dose Error 158
8.3.5 Feedback from Audited Centres 159
8.4 Discussion and Conclusions 161

vi
CHAPTER 9 Summary Conclusions and Future Work
9.1 Summary Conclusions 166
9.1.1 Quality Control of HDR Brachytherapy Equipment 166
9.1.1.1 UK Survey and Analysis 166
9.1.1.2 Development of QC and Commissioning Tests and Performance Requirements 166
9.1.2 HDR Brachytherapy Audit Dosimetry 167
9.1.2.1 Evaluation of Dosimeters 167
9.1.2.2 Optimisation of Radiochromic Film Dosimetry 168
9.1.3 ‘End to End’ Audit of Brachytherapy Dosimetry 169
9.1.3.1 Design of an Audit Phantom and Audit Methodology 169
9.1.3.2 Monte Carlo Simulations 169
9.1.3.3 UK Audit 170
9.2 Future Work 171
9.2.1 Quality Control and Commissioning Testing for HDR Brachytherapy 171
9.2.2 Brachytherapy Film Dosimetry Development 172
9.2.3 Brachytherapy Dosimetric Audit 172
9.2.3.1 Development of the BRAD System for ‘End to End’ Dosimetry Audit 172
9.2.3.2 Future Directions for Audit 173
References
Reference list 176
Appendices
A. Abstracts of Peer Reviewed Journal Papers Resulting from this Research 192
B. Abstracts of Conference Presentations and Posters Resulting from this Research 197
C. Risk Assessment for Brachytherapy Dosimetric Audit with the BRAD Phantom 203
D. Protocol for Brachytherapy Dosimetric Audit with the BRAD Phantom 204
E. BRAD Phantom Availability in IPEM Virtual Equipment Library (Internet site) 211
F. MCNP5 Input File for Validation Test 212
G. MCNP5 Input File for Phantom Scatter Evaluation 216
H. MCNP5 Input File for the Effect of the Presence of EBT3 Film on Measured Dose 217
I. MCNP5 Input File for the Evaluation of Treatment Applicator Attenuation 219
J. Questionnaire Used for the Survey of HDR/PDR Quality Control Practice in the UK 221

vii
Abstract
This work is concerned with physics-aspects of safety, quality control (QC) and
dosimetry audit in high dose rate (HDR) gynaecological brachytherapy. A survey of
brachytherapy QC practice across the UK was conducted. Areas of least consistency were
addressed, including test method development and establishment of clinical performance
requirements. ‘End to end’ dosimetry auditing was not being utilised and its implementation
was the main focus of this work. Three candidate dosimeters were evaluated for use in audit:
Fibre optic thermoluminescence detector, Gafchromic EBT3® radiochromic film, and
Presage® radiochromic plastic. Film dosimetry was selected, fully characterised, triple-
channel dosimetry evaluated, and uncertainty reduction methods implemented.
A novel ‘end to end’ audit methodology was developed, the BRachytherapy
Applicator Dosimetry (BRAD) system, to measure dose distributions around clinical
brachytherapy applicators and compare to treatment planning system calculations. MCNP5
Monte Carlo code was used to support the design of the BRAD system and validate the use
of film dosimetry. 46 radiotherapy centres in the UK were audited. Delivery of the intended
prescription dose was confirmed to be within clinically acceptable levels at all centres, mean
difference 0.6% for plastic and 3.0% for metal applicators (±3.0% k=1). The intended dose
distribution was faithfully delivered to the film-measured dose planes with a mean gamma
passing rate of 97.8% at 3% (local) 2 mm criteria. Two audits had results that required follow-
up and both were resolved. Each audit included a review of local brachytherapy physics
practice and opportunities for improvement were reported, including imaging, applicator
reconstruction, planning procedures, QC tests, and staff training.
The brachytherapy audit provided the first comprehensive validation of ‘end to
end’ clinical brachytherapy dosimetry, from applicator imaging to treatment delivery,
combined with a review of clinical physics practice. The BRAD system is retained in the
Institute of Physics and Engineering in Medicine (IPEM) phantom library.

viii
Statement of originality
This thesis and the work to which it refers are the results of my own efforts. Any ideas, data, images or text resulting from the work of others
(whether published or unpublished) are fully identified as such within the work and attributed to their originator in the text, bibliography or in
footnotes. This thesis has not been submitted in whole or in part for any other academic degree or professional qualification. I agree that the
University has the right to submit my work to the plagiarism detection service TurnitinUK for originality checks. Whether or not drafts have been
so-assessed, the University reserves the right to require an electronic version of the final document (as submitted) for assessment as above.
© Antony Lee Palmer 2015

ix
Acknowledgments
I would like to thank the following…
My PhD supervisors, Andy Nisbet and David Bradley, for their guidance, encouragement,
scientific knowledge, wealth of experience, and allowing me the freedom to pursue my
interests.
Chris Lee and Ailsa Ratcliffe for discussions of brachytherapy physics and audit phantoms.
Patty Diez for helping me organise audits at 46 radiotherapy centres.
Andre Micke for assistance with film dosimetry from the manufacturer’s perspective.
Laura Gandon, Andrea Wynn-Jones and Peter Bownes, for expertly performing several audits
for me.
Neda Shiravand for many reference film dosimetry exposures while I was auditing.
The staff at all of the audited radiotherapy centres, for their hospitality and interest in my
work.
Edwin Aird, Margaret Bidmead, Peter Bownes, and Gerry Lowe, for informal discussions of
brachytherapy and audit.
Simon Doran for assistance with radiochromic plastic dosimetry.
My two MSc students at the University of Surrey, Poppy Di Pietro and Sheaka Alobaidli, for
their work on radiochromic plastic dosimetry and optical fibre dosimetry, respectively.
Sarah Muscat and John Kearton for covering my ‘day job’ while I was out auditing, and
everyone at the Portsmouth Medical Physics Department for support.
Funding from: NHS Health Education Wessex for PhD fees and backfill; from IPEM, UK, for
costs of audit phantom construction and travel expenses to conduct the audits; from Ashland
ISP Inc., USA, for supply of radiochromic film for research and audits; from Eckert & Ziegler
Bebig GmbH, Germany, Ashland ISP Inc., USA, and University of Surrey, for sponsorship of
conference attendances; and from Portsmouth Hospitals NHS Trust for various expenses.
I would particularly like to thank my wife, Sam, for her encouragement and love, my
wonderful daughter, Erin, for welcome distractions from the thesis, my mother, Fay, father,
Terry, and brother, Andy, for their love and support. Finally, my late grandad, Fred, for views
through his old telescope, cherished earliest memories that sparked my wonder of science.

x

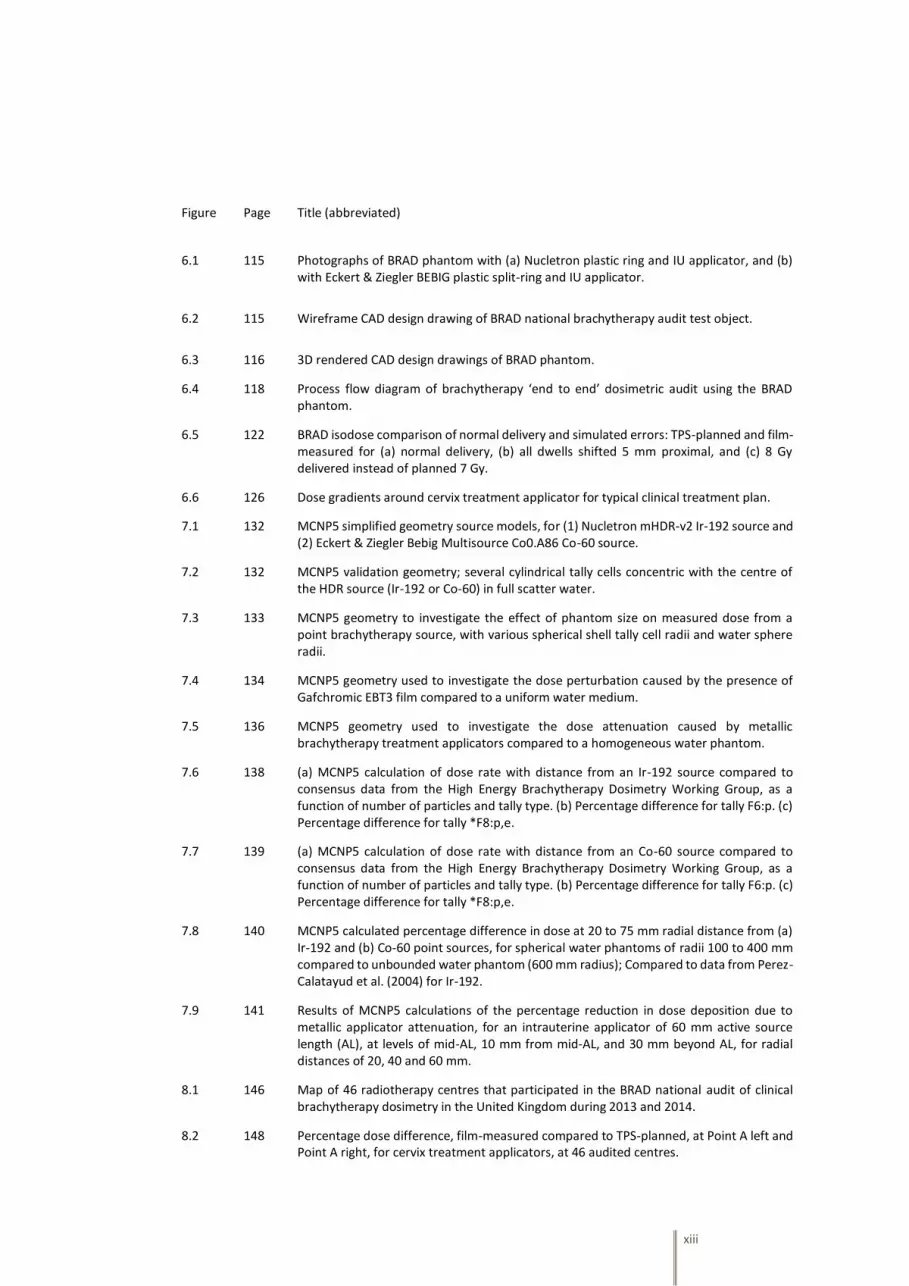
xi
List of Figures
Figure
Page
Title (abbreviated)
2.1 13 HDR brachytherapy physics processes with dosimetric tools that have been applied to measure dose, accuracy and uncertainty, as reported in recent literature.
3.1 27 Transit dose calculation points, D10 and D20, at 10 mm and 20 mm respectively, perpendicular distance from the centre of the intended dwell position.
3.2 46 Position and speed of source during transit from first to second dwell positions, from a series of three dwells at 10.0, 15.0 and 20.0 mm, with new control software.
3.3 46 Position and speed of source during transit from the EZ BEBIG Multisource® on approach to the first dwell position at 10.0 mm, with (a) the new control software and (b) the old control software.
3.4 49 Autoradiographs of actual source dwell positions compared to planned positions (vertical lines) as a function of curvature of the transfer tube.
3.5 51 3D projection illustration of the treatment applicator guide tubes (red), the clinical target volume (orange), the 100% isodose surface (purple) the bladder (green), rectum (yellow) and sigmoid (blue).
3.6 52 The effect on a typical cervix plan isodose distribution of simulated error dwell position shifts in (a) sagittal and (b) coronal projections.
3.7 53 Effect on DVH curves for a typical cervix patient plan for HR-CTV and OARs of simulated dwell position errors of 1, 2, 5 and 10 mm proximal shift.
3.8 53 Effect of systematic proximal dwell position shifts, 0.2 to 6.0 mm, on clinical DVH treatment plan quality parameters.
4.1 64 Schematic diagram of Solid Water test object, shown with (a) lower slab containing one catheter and upper slab with optical fibre cavities, and (b) lower slab with three catheters and upper slab holding radiochromic film.
4.2 64 Measurement of radial dose from a single HDR source, within a plastic catheter, using EBT3 film, secured in a Perspex frame within a full scatter water tank
4.3 65 Presage sample machined with three cavities each containing an HDR brachytherapy catheter for a typical cervix treatment dose distribution irradiation.
4.4 66 TL yield from Ge-doped optical fibres as a function of radial distance from the centre of a Co-60 HDR source, compared to Monte Carlo data.
4.5 67 Dose as function of radial distance from the centre of a Co-60 HDR source measured with EBT3 Gafchromic film, with comparison to Monte Carlo source data.
4.6 68 Presage signal as a function of radial distance from the centre of a Co-60 HDR source, with comparison to Monte Carlo source data.
4.7 69 TL yield from Ge-doped optical fibres as a function of distance across an HDR dose distribution, compared to treatment planning system (TPS) calculation.
4.8 70 Dose measured with EBT3 Gafchromic film as a function of distance across an HDR dose distribution, compared to treatment planning system (TPS) calculation.
4.9 71 Dose measured with Presage as a function of distance across and HDR dose distribution, compared to treatment planning system (TPS) calculation.

xii
Figure
Page
Title (abbreviated)
5.1 82 Arrangement of calibration and test films on flatbed scanner for simultaneous scanning.
5.2 85 Process of delamination and restacking to produce a double-thickness active layer.
5.3 85 Photograph showing natural curvature of a 10 x 10 cm Gafchromic EBT3 film placed on a flatbed scanner glass plate.
5.4 89 Eight Gafchromic EBT3 film calibration strips, irradiated to doses in the range 0 to 16 Gy and scanned 48 hour post exposure.
5.5 89 Gafchromic EBT3 calibration curves, in red, green and blue colour channels (16 bit), for two film batches, scanned 48 hour post exposure, with rational (linear) dose fit equations.
5.6 90 Isodose overlay of two scans, taken 10 minutes apart (thick and thin lines), of the same EBT3 film piece that had previously been exposed by a typical brachytherapy dose distribution, with and without a non-reflective matt at scanning.
5.7 92 EBT3 film net optical density (as a ratio to a simultaneously scanned reference density sample) as a function of time post-irradiation, up to three months (2277 hrs), over a dose range 0 to 14 Gy.
5.8 93 Change in film dose as a function of lateral distance on scanner, using single-channel (red lines) and triple-channel (green lines) film dosimetry, over range 1 to 14 Gy.
5.9 94 Comparison of film-measured (thick lines) and treatment planning system-calculated (thin lines) dose distributions from a typical brachytherapy cervix applicator, with (a) single (red)-channel dosimetry and (b) triple-channel dosimetry.
5.10 95 Effect of film surface perturbation (grease and scratches) on calculated film dose using single-channel and triple-channel dosimetry.
5.11 97 EBT3 film measured and treatment planning system calculated isodose distributions from a typical cervix brachytherapy treatment delivery, with (a) film naturally curved on scanner glass plate and (b) with the film flat on the scanner plate, compressed under glass.
5.12 98 Normalised film dose profiles using single (red)-channel dosimetry across a single EBT3 film irradiated by a 6 MV linac beam, with the film in various flat or curved positions.
5.13 98 Normalised film dose profiles using triple-channel dosimetry across a single EBT3 film irradiated by a 6 MV linac beam, with the film in various flat or curved positions.
5.14 99 Film dose profiles using red and green single-channel dosimetry across an EBT3 film exposed to three dose level regions, with the film flat in contact with the scanner glass plate and with the film raised uniformly by 5 mm.
5.15 101 Normalised dose as a function of radial distance from a Nucletron mHDR-v2 Ir-192 brachytherapy source; EBT3 measured compared to HEBD consensus data.
5.16 101 EBT3-film measured dose with radial distance from an Ir-192 source, at three different dose levels (irradiation times) compared to treatment planning system (TPS) calculated dose.
5.17 102 Normalised dose as a function of radial distance from an Eckert & Ziegler Bebig Co0-A86 Co-60 HDR brachytherapy source; EBT3 measured compared to HEBD consensus data.
5.18 102 EBT3-film measured dose with radial distance from a Co-60 source, at three different dose levels (irradiation times) compared to treatment planning system (TPS) calculated dose.
xiii
Figure
Page
Title (abbreviated)
6.1 115 Photographs of BRAD phantom with (a) Nucletron plastic ring and IU applicator, and (b) with Eckert & Ziegler BEBIG plastic split-ring and IU applicator.
6.2 115 Wireframe CAD design drawing of BRAD national brachytherapy audit test object.
6.3 116 3D rendered CAD design drawings of BRAD phantom.
6.4 118 Process flow diagram of brachytherapy ‘end to end’ dosimetric audit using the BRAD phantom.
6.5 122 BRAD isodose comparison of normal delivery and simulated errors: TPS-planned and film-measured for (a) normal delivery, (b) all dwells shifted 5 mm proximal, and (c) 8 Gy delivered instead of planned 7 Gy.
6.6 126 Dose gradients around cervix treatment applicator for typical clinical treatment plan.
7.1 132 MCNP5 simplified geometry source models, for (1) Nucletron mHDR-v2 Ir-192 source and (2) Eckert & Ziegler Bebig Multisource Co0.A86 Co-60 source.
7.2 132 MCNP5 validation geometry; several cylindrical tally cells concentric with the centre of the HDR source (Ir-192 or Co-60) in full scatter water.
7.3 133 MCNP5 geometry to investigate the effect of phantom size on measured dose from a point brachytherapy source, with various spherical shell tally cell radii and water sphere radii.
7.4 134 MCNP5 geometry used to investigate the dose perturbation caused by the presence of Gafchromic EBT3 film compared to a uniform water medium.
7.5 136 MCNP5 geometry used to investigate the dose attenuation caused by metallic brachytherapy treatment applicators compared to a homogeneous water phantom.
7.6 138 (a) MCNP5 calculation of dose rate with distance from an Ir-192 source compared to consensus data from the High Energy Brachytherapy Dosimetry Working Group, as a function of number of particles and tally type. (b) Percentage difference for tally F6:p. (c) Percentage difference for tally *F8:p,e.
7.7 139 (a) MCNP5 calculation of dose rate with distance from an Co-60 source compared to consensus data from the High Energy Brachytherapy Dosimetry Working Group, as a function of number of particles and tally type. (b) Percentage difference for tally F6:p. (c) Percentage difference for tally *F8:p,e.
7.8 140 MCNP5 calculated percentage difference in dose at 20 to 75 mm radial distance from (a) Ir-192 and (b) Co-60 point sources, for spherical water phantoms of radii 100 to 400 mm compared to unbounded water phantom (600 mm radius); Compared to data from Perez-Calatayud et al. (2004) for Ir-192.
7.9 141 Results of MCNP5 calculations of the percentage reduction in dose deposition due to metallic applicator attenuation, for an intrauterine applicator of 60 mm active source length (AL), at levels of mid-AL, 10 mm from mid-AL, and 30 mm beyond AL, for radial distances of 20, 40 and 60 mm.
8.1 146 Map of 46 radiotherapy centres that participated in the BRAD national audit of clinical brachytherapy dosimetry in the United Kingdom during 2013 and 2014.
8.2 148 Percentage dose difference, film-measured compared to TPS-planned, at Point A left and Point A right, for cervix treatment applicators, at 46 audited centres.

xiv
Figure
Page
Title (abbreviated)
8.3 148 Percentage dose difference, film-measured compared to TPS-planned, mean Point A for cervix treatment applicator, by applicator type, at 46 audited centres.
8.4 150 Distance to agreement, film-measured compared to TPS-planned, at Point A left and Point A right, for cervix treatment applicators, at 46 audited centres.
8.5 150 Distance to agreement, film-measured compared to TPS-planned, mean Point A for cervix treatment applicator, by applicator type, at 46 audited centres.
8.6 152 BRAD dose distribution comparison between TPS-calculated and film-measured, isodose lines in the range 0.7 Gy to 16 Gy.
8.7 153 Mean gamma passing rate, at three different criteria, comparing film-measured to TPS-planned 2D dose distributions in four planes around cervix treatment applicators, at 46 audited centres.
8.8 157 BRAD audit isodose comparison between TPS-calculated and film-measured for (a) audit with good agreement, and (b) audit with discrepancy at the distal end of the IU applicator.
8.9 158 BRAD audit with incorrect dose normalisation. Section of plan parameters hard copy from TPS, showing (a) prescription dose of 7 Gy and (b) calculated dose to Point A average 10.2 Gy.
E.1 211 IPEM webpage advertising BRAD phantom in Virtual Phantom Library.

xv
List of Tables
Table
Page
Title (abbreviated)
2.1 14 Dosimeter selection considerations for brachytherapy dose distribution measurement in the context of an external audit
3.1 30 Methods employed, and their popularity, for source strength measurement of HDR & PDR sources at centres in UK.
3.2 30 Methods employed, and their popularity, to independently verify treatment planning system (TPS) calculations at centres in UK.
3.3 31 Primary sources of guidance for establishing QC schedules, and their popularity at centres in UK.
3.4 34 HDR & PDR QC survey: Response to questionnaire on test popularity, measurement frequency and tolerance values.
3.5 40 UK QC survey: Additional tests identified by responding centres as being included in local QC procedures but not included in original survey questionnaire.
3.6 41 QC tests included in all UK centres’ schedules, with comparison to published recommendations.
3.7 42 Comparison of UK practice and published recommendations for two QC tests included in only half of UK centres’ schedules.
3.8 43 Suggested QC tests not included in any UK centres’ schedules (at the time of the UK survey).
3.9 44 Required areas of investigation for HDR brachytherapy system commissioning, or for consideration after re-commissioning following hardware or software update.
3.10 47 Comparison of actual calculated transit dose and Eckert & Ziegler BEBIG Multisource® compensated transit dose, for each dwell position in a series of three dwells, at 10.0, 15.0 and 20.0 mm, evaluated at D10 and D20.
3.11 51 Effect of dwell position shifts, 0.2 to 2.0 mm, on DVH treatment plan metrics, modes (a) and (b) see text.
4.1 72 Uncertainty budget for optical fibre, Gafchromic film, and Presage, for the experimental methodology used in this work, for isolated source radial dose rate measurement.
4.2 75 Dosimetric and practical considerations of the dosimetry system for brachytherapy audit, comparing optical fibre, Gafchromic film, and Presage.
5.1 88 Rational (linear) calibration equation parameters, see text, for two Gafchromic EBT3 film batches (lot a=#01171401, lot b=#12171303), scanned 48 hour post exposure.
5.2 91 Calculated mean film dose from ten test films, at four irradiation dose levels, using different linear-scaling calibration dose references.
5.3 96 Calculated film dose for original and ‘double active layer’ film using single- and triple-channel analysis with Gafchromic EBT3 film in the range 1 to 14 Gy.

xvi
Table
Page
Title (abbreviated)
6.1 110 Summary of published HDR/PDR brachytherapy dosimetric audits.
6.2 124 Uncertainty budget for the experimental determination of the dose difference at Point A between treatment planning system calculated and film-measured dose using the BRAD ‘end to end’ audit system.
7.1 135 Specifications of metallic intrauterine treatment applicators in use during the UK brachytherapy audit, and availability of attenuation correction in manufacturers’ treatment planning systems.
7.2 137 Results of MCNP5 calculation comparing dose deposition to a water cell of dimensions equivalent to EBT3 film active layer, with and without a 15 mm width film between the source and tally cell, for Ir-192 and Co-60.
8.1 149 p-values and statistical significance of unpaired two-tailed t-test comparing dose difference at Point A (film-measured to TPS-planned) for various grouped data from the 46 audits.
8.2 153 Mean and standard deviation (sd) gamma passing rate, at three different criteria, for 46 audited centres.
C.1 203 Risk assessment for BRAD audit.

xvii
List of Abbreviations
Abbreviation
Meaning
2D Two dimensional
3D Three dimensional
AAPM American Association of Physicists in Medicine
ABS American Brachytherapy Society
ASTRO American Society for Radiation Oncology
BRAD Brachytherapy Applicator Dosimetry
BRAPHYQS Brachytherapy Physics Quality Assurance System Working Group of ESTRO
CAD Computer aided design
CT Computed tomography (imaging)
D90 Minimum dose delivered to 90% of the volume
D2cc Highest dose to 2 cm3 of the volume
DH Department of Health, UK
DICOM Digital imaging and communications in medicine (standard)
DTA Distance to agreement
DVH Dose volume histogram
ESTRO European Society for Radiotherapy and Oncology
EQUAL ESTRO quality assurance network
GEC-ESTRO Gynaecological ESTRO Working Group
HDR High dose rate
HEBD High Energy Brachytherapy Source Dosimetry Working Group of AAPM and ESTRO
HR-CTV High risk clinical target volume
HSE Health and Safety Executive, UK
IAEA International Atomic Energy Agency
ICRU International Commission on Radiation Units
IMRT Intensity modulated radiotherapy
IPEM Institute of Physics and Engineering in Medicine
IU Intrauterine
kV Kilovoltage
LDR Low dose rate
MCNP Monte Carlo N-Particle
MCNP5 Monte Carlo N-Particle code version 5

xviii
Abbreviation
Meaning
MOSFET Metal oxide semiconductor field effect transistor
MRI Magnetic resonance imaging
MV Megavoltage
NHS National Health Service, UK
OAR Organ at risk
PDR Pulsed dose rate
QA Quality assurance
QC Quality control
rgb Red green blue
RTDose Radiotherapy dose expansion of DICOM standard (3D dose grid)
sd Standard deviation
sem Standard error of the mean
TL Thermoluminescent
TLD Thermoluminescent dosimetry
TPS Treatment planning system
TRAK Total reference air kerma
UK United Kingdom
VMAT Volumetric modulated radiotherapy

1
CHAPTER 1
Introduction and Overview

2
1.1. Introduction
1.1.1. Brachytherapy
Radiotherapy is the medical use of ionising radiation primarily in cancer
treatment, with curative or palliative intent, and may be combined with other treatment
modalities, depending on a number of factors including the tumour site and extent.
Brachytherapy is a form of radiotherapy concerning the treatment of cancer using small
radioactive sources inserted within or very close to the tumour. There is a rapid fall-off of
dose around the radioactive sources enabling a high dose to be delivered to the tumour with
sparing of surrounding normal structures. However, this requires high accuracy and precision
of the source delivery mechanisms. The technique is sub-divided into low dose rate
treatments, usually permanent implantation of radioactive material with dose rates in the
range 0.4 to 2 Gy per hour, high dose rate (HDR), which utilise the temporary introduction of
a radioactive source within the body with dose rates in excess of 12 Gy per hour, and pulsed
dose rate (PDR), which uses similar sources and equipment to HDR but with repeating low
exposures pulses to simulate a low dose rate approach (Gerbaulet et al. 2002, Venselaar et
al. 2013). This work considers HDR brachytherapy treatment, for gynaecological applications.
The most common radionuclide used for HDR brachytherapy is Ir-192. Recently, HDR
treatments using Co-60 sources have also been introduced in a minority of centres, including
one centre in the United Kingdom (UK) (Andrassy et al. 2012, Palmer et al. 2012d). Co-60 has
a half-life of 5.26 years compared to 73.8 days for Ir-192, and has emissions at 1.17 and 1.33
MeV, compared to a complex emission spectrum for Ir-192 with mean energy 0.38 MeV. The
HDR brachytherapy treatment unit consists of a HDR source, of a few mm length, attached
to a wire. The source is stepped through treatment applicators and catheters using computer
software control such that a planned dose distribution is delivered.
1.1.2. Requirements for Accuracy of Dose Delivery
The need for dosimetric accuracy in external beam radiotherapy is well
established (ICRU 1976, Brahme 1984). A standard requirement of the combined
uncertainties in absorbed dose delivery is often stated as 3.5% at one standard deviation,
first quoted by Mijnheer et al. (1987), or more recently expressed as ±3% (1 sd) at the
prescription point, ±3-5% (1 sd) across the entire target volume, and geometric accuracy 2-4
mm (1 sd), for the majority of external beam treatments (Thwaites 2013). A standard
accuracy requirement for advanced external beam radiotherapy is often quoted in terms of
a 3%, 3 mm criteria. Dosimetric accuracy of HDR brachytherapy may also be expected to
contribute to the achievement of clinical treatment aims, tumour control and minimised
normal tissue toxicity, due to the steepness of the clinical dose effect curves. Van Dyk et al.
(1993) defined a requirement for brachytherapy treatment delivery of 3% accuracy in dose
at distances of 0.5 cm or more at any point for any radiation source. IAEA (2004) have
recommended that 5% dose agreement and 2 mm spatial agreement is required for
brachytherapy. The dosimetric challenge is particularly difficult in brachytherapy due to small

3
treatment distances, very high dose gradients and orders of magnitude variation in dose
deposition across volumes of interest.
Brachytherapy is currently undergoing a period of significant innovation and
rapid modernisation (Potter and Kirisits 2012), including a shift from 2D to 3D basis (Hepel
and Wazer 2012), the enhanced use of imaging (Haie-Meder et al. 2011), patient-specific
treatment plan optimisation, fully volume-based prescribing (Wanderas et al. 2012), inverse-
planning (Siauw et al. 2011), advanced planning algorithms (Rivard et al. 2009), use of
advanced treatment applicators (Bernstein et al. 2012, Song et al. 2012), and in-vivo
dosimetry verification systems (Suchowerska et al. 2011). It is essential that fundamental
assurances of quality and dose delivery accuracy are not lost amongst these developments.
1.1.3. Quality Control, Dosimetry Audits and Treatment Errors
Quality control (QC) of HDR brachytherapy techniques has received only
moderate research attention in recent years compared with external beam radiotherapy,
however with current and imminent changes to the complexity and patient-specific
optimisation opportunities in HDR brachytherapy (Thomadsen et al. 2008, Ibbott et al. 2008),
as described above, the appropriateness of current QC techniques requires review. It is
essential that physics-aspects of quality verification keep pace with the changing technology
and clinical practice. This includes re-assessing the use of historic QC tests that are no longer
fit for purpose and replacing with more relevant QC, or where system performance is verified
by other means, avoiding unnecessary redundancy. Guidance on HDR brachytherapy QC
from the professional body of Medical Physicists in the UK, IPEM, does exist but may be ‘out
of date’ having been published in 1999 (Mayles et al. 1999) and is currently being revised.
Similar guidance from outside the UK also requires review and modernisation, dating from
1997 in USA (Nath et al. 1997) and 2004 in Europe (Vanselaar and Perez-Calatayud 2004).
Control of dose delivery is particularly difficult to achieve in brachytherapy due
to small treatment distances, very high dose gradients and a multitude of aspects that affect
accuracy (Palmer et al. 2012b). A quality assurance system in radiotherapy is essential to
ensure treatment delivery is consistent and as intended. This will include a multitude of
quality control (QC) tests designed to evaluate actual operating performance in comparison
to goal values, and to enable rectification/reconciliation of any differences. A comprehensive,
robust QC system should include complementary, independent external audit. With the
exception of a basic ESTRO mailed dosimetry service, there has been little brachytherapy
dosimetric audit activity reported in the literature, when compared with external beam
radiotherapy verification which has been active in the UK for over 20 years (Thwaites et al.
1991, Nisbet and Thwaites 1997). External quality audits in brachytherapy are therefore not
common practice but it is clear that future advancements in brachytherapy should be
underpinned by the reassurance of comprehensive dosimetric audit. Assuring confidence in
the clinical utility of brachytherapy requires many aspects of clinical audit, of which
dosimetric audit is an essential component.

4
The need for dosimetric audit in brachytherapy exactly mirrors the need in
external beam radiotherapy: to detect any errors, to provide reassurance, to enable
improvements, and to demonstrate compliance. There are of course numerous sources of
uncertainty in brachytherapy (Kirisits et al. 2014), and there have been previous errors in
brachytherapy delivery (ICRP 2000, ICRP 2005a, ICRP 2005b, Daigh 2010) including: well
chamber calibration error (Dempsey 2011); confusion over units (USNRC 2009); media
reports of at least two incidents involving incorrect dwell positions in treatment applicators
(ASAHI SHIMBUN 2013, Sydney Morning Herald 2003a and 2003b); and manufacturer safety
notifications, including potentially incorrect HDR source dwell times under special
circumstances (Varian 2010), potential incorrect dose/number of treatment fractions for
standard plans (Nucletron 2014), potential source positioning errors in applicators (Eckert &
Ziegler BEBIG 2014). It is not sufficient to just investigate the cause of problems that have
occurred in the past, but one must investigate systems for problems that may occur in the
future. The great benefit of ‘on-site’ external audit is that it also allows discussion of
processes with the staff that undertake them, and hence it is one of only a few methods to
provide quality assurance of the ‘qualitative’ issues in safety which are normally ‘resistant’
to discovery by conventional, technical device-centric QC.
1.2. Research Questions and Objectives
To ensure safety and optimisation in medical radiation exposures, there is a
fundamental requirement for “adequate tests of equipment performance at appropriate
levels” (HSE 2006). For radiotherapy, the tests, methods, frequencies and tolerances are the
responsibility of Medical Physicists and their judgment. The purpose of this research work is
to contribute to this challenging endeavour, specifically to contribute to the development of
physics aspects that improve patient safety and best practice in HDR brachytherapy. The
specific research questions are summarised below:
What is the consistency of practice for QC of HDR treatment equipment in the UK?
Guidance from IPEM is over 20 years old and there have been significant technological
and clinical practice changes in this time. A new consensus benchmark is required.
Are there any specific QC tests that should be championed or techniques developed? Is
there an efficient method for dwell position, source movement and transit dose
assessment?
What is the required accuracy for HDR treatment equipment performance, particularly
dwell position tolerance? How does this impact treatment plan quality parameters?
What is the status of interdepartmental/external audit in the UK and does this need to
be developed for brachytherapy? What is the value of external audit alongside routine
QC, and is this worthwhile in brachytherapy?

5
Can a phantom and dosimetry system be developed to provide a convenient external
audit measurement for brachytherapy? Can this be implemented as an ‘end to end’
system check for brachytherapy physics dosimetry?
What form of dosimetric measurement is necessary for ‘end to end’ audit in
brachytherapy? Which detectors could be used and how would results be analysed and
interpreted?
How might radiochromic film dosimetry be applied for an ‘end to end’ brachytherapy
dosimetry audit? Can film dosimetry be sufficiently well characterised, accuracy
improved and uncertainties minimised for a brachytherapy audit?
Is it feasible to undertake an ‘end to end’ dosimetry audit at every brachytherapy centre
in the UK and how might this be organised?
Are there any variations in physics practice for HDR gynaecology brachytherapy and any
opportunities for improvement?
The initial objective of the research was to review and improve QC practices for
HDR brachytherapy. It became clear there was a particular need to improve brachytherapy
audit, and a subsequent focus of the research was then to design and implement an ‘end to
end’ dosimetry audit for brachytherapy in the UK. Dosimetric audit is recommended in many
authoritative documents, is a mandatory requirement in many countries, and advocated by
the majority of physicists working in radiotherapy. Whether for improvements in patient
care, reassurance of accuracy, fulfilling a legal requirement, credentialing for clinical trials,
simple best-practice approach, minimising the risk of error, avoiding litigation, or adding
security in a high pressure environment, audit is a valuable tool and its application in
brachytherapy is worthwhile. ‘End to end’ testing includes the entire preparation and
delivery process, with a quantitative measurement that can be evaluated at the end of the
test to confirm accurate delivery of the planned treatment (ASTRO 2012). Brachytherapy is
undergoing significant clinical and technical developments, the quality of which should be
underpinned by the reassurance of comprehensive dosimetric audit.
1.3. Summary of Thesis
This thesis documents research conducted into physics-aspects of safety
assurance in HDR brachytherapy. There are four linked themes to this work; brachytherapy
QC; dosimeters for brachytherapy audit; development and implementation of a
brachytherapy audit in the UK; and supporting Monte Carlo simulations. The thesis is
necessarily split into self-contained chapters, with joint sections for introduction, theory,
summary conclusions, and future work.

6
Chapter 2 provides a succinct review of relevant theory, including brachytherapy
physics, dosimetric accuracy, definition and need for brachytherapy audit, brachytherapy
dosimetry measurement, optical fibre dosimeters, radiochromic film dosimeters,
radiochromic plastic dosimeters, and Monte Carlo methods.
Chapter 3 opens with a review of QC testing and commissioning of
brachytherapy equipment and highlights a number of brachytherapy treatment errors that
have occurred in recent years. There are three elements to the research presented in this
chapter. First, a UK survey of brachytherapy QC was undertaken to establish benchmark
consensus and inform on areas requiring development. This led to the second section which
provides a methodology for the measurement of dwell position accuracy and transit dose,
and led to consultation with a manufacturer to improve their HDR equipment performance.
The final section is a treatment planning study to establish requirements for source dwell
positioning accuracy, the impact of systematic errors on treatment planning quality
parameters, and suitability of dose measuring points to detect errors.
Chapter 4 is concerned with the evaluation and selection of a dosimetry system
for brachytherapy applicator dose measurement, appropriate for a national audit. Three
systems are evaluated: point-dose measurement with doped silica glass optical fibres; 2D
measurement with Gafchromic EBT3 radiochromic film; and 3D measurement with Presage
solid radiochromic polymer. A Solid Water (RMI457) test object was designed for the fibre
and film measurements, while cavities were machined directly into the Presage sample for
irradiation. Each dosimeter is evaluated as follows: initial processing and calibration; radial
dose measurements from an HDR source; measurement of typical brachytherapy dose
distribution; practical considerations; and an uncertainty budget estimate.
Chapter 5 presents research and development into the characterisation and
optimal use of radiochromic film for brachytherapy audit applications, building on the results
presented in Chapter 4. The objectives and need for film dosimetry development are first
outlined. Film-related and scanner-related performance characteristics are then evaluated,
as well as the use of triple-channel compared to single-channel dosimetry, and
recommendations made for the reduction of uncertainties.
Chapter 6 presents research on the development of a phantom and
methodology for brachytherapy audit using radiochromic film, enabling an ‘end to end’
system test approach, as advocated in the joint American societies document ‘Safety is No
Accident’ (ASTRO 2012). A review and evaluation of previous brachytherapy audits is
provided to give context and inform development objectives for the UK brachytherapy audit.
The phantom design, audit methodology, and its sensitivity to simulated errors are discussed.
A detailed protocol for the optimal use of film dosimetry for brachytherapy audit is provided,
building on research work presented in Chapter 5. An uncertainty budget for the audit
approach is evaluated.
Chapter 7 describes the Monte Carlo work undertaken to support the
brachytherapy dosimetry audit development. MCNP5 is used to determine the required audit
phantom size, to confirm water equivalence of EBT3 film in the context of the brachytherapy

7
audit measurement, and to estimate the dose attenuation due to metallic treatment
applicators to interpret results of the national brachytherapy audit.
Chapter 8 discusses the scope and results of a national brachytherapy audit
undertaken as a key element of the thesis work. The audit phantom and methodology
described in Chapter 6 is utilised. Film is used to assess the agreement between delivered
dose and planned dose as an ‘end to end’ audit of the clinical brachytherapy treatment
process, in terms of dose to the prescription point and dose distribution in clinically relevant
regions. Differences in physics brachytherapy practice between centres are discussed,
highlighting potential opportunities for improvement, and audit results requiring further
investigation are described.
Chapter 9 brings the body of work together with a summary review of the key
results from the thesis, as well as highlighting potential areas for future work.
1.4. List of Publications and Presentations Arising From this Work
1.4.1. Quality Control and Accuracy of Brachytherapy
Journal Publications:
J 1. Palmer A. Impact of software changes: Transit dose and source position
accuracy of the Eckert & Ziegler BEBIG GmbH Multisource high dose rate (HDR)
brachytherapy treatment unit. J. Radiother. Pract. 2013:12;80-87.
J 2. Palmer A.L., Bidmead M., Nisbet A. A survey of quality control practices for high
dose rate (HDR) and pulsed dose rate (PDR) brachytherapy in the United
Kingdom. J. Contemp. Brachyther. 2012;4:232-240.
J 3. Palmer A., Bradley D., Nisbet A. Physics-aspects of dose accuracy in high dose
rate (HDR) brachytherapy: source dosimetry, treatment planning, equipment
performance and in-vivo verification techniques. J. Contemp. Brachyther.
2012;4(2):81-91.
Conference Publications, Posters and Presentation:
C 1. Palmer A.L., Bradley D.A., Nisbet A. Improving quality assurance of HDR
brachytherapy: Verifying agreement between planned and delivered dose
distributions using DICOM RTDose and advanced film dosimetry. Poster at
AAPM 2014 annual meeting, Austin, Texas, July 2014.
C 2. Patel I., Palmer A. Revision of IPEM guidance on quality control of radiotherapy
equipment. Med. Phys. Int. 2013;1(2):179. Invited oral presentation at
ICMP2013, Brighton, UK.

8
C 3. Palmer A.L., Nisbet A., Bradley D.A. A new standard for HDR brachytherapy
quality control: practical and advanced film dosimetry for treatment applicators
and sources. Proceedings of the 2nd Estro Forum, Geneva, Switzerland.
Radiother. Oncol. 2013;106:S368-9.
C 4. Nisbet A., Palmer A.L.*, Bradley D.A. Available guidance, current UK practice,
and future directions for HDR brachytherapy quality control. Proceedings of the
2nd Estro Forum, Geneva, Switzerland. Radiother. Oncol. 2013;106:S370. (* main
and presenting author)
C 5. Palmer A., Ioannou L., Hayman O., Nagar Y.S. Is HDR equipment performance
suitable for modern brachytherapy? Positional errors, dosimetric impact & case
study. Proceedings of the World Congress of Brachytherapy, Barcelona, Spain.
Radiother. Oncol. 2012;103:S132-3.
1.4.2. Dosimeters for Brachytherapy Audit
Journal Publication:
J 4. Palmer A.L., Di Pietro P., Alobaidli S., Issa F., Doran S., Bradley D., Nisbet A.
Comparison of methods for the measurement of radiation dose distributions in
high dose rate (HDR) brachytherapy: Ge-doped optical fibre, EBT3 Gafchromic
film, and PRESAGE® radiochromic plastic. Med. Phys. 2013;40(6):061707-1-11
1.4.3. Radiochromic Film Methodology
Journal Publications:
J 5. Palmer A.L., Bradley D., Nisbet A. Evaluation and mitigation of potential errors
in radiochromic film dosimetry due to film curvature at scanning. J. Appl. Clin.
Med. Phys. 2015 (in press)
J 6. Palmer A.L., Bradley D., Nisbet A. Evaluation and implementation of triple-
channel radiochromic film dosimetry in brachytherapy. J. Appl. Clin. Med. Phys.
2014;15(4):280-296.
J 7. Palmer A.L., Nisbet A., Bradley D. Verification of high dose rate brachytherapy
dose distributions with EBT3 Gafchromic film quality control techniques. Phys.
Med. Biol. 2013;58:497-511.
Conference Publications, Posters and Presentation:
C 6. Palmer A.L. Advanced Film Dosimetry for Brachytherapy. Invited oral
presentation as Guest Speaker at Gafchromc Symposium, Ashland Inc, held
during AAPM 2014 annual conference, Austin, Texas, July 2014. Available at:
http://www.filmqapro.com/documents/Palmer_Brachy%20Audit_Gafchromic_
AAPM_2014.pdf

9
C 7. Palmer A.L., Nisbet A., Bradley D.A. Semi-3D dosimetry of high dose rate
brachytherapy using a novel Gafchromic EBT3 film-array water phantom. J.
Phys.: Conf. Ser. 2013;444:012101. Published abstract, poster and oral
presentation at the conference: Proceedings of the International Conference on
3D Dosimetry (IC3DDose), Sydney, Australia, November 2012.
1.4.4. Brachytherapy Audit
Journal Publications:
J 8. Palmer A.L., Diez P., Gandon L., Wynn-Jones A., Bownes P., Lee C., Aird E.,
Bidmead M., Lowe G., Bradley D., Nisbet A. A multicentre ‘end to end’ dosimetry
audit for cervix HDR brachytherapy treatment. Radiother. Oncol. 2015 (in press,
http://dx.doi.org/10.1016/j.radonc.2014.12.006).
J 9. Palmer A.L., Bradley D., Nisbet A. Dosimetric audit in brachytherapy. Br. J.
Radiol. 2014;87:20140105. (http://dx.doi.org/10.1259/bjr.20140105)
J 10. Palmer A.L., Lee C., Ratcliffe A.J., Bradley D., Nisbet A. Design and
implementation of a film dosimetry audit tool for comparison of planned and
delivered dose distributions in high dose rate (HDR) brachytherapy. Phys. Med.
Biol. 2013;58:6623-6640. This article was listed as a “Featured Article” (“recent
articles of high-interest across IOP content”) on the PMB website.
Conference Publications, Posters and Presentation:
C 8. Palmer A.L. Auditing HDR/PDR Brachytherapy Physics in UK. Invited oral
presentation at the IPEM Biennial Radiotherapy Meeting, Sept 2014, Glasgow.
C 9. Palmer A.L., Bradley D.A., Nisbet A. Comprehensive audit of brachytherapy dose
distributions: A methodology and UK audit results. Poster at ESTRO33
conference, Vienna, Austria, April 2014. (Radiother. Oncol. supplement in press)
C 10. Palmer A.L. Group hugs in brachytherapy physics. Invited oral presentation at
the Medical Physics Research Away Day, Portsmouth Hospitals NHS Trust,
February 2014.
C 11. Palmer A.L. UK Brachytherapy Audit: origin, funding and collaboration. Invited
oral presentation at the IPEM, NPL, CTRad meeting on “Reaching a Consensus
on Verification of Radiotherapy Deliver”, held at NPL, December 2013.
C 12. Palmer A.L., Diez P., Aird E., Lee C., Radcliffe A., Gouldstone C., Sander T., Bradley
D., Nisbet A. Development of a UK dosimetry audit for HDR/PDR brachytherapy.
Med. Phys. Int. 2013;1(2):233. Oral presentation at ICMP2013, Brighton, UK.

10
1.4.5. Monte Carlo Calculations
Conference Publications, Posters and Presentation:
C13. Palmer A.L., Bradley D., Nisbet A. Monte Carlo derived correction factors for
brachytherapy film dosimetry for audit and QC. Accepted for poster
presentation at the ESTRO 3rd Forum conference, Barcelona, April 2015.
1.4.6. Miscellaneous Publications Relating to PhD Work
Journal Publications:
J 11. Palmer A.L. BJR brachytherapy dosimetry special feature. Br. J. Radiol.
2014;87:20140506.

11
CHAPTER 2
Theory
12
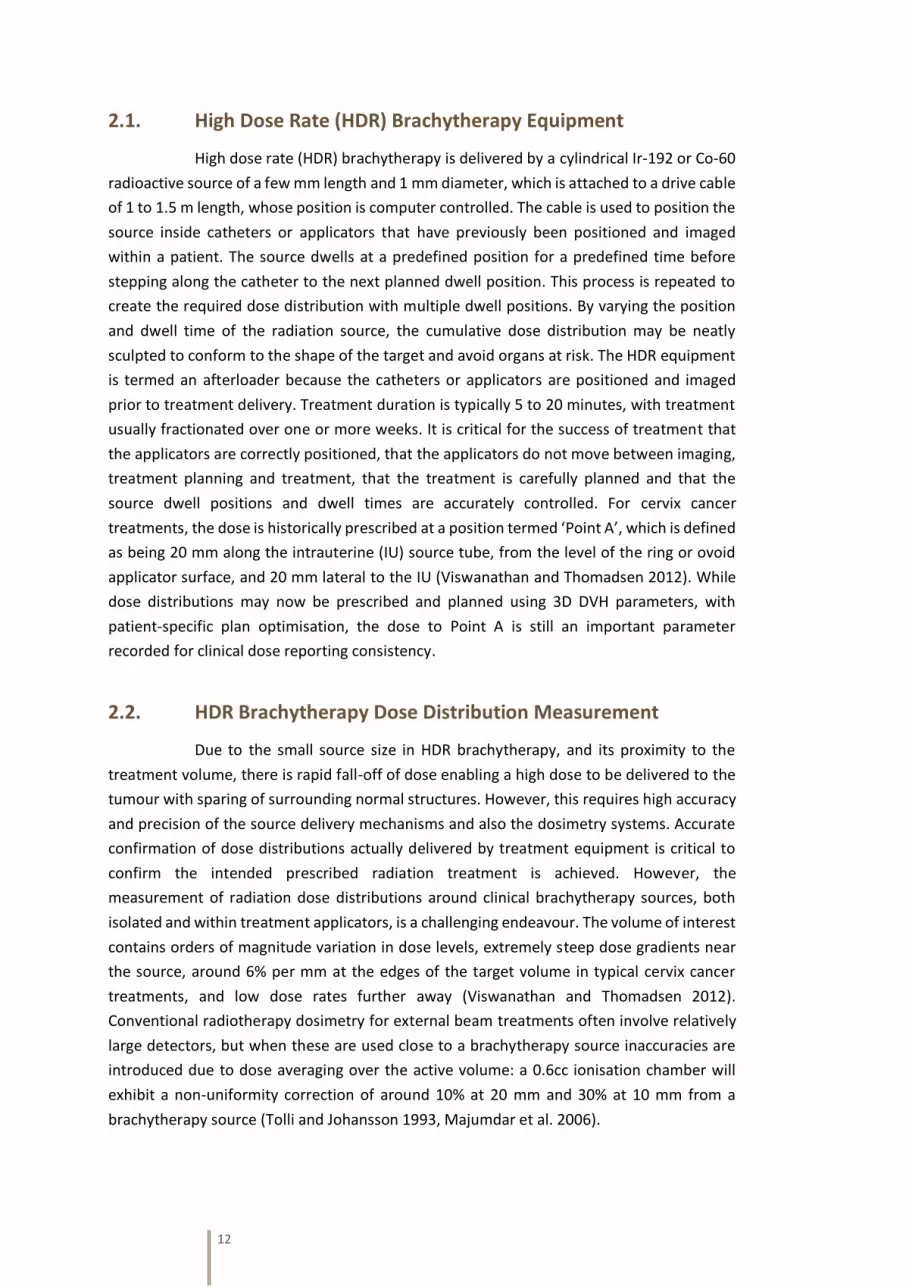
2.1. High Dose Rate (HDR) Brachytherapy Equipment
High dose rate (HDR) brachytherapy is delivered by a cylindrical Ir-192 or Co-60
radioactive source of a few mm length and 1 mm diameter, which is attached to a drive cable
of 1 to 1.5 m length, whose position is computer controlled. The cable is used to position the
source inside catheters or applicators that have previously been positioned and imaged
within a patient. The source dwells at a predefined position for a predefined time before
stepping along the catheter to the next planned dwell position. This process is repeated to
create the required dose distribution with multiple dwell positions. By varying the position
and dwell time of the radiation source, the cumulative dose distribution may be neatly
sculpted to conform to the shape of the target and avoid organs at risk. The HDR equipment
is termed an afterloader because the catheters or applicators are positioned and imaged
prior to treatment delivery. Treatment duration is typically 5 to 20 minutes, with treatment
usually fractionated over one or more weeks. It is critical for the success of treatment that
the applicators are correctly positioned, that the applicators do not move between imaging,
treatment planning and treatment, that the treatment is carefully planned and that the
source dwell positions and dwell times are accurately controlled. For cervix cancer
treatments, the dose is historically prescribed at a position termed ‘Point A’, which is defined
as being 20 mm along the intrauterine (IU) source tube, from the level of the ring or ovoid
applicator surface, and 20 mm lateral to the IU (Viswanathan and Thomadsen 2012). While
dose distributions may now be prescribed and planned using 3D DVH parameters, with
patient-specific plan optimisation, the dose to Point A is still an important parameter
recorded for clinical dose reporting consistency.
2.2. HDR Brachytherapy Dose Distribution Measurement
Due to the small source size in HDR brachytherapy, and its proximity to the
treatment volume, there is rapid fall-off of dose enabling a high dose to be delivered to the
tumour with sparing of surrounding normal structures. However, this requires high accuracy
and precision of the source delivery mechanisms and also the dosimetry systems. Accurate
confirmation of dose distributions actually delivered by treatment equipment is critical to
confirm the intended prescribed radiation treatment is achieved. However, the
measurement of radiation dose distributions around clinical brachytherapy sources, both
isolated and within treatment applicators, is a challenging endeavour. The volume of interest
contains orders of magnitude variation in dose levels, extremely steep dose gradients near
the source, around 6% per mm at the edges of the target volume in typical cervix cancer
treatments, and low dose rates further away (Viswanathan and Thomadsen 2012).
Conventional radiotherapy dosimetry for external beam treatments often involve relatively
large detectors, but when these are used close to a brachytherapy source inaccuracies are
introduced due to dose averaging over the active volume: a 0.6cc ionisation chamber will
exhibit a non-uniformity correction of around 10% at 20 mm and 30% at 10 mm from a
brachytherapy source (Tolli and Johansson 1993, Majumdar et al. 2006).

13
2.2.1. Review of Contemporary Dosimetry Systems for Brachytherapy
Figure 2.1 summarises dosimetry tools that have been used recently in HDR
brachytherapy physics, for the measurement of dose parameters or to assess accuracy and
uncertainty. At least ten dosimetry systems have been discussed in publications over the last
five years for basic source and equipment dosimetry (Palmer et al. 2012b), including
thermoluminescent dosimeters (Karaiskos et al. 1998, Kirov et al. 1995, Zhang et al. 2010),
ionisation chambers (Mishra et al. 1997), semiconductor diodes (Kirov et al. 1995), MOSFETS
(Zilio et al. 2006, Toye et al. 2007, Mason et al. 2013), radiochromic film (Sharma et al. 2004,
Sureka et al. 2007, Aldelaijan et al. 2011), and Polymer or Fricke gel dosimetry (Baras et al.
2002). There is no clear consensus on the optimum dosimetry systems to use for the various
measurement situations.
Figure 2.1. HDR brachytherapy physics processes with dosimetric tools that have been applied to
measure dose, accuracy and uncertainty, as reported in recent literature.
LiF thermoluminescent dosimetry (TLD) has historically been the method of
choice for the experimental determination of source dosimetry parameters defined by the
American Association of Physicists in Medicine (AAPM) Task Group report TG-43 (Rivard et
al. 2004) and for the measurement of brachytherapy dose. Indeed Rivard et al. (2004)
comments the validity for using other detectors has not yet been convincingly demonstrated,
and that “multiple publications of results in peer-reviewed journals by independent

14
investigators are desirable to demonstrate independence and consistency. Therefore, use of
other experimental dosimeters is an area for future research of significant scientific value”.
The selection of a dosimetry system to sample the dose distribution around
clinical brachytherapy treatment applicators in the context of an interdepartmental
dosimetry audit (Chapter 4 and Chapter 8) is a trade-off between desirable characteristics,
with no one detector performing optimally in all criteria. Table 2.1 provides a summary of
considerations for potential dosimeters for use in brachytherapy dosimetry audit.
Table 2.1 Dosimeter selection considerations for brachytherapy dose distribution measurement
in the context of an external audit
Criteria Considerations
Detector response to HDR brachytherapy sources
Accuracy, precision, dose rate response, energy response, angular response, dynamic range, detection limit
Spatial resolution Detector size, readout resolution
Cost Individual detector cost, re-usable?, other equipment
Availability Commercially available or ease of local production
Handling Time to set-up and ease of operation during audit
Geometric accuracy Accuracy and speed of positioning with respect to brachytherapy applicator
Readout method Time required for read-out process, and ability to delay read-out may be required
Robustness Appropriateness of detector for UK-wide dosimetry audit visits, susceptibility to transport damage
Maturity of technology Level of prior evidence of application in brachytherapy dose measurement or audit
Taking account of the required characteristics in Table 2.1 and the available
detectors in Figure 2.1, one dosimetry system was chosen for each of three potential
measurement modes: multiple point detectors, 2D detector, or 3D detector. Optical fibre
dosimeters are a potential very low cost, high spatial resolution multiple point detector
system. Radiochromic film is a potential very high spatial resolution, commercially available
2D system with ease of geometric positioning. Radiochromic plastic is a robust detector with
potential for good spatial resolution in 3D. Key aspects of the theoretical considerations of
operation of these chosen detectors is provided in Sections 2.2.2 to 2.2.4.

15
2.2.2. Optical Fibre Dosimetry
A comprehensive review of the thermoluminescent (TL) properties of doped
silica glass optical fibres and their application as dosimeters in radiation therapy has been
conducted by Bradley et al. (2012). Primary advantages include significantly improved spatial
resolution in one dimension (typically 9 µm active core diameter within 100 µm diameter
fibre) compared to conventional LiF TL dosimeters (several mm), hygroscopic nature
(impermeability to water) facilitating possible use as in vivo detector, a linear response of TL
yield as a function of dose, and a high dynamic range. Disadvantages include a current
requirement for manual preparation from commercial optical fibre cables, their fragility, and
lack of water-equivalent atomic number (Zeff = 11.4 for SiO2 with Ge-doping 0.15-0.19 mol%
(Bradley et al. 2012) compared to Zeff = 7.3 for water). To date, the application of doped
optical fibres in brachytherapy dosimetry has been limited to measurements at less than 50
mm from low dose rate (LDR) I-125 seeds (Bradley et al. 2012), with similar work by Issa et
al. (2012) who conducted measurements at less than 20 mm from Ba-133 and Co-60
laboratory sources.
2.2.3. Radiochromic Film Dosimetry
Radiochromic film has a long history in radiation dosimetry (Butson et al. 2003)
and provides a number of advantages over other dosimetry methods, including high spatial
resolution, low energy dependence, and near water equivalence. The film is self-developing
after exposure to ionising radiation, by a topochemical (solid-state) photopolymerisation
process with diacetylene monomers. The rod shaped (2 µm x 15 µm) polymers are highly
anisotropic, being preferentially aligned parallel to the coating direction during manufacture,
and hence act as visible light polarizers. Gafchromic EBT31 film, available from late 2011, is
composed of an active radiochromic layer 26-28 µm thickness, laminated between two 100
µm polyester layers, creating a symmetric structure, different to the asymmetric structure of
its predecessor EBT2 (Reinhardt et al. 2012). The total film thickness is 0.23 mm. The matte
polyester contains microscopic silica spheres at the surface eliminating Newton’s Rings
artefacts at scanning. A marker dye within the active layer is included for film uniformity
correction, via the blue scanner channel. The film has a near water-equivalent effective
atomic number, Zeff (EBT3) = 6.84, compared to Zeff (water) = 7.3 (Arjomandy et al. 2010). An
absorbed-dose energy dependence is only significant below 100 kV (Sutherland and Rogers
2010, Massillon et al. 2012, Bekerat 2012). Brown et al. (2012) have demonstrated weaker
energy dependence with EBT3 Gafchromic film at low keV, compared to the older Gafchromic
films (EBT, EBT2).
Film readout can be performed with specialised densitometers, however it is
now accepted practice that conventional ‘high-end’ office flatbed film or document scanners
may be used for film dosimetry (Butson et al. 2003, Devic et al. 2005, Lewis et al. 2012).
Radiochromic reactions by definition are a direct colouration of a media by the absorption of
1 Ashland ISP Inc, Wayne, New Jersey, USA

16
radiation. The attenuation of visible light traversing the exposed film is a measure of its
optical density. It is essential that no automatic software colour correction is made to the
scanned image. Red, green and blue image channels are available, and various approaches
have been used to generate the calibrated dose image, either red channel alone (Bouchard
et al. 2009), different channels for different dose ranges (Andres et al. 2010), ratios between
channels (Mayer et al. 2012), or triple-channel approaches (Devic et al. 2009, Tamponi et al.
2014, Mendez et al. 2014). It is also possible to use a correction/subtraction method with a
pre-irradiation scan of the film, for the single channel approach (Devic et al. 2005, Paelinck
et al. 2007, Menegotti et al. 2008). Van Hoof et al. (2012) found the triple-channel
radiochromic film read-out method performed at least as well as the single-channel method
with inclusion of a pre-irradiation film scan, and that it reduced film non-uniformity and
saved time with the elimination of the pre-irradiation scan. Mendez et al. (2013) studied
various aspects of radiochromic dosimetry, and stated “three-channel dosimetry was found
to be substantially superior to red-channel dosimetry”. In this thesis, triple-channel
dosimetry is the favoured method, with comparisons to single-channel dosimetry in some
experimental work. The triple-channel algorithm developed by Micke et al. (2011) is used ‘as
is’ as an established and accepted film dosimetry method (van Hoof et al. 2012, Lewis et al.
2012, Hayashi et al. 2012, Mendez et al. 2013, Mendez et al. 2014). Although its application
for brachytherapy is evaluated and characterised, the algorithm itself is not further
developed.
Until recently, the majority of film dosimetry applications have been in the
verification of relative dose distribution for external beam radiotherapy (Molineu et al. 2013).
However, recent improvements in the latest radiochromic film technology (Gafchromic EBT3)
and advances in scanning and analysis methods using triple-channel dosimetry (as above)
may enable calibrated absolute dose measurement of brachytherapy dose distributions. The
majority of prior published work using film in brachytherapy has studied single source Ir-192
dose rate distributions (Sellakumar et al. 2009, Aldelaijan et al. 2011) or low dose rate seeds
(Acar et al. 2013), usually single-channel film analysis (Bouchard et al. 2009) and
measurements with older EBT and EBT2 Gafchromic film versions (Carrasco et al. 2013).
Reinhardt et al. (2012) have demonstrated the validity of EBT3 in photon and proton beams.
DeWerd et al. (2011) states there have been conflicting results for radiochromic
film in the literature, which requires further research. Perez-Calatayud et al. (2012a) reported
that radiochromic film must be considered “under development at this time because of
numerous artefacts which require rigorous correction”. For these reasons, radiochromic film
requires careful characterisation and validation when used, particularly for novel
applications.

17
2.2.4. Radiochromic Plastic Dosimetry
The use of polymer gels and plastics for radiation dosimetry has evolved over
the last two decades, reviewed by Doran (2009) and Baldock et al. (2010), and has a long
history (McJury et al. 1999, De Deene et al. 2001). However, only recently has the technology
developed to give the potential for routine clinical dosimetry applications (Adamson et al.
2012, Gorjiara et al. 2012). Probably the most promising material for brachytherapy
applications is Presage2 which has a number of advantages over gel radiochromic dosimetry
materials including; an insensitivity to oxygen, which frustrated early users of gel dosimeters
(De Deene et al. 2002) and is key for the insertion of catheters into the dosimeter; light
absorption rather than scattering as a contrast mechanism, which is favourable for optical CT
readout using a pixelated detector rather than a scanning laser beam; a machineable
dosimeter material that does not require an external container (Guo et al. 2006, Jordan
2010), and is water equivalent (Zeff = 7.4). Of the publications that have used 3D radiochromic
material for radiotherapy dosimetry, a clear majority have considered only external beam
radiotherapy dosimetry, with a few investigations considering brachytherapy sources
(Austerlitz et al. 2007, Wai et al. 2009, Pierquet et al. 2010, Massillon et al. 2012).
2.3. Brachytherapy Audit
2.3.1. Definition of Audit and the Need for Dosimetric Audit in Radiotherapy
Audit is required in a multitude of scenarios in medicine, and the term has
acquired different meanings over time in relation to health care quality. Clinical audit, for
example, may involve systematically looking at the procedures for diagnosis, care and
treatment, examining how resources are used, investigating the effect care has on the
outcome for the patient, and importantly recognising audit as a quality improvement process
not just a monitoring system. Audit may consider any aspect of infrastructure, procedure or
outcome to ensure safe, effective and best-practice processes and enable improvements.
NHS England has defined clinical audit as “a way to find out if healthcare is being provided in
line with standards”, and importantly “the aim is to allow quality improvement to take place
where it will be most helpful and will improve outcomes for patients” (NHS England 2014).
Audit therefore needs to be undertaken, and it needs to be directed appropriately. In this
work, the scope is limited to specific consideration of dosimetric audit of brachytherapy.
In radiotherapy physics, a key component of auditing is to review the most
fundamental of requirements; that prescribed radiation doses are being accurately delivered.
This may involve testing the dissemination of dosimetry calibration from national standards
laboratories, verifying dose or dose distribution for particular treatment techniques, or
assuring dose delivery for compliance with clinical trial protocols (EORTC 2014). With regard
to the latter it has been demonstrated that the number of patients required in a randomised
clinical trial may be reduced by introducing appropriate dosimetry quality assurance as the
risk of under-powering the study is minimized (Pattersen et al. 2008). The largest dosimetric
2 Heuris Inc, Skillman, New Jersey, USA

18
audit networks at present are operated by the International Atomic Energy Agency (IAEA
2007), the American Radiological Physics Centre (RPC 2014), and in Europe the European
Society for Radiotherapy and Oncology ESTRO Quality Assurance network (EQUAL) (Ferreira
et al. 2000). The reader is directed to the proceedings of a 2010 IAEA meeting on Standards,
Applications and Quality Assurance in Medical Radiation Dosimetry (IDOS) for a number of
papers on external beam audit (IAEA 2011) and a review of audits for advanced treatment
dosimetry by Ibbott and Thwaites (2015). There are also many national audit groups, for
example in the UK standard auditing is coordinated by the Institute of Physics and
Engineering in Medicine (IPEM) via a number of regional groups (Bolton 2009, Palmer et al.
2011). This network arose following an IPEM coordinated national megavoltage photon
beam dosimetry audit (Thwaites et al. 1991) and a later national electron beam dosimetry
audit (Nisbet and Thwaites 1997). Audits for clinical trials in the UK are conducted by the
Radiotherapy Trials Quality Assurance Group (RTTQA), Mount Vernon Cancer Centre, UK. In
2012, the IAEA surveyed the worldwide coverage of dosimetry audit programmes for
radiotherapy (Izewska et al. 2012), finding audit activity in 45 countries, of which 16 had a
mandatory requirement for participation, but with around 1/3 of world radiotherapy centres
having no independent assessment. In the UK a consortium of professional bodies published
‘Towards Safer Radiotherapy’ (RCR 2008) which recommends that “all centres should
participate in dosimetric audit networks” and that “comparative audits between
departments can provide valuable opportunities to ensure safe delivery of radiotherapy and
consistency of patient outcomes”. The National Health Service (NHS) National Cancer Peer
Review Programme Manual for Cancer Services: Radiotherapy Measures (NHS DH 2013),
requires centres to take part in local audit networks. This is typical of publications from
several bodies in recent years suggesting how radiotherapy could be made safer. Dunscombe
(2012), has analysed seven authoritative documents, including ‘Towards Safer Radiotherapy’,
to find commonalities between the recommendations. “Dosimetric audit” was one of twelve
topics identified in three or more documents as being pertinent to the improvement of
patient safety in radiotherapy. Dunscombe (2012) states that “organisations like the RPC and
EQUAL-ESTRO have had, and continue to have, a huge positive influence on the safety and
quality of radiotherapy”. However, Dunscombe also discusses that dosimetric audits are not
always carried out appropriately, stating audits should “take place prior to the first clinical
use”, and enable “testing the device under conditions other than those used to calibrate it”,
citing a treatment error from Ontario as an example that might be avoided if audits were
optimally used (Dunscombe et al. 2008).
The increasing complexity of radiotherapy planning and delivery makes
dosimetric audits challenging, and it is no longer sufficient to verify only the absolute dose
delivery at a reference point, which has been one of the standard approach in the last two
decades. Kron et al. (2013) states the focus of current research is to adapt dosimetry audit
for ever more diversified radiotherapy procedures including image guided/adaptive
radiotherapy, motion management and brachytherapy.

19
2.3.2. The Need for Dosimetric Audit in Brachytherapy
In comparison to external beam radiotherapy, the physical processes by which
the majority of brachytherapy equipment calculates and delivers treatment is relatively
simple. However, this does not mean that dosimetric audit is without complexity. Indeed, the
high dose gradients, orders of magnitude variation in dose deposition across clinical regions
of interest, and small spatial scales, mean measurements to verify absolute dose and dose
distribution are challenging. Haworth et al. (2013) states “to date, dosimetric audits of HDR
facilities have not been conducted in Australia despite the high risks associated with these
treatments due to the challenges presented by measuring doses in steep dose gradients”. In
the UK, the National Cancer Peer Review Programme Manual for Cancer Services:
Radiotherapy Measures (NHS DH 2013), states there is a requirement that “the department
should have taken part in the External Quality Control programme”, but this is only
specifically listed within the external beam radiotherapy measures, not within the
brachytherapy measures. This may be due to the then lack of availability of brachytherapy
dosimetric audit, difficulties in implementation, or prioritisation of need. However, in the
more recent NHS England Service Specification document for 2013/14 for brachytherapy
(NHS England 2013) it is stated that “to ensure that the services being delivered offer high
quality brachytherapy to patients”, one of the specific requirements is that “the provider
department must participate in the national inter-departmental dosimetry audit programme
(National audit of high dose-rate (HDR) brachytherapy)”. In addition to the audit work
presented in this thesis, two other brachytherapy audits are ongoing in the UK (currently
unpublished), one a well-chamber intercomparison, and the other an alanine and Farmer-
type ionisation chamber measurement of dose to a point from a straight catheter.
In the last few years, numerous commercial detectors and phantoms have been
specifically developed to verify dose distributions in external beam radiotherapy, partly
driven by the adoption of intensity modulated radiotherapy (IMRT) and volumetric
modulated radiotherapy (VMAT) techniques. These active detectors may conveniently be
adopted for dosimetric audit (Hussein et al. 2013). However, there have been no similar
commercial developments for brachytherapy. Well-type ionisation chambers have been
adopted for source strength determination, and commonly TLDs have been used for point-
dose measurements, but there is no clear consensus on techniques for verification of dose
distribution measurement in brachytherapy. In the last decade, many dosimetry systems
have been investigated for brachytherapy measurement, including gel dosimetry,
thermoluminescent detectors, semiconductor diodes, ionisation chambers, MOSFET
detectors, alanine, radiochromic film, radiochromic plastic, calorimetry, and optically
stimulated or radioluminescent detectors (Palmer et al. 2012b).
The need for dosimetric audit in brachytherapy exactly mirrors the need in
external beam radiotherapy: to detect any errors, to provide reassurance, to enable
improvements, and to demonstrate compliance. In brachytherapy, a dosimetry system audit
may be useful to test many aspects of dosimetric accuracy, for example assessing the extent
by which simplifications in the TG-43 dosimetry formulism (Zehtabian et al. 2012) give rise to
differences between calculation and delivered doses in HDR treatment delivery, including

20
scatter, tissue homogeneity, and applicator attenuation. There are of course numerous
sources of uncertainty in brachytherapy (Kirisits et al. 2013) that could be assessed by
dosimetry audit and there have been previous errors in brachytherapy delivery that may be
discovered through audit (ICRP 2000, ICRP 2005a, ICRP 2005b, USNRC 2009, Daigh 2010,
Dempsey 2011). The pace of change in brachytherapy equipment, physics and clinical
processes has also been rapid in recent years with the integration of multi-modality 3D
imaging and voluming, improved dosimetry (Sander 2014), and new equipment and
applicators (Thomadsen et al. 2008, Rivard et al. 2010, Beaulieu et al. 2012). Treatment
planning algorithms in brachytherapy may also be on the verge of a step-change in
complexity (Papagiannis et al. 2014) and a move from standard planning to fully flexible
optimisation may have widespread uptake (Thomadsen et al. 2008, Rivard et al. 2009, Rivard
et al. 2010, Beaulieu et al. 2012, Lee et al. 2014). To contribute to overall quality, safety and
reassurance, brachytherapy should be subject to the same rigor of local quality checks
(Palmer et al. 2012a) and audit mechanisms as external beam radiotherapy.
2.4. Monte Carlo MCNP5 Simulation
2.4.1. The Monte Carlo Method
Monte Carlo software codes can be used to duplicate theoretically a statistical
process, such as the interaction of nuclear particles with materials. They are particularly
useful for complex problems that cannot be modelled by computer codes that use
deterministic methods. The individual probabilistic events that comprise a process are
simulated sequentially, with probability distributions governing the events statistically
sampled to describe the total phenomenon. The sampling process is based on the selection
of random numbers (X-5 Monte Carlo Team, 2008a). Monte Carlo methods are very
convenient to estimate the result of measurement situations that would be problematic to
undertake practically, such as dose measurements in the steep dose gradients and small
spatial scales of brachytherapy sources. There are many Monte Carlo codes available for
radiation transport simulation (COG, EGSnrc, GEANT4, MCNP, MCSHAPE, PENELOPE, SCALE,
SRIM, TRIPOLI). The Monte Carlo N-Particle (MCNP)3 code has been chosen because it is a
widely used general-purpose code with capabilities including photon and electron transport
(Dunn and Shultis 2012). MCNP5 version 1.60 is used in this thesis.
2.4.2. MCNP5 Applied to Brachytherapy
MCNP has been widely used and validated in numerous medical physics
applications which are relevant to the present work. Examples of MCNP5 application for
brachytherapy dosimetry are provided by the following authors; MCNP5 Development Team
(2005), Yang and Rivard (2009), Gerardy et al. (2010), Adamson et al. (2012), Mosleh-Shirazi
et al. (2012), Reda (2013), Fronseca et al. (2013), Rivard et al. (2014). MCNP5 code may
3 Los Alamos National Laboratory, Los Alamos, New Mexico, USA

21
therefore be used ‘as is’ in this thesis with no further requirement to demonstrate
applicability of the code. However, it is essential to validate local implementation of the code
and input files to ensure correct operation. Advice on the application of Monte Carlo
methods in brachytherapy is provided in a report of the AAPM and ESTRO, published by
Perez-Calatayud et al. (2012a).
2.4.3. MCNP5 Input and Output Files
MCNP input files are used to define the problem; source, structures, tallies, and
other physics or simulation control data. There is a strict format required for the input file (X-
5 Monte Carlo Team 2008b), consisting of message block, problem title card with cell cards,
surface cards, and data cards, each delimited with single blank lines. Input lines have a
maximum of 80 columns, command mnemonics beginning in the first 5 columns or if blank
assumed a continuation of the previous line. Comment lines, ignored by the code, commence
with ‘c ‘.
Tallies are used in MCNP to specify and collect the required output data, in terms
of particle current, particle flux or energy deposition for specified geometries. Tallies are
normalized to be per source particle. There are two tallies in MCNP5 that may be used to
estimate energy deposition for brachytherapy problems. The F6 tally calculates the deposited
energy in a cell, via the transport of photons only, with local deposition of electron energy. It
consists of a track length tally multiplied by a reaction rate convolved with an energy-
dependent heating function. The *F8 pulse height tally provides the energy distribution of
pulses (or total energy if no bins are specified) created in a detector by radiation. *F8 is most
rigorous as both photons and electrons may be transported. However, F6 calculation is more
efficient, faster, and with reduced statistical uncertainty for the same number of particle
histories. *F8:p,e is the theoretically preferred method for photon and electron transport
problems as all details of the transport are followed (Goorley 2007). F6 tally estimates energy
deposition by integrating the track-length photon flux weighted by photon heating numbers.
These numbers represent the average kinetic energy given to electrons along the photon
path. Therefore, this tally is approximately valid only when most of the electrons are trapped
in the tallied cells. If the cells are small enough that a significant amount of electron energy
can escape, then the F6 tally will overestimate the energy deposition. In contrast, the *F8
tally performs a detailed accounting of the energy entering a cell minus the energy leaving a
cell for each history in a mode p,e problem.
A wealth of information is available in the MCNP output file, the content of
which is controlled by the inclusion of optional commands in the input file. The output file
always contains the input file listing, summary of particle loss/creation, tallies and tally
fluctuation charts. Data in the output file provides information for the user to assess the
precision (not the accuracy) of the tally results, particularly the ‘ten statistical indices’
calculated by MCNP. The relative error, R, is the fractional 1-sigma estimated uncertainty in
the tally mean, i.e. the ratio of the standard deviation of the tally mean to the mean. If R <0.1
the tally is reliable except for point/ring detectors, if R <0.05 the tally is reliable even for

22
point/ring detectors (Shultis and Faw 2011). The relative error must not be consulted in
isolation, and all 10 statistical tests should pass (X-5 Monte Carlo Team 2008b). If any of the
tests are failed, MCNP automatically produces additional output to aid the user in
interpreting the seriousness of the failure.

23
CHAPTER 3
Quality Control of High Dose Rate
(HDR) Brachytherapy Treatment
Equipment

24
3.1. The Need to Review Quality Control and Commissioning
Procedures and Establish Performance Requirements
3.1.1. Quality Control Testing of HDR Brachytherapy Systems
In comparison to external beam radiotherapy, the physical process by which
high dose rate (HDR) brachytherapy treatment units deliver treatment is simple. However,
this does not mean the quality control task is without complexity, and this must be
undertaken comprehensively to mitigate risk of treatment error. Quality assurance of all
brachytherapy techniques has recently received increased attention following a low dose
rate brachytherapy incident in 2009 at the Philadelphia VA Medical Centre in which a number
of patients received poor quality prostate seed brachytherapy treatment (Daigh 2010). There
have been many reported errors in brachytherapy delivery (ICRP 2000, ICRP 2005a, ICRP
2005b), including well chamber calibration error (Dempsey 2011), confusion over units
(USNRC 2009), media report of at least two incidents involving incorrect dwell positions
(ASAHI SHIMBUN 2013, Sydney Morning Herald 2003a and 2003b), and ‘field safety notices’
from equipment manufacturers, see Section 1.1.3. It is important that QC testing is robust
and comprehensive and meets the needs of modern equipment and treatment techniques.
It is over twenty years since a comprehensive assessment was undertaken of
brachytherapy QC practice in the United Kingdom (UK) (IPEM Radiotherapy Physics Topic
Group 1992), reproduced in the Institute of Physics and Engineering in Medicine (IPEM)
Report 81 (Mayles et al. 1999). The IPEM guidance on QC for radiotherapy is currently being
revised, and it is therefore timely to undertake a repeat benchmark exercise of current QC
practice for brachytherapy. The present survey has been endorsed by the IPEM Radiotherapy
Special Interest Group. A similar survey was conducted in 2002 in the Netherlands and
Belgium (Elfrink et al. 2001a), which reported large variations in test frequencies and
methods, and differences in QC-philosophy and available equipment. The author is not aware
of any other recent surveys of brachytherapy QC practice between centres.
The presentation here of a comprehensive assessment of current QC practice
has several potential benefits for individual radiotherapy departments: centres may be
reassured that their QC systems are in-line with accepted practice; alternatively, centres may
identify discrepancies against standards of practice. Following investigation, this may lead to
either reduction of tests or frequencies and hence efficiency savings, or resolution of
deficiencies and potential improvements in safety and quality. However, the details of QC
tests presented here should not be interpreted as guidelines or recommendations, but as a
‘snapshot’ of current UK practice against which individual centres may benchmark
themselves. It is important to be aware that specific QC testing is a local decision, based on
many local factors, and should ideally be based on risk-assessment approaches.

25
3.1.2. Commissioning of HDR Brachytherapy Systems
The performance of an HDR unit and its ability to accurately implement a series
of planned source dwells is critical to the quality of the treatment. The accuracy of delivered
doses is particularly dependent on source positioning due to the short distances between
target and source, steep dose gradients and large inverse-square law corrections for any
geographic errors. Prior to clinical use, new HDR treatment units require a complete and
thorough assessment to verify that the manufacturer’s and clinical users’ performance and
accuracy requirements are met, and that recommended baseline QC and dosimetric criteria
are satisfied. Previous performance evaluations (McDermott et al. 1996, Wallace 1997) have
shown that there can be appreciable source control and dosimetric differences between
different models of HDR systems. There are several publications on the general quality
control requirements for HDR units (Nath et al. 1997, Mayles et al. 1999, Venselaar et al.
2004, Wilkinson 2006), but no known contemporary review of proposals for an optimum
commissioning schedule.
A previous publication by the author presented baseline comparative
commissioning data for the first Eckert & Ziegler Bebig4 HDR brachytherapy system in the UK
(Palmer and Mzenda 2009). The work concluded with three suggestions for technical
improvements to (a) the compensation calculation for transit dose, (b) the source transit
movement profile to the first dwell point, and (c) the effect of curvature of source transfer
tubes on source position accuracy. Positioning errors of the source, of up to 1.0 mm for slight
bends, 2.0 mm for moderate bends and 5.0 mm for extreme curvature (depending on
applicators and transfer tube used) were reported in the study. The current work has
involved communication with the manufacturer to optimise the performance of the control
system software, addressing the technical issues above. Following issue of new software,
detailed measurements were performed on the source dwell positioning accuracy, using
both video analysis and autoradiography techniques, and on the transit dose and associated
corrections made by the HDR unit.
It is accepted practice that HDR treatment planning systems do not make any
correction for radiation dose resulting from transits of the source between dwells, presuming
these can safely be ignored due to the low actual transit time and dose, and that the HDR
unit will itself make correction to the planned dwell time to account for the transit dose. The
magnitude of the transit dose and the actual corrected dwell time are not normally presented
to the clinical user. The practice and validity of not considering transit doses in treatment
calculations must be verified for each manufacturer’s HDR unit, relating to its particular
source velocity, resulting transit dose, and the accuracy of transit dose corrections that are
made by the system. Similarly, the ability of a particular HDR unit to accurately and
reproducibly position the source at a series of dwell positions must be tested in a range of
clinical situations, in order to provide reassurance of the ability to deliver high quality
treatments. An action level of 2 mm source positioning error has been proposed as an upper
limit in clinical conditions (Venselaar et al. 2004). It is also important to consider the
4 Eckert & Ziegler Bebig GmbH, Berlin, Germany

26
possibility of any effect on source positioning and dwell timing of variations in the clinical use
of the HDR system.
3.1.3. Performance Requirements: Effect of Simulated Source Position Errors
There is also a need to determine performance requirement of brachytherapy
equipment in terms of basic source positioning accuracy and their effect on clinical treatment
planning parameters. An objective of the work below was to undertake a retrospective
treatment planning study to investigate the effect of simulated HDR source dwell position
errors on the dose to the (high risk) clinical target volume (HR-CTV) and organs at risk (OAR)
in cervix cancer. The aim was to determine the clinically relevant positional accuracy
requirements for source dwells in modern brachytherapy techniques, and hence decide
appropriate acceptable limits for routine QC tests for modern brachytherapy. An indication
of treatment dose uncertainty resulting from dwell position uncertainty was also derived.
3.2. Methodology
3.2.1. Survey of Quality Control Practices in the United Kingdom (UK)
All 64 radiotherapy centres in the UK were contacted by email in June 2012 to
request their contribution to the study, with collation of responses taking place during June
to August 2012. Centres were asked to complete a detailed questionnaire on their routine
QC practices and other aspects of high and pulsed dose rate (HDR and PDR) service provision.
The questionnaire is provided in Appendix J. To enable a contextual review of QC practice,
initial questions asked included equipment type, average patient workload, sites treated,
source strength calibration methods, level of image guidance, and prescribing practice. A
spreadsheet containing a comprehensive list of possible quality control tests for treatment
and planning equipment was also provided. Centres were asked to document whether they
routinely perform each test, at what frequency, by which staff group, and the acceptable
tolerance values used. They were also asked to comment whether the target test frequencies
were actually achieved in practice.
3.2.2. HDR Treatment Unit Commissioning Tests, Dwell Position and Transit Dose
Published guidance for the initial commissioning, or re-commissioning after
hardware or software change, for HDR treatment units was compiled and a list of activities
produced. This was then applied to the re-commissioning of an Eckert & Ziegler Bebig
brachytherapy system following a software change. The system consists of the treatment
unit, MultiSource, and a separate treatment planning system, HDRplus, which uses TG-43
formalism based dosimetry (Rivard et al. 2004). Importantly, the BEBIG HDR unit moves the
source through the planned dwells in a distal to proximal direction. An Eckert & Ziegler Bebig
MultiSource HDR treatment unit with software version 7.4.1, firmware version 4.14.1, was
used throughout this study. The results of all analyses were compared to data obtained with

27
the previous HDR control software, version 7.4.0, firmware version 4. All results are based
on use of the HDR unit with an Ir-192 source, model Ir2.A85-2.
To assess source positioning and movements over large distances a treatment
consisting of three dwells at 5.0, 35.0 and 105.0 mm was evaluated using x-ray film
autoradiography (Kodak EDR2 Ready Pack film), using dwells of 1 s for optimum film density.
A scanning optical densitometer (Vidar VXR-16) was used to locate the centre of the source.
The actual dwell position may be affected by curvature of the transfer tube between the HDR
unit and the applicator. Therefore measurements were made with a curvature induced in the
transfer tube by displacing the distal end of the tube by distances of 100, 300 and 900 mm,
while maintaining a stationary proximal end at the HDR unit. The 900 mm displacement was
included as an extreme ‘physically limiting’ case and not an expected realistic clinical
situation.
To assess source positioning and movements over smaller distances a high
definition video camera (Panasonic HDC-SD10) was used to image a catheter during a
treatment prescription consisting of three dwells at 10.0, 15.0 and 20.0 mm. The centre of
the source was identified visually in each video frame, at a resolution of 25 frames per
second, and the position recorded against a ruler also located within the video image. This
data set was used to evaluate the location of the source as a function of time between dwell
positions and to calculate the speed of source movement by the simple division of
displacement and elapsed time.
Using the above data set, the source position was recorded at 1/25 s intervals in
the approach to the first dwell position, between dwells, and from the last dwell back to the
HDR unit. An approximation of the transit dose was calculated by the summation of the dose
delivered by the source considered to be stationary for 1/25 s at each of the imaged
positions, using published dose-rate distribution data (Granero and Perez-Calatayud 2007).
The transit dose was calculated separately for the movement of the source to and from the
dwell position, and evaluated at two interest points, D10 and D20, located at 10 mm and 20
mm respectively from the centre of the dwell position, perpendicular to the source
movement axis, shown in Figure 3.1.
Figure 3.1. Transit dose calculation points, D10 and D20, at 10 mm and 20 mm respectively,
perpendicular distance from the centre of the intended dwell position.

28
The Eckert & Ziegler Bebig Multisource makes corrections for transit doses by
reducing the actual dwell time for each dwell position using the following algorithm (Spiller
2012):
100 cd T- T DT - TpDT rfrom dwellrto dwellr
where pDT is the performed dwell time (ms), DT is the planned dwell time (ms),
Tr is the time reduction applied to the dwell position for each transit (ms), d is the distance
between dwell positions (mm), and c is a constant which equals 3 for dwell separations of
less than or equal to 100 mm, and equals 2 for dwell separations of greater than 100 mm. Tr
for the first and last dwell positions is fixed at 450 ms. The fixed time reduction applied to
the first and last dwells was introduced with the new software, all other algorithm
parameters being consistent with the previous software version.
The transit dose correction implemented by the Eckert & Ziegler Bebig
Multisource was evaluated for the specific treatment situation detailed above, and the
‘equivalent dose reduction’ resulting from this dwell time reduction was compared to the
calculated transit dose, using the video analysis data.
3.2.3. Treatment Planning Study to Determine the Effect of Simulated Source
Position Errors
Simulated dwell position errors, in the range 0.2 to 10.0 mm, were introduced
in the treatment plans of a consecutive series of eight HDR cervix patients previously treated
at Portsmouth Hospitals NHS Trust. The dosimetric effect on ICRU reference point doses
(Chassagne et al. 1985) and GEC-ESTRO 3D dose volume histogram (DVH) parameters (Potter
et al. 2006) were calculated for the HR-CTV and OARs. Two error modes were simulated: (a)
incorrect calibration of the source position, modelled by the systematic proximal shift
(towards the HDR unit) of all dwell positions, separately evaluated with error magnitudes of
0.2, 0.5, 1.0, 2.0, 3.0, 4.0, 5.0 and 10.0 mm; and (b) a potential error mode of source cable
take-up lag, in which the first dwell position is unaffected and all others are shifted distally
(Palmer and Mzenda 2009). The CT-based treatment planning simulations were performed
on the Eckert & Ziegler Bebig HDRplus treatment planning system (version 2.5) employing a
TG-43 dose calculation, with an Ir-192 HDR source (model Ir.A85-2) and split-ring and IU
clinical treatment applicator.
3.3. Results
3.3.1. UK Survey: Brachytherapy Equipment Profile and Physics Processes
47 (73%) of the 64 UK radiotherapy centres that were invited to take part in the
survey of HDR and PDR QC responded. 31 centres had appropriate brachytherapy equipment
and provided fully completed questionnaires on their QC practice. 13 centres reported no
HDR or PDR brachytherapy facilities, and a further 3 intended to commence HDR
brachytherapy in the near future (at June 2012).

29
The majority (29) of radiotherapy centres had HDR units, with only three having
access to PDR treatments, two having exclusively PDR. The equipment profile of the
responding centres included 20 Nucletron/Elekta microSelectron, 7 Varian GammaMed, 4
Nucletron/Elekta/Isodose Control Flexitron, 1 Eckert & Ziegler Bebig HDR Multisource, and 1
Varian Varisource. One centre had 3 treatment units, 1 HDR and 2 PDR, all others had 1 unit.
One centre had a Co-60 source (HDR), the others were all using Ir-192. The latter radionuclide
being exchanged at 3-monthly intervals in all but two centres: one at 4-monthly intervals and
another PDR centre at between 3 and 6 months. One centre stated they were considering
moving to 4-monthly intervals to reduce cost. The planned frequency of exchange for the Co-
60 source was 4 years. The mean number of HDR fractions delivered per year at each centre
was 281, with interquartile range 173 to 359 (minimum 80 and maximum 730).
There was a lack of agreement as to whether the locally measured value or the
manufacturer’s supplied source certificate should be used for the source strength value in
treatment planning calculations; 18 centres (58%) preferring to use their own measurement.
The current UK Code of Practice for HDR brachytherapy dosimetry (Bidmead et al. 2010)
recommends a well chamber for the primary source strength measurement, but allows some
flexibility in the method used to obtain the second independent verification value. Table 3.1
lists methods used for source calibration and their relative popularity within UK centres (at
June 2012).
The quoted origin of the TG-43 (Rivard et al. 2004) source model data used in
the treatment planning systems also varied between centres. 14 (45%) used the supplied
manufacturer data, 8 (26%) used journal published data, and 8 (26%) used manufacturer data
and verified this against publications, (with 1 (3%) not answering the question). There was
also a variety of methods quoted as an independent check of the output of the treatment
planning system. The methods and their popularity are given in Table 3.2.

30
Table 3.1 Methods employed, and their popularity, for source strength measurement of HDR and
PDR sources at centres in the UK (at June 2012).
Technique for determination of source strength Centres citing method,
Number Percentage
Initial method Well chamber 29 94%
Manufacturer supplied source certificate 1 3%
NE2571 chamber with in-air jig 1 3%
Verification method
Well chamber (second unit) 14 45%
NE2571 chamber with in-air jig 12 39%
NE2571 chamber in solid phantom 2 6%
Manufacturer supplied source certificate 1 3%
I-125 seed device with adaptor 1 3%
Gafchromic film calibrated via 260kV x-rays 1 3%
Table 3.2. Methods employed, and their popularity, to independently verify treatment planning
system (TPS) calculations at centres in the UK (at June 2012).
Technique for verification of TPS calculation Centres citing method,
Number Percentage
Locally developed check software (including systems based on Matlab, Excel, Java, visual basic; usually employing either TG43 (Rivard et al. 2004) or BIR/IPSM 1993 (Aird et al. 1993)
16 52%
Commercial check software or additional TPS (including IMSure QA, Radcalcbrachy, Lifeline)
7 23%
Manual calculation or use of data tables 3 10%
Nomogram (prostate treatment) or TRAK relationship to target volume 2 6%
Use of standard plans only with initial independent calculation, no per-patient plan verification
2 6%
Consistency check performed with standard plan on same day 2 3%

31
Table 3.3. Primary sources of guidance for establishing QC schedules, and their popularity at
centres in the UK (at June 2012).
Documents providing guidance on HDR or PDR QC Centres citing document,
Number Percentage
Physics aspects of quality control in radiotherapy, IPEM Report 81 (Mayles et al. 1999)
19 61%
A practical guide to quality control of brachytherapy equipment, ESTRO Booklet No. 8 (Venselaar and Perez-Calatayud 2004)
15 48%
The IPEM code of practice for the determination of the reference air kerma rate for HDR (192)Ir brachytherapy sources based on the NPL air kerma standard, (Bidmead et al. 2010)
10 32%
Code of practice for brachytherapy physics, AAPM TG-56, 1997 (Nath et al. 1997)
8 26%
Discussion with colleagues and other centres’ documents 6 19%
High dose-rate brachytherapy treatment delivery, AAPM TG-59, (Kubo et al. 1998)
4 13%
Recommendations for Brachytherapy Dosimetry, BIR/IPSM Report 1993 [Aird et al. 1993]
3 10%
Calibration of photon and beta ray sources used in brachytherapy, IAEA TecDoc 1274, (IAEA 2002)
3 10%
Quality assurance for clinical radiotherapy treatment planning, AAPM TG-53, (Fraass et al. 1998)
2 6%
Quality assurance tests for prostate brachytherapy ultrasound systems, AAPM TG-128, (Pfeiffeera et al. 2008)
2 6%
Manufacturer’s guidance or manual (unspecified) 2 6%
A revised AAPM protocol for brachytherapy dose calculations, AAPM TG-43U1, (Rivard et al. 2004)
2 6%
Thomadsen BR ‘Achieving quality in brachytherapy’, (Thomadsen 1999) 2 6%
Other radiotherapy or brachytherapy text books, each n=1 2 6%
Remote afterloading technology, AAPM TG-41, (Glasgow et al. 1993) 1 3%
Towards Safer Radiotherapy, joint report of RCR, SoR, CoR, IPEM, NPSA, BIR, (RCR 2008)
1 3%
In-house experience with treatment unit 1 3%
Quoted “Relevant regulations” 1 3%
Quoted “Unsure of origin” 1 3%

32
Treatment plan optimisation in some form was used in 23 centres (73%),
including for cervix (majority), prostate (next most common), skin/limb moulds, interstitial
anus, vaginal vault, lung, head & neck, multilumen mammosite breast, intraluminal, and
keloid scars. 27 centres (87%) optimised treatment plans for individual patients; 19 (61%)
employing manual methods and the others inverse planning optimisation, often with final
manual adjustment. 6 centres (19%) stated they used pre-optimised standard plan libraries.
The level of image-guidance varied significantly between centres. In cervix
treatments, 16 (52%) used CT alone for treatment planning, 12 (39%) MRI with CT, 2 (6%)
MRI alone, and 1 (3%) c-arm 2D imaging alone. When MRI was available this was often used
for the first fraction, with CT used in subsequent treatments. For vaginal vault treatments,
13 (42%) did not image, 10 (32%) used orthogonal 2D x-ray, and 8 (26%) used CT. Some
centres responded they would only image vault treatments for complex cases or if
individualised plans were required. There were an insufficient number of responses on
imaging used for other treatment sites for statistical significance.
Gynaecology cancers were the most commonly treated. In cervix, 22 centres
(71%) still prescribe treatment doses to Manchester Point A. For those prescribing instead to
high-risk clinical target volume, HR-CTV (Potter et al. 2006), all centres additionally record
the Point A dose. Only 2 centres (6%) exclusively recorded ICRU organ at risk (OAR) point
doses, likely when only orthogonal imaging is used, the others recorded either just GEC-
ESTRO dose-volume histogram (DVH) data (48%), or both ICRU point dose and DVH data
(46%).
Centres were asked to list the primary sources of guidance used in establishing
their HDR or PDR quality control schedules. Table 3.3 provides a list of the documents that
were indicated and their popularity, quoted as the percentage of centres citing the
document. All centres stated they had reviewed the content of their HDR/PDR QC schedule
within the last two years, except two which did not answer the question.
3.3.2. UK Survey: Quality Control Testing
Table 3.4 shows the percentage of centres that include each of the specific tests
in their planned QC schedules, from the UK survey. A centre is deemed to have included the
test in their regular QC if it is performed within the department whether it is in the specific
‘physics QC documentation’ or other ‘standard operating procedures’, for plan checking for
example. A test is deemed not to be in regular QC if it was only intended to be performed
once at initial equipment commissioning. The mean and range of frequencies of testing and
acceptable tolerance levels are provided in the table. There is a significant variation in
consistency between centres across the range of tests. Inclusion of tests in QC schedules
varies from 31 centres (100%) for source strength measurements to just 2 centres (6%) for
MRI tests, the latter of course being due to limitations of access to MRI for brachytherapy-
specific clinical use and QC testing. There is also a lack of consistency between centres in the
frequency of testing and the acceptable tolerance levels used for individual QC tests. Of the
45 tests included in the survey, 21 were performed at greater than 75% of centres, and 4

33
were performed at less than 25% of centres. Only 2 centres (6%) reported that achieved
measurement frequencies were below planned measurement frequencies, and then only for
up to two tests each.
Table 3.5 lists additional QC tests suggested by responding centres, which were
not included in the original set of tests in the distributed survey. These are generally
proposals made by single centres and there is no information of the popularity of these tests
across UK, however they are included for completeness. Quality control testing of dosimetry
equipment associated with HDR and PDR use has not been included in the results tables;
secondary standard calibrations and consistency testing of well chambers and Farmer-type
ionisation chambers are covered elsewhere and in published codes of practice.
It is valuable to consider in further depth those tests that are: (a) included in QC
schedules at all UK centres, Table 3.6; (b) those at around half of centres, Table 3.7; and (c)
those not currently in any centres QC schedule, Table 3.8. The tests of primary importance,
source strength, timer accuracy, and basic source position (in straight catheter), were
included in all UK centres’ QC schedules, and the published guidance documents are
generally in good agreement, see Table 3.6. This was a valuable validation of basic quality
checking. However, there was disagreement among UK centres, and in published guidance
documents, as to the value of including other tests in routine QC. Two such tests are given in
Table 3.7, accuracy of dwell positions in clinical applicators and measurement of source
transit time/dose. A method for the evaluation of transit dose is provided in Sections 3.3.3.2
along with discussion indicating the value of this test. The need to test the position of source
dwells in clinical treatment applicators is indicated in Sections 3.3.3.3, 3.3.4, and also due to
prior errors of source positioning having been reported, Section 1.1.3.
Table 3.8 lists three performance tests that were not included in any UK centres’
QC schedules at the time of the survey, and are not included in published guidelines: ‘end to
end’ testing, measurement of dose distributions around clinical treatment applicators, and
checking of advanced planning system features available for modern brachytherapy, such as
inverse optimisation and inhomogeneity correction
3.3.3. Commissioning and QC of HDR Treatment Units
A list of activities that comprise the required commissioning test for HDR
brachytherapy systems is provided in Table 3.9. This provides a contemporary collation of
areas of investigation that are required, derived from several publications (Bastin et al. 1993,
McDermott et al. 1996, Wallace 1997, Mayles et al. 1999, Sahoo et al. 2001, Venselaar and
Perez-Calatayud 2004, Wilkinson 2006, Evans et al. 2007), suggestions from other UK
radiotherapy centres via personal communication with the author, and the author’s own
opinion. This table is useful to put into context the detailed results in the following sections.

34
Table 3.4. HDR and PDR QC survey: Response to questionnaire on test popularity, measurement
frequency and tolerance values (at June 2012).
QC test % of centres including in routine QC
Measurement intervals, % using mean value (and range of responses)
Tolerance, % using mean value (and range of responses)
Comments
Sou
rce
str
en
gth
Initial measurement after source installation
100% 100% at source change
(all centres)
52% use 3%
(2% to 5%) Achievable
tolerance depends on test
method and whether result is compared to
certificate or 1st measurement
Independent measurement after source installation
100% 100% at source change
(all centres)
35% use 3%
(0.5% to 5%)
Repeat measurements during life of source
75% 83% at 1m
(1 d to 1m)
56% use 3%
(0.5% to 5%)
Leak testing of source
97% 97% at source change
(1m to source change)
71% not > background
(zero to 200 Bq)
Tre
atm
en
t u
nit
fu
nct
ion
Confirm accuracy of source data at treatment unit
97%
41% at each patient
(each patient to commissioning only)
55% use exact match
(exact to 4%)
Confirm accuracy of decay correction at treatment unit for plans
91%
86% at each patient
(weekly to commissioning only
22% use 1%
(exact match to 3%)
Tolerance depends on
how frequently unit makes
decay correction
Plan data transfer from TPS
83%
96% at each patient
(weekly to commissioning only)
63% use exact match
(0.1 s to 2%)
Some standard template plans
only, no transfer
Simulated treatment functionality test
68% 68% at 1d
(1d to 12m)
50% use 1mm
(1 mm to 2 mm)
May be independent
test or combined
System display and print-out accurate and in agreement
96%
83% at each patient
(each patient to commissioning only)
88% use exact match
(exact to 2%)
Test of function with mains power loss
58% 50% at 3m
(1m to 12m)
Test of UPS power supply
44% 31% at 3m
(1d to 12m)
d = day, w = week, m = month, y = year, TPS = treatment planning system
Table 3.4 continued on next page…

35
…Table 3.4 continued from previous page
QC test % of centres including in routine QC
Measurement intervals, % using mean value (and range of responses)
Tolerance, % using mean value (and range of responses)
Comments
Tre
atm
en
t p
lan
nin
g sy
ste
m
Accuracy of source model data used by TPS (e.g. check TG-43 data against reference values)
36% 65% at commissioning
(1m to commissioning)
No consistency
(Interpolation to 5%)
Normally undertaken at
software updates
Accuracy of individual source data used by TPS (e.g. source strength, calibration date)
89% 64% at each patient
(each patient to 3m)
No consistency, responses were:
exact match, rounding error, 1
day correction, 0.5%, 1%, 2%, 3%.
Tolerance may depend on how frequently unit
makes decay correction
Calculation of standard plans compared to reference data
63% 28% at 3m
(1d to commissioning)
No consistency, responses were:
exact match, 1%, 2%, 3%, 5%, 1 mm
idsodose lines
Independent check calculation of TPS patient plans or standard plans.
62%
74% at each patient
(each patient to commissioning)
50% use 3%
(1% to 5%)
Depends whether
patient-specific optimised or
standard plans are in use
Repeat of tests performed at TPS commissioning (e.g. DVH accuracy, geometric tests)
32% 39% at 3m
(1m to commissioning)
33% use 2 mm
(variety of definitions including
mm, % of DVH or dose points)
Often performed at
software updates only
d = day, w = week, m = month, y = year, TPS = treatment planning system
Table 3.4 continued on next page…

36
…Table 3.4 continued from previous page
QC test % of centres including in routine QC
Measurement intervals, % using mean value (and range of responses)
Tolerance, % using mean value (and range of responses)
Comments
Ap
plic
ato
rs, s
ou
rce
po
siti
on
an
d s
ou
rce
mo
vem
en
t
Visual inspection of applicators and transfer tubes for damage
97% 70% at 1d
(1d to 12m)
Measurement of dimensions and angles of applicators and transfer tubes
48% 46% at commissioning
(each patient to 12m)
75% use 1 mm
(0.5 mm to 1 mm)
Often rely on image match to
TPS library
X-ray imaging of applicators
32% 64% at commissioning
(3m to 12m) 100% use 1 mm
Most commonly only when suspected
damage
Verification of source dwell timer accuracy
97% 38% at 1d
(1d to 12m)
38% use 1s
(0.1 s to 2 s)
Large variation in definition of
test methodology
Measurement of source dwell positions in straight catheter (not clinical applicator)
100% 42% at 1d
(1d to 4m)
78% use 1 mm
(0.5 mm to 2 mm)
Multiple techniques
often in use at each centre
Measurement of source dwell positions in clinical applicators
55% 36% at commissioning
(2w to 12m)
79% use 1 mm
(1 mm to 2 mm)
Measurement of actual source dwell positions compared to TPS stated position in complex geometry e.g. ring applicator
41% 35% at 3m
(2w to commissioning)
67% use 1 mm
(1 mm to 3 mm)
Absence of test often due to
ring applicator not being used
Source position relative to dummy source or marker wire
60% 35% at commissioning
(1d to 12m)
72% use 1 mm
(0.5 mm to 2 mm)
Absence of test normally due to marker wire not
being used
d = day, w = week, m = month, y = year, TPS = treatment planning system
Table 3.4 continued on next page…

37
…Table 3.4 continued from previous page
QC test % of centres including in routine QC
Measurement intervals, % using mean value (and range of responses)
Tolerance, % using mean value (and range of responses)
Comments
Ap
plic
ato
rs, s
ou
rce
po
siti
on
an
d s
ou
rce
mo
vem
en
t (c
on
t.)
Applicator/transfer tube connection interlock and simulated error
73% 68% at 1d
(1d to 6m)
Verification of expected position of internal applicator shielding
15%
50% at each patient
(each patient to commissioning)
Not commonly
in use in UK
Measurement of source transit times
47% 41% at 3m
(1w to commissioning)
No consistency, responses were:
0.1 s, < 0.5 s, <1 s, not > baseline, not
> 0.05 s dwell equivalent
Large variety of techniques (well
chamber to stop watch) and tolerance values
Confirm error code ‘meanings and actions’ are available at treatment unit
36%
25% each at 1d and 12m
(1d to commissioning)
Historic test, mostly replaced
with improved software interface
information
Radiation monitor of applicators after use
26% 86% at each patient
(each patient to 1w)
100% not above background
Majority rely on in-room
radiation monitor
Availability of in-vivo dosimetry system for brachytherapy?
19%
Not in clinical use in the
majority of centres.
Included TLD, diode, MOSFET.
Calibration of in-vivo dosimetry system
60% (of 19%) 50% at 1m
(1m to ‘as required’) 100% use 5%
Test of in-vivo measurement against expected /planned dose measured in phantom
60% (of 19%) 50% each at 1w and
12m 100% use 5%
d = day, w = week, m = month, y = year, TPS = treatment planning system
Table 3.4 continued on next page…

38
…Table 3.4 continued from previous page
QC test % of centres including in routine QC
Measurement intervals, % using mean value (and range of responses)
Tolerance, % using mean value (and range of responses)
Comments
Faci
litie
s
Visual (CCTV) and audible (intercom) patient monitoring
100% 93% at 1d
(1d to 3m) functional
Radiation warning lights
100% 90% at 1d
(1d to 4m) functional
Independent radiation monitor (room monitor)
100% 83% at 1d
(1d to 4m) functional
Interlocks (e.g. door, timer delay)
100% 90% at 1d
(1d to 4m) functional
Emergency stop control
100% 81% at 1d
(1d to 4m) functional
Co
nti
nge
nci
es
Practice of simulated emergency (e.g. source stuck)
97% 46% at 12m
(1w to 12m)
Presence of emergency equipment (e.g. source container, forceps, shield, monitor)
97% 91% at 1d
(1d to 12m)
Review of responsibilities (e.g. who removes applicator if source stuck)
84% 50% at 1d
(1d to 12m)
d = day, w = week, m = month, y = year, TPS = treatment planning system
Table 3.4 continued on next page…

39
…Table 3.4 continued from previous page
QC test % of centres including in routine QC
Measurement intervals, % using mean value (and range of responses)
Tolerance, % using mean value (and range of responses)
Comments
Imag
ing 2D kV imaging
tests, including applicator reconstruction
24% 29% at 1d
(1d to commissioning)
50% use 2%
(1% to 2%, or 2 mm)
Absence of test often due to 2D
imaging not being used
CT imaging tests, including applicator reconstruction
38%
50% at commissioning
(each patient to commissioning)
No consistency, responses were:
1%, 2%, 3%, 5%, 1 mm, 2 mm
Absence of specific tests often due to
reliance on TPS applicator
library
MR imaging tests, including applicator reconstruction and distortion
6% 60% at commissioning
(3m to commissioning)
50% use 2 mm
(1 mm to 2 mm)
Absence of test often due to
brachytherapy-specific MR imaging not being used.
Access to MR for QC often a
problem.
Ultrasound imaging tests, including applicator reconstruction and grid alignment
26% 43% at 3m
(1m to commissioning)
No consistency, responses were:
1 mm, 2 mm, 1 cc, 5%
Absence of test often due to
ultrasound imaging not being used
Accuracy of image data transfer to TPS
60%
27% at each patient
(each patient to commissioning)
43% use exact match
(exact to 2 mm, or 2%)
Image-based data only
d = day, w = week, m = month, y = year, TPS = treatment planning system

40
Table 3.5. UK QC survey: Additional tests identified by responding centres as being included in local
QC procedures but not included in original survey questionnaire.
Additional possible QC tests not included in the survey
Equ
ipm
en
t p
erf
orm
ance
Dwell time linearity
Check behaviour if transfer tube loop/curvature too tight
Treatment interruption behaviour
Source drive motor operational (check audible indication of movement)
Satisfactory performance of system self-test
PD
R
PDR pulse timing
Check of nurses’ station and remote control panels
Catheter integrity and connectivity to PDR unit
Partial treatment completion
TPS
Consistency of plans between software version
Data security including backup (patient information, source data, system settings)
Imag
ing
Image fusion CT/MR
MR image scaling
Rad
iati
on
pro
tect
ion
Radiation monitoring of treatment unit (e.g. dose rate at 5cm or 1m)
Radiation monitor empty treatment unit during source change
Receipt and return of source paperwork
Confirm controls in place for source security
Mis
c.
External audit of system quality control/performance

41
Table 3.6. QC tests included in all surveyed UK centres’ schedules (at June 2012), with comparison
to published recommendations.
QC test UK survey:
Measurement
frequency,
mean with
range in
brackets.
UK survey:
Acceptable
tolerance,
mean with
range in
brackets
Comparison to published recommendations
Initial and
independent
measurement
of source
strength
At source
change
(all)
3%
(2% to 5%)
AAPM: 3-monthly, 3%
ACPSEM: 3-month/source change, 3% tolerance, 5%
action
CAPCA: 3-month/source change, 3% tolerance, 5%
action
ESTRO: source change, action level >5%
IPEM: source change, investigate 3%, do not use >5%
Source dwell
timer accuracy
Daily
(daily to
annually)
1s
(0.1s to 2s)
AAPM: no value given
ACPSEM: daily and source change, 1% tolerance, 2%
action
CAPCA: 3-monthly, 1% tolerance, 2% action
ESTRO: annually, action >1%
IPEM: no value given
Source dwell
positions in
straight
catheter
Daily
(daily to at
source change)
1 mm
(1 mm to 2
mm)
AAPM, daily, 1 mm
ACPSEM: daily and source change, 1 mm tolerance, 2
mm action
CAPCA: daily, 1 mm tolerance, 2 mm action
ESTRO: daily, action >2 mm
IPEM: no value given
AAPM (Nath et al. 1997), IPEM (Mayles et al. 1999), ESTRO (Venselaar and Perez-Calatayud 2004), CAPCA
(Arsenault et al. 2006), ACPSEM (Dempsey et al. 2013).

42
Table 3.7. Comparison of UK practice and published recommendations for two QC tests included
in only half of surveyed UK centres’ schedules. (Source dwells in clinical applicators in
55% of schedules and transit dose in 47%)
QC test UK survey:
Measurement
frequency, mean
with range in
brackets.
UK survey:
Acceptable
tolerance,
mean with
range in
brackets
Comparison to published recommendations
Source dwell
positions in
clinical
applicators
At commissioning
(2-weekly to
annually)
1 mm
(1 mm to 2
mm)
AAPM: 3-monthly, ±2 mm position relative to
applicator, 0.5 mm relative to dummy markers
ACPSEM: X-ray marker positional accuracy,
annually, 1 mm tolerance, 2 mm action
CAPCA: annually, 1 mm tolerance, 2 mm action
ESTRO: not explicitly required, suggestion of jig
IPEM: “preferably less than 1 mm”, no frequency
given
Measurement
of source transit
time or dose
3-monthly
(weekly to at
commissioning)
Large
variations in
definition
AAPM: annually, “influence of transit dose must be
evaluated and corrected for if necessary”
ACPSEM: annually, “transit dose reproducibility”,
1% action, 2% tolerance
CAPCA: annually, 1% action, 2% tolerance
ESTRO: annually, no tolerance given
IPEM: not stated
AAPM (Nath et al. 1997), IPEM (Mayles et al. 1999), ESTRO (Venselaar and Perez-Calatayud 2004), CAPCA
(Arsenault et al. 2006), ACPSEM (Dempsey et al. 2013).

43
Table 3.8. Suggested QC tests not included in any surveyed UK centres’ schedules (at the time of
the UK survey).
QC test UK survey:
Measurement
frequency
UK survey:
Tolerance
value
Comparison to published recommendations
‘End-to-end’
check,
including
imaging,
planning and
delivery
Not included in
any routine QC
Not included
in any routine
QC
AAPM: No specific recommendation
ACPSEM: No specific recommendation
CAPCA: No specific recommendation
ESTRO: No specific recommendation
IPEM: No specific recommendation
Verify dose
distribution
around
clinical
treatment
applicators
Not included in
any routine QC
Not included
in any routine
QC
AAPM: No specific recommendation
ACPSEM: No specific recommendation
CAPCA: No specific recommendation
ESTRO: No specific recommendation
IPEM: No specific recommendation
Check of plan
optimisation
software
performance
(and other
advanced TPS
features)
Not included in
any routine QC
Not included
in any routine
QC
AAPM : initially and new software versions, “series of
test cases based on idealised implant geometries,
develop sense of what optimisation does to an
implant compared to uniform loading”
ACPSEM: No specific recommendation
CAPCA: No specific recommendation
ESTRO: No specific recommendation
IPEM: No specific recommendation
AAPM (Nath et al. 1997), IPEM (Mayles et al. 1999), ESTRO (Venselaar and Perez-Calatayud 2004), CAPCA
(Arsenault et al. 2006), ACPSEM (Dempsey et al. 2013).

44
Table 3.9. Required areas of investigation for HDR brachytherapy system commissioning, or for
consideration after re-commissioning following hardware or software update.
Process
Critical Examination, radiation shielding survey, local rules
Manufacturer’s acceptance testing schedule
Mechanical and electrical safety tests
Interlocks, safety features and basic operational checks, including timer accuracy checks
Source positioning: in straight catheter and in all clinical treatment applicators, with comparison to
manufacturer specification and to actual TPS positioning.
Source dwell time: accuracy over full clinical range.
Source transit time
Source specification data
Manufacturer’s source certificate
Source strength measurement with a well chamber
Source strength measurement with an independent method, e.g. thimble ionisation chamber in-phantom
Data transfer from the treatment planning system (TPS)
TPS algorithm, functionality tests, and source data
Applicator commissioning including labelling, rigidity, consistency with TPS library of applicators and
transmission measurements
Definition of, and baseline results for, routine quality checks
Training materials and documentation
3.3.3.1. Source Movement Profile
Figure 3.2 shows the movement profile, position of the source as a function of
time at 1/25 s resolution imaged with a video camera, between 10.0 and 15.0 mm dwell
positions, which is similar to that between 15.0 and 20.0 mm dwells (not shown). Movement
between all dwells appeared smooth with equal phases of acceleration and deceleration, no
‘overshoot’ in dwell positioning, nor any fine corrections required to achieve the final dwell
position.
Figure 3.3 shows the movement profile on approach to the first dwell, when the
Eckert & Ziegler BEBIG MultiSource® system was operated with (a) new control system
(software version 7.4.1, firmware 4.14.1), and (b) previous version control system (software
version 7.4.0, firmware 4.13.0). The newer software moves the source directly to the first
dwell position, rather than intentionally driving beyond the first position and pausing as
controlled by the old software. The intentional pause was implemented in the previous
software to enable any slack or ‘snaking’ of the cable to be released prior to fine final

45
positioning. The new software implements an empirical correction (applicator and transfer
tube specific) to account for this and achieves the same final positional accuracy. The
maximum recorded source transit speed was 400 (±20) mm s-1 in both data sets. The
maximum speed achieved between dwells of 5.0 mm separation was 63 (±4) mm s-1 with the
new control software, which is consistent with measurements made with the old software at
62 (±4) mm s-1 (Palmer and Mzenda 2009).
The largest positional uncertainty from the video analysis technique was ±2 mm
at maximum source speed, which reduced as the source slowed; this was estimated from the
extent of blurring in the video frames. The final intended source dwell position was always
achieved within ±0.5 mm. The uncertainty in speed is quoted as the quadrature sum of
positional and time uncertainty.
3.3.3.2. Transit Dosimetry
Table 3.10 presents transit doses calculated from video analysis of source
movement compared to the equivalent dose reduction implemented from the Eckert &
Ziegler BEBIG MultiSource® system correction algorithm, at D10 and D20 (10.0 and 20.0 mm
from the centre of the dwell position perpendicular to the source movement axis), for the
previous and updated control software. The magnitude of the actual transit dose at the first
dwell is reduced with the new software due to the absence of the preceding ‘pause’ in
approaching the first dwell, see Figure 3.2. All other actual transit doses are consistent within
experimental uncertainty between the two software versions.
At both D10 and D20 the applied correction for a dwell within a series (15.0 mm
dwell point in this example) is consistent between the two software versions, and is
equivalent to the actual transit dose calculated from the video analysis. The majority of
dwells in a clinical treatment will be mid-series dwells, hence this result is most significant.
The newer control software applies a larger transit dose correction for the first
dwell compared to the old software, 0.45 s compared to 0.115 s, and this is in closer
agreement to the actual transit dose in the cases considered; At D10 the actual transit dose is
2.94 (±0.05) cGy for the new software and 7.45 (±0.05) cGy for the old software, resulting in
transit dose correction errors of -2.6% and 6.0% respectively. At D20 the actual transit dose is
0.91 (±0.05) cGy and 3.00 (±0.05) cGy for the new and old software, resulting in errors of -
0.5% and 2.6% respectively.
The magnitude of the actual transit dose will reduce as the source decays since
the transit time is unchanged but the dose rate from the source will decrease. At D20, for a
dwell point within a series of 5.0 mm separation dwells, as above, there will be a software
time correction (both new and old versions) resulting in an equivalent dose reduction of 0.72
(±0.02) cGy. For a new Ir-192 source the actual transit dose in this case is 0.73 (±0.05) cGy.
However, when the source has decayed to the end of its normal clinical use period, the actual
transit dose is reduced to 0.31 (±0.05) cGy at 3 months or 0.23 (±0.05) cGy at 4 months,
leading to a small overcorrection by the software.

46
Figure 3.2. Position and speed of source during transit from first to second dwell positions, from a
series of three dwells at 10.0, 15.0 and 20.0 mm, with new control software.
Figure 3.3. Position and speed of source during transit from the Eckert & Ziegler BEBIG Multisource®
on approach to the first dwell position at 10.0 mm, with (a) the new control software
and (b) the old control software.

47
Table 3.10. Comparison of actual calculated transit dose and Eckert & Ziegler BEBIG Multisource®
compensated transit dose, for each dwell position in a series of three dwells, at 10.0,
15.0 and 20.0 mm, evaluated at D10 and D20 (10.0 and 20.0 mm from the centre of the
dwell position perpendicular to the source movement axis), for the apparent activity of
a new Ir-192 source. The data is presented for both the newer and older control system
software (see text).
D10, New control software:
Dwell point Treatment unit calculated dwell time reduction (s)
Equivalent dose reduction implemented (cGy) (±0.02)
Actual transit dose (cGy) (±0.05)
Transit dose error ‘actual – corrected’ dose (cGy) (±0.1)
10.0 mm (first) 0.45 5.49 2.94 -2.6
15.0 mm 0.23 2.81 2.66 -0.2
20.0 mm (last) 0.45 5.49 2.65 -2.8
D10, Old control software:
Dwell point Treatment unit calculated dwell time reduction (s)
Equivalent dose reduction implemented (cGy) (±0.02)
Actual transit dose (cGy) (±0.05)
Transit dose error ‘actual – corrected’ dose (cGy) (±0.1)
10.0 mm (first) 0.115 1.41 7.45 6.0
15.0 mm 0.23 2.81 2.62 -0.2
20.0 mm (last) 0.115 1.41 2.72 1.3
Table 3.10 continued on next page…

48
…Table 3.10 continued from previous page
D20, New control software:
Dwell point Treatment unit calculated dwell time reduction (s)
Equivalent dose reduction implemented (cGy) (±0.02)
Actual transit dose (cGy) (±0.05)
Transit dose error ‘actual – corrected’ dose (cGy) (±0.1)
10.0 mm (first) 0.45 1.41 0.91 -0.5
15.0 mm 0.23 0.72 0.73 0.0
20.0 mm (last) 0.45 1.41 0.90 -0.5
D20, Old control software:
Dwell point Treatment unit calculated dwell time reduction (s)
Equivalent dose reduction implemented (cGy) (±0.02)
Actual transit dose (cGy) (±0.05)
Transit dose error ‘actual – corrected’ dose (cGy) (±0.1)
10.0 mm (first) 0.115 0.36 3.00 2.6
15.0 mm 0.23 0.72 0.73 0.0
20.0 mm (last) 0.115 0.36 0.85 0.5
3.3.3.3. Dwell Position Accuracy with Transfer Tube Curvature
Figure 3.4 compares the effect of source transfer tube curvature on actual dwell
positions between the old and new Eckert & Ziegler BEBIG MultiSource® control system
software. There is a clear and significant improvement in accuracy of the actual compared to
intended dwell positions with the new software. In all but the extreme curvature case (90 cm
displacement), the dwells are accurate within 1.0 (±0.5) mm with the new software,
compared to typical errors of 3.0 (±0.5) mm at 100 mm displacement and up to 6.5 (±0.5)
mm at 300 mm displacement, with the old software.
Previous work by the author (Palmer and Mzenda 2009) proposed that dwell
position errors due to transfer tube curvature are the result of the drive cable taking the
outer radius of the source transfer tube during the outward drive motion, as well as potential
‘snaking’, and then taking up this ‘slack’ during distal-to-proximal stepping of the source
during the initial few dwells; the drive cable taking the internal radius on return to the Eckert
& Ziegler BEBIG MultiSource® unit. The new control software has mitigated this error by using
empiric applicator factors to account for resistance and moving properties of the source
cable, for each applicator and transfer tube combination (Spiller 2012). An unintended dose
enhancement at the first dwell position can be seen on the autoradiograph with the old
software, which is no longer present with the new software, Figure 3.4. This is due to the
elimination of the transit pause prior to the first dwell.

49
Figure 3.4. Autoradiographs of actual source dwell positions compared to planned positions
(vertical lines) as a function of curvature of the transfer tube, for the 1400 universal
applicator (140 cm length), both for the previous EZ BEBIG Multisource® control system
software, “old”, and the latest software, “new”. The autoradiographs are for a straight
transfer tube and for bends induced by displacements of the distal end by 10, 30 and 90
cm towards the treatment unit.
3.3.4. Treatment Planning Study of Simulated Source Positioning Errors
Figure 3.5 shows a 3D projection of the applicator, HR-CTV and OARs in order to
provide context of a typical HDR brachytherapy cervix treatment to the presented results.
The close proximity of the target and critical radiosensitive normal structures confirms the
need for accurate source dwell positioning.
An illustration of the isodose shifts resulting from the simulated source
positioning errors for a typical cervix treatment plan is shown in Figure 3.6. In the sagittal
projection, Figure 3.6(a), noticeable isodose shifts can be seen across the 2, 5 and 10 mm
magnitudes at the tip of the IU applicator, and at the location of the bladder balloon and

50
rectum. In the coronal projection, Figure 3.6(b), no effect on isodose position is observed
even for the 10 mm shift in the region of the Manchester Point A location, which is
traditionally the dose prescription point for cervix treatment.
Figure 3.7 presents the DVH for the bladder, rectum and HR-CTV for the case in
Figures 3.5 and 3.6, with intended dose delivery and with simulated dwell position errors. It
is problematic to infer radiobiological implications of small changes in DVH curves, but it is
apparent that changes occur at 2 mm shift and are significant at 5 and 10 mm shift in terms
of the changed dose to structures.
Figure 3.8 represents combined data from eight cervix patient plans with
simulated errors, showing the mean and interquartile range, for the dose received by 90% of
the HR-CTV, D90, and the maximum dose received by a 2 cm3 volume, D2cc, of the OARs
bladder, rectum and sigmoid. There is an approximate linear relationship; shifts of 1.0 mm
result in a 2.0% change, and 4.0 mm in 10.0% change. Point A exhibits less change than DVH
metrics, 0.4% and 0.7% respectively. Bladder doses increase while rectum, sigmoid and HR-
CTV decrease due to the proximal shift direction of dwells. This would be reversed for distal
shifts.
Table 3.11 provides detailed DVH data for simulated dwell position errors in the
range 0.2 to 2.0 mm, for two error modes (a) systematic proximal shift of all dwell positions,
and (b) source cable take-up lag, in which the first dwell position is unaffected and all others
are shifted distally (Palmer and Mzenda 2009). In addition to D90, the volume receiving 100,
150 and 200% of the prescribed dose is provided for the HR-CTV. The maximum dose received
by 1 and 2 cm3 of OARs bladder, rectum and sigmoid are provided. Only at ±0.2 mm accuracy
between simulated and intended dwell positions were the effects on all considered
parameters within 1.0%. An accuracy of at least ±1.0 mm was required to limit the dose
uncertainty on the most important clinically relevant parameters, D90, D2cc, to within an
acceptable level of 3.0%.
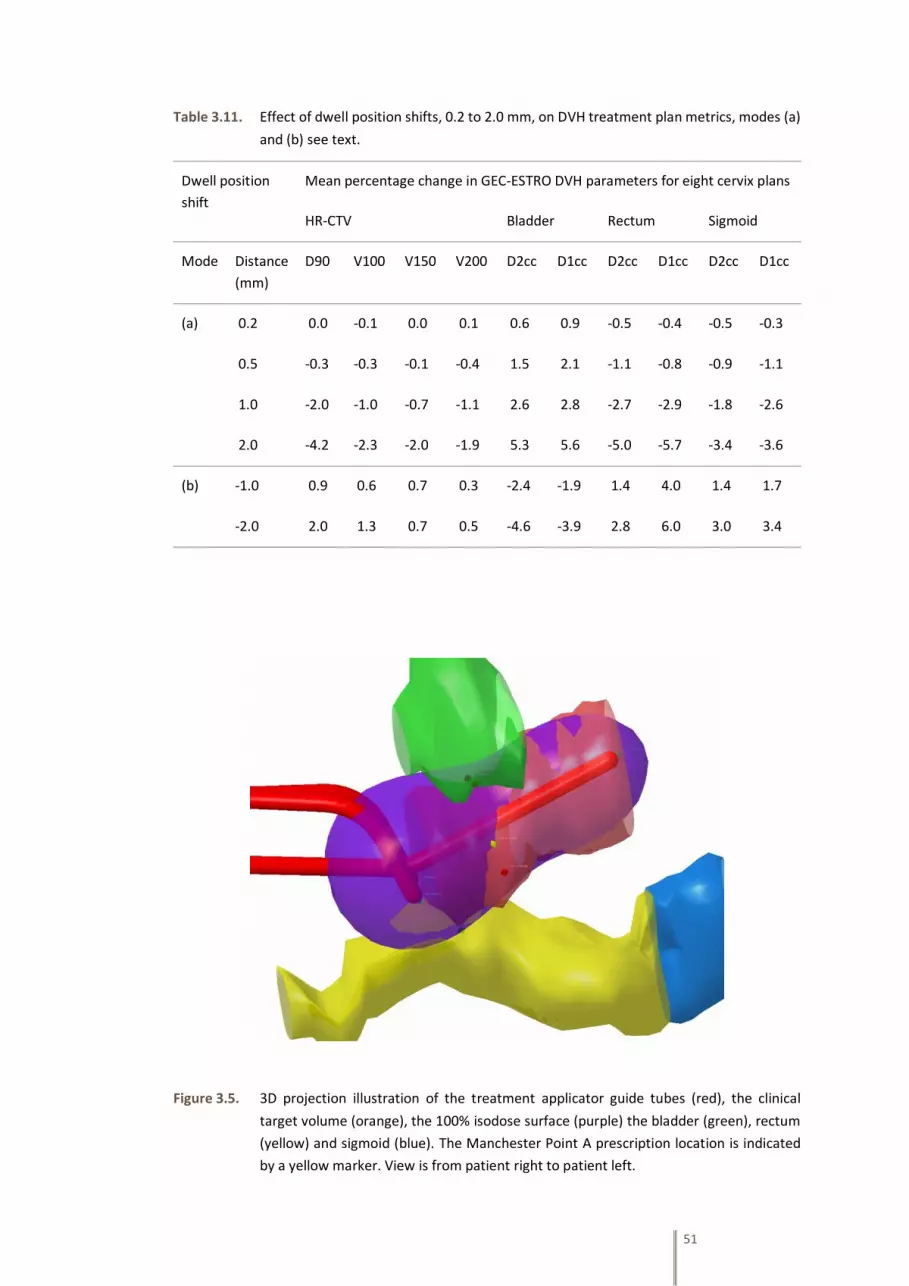
51
Table 3.11. Effect of dwell position shifts, 0.2 to 2.0 mm, on DVH treatment plan metrics, modes (a)
and (b) see text.
Dwell position
shift
Mean percentage change in GEC-ESTRO DVH parameters for eight cervix plans
HR-CTV Bladder Rectum Sigmoid
Mode Distance
(mm)
D90 V100 V150 V200 D2cc D1cc D2cc D1cc D2cc D1cc
(a) 0.2 0.0 -0.1 0.0 0.1 0.6 0.9 -0.5 -0.4 -0.5 -0.3
0.5 -0.3 -0.3 -0.1 -0.4 1.5 2.1 -1.1 -0.8 -0.9 -1.1
1.0 -2.0 -1.0 -0.7 -1.1 2.6 2.8 -2.7 -2.9 -1.8 -2.6
2.0 -4.2 -2.3 -2.0 -1.9 5.3 5.6 -5.0 -5.7 -3.4 -3.6
(b) -1.0 0.9 0.6 0.7 0.3 -2.4 -1.9 1.4 4.0 1.4 1.7
-2.0 2.0 1.3 0.7 0.5 -4.6 -3.9 2.8 6.0 3.0 3.4
Figure 3.5. 3D projection illustration of the treatment applicator guide tubes (red), the clinical
target volume (orange), the 100% isodose surface (purple) the bladder (green), rectum
(yellow) and sigmoid (blue). The Manchester Point A prescription location is indicated
by a yellow marker. View is from patient right to patient left.
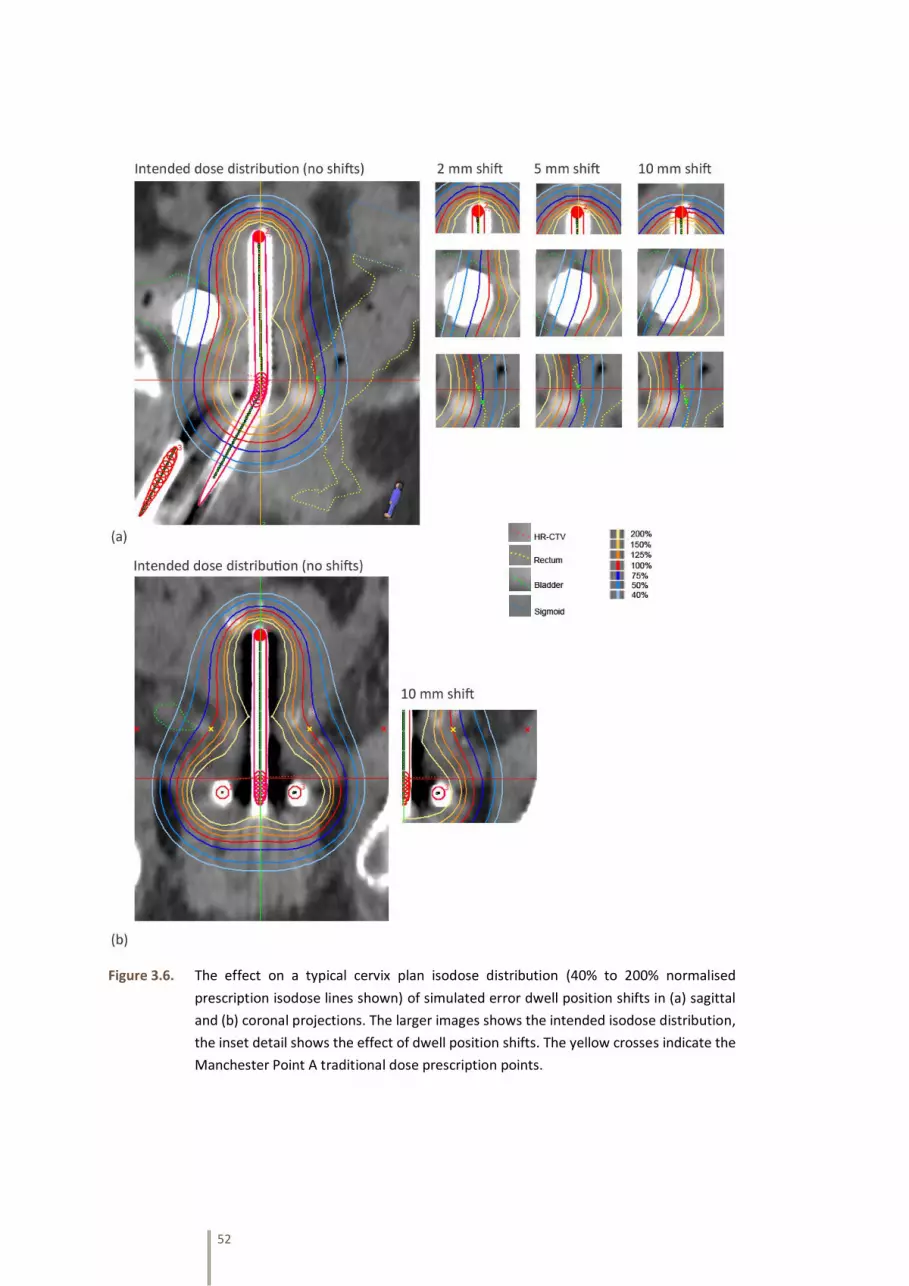
52
Figure 3.6. The effect on a typical cervix plan isodose distribution (40% to 200% normalised
prescription isodose lines shown) of simulated error dwell position shifts in (a) sagittal
and (b) coronal projections. The larger images shows the intended isodose distribution,
the inset detail shows the effect of dwell position shifts. The yellow crosses indicate the
Manchester Point A traditional dose prescription points.

53
Figure 3.7. Effect on DVH curves for a typical cervix patient plan for HR-CTV and OARs of simulated
dwell position errors of 1, 2, 5 and 10 mm proximal shift.
Figure 3.8. Effect of systematic proximal dwell position shifts, 0.2 to 6.0 mm, on clinical DVH
treatment plan quality parameters. Data is the mean and interquartile range from eight
cervix plans, for HR-CTV target and maximum dose to OAR D2cc.

54
3.4. Discussion and Conclusions
3.4.1. UK Survey
The survey data presented in this report represents the current practice in the
majority of brachytherapy centres within the UK (at the survey date of June 2012). Whilst
there is a high level of consistency in inclusion, frequency and tolerance values for some tests,
such as source strength measurement, there are varied responses to other tests. This is likely
due to differences in local planning and treatment procedures in clinical use, availability of
equipment, and differing functionality or performance of equipment. Local assessment of
QC needs is essential in determining schedules, rather than simple reliance on the ‘majority
view’. However, benchmarking against accepted practice is a good starting point for local
review. A risk assessment approach including local known factors is advocated for final
decisions on QC testing. All schedules must include measurement of source strength, source
position and dwell time, but the specific details require knowledge of local clinical practice
and equipment in use. There are difference in the published recommendations for QC testing
frequencies and tolerances, shown in Tables 3.6 to 3.8. This may in part be attributed to the
range in publication dates of the guidance documents, as equipment, clinical techniques and
knowledge evolved over time (AAPM published in 1997, IPEM in 1999, ESTRO in 2004, CAPCA
in 2006, and ACPSEM in 2013).
While there was some variation in staff groups involved in QC testing between
centres, physics staff most commonly performed all of the QC tests except daily facilities
testing, which was almost exclusively performed by radiographers. Within each centre, a
specific QC test may be performed in multiple ways, including staff group involved,
equipment used, frequency of measurement, and tolerance value. Each different
measurement method has been included in the results table. For example, ‘decay correction
accuracy at treatment unit’ may be performed prior to each patient treatment by
radiographers, and separately by radiotherapy physics after each source change but to a
tighter investigation tolerance level. The achievable tolerance value for this test is also
dependent on the equipment design, whether the software makes hourly corrections for
source decay or 12-hourly for example. The standard operating procedures of individual
departments also have a significant effect on the QC testing that is performed. This includes
all aspects such as whether optimised or standard/tabulated planning is used, whether 2D or
3D imaging is utilised, and whether electronic transfer of data is available. An independent
method for the verification of the accuracy of treatment plans is required for individually-
optimised treatments, but may not be required for each patient if a standard plan is used
that has previously been verified and is checked for consistency.
Some tests are adopted by all centres such as ‘source strength measurement’
and ‘source position in a straight catheter’. However others such as ‘x-ray imaging of
applicators’ is undertaken by only 32% of centres. The difference may be attributed to
whether the process is already being assessed by alternative means, and there is some
evidence from the survey to support this. For applicator dimensions and angles, a specific
measurement may not be necessary if the consistency of shape is evaluated through
55
agreement to planning system library applicators used for each individually-planned
treatment (provided both physical applicator and library applicator have already been tested
at commissioning). Checking of the 1st dwell position should however be verified in this case.
The number of centres including a routine measurement of actual source dwell
positions in clinical applicators was surprisingly low, at 17 centres (55%). Such testing should
be performed at commissioning and at regular intervals, comparing the actual and TPS
planned dwell positions.
IPEM Report 81 (Mayles et al. 1999) was the most frequently cited document
used for guidance on required HDR or PDR QC tests, but it is surprising that only 61% of UK
centres cited this document, being the UK professional body’s recommendations for QC. This
may be because the document is now quite dated. More recent, but again surprisingly cited
by only 48% of centres is the ESTRO Booklet No. 8 (Venselaar and Perez-Calatayud 2004).
There is a large range in the documents identified by individual centres as their primary
sources of guidance for QC testing, supporting the need for an update of IPEM Report 81 in
the UK.
A benchmark data set of brachytherapy HDR and PDR QC testing has been
presented which is representative of practice across the UK. This updates a previous survey
conducted over twenty years ago.
3.4.2. Treatment Unit Commissioning and QC: Dwell Position Accuracy and Transit
Dose
The results of this work demonstrate how a change in equipment software can
significantly affect the performance of a medical device. The need for robust quality control
checks after software changes is therefore reinforced, either to confirm improvements or to
detect any unexpected changes in performance.
In the HDR brachytherapy treatment unit case presented, the accuracy of dwell
positions with transfer tube curvature, transit dose at the first dwell, and transit dose
corrections have been markedly improved with the latest internal operating software. This
was following discussions between the author and the manufacturer.
3.4.3. Equipment Performance Requirements
The study on simulated dwell position errors has shown even small deviations
in source position can have a demonstrable impact on 3D dose delivery parameters. Only at
±0.2 mm accuracy between actual and intended dwell positions were the effects on all
considered parameters within 1.0%. An accuracy of at least ±1.0 mm was required to limit
the dose uncertainty on clinically relevant parameters (D90, D2cc) to within an acceptable
level of 3.0%. While the adoption of a QC action level of ±0.5 mm is perhaps indicated from
the results, taking account of all other uncertainties in brachytherapy and practical
limitations, a ±1.0 mm maximum tolerance is adequate to ensure equipment performance

56
does not adversely impact on dose delivery accuracy to target and OARs. A 2.0 mm maximum
tolerance (as prescribed in ACPSEM, CAPCA, ESTRO guidance, Table 3.6) is too large according
to the results of the presented work. Instead, it is proposed that ±0.5 mm action level and
±1.0 mm maximum tolerance level (as prescribed by AAPM, Table 3.6) for source position
accuracy in straight or simple curvature applicators (IU tube or ovoids) is appropriate for
modern brachytherapy. It is accepted that the mechanical performance in ring applicators
may be insufficient to achieve this suggested tolerance, however custom dwell-paths should
be used to account for any deviations, where possible.
The potential impact of dwell position errors on dose delivery accuracy has been
demonstrated in this work for simulated inaccuracies (position calibration errors). The
magnitude of dose uncertainties observed is generally applicable but actual values in each
clinic will be dependent on the specific HDR applicator, HDR equipment, and control system
software in use.
Importantly, the results demonstrate that measurements of dose at the
traditional prescription Point A, are insensitive to dwell position errors. This is because the
isodose distribution is relatively uniform at this point along the axis of the treatment
applicator. QC measurements of dose at Point A are not sufficient to infer accurate intended
dose delivery at other locations in the 3D dose distribution, particularly at the distal end of
the applicator, and at the bladder and rectum OAR positions. An improved system for QC of
HDR dose delivery is required rather than simple measurements of dose in the vicinity of
Point A. The same conclusion is drawn for dosimetric audit measurements of point dose or
dose distribution. An independent dose assessment in the region of Point A is likely to be
insensitive to all but gross errors in source positioning accuracy. A more comprehensive
assessment of dose distribution around treatment applicators would be required to be
sensitive to dwell position errors.
3.4.4. Future Directions for Quality Control Testing of HDR Brachytherapy
Based on the developments that have taken place in brachytherapy treatment
techniques in recent years, comparisons to external beam QC and judgement of value-added
testing, it is the author’s opinion the tests in Tables 3.7 and 3.8 should be considered by
brachytherapy physicists for inclusion in routine QC schedules for brachytherapy equipment.
Transit dose has therefore been studied in Section 3.3.3.2, and a focus of the remainder of
this thesis is concerned with improved verification that any inaccuracy in source positions in
clinical applicators has an acceptable impact on measured dose distributions, via an ‘end to
end’ test. This is applied for the purposes of dosimetric audit in this thesis, but could also be
adopted for local routine QC.
There is a general need to review fundamental approaches to QC in
radiotherapy, improving its effectiveness and reducing its resource-intensive burden, which
is likely to include moving from an exclusively device-centric approach, to a more system-
based evaluation of quality confirmation. A recent ‘point/counterpoint’ debate published in
the journal Medical Physics hypothesised that “QA procedures in radiation therapy are

57
outdated and negatively impact the reduction of errors” (Amols and Klein 2011). The planned
‘end to end’ audit for brachytherapy is consistent with this proposal. In the joint American
societies document ‘Safety is No Accident’ (ASTRO 2012), it is recommended for external
beam radiotherapy to undertake “end-to-end testing for representative treatments,
performing the entire process, with dosimetric or other quantitative tests that can be
evaluated at the end of the test to confirm accurate delivery of the planed treatment”.
Although not stated in the document, it is a reasonable assumption that an ‘end to end’ test
would be as valuable in brachytherapy as for external beam radiotherapy.

58

59
CHAPTER 4
Candidate Dosimeters for
Brachytherapy Applicator
Dosimetry Audit
60
4.1. Requirements of Dosimetry Systems for Brachytherapy Audit
In selecting an appropriate detector for brachytherapy dosimetry, the nature of
the dose distributions to be measured must be considered. Brachytherapy uses radioactive
sources of several mm length inserted within or very close to the tumour. Because of the
small source size and its proximity to the treatment volume there is rapid fall-off of dose
around the radioactive source. The measurement of radiation dose distributions around
clinical brachytherapy sources, both isolated and within treatment applicators, is therefore
a challenging endeavour. The volume of potential interest for an audit contains orders of
magnitude variation in dose levels, extremely steep dose gradients near the source, around
6% mm-1 at the edges of the target volume in typical cervix cancer treatments, and low dose
rates further away (Viswanathan and Thomadsen 2012). Conventional measurement
techniques in radiotherapy often involve relatively large detectors, but when these are used
close to brachytherapy sources they introduce inaccuracies due to dose averaging over the
active volume: A 0.6cc ionisation chamber will exhibit a non-uniformity correction of around
10% at 20 mm and 30% at 10 mm from a brachytherapy source (Tolli and Johansson 1993,
Majumdar et al. 2006).
Perez-Calatayud et al. (2012a) defined four characteristic requirements of
detectors for brachytherapy: wide dynamic range; small active volume, flat or well-
characterized energy response; sufficient precision and reproducibility to permit dose rate
measurements, quoting k=1 Type A (statistical) uncertainties ≤ 3% and k=1 Type B (systematic
or calculable) uncertainties ≤ 6%. These requirements are more demanding than those
previously quoted by Rivard et al. (2004) of ≤ 5% and ≤ 7% respectively. For routine
brachytherapy quality control measurements in clinics or interdepartmental audit, one
should also consider practicalities, cost and availability of the dosimetry system. Perez-
Calatayud et al. (2012a) also make recommendations of phantom material for brachytherapy
dosimetry. Consequently, dosimeters should be used in test objects manufactured from
appropriate materials such as Solid Water (RMI457, Gammex, Middleton, WI, USA), or liquid-
water tanks, of sufficient volume to provide full scatter conditions, or appropriate corrections
made.
For the purposes of brachytherapy dosimetry audit, the measurement of dose
around clinical treatment applicators could be accomplished by dosimetry system operating
in one of three different sampling modes: (1) multiple point detectors, (2) one or several 2D
detectors, or (3) full 3D dose measurement. The considerations for selection of an optimum
measurement system are not related solely to the performance of the detector in the
particular brachytherapy dose field, as may be of primary concern in a laboratory setting, but
practicalities of the audit measurement process, at many sites across the UK, is relevant; such
as cost, robustness, transport convenience, and potential read-out delay. This study
compares the three potential measurement sampling modes (multiple point, 2D and 3D), by
selecting and evaluating one dosimetry system in each category. The chosen detectors are
(1) Ge-doped optical fibres as thermoluminescent dosimeters; (2) the latest Gafchromic EBT3
radiochromic film with advanced triple-channel optical scanning and analysis; and (3) Presage
radiochromic plastic with optical CT scanning. These detectors were chosen as potential

61
candidates for high spatial resolution measurement of dose distributions in brachytherapy
audit around treatment applicators, in the setting of a dosimetry audit visit. Optical fibres
and Presage have very limited prior application in brachytherapy. While radiochromic film
has been widely used in brachytherapy, the new EBT3 film with triple-channel analysis has
not. In order to validate each dosimetry system, an investigation of the ability of each
dosimeter to measure the dose (or signal proportional to dose) as a function of radial
distance from an HDR source was undertaken, with comparison to Monte Carlo source model
calculation as a gold-standard. Each system was then used to sample the dose distribution
along one or more lines perpendicular to three brachytherapy treatment catheters, with
source dwell positions and a dose plan typical of cervix cancer treatments. This tested the
dosimetry systems’ response to typical clinical dose distribution measurement situations and
was compared to a brachytherapy treatment planning system (TPS) calculation as a gold-
standard.
4.2. Methodology
All HDR brachytherapy exposures were performed with the Eckert & Ziegler
Bebig GmbH MultiSource® HDR treatment unit with a Co-60 source. Comparative Monte
Carlo derived TG-43 data (Rivard et al. 2004) of the Co-60 source was obtained from data
tables published by Granero et al. (2007). Treatment planning system (TPS) dose calculations
were made with the Eckert & Ziegler Bebig GmbH HDR Plus® software, utilizing a TG-43 based
dose calculation. The TPS plans used for dose distribution measurement comprised three
parallel catheters to deliver typical ‘pear-shaped’ isodose curves used for cervix treatments
(Viswanathan and Thomadsen 2012). The line of dosimetric measurement was orthogonal to
the catheters at the proximal end of the high dose region. The plan used for Presage
measurement was modified to include additional modulation within the measurement
volume by the removal of several dwells in the central catheter.
4.2.1. Dosimetry Systems
4.2.1.1. Doped Silica Glass Optical Fibres
The optical fibres used in this work were described by Bradley et al. (2012) and
consist of Ge-doped SiO2 telecommunication fibre (CorActive High Tech., Canada). Dosimeter
rods were cut to 5.0 ± 0.5 mm lengths from a continuous reel of fibre optic cable, and their
protective coating removed with an optical fibre stripper. A conventional heating cycle and
annealing process was utilised with a standard TL reader system; preheat 160 °C for 10 s,
readout 300 °C for 25 s, heating rate 25 °C s-1. The sensitivity of each dosimeter rod is
described as the TL yield per unit dose per unit mass, and is expected to vary along the length
of the fibre optic cable. Fibre dosimeters of a 3.5% sensitivity range were selected via a
screening process in which large sample groups were irradiated with a dose of 3 Gy from a
linear accelerator of nominal 6 MV photon energy, at 5 cm depth in a water phantom, and
the TL yield from each individual dosimeter separately read out.

62
Because of their small physical size, it was possible to use a group of seven
dosimeter rods at each measurement position (a central rod surrounded by a circle of six
other rods) to reduce uncertainty, with the resulting data value being the arithmetic mean
TL yield of all fibres at a particular location. It was not considered necessary to establish an
absolute calibration of the fibres for the scope of this work, and instead they have been used
to give normalised relative dose results. There are also practical difficulties in absolute dose
measurement with fibres including TL fading.
4.2.1.2. Radiochromic Film
All radiochromic film measurements were performed with Gafchromic EBT3 film
(Ashland ISP Advanced Materials, NJ, USA) from the same batch (Lot #A12141101). The
procedure summary recommendations for handling radiochromic film as defined in AAPM
TG-55 (Niroomand-Rad et al. 1998) were adopted. All EBT3 films were scanned in red-green-
blue (rgb) format using a 48-bit (16-bit per channel) scanner (Epson Perfection V750 Pro) at
72 dpi, in transmission mode, with no colour or sharpness corrections and consistent
orientation and time-since-exposure protocol. A nominal 6 MV linear accelerator, with
calibration traceable to a primary standard at the National Physical Laboratory, Teddington,
UK, was used for the film calibration. Ten separate film strips of 10 cm x 5 cm were exposed
to ten doses in the range 0 Gy to 50.8 Gy, positioned on the central axis in a 10 cm x 10 cm
field at 5 cm depth in Solid Water (RMI457, Gammex, Wisconsin, USA). The average film pixel
values in a 4 cm x 4 cm region centred on the axis of the beam were used to derive the
average film response at each dose level, establishing a calibration of the film as a function
of the three colour channels. Test images were converted to dose maps using a rgb triple-
channel algorithm via FilmQAPro® software (Ashland ISP Advanced Materials, NJ, USA,
version 2.0.4631.19736) using the method proposed by Micke et al. (2011). This multi-
channel method enables the separation of the scanned signal into a dose-dependent part
and a dose-independent part that enables corrections for a variety of disturbances including
non-uniformities in the film active layer and artefacts from the film scanner. All HDR test films
were exposed contemporaneously with a suitable dose reference patch at the linac, to a
known dose level approximately 75% of the expected test film maximum dose, from the same
film batch. This allowed linear scaling of film calibration functions to correct for any residual
time-since-exposure darkening kinetics of the film calibration and any inconsistencies in the
film scanner compared to the calibration scans (Lewis et al. 2012). 75% was chosen to force
consistency at an appropriate dose level (close to the prescription dose) within the large dose
range of the brachytherapy dose distributions.

63
4.2.1.3. Solid Radiochromic Polymer
Cylindrical Presage® samples (Heuris Inc. LLC, Skillman, NJ, USA) of 60 mm
diameter and 100 mm height were used in this study. A parallel beam optical CT readout
system, described by Krstajic and Doran (2006) was utilised, with samples held within an
optical matching fluid tank during rotation and image acquisition. 400 projections were
acquired for each sample and reconstructed by filtered back-projection into images of matrix
size 256 x 256 using software written in IDL by S.J. Doran at University of Surrey
(unpublished). A region of the Presage sample that approximates to being un-irradiated,
distant from the HDR brachytherapy sources, was used for background subtraction. The
resulting Presage signal was then expected to be directly proportional to the dose received.
The optical density response was known to evolve with time and in a fashion dependent on
storage temperature. Since it was not the primary purpose of this comparative study to
provide an absolute dose measurement, no dose calibration was performed. Instead relative
dose-proportional distributions were measured, the suitability of this method having been
demonstrated by Wai et al. (2009). 10 Presage cuvettes were irradiated in the range 0 Gy to
20 Gy using a nominal 6 MV linear accelerator, in order to verify a linear dose-response
relationship and determine an optimum dose response level for the particular Presage
formulation.
4.2.2. Test Objects and Irradiation Conditions
A Solid Water (RMI457, Gammex, Middleton, WI, USA) test object was purpose-
designed for this work, as shown in Figure 4.1. Interchangeable slabs were constructed, with
a lower block containing either a single or three catheter channels and an upper block either
flat to hold film or with cavities for optical fibres. Fibre cavities were offset from the plane
containing the catheter to ensure no perturbation effect from each measuring position on
the others. This test object was used for treatment plan dose distribution measurements
using optical fibres and film, and for the single source measurement with fibres. 13 cavities
were located each side of the single catheter at radial distances of between 5 and 140 mm,
to match standard TG-43 tabulated data resolution. Measurements of radial dose from a
single source using film were conducted by carefully attaching a catheter along a film edge,
held in a water tank, shown in Figure 4.2. For Presage measurements, no external test object
was required and either one or three cavities were machined directly into the Presage
material samples. Figure 4.3 is a photograph of a Presage sample containing three cavities
with inserted HDR brachytherapy treatment catheters. The Presage samples, Solid Water test
objects, and ‘single catheter with film’ were all placed at the centre of 120 litre cubic liquid
water tank during irradiation to ensure full scatter conditions.

64
Figure 4.1. Schematic diagram of Solid Water test object, shown with (a) lower slab containing one
catheter and upper slab with optical fibre cavities, and (b) lower slab with three
catheters and upper slab holding radiochromic film. In all cases, the measurement plane
is 15 mm from the source catheter plane.
Figure 4.2. Measurement of radial dose from a single HDR source, within a plastic catheter, using
EBT3 film, secured in a Perspex frame within a full scatter water tank.

65
Figure 4.3. Presage sample machined with three cavities each containing an HDR brachytherapy
catheter for a typical cervix treatment dose distribution irradiation. The grey marker
indicates the approximate location of the plane of considered dose profiles.
4.3. Results
4.3.1. Initial Processing and Calibration of Dosimeters
Screening of the TL yield from optical fibres showed considerable variation
between individual dosimeters, up to 60%, attributed to variations in doping concentration
and other non-uniformities in the fibres. To achieve a batch variation of 3.5% deviation from
a nominal mean, a rejection rate of 75% of fibres was required. It was impractical to achieve
an improved consistency of sensitivity due to the number of fibres required: 7 fibres were
used at each of 13 measuring positions, with three experiment runs. A total of 273 fibres
were used, selected for consistency from an initial set of 1500 fibres. For EBT3 Gafchromic
film calibration, the multi-channel dosimetry method was successfully utilised to establish a
dose-response relationship in three colour channels over a range 0 to 50 Gy with a rational
fit function. For Presage dosimetry, optical spectral analysis of ten cuvettes was used to verify
the absence of any saturation in the range 0 Gy to 20 Gy. Initial results indicated a linear
dose-response relationship.

66
4.3.2. Isolated Source Radial Dose Measurements
The response as a function of radial distance from the centre of the Co-60 HDR
source measured with optical fibres, EBT3 Gafchromic film and Presage is given in Figures 4.4
to 4.6 and compared to source model data from Monte Carlo calculation. The ordinate data
have been multiplied by the radial distance squared to remove the inverse square law
dependence to improve visualisation. Uncertainty analysis is given in Section 4.3.4.
Figure 4.4 presents three repeated measurements of dose as a function of radial
distance from a Co-60 HDR source using the TL yield from Ge-doped optical fibre dosimeters,
compared to Monte Carlo source model data, all normalised at 20 mm from the source.
Different sets of fibre dosimeters were used in each measurement, and each data point is
the arithmetic mean of 7 fibres. There is good agreement between optical fibre and Monte
Carlo data in the range 5 mm to 40 mm, the mean relative TL yield being within 8% of Monte
Carlo data. There is a 4 to 9% repeatability variation in the fibre response (magnitude of
absolute difference (globally normalised response), rather than relative difference (local
percentage difference). There is a consistent over-response of the fibres at lower dose levels,
apparent at greater than 60 mm from the source, equivalent to less than 14 cGy in this data,
with the magnitude of discrepancy increasing with increasing distance from the source, i.e.
reduced dose-rate and dose level (20% over-response at 80 mm, 30% at 140 mm).
Figure 4.4. TL yield from Ge-doped optical fibres as a function of radial distance from the centre of
a Co-60 HDR source, compared to Monte Carlo data (Granero et al. 2007), all normalised
at 20 mm, showing repeatability from three separate measurements. (Vertical blue lines
indicate error bars, expanded uncertainty estimate at k=2, shown for trial 1 only for
clarity).
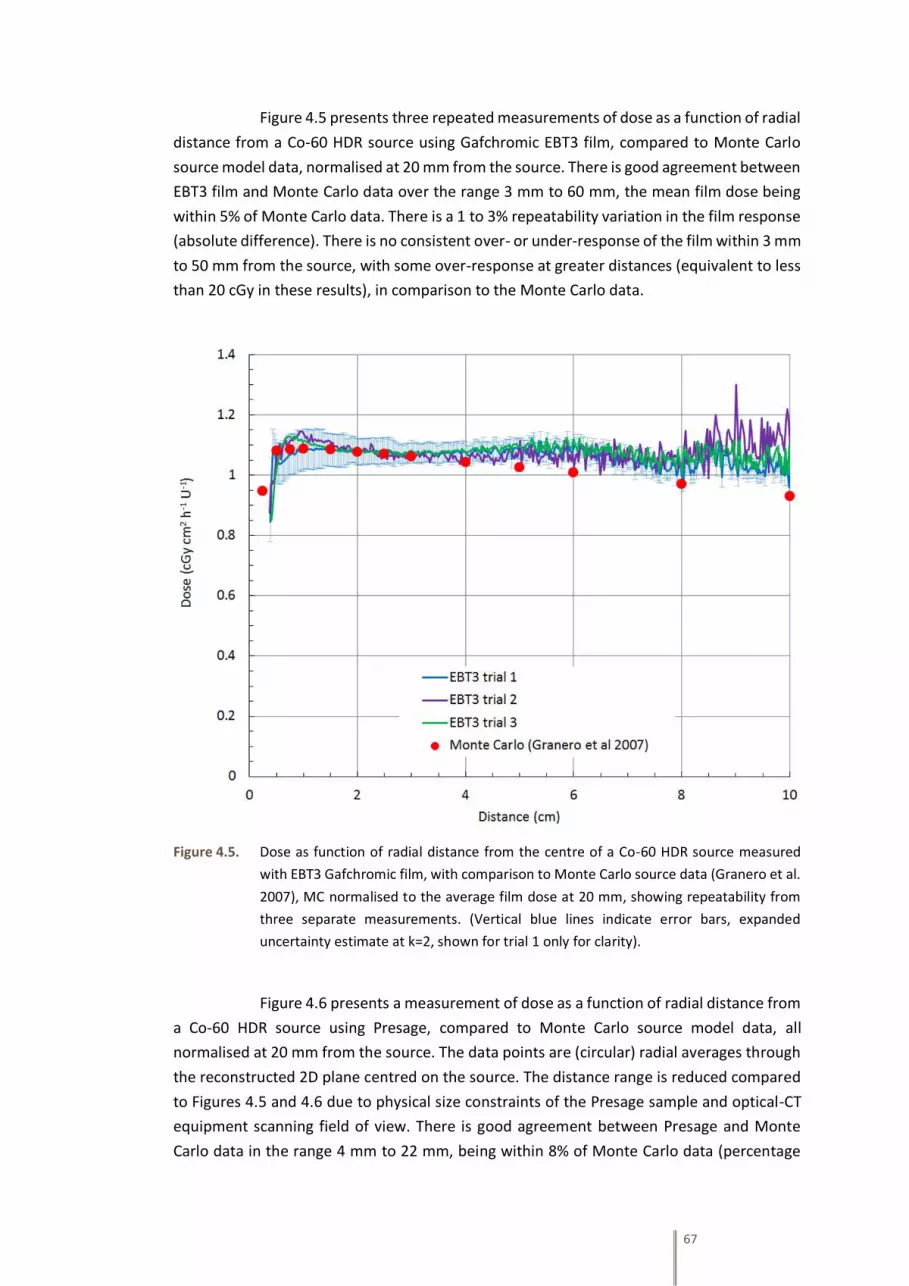
67
Figure 4.5 presents three repeated measurements of dose as a function of radial
distance from a Co-60 HDR source using Gafchromic EBT3 film, compared to Monte Carlo
source model data, normalised at 20 mm from the source. There is good agreement between
EBT3 film and Monte Carlo data over the range 3 mm to 60 mm, the mean film dose being
within 5% of Monte Carlo data. There is a 1 to 3% repeatability variation in the film response
(absolute difference). There is no consistent over- or under-response of the film within 3 mm
to 50 mm from the source, with some over-response at greater distances (equivalent to less
than 20 cGy in these results), in comparison to the Monte Carlo data.
Figure 4.5. Dose as function of radial distance from the centre of a Co-60 HDR source measured
with EBT3 Gafchromic film, with comparison to Monte Carlo source data (Granero et al.
2007), MC normalised to the average film dose at 20 mm, showing repeatability from
three separate measurements. (Vertical blue lines indicate error bars, expanded
uncertainty estimate at k=2, shown for trial 1 only for clarity).
Figure 4.6 presents a measurement of dose as a function of radial distance from
a Co-60 HDR source using Presage, compared to Monte Carlo source model data, all
normalised at 20 mm from the source. The data points are (circular) radial averages through
the reconstructed 2D plane centred on the source. The distance range is reduced compared
to Figures 4.5 and 4.6 due to physical size constraints of the Presage sample and optical-CT
equipment scanning field of view. There is good agreement between Presage and Monte
Carlo data in the range 4 mm to 22 mm, being within 8% of Monte Carlo data (percentage
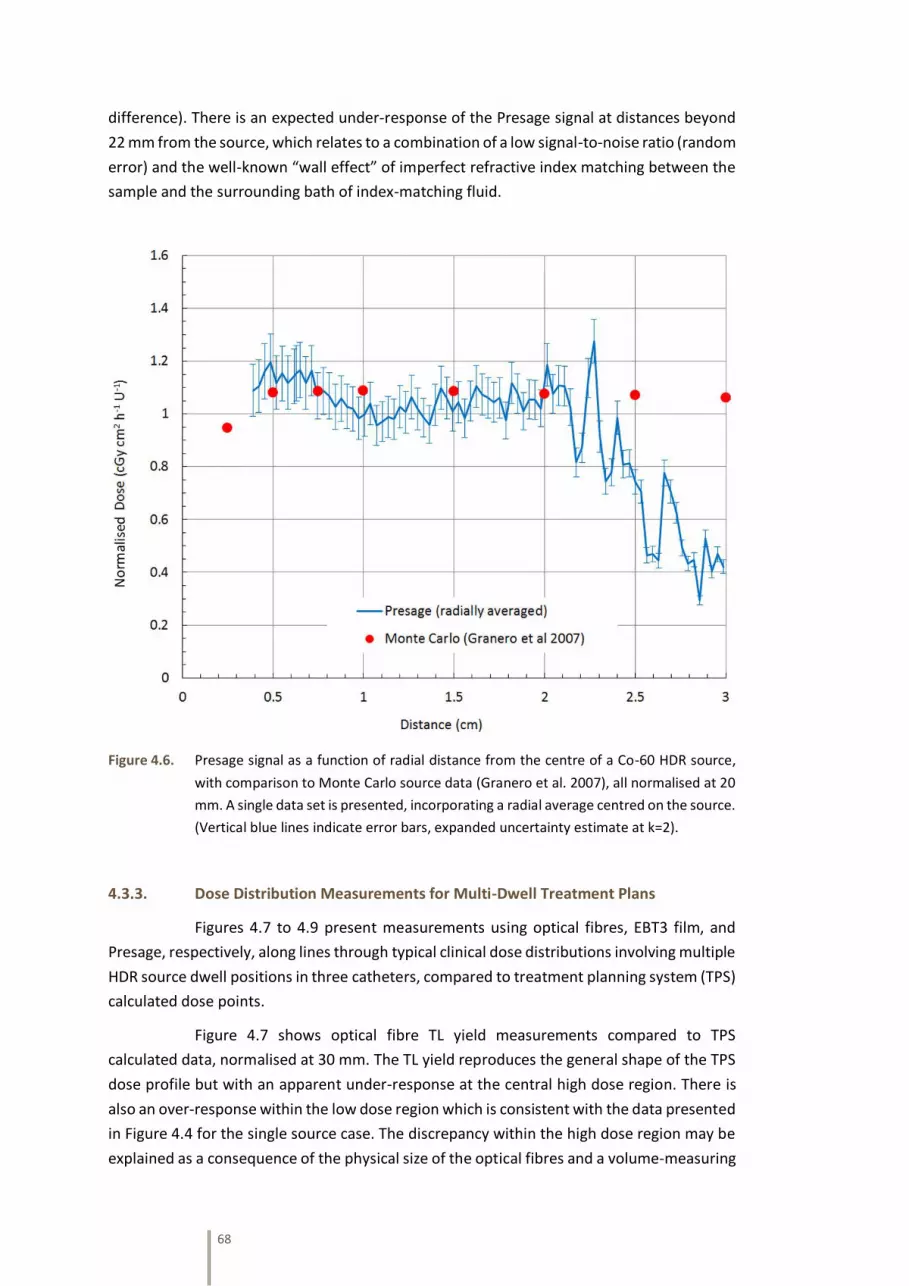
68
difference). There is an expected under-response of the Presage signal at distances beyond
22 mm from the source, which relates to a combination of a low signal-to-noise ratio (random
error) and the well-known “wall effect” of imperfect refractive index matching between the
sample and the surrounding bath of index-matching fluid.
Figure 4.6. Presage signal as a function of radial distance from the centre of a Co-60 HDR source,
with comparison to Monte Carlo source data (Granero et al. 2007), all normalised at 20
mm. A single data set is presented, incorporating a radial average centred on the source.
(Vertical blue lines indicate error bars, expanded uncertainty estimate at k=2).
4.3.3. Dose Distribution Measurements for Multi-Dwell Treatment Plans
Figures 4.7 to 4.9 present measurements using optical fibres, EBT3 film, and
Presage, respectively, along lines through typical clinical dose distributions involving multiple
HDR source dwell positions in three catheters, compared to treatment planning system (TPS)
calculated dose points.
Figure 4.7 shows optical fibre TL yield measurements compared to TPS
calculated data, normalised at 30 mm. The TL yield reproduces the general shape of the TPS
dose profile but with an apparent under-response at the central high dose region. There is
also an over-response within the low dose region which is consistent with the data presented
in Figure 4.4 for the single source case. The discrepancy within the high dose region may be
explained as a consequence of the physical size of the optical fibres and a volume-measuring

69
effect within a high dose-gradient region of the treatment dose distribution (average 3% mm-
1). In the high dose region, the dose gradient led to a change from 8 Gy to 9 Gy along the 5.0
mm length of the optical fibre and a calculation of the average volume dose across the optical
fibre indicates agreement with the measured values. The dose gradient in the low dose
regions was negligible along the length of the fibres. Figure 4.7 has been normalised at 30
mm as a reasonable balance between acceptable dose gradient and sufficient signal strength.
Figure 4.7. TL yield from Ge-doped optical fibres as a function of distance across an HDR dose
distribution, compared to treatment planning system (TPS) calculation, in a plane 15 mm
from three source catheters with multiple source dwell positions. TL yield has been re-
normalised to the TPS calculated dose level at 30 mm. (Discussion of uncertainty in data
values given in the text; error bars indicate expanded uncertainty estimate at k=2).
Figure 4.8 presents an EBT3 film measurement of dose distribution, showing
excellent agreement with TPS calculated data, within 1.5% measurement uncertainty across
the plateau high dose region. In the steep gradient and lower dose regions, the EBT3 derived
dose is indistinguishable from the planning system calculation. The EBT3 dose has not been
scaled to match the TPS data and represents the un-normalised absolute dose as determined
by the multi-channel film analysis technique.

70
Figure 4.8. Dose measured with EBT3 Gafchromic film as a function of distance across an HDR dose
distribution, compared to treatment planning system (TPS) calculation, in a plane 15 mm
from three source catheters with multiple source dwell positions. No re-normalisation
of either EBT3 or TPS calculated dose has been performed. (Vertical blue lines indicate
error bars, expanded uncertainty estimate at k=2).
Figure 4.9 presents results of a Presage measurement of the dose distribution
from multiple HDR source dwells in three catheters. A reduction in the abscissa range
compared to Figures 4.7 and 4.8 is required due to limitations of the physical size of the
Presage sample. A different treatment plan is used compared to film and optical fibre
measurements, to ensure sufficient modulation of the dose distribution within the measured
region. Taking advantage of the full 3D data set available, line profiles at several distances, 5
mm to 20 mm orthogonal distance from the source catheters are analysed in comparison to
TPS data. The Presage-derived normalised dose distribution data at all considered distances
from the catheters is in good agreement with the general shape of the TPS calculation,
although there is significant noise or artefacts present in the measurement data, leading to
errors of between 3% and 14% across the curves. The principal systematic error in the
Presage measurement occurs for the profile acquired 5 mm from the source plane, where
there is a significant deviation in the region between the source catheters. Inspection of the
original optical CT image data reveals a significant reconstruction artefact along, and
immediately adjacent to, the line between the catheters. This was caused by perturbation of
the light transmission through the catheter walls.

71
Figure 4.9. Dose measured with Presage as a function of distance across and HDR dose distribution,
compared to treatment planning system (TPS) calculation, in planes at distances
between 5 mm and 20 mm from three source channels with multiple source dwell
positions. Presage value has been re-normalisation to the TPS calculated dose level at 0
mm. (Error bars indicate expanded uncertainty estimate at k=2, shown for one data set
only, for clarity. Note, the treatment plan used in Figure 4.8 is different from that used
in Figures 4.6 and 4.7, see text).
4.3.4. Uncertainty Analysis
The primary sources of uncertainty using the experimental methodologies in
Section 4.3.2 are presented in Table 4.1, quoted at a coverage factor of 2 (k=2), for the case
of isolated source radial dose rate measurements. This analysis has been conducted following
the recommendations by DeWerd et al. (2011). The calculated dose uncertainty due to
detector-to-source positional uncertainty is modified by the inverse square law resulting in a
variable uncertainty with distance from the source. An estimate of the combined uncertainty
has been calculated using a simple quadrature sum of individual components for each
dosimetry system: The combined expanded uncertainty (k=2) for the optical fibre dosimeter
is estimated as 14% at a distance from the source of 10 mm (high dose gradient) and 8.3% at
30 mm from the source (low dose gradient). For EBT3 film dosimeter the values are 7.1% and
2.3%, and for the Presage dosimeter are 8.2% and 6%, at 10 mm and 30 mm respectively (all
k=2). For measurements in typical dose distributions, Section 4.3.3, the uncertainty of source
to detector distance has less impact due to reduced dose gradients, compared to the single
isolated source case.
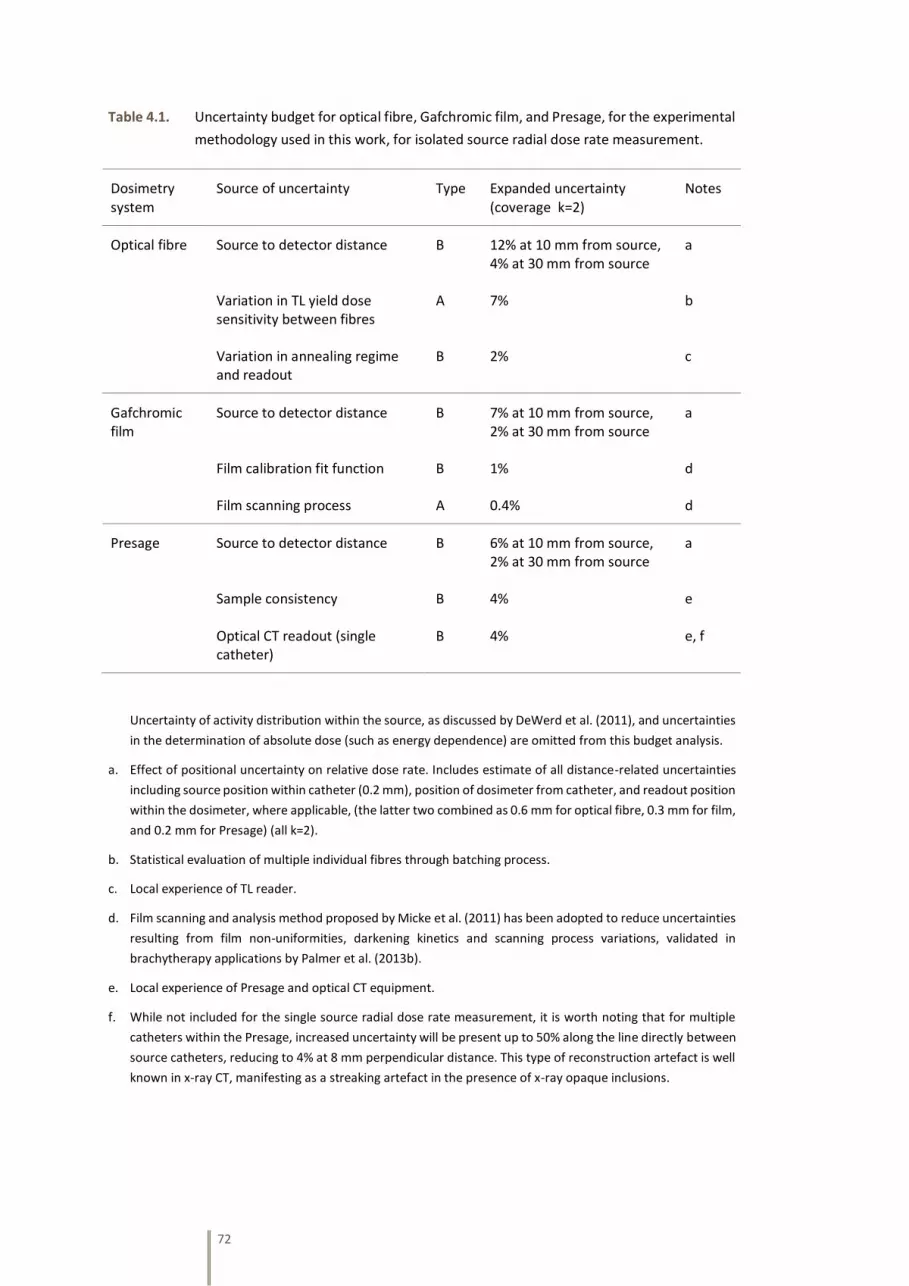
72
Table 4.1. Uncertainty budget for optical fibre, Gafchromic film, and Presage, for the experimental
methodology used in this work, for isolated source radial dose rate measurement.
Uncertainty of activity distribution within the source, as discussed by DeWerd et al. (2011), and uncertainties
in the determination of absolute dose (such as energy dependence) are omitted from this budget analysis.
a. Effect of positional uncertainty on relative dose rate. Includes estimate of all distance-related uncertainties
including source position within catheter (0.2 mm), position of dosimeter from catheter, and readout position
within the dosimeter, where applicable, (the latter two combined as 0.6 mm for optical fibre, 0.3 mm for film,
and 0.2 mm for Presage) (all k=2).
b. Statistical evaluation of multiple individual fibres through batching process.
c. Local experience of TL reader.
d. Film scanning and analysis method proposed by Micke et al. (2011) has been adopted to reduce uncertainties
resulting from film non-uniformities, darkening kinetics and scanning process variations, validated in
brachytherapy applications by Palmer et al. (2013b).
e. Local experience of Presage and optical CT equipment.
f. While not included for the single source radial dose rate measurement, it is worth noting that for multiple
catheters within the Presage, increased uncertainty will be present up to 50% along the line directly between
source catheters, reducing to 4% at 8 mm perpendicular distance. This type of reconstruction artefact is well
known in x-ray CT, manifesting as a streaking artefact in the presence of x-ray opaque inclusions.
Dosimetry system
Source of uncertainty Type Expanded uncertainty (coverage k=2)
Notes
Optical fibre Source to detector distance B 12% at 10 mm from source, 4% at 30 mm from source
a
Variation in TL yield dose sensitivity between fibres
A 7% b
Variation in annealing regime and readout
B 2% c
Gafchromic film
Source to detector distance B 7% at 10 mm from source, 2% at 30 mm from source
a
Film calibration fit function B 1% d
Film scanning process A 0.4% d
Presage Source to detector distance B 6% at 10 mm from source, 2% at 30 mm from source
a
Sample consistency B 4% e
Optical CT readout (single catheter)
B 4% e, f

73
4.4. Discussion and Conclusions
4.4.1. Doped Silica Glass Optical Fibres
The variation in TL yield for individual Ge-doped optical fibres was significant
and required a large percentage rejection rate (75%) to achieve a reasonable batch size of
similarly responding dosimeters (±3.5%) from a nominal mean value. However, the
‘discarded’ fibres can themselves be grouped around other means and hence multiple
batches of similarly responding dosimeters can be obtained from the preparation process.
Fibres can of course also be re-used multiple times once the batching process has been
completed. However, the inherent variation between fibres leads to an unacceptable
uncertainty and reproducibility of measurement for practical batch sizes from an initial
sample set. To mitigate, several fibres were used at each measuring position and an
arithmetic mean response used. However, this multiple dosimeter approach is not an ideal
experimental proposal, compromises the attractive spatial resolution, and leads to additional
uncertainties in position. The fibres are fragile and difficult to manipulate and position
accurately due to their small size.
For measurements of dose as a function of radial distance from an isolated HDR
source, optical fibres provide a reasonable representation of the Monte Carlo source model
data, Figure 4.4, especially at higher dose levels. In this experimental measurement, the
fibres were placed orthogonal to the radial source vector, and hence the smallest physical
dimension, and therefore highest resolution, was aligned with the dimension of interest.
When used in this mode, optical fibres demonstrate a significant spatial resolution advantage
over other detectors. However, when used to measure the dose distribution in a typical
clinical brachytherapy treatment, Figure 4.7, there was a significant dose gradient in three
dimensions close to the source, and hence the longer dimension of the fibres led to an
unacceptable dose-averaging along the length of the fibre, and a resulting significant
disagreement with TPS calculation (under-response in Figure 4.7). The fibre optic dosimeter
cannot be considered a ‘point-detector’ in the context of brachytherapy dosimetry. Whilst
current accepted practice is for optical fibres of several mm length, it would be possible to
reduce this dimension to perhaps 1 mm, but with reduced sensitivity and challenging
practical handling, especially at readout. In both the isolated source and treatment plan
measurements, fibres exhibited an over-response at low dose levels. This may be due to
exposure to ambient light during the preparation and cutting, phantom-loading, and readout
of the fibres. While this is not a large effect, it could add appreciably to the net signal at low
dose exposure levels and is difficult to avoid in the manual preparation and read-out process.
Fibre optic material is relatively inexpensive, and standard TL readers are widely available.
However, due to inefficiencies in batch production, inherent variation in sensitivity, excessive
size in longest dimension, the need for external geometry fixation test objects, and the time-
consuming nature of the experiments, optical fibres as utilised in this study are not currently
recommended for clinical brachytherapy dosimetry and further research and development
is required to fully realise their other dosimetric advantages.

74
4.4.2. Radiochromic Film
The use of Gafchromic EBT3 film with triple-channel analysis has shown
excellent agreement with both Monte Carlo source models in measurements of radial dose
from an isolated source, and with TPS calculations in measurements of complex
brachytherapy treatment dose distributions. A dose-response calibration for the film was
implemented over a range 0 Gy to 50 Gy and applied in the clinical dose distribution
measurement, with resulting agreement of absolute dose measurement using film to within
1.5% of TPS calculation. However, to obtain high quality dosimetric results with film, careful
attention is required to scanning protocols and triple-channel analysis is advocated (Micke et
al. 2011). Of the three dosimeters investigated for use in brachytherapy dosimetry in this
work, only EBT3 film with multi-channel analysis satisfies the investigated characteristics of
detectors as specified by Perez-Calatayud et al. (2012a). The energy dependence of film
(Brown et al. 2012, Masillon et al. 2012) has not been explicitly investigated in the work
presented in Section 4, however the overall response of the dosimeters, which includes all
sources of uncertainty, has been successfully evaluated against Monte Carlo data.
4.4.3. Solid Radiochromic Polymer
The use of Presage radiochromic material with optical CT readout has shown
good agreement to both Monte Carlo data of radial dose function from a single source and
with TPS calculations of a complex multi-dwell dose distribution. A significant advantage of
the method is the ability to validate complete 3-D dose distributions with a single
measurement and without the need to construct a specially designed phantom for film
positioning. Data can be analysed in any orientation, as might be most convenient for a
particular problem, whereas film measurements are restricted to pre-defined planes and it
is extremely difficult to generate isotropic 3-D information via film measurements.
Nevertheless, despite these attractive features, the preliminary experimental results
presented here indicate a significant level of noise or artefact in the measurement of dose
distributions using Presage. However, there are at least three available mitigation strategies
that may be explored in future research development: with existing equipment, combine
repeated readouts at different levels of illumination (Krstajic and Doran 2007a), and at
different dose levels, to extend the dynamic range; modify existing equipment to sample the
optical absorption spectrum at two different wavelengths and hence two different dose
sensitivities; use a laser scanner rather than a CCD-based device to improve signal-to-noise
and reduce artefact (Krstajic and Doran 2007b). Whilst the Presage samples used in this study
were limited in physical size, thus reducing the clinical utility of the results presented, much
larger samples may be obtained from the manufacturer, albeit at significant cost. The optical
CT equipment used in this study was a bespoke lab-based solution, but commercial options
are now available (example Vista Optical CT Scanner, Modus Medical, USA) that could be
used in a hospital medical physics department.

75
4.4.4. Dosimetric and Practical Considerations for Dosimetry System Choice
The characterisation of the response of a detector to brachytherapy source
irradiation, as evaluated in preceding sections, is the primary consideration in determining
suitability. However, other practical considerations are also relevant for application of the
dosimetry system in brachytherapy dosimetric audit. A summary of key considerations of
both a dosimetric and a practical nature are summarised in Table 4.2, for the experimental
methods and materials used in this work.
Table 4.2. Dosimetric and practical considerations of the dosimetry system for brachytherapy
audit, comparing optical fibre, Gafchromic EBT3 film, and Presage.
Consideration Optical fibre
thermoluminescence
(point detector)
Gafchromic EBT3
radiochromic film
(2D detector)
Presage radiochromic
plastic
(3D detector)
HDR source radial dose vs. Monte Carlo, in high dose region
Disadvantage
Normalised dose within 8%, repeatability 9%, high noise
Advantage
Absolute dose within 5%, repeatability 3%, low noise
Neutral
Normalised dose within 8%, repeatability n/a, medium noise
Spatial resolution
Neutral
9 µm diameter x 5 mm length (in this study)
Advantage
26-28 µm active layer thickness x scanner resolution (typically 72dpi, 0.35 mm)
Advantage
0.25 mm voxels (in this study) dependent on optical CT system
Effective atomic number
Disadvantage
11.4
Advantage
6.84
Advantage
7.4
Potential geometric uncertainty
Disadvantage
Accuracy of placement problematic
Advantage
Fixed 2D array of detection
Advantage
Fixed 3D matrix of detection
Cost Advantage
Low individual detector cost per detector (pence), but labour intensive production
Advantage
Moderate cost per sheet (approx. £25) sufficient for several brachytherapy-sized detectors
Disadvantage
Expensive purchase cost per sample (approx. £100 for 6cm diameter cylinder)
Availability Disadvantage
Need manual preparation of dosimeter, high initial rejection rate
Advantage
Purchase direct from supplier, readily available
Disadvantage
Limited supply, not ‘off the shelf’ item
Ease of use & readout device
Disadvantage
Requires TL readout. Need many individual detectors to assess dose distribution.
Neutral
Requires careful and advanced methodology to reduce uncertainties, but only requires (high-end) flatbed scanner
Disadvantage
Requires specialised optical CT, not widely available, and careful handling

76
4.4.5. Selection of Dosimeter
The suitability of three emerging dosimetry systems has been investigated for
the measurement of dose distributions in clinical HDR brachytherapy applications for (a)
measurement of radial dose distribution from an isolated HDR source and (b) measurement
of dose distribution along a profile in a typical clinical treatment plan. Thermoluminescent
properties of Ge-doped optical fibres, the dose response of 2D EBT3 Gafchromic film with
multi-channel dosimetry, and radiochromic properties of 3D Presage with optical-CT readout
have been investigated (Palmer et al. 2013d)5. EBT3 film is a commercial product, subject to
robust quality assurance by the manufacturer, this is not the case for the other two detectors
studied, which are more exploratory media at this time. Based on the dosimetric results from
this investigation and practicalities for use, EBT3 Gafchromic film is advocated as a suitable
dosimetry system for commissioning activities, routine QC measurements, or
interdepartmental audit dose distribution measurements in HDR brachytherapy applications.
5 This publication is co-authored by Poppy Di Pietro, Sheaka Alobaidli, Fatma Issa and Simon Doran, who contributed to initial work on optical fibre and Presage dosimetry. The first two are MSc students who were supervised by the author in projects related to the PhD thesis work. The last two are physicists at the University of Surrey who had prior experience in these techniques and contributed theoretical and practical background knowledge. This contribution relates to initial experimental work on these two techniques, but not the concept design, data analysis nor conclusions presented in this chapter, which are the author’s. The film dosimetry work was wholly instigated and conducted by the author.

77
CHAPTER 5
Development of Radiochromic Film
Dosimetry for Brachytherapy Audit
78
5.1. Objectives for the Development and Evaluation of Film
Dosimetry for Brachytherapy
In Chapter 4, the use of Gafchromic EBT3 film was advocated in general as a
suitable dosimetry system for the measurement of brachytherapy dose and dose
distributions. In this chapter, further research is presented that enabled its use for the
national brachytherapy dosimetry audit. This includes testing the film’s useable dose range,
checking for any dose-rate variations, and validating dose-response with radial distance from
Ir-192 and Co-60 HDR brachytherapy sources, in comparison to Monte Carlo and TPS data.
Simple tests are performed to confirm orientation dependence, scanner warm-up
characteristics, and repeatability. The use of film dosimetry for brachytherapy audit
applications requires further technique development and research, including optimisation of
calibration and scanning methodology, evaluation of advanced triple-channel dosimetry
techniques, and a detailed evaluation and understanding of uncertainties and strategies for
their reduction.
The resulting pixel value in a scanner-produced image of a radiochromic film is
a complex convolution of scanning lamp emission, absorption of the film, sensitivity of CCD
array and, importantly, optical properties of the scanner along the light path influenced by
polarisation caused by the film. All of these may change as a function of position on the
flatbed scanner, and each have further dependencies including scanner warm-up
characteristics and fluctuations, film orientation, film temperature, film humidity level, post-
irradiation film darkening kinetics, dose-dependent effect on polarisation, and scan and
analysis protocols. There are likely to be large dose variations across films used in
brachytherapy dosimetry, which may exacerbate the above issues. For brachytherapy
dosimetry, Perez-Calatayud et al. (2012a) reports that radiochromic film must be considered
“under development at this time, because of numerous artefacts which require rigorous
correction”. Advanced film dosimetry techniques, including triple-channel scan processing
(Micke et al. 2011, Mayer et al. 2012) has the potential to improve the accuracy and reliability
of film dosimetry and mitigate sources of uncertainty. The use of all three colour channels of
a flatbed scanner has been proposed to correct for deviations from the calibrated average
film-scanner response. Hence the non-dose–dependent signal component can be separated
from the signal and compensated for. The triple-channel film dosimetry implemented by
Ashland Inc. (Micke et al. 2011), is stated to have the following features and advantages: a)
separates dose-dependent and dose-independent parts of the signal and signal disturbances,
such as film thickness variation, scanner distortion, and background correction, which can
then be accounted for; b) enables use of the entire dynamic dose range of the film; c)
improves dose map accuracy; and d) indicates any inconsistencies between film and
calibration and estimates the dose uncertainty of the measurement. Triple-channel film
techniques have been studied in external beam radiotherapy applications, typically up to 2
to 3 Gy (Van Hoof et al. 2012, Sim et al. 2013), but their application in brachytherapy, with
prescription doses of 7 to 8 Gy and peak doses that are significantly higher, as well as
different dose distribution and different energy spectrum, needs further investigation.

79
In brachytherapy, film dosimetry applications are usually for routine quality
control, commissioning or audit, where there is generally some freedom in the time between
irradiation and scanning. However, post-irradiation film darkening kinetics is often
considered a potentially significant uncertainty in film dosimetry (Devic et al. 2010).
Polymerization of the active component in radiochromic film continues after irradiation, but
the rate of polymer growth decreases with time. Casanova Borca et al. (2013) studied post-
irradiation darkening appropriate for external beam radiotherapy, up to 4 Gy over three days.
The effect is studied in the present work at dose levels and scan times appropriate for
brachytherapy applications, up to 14 Gy, and darkening kinetics are evaluated during a three-
month post-irradiation period. Irrespective of whether multiple or single-channel dosimetry
is used, it is important to characterize post-irradiation darkening to minimise uncertainties
in film dosimetry.
Several characteristics of film dosimetry that must be appreciated for accurate
use are well-understood and have been documented in the literature, including film
orientation, batch consistency, and disabling scanner image correction (Niroomand-Rad et
al. 1998, Martisikova et al. 2008). These considerations are not extensively repeated in the
current work. There are, however, factors that have not been sufficiently researched, nor
their impact in brachytherapy applications assessed: post-irradiation darkening, lateral
scanner effect, film surface perturbation, film active layer thickness, measurement of clinical
brachytherapy dose distributions, film curling, and proposed film dosimetry methodologies,
and where appropriate, whether triple-channel dosimetry can improve dosimetric accuracy.
A potentially significant artefact is the response of the scanner to the film as a function of
lateral distance on the scan plane, the artefact increasing with dose level, described by
Menegotti et al. (2008) in the range 0 to 7 Gy. The response artefact is caused by the
polarisation of transmitted light by the near-linear array of polymer rods in the film, and the
varying transmission on reflection at mirrors in the scanner being a function of angle for
polarised light, which changes with lateral position on the scanner. The longer wavelength
red light is affected significantly more than green and blue light; hence, it is expected the
multichannel process will mitigate the artefact. In this work, we investigate the effect at up
to 14 Gy, appropriate for brachytherapy, and compare the calculated film dose using single-
and triple-channel dosimetry.
Inadvertent surface contamination, such as fingerprint grease and scratches
from contact with phantoms and jigs, particularly of concern in the context of a national
audit, can cause artefacts in film dosimetry, changing the optical density in the scanned
image. The measured density will also vary proportionally with the thickness of the active
layer, which for Gafchromic EBT3 has a design specification of 28 microns. Manufacturing
tolerances of the active layer thickness are typically up to 1.5% (personal communication
with manufacturer), which would result in an uncertainty in reported dose of 1.5% for single-
channel conventional dosimetry. Triple-channel film dosimetry is expected to mitigate such
dose-independent signal components. The film-dose response using single- and triple-
channel dosimetry in the presence of such film surface perturbations and extreme active
layer thickness variations in doses typical for brachytherapy applications is investigated.

80
A methodology for efficient dosimetry using radiochromic film has been
proposed by Lewis et al. (2012) in which test films are scanned together with a reference
dose film strip and an unexposed film strip in order to eliminate, by normalizing, any scan-
dependent uncertainty, such as scanner lamp output. This protocol is evaluated for external
beam radiotherapy (IMRT and VMAT) by Lewis et al. (2012). The evaluation is extended to
typical clinical brachytherapy situations below, with a suggested modification.
In this chapter, the perceived advantages of triple-channel compared to single-
channel analysis are evaluated in dosimetric test situations applicable for brachytherapy,
using the latest Gafchromic EBT3 film, which is structurally different to its predecessors, EBT
and EBT2; the latter having had greater coverage in the published literature to date
(Reinhardt et al. 2012). Film dose maps calculated using single- and triple-channel film
dosimetry for brachytherapy exposures are compared with brachytherapy treatment
planning system intended dose distributions, to evaluate any benefit of increased film dose
range and dose map accuracy of the triple-channel technique. Finally, taking account of the
above work, an optimum methodology for film dose distribution measurement in
brachytherapy is proposed.
5.2. Methodology
Radiation doses were delivered to an estimated precision of ±0.5% and
distances measured to a precision of ±0.05 cm throughout this work (irrespective of the
number of significant figures presented).
5.2.1. Film Dosimetry Equipment, Calibration and Scanning
All film measurements were performed with Gafchromic EBT3 (Ashland ISP
Advanced Materials, NJ) from two batches (Lot #01171401 and #12171303), with each test
using film from a single batch, unless otherwise stated. The procedure summary
recommendations for handling radiochromic film as defined by Niroomand-Rad et al. (1998)
in AAPM TG-55 were adopted. Initially a set of basic film dosimetry usage tests were
undertaken. Film samples exposed to 1 and 8 Gy were scanned at 0, 90, 180, and 270°
rotation on the flatbed scanner, and with each face of the film in turn towards the scanner
detectors. Multiple scans were performed to evaluate scanner warm-up characteristics and
repeatability in response. The effect of water submersion and cutting of the film was also
examined visually and in terms of scanner response. A film exposed to a typical
brachytherapy dose distribution was scanned with and without a non-reflective matt
surround (black card) to evaluate the necessity of minimising stray light in the scanner.
Film scanning was performed in red-green-blue (rgb) format using a 48-bit (16-
bit per channel) scanner (two identical scanners were initially compared for consistency;
Epson Perfection V750 Pro; US Epson, Long Beach, CA) at 72 dpi, in transmission mode, with
no colour or sharpness corrections, consistent orientation on the scanner, and 48 hours from
exposure to scanning, unless otherwise stated in the methodology. Dose-response

81
calibration of the film was undertaken within FilmQAPro® software (Ashland ISP Advanced
Materials, versions 2.0.4631 (2012), 3.0.4835 (2013) and 4.0.5323 (2014)). A nominal 6 MV
linear accelerator, traceably calibrated to a primary standard at the National Physical
Laboratory (Teddington, UK) and measured using an ionization chamber calibrated for
absorbed dose to water, was used for film calibrations, and all test film dose exposures. Film
strips of 10 × 5 cm were positioned on the central axis in a 10 × 10 cm field at 5 cm depth in
Solid Water® (RMI457, Gammex, Middleton, WI) and each exposed to a different dose level:
0, 1, 2, 4, 7, 10, 13, and 16 Gy, corresponding to the range expected for films in the BRAD
phantom (Section 6.4.1). The average film pixel values in a 4 × 5 cm region centred on the
axis of the beam were used to derive the average film response at each dose level. Scanned
images of irradiated films in TIFF format were converted to dose maps using both a single-
channel method (red channel) and a triple-channel method (red, green, and blue channels),
via FilmQAPro software. The single-channel dose conversion utilizes a simple calibration
function; the red channel was chosen, as this is the most commonly used in simple
radiochromic film dosimetry since this wavelength has the highest absorption spectra (Devic
2011). The multichannel analysis method uses an algorithm described by Micke et al. (2011)
to separate the scanned signal into a dose-dependent part and a dose-independent part. The
algorithm essentially determines and subtracts a disturbance function that is independent of
dose by fitting the measured colour signal to allowed colours in the dose-to-rgb signal
calibration. Calibration fits, based on a rational (linear) fit function of the form in Equation
5.1 were derived for each colour channel:
X(D) = (A+BD)/(C+D) Equation 5.1
where X(D) is the scanner response, ranging between 0 and 1, at dose D, and A,
B, and C are the fitted function constants. The derived constants were compared for two film
batches.
Reference dose films were also used for linear rescaling of the calibration
function and this methodology was evaluated. Lewis et al. (2012) have proposed an efficient
methodology for film dosimetry in external beam radiotherapy, in which one reference dose
film and an unexposed film are scanned simultaneously with the test film, to account for
scanner-related variations and time-since-exposure darkening compensation from the
calibration condition. In brachytherapy, the dose range across films may be somewhat
greater than that in external beam radiotherapy, and the dose level for the reference dose
film may need different considerations. Ten EBT3 test films were each exposed to accurately
known dose levels of 5, 7.5, 10, and 13 Gy, representative of dose ranges expected in
brachytherapy film dosimetry applications, at 5 cm depth in a Solid Water phantom. The film
dose in 4 × 4 cm regions of interest at each dose level for each film was calculated using
FilmQAPro software, triple-channel dosimetry, using 0 and 7.5 Gy, and then 0 and 13 Gy
reference doses for linear rescaling of the film calibration function. The average percentage
difference of the film-calculated dose at each dose level from the anticipated dose for the
two calibration systems was recorded and compared.

82
Figure 5.1 shows the arrangement of test films with reference films for
simultaneous scanning on the flatbed scanner. The regions of interest are shown as red
rectangles and were placed centrally left-to-right in the scan window to mitigate effects of
lateral scanner response, Section 5.3.4. For the brachytherapy audit test films, the region of
interest is the corner of the film which was closest to the clinical applicator and received the
highest dose (see Section 6.3.1). This region is aligned centrally with the regions used for
calibration and validation. Due to the large dose range across the film, it is proposed that two
reference calibration films, in addition to the unexposed film, are required to provide
assurance of accuracy across the range of doses: it is suggested that one film be accurately
exposed to the brachytherapy prescription dose, as this is generally of primary interest, and
another to the expected maximum dose to be recorded on the film, to confirm accuracy
across the dose range.
Figure 5.1. Arrangement of calibration and test films on flatbed scanner for simultaneous scanning.
The regions of interest, shown as red rectangles in the figure, were placed centrally left-
to-right in the scan window, to mitigate lateral scanner artefact.
83
5.2.2. Investigation of Film Dosimetry Performance Parameters and Evaluation of
Triple-Channel Dosimetry
Post-Irradiation Film Darkening
It is known that darkening of radiochromic film after irradiation continues for
some time post-exposure (Devic et al. 2010). It is important to take account of the time delay
to scanning in all dosimetry evaluations. The exposure of reference dose films along with test
films which are then subsequently scanned together can be used for calibration scaling as
described above. In external beam therapy dosimetry, test and reference films can be
irradiated consecutively from the same radiation source. However in brachytherapy, and
especially in the context of a national dosimetry audit, there may be significant delays
between the irradiation of test films on a brachytherapy unit and corresponding reference
films from an external beam linear accelerator (used to provide uniform film dose irradiation)
due to practical equipment access issues and logistics of the audit. To establish the post-
exposure darkening kinetics of EBT3 film, nine samples were exposed to doses up to 14 Gy
and then repeatedly scanned over a period of three months. Reference films were also
acquired and scanned only once at three months to confirm no darkening of the test films
due to exposure to multiple scans. The data was used to determine the required delay
between test exposure and scanning, as a function of the time difference between test film
and reference film, in order not to introduce error due to differential darkening between the
two films.
Lateral Scanner Effect
Four 4 × 4 cm EBT3 film pieces were exposed to 1, 8, 12, and 14 Gy, respectively,
at 5 cm depth in a Solid Water phantom. The films were cut in half to provide two identical
film samples at each dose level. One of each dose level film was positioned along the central
axis of the scanner, while the other piece was displaced laterally by 1, 2, 3, 4, 6, 7 and 9 cm,
in both positive and negative directions. The lateral direction is defined as being
perpendicular to the direction of travel of the scanning lamp, with zero lateral displacement
being the centre of the scan plane. Film dosimetry, using single-channel and triple-channel
analysis, was performed for each film piece in each scan. To account for any scan-dependent
variations, the calculated film dose of the laterally displaced piece was corrected for any
variations in the reported dose of the central piece. The resulting change in dose was a
function of the lateral scanner effect only, and this was compared for the two dosimetry
methods.
The potential mitigation of lateral scanner effect by the use of triple-channel
dosimetry was evaluated for a typical brachytherapy dose distribution, similar to films
subsequently acquired for the national brachytherapy audit (Chapter 8). With a prescription
dose of 7 Gy to Point A, the dose range across the films was 0.3 to 13 Gy, with the highest
doses at the corner of the film closest to the applicator. Films were converted to dose maps
with single-channel and triple-channel dosimetry and compared to the Nucletron Oncentra
Brachy (version v4.1.0.132) (Nucletron) TPS-calculated 3D dose grid (1.0mm resolution),

84
using FilmQAPro software. Isodose overlay was used to compare the film-measured dose
with the TPS dose.
Film Surface Perturbation
Three 4 × 4 cm GAFCHROMIC EBT3 film samples were uniformly exposed to 0,
4, and 10 Gy respectively, at 5 cm depth in a Solid Water phantom. Each film had surface
perturbations applied on one face: scratches were made with medium hand pressure using
a solid block corner at one end and a thin layer of grease applied at the other end, typical of
fingerprint marks. The change in colour signal caused by these disturbances was between 6%
and 13% (at 16 bits per channel, in the red channel; for the 0 Gy film a maximum reduction
from 40420 to 35280 (relative pixel values), and for the 10 Gy film, a maximum reduction
from 13900 to 11860). Variations in surface perturbations between the films are
inconsequential, as this test examined the qualitative performance of single-channel and
triple-channel dosimetry at each dose level. Film dose maps were created using single-
channel and triple-channel dosimetry. Dose profiles were taken through the two dose maps,
and the effect of surface perturbations was compared.
Film Active Layer Thickness
The measurement of the effect of variations in film active layer thickness on the
scanned image and calculated film dose is limited by difficulties in measuring the actual
thickness of the active layer, sandwiched between two polyester layers. However, to test the
concept of thickness compensation by triple-channel film dosimetry, the active layer of
irradiated film samples was doubled through a process of delamination of irradiated EBT3
film and restacking to produce an effective double active layer, as shown in Figure 5.2. While
there are significant uncertainties in the physical process of de-laminating and re-laminating,
the process is sufficient to test the relative performance of single-channel and triple-channel
dosimetry to significant variations in active layer thickness, accepting the additional error
sources introduced by this process. One can then infer relative performance of the two
systems to more modest variations that may be encountered in commercially available film.
Four film samples were exposed uniformly to 1, 8, 12, and 14 Gy, at 5 cm depth in a Solid
Water phantom. Each sample was cut into three pieces, two of which were carefully
delaminated. In de-laminating, the active layer remained adhered to one of the polyester
sheets, the other being essentially clear, see Figure 5.2. The polyester layers with the active
layer attached were stacked together to produce a sample with an active layer of effectively
double the original thickness. A scan was made of the two configurations: original film and
restacked delaminated with a double active layer. The film dose for each of these at each
dose level was determined using single-channel and multichannel dosimetry.
Film Curvature at Scanning
No prior publications have considered the potential uncertainty introduced in
film dosimetry by film-curling at the time of scanning, which is often undetected or deemed
insignificant by the operator, but could introduce a substantial dose error. Due to the
manufacture process, film naturally curls. Smaller film sample sizes, such as those used in the
brachytherapy national audit (Chapter 8), are more susceptible to curling than large films

85
typical in external beam verification (in which the weight of the film supresses the tendency
to curl). A 100 mm width film is shown in Figure 5.3, exhibiting a natural curl of 1.5 mm
maximum height from the flatbed scanner glass plate, along the film central axis.
Figure 5.2. Process of delamination and restacking to produce a double-thickness active layer: (a)
original films, (b) delaminated with active layer adhered to one polyester, (c) restacked
with effective two active layer thickness.
Figure 5.3. Photograph showing natural curvature of a 100 x 100 mm Gafchromic EBT3 film placed
on a flatbed scanner glass plate.

86
The methodology to investigate film curvature at scanning utilised three test
situations. The first to evaluate the effect on brachytherapy dose distributions, and the
others to establish the magnitude of the effect under controlled conditions of uniform
irradiation. (1) An EBT3 film of a clinical dose distribution was scanned flat and with natural
film curvature. A 100 mm x 100 mm EBT3 film previously irradiated with a typical clinical
cervix brachytherapy dose distribution as for the national brachytherapy audit (Chapter 8)
was used, resulting in a film dose range 2 to 13 Gy. The film was scanned flat under a glass
compression plate and also scanned allowing the natural curve in the film to be exhibited, as
shown in Figure 5.3. Dose maps were calculated for the flat and naturally curved cases and
compared to the treatment plan. Gamma evaluation index (Low et al. 1998) was calculated
using FilmQAPro® software comparing the treatment planning system intended dose
distribution and the film-measured dose distributions, for the flat and naturally curved film
scans.
(2) An EBT3 test film was irradiated with a nominal 6 MV linear accelerator, at 5
cm deep in Solid Water (RMI457, Gammex, WI, USA), with a 200 mm x 200 mm field to 7.5
Gy. The film was scanned with controlled curvature, held in contact with the scanner plate at
two opposite edges and raised at the centre by 1, 2, and 4 mm above the scanner plate. The
film was also scanned perfectly flat at 0 mm height, achieved by taping the edges of the film
to the scanner plate, and then achieved with a compression glass plate of 2 mm thickness
above the film. Finally, the film was scanned horizontally flat raised uniformly 1 mm from the
scanner plate. The film was held under tension to prevent any curvature at 1 mm height.
Dose profiles using single red-channel and triple-channel dosimetry were compared for the
flat and raised film scans.
(3) An EBT3 test film was irradiated with a nominal 6MV linear accelerator in
three 30 mm x 30 mm fields to doses of 1.8, 3.5, and 6 Gy respectively. The film was scanned
horizontally flat with 5 mm vertical displacement above the scanner plate, and flat with no
vertical displacement, the latter with and without a glass compression plate. The scans were
taken with the film horizontally flat, at height above the scanner, to evaluate whether the
change in pixel value is a result of film curvature only or height of film above the conventional
scan plane. 5 mm height represents an extreme case of film positioning difference from the
conventional position in contact with the scanner. 5 mm is the maximum gap between
scanner glass and scanner lid for the Epson V750 scanner model. The three dose level squares
were aligned along the scan direction axis of the scanner to prevent any effects of lateral
scanner uncertainty. Dose profiles were separately created using single-channel red and
green dosimetry (the colours most commonly used for film dosimetry) and compared, for the
flat and raised film scans.

87
5.2.3. Validation of Film Dosimetry Response to HDR Brachytherapy Sources
The response of EBT3 film to irradiation from a single HDR source was compared
to Monte Carlo derived consensus data sets (Perez-Calatayud et al. 2012b) as a simple
method to experimentally validate the use of the film dosimetry system for HDR
brachytherapy: combined effect of all variables including dose range, dose rate, energy
dependency, triple-channel dosimetry, dose scaling. This was done for both Ir-192 and Co-60
HDR sources using a custom made Perspex film holder in a near full-scatter water tank
(Palmer et al. 2013b) using plastic source transfer tubes. The repeatability of results was
assessed for both the Ir-192 and Co-60 sources using a second measurement for each.
Any dose-rate effect on film response was evaluated by exposing films to the
same dose level but at different distances from the source and hence different dose rates,
using appropriately calculated irradiation times. The expected dose was calculated from a
TPS using Monte Carlo derived TG-43 data, with knowledge of the source strength and
exposure time.
5.3. Results
5.3.1. Film Calibration, Scanning and Processing
The film orientation on the scanner had a significant effect on the scan signal.
For red, green and blue channels at 1 and 8 Gy, films scanned at 0° and 180° were identical,
and those scanned at 90° and 270° were identical, but the two sets differed by between 4.7%
and 8.4% depending on colour channel and dose level, red high dose exhibiting the largest
difference. Modest scanner warm-up characteristics were observed, with the first scan after
switch on being between 0.5 to 1.5% below steady-state values, which were achieved within
0.2% by the fourth scan and then consistently for the remaining scans in the series.
Repeatability of multiple scanning was found to generally be within 0.2%, occasionally up to
0.5%. Any change in signal depending on which side of the film was towards the light source
was within the general scan-to-scan variation and could not be statistically demonstrated.
Submersion into water affected the edges but not the faces of the EBT3 film, with an opaque
edge appearing of width 0.2 mm after 1 h, 0.4 mm after 2 h, up to a maximum 0.5 mm after
3 h. Following a drying period of around two hours at ambient room temperature, the
opaque edge faded, with no impact on scanner response. A more significant effect was
occasional de-lamination of the film at cut edges. Depending on the cutting technique used
a dysfunctional edge of 0.2 to 1.0 mm, occasionally up to 3.0 mm, was observed along cut
lines. Delamination of the film increased the standard deviation of scanned pixel values and
was unpredictable in terms of scanner response; hence films with apparent delamination
were discarded. An optimum cutting method which minimised de-lamination was achieved
with a rotary paper cutter (Staples A5 Precision Trimmer), which compressed the film from
above and below at the point of cutting.

88
Figure 5.4 shows eight EBT3 film strips, from the same batch, used for the dose-
response calibration that were exposed to doses in the range 0 to 16 Gy. The level of
colourisation darkening increases with dose, with no evidence of saturation. Figure 5.5 shows
the corresponding pixel values in three colour channels as a function of irradiated dose, for
two film batches, scanned 48 hours post-exposure. There is an apparent difference between
the colour response of the two batches, confirming the need for careful batch control and
re-calibration for each new batch. The systematic difference in the blue channel could be the
result of a difference in thickness of the active layer between the two batches.
Table 5.1 provides the calibration function constants of Equation 5.1 for the two
EBT3 film batch calibration curves in Figure 5.5. The calibration fit was derived via FilmQAPro
(Ashland, NJ, USA) software. It is clear that different film batches must have their own unique
calibration. The two film batches presented were used for the film dosimetry research in this
thesis and for the national brachytherapy audit (Chapter 8).
Table 5.1. Rational (linear) calibration equation parameters, see text, for two Gafchromic EBT3 film
batches (lot a=#01171401, lot b=#12171303), scanned 48 hour post exposure.
Colour channel Red Green Blue
EBT3 film batch Lot a Lot b Lot a Lot b Lot a Lot b
Calibration parameter A 2.031 2.334 3.655 4.754 3.570 4.675
Calibration parameter B 0.063 0.034 0.021 -0.047 0.070 0.020
Calibration parameter C 3.098 3.694 6.215 8.568 11.406 16.725
Figure 5.6 shows dose-map isodose lines from a scanned test irradiation of EBT3
film, exposed to a typical brachytherapy dose distribution with Ir-192 source (using the BRAD
phantom, Section 6.4.1) scanned 48 hours post exposure, and processed using FilmQAPro
software. The film was scanned twice, 10 minutes apart, separately represented by thick and
thin isodose lines, once with a non-reflective matt surrounding the film piece on the flatbed
scanner, and once without. The two sets of isodose lines are identical at isodose levels 150
to 2200 cGy, with deviations <1.0 mm seen at 70 and 100 cGy isodoses, demonstrating
excellent scanner repeatability and negating the need for a matt surround to the film for
scanning.

89
Figure 5.4. Eight Gafchromic EBT3 film calibration strips (film batch lot b=#12171303), irradiated
to doses in the range 0 to 16 Gy and scanned 48 hour post exposure.
Figure 5.5. Gafchromic EBT3 calibration curves, in red, green and blue colour channels (16 bit), for
two film batches (lot a=#01171401, lot b=#12171303), scanned 48 hour post exposure,
with rational (linear) dose fit equations.

90
Figure 5.6. Isodose overlay of two scans, taken 10 minutes apart (thick and thin lines), of the same
EBT3 film piece that had previously been exposed by a typical brachytherapy dose
distribution with Ir-192 source, with and without a non-reflective matt at scanning.
5.3.2. Calibration Function Linear-Scaling
Table 5.2 shows the average calculated film dose at four known dose levels
across a wide dose range from a series of ten test films. The primary calibration function was
derived over a dose range 0 to 16 Gy. Within FilmQAPro software, the calibration function
was rescaled to an unexposed film and a known dose level film, scanned within the same
image as the test film. This allows correction for any scanner-related response changes
compared to film calibration scans. The calculated film dose is forced into agreement with
the expected dose at the reference dose level, with the percentage difference increasing at
other dose levels. While maintaining the 0 to 16 Gy calibration function, two different sets of
reference dose films, scanned with the test film, were used. With reference doses of 0 and
7.5 Gy, a maximum discrepancy of 1.4% across the range 5 to 10 Gy, increasing to 2.3% at 13
Gy, was found. Using reference doses of 0 and 13 Gy gave agreement of 0.1% at 13 Gy, but a
maximum discrepancy of 2.1% across 5 to 10 Gy.

91
Table 5.2. Calculated mean film dose from ten test films, at four irradiation dose levels, using
different linear-scaling calibration dose references. The percentage difference of the
reported film dose to the actual irradiated dose level is shown in the table.
Dose references for calibration
function linear scaling
Percentage difference of calculated film-dose from true dose,
at each dose level
5 Gy 7.5 Gy 10 Gy 13 Gy
0 Gy and 7.5 Gy 0.1% 0.4% 1.4% 2.3%
0 Gy and 13 Gy -1.0% -2.1% -1.1% 0.1%
5.3.3. Post-Irradiation Film Darkening
Figure 5.7 shows the net optical density of EBT3 film as a function of time, post-
irradiation, over a range 0.7 to 2277 h (approximately three months), at nine dose levels
between 0 and 14 Gy. All curves fit a logarithmic function with time, of increasing gradient
with dose level. The data in Figure 5.7 has been used to determine the required delay before
scanning of simultaneous test and reference films, such that post-exposure darkening of both
films does not introduce significant uncertainty into the dosimetry results, if the test and
reference films were exposed at different times. The rate of change of optical density post-
exposure increases with dose level; hence, the longest delay before scanning is required for
the highest dose level. Considering the measured rate of change at 14 Gy exposure, the
required delay for typical brachytherapy dosimetry situations has been evaluated. A worst
case delay between a brachytherapy test exposure and a reference film exposure from a
different (external beam) treatment unit may be typically 24 hrs, for the national
brachytherapy dosimetry audit (Chapter 8). If the test film irradiation is performed at time t
= 0 h and the reference film irradiation at t = 24 h for the same 14 Gy dose level, the difference
in net optical density of the films due to post-exposure darkening would be 5% if scanned at
0.1 h following the reference film exposure. This reduces to 3% at 1 h, 1% at 12 h, 0.6% at 48
h, 0.4% at 72 h, and 0.2% at 96 h following reference film exposure. For a time difference of
6 hrs between test and reference films, the net optical density difference between the films
at a dose of 14 Gy is 3.8% at 0.1 h post-exposure, reducing to 0.3% at 24 hrs. For a time
difference of 2 hrs, the difference in net optical density at 14 Gy is 2.8% at 0.1 hr, reducing
to 0.3% at 8 hrs post-exposure.

92
Figure 5.7. EBT3 film net optical density (as a ratio to a simultaneously scanned reference density
sample) as a function of time post-irradiation, up to three months (2277 hrs), over a
dose range 0 to 14 Gy. (Error bars indicate one standard deviation of the sampled pixels).
5.3.4. Lateral Position of Film on Scanner
Figure 5.8 shows film dose obtained using triple-channel and single-channel
dosimetry as a function of the lateral position of the film on the scanner, at dose levels 1, 8,
12, and 14 Gy. For both triple-channel and single-channel dosimetry, there is a lateral-
scanner effect, which increases the reported film dose with increasing lateral position of the
film on the scanner. The effect is significantly larger for single-channel compared to triple-
channel. The percentage increase in film dose at 4 cm lateral distance compared to the film
dose on the central axis of the scanner, at 1 Gy, was 6% with single-channel dosimetry and
1% with triple-channel dosimetry; at 8 to 12 Gy was 7% with single-channel and 1% with
triple-channel dosimetry; and at 14 Gy was 11% with single-channel and 2% with triple-
channel dosimetry. At 9 cm lateral distance, at 1 Gy, the dose increase was 20% with single-
channel dosimetry and 5% with triple-channel dosimetry; and at 14 Gy, the dose increase
was 24% with single-channel dosimetry and 9% with triple-channel dosimetry. The results for
positive and negative displacements in the lateral direction were consistent within
experimental error.

93
Figure 5.8. Change in film dose as a function of lateral distance on scanner, using single-channel
(red lines) and triple-channel (green lines) film dosimetry, over range 1 to 14 Gy. (Error
bars indicate one standard deviation of the sampled pixels).

94
Figure 5.9 shows isodose comparisons between TPS-calculated and film-
measured dose planes, from a film exposed in the national brachytherapy audit phantom
(Section 6.4.1), using single-channel and triple-channel dosimetry. Both single- and triple-
channel dosimetry provide good agreement close to the applicator axis, up to 20 mm lateral
(abscissa), corresponding to 3 to 13 Gy, and good agreement up to 105 mm from the
applicator base (ordinate), corresponding to 5 to 13 Gy. While triple-channel film dosimetry
maintains good agreement with TPS calculation across the entire film, the single-channel
analysis exhibits an increasing difference between film dose and TPS dose with increasing
lateral distance (abscissa). This corresponds to increased lateral distance on the scanner.
Comparing the film and TPS doses in Figure 5.9 using gamma analysis, with criteria of 3%
(local normalisation) and 2 mm (with zero threshold for analysis across the full film), the
passing rate was 90.6% for triple-channel and 37.5% for single-channel. The gamma passing
rate is dramatically improved when triple-channel dosimetric analysis is used.
Figure 5.9. Comparison of film-measured (thick lines) and treatment planning system-calculated
(thin lines) dose distributions (isodose lines from 30 cGy to 1300 cGy shown), from a
typical brachytherapy cervix applicator, with (a) single (red)-channel dosimetry and (b)
triple-channel dosimetry. Abscissa aligned with lateral direction of the scanner, where
x=0 represents the middle of the scanner.

95
5.3.5. Film Surface Perturbation
Figure 5.10 shows film dose profiles through three EBT3 film samples exposed
to 0, 4, and 10 Gy, respectively, each with surface perturbations caused by the application of
grease and scratches. Film dose calculated using triple-channel and single-channel dosimetry
is compared in the Figure. The surface perturbations have significantly greater effect on the
reported dose using single-channel, compared to triple-channel dosimetry, with the latter
accurately reporting the expected dose values for all three films. Single-channel analysis
reported significantly higher dose values due to the presence of grease and scratches.
Figure 5.10. Effect of film surface perturbation (grease and scratches) on calculated film dose using
single-channel and triple-channel dosimetry. Profile through three film samples
irradiated to 0, 4, and 10 Gy each, with grease and scratches.

96
5.3.6. Film Active Layer Thickness
Table 5.3 gives the calculated dose values for the original film and ‘doubled
active layer’ film scanned and analysed using single-channel and triple-channel dosimetry
methods, at dose levels of 1, 8, 12, and 14 Gy. The process of de-laminating and restacking
increases the noise in the scanned image, shown as an increase in the standard deviation of
the sample region. However, it is clear that an effective doubling of the active layer is
reported as an approximate doubling of the dose with single-channel dosimetry, but has
much less effect on the dose reported by triple-channel dosimetry, with doses being
approximately consistent with the original single active layer film. Triple-channel dosimetry
is clearly less sensitive to active layer thickness variations than single-channel dosimetry.
Table 5.3. Calculated film dose for original and ‘double active layer’ film using single- and triple-
channel analysis with Gafchromic EBT3 film in the range 1 to 14 Gy. (One standard
deviation of the dose values in the regions of interest are shown in brackets).
Film-dose (cGy) from original film Film-dose (cGy) from de-laminated
film restacked with two active layers
Dose level (Gy) Single-channel
dosimetry
Triple-channel
dosimetry
Single-channel
dosimetry
Triple-channel
dosimetry
1 102 (2) 100 (2) 247 (105) 92 (35)
8 785 (11) 799 (16) 1681 (269) 866 (118)
12 1166 (26) 1214 (28) 2452 (204) 1188 (223)
14 1401 (22) 1400 (35) 2601 (390)
1427 (261)
5.3.7. The Effect of Film Curvature at Scanning
Figure 5.11 provides isodose overlay comparisons of film-measured and TPS-
calculated dose distributions for a dose distribution typical of the national audit (Chapter 8),
with the film permitted to exhibit its natural curvature, Figure 5.11(a), and with the film
scanned flat under a glass compression plate, Figure 5.11(b). When scanned flat there was
good agreement between film-measured and TPS-calculated isodoses. With natural film
curvature, there was good agreement where the film was in contact with the glass plate but
poorer agreement where the film was displaced above the scanner, leading to a maximum 2
mm shift in isodose line for a 1.5 mm vertical height offset, for the dose gradient considered
in this example. For these dose distributions, the gamma passing rates comparing film-
measured and TPS-calculated isodose distribution for (a) film naturally curved and (b) held
flat under glass plate, were 95.7% and 100.0% respectively at 3% (local) 2 mm criteria, and
28.1% and 94.2% respectively at 2% (local) 1 mm criteria.
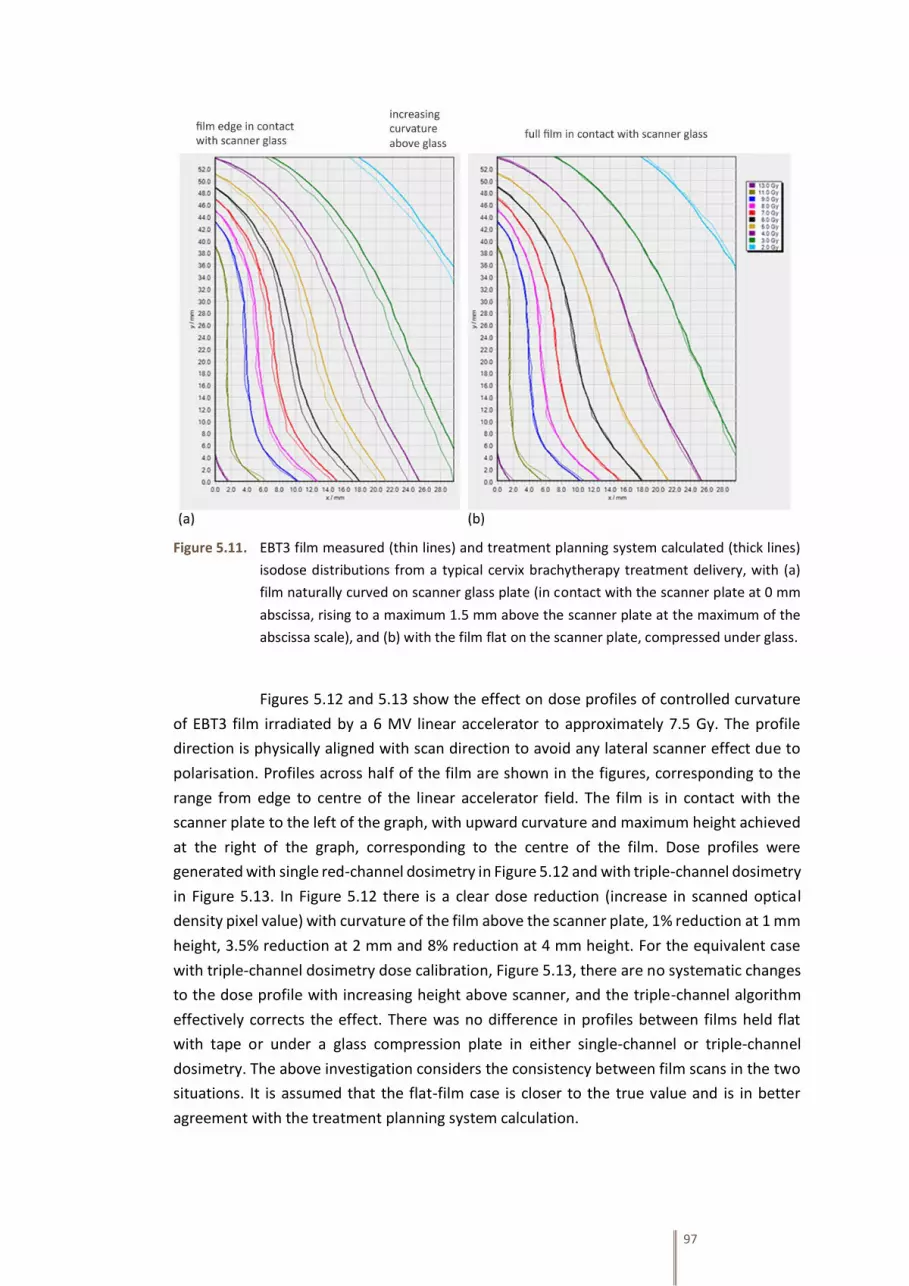
97
Figure 5.11. EBT3 film measured (thin lines) and treatment planning system calculated (thick lines)
isodose distributions from a typical cervix brachytherapy treatment delivery, with (a)
film naturally curved on scanner glass plate (in contact with the scanner plate at 0 mm
abscissa, rising to a maximum 1.5 mm above the scanner plate at the maximum of the
abscissa scale), and (b) with the film flat on the scanner plate, compressed under glass.
Figures 5.12 and 5.13 show the effect on dose profiles of controlled curvature
of EBT3 film irradiated by a 6 MV linear accelerator to approximately 7.5 Gy. The profile
direction is physically aligned with scan direction to avoid any lateral scanner effect due to
polarisation. Profiles across half of the film are shown in the figures, corresponding to the
range from edge to centre of the linear accelerator field. The film is in contact with the
scanner plate to the left of the graph, with upward curvature and maximum height achieved
at the right of the graph, corresponding to the centre of the film. Dose profiles were
generated with single red-channel dosimetry in Figure 5.12 and with triple-channel dosimetry
in Figure 5.13. In Figure 5.12 there is a clear dose reduction (increase in scanned optical
density pixel value) with curvature of the film above the scanner plate, 1% reduction at 1 mm
height, 3.5% reduction at 2 mm and 8% reduction at 4 mm height. For the equivalent case
with triple-channel dosimetry dose calibration, Figure 5.13, there are no systematic changes
to the dose profile with increasing height above scanner, and the triple-channel algorithm
effectively corrects the effect. There was no difference in profiles between films held flat
with tape or under a glass compression plate in either single-channel or triple-channel
dosimetry. The above investigation considers the consistency between film scans in the two
situations. It is assumed that the flat-film case is closer to the true value and is in better
agreement with the treatment planning system calculation.

98
Figure 5.12. Normalised film dose profiles using single (red)-channel dosimetry across a single EBT3
film irradiated by a 6 MV linac beam, with the film in various flat or curved positions.
(Profiles aligned with scan direction to avoid lateral scanner effect).
Figure 5.13. Normalised film dose profiles using triple-channel dosimetry across a single EBT3 film
irradiated by a 6 MV linac beam, with the film in various flat or curved positions. (Profiles
aligned with scan direction to avoid lateral scanner effect).

99
Figure 5.14 shows single-channel (red and green) dose profiles across three 30
mm x 30 mm fields from a linear accelerator at dose levels of 1.8, 3.5 and 6 Gy, for EBT3 film
held flat and raised uniformly by 5 mm above the scanner glass plate. The profile direction is
physically aligned with scan direction to avoid any lateral scanner effect due to polarisation.
There is a clear reduction in reported dose with the film raised 5 mm compared to the case
in contact with the scanner plate. The average dose reduction in the red channel at 1.8 Gy
was 21%, at 3.5 Gy was 17%, and at 6 Gy was 14%. The average dose reduction in the green
channel at 1.8 Gy was 33%, at 3.5 Gy was 21%, and at 6 Gy was 16%.
Figure 5.14. Film dose profiles using red and green single-channel dosimetry across an EBT3 film
exposed to three dose level regions (180, 350 and 600 cGy), with the film flat in contact
with the scanner glass plate and with the film raised uniformly by 5 mm. (Profiles aligned
with scan direction to avoid lateral scanner effect).

100
5.3.8. Film Measurement and Validation of Radial Dose from an Ir-192 HDR
Brachytherapy Source
Figure 5.15 shows EBT3 film measured dose as a function of radial distance from
the centre of an isolated Ir-192 HDR source. The response was measured with a single film
over the range 5.0 to 60.0 mm from the source axis, corresponding to a range 8 to 0.06 Gy in
this exposure. There is good agreement with Monte Carlo data, within experimental
uncertainty (1.8% at k=2, see Section 6.4.5, not including film positional uncertainty) across
the full distance range considered.
Figure 5.16 shows the dose derived from three EBT3 film measurements each
with different exposure times and dose rates (different distances from the source), achieving
similar dose ranges across the full width of each film. The film doses are compared to TPS
calculated dose points in the Figure. Neither re-normalization nor axis shifts of the film or
TPS dose data has been applied, showing true measured dose agreement directly with that
calculated by the TPS in the three dose ranges. The Figure demonstrates there is a negligible
dose-rate dependence on EBT3 response in the range considered. The three films were
exposed to the same dose, but at different distances from the source and hence different
dose rates, using appropriately calculated irradiation times. For example, 8.0 Gy was
delivered to the low, medium and high irradiation time films at distances of 8, 18 and 34 mm,
corresponding to dose rates of 350.5, 69.2 and 19.4 cGy min−1, respectively, for the HDR
source used in this study. The distance to agreement between film measured and TPS
calculated (interpolated) dose at the 8.0 Gy dose level was 0.5, 0.2 and 0.1 mm, respectively.
5.3.9. Film Measurement and Validation of Radial Dose from a Co-60 HDR
Brachytherapy Source
Figures 5.17 and 5.18 show film measured dose as a function of radial distance
from an isolated Co-60 source, using the same methodology as for the Ir-192 source in
Section 5.3.8. Agreement with Monte Carlo data is within experimental uncertainty. 8.0 Gy
was delivered to the low, medium and high irradiation time films at distances of 9, 27 and 43
mm, corresponding to dose rates of 391.6, 41.4 and 15.8 cGy min−1, respectively, for the HDR
source used in this study. The distance to agreement between film measured and TPS
calculated dose at the 8.0 Gy dose level was 0.5, 0.2 and 0.1 mm, respectively.

101
Figure 5.15. Normalised dose as a function of radial distance from a Nucletron mHDR-v2 Ir-192
brachytherapy source; EBT3 measured compared to HEBD consensus data (Perez-
Calatayud et al. 2012b).
Figure 5.16. EBT3-film measured dose with radial distance from a Nucletron mHDR-v2 Ir-192
brachytherapy source, at three different dose rates and irradiation times, compared to
treatment planning system (TPS) calculated dose.

102
Figure 5.17. Normalised dose as a function of radial distance from an Eckert & Ziegler Bebig Co0-
A86 Co-60 HDR brachytherapy source; EBT3 measured compared to HEBD consensus
data (Perez-Calatayud et al. 2012b).
Figure 5.18. EBT3-film measured dose with radial distance from an Eckert & Ziegler Bebig Co0-A86
Co-60 HDR brachytherapy source, at three different dose rates and irradiation times,
compared to treatment planning system (TPS) calculated dose.

103
5.4. Discussion and Conclusions
5.4.1. Dosimeter Performance Characteristics
The post-irradiation darkening behaviour of Gafchromic EBT3 film has been
shown to be a logarithmic function, continuing at least three months post-exposure, with the
effect more significant at higher dose levels, shown in Figure 5.7. These results differ from
Borca et al. (2013) who considered post-irradiation colouration over 72 hrs and concluded
net optical density stabilized after nearly 0.5 h at dose levels up to 2 Gy, and 2 h would be
sufficient to guarantee stability to perform analysis at studied doses up to 4 Gy. Theoretically,
the film active layer polymer formed by exposure will continue to grow, but the rate of
growth will rapidly decrease as the distance from the growing polymer chain to the next
available monomer increases. Growth will only occur on random occasions when enough
thermal energy is acquired to bridge the gap. The results presented here demonstrate post-
irradiation colouration is a continual, logarithmic function. It is important to appreciate that
continual darkening of the film occurs, and reference dose films irradiated for purposes of
calibration scaling, scanned simultaneously with test films, must be irradiated at the same
time, or the time difference recorded and sufficient time allowed between test and reference
irradiations prior to scanning. The anecdotal recommendation of delaying scanning by a time
four times the interval between test and reference films has been shown to be valid (in this
work, up to 14 Gy and 24 hrs between test and reference films), in order to reduce dose
errors to less than 0.3%.
The lateral scanner artefact described by Menegotti et al. (2008) for doses up to
7 Gy, has been confirmed in this work and documentation of its effect extended up to 14 Gy,
appropriate for brachytherapy film dosimetry. Menegotti and colleagues showed a change
in pixel value in the range 9% to 19%, depending on scanner model, for a 7 Gy exposure at
10 cm lateral to the central axis of the scanner. The results presented in the current work
indicate a reported dose increase of 23% at 14 Gy, 9 cm lateral position, for single-channel
film dosimetry. However, this effect is reduced to 9% with triple-channel dosimetry. The
array of monomer and polymer rods in the film means the amount of polarization of light is
different depending on whether the film is 0° or 90° rotated on the scanner, and this may
explain the difference in results between the current work and Menegotti et al. (2008).
Schoenfeld et al. (2014) showed theoretically that radiation-induced polymers in EBT3 film
cause polarisation and scattering of scanner light, causing lateral scanner artefacts (termed
the parabola effect by Schoenfeld).
The advantage of triple-channel dosimetry over single-channel dosimetry in
mitigating the effect of lateral scanner artefact has been demonstrated at dose levels and
distributions typical for brachytherapy dosimetry. However, the useable scanner width is
limited even with triple-channel dosimetry to less than ±4 cm width to reduce lateral scanner
effect to less than 1% with the Epson V750 Pro scanner (the useable width may increase with
physically larger scanners). The effects of film surface perturbations and of variations in
active layer thickness have been shown to be significantly reduced with triple-channel
compared to single-channel dosimetry.

104
A proposed methodology for brachytherapy film dosimetry has been discussed,
using three reference strips (including zero dose), rather than two (including zero dose), in
order to confirm accurate dosimetry over the large dose ranges encountered in
brachytherapy. It has also been demonstrated that choice of reference film dose level for
linear calibration rescaling can improve the dose uncertainty at dose levels of interest. This
is particularly important in brachytherapy dosimetry in which there are often very large dose
ranges across films. It is recommended to use a reference dose level for rescaling of the film
response function around the dose level of particular interest, such as the prescription dose,
rather than the maximum dose in the film, as recommended by Lewis et al. (2012), for
external beam radiotherapy dosimetry applications, in which there is often a smaller dose
range. It is also recommended that film is perfectly flat on the scanner to provide reliable
dosimetric results, avoiding changes in scanner response which may be due to variations in
illumination, optical disturbances, and effects such as that described by Callier (Chavel and
Lowenthal 1978) in which light changes from a collimated to a diffuse source. A compression
glass plate positioned on top of the film is suggested to ensure sufficient flatness.
The proposed methodology for film dosimetry utilising the triple-channel
algorithm and linear rescaling, implemented within FilmQAPro software, as discussed in this
work, has been applied to the measurement of dose distributions around clinical
brachytherapy treatment applicators. Using gamma analysis to compare film-measured and
TPS-calculated dose distributions, at criteria 3% local normalisation and 2 mm distance to
agreement, over a region of interest of 115 x 80 mm (equivalent to 0.3 to 11 Gy dose range),
gamma passing rates exceeding 90% for triple-channel dosimetry have been reported, but
the passing rate reduced to exceeding 37% for single-channel dosimetry. (Due to very steep
dose gradients, the position sensitivity of the gamma map is high, and in each case the
relative position of the film dose and plan dose was optimised for maximum gamma pass
rate). The significant reduction in performance of film dosimetry for brachytherapy with
single-channel dosimetry compared to triple-channel dosimetry is likely to be primarily the
result of lateral scanner artefact, which is mitigated with triple-channel dosimetry.
At the currently achieved uncertainty levels for film dosimetry, quoted between
1% and 10% depending on the situation (Martisikova et al. 2008, Bouchard et al. 2009,
DeWerd et al. 2011), film curling during scanning can be a substantial error source if not
addressed. Displacement of film above the scanner plate by 1 mm to 2 mm can increase pixel
values and reduce reported dose by 1% to 4%. From the data presented, the physical height
of the film above the scanner plate appeared to cause changes in scanned pixel value, and
hence reported dose, irrespective of any inherent curvature of the film. Increasing the height
of the film above the scanner plate increased the effect on scanned pixel value. No difference
was found with films scanned flat using adhesive tape on the scanner or scanned under a
compression glass plate, with the latter being more convenient. Moderate natural film
curling has been observed, as may be experienced with small film pieces typical of the
national brachytherapy audit (Chapter 8), which may be a significant source of uncertainty
and error in film dosimetry. A glass compression plate may be conveniently used to flatten
small film pieces, and triple-channel dosimetry is able to mitigate the detrimental effect on

105
film dosimetry accuracy when scanning curved films. The magnitude of the effect is likely to
be dependent on the film type and the scanner model used as well as scanning protocols,
and results presented here should be confirmed for local film dosimetry situations. Film
curvature must be considered and controlled alongside the other uncertainties present in
film dosimetry for the national brachytherapy audit.
The mechanism by which deviations from perfectly flat film at scanning result in
variations in scanner response is not clear, and the magnitude of the effect has not been
reported to date in the literature. The flatbed scanner manufacturer in a private
communication has reported that “any [film] curve will cause a change in the resultant scan
due to the media potentially being outside the focal plane of the scan head. Additionally it
can affect the uniformity of lighting. We would recommend the film is held flat in a frame
during scanning. A fluid mount kit may be an option” (Epson 2014). There is no information
in the literature on film curvature or height above scan plane at scanning for dosimetry
applications, but there has been discussion of film height above imaging plane in
photographic film scanning and optical photographic developers and enlargers. In
photographic applications, small changes in film position can have marked changes in the
resulting signal due to the Callier effect (Chavel and Lowenthal 1978) which describes
changes in optical density resulting from variations in illumination, such as from a collimated
to diffuse source within the optical system. Any curved film will also have different effective
film thicknesses for light paths at different scan positions and will affect surface scattering
from the film. A glass compression plate has been used to achieve flat film scan conditions in
the above methodology. EBT3 film may be used in contact with the glass scanner plate and
the glass compression plate film without the formation of light reflection interference
patterns, such as Newton’s rings, since the film is formed of matte polyester layers with silica
particles at the surface creating a 5 µm air gap to the glass plates which is significantly larger
than the light wavelength. Other films, such as the predecessor EBT2, may suffer from
interference artefact when in contact with either the upper or lower glass plates since they
are constructed with smooth polyester layers. To achieve reduced dose uncertainty with a
glass plate compression technique, EBT3 film must be used for the national brachytherapy
dosimetry audit.
5.4.2. Use of Radiochromic Film Dosimetry for Brachytherapy Dosimetric Audit
The use of film dosimetry has been evaluated in brachytherapy applications in
both test cases and clinical dose distribution measurements. It has been demonstrated that
radiochromic film dosimetry with Gafchromic EBT3 film and a flatbed scanner is a viable
method for brachytherapy dosimetry, and uncertainties may be reduced with triple-channel
dosimetry, linear dose re-scaling, and specific film analysis methodologies including a glass
compression plate and minimising lateral displacement on the scanner. The separation of the
scanner signal into dose-dependent and dose-independent parts via triple-channel
dosimetry enables the mitigation of signal disturbances, such as variations in film active layer
thickness, film surface perturbations, and also to some extent lateral scanner effect. The
lateral effect is particularly significant for accurate dosimetry and must be considered in

106
brachytherapy exposures to high dose levels and, even with triple-channel dosimetry, limits
the usable lateral region of the scan plane. The use of simultaneous scanning of calibration
reference films with test films is advantageous to scale the pixel value for any scanner
fluctuations, provided post-exposure darkening kinetics are accounted for between the two
films. Darkening of the film continues after irradiation as a logarithmic function with time, at
least up to three months. The importance of keeping film flat when scanning has been
demonstrated, an effect overlooked in previous recommendations on film dosimetry, but it
is not necessary to use a non-reflective matte around the films.

107
CHAPTER 6
Development of an ‘End to End’
Brachytherapy Dosimetric Audit
using Radiochromic Film

108
6.1. Review and Evaluation of Previous Brachytherapy Dosimetric
Audits
Prior to developing the national brachytherapy dosimetry audit, a systematic
review was conducted of journal articles published over the last three decades, that have
discussed concepts, research and practices of dosimetric audit in brachytherapy. Medline
and Embase databases were searched, internet search engines utilised, and several
brachytherapy experts across the world consulted. Eight peer-reviewed journal publications
were obtained that presented results of fully completed audits, or pilot audits at several
centres, involving dosimetric measurement (Haworth et al. 2013, Venselaar et al. 1994, de
Almeida et al. 1999, Elfrink et al. 2001b, Heeney et al. 2005, Roue et al. 2007, Carlsson
Tedgren and Grindborg 2008, Casey et al. 2013), and one concerned with a geometric
applicator reconstruction audit (Roue et al. 2006). Each of these above audits deals with
afterloading equipment. There was also one completed dosimetric audit of electronic
brachytherapy in the UK (Eaton et al. 2013). There have also been conference presentations
on brachytherapy audit, however the full content is not always widely available in searchable
proceedings or publications (Ratcliffe et al. 1997, Sudom and Ratcliffe 1998, Aukett et al.
1999, Thwaites and Nisbet 2003a, Thwaites et al. 2003b). An IAEA survey of dosimetric audit
networks in 2013 indicated only 13 of 53 organisations worldwide undertook audits in
brachytherapy of any modality (Grochowska and Izewska 2013). A summary of published
dosimetric audits conducted on HDR/PDR brachytherapy equipment is provided in Table 6.1
(reproduced in Palmer et al. 2014b).
In approximately one-third of the published audits, errors were detected at one
centre in each audit, which appear to be clinically significant. Causes of the errors were stated
as calibration factor, calibration coefficient, certificate source strength, and step-size
mismatch between TPS and treatment delivery system. In 2001, Elfrink et al. (2001b) studied
agreement between ion-chamber measured dose and dose calculated by a treatment
planning system at the chamber measurement point from straight catheters and found one
clinic where a 6.8% deviation was recorded and attributed to an error in the source strength
value on the source certificate. The source position accuracy at seven clinics had errors larger
than 1 mm, three of which exceeded 2 mm. Roue et al. (2007) reported on audits with a
remote mailed phantom and TLD, developed by the ESTRO BRAPHYQS Physics Network and
the EQUAL-ESTRO laboratory, consisting of three straight catheters around a central TLD
holder. It is reported that one audit result was initially outside the tolerance level, with the
error being due to the use of an “inadequate calibration coefficient”. Once rectified, the audit
was repeated and a result within tolerance was obtained. The acceptable limit used by the
EQUAL-ESTRO Laboratory for dose deviation is 7% (Veres 2013). A dosimetric audit of source
strength using a well-type chamber reported by Carlsson Tedgren and Grindborg (2008)
found agreement within 1%, except one case which was within 3%. Another audit-detected
error was reported by Haworth et al. (2013), discussed below.

109
The only publication to date of a brachytherapy audit incorporating imaging and
reported as a full system test, was described by Haworth et al. (2013), however in common
with the above audits, only straight source catheters were used. The audit was conducted at
seven clinics in Australia as a pilot study to demonstrate feasibility prior to a more complex
audit to be devised. The current phantom was based on the design described by Roue et al.
(2007), using two source dwell positions (±30 mm from the dosimeter) in each of three
straight catheters with a central TLD measurement in a homogeneous dose region. The
phantom was filled with water and CT imaged using normal clinical protocols, identifying
source catheters and radio-opaque markers in the position of the central TLD. A host
treatment plan was produced to deliver 1 Gy to the TLD, and delivered using normal clinical
processes. All results were within the stated ‘optimal’ tolerance of ±5%, except one centre in
which a 25% error was reported, outside the ‘emergency’ tolerance level. This was caused by
the use of a 5 mm step-size at the treatment console for delivery, rather than the 2.5 mm
step size that has been used at the TPS. A repeat audit once this had been rectified was within
the ‘optimal’ tolerance.
6.2. Objectives for a Dosimetric Audit in Brachytherapy
There is no doubt that clinical and physics aspects of brachytherapy will continue
to develop at a significant rate, including the realisation of advanced and functional imaging
in brachytherapy, a new era of dose calculation algorithms for brachytherapy, and an
evolution away from traditional template planning to fully patient-specific optimisation
(Palmer 2014a). As a result, the scope of dosimetric audit in brachytherapy will continue to
be challenged to be fit for purpose. The dosimetric audits discussed in Section 6.1 had the
objective of accurate confirmation of source strength, using straight source catheters, with
dwell patterns designed to generate homogeneous dose deposition regions at the dosimeter.
Indeed, the majority of audits have been designed to minimise the effect of source
positioning errors on the measured dose: the design by Casey et al. (2013) stating “variations
in distal/proximal source positioning up to 10 mm had minimal effect on dose measurement
accuracy”. Verification of source strength for afterloading equipment was a key aim for
earlier dosimetric audits, since there was indeed a need to confirm the accuracy of this
parameter. There had been a lack of primary standards for Ir-192 and the uncertainty of
source strength quoted by manufactures some years ago was ±10% (Venselaar et al. 1994,
Baltas et al. 1999). The uncertainty quoted by manufacturers is now often ±5% at k=3, with
their source strength measurements traceable to national standards laboratories. The ability
for local radiotherapy clinics to determine source strength has also improved, with the
development of well-type ionisation chambers designed specifically for brachytherapy
(Goetsch et al. 1992), which are more robust, less sensitive to positional inaccuracies and
room-scatter effects, and produce higher ionisation currents compared to free in-air
measurements with smaller ionisation chambers (Carlsson Tedgren 2008). Early results from
a UK well-chamber intercomparison demonstrated excellent agreement in source strength
determination comparing local measurement, auditor measurement, and source certificate,
with 14 centres having agreement within 0.5% (Lee 2012).

110
Table 6.1 Summary of published HDR/PDR brachytherapy dosimetric audits.
Reference Dosimeter used Region Number
of audits
Results
Venselaar
et al. 1994
Thimble-type
ionisation chamber
with in-air jig
The
Netherlands
and Belgium
13 Auditor compared to local
measurement: Mean +1.3%,
range -0.4% to +3.0%
De Almeida
et al. 1999
Thimble ionisation
chamber with in-air jig
and/or well-type
ionisation chamber
Brazil 10 Visiting centres compared to
reference measurement: All
within ±3.0%, except one error
detected (-4.6%), calibration
factor
Elfrink
et al. 2001b
Thimble ionisation
chamber in solid
cylindrical PMMA
phantom with three
straight catheters
The
Netherlands
and Belgium
33 Measured compared to
prescribed: For HDR mean + 0.9%
±1.3% (1sd), for PDR mean +1.0%
±2.3% (1sd). One error detected
(6.8%) source strength certificate.
Heeney
et al. 2005
Thimble-ionisation
chambers in custom-
designed in air jig
Ireland,
Scotland and
the north of
England
11 (at 9
clinics)
Auditor compared to local
measurement: For HDR, mean
+0.8%, range -0.9% to +1.5%, For
PDR, mean +0.3%, range - 3.8% to
+2.4%.
Roue et al.
2007,
EQUAL-
ESTRO
Laboratory
Mailed TLD with
phantom comprising
three PMMA tubes
around central
dosimeter, in water
Europe 17 Measured compared to
treatment planning system:
Range -4.7% to +4.7%. One error
detected, calibration coefficient.
Carlsson
Tedgren
and
Grindborg
2008
Well ionisation
chamber
Sweden 14 (at 7
clinics)
Auditor compared to local
measurement: All within ±1.0%,
except one within +3%. Auditor
to certificate and local to
certificate: range -1.5% to +3%.
Haworth et
al. 2013
‘End-to-end’ audit.
TLD with phantom
comprising three
PMMA tubes around
central dosimeter, in
water
Australia 7 Measured compared to
treatment planning system. All
results within ±5%, except one
large error detected (25%),
incorrect step size used at
treatment unit compared to TPS.
Casey
et al.
2013
Optically stimulated
luminescence (OSL)
nanoDots in mailable
polystyrene phantom
USA 8 Measured compared to
treatment planning system.
Mean 0.0% ±1.2% (1 sd)

111
While previous concerns of source calibration may now essentially be resolved,
which should lead to reduced uncertainty in determination of source strength, it is important
not to abandon audit checks of this fundamental parameter, but it does enable a shift in
focus to more complex areas for audit. The alternative novel approach used in the present
work is to audit the dose delivered in typical clinical situations, assessing the combined effect
of all dosimetric uncertainties, including applicator reconstruction on planning scans,
treatment planning system calculation, data transfer and consistency, dwell position length
calibration, dwell paths in treatment applicators, attenuation by the applicators, as well as
source strength calibration. This has the benefit of a more ‘clinically realistic’ dosimetric
audit. Dosimetric measurements in clinical brachytherapy situations are problematic and
measurement uncertainties may increase as we move closer to the clinical treatment
situation. Therefore, results of such an audit may lack specificity of the cause of any error,
but the reassurance of auditing the full ‘patient path’ is particularly advantageous in a clinical
radiotherapy department. It is important that brachytherapy equipment is tested under
conditions other than those used for routine calibration, and assessment of dose
distributions rather than point doses is a particular requirement for robust assurance of
treatment dose delivery.
The advantage of a visiting auditor conducting audits rather than using mailed-
phantom/detector dosimetry approaches is the opportunity to discuss local physics clinical
procedures and to reduce operator error in set up. An aim of the national brachytherapy
dosimetric audit was to enable such discussion, hence site visits were required by an auditing
physicist experienced in brachytherapy physics. A simple review of brachytherapy
procedures and infrastructure during the course of an audit is designed to at least
qualitatively attempt assessment of the likelihood of errors, and offer any quality
improvement suggestions to mitigate risks.
Brachytherapy is an effective treatment modality for a number of sites, but it is
most frequently utilised for carcinoma of the cervix in the UK, followed by prostate. It is a
logical choice to undertake brachytherapy system audit on the most frequently used
treatments. Also, since cervix applicators generally have more challenging geometry for
accurate source positioning due to high levels of curvature (Stern and Liu 2010), compared
to other sites which utilise approximately straight catheters, cervix brachytherapy has been
chosen for the national audit. Brachytherapy treatment planning requires applicator
reconstruction, usually on patient CT scans, and this has the potential to be a significant
source of uncertainty (Hellebust et al. 2010, Kirisits et al. 2014). It is therefore a key objective
that the national brachytherapy audit incorporates this aspect within the ‘end to end’ audit,
the intention being to incorporate each stage of the patient imaging, planning and treatment
process.
The scope of the audit is to include only the primary aspects of the
brachytherapy process, and include only those that usually come under the responsibility of
Medical Physics Departments. Of course ‘physics-aspects’ are not the only contributors to
dose delivery uncertainty in brachytherapy and indeed the more ‘clinically’ related aspects
have the potential for more, or even overwhelming, influence on the treatment outcome

112
than ‘physics’ aspects, if physics aspects are delivered within expected quality levels and no
significant error. There are numerous clinical uncertainties in brachytherapy treatment
(Thomadsen et al. 2003, Kirisits et al. 2014), that are not tested by the current audit
approach, including target volume definition and contouring (Petric et al. 2013, Hellebust et
al. 2013), tissue heterogeneities, human factors in applicator positioning, internal organ
motion and inter- and intra-fraction applicator movement (Nesvacil et al. 2013, Anderson et
al. 2013). The magnitude and importance of various uncertainties were discussed in a special
volume of Radiotherapy & Oncology in April 2013. Tanderup et al. (2013) calculated the one
standard deviation combined uncertainty for a single fraction of intracavitary brachytherapy
as 12% for the HR CTV D90 target, and 21-26% for D2cc organs at risk, reducing with multiple
fractions.
6.3. Methodology
6.3.1. Design of an Audit Phantom
The purpose of this work is to approach HDR brachytherapy audit from a novel
perspective: to measure dose distributions around clinical treatment applicators and
compare to TPS isodose calculations, rather than traditional audits in brachytherapy of point
doses from straight catheters. The measurement is therefore more closely aligned with
external beam patient-specific QC for IMRT/VMAT delivery verification than conventional
brachytherapy QC tests. The intention of the phantom is to enable a comparison between
measured dose using film and TPS calculated dose distributions. To achieve this aim, a
phantom was required that securely held any cervix gynaecology HDR/PDR applicator and
held measurement film accurately at known positions around the applicator. Film positioning
was required that enabled dose to traditional prescription location Point A (Viswanathan and
Thomadsen 2012) to be determined, as well as measuring dose distribution in clinically
relevant regions. It was also important that the treatment applicator be imaged in
approximately the orientation used for patient imaging, such that assessment of applicator
reconstruction was realistic to the clinical pathway.
The reference medium recommended by the AAPM Task Group 43 for obtaining
the dose rate distribution around a brachytherapy source is liquid water (Rivard et al. 2004).
The requirement for a sufficiently large phantom for brachytherapy dosimetry, either for
practical measurement or theoretical calculation, is well known (Perez-Calatayud et al. 2004,
Melhus and Rivard 2006, Granero et al. 2008, Perez-Calatayud et al. 2012a). It is essential the
phantom for the national brachytherapy audit either provides full-scatter conditions or the
correction for lack of scatter is known. The scatter assessment is required for both Ir-192 and
Co-60 HDR sources, and to inform the practical decision on phantom size that can be
conveniently transported for a UK dosimetric survey. Monte Carlo calculations were
undertaken to inform the decision on audit phantom size, see Section 7.3.2.

113
6.3.2. ‘End to End’ Audit Procedure Development
The uncertainty in any measurement system should be significantly less than the
variations to be measured in the test signal. There are uncertainties in film dosimetry,
including positional, darkening kinetics and scanning characteristics, but these can be
mitigated by advanced film dosimetry methods, reported in Chapter 5, and any residual
uncertainty is expected to be acceptable for the intended purpose of this work. The audit
procedure is designed not to precisely establish TG-43 type dose-rate functions (Rivard et al.
2004) but to confirm the dose distributions around clinical treatment applicators is consistent
with TPS calculated intended distributions, within acceptable clinical tolerance. An increased
level of uncertainty is acceptable for this purpose.
6.3.3. Sensitivity to Simulated Errors
In order to confirm the BRAD audit process was sufficiently sensitive to detect
errors in treatment delivery, a typical brachytherapy treatment plan using ring and ovoid
applicator, was modified at the TPS to induce two different types of simulated errors: (1) All
dwells shifted 5 mm proximal from their planned position, (2) treatment times scaled for the
delivery of 8 Gy instead of planned 7 Gy. These error were chosen as conceivable failure
modes for a brachytherapy treatment, at a magnitude that would be of clinical significance.
The treatment plan was compared to the film-dose measurement using isodose overlay and
gamma analysis, for the normal delivery case and the two simulated error cases.
6.4. Results
6.4.1. BRachytherapy Applicator Dosimetry (BRAD) Phantom Design
A test object was designed to measure the dose distributions around any ring or
ovoids and intrauterine (IU) clinical treatment applicator for HDR or PDR brachytherapy for
cervix cancer. The use of additional interstitial needles was not accommodated in the design.
Several prototype phantoms were conceived and tested (constructed of polystyrene or
Perspex) prior to the final design being selected. An early concept design to test the use of
film for brachytherapy dosimetry is shown in Figure 4.2, which consisted of a three sided
Perspex frame with grooves to hold an array of several films. Alignment of the HDR treatment
applicator between film planes had unacceptable positional uncertainty, and films were
susceptible to curvature. Other designs included slots for film in water-equivalent plastic,
however accurate positioning of films was difficult and the design did not satisfy a primary
intention to use of liquid water around the films. The final design enabled accurate film
placement against thin water equivalent material sheets, within a water tank, with well-
defined applicator positioning with respect to the film, as described below.

114
The BRachytherapy Applicator Dosimetry (BRAD) was designed to maximize the
volume of liquid water around the applicator and film with all supporting and alignment
material constructed of Solid Water6 (Gammex RMI-457) which introduces acceptable
corrections from liquid water (Perez-Calatayud et al. 2012). Aldelaijan et al. (2011) has
quantified the ratio of dose delivered to radiochromic film in liquid water compared to the
dose delivered in Solid Water using Monte Carlo simulations to be 0.9941 ± 0.0007. Thin
sheets of Solid Water, 5 mm thickness, are used to accurately position the film.
There is a practical limitation on the size of a water tank that can be used for the
national dosimetric audit measurements due to transportation requirements. A full scatter
phantom may be required to reproduce TG-43 assumptions. A competing argument is that
the scattering volume should equate to approximate patient dimensions to compare
delivered and planned dosimetry, rather than unbound scattering conditions. It was decided
to not include limitations of TG-43 dosimetry in the audit and hence a full-scatter phantom
was designed. Monte Carlo modelling (Section 7.3.2), was used to establish the required
dimension of a phantom in order to reduce the magnitude of the scatter correction for dose
measurements at Point A. Balancing the theoretical requirement and practical consideration
of transportation, a scatter phantom comprising a cubic water tank with each side dimension
400 mm was selected.
The BRAD test object enabled four films to be placed in orthogonal planes
crossing the IU tube of the clinical treatment applicator. Figure 6.1 shows photographs of the
final BRAD phantom, Figure 6.2 a wireframe CAD design drawing, and Figure 6.3 3D rendered
CAD views. The applicator ring or ovoids were placed in contact with the upper surface of the
test object with the IU tube inserted into the central cavity. A range of collars and spacers
were available for the central cavity to ensure accurate positioning along the central axis of
the test object, for any HDR applicator in use in the UK. The appropriate inserts were selected
to match the external diameter and length of each IU tube. An applicator support arm and
clamp were used to rigidly hold the applicator in a consistent position for CT scanning and
radiation delivery. One Gafchromic EBT3 film of dimensions 100 × 120 mm was positioned
on each of four vanes in the test object, with the film moved up against end stops towards
the central axis and upper surface of the test object, giving a reproducible film-edge-to-IU-
axis distance of 10.0 mm and a film-edge-to-surface-of-applicator ring or ovoid distance of
5.0 mm. The evaluated region was film edge to 50 mm away from the IU and film edge to 70
mm along the IU, (the unused portion of film was for ID marking and handling). The film
positions were intended to sample the dose distribution through the majority of the HR-CTV
and into typical locations of OAR. Left lateral and right lateral films containing CTV and
conventionally defined Point A, the anterior film including CTV and the closest section of
typical bladder; and the posterior film including CTV and closest sections of typical rectum
and sigmoid, for cervical cancer brachytherapy.
6 Gammex Inc, Middleton, Wisconsin, USA

115
Figure 6.1 Photographs of BRAD phantom with (a) Nucletron plastic ring and IU applicator, and (b)
with Eckert & Ziegler Bebig plastic split-ring and IU applicator
Figure 6.2 Wireframe CAD design drawing of BRAD national brachytherapy audit test object. One
film shown in position, yellow shading, with one insert and spacer shown above prior to
insertion, applicator support arm shown without clamp detail. Position of applicator ring
and IU tube indicated in green with position of point A indicated by red dot. (All
dimensions in mm).

116
Figure 6.3 3D rendered CAD design drawings of BRAD phantom (left to right: oblique from above,
oblique from side, oblique from below).

117
6.4.2. ‘End to End’ Audit Procedure
To provide an ‘end to end’ system test of brachytherapy dosimetry, it was
essential that all normal operating procedures were utilised for the phantom as for patients,
including CT scan protocol, data transfer, planning process, export to treatment unit, and
treatment delivery. The steps in the audit process are shown in Figure 6.4 and described
below. The full work instructions used by the auditing physicist is provided in Appendix D.
During these process steps, local brachytherapy physics practice was discussed between
auditor and host physicists.
CT scan
For each audit, a clinical cervix treatment applicator was selected and
appropriate collars and spacers inserted into the central cavity of the BRAD phantom to
match the outer dimension of the IU tube and the distance from ring/ovoid surface to IU tip.
The applicator was inserted into the phantom and the clamp adjusted and secured to ensure
no movement, shown in Figure 6.3. The phantom was placed on its side such that the
applicator was in an approximate clinical position, shown in Figure 6.4, and then CT scanned
using the audit centre’s normal gynaecology brachytherapy protocol.
Treatment planning
Using normal clinical protocols, the applicators were reconstructed on the CT
images (with the assumption that reconstruction of an applicator scanned in-air would be
consistent with one scanned in-patient), and a typical cervix treatment plan prepared, either
prescribing to point A (usual) or noting its dose. Confirmation that the locally used definition
of point A was as defined by the 2012 ABS recommendations (Viswanathan and Thomadsen
2012) was established, or a correction applied. Local standard planning approach was used
to generate a suitable treatment plan, with typical local prescription dose. Following export
of the plan to the treatment delivery unit, the DICOM RTDose file (3D dose grid) was also
exported for later analysis.
Treatment delivery
An EBT3 film was positioned on each vane of the phantom, ensuring contact
with the central and upper end-stops, and secured in place using the film clamps. The
phantom was then placed vertically in the custom water tank and irradiated according to the
imported treatment plan.

118
Figure 6.4 Process flow diagram of brachytherapy ‘end to end’ dosimetric audit using the BRAD
phantom

119
6.4.3. Film Dosimetry and Data Analysis Procedure
The procedure for film dosimetry for the BRAD system has been developed
based on work reported in Chapter 5 on the optimisation of film measurements for
brachytherapy, taking account of the specific requirements for the national brachytherapy
audit, including anticipated dose rages. The procedure is outlined below:
Film calibration, with audit and reference dose films from the same film batch.
All films scanned with consistent orientation on central axis of scanner and under a glass
compression plate to prevent curvature, using rgb format tiff with 16-bits per channel.
Gafchromic EBT3 film dose-response calibration undertaken using triple-channel
dosimetry, at dose levels of 0, 1, 2, 4, 7, 10, 13, 16 Gy.
Gafchromic EBT3 film cut into four sheets of 100 x 120 mm for use in BRAD.
Audit films exposed in BRAD phantom to brachytherapy dose distribution at audited
radiotherapy centre, at approximately the same time (within 6 h) as reference dose
strips exposed to well-defined dose (7 Gy) from a nominal 6 MV linear accelerator at
Portsmouth Hospitals NHS Trust (the audit coordinating centre).
Audit and reference dose films scanned simultaneously (in same scan image) on a
flatbed scanner at a time following irradiation of at least a multiple of four of the time
difference between irradiation of test and reference films.
Triple-channel dosimetry and linear-scaling of calibration function using reference
doses, undertaken within FilmQAPro software (Ashland, USA).
Dose to Point A, and distance to agreement with TPS dose, obtained using geometric
distance from corner of film.
Isodose overlay (visual assessment) and gamma evaluation (including 3% local
normalisation, 2 mm, 2 Gy lower threshold) comparing film-measured dose to TPS
RTDose file.
The film dose to Point A was evaluated by first obtaining the scanned pixel
coordinate of the corner of the film closest to the treatment applicator. The BRAD system
accurately places the film corner at 10.0 mm from the applicator IU axis and 5.0 mm from
the surface of the applicator ring (or ovoid). Point A is conventionally defined as 20 mm from
the IU axis and 20 mm from the surface of the ring. Hence the dose at pixel coordinates 10
mm (20 – 10 mm) from the edge of the film away from the IU, and 15 mm (20 – 5 mm) from
the edge of the film away from the ring/ovoid, is evaluated to find Point A dose. Any deviation
of the locally defined position of Point A, or any special circumstances with applicator
alignment, may amend the above pixel positions and are taken into account. All pixels in the
vicinity of the geometric position of Point A are inspected in the film-dose image to find the
‘distance to agreement’ of the TPS planned dose.

120
Visual evaluation of isodose overlay between TPS-calculated and film-measured
dose distribution was used, which is a rapid qualitative method and provides information as
to the location of any particular discrepancies. A quantitative assessment was made using
gamma analysis (Low et al. 1998, Low and Dempsey 2003) in FilmQAPro (version 3.0.4835)
(Ashland, USA) software. The gamma calculation in FilmQAPro software uses the average film
dose calculated to the same resolution as the TPS dose grid, hence eliminating film noise
effects artificially improving the gamma score (Low 2010), and uses interpolation. The
determination of a ‘clinically relevant’ departure between intended and actually delivered
radiation dose distribution is difficult to define and depends on local factors for each
radiotherapy centre. It is likely to be in the region of a dose difference greater than 5.0%, or
a shift in isodose position of greater than 3.0 mm (Thwaites 2013). The clinically acceptable
passing rate for a gamma analysis in HDR brachytherapy is particularly problematic to
establish, with no prior published work having considered this concept. Gamma is therefore
used here as a benchmark, as an indicator of consistency between centres, and the results
for each audit may be compared to the normal range of gamma established for this particular
measurement, software, and analysis situation, to establish what is ‘acceptable.’
To constrain the gamma evaluation to regions of increased clinical significance,
a 2 Gy lower cut-off threshold and a region of interest of 50 mm (away) by 70 mm (along)
from the film corner, has been used for the analysis of BRAD data. A larger analysis region
including significantly lower doses can give a misleading result, particularly in brachytherapy
dose distributions. A significant difference between external beam and brachytherapy dose
distributions is the much larger range of dose levels and extent of low-dose regions present
in the latter, and it follows that a locally-normalised (rather than globally normalised) gamma
calculation is required for brachytherapy. If a single high-dose global normalisation point is
used for gamma calculations in brachytherapy, any deviations in the much lower dose regions
would be rendered insignificant. The gamma calculation passing rate could be artificially
increased simply by including a larger region of lower doses in the analysis. Local
normalisation allows the percentage dose difference to be applied at each dose level,
avoiding biasing the gamma calculation passing rate to only the high dose region.
It is not easy, nor rigorously defined, as to how to select criteria for the gamma
analysis for any given clinical situation. One approach is to use the detector uncertainty
estimate to establish the criteria, which may be derived from say positional uncertainty and
impact on dose (1 mm and 6% at the maximum dose gradient of Point A, see Figure 6.6). For
the national brachytherapy audit using BRAD, the emphasis is on assessment of dosimetric
accuracy across the ‘end to end’ treatment process, hence the decision on acceptability of
an audit result should be based on the largest errors that would be clinically acceptable.
Gamma criteria of 5% dose difference and 3 mm DTA is a reasonable estimate of the
maximum error acceptable in HDR/PDR brachytherapy. A tighter target level of 3% and 2 mm
is also reasonable. An additional tolerance has also been included, at 2% and 1.5 mm, to
discriminate results, with 1.5 mm being chosen as a maximum based on typical 1.0 mm
RTDose grid resolution in brachytherapy treatment planning systems. Consideration of
typical dose gradients is also informative in setting gamma criteria. In brachytherapy, the

121
dose gradient may change considerably across the region of interest; at Point A the gradient
is approximately 6% mm-1 radially away from the source and 1% mm-1 parallel with the source
axis, shown in Figure 6.6. The radial dose gradient decreases significantly with distance from
the source. A value of 1.5% mm-1 is a representative average across the regions of interest
for the BRAD film phantom. Gamma criteria set via this average dose gradient would give a
ratio of dose difference and DTA consistent with 3% and 2 mm criteria, above. Thwaites
(2013) suggests the DTA value should be numerically less than the dose value for gamma
criteria, which is also satisfied by the above criteria. As a general rule, the evaluated
distribution data spacing should be less than or equal to one-third of the DTA criteria in
gamma. Therefore, to use a DTA criteria of 1.5 mm, film scanning resolution of at least 72 dpi
is required (0.35 mm per pixel).
6.4.4. Sensitivity to Simulated Errors
Figure 6.5 shows isodose overlay comparisons of TPS-planned and film-
measured doses using the BRAD system for (a) normal delivery, (b) systematic dwell position
error, and (c) dwell time/prescription dose error, for an IU and ovoid applicator. The two
simulated errors are clearly evident in the visual isodose comparison. In Figure 6.5 (b) the
measured dose is shifted proximally at the applicator IU tip (top left of the figure) by
approximately 5 mm, which agrees with the induced error in the plan. Little effect is seen
near Point A, this position being fairly insensitive to dwell position errors (as modelled in
Section 3.3.4). A shift in isodose lines is also seen close to the ovoids (lower edge of the
figure), due to a shift in dwell positions left to right in the ring as seen in this image. Figure
6.5 (c) shows an apparent shift in all isodose lines, with the measured 7 Gy isodose overlaying
the planned 8 Gy isodose, exactly as expected from the magnitude of the induced dose error.
The gamma passing rate, with criteria 3% (local) 2 mm, with normal delivery case (a) was
95.1%, for dwell position error case (b) was 51.5%, and for dose delivery error case (c) was
38.9%.
6.4.5. BRAD Audit Uncertainty Budget
Brachytherapy dose distributions are characterised by steep dose gradients
close to sources. The positioning of detectors for brachytherapy measurement can be a
significant source of uncertainty and requires particular care. Figure 6.6 illustrates the dose
gradients at the prescription Point A for a typical cervix brachytherapy treatment. Parallel to
the intrauterine (IU) tube the dose gradient is 1% mm-1 at Point A, increasing to 6% mm-1
perpendicular to the IU tube.
The combined standard uncertainty (k=1) for the BRAD dosimetry audit has
been estimated as 3.0% using a simple quadrature sum of individual components of the
dosimetry system as detailed in Table 6.2. The expanded uncertainty, k=2, is estimated as
5.9%. This represents the uncertainty in the determination of point dose differences between
film-measured and TPS-calculated dose at Point A. Due to varying dose gradients across the
film, positional uncertainties have a variable effect on dose uncertainty, the prior values

122
having been evaluated in the vicinity of Point A. Delivered doses closer to the applicator than
Point A are of less clinical significance even though the dose gradient is higher and
uncertainties would be larger. Regions of lower dose would have associated lower
uncertainties due to lower dose gradients, however it is not appropriate to calculate a
separate uncertainty estimate at each point and hence the Point A uncertainty estimate is
taken as an upper limit for analysis.
The combined standard uncertainty of the reported dose value from film
dosimetry alone, not including uncertainties of the BRAD audit such as position and
brachytherapy treatment unit calibration and performance, is 0.9% (k=1), expanded
uncertainty estimated at 1.8% (k=2). This assumes robust film dosimetry, triple-channel
dosimetry and dose linear scaling and measurement close to the scanner central axis, i.e.
does not include lateral scanner effects (see Chapter 5).
Figure 6.5 BRAD isodose comparison of normal delivery and simulated errors: TPS-planned (thick
lines) and film-measured (thin lines) for (a) normal delivery, (b) all dwells shifted 5 mm
proximal, and (c) 8 Gy delivered instead of planned 7 Gy.

123
6.5. Discussion and Conclusions
The BRachytherapy Applicator Dosimetry (BRAD) phantom has been designed,
built and evaluated for use in a national ‘end to end’ brachytherapy dosimetry audit (Palmer
et al. 2013c)7. The system consists of a Solid Water (RMI-457, Gammex USA) frame which
accurately holds any gynaecology cervix treatment applicator and four Gafchromic EBT3 films
at well-defined positions with respect to the applicator. The phantom is CT scanned on its
side with the treatment applicator in a near-clinical orientation; the phantom is then
positioned upright, with film dosimeters, in a full-scatter water tank for treatment delivery.
Advanced film dosimetry methods have been used and documented to obtain film-dose for
comparison to TPS-calculated dose via the export of DICOM RTDose file within FilmQAPro
software (Ashland, NJ, USA). Methods for analysis by visual isodose overlay and gamma
evaluation of the dose distribution, and percentage dose difference and distance to
agreement at Point A, have been described. The standard uncertainty of the evaluation of
the difference between film-dose and TPS-dose has been estimated at 3.0% (k=1).
7 Chris Lee and Ailsa Ratcliffe are co-authors of this work. As experts in brachytherapy physics in UK, my design ideas were discussed with these physicists to check appropriateness and validity of concept. Chris assisted in liaising with workshop engineers and Ailsa had previous, if historic, experience of small-scale auditing in brachytherapy.

124
Table 6.2. Uncertainty budget for the experimental determination of the dose difference at Point
A between TPS-calculated and film-measured dose using the BRAD ‘end to end’ audit
system. Values quoted are the ‘expected’ uncertainty under normal operating
conditions and good-practice processes.
Component Source of uncertainty Type Uncertainty
(k=1)
Note
Applicator
reconstruction
Reconstruction of applicator in CT data set A/B 2.25% a
TPS dose
calculation
Monte Carlo derived TG-43 source model
parameters
B 0.5% b
Source strength Prior determination of source strength at host
centre
A 0.4% c
Treatment
equipment
performance
Source dwell position and time performance
(normal operating conditions)
A/B 0.5% d
Film dosimetry Linear accelerator output calibration for
reference film exposures
A/B 0.5% e
Film calibration fit function B 0.5% f
Film position A 1.5% g
Energy dependence of film B 0.5% h
Phantom scatter compared to unbounded
case
B 0.0% i
Film scanner, effect of lateral position B 0.0% j
Film scanner, scan repeatability A 0.2% k
Combined standard uncertainty (k=1)
Expanded uncertainty (k=2)
3.0%
5.9%
Notes
a. Applicator reconstruction for the BRAD phantom CT images is expected to have less uncertainty than reported estimates of uncertainty in clinical practice (Tanderup et al. 2008, Hellebust et al. 2010). The uncertainty may depend on CT slice width, and the dose effect is dependent on proximity to the source; using the maximum typical dose gradient of 6% mm-1 at Point A, (Figure 6.6) a typical value of 4.5% is derived for a 0.75 mm uncertainty in applicator reconstruction at coverage k=2; 2.25% at k=1.
b. Estimate based on general Monte Carlo uncertainty, for relative dose distribution only not absolute cGy h -1
U-1 c. Uncertainty in calibration of well chamber at NPL, IPEM/NPL HDR code of practice (Bidmead et al. 2010).
Estimate of uncertainty in use of calibrated well chamber to determine source strength is not additionally included.

125
d. Uncertainty in HDR treatment equipment performance under normal operating conditions may include 1.0 mm systematic error in source position calibration, however the dose to Point A is insensitive to small dwell position errors, see Section 3.3.4 (Palmer et al. 2012c). An uncertainty of 1.0% at k=2 is included to account for all possible treatment unit performance issues, including dwell timer accuracy and transit dose; 0.5% at k=1.
e. Uncertainty taken from IPSM 1990 MV Code of Practice (Lillicrap et al. 1990). f. Consistency of triple-channel film calibration and estimated uncertainties from film analysis software, for
films scanned under glass compression plate g. Film position uncertainty estimated at 0.5 mm, at coverage k=2, in BRAD phantom. The dose effect is
dependent on proximity to the source, but a value of 3.0% is used, from maximum typical gradient of 6% mm-1 at Point A, at coverage k=2; 1.5% at k=1.
h. The energy dependence uncertainty of EBT3 film is taken as the correction from calibration in 6MV to measurement in HDR energies, estimated as 1% at coverage k=2 from Bekerat (2012) and Brown et al. (2012); 0.5% at k=1.
i. Scatter correction for bounded scatter in 400 mm side square BRAD phantom compared to unbounded case calculated using MCNP as 0.0%, see Section 7.3.2.
j. Lateral scanner effect at ±25 mm from scanner central axis, at 7 Gy, consistent with BRAD audit dosimetry requirements, see Section 5.3.4.
k. From author’s prior study of repeatability of film scanning, after lamp warm-up.

126
Figure 6.6. Dose gradients around cervix treatment applicator for typical clinical treatment plan. (a)
RTDose map from treatment planning computer, (b) 3D visualisation of dose gradients,
(c) Profiles through clinical prescription Point A.

127
CHAPTER 7
Monte Carlo Simulations for the
Brachytherapy Film Dosimetry
Audit

128
7.1. Objectives for MCNP5 Simulations
Monte Carlo calculations have been used to fulfil several objectives relating to
the UK brachytherapy dosimetry audit: (a) Determine the necessary dimensions for full-
scatter for an audit phantom, or a correction factor if a smaller phantom size were to be
used; (b) Evaluate uncertainties of using radiochromic film for brachytherapy dose
measurement in terms of any disturbance from the film itself when irradiated along the
length of the film; (c) Estimate the attenuation effect of metal treatment applicators on the
delivered dose. The findings have been employed to help interpret the results of the UK
brachytherapy audit. This chapter includes discussion of the choice of input file parameters
and appropriate tallies for Monte Carlo simulation with MCNP5 for the above cases, and
describes the process used for validation of the Monte Carlo implementation used in this
work.
7.2. Methodology
7.2.1. MCNP5 Input Files
The basic required format of input files for MCNP5 is described in Section 2.4.1.
The methodology discussed below is concerned with decisions on the specific details of the
input files applied for each brachytherapy problem, including how the calculation is
performed (mode, physics treatment, tally card) and how the problem is defined (origin of
material data, source energy spectra).
For HDR or PDR brachytherapy applications, it is often appropriate to use
photon-only transport and the F6 tally. However, there are cases where the collision kerma,
F6 tally, is not a good approximation for the absorbed dose, and in these cases the *F8 tally
with full photon and electron transport is more appropriate. In these cases, F6 and *F8 tallies
may give different results. Examples of such cases are (a) within the first few mm from an
HDR source where a beta radiation component may be present, (b) regions in which there is
a loss of charged particle equilibrium such as at a tissue inhomogeneity interface or the
surface of a patient, and (c) relevant to the present work, when calculating absorbed dose to
a very thin layer of medium, << 1 mm, such as within the active layer of Gafchromic EBT3
film, 25µm thick. Electrons generated from photon interactions in the polyester layers above
and below the active layer of the film may lead to energy deposition in the active layer, in
which case the collision kerma approximation in the active layer may not be appropriate. The
phantom scatter and applicator attenuation MCNP5 calculations, Sections 7.2.3 and 7.2.5,
use F6 tally with photon-only transport (mode p). The calculations including film in the
geometry, Section 7.2.4, use *F8 with photon and electron transport (mode p e). Both tallies
are used in the simple source geometry cases, Section 7.2.2, to evaluate differences in the
tallies and validate the MCNP5 implementation for this work. The F6 tally gives results in MeV
g-1 and are converted to J kg-1, equivalent to Gray (Gy), using a tally multiplier card, FM card,
multiplying by 1.602E-10. The *F8 tally gives results in MeV and are later converted to Gy by

129
dividing by the mass within the cell, and multiplying by 1.602E-10 to convert from MeV g-1
to J kg-1 (Gy).
The physics treatment of interactions is controlled by the PHYS card in MCNP:
Simple or full physics treatment of interactions is possible. The simple physics ignores
coherent (Thomson) scattering and fluorescent photons from photoelectric absorption. For
brachytherapy source modelling, full physics treatment is required, including coherent
scattering and Doppler energy broadening. Simple physics treatment is primarily intended
for photons of higher energy than modelled for brachytherapy. Full physics is the default
setting in MCNP5 for photon energies with upper energy limit of 100 MeV (X-5 Monte Carlo
Team, 2008), hence no PHYS card is required in the MCNP5 input files for the brachytherapy
cases considered in this work. The CUT card in MCNP5 can be used to set a lower energy level
below which particles will not be tracked. It is important not to cut-off electrons at low
energies since these contribute to the majority of dose deposition. However it is possible to
set an energy cut-off for photons if efficiencies need to be made in calculation process time.
The default value in MCNP5 is 1 keV cut-off for photons. A cut-off value of 10 keV was used
in this work only for calculations including electron transport in order to reduce the
calculation time (validated in Section 7.2.2). No energy cut-off was required for photon-only
calculations.
The number of source particle histories has been set to 1E9 (1 x 10⁹) for the
brachytherapy simulations. Validation calculations have also been undertaken with fewer
particles to investigate the dependency on the number of source particles in the
brachytherapy calculations. In all cases, the relative error, R, given in the MCNP5 output file
has been inspected to ensure the number of particles is adequate for acceptable precision of
the tally results. Only MCNP5 calculation results in which the standard error, R < 0.05 (X-5
Monte Carlo Team, 2008b), and where the ten statistical tests provided in the output file are
passed, have the results been accepted as reliable, see Section 2.4.3.
Perez-Calatayud et al. (2012a) have published methodological
recommendations for Monte Carlo based dosimetry, which are adopted in the current work.
The recommendations advise that HDR/PDR sources may be specified with emitted photon
energies above 10 keV only, being adequate due to attenuation of lower energies in the
source encapsulation, and being the commonly used value in publications. It is reported that
a lower energy cut off does not produce more accurate results but prolongs calculation time
for the same uncertainty level. The emission energy spectra for Co-60 and Ir-192
brachytherapy sources used in the MCNP5 input files has been derived from the Chart of
Nuclides published by the National Nuclear Data Centre, Brookhaven National Laboratory,
NY, USA (NNDC cited 2014), omitting energies below 10 keV and those with very low
probability per disintegration, < 0.03%, since these contribute minimally to the overall dose
deposition. The resulting energy spectra, presented in the MCNP5 input files in Appendices
F to I, were compared to those listed by Rivard et al. (2010) and the Live Chart of Nuclides
provided by the Nuclear Data Section of the International Atomic Energy Agency, Vienna,
Austria (IAEA cited 2014), and were deemed acceptable for the purposes of the Monte Carlo
brachytherapy calculations of the current work. Rivard et al. (2010) proposed that the AAPM

130
consider recommending NNDC data for medical physics applications of all brachytherapy
radionuclides, and it is this data that is used for the MCNP input files used in the current
work.
The materials and dimensions of the HDR brachytherapy sources were taken
from the 2012 Report of the AAPM and ESTRO from the High Energy Brachytherapy Source
Dosimetry (HEBD) Working Group (Perez-Calatayud et al. 2012b). This includes definition of
the source encapsulation material as 316L steel for the Ir-192 and Co-60 sources considered
in the MCNP calculations in the current work. The brachytherapy sources were modelled
using simplified geometry, which accurately reproduces the radial thicknesses of materials
but omits any air gaps within the source. The sources were treated as cylinders with
simplified end caps of appropriate material thickness, with no attached cable. This geometry
was sufficient (validated in Section 7.2.2) for the purposes of the investigations presented
below, in which only relative dose rate with radial distance from the centre of the source in
a direction perpendicular to the source axis (or at a small angle from perpendicular) is
required. The source geometries are shown in Figure 7.1, created using the MCNP5 geometry
plotter. Material composition data for MCNP5 input files was obtained from the
compendium of material data published by the Pacific Northwest National Laboratory, WA,
USA, (McConn et al. 2011). Liquid water has been used in each of the MCNP calculations
presented below, and the material has been specified as recommended by AAPM TG-43U1
to be pure degassed liquid water (H2O) with a mass density of 0.998 g cm3 (Rivard et al. 2004).
MCNP5 code was installed and run on two personal computers, one with quad
Intel Core i3-3220 processor with 4 GB RAM within Windows XP operating system, and the
other with quad Intel Core i5-2450M with 6 GB RAM within Windows 7 operating system,
with calculation times up to 24 hours. The MCNP5 code was operated under a single-user
software licence issued to Antony Palmer by the Radiation Safety Information Computational
Centre (RSICC), Oak Ridge National Laboratory, United States Department of Energy.
7.2.2. MCNP5 Validation of Implementation
The implementation of the MCNP5 code, the choice of input card parameters,
and the accuracy of source geometries and material definitions, were validated by calculation
of the normalised dose rates as a function of radial distance from the centre of the source
and comparison to consensus data from the High Energy Brachytherapy Source Dosimetry
(HEBD) Working Group (Perez-Calatayud et al. 2012b). The validation exercise was also used
to investigate the required number of particle histories, differences between the F6 and *F8
tally results, and the associated relative errors, for brachytherapy source calculations.
The MCNP5 calculation geometry is shown in Figure 7.2. The source was placed
centrally in a water sphere of 600 mm radius, to provide full scatter conditions (Perez-
Calatayud et al. 2004). Nine cylindrical tally cells were defined of 0.5 mm radial width and 0.5
mm length, centred at radii of 7.5, 10, 15, 20, 30, 40, 50, 60 and 70 mm from the source,
aligned with the central axis of the source. The tally cell dimensions were chosen to minimise
the impact of voxel size effects while maintaining reasonable counting efficiency, consistent
131
with the recommendations of Perez-Calatayud et al. (2012b). Photon and electron transport
was considered, calculating F6:p and *F8:p,e for each tally cell, for 1E6, 1E7, 1E8 and 1E9
source particle histories. The MCNP5 input files for the Ir-192 and Co-60 source validation
are provided in Appendix F.
7.2.3. Phantom Scatter: Spherical Scatter Volume with Point Source
Figure 7.3 shows the MCNP5 geometry that was used to investigate the effect
of phantom size on delivered dose from a point source, compared to results for an essentially
unbound phantom of radius 600 mm, within a calculation sphere of radius 800 mm air.
Spherical shells of radial thickness 2 mm centred at radii of 20, 50, 60, and 75
mm were used as tally cells. 20 mm radius was of particular interest as this is the standard
prescription distance from applicators in clinical brachytherapy treatments (Point A). 50 and
60 mm were chosen as likely maximum radial distances from the source that would be of
interest in film audit measurements, being the maximum extent of clinically relevant dose
levels. 75 mm was chosen to enable a direct comparison of the results of this study to work
by Perez-Calatayud et al. (2004).
Spherical water phantom dimensions of radii 100, 150, 200, 230, 300, 400 and
600 mm were simulated, corresponding to the potential range of phantoms that could
practically be used for external audit of radiotherapy centres, and a full-scatter condition.
230 mm radius was also studied specifically as this corresponds to the equivalent scatter
conditions of a 400 mm side-length cube, for Ir-192 and Cs-137, according to Granero et al.
(2008):
Rsph = 1.1Rcub+10 mm
where Rsph is the radius of a sphere and 2Rcub is the side length of a cube of equivalent scatter,
for 100 mm < Rcub < 300 mm. A 400 mm cube was considered the maximum size for
convenient practical transportation. Photon transport only was considered, calculating F6
tally with 1E9 source particle histories. An example MCNP5 input file for the Ir-192 source is
provided in Appendix G.

132
Figure 7.1. MCNP5 simplified geometry source models, viewed from (a) side and (b) end, for (1)
Nucletron mHDR-v2 Ir-192 source and (2) Eckert & Ziegler Bebig Multisource Co0.A86
Co-60 source.
Figure 7.2. MCNP5 validation geometry; several cylindrical tally cells concentric with the centre of
the HDR source (Ir-192 or Co-60) in full scatter water, viewed from (a) side, with enlarged
central region, and (b) end of the source.

133
Figure 7.3. MCNP5 geometry to investigate the effect of phantom size on measured dose from a
point brachytherapy source, with various spherical shell tally cell radii and water sphere
radii.
7.2.4. Effect of the Presence of EBT3 Film on Measured Dose
Figure 7.4 shows the MCNP5 geometry that was used to investigate whether the
presence of Gafchromic EBT3 film perturbs the dose distribution that would be present in a
uniform water medium. A geometry simulating the use of film in the BRAD phantom for a
cervix treatment applicator (Section 6.4.1) was devised: An extended source of 10 mm
length, simulating several dwells in a ring or ovoid, was positioned 10 mm from the film edge,
the film itself having a width of 15 mm, being the dimensions of film between the source and
the prescription Point A in the BRAD phantom. A ring geometry was used to improve source
particle collection efficiency. A water tally cell outside and level with the film was used to
calculate dose per source particle. The tally cell was of the same thickness as the film active
layer. The dose was compared for the case with the film present and for a case with the film
replaced by water. Due to the thin tally cell dimensions, both photon and electron transport
were considered (mode p e), with calculation of *F8:p,e tally, using 1E9 source particle
histories. The MCNP5 input file is provided in Appendix H.

134
Figure 7.4. MCNP5 geometry used to investigate the dose perturbation caused by the presence of
Gafchromic EBT3 film compared to a uniform water medium (where the film is replaced
by water, not shown).
7.2.5. Applicator Attenuation
Applicator dimensions and materials were obtained by personal communication
with the brachytherapy equipment manufacturers (Varian, Nucletron and Eckert & Ziegler
Bebig), for applicators that were used in the UK brachytherapy audit, see Table 7.1. Figure
7.5 shows the MCNP5 geometry to investigate the radiation attenuation due to metallic
treatment applicators, to interpret results obtained during the UK brachytherapy dosimetry
audit, Section 8.3.1. An extended source was modelled, 60 mm length, simulating a series of
dwells in a typical cervix intrauterine treatment applicator. Ring tally cells were defined at
three radial distances from the source, 20, 40, and 60 mm, and at three positions along the
source train, mid-source, 10 and 60 mm from centre. The dose at the nine tally cells was
calculated with and without the treatment applicator present. Photon transport only was
considered, calculating F6 tally with 1E9 source particle histories. An example MCNP5 input
file with an Ir-192 source and Varian titanium applicator is provided in Appendix I.

135
Table 7.1. Specifications of metallic intrauterine treatment applicators in use during the UK
brachytherapy audit (data from personal communication with manufacturers, at stated
precision), and availability of attenuation correction in manufacturers’ treatment
planning systems.
Manufacturer Material Internal radius,
Wall thickness,
External radius,
(mm)
Brachytherapy
sources used
Attenuation correction
in treatment planning
system (TPS)?
Varian Titanium
(Stainless steel
applicator also
available but
not
encountered
during UK audit)
1.0,
0.5,
1.5
Ir-192 No
(Available in Acuros®
TPS, but not
encountered during UK
audit)
Nucletron Titanium 1.01,
0.48,
1.49
Ir-192 Optional: single
correction factor
(Used at only 1 centre
during UK audit)
Eckert &
Ziegler Bebig
Titanium
(Stainless steel
applicator also
available but
not
encountered
during UK audit)
1.75,
0.75,
2.5
Co-60
(Ir-192 also
available but
not
encountered
during UK audit)
Yes: single correction
factor applied
automatically

136
Figure 7.5. MCNP5 geometry used to investigate the dose attenuation caused by metallic
brachytherapy treatment applicators compared to a homogeneous water phantom
(where the applicator is replaced by water, not shown).
7.3. Results
7.3.1. Validation
Figure 7.6 and 7.7 show results of the calculations used to validate the local
implementation of MCNP5 and the simplified source models. The calculated dose rate with
radial distance from the source were compared to consensus data from Perez-Calatayud et
al. 2012b, normalised at 10 mm, for Ir-192 in Figure 7.6(a) and for Co-60 in Figure 7.7(a), over
a range 7.5 to 70 mm, (distance range required for the UK brachytherapy audit). The standard
error, R, for the MCNP5 tallies were all < 0.05 except for the case of 1E6 histories for *F8:p,e
tally. This curve showed the greatest departure from the consensus data and it was clear an
increased number of particles histories were required. Figures 7.6(b) and 7.7(b) show the
percentage difference of the MCNP5 F6:p tally from the consensus data, with 1E6 particle
histories within 2%, 1E7 within 1%, 1E8 within 0.5% and 1E9 within 0.2%. Figures 7.6(c) and
7.7(c) show greater uncertainty of *F8:p,e tally against the consensus data than for the F6:p
tally, with 1E6 particle histories having up to 25% disagreement, improving to 0.8% at 1E9
histories.

137
7.3.2. Phantom Scatter
Figure 7.8 shows MCNP5 results of the percentage change in dose at tally cell
radii in the range 20 to 75 mm, between an unbounded water phantom and spherical water
phantoms of radii 100 to 400 mm, with centrally located point sources of (a) Ir-192 and (b)
Co-60. The difference in dose between unbounded and finite sized water phantoms was
more significant at greater radial distances and for smaller phantoms, and of greater
magnitude for Ir-192 than for Co-60. At a radial measurement distance of 75 mm, a scatter
correction of 9.0% was required for Ir-192 within a 100 mm radius phantom, 1.1% for a 200
mm radius phantom and 0.1% for a 300 mm radius phantom. Perez-Calatayud et al. (2004)
modelled the same geometric conditions, finding 9%, 1%, 0%, respectively for the above
cases. MCNP5 calculations were also performed for a water sphere of radius 230 mm,
equivalent to a cube of side length 400 mm, this dimension having been selected based on
the above data, as a compromise between low scatter correction and practicality of
transportation for an audit phantom. For the BRAD audit phantom (Section 6.4.1), the dose
at 20 mm radial distance was of particular importance, corresponding to the clinical
prescription Point A, and also at the maximum extent of the measuring film, 60 mm radial
distance. The scatter corrections at radii 20 mm and 60 mm in a 230 mm radius sphere were
0.0% and 0.4% for Ir-192 and 0.0% and 0.2% for Co-60, respectively.
7.3.3. Film Dosimetry Dose Perturbation
Table 7.2 presents results of the MCNP5 calculations comparing the dose
delivered to a water tally cell, of dimensions equivalent to EBT3 film active layer, with and
without 15 mm width of EBT3 film between the source and tally cell. For both Ir-192 and Co-
60 sources, there is a negligible percentage change in dose due to the presence of the film.
Table 7.2. Results of MCNP5 calculation comparing dose deposition to a water cell of dimensions
equivalent to EBT3 film active layer, with and without a 15 mm width film between the
source and tally cell, for Ir-192 and Co-60.
Source type: Ir-192 Co-60
*F8:p,e tally
(MeV/source
particle)
[relative error, R]
With 15 mm width of EBT3
film between source and
tally cell
3.379E-5
[0.0027]
3.421E-5
[0.0016]
With water between source
and tally cell
3.380E-5
[0.0030]
3.425E-5
[0.0016]
Ratio of *F8:p,e tally with 15 mm film compared to
no film
1.000 0.999
% change in dose due to presence of film 0.0% -0.1%

138
Figure 7.6. (a) MCNP5 calculation of dose rate with distance from an Ir-192 source compared to
consensus data from the High Energy Brachytherapy Dosimetry Working Group, HEBD
WG (Perez-Calatayud et al. 2012b), as a function of number of particles and tally type.
(b) Percentage difference for tally F6:p. (c) Percentage difference for tally *F8:p,e.

139
Figure 7.7. (a) MCNP5 calculation of dose rate with distance from a Co-60 source compared to
consensus data from the High Energy Brachytherapy Dosimetry Working Group, HEBD
WG (Perez-Calatayud et al. 2012b), as a function of number of particles and tally type.
(b) Percentage difference for tally F6:p. (c) Percentage difference for tally *F8:p,e.

140
Figure 7.8. MCNP5 calculated percentage difference in dose at 20 to 75 mm radial distance from (a)
Ir-192 and (b) Co-60 point sources, for spherical water phantoms of radii 100 to 400 mm
compared to unbounded water phantom (600 mm radius); Compared to data from
Perez-Calatayud et al. (2004) for Ir-192 (note 25 mm rather than 20 mm in the latter
data set).

141
7.3.4. Applicator Attenuation
Figure 7.9 presents results of the MCNP5 calculations of applicator attenuation,
for Ir-192 with Nucletron titanium applicator and for Co-60 with Eckert & Ziegler Bebig
titanium applicator. The percentage reduction in dose at three radial distances is plotted for
three levels along a 60 mm active length of a typical intrauterine applicator, as involved in
the UK brachytherapy audit. The MCNP5 F6:p tally relative error was <0.003 for all
calculations. The effect of applicator attenuation is dependent on the level of obliquity of the
radiation path through the metallic applicator. This is increased for measurement points
radially closer to the applicator or for points closer to the end, or beyond, the active source
length (AL). At the clinical dose prescription Point A, shown as circled data points on Figure
7.9, there is a 1.5% reduction in dose for Co-60 irradiation, and 2.0% reduction for Ir-192. At
30 mm beyond the end of the active length, at the same radial distance, the attenuation
increases to 3.8% for Co-60 and 4.3% for Ir-192.
Figure 7.9. Results of MCNP5 calculations of the percentage reduction in dose deposition due to
metallic applicator attenuation, for an intrauterine applicator of 60 mm active source
length (AL), at levels of mid-AL, 10 mm from mid-AL, and 30 mm beyond AL, for radial
distances of 20, 40 and 60 mm. The data for clinical prescription Point A are circled.

142
7.4. Conclusions and Discussion
The local implementation of MCNP5 and the source geometries and materials
used were validated for use in the brachytherapy scenarios considered in this thesis, in which
radial dose alone is of significance. 1E9 histories were required for *F8:p,e tally MCNP5
calculations to provide agreement better than 1% of radial dose rate to published consensus
data. 1E8 was sufficient for F6:p tallies, however due to the significantly faster calculation
time of photon-transport only calculations, 1E9 was used for both scenarios.
Scatter corrections were calculated as a function of measurement position and
phantom size within spherical water phantoms compared to an unbounded case. The results
were consistent with data provided by Perez-Calatayud et al. (2004) for Ir-192, who also
reported lower scatter corrections for the higher energy Cs-137 compared to Ir-192 (mean
energies 0.6617 MeV and 0.3722 MeV, respectively). This is consistent with lower corrections
calculated for Co-60 (mean energy 1.2520 MeV) compared to Ir-192 in the present work. The
radial dose function for Co-60 is lower than Ir-192 up to 120 mm from the source but scatter
from the higher energy source is much more forward-biased, with back-scatter and hence
phantom-scatter to measuring points being more significant from Ir-192. For film dosimetry
measurements in the BRAD phantom (Section 6.4.1), at the prescription Point A, no scatter
correction was required and measurements could be assumed to be equivalent to an
unbound phantom. The scatter correction increases with radial distance and at the edge of
the measuring film, a correction of 0.4% for Ir-192 and 0.2% for Co-60 has been estimated.
This was included in the uncertainty budget but no correction made to measured film doses.
Films are held in the BRAD phantom such that a proportion of the radiation from
the HDR brachytherapy source travels along the length of the film. MCNP5 calculations have
shown that there is a negligible perturbation of the delivered dose due to the presence of
Gafchromic EBT3 film in these irradiation situations.
The attenuation of delivered dose due to metallic applicators was generally not
included in treatment planning system calculations encountered during the UK
brachytherapy audit. The results of MCNP5 calculations estimate the reduction in dose at
prescription Point A (20 mm radial distance) from an extended source active length, as 1.5%
for Co-60 and 2.0% for Ir-192. Ye et al. (2004) gave the applicator attenuation factor for a
single Ir-192 source dwell position as 1.3% at 20 mm radial distance. It is expected that a
series of dwells creating a longer active length would exhibit a larger correction, due to
source contributions with increasing obliquity through the applicator walls. The User Manual
for the Eckert & Ziegler Bebig treatment planning system, which unusually does include a
single global correction for metal applicator attenuation, gives a dose reduction factor for
titanium applicators of 1.3% for Co-60 and 2.0% for Ir-192, which is consistent with the above
MCNP5 calculations. The MCNP5 calculated attenuation factors were used to interpret
results of the UK brachytherapy audit for centres that used metallic applicators with no dose
correction at the treatment planning system.

143
CHAPTER 8
‘End to End’ Audit of Clinical
Brachytherapy Dosimetry in the
United Kingdom
144
8.1. Objectives for the UK Brachytherapy Audit
The objective of this work was to undertake the first comprehensive national
audit of physics-aspects of brachytherapy dosimetry in the UK. Concerned primarily with
dose measurement in comparison to planned, the audit also included discussion of clinical
brachytherapy processes with local physicists.
The BRachytherapy Applicator Dosimetry (BRAD) phantom, described in Section
6.4.1, provided an audit tool for the comparison of planned and delivered dose distributions
in 2D planes around clinical gynaecological applicators with HDR or PDR brachytherapy
treatment equipment using Ir-192 or Co-60 sources. The process constitutes a full system
‘end to end’ audit which provides a combined performance assessment of CT scanning,
reconstruction of the applicator, dose prescribing, dose calculation and source data in the
treatment planning system (TPS), plan export consistency, delivery performance at the
treatment unit with clinical treatment applicators, and inherent confirmation of source
calibration data in the TPS. The advanced film dosimetry methods described in Chapter 5 are
utilised for the audit dose measurement.
8.2. Methodology
8.2.1. Establishment of a Working Party of the Institute of Physics and Engineering in
Medicine (IPEM)
The author submitted a request to the Institute of Physics and Engineering in
Medicine (IPEM) for funding to establish a Working Party for brachytherapy audit, and when
this was approved, chaired the group. The working party was established to primarily bring
in funding, but also to coordinate brachytherapy audit activity and ensure no duplication of
effort between three separate audits that were coincidentally being conducted in 2013-2014
in the UK: BRAD ‘end to end’ audit (the current work); well-chamber intercomparison audit
(source strength verification); INTERLACE clinical trial audit (dose to a point from a short
active length in a straight plastic catheter). The funding request had been made to cover the
cost of construction of BRAD phantom and expenses for conducting the UK audits. The author
obtained separate funding from Ashland, USA, to cover the cost of Gafchromic EBT3 film for
the audits.
8.2.2. Brachytherapy Applicator Dosimetry ‘End to End’ Audit Methodology
The audit methodology proposed in Section 6.4.2 was used, with the BRAD
phantom described in Section 6.4.1. The full audit protocol is provided in Appendix D, and a
risk assessment for conducting the audit summarised in Appendix C. The audit process was
designed to match as closely as possible to that for a patient treatment. A typical gynaecology
cervix treatment applicator was CT scanned in approximate clinical orientation using local
brachytherapy acquisition protocols. The data was exported to the TPS, applicator
reconstructed using normal clinical methods, and a treatment planned using normal clinical

145
procedure and typical dose prescription. The DICOM RTDose file was exported for later
analysis, and the treatment data sent to the HDR or PDR unit and treatment delivered exactly
as for a patient. Gafchromic EBT3 films were placed in the BRAD phantom prior to treatment
delivery to measure the delivered dose.
During the audit at each radiotherapy centre, the local brachytherapy physics
practice was informally discussed. The intention was to discover any significant departures
from accepted standard practice across the UK, any opportunities for improvement, or any
particular safety risks that may be identified. Following the audit, feedback was elicited via
email to evaluate the process and any suggestions for development or further work.
Any quantitative results of the audit which deviated significantly from mean
values or any notable discrepancies in physics brachytherapy procedures from accepted
standard practice across the UK were discussed with the lead physicist for brachytherapy or
the head of radiotherapy physics at the host centre. The results of the audits were
confidential and only anonymised data is reported here and in publications. The limitations
of the scope of the audit were also discussed (see Appendices C and D).
8.2.3. Data Analysis
Audit films were analysed using the methodology described in Section 6.4.3:
triple-channel dosimetry and linear dose-scaling with reference dose films scanned
simultaneously with the audit films. The DICOM RTDose file was exported from the audited
centre’s TPS and analysed in FilmQAPro software against the film-measured dose maps. The
percentage dose difference between film-measurement and TPS-calculation was evaluated
at prescription Point A (Viswanathan and Thomadsen 2012) along with a distance to dose
agreement on the film. The difference in 2D dose distribution planes around the clinical
treatment applicator between film-measured and TPS-calculated doses were evaluated using
isodose overlay and gamma analysis (Low et al. 1998, Low and Dempsey 2003).
To investigate if there was any correlation between the results of the percentage
difference in planned and measured Point A doses and other defined variables such as type
of applicator and manufacturer, unpaired two-tailed t-tests were applied to the data. This is
a measure of the strength of a linear association between two variables. However, such
analysis is problematic as there are a multitude of influences on the overall accuracy of dose
delivery in the brachytherapy audit. A perceived relationship may be incorrectly estimated
due to the failure to account for confounding factors, i.e. omitted-variable bias. The
difference in Point A agreement between metal and plastic applicators is assessed. Any
difference in Point A agreement with other variables is tested for metal and plastic
applicators separately such that the material type doesn’t confound the analysis.

146
8.2.4. Schedule of Audits
Figure 8.1 provides a map of all audited centres in the UK. Two pilot audits were
undertaken in March and April 2013, with the remaining audits being conducted from May
2013 to August 2014. A total of 46 of the 47 brachytherapy centres in the UK were audited.
The majority of audits were personally conducted by the author (83%, n=38), with three
other physicists auditing several centres (n=8 total), having received prior training from the
author. The data analysis for every audit was performed by the author.
Figure 8.1. Map of 46 radiotherapy centres that participated in the BRAD national audit of clinical
brachytherapy dosimetry in the United Kingdom during 2013 and 2014. Marker colours
indicate different auditors.

147
8.3. Results
8.3.1. Point A Dose Measurement for Cervix Treatment Applicators
Figures 8.2 and 8.3 show results of the differences in Point A dose between film-
measured and TPS-calculated, for the 46 audited brachytherapy centres. The standard
uncertainty in this parameter was estimated at 3.0% (Section 6.4.5), represented as vertical
lines on the Figures. Point A is defined laterally to both the left and to the right of the
treatment applicator, and Figure 8.2 shows the percentage dose difference values for both
the left and right films at Point A. There is a mean difference of 1.6% between the left and
right Point A values, range 0.0 to 6.0% across all audits. All left and right Point A doses are
consistent within the estimated standard uncertainty. Figure 8.3 shows the mean of the left
and right Point A percentage differences for each audited centre, with the data categorised
by applicator type; plastic, metal, or metal with dose attenuation correction in the TPS. The
mean Point A difference for the plastic applicators was -0.6% (1.3% sd), the mean for the
metal applicators was -3.0% (1.3% sd), and the mean for the metal applicators with
attenuation corrected in TPS was -0.4% (two data values, 0.5 and -1.2).
Table 8.1 provides data on the statistical significance of differences in Point A
dose agreement values with various parameters of the audit data, including construction
material of applicator, ring or ovoid type, manual or TPS-model based applicator
reconstruction, and manufacturer, the latter groups being further subdivided by material
type to avoid omitted-variable bias. There is a high statistical significance of the difference
between metal and plastic applicators for the percentage dose difference at Point A, p<0.001
in unpaired two-tailed t-test. A statistical significance, p=0.02, was seen for the mean
percentage difference at Point A between plastic ring and plastic ovoid applicators. All other
tests showed no statistical significance, comparing metal ring and metal ovoid applicators,
reconstruction method, or manufacturer.
Figures 8.4 and 8.5 show results of the ‘distance to agreement’ (DTA) between
TPS-calculated and film-measured doses at Point A, for the 46 audited brachytherapy
centres. An uncertainty in the measured DTA has been estimated using a typical maximum
dose gradient at Point A of 6% mm-1 and the 3.0% standard uncertainty in dose difference at
Point A (Section 6.4.5), deriving a standard uncertainty in distance to agreement of 0.5 mm
(represented as vertical lines on the figures). Figure 8.4 shows the DTA values for both the
left side and right side Point A, for each audited centre. The mean difference in DTA value
between left and right side for each centre is 0.4 mm, with a range 0.0 to 1.0 mm. Figure 8.5
shows the mean DTA for each centre, with the data categorised by applicator type; plastic,
metal, or metal with dose attenuation correction in the TPS. The mean DTA for plastic
applicators was 0.5 mm (0.2 mm sd) and for metal applicators was 0.7 mm (0.3 mm sd), with
a combined mean DTA for all data values of 0.6 mm, range 0.1 to 1.2 mm.
Pearson’s product-moment correlation coefficient was used to assess
correlation between CT slice width and percentage dose difference at Point A and DTA at
Point A. No correlation was found in either case, r = -0.09 and -0.05 respectively.

148
Figure 8.2. Percentage dose difference, film-measured compared to TPS-planned, at Point A left
and Point A right, for cervix treatment applicators, at 46 audited centres.
Figure 8.3. Percentage dose difference, film-measured compared to TPS-planned, mean Point A for
cervix treatment applicator, by applicator type, at 46 audited centres. (Mean of each
data set shown as horizontal lines)

149
Table 8.1. p-values and statistical significance of unpaired two-tailed t-test comparing dose
difference at Point A (film-measured to TPS-planned) for various grouped data from the
46 audits. Table includes number (n), mean, standard deviation (sd), and standard error
of the mean (sem) for each of the grouped data sets.
Material:
Plastic v.
Metal
Type:
ring v. ovoid
(plastic)
Type:
ring v. ovoid
(metal)
All
pla
stic
app
licat
ors
All
met
al
app
licat
ors
Pla
stic
rin
g
app
licat
ors
Pla
stic
ovo
id
app
licat
ors
Met
al r
ing
app
licat
ors
Met
al o
void
app
licat
ors
n 26 18 19 7 8 9
Mean -0.63 -2.96 -0.27 -1.57 -3.00 -3.09
sd 1.32 1.18 1.13 1.39 1.10 1.28
sem 0.27 0.28 0.27 0.53 0.39 0.43
p-value <0.001 0.023 0.881
Statistical
significance
Highly
significant Significant
Not
significant
Reconstruction:
manual v. model
(plastic)
Reconstruction:
manual v. model
(metal)
Manufacturer:
Varian v. Elekta
(plastic)
Manufacturer:
Varian v. Elekta
(metal)
Pla
stic
man
ual
-
reco
nst
ruct
ion
Pla
stic
TP
S-
reco
nst
ruct
ion
Met
al m
anu
al-
reco
nst
ruct
ion
Met
al T
PS-
reco
nst
ruct
ion
Pla
stic
Var
ian
app
licat
or
Pla
stic
Ele
kta/
Nu
clet
ron
app
licat
or
Met
al V
aria
n
app
licat
or
Met
al E
lekt
a/
Nu
clet
ron
app
licat
or
n 12 14 12 6 0 25 15 3
Mean -0.79 -0.49 -3.03 -2.83 -3.11 -2.20
sd 1.39 1.30 1.25 1.14 1.23 0.46
sem 0.40 0.36 0.36 0.47 0.32 0.27
p-value 0.573 0.76 (no plastic Varian
applicators) 0.23
Statistical
significance
Not
significant
Not
significant
Not
significant

150
Figure 8.4. Distance to agreement, film-measured compared to TPS-planned, at Point A left and
Point A right, for cervix treatment applicators, at 46 audited centres.
Figure 8.5. Distance to agreement, film-measured compared to TPS-planned, mean Point A for
cervix treatment applicator, by applicator type, at 46 audited centres. (Mean of each
data set shown as horizontal lines)

151
8.3.2. Dose Distribution Measurement for Cervix Treatment Applicators
Figure 8.6 shows isodose comparisons between film-measured and TPS-
calculated dose distributions from three audits using the BRAD phantom, typical of the
results of the national brachytherapy audit. Two of the four films from each audit are shown
in the Figure; planes left lateral and anterior to the cervix treatment applicator. (The opposite
planes were similar and are not reproduced here). Inset in the Figure are 2D planes through
the DICOM RTDose data, with the location of the evaluated film region shown; the bright
areas are high dose regions in the RTDose data, corresponding to the position of the
treatment applicator. Good agreement is seen between the film and TPS dose distributions,
generally better than 1 mm deviation for isodose lines in the range 2 to 16 Gy, with deviations
increasing at lower doses further from the applicator, up to 2 mm for isodoses 0.7 to 1.5 Gy.
Figure 8.7 shows gamma passing rates of the film-measured and TPS-calculated
dose distributions, for the 46 audited brachytherapy centres. The data are the mean passing
rate of all four films for each audit, with the data categorised by applicator material and
gamma evaluation criteria (all locally normalised percentage difference and with 2 Gy lower
cut-off threshold). The film dose distributions were resampled to the lower TPS RTDose grid
resolution and interpolated as necessary for analysis (via FilmQAPro software), to prevent
film noise artificially increasing the passing rate. The gamma passing rates for centre 33 on
Figure 8.7 are below the typical range of other centres, likely the result of library applicator
misalignment, discussed below in Section 8.3.4.1. With this outlier omitted, the gamma
passing rate for all audits exceed 98% at 5% (local) 3 mm criteria, and exceeded 95% at 3%
(local) 2 mm criteria, except for centre 16, at 92%. The TPS at this centre (Oncentra GYN) had
a grid resolution limitation of 2.1 mm rather than the usual 1 mm for audit data, hence it is
unsurprising the results for gamma with small distance criteria may be compromised. The
gamma passing rate at 2% (local) 1.5 mm are more variable, within a range 82% to 99%. Table
8.2 provides the mean and standard deviation gamma passing rates, at the three criteria, for
all 46 audited centres.

152
Figure 8.6. BRAD dose distribution comparison between TPS-calculated (thick lines) and film-
measured (thin lines), isodose lines in the range 0.7 Gy to 16 Gy. The graphs to the left
are planes lateral to a cervix applicator, to the right are planes anterior to a cervix
applicator, on the axis of the intrauterine (IU) tube. Inset images are the RTDose planes
showing the evaluated region of interest. For (a) 70 mm IU and ovoid applicator, (b) 60
mm IU and ring applicator, and (c) 40 mm IU and ring applicator.

153
Figure 8.7. Mean gamma passing rate, at three different criteria, comparing film-measured to TPS-
calculated 2D dose distributions in four planes around cervix treatment applicators, at
46 audited centres.
Table 8.2. Mean and standard deviation (sd) gamma passing rate, at three different criteria, for 46
audited centres
n Gamma passing rate at:
5% (local), 3 mm 3% (local), 2 mm 2% (local), 1.5 mm
mean (sd) mean (sd) mean (sd)
All applicator types 46 99.7 (1.0) 97.8 (3.2) 90.0 (4.8)
Plastic applicators 26 99.6 (1.3) 97.6 (3.7) 89.3 (4.6)
Metal applicators 18 99.9 (0.2) 98.4 (1.9) 91.0 (4.9)
Attenuation corrected
metal applicators (data
values only)
2 99.7, 100.0 95.3, 99.2 85.2, 93.8

154
8.3.3. Review of Physics Procedures for HDR Brachytherapy Treatment
The national brachytherapy audit afforded the opportunity to review local
brachytherapy physics practice with host physicists and compare to accepted standards
across UK. This was a valuable outcome of the audit visits. A summary of findings which
provided opportunities for development or further review, that were reported to audited
centres, is provided below.
Brachytherapy equipment
Occasionally the local brachytherapy physicist had difficulty assembling the treatment
applicator, and was unsure of correct alignment. In one audit, the applicator was initially
assembled with the ovoid curvature in the wrong direction with respect to the IU
curvature. In two cases the physicist was unsure of the correct ring cap dimension to be
used, or whether this made a difference. The cervical stopper was omitted or located in
the wrong position with respect to the ovoids in two audits.
Imaging
The majority of centres use CT reconstruction slice width of between 1.0 and 2.0 mm
for brachytherapy treatment planning. In 4 of the 46 centres, 3.0 mm slice width was
used, which has potential to increase uncertainties in applicator reconstruction.
TPS – applicator reconstruction and use
There were several occasions when the TPS applicator library did not match as well as
would be expected to the CT-image of the applicator, in terms of length of IU, curvature
of IU, tilt of ring with respect to IU, or relative height of ovoids. At two centres, it was
not clear which applicator library should be used to match the physical applicator used
for the audit. In one case, the difference between library applicator and imaged
applicator was sufficiently great to seek further investigation by the manufacturer.
(Section 8.3.4.1).
A few centres appeared to lack confidence, and QC evidence, of the physical position of
the first distal dwell position in an applicator in relation to the CT image of that
applicator on the TPS. Several different techniques were in use to confirm the dwell
positions were correctly positioned on the CT data along the IU. In two audits the locally
expected distance from tip to first dwell was not reproduced when the auditor asked for
a measurement to be made on the TPS.
In 1 audit, the treatment planner placed the ring source path at the wrong level on the
CT image of the applicator, due to sub-optimal image windowing, and the auditor had
to intervene prior to plan finalisation.
Depending on the TPS, Point A may be automatically imported along with the applicator
library, and subsequent movement of the applicator can change position of Point A if
they are linked. In one audit this was not appreciated by the planner and the auditor
had to intervene to correct the position of Point A.

155
2 of the 20 centres using metal applicators make a 2% correction in the TPS for
attenuation, the other centres do not. A few physicists were unaware whether their TPS
made a correction, and the magnitude of attenuation.
TPS - planning procedures
There were several centres that had different definitions of prescription Point A
compared to consensus view, or used an alternative prescription point. For ring
applicators, the vast majority define Point A as 20 mm up from the surface of the ring,
often measured as 20 mm + cap dimension from level of sources in ring. One centre
measured 20 mm from the level of the sources to define their Point A, a few others used
a cervical stopper rather than the ring surface. One centre used their own locally defined
point C for prescription, 7 mm lateral to the ring plastic edge at the level of the sources.
Another centre defined Point A laterally from a specific dwell point in the IU. For ovoids,
some use the centre of the cervical stopper (flange) while others use the distal surface.
In a few centres, the standard loading pattern, used as a starting point for manual
optimisation, had unexplained rotation of dwell positions in the ring to be not laterally
symmetric, and one had dwell positions in the IU giving an active length approximately
2 cm proximal to the level of the ring (noted to be an error during the audit). In several
audits, the planner stated the ‘standard loading pattern’ is always amended for clinical
use, such as reducing the library plan loading of 6 dwells each side of the ring to 4, or
rotating the dwells in the ring.
In one centre, a planner did not appreciate a difference between the TPS allowed step
size and the actual step size limitations at the HDR treatment unit, causing a systematic
difference between planned and delivered doses of 0.5 mm.
Variations in the level of optimisation of HDR brachytherapy treatment planning across
the UK is significant. The process for individual planning of patients’ treatments ranged
from delivery of standard plans with no optimisation, indeed one centre only performed
retrospective dosimetry on the TPS after treatment delivery had taken place, to fully
inverse-planned treatments to 3D target volumes (HR-CTV) based on MRI imaging. The
majority of centres (approximately three-quarters) undertook a reasonable level of
manual optimisation based on CT-derived 3D target volumes.
Data transfer
1 centre did not use network transfer of plan data from the TPS to the treatment unit,
instead relying on CD data transfer. Two centres planned the treatment at the TPS using
standard loading, but then did not transfer any data to the treatment unit and instead
recalled the standard plan at the treatment unit.
Quality control
3 of the 46 audited centres had no independent check method for TPS calculations,
although these were all in centres where standard plans were delivered and instead had
consistency checks against local data tables.

156
At one centre the local physicist stated that film measurements “several months ago”
had shown dwell positions in the ring were in error by 5 mm on one side, but that a
correction was awaiting independent verification prior to clinical implementation. At the
request of the local physicist the audit was conducted with the dwell position correction
implemented since “the current clinical technique was known to have source position
errors”. (This was followed up with the Head of Radiotherapy Physics at the centre, who
stated their TPS studies had shown no significant change in clinically relevant plan
dosimetry).
There is a variation in QC measurements performed, such as whether to routinely assess
dwell position accuracy in clinical applicators including ovoid channels. (In 2013 a
significant error was publicised in one centre in Japan in which dwell positions in ovoids
had significant error “about 3 cm”, affecting 100 patients. In 2014, a different
manufacturer issued a field safety notice indicating dwell positions in ovoids may be 2-
3 mm from expected positions. It is recommended to periodically check dwell positions
in all applicators).
8.3.4. Results Requiring Further Investigation
8.3.4.1. Library Applicator Misalignment
There was only one audit in which a clear discrepancy was seen between the
TPS-calculated and film-measured dose distribution on isodose overlay analysis, as illustrated
in Figure 8.8. A good agreement is seen between TPS-calculated (thick lines) and film-
measured (thin lines) isodoses in the audit results of Figure 8.8(a), obtained from a different
audit for comparison. By contrast, in Figure 8.8(b), there is a clear discrepancy between the
film and TPS isodose lines at the level of the distal tip of the IU applicator. The Figure shows
the TPS applicator library overlay on the CT image, which is in good agreement in 8.8(a) but
there is a clear discrepancy in 8.8(b) resulting in shift in TPS modelled dwell positions of
approximately 3 mm. In the audit of Figure 8.8(b), the TPS applicator library was correctly
aligned with the CT image at the level of the ring, but there was a difference in the apparent
length of the IU applicator of approximately 3 mm. With retrospective analysis, there were
only two other centres using the same specific applicator design in the UK audit: in one case
a similar discrepancy was seen but of a lower magnitude, isodose shift around 1 to 2 mm,
and in the other this discrepancy was mitigated in routine clinical practice by decoupling the
IU and ring applicators and manually aligning them with the CT image. The results were
reported to the manufacturer who conducted an investigation and stated “applicator
libraries should be considered as an ideal representation but may deviate due to production
tolerances, mechanical forces within a patient, or incorrect sterilization and handling”
(personal email to author, September 2014). The manufacturer concluded that “The
difference in tip position between Applicator Library model and imaged applicator can be
caused by product variations. Recommendation is to use the Applicator Library in
combination with the appropriate CT markers to ensure accurate positioning of the model”
(personal email to author, October 2014).

157
Figure 8.8. BRAD audit isodose comparison between TPS-calculated (thick lines) and film-measured
(thin lines) for (a) audit with good agreement, and (b) audit with discrepancy at the distal
end of the IU applicator. Inset enlargements of CT images of distal tip of IU with TPS
library applicator overlay and source dwell positions.

158
8.3.4.2. Prescription Dose Error
There was only one audit in which the initial film results indicated a potentially
significant dose error. Subsequent analysis was able to find ‘human factors’ as a cause and
there was no systematic error in dosimetry at the audited centre. However, this served as a
reminder that ‘human error’ may be a significant cause of incorrect treatment delivery.
Figure 8.9 shows excerpts of the TPS planning information hard copy. The
intention of the audit was to deliver 7 Gy prescription dose, and this was entered in the TPS
and is shown on the front page of the TPS data sheet, Figure 8.9(a). Analysis of the audited
film dose at Point A gave a measured dose value of 10.2 Gy, a 46% increase on the
prescription value. Subsequent analysis confirmed the TPS had calculated the Point A doses
correctly, shown in Figure 8.9(b), but the point of normalisation used in the TPS had been
incorrectly set by the planner. (The actual TPS dose to Point A and the film measured doses
are used in the earlier sections of this Chapter to derive percentage difference and DTA
results).
Figure 8.9. BRAD audit with incorrect dose normalisation. Section of plan parameters hard copy
from TPS, showing (a) prescription dose of 7 Gy and (b) calculated dose to Point A
average 10.2 Gy

159
8.3.5. Feedback from Audited Centres
Of the 46 radiotherapy centres audited, 25 provided feedback after the audit via
email. All responses were positive and found the audit to be of value. A representative
selection of comments is provided below:
Administration and set-up
“Thank you very much for the quick response with the detailed report.”
“Thank you for the comprehensive report, a valuable exercise. It’s reassuring to know
that the dose distribution is good and that there weren’t any glaring discrepancies.”
“The process was well organised, including communications pre and post audit,
equipment delivery, documentation.”
“Brachytherapy physics dosimetry audit has lagged behind external beam so it's great
that the process has at last started.”
“I think the audit was very good. It was quick, required minimal preparation from us,
and measured something that was clinically relevant. We are very satisfied with the
whole process.”
“I thought the audit was quite painless, especially as you came and did the
measurements yourself and we weren't battling with unfamiliar kit and instructions. It
is always reassuring to know that a more clinical situation has been verified rather than
just the source output.”
“We found the audit process very helpful and reassuring. External audit is a very
important process to ensure consistency across the UK, it is a valuable source of
assurance and gives confidence to the clinical team.”
“I definitely feel that the audit was useful; as far as I can recall it is the first time we have
had an audit on the ring and tandem and got the results back, so it’s reassuring that
we’re giving the doses we think we are.”
“This is the first time we have been audited in this way and it complements the internal
QA we do.”
“I was really impressed with the efficiency and comprehensiveness of the audit process.
The format of the report is similarly comprehensive but succinct, and ideal for sharing
with clinical/radiographer colleagues as a confidence-booster. We also really
appreciated the knowledge-sharing and interaction during the planning process that
your involvement brought to the day.”
“I think the audit was valuable in confirming the whole process from scanning, planning
through to treatment. The process seemed quite efficient as well.”
“The E2E [end to end] tests you’ve carried out here are of a much higher standard than
we could have hoped to achieve in the time available, and we have the added benefit of
being benchmarked against other centres.”

160
Methodology
“You have demonstrated film dosimetry is a good option to measure brachytherapy
dose.”
“We tried to get something sensible with TLD during commissioning but due to the large
dose gradients we had to accept errors of around 15%.”
“It tested the whole of the patient pathway very smoothly.”
“I was very impressed with the audit, in particular the design of a phantom that enabled
such accurate measurements close to a brachytherapy source.”
“The phantom is impressive and a very useful tool.”
Results
“We will certainly have a review of our procedure based on your recommendations set
out in the report.”
“I will now make changes to the CT reconstruction.”
“I am very pleased (and relieved) that the results are good, that is reassuring.”
“Very pleased to see that the results give no cause for concern.”
“General discussions about brachytherapy procedures was very interesting and useful.
The report was prompt, detailed and informative.”
“I take on board your comments and agree… I am reviewing Point A location for our new
applicators.”
“It is reassuring that the results are good despite the issues raised during the audit. I
found the audit very useful and your comments/suggestions will certainly be taken on
board.”
“The audit highlighted the fact that we need to review our whole process to bring us
into line with what other centres are doing and to have confidence in our own working
practices.”
Criticism and suggestions for future audits
“The phantom is somewhat fragile.”
“The only part that was tricky was setting up the phantom, holding down the ring whilst
the clamp was tightened.”
“I got the feeling that it was more designed around the ring system than our ovoids and
that is perhaps why we had a bit of a gap between the flange and the phantom surface
maybe an interchangeable central piece might fix that.”
“Extending the audit to suit other applicators would be great for future work.”
“Possible future audits – maybe a skin type treatment with Frieburg flap and tissue
equivalent phantom rather than just water? Also, possibly the current phantom could
be adapted to take needles as well”

161
“When digitising the applicators, they weren’t as easy to visualise as when they are in a
patient, so that might have introduced a small positional error.”
“My only suggestion would be to develop it further for commercialisation, perhaps by
reworking so that the pieces interlock into a more robust solid cube which wouldn’t
require submersion in water.”
“Voluming and the interpretation of the HR-CTV is one huge area of confusion. Would
be interesting to send an image set round the country and see if the patient would get
the same treatment from different centres.”
“It's too early to audit in vivo dosimetry in brachy yet but that would be good in the
future. Also ... in a few years, non-TG43-based dosimetry.”
“Adapting the phantom to provide for instance a ‘prostate hdr’ audit, would be as useful
as this ‘gynae hdr’ audit. GAF would also appear well suited to test curved ‘brachy
moulds’.”
8.4. Discussion and Conclusions
The BRAD ‘end to end’ brachytherapy dosimetry audit system has been
successfully used to audit 46 radiotherapy centres in UK, with generally good results. The
mean percentage dose difference of the film-measured dose from the TPS-calculated dose
at Point A was -0.6% for plastic applicators and -3.0% for metal applicators, Figure 8.3, with
a high statistical significance of the difference, Table 8.1. The attenuation due to metal
applicators has been calculated using Monte Carlo techniques in Section 7.3.4, giving 2.0%
as an estimate for Ir-192 in the vicinity of Point A, and increasing as path-length obliquity
through the applicator increases. The standard uncertainty of the dose difference between
TPS-calculated and film-measured dose at Point A has been estimated as 3.0% (k=1) in
Section 6.4.5. It follows that all of the audit determined doses at Point A (mean of the Point
A doses for the left and right side films) were within one standard uncertainty from the
planned value for all of the audited centres, if the attenuation of the metal applicators not
modelled in the TPS, is taken into account. The accuracy of dose delivery agrees with the
planned dose within the uncertainty of the audit methodology, which is therefore deemed
to be within clinically acceptable levels.
Differences between film-measured Point A for the left and right side films could
indicate lateral displacement of the source within the applicator, movement of the applicator
intrauterine tube from the central axis of the phantom, offset of applicator reconstruction in
the treatment planning system, unintentional movement of either of the films, or be the
result of inherent uncertainty in the film dosimetry process. All of the left to right side
differences were within the estimated standard uncertainty.
There was a high statistical significance for the difference in agreement between
film-measured and TPS-calculated dose to Point A for plastic and metal applicators, as would
be expected due to the lack of compensation for metal attenuation in TPS. Table 8.1 also

162
showed a moderate statistical significance between ring and ovoid plastic applicators, but
not for ring and ovoid metal applicators. The uncertainty in the physical audit set-up was
considered to be less for ring applicators than for ovoids, especially where the design of the
applicator meant the ovoids were not parallel with the top surface of the BRAD phantom, or
for those plastic ovoid applicators with curved IU tubes. Also the ovoid applicator geometry
is in general not as fixed as for ring applicator, which may have increased uncertainty
between imaging and delivery. The plastic ovoid applicators may be more susceptible to
movement than the metal ovoids between the time of CT and treatment delivery due to the
fixing mechanisms. No statistically significant difference was seen between manual or TPS-
model-assisted applicator reconstructions for either metal or plastic applicators. The overall
accuracy is likely to be primarily a function of the skill, experience and knowledge/training of
the operator rather than whether an applicator-model library is available in the TPS.
However, it was seen that an applicator model library is a more rapid method of applicator
reconstruction, and could be expected to improve efficiency. However, this does rely on the
applicator library model being an accurate representation of the true physical situation, and
care must be taken for each patient to ensure the applicator library and actual imaged
applicator are in geometric agreement, otherwise errors are possible as discussed in Section
8.3.3 and 8.3.4.1. There was an insufficient sample size for reliable statistics to compare
Varian and Nucletron treatment systems without omitted-variable bias: There were no
plastic Varian applicators in use, and a very small number of metal Nucletron applicators.
However, the mean value for Nucletron and Varian metal applicators is in agreement within
one standard deviation.
The mean distance to agreement, DTA, for all audits was 0.6 mm, which is of the
same order as the derived standard uncertainty estimate of 0.5 mm. The DTA for metal
applicators was higher than for plastic applicators, 0.7 mm compared to 0.5 mm. This is most
likely a result of the metal attenuation not accounted for in the TPS calculation. The DTA is
always a positive value for both left and right Point A films, hence any displacement of the IU
applicator from the central axis of the phantom will increase the DTA on both films, and the
mean DTA, in contrast to the mean percentage dose difference at Point A in which applicator
shifts may increase dose in one film compensated by a decrease in the other film’s Point A
location.
Excellent agreement was seen between film-measured and TPS-calculated
isodose distributions over a wide dose range, generally 0.7 to 16 Gy analysed film, shown in
Figure 8.6. The gamma evaluation of the two dose distributions for each audit had passing
rates exceeding 95% at 3% (local) 2 mm for all audits, except one centre in which a
misalignment was evident between the TPS applicator library and the CT-imaged applicator,
discussed in Section 8.3.4.1. The mean gamma passing rate over all audits was 97.8% (3.2%
sd) at 3% (local) 2 mm and 99.7% (1.0% sd) at 5% (local) 3 mm. It may be concluded that no
errors were detected in the basic TG-43 source data in use within the TPS at each of the
audited centres, and that treatment equipment performance was sufficient to faithfully
delivery the calculated dose distribution within clinically significant parameters, for the
situations and locations measured.

163
25 of the 46 audited centres provided feedback; all finding the process to be a
positive experience. In particular the process was perceived as being novel for brachytherapy
and valuable to cover the ‘end to end’ dosimetry process. The associated discussion of
physics brachytherapy processes was seen to be valuable and host physicists were happy to
receive suggestions for development.

164

165
CHAPTER 9
Summary Conclusions
and Future Work

166
9.1. Summary Conclusions
This section provides an overview of principal conclusions from the distinct
sections of this thesis, and cites relevant publications by the author. Further discussion and
conclusions are provided at the end of each relevant preceding chapter. The research work
also included an initial publication reviewing physics-aspects of dose accuracy in HDR
brachytherapy (Palmer et al. 2012b), and concluded with an editorial on brachytherapy
dosimetry (Palmer 2014a) and a publication reviewing dosimetric audit in brachytherapy
(Palmer et al. 2014b). Several oral and poster presentations were also given at major national
and international conferences, including in the UK (Brighton, Glasgow, London and
Portsmouth), mainland Europe (Barcelona, Geneva and Vienna), North America (Austin), and
Australia (Sydney), details provided in Section 1.4.
9.1.1. Quality Control of HDR Brachytherapy Equipment
9.1.1.1. UK Survey and Analysis
Chapter 3 provided data and analysis on a comprehensive survey of quality
control practice for HDR/PDR brachytherapy, which collated data from 31 clinically active
brachytherapy centres in the UK. This was the only systematic analysis of its kind to be
undertaken in recent years and provides a valuable benchmark resource. While there was
agreement on the need for QC testing of basic performance parameters, such as source
strength, QC schedules differed significantly in other areas, such as the need for routine
testing of dwell position accuracy in clinical treatment applicators. There was no evidence of
‘system tests’ or confirmation of delivered dose distributions with clinical treatment
applicators, and this was identified as an objective for further study in the thesis. Decisions
on QC testing should be based on risk assessment and local factors, and it is recommended
centres should review their practice against the UK survey benchmark data presented in this
thesis and associated publication (Palmer et al. 2012a).
9.1.1.2. Development of QC and Commissioning Tests and Performance Requirements
From results of the UK survey, dwell position accuracy, transit dose, and end to
end process dosimetry were identified as QC tests that would benefit from procedure
development. A proposed method for the assessment of source dwell position, movement
profile, and transit dose using a video camera was described and tested, in Chapter 3. It was
shown that dwell positions and transit dose corrections can be sub-optimal even with
modern HDR treatment systems. A source positioning error due to transfer tube curvature
and a movement profile with inappropriate transit corrections were presented, and following
discussion with the manufacturer, a new control system software version was released which
improved accuracy (Palmer 2013a).

167
A planning study evaluation of the impact of systematic dwell position errors
showed that an accuracy of 1.0 mm is an optimum tolerance to limit changes in typical
planning quality parameters (D90, D2cc) to within 3%. The tolerance limit for random dwell
positioning errors may be larger, if it is assumed a level of compensation from adjacent dwells
due to the random nature. It was also shown the dose at prescription Point A, for
gynaecological treatment applicators, is relatively insensitive to dwell position errors
(typically 0.7% change for a systematic 4 mm error). The implication is that dose
measurements at Point A, for QC or audit, while valuable for point-dose and source strength
confirmation are insufficient to confirm dwell position accuracy and overall (dose
distribution) treatment quality.
9.1.2. HDR Brachytherapy Audit Dosimetry
9.1.2.1. Evaluation of Dosimeters
Chapter 4 presented an evaluation of three dosimeters specifically chosen as
candidates for the measurement of dose distributions around brachytherapy treatment
applicators in the context of an external audit. One dosimetry system was chosen for
investigation in each of the following three potential measurement modes: multiple point
detectors, one or several 2D detectors, full 3D detector. Doped silica glass optical fibres,
radiochromic film, and solid radiochromic polymer were investigated in terms of (a)
preparation, processing and calibration, (b) measurement of radial dose from an isolated
HDR source, and (c) measurement of dose distribution from multiple HDR source dwell
positions.
The manual preparation process of doped silica glass dosimeters from optical
fibres was inefficient, with a 75% rejection rate for batch sensitivity consistency of the fibre
used in this study, and the process was labour intensive. With further refinement the process
may be improved, but fundamentally fibre dosimeters were abandoned as the spatial
resolution in their long dimension was unsatisfactory for brachytherapy audit
measurements, and challenges with handling and accurate positioning were significant.
The use of Presage, a solid radiochromic polymer, gave encouraging results for
full 3D measurement of brachytherapy dosimetry, albeit with cylindrical averaging required
to reduce noise in measurements of radial dose from a brachytherapy source. It was likely
that further research of the optical CT readout system would be beneficial but that the
development required was too great to implement for a brachytherapy audit in a reasonable
timescale. The limited physical dimensions, availability and cost of the dosimeter were also
negative features, and it was decided full 3D measurement was unnecessary to fulfil the
brachytherapy audit objectives.
Initial testing of radiochromic film, Gafchromic EBT3, as a dosimeter for
brachytherapy audit was successful, with robust calibration achievable over a wide dose
range (up to 50 Gy) and both radial dose measurement and dose distribution measurement
agreeing with Monte Carlo and TPS calculations within 5% over a range of clinical relevant
conditions. It was expected that with further research and development of techniques,

168
reduction of uncertainties and overall accuracy may be improved. At the current stage of
development of the three dosimeters, only Gafchromic film was able to be calibrated in terms
of absolute dose, the others requiring individual normalisation of each detector. It was
decided to progress with film dosimetry as the most promising dosimeter for brachytherapy
audit measurements. Results and further discussion are presented in Chapter 4 (Palmer et
al. 2013d).
9.1.2.2. Optimisation of Radiochromic Film Dosimetry
Having decided to proceed with a radiochromic film dosimetry system for
brachytherapy audit, further research and development was required on the technique to
ensure an accurate, robust methodology with minimised uncertainties, described in Chapter
5. Radiochromic film is widely used in radiotherapy but its application in brachytherapy is less
well documented, especially using advanced film techniques.
Post-irradiation darkening of film was investigated as this was important in the
context of a dosimetry audit, since films were exposed at the audited centre and analysis
performed at a later time at a different location. Darkening of film continues following
irradiation as a logarithmic function with time. For the audit, a methodology was derived in
which reference dose films were exposed at a similar time to audit films and both were
scanned simultaneously. Scanning would take place at a time interval after exposure at least
a multiple of four of the time difference between reference and audit film exposures for
reliable dosimetry. Scanner and film related uncertainties were comprehensively
investigated. The lateral scanner effect could be significant at brachytherapy dose levels, with
errors up to 23% at a 9 cm lateral position off axis at 14 Gy for the particular equipment used.
It was essential to limit analysis regions to close to the axis of the scanner and with triple-
channel dosimetry, errors within 1% at the edges of an 8 cm scan width were achievable. The
potential for natural film curvature during the scanning processes was also found to be a
potentially significant error, up to 4% for 2 mm vertical displacement, which had not
previously been reported in the literature. However, this could be completely mitigated using
a glass compression plate on top of the film at scanning.
The application of triple-channel film dosimetry with linear calibration scaling
using simultaneously scanned reference dose films was investigated and found to be an
appropriate technique for the brachytherapy audit. Comparison of triple-channel and single-
channel dosimetry showed significantly improved results with the former in controlled test
cases and for typical brachytherapy dose distribution measurements. The triple-channel
approach was also able to correct for surface contamination of the film, particularly useful in
the context of a brachytherapy audit, and appeared to correct for any potential of
manufacturing variations in film active layer thickness. Results and further discussion are
presented in Chapter 5 (Palmer et al. 2013b, Palmer et al. 2014c, and Palmer et al. 2015b).

169
9.1.3. ‘End to End’ Audit of Brachytherapy Dosimetry
9.1.3.1. Design of an Audit Phantom and Audit Methodology
There have been several HDR brachytherapy audits reported in the literature,
see Section 6.1, but no fully ‘end to end’ approaches nor any UK-wide external audit for
brachytherapy, prior to the current work. The value of such audit, concerned with the full
treatment process rather than being limited to a more conventional audit of only source
strength, was discussed in Section 6.2. Chapter 6 presented the development of a unique
film-based ‘end to end’ dosimetric audit system for gynaecological brachytherapy. A novel
phantom was designed to enable the measurement of point dose and dose distributions
around clinical brachytherapy applicators in the context of a full system dosimetry audit;
including CT, treatment planning and treatment delivery. The BRachytherapy Applicator
Dosimetry phantom (BRAD) was designed and successfully tested (Palmer et al. 2013c). The
design concept was to rigidly hold four film dosimeters at accurately known positions with
respect to a clinical treatment applicator, and sample the dose distribution in clinically
relevant regions with comparison to intended doses from the TPS. The phantom essentially
consists of a Solid Water (Gammex RMI457) frame, clamps for the applicator and film, and
accompanying full-scatter water tank.
The film dosimetry methodology for the audit, described in Section 6.4.2, was
specified to address and mitigate many of the characteristics and uncertainties associated
with the use of radiochromic film, discussed in Chapter 5. This included attention to film
batch, orientation, time since exposure, position on scanner, forced physical flatness,
reference dose films in the same scanner image for calibration scaling, and use of triple-
channel dosimetry calibration. It was decided to use percentage difference and distance to
agreement (separately) at prescription Point A, as well as gamma analysis and visual isodose
overlay inspection comparing planned and measured dose distributions across the films. The
BRAD system was tested for sensitivity to simulated errors of dwell position calibration error
and systematic dwell time/prescription dose error. Results clearly discriminated between
normal delivery and the simulated error cases. Finally, an uncertainty budget was evaluated
for the percentage dose difference at prescription Point A between TPS-calculated and film-
measured dose, at standard uncertainty of 3.0% (k=1). The audit procedure also importantly
included scope for a discussion between auditor and host physicist of the brachytherapy
procedures in use at the centre.
9.1.3.2. Monte Carlo Simulations
Monte Carlo code calculations were used to support the research work in this
thesis, discussed in Chapter 7. The local implementation of MCNP5 and the Ir-192 and Co-60
HDR source model approximations were validated in terms of dose with radial distance
compared to published reference data, all agreement was within 1%. MCNP5 was used to
determine the required physical dimensions of the water tank for the BRAD audit system to
ensure full scatter at the measurement points. A cube of side length 400 mm was selected to
provide full-scatter at the prescription Point A, approximately 20 mm from the centre of the

170
phantom. The Monte Carlo code was used to confirm the water equivalence of the EBT3 film
and that its presence did not perturb dose deposition, in situations resembling the BRAD
audit. The percentage dose change with and without film at prescription Point A in the BRAD
phantom was ≤ 0.1% for Ir-192 and Co-60 sources. An estimate of the dose attenuation by
metallic applicators in the BRAD measurement situation was calculated, in order to interpret
results from the UK audit. For Ir-192 the dose reduction was at least 2.0% (increasing with
longitudinal distance from sources) and for Co-60 was 1.5%, for typical clinical brachytherapy
applicator dimensions.
9.1.3.3. UK Audit
The BRAD system was successfully used to undertake ‘end to end’ audits at 46
of the 47 brachytherapy centres in the UK, demonstrating such an audit is worthwhile and
feasible. This was funded and organised via a Working Party of the IPEM, which the author
proposed and chaired. Full results and discussion of the UK audit are provided in Chapter 8
(and in Palmer et al. 2015a). It may be concluded that no errors were detected in the basic
TG-43 source data in use within the TPS at each of the audited centres, and that treatment
equipment performance was sufficient to faithfully deliver the calculated dose distribution
within clinically significant parameters, for the situations and locations measured. In all cases,
the measured dose at prescription Point A was in agreement with the TPS calculated dose
within experimental uncertainty, and within clinically relevant tolerance. The mean
difference between measured and calculated dose was 0.6% for plastic applicators and 3.0%
for metal applicators, with high statistical significance of the difference (p<0.001). The higher
percentage difference with metal applicators being due to a lack of compensation for
applicator attenuation in TPS, which in Section 7.3.4 has been calculated to be in excess of
2%. The mean distance to agreement at Point A between measured and calculated dose was
0.6 mm, within clinically relevant tolerance. Excellent agreement was seen between film-
measured and TPS-calculated isodose distributions, typically over a film-measured range of
0.7 to 16 Gy, with a mean gamma passing rate over all audits of 97.8% (3.2% sd) at 3% (local)
2 mm criteria, with 2 Gy cut-off. Two audits required follow-up to investigate the cause of
sub-optimal audit results. Both were resolved, the first being most likely due to applicator
overlay misalignment at the TPS (subsequently also investigated by the manufacturer) and
the second due to ‘human error’ in dose normalisation at the TPS.
The brachytherapy audit afforded the opportunity to review local brachytherapy
physics practice with host physicists and make comparisons to accepted standards across the
UK. Suggestions for improvement were reported to the local centres, which included HDR
equipment issues, imaging protocols, applicator reconstruction procedure, planning
procedures, data transfer methods, and quality control tests. This was a valuable outcome of
the audit visits. Variations in the level of patient-specific optimisation of HDR brachytherapy
treatment planning across the UK was significant. The process for individual planning of
patients’ treatments ranged from delivery of standard plans with no optimisation, indeed
one centre only performed retrospective dosimetry on the TPS after treatment delivery had
171
taken place, to fully inverse-planned treatments to 3D target volumes (HR-CTV) based on
magnetic resonance imaging.
Around half of the audited centres provided feedback after the audit; all
reporting the process had provided valuable reassurance of dosimetric accuracy. Particularly
the ‘end to end’ approach was perceived as being of particular value, and that their
brachytherapy processes had not previously been subject to comprehensive audit.
9.2. Future Work
9.2.1. Quality Control and Commissioning Testing for HDR Brachytherapy
While the fundamental tests of source strength, linear position accuracy and
dwell time were included in all UK centres’ QC schedules, Chapter 3, there was scope for
improved consistency and consideration of other QC tests. This will be included and
discussed in a forthcoming revision of IPEM Report 81, for which the author is a joint-editor.
The BRAD system measurement was conducted as a one-off national audit in
the UK during 2013-2014. However, the phantom is now available via the IPEM virtual
phantom library and proposed future work is to continue to provide the equipment and
dosimetry service as may be requested by centres commissioning new treatment equipment.
The ‘end to end’ audit approach used in this research work was well received by
host centres, as the ‘system test’ is a valuable addition to equipment-centric traditional QC
methods. It would be valuable if a simple QC-test could be developed for brachytherapy to
provide an ‘end to end’ test that could be conveniently implemented at centres without the
need for a more complex BRAD-type measurement system. This would be valuable for both
QC and equipment commissioning, rather than limiting the technique to essentially a ‘one-
off’ national audit, which has been the basis of the current research. It may be possible to
use point detectors (such as diodes) at selected locations informed by the results of this
study, if this is more convenient for routine QC and if centres do not have sufficient
equipment or experience for film dosimetry.
A new film phantom design incorporating a patient surface may be valuable for
QC or commissioning, with film an ideally suited dosimeter for 2D surface measurements,
particularly if curved surfaces were incorporated. Such a phantom could be utilised for
validation of interstitial breast brachytherapy as well as for skin surface treatments. Both of
these scenarios challenge current TG-43 TPS systems, and would be valuable for the
commissioning of advanced algorithm-based TPS.
A possible application of film dosimetry in brachytherapy is for the confirmation
of TG-43 model data for each individual HDR or PDR source, which may be performed when
new sources are first received at radiotherapy centres. There are no publications on the
potential variability of individual brachytherapy sources due to manufacturing tolerances and
distribution of radioactive material, and film could be applied to undertake new-source
commissioning tests. A strip of film could be positioned within a cylinder with the source on

172
the axis, and the resulting dose profile around the film would inform of any radial anisotropy
of the source, currently assumed to be negligible. The source could also be positioned with
its long axis in the plane of the film, to confirm TG-43 away-along dose rate tables, or
variations in dose rate with polar angle.
9.2.2. Brachytherapy Film Dosimetry Development
The use of Gafchromic EBT3 film for brachytherapy dose distribution
measurement in 2D planes has been demonstrated and successfully applied in this work. It
would be possible to extend the application of radiochromic film in brachytherapy to a
pseudo-3D measurement system using a stack of film dosimeters, perhaps with Solid Water
spacers, as has been achieved by McCaw et al. (2013) in external beam radiotherapy. Further
Monte Carlo simulation should be undertaken to confirm water-equivalence over a larger
volume and any perturbation compared to the equivalent water medium.
9.2.3. Brachytherapy Dosimetric Audit
9.2.3.1. Development of the BRAD System for ‘End to End’ Dosimetry Audit
The concept of ‘end to end’ external audit of brachytherapy dosimetry was well
received by all audited centres in UK. The feedback received from centres, discussed in
Section 8.3.5, and further reflection based on practical experience conducting the audits, has
been used to propose the following possible modifications to the BRAD system.
The concept of CT scanning the treatment applicator in the BRAD frame alone
and then inserting into the water tank for treatment delivery was designed to allow
applicators to be in near clinical orientation for imaging (without their open ends being
submerged in water) and then providing full scatter for irradiation. However, the appearance
of the applicator in the phantom (with large surrounding air volume) was reported by a few
physicists as being different to the image usually obtained when surrounded by the patient.
The BRAD system could be modified to recreate more closely the patient CT image with
additional water equivalent material.
The BRAD phantom could be further developed to incorporate CT-imaged
structures, or at least CT-visible outlines, to enable contouring processes to be included in
the ‘end to end’ system audit. This would then provide opportunity for volume-based
prescribing and evaluation in treatment planning, including evaluating the ability to cover the
target volume and avoid organs at risk, perhaps correlating results with the level of
optimisation of the plan (standard plan, manual optimisation, TPS-based inverse plan
optimisation). Structures of different density, modelling true patient anatomy, and realistic
patient-based phantom size (rather than nominal full scatter) could be included to test
calculation accuracy for non-TG43 based TPS algorithms (Papagiannis et al. 2014). This may
provide a valuable commissioning system as these algorithms become adopted in routine
clinical practice. A brachytherapy dosimetry audit developed in this way would then fully

173
satisfy the Level III audit definition proposed by the Australian Clinical Dosimetry Service for
an “anthropomorphic phantom end to end” audit (Kron et al. 2013).
The BRAD phantom could be modified with a replacement top-plate that would
allow cervix treatment applicators incorporating both intracavitary and interstitial needles to
be tested. Dose distribution shaping by the addition of low-weighted needles is becoming
accepted practice and may see widespread adoption. A more radical redesign of the BRAD
concept could be pursued for ‘end to end’ dosimetry testing of non-gynae applicators, such
as skin brachytherapy (with realistic contours and ‘missing scatter’), and oesophageal and
bronchial brachytherapy (with associated air volumes).
A significant potential source of uncertainty in the BRAD system was the
alignment of films. It would be possible to redesign the phantom to use a continuous single
film that sampled both left and right Point A as well as regions distal to the tip of the
intrauterine applicator. This would limit the uncertainty to movement of a single film with
respect to the applicator, rather than the potential of independent movement in two films
about the applicator. This would aid confirmation of alignment between film-measured and
TPS-calculated dose distributions.
9.2.3.2. Future Directions for Audit
There is no doubt that clinical and physics aspects of brachytherapy will continue
to develop at a significant rate, including the realisation of advanced and functional imaging
in brachytherapy, a new era of dose calculation algorithms for brachytherapy, and an
evolution away from traditional template planning to fully patient-specific optimisation. As a
result, the scope of dosimetric audit in brachytherapy will continue to be challenged to be fit
for purpose. Future directions will require more complexity of the BRAD-system.
Film dosimetry has been successfully applied for the first UK ‘end to end’ audit
described in this thesis. However, a limitation of film dosimetry is that it only provides a 2D
dose measurement. While this is preferable to point-dosimetry, true 3D measurements of
dose distributions in brachytherapy may be desirable and further research and development
work is advocated for high precision measurements in 3D, such as with Presage, or perhaps
an equivalent 3D EBT3 material or film-stack (as discussed above).

174

175
References

176
Acar H., Chiu-Tsao S.-T., Ozbay I., Kemikler G., Tuncer S. Evaluation of material heterogeneity
dosimetric effects using radiochromic film for COMS eye plaques loaded with 125I seeds (model
I25.S16). Med. Phys. 2013;40:011708.
Adamson J., Newton J., Yang Y., Steffey B., Cai J., Adamovics J., Oldham M., Chino J., Craciunescu O.
Commissioning a CT-compatible LDR tandem and ovoid applicator using Monte Carlo calculation and
3D dosimetry. Med. Phys. 2012;39:4515-4523.
Aird E.G.A., Jones C.H., Joslin C.A.F., Klevenhagen S.C., Rossiter M.J., Welsh A.D., Wilkinson J.M.,
Woods M.J., Wright S.J. Recommendations for brachytherapy dosimetry. Report of a joint working
party of the BIR and the IPSM. London, UK: British Institute of Radiology (BIR), 1993.
Aldelaijan S., Mohammed H., Tomic N., Liang L.H., DeBlois F., Sarfehnia A., Abdel-Rahman W.,
Seuntjens J., Devic S. Radiochromic film dosimetry of HDR 192Ir source radiation fields. Med. Phys.
2011;38:6074-6083.
Amols H.I., Klein E.E. QA procedures in radiation therapy are outdated and negatively impact the
reduction of errors. Med. Phys. 2011;38:5835-5837.
Anderson C., Lowe G., Wills R. Critical structure movement in cervix brachytherapy. Radiother. Oncol.
2013;107:39-45.
Andrassy M., Niatsetsky Y., Perez-Calatayud J. Co-60 versus Ir-192 in HDR brachytherapy: scientific and
technological comparison. Rev. Fis. Med. 2012;13:125-30.
Andres C., del Castillo A., Tortosa R., Alonso D., Barquero R. A comprehensive study of the Gafchromic
EBT2 radiochromic film. A comparison with EBT. Med. Phys. 2010;37(12):6271-6278.
Arjomandy B., Tailor R., Anand A., Sahoo N., Gillin M., Prado K., Vici M. 2010 Energy dependence and
dose response of Gafchromic EBT2 film over a wide range of photon, electron and proton beam
energies. Med. Phys. 2010;37:1942-7.
Arsenault C., Bissonnette J.-P., Dunscombe P., Johnson H., Mawko G., Seuntjens J. Standards for quality
control at Canadian radiation treatment centres: Brachytherapy remote afterloaders. Canadian
Association of Provincial Cancer Agencies (CAPCA), December 2006.
ASAHI SHIMBUN, Asia & Japan Watch internet media site. Hospital delivers radiation to wrong spots
in 100 cancer treatment cases, 26 December 2013. [cited 2014 Jan 5, 1 p.]. Available from
http://ajw.asahi.com/article/behind_news/social_affairs/AJ201312260063.
ASTRO. Safety is no accident. A framework for quality radiation oncology and care. Sponsored by
ASTRO. Developed and endorsed by AAMD, AAPM, ABR, ABS, ACR, ACRO, ARS, ASTRO, ASRT, AFROC,
SCAROP, SROA. Fairfax, VA, USA: American Society for Radiation Oncology (ASTRO), 2012.
Aukett R.J., Ratcliffe A.J., Mills J.A., Bonnett D.E. Audit techniques for LDR remote afterloading
brachytherapy. IPEM Meeting on current developments in brachytherapy, London, 1999.
Austerlitz C., Mota H., Almeida C.E., Allison R., Sibata C. Quality assurance of HDR 192Ir sources using
a Fricke dosimeter. Med. Phys. 2007;34:1348-1353.
Awunor O.A., Dixon B., Walker C. Direct reconstruction and associated uncertainties of 192Ir source
dwell positions in ring applicators using Gafchromic film in the treatment planning of HDR
brachytherapy cervix patients. Phys. Med. Biol. 2013;58:3207.
Baldock C., De Deene Y., Doran S., Ibbott G., Jirasek A., Lepage M., McAuley K.B., Oldham M., Schreiner
L.J. Polymer gel dosimetry. Phys. Med. Biol. 2010;55:R1-R63.
177
Baltas D., Geramani K., Ioannidis G.T., Hierholz K., Rogge B., Kolotas C., Muller-Sievers K., Milickovic
N., Kober B., Zamboglou N. Comparison of calibration procedures for 192Ir high-dose-rate
brachytherapy sources. Int. J. Radiat. Oncol. Biol. Phys. 1999;43(3):653-61.
Baras P., Seimenis I., Kipouros P. Polymer gel dosimetry using a three-dimensional MRI acquisition
technique. Med. Phys. 2002;29:2506-16.
Bastin K.T., Podgorsak M.B., Thomadsen B.R. The transit dose component of high dose rate
brachytherapy: direct measurements and clinical implications. Int. J. Radiat. Oncol. Biol. Phys.
1993;26:695-702.
Beaulieu L., Carlsson Tedgren A., Carrier J.-F., Davis S.T., Mourtada F., Rivard M.J., Thomson R.M.,
Verhaegen F., Wareing T.A., Williamson J.F. Report of the Task Group 186 on model-based dose
calculation methods in brachytherapy beyond the TG-43 formalism: Current status and
recommendations for clinical implementation. Med. Phys. 2012;39(10):6208-36.
Bekerat H. Improving the energy response of external beam therapy (EBT) Gafchromic dosimetry films
at low energies (≤100 keV). Master of Science Thesis, McGill University, Montreal, Canada. October
2012.
Bernstein M., Mehta K.J., Yaparpalvi R., Kuo H., Kalnicki S. Results of the hybrid interstitial-intracavitary
Utrecht applicator for cervical cancer in an outpatient setting. Radiother. Oncol. 2012;103:S116.
Bidmead A.M., Sander T., Locks S.M., Lee C.D., Aird E.G., Nutbrown R.F., Flynn A. The IPEM code of
practice for determination of the reference air kerma rate for HDR (192)Ir brachytherapy sources
based on the NPL air kerma standard. Phys. Med. Biol. 2010;55:3145-59.
Bolton S. Radiotherapy Physics Audit. Scope 2009;18(3):8-16.
Borca C.V., Pasquino M., Russo G., Grosso P., Cante D., Sciacero P., Girelli G., La Porta M.R., Tofani S.
Dosimetric characterization and use of GAFCHROMIC EBT3 film for IMRT dose verification. J. Appl. Clin.
Med. Phys. 2013;14(2):158–71.
Bouchard H., Lacroix F., Beaudoin G., Carrier J.-F., Kawrakow I. On the characterization and uncertainty
analysis of radiochromic film dosimetry. Med. Phys. 2009;36:1931-1946.
Bradley D.A., Hugtenburg R.P., Nisbet A., Rahman A.T.A., Issa F., Noor N.M., Alalawi A. Review of doped
silica glass optical fibre: Their TL properties and potential applications in radiation therapy dosimetry.
Appl. Radiat. Isotopes. 2012;71:2-11.
Brahme A. Dosimetric precision requirements in radiation therapy. Acta. Radiologica. Oncology.
1984;23:379-91.
Brown T.A.D., Hogstrom K.R., Alvarez D., Matthews K.L., Ham K., Dugas J.P. Dose-response curve of
EBT, EBT2, and EBT3 radiochromic films to synchrotron-produced monochromatic x-ray beams. Med.
Phys. 2012;39:7412-7417.
BRAPHYQS. Working Group of GEC-ESTRO. [cited 2014 Jan 21, 11p.]. Available from
http://www.estro.org/about/governance-organisation/committees-activities/gec-estro-braphyqs.
Butson M.J., Yu P.K.M., Cheung T., Metcalfe P. Radiochromic film for medical radiation dosimetry.
Mater. Sci. Eng., R. 2003;41:61-120.
Casanova Borca V., Pasquino M., Russo G., Grosso P., Cante D., Sciacero P., Girelli G., La Porta M.R.,
Tofani S. Dosimetric characterization and use of GAFCHROMIC EBT3 film for IMRT dose verification. J.
Appl. Clin. Med. Phys. 2013;14(2):158-171.

178
Carlsson Tedgren A., Grindborg J.-E. Audit on source strength determination for HDR and PDR 192Ir
brachytherapy in Sweden. Radiother. Oncol. 2008;86(1):126-30.
Carrasco M.A., Perucha M., Luis F.J., Baeza M., Herrador M. A comparison between radiochromic EBT2
film model and its predecessor EBT film model. Phys. Med.2013;29(4):412-422.
Casey K.E., Alvarez P., Kry S.F., Howell R.M., Lawyer A., Followill D. Development and implementation
of a remote audit tool for high dose rate (HDR) Ir-192 brachytherapy using optically stimulated
luminescence dosimetry. Med. Phys. 2013;40:112102.
Chassagne D., Dutreix A., Almond P., Burgers J., Busch M., Joslin C. Dose and volume specification for
reporting intracavitary therapy in gynaecology. International Commission on Radiation Units and
Measurements, ICRU Report 38, 1985.
Chavel P., Lowenthal S. Noise and coherence in optical image processing. I. The Callier effect and its
influence on image contrast. J. Opt. Soc. Am. 1978;68(5):559-568.
Crijns W., Maes F., van der Heide U.A., van der Heuvel F. Calibrating page sized Gafchromic EBT3 films.
Med. Phys. 2013;40:012102.
Daigh JD. Healthcare Inspection Review of Brachytherapy Treatment of Prostate Cancer, Philadelphia,
Pennsylvania and Other VA Medical Centers. Department of Veterans Affairs, Office of Inspector
General, Washington, USA 2010. [cited 2013 Dec 23. 110 p.]. Available from:
http://www.va.gov/oig/54/reports/VAOIG-09-02815-143.pdf.
de Almeida C.E., Pereira A.J., Marechal M.H., Pereira G., Cruz J.C., Ferraz J.C., Giordani A.J., Khalil C.M.,
Martins R.H., Menegussi G., Moreira D., Rocha J.R., Pinto M.A. Intercomparison of calibration
procedures for 192Ir HDR sources in Brazil. Phys. Med. Biol. 1999;44:N31-8.
De Deene Y., Reynaert N., De Wagter C. On the accuracy of monomer/polymer gel dosimetry in the
proximity of a high-dose-rate 192Ir source. Phys. Med. Biol. 2001;46:2801-2825.
De Deene Y., Hurley C., Venning A., Vergote K., Mather M., Healy B.J., Baldock C. A basic study of some
normoxic polymer gel dosimeters. Phys. Med. Biol. 2002;47:3441-3463.
Dempsey C. Lessons learned from a HDR brachytherapy well ionisation chamber calibration error.
Australas. Phys. Eng. Sci. Med. 2011;34(4):529-33.
Dempsey C., Smith R., Nyathi T., Ceylan A., Howard L., Patel V., Das R., Haworth A. ACPSEM
brachytherapy working group recommendations for quality assurance in brachytherapy. Australas.
Phys. Eng. Sci. Med. 2013;36:387-396.
Devic S., Tomic N., Soares C.G., Podgorsak E.B. Optimizing the dynamic range extension of a
radiochromic film dosimetry system. Med. Phys. 2009;36(2):429-437.
Devic S., Aldelaijan S., Mohammed H., Tomic N., Liang L.-H., DeBlois F., Seuntjens J. Absorption spectra
time evolution of EBT-2 model GAFCHROMICTM film. Med. Phys. 2010;37(5):2207-2214.
Devic S. Radiochromic film dosimetry: past, present, and future. Phys Med. 2011;27(3):122–134.
DeWerd L.A., Ibbott G.S., Meigooni A.S., Mitch M.G., Rivard M.J., Stump K.E., Thomadsen B.R.,
Venselaar J.L.M. A dosimetric uncertainty analysis for photon-emitting brachytherapy sources: Report
of AAPM Task Group No. 138 and GEC-ESTRO. Med. Phys. 2011;38:782-801.
Doran S.J. The history and principles of chemical dosimetry for 3-D radiation fields: Gels, polymers and
plastics. Appl. Radiat. Isotopes. 2009;67:393-398.

179
Dunn W.L., Shultis, J.K. Exploring Monte Carlo methods. Academic Press, 2012.
Dunscombe P. Recommendations for safer radiotherapy: what’s the message? Front. Oncol.
2012;2:129-1-6.
Dunscombe P., Lau H., Silverthorne S. The Ottawa Orthovoltage Incident. Report of the Panel of
Experts convened by Cancer Care Ontario. October 2008. [cited 2014 Jan 21, 48p.]. Available from
https://www.cancercare.on.ca/search/default.aspx?q=orthovoltage&type=0,6-76,6-40484|-1,1377-
78.
Eaton D.J., Earner B., Faulkner P., Dancer N. A national dosimetry audit of intraoperative radiotherapy.
Brit. J. Radiol. 2013;86:20130447.
Eckert & Ziegler BEBIG GmbH. Urgent Field Safety Notice reference 2014LCT82. Mispositioning [sic]
of source. Eckert & Ziegler Bebig GmbH, Berlin, Germany, 17 March 2014.
Elfrink R.J.M., Kolkman-Deurloo I.K.K., van Kleffens H.J., Rijnders A., Schaeken B., Aalbers T.H.L., Dries
W.J.F., Venselaar J.L.M. Quality control of brachytherapy equipment in the Netherlands and Belgium;
current practice and minimum requirements. Radiother. Oncol. 2001a;62:95-102.
Elfrink R.J.M., Kolkman-Deurloo I.-K.K., van Kleffens H.J., Rijnders A., Schaeken B., Aalbers T.H.L., Dries
W.J.F., Venselaar J.L.M. Determination of the accuracy of implant reconstruction and dose delivery in
brachytherapy in The Netherlands and Belgium. Radiother. Oncol. 2001b;59:297-306.
EORTC. Global Clinical Trials Quality Assurance of Radiation Therapy Harmonisation Group. [cited 2014
Jan 21.]. Available from http://rtqaharmonisation.org/.
Epson. Personal communication with e-Service Support Technician at Epson Customer Inter@ction
Centre, email received 07/01/2014.
Evans M.D.C., Devic S., Podgorsak E.B. High dose-rate brachytherapy source position quality assurance
using radiochromic film. Med. Dosimetry 2007;32:13-5.
Ferreira I.H., Duterix A., Bridier A., Chavaudra J., Svensson H. The ESTRO-QUALity assurance network
(EQUAL). Radiother. Oncol. 2000;55:273-84.
Fonseca G.P., Rubo R.A., Minamisawa R.A., dos Santos G.R., Antunes P.C.G., Yoriyaz H. Determination
of transit dose profile for a 192Ir HDR source. Med. Phys. 2013;40(5):051717-1-8.
Fraass B., Doppke K., Hunt M., Kutcher G., Starkschall G., Stern R., van Dyke J. American association of
physicists in medicine radiation therapy committee task group 53: quality assurance for clinical
radiotherapy treatment planning. Med. Phys. 1998;25:1773-829.
Gerardy I., Rodenas J., van Dycke M., Gallardo S., Ceccolini E. Dosimetric characterization of a
brachytherapy applicator using MCNP5 modelisation and in-phantom measurements. Appl. Radiat.
Isotopes 2010;68:735-737.
Gerbaulet A., Potter R., Mazeron J.-J., Meertens H., Van Limbergen E. (Editors). The GEC ESTRO
handbook of brachytherapy. Brussels, Belgium: ESTRO, 2002.
Glasgow G.P., Bourland J.D., Grigsby P.W., Meli J.A., Weaver K.A. A report of AAPM task group no. 41
remote afterloading technology. New York, USA; AAPM, 1993.
Goetsch S.J., Attix F.H., DeWerd L.A., Thomadsen B.R. A new re-entrant ionization chamber for the
calibration of iridium-192 high dose rate sources. Int. J. Radiat. Oncol. Biol. Phys. 1992;24(1):167-70.

180
Goorley, T. Using MCNP for medical physics applications. Computational Medical Physics Working
Group Workshop II, Gainesville FL, October 2007. Los Alamos National Laboratory, 2007;LA-UR-07-
6618. [cited 25 June 2014, 107p]. Available from
https://laws.lanl.gov/vhosts/mcnp.lanl.gov/pdf_files/la-ur-07-6618.pdf
Gorjiara T., Kuncic Z., Doran S., Adamovics J., Baldock C. Water and tissue equivalence of a new
PRESAGE® formulation for 3D proton beam dosimetry: A Monte Carlo study. Med. Phys. 2012;39:7071-
7079.
Granero D., Perez-Calatayud J., Ballester F. Technical note; Dosimetric study of a new Co-60 source
used in brachytherapy. Med. Phys. 2007;34:3485-3488.
Granero D., Perez-Calatayud J., Pujades-Claumarchirant M., Ballester F., Melhus C.S., Rivard J.
Equivalent phantom sizes and shapes for brachytherapy dosimetric studies of 192Ir and 137Cs. Med.
Phys. 2008;35(11):4872-4877.
Grochowska P., Izewska J. An IAEA survey of dosimetry audit networks for radiotherapy. SSDL
Newsletter No. 61. IAEA, June 2013. [cited 2014 Jan 21, 36p.]. Available from http://www-
pub.iaea.org/MTCD/Publications/PDF/Newsletters/SSDL-61.pdf.
Guo P.Y., Adamovics J.A., Oldham M. Characterization of a new radiochromic three-dimensional
dosimeter. Med. Phys. 2006;33:1338-1345.
Haie-Meder C., Siebert F.A., Potter R. Image guided, adaptive, accelerated, high dose brachytherapy
as model for advanced small volume radiotherapy. Radiother. Oncol. 2011;100:333-43.
Haworth A., Wilfert L., Butler D., Ebert M.A., Todd S., Bucci J., Duchesne G.M., Joseph D., Kron T.
Australasian brachytherapy audit: Results of the ‘end-to-end’ dosimetry pilot study. J. Med. Imag.
Radiat. On. 2013;57:490-498.
Hayashi N., Watanabe Y., Malmin R., Kato H. Evaluation of triple channel correction acquisition method
for radiochromic film dosimetry. J. Radiat. Res. 2012;53(6):930-935.
Heeney C., McClean B., Kelly C. A dosimetric intercomparison of brachytherapy facilities in Ireland,
Scotland and the North of England. Radiother. Oncol. 2005;74:149-56.
Hellebust T.P., Kirisits C., Berger D., Perez-Calatayud J., De Brabandere M., De Leeuw A., Dumas I.,
Hudej R., Lowe G., Wills R. and Tanderup K. Recommendations from Gynaecological (GYN) GEC-ESTRO
Working Group: Considerations and pitfalls in commissioning and applicator reconstruction in 3D
image-based treatment planning of cervix cancer brachytherapy. Radiother. Oncol. 2010;96:153-60.
Hellebust T.P., Tanderup K., Lervag C. Dosimetric impact of interobserver variability in MRI-based
delineation for cervical cancer brachytherapy. Radiother. Oncol. 2013;107:13-9.
Hepel J.T., Wazer D.E. A comparison of brachytherapy techniques for partial breast irradiation.
Brachytherapy 2012;11:163-75.
HSE. Equipment used in connection with medical exposure. Guidance Note PM77 (Third edition).
Health and Safety Executive, UK, 2006. [cited 18 Oct 2012]. Available from:
www.hse.gov.uk/pubns/guidance/pm77.pdf.
Hussein M., Tsang Y., Thomas R.A.S., Gouldstone C., Maughan D., Snaith J.A.D., Bolton S.C., Nisbet A.,
Clark C.H. A methodology for dosimetric audit of rotational radiotherapy using a commercial detector
array. Radiother. Oncol. 2013;108(1):78-85.

181
IAEA. International Atomic Energy Agency, Dosimetry and Medical Radiation Physics Section.
Calibration of photon and beta ray sources used in brachytherapy. IAEA-TECDOC-1274. Austria,
Vienna: IAEA, 2002.
IAEA. Commissioning and quality assurance of computerized planning systems for radiation treatment
of cancer. International Atomic Energy Agency, Technical Reports Series No. 430. Vienna, Austria;
IAEA, 2004.
IAEA. Live chart of nuclides. Online resource only. Nuclear Data Section, International Atomic Energy
Agency, Vienna, Austria. [cited 25 June 2014]. Available from:
https://www-nds.iaea.org/relnsd/vcharthtml/VChartHTML.html
IAEA QUATRO (Quality Assurance Team for Radiation Oncology). Comprehensive Audits of
Radiotherapy Practices: A Tool for Quality Improvement. Vienna, Austria: IAEA, 2007.
IAEA. Standards, Applications and Quality Assurance in Medical Radiation Dosimetry (IDOS). External
Quality Audits, Session 7. Proceedings of an International Symposium, Vol. 2; 2010 November 9-12,
Vienna, Austria. Vienna, Austria: International Atomic Energy Agency, 2011.
Ibbott G.S., Thwaites D.I. Audits for advanced treatment dosimetry. J. Phys.: Conf. Ser.
2015;573:012002.
ICRP Publication 86. Prevention of accidents to patients undergoing radiation therapy. Ann. ICRP.
2000;30(3).
ICRP Publication 97. Prevention of high-dose-rate brachytherapy accidents. Ann. ICRP. 2005a;35(2).
ICRP Publication 98. Radiation safety aspects of brachytherapy for prostate cancer using permanently
implanted sources. Ann. ICRP. 2005b;35(3).
ICRU. Determination of Absorbed Dose in a Patient Irradiated by Beams of X or Gamma Rays in
Radiotherapy Procedures. International Commission on Radiation Units and Measurement, Report 24,
1976.
IPEM Radiotherapy Physics Topic Group. Survey of Quality Control Practice in UK Hospitals. Scope
1992;1:49-61. As cited in Mayles W.P.M., Lake R., McKenzie A., Macaulay E.M., Morgan H.M., Jordan
T.J., Powley S.K., Editors. Physics aspects of quality control in radiotherapy. Report no. 81. York, UK:
IPEM, 1999.
Issa F., Rahman A.T.A., Hugtenburg R.P., Bradley D.A., Nisbet A. Establishment of Ge-doped optical
fibres as thermoluminescence dosimeters for brachytherapy. Appl. Radiat. Isotopes. 2012;70:1158-
1161.
Ibbott G., Ma C.M., Rogers D.W.O., Seltzer A.M., Williamson J.F. Anniversary Paper: Fifty years of
AAPM involvement in radiation dosiemtry. Med. Phys. 2008;35:1418-27.
Izewska J., Grochowska P., Meghzifene A. IAEA survey of national dosimetry audit networks for
radiotherapy. Radiother. Oncol. 2012;103:S548.
Jordan K. Review of recent advances in radiochromic materials for 3D dosimetry. J. Phys. Conf. Ser.
2010;250:012043.
Karaiskos P., Angelopoulos A., Sakelliou L. Monte Carlo and TLD dosimetry of an Ir-192 high dose-rate
brachytherapy source. Med. Phys. 1998;25:1975-84.
Kirisits C., Rivard M.J., Baltas D., Ballester F., De Brabandere M., van der Laarse R., Niatsetski Y.,
Papagiannis P., Hellebust T.P., Perez-Calatayud J., Tanderup K., Venselaar J.L.M., Siebert F.-A. Review

182
of clinical brachytherapy uncertainties: Analysis guidelines of GEC-ESTRO and the AAPM. Radiother.
Oncol. 2014;110(1):199-212.
Kirov A.S., Williamson J.F., Meigooni A.S. TLD, diode and Monte Carlo dosimetry of an Ir-192 source
for high dose-rate brachytherapy. Phys. Med. Biol. 1995;40:2015-36.
Kron T., Haworth A., Williams I. Dosimetry for audit and clinical trials: challenges and requirements. J.
Phys. Conf. Ser. 2013;444:012014.
Krstajic N., Doran S.J. Focusing optics of a parallel beam CCD optical tomography apparatus for 3D
radiation gel dosimetry. Phys. Med. Biol. 2006;51:2055-2075.
Krstajic N., Doran S.J. Characterization of a parallel-beam CCD optical-CT apparatus for 3D radiation
dosimetry. Phys. Med. Biol. 2007a;52:3696-3713.
Krstajic N., Doran S.J. Fast laser scanning optical-CT apparatus for 3D radiation dosimetry. Phys. Med.
Biol. 2007b;52:N257-N263.
Kubo H.D., Glasgow G.P., Pethel T.D., Thomadsen B.R., Williamson J.F. High dose-rate brachytherapy
treatment delivery; report of the AAPM radiation therapy committee task group no. 59. Med. Phys.
1998;25:375-403.
Lee C. Personal communication with Chris Lee, Brachytherapy Physicist, The Clatterbridge Cancer
Centre NHS Foundation Trust. 2012 May 17.
Lee C. Recent developments and best practice in brachytherapy treatment planning. Br. J. Radiol.
2014;87:20140146.
Lewis D., Micke A., Yu X., Chan M. An efficient protocol for radiochromic film dosimetry combining
calibration and measurement in a single scan. Med. Phys. 2012;39:6339-6350.
Li G., Zheng H., Sun G., Wu Y. Photon energy spectrum reconstruction based on Monte Carlo and
measured percentage depth dose in accurate radiotherapy. Prog. Nuc. Sci Tech Conf. Ser. 2011;2:160-
164. The Joint International Conference of the 7th Supercomputing in Nuclear Applicaton and the 3rd
Monte Carlo, October 2010, Tokoyo, Japan. [cited 25 June 2014] Available from
http://www.aesj.or.jp/publication/pnst002/data/160-164.pdf
Lillicrap S.C., Owen B., Williams J.R., Williams P.C. Code of practice for high-energy photon therapy
dosimetry based on the NPL absorbed dose calibration service. Phys. Med. Biol. 1990;35:1355.
Low D.A., Harms W.B., Mutic S., Purdy J.A. A technique for the quantitative evaluation of dose
distributions. Med. Phys. 1998;25:656-661.
Low D.A., Dempsey J.F. 2003 Evaluation of the gamma dose distribution comparison method
Med.Phys. 2003;30:2455–2464.
Low D.A. Gamma dose distribution evaluation tool. J. Phys.: Conf. Ser. 2010;250:012071.
Lowenstein J.R., Roll J., Hanson H.W., Davis D.S., Lanciano R., Calkins A., Petereit D., Varia M., Ibbott
G.S. Radiotherapy quality assurance of gynecologic oncology group (COG) protocol 165, a
cooperative group study of carcinoma of the cervix. RPC, 2002. [cited 2014 Jan 21, 11p.]. Available
from
http://rpc.mdanderson.org/RPC/Publications/RPC_Presentations/2002%20AAPM%20Posters/ASTRO
%20Poster%202002%20JL.pdf.
Majumdar B., Patel N.P., Vijayan V. The non-uniformity correction factor for the cylindrical ionization
chambers in dosimetry of an HDR 192Ir brachytherapy source. J. Med. Phys. 2006;31:83-88.

183
Martisikova M., Ackermann B., Jakel O. Analysis of uncertainties in Gafchromic EBT film dosimetry of
photon beams. Phys. Med. Biol. 2008;53(24):7013–27.
Massillon-JL G., Minniti R., Mitch M.G., Soares C.G. Measurement of the absorbed dose distribution
near an 192Ir intravascular brachytherapy seed using a high-spatial-resolution gel dosimetry system.
Phys. Med. Biol. 2012;57:3407-3418.
Masillon-JL G., Chiu-Tsao S.-T., Domingo-Munoz I., Chan M.F. Energy dependence of the new
Gafchromic EBT3 film: dose response curves for 50 kV, 6 and 15 MV x-ray beams. Int. J. Med. Phys.
Clin. Eng. Radiat. Oncol. 2012;1:60-65.
Mayer R.R., Ma F., Chen Y., Miller R.I., Belard A., McDonough J., O’Connell J.J. Enhanced dosimetry
procedures and assessment for EBT2 radiochromic film. Med. Phys. 2012;39(4):2147-2155.
Mayles W.P.M., Lake R., McKenzie A., Macaulay E.M., Morgan H.M., Jordan T.J., Powley S.K., editors.
Physics aspects of quality control in radiotherapy. Report no. 81. York, UK: IPEM, 1999.
McCaw T.J., Micka J.A., DeWerd L.A. Development and characterization of a three-dimensional film
stack dosimeter. J. Phys.: Conf. Ser. 2013;444:012018.
McConn Jr R.J., Gesh C.J., Pagh R.T., Rucker R.A., Williams III R.G. Radiation portal monitor project:
Compendium of material composition data for radiation transport modelling. Pacific Northwest
National Laboratory, Richland, Washington, 2011.
McDermott P.N., Somnay A.R. and Alecu R. Acceptance testing and commissioning of a new model
HDR afterloader. Radiother. Oncol. 1996;39:S25.
MNCP5 Development Team. Using MCNP5 for medical physics applications. Document LA-UR-05-
2755. American Nuclear Society Topical Meeting – Monte Carlo, Chatanooga, TN, USA. April 2005.
McJury M., Tapper P.D., Cosgrove V.P., Murphy P.S., Griffin S., Leach M.O., Webb S., Oldham M.
Experimental 3D dosimetry around a high-dose-rate clinical 192Ir source using a polyacrylamide gel
(PAG) dosimeter. Phys. Med. Biol. 1999;44:2431-2444.
Meertens H. In-phantom calibration of Selectron-LDR sources. Radiother. Oncol. 1990;17:369-78.
Melhus C.S., Rivard J. Approaches to calculating AAPM TG-43 brachytherapy dosimetry parameters for
137CS, 125I, 192Ir, 103Pd, and 169Yb sources. Med. Phys. 2006;33(6):1729-1737.
Mendez I., Hartman V., Hudej R., Strojnik A., Casar B. Gafchromic EBT2 film dosimetry in reflection
mode with a novel plan-based calibration method. Med. Phys. 2013;40(1):011720-1-9.
Mendez I.,Peterlin P., Hudej R., Strojnik A., Casar B. On multichannel film dosimetry with channel-
independent perturbations. Med. Phys. 2014;41(1):011705
Menegotti L., Delana A., Martignano A. Radiochromic film dosimetry with flatbed scanners: A fast and
accurate method for dose calibration and uniformity correction with single film exposure. Med. Phys.
2008;35(7):3078–3085.
Micke A., Lewis D.F., Yu X. Multichannel film dosimetry with nonuniformity correction. Med. Phys.
2011;38(5):2523-2534.
Mijnheer B.J., Battermann J.J., Wambersie A. What degree of accuracy is required and can be achieved
in photon and neutron therapy? Radiother. Oncol. 1987;8:237-52.
Mishra V., Waterman F.M., Suntharalingam N. Anisotropy of an 192iridium high dose rate source
measured with a miniature ionization chamber. Med. Phys. 1997;24:751-5.

184
Molineu A., Hernandez N., Nguyen T., Ibbott G., Followill D. Credentialing results from IMRT
irradiations of an anthropomorphic head and neck phantom. Med. Phys. 2013;40:022101.
Mosleh-Shirazi M.A., Hadad K., Faghihi R., Baradaran-Ghahfarokhi M., Naghshnezhad Z., Meigooni A.S.
Echoseed model 6733 Iodine-125 brachytherapy source: Improved dosimetric characterization using
the MCNP5 Monte Carlo code. Med. Phys. 2012;39(8):4653-4659.
Nath R., Anderson L.L., Meli J.A., Olch A.J., Stitt J.A., Williamson J.F. Code of practice for brachytherapy
physics: Report of the AAPM Radiation Therapy Committee Task Group No. 56. Med. Phys.
1997;24:1557-98.
Nesvacil N., Tanderup K., Hellebust T.P. A multicentre comparison of the dosimetric impact of inter-
and intra-fractional anatomical variations in fractionated cervix cancer brachytherapy. Radiother.
Oncol. 2013;107:20-5.
NHS DH. National Health Service Department of Health. Manual for Cancer Standards version 5.0.
London, UK: DH, 2013. [cited 2014 Jan 21, 63p.]. Available from http://www.cquins.nhs.uk/.
NHS England. 2013/14 NHS Standard Contract for Brachytherapy and Molecular Radiotherapy (All
Ages). Section B Part 1 – Service Specification No. B01/S/b. NHS Commissioning Board 2013 [cited
2013 Dec 23. 21 p.]. Available from: http://www.england.nhs.uk/wp-content/uploads/2013/06/b01-
brachytpy-molecular-radio.pdf.
NHS England. Clinical audit. [cited 2014 Jan 21. 1 p.]. Available from:
http://www.england.nhs.uk/ourwork/qual-clin-lead/clinaudit/
Niroomand-Rad A., Blackwell C.R., Coursey B.M., Gall K.P., Galvin J.M., McLaughlin W.L., Meigooni A.S.,
Nath R., Rodgers J.E., Soares C.G. Radiochromic film dosimetry: recommendations of AAPM Radiation
Therapy Committee Task Group 55. American Association of Physicists in Medicine Report no. 63. Med.
Phys. 1998;25(11):2093-2115.
Nisbet A., Thwaites D.I. A dosimetric intercomparison of electron beams in UK radiotherapy centres.
Phys. Med. Biol. 1997;42:2393-409.
NNDC. Chart of nuclides. Online resource only. National Nuclear Data Centre, Brookhaven National
Laboratory, NY, USA. [cited 25 June 2014]. Available from http://www.nndc.bnl.gov/chart/
NRC. United States Nuclear Regulatory Commission. NRC Information Notice 2009-17: Reportable
medical events involving treatment delivery errors caused by confusion of units for the specification
of brachytherapy sources. Washington, USA: NRC; 2009. [cited 31st Aug 2012]. Available from:
http://pbadupws.nrc.gov/docs/ML0807/ML080710054.pdf.
Nucletron. Urgent field safety notice: Flexitron HDR. Reference 555.00267FSN. 2014 [cited 17 Sept
2014, 2p]. Available from:
http://www.mhra.gov.uk/home/groups/fsn/documents/fieldsafetynotice/con249618.pdf.
Paelinck L., De Neve W., De Wagter C. Precautions and strategies in using a commercial flatbed scanner
for radiochromic film dosimetry. Phys. Med. Biol. 2007;52:
Palmer A., Mzenda B. Performance assessment of the BEBIG Multisource® high dose rate
brachytherapy treatment unit. Phys. Med. Biol. 2009;54:7417-7434.
Palmer A., Mzenda B., Kearton J., Wills R. Analysis of regional radiotherapy dosimetry audit data and
recommendations for future audits. Br. J. Radiol. 2011;84:733-42.

185
Palmer A.L., Bidmead M., Nisbet A. A survey of quality control practices for high dose rate (HDR) and
pulsed dose rate (PDR) brachytherapy in the United Kingdom. J. Contemp. Brachyther. 2012a;4(4):232-
40.
Palmer A., Bradley D., Nisbet A. Physics-aspects of dose accuracy in high dose rate (HDR)
brachytherapy; source dosimetry, treatment planning, equipment performance and in vivo
verification techniques. J. Contemp. Brachy. 2012b;4:81-91.
Palmer A., Hayman O., Ioannou L., Nagar Y.S. Is HDR equipment performance suitable for modern
brachytherapy? Positional errors, dosimetric impact & case study. Radiother. Oncol. 2012c;103:S132-
3.
Palmer A., Hayman O., Muscat S. Treatment planning study of the 3D dosimetric differences between
Co-60 and Ir-192 sources in high dose rate (HDR) brachytherapy for cervix cancer. J. Contemp.
Brachyther. 2012d;4:52-9.
Palmer A. Impact of software changes: transit dose and source position accuracy of the Eckert and
Ziegler BEBIG GmbH multisource high dose rate (HDR) brachytherapy treatment unit. J. Radiother.
Pract. 2013a;12:80–87.
Palmer A.L., Nisbet A., Bradley D. Verification of high dose rate brachytherapy dose distributions with
EBT3 Gafchromic film quality control techniques. Phys. Med. Biol. 2013b;58:497-511.
Palmer A.L., Lee C., Ratcliffe A.J., Bradley D., Nisbet A. Design and implementation of a film dosimetry
audit tool for comparison of planned and delivered dose distributions in high dose rate (HDR)
brachytherapy. Phys. Med. Biol. 2013c;58:6623-6640.
Palmer A.L., Di Pietro P., Alobaidli S., Issa F., Doran S., Bradley D., Nisbet A. Comparison of methods
for the measurement of radiation dose distributions in high dose rate (HDR) brachytherapy: Ge-doped
optical fiber, EBT3 Gafchromic film, and PRESAGE® radiochromic plastic. Med. Phys.
2013d;40(6):061707-1-11.
Palmer A.L. BJR brachytherapy dosimetry special feature. Br. J. Radiol. 2014a;87:20140506.
Palmer A.L., Bradley D.A., Nisbet A. Dosimetric audit in brachytherapy. Br. J. Radiol.
2014b;87:20140105.
Palmer A.L., Bradley D., Nisbet A. Evaluation and implementation of triple-channel radiochromic film
dosimetry in brachytherapy. J. Appl. Clin. Med. Phys. 2014c;14(4):280-296.
Palmer A.L., Diez P., Gandon L., Wynn-Jones A., Bownes P., Lee C., Aird E., Bidmead M., Lowe G.,
Bradley D., Nisbet A. A multicentre ‘end to end’ dosimetry audit for cervix HDR brachytherapy
treatment. Radiother. Oncol. 2015a (in press, http://dx.doi.org/10.1016/j.radonc.2014.12.006).
Palmer A.L., Bradley D., Nisbet A. Evaluation and mitigation of potential errors in radiochromic film
dosimetry due to film curvature at scanning. J. Appl. Clin. Med. Phys. 2015b (in press).
Papagiannis P., Pantelis E., Karaiskos P. Current state of the art brachytherapy treatment planning
dosimetry algorithms. Br. J. Radiol. 2014;87:20140163.
Park C.C., Yom S.S., Podgorsak M.B., Harris E., Price R.A. Jr, Bevan A., Pouliot J., Konski A.A., Wallner
P.E. American Society for Therapeutic Radiology and Oncology (ASTRO) Emerging Technology
Committee report on electronic brachytherapy. Int. J. Radiat. Oncol. Biol. Phys. 2010;76(4):963-72.
Pattersen M.N., Aird E., Olsen D.R. Quality assurance of dosimetry and the impact on sample size in
randomized clinical trials. Radiother. Oncol. 2008;86(2):195-9.
186
Perez-Calatayud J., Granero D., Ballester F. Phantom size in brachytherapy source dosimetric studies.
Med. Phys. 2004;31(7):2075-2081.
Perez-Calatayud J., Ballester F., Das R.K., DeWard L.A., Ibbott G.S., Meigooni A.S., Ouhib Z., Rivard
M.J., Sloboda R.S., Wiliamson J.F. Dose calculation for photon-emitting brachytherapy sources with
average energy higher than 50 keV: Report of the AAPM and ESTRO. Med. Phys. 2012a;39:2904-2929.
Perez-Calatayud J., Ballester F., Das R.K., DeWerd L.A., Ibbott G.S., Meigooni A.S., Ouhib Z., Rivard M.J.,
Sloboda R.S., Williamson J.F. Dose calculation for photon-emitting brachytherapy sources with average
energy higher than 50 keV: Full report of the AAPM and ESTRO. Report of the High Energy
Brachytherapy Source Dosimetry (HEBD) Working Group. American Association of Physicists in
Medicine, MD, USA, 2012b.
Petric P., Hudej R., Rogelj P. Uncertainties of target volume delineation in MRI guided adaptive
brachytherapy of cervix cancer: A multi-institutional study. Radiother. Oncol. 2013;107:6-12.
Pierquet M., Craciunescu O., Steffey B., Song H., Oldham M. On the feasibility of verification of 3D
dosimetry near brachytherapy sources using Presage/Optical-CT. J. Phys. Conf. Ser. 2010;250:012091.
Pi Medical Research. 3D Matrix Phantom (Baltas Phantom). [cited 2014 Jan 21. 1 p.]. Available from
http://www.pi-medical.gr/products/tools/matrix-phantom
Potter R., Haie-Meder C., Van Limbergen E., Barillot I., De Brabandere M., Dimopoulos J., Dumas I.,
Erickson B., Lang S., Nulens A., Petrow P., Rownd J., Kirisits C. Recommendations from gynaecological
(GYN) GEC ESTRO working group (II): concepts and terms in 3D image-based treatment planning in
cervix cancer brachytherapy-3D dose-volume parameters and aspects of 3D image-based anatomy,
radiation physics, radiobiology. Radiother. Oncol. 2006;78:67-77.
Potter R., Kirisits C. Upcoming ICRU/GEC ESTRO recommendations for brachytherapy in cancer of the
cervix (1). Radiother. Oncol. 2012;103:S42.
Ratcliffe A.J., Bonnett D.E., Farajollahi A.R., Aukett R.J., Mills JA. Quality assurance audit methods for
low dose rate afterloading machines. GEC-ESTRO Brachytherapy Meeting, Stockholm, 1997.
RCR. The Royal College of Radiologists, Society and College of Radiographers, Institute of Physics and
Engineering in Medicine, National Patient Safety Agency, British Institute of Radiology. Towards Safer
Radiotherapy. London, UK: The Royal College of Radiologists, 2008. [cited 24 Sept 2012, 85p].
https://www.rcr.ac.uk/docs/oncology/pdf/Towards_saferRT_final.pdf.
Reda S.M. Comparative study on homogeneous and inhomogeneous photon dose distribution from a
high dose rate 192Ir brachytherapy source using MCNP5. Arab J. Nuc. Sci. App. 2013;46(4):165-175.
Reinhardt S., Hillbrand M., Wilkens J.J., Assmann W. Comparison of Gafchromic EBT2 and EBT3 films
for clinical photon and proton beams. Med. Phys. 2012;39:5257-5262.
Rivard M.J., Coursey B.M., DeWerd L.A., Hanson W.F., Huq M.S., Ibbott G.S., Mitch M.G., Nath R.,
Williamson J.F. Update of AAPM Task Group No. 43 Report: A revised AAPM protocol for
brachytherapy dose calculations. Med. Phys. 2004;31:633-674.
Rivard M.J., Venselaar J.L.M., Beaulieu L. The evolution of brachytherapy treatment planning. Med.
Phys. 2009;36:2136-53.
Rivard M.J., Granero D., Perez-Calatayud J., Ballester F. Influence of photon energy spectra from
brachytherapy sources on Monte Carlo simulations of kerma and dose rates in water and air. Med.
Phys. 2010;37(2):869-876.

187
Rivard M.J., Beaulieu L., Mourtada F. Enhancements to commissioning techniques and quality
assurance of brachytherapy treatment planning systems that use model-based dose calculation
algorithms. Med. Phys. 2010;37(6):2645-58.
Rivard M.J., Reed J.L., DeWerd L.A. 102Pd strings: Monte Carlo assessment of a new approach to
brachytherapy source design. Med. Phys. 2014;41:011716-1-11.
Roue A., Ferreira I.H., Van Dam J., Svensson H., Venselaar J.L.M. The EQUAL-ESTRO audit on geometric
reconstruction techniques in brachytherapy. Radiother. Oncol. 2006;78(1):78-83.
Roue A., Venselaar J.L.M., Ferreira I.H., Bridier A., Van Dam J. Development of a TLD mailed system for
remote dosimetry audit for 192IR HDR and PDR sources. Radiother. Oncol. 2007;83(1):86-93.
RPC. M.D. Anderson Dosimetry Laboratory. Radiological Physics Centre. [cited 21 Jan 2014]. Available
from: http://rpc.mdanderson.org/RPC/home.htm.
Sahoo N. Measurement of transit time of a remote after-loading high dose rate brachytherapy source.
Med. Phys. 2001;28:1786-1790.
Sander T. Air kerma and absorbed dose standards for reference dosimetry in brachytherapy. Br. J.
Radiol. 2014;87:20140176.
Schoenfeld A.A., Poppinga D., Harder D., Doerner K.-J., Poppe B. The artefacts of radiochromic film
dosimetry with flatbed scanners and their causation by light scattering from radiation-induced
polymers. Phys. Med. Biol. 2014;59:3575-97.
Sellakumar P., Kumar A.S., Supe S.S., Anand M.R., Nithya K., Sajitha S. Evaluation of dosimetric
functions for Ir-192 source using radiochromic film. Nucl. Instrum. Methods Phys. Res., Sect. B
2009;267:1862-1866.
Sharma S.D., Bianchi C., Conte L. Radiochromic film measurement of anisotropy function for high-dose-
rate Ir-192 brachytherapy source. Phys. Med. Biol. 2004;49:4065-72.
Shultis J.K., Faw R.E. An MCNP primer. Dept. of Mechanical and Nuclear Engineering, Kansas State
University, Manhattan, KS 66506: December 2011. [cited 21 Sept 2014, 45p]. Available from:
http://krex.k-state.edu/dspace/handle/2097/15754.
Siauw T., Cunha A., Atamturk A., Hsu I.C., Pouliot J., Goldberg K. IPIP: a new approach to inverse
planning for HDR brachytherapy by directly optimizing dosimetric indices. Med. Phys. 2011;38:4045-
51.
Sim G.S., Wong J.H.D., Ng K.H. The use of radiochromic EBT2 film for the quality assurance and
dosimetric verification of 3D conformal radiotherapy using Microtek ScanMaker 9800XL flatbed
scanner. J. Appl. Clin. Med. Phys. 2013;14(4):85-95.
Song W, Webster M., Han D., Einck J., Scanderbeg D., Vuong T., Devic S. Dynamic modulated
brachytherapy (DMBT): concept, design, and simulations. Radiother. Oncol. 2012;103:S44-5.
Spiller A., on behalf of Eckert & Ziegler Bebig GmbH. Personal communication with the author via
email, July 2012.
Stern R.L., Liu T. Dwell position inaccuracy in the Varian GammaMed HDR ring applicator. J. Appl. Clin.
Med. Phys. 2010;11:291-6.
Suchowerska N., Jackson M., Lambert J., Yin Y.B., Hruby G., McKenzie D.R. Clinical trials of a urethral
dose measurement system in brachytherapy using scintillation detectors. Int. J. Radiat. Oncol. Biol.
Phys. 2011;79:609-15.

188
Sudom T.S., Ratcliffe A.J. Radiotherapy physics audit – A technique for Iridium-192 hairpins. IPEM
Biennial Radiotherapy Physics Meeting, York, 1998.
Sureka C.S., Sunny C.S., Subbaiah K.V. Dose distribution for endovascular brachytherapy using Ir-192
sources: comparison of Monte Carlo calculations with radiochromic film measurements. Phys. Med.
Biol. 2007;52:525-37.
Sutherland J.G.H., Rogers D.W.O. Monte Carlo calculated absorbed-dose energy dependence of EBT
and EBT2 film. Med. Phys. 2010;37:1110-1116.
Sydney Morning Herald. Cancer therapy missed tumour sites. 21 June 2003a. [cited 2014 Jan 21,
1p.]. Available from http://www.smh.com.au/articles/2003/06/20/1055828490830.html.
Sydney Morning Herald. Critically ill received wrong radiation therapy due to human errors: review.
12 September 2003b. [cited 2014 Jan 21, 1p.]. Available from
http://www.smh.com.au/articles/2003/09/11/1063268518775.html?from=storyrhs.
Tamponi M., Bona R., Poggiu A., Marini P. A practical tool to evaluate dose distributions using
radiochromic film in radiation oncology. Physica Medica 2014 (in press, available online ahead of print,
August 2014).
Tanderup K., Hellebust T.P., Lang S., Granfeldt J., Potter R., Lindegaard J.C. Kirisits C. Consequences of
random and systematic reconstruction uncertainties in 3D image based brachytherapy in cervical
cancer Radiother. Oncol. 2008;89:156-63.
Tanderup K., Nesvacil N., Potter R., Kirisits C. Uncertainties in image guided adaptive cervix cancer
brachytherapy: Impact on planning and prescription. Radiother. Oncol. 2013;107:1-5.
Thomadsen BR. Achieving Quality in Brachytherapy. Madison, USA; Taylor & Francis, 1999.
Thomadsen B., Lin S.-W., Laemmrich P. Waller T., Cheng A., Caldwell B., Rankin R., Stitt J. Analysis of
treatment delivery errors in brachytherapy using formal risk analysis techniques. Int. J. Radiat. Oncol.
Biol. Phys. 2003; 57: 1492-1508.
Thomadsen B.R., Williamson J.F., Rivard M.J., Meigooni A.S. Anniversary paper: past and current
issues, and trends in brachytherapy physics. Med. Phys. 2008;35:4708-23.
Tolli H., Johansson K.-A. Quality assurance in brachytherapy: the displacement effect in the vicinity of
60Co and 192Ir brachytherapy sources. Phys. Med. Biol. 1993;38:1485-1492.
Thwaites D.I., Williams J.R., Aird E.G., Klevenhagen S.C., Williams P.C. A dosimetric intercomparison of
megavoltage photon beams in UK radiotherapy centres. Phys. Med. Biol. 1991;37(2):445-461.
Thwiates D.I., Nisbet A. The Scottish+ radiotherapy dosimetry audit system – an example of the UK
network. Proceedings of the World Congress of Medical Physics, Sydney, Australia, 2003a. Int. Fed.
Med. Phys. Biol. Eng. ISBN 1 877040 14 2: A03.13.4200.
Thwaites D.I., Powley S., Nisbet A., Allahverdi M. The United Kingdom’s radiotherapy dosimetry audit
network. In: Standards and Codes of Practice for Medical Radiation Dosimetry, IAEA:Vienna (2003b),
IAEA-STI-PUB-1153, vol 2, 183-190.
Thwaites D. Accuracy required and achievable in radiotherapy dosimetry: have modern technology
and techniques changed our views? J. Phys.: Conf. Ser. 2013;444:012006.
Toye W.C., Das K.R., Todd S.P. An experimental MOSFET approach to characterize (192)Ir HDR source
anisotropy. Phys. Med. Biol. 2007;52:5329-39.

189
USNRC, United States Nuclear Regulatory Commission. NRC Information Notice 2009-17: Reportable
medical events involving treatment delivery errors caused by confusion of units for the specification
of brachytherapy sources. NRC, Washington 2009. [cited 2012 Aug 31. 5 p.]. Available from
http://pbadupws.nrc.gov/docs/ML0807/ML080710054.pdf.
Van Dyk J., Barnett R.B., Cygler J.E., Shragge P.C. Commissioning and quality assurance of treatment
planning computers. Int. J. Radiat. Oncol. Biol. Phys. 1993;20:261-73.
Van Hoof S.J., Granton P.V., Landry G., Podesta M., Verhaegen F. Evaluation of a novel triple-channel
radiochromic film analysis procedure using EBT2. Phys. Med. Biol. 2012;57(13):4353-4368.
Varian Medical Systems. Urgent field safety notice: Varisource iX console incorrect dwell times under
special circumstances. Varian document PNL-VS-02.2010. April 2010. [cited 17 Sept 2014, 5p].
Available from: http://www.mhra.gov.uk/home/groups/dts-iac/documents/fieldsafetynotice/
con081794.pdf.
Venselaar J.L.M., Brouwer W.F.M., van Straaten B.H.M., Aalbers A.H.L. Intercomparison of calibration
procedures for Ir-192 HDR sources in The Netherlands and Belgium. Radiother. Oncol. 1994;30(2):155-
61.
Vanselaar J, Perez-Calatayud J. (Editors). A Practical guide to quality control of brachytherapy
equipment. ESTRO Booklet No. 8. Brussels, Belgium: ESTRO, 2004.
Venselaar J.L.M., Baltas D., Meigooni A.S., Hoskin P.J. (Editors). Comprehensive brachytherapy physical
and clinical aspects. Boca Raton, FL, USA: CRC Press, 2013.
Veres, A. Personal communication via email with Attila Veres, Physicist in Charge, Equal-ESTRO
Laboratory, Paris-Villejuif, France. 2013 Dec 6.
Viswanathan A.N., Thomadsen B. American Brachytherapy Society consensus guidelines for locally
advanced carcinoma of the cervix. Part I: General principles. Brachytherapy 2012;11: 33-46.
Wai P., Adamovics J., Krstajic N., Ismail A., Nisbet A., Doran S. Dosimetry of the microSelectron-HDR
Ir-192 source using Presage™ and optical CT. Appl. Radiat. Isotopes 2009;67:419-42.
Wallace A.B. Acceptance testing, commissioning and quality assurance for a 370GBq Ir-192 HDR
brachytherapy afterloader. Australas. Phys. Eng. Sci. Med. 1997;20:112-6.
Wanderas A.D., Sundset M., Langdal I., Danielsen S., Frykholm G., Marthinsen A.B.L. Adaptive
brachytherapy of cervical cancer, comparison of conventional point A and CT based individual
treatment planning. Acta. Oncol. 2012;51:345-54.
Wilkinson D.A. High dose rate (HDR) brachytherapy quality assurance: a practical guide. Biomed.
Imaging Interv. J. 2006;2:2-7.
X-5 Monte Carlo Team. MCNP - A general Monte Carlo N-Particle Transport Code, version 5. Volume
I: Overview and theory. Los Alamos National Laboratory, 2008a;LA-UR-03-1987. [cited 25 June
2014, 416p]. Available from https://laws.lanl.gov/vhosts/mcnp.lanl.gov/pdf_files/la-ur-03-1987.pdf
X-5 Monte Carlo Team. MCNP - A general Monte Carlo N-Particle Transport Code, version 5. Volume
II: User’s guide. Los Alamos National Laboratory, 2008b;LA-UR-03-1987.
Yang Y., Rivard M.J. Monte Carlo simulations and radiation dosimetry measurements of peripherally
applied HDR Ir192 breast brachytherapy D-shaped applicators. Med. Phys. 2009;36(3):809-815
Ye S-J., Brezovich I.A., Shen S., Duan J., Popple R.A., Pareek P.N. Attenuation of intracavitary
applicators in 192Ir-HDR brachytherapy. Med. Phys. 2004;31(7):2097-2106.

190
Zehtabian M., Faghihi R., Sina S. A Review on Main Defects of TG-43, Brachytherapy, Dr. Kazushi Kishi
(Ed.), ISBN: 978-953-51-0602-9, InTech, 2012. http://www.intechopen.com/books/brachytherapy/a-
review-on-the-main-defects-of-aapm-task-group-43
Zhang M., Zhang L., Yuan S. A study of experimental measurements of dosimetric parameters in HDR
Ir-192 source. Med. Dosim. 2010;35:250-4.
Zilio V.O., Joneja O.P., Popowski Y. Absolute depth-dose-rate measurements for an Ir-192 HDR
brachytherapy source in water using MOSFET detectors. Med. Phys. 2006;33:1532-9.

191
Appendices

192
A. Abstracts of Peer Reviewed Journal Papers Resulting from
this Research
Palmer A.L., Bidmead M., Nisbet A. A survey of quality control practices for high dose rate
(HDR) and pulsed dose rate (PDR) brachytherapy in the United Kingdom. J. Contemp.
Brachyther. 2012;4:232-240.
Purpose: A survey of quality control (QC) currently undertaken in UK radiotherapy centres for high dose
rate (HDR) and pulsed dose rate (PDR) brachytherapy has been conducted. The purpose was to benchmark
current accepted practice of tests, frequencies and tolerances to assure acceptable HDR/PDR equipment
performance. It is 20 years since a similar survey was conducted in the UK and the current review is timed
to coincide with a revision of the IPEM Report 81 guidelines for quality control in radiotherapy.
Material and Methods: All radiotherapy centres in the UK were invited by email to complete a
comprehensive questionnaire on their current brachytherapy QC practice, including: equipment type,
patient workload, source calibration method, level of image guidance for planning, prescribing practices,
QC tests, method used, staff involved, test frequencies, and acceptable tolerance limits.
Results: Survey data was acquired between June and August 2012. Of the 64 centres invited, 47 (73%)
responded, with 31 centres having brachytherapy equipment (3 PDR) and fully completing the survey, 13
reporting no HDR/PDR brachytherapy, and 3 intending to commence HDR brachytherapy in the near
future. All centres had comprehensive QC schedules in place and there was general agreement on key
test frequencies and tolerances. Greatest discord was whether source strength for treatment planning
should be derived from measurement, as at 58% of centres, or from the certified value, at 42%. IPEM
Report 81 continues to be the most frequently cited source of QC guidance, followed by ESTRO Booklet
No.8.
Conclusions: A comprehensive survey of QC practices for HDR/PDR brachytherapy in UK has been
conducted. This is a useful reference to which centres may benchmark their own practice. However
individuals should take a risk-assessment based approach, employing full knowledge of local equipment,
clinical procedures and available test equipment in order to determine individual QC needs.
Palmer A., Bradley D., Nisbet A. Physics-aspects of dose accuracy in high dose rate (HDR)
brachytherapy: source dosimetry, treatment planning, equipment performance and in-vivo
verification techniques. J. Contemp. Brachyther. 2012;4(2):81-91.
This study provides a review of recent publications concerned with dosimetric accuracy in high dose rate
(HDR) brachytherapy treatments. This includes work on the determination of dose rate fields around
brachytherapy sources, the capability of treatment planning systems, the performance of treatment units,
and methods to verify dose delivery. The main aims of the paper is to review the current techniques and
methods employed for HDR brachytherapy dosimetry, to discuss the current achievable accuracy in HDR
brachytherapy and to identify future areas for research in this field.
A systematic review was conducted of journal articles discussing concepts, research, and practices of
dosimetry in HDR brachytherapy published from 2002 to 2012. Medline and Embase databases were
searched with keywords “high dose rate”, “brachytherapy”, “dosimetry”, and alternative forms, limited
to English language 116 articles were found of which 84 were directly relevant for the purposes of this
review. This information was supplemented by reviewing reference lists and personal files. No other
systematic reviews of HDR brachytherapy dosimetry methods were located. This work highlights the
determinants of accuracy in HDR dosimetry and treatment delivery and presents a selection of papers,
focusing on articles from the last five years, to reflect active areas of research and development.

193
The majority of publications are related to Ir-192, this being the most common isotope in clinical use, with
a lack of work for newer HDR sources such as Co-60. With the exception of the ESTRO mailed dosimetry
service, there is little dosimetric audit activity reported in the literature, when compared with external
beam radiotherapy verification. Apart from Monte Carlo modelling of source dosimetry, there is no clear
consensus on the optimum techniques to be used to assure dosimetric accuracy through all the processes
involved in HDR brachytherapy treatment.
Palmer A. Impact of software changes: Transit dose and source position accuracy of the
Eckert & Ziegler BEBIG GmbH Multisource high dose rate (HDR) brachytherapy treatment
unit. J. Radiother. Pract. 2013:12;80-87.
Purpose: Medical device performance checks are essential following changes to control system software.
This work investigates the effects of new software on the performance of a high dose rate (HDR)
brachytherapy treatment unit.
Methods and Materials: A performance assessment was undertaken of the Eckert & Ziegler BEBIG GmbH
MultiSource® HDR treatment unit following software upgrade. Video recordings of source transits were
used to calculate transit doses, and autoradiography used to measure source dwell positions. Results were
compared to a previous study.
Results: All results showed improved performance with the new compared to old control software.
Optimal source movement profiles were observed with maximum transit speeds of 63 (+/-4) mm s-1
between dwells of 5.0 mm separation. The maximum error in transit dose correction with the new
software was 2.5 % at 10.0 mm perpendicular from the source axis, compared to 5.6 % previously. The
new software eliminated a causal relationship between curvature of the source transfer tubes and dwell
position uncertainty.
Conclusions: This work demonstrates the need for comprehensive medical device system checks following
software changes. Technical improvements in HDR device performance have been achieved with the new
software; reducing transit doses, improving transit dose correction, and improving source positioning
accuracy.
Palmer A.L., Di Pietro P., Alobaidli S., Issa F., Doran S., Bradley D., Nisbet A. Comparison of
methods for the measurement of radiation dose distributions in high dose rate (HDR)
brachytherapy: Ge-doped optical fibre, EBT3 Gafchromic film, and PRESAGE® radiochromic
plastic. Med. Phys. 2013;40(6):061707-1-11.
The measurement of dose distributions in clinical brachytherapy, for the purpose of quality control,
commissioning or dosimetric audit, is challenging and requires development. Radiochromic film dosimetry
with a commercial flatbed scanner may be suitable but careful methodologies are required to control
various sources of uncertainty. Triple-channel dosimetry has recently been utilised in external beam
radiotherapy to improve the accuracy of film dosimetry, but its use in brachytherapy, with characteristic
high maximum doses, steep dose gradients and small scales, has been less well researched. We investigate
the use of advanced film dosimetry techniques for brachytherapy dosimetry evaluating uncertainties and
assessing the mitigation afforded by triple-channel dosimetry. We present results on post-irradiation film
darkening, lateral scanner effect, film surface perturbation, film active layer thickness, film curling, and
examples of the measurement of clinical brachytherapy dose distributions. The lateral scanner effect in
brachytherapy film dosimetry can be very significant, up to 23% dose increase at 14 Gy, at ±9 cm lateral
from the scanner axis for simple single-channel dosimetry. Triple-channel dosimetry mitigates the effect,
but still limits the useable width of a typical scanner to less than 8 cm at high dose levels to give dose
uncertainty to within 1%. Triple-channel dosimetry separates dose and dose-independent signal
components and effectively removes disturbances caused by film thickness variation and surface

194
perturbations in the examples considered in this work. The use of reference dose films scanned
simultaneously with brachytherapy test films is recommended to account for scanner variations from
calibration conditions. Post-irradiation darkening, which is a continual logarithmic function with time,
must be taken into account between the reference and test films. Finally, films must be flat when scanned
to avoid Callier-type effect and to provide reliable dosimetric results. We have demonstrated that
radiochromic film dosimetry with Gafchromic EBT3 film and a commercial flatbed scanner is a viable
method for brachytherapy dose distribution measurement, and uncertainties may be reduced with triple-
channel dosimetry and specific film scan and evaluation methodologies.
Palmer A.L., Nisbet A., Bradley D. Verification of high dose rate brachytherapy dose
distributions with EBT3 Gafchromic film quality control techniques. Phys. Med. Biol.
2013;58:497-511.
It is essential that quality control (QC) techniques are developed to keep pace with modern high dose rate
(HDR) brachytherapy. Current QC methods may be insufficient to fully assure the accuracy of 3D-
optimised dose delivery. This work presents an evaluation of Gafchromic EBT3 film, with multi-channel
analysis, in HDR dose environments for advanced QC and commissioning. ‘Film-array in water’ and ‘three-
channel Solid Water block’ purpose-designed phantoms are utilised. Dose and dose-rate dependency and
practical film usage has been evaluated. EBT3 measurements of dose with radial distance from a HDR
source are compared to Monte Carlo data. Semi-3D dose distributions around clinical HDR applicators are
compared to treatment plans. The measurement of delivery accuracy for inverse-planned pseudo-clinical
test cases, with correct delivery and simulated treatment errors, has also been investigated. Local gamma
criteria of 3%, 3 mm is recommended with passing rates of at least 96% typically achieved. The system is
sensitive to simulated errors in HDR delivery, with significant reductions of passing rate. It has been
demonstrated that EBT3 Gafchromic film, in combination with multi-channel analysis, is appropriate for
applicator, treatment unit and planning system commissioning measurements as well as practical routine
QC to confirm agreement of planned and delivered complex HDR brachytherapy dose distributions.
Palmer A.L., Lee C., Ratcliffe A.J., Bradley D., Nisbet A. Design and implementation of a film
dosimetry audit tool for comparison of planned and delivered dose distributions in high
dose rate (HDR) brachytherapy. Phys. Med. Biol. 2013;58:6623-6640.
A novel phantom is presented for ‘full system’ dosimetric audit comparing planned and delivered dose
distributions in HDR gynaecological brachytherapy, using clinical treatment applicators. The
BRachytherapy Applicator Dosimetry (‘BRAD’) test object consists of a near full-scatter water tank with
applicator and film supports constructed of Solid Water, accommodating any typical cervix applicator.
Film dosimeters are precisely held in four orthogonal planes bisecting the intrauterine (IU) tube, sampling
dose distributions in the high risk clinical target volume (HR-CTV), Points A and B, bladder, rectum and
sigmoid. The applicator position is fixed prior to CT scanning and through treatment planning and
irradiation. The CT data is acquired with the applicator in a near clinical orientation to include applicator
reconstruction in the system test. Gamma analysis is used to compare treatment planning system
exported RTDose grid with measured multi-channel film dose maps. Results from two pilot audits are
presented, using Ir-192 and Co-60 HDR sources, with mean gamma passing rates of 98.6% using criteria
of 3% local normalisation and 3 mm distance to agreement (DTA). The mean DTA between prescribed
dose and measured film dose at Point A was 1.2 mm. The phantom was funded by IPEM and will be used
for a UK national brachytherapy dosimetry audit.

195
Palmer A.L., Bradley D., Nisbet A. Evaluation and implementation of triple-channel
radiochromic film dosimetry in brachytherapy. J. Appl. Clin. Med. Phys. 2014;15(4):280-296.
The measurement of dose distributions in clinical brachytherapy, for the purpose of quality control,
commissioning or dosimetric audit, is challenging and requires development. Radiochromic film dosimetry
with a commercial flatbed scanner may be suitable but careful methodologies are required to control
various sources of uncertainty. Triple-channel dosimetry has recently been utilised in external beam
radiotherapy to improve the accuracy of film dosimetry, but its use in brachytherapy, with characteristic
high maximum doses, steep dose gradients and small scales, has been less well researched. We investigate
the use of advanced film dosimetry techniques for brachytherapy dosimetry evaluating uncertainties and
assessing the mitigation afforded by triple-channel dosimetry. We present results on post-irradiation film
darkening, lateral scanner effect, film surface perturbation, film active layer thickness, film curling, and
examples of the measurement of clinical brachytherapy dose distributions. The lateral scanner effect in
brachytherapy film dosimetry can be very significant, up to 23% dose increase at 14 Gy, at ±9 cm lateral
from the scanner axis for simple single-channel dosimetry. Triple-channel dosimetry mitigates the effect,
but still limits the useable width of a typical scanner to less than 8 cm at high dose levels to give dose
uncertainty to within 1%. Triple-channel dosimetry separates dose and dose-independent signal
components and effectively removes disturbances caused by film thickness variation and surface
perturbations in the examples considered in this work. The use of reference dose films scanned
simultaneously with brachytherapy test films is recommended to account for scanner variations from
calibration conditions. Post-irradiation darkening, which is a continual logarithmic function with time,
must be taken into account between the reference and test films. Finally, films must be flat when scanned
to avoid Callier-type effect and to provide reliable dosimetric results. We have demonstrated that
radiochromic film dosimetry with Gafchromic EBT3 film and a commercial flatbed scanner is a viable
method for brachytherapy dose distribution measurement, and uncertainties may be reduced with triple-
channel dosimetry and specific film scan and evaluation methodologies.
Palmer A.L., Bradley D., Nisbet A. Dosimetric audit in brachytherapy. Br. J. Radiol.
2014;87:20140105.
Dosimetric audit is required for the improvement of patient safety in radiotherapy and to aid optimisation
of treatment. The reassurance that treatment is being delivered in line with accepted standards, that
delivered doses are as prescribed, and that quality improvement is enabled, is as essential for
brachytherapy as it is for the more commonly audited external beam radiotherapy. Dose measurement
in brachytherapy is challenging due to steep dose gradients and small scales, especially in the context of
an audit. Several different approaches have been taken for audit measurement to date; thimble and well-
type ionisation chambers, thermoluminescent detectors, optically stimulated luminescence detectors,
radiochromic film, and alanine. In this work, we review all of the dosimetric brachytherapy audits that
have been conducted in recent years, look at current audits in progress, and propose required directions
for brachytherapy dosimetric audit in the future. The concern over accurate source strength
measurement may be essentially resolved with modern equipment and calibration methods, but
brachytherapy is a rapidly developing field and dosimetric audit must keep pace.
Palmer A.L. BJR brachytherapy dosimetry special feature. Br. J. Radiol. 2014;87:20140506.
Editorial publication that did not contain an abstract.

196
Palmer A.L., Bradley D., Nisbet A. Evaluation and mitigation of potential errors in
radiochromic film dosimetry due to film curvature at scanning. J. Appl. Clin. Med. Phys. 2015
(in press)
This work considers a previously overlooked uncertainty present in film dosimetry which results from
moderate curvature of films during the scanning process. Small film samples are particularly susceptible
to film curling which may be undetected or deemed insignificant. In this study we consider test cases with
controlled induced curvature of film and with film raised horizontally above the scanner plate. We also
evaluate the difference in scans of a film irradiated with a typical brachytherapy dose distribution with
the film naturally curved and with the film held flat on the scanner. Typical naturally occurring curvature
of film at scanning, giving rise to a maximum height 1 to 2 mm above the scan plane, may introduce dose
errors of 1 to 4%, and considerably reduce gamma evaluation passing rates when comparing film-
measured doses with treatment planning system calculated dose distributions, a common application of
film dosimetry in radiotherapy. The use of a triple-channel dosimetry algorithm appeared to mitigate the
error due to film curvature compared to conventional single-channel film dosimetry. The change in pixel
value, and calibrated reported dose, with film curling or height above the scanner plate, may be due to
variations in illumination characteristics, optical disturbances, or a Callier-type effect. There is a clear
requirement for physically-flat films at scanning to avoid the introduction of a substantial error source in
film dosimetry. Particularly for small film samples, a compression glass plate above the film is
recommended to ensure flat-film scanning. This effect has been overlooked to date in the literature.
Palmer A.L., Diez P., Gandon L., Wynn-Jones A., Bownes P., Lee C., Aird E., Bidmead M., Lowe
G., Bradley D., Nisbet A. A multicentre ‘end to end’ dosimetry audit for cervix HDR
brachytherapy treatment. Radiother. Oncol. 2015 (in press, http://dx.doi.org/
10.1016/j.radonc.2014.12.006).
Purpose: To undertake the first multicentre fully ‘end to end’ dosimetry audit for HDR cervix
brachytherapy, comparing planned and delivered dose distributions around clinical treatment applicators,
with review of local procedures.
Materials and Methods: A film-dosimetry audit was performed at 46 centres, including imaging, applicator
reconstruction, treatment planning and delivery. Film dose maps were calculated using triple-channel
dosimetry and compared to RTDose data from treatment planning systems. Deviations between plan and
measurement were quantified at prescription Point A and using gamma analysis. Local procedures were
also discussed.
Results: The mean difference between planned and measured dose at Point A was -0.6% for plastic
applicators and -3.0% for metal applicators, at standard uncertainty 3.0% (k=1). Isodose distributions
agreed within 1 mm over a dose range 2-16 Gy. Mean gamma passing rates exceeded 97% for plastic and
metal applicators at 3% (local) 2 mm criteria. Two errors were found: one dose normalisation error and
one applicator library misaligned with the imaged applicator. Suggestions for quality improvement were
also made.
Conclusions: The concept of ‘end to end’ dosimetry audit for HDR brachytherapy has been successfully
implemented in a multicentre environment, providing evidence that a high level of accuracy in
brachytherapy dosimetry can be achieved.

197
B. Abstracts of Conference Presentations and Posters Resulting
from this Research
Palmer A., Ioannou L., Hayman O. Nagar Y.S. Is HDR equipment performance suitable for
modern brachytherapy? Positional errors, dosimetric impact & case study. Proceedings of
the World Congress of Brachytherapy, Barcelona, Spain. Radiother. Oncol. 2012;103:S132-3.
Purpose: To study the effect of simulated HDR source dwell position errors on the dose to the clinical
target volume (HR-CTV) and organs at risk in cervix cancer. Determine the clinically relevant positional
accuracy requirement; inform QC needs and treatment uncertainty estimates. Interpret the performance
of an HDR unit using this data.
Method: Simulated dwell position errors, 0.2 to 10.0 mm, were introduced in eight HDR cervix plans and
the dosimetric effect on ICRU and GEC-ESTRO DVH parameters calculated. CT plans on the Eckert & Ziegler
BEBIG (EZ) HDRplus planning system, with Co-60 source and IUT/split-ring applicator were used
throughout. Two error modes were simulated: (a) systematic proximal shift (away from HDR unit) position
calibration error; (b) source cable take-up lag, possible with older EZ software, first dwell unaffected and
others shifted distally. Video source position tests for the EZ HDR MultiSource were used with the above
simulation data to predict effect on clinical dose delivery.
Results: Figure. 1 shows the relationship between systematic errors in source dwell positions, mode (a),
and the % change in DVH metrics, D90 and D2cc. The mean and interquartile range from eight plans is
provided. There is an approximate linear relationship; errors of 1.0 mm result in 2.0 % change, 4.0 mm
error 10.0 % change. ICRU A pt. exhibits less change than DVH metrics, 0.4% and 0.7% respectively.
Bladder doses increase while rectum, sigmoid and HR-CTV decrease due to the proximal shift direction of
dwells. This would be reversed for distal shifts. Table 1 gives additional detailed DVH data for 0.2 to 2.0
mm position errors for both modes. Thirty QC test results of source position were collated for the EZ HDR
unit. 13% were recorded within 0.25 mm error, 64% within 0.5 mm, and 23% within 1.0 mm. Previous
software version of the EZ unit had the potential for small dwell position errors due to curvature of the
transfer tube: This effect on dose delivery uncertainty is given in Table 1(b). This is eliminated with new
software.
Conclusion: An accuracy of at least 1.0 mm in dwell positions is required to limit the effect on clinically
relevant dose delivery parameters to within an acceptable level of 3.0%. Only at 0.2 mm accuracy are the
effects all within 1.0%. A QC action level of 0.5 mm is proposed, with 1.0 mm maximum tolerance. All
recorded QC position results for the EZ unit were within the clinically relevant accuracy level. Errors due
to source cable take-up lag, with potential DVH uncertainty up to 6%, have been eliminated with the new
software.
Palmer A.L., Nisbet A., Bradley D.A. Semi-3D dosimetry of high dose rate brachytherapy
using a novel Gafchromic EBT3 film-array water phantom. J. Phys.: Conf. Ser.
2013;444:012101. Published abstract, poster and oral presentation at the conference:
Proceedings of the International Conference on 3D Dosimetry (IC3DDose), Sydney, Australia,
November 2012.
There is a need to modernise clinical brachytherapy dosimetry measurement beyond traditional point
dose verification to enable appropriate quality control within 3D treatment environments. This is to keep
pace with the 3D clinical and planning approaches which often include significant patient-specific
optimisation away from ‘standard loading patterns’. A multi-dimension measurement system is required
to provide assurance of the complex 3D dose distributions, to verify equipment performance, and to
enable quality audits. However, true 3D dose measurements around brachytherapy applicators are often

198
impractical due to their complex shapes and the requirement for close measurement distances. A solution
utilising an array of radiochromic film (Gafchromic EBT3) positioned within a water filled phantom is
presented. A calibration function for the film has been determined over 0 to 90Gy dose range using three
colour channel analysis (FilmQAPro software). Film measurements of the radial dose from a single HDR
source agree with TPS and Monte Carlo calculations within 5 % up to 50 mm from the source. Film array
measurements of the dose distribution around a cervix applicator agree with TPS calculations generally
within 4 mm distance to agreement. The feasibility of film array measurements for semi-3D dosimetry in
clinical HDR applications is demonstrated.
Palmer A.L., Diez P., Aird E., Lee C., Radcliffe A., Gouldstone C., Sander T., Bradley D., Nisbet
A. Development of a UK dosimetry audit for HDR/PDR brachytherapy. Med. Phys. Int.
2013;1(2):233 (oral presentation at ICMP2013, Brighton, UK)
Purpose: To report on the development of the first comprehensive dosimetry audit of HDR/PDR
brachytherapy, part-funded by IPEM and RTTQA Interlace trial, supported by NPL. External audit in
brachytherapy is an underdeveloped quality assurance process. Worldwide, only seven audits have been
reported, limited to point dose or source strength, and have omitted treatment applicator dosimetry.
Method: The audit uses two complementary phantoms: (1) accurate measurement of point dose using
alanine from a series of source dwells in a straight plastic catheter, (2) measurement of dose distribution
around clinical cervix applicators using film and comparison to treatment planning system calculations.
Phantom (1) is constructed from Solid Water, within a Perspex scatter box, and contains a central HDR
source catheter with three concentric measuring points at 20 mm, spaced by 120°, which can
accommodate both alanine pellets and Farmer chambers. Phantom (2) consists of a Solid Water frame
which precisely and rigidly holds the applicator and four films, contained within a full scatter water tank.
The latter constitutes a ‘system test’ including applicator CT reconstruction.
Results: Alanine and film dosimetry systems have been calibrated and validated for use in brachytherapy
applications for both Ir-192 and Co-60 sources. Pilot audits have been completed demonstrating the
suitability of the phantom designs. Comparison of planned and measured dose distribution had a mean
gamma passing rates of 98.6% using criteria of 3% local normalisation and 3 mm distance to agreement.
Conclusion: A brachytherapy dosimetry audit has been developed that can provide a unique quality
assurance assessment.
Patel I., Palmer A. Revision of IPEM guidance on quality control of radiotherapy equipment.
Med. Phys. Int. 2013;1(2):179 (invited oral presentation at ICMP2013, Brighton, UK).
Invited presentation, no abstract requested.
Palmer A.L., Nisbet A., Bradley D.A. A new standard for HDR brachytherapy quality control:
practical and advanced film dosimetry for treatment applicators and sources. Proceedings
of the 2nd Estro Forum, Geneva, Switzerland. Radiother. Oncol. 2013;106:S368-9.
Purpose: Robust and relevant quality control (QC) is essential to ensure accuracy and safety in
radiotherapy. QC in HDR brachytherapy has not kept pace with clinical modernisation e.g. volume-based
prescriptions and patient-specific inverse-optimisation. New QC standards are required to confirm dose
distribution accuracy and avoid errors. Typical QC is currently limited to straight catheters, point doses
and well chambers. A 'state of the art' practical implementation of advanced multichannel film dosimetry
is presented to verify delivered dose distributions around treatment applicators and sources. 3 cases are
presented; a cervix ring applicator, a shielded vaginal cylinder, and an isolated source catheter. The
application of gamma assessment criteria in brachytherapy is discussed.

199
Materials and Methods: A film-array water phantom was used to accurately position Gafchromic EBT3
film, cut to 12 x 12 cm. Multichannel film dosimetry separating dose-dependent and dose-independent
components was used (FimQAPro). Dose-maps were compared to treatment plans using isodoses and
gamma. Absolute film dose values were used with no re-normalisation of any data. Isolated source doses
were compared to TG-43 source model values. The value and sensitivity of gamma for brachytherapy
applications was assessed by multivariate analysis of area/position and calculation parameters. Eckert &
Ziegler Bebig GmbH HDR multiSource treatment unit, with Co-60 source, and HDRplus treatment planning
system (TPS) were used throughout.
Results: Figure 1 shows dose maps from 2 films positioned adjacent to and bisecting the cervix applicator
intrauterine (IU) channel, overlaid on TPS isodoses. Agreement in isodoses, 75 cGy to 2000 cGy, is
generally within 1.0 mm. A comparison of the 2 symmetric films confirms sufficient reproducibility.Table
1 provides example gamma results for the cervix and shielded vaginal applicators. The passing rate in
brachytherapy is sensitive to the defined interest region, in the cervix example ranging from 95% at typical
HR-CTV to 100% at a bladder position, for 3% (local) / 2 mm criteria, evaluated over 9 cm2 regions. The
full-region, 144 cm2, passing rate was ~ 98%.The validity of the TG-43 general source model for individual
supplied HDR sources was successfully verified. Gamma passing rates > 95% at 3% (local) / 2 mm between
5 mm and 50 mm from the source.
Conclusions: There is an absence of clinically-relevant QC for modern brachytherapy. We have presented
a practical, robust method of advanced film dosimetry of treatment applicators, which is more closely
aligned to clinical treatments than current QC. Planned and measured isodoses agreed closely, with high
gamma passing rates. Film dosimetry is advocated to confirm validity of the general TG-43 model for
individual supplied sources. The use and sensitivity of gamma for brachytherapy must be carefully
considered; we propose separate calculations in a number of clinically relevant regions.
Nisbet A., Palmer A.L.*, Bradley D.A. Available guidance, current UK practice, and future
directions for HDR brachytherapy quality control. Proceedings of the 2nd Estro Forum,
Geneva, Switzerland. Radiother. Oncol. 2013;106:S370. (*main and presenting author).
Purpose: A survey of high dose rate (HDR) brachytherapy quality control (QC) procedures undertaken at
radiotherapy centres in the United Kingdom (UK) is reported. Published recommendations and guidance
for HDR QC are also reviewed and compared to current UK practice. Recent changes in clinical
brachytherapy techniques and the impact on required QC is discussed. Modern methods to determine
optimum quality checking processes are indicated. This work is conducted in the context of the recent
‘point/counterpoint’ debate in Medical Physics that “QA procedures in radiation therapy are outdated
and negatively impact the reduction of errors” and a review of the dosimetric accuracy in HDR.
Materials and methods: All UK radiotherapy centres were asked to participate in a survey of their
approach and practice for HDR brachytherapy QC. This included guidance used, frequencies and tolerance
values for individual QC tests. A comprehensive evaluation of responses was conducted detailing
popularity of tests, and the average and range values of testing and tolerance. A literature search was
conducted on general guidance, specific QC techniques in both brachytherapy and teletherapy, and on
risk-based systems for quality assurance.
Results: Survey data was acquired from 31 UK radiotherapy centres and statistical analysis of responses
performed. 45 possible individual QC tests were identified. There was general agreement on
measurement frequency and tolerance for key QC tests, e.g. measurement of source position in a straight
catheter, checked daily and with a 1.0mm tolerance in most centres. There was disagreement on a
number of tests, e.g. the need for regular x-ray imaging of applicators. There was absence of tests that
may be deemed necessary for modern brachytherapy practice, e.g. confirmation of planned and delivered
dose distributions. There is likely a need to move from a device-centred to a system-centred approach,
using risk-based assessment methods to determine required QC testing, with emphasis on clinical
processes rather than simple device operation. Table 1 provides sample key results from the work.
200
Conclusion: The only contemporary benchmark survey of HDR QC practice has been undertaken. The
outcome of this work is a review of current practice against available recommendations, relevant recent
changes in clinical brachytherapy techniques, and the use of modern quality process assessments.
Recommendations for appropriate, optimised QC for HDR brachytherapy are made.
Palmer A.L. UK Brachytherapy Audit: origin, funding and collaboration. Presented at IPEM,
NPL, CTRad meeting on “Reaching a Consensus on Verification of Radiotherapy Delivery”,
held at NPL 13th December 2013. (Invited oral presentation).
Invited presentation, no abstract requested.
Palmer A.L. Group hugs in brachytherapy physics. Presented at Medical Physics Research
Away Day, Portsmouth Hospitals NHS Trust, 26/02/14. Iinvited oral presentation).
Invited presentation, no abstract requested.
Palmer A.L., Bradley D.A., Nisbet A. Comprehensive audit of brachytherapy dose
distributions: A methodology and UK audit results. Poster at ESTRO33 conference, Vienna,
Austria, April 2014. (Radiother. Oncol. supplement in press).
Purpose: To describe a methodology for comprehensive dosimetric audit in HDR/PDR brachytherapy and
present results of audits undertaken in the United Kingdom (UK). This work is conducted under the
auspices of the Institute of Physics and Engineering and Medicine (IPEM). Complementary to routine QA
measurements, an independent system-test provides assurance of the dosimetric accuracy of the
combination of all elements of the brachytherapy-physics process and equipment performance.
Dosimetric audit for external beam radiotherapy is common, but is much less developed for
brachytherapy, albeit equally valid; this deficit is addressed by present work. We describe a unique
brachytherapy ‘end-to-end’ quality assurance assessment involving CT scan, applicator reconstruction,
treatment planning system (TPS) calculation, multiple-2D dose measurement around clinical treatment
applicators, and comparison with intended dose distribution and prescription dose.
Materials and methods: A novel water and Solid-WaterTM phantom was used for the audits, conducted
by a visiting-physicist at 10 radiotherapy centres in the UK, June to October 2013, with a further 25 audits
scheduled until April 2014, to be presented. A clinical treatment applicator, ring or ovoids and intrauterine
(IU) tube, was CT scanned in the phantom, reconstructed on CT, treatment planned and the planned dose
delivered to the phantom. Dose was measured using Gafchromic EBT3 film in two planes bisecting the IU,
with 3-channel analysis. The measured dose distribution was compared to the TPS exported RTDose using
isodose overlay and gamma analysis, and compared to the prescribed dose at Point A using distance to
agreement and point percentage difference, shown in the figure. A full uncertainty analysis was
performed. The standard operating procedures at each centre were also reviewed during the audit.
Results: The table provides results comparing TPS planned and film-measured dosimetry from 10 audits
in the UK, including Ir-192, Co-60, HDR and PDR units. Isodose comparison showed mean gamma passing
rate of 99.0% at 3% (local norm.) 3 mm, and mean ‘distance to agreement’ of prescribed and measured
dose at prescription Point A of 1.0 mm (0.6 mm standard uncertainty, k=1).
Conclusion: A brachytherapy audit methodology has been established to provide assurance of dose
delivery: planned dose distribution and prescription dose. The first 10 audits in the UK have shown
clinically acceptable results. Processes were reviewed and comment given, including clarity on dwell
positions within applicators, and use of optimised compared to ‘standard-plans’. The audit system has
also been used during new equipment commissioning and to investigate a reported high toxicity series of
treatments.

201
Palmer A.L., Bradley D.A., Nisbet A. Improving quality assurance of HDR brachytherapy:
Verifying agreement between planned and delivered dose distributions using DICOM
RTDose and advanced film dosimetry. Poster at AAPM 2014 annual meeting, Austin, Texas,
July 2014.
Purpose: HDR brachytherapy is undergoing significant development, and quality assurance (QA) checks
must keep pace. Current recommendations do not adequately verify delivered against planned dose
distributions: This is particularly relevant for new treatment planning system (TPS) calculation algorithms
(non TG-43 based), and an era of significant patient-specific plan optimisation. ‘Full system checks’ are
desirable in modern QA recommendations, complementary to device-centric individual tests. We present
a QA system incorporating TPS calculation, dose distribution export, HDR unit performance, and dose
distribution measurement. Such an approach, more common in external beam radiotherapy, has not
previously been reported in the literature for brachytherapy.
Methods: Our QA method was tested at 24 UK brachytherapy centres. As a novel approach, we used the
TPS DICOM RTDose file export to compare planned dose distribution with that measured using
Gafchromic EBT3 films placed around clinical brachytherapy treatment applicators. Gamma analysis was
used to compare the dose distributions. Dose difference and distance to agreement were determined at
prescription Point A. Accurate film dosimetry was achieved using a glass compression plate at scanning to
ensure physically-flat films, simultaneous scanning of known dose films with measurement films, and
triple-channel dosimetric analysis.
Results: The mean gamma pass rate of RTDose compared to film measured dose distributions was 98.1%
at 3%(local), 2 mm criteria. The mean dose difference, measured to planned, at Point A was -0.5% for
plastic treatment applicators and -2.4% for metal applicators, due to shielding not accounted for in TPS.
The mean distance to agreement was 0.6 mm.
Conclusions: It is recommended to develop brachytherapy QA to include full-system verification of
agreement between planned and delivered dose distributions. This is a novel approach for HDR
brachytherapy QA. A methodology using advanced film dosimetry and gamma comparison to DICOM
RTDose files has been demonstrated as suitable to fulfil this need.
Palmer A.L. Advanced Film Dosimetry for Brachytherapy. Invited oral presentation as
Guest Speaker at Gafchromc Symposium, Ashland Inc, held during AAPM 2014 annual
conference, Austin, Texas, July 2014. Available at:
http://www.filmqapro.com/documents/Palmer_Brachy%20Audit_Gafchromic_AAPM_2014
Invited presentation, no abstract requested.
Palmer A.L. Auditing HDR/PDR Brachytherapy Physics in UK. Invited oral presentation at
IPEM Biennial Radiotherapy Meeting, Sept 2014, Glasgow.
The reassurance that treatment is being delivered in line with accepted standards, that delivered doses
are as prescribed, that opportunities for quality improvement are taken, and that quality control practices
are optimised, is a fundamental requirement in radiotherapy. This is as essential for brachytherapy as it
is for the more commonly audited and reviewed external beam radiotherapy [1]. Unfortunately, dose
measurement in brachytherapy is challenging due to steep dose gradients and small scales, especially in
the context of an external audit. After a brief review of errors in brachytherapy, to set the scene, this
presentation will discuss the concept of dosimetric audit and the recent resurgence of brachytherapy
audit activity in the UK, benefiting from 4 complementary audits being conducted in the UK during 2014.
The presentation will focus on the recently completed IPEM-sponsored BRachytherapy Applicator

202
Dosimetry (BRAD) audit, which comprised an end-to-end system check of planned and delivered dose
distributions around clinical brachytherapy applicators at every brachytherapy centre in UK [2]. The test
object is now available via the IPEM virtual phantom library. Recommendations for film dosimetry
techniques as used for the audit will be discussed [3]. Observations on the diversity of brachytherapy-
physics practice encounter during the audits will be mentioned, with a few suggestions for improvement.
In line with the brachytherapy audit theme, the presentation will also include a brief review of an audit of
brachytherapy quality control practice that was conducted recently in the UK, identifying areas of
consensus and variance.
Palmer A.L., Bradley D.A., Nisbet A. Monte Carlo derived correction factors for
brachytherapy film dosimetry for audit and QC. Poster presentation at ESTRO 3rd Forum
conference, April 2015, Barcelona.
Purpose: Radiochromic film is a valuable dosimeter in brachytherapy used for dosimetry audit or QC.
However, the water-equivalence of film and any resulting dose perturbation when used with Ir-192 and
Co-60 HDR sources has not been sufficiently studied. The need for sufficiently large phantoms for full-
scatter is understood, but an optimum phantom size for practical transport for audit measurements for
both Ir-192 and Co-60, with appropriate correction factors, has not been determined. We address both
issues using Monte Carlo derived correction factors. This work was undertaken for an IPEM brachytherapy
audit in the UK, and will be of value for others conducting brachytherapy film dosimetry measurements
or conducting Monte Carlo calculations in brachytherapy.
Methods: MCNP5 code and Ir-192 and Co-60 HDR source models were initially validated by comparing
radial dose with consensus data. Due to small scale geometries, *F8 tally with full photon and electron
transport was used, with 1E9 particle histories. Gafchromic EBT3 film chemical composition and geometry
were modelled and calculations made to determine any dose perturbation due to the film compared to a
uniform water case. A separate geometry was constructed to study scatter corrections at distances 20 to
75 mm from Ir-192 and Co-60 sources within water spheres of 100 to 600 mm, and equivalent cubes. An
optimum phantom size for brachytherapy dosimetry audit was proposed.
Results: For both Ir-192 and Co-60, there was negligible percentage change in dose due to the presence
of a 15 mm strip of Gafchromic EBT3 film, shown in Table 1, confirming its ‘water equivalence’ for HDR
brachytherapy dosimetry measurements. MCNP5 derived phantom scatter correction factors for Ir-192
and Co-60 are provided in Figure 1. There is agreement within 0.1% with data for Ir-192 calculated by
Perez-Calatayud et al. (Med. Phys. 2004). A water phantom cube of side length 400 mm was considered
optimum for brachytherapy dosimetry audit measurements, requiring scatter correction factors at 20 mm
and 60 mm from the source of 0.0% and 0.4% for Ir-192 and 0.0% and 0.2% for Co-60, respectively. This
is a practical maximum size for convenient transportation.
Conclusions: Monte Carlo calculations using MCNP5 were conducted to support HDR brachytherapy
dosimetry audit and QC measurements. It was confirmed Gafchromic EBT3 film does not disturb dose
distributions compared to water-only cases. An optimum phantom size of 400 mm side cube was
proposed with a maximum 0.4% scatter correction at 60 mm from the source. This data has been utilised
in an IPEM dosimetry audit in the UK and may be applied in other brachytherapy dosimetry situations.
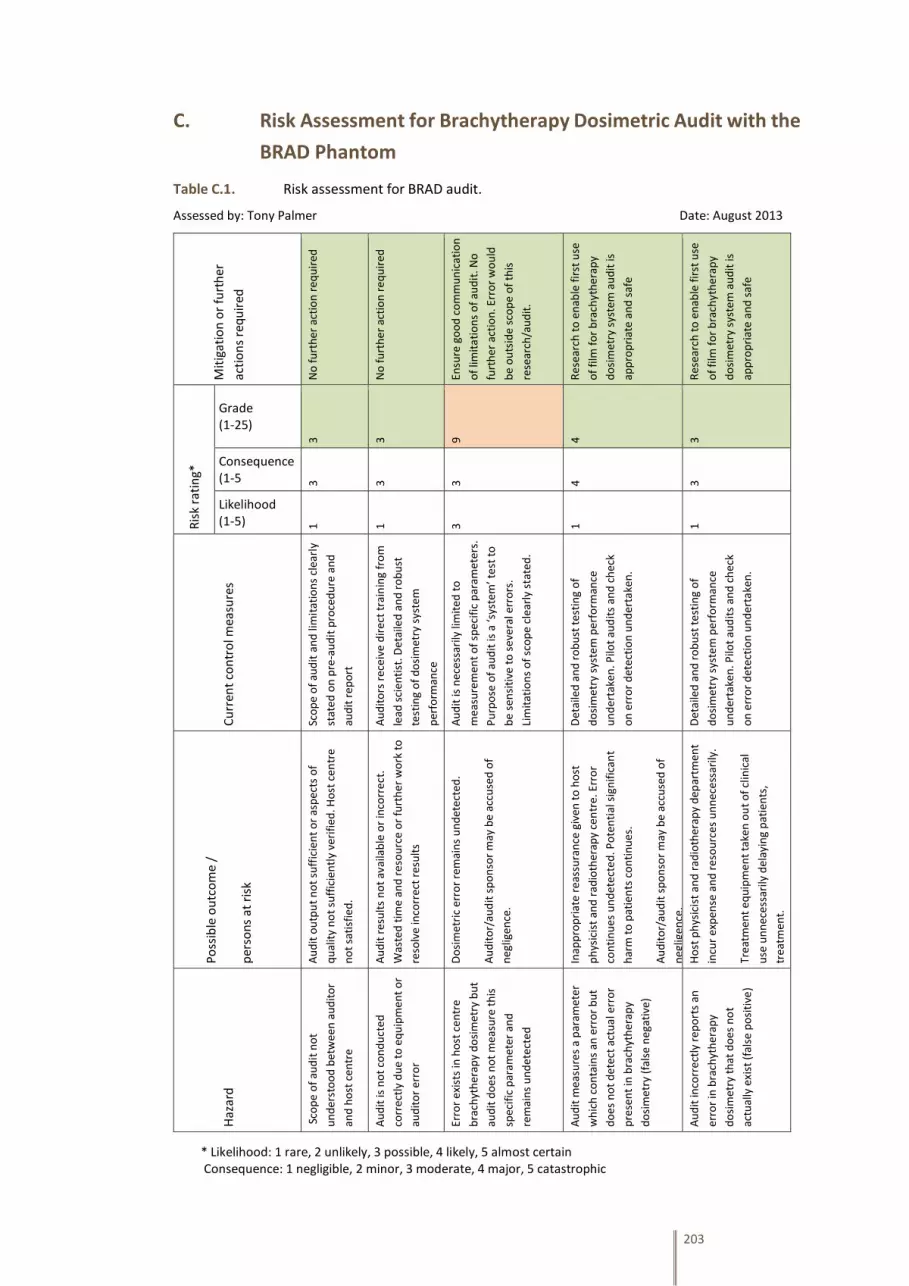
203
C. Risk Assessment for Brachytherapy Dosimetric Audit with the
BRAD Phantom
Table C.1. Risk assessment for BRAD audit.
Assessed by: Tony Palmer Date: August 2013 M
itig
atio
n o
r fu
rth
er
acti
on
s re
qu
ired
No
fu
rth
er a
ctio
n r
equ
ired
No
fu
rth
er a
ctio
n r
equ
ired
Ensu
re g
oo
d c
om
mu
nic
atio
n
of
limit
atio
ns
of
aud
it. N
o
furt
her
act
ion
. Err
or
wo
uld
be
ou
tsid
e sc
op
e o
f th
is
rese
arch
/au
dit
.
Res
earc
h t
o e
nab
le f
irst
use
of
film
fo
r b
rach
yth
erap
y
do
sim
etry
sys
tem
au
dit
is
app
rop
riat
e an
d s
afe
Res
earc
h t
o e
nab
le f
irst
use
of
film
fo
r b
rach
yth
erap
y
do
sim
etry
sys
tem
au
dit
is
app
rop
riat
e an
d s
afe
Ris
k ra
tin
g*
Grade (1-25)
3 3 9 4 3
Consequence (1-5 3 3 3 4 3
Likelihood (1-5) 1 1 3 1 1
Cu
rren
t co
ntr
ol m
easu
res
Sco
pe
of
aud
it a
nd
lim
itat
ion
s cl
earl
y
stat
ed o
n p
re-a
ud
it p
roce
du
re a
nd
aud
it r
epo
rt
Au
dit
ors
rec
eive
dir
ect
trai
nin
g fr
om
lead
sci
enti
st. D
etai
led
an
d r
ob
ust
test
ing
of
do
sim
etry
sys
tem
per
form
ance
Au
dit
is n
eces
sari
ly li
mit
ed t
o
mea
sure
men
t o
f sp
ecif
ic p
aram
eter
s.
Pu
rpo
se o
f au
dit
is a
‘sys
tem
’ tes
t to
be
sen
siti
ve t
o s
ever
al e
rro
rs.
Lim
itat
ion
s o
f sc
op
e cl
earl
y st
ated
.
Det
aile
d a
nd
ro
bu
st t
esti
ng
of
do
sim
etry
sys
tem
per
form
ance
un
der
take
n. P
ilot
aud
its
and
ch
eck
on
err
or
det
ecti
on
un
der
take
n.
Det
aile
d a
nd
ro
bu
st t
esti
ng
of
do
sim
etry
sys
tem
pe
rfo
rman
ce
un
der
take
n. P
ilot
aud
its
and
ch
eck
on
err
or
det
ecti
on
un
der
take
n.
Po
ssib
le o
utc
om
e /
per
son
s at
ris
k
Au
dit
ou
tpu
t n
ot
suff
icie
nt
or
asp
ects
of
qu
alit
y n
ot
suff
icie
ntl
y ve
rifi
ed. H
ost
cen
tre
no
t sa
tisf
ied
.
Au
dit
res
ult
s n
ot
avai
lab
le o
r in
corr
ect
.
Was
ted
tim
e an
d r
eso
urc
e o
r fu
rth
er w
ork
to
reso
lve
inco
rre
ct r
esu
lts
Do
sim
etri
c er
ror
rem
ain
s u
nd
etec
ted
.
Au
dit
or/
aud
it s
po
nso
r m
ay b
e ac
cuse
d o
f
neg
ligen
ce.
Inap
pro
pri
ate
reas
sura
nce
giv
en t
o h
ost
ph
ysic
ist
and
rad
ioth
erap
y ce
ntr
e. E
rro
r
con
tin
ues
un
det
ecte
d. P
ote
nti
al s
ign
ific
ant
har
m t
o p
atie
nts
co
nti
nu
es.
Au
dit
or/
aud
it s
po
nso
r m
ay b
e ac
cuse
d o
f
neg
ligen
ce.
Ho
st p
hys
icis
t an
d r
adio
ther
apy
dep
artm
ent
incu
r ex
pen
se a
nd
res
ou
rces
un
nec
ess
arily
.
Trea
tmen
t eq
uip
men
t ta
ken
ou
t o
f cl
inic
al
use
un
nec
ess
arily
del
ayin
g p
atie
nts
,
trea
tmen
t.
Haz
ard
Sco
pe
of
aud
it n
ot
un
der
sto
od
bet
wee
n a
ud
ito
r
and
ho
st c
entr
e
Au
dit
is n
ot
con
du
cted
corr
ect
ly d
ue
to e
qu
ipm
ent
or
aud
ito
r er
ror
Erro
r ex
ists
in h
ost
cen
tre
bra
chyt
her
apy
do
sim
etry
bu
t
aud
it d
oes
no
t m
easu
re t
his
spec
ific
par
amet
er a
nd
rem
ain
s u
nd
etec
ted
Au
dit
mea
sure
s a
par
amet
er
wh
ich
co
nta
ins
an e
rro
r b
ut
do
es n
ot
det
ect
actu
al e
rro
r
pre
sen
t in
bra
chyt
her
apy
do
sim
etry
(fa
lse
neg
ativ
e)
Au
dit
inco
rre
ctly
rep
ort
s an
erro
r in
bra
chyt
her
apy
do
sim
etry
th
at d
oes
no
t
actu
ally
exi
st (
fals
e p
osi
tive
)
* Likelihood: 1 rare, 2 unlikely, 3 possible, 4 likely, 5 almost certain Consequence: 1 negligible, 2 minor, 3 moderate, 4 major, 5 catastrophic

204
D. Protocol for Brachytherapy Dosimetric Audit with the BRAD
Phantom
BRachytherapy Applicator Dosimetry Audit Protocol v2. Jan 2014 Written by Tony Palmer on behalf of an IPEM RT-SIG Working Party on Brachytherapy Audit
Introduction The BRachytherapy Applicator Dosimetry (BRAD) phantom provides an audit tool for the comparison of planned and delivered dose distributions in several 2D planes around clinical gynaecological applicators with HDR or PDR brachytherapy treatment equipment using Ir-192 or Co-60 sources. (A complementary audit by RTTQA is being conducted in collaboration, aimed at accurate measurement of point dose from a straight catheter). The process provides a ‘full system’ end-to-end audit which provides a combined performance assessment of CT scanning and reconstruction of the applicator, dose prescribing, dose calculation and source data in the treatment planning system (TPS), plan export consistency, and delivery at the treatment unit measuring dose distribution from clinical treatment applicators, and inherent confirmation of source calibration value in the TPS. The audit does not include clinical or technical assessment of outlining accuracy. A ‘standard plan’ or recent/typical treatment plan is used. Local CT scanning protocol and dose prescription levels can be used for the audit. Advanced three-channel dosimetry is used for film dose analysis. The TPS-planned and film-measured dose distributions are compared using isodose overlay and gamma analysis. The percentage difference at Point A and the distance to agreement between the dose measured at Point A and position of the measured prescription isodose is also provided. Further details on the phantom design, testing and typical results are available in Palmer et al. 2013a and on general film dosimetry for brachytherapy dose distribution assessment in Palmer et al. 2013b. 1. Scope, Responsibilities, and Preparations for the Audit The determination of a ‘clinically relevant’ departure between intended and delivered radiation dose distributions may be more difficult to define in brachytherapy than conventional accepted practice in external beam radiotherapy, and may be dependent on local factors for each radiotherapy centre. It is likely to be in the region of a dose difference greater than 5.0%, or a shift in clinically relevant isodose lines of greater than 3.0 mm that is considered significant in brachytherapy. The film dosimetry method has an increased uncertainty compared to conventional primary dosimetric methods such as ionisation chamber dosimetry, but is used here to provide a spatial dose distribution assessment. Films are calibrated in MV radiation against an ionisation chamber with calibration traceable to NPL primary standard. The brachytherapy audit is conducted as a ‘spot check’ only and is not a comprehensive assessment of all possible treatment modes or equipment. This necessarily constitutes an assessment of one specific aspect of physics dosimetry alone, not any clinical aspects of treatment. The result is of course valid only at the time of measurement. The audit is conducted under the auspices of a Working Party of IPEM RT-SIG, and is therefore underwritten by professional indemnity insurance of IPEM, covering activities of members while acting on behalf of IPEM. A general disclaimer is made that it is the responsibility of the local physicist for accuracy of all treatments and caution should be exercised in interpreting results from any single audit process. This must be done in conjunction with comprehensive local commissioning and quality control measurement schedules. Preparing for the audit: The CT scan acquired on the day is utilised hence no pre-planning is required. It is essential that a clinical cervix treatment applicator is available with central IUT and ovoids or ring, that a CT session has
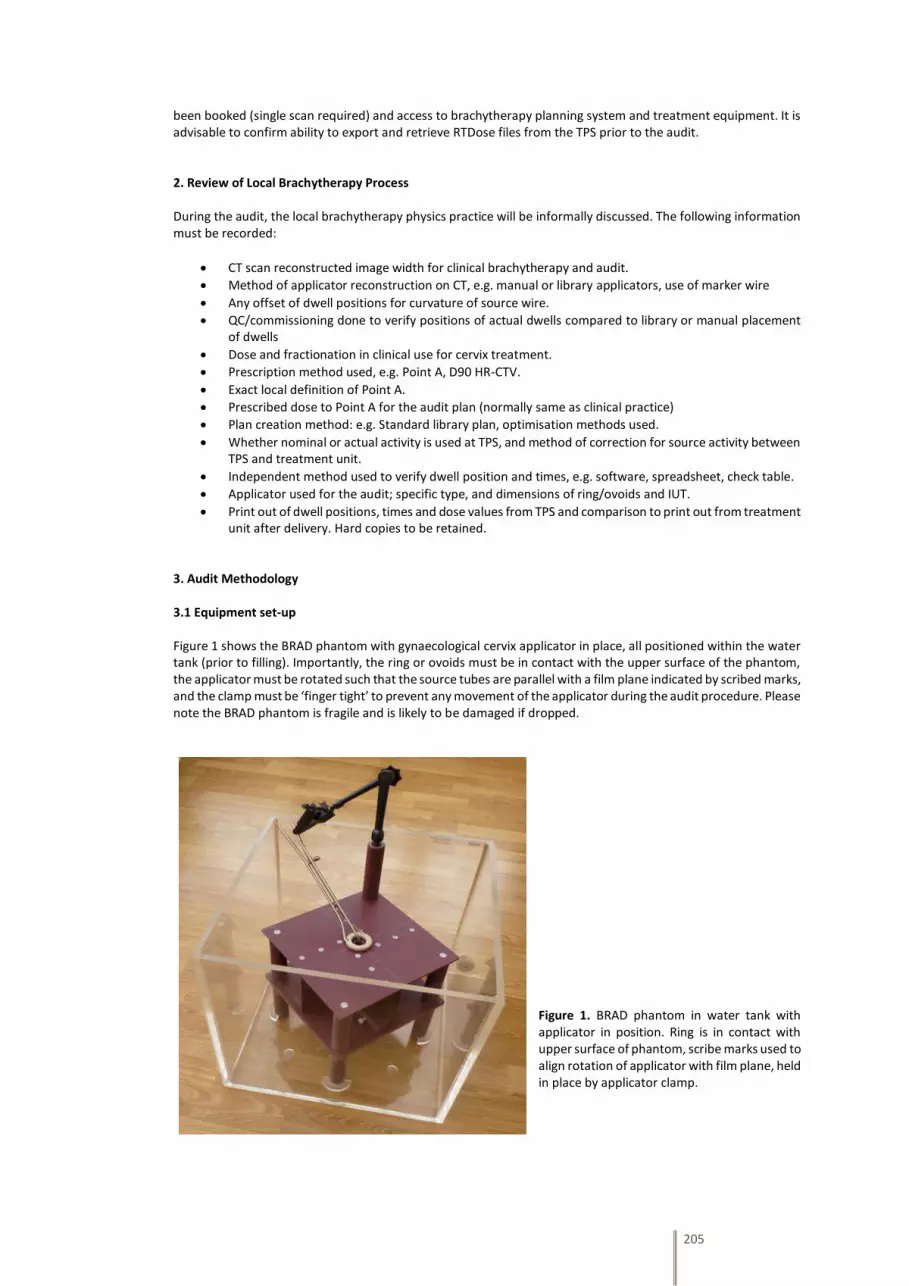
205
been booked (single scan required) and access to brachytherapy planning system and treatment equipment. It is advisable to confirm ability to export and retrieve RTDose files from the TPS prior to the audit. 2. Review of Local Brachytherapy Process During the audit, the local brachytherapy physics practice will be informally discussed. The following information must be recorded:
CT scan reconstructed image width for clinical brachytherapy and audit.
Method of applicator reconstruction on CT, e.g. manual or library applicators, use of marker wire
Any offset of dwell positions for curvature of source wire.
QC/commissioning done to verify positions of actual dwells compared to library or manual placement of dwells
Dose and fractionation in clinical use for cervix treatment.
Prescription method used, e.g. Point A, D90 HR-CTV.
Exact local definition of Point A.
Prescribed dose to Point A for the audit plan (normally same as clinical practice)
Plan creation method: e.g. Standard library plan, optimisation methods used.
Whether nominal or actual activity is used at TPS, and method of correction for source activity between TPS and treatment unit.
Independent method used to verify dwell position and times, e.g. software, spreadsheet, check table.
Applicator used for the audit; specific type, and dimensions of ring/ovoids and IUT.
Print out of dwell positions, times and dose values from TPS and comparison to print out from treatment unit after delivery. Hard copies to be retained.
3. Audit Methodology 3.1 Equipment set-up Figure 1 shows the BRAD phantom with gynaecological cervix applicator in place, all positioned within the water tank (prior to filling). Importantly, the ring or ovoids must be in contact with the upper surface of the phantom, the applicator must be rotated such that the source tubes are parallel with a film plane indicated by scribed marks, and the clamp must be ‘finger tight’ to prevent any movement of the applicator during the audit procedure. Please note the BRAD phantom is fragile and is likely to be damaged if dropped.
Figure 1. BRAD phantom in water tank with applicator in position. Ring is in contact with upper surface of phantom, scribe marks used to align rotation of applicator with film plane, held in place by applicator clamp.
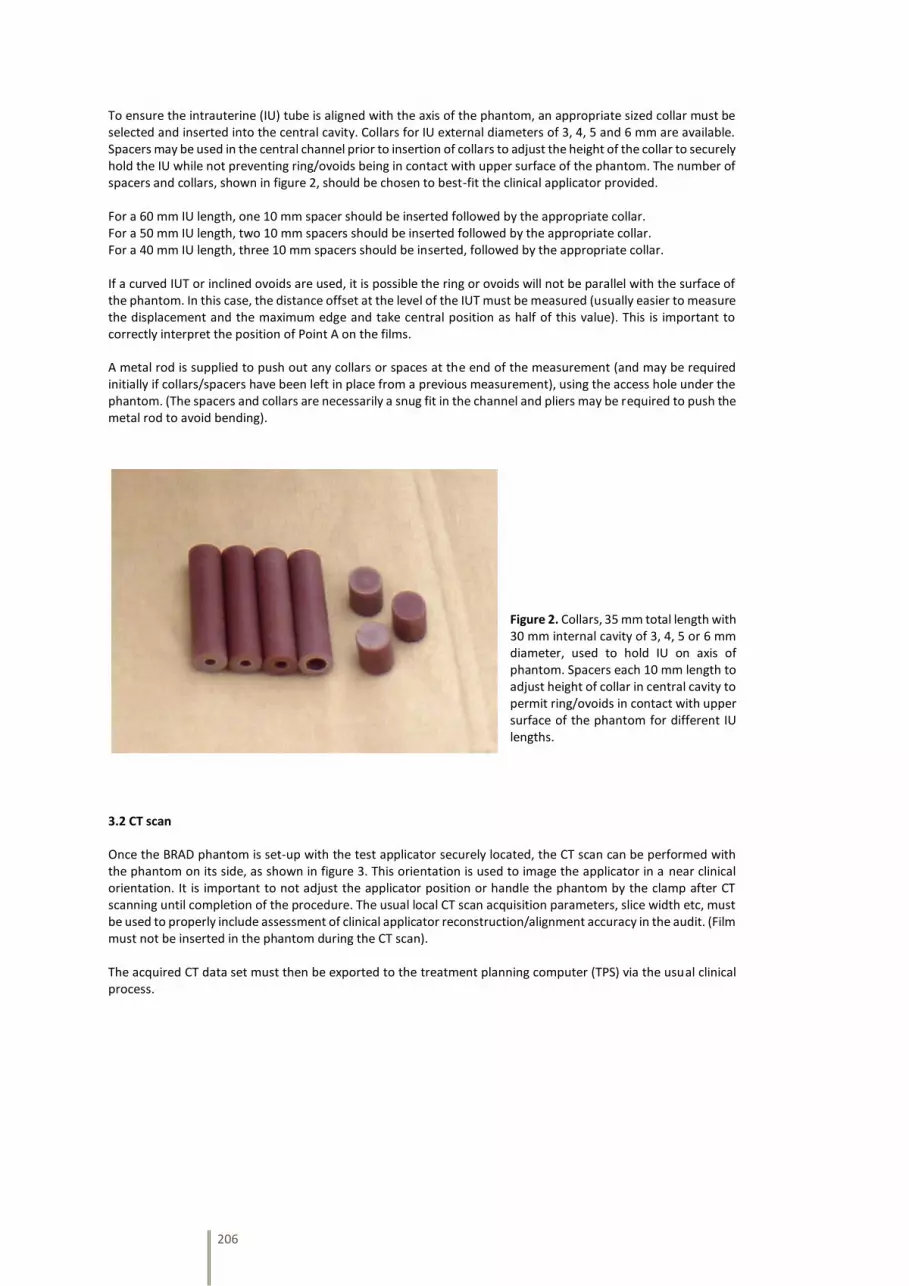
206
To ensure the intrauterine (IU) tube is aligned with the axis of the phantom, an appropriate sized collar must be selected and inserted into the central cavity. Collars for IU external diameters of 3, 4, 5 and 6 mm are available. Spacers may be used in the central channel prior to insertion of collars to adjust the height of the collar to securely hold the IU while not preventing ring/ovoids being in contact with upper surface of the phantom. The number of spacers and collars, shown in figure 2, should be chosen to best-fit the clinical applicator provided. For a 60 mm IU length, one 10 mm spacer should be inserted followed by the appropriate collar. For a 50 mm IU length, two 10 mm spacers should be inserted followed by the appropriate collar. For a 40 mm IU length, three 10 mm spacers should be inserted, followed by the appropriate collar. If a curved IUT or inclined ovoids are used, it is possible the ring or ovoids will not be parallel with the surface of the phantom. In this case, the distance offset at the level of the IUT must be measured (usually easier to measure the displacement and the maximum edge and take central position as half of this value). This is important to correctly interpret the position of Point A on the films. A metal rod is supplied to push out any collars or spaces at the end of the measurement (and may be required initially if collars/spacers have been left in place from a previous measurement), using the access hole under the phantom. (The spacers and collars are necessarily a snug fit in the channel and pliers may be required to push the metal rod to avoid bending).
Figure 2. Collars, 35 mm total length with 30 mm internal cavity of 3, 4, 5 or 6 mm diameter, used to hold IU on axis of phantom. Spacers each 10 mm length to adjust height of collar in central cavity to permit ring/ovoids in contact with upper surface of the phantom for different IU lengths.
3.2 CT scan Once the BRAD phantom is set-up with the test applicator securely located, the CT scan can be performed with the phantom on its side, as shown in figure 3. This orientation is used to image the applicator in a near clinical orientation. It is important to not adjust the applicator position or handle the phantom by the clamp after CT scanning until completion of the procedure. The usual local CT scan acquisition parameters, slice width etc, must be used to properly include assessment of clinical applicator reconstruction/alignment accuracy in the audit. (Film must not be inserted in the phantom during the CT scan). The acquired CT data set must then be exported to the treatment planning computer (TPS) via the usual clinical process.

207
Figure 3. BRAD phantom on side for CT scanning, with brachytherapy applicator in position approximating clinical use.
3.3 Treatment planning and DICOM RTDose export The CT images should be imported into the treatment planning system (TPS) and the treatment applicator reconstructed and aligned using normal clinical procedure. A typical cervix treatment plan should be created, using ‘standard plan’ or ‘usual loading’ or copied from a recent clinical example from the local centre, either prescribing to Point A or noting its dose from the TPS. (A dose of at least 7 Gy to Point A should be used for film dosimetry). Confirmation that the locally used definition of Point A is as defined by the 2012 ABS recommendations (Viswanathan and Thomadsen 2012) or the dose at this point determined. A print-out of intended dwell positions and times must be retained and the plan then sent to the HDR treatment unit using the usual clinical process. The treatment plan should be exported to the treatment unit using the normal clinical procedure, after performing any local independent check process. A 3D dose calculation must be performed to produce the required RTDose data. It is essential the dose grid is aligned orthogonally to the two film planes in the phantom to enable comparison between film-measured and TPS-calculated doses, when creating RTDose file. An inclined axis may have been used for curved IUT or inclined ovoids during treatment planning and this must be re-set normal to the phantom surface for RTDose calculation. The RTDose DICOM file must be obtained for the treatment plan and retained for later comparison of the planned dose distribution with the film-measured distribution. It is essential that the dose calculation grid is aligned orthogonal in both planes with respect to the film holders in the BRAD phantom. It may necessary to re-orient the axes for creation of the 3D dose grid if this alignment is not achieved in normal clinical practice (e.g. for curved IUT or inclined ovoids). The calculation grid must be centred on the applicator and be of dimensions around 18 x 18 x 18 cm, with 0.1 cm resolution. The resulting file size should be of the order 10 to 20 MB. Please see the supplementary information in Appendix A1 to export of RTDose files from various TPS.
The RTDose file should be transferred to an encrypted USB memory stick on the day of the audit to be taken away for analysis. If this is not possible, the file may be sent electronically via Secure File Transfer (SFT) on NHS mail or via a ‘large file transfer service’ to Tony Palmer.

208
3.4 HDR treatment unit delivery The treatment plan must be imported to the HDR or PDR treatment unit using normal clinical procedure and prepared for treatment. The water tank should be filled with room temperature tap water, a yellow plastic tub is supplied to transfer water into and out of the water tank. Gafchromic film has some sensitivity to ambient light and should be kept in the dark at all times other than for HDR treatment irradiation. One film must be placed on each holder in the BRAD phantom, with the long axis vertical. The films should be labelled in the lower corner away from the IU tube with their position (‘N’ under the applicator transfer tubes, and ‘E’, ‘S’ and ‘W’ moving clockwise looking down on the phantom). It is essential that each film is pushed inwards and upwards, in the BRAD phantom against the end stops (behind the holding plates) see figure 4. Extremely light pressure with the supplied screwdriver is required on the screws to hold the film in place – Take extra care not to over tighten and shear off the screws!
Figure 4. Films positioned on all four applicator vanes. Each film is pushed inwards and upwards against end-stops (see arrows) and held in place behind screwed plates.
The BRAD phantom with films should then be carefully lowered into the full water tank and the applicator connected to the treatment unit, as shown in figure 5. The treatment plan should then be delivered. Once complete, a print out of the delivered dwell position and times should be retained. After disconnecting the applicator transfer tubes the BRAD phantom should be removed from the water tank and the films removed and dried before storing in the dark.
Figure 5. Tank filled with tap water and BRAD phantom in use with brachytherapy treatment unit.
At the same date and approximate time as the HDR/PDR irradiation, two reference films from the same batch will be exposed to known MV radiation dose at Portsmouth. These films act as references for subsequent film dosimetry analysis.

209
3.5 Film analysis and results Films must be returned immediately, using light-tight packaging and appropriate protection to prevent bending, to Tony Palmer at Portsmouth for analysis. Postal details are provided in the appendix A4. An envelope is supplied for this purpose. Triple-channel analysis is used to generate film dose maps which are compared to the RTDose data using isodose overlay, shown in figure 6, and gamma analysis.
Figure 6. Comparison of TPS and film-measured dose distribution analysed with isodose overlay and gamma evaluation.
A report of the results will be provided approximately one week following the audit visit. Appendices A1. Supplementary Information for the Export of RTDose file from Treatment Planning Systems Export of DICOM RTDose from brachytherapy treatment planning systems is not normally performed in routine clinical practice, hence supplementary information is provided here which may be useful. It is essential that the dose calculation grid is aligned orthogonally in both planes with respect to the film holders in the BRAD phantom. It may necessary to re-orient the axes for creation of the 3D dose grid if this alignment is not achieved in normal clinical practice (e.g. for curved IUT or inclined ovoids). The calculation grid must be centred on the applicator and ideally be of dimensions around 18 x 18 x 18 cm, with 0.1 cm resolution. It may be necessary to change from default settings to achieve this. The resulting file size should be of the order 10 to 20 MB. Varian BrachyVision. With the patient plan open, go to File>Export>Wizard, and follow the prompts selecting an appropriate destination. Nucletron Oncentra Brachy / Masterplan. With the patient plan open, go to Plan>Calculate 3D Dose Grid, and then using the CM Export window, expand the study and select the RTDOSE file in the left pane and highlight ‘1’ in the right Dicom Objects pane. With the file selected, click Export button and select an appropriate destination. If a suitable destination peer has not been set-up for DICOM export, it should be possible to use the Multicase export function to save the file to desktop. The resulting RTDose file may need a Dicom preamble adding (e.g. via PowerDicom) for use in FilmQAPro. Nucletron Oncentra GYN. There is less flexibility in calculating and exporting RTDose from Oncentra GYN, and it may not be possible to undertake full audit analysis. Please contact Tony Palmer to discuss alternatives if the following procedure is unsuccessful.

210
The dose grid resolution cannot be independently set and will depend on the margin set around the active source dwell positions. A margin of 5 cm will result in a grid resolution around 0.2 cm. It is preferable to calculate and export RTDose at several resolutions for analysis, e.g. margins of 7, 5, 3 cm. Create a folder on the desktop and set this as the DICOM destination: Use Nucletron Smoothbase, configure Dicom, add destination and name it. Select Dicom file and navigate to the created folder. To amend the grid: Dose settings/dose grid position/enter margin size, click apply ASDP (active source dwell position – must be done after creating the plan). Save the dose after saving the plan. To export the RTDose file: Use Nucletron Smoothbase, export to Dicom, complete study, select patient and study, click load, select the Dicom destination named above. It is possible to have Smoothbase and Oncentra GYN open at the same time to facilitate ease of exporting several files with different grid sizes. Eckert & Ziegler Bebig HDRPlus. With the patient plan open, select Patient>Export>Dicom and select an appropriate destination using the windows explorer style interface. A2. Equipment Checklist Please use the checklist below to ensure all equipment is replaced into the travel case at the end of the audit.
BRAD solid water phantom with applicator support arm
White lid tub containing 3 x 10 mm length spacers and 4 x 35 mm length collars (3, 4, 5, 6 mm internal diameter cavity)
Red lid tube containing 2 x metal rods to remove spacers and collars
Clear Perspex water tank
Yellow plastic box for transfer of water into and out of water tank (not shown in photo).
Screwdriver (green/black handle)
Pliers (black handle, not shown in photo)
Figure 7. Transport case showing properly loaded equipment. (Yellow box for ‘water transfer’ should be placed inside the water tank).
A3. Uncertainty Analysis and Typical Results with Suggested Tolerance The combined standard uncertainty in the determination of dose difference at a point between film-measured dose and TPS dose is 3.0% (k=1), and the standard uncertainty in distance to agreement is estimated as 0.5 mm (k=1). Both of these values apply to the dose gradient around Point A, which is approximately 6% mm-1. Multiple film-dosimetry measurements have demonstrated repeatability of film dose distributions assessed by gamma comparison exceeding 95% passing rate at 1% (local), 1.5 mm criteria. Gamma criteria of 5% local normalisation and 3 mm distance to agreement and 3% 2 mm, are used in comparing film-measured and TPS calculated dose distributions. Pilot audits have achieved passing rates exceeding 95% at 5%, 3 mm criteria, and an acceptable limit of 90% is therefore suggested, although local physics must make a final acceptability decision based on local factors. The mean distance between the prescription isodose and the position of Point A in pilot audits was 1.2 mm, and an acceptable limit of 3.0 mm is suggested. The local physicist must interpret results and decide acceptability based on local brachytherapy clinical practice.

211
E. BRAD Phantom Availability in IPEM Virtual Equipment Library
(Internet Site)
Figure E.1 is a screenshot of the IPEM webpage advertising the BRAD phantom, developed
through this project.
Figure E.1. IPEM webpage advertising BRAD phantom in Virtual Phantom Library (only available to
IPEM members hence internet address not given) [cited 28/03/2014].

212
F. MCNP5 Input File for Validation Test
The following two input files were used to validate the implementation of
MCNP5 software code for the brachytherapy applications presented in this research thesis,
as described in Section 7.2.2. The first file is for the Nucletron mHDR-v2 Ir-192 source and
the second for the Eckert & Ziegler BEBIG MultiSource Co0.A86 Co-60 HDR source.
Validation MCNP5 implementation Ir192 dose rate with radial distance c c Input file by Tony Palmer, 2013 c c ----------------------- c cell definitions c ----------------------- c c Source and capsule c 101 3 -22.42 -1001 1004 -1005 imp:p,e 1 $ Source 102 2 -8.000 1001 -1002 1004 -1005 imp:p,e 1 $ Capsule cylinder shell 103 2 -8.000 -1002 1003 -1004 imp:p,e 1 $ Capsule lower end cap 104 2 -8.000 -1002 1005 -1006 imp:p,e 1 $ Capsule upper end cap c c Boundaries of problem c 105 1 -0.998 (-1009 1006 -1007):(-1003 1008 -1007): (-1006 1003 1002 -1007) #107 #108 #109 #110 #111 #112 #113 #114 #115 imp:p,e 1 $ Fill with water 106 0 1007:-1008:1009 imp:p,e 0 $ Outside known universe c c Tally cells for radial dose c 107 1 -0.998 1010 -1011 1012 -1013 imp:p,e 1 $ tally r=0.75cm 108 1 -0.998 1010 -1011 1014 -1015 imp:p,e 1 $ tally r=1.0cm 109 1 -0.998 1010 -1011 1016 -1017 imp:p,e 1 $ tally r=1.5cm 110 1 -0.998 1010 -1011 1018 -1019 imp:p,e 1 $ tally r=2.0cm 111 1 -0.998 1010 -1011 1020 -1021 imp:p,e 1 $ tally r=3.0cm 112 1 -0.998 1010 -1011 1022 -1023 imp:p,e 1 $ tally r=4.0cm 113 1 -0.998 1010 -1011 1024 -1025 imp:p,e 1 $ tally r=5.0cm 114 1 -0.998 1010 -1011 1026 -1027 imp:p,e 1 $ tally r=6.0cm 115 1 -0.998 1010 -1011 1028 -1029 imp:p,e 1 $ tally r=7.0cm c ----------------------- c surface cards c ----------------------- c c Nucletron HDR v2 simplified Ir-192 source in steel capsule c 1001 cx 0.0325 $ Outside radius source, inside radius steel capsule 1002 cx 0.0425 $ Outside radius steel capsule 1003 px -0.02 $ Lower edge of lower end cap of capsule 1004 px 0.001 $ Upper edge of lower end cap of capsule, lower edge source 1005 px 0.36 $ Lower edge of upper end cap of capsule, upper edge source 1006 px 0.38 $ Upper edge of upper end cap of capsule c c Boundaries of problem c 1007 cx 60 $ Radius of edge of known universe 1008 px -60 $ Lower edge of known universe 1009 px 60 $ Upper edge of known universe c c Tally cell surfaces c 1010 px 0.155 $ Lower plane of tally cells 1011 px 0.205 $ Upper plane of tally cells 1012 cx 0.725 $ Radii of cylinders for tally cells 1013 cx 0.775 1014 cx 0.975 1015 cx 1.025 1016 cx 1.475 1017 cx 1.525 1018 cx 1.975 1019 cx 2.025 1020 cx 2.975 1021 cx 3.025 1022 cx 3.975 1023 cx 4.025 1024 cx 4.975 1025 cx 5.025 1026 cx 5.975 1027 cx 6.025 1028 cx 6.975 1029 cx 7.025

213
c ----------------------- c Data cards c ----------------------- c Material cards c ----------------------- c Pacific Northwest National Laboratory, Compendium Material Comp, March 2011 c c Water, liquid c density = 0.998 g/cm3 m1 1000 0.666657 $ H (element and atomic fraction) 8000 0.333343 $ O c c Stainless steel (316L) c density = 8.000 g/cm3 m2 6000 0.001384 $ C 14000 0.019722 $ Si 15000 0.000805 $ P 16000 0.000518 $ S 24000 0.181098 $ Cr 25000 0.020165 $ Mn 26000 0.648628 $ Fe 28000 0.113247 $ Ni 42000 0.014434 $ Mo c c Iridium c density = 22.42 g/cm3 m3 77000 1.0000 $ Ir c c c ----------------------- c Source card c ----------------------- c Isotropic cylindrical Ir-192 volume source c sdef POS=0 0 0 axs=1 0 0 ext=d1 rad=d2 erg=d3 par=2 $ Ir-192 source c si1 0.001 0.36 $ axial source extent, sampling range sp1 -21 0 $ density constant with x c si2 0 0.0325 $ radial source extent, sampling range sp2 -21 1 $ density proportional to radius c c Emission data from www.nndc.bnl.gov Nuclear Data Sheet 113, 1871 (2012) c not included very low emission prob (<0.03%) or very low energies (<10keV) c Discrete Ir-192 energies in MeV and probability of emission si3 L 0.0615 0.0630 0.0633 0.0650 0.0651 0.0668 0.0711 0.0714 0.0714 0.736 0.0754 0.0757 0.0778 0.1364 0.2013 0.2058 0.2833 0.2960 0.3085 0.3165 0.3745 0.4165 0.4205 0.4681 0.4846 0.4891 0.5886 0.6044 0.6125 0.8845 1.0615 sp3 1.190 2.020 0.176 0.300 2.620 4.440 0.238 0.460 0.161 0.681 0.531 1.021 0.364 0.199 0.471 3.310 0.266 28.712 29.700 82.869 0.727 0.670 0.069 47.840 3.190 0.438 4.522 8.216 5.340 0.292 0.053 c c c ----------------------- c Tally cards c ----------------------- c f6:p 107 108 109 110 111 112 113 114 115 fm6 1.6e-10 $ Convert MeV/g to Gy per source particle fc6 f6 Energy deposition (Gy) per source particle c c *f8:p,e 107 108 109 110 111 112 113 114 115 fc8 *f8 Energy deposition (MeV) per particle history c c c ----------------------- c Other data c ----------------------- mode p e $ Transport photons and electrons c $ Phys card defaults detailed physics cut:p j 0.01 $ Cut photon transport at 10keV nps 1000000000 $ Number of particle histories cut card print 110 $ Print first 50 histories End of File

214
Validation MCNP5 implementation Co60 dose rate with radial distance c c Input file by Tony Palmer, 2013 c c ----------------------- c cell definitions c ----------------------- c c Source and capsule c 101 3 -8.900 -1001 1004 -1005 imp:p,e 1 $ Source 102 2 -8.000 1001 -1002 1004 -1005 imp:p,e 1 $ Capsule cylinder shell 103 2 -8.000 -1002 1003 -1004 imp:p,e 1 $ Capsule lower end cap 104 2 -8.000 -1002 1005 -1006 imp:p,e 1 $ Capsule upper end cap c c Boundaries of problem c 105 1 -0.998 (-1009 1006 -1007):(-1003 1008 -1007): (-1006 1003 1002 -1007) #107 #108 #109 #110 #111 #112 #113 #114 #115 imp:p,e 1 $ Fill with water 106 0 1007:-1008:1009 imp:p,e 0 $ Outside known universe c c Tally cells for radial dose c 107 1 -0.998 1010 -1011 1012 -1013 imp:p,e 1 $ tally r=0.75cm 108 1 -0.998 1010 -1011 1014 -1015 imp:p,e 1 $ tally r=1.0cm 109 1 -0.998 1010 -1011 1016 -1017 imp:p,e 1 $ tally r=1.5cm 110 1 -0.998 1010 -1011 1018 -1019 imp:p,e 1 $ tally r=2.0cm 111 1 -0.998 1010 -1011 1020 -1021 imp:p,e 1 $ tally r=3.0cm 112 1 -0.998 1010 -1011 1022 -1023 imp:p,e 1 $ tally r=4.0cm 113 1 -0.998 1010 -1011 1024 -1025 imp:p,e 1 $ tally r=5.0cm 114 1 -0.998 1010 -1011 1026 -1027 imp:p,e 1 $ tally r=6.0cm 115 1 -0.998 1010 -1011 1028 -1029 imp:p,e 1 $ tally r=7.0cm c ----------------------- c surface cards c ----------------------- c c EZ BEBIG HDR simplified Co-60 Co0.A86 source in steel capsule c 1001 cx 0.030 $ Outside radius source, inside radius steel capsule 1002 cx 0.045 $ Outside radius steel capsule 1003 px -0.055 $ Lower edge of lower end cap of capsule 1004 px 0.001 $ Upper edge of lower end cap of capsule, lower edge source 1005 px 0.35 $ Lower edge of upper end cap of capsule, upper edge source 1006 px 0.405 $ Upper edge of upper end cap of capsule c c Boundaries of problem c 1007 cx 60 $ Radius of edge of known universe 1008 px -60 $ Lower edge of known universe 1009 px 60 $ Upper edge of known universe c c Tally cell surfaces c 1010 px 0.155 $ Lower plane of tally cells 1011 px 0.205 $ Upper plane of tally cells 1012 cx 0.725 $ Radii of cylinders for tally cells 1013 cx 0.775 1014 cx 0.975 1015 cx 1.025 1016 cx 1.475 1017 cx 1.525 1018 cx 1.975 1019 cx 2.025 1020 cx 2.975 1021 cx 3.025 1022 cx 3.975 1023 cx 4.025 1024 cx 4.975 1025 cx 5.025 1026 cx 5.975 1027 cx 6.025 1028 cx 6.975 1029 cx 7.025 c ----------------------- c Data cards c ----------------------- c Material cards c ----------------------- c Pacific Northwest National Laboratory, Compendium Material Comp, March 2011 c c Water, liquid c density = 0.998 g/cm3 m1 1000 0.666657 $ H (element and atomic fraction) 8000 0.333343 $ O

215
c c Stainless steel (316L) c density = 8.000 g/cm3 m2 6000 0.001384 $ C 14000 0.019722 $ Si 15000 0.000805 $ P 16000 0.000518 $ S 24000 0.181098 $ Cr 25000 0.020165 $ Mn 26000 0.648628 $ Fe 28000 0.113247 $ Ni 42000 0.014434 $ Mo c c Cobalt c density = 8.900 g/cm3 m3 27000 1.0000 $ Co c c c ----------------------- c Source card c ----------------------- c Isotropic cylindrical Co-60 volume source c sdef POS=0 0 0 axs=1 0 0 ext=d1 rad=d2 erg=d3 par=2 $ Co-60 source c si1 0.001 0.35 $ axial source extent, sampling range sp1 -21 0 $ density constant with x c si2 0 0.03 $ radial source extent, sampling range sp2 -21 1 $ density proportional to radius c c Emission data from www.nndc.bnl.gov Nuclear Data Sheet 113, 1871 (2012) c not included very low emission prob (<0.03%) or very low energies (<10keV) si3 L 1.1732 1.3325 $ Discrete Co-60 energies in MeV sp3 99.87 100.00 $ Probability (normalised) c c c ----------------------- c Tally cards c ----------------------- c f6:p 107 108 109 110 111 112 113 114 115 fm6 1.6e-10 $ Convert MeV/g to Gy per source particle fc6 f6 Energy deposition (Gy) per source particle c c *f8:p,e 107 108 109 110 111 112 113 114 115 fc8 *f8 Energy deposition (MeV) per particle history c c c ----------------------- c Other data c ----------------------- mode p e $ Transport photons and electrons c $ Phys card defaults detailed physics cut:p j 0.01 $ Cut photon transport at 10keV nps 1000000000 $ Number of particle histories cut card print 110 $ Print first 50 histories End of File

216
G. MCNP5 Input File for Phantom Scatter Evaluation
The following input file was used to determine scatter correction factors for
phantoms of various size, for use in brachytherapy dosimetric audit, as described in Section
7.2.3. The file was appropriately modified to independently vary the water phantom and tally
cell radii. The input file included here is for an Ir-192 point source. The source definition was
amended for calculations with Co-60.
Effect of phantom size scatter on point Ir192 source c c Input file by Tony Palmer, 2013 c c ----------------------- c cell definitions c ----------------------- c 100 1 -0.998207 -1001 imp:p,e 1 $ Water sphere (material density surfaces) 101 1 -0.998207 1001 -1002 imp:p,e 1 $ Spherical shell for tally 102 1 -0.998207 1002 -1003 imp:p,e 1 $ Rest of water sphere 103 2 -0.001205 1003 -1004 imp:p,e 1 $ Air 104 0 1004 imp:p,e 0 $ Outside known universe c ----------------------- c surface cards c ----------------------- c 1001 sph 0 0 0 5.9 $ Sphere at origin, rad of inner edge sphere tally 1002 sph 0 0 0 6.1 $ Sphere at origin, rad of outer edge sphere tally 1003 sph 0 0 0 30 $ Sphere at origin, rad to edge of water phantom 1004 sph 0 0 0 80 $ Sphere at origin, rad to outside world c ----------------------- c Data cards c ----------------------- c Material cards c ----------------------- c Pacific Northwest National Laboratory, Compendium Material Comp, March 2011 c c Water, liquid c density = 0.998 g/cm3 m1 1000 0.666657 $ H (element and atomic fraction) 8000 0.333343 $ O c Air, dry, near sea level m2 6000 0.000150 $ C 7000 0.784431 $ N 8000 0.210748 $ O 18000 0.004671 $ Ar c c ----------------------- c Source card c ----------------------- c Point isotropic Ir-192 source at origin sdef POS 0 0 0 erg=d1 par=2 $ Ir-192 source c Emission data from www.nndc.bnl.gov Nuclear Data Sheet 113, 1871 (2012) c not included very low emission prob (<0.03%) or very low energies (<10keV) c Discrete Ir-192 energies in MeV and probability of emission si1 L 0.0615 0.0630 0.0633 0.0650 0.0651 0.0668 0.0711 0.0714 0.0714 0.736 0.0754 0.0757 0.0778 0.1364 0.2013 0.2058 0.2833 0.2960 0.3085 0.3165 0.3745 0.4165 0.4205 0.4681 0.4846 0.4891 0.5886 0.6044 0.6125 0.8845 1.0615 sp1 1.190 2.020 0.176 0.300 2.620 4.440 0.238 0.460 0.161 0.681 0.531 1.021 0.364 0.199 0.471 3.310 0.266 28.712 29.700 82.869 0.727 0.670 0.069 47.840 3.190 0.438 4.522 8.216 5.340 0.292 0.053 c c ----------------------- c Tally cards c ----------------------- c f6:p 101 $ in MeV/g per particle history fm6 1.6e-10 $ Convert MeV/g to Gy fc6 Energy deposition (Gy) per source particle $ Comment string for tally c c ----------------------- c Other data c ----------------------- mode p $ Transport photons 1000000000 $ Number of particle histories cut card print 110 $ Print first 50 histories End of File

217
H. MCNP5 Input File for the Effect of the Presence of EBT3 Film
on Measured Dose
The following input file was used to estimate the perturbation in delivered dose
due to the presence of EBT3 film from a uniform water medium case, for the geometries
involved in the BRAD phantom and dose to prescription Point A, as described in Section 7.2.4.
The input file below was modified to replace the film with water to calculate the undisturbed
case.
Effect of film side on to Co60 10mm source using 15mm film ring c c Input file by Tony Palmer, 2013 c c Simulation of source dwells in ring applicator c Source train 10mm length, 10mm from film edge, c Use film disc around source geometry to improve tally efficiency c Radiation traverse 15mm film to Point A c c ----------------------- c cell definitions c ----------------------- c c Source and capsule c 101 3 -8.900 -1001 1004 -1005 imp:p,e 1 $ Source 102 2 -8.000 1001 -1002 1004 -1005 imp:p,e 1 $ Capsule cylinder shell 103 2 -8.000 -1002 1003 -1004 imp:p,e 1 $ Capsule lower end cap 104 2 -8.000 -1002 1005 -1006 imp:p,e 1 $ Capsule upper end cap c c Boundaries of problem c 105 1 -0.998 (-1009 1006 -1007):(-1003 1008 -1007): (-1006 1003 1002 -1007) #107 #108 #109 #110 #111 #112 imp:p,e 1 $ Fill with water 106 0 1007:-1008:1009 imp:p,e 0 $ Outside known universe c c Tally cells c 107 1 -0.998 1011 -1007 1012 -1013 imp:p,e 1 $ tally lower layer 108 1 -0.998 1011 -1007 1013 -1014 imp:p,e 1 $ tally central layer 109 1 -0.998 1011 -1007 1014 -1015 imp:p,e 1 $ tally upper layer c c Film c 110 4 -1.35 1010 -1011 1012 -1013 imp:p,e 1 $ film lower layer 111 5 -1.20 1010 -1011 1013 -1014 imp:p,e 1 $ film central layer 112 4 -1.35 1010 -1011 1014 -1015 imp:p,e 1 $ film upper layer c ----------------------- c surface cards c ----------------------- c c EZ Bebig Co0.A86 simplified Co-60 1cm length source in steel capsule c 1001 cx 0.030 $ Outside radius source, inside radius steel capsule 1002 cx 0.045 $ Outside radius steel capsule 1003 px -0.02 $ Lower edge of lower end cap of capsule 1004 px 0.001 $ Upper edge of lower end cap of capsule, lower edge source 1005 px 1 $ Lower edge of upper end cap of capsule, upper edge source 1006 px 1.02 $ Upper edge of upper end cap of capsule c c Boundaries of problem c 1007 cx 5 $ Radius of edge of known universe 1008 px -5 $ Lower edge of known universe 1009 px 5 $ Upper edge of known universe c c Tally and film cell surfaces c 1010 cx 1 1011 cx 2.5 $ 1.5cm width ring 1012 px 0.4861 1013 px 0.4986 1014 px 0.5014 1015 px 0.5139 c ----------------------- c Data cards

218
c ----------------------- c Material cards c ----------------------- c Pacific Northwest National Laboratory, Compendium Material Comp, March 2011 c c Water, liquid c density = 0.998 g/cm3 m1 1000 0.666657 $ H (element and atomic fraction) 8000 0.333343 $ O c c Stainless steel (316L) c density = 8.000 g/cm3 m2 6000 0.001384 $ C 14000 0.019722 $ Si 15000 0.000805 $ P 16000 0.000518 $ S 24000 0.181098 $ Cr 25000 0.020165 $ Mn 26000 0.648628 $ Fe 28000 0.113247 $ Ni 42000 0.014434 $ Mo c c Cobalt c density = 8.900 g/cm3 m3 27000 1.0000 $ Co c c c EBT3 matte polyester film base c density = 1.35 g/cm3 m4 1000 0.36364 $ H 6000 0.45455 $ C 8000 0.18182 $ O c c EBT3 active film layer c density = 1.20 g/cm3 m5 1000 0.56800 $ H 3000 0.00600 $ Li 6000 0.27600 $ C 8000 0.13300 $ O 13000 0.01600 $ Al c c ----------------------- c Source card c ----------------------- c Isotropic cylindrical Co-60 volume source c sdef POS=0 0 0 axs=1 0 0 ext=d1 rad=d2 erg=d3 par=2 $ Co-60 source c simulating length of four source dwells in ring or ovoid applicator c si1 0.001 1 $ axial source extent, sampling range sp1 -21 0 $ density constant with x c si2 0 0.0325 $ radial source extent, sampling range sp2 -21 1 $ density proportional to radius c c Emission data from www.nndc.bnl.gov Nuclear Data Sheet 113, 1871 (2012) c not included very low emission prob (<0.03%) or very low energies (<10keV) si3 L 1.1732 1.3325 $ Discrete Co-60 energies in MeV sp3 99.87 100.00 $ Probability (normalised) c c c ----------------------- c Tally cards c ----------------------- c f6:p 107 108 109 T fm6 1.6e-10 $ Convert MeV/g to Gy per source particle fc6 f6 Energy deposition (Gy) per source particle c c *f8:p,e 107 108 109 T fc8 *f8 Energy deposition (MeV) per particle history c c c ----------------------- c Other data c ----------------------- mode p e $ Transport photons and electrons c $ Phys card defaults detailed physics cut:p j 0.01 $ Cut photon transport at 10keV nps 1000000000 $ Number of particle histories cut card ctme 0.1 $ 2880 $ Time cut card print 110 $ Print first 50 histories End of File

219
I. MCNP5 Input File for the Evaluation of Treatment Applicator
Attenuation
The following input file was used to calculate the dose attenuation due to the
presence of metallic treatment applicators, as described in Section 7.2.5. The file below is for
an Ir-192 source with a Varian titanium cervix applicator. The input file was modified for other
manufactures’ titanium and steel applicator dimensions with both Ir-192 and Co-60 sources.
Attenuation Varian Titanium Applicator, long 192Ir source c c Input file by Tony Palmer, 2014 c c ----------------------- c cell definitions c ----------------------- c 101 4 -22.42 -1001 1014 -1017 imp:p,e 1 $ Source 102 2 -7.860 1001 -1002 1014 -1017 imp:p,e 1 $ Capsule cylinder shell 103 2 -7.860 -1002 1013 -1014 imp:p,e 1 $ Capsule lower end cap 104 2 -7.860 -1002 1017 -1018 imp:p,e 1 $ Capsule upper end cap 105 3 -4.510 1003 -1004 1012 -1021 imp:p,e 1 $ Applicator cylinder shell 106 1 -0.998 1005 -1006 1015 -1016 imp:p,e 1 $ Tally cell, mid source, inner 107 1 -0.998 1007 -1008 1015 -1016 imp:p,e 1 $ Tally cell, mid source, middle 108 1 -0.998 1009 -1010 1015 -1016 imp:p,e 1 $ Tally cell, mid source, outer 109 1 -0.998 1005 -1006 1019 -1020 imp:p,e 1 $ Tally cell, above source, inner 110 1 -0.998 1007 -1008 1019 -1020 imp:p,e 1 $ Tally cell, above source, middle 111 1 -0.998 1009 -1010 1019 -1020 imp:p,e 1 $ Tally cell, above source, outer 112 1 -0.998 -1003 1012 -1013 imp:p,e 1 $ Fill inside applicator, below 113 1 -0.998 -1003 1018 -1021 imp:p,e 1 $ Fill inside applicator, above 114 1 -0.998 1002 -1003 1013 -1018 imp:p,e 1 $ Fill from capsule to applicator 115 1 -0.998 1004 -1011 1012 -1021 #106 #107 #108 #109 #110 #111 #117 #118 #119 imp:p,e 1 $ Fill water phantom 116 0 1011:-1012:1021 imp:p,e 0 $ Outside known universe 117 1 -0.998 1005 -1006 1022 -1023 imp:p,e 1 $ Tally cell, end source, inner 118 1 -0.998 1007 -1008 1022 -1023 imp:p,e 1 $ Tally cell, end source, middle 119 1 -0.998 1009 -1010 1022 -1023 imp:p,e 1 $ Tally cell, end source, outer c ----------------------- c surface cards c ----------------------- c 1001 cx 0.0325 $ Outside radius source, inside radius steel capsule 1002 cx 0.0425 $ Outside radius steel capsule 1003 cx 0.1 $ Inside radius metal applicator 1004 cx 0.15 $ Outside radius metal applicator 1005 cx 1.9 $ Inside radius first set tally cells 1006 cx 2.1 $ Outside radius first set tally cells 1007 cx 3.9 $ Inside radius second set tally cells 1008 cx 4.1 $ Outside radius second set tally cells 1009 cx 5.9 $ Inside radius third set tally cells 1010 cx 6.1 $ Outside radius third set tally cells 1011 cx 8 $ Radius of edge of known universe 1012 px -2 $ Lower edge of known universe 1013 px -0.1 $ Lower edge of lower end cap of capsule 1014 px 0.001 $ Upper edge of lower end cap of capsule, lower edge source 1015 px 2.5 $ Lower edge mid source tally cells 1016 px 3.5 $ Upper edge mid source tally cells 1017 px 6 $ Lower edge of upper end cap of capsule, upper edge source 1018 px 6.1 $ Upper edge of upper end cap of capsule 1019 px 8.5 $ Lower edge above source tally cells 1020 px 9.5 $ Upper edge above source tally cells 1021 px 11 $ Upper edge of known universe 1022 px 4.5 $ Lower edge end source tally cells 1023 px 5.5 $ Lower edge end source tally cells c ----------------------- c Data cards c ----------------------- c Material cards c ----------------------- c Pacific Northwest National Laboratory, Compendium Material Comp, March 2011 c c Water, liquid c density = 0.998 g/cm3 m1 1000 0.666657 $ H (element and atomic fraction) 8000 0.333343 $ O c c Stainless steel (202)

220
c density = 7.860 g/cm3 m2 6000 0.003405 $ C 7000 0.004866 $ N 14000 0.009708 $ Si 15000 0.000528 $ P 16000 0.000255 $ S 24000 0.188773 $ Cr 25000 0.086851 $ Mn 26000 0.659160 $ Fe 28000 0.046454 $ Ni c c Titanium c Material data from Elekta for Cervix Rotterdam Applicator c density = 4.510 g/cm3 m3 22000 1.0000 $ Ti c c Iridium c density = 22.42 g/cm3 m4 77000 1.0000 $ Ir c c ----------------------- c Source card c ----------------------- c Elongated source (6 cm) to simulate series of dwells in a straight channel c Isotropic cylindrical volume source c sdef POS=0 0 0 axs=1 0 0 ext=d1 rad=d2 erg=d3 par=2 $ Ir-192 source c si1 0 6 $ axial source extent, sampling range sp1 -21 0 $ density constant with x c si2 0 0.035 $ radial source extent, sampling range sp2 -21 1 $ density proportional to radius c c Emission data from www.nndc.bnl.gov Nuclear Data Sheet 113, 1871 (2012) c not included very low emission prob (<0.03%) or very low energies (<10keV) c Discrete Ir-192 energies in MeV and probability of emission si3 L 0.0615 0.0630 0.0633 0.0650 0.0651 0.0668 0.0711 0.0714 0.0714 0.736 0.0754 0.0757 0.0778 0.1364 0.2013 0.2058 0.2833 0.2960 0.3085 0.3165 0.3745 0.4165 0.4205 0.4681 0.4846 0.4891 0.5886 0.6044 0.6125 0.8845 1.0615 sp3 1.190 2.020 0.176 0.300 2.620 4.440 0.238 0.460 0.161 0.681 0.531 1.021 0.364 0.199 0.471 3.310 0.266 28.712 29.700 82.869 0.727 0.670 0.069 47.840 3.190 0.438 4.522 8.216 5.340 0.292 0.053 c c ----------------------- c Tally cards c ----------------------- c f6:p 106 107 108 $ in MeV/g per particle history fm6 1.6e-10 $ Convert MeV/g to Gy fc6 Energy deposition (Gy) per source particle, tallies at mid source c f16:p 117 118 119 fm16 1.6e-10 fc16 Energy deposition (Gy) per source particle, tallies end of source c f26:p 109 110 111 fm26 1.6e-10 fc26 Energy deposition (Gy) per source particle, tallies above source c c ----------------------- c Other data c ----------------------- mode p $ Transport photons c $ Phys card defaults detailed physics cut:p j 0.01 $ Cut photon transport at 10keV nps 1000000000 $ Number of particle histories cut card ctme 2880 $ Time cut card print 110 $ Print first 50 histories End of File

221
J. Questionnaire Used for the Survey of HDR/PDR Quality
Control Practice in the UK
The following questionnaire was emailed to all radiotherapy centres in the UK to survey HDR/PDR QC practice, see Section 3.2.1.
Survey of Quality Control Practices for HDR and PDR Brachytherapy in UK Please detail in the table below the HDR/PDR brachytherapy QC tests performed at your centre, their frequency and tolerance, and additional supporting information. By completing this survey you are providing consent for all of the data to be retained indefinitely and to be collated for the purposes of publication, however all data will be annonomised prior to any dissemination. Name and centre information is held purely for contact purposes. If you do not have either HDR or PDR equipment, can you please email to state this, and also whether you intend to purchase HDR/PDR in the future and anticipated timescale. Please return the completed document to [email protected]. Thank you, Tony Palmer. Name of person completing form: Email address: Date of completion of survey: Radiotherapy centre name and city: HDR or PDR: Equipment make and model: Source change frequency: Isotope: If applicable, 2nd HDR or PDR unit in Dept: Equipment make and model: Source change frequency: Isotope: Number of HDR and PDR fractions delivered per year: Session(s) (time of day) in which QC is generally performed: Use of measured or certificate source stength for treatment planning: Source strength first measurement method: Source strength second independent method: Origin of TG-43 source model data (manufacturer, journal or consensus data set): Inependent check method for treatment planning system generated plans: Imaging method for each clinical site/treatment technique: Prescription to point A or HR-CTV volume for cervix: Do you record Point A dose if prescribing to volume: Do you record ICRU OAR point doses or GEC-ESTRO DVH parameters or both? Do you perform treatment plan dwell optimisation, for which sites? Optimisation method for each clinical site/treatment technique: Please list the primary sources of guidance used in establishing your QC schedule: When was the content of your QC schedule last reviewed? Any further comments or additional information:

222
A
spec
t
QC
tes
t
Incl
ud
ed in
sch
ed
ule
d r
ou
tin
e Q
C
test
s at
yo
ur
cen
tre?
Met
ho
d u
sed
?
Per
form
ed b
y?
Targ
et m
easu
rem
ent
freq
uen
cy?
Typ
ical
ly a
chie
ved
mea
sure
men
t
freq
uen
cy?
Tole
ran
ce li
mit
(fo
r cl
inic
al u
se)?
Co
mm
ents
Source strength Initial measurement on receipt of source
Independent measurement on receipt
Repeated measurements during life of source
Leak testing of source
Treatment unit function Confirmation of accuracy of source data at treatment unit (calibration date and time, isotope)
Confirmation of decay correction accuracy performed by treatment unit for treatment plans
Plan data transfer check from TPS
Simulated treatment functionality test
Verification of machine timer accuracy
Operating system display and print-out as expected and in agreement
Test of function with mains power loss
Test of Uninterruptable Power Supply (UPS)
Applicators, source position and source movement
Visual inspection of applicators and transfer tubes for damage
Measurement of dimensions and angles of applicators and transfer tubes
X-ray imaging of applicators
Measurement verification of source dwell positions in straight catheter (not clinical applicator)
Measurement verification of source dwell positions within clinical applicators
Measurement verification of actual source dwell positions against TPS planned positions in complex geometry e.g. within applicator ring
Source position relative to dummy source or guide wires
Applicator/transfer tube connection interlock and simulated error
Verification of expected position of internal applicator shielding
Measurement of source transit times
Confirm that error code 'meanings and actions' are available at the treatment unit
Radiation monitor of applicators after use
Treatment planning system (TPS)
Check accuracy/consistency of source model data used by TPS i.e. TG-43 data, against reference values
Check accuracy of specific source data used by TPS e.g. source strength at calibration date, and decay corrected strength, against reference values
Calculation of standard plans compared to reference data
Calculation of standard plans using independent check calculation system compared to reference data and to TPS
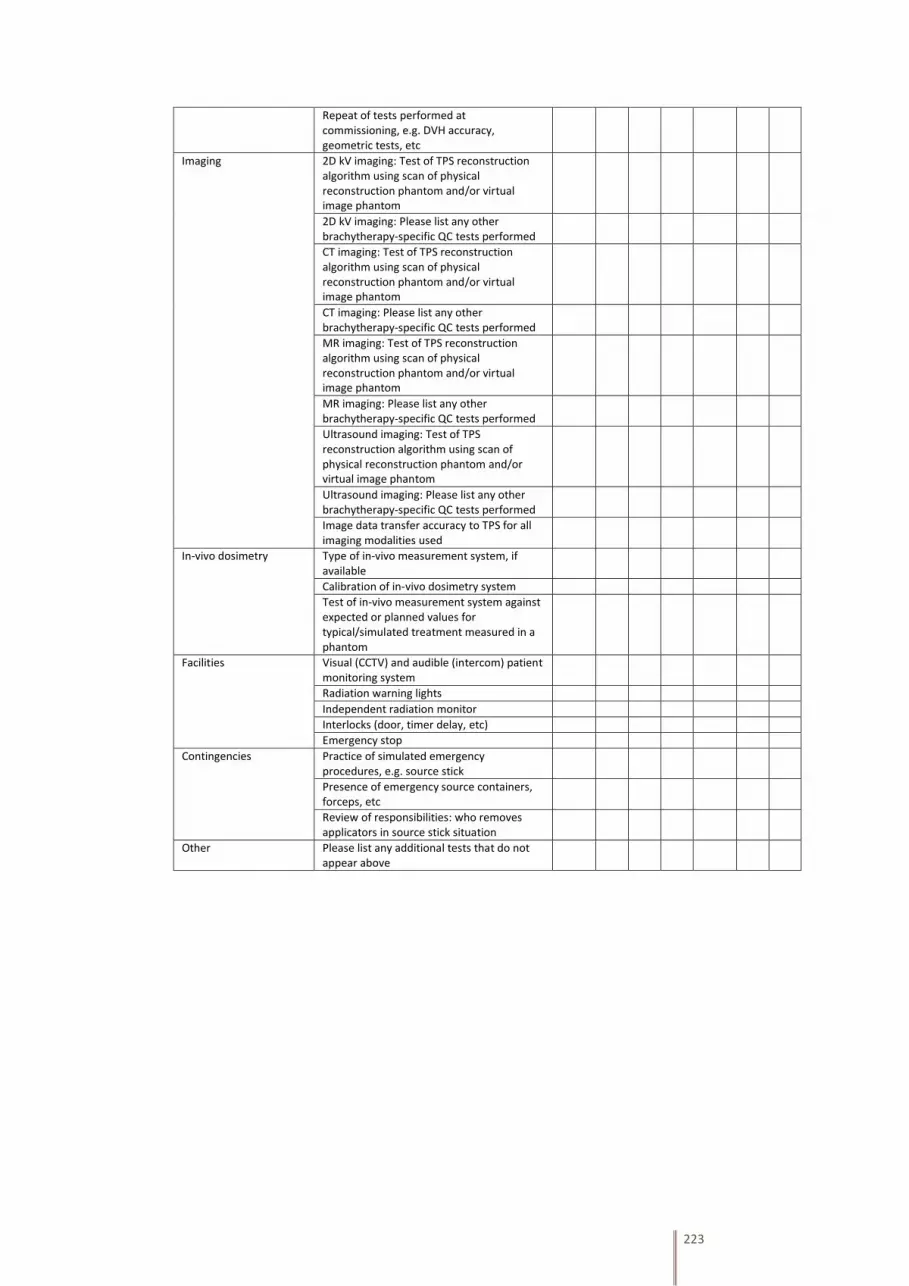
223
Repeat of tests performed at commissioning, e.g. DVH accuracy, geometric tests, etc
Imaging 2D kV imaging: Test of TPS reconstruction algorithm using scan of physical reconstruction phantom and/or virtual image phantom
2D kV imaging: Please list any other brachytherapy-specific QC tests performed
CT imaging: Test of TPS reconstruction algorithm using scan of physical reconstruction phantom and/or virtual image phantom
CT imaging: Please list any other brachytherapy-specific QC tests performed
MR imaging: Test of TPS reconstruction algorithm using scan of physical reconstruction phantom and/or virtual image phantom
MR imaging: Please list any other brachytherapy-specific QC tests performed
Ultrasound imaging: Test of TPS reconstruction algorithm using scan of physical reconstruction phantom and/or virtual image phantom
Ultrasound imaging: Please list any other brachytherapy-specific QC tests performed
Image data transfer accuracy to TPS for all imaging modalities used
In-vivo dosimetry Type of in-vivo measurement system, if available
Calibration of in-vivo dosimetry system
Test of in-vivo measurement system against expected or planned values for typical/simulated treatment measured in a phantom
Facilities Visual (CCTV) and audible (intercom) patient monitoring system
Radiation warning lights
Independent radiation monitor
Interlocks (door, timer delay, etc)
Emergency stop
Contingencies Practice of simulated emergency procedures, e.g. source stick
Presence of emergency source containers, forceps, etc
Review of responsibilities: who removes applicators in source stick situation
Other Please list any additional tests that do not appear above

224

225

226


![Monte Carlo-aided dosimetry of the symmetra model I25.S06 [sup 125]I, interstitial brachytherapy seed](https://img.pdfslide.net/doc/110x75/63542d3e25654d63c100effd/monte-carlo-aided-dosimetry-of-the-symmetra-model-i25s06-sup-125i-interstitial.jpg)


