Embed Size (px)
Citation preview


Pakistan Journal of Scientific and Industrial ResearchSeries A: Physical Sciences
EDITORIAL BOARD
Dr. Shahzad AlamChief Editor
Dr. Muhammad YaqubExecutive Editor
MEMBERS
Prof. R. Amarowicz
Polish Academy of SciencesOlsztyn, PolandDr. A. Chauhan
Nat. Institute of Pharma. Educationand Research, Mohali, IndiaDr. Debanjan Das
C.B. Fleet Company, Inc.,VA, USADr. S. Goswami
Rawenshaw University, Cuttack, India
Prof. S. Haydar
University of Engg. & TechnologyLahore, PakistanDr. H. Khan
Institute of Chemical SciencesUniversity of Peshawar, PakistanProf. W. Linert
Institute of AppliedSynthetic Chemistry,Vienna, Austria
Prof. R. Mahmood
Slippery Rock UniversityPennsylvania, USADr. S. K. Rastogi
Dept. of Chem. &Biochemistry, Texas StateUniversity, USADr. I. Rezic
Faculty of Textile TechnologyZagreb, Croatia
Editors: Ghulam Qadir Shaikh Shagufta Yasmin Iqbal Shahida Begum Sajid Ali
Pakistan Journal of Scientific and Industrial Research started in 1958, has been bifurcated in 2011 into:
Series A: Physical Sciences [ISSN 2221-6413 (Print); ISSN 2223-2559 (online)] (appearing as issues of January-February, May-June and September-October) andSeries B: Biological Sciences [ISSN 2221-6421 (Print); ISSN 2223-2567 (online)] (appearing as issues of March-April, July-August and November-December).Each Series will appear three times in a year.
This Journal is indexed/abstracted in Biological Abstracts and Biological Abstracts Reports, Chemical Abstracts, Geo Abstracts, CABInternational, BioSciences Information Service, Zoological Record, BIOSIS, NISC, NSDP, Current Contents, CCAB, Rapra Polymer Database,Reviews and Meetings and their CD-ROM counterparts etc.
Subscription rates (including handling and Air Mail postage): Local: Rs. 2500 per volume, single issue Rs. 425; Foreign: US$ 450 pervolume, single issue US$ 75.
Electronic format of this journal is available with: Bell & Howell Information and Learning, 300, North Zeeb Road, P.O. 1346, Ann Arbor,Michigan 48106, U.S.A; Fax.No.313-677-0108; http://www.proquest.com
Photocopies of back issues can be obtained through submission of complete reference to the Executive Editor against the payment of Rs.25 per page per copy (by Registered Mail) and Rs. 115 per copy (by Courier Service), within Pakistan; US$ 10 per page per copy (by RegisteredMail) and US$25 per page per copy (by Courier Service), for all other countries.
Copyrights of this Journal are reserved; however, limited permission is granted to researchers for making references, and libraries/agenciesfor abstracting and indexing purposes according to the international practice.
Printed and Published by: PCSIR Scientific Information Centre, PCSIR Laboratories Campus, Shahrah-e-Dr. Salimuzzaman Siddiqui,Karachi-75280, Pakistan.
Editorial Address
Executive EditorPakistan Journal of Scientific and Industrial Research, PCSIR Scientific Information Centre
PCSIR Laboratories Campus, Shahrah-e-Dr. Salimuzzaman Siddiqui, Karachi-75280, Pakistan
Tel: 92-21-34651739-40, 34651741-43; Fax: 92-21-34651738; Web: http://www.pjsir.org, E-mail: [email protected]
Dr. J. P. Vicente
ETSCE, Universitat Jaume ISpainProf. Z. Xie
Imperial CollegeLondon UniversityUKProf. Z. Xu
Chinese Academy of SciencesBeijing, China

AIMS & SCOPE
Pakistan Journal of Scientific and Industrial Research ( PJSIR ) was started in 1958 to disseminate
research results based on utilization of locally available raw materials leading to production
of goods to cater to the national requirements and to promote S&T in the country. Over the past
58 years, the journal conveys high quality original research results in both basic and applied
research in Pakistan. A great number of major achievements in Pakistan were first disseminated
to the outside world through PJSIR.
It is a peer reviewed journal and published in both print and electronic form. Original research
articles, review articles and short communications from varied key scientific disciplines are
accepted however, papers of Pure Mathematics, Computer Sciences, Engineering and Medical
Sciences are not entertained.
From 54th Volume in 2011, it has been bifurcated into Series A: Physical Sciences & Series
B: Biological Sciences. Each series appears three times in a year as follows:
Physical Sciences in January-February, May-June and September-October issues. It includes
research related to Natural Sciences, Organic Chemistry, Inorganic Chemistry, Industrial
Chemistry, Physical Chemistry, Environmental Sciences, Geology, Physics, Polymer Sciences
and Technology.
Biological Sciences in March-April, July-August and November-December issues. Papers
included in this series are from Agriculture, Agronomy, Botany, Biochemistry, Biotechnology,
Food Sciences, Genetic Engineering, Pharmaceutical Sciences, Microbiology, Marine Sciences,
Soil Sciences, Tissue Culture, Zoology and Technology.
Due to many global issues, we are encouraging contributions from scientists and researchers
from all across the globe with the sole purpose of serving scientific community worldwide on
the whole and particularly for our region and third world countries.

Pakistan Journal of Scientific and Industrial ResearchSeries A: Physical Sciences
Vol. 59, No.1, January-February, 2016
Contents
Preparation, Characterisation and Photocatalytic Activity of La-doped ZnO
Nanopowders Synthesised using Auto-Combustion
Makhtar Ahmad, Eijaz Ahmed, Muhammad Ikram, Zhanglian Hong, Abdul Hafeez,
Khalid Nadeem Riaz, Fezza Zafar, Niaz Ahmed Niaz and Waqar Ahmed 1
Kinetics of Adsorptive Removal of Drimarene Brilliant Red from Aqueous Solution
Using Untreated Agricultural Residues
Ch. Tahir Mehmood, Muhammad Arshad, Tayyab Ashfaq, Muhammad Bilal,
Muhammad Shafiq and Kiran Hina 11
Synthesis and Application of Highly Active Dithioxamide Functionalised Multi-Walled
Carbon Nanotubes Toward Mercury Removal from Aqueous Solution
Mirabi Ali, Shokuhi Rad Ali, Siadati Seyyed Amir and Alavi Tabari Seyyed Ali 23
Remote Controlling and Monitoring of Microscopic Slides
Ghulam Mustafa, Muhammad Tahir Qadri and Umar Daraz 30
Seasonal and Temporal Variations of Criteria Air Pollutants and the Influence of
Meteorological Parameters on the Concentration of Pollutants in Ambient Area in
Lahore, Pakistan
Amtul Bari Tabinda, Saleha Munir, Abdullah Yasar and Asad Ilyas 34
Evaluation of Groundwater Quality of Selected Boreholes in Ohaozara and
Ivo Council Areas of Ebonyi State, Nigeria
Omaka Ndukaku Omaka, Ifeanyi Francis Offor, David Obasi Igwe and Ewuzie Ugochukwu 43
The Comfort of Knitted Fabric as Affected by its Structure
Muhammad Qamar Tusief, Nabeel Amin, Mudassar Abbas and Zahid Hussain 52
Short Communications
An Investigation into the In situ Preparation of Hetero Bifunctional
Monochlorotriazinyl-Vinyl Sulphone Reactive Dyes for Cotton
Khalid Pasha and John Anthony Taylor 56

Activated Sludge Process and its Suitability for Treatment of Tannery Waste Water
Niaz Ahmed Memon, Nisar Ahmed, Nusrat Jalbani, Tahira Ayaz, Razia Bagum and
Alia Bano Munshi 60

Preparation, Characterisation and Photocatalytic Activity of
La-doped ZnO Nanopowders Synthesised using Auto-combustion
Mukhtar Ahmadab*
, Eijaz Ahmeda, Muhammad Ikram
a, Zhanglian Hong
b, Abdul Hafeez
c,
Khalid Nadeem Riazd, Fezza Zafar
a, Niaz Ahmed Niaz
a and Waqar Ahmed
ef
aDepartment of Physics, Bahauddin Zakariya University, Multan 60800, PakistanbState Key Laboratory of Silicon Materials, Department of Materials Science & Engineering,
Zhejiang University, Hangzhou 310027, ChinacScience and Technology Division, University of Education, Lahore, Pakistan
dDepartment of Physics, University of Gujrat, Gujrat 50700, PakistaneInstitute of Nanotechnology and Bioengineering, University of Central Lancashire, School of Medicine,
Preston PR1 2HE, United KingdomfDentistry and School of Pharmacy, Preston PR1 2HE, United Kingdom
(received August 18, 2014; revised August 9, 2015; accepted August 18, 2015)
Pak. j. sci. ind. res. Ser. A: phys. sci. 2016 59 (1) 1-10
Introduction
Fabrication and characterisation of semiconducting
nanostructured materials have received considerable
attention over the last few years due to increasing
influence on our everyday life (Suwanboon and
Amornpitoksuk, 2011; Wang and Herron, 1991). Zinc
oxide (ZnO) has attracted interest due to its photocatalytic
ability useful for the degradation of environmental
pollutants and is attractive alternative to TiO2 as a
photoactive catalyst (Kaneva et al., 2011; Anandan
et al., 2007). ZnO has exhibited superior performance
with lower cost compared to TiO2 in degrading organic
dyes in acidic and basic media. It has a hexagonal
wurtzite structure with an n-type conductivity (Reddy
et al., 2011; Chen et al., 1998). The structural, optical,
electrical and physical properties of ZnO nanoparticles
and the effects of doping on these properties have been
studied earlier by several researchers (Ahmad et al.,
2013; Shinde et al., 2006; Ismail et al., 2001). Dramatic
changes in the electrical and optical properties of ZnO
and unique properties due to doping have been observed
by Bouderbala et al. (2008). Due to its useful properties,
ZnO has been used in photocatalytic applications (Xiao
et al., 2015; Zhou et al., 2009). ZnO is an ideal catalyst
in photocatalysis since it is nontoxic with holes of strong
oxidising power and being inexpensive (Peng et al.,
2007). When ZnO nanoparticle is illuminated with a
light of appropriate wavelength, the valence band
potential is positive enough to generate hydroxyl radicals
at the surface, and the conduction band potential is
negative enough to reduce molecular O2. The hydroxyl
radical is a powerful oxidising agent and can attack
organic pollutants present at or near the surface of the
ZnO to degrade it. However, the photocatalytic efficiency
at the present stage is still very low, which is mainly
caused by the fast recombination of photogenerated
electron-hole pairs during photocatalysis. Thus, further
improving the photocatalytic efficiency is still a major
challenge in the research field of photocatalysis until*Author for correspondence; E-mail: [email protected]
Abstract. Nanocrystalline nanoparticles of pristine ZnO and La-doped ZnO have been synthesised using
a combustion method using various concentrations of lanthanum dopant followed by calcination for 3 h
at 700 °C. The crystalline structure, chemical composition and optical characteristics have been characterised
using X-ray diffraction (XRD), scanning electron spectroscopy (SEM) attached with energy dispersive
X-ray (EDX) spectroscopy, Brunauer Emmett Teller (BET), UV-vis. spectroscopy and photoluminescence
(PL) spectroscopy. Absorption spectra showed that the absorbance increased with La-doping and the blue
shift observed was due to an increase in the band gap from 3.24 to 3.27 eV. The photocatalytic activities
of the samples prepared were evaluated using the photocatalytic degradation of methyl orange (MO) under
irradiation by sunlight. The textile mill effluents containing organic matter were also irradiated with sunlight
inducing photocatalysis and the chemical oxygen demand (COD) of the treated effluent were investigated.
The results showed that the ZnO photocatalyst doped with 1.0 at.% lanthanum exhibited four times
enhancement in the photocatalytic activity compared to pure ZnO.
Keywords: ZnO, combustion, XRD, photocatalysis, methyl orange, La-doped ZnO
1
now. Therefore, for enhancing photocatalytic activity
of ZnO, doping of metal or nonmetal ions is a useful
technique (Abed et al., 2015; Elangoran et al., 2015).
Metal doping induces localized states between the
valence band and the conduction band. These mid-gap
states could trap temporarily the photogenerated electron-
hole pairs, thus suppress the recombination of charge
carriers (Wan et al., 2015; Zhao et al., 2015). Recent
research has been focused on the doping of ZnO by
lanthanide ions with 4f electron configuration.
Lanthanide ions can form complexes with various Lewis
bases including organic acids, amines, aldehydes,
alcohols, and thiols by the interaction of the functional
groups with their f-orbital (Ahmad et al., 2015). Thus,
doping lanthanide ions into a ZnO matrix could provide
a means to concentrate organic pollutants on the
semiconductor surface and therefore, can improve the
separation efficiency of photo-induced electron-hole
pairs of ZnO to enhance the photoreactivity (Ahmad
et al., 2015; Ciciliati et al., 2015).
In this study, pure ZnO and La-doped ZnO using the
auto-combustion technique has been synthesised
producing highly pure nanocrystalline powders with
large surface area at relatively low temperatures (Hwang
and Wu, 2004). Variations in the properties of ZnO
powders were studied as a function of the lanthanum
dopant concentrations.
Materials and Methods
Synthesis of undoped and La-doped ZnO nano-
powders. Pure and La-doped ZnO nanopowders were
synthesised using the combustion technique. Zinc nitrate
(Zn(NO3)2.6H2O) and glycine (NH2CH2COOH) were
used as starting reagents. The zinc nitrate served as a
source of zinc and as an oxidising agent whereas glycine
acted as a fuel (Ahmad et al., 2013).
Precursor formation. For pure ZnO, homogeneous
mixture of glycine and zinc nitrate was obtained by
mixing them together in the optimised molar ratio
(Ahmad et al., 2012a) through magnetic stirring. This
resulted in the formation of transparent slurry by
absorbing moisture from air due to the hygroscopic
nature of zinc nitrate. The slurry was then dehydrated
at 130 °C to obtain precursor using a hot plate.
Auto-ignition. The precursor was heated at 200 °C to
cause precursor ignition. During combustion the
evolution of gases occurred with generation of heat.
Heat treatment at 700 °C was done for 3 h resulting in
the liberation of gases and formation of dry, crystalline
white ZnO powders. For the preparation of La-doped
ZnO samples, lanthanum nitrate [La(NO3)3.6H2O] was
added to the initial mixture of zinc nitrate and glycine.
Rest of the process was similar to that used for pure
ZnO. The following chemical reaction occurs during
the synthesis of La-doped ZnO samples:
Glycine
Characterisation. Powder X-ray diffraction (XRD)
patterns of as-synthesised ZnO and La-doped ZnO
samples were recorded using a Rigaku Dmax-IIIA X-
ray diffractometer with Ni filtered Cu Ka radiation
source. The surface morphology, particle size and
compositional analysis of photocatalysts were examined
using a scanning electron microscope (Hitachi S-4800)
with EDX and transmission electron microscope (JEOL
JEM 1200EX) and X-ray photoelectron spectroscopy
(XPS, VG ESCALAB MARK II) with a monochromatic
Mg Ka X-ray source. Specific surface areas of samples
were determined using Brunauer Emmett Teller (BET)
surface area analyzer (NOVA 2200e Quantachrome,
USA) using nitrogen as a purge gas. UV-vis diffuse
reflectance spectra (DRS) were measured in the range
of 380-460 nm using a Hitachi U-4100 UV-vis pectro-
meter. PL emission spectra were recorded using Hitachi
F-4500 fluorescence spectrophotometer. The sample
excitation was made at 325 nm at room temperature.
Measurement of photocatalytic activity. Photocatalytic
activities of ZnO and La-doped ZnO nanopowders were
estimated by monitoring the degradation of methyl
orange (MO) as a model compound in a self-assembled
apparatus under natural sunlight radiation source. In
this study, photocatalytic activities under natural sunlight
were investigated. The peak at 464 nm was used to
monitor the photocatalytic degradation of MO. For the
photocatalytic experiment, 50 mg photocatalysts were
suspended in MO aqueous solution (50 mL) with a
concentration of 20 mg/L in a beaker. The suspension
was magnetically stirred for 30 min to reach the
adsorption/desorption equilibration without light
exposure. This was followed by a photocatalytic reaction
started by the exposure of the desired light. The
temperature of the suspension was kept at about 20 °C
by an external cooling jacket with recycled water. After
a setup exposure time, 5 mL suspension was sampled,
centrifuged and the supernatant was taken out for uv-
2 Mukhtar Ahmad et al.
Zn(NO3)2.6H2O + La(NO3)3.6H2O ®Zn1-xLxO
+ Gases (CO2 + N2+ H2O vapours)
vis absorption spectrum measurement. The intensity of
the main absorption peak of the MO dye was referred
to as the measure of the residual dye concentration.
Analytical method. Total organic carbon (TOC) content
was measured after the degradation of model dye in the
presence of the photocatalysts under sunlight irradiation
(Mukherjee, 2011). After photodegradation, the total
organic carbon content of model dye was observed to
decrease with time. The decrease of carbon content
indicates the degradation of the organic dye into nontoxic
decomposed compounds. Moreover, the mineralisation
of substrate was measured by chemical oxygen demand
(COD) reduction method. Chemical oxygen demand of
textile effluent was estimated before and after the
photocatalytic treatment with a standard dichromate
method, using COD digester. Arsenic effluent was
diluted to facilitate light penetration through solution
and the initial COD of diluted effluent was 412 mg/L.
The amount of catalysts was 50 mg/25 mL and an
average intensity of sunlight was 1.20 × 10⁵ lux during
the photocatalytic measurements. The percentage
photodegradation efficiency (h) was calculated from
the following expression:
Where:
CODi = before treatment
CODf = after treatment
All the experiments were performed under the same
experimental conditions such as sunlight irradiation
(between 9 am and 3 pm), constant temperature, pH
and photocatalyst load etc.
Results and Discussion
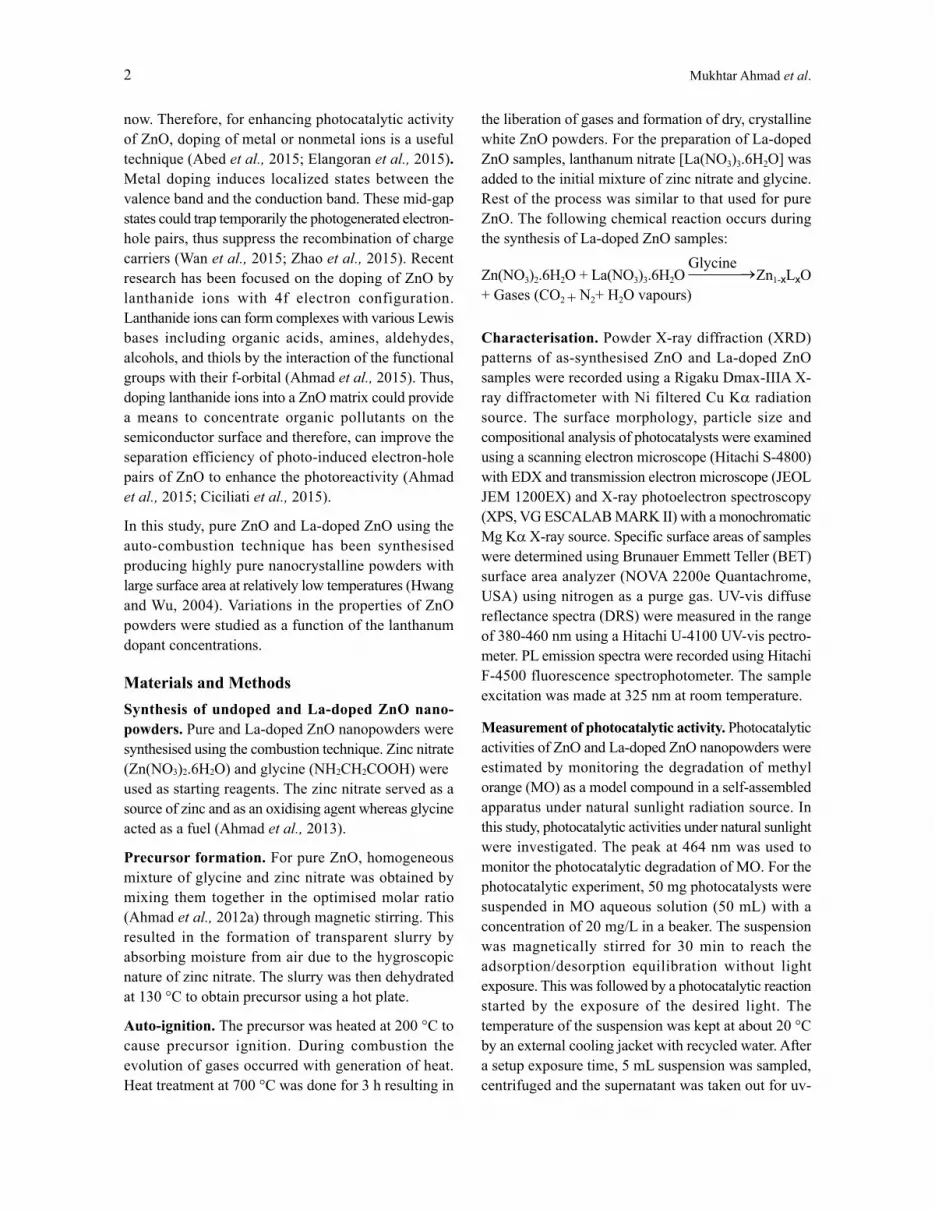
XRD analysis. Figure 1 shows powder X-ray diffraction
patterns of pure ZnO and La-doped ZnO as a function
of lanthanum dopant concentrations. The physical
characteristics such as crystallite size and unit cell
parameters are presented in Table 1. The strong and
sharp peaks existing in the XRD spectra show the
presence of wurtzite structure of ZnO. The strong peaks
are located at an angle (2q) of 31.7°, 34.4° and 36.2°
correspond to (1 0 0), (0 0 2) and (1 0 1) along with the
other peaks which are found at the angles of 47.5o,
56.6°, 62.9°, 66.4°, 67.9°, 69.2°, 72.7° and 77.0°
correspond to (1 0 2), (1 1 0), (1 0 3), (2 0 0), (11 2),
(2 0 1), (0 0 4) and (2 0 2) planes, which all are found
in correspondence to those given in JCPDS 05-0664
and previous studies (Ghouri et al., 2014; Ahmad et al.
2013). The diffraction patterns of La-doped ZnO were
similar to the undoped ZnO showing that lanthanum
doping in ZnO did not affect its crystal structure.This
also indicates that La3+ is uniformly dispersed on ZnO
nanoparticles in the form of small La2O3 cluster
(Anandan et al., 2007). The observed peaks for La-
doped ZnO, however, are wider with the width increasing
with increasing La-content. La-doping caused a random
variation in diffraction peak intensities. Intensity
decreased up to 2.0 at% La-content and then increased.
The change in the intensity and width of the observed
diffraction peaks as a function of La-content is attributed
to the decrease in the crystallite size (Suwanboon and
Fig. 1. X-ray diffraction patterns of pure ZnO and
La-doped ZnO sample
h =CODi - CODf
CODix100
Table 1. Crystallite size and unit cell parameters of
pure ZnO and La-doped ZnO sample.
Photocatalysts Crystallite Lattice parameterssize (nm) �a� (Å) �c� (Å)
Pure ZnO 27 3.254 5.208
1.0 at.% La- 24 3.258 5.203
doped ZnO
2.0 at.% La- 22 3.262 5.199
doped ZnO
4.0 at.% La- 23 3.263 5.195
doped ZnO
8.0 at.% La- 19 3.265 5.186
doped ZnO
3La-doped ZnO Nanopowders Synthesis
10 20 30 40 50 60 70 80
20
20
04
20
111
22
0010
3
11
0
10
2
10
10
02
8.0 at% La-doped ZnO
4.0 at% La-doped ZnO
2.0 at% La-doped ZnO
1.0 at% La-doped ZnO
ZnO
Inte
nsity (
a.u
.)
10
0
2q (degree)

Amornpitoksuk, 2011; Flickyngerova et al., 2008;
Anandan et al., 2007), which goes on changing inversely
with change in La concentration. Lattice parameters �a�
and �c� were estimated using the formula:
Lattice parameters and crystallite size variation as
functions of La-content were calculated. The calculated
values of lattice parameters �a� and �c� are 3.254 Å and
5.208 Å while for 2.0 at.% La-doped ZnO are 3.262 Å
and 5.199 Å, respectively. Lattice parameters increased
with increase in La-content which is obvious as ionic
radius of Zn+2 is 0.074 nm and that of La+3 is 0.106
(Suwanboon and Amornpitoksuk, 2011) and lattice
parameters should expand if ionic radius of the dopant
is greater as compared to Zn ions (Dole et al., 2011).
Average crystallites sizes were estimated using the full
width at half maximum (FWHM) of highly intense
diffraction peak in Debye-Scherrer�s formula (Culity
and Stock, 2001).
Average crystallite size estimated for pure ZnO to be
27 nm which decreases up to 19 nm with increase in
La-content. It is interesting to note that the particle size
of La doped ZnO is smaller as compared with that of
the pure ZnO. The decrease in the particle size of La-
doped ZnO is mainly attributed to the formation of
La�O�Zn on the surface of the doped samples, which
hinders the growth of crystal grains (Korake et al.,2014;
Jia et al., 2009; Anandan et al., 2007).
SEM, EDX and TEM. Figure 2(a-d) displays the
surface morphology of pure ZnO and 2.0 at% La-doped
ZnO nanopowders. SEM micrographs of pristine ZnO
nanopowders exhibited clusters of tiny particles, whilst
2.0 at% La-doped ZnO nanopowders revealed flakes
of ultrafine particles with voids or holes. The high
porosity in the nanopowders could be attributed to the
liberation of large amount of gaseous products such as
H2O vapours, CO2 and N2 during combustion process
(Ahmad et al., 2013b). TEM images in Fig. 2, show
that, for undoped ZnO nanopowders, the particles are
spherical and. larger and, while for 2.0 at% La-doped
ZnO nanopowders, they are smaller and quasi spherical.
Lanthanum doping thus changes the morphology of the
1
dhkl
h2 + k2 + hk
a2=
4
3+
l 2
c2
2
0.9lb cosq
t =
Fig. 2. (a-d) SEM micrograph of (a) pure ZnO and
(b) 2.0 at% La-doped ZnO samples; TEM
images of (c) pure ZnO and (d) 2.0 at% La-
doped ZnO sample.
4 Mukhtar Ahmad et al.

final product. TEM investigations of all of the samples
revealed that the crystallites are of nanometer size. The
diameter of ZnO and 2.0 at% La-doped ZnO were found
to be about 33 and 24 nm, respectively agreeing with
the XRD results. The chemical compositional analysis
is important for monitoring the concentration of the
dopant. Figure 3 shows the EDX spectra of undoped
ZnO and La-doped ZnO nanoparticles. The EDX
spectrum of the La-doped ZnO displays a clear
lanthanum line at 4.65 keV showing La doping. No
traces of other elements were found in the spectra which
confirm the purity of the samples. Also Table 2 shows
the atomic percentage of Zn, La and O for undoped and
La-doped ZnO samples. Here the actual concentration
of La is found to be 1.76 at% for 2.0 at% La-doped
ZnO sample.
XPS analysis. The nature and the co-ordination of the
elements present in the La-doped ZnO were investigated
by X-ray photoelectron spectroscopy (XPS). The La 3d
spectrum of 2.0 at% La-doped ZnO is shown in Fig. 4. The spectrum exhibits two components with the binding
energy values of 837.1 eV and 840.0 eV. The highest
energy contribution is assigned to the bonding between
lanthanum and zinc while the lowest energy contribution
is attributed to the bonding in the lanthanum oxide
clusters (Anandan et al., 2007). These results demonstra-
ted that the bonding between the lanthanum and zinc
has occurred and the interaction between the lanthanum
oxide clusters and the ZnO surface are strongly
developed.
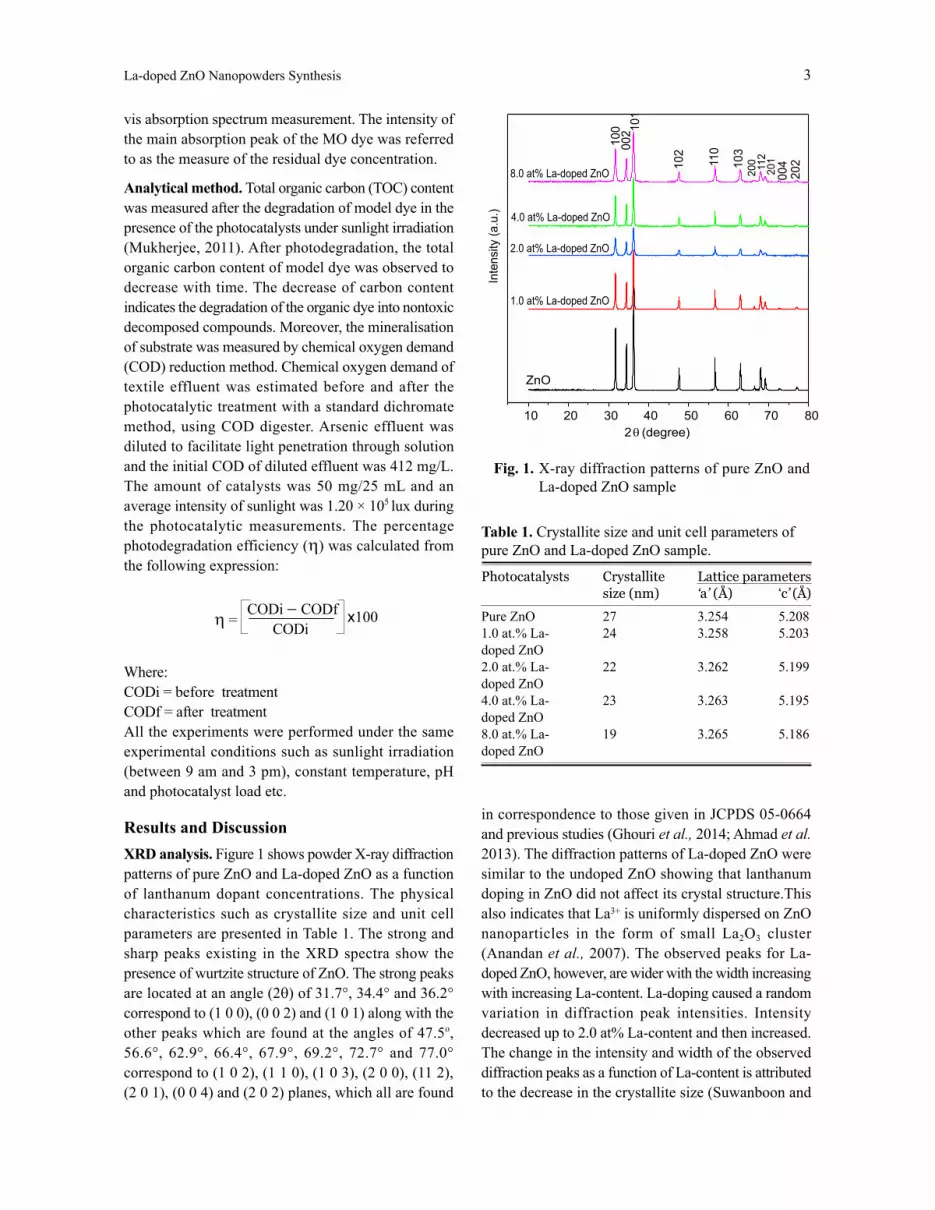
UV-visible spectra. Optical properties of ZnO and La-
doped ZnO photocatalysts with different La-content
were measured by diffuse reflectance spectroscopy
(DRS) at room temperature. The absorbance spectra of
different samples are shown in Fig. 5. The band edge
for the ZnO sample was appeared at about 387 nm
while the band edges of the La-doped ZnO samples
was shifted to shorter wavelength regions with higher
absorption intensity after La-doping. The blue shift in
wavelength is attributed to gradual increase in band gap
of ZnO on La-doping. The absorbance coefficient (a)
was calculated from the raw absorbance data to obtain
the optical band gap (Eg). The band gap values were
thus determined by the extrapolation of the linear portion
of the (ahn)2 curve versus the photon energy hn and
are shown in Table 3. With increasing the La-content
from 0.0 at% to 8.0 at%, the band gap energies increased
in the range of 3.24-3.27 eV as shown in Fig. 6. The
following explanation may be given; the band gap of
ZnO is about 3.37 eV whereas that of La2O3 is about
0 1 2 3 4 5 6 7 8 9 10
Zn KaLa
Zn La
O K
a
2.0 at.% La-doped ZnO
ZnOInte
nsity
(a.u
.)
Energy (keV)
Zn K
b
Zn La
O K
a
Zn Ka
Zn K
b
Fig. 3. EDX pattern of ZnO and 2.0 at%La-doped
ZnO sample.
846 844 842 840 838 836 834 832 830 828
837.1 eV
La-3d
Counts
(a.u
.)
Binding Energy (eV)
840.0 eV
Fig. 4.XPS high resolution spectra of La-3d region
for 2 at % La- ZnO sample.
Table 2. Chemical composition (atomic % of ZnO and
La-doped ZnO sample.
Element Zn (at%) O (at%) La (at%) Total
(at%)
ZnO 50.68 49.32 - 100
2.0 at% 48.73 49.51 1.76 100
La-doped
ZnO
5La-doped ZnO Nanopowders Synthesis
5.5 eV (Jia et al., 2009), which is much higher than that
of pure ZnO. An additional energy level could be formed
above the conduction band of ZnO due to the La-doping.
Furthermore, this could be attributed to the quantum
size effect as well as the strong interaction between the
surface oxides of Zn and La. These observations strongly
suggest that the La doping significantly affects the
particle size and hence the absorbance properties.
Moreover, these results are in good agreement with the
conclusion derived from the XRD results and a similar
result has also been reported in La-doped TiO2 by
Liqiang et al.(2004) and La-doped ZnO by Anandan
et al. (2007).
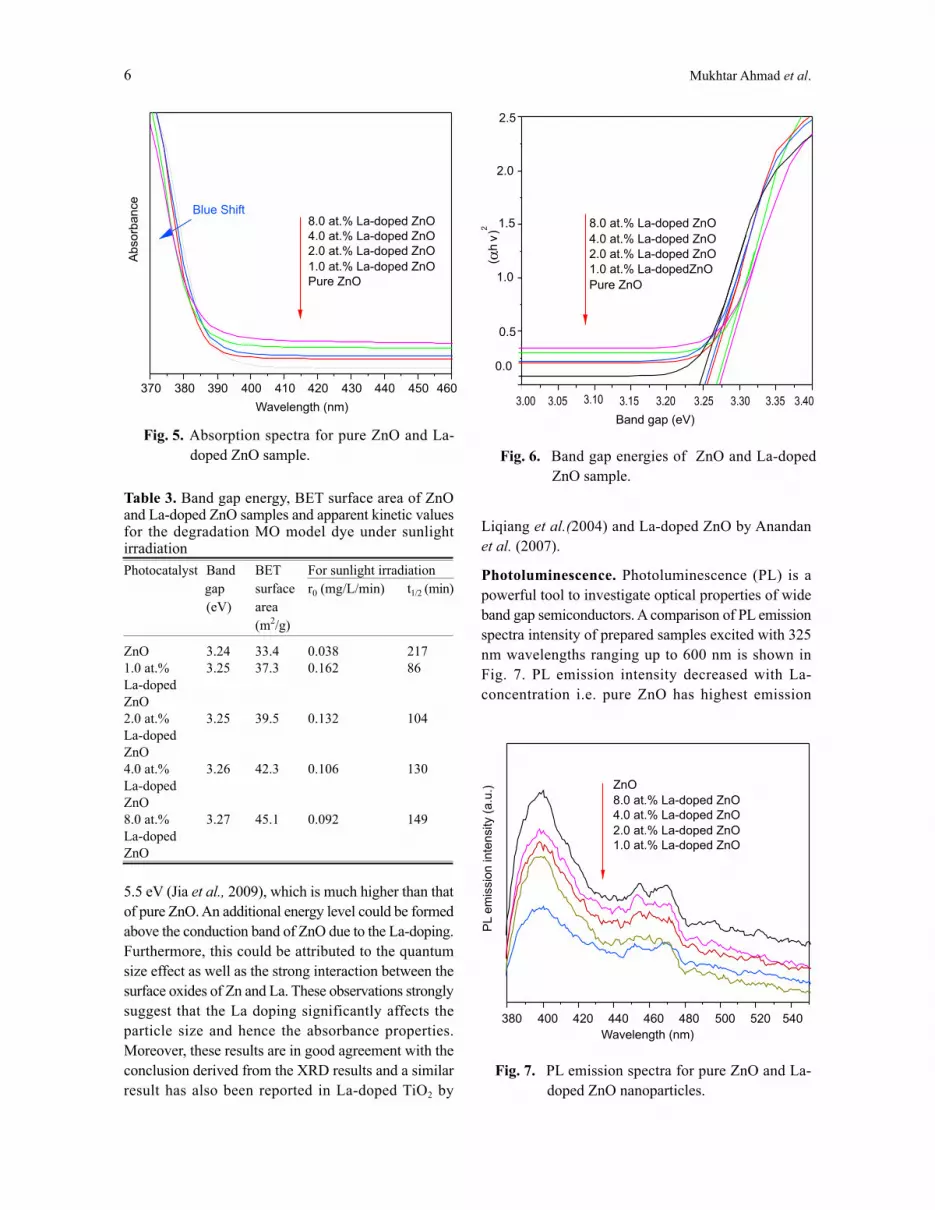
Photoluminescence. Photoluminescence (PL) is a
powerful tool to investigate optical properties of wide
band gap semiconductors. A comparison of PL emission
spectra intensity of prepared samples excited with 325
nm wavelengths ranging up to 600 nm is shown in
Fig. 7. PL emission intensity decreased with La-
concentration i.e. pure ZnO has highest emission
8.0 at.% La-doped ZnO
4.0 at.% La-doped ZnO
2.0 at.% La-doped ZnO
1.0 at.% La-doped ZnO
Pure ZnO
Absorb
ance
Wavelength (nm)
Blue Shift
370 380 390 400 410 420 430 440 450 460
Fig. 5. Absorption spectra for pure ZnO and La-
doped ZnO sample.
PL e
mis
sio
n in
ten
sity (
a.u
.)
380 400 420 440 460 480 500 520 540
Wavelength (nm)
ZnO
8.0 at.% La-doped ZnO
4.0 at.% La-doped ZnO
2.0 at.% La-doped ZnO
1.0 at.% La-doped ZnO
Fig. 7. PL emission spectra for pure ZnO and La-
doped ZnO nanoparticles.
3.00 3.05 3.10 3.15 3.20 3.25 3.30 3.35 3.40
0.0
0.5
1.0
1.5
2.0
2.5
8.0 at.% La-doped ZnO
4.0 at.% La-doped ZnO
2.0 at.% La-doped ZnO
1.0 at.% La-dopedZnO
Pure ZnO
Band gap (eV)
( ah
v)2
Fig. 6. Band gap energies of ZnO and La-doped
ZnO sample.
6 Mukhtar Ahmad et al.
Table 3. Band gap energy, BET surface area of ZnOand La-doped ZnO samples and apparent kinetic valuesfor the degradation MO model dye under sunlightirradiation
Photocatalyst Band BET For sunlight irradiation
gap surface r0 (mg/L/min) t1/2 (min)
(eV) area
(m2/g)
ZnO 3.24 33.4 0.038 217
1.0 at.% 3.25 37.3 0.162 86
La-doped
ZnO
2.0 at.% 3.25 39.5 0.132 104
La-doped
ZnO
4.0 at.% 3.26 42.3 0.106 130
La-doped
ZnO
8.0 at.% 3.27 45.1 0.092 149
La-doped
ZnO

intensity, which can be attributed to several defects such
as oxygen and zinc vacancies or oxygen and zinc
interstitials (Ismail et al., 2001). However, the addition
of La ions tends to stop the reduction in the band gap
resulting in lower PL emission intensity first and then
increasing with increasing dopant La-content.
Photocatalytic activity. Pristine ZnO and doped ZnO
are well known catalysts used in photocatalytic
degradation of pollutants. Photocatalytic activities of
the ZnO and La-doped ZnO samples were determined
through a series of experiments carried out for
degradation of methyl orange (MO) in aqueous
suspension under natural sunlight irradiation. A blank
experiment study of MO degradation without catalyst
loading under the same condition was also observed.
The results indicate that the mere photolysis can be
ignored as the corresponding degradation is about 0.3%
after irradiations for 2 h. Figure 8 shows a comparison
of photocatalytic performances of pure ZnO and La-
doped ZnO nanoparticles. About 9% of the MO was
adsorbed for ZnO sample upon stirring for 30 min in
the dark and increased for La-doped ZnO in comparison
to ZnO nanopowders. The pronounced adsorption is
due to increase in specific surface area, increase in
porosity and defects creation within band gap by
lanthanum doping. Photocatalytic degradation of MO
follows pseudo first-order reaction kinetics for low dye
concentrations
ln(C0/C) = kappt
where:
kapp = the apparent constant, used as the basic kinetic
parameter for different photocatalysts; C0 = the initial
concentration of MO in aqueous solution and C = the
residual concentration of MO at time t.
The initial degradation rate (r0=kappC0) of 20 mg/L MO
with different photocatalysts was studied and the results
are presented in Table 3. The photodegradation rate of
MO follows the ascending order; 1.0 at% La-doped
ZnO > 2.0 at% La-doped ZnO > 4.0 at% La-doped ZnO
> 8.0 at% La-doped ZnO > ZnO > commercial ZnO.
The degradation rate under sunlight for 1.0 at% La-
doped ZnO photocatalyst was found superior to other
La-doped ZnO and ZnO samples. The specific surface
areas were seen to increase gradually with the increasing
lanthanum content (Table 3) enhancing the adsorption
performance. The photocatalytic efficiency of La-doped
ZnO mainly originates from the formation of La-O-Zn
bonds on ZnO surface. Photocatalytic degradation rate
of MO is observed to be lower under La-doped ZnO.
Table 3 shows that the degradation rate of MO enhanced
with La-content up to 1.0 at% La-content and then
decreased with La-loading leading to the conclusion
that 1.0 at% doping concentration is the optimum loading
to ZnO that is more efficient in separating photoinduced
electron-hole pairs which in turn increases photoactivity
of ZnO. The high photocatalytic activity at 1.0 at% La-
doped ZnO can be explained as follows: lanthanum ions
in ZnO can result in the formation of a space charge
layer on the surface of ZnO which acts as a barrier for
recombination of photoinduced electron-hole pairs
resulting in an increase in the photocatalytic activity.
This increase was observed up to 1.0 at% La-doping in
the present study. The decrease in photocatalytic activity
of ZnO beyond 1.0 at% La-doping is justified as: The
incorporation of lanthanum beyond 1.0 at% is supposed
to likely result in the formation of more La-O-Zn bond
on ZnO surface due to which surface charge region is
negatively affected causing a decrease in its efficiency
to separate the photoinduced electron-hole pairs and
instead of acting as traps sites for photoinduced electron-
hole pairs, it acts as recombination centre (Jia et al.,
2009). This results in decrease of photocatalytic activity
of ZnO.
Fig. 8. Photocatalytic activity of pure ZnO,
Commercial ZnO and La-doped ZnO
nanopowders for MO degradation under
sunlight irradiation.
7La-doped ZnO Nanopowders Synthesis
0 30 60 90 120 15020
30
40
50
60
70
80
90
100
110
Irradiation Time (min)
PhotocatalysisAdsorption
1.0 wt.% La-doped ZnO 2.0 wt.% La-doped ZnO
Blank ZnO (com.) ZnO
4.0 wt.% La-doped ZnO 8.0 wt.% La-doped ZnO
(%)
C/C
0

A simple mechanism to understand the enhancement
of photocatalytic activity of La-doped ZnO photo-
catalysts is the loading of lanthanum metals on the ZnO
surface, which can accelerate the transport of photo-
generated electrons to the outer systems. The transfer
of electrons to the deposited metal causes these to
become negatively charged (Behnajady et al., 2009).
In the photocatalytic systems, lanthanum deposited on
the ZnO surface increased the photocatalytic activity
by accelerating the transfer of electrons to dissolved
oxygen molecules. Superoxide anion radical was
prepared as a result of oxygen reduction by transfer of
trapped electrons from lanthanum metal to oxygen.
Consequently, the recombination of the photo-generated
carriers were effectively suppressed leading to an
increase in the photo-oxidation efficiency. The photo-
catalyst 1.0 at% La-doped ZnO exhibited superior
catalytic performance, but further increase in the
concentration of lanthanum would decrease photo-
catalytic activity because too much doping of lanthanum
is likely to serve as recombination centre than as trap
sites for the charge transfer at the interface. The total
organic carbon (TOC) content was measured after the
degradation of methyl orange dye in the presence of
the photocatalysts under sunlight irradiation. After
photodegradation the total organic carbon content of
MO was observed to decrease with time and the results
are presented in Fig. 9. TOCo and TOCt are the initial
concentration and the reaction concentration of MO,
respectively. The experimental data are fitted using the
pseudo-first-order kinetic equation.
During dye production and textile manufacturing
processes an enormous amount of waste water containing
dyestuffs with intensive colour and toxicity is introduced
into the aquatic system. An effluent of this type has
been considered for this photocatalytic degradation
study using the same experimental conditions discussed
in the experimental section. COD removal efficiencies
of the effluent by ZnO, La-doped ZnO nanopowders
0 30 60 90 120 150
Irradiation Time (min)
Methyl Orange
0.00
0.25
0.50
0.75
1.00
1.25
1.50
ln(T
OC
o/T
OC
t)
ZnO (com.) ZnO 1.0 at.% La-doped ZnO
2.0 at.% La-doped ZnO 4.0 at.% La-doped ZnO
8.0 at.% La-doped ZnO
Fig. 9. The In(TOCo/TOCt vs time curves of
mineralization of methly orange.
1 2 3 4 5 6 7
Efficiency (%)
ZnO
I n i t i a
lCO
D (
mg
/L)
Photocatalysts
Photocatalysts
49
5670
6562
58
ZnO (com.)ZnO
1.0 at.% La-doped ZnO2.0 at.% La-doped ZnO4.0 at.% La-doped ZnO
8.0 at.% La-doped ZnO
0
50
100
150
200
250
300
350
400
450
Zn
O(c
om
.)
1.0
% L
a-Z
nO
2.0
% L
a-Z
nO
4.0
% L
a-Z
nO
8.0
% L
a-Z
nO
Fig. 10. COD values of the treated effluent and
percentage photodegradation efficiency (h)
for different photocatalysts under sunlight
irradiation
0 150 300 450 600 750
T i m e ( m i n )
C/C
(%
)O
0
20
40
60
80
1001
st Cycle 2
nd
Cycle 3rd Cycle 4
th Cycle 5
th Cycle
Fig. 11. Photo-stability of 1.0 at% La-doped ZnO
sample.
8 Mukhtar Ahmad et al.

photocatalysts under the sunlight irradiation are shown
in Fig. 10. COD reduction confirms the destruction of
the organic molecules in the effluents along with colour
removal. The photo-stability of 1.0 at% La-doped ZnO
sample as catalyst under sunlight was also studied (Fig.
11). The photocatalytic activity of the sample did not
decrease significantly after five successive cycles of
degradation tests, indicating that the photocatalyst was
fairly stable under the conditions used in this study.
Conclusion
Pure ZnO and La-doped ZnO nanoparticles were
synthesised via fast and facile conventional combustion
method and characterised using a variety of charac-
terisation techniques. From XRD patterns all synthesised
samples had a hexagonal wurtzite structure showing
that La-doping has no structural effect on ZnO. It was
found that La3+ is uniformly dispersed on ZnO nano-
particles in the form of small La2O3 cluster. The XRD
and UV-vis results revealed that the particle size of La-
doped ZnO is much smaller as compared to that of pure
ZnO and decreases with increasing La loading. Highly
porous surface of La-doped ZnO was observed by SEM,
which is critical for enhancing the adsorption and
photocatalytic activity. The photocatalytic activity of
La-doped ZnO for the degradation of MO was studied
and the results are compared with ZnO and commercial
ZnO. It was observed that the rate of degradation of
MO over La-doped ZnO increases with increasing La
loading up to 1.0 at% and then decreases. The TOC
results demonstrated that La-doped ZnO requires shorter
irradiation time for the complete mineralization of MO
than pure ZnO. The relative photonic efficiencies and
the photocatalytic activity of the 1.0 at% La-doped ZnO
are much higher as compared to those of pure ZnO and
commercial ZnO. It is concluded that, small particle
size, separation of charge carriers, highly porous surface
and larger specific surface area of La-doped ZnO are
the major constituents for its enhanced photocatalytic
activity in the present study.
Acknowledgement
Mukhtar Ahmad is thankful to Higher Education
Commission (HEC) of Pakistan for providing financial
assistance through Indigenous and IRSIP Scholarship
Programme and the Zhejiang University of China for
providing opportunity to work in its laboratories.
References
Abed, C., Bouzidi, C., Elhouichet, H., Gelloz, B., Ferid,
M. 2015. Mn doping induced high structural quality
of sol-gel ZnO crystals: Application in photo-
catalysis. Applied Surface Science, 349: 855-863.
Ahmad, M., Ahmed, E., Zafar, F., Khalid, N.R., Niaz,
N.A., Hafeez, A., Ikram, M., Khan, M.A., Hong,
Z.L. 2015. Enhanced photocatalytic activity of
Ce-doped ZnO nanopowders synthesized by com-
bustion method. Journal of Rare Earths, 33: 255-260.
Ahmad, M., Ahmed, E., Hong, Z.L., Iqbal, Z., Khalid,
N.R., Abbas, T., Ahmad, I., Elhissi, A., Ahmed,
W. 2013. Structural, optical and photocatalytic
properties of hafnium doped zinc oxide nanophoto-
catalyst. Ceramic International, 39: 8693-8700.
Ahmad, M., Ahmed, E., Hong, Z.L., Khalid, N.R.,
Zhang, Y., Ullah, M. 2013a. Preparation of highly
efficient Al doped ZnO photocatalyst by combustion
synthesis. Current Applied Physics, 13: 697-704.
Ahmad, M., Iqbal, Z., Hong, Z., Yang, J., Zhang, Y.,
Khalid, N.R., Ahmed, E. 2013b. Enhanced sunlight
photocatalytic performance of hafnium doped ZnO
nanoparticles for methylene blue degradation.
Integrated Ferroelectrics, 145: 108-114.
Ahmad, M., Ahmed, E., Hong, Z.L., Khalid, N.R.,
Elhissi, E., Ahmed, W. 2013c. Graphene-Ag/ZnO
nanocomposite as a high performance photocatalyst
under visible light irradiation. Journal of Alloys
and Compounds, 577: 717-727.
Ahmad, M., Ahmed, E., Khalid, N.R., Jackson, M.J.,
Ahmed, W. 2012a. Synthesis and characterization
of hexagonal shaped nanocrystalline zinc oxide
powders. International Journal of Manufacturing
Materials and Mechanical Engineering, 2: 61-76.
Ahmad, M., Ahmed, E., Hong, Z.L., Khalid, N.R. 2012b.
Effect of fuel to oxidant molar ratio on the photo-
catalytic activity of ZnO nanopowders. Ceramic
International, 39: 3007-3015.
Anandan, S., Vinu, A., Lovely, K.L.P.S., Gokulakrishnan,
N., Srinivasu, P., Mori, T., Murugesan, V.,
Sivamurugan, V., Ariga, K. 2007. Photocatalytic
activity of ZnO for the degratation of monocroto-
phos in aqueous suspension Journal of Molecular
Catalysis A: Chemical, 266: 149-157.
Behnajady, M.A., Modirshahla, N., Shokri, M.,
Zeininezhad, A., Zamani, H.A. 2009. Enhancement
photocatalytic activity of ZnO nanoparticles by
silver doping with optimization of photo-deposition
method parameters. Journal of Environmental
Science: Health Part A, 44: 666-672.
Bouderbala, M., Hamzaoui, S., Amrani, B., Reshak,
A.H., Adnane, M., Sahraoui, T., Zerdali, M.
2008.Thickness dependence of structural, electrical
and optical behaviour of undoped ZnO thin films.
Physica B: Condensed Matter, 403: 3326-3330.
Chen, Y.F., Bagnall, D.M., Koh, H.J., Park, K.T., Hiraga,
9La-doped ZnO Nanopowders Synthesis

K.J., Zhu, Z.Q., Yao, T.F. 1998. Plasma assisted
molecular beam epitaxy of ZnO on c-plane
sapphire-growth and characterization. Journal of
Applied Physics, 84: 3912-3918.
Ciciliat, M.A., Silva, M.F., Fernandes, D.M., de Melo,
M.A.C., Hechenleitnar, A.A.W., Pineda, E.A.G.
2015. Fe-doped ZnO nanoparticles: Synthesis by
a modified Sol-gel method and characterization.
Materials Letters, 159: 84-86.
Culity, B.D., Stock, S.R. 2001. Elements of X-ray
Diffraction, 3rd edition., pp. 388 Prantice-Hall Inc.,
New Jersey, USA.
Dole, B.N., Mote, V.D., Huse, V.R., Purushotham, Y.,
Lande, M.K., Jadhav, K.M., Shah, S.S. 2011.
Structural studies of Mn doped ZnO nanoparticles.
Current Applied Physics, 11: 762-766.
Elangoran, S.V., Chandramohan, V., Sivakumar, N.,
Senthil, T.S. 2015. Synthesis and characterization
of sodium doped ZnO nanocrystals and its appli-
cations to photocatalysis. Superlattices and Micro-
structures, 85: 901-907
Flickyngerova, S., Shtereva, K., Stenova, V., Hasko,
D., Novotny, I., Tvarozek, V., Sutta, P., Vavrinsky,
E. 2008. Structural and optical properties of
sputtered ZnO thin films. Applied Surface Science,
254: 3643-3647.
Ghouri, M.I., Ahmad, E., Khalid, N.R., Ahmad, M.,
Ramzan, M., Shakoor, A., Niaz, N.A. 2014.
Gadolinium doped ZnO nanocrystalline powders
and its photocatalytic performance for degradation
of methylene blue under sunlight. Journal of Ovonic
Research, 10: 89-100.
Hwang, C.C., Wu, T.Y. 2004. Synthesis and charac-
terization of nanocrystalline ZnO powders by a
novel combustion synthesis method. Materials
Science and Engineering B, 111: 197-206.
Ismail, B., Abaab, M., Rezig, B. 2001. Structural and
electrical properties of ZnO films prepared by screen
printing technique. Thin Solid Films, 383: 92-94.
Jia, T., Wang, W., Long, F., Fu, Z., Wang, H., Zhang,
Q. 2009. Fabrication characterization and Photoca-
talytic ctivity of La-doped ZnO nanowires. Journal
of Alloys and Compounds,484: 410-415.
Kaneva, N.V., Dimitrov, D.T., Dushkin, C.D. 2011.
Effect of nickel doping on the photocatalytic activity
of ZnO thin films under UV and visible light.
Applied Surface Science, 257: 8113-8120.
Korake, P.V., Dhabbe, R.S., Kadam, A.N., Gaikwad,
Y.B., Garadkar, K.M. 2014. Highly active
lanthanum doped ZnO nanorods for photode-
gradation of metasystox. Journal of Photochemistry
and Photobiology B: Biology,130: 11-19.
Liqiang, J., Xiaojun, S., Baifu, X., Baiqi, W., Weimin,
C., Honggang, F. 2004. The preparation and
characterization of La-doped TiO2 nanoparticles
and their photocatalytic activity. Journal of Solid
State Chemistry, 177: 3375-3382.
Mukherjee, D. 2011. Development of a Novel TiO2-
Polymeric Film Photocatalyst for Water Purification
both under UV and Solar Illumination. Ph.D. Thesis,
143 pp., University of Western Ontario, Canada.
Peng, F., Zhu, H., Wang, H., Yu, H. 2007. Preparation
of Ag-sensitized ZnO and its photocatalytic
performance under simulated solar light. Korean
Journal of Chemical Engineering, 24: 1022-1026.
Reddy, A.J., Kokila, M.K., Nagabhushana, H., Rao,
J.L., Shivakumara, C., Nagabhushana, B.M.,
Chakradhar, R.P.S. 2011. Combustion synthesis,
characterization and Raman studies of ZnO nano-
powders. Spectrochimica Acta Part A, 81: 53-58.
Shinde, V.R., Gujar, T.P., Lokhande, C.D., Mane, R.S.,
Han, S.H. 2006. Mn doped and undoped ZnO film:
A comparative structrual, optical and electrical
properties study. Materials Chemistry and Physics,
96: 326-330.
Suwanboon, S., Amornpitoksuk, P. 2011. Preparation
and characterization of nanocrystalline La-doped
ZnO powders through a mechanical milling and
their optical properties. Ceramics International,
37: 3515-3521.
Wan, X., Liang, X., Zhang, C., Li, X., Liang, W., Xu,
H., Lan, S., Tie, S. 2015. Morphology controlled
synthesis of Cu-doped ZnO, tubular Zn(Cu)O and
Ag decorated tubular Zn(Cu)O microcrystals for
photocatalysis. Chemical Engineering Journal,
272: 58-68.
Wang, Y., Herron, N. 1991. Nanometre-sized semi-
conductor cluster: Material synthesis, quantum size
effects, and photophysical properties. Journal of
Physical Chemistry, 95: 525-532.
Xiao, S., Li, H., Liu, L., Lian, J. 2015. Glucose-assisted
generation of assembled mesoporous ZnO sheets
with highly efficient photocatalytic performance.
Materials Science in Semiconductor Processing,
39: 680-685.
Zhao, T., Fu, Y., Zhao, Y., Xing, L., Xue, X. 2015. Ga-
doped ZnO nanowire nanogenerator as self-
powered/active humidity sensor with high
sensitivity and fast response. Journal of Alloys and
Compounds, 648: 571-576
Zhou, X., Li, Y., Peng, T., Xie, W., Zhao, X. 2009.
Synthesis, characterization and its visible-light-
induced photocatalytic property of carbon doped
ZnO. Materials Letters, 63: 1747-1749.
10 Mukhtar Ahmad et al.
Kinetics of Adsorptive Removal of Drimarene Brilliant Red fromAqueous Solution Using Untreated Agricultural Residues
Ch. Tahir Mehmooda, Muhammad Arshada*, Tayyab Ashfaqb, Muhammad Bilalc,
Muhammad Shafiqc and Kiran Hinad
aInstitute of Environmental Sciences and Engineering (IESE), School of Civil and
Environmental Engineering (SCEE), National University of Sciences and Technology (NUST),
Sector H-12, Islamabad, 44000, PakistanbDepartment of Civil Engineering, COMSATS Institute of Information Technology, University Road,
Abbottabad-22060, PakistancDepartment of Environmental Sciences, COMSATS Institute of Information Technology,
University Road, Abbottabad-22060, PakistandDepartment of Environmental Sciences, Hafiz Hayat Campus, University of Gujrat,
Gujrat, 54000, Pakistan
(received January 6, 2015; revised March 26, 2015; accepted April 2, 2015)
Pak. j. sci. ind. res. Ser. A: phys. sci. 2016 59 (1) 11-22
Introduction
Textile sector produces large quantities of wastewater
that result in the release of toxic dyes into freshwater
bodies. According to estimates, 12-20 tonnes/day
production of finished fabric results into generation of
1,000-3,000 m3. Globally more than 1´107 kg/year of
dyes stuff is produced and contributes about 1-2´106 kg
of active dye into freshwater bodies annually (Prigione
et al., 2012; Allen et al., 2003). These dyes are considered
responsible for dermatitis, allergies, skin irritation, cell
mutation and cancer. The dyes also pose serious hazards
to aquatic organisms as well as affect photosynthetic
activity in aquatic ecosystems. Presence of dyes in water
badly affects light penetration, creating problems for
photosynthetic activities in aqueous flora (Royer et al.,
2009). Degradation of some dyes generates byproducts,
as metabolites which are more genotoxic or carcinogenic
(Zhang et al., 2011).
Complex molecular structure and synthetic origin of
textile dyes make them stable to light, heat, oxidizing
agents and microbial degradation (Sun and Yang, 2003).
Conventional methods for dye removal include reverse
osmosis, coagulation/flocculation, advanced oxidation,
micro, ultra, and nano-filtration, and electrochemical
as a tertiary treatments, as well as aerobic and anaerobic
processes. Many of the aforementioned methods either
have the disadvantage of producing toxic sludge, which
create disposal issues, or have higher treatment costs.
So there is a need for more sustainable option.
Many studies have reported the use of different adsorbents
like activated carbon, peat, coir pith, chitin, silica and fly
ash to remove contaminants (Royer et al., 2009; Ponnusami
et al., 2007; Sun and Yang, 2003). A comprehensive list
of adsorbents and target dyes is provided in a recent review
(Noroozi and Sorial, 2013). Chitosan was reported as an
efficient adsorbent for 90% removal of Food Yellow 3 and
Acid Blue 9 (Goncalves et al., 2013). Zhang et al. (2014)
have reported adsorption capacities up to 84.2, 79.6 and*Author for correspondence; E-mail: [email protected]
Abstract. The potential of untreated banana and orange peels, and rice husk was tested for drimarene
brilliant red (DBR) dye removal from aqueous solution. Kinetics was also studied in a batch experiment.
Dose of adsorbents varied from 6 to 12 g/L, particle sizes 0.2 and 0.8 mm and contact time 2�32 h. High
dose and small particle size favoured DBR removal efficiency significantly. The highest adsorption capacity
was shown by rice husk (10 mg/g), then orange peels (9 mg/g) and the lowest by banana peels (4 mg/g).
Langmuir isotherm (R2=0.99) and pseudo-second order model (R2=0.99) depicted well the equilibrium
and best explained the kinetics for rice husk, respectively. Initial adsorption appeared as pore diffusion
in all the cases and film diffusion was controlling the rate, later on. Based upon the analytical data, a simple
model has been presented that fitted best to describe rice husk adsorption kinetics.
Keywords: adsorption, drimarene brilliant red, banana peels, orange peels, rice husk
11

99.9% for methyl orange, disperse blue and malachite
green chloride, respectively, with a synthetic carboxymethyl
cellulose-acrylic acid adsorbent. Base treated Shorea
dasyphylla sawdust has been reported for the removal of
acid blue 25 (Hanafiah et al., 2012).
High cost of some adsorbents, like activated carbon,
is a major impediment to its application in developing
countries like Pakistan. For low cost sustainable
solutions, agricultural/plant residues have the potential
to offer a replacement to existing costly adsorbents.
Considerable efforts have been made to explore the
effectiveness of plants and plant materials for textile
wastewater treatment (Verma et al., 2012). However,
these efforts are fragmented and more research is
required using indigenous bio resources. In agricultural
countries, like Pakistan, rice husk could prove a good
option for sorption processes, since it is available
either free of cost or at very low price. Average annual
productions of rice, orange and banana during 2009-
2013 were 6072, 2149 and 124 thousand tonnes,
respectively. These led to estimated waste production
of 1214, 516 and 41 thousand tonnes in the form of
rice husk, orange and banana peels, respectively. The
present study was conducted to compare various low
cost adsorbents; banana and orange peels, and rice
husk for their efficiency for drimarene brilliant red
(DBR) dye removal without prior treatment.
Experimental conditions such as particle size, dose
and time required for maximum removal of dye were
optimized. Furthermore, the mechanism of dye
adsorption on various biomass materials was
investigated using various isotherms and kinetic
models. Finally, a very simple model is proposed
which describes the adsorption by rice husk.
Materials and Methods
The adsorption potential of banana and orange peels,
and rice husk was investigated for the reactive dye
drimarene brilliant red (K-4BL-CDG) (Fig. 1) from
aqueous dye solution.
Bio-adsorbent preparation. The banana and orange
peels were obtained from a local market of Islamabad,
Pakistan. Initially, the peels were washed to remove
any adhering dirt and then subjected to drying, crushing
and sieving to get different particle sizes (0.2 and 0.8
mm). Rice husk was obtained from Kisan Rice Pvt.
Ltd. Gujranwala, Pakistan, then air dried and sieved
before use.
Reagents and solutions. Drimarene brilliant red (DBR)
(99% purity), a reactive textile dye widely used in textile
industry, was purchased from Hangzhou Weiyi Chemical
Co., Ltd. China, through local supplier. The stock
solution (500 mg/L) of DBR was prepared by addition
of 0.5 g of DBR in 1 L distilled water. The solutions of
required concentrations were further prepared through
dilution of the stock solution. All the tests were
performed at an original solution with pH of 5.3. The
chemical oxygen demand (COD) of the resulting dye
solution was 580 mg/L.
Adsorption studies. All the adsorption experiments
were conducted in 250 mL flasks using 100 mL of dye
solution at the original pH. Factorial experimental design
was used to perform the experiments and the factors
like adsorbent dose (g/L), particle size (mm) and contact
time (h) were varied. Calculated quantities of bio-
adsorbents were mixed with dye solution, followed by
agitation at a rate of 200 rpm in an orbital shaker
(Stauart, SSL2, UK). For adsorption kinetics experi-
ments, constant temperature of 25 °C was maintained.
Initial adsorbent dose was varied from 6 to 12 g/L for
a total contact time from 2 to 32 h. A sample (3 mL)
was carefully withdrawn at desired time intervals. Each
sample was analyzed after centrifugation at 4000 rpm
for 30 min to separate the adsorbent from dye solution.
The adsorption capacity (qe) and colour removal
efficiency (R) were calculated using the following
equations, respectively:
Fig. 1. Structural formula of reactive dye drimarene
brilliant red (DBR).
12 Muhammad Arshad et al.
SO
NN
H
-O O
SO
O-O
O N
S
O
O
O-
HO
NH
ClN
N
F
F
Na+
Na+
Na+

where:
Co is the initial dye concentration (mg/L), Ct is the
residual dye concentration (mg/L) at time t (h) and m
is the mass of an adsorbent (g/L).
Rate constants of decoloration were determined using
exponential relation below:
where:
C was concentration of dye, time t and Co was initial
dye concentration. A plot of lnC/Co versus t without
intercept yields slope equals to k.
Analytical procedure. The dye removal was determined
at maximum absorption wavelength (530 nm) using
visible spectrophotometer (HACH DR2400). The COD
was determined through wet digestion by taking 2 mL
of dye solution, 1.5 mL of COD reagent and 3.5 mL
of H2SO4 (Boyd et al., 1947) using closed reflux
colorimetric method. The COD reagent was prepared
using 500 mL distilled water, 10.22 g K2Cr2O7, 167
mL H2SO4 and 33.3 g HgSO4 and then diluted to 1000
mL. Afterwards, the solution was digested at 150 ºC
for 2 h using block digester (Lovibond, model ET 108,
Germany), and finally titrated with ferrous ammonium
sulphate (FAS) solution. Solution pH was recorded with
digital pH meter (BMS, model pH-200L) after three
stage calibration with buffers of pH 4, 7 and 10.
Experimental design and statistical analysis. Main
factors; adsorbent dose (A), particle size (B) and,
contact time (C) were investigated. An analysis of
variance (ANOVA) was performed to analyze the data
using SPSS 17 software for the experimental design
and statistical significance at 95% confidence interval.
Means were also compared using least significant
difference (LSD). Multiple regression analysis was
performed according to the equation given below:
where:
y is the response vector for qe (adsorption capacity) and
R (colour removal %). The bo and bi are regression
coefficients for the intercept, whereas xi is the independent
factor in coded units, and e is the error term (Chang et al.
2011). Coefficients of determination (R2) were calculated
to evaluate the fitness of regression model.
Results and Discussion
Screening factors for dye removal. Experimental design
matrix at 32 h contact time is given in Table 1, which
shows adsorption capacity (qe) and colour removal (%)
of banana and orange peels, and rice husk. Adsorption
capacity of the rice husk was maximum ranging from 6.0
to 10.0 mg/g followed by orange peels i.e. 5.1 to 8.7 mg/g.
The lowest qe was observed in case of banana peels with
a maximum value of 3.7 mg/g. Colour removal was also
highest with the rice husk showing 84.8% removal.
Effect of adsorbent dose. Dye removal increased with
increasing adsorbent doses (Table 1). Statistical
significance was determined using analysis of variance
(ANOVA) by general linear method of SPSS. The
Table 1. Factorial design matrix for investigated factors for adsorption capacity and colour removal after 32 h
contact time at 25 °C
Coded Actual factorial level Adsorption capacity Colour removal
factors qe (mg/g) R (%)
A B Adsorbent Particle Banana Orange Rise Banana Orange Rise
dose (g/L) size (mm) peels peels husk peels peels husk
1 1 6 0.2 3.7 8.7 10.0 22.2 52.3 59 .8
1 2 6 0.8 3.1 7.0 6.6 18.6 42.1 39 .9
2 1 8 0.2 3.2 6.8 9.5 25.9 54.6 76 .1
2 2 8 0.8 2.6 5.6 6.2 21.0 44.4 49 .9
3 1 10 0.2 3.1 5.6 8.1 30.8 55.6 80 .8
3 2 10 0.8 2.8 5.9 6.2 28.4 59.3 62.5
4 1 12 0.2 2.8 5.3 7.1 33.7 63.4 84 .8
4 2 12 0.8 2.6 5.1 6.0 31.5 61.1 72 .2
qe (mg/g) =
Ct - Co
m
R (%) =
Ct - Co ´ 100
Co
(1)
(2)
In = - ktC
Co
( ) (3)
y = bo + S bici + e (4)
13Drimarene Brilliant Red Removal

adsorption capacity of banana peels ranged 2.6-3.1 mg/g
with the maximum colour removal of 33.7% at the
highest adsorbent dose i.e. 12 g/L (Table 1). Higher
decolourisation was achieved at higher adsorbent dose
i.e. 12 g/L, which was probably due to the presence of
unoccupied binding sites for the attachment of dye
molecules.
Effect of contact time. Statistically significant colour
removal was observed with increasing contact time. Orange
peels showed better adsorption capacity and colour removal
efficiency (63.4%) as compared to the banana peels with
increasing contact time (Fig. 2). Rice husk was the most
efficient among the tested adsorbents, achieving colour
removal of 84.8% from aqueous dye solution with 12 g/L
of an adsorbent dose. Average removal efficiency at 32 h
was slightly higher as compared to 16 h contact time, but
there was no statistically significant difference. Colour
removal was faster initially and decreased with time. In
case of banana peel, most decolourisation occurred within
16 h of contact time. In the case of orange peel and rice
husk, most decolourisation occurred within 8 h of contact
time (Fig. 2). Colour removal rates decreased gradually
which could be due to active binding site saturation and
probably more time was required to bind further dye
molecules with inactive or less active binding sites. Similar
trends have been observed by Han et al. (2008).
Effect of particle size. Particle size significantly affected
the colour removal efficiency of all the bio adsorbents under
consideration (Table 1 and Fig. 2). Smaller particle size
(0.2 mm) was strongly correlated with colour removal
(R2=0.99) as compared to the larger particle size (0.8 mm)
with R2 value of 0.88. Smaller particle size (0.2 mm) was
highly correlated (R2=0.99) with dye removal as compared
to larger particle size (0.8 mm). Similar results have been
reported in a study (Punjongharn et al., 2008), where increase
in adsorption with decrease in particle size was observed.
Regression analysis. Regression analyses displayed
the leading effects of an adsorbent dose, contact time
(positive) and, particle size (negative), on colour removal
as compared to contact time. Following are the codified
polynomial regression models for banana peels which
correlate to qe and R (%):
qe (mg/g) = + 0.476 + 0.158A � 0.423B + 0.071C (5)
R (%) = +6.765 + 1.848A � 3.540B + 0.601C (6)
where:
A, B, C correspond to adsorbent dose, adsorbent particle
size and contact time, respectively. The qe indicates
adsorption capacity and R stands for colour removal.
Factors exhibiting the positive values for their
coefficients could improve the respective response
vector while negative value of the coefficients suggested
their inverse relationship with the response vectors.
Regression analysis for orange peels revealed that dye
removal was strongly affected by the particle size and
adsorbent dose. The regression equations for orange
peels are given as follows:
qe (mg/g) = +0.045 + 0.296A � 1.010B + 0.126C (7)
R (%) = +5.874 + 3.527A � 8.590B + 1.049C (8)
Regression analysis for rice husk shows that coded
factor B (particle size) displayed the greatest effect both
on colour removal and adsorption capacity followed by
the adsorbent dose and least effect of contact time was
observed. The regression equations are as follows;
qe (mg/g)= +2.024 + 0.512A � 2.823B + 0.064C (9)
R (%)= +7.366 + 6.025A � 23.91B + 0.532C (10)
Regression analysis for rice husk showed that coefficient
of determination (R2) and adjusted R2 for the model
was correlated well (0.99, 0.98).
These findings are in accordance with the theory that larger
particles have less surface area compared to the smaller
particles having more surface area, for a given volume of
particles. The facts are also supported by the correlation
values (R2=0.99) for smaller particle size (0.2 mm). Similar
trends have already been reported by Han et al. (2008)
and Punjongharn et al. (2008).
According to chemical composition of banana peels, it
contains about 41% carbon by weight, which is an
advantage with adsorption processes. This high amount
of carbon could be helpful for treating wastewater
containing hazardous compounds like dyes (Palma et al.,
2011). But in the same research, it has been reported that
banana peel was effective only on certain dyes and it had
its limitations to remove colour of textile wastewater.
Since it was only able to remove 33.7% colour (Table 1)
of DBR dye, it was inferred that banana peels cannot be
used widely. However, there may be some potential if it
is used after pre-treatment with an acid (Xi and Chen,
2014) or alkali and temperature variations (Crini, 2006)
that will increase the treatment cost.
Regression analysis for orange peels also revealed that
colour removal is strongly influenced by the particle size
and adsorbent dose. Similar trends were observed for the
adsorption capacity. Fair colour removal efficiency (63.4%)
with orange peels is probably due to their citrus content,
14 Muhammad Arshad et al.

Tab
le 2
. Is
oth
erm
and k
inet
ic m
odel
s use
d i
n p
rese
nt
study
Model
E
quat
ion
Plo
t P
aram
eter
sR
efer
ence
s
Isoth
erm
model
s
Lan
gm
uir
C
e /
qe
~ C
eq
e(m
g/g
)=eq
uil
ibri
um
adso
rpti
on c
apac
ity
(Lan
gm
uir
, 1916)
Kad
s(L
/mg)=
langm
uir
const
ant
rela
ted t
o f
ree
ener
gy o
f ad
sorp
tion
Qm
ax(m
g/g
)=m
axim
um
adso
rben
t ca
pac
ity
RL=
separ
atio
n f
acto
r
Co(m
g/L
)=in
itit
alad
sorb
ate
conce
ntr
atio
n i
n s
olu
tion
Ce(
mg/L
)=eq
uil
ibri
um
adso
rbat
e co
nce
ntr
atio
n i
n s
olu
tion
Fre
undli
chq
e =
x/m
= K
fCen
qe
~ C
eq
e(m
g/g
)=eq
uil
ibri
um
adso
rpti
on c
apac
ity
(Fre
undli
ch, 1906)
Ce(
mg/L
)=eq
uil
ibri
um
adso
rbat
e co
nce
ntr
atio
n i
n s
olu
tion
Kf(
mg/g
)(L
/g)n
=fr
eubndli
ch c
onst
ant
h=
het
erogen
eity
fac
tor
Kin
etic
mod
els
Pse
udo 1
st o
rder
L
og(q
e -
qe)
=lo
g q
e -
k1t/
2.3
03
Log (
qe
- q
t)~
tq
t (m
g/g
)=am
ount
of
adso
rbat
es a
dso
rbed
at
tim
e t
(Lag
ergre
n, 1898)
k1(h
-1)=
pse
udo 1
st o
rder
rat
e co
nst
ant
Pse
udo 2
nd o
rder
t/ q
t ~
tk
2(g
m/g
.h)=
pse
udo 2
nd o
rder
rat
e co
nst
ant
(Mohan
et
al.
, 2008)
h(m
g/g
.h)=
init
ial
adso
rpti
on r
ate
h=
k2qe2
qt =
kin
tt1/2
+C
qt ~
t1/2
Intr
apar
ticl
e dif
fusi
on
ki(
mg/g
h1/2
)=in
trap
arti
cle
dif
fusi
on r
ate
const
ant
(Web
er-m
orr
is m
odel
)C
(mg/g
)=boundar
y l
ayer
eff
ect
Dum
wal
d-w
agner
model
Log (
1-F
2)~
tK
(h-1
)=ra
te c
onst
ant
of
adso
rpti
on
F=
is t
he
frac
tion o
f ad
sorb
ate
in t
he
sorb
ent
at
tim
e t
(unit
less
).
(Wan
g e
t al.
, 2004)
Double
exponen
tial
model
D1&
D2(m
g)=
dif
fusi
on r
ate
par
amet
er f
or
slow
and r
apid
ste
p r
espec
tivel
y(W
ilcz
ak a
nd K
einat
h,
K1&
K2(h
-1)=
adso
rpti
on r
ate
par
amet
er f
or
slow
and r
apid
ste
p r
espec
tivel
y1993)
ma(
g)
=m
ass
of
adso
rben
t
Boyd m
odel
Bt~
tB
(h-1
) =
Rat
e co
effi
cien
t,(B
oyd e
t al.
, 1947)
Def
f(m
m2h
-1)
=li
quid
fil
m e
ffec
tive
dif
fusi
on c
oef
fici
ent
R (
mm
) =
rad
ius
of
adso
rben
t bea
ds
for
F<
0.8
5
and B
t=-0
.498-l
n(1
-F)
for
F>
0.8
5
Pro
pose
d m
odel
qT=
k¢(
lnt)
nq
e ~
lnt
k¢=
rate
const
ant(
mg/g
.hn)
This
pap
er
Kad
s Q
max
Ce
qe =
1 +
Kad
s C
e
Eq
.11
c e qe
= 1
1 +
Kad
s C
e E
+ C
e
Qm
ax E
q.1
2
1
1 +
Kad
s C
o
Eq
.13
RL=
= 1
K2
Q2
2+
t qt
1 q2
t
exp
(-n
2K
1)
= 1
-q
t
qe
F =
6 n2S
1 n2
Log[(
1 -
F2])
= -
K
t
2.3
03
qt=
qe -
D2 e
xp
(- k
1t)
m
a
D2 e
xp (
- k
2
L
n(q
e-q
t)~t
m
a
-
In(q
e- q
t) =
In D
2
m
a
K2 t
-
exp
(-n
2B
t)=
1 -
qt
qe
F =
6 n2S
1 n2
Bt
= Ö
p -
p
-Ö
p2
F
3
(
)
(
)2
p2 D
eff
R
2B
=
¥
¥ n=
1
n=
1
15Drimarene Brilliant Red Removal

which is capable of binding dye molecules (Sivaraj et al.,
2001). Orange peel contains carboxyl and hydroxyl groups
and adsorption capacity improves with increase in carboxyl
and hydroxyl content. These properties make it a suitable
material for adsorption of a wide range of contaminants.
It is found that orange peel contains relatively high content
of pectin which plays an important role in adsorption.
Regression analysis for rice husk showed that coefficient
of determination (R2) and adjusted R2 for the model was
correlated well (0.99, 0.98). Minor difference in these
values infers that there was a negligible possibility of
adding any insignificant term in these regression models
(Chang et al., 2011). The normal distribution of the predicted
values along respective mean values confirmed the
appropriateness of the regression models to explain colour
removal efficiency and adsorption capacity according to
eq. (9) and eq. (10).
Adsorption isotherms. Various isotherm models as
well as kinetic models used in present study are shown
in Table 2. Langmuir and Freundlich isotherms were
selected from several isotherm equations, eq. 11, 12
and 13 already used in the literature (Langmuir, 1916;
Freundlich, 1906). In the Langmuir isotherm, it is
supposed that adsorption occurs at specific homogeneous
sites on surface of an adsorbent and there are no
significant interactions within adsorbed species. The
adsorbent surface is saturated by a single layer of
adsorbent molecules. The linearized Langmuir isotherm
equation also known as Hanes-Woolf plot is represented
by eq. 11 (Table 2). Linear relationships of rice husk
for both particle sizes were found (R2 =0.99). This
indicates suitability of the model to explain the adsorption
process equilibrium (Wu et al., 2007) for rice husk. The
closeness of calculated qm (7.2 mg/g) and experimental
adsorption capacity (6.7 mg/g) confirmed the validity
of this model for the adsorbent.
Langmuir isotherm�s characteristics are expressed by
equilibrium parameter RL which is a dimension less
Table 3. First and second order kinetic parameters for adsorption of dye on untreated biomass
Adsorbent Size Dose Qexp
First order kinetic model Second order kinetic model R2
(mm) mg/L (mg/g) Qcalc
K1
R2
Qcalc
K2
Initial
(mg/g) (h-1
) (mg/g) (mg/g.h) adsorption
rate h=k2qe
2
(mg/g.h)
Rice husk 0.8 6 10.020 7.394 0.160 0.988 11.100 0.030 3.660 0.999
8 9.550 9.940 0.441 0.956 10.000 0.102 10.200 0.997
10 8.110 3.683 0.266 0.976 8.403 0.163 11.490 0.999
12 7.110 2.047 0.155 0.942 7.300 0.174 9.260 0.999
0.2 6 6.690 3.038 0.139 0.890 7.040 0.087 4.310 0.999
8 6.270 4.396 0.204 0.998 6.700 0.077 3.460 0.999
10 6.270 2.053 0.114 0.770 6.490 0.125 5.260 0.999
12 6.040 3.125 0.232 0.989 6.290 0.159 6.290 0.999
Orange peel 0.8 6 8.796 13.820 0.234 0.940 76.923 8.000 0.311 0.012
8 6.887 8.521 0.262 0.893 9.461 0.011 0.989 0.895
10 5.602 7.405 0.344 0.865 7.128 0.020 1.030 0.932
12 5.324 26.687 0.698 0.907 6.780 0.022 0.995 0.918
0.2 6 7.099 9.759 0.145 0.972 85.470 0.000 0.263 0.006
8 5.613 8.656 0.306 0.974 9.074 0.007 0.595 0.542
10 4.954 8.488 0.290 0.968 7.353 0.012 0.651 0.812
12 4.128 3.499 0.051 1.000 5.519 0.020 0.595 0.848
Banana peel 0.8 6 3.749 10.703 0.281 0.878 -2.771 0.008 0.062 0.327
8 3.270 4.242 0.096 0.971 62.112 0.000 0.115 0.005
10 3.105 3.929 0.182 0.964 5.359 0.010 0.280 0.599
12 2.832 4.158 0.281 0.981 3.392 0.056 0.647 0.979
0.2 6 3.178 5.390 0.149 0.878 -2.620 0.008 0.053 0.433
8 2.689 4.094 0.142 0.936 -33.33 0.000 0.091 0.021
10 2.861 3.776 0.176 0.923 5.528 0.007 0.222 0.495
12 2.649 3.926 0.230 0.941 3.577 0.029 0.374 0.932
16 Muhammad Arshad et al.

constant that measures the favourability and shape of the
adsorption isotherm of using eq. 13 (Table 2).The RL
value determines either the isotherm is linear (RL= 1),
favourable (0 <RL< 1), unfavourable (RL> 1) or
irreversible (RL= 0). The Freundlich model can be used
to explain multilayer and heterogeneous adsorption on
surfaces (Freundlich, 1906). Power series regression
analysis of the plot of qe against Ce resulted into correlation
coefficients� (R2) value of less than 0.944. This indicated
that the Freundlich plots did not agree well with the
experimental data.
For similar adsorption studies, Langmuir model has
been applied and reported (Low et al., 2011). Orange
and banana peel did not follow the Langmuir model
(Table 2). Also, the parameters for Langmuir model
came out to be negative, which does not have any
physical significance. All the values of RL calculated
from the Langmuir equation ranged between 0-1 for
rice husk highlighting the fact that adsorption process
was favourable for both particle sizes. This provided
the evidence that, rice husk can be used for the
commercial scale treatment of dye wastewater. In all
the other cases Langmuir model gave fairly low R2
value in most cases indicating that this model cannot
be applied on other biomass materials.
Adsorption kinetics. Kinetics is a significant aspect
in assessment of sorption potential of any substance.
The kinetic constants can help to adjust residence
conditions for dye adsorption. For the adsorption of
DBR dye on rice husk after 32 h of contact time,
Langmuir isotherm plot is presented in Fig. 3. The rate
of achieving equilibrium on the large particle size of
rice husk was quicker than that of smaller particle size.
Kinetic models usually used in literature are divided
into following two categories: (a) Adsorption reaction
models (b) Adsorption diffusion models;
The adsorption capacities of larger particle size were lesser
than those of small particle size. Large sized particles
reached equilibrium earlier because of small surface area
as compared to fine particles having large surface area.
Three mass transport steps are linked in adsorption process
(Wu et al., 2007). In the first step, adsorbate moves through
the solution to reach external surface of adsorbent by
molecular diffusion (film or external diffusion). Then
solute movement takes place by pore diffusion from surface
of the particle into interior site. In the final step, adsorption
of adsorbate takes place on the active sites. The phenomenon
requires relatively longer contact time (Crini, 2006).
Orange and banana peels seem to follow pseudo 1st
order kinetics with correlation coefficient. Rice husk
did not give a strong correlation (R2=0.77-0.99) in most
cases. Pseudo-first order reaction model also indicates
film diffusion as rate controlling process. Hence, in
case of orange peel and banana peel film diffusion
seemed to be rate controlling. The rice husk seems to
follow pseudo-second order kinetics quite well. The R2
values for two particle sizes were found as 0.99 which
shows that the adsorption of DBR on rice husk followed
pseudo-second order kinetic model (Arami et al., 2005).
The average percentage error between calculated and
experimental capacity was less than 5%. There seems
to be strong correlation between experimental and
Fig. 3. Langmuir isotherm plot for the adsorption
of DBR dye on rice husk (contact time =
32 h; pH = 5.3; temperature = 25 °C).
Fig. 2. Effect of contact time on adsorption capacity
of different bioadsorbents. BP = banana peel;
OP = orange peel; RH = rice husk; 0.2 and
0.8 mm sizes.
0
20
40
60
80
100
2 4 8 16 32
BP 0.2OP 0.8
BP 0.8RH 0.2
OP 0.2RH 0.8
Time (h)
Perc
ent re
moval (%
)
10 20 30 40 50 60
2
3
4
5
6
7
8
9
Ce(mg/L)
Ce/q
e(g
/L)
Rice husk (0.8mm)
Qmax = 12.937mg/g
Ka = 0.092L/mg
R2 = 0.992
Rice husk (0.2mm)
Qmax = 7.210mg/g
Ka = 0.174L/mg
R2 = 0.977
17Drimarene Brilliant Red Removal
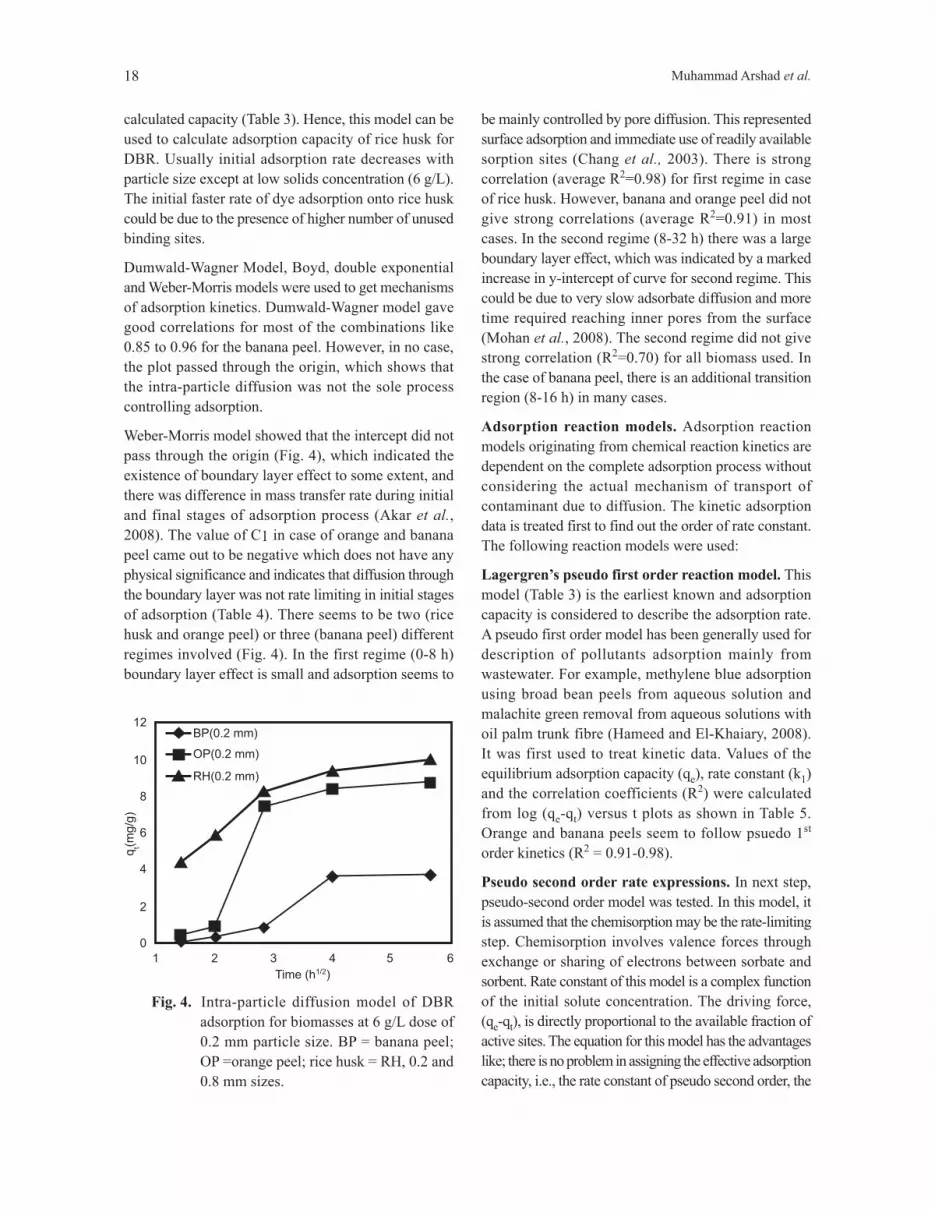
calculated capacity (Table 3). Hence, this model can be
used to calculate adsorption capacity of rice husk for
DBR. Usually initial adsorption rate decreases with
particle size except at low solids concentration (6 g/L).
The initial faster rate of dye adsorption onto rice husk
could be due to the presence of higher number of unused
binding sites.
Dumwald-Wagner Model, Boyd, double exponential
and Weber-Morris models were used to get mechanisms
of adsorption kinetics. Dumwald-Wagner model gave
good correlations for most of the combinations like
0.85 to 0.96 for the banana peel. However, in no case,
the plot passed through the origin, which shows that
the intra-particle diffusion was not the sole process
controlling adsorption.
Weber-Morris model showed that the intercept did not
pass through the origin (Fig. 4), which indicated the
existence of boundary layer effect to some extent, and
there was difference in mass transfer rate during initial
and final stages of adsorption process (Akar et al.,
2008). The value of C1 in case of orange and banana
peel came out to be negative which does not have any
physical significance and indicates that diffusion through
the boundary layer was not rate limiting in initial stages
of adsorption (Table 4). There seems to be two (rice
husk and orange peel) or three (banana peel) different
regimes involved (Fig. 4). In the first regime (0-8 h)
boundary layer effect is small and adsorption seems to
be mainly controlled by pore diffusion. This represented
surface adsorption and immediate use of readily available
sorption sites (Chang et al., 2003). There is strong
correlation (average R2=0.98) for first regime in case
of rice husk. However, banana and orange peel did not
give strong correlations (average R2=0.91) in most
cases. In the second regime (8-32 h) there was a large
boundary layer effect, which was indicated by a marked
increase in y-intercept of curve for second regime. This
could be due to very slow adsorbate diffusion and more
time required reaching inner pores from the surface
(Mohan et al., 2008). The second regime did not give
strong correlation (R2=0.70) for all biomass used. In
the case of banana peel, there is an additional transition
region (8-16 h) in many cases.
Adsorption reaction models. Adsorption reaction
models originating from chemical reaction kinetics are
dependent on the complete adsorption process without
considering the actual mechanism of transport of
contaminant due to diffusion. The kinetic adsorption
data is treated first to find out the order of rate constant.
The following reaction models were used:
Lagergren�s pseudo first order reaction model. This
model (Table 3) is the earliest known and adsorption
capacity is considered to describe the adsorption rate.
A pseudo first order model has been generally used for
description of pollutants adsorption mainly from
wastewater. For example, methylene blue adsorption
using broad bean peels from aqueous solution and
malachite green removal from aqueous solutions with
oil palm trunk fibre (Hameed and El-Khaiary, 2008).
It was first used to treat kinetic data. Values of the
equilibrium adsorption capacity (qe), rate constant (k1)
and the correlation coefficients (R2) were calculated
from log (qe-qt) versus t plots as shown in Table 5.
Orange and banana peels seem to follow psuedo 1st
order kinetics (R2 = 0.91-0.98).
Pseudo second order rate expressions. In next step,
pseudo-second order model was tested. In this model, it
is assumed that the chemisorption may be the rate-limiting
step. Chemisorption involves valence forces through
exchange or sharing of electrons between sorbate and
sorbent. Rate constant of this model is a complex function
of the initial solute concentration. The driving force,
(qe-qt), is directly proportional to the available fraction of
active sites. The equation for this model has the advantages
like; there is no problem in assigning the effective adsorption
capacity, i.e., the rate constant of pseudo second order, the
Fig. 4. Intra-particle diffusion model of DBR
adsorption for biomasses at 6 g/L dose of
0.2 mm particle size. BP = banana peel;
OP =orange peel; rice husk = RH, 0.2 and
0.8 mm sizes.
BP(0.2 mm)
OP(0.2 mm)
RH(0.2 mm)
1 2 3 4 5 6
0
2
4
6
8
10
12
Time (h1/2)
qt(m
g/g
)
18 Muhammad Arshad et al.

adsorption capacity, and the initial adsorption rate, these
can be calculated from the equation, without any need to
know any particular parameter beforehand. This model
was applied by plotting t/qt vs t. The parameters; rate
constant (k2) and initial adsorption rate (h = k2qe2), were
determined from the intercept and the slope of plot.
Adsorption diffusion models. On the basis of previous
studies, it can be claimed that adsorption kinetics are
always controlled by intra-particle diffusion or liquid
film diffusion (Meng, 2005). So adsorption diffusion
models are developed to explain the film diffusion
and/or the process of intra particle diffusion.
Dumwald-Wagner model. Dumwald-Wagner proposed
another intra-particle diffusion model (Wang et al.,
2004). This model gave fairly good correlations for
most of the combinations and R2 value was above 0.90,
whereas, for banana peels it ranged from 0.85 to 0.96
(Table 5).
Boyd�s model. The Boyd�s model (Boyd et al., 1947)
is often used to explain the adsorption kinetics
mechanism. Originally proposed for intra-particle
diffusion in a spherical particle, it is better known as
the Boyd�s film-diffusion model. It allows identification
of the slowest stage between intra-particle diffusion
and film-diffusion. Although the plot of Bt versus t is
linear but does not pass through the origin, which
indicates that the process is controlled by film diffusion.
The effective diffusion coefficient, Deff (mm2 /h) is as
calculated in Table 5.
Double-exponential model (DEM). A double-
exponential function proposed was used to describe
lead and copper adsorption onto activated carbon
(Wilczak and Keinath, 1993). In this model, the uptake
process is divided into two steps, a rapid phase for
external and internal diffusions and then a slow phase
involving intra-particle diffusion. It was demonstrated
Table 4. Kinetic parameters for Weber-Morris model and proposed model for adsorption of dye on untreated
biomass at different dosage level
Adsorbent Size Dose Weber - Morris model Proposed model
(mm) (mg/L) Kid1
C1
R2
Kid2
C2
R2
K� N R2
(mg/g.h1/2
) (mg/g) (mg/g.h1/2
) (mg/g.h1/2
) (mg/g.h1/2
)
Rice husk 0.8 6 2.734 0.493 0.998 0.602 6.724 0.929 5.278 0.539 0.979
8 2.186 3.026 0.987 0.075 9.247 0.145 6.920 0.304 0.915
10 1.100 0.452 0.989 0.136 7.433 0.516 6.510 0.195 0.937
12 0.928 4.070 1.000 0.145 6.301 0.983 5.720 0.182 0.977
0.2 6 1.615 1.554 0.977 0.232 5.376 1.000 4.359 0.371 0.979
8 1.308 1.654 0.996 0.299 4.672 0.813 3.970 0.383 0.967
10 1.270 2.283 0.948 0.181 5.212 0.925 4.489 0.285 0.967
12 1.091 2.528 0.956 0.162 5.233 0.495 4.440 0.281 0.972
Orange peel 0.8 6 5.161 -7.781 0.872 0.448 6.364 0.894 0.869 2.087 0.887
8 3.763 -4.492 0.956 0.160 6.010 0.943 1.910 1.089 0.924
10 2.998 3.307 0.924 0.048 5.342 0.919 1.870 1.011 0.886
12 2.825 -3.075 0.893 0.021 5.250 0.093 1.830 0.980 0.850
0.2 6 2.782 -3.885 0.963 0.952 2.286 0.556 0.600 2.111 0.971
8 2.692 -2.650 0.804 0.365 3.708 0.704 1.309 1.450 0.837
10 2.455 -2.885 0.983 0.226 4.027 0.158 1.256 1.321 0.943
12 2.517 -3.026 0.887 0.119 4.956 0.206 1.330 1.103 0.828
Banana peel 0.8 6 0.408 -0.380 0.949 0.043 3.471 1.000 0.178 2.538 0.969
8 0.517 -0.397 0.990 0.713 -0.614 0.913 0.309 1.949 0.995
10 0.795 -0.334 0.883 0.411 0.920 0.793 0.643 1.447 0.917
12 0.754 0.000 0.981 0.210 1.734 0.714 1.660 0.899 0.960
0.2 6 0.285 -0.309 0.990 0.904 -1.617 0.786 0.155 2.366 0.933
8 0.528 -0.641 0.967 0.610 -0.572 0.827 0.252 1.904 0.959
10 0.773 -0.573 0.643 0.484 0.300 0.773 0.541 1.489 0.908
12 0.770 -0.461 0.808 0.353 0.799 0.724 0.761 1.105 0.951
19Drimarene Brilliant Red Removal

that the two-step mechanism can be described fairly
well with the double-exponential model (Table 5). If
K1>K2, this means that the contribution of rapid process
on the overall kinetics can be assumed to be negligible
hence, this can be simplified as and be rearranged to a
linear form.
Weber-morris model. This model (qt=kint t1/2+C) helps
us to understand intra-particle diffusion. In this model,
kint is the intra-particle diffusion rate constant (mg/g
min1/2) and C (mg/g) is a constant linked to thickness
of the boundary layer. Its higher value means larger
boundary layer effect and vice versa. The plot of qt
versus t1/2 would result in a linearised relationship.
Diffusion would be the rate limiting step if the line
passes through the origin. If it is not so, the intra-particle
diffusion is responsible for the sorption but it might not
be the only step controlling sorption rate. Boundary
layer control and some other processes occurring at the
same time may also be responsible. In all the cases it
is clear that adsorption is not diffusion controlled and
boundary layer has significant effect on the overall
adsorption rate as well as capacity.
Proposed kinetic model. It was found that in most cases
the adsorption kinetic seems to follow the empirical model
�qt=K�(lnt)n�
where:
�qt� is the adsorption capacity at time �t�. This model gave
a very good correlation in most of the cases as shown in
Table 4.
Conclusion
Out of the three bio adsorbents used, rice husk was the
most effective for removal of DBR dye. The optimised
conditions for the maximum colour removal efficiency
at 25 °C using rice husk were 0.2 mm particle size,
12 g/L dose of adsorbent and 16 h contact time. In the
case of rice husk, initial adsorption seemed to be intra-
Table 5. Kinetic parameters for Dumwald-Wagner, double exponential and Boyd model for adsorption of dye on
untreated biomass at different dosage level
Adsorbent Size Dose Dumwald-wagner model Double exponential model Boyds model
(mm) (mg/L) K1
R2
K2
D2
R2
Deff
R2
(h-1
) (h-1
) (mg) (cm2/h)
Rice husk 0.8 6 0.140 0.993 0.160 4.437 0.988 1.327E-06 0.991
8 0.411 0.950 0.441 7.953 0.956 6.678E-06 0.953
10 0.248 0.973 0.265 3.683 0.976 3.645E-06 0.975
12 0.148 0.947 0.155 2.456 0.942 3.237E-06 0.943
0.2 6 0.126 0.904 0.139 1.823 0.890 3.209E-05 0.897
8 0.188 0.994 0.204 3.270 0.998 6.103E-05 0.996
10 0.103 0.781 0.114 2.053 0.770 4.399E-05 0.775
12 0.209 0.994 0.232 3.749 0.989 4.582E-05 0.991
Orange peel 0.8 6 0.187 0.963 0.233 8.292 0.940 8.700E-07 0.959
8 0.225 0.908 0.262 6.817 0.893 2.911E-06 0.904
10 0.310 0.876 0.344 7.405 0.865 1.560E-06 0.869
12 0.620 0.900 0.698 32.028 0.907 1.791E-06 0.9
0.2 6 0.074 0.928 0.145 5.761 0.972 3.488E-06 0.923
8 0.272 0.964 0.306 6.924 0.974 7.157E-05 0.968
10 0.211 0.939 0.290 8.488 0.968 1.150E-05 0.936
12 0.022 1.000 0.051 4.207 1.000 4.183E-06 1.000
Banana peel 0.8 6 0.233 0.850 0.280 6.421 0.878 5.497E-07 0.848
8 0.073 0.919 0.111 3.394 0.971 2.267E-07 0.913
10 0.148 0.944 0.182 3.929 0.964 4.913E-07 0.944
12 0.252 0.964 0.281 4.990 0.981 1.261E-06 0.968
0.2 6 0.105 0.888 0.148 3.234 0.878 4.137E-06 0.846
8 0.101 0.838 0.142 3.275 0.936 2.684E-06 0.883
10 0.142 0.899 0.176 3.776 0.923 6.334E-06 0.897
12 0.203 0.916 0.230 4.710 0.941 1.394E-05 0.917
20 Muhammad Arshad et al.

particle pore diffusion controlled, while later on, film
diffusion appeared as the rate limiting mechanism.
Adsorption models and kinetic studies indicated the
potential of using untreated rice husk as an effective
adsorbent. These findings can help us in developing
cost-effective remediation process for coloured/textile
wastewater. The utilization of such biomass in fixed
bed reactor designs for dyes removal from wastewaters
needs to be tested.
Acknowledgement
The research was supported and funded by Science and
Technology Fund, National University of Sciences and
Technology (NUST), Islamabad, Pakistan. We thank Dr.
M. Ali Awan for his support and guidance on technical
issues during the study. Authors would also like to thank
Dr. James Hanly, Institute of Agriculture and Environment,
Massey University, New Zealand for critical review and
corrections at first stage.
References
Akar, T., Ozcan, S.A., Tunali, S., Ozcan, A. 2008.
Biosorption of a textile dye (Acid Blue 40) by cone
biomass of Thuja orientalis: Estimation of equilibrium,
thermodynamic and kinetic parameters. Bioresource
Technology, 99: 3057-3065.
Allen, S.J., Gan, Q., Matthews, R. Johnson, P.A. 2003.
Comparison of optimised isotherm models for basic
dye adsoption by kudzu. Bioresource Technology,
88: 143-152.
Arami, M., Limaee, N.Y., Mahmoodi, N.M., Tabrizi,
N.S. 2005. Removal of dyes from colored textile
wastewater by orange peel adsorbent: equilibrium
and kinetic studies. Journal of Colloid and Interface
Science, 288: 371-376.
Boyd, G.E., Adamson, A,W., Myers Jr., L.S. 1947. The
exchange adsorption of ions from aqueous solutions
by organic zeolites, II, Kinetics. Journal of the
American Chemical Society, 69: 2836-2848.
Chang, C.Y., Sai, W.T.T., Ing, C.H., Chang, C.H. 2003.
Adsorption of polyethylene glycol (PEG) from
aqueous solution onto hydrophobic zeolite. Journal
of Colloid and Interface Science, 260: 273-279.
Chang, S.H., Teng, T.T., Ismail, N. 2011. Screening of
factors influencing Cu (II) extraction by soybean
oil-based organic solvents using fractional factorial
design. Journal of Environmental Management,
92: 2580-2585.
Crini, G. 2006. Non-conventional low-cost adsorbents
for dye removal: A review. Bioresource Technology,
97: 1061-1085.
Freundlich, H.M.F. 1906. Over the adsorption in solution.
Journal of Physical Chemistry A, 57: 385-470.
Gonçalves, J.O., Duarte, D.A., Dotto, G.L., Pinto, L.A.A.
2014. Use of Chitosan with different deacetylation
degrees for the adsorption of food dyes in a binary
system. CLEAN - Soil, Air, Water, DOI. 10. 1002/
clean.20120065.
Hameed, B.H., El-Khaiary, M.I. 2008. Sorption kinetics
and isotherm studies of a cationic dye using
agricultural waste: Broad bean peels. Journal of
Hazardous Materials, 154: 639-648.
Han, R., Han, P., Cai, Z., Zhao, Z., Tang, M. 2008.
Kinetics and isotherms of Neutral Red adsorption
on peanut husk. Journal of Environmental Sciences,
20: 1035-1041.
Hanafiah, M.A.K.M., Ngah, W.S.W., Zolkafly, S.H.,
Teong, L.C., Majid, Z.A.A. 2012. Acid Blue 25
adsorption on base treated (Shorea dasyphylla)
sawdust: Kinetic, isotherm, thermo dynamic and
spectroscopic analysis. Journal of Environmental
Sciences, 24: 261�268.
Lagergren, S. 1898. About the theory of so-called adsorption
of soluble substances. Kungliga Svenska Vetenskapsa
kademiens Handlingar, 24: 1-39.
Langmuir, I. 1916. The constitution and fundamental
properties of solids and liquids. Part I. Solids. Journal
of the American Chemical Society, 38: 2221-2295.
Low, L.W., Teng, T.T., Ahmad, A., Morad, N., Wong,
Y.S. 2011. A novel pretreatment method of
lignocellulosic material as adsorbent and kinetic
study of dye waste adsorption. Water, Air, & Soil
Pollution, 218: 293-306.
Meng, F.W. 2005. Study on a Mathematical Model in
Predicting Breakthrough Curves of Fixed-bed
Adsorption onto Resin Adsorbent. MS Thesis,
pp. 28-36, Nanjing University, China.
Mohan, S.V., Ramanaiah, S.V., Sarma, P.N. 2008.
Biosorption of direct azo dye from aqueous phase
onto Spirogyra sp. I02: Evaluation of kinetics and
mechanistic aspects. Biochemical Engineering
Journal, 38: 61-69.
Noroozi, B., Sorial, G.A. 2013. Applicable models
for multi-component adsorption of dyes: A review.
Journal of Environmental Sciences, 25: 419-429.
Palma, C., Contreras, E., Urra, J., Martinez, M.J. 2011. Eco-
friendly technologies based on banana peel use for the
decolourization of the dyeing process wastewater. Waste
21Drimarene Brilliant Red Removal

and Biomass Valorization, 2: 77-86.
Ponnusami, V., Krithika, V., Madhuram, R. Srivastava,
S.N. 2007. Biosorption of reactive dye using acid-
treated rice husk: Factorial design analysis. Journal
of Hazardous Materials, 142: 397-403.
Prigione, V., Grosso, I., Tigini, V., Anastasi, A., Varese,
G.C. 2012. Fungal waste-biomasses as potential
low-cost biosorbents for decolorization of textile
wastewaters. Water, 4: 770-784.
Punjongharn, P., Meevasana, K., Pavasant, P. 2008.
Influence of particle size and salinity on adsorption
of basic dyes by agricultural waste: dried Seagrape
(Caulerpa lentillifera). Journal of Environmental
Sciences, 20: 760-768.
Royer, B., Cardoso, N.F., Lima, E.C., Vaghetti, J.C.,
Simon, N.M., Calvete, T.,Veses, R.C. 2009.
Applications of Brazilian-pine fruit shell in natural
and carbonized forms as adsorbents to removal of
methylene blue from aqueous solutions-kinetic and
equilibrium study. Journal of Hazardous Materials,
164: 1213-1222.
Sivaraj, R., Namasivayam, C., Kadirvelu, K. 2001.
Orange peel as an adsorbent in the removal of acid
violet 17 (acid dye) from aqueous solutions. Waste
Management, 21: 105-110.
Sun, Q., Yang, L. 2003. The adsorption of basic dyes
from aqueous solution on modified peat-resin
particle. Water Research, 37: 1535-1544.
Verma, A.K., Dash, R.R., Bhunia, P. 2012. A review on
chemical coagulation/flocculation technologies for
removal of colour from textile wastewaters. Journal
of Environmental Management, 93: 154-168.
Wang, H.L., Chen, J.L., Zhai, Z.C. 2004. Study on
thermodynamics and kinetics of adsorption of p-
toluidine from aqueous solution by hyper-cross-
linked polymeric adsorbents. Environmental
Chemistry, 23: 188-192.
Wilczak, A., Keinath, T.M. 1993. Kinetics of sorption
and desorption of copper(II) and lead(II) on
activated carbon. Water Environment Research,
65: 238-244.
Wu, X,. Wu, D., Fu, R. 2007. Studies on the adsorption
of reactive brilliant red X-3B dye on organic and
carbon aerogels. Journal of Hazardous Materials,
147: 1028-1036.
Xi, Z., Chen, B. 2014. Removal of polycyclic aromatic
hydrocarbons from aqueous solution by raw and
modified plant residue materials as biosorbents.
Journal of Environmental Sciences, 26: 737-748.
Zhang, G., Yi, L., Deng, H., Sun, P. 2014. Dyes adsorption
using a synthetic carboxymethyl cellulose-acrylic acid
adsorbent. Journal of Environmental Sciences, 26:
1203-1211.
Zhang, W., Yan, H., Li, H., Jiang, Z., Dong, L., Kan, X.,
Yang, H., Li, A., Cheng, R. 2011. Removal of dyes
from aqueous solutions by straw based adsorbents:
Batch and column studies. Chemical Engineering
Journal, 168: 1120-1127.
22 Muhammad Arshad et al.

Introduction
Mercury is considered as a highly toxic element because
of its accumulative and persistent character in the
environment (Wu et al., 2007). It is one of the famous
agents in wide range of human disorders especially in
breath cancer (Mishra et al., 2005). Although mercury
is not an abundant chemical element in nature, it has
become dangerously widespread as a result of many
industrial and agricultural applications and its threat is
rising day-by-day. The major sources of mercury pollution
to the environment are waste effluents from the metal
plating industry, mining operations, fertilizer industry,
tanneries, and textile industry (Farajim et al., 2010;
Sukocheva et al., 2005). The major effects of mercury
poisoning are neurological and renal disturbances as
well as impairment of pulmonary function. Natural inputs
of mercury to the environment are related to weathering
of mercuriferous areas, the degassing from surface water
and from the crust through volcanic eruptions, naturally-
caused forest fires, and biogenic emissions of the earth
(Jones et al., 2007; Liu et al., 2007; Green-Ruiz, 2006;
Manohar et al., 2002; Boening, 2000), therefore, elimina-
tion of the Hg(II) ions from water is essentially required.
In this regard, different types of sorbents such as resins,
activated chars(Klasson et al., 2010), polymers (Zong
et al., 2001), metal nanooxides, oxidized carbon nano-
tubes and fibre biosorbents (Johari et al., 2014) were
evaluated. Sorbents with high surface area, which can
lead to high removal of Hg(II) ions, are interesting to
the researchers. Discovery of multi-walled carbon
nanotubes (MWCNT) in 1991 has generated extensive
activity in most areas of science and engineering due
to molecular electronics, sensoring, nerve cell stimuli,
drug delivery, cancer therapy and chemical properties
(El-Sheikh et al., 2011). They have become attractive
materials for their novel structure characters and high
surface area. The unique tubular structure makes CNTs
promising absorbent materials, and thus may be used
in removal of many pollutants.
In particular, chemical functionalization of carbon
nanotubes (CNTs) can modify their physical and chemical
properties, leading to the improvement of their performance
for specific applications. Thus, the extensive research
has been focused on the functionalization of CNTs
which can be cited fluorination (Pourrezar et al., 2009),
carbene addition (Malic et al., 2010), esterification (Hu
et al., 2004) and amidation (Venkatesan et al., 2005).
One method for functionalizing of the carbon nanotubes
is its oxidation by a strong and concentrated nitric and
sulphuric acids mixture (Kalita et al., 2008; Yu et al.,
2008).
Synthesis and Application of Highly Active Dithiooxamide
Functionalised Multi-Walled Carbon Nanotubes Toward
Mercury Removal from Aqueous Solution
Mirabi Alia*, Shokuhi Rad Alib, Siadati Seyyed Amira and Alavi Tabari Seyyed Alia
aDepartment of Chemistry, Qaemshahr Branch, Islamic Azad University, Qaemshahr, IranbDepartment of Chemical Engineering, Qaemshahr Branch, Islamic Azad University, Qaemshahr, Iran
(received January 20, 2015; revised July 31, 2015; accepted August 3, 2015)
Pak. j. sci. ind. res. Ser. A: phys. sci. 2016 59 (1) 23-29
Abstract. Highly sensitive and accurate method has been applied for removal of toxic mercury(II) ions
in aqueous solution, using synthesised nanosorbent. Determination of mercury(II) was carried out by flame
atomic absorption spectrometer. A nanosorbent multi-walled carbon nanotubes (MWCNT) was synthesised
by the reaction of dithiooxamide with functionalised multi-walled carbon nanotubes. Initially, the surface
of the multi-walled carbon nanotubes was oxidised by a mixture of nitric and sulphuric acids and then was
functionalised using thionyl chloride. The ligand has been attached to the multi-walled carbon nanotubes
in somewhat shorter time and lower temperature than previous reported methods. The sorbent was
characterised by Fourier transmission infrared and scanning electron microscopy. In this research study,
the effect of different parameters in removal of mercury(II) ions by nanosorbent, such as pH, amount of
nanosorbent, time and concentration of Hg(II), was investigated. Experiments show that the new MWCNT
with loading amount of 1.02 mmol/g is a powerful sorbent for removing the Hg(II) ions from water.
Keywords: carbon nanotubes, mercury removal, aqueous solution, dithiooxamide
*Author for correspondence; E-mail: [email protected]
23

The produced MWCNT-COOH was reacted with thionyl
chloride in the presence and absence of dimethyl-
formamide (DMF) (Yu et al., 2008b). Moreover, the
MWCNT-COCl reacts with various ligands which
mostly take more than 80 h (Sone and Yagi, 2009;
Teixeira et al., 2006; Wang et al., 2006).
In this study, oxidation of MWCNT was performed by
a mixture of nitric and sulphuric acids. Thionyl chloride
was then used to produce the acid chloride functional
group on the CNT. Finally the MWCNT-COCl was
reacted with dithiooxamide in shorter time and under
lower temperature than previous reported methods
(Tahermansouri et al., 2013; Barbara et al., 2011; Yang
et al., 2009) and then the dithiooxamide functionalised
MWCNT was used as a sorbent to remove the toxic
Hg(II) ions in different aqueous solutions.
Materials and Methods
Reagents. All chemicals were in analytical grade reagents.
All solutions were prepared using double distilled water.
A stock standard solution containing 1000 mg/L of Hg(II)
was prepared via dissolving appropriate amounts of its
nitrate salt Hg(NO3)2 (obtained from Merck company,
Darmstadt, Germany) in distilled water and 0.5 mL con-
centrated nitric acid that was purchased from Merck
company. The multi-walled carbon nanotubes (MWCNT),
thionylchloride, triethanolamine, dimethylformamide
(DMF), dithiooxamide (ligand), sulphuric acid, and
nitric acid were used without further purification.
Instrumentation. Thermo Scientific (model: M5) flame
atomic absorption spectrometer with a mercury hollow
cathode lamp as a radiation source, operated at 15 mA
with a monochromator spectral band pass of 1.0 nm
was used for the determination of the exact mercury
amount. The wavelength selected for mercury was
253.6 nm. An air-acetylene flame was used for the
determination of mercury ions and their flow rates were
10.0 L/min and 0.8 L/min, respectively. Also, this device
was equipped with a 50 mm burner head and deuterium
background correction. The pH was measured using a
Metrohm pH meter (model 744) with a combined pH
glass electrode calibrated against two standard buffer
solutions (pH 4.0 and 7.0). Other instruments which
have been used were: Fourier transmission infrared
spectrophotometer (Shimadzu, model 1280), scanning
electron microscope (LEO 440i, leo electron microscopy,
Cambridge, England) and UV-Vis spectrophotometer
(Jenway model 6505).
Functionalisation of carbon nanotubes sorbent. The
MWCNT (4.0 g) were added to 30.0 mL of a mixture
of sulphuric acid and nitric acid (3:1 v/v), and then the
mixture was heated at 80 °C for 2 h. The resulted
MWCNT-COOH was centrifuged at 4000 rpm for
5 min to remove excess acids and then was eluted by
distilled water and dried at 80 °C. Dried 3.0 g of the
MWCNT-COOH was dispersed in 15.0 mL of thionyl
chloride and refluxed at 70 °C for 1 h. After synthesis
of MWCNT-COCl it was eluted with anhydrous toluene
and then dried in oven at 70 °C for 48 h. 3.0 g of MWCNT-
COCl has been dispersed using ultrasonic in DMF as
solvent and 0.5 g of dithiooxamide and 0.3 mL of
triethanolamine were added to the mixture, subsequently
(Scheme 1). The mixture was heated at 80 °C for 30 h.
The synthesised MWCNT-CO-dithiooxamide was
separated from the reaction mixture by centrifugation
and washed with distilled water.
Scheme 1. Preparation of dithiooxamide functiona-
lised multi walled carbon nanotubes.
HNO3, H2SO4
80 C,2ho 70 C,1h
o
SOCl2O
OH
C
O
Cl
C
MWCNT MWCNT MWCNT
Dithiooxamide, Triethanolamine
MWCNT
DMF, 80 C, 30ho
S S
NH2C C
O
NH
C
Procedure for removal of Hg(II) ion. The effect of
different parameters such as pH, sorbent dosage, time
and the mercury concentration on removal of mercury
ions were studied. The pH effect was studied within
the pH range of 4.0-9.0. In other hand the effect of the
sorbent dosage was studied by different absorbent values
between 20-100 mg. Also the effect of the time was
studied by different times between 10-70 min. Moreover,
the effect of mercury concentration was observed within
the concentration range of 40-300 mg/L. Conventional
one factor- at-a-time method was used, and optimised
amount of any parameter was used to next optimisation
of other amounts.
Dithiooxamide functionalized multi walled carbon
nanotubes (70 mg) was added to 100 mL of mercury(II)
ions solution (150 mg/L). The pH value was adjusted
24 Mirabi Ali et al.

by adding 0.5 mL of ammonia/ammonium chloride
buffer solution (1.0 × 10⁻³ mol/L, pH 9.0). Afterwards,
the solution was stirred at room temperature for 30 min
and then the MWCNT sorbent separated from the
solution using centrifuge for 5 min at 4000 rpm. For
determination of residual mercury(II) ions, the
supernatant was analysed by flame atomic absorption
spectrometer (FAAS). Our calculation for mercury
removal and loading amount has been done based on
eq.1 and eq.2.
R% = Ci � Ce / Ci × 100 .................................. (1)
where:
R% = mercury removal percent; Ci and Ce (mg/L) =
the initial and equilibrium concentrations of Hg(II),
respectively.
L.A. = V×C×%R/MHg × ms ............................. (2)
where:
L.A. = loading amount; V = volume of solution sample
(L); C = concentration of Hg (mg/L); MHg = the atomic
weight of Hg (g) and ms = the mass of nanosorbent (g).
Results and Discussion
Synthesis of dithiooxamide functionalized MWCNT
as sorbent. In order to verify the linkage between
MWCNT and the dithiooxamide ligand, the Fourier
transmission infrared spectroscopy (FT-IR) was used
(Fig. 1a-b). Comparison of the FT-IR spectra of MWCNT-
COOH with that of MWCNT-dithiooxamide, gives
important results to identify the groups substitution.
The FT-IR spectra of MWCNT-COOH (Fig. 1a) iden-
tified the peaks of C=O at 1704.96 cm-1 and O-H at
3386.77 cm-1, respectively. In the FT-IR spectra of
MWCNT-dithiooxamide (Fig. 1b), the sharp peak of
N-H bond appeared at the area of 3425.34 cm-1 instead
of wide peak of O-H group which proves attachment of
dithiooxamide to the carbon nanotubes (see Scheme 1).
Surface morphology. The size and morphology of
dithiooxamide functionalized MWCNT before and
after absorbing the mercury(II) ions are illustrated in
(Fig. 2a-b) by using SEM. After precipitating with
mercury ions, Fig. 2b indicates a significant change
which was observed along the tube walls. This significant
change on the surface of CNT proves the precipitation
of mercury ions on this sorbent.
Optimisation of adsorption conditions. Effect of pH.
The pH value of the solution is one of the most important
Fig. (1a-b). FT-IR spectrum of (a) MWCNT-COOH
and (b) MWCNT-CO-dithiooxamide.
100
95
90
85
%T
3919
.79
3741
.34
3741
.65
3170
.76
3062
.75
2023
.88
3008
.75
2862
.17
2731
.02
2623
.01
2391
.57
2306
.71
2160
.13
2067
.55
1650
.95
1519
.80
1380
.94
1257
.50
1026
.06
748.
3370
9.76
594.
0346
2.88
4000 3750 3500 3250 3000 2750 2500 2250 20001750 15001250 1000 750 500
b)
100
90
80
70
%T
4000 3750 35003250 3000 2750 2500 225020001750 15001250 1000 750 500
3895
.94
3803
.36
3733
.93
3386
.77
3271
.05
3109
.04
3016
.46
2962
.46
2877
.60
2599
.86
2422
.43
2491
.86
2190
.98
2067
.55
2021
.26
1704
.96
1635
.52
1542
.95
172.
6410
64.6
3
879.
4884
8.62
771.
47
678.
6045
5.17
a)
25Synthesis of Carbon Nanotubes
Fig. 2(a-b). SEM image of dithiooxamide multiwalled carbon nanotubes (a) beforeabsorption of mercury (II) ions, (b)after absorption of mercury(II) ions.
School of MetallurgyMotor Auto Engineering

factors which affect the adsorption behaviour of mercury
ions on sorbents. It is not only due to the surface structure
of sorbents, but it may also influence the interaction
between sorbents and mercury ions. In this case, due
to the presence of amide functional group in the ligand
structure, the decrease in pH can also significantly
reduce the activity of sorbent (Scheme 2). The effect
of pH was studied within the pH range of 4.0-9.0. At
low pH values the surface of dithiooxamide gives positive
charge because of acidic situation. So repeal interaction
will occur between the positive surface and Hg2+ resulting
decrease in adsorption. In contrast at higher pH values,
reveres interaction happens resulting increase in adsorp-
tion. According to Fig. 3, the most suitable pH value
for this sorbent was found to be 9.0 which results in
the highest amount of mercury removal.
Effect of the sorbent dosage. The effect of the sorbent
dosage on the adsorption of Hg(II) was studied by
different absorbent values between 20-100 mg. The
results in Fig. 4 show that, Hg(II) was approximately,
adsorbed on the surface of sorbent. According to these
results, after about 70 mg of sorbent, the value of
adsorption for Hg(II) does not change significantly. So,
70 mg of the sorbent was selected for further studies.
Effect of time. The effect of time on the adsorption of
Hg(II) was studied by different times between 10-70 min
and illustrated in Fig. 5. The results show that, after
about 30 min of adsorption process, the value of adsorp-
tion does not change significantly. So, this time is the
contact time required for achieving the adsorption
equilibrium which is lower than the required contact
time (120 min) (Johari et al., 2014).
Scheme 2. Suggested binding model of dithiooxa-
mide functionalised multi walled carbon
nanotubes and mercury(II) ions.
O
NH
C
S
C
C
S
NH1
Hg2+
MWCNT
C
O
NH
Hg2+S
C
C
SHg2+
NH1
MWCNT
O
C
NH
S
C
C
S
NH1+
MWCNT
H+
Fig. 3. The effect of pH on the sorbent activity.
Removal conditions: aqueous solution
volume (100.0 mL); sorbent dosage (70 mg);
time of adsorption (30 min); concentration
of mercury (150 mg/L).
100
90
80
70
60
50
40
30
20
Rem
oval (%
)
pH
4 5 6 7 8 9
Fig. 4. The effect of sorbent dosage on adsorption.
Removal conditions: aqueous solution volume
(100.0 mL); pH (9.0); time of adsorption (30
min); concentration of mercury (150 mg/L).
90
80
70
60
50
40
Rem
oval (%
)0 0.02 0.04 0.06 0.08 0.1 0.12
Sorbent dosage (g)
Fig. 5. The effect of time of adsorption. Removal
conditions: aqueous solution volume
(100.0 mL); sorbent dosage (70 mg); pH
(9.0); concentration of mercury (150 mg/L).
95
90
85
80
75
70
65
Rem
oval (%
)
10 20 30 40 50 60 70
Time(min)
26 Mirabi Ali et al.
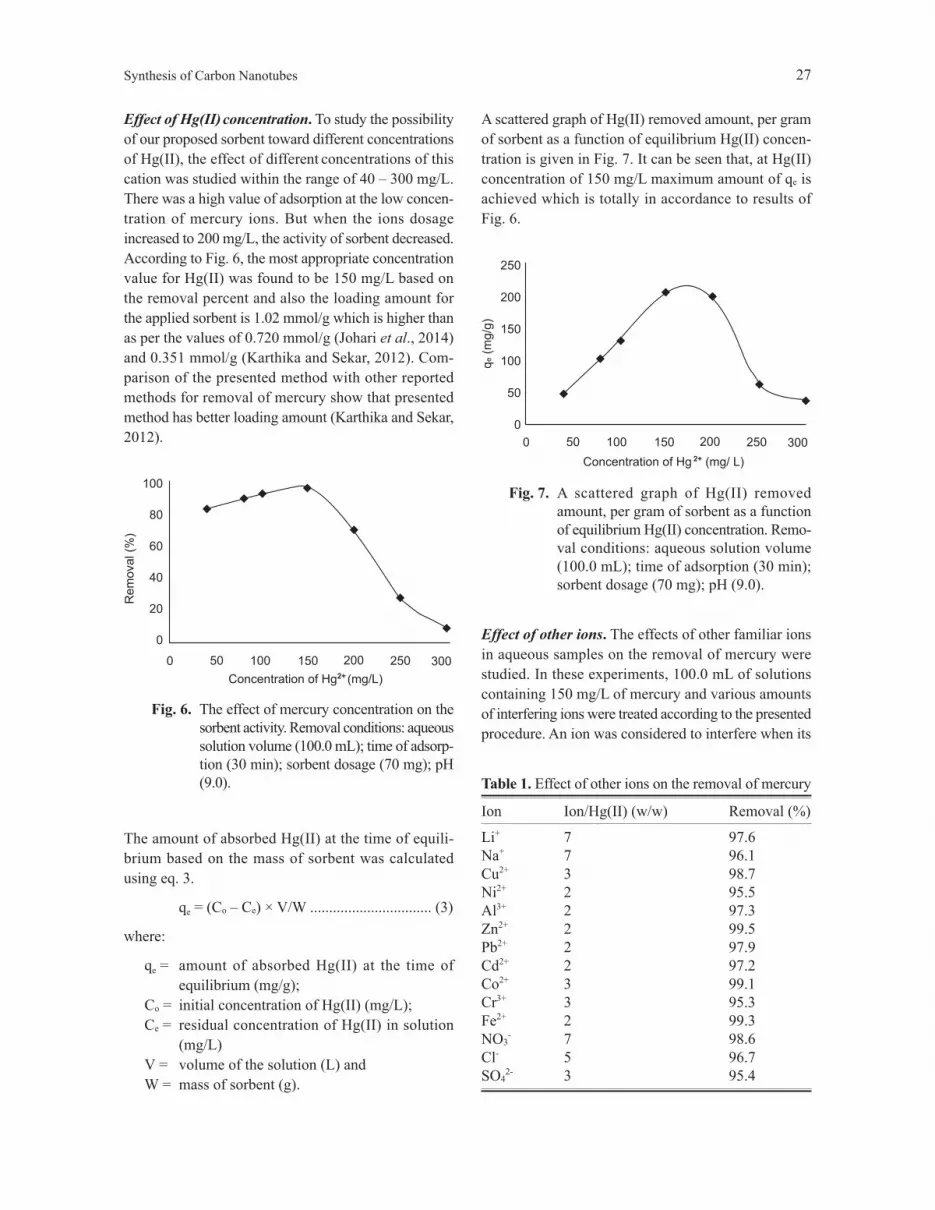
Effect of Hg(II) concentration. To study the possibility
of our proposed sorbent toward different concentrations
of Hg(II), the effect of different concentrations of this
cation was studied within the range of 40 � 300 mg/L.
There was a high value of adsorption at the low concen-
tration of mercury ions. But when the ions dosage
increased to 200 mg/L, the activity of sorbent decreased.
According to Fig. 6, the most appropriate concentration
value for Hg(II) was found to be 150 mg/L based on
the removal percent and also the loading amount for
the applied sorbent is 1.02 mmol/g which is higher than
as per the values of 0.720 mmol/g (Johari et al., 2014)
and 0.351 mmol/g (Karthika and Sekar, 2012). Com-
parison of the presented method with other reported
methods for removal of mercury show that presented
method has better loading amount (Karthika and Sekar,
2012).
A scattered graph of Hg(II) removed amount, per gram
of sorbent as a function of equilibrium Hg(II) concen-
tration is given in Fig. 7. It can be seen that, at Hg(II)
concentration of 150 mg/L maximum amount of qe is
achieved which is totally in accordance to results of
Fig. 6.
Table 1. Effect of other ions on the removal of mercury
Ion Ion/Hg(II) (w/w) Removal (%)
Li+ 7 97.6
Na+ 7 96.1
Cu2+ 3 98.7
Ni2+ 2 95.5
Al3+ 2 97.3
Zn2+ 2 99.5
Pb2+ 2 97.9
Cd2+ 2 97.2
Co2+ 3 99.1
Cr3+ 3 95.3
Fe2+ 2 99.3
NO3- 7 98.6
Cl- 5 96.7
SO42- 3 95.4
The amount of absorbed Hg(II) at the time of equili-
brium based on the mass of sorbent was calculated
using eq. 3.
qe = (Co � Ce) × V/W ................................ (3)
where:
qe = amount of absorbed Hg(II) at the time of
equilibrium (mg/g);
Co = initial concentration of Hg(II) (mg/L);
Ce = residual concentration of Hg(II) in solution
(mg/L)
V = volume of the solution (L) and
W = mass of sorbent (g).
Effect of other ions. The effects of other familiar ions
in aqueous samples on the removal of mercury were
studied. In these experiments, 100.0 mL of solutions
containing 150 mg/L of mercury and various amounts
of interfering ions were treated according to the presented
procedure. An ion was considered to interfere when its
Fig. 6. The effect of mercury concentration on the
sorbent activity. Removal conditions: aqueous
solution volume (100.0 mL); time of adsorp-
tion (30 min); sorbent dosage (70 mg); pH
(9.0).
Rem
oval (%
)
100
80
60
40
20
0
Concentration of Hg (mg/L)2+
0 50 100 150 200 250 300
Fig. 7. A scattered graph of Hg(II) removed
amount, per gram of sorbent as a function
of equilibrium Hg(II) concentration. Remo-
val conditions: aqueous solution volume
(100.0 mL); time of adsorption (30 min);
sorbent dosage (70 mg); pH (9.0).
250
200
150
100
50
0
qe (
mg/g
)
0 50 100 150 200 250 300
Concentration of Hg (mg/ L)2+
27Synthesis of Carbon Nanotubes

presence produced a variation of more than 5% in the
removal of mercury in aqueous sample. The results of
Table 1, indicate that the removal of mercury is almost
quantitative in the presence of interfering ions.
Conclusion
A new effective sorbent was synthesised by functiona-
lization of the MWCNT. Experiments show that the
new modified MWCNT with a loading amount of
1.02 mmol/g is a powerful sorbent for removing the
Hg(II) ions from water. This method indicates that
95.7% removal of Hg2 + is possible at optimal conditions
of pH = 9, mercury ion concentration = 150 mg/L, and
the sorbent dosage = 0.07 g. The results showed that,
MWCNT-dithiooxamide is an excellent absorbent for
moderate concentrations of mercury ions. This proposed
method applies an environment friendly non-toxic
absorbent which does not threaten human health. Also
this method is simple, highly sensitive, selective and
relatively fast.
Acknowledgement
The authors thank the Research Council at the Qaemshahr
Branch, Islamic Azad University for technical and
financial support.
References
Barbara, C.F., Bonalume, G.W.L., Jesualdo Luiz, R.
2011. Functionalized carbon nanotubes for nano-
composites. In: 16th International Conference on
Composite Structures ICCS 16, A.J.M. Ferreira
(ed), Porto, Portugal.
Boening, D.W. 2000. Ecological effects, transport, and
fate of mercury: a general review. Chemosphere,
40: 1335-1351.
Chiarle, S., Ratto, M., Rovatti, M. 2000. Mercury
removal from water by ion exchange resins absorp-
tion. Water Research, 34: 2971-2978.
El-Sheikh, A.H., Al-Degs, Y.S., Al-Asad, R.M., Sweileh,
J.A. 2011. Effect of oxidation and geometrical
dimensions of carbon nanotubes on Hg(II) sorption
and preconcentration from real waters. Desalination,
270: 214-220.
Ghambarian, M., Khalili-Zanjani, M.R., Yamini, Y.,
Esrafili, A., Yazdanfar, N. 2010. Preconcentration
and speciation of arsenic in water specimens by
the combination of solidification of floating drop
microextraction and electrothermal atomic absorp-
tion spectrometry. Talanta, 81: 197-201.
Green-Ruiz, C.R. 2006. Mercury(II) removal from
aqueous solutions by nonviable Bacillus sp. from
a tropical estuary. Bioresource Technology, 97:
1907-1911.
Hu, H., Ni, Y., Montana, V., Haddon, R.C., Parpura, V.
2004. Chemically functionalized carbon nanotubes
as substrates for neuronal growth. Nano Letter, 4:
507-511.
Johari, K., Saman, N., Song, S.T., Heng, J.Y.Y., Mat,
H. 2014. Study of Hg(II) removal from aqueous
solution using lignocellulosic coconut fiber biosor-
bents: Equilibrium and kinetic evaluation. Chemical
Engineering Communications, 201: 1198-1220.
Jones, A.P., Hoffmann, J.W., Smith, D.N., Feeley, T.J.3rd,
Murphy, J.T. 2007. DOE/NETL's phase II mercury
control technology field testing program. Preliminary
economic analysis of activated carbon injection.
Environmental Science and Technology, 41: 1365-
1371.
Kalita, G., Adhikari, S., Aryal, H.R., Ghimre, D.C.,
Afre, R., Soga, T., Sharon, M., Umeno, M. 2008.
Flourination of multi-walled carbon nanotubes
(MWNTs) via surface microwave (SW-MW) plasma
treatment. Physica E, 41: 299-303.
Karthika, C., Sekar, M. 2012. Removal of Hg(II) ions
from aqueous solution by acid acrylic resin_A study
through absorption isotherms analysis. I Research
Journal of Environment Sciences, 1: 34-41.
Klasson, K.T., Lima, I.M., Boihem, J.L.L., Wartelle,
L.H. 2010. Feasibility of mercury removal from
simulated flue gas by activated chars made from
poultry manures. Journal of Environmental
Management, 91: 2466-2470.
Liu, S.H., Yan, N.Q., Liu, Z.R., Qu, Z., Wang, H.P.,
Chang, S.G., Miller, C. 2007. Using bromine gas
to enhance mercury removal from flue gas of coal-
fired power plants. Environmental Science and
Technology, 41: 1405-1412.
Malic, E., Maultzsch, J., Reich, S., Knorr, A. 2010.
Excitonic absorption spectra of metallic single-
walled carbon nanotubes. Physical Review B, 82:
035433.
Manohar, D.M., Krishnan, A.K., Anirudhan, T.S. 2002.
Removal of mercury(II) from aqueous solutions
and chlor-alkali industry wastewater using 2-
mercaptobenzimidazole-clay. Water Research, 36:
1609-1619.
Mishra, S., Tripathi, R.M., Bhalke, S., Shukla, V.K.,
Puranik, V.D. 2005. Determination of methylmercury
and mercury(II) in a marine ecosystem using solid-
28 Mirabi Ali et al.

phase microextraction gas chromatography-mass
spectrometry. Analytica Chimica Acta, 551: 192-
198.
Pourreza, N., Parham, H., Kiasat, A.R., Ghanemi, K.,
Abdollahi, N. 2009. Solid phase extraction of
mercury on sulfur loaded with N-(2-chloro ben-
zoyl)N'-phenylthiourea as a new adsorbent and
determination by cold vapor atomic absorption
spectrometry. Talanta, 78: 1293-1297.
Sone, K., Yagi, M. 2009. Chemical adsorption onto an
ITO substrate of single-wall carbon nanotube
functionalized by carboxylic groups as an efficient
support for electrocatalyst. Electroanalysis, 21:
144-149.
Sukocheva, O.A., Yang, Y., Gierthy, J.F., Seegal, R.F.
2005. Methyl mercury influences growth-related
signaling in MCF-7 breast cancer cells. Environ-
mental Toxicology, 20: 32-44.
Tahermansouri, H., Aryanfar, Y., Biazar, E. 2013.
Synthesis, characterization, and the influence of
functionalized multi-walled carbon nanotubes with
creatinine and 2-aminobenzophenone on the gastric
cancer cells. Bulletin of Korean Chemical Society,
34: 149-153.
Teixeira Tarley, C.R., Barbosa, A.F., Segatelli, M.G.,
Figueiredo, E.C., Luccas, P.O. 2006. Highly
improved sensitivity of TS-FF-AAS for Cd(II)
determination at ng L-1 levels using a simple flow
injection minicolumn preconcentration system
with multiwall carbon nanotubes. Journal of
Analytical Atomic Spectrometry, 21: 1305-1313.
Venkatesan, N., Yoshimitso, J., Ito, Y., Shibata, N.,
Takada, K. 2005. Liquid filled nanoparticles as a
drug delivery tool for protein therapeutics. Journal
Biomaterials, 26: 7154-7163.
Wang, X., Li, W., Chen, Z., Waje, M., Yan, Y. 2006.
Durability investigation of carbon nanotube as
catalyst support for proton exchange membrane
fuel cell. Journal of Power Sources, 158: 154-159.
Wu, G., Wang, Z., Wang, J., He, C. 2007. Hierarchically
imprinted organic-inorganic hybrid sorbent for
selective separation of mercury ion from aqueous
solution. Analytica Chimica Acta, 582: 304-310.
Yang, K., Gu, M., Guo, Y., Pan, X., Mu, G. 2009. Effects
of carbon nanotubes functionalization on the
mechanical and thermal properties of expoxy
composites. Carbon, 47: 1723-1737.
Yu, J.G., Huang, K.L., Liu, S.Q., Tang, J.C. 2008a.
Preparation and characterization of soluble
methyl- b-cyclodextrin functionalized single-walled
carbon nanotubes. Physica E: Low-Dimensional
Systems & Nanostructures, 40: 689-692.
Yu, J.G., Huang, K.L., Tang, J.C. 2008b. Chemical
attachment of dibromocarbene to carbon nano-
tubes. Physica E: Low-Dimensional Systems &
Nanostructures, 41: 181-184.
Zong, G., Chen, H., Qu, R., Wang, C., Ji, N. 2011.
Synthesis of polyacrylonitrile-grafted cross-linked
N-chlorosulfonamidated polystyrene via surface-
initiated ARGET ATRP, and use of the resin in
mercury removal after modification. Journal of
Hazardous Materials, 186: 614-621.
29Synthesis of Carbon Nanotubes

Remote Controlling and Monitoring of Microscopic Slides
Ghulam Mustafaa*, Muhammad Tahir Qadrib and Umar Darazc
aPCSIR Laboratories Complex, Karachi-75280, PakistanbDepartment of Electronics Engineering, Sir Syed University of Engineering & Technology, Karachi, Pakistan
cPathological Department of Civil Hospital, Karachi, Pakistan
(received December 18, 2014; revised May 11, 2015; accepted May 21, 2015)
Pak. j. sci. ind. res. Ser. A: phys. sci. 2016 59 (1) 30-33
Introduction
Health care is the most important sector these days and many
scientists are busy in their research using the new era
technologies to provide health facilities to human beings
(John et al., 2009; Kamel- Boullos and Wheeler 2007;
Eysenbach, 2001). In the recent time there is a rapid
development in information technologies i.e., growth of
internet through high speed networks, communication
technologies, web technologies, etc. Combination of new
age technologies gave birth of a new field which is remote
monitoring and controlling which rises the technological
change in the field of control industries, communication
industries, automotive industries, medical, agriculture etc.
The aim of present study is to facilitate the personnels
working in medical field, specifically a pathologist and to
reduce the time of diagnosis of a disease. This research paper
introduces a new solution for monitoring and controlling the
microscopic slides regardless of the location of the pathologist.
Facilitating a pathologist has always remained an impor-
tant issue of discussion, because in an emergency diagnosis
can be delayed due to unavailability of the pathologist
which is a high risk of patient�s life. So there have been
several methods used previously to resolve this matter.
But monitoring and controlling the slides from any location
in the world is a great achievement. This research shows
the real implementation of the method that could be used
for remote monitoring of slides and control of the stage
in up-down, right-left and in and out movements.
The machine is composed of a visualization system which
is interfaced with the microscope, a control board that
controls and interfaces the user interface with motors, a
graphical user interface which contains the graphical push
buttons providing the control in three dimensions and a
software through which the doctor can interact with the
user interface remotely.
This is a low cost and very effective method by which the
time to diagnose a disease would be readily decreased.
Microscopic examination cost is very high for the
underdeveloped countries where the slides are being sent
to other cities to the specialist. Now, using this technique
the pathologist can give his report in a few minutes. Also
this will reduce the health care cost that was previously
bared by the patients and the pathological laboratories.
Also the pathologists will be free from moving into different
labs and can easily perform their task from any location
even from their home. This will facilitate them physically
as well as economically.*Author for correspondence; E-mail: [email protected]
Abstract. Remotely controlled microscopic slide was designed using especial Graphical User Interface (GUI)
which interfaces the user at remote location with the real microscope using site and the user can easily view
and control the slide present on the microscope�s stage. Precise motors have been used to allow the movement
in all the three dimensions required by a pathologist. The pathologist can easily access these slides from any
remote location and so the physical presence of the pathologist is now made easy. This invention would
increase the health care efficiency by reducing the time and cost of diagnosis, making it very easy to get the
expert�s opinion and supporting the pathologist to relocate himself for his work. The microscope is controlled
with computer with an attractive Graphical User Interface (GUI), through which a pathologist can easily
monitor, control and record the image of a slide. The pathologist can now do his work regardless of his
location, time, cost and physically presence of lab equipment. The technology will help the specialist in
viewing the patients slide from any location in the world. He would be able to monitor and control the stage.
This will also help the pathological laboratories in getting opinion from senior pathologist who are present
at any far location in the world. This system also reduces the life risks of the patients.
Keywords: pathology, remote monitoring, microscope, motor control, LabVIEW, Arduino, teamviewer
30

Materials and Methods
This system model is described as follows: The system
consists of five parts. The first part is the image acquisition
whose purpose is to acquire the real time video signal using
LabVIEW (NILS, 2014) based graphical user interface
(GUI). The second part is to process the video signal using
image processing tools in LabVIEW. The GUI is designed
for this purpose which is the medium of communication
between the physician and the microscopic unit. The third
part is the design of controlling circuitry in order to control
the movement of microscopic slides using stepper motors.
The fourth part is the arduino (Arduino, 2014a) based
controlling unit which is interfaced with the GUI to move
the slides accordingly. The last part of the system is to
publish the GUI on internet for remote monitoring and
controlling of the microscopic slides. The overall block
diagram of the system is illustrated in Fig. 1.
Image acquisition. The most important part of the
microscope is the eye piece from where the image of the
slide is seen by the pathologist. In order to acquire the
image from the eye piece, a digital camera of high resolution
is attached on the eye piece. The camera is interfaced at
the USB port of the system and is able to transmit live
video of the slide to the attached computer. For this purpose
LabVIEW software (NILS, 2014) is used.
To interface the camera in LabVIEW an additional
tool kit is required. LabVIEW provides a solution
known as vision acquisition software (NIVAS, 2014)
which makes it very easy to interface any USB camera
in LabVIEW. After interfacing the camera the live
video of the slide of microscope was viewed as shown
in Fig. 2.
LabVIEW based GUI. To get the user�s input and translate
it into machine understandable format, an interface is
required to communicate. This interface must be easy to
understand and simple to use, so that the user can perform
its task very easily. The interface developed here is named
as a graphical user interface. This is the main link of the
whole system as it provides the communication between
the user�s interface and the central control board, which
is arduinio based system. The task of the GUI is to handle
the following operations.
i. Image acquisition.
ii. To process the user�s input.
iii. Communicating the data to the control board.
The image was acquired in LabVIEW using the Vision
Acquisition Software, which provides the opportunity to
interface any USB imaging device having direct show
support. In order to view the slide continuously, the camera
is used in a live video display mode.
As the slide can be moved in all the three dimensions,
therefore, the user is provided with the control buttons on
the front panel to move it accordingly. These controls are
simply made by using push buttons. The GUI contains the
push buttons to adjust the position of slide and a control
which displays the live video of the slide. The hardware
interfaced gets the input corresponding specific button
pressed by the user, as illustrated in Fig. 3.
Finally, the control board is made by using Arduino
mega2560 (Arduino, 2014b) microcontroller board. This
board is interfaced with LabVIEW on HyperTerminal
(HTS, 2014) on USB port.
Microscopic slides controlling. The slide is placed on
the microscope called as �Stage�. After placing a slide on
the stage of microscope, the stage is moved �up�, �down�,
�in� and �out� and the slide can be moved in right and left
directions. These all actions are performed using the
mechanical knobs present for the tasks in microscope. In
order to control these movements through a computer,
especial stepper motors are required to be attached with
Fig. 1. Overall block diagram of the system.
Electroniccontrol board
Microscopic unit
Camera
MotorsMechanical
control
Eye pieceGraphical user
interface
Rem
ote
cont
rolli
ng a
nd m
onito
ring
Fig. 2. Snapshot of the microscopic slide video.
31Microscopic Slides Remote Controlling

individual knob. Since our requirement is two dimension
accurate movement in each dimension. A stepper motor
of 1.8° step is feasible for the task. The torque of the motor
is dependent upon the mechanical force required to move
the knob. An easily available stepper motor can provide
enough torque to rotate it.
Electronic circuit is required to control the rotation of the
motors. �Arduino Motor Control Shield� was used to
control the stepper�s movement. The Arduino shield can
be easily attached with the Arduino main board and provide
the additional library of motor control through which the
user can control the acceleration, direction and torque of
the motor easily.
The arduino shield has the capacity to control two stepper
motors at a time. Therefore, an additional circuit developed
on ULN2003 was used which was directly attached with
the Arduino main board and the stepper motor. With
these attachments it became easy to have a control on
the movement of slide of microscope. In order to view
the sample of the slide especial arrangement has to be
made through which the slide moves accurately and
precisely.
In order to control the slide�s direction on the stage, an
especial control circuitry is required to accurately move
the slide in three dimensions. The slide placed by the
technician on the stage of microscope could only be seen
easily by the doctor when he can view the whole span of
the slide. In order to achieve the target, three stepper motors
were used to control the up-down, right-left and in-out
motion of it. Each stepper motor with the accuracy of 1.8°
was used, which was providing accurate linear motion in
all dimensions.
Arduino based controlling unit. A central control
board was required to get the signal from the user and
then to control the required motor in specified direction
and with specific speed. There are several options to
perform the task, but an Arduino board is a good option.
The Arduino board is developed around Atmega AVR
Microcontrollers and provides the opportunity to use
its ports. The Arduino also provides an easy to learn
and programme code that could be used to run the
microcontroller used in the board. The Arduino board
is USB powered and is supplied with its own compiler,
so it gets very easy for the user to write, compile and
upload the code. The Arduino Board comes in variety
and the user can select specific board according to their
requirements. Due to Arduino Motor Shield with a
facility to drive three stepper at a time Arduino mega
2560 board was used in the present study. This board
has 8 bit microcontroller having 86 digital I/O pins to
cope with present requirement.
The Arduino mega board was programmed to control the
motor and to communicate with the GUI. The Central
Control board communicates with computer and gets the
control signals from the user and transmits this into the
motor control signal to specific motor.
Remote monitoring and controlling of the slides.
Accurate software through which the remote monitoring
and controlling could be done was the most important
part of this solution. To access any system remotely it
is always important to provide a secure access so that
only that person can use it having the full authority.
Remote computer controlling software was used for
this purpose which provides a secure access to the user
present at the remote location. There are many softwares
available in the market that provides the remote desktop
sharing option, they also provide the control of the
desktop. Team viewer software (TVS) is one of them.
Team viewer software was used to share the desktop
of the computer on which the GUI was present. Figure
4 shows the front panel view from the remote location.
Results and Discussion
The operation of the complete remote controlled
microscope is divided into two ends. One end is the
microscope interfaced with the PC and the other end is
the remote computer on which the pathologist is present
to view the slide.
At the first end a PC is interfaced with the microscope
through its camera and Arduino board connected at the
Fig. 3. LabVIEW based GUI.
32 Ghulam Mustafa et al.
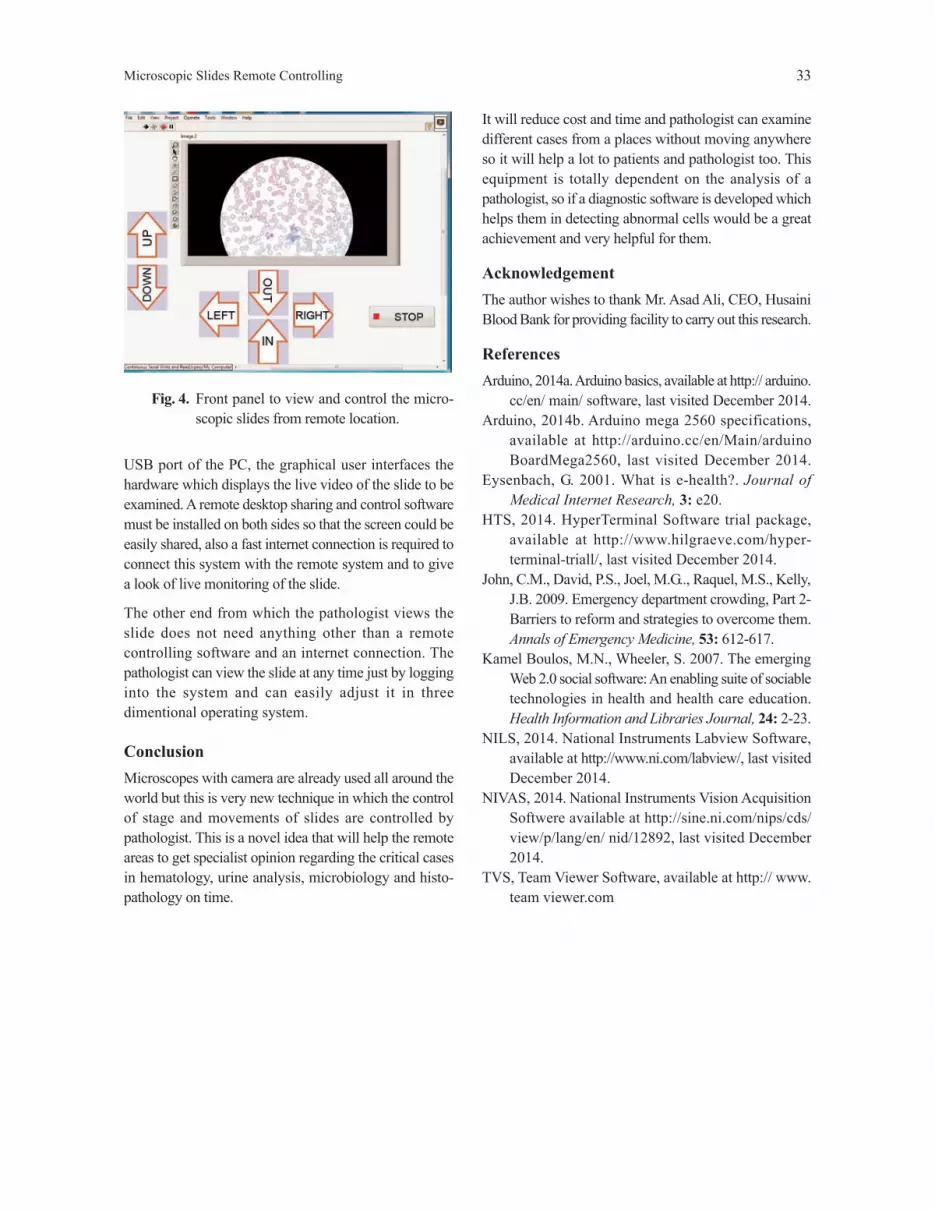
USB port of the PC, the graphical user interfaces the
hardware which displays the live video of the slide to be
examined. A remote desktop sharing and control software
must be installed on both sides so that the screen could be
easily shared, also a fast internet connection is required to
connect this system with the remote system and to give
a look of live monitoring of the slide.
The other end from which the pathologist views the
slide does not need anything other than a remote
controlling software and an internet connection. The
pathologist can view the slide at any time just by logging
into the system and can easily adjust it in three
dimentional operating system.
Conclusion
Microscopes with camera are already used all around the
world but this is very new technique in which the control
of stage and movements of slides are controlled by
pathologist. This is a novel idea that will help the remote
areas to get specialist opinion regarding the critical cases
in hematology, urine analysis, microbiology and histo-
pathology on time.
Fig. 4. Front panel to view and control the micro-
scopic slides from remote location.
It will reduce cost and time and pathologist can examine
different cases from a places without moving anywhere
so it will help a lot to patients and pathologist too. This
equipment is totally dependent on the analysis of a
pathologist, so if a diagnostic software is developed which
helps them in detecting abnormal cells would be a great
achievement and very helpful for them.
Acknowledgement
The author wishes to thank Mr. Asad Ali, CEO, Husaini
Blood Bank for providing facility to carry out this research.
References
Arduino, 2014a. Arduino basics, available at http:// arduino.
cc/en/ main/ software, last visited December 2014.
Arduino, 2014b. Arduino mega 2560 specifications,
available at http://arduino.cc/en/Main/arduino
BoardMega2560, last visited December 2014.
Eysenbach, G. 2001. What is e-health?. Journal of
Medical Internet Research, 3: e20.
HTS, 2014. HyperTerminal Software trial package,
available at http://www.hilgraeve.com/hyper-
terminal-triall/, last visited December 2014.
John, C.M., David, P.S., Joel, M.G.., Raquel, M.S., Kelly,
J.B. 2009. Emergency department crowding, Part 2-
Barriers to reform and strategies to overcome them.
Annals of Emergency Medicine, 53: 612-617.
Kamel Boulos, M.N., Wheeler, S. 2007. The emerging
Web 2.0 social software: An enabling suite of sociable
technologies in health and health care education.
Health Information and Libraries Journal, 24: 2-23.
NILS, 2014. National Instruments Labview Software,
available at http://www.ni.com/labview/, last visited
December 2014.
NIVAS, 2014. National Instruments Vision Acquisition
Softwere available at http://sine.ni.com/nips/cds/
view/p/lang/en/ nid/12892, last visited December
2014.
TVS, Team Viewer Software, available at http:// www.
team viewer.com
33Microscopic Slides Remote Controlling

Seasonal and Temporal Variations of Criteria Air Pollutants and
the Influence of Meteorological Parameters on the Concentration
of Pollutants in Ambient Air in Lahore, Pakistan
Amtul Bari Tabindaa, Saleha Munira*, Abdullah Yasara and Asad Ilyasb
aSustainable Development Study Centre, GC University Lahore, PakistanbIB & M, University of Engineering and Technology Lahore, Pakistan
(receivd September 6, 2013; revised December 19, 2014; accepted December 31, 2014)
Pak. j. sci. ind. res. Ser. A: phys. sci. 2016 59 (1) 34-42
Abstract. Criteria air pollutants have their significance for causing health threats and damage to the
environment. The study was conducted to assess the seasonal and temporal variations of criteria air pollutants
and evaluating the correlations of criteria air pollutants with meteorological parameters in the city of
Lahore, Pakistan for a period of one year from April 2010 to March 2011. The concentrations of criteria
air pollutants were determined at fixed monitoring stations equipped with HORIBA analyzers. The annual
average concentrations (µg/m3) of PM2.5, O3, SO2, CO and NOx (NO+NO2) for this study period were
118.94±57.46, 46.0±24.2, 39.9±8.9, 1940±1300 and 130.9±81.0 (61.8±46.2+57.3±22.19), respectively.
PM2.5, SO2, CO and NOx had maximum concentrations during winter whereas O3 had maximum concentration
during summer. Minimum concentrations of PM2.5, SO2 and NOx were found during monsoon as compared
to other seasons due to rainfall which scavenged these pollutants. The O3 showed positive correlation with
temperature and solar radiation but negative correlation with wind speed. All other criteria air pollutants
showed negative correlation with wind speed, temperature and solar radiation. A significant (P<0.01)
correlation was found between NOx and CO (r = 0.779) which showed that NOx and CO arise from common
source that could be the vehicular emission. PM2.5 was significantly correlated (P<0.01) with NOx (r = 0.524)
and CO (r = 0.519), respectively. High traffic intensity and traffic jams were responsible for increased air
pollutants level especially the PM2.5, NOx and CO.
Keywords: PM2.5, O3, SO2, CO, NOx, seasonal variations, air pollution, meteorological parameters
Introduction
Among the current environmental problems faced by
the society, air quality issues are most problematic to
handle as more and more studies report the human
health and environmental impact of air pollution
(Desauziers, 2004). Lahore is the second largest city
in Pakistan, it stands at number 40 in the ranking of
world�s most populated urban cities. The population of
Lahore is growing at a rapid rate and has now reached
10 million (Hameed and Nazir, 2011). Lahore is situated
in east of Pakistan (latitude 31.470 N and longitude
74.253 E) and has an altitude of 702ft from sea level
(Fig. 1). It is commercial, industrial, cultural and
educational hub of Pakistan. The selected site is ideal
for the study as it represents the local and distant air
pollution sources. Lahore city has arid and hot climate
and it presents four seasons. The winter season starts
from November and ends at February. The temperature
is lowest during winter having an average of 12.14 ±
4.12 °C. Spring season comprises of two months March
and April. The summer season is from May to July and
temperature is highest during these months having an
average of 34.8±11.8 °C.
Lahore receives bulk of rainfall during July to September
and the fall season is in October. During the last 10 years
the rainfall varied from 333-1232 mm and relative
humidity in this area was 17% to 70%. The growing
volume of population and traffic are major factors for
rise in air pollution. The Lahore city has 1.4 million
registered vehicles (Ali and Athar, 2008). Many earlier
studies show that Lahore is one of the world�s most
polluted cities (Mehta et al., 2009; Hopke, 2009; Biswas
et al., 2008; Wahid, 2006; Barletta et al., 2002; Parekh
et al., 2001; Harrison et al., 1997; Hussainet al., 1990).
In 1992 WHO conducted an air quality monitoring
programme which revealed that total concentration of
suspended particulate in Lahore was among the highest
in the world (Smith et al., 1996; WHO and UNEP, 1992).
Air pollution is caused mainly by fossil fuel (oil, coal
and natural gas) use in industry, domestic sector, power
generation and transport (Jaffary and Faridi, 2006). In
addition; animal waste, agricultural waste and biomass*Author for correspondence; E-mail: [email protected]
34

burning also contribute in polluting air. The pollutant
emission into ambient air has direct and indirect effects
like eutrophication, stratospheric ozone depletion, acidi-
fication and production of ground level ozone. This
may in turn worsen the air quality and leave its impact
on the ecosystem, buildings, agriculture and human
health (Schwella, 2008). Meteorological parameters
have an important role in dispersion, dilution, formation
and transport of pollutants in air (Ying et al., 2012).
For understanding atmospheric air quality the accurate
measurement and monitoring of meteorological parameter
is a principal requirement (Seaman, 2003). The ambient
weather conditions influence the chemical reaction of
air pollutants (Elminir, 2005). The air quality of cities
is correlated with the various meteorological factors
like wind speed, air temperature and solar radiation
(Gupta et al., 2004). This study was conducted to assess
the seasonal and temporal variations of criteria air
pollutants and evaluating the correlations of criteria air
pollutants with meteorological parameters in the city
of Lahore, Pakistan.
Materials and Methods
Description of study site. Complete monitoring data
for the criteria air pollutants PM2.5, O3, SO2, CO and
NOx (NO+NO2) was obtained with the courtesy of
Environment Protection Department (EPD) Lahore,
Pakistan for a period of one year from April 2010 to
March 2011. Figure 1 represents the map of Lahore.
Environment Protection Agency Punjab is continuously
monitoring the air quality of Lahore at two sites through
fixed monitoring stations. One of them is located at
Town Hall on lower Mall Area Lahore, Pakistan. This
is a general air quality monitoring station situated on
the roof top (25 f from ground level) of local EPA office.
Its distance from the main busiest roads like Mall Road,
Lower Mall, Bank Road and Anarkali Road is about
200 meter. Lower Mall Area is situated in the centre of
the city. It is surrounded by busiest road of city and
commercial activities. About 3 kilometers away from
this site is an industrial centre named Badami Bagh
industrial area. The dominant industrial activity in this
area is steel scrap processing units and plastic industry.
The other fixed monitoring station is located in Township
in south of Lahore. It has residential area as well as
small industrial area.
Instrument and statistical analysis. PM2.5 was moni-
tored with HORIBA instrument APDA-371. It works
on the principle of betaray attenuation. The lower
detection limit for 1 h is < 4.8 µg/m3 and for 24 h is <
1.0 µg/m3. CO monitoring was done with HORIBA
instrument APMA-370. It uses solenoid valve cross
flow modulation, non-dispersive infrared (NDIR)
absorption technology (Detection limit 0.02 ppm). NOx
(NO2+NO) were monitored with APNA-370. The
principle of measurement is cross flow modulation
type reduced pressure chemiluminescence (CLD) with
lower detection limit of 0.5 ppb. O3 was monitored with
APOA-370. The instrument operates on cross flow
modulation type, Ultra-violet-absorption method
(NDUV) and the lower detection limit is 0.5 ppb. SO2
was monitored with APSA-370. The instrument works
on Ultra Violet Florescence Technology (lower detection
limit 0.5 ppb).
Pearson correlation was used to correlate between
criteria air pollutants and meteorological parameters
using SPSS Statistics v20.
Results and Discussion
Monthly average concentrations of criteria air pollutants
PM2.5, O3, SO2, CO and NOx (NO+NO2) are presented in
Fig. 2(a-e). and monthly ranges along with simultaneously
measured meteorological data is represented in Table 1.
The seasonal variation is presented in Fig. 3. Highest
Fig. 1. Map of Lahore, Pakistan.
35Criteria Air Pollutants in Lahore

and lowest PM2.5 levels were observed in winter and
monsoon, respectively. The highest PM2.5 concentration
in winter months can be attributed to residential heating.
The PM2.5 concentration in winter was 2.2 times higher
than the PM2.5 concentration in summer and 3.7 times
higher than the PM2.5 concentration in monsoon season.
The PM2.5 level during the winter season was 7.7 times
higher than the WHO prescribed limit of 25 µg/m3
(WHO, 2006) and 4.8 times greater than the Pak-EPA
limit of 40 µg/m3 (Pak-EPA, 2009). During the summer
season the PM2.5 level was 3.4 times higher than the
standard WHO limit (WHO, 2006) and 2.1 times greater
than the Pak-EPA standards (Pak-EPA, 2009). The
PM2.5 level during the spring and fall also violated the
standards. The PM2.5 concentration was 4.2 times in
excess the WHO standard (WHO, 2006) and 2.6 times
in excess than Pak-EPA standard (Pak-EPA, 2009)
during spring and 5.4 times in excess than WHO limit
(WHO, 2006) and 3.4 times in excess than Pak-EPA
limits (Pak-EPA, 2009) during fall. During monsoon
the PM2.5 level was 2 times greater than the WHO limit
(WHO, 2006) and 1.3 times in excess the Pak-EPA
standard (Pak-EPA, 2009). The PM2.5 levels in air reduced
during the monsoon season because the rain scavenges
the particulate matter in air and wash it out (McCully
et al., 1956). Yaseen (2000) reported similar results in
Malaysia where rainfall drops washout the particulate
in air and thus reduces its concentration in ambient air.
The first study on particulate matter in Lahore was
carried out by Global Environment Monitoring System
(GEMS) which reported that the annual mean suspen-
ded particulate matter (SPM) concentration in Lahore
was 332 µg/m3 in 1978 at commercial city centre and
749 µg/m3 and 690 µg/m3 during 1979 and 1980, res-
pectively at the suburban residential site (WHO, 1984).
Similarly Smith et al. (1996) studied annual mean total
suspended particulate (TSP) level in Lahore and reported
that 838, 590 and 607 µg/m3 of particulate was present
at rural, industrial and city site in Lahore, respectively.
Pak-EPA/JICA (2001) reported the hourly average con-
centration of suspended particulate matter (SPM) at
Lahore was 895 µg/m3. Waheed et al. (2005) reported
that the particulate matter in Lahore was in the range
of 1, 128-1, 870 µg/m3. Hussain et al. (2007) studied
PM2.5 level in Lahore during 2005-2006 and the PM2.5
level was in range of 53-476 µg/m3. Ghauri et al. (2007)
reported that, total suspended particulate (TSP) in Lahore
during 2003-2004 was 482 µg/m3 and the level of PM10
in Lahore during 2003-2004 was 200 µg/m3. Lodhi
Fig. 2(a-e). Monthly average concentrations of
criteria air pollutants in Lahore, Pakistan.
300
200
100
0
PM
(m
g/m
3)
2.5
Ma
r-1
0
Ap
r-1
0
Ma
y-1
0
Ju
n-1
0
Ju
l-1
0
Au
g-1
0
Se
p-1
0
Oct-
10
No
v-1
0
De
c-1
0
Ja
n-1
1
Fe
b-1
1
Ma
r-11
(a)
Mar-
10
Apr-
10
May-1
0
Jun-1
0
Jul-10
Aug-1
0
Sep-1
0
Oct-
10
Nov-1
0
Dec-1
0
Jan-1
1
Feb-1
1
Mar-
11
O (m
g/m
)2
3
150
100
50
0
(b)
Mar-
10
Apr-
10
May-1
0
Jun-1
0
Jul-10
Aug-1
0
Sep-1
0
Oct-
10
Nov-1
0
Dec-1
0
Jan-1
1
Feb-1
1
Mar-
11
80
60
40
20
0
SO
(m
g/m
)3
3(c)
6
4
2
0
Mar-
10
Apr-
10
May-1
0
Jun-1
0
Jul-10
Aug-1
0
Sep-1
0
Oct-
10
Nov-1
0
Dec-1
0
Jan-1
1
Feb-1
1
Mar-
11
CO
(m
g/m
)3
(d)
Nox NO2 NO
400
300
200
100
0
2N
Ox (N
O+
NO
)(m
g/m
)3
Mar-
10
Apr-
10
May-1
0
Jun-1
0
Jul-10
Aug-1
0
Sep-1
0
Oct-
10
Nov-1
0
Dec-1
0
Jan-1
1
Feb-1
1
Mar-
11
(e)
36 Amtul Bari Tabinda et al.

et al. (2009) reported that PM2.5 annual arithmetic mean
during 2007 was 103 µg/m3.
In the present study (2010-2011), the observed annual
mean of PM2.5 is 118.9 µg/m3. This level is 4.8 times
in excess the WHO standard (WHO, 2006) and 3 times
greater than the Pak-EPA limit (Pak-EPA, 2009). From
this, it is obvious that Lahore is facing alarming parti-
culate matter levels. This is due to excessive increase in
vehicle use, outdated unfit vehicles, poorly maintained
old vehicles, old buses model, fuel adulteration and lack
of paved areas, road side vegetation and soil erosion.
The number of vehicles in Lahore has reached up to
2.48 million (Haider, 2010). Motor vehicles emit a
mixture of pollutants i.e. PM10, CO, O3 and NOx (Kadiyali,
2008).To combat the excessive particulate matter con-
centration in air the government has encouraged the
use of compressed natural gas (CNG) instead of diesel
and petrol. Now, Pakistan ranks third in the world for
using CNG and it is the largest CNG user in Asia (GOP,
2005). Although particulate matter levels are still elevated
due to poor CNG technology use (Narain and Krupnick,
2007).
Seasonal O3 variation showed inverse trend as compared
to other gaseous pollutants monitored in study. The
monthly concentrations are represented in Fig. 2b. The
seasonal concentrations are presented in Fig. 3b. Ozone
concentrations were lowest during winter season and
greater during summer season. The highest O3 con-
centration was found in June (88.6±56.8 µg/m3) and
lowest O3 concentration was observed in January
(11.3±10.9 µg/m3). However, the O3 concentration
throughout the year was within the permissible limits
of Pak-EPA (2009). The higher concentration of O3
during summer as compared to winter is due to the high
Table 1. Monthly ranges of criteria air pollutants and simultaneously measured meteorological data (March 2010
to March 2011) in Lahore, Pakistan
Months PM2.5 SO2 CO O3 NOx NO2 NO Tempe- Wind Radiation
(mg/m3) rature speed (W/m2)
(°C) (m/s)
Apr-2010 0.27-336.00 7.50-247.60 270-16100 1.20-227.70 7.50-679.10 8.60-211.50 1.20-584.30 16.90-41.50 0.16-2.90 1.50-896.20
May-2010 17.67-443.00 4.77-316.20 250-13620 8.26-345.94 7.81-747.66 6.59-186.88 0.97-613.47 20.72-44.27 0.37-3.17 1.40-541.10
Jun-2010 19.50-391.80 3.20-262.80 150-10100 8.90-248.00 5.50-636.10 5.42-224.80 0.70-515.40 24.80-45.20 0.10-2.70 1.50-532.60
Jul-2010 10.10-399.50 1.03-43.90 70-4010 4.40-207.20 5.00-141.90 4.85-132.80 0.10-40.30 26.10-39.70 0.20-4.00 1.30-917.40
Aug-2010 15.00-174.00 1.70-56.10 20-6600 0.03-199.70 3.35-235.70 3.30-120.60 0.10-128.20 27.70-36.40 0.40-3.14 1.40-760.50
Sep-2010 5.00-113.30 1.80-44.50 40-9800 0.80-197.40 4.30-430.70 3.09-268.00 0.05-170.30 20.70-34.90 0.03-2.03 1.40-172.20
Oct-2010 18.00-430.01 0.24-140.77 250-18170 0.28-268.67 11.19-759.36 9.37-244.40 0.80-632.74 16.59-32.14 0.17-3.18 1.40-150.30
Nov-2010 21.1-825.00 9.40-193.80 330-19900 1.60-228.20 15.10-818.20 25.08-217.00 2.20-635.80 11.70-28.20 0.14-1.24 1.50-68.50
Dec-2010 30.33-560.00 10.95-305.34 490-20010 0.10-154.73 31.34-746.26 34.91-192.66 3.23-647.06 6.68-22.47 0.13-1.31 1.40-76.90
Jan-2011 1.79-413.00 6.01-230.50 300-21400 0.10-108.20 15.80-726.40 24.10-183.60 3.60-625.20 5.70-19.90 0.19-1.23 1.30-87.50
Feb-2011 21.00-377.30 7.07-134.90 150-10700 0.10-108.80 15.40-704.50 12.50-171.10 2.90-618.60 9.70-23.70 0.10-2.07 1.30-144.60
Mar-2011 24.00-347.00 6.68-183.66 160-10540 0.01-250.58 12.33-602.77 9.81-135.91 2.16-536.81 11.75-30.46 0.22-1.52 1.40-680.70
Fig. 3(a-e). Seasonal variations of criteria air
pollutants in Lahore, Pakistan.
205
200
150
100
50
0
PM
2.5
(m
g/m
3)
O3
(m
g/m
3)
9080706050403020100
(a) (b)
Summer Fall Winter Spring Summer Fall Winter Spring
Seasons Seasons
40
30
20
10
0S
O2 (m
g/m
3)
Summer Fall Winter Spring
Seasons
(c) 6
5
4
3
2
1
0
CO
(m
g/m
3)
Summer Fall Winter Spring
Seasons
(d)
300
250
200
150
100
50
0
CO
(mg/m
3)
Seasons
(e)
Summer Fall Winter Spring
37Criteria Air Pollutants in Lahore

solar radiation during summer months. Selvaraj et al.
(2010) reported similar results where high level of O3
was present during summer months due to high solar
radiations. Pak-EPA/ JICA (2011) also reported similar
results where low concentration of O3 during winter
season was linked with low solar radiation.
Pak-EPA/JICA (2001) reported that hourly average
concentration of O3 was 17 µg/m3. Ghauri et al. (2007)
reported that level of O3 in Lahore was 44 µg/m3
(48 h mean) during 2003-2004. In the present study,
the observed annual mean of O3 was 46.04 µg/m3.
The O3 concentration in Lahore was within the permis-
sible limit of Pak-EPA of 130 mg/m3 (Pak-EPA, 2009).
However, as a result of rise in CNG vehicles use in
Lahore the concentration is likely to rise due to emission
of NO2 from vehicles.
The concentration of SO2 remained high throughout
the year. The monthly concentrations are represented
in Fig. 2c and seasonal variation is shown in Fig. 3c.
Low concentration of SO2 was observed during the
monsoon season. This is due to the fact that SO2 has
been converted to H2SO4 due to the rainfall (Ravindra
et al., 2003). Gupta et al. (2008) reported similar results
in Kolkata, India where, the SO2 concentration decreased
in air due to monsoon precipitation.
GEMS study showed that SO2 annual concentration in
Lahore was 49 µg/m3 in 1978 at city center and 40 µg/m3
in 1979 at suburban residential area (WHO, 1984).
Pak-EPA/JICA (2001) reported that hourly average
concentration of SO2 was 44.6 µg/m3. Ghauri et al. (2007)
found concentration of SO2 in Lahore was 57.6 µg/m3
(48 h mean) during 2003-2004.
In the present study, the observed SO2 annual mean
was 39.9 µg/m3. The annual mean concentration of
SO2 (2010-2011) was below the permissible limit of
80 µg/m3 of Pak-EPA (2009). The presence of SO2 in
air in Lahore is due to 1% (10,000 ppm) sulphur in
diesel. The SO2 level is low in air due to the use of
CNG based public transport vehicles. According to
Haider (2010) the number of total CNG vehicles in
Lahore (628269) is about three folds higher in number
as compared to diesel vehicles (207656). Moreover, a
CNG bus emits 5.45 times less SO2 than the diesel bus
and CNG wagon emits 5 times less SO2 than diesel
wagon (Haider, 2010). Narain and Krupnick (2007)
reported similar results in Delhi, India where, SO2 levels
decreased from 1997 to 2005 due to conversion of
vehicles from diesel to CNG.
High CO concentrations were prevalent in winter months.
The maximum CO monthly average was observed in
December (4690±3910) and minimum CO concentra-
tion was recorded in July (540±490). Monthly variation
in CO concentration is represented in Fig. 2d. The seasonal
trends are shown in Fig. 3d, it reveals very high CO
concentrations in winter months as compared to summer
season. The concentration of CO in winter months in
2010-2011 approached the Pak-EPA standard of 5000
µg/m3 (5 mg/m3) (Pak-EPA 2009). These elevated CO
level in colder days was due to residential heating.
Pak-EPA/JICA (2001) reported 2820 µg/m3 hourly
average concentration of CO. Ghauri et al., (2007)
studied CO in Lahore and found its concentration as
4000 µg/m3 (48 h mean) during 2003-2004. In present
study, the observed annual mean of CO was 1940 µg/m3.
The level of CO is a result of burning of solid waste,
increase in vehicular number and poorly maintained
mass transit system. Lahore is a city with high pollution
level per vehicle. The international and public pressure
has forced the government so it took measures to control
the pollution level through conver-sion of public transport
to CNG, ban on two stroke vehicle production, subsidy
on four stroke rickshaws and installation of CNG kits
in diesel buses. Therefore, decrease in CO concentration
seems to be due to shifting of vehicles on CNG. Kim
and Chung (2008) reported similar results where CO
level decreased in Korea due to switching to CNG fuel.
In Delhi, India CO level declined from 1997-2005 due
to shift in vehicle from diesel to CNG (Narain and
Krupnick, 2007).
NOx is mainly comprised of nitrogen dioxide and nitric
oxide. Fig. 2e, illustrates the seasonal variation of NOx
(NO+NO2). The maximum and minimum NOx monthly
average concentration was observed in December
(279.8±233.9 µg/m3) and in July (28.3±23.9 µg/m3),
respectively. The seasonal concentrations are repre-
sented in Fig. 3e. The highest NOx concentration was
during winter season and lowest NOx level was during
summer and monsoon season. The cold season has 3.7
times greater concentration of NOx as compared to hot
season. The anthropogenic sources of NOx include
power plants, residential combustion units industry and
motor vehicles. In our study, NOx showed elevated con-
centration during cold season mainly due to residential
heating. During the cold season, the NOx concentration
was 5.7 times higher than the WHO limits of 40 µg/m3
(WHO, 2006) and 2.9 times greater than the Pak-EPA
38 Amtul Bari Tabinda et al.

standards of 80 µg/m3 (Pak-EPA 2009). The lower NOx
concentration in monsoon is due to washout of NOx by
rainfall (Ravindra et al., 2003). Gupta et al. (2008)
reported similar results in Kolkata, India where the NOx
level decreased in air due to monsoon.
Pak-EPA/JICA (2001) reported the hourly average
concentration of NO 88.4 µg/m3 and NOx 156.6 µg/m3.
Ghauri et al. (2007) studied NOx in Lahore and found
its concentration to be 55 µg/m3 (48 h mean) during
2003-2004. In the present study, the observed annual
mean of NOx, NO2 and NO was 130.9, 57.3 and 61.8
µg/m3, respectively. This NOx level is 3.3 times greater
than the WHO standard (WHO, 2006) and 1.6 times
greater than the Pak-EPA limit (Pak-EPA, 2009). A
study was carried out in Brazil which revealed that
conversion of vehicle from gasoline to CNG reduced
CO by 53% but increased NOx by 171% (LuzDondero
and Goldemberg, 2005). Narain and Krupnick (2007)
reported similar results in Delhi, India where, NOx
levels increased from 1990-2005 due to use of CNG
vehicles.
Correlation of criteria air pollutants with meteoro-
logical parameters. Concentration of all the criteria air
pollutants was correlated with wind speed, temperature
and solar radiation (Table 2).
Wind is the air in motion and wind speed is rate of air
motion. No seasonal fluctuations were observed with
varying wind speed and low wind speed values were
dominant ranging from 0.03 to 3.18 m/s. The average
wind speed was 1.14 m/s. Significant inverse correlation
was observed between wind speed and criteria air
pollutants (P<0.01). The inverse relationship between
variables can be explained on the basis of fact that when
wind speed is low, it will not influence the distribution
of air pollutants in an area but when the wind speed
will be high it will disperse the pollutants and thus
reducing the concentration of air pollutants in an area.
Tasdemir et al. (2005) reported similar results.
PM2.5, NOx, CO and SO2 were negatively correlated
(P<0.01) with air temperature and solar radiation. The
SO2 showed lowest correlation value with air tempe-
rature and solar radiation. This can be linked with the
burning of coal containing sulphur, used for the heating
purpose but the �r� values were not high enough. The
lower burning efficiency of coal also contributed to
elevated CO and PM2.5 emissions. PM2.5 was signifi-
cantly correlated with NOx (r = 0.524, P<0.01) and CO
(r = 0.519, P<0.01). Positive correlation depicts a similar
source for these gases. High traffic intensity and traffic
jams were responsible for increased air pollutants level
especially the PM2.5, NOx and CO.
Table 2. Correlations of criteria air pollutants with meteorological parameters
Parameters PM2.5 NOx O3 CO SO2 Wind Tempe- Radia-speed rature tion
PM2.5 Pearson coefficient (r) 1 - - - - - - -
Significance (P) - - - - - - - -
NOx Pearson coefficient (r) .524** 1 - - - - - -
Significance (P) .000 - - - - - - -
O3 Pearson coefficient (r) -.330** -.450** 1 - - - - -
Significance (P) .000 .000 - - - - - -
CO Pearson coefficient (r) .519** .779** -.422** 1 - - - -
Significance (P) .000 .000 .000 - - - - -
SO2 Pearson coefficient (r) .316** .331** -.176** .261** 1 - - -
Significance (P) .000 .000 .000 .000 - - - -
Wind speed Pearson coefficient (r) -.253** -.332** -.284** -.327** -.117** 1 - -
Significance (P) .000 .000 .000 .000 .000 - - -
Temperature Pearson coefficient (r) -.324** -.264** .469** -.253** -.039* .179** 1 -
Significance (P) .000 .000 .000 .000 .044 .000 - -
Radiation Pearson coefficient (r) -.161** -.244** .369** -.232** -.030 .314** .304** 1
Significance (P) .000 .000 .000 .000 .121 .000 .000 -
39Criteria Air Pollutants in Lahore

In the present study, a high correlation was found between
NOx and CO (r = 0.779, P<0.01). A positive correlation
between CO and NOx indicates that they arise from
same source. Kimmel et al. (2002); Bogo et al. (1999)
and Cardens et al. (1998) suggested that NOx and CO
arise from common source(s) that could be the vehicular
emission. NOx and CO are emitted from incomplete
combustion of organic fuel in motor vehicles (Goyal
and Sidhartha, 2003).
The O3 showed positive relation with solar radiation
and air temperature (P<0.01). This is due to the fact
that the reaction between nitrogen oxides, volatile
organic compounds and carbon monoxide take place
in the presence of sunlight to produce ozone. So, the
availability of high amount of solar radiation contri-
butes to the production of ozone at ground level and
increased its concentration in ambient air (Selvaraj
et al. 2010). The negative correlation of NOx with O3
(r = -0.450, P<0.01) also support this argument. Shan
et al. (2008) and Tu et al. (2007) reported the positive
correlation of ozone concentration with air temperature.
Pulikesi et al. (2006) linked the ozone concentration
with intense solar radiation.
Conclusion
Criteria air pollutants are known to cause serious health
issues and damage to environment. Keeping this fact
in mind, the present study was conducted in Lahore,
Pakistan for the assessment as well as correlation of
criteria air pollutants with meteorological parameters.
Results showed that O3 concentration increased in
summer season while the concentration of PM2.5, SO2,
CO and NOx raised during winters. PM2.5 concentration
was highest in winter due to heating but its elevated
levels were also found during summer due to poorly
maintained out dated vehicles, lack of paved areas and
vegetation. O3 remained highest in summer season due
to high solar radiations which enhance the production
of ground level ozone. SO2 and CO level remained
within the permissible limit due to shifting in vehicle
from petrol and diesel to CNG. Level of NOx remained
high and its elevated level was contributed by CNG
vehicles. PM2.5, SO2 and NOx remained lowest during
monsoon due to washout from rains. O3 remained lowest
in winter due to less solar radiation. CO remained lowest
during summer due to decreased residential burning.
The concentration of air pollutants was negatively
correlated with wind speed showing that the increase
in wind speed causes dispersion of pollutants. O3 showed
positive correlation with temperature and solar radiation
but negative correlation with wind speed. All other
criteria air pollutants showed negative correlation with
wind speed, temperature and solar radiation.
References
Ali, M., Athar, M. 2008. Air pollution due to traffic, air
quality monitoring along three sections of National
Highway N-5, Pakistan. Environmental Monitoring
and Assessment, 136: 219-226.
Barletta, B., Meinardi, S., Simpson, I.J., Khwaja, H.A.,
Blake, D.R., Rowland, F.S. 2002. Mixing ratios
of volatile organic compounds (VOCs) in the
atmosphere of Karachi, Pakistan. Atmospheric
Environment, 36: 3429-3443.
Biswas, K.F., Ghauri, B., Husain, L. 2008. Gaseous
and aerosol pollutants during fog and clear episodes
in South Asian urban atmosphere. Atmospheric
Environment, 42: 7775-7785.
Bogo, H., Negri, M., Roman, E.S. 1999. Continuous
measurement of gaseous pollutants in Buenos Aires
city. Atmospheric Environment, 33: 2587-2598.
Cardenas, L.M., Austin, J.F., Burgess, R.A., Clemitshaw,
K.C., Dorling, S., Penkett, S.A., Harrison, R.M.
1998. Correlations between CO, NOx, O3 and non-
methane hydrocarbons and their relationships with
meteorology during winter 1993 on the North
Norfolk Coast, UK. Atmospheric Environment, 32:
3339-3351.
Desauziers, V. 2004. Traceability of pollutant measure-
ments for ambient air monitoring. Trends in Analytical
Chemistry, 23: 252-260.
Elminir, H.K. 2005. Dependence of urban air pollutants
on meteorology. The Science of the Total Environ-
ment, 350: 225-237.
Ghauri, B., Lodhi, A., Mansha, M. 2007. Development
of baseline (air quality) data in Pakistan. Environ-
mental Monitoring and Assessment, 127: 237-252.
GOP, 2005. Pakistan Millennium Development Goals
Report, Government of Pakistan Planning Com-
mission. Islamabad, Pakistan.
Goyal, P., Sidhartha, 2003. Present scenario of air quality
in Delhi: A case study of CNG implementation.
Atmospheric Environment, 37: 5423-5431.
Gupta, A.K., Karar, K., Ayoob, S., John, K. 2008. Spatio-
temporal characteristics of gaseous and particulate
pollutants in an urban region of Kolkata, India.
Atmospheric Research, 87: 103-115.
Gupta, A.K., Patil, R.S., Gupta, S.K. 2004. Influence
40 Amtul Bari Tabinda et al.

of meteorological factors on air pollution concen-
tration for a coastal region in India. International
Journal of Environment and Pollution, 21: 253-262.
Hameed, R., Nazir, S. 2011. Improving secondary collec-
tion of solid waste. The experience of performance
based system in Lahore. The Journal of American
Science, 7: 157-164.
Haider, R. 2010. Usefulness of CNG as vehicular fuel
over gasoline and diesel in the city of Lahore.
M. Phil Thesis, 34 pp., Government College University,
Lahore, Pakistan.
Harrison, R.M., Smith, D.J.T., Piou, C.A., Castro, L.M.
1997. Comparative receptor modeling study of
airborne particulate pollutants in Birmingham
(United Kingdom), Coimbra (Portugal) and Lahore
(Pakistan). Atmospheric Environment, 31: 3309-
3321.
Hopke, P.K. 2009. Contemporary threats and air pollu-
tion. Atmospheric Environment, 43: 87-93.
Hussain, L., Dutkiewicz, V.A., Khan, A.J. 2007.
Characterization of carbonaceous aerosols in urban
air. Atmospheric Environment, 41: 6872-6883.
Hussain, K., Riffat, R., Shaukat, A., Siddiqui, M. 1990.
A study of suspended particulate matter in Lahore
(Pakistan). Advances in Atmospheric Sciences, 7:
178-185.
Jaffary, Z.A., Faridi, I.A. 2006. Air pollution by roadside
dust and automobile exhaust at busy road-crossings
of Lahore. Pakistan Journal of Physiology, 2: 31-
34.
Kadiyali, L.R. 2008. Traffic Engineering and Transport
Planning, 256 pp., 7th edition, Khanna publishers,
New Delhi, India.
Kimmel, V., Tammet, H., Truuts, T. 2002. Variation of
atmospheric air pollution under conditions of rapid
economic change-Estonia 1994-1999. Atmospheric
Environment, 36: 4133-4144.
Kim, H., Chung, Y. 2008. Satellite and ground observa-
tions for large scale air pollution transport in the
yellow sea region. Journal of Atmospheric Chemistry,
60: 103-116.
Lodhi, A., Ghauri, B., Khan, M.R., Rahmana, S.,
Shafiquea, S. 2009. Particulate matter (PM2.5)
concentration and source apportionment in Lahore.
Journal of Brazilian Chemical Society, 20: 1811-
1820.
LuzDondero, Goldemberg, J. 2005. Environmental
implications of converting light gas vehicles: the
Brazililian experience. Energy Policy, 33: 1703-
1708.
McCully, C.R., Fisher, M., Langer, G., Rosinski, J.,
Glaess, H., Werle, D. 1956. Scavenging action of
rain on air-borne particulate matter. Industrial and
Engineering Chemistry, 48: 1512-1516.
Mehta, B., Venkataraman, C., Bhushan, M., Tripathi,
S.N. 2009. Identification of sources affecting fog
formation using receptor modeling approaches and
inventory estimates of sectoral emissions. Atmos-
pheric Environment, 43: 1288-1295.
Narain, U., Krupnick, A. 2007. The impact of CNG
programme on Delhi air quality. 1 pp., Resources
for the future discussion paper. http://www.rff.org/
documents/RFF-DP-07-06.pdf. Washington DC
20036, USA.
Pak-EPA/JICA, 2011. Comprehensive Environmental
Monitoring Report for Selected Pilot Areas in
Pakistan. Japan International Cooperation Agency-
Pakistan Environment Protection Agency, Pakistan.
Pak-EPA/JICA, 2001. Report. 3 Cities Investigation of
Air and Water Quality (Lahore, Rawalpindi and
Islamabad). Japan International Cooperation
Agency-Pakistan Environment Protection Agency,
Pakistan.
Pak-EPA, 2009. National Environmental Quality
Standards (NEQS) for ambient air. http://www.
environment.gov.pk/act-rules/NEQS%20for%
20Ambient%20Air.pdf
Parekh, P., Khwaja, P., Khan, H.A., Naqvi, A.R., Malik,
A., Shah, S.A. 2001. Ambient air quality of two
metropolitan cities of Pakistan and its health
implications. Atmospheric Environment, 35: 5971-
5978.
Pulikesi, M., Baskaralingam, P., Rayudu, V.N., Elango,
D., Ramamurthi, V., Sivanesan, S. 2006. Surface
ozone measurement at urban coastal site Chennai,
in India. Journal of Hazardous Material, 137:
1554-1559.
Ravindra, K., Mor, S., Ameena, Kamyotra, J.S., Kaushik,
C.P. 2003. Variation in spatial pattern of criteria
air pollutants before and during initial rain of
monsoon. Environmental Monitoring and Assess-
ment, 87: 145-153.
Schwella, D. 2008. Air pollution and health in urban
areas. Reviews on Environment Health, 15: 13-42.
Seaman, N.L. 2003. Future directions of meteorology
related to air-quality research. Environment Inter-
national, 29: 245-252.
Selvaraj, R.S., Selvi, S.T., Priya, S.P.V. 2010. Association
between surface ozone and solar activity. Indian
Journal of Science and Technology, 3: 332-334.
41Criteria Air Pollutants in Lahore

Shan, W.P., Yin, Y.Q., Zhang, J.D., Ding, Y.P. 2008.
Observational study of surface ozone at an urban
site in East China. Atmospheric Research, 89: 252-
261.
Smith, D.J.T., Harrison, R.M., Luhana, L., Pio, C.A.,
Castro, L.M., Tariq, M.N. 1996. Concentrations
of particulate airborne polycyclic aromatic
hydrocarbons and metals collected in Lahore,
Pakistan. Atmospheric Environment, 30: 4031-
4040.
Tasdemir, Y., Siddik, C., Fatma, E. 2005. Monitoring
of criteria air pollutants in Bursa, Turkey. Environ-
mental Monitoring and Assessment, 110: 227-241.
Tu, J., Xia, Z.G., Wang, H.S., Li, W.Q. 2007. Temporal
variations in surface ozone and its precursors and
meteorological effects at an urban site in China.
Atmospheric Research, 85: 310-337.
Waheed, S., Rahman, A., Khalid, N., Ahmad, S. 2005.
Assessment of air quality of two metropolitan cities
in Pakistan: Elemental analysis using INAA and
AAS. Radiochimica Acta, 94: 161-166.
Wahid, A. 2006. Productivity losses in barley attributable
to ambient atmospheric pollutants in Pakistan.
Atmospheric Environment, 40: 5342-5354.
WHO, 2006. Air Quality Guidelines Global Update,
2005. WHO Regional Office for Europe, Copenhagen,
Denmark.
WHO, 1984. Urban Air Pollution 1973-1980. World
Health Organization, Geneva, Switzerland.
WHO & UNEP, 1992. Urban Air Pollution in Megacities
of the World. 196 pp., Oxford, Blackwell, USA.
Yaseen, M.E. 2000. The relationships between dust
particulates and meteorological Parameters in
Kualalumpur and Petalingjaya, Malaysia. http://
nargeo.geo.uni.lodz.pl/~icuc5/text/P_3_4.pdfAcc
essed 26 March 2012.
Ying, T.Y., Fook, L.S., Glasow, R.V. 2012. The influence
of meteorological factors and biomass burning on
surface ozone concentrations at Tanah Rata, Malaysia.
Atmospheric Environment, 70: 435-446.
42 Amtul Bari Tabinda et al.

Evaluation of Groundwater Quality of Selected Boreholes inOhaozara and Ivo Council Areas of Ebonyi State, Nigeria
Omaka Ndukaku Omakaa, Ifeanyi Francis Offor a*, David Obasi Igweb and Ewuzie Ugochukwuc
aDepartment of Chemistry, Federal University, Ndufu-Alike, Ikwo, P.M.B. 1010, Ebonyi State, NigeriabDepartment of Industrial Chemistry, Ebonyi State University, P.M.B. 053,
Abakaliki, Ebonyi State, NigeriacDepartment of Pure and Industrial Chemistry, Abia State University, P.M.B. 2000, Uturu,
Abia State, Nigeria
(received October 13, 2014; revised January 26, 2015; accepted January 31, 2015)
Pak. j. sci. ind. res. Ser. A: phys. sci. 2016 59 (1) 43-51
Introduction
Water is essential for the sustenance of life. It occupies
71% of the entire earth�s surface and biologically makes
up a large percentage of the total body fluids of all living
things (Obasi and Akudinobi, 2013). Quality of water is
determined by its physicochemical makeup and the amount
of trace contaminants it contains.The use of poor quality
water is associated with significant health implications
hence, require adequate treatment before use (Centeno et
al., 2005; Carter and Stewart, 2000; Smith et al., 2000).
The human health is directly related to the quality of water
used for drinking and other purposes, because about 75%
of all diseases suffered by human beings may be partially
caused by consumption of contaminated water (Pink, 2006).
Review of relevant literature reveals that, geogenic and
anthropogenic processes both contribute to the degradation
of natural water quality (Jan, 2011; Ayeni et al., 2009;
Obasi and Balogun, 2001; Ovrawah and Hymore, 2001;
Ojekunle, 2000).
According to available statistics, an average water
consumption rate of 10 L per person per day has been
recommended for small rural communities (UNICEF,
1989). However, this quantity still falls below the WHO
recommended standard of at least 20 L per person per day
(WHO, 1984). According to relevant statistics, only about
61% of urban dwellers in developing countries have access
to safe water supply sources (Igwenyi and Aja-Okorie,
2014). It is also estimated that 1.2 billion people around
the world lack access to safe water, and close to 2.5 billion
people are not provided with adequate sanitation (WWC,
2003). In Nigeria, 75-80% of the total population of about
160 million people live in rural areas, and less than 50%
of that number have access to potable water (Obasi and
Akudinobi, 2013).
In most local investigations of groundwater quality,
physicochemical parameters are mostly measured and in
some cases, trace metal constituents. However, it has been
observed that most of these local researches on groundwater
quality in Nigeria tend to neglect the possible contamination
of the water by arsenic from both natural and anthropogenic
sources.
Arsenic occurs in various forms in nature but its most
toxic forms are arsenate and arsenite which comes from
anthropogenic sources such as application of As-containing
herbicides/pesticides, phosphorus fertilizers on cultivated
lands and the discharge of industrial effluents containing
As into water bodies (Okorie, 2010; Feng et al., 2009;
Jung et al., 2009; Williams and Silver, 1984).*Author for correspondence; Email:[email protected]
Abstract. Groundwater quality in study areas was evaluated by measuring the physicochemical parameters
including selected ions in water samples collected from 12 boreholes in Akaeze, Okposi and Uburu towns
of Ebonyi State, Nigeria in April, 2013 and analysed using standard methods. Results obtained showed
that, except for As5+ content, all other parameters investigated fall within WHO standards for potable water.
Regression analysis showed that conductivity, SO42- and As5+ levels are important variables in predicting
the TDS values of the samples while NO3-, Cl-, PO4
3- and TDS are important in predicting the As5+ content
of the water samples. One-way ANOVA at P < 0.05 showed Fcal (1.862) > Ftab (0.619), implying a significant
difference between the parameters for all locations.
Keywords: borehole water, water quality, physicochemical parameters
43

Therefore, the aim of this study is to determine the
physicochemical parameters and ionic (including As5+)
content of selected boreholes within Uburu, Okposi and
Akaeze Communities in Ohaozara and Ivo Council Areas
of Ebonyi State, Nigeria and to compare data obtained
with existing permissible limits set by different regulatory
bodies.
Materials and Methods
Study area. Okposi, Uburu and Akaeze are all rural
communities in Ebonyi South Senatorial zone of Ebonyi
State. Okposi and Uburu are located in Ohaozara Local
Government Area (LGA) while Akaeze is located in Ivo
LGA; both LGAs forming part of the 13 LGAs that make
up Ebonyi State. Okposi, Uburu and Akaeze communities
are located within longitudes 5° 52' N and 6° 07' N and
latitudes 7° 40' E to 7° 54' E and they all fall within the
Imo-Cross River Basin province of Southeastern Nigeria.
The study site consists mainly of undulating land and
sedimentary rocks from the Albian age. The introduction
of As into drinking water can occur as a result of its natural
geological presence in local bedrock (Garelick et al., 2008).
Ground waters are generally more vulnerable to As contami-
nation than surface water because of their interaction with
aquifer minerals, and the increased potentials in aquifer
for the generation of physicochemical conditions favourable
for As release (Smedley, 2008). The lithology of Uburu
Salt Lake shows that it consists of sandstone beds with
intercalation of fine-grained bands of silts and shales,
whereas, that of Okposi Salt Lake is a mud filled depression
surrounded by sandstone exposures (Okoyeh and Egboka,
2013). Smedley and Kinniburgh (2002) stated that the
highest arsenic concentrations (20�200 mg/kg) are typically
found in organic-rich and sulphide-rich shales, sedimentary
iron stones, phosphatic rocks, and some coals. This is
definitely a source of As in the water samples within the
study sites. They further opined that in sedimentary rocks,
As is concentrated in clays and other fine-grained sediments.
High concentration of naturally occurring As are also
found in oxidizing conditions where groundwater pH
values are high (ca. >8) (Smedley and Kinniburgh, 2002).
The pH results (8.3-8.8) of this study, lucidly support the
above finding, and buttress the rationale for high As level
of the samples. Also, salt harvesting by the rural women,
could as well lead to increasing As concentration.
Mechanisms by which As is released from minerals are
varied, and are accounted for by many (bio)geochemical
processes: oxidation of As-bearing sulphides, desorption
from oxides and hydroxides, reduction dissolution,
evaporation concentration, leaching from sulphide by
carbonates, and microbial mobilisation (Garelick et al., 2008).
Surface drainage pattern within the area consists of small
rivers such as Asumgbom, Atte, Azuu, Ovum, Enu and
Oshi rivers which tends to dry up by flowing into the larger
Asu river (Obasi and Akudinobi, 2013; Okoyeh and
Egboka, 2013). A map of the study area indicating the 12
sampling locations is shown in Fig. 1.
Sampling and laboratory analyses. Groundwater samples
were collected from 12 hand-dug boreholes in April, 2013
from various locations within the study areas. Six samples
were collected from Akaeze town in Ivo LGA and three
samples each were collected from Uburu and Okposi
towns both located in Ohaozara LGA of Ebonyi State.
Sampling was done at the beginning of the dry season
under good weather conditions in order to avoid rain water
contamination, which would have impacted on the quality
of the water samples. All chemical reagents used were of
analytical grade and purchased from Fisher Scientific UK.
Ltd. (Loughborough, Leicestershire). All sample vessels
were first washed, soaked overnight in 5% nitric acid and
rinsed in high purity deionised water (Okorie, 2010). To
maintain the integrity of the water samples, parameters
that are sensitive to environmental changes, which include
pH, dissolved oxygen (DO), electrical conductivity (EC)
and temperature were measured and recorded in-situ using
portable digital meters.
Furthermore, water samples used for determination of
SO42-, NO3
-, Arsenate (As5+) and selected physical
parameters were collected in plastic containers while those
for the determination of chemical oxygen demand (COD),
biochemical oxygen demand (BOD) and PO43- were
collected in specialised glassware. The samples were
transported to the laboratory in ice chest and then analysed
for different parameters such as physicochemical properties
[total hardness, total alkalinity, total dissolved solids (TDS),
turbidity], Arsenate (As5+) and anions (SO42-, Cl-, NO3
-,
PO43-) using standard methods.
Analyses of water samples were carried out using either
the American Public Health Association (APHA et al.,
2012) or the American Standard for Testing Material
(ASTM, 2012) standard procedure.
The pH was determined in-situ using Jenway pH meter,
model 350 after calibration with buffers 4 (potassium
hydrogen phthalate) and 9 (sodium borate decahydrate)
(ASTM D1293-12). TDS determination was performed
using APHA 2540C method, while EC was determined
using APHA 2510B.
44 Ifeanyi Francis Offor et al.

Determinations of SO42-, Cl- and PO4
3- were performed
according to ASTM D 4327-03 method, while temperature
and NO3- were determined following APHA 2550 and
ASTM D3867-90A methods, respectively. Analysis of
water samples for As5+ determination was done by Atomic
Absorption Spectrophotometry�Hydride Generation
(ASTM D2972-08B). APHA 2130B and 2340-B methods
were employed in the determination of turbidity (HACH
2100AN turbidimeter) and total hardness of water samples,
respectively. COD, BOD and alkalinity determinations
were done according to ASTM D6238-98 and D1067-11
standard methods, respectively.
Statistical analysis. Statistical analyses of data were carried
out using SPSS 16.0 for windows (SPSS Inc., Polar
Engineering and Consulting 2007) and Excel 2007 statistical
package programmes. For regression analysis, simultaneous
method of the multiple linear regression was adopted while
for ANOVA, one-way ANOVA approach was chosen.
A multiple linear regression model of the form: Yi = b0 +
b1X1i + b2X2i + ���..+ bmXmi + x1 was obtained;
where:
Yi = dependent variable as predicted by regression model;
b0 = intercept or constant; b1 = ith coefficient of Xi, Xi = ith
Fig. 1. Map of the study area showing 12 sampling stations in Uburu, Okposi and Akaeze towns, Nigeria.
River A
su
7 40� E
6 07� N ONICHA - UBURUIsuachara
Ndiagu Onicha Eneagu
SchMki Ugulangu
Afia ochieMkt
lvu-ezuzoCourt-Area
OkposiUmuka
Ugulangu
Ohodoma Village sqAsumgbom
Ogudu PrimarySch
Ono-Ogrdu Uburu
Leproserium
Etu
Uburu farmOgo ubi
100100
100
Ndioko
Amenu
Amenuro
Amasri
River Asu
Rotoni
Ndinwachukwu
Ndioban
Aka-azeOgidl
EluaviaAmaeguta
Mam
a R
Elugoro-Ndiorji
Amachi
Ndala-Umulu
R Eze
Ara
200
5 52�N
7 40�E 0 50 100 200 300 400Kilometers
Scale: 100,000
7 54�E
5 52�N
7 54� E
6 07� N
Legend:
100
N
E
S
W
Sampled locations; Contours; River; Road
45Groundwater Quality Evaluation in Nigeria

independent variable from total set of m variables and
x1 = random errors.
The multiple linear regression analysis was conducted to
investigate the effects of arsenic (V) content and total
dissolved solids (TDS) as dependent variables on
independent variables such as electrical conductivity (EC),
Cl-, NO3-, SO4
2- and PO43- levels in order to predict the
water quality of different boreholes while analysis of
variance test was conducted to check for significant
differences between the physicochemical parameters of
borehole water from different locations.
Results and Discussion
Physicochemical analysis. A comparison of analytical
data generated in this study with national and global
drinking water standards like the Nigerian Institute of
Standards (NIS, 2007) and World Health Organization
(WHO, 2011) water standards for drinking and public
health purposes are presented in Table 1. Also, a summary
of the data for physicochemical parameters, arsenate,
sulphate, chloride, nitrate and phosphate contents of the
borehole water samples are given in Table 2.
The pH of the water samples ranged from 8.3-8.8 with a
mean value of 8.5, which was within the WHO stipulated
tolerable pH range of 6.5-8.5 for potable water (WHO,
2011). This indicated that most of the groundwater samples
were mildly alkaline, which can be attributed to the nature
of bedrock geology of the study sites. Comparable pH
ranges: 5.8-6.9, 3.84-7.72 and 8.3-9.6 were observed in
similar researches by Okiongbo and Douglas (2013),
Talabi et al. (2013) and Nwankwoala and Udom (2011),
respectively.
Furthermore, reports from Iran (Mosaferi et al., 2014),
Pakistan (Iqbal et al., 2013) and South Africa (Mpenyana-
Monyatsi et al., 2012) had indicated pH values of 6.09-
8.02, 6.44-7.27, and 7.1-8.0, respectively, which were all
less than the result of this study. In the same vein, Nag
and Lahiri (2012) reported pH values ranging from 6.1 to
7.9 for both pre- and post- monsoon periods.
The temperature of the water samples ranged between
22 and 28 °C, with mean temperature of 25 °C, which
was below the mean atmospheric temperature of 28 °C.
This relatively low temperature implied that the
concentration of dissolved oxygen in the water samples
was higher than normal, which might improve the water�s
taste (Olajire and Imeokparia, 2001; Deas and Lowny,
2000). The result of this study was comparable with that
of Mpenyana-Monyatsi et al. (2012) which ranged from
19.4 to 24.9.
Table 1 shows that the electrical conductivity (EC) of the
water samples ranged from 0.370-1.722 dS/m. OVSOB
had the lowest EC value (0.370 dS/m) while, OOUB
recorded the highest EC value (1.722 dS/m). Two out of
twelve samples of locations namely; OVSOB (0.370 dS/m)
and NUIAB (0.418 dS/m) had EC values below the WHO
minimum limit of 0.500 dS/m, while all other locations
had EC values above the WHO minimum limit. However,
only three locations (OOUB, OPSUB and EIUB) recorded
EC values that were above the WHO maximum limit of
1.250 dS/m (WHO, 2011). Nevertheless, electrical
conductivities (0.110-1.750 dS/m) and (0.040-3.400 dS/m)
reported by Nag and Lahiri (2012) and Mosaferi et al.
(2014), respectively were relatively comparable with our
study, whereas the EC ranged of 2.860-3.860 dS/m reported
Table 1. Descriptive statistics of analysed borehole water samples compared with NIS and WHO Standards for
drinking water quality
Parameter Minimum Maximum Mean± SD NIS (2007) WHO (2011)
limit limit
Temp. (°C) 22.0 28.5 24.65±0.56 25 -
pH 8.3 8.8 8.53±0.04 6.5-8.5 6.5-8.5
DO (mg/L) 9.82 10.04 9.92±0.04 - 4
TDS (mg/L) 204 947 517.33±74.14 500 1200
EC(dS/m) 0.370 1.722 0.940±0.135 1.000 1.250
TA (mg/L) 60.70 578.70 272.48±47.87 - -
TH (mg/L) 43.30 222.00 113.39±16.61 150 -
As5+ (mg/L) 2.63 5.53 4.53±0.33 0.01 0.01
Cl- (mg/L) 100.53 147.89 130.08±3.41 250 250
SO42- (mg/L) 16.59 65.41 38.17±4.18 100 500
NO3- (mg/L) 0.65 0.86 0.78±0.02 50 50
PO43- (mg/L) 0.02 0.19 0.10±0.01 - 10
46 Ifeanyi Francis Offor et al.

by Mosaferi et al. (2014) was above that of our study and
WHO limit.
All the borehole water samples contained dissolved oxygen
(DO) ranging from 9.55-10.04 mg/L with an average DO
of 9.92 mg/L. In each case, the WHO maximum allowable
limit for DO in water (4 mg/L) was exceeded (WHO,
2011). The high level of DO concentration in the water
samples may be attributed to the absence of organic matter
in the underground water samples, thus, improving the
water taste while also posing as a source of corrosion to
water pipes in these areas (Narasimha et al., 2011; Adekunle
et al., 2007).
Total dissolved solids (TDS) of the water samples varied
from 112 to 832 mg/L. All the samples recorded TDS
values below the WHO recommended maximum limit of
1200 mg/L (WHO, 2011). Appreciable concentrations of
carbonates, bicarbonates, cations and anions might have
contributed to the presence of TDS in the samples
(Adejuwon and Mbuk, 2011). Of similar studies in South
Africa. (Mpenyana-Monyatsi et al., 2012) Iran, (Mosaferi
et al., 2014), Pakistan (Iqbal et al., 2013), and India (Nag
and Lahiri, 2012), only TDS values (107.1-439 mg/L) of
samples studied in South Africa were comparable with
our result; others: 71.5-1137.5 mg/L, 1916-2586 mg/L
and 30-1365 mg/L, respectively, were averagely higher
than the result of this study.
All the borehole water samples were clear (turbidities were
very low) implying that there were little or no suspended
solids in the samples. They were all below the WHO
recommended turbidity limit (5 NTU) in drinking water
(WHO, 2011).
Total alkalinity values of the water samples ranged between
60.7 and 574.7 mg/L with a mean value of 272.5 mg/L.
The samples showed total alkalinity values that were within
the WHO acceptable limits (WHO, 2011). Presence of
carbonates, bicarbonates and hydroxides in the samples
might have contributed to the concentration of total
alkalinity recorded. Chloride content in the water samples
ranged from 100.53 mg/L to 147.89 mg/L, implying that
they all fell within the WHO recommended chloride limit
of 250 mg/L in drinking water. Sources of chloride in
drinking water include natural sources, sewage and
industrial effluents, urban run-off containing de-icing salt
and saline intrusion. Total alkalinity affects the chloride
content of potable water, which may lead to a detectable
taste if chloride is in excess (WHO, 2011).
Sulphate content in the water samples varied from 16.59
mg/L to 65.41 mg/L, which was well below the WHO
maximum recommended limit of 500 mg/L in drinking
water. The low values recorded for SO42- in these water
samples could be due to its removal from the water by
bacteria (Freeze and Cherry, 1979). Sulphates are discharged
into water through industrial wastes and atmospheric
depositions, however their highest concentrations are found
in groundwater and from natural sources. Drinking of
potable water with high sulphate levels may lead to
gastrointestinal effects (WHO, 2011). Mosaferi et al. (2014)
and Nag and Lahiri (2012) reported SO42- concentrations
of 11.6-163.9 and 1.8-220.5 mg/L, respectively, which
were relatively higher than sulphate contents of this study
but less than the WHO limits.
In the case of nitrates, its level in the water samples varied
from 0.65 mg/L to 0.86 mg/L, which was relatively low
Table 2. Hydrogeochemical analysis of groundwater samples from selected boreholes within Ivo and Ohaozara
LGAs, Ebonyi State, Nigeria
S. Sample location Temp. pH DO TDS EC TH TA SO42- Cl- NO
3PO
43- As5+
no. (°C) (mg/L) (dS/m) (mg/L)
1. Afia Ochie (AOUB) 26.2 8.6 10.0 441 0.801 43.3 60.7 16.59 133 0.81 0.11 4.59
2. Onu-Ogudu (OOUB) 22.0 8.3 10.0 947 1.722 207.4 304.2 45.04 125 0.84 0.11 5.01
3. Ogudu Primary School (OPSUB) 26.1 8.6 9.99 913 1.659 97.0 315.7 45.46 138 0.78 0.09 4.47
4. Obodoma Village Square (OVSOB) 22.4 8.6 9.89 204 0.370 93.0 86.2 17.74 132 0.79 0.10 3.58
5. Ivu-ezuzor Okposi-Okwu (IOOB) 23.3 8.7 9.92 356 0.648 222.0 183.7 22.26 127 0.76 0.13 2.98
6. Court Area Isi-Okposi (CAIOB) 24.8 8.3 9.55 315 0.573 83.0 183.7 50.39 148 0.66 0.14 2.63
7. Amaeguta, Akaezeukwu (AAB) 28.5 8.5 10.0 408 0.742 90.0 311.7 38.95 100 0.86 0.03 6.66
8. Eluavia Ihenta, Umoihe (EIUB) 25.4 8.8 10.0 810 1.472 101.0 578.7 65.41 141 0.82 0.02 3.74
9. Ogidi Omoihe (OUB) 26.0 8.6 9.94 636 1.156 183.0 479.0 28.56 130 0.84 0.19 5.53
10. Elugoro Ndiorji Umoihe (ENUB) 25.0 8.5 9.88 562 1.022 92.0 454.2 38.22 131 0.83 0.02 5.00
11. Amachi Umoihe (AUB) 23.5 8.4 9.82 386 0.701 85.0 211.2 45.25 134 0.68 0.12 5.25
12. Ndala Umulu, Iyioji Akaeze (NUIAB) 22.6 8.4 10.04 230 0.418 64.0 100.7 44.20 122 0.65 0.09 4.96
DO = dissolved oxygen,; EC = electrical conductivity; TDS = total dissolved solids; TA = total alkalinity; TH = total hardness.
47Groundwater Quality Evaluation in Nigeria

as compared to the WHO limit of 50 mg/L. Sources of
nitrate contamination of surface and groundwater include
agricultural activities like excess application of inorganic
nitrogenous fertilizers and manures, wastewater disposal,
oxidation of nitrogenous waste products and leaching from
natural vegetation (WHO, 2011). Nitrate concentrations
of 0.4-59.4 and 21-127 mg/L were reportedly obtained by
Mosaferi et al. (2014) and Iqbal et al. (2013) from the
study of groundwater samples in Iran and Pakistan,
respectively. In a similar study in India, nitrate concentration
in 73.68% of samples exceeded the guideline value (50
mg/L) (Balakrishnan et al., 2011).
Table 4. Regression statistics for predicting arsenic (V) content in selected boreholes from Ohaozara and Ivo
LGAs
Water quality Unstandardised Standardised t-values Sig. 95% confidence
predictor coefficients coefficients interval for B
variable (Beta) (P-values)
B Std. error Lower Upper
bound bound
Constant 6.308 6.876 - 0.917 0.401 -11.368 23.984
EC -0.435 0.272 -0.001 -1.601 0.170 -1.133 0.263
NO3-
4.104 5.384 0.000 0.762 0.480 -9.736 17.943
Cl-
1.583 5.364 0.000 0.295 0.780 -12.207 15.372
SO42-
-0.053 0.029 -0.001 -1.815 0.129 -0.127 0.022
PO43-
0.019 0.025 0.001 0.755 0.484 -0.045 0.083
As5+
1.818 0.002 1.000 1.199 0.000 1.814 1.822
R - - - 1.000 - - -
R square - - - 1.000 - - -
Adjusted R square - - - 1.000 - - -
Standard error - - - 0.633 - - -
F-test statistics - - - 9.984 - - -
Overall significance - - - 0.000 - - -
Table 3. Regression statistics for predicting total dissolved solids (TDS) in selected boreholes from Ohaozara and
Ivo LGAs
Water quality Unstandardised Standardised t-values Sig. 95% confidence
predictor coefficients coefficients interval for B
variable (Beta) (P-values)
B Std. error Lower Upper
bound bound
Constant -3.482 3.780 - -0.921 0.399 -13.199 6.236
EC 0.239 0.149 0.01 1.602 0.170 -0.145 0.623
NO3-
-2.252 2.962 0.00 -0.760 0.481 -9.867 5.363
Cl-
-0.861 2.951 0.00 -0.292 0.782 -8.447 6.726
SO42-
0.029 0.016 0.001 1.818 0.129 -0.012 0.070
PO43-
-0.01 0.014 0.000 -0.752 0.486 -0.046 0.025
As5+
0.550 0.00 1.000 1.199 0.000 0.549 0.551
R - - - 1.000 - - -
R square - - - 1.000 - - -
Adjusted R square - - - 1.000 - - -
Standard error - - - 0.348 - - -
F-test Statistics - - - 9.985 - - -
Overall significance - - - 0.000 - - -
48 Ifeanyi Francis Offor et al.

Phosphate levels in the water samples ranged from 0.02
mg/L to 0.19 mg/L, which was relatively low as compared
to the WHO limit of 10 mg/L in drinking water (WHO,
2011). This implied that phosphate pollution due to
percolation of agricultural fertilisers, detergents and
pharmaceuticals were very minimal. In addition, it showed
that the underlying rocks of the study area contained little
or no phosphate (Edeogu, 2007).
Arsenic content of the water samples ranged from 2.63
mg/L to 6.66 mg/L, which was above the WHO limit of
0.01mg/L (WHO, 2011). Thus, with respect to As (V)
content, the water samples are not too safe for consumption.
Arsenic is mainly present as As (V) in water but in anaerobic
conditions, it is likely to be present as As (III). In natural
waters, they are found in concentrations of less than 1-2
µg/L but in groundwater, they are found at slightly elevated
concentrations due to sulphide mineral deposits and
sedimentary deposits derived from volcanic rocks (WHO,
2011).
A Schoeller diagram depicting logarithmic data plots for
the major ions investigated in the study, is shown in
Fig. 2 with the peaks and troughs of the individual water
samples indicating their dominant and less dominant ions,
respectively. In Fig. 2, chloride is depicted as the most
abundant ion followed by sulphate and arsenate while
nitrate and phosphate ions are the least dominant ions.
Regression analysis. The multiple linear regression models
for predicting TDS and As (V) content of boreholes around
Ohaozara and Ivo LGAs of Ebonyi State were shown in
equation (1) and (2), respectively:
TDS = -3.482 + 0.239 EC � 2.252 NO3 � 0.861Cl- + 0.029
SO4 � 0.01 PO43- + 0.550 As ----------------------------- (1)
As = 6.308 � 0.435 EC + 4.104 NO3- + 1.583 Cl- � 0.053
SO4 + 0.019 PO43- + 1.818 TDS --------------------------- (2)
Equation (1) showed that positive relationships existed
between TDS and EC, as well as between TDS-SO42- and
TDS-AS5+ constituents of the water samples, while a
negative relationship was maintained between TDS and
other parameters (NO3-, Cl- and PO4
3-). However, from
equation (2), it could be deduced that positive relationship
existed among the pairs of As5+-NO3-, As5+-Cl-, As5+-PO4
3,
and As5+-TDS, while negative relationship existed between
the pairs of As5+-EC and As5+-SO42-. This is in line with
literature assertion that in oxidising conditions where
groundwater pH values are high, inorganic As (V)
predominates, and arsenic concentrations are positively
correlated with those of other anion-forming species such
as F-, Cl-, etc (Smedley and Kinniburgh, 2002). The
regression statistics for the models represented in equations
(1) and (2) have been summarised in Tables 3- 4. The high
t-values and low P-values suggested that EC, SO43- and
As5+ levels were important factors in the prediction of the
TDS value for different water samples (Table 3). Similarly,
high t-values and low P-values indicated that NO3-, Cl-,
PO43- and TDS were important variables in the prediction
of As (V) content of different water samples. Furthermore,
comparison of the adjusted R square and the R square
values for the two regression models (Tables 3- 4) indicate
that they accounted for almost 100% of the variance (except
for minimal errors) in the TDS and As (V) levels of the
water samples.
Analysis of variance. One-way ANOVA at P < 0.05 (95%
confidence level) showed that Fcal (1.862) was greater than
Ftab (0.619) implying that a significant difference existed
among the physicochemical parameters in water samples
from the 12 different locations investigated. This might
be due to the influence of natural and anthropogenic factors
on the physicochemical parameters found in the aquatic
environment.
Conclusion
The hydrochemical assessment of groundwater resources
in Ivo and Ohaozara LGAs, Nigeria revealed that the water
in these areas was generally alkaline, non-turbid, moderately
hard and saline in nature. With the exception of arsenic
160
140
120
100
80
60
40
20
0
Arsenate Chloride Sulphate Nitrate Phosphate
Fig. 2. Schoeller diagram depicting ionic species
investigated.
AOUB, OOUB, OPSUB, OVSOB, IOOB, CAIOB,
AAB, EUB, OUB, ENUB, AUB, NUIAB
49Groundwater Quality Evaluation in Nigeria

content level, all other physicochemical parameters
investigated in the water samples were within the stipulated
NIS and WHO limits for contaminants in potable water.
This implied that the water in these areas might be fit for
other domestic uses apart from drinking, and would require
further standard treatment before it could be fit for drinking
purposes. It is recommended that certain strategies such as
proper sewage disposal, proper siting of boreholes and
installation of point-of-use water treatment devices be
adopted in order to improve the quality of groundwater
located in the study areas. Generally, the water samples
are deemed fit for domestic uses; though its high arsenic
level may pose potential health threats for children.
Point-of-use water treatment devices should be installed
in the boreholes to improve water quality.
References
Adejuwon, J.O., Mbuk, C.J. 2011. Biological and
physiochemical properties of shallow wells in Ikorodu
town, Lagos, Nigeria. Journal of Geology and Mining
Research, 3: 161-168.
Adekunle, I.M.N., Adetunji, M.T., Gbadebo, A.M.,
Banjoko, O.B. 2007. Assessment of groundwater
quality in a typical rural settlement in Southwest,
Nigeria. International Journal of Environmental
Research and Public Health, 4: 307-318.
APHA, AWWA, WPCF, 2012. Standard Methods for the
Examination of Water and Wastewater. 22th edition,
American Public Health Association. American Water
Works Association. Water Pollution Control
Federation. Washington DC., USA.
ASTM, 2012. American Society Testing Materials. Annual
Book of (ASTM) Standards. vol. 11.01. Available in:
http://www.astm.org. Access in: Oct. 2014.
Ayeni, A.O., Soneye, A.S.O., Balogun, I.I. 2009. State of
water supply sources and sanitation in Nigeria:
Implication of Muslims. In Ikare-AKOKO Township.
The Arab World Geographer, 12: 95-104.
Balakrishnan, P., Saleem, A,. Mallikarjun, N.D. 2011.
Groundwater quality mapping using geographic
information system (GIS): A case study of Gulbarga
City, Karnataka, India. African Journal of Environ-
mental Science Technology, 5: 1069-1084.
Carter, E., Stewart, A.G. 2000. Environmental geochemistry
and health: an integrated future in medical and
geochemical studies, the example of Iodine. Journal
of the Geological Society of London, 157: 835-836.
Centeno, A., Millic, F.G., Finkleman, R.I., Sellinus, O.
2005. Medical geology. Military Medical Technology
online, 9: 1-5.
Davies, S.N., De-Wiest, R.M.J. 1966. Hydrogeology,
463 pp. John Wiley & Sons, Inc., New York, USA.
Deas, M.L., Lowney, C.L. 2000. Water Temperature
Modeling Review, Technical Report to Bay Delta
Modeling Forum, 113 pp.
Edeogu, C.O. 2007. Nitrate, sulphate, phosphate and
chloride status of stable food crops, soils and water
as indicator of environmental base anion pollution
load in Ebonyi State, Nigeria. Journal of Biological
Sciences, 7: 745-751.
Feng, L., Yuan-Ming, Z., Ji-Zheng, H. 2009. Microbes
influence the fractionation of arsenic in paddy soils
with different fertilization regimes. The Science of
the Total Environment, 407: 2631-2640.
Freeze, R.A., Cherry, J.A. 1979. Groundwater, pp. 250-
263, Prentice-Hall, Englewood Cliffs, New Jersey,
USA.
Garelick, H., Jones, H., Dybowska, A., Valsami-Jones, E.
2008. Arsenic pollution sources. Reviews of Environ-
mental Contamination Toxicology, 197: 17-60.
Igwenyi, I.O., Aja-Okorie, 2014. Physicochemical
properties and heavy metal analysis of major water
sources in Dhaozara, Ebonyi State, Nigeria. IOSR
Journal of Environmental Science, Toxicology and
Food Technology, 8: 41-44.
Iqbal, F., Ali, S., Tauqeer, H.M., Shakoor, M.B., Farid,
M., Iftikhar, U., Nazir, M.M. 2013. Assessment of
ground water contamination by various pollutants
from sewage water in Chakera village, Faisalabad.
International Journal of Environmental Monitoring
and Analysis, 1: 182-187.
Jan, M.H. 2011. Characterization of the inorganic
chemistry of surface waters in South Africa. Water
S.A, 37: 401-410.
Jung, U.L.S., Sang, W.L., Hyo, T., Kyoung, W.K., Jin,
S.L. 2009. Enhancement of arsenic mobility by
indigenous bacteria from mine tailings as response
to organic supply. Environment International, 35:
496-501.
Mosaferi, M., Pourakbar, M., Shakerkhatibi, M., Fatehifar,
E., Belvasi, M. 2014. Quality modeling of drinking
groundwater using GIS in rural communities,
northwest of Iran. Journal of Environmental Health
Science & Engineering, 12: 99.
Mpenyana-Monyatsi, L., Onyango, M.S., Momba, M.N.B.
2012. Groundwater quality in a South African rural
community: A threat to public health. Polish Journal
of Environmental Studies, 21: 1349-1358.
Nag, S.K., Lahiri, A. 2012. Hydrochemical characteristics
50 Ifeanyi Francis Offor et al.

of groundwater for domestic and irrigation purposes
in dwarakeswar watershed area, India. American
Journal of Climate Change, 1: 217-230.
Narasimha, R.C., Dorairaju S.V., Bujasendra, R.M.,
Chalapathi, P.V. 2011. Statistical analysis of drinking
water quality and its impact on human health in
Chandragiri near Tirupati, India. Retrieved October
05, 2014 from www.ecowbeb.com/edi/11121.
NIS, 2007. Nigerian Industrial Standard for Drinking
Water Quality. Standards Organization of Nigeria,
Abuja, Nigeria.
Nwankwoala, H.O., Udom, G.J. 2011. Hydrogeochemical
evaluation of groundwater in parts of eastern Niger
Delta, Nigeria. Journal of Academic and Applied
Studies, 1: 33-58.
Obasi, P.N., Akudinobi, B.E. 2013. Hydrochemical
evaluation of water resources of the Ohaozara areas
of Ebonyi State, southeastern Nigeria. Journal of
Natural Sciences Research, 3: 75-80.
Obasi, R.A., Balogun, O. 2001. Water quality and
environmental impact assessment of water resources
in Nigeria. African Journal of Environmental
Studies, 2: 228-231.
Ojekunle, I.A. 2000. Transport and Urban Environmental
Quality in Nigeria in Contemplary to AD 2000,
Frankad Publishers, Lagos, Nigeria.
Okiongbo, K.S., Douglas, R. 2013. Hydrogeochemical
analysis and evaluation of groundwater quality in
Yenagoa city and environs, Southern Nigeria. Ife
Journal of Science, 15: 209-222.
Okorie, I.A. 2010. Determination of potentially toxic
elements (PTEs) and an assessment of environmental
health risk from environmental matrices. PhD. Thesis,
pp. 20-35, Northumbria University, UK.
Okoyeh, E.I., Egboka, B.C.E. 2013. Evaluation of
hydrochemical parameters of Okposi and Uburu salt
lakes, Nigeria. International Journal of Scientific and
Engineering Research, 4: 2882-2889.
Olajire, A.A., Imeokparia, F.E. 2001. Water quality
assessment of Osun River: Studies on inorganic
nutrients. Environmental Monitoring and Assessment,
69: 17-28.
Ovrawah, I., Hymore, F.K. 2001. Quality of water from
hand-dug wells in the Warri environs of Niger delta
region. African Journal of Environmental Studies,
2: 169-173.
Pink, D.H. 2006. Investing in Tomorrow�s Liquid Gold,
Retrieved October 03, 2014 from: www. finance.
yalow.com
Smedley, P.L. 2008. Sources and distribution of arsenic
in groundwater and aquifers. In: Arsenic in
Groundwater: A World Problem, Appelo, Tony
(ed.) pp 4-32.IAH, Utrecht, The Netherlands.
Smedley, P.L., Kinniburgh, D.H. 2002. A review of the
source, behaviour and distribution of arsenic in
natural waters. Applied Geochemistry, 17: 517-568.
Smith, A.H., Lingas, E.O., Rahman, M. 2000. Contamination
of drinking water by arsenic in Bangladesh. Public
Health Emergency Bulletin of World Health Organiza-
tion, 78: 1093-1103.
Talabi, A.O., Afolagboye, O.L., Tijani, M.N., Aladejana,
J.A., Ogundana, A.K. 2013. Hydrogeochemical
assessment of surface water in the central part of
Ekiti-State, Southwestern Nigeria. American Journal
of Water Resources, 1: 56-65.
WWC, 2003. Third World Water Forum and Ministorial
Conference. World Water Council and Government
of Japan. 16-23 March, Kyoto, Osaka and Shiaga,
Japan. Forum Bulletin, 30: 35-37.
Williams, J.W., Silver, S. 1984. Bacterial resistance and
detoxification of heavy metals. Enzyme and
Microbiology Technology, 6: 530-537.
WHO, 2011. Guidelines for Drinking Water Quality,
4th edition, World Health Organization (WHO),
Geneva, Switzerland.
WHO, 1984. Guidelines for Drinking Water Quality,
pp. 99-102, World Health Organization (WHO),
Geneva, Switzerland.
51Groundwater Quality Evaluation in Nigeria

The Comfort of Knitted Fabric as Affected by its Structure
Muhammad Qamar Tusief a*, Nabeel Aminb, Mudassar Abbasa and Zahid Hussainc
aDepartment of Fibre and Textile Technology, University of Agriculture, Faisalabad, PakistanbSchool of Textile and Design, University of Management and Technology, Lahore, Pakistan
cInterloop Private Limited, Khurrianwala-Jaranwala Road, Khurrianwala, Faisalabad, Pakistan
(received September 2, 2014; revised February 16, 2015; accepted February 17, 2015)
Pak. j. sci. ind. res. Ser. A: phys. sci. 2016 59 (1) 52-55
Introduction
Developments in science and technology have brought
about radical changes in the textile industry. The textile
industry being the backbone of Pakistan�s economy needs
improvement due to the introduction of various factors
like increasing competition in the global marketplace,
introduction of state of the art technology in textile field,
high raw material prices and quality of raw material etc.
The above mentioned factors invite both, our industrialists
and planners to place greater emphasis on quality as well
as productivity to compete in global market.
Knitting is one of the most important sectors of textile.
Knitted fabrics are commonly used because of their
excellent meachanical and comfort properties. Because of
their integral qualities like softness, coolness, sweat
absorbance and durability, such garments are very popular
all over the world, particularly in the developed countries.
In addition, the comfort knitted fabric give light weight,
warmness, resistance to wrinkle and easy care due to
stretch imparted by the looped yarn structure (Ogulata and
Mavruz, 2010).
From the last few years, living standards of people have
changed that increased the demand of fabrics having some
special features. Now a days clothing is not only for
aesthetic and ethical reasons; but its comfort parameters
are also included like elasticity, softness, air permeability,
thermal insulation and water vapour permeability are
expected from garments. Comfort is mainly affected by
type of fibre, yarn properties and structure of fabric. During
the previous decades the knitting technology has been
developed in respect of knitted structure, modified yarn
and various kinds of knitting instruments. The fabric
properties are not only affected by the yarn properties but
also by the parameters of the fabric construction. Wetting
and wicking are the properties producing major issues in
the processing and application of fibre materials. Wicking
and wetting both are the significant characteristics related
to the comfort properties of knitted fabric that occur during
wearing. The nature, volume, arrangement and division
of fibres, fabric structure, yarn kind and different types of
chemicals affect on the wetting performance of the fabrics
(Yanilmaz et al., 2012).
Knitting is the procedure of forming a fabric that involves
the inter-looping of thread in a sequence of connected
loops through needles. Knitted fabrics have famous
outstanding comfort characteristics. Knitted fabrics are
commonly used because of their excellent mechanical and
comfort properties. They possess high extensibility under
low loads, allowing comfortable fit on any part pulled.
The advantages of using knitted fabrics, as opposed to
conventional fabrics, lie in their low cost, improved barrier
properties, adequate strength, and comfort properties. They
are also lightweight and flexible.
They not only allow stretching and light movement, but
also have good handling characteristics and facilitate a
smooth transition of moisture from the body. These
characters make knitted fabric the commonly favourite
choice for casual wear, fire fighters� socks, gloves, helmet
liner, sportswear and underwear. Comfort is one of the
most important characteristic of clothing. For the selection
of knitted fabric comfort plays very important role. Several
factors effect on comfort provided by clothing like thermal
comfort, flexibility, moisture flow and softness, etc. Comfort*Author for correspondence; E-mail: [email protected]
Abstract. The present study was carried to investigate the effect of various knitted fabric structure on its
comfort related properties. It was observed that, all comfort properties of knitted fabric have direct relation
to its structure. The plain knitted fabric was found best for optimum comfort.
Keywords: air permeability, absorbency, drying time, fabric structure
52

properties like drying time, air permeability, wicking and
absorbency are influenced by fabric properties like knitted
structure, fabric, thickness, fabric porosity, density, type
of weave and yarn properties like yarn count, yarn twist,
yarn hairiness etc. The interest in knitted fabric have been
increased for the last few years because of their simple
production methods, low cost, high level of comfort ability
and wide product range (Chidambaram et al., 2011; Ibrahim
et al., 2011, 2010). The research projects upon studying
the effects of various yarn and fabric variables on the
comfort of knitted fabrics were made in past but an
integrated work to check the effect of knitted structure on
the comfort properties of knitted fabric was not reported
especially in Pakistan. Hence, this research study was
planned to check the manipulation of knitting structure of
fabric on its comfort in order to optimize the quality of
the fabric to make it best for wearing near to skin as well
as a guide path for the manufacturers and users to make
a right choice for their product.
Materials and Methods
Circular knitting machine of the following specificationwas engaged for the preparation of plain, terry and ribknitted grey fabrics.
Brand = Lonati
Gauge = 14"
Stitch length = 0.30
No. of needles = 144
Voltage = 380V
Machine speed = 22 rpm
The fabric samples so made were subjected to test for their
comfort related properties. Therefore, methods applied to
test the comfort properties like air permeability, absorbency,
vertical wicking, drying time of fabric are given as under:
Air permeability. The air permeability of the fabric samples
were tested according to the standard test method as
suggested by ASTM Committee D-737-04 (ASTM, 2008).
Absorbency. The absorbency characteristics of a fabric can
influence the uniformity and completeness of bleaching and
dyeing by the ability to take in water into the fibre, yarn, or
fabric construction. The suitability of a fabric for a particular
use as in the case of gauze or toweling is also dependent
upon the fabrics ability and propensity to take up water. The
absorbency of the fabric samples were tested according to
AATCC absorbency test method D-79 (AATCC, 2010).
Vertical wicking. Vertical wicking of the knitted fabric
samples were tested according to AATCC method
(AATCC, D-197., 2013).
Drying time. The drying time of the fabric samples was
calculated using the apparatus and procedure as recommen-
ded by AATCC (AATCC, D-199., 2013).
Results and Discussion
Air permeability. The individual comparison of means
for knitting structures (S) have been presented in Table 1.
It shows that the mean value of air permeability for different
knitting structures plain, terry and rib are 35.417, 32.334
and 34.00 (cm3/ cm2/ sec), respec-tively. These values
differ significantly from each other. The present findings
are also disclosed in Fig.1. The results reveal that plain
knitted structure gives the maximum value while the
minimum value is recorded for terry knitted structure.
These results are well supported from the research study
of Ogulata (2006) who stated that the air permeability
was mainly dependent upon the fabric�s weight and
construction (thickness and porosity). He also stated that
the air permeability of fabrics was influenced by several
factors: the type of fabric structure, the number of warp
and weft yarns per centimeter (or inch), the amount of
twist in yarn structure. Similarly, Raj and Sreenivasan
(2009) also discussed that the increase in more open
structure of the fabric and the fineness of the yarn
improved air permeability of the fabric. Therefore, it can
be explained that structural parameters of fabric influence
on air permeability.
Absorbency. The comparison of mean values of fabric
absorbency for various knitting structures, plain, terry and
rib as given in Table 1, are 11.167, 16.917 and 14.083
(sec), respectively. These values differ significantly from
Fig. 1. Comfort properties of knitted fabric for its
various structures.
Air permeability (cm3/cm2/sec) Absorbency (sec)
Vertical wicking (min) Drying time (min)
40
35
30
25
20
15
10
5
0
Plain Terry Rib
Mean v
alu
es
53Study of Knitted Fabric Structure

each other. These findings are also explained in Fig.1. The
results reveal that terry knitted structure gives the maximum
value while, the minimum value is recorded for plain
knitted structure. These results show that in terry structure
there exists less space within the fabric structure as
compared to that of other structures. These results are well
supported from the research study of Ogulata (2006) who
in study reported that the water absorbency of the fabric
mainly depended on the moisture regain of component
fibre and open spaces within the fabric structure.
Vertical wicking. The comparison of mean values of
vertical wicking for different knitting structures of
the fabric i.e. plain, terry and rib are 16.750, 22.500 and
19.500 (min), respectively (Table 1). These values differ
significantly from each other. The range of vertical wicking
for different knitting structures is recorded from 16.750
to 22.500 (min). These findings are also interpreted in
Fig. 1. The results reveal that terry knitted fabric gives the
maximum value while the minimum value is recorded for
plain knitted structure. These results are well supported
from the research study of Onofrei et al.(2011) who
accomplished that the knitted structure influenced on
wicking ability and the drying ability was mostly determined
by raw material and knitted structure parameters. Single
jersey fabric having highest water up-take capacity and
very high initial wicking rate. This behaviour is most
probably due to the structures� ability to behave like a
capillary system, removing and transporting water through
the structure. Knitting structures having high thickness
showed the worse wicking ability.
Drying time. The mean values of drying time of fabric
for knitting structures, plain, terry and rib as presented in
Table 1, are 16.667, 20.250 and 18.917 (min), respectively.
These values differ significantly from each other. These
results are also elaborated in Fig.1. The results reveal that
terry knitted structure gives the maximum value while the
minimum value is recorded for plain knitted structure.
These results are well supported from the research study
of Onoferi et al. (2011) who stated that knitted structure
parameters affect drying ability. Single jersey fabrics have
the highest drying rate and also the largest water diffusion
area. This is probably due to fabric characteristics, namely,
low thickness and mass per unit area and knitted structure.
In the same line Laing et al. (2007) depicted that the fabrics
which dried most rapidly on the line were typically thinnest
and lightest, whereas those taking the longest time to dry
were typically the non-woven, wool, and among the
heaviest but not always the thickest.
Conclusion
From the above research study it is concluded that plain
knit structure showed better results in sense of the comfort
related properties of the knitted fabric as compared to that
of terry and rib knitted structure.
References
AATCC, 2013. Test method for vertical wicking and
drying time of textiles. D-197, 199, USA: American
Association of Textile Chemists and Colorists,
USA.
AATCC, 2010. Test method for absorbency of textile.
D-79. USA: American Association of Textile
Chemists and Colorists, USA.
ASTM, 2008. Standard test method for measurement
of fabric properties. ASTM Designation: D-737-
04. American Society for Testing and Material,
Philadelphia, USA.
Chidambaram, P., Govind, R., Venkataraman, K.C.
2011. The effect of loop length and yarn linear
density on the thermal properties of bamboo knitted
fabric. AUTEX Research Journal, 11: 102-105.
Ibrahim, N.A., Khalifa, T.F., El-Hossamy, M.B.,Twafik,
T. M. 2011. Factors affecting the functional and
comfort-related properties of reactive dyed cotton
knits, Journal of Industrial Textiles, 41: 41-56.
Ibrahim, N.A., Khalifa, T.F., El-Hossamy, M.B.,Twafik,
T. M. 2010. Effect of knit structure and finishing
treatments on functional and comfort properties of
cotton knitted fabrics. Journal of Industrial Textiles,
40: 49-64.
Laing, R.M., Wilson, C.A., Gore, S.E., Carr, D.J., Niven,
B.E. 2007. Determining the drying time of apparel
fabrics. Textile Research Journal, 77: 583-590.
Oglakcioglu, N., Marmarali, A. 2007. Thermal comfort
properties of some knitted structures. Fibres &
Textiles in Eastern Europe, 15: 94-96.
Ogulata, R.T., Mavruz, S. 2010. Investigation of porosity
and air permeability values of plain knitted fabrics.
Table 1. Mean values of various fabric comfort related
properties for various knitted fabric
Knitting Fabric properties
structure Air permeability Absorbency Vertical Drying
(cm3/cm2/sec) (sec) wicking time
(min) (min)
Plain 35.417 11.167 16.750 16.667
Terry 32.334 16.917 22.500 20.250
Rib 34.000 14.083 19.500 18.917
54 Muhammad Qamar Tusief et al.

Fibre and Textile in Eastern Europe, 5: 71-75.
Ogulata, R.T. 2006. Air permeabillity of woven fabrics.
Journal of Textile and Apparel,Technology and
Management, 5: 1-10.
Onofrei, E., Rocha, A., Catarino, A. 2011. The influence
of knitted fabrics� structure on the thermal and
moisture management properties. Journal of
Engineered Fibres and Fabrics, 6: 10-22.
Raj, S., Sreenivasan, S. 2009. Total wear comfort index
as an objective parameter for characterization of
overall wearability of cotton fabrics. Journal of
Engineered Fibres and Fabrics, 4: 29-41.
Yanilmaz, M., Plev, B.F., Kalaoglu, F. 2012. A study
on the influence of knit structure on comfort
properties of acrylic knitted fabrics. Smartex
Research Journal, 1: 88-92.
55Study of Knitted Fabric Structure

Sumifix Supra dyes developed by Sumitomo showed
minimal sensitivity to changes in electrolyte, alkali, liquor
and exhibit high fixation over a range of processing
conditions as compared with homobifunctional dyes
(Aspland, 1993; Abeta et al., 1984; Fujioka and Abeta,
1982). These hetero bifunctional reactive dyes are also
robust to changes in processing conditions such as appli-
cation temperature (Hunter and Renfrew, 1999). Earlier
it was assumed that under strict neutral conditions and
at constant temperature the major reaction would be
the condensation reaction of dichlorotriazinyl dyes
with aminophenyl-b-sulphatoethyl sulphone not the
hydrolysis of dichlorotriazinyl dyes or of vinyl sulphone
group with water (Lewis and Loan, 2007; Weber and
Vicki, 1993). An attempt was made in this research
work to condense dichlorotriazine dyes with amino-
phenyl-b-sulphatoethyl sulphone in the dye bath under
neutral conditions prior to addition of salt and alkali
required for the (neutral) exhaustion and (alkaline)
fixation stages.
Dichlorotriazinyl dyes CI Reactive Orange 86, CI
Reactive Red 11, CI Reactive Blue 168 and dyes of
Sumifix Supra type CI Reactive Yellow 145, CI Reactive
Red 195, CI Reactive Blue 221 were available commer-
cially. All other chemicals used in this study were of
general laboratory grade purchased from Aldrich or
Merck. Samples of para and meta aminophenyl-b-
sulphatoethyl sulphone were generously provided by
BASF. The strength of dyestuff samples were estimated
from the ratio of its actual molecular weight (MW) to
its effective molecular weight (Mole In) estimated by
titanous chloride titration method (Murtagh, 2004) and
is given in Table 1.
An Investigation into the In situ Preparation of
Hetero Bifunctional Monochlorotriazinyl-Vinyl Sulphone
Reactive Dyes for Cotton
Khalid Pashaa* and John Anthony Taylorb
aTextile Engineering Department, NED University of Engineering and Technology, Karachi, PakistanbColour Synthesis Solution Ltd., Hexagon Tower, Manchester M9 8ZS, UK
(received June 3, 2014; revised March 3, 2015; accepted April 1, 2015)
Pak. j. sci. ind. res. Ser. A: phys. sci. 2016 59 (1) 56-59
Abstract. An attempt has been made in in-situ preparation and application of two isomers (para and meta)
of aminophenyl-b-sulphatoethyl sulphone reagents (PABSES and MABSES) with three dichlorotriazinyl
dyes i.e. CI Reactive Orange 86, CI Reactive Red 11 and CI Reactive Blue 168 to generate mixed hetero
bifunctional dyes in dye bath. Dyeing results when compared with similar targeted type of commercially
available Sumifix Supra dyes were found not up to the mark. Build up properties of all in situ prepared
dyes were lower except for few light depth of shades as compared to preformed commercial Sumifix Supra
dyes. This could be because of inefficient condensation of dichlorotriazinyl dyes with the aminophenyl-
b-sulphatoethyl sulphone. However, meta isomer of aminophenyl-b-sulphatoethyl sulphone appeared to
be more effective than the para isomer.
Keywords: colouration, reactive dyes, cotton, hetero bifunctional dyes, fixation
*Author for correspondence; E-mail: [email protected]
Short Communication
Table 1. Effective dye strength
Dyes Moles In
CI Reactive Orange 86 1792
CI Reactive Red 11 1482
CI Reactive Blue 168 2919
CI Reactive Yellow 145 1472
CI Reactive Red 195 1705
CI Reactive Blue 221 3310
Experimental results suggested that for in situ application
of dichlorotriazine dye and sulphatoethyl sulphones
agents, temperature of dye bath should be at 70 °C, and
pH should be 6.0�6.5 using phosphate buffer with
reaction time of 1 h, however, reaction period of 2 and
4 h were also measured. Each dye was applied to bleach
unmercerised woven cotton at five depths, viz. 1, 2, 4,
6 and 9% dye o.m.f. at 60 °C and liquor ratio 10:1,
using the quantities of Glauber�s salt (exhaustion for
30 min) and soda ash (fixation for 60 min) as shown in
56

Table 2. After dyeing, the fabric was rinsed with cold
and hot water before soaping at boil for 10 min and
finally rinsed with cold water and air dried at room
temperature. Colorimetric properties of dyeing were
determined using a Spectraflash 600 spectrophotometre
(D65 illumination, 10° observer). To facilitate the com-
parison of the build-up properties of these dyes, k/s
values versus dye concentrations in millimoles per
100 g of fabric were plotted.
supporting the premise that a Sumifix Supra type of
heterobifunctional dye is indeed formed in the dye bath.
Dyeing results appeared to indicate partial conversions
of dichlorotriazine to a monochlorotriazine-vinyl sulphone
mixed reactive system. Results for meta isomer (MABSES)
are given in Fig. 2 and shows that significant conversion
to mixed bifunctional dye had occurred within two
hours but again build up was inferior on an equimolar
basis to CI Reactive Yellow 11.
Table 2. Amount of salt and alkali used
Shades Sodium sulphate (g/L) Sodium carbonate(g/L)
% dye Procion Sumifix Procion Sumifix
(o.m.f) MX supra MX supra
1 & 2 35 35 10 20
4 45 50 15 20
6 & 9 55 50 20 20
Results for both isomers (PABSES and MABSES) with
CI Reactive Red 11 are depicted in Fig. 3-4 and shows
that the best build up was obtained when dichlorotriazine
and amine were reacted at 70 °C for 2 h prior to addition
of salt and alkali. Interestingly, with CI Reactive Red
11, the para isomer performed significantly better than
the meta isomer.
CI Reactive Blue 168 showed mixed results which are
shown in Fig. 5-6. In some cases build-up was almost
comparable to CI Reactive Blue 168 (commercial
counterpart). However, in all cases build-up tailed off
above 4% depth of dye shade.
Fig. 2. CI Reactive Orange 86 with MABSES.
Legends: Series 1: CI Reactive Orange 86 with meta amino-phenyl-b-sulphatoethyl sulphone (MABSES), reaction time one hour at70 °C before dyeing, Series 2: CI Reactive Orange 86 with MABSES,reaction time two hour at 70 °C before dyeing, Series 3: CI ReactiveOrange 86 with MABSES, reaction time four hour at 70 °C beforedyeing, Series 4: CI Reactive Orange 86 kept in dye bath under sameconditions as for series 1, 2 and 3 but without MABSES beforedyeing, Series 5: CI Reactive Orange 86 dyed to cotton without anymodification at standard Sumifix Supra dyeing conditions, Series 6:CI Reactive Orange 86 dyed to cotton without any modification atstandard MX dyeing conditions, Series 7: Commercial CI ReactiveYellow 145 dyed to cotton without any modification at standardSumifix Supra dyeing conditions.
30
25
20
15
10
5
0
k/s
valu
es
series 1 series 2 series 3 series 4 series 5
series 6 series 7
mmoles of dye/100 g of fabric
0 0.1 0.2 0.3 0.4
Dyeing results of CI Reactive Orange 86 with PABSES
(Fig. 1) showed that the depths of shade under these
conditions are far inferior to when PABSES is present,
Fig. 1. CI Reactive Orange 86 with PABSES.
Legends: Series 1: CI Reactive Orange 86 with para aminophenyl-b-sulphatoethyl sulphone (PABSES), reaction time one hour at70 °C before dyeing, Series 2: CI Reactive Orange 86 with PABSES,reaction time two hour at 70 °C before dyeing, Series 3: CI ReactiveOrange 86 with PABSES, reaction time four hour at 70
°C before
dyeing, Series 4: CI Reactive Orange 86 kept in dye bath under sameconditions as for series 1, 2 and 3 but without PABSES before dyeing,Series 5: CI Reactive Orange 86 dyed to cotton without any modi-fication at standard Sumifix Supra dyeing conditions, Series 6: CIReactive Orange 86 dyed to cotton without any modification atstandard MX dyeing conditions, Series 7: Commercial CI ReactiveYellow 145 dyed to cotton without any modification at standardSumifix Supra dyeing conditions.
30
25
20
15
10
5
0
k/s
valu
es
mmoles of dye/100 g of fabric
series 1 series 2 series 3 series 4 series 5
series 6 series 7
0 0.1 0.2 0.3 0.4
57Short Communication: Reactive Dyes for Cotton

Fig. 6. CI Reactive Blue 168 with MABSES.
Legends: Series 1: CI Reactive Blue 168 with meta amino-phenyl-b-sulphatoethyl sulphone (MABSES), reaction time one hour at70 °C before dyeing, Series 2: CI Reactive Blue 168 with MABSES,reaction time two hour at 70 °C before dyeing, Series 3: CI ReactiveBlue 168 with meta MABSES, reaction time four hour at 70 °Cbefore dyeing, Series 4: CI Reactive Blue 168 kept in dye bath undersame conditions as for series 1, 2 and 3 but without MABSES beforedyeing, Series 5: CI Reactive Blue 168 dyed to cotton without anymodification at standard Sumifix Supra dyeing conditions, Series 6:Procion Blue MX-4GD dyed to cotton without any modification atstandard MX dyeing conditions, Series 7: Commercial CI ReactiveBlue 221 dyed to cotton without any modification at standard SumifixSupra dyeing conditions.
35
30
25
20
15
10
5
0
mmoles of dye/100 g of fabric
k/s
valu
es
0 0.05 0.1 0.15 0.2
series 1 series 2 series 3 series 4 series 5
series 6 series 7
Fig. 3. CI Reactive Red 11 with PABSES.
Legends: Series 1: CI Reactive Red 11 with para aminophenyl-b-sulphatoethyl sulphone (PABSES), reaction time one hour at 70 °Cbefore dyeing, Series 2: CI Reactive Red 11 with PABSES, reactiontime two hour at 70 °C before dyeing, Series 3: CI Reactive Red 11with PABSES, reaction time four hour at 70 °C before dyeing, Series4: CI Reactive Red 11 kept in dye bath under same conditions as forseries 1, 2 and 3 but without PABSES before dyeing, Series 5: CIReactive Red 11 dyed to cotton without any modification at standardSumifix Supra dyeing conditions, Series 6: CI Reactive Red 11 dyedto cotton without any modification at standard MX dyeing conditions,Series 7: Commercial CI Reactive Red 195 dyed to cotton withoutany modification at standard Sumifix Supra dyeing conditions.
35
30
25
20
15
10
5
0
k/s
valu
es
mmoles of dye/100 g of fabric
0 0.1 0.2 0.3 0.4
series 1 series 2 series 3 series 4 series 5
series 6 series 7
Fig. 4. CI Reactive Red 11 with MABSES.
Legends: Series 1: CI Reactive Red 11 with meta amino-phenyl-b-sulphatoethyl sulphone (MABSES), reaction time one hour at 70 °Cbefore dyeing, Series 2: CI Reactive Red 11 with MABSES, reactiontime two hour at 70
°C before dyeing, Series 3: CI Reactive Red 11
with MABSES, reaction time four hour at 70 °C before dyeing, Series4: CI Reactive Red 11 kept in dye bath under same conditions as forseries 1, 2 and 3 but without MABSES before dyeing, Series 5: CIReactive Red 11 dyed to cotton without any modification at standardSumifix Supra dyeing conditions, Series 6: CI Reactive Red 11 dyedto cotton without any modification at standard MX dyeing conditions,Series 7: Commercial CI Reactive Red 195 dyed to cotton withoutany modification at standard Sumifix Supra dyeing conditions.
35
30
25
20
15
10
5
0
k/s
valu
es
mmoles of dye/100 g of fabric
0 0.05 0.1 0.15 0.2 0.25
series 1 series 2 series 3 series 4 series 5
series 6 series 7
Fig. 5. CI Reactive Blue 168 with PABSES.
Legends: Series 1: CI Reactive Blue 168 with para amino-phenyl-b-sulphatoethyl sulphone (PABSES), reaction time one hour at 70 °Cbefore dyeing, Series 2: CI Reactive Blue 168 with PABSES, reactiontime two hour at 70 °C before dyeing, Series 3: CI Reactive Blue 168with PABSES, reaction time four hour at 70 °C before dyeing, Series4: CI Reactive Blue 168 kept in dye bath under same conditions as forseries 1, 2 and 3 but without PABSES before dyeing, Series 5: CIReactive Blue 168 dyed to cotton without any modification at standardSumifix Supra dyeing conditions, Series 6: CI Reactive Blue 168 dyedto cotton without any modification at standard MX dyeing conditions,Series 7: Commercial CI Reactive Blue 221 dyed to cotton withoutany modification at stand. Sumifix Supra dyeing conditions.
0 0.05 0.1 0.15 0.2
mmoles of dye/100 g of fabric
series 1 series 2 series 3 series 4 series 5
series 6 series 7
35
30
25
20
15
10
5
0
k/s
valu
es
58 Khalid Pasha and John Anthony Taylor

Dyeing results when compared with commercial Sumifix
Supra dyes of similar shades were inferior in perfor-
mance. Meta isomer of aminophenyl-b-sulphatoethyl
sulphone appeared to be more effective than the para
isomer. This probably reflects more nucleophilic character
of the former isomer (Sheng, 1998). The falling-off of
the build-up properties of some of the dyes at darker
shades may be due to blocking effect.
References
Abeta, S., Yoshida, T., Imada, K. 1984. Problems and
progress in reactive dyes. American Dyestuff Reporter,
73: 26-49.
Aspland, J.R. 1993. A Series on dyeing, Chapter 15,
Colour, colour measurement and control. Journal
of the American Association of Textile Chemists
and Colourists, 25: 34-42.
Fujioka, S., Abeta, S. 1982. Development of novel
reactive dyes with a mixed bifunctional reactive
system. Dyes and Pigments, 3: 281-294.
Renfrew, A.H.M. 1999. Reactive Dyes for Textile Fibres.
224 pp., Society of Dyers and Colourists, Bradford,
UK.
Lewis, D.M., Loan, T.T.V. 2007. Dyeing cotton with
reactive dyes under neutral conditions. Coloration
Technology, 123: 306-311.
Sheng, Y., Zhenghua, Z. 1998. Kinetic study of reaction
of vinylsulfonyl aniline and dichlorotriazinyl group.
Dyes and Pigments, 38: 137-146.
Taylor, J.A., Murtagh, V. 2004. A simple titrimetric
method for the estimation of reactive dye fixation
on cellulosic fabrics. Dyes and Pigments, 63: 17-
22.
Weber, E.J., Stickney, V.C. 1993. Hydrolysis kinetics
of reactive blue 19-vinyl sulfone. Water Research,
27: 63-67.
59Short Communication: Reactive Dyes for Cotton

Activated Sludge Process and its Suitability for Treatment of
Tannery Waste Water
Niaz Ahmed Memona*, Nisar Ahmedb, Nusrat Jalbania, Tahira Ayazb, Razia Baguma
and Alia Bano Munshia
aPCSIR Laboratories Complex, Shahrah-e-Dr. Salimuzzaman Siddiqui, Karachi-75280, PakistanbLeather Research Centre, PCSIR, D-102, S.I.T.E., South Avenue, Karachi-75700, Pakistan
(receivd April 30, 2014; revised January 1, 2015; accepted January 14, 2015)
Pak. j. sci. ind. res. Ser. A: phys. sci. 2015 59 (1) 60-62
Abstract. This study was conducted for the treatment of tannery wastewater and to develop simple design
criteria under local conditions. BOD5, COD, total Cr, SO42-, S2-, SS, TDS and TS of the influent and effluent
were measured to find process efficiency at various mixed liquor volatile suspended solids (MLVSS),
dissolved oxygen (DO) and hydraulic detention time. Results of the study demonstrated that an efficiency
of above parameters 93.0%, 92.5%, 94.9%, 62.6%, 98.2%, 87.9%, 82.1% and 82.4%, respectively,
could be obtained if the activated sludge process (ASP) is operated at the MLVSS concentration of
3500-4500 mg/L, (DO) concentration of 4.1-5.5 mg/L keeping an aeration time of 12 h.
Keywords: activated sludge, biological treatment, tannery wastewater
Treatment of tannery effluent through the use of activated
sludge process has been reported by many researchers
(Ahmed et al., 2014; Al-Hussieny et al., 2014; Deepika
et al., 2014; Pal et al., 2014; Shyam et al., 2014;
Ambreen et al., 2013; Mouna et al., 2013; Niaz et al.,
2012; Durai et al., 2011). All these studies indicate a
BOD removal of 90-97% and COD 60-80% when
combined with physicochemical pretreatment for the
tannery effluent. The characteristics of tannery effluent
vary considerably from tannery to tannery (Ilou et al.,
2014). A survey was conducted in Pakistan for quality
characteristics range of effluent from tanneries pro-
cessing as given in Table 1 (Iqbal et al., 1998). Various
parameters of importance relating to growth of micro-
organisms and substrate utilization on which the
operation of the reactor is based has been studied by
Bestawy et al. (2014); Khairnar et al. (2014) and Marco
et al. (2014).
The present work was carried out that activated sludge
process (ASP) for the treatment of settled tannery
effluent and to develop general guidelines for the process
design under local conditions. A bench scale continuous
flow activated sludge reactor was used in this study. It
consisted of an aeration tank of 300 L capacity and a
settling portion of 200 L capacity.
The influent was subjected to settling in an underground
tank. A peristaltic pump used to fill the settled influent
to the aeration tank and pure oxygen cylinder was used
to inject the oxygen to the aeration tank; a portion of
gas was wasted from the tank to reduce the concentration
of carbon dioxide. Pure oxygen was supplied by a fine
bubble diffuser; flow was regulated at 4 mg/L/min by
a flow meter. The reactor had to operate at different
MLVSS and DO concentrations. Due to unavailability
of mechanical return sludge facility, 100% of the settled
sludge was daily removed from the final clarifier tank
and manually returned to the aeration tank. In order to
maintain the desired MLVSS and DO concentration in
the reactor the calculated fraction of the volume of the
aeration tank (ranging from one third to one tenth) was
removed manually on daily basis and the tank was filled
to the original volume by the treated effluent. No external
nutrients were added to the influent (Vaiano et al., 2014;
Pradyut et al., 2013).
Pure oxygen was supplied through diffuser stones to
maintain a DO level of more than 3 mg/L. Temperature
and pH values for settled influent and effluent were
measured on daily basis while, MLVSS in the reactor,
COD, BOD, total Cr, SO42-, S2-, SS, TDS and TS of
influent and effluent were measured twice a week.
The three chosen operating parameters i.e. MLVSS
concentration, detention time (è) and DO were varied
during the course of the study keeping into consideration
the generally applied range in activated sludge process
for industrial effluent treatment (Pooja, 2014; Zahrim
et al., 2009). The reactor was operated for an MLVSS
concentration range of 1500-4500 mg/L, DO concen-
tration 1.9-5.5 mg/L and è value of 4-12 h, respectively.*Author for correspondence; E-mail: [email protected]
Short Communication
60

During the course of study, pH of the reactor was varied
between 7.8 and 8.23 which is a suitable range for bio-
logical treatment. DO of the reactor was maintained
above 4 mg/L which is required for satisfactory biological
treatment. A large amount of sludge is generated along
with high energy consumption in the process (Table 1).
Table 2. Removal efficiency at 3500-4500 MLVSS
mg/L, 12 h time, 5.5 mg/L DO and pH 7.93
Parameters Mean Mean Removal
influent effluent efficiency (%)
BOD5 (mg/L) 982 69 93.0
COD (mg/L) 1876 140 92.5
Total chrome (mg/L) 917 47 94.9
Sulphate (mg/L) 5378 2010 62.6
Sulphide (mg/L) 285 05 98.2
SS (mg/L) 1260 152 87.9
TDS (mg/L) 8536 1530 82.1
TS (mg/L) 9517 1668 82.4
Experimental work was performed for a period of 190
days. The treatment efficiency of the reactor in terms
of BOD, COD, total Cr, SO42-, S2-, SS, TDS and TS
removals was studied for MLVSS concentrations of
1500, 2000, 2500, 3000, 3500 and 4500 mg/L, DO 1.9,
1.8, 3.2, 3.1, 4.1 and 4.3 mg/L and retention time 2, 4,
6, 8 and 12 h. It was noted that the process efficiency
improved with increase in MLVSS, DO concentrations
and è. Under optimum conditions thus the results are
showed, ASP should be operated at MLVSS concen-
tration of 3500-4500 mg/L, DO concentration 4.5 mg/L
and è value of 12 h. It is thus proposed to carry out
bench scale studies for obtaining optimal values of the
above said parameters for a specific tannery before
designing a biological treatment system.
As shown in Fig. 1, maximum removal efficiency of
93.0%, 92.5%, 94.9%, 62.6%, 98.2%, 87.5%, 82.1%
and 82.4% was achieved at MLVSS concentration of
3500-4500 mg/L and è of 12 h for BOD5, COD, total
Cr, SO42-, S2-, SS, TDS and TS, respectively, as sum-
marized in Table 2. Furthermore, residual values of
BOD5 and COD at this MLVSS and è are 65 mg/L and
140 mg/L, respectively. It shows that BOD5 and COD
meet National Environmental Quality Standards (NEQS)
limits, which are 80 and 150 mg/L. As indicated in
Table 3, an average COD/BOD5 ratio of 1.93 and 2.01,
respectively. In the light of these results, it was concluded
that a reasonably good approximation of BOD5 can be
obtained from a COD measurement once a relationship
has been established between the two parameters from
the available data.
ASP is a feasible treatment technology for tannery
wastewater especially where limited space restricts the
use of other biological methods. ASP for Leather Research
Centre may be operated with MLVSS concentration of
3500-4500 mg/L, DO concentration of 4.1-4.3 mg/L
and è value of 10-12 h in order to obtain optimal removal
Table 3. Influent and effluent COD and BOD5 ratio
Average COD Average BOD5 Average
(mg/L) (mg/L) COD/BOD5
Range Mean Range Mean
Influent
1700-2023 1861 901-1025 963 1.93
Effluent
140-1018 579 511-65 288 2.01
Table 1. Range of tannery effluent quality parameters
Parameters Range
pH (unsettled effluent) 7.3-10
BOD5, mg/L (30 min settling) 840-18,620
COD, mg/L (30 min settling) 1320-54,000
Suspended solids, mg/L (30 min settling) 220-1610
Settleable solids, mg/L (30 min settling) 11-40
Sulphate, mg/L (unsettled effluent) 800-6480
Sulphide, mg/L (at 0 time settling) 800-6480
Chromium, mg/L (unsettled effluent) 41-133 Fig. 1. Removal of pollutants.
100
90
70
60
50
40
30
20
10
0
(%)
1500 2000 2500 3000 3500 4000 4500
MLVSS
BOD, COD, Chrome, Sulphate, Sulphide,
SS, TDS, TS,
61Short Communication: Activated Sludge to Tannery Waste
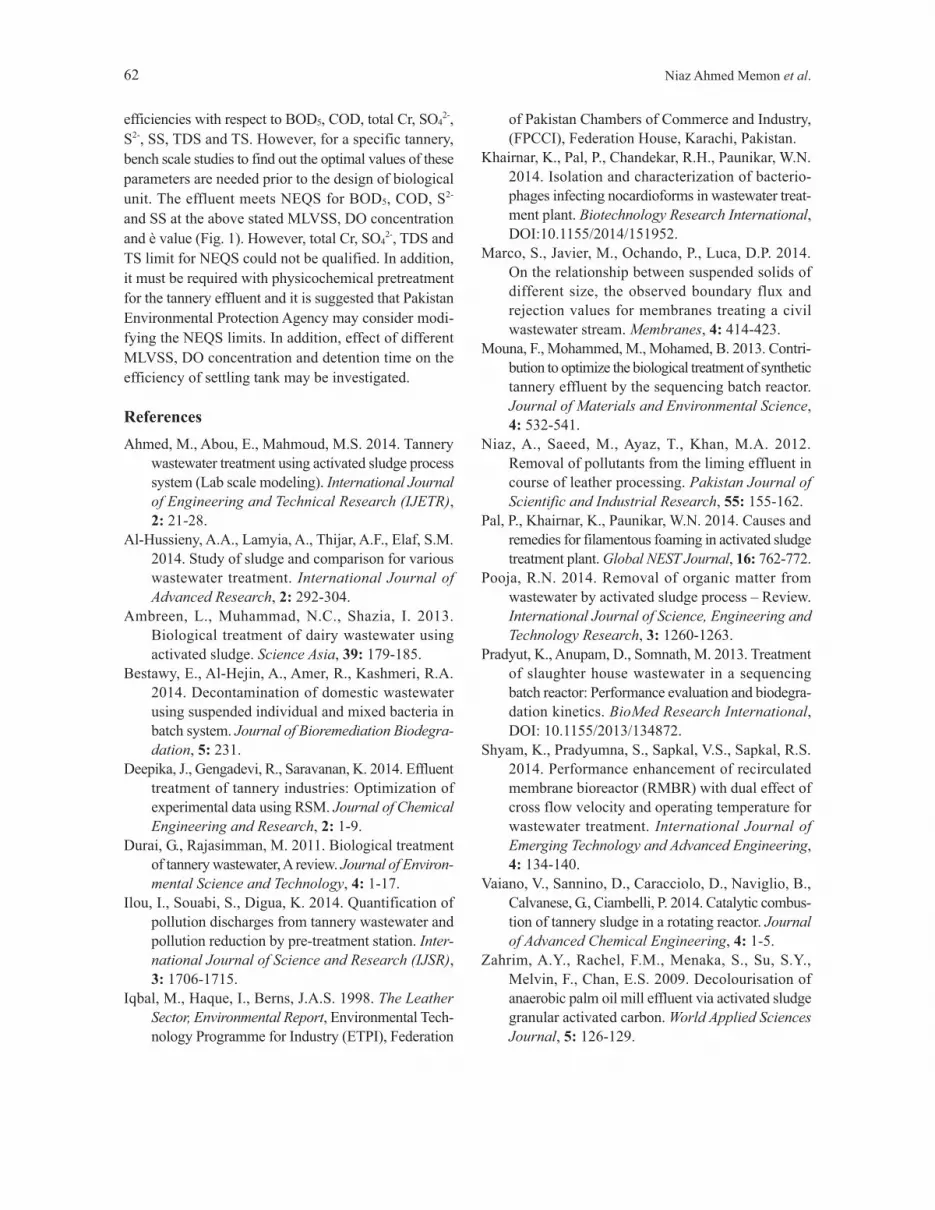
of Pakistan Chambers of Commerce and Industry,
(FPCCI), Federation House, Karachi, Pakistan.
Khairnar, K., Pal, P., Chandekar, R.H., Paunikar, W.N.
2014. Isolation and characterization of bacterio-
phages infecting nocardioforms in wastewater treat-
ment plant. Biotechnology Research International,
DOI:10.1155/2014/151952.
Marco, S., Javier, M., Ochando, P., Luca, D.P. 2014.
On the relationship between suspended solids of
different size, the observed boundary flux and
rejection values for membranes treating a civil
wastewater stream. Membranes, 4: 414-423.
Mouna, F., Mohammed, M., Mohamed, B. 2013. Contri-
bution to optimize the biological treatment of synthetic
tannery effluent by the sequencing batch reactor.
Journal of Materials and Environmental Science,
4: 532-541.
Niaz, A., Saeed, M., Ayaz, T., Khan, M.A. 2012.
Removal of pollutants from the liming effluent in
course of leather processing. Pakistan Journal of
Scientific and Industrial Research, 55: 155-162.
Pal, P., Khairnar, K., Paunikar, W.N. 2014. Causes and
remedies for filamentous foaming in activated sludge
treatment plant. Global NEST Journal, 16: 762-772.
Pooja, R.N. 2014. Removal of organic matter from
wastewater by activated sludge process � Review.
International Journal of Science, Engineering and
Technology Research, 3: 1260-1263.
Pradyut, K., Anupam, D., Somnath, M. 2013. Treatment
of slaughter house wastewater in a sequencing
batch reactor: Performance evaluation and biodegra-
dation kinetics. BioMed Research International,
DOI: 10.1155/2013/134872.
Shyam, K., Pradyumna, S., Sapkal, V.S., Sapkal, R.S.
2014. Performance enhancement of recirculated
membrane bioreactor (RMBR) with dual effect of
cross flow velocity and operating temperature for
wastewater treatment. International Journal of
Emerging Technology and Advanced Engineering,
4: 134-140.
Vaiano, V., Sannino, D., Caracciolo, D., Naviglio, B.,
Calvanese, G., Ciambelli, P. 2014. Catalytic combus-
tion of tannery sludge in a rotating reactor. Journal
of Advanced Chemical Engineering, 4: 1-5.
Zahrim, A.Y., Rachel, F.M., Menaka, S., Su, S.Y.,
Melvin, F., Chan, E.S. 2009. Decolourisation of
anaerobic palm oil mill effluent via activated sludge
granular activated carbon. World Applied Sciences
Journal, 5: 126-129.
efficiencies with respect to BOD5, COD, total Cr, SO42-,
S2-, SS, TDS and TS. However, for a specific tannery,
bench scale studies to find out the optimal values of these
parameters are needed prior to the design of biological
unit. The effluent meets NEQS for BOD5, COD, S2-
and SS at the above stated MLVSS, DO concentration
and è value (Fig. 1). However, total Cr, SO42-, TDS and
TS limit for NEQS could not be qualified. In addition,
it must be required with physicochemical pretreatment
for the tannery effluent and it is suggested that Pakistan
Environmental Protection Agency may consider modi-
fying the NEQS limits. In addition, effect of different
MLVSS, DO concentration and detention time on the
efficiency of settling tank may be investigated.
References
Ahmed, M., Abou, E., Mahmoud, M.S. 2014. Tannery
wastewater treatment using activated sludge process
system (Lab scale modeling). International Journal
of Engineering and Technical Research (IJETR),
2: 21-28.
Al-Hussieny, A.A., Lamyia, A., Thijar, A.F., Elaf, S.M.
2014. Study of sludge and comparison for various
wastewater treatment. International Journal of
Advanced Research, 2: 292-304.
Ambreen, L., Muhammad, N.C., Shazia, I. 2013.
Biological treatment of dairy wastewater using
activated sludge. Science Asia, 39: 179-185.
Bestawy, E., Al-Hejin, A., Amer, R., Kashmeri, R.A.
2014. Decontamination of domestic wastewater
using suspended individual and mixed bacteria in
batch system. Journal of Bioremediation Biodegra-
dation, 5: 231.
Deepika, J., Gengadevi, R., Saravanan, K. 2014. Effluent
treatment of tannery industries: Optimization of
experimental data using RSM. Journal of Chemical
Engineering and Research, 2: 1-9.
Durai, G., Rajasimman, M. 2011. Biological treatment
of tannery wastewater, A review. Journal of Environ-
mental Science and Technology, 4: 1-17.
Ilou, I., Souabi, S., Digua, K. 2014. Quantification of
pollution discharges from tannery wastewater and
pollution reduction by pre-treatment station. Inter-
national Journal of Science and Research (IJSR),
3: 1706-1715.
Iqbal, M., Haque, I., Berns, J.A.S. 1998. The Leather
Sector, Environmental Report, Environmental Tech-
nology Programme for Industry (ETPI), Federation
62 Niaz Ahmed Memon et al.

Pakistan Journal of Scientific and Industrial ResearchPCSIR - Scientific Information Centre
PCSIR Laboratories Campus, Shahrah-e-Dr. Salimuzzman Siddiqui, Karachi - 75280, PakistanPh: 92-21-34651739-42, Fax: 92-21-34651738, E-mail: [email protected] Website: www.pjsir.org
EXCHANGE FORMWe wish to receive Pakistan Journal of Scientific and Industrial Research Ser. A: Phys. Sci: and/or Ser. B: Biol. Sci. in exchange of :
Name of Journal: _____________________________________________________Frequency: _____________________________________________________Subjects Covered: _____________________________________________________Institution: _____________________________________________________Address: _____________________________________________________
__________________________________________________________________________________________________________
Signature: _____________________________________________________Name: _____________________________________________________Designation: _____________________________________________________Date: _____________________________________________________E-mail: _____________________________________________________Fax: _____________________________________________________Phone: _____________________________________________________
- - - - - - - - - - - - - - - - - - - - - - - - - - - - - - - - - - - - - - - - - - - - - - - - - - - - - - - - - - - - - - - - - - - - - - - - - - - - - - - - - - - - - -
Pakistan Journal of Scientific and Industrial ResearchPCSIR - Scientific Information Centre
PCSIR Laboratories Campus, Shahrah-e-Dr. Salimuzzman Siddiqui, Karachi - 75280, PakistanPh: 92-21-34651739-42, Fax: 92-21-34651738, E-mail: [email protected] Website: www.pjsir.org
SUBSCRIPTION FORMI / we wish to subscribe to ‘Pakistan Journal of Scientific and Industrial Research’ Ser. A: Phys. Sci: and/or Ser. B: Biol. Sci.
The filled in proforma is being returned for compliance.
Subscriber’s data:Name: _____________________________________________________Address: _____________________________________________________
__________________________________________________________________________________________________________
E-mail: _____________________________________________________Fax: _____________________________________________________Phone: _____________________________________________________
Signature: _____________________________________________________Order Membership No. (if any): ____________________________________________
Tick the relevant box: Send invoice Bill later on Cheque for ...................enclosed
RevisedSubscription Local: Rs. 2500/ = per volume; Rs. 425/ = per copyRates: Foreign: US$ 450/ = per volume; US$ 75/ = per copy
Payment should be made through cross cheque in favour of Pakistan Journal of Scientific and Industrial Research andmailed to the Director PCSIR - Scientific Information Centre, PCSIR Laboratories Campus, Shahrah-e-Dr. SalimuzzamanSiddiqui, Karachi-75280, Pakistan.


![Der Gebirgsbote 1891 [Jg.59]](https://img.pdfslide.net/doc/110x75/63142887aca2b42b580d6f4e/der-gebirgsbote-1891-jg59.jpg)


