Embed Size (px)
Citation preview

arX
iv:0
911.
2709
v2 [
astr
o-ph
.CO
] 24
Dec
200
9Astronomy & Astrophysicsmanuscript no. pks2005˙mwl c© ESO 2009December 24, 2009
PKS 2005−489 at VHE: Four years of monitoring with HESS andsimultaneous multi-wavelength observations
HESS Collaboration, F. Acero15, F. Aharonian1,13 , A.G. Akhperjanian2 , G. Anton16, U. Barres de Almeida8 ⋆,A.R. Bazer-Bachi3, Y. Becherini12, B. Behera14, W. Benbow1 ⋆⋆, K. Bernlohr1,5, A. Bochow1, C. Boisson6,
J. Bolmont19, V. Borrel3, J. Brucker16, F. Brun19, P. Brun7, R. Buhler1, T. Bulik29, I. Busching9, T. Boutelier17,P.M. Chadwick8, A. Charbonnier19 , R.C.G. Chaves1, A. Cheesebrough8 , L.-M. Chounet10, A.C. Clapson1,G. Coignet11, L. Costamante1,30 ⋆⋆⋆, M. Dalton5, M.K. Daniel8, I.D. Davids22,9, B. Degrange10, C. Deil1,
H.J. Dickinson8, A. Djannati-Ataı12 , W. Domainko1, L.O’C. Drury13, F. Dubois11, G. Dubus17, J. Dyks24, M. Dyrda28,K. Egberts1, P. Eger16, P. Espigat12, L. Fallon13, C. Farnier15, S. Fegan10, F. Feinstein15, A. Fiasson11, A. Forster1,G. Fontaine10, M. Fußling5, S. Gabici13, Y.A. Gallant15, L. Gerard12, D. Gerbig21, B. Giebels10, J.F. Glicenstein7 ,
B. Gluck16, P. Goret7, D. Goring16, M. Hauser14, S. Heinz16, G. Heinzelmann4, G. Henri17, G. Hermann1,J.A. Hinton25, A. Hoffmann18, W. Hofmann1, P. Hofverberg1, M. Holleran9, S. Hoppe1, D. Horns4,
A. Jacholkowska19 , O.C. de Jager9, C. Jahn16, I. Jung16, K. Katarzynski27 , U. Katz16, S. Kaufmann14,M. Kerschhaggl5, D. Khangulyan1 , B. Khelifi10, D. Keogh8, D. Klochkov18, W. Kluzniak24, T. Kneiske4, Nu. Komin7,
K. Kosack1, R. Kossakowski11, G. Lamanna11, J.-P. Lenain6, T. Lohse5, V. Marandon12 , O. Martineau-Huynh19 ,A. Marcowith15, J. Masbou11, D. Maurin19, T.J.L. McComb8, M.C. Medina6, J. Mehault15, R. Moderski24,
E. Moulin7, M. Naumann-Godo10, M. de Naurois19, D. Nedbal20, D. Nekrassov1, B. Nicholas26, J. Niemiec28,S.J. Nolan8, S. Ohm1, J-F. Olive3, E. de Ona Wilhelmi1, K.J. Orford8, M. Ostrowski23, M. Panter1, M. Paz Arribas5,
G. Pedaletti14, G. Pelletier17, P.-O. Petrucci17, S. Pita12, G. Puhlhofer18,14, M. Punch12, A. Quirrenbach14 ,B.C. Raubenheimer9, M. Raue1,30, S.M. Rayner8, M. Renaud12,1, F. Rieger1,30, J. Ripken4, L. Rob20, S. Rosier-Lees11 ,G. Rowell26, B. Rudak24, C.B. Rulten8, J. Ruppel21, V. Sahakian2, A. Santangelo18, R. Schlickeiser21 , F.M. Schock16,U. Schwanke5, S. Schwarzburg18 , S. Schwemmer14, A. Shalchi21, M. Sikora24, J.L. Skilton25, H. Sol6, Ł. Stawarz23,
R. Steenkamp22, C. Stegmann16, F. Stinzing16, G. Superina10, A. Szostek23,17, P.H. Tam14, J.-P. Tavernet19,R. Terrier12, O. Tibolla1, M. Tluczykont4 , C. van Eldik1, G. Vasileiadis15, C. Venter9, L. Venter6, J.P. Vialle11,
P. Vincent19, M. Vivier7, H.J. Volk1, F. Volpe1, S.J. Wagner14, M. Ward8, A.A. Zdziarski24, and A. Zech6
(Affiliations can be found after the references)
Received; accepted
ABSTRACT
Aims. Our aim is to study the very high energy (VHE;E > 100 GeV) γ-ray emission from BL Lac objects and the evolution in time oftheirbroad-band spectral energy distribution (SED).Methods. VHE observations of the high-frequency peaked BL Lac objectPKS 2005−489 were made with the High Energy Stereoscopic System(HESS) from 2004 through 2007. Three simultaneous multi-wavelength campaigns at lower energies were performed duringthe HESS data taking,consisting of several individual pointings with the XMM-Newton and RXTE satellites.Results. A strong VHE signal,∼17σ total, from PKS 2005−489 was detected during the four years of HESS observations (90.3 hrs live time).The integral flux above the average analysis threshold of 400GeV is∼3% of the flux observed from the Crab Nebula and varies weakly on timescales from days to years. The average VHE spectrum measuredfrom∼300 GeV to∼5 TeV is characterized by a power law with a photon index,Γ = 3.20±0.16stat ±0.10syst. At X-ray energies the flux is observed to vary by more than an order of magnitude between 2004 and 2005. Strongchanges in the X-ray spectrum (∆ΓX ≈ 0.7) are also observed, which appear to be mirrored in the VHE band.Conclusions. The SED of PKS 2005−489, constructed for the first time with contemporaneous data on both humps, shows significant evolution.The large flux variations in the X-ray band, coupled with weakor no variations in the VHE band and a similar spectral behavior, suggest theemergence of a new, separate, harder emission component in September 2005.
Key words. Galaxies: active - BL Lacertae objects: Individual: PKS 2005−489 - Gamma rays: observations
Send offprint requests to: [email protected] or [email protected]
⋆ supported by CAPES Foundation, Ministry of Education of Brazil⋆⋆ now at Harvard-Smithsonian Center for Astrophysics, Cambridge,USA⋆⋆⋆ now at W.W. Hansen Experimental Physics Laboratory & KavliInstitute for Particle Astrophysics and Cosmology, Stanford University,Stanford, USA
1. Introduction
PKS 2005−489 is one of the brightest BL Lac objects, at allwavelengths, in the Southern Hemisphere. It was initially dis-covered as a strong radio source in the Parkes 2.7 GHz sur-vey (Wall et al. 1975) and later identified as a BL Lac object(Wall et al. 1986). It belongs to the complete 1-Jy radio cata-
2 The HESS Collaboration: VHE monitoring of PKS 2005–489 andsimultaneous multi-wavelength observations.
log (Stickel et al. 1991), and is one of the few extragalacticob-jects detected in the EUV band (Marshall et al. 1995). Its red-shift, z = 0.071 (Falomo et al. 1987), is determined from weak,narrow emission lines observed during a low optical state.
PKS 2005−489 is classified as a High-frequency peakedBL Lac object (HBL; Giommi & Padovani 1994), because ofits high X-ray-to-radio flux ratio (Sambruna et al. 1995) andbe-cause its broad-band spectral energy distribution (SED) peaksin the UV–soft X-ray band. As is typical of HBLs, the X-rayspectrum is dominated by the synchrotron emission of high-energy electrons. The second SED hump is expected to peakin the GeV−TeV γ-ray band, and is commonly believed to beproduced by the same electrons up-scattering via the inverseCompton mechanism seed photons of lower energy.
In the X-ray band, PKS 2005−489 has been studied ex-tensively, showing an extreme flux and spectral variability.Large flux variations with correlated spectral hardening ofthegenerally steep spectrum (photon index1 Γ = 2.7 − 3.1)were observed during five EXOSAT observations (Giommi et al.1990; Sambruna et al. 1994). Two ROSAT observations in1992 confirmed the EXOSAT results and similarly show asoft spectrum (Γ ≃ 3; Sambruna et al. 1995). A harderspectrum (Γ = 2.3 from 2 to 10 keV) was observed inSeptember 1996, duringBeppoSAX observations of a brighterX-ray state (Padovani et al. 2001). In October−November 1998PKS 2005−489 underwent a period of exceptional activity,with several strong X-ray flares. RXTE monitoring observa-tions (Perlman et al. 1999) were performed during the entireepoch, and the 2−10 keV flux reached∼3×10⁻¹⁰ ergs cm−2
s−1, approximately 30 times higher than the ROSAT values.These RXTE observations yielded a detection up to 40 keV andshowed variations in the photon index betweenΓ = 2.3 and 2.8.An X-ray flare alert also triggeredBeppoSAX observations onNovember 1−2, 1998. The X-ray spectrum was measured be-tween 0.1 to 200 keV and was characterized by a curved shapeand harder photon indices, in both the soft (Γ1 = 2.0) and hard(Γ2 = 2.2) X-ray bands (< and>2 keV; Tagliaferri et al. 2001).More recently, observations with theSwiftsatellite have gener-ally shown PKS 2005−489 in a low-flux, steep-spectrum state(Γ ≃ 3, Massaro et al. 2008).
Strong correlations between X-ray andγ-ray emissionhave been observed in many HBL (e.g. Pian et al. 1998;Maraschi et al. 1999; Krawczynski et al. 2004; Fossati et al.2008; Aharonian et al. 2009), and are typically expected ina synchrotron-Compton scenario. Therefore the very brightflux and large flux/spectral variability at X-ray energies makePKS 2005−489 one of the most promising targets for observinga similar behavior in theγ-ray domain.
In the VHE (E > 100 GeV) band, PKS 2005−489was detected neither during observations made between 1993and 2000 by either the CANGAROO or Durham groups(Roberts et al. 1998, 1999; Nishijima 2002; Chadwick et al.2000), nor by HESS with a partial array during its commission-ing in 2003. In 2004, HESS discovered VHEγ-ray emissionfrom PKS 2005−489 with a significance of 6.7σ, at a flux ofa few percent of the Crab Nebula (Aharonian et al. 2005). Themeasured spectrum was soft (Γ = 4.0). In the MeV-GeV band,PKS 2005−489 is one of the few HBL detected by EGRET.However, the observed significance is marginal: 3.7σ above 100MeV (Lin et al. 1996) and 4.1σ above 1 GeV (Lamb & Macomb1997). It was instead detected byFermi with high significance
1 The power-law spectrum is described asN(E) = N0 E−Γ
]2 [ deg 2 θ0 0.05 0.1 0.15
Eve
nts
1800
2000
2200
2400
2600
2800 On-source
Off-source
PSF
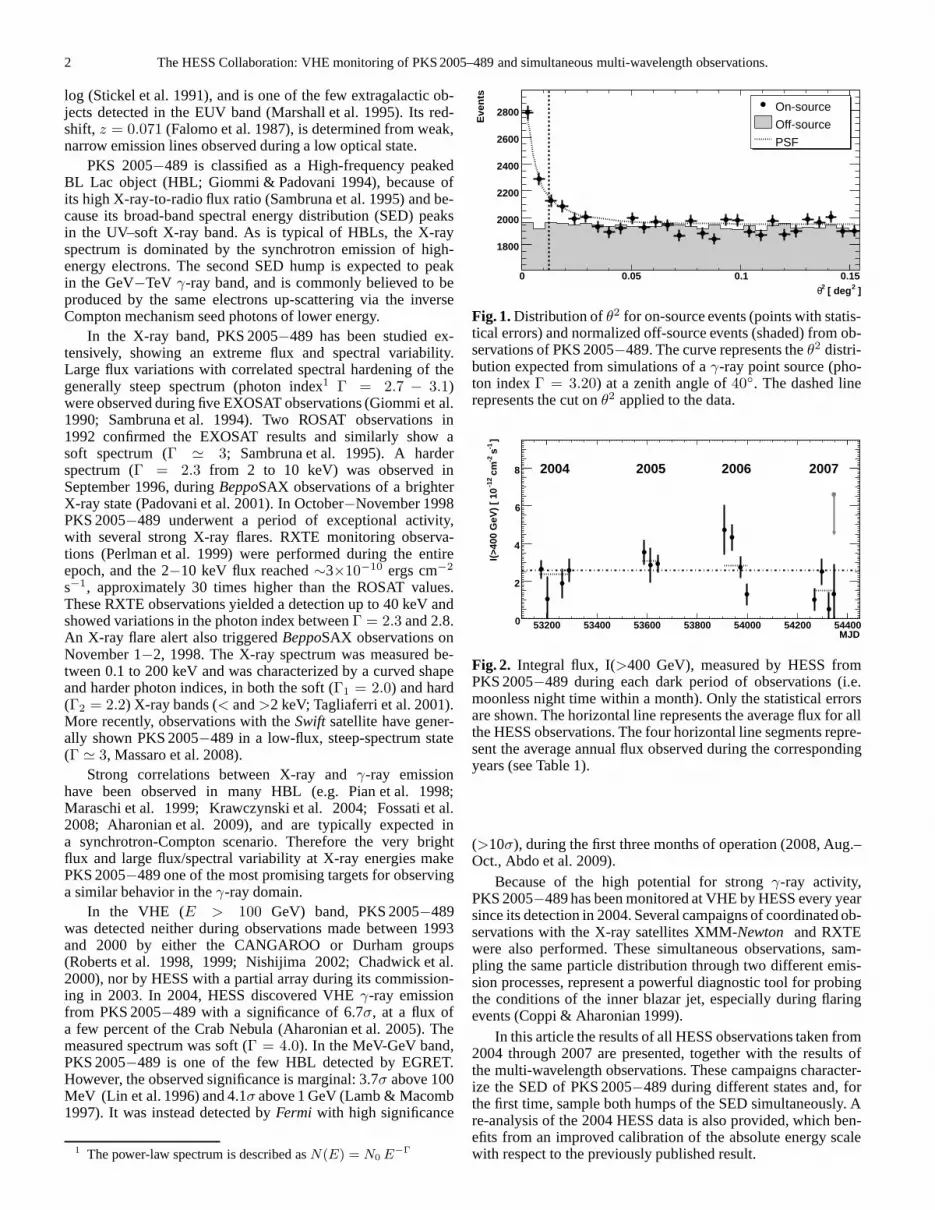
Fig. 1. Distribution ofθ2 for on-source events (points with statis-tical errors) and normalized off-source events (shaded) from ob-servations of PKS 2005−489. The curve represents theθ2 distri-bution expected from simulations of aγ-ray point source (pho-ton indexΓ = 3.20) at a zenith angle of40◦. The dashed linerepresents the cut onθ2 applied to the data.
MJD53200 53400 53600 53800 54000 54200 54400
]-1
s-2
cm
-12
I(>4
00 G
eV)
[ 10
0
2
4
6
8 2004 2005 2006 2007
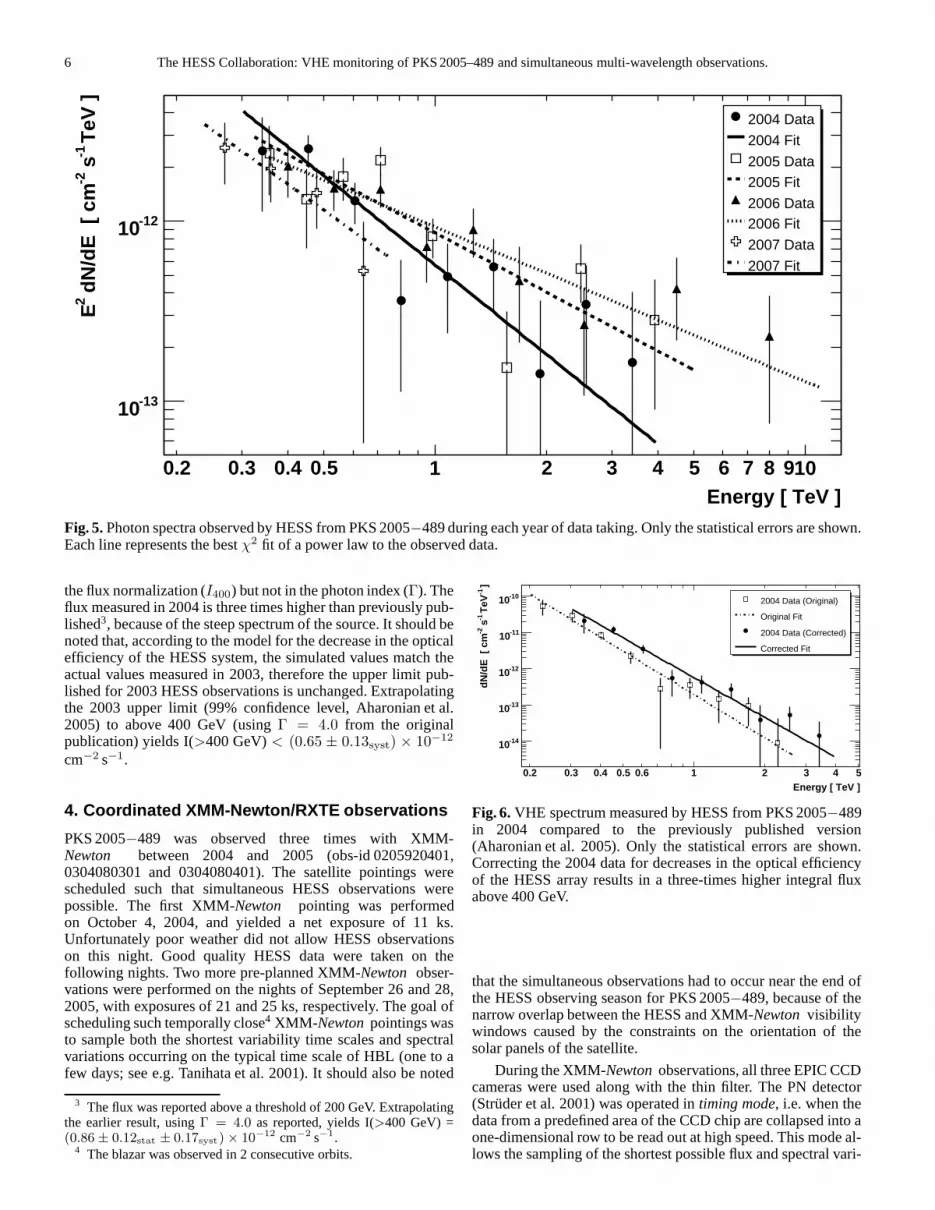
Fig. 2. Integral flux, I(>400 GeV), measured by HESS fromPKS 2005−489 during each dark period of observations (i.e.moonless night time within a month). Only the statistical errorsare shown. The horizontal line represents the average flux for allthe HESS observations. The four horizontal line segments repre-sent the average annual flux observed during the correspondingyears (see Table 1).
(>10σ), during the first three months of operation (2008, Aug.–Oct., Abdo et al. 2009).
Because of the high potential for strongγ-ray activity,PKS 2005−489 has been monitored at VHE by HESS every yearsince its detection in 2004. Several campaigns of coordinated ob-servations with the X-ray satellites XMM-Newton and RXTEwere also performed. These simultaneous observations, sam-pling the same particle distribution through two differentemis-sion processes, represent a powerful diagnostic tool for probingthe conditions of the inner blazar jet, especially during flaringevents (Coppi & Aharonian 1999).
In this article the results of all HESS observations taken from2004 through 2007 are presented, together with the results ofthe multi-wavelength observations. These campaigns character-ize the SED of PKS 2005−489 during different states and, forthe first time, sample both humps of the SED simultaneously. Are-analysis of the 2004 HESS data is also provided, which ben-efits from an improved calibration of the absolute energy scalewith respect to the previously published result.

The HESS Collaboration: VHE monitoring of PKS 2005–489 and simultaneous multi-wavelength observations. 3
MJD53200 53250 53300
]-1
s-2
cm
-12
I(>4
00 G
eV)
[ 10
-5
0
5
10
06/2004 07/2004 09/2004 10/2004
MJD53580 53600 53620 53640
]-1
s-2
cm
-12
I(>4
00 G
eV)
[ 10
-5
0
5
10
07/2005 08/2005 09/2005
MJD53900 53950 54000
]-1
s-2
cm
-12
I(>4
00 G
eV)
[ 10
-5
0
5
10
06/2006 07/2006 08/2006 09/2006
MJD54260 54280 54300 54320 54340
]-1
s-2
cm
-12
I(>4
00 G
eV)
[ 10
-5
0
5
10
06/2007 07/2007 08/2007 09/2007
Fig. 3. Integral flux, I(>400 GeV), measured by HESS from PKS 2005−489 during each night of observations. The individual plotsrepresent each of the four years (2004−2007) of data taking. Only the statistical errors are shown.The horizontal lines represent theaverage annual flux observed during the respective year. Thevertical lines at MJD 53282, 53640, and 53642 represent the nights ofXMM- Newton observations. The epoch of the RXTE observations is betweenthe vertical lines at MJD 53609 and 53623.

4 The HESS Collaboration: VHE monitoring of PKS 2005–489 andsimultaneous multi-wavelength observations.
Table 1. Results from long-term HESS observations of PKS 2005−489.
Dark MJD MJD Time On Off α Excess Sig I(>400 GeV)a Crabb χ2 (NDFc) P(χ2)c
Period First Last [hrs] [σ] [10−12 cm−2 s−1] %
06/2004 53171 53185 8.1 678 5877 0.0919 138 5.4 2.64 ± 0.50 3.0 7.2 (10) 0.7107/2004 53199 53205 1.5 105 985 0.0909 15 1.5 1.06 ± 1.18 1.2 1.4 (1) 0.7509/2004 53255 53268 5.6 342 3171 0.0916 52 2.8 1.89 ± 0.78 2.1 2.1 (5) 0.8410/2004 53285 53292 9.0 569 5065 0.0916 105 4.5 2.58 ± 0.62 2.9 1.5 (4) 0.8307/2005 53582 53595 9.4 573 4504 0.0908 164 7.3 3.56 ± 0.67 4.0 9.2 (9) 0.4208/2005 53609 53618 5.1 286 2159 0.0989 73 4.5 2.86 ± 0.93 3.2 4.6 (4) 0.3309/2005 53639 53646 18.1 1072 9125 0.0928 225 7.1 2.93 ± 0.46 3.3 13.1 (6) 0.04106/2006 53908 53909 1.3 127 824 0.0938 50 4.9 4.72 ± 1.32 5.3 0.0 (1) 0.9707/2006 53938 53940 4.4 397 2927 0.0901 133 7.3 4.33 ± 0.70 4.8 1.3 (2) 0.5208/2006 53967 53977 8.4 500 4261 0.0913 111 5.1 2.74 ± 0.57 3.1 15.1 (7) 0.03509/2006 53995 54002 7.4 405 4116 0.0920 26 1.3 1.31 ± 0.58 1.5 6.0 (5) 0.3006/2007 54264 54270 5.3 333 3006 0.0924 55 3.1 1.02 ± 0.60 1.1 1.9 (6) 0.9307/2007 54291 54304 4.4 309 2412 0.0964 76 4.5 2.51 ± 0.70 2.8 15.2 (8) 0.05608/2007 54321 54329 1.8 93 849 0.0977 10 1.0 0.52 ± 0.92 0.6 2.9 (3) 0.4109/2007 54345 54345 0.5 11 114 0.1000 0 −0.1 < 6.60d <7.4 − −
2004 53171 53292 24.2 1694 15098 0.0917 310 7.7 2.37 ± 0.33 2.6 2.0 (3) 0.572005 53582 53646 32.6 1931 15785 0.0930 462 11.0 3.09 ± 0.35 3.5 0.6 (2) 0.732006 53908 54002 21.5 1429 12128 0.0914 320 8.8 2.84 ± 0.34 3.2 13.5 (3) 0.00372007 54264 54345 12.0 746 6381 0.0947 141 5.3 1.50 ± 0.40 1.7 3.8 (3) 0.28
Total 53171 54345 90.3 5800 49392 0.0924 1233 16.7 2.57 ± 0.18 2.9 10.2 (3) 0.016
a The integral flux above 400 GeV is calculated using the excessof events above an energy threshold, which differs slightlyfrom the observedexcess. The quoted error is statistical only and the 20% systematic error on the observed flux is not shown.
b The percentage is calculated relative to the HESS Crab Nebula flux above 400 GeV (Aharonian et al. 2006a).c Theχ2, degrees of freedom (NDF), and correspondingχ2 probability P(χ2) are given for fits of a constant to I(>400 GeV) binned nightly
within a dark period, or monthly within a year, or yearly within the total.d The upper limit is calculated at a 99.9% confidence level (Feldman & Cousins 1998).
2. HESS observations and analysis technique
PKS 2005−489 was observed with the HESS array (Hinton2004) for a total of 158.0 hours (352 runs of∼28 min each)from 2004 through 2007. During these observations the arraytracked a position offset from the blazar by 0.5◦ in alternatingdirections to enable both on-source observations and simulta-neous estimation of the background induced by charged cos-mic rays. A total of 207 runs pass the standard HESS data-quality selection, yielding an exposure of 90.3 hrs live time ata mean zenith angleZmean = 35◦. The results presented herewere generated using the standard HESS calibration methods(Aharonian et al. 2004) and analysis tools (Benbow 2005), withthe standard cutsevent-selection criteria (except for the 2007spectrum, see Sect 3.2). On-source data were taken from a cir-cular region of radiusθcut=0.11◦ centered on PKS 2005−489,and the background (off-source data) was estimated using theReflected-Regionmethod (Berge et al. 2007). Equation (17) inLi & Ma (1983) was used to calculate the significance of anyexcess. All VHE integral fluxes reported throughout this arti-cle were calculated assuming the time-average photon indexofΓ = 3.20 determined in Sect. 3.2.
The PKS 2005−489 observations presented here span fouryears (2004−2007) of HESS data taking. During this time theoptical throughput of the instrument decreased, because ofthedegradation of the reflective surfaces of the mirrors and Winstoncones, as well as accumulation of dust on the optical elements.For the entire data sample, the optical efficiency has decreasedby an average of 28% compared to a newly commissioned in-strument, with its mirrors installed in Oct. 2001, Dec. 2002,June 2003, and August 2003 on CT3, CT2, CT4, and CT1, re-
spectively. To minimize the effects of long-term variationin theoptical efficiency of the HESS array, the estimated energy ofeach event was corrected using the ratio of efficiencies deter-mined on a run-wise basis from simulated and observed muons(Aharonian et al. 2006a). After accounting for the decreasingoptical throughput of the HESS array, the average energy thresh-old of the analysis atZmean is 400 GeV.
3. HESS results
PKS 2005−489 was clearly detected in each of the four years(2004−2007) that it was observed by HESS. A total of 1233excess events, corresponding to a statistical significanceof 16.7standard deviations (σ), was detected from the direction of theblazar. The results of the HESS observations are given in Table 1,which shows the dead time corrected observation time, the num-ber of on and off-source events, the on/off normalization (α), theexcess and the corresponding statistical significance, forvarioustemporal breakdowns of the HESS data sample.
Figure 1 shows the on-source and normalized off-source dis-tributions of the square of the angular difference between thereconstructed shower position and the source position (θ2) forall observations. As can be seen in the figure, the distribution ofthe excess (i.e. the observed signal) is very similar to whatis ex-pected from a simulated point-source of VHEγ-rays at compa-rable zenith angles. The off-source distribution is approximatelyflat in θ2, as expected.
The map of excess counts is well-fit by a two-dimensionalGaussian with a centroid located atαJ2000 = 20h09m27.0s ±1.5s
stat ± 1.3ssyst andδJ2000 = −48◦49′52′′ ± 16′′stat±20′′syst. As

The HESS Collaboration: VHE monitoring of PKS 2005–489 and simultaneous multi-wavelength observations. 5
Table 2. Bestχ2 fits of a power-law to the various spectra of PKS 2005−489 measured by HESS.
Epoch Elower Eupper Γ I400 χ2 NDF P(χ2)[TeV] [TeV] [ 10−11 cm−2 s−1 TeV−1]
2004 (AH05)a 0.2 2.7 3.98 ± 0.38stat ± 0.10syst 0.74 ± 0.27stat ± 0.15syst 5.6 7 0.59
2004b 0.30 4.0 3.65 ± 0.39stat ± 0.10syst 1.62 ± 0.33stat ± 0.32syst 6.7 7 0.462005 0.32 5.1 3.09 ± 0.22stat ± 0.10syst 1.46 ± 0.28stat ± 0.29syst 13.3 6 0.0382006 0.35 11 2.86 ± 0.20stat ± 0.10syst 1.28 ± 0.20stat ± 0.26syst 3.7 7 0.532007c 0.24 0.75 3.48 ± 0.68stat ± 0.10syst 1.00 ± 0.22stat ± 0.20syst 0.6 2 0.74
Total 0.3 5.3 3.20 ± 0.16stat ± 0.10syst 1.37 ± 0.17stat ± 0.27syst 9.9 8 0.27
a This (AH05) is the previously published HESS result (Aharonian et al. 2005) for 2004, and was not corrected for long-termchanges in theoptical efficiency of the system.
b The 2004 entry is the very same data as presented in AH05, but with a correction (see text) applied to account for relative changes in theoptical throughput of the HESS array. The 2005, 2006, 2007, and total entries also have this correction applied.
c The 2007 spectrum is generated with thespectrum cuts(Aharonian et al. 2006b), see Sect 3.2
expected, the fit location of HESS J2009−488 is consistent2 withthe position (αJ2000 = 20h9m25.4s, δJ2000 = −48◦49′54′′) ofthe blazar (Johnston et al. 1995). The upper limit (99% confi-dence level) on the extension of HESS J2009−488 is 1.0’.
3.1. VHE Flux
The observed integral flux above 400 GeV for the entire data setis I(>400 GeV) =(2.57±0.18stat±0.51syst)×10−12 cm−2 s−1.This corresponds to∼2.9% of the flux above 400 GeV from theCrab Nebula, as determined by HESS (Aharonian et al. 2006a).Figures 2 and 3 show the flux measured for each dark periodand night, respectively.
The integral flux I(>400 GeV) observed during variousepochs is reported in Table 1, together with theχ2 and corre-sponding probability, P(χ2), for fits of a constant to the datawhen binned by nights within each dark period, by dark pe-riods within a year, and by year within the total observations.There are weak indications (P(χ2) < 0.05) of variability on an-nual time scales, monthly time scales in 2006, and nightly timescales in the dark periods of September 2005 and August 2006.The combined variations on different time scales lead to an in-dication of variability in the overall monthly curve (χ2 = 30.5for 13 NDF, with P(χ2). 0.004, Fig. 2). Although no variabil-ity is seen inside the other epochs (e.g. monthly time scalesin2004, 2005, or 2007), variations in amplitude comparable tothestatistical errors cannot be ruled out.
3.2. VHE spectra
The time-average photon spectrum for the entire data set isshown in Fig. 4. All points in the energy range 300 GeV to∼5.3 TeV are significant except the last (1.5σ) at ∼4.6 TeV.The data are well-fit,χ2 of 9.9 for 8 degrees of freedom, by apower law (dN/dE =I400 (E / 400 GeV)−Γ) with a photon indexΓ = 3.20 ± 0.16stat ± 0.10syst. Removing the∼4.6 TeV pointdoes not significantly affect the fit result. No evidence is foundfor significant features, such as a cut-off or break, in the energyspectrum, also considering the upper limits at higher energies.
The time-average spectra measured during each year of data-taking are shown in Fig. 5. The results of the bestχ2 fits ofa power law to these data are shown in Table 2. All spectra
2 The difference between the two positions is25′′± 28′′.
Energy [ TeV ]0.3 0.4 0.5 1 2 3 4 5 6 7 8 910
]-1
TeV
-1 s
-2d
N/d
E [
cm
-1510
-1410
-1310
-1210
-11102004 - 2007 Data
Overall Fit
Fig. 4. Time-average VHE energy spectrum observed fromPKS 2005−489. The dashed line represents the bestχ2 fit of apower law to the observed data (see Table 2), and then extrapo-lated to 10 TeV. Only the statistical errors are shown and theup-per limits are at the 99% confidence level (Feldman & Cousins1998).
are generated withstandard cuts(Benbow 2005), except for2007. Given the short exposure, low flux, steep spectral slope,and degradation of the optical efficiency, a spectrum for 2007could only be generated with thespectrum cuts(Aharonian et al.2006b), which lower the energy threshold of the analysis at theexpense of sensitivity at higher energies. In Table 2, the epoch,lower and upper energy bounds, photon index, differential fluxnormalization at 400 GeV (I400), χ2, degrees of freedom (NDF),andχ2 probability P(χ2) for each fit are given. Theχ2 probabil-ity for a fit of a constant to the annualΓ values is 0.30.
3.3. Correction to 2004 HESS data
The data previously published (Aharonian et al. 2005) for HESSobservations of PKS 2005−489 in 2004 were not corrected fora 19% average decrease in the optical efficiency until 2004. Inaddition, the early simulations neglected the small gaps betweenWinston cone apertures, the combined effect being an overallcorrection of 22% compared to the initial analysis. Figure 6illus-trates the effect of correcting the energy of individual events forthe relative optical efficiency of the system, as described earlier.Comparing (see Table 2) the spectrum for 2004 determined hereto the previously published one shows significant differences in
6 The HESS Collaboration: VHE monitoring of PKS 2005–489 andsimultaneous multi-wavelength observations.
Energy [ TeV ]0.2 0.3 0.4 0.5 1 2 3 4 5 6 7 8 910
TeV
]-1
s-2
dN
/dE
[ c
m2
E
-1310
-1210
2004 Data
2004 Fit
2005 Data2005 Fit
2006 Data2006 Fit
2007 Data
2007 Fit
Fig. 5. Photon spectra observed by HESS from PKS 2005−489 during each year of data taking. Only the statistical errors are shown.Each line represents the bestχ2 fit of a power law to the observed data.
the flux normalization (I400) but not in the photon index (Γ). Theflux measured in 2004 is three times higher than previously pub-lished3, because of the steep spectrum of the source. It should benoted that, according to the model for the decrease in the opticalefficiency of the HESS system, the simulated values match theactual values measured in 2003, therefore the upper limit pub-lished for 2003 HESS observations is unchanged. Extrapolatingthe 2003 upper limit (99% confidence level, Aharonian et al.2005) to above 400 GeV (usingΓ = 4.0 from the originalpublication) yields I(>400 GeV)< (0.65 ± 0.13syst) × 10−12
cm−2 s−1.
4. Coordinated XMM-Newton/RXTE observations
PKS 2005−489 was observed three times with XMM-Newton between 2004 and 2005 (obs-id 0205920401,0304080301 and 0304080401). The satellite pointings werescheduled such that simultaneous HESS observations werepossible. The first XMM-Newton pointing was performedon October 4, 2004, and yielded a net exposure of 11 ks.Unfortunately poor weather did not allow HESS observationson this night. Good quality HESS data were taken on thefollowing nights. Two more pre-planned XMM-Newton obser-vations were performed on the nights of September 26 and 28,2005, with exposures of 21 and 25 ks, respectively. The goal ofscheduling such temporally close4 XMM- Newtonpointings wasto sample both the shortest variability time scales and spectralvariations occurring on the typical time scale of HBL (one toafew days; see e.g. Tanihata et al. 2001). It should also be noted
3 The flux was reported above a threshold of 200 GeV. Extrapolatingthe earlier result, usingΓ = 4.0 as reported, yields I(>400 GeV) =(0.86 ± 0.12stat ± 0.17syst) × 10−12 cm−2 s−1.
4 The blazar was observed in 2 consecutive orbits.
Energy [ TeV ]0.2 0.3 0.4 0.5 0.6 1 2 3 4 5
]-1
TeV
-1 s
-2d
N/d
E [
cm
-1410
-1310
-1210
-1110
-1010 2004 Data (Original)
Original Fit
2004 Data (Corrected)
Corrected Fit
Fig. 6. VHE spectrum measured by HESS from PKS 2005−489in 2004 compared to the previously published version(Aharonian et al. 2005). Only the statistical errors are shown.Correcting the 2004 data for decreases in the optical efficiencyof the HESS array results in a three-times higher integral fluxabove 400 GeV.
that the simultaneous observations had to occur near the endofthe HESS observing season for PKS 2005−489, because of thenarrow overlap between the HESS and XMM-Newton visibilitywindows caused by the constraints on the orientation of thesolar panels of the satellite.
During the XMM-Newtonobservations, all three EPIC CCDcameras were used along with the thin filter. The PN detector(Struder et al. 2001) was operated intiming mode, i.e. when thedata from a predefined area of the CCD chip are collapsed into aone-dimensional row to be read out at high speed. This mode al-lows the sampling of the shortest possible flux and spectral vari-

The HESS Collaboration: VHE monitoring of PKS 2005–489 and simultaneous multi-wavelength observations. 7
10−
30.
010.
11
coun
ts/s
ec/k
eVPKS 2005−489
broken power−law4 Oct 2004PNMOS2
1 100.2 0.5 2 5
0.5
11.
5
ratio
channel energy (keV)
0.01
0.1
110
coun
ts/s
ec/k
eV
PKS 2005−489broken power−law26 Sept 2005PN MOS1MOS2
1 100.2 0.5 2 5
0.8
11.
2
ratio
channel energy (keV)
Fig. 7. Best-fit data and folded model, plus residuals, of the XMM-Newton PN (upper) and MOS2/1 (lower) spectra ofPKS 2005−489, in October 4, 2004 (left panel) and September 26, 2005 (right panel). The spectra are fitted with a concave brokenpower-law model plus Galactic absorption.
Table 3. Fits to the X-ray spectraa in the different epochs.
Instrument Band Date Modelb Γ1 Ebreak Γ2 F b
0.1−2.0 keV F b
2−10 keV χ2r (NDF)
keV keV ergs cm−2s−1
XMM Mos2+PN 0.15–10 4/10/04 p.l. 3.04 ± 0.02 – – 2.46×10⁻¹¹ 1.03×10⁻¹² 1.110 (284)b.p.l. 3.06 ± 0.02 2.5 ± 0.5 2.64 ± 0.20 2.77×10⁻¹¹ 1.19×10⁻¹² 1.048 (282)
RXTE PCU2 3–20 20/8-19/9/05 p.l. – – 2.90 ± 0.18 – 7.54×10⁻¹² 0.79 (16)
XMM Mos+PN 0.15–10 26/9/05 p.l. 2.31 ± 0.01 – – 7.55×10⁻¹¹ 1.93×10⁻¹¹ 1.138 (860)b.p.l. 2.34 ± 0.01 0.79 ± 0.11 2.30 ± 0.01 7.72×10⁻¹¹ 1.95×10⁻¹¹ 1.122 (858)
XMM Mos+PN 0.15–10 28/9/05 p.l. 2.37 ± 0.01 – – 8.01×10⁻¹¹ 1.77×10⁻¹¹ 1.509 (888)b.p.l. 2.39 ± 0.01 1.78 ± 0.15 2.31 ± 0.02 8.19×10⁻¹¹ 1.83×10⁻¹¹ 1.372 (886)
a The errors are reported at a 90% confidence level for 1 parameter (∆χ2 = 2.71).b Fits with fixed GalacticNH = 3.93 × 1020 cm−2; power-law (p.l.) and broken power-law (b.p.l.) models. Unabsorbed fluxes.
ations without potential pile-up5 problems during bright states.The two MOS (Turner et al. 2001) instruments were used in dif-ferent configurations. MOS1 took data intiming modein 2004and insmall-window modeduring both 2005 observations. TheMOS2 camera was operated insmall-window modein 2004 andin large-window modein 2005. Simultaneous observations werealso performed with the Optical Monitor (OM) onboard XMM-Newton, using all photometric filters sequentially. For these datathe central window was read infast modeto enable temporalstudies within the data. The exposure for each filter varied be-tween 1800 and 4400 s, ultimately constrained by the overallduration of the pointing.
In August 2005, target-of-opportunity observations ofPKS 2005−489 with RXTE were triggered based on apparentenhanced VHE activity in preliminary analysis of uncalibratedHESS data. The satellite pointings were scheduled such thatfur-ther HESS data could be taken simultaneously. Unfortunately,only a limited subset of the HESS data in this epoch passes stan-dard quality selection criteria because of poor weather condi-tions in Namibia.
5 That is, when more than one X-ray photon arrives in one camerapixel or adjacent pixels before the CCD is read out.
4.1. XMM-Newton data analysis
The EPIC data were processed and analyzed withSASv7.1.0, using the calibration files as of July 2008 and stan-dard screening criteria6. A period of∼30 minutes at the endof Obs-ID 0304080401 was excluded from the analysis becauseof high background rates. The MOS1 and MOS2 imaging ob-servations are slightly to moderately affected by pile-up.Theseeffects were explored usingepatplot (which computes thefractions of single and double pixel events showing if they dif-fer from normal values), and are sufficiently suppressed by theuse of only single-pixel (PATTERN=0) events in the analysis.Background events for MOS2 are extracted from an annulusaround the source with inner radius125′′ and outer radius160′′.For MOS1 the background information was taken from the samesource region in blank-sky observations, since there is no regionfree of source photons on the same CCD. A check was also per-formed using background regions from the outer CCDs, as sug-gested in the SAS Analysis Guide. For the PN, the spectra wereextracted from a rectangular box 20 pixels wide, centered onthesource strip and extended along the CCD (in raw pixel coordi-nates, 28≤RAWX≤48). The background events were extractedfrom rows 2≤RAWX≤18, avoiding the noisier strip on the CCDborder.
6 see SAS User Guide andCAL-TN-0018.

8 The HESS Collaboration: VHE monitoring of PKS 2005–489 andsimultaneous multi-wavelength observations.
Table 4. Optical Monitor parameters and source fluxes for thethree XMM-Newton observations.
Filter λa
e Aλe/Ab
VF c
conv Fd
4/10Fd
26/9Fd
28/9
V 5430 1.016 2.49×10⁻¹⁶ 11.84 14.51 14.42B 4500 1.293 1.29×10⁻¹⁶ 9.64 12.08 12.09U 3440 1.634 1.94×10⁻¹⁶ 7.48 9.79 9.78UV W1 2910 1.870 4.76×10⁻¹⁶ 6.12 8.27 8.14UV M2 2310 2.827 2.20×10⁻¹⁵ 5.57 7.74 7.71UV W2 2120 3.167 5.71×10⁻¹⁵ – – 7.08
a The effective wavelength of the filter inA.b The ratio ofAλe , i.e. the extinction in magnitudes at the effective wavelength of
the filter λe , to AV (5500A) obtained from the interstellar reddening curve givenby Cardelli et al. (1989) and updated by O’Donnell (1994).
c The conversion factor from rate (Counts s−1) to flux (erg cm−2s−1A−1) from theOM in-orbit calibration (see SAS watch-out page).
d The flux of PKS 2005−489, corrected for galactic extinction, measured in the threeepochs (Oct. 4, 2005; Sept. 26 and 28, 2005). The units are mJy.
The spectral analysis was performed withXSPECv11.3.2ag, testing different binning schemes with atleast 50 counts in each new bin. For the 2004 observation, thespectrum from the MOS1 instrument is not included since thetiming modedata are significantly noisier than, but consistentwith, the other detectors. The MOS and PN spectra are fittogether, with a free constant to allow for different MOS/PNnormalizations. The PN flux is adopted as the reference value,but the MOS fluxes are typically within a few percent ofthe PN fluxes. The X-ray spectra are each fit with singleand broken power-law models, with interstellar absorptionmodelled byTBabs (Wilms et al. 2000). This model is usedwith the solar abundances of Wilms et al. (2000) and thecross-sections by Verner et al. (1996) (for a discussion, seeBaumgartner & Mushotzky 2006). The results of the fits areshown in Fig. 7 and Table 3 (details in Sect. 5.2).
The data from the OM were processed with the tasksomichain for the photometry andomfchain for the timinganalysis. Since no variations are found in the light curves,thewhole exposure is used to derive the flux measurements. Thephotometry was processed interactively withomsource for ev-ery filter, to assure the use of point-source analysis procedures.A standard aperture of 6 pixels on the 2x2 binned images (12 forthe unbinned images of the 2004 October data set) is used for allfilters. This corresponds to an aperture of 6′′ for the optical filters(V, B, U). The counts for the UV filters are extrapolated by thesoftware, using the UV point-spread function, to an aperture of17′′.5. These are the two apertures for which the OM count-rate-to-flux conversion is calibrated. The OM images are affectedbystray light from a bright star in the field of view, which increasesthe background near one side of the source region. Thereforebackground events are taken from both an annulus around thesource and from two different circular regions at the same dis-tance of the source from the main stray-light reflex. Tests per-formed with different background sizes and locations show thatthe photometry does not change by more than 1%, well belowthe systematic uncertainties of the flux conversion (estimated at∼10%, see XMM-SOC-CAL-TN-0019).
The source fluxes were obtained from the count rates usingthe OM conversion factors for white dwarfs7, adding the 10%systematic error in quadrature. The fluxes were de-reddenedforGalactic absorption using the extinction curve by Cardelliet al.(1989) with the updates by O’Donnell (1994), and assuming
7 http://xmm2.esac.esa.int/sas/7.1.0/watchout/
Fig. 8. Simultaneous X-ray and VHE data taken by RXTE,XMM- Newton and HESS in August-October 2005. Upperpanel: the X-ray photon index. The XMM-Newton values wereobtained from fits above 2 keV, to be consistent with the RXTEenergy range. Lower panel: the observed X-ray and VHE flux.The X-ray data (filled circles) are energy fluxes integrated in the2-10 keV band. The HESS data (open squares) are integral pho-ton fluxes above 400 GeV. The vertical scales on the left andright are for the X-ray and HESS data, respectively. All errorsare shown at the 1σ confidence level.
RV [= AV /E(B − V )] = 3.1. This is the average value for theGalactic diffuse ISM. For the line of sight of PKS 2005−489, avalue of AB = 0.241 is used (from NED; Schlegel et al. 1998),corresponding to AV(5500) = 0.182. The conversion factors, ex-tinction ratios and the resulting source fluxes are reportedforeach of the filters in Table 4.
PKS 2005−489 is hosted by a giant elliptical galaxy of totalR magnitude 14.5 and half-light radius 5.7′′ (from HST snapshotobservations, Scarpa et al. 2000). For the SEDs (Figs. 9 and 10),the OM fluxes were corrected for the contribution of the hostgalaxy. The wavelength-dependent correction was determinedusing a template SED for elliptical galaxies (Silva et al. 1998),rescaled to the host-galaxy flux in the R band, and accounts forthe given apertures. The OM fluxes are always dominated by thenon-thermal emission, and the small contribution of the host-galaxy is only noticeable in the V and B filters.
4.2. RXTE data analysis
The RossiXTE/PCA (Jahoda et al. 1996) performed 15 snap-shot observations of PKS 2005−489 between August 20 andSeptember 19, 2005, yielding a total exposure of 23.4 ks. Theobservations were mostly done with PCU0 and PCU2. The PCASTANDARD2 data were reduced and analyzed with the standardFTOOLS routines in HEASOFT V6.3.2, using the filtering cri-teria recommended by the RXTE Guest Observer Facility. Thenew SAA history file and parameters for the background calcu-lation provided in September 2007 were used, which correct a

The HESS Collaboration: VHE monitoring of PKS 2005–489 and simultaneous multi-wavelength observations. 9
bug in the calculation of the faint background model8. Only thetop-layer events were processed and only the PCU2 data wereconsidered, to ensure a more accurate spectral measurement.The average net count rate in the 3-15 keV band is0.54 ± 0.02cts s−1 pcu−1. The RXTE spectra were extracted and fitted sep-arately for each pointing, and summed together to obtain theav-erage spectrum. Each spectrum is well-fit by a single power-lawmodel.
5. XMM-Newton/RXTE results
5.1. Flux variability
The 2004 and both 2005 EPIC light curves contain no evidenceof flux variability within each exposure, and have average netcount rates in the MOS2 camera of1.14±0.04, 6.38±0.08, and6.15±0.08 counts s−1, respectively. The probability of constantemission is Pconst ≥ 0.99, 0.92 and 0.99 for the three epochs,respectively. Similarly, no flux variability is observed inthe OMdata for any of the observed filters. No significant flux variations(Pconst ≥ 0.76) are detected during the RXTE observations (seeFig. 8) as well. However, night-by-night flux variations of afewtens of percent cannot be excluded, due to low statistics in theRXTE measurements.
Although no variability is found within any of the XMM-Newtonexposures or within the complete RXTE sample, strongflux variations are found on longer time scales. The 2-10 keVflux varies by a factor of∼16 between 2004 and 2005. In theUV and optical bands the flux increases by∼40% and∼20%, re-spectively, between 2004 and 2005. A smaller (factor of 2.5), butsignificant, change in the 2-10 keV flux also occurs during the17days between the final RXTE and first XMM-Newton pointingin September 2005.
5.2. X-ray spectrum
Since there is no variability in the X-ray flux or hardness ratio,during each XMM-Newton exposure, a single X-ray spectrumwas extracted for each of the three pointings (see Table 3 andFig. 7). The spectra from the individual RXTE exposures do notvary significantly (see Fig. 8) and are consistent with the fittothe complete RXTE sample reported in Table 3. In each case(XMM- Newton and RXTE), the Galactic absorption is fixed toNH = 3.93× 1020 cm−2, as recently determined from the LABsurvey (Kalberla et al. 2005). It is important to note that there isa discrepancy between the LAB survey estimate and the valueobtained from the HI maps by Dickey & Lockman (1990) (DL,NH = 5.08 × 1020 cm−2). The LAB survey value is adoptedbecause it provides better residuals, is consistent with the re-sults whenNH is left as free parameter ((3.96 ± 0.17) × 1020
cm−2), and is close to the value previously adopted for theBeppoSAX results on the large flare of 1998 (4.2 × 1020 cm−2,Tagliaferri et al. 2001). Using the DL value significantly changesthe slope of the source spectrum below 1 keV. Therefore bothcases are considered for interpreting the fits results, as additionalsystematic uncertainty.
In all three data sets, the EPIC spectra are better fit by a bro-ken power-law model with respect to a single power law, withhigh significance (F-test> 99.9%). Remarkably, the parametersreveal an inverted broken power-law spectrum, where the slope
8 Details at http://www.universe.nasa.gov/xrays/programs/rxte/pca/doc/bkg/bkg-2007-saa/
Fig. 9. SED of PKS 2005−489 in the frequency range coveredby the XMM-Newton and RXTE observations (filled circles).Archival X-ray spectra are shown along with those measured byXMM- Newtonon Oct. 4, 2004 (red points), RXTE in Aug-Sept2005 (green points) and XMM-Newton on Sept. 26, 2005 (bluepoints). For the latter, two fits are plotted, showing the effectsof using two different estimates of the Galactic column density(NH = 5.08 or 3.93×1020 cm−2; see text). For better visibility,the XMM-Newton spectrum of Sept. 28, 2005 is not plotted asit would appear superposed on the Sept 26 data. The flux of thehost galaxy in the R band is plotted as black square. Historicaldata are shown in gray (from NED and Tagliaferri et al. 2001).In the X-ray range, they correspond to (from top to bottom): theBeppoSAX data of the 1998 flare (Tagliaferri et al. 2001), theBeppoSAX 1996 data (Padovani et al. 2001), theSwiftspectrumin April 2005 (filled bow-tie, Massaro et al. 2008), and the 1992ROSAT spectrum (open bow-tie, Comastri et al. 1997).
in the soft X-ray band is steeper than in the hard X-ray band(Γ2 < Γ1).
In the 2004 dataset, the X-ray spectrum is characterized bythe lowest flux ever recorded from this source (see Fig. 9) andavery steep slope ofΓ ≃ 3 up to∼3 keV. At higher energies, thereis evidence of a moderate hardening trend. The trend is consis-tent between the MOS and PN spectra, but is only significant inthe PN data thanks to better statistics. This hardening can alsobe reproduced by the sum of two power-law models, the secondhaving a harder index. The slope of this second power-law func-tion is not well constrained. However, assuming a fixed valueofΓ = 1.5, as could be expected for the inverse Compton emissionof low-energy electrons, a good fit (χ2
r = 1.07 for 283 NDF)is obtained with a flux normalization at 1 keV for the secondpower-law function at2.8 ± 0.7% of the first power law. In thiscase, the two power-law functions would cross at about 20 keV.Using the highNH has minimal impact on this result, steepeningthe low-energy slope by only+0.1.
The difference between the EPIC spectra of September 26and 28, 2005 is negligible. However, the spectrum from eitherof the 2005 observations is significantly harder and brighter thanin 2004 (Fig. 9). Either 2005 spectrum is represented well bya pure power-law model withΓ = 2.3 from ∼1 to 10 keV.

10 The HESS Collaboration: VHE monitoring of PKS 2005–489 and simultaneous multi-wavelength observations.
Table 5. Best power-law fits to the HESS spectra corrected forEBL absorption following Franceschini et al. (2008).
Epoch Γaint νFν(1TeV)b χ2 (NDF)
[10−12 erg cm−2 s−1]
2004 3.1 ± 0.4 1.8 ± 0.4 6.4 (7)2005 2.6 ± 0.2 2.7 ± 0.4 13.2 (6)2006 2.4 ± 0.2 2.9 ± 0.4 4.3 (7)2007 3.1 ± 0.7 1.2 ± 0.9 0.5 (2)
2005 7-8c 3.2 ± 0.4 2.4 ± 0.6 9.2 (4)2005 9c 2.5 ± 0.3 2.9 ± 0.5 4.7 (6)
Total 2.69 ± 0.16 2.34 ± 0.20 8.9 (8)a Only the statistical errors are shown.b The normalization at 1 TeV, inνFν units.c The HESS spectrum in 2005, extracted in two different epochs(see Fig. 3): before the
XMM pointings (observing periods 2005, 7-8) and during the XMM epoch (period2005, 9).
At lower energies, each has a slightly steeper slope. Althoughmodest (∆Γ . 0.1), the spectral break is significant (F-test> 99.99%) and is not caused by the extension of the MOS dataat low energies, or by the cross-calibration between the detec-tors. The broken power-law model is also statistically requiredfor the PN spectrum alone (F-test> 99.99%), as well as for theMOS spectra fitted separately. It should be noted however thatthe precise location of the break is affected by systematic morethan statistical errors. In Table 3, the break energy for thefit withthe overall minimumχ2 is reported, but there are other similarlocal minima between 0.7 and 2.2 keV, whose hierarchy inχ2
can change according to the calibration of the effective area nearthe instrumental Si and Au edges (at 1.7 and 2.1 keV). The truebreak therefore should be considered more realistically insidethe range 0.7–2.2 keV. This does not affect the values of the softand hard slopes in a relevant way (they do not change by morethan0.04 and0.02, respectively).
The amount of the spectral break, however, depends on theadopted value of the Galactic column density. Using the DLvalue instead of the LAB survey value, the soft X-ray slope be-comes steeper (Γ1 = 2.6), making the break more pronounced(∆Γ ≃ 0.3). The two cases are shown in Fig. 9, where the spec-tra are plotted together with the other data sets and archival data.Allowing instead the column density to be lower than all avail-able estimates, a single power-law spectrum is obtained withNH = 3.76 ± 0.08 cm−2 (χ2
r = 1.226 for 859 NDF), thougha broken power-law model still seems to provide a better repre-sentation (F-test> 95%).
The 2005 RXTE observations yield a very steep (Γ = 2.9)spectrum from 3-15 keV. This spectrum is almost parallel tothe 2004 XMM-Newton spectrum but with∼6 times higherflux. The RXTE photon index and flux are in good agreementwith the values measured bySwift in April 2005 (Massaro et al.2008). This suggests that the hardening of the X-ray spectrum ofPKS 2005−489 occurred in September 2005, between the RXTEand XMM-Newton pointings.
6. Discussion
The spectral energy distribution (SED) of PKS 2005−489, as-sembled with the data taken in 2004 and 2005, is shown inFig. 10. The VHEγ-ray spectra are corrected for the energy-dependent attenuation caused by interactions with the optical-IR photons of the diffuse extragalactic background light (EBL).
The correction was performed adopting the EBL model ofFranceschini et al. (2008). This model takes into account themost recent results on galaxy emission and evolution, andagrees with both the upper limits on the EBL derived fromblazar spectra (Aharonian et al. 2006c, 2007) and the lower lim-its given by galaxy counts, at both optical and infrared wave-lengths (Madau & Pozzetti 2000; Fazio et al. 2004). The fits tothe absorption-corrected spectra are reported in Table 5, andplotted in Fig. 10.
The simultaneous observations do not show evidence ofstrong changes in the location of the SED peaks over the years,with respect to the historical values. The hard optical-UV spec-trum from the OM photometry and the steep X-ray spectrumabove 0.1 keV locate the synchrotron peak between the twobands, at approximately 0.5×10¹⁶ Hz. At VHE, the steep spectraconstrain the peak of theγ-ray emission to energies<0.2 TeV.The low flux in the VHE band does not enable a determination ofthe spectral properties in exactly the same (short) observing win-dows of the X-ray observations. However, given the lack of sig-nificant VHE variability in 2004 or 2005, the monthly or yearlyaverage spectra can be considered a reasonable approximationto the VHE spectra during the epoch of the X-ray observations.
In 2004, PKS 2005−489 was in a very low state in boththe X-ray and VHE bands. The spectral slopes are also simi-lar (Γ ∼ 3) for the X-ray and VHE emission. The X-ray fluxaround few keV is more than two orders of magnitude less thanthe BeppoSAX flux during the active state of 1998. The slightspectral hardening towards higher X-ray energies is consistentwith the onset of the concavity expected from the emergence ofthe inverse-Compton emission in the SED. This emission, pro-duced by low-energy electrons, is usually not visible in theX-rayspectra of HBL because of the dominance of the synchrotronemission from high-energy electrons. In this data set, its pres-ence becomes detectable because of the steepness and very lowflux of the synchrotron (X-ray) spectrum. A similar behaviorhasrecently been observed in the HBL PKS 2155-304 during a lowstate (Foschini et al. 2008; Zhang 2008). This transition betweensteep synchrotron and flat inverse-Compton spectra is insteadfully visible inside the observed X-ray passband for intermediateBL Lac objects (e.g. ON 231, see Tagliaferri et al. 2000).
In 2005, the X-ray spectrum changes radically.Swift andRXTE measurements made in April and August-September2005, respectively, show a large increase in flux but little changein the spectral slope compared to 2004. Shortly after the RXTEobservations, a much harder spectrum (∆ΓX ≃ 0.7) and abrighter state than in the previous epochs is found during XMM-Newtonobservations. Most interestingly, the data require a spec-tral break with a steeper spectrum towards lower energies. Thisbreak is more apparent when a higher galactic NH is used (e.g.the DL versus LAB survey values; see Fig. 9), but even whenconsidering a single power-law shape with an ad-hoc NH, theextrapolation of the X-ray spectrum down to lower frequenciesdoes not match the UV-optical data, which are still rising withfrequency. A hump with a steeper soft X-ray slope is needed tosmoothly connect with the optical-UV spectrum, and this featureindicates the presence of two particle populations, since it can-not be easily reproduced by synchrotron radiation with a singleelectron distribution.
At VHE, the comparison between the 2004 and 2005 spec-tra indicates a hardening trend as well, though with marginalsignificance (∼1 sigma; see Table 5) due to the large errors onthe HESS measurement. However, if this trend is real, and ifthe VHE spectrum is indeed produced by the same particlesas are responsible for the X-ray emission (as suggested by the

The HESS Collaboration: VHE monitoring of PKS 2005–489 and simultaneous multi-wavelength observations. 11
Fig. 10. SED of PKS 2005−489, in different epochs and states. The XMM-Newtonand RXTE data are plotted as in Fig. 9, togetherwith historical data (shown in grey; from Tagliaferri et al.2001; Massaro et al. 2008). The recentFermi-LAT spectrum (0.2<E<10GeV) from Aug–Oct 2008 is also plotted, for reference (open bow-tie; Abdo et al. 2009). For clarity, the HESS spectra (E>300GeV) are plotted as bow-ties, and have been corrected for EBLabsorption with the model by Franceschini et al. (2008, see Table 5).Main panel: the HESS time-averaged spectrum from 2004 (red filled bow-tie) and 2005 (blue hatched bow-tie). Right mini-panel:the HESS spectrum in 2005, divided in two subsets: before theXMM pointings (periods 07-08/2005 in Fig. 3; green filled bow-tie)and during the XMM epoch (period 09/2005 in Fig. 3; blue hatched bow-tie). Same colors associate optical, X-ray and VHE datasetscorresponding to same epochs.
similar spectral slopes in 2004-2005 and by the location of thesynchrotron peak9), a similar behavior is expected. Namely, theVHE spectral hardening should have occurred after the RXTEobservations, during the epoch of the XMM-Newton pointings,while the 2005 July-August VHE spectrum should be similar tothe 2004 spectrum (modulo normalization).
To test this hypothesis, the 2005 HESS data set was di-vided into two subsets. The first consists of all VHE data be-fore the XMM-Newton pointings (2005 July-August dark pe-riods), and the second contains all 2005 HESS data taken dur-ing or after the pointings (2005 September dark period). Table 5shows the results of power-law fits to the spectra from these sub-sets, after correction for the absorption of VHE photons on theEBL. The HESS spectrum in the XMM epoch is indeed harder(∆Γint = 0.72±0.47) than the pre-XMM spectrum, and the sta-tistical significance of the spectral change increases (∼2σ) withrespect to the comparison between yearly spectra. In addition,the pre-XMM spectrum has the same slope as the 2004 HESSspectrum. The HESS data therefore are fully consistent witha
9 If the VHE electrons were emitting by synchrotron at energies wellbelow the X-ray range, they would correspond to the synchrotron peak,around1016 Hz. Since the SSC scattering at the peak would be in theThomson regime for this frequency, the gamma-ray peak should thenbe inside the VHE band, which is not observed.
behavior in the VHE band that mirrors the spectral variationsseen in the X-ray band, as expected if both emissions are pro-duced by the same electrons. Interestingly, the harder VHE statecontinues in 2006. Because of the limited exposure in 2007, theVHE statistics are too poor to draw any meaningful conclusions.
The most remarkable feature of the VHE emission, however,is the lack of flux variability. Comparing the average statesin2004 and 2005, the integrated energy flux (e.g. for referenceinthe decade 0.3-3 TeV) does not vary by more than 40% between2004 and 2005, and is consistent with a constant flux. In contrast,the X-ray flux increased by a factor of∼16 in the 2-10 keV band(see Table 3). The optical-UV emission, which is close to thesynchrotron peak and which typically provides the target pho-tons for the IC scattering in the VHE band, shows an increaseas well (∼40%). In a homogeneous SSC scenario, if the VHEemission is produced by the same electrons emitting in the X-ray band (as indicated in this case by the spectral behavior), afresh injection of electrons should make the VHE flux increaseat least linearly with the X-ray flux. The reason is that the energydensity of all possible seed photons for the IC scattering has in-creased or is constant between the two epochs. For the VHE fluxto remain constant, a corresponding decrease in the seed photonsenergy density is required.

12 The HESS Collaboration: VHE monitoring of PKS 2005–489 and simultaneous multi-wavelength observations.
The X-ray and VHE data taken together, therefore, suggestthat a new jet component is emerging in the SED of PKS 2005-489, which is physically separated from the main emitting re-gion. The emission at the synchrotron peak of this new com-ponent should be lower, remaining hidden below the observedSED, while its harder spectrum at high energies emerges in thehard-X band. The electrons of this new component would notsee the energy density of the observed synchrotron peak, butthelower energy density of their self-produced synchrotron peak in-stead.
7. Conclusions
PKS 2005−489 is detected at VHE in each of the four yearsit was being observed by HESS (2004–2007). The 2005–2007data clearly confirm the VHE discovery reported by HESS(Aharonian et al. 2005) and quadruple the statistics of the initialspectrum measurement. Re-analysis of the previously published2004 HESS data, using the improved calibration of the detec-tor’s energy scale, results in a∼3 times higher flux and a similarphoton index.
The measured VHEγ-ray flux is low (∼3% Crab) and onlyshows weak variations on time scales ranging from days toyears. The observed time-averaged (2004–2007) VHE spectrumis soft, with a photon indexΓ = 3.20 ± 0.16. Although evi-dence of VHE spectral variations is marginal by itself, the VHEspectrum seems to track the X-ray slope variations when multi-wavelength coverage is available. Observations performedwithXMM- Newton and RXTE in 2004 and 2005 reveal remarkablechanges in the X-ray spectrum, but without shifting the locationof the synchrotron peak with respect to historical observations.
Interpreting these measurements along with the HESS datasuggests the emergence of a new jet component in the SEDthat is characterized by a harder electron spectrum. This compo-nent must be separate: its particles cannot interact with the syn-chrotron photons of the observed SED peak, otherwise higherVHE fluxes than observed would be implied.
PKS 2005−489 is found overall in a very low state, in boththe X-ray and VHE bands, during the observations presentedin this article. PKS 2005−489 has historically demonstrated a100× dynamical range in the X-ray band. Thus, dramaticallyhigher VHE fluxes (102 − 104×) can be expected in the future,unless such an increase in the X-ray flux is counter-balancedbya strong (>10×) and simultaneous increase in the blazar’s mag-netic field. Further monitoring of this object is highly encour-aged, as it is one of the few HBL easily detected at VHE duringlow states and has the potential for extreme brightness and vari-ability.
The results presented here confirm the strong diagnostic po-tential of coordinated optical–X-ray–VHE observations. Futurestudies can be significantly improved by incorporating datafromthe recently launched Fermiγ-ray satellite. The Fermi data willprovide information on the lower energy side of the inverse-Compton peak, enabling contemporaneous measurements ofboth sides of each blazar hump.
Acknowledgements.The support of the Namibian authorities and of theUniversity of Namibia in facilitating the construction andoperation of HESS isgratefully acknowledged, as is the support by the German Ministry for Educationand Research (BMBF), the Max Planck Society, the French Ministry forResearch, the CNRS-IN2P3 and the Astroparticle Interdisciplinary Programmeof the CNRS, the U.K. Science and Technology Facilities Council (STFC), theIPNP of the Charles University, the Polish Ministry of Science and HigherEducation, the South African Department of Science and Technology andNational Research Foundation, and by the University of Namibia. We appreciatethe excellent work of the technical support staff in Berlin,Durham, Hamburg,
Heidelberg, Palaiseau, Paris, Saclay, and in Namibia in theconstruction and op-eration of the equipment. The article is based on observations obtained withXMM-Newton, an ESA science mission with instruments and contributionsdirectly funded by ESA Member States and NASA. The authors thank theRXTE team for support during the ToO trigger. This research has made useof the NASA/IPAC Extragalactic Database (NED) which is operated by the JetPropulsion Laboratory.
ReferencesAbdo, A. A., et al. (LAT Collaboration) 2009, ApJ, 700, 597Aharonian, F., et al. (HESS Collaboration) 2004, Astroparticle Physics, 22, 109Aharonian, F., et al. (HESS Collaboration) 2005, A&A, 436, L17Aharonian, F., et al. (HESS Collaboration) 2006a, A&A, 457,899Aharonian, F., et al. (HESS Collaboration) 2006b, A&A, 448,L19Aharonian, F., et al. (HESS Collaboration) 2006c, Nature, 440, 1018Aharonian, F., et al. (HESS Collaboration) 2007, A&A, 475, L9Aharonian, F., et al. (HESS Collaboration) 2009, A&A, arXiv:0906.2002Baumgartner, W. H. & Mushotzky, R. F. 2006, ApJ, 639, 929Benbow, W. 2005, in , Proceedings of Towards a Network of Atmospheric
Cherenkov Detectors VII (Palaiseau), 163Berge, D., Funk, S., & Hinton, J. 2007, A&A, 466, 1219Cardelli, J. A., Clayton, G. C., & Mathis, J. S. 1989, ApJ, 345, 245Chadwick, P. M., Daniel, M. K., Lyons, K., et al. 2000, A&A, 364, 450Comastri, A., Fossati, G., Ghisellini, G., & Molendi, S. 1997, ApJ, 480, 534Coppi, P. S. & Aharonian, F. A. 1999, ApJ, 521, L33Dickey, J. M. & Lockman, F. J. 1990, ARA&A, 28, 215Falomo, R., Maraschi, L., Treves, A., & Tanzi, E. G. 1987, ApJ, 318, L39Fazio, G. G., Ashby, M. L. N., Barmby, P., et al. 2004, ApJS, 154, 39Feldman, G. J. & Cousins, R. D. 1998, Phys. Rev. D, 57, 3873Foschini, L., Treves, A., Tavecchio, F., et al. 2008, A&A, 484, L35Fossati, G., Buckley, J. H., Bond, I. H., et al. 2008, ApJ, 677, 906Franceschini, A., Rodighiero, G., & Vaccari, M. 2008, A&A, 487, 837Giommi, P., Barr, P., Pollock, A. M. T., Garilli, B., & Maccagni, D. 1990, ApJ,
356, 432Giommi, P. & Padovani, P. 1994, MNRAS, 268, L51+Hinton, J.A. 2004, New Astron. Rev., 48, 331Jahoda, K., Swank, J. H., Giles, A. B., et al. 1996, in Societyof Photo-Optical
Instrumentation Engineers (SPIE) Conference Series, Vol.2808, Society ofPhoto-Optical Instrumentation Engineers (SPIE) Conference Series, ed. O. H.Siegmund & M. A. Gummin, 59–70
Johnston, K. J., Fey, A. L., Zacharias, N., et al. 1995, AJ, 110, 880Kalberla, P. M. W., Burton, W. B., Hartmann, D., et al. 2005, A&A, 440, 775Krawczynski, H., Hughes, S. B., Horan, D., et al. 2004, ApJ, 601, 151Lamb, R. C. & Macomb, D. J. 1997, ApJ, 488, 872Li, T.-P. & Ma, Y.-Q. 1983, ApJ, 272, 317Lin, Y. C., Bertsch, D. L., Dingus, B. L., et al. 1996, ApJS, 105, 331Madau, P. & Pozzetti, L. 2000, MNRAS, 312, L9Maraschi, L., Fossati, G., Tavecchio, F., et al. 1999, ApJ, 526, L81Marshall, H. L., Fruscione, A., & Carone, T. E. 1995, ApJ, 439, 90Massaro, F., Tramacere, A., Cavaliere, A., Perri, M., & Giommi, P. 2008, A&A,
478, 395Nishijima, K. 2002, Publications of the Astronomical Society of Australia, 19,
26O’Donnell, J. E. 1994, ApJ, 422, 158Padovani, P., Costamante, L., Giommi, P., et al. 2001, MNRAS, 328, 931Perlman, E. S., Madejski, G., Stocke, J. T., & Rector, T. A. 1999, ApJ, 523, L11Pian, E., Vacanti, G., Tagliaferri, G., et al. 1998, ApJ, 492, L17+Roberts, M. D., Dazeley, S. A., Edwards, P. G., et al. 1998, A&A, 337, 25Roberts, M. D., McGee, P., Dazeley, S. A., et al. 1999, A&A, 343, 691Sambruna, R. M., Barr, P., Giommi, P., et al. 1994, ApJ, 434, 468Sambruna, R. M., Urry, C. M., Ghisellini, G., & Maraschi, L. 1995, ApJ, 449,
567Scarpa, R., Urry, C. M., Falomo, R., Pesce, J. E., & Treves, A.2000, ApJ, 532,
740Schlegel, D. J., Finkbeiner, D. P., & Davis, M. 1998, ApJ, 500, 525Silva, L., Granato, G. L., Bressan, A., & Danese, L. 1998, ApJ, 509, 103Stickel, M., Fried, J. W., Kuehr, H., Padovani, P., & Urry, C.M. 1991, ApJ, 374,
431Struder, L., Briel, U., Dennerl, K., et al. 2001, A&A, 365, L18Tagliaferri, G., Ghisellini, G., Giommi, P., et al. 2001, A&A, 368, 38Tagliaferri, G., Ghisellini, G., Giommi, P., et al. 2000, A&A, 354, 431Tanihata, C., Urry, C. M., Takahashi, T., et al. 2001, ApJ, 563, 569Turner, M. J. L., Abbey, A., Arnaud, M., et al. 2001, A&A, 365,L27Verner, D. A., Ferland, G. J., Korista, K. T., & Yakovlev, D. G. 1996, ApJ, 465,
487

The HESS Collaboration: VHE monitoring of PKS 2005–489 and simultaneous multi-wavelength observations. 13
Wall, J. V., Pettini, M., Danziger, I. J., Warwick, R. S., & Wamsteker, W. 1986,MNRAS, 219, 23P
Wall, J. V., Shimmins, A. J., & Bolton, J. G. 1975, AustralianJournal of PhysicsAstrophysical Supplement, 34, 55
Wilms, J., Allen, A., & McCray, R. 2000, ApJ, 542, 914Zhang, Y. H. 2008, ApJ, 682, 789
1 Max-Planck-Institut fur Kernphysik, P.O. Box 103980, D 69029Heidelberg, Germany2 Yerevan Physics Institute, 2 Alikhanian Brothers St., 375036
Yerevan, Armenia3 Centre d’Etude Spatiale des Rayonnements, CNRS/UPS, 9 av. du
Colonel Roche, BP 4346, F-31029 Toulouse Cedex 4, France4 Universitat Hamburg, Institut fur Experimentalphysik,Luruper
Chaussee 149, D 22761 Hamburg, Germany5 Institut fur Physik, Humboldt-Universitat zu Berlin, Newtonstr.
15, D 12489 Berlin, Germany6 LUTH, Observatoire de Paris, CNRS, Universite Paris Diderot, 5
Place Jules Janssen, 92190 Meudon, France7 IRFU/DSM/CEA, CE Saclay, F-91191 Gif-sur-Yvette, Cedex,
France8 University of Durham, Department of Physics, South Road,
Durham DH1 3LE, U.K.9 Unit for Space Physics, North-West University, Potchefstroom
2520, South Africa10 Laboratoire Leprince-Ringuet, Ecole Polytechnique,CNRS/IN2P3, F-91128 Palaiseau, France11 Laboratoire d’Annecy-le-Vieux de Physique des Particules,Universite de Savoie, CNRS/IN2P3, F-74941 Annecy-le-Vieux,France12 Astroparticule et Cosmologie (APC), CNRS, Universite Paris 7Denis Diderot, 10, rue Alice Domon et Leonie Duquet, F-75205ParisCedex 13, France UMR 7164 (CNRS, Universite Paris VII, CEA,Observatoire de Paris)13 Dublin Institute for Advanced Studies, 5 Merrion Square, Dublin2, Ireland14 Landessternwarte, Universitat Heidelberg, Konigstuhl, D 69117Heidelberg, Germany15 Laboratoire de Physique Theorique et Astroparticules, UniversiteMontpellier 2, CNRS/IN2P3, CC 70, Place Eugene Bataillon,F-34095 Montpellier Cedex 5, France16 Universitat Erlangen-Nurnberg, Physikalisches Institut, Erwin-Rommel-Str. 1, D 91058 Erlangen, Germany17 Laboratoire d’Astrophysique de Grenoble, INSU/CNRS,Universite Joseph Fourier, BP 53, F-38041 Grenoble Cedex 9,France18 Institut fur Astronomie und Astrophysik, Universitat T¨ubingen,Sand 1, D 72076 Tubingen, Germany19 LPNHE, Universite Pierre et Marie Curie Paris 6, UniversiteDenis Diderot Paris 7, CNRS/IN2P3, 4 Place Jussieu, F-75252, ParisCedex 5, France20 Charles University, Faculty of Mathematics and Physics, Instituteof Particle and Nuclear Physics, V Holesovickach 2, 180 0021 Institut fur Theoretische Physik, Lehrstuhl IV: WeltraumundAstrophysik, Ruhr-Universitat Bochum, D 44780 Bochum, Germany22 University of Namibia, Private Bag 13301, Windhoek, Namibia23 Obserwatorium Astronomiczne, Uniwersytet Jagiellonski, ul.Orla 171, 30-244 Krakow, Poland24 Nicolaus Copernicus Astronomical Center, ul. Bartycka 18,00-716 Warsaw, Poland25 School of Physics & Astronomy, University of Leeds, Leeds LS29JT, UK26 School of Chemistry & Physics, University of Adelaide, Adelaide5005, Australia27 Torun Centre for Astronomy, Nicolaus Copernicus University, ul.Gagarina 11, 87-100 Torun, Poland28 Instytut Fizyki Jadrowej PAN, ul. Radzikowskiego 152, 31-342Krakow, Poland29 Astronomical Observatory, The University of Warsaw, Al.Ujazdowskie 4, 00-478 Warsaw, Poland
30 European Associated Laboratory for Gamma-Ray Astronomy,jointly supported by CNRS and MPG


![pkS/kjh j.kchj flag fo'ofo|ky;]thUn - CRSU](https://img.pdfslide.net/doc/110x75/633d9c9a5fdfc7998b01fac0/pkskjh-jkchj-flag-foofokythun-crsu.jpg)


