Embed Size (px)
Citation preview

Planned Versus Unplanned Grocery Shopping Behaviour: An Empirical Study
Dr Michael Bourlakis
School of Agriculture, Food & Rural Development University of Newcastle upon Tyne
Agriculture Building, Newcastle upon Tyne, NE1 7RU UNITED KINGDOM
Dr Spyridon Mamalis
Department of Marketing and Quality Control of Agricultural Products Technological Educational Institute of Western Macedonia
62045, Alistrati Serron GREECE
Jessica Sangster
School of Agriculture, Food & Rural Development University of Newcastle upon Tyne
Agriculture Building, Newcastle upon Tyne, NE1 7RU UNITED KINGDOM
Abstract: - This study is being carried out in order to identify what affects unplanned behaviour, which accounts for a significant amount of supermarket purchases. This should have a significant affect on the way products are marketed given that most purchasing decisions would appear to be made in the store itself. The empirical work combined qualitative and quantitative methods and the results found that consumers paid emphasis to specific attributes that, in turn, influence their purchasing behaviour, either planned or unplanned. The above will support retail managers during the development of store strategies with the ultimate aim to influence consumer behaviour towards increased product purchasing. Key- Words: Shopping Behaviour, Planned - Unplanned Purchasing, Grocery Retailing, U.K. 1. Introduction Unplanned behaviour can be difficult to establish after purchases have been made as customers will readily justify that they needed a product. The aim of this paper is to shed light on the above. Specifically, the authors aim to examine consumers’ planned purchases prior to shopping by asking for an oral or written version of what they intend to buy. In addition, we intend to identify participants unplanned purchases by asking to see their receipt after their shopping trip and to question respondents immediately after shopping to identify reasons for unplanned purchases being made. Finally, we investigate what aspects of the retail environment have the most significant affects on unplanned purchases. The work in this study is organised as follows; the next section includes the relevant literature review and a subsequent section introduces the methodology employed. Once this
has been done, the results are presented and the paper concludes by providing specific recommendations. 2. Literature Review Several models have been developed to provide a theoretical framework for consumer decision making. Omar (1999) suggests that there are five basic variables affecting that process: shopping experience, the shopper’s lifestyle, retail promotion, the price and point of sale. Phillips (1993) identifies visual perception as an important variable affecting the shopping process and states that it is through peripheral processes that consumers first filter out what is and what is not relevant to them. Beatty and Ferrel (1998) highlight that there is little known about the process
Proceedings of the 5th WSEAS Int. Conf. on DISTANCE LEARNING AND WEB ENGINEERING, Corfu, Greece, August 23-25, 2005 (pp1-6)

of impulse buying and the variables affecting its enactment. The study highlights severable variables that affect impulse buying and therefore unplanned purchases. Mood, especially positive mood was identified as a variable that influenced impulse buying. The results of the study found that in store browsing was positively affected by time available and the customer’s perceived amount of available money and time produced positive feelings and positive influences on actual purchasing. Several researchers tried to come up with alternative models that are more specific to different types of shopping. Phillips (1993) aimed to provide an alternative model of buyer behaviour which stated that customers are in a continuous state of interaction with their environment; the intent to purchase is far from fixed and can continue to be modified right up to the point of purchase. This means that consumers do not go through stages like previous models but are continually deciding what they want to buy. Aylott and Mitchell (1998) show that some stressors such as crowding and queues that appear too long can force consumers walk out of the stores leaving all their potential purchases behind. Therefore, consumer decision making is affected by the retail environment and such as an effect can emanate from atmospherics. Atmospherics have a huge influence on the way in which the consumer perceives their environment and therefore the amount of both planned and unplanned purchases they make. Kotler (1973) defined store atmosphere as the effort to design buying environments to produce specific emotional affects in the buyer that enhance purchase probability. According to Tai and Fung (1997), the atmosphere design is important for the retailer when the number of competitive outlets increases, when product and price differences are small or when product entries are aimed at distinct social classes or lifestyle buyer groups. A report by Mintel (2004a) shows specific aspects which can be used to help create atmosphere such as colour, lighting, sound and multimedia, scent and taste, materials and texture, movement and interactivity and accessories. Aylott and Mitchell (1998) report that consumers spend significantly less time in stores when music is loud compared to when it is soft but there were no significant difference in sales or the consumers’ reported level of satisfaction. They also reported that the pace of in-store traffic flow was significantly slower and sales significantly higher with slow-tempo music. Bakamitsos and Siomkos (2004) reviewed the basic effects on consumers’ affective state (mood) on
attitude formation and noted that the affective state of consumers at the time they process information may affect their judgement; therefore, atmospherics could have considerable impact on sales as well as the level of unplanned purchases. This suggests that manipulation of the physical environment may have a powerful effect on consumer behaviour. This is further advocated by Turley and Chebat (2002) who indicated that the environment has the capacity to influence purchasing behaviour of shoppers in a wide variety of types and classifications of stores; hence, relatively small changes in a number of elements in the retail environment can have an impact on sales and purchasing behaviour. Iyer (1989) explains that impulse buying “occurs when a consumer experiences a sudden, often powerful and persistent urge to buy something immediately”. On the other hand, unplanned purchasing includes “items for which the purchasing decision was made in the store and not prior to entering the store”. Thus, all impulse buying is unplanned, but all impulse purchases are not necessarily bought on impulse.” Beatty and Ferrell (1998) define impulse buying as being “a sudden and immediate purchase with no pre-shopping intentions either to buy the specific product category or to fulfil a specific buying task. The behaviour occurs after experiencing an urge to buy and it tends to be spontaneous and without a lot of reflection.” Further research indicates that the definition of unplanned purchasing is still unclear (www.marketingpower.com). Overall, Kollat and Willet (1969) mention that there are a plethora of definitions of unplanned and impulse purchasing depending on the viewpoint taken and similar research denotes the confusion created (www.marketingpower.com). Based on the above, the authors will refer to unplanned purchasing and impulse purchasing as being interrelated as there appears to be very little definable difference between them. 3. Methodology Employed and Empirical Setting A combination of qualitative and quantitative methods was employed. At the start, an exploratory focus group was carried out which assisted with the design of the initial questionnaire and was subsequently pre-tested. The final questionnaire consisted of both open ended questions, allowing for more in-depth information to be collected, and of a set of importance scale questions allowing for an information provision on, inter alia, the
Proceedings of the 5th WSEAS Int. Conf. on DISTANCE LEARNING AND WEB ENGINEERING, Corfu, Greece, August 23-25, 2005 (pp1-6)

importance respondents place on supermarket store features. The empirical work involved dealing with a sample of consumers who shop at a leading U.K. food retailer named in the paper as “Retailer X” and permission was granted by that retailer before embarking on the research. According to Mintel (2004b), food retailing is the largest sector of UK retailing. These firms provide convenience, low prices and product innovation. Currently, within the U.K. food retailing sector, there are four main retailers: Tesco, Asda, Sainsbury’s and the Morrisons/Safeway group that account for 65% of the total food retailing sector sales. The authors implemented convenience sampling and 100 consumers participated altogether. We aimed to achieve an equal amount of male and females and a range of ages to make the sample as unbiased as possible. Respondents were asked before their shopping trip what they intend to buy and an exact list was devised (see Iyer, 1989). On completing their shopping, respondents were asked to list their purchases and this was compared to the list they gave before shopping (see Block and Morwitz, 1999). Unplanned purchases were noted along with any planned purchases that were not made. Subsequently, we aimed to establish the key reasons that modified respondents’ behaviour and 13 questions are designed using a 5-point importance scale which will gather data on participants’ importance ratings of store features. This will allow for a later factor analysis. Data was collected and inputted into SPSS and a frequency distribution technique was used to analyse the results for participants’ characteristics. Factor analysis is a multivariate statistical method whose primary purpose is to define the underlying structure in a data matrix. It addresses the problem of analysing the structure of the correlations among a large number of variables by defining a common set of underlying dimensions known as factors (Hair, 1998). It is also important to be able to identify how many factors should be used; the latter can be done by using either the eigenvalue criterion or a scree test or the variance / cumulative variance criterion. The objective of the analysis was to identify the underlying dimensions related to data. This was conducted on the importance respondents placed on 13 supermarket features and a varimax solution was used to help derive the factors. Out of the 100 respondents sampled, 96 agreed to complete the questionnaire, a 96% response rate.
4. Key Findings The results show that the spread of male and female respondents was fairly even and the age groups varied dramatically with over half the respondents questioned being under 34. This could be for a number of reasons; for example, nearby was a student residence which would have accounted for the large number of students questioned. Very few people over 65 were questioned that again could be down to the location of the supermarket. Although near a residential area, it could still be deemed to be far away by some elderly people. The results for social class and income groups reflected each other; over 40% of respondents belonged to the lower social class DE and over 50% of respondents earned between £0-19,999. The research was carried within an area with the lowest participation from the top socioeconomic group (AB) and the 2nd highest long term unemployment in the U.K. (http://www.statistics.gov.uk). This could account for the uneven spread on AB, C1C2 and DE social groups. Respondents were asked for an exact purchasing list. Specifically, 74% of respondents came to the store with the intention of buying 4 or less products; however the majority of people questioned were carrying baskets rather than pushing trolleys which would account for the low level of planned purchases. The fact that people were using baskets rather than trolleys could also reflect the low level of unplanned purchases, as only 4.1% made over 7 unplanned purchases. Over 43% of respondents made between one and two unplanned purchases and 70% of respondents made between one and six unplanned purchases. It is also possible that as many people were questioned during lunch time hours that they did not want to buy anything unnecessary to take back to work with them. Factor analysis was also carried out to allow for the results to be analysed along side the results for unplanned and planned purchasing. This may provide further information as to why unplanned purchases are made and what factors affect them. Using Bartlett’s test for Sphericity, it is possible to test whether the data is correlated. Hο: The data is not correlated H: The data is correlated At 5% significance level, the null hypothesis can be rejected as the Bartlett’s test for sphericity contains value of 286.441 and the output produced a result of almost 0.7 (rounded) classified as ‘middling’.
Proceedings of the 5th WSEAS Int. Conf. on DISTANCE LEARNING AND WEB ENGINEERING, Corfu, Greece, August 23-25, 2005 (pp1-6)
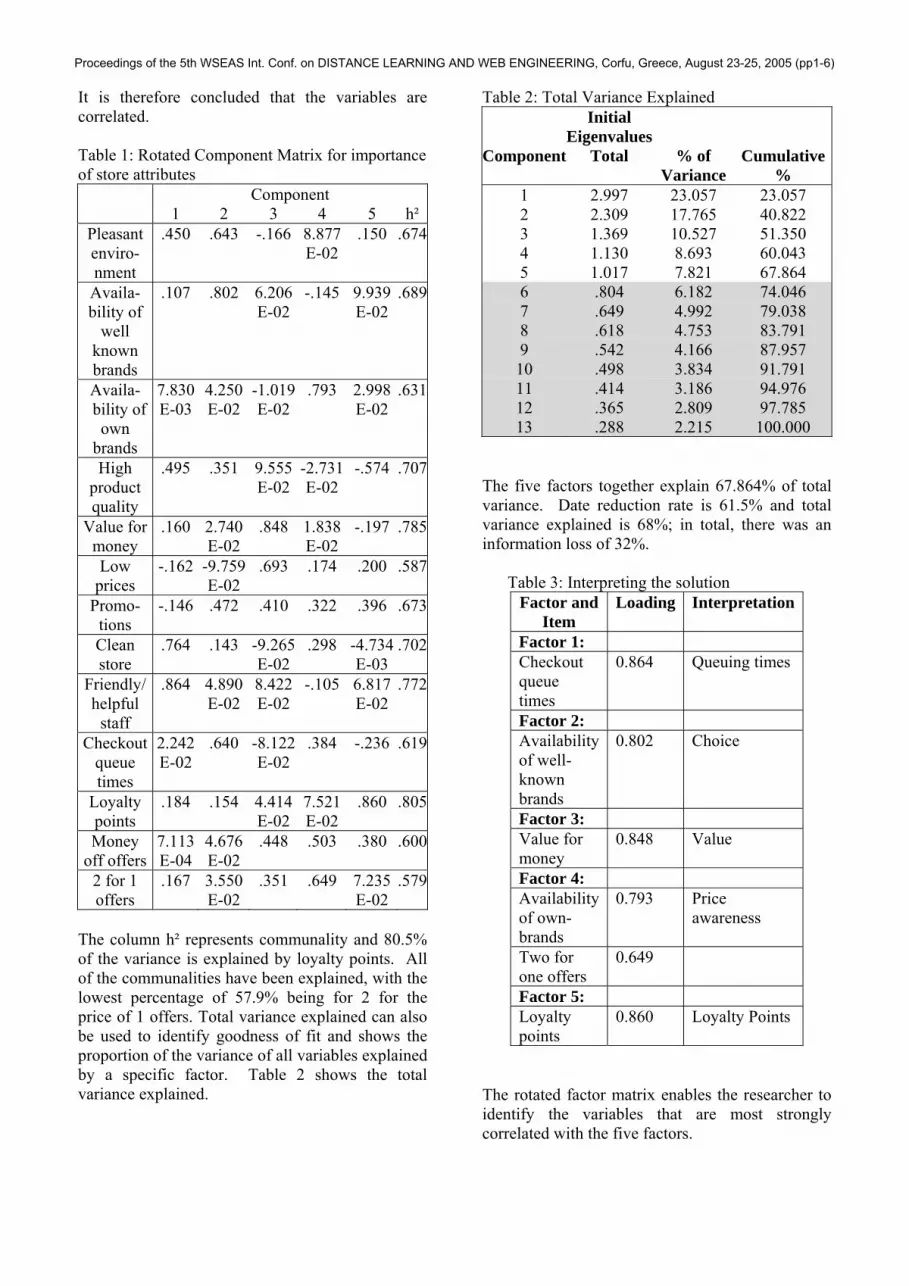
It is therefore concluded that the variables are correlated. Table 1: Rotated Component Matrix for importance of store attributes
Component 1 2 3 4 5 h²
Pleasant enviro- nment
.450 .643 -.166 8.877 E-02
.150 .674
Availa- bility of
well known brands
.107 .802 6.206 E-02
-.145 9.939E-02
.689
Availa- bility of
own brands
7.830 E-03
4.250 E-02
-1.019 E-02
.793 2.998E-02
.631
High product quality
.495 .351 9.555 E-02
-2.731 E-02
-.574 .707
Value for money
.160 2.740 E-02
.848 1.838 E-02
-.197 .785
Low prices
-.162 -9.759 E-02
.693 .174 .200 .587
Promo- tions
-.146 .472 .410 .322 .396 .673
Clean store
.764 .143 -9.265 E-02
.298 -4.734E-03
.702
Friendly/ helpful
staff
.864 4.890 E-02
8.422 E-02
-.105 6.817E-02
.772
Checkout queue times
2.242 E-02
.640 -8.122 E-02
.384 -.236 .619
Loyalty points
.184 .154 4.414 E-02
7.521 E-02
.860 .805
Money off offers
7.113 E-04
4.676 E-02
.448 .503 .380 .600
2 for 1 offers
.167 3.550 E-02
.351 .649 7.235E-02
.579
The column h² represents communality and 80.5% of the variance is explained by loyalty points. All of the communalities have been explained, with the lowest percentage of 57.9% being for 2 for the price of 1 offers. Total variance explained can also be used to identify goodness of fit and shows the proportion of the variance of all variables explained by a specific factor. Table 2 shows the total variance explained.
Table 2: Total Variance Explained Initial
Eigenvalues
Component Total % of Variance
Cumulative %
1 2.997 23.057 23.057 2 2.309 17.765 40.822 3 1.369 10.527 51.350 4 1.130 8.693 60.043 5 1.017 7.821 67.864 6 .804 6.182 74.046 7 .649 4.992 79.038 8 .618 4.753 83.791 9 .542 4.166 87.957
10 .498 3.834 91.791 11 .414 3.186 94.976 12 .365 2.809 97.785 13 .288 2.215 100.000
The five factors together explain 67.864% of total variance. Date reduction rate is 61.5% and total variance explained is 68%; in total, there was an information loss of 32%. Table 3: Interpreting the solution
Factor and Item
Loading Interpretation
Factor 1: Checkout queue times
0.864 Queuing times
Factor 2: Availability of well-known brands
0.802 Choice
Factor 3: Value for money
0.848 Value
Factor 4: Availability of own-brands
0.793 Price awareness
Two for one offers
0.649
Factor 5: Loyalty points
0.860 Loyalty Points
The rotated factor matrix enables the researcher to identify the variables that are most strongly correlated with the five factors.
Proceedings of the 5th WSEAS Int. Conf. on DISTANCE LEARNING AND WEB ENGINEERING, Corfu, Greece, August 23-25, 2005 (pp1-6)
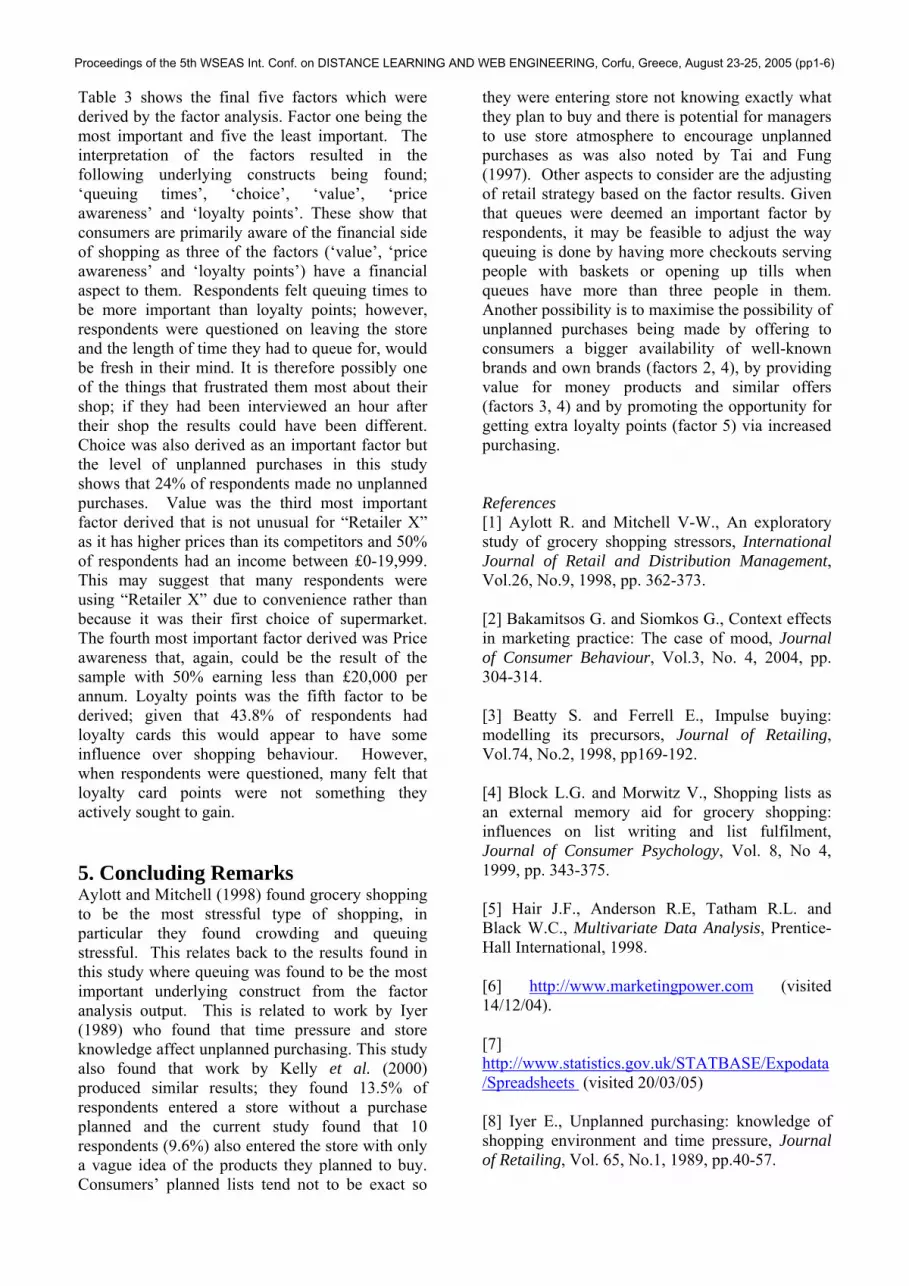
Table 3 shows the final five factors which were derived by the factor analysis. Factor one being the most important and five the least important. The interpretation of the factors resulted in the following underlying constructs being found; ‘queuing times’, ‘choice’, ‘value’, ‘price awareness’ and ‘loyalty points’. These show that consumers are primarily aware of the financial side of shopping as three of the factors (‘value’, ‘price awareness’ and ‘loyalty points’) have a financial aspect to them. Respondents felt queuing times to be more important than loyalty points; however, respondents were questioned on leaving the store and the length of time they had to queue for, would be fresh in their mind. It is therefore possibly one of the things that frustrated them most about their shop; if they had been interviewed an hour after their shop the results could have been different. Choice was also derived as an important factor but the level of unplanned purchases in this study shows that 24% of respondents made no unplanned purchases. Value was the third most important factor derived that is not unusual for “Retailer X” as it has higher prices than its competitors and 50% of respondents had an income between £0-19,999. This may suggest that many respondents were using “Retailer X” due to convenience rather than because it was their first choice of supermarket. The fourth most important factor derived was Price awareness that, again, could be the result of the sample with 50% earning less than £20,000 per annum. Loyalty points was the fifth factor to be derived; given that 43.8% of respondents had loyalty cards this would appear to have some influence over shopping behaviour. However, when respondents were questioned, many felt that loyalty card points were not something they actively sought to gain. 5. Concluding Remarks Aylott and Mitchell (1998) found grocery shopping to be the most stressful type of shopping, in particular they found crowding and queuing stressful. This relates back to the results found in this study where queuing was found to be the most important underlying construct from the factor analysis output. This is related to work by Iyer (1989) who found that time pressure and store knowledge affect unplanned purchasing. This study also found that work by Kelly et al. (2000) produced similar results; they found 13.5% of respondents entered a store without a purchase planned and the current study found that 10 respondents (9.6%) also entered the store with only a vague idea of the products they planned to buy. Consumers’ planned lists tend not to be exact so
they were entering store not knowing exactly what they plan to buy and there is potential for managers to use store atmosphere to encourage unplanned purchases as was also noted by Tai and Fung (1997). Other aspects to consider are the adjusting of retail strategy based on the factor results. Given that queues were deemed an important factor by respondents, it may be feasible to adjust the way queuing is done by having more checkouts serving people with baskets or opening up tills when queues have more than three people in them. Another possibility is to maximise the possibility of unplanned purchases being made by offering to consumers a bigger availability of well-known brands and own brands (factors 2, 4), by providing value for money products and similar offers (factors 3, 4) and by promoting the opportunity for getting extra loyalty points (factor 5) via increased purchasing. References [1] Aylott R. and Mitchell V-W., An exploratory study of grocery shopping stressors, International Journal of Retail and Distribution Management, Vol.26, No.9, 1998, pp. 362-373. [2] Bakamitsos G. and Siomkos G., Context effects in marketing practice: The case of mood, Journal of Consumer Behaviour, Vol.3, No. 4, 2004, pp. 304-314. [3] Beatty S. and Ferrell E., Impulse buying: modelling its precursors, Journal of Retailing, Vol.74, No.2, 1998, pp169-192. [4] Block L.G. and Morwitz V., Shopping lists as an external memory aid for grocery shopping: influences on list writing and list fulfilment, Journal of Consumer Psychology, Vol. 8, No 4, 1999, pp. 343-375. [5] Hair J.F., Anderson R.E, Tatham R.L. and Black W.C., Multivariate Data Analysis, Prentice-Hall International, 1998. [6] http://www.marketingpower.com (visited 14/12/04). [7] http://www.statistics.gov.uk/STATBASE/Expodata/Spreadsheets (visited 20/03/05) [8] Iyer E., Unplanned purchasing: knowledge of shopping environment and time pressure, Journal of Retailing, Vol. 65, No.1, 1989, pp.40-57.
Proceedings of the 5th WSEAS Int. Conf. on DISTANCE LEARNING AND WEB ENGINEERING, Corfu, Greece, August 23-25, 2005 (pp1-6)

[9] Kelly P. J., Smith S.M. and Hunt K.H., Fulfilment of planned and unplanned purchases of sale and regular-price items: a benchmark study, The International Review of Retail, Distribution and Consumer Research, Vol. 10, No.3, 2000, pp. 247-263. [10] Kollat D.T. and Willett R.P, Is impulse purchasing really a useful concept for marketing decisions?, Journal of Marketing, Vol. 33, 1969, pp. 79-83. [11] Kotler P., Atmospherics as a marketing tool, Journal of retailing, Vol. 49, 1973, pp. 48-64. [12] Mintel, Retail Store Design, the Elements of Store Design, Mintel Market Intelligence Reports, 2004a, London. [13] Mintel, Food Retailing, Mintel Market Intelligence Reports, 2004b, London. [14] Omar O., Retail Marketing, Prentice Hall, 1999. [15] Phillips H., How customers actually shop: customer interaction with the point of sale, Journal of Market Research Society, Vol.35, No.1, 1993, pp. 51-63. [16] Tai S.H.C. and Fung A.M.C., Application of an environmental psychology model to in-store buying behaviour, The International Review of Retail, Distribution and Consumer Research, Vol. 7, No. 4, 1997, pp. 331-337. [17] Turley L. W. and Chebat J-C., Linking retail strategy, atmospheric design and shopping behaviour, Journal of Marketing Management, Vol. 18, 2002, pp. 125-144.
Proceedings of the 5th WSEAS Int. Conf. on DISTANCE LEARNING AND WEB ENGINEERING, Corfu, Greece, August 23-25, 2005 (pp1-6)


