Embed Size (px)
Citation preview

PLANNING OF PUBLIC TRANSPORT
SYSTEM FOR DEHRADUN
A DISSERTATION
Submitted in partial fulfillment of the require rnei , is for the award of the degree
of
MASTER OF TECHNOLOGY in
CIVIL ENGINEERING (With Specialization in Transportation Engineering)
RANC,A SWAMP SI RIGIRI
A& -qJL S~
• ~0011~ vv
DEPARTMENT OF CIVIL ENGINEERING INDIAN INSTITUTE OF TECHNOLOGY ROORKEE
ROORKEE - 247 667 (INDIA) JUNE, 2007

CANDIDATE'S DECLARATION
I hereby declare that the work which is being presented in the dissertation
entitled "PLANNING OF PUBLIC TRANSPORT SYSTEM FOR DEHRADUN"
in partial fulfilment of the requirements for the award of degree of
Master of Technology in Civil Engineering with specialisation in
Transportation Engineering, submitted in the department of Civil Engineering,
Indian Institute of Technology Roorkee, Roorkee is an authentic record of my own
work carried out from October, 2006 to June, 2007 under the guidance of
Dr. S.S. Jain, Professor of Civil Engineering & Head, Centre for Transportation
Systems (CTRANS), Indian Institute of Technology Roorkee, Roorkee and Dr. M.
Parida, Associate Professor, Transportation Engineering Group, Department of Civil
Engineering, Indian Institute of Technology Roorkee, Roorkee.
The matter embodied in this dissertation has not been submitted by me for
award of any other degree or diploma.
Place : Roorkee
Dated : June 1 1 2007
(RANGA S AMY SIRIGIRI)
CERTIFICATE This is to certify that the above statement made by the candidate is correct to
the best of our knowledge.
Dr. M. Parida Associate Profesor Transportation Engineering Group Department of Civil Engineering Indian Institute of Technology Roorkee Roorkee-247667, India
Dr_ SS. .Twin 2-' i Professor of Civil Engineering & Head, Centre for Transportation Systems (CTRANS) Indian Institute of Technology Roorkee Roorkee-247667, India
(i)

ACKNOWLEDGEMENT
I wish to express my deep sense of gratitude to Prof. S.S. Jain, Professor and
Coordinator, Centre of Transportation Engineering, Department of Civil Engineering,
Indian Institute of Technology Roorkee, Roorkee and Dr. M. Panda, Associate
Professor, Transportation Engineering Section, Department of Civil Engineering,
Indian Institute of Technology Roorkee, Roorkee for their kind help, timely
suggestions and constant encouragement throughout the course of this thesis work. I
also wish to express my sincere thanks to the entire faculty of Transportation
Engineering for extending all the help possible to me.
My sincere thanks are also due to all the staff of the Centre of Transportation
Engineering (COTE) for the help and co-operation extended by them during various
stages of data collection and analysis.
I am greatful to my guide, Dr. S.S. Jain, Professor and Coordinator, Centre of
Transportation Engineering (COTE) for allowing to use the computer facilities of the
COTE during the study.
Special thanks are due to each of the interviewee who gave their valuable time
and support and for their patient and useful reply to detailed questionnaire. This work
could not have been completed without their active support.
I also wish to express my profound gratitude to all my family members and
well wishers for the faith imposed in me and without whose patience and blessings
this thesis would not have reached its present form.
Special thanks are due to Mr. Ritesh Roshan Dash and Mr. Pankaj Guptha
(M.Tech II Year, Transportation Engineering) for their cooperation during the data
collection in Dehradun is thankfully acknowledged.

I am also thankful to five B.Tech. Civil final year students namely, Mr.
Dinesh, Mr. Sreekanth, Mr. Sarat, Mr. Uday kiran and Mr. Balakrishna for their help
during traffic volume count in Dehradun.
A word of thanks also goes out to all my friends who have provided valuable
suggestions and inputs during the various phases of my work.
I dedicate this thesis to all those who are striving towards achieving an
efficient transport system for improvement in users comfort, safety, quality of social
life and enhancement of national economy.
Dated: June , 2007 (RANGA SWAMY SIRIGIRI)

ABSTRACT
Growing chronic traffic congestion, with increase in number of vehicular
traffic which results in problems of environmental damage, enormous economic
losses, more use of energy and road accidents are main reasons for many cities
worldwide to consider new initiatives in public transport systems. Public transport
system plays a vital role by providing cost effective and energy saving means of
transport. There are a variety of possible systems for a new public transport system
such as suburban rail, metro, light rail, improved bus services, bus ways, guided
buses and so on, or some combination of these.
Dehradun is the fastest growing city of Uttranchal had a population of 5.28
lakh as per 2001 census and it needs the immediate requirement of efficient Public
transport system. In the present study, a stated preference questionnaire was designed
for field study programme and face-to-face interviews of commuters in Dehradun
were conducted on some selected bus routes and locations. A total of 120 samples
were collected in the survey exclusive of pilot survey. It was observed from the
survey that there is only 38.33% of commuters were captive to Public Transport mode
and there is a high vehicle ownership, which indicating the lack of good public
transport system. In this survey, an attempt has been made to assess the switch over
behaviour of commuters from personalised vehicles to new innovative mode of
transport as Bus Rapid Transit System.
The stated preference questionnaire was designed on four set of choice levels
by varying different attributes such as COST, IVTT and OVTT for different mode
users and these data was modelled using binary logistic regression for calibration and
MS-EXCEL software was used for regression analysis i.e. for determining the
regression coefficients. The sensitivity analysis was carried out for predicting revised
probability of Bus Rapid Transit System based on incremental logit concept as a part
of application.
(iv)

CONTENTS Page No.
CANDIDATE'S DECLARATION (i)
ACKNOWLEDGEMENT (ii)
ABSTRACT (iv)
LIST OF TABLES (x)
LIST OF FIGURES (xiii)
CHAPTER 1: INTRODUCTION
1.1 General 1
1.2 Urban Transport System in India 2
1.2.1 Growth of Vehicles in India 2
1.3 Transit Systems and Technology 3
1.3.1 Common Mass Transit Systems 3
1.3.1.1 Heavy Rail Transit 3
1.3.1.2 Automated Guideway Transit 4
1.3.1.3 Monorail 4
1.3.1.4 Light Rail Transit 4
1.3.1.5 Commuter Rail or Regional Rail 4
1.3.1.6 Bus Rapid Transit 5
1.4 Comprehensive Transport Planning and Mode Choice Analysis 7
1.4.1 Four stage transport planning process 7
1.4.2 Modal Split 7
1.5 Methodology Adopted 7
1.5.1 Revealed Preference Approach (RPA) 7
1.5.2 Stated Preference Approach (SPA) 9
1.6 Objectives of the Study 9
1.7 Structure of the Thesis 9
(v)

CHAPTER 2: LITERATURE REVIEW 2.1 Historical Development of Public Transportaton System 11 2.2 Chronology of Inventions in Urban Public Transportation Technology 12
2.3 Studies of Public Transport System in Abroad 15 2.3.1 The China experience 15 2.3.2 The Singapore experience 15 2.2.1 Delhi Case Study 15
2.4 Studies of Public Transport System in India 16 2.4.1 Delhi Case Study 16 2.4.2 Mumbai Case Study 17
2.5 Studies on Bus Rapid Transit System (BRTS) 17 2.5.1 Introduction on Bus Rapid Transit System 17
2.5.2 Definitions 18
2.5.3 Major elements of BRTS 18 2.5.4 Historical Development of BRTS in World 19 2.5.5 BRT Introduction in Asia 19 2.5.6 Case Studies on BRTS in India 20
2.5.6.1 Bus Rapid Transit System, Ahmedabad 20 2.5.6.1.1 BRTS corridor phasing 21
2.5.6.2 Bus Rapid Transit System, Jaipur 22 2.5.6.2.1 Suggested alignment 22
CHAPTER 3: STUDY AREA AND TRAFFIC VOLUME STUDIES 3.1 Study Area 24
3.1.1 Population Growth 24
3.1.2. Registered Vehicles 26 3.1.3 Road Accidents in Dehradun City 26 3.1.4 Road Transport Network in Dehradun 26 3.1.5 Existing Public Transport System in Dehradun 27
3.2 Traffic Volume Studies on Mid Block Locations 32 3.2.1 Identificatified Corridors for Traffic Volume Studies 32
(vi)

3.2.2 Classified Traffic Volume Studiesat Mid Block Section 32 on Identified Coriidors
3.3 Vehicle Occupancy Survey 39
3.4 Selection Creteria of Public Transport Technology 40
CHAPTER 4: SURVEY ORGANISATION
4.1 Revealed and Stated Preference Approaches 41
4.1.1 Present state-of-the-art 41
4.1.2 Reveled Preference Approach 41
4.1.3 Stated Preference Approach 42
4.1.4 Comparision of RP and SP approaches 42
4.2 Evolution of Questionnaire for Behaviour Modelling 44
4.2.1. Personal information 44
4.2.2 Household information 44
4.2.3 Travel information 44
4.3 Design of Stated Preference Questionnaire 45
4.3.1 Assumptions for Bus Rapid Transit System (BRTS) of 46
Dehradun
4.3.2 Cost Variations 46
4.3.3 In-Vehicle-Travel time (IVTT) variations 47
4.3.4 Out-of-Vehicle-Travel Time (OVTT) variations 47
4.4 Field Survey Organisation 48
4.4.1 Pilot Survey 48
4.4.2 Final Survey 48
CHAPTER 5: ANALYSIS OF FIELD DATA AND PRESENTAION
5.1 Approach to Analysis 51
5.1.1 Sorting of Samples 51
5.1.2 Segmentation 51
5.13 Analysis of Revealed Preference (RP) Data 51
5.1.4 Analysis of Stated Preference (SP) Data 52

5.2 Aggregate Travel Behaviour 52 5.2.1 Composition of commuters based on Mode used 52 5.2.2 Composition of commuters based on income groups 52 5.2.3 Composition of commuters based on trip length 52 5.2.4 Composition of commuters based on vehicle ownership 53 5.2.5 Composition of commuters based on Expenditure 53
on transport by different income groups
5.2.6 Composition of commuters based on Trip purpose 53 5.2.7 Composition of commuters based on Profession 59 5.2.8 Composition of commuters based on size of family 59
5.3 Mode choice Analysis Based on Revealed Preference (RP) 60 5.3.1 Mode choice of Commuters based on Different 60
Income Groups
5.3.2 Mode choice of Commuters based on Trip Lengths 60 5.4 Mode Choice Analysis Based on Stated Preference (SP) 64
5.4.1 Switching Over Behaviour of 2-Wheeler Mode Commuters 64
5.4.2 Switching Over Behaviour of Vikram Mode Commuters 64 5.4.3 Switching Over Behaviour of Bus Mode Commuters 65 5.4.4 Switching Over Behaviour of Car Mode Commuters 65
CHAPTER 6: MODEL DEVELOPMENT AND ANALYTICAL RESULTS
BASED ON STATED PREFERENCE DATA 6.1 Approach to Mode Choice Model 66 6.2 Development of Logistic Regression Model - 66
6.2.1 Introduction to Logistic Regression Model 66 6.2.1.1 Assumptions of Logistic Regression Model 67
6.2.2 Utility Function Concept in Mode Choice Modelling 68 6.2.3 Mode Choice Model Based On Stated Preference 69 6.2.4 Segmentation Strategy for Analysis 69 6.2.5 Logistic Regression Model Derivation based on 69
SP Approach
(viii)

6.2.6 Sequential Procedure for Analysis of SP Data 70
using Regression
6.3 Revised Probability of Modes by Sensitivity Analysis 77
CHAPTER 7 : PROPOSED BUS RAPID TRANSIT SYSTEM FOR DEHRADUN CITY
7.1 Proposed Corridors for Bus Rapid Transit System 87
7.2 Projected Demand on the corridors for the Bus Rapid Transit System 87
7.3 Existing Cross Sectional Details on the Proposed Corridors 94
7.4 Proposed Cross Sectional Details on the Proposed Corridors (2017) 94
7.5 Evolving Cross Sectional Details for Bus Rapid Transit System 94
CHAPTER 8:CONCLUSIONS AND RECOMMENDATIONS
8.1 Conclusions 98
8.2 Recommendations 102
REFERENCES 103
APPENDIX 106

LIST OF TABLES
SI.No. Description Page No.
1.1 Growth of Vehicles in India 2
1.2 Comparisons of Different Types of Transit Systems 6 2.1 Chronology of Inventions in Urban Public Transportation 13
Technology 3.1 Dehradun Population and Decadal Growth Rate 25 3.2 Projected Population 25 3.3 Growth of Registered Vehicles in Dehradun Sub-area 25 3.4 Serious and Fatal Road Accidents (1990-2005) 26 3.5 City Bus Routes 30 3.6 Tempo Routes 31 3.7 Classified Traffic Volume on Saharanpur Roads (Towards ISBT) 33 3.8 Classified Traffic Volume on Saharanpur Roads (Towards 33
Saharanpur Chowk)
3.9 Classified Traffic Volume on Gandhi Road (Towards Clock 34 Tower)
3.10 Classified Traffic Volume on Gandhi Road (Towards Prince 34 Chowk)
3.11 Classified Traffic Volume on Rajpur Road (Towards Clock 35 Tower)
3.12 Classified Traffic Volume on Rajpur Road (Towards Rajpur) 35 3.13 Classified Traffic Volume on Chakrata Road (Towards Ballupur) 36 3.14 Classified Traffic Volume on Chakrata Road (Towards Clock 36
Tower)
3.15 Classified Traffic Volume on Haridwar Road (Towards Prince 37 Chowk)
3.16 Classified Traffic Volume on Haridwar Road (Towards 37 Dharampur)
3.17 Average Vehicle Occupancy in Dehradun 39.
(x)

4.1 Final choice Combinations with Different Levels of Attributes of 45 Bus Rapid Transit System to Generate Stated Preference Questionnaire
4.2 Level Variations in Cost for Different Modes 47 4.3 Level Variations in In-Vehicle-Travel Time (IVTT) for Different 47
Modes 4.4 Level Variations in Out-of-Vehicle-Travel Time (OVTT) for 48
Different Modes
5.1 Sample Size Distribution Based on Mode Used 53 5.2 Sample Size Distribution Based on Income Categories 54 5.3 Sample Size Distribution Based on Trip Length 54 5.4 Composition of Commuters Based on Vehicle Owned 54 5.5 Expenditure on Traveling by Different IncomeGroups (%) 55 5.6 Sample Size Distribution Based on Trip Purpose 55 5.7 Sample Size Distribution Based on Profession 59 5.8 Composition of Commuters Based on Size of Family 59 5.9 Mode Choices of Commuters Based on IncomeGroup (In Percent) 61 5.10 Mode Choices of Commuters Based on Trip Length (In Percent) 62
6.1 Reduced SP Data of Two-Wheeler Mode Users 72 6.2 Reduced SP Data of Vikram Mode Users 73 6.3 Reduced SP Data for Bus Mode Commuters 75 6.4 Regression Coefficients for Mode Use 76 6.5 Revised probability of 2-Wheeler Mode User Due to Change in 78
Cost of Travel by BRTS
6.6 Revised Probability of 2-Wheeler Mode User Due to Change in 79 IVTT by BRTS
6.7 Revised Probability of 2-Wheeler Mode User Due to Change in 80 OVTT by BRTS-
6.8 Revised Probability of Vikram Mode User Due to Change in Cost 81 by BRTS
6.9 Revised Probability of Vikram Mode User Due to Change in IVTT 82 by BRTS
6.10 Revised Probability of Vikram Mode User Due to Change in 83 OVTT by BRTS

6.11 Revised Probability of Bus Mode User Due to Change in Cost by 84 BRTS
6.12 Revised Probability of Bus Mode User Due to Change in IVTT by 85 BRTS
6.13 Revised Probability of Bus Mode User Due to Change in OVTT 86 by BRTS
7.1 Total Projected Person Trips in PHPDT for Sahranpur Road 89
7.2 Total Switching over trips to BRTS for Saharanpur Road 89 7.3 Total Projected Person Trips in PHPDT for Gandhi Road 90 7.4 Total Switching over trips to BRTS for Gandhi Road 90 7.5 Total Projected Person Trips in PHPDT for Rajpur Road 91 7.6 Total Switching over trips to BRTS for Rajpur Road 91 7.7 Total Projected Person Trips in PHPDT for Chakrata Road 92 7.8 Total Switching over trips to BRTS for Chakrata Road 92 7.9 Total Projected Person Trips in PHPDT for Haridwar Road 93 7.10 Total Switching over trips to BRTS for Haridwar Road 93 7.11 Existing Cross Sectional Details 94 7.12 Proposed Cross Sectional Details (2017) 94

LIST OF FIGURES
SI.No. Description Page No.
1.1 Urban Transportation Planning Process 8
3.1 A Complete Road Network of Dehradun City 28
5.1 Sample Size Distribution Based on Mode Used 56
5.2 Sample Size Distribution Based on Income Categories 56
5.3 Sample Size Distribution Based On Trip Length 57
5.4 Sample Size Distribution Based on Vehicle Owned 57
5.5 Expenditure on Travel by Different Income Groups 58
5.6 Sample Size Distribution Based on Trip Length 58
5.7 Sample Size Distribution Based on Profession of the Commuters 60
5.8 Sample Size Distribution Based on Family Size of the 60 Commuters
5.9 Mode Choice of Commuters based on Income (%) 63
5.10 Mode Choice of Corn muters based on Trip Length (%) 63
6.1 Reviseed Probability of 2-Wheeler Mode User Due to Change in 78 Cost of Travel by BRTS .
6.2 Revised Probability of 2-Wheeler Mode User Due to Change 79 in IVTT by BRTS
6.3 Revised Probability of 2-Wheeler Mode User Due to Change in 80 OVTT by BRTS
6.4 Revised Probability of Vikram Mode User Due to Change in Cost 81 of Travel by BRTS
6.5 Revised Probability of Vikram Mode User Due to Change in 82 IVTT by BRTS
6.6 Revised Probability of Vikrm Mode User Due to Change in 83 OVTT by BRTS
6.7 Revised Probability of Bus Mode User Due to Change in Cost of 84 Travel by BRTS
6.8 Revised Probability of Bus Mode User Due to Change in IVTT 85 by BRTS
6.9 Revised Probability of Bus Mode User Due to Change in OVTT 86 by BRTS
7.1 Proposed Routes for BRTS in Dehradun 88

7.2 BRT System Cross Section at Bus Station (30mROW) 96
7.3 BRT System Cross Section at Bus Station (40mROW) 96
7.4 Typical Cross Section of minimum ROW road required for 97 elevated BRT Corridor (for 4-lane)
7.5 Typical Cross Section of minimum ROW road required for 97 elevated BRT Corridor (for 6-lane)
(xiv)

CHAPTER 2
LITERATURE REVIEW
2.1 HISTORICAL DEVELOPMENT OF PUBLIC TRANSPORTATION SYSTEM With the industrial revolution of the nineteenth century, cities began to grow
and expand in population, and with this growth came the need for traveling greater
distances, which in turn increased the demand for improved means of transportation.
Thus, animal-drawn vehicles became commonplace as a means of public and private
transportation. This brought about new dimensions in transportation and a new form
of traffic congestion.
In the days of animal-drawn vehicles, for providing a smoother-riding surface
and to permit one horse to do the work of several, many transit companies built street
railways for horse-drawn transit vehicles. This horse-drawn "tram" was typical of
those used in New York city in the mid-nineteenth century. In 1829, George
Shillibeer introduced an omnibus service in London. His vehicles were larger than
those operating in Paris, carrying 20 passengers as against 14 in Paris, and drawn by
three horses instead of two. The first omnibus type of service in the United States was
in New York City, where in 1827, Abraham Brower commenced operation on
Broadway with a 12-passenger open-sided vehicle, the "Accommodation". The great
strength of the omnibus was its flexibility, and this combined with gradual
improvement in the condition of city streets gave it a commanding position in urban
transit during the middle third of the nineteenth century.
In 1879, Siemens' firm, Siemens & Halske, built a demonstration electric
railway for the Berlin Trade Fair, and two years later the world's first electric
streetcar line, developed by the same firm, opened at Lichterfelde near Berlin. The
first regular electric streetcar service in United States commenced operation in
Clevenland in 1884. In 1890, the total length of electric tramway lines in Europe was
only 96 km. Tramway electrification proceeded more slowly than in the United States
until the last few years of the century. At the beginning of the twentieth century the basic breakthrough in transit
invention of an operational mechanized technology had been achieved, and streetcars
systems were in use in most large and medium-size cities. Streetcar vehicles and

infrastructure were further improved and new modes notably the motorbus and
trolleybus were invented and made operational. The motorbus eventually become the
°
dominant street transit mode. The motorbus increased in popularity as advancements
in technology improved operational capability. The steam-powered double-deck bus
was used in London in the early twentieth century. Buses were more compatible with
other traffic, and routes could be altered as demand changed. Even so, the use of
buses did not eliminate congestion. Today, about three-fourths of transit ridership is
carried by buses.
Parallel with the beginnings of local transit services, large cities began to
utilize rail technology for higher speed services on lines with partially or fully
separated rights-of-way. Three different modes providing such services emerged.
Suburban railways originated as local services on the main, intercity railroad lines.
Interurbans, large streetcar-type vehicles operating mostly on private rights-of-way
between adjacent cities and towns, were developed after the invention of electric
traction. Rapid transit, intraurban transit on fully separated rights-of-way, eventually
became the most important high-speed urban transit mode. Although its first line
(1863) was built for steam traction, rapid transit began to be widely utilized when the
invention of electric traction made underground operation efficient and attractive.
One of the more recently fully operational systems to open in the United
States is BART, the Bay Area Rapid Transit System, serving the San Francisco-
Oakland area. It is, indeed, more modern in appearance than any previous system and
was designed to be more automated. The vehicles are spacious, comfortable, and
modern in appearance with upholstered seats and carpeted floors.
2.2 CHRONOLOGY OF INVENTIONS IN URBAN PUBLIC TRANSPORTATION TECHNOLOGY The details of chronological development till 1970's have been tabulated in
below table 2.1.
12

Table 2.1 Chronology of Inventions in Urban Public Transportation Technology
Year (AD) Location Event Ca. 1600 London "Hackney coaches" — taxicab
services 1612 Paris "Fiacre"- taxicab service 1662 Paris First urban public coaches -
common carriers, horse-drawn carriage.
Ca. 1765 England Invention of steam engine (Watt)
1825 Stockton-Darlington, England First railway opened. 1826 Nantes, France First horse-drawn omnibuses 1832 New York First horse-drawn streetcar line 1838 Boston First commuter fares on a
railway line 1838 London First suburban railway service. 1863 London First under-ground rapid transit
line 1868 New York First elevated rapid transit 1873 San Francisco Invention of cable car (Hallidie) 1878 Germany First application of electric
motor for transaction (Siemens) 1879 Berlin First electric streetcar (Siemens) 1881 Berlin First electric streetcar (Siemens) 1882 Hallensee, Germany Demonstration of the first
trolleybus (Siemens) 1883 Germany First lightweight ICE (Daimler) 1886 Mannheim, Germany First automobile built (Benz) 1886 Montgomery, Alabama Invention of under-running
spring-loaded trolley pole for streetcar (Van Depoele)
1888 Richmond, Virginia First successful major streetcar line (Sprague)
1890 London First rapid transit with electric traction
1892 Germany Invention of compression -ignition engine (Diesel)
1893 Ohio & Oregon First interurban lines 1897 United States Invention of multiple-unit train
control (Sprague) 1897 Boston First streetcar tunnel 1899 Great Britain First motorbuses 1901 Fontainebleau, France First trolleybus line in operation
(Lombard-Gerin
13

1902 Bielatal, Germany Practical overhead power pickup for trolley bus (Lombard-Gerin)
1904 New York First 4-track rapid transit line for. local and express service.
1914 United States Introduction of Jitneys
Ca. 1920 United States Use of pneumatic tires for buses.
Ca. 1927 Nottinghamshire, England Introduction of diesel motors for bus propulsion
1936 New York Firct PC(' nar in ePrt»na
1955 Dusseldort First modern articulated streetcar contributing to the development of light rail transit mode (DUWAG)
1955 Cleveland First extensive park-and-ride system (with rapid transit)
1956 Paris First rubber-tyred raid transit 1957 Hamburg First rapid transit with one-
______________________________ person train crews Late 1950s West Germany First modern articulated buses
and trolleybuses. 1962 New York (42° St. Shuttle) First fully automated rapid
transit 1960 Europe Widespread use of self-service
far collection 1968 Victoria Line, London First automated fare collection
with graduated fare Late 1960 Western Europe, United States Introduction of transit (LRT,
bus) malls 1969 Shirley Highway, Washington First exclusive bus way for
commuter transit (Later converted to HOV road way)
Early 1970 Western Europe, United States First major use of thyristor chopper control of electric motor Japan
1972 BART, San Francisco First computer controlled rapid transit system
1970 United States Widespread development of innovative types of paratransit services.
1975 Morgantown, West Virginia First fully automated transit system with unmanned vehicles
Late 1970 Western Europe, United States A number of tests of ac electric motors on transit vehicles
Ca. 1978 West Germany Development of dual-mode trolley-bus with auxiliary propulsion and remote trolley pole control.
14
2.3 STUDIES OF PUBLIC TRANSPORT SYSTEM IN ABROAD 2.3.1 The China Experience
Public transport has been developing in china since the beginning of this
century. Trams first appeared with big attraction in Tianjin in 1906 AD. The first
trolley bus line was put in to operation in 1914 AD in Shanghai.
During the past 80 years, old tram cars had been gradually replaced by
articulated trolley bus which is very popular in almost all the bit cities in china. They
are not only efficient and reliable, but also environmentally attractive due to low noise
and less pollution. Another important factor is the energy situation because they use
electricity instead of oil. Trolley bus routes are generally heavily loaded.
Now as the mass rapid transit system is Shanghai, rail mass transit system
proposed subway network will have a total route length of about 170Km when
completed. Dalian has a plan to upgrade the existing tramway network into a light rail
system and the feasibility study for its first stage construction of a 6.2 Km — line has
been evaluated. Tianjin has studied the possibility of constructing a 56 Kin light rail
line linking the railway station with the Tianjin Harbor and the economic
development zone.
2.3.2 The Singapore Experience
Singapore is a small, densely populated city-state with a total population of 4
million, with limited land supply, encouraging the use of public transport and
restraining car ownership and usage seems to be the way to solve future transport
problems. The Land Transport Authority (LTA), a statutory board under the ministry
of transport in Singapore is responsible for transport planning, development and
management of the land transport system. The government has always been
attempting to improve the public transport systems to make them a more attractive
alternative to the private car. LTA will be developing the road and rail transit system
master plans to cater the transport needs of the increased population expected in 2045.
Its objective is to develop an integrated land use and to improve public transport
system and regulations to the car use.
The late 60s and early 70s saw the beginning of Singapore's long term urban
development studies. At the same time, immediate actions were necessary to provide
basic mobility to a increasingly active population. The restructuring of eleven bus
15

companies into four, then three, and ultimately into one company was part of the scheme.
In 1982 AD, the Government allocated about 10% of the bus service to Trans-
Island Bus Service (TIBS) in an effort to introduce a measure of competition for
Singapore Bus Service (SBS) and to provide a Yardstick against which the -performance of SBS could be measured.
By that time bus capacity had reached an adequate level and both operators
introduced a few air — conditioned services at premium fares, thus adding comfort for public transport passengers.
The main public transport services in Singapore include the Bus, Mass Rapid
Transit (MRT), Light Rail Transit (LRT) and Taxi. The various improvements that
have been made not only cover the transport modes themselves; they also involved
improvements to all intermediate and end-point facilities, such as linkways, service information customer service, etc.
2.4 STUDIES OF PUBLIC TRANSPORT SYSTEM IN INDIA 2.4.1 Delhi Case Study
Unlike most Indian cities, the traffic in Delhi is predominantly motorized
vehicles. In Delhi, number of two wheelers and cars continue to rise. The roads are
occupying 21% of the total city area; this large number of motor vehicles causes
extreme congestion on roads, ever slowing speed, fuel wastage, environmental
pollution and an unacceptable level of the road accidents.
The Delhi Government considers construction of metro rail systems as an
important counter measure to reduce congestion, number of buses, environmental
pollution, and the number of road traffic crashes would reduce. Almost all megacities
in Asia have plans to construct this system. RITES recommended a rail-based system,
comprising a network of underground, elevated and surface corridors, aggregated to
198.5kms, to meet the traffic demand up to year 2021.. Total length of 198.5 km of
metro rail will cost Rs. 10751/- Crores (excluding taxes and duties) and metro has not
mentioned anything about maintenance cost. First phase of metro has been completed
through the Delhi Metro Rail Corporation (DMRC). These consists three lines —
Shandara — Trinagar — Rithala (line no.1), Vishwa Vidyalaya — Central Sectt. (Line
no.2) and Barakhamba Road — Connaught Place — Dwaraka (line no.3).
16

Delhi has also been at the forefront of innovations in bus services, both by
requiring a complete switchover to non-polluting CNG buses and by introducing
privatization, deregulation, and competing among bus firms to reduce costs. Both of
these policy changes caused enormous disruptions in service for several transitional
years, but the overall result has been positive.
2.4.2 Mumbai Case Study
Mumbai, the commercial capital of India, is relatively less transport energy-
intensive in comparision with other metropolitan cities, because of its well-developed
rail network. Mumbai Metro Rail (MMR) is one of the largest Public Transport
oriented cities is facing declining public transport share as given in earlier sections in
spite of optimization measures to maximize the capacity of suburban system. Mumbai
Metropolitan Region Development Authority (MMRDA) has taken the initiatives of
MMR. Mumbai Metro Rail project having 9 corridors with a total of 148.5 kms. has
been taken up at an approximate cost of Rs. 19,525 crores. This facility will benefit
the overstressed commuters in terms of greater comfort, reduced travel time and
quality of travel.
With addition to this, more innovative is the planned sky bus system, which
will feature several lines of express buses on elevated guideways. Finally, the main
bus operator in Mumbai (BEST) has already introduced smart cards for fare
collection on some premium bus services and also plans to introduce low floor buses
to facilitate travel by passengers with disabilities.
2.5 STUDIES ON BUS RAPID TRANSIT SYSTEM (BRTS)
2.5.1 Introduction on Bus Rapid Transit System Bus Rapid Transit System (BRTS) also known as the High Capacity Bus
System (HCBS) is high quality, ultra-modem and passenger oriented transit that
delivers fast, comfortable and low-cost urban mobility. BRT has become increasingly
popular in cities throughout the world. It provides more operating flexibility, adapts
better to stage development and generally costs less than rail transit. Bus Rapid
Transit involves coordinated improvements in a transit system's infrastructure,
equipment, operations, and technology that give preferential treatment to buses on
urban roadways. Bus Rapid Transit is not a single type of transit system; rather it
encompasses a variety of approaches, including buses using exclusive busways or
HOV lanes with other vehicles, and improving bus service on city arterial streets.
17

Busways-special roadways designed for the exclusive use of buses-can be totally
separate roadways or operate within highway rights-of-way separated from other
traffic by barriers.
2.5.2 Definition There is no precise definition of BRT. Wright (2005) defines it as a "bus-
based mass transit system that delivers fast, comfortable, and cost-effective urban mobility"
Levinson et al. (2003), it is defined as "a flexible, rubber-tired rapid-transit
mode that combines stations, vehicles, services, -running ways, and Intelligent
Transportation System (ITS) elements into an integrated system with a strong positive identity that evokes a unique image ".
2.5.3 Major Elements of BRT
The major elements of Bus Rapid Transit are described below. 1. Running Ways - Running ways drive travel speeds, reliability and identity.
Options . range from general traffic lanes to fully-grade separated BRT
transitways.
2. Stations — Stations, as the entry point to the system, are the single most
important customer interface, affecting accessibility, reliability, comfort,
safety, and security, as well as dwell times, and system image. BRT station
options vary from simple stops with basic shelters to complex intermodal
terminals with many amenities.
3. Vehicles - BRT systems can utilize a wide range of vehicles, from standard
buses to specialized vehicles. Options vary in terms of size, propulsion
system, design, internal configuration, and horizontal/longitudinal ,control, all
of which impact system performance, capacity and service quality.
Aesthetics, both internal and external are also important for establishing and.
reinforcing the brand identity of the system.
4. Fare Collection — Fare collection affects customer convenience and
accessibility, as well as dwell times, service reliability and passenger security.
Options range from traditional pay-on-board methods to pre-payment with
electronic fare media (e.g., smart cards).
18

5. Intelligent Transportation Systems (ITS) — A wide variety of ITS technologies can be integrated into BRT systems to improve BRT system
performance in terms of travel times, reliability, convenience, operational
efficiency, safety and security. ITS options include vehicle priority,
operations and maintenance management, operator communications, real-time
passenger information, and safety and security systems.
6. Service and Operations Plan — Designing a service plan that meets the
needs of the population and employment centers in the area and matches the
demand for service is a key step in defining a BRT system. How it is designed
can impact system capacity, service reliability, and travel times, including
wait and transfer times.
2.5.4 Historical Development of BRT in the World
The first wide-scale development of the BRTs started in Curitiba (Brazil) in
1974, although there were several smaller-scale projects prior to its development.
Since. then, Curitiba's experience has inspired other cities to develop similar systems.
In the 1970s, development of BRT systems was limited to the North and South
American continent. In the late I990s, the replication of the BRT concept gained
momentum and BRT systems were opened in Quito, Equador (1996), Los Angeles,
USA (1999) and Bogota, Columbia (2000). Especially, the TransMilenio project in
Bogota started operation in 2000 and its success drew attention from the world
community as an example of the state of the art in BRT systems. As of 2005, there
may be up to 70 systems around the world, depending on one's definition of BRT
(Levinson et al. 2003; Ernst 2005; Wright 2005).
2.5.5 BRT Introduction in Asia In Asia, prior to 2000, the experience of BRTs was very limited in number and
scope. The systems in Nagoya, Japan and Taipei were regarded as relatively complete
systems in the Asian region (Wright 2005). The spread of BRT in Asia has become
more conspicuous since 2004. In 2004, the TransJakarta busway was started along
through the city centre (Hook and Ernst 2005). On 1 July 2004, three BRT corridors
totalling about 37 km were installed as a part of Seoul's reform of its public transport
system (Pucher et al. 2005). On 25 December 2004, the first stage commercial
operation of BRT was started in Beijing as a pilot line for 5 km (Chang 2005). In
19

Bangkok, the plan for BRT was declared in 2004 by the newly elected governor of
Bangkok Metropolitan Administration (BMA) indicating that the first BRT lines
would be opened in October 2005.
Although there was some 'confusion in Indonesia and Seoul when those lines
were first introduced, the BRTs in Jakarta, Seoul, and Beijing have shown some
success and those systems are under the process of expansion and upgrading. In
contrast, the plan for BRT in Bangkok has been delayed and has not been introduced
yet, although rail and light rail expansion is underway.
The number of cities looking into BRT is rapidly increasing. In China, a BRT
longer than that in Beijing was officially opened in Hangzou in April 2006 (CAI-Asia
2006b). According to a Website by CAI-Asia (2006a), BRTs are now planned or
under construction in 18 cities and under consideration in 5 cities in Asia.
2.5.6 Case Studies on BRTS in India The. increasing need for urban mass transit mobility is now being addressed by
various cities in India, following the best practices in the world. The Jawaharlal Nehru
National Urban Renewal Mission (JNNURM) which aims to encourage reforms and
fast track planned development in 63 cities does consider projects in the field of
urban, public transport. Safe, versatile, flexible and economic, the Bus Rapid Transit
System (BRTS) also known as the High Capacity Bus System (HCBS) is increasingly
being adopted by cities in India. BRTS proposals are in various stages of appraisal
and implementation in Ahmedabad, Bhopal, Delhi, Indore, Jaipur, Pune and
Vishakapatnam.
2.5.6.1 Bus Rapid Transit System, Ahmedabad
Ahmedabad, the largest city among all cities of Gujarat state, accommodating
about 4.5 million people, has a registered vehicular strength of 1.4 million. The Bus
Rapid Transit System (BRTS) is initiated by Gujarat Infrastructure Development
Board (GIBD) with Ahmedabad Municipal Corporation (AMC) and Ahmedabad
Urban Development Authority (AUDA), in 2005. The aim of bus transport system is
to increase the public transport share from 5% to 40% over a period of 10 years. The
proposed BRTS system has the following forms:
• Exclusive. BRTS Service: closed system
• BRTS Mixed Service: open system
2

Technical feasibility to implement BRTS treatment includes Road Width, Corridor
Length, number and nature of bottlenecks and environmental and social issues. For
providing exclusive BRTS lanes, the team suggested a critical minimum of 30 meters
width is required. Any corridor with lesser width would mean either BRTS runs as
mixed operations on those stretches or road widening or road closer for certain
vehicles would be required. At this stage implementation of BRTS exclusive lanes on
corridor with inadequate road-width would receive less priority.
Eighteen corridors have been identified on which opportunities for developing
BRTS were explored. The circular corridor 1 (Vasna-Sabarmati-Naroda-Narol) has
been prioritized for implementation based on the ranking. In addition, a link has also
been proposed joining Danilimda with Maninagar and Kalupur and Kalupur to Odhav
to be implemented in the later part of the first phase as a mixed BRTS corridor. The
north-south corridor Sabarmati to Sarkhej Via Ashram road and Thalthej to Kalupur
east-west corridors got second rank. Shivranjani-Kalupur Via Shreyas, New Bridge,
St got third rank.
2.5.6.1.1 BRTS corridor phasing
In addition to the rankings, in the decision process, following principles
have been added.
1. Metro Phase-1 Proposals (2 Corridors) have been taken as given
2. Similarly Regional Rail Proposals are taken as given
3. The corridor on which Metro is proposed during phase-1 BRTS exclusive
lane is not proposed. However it is recommended that on these corridors
AMTS-BRTS mixed services should be operated. These services are expected
to maintain certain quality -- quantity standards.
4. On the same line exclusive bus lanes would not be implemented on corridors
parallel to regional rail proposal only mixed services should be provided till
the rail project materializes.
For the city Ahmedabad, experts suggest that median lane option for BRTS is recommended than sidelanes/curblanes and it is also recommended to have a closed
system on the corridors where BRT system lane is proposed to be developed. The
exclusive BRT lanes must be physically separated from the rest of the traffic by a
physical barrier. However, criticality of services, it is recommended that Fire Brigade
and Ambulances will be allowed on the BRTS lanes. A thumb rule capital cost for the
21

development of the identified BRT corridor phase-1(Circular: Shivaranjani —
Sabarmati — Narol — Shivaranjani) has been estimated as Rs. 46,070 lakhs.
2.5.6.2 Bus Rapid Transit System, Jaipur:
Jaipur, the capital of Rajasthan state, is one of the major tourist destinations in
the country, Situated on the Northwest part of India, it is referred to as the "PINK CITY". It had a population of 2.3 million in 2001. It has about 0.82 million registered
motor vehicles (2004), of which 70% are 2 wheelers. As a part of BRTS Master Plan,
a 138 km of corridor length has been identified for the implementation of the BRTS,
covering most of the major residential and activity places including the proposed
industrial and residential growth centers of the Jaipur city. The identified corridors
will further validate under Land Use Master Plan prepared by Jaipur Development
Authority (JDA). The project will be implemented under three phases. As a part of
Phase -1 a total length of 42 km will be implemented, which covers major arterial
road networks of the Jaipur.
2.5.6.2.1 Suggested alignment
There are 2 options for the suggested alignment i.e. Atgrade BRTS System
and Atgrade BRTS and Elevated Monorail . System. The alignment will be having 4
segments. In this alignment, the main hub of the transit system is located near
Government Hostel Crossing. All the corridors of this alignment would pass through this point.
Option 1: At-grade BRTS System
In Option-1, the total corridor has been broadly divided in to four segments with at-
grade BRTS as the mass transport option as discussed below. Segment 1: Government Hostel Crossing to Sanganer Airport
Segment 2: Government Hostel Crossing to Ajmer Bypass on Sikar Road via Collectorate
Segment 3: Government Hostel Crossing to Transport Nagar via MI Road
Segment 4: Government Hostel Crossing to Amrut Nagar (ISKON Tample) via
Ajmer Road
The total estimated project costs for introducing the recommended BRT option
1 for Jaipur city is Rs. 783.32 Crores and expected to be start in early 2007 and will be
finished by the end of 2008.
22
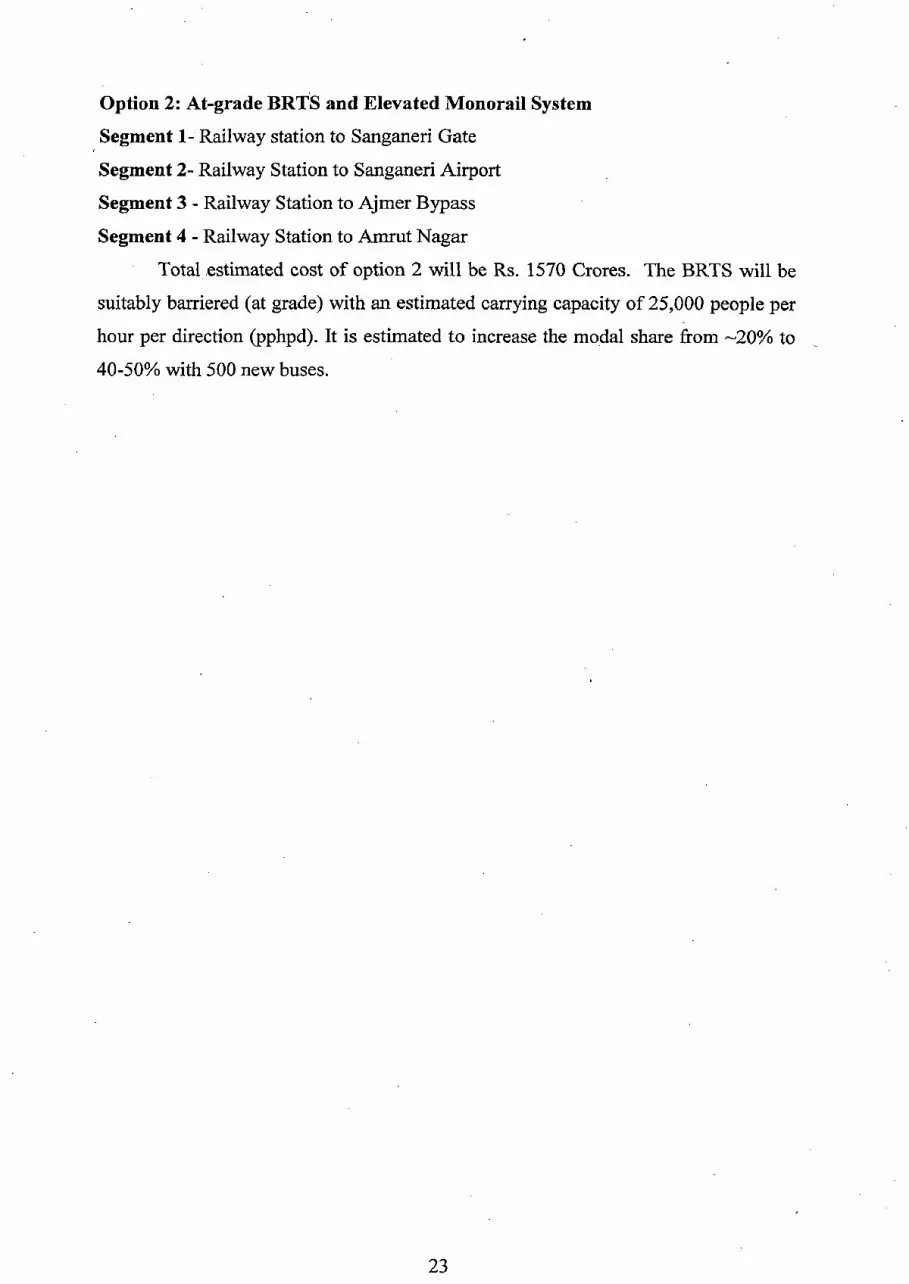
Option 2: At-grade BRTS and Elevated Monorail System
Segment 1- Railway station to Sanganeri Gate
Segment 2- Railway Station to Sanganeri Airport
Segment 3 - Railway Station to Ajmer Bypass
Segment 4 - Railway Station to Amrut Nagar
Total estimated cost of option 2 will be Rs. 1570 Crores. The BRTS will be
suitably barriered (at grade) with an estimated carrying capacity of 25,000 people per
hour per direction (pphpd). It is estimated to increase the modal share from -20% to
40-50% with 500 new buses.
23

CHAPTER 3
STUDY AREA CHARACTERISTICS AND TRAFFIC VOLUME STUDIES
3.1 STUDY AREA The City of Dehradun in the Shivalik foothills of Himalayan Ranges is the
capital of the New State of Uttarakhand. Dehradun is one of the most beautiful cities
in Northern India. The City, the last railhead in the State - acts as a Gateway to
Garhwal Hills and Queen of Hills — Mussoorie attracting a large number of tourists
for their onward journeys. It is also an important educational centre of the Country.
The Indian Military Academy, Forest Research Institute, Oil and Natural Gas
Commission, Survey of India and many more offices of Central and State Govt. are
also situated in the City.
Mussoorie Dehradun Development Area comprises of about 185 villages,
which now form the part of urban extension. The Study Area has been defined as
Dehradun Development Area encompassing Municipal Corporation, Cantonments and
urban villages.
3.1.1 Population Growth Dehradun Urban Area supported a population of 5.28 lakh as per 2001 census,
which includes a population of 4.48 lakh in Municipal Limits and 0.30 lakh in the
cantonment limits. The growth rate for past few decades has been constant except for
the high growth rate of 66% in last decade (1991-2001) on account of large-scale
migration - after Dehradun was declared the Interim State Capital of Uttarakhand. The
average household size is about 5 persons in the City. The increase in population of
Dehradun from last few decades and the decadal growth rate has been shown in Table
3.1 and the projected population for the horizon year 2031 has been shown in
Table 3.2.
24

Table 3.1 Dehradun Population and Decadal Growth Rate
Table 3.2 Projected Population
Year Population ('000 persons)
2011* 627 2021* , 883 2031* 1238
Table 3.3 Growth of Registered Vehicles in Dehradun Sub-Area
YEAR Car/Jeep / Van
Scooter/ M.Cycle/ Moped
Taxi /Maxi
Auto /Tempo
Bus /Minibus
/Omnibus
Goods Vehicle Others TOTAL
(1) (2) (3) (4) (5) (6) (7) (8) (9)
1994-95 4852 66104 348 211 1028 1948 552 75043 1995-96 5690 72716 591 281 1105 2186 617 83186 1996-97 7419 80415 875 375 1146 2602 708 93540 1997-98 8879 88557 1140 500 1249 2892 806 104023 1998-99 10426 98566 1337 666 1300 3163 934 116392 1999-00 12972 109498 1678 905 1405 3502 1207 131167 2000-01 15262 121678 2135 1567 1461 3835 1427 147365 2001-02 17479 135202 2620 1956 1546 4155 1612 164570 2002-03 20214 150296 3041 2187 1621 4658 1754 183771
2003-04 23859 166399 3370 2484 1991 5479 1987 205569
2004-05 28274 184535 3901 3781 2189 7062 2116 231858
2005-06 34020 210917 4155 4580 2366 9705 2557 268300 Growth
Rate (p.a.) 17% 10% 25% 28% 7% 11% 14% 11%
Source: RTO Dehradun => Col 6 includes (Stage Carriage - Corporate Carriage - School - SRTC - Omni —Private) Buses
25

3.1.2 Vehicular Growth
The growth of motor vehicles in Dehradun has been phenomenal. There were
about 2.7 lakh registered motor vehicles in Dehradun Region in the year 2005-06.
During the year 2005-2006, the growth of vehicles is around 10.36%. The registered
vehicles have grown at a rate of about 11% p.a. during last 12 years. Table 3.3 shows
the growth of registered vehicles in Dehradun sub-area. It is observed from the Table
3.3 that Car, motorised. two-wheelers constitute more than 14% and 75% of the total
vehicles respectively in the city. Growth of taxis and IPT modes have been
phenomenal at the rate of 25% and 28% respectively since 1994-95 - indicating a
short-supply of public transport fleet i.e. Buses have grown at the rate of only 7% p.a
in the same period.
3.1.3 Road Accidents in Deharadun City
The details of road accidents from 1999 to 2005 were collected from Traffic
Police Department. A total of 189 accidents were been reported in year 2005. The
share of fatalities is increased. About 39% (Table 3.4) of road accidents were fatal in
the serious/fatal group resulting in loss of life. The major road accident locations are
Saharanpur road, Haridwar road, Rajpur road, Gandhi road, GMS road, Daranwala —
check post road, Sahastradhara road, Canal road, Chakrata road, Raipur road, Prem
Nagar check post, Patel Nagar mandi and Asherwad Petrol Pump.
Table 3.4 Serious and Fatal Road Accidents (1999-2005)
Year Number of Accidents Fatal/Serious % fatal
1999 127 36 2000 133 38 2001 178 37 2002 196 34 2003 182 31 2004 149 35 2005 189 39
Source: Traffic Police
3.1.4 Road Transport Network in Dehradun
The road system is radial originating from the City Core area of Paltan Bazaar
with Rajpur Road, Hardwar Road, Saharanpur Road and Chakrata Road forming the
major travel corridors. The traffic carrying capacities are low due to limited widths,
N
intense landuse . and encroachments. A new bypass has been constructed connecting
Saharanpur Road near Transport Nagar with Haridwar Road. Other important roads in
the City are Kaulagarh Road, Raipur Road, Sahastradhara Road, Kaonli Road, New
Cantonment Road, Subash Road and East Canal Road. The nearest Airport is at Jolly
Grant, which is about 24 km from the City. Figure 3.1 shows the complete road
network of Dehradun city.
Dehradun is well connected by rail and road. NH-72 passes through the city
connecting Rishikesh and Haridwar in the east to Himachal Pradesh in the western
side. NH-72A connect the city with Saharanpur in the S-W and Roorkee in the south.
is a large tempo attraction in the CBD area due to the presence of offices, commercial
establishments. The tempos stop wherever passengers board/alight, thereby causing
congestion and delay to other vehicles. It has been observed that areas like clock
tower, railway station, paltan bazaar; Connaught place are having heavy pedestrian
flows.
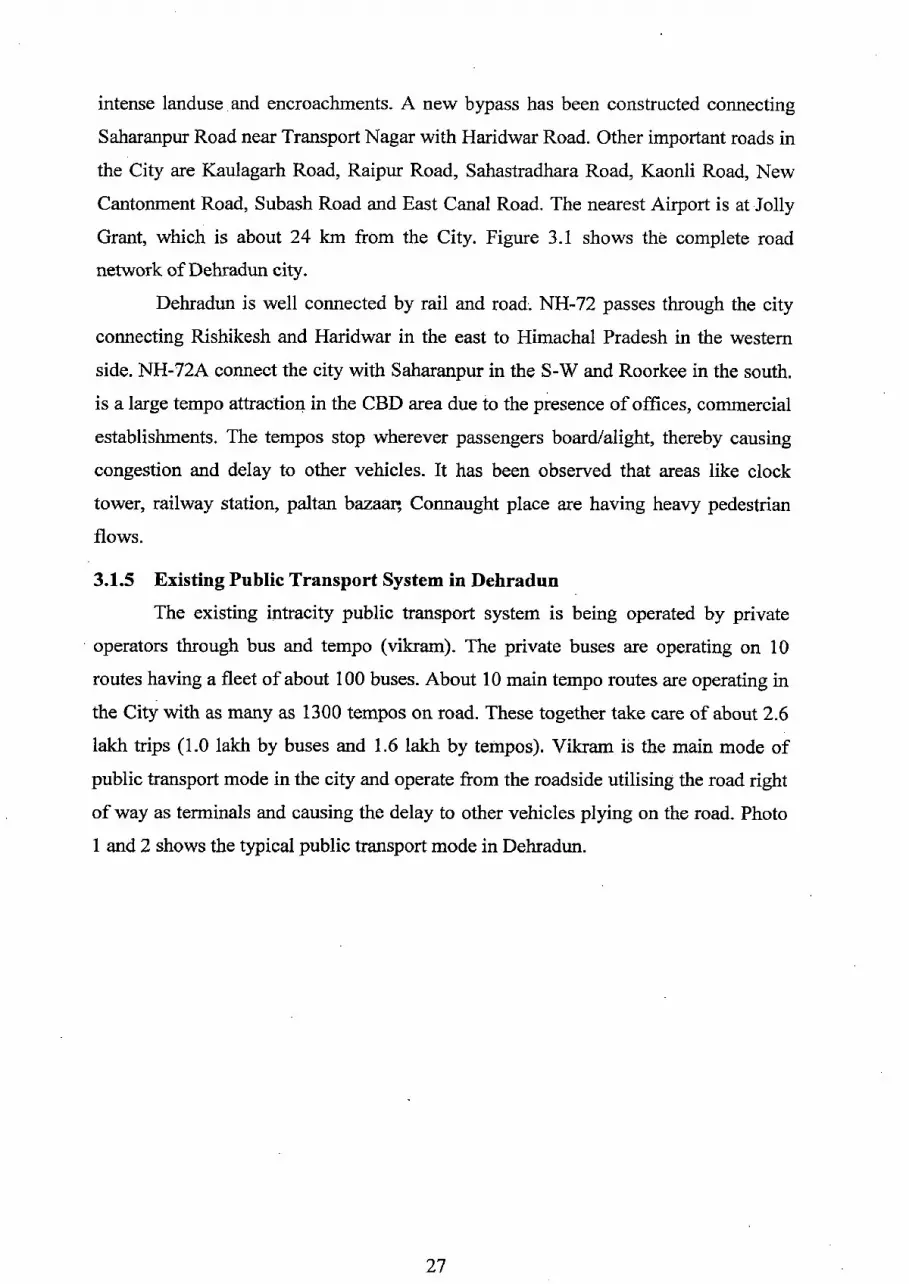
3.1.5 Existing Public Transport System in Dehradun
The existing intracity public transport system is being operated by private
operators through bus and tempo (vikram). The private buses are operating on 10
routes having a fleet of about 100 buses. About 10 main tempo routes are operating in
the City with as many as 1300 tempos on road. These together take care of about 2.6
lakh trips (1.0 lakh by buses and 1.6 lakh by tempos). Vikram is the main mode of public transport mode in the city and operate from the roadside utilising the road right
of way as terminals and causing the delay to other vehicles plying on the road. Photo
1 and 2 shows the typical public transport mode in Dehradun.
27

28

4 Photo 1: A Typical Tempo (Vikram) in
Dehradun
Photo 2: A Typical City Bus Service in Dehradun
29

Inter city traffic is served by a new Inter State Bus Terminal (ISBT) -
commissioned in June, 2004. In addition, there are 10 minibus / bus intracity routes
organised by the private operators. The route and fare structure is fixed by Road
Transport Authority. The minibus / bus and tempo routes for intracity are presented in
tables 3.5 and 3.6.
Table 3.5 City Rus Routes
Route Route Structure Operational Bus No. fleet
I Rajpur Road — Clement Town via Clement Town, Majra, Saharanpur Chk, Gandhi Road, Parade, Subash Road, Dillaram Balar, (Shahanshai Ashram) Extended Routes: 24
Char Khamba Subash Nagar Bharu Wala
2 D. L. Road — Defence Colony Via Police Chauki, Dillaram Bazar, Clock Tower Prince Chk, Haridwar Road, Defence Colony Extended routes:
Defence Colony — Nabada 12 Nabada — Majri Defence Colony — Kedar Puram Shiv Nagar — Gaurakhpur Rispana Rao — Jogiwala
3 Parade — Sahastradhara via Parade Ground 14
4 Prem Nagar - Gular Ghati via Bhaliwala Chk., Prince Chk, Jogiwala, Harawala, Bailer Wala, Gular Ghati. 18 Extended routes Premnagar — Panda — Bhawal
5 Banjara Wala — Gular Ghati Via Kargi, Guro Ram Rai Degree College, Shahran Pur Chk, Prince Chk, Darshan Lal Chowk, Parade, Survey Chk., Sahartradhara Jn., Raipur, Ranjha Wala, Nathu Wala, Balwali, Gular Ghati, Extended routes 9
Tapovan to Nala Pani Raipur to Ordinance Factory Banjara Wala to Muthra Wala Prince Chowk to Nehru Gram Nehru Gram to Upper Nehru Gram
6 Parade Ground — Parwal via Darshan Lal Chk, Cannaught Place, Prem Nagar Parwal 8
7 Purkal Gaon — Mathura Wala via Chand Roti , Anarwala (Surdly Depot); Hathi Badkala, Dilram 9 Bazar, Globe Chk, Pavillion, Subash Depot, harampur, Azabpur,
30

Route Route Structure Operational Bus No. fleet
Mathura Wala. 8 Thana Central — Ballupur
via, GMS Road, Sabzi Mandi, Majra, By Pass — Rispana Rao — I Subash Road — Pande
9 Nabada Majra - Rispanapur via, Subhash Marg, Parade ground, Majra, By Pass — Rispanapur 1
10 Prem Nagar — Dhonlas Ki Chakki via Nanda Chk, Phulsoni, Amwala. 1
Total 97
Table 3.6 Tempo Routes
Route Route Structure Operational No. Tempo Fleet
1 Ashley Hall — Rajpur 59
Via Globe Chowk, Dilaram Bazar, Jakhan
2 Ashley — Garhi Cantonment 19
Globe Chowk, Dilaram Bazar, Hathi Wadkala
3 Connaught Place — Garhi Cantonment 12
Via Bindal Bridge, Doon School, Cantt. Road
4 Connaught Place - Kaulagarh 50
Via Bindal Bridge, Kishan Nagar Chowk
5 Connaught Place - Premnagar 68
Via Bindal Bridge, Kishannagar, Ballupur Chowk, Panditwari
6 Parade Ground — Premnagar 22
Via Darshan Lal Chowk, Prince Chowk, Kaonli Road
7 Parade Ground — Sema Dwar (Vasant Vihar) 90
Via Prince Chowk, Kaonli Road, Balliwala
8 Parade Ground — Majra
via Prince Chowk, Saharanpur Chowk, Patel Nagar, Majra, Subhash 240
Nagar, Clement Town, Mahuvewala
9 Dharampur — Mothurawala 140
Via Bypass
10 Parade Ground — Raipur 67
Total 767
Source : Reference (27)
31

3.2 TRAFFIC VOLUME STUDIES AT MID BLOCK LOCATIONS
3.2.1 Identified Corridors for Traffic Volume Studies
From the previous studies conducted by RITES Ltd. 2004, the following 5
corridors were identified for conducting the traffic volume studies on a mid block
locations. These identified corridors are:
• Saharanpur Road
• Gandhi Road
• Rajpur Road
• Chakrata Road
• Haridwar Road
3.2.2 Classified Traffic Volume Studies at Mid Block Locations on Identified Corridors
Classified traffic volume survey was carried out on selected 5 corridors. The
traffic survey was carried out on both the directions for morning and evening peak
hours on weekdays (9:00 A.M. to 11:00A.M. in the morning and 5:00P.M. to
7:00P.M. in the evening). These traffic volume studies were used in fmding the
passenger trips in peak hour in peak directions (PHPDT) for further
calculations corridors for selecting the suitable public transport system on
these identified corridors. Table 3.7 to 3.16 shows the traffic volume on these routes.
The peak hour traffic on Saharanpur Road was observed as 1716 vph, on Gandhi
Road it was observed as 2621 vph, on Rajpur Road it was observed as 2319 vph, on
Chakrata Road it was observed as 2027 vph and on Haridwar Road it was 2055 vph. It
was observed that on Gandhi Road the peak hour traffic is high due to it being the city
core area.
32

i
a

L
00 h "0 '~
IA
C3 N N c iI)
s
N V1 — N S Q\
L O
CC ON — —+
Ey
OO O
L d1 Vn
rn
C N t M
00
0 0 ° ° o
© 0
1 1 1 1
° o 00 00 0 o
M
00
~ ~"~ ~
01 O~
In Obi O M
o
►0
j c*1 N O •
a s A
o o
CP
O
V V L O .-+ O M
N S E L • 0
GO
C4 U u
L v~ ON N '•
•_ '1 • • N V)
2
FI ~I ~~ N N
UI NI -I ~I 1

O+ O Cl
O \6 Yl
M 00
o r
00 C [- in
L
N ~,
. ' [ '.O n
M M
N N
0% 00 N
\D M ca
w Q ~D O
N M N
E F L 0
L — O N ~--
E M ON N Ot
N
3... 00
- N' N F
_C ~!1 M
— C'. CI
N
- - M N
O O O O
6~ O - i
Q p p
O O
O O
M Q\ d M M el M Q'.
i M
-~' Y O . 3.1.)3.1.)
V') 00 00
1
M
ti N N N M
ca
C O 4 o f'') f') `°
O N N M
F 3.- C
Cd N O N
F
cl d
N 00
M
i N •--• - F
H O
• N v1
I/1 O N N — C') N —
O O O O .. 00
p O O
tn M

A
,- .-.. M N N - N
CJ 00 .r Q~
I . N d 'r O Mi
00
—
ti L
N N
N m
•N m
00
CO
s O-.
O .--
o N
'.O 'o -
E as
0+ O
N- — .-r N
N c7 O
rA • N N
oO \D N
v1
0 C 0 o 0 0 0
4
N - N
CJ m ~ N N O ~A Ga ~
r
CC - N M
0
O N
E
0.. C 0 0 0
—
•
C G' N - N '.O M M N
I') d' 01 N
o 0 o 0 0 1 1 1 • F=1 d a a Q
° C ° °o °o C

enf Oaf Off VJ
Er - N
U ' p v — 00
O ~ G
.Q .0
O a
y ~
0 Q
00
rM
N N O Ifj
00 M O
00
\O 00
F
C
y ~
O
v F ci E.
00
•i.i V1 rl
.~ v U U i GO N — N
~ M y M y
~--~ N N - . -~ F
M N M en Os l
Q S N 00 o 00 v1
I-
'0 50 50 N
i
U
N
—
O 00 N N
-
M
0 - N 5O M 5D
O N — -. O
FA'(5--M
- N N N
N-M
d o a a
d a a d o IR a o
~IMR~oHen

Photo 3: A Heavy Traffic on Clock Tower Junction
Photo 4: Performing the Traffic Volume Couu#
3R

3.3 VEHICLE OCCUPANCY SURVEY
Vehicle occupancy survey has been done by taking 25 observations of each of
passenger vehicles on each of the above selected 5 corridors by stopping vehicles and
observing total occupancy. A Vehicle Occupancy Sheet has been shown in Appendix-
II. The Average . occupancy of each type of passenger vehicles on all selected 5
corridors has been calculated as given below:
Average occupancy of each vehicle = Total occupancy of that type of 25 vehicles /25.
The Average occupancy of vehicle details are used in estimating projected
persons peak hour in peak direction trips (PHPDT). Table 3.17 shows the Average
passenger vehicle occupancy observed in Dehradun. From the - local bus union
enquiry, the capacities of bus, minibus, vikram and auto rickshaw are 35, 22, 7 and 4 respectively.
Table 3.17 Average Vehicle Occupancy in -Dehradun S.No. Type of vehicle Average Occupancy
1 2-Wheeler 1.4 2 Car/Jeep 3.5 3 Bus 29.92 4 Mini bus 19.9 5 Vikram 6.72 6 Auto Rickshaw 3.74 7 Cycle 1.48
8 Cycle Rickshaw 1.8
39

3.4 SELECTION CRETERIA OF PUBLIC TRANSPORT TECHNOLOGY For calculating total projected peak hour traffic for future horizon years for
each kind of passenger vehicles in peak hour in peak direction trips (PHPDT), the
calculated annual growth rate of personalized (2-wheeler and 4-wheeler) registered
vehicles were taken as 10 % and 17 % respectively. But in case of other kind of
vehicles, the calculated annual average growth rate is not suitable for calculating
projected peak hour traffic. This has been taken a constant growth rate of 7%. The
growth rate for cycle and cycle rickshaw has also been taken equal to 7 %.
The projected total person trips in PHPDT for each type of passenger vehicles
has been calculated by multiplying average occupancy and total projected traffic in
PHPDT have been calculated at five selected corridors of Dehradun city. With the
prediction of future potential trips (switchover trips) made by the Bus Rapid Transit
commuters, the demand can be assessed. The selection of suitable public transport
technology with total person trips in PHPDT is considered as:
• Bus Transport System (BTS)
• Bus Transport System with exclusive
Bus lane (BRTS)
• Light Rail Transit System (LRTS)
• Mass Rapid Transit System (MRTS)
: <10000 PHPDT
: 10000 — 15000 PHPDT
: 15000 — 40000 PHPDT
: >40000 PHPDT
CHAPTER 4
SURVEY ORGANISATION
4.1 REVEALED AND STATED PREFERENCE APPROACHES 4.1.1 Present State-of-the-art
It is well known that mode choice analysis an essential element in four stage
transport planning. The mode choice analysis procedure has become more complex
principally due to the disaggregation strategy involving collection of sample
information about individual travel behaviour. Mainly, two streams of approaches are
popular i.e. revealed preference (RP) and stated preference (SP) approaches. They are
being widely used now-a-days in the study of traveller behaviour to produce empirical
models for predicting travel choices. These approaches are concerned with socio-
economic behaviour of the commuters and their psychology. The field work done in
this study was aimed at assessing the switching over behaviour of personalised
vehicle users to BRTS in Dehradun based on revealed and stated preferences. In
contrast to revealed preference method, stated preference method is highly sensitive to
the observations in the surveying stage. It is the experimental design that matters a lot
in the stated preference technique. The questionnaires for survey work were prepared
cautiously so that it can be implemented successfully.
4.1.2 Revealed Preference Approach In RP approach the models are based on the data obtained in surveys related to
the actual behaviour. A comparison of chosen travel alternatives and the rejected
alternatives reveals the preference of the travelers. Most applications were initially in
the field of urban travel, determining the share of different modes. This approach
being based on the existing choice behaviour has been found to be inadequate for
predicting the demand of an innovative mode which is yet to be introduced. On the
other hand stated preference (SP) approach has an edge over revealed preference
approach in modeling a hypothetical travel scenario for estimating market demand of
new mode.
41

4.1.3 Stated Preference Approach
The stated preference approach deals with the choices (ratings or rankings)
made by an individual when asked to do so under one or more hypothetical situations.
The main feature of stated preference technique is that it allows the researcher to
"experiment". Stated preference technique provides good quality information travel
demand and behaviour for a very reasonable cost. A well designed stated preference
study can predict the demand for a new mode before its introduction.
The principal features of a stated preference study are listed below:
1. It is a market research survey tool which obtains people's statement of how
they would respond to different hypothetical travel situations.
2. These travel situations present each individual with different combinations of
factors that are relevant to the travel decision process.
3. The researcher constructs the travel situations in such a way as to ensure that
the individual effect of each factor in those situations can be quantitatively
measured.
4. The researcher needs to ensure that the individuals being interviewed are
given hypothetical situations that can be clearly understood and realistic, and
relate to individual's current level of experience.
5. The responses given by the individuals are, analysed in such a way as to
provide quantitative measures of the relative importance of each factor
presented in the hypothetical travel situations, this requires the use of
appropriate statistical modeling techniques.
6. The result of the survey provide the transport operators or policy maker with
measurements that will assist in the identification of investment/planning
priorities and the forecasting of travel demand and behaviour.
4.1.4 Comparison of RP and SP Approaches Revealed preference approach has got some limitations which can be
overcome by stated preference approach that is why stated preference approach has
gained an upper hand in transport planning. Limitations of revealed preference
approach are as follows.
1. Observations of existing behaviour (revealed preference) may not vary
sufficiently for the construction of accurate statistical models for evaluation
and forecasting. The variables may also be correlated (Multicollinear), so that
42

accurate measurements of the importance which people attach to different
factors will not be obtainable.
2. The observed behaviour may reflect factors that are not of interest to the
policy makers. The effects of the variables that are of interest may be
`swamped' by these other factors. This is a particular problem with
"secondary" qualitative variables.
3. In situations where a policy is completely new (for example, new public
transport vehicles that do not currently operate), there is no information on
how people will respond.
4. To obtain adequate observations of behaviour, very large and therefore very
expensive surveys may have to be carried out.
It is primarily in response to these limitations that stated preference approach
has been developed. Its advantages are largely related to the drawback of revealed
preference listed above. Advantages of stated preference are as follows:
1. As the researcher can precisely control the choices offered to respondents,
stated preference techniques can ensure data is of sufficient quality to
construct good quality statistical models.
2: The effects of variables of interest can be isolated from the effects of other
factors due to the control available to the researcher.
3. Where a policy is completely new, so that no RP data is available, stated
preference techniques may represent the only practical basis for evaluation and
forecasting.
4. In stated preference efficient statistical models can be developed for much
smaller sample sizes than RP. Each stated preference interview produces
multiple observations per individual, as respondents are asked to consider a
number of situations, compared to the single observation per individual
available from RP data.
The principal weakness of stated preference techniques rests on the fact that
the data obtained represents individual's statements of what they would do given
hypothetical choices. This obviously places an emphasis on presenting respondents
with as realistic as set of situations as possible.
43

4.2 EVOLUTION OF QUESTIONNAIRE FOR .BEHAVIOUR MODELLING Modelling of commuter behaviour is used to study the existing mode choice
behaviour with respect to income, trip length, walk time, out-of-vehicle-travel time.
Besides mode choice, mode specific socio-economic characteristics of commuters are
required to be studied. In this questionnaire the various informations have been
incorporated in three categories viz personal information, household information and
travel information which are discussed below.
4.2.1 Personal Information In this category the information about name, sex, age, address, martial status,
profession, monthly income and monthly expenditure on transport are included. These
informations were used to explore the personal profile of commuters and were used to
stratify the commuters into homogeneous segments.
4.2.2 Household Information Household information of a commuter includes number of family members,
number of earners, monthly household income, monthly expenditure on transport,
vehicle ownership and number of school/college going members. Vehicle ownership,
monthly household expenditure on transport and number of employees in a family has
been found to be influencing the mode choice of commuters.
4.2.3 Travel Information
Travel information of a commuter is perhaps the most important exercise
among other informations since it is directly used in the modeling aspect of transport
planning. Travel information includes mode chosen for work journey, trip purpose,
route followed, distance from home to workplace and reasons for using present mode
over public transport mode and perception of public mode (bus and vikram). The
various stages in journey/trip were obtained from the commuters. These stages are
meant for estimating in-vehicle-travel time, out-of-vehicle-travel time (which includes
walking time from home to bus stop + waiting time at bus stop + walking time to
destination) and cost of travel per trip. A detailed questionnaire is shown in
Appendix I.

4.3 DESIGN OF STATED PREFERENCE QUESTIONNAIRE
One important issue in designing a Stated Preference Questionnaire is what
type of SP data (ranking, rating or choice) is best to be collected in a given situation.
Introduction of a new mode or improvement of previous one in a growing city like
Dehradun city will result in switching over of commuters of existing mode into the
new mode (BRTS) or improved mode. The switching behaviour of commuters is
mainly guided by the comparative utilities of existing and new mode introduced
within the domain of utility maximization principle. The questionnaire has been
designed to study the switching behaviour of commuters using different modes into
the Bus Rapid Transit System having efficient feeder services to its stations. To
explain the physical characteristics of BRTS to commuters a set of BRT photographs
of different types were shown along with the questionnaire to comprehend the
commuters without difficulty.
For simplicity it was decided to consider three attributes namely cost, in-
vehicle-travel time (IVTT) and out-of-vehicle-travel time (OVTT). To generate
various choice scenarios all the above three attributes have been varied at two levels,
i.e. low and high. The variations of these attributes are done in such a way that the
commuters can easily trade-off between COST, IVTT and OVTT values. To develop
a clear cut trade-off scenario using these three variables a number of combinations
were tested and finally four choice scenarios have been retained as given in Table 4.1
Table 4.1 Final Choice Combinations with Different Levels of Attributes of Bus Rapid Transit System to Generate Stated Preference Questionnaire
CHOICE No. COST IVTT OVTT 1. LOW LOW HIGH 2. LOW HIGH LOW
3. HIGH HIGH HIGH 4. HIGH LOW LOW
45

4.3.1 Assumptions for Bus Rapid Transit System (BRTS) of Dehradun
The details of level of variations in the attributes were done based on some
hypothetical assumptions about the Bus Rapid Transit System. The following
assumptions were made for implementation of the system in the city.
1. For at-grade BRTS, the desirable ,Right-Of-Way requirement is 35m to meet
the requirements of IRC code, but with an absolute minimum of 25m is
required. Additional 7m space is required at station/stops.
2. For elevated BRTS, desirable ROW is 30m and an obsolute minimum of 20m
because at ground level the space is required only for a column and its
protective measures. At stations, additional space is required on roadside.
3. Exclusive bus lanes should be provided mostly at grade, for segregation of
existing traffic by means of a physical separation.
4. The average speed of the BRT is assumed to be 30-50 kmph, which can be
achieved through modernised signaling.
5. The frequency of BRT is assumed to be 5-10minutes in peak hours and 10-15
minutes in off-peak hour so that the maximum waiting time at station is 10-15
minutes.
6. The walking time is to be assumed as 5 to 15 minutes per trip and proper
feeder service can be provided at all bus stations for those passengers, their
walking distance more than 0.5 to 1 km.
7. The cost has been taken at the maximum to be double the cost of bus/vikram,
considering high operational cost involved for maintaining high speed and
high frequency of the BRT and having limited stoppages.
8. Average spacing between two.bus stops should be 0.5 to 0.8km. and generally
bus stops located before intersections in the direction of travel to utilize the
stoppage time wherever practicable/possible.
4.3.2 Cost Variations
Since the existing fare levels of bus and vikram is low, fare for BRTS were
adopted to be 1.5 to 2 times the existing travel cost of the above two systems. Based
on this level, two level variations have been made for different modes i.e.
Bus/Vikram, Two-wheeler, Car and Personalised hired modes such that lowest value
has marginal increase in cost in case of public transport modes (bus/vikram) and

decrease in cost for personalised modes and hired modes. The detail of level
variations in cost has been indicated in table 4.2.
Table 4.2 Level Variations in Cost for Different Modes
MODE TYPE LOW HIGH Bus/Vikram +50% +100%
Two-Wheeler -20% -50%
Car -50% -80%
Hired Mode -40% -80%
4.3.3 In-Vehicle-Travel Time (IVTT) Variations The level of variation in IVTT for different modes is shown in table 4.3.
IVTT for BRTS was assumed to have decreased by 60% at the higher level and 10%
at the lower level. This reduction in IVTT was consider due to the higher average
speed of BRT than the existing bus/vikram , the reduction in IVTT for other modes
i.e. car, two-wheeler and hired mode was envisaged after the roads were decongested
due to efficient transport system.
Table 4.3 Level Variation In-Vehicle —Travel Time (IVTT) For Different Modes
MODE TYPE LOW HIGH Bus/Vikram -20% -60%
Two-Wheeler -10% -20%
Car -10% -20%
Hired Mode -10% -20%
4.3.4 Out-of-Vehicle-Travel Time (OVTT) Variations
The level variations in OVTT for different modes are shown in Table 4.4. For
bus/vikram a 15 minutes reduction in OVTT was consider at high level and 10
minutes at low level because of lesser wait and walk time. For personal mode i.e. two-
wheeler and car an increase in OVTT of 15 minutes at high level and 10 minutes at
low level can be considered for developing the questionnaire.
47

Table 4.4 Level Variation in Out-of-Vehicle—Travel Time (OVTT) for Different Modes
MODE TYPE LOW HIGH
Bus/Vikram -10min -15 min
Two-Wheeler 10 min 15 min
Car 10 min 15 min
Hired Mode -5 min -10 min
4.4 FIELD SURVEY ORGANISATION
4.4.1 Pilot Survey
The revealed preference and stated preference questionnaire were clubbed into
a single questionnaire and pilot survey was undertaken to check , whether the
commuters could comprehend the easily. The pilot survey was undertaken at the ISBT
bus stop and few residential places near the race course colony. After scanning the
pilot survey questionnaires, minor modifications were made to delete and enter some
of the questions to get more relevant information.
4.4.2 Final Survey
The final survey was carried out randomly at different locations i.e.
Government and private offices, colleges, schools, shops, different bus stops and
residential areas which are located within 1 km distance from the main bus routes.
The mode of survey was direct interviewing. A total of 120 samples were collected
for both SP and RP survey excluding pilot survey. The areas covered while doing the
survey are Dharampur, Ajabpur ka Danda, Majra, Nehru Nagar Colony, Jogiwala,
Racecourse Colony, Patel Nagar, Ballapur, Premnagar, Nanda ki Chauki, Connaught
Place, Chukkuwala, Yamuna Colony, Indira Colony, Vijay Colony, Dobhalwala,
Hathibarkala, Karanpur, Old Dalanwala, Khurbura, Dandipur and Chandra Nagar.
Photographs 4.1 to 4.4 showing how the stated preference survey was carried out in
the field.

I," •, J I
Photo 4.1: Sample Collected from a College Clerk
• I! r 1. - &g
tu :. - I
Photo 4.2: Sample Collected from a Business Man
ELI

Photo 4.3: Sample Collected from a Central Government Employee
Photo 4.4: Sa lected from a College Student
1
'~~ aoet►~~
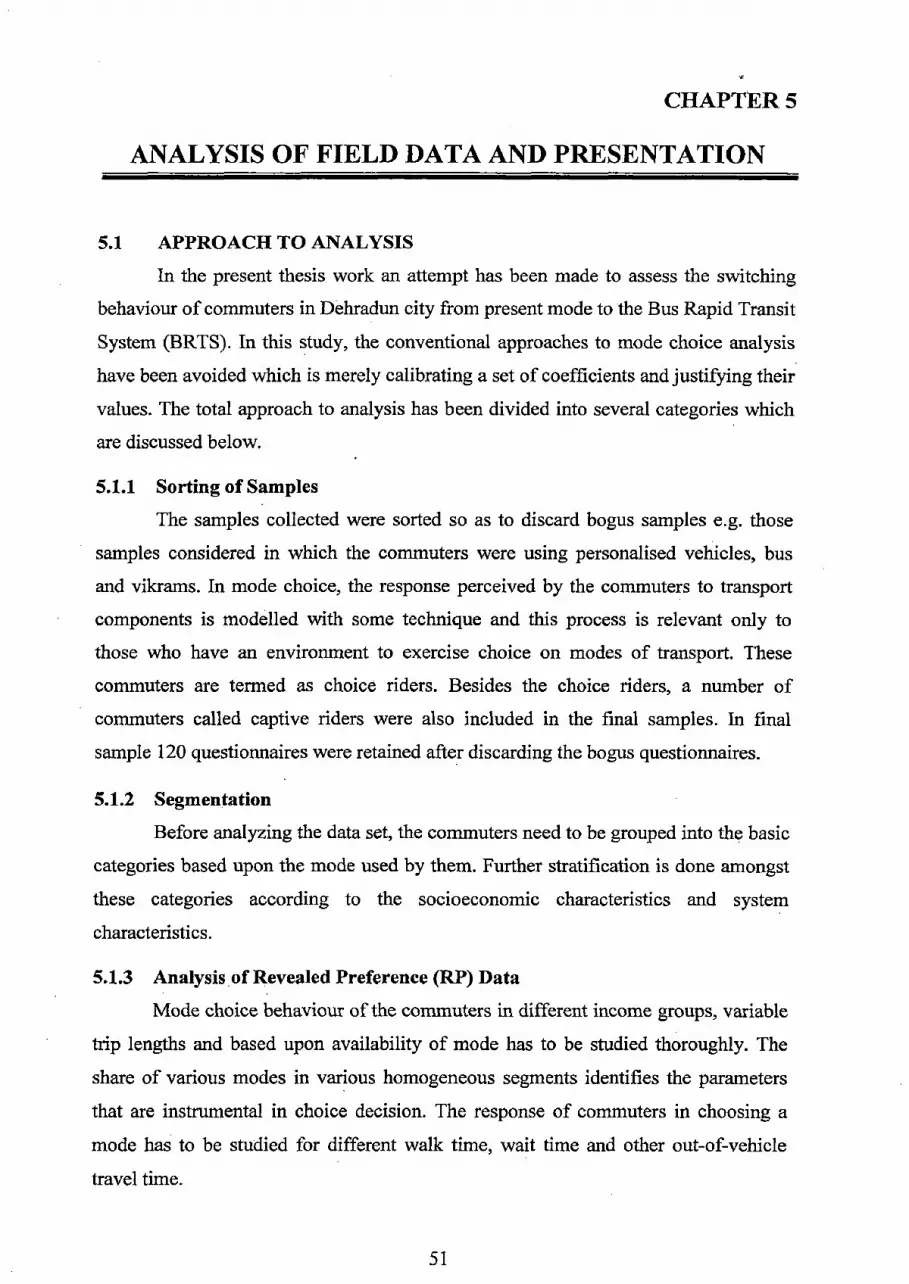
CHAPTER 5
ANALYSIS OF FIELD DATA AND PRESENTATION
5.1 APPROACH TO ANALYSIS In the present thesis work an attempt has been made to assess the switching
behaviour of commuters in Dehradun city from present mode to the Bus Rapid Transit
System (BRTS). In this study, the conventional approaches to mode choice analysis
have been avoided which is merely calibrating a set of coefficients and justifying their
values. The total approach to analysis has been divided into several categories which
are discussed below.
5.1.1 Sorting of Samples The samples collected were sorted so as to discard bogus samples e.g. those
samples considered in which the commuters were using personalised vehicles, bus
and vikrams. In mode choice, the response perceived by the commuters to transport
components is modelled with some technique and this process is relevant only to
those who have an environment to exercise choice on modes of transport. These
commuters are termed as choice riders. Besides the choice riders, a number of
commuters called captive riders were also included in the final samples. In final
sample 120 questionnaires were retained after discarding the bogus questionnaires.
5.1.2 Segmentation Before analyzing the data set, the commuters need to be grouped into the basic
categories based upon the mode used by them. Further stratification is done amongst
these categories according to the socioeconomic characteristics and system
characteristics.
5.1.3 Analysis of Revealed Preference (RP) Data Mode choice behaviour of the commuters in different income groups, variable
trip lengths and based upon availability of mode has to be studied thoroughly. The
share of various modes in various homogeneous segments identifies the parameters
that are instrumental in choice decision. The response of commuters in choosing a
mode has to be studied for different walk time, wait time and other out-of-vehicle
travel time.
51
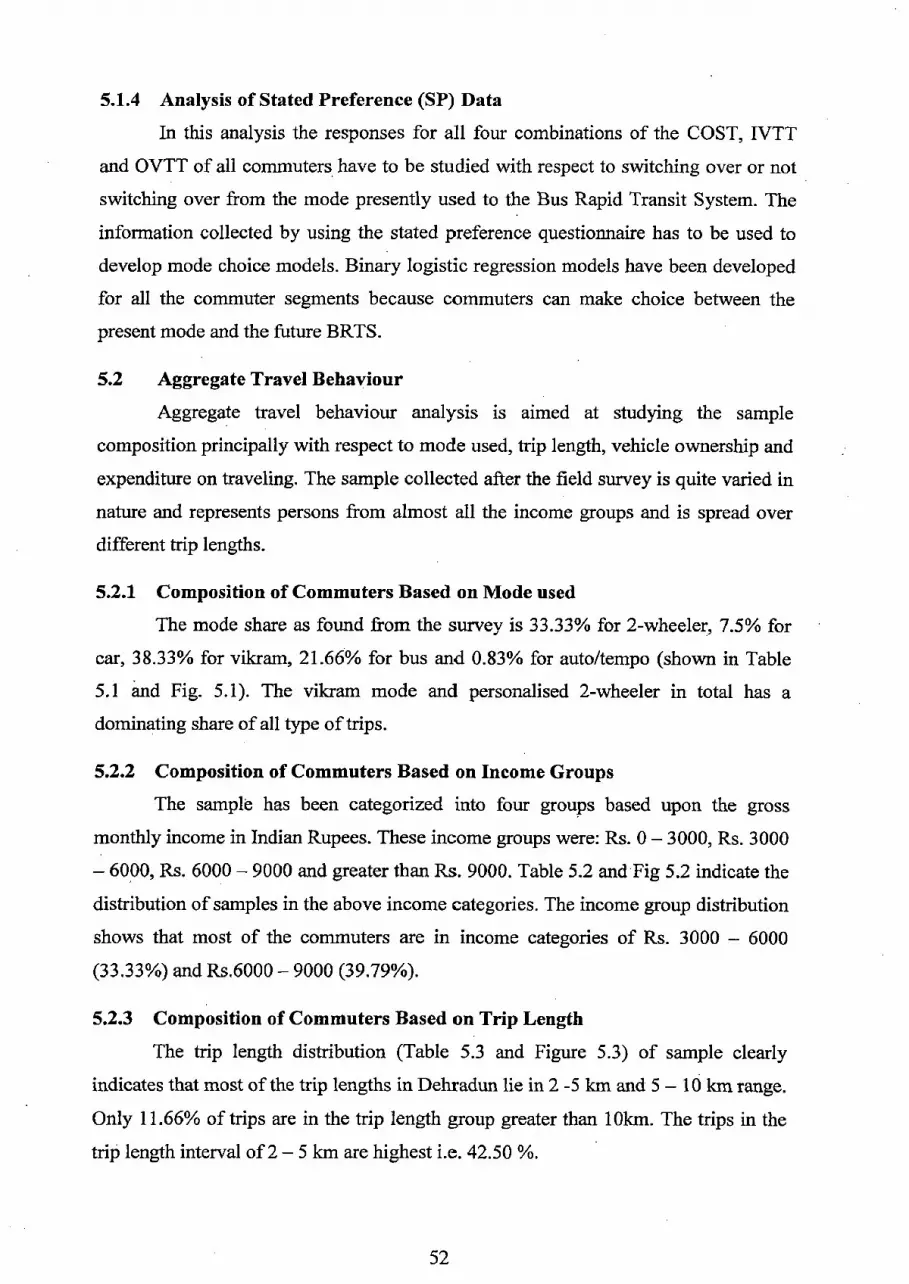
5.1.4 Analysis of Stated Preference (SP) Data
In this analysis the responses for all four combinations of the COST, IVTT
and OVTT of all commuters, have to be studied with respect to switching over or not
switching over from the mode presently used to the Bus Rapid Transit System. The
information collected by using the stated preference questionnaire has to be used to
develop mode choice models. Binary logistic regression models have been developed
for all the commuter segments because commuters can make choice between the
present mode and the future BRTS.
5.2 Aggregate Travel Behaviour Aggregate travel behaviour analysis is aimed at studying the sample
composition principally with respect to mode used, trip length, vehicle ownership and
expenditure on traveling. The sample collected after the field survey is quite varied in
nature and represents persons from almost all the income groups and is spread over
different trip lengths.
5.2.1 Composition of Commuters Based on Mode used The mode share as found from the survey is 33.33% for 2-wheeler, 7.5% for
car, 38.33% for vikram, 21.66% for bus and 0.83% for auto/tempo (shown in Table
5.1 and Fig. 5.1). The vikram mode and personalised 2-wheeler in total has a
dominating share of all type of trips.
5.2.2 Composition of Commuters Based on Income Groups The sample has been categorized into four groups based upon the gross
monthly income in Indian Rupees. These income groups were: Rs. 0 — 3000, Rs. 3000
— 6000, Rs. 6000 — 9000 and greater than Rs. 9000. Table 5.2 and Fig 5.2 indicate the
distribution of samples in the above income categories. The income group distribution
shows that most of the commuters are in income categories of Rs. 3000 — 6000
(33.33%) and Rs.6000 — 9000 (39.79%).
5.2.3 Composition of Commuters Based on Trip Length
The trip length distribution (Table 5.3 and Figure 5.3) of sample clearly
indicates that most of the trip lengths in Dehradun lie in 2 -5 km and 5 — 10 km range.
Only 11.66% of trips are in the trip length group greater than 10km. The trips in the
trip length interval of 2 — 5 km are highest i.e. 42.50 %.
52

5.2.4 Composition of Commuters Based on Vehicle Ownership
Based on the vehicle ownership there are three categories have been
considered i.e. Persons owning two-wheeler, Persons owning car and persons owning
no vehicle. This classification (Table 5.4 and Fig 5.4) indicates that 51.67 %
commuters own two-wheeler and 10% commuters own car and 3 8.3 3 % commuters
have no vehicle and these commuters are principally captive to public transport system.
5.2.5 Composition of Commuters Based on Expenditure on Transport by Different Income Groups
Classification of commuters for their trip on the basis of average monthly
income and expenditure on traveling (Table 5.5 and Fig5.5) shows that, mostly for all
income groups, the commuters spend nearly at an average of 10 % of their income
only for commuting. This type of study can be used very significantly to decide the
fare structure of the public transit system so that commuters of lower income group
have to bear lesser burden of transport expenditure compared to people of higher income groups.
5.2.6 Composition of Commuters Based on Trip Purpose
Table 5.6 and Fig 5.6 show the sample distribution based on trip purpose. It
can be clearly observed that work trips are prominent among other trip purpose and
constitute a 74.17 % of total trips. The compositions of other trips are 14.16 % for
education, 7.50 % for shopping, 2.5 % for social and 1.67 % for recreational trips.
Table 5.1 Sample Size Distribution Based on Mode Used
S.No MODE USED NO. OF COMMUTERS % 1 2- WHEELER 40 33.33 2 CAR 9 7.50 3 VIKRAM 46 38.33 4 BUS 26 21.66 5 AUTO/TEMPO 1 0.83
TOTAL 120. 100
53

Table 5.2 Sample Size Distribution Based on Income Categories
S.No INCOME CATAGORIES Rs/Month
NO. OF COMMUTERS
o ~O
1 0-3000 8 8.60 2 3000-6000 31 33.33 3 6000-9000 37. 39.79 4 >9000 17 18.28
TOTAL 93 100
Table 5.3 Sample Size Distribution Based on Trip Length
S.No TRIP LENGTH (Km) NO. OF COMMUTERS
%
1 0 - 2 17 14.16 2 2-5 51 42.50 3 5-10 38 31.66 4 >10 14 11.66
TOTAL 120 100
Table 5.4 Composition of Commuters Based on Vehicle Owned
S.No. TYPE OF VEHICLE NO.OF COMMUTERS
%
1 TWO - WHEELER (2-W) 62 51.67 2 FOUR - WHEELER 12 10.00 3 NO VEHICLE 46 38.33
TOTAL 120 100
54

Table 5.5 Expenditure on Traveling by Different Income Groups (%)
INCOME GROUPS
EXPENDITURE ON TRANSPORT (Rs)
<300 300-600 600-1000 >1000
<3000 66.67 25.00 8.33 -- 3000-6000 12.82 51.28 25.64 10.26 6000-9000 14.89 38.31 31.91 14.89 >9000 4.55 13.64 31.81 50.00
Table 5.6 Sample Size Distribution Based on Trip Purpose
S.No TRIP PURPOSE COMMUTERS 1 WORK 89 _ 74.17
2 EDUCATION 17 14.16
3 SHOPPING 9 7.50
4 SOCIAL 3 2.50
5 RECREATION 2 1.67
TOTAL 120 100
55

50
45
co 40
F 35
2 30
o25
U-
15
z10
5
0
MODE USED
•2-WHEELER 9 CAR ®VIKRAM 0 BUS ❑ AUTO/TEMPO
Fig 5.1 Sample Size Distribution Based on Mode Used
40
35
W 30 I-
25
0 20 0 LL 15 0 O 10 Z
5
/1
0-3000 3000-6000 6000-9000 >9000 INCOME (Rs Per Month)
■ 0-3000 o 3000-6000 a 6000-9000 M >9000
Fig 5.2 Sample Size Distribution Based on Income Categories
56

60
50 c LU I-- 40 M
0 30 0 a_ O 20 O Z 10
0
iH 0-2 2to5 5to10 >10
TRIP LENGTH (In Km) ■0-2 m2to5 ®5to10 a>10
Fig 5.3 Sample Size Distribution Based on Trip Length
60
50
_ 40 z w ix 30 w a
20
10
0 WO - WHEELER FOUR - WHEELER NO VEHICLE
VEHICLE OWNED
Fig 5.4 Sample Size Distribution Based on Vehicle Owned
57

80
70
60
z 50
0 40
0. 30
20
10
0
I Ø /WI I ø,1irø6iwi4
<3000 3000-6000 6000-9000 >9000 INCOME (IN Rs)
Fig 5.5 Expenditure on Travel by Different Income Groups
60
50
U, w 40
0 30 V LL
O 20 z
10
0 0 -2 2to5 5to10 >10
TRIP LENGTH (In Km)
Fig 5.6 Sample Size Distribution Based on Trip Length
58

5.2.7 Composition of Commuters Based on Profession
Table 5.7 and Fig 5.7 show the sample size distribution based on profession of
commuters. This distribution clearly indicates that major portions of 33.33 % of
sample are in private service and 26.67 % commuters are in government services. The
commuters having business as profession constitute 20.83 %, students having 15.83 %
and rest 3.33 % are others.
5.2.8 Composition of Commuters Based on Size of Family
Table 5.8 and Fig 5.8 shows sample size distribution based on family members
and it is observed that most of the commuters have family size of 4 -- 6 members
(67.50 %).
Table 5.7 Sample Size Distribution Based on Profession
S.No PROFESSION NO. OF COMMUTERS
1 STATE/CENTRAL GOVT. SERVICE 32 26.67 2 PRIVATE SERVICE 40 33.33 3 BUSINESS 25 20.83 4 STUDENT 19 15.83 5 OTHERS 4 3.33
TOTAL 120 100
Table 5.8 Composition of Commuters Based on Size of Family
S.No. NO. OF FAMILY MEMBERS NO. OF COMMUTERS
%
1 3 16 13.33 2 4-6 81 67.50 3 ?7 23 19.16
TOTAL 120 100
59

45
40
0 35 w Iii 1-. 30
25 0 020 U- 015
z 10
5
0
STATE/CENTRAL GOVT. SERVICE
PRIVATE SERVICE
BUSINESS
0 STUDENT
i2 OTHERS
PROFESSION
Fig 5.7 Sample Size Distribution Based on Profession of the Commuters
90 80
Cl) 70
w 60
50 0 0 40 LL. o 30
020 z 10
0
3 4to6 NO OF FAMILY MEMBERS
4to6
Fig 5.8 Sample Size Distribution Based on Family Size of the Commuters

5.3 MODE CHOICE ANALYSIS BASED ON REVEALED PREFERENCE (RP)
5.3.1 Mode Choice of Commuters Based on Different Income Groups
Table 5.9 and Fig 5.9 show the mode choice of commuters based on income
groups. The following points may deciphered from the table.
1. It is clear from this table that low income group people tend to use public
transport mode although they own vehicle. For income group less than•
Rs.3000, 50% people are using vikram and 37.5% are using bus mode for their
travel. This may be due to the fact that cost of journey plays a vital role in
choosing mode for low income group people. As the income level increases,
using of personalized vehicles are increasing for their work journey.
2. For income group Rs.3000-6000, 38.48 % of the commuters are using bus
mode and 32.26 % are using vikram for travel. The composition of two-
wheeler mode is 22.58 %.
3. For income group Rs.6000-9000, the commuters relying on two-wheeler mode
are 37.84 %, 29.73 % on bus mode and 24.33 % on vikram mode as their
travel option.
4. For income group more than Rs.9000, 47.06 % rely on two-wheeler mode and
23.53 % on car as their travel. The share of bus mode commuters is 17.64 %
and hired mode is 11.76 %.
Table 5.9 Mode Choices of Commuters Based on Income Group (In Percent)
INCOME GROUPS
(RslMONTH)
MODE USED 2
WHEELER CAR BUS VIKRAM AUTO/TEMPO
<3000 12.50 -- 37.50 50.00 --
3000-6000 22.58 3.23 38.48 32.26 3.23
6000-9000 37.84 2.70 29.73 24.33 5.40
>9000 47.06 23.53 17.64 -- 11.76
5.3.2 Mode Choice of Commuters Based on Trip Lengths
Table . 5.10 and Fig 5.10 show mode choice of commuters based on trip
lengths. The following points can be deciphered from the table.
61

Table 5.10 Mode Choices of Commuters Based on Trip Length (In Percent)
TRIP LENGTH(Km)
MODE USED
WHEELER CAR BUS VIKRAM AUTO/TEMPO
0-2 29.41 -- 17.65 52.94 --
2-5 27.45 5.88 25.49 37.26 3.92
5-10 28.95 15.79 31.58 21.05 2.63
>10 21.43 21.43 35.71 21.43 --
1. For trip length less than 2 km the share of car and hired mode is nil and the
share of vikram is 52.94 %, bus mode is 17.65 % and the share of two-wheeler
is 29.41 %.
2. For trip length 2-5 km the share of vikram mode accounts for 37.26 % and that
for bus and two-wheeler mode is 25.49 % and 27.45 % respectively. This is
due to the fact that for this range of trip length vikram and bus mode is viable
alternative due to better accessibility to origin and destination.
3. For trip length 5-10 km, the modal share for two-wheeler is 28.95 % and for
bus and vikram mode is 31.58 % and 21.05 % respectively.
4. For trip length greater than 10 km, 35.71 % commuters were using bus mode
and 21.43 '% were using vikram mode for work journey. In this segment two-
wheeler and car mode is used by 21.43 % and 21.43 % respectively. Thus for
longer journeys the trend of using all modes is approximately the same.
62
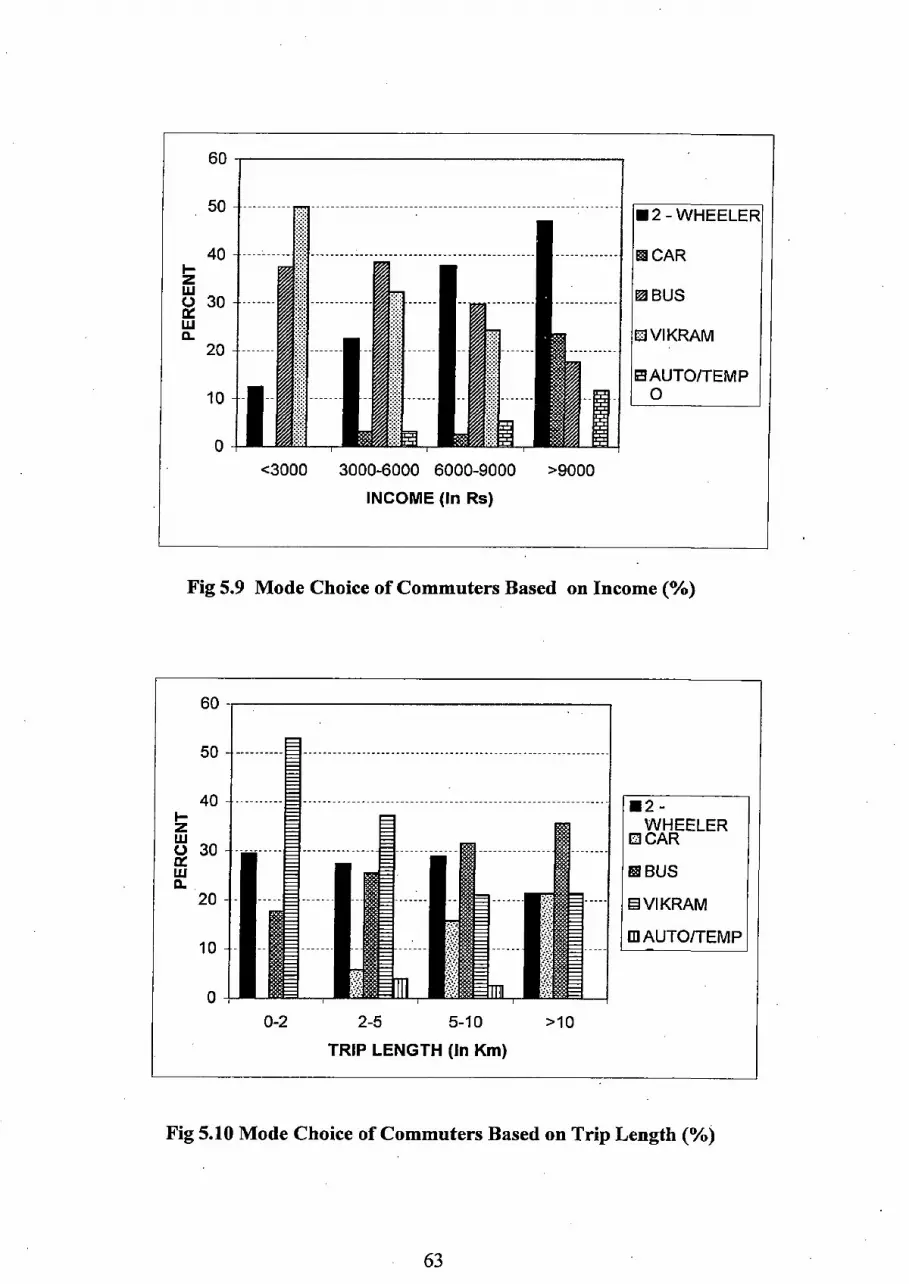
.1
1
0 ____
• 1
ii "
f
/
c• / ! /
111 111 •111 •111 •111 •111
•
Fig 5.9 Mode Choice of Commuters Based on Income (%)
60
vzw 3500 ---
----------------------- 40
-
---------------------
---------------------------------------------------------------------------------------------------------
00W2
C A
- HRE
ELER
a
10
20 ®VI KRAM
Uj Ill BUS
M AUTO/TEMP
0
0-2 2-5 5-10 >10
TRIP LENGTH (In Km)
Fig 5.10 Mode Choice of Commuters Based on Trip Length (%)
63

5.4 MODE CHOICE ANALYSIS BASED ON STATED PREFERENCE (SP) This section deals with responses of different mode using commuters towards
the four combinations of Cost of Travel (COST), In-Vehicle Travel Time (IVTT) and
Out-of-Vehicle Travel Time (OVTT) to study the switching over behaviour to Bus
Rapid Transit System.
5.4.1 Switching Over Behaviour of 2-Wheeler Mode Commuters
1. For 20% reduction in Cost, 10% reduction in IVTT and 15 minutes of OVTT, 25% persons would like to shift from their present mode of travel i.e. Two-wheeler to the BRTS. This indicates that the persons were less interested in walking and waiting at bus stops, even though reduction in cost.
2. For the same 20% reduction in Cost, 20% reduction in IVTT and 10 minutes of OVTT, 50% persons would like to shift from their present mode of travel to the BRTS. This clearly indicating that IVTT and OVTT play an important role in selecting the mode.
3. For 50% reduction in Cost, 20% reduction in IVTT and 15 minutes of OVTT, 40% persons would like to shift from their present mode of travel to the BRTS. This again indicates that OVTT play a.wider role in selecting mode even though a half reduction in Cost. These type of commuters might be of higher income and more trip length group.
4. For same 50% reduction in Cost, 10% reduction in IVTT and 10 minutes of OVTT, 70% persons would like to shift from their present mode of travel to the BRTS. This combination having the highest switching over percent from their present mode towards BRTS. Cost and OVTT plays an important role for these type of commuters.
5.4.2 Switching Over Behaviour of Vikram Mode Commuters 1. For 50% increase in Cost, 20% reduction in IVTT and 15 minutes of OVTT,
70% persons would like to shift from their present mode of travel to the
BRTS. People are more interested in using new innovative mode of BRTS
than vikram due to fast of travel and traffic congestion even though the cost
increases to 1.5 times the present mode.
2. For same 50% increase in Cost, 60% reduction in IVTT and 10 minutes of
OVTT, 73% persons would like to shift from their present mode of travel to
the BRTS. This will indicates people more sensitive to IVTT and OVTT.

3. For 100% increase in Cost of travel, 60% reduction in IVTT and 15 minutes of
OVTT, 61% persons would like to shift from their present mode of travel to
the BRTS. This reduction in percent compared to above combination will have
the effect of doubling the cost than reduction in IVTT.
4. For the same 100% increase in Cost of travel, 20% reduction in IVTT and 10
minutes of OVTT, 26% persons would like to shift from their present mode of
travel to the BRTS. This high reduction in switching percent of commuters
might belong to lower income group and longer trip makers.
5.4.3 Switching Over Behaviour of Bus Mode Commuters 1 The four combinations of the three attributes COST, IVTT and OVTT for bus
mode are same as the vikram mode as shown in the previous chapter.
2. For above four combinations the switching behaviour of commuters towards
BRTS are 77%, 73%, 69% and 27% respectively. A similar type of vikram
mode behaviour were observed.
5.4.4 Switching Over Behaviour of Car Mode Commuters 1. For 50% reduction in Cost of travel, 10% reduction in IVTT and 15 minutes of
OVTT, 33% of commuters would like to shift from their present mode of
travel to the BRTS. This category people might be of high income group and
OVTT will consider as main factor.
2. For same 50% reduction in Cost of travel, 20% reduction in IVTT and 10
minutes of OVTT, 55% of commuters would like to shift from their present
mode of travel to the BRTS. This clearly indicates that these category people
might be of middle income groups and all the three attributes will be important
to them.
3. For 80% reduction in Cost of travel, 20% reduction in IVTT and 15 minutes of
OVTT, 44% of commuters would like to shift from their present mode of
travel to the BRTS. For these category people it seems that OVTT is important
to them.
4. For same 80% reduction in Cost of travel, 10% reduction in IVTT and 10
minutes of OVTT, 67% of commuters would like to shift from their present
mode of travel to the BRTS. This combination is having the highest switching
over percent than other combinations due high reduction in cost of travel and
less OVTT.

CHAPTER 6
MODEL DEVELOPMENT AND ANALYTICAL RESULTS BASED ON STATED PREFERENCE DATA
6.1 APPROACH TO MODE CHOICE MODEL For the study of mode choice behaviour of commuters, Binomial (or binary)
logistic regression is most prominent methodology for modelling when the dependent
is a dichotomy and the independents are of any type. In this thesis, an attempt has
been made to study the switching over behavior of vikram, bus and personalized
vehicle users to Bus Rapid Transit System. This chapter deals with development of
logistic regression model, specification of utility function, variables, choice set
determination, model calibration and sensitivity analysis in great detail.
6.2 DEVELOPMENT OF LOGISTIC REGRESSION MODEL
6.2.1 Introduction to Logistic Regression Model Logistic regression is part of a category of statistical models called generalized
linear models. This broad class of models includes ordinary regression and ANOVA,
as well as multivariate statistics such as ANCOVA and loglinear regression. Logistic
regression allows one to predict a discrete outcome, such as group membership, from
a set of variables that may be continuous, discrete, dichotomous, or a mix of any of
these. Generally, the dependent or response variable is dichotomous, such as
presence/absence or success/failure. The probability of success/failure will be either 0
or 1. Discriminant analysis is also used to predict group membership with only two
groups. However, discriminant analysis can only be used with continuous independent
variables. Thus, in instances where the independent variables are a categorical, or a
mix of continuous and categorical, logistic regression is preferred. As mentioned
previously, the independent or predictor variables in logistic regression can take any
form. That is, logistic regression makes no assumption about the distribution of the
independent variables. They do not have to be normally distributed, linearly related or
of equal variance within each group. The relationship between the predictor and
response variables is not a linear function in logistic regression; instead, the logistic
regression function is used, which is the logit transformation of the variable.

Logistic regression applies maximum likelihood estimation after transforming
the dependent into a logit . variable (the natural log of the odds of the dependent
occurring or not). In this way, logistic regression estimates the probability of a certain
event occurring. logit coefficients corresponds to be the coefficients in the logistic
regression equation, the standardized logit coefficients correspond to pseudo R2 statistic is available to summarize the strength of the relationship. The success of the
logistic regression can be assessed by looking at the classification table, showing
correct and incorrect classifications of the dichotomous, ordinal, or polytomous
dependent. Also, goodness-of-fit tests such as model chi-square are available as
indicators of model appropriateness as is the Wald statistic to test the significance of
individual independent variables.
Odds, odds ratios, and logits are all important basic terms in logistic
regression. Logits (log odds) are the natural log of the odds ratio, expressed as In
(odds ratio). Parameter estimates (coefficients) are logits of explanatory variables
used in the logistic regression equation to estimate the log odds that the dependent
equals I (binomial logistic regression) or that the dependent equals its highest/last
value. Odds ratio is the most common way of interpreting a logit is to convert it to an
odds ratio using the exp (function). The closer the odds ratio is to 1.0, the more the
independent variable's categories (ex., male and female for gender) don't matter and
are independent of the dependent variable, with 1.0 representing full statistical
independence.
6.2.1.1 Assumptions of logistic regression model 1. Logistic regression . does not assume a linear relationship between the
dependents and the independents. It may handle nonlinear effects even when
exponential and polynomial terms are not explicitly added as additional
independents because the logit link function on the left-hand side of the
logistic regression equation is non-linear.
2. The dependent variable need not be normally distributed (but does assume its
distribution is within the range of the exponential family of distributions, such
as normal, Poisson, binomial,. gamma).
3. The dependent variable need not be homoscedastic for each level of the
independents; that is, there is no homogeneity of variance assumption:
variances need not be the same within categories.
67

4. Normally distributed error terms are not assumed.
5. Logistic regression does not require that the independents be interval.
6. Logistic regression does not require that the independents be unbounded.
6.2.2 Utility Function Concept in Mode Choice Modelling A commuter chooses a particular mode of transport if its utility is higher i.e.
maximum in comparison to other modes. In other words a mode is selected if its
disutility is minimum with respect to other modes. The probability of an individual
choosing a given option of commuters is a function of their socioeconomic
characteristics and the relative attractiveness of the option. To represent the
attractiveness of the alternativeness of the alternatives the concept of utility is used.
Alternatives, do not produce utility, this is derived from their characteristics
(Lancaster 1966) and those of individual. For example, the observable utility is
usually defined as linear combinations of variables. The general form of utility
function is
Umode J a. +a,x11 + a2x2 +a3 x3 ...............
Where a0 , a1 , a2 , a3 .................... are the regression coefficients
X11, x21, x31 ................. are the variables
A mode `x' is chosen over mode `y' if the utility of mode `x' is higher then mode `y'.
The variables in the utility equation are of following types.
i. Generic variable
A variable which appears in the utility function of all the alternatives is called
generic variable. The variables used in developing mode choice models for the
present study are taken as generic variables. A model based on generic variables is
quite useful estimating the demand of innovative mode.
ii. Alternative specific variable
A variable that occurs in utility function of particular alternative then it is
termed as alternative specific variable.

In the present thesis, the various influencing variables i.e. in-vehicle travel
time (IVTT), out-of-vehicle time (OVTT) and travel cost are specified generically.
6.2.3 Mode Choice Model Based'on Stated Preference
In stated preference questionnaire each commuter was asked to compare the
system attributes i.e. COST, IVTT and OVTT between his/her present mode and the
hypothetical Bus Rapid Transit System. Hence the choice set for all the commuters
has been binary (0 or 1 i.e. chose or not). The independent variable information about
the above two alternatives are utilized to develop binary logistic regression model for
SP information.
6.2.4 Segmentation Strategy for Analysis
For developing the logistic regression models, mode wise segmentation were
used. A total of 3 set of modes were taken i.e. 2-wheeler, vikram and bus. As the car
mode user's data were very less, the regression model can't buildup as much.
Therefore this was neglected for the analysis.
6.2.5 Logistic Regression Model Derivation Based on SP Approach
Let u1 and u2 are the two utility functions for two different modes of travel,
then the probability of using mode 1 and 2 are given by
e U1
p1 = e +eU2
e uz
P2 — U u' +eu e 2
Where U1 = a. + a1x11 + a2x21 + a3x31
U2 = a1x12 + a2x22 + a3x32
........................................... (i)
........................................... (ii)
ao , al , a2 , a3 Are the regression coefficients
x11 , x21 , x31 Are the three attributes i.e. Cost of Travel, IVTT and
OVTT of the mode 1 respectively.
x12 , x22 , x32
Are the three attributes i.e. Cost of Travel, IVTT and
OVTT of the mode 2 respectively
For mode 2, the coefficient 'a0' will be equal to Zero.

p1 .......................................................(iii) P2
Applying `log' on both sides of equation (iii), we get
Pl = u, — U 2 = Y ....................:................................ (. iv) p2
Since, Y=f ( x11 , x2, , x31 , x12 , x22 , x32 ) and -
P =j(x)
Therefore, u1—u2 = al (X 11 —X12) + a2 (x21 — x22) + a3 ('x31 —x32)
Where, . (x11 — X12) , (x21 — x22 ) and (X31 — X32) are the corresponding
differences in Cost, IVTT and OVTT for mode 1 and 2 respectively.
In this analysis model is taken 2-wheeler/vikram/bus and mode 2 is taken as
the BRTS.
(x11 —x12) = Xi
(x21 —x22) = X2
(x31 — x32) = X3
The logIP2p' and X1, X2, X3 values for all three modes of reduced stated preference
data are calculated. By using this data, with the help of regression analysis the
regression coefficients are calculated and cheked the statistical R2 values for how the
goodness of fit for the model developed. Based on this coefficients, the utility
functions for mode 1 and mode 2 are developed. Sensitivity analysis has been done
for the revised probability of modes by changing the different system variables.
6.2.6 Sequential Procedure for Analysis of SP Data using Regression
For developing the Model, the raw data has been separated for different mode
segments with the similar option set of data i.e. IA, 2A, 3A etc... Combined. The
individual decisions of data of different mode users for every option have been taken
separately. For Vikram mode user a total of 160 set of data has been reduced to 32 set
of data by taking the average of 5 set of similar option's data set into a single mean.
Similarly for 2-wheeler mode users it has reduced to 36 set and for bus mode users it
70

has reduced to 20. As car mode user's data were very less, the regression model can't
buildup as much. The probabilities and log p' values are calculated for each Pi
mode. These are shown in Tables 6.1 to 6.3. MS EXCEL software has been used for
calibrating regression coefficients based on X1, X2, X3 and log[~21p' values and
checked the statistical `R2' values of each mode separately for goodness of fit for the
model developed. Based on this coefficients, the utility functions for mode 1 and
mode 2 are developed separately. The details of regression coefficients and `R2'
values are presented in Table 6.4. Finally, Sensitivity analysis has been done for the
revised probability of modes by changing the different system variables as a part of
application of the model.
71

Cfl (O (0 O) CO a o 0 0 0 o O o a 0 0 0 0 o a o a o a 0 a 000000000000 r N N N CD N N CO N CD CD N CO O O N O CO N N CO CO CO N co CO co O N N N (0 N d O O C) N- O O N. O N. N. O r- ti N- O ti N. CD CD N. t-- r- O N. N. N- N- O 00 N. O 0 O O 0 0 O O O O 0 O O O O O O O O O O O O O Q O O O
O O O O O O O O O O O O O O O O O O O O O O O Q O a a O O O O O M 00000000000000000000000000000000 X In In In lf) to LA to ~A 0 0 0 0 0 0 O O L6 Lo ~fi L6 L6 uj L6 0 O O O O O O O
r T r T r T T T T T C- T T T r T T T T T T T T T T T T T r r T '- I 1 1 1 1 1 1 1 1 1 1 1 1 1 1 1 i 1 1 1 1 1 1 II 1 1 1 1 1
N CO O O m O O O O H O O (D Q Q O O LA O O w O 0 0 0 co O O CD O O O O X CIO '14 'V' CD O M f'- r CO OD M O CO N f- 00 00 M O CO It N CO ~}' (D O M V7 r r N i- N i- T N M N I M I N (1) 't M N M 1 N M N T N T N r T (y
co oO CO O O CO O CD 00 CO O I O CO O O O O O O O O O O O O O O a O O X T cq In O N 00 7 N 7 OO In O N 00 r N O N O T O O O O N O M T O 0) O i- 0 t-° r r O O
tO ~. N N N ` t N N N-t I M I CO CO N CO Nt N OO If I I N d. CO CO CO OO OD OO (p .0 04 H_ m
000 O 000000000000000 O 000000 O O 000 O Cf
to
m a oD c0 00 CO oO oO (O a0 CO CO N CO I ~t o0 1 CO oD N (O CO CO oO CO I 11~r N N N I N I j
O Q p p O O O O O O O O O O O O O o O O O O O O O O O O O O O O to a o
co
m Lo Lo LoLnLr)LoL~Ln0000000C)mLf) oLoLoLnUnu00000000a`~ T T T r r r T T T T T T T T T T T T T r T T T T T T T T T T T (N
O
U)
cp co C, 1-- m O N N : w o0 C N N CO oR P co CO I~ M d) W (N .-- i- (C) CO T C) j O M CD T M C6 i- a CM W N cc r to c0 (I)
T T (V r T r r T r r r T T r T T T T r T N r r T r.
o v cc
( j d m co M CD d CV N c~ N ch N
U M
- 00000000000000000000 0 0 0 0 0 0 0 0 0 0 0 0 0
I-
~
CO r- N CO N r r N CO r N M N T T N T N N r T N W T N N r r N pp s T
00 OO N COo0 '~t o0 N oO o0 00 N o0 00 00 N o0 N ~-- tc? CO (O to to ~ f- CD U) to N. CO In (C) 'cl' 1- CO to O V
0 C .- N M d u) CO N- COO) O T N co ~} to CD N COO) O T N Z T N (1) I (C) W I- CO O r r T r r T N N N N N N N N N N M (V) M w fA >
N
N CD (O O N O CO C4 CO p C~ CO rn CO M CO CO O ch CO O CO CO p) O O O c7 Cp Q_ O O O
~ T O O O
p O O O O O O O O O O p O O p O O M O O O C) 00 0 O O ti oar'- oo o CO N- T N a r--r-~oot-- oo N- ti r,- N-
CO CO ct CL) CO CD O CO (D T CO T CO CO T C) CO (p CD (0 T l- C~ ) cc O O O O p O O O p O O 0 O
I O OI O OI O~ O~
O O O O O 0 O O O O O O O O O O O O O Q O O O O O O O O M O It O O O O It O O O O O O 0 0 0 0 0 0 ~' O O O O t O O O x tfi V M d U) V' M IT LO O O O G O O O O to d 4 L6 -q- 6 v L6 O
T T T T T T r T T T T T T T T T T T T T T T T T T T r' T
0 p p O O O O O tl O O p 0 0 0 O O O O O O O O O p ~y O Cp O O O N O O O O (O O O O CV O X N O O N O C7 O V (D W f7 CO C7 d I~ CO f~ 1n Ln ~j w N f-- 00 T CO ' m CV (N m r Cp - N T T r N r [- O O r N s- N r T
O 0 O O O O O O M O O O O O O O O M O O O O O O O O f- O X 00 In f~ O 00 ") CO IT C7 od I- O 00 lf) CO v M CO O "T O CO O N 00 CO CO T N N N N CV CV CV r CV r- CV (V (V CV CV CV C7 In Cry LD L{j lfj ~rj
N ti ti F m cc cc cc CO 00 CO CO u) CO 00 to CO CO CO CO (0 COO CO N CO 00 W (0 Cfl COO N 0 0 0 0 0 0 0 0 0 0 0 0 0 0 0 0 0 o 0 0 0 0 0 o a c o
m m
N N V N CO N N N LO N N N dt N N chi N M N N CO ~t d cM op n. a o0000000000000c000~00000000~o
0 0
co
co co
m d h C7 w O m T 00 M O OO O f~ N M O T M r T M r T M d f~ C7 In r ( 7 T 00 M O O M ) cc
0 co
O M M 00 M 00
m T N r CO N N N N (00 CO O CO . '' r C) M CO '' Cfl Op T OT N N
N T U) N r
W CO) ~ O
m ~7
u)- O v Ln 00 N O LO- v LO 00 N O N O 00 p CO M N N ~t
O U) Oj M
V 0 N. N- of LL Ci o N C,.) cv) M
0 CM d co "t co
0 ` O~COONN N N M O N a)0 N ~ N NMO~ ~OONT N (N 0)
o N N N N
i N co co C c ) co
`'' CO O U) r LC) C) CC) N- M CD O U) . U) C) CO I- M CO O LO - CO Cl U) N. N CO C') . N C') C') C') N E+ry T C'). (N C') C') C') N C T C')' (N C') c') C') N CD
N N N
N r N- N. CO CC) CO Q ~ - cc Lo CO CO CO CD N CO CCD (0 v CO N CO COo co
c7 cM In lf) v (0 M M lf) to Nr cM co lA 1p et M 0 U
?O O T (vJ C7 N. O O .- N co t] W CO N. CO N M O ~` O O r T - T .- T- r- e- N N N N N N N N N N
M C-

c~ G1 O ID O Cfl 00 a a 0 0 rn N CD CD N (O N o0 O r- r - O I. O O) ]LI Eó1[ter
O o
Iac--I
0 0 0 0 a 0 0 o 000 •0000000
OIOIOIOIOIOI(O O N O O O 1p M l- u In
0 0 0 0 0 0 1` O (Q O N o0 Cfl
N~d 1,.*:
I('4 IN~CCD Co O O O OIO O O O
~IoIciciciclm O O O O O O M N
CEO co
r O N N N O M N L() N
OIO~e-1 01 C:) c IN
CMM ca
(O r N N
m M to r lf) O f~ M N M M M N M M
cd CC N N
' C CO L!')M
IIMIICo) CO) M MIMIM

C) 0 C) o M O O C) o C) o o C) 0 C) o 0 0 o M a Cfl N N N 00 CO N N ('4w- N (0 ('4 (0 • c'i N M CO aO A N- C) O O d) N- C) C) CO O O 1` O N- C) O d ti ti O e- CO Cfl CO CO e- C4 CO CC) M CD r CO ~- M CD CO T r (D
O 999 O O 9999999 O O O O O O O O
CO In to L() U) U) O O O O O Lo Lt) Ln to lf) C) C) C) O C) [- r r T T r r r r r T r r T r r l- r 'C '-
('4 X
N N CO U) U O CP O O O (0 O LO N N CO In
U) CL1 N. CD
OO1`OOOOl--OOOMOOOOMrCo O N r OO O N- r O CO 00 '4' M O (D 00 Mx N N N M fV N N N M Ln to t ~j (O ~O to LO ecj co.
N CO CO oO 00 00 CO CO o0 00 CD oD CD 00 CO COO N N IT V' CO CO 00 O
m 0 0 0 0 C9 0 O 0 O CO O O O C O O O Q(D- N — a O O O C) C)
in
M Nr N CV N COO V' N N N co N d' c J d' CO
o0 CO CO (0 CO co rj. a a O O O O O O O O M O O O O O O O O m M
0 C) O O 00
m `- f~ O OC~N d' I~ rn OOWN'T Lo ~t r r r r r N r r r r r N O
I... r r r
a O O 2 N
m m O o0 00 d O O d ~t N M O ct N M 0 w 00 O M N N N N r r r r --- -- r C GO N o0 N N N N N r
co
m Lo I- r lA In d; f- r Ln O N CD CO co O N co 00 co to
j.. 1~ CO Ln CO W 1~ CO Cn CO O `~ r r O T r r O IT O N
'- C) CO
O CO N d • O CD N d' •Cl CO N d •O Co N; N N N N N N N N N N N N CV N N N N N N N N
0
U) r co Co Lo r CC) CO LA c- CD CO LO- CO CO LO F- N Cl) CO N M N Cl) CO (N M CV CO CO N M ('4(0 M N M M h-
M co M CM N- (D Co CMO CO oO v M co Co v CM') co 00 V. M COO
O LO to Ln M O to L6 Ln M In LO In M In LA In M N O (0 CO CO CO Lt) C.)
Z r N Md LSD (D 1~ 00 O O r N M ~i L CO f~ 00 O O IT r r Cl)
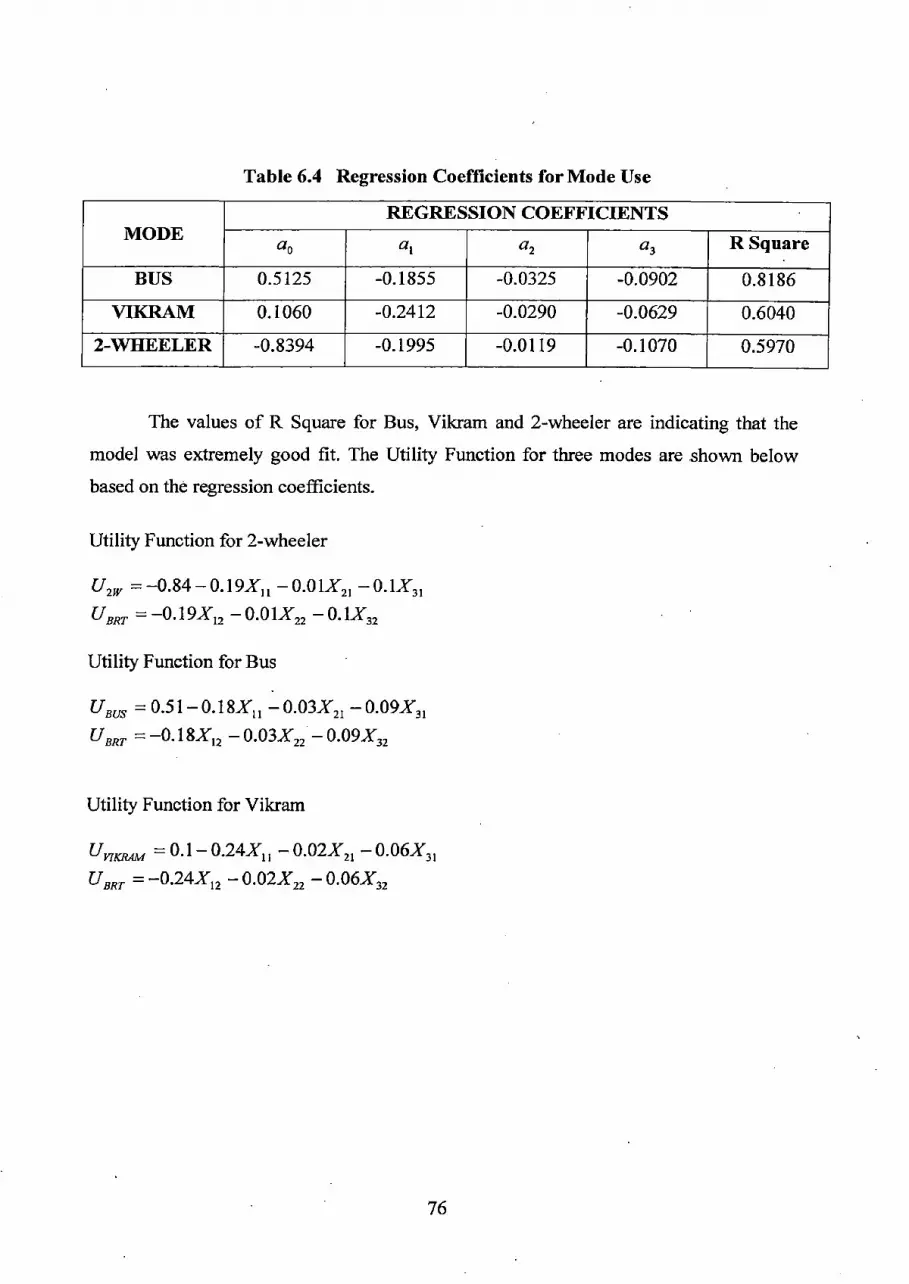
Table 6.4 Regression Coefficients for Mode Use
REGRESSION COEFFICIENTS MODE ao al a2 a3 R Square
BUS 0.5125 -0.1855 -0.0325 -0.0902 0.8186
VIKRAM 0.1060 -0.2412 -0.0290 -0.0629 0.6040 2-WHEELER -0.8394 -0.1995 -0.0119 -0.1070 0.5970
The values of R Square for Bus, Vikram and 2-wheeler are indicating that the
model was extremely good fit. The Utility Function for three modes are shown below based on the regression coefficients.
Utility Function for 2-wheeler
U2W = -0.84-0.19X11 -0.01X21 -0.1X31
UBRT = -0.19X12 - 0.01X22 -0.1X32
Utility Function for Bus
UBUS = 0.51-0.18X 11 -0.03X21 - 0.09X31
UBRT = -0.18X12 - 0.03X22 - 0.09X32
Utility Function for Vikram
= 0.1- 0.24X11 - 0.02X21 - 0.06X31 UBRT = -0.24X12 -- 0.02X22 - 0.06X32
76

6.3 REVISED PROBABILITY OF MODES BY SENSITIVITY ANALYSIS
The sensitivity analysis indicates mode-choice probability due to change in
various system variables. The revised probability of modal choice with respect to BRTS
can be calculated by the following equation.
e U BATS
e u; + e uBRT1
Where RP(i) = Revised Probability mode i with respect to BRTS
U, = Utility of mode i.
UBRIS = Utility of BRTS
= al * (Change in COST of BRTS) + a2 * (Change in IVTT of
BRTS) + a3 * (Change in OVTT of BRTS)
al , a2 , a3 = Coefficients of COST, IVTT and OVTT obtained by calibration
of logistic regression model.
For undertaking sensitivity analysis the cost of travel (COST) has been varied
from -200 paise to +200 paise, IVTT has been varied from -10 minutes to +10 minutes
and OVTT has been varied from -10 minutes to +10 minutes to assess the commuters
switching behaviour to Bus Rapid Transit System. The final revised probability have
been presented in several tables and curves shown below.
77

Table 6.5 Revised probability of 2-Wheeler Mode User Due to Change in Cost of Travel by BRTS
CHANGE IN COST (in Paise) REVISED PROBABILITY (%)
-200 0.61 -100 0.56
0 0.51 100 0.45 200 0.4
0.65
0.6
0.55-
0.5 0 nom. 0.45
N 0.4
LU 0.35
0.3 -300 -200 -100 0 100 200 300
CHANGE IN COST (Paise)
Fig 6.1 Revised Probability of 2-Wheeler Mode User Due to Change in Cost of Travel by BRTS
78

Table 6.6 Revised Probability of 2-Wheeler Mode User Due to Change in IVTT by BRTS
CHANGE IN IVTT (in minutes) REVISED PROBABILITY(%)
-10 0.53
-5 0.52
0 0.49
5 0.48 10 0.46
0.54
0.53
0.52
0.51
00 0.5 O a. 0.49
w 0.48
~ 0.47 w
0.46
0.45 -15 -10 -5 0 5 10 15
CHANGE IN IVTT (in minutes)
Fig 6.2 Revised Probability of 2-Wheeler Mode User Due to Change in IVTT by BRTS
79

Table 6.7 Revised Probability of 2-Wheeler Mode User Due to Change in OVTT by BRTS
CHANGE IN OVTT REVISED PROBABILITY(%)
-10 0.75 -5 0.63 0 0.52 5 0.38 10 0.24
0.8
0.7
! 0.6 J
0.5
0 0.4 a. 0.3 N 0.2 ui 0.1
0 -15 -10 -5 0 5 10 15
CHANGE IN OVTT (in minutes)
Fig 6.3 Revised Probability of 2-Wheeler Mode User Due to Change in OVTT by BRTS
:1

Table 6.8 Revised Probability of Vikram Mode User Due to Change in Cost by BRTS
CHANGE IN COST REVISED PROBABILITY(%)
-200 0.99 -100 0.99
0 0.99 100 0.98 200 0.97
0.98 >- 0.96
0.94 a 0.92 0 0.9 a 0.88 W 0.86
0.84 0.82- 0.8
-300 -200 -100 0 100 200 300 CHANGE IN COST (in paise)
Fig 6.4 Revised Probability of Vikram Mode User Due to Change in Cost of Travel by BRTS
81

Table 6.9 Revised Probability of Vikram Mode User Due to Change in IVTT by BRTS
CHANGE IN IVTT REVISED PROBABILITY
-10 1
-5 0.99
0 0.99
5 0.99
10 0.98
1.02
~ 1
m 0.98
o 0.96 w a c 0.94 w
W 0.92
0.9 -15 -10 -5 0 5 10 15
CHANGE IN-IVTT (in minutes)
Fig 6.5 Revised Probability of Vikram Mode User Due to Change in IVTT by BRTS
82

Table 6.10 Revised Probability of Vikram Mode User Due to Change in OVTT by BRTS
CHANGE IN OVTT REVISED PROBABILITY(%)
-10 1
-5 1
0 1
5 0.99
10 0.99
1.002
0.998
0.996
0 0.994
U3 0.992 U)
W 0.99 tr
0.988
-15 -10 -5 0 5 10 15
CHANGE IN OVTT (in minutes)
Fig 6.6 Revised Probability of Vikrm Mode User Due to Change in OVTT by BRTS

Table 6.11 Revised Probability of Bus Mode User Due to Change in Cost by BRTS
CHANGE IN COST REVISED PROBABILITY(%)
-200 0.65
-100 0.6
0 0.55
100 0.5
200 0.45
0.7
0.65
0.6 J
0.55
0 0.5 w
0.45
N 0.4
LU 0.35
0.3 -300 -200 -100 0 100 200 300
CHANGE IN COST (in paise)
Fig 6.7 Revised Probability of Bus Mode User Due to Change in Cost of Travel by BRTS

Table 6.12 Revised Probability of Bus Mode User Due to Change in IVTT by BRTS
CHANGE IN IVTT REVISED PROBABILITY(%)
-10 0.63
-5 0.6
0 0.56
5 0.51
10 0.46
0.65
0.6
Q 0.55
a. 0.5
w m j 0.45
0.4 -15 -10 -5 0 5 10 15
CHANGE IN IVTT (in minutes)
Fig 6.8 Revised Probability of Bus Mode User Due to Change in IVTT by BRTS
85-

Table 6.13 Revised Probability of Bus Mode User Due to Change in OVTT by BRTS
CHANGE IN OVTT REVISED PROBABILITY(%)
-10 0.77 -5 0.66 0 0.55 5 0.44
10 1
0.32
0.8
0.7
J 0.6
O0 0.5 a W 0.4
w 0.3
0.2 -15 -10 -5 0 5 10 15
CHANGE IN OVTT (in minutes)
Fig 6.9 Revised Probability of Bus Mode User Due to Change in OVTT by BRTS

CHAPTER 7
PROPOSED BUS RAPID TRANSIT SYSTEM FOR DEHRADUN CITY
7.1 PROPOSED CORRIDORS FOR BUS RAPID TRANSIT SYSTEM From the traffic volume studies conducted on 5 corridors, the potential
corridors for proposing the Bus Rapid Transit System were identified as listed below.
• Chakrata Road (Nanda Ki Chauki to Connaught Place)
• Haridwar Road (Jogiwala to Ballapur Chowk via Prince Chowk, Kaonli road)
• Saharanpur Road (New ISBT to Survey Chowk)
• Rajpur Road (Clement Town to Dilaram Bazar).
These proposed routes for BRTS are shown in Figure 7.1.
7.2 PROJECTED DEMAND ON THE CORRIDORS FOR THE BUS RAPID TRANSIT SYSTEM
The projected person trips in peak hour in peak direction (PHPDT) and total
switching over trips to BRTS for horizon year 2027 on Saharanpur Road have been
given in Table 7.1 and 7.2. Similarly, for Gandhi Road have been given in Table 7.3
and 7.4, for Rajpur Road shown in 7.5 and 7.6, for Chakrata Road shown in Table 7.7
and 7.8 and for Haridwar Road shown in Table 7.9 and 7.10.
The determination of total projected person trips in peak hour in peak direction
(PHPDT) has been mentioned in Chapter 3. The total probability of switching over of
commuters to BRTS is determined from the SP data and is given as 0.54.
87

41
M U SSOORI LINE DIAGRAM OF DEHRADUN CITY ROAD NETWORK
o h ,PUR a RESERVE
~~ PROPOSED ROUTES FOR BRTS FOREST 5AHASRADFi~ MALSI DEER PARK
RESERVE FOREST ROBBER'S
CAVE
BiRPUR . Q -
oQ4 `r GHANGORA Q- 2
~ Q a J
TEPKESHW TEMPLE Q~
HAT IBARKALA Q RESERVE 9 ,r4 FOREST
KAUEA ARH vIiA F CO LONY
O
F. R.I o OOSHALWAL TAPOBAN ASHRAM
DAY COL
PAONTA SAHIB CH UJUcHUWAL RAN
PREM C1►KRT VIJAY P NNAUG , NAGA VASANT
x
VIHAR LO ' KHURBURA , RA,pVR CRO ING CROSSING IQOgO
CU F~ OLD TEA o~ PATEL PA1 DA ALA RAI' R
GARDEN ~ :+ NAGAR STAT10 PR CHO ~o
BHANDARI R 0 BAfiH A 5AN1AY
rP OUR Q %
COL ONY HARBANSWALA ~Q
DHA R
• MA J RA •`
ATE -. , NH-72
1 SBT
BYPASS ROAD DEHRADOON DE NCE MOHKAMPUR
COLO Y
CLEMENTTOWN MOTHRONWALA YSAHARANPUR JOLLY GRANT AIRPORT
DOIWALA,RISHIKESH HARI DWAR
Fig 7.1 PROPOSED ROUTES FOR BRTS
88

Table 7.1 Total Projected Person Trips in PHPDT for Sahranpur Road
Type of vehicle 2-
Wheeler Car/ Jeep Bus M 11M bus Vikram Tempo Cycle CR
Traffic in peak direction 732 339 12 31 359 142 73 15
Avg. occupancy 1.4 3.5 29.92 19.9 6.72 3.64 1.48 1.8 Annual avg.
growth rate % 10 17 7 7 7 7 7 7'
Year Total 2007 1025 1187 359 617 2412 517 108 27. 6252
Total projected
2012 1650 2601 504 865 3384 725 152 38 9919
person 2017 2658 5703 706 1214 4746 1017 213 53 16309 trips in PHPDT.
2022 4281 12504 991 1702 6656 1426 298 74 27932
2027 6894 27415 1389 2387 9336 2000 418 104 49944
Table 7.2 Total Switching over trips to BRTS for Saharanpur Road
Total person Switching over Year trips (T) trips to BRTS
= 0.54xT 2007 6252 3376
2012 9919 5356
2017 16309 8807
2022 27932 15083
2027 49944 26970

Table 7.3 Total Projected Person Trips in PHPDT for Gandhi Road
Type of vehicle 2-
Wheeler Car/ Jeep Bus Mini bus Vikram Tempo Cycle CR
Traffic in peak direction 1359 714 13 51 84 194 188 11
Avg. occupancy 1.4 3.5 29.92 19.9 6.72 3.64 1.48 1.8 Annual avg.
growthrate 10 17 7 7 7 7 7 7
Year Total
Total 2007 1903 2499 389 1015 564 706 278 20 7374
projected 2012 3064 5479 546 1423 792 990 390 28 12712
person trips in
2017 4935 12012 765 1996 1110 1389 547 39 22795. 2022 7948 26336 1073 2800 1557 1948 768 55 42485
PHPDT 2027 12800 57741 1505 3927 2184 2733 1077 77 82043
Table 7.4 Total Switching over trips to BRTS for Gandhi Road
Total person Switching over Year trips (T) trips to BRTS
= 0.54xT 2007 7374 3982
2012 12712 6864
2017 22795 12309
2022 42485 22942
2027 82043 44303
.'1

Table 7.5 Total Projected Person Trips in PHPDT for Rajpur Road
Type of vehicle 2- Car/ Bus us Mini Vikram Tempo Cycle CR Wheeler Jeep bus
Traffic in peak 1113 381 17 48 308 326 93 16 direction Avg. occupancy 1.4 3.5 29.92 19.9 6.72 3.64 1.48 1.8
Annual avg. 10 17 7 7 7 7 7 7 growthrate Year Total 2007 1558 1334 509 955 2070 1187 138 29 7778
Total projecte 2012 2509 2924 713 1340 2903 1664 193 40 12287
d 2017 4042 6410 1001 1879 4072 2334 271 57 20064 person
2022 6509 14053 1403 2635 5711 3274 380 79 34045 trips in PHPDT 2027 10483 30811 1968 3696 8009 4592 533 111 60204
Table 7.6 Total Switching over trips to BRTS for Rajpur Road
Total person Switching over Year trips (T) trips to BRTS
= 0.54xT 2007 7778 4200
2012 12287 6635
2017 20064 10835
2022 34045 18384
2027 60204 32510
91

Table 7.7 Total Projected Person Trips in PHPDT for Chakrata Road
Type of vehicle 2- Car/ Mini Wheeler Jeep Bus bus Vikram Tempo Cycle CR
Traffic in peak 936 662 11 26 19 203 151 16 direction
Avg. occupancy 1.4 3.5 22'9 19.9 6.72 3.64 1.48 1.8
Annual avg. 10 17 7 7 7 7 7 7 growthrate %
Year Total 2007 1310 2317 329 517 128 739 223 29 5593
Total 2012 2110 5080 462 726 179 1036 313 40 9947 projected person 2017 3399 11137 647 1018 251 1454 440 57 18403 trips in 2022 5474 24418 908 1428 352 2039 617 79 35315 PHPDT
2027 8816 53536 1274 2002 494 2859 865 111 69957
Table 7.8 Total Switching over trips to BRTS for Chakrata Road Switching over
Total person Year - trips to BRTS
trips (T) = 0.54xT
2007 5593 3020
2012 9947 5371
2017 18403 9938
2022 35315 19070
2027 69957 37777
92

Table 7.9 Total Projected Person Trips in PHPDT for Haridwar Road
Type of vehicle 2-
Wheeler Car/ Jeep
Bus Mini bus Vikram Tempo Cycle CR
Traffic in peak direction 1167 453 3 17 103 186 105 18
Avg. occupancy 1.4 3.5 29.92 19.9 6.72 3.64 1.48 1.8 Annual avg.
growthrate % 10 17 7 7 7 7 7 7
Year Total Total 2007 1634 1586 90 338 692 677 155 32 5204
projected 2012 2631 3476 126 474 971 950 218 45 8892
person 2017 4238 7621 177 665 1362 1332 306 64 15764
trips in 2022 6825 16709 248 933 1910 1868 429 89 29011
PHPDT 2027 10991 36634 347 1309 2678 2620 601 125 55307
Table 7.10 Total Switching over trips to BRTS for Haridwar Road
Switching over Total person
Year trips to BRTS trips (T)
= 0.54xT
2007 5204 2810
2012 8892 4802
2017 15764 8513
2022 29011 15666
2027 55307 29866
93

7.3 EXISTING CROSS SECTIONAL DETAILS ON THE PROPOSED CORRIDORS Table 7.11 shows the existing road sectional details on the proposed BRTS
corridors.
Table 7.11 Existing Cross Sectional Details
S.No. Name of the Road Carriage Way (m)
Lanes
1. Saharanpur Road 9.5 2.7
2. Haridwar Road 9.0 2.6
3. Chakrata Road 9.0 2.6
4. Rajpur Road 14.0 4.0
7.4 PROPOSED CROSS SECTIONAL DETAILS ON THE PROPOSED CORRIDORS (2017)
Table 7.11 shows the -recommended cross sectional details for the horizon year
2017.
Table 7.12 Proposed Cross Sectional Details (2017)
S.No. Name of the Road Land Width Required(m)
Lanes Recommended ROW (m)
1. Saharanpur Road 9.5 6.0 30
2. Haridwar Road 9.0 6.0 30
3. Chakrata Road 9.0 6.0 30
4. Rajpur Road 14.0 6.0 40
7.5 EVOLVING CROSS SECTIONAL DETAILS FOR BUS RAPID TRANSIT SYSTEM
Option 1: At-Grade level BRTS
(a) For 30m ROW
Two central bus lanes, each of 3.5m width, one for each direction of travel
will replace the existing median. These will be abutted by a 1.Om wide physical
separator on each direction of travel. There will be a motorized lane of 6.5m wide for
each direction of travel. The motorized lane will be followed by a cycle track (2.Om
wide) and then a footpath (2.Om wide) on each direction of travel. Underneath the

footpath, there would be storm water drain. The proposed cross-section is presented in
Figure 7.2.
(b) For 40m ROW Two central bus lanes, each of 3.5m width, one for each direction of travel
will replace the existing median. These will be abutted by a 2.5m wide footpath-cum-
bus stop/shelter/platform on each side. There will be two motorized lanes for mixed
traffic, 7.Om wide for each direction of travel. The mixed lane will be abutted by a
2.5m wide parking lane (parallel) for each direction of travel. The parking lane will
followed by a slightly elevated cycle track (2.Om wide) and then a footpath (2.0m
wide) on each direction of travel. There would be storm water drain below the
footpath. The proposed cross-section is presented in Fig. 7.3.
Option 2: Elevated or Grade Separated BRTS If the ROW is inadequate and cannot be widened, and/or the route is
congested, an elevated road is proposed for the BRT .At-grade modes require more
space than elevated modes. The proposed cross-sections for 4-lane and 6-lane road are
shown in Fig. 7.4 and 7.5.
From the all above details presented, it is recommended that for the city like
Dehradun At-Grade Bus Rapid Transit System (Exclusive lanes) or Elevated
Monorail system with guided track depending on the availability of land width, traffic
congestion, type of corridor is suitable.
a

1

11000
Building Line
12000
I
III ~
Property Line ~ X5000 r
Foot path Carriage way
2000 7500 4000 7500 2000
23000
FIG.7.4 Typical cross-section of minimum right of way of road required for elevated BRTcorridor (for 4-lane)
11000
2000 10500 4000 10500 2000
29000 I
FIG.7.5 Typical cross-section of minimum right of way of road required for elevated BRTcorridor (for 6-lane)
97

CHAPTER 8
CONCLUSIONS AND RECOMMENDATIONS
8.1 CONCLUSIONS The following conclusions have been drawn based on the present study:
I.
The data collected involving face-to-face interviews of commuters in
Dehradun on stated preference technique reveals the following information
1. There is a significant high vehicle ownership in Dehradun. Based on the data
collected, 51.67% commuters have two-wheelers and 10% commuters have
car. 38.33% will have no motorised vehicle and they are principally captive to
public transport system. This clearly indicating the lack of good public
transport system.
2. In Dehradun city, vikram is the main public transport mode to those
commuters, they did not have any motorized vehicle. The mode share of
vikram was 38.33%, for two-wheeler it was 33.33% and for bus mode the
share was 21.66%.
3. Low income group commuters prefer more in choosing public transport mode
as their mode of travel, although they own vehicle. As income increasing the
vehicle ownership also increasing. For income group less than Rs.3000, 50%
people are using vikram and 37.5% are using bus mode for their travel. For
income group more than Rs.9000, 47.06 % rely on two-wheeler mode and
23.53 % on car as their travel.
4. Sample size distribution based on trip length reveals that 42.5% commuters
are making trips in the range of 2-5 km and 31.66% commuters were making
the trips in the range of 5-10km. Therefore, it is clear that for the city like
Dehradun an average trip length of commuter is around 5 - 6km.
5. The work trips are predominating among other type of trips and constitute of
74.17% of total trips.
6. Expenditure on travel based on income group reveals that, around 10% of
expenditure are due transportation. This will more impact on the lower income
group for their travel.

7. For smaller trip lengths,, share of vikram mode is higher compared to bus
mode due to more flexibility of vikram mode. As trip length increases, people
feels in-convenient for their travel. But, the two-wheeler 'mode share is nearly
similar irrespective of trip lengths. The car mode share increasing as trip
length increases.
II The commuters response based on stated preference questionnaire for different
combinations of attributes of different mode users
(a) Two-Wheeler Mode User
1. The response of commuters of different two-wheeler mode user indicates 25%
of commuters irrespective of their income would like to switchover to BRTS
at 20% reduction in cost, 10% reduction in IVTT and 15 min of OVTT and the
response of switchover for same 20% reduction in cost, 20% reduction in
IVTT and 10min of OVTT is 50%.
2. Similarly, for 50% reduction in Cost, 20% reduction in IVTT and 15 minutes
of OVTT, 40% persons would like to shift from their present mode of travel to the BRTS and For same 50% reduction in Cost, 10% reduction in IVTT and
10 min of OVTT, 70% persons would like to shift from their present mode of
travel to the BRTS. Therefore, choice 4 having highest share of switchover
percentage. Based on this scenario, we will impose Rs 4/- as cost of travel and
12.5 min as OVTT to average trip maker of two-wheeler.
(b) Vikram Mode User 1. For 50% increase in Cost, 20% reduction in IVTT and 15 minutes of OVTT,
70% persons would like to shift from their present mode of travel to the BRTS
and for the same 50% increase in Cost, 60% reduction in IVTT and 10
minutes of OVTT, 73% persons would like to shift from their present mode of
travel to the BRTS.
2. For 100% increase in Cost of travel, 60% reduction in IVTT and 15 minutes of
OVTT, 61% persons would like to shift from their present mode of travel to
the BRTS. For the same 100% increase in Cost of travel, 20% reduction in
IVTT and 10 minutes of OVTT, 26% persons would like to shift from their
present mode of travel to the BRTS. Therefore, scenario 2 having the highest
share of switching over pattern. Based on this scenario, An average cost of Rs
8 to 9/-, 16 min of IVTT and 10min of OVTT can be suggestable.
(c) Bus Mode User
For bus mode user a similar behaviour of vikram mode is observed due to the
same level of combinations. Therefore, the same suggestions as mentioned for
vikram are adoptable.
(d) Car Mode User
1. For 50% reduction in Cost of travel, 10% reduction in IVTT and 15 minutes of
OVTT, 33% of commuters would like to shift from their present mode of
travel to the BRTS and for the same 50% reduction in Cost of travel, 20%
reduction in IVTT and 10 minutes of OVTT, 55% of commuters would like to
shift from their present mode of travel to the BRTS.
2. For 80% reduction in Cost of travel, 20% reduction in IVTT and 15 minutes of
OVTT, 44% of commuters would like to shift from their present mode of
travel to the BRTS and for same 80% reduction in Cost of travel, 10%
reduction in IVTT and 10 minutes of OVTT, 67% of commuters would like to
shift from their present mode of travel to the BRTS. this mode users are more
sensitive to OVTT and IVTT. Therefore 5 to 10min OVTT is suggestable to
them.
III From the logistic regression model, the regression coefficients calibrated by
the software are significant and effect the choice behaviour of the commuters.
The logistic models developed for different mode users with respect to the
three attributes are as follows:
(a) For Two- wheeler mode (R2 = 0.5970)
U2~, =-0.84-0.19*COST-0.01*IVTT-0.1*OVTT
(b) For Vikram mode (R2 = 0.6040)
= 0.1— 0.24COST -- 0.021J/TT — 0.06OVTT
(c) For Bus mode user (R2 =0.8186)
UBUS = 0.51-0.1 8COST — 0.031J/TT — 0.090VTT
100

IV The sensitivity analysis for the Bus Rapid Transit was done for estimation of
Revised patronage of different modes. The following conclusions are drawn
based on this analysis:
(a) Two-Wheeler Mode User
1. The present share of two-wheeler mode user is 51.25%. This share would be
61% if the cost of BRTS is reduced by Rs. 2/- and the share is 40% if the cost
is increased to Rs. 2/-. The revised share of Bus Raipd Transit System 51% at
no change in cost. The revised share will be 53% if IVTT is reduced by 10
minutes and it reduced to 46% if it increased to l Ominutes.
2. The revised share is 75% if the OVTT is reduced by I0 minutes and the share
is drastically reduced to 24% if the OVTT value is increased by 10 minures. It
is clear that people are not interested in waiting, walking even though the cost
reduces.
(b) Vikram Mode User
The revised share of Vikram mode user by changing the all parameters like
Cost, IVTT and OVTT is nearly equal to 1. Therefore, it is evident that this
mode user's will strongly interested in switchover to BRTS by providing good
access to them.
(c) Bus Mode User The revised -share of bus mode user is 65% if the cost is reduced to Rs. 2/- and
it will be 45% if the cost is increased by Rs. 2/-. The change in share is 77% if
OVTT is reduced by 10 minutes and it is drastically reduced to 32% if the
OVTT is increased by 10 minutes.
For the city Dehradun, it is recommended from the all above considerations
that bus rapid transit system with at-grade BRTS or an elevated system is suitable
depending upon road width, traffic and other parameters available. The demand for
the BRTS will meet in horizon year of 2017 on the proposed corridors for the
implementation.
101

8.2 RECOMMENDATIONS The following recommendations are made for further studies.
1. The present study has been carried out using a limited set of data. A need to
carry-out this analysis with an extended data set has now been established and
the procedure has been outlined. Such a work is now recommended for being
undertaken.
2. The present study has considered three generic parameters i.e. COST, IVTT
and OVTT within the constraints time and finances. A number of socio-
economic and other level-of-service variables may be considered in the further
study for developing models which would be able to make more accurate
predictions.
3. The present study was done using simple logistic regression for analysis. It is
recommended that a number of software's are available for calibrations of
models, the predictions are done by this way gives more accurate results than
manually.
4. The role of Unified authority for implementing the new innovative mode of
Bus Rapid Transit System for Dehradun city need to be assured.
102

REFERENCES
1. Advani, M. and Tiwari, G. (2005)," Evaluation of Public Transport Systems: Case Study of Delhi Metro", START-2005 conference held at IIT Kharagpur, India.
2. Agresti, A., "An Introduction to Categorical Data Analysis", New York: John wiley, 1996.
3. Cai, J.S.,"Public Transport in China", A paper in UITP conference held on "City Transport in Asia", held in Singapore, 11-13, Oct.1988.
4. Dash, R.R.,"Public Transportation System Requirement in Bhubaneswar", A M.Tech. Project report, Indian Institute of Technology Roorkee, 2006.
5. Gupta, A., "Studies and Analysis of Proposed MRTS for Delhi", M.E. Thesis, Department of Civil Engineering, University of Roorkee, January 1995.
6. Gupta, A.K., Khanna, S.K., Panda, M., "Necessity of Multimodal Mass Transit System For Delhi", National Seminar on Advances in Transportation System: Planning and Management, IIT Madras, 1992.
7. Fam, M., "Public Transport in Singapore", A paper in UITP conference held on "City Transport in Asia", held in Singapore, 11-13, Oct.1988.
8. Hunt, J.D. and McMillan, J.D.P. (1997), "Stated Preference Examination of Attitudes towards Carpooling to work in Calgary", Transport Research Record 1598, 9-17.
9. Kumar, P., "Analysis of Interface between Bus and Rail Transportation System", M.E. Thesis, Department of Civil Engineering, University of Roorkee, March 1997.
10. Kumar, V., "An Integrated Mass Transportation System Planning on Zonal Basis", Ph.D. Thesis, University of Roorkee, 1894.
11. Liu, R.,P.E. and Guan C.Q. (2005), "Modes Biases of Urban Transportation Policies in China and their Implications ", Journal of Urban Planning and Development, vol-131, No.2, June 1, 2005, 58-70.
12. Mackett, R.L. and Edwards, M. (1996)," Developing New Urban Public Transport Systems", Transport Policy, Vol. 3, No.4, 225-239.
103

13. Mackett, R.L. and Edwards, M. (1996a)," Guidelines for Planning a New Urban Public Transport System", Proceedings of the Institution of Civil Engineers: Transport 117, 193-201.
14. Murthy, P.R.K. and Lakshmi, K.V., "Mumbai Metro Rail Project-An Over View", Journal of Institute of Urban Transport (India), 14-22, December 2006.
15. Ortuzar, J. de D. and Garrido, R.A. (1994b),"A Practical Assessment of Stated Preference Methods", Transportation 21, 289-305.
16. Ortuzar J.de.D. and Williumsen, L.G.", modelling transport", John Wiley and Sons Ltd. Baffins Lane, Chichester, West Sussex P019 IUD, England.
17. Panda, M., "Mode Choice Analysis Based on Stated and Revealed Preferences for Home Based Work Trips in Delhi", Ph.D. Thesis, Department of Civil Engineering, University of Roorkee, July, 1994.
18. Raghavachari, S. (1988), a final report on "Hyderabad Area Transportation Study (HATS)", June.
19. Rao, N., "Urban Transport System Characteristics", A Seminar Report, University of Roorkee, Roorkee, July 1993.
20. Rastogi, R., "Household Survey Design: Regional Applicability and Adaptability", Journal of Indian Highways, May 2007.
21. Rastogi, R. and Rao, K.V.K., "Collection of Stated Information for Predicting Travel Behaviour", A document.
22. Rastogi, R. and Rao, K.V.K. (2002), "Survey Design for Studying Transit Access Behaviour in Mumbai City, India", Journal of Transportation Engineering, . vol. 128 (1), American Society of Civil Engineers, USA, pp. 69-79.
23. Reddy, A.K.N., Anand Y.P. and D'Sa, Antonette (2000), "Energy for a Sustainable Road/Rail Transport System in INDIA", Energy for sustainable development, vol. IV No.1, June 2000, 29-44.
24. Reddy, B.S. "Urban Transportation in India: a Tale of Two Cities", Energy for sustainable development, vol. IV No.1, June 2000, 65-76.
25. RITES (1998), "Traffic and Transport Policies and Strategies in Urban areas in India", Final Report.
26. RITES (2004), "Development of Bus Rapid Transit System (BRTS) for Jaipur", A Detailed Project Report.
27. RITES Final Report of "Comprehensive Traffic & Transportation Plan for Dehradun City", October 2005.
104

28. Shiftan, Y., Kaplan, S. and Hakkert, S. (2003), "Scenario Building as a Tool for Planning a Sustainable Transportation System", A Journal of Transportation Research part D 8, 323-342.
29. Srivastava, P.K., "A Study on Multimodal Transport System for Delhi", M.E. Thesis, Department of Civil Engineering, University of Roorkee, March 1996.
30. Tiwari, G. (2001), "Urban Transport Priorities Meeting the Challenge of Socio-Economic Diversity in Cities-Case Study Delhi, India", 20th South African Transport Conference paper, South Africa, 16-20 July, 2001.
31. Vuchic, V.R. (1981)," Urban Public Transportation Systems and Technology", Prentice-Hull Inc, Englewood cliffs, New Jersey.
32. Zhao,B., Zhao, J. and Wang .J. (2000)," "Prospects and Characteristics of Urban Public Transport in China," Implementing efficient urban transit systems and enhance transit usage" , ASCE , New York.
33. A Detailed Project Report of "Bus Rapid Transit System for Ahmedabad", March 2006.
34. "A Document on Urban Public Transport in India: Trends, Challenges and Innovations", Indian journal of Transport Management, 578-587, December-October 2004.
35. http://www2.chass.ncsu.edu/ ark sonZpa765/logistic.htm
36. http://www.indiana.edu/—statmath/stat/all/cat/2cl.html
37. www.hbaspecto.com
105

Appendix — I
Date: Survey Form No:
STUDY ON MODE CHOICE OF COMMUTERS FOR JOURNEYS IN
DEHRADUN TRANSPORTATION ENGINEERING SECTION
DEPT. OF CIVIL ENGINEERING, IIT ROORKEE
A. PERSONAL INFORMATION: 1. Name: 2. Sex: 3. Martial Status: 4. Age: 5.Stay in Dehradun (yrs):
6. Address (Office)
Ph No: (Residence) Ph No:
7. Profession State / Central Service Private Service
Business 1 Student j Others
8. Monthly income: Rs:
9. Monthly expenditure on transport Rs:
10. Traveling allowance is given by the company yes / No If yes, the amount received per month is Rs:
B. TRAVELLERS HOUSEHOLD INFORMATION: 1. No of family members:
2. Type of house: Own/Rented
3. No of earners:
4. No of school/college going members:
5. Monthly household income: Rs
6. Monthly household expenditure on transport: Rs
7. Vehicle ownership Type Number

C. TRAVEL INFORMATION: 1. Trip purpose: Work Shenning Fcln cati ona]
Social Recreation
2. Mode chosen: Bus Vikram Personalised hired mode
Own vehicle 2- wheeler car
3. Route followed: (Important landmarks)
4. Approximate distance from home to workplace (Km)
5. No. of transfers to reach the destination:
6. Reasons for not using any public transport
7. Distance from the nearest busstop/vikram stop and frequencies:
8. Alternate modes available for work journeys
Public Transport mode Bus / Vikram
Personalised hired mode Taxi / Auto
Own vehicle Car / 2-Wheeler
Q
Stages in journey Mode used for journey
Own vehicle Public transport Hired modes Auto / Taxi Car 2-wheeler Bus Vikram
1. Walking time from house to bus stop(min) 2. Waiting time at bus stop (min) 3. In-Vehicle time 4. Walking time to destination 5. Ticket fare 6. Parking charges (Rs)
107

FOR THE SAME ROUTE TO AND FROM WORKPLACE FOLLOWING CHANGES ARE MADE, WHAT IS YOUR RESPONSE:
1. FOR BUS / VIKR.AM MODE COMMUTERS
1 Cost IVTT OVTT Choice
Mode Presently used
Alternative mode -15min
150% 80%
2 Cost IVTT OVTT Choice Mode Presently used
Alternative mode -10min
150% 40%
3 Cost IVTT OVTT Choice Mode Presently used
Alternative mode -15min
200% 40%
4 Cost IVTT OVTT Choice
Mode Presently used
Alternative mode -10min
200% 80%

2. FOR TWO WHEELER MODE COMMUTERS
1 Cost IVTT OVTT Choice
Mode Presently used
Alternative mode 15min
80% 90%
2 Cost IVTT OVTT Choice
Mode Presently used
Alternative mode 10min
80% 80%
3 Cost IVTT OVTT Choice
Mode Presently used
Alternative mode 15min
50% 80%
4 Cost IVTT OVTT Choice
Mode Presently used
Alternative mode 10min
50% 90%
109

3. FOR CAR MODE COMMUTERS
1 Cost IVTT OVTT Choice
Mode Presently used
Alternative mode 15min
50% 90%
2 Cost IVTT OVTT Choice
Mode Presently used
Alternative mode 10min
50% 80%
3 Cost IVTT OVTT Choice
Mode Presently used
Alternative mode 15min
20% 80%
4 Cost IVTT OVTT Choice
Mode Presently used
Alternative mode 10min
20% 90%
110

4. FOR HIRED MODE COMMUTERS
1 Cost IVTT OVTT Choice
Mode Presently used
Alternative mode -10min
60% 90%
2 Cost IVTT OVTT Choice
Mode Presently used
Alternative mode -5min
60% 80%
3 Cost IVTT OVTT Choice
Mode Presently used
Alternative mode -10min
20% 80%
4 Cost IVTT OVTT Choice
Mode Presently used
Alternative mode -5min
20% 90%
111

v z
V
In
e-~
Q'
O --- C
C zN
In
N

w
as
C.)
ea "
E-+
rA
O
O > LCD
~ N
~ O
z
00
N
ti
Cd
CID V
11 V
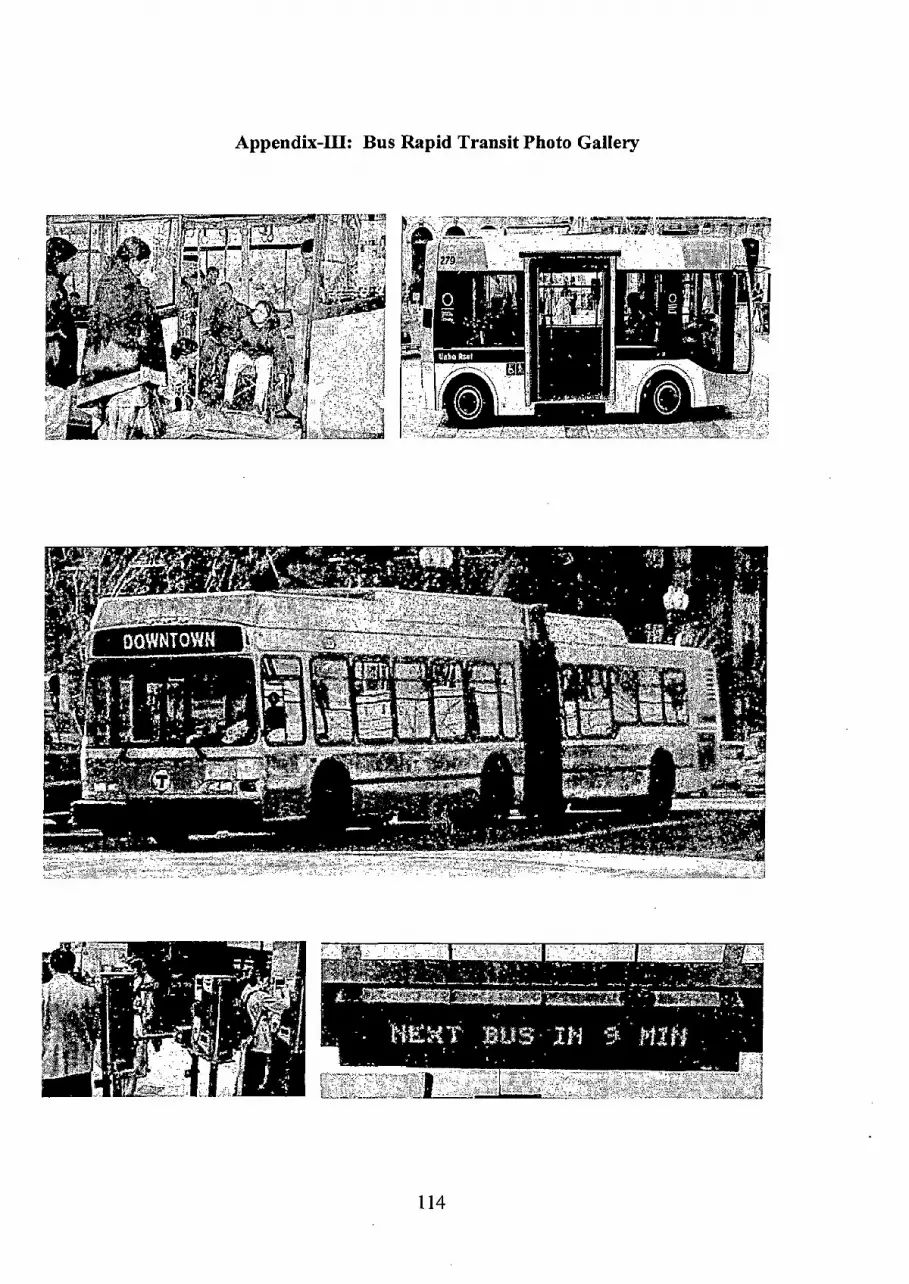
Appendix-III: Bus Rapid Transit Photo Gallery
114

115

w w H-M S S 0 U W U,
W a 0 2 It LU J LU LU
0
0 LL
❑ Q. U) U-0 U) J
LU
MCI
ai
z w
UU m
J ~ W m N N
❑ 0 r r r O r r r O r T c- O r r r r r r 00 r r O r r r O
lD LO LO In to LO LO LO LO tf) LO In lO lO LCD Lo Ln to to LO lO LO Lc) Lo lc) to to to /~/~
OW r r r r T r r T r T r r ~ r — 1— r r r r T r T r T r r r
LO N '0 m U') to tf~ O LO d 00 OO LO M 00 (O Ln 00 O O r O r O r M M M r O
U)
m '~t O V, N CO q N M W CO N N O N 00 CO N q C0 "7' I`.. N N CO CO LO CO O r r CO N N CO I' 0j CO r t1) N co O U
S O O O O O O O O O O O O 0000 O 0 0 0 0 0 0 0 0 0 0 0
0
IC) co U) M 00 M LI) to tl) 0 0 0 LI) N 00 LA ti 0 0 0 If) 10 00 r N r r' N r N -C') N r r (N r
S ~--. LC) CO CO O CO d N P- U) In CO N o Co O CO d CO N d N f- CO
O U
z O Q Q Q Q Q Q Q Q Q A Q Q Q Q Q Q Q Q Q Q 4 Q Q Q Q Q Q Q CO LI) CO I- CO O) O r N CO LO CO fl- M O) O r N CO '~ L() co N- 00 a r r c- r e- r r-- r r N N N N N N (N N N O

U) O O r O O O r O O O O N
C)
U) r r O r O r r O r r r r N
O
U[) U) U In U) r T- ?r-
In U) to LO ~f) U) 10 In N O . cM r c*i r cM r (V (h O CV M N r ('4 (0
r
CO N CO CD Co ('.1 d' CO 'f) O N M M I-T r d co N LO N'
O O O O O O O O O O O O O
'4) O O U) LO LO In UO O U O LO P r N M e" - r N M r r N Cp
co U d CD N U) CO CD r (Y) I- L
W
QaaaaaaQa¢¢Q¢ O O r- In CO I` 00 O) O Q=
z TTT
0 c O O O r. O C. C. r- r r O r O
m LU }
W m c N W 0
O r
C) r O r O r O r O r O r O r O r O r
CD r O O O O O O
°m r r r r r r
r (0 N (('4 o0 V C) r. O CO M Q) Co
m ('4 ('4 CO C') r U) CO CO r r M
N 0
O O O O O O O O O O O O O O O O O
0
U) r '4) CO 'C) Cr)
C) C')
C) r U) L() r
'4) r
O r O C) U) N C) N (N 'CT r N
~-- LO M C') CD Co ' t ('4 I- Nt U) U) m ('4 U) U) ° C.)
z ° mmmmmmmmmmmmmmmmm
r N M"T In CD 1-- m O
0

O T O r O O T T r T O O r O O T O O T T O O T Ln O
r O T O r T O O O O r r O T r O T T O O T r O O
O T O r O T O T O T O T O T O T O r O r O T O T O T O T O T O T O r O r O T O r O T O T O r O r
O CO ( co (0 r N Cr) N r N r (0 co 00 (0 r a) N r N r It N T C) 1 N r co O ~1 . (N U c- N N (N N
'C O N oD CO N CO CO -' 't (D N oo CO 00 O N co m CV N M 0) M r U) N (N O) M M CV LO \T
0 0 0 o O o 0 o a o 0 o a a o O 0 o 0 0 o a o 0
OLD O O C) LOU) 0 0 0 0 10 10 In Ln O 10 O U) O - M~ T N T N T T N M r T r N (4). T (N c
U)
M C) M ~t CO CN v 10 (N N M M t1') CO N to CO t M I- CN U)
W 0
m m m m m m m m m m m m m m m m m m m m m m m Q w O O T N M Cfl 1` 00 O O r N M't In 0 1- oO O O ~' r r N N N N N N N N N N M M M M M M M M M M W
z y O ~000Tr -o
LJ c
W m c N W
U) ["
LO r
LO '-
LO r
LO r
U)
O o0
VI
a r Cp N N CO
Cl)
1.~
m LO lq' N co 0 U
o 0 0 0 0 0
O
U) 00 M M
r-.
~--. 10 M M CD aD NY
0 U
z 0 (UUUUUU
T N LO Cp
0
-4
-4

'— T T T r t^' T r r r T r r T r r r T r T T r T T r T T T T T r T T T
O N r N r po CQ r N C~ O (o r M (y N po to T N N r N T C- r M M CQ r r N (N N M O N CO M pj M co N T r N N r N
r N N N M r N N lfJ N M CO N N r- C~ N M r N M N N co 00
O O O O O O O O O O O O O O O O O O O O O O O O O O O O O O O O O O O
LU LO Un U) U) C) C) C) ,n U) N O o U) o C) O Un U) V) O o 0 0 LU LU U) ,n U) LU O U) C) U) O
N r r r N t ' T' N r CO r N r r N. r N Cr. r r r N co '- r N Co
N f~ LO C4 N ~1 LO M M CO V N 1l- M M 0 CO N to d M r- LU
W
T r r T r r r r r r N N N N N N N N N N M M M M M M M M M M It W

Z O_ cn I.. T O O r r T O r T 00 T T Q T r Q r T T T r T - o r T r O T T Ui
fli W m N LIi ~ v
O T r O O O T O O r T O O r O O r O O O O O O O T O O O T O O
O O T r
o o O o r T r T
O o CD T r r
o T O o T T
o r O T o 0 T r
0 0 0 o a a O o O O O o O o 0 ~./~
OW v
T r r r r T T T T r r T T -
~ ) Lf) N m LO In Ln M LO LC) 00 00 L M 00 CO LO LO In rM
tf') r O M N N r M O r M O O r- O r O r M M M d O O T
10 V N r N N M C~ N ~ CV '- r- N M CV lC) T N N- C r CV T Co r- r N Cl) O V
O O O O O O O O O O O O O O O O O O O O O O O O O O O O O O O
0
U) O U) CC LO to U) U) 00 0 LO U) N O O LC) O O O U) LO O O O O U') CO Co r N r r r N f Y - N r Co r N 'V' e- N T T N Co
U) CO CO CD CO N I- Uo U) (D T N r tC) CO CD co Nr CD d U) N N- Co C') U) O
z O ••i ❑ • '_ ❑ ❑ ❑ ❑ ❑ ❑ ❑ ❑ ❑ ❑ ❑ ❑ ❑ ❑ ❑ ❑ ❑ ❑ ❑ ❑ ❑ ❑ ❑ ❑ ❑ ❑ ❑ a r N M.. U) CO N. co O O r N M Iq LO CO I` OO CA 0- (N CO lt LU (0 (- CC CA O r T r r T T N N N N N CSI N N N N Co Co 0

W F- S S 0 LU N M W
0 S
O LL
❑ a Cl) U. O. N J
W ci
~ O r r O r T r O r O
r O O r O O O r O M O
O r O r O r O r O r O T O T O O r T
O r
U) Un Ln ~n u) Un v
r r r N r N (\J Cp r
U) N
N M r M m N c T CV ~- cM a0 N
O O O O O O O O O O
U) LOU) U-) LO O ) O LO Q -'- co
U)
L
uU
N M u) CO f` w O) O 2' M M M M M M M M cr w
z 0 r T C) r T T r O T r CD r r C). O
U
J W m N
W S
0 N O O r C) O C) C). C) O r O C) r C) T O
U) O C) LC) C) X17 T- t[) LL) O Ln O U) r to Om
j. C1)
Cfl r CO r CO oO r N -. N M M (DC) N CO r N r N r N T d' N Co T -m
U)
O N
to T N T
O lA N N N T O
N O M O N
O N
tf) T O N
tp T O N
O M O N
0
N
C) N C) N O ~--' C) ~- C) In N CO) LO O It U) N}' t!) N O N O~ r- T to r U) T O M C) N
N 5
~i v M m co M lA fl- v Nr M v M M U) IT
0 V
Z O ¢ ¢ ¢ ¢ 4 ¢ ¢ ¢ ¢ Q ¢ ¢ Q ¢ ¢ ¢ ¢ a T N M LO M Il- W O O
T
r T
N T
M r
r T
Lo T
M T
I~ r

O r r r r O O r O r r O r c r r r p c— r c— O O r N-
0
O 0000r oT-oo.- 0aoOoo o000rrOr -rOoCO 0
O in O C) to Uf l O O LO CD O O O LO N La O O O O N In W
M N O N CO O CD CO O Co O I' N O Vf N t0 N o0 Cc O cc O N N N CO O - N r - t- N N M N N N d M N M N r c- M CO r N N
N
CO CO ~rj p O CO CO p CO O Cp CO O Cp 00
U') O O O O tf) O O to O O to LO O N O O O O O O O LC) O O O Lo O N r M M N N N r r N N r M e- - M N N N M r N - "t N N (N N
In LO 11') O O O cc O O Lo O O Ln O O M O O to Ln O O LC) O O O Lo O N r CO N M- N N M M M M r (D M Nr N N r t N N M Cp ('4
a)
W
Q Q Q Q Q Q Q Q Q Q Q Q Q Q Q Q Q Q Q Q Q Q Q Q Q Q Q Q Q Q 00 d) O - N M q LO CD N- 00 O) O - N M "t cc cc I- 00 O) O N M u) CD Q
N N

z O
- T Q T r r T T T CD CD T r O T [- T T C) [- [- O T [- O T T O T r
LMi (0 V
-1 4L~
W En N
0 N O O T O O O C) C) O T r O O T 00 C) O r O CD r CD O r CD O i--' O O C)
0 F" O r to r O r m
r N O r O
N O '-
O r O r LO O r O N
O r In O r
O O N
to r Ln r
O r O r m O O r In r
O O N ca o m
~ ~ 00 Co d' co 'V N C4 cO O Co '4 - CO co Co N co Co O CO 'T O O - O O N (D d N r T T T r r N r r r T r T
m
m ~n 1 1 m 'M 14) 14n U) 14) 14) ~n L ~n . r CO CO GO O) p CO Cfl CO CO CD CO co Q O CO C4 p I~- (D
o 0 V
N
O 'C) 1) O N O O O O 1f) O 14)00014) 0 0 0 O 14) O O 14) C) O 14) lf) O N r N T N N T N M N N r- N r N C) N r- N T C) C) N N N r- r- (N N - o') >
0
N
0 0 0 0 0 LO O O L) 14)00 1) 'C) m O O '4) 14) 14) O O O 14) O O 1C) O O 1C) O ~.. N N. T N CO N N' r T c- CO CV ' N r (0 U) N CO Z- N N CO c1' CO co
d' CO Nr CO CO CO 14) t` CO CO Co LO V m O) 1-- CO CD CO U) 1- Lf) NT
0 U
Z m m m m m m m m m m m m m m m m m m m m m Q m m m m m m m m m I- r N M O O t- O O r r T T O r r r r T r N N N N N O N N N N N M M
0

-- --- -- -- ---
N CD r r r r r O O O r r t— O r N O
oD O r O O O O O r r r O O O r O N
O
N O O O O LU Lo O O
O O
O O Q U co
O N CO r r r N r M r r r 0
O N r O Nr (0 (N r CO r O O r O Cp r (0 r O O N r r C r
l~ N O LO N O O LO 10 un O O lO LO N- r N- r N- N- N- CO
N-. N O O O O O O lA O O O Lo Q
N
O to O O m to O O uo O O O to O M r (p M Cf N N r r IT N N M ~p
(N
O) LO M 00 CO [n o0 ~h ~t M M to Cp LLB Lo LO
W
m m m m m m m m m m m m m m m Q (N M 't LU Cp I- CO O) O r N C) - LU CO
z r o r r r O r O O O r O ()U J I m W
N N
G~ N O r O O O r O r r r O
In O O LU O U) U) U) O om
co co Co d' r
N r r r
co -
N I.-
CO co co CO (0 CD O CO co Co
CO 0 U
N
CD N
1n r
U) N
LU r'
O N
U) (N
(N CD t- N
O M
O N
O 1!)
0
N
`-' CD O O CD E-
CD t O LU In O Q
N
I- M M (0 M [n N- CO
0 U
Z U U U U U U U U U U U r N M c LU (ON- co 0) t
o
N

r T r T r T CD r O T CD CD r T O O r O T r- O r O T T r O O T T T O r CO
O)
O
O lA O 1p O LO LO O O O O Lf ) O T O T O O tD l~ O O O Ln O LO t1) Lf) O T M O T- T T r r N r T r N O
CO Cn CO N w co O r O O O 14, r _ O O r N T CO r T N N O r '4t CQ r 'V' r a0 r O r pp mot' CO CD co O O LV IC) N N T T r r
t--
M O O O M M M O 0o O N O M ap O ~t O M O O (0 N O fD M M O O O N O O O f-
O l~ O O O In O O O O 1ST O O m O O to 1 O N 0 0 0 O LO L0 O O O l0 0 0 0 10 0 (1
U) 10U) O CD LOU) 10 O O O U) O CD LO CD CD IC) CD CD U) CD O 10 10 IC) Cl CD IC) CD CD O LO O
N
0) M M uO Iq d ~7 m O f- M m M v ~7 LO I- '4t LO M o0 CO LO OD IT M M LO Cfl t u-) LO
W
0000000000000000000000000000000000<
tn N

Z 0 o O- O o 0 T o 0 O 0 O 0 O r o r r O o- T O O O O r O O O O U H
W aI N
❑ 0 N r r O r r T O T r T r r T r C. O C. r O O T T r T O r T r r
I"' O r
lA r O r r N O T
O N
O r
O T
O r
O r
O N O r
O r O O
CN N CU) r r CC
r O O r
Ln T
O om
N
CO T
CD T
M M Cfl T
00 N CO O CO r O N r N r
N c-
CD r
N r
O N T
M O CD c-
cc M CO O '}' N c r N M M N N N t}' N T N N CO N N
—
00 cc co CO N co O 00 co CO OD CO CO O cc cc co Cfl o0 cc N CO 40 co O T
O T co
v/ O C,
N
O LI) LI) LI) C) LI) N O O O O LC) O LI) O O O LI) O O O OLI) O O LI) O O X17 LI) o N N N N M (N (N. N T N M N T (N. M c) N N (N. . N N M
0
N
O O O O OLI) O LI) B O O t1) LC) LI) O O LI) LI) to O O O O O L) O O LI) O N N N CO "T N N r' r r- r M N r' N r (p LI) N M r- N ('4 C') M M
H
CO co CO M LI) N N M M M LI) M (3) N M CO M t w N- LC) -
0
Z
❑ ❑ ❑ ❑ ❑ ❑ ❑ ❑ ❑ ❑ ❑ ❑ ❑ ❑ ❑ ❑ ❑ ❑ ❑ ❑ ❑ ❑ ❑ ❑ ❑ ❑ ❑ ❑ ❑ ❑ ❑ N M 4C) (0 I— cc O O r N M '' LI) CO N M O) O e- N M L) M N COO) O r -
o

O O O O r O O r O O O O O (N O
D O r r r r O r r- D r r r r r ti O
ti N O O CD O U) to O O O LO O O O U) C)
N co r r r N r CY) r r r
M `qr N 00 (N a0 (0 O (0 O N N N CO O ~t N r M N M N r r CM Cl) e- N N
N
O O C0 N O (O O O O O O N c0 O O
ti N O O O O U) Lo O O O U) O O O U C)
N
O LO O O LO U) U) O O U) O O O L0 O N
N
O Lo M 00 CO oO d' d M M LA CO Lo Lo Lq
LU CD
❑ ❑ ❑ ❑ ❑ ❑ ❑ ❑ ❑ ❑ ❑ ❑ ❑ ❑ ❑ Q N M U) Cfl I-- 00 O O r N M V U) CO

w I-
0 V
w Co
w G 0
0 U.
a a
LL. 0 U) J
F-LU 0
Z F.. N- ° r r r O O Q. r r r r r r O r O r r c- r e- O e- e- e- c- r-
UN ID o
J m w
N N w
C C C O
m U) O C) lA N to LO LO r LO O r O Lo N Lo Lo Lo C) U.) Lo CD to C) a0 °m v
N
~~ N co N Co 'CP N 00 'cf Cfl O It 00 N O O d It 00 (0 O Nt 00 O O co
N (N N
m ~--
CO CD N CO 07 LC) LO U) co N In U) U U N U (p ~t
° V
M 00
O O LO In O O O O O O O Q LO O LO O O O O d Lo O O Lo O Lo 00 N N r N N V N M N N M N r M r N V N N N N N M N N r- nj
N 0
Co O U) CD O O O U) O O O O O U) Cl U) to O C) O L!) O O O In U) j) LO M r N [r N CO. (0 CO N U) CO CO N N CO CO r Lo CO CO CO N N (p
cn t7 00 Cfl M C) tf') 00 t!~ In 1l- "T LO CO lA CO CO 1- (0 CO tf) Cl) U) 0 U
z w
a r N CO 4t In (0 I- CO M O r N M N N N (N r- r r r '-- e- N N N N N N N W

Z TT T
M Q O r r C) r r r C) r r r r r C. O r r r r O O r r r r N
WI- Win NN
v O r O O r 0 0 0 r O O a O O r O ~- O o a O r r O a Q a r- N O
O r
O r r
0 c)
0 r
0 (N
0 r
0 r-
0 (y
0 r
O (V
O r
O C~)
O r
O r
O r
In r
O O r
10 O M N Oro
..r
CO I N O M C4
r M N
r Ct N
N r
M O N r
d r
CO r
O O N N CO o N N T O O N N r r r r r N r r r r r N m
m c0 c0 N c0 O ef) uo IC) M N r
to U) IC) M lO N.
O LU N- L0 N 10 r O rn c~
a c7 F N. r c1 r N. I- N. 0 r0 ti 00
O U
M a
a N (N O t- N a N o ' a N
o M o N o N a M o N Ln r o M 1n r o (N 0 ' 0 N 0 N 0 N LU N o N o M Un (N o N Xn r 00 nj
O
M M
~-' O IC) C) O C) Cl U) O O C) O O I() 0 1010 O O O LU O O O Lo to IC) LU I-- M r N N M r (p M N LO M C,) N (N Cr) C'). M M M N N p I-- M
Lo E.. IC) d' lq- 00 d' CD M C) LU V CO LU LO N V IC) (0 In M o0 C) N (0 (0 14, U) O
O C.)
Z W
0 m m m m m m m m m m m m m m [o m m m m m m m m m m m Q CV C') LO CO N. COO) O r N M t7 In CO N 00 d) C) r N M Nr LC) CO X'
O Q

Z Q O r r r r C) r O r r r r c- O O t^ e- T O T O r C) r a-
o CO
V QC) o WI-
Wm C W
0 M T O O O O r O t— O O O O O ~— O T O O O T O T O T O O r M O
I" O Q'~ to LO O VP T O O r LU T O r lO O o0 pp
om r
to m O O O
CO O T O
O N r r T M O T O r N T N r
00 T
O N T N r T O O N
r r T N N T N r I- - hj T
CD O CO T
N T
O N
O T
CO T
O T
C) T
d T
O r
N T
O T
CO T
O (N T
N r
N T
C) T
M T H T
I U)
0
M 2 Co
O O LU LU Co C) Co C) O O O O LU O to O C) O O O L C) O LU O to CO N N v— N N It (N C) N (N CO N T ce) v— N V N N N N N M N N T
> 0
M 2 CO
C) LA C) O O O LU C) C) O O C) LU C) LU LU C) O O LU O C) O LU O LC) LU I— c') T N N c) r-' CO M N LU CO M T N N CO CO v— 'V M M c') CO N N p I— co
lf) V' CO '47 CO M Cl U) Nr CO En U) N v to Cp LU C1) w CD N. CD (O d UL) O
0 I II 1 1 111 I V 1111 1 I
Z w U U U U U U U U U U U U U U U U U U U U U U U U Q T N M '~ l!') Cfl I— CO O O
r- r e— N r
M r e—
LU r (O r
f` T
CO r
O) r
O N N
N N N
C'') N
N N
N N (NiN
Q' V J
PHH HW

z N- 0 O r O O O O r O O O r O O O r O O r r O O O O O r N
U N
J W m N W 0 M r O r r r r O r r r O r r r 0.— r O O r r r r r O r M N-
I— U) co O r
O r
U) r
0 r
0 CO
0 r
0 CN
0 r
0 r
0 (y
0 r U
O (~J LO
O r
O C')
O r
O r
O r
LO r
O r
O (V
LO r
O r
LO O N
O oo
I"' N
F O O O fD O O O O
r m (O O O tt aD O N O O Cfl O N N O O C") ('V r r r.- r r r r (N r r r r
U) O U
co O 0 0 0 0 0 0 0 0 to O LO O O O O O ll) O O V) O u, O N N r N N N M N N M N r M r N q7 N N N N N M N N r nj
> 0
CO O U[) O O O O U) O O O O O U) O ~A O O O U) O O O U) U) to U) I- C') r N IT N CO r CO M (N U) C') C') I' (N (N C') CO r g U) CO M M N (N
F" c')
E-- 00 CO Cl) U) CO U) lf) N- In CO U) M CO N- CD (0 T U) O 10
O U
Z I l o w
r N M IT In CO N- CO 6) O r N M"t U) (D N- CO O) 0.- NC') I U) Cp Of n, r r r- r r- r r r r r N N N N N N NI w
Q

w W I-
0 U W U)
W 0 0
Q U
0 U- 4 Q
a U) w 0 U)
a I- w a
z 0
N F- o r o O r- O- O o
M C
N O U)
W J W m c W
o v -- '-(0 - O O o O
fn O H
> '- ' ' ' '- UD '
Ln o '-U)
~N„ LOU) O '0 O O U) U) O tC)
N
rn Co O N'— N N O '- a- O (0 N O e- N O U
O o o O o o O O O O o
0
O
O o Ln Ln o Ln O Ln Ln O LO N st N N N p
I- N >
00 O O ~f N 00 (D r o N o N N M 't (N ti Lj N
O N U
Z w C~ ° <<<<<<a<<< a •- N M v Ln cD N-(0 M O >
Z cn co O O •--- O r- '- o U)
V N m 0
W m N N W
O ~O OC) C)c) -~ O
N CD > o o
r O o r 0 r o r 0 r 0 r 0 r- o 0
Om
N F- > co N N '- N M N '- CO e- N e- O N CD '(0 — Co
N H 0 O Co o
N N r
I7 N
o '-
O '-
(0 N O
U 0 U
O O O O O O O O O O o
0
O
(0 o U) U) o U) o 14) u) o N N r N N p
F- N >
00
N O O t w (0 O O N t N-
O N U
Z w O O m m m m m m m m m Q
a N M tt 14) (0 N- c Q) w
0 >

z O N ~ o o o O o v O N m C)
H ~
W m N N W O (° O .- O O O LO O
-Cl) C) f-
> C Un ' Un T- Un ' Un ' Un ' Un Un Un Un '
C) U)
Om
E_U) v H 00 C) N
>Q N N (0 N C) (0
m
H
'T 0) co (0 L() N 0 U
C) o 0 0 0 0 0 0 0 0 0
C)
0
o o Un Un o Un O ►n Un O U I-• r- N - N N N p I-- N >
co O O ~t ~t N o0 CD O N O N N M N r- Lj N
O N V
Z W C0 0 0 0 0 0 0 0 0 0 0 < a N M v Un (D r~ co rn 0
Z 0 (0 U y m o
F- W m C W 1 v M
N
C)
C) > C) C) C) O C) C) C) C) C) 0
C) Om
LO LO o Lo o Lo LO o U > _ O N N M r- M M M N N --
N H
m CD O 00 CO N 00 O) C) Cfl IT L6
U) 0 U
C) 0 0 0 0 0 0 0 0 0 0
0
0
oU)UnOU)OUnUnoto F- N >
O O O
~7 N 00 (D O
N O N
N M
Vf N
r- Uj
O N U
Z W O I-
0 •- NM V U)(0N-WMw
0 >
M M


