Embed Size (px)
Citation preview

Euphytica 36 (1987) 677-686
PLANT CHARACTER CORRELATIONS AND PATH ANALYSIS OF POD YIELD IN OKRA
(ABELMOSCHUS ESCULENTUS)
0. J.ARIYOi, M. E. AKEN’OVA and C.A. FATOKUN
Agronomy Department, University of Ibadan, Nigeria
Received 7 April 1986
INDEX WORDS
Okra, character correlations, path coefficient analysis.
SUMMARY
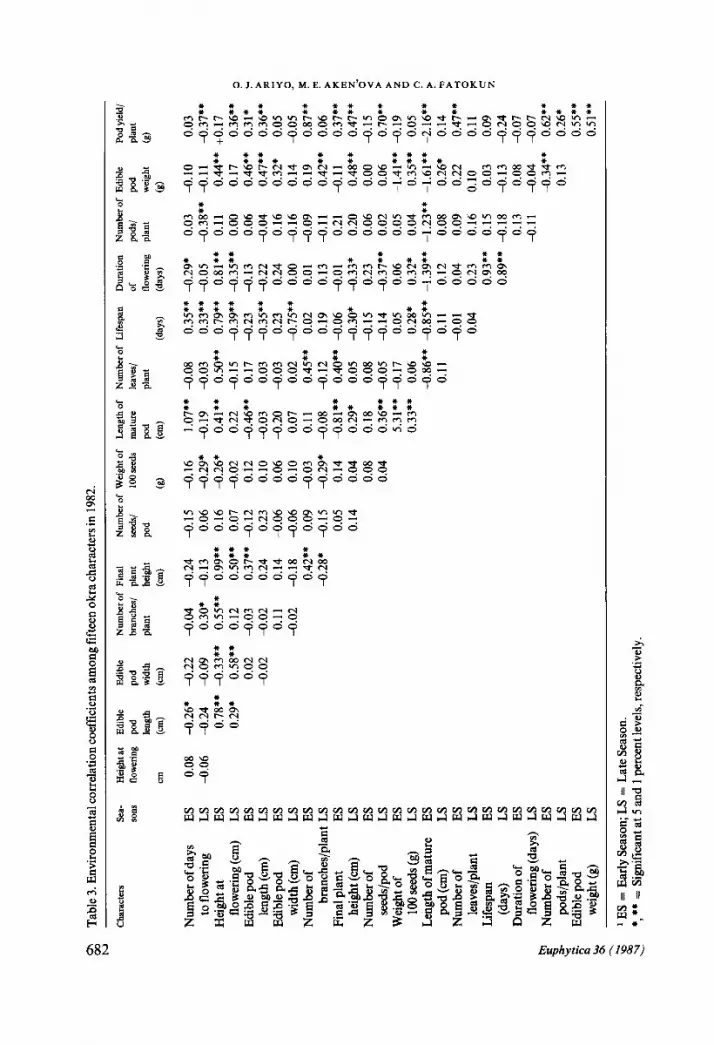
Genotypic, phenotypic and environmental correlation coefficients were calculated for fifteen characters during two growing seasons. Correlation coefficients varie between seasons. Edible pod weight, edible pod length, edible pod width, number of seeds per plant, weight of 100 seeds, length of mature pods and number of branches per plant showed significant genotypic correlation with pod yield per plant; only number of branches per plant, edible pod length and weight of 100 seeds were phenotypically correlated with pod yield. Environmental correlation coefftcients were generally low but edible pod length, final plant height and edible pod weight showed significant environmental correlation with pod yield during the two seasons.
The genotypic correlation coefficients of selected eight characters with pod yield were partitioned into direct and indirect causes. In the early seasons, edible pod weight had the largest positive direct effect on pod yield with its largest indirect effect through reduction in edible pod width. Edible pod width which was highly correlated with pod yield had a negative direct effect on pod yield. In the late season, edible pod weight had the largest direct effect on pod yield, with large indirect effects through reduction in number of days to flowering and number of pods per plant. Number of days to flowering had a large direct effect on pod yield with its largest indirect effect through reduction in edible pod weight. The residual factors during the two seasons were negative. The study indicated that only number of branches per plant, edible pod length and weight of 100 seeds would be useful for indirect selection for pod yield. The path analysis indicated that edible pod weight was the most reliable and effective character to select for when high yield is the objective.
INTRODUCTION
Knowledge of inter-character relationships is very important in plant breeding for indirect selection for characters that are not easily measured and for those that exhibit low heritability. Correlation studies between characters have also been of great value in the determination of the most effective breeding procedures. As the number of inde- pendent characters affecting a dependent character increases, there is bound to be some amount of interdependence. Under such a complex situation, correlations alone become insufficient to explain relationships among characters. Path analysis permits
i Present address: International Institute ofTropical Agriculture. P.M.B. 5320, Ibadan, Nigeria.
677

0. LARIYO, M. E. AKEN’OVA AND CA. FATOKUN
identification of direct and indirect causes of association and measures the relative importance of each character.
RAO & RAMU (1975) and KAUL et al. (1978) showed that the pod yield in a number of okra varieties was influenced chiefly by the number of pods per plant. SINGH & SING (1977) reported that pod yield had a positive and significant association with the number of pods per plant, number of branches per plant, edible pod length and plant height while plant height had the largest direct effect on pod yield. The present study determined phenotypic, genotypic and environmental correlations among fif- teen characters of okra at Ibadan, S.W. Nigeria.
MATERIALSANDMETHODS
In a randomised complete block design with 3 replications, 30 Okra genotypes were grown during the early (April planting) and late (September planting) rainy seasons of 1982. Each row was 3.15 m long and 90 cm between rows and plants were spaced 45 cm apart within the row to give eight plants in a row. Three weeks after sowing, plants were thinned to one plant per hill. From five competitive plants in each row, data were collected on the following characters: pod yield per plant, number of pods per plant, edible pod length, edible pod width, edible pod weight, final plant height and lifespan. The remaining 3 plants in each row were observed for number of seeds per pod, weight of 100 seeds, and length of mature pods.
The number of leaves per plant was determined by counting the number of nodes on the main stem and all branches while lifespan was determined as the period between platning date and when the plants had shed their leaves and floral apparatus. Length of mature pods was determined when pods turned yellow on the plants. Duration of flowering was determined as the difference between lifespan and the number of days to flowering. Number of days to flowering was determined at the average of the number of days to flowering of the five competitive plants.
Phenotypic and genotypic correlation were calculated from the mean values of the genotypes using the procedure outlined by MILLER et al. (1958). Environmental corre- lations coefficients were calculated according to the procedure of FALCONER (1981). Path analysis was done according to DEWEY & Lu (1959). The nature of the causal scheme including eight characters and pod yield is illustrated in Fig. 1.
RESULTS
The genotypic, phenotypic and environmental correlation coefficients among different characters are presented in Tables 1,2 and 3, respectively. In some cases, differences in both magnitude and direction of correlation coeMicients were observed in different seasons. Edible pod length, edible pod width, number of branches per plant, number of seeds per pod, weight of 100 seeds, length of mature pod and edible pod weight exhibited significant positive genotypic correlations with the pod yield per plant during early and late seasons.
Only edible pod length and edible pod weight showed significant phenotypic correla- tions with pod yield in the two seasons.
Edible pod weight showed significant positive genotypic and phenotypic correlation
678 Euphytica 36 (1987)

CHARACTER RELATIONS IN OKRA
EXPLANATION (II:= Days to flowering 0 = Pod length Q) = Pod width @ = Number of branches/plOnt 6) = Final plant hefght 6l = Lifespan a = Psd/ plant 8 = Pod weight (!8 = Pod yield /plant
@ = Residual factors
Fig. 1. Path diagram of factors influencing pod yield in okra.
with edible pod width. Although edible pod weight also had positive and significant genotypic correlation with number of pods per plant, the corresponding phenotypic correlation was non-significant. Number of days to flowering showed significant but negative genotypic and phenotypic correlations with the length of edible and mature pod in both seasons.
Environmental correlation coefficients among the 15 characters under study also showed seasonal differences. Significant positive environmental correlation with pod yield were exhibited by edible pod length, final plant height, edible pod weight, number of pods per plant, height at flowering and number of leaves per plant, either in early or late season or in both seasons, while number of days to flowering showed negative correlation with pod yield in the late season.
The direct and indirect effects of some characters on pod yield as well as the residual factors during early and late seasons are given in Table 4. In the early season, pod weight had the largest positive direct effect on pod yield with its largest indirect effect
Euphytica 36 (1987) 679

g Ta
ble 1
. Gen
otyp
ic co
rrelat
ion
coef
ficie
nts
amon
g fif
teen
okr
a ch
arac
ters
in 1
982.
0
Num
ber
of d
ays
ES
to fl
ower
ing
LS
Heig
ht a
t ES
flo
werin
g (c
m)
LS
Edibl
e po
d ES
len
gth
(cm
) LS
Ed
ible
pod
ES
widt
h (c
m)
LS
Num
ber
of
ES
bran
ches
/pla
nt
LS
Fina
l plan
t ES
he
ight
(cm
) LS
Nu
mbe
r of
ES
se
eds/
pod
LS
Wei
ght
of
ES
100 s
eeds
(g)
LS
Leng
th o
f mat
ure
ES
pod
WI
LS
Num
ber
of
ES
leav
es/p
lant
LS
Lif
espa
n ES
(d
ays)
LS
Du
ratio
n of
ES
flo
werin
g (d
ays)
LS
Nu
mbe
r of
ES
po
ds/p
lant
LS
Ed
ible
pod
ES
weig
ht (
g)
LS
Hei
ght
at
Edi
ble
Edi
ble
Num
ber
of
Fina
l N
umbe
r of
W
eigh
t of
Le
ngtb
of
Num
ber
of
Life
span
D
urat
ion
Num
ber
of
Edi
ble
Pod
yiel
d/
t-low
erin
g po
d po
d br
anch
es/
plan
t se
eds/
10
0 se
eds
mat
ure
leav
es/
of
pods
/ po
d pl
ant
leng
th
wid
th
plan
t he
ight
po
d Po
d pl
ant
flow
erin
g pl
ant
wei
ght
(8)
an
(W
(W
c+
(9)
(4
WYS
) W
Y@
Cl-9
0.96
**
-0.4
5**
-0.1
4 0.
62**
0.
63**
0.
22
-0.5
3**
&69*
* 0.
51**
0.
58**
0.
10
-0.4
3**
4.48
**
-2.1
3**
0.21
AI
.40*
* a.
30
0.27
* 0.
35**
0.
54**
-0
.38*
* -0
.47*
* 0.
50**
0.
56**
AI
.30
0.44
**
4.44
**
0.22
0.
11
-0.1
4 0.
63**
1.
22**
-0
.26:
-0
.25*
4.
99**
0.
51**
1.
03**
0.
65
-0.2
1 a.
14
-0.3
2*
-0.1
1 4.
69**
a.
03
0.92
**
0.39
**
-0.3
1*
0.11
0.
29*
0.27
* 4.
35**
0.
05**
+X
29**
-0.2
1 -0
.23
4.34
**
0.10
4.
47**
+0
.36*
* 0.
39**
-0
.24
a.03
0.
24
-0.2
3 +0
.04
0.43
**
c 4.
27*
4.93
**
0.11
4
50**
0:
13
+0.0
02
0.81
**
-0.3
8**
0.07
0.
39**
-0
.29*
-0
.17
0.46
**
0.16
-0
.16
0.02
**
a.1
1 0.
34**
a.
03
0.02
0.
08
0.87
;
0.67
**
-0.7
7**
a.22
0.
10
-0.2
7*
+0.3
4**
a.15
0.
78**
q
4.38
**
0.63
**
0.67
**
0.80
**
-0
0.74
0.
29*
-0.5
2**
-1.0
2 1.
06**
0.
99*
0.85
**
0.82
**
0.15
0.
77**
g
-0.1
7 4.
47**
-0
.67*
* -1
.15*
* 1.
34**
0.
11
-0.1
9 1.
61**
0.
42**
1.
03**
m
-0
.20
-0.4
5**
JI.6
2**
0.73
**
0.94
**
0.75
**
a.03
-0
.02
0.08
2
0.30
* -0
.17
0.26
* -0
.09
0.10
0.
23
-0.2
7**
-0.3
7**
-0.2
4 g
0.12
0.
49**
0.
23
4.08
-0
.20
0.32
* 0.
05
0.34
**
0.41
**
-0.0
8 0.
63**
0.
25*
a.24
0.
07
2 4.
29*
+0.5
0**
P 1.
47**
-0
.47*
* 4.
28*
-0.0
1 4.
34**
0.
28*
0.45
**
k 0.
41**
-0
.36*
* a.
12
0.17
4.
39**
0.
10
0.98
**
0 -0
.88*
* 4.
44**
-0
.09
4.29
* 0.
41**
0.
58**
-0
.37*
* XI
.17
0.20
4.
16
0.04
0.
78**
;
0.79
**
+0.6
4**
0.28
0.
17
0.37
**
2 0.
29*
1.57
**
0.21
4.
99**
-0
.27*
;:
0.86
**
-0.1
6 a.
09
0.11
0.
62**
0.
39**
-0
.17
0.50
**
;
0.07
0.
30*
0.62
**
0.15
0.
14
0.13
0.
30*
0.10
0.
67**
1.
23**
1.
04**
0.
40**
6 a 22
r E
S =
Early
Sea
son;
LS
= La
te S
easo
n.
Y *,
** =
Sign
ifican
t at
5 a
nd 1
perc
ent
leve
ls, re
spec
tivel
y.

$ Ta
ble
2. Ph
enoty
pic
corre
lation
co
effici
ents
amon
g fift
een
okra
chara
cters
in 19
82.
h .a
cm
Edi
ble
pod
leng
th
(4
Edi
ble
pod
wid
th
(4
Num
ber
of
Fina
l br
anch
es/
plan
t pl
ant
heig
ht
(4
Num
ber
of
Wei
ght
of
Leng
th o
f N
umbe
r of
Li
fesp
an
Dur
atio
n N
umbe
r of
E
dibl
e Po
d yi
eld/
se
eds/
lO
Ose
eds
Inat
ure
leav
es/
of
pods
/ po
d pl
ant
pod
pod
plan
t Ilo
wer
ing
plan
t w
eigh
t (9
) cd
(4
C
&Y@
(d
ays)
(9
)
-0.41
** a.1
5 0.
37**
0.48
** 0.1
1 -0
.45**
445*
* 0.
42**
0.48
** -0
.01
-0.23
** 4.
36**
4.70
** -0
.37**
-0.24
0.
40**
0.27
* 0.
46**
-0.33
** &4
** 0.2
2 0.
49**
4.25
* 0.0
5 XI
.29*
0.2
2 0.1
9 4.1
6 0.
53**
1.19
** a.1
7 -0
.25*
-0.88
** 0.
67**
0.97
** 0.
64**
a.02
a.02
0.05
-0.05
4.
40**
0.02
0.85
** 0.
34**
-0.24
AI
.08
0.10
0.14
-0.33
** 0.0
2 a.1
3 0.0
3 4.1
9 -0
.23
0.14
-0.36
** +0
.32*
0.29;
a.19
a.07
0.15
-0.11
0.1
5 0.
35**
4.19
* 4.
40**
0.14
-0.34
** 0.0
3 0.
68**
xX15
** -0
.05
0.22
a.12
0.08
0.30
* 0.1
3 -0
.12
0.08
0.03
a.12
0.30
* 0.0
2 0.0
7 0.1
0 0.
95**
0.48
** 0.2
4 -0
.58**
a.17
0.10
AI.1
9 0.1
4 -0
.38**
a.24
0.11
0.40
** 0.1
9 0.
59**
0.20
-0.34
** 4.
67**
0.80
** 0.
61**
0.49
** 0.
31*
0.17
0.83
** -0
.18
4.26
* -0
.41**
-0.55
** 0.2
3 0.
34**
a.01
0.23
-0.16
0.2
2 4.1
4 4.
36**
-0.63
** 0.
69**
0.75
** 0.
57**
-0.04
-0
.04
0.15
0.29
* 0.1
1 0.
26*
4.02
a.01
a.24
a.02
-0.06
a.2
4 0.1
1 0.
40**
0.16
a.01
a.05
0.19
0.03
0.11
0.30
* -0
.20
0.25
* 0.1
4 4.2
7; 0.0
1 a.1
4 0.
46**
0.70
** 4.
43**
-0.21
0.0
1 -0
.21
-0.17
0.
25*
0.37
** -0
.11
0.02
0.22
-0.11
0.2
1 0.3
0 4.
87**
-0.48
** -0
.28*
-0.43
** 0.0
3 a.0
7 a.1
4 -0
.11
0.18
a.04
0.08
0.30
* 0.
66**
+0.5
1**
0.19
0.17
0.33
** XI
.09
0.29
* 0.1
7 -0
.24
0.04
0.87
** -0
.03
-0.05
0.0
3 0.
71**
0.03
-0.15
0.
01**
0.10
0.22
0.30
* -0
.01
0.05
0.00
-0.02
0.
41**
- 0.0
8 0.0
4 0.
79**
0.46
**
Numb
er
of da
ys
ES
to flo
werin
g LS
He
ight
at ES
flo
werin
g (cm
) LS
Ed
ible
pod
ES
lengt
h (cm
) LS
Ed
ible
pod
ES
widt
h (cm
) LS
Nu
mber
of
ES
bran
ches
/plan
t LS
Fi
nal
plant
ES
he
ight
(cm)
LS
Numb
er
of ES
se
eds/p
od
LS
Weig
ht of
ES
100
seed
s(g)
LS
Leng
th
of ma
ture
ES
pod
(cm)
LS
Numb
er
of ES
lea
ves/p
lant
LS
Lifes
pan
ES
(days
) LS
Du
ratio
n of
ES
flowe
ring
(days
) LS
Nu
mber
of
ES
pods
/plan
t LS
Ed
ible
pod
ES
weigh
t 69
LS
0.82
** 0.1
8
kz2
1 ES
= Ea
rly
Seas
on;
LS
= La
te Se
ason
. L
*, **
= Si
gnific
ant
at 5
and
1 per
cent
levels
, re
spec
tively
.
$ Ta
ble 3
. Env
ironm
enta
l co
rrelat
ion
coef
ficie
nts
amon
g fif
teen
okr
a ch
arac
ters
in 1
982.
I.3
H
eigh
t at
E
dibl
e E
dibl
e flo
wel
ing
pod
pod
leng
th
wid
th
cm
(4
(4
Num
ber
of
Fina
l N
umbe
r of
W
eigh
t of
Le
ngth
of
Num
ber
of
Life
span
D
urat
ion
Num
ber
of
Edi
ble
Pod
yiel
d/
bran
ches
/ pl
ant
=w
loos
eeds
m
atur
e le
aves
/ of
po
ds/
pod
plan
t pl
ant
heig
ht
pod
Pod
plan
t flo
wer
ing
plan
t w
eigh
t cd
cm
(9
) c-
w W
Y@
(day
s)
k)
Num
ber
of d
ays
ES
to fl
ower
ing
LS
Heig
ht a
t ES
flo
werin
g (c
m)
LS
Edibl
e po
d ES
le
ngth
(cm
) LS
Ed
ible
pod
ES
widt
h (c
m)
LS
Num
ber
of
ES
bran
ches
/pla
nt
LS
Fina
l plan
t ES
he
ight
(cm
) LS
Nu
mbe
r of
ES
se
eds/
pod
LS
weig
ht o
f ES
10
0 see
ds (g
) LS
Le
ngth
of m
atur
e ES
po
d (W
LS
Nu
mbe
r of
ES
le
aves
/pla
nt
LS
Lifes
pan
ES
(day
s)
LS
Dura
tion
of
ES
flowe
ring
(day
s)
LS
Num
ber
of
ES
pods
/pla
nt
LS
Edibl
e po
d ES
we
ight
(g)
LS
0.08
-0
.26*
a.
22
4.04
4.
24
-0.1
5 a.
06
-0.2
4 a.
09
0.30
* -0
.13
0.06
0.
78**
4.
33**
0.
55**
0.
99**
0.
16
0.29
* 0.
58**
0.
12
0.50
**
0.07
0.
02
-0.0
3 0.
37**
a.
12
-0.0
2 a.
02
0.24
0.
23
0.11
0.
14
-0.0
6 -0
.02
-0.1
8 -0
.06
0.42
**
0.09
-0
.28*
a.
15
0.05
0.
14
-0.1
6 -0
.29*
+2
6*
a.02
o.
i2 0.
10
0.06
0.
10
XI.0
3 4.
29*
0.14
0.
04
0.08
0.
04
1.07
**
-0.0
8 0.
35**
4.
29*
0.03
4.
10
0.03
-0
.19
-0.0
3 0.
33**
a.
05
4.38
**
a.11
4.
37**
0.
41**
0.
50**
0.
79**
0.
81**
0.
11
0.44
**
+0.1
7 0.
22
a.15
+3
9**
x).3
5**
0.00
0.
17
0.36
**
-0.4
6**
0.17
-0
.23
-0.1
3 0.
06
0.46
**
0.31
* -0
.03
0.03
-0
.35*
* -0
.22
-0.0
4 0.
47+*
0.
36**
AI
.20
a.03
0.
23
0.24
0.
16
0.32
* 0.
05
0.07
0.
02
4.75
**
0.00
-0
.16
0.14
-0
.05
0.11
0.
45**
0.
02
0.01
-0
.09
0.19
0.
87**
a.
08
a.12
0.
19
0.13
-0
.11
0.42
**
0.06
-0
.81*
* 0.
40**
a.
06
a.01
0.
21
4.11
0.
37**
0.
29*
0.05
-0
.30*
-0
.33*
0.
20
0.48
**
0.47
**
0.18
0.
08
Xl.1
5 0.
23
0.06
0.
00
a.15
0.
36**
a.
05
a.14
4.
37**
0.
02
0.06
0.
70**
5.
31**
-0
.17
0.05
0.
06
0.05
-1
.41*
* a.
19
0.33
**
0.06
0.
28*
0.32
* 0.
04
0.35
**
0.05
-0
.86*
* -0
.85*
* -1
.39*
* -1
.23*
* -1
.61*
* -2
.16*
* 0.
11
0.11
0.
12
0.08
0.
26*
0.14
a.
01
0.04
0.
09
0.22
0.
47**
0.
04
0.23
0.
16
0.10
0.
11
0.93
**
0.15
0.
03
0.09
0.
89**
a.
18
a.13
a.
24
0.13
0.
08
AI.0
7 a.
11
a.04
-0
.07
X1.3
4**
0.62
**
0.13
0.
26*
0.55
**
0.51
**
-. 2 22
1 ES
= Ea
rly S
easo
n; LS
= L
ate
Seas
on.
2 *,
** =
Sign
ifican
t at
5 a
nd 1
perc
ent
leve
ls, re
spec
tivel
y.

Table
4. D
irect
and
indir
ect
effe
cts o
f som
e ch
arac
ters
on
pod
yield
in ok
ra.
Char
acte
rs
Sea-
so
ns
Num
ber
of d
ays
ES
5.61
to
flow
ering
LS
1.
43
Edibl
e po
d ES
2.
11
leng
th(c
m)
LS
0.95
Ed
ible
pod
ES
-14.
92
widt
h&m
) LS
0.
52
Num
ber
of
ES
5.31
br
anch
es/p
lant
LS
-
0.80
Fi
nal
plant
ES
-1
9.59
he
ight
(cm
) LS
0.
33
Lifes
pan
(day
s)
ES
10.4
3 LS
-
0.25
Nu
mbe
r of
ES
-
3.77
po
ds/p
lant
LS
0.
81
Edibl
e po
d ES
15
.64
weigh
t(g)
LS
1.80
Dire
ct
effe
ct o
n po
d yie
ld
Indi
rect
effe
ct on
pod
yiel
d th
roug
h nu
mbe
r of
ed
ible
pd
edibl
e po
d da
ys to
len
ght
widt
h flo
werin
g (c
m)
(cd
XI.9
5 -0
.38
-2.5
3 -0
.57
-0.7
9 a.
49
-0.4
3 a.
26
3.48
AI
.72
0.39
a.
89
3.54
0.
21
0.50
0.
11
3.26
-0
.06
0.80
0.
07
-2.4
1 0.
49
0.63
a.
28
-2.6
9 0.
08
-0.6
3 -0
.16
2.09
-
1.16
3.
43
- 0.
14
- 2.
39
0.35
2.
39
- 0.
40
0.45
-
0.08
-
1.19
0.
33
-12.
96
0.35
num
ber
of
bran
ches
/
3.29
-0
.22
-1.8
1 0.
74
0.85
0.
54
3.93
0.
14
5.26
-0
.09
4.35
-1
.29
0.80
a.
34
final
plant
he
ight
@N
-12.
34
0.12
-
1.96
0.
04
3.14
-
0.25
-1
4.50
-
0.06
-18.
42
0.03
0.
59
- 0.
09
0.39
-
0.12
lifesp
an
(day
s)
6.05
-
0.14
-
0.31
-
0.02
-
0.31
0.
04
-10.
33
- 0.
03
9.81
-
0.03
- 1.
67
- 0.
10
0.94
0.
04
num
ber
of
1.62
0.
36
0.87
a.
24
a.30
0.
51
-3.0
9 1.
31
0.11
4.
22
0.60
0.
32
-1.1
3 a.
55
edibl
e pd
we
ight
k)
- 7.
51
0.79
0.
87
- 0.
31
13.6
0 1.
21
2.34
0.
76
- 0.
31
- 0.
67
- 1.
41
- 0.
31
4.69
1.
21
Geno
typi
c co
rrelat
ion
coef
ficie
nts
-2.1
3**
0.22
0.
43**
0.
46
0.78
**
0.80
**
0.77
**
; 1.
03**
El
0.
08
Fi
a.24
1 %
J 0.
11
0.50
**
E 0.
10
F t’ 1.
23**
s
1.04
**
rJx
0.40
**
5
r ES
= Ea
rly s
easo
n; LS
= L
ate
seas
on.
*, **
= S
ignific
ant
at 5
and
1 per
cent
lev
els,
resp
ectiv
ely.
Re
sidua
l fac
tors
: ES
= -2
2.66
; LS
= -
1.69
.

0. J. ARIYO, M. E.AKEN’OVA AND C. A. FATOKUN
through reduction in edible pod width. Although final plant height had low and non- significant genotypic correlation with pod yield, it had the largest negative direct effect on pod yield, with a large indirect effect through lifespan. Edible pod width also exhi- bited a high direct but negative effect on pod yield with a large indirect effect through edible pod weight.
In the late season, edible pod weight had the largest direct effect on pod yield, with large indirect effects through reduction in number of days to flowering and number of pods per plant. Number of days to flowering also had a large direct effect on pod yield with its largest indirect effect via reduction in edible pod weight. Edible pod length, edible pod width and number of pods per plant had positive direct effects on pod yield.
Inspite of the large number of characters used in the pathcoeflicient analysis, the residual factors were -22.7 and -1.69 for early and late season, respectively. This may be due to the fact that correlation coefficients were mere estimates and to rounding-off errors.
DISCUSSION
Although phenotypic correlation incorporates genotypic and environmental correla- tions, it was observed that genotypic correlations were in most cases, higher than their corresponding phenotypic correlations. However, since environmental correlation co- efficients were low in most cases, phenotypic correlation coefficients would be good indices of genotypic correlations coefficients.
Edible pod length, edible pod width, number of branches per plant, number of seeds per pod, weight of 100 seeds, length ofmature pod and edible pod weight were genotyp- ically correlated with pod yield during early and late season indicating that pod yield may be improved through selections for these characters. However only edible pod weight and edible pod length showed significant phenotypic correlation with pod yield. The other characters may therefore not be of practical value in selecting for pod yield since selection is based on the phenotype of the characters.
Characters which are phenotypically correlated but not genotypically correlated will not produce repeatable estimates of inter-character associations and any selection based on the relationship is likely to be unreliable. This is true of the relationship between edible pod weight and edible pod length, and between edible pod weight and weight of 100 seeds during late season.
Negative genotypic correlation between pod yield and number of days to flowering in the early season indicated that early flowering lines were higher yielding as early season data indicated. This may be due partly to the considerable decline in rainfall relatively early in the season, a situation that placed the early flowering lines at a relative advantage in terms of productivity.
The significant genotypic correlation between pod yield and number of branches per plant may be related to greater photosynthetic capacity provided by more leaves since number of leaves per plant and number of branches per plant were highly corre- lated. Also more branches implied more fruit bearing nodes. The significant correla- tion between pod yield and duration of flowering in early season, may be expected since so long as flowering took place, more fruits would be produced.
684 Euphytica 36 (1987)

CHARACTER RELATIONS IN OKRA
The significant genotypic and phenotypic correlation between edible pod weight and edible pod width could be a good index for selecting for high yielding lines as plump pods will substantially increase total yield through relatively greater weight. Although there was a significant genotypic correlation between edible pod weight and number of pods per plant, not much success may be expected in selecting for a large number of pods per plant through edible pod weight since the two characters are not phenotypically correlated.
Significant genotypic and phenotypic correlations between number of days to flow- ering and lifespan suggested that number of days to flowering can be used as a criterion for selecting lines with short lifespan by selecting for fewer number of days to flower- ing. Early flowering lines will be best suited to areas with short growing season.
Non-significant genotypic correlation between weight of 100 seeds and number of seeds per pod indicated that the two characters were indepedent of each other and that they could be selected for separately as they are components of seed yield. Since there was a significant association between edible pod length and pod yield and be- tween edible pod length and length of mature pod, it follows that selecting for high pod yield will simultaneously result in high seed yield.
The significant environmental and phenotypic correlations with pod yield exhibited by edible pod length, and edible pod weight during the two seasons, and by number of pods per plant, number of leaves per plant in early season and final plant height in the late season indicated that selection for pod yield based on the phenotypic perfor- mance of these characters will not be effective.
Number of days to flowering had a positive direct contribution to yield, inspite of its negative genotypic correlation with pod yield. This demonstrates the defects of selecting only on the basis of inter-character correlation as such a selection may not produce the desired results. The path analysis further revealed that the adverse effect of number of days to flowering on pod yield was largely due to the indirect effects of final plant height and edible pod weight. During the early season, edible pod width and pod yield were highly correlated but edible pod width had a negative direct path towards pod yield. The direct path was masked by edible pod weight, final plant height and number of branches per plant. In the late season, edible pod weight also had the largest direct effect on pod yield, with a large indirect effect through reduction in number of days to flowering. Considering its association with pod yield in the early and late season, edible pod weight appeared to be the most reliable index of pod yield. Although edible pod width was still highly correlated with pod yield in the late season, its direct effect on pod yield was relatively small with its largest indirect effect through edible pod weight. Because of the close association between edible pod with and edible pod weight, and since edible pod weight cannot be visually determined on the field, edible pod width may be a more appropriate character to select for when high yield is the objective.
REFERENCES
DEWEY, D. R. & K. H. Lu 1959. A correlation and path-coefficient analysis of components of crested wheatgrass seed production. Agron. J. 51: 515-518.
FALCONEIR, D. S., 1981. Introduction to quantitative genetics. Longmann. 340 pp.
Euphytica36 (1987) 685

0. J. ARIYO, M. E. AKEN’OVA AND C. A. FATOKUN
KAUL, T. G. LAL & K. V. PETER, 1978. Correlations and path coeflicient analysis of components of earliness, pod yield and seed yield in okra. Indian J. Agric. Sci. 48: 459-463.
MILLER, P. A., V. C. WILLIAMS, H. P. ROBIN~IDN & R. C. COMESTOCK, 1958. Estimates of genotypic and environmental variances and covariances in upland cotton and their implications in selection. Agron. J. 5: 126131.
RAO, T. S. & R. M. RAMU, 1975. Breeding investigations in bhindi (Abelmoschus esculentus L) MOENCH). Mysore J. Agric. Sci. 10: 146 (Abstr).
SINGH, K. B. & H. N. SINGH, 1977. Path-coefficient analysis for yield in okra. Indian J. Agric. Sci. 49: 244-246.
SINGH, K., Y. MALIKI, S. KALLOO & N. MEIIROTRA, 1974. Genetic variability and correlation studies in bhindi (Abelmoschus esculentus (L.). MOENCH) Vegetable Sci. 1: 4547.
686 Euphytica 36 (1987)


