Embed Size (px)
Citation preview
Plant community composition affects thespecies biogeochemical niche
IFIGENIA URBINA,1,2,� JORDI SARDANS,1,2 ORIOL GRAU,1,2 CARL BEIERKUHNLEIN,3
ANKE JENTSCH,3 J€UERGEN KREYLING,4 AND JOSEP PE ~NUELAS1,2
1CSIC, Global Ecology Unit CREAF-CSIC-UAB, 08913 Bellaterra, Catalonia, Spain2CREAF, 08913 Cerdanyola del Vall�es, Catalonia, Spain
3Disturbance Ecology, BayCEER, University of Bayreuth, 95440 Bayreuth, Germany4DFG Heisenberg-Professorship, Institute of Botany and Landscape Ecology Experimental Plant Ecology Germany,
University of Greifswald, 17487 Greifswald, Germany
Citation: Urbina, I., J. Sardans, O. Grau, C. Beierkuhnlein, A. Jentsch, J. Kreyling, and J. Pe~nuelas. 2017. Plantcommunity composition affects the species biogeochemical niche. Ecosphere 8(5):e01801. 10.1002/ecs2.1801
Abstract. Nutrients are essential for plant development, and their availability and stoichiometric ratioscan influence the composition of plant communities. We investigated the possibility of the reverse influ-ence: whether the conditions of contrasting species coexistence determine foliar element concentrationsand plant stoichiometry, that is, species biogeochemical niche (BN). The experiment was conducted at theEcological-Botanical Garden of the University of Bayreuth, Germany. We analyzed foliar element concen-trations of two dwarf shrubs (Calluna vulgaris and Vaccinium myrtillus) and two grasses (Holcus lanatus andArrhenatherum elatius) growing in different community compositions (monocultures and various mixedstands). Foliar nutrient concentrations and stoichiometry (taken as a proxy of species BN) were speciesspecific; each species showed its own BN in all communities. Furthermore, V. myrtillus and H. lanatusspecies shifted their BN in response to changes in their community, accomplishing the “biogeochemical nichedisplacement” hypothesis. We conclude that plants can readjust their foliar element concentration if theygrow in communities with contrasting plant composition, suggesting a differential use of elementresources when the patterns of species coexistence change. These results also support the complementaryniche hypothesis.
Key words: biogeochemical niche; community composition; grass; homeostasis; shrub; stoichiometry.
Received 18 January 2017; revised 13 February 2017; accepted 15 February 2017. Corresponding Editor: Debra P. C.Peters.Copyright: © 2017 Urbina et al. This is an open access article under the terms of the Creative Commons AttributionLicense, which permits use, distribution and reproduction in any medium, provided the original work is properly cited.� E-mail: [email protected]
INTRODUCTION
In recent decades, plant nutrient stoichiometry,defined as the relative proportion of C and nutri-ents in plant tissues (leaves, roots, shoots, andwood), has gained significant importance in eco-logical studies (Elser and Urabe 1999, Sternerand Elser 2002, Moe et al. 2005, Cross et al. 2005,Elser and Hamilton 2007, Sardans et al. 2012a). Ithas been found that plant nutrient stoichiometryinfluences several ecological processes that arepivotal to ecosystem functions and dynamics,
such as plant–herbivore interactions (Daufresneand Loreau 2001, Millett et al. 2005, Newinghamet al. 2007), the structure and function of arbus-cular mycorrhizae (Johnson 2010), and popula-tion dynamics (Andersen et al. 2004). Recentstudies have also found a strong relationshipbetween changes in foliar C:N:K ratios andchanges in foliar metabolites in response to vary-ing environmental conditions (Pe~nuelas and Sar-dans 2009, Rivas-Ubach et al. 2012). However,the link between foliar nutrient concentrationand community composition has proven to be
❖ www.esajournals.org 1 May 2017 ❖ Volume 8(5) ❖ Article e01801
challenging and remains poorly explored. This isunderstandable because the composition of plantcommunities depends on several ecologicalprocesses and functions such as productivity,resource use, nutrient cycling, biotic interactions(Grime 1974, Tilman et al. 1996, Roem 2000),while plant stoichiometry is influenced by sev-eral factors such as soil fertility, source and quan-tity of water supply, phylogenetic affiliation, andclimatic conditions (Sterner and Elser 2002).Additionally, soil-layer interactions and competi-tion with microbial communities make it difficultto establish a direct link between soil resourcesand plant diversity (Hooper and Vitousek 1997),increasing even further the difficulties associatedwith studying the link between plant stoichiome-try and community composition.
In this context, Pe~nuelas et al. (2008) shed lightinto the relationship between plant stoichiometryand plant coexistence. The authors proposedthe “biogeochemical niche hypothesis” wherespecies have a species-specific stoichiometry in amultivariate space generated by the contents ofmacro- and micronutrients in plant tissues. Thishypothesis is based on coexisting plant speciestending to use the main nutrients N, P, and K(and other essential nutrients such as Ca, Mg,and S) in differing proportions (Pe~nuelas et al.2008, 2010). Since different plant structures andmetabolic processes have distinct and divergentrequirements for each of the essential nutrients,the species-specific biogeochemical niches (BNs)should be the result of species specialization toparticular abiotic and biotic conditions. Biogeo-chemical niche should reflect the different spe-cies-specific strategies of growth and uptake ofresources and the differences in soil space andtime occupation reducing direct competitionamong sympatric species and optimizing thenutrient use by the overall community. Biogeo-chemical niche also hypothesized that the exis-tence of stoichiometric flexibility (the capacity tochange the BN) of a species is an important trait,as it is related to the quality of plants tissues andtheir capacity to cope with changes in envi-ronmental conditions. Building further on thishypothesis, Yu et al. (2010) argued that speciesexhibit stoichiometric flexibility in response toenvironmental changes (including ontogenicand seasonal changes) and ;competitive situa-tions, probably under a tradeoff between the
stoichiometry flexibility and homeostatic regula-tion (the maintenance of constant internal condi-tions in the face of externally imposed variation).Recent studies in Spanish and European forestshave shown that elemental stoichiometries of dif-ferent forest species were strongly determinedgenetically, which is consistent with their long-term adaptation to specific abiotic and bioticenvironments leading to optimized metabolicand physiological functions and morphologicalstructures determining the specific use of variousnutrients (Sardans et al. 2015, 2016). These stud-ies have also shown that current climate is also animportant driver of uptake and nutrient use andthat BN should reflect trade-offs among severalfunctions such as plant growth, resource storage,and/or anti-stress mechanisms for maximizingplant fitness in each of particular climate. Moredifferences in foliar composition stoichiometryamong sympatric species than among allopatricspecies have been reported (Sardans et al. 2015,2016). The BN hypothesis thus claims that all spe-cies are adapted, to some extent, to different com-binations of environmental factors implying atrade-off between different basic functions suchas growth rates, reproduction, and stress toler-ance. The different BN can also be taken as a finalresult of an optimum adaptation to environmen-tal gradients and can be compared to the pro-posed ecological strategies as, for example, theGrime R-C-S model (1977) where different speciescan be placed in an specific “space” in the gradi-ent among these different ecological strategies.Following Pe~nuelas et al.’s (2008) BN hypothe-
sis, we here investigated the inverse relationshipbetween the changes in species coexistence andthe BN of species. We aimed to determinewhether the composition of plant communitiesaffects the BN of individual species. We includedas many elements as possible in the analysisbecause of the well-known importance of severalelements such as K, Mg, S, and Ca in plant physi-ology in water stress avoiding strategies, photo-synthetic machinery, regulation of ion balance(homeostasis) in chloroplast and vacuoles, trans-port of sugar into the phloem, and secondarymetabolism (Sawhney and Zelitch 1969, Knightet al. 1991, Bourgis et al. 1999, Romeis et al. 2001,Shaul 2002, Franceschi and Nakata 2005, Cakmak2005, Gill and Tuteja 2011, Sardans and Pe~nuelas2015). Our main research question was as follows:
❖ www.esajournals.org 2 May 2017 ❖ Volume 8(5) ❖ Article e01801
URBINA ET AL.
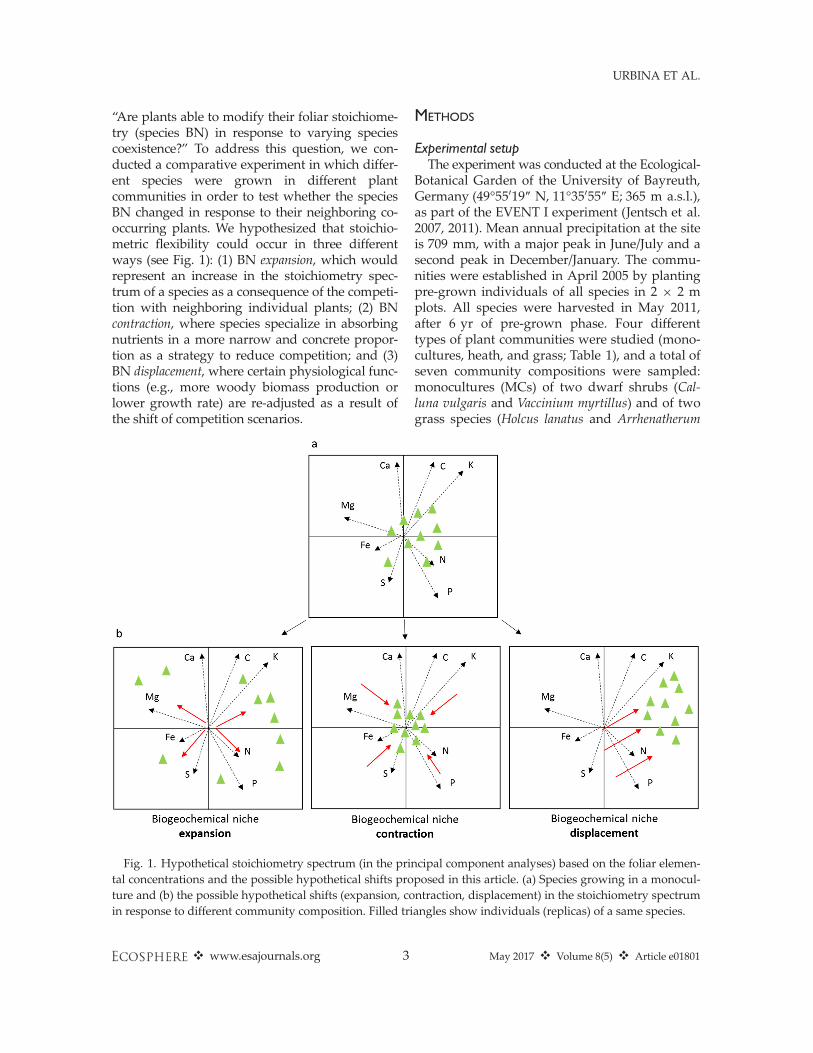
“Are plants able to modify their foliar stoichiome-try (species BN) in response to varying speciescoexistence?” To address this question, we con-ducted a comparative experiment in which differ-ent species were grown in different plantcommunities in order to test whether the speciesBN changed in response to their neighboring co-occurring plants. We hypothesized that stoichio-metric flexibility could occur in three differentways (see Fig. 1): (1) BN expansion, which wouldrepresent an increase in the stoichiometry spec-trum of a species as a consequence of the competi-tion with neighboring individual plants; (2) BNcontraction, where species specialize in absorbingnutrients in a more narrow and concrete propor-tion as a strategy to reduce competition; and (3)BN displacement, where certain physiological func-tions (e.g., more woody biomass production orlower growth rate) are re-adjusted as a result ofthe shift of competition scenarios.
METHODS
Experimental setupThe experiment was conducted at the Ecological-
Botanical Garden of the University of Bayreuth,Germany (49°55019″ N, 11°35055″ E; 365 m a.s.l.),as part of the EVENT I experiment (Jentsch et al.2007, 2011). Mean annual precipitation at the siteis 709 mm, with a major peak in June/July and asecond peak in December/January. The commu-nities were established in April 2005 by plantingpre-grown individuals of all species in 2 9 2 mplots. All species were harvested in May 2011,after 6 yr of pre-grown phase. Four differenttypes of plant communities were studied (mono-cultures, heath, and grass; Table 1), and a total ofseven community compositions were sampled:monocultures (MCs) of two dwarf shrubs (Cal-luna vulgaris and Vaccinium myrtillus) and of twograss species (Holcus lanatus and Arrhenatherum
Fig. 1. Hypothetical stoichiometry spectrum (in the principal component analyses) based on the foliar elemen-tal concentrations and the possible hypothetical shifts proposed in this article. (a) Species growing in a monocul-ture and (b) the possible hypothetical shifts (expansion, contraction, displacement) in the stoichiometry spectrumin response to different community composition. Filled triangles show individuals (replicas) of a same species.
❖ www.esajournals.org 3 May 2017 ❖ Volume 8(5) ❖ Article e01801
URBINA ET AL.
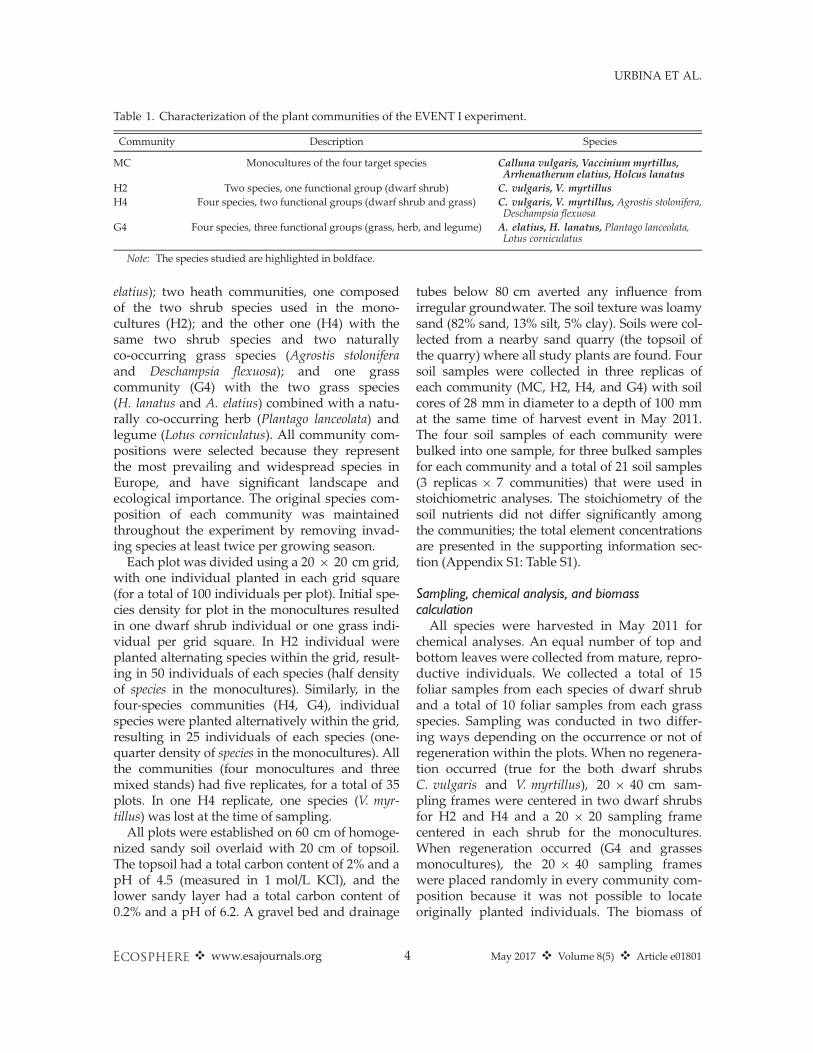
elatius); two heath communities, one composedof the two shrub species used in the mono-cultures (H2); and the other one (H4) with thesame two shrub species and two naturallyco-occurring grass species (Agrostis stoloniferaand Deschampsia flexuosa); and one grasscommunity (G4) with the two grass species(H. lanatus and A. elatius) combined with a natu-rally co-occurring herb (Plantago lanceolata) andlegume (Lotus corniculatus). All community com-positions were selected because they representthe most prevailing and widespread species inEurope, and have significant landscape andecological importance. The original species com-position of each community was maintainedthroughout the experiment by removing invad-ing species at least twice per growing season.
Each plot was divided using a 20 9 20 cm grid,with one individual planted in each grid square(for a total of 100 individuals per plot). Initial spe-cies density for plot in the monocultures resultedin one dwarf shrub individual or one grass indi-vidual per grid square. In H2 individual wereplanted alternating species within the grid, result-ing in 50 individuals of each species (half densityof species in the monocultures). Similarly, in thefour-species communities (H4, G4), individualspecies were planted alternatively within the grid,resulting in 25 individuals of each species (one-quarter density of species in the monocultures). Allthe communities (four monocultures and threemixed stands) had five replicates, for a total of 35plots. In one H4 replicate, one species (V. myr-tillus) was lost at the time of sampling.
All plots were established on 60 cm of homoge-nized sandy soil overlaid with 20 cm of topsoil.The topsoil had a total carbon content of 2% and apH of 4.5 (measured in 1 mol/L KCl), and thelower sandy layer had a total carbon content of0.2% and a pH of 6.2. A gravel bed and drainage
tubes below 80 cm averted any influence fromirregular groundwater. The soil texture was loamysand (82% sand, 13% silt, 5% clay). Soils were col-lected from a nearby sand quarry (the topsoil ofthe quarry) where all study plants are found. Foursoil samples were collected in three replicas ofeach community (MC, H2, H4, and G4) with soilcores of 28 mm in diameter to a depth of 100 mmat the same time of harvest event in May 2011.The four soil samples of each community werebulked into one sample, for three bulked samplesfor each community and a total of 21 soil samples(3 replicas 9 7 communities) that were used instoichiometric analyses. The stoichiometry of thesoil nutrients did not differ significantly amongthe communities; the total element concentrationsare presented in the supporting information sec-tion (Appendix S1: Table S1).
Sampling, chemical analysis, and biomasscalculationAll species were harvested in May 2011 for
chemical analyses. An equal number of top andbottom leaves were collected from mature, repro-ductive individuals. We collected a total of 15foliar samples from each species of dwarf shruband a total of 10 foliar samples from each grassspecies. Sampling was conducted in two differ-ing ways depending on the occurrence or not ofregeneration within the plots. When no regenera-tion occurred (true for the both dwarf shrubsC. vulgaris and V. myrtillus), 20 9 40 cm sam-pling frames were centered in two dwarf shrubsfor H2 and H4 and a 20 9 20 sampling framecentered in each shrub for the monocultures.When regeneration occurred (G4 and grassesmonocultures), the 20 9 40 sampling frameswere placed randomly in every community com-position because it was not possible to locateoriginally planted individuals. The biomass of
Table 1. Characterization of the plant communities of the EVENT I experiment.
Community Description Species
MC Monocultures of the four target species Calluna vulgaris, Vaccinium myrtillus,Arrhenatherum elatius, Holcus lanatus
H2 Two species, one functional group (dwarf shrub) C. vulgaris, V. myrtillusH4 Four species, two functional groups (dwarf shrub and grass) C. vulgaris, V. myrtillus, Agrostis stolonifera,
Deschampsia flexuosaG4 Four species, three functional groups (grass, herb, and legume) A. elatius, H. lanatus, Plantago lanceolata,
Lotus corniculatus
Note: The species studied are highlighted in boldface.
❖ www.esajournals.org 4 May 2017 ❖ Volume 8(5) ❖ Article e01801
URBINA ET AL.
photosynthetic tissues per area was calculated in20 9 40 cm (0.08 m2) of sampling area. In thedwarf shrubs monoculture, because the samplingwas carried out with 20 9 20 frame, the valuewas corrected by multiplying by two, resultingin the same area.
The collected leaves were oven-dried at 70°Cfor 72 h, pulverized, re-dried at 70°C for 48 h,and stored in desiccators until analyzed (<15 d).C and N concentrations were determined for 0.7–0.9 mg of pulverized dried samples by combus-tion coupled to gas chromatography with an Ele-mental Analyzer CHNS Eurovector 3011 ThermoElectron Gas Chromatograph, model NA 2100(CE Instruments/Thermo Electron, Milan, Italy).The concentrations of the other elements (P, K,Ca, Mg, S, and Fe) were determined for 0.25 g ofpulverized dried sample dissolved with an acidicmixture of HNO3 (60% w/v) and H2O2 (30% w/v)and digested in a MARSXpress microwave sys-tem (CEM GmbH, Kamp-Lintfort, Germany).The digests were then diluted to a final volumeof 50 mL with ultrapure water and 1% HNO3.Blank solutions (5 mL of HNO3 and 2 mL ofH2O2 with no sample) were regularly analyzed.The concentrations of Ca, K, Mg, S, P, and Feafter digestion were analyzed by ICP-OES induc-tively coupled plasma optical emission spectrom-etry (Optima 4300 DV, Perkin-Elmer, Waltham,USA). The accuracy of the biomass digestionsand analytical procedures was assessed with acertified biomass NIST 1573a (tomato leaf, NIST,Gaithersburg, Maryland, USA) standards.
Statistical analysisPrincipal component analyses (PCAs) were
conducted based on the foliar stoichiometric dataof each species in order to explore the possibledifferent groups formed by the community factor.A complementary PERMANOVA was conductedto test the statistical significance of the groups.
One-way ANOVAs were conducted using ele-ment concentrations and C:N, C:P, C:K, N:P, N:K,and P:K ratios as dependent variables and com-munity as a categorical factor for each species inorder to evaluate the differences in element con-centrations within the different communities.ANOVA was also applied to test differences inspecies biomass per area in the different com-munities. We used Tukey’s honestly significantdifference procedure test and the pairwise test
with Bonferroni corrections to differentiate com-munity groups. Prior to the statistical analyses, wetested for normality and homogeneity of variancesof element concentrations using the Shapiro–Wilknormality test. Also, the residuals vs. the expectedplots and the normal qq plots of the linear modelswere examined. All statistical analyses were con-ducted with R packages in R 3.2.1. FactoMineRpackage was used for the PCA, Vegan package forthe ANOVAs, Permute package for the PERMA-NOVA, and ggplot2 for graphics.
RESULTS
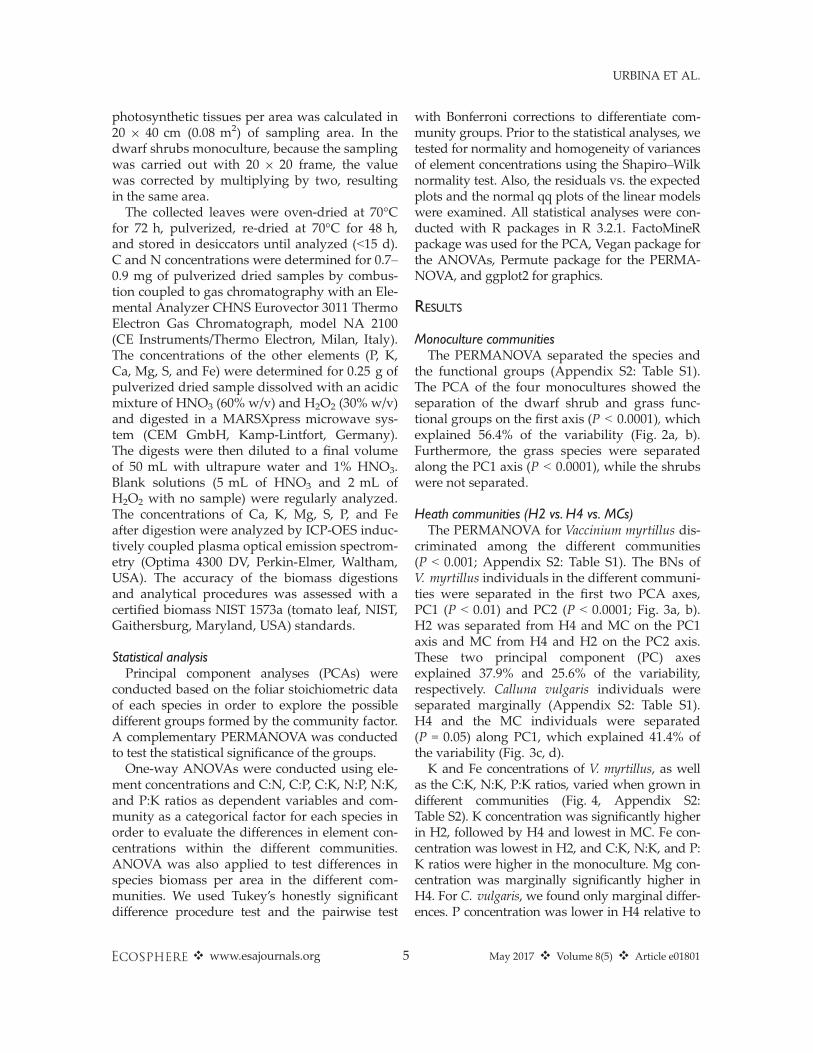
Monoculture communitiesThe PERMANOVA separated the species and
the functional groups (Appendix S2: Table S1).The PCA of the four monocultures showed theseparation of the dwarf shrub and grass func-tional groups on the first axis (P < 0.0001), whichexplained 56.4% of the variability (Fig. 2a, b).Furthermore, the grass species were separatedalong the PC1 axis (P < 0.0001), while the shrubswere not separated.
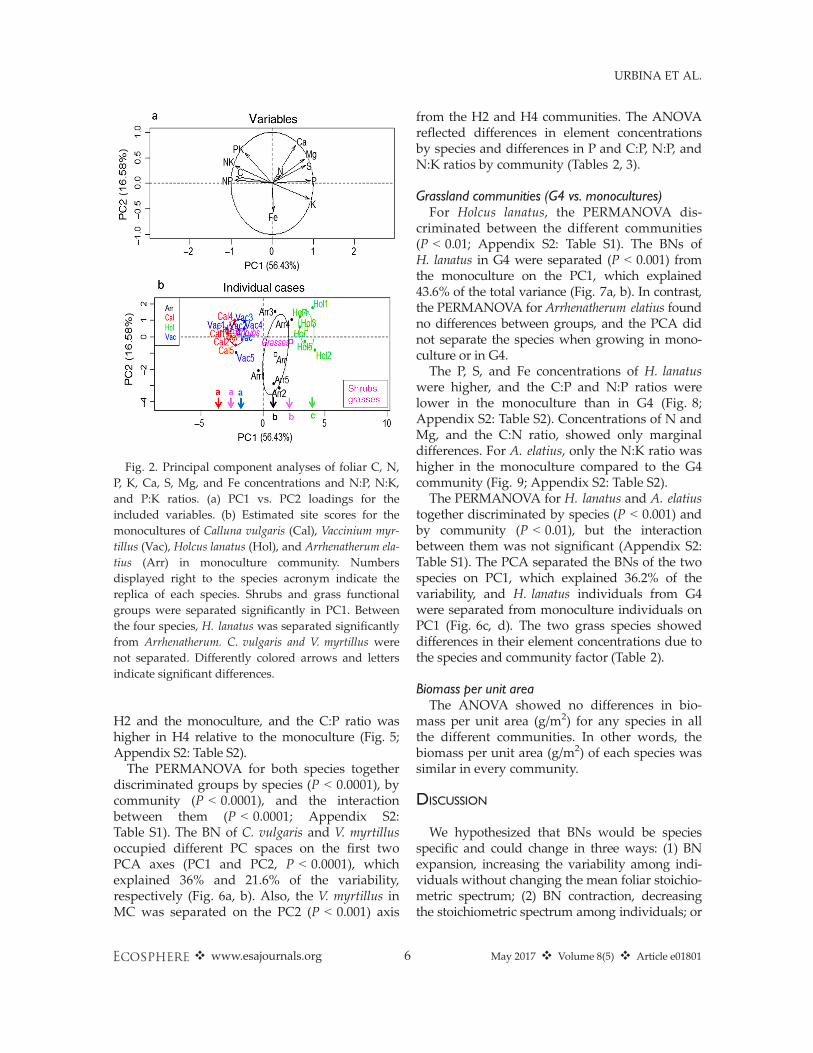
Heath communities (H2 vs. H4 vs. MCs)The PERMANOVA for Vaccinium myrtillus dis-
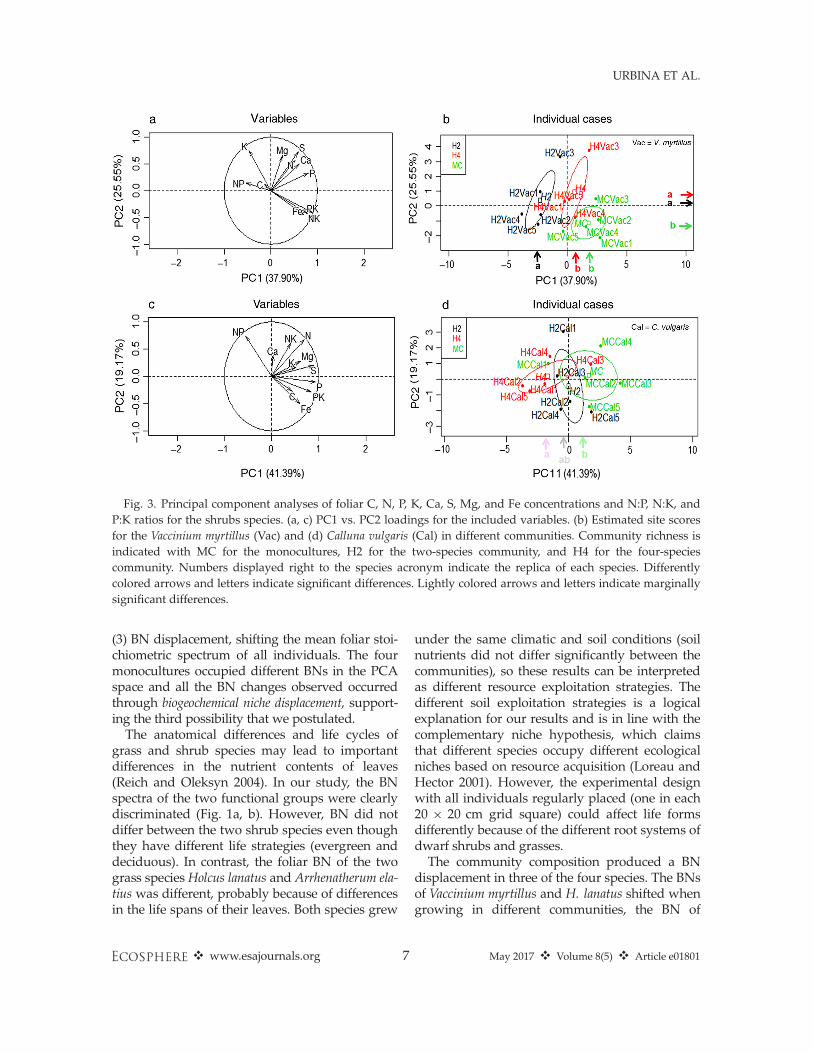
criminated among the different communities(P < 0.001; Appendix S2: Table S1). The BNs ofV. myrtillus individuals in the different communi-ties were separated in the first two PCA axes,PC1 (P < 0.01) and PC2 (P < 0.0001; Fig. 3a, b).H2 was separated from H4 and MC on the PC1axis and MC from H4 and H2 on the PC2 axis.These two principal component (PC) axesexplained 37.9% and 25.6% of the variability,respectively. Calluna vulgaris individuals wereseparated marginally (Appendix S2: Table S1).H4 and the MC individuals were separated(P = 0.05) along PC1, which explained 41.4% ofthe variability (Fig. 3c, d).K and Fe concentrations of V. myrtillus, as well
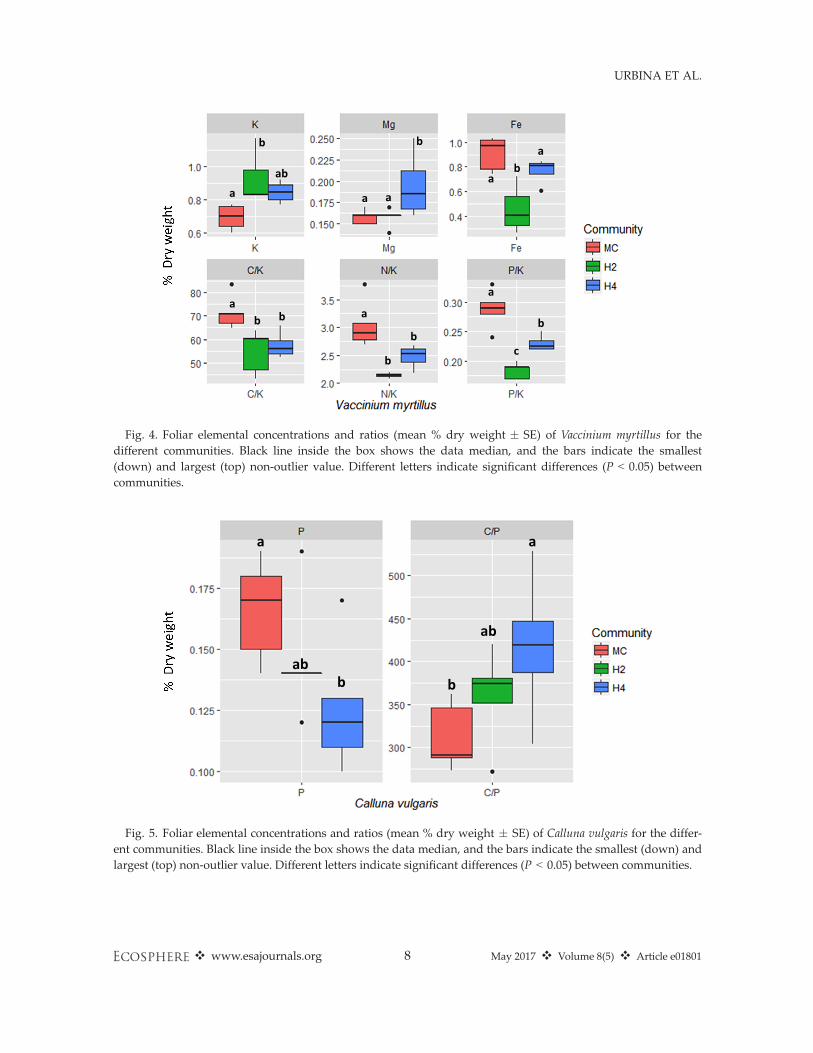
as the C:K, N:K, P:K ratios, varied when grown indifferent communities (Fig. 4, Appendix S2:Table S2). K concentration was significantly higherin H2, followed by H4 and lowest in MC. Fe con-centration was lowest in H2, and C:K, N:K, and P:K ratios were higher in the monoculture. Mg con-centration was marginally significantly higher inH4. For C. vulgaris, we found only marginal differ-ences. P concentration was lower in H4 relative to
❖ www.esajournals.org 5 May 2017 ❖ Volume 8(5) ❖ Article e01801
URBINA ET AL.
H2 and the monoculture, and the C:P ratio washigher in H4 relative to the monoculture (Fig. 5;Appendix S2: Table S2).
The PERMANOVA for both species togetherdiscriminated groups by species (P < 0.0001), bycommunity (P < 0.0001), and the interactionbetween them (P < 0.0001; Appendix S2:Table S1). The BN of C. vulgaris and V. myrtillusoccupied different PC spaces on the first twoPCA axes (PC1 and PC2, P < 0.0001), whichexplained 36% and 21.6% of the variability,respectively (Fig. 6a, b). Also, the V. myrtillus inMC was separated on the PC2 (P < 0.001) axis
from the H2 and H4 communities. The ANOVAreflected differences in element concentrationsby species and differences in P and C:P, N:P, andN:K ratios by community (Tables 2, 3).
Grassland communities (G4 vs. monocultures)For Holcus lanatus, the PERMANOVA dis-
criminated between the different communities(P < 0.01; Appendix S2: Table S1). The BNs ofH. lanatus in G4 were separated (P < 0.001) fromthe monoculture on the PC1, which explained43.6% of the total variance (Fig. 7a, b). In contrast,the PERMANOVA for Arrhenatherum elatius foundno differences between groups, and the PCA didnot separate the species when growing in mono-culture or in G4.The P, S, and Fe concentrations of H. lanatus
were higher, and the C:P and N:P ratios werelower in the monoculture than in G4 (Fig. 8;Appendix S2: Table S2). Concentrations of N andMg, and the C:N ratio, showed only marginaldifferences. For A. elatius, only the N:K ratio washigher in the monoculture compared to the G4community (Fig. 9; Appendix S2: Table S2).The PERMANOVA for H. lanatus and A. elatius
together discriminated by species (P < 0.001) andby community (P < 0.01), but the interactionbetween them was not significant (Appendix S2:Table S1). The PCA separated the BNs of the twospecies on PC1, which explained 36.2% of thevariability, and H. lanatus individuals from G4were separated from monoculture individuals onPC1 (Fig. 6c, d). The two grass species showeddifferences in their element concentrations due tothe species and community factor (Table 2).
Biomass per unit areaThe ANOVA showed no differences in bio-
mass per unit area (g/m2) for any species in allthe different communities. In other words, thebiomass per unit area (g/m2) of each species wassimilar in every community.
DISCUSSION
We hypothesized that BNs would be speciesspecific and could change in three ways: (1) BNexpansion, increasing the variability among indi-viduals without changing the mean foliar stoichio-metric spectrum; (2) BN contraction, decreasingthe stoichiometric spectrum among individuals; or
Fig. 2. Principal component analyses of foliar C, N,P, K, Ca, S, Mg, and Fe concentrations and N:P, N:K,and P:K ratios. (a) PC1 vs. PC2 loadings for theincluded variables. (b) Estimated site scores for themonocultures of Calluna vulgaris (Cal), Vaccinium myr-tillus (Vac), Holcus lanatus (Hol), and Arrhenatherum ela-tius (Arr) in monoculture community. Numbersdisplayed right to the species acronym indicate thereplica of each species. Shrubs and grass functionalgroups were separated significantly in PC1. Betweenthe four species, H. lanatus was separated significantlyfrom Arrhenatherum. C. vulgaris and V. myrtillus werenot separated. Differently colored arrows and lettersindicate significant differences.
❖ www.esajournals.org 6 May 2017 ❖ Volume 8(5) ❖ Article e01801
URBINA ET AL.
(3) BN displacement, shifting the mean foliar stoi-chiometric spectrum of all individuals. The fourmonocultures occupied different BNs in the PCAspace and all the BN changes observed occurredthrough biogeochemical niche displacement, support-ing the third possibility that we postulated.
The anatomical differences and life cycles ofgrass and shrub species may lead to importantdifferences in the nutrient contents of leaves(Reich and Oleksyn 2004). In our study, the BNspectra of the two functional groups were clearlydiscriminated (Fig. 1a, b). However, BN did notdiffer between the two shrub species even thoughthey have different life strategies (evergreen anddeciduous). In contrast, the foliar BN of the twograss species Holcus lanatus and Arrhenatherum ela-tius was different, probably because of differencesin the life spans of their leaves. Both species grew
under the same climatic and soil conditions (soilnutrients did not differ significantly between thecommunities), so these results can be interpretedas different resource exploitation strategies. Thedifferent soil exploitation strategies is a logicalexplanation for our results and is in line with thecomplementary niche hypothesis, which claimsthat different species occupy different ecologicalniches based on resource acquisition (Loreau andHector 2001). However, the experimental designwith all individuals regularly placed (one in each20 9 20 cm grid square) could affect life formsdifferently because of the different root systems ofdwarf shrubs and grasses.The community composition produced a BN
displacement in three of the four species. The BNsof Vaccinium myrtillus and H. lanatus shifted whengrowing in different communities, the BN of
Fig. 3. Principal component analyses of foliar C, N, P, K, Ca, S, Mg, and Fe concentrations and N:P, N:K, andP:K ratios for the shrubs species. (a, c) PC1 vs. PC2 loadings for the included variables. (b) Estimated site scoresfor the Vaccinium myrtillus (Vac) and (d) Calluna vulgaris (Cal) in different communities. Community richness isindicated with MC for the monocultures, H2 for the two-species community, and H4 for the four-speciescommunity. Numbers displayed right to the species acronym indicate the replica of each species. Differentlycolored arrows and letters indicate significant differences. Lightly colored arrows and letters indicate marginallysignificant differences.
❖ www.esajournals.org 7 May 2017 ❖ Volume 8(5) ❖ Article e01801
URBINA ET AL.
aa
ab
abb b
Fig. 5. Foliar elemental concentrations and ratios (mean % dry weight � SE) of Calluna vulgaris for the differ-ent communities. Black line inside the box shows the data median, and the bars indicate the smallest (down) andlargest (top) non-outlier value. Different letters indicate significant differences (P < 0.05) between communities.
aa
aa
a
aa
a
b b
bb
b
b
b
b
c
ab
Fig. 4. Foliar elemental concentrations and ratios (mean % dry weight � SE) of Vaccinium myrtillus for thedifferent communities. Black line inside the box shows the data median, and the bars indicate the smallest(down) and largest (top) non-outlier value. Different letters indicate significant differences (P < 0.05) betweencommunities.
❖ www.esajournals.org 8 May 2017 ❖ Volume 8(5) ❖ Article e01801
URBINA ET AL.
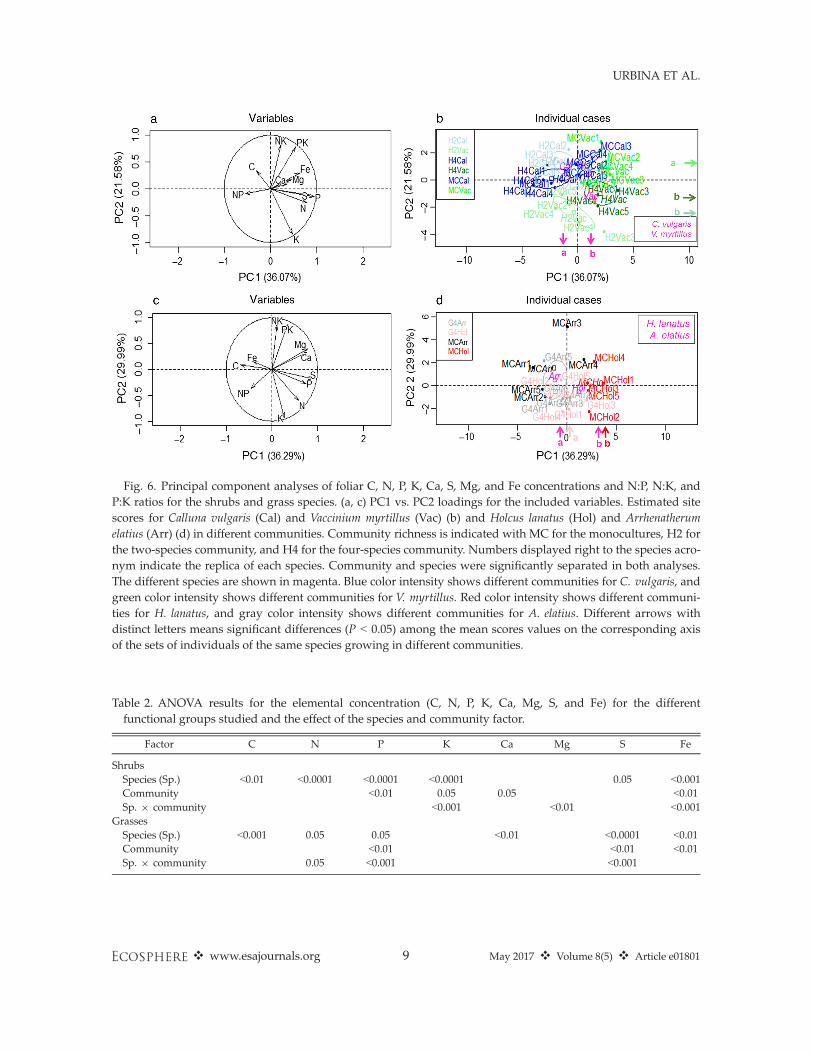
Fig. 6. Principal component analyses of foliar C, N, P, K, Ca, S, Mg, and Fe concentrations and N:P, N:K, andP:K ratios for the shrubs and grass species. (a, c) PC1 vs. PC2 loadings for the included variables. Estimated sitescores for Calluna vulgaris (Cal) and Vaccinium myrtillus (Vac) (b) and Holcus lanatus (Hol) and Arrhenatherumelatius (Arr) (d) in different communities. Community richness is indicated with MC for the monocultures, H2 forthe two-species community, and H4 for the four-species community. Numbers displayed right to the species acro-nym indicate the replica of each species. Community and species were significantly separated in both analyses.The different species are shown in magenta. Blue color intensity shows different communities for C. vulgaris, andgreen color intensity shows different communities for V. myrtillus. Red color intensity shows different communi-ties for H. lanatus, and gray color intensity shows different communities for A. elatius. Different arrows withdistinct letters means significant differences (P < 0.05) among the mean scores values on the corresponding axisof the sets of individuals of the same species growing in different communities.
Table 2. ANOVA results for the elemental concentration (C, N, P, K, Ca, Mg, S, and Fe) for the differentfunctional groups studied and the effect of the species and community factor.
Factor C N P K Ca Mg S Fe
ShrubsSpecies (Sp.) <0.01 <0.0001 <0.0001 <0.0001 0.05 <0.001Community <0.01 0.05 0.05 <0.01Sp. 9 community <0.001 <0.01 <0.001
GrassesSpecies (Sp.) <0.001 0.05 0.05 <0.01 <0.0001 <0.01Community <0.01 <0.01 <0.01Sp. 9 community 0.05 <0.001 <0.001
❖ www.esajournals.org 9 May 2017 ❖ Volume 8(5) ❖ Article e01801
URBINA ET AL.
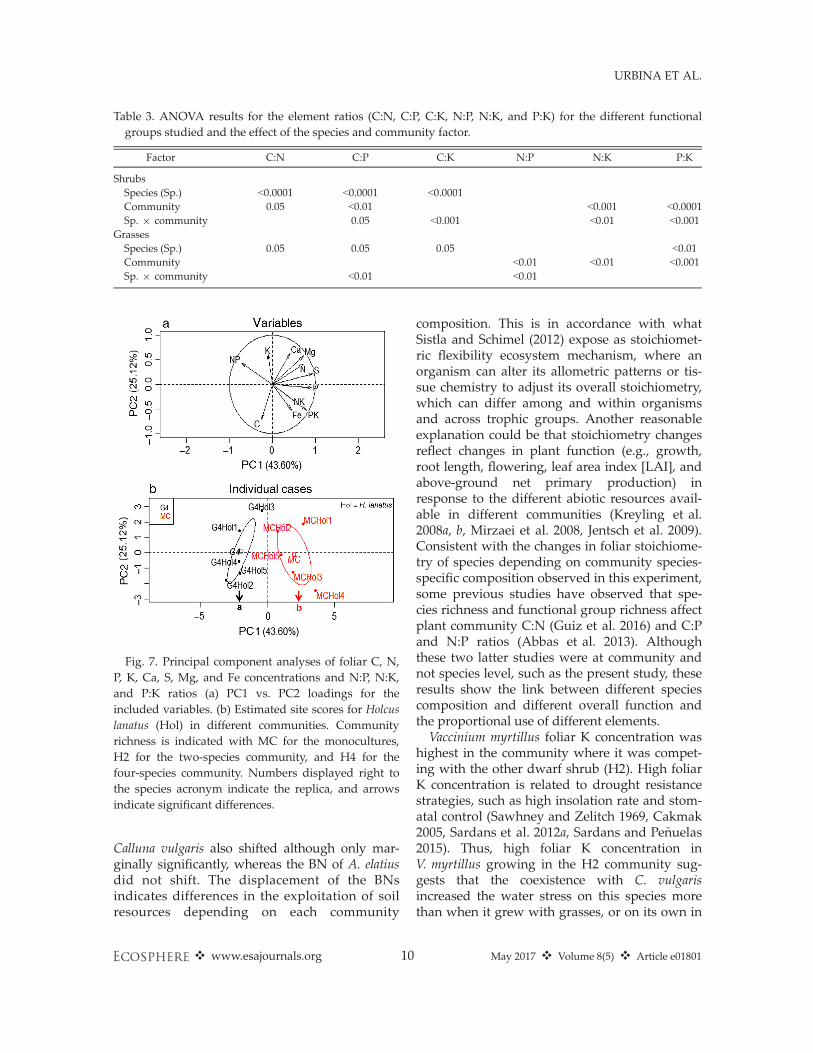
Calluna vulgaris also shifted although only mar-ginally significantly, whereas the BN of A. elatiusdid not shift. The displacement of the BNsindicates differences in the exploitation of soilresources depending on each community
composition. This is in accordance with whatSistla and Schimel (2012) expose as stoichiomet-ric flexibility ecosystem mechanism, where anorganism can alter its allometric patterns or tis-sue chemistry to adjust its overall stoichiometry,which can differ among and within organismsand across trophic groups. Another reasonableexplanation could be that stoichiometry changesreflect changes in plant function (e.g., growth,root length, flowering, leaf area index [LAI], andabove-ground net primary production) inresponse to the different abiotic resources avail-able in different communities (Kreyling et al.2008a, b, Mirzaei et al. 2008, Jentsch et al. 2009).Consistent with the changes in foliar stoichiome-try of species depending on community species-specific composition observed in this experiment,some previous studies have observed that spe-cies richness and functional group richness affectplant community C:N (Guiz et al. 2016) and C:Pand N:P ratios (Abbas et al. 2013). Althoughthese two latter studies were at community andnot species level, such as the present study, theseresults show the link between different speciescomposition and different overall function andthe proportional use of different elements.Vaccinium myrtillus foliar K concentration was
highest in the community where it was compet-ing with the other dwarf shrub (H2). High foliarK concentration is related to drought resistancestrategies, such as high insolation rate and stom-atal control (Sawhney and Zelitch 1969, Cakmak2005, Sardans et al. 2012a, Sardans and Pe~nuelas2015). Thus, high foliar K concentration inV. myrtillus growing in the H2 community sug-gests that the coexistence with C. vulgarisincreased the water stress on this species morethan when it grew with grasses, or on its own in
Table 3. ANOVA results for the element ratios (C:N, C:P, C:K, N:P, N:K, and P:K) for the different functionalgroups studied and the effect of the species and community factor.
Factor C:N C:P C:K N:P N:K P:K
ShrubsSpecies (Sp.) <0.0001 <0.0001 <0.0001Community 0.05 <0.01 <0.001 <0.0001Sp. 9 community 0.05 <0.001 <0.01 <0.001
GrassesSpecies (Sp.) 0.05 0.05 0.05 <0.01Community <0.01 <0.01 <0.001Sp. 9 community <0.01 <0.01
Fig. 7. Principal component analyses of foliar C, N,P, K, Ca, S, Mg, and Fe concentrations and N:P, N:K,and P:K ratios (a) PC1 vs. PC2 loadings for theincluded variables. (b) Estimated site scores for Holcuslanatus (Hol) in different communities. Communityrichness is indicated with MC for the monocultures,H2 for the two-species community, and H4 for thefour-species community. Numbers displayed right tothe species acronym indicate the replica, and arrowsindicate significant differences.
❖ www.esajournals.org 10 May 2017 ❖ Volume 8(5) ❖ Article e01801
URBINA ET AL.
the monoculture. This could have happenedbecause C. vulgaris (a shrub) has higher individ-ual biomass than the grass species and thereforedemands more water.
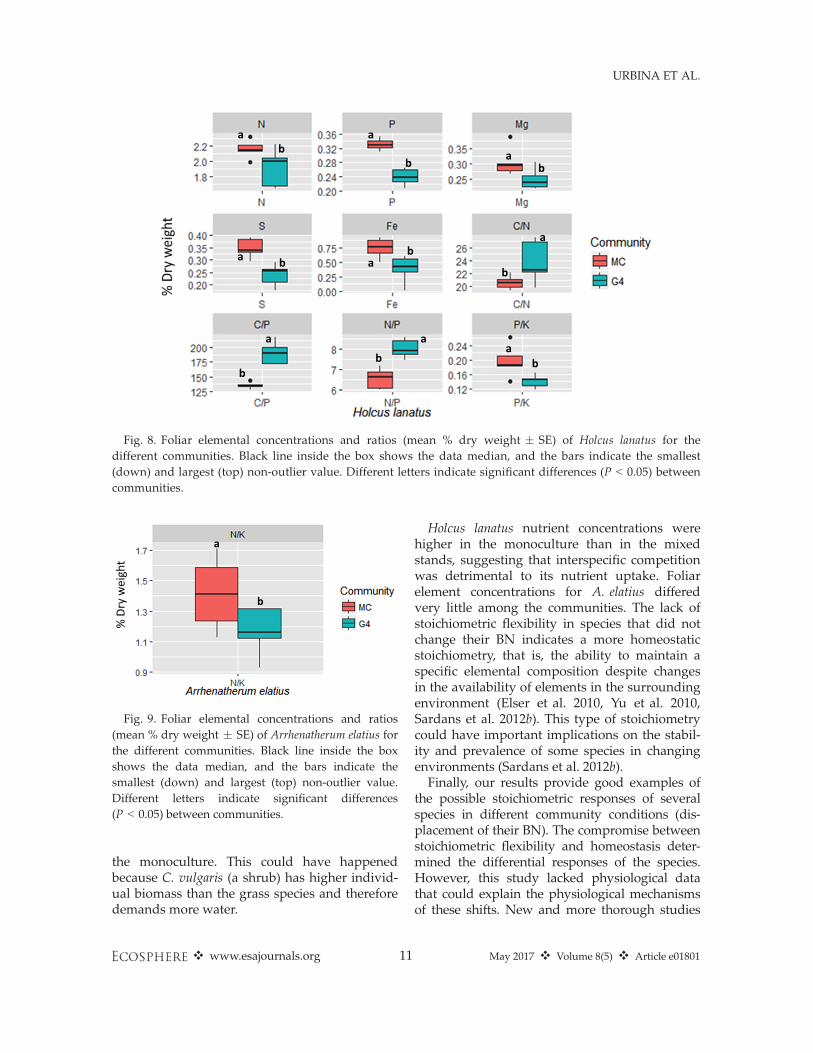
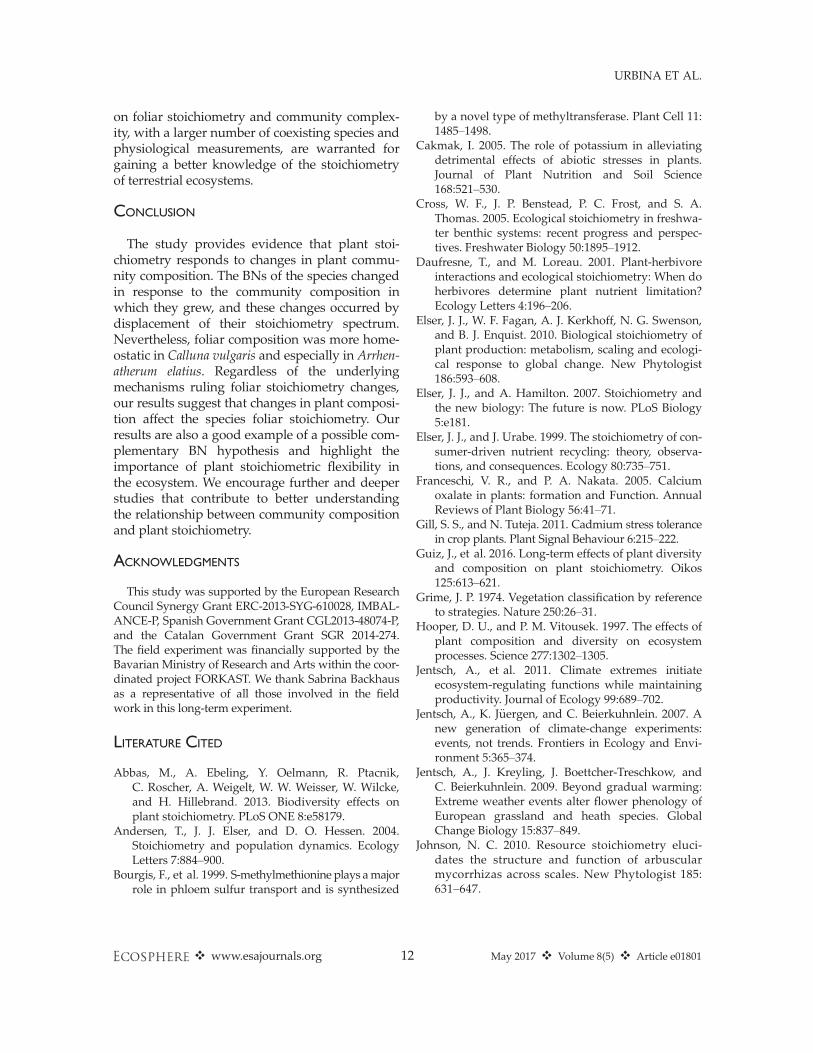
Holcus lanatus nutrient concentrations werehigher in the monoculture than in the mixedstands, suggesting that interspecific competitionwas detrimental to its nutrient uptake. Foliarelement concentrations for A. elatius differedvery little among the communities. The lack ofstoichiometric flexibility in species that did notchange their BN indicates a more homeostaticstoichiometry, that is, the ability to maintain aspecific elemental composition despite changesin the availability of elements in the surroundingenvironment (Elser et al. 2010, Yu et al. 2010,Sardans et al. 2012b). This type of stoichiometrycould have important implications on the stabil-ity and prevalence of some species in changingenvironments (Sardans et al. 2012b).Finally, our results provide good examples of
the possible stoichiometric responses of severalspecies in different community conditions (dis-placement of their BN). The compromise betweenstoichiometric flexibility and homeostasis deter-mined the differential responses of the species.However, this study lacked physiological datathat could explain the physiological mechanismsof these shifts. New and more thorough studies
a
b
Fig. 9. Foliar elemental concentrations and ratios(mean % dry weight � SE) of Arrhenatherum elatius forthe different communities. Black line inside the boxshows the data median, and the bars indicate thesmallest (down) and largest (top) non-outlier value.Different letters indicate significant differences(P < 0.05) between communities.
a
aa
a
a
a
a
a
a
b
b
b
b
b
b
bbb
Fig. 8. Foliar elemental concentrations and ratios (mean % dry weight � SE) of Holcus lanatus for thedifferent communities. Black line inside the box shows the data median, and the bars indicate the smallest(down) and largest (top) non-outlier value. Different letters indicate significant differences (P < 0.05) betweencommunities.
❖ www.esajournals.org 11 May 2017 ❖ Volume 8(5) ❖ Article e01801
URBINA ET AL.
on foliar stoichiometry and community complex-ity, with a larger number of coexisting species andphysiological measurements, are warranted forgaining a better knowledge of the stoichiometryof terrestrial ecosystems.
CONCLUSION
The study provides evidence that plant stoi-chiometry responds to changes in plant commu-nity composition. The BNs of the species changedin response to the community composition inwhich they grew, and these changes occurred bydisplacement of their stoichiometry spectrum.Nevertheless, foliar composition was more home-ostatic in Calluna vulgaris and especially in Arrhen-atherum elatius. Regardless of the underlyingmechanisms ruling foliar stoichiometry changes,our results suggest that changes in plant composi-tion affect the species foliar stoichiometry. Ourresults are also a good example of a possible com-plementary BN hypothesis and highlight theimportance of plant stoichiometric flexibility inthe ecosystem. We encourage further and deeperstudies that contribute to better understandingthe relationship between community compositionand plant stoichiometry.
ACKNOWLEDGMENTS
This study was supported by the European ResearchCouncil Synergy Grant ERC-2013-SYG-610028, IMBAL-ANCE-P, Spanish Government Grant CGL2013-48074-P,and the Catalan Government Grant SGR 2014-274.The field experiment was financially supported by theBavarian Ministry of Research and Arts within the coor-dinated project FORKAST. We thank Sabrina Backhausas a representative of all those involved in the fieldwork in this long-term experiment.
LITERATURE CITED
Abbas, M., A. Ebeling, Y. Oelmann, R. Ptacnik,C. Roscher, A. Weigelt, W. W. Weisser, W. Wilcke,and H. Hillebrand. 2013. Biodiversity effects onplant stoichiometry. PLoS ONE 8:e58179.
Andersen, T., J. J. Elser, and D. O. Hessen. 2004.Stoichiometry and population dynamics. EcologyLetters 7:884–900.
Bourgis, F., et al. 1999. S-methylmethionine plays amajorrole in phloem sulfur transport and is synthesized
by a novel type of methyltransferase. Plant Cell 11:1485–1498.
Cakmak, I. 2005. The role of potassium in alleviatingdetrimental effects of abiotic stresses in plants.Journal of Plant Nutrition and Soil Science168:521–530.
Cross, W. F., J. P. Benstead, P. C. Frost, and S. A.Thomas. 2005. Ecological stoichiometry in freshwa-ter benthic systems: recent progress and perspec-tives. Freshwater Biology 50:1895–1912.
Daufresne, T., and M. Loreau. 2001. Plant-herbivoreinteractions and ecological stoichiometry: When doherbivores determine plant nutrient limitation?Ecology Letters 4:196–206.
Elser, J. J., W. F. Fagan, A. J. Kerkhoff, N. G. Swenson,and B. J. Enquist. 2010. Biological stoichiometry ofplant production: metabolism, scaling and ecologi-cal response to global change. New Phytologist186:593–608.
Elser, J. J., and A. Hamilton. 2007. Stoichiometry andthe new biology: The future is now. PLoS Biology5:e181.
Elser, J. J., and J. Urabe. 1999. The stoichiometry of con-sumer-driven nutrient recycling: theory, observa-tions, and consequences. Ecology 80:735–751.
Franceschi, V. R., and P. A. Nakata. 2005. Calciumoxalate in plants: formation and Function. AnnualReviews of Plant Biology 56:41–71.
Gill, S. S., and N. Tuteja. 2011. Cadmium stress tolerancein crop plants. Plant Signal Behaviour 6:215–222.
Guiz, J., et al. 2016. Long-term effects of plant diversityand composition on plant stoichiometry. Oikos125:613–621.
Grime, J. P. 1974. Vegetation classification by referenceto strategies. Nature 250:26–31.
Hooper, D. U., and P. M. Vitousek. 1997. The effects ofplant composition and diversity on ecosystemprocesses. Science 277:1302–1305.
Jentsch, A., et al. 2011. Climate extremes initiateecosystem-regulating functions while maintainingproductivity. Journal of Ecology 99:689–702.
Jentsch, A., K. J€uergen, and C. Beierkuhnlein. 2007. Anew generation of climate-change experiments:events, not trends. Frontiers in Ecology and Envi-ronment 5:365–374.
Jentsch, A., J. Kreyling, J. Boettcher-Treschkow, andC. Beierkuhnlein. 2009. Beyond gradual warming:Extreme weather events alter flower phenology ofEuropean grassland and heath species. GlobalChange Biology 15:837–849.
Johnson, N. C. 2010. Resource stoichiometry eluci-dates the structure and function of arbuscularmycorrhizas across scales. New Phytologist 185:631–647.
❖ www.esajournals.org 12 May 2017 ❖ Volume 8(5) ❖ Article e01801
URBINA ET AL.
Knight, M. R., A. K. Campbell, S. M. Smith, and A. J.Trewavas. 1991. Transgenic plant aequorin reportsthe effects of touch and cold-shock and elicitors oncytoplasmic calcium. Nature 352:524–526.
Kreyling, J., C. Beierkuhnlein, L. Ellis, and A. Jentsch.2008a. Invasibility of grassland and heath commu-nities exposed to extreme weather events - additiveeffects of diversity resistance and fluctuating physi-cal environment. Oikos 117:1542–1554.
Kreyling, J., M. Wenigmann, C. Beierkuhnlein, andA. Jentsch. 2008b. Effects of extreme weather eventson plant productivity and tissue die-back are modi-fied by community composition. Ecosystems 11:752–763.
Loreau, M., and A. Hector. 2001. Partitioning selectionand complementarity in biodiversity experiments.Nature 412:72–76.
Millett, J., P. Millard, A. J. Hester, and A. J. S. McDonald.2005. Do competition and herbivory alter theinternal nitrogen dynamics of birch saplings?Ecology Letters 168:413–422.
Mirzaei, H., J. Kreyling, M. Zaman Hussain, Y. Li,J. Tenhunen, C. Beierkuhnlein, and A. Jentsch.2008. A single drought event of 100-year recurrenceenhances subsequent carbon uptake and changescarbon allocation in experimental grassland com-munities. Journal of Plant Nutrition and Soil Science171:681–689.
Moe, S. J., R. S. Stelzer, M. R. Forman, W. S. Harpole,T. Daufresne, and T. Yoshida. 2005. Recentadvances in ecological stoichiometry: insights forpopulation and community ecology. Oikos 109:29–39.
Newingham, B. A., R. M. Callaway, and H. Bassiridad.2007. Allocating nitrogen away from a herbivore: anovel compensatory response to root herbivory.Oecologia 153:913–920.
Pe~nuelas, J., and J. Sardans. 2009. Ecology: elementaryfactors. Nature 460:803–804.
Pe~nuelas, J., J. Sardans, J. Llusi�a, S. M. Owen, J. Carnicer,T. W. Giambelluca, E. L. Rezende, M. Waite, and€U. Niinemets. 2010. Faster returns on “leafeconomics” and different biogeochemical niche ininvasive compared with native plant species.Global Change Biology 16:2171–2185.
Pe~nuelas, J., J. Sardans, R. Ogaya, and M. Estiarte.2008. Nutrient stoichiometric relations and bio-geochemical niche in coexisting plant species: effectof simulated climate change. Polish Journal ofEcology 56:613–622.
Reich, P. B., and J. Oleksyn. 2004. Global patterns ofplant leaf N and P in relation to temperature andlatitude. Proceedings of the National Academy ofSciences USA 101:11001–11006.
Rivas-Ubach, A., J. Sardans, M. P�erez-Trujillo, M. Estiarte,and J. Pe~nuelas. 2012. Strong relationship betweenelemental stoichiometry and metabolome in plants.Proceedings of the National Academy of SciencesUSA 109:4181–4186.
Roem, W. 2000. Soil acidity and nutrient supplyratio as possible factors determining changes inplant species diversity in grassland and heath-land communities. Biological Conservation 92:151–161.
Romeis, T., A. A. Ludwig, R. Martin, and J. D. G. Jones.2001. Calcium-dependent protein kinases play anessential role in a plant defence response. EmboJournal 20:5556–5567.
Sardans, J., and J. Pe~nuelas. 2015. Potassium: aneglected nutrient in global change. Global Ecologyand Biogeography 24:261–265.
Sardans, J., J. Pe~nuelas, M. Coll, J. Vayreda, andA. Rivas-Ubach. 2012a. Stoichiometry of potassiumis largely determined by water availability andgrowth in Catalonian forests. Functional Ecology26:1077–1089.
Sardans, J., A. Rivas-Ubach, and J. Pe~nuelas. 2012b.The C:N: P stoichiometry of organisms and ecosys-tems in a changing world: a review and perspec-tives. Perspectives in Plant Ecology, Evolution, andSystematic 14:33–47.
Sardans, J., I. A. Janssens, R. Alonso, S. D. Veresoglou,M. C. Rillig, T. G. M. Sanders, J. Carnicer, I. Filella,G. Farr�e-Armengol, and J. Pe~nuelas. 2015. Foliarelemental composition of European forest tree spe-cies associated with evolutionary traits and presentenvironmental and competitive conditions. GlobalEcology and Biogeography 24:240–255.
Sardans, J., R. Alonso, J. Carnicer, M. Fernandez-Martinez, M. G. Vivanco, and J. Penuelas. 2016.Factors influencing the foliar elemental compositionand stoichiometry in forest trees in Spain. Perspec-tives in Plant Ecology, Evolution and Systematics 18:52–69.
Sawhney, B. L., and I. Zelitch. 1969. Direct determina-tion of potassium ion accumulation in guard cellsin relation to stomatal opening in light. PlantPhysiology 44:1350–1354.
Shaul, O. 2002. Magnesium transport and function inplants: the tip of the iceberg. BioMetals 15:307–321.
Sistla, S. A., and J. P. Schimel. 2012. Stoichiometricflexibility as a regulator of carbon and nutrientcycling in terrestrial ecosystems under change.New Phytologist 196:68–78.
Sterner, R. W., and J. J. Elser. 2002. Ecological stoi-chiometry: the biology of elements from moleculesto the biosphere. Princeton University Press,Princeton, New Jersey, USA.
❖ www.esajournals.org 13 May 2017 ❖ Volume 8(5) ❖ Article e01801
URBINA ET AL.
Tilman, D., D. Wedin, and J. Knops. 1996. Produc-tivity and sustainability influenced by biodi-versity in grassland ecosystems. Nature 379:718–720.
Yu, Q., Q. Chen, J. J. Elser, N. He, H. Wu, G. Zhang,J. Wu, Y. Bai, and Y. Han. 2010. Linking stoichio-metric homoeostasis with ecosystem structure, func-tioning and stability. Ecology Letters 13:1390–1399.
SUPPORTING INFORMATION
Additional Supporting Information may be found online at: http://onlinelibrary.wiley.com/doi/10.1002/ecs2.1801/full
❖ www.esajournals.org 14 May 2017 ❖ Volume 8(5) ❖ Article e01801
URBINA ET AL.


