Embed Size (px)
Citation preview

JOURNAL OF GEOPHYSICAL RESEARCH, VOL. 94, NO. A3, PAGES 2459-2470, MARCH 1, 1989
Plasmoid-Associated Energetic Ion Bursts in the Deep Magnetotail' Numerical Modeling of the Boundary Layer
M. SCHOLER AND F. J AMITZKY
Institut f•r eztraterrestrische Physik, Maz-Planck-Institut fa'r Physik und Astrophysik Garching, Federal Republic of Germany
Single particle orbits are numerically followed in a time dependent two-dimensional resistive MHD model of tail reconnection. In this model, near-Earth reconnection disconnects the plasma sheet and the tailward departing closed field line region is surrounded by a thickening layer of disconnected lobe field lines. Orbits starting in this layer are traced backward in time, and their interaction with the current sheet close to the X line is studied. The model predicts the spatial distribution of energetic protons in the boundary layer surrounding pissmolds. It is argued that lower energy protons are injected after their acceleration onto lobe field lines closer to the neutral line than higher energy ions. Thus the low-energy proton boundary layer will be found closer to the separatrix than the higher energy proton layer. This is confirmed by the numerical calculations. Further downtail from the neutral line the energy dispersion due to the dawn-dusk electric field becomes larger and leads to the usual inward dispersion. Applying Liouville's theorem, we calculate the distribution function of accelerated ions in the boundary layer. Comparison with measurements obtained in the deep tail indicates that proton intensities observed in the layer around plasmoids at energies above ~ 30 keV can be obtained by the neutral line acceleration of a suitable lobe ion distribution.
INTRODUCTION
Recent observations of the distant geomagnetic tail by the ISEE-3 spacecraft between -• 100 and -• 220 R E have provided strong evidence for the existence of closed- loop field lines (p!asmoids) in the course of geomagnetic substorms. The identification of the plasmoid s is based on the typical north-south excursion of the magnetic field [Hones et al., 1984] and on the observation of isotropic en- ergetic electron distributions [Scholer et al., 1984a] when the plasmoids move with velocities of up to -• 1200 km/s over the spacecraft. These structures are believed to be due to pinching off of the quiet time plasma sheet by near- Earth reconnection at a newly created neutral line near substorm onset [Hones, 1977]. Figure 1, from Richard- son et al. [1987], illustrates the formatio n and down- tail propagation of a pissmold. The hatched area in- dicates the plasma sheet region, including the plasmoid (PM) and the postplasmoid plasma sheet (PPPS). During steady reconnection the accelerated lobe plasma consti- tuting the postplasmoid plasma sheet occupies a central wedge shaped portion of the region of reconnected field lines contained between the seœaratrices mapping to the neutral line [Cowley, 1984].
Scholer et al. [1984a] and Richardson and Cowley [1985] have reported the features of "bursts" of energetic ions and electrons associated with these plasmoids in the deep tail. At the beginning of the events tailward stream- ing energetic electrons (75-115 keV) are observed followed a few minutes later by strongly tailward streaming pro- tons with energies between ~ 30 and ~ 300 keV. The pro- tons exhibit typical energy dispersion effects at the onset with higher energy protons arriving before lower energy protons. These distributions are followed by isotropic
Copyright 1989 by the American Geophysical Union.
Paper number 88JA03762.
0148-0227/89/88 JA-03762505.00
energetic electrons, indicating a population trapped on closed-loop magnetic field lines. The duration of isotropic energetic electron fluxes has been interpreted by Soholet et al. [1984a, b] as the duration of th e plasmoid passage. The energetic protons in the pissmolds stream tailward. However, the angular distribution is considerably broader than before the plasmoid encounter. This anisotropy can be interpreted in terms of bulk flow and allows determina- tion of plasma speed and plasmoid length [Soholet et al., 1984b; Gloeckler et al., 1984; Daly et al., 1985; Richardson et al., 1987].
The observation of energy dispersion effects in ener- getic particles before the spacecraft is engulfed by the plasmoid can be interpreted either in terms of an en- counter with reconnecting field lines where various par- ticle species reach the spacecraft after their rectilinear travel time or in terms of spatial structures which move over the spacecraft.' Both effects are in principle present at the same time, and Richardson and Cowley [1985] have Shown how they can be observationally separatedø These authors found in their statistical analysis that in the ma- jority of gases the layer of energetic particles is swept across the spacecraft by the arrival of the plasmoid in the deep tail. Suprathermal particles injected or produced near the neutral line will stream ahead of the thermal plasma in the region between the the outer edge of the plasma sheet and the separatrices. Particles with suc- cessively higher energies will be found closer to the sep- aratrices. The dotted regions in Figure i between the plasma sheet boundary (dashed line) and the field separa- trices mapping to th• neutral lines represent these plasma sheet boundary layers (PSBL) containing spatially dis- persed layers of energetic particles.
Due to the velocity filter effect, ions with different parallel energy but the same total energy Will be found at different spatial positions in the boundary layer. Such a dispersion leads naturally to highly beamed distribu- tions if the particles originate from a localized source and the spectrum is steep. However, Scholer et al. [198.7]
2459

2460 SCHOLER AND JAMITZKY: BOUNDARY LAYER IN THE DEEP MAGNETOTAIL
o moo R E 200 R E I I i I I
(b) ...................................................... o
ß
PPPS PM PSBL
(c)
Fig. 1. Sketches of the geomagnetic tail illustrating the formation and downtail propagation of plasmoids according to the neutral line model of substorms. PM indicates the plasmoid, PSBL the plasma sheet boundary layer, and PPPS the postplasmoid plasma sheet [from Richardson et al., 1987].
reported that the ions in these layers are not only highly field aligned, but that intensities of ions with a certain to- tal energy at large pitch angles are considerably reduced compared to the field-aligned intensities also when com- paring at different positions in the layer. In other words, the boundary layer is deficient of large pitch angle parti- cles. This indicates that the particles are injected prefer- rentially parallel to the field or are adiabatically focussed during their propagation. The streaming ion beams in the boundary layer are probably responsible for the right- hand polarized, large-amplitude wave events found in this region of space [ Tsurutani et al., 1985].
The near-Earth neutral line model as discussed above
can explain many of the observed features of the bound- ary layer. However, the basic question as to the ori- gin of the ions with energies up to 300-keV and higher is unanswered. Lyons and Speiser [1982] have proposed that mantle plasma ions drift toward the center of the plasma sheet. Current sheet acceleration of these ions in the dawn to dusk electric field and subsequent ejection toward the Earth is thought to be the process producing the boundary layer in the near-Earth region. Similarily, acceleration of lobe plasma in the electric field along the substorm related new neutral line may be responsible for the high-energy particles observed in the boundary layer around plasmoids. It is the purpose of the present paper to evaluate quantitatively ion acceleration in the near- Earth neutral line substorm model. Since the usual guid- ing center particle theory which conserves the first two adiabatic invariants is not valid in the vicinity of a neu- tral line we will perform numerical calculations of particle trajectories in a reconnection configuration.
Several papers have addressed in the past particle ac- celeration in a reconnection configuration. Sato et al. [1982] followed numerically trajectories in the electric and magnetic fields obtained from a two-dimensional simula- tion of driven reconnection with a single X line. Protons were accelerated near the X line to 1-200-keV, depending on how close they reached the neutral line after injection. Matthaeus et al. [1984] studied particle orbits in two- dimensional incompressible MHD fields produced from a spectral method simulation of a sheet pinch. They found that some particles can get trapped in finite amplitude fluctuations convected out of the reconnection region and will thus experience the electric field close to the neutral line for the order of an Alfv•n transit time. This could
lead to acceleration up to energies between 500-keV and 2- MeV [Goldstein et al., 1986]. Scholer and Jamitzky [1987] proposed that a single neutral line can split into a pair of neutral lines with subsequent evolution of a plasmoid. Particles injected at the time of the secondary tearing drift large distances along the electric field and the high- energy particles are subsequently contained within the developing plasmoid. However, all these simulations can- not be directly applied to the structure of the boundary layer around plasmoids in the distant tail. In particular, none of the simulations deals with the spatial structure of the boundary layer, the details of the distribution func- tion and the question whether acceleration of lobe ions is sufficient to produce the spectra and absolute intensities observed in the deep tail. We have therefore calculated the particle orbits in the electric and magnetic field of a more realistic model of tail reconnection. The model is a
two-dimensional MHD simulation of reconnection where
the initial configuration is a self-consistent magnetotail configuration with a northward (positive Bz) component throughout the plasma sheet and a flaring lobe magnetic field [Birn et al., 1975]. The next section briefly describes the MHD model. We then quantitatively evaluate neutral line acceleration of lobe ions using numerical calculations of particle trajectories. We conclude that acceleration of lobe ions via single-particle motion along a substorm re- lated near-Earth neutral line does explain many features of the distant plasma sheet boundary layer.
BOUNDARY LAYER OBSERVATIONS
IN THE DEEP TAIL
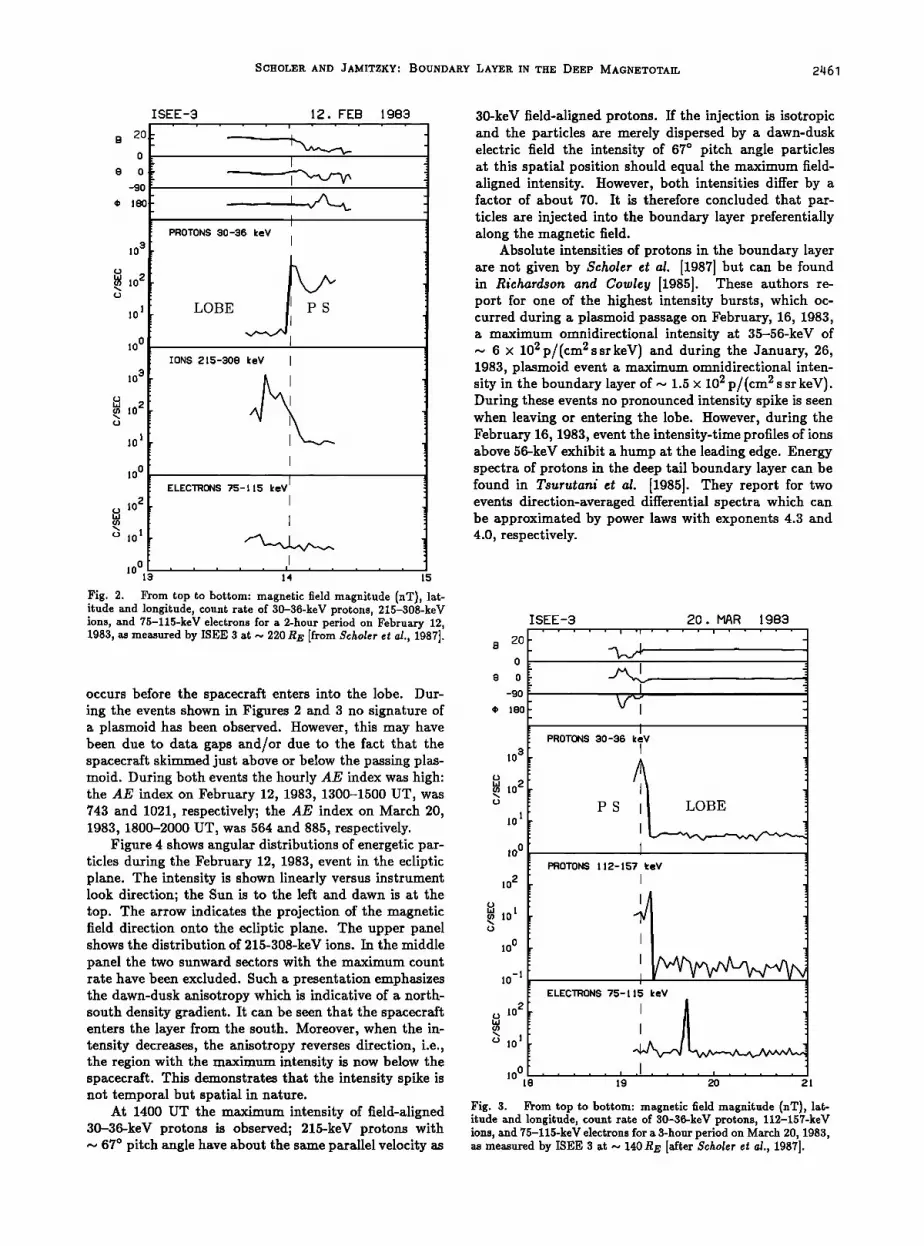
In this section we will briefly review some of the fea- tures of the boundary layer in the deep tail as observed by ISEE 3. Figure 2, taken from Scholer et al. [1987], shows from top to bottom magnetic field data (magnitude in nanoteslas, latitude and longitude in GSE coordinates) and energetic particle count rates (30-36-keV protons, 215-308-keV ions, 75-115-keV electrons) as obtained by ISEE 3 at N 220 R E. Before entering the plasma sheet (PS) from the southern lobe the spacecraft encounters bursts of energetic particles. Higher velocity particles are observed before lower velocity particles. There is a dis- tinct intensity spike in the beginning of the burst. A dashed vertical line is drawn at the time of the maximum
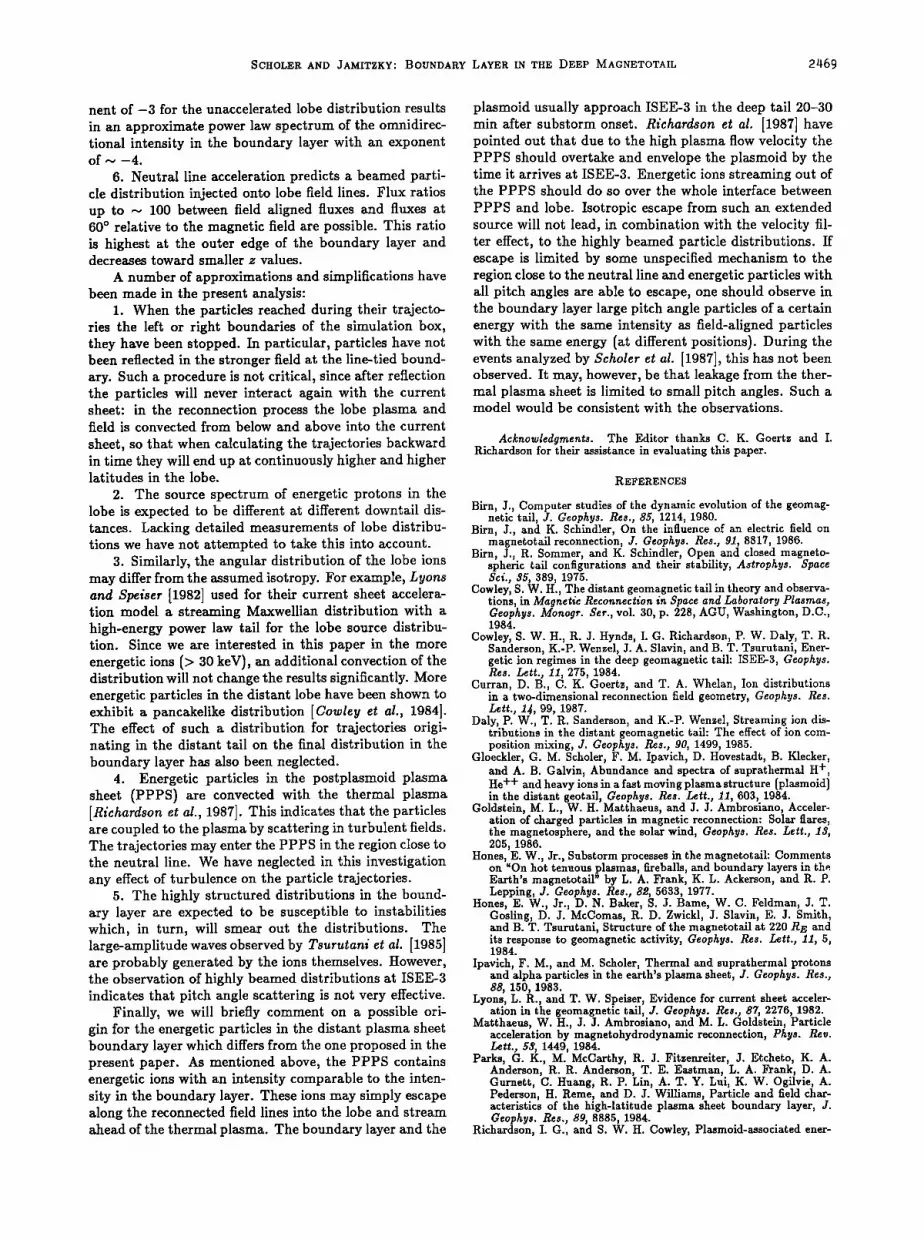
intensity of the 30-36-keV protons. Figure 3 shows an ex- ample where the spacecraft leaves the boundary layer at N 140 RE into the northern lobe. The dispersion effects are seen in reversed order, and the maximum intensity
SCHOLER AND JAMITZKY: BOUNDARY LAYER IN THE DEEP MAGNETOTAIL 2q61
20- o
0:.-
-90 .
180 - -
10 3
• o 2 v) I
1 10
10 ø
10 3
m o 2 v) I
1 10
10 ø
(j 1o 2 • 1 o 1o
ISEE-3 12. FEB 1983
PROTONS 30-36 key
LOBE P S
IONS 215-308 key
I
I ELECTRONS 75-115 keV
I
I
I 10 0 ..... • .....
13 14 15
Fig. 2. From top to bottom: magnetic field magnitude (nT), lat- itude and longitude, count rate of 30-36-keV protons, 215-308-keV ions, and 75-115-keV electrons for a 2-hour period on February 12, 1983, as measured by ISEE 3 at ~ 220 RE [from $cl•oler ½t al., 1987].
occurs before the spacecraft enters into the lobe. Dur- ing the events shown in Figures 2 and 3 no signature of a plasmoid has been observed. However, this may have been due to data gaps and/or due to the fact that the spacecraft skimmed just above or below the passing plas- moid. During both events the hourly AE index was high: the AE index on February 12, 1983, 1300-1500 UT, was 743 and 1021, respectively; the AE index on March 20, 1983, 1800-2000 UT, was 564 and 885, respectively.
Figure 4 shows angular distributions of energetic par- ticles during the February 12, 1983, event in the ecliptic plane. The intensity is shown linearly versus instrument look direction; the Sun is to the left and dawn is at the top. The arrow indicates the projection of the magnetic field direction onto the ecliptic plane. The upper panel shows the distribution of 215-308-keV ions. In the middle
panel the two sunward sectors with the maximum count rate have been excluded. Such a presentation emphasizes the dawn-dusk anisotropy which is indicative of a north- south density gradient. It can be seen that the spacecraft enters the layer from the south. Moreover, when the in- tensity decreases, the anisotropy reverses direction, i.e., the region with the maximum intensity is now below the spacecraft. This demonstrates that the intensity spike is not temporal but spatial in nature.
At 1400 UT the maximum intensity of field-aligned 30-36-keV protons is observed; 215-keV protons with ~ 67 ø pitch angle have about the same parallel velocity as
30-keV field-aligned protons. If the injection is isotropic and the particles are merely dispersed by a dawn-dusk electric field the intensity of 67 ø pitch angle particles at this spatial position should equal the maximum field- aligned intensity. However, both intensities differ by a factor of about 70. It is therefore concluded that par- ticles are injected into the boundary layer preferentially along the magnetic field.
Absolute intensities of protons in the boundary layer are not given by $½holer et al. [1987] but can be found in Richardson and Cowley [1985]. These authors re- port for one of the highest intensity bursts, which oc- curred during a plasmoid passage on February, 16, 1983, a maximum omnidirectional intensity at 35-56-keV of N 6 x 10² p/(cm 2 s srkeV) and during the January, 26, 1983, plasmoid event a maximum omnidirectional inten- sity in the boundary layer of ~ 1.5 x 10² p/(cm 2 s sr keV). During these events no pronounced intensity spike is seen when leaving or entering the lobe. However, during the February 16, 1983, event the intensity-time profiles of ions above 56-keV exhibit a hump at the leading edge. Energy spectra of protons in the deep tail boundary layer can be found in Tsurutani et al. [1985]. They report for two events direction-averaged differential spectra which can be approximated by power laws with exponents 4.3 and 4.0, respectively.
ISEE-3 ß ,
El 20 o
tB 0
-90
d) 150
103
,,i 02 u) I
1 10
10 ø
102 o ,,, 1 (a 10
o
1o ø
-1 1o
o 102
o 101
10 0 .
2O. hIAR 1983
PROTONS 30-36 keV
I
P s LOBE
PROTONS 112-157 keV
I
I
I ELECTRONS 75-115 keV
ß i i m ..... i .....
2O 2
Fig. 3. From top to bottom: magnetic field magnitude (nT), lat- itude and longitude, count rate of 30-36-keV protons, 112-157-keV ions, and 75-115-keV electrons for a 3-hour period on March 20, 1983, as measured by ISEE 3 at ~ 140 RE [after $cholcr ½i al., 1987].

2462 SCHOLER AND JAMITZKY: BOUNDARY LAYER IN THE DEEP MAGNETOTAIL
IONS 215 -308 key
IONS 215 -308 keV
ELECTRONS 75-115 key
13 :/.2:59 13 :/.5:07 13 :/.7:15 13:/.9:23 13:51' 31
IONS 215 -308key
IONS 215 -308 key
PROTONS 30-36 keV
13:53:39 13:55:/.7 13:57'55 1/,'00:03 1/..02'11
Fig. 4. Energetic particle angular distributions, averaged over 128 s, on February 12, 1983. Shown is the intensity versus look direction in the ecliptic plane (the Sun is to the left of the figure). In the middle panel the two sunward looking sectors are eliminated in order to emphasize dawn-dusk anisotropies [from $½hoIcr ½t aL, 1987].
RECONNECTION MODEL
AND ORBIT CALCULATION SCHEME
In order to simulate numerically the deep tail bound- ary layer, particle trajectories are followed in a time vary- ing electric and magnetic field model. This model is con- structed by a two-dimensional compressible MHD simu- lation of reconnection. Details can be found in the pa- per by $choler [1987]. The initial configuration is a self- consistent two-dimensional magnetotail configuration ac- cording to Birn et al. [1975] with a northward (positive Bz) component throughout the plasma sheet and a flar- ing lobe magnetic field [see Figure 2a of Birn, 1980]. In the initial configuration the Bz component on the x axis decreases with increasing x proportional to l/(x + Xmax), where Xmax is the maximum value of x (i.e., 80 RE) , and the Bx component at x = 0 is equal to Bx of a Har- ris sheet (i.e., Bx(0, z) •x tanh(z/A)). The characteristic plasma sheet half thickness, A, is assumed to be 2 R E at the near-Earth boundary. In the computations the ac- tual variables are normalized by the following quantities: magnetic field by the lobe magnetic field Bo, density by the density difference between plasma sheet center and lobe (po - pc -Pl), both taken at the near-Earth bound-
ary (x = 0), length x by l = 1 R E (6371 km), velocity by VAo = Bo/(t•oPo) 1/2, and time by the Alfv4n transit time r A = l/VAo. Note that the characteristic speed is based on lobe magnetic field strength and the density difference between plasma sheet and lobe. Current density, pres- sure, electric field, and resistivity are then normalized by Bo/(•ol), Bo•/(2•o), Eo = VAoBo, and •olVAo, respec- tively. In the MHD simulation the resistivity is allowed to be a function of the current density: • = a(j- jet) if j > jet, where j is the electrical current and jet a critical threshold current, or r• - 0 if j < jer. In the simula- tion run we have assumed a value of jcr = 0.5 in our dimensionless units, which is equal to the maximum cur- rent density in the initial configuration (at x = 0, z = 0). The temperature is initially assumed to be constant in the whole configuration. The initial pressure equilibrium can be written as p = • + i - B 2, where • is the ratio of particle to magnetic field pressure outside the plasma sheet. The lobe density is then given by Pl - •. We have assumed initially a constant lobe density of 0.15. The calculations are made inside a rectangular box sur- rounded by four planes. The size of the box is 87 x 17.4 in units of R•7. The actual calculations are performed only in the upper half, and symmetry is imposed at the mid- plane. The upper and right-hand boundaries are placed at Zmax -- 8.7 and Xmax -- 87, respectively. The magnetic field is line-tied at the left-hand boundary (x - 0), where the velocity is equal to zero. Reconnection occurs either by allowing the tearing mode to grow unstable [e.g., Birn and Schindler, 1986], by prescribing a nonuniform inflow at the high-latitude boundary z -- Zmax and thus driving the system [e.g., $ato and Hayashi, 1979] or by applying initially a small localized resistivity in the central current sheet at some position z- z N [e.g., Ugai, 1987].
We will use in this study results obtained by apply- ing initially a localized resistivity at a position z N - 20. Figure 5, taken from $choler [1987], shows the magnetic field lines and the flow pattern at two different times: at t - 150, when reconnection has just disconnected the closed field line region and tail lobe flux is reconnected, and at t - 210, when the departing closed field line re- gion is surrounded by a thickening layer of disconnected lobe field lines. Figure 5 is the numerical simulation of the situation described schematically in Figure 1.
The electric and magnetic field data at all grid points (175 x 89 in the upper half plane) were stored every five time steps. Test particles were introduced into these fields at various times and their three-dimensional trajectories were computed in space r and velocity u by solving the equations of single particle motion
dr
d•' = u (1) du
d-•' = '7[u x B + E l (2) Here r and u are also normalized to l and VAo, respec- tively; ff is given by
qrABo = (s)
mp

SCHOLER AND JAMITZKY' BOUNDARY LAYER IN THE DEEP MAGNETOTAIL 21463
z o
-80 20 40 60 80 8 ........ , ....... •••..• .........
_80' ===================================== 20 40 60 80
t 21o ,o
o
-80 20 40 60 80
Z 0
-8
X •
Fig. 5. Evolution of the magnetic field configuration and of the flow pattern obtained from an MHD simulation of tail reconnection. The dashed lines in the panel with the magnetic field configuration and the solid lines in the panel with the flow pattern, respectively, represent the separatrices [from $½holcr, 1987].
where q and mp are the particle's charge and mass, respec- tively. The equations of motion are solved by a high-order Runge-Kutta method. The values of E and 13 at position r are linearly interpolated by using values at the nearest four grid points.
CALCULATIONS OF PARTICLE ACCELERATION
For the test particle calculations we have to spec- ify the parameter if. If we assume a lobe magnetic field strength Bo = 25nT, a lobe density Pt = 6.7 x 10 -22 kg/m 3 (corresponding to 0.4 cm-3), we get a unit velocity of VAo -- 350 km/s and a lobe Alfv•n velocity of VAi = 860 km/s. Note that the quantities Bo and Pl are the values at the near-Earth boundary. The unit electric field is then 8 mV/m. This leads to a value of ff • 46 for protons.
To investigate the structure of the boundary layer par- ticle orbits starting at various z values tailward of the X line are followed backward in time. We specify at a partic- ular spacecraft position (xf,zf) a particle velocity vector (corresponding to a "final" energy Kf) and trace the or- bits through the current sheet until all interactions with the current sheet are complete and the particle reaches the left- or right-hand boundary. At this time we know its "initial" energy K i and have determined that it has either a plasma sheet or lobe origin. Assuming a dis- tribution function for the lobe ions and using Liouville's theorem, we are then able to construct the distribution function at any position downstream of the X line. In the following, we fix the xf position to 60 R E. The maximum distance of the MHD and orbit calculations is basically de-
termined by economical considerations. The ISEE-3 ob- servations of the boundary layer have actually been made in the more distant tail at distances between ~ 100 and
~ 220 R E. However, after their interaction with the cur- rent sheet the energetic particles move essentially adia- batically along the reconnected lobe field lines tailward and are only subject to the dawn-dusk electric field. This leads to a broadening of the boundary layer with increas- ing distance.
The tailward streaming ions at the edge of the depart- ing plasmoid were simulated by calculating orbits starting at various z values parallel to the magnetic field at t - 220 backward in time. Figure 6 shows for four different val- ues of K/ (120 keV, 60 keV, 30 keV, 10 keV) the initial energy K i versus z between z - 5 and z - 6. At this time the separatrix was located at z - 5.6. Coming from larger z values within the separatrix the energy K i con- tinuously decreases over some width in z and reaches a miniurn value. The z location of the minimum decreases
with decreasing energy. This is due to fact that the par- ticles are subject to the dawn-dusk electric field during their motion along the reconnected lobe field line.
Inspecting individual orbits it is found that a particle moves along a lobe field line which is convected into the
Ene r By/k eV
180 [ • • 120
60
0 I I 180
120
6O
o
6o
4o
2o
o
2o I I
0 5.2 5.5 I
5.8 6
Fig. 6. The initial energy of a proton observed parallel to the field with final energies (from top to bottom) 120-keV, 60-keV, 30-keV, and 10-keV versus z at x = 60.

2464 SCHOLER AND JAMITZKY: BOUNDARY LAYER IN THE DEEP MAGNETOTAIL
reconnection region. Particles close to the minimum en- ergy arrive at the current sheet some distance from the neutral line and perform essentially a gyromotion in the residual Bz normal magnetic field. The energy increase is maximum (minimum energy in Figure 7) when the par- ticle performs either half a gyroradius on one side of the neutral line or two quarter gyroradii on each side of the neutral line before it is ejected again with 0 ø pitch an- gle onto reconnected lobe field lines. Particles ending up closer to the separatrix meet the neutral line at a large angle and are transmitted from one side of the neutral line to the other side by drifting only a small distance in the y direction. This will be shown later in more detail when discussing individual orbits (cf. Figure 11).
The spiky behavior of K i is a consequence of the chaotic nature of the particle motion in this magnetic field geometry: these particles interact many times with the current sheet before being ejected with 0 ø pitch an- gle onto lobe field lines. Similar intensity structures have been found by Curran et al. [1987], who performed par- ticle orbit calculations in an analytical magnetic X line configuration and applied the results to magnetopause re- connection.
It is necessary to specify the distribution of ions at the initial position and the energy K i in order to calculate the
j/cm2$ec $ter keV 10 0 - • •
o
10-1
10-2 I I lO 2
lO 1
lO o
lO-1
10-2 10 3
10 2
lO 1
lO o
10-1 10 6
10 5
10 4
10 3
10 2
101
keV
60 keV
i i
30 keV
i i i
i i I
10 keV _ _
=
.
lO 0 i i i 5 0 5.2 5.5 5.8 6 0
z
Fig. 7. The variation of the differential intensity at 0 ø pitch angle with z at z = 60 and at various energies.
particle distribution in the boundary layer resulting from the neutral line acceleration. Since the initial position is always outside of the original plasma sheet the particle distribution observed in the model boundary layer origi- nates in the lobe. The lobe source locations (xi, zi) can be located anywhere in the deep tail or in the near-Earth region. Thus the source distribution in the lobe should be specified over the whole distance range from the near- Earth region to the deep tail. However, observations of lobe distributions are rather limited. Lacking detailed measurements and in order to demonstrate the principal effect of near-Earth neutral line acceleration we assume
in the following one particular distribution to be repre- sentative for the whole lobe. We have chosen an ion dif-
ferential spectrum reported by Parks et al. [1984], which was measured by ISEE-1 at ~ 15 R E in the lobe close to the plasma sheet boundary (time interval 1155-1159 UT in Figure 11 of Parks et al. [ 1984]). For our purpose, we have approximated this spectrum in the energy range above 2 keV by a simple power law
j = 8 x 10⁴ E -3 p/(cm 2 s sr keY)
where E is in keV. At 100 keV this results in an intensity
of 8 x 10⁻² p/(cm2ssrkeV). For comparison, the average intensity at 100 keV in the near-Earth plasma sheet is 102-103 p/(cm 2 ssrkeV) [e.g., Ipavich and Scholer, 1983]. Using Liouville's theorem we then calculate the differen- tial intensity at various energies. Figure 7 shows the dif- ferential intensity at 120, 60, 30, and 10 keV versus z. The structure in Figure 7 is of course a mirror image of the structure in Figure 6. The absolute intensities obtained from the neutral line acceleration compare favorably well with observed intensities as presented, e.g., by Richardson and Cowley [1985]. As can be seen from Figure 7, we ob- tain a maximum intensity parallel to the magnetic field of 103 p/(cm 2 s sr keV). The model furthermore results in a gradual increase of the intensity at a certain energy when entering the boundary layer. Such a gradual increase is not incorporated in the model of Cowley [1984], wherein particle boundaries of particles having a certain velocity are necessarily sharp.
Several factors determine the occurrence of the inten-
sity maximum within the separatrix. In order to eject par- ticles from the current sheet there has to be a small com-
ponent of the magnetic field perpendicular to the sheet [Speiser, 1965]. The qualitative behavior of particle orbits can be understood by transforming locally with velocity E/Bz (actually E/('•Bz)in our dimensionless variables, but we will neglect the factor -• in the following) into a frame where the electric field E is zero. Note that the
use of this transformation requires both constant E and Bz over the particle trajectory and is thus a bad approx- imation close to the neutral line. In this frame energy is conserved and thus the energy gained in the station- ary frame is either inversely proportional to the size of the perpendicular component of magnetic field, Bz, if the particle's initial velocity vz is larger than the frame trans- formation velocity or inversly proportional to Bz 2 if the particle's initial velocity is smaller than the frame trans- formation velocity. Since Bz increases away from the neu- tral line, the energy gain decreases for particles ejected further away from the neutral line, and thus the intensity

SCHOLER AND JAMITZKY: BOUNDARY LAYER IN THE DEEP MAGNETOTAIL 2l$65
decreases in the layer further away from the separatrix. Speiser and Lyons [1984] have shown that ejection occurs approximately at a time equal to to half the gyroperiod about the weak Bz. Particles coming close to the neutral line during their gyroorbit in the x-y plane and thus gaining the maximum amount of energy are ejected at a position at least one gyroradius tailward of the neutral line. This should approximately determine the position of the maximum intensity. Since the lower energy particles have a smaller gyroradius, their injection occurs closer to the neutral line.
Let us assume that away from the neutral line the magnetic field normal component increases with x accord- ing to some function f, Bz = f(x). We further assume that injection onto lobe field lines occurs at a distance x i away from the neutral line, such that x i equals the gyrora- dius rg in the gyroorbit-averaged magnetic field < Bz >:
K1/2
x i - rg oc 1 • Bz(x)dx (4) Neglecting energy dispersion due to the dawn-dusk elec- tric field, we obtain from magnetic flux conservation that the particle will be found in the lobe at a distance Az away from the separatrix which is equal to the gyroradius Rg in the lobe field Bo. Thus lower energy particles will be found closer to the separatrix than higher energy par- ticles. This is opposite to the energy dispersion due to the E x B drift. Magnetic flux conservation and Farady's law yield that at a distance L downstream of the neutral
line a particle with velocity vii parallel to the lobe field is found at a distance Az from the separatrix [Richardson and Cowley, 1985]
•_(•) •
We may ask at which distance •, downstream of a neutral line layers of particles with two different energies K1, K2 cross each other. This distance is given by
•, E 1 1 ) _[_ Rgl _ Rg2 _ 0 (6)
Assuming in the more distant tail a lobe magnetic field of 10 nT, we find that 30-keV and 100-keV proton layers cross at ,-- 33 R E downstream of a neutral line and 10- keV and 30-keV layers cross ,-- 11 R E downstream. Thus the dispersion of protons with different energies due to the injection at a different distance from the neutral line has to be taken into account when determining electric fields from energy dispersion in the boundary layer unless the distance neutral line-spacecraft is considerably larger than •,.
We have verified this simple picture by tracing numer- ically particle orbits backward in time which start in the boundary layer closer to the neutral line. Figure 8 shows the initial energy of particles which reach 120 keV and 30 keV, respectively, at x- 40, i.e., close to the neutral line with 0 ø pitch angle versus z. Clearly, the intensity max- imum of 30-keV protons is at this distance closer to the separatrix than the intensity maximum of 120-keV pro- tons. Note that the assumption of a power law spectrum
œner•y/keV
240' l ' 180.
120.
60.
O. 0.5 1.0
60. , I
45
30
1õ
o i i '0. 0.5 1.0
z
I
1.5 2
1.5 2
Fig. 8. The initial energy of a proton observed parallel to the field with a final energy of 120-keV (top) and 30-keV (bottom) versus z at x -- 40.
results in a maximum intensity at the position where the initial energy is minimum.
Close to the neutral line the assumption of constant E/Bz is of course violated and particle trajectories cannot be understood easily. Two typical particle trajectories are shown in Figure 9. The heavy line in each panel is the orbit in stereo projection, the lighter lines are projections of the orbit onto the z-y, x-y and z-x planes. Also shown below each orbit is the energy versus time. Both particles reach a final energy of 90 keV and have a pitch angle of 0 ø. The particle in the lower part started at ,-- 40 keV in the northern lobe of the distant tail, reaches the current sheet near the neutral line, and performs there an oscillatory motion in the y direction till it is ejected in the tailward direction in the northern boundary layer with an energy of 90 keV. However, due to the chaotic behavior of orbits near a neutral line, it is also possible for a particle ending at a slightly lower z position in the boundary layer to loose energy while drifting from dusk to dawn, then to perform a large gyroorbit in the residual Bz magnetic field and to gain the energy back before also being injected with 0 ø pitch angle and 90 keV along the field. This particle (top part of Figure 9) started with 60 keV in the northern lobe to the earthward side of the reconnection line. Particles
observed in the boundary layer parallel to the field at the same energy but at slightly different z positions can thus originate from widely different positions in phase space, i.e., in configuration as well as velocity space. This will be important when considering the composition in the boundary layer, since the source distribution in the near- Earth lobe may contain a large ionospheric contribution as compared to the more distant lobe.
DISTRIBUTION FUNCTION MAPPING
In order to demonstrate the beaming of ions due to the neutral line acceleration, we have constructed the dis- tribution function in velocity space at position z - 5.37 where the intensity of 60-keV protons is maximum. We show contour plots of the accelerated particle distribution
function in the vii- vñ plane in Figure 10. The unit ve- locity is the velocity VAo. The solid circles indicate the

2466 SCHOLER AND JAMITZKY' BOUNDARY LAYER IN THE DEEP MAGNETOTAIL
z
En e r gy/k eV
90.
60.
30.
0. 200.0 205.0 210.0 215.0 220.0
Time
Z
8.
0
-•b. 60.
20.
o. -20. y Ene r gy/keV
90.
S0.
30.
20R.R 209.9 213.3 21R.R 220.0
Time
Fig. 9. Three-dimensional display of particle trajectories (heavy lines) and projections of the orbit onto the z- z, z - y, and y- z planes (lighter lines). Below the orbits and their projections is shown the particle's energy versus time. Both particle orbits end parallel to the field with 90-keV, but at slightly different z values (Az = 0.01).
contours of an isotropic distribution. Six thousand parti- cles have been isotropically distributed in energy between 10 and 120 keV and in pitch and phase angle, and the trajectories are followed backward in time. Using Liou- ville's theorem and averaging over phase angle we obtain
the distribution function in the vii- vñ plane. It can be clearly seen that the distribution is beamed along the magnetic field. This beaming is less pronounced at the very low velocities and at the highest velocities. Low- velocity particles at this z position could not have come from the neutral sheet but are "unprocessed" background lobe particles. The same holds for protons with vii • 0.
Speiser and Lyons [1984] have shown that in the case of a one-dimensional current sheet the accelerated dis-
tribution function fa(vz, vy, Vz) can be obtained approx-
imately by substituting vz- 2E/Bz for vz in the ini- tial distribution function fl. This assumes that in the E - 0 frame a particles's x component of velocity is merely turned around due to the current sheet interac- tion. Assuming fi o• E -4, we obtain
- + Bz
after imposing reflection symmetry about the vñ axis. In the two-dimensional system with a neutral line there is no unique velocity E/Bz such that the electric field is zero in a transformed frame. Nevertheless, some understanding can be gained by applying equation (7). At the very high velocities particles perform a large gyroorbit in the x-y plane and are injected a large x distance (one gyroradius) away from the X line where Bz is such that vx >> E/Bz. In this velocity range the isointensity contours are close to being circles. In an intermediate range vx << E/Bz, since the orbit is close to the neutral line where Bz is small. Isointensity contours are thus closely parallel to
the vii axis. At the very low energies, particles reaching this point in the boundary layer have not interacted in the past with the current sheet. Isointensity contours are again expected to be close to circles.
Figure 10 exhibits closed contours at about 20 ø pitch angle and 30 keV. The maximum of the distribution func-
tion at this position in the vii-vñ plane occurs only at a certain phase and is due to remote sensing of the high intensity 30-keV layer at the present spatial position, i.e., in the maximum of the 60-keV layer. At this spatial po- sition the intensity of the 30-keV protons steeply rises toward smaller z distances. Figure 11 is an example of three proton orbits which end up at this spatial position with an energy of 30 keV parallel to the field (top, orbit 1) and at an angle of 20 ø to the field (middle, orbit 2), respectively, and with an energy of 60 keV and 0 ø pitch angle (bottom, orbit 3). The orbit ending parallel to the field with 30 keV (orbit 1) starts with an energy slightly below its final energy in the southern lobe and drifts only a small distance in the y direction during its interaction with the current sheet. The particle ending with an angle of 20 ø with respect to the magnetic field (orbit 2) starts
f 20.
15. -
vii 10.
5.
0 '0 5. 10. 1 5. 20.
Vl
Fig. 10. Mapping of a power law distribution function through the neutral line acceleration mechanism. The distribution is phase averaged and shown at the z position {at z = 60} where the 60-keV intensity parallel to the field is maximum.

SCHOLER AND JAMITZKY: BOUNDARY LAYER IN THE DEEP 1V•AGNETOTAIL 2467
z
o. -20. y
z
O.
•o.•.... •-•o. •ø'•-•...•• o.
o. -20. y
Fig. 11. Three-dimensional display of particle trajectories (heavy lines) and projections of the orbit onto the s - z, z - y, and y - s planes (lighter lines). (top) Particle ending with 30-keV and 0 ø pitch angle. (middle) Particle ending with 30-keV and a velocity vector of 20 ø to the magnetic field. (bottom) Particle ending with 60-keV and 0 ø pitch angle. All particles end at s = 5.34, x = 60.
in Figure 9. Also shown is the E -3 background (lobe) spectrum. The spectrum in the lower panel is the omnidi- rectional spectrum obtained somewhat further away from the separatrix, i.e., at z - 5.34 where the 30 keV paral- lel intensity is maximum. The spectrum above ~ 35 keV is close to a E -4 power law spectrum which has been reported in the boundary layer around plasmoids by Tsu- rutani et al. [1985]. Absolute fluxes are close, although somewhat smaller than what is typically observed in the boundary layer. Note that the lobe intensity chosen is rather low; Lyons and $peiser [1982] assumed for their current sheet acceleration model at 100 keV a mantle in-
tensity of 2p/(cm 2 s srkeV) which has to be compared with our value of 8 x 10⁻² p/(cm2 ssrkeV). The omnidi- rectional differential spectrum below ~ 35 keV turns over
1ø 4 3
10 3
lO 2 z
lO 1 O.
_• 1 0 0 613. '
20.
20 0••__•• 0. -•o • 10-210
/cm2sec ster key
with low energy in the southern lobe and performs a half gyroorbit in the residual Bz close to the neutral line, thus gaining a large part of the cross tail potential. By inspect- ing many orbits we found that the drift in the y direction of an orbit coming close to the neutral line depends on whether the orbit projection in the y-x plane is almost tangent to the neutral line or crosses it with a large an- gle. Particles which meet the neutral line almost tangent perform either a half gyroorbit on one side (e.g., orbit 2) or a quarter gyroorbit on both sides of the neutral line (orbit 3). Orbits meeting the neutral line at a large angle are transmitted from one side of the neutral line to the
other side by drifting only a small distance in the y direc- tion (orbit 1). These particles gain only a small amount of energy and end up in boundary layer between separatrix and the position of maximum intensity.
Figure 12 shows in the top panel the omnidirectional spectrum obtained from the distribution function shown
i I I I I i
10 3
10 2
lO 1
lO 0
!0-1
10-210
-= z : 5.34
[n e r I•y/k eV
Fig. 12. The omnidirectional differential intensity at two different positions in the boundary layer. Also shown is the K -3 lobe spectrum assumed for the neutral line acceleration mechanism.

2468 SCHOLER AND JAMITZKY: BOUNDARY LAYER IN THE DEEP MAGNETOTAIL
ster keV 10 2 ,
lO 1
lO 0
lO-1
10-2 i I I
10 o
10-1 =
10-2 I I 5.0 5.2 5.5 5.• 6.0
Fig. 13. The directional differential intensities at 60-keV parallel to the magnetic field (top panel) and at 60 ø relative to the magnetic field (bottom panel) versus z at z = 60.
toward lower energiesø The spectrum below • 20 keV is identical to the lobe spectrum, since particles of this en- ergy and at this position in space have not interacted in the past with the current sheetø
Both Richardson and Cowley [1985] and Scholer et al. [1987] found that during the events investigated the inten- sity of protons with the same total energy Kf but smaller vii (larger pitch angle) is smaller than the field-aligned intensity everywhere in the boundary layer. This shows that beaming in the boundary layer is not due to a spa- tial separation of an initially isotropic distribution by the velocity filter effect of the dawn-dusk electric field. Ac- cording to equation (7), neutral line acceleration should result in such beamed distributions. We have investigated neutral line acceleration of particles with the same final energy Kf but different pitch angles. One thousand par- ticles were evenly distributed between z = 5 and z = 6 at x = 60. The final phase angle at these final positions was randomly chosen. Figure 13 shows the differential direc- tional intensity of 60-keV protons parallel to the magnetic field (top panel) and at 60 ø to the magnetic field (bottom panel), respectively, versus z. It can be seen that there is a large difference between the 0 ø intensity and the 60 ø intensity everywhere in the boundary layer. At z • 6 the 60 ø intensity is somewhat lower than that at 0 ø, which is the background lobe intensity. The 60 ø pitch angle par- ticles come from slightly higher energy and have drifted opposite to the dawn-dusk electric field, thus loosing some energy. The measured ratio of fluxes at 0 ø and at 60 ø is according to Figure 4 during the February 12, 1983,
boundary traversal on the average ~ 10. This is larger than the ratio obtained in the simulation: only at the z location of the 0 ø intensity peak is the intensity ratio of the order of ~ 100. The ratio decreases toward smaller z values and is ~ 3 at z- 5.
LIMITATIONS AND CONCLUSIONS
Particle orbits have been followed numerically in the electric and magnetic field obtained from a two-dimensio- nal resistive MHD simulatio of tail reconnection. In this
model the plasma sheet is disconnected by near-Earth re- connection and the departing closed field line region is sur- rounded by a thickening layer of disconnected lobe field lines. Proton acceleration resulting from single particle motion within a current sheet and the dawn to dusk elec-
tric field is known to be an important mechanism [e.g., Lyons and Speiser, 1982; Speiser and Lyons, 1984]. Ejec- tion of the accelerated particles results from the weak magnetic field across the sheet. The acceleration effi- ciency is expected to increase close to the neutral line, since the normal magnetic field component decreases to- ward the neutral line. Proton orbits starting with a cer- tain velocity vector at various positions in the layer of disconnected lobe field lines have been followed backward
in time until their nonadiabatic interaction with the cur-
rent sheet is complete. The results can be summarized as follows.
1. Particles gain the maximum amount of energy when they perform either a half gyrorbit closest to the neutral line or two quarter gyroorbits on both sides of the neutral line in the small magnetic field normal to the current sheet before being ejected onto reconnected lobe field lines. This leads to a dispersion in the boundary layer such that lower energy particles will be found closer to the separatrix than higher energy particles. Further downtail from the neutral line the energy dispersion due to the drift in the dawn-dusk electric field becomes larger and will lead to the usual inward dispersion.
2. The model predicts a maximum of the field-aligned proton flux near the outer edge of the boundary layer, i.e., to the lobeward side. These maxima occur at different
locations according to ion energy. Such intensity spikes have been observed by Scholer et al. [1987].
3. Due to the chaotic behavior of the ion orbits in
the current sheet close to the neutral line, energetic parti- cles observed at slightly different position in the boundary layer may originate from vastly different positions in the lobe, e.g., from the earthward or tailward side of the neu- tral line. Since source spectra are expected to be different in different parts of the tail this may influence greatly the structure of the boundary layer. In particular, the compo- sition is expected to be different, depending on whether particle orbits originate from the earthward or tailward side of the neutral line.
4. Applying Liouville's theorem we calculated the distribution function of accelerated ions in the boundary layer. The magnitudes of the calculated distribution func- tion of the accelerated ions were found to agree well with the observations in the deep tail when we used an initial, unaccelerated ion distribution representative of the lobe.
5. A power law differential spectrum with an expo-
SCHOLER AND JAMITZKY: BOUNDARY LAYER IN THE DEEP MAGNETOTAIL 2469
nent of -3 for the unaccelerated lobe distribution results
in an approximate power law spectrum of the omnidirec- tional intensity in the boundary layer with an exponent of ~ -4.
6. Neutral line acceleration predicts a beamed parti- cle distribution injected onto lobe field lines. Flux ratios up to ~ 100 between field aligned fluxes and fluxes at 60 ø relative to the magnetic field are possible. This ratio is highest at the outer edge of the boundary layer and decreases toward smaller z values.
A number of approximations and simplifications have been made in the present analysis:
1. When the particles reached during their trajecto- ries the left or right boundaries of the simulation box, they have been stopped. In particular, particles have not been reflected in the stronger field at the line-tied bound- ary. Such a procedure is not critical, since after reflection the particles will never interact again with the current sheet' in the reconnection process the lobe plasma and field is convected from below and above into the current
sheet, so that when calculating the trajectories backward in time they will end up at continuously higher and higher latitudes in the lobe.
2. The source spectrum of energetic protons in the lobe is expected to be different at different downtail dis- tances. Lacking detailed measurements of lobe distribu- tions we have not attempted to take this into account.
3. Similarly, the angular distribution of the lobe ions may differ from the assumed isotropy. For example, Lyons and $peiser [1982] used for their current sheet accelera- tion model a streaming Maxwellian distribution with a high-energy power law tail for the lobe source distribu- tion. Since we are interested in this paper in the more energetic ions (• 30 keV), an additional convection of the distribution will not change the results significantly. More energetic particles in the distant lobe have been shown to exhibit a pancakelike distribution [Cowley et al., 1984]. The effect of such a distribution for trajectories origi- nating in the distant tail on the final distribution in the boundary layer has also been neglected.
4. Energetic particles in the postplasmoid plasma sheet (PPPS) are convected with the thermal plasma [Richardson et al., 1987]. This indicates that the particles are coupled to the plasma by scattering in turbulent fields. The trajectories may enter the PPPS in the region close to the neutral line. We have neglected in this investigation any effect of turbulence on the particle trajectories.
5. The highly structured distributions in the bound- ary layer are expected to be susceptible to instabilities which, in turn, will smear out the distributions. The large-amplitude waves observed by Tsurutani et al. [1985] are probably generated by the ions themselves. However, the observation of highly beamed distributions at ISEE-3 indicates that pitch angle scattering is not very effective.
Finally, we will briefly comment on a possible ori- gin for the energetic particles in the distant plasma sheet boundary layer which differs from the one proposed in the present paper. As mentioned above, the PPPS contains energetic ions with an intensity comparable to the inten- sity in the boundary layer. These ions may simply escape along the reconnected field lines into the lobe and stream ahead of the thermal plasma. The boundary layer and the
plasmoid usually approach ISEE-3 in the deep tail 20-30 rain after substorm onset. Richardson et al. [1987] have pointed out that due to the high plasma flow velocity the PPPS should overtake and envelope the plasmoid by the time it arrives at ISEE-3. Energetic ions streaming out of the PPPS should do so over the whole interface between
PPPS and lobe. Isotropic escape from such an extended source will not lead, in combination with the velocity fil- ter effect, to the highly beamed particle distributions. If escape is limited by some unspecified mechanism to the region close to the neutral line and energetic particles with all pitch angles are able to escape, one should observe in the boundary layer large pitch angle particles of a certain energy with the same intensity as field-aligned particles with the same energy (at different positions). During the events analyzed by Scholer et al. [1987], this has not been observed. It may, however, be that leakage from the ther- mal plasma sheet is limited to small pitch angles. Such a model would be consistent with the observations.
Acknowledgments. The Editor thanks C. K. Goertz and I. Richardson for their assistance in evaluating this paper.
REFERENCES
Birn, J., Computer studies of the dynamic evolution of the geomag- netic tail, J. Geophys. Res., 85, 1214, 1980.
Birn, J., and K. Schindler, On the influence of an electric field on magnetotail reconnection, J. Geophys. Res., 91, 8817, 1986.
Birn, J., R. Sommer, and K. Schindler, Open and closed magneto- spheric tail configurations and their stability, Astrophys. Space Sci., 35, 389, 1975.
Cowley, S. W. H., The distant geomagnetic tail in theory and observa- tions, in Magnetic Reconnection in Space and Laboratory Plasmas, Geophys. Monogr. Set., volo 30, p. 228, AGU, Washington, D.C., 1984.
Cowley, S. W. H., R. J. Hynds, I. G. Richardson, P. W. Daly, T. R. Sanderson, K.-P. Wenzel, J. A. Slavin, and B. T. Tsurutani, Ener- getic ion regimes in the deep geomagnetic tail: ISEE-3, Geophys. Res. Lett, 11, 275, 1984.
Curran, D. B., C. K. Goertz, and T. A. Whelan, Ion distributions in a two-dimensional reconnection field geometry, Geophys. Res. Lett, 16, 99, 1987.
Daly, P. W., T. R. Sanderson, and K.-P. Wenzel, Streaming ion dis- tributions in the distant geomagnetic tail: The effect of ion com- position mixing, J. Geophys. Res., 90, 1499, 1985o
Gloeckler, G. M. Scholer, F. M. Ipavich, D. Hovestadt, B. Klecker, and A. B. Galvin, Abundance and spectra of suprathermal H +, He ++ and heavy ions in a fast moving plasma structure (plasmoid) in the distant geotail, Geophys. Res. Lett., 11, 603, 1984.
Goldstein, M. L., W. H. Matthaeus, and J. J. Ambrosiano, Acceler- ation of charged particles in magnetic reconnection: Solar flares, the magnetosphere, and the solar wind, Geophys. Res. Lett., 13, 205, 1986.
Hones, E. W., Jr., Substorm processes in the magnetotail: Comments on "On hot tenuous plasmas, fireballs, and boundary layers in the Earth's magnetotail" by L. A. Frank, K. L. Ackerson, and R. Po Lepping, J. Geophys. Res., 8œ, 5633, 1977.
Hones, E. W., Jr., D. N. Baker, S. J. Bame, W. C. Feldman, J. T. Gosling, D. J. McComas, R. D. Zwickl, J. Slavin, E. J. Smith, and B. T. Tsurutani, Structure of the magnetotail at 220 RE and its response to geomagnetic activity, Geophys. Res. Lett., 11, 5, 1984.
Ipavich, F. M., and M. Scholer, Thermal and suprathermal protons and alpha particles in the earth's plasma sheet, J. Geophys. Res., 88, 150, 1983.
Lyons, L. R., and T. W. Speiser, Evidence for current sheet acceler- ation in the geomagnetic tail, J. Geophys. Res., 87, 2276, 1982.
Matthaeus, W. H., J. J. Ambrosiano, and M. L. Goldstein, Particle acceleration by magnetohydrodynamic reconnection, Phys. Rev. Lett., 53, 1449, 1984.
Parks, G. K., M. McCarthy, R. J. Fitzenreiter, J. Etcheto, K. A. Anderson, R. R. Anderson, T. E. Eastman, L. A. Frank, D. A. Gurnett, C. Huang, R. P. Lin, A. T. Y. Lui, K. W. Ogilvie, A. Pederson, H. Reme, and D. J. Williams, Particle and field char- acteristics of the high-latitude plasma sheet boundary layer, J. Geophys. Res., 89, 8885, 1984.
Richardson, I. G., and S. W. H. Cowley, Plasmoid-associated ener-

2470 SCHOLER AND JAMITZKY: BOUNDARY LAYER IN THE DEEP MAGNETOTAIL
getic ion bursts in the deep geomagnetic tail: Properties of the boundary layer, J. Geophys. Res., 90, 12,133, 1985.
Richardson, I. G., S. W. H. Cowley, E. W. Hones, Jr., and S. J. Bame, Plasmoid-associated energetic ion bursts in the deep geomagnetic tail: Properties of plasmoids and the post-plasmoid plasma sheet, J. Geophys. Res., 92, 9997, 1987.
Sato, T., and T. Hayashi, Externally driven magnetic reconnection and a powerful energetic energy converter, Phys. Fluids, 22, 1189, 1979.
Sato, T., H. Matsumoto, and K. Nagai, Particle acceleration in time- developing magnetic reconnection process, J. Geophys. Res., 87, 6089, 1982.
Scholer, M., Earthward plasma flow during near-Earth reconnection: Numerical simulations, J. Geophys. Res., 92, 12,425, 1987.
Scholer, M., and F. Jamitzky, Particle orbits during the development of plasmoids, J. Geophys. Res., 92, 12,181, 1987.
Scholer, M., G. Gloeckler, B. Klecker, F. M. Ipavich, D. Hovestadt, and E. J. Smith, Fast moving plasma structures in the distant magnetotail, J. Geophys. Res., 89, 6717, 1984a.
Scholer, M., G. Gloeckler, D. Hovestadt, B. Klecker, and F. M. Ipavich, Characteristics of plasmoid-like structures in the distant magnetotail, J. Geophys. Res., 89, 8872, 1984b.
Scholer, M., B. Klecker, D. Hovestadt, G. Gloeckler, F. M. Ipavich, A. B. Galvin, D. N. Baker, and B. T. Tsurutani, Energetic ion and electron beams at the plasma-sheet boundary in the distant
tail, in Magnetotail Physics, edited by A. T. Y. Lui, p. 245, Johns Hopkins University Press, Baltimore, Md., 1987.
Speiser, T. W-, Particle orbits in model current sheets, 1., Analytical solutions, J. Geophys. Res., 70, 4219, 1965.
Speiser, T. W., and L. R. Lyons, Comparison of an analytical ap- proximation for particle motion in a current sheet with precise numerical calculations, J. Geophys. Res., 89, 147, 1984.
Tsurutani, B. T., I. G. Richardson, R. M., R. M. Thorne, W. Butler, E. J. Smith, S. W. H. Cowley, S. P. Gary, S.-I. Akasofu, and R. D. Zwickl, Observations of the right-hand resonant ion beam instability in the distant plasma sheet boundary layer, J. Geophys. Res., 90, 12,159, 1985.
Ugai, M., Strong loop heating by the fast reconnection in the closed system, Geophys. Res. Left., lJ, 103, 1987.
F. Jamitzky and M. Scholer, Max-Planck-Institut fiir Physik und Astrophysik, Institut fiir extraterrestrische Physik, 8046 Garching bei Mfinchen, Federal Republic of Germany.
(Received May 3, 1988; revised August 24, 1988,
accepted September 29, 1988.)


