Embed Size (px)
Citation preview
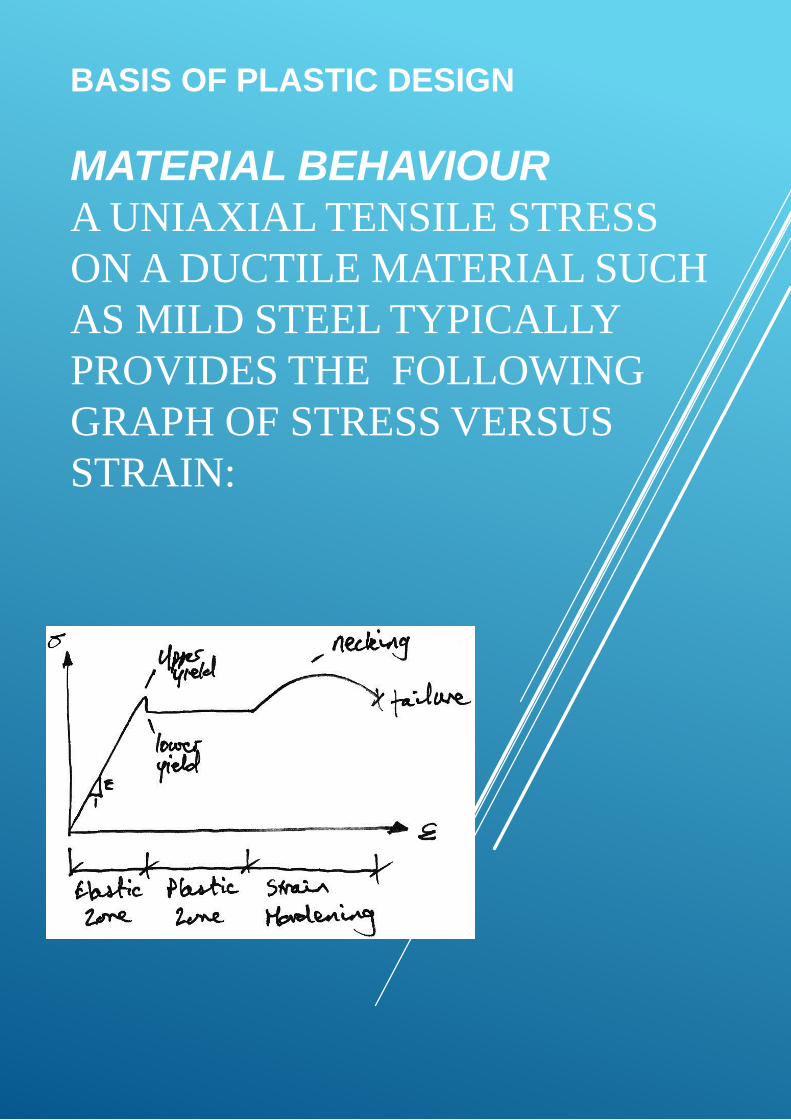
BASIS OF PLASTIC DESIGN
MATERIAL BEHAVIOUR
A UNIAXIAL TENSILE STRESS
ON A DUCTILE MATERIAL SUCH
AS MILD STEEL TYPICALLY
PROVIDES THE FOLLOWING
GRAPH OF STRESS VERSUS
STRAIN:
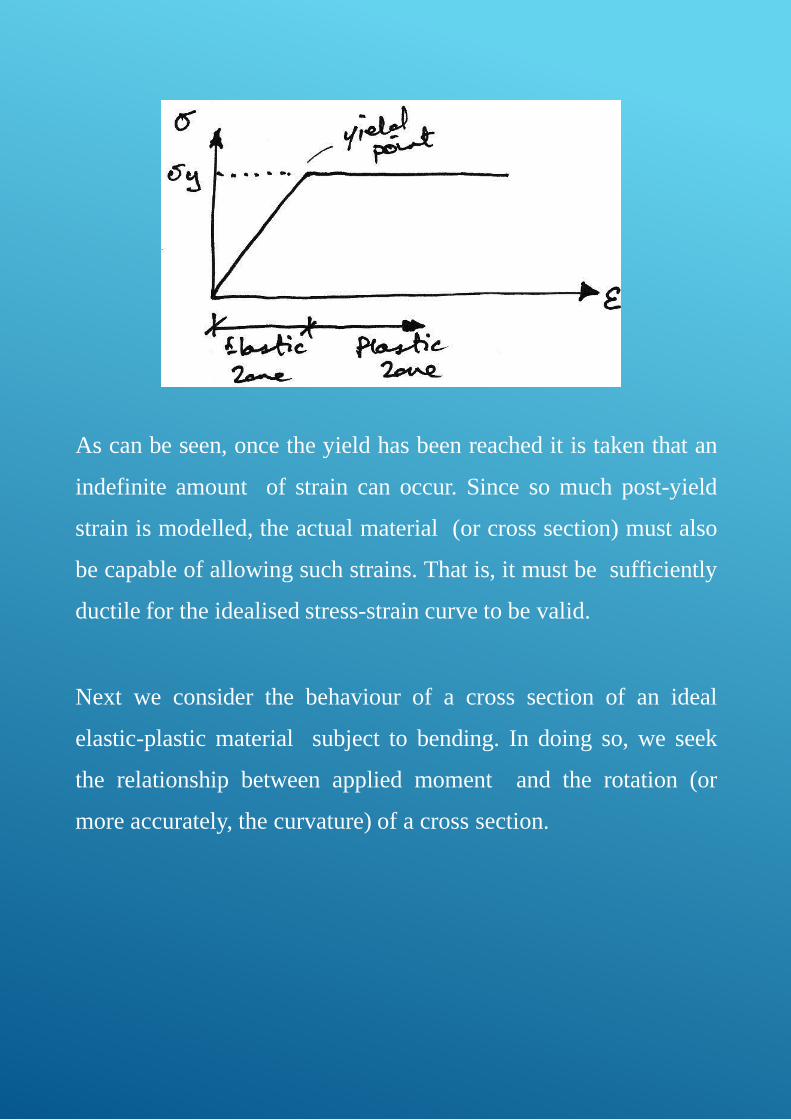
As can be seen, once the yield has been reached it is taken that an
indefinite amount of strain can occur. Since so much post-yield
strain is modelled, the actual material (or cross section) must also
be capable of allowing such strains. That is, it must be sufficiently
ductile for the idealised stress-strain curve to be valid.
Next we consider the behaviour of a cross section of an ideal
elastic-plastic material subject to bending. In doing so, we seek
the relationship between applied moment and the rotation (or
more accurately, the curvature) of a cross section.
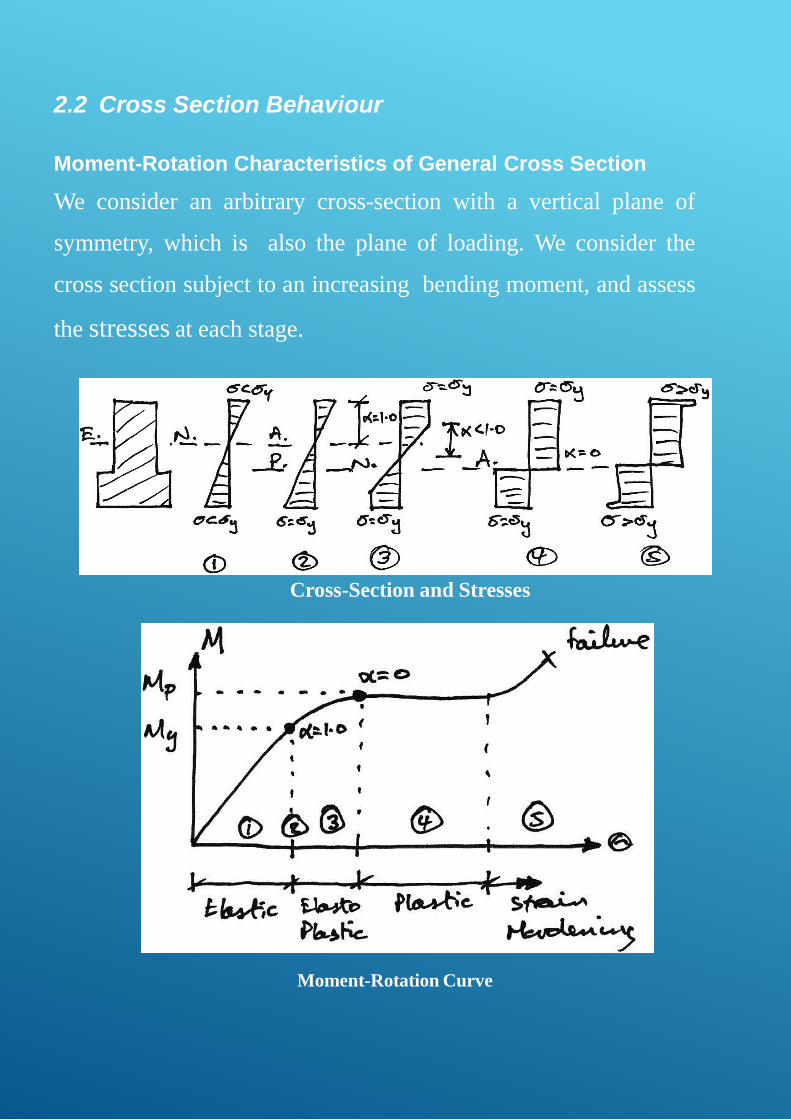
2.2 Cross Section Behaviour
Moment-Rotation Characteristics of General Cross Section
We consider an arbitrary cross-section with a vertical plane of
symmetry, which is also the plane of loading. We consider the
cross section subject to an increasing bending moment, and assess
the stresses at each stage.
Cross-Section and Stresses
Moment-Rotation Curve
Stage 1 – Elastic Behaviour
The applied moment causes stresses over the cross-section that are all less than the
yield stress of the material.
Stage 2 – Yield Moment
The applied moment is just sufficient that the yield stress of the material is reached at
the outermost fibre(s) of the cross-section. All other stresses in the cross section are
less than the yield stress. This is limit of applicability of an elastic analysis and of
elastic design. Since all fibres are elastic, the ratio of the depth of the elastic to plastic
regions, =1.0 .
Stage 3 – Elasto-Plastic Bending
The moment applied to the cross section has been increased beyond the yield
moment. Since by the idealised stress-strain curve the material cannot sustain a stress
greater than yield stress, the fibres at the yield stress have progressed inwards towards
the centre of the beam. Thus over the cross section there is an elastic core and a
plastic region. The ratio of the depth of the elastic core to the plastic region is
1.0 0 . Since extra moment is being applied and no stress is bigger than the yield
stress, extra rotation of the section occurs: the moment-rotation curve losses its
linearity and curves, giving more rotation per unit moment (i.e. looses stiffness).
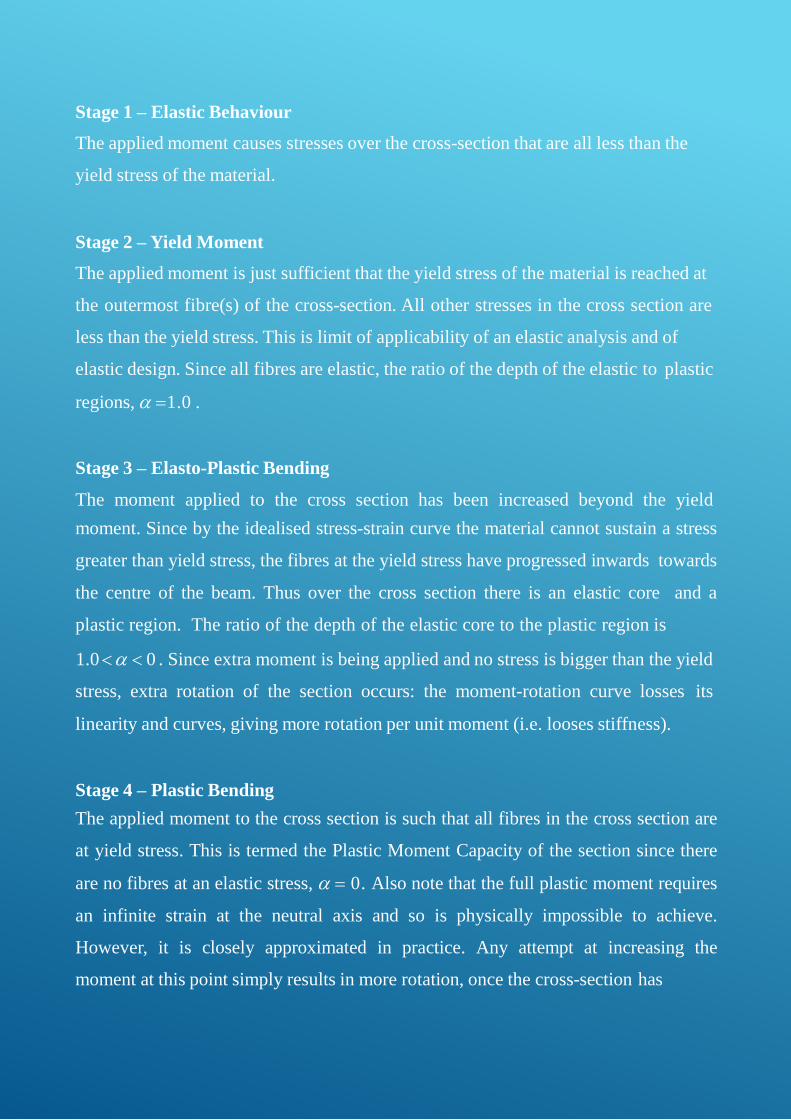
Stage 4 – Plastic Bending
The applied moment to the cross section is such that all fibres in the cross section are
at yield stress. This is termed the Plastic Moment Capacity of the section since there
are no fibres at an elastic stress, = 0. Also note that the full plastic moment requires
an infinite strain at the neutral axis and so is physically impossible to achieve.
However, it is closely approximated in practice. Any attempt at increasing the
moment at this point simply results in more rotation, once the cross-section has
sufficient ductility. Therefore in steel members the cross section classification must
be plastic and in concrete members the section must be under-reinforced.
Stage 5 – Strain Hardening
Due to strain hardening of the material, a small amount of extra moment can be
sustained.
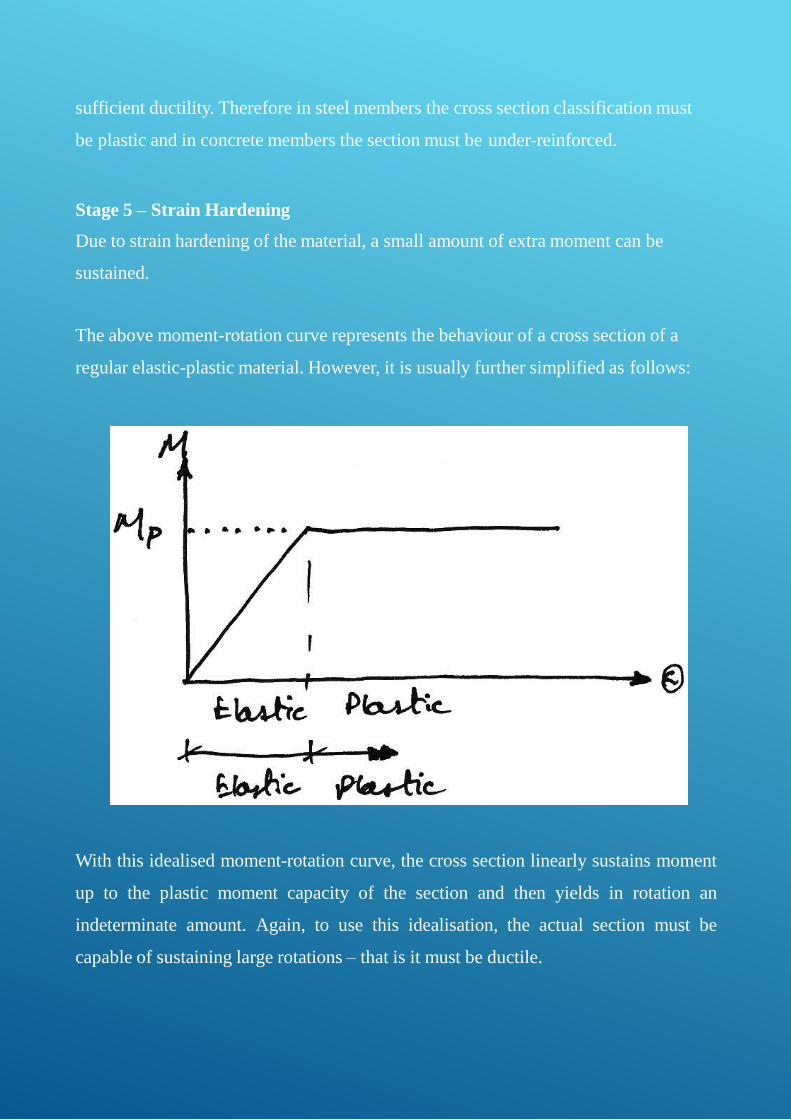
The above moment-rotation curve represents the behaviour of a cross section of a
regular elastic-plastic material. However, it is usually further simplified as follows:
With this idealised moment-rotation curve, the cross section linearly sustains moment
up to the plastic moment capacity of the section and then yields in rotation an
indeterminate amount. Again, to use this idealisation, the actual section must be
capable of sustaining large rotations – that is it must be ductile.

Plastic Hinge
Note that once the plastic moment capacity is reached, the section can rotate freely –
that is, it behaves like a hinge, except with moment of M P at the hinge. This is
termed a plastic hinge, and is the basis for plastic analysis. At the plastic hinge
stresses remain constant, but strains and hence rotations can increase.
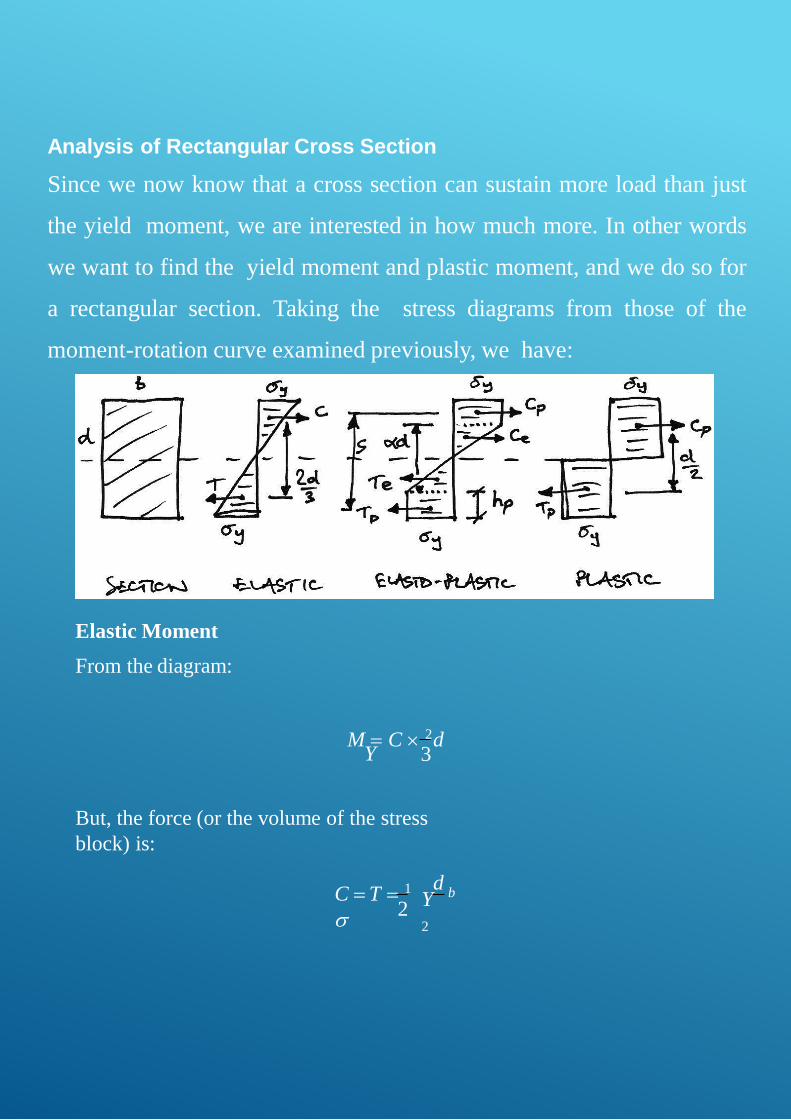
Analysis of Rectangular Cross Section
Since we now know that a cross section can sustain more load than just
the yield moment, we are interested in how much more. In other words
we want to find the yield moment and plastic moment, and we do so for
a rectangular section. Taking the stress diagrams from those of the
moment-rotation curve examined previously, we have:
Elastic Moment
From the diagram:
3YM = C 2d
But, the force (or the volume of the stress
block) is:
2Y
2
dbC = T = 1
2
6Y
bd
db 2
d M = 1
Y 2 Y 2 3
=
= ZY
The term bd 2 6 is thus a property of the cross section called the elastic section
modulus and it is termed Z.
Elasto-Plastic Moment
The moment in the section is made up of plastic and elastic components:
M = M ' + M '
EP E P
The elastic component is the same as previous, but for the reduced depth, d instead
of the overall depth, d:
'
2
2
3
6Y
bd
1 d 2d M =
E 2 Y 2
=
The plastic component is:
P PM ' = C s
The lever arm, s, is:
s =d + hp
2 2p
h =d − d
=d
(1− )
Thus,
2 2
2
s =d +d
−d
=d (1+ )
The force is:
2Y
CP = Y hpb
= bd
(1− )
Hence,
( ) ( )'
2
2
4
P Y
Y
d d
bd2
M = b 1− 1+ 2
= (1 − )
And so the total elasto-plastic moment is:
2
6 4
6 2
EP Y Y
Y
bd 2 bd 2
bd 2
M = + (1− 2 )
(3− 2 )=
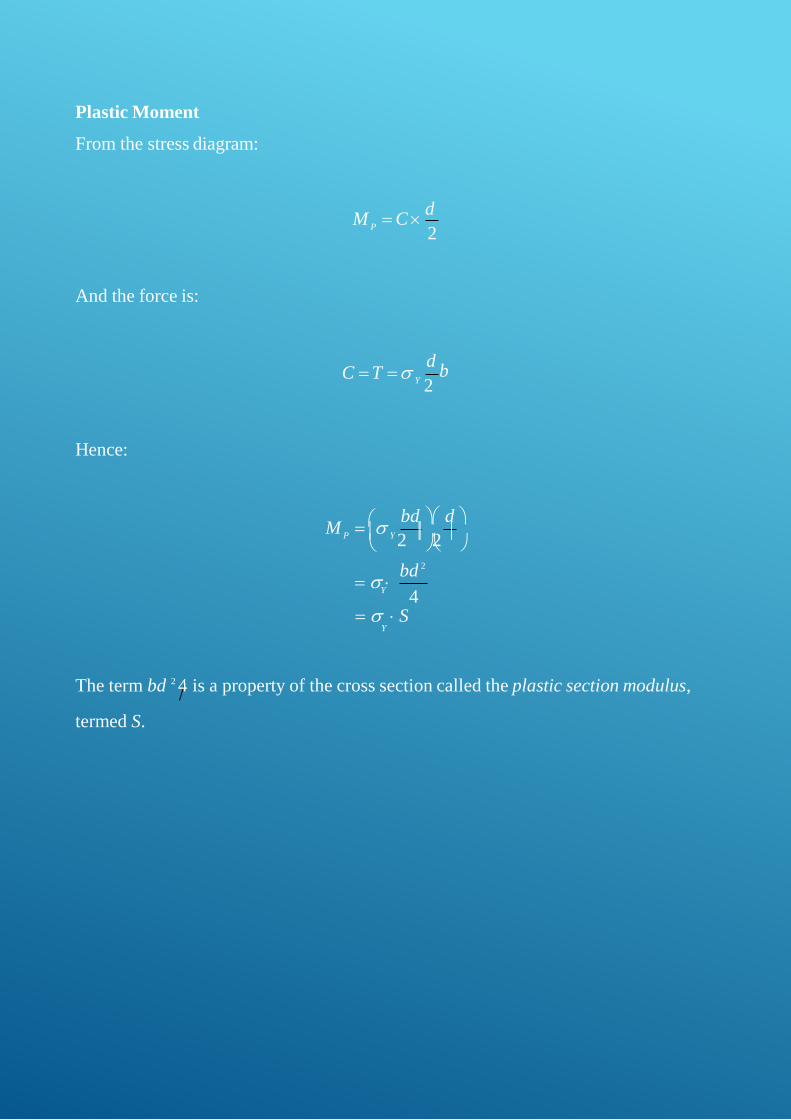
Plastic Moment
From the stress diagram:
2P
M = C d
And the force is:
Y 2
dbC = T =
Hence:
4Y
bd
bd d M =
P Y 2 2
2
=
= SY
The term bd 2 4 is a property of the cross section called the plastic section modulus,
termed S.
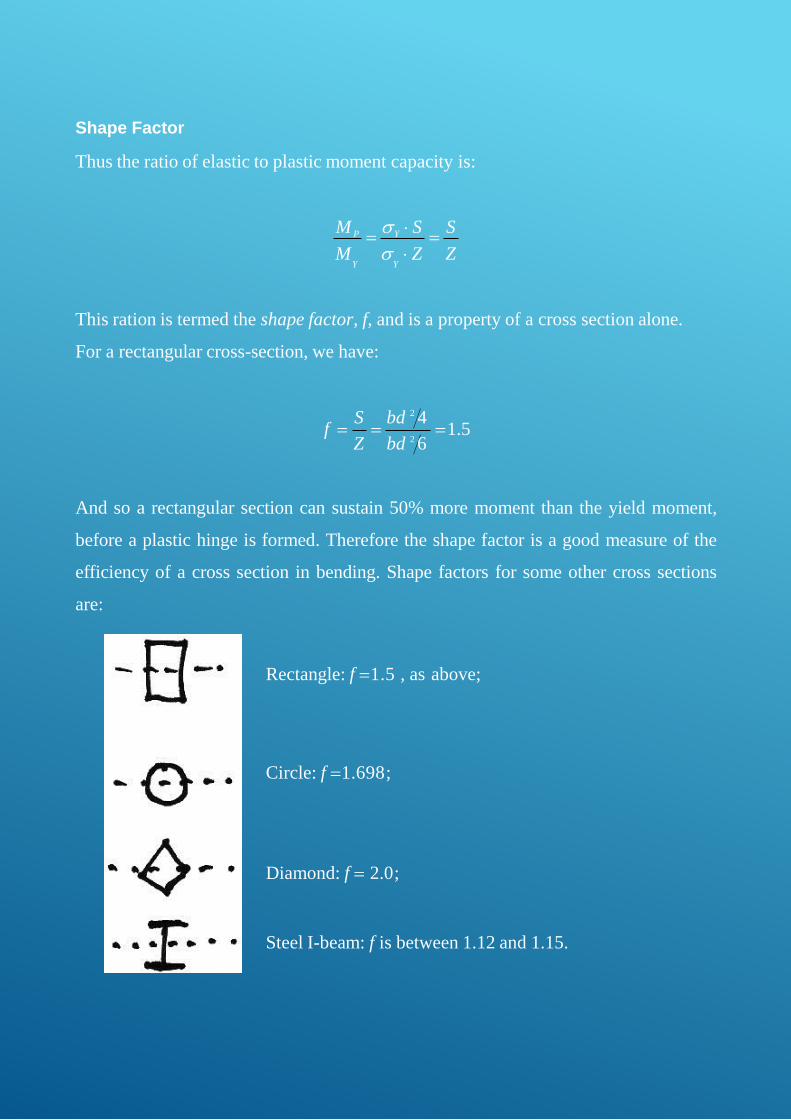
Shape Factor
Thus the ratio of elastic to plastic moment capacity is:
M P =Y S
=S
M Z ZY Y
This ration is termed the shape factor, f, and is a property of a cross section alone.
For a rectangular cross-section, we have:
S bd 2 4
Z bd 2 6f = = =1.5
And so a rectangular section can sustain 50% more moment than the yield moment,
before a plastic hinge is formed. Therefore the shape factor is a good measure of the
efficiency of a cross section in bending. Shape factors for some other cross sections
are:
Rectangle: f =1.5 , as above;
Circle: f =1.698;
Diamond: f = 2.0;
Steel I-beam: f is between 1.12 and 1.15.
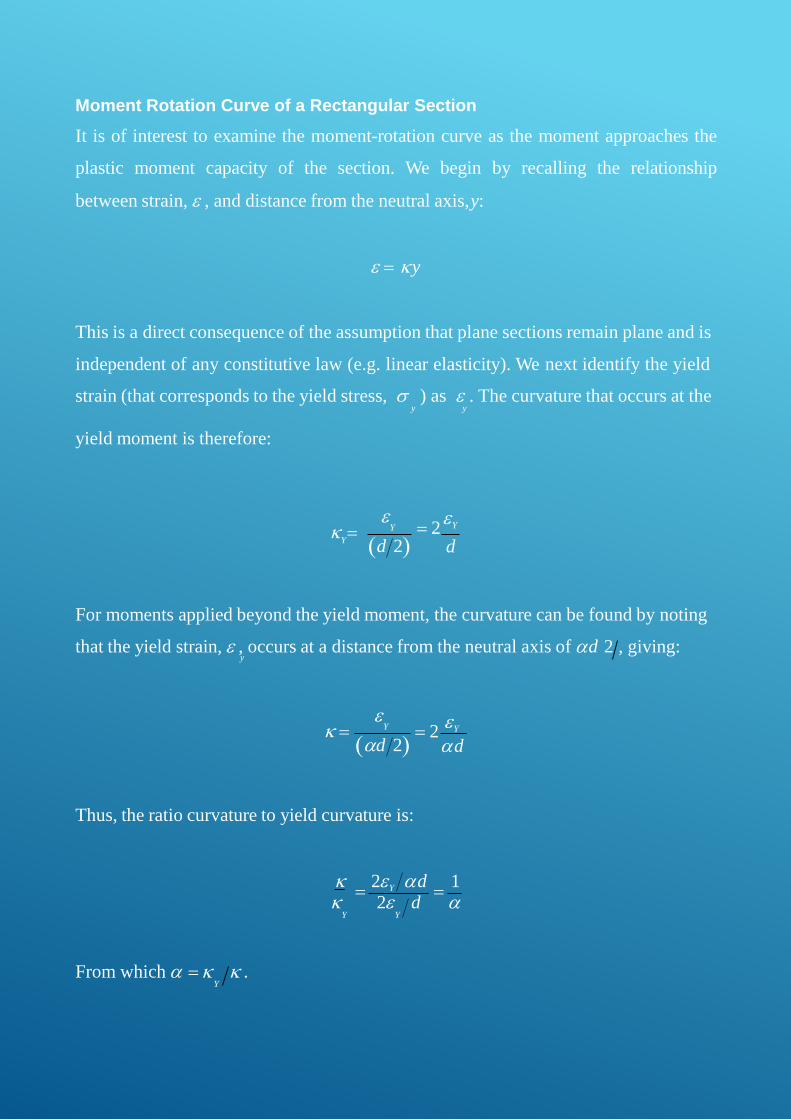
Moment Rotation Curve of a Rectangular Section
It is of interest to examine the moment-rotation curve as the moment approaches the
plastic moment capacity of the section. We begin by recalling the relationship
between strain, , and distance from the neutral axis,y:
= y
This is a direct consequence of the assumption that plane sections remain plane and is
independent of any constitutive law (e.g. linear elasticity). We next identify the yield
strain (that corresponds to the yield stress, ) as . The curvature that occurs at they y
yield moment is therefore:
Y
Y
(d 2) = = 2
Y
d
For moments applied beyond the yield moment, the curvature can be found by noting
that the yield strain, , occurs at a distance from the neutral axis of d 2 , giving:y
Y
(d 2) d = = 2
Y
Thus, the ratio curvature to yield curvature is:
=
2Y d=
1
2 d Y Y
From which = .Y
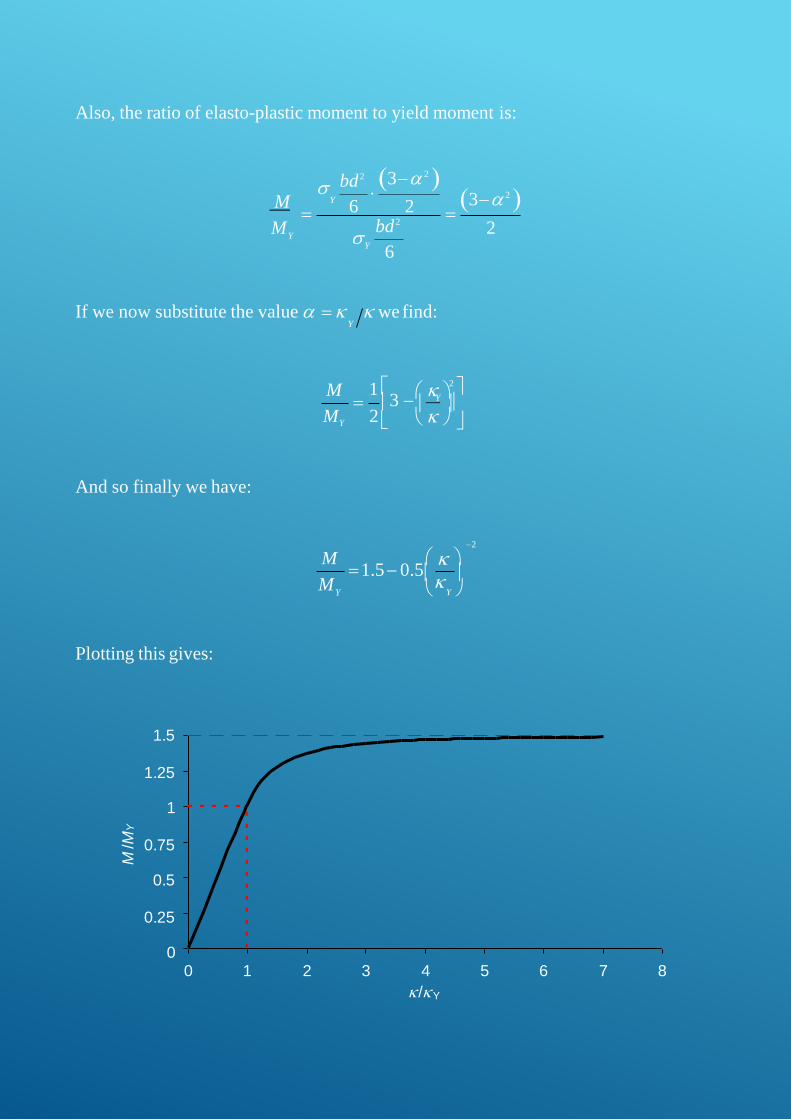
Also, the ratio of elasto-plastic moment to yield moment is:
6 2
2
6Y
Y
bd2
M
bd2M
Y
(3− 2 ) (3− 2 )
= =
If we now substitute the value = we find:Y
M 1 2
= 3 − Y
MY 2
And so finally we have:
Y
M
M
−2
=1.5 − 0.5
Y
Plotting this gives:
1.5
1.25
1
0.75
0.5
0.25
00 1 2 3 5 6 7 84
/Y
M/M
Y
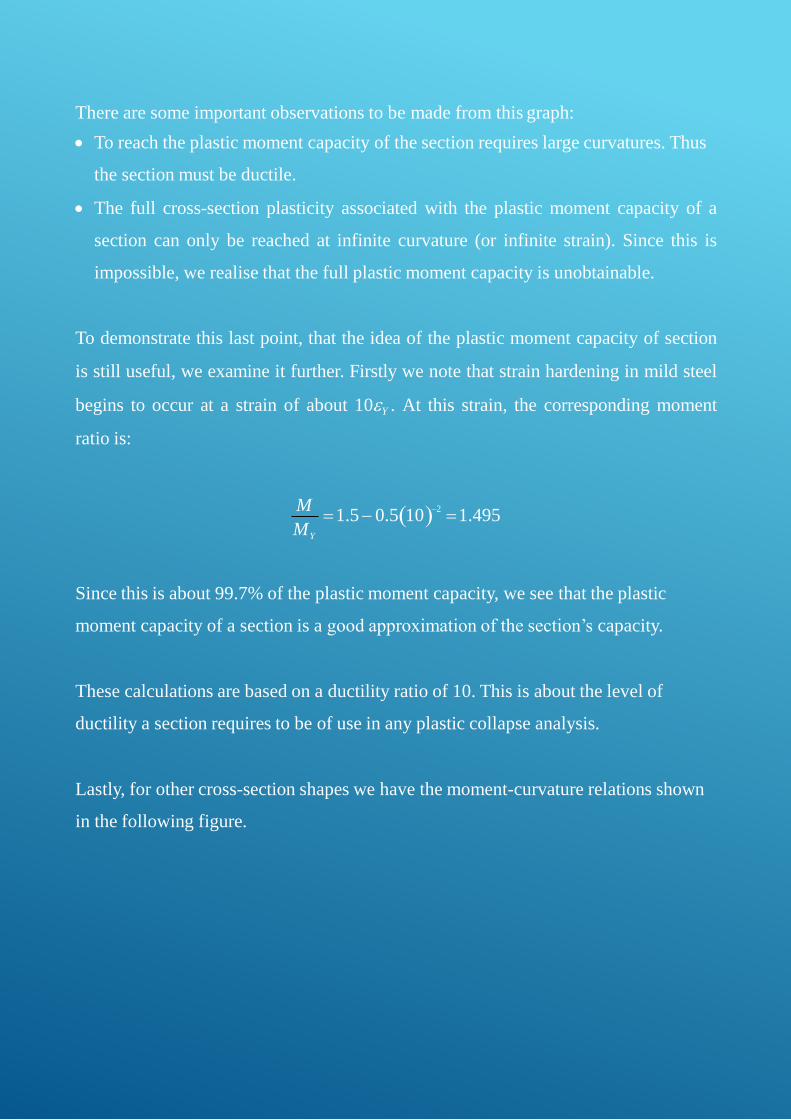
There are some important observations to be made from this graph:
• To reach the plastic moment capacity of the section requires large curvatures. Thus
the section must be ductile.
• The full cross-section plasticity associated with the plastic moment capacity of a
section can only be reached at infinite curvature (or infinite strain). Since this is
impossible, we realise that the full plastic moment capacity is unobtainable.
To demonstrate this last point, that the idea of the plastic moment capacity of section
is still useful, we examine it further. Firstly we note that strain hardening in mild steel
begins to occur at a strain of about 10Y . At this strain, the corresponding moment
ratio is:
MY
M =1.5 − 0.5(10)−2
=1.495
Since this is about 99.7% of the plastic moment capacity, we see that the plastic
moment capacity of a section is a good approximation of the section’s capacity.
These calculations are based on a ductility ratio of 10. This is about the level of
ductility a section requires to be of use in any plastic collapse analysis.
Lastly, for other cross-section shapes we have the moment-curvature relations shown
in the following figure.
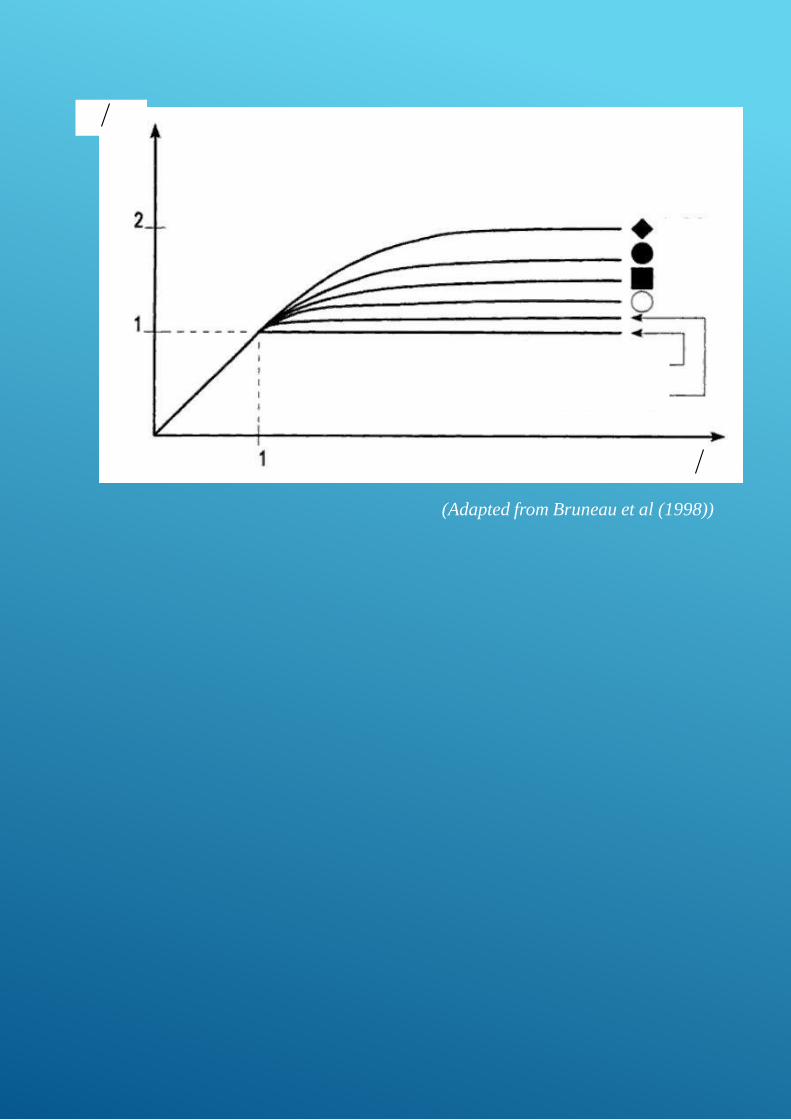
f = 2.0
f = 1.7
f = 1.5
f = 1.27
Ideal I-Section (f 1.0)
Typical I-Section (f 1.14)
Y
(Adapted from Bruneau et al (1998))
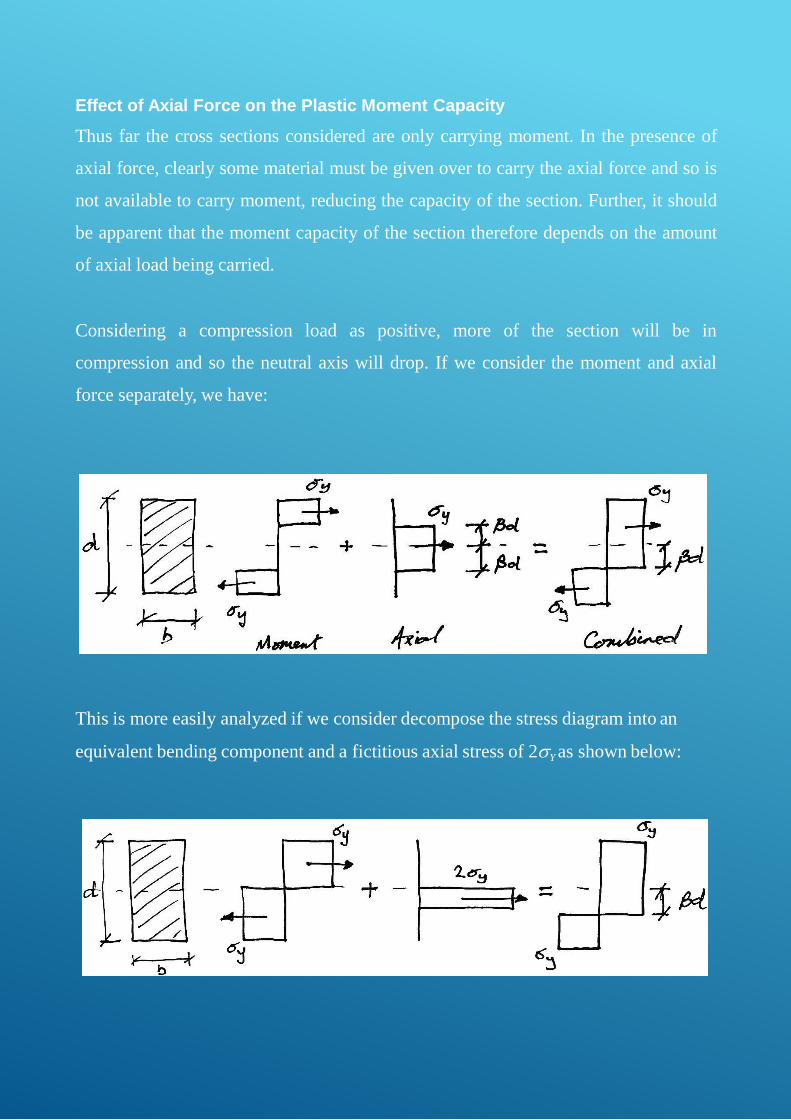
Effect of Axial Force on the Plastic Moment Capacity
Thus far the cross sections considered are only carrying moment. In the presence of
axial force, clearly some material must be given over to carry the axial force and so is
not available to carry moment, reducing the capacity of the section. Further, it should
be apparent that the moment capacity of the section therefore depends on the amount
of axial load being carried.
Considering a compression load as positive, more of the section will be in
compression and so the neutral axis will drop. If we consider the moment and axial
force separately, we have:
This is more easily analyzed if we consider decompose the stress diagram into an
equivalent bending component and a fictitious axial stress of 2Y as shown below:
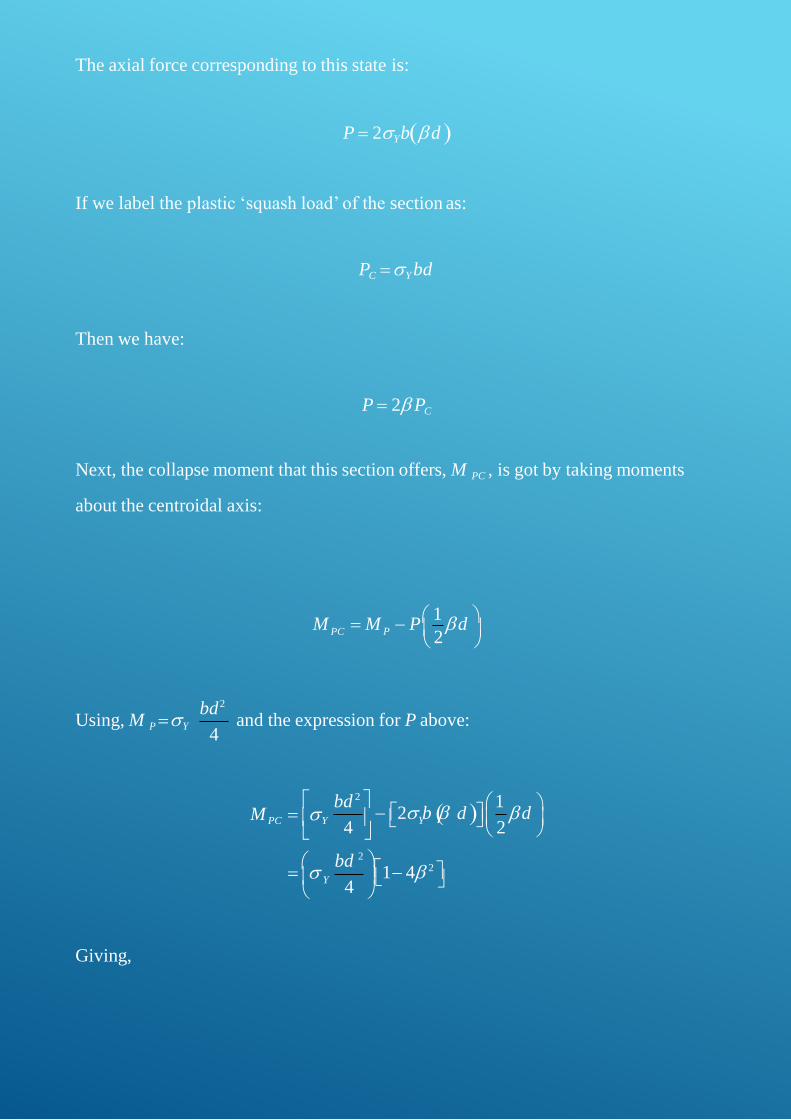
The axial force corresponding to this state is:
P = 2Yb(d )
If we label the plastic ‘squash load’ of the section as:
PC = Y bd
Then we have:
P = 2 PC
Next, the collapse moment that this section offers, M PC , is got by taking moments
about the centroidal axis:
PCM = M − P 1
d P 2
4
bd2
Using, M P =Y and the expression for P above:
( )4 2
4
Yd
bd 2 1 − 2 b d M PC = Y
bd 2 =
Y 1− 4 2
Giving,
M PC = M P (1− 4 )2
Noting that 2 = P PC from earlier, we now have:
( )2M
PC
M P
P 2
=1− 2 =1− PC
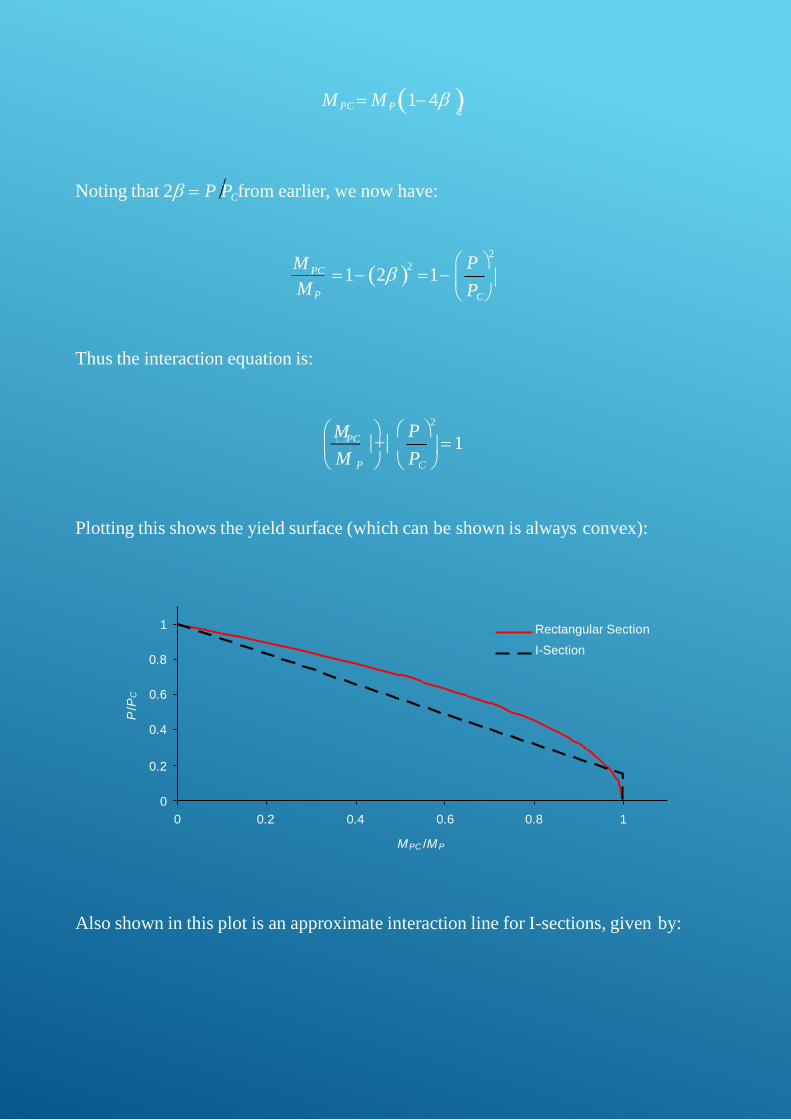
Thus the interaction equation is:
M P 2
= 1 PC
+ M P PC
Plotting this shows the yield surface (which can be shown is always convex):
0.6
0.4
0.2
0
0.8
1
0 0.2 0.4 0.8 10.6
MPC /MP
P/P
C
Rectangular Section
I-Section
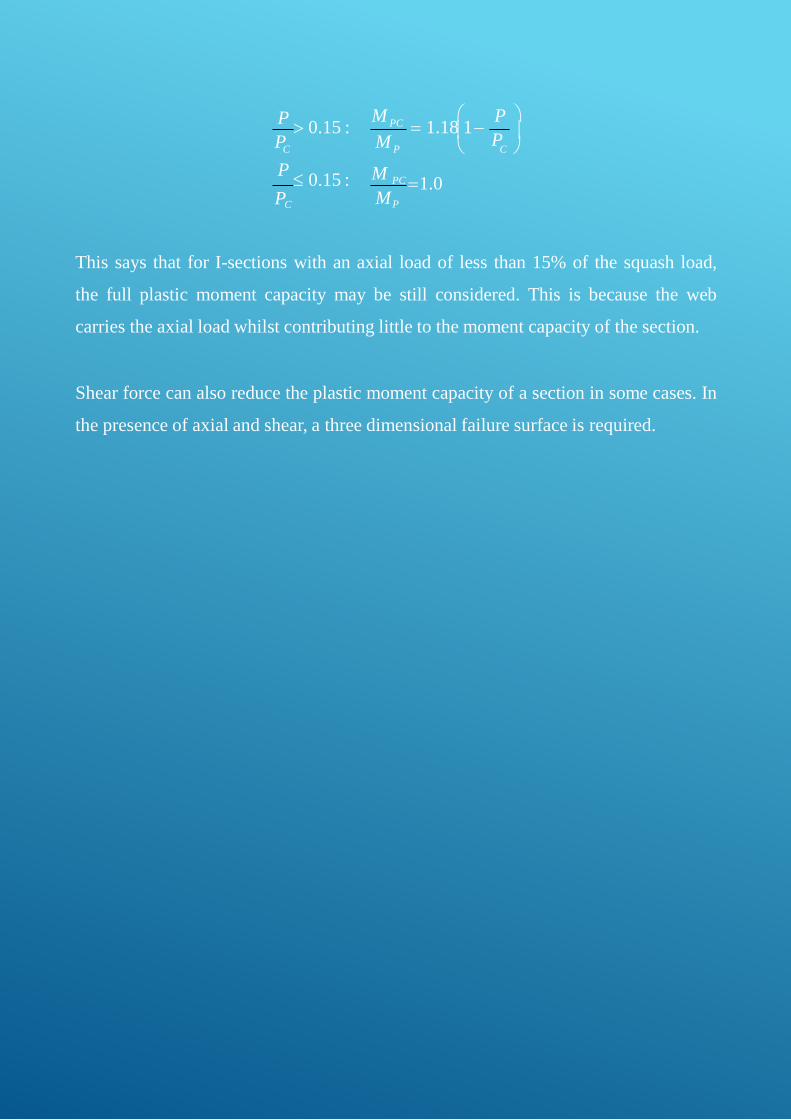
Also shown in this plot is an approximate interaction line for I-sections, given by:
PC
C P
M P
P M
MP
P 0.15 : = 1.18 1− P
C
P 0.15 :
PC
M PC =1.0
This says that for I-sections with an axial load of less than 15% of the squash load,
the full plastic moment capacity may be still considered. This is because the web
carries the axial load whilst contributing little to the moment capacity of the section.
Shear force can also reduce the plastic moment capacity of a section in some cases. In
the presence of axial and shear, a three dimensional failure surface is required.


