Embed Size (px)
Citation preview
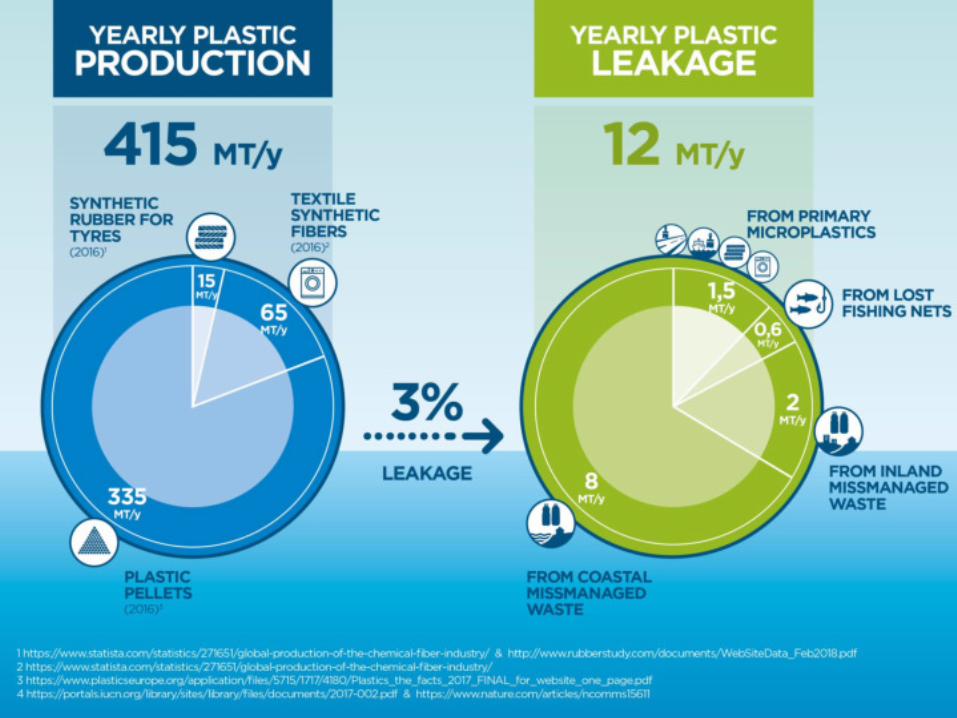
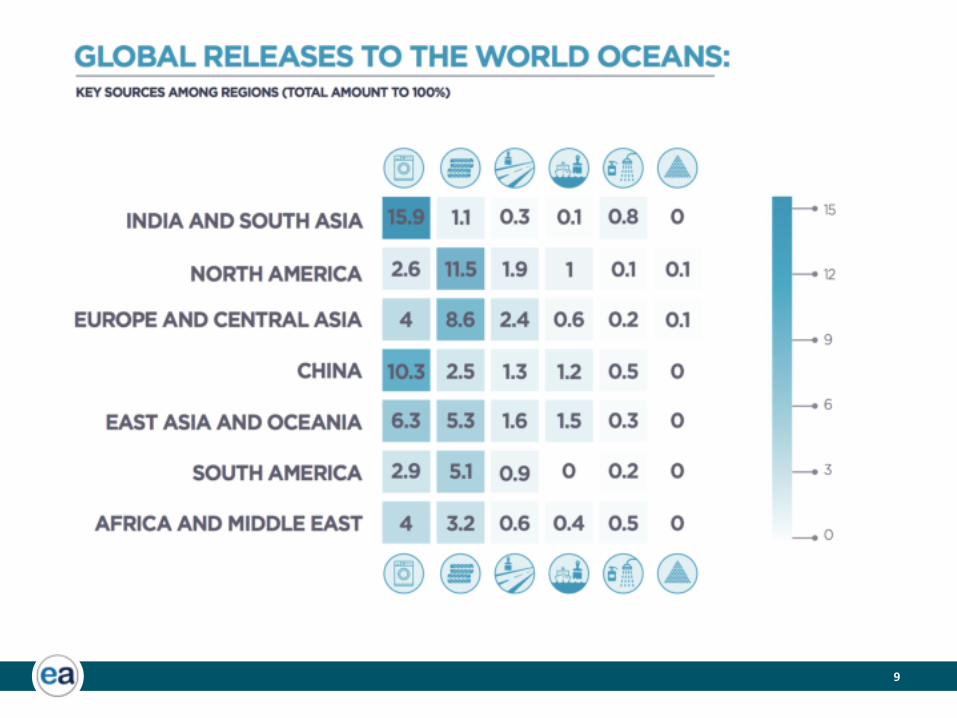
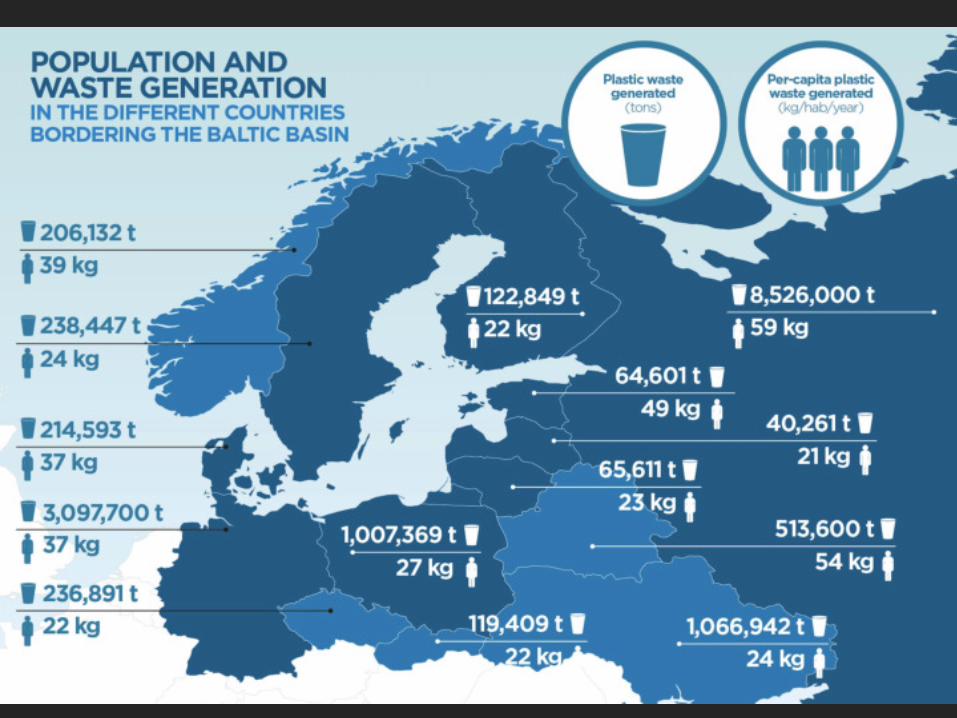
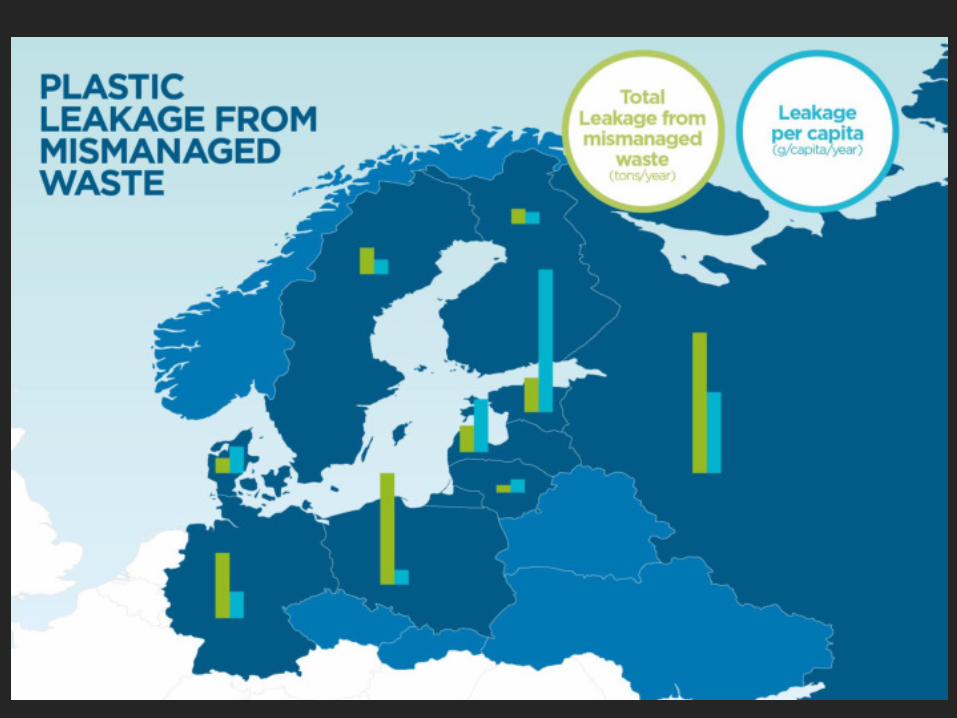
HOW MUCH PLASTIC IS LEAKING INTO THE BALTIC SEA BASIN ?
Dr Julien Boucher – EA
October 2018, v1.1
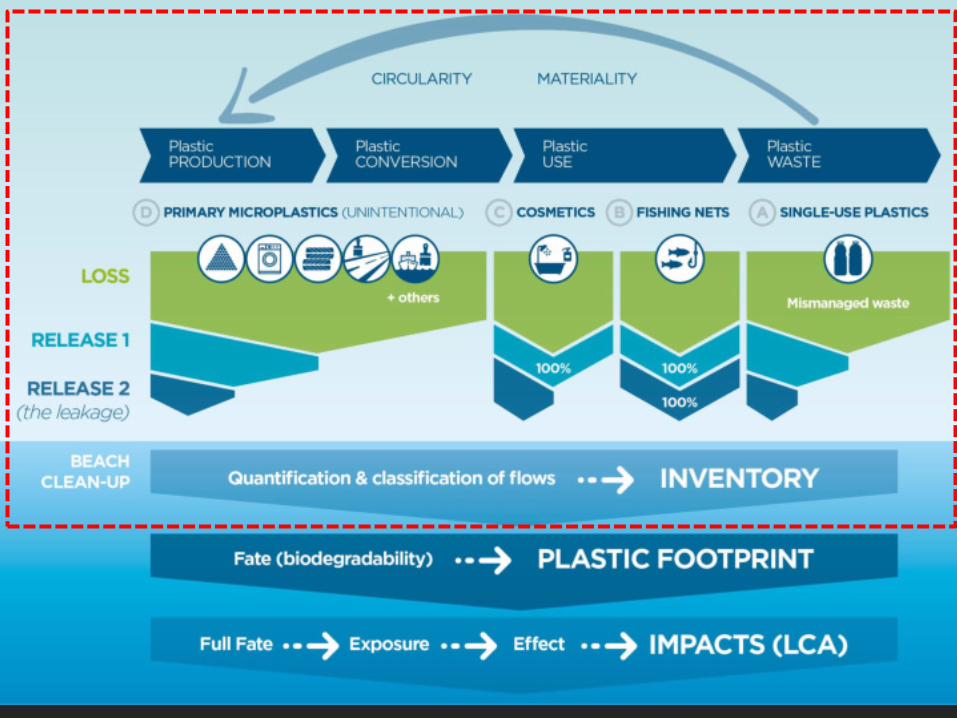
THE MARINE PLASTIC FOOTPRINT
2
3
Guiding line
1. THE PLASTIC LEAKAGE
2. THE MARINE PLASTIC FOOTPRINT METHODOLOGY
3. INDUSTRY CASE STUDIES
4. PLASTIC FOOTPRINT OF THE BALTIC BASIN
5. WAYS FORWARD
THE PLASTIC LEAKAGEBIG PICTURE AND CHALLENGES
5
6
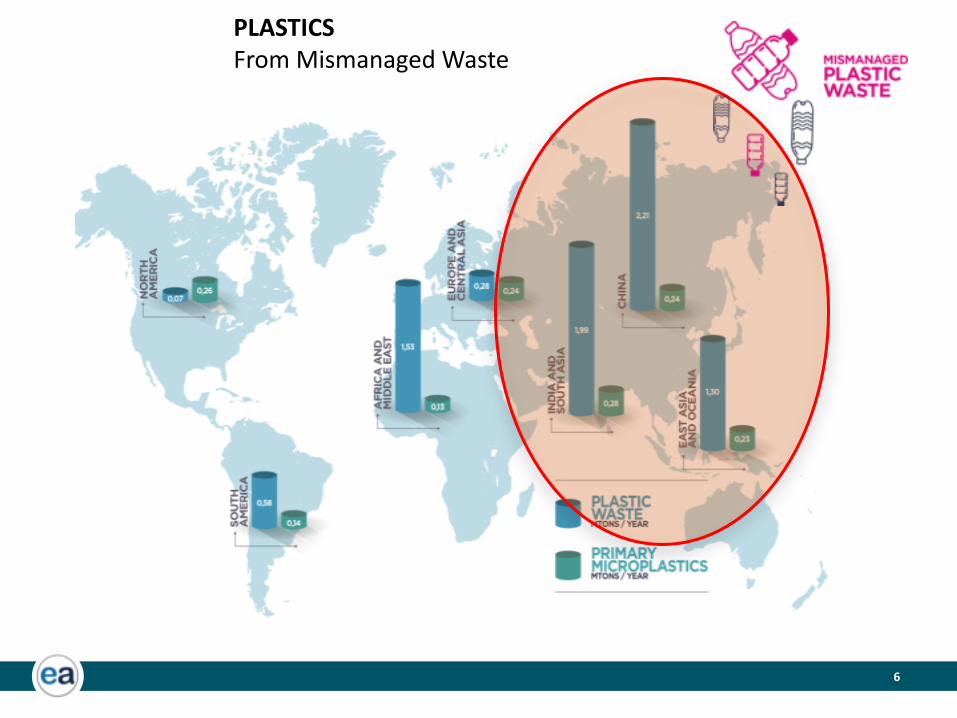
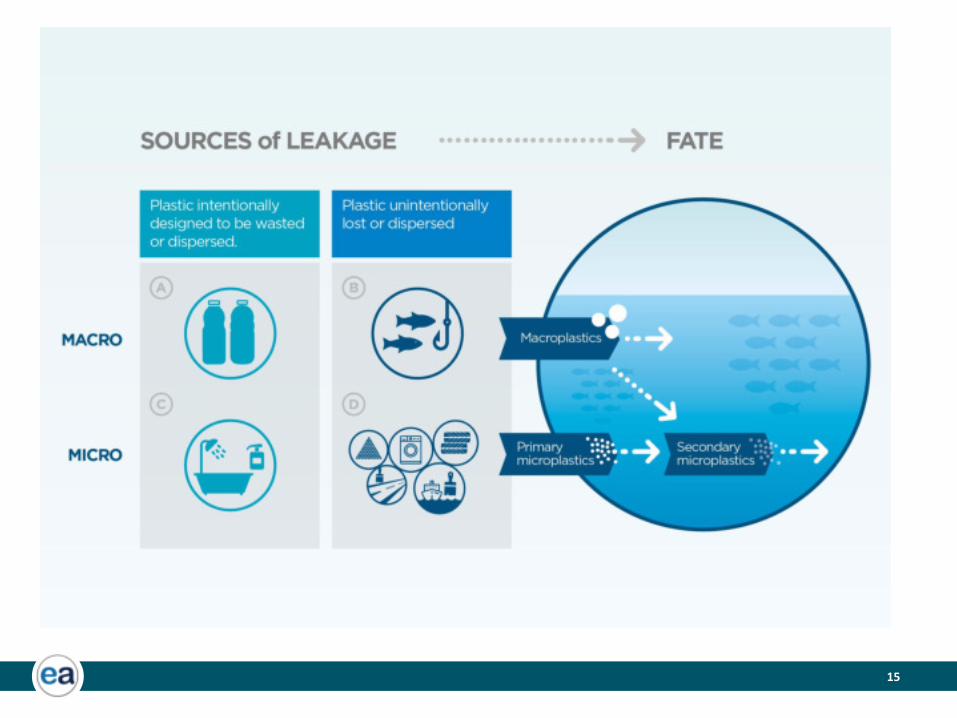
PLASTICS
From Mismanaged Waste
7
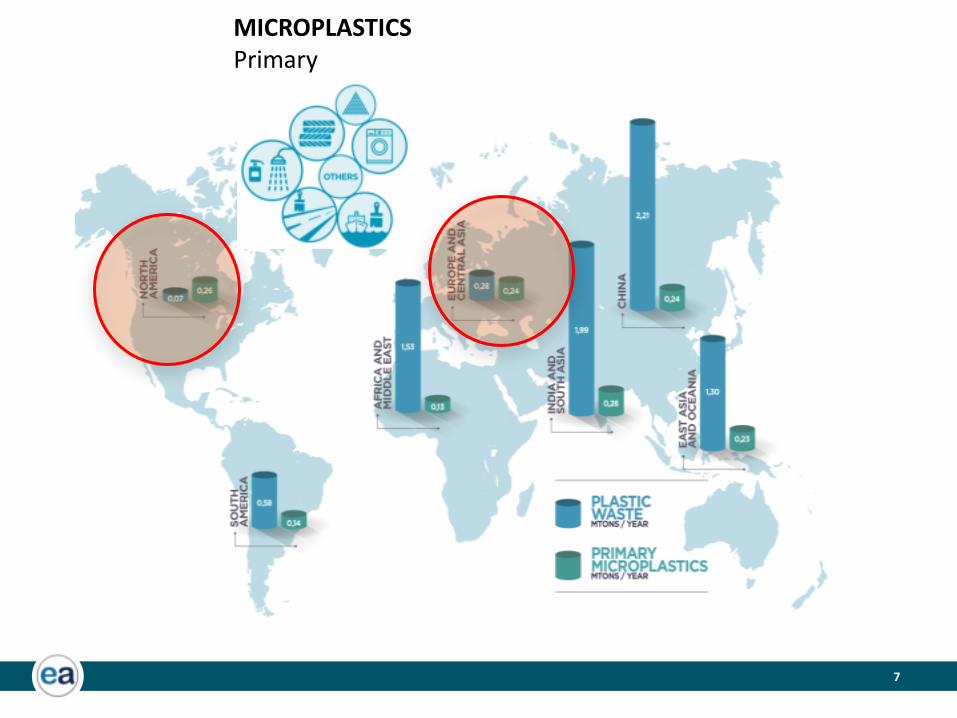
MICROPLASTICS
Primary
8
9
10
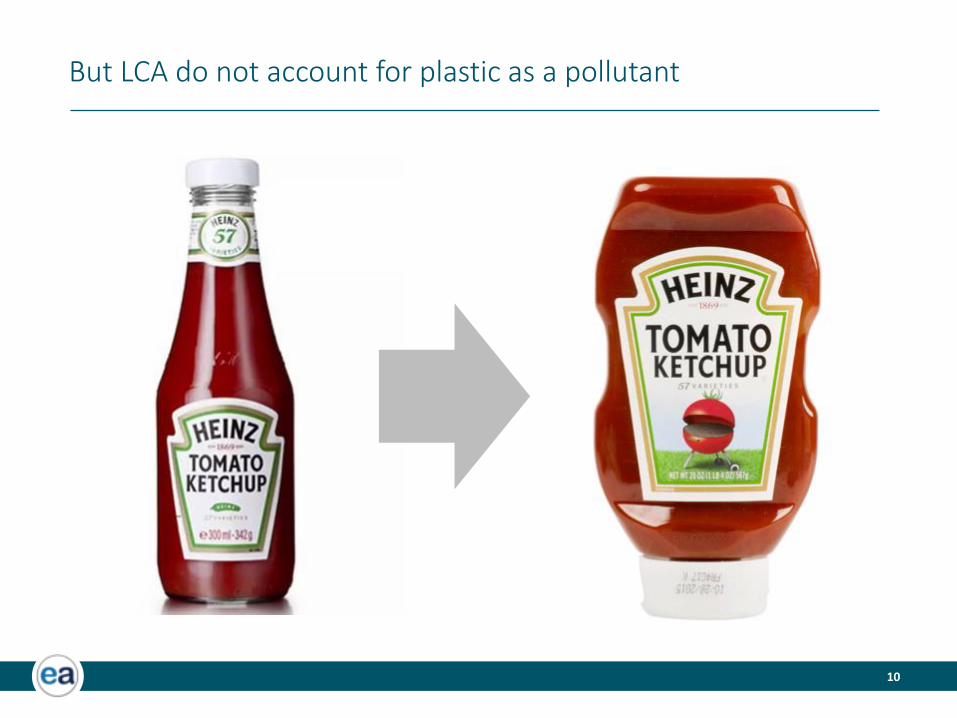
But LCA do not account for plastic as a pollutant
11
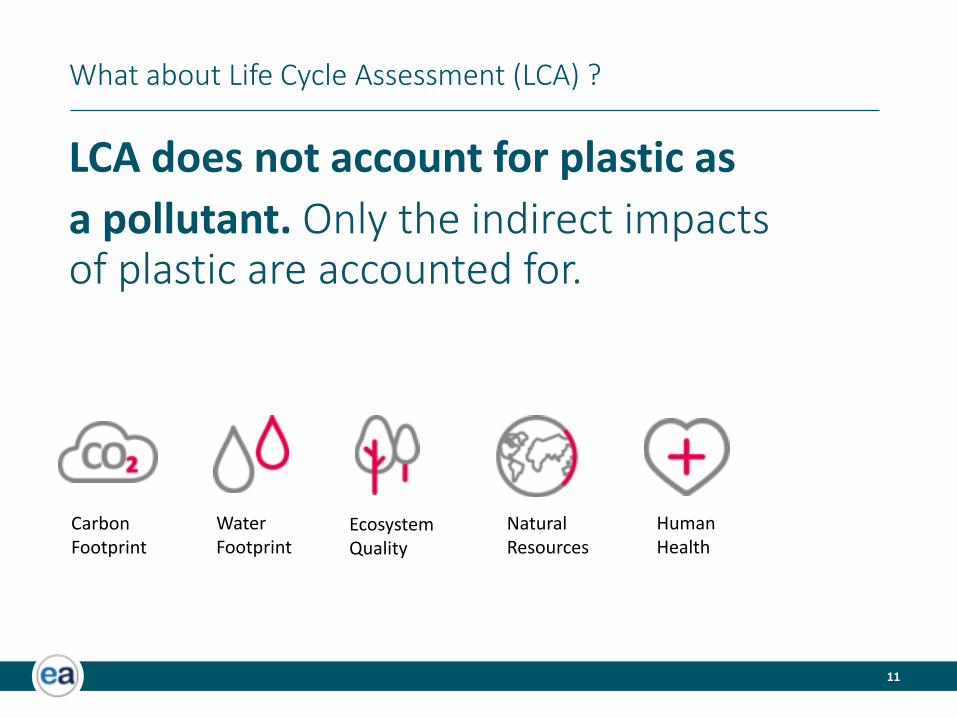
What about Life Cycle Assessment (LCA) ?
LCA does not account for plastic as
a pollutant. Only the indirect impacts of plastic are accounted for.
Carbon
Footprint
Water
Footprint
Ecosystem
Quality
Natural
Resources
Human
Health
12
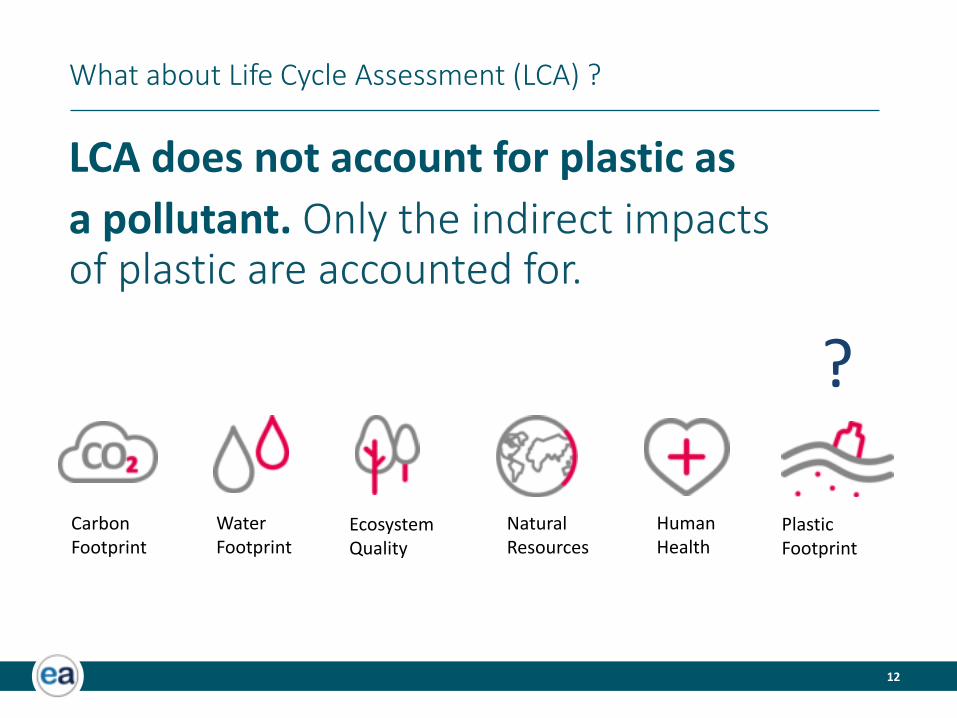
What about Life Cycle Assessment (LCA) ?
LCA does not account for plastic as
a pollutant. Only the indirect impacts of plastic are accounted for.
Plastic
Footprint
Carbon
Footprint
Water
Footprint
Ecosystem
Quality
Natural
Resources
Human
Health
?
THE MARINE PLASTIC FOOTPRINTOVERVIEW OF THE METHODOLOGY
Overview
15
16
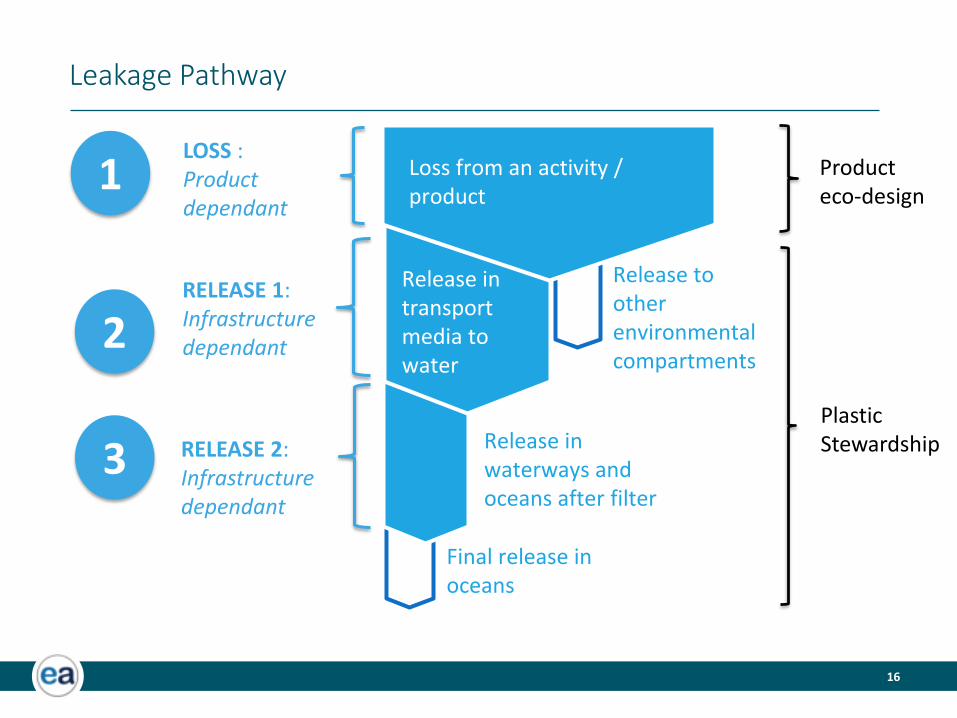
Leakage Pathway
LOSS :
Product
dependant
RELEASE 1:
Infrastructure
dependant
RELEASE 2:
Infrastructure
dependant
1
2
3Release in
waterways and
oceans after filter
Loss from an activity /
product
Release in
transport
media to
water
Final release in
oceans
Release to
other
environmental
compartments
Product
eco-design
Plastic
Stewardship
17
Leakage from
missmanaged waste
19
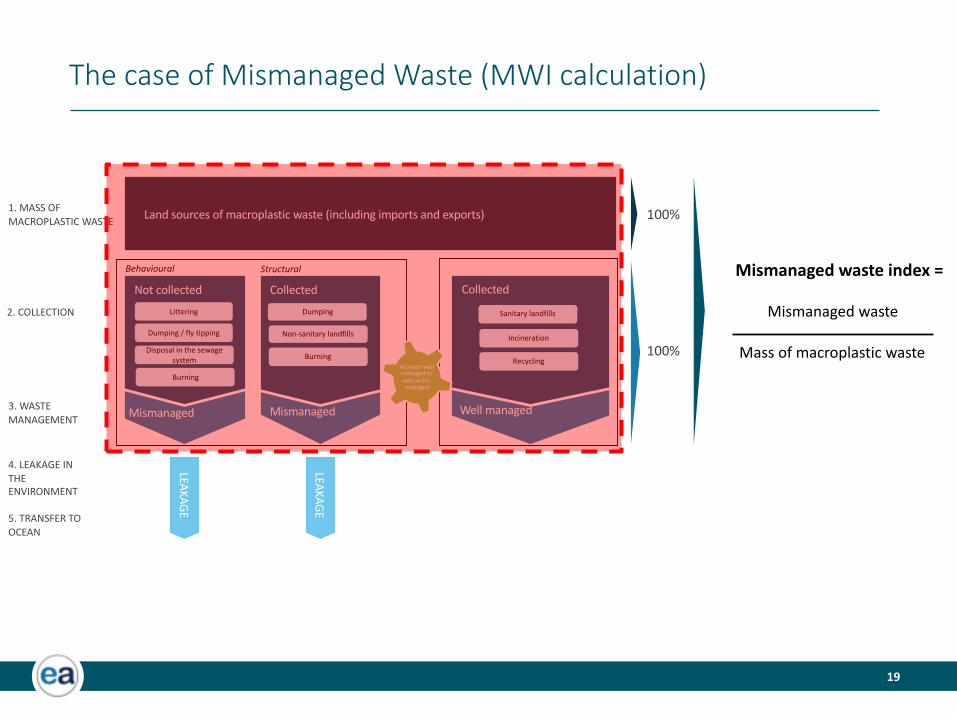
Not collected
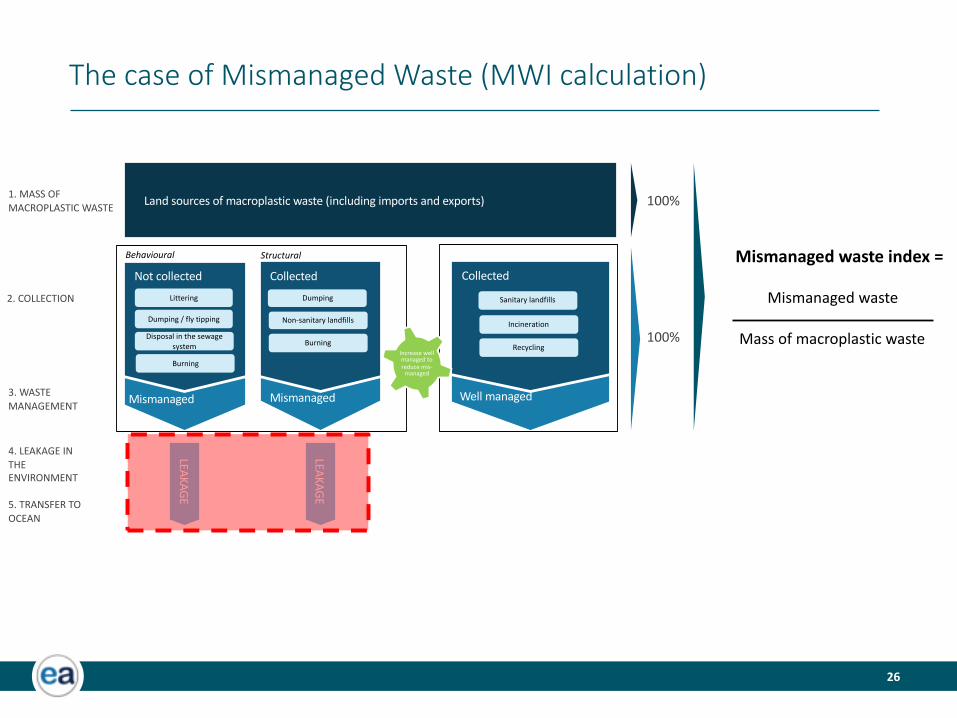
Land sources of macroplastic waste (including imports and exports)
3. WASTE
MANAGEMENT
5. TRANSFER TO
OCEAN
2. COLLECTION
4. LEAKAGE IN
THE
ENVIRONMENT
1. MASS OF
MACROPLASTIC WASTE
LEA
KA
GE
Mismanaged
Collected
Mismanaged
Collected
Well managed
Behavioural Structural
LEA
KA
GE
Increase well managed to
reduce mis-managed
100%
100%
Littering
Dumping / fly tipping
Disposal in the sewage
system
Burning
Dumping
Non-sanitary landfills
Burning
Sanitary landfills
Incineration
Recycling
Mismanaged waste index =
Mismanaged waste
Mass of macroplastic waste
The case of Mismanaged Waste (MWI calculation)
20
Land sources of macroplastic waste (including imports and exports)
- Sanitary landfills
- Incineration
- Recycling
3. WASTE
MANAGEMENT
5. TRANSFER TO
OCEAN
2. COLLECTION
4. LEAKAGE IN
THE
ENVIRONMENT
1. MASS OF
MACROPLASTIC WASTE
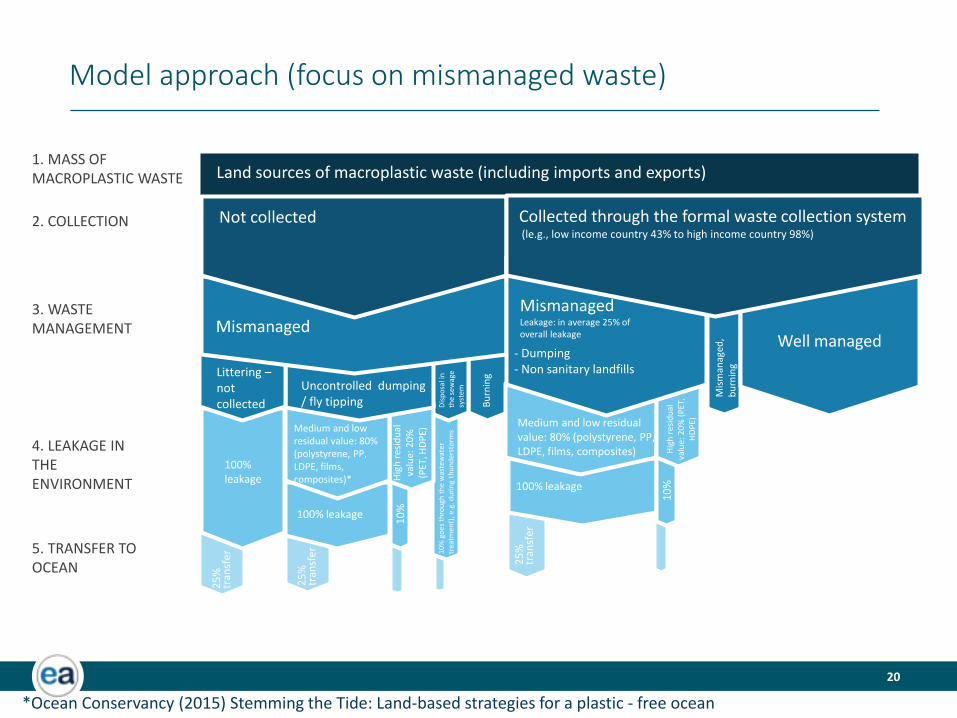
Not collected
25
%
tra
nsf
er
Littering –not
collected
Mismanaged
Uncontrolled dumping
/ fly tippingH
igh
re
sid
ua
l
va
lue
: 2
0%
(PE
T, H
DP
E)Medium and low
residual value: 80%
(polystyrene, PP,
LDPE, films,
composites)*
100% leakage
10
%
25
%
tra
nsf
er
100%
leakage
Dis
po
sal
in
the
se
wa
ge
syst
em
Bu
rnin
g
10
% g
oe
s th
rou
gh
th
e w
ast
ew
ate
r
tre
atm
en
t),
e.g
. d
uri
ng
th
un
de
rsto
rms
Collected through the formal waste collection system(le.g., low income country 43% to high income country 98%)
Hig
h r
esi
du
al
va
lue
: 2
0%
(P
ET
,
HD
PE
)
Medium and low residual
value: 80% (polystyrene, PP,
LDPE, films, composites)
100% leakage
10
%
25
%
tra
nsf
er
Mismanaged Leakage: in average 25% of
overall leakage Well managed
- Dumping
- Non sanitary landfills
Mis
ma
na
ge
d,
bu
rnin
g
Model approach (focus on mismanaged waste)
*Ocean Conservancy (2015) Stemming the Tide: Land-based strategies for a plastic - free ocean
21+
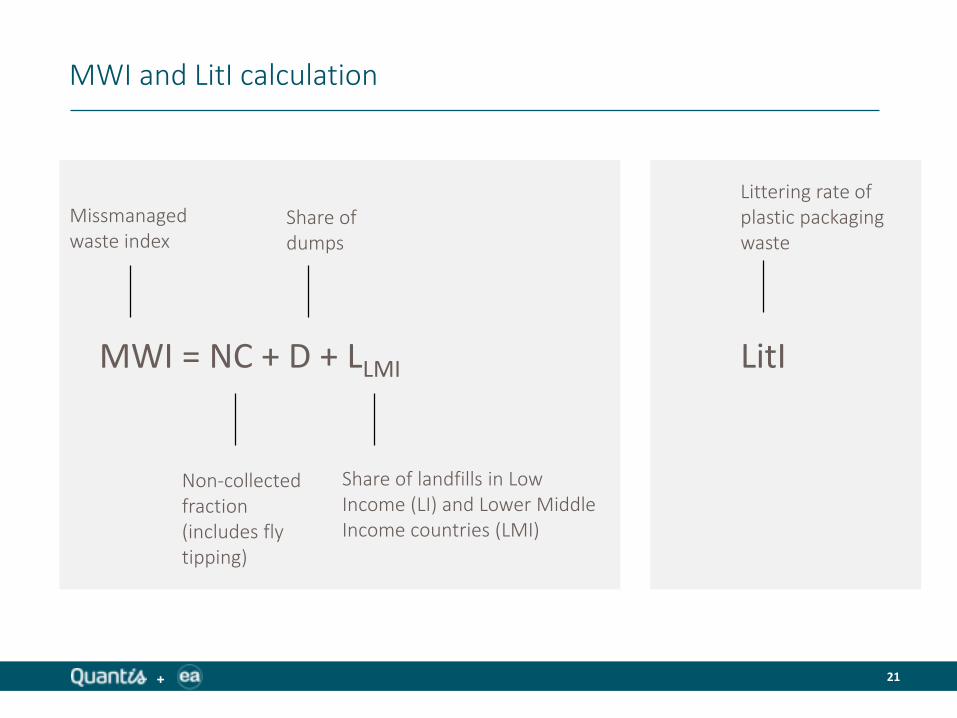
MWI and LitI calculation
Littering rate of
plastic packaging
waste
MWI = NC + D + LLMI
Missmanaged
waste index
Share of
dumps
Share of landfills in Low
Income (LI) and Lower Middle
Income countries (LMI)
Non-collected
fraction
(includes fly
tipping)
LitI
22+
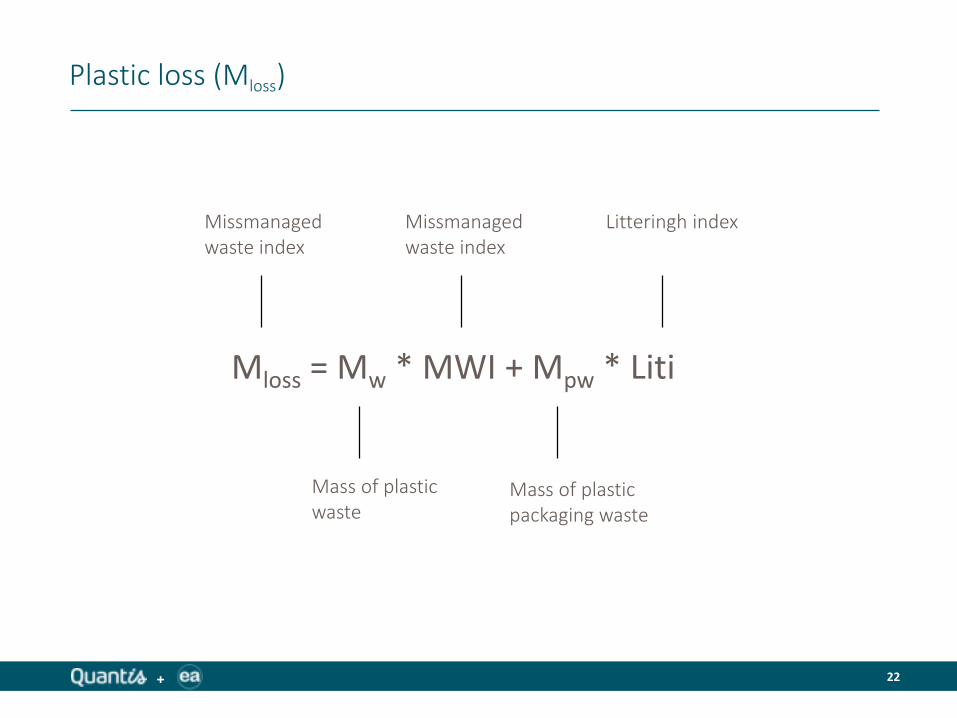
Plastic loss (Mloss)
Mloss = Mw * MWI + Mpw * Liti
Missmanaged
waste index
Missmanaged
waste index
Litteringh index
Mass of plastic
wasteMass of plastic
packaging waste
26
Not collected
Land sources of macroplastic waste (including imports and exports)
3. WASTE
MANAGEMENT
5. TRANSFER TO
OCEAN
2. COLLECTION
4. LEAKAGE IN
THE
ENVIRONMENT
1. MASS OF
MACROPLASTIC WASTE
LEA
KA
GE
Mismanaged
Collected
Mismanaged
Collected
Well managed
Behavioural Structural
LEA
KA
GE
Increase well managed to
reduce mis-managed
100%
100%
Littering
Dumping / fly tipping
Disposal in the sewage
system
Burning
Dumping
Non-sanitary landfills
Burning
Sanitary landfills
Incineration
Recycling
Mismanaged waste index =
Mismanaged waste
Mass of macroplastic waste
The case of Mismanaged Waste (MWI calculation)
27
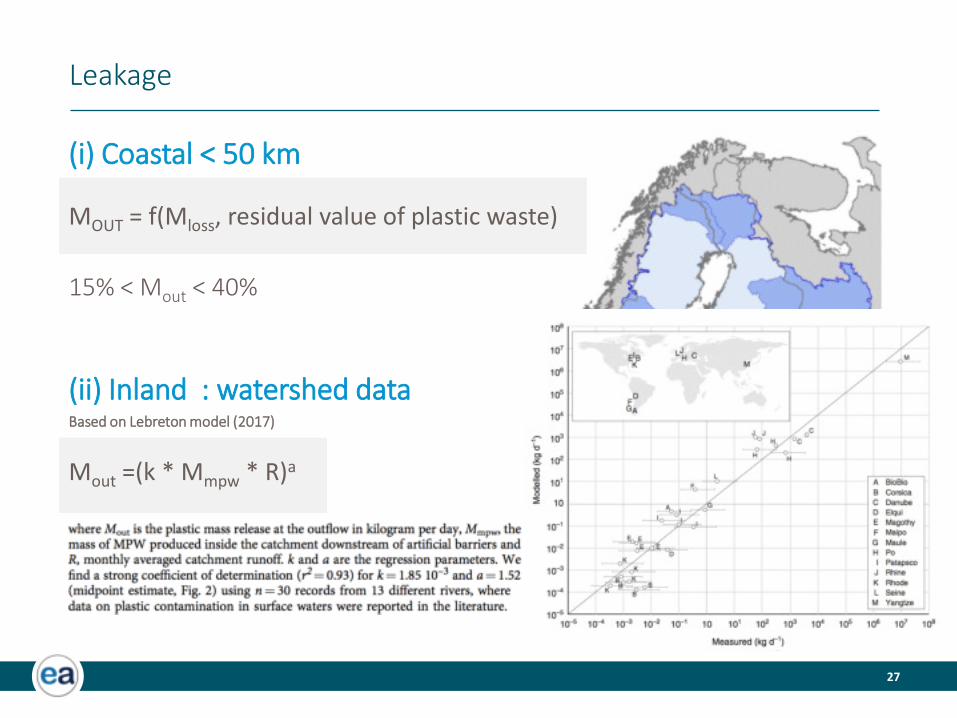
Leakage
(i) Coastal < 50 km
15% < Mout < 40%
(ii) Inland : watershed dataBased on Lebreton model (2017)
Mout =(k * Mmpw * R)a
MOUT = f(Mloss, residual value of plastic waste)
28
Circularity index
31
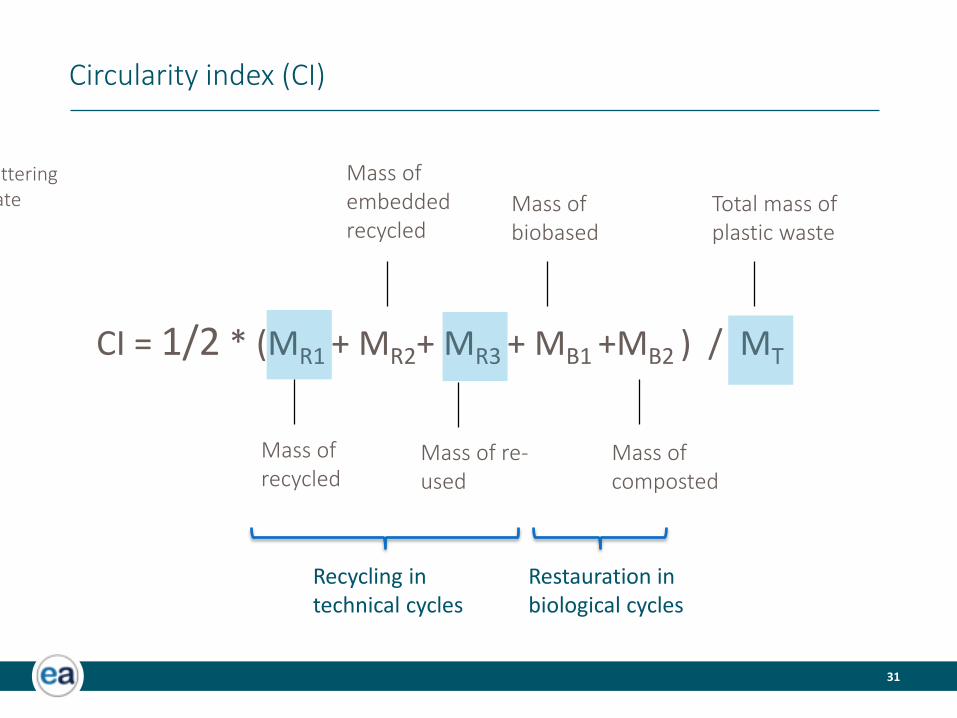
Circularity index (CI)
CI = 1/2 * (MR1 + MR2+ MR3 + MB1 +MB2 ) / MT
Mass of
recycled
Mass of
embedded
recycled
Mass of
composted
Mass of
biobased
Total mass of
plastic waste
Recycling in
technical cycles
Restauration in
biological cycles
Mass of re-
used
Littering
rate
32
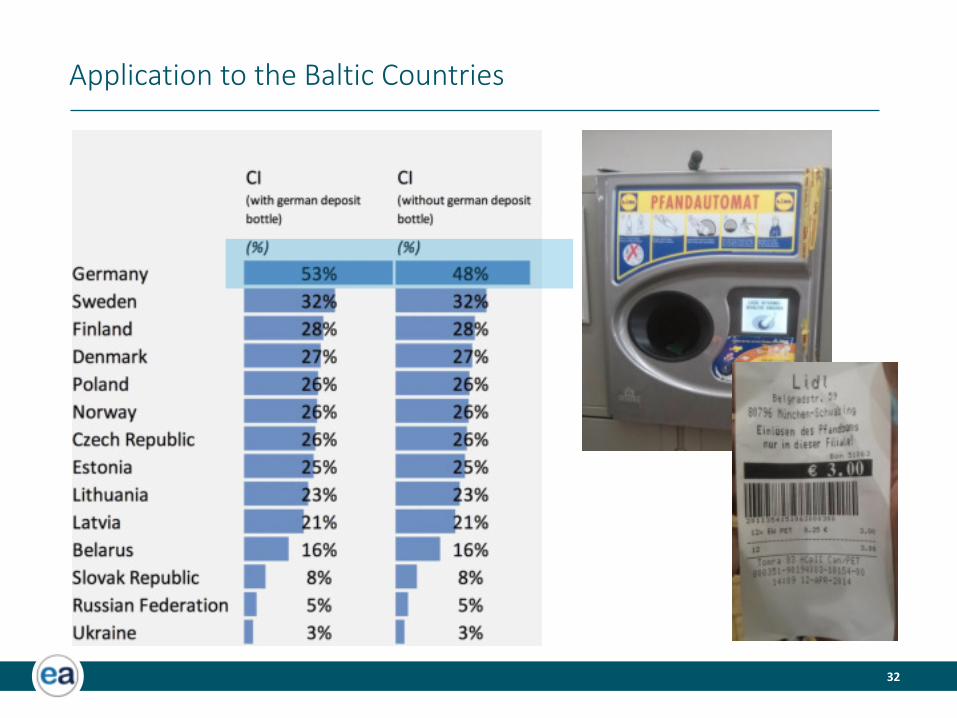
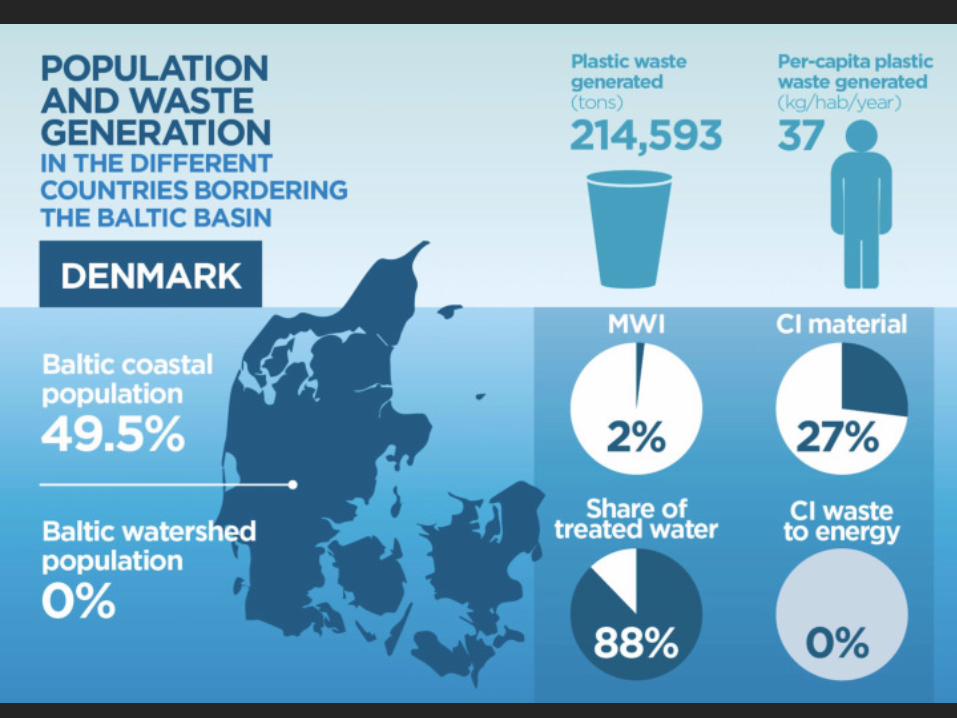
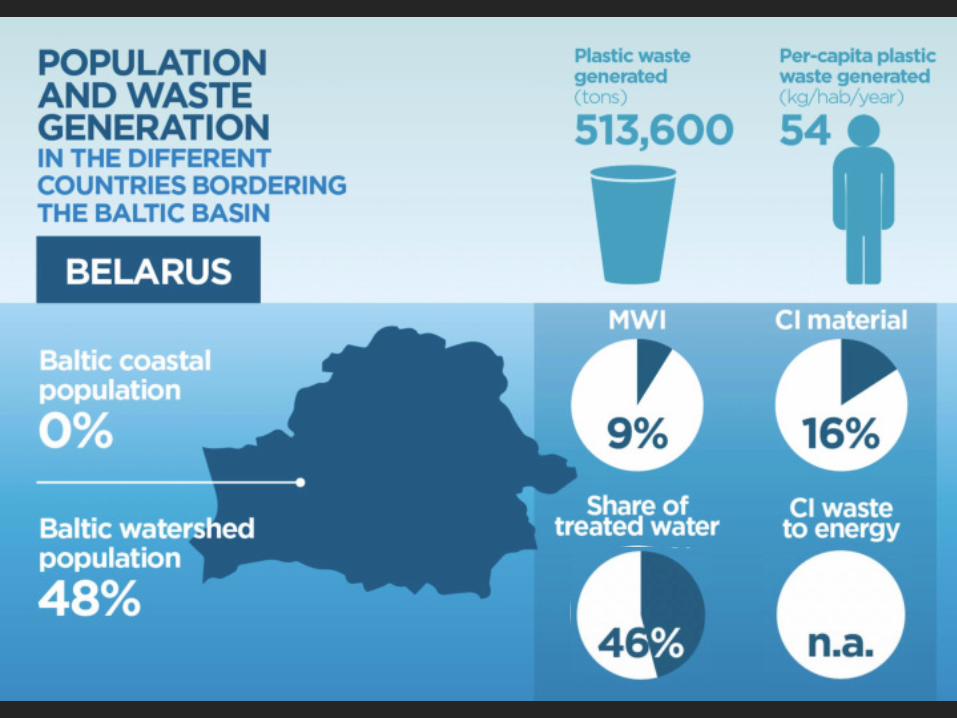
Application to the Baltic Countries
Leakage from
primary microplastics
34
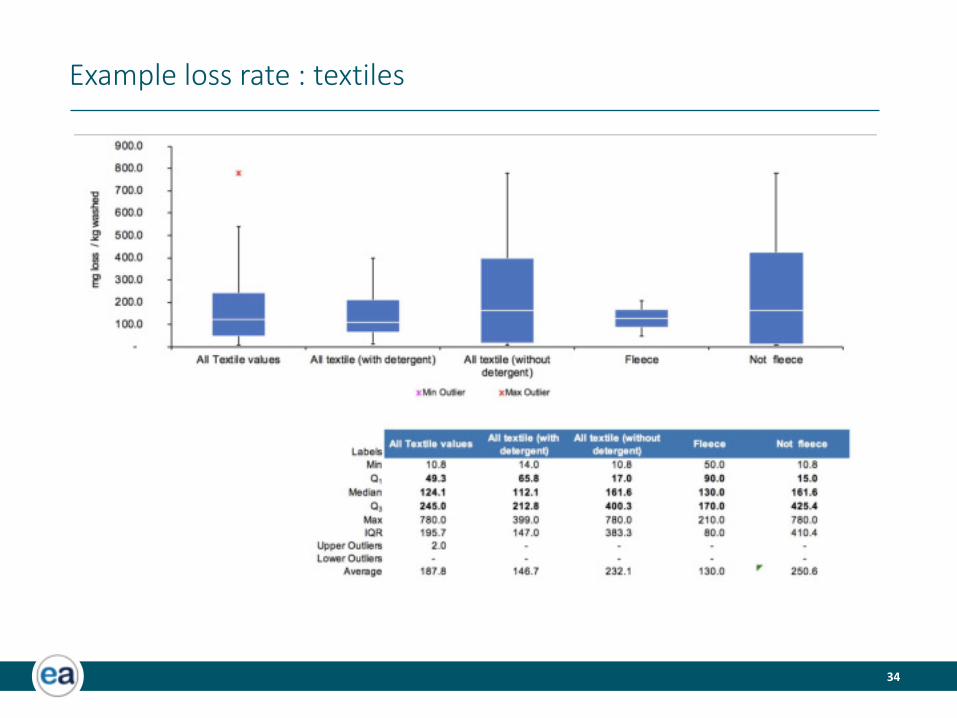
Example loss rate : textiles
35
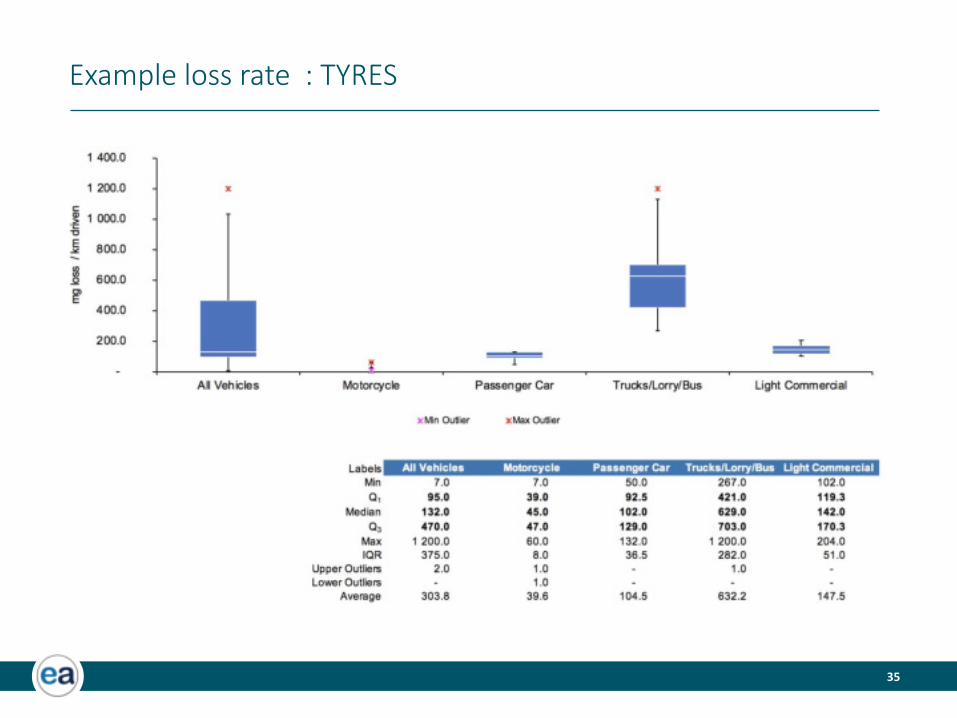
Example loss rate : TYRES
36
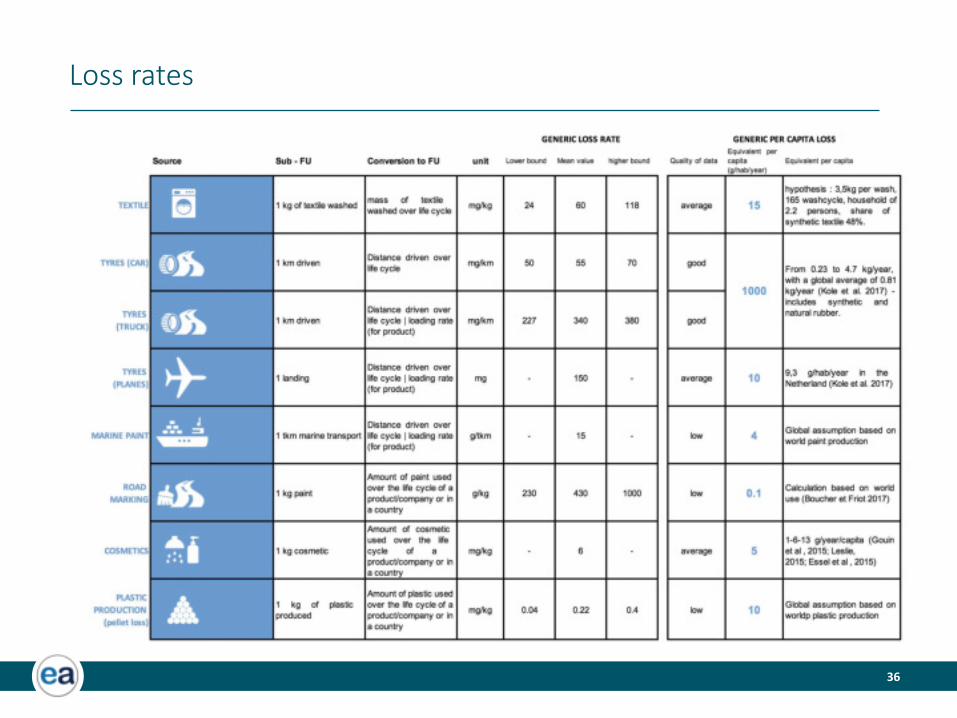
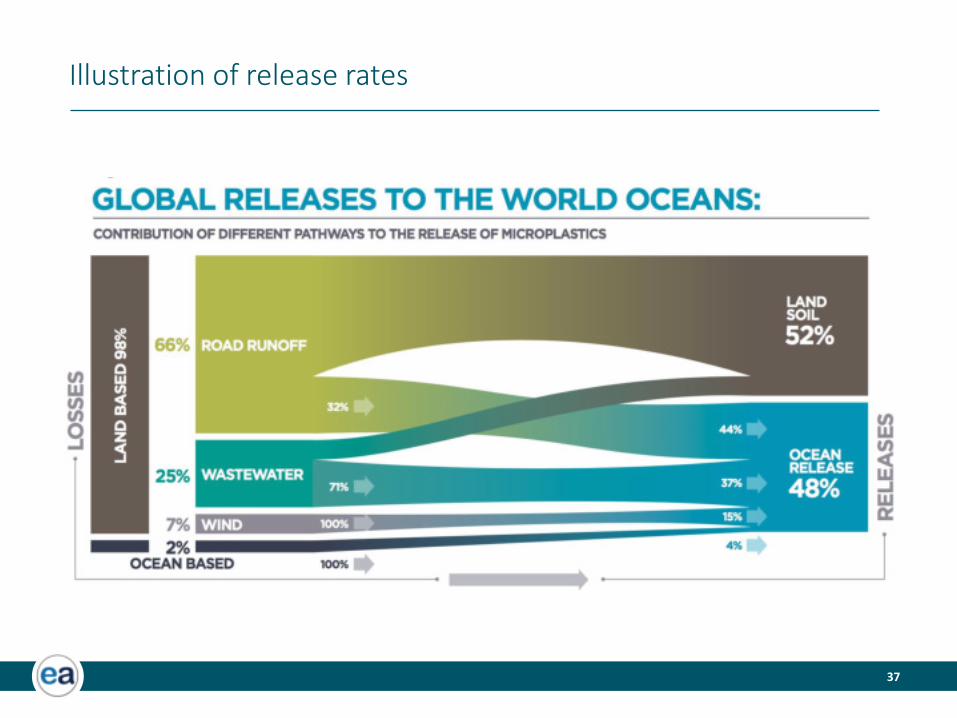
Loss rates
37
Illustration of release rates
SECTORAL CASE STUDIESTEXTILE AND PACKAGING
39
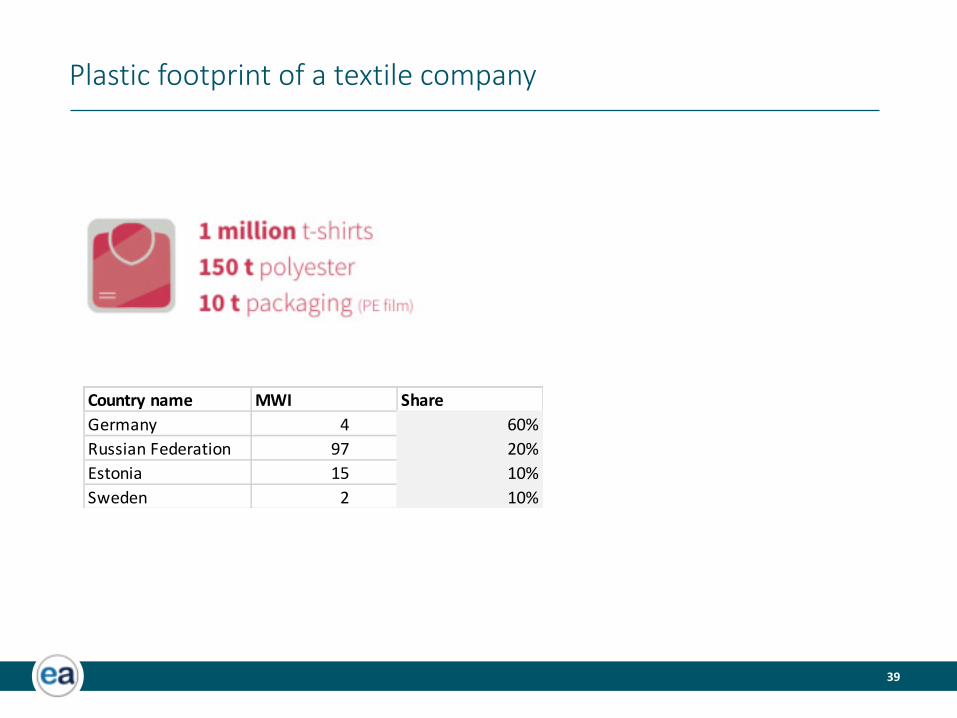
Plastic footprint of a textile company
Country name MWI Share
Germany 4 60%
Russian Federation 97 20%
Estonia 15 10%
Sweden 2 10%
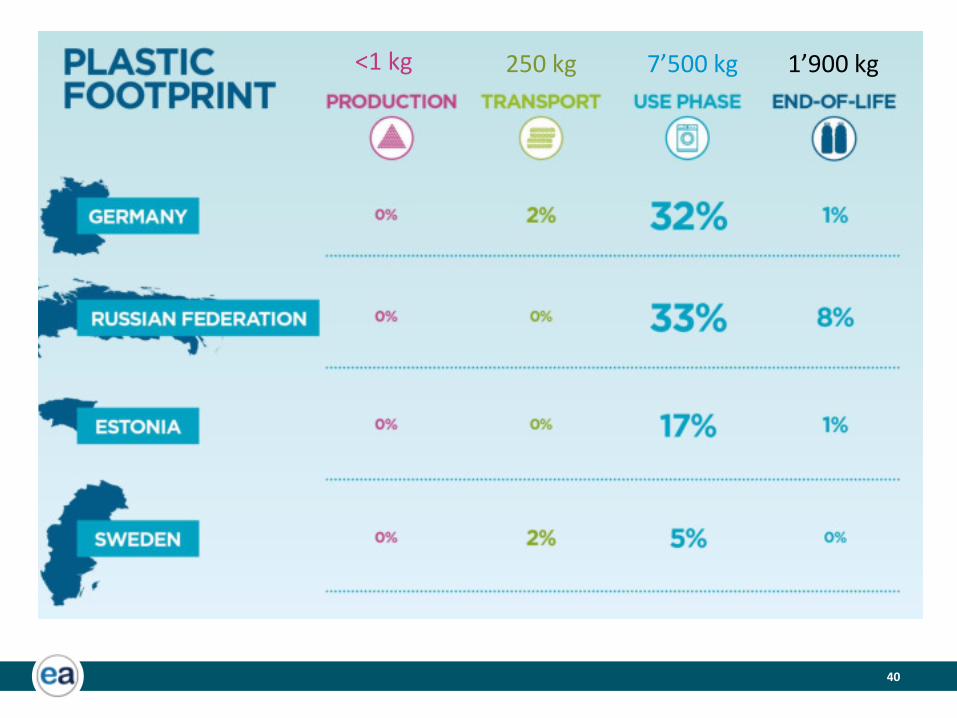
40
<1 kg 250 kg 7’500 kg 1’900 kg
41
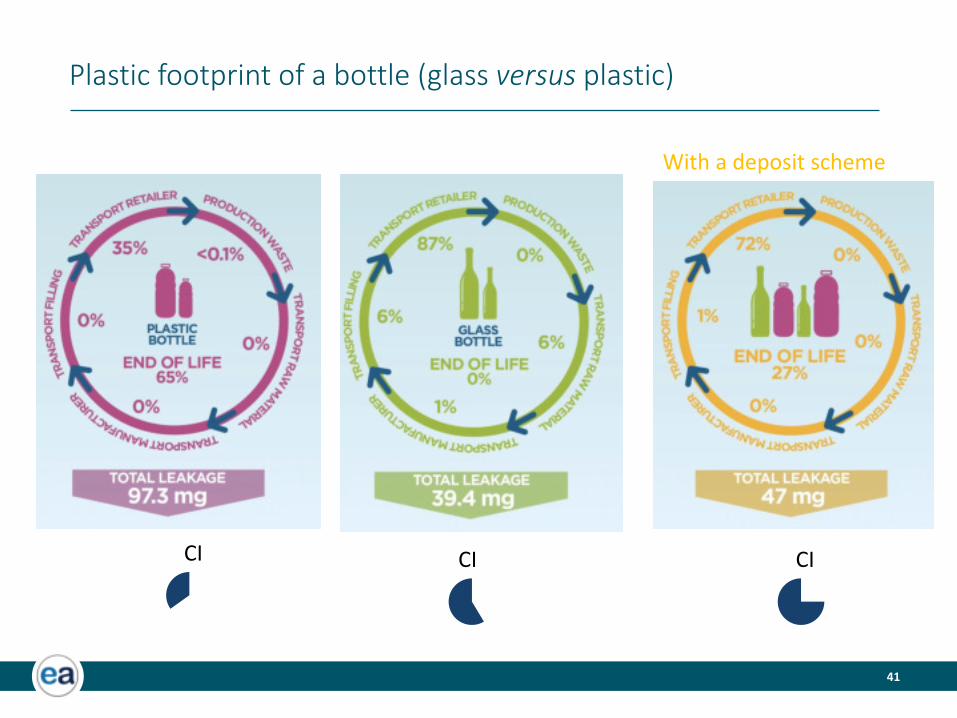
Plastic footprint of a bottle (glass versus plastic)
CI
With a deposit scheme
CI CI
REGIONAL CASE STUDYPLASTIC FOOTPRINT OF THE BALTIC BASIN

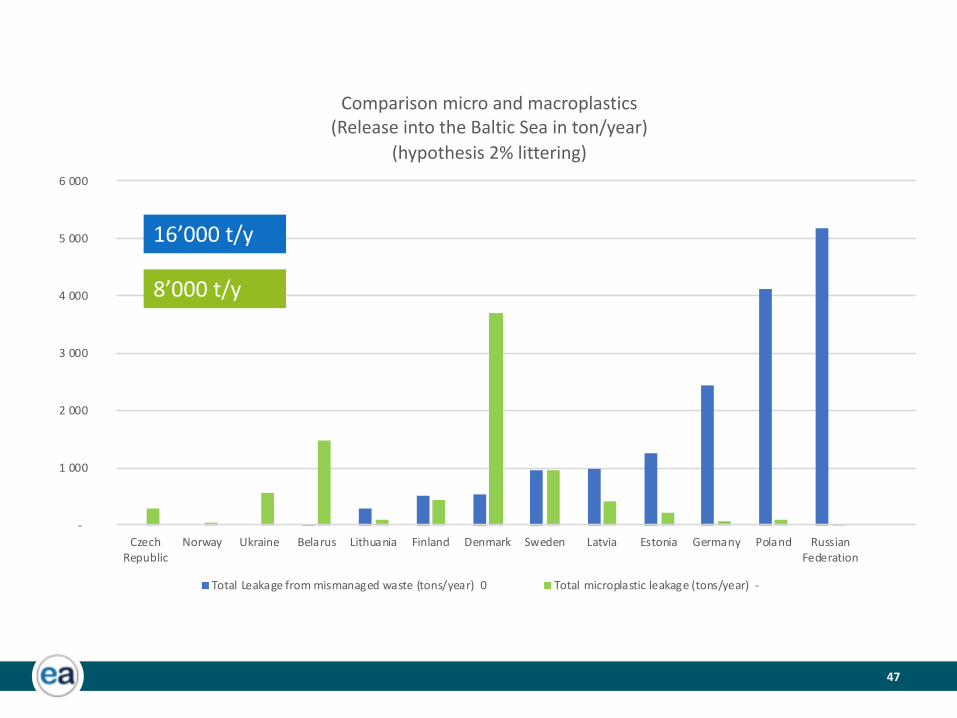
47
-
1 000
2 000
3 000
4 000
5 000
6 000
Czech
Republic
Norway Ukraine Belarus Lithuania Finland Denmark Sweden Latvia Estonia Germany Poland Russian
Federation
Comparison micro and macroplastics
(Release into the Baltic Sea in ton/year)
(hypothesis 2% littering)
Total Leakage from mismanaged waste (tons/year) 0 Total microplastic leakage (tons/year) -
16’000 t/y
8’000 t/y
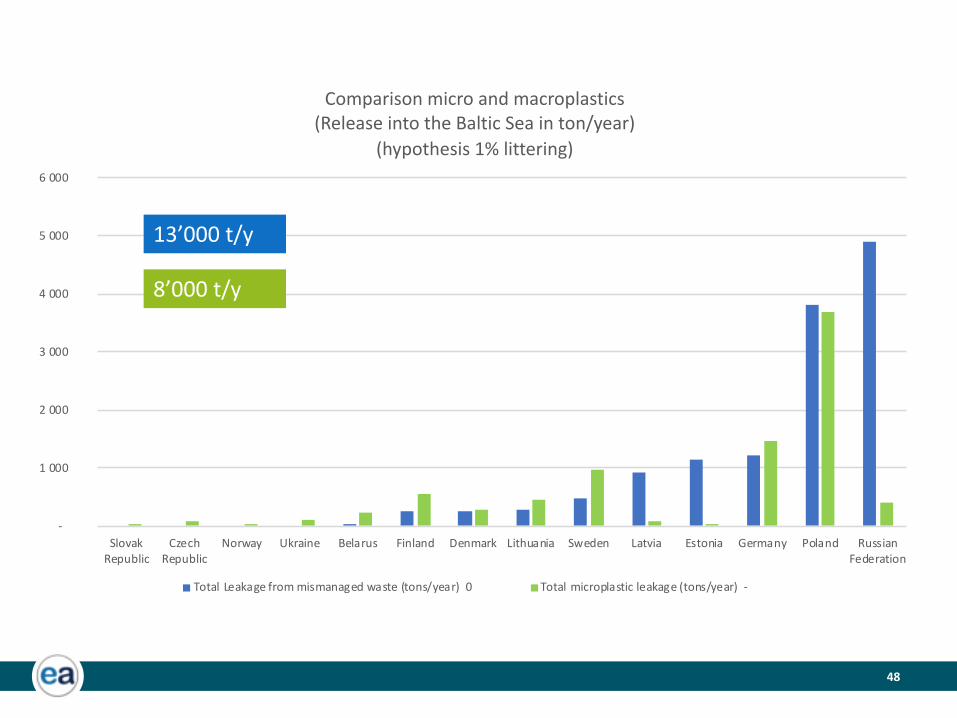
48
-
1 000
2 000
3 000
4 000
5 000
6 000
Slovak
Republic
Czech
Republic
Norway Ukraine Belarus Finland Denmark Lithuania Sweden Latvia Estonia Germany Poland Russian
Federation
Comparison micro and macroplastics
(Release into the Baltic Sea in ton/year)
(hypothesis 1% littering)
Total Leakage from mismanaged waste (tons/year) 0 Total microplastic leakage (tons/year) -
13’000 t/y
8’000 t/y
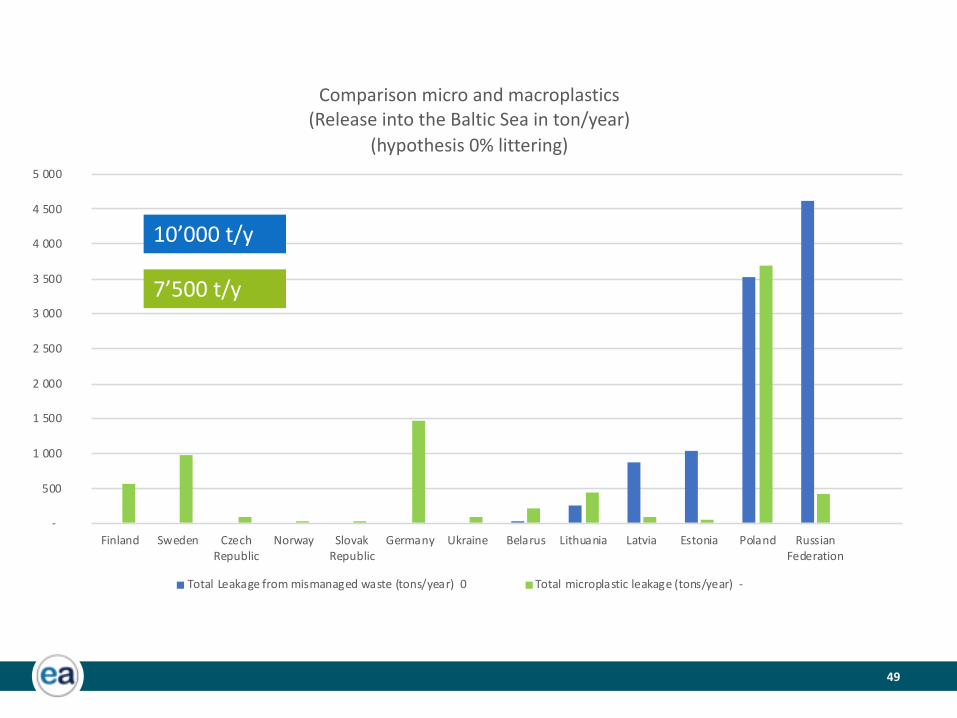
49
-
500
1 000
1 500
2 000
2 500
3 000
3 500
4 000
4 500
5 000
Finland Sweden Czech
Republic
Norway Slovak
Republic
Germany Ukraine Belarus Lithuania Latvia Estonia Poland Russian
Federation
Comparison micro and macroplastics
(Release into the Baltic Sea in ton/year)
(hypothesis 0% littering)
Total Leakage from mismanaged waste (tons/year) 0 Total microplastic leakage (tons/year) -
10’000 t/y
7’500 t/y
Unit : tons / year
WAYS FORWARDA COOLABORATION TOWARDS BETTER DATA
52
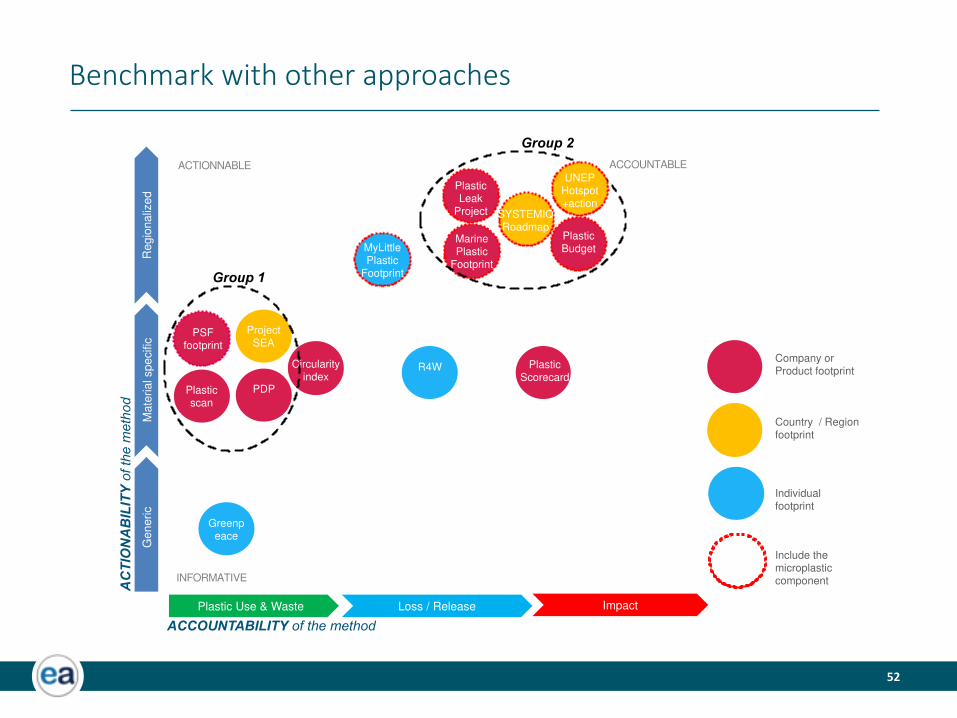
Benchmark with other approaches
ImpactLoss / ReleasePlastic Use & Waste
Plastic scan
Marine Plastic
Footprint
PDP
PSF footprint
Project SEA
MyLittlePlastic
Footprint
Greenpeace
R4W Plastic Scorecard
Generic
Mate
rial specific
Regio
naliz
ed
ACTIONNABLE ACCOUNTABLE
INFORMATIVE
Circularity index
ACCOUNTABILITY of the method
AC
TIO
NA
BIL
ITY
of th
e m
eth
od
Plastic Leak
Project
Company or Product footprint
Country / Region footprint
Individual footprint
Include the microplastic component
Group 1
Group 2
UNEPHotspot+action
SYSTEMIQ Roadmap
Plastic Budget
53
Elements for discussion
• Refining data IN A COLLABORATIVE MANNER
• Better understanding the leakage pathways
• Better understanding littering drivers and numbers
• Understanding the learnings from such an approach
• WARNING : the indirectccomponent of the footprint
is not accounted for


![[Document subtitle] [DATE] - Environmental Footprint Institute](https://img.pdfslide.net/doc/110x75/631ca10e7051d371800f901d/document-subtitle-date-environmental-footprint-institute.jpg)


