Embed Size (px)
Citation preview
Polarization Studies by the TSC Technique on a Blend of Cellulose Acetate and Polyvinyl Acetate
P. K. C. PILLAI, BRIJESH K. GUPTA, and MALT1 GOEL, Department of Physics, Indian Institute of Technology, New Delhi 110016, India
Synopsis
The thermally stimulated current (TSC) technique has been used to study solvent-cast blends of a cellulose derivative with a vinyl polymer. TSC peaks are observed at 56,80, and 120OC. Their origin is investigated because the TSC spectra of the blends differ from the spectra of the individual components. Data on blends with components in the weight ratios 25:75,5050, and 75:25 indicate that the 5050 blend shows the greatest polarization. The enhancement of depolarization currents observed on blending is explained on the basis of a Maxwell-Wagner-Sillars polarization due to increased heterogeneity in the structure. Effects of forming conditions (time, temperature, field) on polarization have been investigated. Activation energies and relaxation times are calculated; there is good agreement between the values obtained from the initial-rise and the full-curve methods.
INTRODUCTION
The thermally stimulated current (TSC) technique has become one of the most powerful tools for investigating electrical properties of polymers and other di- electric materia1s.l-6 Although many polymers have been studied and charac- terized by TSC,7-9 it has not often been applied to copolymers, polymer blends, and composite systems. Polymer blends are heterogeneous systems and TSC studies are likely to give some insight into molecular interactions and the extent of mixing between the components. van TurnhoutlO has studied some copolymer systems and has shown that they generally appear to average out the polarization effects of the individual components. Tanaka et a1.l1 have shown from TSC studies on composites of epoxy resin and mica flakes that additional peaks arise due to dipolar polarization and space-charge polarization effects associated with molecular motion in boundary regions between the two phases.
In the present investigation, a polyblend consisting of cellulose acetate and polyvinyl acetate has been studied in detail in various weight proportions and under different forming conditions. This particular combination, in which the two components have the same functional groups, forms a thermodynamically compatible system.12 Our measurements revealed that blending results in po- larization effects much greater than those for the individual components.
EXPERIMENTAL
Cellulose acetate (BDH Chemicals) had an acetic acid content of 53.5-54.5%, and the viscosity of a 6% solution in 95% acetone/5% water mixture a t 25°C was 75-110 cS. Polyvinyl acetate (Polysciences Inc., USA) had a molecular weight of about lo5. The polymers were dissolved separately in dioxane. The two
Journal of Polymer Science: Polymer Physics Edition, Vol. 19, 1461-1470 (1981) 0 1981 John Wiley & Sons, Inc. CCC 0098-1273/81/091461-10$01.00
1462 PILLAI, GUPTA, AND GOEL
solutions, each with a concentration of 120 g/L, were then mixed in proportions of 25:75,50:50, and 7525 by weight. After sufficient stirring, the mixed solution was almost transparent. Films were cast on a glass plate and slowly dried in a saturated dioxane atmosphere. Films were further dried for 40-50 h in a dry atmosphere and were finally kept in an oven at 50°C for 24 h to evaporate residual solvent. Specimens (2x2 cm) were taken from these solvent-cast films. The thickness of the samples was 90 pm.
For TSC experiments, specimens were sandwiched between two aluminum electrodes in a sample holder and kept in a temperature-controlled cell. After a constant temperature T p had been attained, a static electric field Ep was ap- plied across the specimen. After time t p , the specimen was cooled to room temperature in the presence of the electric field. The electric field was then removed and the specimen was short circuited for 10 min in order to eliminate rapid discharge. TSC was observed by reheating the sample at a constant rate 0. A Keithley electrometer (Model 610C) was used for the current measure- ments.
RESULTS
Effect of Blending
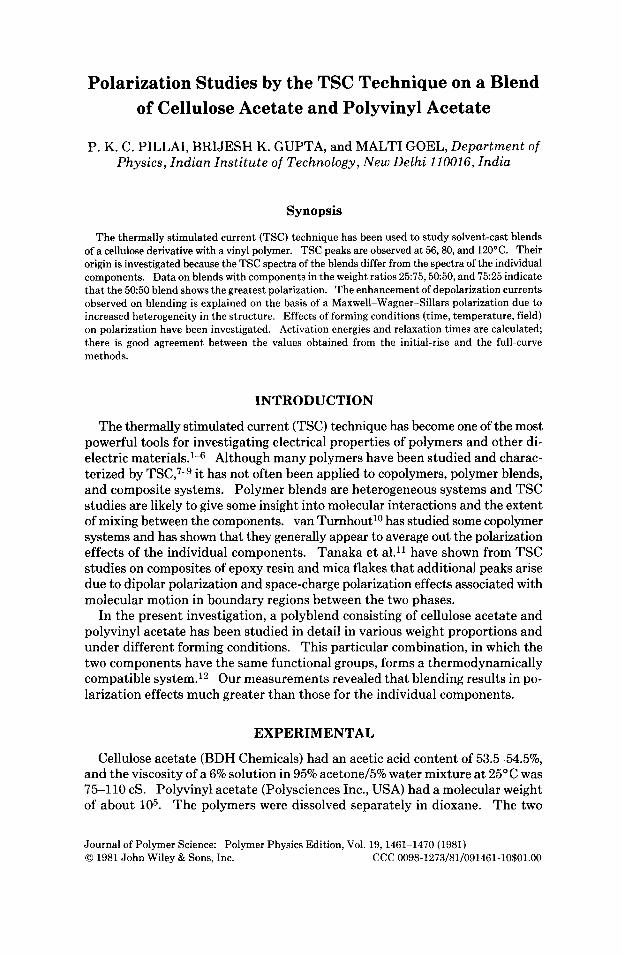
The TSC spectrum of a 50:50 blend of polyvinyl acetate (PVAc) and cellulose acetate (CA) is shown in Figure 1. The conditions of polarization are polarizing field 55 kV/cm, polarizing temperature 14OoC, and polarizing time 1 h. The TSC spectrum, taken at a constant heating rate of 4"C/min, shows three current maxima above room temperature. These peaks, a t 56,80, and 120°C, are des-
TEMPERATURE ('C)
Fig. 1. TSC spectra of CA-PVAc, 5050 blend (-); polyvinyl acetate (- - -), and cellulose acetate ( - - -). The inset shows a 5X magnified view (along they axis) of a portion of the CA spectrum (near 8OoC) to make the hump visible.
TSC OF A BLEND 1463
20.0 -
16.0 -
12.0 - n
E F ' Z - 8.0
.?
- -
I) u
4 . 0 -
1 2
Temp ( "C )
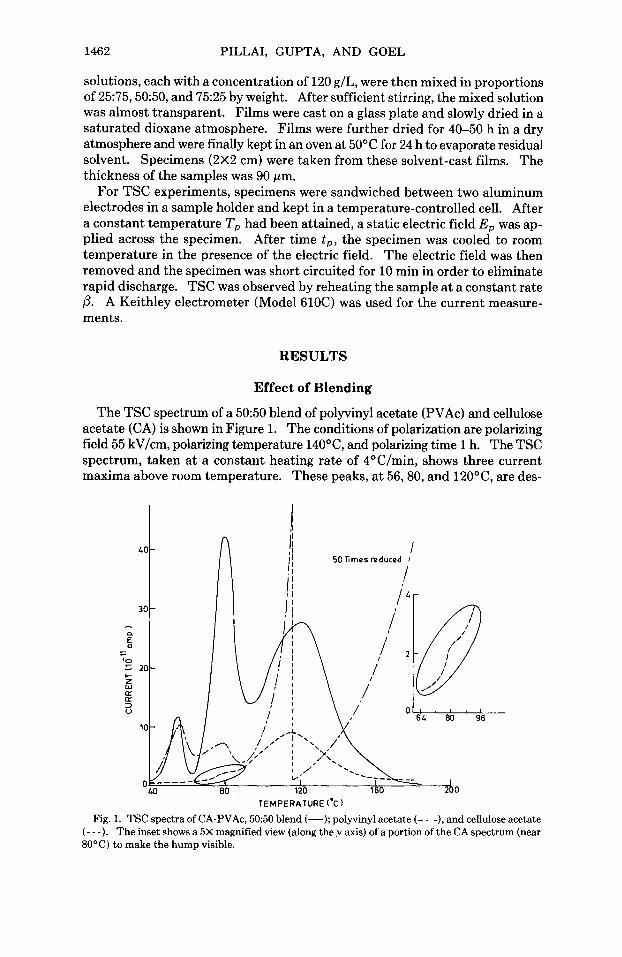
Fig. 2. Variation in TSC spectrum of PVAc by successive polarizations under identical condi- tions.
ignated a1, a2, and as, respectively. TSC spectra of 100% PVAc and 100% CA are also shown in Figure 1. PVAc shows current peaks at 56 (ap) and 80°C (a;); CA shows a small hump at about 80°C (0,) and a large broadened peak at 120°C ( p c ) . At 56"C, PVAc has its (glass to rubber) transition14 resulting from micro-Brownian motion of the main-chain backbone. The a; peak observed at higher temperature may be associated with a space-charge polarization due to charge generation at the electrode-sample interface and also to motion of excess charge due to increased chain mobility. The observation on one sample (see Fig. 2) that the intensity of a; peak increases on repeated polarization and depolarization cycles suggests that its formation is due to charge injection from the electrodes. At still higher temperatures, above 95"C, high conduction cur- rents are observed up to 180OC in PVAc. Incidentally, the relaxation in PVAc due to rotation of the polar acetate group occurs below room temperature,14 and is not observed in the present investigation. In Figure 1, a1 of the blend coincides with a,, of PVAc and is largely unaffected by blending.
A small current hump near 80°C for CA is associated with the Pc transition, i.e., molecular motion of the polar side groups.15J6 The structure of cellulose acetate with a polar main chain with polar side groups enhances formation of free carriers, which accumulate at the electrode during formation. Their high concentration produces excess charges which on subsequent trapping give rise to the pc peak during depolarization. This pc peak is further enhanced by ad- ditional traps possible in the 5050 blend and appears as the a3 peak.
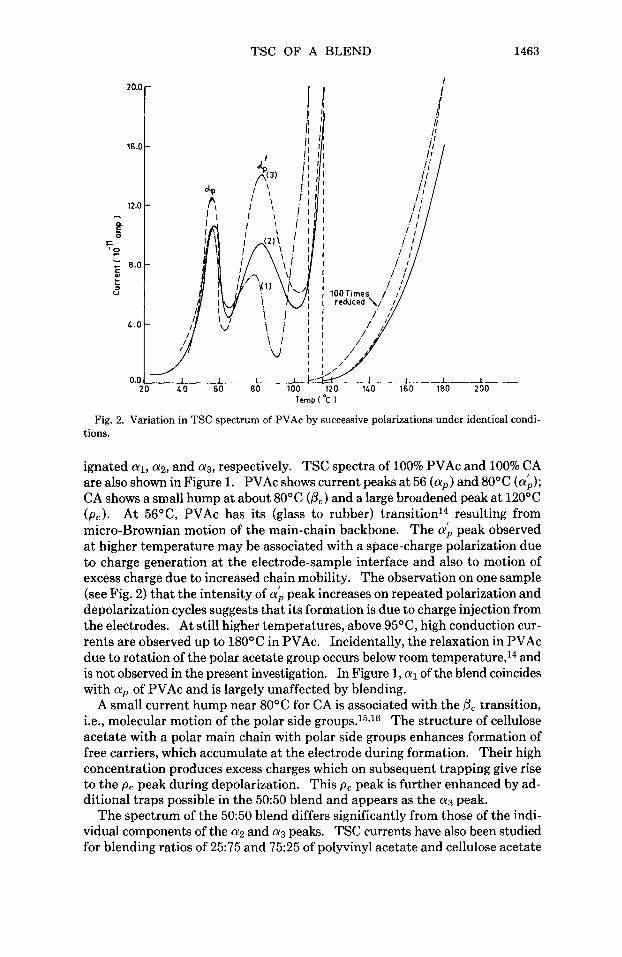
The spectrum of the 5050 blend differs significantly from those of the indi- vidual components of the a2 and 013 peaks. TSC currents have also been studied for blending ratios of 25:75 and 7525 of polyvinyl acetate and cellulose acetate
1464 PILLAI, GUPTA, AND GOEL
TEMPERATURE ('C)
5050 (-1, 25:75 (- - -), and 75:25 (- - -) propor- Fig. 3. TSC spectra of CA-PVAc blend: tions.
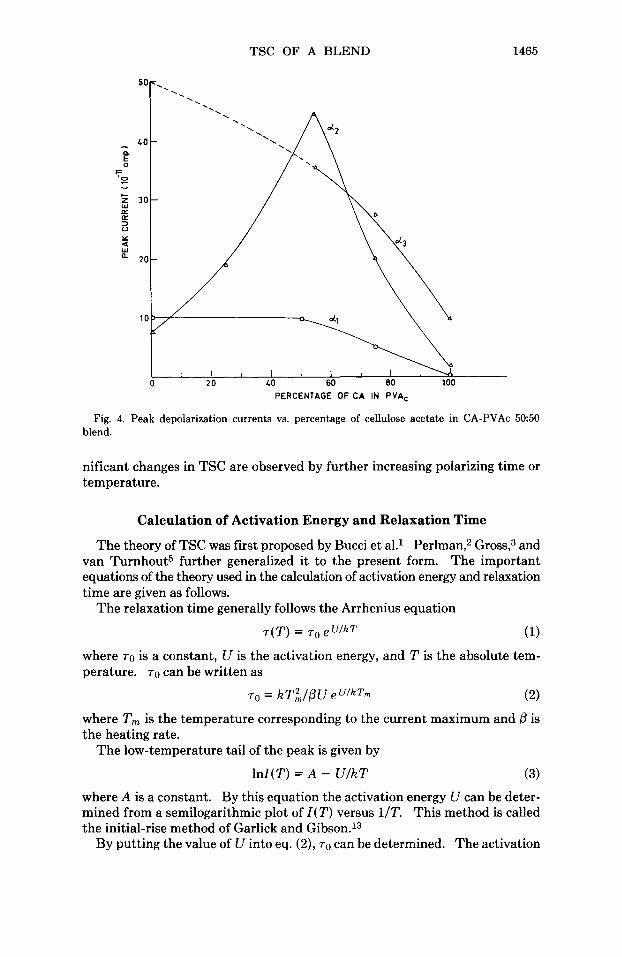
(see Fig. 3). The positions of a1, ap, and a3 are unchanged, while their magni- tudes are considerably affected by composition. The peak currents as a function of the blending ratio for the three peaks are shown in Figure 4.
Effect of the Forming Field
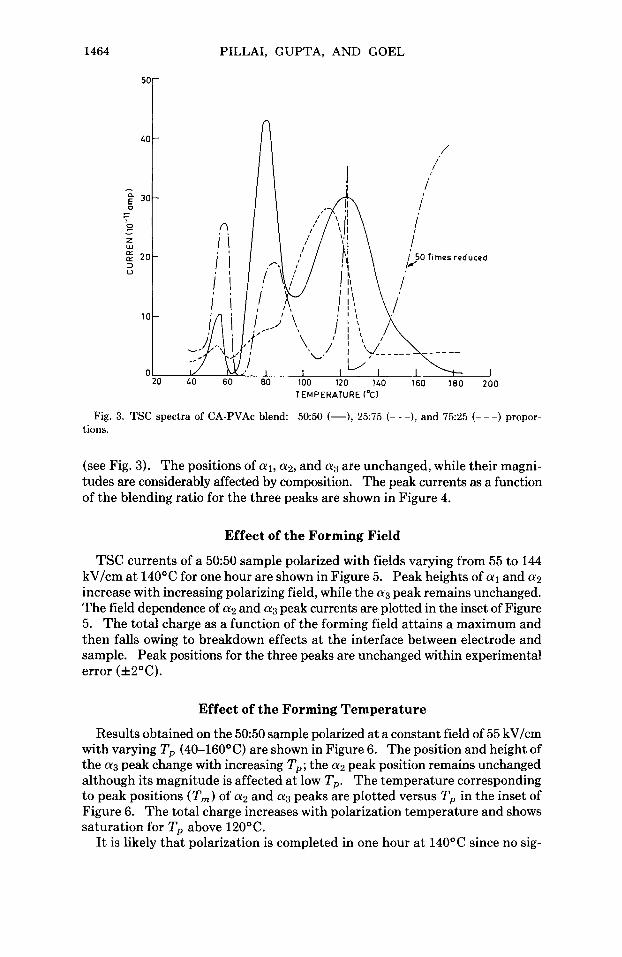
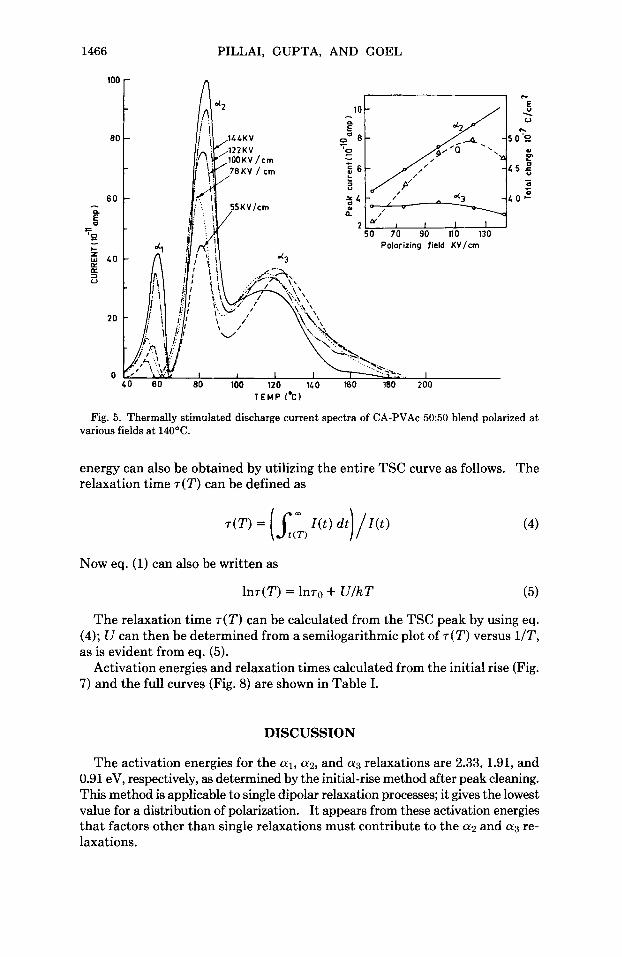
TSC currents of a 5050 sample polarized with fields varying from 55 to 144 kV/cm at 140°C for one hour are shown in Figure 5 . Peak heights of a1 and a2 increase with increasing polarizing field, while the a3 peak remains unchanged. The field dependence of a2 and a3 peak currents are plotted in the inset of Figure 5. The total charge as a function of the forming field attains a maximum and then falls owing to breakdown effects a t the interface between electrode and sample. Peak positions for the three peaks are unchanged within experimental error (f2OC).
Effect of the Forming Temperature
Results obtained on the 50:50 sample polarized at a constant field of 55 kV/cm with varying Tp (40-160OC) are shown in Figure 6. The position and height of the a3 peak change with increasing Tp; the ap peak position remains unchanged although its magnitude is affected at low Tp. The temperature corresponding to peak positions (T,) of a2 and a3 peaks are plotted versus T p in the inset of Figure 6. The total charge increases with polarization temperature and shows saturation for Tp above 120°C.
It is likely that polarization is completed in one hour at 14OOC since no sig-
TSC OF A BLEND 1465
PERCENTAGE OF CA IN PVA,
Fig. 4. Peak depolarization currents vs. percentage of cellulose acetate in CA-PVAc 5050 blend.
nificant changes in TSC are observed by further increasing polarizing time or temperature.
Calculation of Activation Energy and Relaxation Time
The theory of TSC was first proposed by Bucci et a1.l Perlman,2 Gross? and van Turnhout5 further generalized it to the present form. The important equations of the theory used in the calculation of activation energy and relaxation time are given as follows.
The relaxation time generally follows the Arrhenius equation
7 ( T ) = 70 eu lkT (1)
where 70 is a constant, U is the activation energy, and T is the absolute tem- perature. 70 can be written as
TO = kT%/PU e U I k T m (2)
where T,,, is the temperature corresponding to the current maximum and ,6 is the heating rate.
The low-temperature tail of the peak is given by
lnl(T) = A - U/kT (3) where A is a constant. By this equation the activation energy U can be deter- mined from a semilogarithmic plot of I ( T ) versus 1/T. This method is called the initial-rise method of Garlick and Gibson.l3
By putting the value of U into eq. (2), 70 can be determined. The activation
1466 PILLAI, GUPTA, AND GOEL
T E M P ( % I
Fig. 5. Thermally stimulated discharge current spectra of CA-PVAc 5050 blend polarized at various fields at 140OC.
energy can also be obtained by utilizing the entire TSC curve as follows. The relaxation time T ( T ) can be defined as
Now eq. (1) can also be written as
h ( T ) = 11170 + U/kT (5)
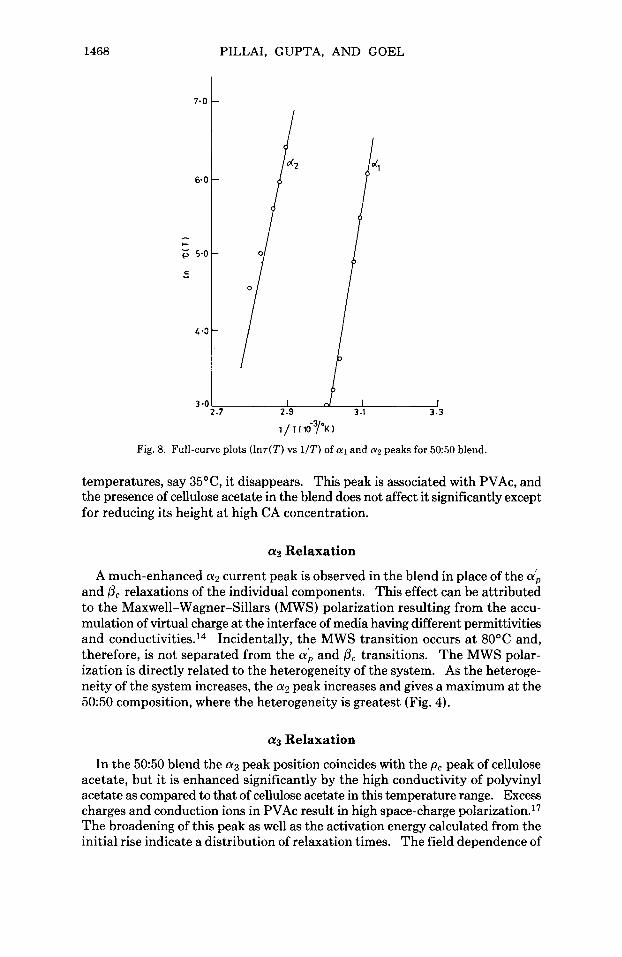
The relaxation time T ( T ) can be calculated from the TSC peak by using eq. (4); U can then be determined from a semilogarithmic plot of 7 ( T ) versus 1/T, as is evident from eq. (5).
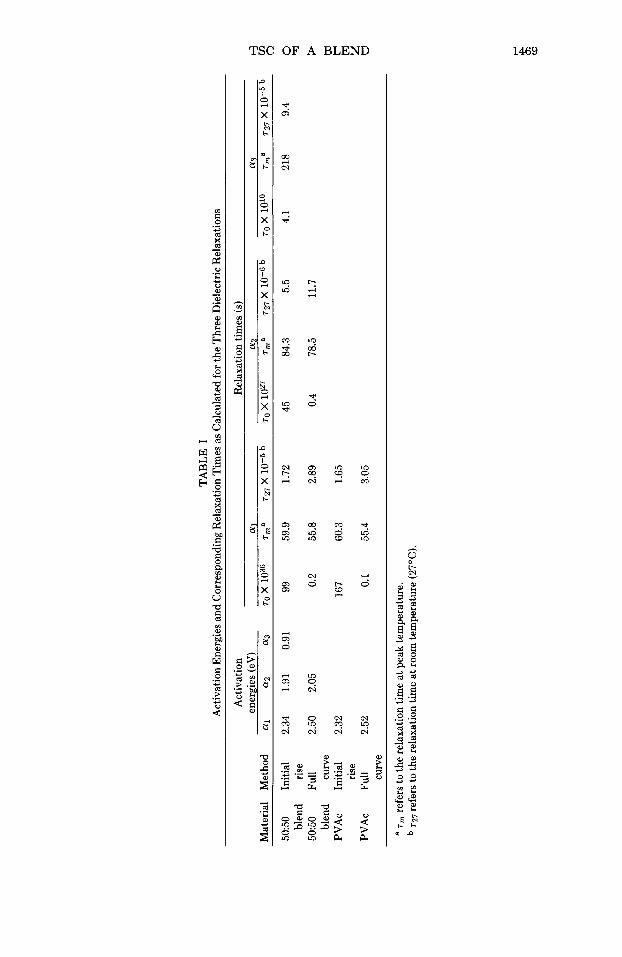
Activation energies and relaxation times calculated from the initial rise (Fig. 7) and the full curves (Fig. 8) are shown in Table I.
DISCUSSION
The activation energies for the a1, a2, and a3 relaxations are 2.33, 1.91, and 0.91 eV, respectively, as determined by the initial-rise method after peak cleaning. This method is applicable to single dipolar relaxation processes; it gives the lowest value for a distribution of polarization. It appears from these activation energies that factors other than single relaxations must contribute to the a2 and a3 re- laxations.
TSC OF A BLEND 1467
-21
-23 - + - - c -
-25
- 2 7
TEMP ('C)
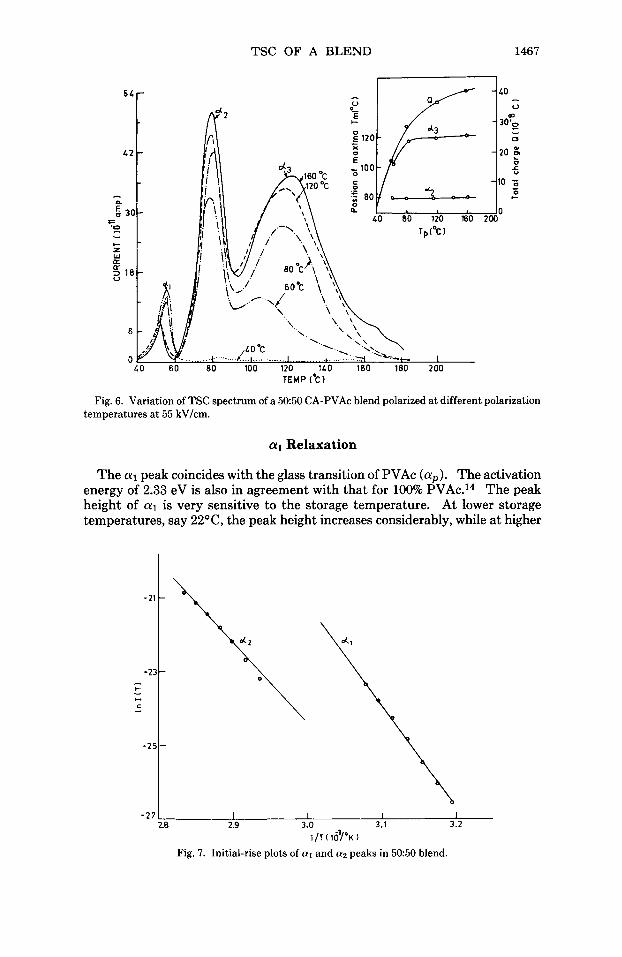
Fig. 6. Variation of TSC spectrum of a 5050 CA-PVAc blend polarized at different polarization temperatures at 55 kV/cm.
-
-
-
I I I I 2.8 2.9 3.0 3.1 3.2
a1 Relaxation
The a1 peak coincides with the glass transition of PVAc (ap) . The activation energy of 2.33 eV is also in agreement with that for 100% PVAc.14 The peak height of a1 is very sensitive to the storage temperature. At lower storage temperatures, say 2Z0C, the peak height increases considerably, while at higher
1468 PILLAI, GUPTA, AND GOEL
I I I 7 2.9 3.1 3.3
1 / T ( 16YK 1
Fig. 8. Full-curve plots (lnT(T) vs 1/T) of a1 and ( ~ 2 peaks for 5050 blend.
temperatures, say 35OC, it disappears. This peak is associated with PVAc, and the presence of cellulose acetate in the blend does not affect it significantly except for reducing its height a t high CA concentration.
a2 Relaxation
A much-enhanced a2 current peak is observed in the blend in place of the a> and P, relaxations of the individual components. This effect can be attributed to the Maxwell-Wagner-Sillars (MWS) polarization resulting from the accu- mulation of virtual charge at the interface of media having different permittivities and condu~tivities.'~ Incidentally, the MWS transition occurs a t 80°C and, therefore, is not separated from the a; and P, transitions. The MWS polar- ization is directly related to the heterogeneity of the system. As the heteroge- neity of the system increases, the a2 peak increases and gives a maximum at the 5050 composition, where the heterogeneity is greatest (Fig. 4).
a3 Relaxation
In the 5050 blend the a3 peak position coincides with the pc peak of cellulose acetate, but it is enhanced significantly by the high conductivity of polyvinyl acetate as compared to that of cellulose acetate in this temperature range. Excess charges and conduction ions in PVAc result in high space-charge p01arization.l~ The broadening of this peak as well as the activation energy calculated from the initial rise indicate a distribution of relaxation times. The field dependence of
TA
BL
E I
A
ctiv
atio
n E
nerg
ies a
nd C
orre
spon
ding
Rel
axat
ion
Tim
es a
s C
alcu
late
d fo
r the
Thr
ee D
iele
ctri
c R
elax
atio
ns
Act
ivat
ion
Rel
axat
ion
times
(s)
ener
gies
(eV
) 01
1 01
2 'y
3 M
ater
ial
Met
hod
a1
012
013
Ta
x 10
36
Tm
a
72
7 x
T
ax
loz7
T
ma
72
7 x
Ta
x 10
" 7,'
727
x
5050
In
itial
2.
34
1.91
0.
91
99
59.9
1.
72
45
84.3
5.
5 4.
1 21
8 9.
4
50:5
0 Fu
ll 2.
50
2.05
0.
2 55
.8
2.89
0.
4 78
.5
11.7
>
blen
d cu
rve
m
PVA
c In
itial
2.
32
167
60.3
1.
65
F
PVA
c Fu
ll 2.
52
0.1
55.4
3.
05
U
blen
d ris
e
rise
Y cu
rve
a T,
,, re
fers
to th
e re
laxa
tion
time
at p
eak
tem
pera
ture
. 7.
27 r
efer
s to
the
rela
xatio
n tim
e at
room
tem
pera
ture
(27
°C).
1470 PILLAI, GUPTA, AND GOEL
this peak is shown in Figure 5. Saturation has already set in at 55 kV/cm, suggesting space-charge polarization. The temperature dependence, however, shows a shift of the peak position at lower polarizing temperatures (Fig. 6 ) and no change at higher Tp. This behavior is attributed to the presence of distrib- uted potential wells in which trapped charges reside.l8
CONCLUSIONS
Thermal depolarization currents of blends of polyvinyl acetate with cellulose acetate are sutdied for various compositions between room temperature and 18OOC. Current peaks at 80 and 120OC are enhanced in the blend. The en- hancement of the peak at 8OoC is attributed to the MWS polarization at this temperature due to the increased heterogeneity in the blend structure. The peak at 12OOC arises from distributed space-charge polarization in the cellulose acetate. In the blend, this peak is enhanced by the increased conductivity of PVAc at this temperature.
We are indebted to the Department of Science and Technology and the Indian Space Research Organization, Government of India, for financial aid.
References
1. C. Bucci, R. Fieschi, and G. Guidi, Phys. Reu., 148,816 (1966). 2. M. M. Perlman, J . Appl. Phys., 42,2645 (1971). 3. B. Gross, J. Electrochem. SOC., 115,376 (1968). 4. M. M. Perlman, J . Electrochem. SOC., 119,892 {1972). 5. J. van Turnhout, Polym. J. , 2,173 (1971). 6. P. K. C. Pillai, K. Jain, and V. K. Jain, Phys. Lett . , 39A, 2161 (1972). 7. P. K. C. Pillai, K. Jain, and V. K. Jain, Phys. Status Solidi, 17,221 (1973); Ind. J. Pure Appl.
8. Y. Aoki and J. 0. Brittain, J. Appl. Polym. Sci., 20,2879 (1976). 9. T. Hino, Jpn. J . Appl. Phys., 11,1573 (1972).
Phys., 11,597 (1973).
10. J. van Turnhout, Thermally Stimulated Discharge in Polymer Electrets, Elsevier, Amsterdam,
11. T. Tanaka, S. Hayashi, and K. Shibayama, J. Appl. Phys., 48,3478 (1977). 12. C. Vasile, S. Ioan, N. Asandei, and I. A. Schneider, Makromol Chem., 6,24 (1969). 13. G. F. J. Garlick and A. F. Gibson, Proc. Phys. SOC., 61,574 (1948). 14. P. Hedvig, Dielectric Spectroscopy of Polymers, Adam Hilger, Bristol, 1977. 15. G. P. Mihailov, A. I. Artyuhov, and T. I. Borisov, Vysokomol. Soedin., AS, 2401 (1967). 16. R. J. Gable and R. A. Wallace, J. Biomed. Muter. Res., 8,91(1974). 17. C . Vasile and I. A. Schneider, Eur. Polym. J . , 9,1063 (1973). 18. M. Goel and P. K. C. Pillai, J . Mucromol. Sci. Phys., B16,397 (1979).
1975.
Received August 4,1980 Accepted April 13,1981


