Embed Size (px)
Citation preview

POLYCARBONATE-CARBON NANOTUBES TRANSDUCERS WITH HIERARCHICAL STRUCTURE FOR VAPOR SENSING
Mickaël Castro, Bijandra Kumar, Jianbo Lu, Jean-François Feller Smart Plastics Group, European University of Brittany (UEB), LIMATB-UBS, Lorient, France
ABSTRACT
Combining multiwall carbon nanotubes (CNT) with an insulating polymer matrix provides a new promising generation of cost effective conductive polymer nanocomposites (CPC). CPC can be used to develop smart materials revealing changes of electrical properties upon external stresses such as heat, vapor or strain. In this work the development of conductive polymer nanocomposite (CPC) sensors for volatile organic compounds (VOC) detection has been carried out using a spray layer by layer process. This technique was successfully used to hierarchically structure polycarbonate-multiwall carbon nanotubes (PC-CNT) solutions into a double percolated architecture as attested by atomic force microscopy (AFM) and optical microscopy (OM). Chemo-electrical properties were investigated in the presence of different solvents at room temperature. Results have shown that vapor sensing properties of the obtained samples are related to different parameters such as filler content, vapor nature, thickness of samples and vapor flow rate. Finally, the applicability of PC-CNT sensor as a component of array for e-nose demonstration has been explored.
1. INTRODUCTION
New unique acumen abilities towards solvents’ vaporof electrically Conductive Polymer nanoComposites (CPCs)have made it a subject, holding the attention of scientific community [ 1- 30]. The direct conversion from chemical information into an electrical signal associated to existing low power microelectronics and sensing technology makes it an attractive material. CPC versatility comes from the wide variety of combinations of conductive fillers and insulating polymer matrices used for their development. Recently there havebeen some successful attempts to structure carbon nanotubes (CNT) architectures to develop CPC materials [ 10, 11, 17, 22, 23, 26, 27, 31]. Since their discovery in 1991 [ 32], many studies have concerned the dispersion of carbon nanotubes into polymer matrices to improve their mechanical [ 33, 35, 38] and electrical [ 36, 37, 39] properties.Actually, only a couple of groups have been working on CNT based CPC chemo-electrical properties [ 10, 11, 17, 22, 23, 26- 28]. Regarding final application such as vapor identification and quantification, vapor sensors have to be combined into an array [ 1- 9]. Special attention has to be paid to their formulation to achieve controlled individual characteristics and thus efficient combination.Regarding formulationit has been seen that crystallinity can be an influent parameter. Amorphous matrix often leads to a more stable chemo-electrical behavior[ 7, 14, 18- 19]. Thus the simple amorphous morphology of poly(carbonate) appeared to be more suitable to reveal the vapor sensing mechanisms. For conductive filler, multiwall CNTalready proved to be easily dispersible in solution, leading to resistivity from 1 ohm to 106 ohm [ 28]. Thus the only adjustable factor of the formulation is the filler content which changes vapor sensitivity according to percolation theory: CPC with filler content closer to the percolation threshold are expected to exhibit higher sensitivity due to a more easy disconnection of their

conducting pathways upon vapor molecules diffusion, but conversely they will also have less stable responses [ 16, 20, 29].Concerning CPC processing route, the key issue is of cause, to achieve the right level of CNT dispersion within the polymer matrix, i.e., between full CNT individualization and partial aggregation of CNT bundles. As both thin films and appropriate nanofillers dispersion are hard to obtain via melt processing [ 37], solution dispersion under sonication was preferred [ 10, 16, 26]. Moreover, vapor sensor performances are determined by transducers thickness [ 6, 24], thus the Layer-by-Layer (LbL) assembly approach is a very attractive method to vary this parameter and obtain well dispersed multilayers CPC films [ 14, 22, 40- 42].Considering the differences in both formulation and processing conditions used in the literature, no clear interpretation can be made onthe origin of CPC selectivity towards vapors. Nevertheless some driving parameters can be identified as: analyte molecular size [ 30], saturating pressure [ 1, 17], solubility parameters [ 23, 25, 44], intermolecular interactions [ 7, 44] and obviously the amount of molecules [ 17, 23, 26].The objective of this paper is to better understand the links between PC-CNT transducers structure and the resulting chemo-electrical properties. The sensor processing carried out by spray LbL is expected to allow a precise control of the 3D structuring that can be characterized at the nanoscale by atomic force microscopy (AFM) and at the microscale by optical microscopy (OM). The sensing mechanism, based on chemo-electrical properties is investigated by changing the transducers environmental conditions (nature, content and dynamics of organic vapors).
2. EXPERIMENTATION
2.1 Materialsand techniques Polycarbonate (PC, LEXAN 141R) was purchased from GE Plastics (density: 1.2 g/cm3, Tg: 150°C) and was used as received. Multi-wall carbon nanotubes (MWNT, 7000) were kindly provided by Nanocyl® (Belgium) and dried under vacuum at 60°C temperature for 24 hours prior to solution preparation. Chloroform, Methanol and toluene were received from Aldrich. All solvents were of analytical grade and used without any further purification.
2.1.1 Optical microscopy PC-CNT conducting micro scale architecture was observed using a LEICA DMLP optical microscope in non polarized monochromatic light at x200 magnification coupled with a tri CCD video acquisition device.
2.1.2 Spray layer by layer deposition A two step method was used to prepare the CPC transducers. Firstly poly(carbonate) is dissolved in chloroform, then carbon nanotubes are introduced into the solution and dispersed under sonication (Branson 3510, 100 W, 40 kHz) for 6h at 60°C (sonication bath temperature). Typically 200 mg of PC-CNT were dispersed in 20 cm3 of liquid chloroform. In a second step CPC solution is sprayed layer by layer onto a clean printed circuit board (PCB) (10 mm x 10 mm x 2 mm), with an interdigitated array of copper tracks (interval of tracks is 0.5 mm, width of finger is 0.25 mm). After being sprayed, samples were dried at room temperature for one day. Spray was done using a custom-made device allowing the precise control of spraying conditions like nozzle flow rate, air pressure, sweep speed and target to nozzle distance.

2.1.3 Atomic Force Microscopy characterization (AFM) Nanoscale morphology of PC-CNT transducers was investigated by atomic force microscopy in ambient conditions using light tapping mode (TM-AFM) on a Nanoscope IIIa multimode scanning probe microscope from Digital Instruments-Veeco (France). The ratio of the set point amplitude to the free amplitude was maintained at 0.9 and RTESP tips from Veeco, with typical resonance frequency between 300 and 400 kHz and radius between 5 and 15 nm were used. Carbon nanotubes diameters were measured using V6.13r1 section analysis software from Digital instruments. To limit surface roughness below one micron and obtain nice AFM pictures it was necessary to spray PC-CNT solution on mica instead of PCB maintaining the same LbL parameter for comparison.
2.1.4 Dynamical vapour sensing measurement Chemo-electrical properties of PC-CNT composites were investigated by recording their electrical responses when submitted to 10 min successive cycles of nitrogen and vapors streams. Samples are placed in 9 cm×3 cm×3.5 cm chamber. The dynamic system consisting in mass flow controllers, solvent bubblers and electrical valves is controlled by LabView software. Bubbling nitrogen in liquid solvent provides a saturated vapor stream, which was in turn diluted by nitrogen flow to the desired concentration at room temperature. The design of the device allows to keep constant the total flow rate at Qv=100 cm3.min-1, while the analyte flow rate is set to Qv=10 cm3.min-1, 50 cm3.min-1or 100 cm3.min-1 to investigate the effect of analyte flow rate. Electrical characteristics of the CPC transducer were recorded with a KEITHLEY 6517A multimeter.
3. RESULTS
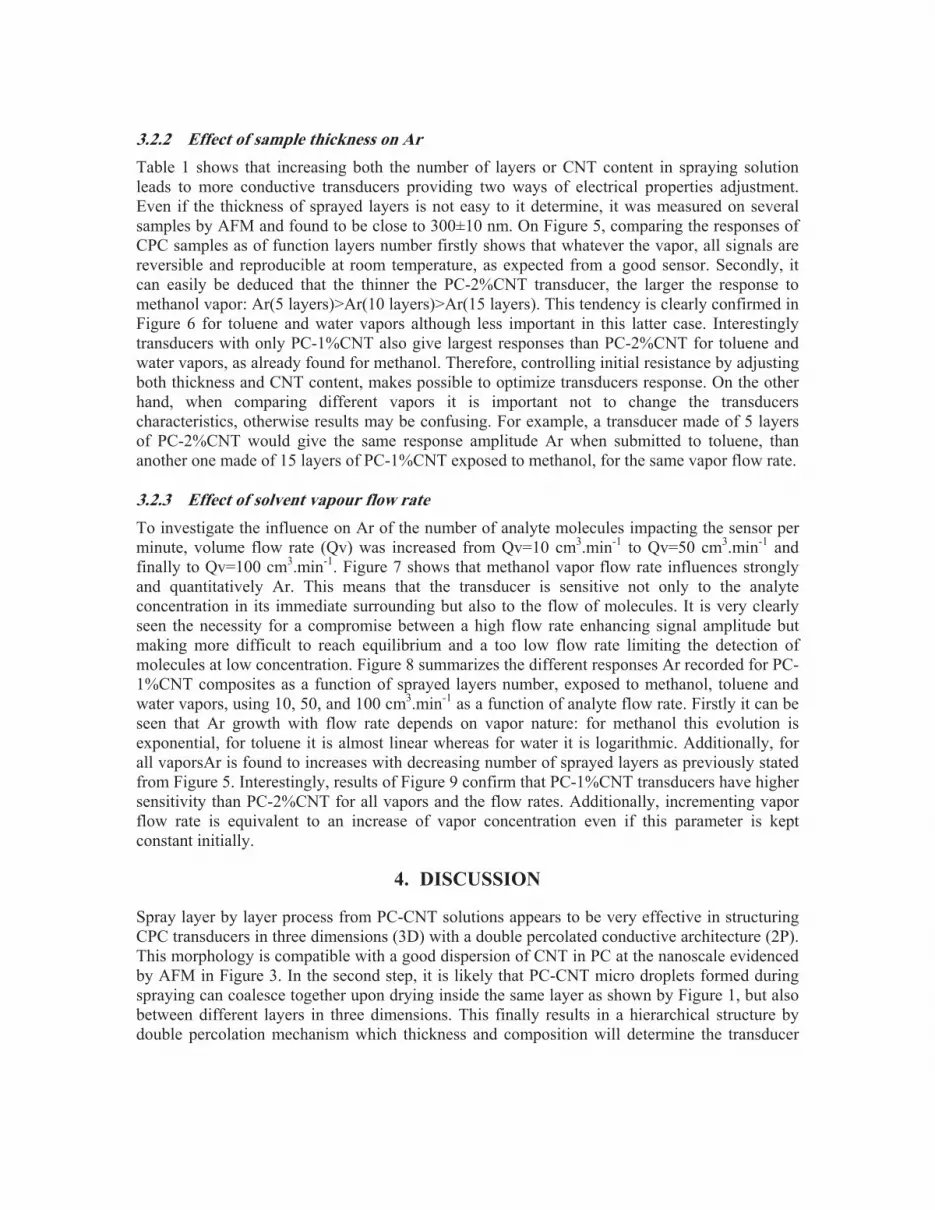
3.1 Transducers morphology 3.1.1 Sample microstructure by Optical Microscopy (OM) LbL films micro scale morphology was observed by optical microscopy as illustrated in Figure 1. Despite their low magnification that precludes distinguishing individual CNTs, these images provide a general view of PC-CNT conducting network microstructure. For both CNT contents, the composite film architecture appears relatively homogeneous and built from auto-associated CPC microdroplets in which CNT are well dispersed. The fact electrons can circulate along the LbL film is intrinsically a strong indication of a double percolated structure of both CNT and CPC microdroplets. Some microvoids resulting from solvent evaporation during sample preparation are also visible. It is also clear that increasing CNT content from 1 to 2% w/w decreases drastically the film transparency.
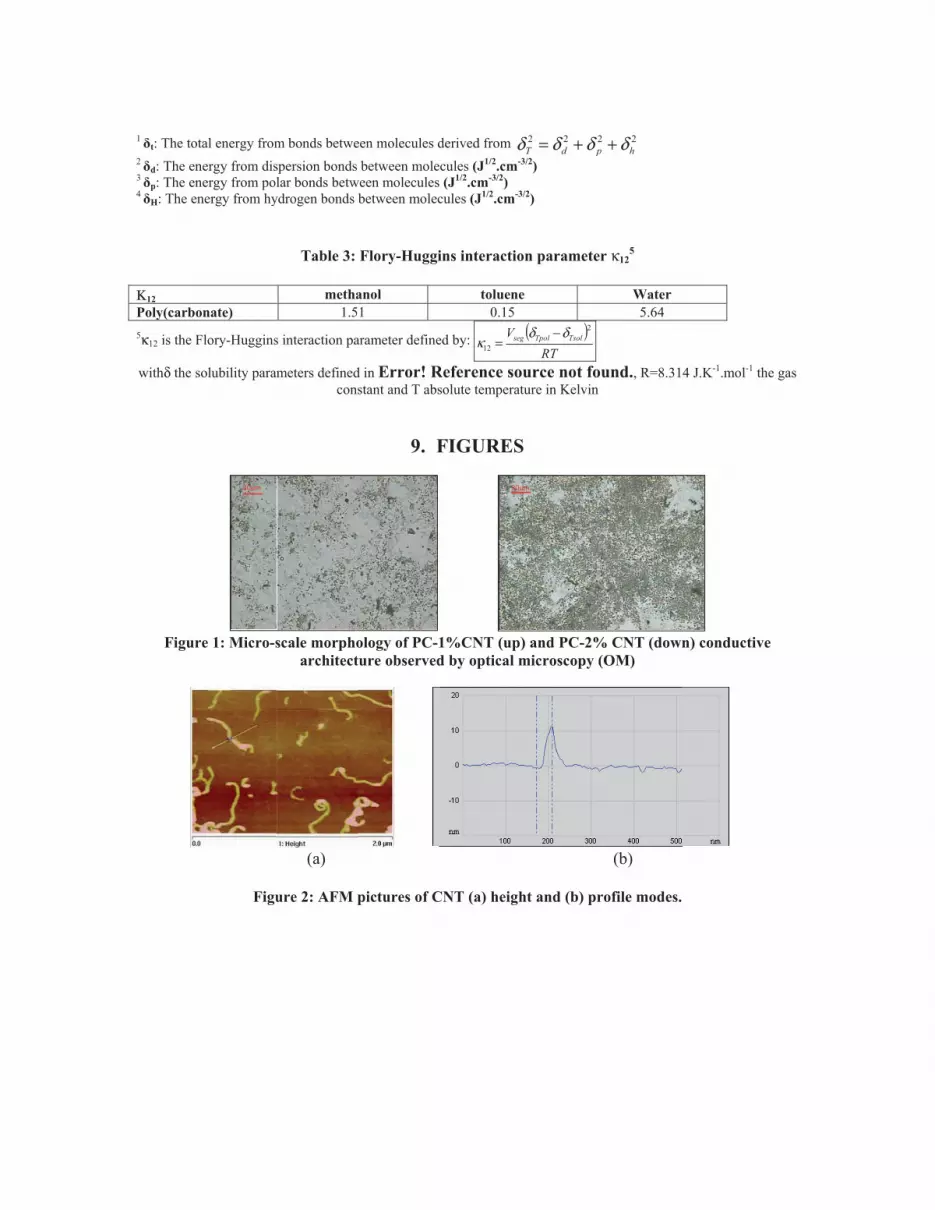
3.1.2 Nanoscale surface analysis by atomic force microscopy (AFM) In a first step pristine CNT morphology has been determined by atomic force microscopy (AFM) in tapping mode after deposition of a CNT, dispersed into chloroform, onto silicon wafer substrate. Height picture (Figure 2a) shows that most CNT make coils and appear to be well separated from each others. Measurements of CNT dimensions from height and profile pictures (resp. Figure 2a & Figure 2b) led to an average length comprised between 0.8 μm and 1 μm and a mean diameter in the range 8-11 nm, consistent with producer’s characteristics.In a second

step, the nanoscale dispersion of the same kind of nanotubes into a poly(carbonate) matrix was investigated by AFM. Samples were prepared by spraying one layer of a PC-CNT solution in chloroform onto mica substrate. Typical AFM images (Figure 3a, b, c, d) illustrate well the association of CNT with poly(carbonate) matrix. At low magnification (5 μmx5 μm full scale), Figure 3a & c show a network of CNT and PC nanodroplets, more dense when CNT content increases from 1 to 2% w/w (relatively to PC). Figure 3b & d are obtained by additional magnification of the inset in the previous pictures up to 2 μmx2 μm in full scale. Interestingly PC nanodroplets appear to embed CNT in a rosary like structure. Moreover, it is likely that PC coats CNT also between droplets because their diameter is found to be larger than that of pristine nanotubes. This suggests a rather good wetting of PC onto CNT and in turn specific interactions between these compounds.
3.2 Vapor sensing 3.2.1 Chemo-electrical behavior Vapor sensing ability of PC-CNT films results from their original chemo-electrical behavior, i.e., their resistance change in the presence of a small amount of solvent molecules. Sample performance was investigated through exposure to a set of vapors like methanol, toluene and water, differing in the nature of their possible interactions with PC-CNT, as shown in Table 2, in which solubility parameters δT, δd,δp ,δh , dielectrical permittivity εr and size of penetrant are summarized. The sensitivity of PC-CNT transducers can be expressed by calculating the relative amplitude of responses Ar, according to Eq 1,
Ar= (R � R0)/R0 , (1)
where R and R0 are respectively the CPC resistance in the presence of vapor and the initial resistance in nitrogen.
Figure 4 illustrates the chemo-electrical behaviorof PC-CNT sensors when exposed to a constant analyte flow rate of 100 cm3.min-1. It appears that upon exposure to methanol vapors, the sensor reaches about 90% of its maximum amplitude in less than 1.5 min which is rather quick in dynamic flow conditions, whereas in the second part of the cycle, when exposed to dry nitrogen atmosphere, Ar decreases quite instantaneously of about 50% then comes back to its initial state in less than 10 min. The same features can be observed for water vapors but at a different scale and with quicker response times, only with toluene does the sensor behave differently. For this vapor no plateau is reached within cycle time (10 min), suggesting that the system is not thermodynamically stable and would have needed more time to saturate with toluene. Nevertheless, ranking PC-CNT sensor response to vapors by decreasing order of their maximum amplitude gives: Ar(methanol)>Ar(toluene)>Ar(water). Apart from the fact that these results show a good selectivity of the transducer towards vapors nature, which is highly expected, it cannot be explained simply in terms of polymer/solvents interactions from the different parameters of Table 2.Secondly, comparing Ar for PC-1%CNT and PC-2%CNT shows that the former has a higher sensitivity to all vapors and a shorter response time. This is consistent with the fact that generally the closer the CNT content to the percolation threshold (less than 0.5% w/w for PC-CNT, from ref. 37) the higher Ar. Figure 4 also shows that at decreasing CNT content also makes the electrical signal more noisy; thus, 1%CNT must not be far from the optimal compromise between large amplitude and low noise.
3.2.2 Effect of sample thickness on Ar Table 1 shows that increasing both the number of layers or CNT content in spraying solution leads to more conductive transducers providing two ways of electrical properties adjustment. Even if the thickness of sprayed layers is not easy to it determine, it was measured on several samples by AFM and found to be close to 300±10 nm. On Figure 5, comparing the responses of CPC samples as of function layers number firstly shows that whatever the vapor, all signals are reversible and reproducible at room temperature, as expected from a good sensor. Secondly, it can easily be deduced that the thinner the PC-2%CNT transducer, the larger the response to methanol vapor: Ar(5 layers)>Ar(10 layers)>Ar(15 layers). This tendency is clearly confirmed in Figure 6 for toluene and water vapors although less important in this latter case. Interestingly transducers with only PC-1%CNT also give largest responses than PC-2%CNT for toluene and water vapors, as already found for methanol. Therefore, controlling initial resistance by adjusting both thickness and CNT content, makes possible to optimize transducers response. On the other hand, when comparing different vapors it is important not to change the transducers characteristics, otherwise results may be confusing. For example, a transducer made of 5 layers of PC-2%CNT would give the same response amplitude Ar when submitted to toluene, than another one made of 15 layers of PC-1%CNT exposed to methanol, for the same vapor flow rate.
3.2.3 Effect of solvent vapour flow rate To investigate the influence on Ar of the number of analyte molecules impacting the sensor per minute, volume flow rate (Qv) was increased from Qv=10 cm3.min-1 to Qv=50 cm3.min-1 and finally to Qv=100 cm3.min-1. Figure 7 shows that methanol vapor flow rate influences strongly and quantitatively Ar. This means that the transducer is sensitive not only to the analyte concentration in its immediate surrounding but also to the flow of molecules. It is very clearly seen the necessity for a compromise between a high flow rate enhancing signal amplitude but making more difficult to reach equilibrium and a too low flow rate limiting the detection of molecules at low concentration. Figure 8 summarizes the different responses Ar recorded for PC-1%CNT composites as a function of sprayed layers number, exposed to methanol, toluene and water vapors, using 10, 50, and 100 cm3.min-1 as a function of analyte flow rate. Firstly it can be seen that Ar growth with flow rate depends on vapor nature: for methanol this evolution is exponential, for toluene it is almost linear whereas for water it is logarithmic. Additionally, for all vaporsAr is found to increases with decreasing number of sprayed layers as previously stated from Figure 5. Interestingly, results of Figure 9 confirm that PC-1%CNT transducers have higher sensitivity than PC-2%CNT for all vapors and the flow rates. Additionally, incrementing vapor flow rate is equivalent to an increase of vapor concentration even if this parameter is kept constant initially.
4. DISCUSSION
Spray layer by layer process from PC-CNT solutions appears to be very effective in structuring CPC transducers in three dimensions (3D) with a double percolated conductive architecture (2P). This morphology is compatible with a good dispersion of CNT in PC at the nanoscale evidenced by AFM in Figure 3. In the second step, it is likely that PC-CNT micro droplets formed during spraying can coalesce together upon drying inside the same layer as shown by Figure 1, but also between different layers in three dimensions. This finally results in a hierarchical structure by double percolation mechanism which thickness and composition will determine the transducer

chemo-electrical properties. Both parameters need to be tailored to find a compromise between high amplitude of the response and degradation of signal by background noise.The adjustment of CNT content must be done accordingly to the percolation threshold concept. Conductive networks are built by inter-connection of entangled carbon nanotubes dispersed in the insulating poly(carbonate) host. As a result, electrons can circulate via this percolated structure either when CNT are in direct contact or when they are close enough to permit jumps by tunneling (less than 10 nm). Thus the probability for significant network disconnection and consequently large PVC, is higher at low filler content, because the number of efficient conducting branches is lower. But getting too close to the percolation threshold will promote too much tunneling, so that the perturbations induced by analyte diffusion will not be easily seen in a scattered background. On the other hand, morphological investigations revealed that it was more difficult to prevent CNT aggregation in PC-2%CNT than in PC-1%CNT, which was found to be homogeneously dispersed at micro- and nano-scale. Finally, considering all these constraints it seems that 1%CNT is not far from the optimal content.Considering potential application in the area of e-noses from an array of non-specific chemical sensors, an attempt of combining sixdifferent polymer-based CPC transducers, including the studied sample based on polycarbonate, was performed [45]. We investigated the identification and discrimination ability of an e-nose composed of an array of CNT based CPC tranducers, when exposed to organic solvent vapours, in association with linear recognition method; i.e. Principal Component Analysis (PCA). As illustrated on Figure 11, combining CNT-filled CPC transducers allowed us to discriminate different organic solvent vapours with 78% of the total variance within the data being contained in the first two principal components. CNT based transducers, prepared via LbL technique, appear to be interesting candidate for organic vapour recognition, and potentially offer new perspective in designing transducer array based electronic noses.
5. CONCLUSIONS
The sensing ability of PC-CNT transducers for water, methanol and toluene vapors has been investigated together with the origin of their selectivity. The spray LbL process was found to be an effective way to control the 3D architecture of CPC transducers. At the microscale (OM), the film structure appears homogeneous and built from auto-associated CPC microdroplets in which CNT form a network of PC nanodroplets appear to embed CNT in a rosary like structure (AFM). From these morphological observations it is assumed that a double percolated structure (2P) of both CNT and CPC microdroplets take place as attested by current circulation through CPC film.PC-CNT transducers chemo-electrical behavior has been investigated in dynamic flow mode by sequentially exposing the transducers to a set of vapors comprising methanol, toluene and water. PC-CNT transducers selectivity analysis led to the following ranking Ar(toluene)>Ar(methanol)>Ar(water), coherent with κ12 Flory-Huggins interaction parameters provided that responses have been first normalized by penetrant molecules number, i.e., the saturation pressure Ps.An optimal formulation was obtained with a CNT content of 1% w/w and only five sprayed layers. Varying the vapor flow rate demonstrated both the necessity for a compromise between high amplitude (high Qv) and saturation of signal (low Qv) and the influence of this parameter on signals shapes. Finally PC-CNT transducer appears to be a good candidate for further implementation into an array for VOC identification.

6. ACKNOWLEDGMENTS
The authors are grateful to Hervé BELLEGOU, Françoise PERESSE, Gijo RAJ and Eric BALNOIS for their contribution to this work. This research was financed by INTELTEX (Intelligent multi-reactive textiles integrating nano-filler based CPC-fibres) European Integrated Project supported through the Sixth Framework Program for Research and Technological Development of European Commission (NMP2-CT-2006-026626).
7. REFERENCES
[1] C. Lonergan, M.S. Freund, E.J. Severin, B.J. Doleman, R.H. Grubbs, N.S. Lewis, “Array-based vapor sensing using chemically sensitive polymer composite resistors, Chemistry of Materials 8 (9) (1996) 2298–2312.
[2] B.J. Doleman, E.J. Severin, N.S. Lewis, “Trends in odor intensity for humans and electronic noses: relative roles of odorant vapour pressure vs. molecularly specific odorant binding”, in: Proceeding of the National Academy of Science of USA, vol. 95, 1998, pp. 5442–5447.
[3] J. Chen, N. Tsubokawa, “A novel gas sensor from polymer-grafted carbon black: responsiveness of electric resistance of conducting composite from LDPE and PE-b-PEO-grafted carbon black in various vapors”, Polymers for Advanced Technologies, 11 (2000) 101–107.
[4] J. Chen, N. Tsubokawa, “Novel gas sensor from polymer-grafted carbon black: vapor response of electric resistance of conducting composites prepared from poly(ethylene-block-ethylene oxide)-grafted carbon black”, Journal of Applied Polymer Science 77 (2000) 2437–2447.
[5] J.A. Covington, J.W. Gardner, D. Briand, N.F. De Rooij, “A polymer gate FET sensor array for detecting organic vapors”, Sensors & Actuators B: Chemical 77 (2001) 155–162.
[6] J.R. Li, J.R. Xu, M.Q. Zhang, M.Z. Rong, “Carbon black/polystyrene composites as candidates for gas sensing materials”, Carbon 41 (2003) 2353–2360.
[7] A.V. Shevade, M.A. Ryan, M.L. Homer, A.M. Manfreda, H. Zhou, K.S. Manatt, “Molecular modeling of polymer composite-analyte interactions in electronic nose sensors”, Sensors & Actuators B: Chemical 93 (2003) 84–91.
[8] J.F. Feller, D. Langevin, S. Marais, “Influence of processing conditions on sensitivity of conductive polymer composites to organic solvent vapours”, Synthetic Metals 144 (1) (2004) 81–88.
[9] M.E. Koscho, R.H. Grubbs, N.S. Lewis, “Properties of vapour detector arrays formed through plasticization of carbon black-organic polymer composites”,Analytical Chemistry 74 (2004) 1307–1315.
[10] J.K. Abraham, B. Philip, A. Witchurch, V.K. Varadan, C.C. Reddy, “A compact wirelessgas sensor using a carbon nanotube/PMMA thin film chemiresistor”, SmartMaterials & Structure 13 (2004) 1045–1049.
[11] K.H. An, S.Y. Jeong, H.R. Hwang, Y.H. Lee, “Enhanced relative differentialresistance responses of a gas sensor incorporating single-walled carbonnanotube-polypyrrole nanocomposites”, Advanced Materials 16 (2004)1005–1009.
[12] J.F. Feller, Y. Grohens, “Evolution of electrical properties of some conductivepolymer composite textiles with organic solvent vapours diffusion”, Sensors &Actuators B: Chemical 94 (2004) 231–242.
[13] E. Segal, R. Tchoudakov,M. Narkis, A. Siegmann, Y.Wei, “Polystyrene/polyaniline nanoblends for sensing of aliphatic alcohols”, Sensors and Actuators B: Chemical104 (1) (2005) 140–150.
[14] J.F. Feller, Y. Grohens, “Electrical response of poly(styrene)/carbon black conductivepolymer composites (CPC) to methanol, toluene, chloroform and styrene vapours as a function of filler nature and matrix tacticity”, Synthetic Metals 154(2005) 193–196.
[15] S.G. Chen, J.W. Hu, M.Q. Zhang, M.Z. Rong, “Effects of temperature and vaporpressure on the gas sensing behavior of carbon black filled polyurethane composites”,Sensors & Actuators B: Chemical 105 (2005) 187–193.

[16] J.F. Feller, H. Guézénoc, H. Bellégou, Y. Grohens, “Smart poly(styrene)/carbonblack conductive polymer composites films for styrene vapour sensing”, Macromolecular Symposia 222 (2005) 273–280.
[17] K.S.V. Santhanam, R. Sangoi, L. Fuller, “A chemical sensor for chloromethanes using a nanocomposite of multiwalled carbon nanotubes with poly(3-methylthiophene)”, Sensors & Actuators B: Chemical 106 (2005) 766–771.
[18] S.G. Chen, J.W. Hu, M.Q. Zhang, M.Z. Rong, “Effects of temperature and vapor pressure on the gas sensing behaviour of carbon black filled polyurethane composites”,Sensors & Actuators B: Chemical 105 (2005) 187–193.
[19] S.G. Chen, X.L. Hu, J. Hu,M.Q. Zhang, M.Z. Rong, Q. Zheng, “Relationships between organic vapor adsorption behaviors and gas relative differential resistanceresponses of carbon black filled waterborne polyurethane composites”, Sensors& Actuators B: Chemical 119 (2006) 110–117.
[20] K. Zribi, J.F. Feller, K. Elleuch, A. Bourmaud, B. Elleuch, “Conductive polymer composites obtained from recycled poly(carbonate) and rubber blends for heatingand sensing applications”, Polymers for Advanced Technologies 17 (2006)727–731.
[21] H. Xie, Q. Yang, X. Sun, J. Yang, Y. Huang, “Gas sensor arrays based on polymercarbonblack to detect organic vapors at low concentration”, Sensors & ActuatorsB: Chemical 113 (2006) 887–891.
[22] H. Yu, T. Cao, L. Zhou, E. Gu, D. Yu, D. Jiang, “Layer-by-Layer assembly and humidity sensitive behaviour of poly(ethyleneimine)/multiwall carbon nanotubes composite films”, Sensors & Actuators B: Chemical 119 (2006) 512–515.
[23] P.G. Su, S.C. Huang, “Electrical and humidity sensing properties of carbonnanotubes-SiO2-poly(2-acrylamido-2-methylpropane sulfonate) composite material”, Sensors & Actuators B: Chemical 113 (2006) 142–149.
[24] B. Zhang, R. Fu, M. Zhang, X. Dong, B. Zhao, L. Wang, C.U. Pittman, “Studies of the vapour-induced sensitivity of hybrid composites fabricated by fillingpolystyrene with carbon black and carbon nanofibers”,Composites A: Applied Science & Manufacturing 37 (11) (2006) 1884–1887.
[25] H. Iwata, T. Nakanoya, H.Morohashi, J. Chen, T. Yamauchi, N. Tsubokawa, “Novel gas and contamination sensor materials from polyamide-block-poly(ethyleneoxide)-grafted carbon black”, Sensors & Actuators B: Chemical 113 (2006)875–882.
[26] H.C. Wang, Y. Li, M.J. Yang, “Sensors for organic vapor detection based on compositesof carbon nanotubes functionalized with polymers”, Sensors & ActuatorsB: Chemical 124 (2007) 360–367.
[27] L. Niu, Y. Luo, Z. Li, “A highly selective chemical gas sensor based on functionalization of multi-walled carbon nanotubes with poly(ethylene glycol)”, Sensors& Actuators B: Chemical 126 (2007) 361–367.
[28] M. Castro, J. Lu, B. Kumar, S. Bruzaud, J.F. Feller, “Influence of carbon nanotubes grafting on chemo-electrical properties of conductive polymer nanocomposites”, in: MRS Fall Meeting, Boston, KK, 2008, p. 1143E.
[29] M. Knite, K. Ozols, G. Sakale, V. Teteris, “Polyisoprene and high structure carbon nanoparticle composite for sensing organic solvent vapours”, Sensors &Actuators B: Chemical 126 (1) (2007) 209–213.
[30] W. Zeng, M.Q. Zhang, M.Z. Rong, Q. Zheng, “Conductive polymer composites asgas sensors with size-related molecular discrimination capability”, Sensors &Actuators B: Chemical 124 (1) (2007) 118–126.
[31] L. Liu, J.C. Grunlan, “Clay-assisted dispersion of carbon nanotubes in conductive epoxy nanocomposites”, Advanced Functional Materials 17 (14) (2007)2343–2348.
[32] S. Iijima, “Helical microtubules of graphitic carbon”, Nature 354 (1991) 56–58.
[33] J.N. Coleman, U. Khan, W.J. Blau, Y.K. Gun’ko, “Small but strong: a review ofthe mechanical properties of carbon nanotube–polymer composites”, Carbon44 (2006) 1624–1652.
[34] R. Haggenmueller, H.H. Gommans, A.G. Rinzler, J.E. Fischer, K.I. Winey, “Alignedsingle-wall carbon nanotubes in composites by melt processing methods”,Chemical Physics Letters 330 (3–4) (2000) 219–225.
[35] W.Wang, P. Ciselli, E. Kuznetsov, T. Peijs, A.H. Barber, “Effective reinforcement in carbon nanotube-polymer composites”, Philosophical Transactions of the RoyalSociety A 366 (2008) 1613.

[36] Y.T. Sung, M.S. Han, K.H. Song, J.W. Jung, H.S. Lee, C.K. Kum, J. Joo, W.N. Kim, “Rheological and electrical properties of polycarbonate/multi-walled carbon nanotube composites”, Polymer 47 (2006) 4434–4439.
[37] S. Pegel, P. Pötschke, G. Petzold, I. Alig, S.M. Dudkin, D. Lellinger, “Dispersion agglomeration, and network formation of multiwalled carbon nanotubes in polycarbonate melts”, Polymer 49 (2008) 974–984.
[38] P. Calvert, “Nanotube composites: a recipe for strength”, Nature 399 (1999)210–211.
[39] C. Li, E.T. Thostenson, T.W. Chou, “Sensors and actuators based on carbon nanotubesand their composites: a review”, Composites Science & Technology 68(2008) 1227–1249.
[40] T. Vossmeyer, B. Guse, I. Besnard, R.E. Bauer, K. Müllen, A. Yasuda, “Gold nanoparticle/polyphenylene dendrimer composite films: preparation andvapour-sensing properties”, Advanced Materials 14 (3) (2002) 238–242.
[41] N. Krasteva, I. Besnard, B. Guse, R.E. Bauer, K. Mullen, A. Yasuda, T. Vossmeyer, “Self-assembled gold nanoparticle/dendrimer composite films for vapour sensing applications”, Nano Letters 2 (5) (2002) 551–555.
[42] R. Schweiss, N. Zhang, W. Knoll, “Layer-by-layer composite films of polyaniline and vanadium pentoxide sol gels studied by electrochemical surface Plasmon spectroscopy”, Journal Physical Chemistry B 107 (2003) 8351.
[43] J. Brandrup, E.H. Immergut, E.A. Grulke, Polymer Handbook, fourth ed., John &Wiley Sons, Inc., New Jersey, USA, 1999.
[44] A. Bouvree, J.F. Feller, M. Castro, Y. Grohens, M. Rinaudo, “Conductive polymer nano-biocomposite (CPC): chitosan-carbon nanoparticle a good candidate to design polar vapour sensors”, Sensors & Actuators B: Chemical 138 (2009)138–147.
[45] Machado, R., F., Laskowski, D., Deffenderfer, O., Burch, T., Zheng, S., Mazzone, P., J., Mekhail, T., Jennings, C., Stoller, J., K., Pyle, J., Duncan, J., Dweik, R., A., & Erzurum S., C., “Detection of Lung Cancer by Sensor Array Analyses of Exhaled Breath” Am J RespirCrit Care Med 171 (2005): 1286–1291.
8. TABLES
Table 1: Electrical resistance and thickness of PC-CNT transducers
PC-1%CNT w/w [ohm] PC-2%CNT w/w[ohm] Thickness [μm] 5 layers 57000 7400 1.5 10 layers 14000 1400 3 15 layers 12000 1100 4.5
Table 2: Hildebrand solubility parameter, dielectrical permitivity and size of penetrant [Error! Reference source not found.]
δt
1
(J1/2.cm-3/2) �d
2 (J1/2.cm-3/2)
δp3
(J1/2.cm-3/2)
�h4
(J1/2.cm-3/2) εr (F.m-1) d (nm) Vmol(cm3.m
ol-1) Ps (kPa) at 25°C
Methanol 29.7 15.1 12.3 22.3 32 0.41 40.7 12.3
Toluene 18.2 18 1.4 2 2.57 0.575 106.3 2.91
Water 47.9 15.5 16 42.4 75 0.34 18.1 2.34
PC 20.1 18.7 2.9 7 2.9-3.2 - - -
1 �t: The to2 �d: The en3 �p: The en4 �H: The e
Κ12 Poly(carbo5κ12 is the F
withδ the s
Figur
otal energy fromnergy from disnergy from pol
energy from hy
onate)
Flory-Huggins
solubility param
re 1: Micro-s
Figu
30µm30µm
m bonds betwespersion bonds lar bonds betw
ydrogen bonds
Table 3:
metha1.5
s interaction pa
meters definedcons
scale morphoarchitect
(a)
ure 2: AFM p
een molecules dbetween mole
ween moleculesbetween molec
Flory-Huggi
anol 1
arameter define
d in Error! Rstant and T abs
9. F
ology of PC-1ture observed
pictures of C
derived from δecules (J1/2.cm-
s (J1/2.cm-3/2) cules (J1/2.cm-3
ins interactio
toluene0.15
ed by: Vseg12κ =
Reference sosolute temperat
FIGURES
1%CNT (upd by optical m
CNT (a) heigh
30µ
222pdT δδδ +=
-3/2)
3/2)
on parameter
e
( )RT
TsolTpolg2δδ −
ource not foture in Kelvin
S
) and PC-2%microscopy (
ht and (b) pr
µm
22hp δ+
r κ125
Water 5.64
und., R=8.31
% CNT (down(OM)
(b)
rofile modes.
4 J.K-1.mol-1 th
n) conductiv
he gas
ve

(a) (b)
(c) (d)
(e)
Figure 3: AFM images (amplitude) of PC-CNT composite on mica. (a) PC-1%CNT (5×5 μm) (b) higher resolution of PC-1%CNT w/w (2×2 μm) (c) PC-2%NT w/w, (5×5 μm) (d) higher resolution
of PC-2%CNT w/w (2×2 μm) (e) 3D image of PC-1%CNT w/w (height image)

Figure 4: PC-CNT sensor dynamics depending on CNT content (1 or 2% w/w) and vapour nature:
methanol, toluene or water (Qv=100 cm3.min-1, 10 layers)
Figure 5: Effect of thickness in vapour sensitivity with PC-2%CNT w/w (Methanol, Qv=100
cm3.min-1)
0 600 1200
0.0
0.1
0.2
0.3
0.4
0 600 12000 600 1200
WaterToluene
PC/1 % CNT
PC/2 % CNT
AR
Time [s]
on
onon
off
off
off
Methanol
0 600 1200 1800 2400 3000 36000.0
0.1
0.2
0.3
0.4
0.5
0.6
0.7
0.8
AR
Time [s]
5 layers
10 layers
15 layers

Figure 6: Response of PC-CNT sensors as a function of layer number, filler content and vapour
nature (Qv=100 cm3.min-1)
Figure 7: Effect of flow rate of methanol vapour on PC-2%CNT sensor (10 layers) response
amplitude Ar.
5 10 150.0
0.1
0.2
0.3
0.4
0.5
0.6
5 10 15 5 10 15
WaterToluene
PC/1% CNT
PC/2% CNT
AR
Layer number
Methanol
0 600 1200 1800 2400 30000.00
0.05
0.10
0.15
0.20
0.25
0.30
0.35
0.40
0.45
0.50
AR
Time [s]
100 ml/min
50 ml/min
10 ml/min

Figure 8: Effects of vapour flow rate on PC-1%CNT response amplitude Ar for methanol, toluene
and water vapours.
Figure 9: Effects of vapour flow rate on PC-2%CNT CPC towards methanol, toluene and water
0 20 40 60 80 1000.0
0.1
0.2
0.3
0.4
0.5
0 20 40 60 80 100 0 20 40 60 80 100
Methanol Toluene Water
AR
Flow rate [ml/min]
PC/1% CNT 5 layers
PC/1% CNT 10 layers
PC/1% CNT 15 layers
0 20 40 60 80 1000.0
0.1
0.2
0.3
0.4
0 20 40 60 80 100 0 20 40 60 80 100
PC/2% CNT 5 layers
PC/2% CNT 10 layers
PC/2% CNT 15 layers
AR
Flow rate [ml/min]
Methanol Toluene Water

Figure 10: PC-CNT sensor dynamics corrected from Ps (Qv=100 cm3.min-1, 10 layers)
Figure 11: Results from the array upon exposure to organic solvents in the first two dimensions of principal-component space.
0 600 12000
1
2
3
4
5
6
7
8
0 600 12000 600 1200
WaterToluene
PC/1 % CNT
PC/2 % CNT
100*A
R/P
s(k
Pa
-1)
Time [s]
on
on
on
off
off
off
Methanol
acetone
chloroform
ethanol
DCM
butan1ol
water
isopropanol
toluene
thf
-3,0 -2,5 -2,0 -1,5 -1,0 -0,5 0,0 0,5 1,0 1,5 2,0 2,5 3,0
-1,5
-1,0
-0,5
0,0
0,5
1,0
1,5
PC
2(1
7.6
%)
PC1(60%)


![Chapter 3 Sensors and Transducers[1]](https://img.pdfslide.net/doc/110x75/63151b03fc260b71020fd938/chapter-3-sensors-and-transducers1.jpg)


