Embed Size (px)
Citation preview

2061
© 2015 American Heart Association, Inc.
Circulation is available at http://circ.ahajournals.org DOI: 10.1161/CIRCULATIONAHA.115.015489
Received June 17, 2014; accepted April 6, 2015.From Departments of Radiology (R.S.D., L.K.M., C.-H.C., D.S.K., J.B.B., A.M.D.), Cognitive Science (A.J.S., A.M.D.), Neurosciences (Y.W., D.H.,
J.B.B., A.M.D.), and Psychiatry (W.K.T., O.A.A.), University of California, San Diego, La Jolla; NORMENT, Institute of Clinical Medicine, University of Oslo, Norway (Y.W., C.-H.C., A.W., O.A.A., A.M.D., T.F.); Division of Mental Health and Addiction (Y.W., C.-H.C., A.W., O.A.A., A.M.D.), Norwegian Centre for Dementia Research, Department of Old Age Psychiatry (I.D.U.), and Department of Medical Genetics, (S.D.), Oslo University Hospital, Norway; Departments of Epidemiology (A.D., M.A.I., S.J.v.d.L., C.M.v.D.) and Radiology (M.A.I.), Erasmus Medical Center, Rotterdam, The Netherlands; Center for Cardiovascular Disease Prevention, Division of Preventative Medicine, Brigham and Women’s Hospital, Harvard Medical School, Boston, MA (P.M.R., D.I.C.); Department of Radiology and Biomedical Imaging, University of California, San Francisco (C.P.H.); Medical Research Council Centre for Neuropsychiatric Genetics and Genomics, Institute of Psychological Medicine and Clinical Neurosciences, Cardiff University School of Medicine, Wales, UK (J.W., R.S., M.C.O.); Department of Biostatistics, School of Public Health, Boston University, MA (S.H.C., A.L.D.); Department of Internal Medicine (J.C.B.) and Cardiovascular Health Research Unit, Departments of Medicine, Epidemiology, and Health Services (B.M.P.), University of Washington, Seattle (J.C.B.); Icelandic Heart Association, Kopavogur, Iceland (V.G.); Faculty of Medicine, University of Iceland, Reykjavik (V.G., K.S.); National Heart, Lung, and Blood Institute’s Framingham Heart Study, Framingham, MA (A.L.D., S. Seshadri); Group Health Research Institute, Group Health Cooperative, Seattle, WA (B.M.P.); Laboratory of Epidemiology, Demography, and Biometry, Intramural Research Program, National Institute on Aging, Washington, DC (L.L.); Department of Neurology (S. Seshadri) and Departments of Medicine (Biomedical Genetics), Neurology, Ophthalmology, Biostatistics, and Epidemiology (L.A.F.), Boston University School of Medicine, MA; John P. Hussman Institute for Human Genomics, University of Miami, FL (M.A.P.-V.); Department of Neurology, Taub Institute on Alzheimer’s Disease and the Aging Brain, and Gertrude H. Sergievsky Center, Columbia University, New York (R.M.); Department of Epidemiology and Biostatistics and Institute for Computational Biology, Case Western University, Cleveland, OH (J.L.H.); Department of Molecular Neuroscience, UCL Institute of Neurology, London, UK (J.H.); Alzheimer’s Disease Research Centre, Department of Neurobiology, Care Sciences and Society, Karolinska Institute, Stockholm, Sweden (D.A.); Centre for Age-Related Medicine, Stavanger University Hospital, Norway (D.A.); Department of Geriatric Psychiatry, Akershus University Hospital, Oslo, Norway (D.A.); Department of Neurology, Akershus University Hospital, Akershus, Norway (T.F.); Department of Neuroscience, Norwegian University of Science and Technology, Trondheim, Norway (L.R.W., S.B.S.); Department of Neurology, St. Olav’s Hospital, Trondheim University Hospital, Trondheim, Norway (L.R.W., S.B.S.); Department of Psychiatry, Haugesund Hospital, Norway (A.R.); NORMENT, KG Jebsen Centre for Psychosis Research, Department of Clinical Science, University of Bergen, Norway (S.D.); Department of Neurology, Massachusetts General Hospital, Boston (B.T.H.); Department of Geriatric Medicine, University Hospital Reykjavik, Iceland (J.S.); deCODE Genetics, Reykjavik, Iceland (S. Steinberg, H.S., K.S.); and Department of Pathology and Laboratory Medicine, University of Pennsylvania Perelman School of Medicine, Philadelphia (G.D.S.).
*A.J. Schork and Dr Wang contributed equally.†A complete list of the Inflammation Working Group and IGAP and DemGene Investigators can be found in the online-only Data Supplement.The online-only Data Supplement is available with this article at http://circ.ahajournals.org/lookup/suppl/doi:10.1161/CIRCULATIONAHA.
115.015489/-/DC1.Correspondence to Rahul S. Desikan, MD, PhD, and Anders M. Dale, PhD, Department of Radiology, University of California, San Diego, 8950
Villa La Jolla Dr, Ste C10, La Jolla, CA 92037-0841. E-mail [email protected] or [email protected] or Ole A. Andreassen, MD, PhD, KG Jebsen Centre for Psychosis Research, Bldg 49, Oslo University Hospital, Ullevål, Kirkeveien 166, PO Box 4956 Nydalen, 0424 Oslo, Norway. E-mail [email protected]
Polygenic Overlap Between C-Reactive Protein, Plasma Lipids, and Alzheimer Disease
Rahul S. Desikan, MD, PhD; Andrew J. Schork, MS*; Yunpeng Wang, PhD*; Wesley K. Thompson, PhD; Abbas Dehghan, MD, PhD; Paul M Ridker, MD, MPH;
Daniel I. Chasman, PhD; Linda K. McEvoy, PhD; Dominic Holland, PhD; Chi-Hua Chen, PhD; David S. Karow, MD, PhD; James B. Brewer, MD, PhD; Christopher P. Hess, MD, PhD;
Julie Williams, PhD; Rebecca Sims, PhD; Michael C. O’Donovan, FRCPsych, PhD; Seung Hoan Choi, MA; Joshua C. Bis, PhD; M. Arfan Ikram, MD, PhD;
Vilmundur Gudnason, MD, PhD; Anita L. DeStefano, PhD; Sven J. van der Lee, MD; Bruce M. Psaty, MD, PhD; Cornelia M. van Duijn, PhD; Lenore Launer, PhD; Sudha Seshadri, MD; Margaret A. Pericak-Vance, PhD; Richard Mayeux, MD;
Jonathan L. Haines, PhD; Lindsay A. Farrer, PhD; John Hardy, PhD; Ingun Dina Ulstein, MD, PhD; Dag Aarsland, MD, PhD; Tormod Fladby, MD, PhD;
Linda R. White, PhD; Sigrid B. Sando, MD, PhD; Arvid Rongve, MD, PhD; Aree Witoelar, PhD; Srdjan Djurovic, PhD; Bradley T. Hyman, MD, PhD; Jon Snaedal, MD;
Stacy Steinberg, PhD; Hreinn Stefansson, PhD; Kari Stefansson, MD, PhD; Gerard D. Schellenberg, PhD; Ole A. Andreassen, MD, PhD; Anders M. Dale, PhD; for the
Inflammation Working Group and International Genomics of Alzheimer’s Disease Project (IGAP) and DemGene Investigators†
at BOSTON UNIV MEDICAL LIB on June 13, 2015http://circ.ahajournals.org/Downloaded from at BOSTON UNIV MEDICAL LIB on June 13, 2015http://circ.ahajournals.org/Downloaded from at BOSTON UNIV MEDICAL LIB on June 13, 2015http://circ.ahajournals.org/Downloaded from at BOSTON UNIV MEDICAL LIB on June 13, 2015http://circ.ahajournals.org/Downloaded from at BOSTON UNIV MEDICAL LIB on June 13, 2015http://circ.ahajournals.org/Downloaded from at BOSTON UNIV MEDICAL LIB on June 13, 2015http://circ.ahajournals.org/Downloaded from at BOSTON UNIV MEDICAL LIB on June 13, 2015http://circ.ahajournals.org/Downloaded from at BOSTON UNIV MEDICAL LIB on June 13, 2015http://circ.ahajournals.org/Downloaded from at BOSTON UNIV MEDICAL LIB on June 13, 2015http://circ.ahajournals.org/Downloaded from at BOSTON UNIV MEDICAL LIB on June 13, 2015http://circ.ahajournals.org/Downloaded from at BOSTON UNIV MEDICAL LIB on June 13, 2015http://circ.ahajournals.org/Downloaded from at BOSTON UNIV MEDICAL LIB on June 13, 2015http://circ.ahajournals.org/Downloaded from at BOSTON UNIV MEDICAL LIB on June 13, 2015http://circ.ahajournals.org/Downloaded from at BOSTON UNIV MEDICAL LIB on June 13, 2015http://circ.ahajournals.org/Downloaded from at BOSTON UNIV MEDICAL LIB on June 13, 2015http://circ.ahajournals.org/Downloaded from at BOSTON UNIV MEDICAL LIB on June 13, 2015http://circ.ahajournals.org/Downloaded from at BOSTON UNIV MEDICAL LIB on June 13, 2015http://circ.ahajournals.org/Downloaded from at BOSTON UNIV MEDICAL LIB on June 13, 2015http://circ.ahajournals.org/Downloaded from at BOSTON UNIV MEDICAL LIB on June 13, 2015http://circ.ahajournals.org/Downloaded from at BOSTON UNIV MEDICAL LIB on June 13, 2015http://circ.ahajournals.org/Downloaded from at BOSTON UNIV MEDICAL LIB on June 13, 2015http://circ.ahajournals.org/Downloaded from at BOSTON UNIV MEDICAL LIB on June 13, 2015http://circ.ahajournals.org/Downloaded from at BOSTON UNIV MEDICAL LIB on June 13, 2015http://circ.ahajournals.org/Downloaded from at BOSTON UNIV MEDICAL LIB on June 13, 2015http://circ.ahajournals.org/Downloaded from at BOSTON UNIV MEDICAL LIB on June 13, 2015http://circ.ahajournals.org/Downloaded from at BOSTON UNIV MEDICAL LIB on June 13, 2015http://circ.ahajournals.org/Downloaded from

2062 Circulation June 9, 2015
Background—Epidemiological findings suggest a relationship between Alzheimer disease (AD), inflammation, and dyslipidemia, although the nature of this relationship is not well understood. We investigated whether this phenotypic association arises from a shared genetic basis.
Methods and Results—Using summary statistics (P values and odds ratios) from genome-wide association studies of >200 000 individuals, we investigated overlap in single-nucleotide polymorphisms associated with clinically diagnosed AD and C-reactive protein (CRP), triglycerides, and high- and low-density lipoprotein levels. We found up to 50-fold enrichment of AD single-nucleotide polymorphisms for different levels of association with C-reactive protein, low-density lipoprotein, high-density lipoprotein, and triglyceride single-nucleotide polymorphisms using a false discovery rate threshold <0.05. By conditioning on polymorphisms associated with the 4 phenotypes, we identified 55 loci associated with increased AD risk. We then conducted a meta-analysis of these 55 variants across 4 independent AD cohorts (total: n=29 054 AD cases and 114 824 healthy controls) and discovered 2 genome-wide significant variants on chromosome 4 (rs13113697; closest gene, HS3ST1; odds ratio=1.07; 95% confidence interval=1.05–1.11; P=2.86×10⁻⁸) and chromosome 10 (rs7920721; closest gene, ECHDC3; odds ratio=1.07; 95% confidence interval=1.04–1.11; P=3.38×10⁻⁸). We also found that gene expression of HS3ST1 and ECHDC3 was altered in AD brains compared with control brains.
Conclusions—We demonstrate genetic overlap between AD, C-reactive protein, and plasma lipids. By conditioning on the genetic association with the cardiovascular phenotypes, we identify novel AD susceptibility loci, including 2 genome-wide significant variants conferring increased risk for AD. (Circulation. 2015;131:2061-2069. DOI: 10.1161/CIRCULATIONAHA.115.015489.)
Key Words: Alzheimer Disease ◼ Genome-Wide Association Study ◼ inflammation ◼ lipids
Late-onset Alzheimer disease (AD) is the most common form of dementia, with an estimated prevalence of 30 mil-
lion people worldwide, a number that is expected to quadruple in the next 40 years.1 Given the absence of disease-modifying therapies and increasing awareness that symptoms develop over many years, there is significant interest in identifying effective strategies for AD prevention. Delaying dementia onset by a modest 2 years could potentially lower the world-wide prevalence of AD by >22 million cases over the next 40 years, resulting in significant societal savings.1
Clinical Perspective on p 2069
A growing body of evidence suggests an association between AD and potentially modifiable processes, includ-ing dyslipidemia and inflammation. In observational stud-ies, high serum cholesterol levels have been associated with increased risk of AD,2,3 and molecular4 and biomarker find-ings5 suggest that phospholipids may play an integral role in modulating AD-associated pathogenesis. Complement fac-tors and activated microglia are established histopathologi-cal features in brains of AD patients,6 and epidemiological studies in older individuals indicate that high serum levels of inflammatory proteins are associated with cognitive decline7 and may predict dementia risk.8 Genome-wide association studies (GWASs) in late-onset AD have replicated the estab-lished association with apolipoprotein E (APOE) and identi-fied single-nucleotide polymorphisms (SNPs) implicated in lipid metabolism such as CLU and ABCA7 and inflammatory processes such as CR1 and HLA-DRB5.9,10 In addition, a rare sequence variant in TREM-2 with known anti-inflammatory function has recently been identified as conferring increased risk for AD.11,12 Taken together, these findings suggest that processes involved with lipid metabolism and inflammation may also affect AD pathogenesis.
Combining GWASs from multiple disorders and pheno-types provides insights into genetic pleiotropy (defined as a single gene or variant being associated with >1 distinct phe-notype) and could elucidate shared pathobiology. Using this approach, we have recently reported genetic overlap between a number of diseases and phenotypes and identified novel common variants associated with schizophrenia,13,14 bipolar disorder,13 prostate cancer,15 hypertension,16 and primary scle-rosing cholangitis.17 Here, we applied this method to AD, tak-ing advantage of several large GWASs,18–20 to identify SNPs associating with clinically diagnosed AD, C-reactive protein (CRP) levels, and plasma lipid levels (specifically triglycer-ides, high-density lipoprotein [HDL], and low-density lipo-proteins [LDL]).
MethodsParticipant SamplesWe evaluated complete GWAS results in the form of summary statis-tics (P values and odds ratios [ORs]) for clinically diagnosed AD,18 CRP levels,19 and plasma lipid levels (triglycerides, HDL, and LDL20; Table 1). The CRP GWAS summary statistic data consisted of 82 725 individuals drawn from 25 studies with genotyped or imputed data at 2 671 742 SNPs (for additional details, see Reference 19). The plasma lipid GWAS summary statistic data consisted of 188 577 individuals with genotyped or imputed data at 2 508 375 SNPs (for additional details, see reference 20). We obtained publicly available AD GWAS summary statistic data from the International Genomics of Alzheimer’s Disease Project (IGAP stage 1 and 2; for additional details, see the online-only Data Supplement and Reference 18). We used IGAP stage 1 as our discovery cohort, which consisted of 17 008 AD cases (mean age, 74.7±7.7 years; 59.4% female) and 37 154 con-trols (mean age, 76.3±8.1 years; 58.6% female) drawn from 4 differ-ent consortia across North America and Europe with genotyped or imputed data at 7 055 881 SNPs (for a description of the AD cases and controls within the IGAP stage 1 substudies, see Reference 18). To confirm our findings from IGAP stage 1, we assessed the P values of pleiotropic SNPs (conditional false discovery rate [FDR] <0.05; see Statistical Analysis) from the discovery analyses in 3 independent
at BOSTON UNIV MEDICAL LIB on June 13, 2015http://circ.ahajournals.org/Downloaded from

Desikan et al Inflammation and Dyslipidemia in AD 2063
AD cohorts, namely the IGAP stage 2 sample, a cohort of AD cases and controls drawn from the population of Iceland (deCODE), and a cohort of AD cases and controls drawn from the population of Norway (DemGene). The IGAP stage 2 sample consisted of 8572 AD cases (mean age, 72.5±8.1 years; 61% female) and 11 312 controls (mean age, 65.5±8.0 years; 43.3% female) of European ancestry with geno-typed data at 11 632 SNPs (for additional details, see Reference 18). Clinical diagnosis of probable AD within the IGAP stage 2 cohort was established according to the Diagnostic and Statistical Manual of Mental Disorders–3rd Edition Revised and National Institute of Neurological and Communicative Diseases and Stroke/Alzheimer's Disease and Related Disorders Association (NINCDS-ADRDA) criteria.21 The deCODE data set, drawn from the Icelandic popula-tion, included 2470 genotyped AD cases (age, 84.9±7.2 years; 65.8% female) and 65 347 genotyped controls (age, 68.8±13.7 years; 57.8% female; for additional details, see Reference 12). As previously described,12 patients from Iceland were diagnosed with definite, prob-able, or possible AD on the basis of the NINCDS-ADRDA criteria21 or according to guidelines for International Classification of Diseases, 10th Revision F00 and were compared with population controls. The Norwegian sample (DemGene) included 1004 cases (age, 74.1±9.6 years; 60.2% female) and 1011 controls (age, 74.6±9.3 years; 57.7% female) with genotyped data at 693 377 SNPs. Clinical diagnosis of AD and dementia within the DemGene sample was established with International Classification of Diseases, 10th Revision research cri-teria,22 the recommendations from the National Institute on Aging-Alzheimer’s Association criteria,23 or the NINCDS-ADRDA criteria21 (online-only Data Supplement). The relevant institutional review boards or ethics committees approved the research protocol of the individual GWAS used in the present analysis, and all human partici-pants gave written informed consent.
For gene expression analyses, we used publicly available total RNA expression data from 1647 autopsied brain tissues (from the dorsolat-eral prefrontal cortex, visual cortex, and cerebellum) in 549 brains of 376 AD patients and 173 nondemented healthy controls from the Gene Expression Omnibus data set GSE44772.24 As described previ-ously,24 all subjects were diagnosed at intake, and each brain under-went extensive neuropathology examination. Tissues were profiled on a custom-made Agilent 44K array of 40 638 DNA probes.
Statistical AnalysisUsing recently developed statistical methods to evaluate pleiotro-pic effects,13–17 we evaluated SNPs associating with AD (discovery cohort, IGAP stage 1) and CRP levels, as well as AD and plasma lipid levels. For given associated phenotypes A and B, pleiotropic enrich-ment of phenotype A with phenotype B exists if the proportion of SNPs or genes associated with phenotype A increases as a function of increased association with phenotype B. To assess for enrichment, we constructed fold-enrichment plots of nominal –log
10(P) values for
all AD SNPs and for subsets of SNPs determined by the significance
of their associations with CRP and plasma lipids. We also used con-ditional quantile-quantile plots, which are complementary to fold-enrichment plots and provide visualization of polygenic enrichment (for additional details, see the online-only Data Supplement). In fold-enrichment plots, the presence of enrichment is reflected as an upward deflection of the curve for phenotype A if the degree of deflection from the expected null line is dependent on the degree of association with phenotype B. To assess for polygenic effects below the standard GWAS significance threshold, we focused the fold-enrichment plots on SNPs with nominal –log
10(P)<7.3 (corresponding to P>5×10⁻⁸).
The enrichment seen can be directly interpreted in terms of true dis-covery rate (true discovery rate=1−FDR; for additional details, see the online-only Data Supplement).
To identify specific loci, we computed conditional FDRs.13,14 The standard FDR framework derives from a model that assumes that the distribution of test statistics in a GWAS can be formulated as a mixture of null and nonnull effects, with true associations (nonnull effects) having more extreme test statistics, on average, than false associations (null effects). The FDR can be interpreted as the prob-ability that an SNP is null given that its P value is as small or smaller than its observed P value. The conditional FDR is an extension of the standard FDR, which incorporates information from GWAS sum-mary statistics of a second phenotype to adjust its significance level. The conditional FDR is defined as the probability that an SNP is null in the first phenotype given that the P values in the first and second phenotypes are as small as or smaller than the observed values. It is important to note that ranking SNPs by standard FDRs or by P values gives the same ordering of SNPs. In contrast, if the primary and secondary phenotypes are related genetically, conditional FDR reorders SNPs and results in a different ranking than that based on P values alone. We used an overall FDR threshold of <0.05, which means 5 expected false discoveries per 100 reported. Additionally, we constructed Manhattan plots based on the ranking of conditional FDR to illustrate the genomic location. In all analyses, we controlled for the effects of genomic inflation by using intergenic SNPs (see the online-only Data Supplement). Detailed information on fold-enrich-ment and conditional quantile-quantile plots, Manhattan plots, and conditional FDR can be found in the online-only Data Supplement and prior reports.13–17
For loci with conditional FDR <0.05, we performed a fixed-effects, inverse variance-weighted meta-analysis25 across all available AD cohorts (IGAP stages 1 and 2, deCODE, and DemGene; total: n=29 054 AD cases and 114 824 healthy controls) using the R pack-age meta (http://CRAN.R-project.org/package=meta). Briefly, the fixed-effects, inverse variance-weighted meta-analysis summarizes the combined statistical support across independent studies under the assumption of homogeneity of effects. Individual study β estimates (log ORs) are averaged, weighted by the estimated standard error.26 The IGAP stage 1 and 2 β estimates and standard errors were obtained from the publicly available summary statistics (for additional details, see the online-only Data Supplement and the Supplementary Note in
Table 1. Summary Data From All GWASs Used in the Present Study
Disease/Trait n SNPs, n Reference
AD, IGAP stages 1+2 74 046(25 580 AD cases+48 466 controls)
7 055 881 (stage 1)+11 632 (stage 2) Lambert et al18
AD, deCODE 67 817(2470 cases+65 357 controls)
Whole-genome sequencing Jonsson et al12
AD, DemGene 2015(1004 cases+1011 controls)
693 377 N/A
TG 188 577 2 508 369 Teslovich et al20
LDL 188 577 2 508 375
HDL 188 577 2 508 370
CRP 82 725 2 671 742 Dehghan et al19
AD indicates Alzheimer disease; CRP, C-reactive protein; HDL, high-density lipoprotein; IGAP, International Genomics of Alzheimer’s Disease Project; LDL, low-density lipoprotein; and TG, triglycerides.
at BOSTON UNIV MEDICAL LIB on June 13, 2015http://circ.ahajournals.org/Downloaded from

2064 Circulation June 9, 2015
Reference18). For the DeCODE and DemGene cohorts, β estimates and standard errors were estimated via logistic regression, predicting AD case/control status from SNP risk alleles count and adjusting for appropriate covariates, including principal components.
For the gene expression analyses, we focused on transcript expres-sion (total RNA levels) of genes closest (within 500 kB) to the SNPs reaching genome-wide significance in our meta-analysis. Using logistic regression, we examined whether transcript expression of these genes significantly differed between AD cases and controls.
ResultsWe observed SNP enrichment for AD (IGAP stage 1, discovery cohort) across different levels of significance, with CRP, triglycerides, HDL, and LDL levels indicating a genetic association between AD and the 4 cardiovascu-lar phenotypes (Figure 1). For progressively stringent P value thresholds for AD SNPs [ie, increasing values of nominal −log
10(P)], we found at least 50-fold enrichment
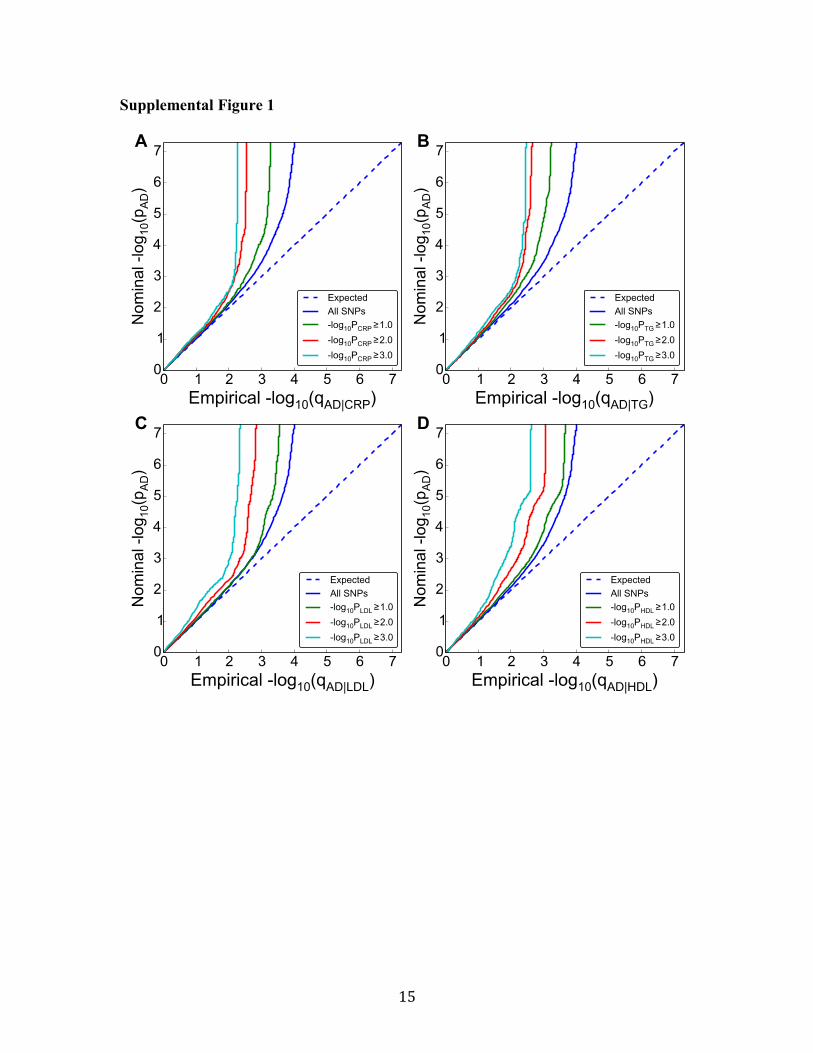
using CRP, 30-fold enrichment using triglycerides, 20-fold enrichment using HDL, and 40-fold enrichment using LDL (Figure 1). Conditional quantile-quantile plots similarly demonstrated polygenic enrichment in AD as a function of CRP and plasma lipids (Figure I in the online-only Data Supplement).
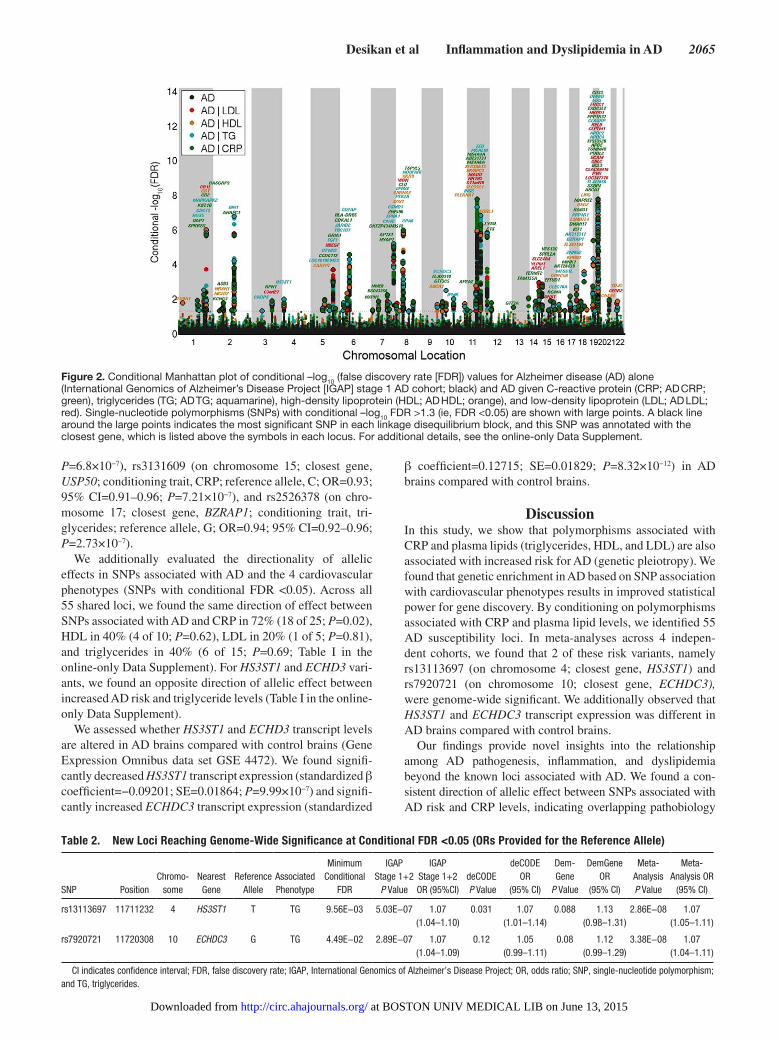
To identify AD-associated polymorphisms that are more likely to replicate, we ranked IGAP stage 1 AD SNPs condi-tional on their genetic association with CRP and plasma lipids (conditional FDR). We restricted our analyses to SNPs found in both IGAP stages 1 and 2 and focused on those AD vari-ants that have not previously been described at a genome-wide significant level. At a conditional FDR <0.05, we found 55 AD susceptibility loci from IGAP stage 1 (Figure 2 and Table I in the online-only Data Supplement). For these 55 loci, we performed a meta-analysis across all available AD cohorts and found 2 novel genome-wide significant (P<5×10⁻⁸) loci associated with increased risk for AD (Table 2). These 2 vari-ants are rs13113697 (chromosome 4; closest gene, HS3ST1; conditioning trait, triglycerides; reference allele, T; OR=1.07; 95% CI=1.05–1.11; P=2.86×10⁻⁸; Figures 3A and 4A) and rs7920721 (chromosome 10; closest gene, ECHDC3; condi-tioning trait, triglycerides; reference allele, G; OR=1.07; 95% CI=1.04–1.11; P=3.38×10⁻⁸; Figures 3B and 4B).
The meta-analysis also revealed 3 suggestive AD suscepti-bility loci with values of P<1×10⁻⁶ (Table 3 and Figure II in the online-only Data Supplement). These 3 loci are rs7396366 (on chromosome 11; closest gene, AP2A2; conditioning trait, CRP; reference allele, C; OR=0.94; 95% CI=0.92–0.96;
Figure 1. Fold-enrichment plots of enrichment vs nominal −log10 P values (corrected for inflation) in Alzheimer disease (AD) below the standard genome-wide association study threshold of P<5×10⁻⁸ as a function of significance of association with C-reactive protein (CRP; A), high-density lipoprotein (HDL; B), low-density lipoprotein (LDL; C), and triglycerides (TG; D) at the level of −log10(P)≥0, −log10(P)≥1, and −log10(P)≥2 corresponding to P≤1, P≤0.1, and P≤0.01, respectively. Blue line indicates all single-nucleotide polymorphisms (SNPs).
at BOSTON UNIV MEDICAL LIB on June 13, 2015http://circ.ahajournals.org/Downloaded from
Desikan et al Inflammation and Dyslipidemia in AD 2065
P=6.8×10⁻⁷), rs3131609 (on chromosome 15; closest gene, USP50; conditioning trait, CRP; reference allele, C; OR=0.93; 95% CI=0.91–0.96; P=7.21×10⁻⁷), and rs2526378 (on chro-mosome 17; closest gene, BZRAP1; conditioning trait, tri-glycerides; reference allele, G; OR=0.94; 95% CI=0.92–0.96; P=2.73×10⁻⁷).
We additionally evaluated the directionality of allelic effects in SNPs associated with AD and the 4 cardiovascular phenotypes (SNPs with conditional FDR <0.05). Across all 55 shared loci, we found the same direction of effect between SNPs associated with AD and CRP in 72% (18 of 25; P=0.02), HDL in 40% (4 of 10; P=0.62), LDL in 20% (1 of 5; P=0.81), and triglycerides in 40% (6 of 15; P=0.69; Table I in the online-only Data Supplement). For HS3ST1 and ECHD3 vari-ants, we found an opposite direction of allelic effect between increased AD risk and triglyceride levels (Table I in the online-only Data Supplement).
We assessed whether HS3ST1 and ECHD3 transcript levels are altered in AD brains compared with control brains (Gene Expression Omnibus data set GSE 4472). We found signifi-cantly decreased HS3ST1 transcript expression (standardized β coefficient=−0.09201; SE=0.01864; P=9.99×10⁻⁷) and signifi-cantly increased ECHDC3 transcript expression (standardized
β coefficient=0.12715; SE=0.01829; P=8.32×10⁻¹²) in AD brains compared with control brains.
DiscussionIn this study, we show that polymorphisms associated with CRP and plasma lipids (triglycerides, HDL, and LDL) are also associated with increased risk for AD (genetic pleiotropy). We found that genetic enrichment in AD based on SNP association with cardiovascular phenotypes results in improved statistical power for gene discovery. By conditioning on polymorphisms associated with CRP and plasma lipid levels, we identified 55 AD susceptibility loci. In meta-analyses across 4 indepen-dent cohorts, we found that 2 of these risk variants, namely rs13113697 (on chromosome 4; closest gene, HS3ST1) and rs7920721 (on chromosome 10; closest gene, ECHDC3), were genome-wide significant. We additionally observed that HS3ST1 and ECHDC3 transcript expression was different in AD brains compared with control brains.
Our findings provide novel insights into the relationship among AD pathogenesis, inflammation, and dyslipidemia beyond the known loci associated with AD. We found a con-sistent direction of allelic effect between SNPs associated with AD risk and CRP levels, indicating overlapping pathobiology
Figure 2. Conditional Manhattan plot of conditional –log10 (false discovery rate [FDR]) values for Alzheimer disease (AD) alone (International Genomics of Alzheimer’s Disease Project [IGAP] stage 1 AD cohort; black) and AD given C-reactive protein (CRP; AD CRP; green), triglycerides (TG; AD TG; aquamarine), high-density lipoprotein (HDL; AD HDL; orange), and low-density lipoprotein (LDL; AD LDL; red). Single-nucleotide polymorphisms (SNPs) with conditional –log10 FDR >1.3 (ie, FDR <0.05) are shown with large points. A black line around the large points indicates the most significant SNP in each linkage disequilibrium block, and this SNP was annotated with the closest gene, which is listed above the symbols in each locus. For additional details, see the online-only Data Supplement.
Table 2. New Loci Reaching Genome-Wide Significance at Conditional FDR <0.05 (ORs Provided for the Reference Allele)
SNP PositionChromo -
someNearest
GeneReference
AlleleAssociated Phenotype
Minimum Conditional
FDR
IGAP Stage 1+2
P Value
IGAP Stage 1+2 OR (95%CI)
deCODE P Value
deCODE OR
(95% CI)
Dem - Gene
P Value
DemGene OR
(95% CI)
Meta-Analysis P Value
Meta-Analysis OR
(95% CI)
rs13113697 11711232 4 HS3ST1 T TG 9.56E−03 5.03E−07 1.07(1.04–1.10)
0.031 1.07(1.01–1.14)
0.088 1.13(0.98–1.31)
2.86E−08 1.07(1.05–1.11)
rs7920721 11720308 10 ECHDC3 G TG 4.49E−02 2.89E−07 1.07(1.04–1.09)
0.12 1.05(0.99–1.11)
0.08 1.12(0.99–1.29)
3.38E−08 1.07(1.04–1.11)
CI indicates confidence interval; FDR, false discovery rate; IGAP, International Genomics of Alzheimer’s Disease Project; OR, odds ratio; SNP, single-nucleotide polymorphism; and TG, triglycerides.
at BOSTON UNIV MEDICAL LIB on June 13, 2015http://circ.ahajournals.org/Downloaded from

2066 Circulation June 9, 2015
between AD and inflammation. These results are consistent with the hypothesis that inflammatory mechanisms influence AD pathogenesis9,27,28 and may have implications for treatment and prevention strategies in AD. On the other hand, we did not find a consistent direction of allelic effect between SNPs associ-ated with AD risk and plasma lipid levels (LDL, HDL, and tri-glycerides). Additionally, for HS3ST1 and ECHD3 variants, we found an opposite direction of allelic effect between increased AD risk and triglycerides levels. One hypothesis for these find-ings is that the observed pleiotropy between AD and plasma lipids could be attributable to different haplotypes/gene alleles involving the same SNPs. Another equally plausible hypothesis is that the same haplotypes/gene alleles are involved in both AD and plasma lipids but the underlying biological mechanisms are distinct. From these findings, it seems less likely that the pleio-tropic SNPs detected in this study influence AD pathogenesis via cholesterol-mediated pathways.
Unlike epidemiological studies, coheritability analyses,29 or bivariate GWAS methods,30 one strength of our present
approach is the ability to detect genetic pleiotropy even when there is no correlation of the signed effects (mixed directional-ity of effect). The conditional FDR method can detect SNPs that have a nonnull effect in one trait and that also tend to have a nonnull effect in another trait, independently of directional-ity. Another strength of this framework is leveraging genetic signal in one phenotype to identify variants in a second phe-notype that would otherwise not be detected with a single phe-notype approach. We note that the conditional FDR approach allows reordering (and reranking) of SNPs based on P value significance in the second phenotype (eg, CRP or triglycer-ides), thus enabling identification of novel SNPs in the primary phenotype (eg, AD). In addition, as previously demonstrated, these genetic analysis methods result in improved sensitivity for a given specificity.13 Using this “pleiotropic” approach, we detected 55 novel variants, indicating that genetic enrichment improves statistical power for gene discovery.
In meta-analyses, we discovered 2 GWAS significant AD susceptibility loci. The closest genes associated with
Figure 4. Regional association plots for (A) rs13113697 on chromosome 4 and (B) rs7920721 on chromosome 10. Linkage disequilibrium measured in the 1000 genomes European populations with plink version 1.07.
Figure 3. Forest plots for (A) rs13113697 on chromosome 4 and (B) rs7920721 on chromosome 10. CI indicates confidence interval; IGAP, International Genomics of Alzheimer’s Disease Project; and OR, odds ratio.
at BOSTON UNIV MEDICAL LIB on June 13, 2015http://circ.ahajournals.org/Downloaded from

Desikan et al Inflammation and Dyslipidemia in AD 2067
the 2 risk variants showed altered RNA levels in postmor-tem AD brains compared with control brains, suggesting a functional role. The first variant (rs13113697) is closest to the HS3ST1 gene on chromosome 4 (Figure 4A), which encodes heparan sulfate glucosaminyl 3-O-sulfotransferase, an intraluminal Golgi protein enzyme with multiple biologi-cal activities.31 The second variant (rs7920721) is closest to the ECHDC3 gene on chromosome 10 (Figure 4B), which encodes an enzyme called enoyl CoA hydratase domain con-taining 3.32 We note that by conditioning on cardiovascular traits and evaluating additional AD cohorts (deCODE and DemGene), we were able to find genome-wide significant evidence for previously18 suggested signal close to HS3ST1 and ECHDC3. At a value of P<1.0×10⁻⁶, we additionally found 3 suggestive variants on chromosome 11 (rs7396366; closest gene, APA2A), chromosome 15 (rs3131609; clos-est gene, USP50), and chromosome 17 (rs2526378; closest gene, BZRAP1).
It is important to note that in this study the diagnosis of AD was established clinically. Postmortem evidence from community- and population-based cohorts indicates that vascular brain injury often presents concomitantly with AD pathology and correlates with cognitive impairment above and beyond AD neuropathology.33 It is feasible that the individuals with clinically diagnosed AD from the IGAP, deCODE, and DemGene cohorts may have concomitant vascular brain dis-ease, which may further contribute to their cognitive decline and dementia. Therefore, an alternative interpretation of our findings is that the susceptibility loci identified in this study may increase brain vulnerability to vascular or inflamma-tory insults, which in turn may exacerbate the clinical conse-quences of AD pathological changes.
ConclusionsWe found polygenic overlap among AD, CRP, and plasma lip-ids and leveraged this association to identify 2 novel genome-wide significant variants associated with increased AD risk. Careful and considerable effort will be required to further characterize the novel candidate genes detected in this study and to detect the functional variants responsible for the asso-ciation of these loci with AD risk. Although no single com-mon variant may be informative clinically, a combination of variants involved with inflammation or lipid metabolism may help identify older individuals at increased risk for AD. Our findings may also have implications for AD prevention trials involving anti-inflammatory agents.
AcknowledgmentsWe thank the IGAP for providing summary results data for these analyses.
Sources of Funding This research was supported by grants from the National Institutes of Health (K02 NS067427, T32 EB005970, R01GM104400-01A, R01MH100351, AG033193, and U0149505), the Research Council of Norway (grants 213837, 225989, 223273, 237250/EU JPND), the South East Norway Health Authority (2013-123), the Norwegian Health Association, and the KG Jebsen Foundation. A.J. Schork was supported by National Institutes of Health grants RC2DA029475 and R01HD061414 and the Robert J. Glushko and Pamela Samuelson Graduate Fellowship. Dr Dehghan was supported by an NWO grant (veni, 916.12.154) and the Erasmus University Rotterdam Fellowship. Please see the Acknowledgments in the online-only Data Supplement for IGAP funding sources.
DisclosuresNone.
References 1. Brookmeyer R, Johnson E, Ziegler-Graham K, Arrighi HM. Forecasting
the global burden of Alzheimer’s disease. Alzheimers Dement. 2007;3:186–191. doi: 10.1016/j.jalz.2007.04.381.
2. Shepardson NE, Shankar GM, Selkoe DJ. Cholesterol level and statin use in Alzheimer disease, I: review of epidemiological and preclinical studies. Arch Neurol. 2011;68:1239–1244. doi: 10.1001/archneurol.2011.203.
3. Matsuzaki T, Sasaki K, Hata J, Hirakawa Y, Fujimi K, Ninomiya T, Suzuki SO, Kanba S, Kiyohara Y, Iwaki T. Association of Alzheimer disease pathology with abnormal lipid metabolism: the Hisayama Study. Neurology. 2011;77:1068–1075. doi: 10.1212/WNL.0b013e31822e145d.
4. Di Paolo G, Kim TW. Linking lipids to Alzheimer’s disease: cholesterol and beyond. Nat Rev Neurosci. 2011;12:284–296. doi: 10.1038/nrn3012.
5. Mapstone M, Cheema AK, Fiandaca MS, Zhong X, Mhyre TR, MacArthur LH, Hall WJ, Fisher SG, Peterson DR, Haley JM, Nazar MD, Rich SA, Berlau DJ, Peltz CB, Tan MT, Kawas CH, Federoff HJ. Plasma phospho-lipids identify antecedent memory impairment in older adults. Nat Med. 2014;20:415–418. doi: 10.1038/nm.3466.
6. Eikelenboom P, Hoozemans JJ, Veerhuis R, van Exel E, Rozemuller AJ, van Gool WA. Whether, when and how chronic inflammation increases the risk of developing late-onset Alzheimer’s disease. Alzheimers Res Ther. 2012;4:15. doi: 10.1186/alzrt118.
7. Dik MG, Jonker C, Hack CE, Smit JH, Comijs HC, Eikelenboom P. Serum inflammatory proteins and cognitive decline in older persons. Neurology. 2005;64:1371–1377. doi: 10.1212/01.WNL.0000158281.08946.68.
8. Tan ZS, Beiser AS, Vasan RS, Roubenoff R, Dinarello CA, Harris TB, Benjamin EJ, Au R, Kiel DP, Wolf PA, Seshadri S. Inflammatory mark-ers and the risk of Alzheimer disease: the Framingham study. Neurology. 2007;68:1902–1908. doi: 10.1212/01.wnl.0000263217.36439.da.
9. Jones L, Holmans PA, Hamshere ML, Harold D, Moskvina V, Ivanov D, Pocklington A, Abraham R, Hollingworth P, Sims R, Gerrish A, Pahwa JS, Jones N, Stretton A, Morgan AR, Lovestone S, Powell J, Proitsi P, Lupton MK, Brayne C, Rubinsztein DC, Gill M, Lawlor B, Lynch A, Morgan
Table 3. SNPs Showing Suggestive Association With AD at Conditional FDR <0.05 (ORs Provided for the Reference Allele)
SNP PositionChromo -
someNearest
GeneReference
AlleleAssociated Phenotype
Minimum Conditional
FDR
IGAP Stage 1+2
P Value
IGAP Stage 1+2 OR (95%CI)
deCODE P Value
deCODE OR (95% CI)
DemGene P Value
DemGene OR
(95% CI)
Meta-Analysis P Value
Meta-Analysis OR
(95% CI)
rs7396366 11711232 11 AP2A2 C CRP 3.91E−02 2.89E−06 0.93(0.91–0.96)
0.22 0.96(0.91–1.02)
0.21 0.92(0.91–0.96)
6.80E−07 0.94(0.92–0.96)
rs3131609 11720308 15 USP50 C CRP 4.49E−02 3.90E−07 0.93(0.90–0.96)
0.94 1.0(0.93–1.08)
0.95 0.99(0.86–1.15)
7.21E−07 0.93(0.91–0.96)
rs2526378 47336320 17 BZRAP1 G TG 1.83E−03 8.34E−07 0.94(0.91–0.96)
0.50 0.98(0.93–1.03)
9.20E−04 0.80(0.70–0.91)
2.73E−07 0.94(0.92–0.96)
AD indicates Alzheimer disease; CI, confidence interval; CRP, C-reactive protein; FDR, false discovery rate; IGAP, International Genomics of Alzheimer’s Disease Project; OR, odds ratio; SNP, single-nucleotide polymorphism; and TG, triglycerides.
at BOSTON UNIV MEDICAL LIB on June 13, 2015http://circ.ahajournals.org/Downloaded from

2068 Circulation June 9, 2015
K, Brown KS, Passmore PA, Craig D, McGuinness B, Todd S, Holmes C, Mann D, Smith AD, Love S, Kehoe PG, Mead S, Fox N, Rossor M, Collinge J, Maier W, Jessen F, Schürmann B, Heun R, Kölsch H, van den Bussche H, Heuser I, Peters O, Kornhuber J, Wiltfang J, Dichgans M, Frölich L, Hampel H, Hüll M, Rujescu D, Goate AM, Kauwe JS, Cruchaga C, Nowotny P, Morris JC, Mayo K, Livingston G, Bass NJ, Gurling H, McQuillin A, Gwilliam R, Deloukas P, Al-Chalabi A, Shaw CE, Singleton AB, Guerreiro R, Mühleisen TW, Nöthen MM, Moebus S, Jöckel KH, Klopp N, Wichmann HE, Rüther E, Carrasquillo MM, Pankratz VS, Younkin SG, Hardy J, O’Donovan MC, Owen MJ, Williams J. Genetic evidence implicates the immune system and cholesterol metab-olism in the aetiology of Alzheimer’s disease. PLoS One. 2010;5:e13950. doi: 10.1371/journal.pone.0013950.
10. Karch CM, Cruchaga C, Goate AM. Alzheimer’s disease genetics: from the bench to the clinic. Neuron. 2014;83:11–26. doi: 10.1016/j.neuron.2014.05.041.
11. Guerreiro R, Wojtas A, Bras J, Carrasquillo M, Rogaeva E, Majounie E, Cruchaga C, Sassi C, Kauwe JS, Younkin S, Hazrati L, Collinge J, Pocock J, Lashley T, Williams J, Lambert JC, Amouyel P, Goate A, Rademakers R, Morgan K, Powell J, St George-Hyslop P, Singleton A, Hardy J; Alzheimer Genetic Analysis Group. TREM2 variants in Alzheimer’s dis-ease. N Engl J Med. 2013;368:117–127. doi: 10.1056/NEJMoa1211851.
12. Jonsson T, Stefansson H, Steinberg S, Jonsdottir I, Jonsson PV, Snaedal J, Bjornsson S, Huttenlocher J, Levey AI, Lah JJ, Rujescu D, Hampel H, Giegling I, Andreassen OA, Engedal K, Ulstein I, Djurovic S, Ibrahim-Verbaas C, Hofman A, Ikram MA, van Duijn CM, Thorsteinsdottir U, Kong A, Stefansson K. Variant of TREM2 associated with the risk of Alzheimer’s disease. N Engl J Med. 2013;368:107–116. doi: 10.1056/NEJMoa1211103.
13. Andreassen OA, Thompson WK, Schork AJ, Ripke S, Mattingsdal M, Kelsoe JR, Kendler KS, O’Donovan MC, Rujescu D, Werge T, Sklar P, Roddey JC, Chen CH, McEvoy L, Desikan RS, Djurovic S, Dale AM; Psychiatric Genomics Consortium (PGC); Bipolar Disorder and Schizophrenia Working Groups. Improved detection of common vari-ants associated with schizophrenia and bipolar disorder using pleiotropy-informed conditional false discovery rate. PLoS Genet. 2013;9:e1003455. doi: 10.1371/journal.pgen.1003455.
14. Andreassen OA, Djurovic S, Thompson WK, Schork AJ, Kendler KS, O’Donovan MC, Rujescu D, Werge T, van de Bunt M, Morris AP, McCarthy MI, Roddey JC, McEvoy LK, Desikan RS, Dale AM; International Consortium for Blood Pressure GWAS; Diabetes Genetics Replication and Meta-analysis Consortium; Psychiatric Genomics Consortium Schizophrenia Working Group. Improved detection of com-mon variants associated with schizophrenia by leveraging pleiotropy with cardiovascular-disease risk factors. Am J Hum Genet. 2013;92:197–209. doi: 10.1016/j.ajhg.2013.01.001.
15. Andreassen OA, Zuber V, Thompson WK, Schork AJ, Bettella F, Djurovic S, Desikan RS, Mills IG, Dale AM; PRACTICAL Consortium; CRUK GWAS. Shared common variants in prostate cancer and blood lipids. Int J Epidemiol. 2014;43:1205–1214. doi: 10.1093/ije/dyu090.
16. Andreassen OA, McEvoy LK, Thompson WK, Wang Y, Reppe S, Schork AJ, Zuber V, Barrett-Connor E, Gautvik K, Aukrust P, Karlsen TH, Djurovic S, Desikan RS, Dale AM; International Consortium for Blood Pressure Genome-Wide Association Studies, Genetic Factors for Osteoporosis Consortium. Identifying common genetic variants in blood pressure due to polygenic pleiotropy with associated phenotypes. Hypertension. 2014;63:819–826. doi: 10.1161/HYPERTENSIONAHA.113.02077.
17. Liu JZ, Hov JR, Folseraas T, Ellinghaus E, Rushbrook SM, Doncheva NT, Andreassen OA, Weersma RK, Weismüller TJ, Eksteen B, Invernizzi P, Hirschfield GM, Gotthardt DN, Pares A, Ellinghaus D, Shah T, Juran BD, Milkiewicz P, Rust C, Schramm C, Müller T, Srivastava B, Dalekos G, Nöthen MM, Herms S, Winkelmann J, Mitrovic M, Braun F, Ponsioen CY, Croucher PJ, Sterneck M, Teufel A, Mason AL, Saarela J, Leppa V, Dorfman R, Alvaro D, Floreani A, Onengut-Gumuscu S, Rich SS, Thompson WK, Schork AJ, Næss S, Thomsen I, Mayr G, König IR, Hveem K, Cleynen I, Gutierrez-Achury J, Ricaño-Ponce I, van Heel D, Björnsson E, Sandford RN, Durie PR, Melum E, Vatn MH, Silverberg MS, Duerr RH, Padyukov L, Brand S, Sans M, Annese V, Achkar JP, Boberg KM, Marschall HU, Chazouillères O, Bowlus CL, Wijmenga C, Schrumpf E, Vermeire S, Albrecht M, Rioux JD, Alexander G, Bergquist A, Cho J, Schreiber S, Manns MP, Färkkilä M, Dale AM, Chapman RW, Lazaridis KN, Franke A, Anderson CA, Karlsen TH; UK-PSCSC Consortium; International IBD Genetics Consortium; International PSC Study Group. Dense genotyping of immune-related disease regions identifies nine new risk loci for primary sclerosing cholangitis. Nat Genet. 2013;45:670–675. doi: 10.1038/ng.2616.
18. Lambert JC, Ibrahim-Verbaas CA, Harold D, Naj AC, Sims R, Bellenguez C, DeStafano AL, Bis JC, Beecham GW, Grenier-Boley B, Russo G, Thorton-Wells TA, Jones N, Smith AV, Chouraki V, Thomas C, Ikram MA, Zelenika D, Vardarajan BN, Kamatani Y, Lin CF, Gerrish A, Schmidt H, Kunkle B, Dunstan ML, Ruiz A, Bihoreau MT, Choi SH, Reitz C, Pasquier F, Cruchaga C, Craig D, Amin N, Berr C, Lopez OL, De Jager PL, Deramecourt V, Johnston JA, Evans D, Lovestone S, Letenneur L, Morón FJ, Rubinsztein DC, Eiriksdottir G, Sleegers K, Goate AM, Fiévet N, Huentelman MW, Gill M, Brown K, Kamboh MI, Keller L, Barberger-Gateau P, McGuiness B, Larson EB, Green R, Myers AJ, Dufouil C, Todd S, Wallon D, Love S, Rogaeva E, Gallacher J, St George-Hyslop P, Clarimon J, Lleo A, Bayer A, Tsuang DW, Yu L, Tsolaki M, Bossù P, Spalletta G, Proitsi P, Collinge J, Sorbi S, Sanchez-Garcia F, Fox NC, Hardy J, Deniz Naranjo MC, Bosco P, Clarke R, Brayne C, Galimberti D, Mancuso M, Matthews F, Moebus S, Mecocci P, Del Zompo M, Maier W, Hampel H, Pilotto A, Bullido M, Panza F, Caffarra P, Nacmias B, Gilbert JR, Mayhaus M, Lannefelt L, Hakonarson H, Pichler S, Carrasquillo MM, Ingelsson M, Beekly D, Alvarez V, Zou F, Valladares O, Younkin SG, Coto E, Hamilton-Nelson KL, Gu W, Razquin C, Pastor P, Mateo I, Owen MJ, Faber KM, Jonsson PV, Combarros O, O’Donovan MC, Cantwell LB, Soininen H, Blacker D, Mead S, Mosley TH Jr, Bennett DA, Harris TB, Fratiglioni L, Holmes C, de Bruijn RF, Passmore P, Montine TJ, Bettens K, Rotter JI, Brice A, Morgan K, Foroud TM, Kukull WA, Hannequin D, Powell JF, Nalls MA, Ritchie K, Lunetta KL, Kauwe JS, Boerwinkle E, Riemenschneider M, Boada M, Hiltuenen M, Martin ER, Schmidt R, Rujescu D, Wang LS, Dartigues JF, Mayeux R, Tzourio C, Hofman A, Nöthen MM, Graff C, Psaty BM, Jones L, Haines JL, Holmans PA, Lathrop M, Pericak-Vance MA, Launer LJ, Farrer LA, van Duijn CM, Van Broeckhoven C, Moskvina V, Seshadri S, Williams J, Schellenberg GD, Amouyel P; European Alzheimer’s Disease Initiative (EADI); Genetic and Environmental Risk in Alzheimer’s Disease; Alzheimer’s Disease Genetic Consortium; Cohorts for Heart and Aging Research in Genomic Epidemiology. Meta-analysis of 74,046 individuals identifies 11 new sus-ceptibility loci for Alzheimer’s disease. Nat Genet. 2013;45:1452–1458. doi: 10.1038/ng.2802.
19. Dehghan A, Dupuis J, Barbalic M, Bis JC, Eiriksdottir G, Lu C, Pellikka N, Wallaschofski H, Kettunen J, Henneman P, Baumert J, Strachan DP, Fuchsberger C, Vitart V, Wilson JF, Paré G, Naitza S, Rudock ME, Surakka I, de Geus EJ, Alizadeh BZ, Guralnik J, Shuldiner A, Tanaka T, Zee RY, Schnabel RB, Nambi V, Kavousi M, Ripatti S, Nauck M, Smith NL, Smith AV, Sundvall J, Scheet P, Liu Y, Ruokonen A, Rose LM, Larson MG, Hoogeveen RC, Freimer NB, Teumer A, Tracy RP, Launer LJ, Buring JE, Yamamoto JF, Folsom AR, Sijbrands EJ, Pankow J, Elliott P, Keaney JF, Sun W, Sarin AP, Fontes JD, Badola S, Astor BC, Hofman A, Pouta A, Werdan K, Greiser KH, Kuss O, Meyer zu Schwabedissen HE, Thiery J, Jamshidi Y, Nolte IM, Soranzo N, Spector TD, Völzke H, Parker AN, Aspelund T, Bates D, Young L, Tsui K, Siscovick DS, Guo X, Rotter JI, Uda M, Schlessinger D, Rudan I, Hicks AA, Penninx BW, Thorand B, Gieger C, Coresh J, Willemsen G, Harris TB, Uitterlinden AG, Järvelin MR, Rice K, Radke D, Salomaa V, Willems van Dijk K, Boerwinkle E, Vasan RS, Ferrucci L, Gibson QD, Bandinelli S, Snieder H, Boomsma DI, Xiao X, Campbell H, Hayward C, Pramstaller PP, van Duijn CM, Peltonen L, Psaty BM, Gudnason V, Ridker PM, Homuth G, Koenig W, Ballantyne CM, Witteman JC, Benjamin EJ, Perola M, Chasman DI. Meta-analysis of genome-wide association studies in >80 000 subjects identifies multiple loci for C-reactive protein levels. Circulation. 2011;123:731–738. doi: 10.1161/CIRCULATIONAHA.110.948570.
20. Teslovich TM, Musunuru K, Smith AV, Edmondson AC, Stylianou IM, Koseki M, Pirruccello JP, Ripatti S, Chasman DI, Willer CJ, Johansen CT, Fouchier SW, Isaacs A, Peloso GM, Barbalic M, Ricketts SL, Bis JC, Aulchenko YS, Thorleifsson G, Feitosa MF, Chambers J, Orho-Melander M, Melander O, Johnson T, Li X, Guo X, Li M, Shin Cho Y, Jin Go M, Jin Kim Y, Lee JY, Park T, Kim K, Sim X, Twee-Hee Ong R, Croteau-Chonka DC, Lange LA, Smith JD, Song K, Hua Zhao J, Yuan X, Luan J, Lamina C, Ziegler A, Zhang W, Zee RY, Wright AF, Witteman JC, Wilson JF, Willemsen G, Wichmann HE, Whitfield JB, Waterworth DM, Wareham NJ, Waeber G, Vollenweider P, Voight BF, Vitart V, Uitterlinden AG, Uda M, Tuomilehto J, Thompson JR, Tanaka T, Surakka I, Stringham HM, Spector TD, Soranzo N, Smit JH, Sinisalo J, Silander K, Sijbrands EJ, Scuteri A, Scott J, Schlessinger D, Sanna S, Salomaa V, Saharinen J, Sabatti C, Ruokonen A, Rudan I, Rose LM, Roberts R, Rieder M, Psaty BM, Pramstaller PP, Pichler I, Perola M, Penninx BW, Pedersen NL, Pattaro C, Parker AN, Pare G, Oostra BA, O’Donnell CJ, Nieminen MS, Nickerson DA, Montgomery GW, Meitinger T, McPherson R, McCarthy MI, McArdle W, Masson D, Martin NG, Marroni F, Mangino M, Magnusson PK, Lucas G,
at BOSTON UNIV MEDICAL LIB on June 13, 2015http://circ.ahajournals.org/Downloaded from

Desikan et al Inflammation and Dyslipidemia in AD 2069
Luben R, Loos RJ, Lokki ML, Lettre G, Langenberg C, Launer LJ, Lakatta EG, Laaksonen R, Kyvik KO, Kronenberg F, König IR, Khaw KT, Kaprio J, Kaplan LM, Johansson A, Jarvelin MR, Janssens AC, Ingelsson E, Igl W, Kees Hovingh G, Hottenga JJ, Hofman A, Hicks AA, Hengstenberg C, Heid IM, Hayward C, Havulinna AS, Hastie ND, Harris TB, Haritunians T, Hall AS, Gyllensten U, Guiducci C, Groop LC, Gonzalez E, Gieger C, Freimer NB, Ferrucci L, Erdmann J, Elliott P, Ejebe KG, Döring A, Dominiczak AF, Demissie S, Deloukas P, de Geus EJ, de Faire U, Crawford G, Collins FS, Chen YD, Caulfield MJ, Campbell H, Burtt NP, Bonnycastle LL, Boomsma DI, Boekholdt SM, Bergman RN, Barroso I, Bandinelli S, Ballantyne CM, Assimes TL, Quertermous T, Altshuler D, Seielstad M, Wong TY, Tai ES, Feranil AB, Kuzawa CW, Adair LS, Taylor HA Jr, Borecki IB, Gabriel SB, Wilson JG, Holm H, Thorsteinsdottir U, Gudnason V, Krauss RM, Mohlke KL, Ordovas JM, Munroe PB, Kooner JS, Tall AR, Hegele RA, Kastelein JJ, Schadt EE, Rotter JI, Boerwinkle E, Strachan DP, Mooser V, Stefansson K, Reilly MP, Samani NJ, Schunkert H, Cupples LA, Sandhu MS, Ridker PM, Rader DJ, van Duijn CM, Peltonen L, Abecasis GR, Boehnke M, Kathiresan S. Biological, clinical and population relevance of 95 loci for blood lipids. Nature. 2010;466:707–713. doi: 10.1038/nature09270.
21. McKhann G, Drachman D, Folstein M, Katzman R, Price D, Stadlan EM. Clinical diagnosis of Alzheimer’s disease: report of the NINCDS-ADRDA Work Group under the auspices of Department of Health and Human Services Task Force on Alzheimer’s Disease. Neurology. 1984;34:939–944.
22. WHO. (World Health Organization, 1992). 23. McKhann GM, Knopman DS, Chertkow H, Hyman BT, Jack CR Jr,
Kawas CH, Klunk WE, Koroshetz WJ, Manly JJ, Mayeux R, Mohs RC, Morris JC, Rossor MN, Scheltens P, Carrillo MC, Thies B, Weintraub S, Phelps CH. The diagnosis of dementia due to Alzheimer’s disease: recom-mendations from the National Institute on Aging-Alzheimer’s Association workgroups on diagnostic guidelines for Alzheimer’s disease. Alzheimers Dement. 2011;7:263–269. doi: 10.1016/j.jalz.2011.03.005.
24. Zhang B, Gaiteri C, Bodea LG, Wang Z, McElwee J, Podtelezhnikov AA, Zhang C, Xie T, Tran L, Dobrin R, Fluder E, Clurman B, Melquist S, Narayanan M, Suver C, Shah H, Mahajan M, Gillis T, Mysore J, MacDonald ME, Lamb JR, Bennett DA, Molony C, Stone DJ, Gudnason V, Myers AJ, Schadt EE, Neumann H, Zhu J, Emilsson V. Integrated systems
approach identifies genetic nodes and networks in late-onset Alzheimer’s disease. Cell. 2013;153:707–720. doi: 10.1016/j.cell.2013.03.030.
25. Willer CJ, Li Y, Abecasis GR. METAL: fast and efficient meta-analysis of genomewide association scans. Bioinformatics. 2010;26:2190–2191. doi: 10.1093/bioinformatics/btq340.
26. Laird NM, Mosteller F. Some statistical methods for combining experi-mental results. Int J Technol Assess Health Care. 1990;6:5–30.
27. Johansson JU, Woodling NS, Wang Q, Panchal M, Liang X, Trueba-Saiz A, Brown HD, Mhatre SD, Loui T, Andreasson KI. Prostaglandin signal-ing suppresses beneficial microglial function in Alzheimer’s disease mod-els. J Clin Invest. 2015;125:350–364. doi: 10.1172/JCI77487.
28. International Genomics of Alzheimer’s Disease Consortium (IGAP). Convergent genetic and expression data implicate immunity in Alzheimer’s disease. Alzheimers Dement. 2014 Dec 20. doi: 10.1016/j.jalz.2014.05.1757.
29. Chen GB, Lee SH, Brion MJ, Montgomery GW, Wray NR, Radford-Smith GL, Visscher PM; International IBD Genetics Consortium. Estimation and partitioning of (co)heritability of inflammatory bowel disease from GWAS and immunochip data. Hum Mol Genet. 2014;23:4710–4720. doi: 10.1093/hmg/ddu174.
30. Yang J, Benyamin B, McEvoy BP, Gordon S, Henders AK, Nyholt DR, Madden PA, Heath AC, Martin NG, Montgomery GW, Goddard ME, Visscher PM. Common SNPs explain a large proportion of the heritability for human height. Nat Genet. 2010;42:565–569. doi: 10.1038/ng.608.
31. Liu J, Shworak NW, Fritze LM, Edelberg JM, Rosenberg RD. Purification of heparan sulfate D-glucosaminyl 3-O-sulfotransferase. J Biol Chem. 1996;271:27072–27082.
32. Silbiger VN, Luchessi AD, Hirata RD, Lima-Neto LG, Cavichioli D, Carracedo A, Brión M, Dopazo J, García-García F, dos Santos ES, Ramos RF, Sampaio MF, Armaganijan D, Sousa AG, Hirata MH. Novel genes detected by transcriptional profiling from whole-blood cells in patients with early onset of acute coronary syndrome. Clin Chim Acta. 2013;421:184–190. doi: 10.1016/j.cca.2013.03.011.
33. Cholerton B, Larson EB, Baker LD, Craft S, Crane PK, Millard SP, Sonnen JA, Montine TJ. Neuropathologic correlates of cognition in a pop-ulation-based sample. J Alzheimers Dis. 2013;36:699–709. doi: 10.3233/JAD-130281.
CLINICAL PeRSPeCTIveLate-onset Alzheimer disease (AD), the most common form of dementia, places a large economic and financial burden on families and society. With the aging of the US population and high costs associated with caring for cognitively impaired elderly, identifying strategies that prevent AD is of utmost importance. Cardiovascular disease (CVD) is being increasingly recognized as an important etiologic characteristic of AD. Many CVD traits such as dyslipidemia and inflammation can serve as therapeutic targets and are modifiable. Thus, focusing on the genetic and molecular overlap between CVD and AD may provide avenues to prevent or delay AD pathology. Although a number of epidemiological studies have examined the association between AD and CVD, a significant limitation of this approach is the inability to determine causal associations between CVD risk factors and AD pathobiology. Large-scale genome-wide association studies provide valuable insights into the role of specific biological pathways in disease pathogenesis, and combining genome-wide association studies from multiple disorders and phenotypes could elucidate shared pathobiology. Using data from large recent genome-wide asso-ciation studies, we examined genetic overlap between AD, dyslipidemia, and inflammation. We found that genetic variants associated with increased plasma lipid and C-reactive protein levels are also associated with increased AD risk. By con-ditioning on genetic variants associated with the cardiovascular traits, we found novel AD susceptibility loci, including 2 genome-wide significant variants conferring increased risk for AD. Our findings provide novel insights into the relationship among AD pathogenesis, inflammation, and dyslipidemia and may have implications for AD prevention trials involving anti-inflammatory agents.
at BOSTON UNIV MEDICAL LIB on June 13, 2015http://circ.ahajournals.org/Downloaded from

1
SUPPLEMENTAL MATERIAL
SUPPLEMENTAL METHODS
IGAP Cohort
International Genomics of Alzheimer's Project (IGAP) is a large two-stage study based
upon genome-wide association studies (GWAS) on individuals of European ancestry. In
stage 1, IGAP used genotyped and imputed data on 7,055,881 single nucleotide
polymorphisms (SNPs) to meta-analyse four previously-published GWAS datasets
consisting of 17,008 Alzheimer's disease cases and 37,154 controls (The European
Alzheimer's disease Initiative – EADI the Alzheimer Disease Genetics Consortium –
ADGC The Cohorts for Heart and Aging Research in Genomic Epidemiology consortium
– CHARGE The Genetic and Environmental Risk in AD consortium – GERAD). In stage
2, 11,632 SNPs were genotyped and tested for association in an independent set of 8,572
Alzheimer's disease cases and 11,312 controls. Finally, a meta-analysis was performed
combining results from stages 1 & 2.
DemGene Cohort
Patients were recruited from research cohorts in Norway as part of the nationwide
DemGene Study, including samples from the HUKLI, DemVest, TrønderBrain, and
AHUS case-control cohorts. Selection criteria and diagnostic procedures have been
published for all cohorts. These three studies had received approval from the relevant
regional IRB, and all subjects provided written informed consent. The patients include in
this study were all classified as mild cognitive impairment1 or AD according to the ICD-

2
10 criteria, the recommendations from the National Institute on Aging-Alzheimer’s
Association (NIA/AA) or the 1984 NINDS-ADRDA-criteria.
Patients were diagnosed by trained specialists in neurology, geriatric medicine or
psychiatry, all trained and experienced in diagnosing dementia. The diagnostic
procedures differed slightly among centers, but all patients underwent a standardized
comprehensive assessment program, which consisted of a medical history from the
patient as well as a close family member, neuropsychological testing, a physical and
psychiatric examination with the use of standardized assessment scales, blood sample
analyses, and brain imaging. Cognitive assessment consisted of the MMSE global
screening scale and a comprehensive battery of neuropsychological battery for memory,
attention, executive and visuospatial functions and language. Standardized tests of
depression and other neuropsychiatric symptoms were administered. Routine blood
sample analysis and brain imaging was performed. In the different cohorts, either all or
subgroups of patients had CSF Ab42, T-tau and P-tau AD biomarkers all analyzed at the
same certified lab.
Fold enrichment plots
To assess genetic enrichment, we used fold enrichment plots conditional by ‘pleiotropic’
effects. For a given associated phenotype, enrichment for pleiotropic signals is present if
the degree of deflection from the expected null line is dependent on SNP associations
with the second phenotype. We constructed fold-enrichment plots of empirical quantiles
of nominal –log10(p) values for SNP association with AD for all SNPs, and for subsets
(strata) of SNPs determined by the nominal p-values of their association with CRP, TG,

3
HDL and LDL. Specifically, we computed the empirical cumulative distribution of
nominal p-values for a given phenotype for all SNPs and for SNPs with significance
levels below the indicated cut-offs for the other phenotypes (–log10(p) ≥ 0, –log10(p) ≥ 1,
–log10(p) ≥2 corresponding to p < 1, p < 0.1, p < 0.01 respectively). The nominal p-values
(–log10(p)) are plotted on the x-axis, and fold enrichment in the first phenotype as a
function of the second phenotype is plotted on the x-axis (Figure 1). To assess for
polygenic effects below the standard GWAS significance threshold, we focused the fold
enrichment plots on SNPs with nominal –log10(p) < 7.3 (corresponding to p > 5x10⁻⁸
).
Conditional Q-Q plots
Q-Q plots compare a nominal probability distribution against an empirical distribution.
In the presence of all null relationships, nominal p-values form a straight line on a Q-Q
plot when plotted against the empirical distribution. For AD, CRP, TG, HDL and LDL
SNPs and for each categorical subset (strata), -log10
nominal p-values were plotted
against -log10
empirical p-values (conditional Q-Q plots, see Supplemental Figure 1).
Deflections of the observed distribution from the projected null line reflect increased tail
probabilities in the distribution of test statistics (z-scores) and consequently an over-
abundance of low p-values compared to that expected by chance (enrichment).
Under large-scale testing paradigms, such as GWAS, quantitative estimates of
likely true associations can be estimated from the distributions of summary statistics.2,3
One common method for visualizing the enrichment of statistical association relative to
that expected under the global null hypothesis is through Q-Q plots of nominal p-values
obtained from GWAS summary statistics. The usual Q-Q curve has as the y-ordinate the

4
nominal p-value, denoted by “p”, and as the x-ordinate the corresponding value of the
empirical cdf, denoted by “q”. Under the global null hypothesis the theoretical
distribution is uniform on the interval [0,1]. As is common in GWAS, we instead plot -
log10 p against -log10 q to emphasize tail probabilities of the theoretical and empirical
distributions. Therefore, genetic enrichment results in a leftward shift in the Q-Q curve,
corresponding to a larger fraction of SNPs with nominal -log10 p-value greater than or
equal to a given threshold. Conditional Q-Q plots are constructed by creating subsets of
SNPs based on levels of an auxiliary measure for each SNP, and computing Q-Q plots
separately for each level. If SNP enrichment is captured by variation in the auxiliary
measure, this is expressed as successive leftward deflections in a conditional Q-Q plot as
levels of the auxiliary measure increase.
We constructed conditional Q-Q plots of empirical quantiles of nominal –log10(p)
values for SNP association with AD for all SNPs, and for subsets (strata) of SNPs
determined by the nominal p-values of their association with CRP, TG, HDL and LDL.
Specifically, we computed the empirical cumulative distribution of nominal p-values for
a given phenotype for all SNPs and for SNPs with significance levels below the indicated
cut-offs for the other phenotypes (–log10(p) ≥ 0, –log10(p) ≥ 1, –log10(p) ≥2 corresponding
to p < 1, p < 0.1, p < 0.01 respectively). The nominal p-values (–log10(p)) are plotted on
the y-axis, and the empirical quantiles (–log10(q), where q=1-cdf(p)) are plotted on the x-
axis (Supplemental Figure 1). To assess for polygenic effects below the standard GWAS
significance threshold, we focused the conditional Q-Q plots on SNPs with nominal –
log10(p) < 7.3 (corresponding to p > 5x10⁻⁸
).

5
Genomic Control
The empirical null distribution in GWAS is affected by global variance inflation
due to population stratification and cryptic relatedness 4 and deflation due to over-
correction of test statistics for polygenic traits by standard genomic control methods. 5
We applied a control method leveraging only intergenic SNPs, which are likely depleted
for true associations. 6 First, we annotated the SNPs to genic (5’UTR, exon, intron,
3’UTR) and intergenic regions using information from the 1KGP. We used intergenic
SNPs because their relative depletion of associations suggests that they provide a robust
estimate of true null effects and thus seem a better category for genomic control than all
SNPs. We converted all p-values to z-scores and for all phenotypes we estimated the
genomic inflation factor λGC for intergenic SNPs. We computed the inflation factor, λGC
as the median z-score squared divided by the expected median of a chi-square
distribution with one degree of freedom and divided all test statistics by λGC.
Conditional True Discovery Rate (TDR)
Enrichment seen in the fold enrichment plots can be directly interpreted in terms of TDR
(equivalent to one minus the False Discovery Rate (FDR)). 7 We applied the conditional
FDR method, 8 previously used for enrichment of GWAS based on linkage information.
9
Specifically, for a given p-value cutoff, the FDR is defined as
FDR(p) = π0F0(p) / F(p), [1]

6
where π0 is the proportion of null SNPs, F0 is the null cdf, and F is the cdf of all SNPs,
both null and non-null. Under the null hypothesis, F0 is the cdf of the uniform distribution
on the unit interval [0,1], so that Eq. [1] reduces to
FDR(p) = π0p / F(p), [2]
p p is the number of
SNPs with p-values less than or equal to p, and N is the total number of SNPs. Replacing
F by q in Eq. [2], we get
Estimated FDR(p) = π0p / q, [3]
which is biased upwards as an estimate of the FDR. 10
Replacing π0 in Equation [3] with
unity gives an estimated FDR that is further biased upward;
q* = p/q [4]
If π0 is close to one, as is likely true for most GWAS, the increase in bias from Eq. [3] is
minimal. The quantity 1 – p/q, is therefore biased downward, and hence is a conservative
estimate of the TDR.
Referring to the formulation of the Q-Q plots, we see that q* is equivalent to the
nominal p-value divided by the empirical quantile, as defined earlier. Given the -log10 of
the Q-Q plots we can easily obtain
-log10(q*) = log10(q) – log10(p) [5]
demonstrating that the (conservatively) estimated FDR is directly related to the horizontal
shift of the curves in the conditional Q-Q plots from the expected line x = y, with a larger
shift corresponding to a smaller FDR, as illustrated in Supplemental Figure 1. As before,
the estimated TDR can be obtained as 1-FDR.

7
Conditional statistics – test of association with AD
To improve detection of SNPs associated with AD, we used a conditional FDR approach.
Specifically, we conditioned AD SNPs based on p-values in a pleiotropic phenotype (e.g.
CRP). We then assigned a conditional FDR value (denoted as FDR AD| CRP) for AD to
each SNP, based on the combination of p-value for the SNP in AD and the pleiotropic
trait (CRP), by interpolation into a 2-D look-up table. All SNPs with FDR < 0.01 (-
log10(FDR) > 2) in AD given CRP, TG, HDL and LDL are listed in Table 2 after
‘pruning’ (removing all SNPs with r2 > 0.2 based on 1KGP linkage disequilibrium (LD)
structure). A significance threshold of FDR < 0.01 corresponds to 1 false positive per 100
reported associations. Pruned SNPs with FDR < 0.05 (-log10(FDR) > 1.3) in AD given
CRP, TG, HDL and LDL are listed in Supplemental Table 1.
Conditional FDR Manhattan plots
To illustrate the localization of the genetic markers associated with AD given CRP, TG,
HDL and LDL we used a ‘Conditional FDR Manhattan plot’, plotting all SNPs within an
LD block in relation to their chromosomal location. As illustrated in Figure 2 within the
main manuscript, the large points represent the SNPs with FDR < 0.05, whereas the small
points represent the non-significant SNPs. All SNPs before ‘pruning’ (removing all SNPs
with r2 > 0.2 based on 1KGP LD structure) are shown. The strongest signal in each LD
block is illustrated with a black line around the circles. This was identified by ranking all
SNPs in increasing order, based on the conditional FDR value for AD, and then removing
SNPs in LD r2 > 0.2 with any higher ranked SNP. Thus, the selected locus was the most
significantly associated with AD in each LD block (Figure 2).
8
SUPPLEMENTAL ACKNOWLEDGEMENTS
The investigators within IGAP contributed to the design and implementation of IGAP
and/or provided data but did not participate in analysis or writing of this report. IGAP
was made possible by the generous participation of the control subjects, the patients, and
their families. The following is a list of the consortia members:
IGAP consortium:
Jean-Charles Lambert, Carla A Ibrahim-Verbaas, Denise Harold, Adam C Naj, Rebecca
Sims, Céline Bellenguez, Gyungah Jun, Anita L DeStefano, Joshua C Bis, Gary W
Beecham, Benjamin Grenier-Boley, Giancarlo Russo, Tricia A Thornton-Wells, Nicola
Jones, Albert V Smith, Vincent Chouraki, Charlene Thomas, M Arfan Ikram, Diana
Zelenika, Badri N Vardarajan, Yoichiro Kamatani, Chiao-Feng Lin, Amy Gerrish,
Helena Schmidt, Brian Kunkle, Melanie L Dunstan, Agustin Ruiz, Marie-Thérèse
Bihoreau, Seung-Hoan Choi, Christiane Reitz, Florence Pasquier, Paul Hollingworth,
Alfredo Ramirez, Olivier Hanon, Annette L Fitzpatrick, Joseph D Buxbaum, Dominique
Campion, Paul K Crane, Clinton Baldwin, Tim Becker, Vilmundur Gudnason, Carlos
Cruchaga, David Craig, Najaf Amin, Claudine Berr, Oscar L Lopez, Philip L De Jager,
Vincent Deramecourt, Janet A Johnston, Denis Evans, Simon Lovestone, Luc Letenneur,
Francisco J Morón, David C Rubinsztein, Gudny Eiriksdottir, Kristel Sleegers, Alison M
Goate, Nathalie Fiévet, Matthew J Huentelman, Michael Gill, Kristelle Brown, M Ilyas
Kamboh, Lina Keller, Pascale Barberger-Gateau, Bernadette McGuinness, Eric B Larson,
Robert Green, Amanda J Myers, Carole Dufouil, Stephen Todd, David Wallon, Seth
Love, Ekaterina Rogaeva, John Gallacher, Peter St George-Hyslop, Jordi Clarimon,
Alberto Lleo, Anthony Bayer, Debby W Tsuang, Lei Yu, Magda Tsolaki, Paola Bossù,
9
Gianfranco Spalletta, Petroula Proitsi, John Collinge, Sandro Sorbi, Florentino Sanchez-
Garcia, Nick C Fox, John Hardy, Maria Candida Deniz Naranjo, Paolo Bosco, Robert
Clarke, Carol Brayne, Daniela Galimberti, Michelangelo Mancuso, Fiona Matthews,
European Alzheimer’s disease Initiative (EADI), Genetic and Environmental Risk in
Alzheimer’s Disease (GERAD), Alzheimer’s Disease Genetic Consortium (ADGC),
Cohorts for Heart and Aging Research in Genomic Epidemiology (CHARGE), Susanne
Moebus, Patrizia Mecocci, Maria Del Zompo, Wolfgang Maier, Harald Hampel, Alberto
Pilotto, Maria Bullido, Francesco Panza, Paolo Caffarra, Benedetta Nacmias, John R
Gilbert, Manuel Mayhaus, Lars Lannfelt, Hakon Hakonarson, Sabrina Pichler, Minerva
M Carrasquillo, Martin Ingelsson, Duane Beekly, Victoria Alvarez, Fanggeng Zou, Otto
Valladares, Steven G Younkin, Eliecer Coto,Kara L Hamilton-Nelson,Wei Gu, Cristina
Razquin,Pau Pastor, Ignacio Mateo, Michael J Owen, Kelley M Faber, Palmi V Jonsson,
Onofre Combarros, Michael C O’Donovan, Laura B Cantwell, Hilkka Soininen, Deborah
Blacker, Simon Mead, Thomas H Mosley, Jr, David A Bennett, Tamara B Harris, Laura
Fratiglioni, Clive Holmes, Renee F A G de Bruijn, Peter Passmore, Thomas J Montine,
Karolien Bettens, Jerome I Rotter, Alexis Brice, Kevin Morgan, Tatiana M Foroud,
Walter A Kukull, Didier Hannequin, John F Powell, Michael A Nalls, Karen Ritchie,
Kathryn L Lunetta, John S K Kauwe, Eric Boerwinkle, Matthias Riemenschneider,
Mercè Boada, Mikko Hiltunen, Eden R Martin, Reinhold Schmidt, Dan Rujescu,Li-san
Wang, Jean-François Dartigues, Richard Mayeux, Christophe Tzourio,Albert Hofman,
Markus M Nöthen, Caroline Graff, Bruce M Psaty, Lesley Jones, Jonathan L Haines,
Peter A Holmans, Mark Lathrop, Margaret A Pericak-Vance, Lenore J Launer, Lindsay A

10
Farrer, Cornelia M van Duijn, Christine Van Broeckhoven, Valentina Moskvina, Sudha
Seshadri, Julie Williams, Gerard D Schellenberg, and Philippe Amouyel
DemGene Investigators: Ole A. Andreassen, Ingun Dina Ulstein, Dag Aarsland, Tormod
Fladby, Linda R. White, Sigrid B. Sando, Arvid Rongve, Aree Witoelar, Srdjan Djurovic,
Ina Selseth Almdahl, Fred Andersen, Nenad Bogdanovic, Anne Brækhus, Knut
Engedal, Ingvild Saltvedt, Eystein Stordal
Inflammation Working Group: Abbas Dehghan, Josée Dupuis, Maja Barbalic, Joshua C
Bis, Gudny Eiriksdottir, Chen Lu, Niina Pellikka, Henri Wallaschofski, Johannes
Kettunen, Peter Henneman, Jens Baumert, David P Strachan, Christian Fuchsberger,
Veronique Vitart, James F Wilson, Guillaume Paré, Silvia Naitza, Megan E Rudock, Ida
Surakka, Eco JC de Geus, Behrooz Z Alizadeh, Jack Guralnik MD, Alan Shuldiner,
Toshiko Tanaka, Robert YL Zee, Renate B Schnabel, Vijay Nambi, Maryam Kavousi,
Samuli Ripatti, Matthias Nauck, Nicholas L Smith, Albert V Smith, Jouko Sundvall, Paul
Scheet, Yongmei Liu, Aimo Ruokonen, Lynda M Rose, Martin G Larson, Ron C
Hoogeveen, Nelson B Freimer, Alexander Teumer, Dipl-Math, Russell P Tracy, Lenore J
Launer, Julie E Buring, Jennifer F Yamamoto, Aaron R Folsom, Eric JG Sijbrands, James
Pankow, Paul Elliott, John F Keaney, Wei Sun, Antti-Pekka Sarin, João D Fontes, Sunita
Badola, Brad C Astor, Albert Hofman, Anneli Pouta, Karl Werda, Karin H Greiser,
Oliver Kuss, Henriette E Meyer zu Schwabedissen, Joachim Thiery, Yalda Jamshidi, Ilja
M Nolte, Nicole Soranzo, Timothy D Spector, Henry Völzke, Alexander N Parker, Thor
Aspelund, David Bates, Lauren Young, Kim Tsui, David S Siscovick, Xiuqing Guo,
Jerome I Rotter, Manuela Uda, David Schlessinger, Igor Rudan, Andrew A Hicks,
Brenda W Penninx, Barbara Thorand, Christian Gieger, Joe Coresh, Gonneke Willemsen,

11
Tamara B Harris, Andre G Uitterlinden, Marjo-Riitta Järvelin, Kenneth Rice, Dörte
Radke, Veikko Salomaa, Ko Willems van Dijk, Eric Boerwinkle, Ramachandran S Vasan,
Luigi Ferrucci, Quince D Gibson, Stefania Bandinelli, Harold Snieder, Dorret I
Boomsma, Xiangjun Xiao, Harry Campbell, Caroline Hayward, Peter P Pramstaller,
Cornelia M van Duijn, Leena Peltonen, Bruce M Psaty, Vilmundur Gudnason, Paul M
Ridker, Georg Homuth, Wolfgang Koenig, Christie M Ballantyne, Jacqueline CM
Witteman, Emelia J Benjamin, Markus Perola, Daniel I Chasman.

12
SUPPLEMENTAL FUNDING SOURCES
IGAP: The i–Select chips was funded by the French National Foundation on Alzheimer's
disease and related disorders. EADI was supported by the LABEX (laboratory of
excellence program investment for the future) DISTALZ grant, Inserm, Institut Pasteur
de Lille, Université de Lille 2 and the Lille University Hospital. GERAD was supported
by the Medical Research Council (Grant n° 503480), Alzheimer's Research UK (Grant n°
503176), the Wellcome Trust (Grant n° 082604/2/07/Z) and German Federal Ministry of
Education and Research (BMBF): Competence Network Dementia (CND) grant n°
01GI0102, 01GI0711, 01GI0420. CHARGE was partly supported by the NIH/NIA grant
R01 AG033193 and the NIA AG081220 and AGES contract N01–AG–12100, the
NHLBI grant R01 HL105756, the Icelandic Heart Association, and the Erasmus Medical
Center and Erasmus University. ADGC was supported by the NIH/NIA grants: U01
AG032984, U24 AG021886, U01 AG016976, and the Alzheimer's Association grant
ADGC–10–196728.

13
SUPPLEMENTAL REFERENCES
1. Petersen RC. Mild cognitive impairment as a diagnostic entity. J Intern Med.
2004;256:183-94.
2. Efron B. Large-scale inference : empirical Bayes methods for estimation, testing,
and prediction. Cambridge ; New York: Cambridge University Press; 2010.
3. Schweder T, Spjotvoll E. Plots of P-Values to Evaluate Many Tests
Simultaneously. Biometrika. 1982;69:493-502.
4. Devlin B, Roeder K. Genomic control for association studies. Biometrics.
1999;55:997-1004.
5. Yang J, Weedon MN, Purcell S, Lettre G, Estrada K, Willer CJ, Smith AV,
Ingelsson E, O'Connell JR, Mangino M, Mägi R, Madden PA, Heath AC, Nyholt
DR, Martin NG, Montgomery GW, Frayling TM, Hirschhorn JN, McCarthy MI,
Goddard ME, Visscher PM; GIANT Consortium. Genomic inflation factors under
polygenic inheritance. Eur J Hum Genet. 2011;19:807-812.
6. Schork AJ, Thompson WK, Pham P, Torkamani A, Roddey JC, Sullivan PF,
Kelsoe JR, O'Donovan MC, Furberg H; Tobacco and Genetics Consortium;
Bipolar Disorder Psychiatric Genomics Consortium; Schizophrenia Psychiatric
Genomics Consortium, Schork NJ, Andreassen OA, Dale AM. All SNPs are not
created equal: genome-wide association studies reveal a consistent pattern of
enrichment among functionally annotated SNPs. PLoS Genet. 2013;9, e1003449.
7. Benjamini Y, Hochberg Y. Controlling the False Discovery Rate: A Practical and
Powerful Approach to Multiple Testing. Journal of the Royal Statistical Society.
Series B (Methodological). Vol 57: Blackwell Publishing; 1995:289-300.
8. Sun L, Craiu RV, Paterson AD, Bull SB. Stratified false discovery control for
large-scale hypothesis testing with application to genome-wide association studies.
Genetic epidemiology. 2006;30:519-530.
9. Yoo YJ, Pinnaduwage D, Waggott D, Bull SB, Sun L. Genome-wide association
analyses of North American Rheumatoid Arthritis Consortium and Framingham
Heart Study data utilizing genome-wide linkage results. BMC proceedings.
2009;3 S7:S103.
10. Efron B. Size, power and false discovery rates. The Annals of Statistics.
2007;35:1351–1377.

14
SUPPLEMENTAL FIGURE LEGENDS
Supplemental Figure 1. Conditional Q-Q plots of nominal versus empirical -log10 p-
values (corrected for inflation) in Alzheimer’s disease (AD) using IGAP Stage 1 data
below the standard GWAS threshold of p < 5x10⁻⁸
as a function of significance of
association with C-reactive protein (CRP) (panel A), high-density lipoprotein (HDL)
(panel B), low-density lipoprotein (LDL) (panel C), and triglycerides (TG) (panel D) at
the level of -log10(p) ≥ 0, -log10(p) ≥ 1, -log10(p) ≥ 2 corresponding to p ≤ 1, p ≤ 0.1, p ≤
0.01, respectively. Dotted lines in the conditional Q-Q plots indicate the null hypothesis.
Supplemental Figure 2. Forest plots for the three suggestive AD susceptibility loci.
These are a) rs7396366 on chromosome 11, (b) rs3131609 on chromosome 15, and (c)
rs2526378 on chromosome 17.
15
Supplemental Figure 1

16
Supplemental Figure 2a

17
Supplemental Figure 2b

18
Supplemental Figure 2c

19
Supplemental Table 1 All 65 novel AD susceptibility loci at conditional FDR < 0.05. Odds ratios provided for the major allele.
SNP Gene Chr Refere
nce Allele
Min Cond FDR
Associated trait
Direction of Effect
IGAP Stage 1+2 p-value
IGAP Stage 1+2 OR
IGAP Stage1+2 95% CI
deCODE p-value
deCODE OR
deCODE 95% CI
DemGene p-value
DemGene OR
DemGene 95% CI
Meta p-value
Meta OR
Meta 95%CI
rs16847470 KIF21B 1 G 4.01E-02 CRP Same 5.46E-05 0.9210877
0.8811037-0.9610717
0.0241721
0.902 0.8246-0.9866
0.788879
1.02298 0.8662-1.2081
8.96E-06 0.9224723
0.8901951-0.9559198
rs12065199 SPRR2G 1 G 1.21E-02 CRP Same 1.86E-06 1.205266
1.128434-1.282098
0.0881917
0.873 0.75-1.0205
0.681216
0.923219
0.6306-1.3516
0.000374895
1.131027
1.056841-1.21042
rs6668320 UAP1 1 G 2.31E-02 CRP Same 0.0004846
1.056646
1.025678-1.087614
0.910853
1.004 0.9362-1.0767
0.109385
1.134588
0.9721-1.324328
0.000517735
1.050566
1.02171-1.080237
rs12410656 SLC9A1 1 T 1.61E-02 HDL Same 0.02356 0.92 0.85-0.99 0.149766
1.079 0.9729-1.1966
0.822626
1.02751 0.8105-1.3027
0.007537913
1.078561
1.02036-1.140082
rs6540582 MAPKAPK2
1 C 4.64E-02 TG Same 0.0001528
1.215068
1.114324-1.315812
0.265066
0.874 0.6897-1.1076
0.784294
1.077427
0.6316321-1.837897
0.002381245
1.152083
1.051521-1.262262
rs11807823 RGS5 1 G 4.47E-02 TG Different
0.0002802
1.094174
1.045566-1.142782
0.019628
0.866 0.7674-0.9772
0.231384
1.18836 0.8958-1.5765
0.007335995
1.062826
1.016525-1.111236
rs1410397 CDC73 1 C 2.99E-03 TG Different
1.62E-06 1.07961 1.04825-1.11097
0.794604
1.008 0.9493-1.0703
0.326269
1.067294
0.9371-1.2155
7.75E-06 1.06397
1.035444-1.093281
rs1399665 ANAPC1
2 A 4.27E-02 CRP Same 0.01049 0.9662816
0.9400176-0.9925456
0.0451093
0.941 0.8867-0.9987
0.535729
0.9575151
0.8345852-1.098539
0.001333334
0.9619857
0.9394801-0.9850305
rs10200743 RASGRP3
2 C 4.60E-02 CRP Same 2.76E-05 1.065559
1.035963-1.095155
0.0413414
1.07 1.0027-1.1419
0.703532
1.02863 0.8894-
3.12E-06 1.065044
1.037203-

20
1.1896 1.093632
rs17044055 ASB3 2 A 3.57E-02 CRP Same 0.001283 1.051902
1.02113-1.082674
0.44701
1.028 0.9574-1.1038
0.0420914
0.845863
0.7198-0.994
0.004225559
1.041443
1.012869-1.070823
rs222482 KCNG3 2 T 3.81E-02 CRP Different
5.15E-05 1.054641
1.028769-1.080513
0.665892
1.013 0.9553-1.0742
0.192991
1.09157 0.9567-1.2455
6.58E-05 1.048581
1.024435-1.073296
rs9289330 C3orf27 3 G 2.20E-02 LDL Different
8.66E-06 0.9429896
0.9171176-0.9688616
0.249935
0.963 0.9031-1.0269
0.413234
1.05928 0.9228-1.216
1.21E-05 0.9486108
0.9264541-0.9712974
rs1148828 CADPS 3 C 4.74E-02 TG Different
0.001769 1.05 1.02-1.09 0.896116
1.005 0.9325-1.0831
0.0888352
1.17666 0.9756-1.4192
1.71E-03 1.05 1.02-1.08
rs13113697 HS3ST1 4 T 9.56E-03 TG Different
5.03E-07 1.0732 1.0439-1.1032
0.0314107
1.07 1.006-1.138
0.0889826
1.13291 0.9811617-1.13291
2.86E-08 1.074538
1.047598-1.10217
rs4958667 GRIA1 5 G 3.39E-02 CRP Same 0.008062 0.9658951
0.9402191-0.9915711
0.118991
1.048 0.988-1.1116
0.716889
1.025449
0.895175-1.174674
0.08565268
0.9798631
0.9573949-1.002858
rs1990895 CCDC112
5 A 2.50E-02 CRP Different
0.003893 1.039459
1.013195-1.065723
0.182205
1.04 0.9818-1.1017
0.761345
1.02109 0.8924-1.1683
0.001445672
1.038983
1.014821-1.063721
rs11575893 CARTPT 5 T 3.34E-02 HDL Same 0.002321 0.9217327
0.8692047-0.9742607
0.594436
0.972 0.8755-1.0791
0.420488
1.10742 0.864-1.4195
0.005865835
0.9372351
0.8949987-0.9814648
rs11168036 HBEGF 5 T 1.56E-04 LDL Different
9.87E-06 1.058338
1.03325-1.083426
0.0244499
1.068 1.0085-1.131
0.899574
0.9915127
0.8685833-1.131862
1.01E-06 1.058083
1.034408-1.082301
rs413524 DTWD2 5 A 4.49E-02 TG Same 0.02088 1.039459
1.006035-1.065619
0.1128 1.055 0.9874-1.1272
0.385421
0.9353574
0.8043111-1.087666
0.01034106
1.035604
1.008278-1.06367

21
rs17612068 FGF1 5 G 3.27E-02 TG Different
3.10E-05 1.076807
1.041919-1.111695
0.105291
0.936 0.864-1.014
0.081021
0.850849
0.7097-1.0201
0.00433872
1.046897
1.014443-1.08039
rs9465770 CDKAL1 6 C 2.90E-02 CRP Different
0.001659 1.161834
1.068342-1.255326
0.921568
1.009 0.8442-1.206
0.914925
1.02544 0.6468-1.6259
0.005028481
1.123722
1.035772-1.219139
rs764650 JARID2 6 C 1.60E-02 TG Same 0.001127 0.9482852
0.9163372-0.9802332
0.903198
1.005 0.9274-1.0891
0.899237
0.9904324
0.8534608-1.149293
0.004307928
0.9584826
0.9309801-0.9867976
rs293188 NXPH1 7 A 4.25E-02 CRP Different
0.0005676
1.077345
1.035009-1.119681
0.042471
0.882 0.7977-0.9753
0.690657
1.04274 0.8485-1.2814
0.000333419
0.9515838
0.9261325-0.9777346
rs1180296 CAV2 7 T 1.65E-02 TG Different
0.0001831
1.106277
1.053357-1.159197
0.770644
0.982 0.8691-1.1095
0.175931
0.81852 0.6125-1.0939
0.002309404
1.077297
1.026922-1.130142
rs7812391 WRN 8 T 3.90E-02 CRP Same 0.00227 1.047493
1.017701-1.077285
0.491454
1.023 0.9588-1.0915
0.574636
1.04348 0.8994-1.2107
0.001859189
1.043195
1.015777-1.071354
rs888577 ZNF596 8 T 2.34E-02 CRP Different
3.91E-06 1.14855 1.08975-1.20735
0.177354
0.912 0.7978-1.0426
0.548658
0.9077952
0.6617696-1.24533
0.0004348
1.099935
1.043087-1.159882
rs7014168 SOX7 8 A 4.62E-02 HDL Same 0.0001387
0.9421413
0.9115653-0.9727173
0.452848
1.026 0.9595-1.0971
0.964695
1.00369 0.8526-1.1815
0.001858053
0.9573933
0.9314962-0.9840104
rs11995526 XKR9 8 A 4.83E-02 HDL Different
0.003551 1.072615
1.025575-1.119655
0.762267
1.015 0.9217-1.1178
0.0722377
0.804799
0.6351-1.0198
0.01644248
1.05226
1.009365-1.096979
rs11986035 CSMD1 8 T 3.09E-02 TG Same 4.65E-05 1.058762
1.031322-1.086202
0.764596
0.99 0.927-1.0573
0.784484
0.981017
0.8551-1.1255
0.000400554
1.046013
1.02028-1.072395
rs7818382 NDUFA 8 T 2.19E-02 TG Diffe 8.00E-08 1.07132 1.046241- 0.4286 0.977 0.9223- 0.469 1.05006 0.9198 2.94E-06 1.0555 1.0318

22
F6 rent 9 1.096417 02 1.0349 902 -1.1988
44 91-1.079739
rs689266 GTF3C5 9 T 1.67E-02 CRP Same 0.0002007
1.052428
1.025576-1.07928
0.564322
0.982 0.9232-1.0446
0.332122
0.934313
0.8144-1.0718
0.002985776
1.037399
1.012558-1.06285
rs1883025 ABCA1 9 T 1.96E-02 HDL Different
0.000476 1.05327 1.024262-1.082278
0.446452
1.026 0.9604-1.0961
0.205457
0.90744 0.7808-1.0547
0.001182236
1.044227
1.01727-1.071898
rs984668 PLEKHA1
10 A 1.94E-02 HDL Different
0.0004876
0.9543737
0.9281097-0.9806377
0.39767
0.975 0.9194-1.0339
0.0948008
1.12378 0.98-1.2887
0.001443893
0.9623548
0.9399018-0.9853441
rs7920721 ECHDC3 10 G 4.49E-02 TG Different
2.89E-07 1.072 1.045-1.09 0.123968
1.05 0.99-1.11 0.08 1.12 0.99-1.29
3.38E-08 1.070587
1.044974-1.096827
rs7396366 AP2A2 11 C 3.91E-02 CRP Same 2.89E-06 0.9391313
0.9128673-0.9653953
0.229357
0.963 0.9056-1.0241
0.211381
0.9162879
0.7989135-1.050972
6.80E-07 0.9415092
0.9193811-0.9641699
rs10766249 INSC 11 C 3.36E-02 TG Same 0.0005024
1.052112
1.023496-1.080728
0.909386
0.996 0.9296-1.0672
0.0848683
0.877618
0.7565-1.0181
0.004812693
1.038142
1.011475-1.065512
rs2682484 LY49L 12 A 1.62E-02 CRP Same 0.0001493
0.9407292
0.9091732-0.9722852
0.555065
0.98 0.9164-1.048
0.0428516
0.8433054
0.7150518-0.9945301
6.99E-05 0.944522
0.9183212-0.9714704
rs1218788 GTF3A 13 A 2.97E-02 CRP Same 0.004498 1.051271
1.016775-1.085767
0.328863
0.962 0.89-1.0398
0.999751
1.00003 0.8283-1.2074
0.02989411
1.03506
1.003362-1.067759
rs9520713 FAM155A
13 A 8.48E-03 CRP Same 0.002504 0.9554241
0.9258281-0.9850201
0.154781
0.951 0.8874-1.0191
0.0972928
0.881116
0.7587-1.0233
0.000432391
0.9523293
0.9267742-0.9785891
rs10483861 YLPM1 14 C 3.52E-03 LDL Same 6.45E-06 1.116613
1.068789-1.164437
0.397863
0.957 0.8643-1.0597
0.556751
1.07327 0.8478-
0.000887862
1.070457
1.028332-

23
1.3587 1.114309
rs3131609 USP50/SPPL2A
15 C 4.38E-02 CRP Same 3.90E-07 0.9313688
0.9039288-0.9588088
0.936898
1.003 0.9313-1.0802
0.955001
0.995807
0.8606-1.1523
7.21E-07 0.93461
0.9099473-0.9599411
rs17526269 RGMA 15 T 3.91E-02 CRP Same 7.87E-05 0.9459174
0.9182814-0.9735534
0.295085
1.033 0.9721-1.0977
0.512346
0.953982
0.8286-1.0984
0.001273793
0.9601096
0.9366252-0.9841828
rs905450 EFTUD1 15 A 1.43E-02 CRP Different
8.72E-06 0.9339802
0.9037962-0.9641642
0.595034
0.981 0.914-1.0529
0.735151
0.9730466
0.8305648-1.139991
1.85E-05 0.9420084
0.9165977-0.9681237
rs1802376 SNX1 15 A 4.54E-02 LDL Different
6.08E-06 1.22986 1.140288-1.319432
0.35514
1.103 0.896-1.3578
0.570693
0.869693
0.5368-1.4091
1.28E-05 1.197857
1.104565-1.299028
rs4985560 AK128439
16 A 4.60E-02 CRP Same 6.06E-05 1.052954
1.02767-1.078238
0.227454
1.036 0.9782-1.0972
0.245491
0.9249667
0.8108985-1.055075
0.000102973
1.046192
1.022619-1.070309
rs9941245 GPRC5B 16 G 4.20E-02 HDL Different
9.42E-05 0.9369738
0.9042418-0.9697058
0.086832
0.931 0.8578-1.0104
0.620198
0.955316
0.7973-1.1446
8.37E-06 0.9361159
0.9093211-0.9637002
rs4781031 CLEC16A
16 T 1.99E-02 TG Same 4.76E-05 1.059079
1.031443-1.086715
0.642469
1.016 0.9501-1.0864
0.50617
1.04969 0.9098-1.211
6.44E-05 1.052616
1.026471-1.079426
rs12150370 MINK1 17 C 6.43E-03 CRP Same 7.01E-07 1.12 1.08-1.16 0.199014
1.06 0.97-1.16 0.130555
0.85 0.68-1.05
1.21E-06 1.08853
1.051883-1.126455
rs2526378 BZRAP1 17 G 1.83E-03 TG Different
8.34E-07 0.94 0.91-0.96 0.505715
0.98 0.93-1.03 0.00092041
0.8 0.7-0.91
2.73E-07 0.9421268
0.9209578-0.9637824
rs614793 MAPRE2
18 T 2.49E-02 CRP Same 0.002772 0.9470532
0.9113812-0.9827252
0.881478
1.006 0.9299-1.0883
0.668054
1.040545
0.867679-1.2478
0.01098647
0.9593599
0.9291694-0.9905

24
16 313
rs1015228 RAB31 18 A 3.91E-02 CRP Different
5.39E-05 1.054219
1.028543-1.079895
0.935651
0.998 0.9507-1.0477
0.798735
1.017196
0.8922198-1.159689
0.001109608
1.037922
1.014962-1.061402
rs3745091 L3MBTL4
18 C 1.30E-02 HDL Different
3.11E-06 1.217622
1.13491-1.300334
0.895863
1.02 0.7583-1.3721
0.630884
0.919787
0.654-1.2936
1.70E-05 1.185615
1.097112-1.281258
rs17656498 LIPG 18 C 3.97E-02 HDL Different
0.001431 0.9582946
0.9320306-0.9845586
0.605008
1.017 0.9541-1.0841
0.164513
1.10123 0.9612-1.2616
0.009756426
0.968209
0.9447744-0.9922249
rs2298428 YDJC 22 T 1.32E-02 HDL Same 0.0005042
0.94 0.91-0.98 0.101258
0.94 0.87-1.01 0.301784
0.92 0.79-1.08
8.59E-06 0.95 0.92-0.97
rs4819996 CECR2 22 A 1.72E-02 LDL Different
4.67E-05 0.9436499
0.9158179-0.9714819
0.312624
0.97 0.9143-1.0291
0.512027
0.9552102
0.8329169-1.09541
0.000140153
0.9530137
0.9296966-0.9769155

Project (IGAP) and DemGene Investigators for the Inflammation Working Group and International Genomics of Alzheimer�s Disease
Anders M. DaleSteinberg, Hreinn Stefansson, Kari Stefansson, Gerard D. Schellenberg, Ole A. Andreassen andSando, Arvid Rongve, Aree Witoelar, Srdjan Djurovic, Bradley T. Hyman, Jon Snaedal, Stacy
John Hardy, Ingun Dina Ulstein, Dag Aarsland, Tormod Fladby, Linda R. White, Sigrid B.Seshadri, Margaret A. Pericak-Vance, Richard Mayeux, Jonathan L. Haines, Lindsay A. Farrer, DeStefano, Sven J. van der Lee, Bruce M. Psaty, Cornelia M. van Duijn, Lenore Launer, SudhaO'Donovan, Seung Hoan Choi, Joshua C. Bis, M. Arfan Ikram, Vilmundur Gudnason, Anita L.
S. Karow, James B. Brewer, Christopher P. Hess, Julie Williams, Rebecca Sims, Michael C.Paul M Ridker, Daniel I. Chasman, Linda K. McEvoy, Dominic Holland, Chi-Hua Chen, David Rahul S. Desikan, Andrew J. Schork, Yunpeng Wang, Wesley K. Thompson, Abbas Dehghan,Polygenic Overlap Between C-Reactive Protein, Plasma Lipids, and Alzheimer Disease
Print ISSN: 0009-7322. Online ISSN: 1524-4539 Copyright © 2015 American Heart Association, Inc. All rights reserved.
is published by the American Heart Association, 7272 Greenville Avenue, Dallas, TX 75231Circulation doi: 10.1161/CIRCULATIONAHA.115.015489
2015;131:2061-2069; originally published online April 10, 2015;Circulation.
http://circ.ahajournals.org/content/131/23/2061World Wide Web at:
The online version of this article, along with updated information and services, is located on the
http://circ.ahajournals.org/content/suppl/2015/04/10/CIRCULATIONAHA.115.015489.DC1.htmlData Supplement (unedited) at:
http://circ.ahajournals.org//subscriptions/
is online at: Circulation Information about subscribing to Subscriptions:
http://www.lww.com/reprints Information about reprints can be found online at: Reprints:
document. Permissions and Rights Question and Answer this process is available in the
click Request Permissions in the middle column of the Web page under Services. Further information aboutOffice. Once the online version of the published article for which permission is being requested is located,
can be obtained via RightsLink, a service of the Copyright Clearance Center, not the EditorialCirculationin Requests for permissions to reproduce figures, tables, or portions of articles originally publishedPermissions:
at BOSTON UNIV MEDICAL LIB on June 13, 2015http://circ.ahajournals.org/Downloaded from


