Embed Size (px)
Citation preview

ORIGINAL PAPER
Population structure and marker–trait association analysisof the US peanut (Arachis hypogaea L.) mini-core collection
Ming Li Wang • Sivakumar Sukumaran • Noelle A. Barkley • Zhenbang Chen •
Charles Y. Chen • Baozhu Guo • Roy N. Pittman • H. Thomas Stalker •
C. Corley Holbrook • Gary A. Pederson • Jianming Yu
Received: 12 April 2011 / Accepted: 16 July 2011 / Published online: 7 August 2011
� Springer-Verlag (outside the USA) 2011
Abstract Peanut (Arachis hypogaea L.) is one of the
most important oilseed and nutritional crops in the world.
To efficiently utilize the germplasm collection, a peanut
mini-core containing 112 accessions was established in the
United States. To determine the population structure and its
impact on marker–trait association, this mini-core collec-
tion was assessed by genotyping 94 accessions with 81
SSR markers and two functional SNP markers from fatty
acid desaturase 2 (FAD2). Seed quality traits (including oil
content, fatty acid composition, flavonoids, and resveratrol)
were obtained through nuclear magnetic resonance (NMR),
gas chromatography (GC), and high-performance liquid
chromatography (HPLC) analysis. Genetic diversity and
population structure analysis identified four major sub-
populations that are related to four botanical varieties.
Model comparison with different levels of population
structure and kinship control was conducted for each trait
and association analyses with the selected models verified
that the functional SNP from the FAD2A gene is signifi-
cantly associated with oleic acid (C18:1), linoleic acid
(C18:2), and oleic-to-linoleic (O/L) ratio across this diverse
collection. Even though the allele distribution of FAD2A
was structured among the four subpopulations, the effect of
FAD2A gene remained significant after controlling popu-
lation structure and had a likelihood-ratio-based R2 (RLR2 )
value of 0.05 (oleic acid), 0.09 (linoleic acid), and 0.07
(O/L ratio) because the FAD2A alleles were not completely
fixed within subpopulations. Our genetic analysis demon-
strated that this peanut mini-core panel is suitable for
association mapping. Phenotypic characterization for seed
quality traits and association testing of the functional SNP
from FAD2A gene provided information for further
breeding and genetic research.
Introduction
Cultivated peanut (Arachis hypogaea L.) is an allotetra-
ploid species (2n = 4x = 40, AABB), covering two sub-
species and six botanical varieties (Krapovickas and
Gregory 1994), and is one of the most important oilseed
and nutritional crops in the world. Peanut seeds on average
Communicated by J. Wang.
Electronic supplementary material The online version of thisarticle (doi:10.1007/s00122-011-1668-7) contains supplementarymaterial, which is available to authorized users.
M. L. Wang (&) � N. A. Barkley � R. N. Pittman �G. A. Pederson
USDA-ARS, PGRCU, Griffin, GA 30223, USA
e-mail: [email protected]
S. Sukumaran � J. Yu (&)
Department of Agronomy, Kansas State University,
Manhattan, KS 66506, USA
e-mail: [email protected]
Z. Chen
Crop and Soil Sciences Department, University of Georgia,
Griffin, GA 30223, USA
C. Y. Chen
USDA-ARS, National Peanut Research Laboratory, Dawson,
GA 39842, USA
B. Guo
USDA-ARS, CPMRU, Tifton, GA 31793, USA
H. T. Stalker
Department of Crop Science, North Carolina State University,
Raleigh, NC 27695, USA
C. C. Holbrook
USDA-ARS, CGBRU, Tifton, GA 31793, USA
123
Theor Appl Genet (2011) 123:1307–1317
DOI 10.1007/s00122-011-1668-7

contain 50% oil and 25% protein plus other useful com-
pounds such as folic acids, tocopherols, flavonoids, and
resveratrol (Pancholy et al. 1978; Sobolev and Cole 1999;
Wang et al. 2008; Dean et al. 2009). Peanut provides
essential nutritional compounds such as fatty acids, protein,
and carbohydrates, and also phytochemicals beneficial to
human health. For example, consumption of peanut oil
with a high amount of oleic acid (C18:1, a monounsatu-
rated omega-9 fatty acid) and a low amount of linoleic acid
(C18:2, a polyunsaturated omega-6 fatty acid) may
decrease blood pressure, reduce the level of low-density
lipoprotein cholesterol (LDL-C), and maintain the level of
high-density lipoprotein cholesterol (HDL-C) (O’Byrne
et al. 1997; Teres et al. 2008). Consumption of products
rich in resveratrol (such as peanuts, grapes, and red wine)
may also reduce oxidant-induced apoptosis, LDL oxida-
tion, and risk of coronary heart disease (King et al. 2006;
Baur and Sinclair 2006).
During the past four decades, peanut yield and seed
quality have been significantly improved through breeding
efforts. For example, the yield of ‘Florunner’ (developed
from a cross of ‘Early Runnner’ 9 ‘Florispan’ by the
Florida Agricultural Experimental Station in 1969)
increased 18% compared to ‘Early Runner’ (Norden et al.
1969). Two experimental lines (F435-2-1 and F435-2-2)
were identified from the Florida breeding program with
significantly higher oleic-to-linoleic (O/L) ratio of 35:1,
compared with ‘Florunner’ with a O/L ratio of less than 2:1
(Norden et al. 1987). Peanut yield was also greatly
increased through breeding programs by utilizing peanut
germplasm to enhance the genetic base and improve pest
and disease resistance. The yields from newly developed
peanut cultivars were increased over 25% as compared to
‘Georgia Green’ and ‘NC-V11’ (Isleib et al. 2001). Obvi-
ously, most of the peanut yield enhancement and seed
quality improvement were derived from breeding programs
that relied on genetic resources (germplasm collections).
To promote and enhance the utilization of peanut
germplasm in peanut breeding programs, a peanut mini-
core was established by utilizing a stratification strategy
from the U.S. peanut core collection (Holbrook and Dong
2005). This mini-core contained 112 accessions covering
two subspecies [subsp. hypogaea and subsp. fastigiata] and
four botanical varieties [var. hypogaea (Waldron) Krapov.
& W. C. Greg. from the subsp. hypogaea and var. fastig-
iata, peruviana (Waldron) Krapov. & W. C. Greg., and var.
vulgaris Harz (Krapovickas and Gregory 1994) from the
subsp. fastigiata]. Several desirable traits (such as resis-
tances to leaf spot and tomato spotted wilt virus) have been
identified in the mini-core collection and subsequently used
in breeding programs (Holbrook and Dong 2005). The
genetic diversity of this mini-core has been estimated using
simple sequence repeat (SSR) markers (Barkley et al. 2007;
Kottapalli et al. 2007).
Because the O/L ratio is an important chemical trait for
seed quality, the genes encoding fatty acid desaturase 2
(FAD2, the key enzyme responsible for converting oleic
acid to linoleic acid) have been cloned and designated as
FAD2A on genome A and FAD2B on genome B, respec-
tively (Jung et al. 2000a, b). The mutation in FAD2A was a
single base pair substitution (G:C ? A:T) at position 448
after the start codon, resulting in a missense amino acid
substitution from aspartic acid to asparagine (D150 N).
The mutation in FAD2B was a 1-bp insertion (A:T) at
position 442 bp after the start codon, resulting in a
frameshift (Jung et al. 2000b; Lopez et al. 2000). Based on
the gene sequence of FAD2A and FAD2B, functional DNA
markers have been developed for detection of mutations
using different platforms: a cleaved amplified polymorphic
sequence (CAPS) assay (Chu et al. 2007, 2009), real-time
PCR assay (Barkley et al. 2010, 2011), and an allelic-
specific PCR (AS-PCR) assay (Chen et al. 2010). The
functional SNP marker from FAD2A has been used to
screen the U.S. mini-core collection by the CAPS assay
(Chu et al. 2007). Chemical traits of seed quality (including
amino acid, fatty acid composition, and tocopherol and
folic acid content) have also been evaluated for the mini-
core (Dean et al. 2009).
Although chemical traits of seed quality and genetic
diversity for the mini-core have been evaluated, there is a
lack of information on marker–trait associations. Associa-
tion mapping is a powerful approach to search for genotype
(marker)–phenotype (trait) correlations within a diverse
collection of germplasm or breeding materials (Myles et al.
2009). The peanut mini-core is a subset of samples repre-
senting the diversity in the U.S. peanut germplasm col-
lection. Most of the samples in the mini-core are probably
unrelated individuals (accessions) and may be good start-
ing materials for initiating association mapping in peanut.
Based on the scale (sample size), pre-known information
(gene function and pathways), and purpose (questions to be
addressed) of the studies, association mapping can gener-
ally be divided into two main categories: genome-wide
association mapping (GWAS) and candidate gene associ-
ation mapping (CGAS) (Zhu et al. 2008). Although the
functional mutations in FAD2 genes have been identified,
association analysis between the genes (FAD2) and traits
(oleic and linoleic acids) across diverse genetic back-
grounds has not been performed in peanut. To test whether
the U.S. peanut mini-core collection is a good panel for
conducting association analysis, candidate gene association
mapping was initiated between FAD2 genes (candidate
genes) and trait (oleic and linoleic acids). SSR markers
were employed to determine the population structure and at
1308 Theor Appl Genet (2011) 123:1307–1317
123

the same time test whether SSR markers were associated
with seed quality traits.
Use of previously published data from the mini-core for
association analysis is very limited because the data have
been collected from different laboratories and generated
from seeds harvested from different years and locations.
Furthermore, field morphological variation within acces-
sions has been observed for several mini-core entries (Chen
et al., unpublished results). In comparison with field mor-
phological observation, chemical analysis of seed quality
traits is relatively expensive. Therefore, we only collected
seeds from one location but from 2 years for chemical
analysis. The objectives of this study were to (1) assess
genetic diversity and population structure of this mini-core
collection, (2) determine whether the population structure
is associated with botanical varieties, (3) validate whether
the functional SNP markers in FAD2A and FAD2B are
associated with oleic acid or linoleic acid across this
diverse collection, and (4) identify whether the employed
SSR markers are associated with the evaluated seed quality
traits.
Materials and methods
Planting and harvesting seeds from germplasm
accessions
Seeds from 94 of 112 accessions within the U.S. peanut
mini-core (Table S1) were obtained from the USDA–
ARS, Plant Genetic Resources Conservation Unit
(PGRCU), Griffin, GA. The other 18 accessions were
found to be either mixtures in the original collection (i.e.,
an accession cannot be represented by a single individual
plant) or no longer available, and these accessions were
not included in further phenotypic and genotypic analysis.
With a randomized complete block design, 20 seeds from
each accession were planted in two-row 10-feet-long plots
in Dawson, GA, during 2008 and 2009. Off-type plants
were removed from the field when morphological varia-
tion was observed within an accession. In order to con-
firm the type of botanical varieties, five morphological
traits including growth habit, main stem length, presence
of flowers on the main stem, leaf color, and stem
pigmentation were recorded in the field at 10 and
14 weeks after planting, following the procedures used for
standard peanut descriptors (http://www.ars-grin.gov/npgs).
Peanut plants were harvested at physiological maturity by a
small peanut harvesting combine. After drying, pods were
photographed and scored for shape, constriction, reticula-
tion, and number of seeds per pod (http://www.
ars-grin.gov/npgs). Based on field observations and pod
descriptors, the botanical variety classification in the GRIN
database was confirmed and recorded when classification
data were missing (Table S1). The harvested seeds were
used for chemical analysis within one month after har-
vesting for both years of this study.
Analyzing chemical traits of seed quality
Before chemical analysis, seed weight (g/100 seeds) was
recorded for each accession. Fourteen chemical traits of
seed quality were analyzed in the laboratory. Two repli-
cates per accession were conducted for the determination
of each chemical compound concentration. The data for
each chemical trait were collected from each of the two
harvest years with the exception of resveratrol which was
only collected in a single year. For all chemical traits, the
same sample from each replicate was analyzed twice, and
the average was used in data analysis. The details for each
chemical trait analysis were given in the Supplementary
Methods.
Oil content
Oil content analysis was performed by following the
method described by Wang et al. (2009a) and expressed as
percentage (%) of total oil (see Method S1).
Fatty acid composition
Fatty acid methyl esters (FAMEs) were prepared from
peanut seeds and analyzed on gas chromatography (GC)
system (7890A, Agilent Technologies) using the modified
method described by Wang et al. (2009a) (see Method
S2).
Flavonoid content
Two isoflavones (daidzein and genistein) and three
flavonols (myricetin, kaempferol, and quercetin) were
detected previously in peanut seeds (Wang et al. 2008).
Flavonoids were extracted from peanut seeds and analyzed
on high-performance liquid chromatography (HPLC) sys-
tem (1100 series, Agilent Technologies) generally fol-
lowing methodology of Wang et al. (2008) (see Method
S3). Flavonoid compounds were expressed in lg per gram
of seeds.
Trans-resveratrol content
Trans-resveratrol was prepared from peanut seeds and
analyzed on HPLC system (100 Series, Agilent Technol-
ogies) following the method described by Wang and
Pittman (2008) and expressed in lg per gram seeds (see
Method S4).
Theor Appl Genet (2011) 123:1307–1317 1309
123

Genotyping with molecular markers
A small slice of seed (*150 mg) from each accession was
used to extract DNA by following the instructions from an
E.Z.N.A. Plant DNA kit from Omega Bio-Tek (Doraville,
GA). DNA concentration was determined by measurement
with a fluorometer. All DNA samples were dissolved and
diluted in 0.1 9 TE (1 mM Tris, 0.1 mM EDTA, pH 8.0)
to a final concentration of 10 ng/ll for use in PCR. A total
of 83 DNA markers (81 SSR markers plus two functional
SNP markers on FAD2A and FAD2B) were employed to
genotype 94 peanut accessions.
Genotyping with SSR markers
SSR markers were from previously published literature
(Hopkins et al. 1999; He et al. 2003; Ferguson et al. 2004;
Moretzsohn et al. 2004, 2005; Liang et al. 2009; Li et al.
2011; Qin et al. 2011). Eighty-one (26%) of the 308 tested
SSR markers showed polymorphisms across a screening
panel of eight peanut mini-core accessions. The name and
source for the 81 polymorphic SSR markers were listed in
Table S2. Different PCR amplification conditions were
used based on amplicon size and annealing temperature.
Amplicons were separated either on an ABI 377 automated
DNA Sequencer (Foster City, CA) following the condition
described by Barkley et al. (2007) or on a Mega-gel system
(C-DASG-400-50, CBS Scientific Co., Del Mar, CA) fol-
lowing the conditions described by Wang et al. (2009b).
After calling the amplicon size, the scored data were
inspected to remove minor non-specific DNA bands from
the gel images.
Genotyping with functional SNP markers
Two functional SNP markers of FAD2 were employed for
genotyping. Since a high homology (99%) exists between
FAD2A and FAD2B (Bruner et al. 2001), the real-time PCR
assay for detection of functional SNPs for FAD2A and
FAD2B was conducted separately. The real-time PCR
assay for FAD2A and FAD2B functional SNPs genotyping
was carried out according to Barkley et al. (2010, 2011)
(see Method S5). From real-time PCR analysis, the ana-
lyzed accessions were classified into three categories: wild
type, heterozygote, and mutant.
Statistical analysis
DNA marker profile
Alleles produced from each accession were scored based
on size comparison to a molecular weight ladder.
PowerMarker version 3.25 (Liu and Muse 2005) was used
to calculate Chord distance (Cavalli-Sforza and Edwards
1967) among accessions, to compute molecular diversity
statistics, and to construct the unweighted pair group
method with arithmetic mean (UPGMA) tree with 100
replications of bootstrapping.
Population structure analysis
The program STRUCTURE version 2.2.3 (Pritchard et al.
2000; Falush et al. 2003) was used to detect population
structure and to assign individuals to subpopulations. This
program employs model-based clustering in which a
Bayesian approach identifies clusters based on a fit to
Hardy–Weinberg equilibrium and linkage equilibrium. The
STRUCTURE program was run 10 times for each sub-
population (k) value, ranging from 1 to 15, using the
admixture model, correlated allele frequency, with 20,000
replicates for burn-in and 20,000 replicates during analysis.
The initial upper boundary of fifteen for k was set because
of the current sample size and the outcome that we did find
an optimal k below this boundary. The final population
subgroups were determined by the following:(1) the like-
lihood plot of these models; (2) the stability of grouping
patterns across 10 runs; (3) the germplasm information
about the materials under study; and (4) the second order
rate of change of the likelihood function (Dk) (Evanno
et al. 2005). Based on this information, we chose k = 4 as
the optimal grouping. Out of the 10 runs for k = 4, the run
with the highest likelihood value was selected to assign the
posterior membership coefficients (Q) to each accession. A
graphical bar plot was then generated with the posterior
membership coefficients (Fig. 1), and plots were also
generated for k = 2 and 3 for result interpretation (Fig.
S1).
The genetic distances among the four subgroups were
calculated as Nei’s minimum distance and pairwise Fst. To
validate the genetic structure and test for different models,
principal component analysis (PCA) was conducted to
construct plot of the most significant axes for grouping
pattern verification and to obtain axes for further model
testing and association mapping (Patterson et al. 2006;
Price et al. 2007; Zhu and Yu 2009). The PCA decomposes
the overall variation among accessions measured by
molecular markers into orthogonal axes (Zhu and Yu
2009). Kinship (K) was calculated with SPAGeDi 1.3
(Loiselle et al. 1995; Hardy and Vekemans 2002). The
combined display of the color-coded subpopulation mem-
berships from STRUCTURE with other analyses (i.e.,
UPGMA and PCA) and the world map followed that of
recent genetic diversity studies (Kwak and Gepts 2009;
Wang et al. 2009b).
1310 Theor Appl Genet (2011) 123:1307–1317
123

Model comparison and association analysis
To assess the effect of population structure on association
mapping of various quantitative traits measured in the
peanut mini-core panel, model comparison was conducted
using SAS Proc Mixed (SAS Institute 1999). Various
mixed models (Yu et al. 2006; Zhu and Yu 2009) with
subpopulation membership percentage or PCA as fixed
covariates and kinship as a random effect were compared.
The dimension of PCA was determined for each trait
individually (Zhu and Yu 2009). The best fit model was
determined for each trait based on the comparison of the
Bayesian information criterion (BIC) values of the differ-
ent models (i.e., the simple model, Q, PCA, Q?K, and
PCA?K). For each trait, the model with lowest BIC value
was selected to test the marker–trait association in TAS-
SEL (Bradbury et al. 2007). The potential of this mini-core
collection as an association mapping panel was examined
by testing a functional SNP marker in FAD2A and 81 SSR
markers against chemical traits. Subsequently, the quan-
tile–quantile plots of the F-test statistics for the SSR
markers were generated to assess the adequacy of the
selected model in controlling for type I errors. For the oleic
acid, linoleic acid, and O/L ratio, the Q model yielded the
best fit and was used in testing the FAD2A SNP and SSR
markers. In addition, the likelihood-ratio-based R2 (RLR2 )
was calculated for the FAD2A SNP to provide a general
measure for the effect of the functional polymorphism in
mixed-model association mapping of the three traits (Sun
et al. 2010). RLR2 allows comparisons across models with
different random and fixed components and is a general-
ized form of R2 in linear regression model.
Results
Profile of SSR markers and genotype of FAD2
functional SNPs
Eighty-one SSR markers were utilized to genotype 94
accessions from the U.S. mini-core collection. A total of
664 alleles were revealed with an average of 8.1 alleles per
locus and 0.52 for major allele frequency. The mean
polymorphism information content (PIC) was 0.53, and the
G1 G2
G3 G4G2
B1
B3 B4
B2
a b
c d
25 26 73 66 23 48 3111
1875
761
20
49
63
27
29
610
94
19
2
14
17
12
69
70
77
5067
6816
6245
5782
78
79
80
8187868583845264538843
434742288924
65
60
58
39
40
72
3054
715
4441
56
355
4
38
32
9
33
22
37
13
5
35
36
21
598
90
51
7471
9346
6191
92
0.0
0.1
0.2
0.3
0.4
0.5
0.6
0.7
0.8
0.9
1.0
G1 G2 G3 G4
Fre
qu
ency
of
Bo
tan
ical
var
ieti
es
Subpopulations
hy
fa
pr
vu
0.0
0.1
0.2
0.3
0.4
0.5
0.6
0.7
0.8
0.9
1.0
hy fa pr vuFre
qu
ency
of
each
su
bp
op
ula
tio
n
Botanical varieties
G1
G2
G3
G4
Fig. 1 Genetic diversity of accessions within the U.S. peanut mini-
core collection. a Population structure analysis. The y-axis is the
subgroup membership, and the x-axis is the accessions. G (G1–G4)
stands for a subpopulation. b UPGMA tree analysis. B (B1–B4)
stands for a branch or cluster. The UPGMA tree is color coded based
on the results from population structure analysis (red G1, green G2,
blue G3, and yellow G4). c Frequency of botanical variety within each
subpopulation. d Frequency of each subgroup within each botanical
variety
Theor Appl Genet (2011) 123:1307–1317 1311
123

mean genetic diversity was 0.59 (Table 1). The FAD2A
real-time PCR assay revealed three genotypes: 52 wild type
(G:C/G:C), 39 mutants (A:T/A:T), and 3 heterozygotes
(G:C/A:T). No functional mutant allele (i.e., A:T insertion)
from FAD2B was identified within the tested accessions
and, therefore, was dropped from subsequent analyses.
Population structure and genetic diversity
STRUCTURE analysis revealed four subpopulations (or
clusters) with relatively low levels of admixture between
subpopulations named G1, G2, G3, and G4 which con-
tained 35, 24, 12, and 23 accessions, respectively (Fig. 1a).
The level of genetic diversity within G2 (0.55) and G3
(0.56) was higher than that within G1 (0.41) and G4 (0.47)
(Table 1). Additionally, the genetic distances among these
four subgroups measured by Nei’s minimum distance and
pairwise Fst were consistent, the genetic distance between
G1 and G4 (0.30 and 0.47) being the largest, and the
genetic distance between G1 and G3 (0.16 and 0.24) being
the smallest (Table 2). The results of principal component
analysis (Fig. S2a) showed that the G1 and G3 subgroups
were well separated from G2 and G4 subgroups by prin-
cipal component 1 (PC1). The G2 and G4 subgroups were
well separated with some overlap in distribution, but the
G1 and G3 subgroups were not well separated by principal
component 2 (PC2). The results from STRUCTURE
analysis and principal component analysis were consistent.
The UPGMA (unweighted pair group method with
arithmetic average) tree analysis clustered 94 accessions
into four branches (B1, B2, B3, and B4) (Fig. 1b) based on
DNA marker data. First, B1 contained 39 accessions with
34 accessions from subpopulation G1 and five accessions
from subpopulation G3. Second, B2 contained 23 acces-
sions that were all from subpopulation G2. Third, B3
contained eight accessions with six accessions from sub-
population G3 and one each from G1 and G2 subpopula-
tions. Finally, B4 contained 24 accessions with 23
accessions from subpopulation G4 and one accession from
subpopulation G3. The results from UPGMA tree analysis
were generally consistent with the results from STRUC-
TURE analysis with a few exceptions (Fig. 1a, b).
Population structure with botanical variety
and geographic origin
Among 94 accessions, there were four botanical varieties
(abbreviated as ‘fa’ for var. fastigiata, ‘hy’ for var. hypo-
gaea, ‘pe’ for var. peruviana, and ‘vu’ for var. vulgaris)
that were tentatively classified based on morphological
data collected from the field and current GRIN taxonomy.
The number of accessions for each botanical variety,
classified into each subpopulation (G), was listed in Table
S1. The frequency of each botanical variety within each
subpopulation and the frequency of each subgroup within
each botanical variety were presented in Fig. 1c and d,
respectively. From the distribution frequency, 58% of the
var. hypogaea accessions (29/50) were classified into the
subpopulation G1, and 63% of the var. fastigiata acces-
sions (20/32) were classified into the subpopulation G2. All
the accessions (3/3) from the var. peruviana were classified
into the subpopulation G3, and 78% of the var. vulgaris
accessions (7/9) were classified into the subpopulation G4.
Some discrepancies were also observed. For example, PI
331297 (#46) was classified in botanical variety hypogaea
but was grouped into G2 in STRUCTURE analysis. In spite
of discrepancies, the population structure is obviously
associated with the botanical varieties.
Peanut originated in South America. In terms of col-
lection site or country of origin (Fig. S2b), within the
subpopulation G1 (containing 35 accessions), 16 acces-
sions were from Asia (eight from Israel), fifteen accessions
were from Africa, and the remaining four accessions were
from North and South America. Out of 35 accessions, 29
belong to the botanical variety hypogaea. This subpopu-
lation mainly represents the botanical variety hypogaea
from Asia to Africa. Within the subpopulation G2 (con-
taining 24 accessions), 19 accessions were from South
America (14 from Argentina), four accessions were from
Africa (Zimbabwe), and one accession was from Canada.
This subpopulation mainly represents the botanical variety
Table 1 Summary statistics for the whole group of peanut accessions
and subpopulations detected by structure analysis based on 81 SSR
markers
Statistics Overall G1 G2 G3 G4
Sample size 94 35 24 12 23
Total number of alleles 664 374 437 318 355
Number of alleles per locus 8.1 4.9 5.4 3.9 4.4
Major allele frequency 0.52 0.72 0.58 0.53 0.67
Genetic diversity 0.59 0.41 0.55 0.56 0.47
PIC� 0.53 0.37 0.50 0.51 0.43
� Polymorphism information content
Table 2 Genetic distance between peanut groups from structure
analysis
Group G1 G2 G3 G4
G1 0 0.29 0.16 0.30
G2 0.43 0 0.17 0.19
G3 0.24 0.27 0 0.18
G4 0.47 0.30 0.32 0
The top diagonal is Nei’s minimum distance and the bottom diagonal is
pairwise Fst
1312 Theor Appl Genet (2011) 123:1307–1317
123

fastigiata (20/24) from South America. Within the sub-
population G3 (containing 12 accessions), five accessions
were from Africa (three from Zambia), six accessions were
from South America, and one from India. Thus, the G3
subpopulation mainly represents botanical variety peruvi-
ana from Peru and botanical variety hypogaea from
Zambia of Africa. Within the subpopulation G4 (containing
23 accessions), five accessions were from South America,
12 accessions from Africa (six accessions were from
Zambia), and six accessions from Asia. This subpopulation
may be best represented by the botanical variety vulgaris.
This subpopulation was more diversely spread (covering
three continents: Africa, South America, and Asia), but
most of the accessions in the botanical variety vulgaris
(7/9) were classified in this subpopulation.
Model comparison and marker–trait association
Model comparisons determined that the mixed model with
only the population structure has the best fit for C18:1,
C18:2, and O/L ratio. It was identified that after controlling
the population structure, the functional SNP marker from
FAD2A is associated with oleic acid (C18:1, P value =
1.75 9 10-5), linoleic acid (C18:2, P value = 2.36 9
10-7), and O/L ratio (P value = 4.58 9 10-5) with RLR2
values 0.05, 0.09, and 0.07, respectively. The accessions
with the A/A genotype at FAD2A locus had a significantly
higher level of oleic acid (53.57%), lower level of linoleic
acid (26.23%), and higher O/L ratio (2.1) than the acces-
sions with G/G genotype (42.34, 34.92%, and 1.22)
(Table 3).
The FAD2A SNP had a much stronger association when
tested without controlling the population structure, oleic
acid (C18:1, P value = 2.35 9 10-30), linoleic acid
(C18:2, P value = 6.2 9 10-29), and O/L ratio (P value =
2.99 9 10-24). We further verified that the distribution
frequency of the FAD2A SNP alleles was different among
the four subpopulations. The A/A genotype had a high
frequency within G1 (33/35), absent in G2 (0/24), medium
in G3 (12/25), and low in G4 (1/23). The heterozygote
genotype G/A was present at low frequencies in G1 (1/35),
G2 (1/24), and G3 (1/12), but absent in G4. The G/G
genotype was present at a low frequency in G1 (1/35),
medium in G3 (6/12), and high in G2 (23/24) and G4
(22/23). This allele distribution pattern led to a reduced
significance of FAD2A gene to the three traits. But the
FAD2A genes remained significant when tested with popu-
lation structure control because the allele distribution pattern
was not completely correlated with population structure.
Selected models from model comparison for each trait
were used to test individual SSR markers. There were no
other associations identified between markers and chemical
traits (such as resveratrol and flavonoids). Quantile–quan-
tile plots of F-statistics verified the adequate control of
false positives for the mixed model because the deviation
of the observed F-statistics for 75 SSR markers from the
expected value was minimal (Fig. 2). The six SSR markers
that deviated from the expected F-statistics were further
examined for allele frequency (Table S3). Because of the
presence of alleles with very low frequencies and that most
of these markers have a large number of alleles, caution
should be given in interpreting these results.
Discussion
Peanut mini-core collection
The purpose of establishing a core or a mini-core collection
for any crop is to facilitate efficient and economical utili-
zation of plant germplasm for the end users and to identify
accessions with desirable traits from a subset of accessions
for crop improvement. The core collection (representing
11.2% of the total collection) was established from the
entire U.S. germplasm collection, and a mini-core collec-
tion (representing 1.5% of the entire collection) was sub-
sequently established from the core collection. In peanut,
there are two separate core collections that have been
established: the U.S. core collection containing 831
accessions established from 7,432 accessions (Holbrook
et al. 1993) and the International Crop Research Institute
for the Semi-Arid Tropics (ICRISAT) core collection
containing 1,704 accessions established from 14,310
accessions (Upadhyaya et al. 2003). Two mini-core col-
lections were also established from these two separate
peanut core collections, the ICRSAT mini-core containing
184 accessions (Upadhyaya et al. 2002) and the U.S. mini-
core collection containing 112 accessions (Holbrook and
Dong 2005). Due to the ease of procurement of germplasm
accessions, the U.S. peanut mini-core was used in this
study. We found that two (var. aequatoriana and var.
hirsuta) of the six peanut botanical varieties were not
included in the U.S. mini-core, but are part of the ICRISAT
mini-core. These varieties were not included because when
Table 3 Functional SNP marker of FAD2A associated with chemical
traits important for seed quality
Genotype n C18:1� C18:2 O/L ratio
Wild type (G/G) 52 42.34c 34.92a 1.22c
Heterozygote (G/A) 3 50.81b 28.27b 1.88b
Mutant (A/A) 39 53.57a 26.23c 2.10a
C18:1 oleic acid, C18:2 linoleic acid, O/L the ratio of oleic acid to
linoleic acid� a–c: if the letters are different after values, there is a significant
difference at P = 0.05
Theor Appl Genet (2011) 123:1307–1317 1313
123
the U.S. core and mini-core were established, these varie-
ties were not part of the U.S. germplasm collection.
Clearly, the U.S. mini-core needs to be expanded by adding
these two botanical varieties. To date, there have been no
reports comparing or using these mini-core collections
together by the same end users. It would be desirable to
compare these two mini-cores for the purpose of identify-
ing genetic redundancy or common accessions and then use
a combined mini-core for screening accessions with
desirable traits for peanut improvement. Although it was
confirmed that the current U.S. peanut mini-core panel is
suitable for association analysis, this panel should be
enlarged in order to cover all the peanut botanical varieties.
Level of peanut genetic diversity
In comparison with other field crops, there is limited
sequencing information available to develop markers in
peanut. Even though some projects (such as development
of genomic SSRs, EST-SSRs, and BAC-end sequencing)
have been completed, the nature of the peanut genome has
revealed limited polymorphic DNA markers available for
genetic mapping, genotyping, and association studies.
Cultivated peanut is a recent allotetraploid (AA 9 B-
B ? AB ? AABB). Before tetraploidization, a high level
of homology may have existed between the A and B
genomes of the diploid progenitors. Furthermore, peanut is
mainly a self-pollinated species. All these features make
development of markers very challenging. Most of the
markers used in this study were from previously published
reports (Hopkins et al. 1999; He et al. 2003; Ferguson et al.
2004; Moretzsohn et al. 2004, 2005; Liang et al. 2009; Li
et al. 2011; Qin et al. 2011). Among 308 SSR markers
screened with eight germplasm accessions, only 81 poly-
morphic markers were identified and used in this study.
Although these markers had been prescreened previously
and used in other studies, the polymorphism level was still
fairly low (81/308 = 26%). The average number of alleles
revealed per locus in this study was 8.1, which was slightly
lower than 10.1 alleles from a previous study on peanut
germplasm (Barkley et al. 2007), but very close to the 7.9
reported from another study on the peanut mini-core
(Kottapalli et al. 2007). As technology advances, low-path
shotgun sequencing of several key peanut genotypes may
be a quick, economic, and efficient approach to develop
markers, especially for a species like cultivated peanut with
a low level of genetic diversity.
Population structure and genetic diversity
with botanical variety and collection site
Structure analysis can estimate the number of subpopula-
tions, the degree of admixture among subpopulations, and
the genetic relatedness among accessions. On the other
hand, phylogenetic analysis can graphically display rela-
tionships between accessions. Structure analysis assigned
the accessions into four subpopulations (G1–G4), and
UPGMA tree analysis clustered the accessions into four
branches (B1–B4). In general, subpopulations identified by
STRUCTURE corresponded to a genetic cluster on the
phylogeny (G1/B1, G2/B2, G3/B3, and G4/B4). Although
the number of accessions in the corresponding subpopu-
lation and branch was different, most of the accessions
were classified into the corresponding subpopulation and
branch with only a few exceptions. The general separation
of two subspecies (subsp. hypogaea and subsp. fastigiata)
was evident because G1 was the group primarily with var.
hypogaea from subsp. hypogaea while G2, G3, and G4
were mostly from other botanical varieties from subsp.
fastigiata (Fig. 1 and Fig. S1). Our results indicate that the
population structure is associated with the types of botan-
ical varieties. The results from population structure anal-
ysis and genetic clustering analysis may also reflect the
origin of cultivated peanut, world cultivation, and/or
0
5
10
15
20
25
0 1 2 3 4 5
Expected F value
0
5
10
15
20
0 1 2 3 4 5
Ob
serv
ed F
val
ue
Ob
serv
ed F
val
ue
Expected F value
0
10
20
30
0 1 2 3 4 5
Ob
serr
ved
F v
alu
e
Expected F value
FAD2AFAD2A
FAD2A
a
Ah-041
b c
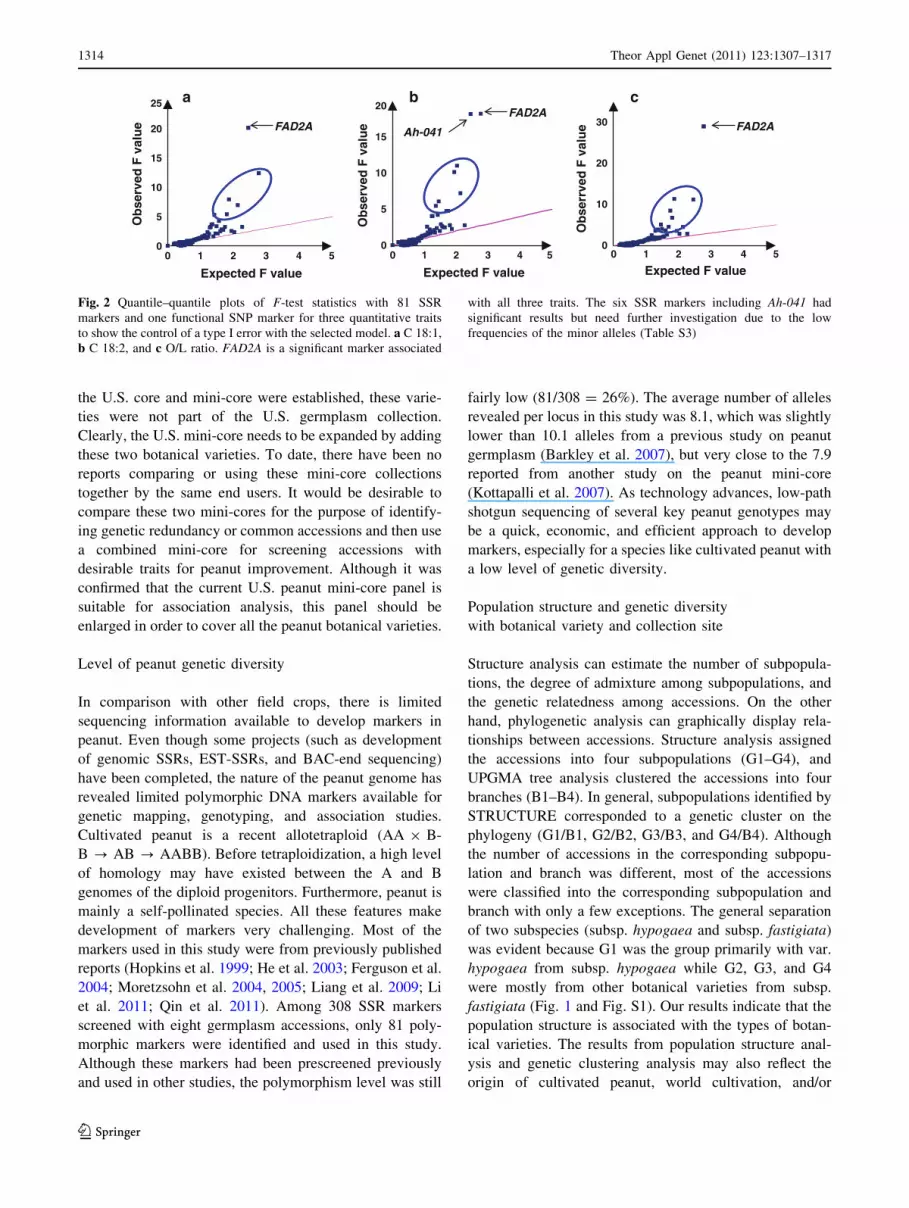
Fig. 2 Quantile–quantile plots of F-test statistics with 81 SSR
markers and one functional SNP marker for three quantitative traits
to show the control of a type I error with the selected model. a C 18:1,
b C 18:2, and c O/L ratio. FAD2A is a significant marker associated
with all three traits. The six SSR markers including Ah-041 had
significant results but need further investigation due to the low
frequencies of the minor alleles (Table S3)
1314 Theor Appl Genet (2011) 123:1307–1317
123

breeding practice. Cultivated peanut originated in South
America (possibly in the southern Bolivia–northern
Argentina regions). From the center of origin, the culti-
vated peanut evolved into six botanical varieties. Through
cultivation, the cultivated peanuts were introduced and
spread out to other continents, but the distribution and
cultivation frequency of each botanical variety was not
necessarily equal (Table S1 and Fig. S2). The peanut cul-
tivation and distribution also directly affect the germplasm
collection by collection sites. The botanical variety hypo-
gaea (red triangles) is spread throughout the world, but the
botanical varieties peruviana (blue diamond) and fastigiata
(green circles) were mainly restricted in South America
and Africa. There is no biological (reproductive) barrier
among these four botanical varieties. Some accessions may
contain mixtures of genetic components from different
subpopulations or from different botanical varieties, and
different mixtures were observed within some of the seed
sources obtained for use in this study. The botanical variety
peruviana was not frequently used as breeding material,
and it was only classified into the subpopulation G3 and
genetic cluster B3. It would be informative to see how the
population structure would change with the inclusion of the
other two botanical varieties (aequatoriana and hirsuta)
not included in this study.
Gene mutation in FAD2 in peanut
FAD2 is the key enzyme converting oleic acid (C18:1) to
linoleic acid (C18:2) by adding a double bond at the delta-
12 position in the hydrocarbon chain in plants. Two func-
tional mutations have been identified on the A and B
genome in peanut, respectively (Jung et al. 2000a, b; Lopez
et al. 2000). Our association analysis with diverse germ-
plasm validates that polymorphisms in FAD2 desaturase
enzyme are responsible for variations in oleic acid and
linoleic acid content. In our study, only the functional
mutation for FAD2A has been identified in some accessions
of the U.S. peanut mini-core collection, but no functional
mutations were identified on the B genome. These results
imply that the functional mutation on the B genome was a
recent event (Norden et al. 1987). Furthermore, there was
no functional mutation of FAD2 identified in the peanut
wild species (including the two putative progenitors of the
cultivated peanut) (Wang et al. 2010). This also implies
that all the functional mutations on FAD2 occurred after
tetraploidization. If the functional mutation on the A gen-
ome occurred after tetraploidization, the question that
needs to be addressed is whether this functional mutant
allele existed in all six botanical varieties.
A survey of the functional mutation allele on FAD2A
within the U.S. mini-core had been conducted by a CAPS
assay (Chu et al. 2007). The CAPS assay suggests that the
functional mutation of FAD2A may not occur in subspecies
fastigiata, but from our real-time PCR assay, at least two
accessions from the subspecies fastigiata carry the mutant
allele. The discrepancy from these two studies can be
explained by four possible reasons: The seeds used came
from different sources, possible misclassification of the
botanical varieties performed in either of these studies,
heterogeneity within an accession, or experimental error
from the two different platform assays. To confirm these
results, more accessions from the subspecies fastigiata
should be assayed with the two different genotyping plat-
forms or the regions containing this mutation site from
these two accessions should be sequenced. The FAD2A
genotyping revealed several heterozygotes (3 out of 94) in
our study, and this was not expected. In theory, the real-
time PCR assay should only identify homozygotes and no
heterozygotes since peanut is mainly self-pollinated spe-
cies. However, outcrossing in peanut does occur (Knauft
et al. 1992).
Marker-assisted selection for enhancing oleate level
in peanut
A functional SNP marker from FAD2A is associated with
oleic acid, linoleic acid, and O/L ratio with RLR2 values
0.05, 0.09, and 0.07, respectively. The SNP marker was
identified from the gene for fatty acid desaturase itself. The
results confirmed the gene function of FAD2A. Interest-
ingly, the SSR marker Ah-041 also deviated from the
expected F value for C18:2 (Fig. 2b), but not for C18:1 and
O/L ratio (Fig. 2a, c). In this study, Ah-041 allele fre-
quency ratio was 2:92, which did not allow a robust
comparison and interpretation of results. More research
work is needed before drawing a final conclusion in this
case. Beyond the U.S. peanut mini-core collection, the
functional mutation allele on FAD2B was identified in
other peanut lines (Norden et al. 1987), and several high
oleate peanut cultivars have been developed by integration
of this mutant allele. Different marker assays for the
detection of this mutant allele have been developed (Chu
et al. 2009; Barkley et al. 2010; Chen et al. 2010). In order
to enhance the oleate level, both mutant alleles (on FAD2A
and FAD2B) are required and need to be introduced to new
peanut cultivars.
In summary, population structure analysis revealed four
subpopulations associated with four botanical varieties. In
general, this peanut mini-core panel is suitable for associ-
ation mapping. However, there are six botanical varieties in
peanut and the U.S. mini-core only covered four botanical
varieties. Accessions from the botanical varieties (vars.
aequatoriana and hirsuta) should be added to the U.S.
mini-core and genotyped. The association analysis revealed
that one functional SNP marker from the FAD2A gene is
Theor Appl Genet (2011) 123:1307–1317 1315
123
associated with oleic acid (C18:1), linoleic acid (C18:2),
and O/L ratio. These associations turn out to be ideal for
improving seed quality because breeders want to increase
the amount of monounsaturated fatty acids (MUFA) and
reduce the amount of polyunsaturated fatty acids (PUFA)
to improve storage life of food products. The identified
DNA markers can be used in marker-assisted selection for
improving peanut seed quality. The functional mutation
(occurred after tetraploidization) has been identified on
FAD2A, but not on FAD2B (a recent event) within the U.S.
mini-core. For researchers to seek germplasm accessions
for enhancing oleate level by integration of the functional
mutant allele on the B genome in peanut breeding pro-
grams, genetic materials from other sources should be
exploited.
Acknowledgments The authors gratefully thank Drs. Paul Raymer,
Weibo Dong, and Peggy Ozias-Akins for giving useful comments and
suggestions to improve the quality of this manuscript, Mr. Brandon
Tonnis for his excellent technical assistance on chemical analysis, and
Ms. Jessica Norris for her assistance in gel electrophoresis and DNA
extraction.
References
Barkley NA, Dean R, Pittman RN, Wang ML, Holbrook CC,
Pederson GA (2007) Genetic diversity of cultivated and wild-
type peanuts evaluated with M13-tailed SSR markers and
sequencing. Genet Res 89:93–106
Barkley NA, Chenault-Chamberlin KD, Wang ML, Pittman RN
(2010) Development of a real-time PCR genotyping assay to
identify high oleic acid peanuts (Arachis hypogaea L.). Mol
Breed 25:541–548
Barkley NA, Wang ML, Pittman RN (2011) A real-time PCR
genotyping assay to detect FAD2A SNPs in peanuts (Arachishypogaea L.). Electron J Biotechnol. doi: 10.2225/vol14-issue1-
fulltext-12
Baur JA, Sinclair DA (2006) Therapeutic potential of resveratrol: the
in vivo evidence. Nat Rev Drug Discov 5:493–506
Bradbury PJ, Zhang Z, Kroon DE, Casstevens TM, Ramdoss Y,
Buckler ES (2007) TASSEL: software for association mapping
of complex traits in diverse samples. Bioinformatics
23:2633–2635
Bruner AC, Jung S, Abbott AG, Powell GL (2001) The naturally
occurring high oleate oil character in some peanut varieties
results from reduced oleoyl-PC desaturase activity from muta-
tion of aspartate 150 to asparagines. Crop Sci 41:522–526
Cavalli-Sforza LL, Edwards AWF (1967) Phylogenetic analysis:
Models and estimation procedures. Am J Hum Genet
19:233–257
Chen Z, Wang ML, Barkley NA, Pittman RN (2010) A simple allele-
specific PCR assay for detecting FAD2 alleles in both A and B
genomes of the cultivated peanut for high-oleate trait selection.
Plant Mol Biol Rep 28:542–548
Chu Y, Ramos L, Holbrook CC, Ozias-Akins P (2007) Frequency of a
loss-of-function mutation in oleoyl-PC desaturase (ahFAD2A) in
the mini-core of the US peanut germplasm collection. Crop Sci
47:2372–2378
Chu Y, Holbrook CC, Ozias-Akins P (2009) Two alleles of ahFAD2B
control the high oleic acid trait in cultivated peanut. Crop Sci
49:2029–2036
Dean LL, Hendrix KW, Holbrook CC, Sanders TH (2009) Content of
some nutrients in the core of the core of the peanut germplasm
collection. Peanut Sci 36:104–120
Evanno G, Regnaut S, Goudet J (2005) Detecting the number of
clusters of individuals using the software structure: a simulation
study. Mol Ecol 14:2611–2620
Excoffier L, Lischer HEL (2010) Arlequin suite ver 3.5: a new series
of programs to perform population genetics analyses under
Linux and Windows. Mol Ecol Res 10:564–567
Falush D, Stephens M, Pritchard JK (2003) Inference of population
structure using multilocus genotype data: linked loci and
correlated allele frequencies. Genetics 164:1567–1587
Ferguson ME, Burow MD, Schulze SR, Bramel PJ, Paterson AH,
Kresovich S, Mitchell S (2004) Microsatellite identification and
characterization in peanut (A. hypogaea L.). Theor Appl Genet
108:1064–1070
Hardy OJ, Vekemans X (2002) SPAGeDi: a versatile computer
program to analyze spatial genetic structure at the individual or
population levels. Mol Ecol Notes 2:618–620
He G, Ming R, Newman M, Gao G, Pittman RN, Prakash CS (2003)
Microsatellites as DNA markers in cultivated peanut (Arachishypogaea L.). BMC Plant Biol 3:3
Holbrook CC, Dong W (2005) Development and evaluation of a mini
core collection for the US peanut germplasm collection. Crop Sci
45:1540–1544
Holbrook CC, Anderson WF, Pittman RN (1993) Selection of a core
collection from the US germplasm collection of peanut. Crop Sci
33:859–861
Hopkins MS, Casa AM, Wang T, Mitchell SE, Dean RE, Kochert GD,
Kresovich S (1999) Discovery and characterization of polymor-
phic simple sequence repeats (SSRs) in peanut. Crop Sci
39:1243–1247
Isleib TG, Holbrook CC, Gorbet DW (2001) Use of plant introduc-
tions in peanut cultivar development. Peanut Sci 28:96–113
Jung S, Powell G, Moore K, Abbott A (2000a) The high oleate trait in
the cultivated peanut [Arachis hypogaea L.]. II. Molecular basis
and genetics of the trait. Mol Gen Genet 263:806–811
Jung S, Swift D, Sengoku E, Pate M, Teule F, Powell G, Moore K,
Abbott A (2000b) The high oleate trait in the cultivated peanut
[Arachis hypogaea L.]. I. Isolation and characterization of two
genes encoding microsomal oleoyl-PC desaturase. Mol Gen
Genet 263:796–805
King RE, Bomser JA, Min DB (2006) Bioactivity of resveratrol.
Compr Rev Food Sci Food Safety 5:65–70
Knauft DA, Chiyembekeza AJ, Gorbet DW (1992) Possible repro-
ductive factors contributing to outcrossing in peanut (Arachishypogaea L.). Peanut Sci 19:29–31
Kottapalli KR, Burow MD, Burow G, Burke J, Puppala N (2007)
Molecular characterization of the US peanut mini core collection
using microsatellite markers. Crop Sci 47:1718–1727
Krapovickas A, Gregory WC (1994) Taxonomia del enero Arachis(Leguminosae). Bonplandia 8:1–186
Kwak M, Gepts P (2009) Structure of genetic diversity in the two
major gene pools of common bean (Phaseolus vulgaris L.,
Fabaceae). Theor Appl Genet 118:979–992
Li Y, Chen CY, Knapp SJ, Culbreath AK, Holbrook CC, Guo BZ
(2011) Characterization of simple sequence repeat (SSR)
markers and genetic relationships within cultivated peanut
(Arachis hypogaea L.). Peanut Sci (in press)
Liang X, Chen X, Hong Y, Liu H, Zhou G, Li S, Guo B (2009) Utility
of EST-derived SSR in cultivated peanut (Arachis hypogaea L.)
and Arachis wild species. BMC Plant Biol 9:35
1316 Theor Appl Genet (2011) 123:1307–1317
123

Liu K, Muse SV (2005) PowerMarker: integrate analysis environment
for genetic marker data. Bioinformatics 21:2128–2129
Loiselle BA, Sork VL, Nason J, Graham C (1995) Spatial genetic
structure of a tropical understory shrub, Psychotria officinalis
(Rubiaceae). Am J Bot 82:1420–1425
Lopez Y, Nadaf HL, Smith OD, Connell JP, Reddy AS, Fritz AK
(2000) Isolation and characterization of the Delta (12)-fatty acid
desaturase in peanut (Arachis hypogaea L.) and search for
polymorphisms for the high oleate trait in Spanish market-type
lines. Theor Appl Gent 101:1131–1138
Moretzsohn MC, Hopkins M, Mitchell SE, Kresovich S, Valls JFM,
Ferreira ME (2004) Genetic diversity of peanut (Arachishypogaea L.) and its wild relatives based on the analysis of
hypervariable regions of the genome. BMC Plant Biol 4:11
Moretzsohn MC, Leoi L, Proite K, Guimaraes PM, Leal-Bertioli
SCM, Gimenes MA, Martins WS, Valls JFM, Grattapaglia D,
Bertioli DJ (2005) A microsatellite-based, gene-rich linkage map
for the AA genome of Arachis (Fabaceae). Theor Appl Genet
111:1060–1071
Myles S, Peiffer J, Brown PJ, Ersoz ES, Zhang Z, Costich DE,
Buckler ES (2009) Association mapping: critical considerations
shift from genotyping to experimental design. Plant Cell
21:2194–2202
Norden AJ, Lipscomb RW, Carver WA (1969) Registration of
Florunner peanuts. Crop Sci 9:850
Norden AJ, Gorbet DW, Knauft DA, Young CT (1987) Variability in
oil quality among peanut genotypes in the Florida breeding
program. Peanut Sci 14:7–11
O’Byrne DJ, Knauft DA, Shireman RN (1997) Low fat-monounsat-
urated rich diets containing high-oleic peanuts improves serum
lipoprotein profile. Lipids 32:687–695
Pancholy SK, Despande AS, Krall S (1978) Amino acids, oil and
protein content of some selected peanut cultivars. Proc Am
Peanut Res Edu Assoc 10:30–37
Patterson N, Price AL, Reich D (2006) Population structure and
eigenanalysis. PloS Genet 2:e190
Price AL, Patterson NJ, Plenge RM, Weiblatt ME, Shadick NA, Reich
D (2007) Principal components analysis corrects for stratification
in genome-wide association studies. Nat Genet 38:904–909
Pritchard J, Stephens M, Donnelly P (2000) Inference of population
structure using multilocus genotype data. Genetics 155:945–959
Qin H, Chen C, Feng S, Guo Y, Knapp S, Culbreath A, He G, Wang
ML, Zhang X, Holbrook CC, Ozias-Akins P, Liang X, Guo B
(2011) An integrated genetic linkage map of cultivated peanut
(Arachis hypogaea L.) constructed from two RIL populations.
Theor Appl Genet (submitted)
Sanders TH, McMichael RW, Hendrix KW (2000) Occurrence of
resveratrol in edible peanuts. J Agric Food Chem 48:1243–1246
SAS Institute (1999) SAS/STAT user’s guide version 8. Cary
Sobolev VS, Cole RJ (1999) Trans-resveratrol content in commercial
peanuts and peanut products. J Agric Food Chem 47:1435–1439
Sun G, Zhu C, Kramer MH, Yang SS, Song W, Piepho HP, Yu J
(2010) Variation explained in mixed-model association map-
ping. Heredity 105:333–340
Teres S, Barcelo-Coblijn G, Benet M, Alvarez R, Bressani R, Halver
JE, Escriba PV (2008) Oleic acid content is responsible for the
reduction in blood pressure induced by olive oil. Proc Natl Acad
Sci USA 105:13811–13816
Upadhyaya HD, Bramel P, Ortiz R, Singh S (2002) Developing a mini
core of peanut for utilization of genetic resources. Crop Sci
42:2150–2156
Upadhyaya HD, Ortiz R, Bramel PJ, Singh S (2003) Development of
a groundnut core collection using taxonomical, geographical and
morphological descriptors. Genet Resour Crop Evol 50:139–148
Wang ML, Pittman RN (2008) Resveratrol content in seeds of peanut
germplasm quantified by HPLC. Plant Genet Resour 7:80–83
Wang ML, Gillaspie AG, Morris JB, Pittman RN, Davis J, Pederson
GA (2008) Flavonoid content in different legume germplasm
seeds quantified by HPLC. Plant Genet Resour 6:62–69
Wang ML, Chen CY, Davis J, Guo B, Stalker HT, Pittman RN
(2009a) Assessment of oil content and fatty acid composition
variability in different peanut subspecies and botanical varieties.
Plant Genet Resour 8:71–73
Wang ML, Zhu C, Barley NA, Chen Z, Erpelding JE, Murray SC,
Tuinstra MR, Tesso T, Pederson GA, Yu J (2009b) Genetic
diversity and population structure analysis of accessions in the
US historic sweet sorghum collection. Theor Appl Genet
120:13–23
Wang ML, Barkley NA, Chinnan M, Stalker HT, Pittman RN (2010)
Oil content and fatty acid composition variability in wild peanut
species. Plant Genet Resour 8:232–234
Yu J, Pressoir G, Briggs WH, Vroh BI, Yamasaki M, Doebley JF,
McMullen MD, Gaut BS, Nielsen D, Holland JB, Kresovich S,
Buckler ES (2006) A unified mixed-model method for associ-
ation mapping that accounts for multiple levels of relatedness.
Nat Genet 38:203–208
Zhu C, Yu J (2009) Nonmetric multidimensional scaling corrects for
population structure in whole genome association studies.
Genetics 182:875–888
Zhu C, Gore M, Buckler ES, Yu J (2008) Status and prospects of
association mapping in plants. Plant Genome 1:5–20
Theor Appl Genet (2011) 123:1307–1317 1317
123


