Embed Size (px)
Citation preview

Journal of Colloid and Interface Science 250, 5–17 (2002)doi:10.1006/jcis.2002.8318, available online at http://www.idealibrary.com on
Porous Structure of Activated Carbons and Tert-butylbenzeneBreakthrough Dynamics
D. Palijczuk,∗ V. M. Gun’ko,†,1 R. Leboda,‡ J. Skubiszewska-Zi ba,‡ and S. Zi tek∗∗Military Institute of Chemistry and Radiometry, 00-910 Warsaw, Poland; †Institute of Surface Chemistry, 17 General Naumov Street,
03164 Kiev, Ukraine; and ‡Department of Chemical Physics, Maria Curie-Sklodowska University, 20-031 Lublin, Poland
E-mail: [email protected]
Received August 3, 2001; accepted February 21, 2002; published online April 29, 2002
The structural and adsorptive characteristics of six activated car-bons were studied by means of nitrogen and benzene adsorption andwater desorption. Tert-butylbenzene (TBB) breakthrough dyna-mics was analyzed by using several integral equations solved with aregularization/singular-value decomposition procedure. TBB inter-action with texturally different activated carbons with the presenceof preadsorbed or adsorbed water under dynamic conditions wasillustrated by the breakthrough plots handled with several models.The influence of the type of activated carbons, their pore size distri-butions, water vapor, and TBB flow rate on the breakthrough times(tb) and the dynamic capacity of the carbon beds has been exploredwith better results for a carbon sample possessing a maximal con-tribution of mesopores at half-width x > 1.5 nm among the carbonsstudied (which also appears on benzene adsorption) and a majorcontribution of microporocity as VDS/Vp ≈ 0.88 and SK/SBET ≈0.15. Another adsorbent, which is characterized by a similar totalporosity but a larger micropore volume, a smaller contribution ofmesopores (SK/SBET ≈ 0.08), greater total and miroporous specificsurface areas, and greater intensity of the pore size distributionat x < 1.5 nm, shows the second result in dynamic TBB retention.C© 2002 Elsevier Science (USA)
Key Words: activated carbons; nitrogen adsorption; benzeneadsorption; pore size distribution; adsorption energy distribu-tion; breakthrough dynamics; tert-butylbenzene adsorption; break-through time; adsorbed water.
INTRODUCTION
Absorption of organics (substituted aromatics and alipha-tics, especially chlorophosphoro-, sulfo-, and nitroorganics, andother harmful compounds) by activated carbons from air andwater is of interest from a theoretical point of view and for in-dustrial, human, and environment protection purposes (1–10).The influence not only of the carbon pore structure, the granulesize (d), and the carbon bed depth (L) but also of the gas streamhumidity and the amounts of preadsorbed water are considered inthe literature on the investigations of the adsorptive capability of
1 To whom correspondence should be addressed. Fax: 38044 4443567.
5
activated carbons with respect to organics (especially substitutedaromatics) in different media. Recently Lodewyckx and Vansant(7) have explored the impact of the humidity on the adsorptionof chlorobenzene, n-heptane, cyclohexane, trichloroethane, n-butyl alcohol, and carbon tetrachloride on activated carbon bedsapplying a modified Wheeler–Jonas model (9) describing thebreakthrough time (tb) versus the carbon bed and gas flow pa-rameters
tb = We
c0
[m0
Q− ρb
kν
ln
(c0 − cx
c0
)], [1]
where m0 is the weight of the carbon bed, We is the equilib-rium adsorption capacity of the carbon for a given vapor, Q isthe volumetric flow rate, c0 is the contaminant concentrationin air, ρb is the bulk density of the carbon bed, and kν denotesthe effective overall adsorption rate coefficient. In many casesthe difference between the breakthrough times calculated usingEq. [1] and experimentally determined values is less than 15%,which is close to the experimental errors. However, a disadvan-tage of Eq. [1] is caused by ignoring water vapor always presentin air up to 100% relative humidity. An additional problem isthe prehumidification of activated carbons. When a respiratorwith a carbon filter has been used previously (even without anycontaminant present) water vapor is already preadsorbed on thecarbon adsorbent and can influence its adsorptive properties.Therefore Eq. [1] has been modified with respect to the We andkν parameters considering water adsorption or preadsorption (7)(LV model).
Jonas and Rehrmann (9b) obtained a simple equation analyz-ing the maximum first-order rate constant of adsorption (β∞)
β∞ = A√
νL
d1.5, [2]
where A is a constant dependent on the saturated pressure andthe molecular weight of an adsorbate, νL is the linear flow rate,and d is the mean diameter of carbon particles. Several equations
0021-9797/02 $35.00C© 2002 Elsevier Science (USA)
All rights reserved.

6 PALIJCZU
and parameters such as
(i) the overall mass transfer coefficient related to pore fillingon adsorption (directly connected to kν in Eq. [1]).
βe = 48β0.33ν0.75L
d1.5[3]
(where β denotes the similarity constant in Dubinin’s theoryof space filling of pores; β = 1 for benzene and 1.72 for tert-butylbenzene, TBB) with the modified Wheeler–Jonas equation;
(ii) the overall adsorption rate coefficient in the presence ofhumidity (pseudoconstant)
βe = βe
(1 − Vw
Vp
)[4]
(where Vw is the total pore volume occupied by water in theabsence of organics, and Vp is the total pore volume);
(iii) the amount of adsorbed/desorbed water per gram ofcarbon
A = Atot
[1 − exp
(−0.00005T νLt
L√|Atot|
)][5]
(where Atot is the total amount of water that can be adsorbed(or desorbed) in the given circumstances, T is the temperature,L is the carbon bed depth, and t is the time); and
(iv) the volume of adsorbed water replaced by organics dur-ing the adsorption
Vs = (Vpre + Vair)
[1 − log
(cw + c0
c0
)log
(ps + pw
pw
)]
[6]
(where Vpre is the volume taken up by the preadsorbed water,Vair is the volume taken up (or liberated) by the humidity of theair stream, cw is the concentration of water vapor in the air, and ps
and pw denote saturation vapor pressures of organics and water,respectively) have been also used to analyze the absorption oforganics without or with the presence of water and to describethe water uptake/loss as a function of time (7). The pore volumereduced because of the water adsorption (V ′
p) can be written as
V ′p = Vp − Vpre − Vair + Vs. [7]
In another model (8), the breakthrough time can be calculatedusing
tb = a
νLc0(L − Hd
√νL), [8]
where d is the granule diameter, a is the probe gas adsorptioncorresponding to c0 − cx , and H is the reduced length of theunused layer of carbon granules dependent on the flow rate. Therelationship between cx and L can be written as
( )
cx = c0 exp −βeLνL. [9]
K ET AL.
From the mentioned equations, it is clear that the larger the βe
value, the longer the tb time at the same cx value. Equation [8]can be rewritten
tb = αa
νc0
[L − H ′ νL
βelog
(c0
cx
)], [10]
where α and H ′ are constants (8). Note that Eq. [10] can be usedfor both dry and wet airstreams (as well as modified Eq. [1]),since βe, α, and H ′ can be recomputed to consider the waterimpact.
It was noticed (8) that tert-butylbenzene is an interesting sub-stance to test breakthrough dynamics, and it can be used as amodel adsorbate simulating such very toxic compounds as, e.g.,sarin (however, TBB per se is not so toxic), since the break-through plots for sarin and TBB interacting with activated car-bon beds under the same conditions are similar. Therefore TBBwas utilized as a probe adsorbate in practical gas-life testing ofthe carbon filters in the canisters (8).
Thus, to describe breakthrough results, several model equa-tions were developed by Bohart and Adams, Yoon and Nelson,Wheeler, Jonas, and Rehrmann, Lodewyckx and Vansant, andothers (7–10). However, known energetic and structural nonuni-formities of carbon adsorbents (1–3, 8, 11, 12) expected to com-pute the distribution functions of the corresponding parameters(e.g., adsorption rate constants and free energy of adsorption)related to the breakthrough phenomena were studied in the lite-rature inadequately. Therefore the aim of this work is to explorethe influence of the textural and adsorptive characteristics of dif-ferent carbon adsorbents by considering their nonuniformity andthe impact of water on TBB breakthrough results. Additionally,it is of interest to investigate the impact of the gas flow rate andthe size of carbon granules on the breakthrough dynamics.
EXPERIMENTAL
(a) Materials
Six activated carbons, characterized by significantly diffe-rent porosity (Table 1, Vp) and specific surface area (SBET) wereused to study tert-butylbenzene breakthrough dynamics. Threecarbon samples (labeled PS1, PS2, and PS3) were preparedfrom plum stones, PS (PSO MASKPOL, Poland), under variedconditions (temperature and time of activation, double activa-tion for PS3) applied to prepare texturally different activatedcarbons. Commercial activated carbons FY5 (labeled here asCS1) (A.U.G. Aktivekohle, Germany) and NPK (labeled CS2)(Gryfskand Hajnowka, Poland) were produced from coconutshells (CS). The granules of the carbons used have irregularforms with a size of 0.5–0.7 mm (first fraction) or 0.71–1.0 mm(second fraction). Commercial activated carbon Norit R 0.8 Ex-tra (labeled Norit) (Norit NV, The Netherlands; granules havea regular cylindrical form at d = 0.8 mm) characterized by
pore parameters (Table 1) and nitrogen and benzene adsorption–desorption isotherms (Fig. 1) similar to those of PS2 was used for
TERT-BUTYLBENZEN
TABLE 1Structural Characteristic of Carbons
Parameter PS1 PS2 PS3 CS1 CS2 Norit
Ash content (wt%) 2.18 6.12 8.00 3.64 3.41 6.04SBET,N2 (m2 g−1) 877 1351 1873 1172 2164 1451SBET,benz (m2 g−1) 826 1449 2004 1169 2037 1526SK,N2 (m2 g−1) 73 174 284 48 180 133Vp,N2 (cm3 g−1) 0.445 0.749 1.037 0.550 1.044 0.748Vp,benz (cm3 g−1) 0.404 0.716 0.999 0.500 0.896 0.685SDS,N2 (m2 g−1) 947 1026 1038 904 1264 1053SDS,benz (m2 g−1) 772 959 954 878 1265 949VDS,N2 (cm3 g−1) 0.377 0.589 0.910 0.532 1.111 0.689VDS,benz (cm3 g−1) 0.333 0.582 0.820 0.480 0.886 0.630xDS,N2 (nm) 0.41 0.59 0.82 0.58 0.80 0.67xDS,benz (nm) 0.45 0.62 0.79 0.56 0.72 0.66δDS,N2 (nm) 0.095 0.23 0.30 0.26 0.35 0.25δDS,benz (nm) 0.098 0.25 0.35 0.23 0.24 0.28DAJ,N2 2.935 2.888 2.851 2.945 2.888 2.898DAJ,benz 2.674 2.512 2.374 2.612 2.804 2.473
Note. Vp is the total pore volume; SDS, VDS, xDS, and δDS are the specificsurface area, the pore volume, the pore half-width, and the size distributiondispersion for micropores, correspondingly, determined by using the modifiedDubinin–Stoeckli equation; SK is the specific surface area of mesopores; DAJ isthe fractal dimension; and the subscripts N2 and benz correspond to parametersdetermined from the adsorption–desorption isotherms for nitrogen and benzenerespectively.
comparative investigations. The structural characteristics of thetested carbons are given in Table 1. Before the measurements,the activated carbons were dried at 383 K for 3 h. Ash was re-moved from two of the activated carbons, namely PS1 and PS3(coded PS1de-ash and PS3de-ash), as described previously (13, 14).To remove ash, samples were washed with a mixture of H2Oand HCl (5 : 1) then concentrated HCl and methanol (2 : 1) in aSoxhlet apparatus; after that the samples were washed with waterto remove residual Cl− ions controlled using AgNO3. Accordingto the literature (3, 15), treatment of carbons in HCl can lead tothe decomposition of carboxyl and lactone surface groups withincreasing concentration of phenolic and carbonyl groups. Sucha treatment results in some enhancement of the concentration ofoxidized surface groups. Therefore this treatment can slightlyaffect the uptake of water or TBB + water.
For an investigation of the influence on adsorbed water onthe structural characteristics of carbons, two samples CS1 andCS2 were frozen with water adsorbed from air and studied usingnitrogen adsorption–desorption at 77.4 K (Table 2).
Tert-butylbenzene (BDH Chemicals Ltd, Poole, England) wasused as a probe organic compound in the breakthrough experi-ments. The choice of TBB is determined by a special interestconcerning removal of substituted aromatics from air.
(b) Adsorption and Breakthrough Measurementsand Computing
Compressed air was purified on columns with activated car-bon, molecular sieves, and silica gel. The TBB vapor was gene-
E BREAKTHROUGH 7
rated by means of an infusion pump with a syringe. Dry air,challenged with required amounts of TBB vapor, was suppliedthrough a glass tube (internal section 5.187 cm2) filled with atested carbon. An initial concentration of TBB was c0 = 1 ±0.1 mg dm−3. The carbon bed with the constant depth L =1.5 cm (the specific density of carbons (ρb) and the weight of car-bon beds (m0) are shown in Table 3) was temperature-controlled
FIG. 1. Nitrogen (a) adsorption–desorption isotherms and (b) reduced (di-vided by Vp) αS plots; and (c) benzene adsorption–desorption isotherms.

8 PALIJCZU
TABLE 2Structural Characteristic of Carbons Frozen with Water Adsorbed
from Air (Nitrogen Adsorption–Desorption)
Parameter CS1∗ CS2∗
SBET (m2 g−1) 854 1311SK (m2 g−1) 53 173Vp (cm3 g−1) 0.416 0.669SDS (m2 g−1) 591 282VDS (cm3 g−1) 0.380 0.649xDS (nm) 0.67 1.31δDS (nm) 0.23 0.58DAJ 2.925 2.819
at 293 K. The volumetric flow rate was Q = 5.19 dm3 min−1
(1.0 dm3 min−1 cm−2), resulting in the linear flow rate νL =1000 cm min−1. Various volumetric flow rates (six values) wereused to test only PS1 (granule fraction 0.71–1.0 mm). The gasflow was controlled by several flow meters. The outlet concen-trations were analyzed in cycles of 3 min by using a CP 9001CHROMPACK gas chromatograph with a flame ionization de-tector. The breakthrough times were determined at the outletconcentration (behind the carbon bed) of TBB cx = 10−5 mgdm−3. To study the water impact on the TBB breakthrough, thewater vapor was added to reach 80% relative humidity (RH)of the air. The equilibrium was assumed when changes in thecarbon bed weight did not exceed 0.01 g for successive mea-surements with respect to the prehumidification of carbon beds.The measurements were performed with dry carbons or withprehumidified carbon (only PS2) at 80% RH. The breakthrough
measurements performed several times for each carbon sampleswere characterized by a high level of the repeatability.To characterize the TBB breakthrough dynamics with consid-eration for the nonuniformity of the carbon adsorbents, Eq. [10]
TABLE 3Dynamic Adsorption of TBB on Dry Carbon Beds
Sample tb (min) Awb (mg g−1) β∗e (min−1) Lc (cm) Wc (g) m0 (g) ρb (g cm−3) We (mg g−1) Fitting equation
aPS1 60 89 14,200 0.81 1.89 3.501 0.450 197 Bx = 0.0707t − 9.2643bPS1 35 50 9,900 1.16 2.66 3.423 0.440 226 Bx = 0.041t − 6.4277aPS2 102 198 14,800 0.78 1.34 2.578 0.331 422 Bx = 0.0455t − 9.6368bPS2 67 130 11,100 1.04 1.80 2.607 0.335 425 Bx = 0.0335t − 7.2357aPS3 152 350 21,200 0.54 0.82 2.256 0.290 559 Bx = 0.0579t − 13.803bPS3 113 227 14,100 0.82 1.31 2.412 0.310 508 Bx = 0.0369t − 9.1817aCS1 87 112 12,900 0.89 2.22 3.735 0.480 276 Bx = 0.0393t − 8.4285bCS1 55 74 10,600 1.09 2.53 3.501 0.450 270 Bx = 0.0345t − 6.8813aCS2 113 248 13,800 0.83 1.39 2.505 0.322 562 Bx = 0.0351t − 8.9833bCS2 88 157 10,800 1.07 1.85 2.606 0.335 534 Bx = 0.0236t − 7.05
Norit 58 94 9,800 1.17 2.45 3.128 0.402 437 Bx = 0.0236t − 6.3744
Note. d = a0.5–0.7 mm or b0.71–1.0 mm; tB is the breakthrough time at the outlet concentration cx = 10−5 mg/dm3; Awb is the adsorption capacity of 1 gactivated carbon at cx = 10−5 mg/dm3; Wc is the critical weight of bed defined as sufficient to keep the effluent concentration below a predefined breakthroughconcentration cx ; m0 is the weight of the bed; We is the kinetic adsorption capacity equal to the kinetic saturation capacity minus (mass of adsorbed vaporTBB)/(mass of adsorbent at concentration c0); Lc is the critical bed depth.
Bx = logcx
c0; Awb = A0
m0; A0 = tBc0 Q;
K ET AL.
To compute several parameters (Tables 3–7, We, Lc, and β∗e )
characterizing the TBB breakthrough dynamics, the equationfor the breakthrough time (9) was used in the form
tb = ρbWe
c0νL
[L − νL
βeln
(c0
cx
)][11]
akin to Eq. [10] and modified to
ln
(cx
c0
)= c0βe
ρbWetb − βe
νLL, [12]
i.e., in a general form
logcx
c0= at − b, [13]
where
b = 0.434βe
νLL; a = 0.434c0βe
ρbWe.
Then
βe = bνL
0.434L[14]
and
We = 0.434c0βe
ρba. [15]
Wc = ρQ ln(c0/cx )
β∗e
; Lc = νL ln(c0/cx )
β∗e
.

N
TERT-BUTYLBENZErewritten in the integral form
C (τ ) =τ∫
0
A exp
[− f (βe)
ν
(L − c0νt
α[c0 − c(t)]
)]dt [16]
(where C (τ ) is the overall amount of organics behind the car-bon bed for the time τ , and A is a constant) was used to com-pute the f (βe) distribution function utilizing the constrainedregularization-SVD (singular-value decomposition) procedurefor an initial portion (for better fitting) of the breakthrough plotsat c(t)/c0 < 0.2. Another integral equation with respect to f (βe)was derived using modified Eq. [1] close to the LV model toconsider not only the carbon nonuniformity but also the waterimpact
C (τ ) =τ∫
0
A
{1 + exp
[(WeW
Qc0− t
)f (βe)c0
ρbWe
]}−1
dt. [17]
The nitrogen adsorption–desorption isotherms (Fig. 1a) wererecorded at 77.4 K using a Micromeritics ASAP 2405N ana-lyzer. Benzene adsorption–desorption isotherms (Fig. 1c) weremeasured gravimetrically at 293 K using a McBain-Bakr quartzmicrobalance. The specific surface area SBET (1, 2), pore vol-ume Vp (estimated at p/p0 ≈ 0.98, where p and p0 denote theequilibrium and saturation pressures, respectively), and other pa-rameters listed in Table 1 were determined on the basis of nitro-gen (subscript “N2”) or benzene (subscript “benz”) adsorption–desorption.
The modified Dubinin–Stoeckli (DS) equation (16, 17) wasused to estimate micropore contribution with correction relatedto adsorption in mesopores. The SDS, VDS, and other parame-ters with the DS subscript (Table 1) were calculated over thepore range at the half-width xDS ≤ 1.0 nm. The specific surfacearea of the mesopores (SK) was determined using the Kiselevequation (18). The normalized nitrogen adsorption isotherm forCabot BP 280 nongraphitized carbon black (19) was used as areference standard adsorption for calculations by using the αS
plot method (1, 2).The pore size distributions (PSDs) f (x) were calculated us-
ing the overall isotherm equation based on the combination ofthe modified Kelvin equation and the statistical adsorbed filmthickness (20) applied to a model of slitlike pores of activatedcarbons (the form of the integral equation and the equation con-stants used were described previously (12, 20)). The nitrogendesorption and benzene adsorption isotherms were used to com-pute the PSDs with the modified regularization-SVD procedureCONTIN (21) under nonnegativity conditions for f (x) with afixed regularization parameter α = 0.001.
Calculations of the fractal dimension (DAJ) of the adsorbentswere performed on the basis of the adsorption data using theadsorption isotherm equation (22) at p/p0 ≤ 0.85 with consi-deration for the capillary condensation.
To characterize the adsorptive properties of carbons, theadsorption potential distributions (APDs) f (A) = −da/d A
E BREAKTHROUGH 9
(where a denotes the adsorbed amount of nitrogen or benzene;A = −G = RgT ln(p0/p) is the differential molar work,which is equal to the negative of the change in the Gibbs freeenergy; Rg is the gas constant) were utilized. The Fowler–Guggenheim (FG) equation describing localized monolayer ad-sorption with lateral interaction (23, 24) was used as the kernelθl in the overall adsorption isotherm in the form of Fredholmintegral equation of the first kind
�(T, p) =ymax∫0
θl(T, p, y) f (y) dy, [18]
where f (y) is an unknown distribution function of the givenparameter y (e.g., y = E or x). A maximal p/p0 value (<0.1)for a nitrogen isotherm portion used with the FG equation cor-responds to nearly monolayer coverage. To calculate the f (y)functions with the overall isotherm equation, a constrained re-gularization method can be used, as the solution of Eq. [18] isa well-known ill-posed problem due to the impact of noise onthe measured data, which does not allow one to utilize exactinversion formulas or iterative algorithms (21, 25). For this pur-pose, the constrained regularization procedure CONTIN (21)was modified to apply different equations to estimate the distri-butions of the pore size f (x), the adsorption energy f (E), themass transfer coefficient f (βe), and the free energy of TBB ad-sorption f (G) at the regularization parameter values fixed orautomatically determined on the basis of F-test and confidenceregions using the parsimony principle.
Thermogravimetric (TG) measurements. Water desorptionfrom activated carbons was investigated over the range 293–573 K by means of differential thermal analysis (DTA) in air us-ing a Derivatograph C (Paulik, Paulik & Erdey, MOM, Budapest)under the linear heating rate 10◦C/min. Water was adsorbed oncarbons in air.
RESULTS AND DISCUSSION
Several structural factors of activated carbons such as thetotal, micro-, and mesoporous specific surface areas, the cor-responding pore volumes, the transport pore network, the gran-ule size, and the carbon bed depth, as well as the chemical natureof the surfaces (e.g., availability of oxygen-containing groupsand other surface functionalities), the composition of organicsin the gas flow, and its humidity, can influence the breakthroughresults. The investigations necessary to elucidate the relation-ships between these characteristics (also with consideration forthe nonuniformity of carbons) and TBB breakthrough dyna-mics can be begun from comparative analysis of the texturaland adsorptive characteristics of the carbon adsorbents.
The activated carbons studied are mainly microporous(Table 1, compare SDS, SK with SBET and VDS with Vp) withrelatively low contribution of mesopores (maximal for PS3 pos-
sessing SK/SBET ≈ 0.152 and VDS/Vp ≈ 0.88). Therefore the
10 PALIJCZU
nitrogen isotherm curves have a small decline at p/p0 > 0.1 (af-ter monolayer formation), especially for CS1 and CS2 (Fig. 1a).The reduced αS plots (Fig. 1b) are typical for microporous ad-sorbents with a major portion of the curves being to the leftfrom that for a referenced Cabot BP 280 nongraphitized carbonblack possessing SBET ≈ 40 m2/g (19). The hysteresis loops ofthe nitrogen and benzene adsorption–desorption isotherms arenarrow (PS2 and Norit) or very narrow (PS1, CS1, and CS2)(Fig. 1); i.e., the capillary condensation of the adsorbates inmesopores is weak or practically absent. For PS3 characte-rized by a maximal hysteresis loop for the nitrogen and ben-zene adsorption–desorption (Figs. 1a and 1c), a decline of theisotherms at p/p0 > 0.4 (capillary condensation region) cor-responds to a maximal contribution of mesopores among thesamples studied. The difference in the nitrogen and benzeneadsorption–desorption isotherms for PS3 and CS2 is noteworthy(Fig. 1) because of the differences in the molecular size of thesecompounds and their interactions with graphite sheets. There-fore one can assume that structural features of PS3 responsiblefor the mentioned behavior of the benzene isotherm in compari-son with that for nitrogen are of importance on the breakthroughdynamics of organic molecules larger than C6H6 (i.e., TBB).
The PSDs with respect to the pore volume fV (x) = dVp/dx(Figs. 2a and 2b), as well as fS(x) = d S/dx related to the spe-cific surface area increments (Figs. 2c and 2d), for all the sam-ples have the main peak corresponding to micropores (splittingfor maximum porous PS3 and CS2) at the half-width x = 0.5–0.6 nm close to xDS with the dispersion δDS of 0.1–0.35 nm(Table 1). The xDS value is maximal for PS3, as well as the f (x)intensity at x > 1.5 nm. However, at x < 1.5 nm, the f (x) in-tensity is maximal for CS2, which is in agreement with its xDS
(average for two adjacent f (x) peaks at x = 0.45 and 0.89 nm),which corresponds to the second xDS magnitude among thestudied samples; however, the specific surface area (Table 1,SDS and to the porosity (VDS) of micropores with respect toboth nitrogen and benzene are maximal for CS2. Therefore onecan assume a great ability of this carbon, as well as PS3, inthe prevention of the TBB breakthrough, especially at low flowrates.
The fV (x) distributions computed using the nitrogen desorp-tion and benzene adsorption isotherms are similar; however, thelast PSDs (Figs. 2e and 2f) are narrower and slightly displaced to-ward x values smaller than those computed on the basis of the ni-trogen isotherms (Figs. 2a and 2b) at the same value of the regu-larization parameter α = 0.001. This effect can be caused bythe difference in the molecular size of the probe compounds andby the fact that the nitrogen desorption and benzene adsorptiondata were utilized (typical positions of the PSD peaks computedfor any adsorbent using adsorption and desorption data slightlydiffer). Thus maximal alterations in the PSDs among the studiedcarbons are observed between those for PS3 or CS2 (possessingmaximal Vp and SBET) and the PSDs of other samples especially
at x > 0.7 nm (Figs. 2a and 2b) due to different contributions ofmicropores and narrow mesopores at x between 0.7 and 2 nmK ET AL.
(supermicropores according to Dubinin’s classification of car-bon adsorbents), which is in agreement with the correspondingcontributions to the specific surface area (SBET, SK, SDS) andthe porosity (Vp, VDS). These features are also reflected in thedifferences in the reduced (divided by Vp) αS plots at αS between0.5 and 3 (i.e., to the left of the αS plot of the BP 280 carbonblack) (Fig. 1b) corresponding to the filling of pores over therange mentioned.
The differences in the PSDs (Fig. 2) are in agreement with thedifferences in the nitrogen (Fig. 3a) and benzene (Fig. 3b) APDs,which have, in general, similar shapes but are differently scaledby A, as the benzene APDs are significantly greater than thosefor nitrogen for the same carbons due to a higher energy of ben-zene adsorption on graphite sheets caused mainly by dispersioninteractions between the π electron systems of the adsorbentand the adsorbate (1, 2). The nitrogen APDs (Fig. 3a) demon-strate marked minima at A < 1.0 kJ/mol, which are associatedwith the completion of the secondary filling of the micropores.Note that a f (A) maximum at A ≈ 6–8 kJ/mol (which is notshown in Fig. 3a due to the relatively high initial p/p0 valuesused) can correspond to the availability of narrow microporesat x ≈ 0.5 nm (12, 19) similar to ones found for the carbonsstudied (Table 1, Fig. 2). However, the computed f (A) andf (E) distributions for nitrogen do not have all the characteristicpeaks, as minimal used p/p0 values were 0.0096–0.0097. Onthe other hand, minimal p/p0 for benzene was approximately10−6; therefore practically total APDs are observed in Fig. 3b.Since TBB has a side C(CH3)3 group, which can change the dis-persion interaction between the TBB ring and the graphite platedue to steric effect but TBB molecule has the dipole moment of0.4 D, slightly increasing polar components of the interaction,the TBB APDs or the distributions of the free energy ( f (G))of TBB adsorption can differ from those for benzene. However,these difference can be relatively small, and maximal APDs forbenzene adsorbed on CS2 and PS3 (Fig. 3b) can correspond tomaximal f (G) for TBB adsorbed on these carbons, which canalso affect the TBB breakthrough dynamics.
The nitrogen adsorption energy distributions (Fig. 3c) havetwo to three peaks related to the adsorption onto the pore wallsin narrow micropores (E > 15 kJ/mol or A > 5 kJ/mol) (19, 24,26) and supermicropores (9 < E < 15 kJ/mol or A < 5 kJ/mol)and secondary pore filling (multilayer adsorption) at E ≈5.6 kJ/mol (equal to the liquefaction heat of nitrogen) or A <
0.5 kJ/mol. It should be noted that we used the energyvalue of lateral interaction between adjacent adsorbed nitrogenmolecules equal to ≈2 kJ/mol (20), which is close to the maximalinteraction energy between two nonadsorbed N2 molecules (27).The integral intensity of the f (E) peaks at 8–10 kJ/mol greaterthan that at 5.6 kJ/mol suggests that the secondary (space) fillingof pores by nitrogen molecules plays a smaller role than adsorp-tion onto the pore walls, as the carbons are microporous withf (x) maximal at x ≈ 0.5–0.9 nm (Fig. 2) close to two nitrogen
layers (≈0.7 nm). Consequently, on dynamic adsorption of TBB(possessing a molecular diameter larger than that of benzene or
TERT-BUTYLBENZENE BREAKTHROUGH 11
FIG. 2. Pore size distributions with respect to (a, b, e, f) dVp/dx and (c, d) d S/dx computed using (a–d) desorption data for nitrogen and (e, f) adsorption
data for benzene.nitrogen) on microporous carbons, the space filling of pores atx < 1.5 nm can play an insignificant role; i.e., one can assumethe importance of the specific surface area value on the TBB
breakthrough, especially at low TBB concentration in the gasflow with relatively small νL.For adsorbed benzene, the availability of broadened f (A)peaks (Fig. 3b) at A between 5 and 35 kJ/mol can correspondto a relatively large roughness or nanoscale nonuniformity of
the carbon surfaces and can be also linked to residual tiny par-ticles with ash. This assumption is confirmed by great values
K
12 PALIJCZUFIG. 3. Adsorption potential distributions for (a) nitrogen and (b) benzene,and (c) nitrogen adsorption energy distributions.
of the fractal dimension DAJ, which, however, are smaller forlarger molecules of benzene and minimal for PS3 characterizedby a maximal contribution of mesopores (Table 1 and Figs. 1and 2). Additionally, one can assume that an increase in small-
scale nonuniformity of the carbon surfaces affects both the com-petitive adsorption of water and organics and the displacementET AL.
of water by organics in the case of prehumidification of thecarbons.
Thermogravimetric measurements of the desorption of wa-ter adsorbed on carbons in air (Fig. 4) depict that the amountof adsorbed water depends rather on the hydrophilic proper-ties of the adsorbents than the total pore volume, since a maxi-mal adsorption is observed for PS1 possessing a minimal porevolume and a minimal adsorption for CS2 having a large porevolume (Table 1). At the same time the freezing of water ad-sorbed on carbons in air results in a significant reduction of theaccessible pore volume and surface area (Table 2). This rela-tive diminution is greater than a portion of pores occupied bywater adsorbed on carbons in air because of the blocking ofpores by ice crystallites, which can be formed in mesoporesand transport pores. Such a water distribution in carbon porescan strongly affect breakthrough results for previously wettedcarbons.
Consequently, one can expect relatively complex relation-ships between breakthrough data and the textural parameters ofcarbon adsorbents, especially with the presence of preadsorbedwater, which can be analyzed using the corresponding distribu-tion functions related to energetic and dynamic characteristicsof the TBB adsorption and its breakthrough.
The c/c0 plots of TBB adsorption versus time show that thedependence of breakthrough results on the structural parametersare really complex (Fig. 5a and Tables 3–6) as mentioned above.However, there is an expected tendency: an increase in Vp andSBET leads to an increase in tb. This is clearly seen for the break-through plots for carbons with a granule fraction at d = 0.71–1.0 mm (Fig. 5b). In the case of d = 0.5–0.7 mm, this rela-tionship has deviations, especially for the nearly pure microp-orous CS1 (Fig. 5a) possessing minimal SK and VDS/Vp = 0.967(Table 1). Additionally, the surface nature (e.g., amount andkind of different groups containing oxygen) can influence the
FIG. 4. Weight loss due to desorption of water adsorbed on carbons in air.

TERT-BUTYLBENZENE BREAKTHROUGH 13
FIG. 5. TBB breakthrough plots for dry carbon beds with granule fractions of (a) 0.5–0.7 mm and (b) 0.71–1.0 mm for all samples studied and (c) for PS1 atvarious flow rates; (d) fitting of the TBB breakthrough plots for PS1 at two values of νL by Eq. [19]; (e) impact of prehumidity of carbon beds with PS2.

14 PALIJCZUK ET AL.
TABLE 4Dynamic Adsorption of TBB on Carbon Beds of PS1 (0.5–0.7 and 0.71–1.0 mm) under Different Conditions
Sample tb (min) Awb (mg g−1) β∗e (min−1) Lc (cm) Wc (g) We (mg g−1) Fitting equation
PS1a 60 89 14,200 0.81 1.89 197 Bx = 0.0707t − 9.2643∗∗PS1a 36 52 10,200 1.13 2.63 211 Bx = 0.046t − 6.6547
PS1de-asha 66 89 12,600 0.91 2.06 231 Bx = 0.0488t − 8.2111
∗∗PS1a 64 89 12,500 0.92 2.08 236 Bx = 0.0486t − 8.1225PS1b 35 50 9,900 1.16 2.66 266 Bx = 0.041t − 6.4277
∗∗PS1b 19 28 8,900 1.29 2.95 201 Bx = 0.0428t − 5.8223PS1de-ash
b 35 51 10,600 1.09 2.37 187 Bx = 0.0544t − 6.8917∗∗PS1de-ash
b 40 56 10,500 1.10 2.39 212 Bx = 0.0461t − 6.8609
Note. ∗∗Air at RH = 80%; d = a0.5–0.7 and b0.71–1.0 mm.
breakthrough curve shapes, especially for wetted carbons dueto changes in the interaction with adsorbed water and changesin the structure of adsorbed water droplets (3, 11). An increasein the flow rate νL causes the displacement of the breakthroughplots toward shorter breakthrough times as tb ∼ 1/νL and resultsin a larger decline of the curves (Fig. 5c). Perhaps, the last isdue to a reduction in the influence of the lateral TBB diffusion(7–9). Additionally, increasing νL nearly linearly enhances β∗
e(Table 7); however, normalized β∗
e /νL decreases with νL akin totb. In the case of the prehumidification, the breakthrough graphsshift toward shorter breakthrough times; however, the curve de-cline decreases (Fig. 5e) in contrast to that with increasing νL
(Figs. 5c and 5d). The prehumidification results in a significantdiminution of the adsorptive capability of PS2, especially in thecase of the larger granule fraction (Table 5), due to pore fill-ing by water (large Vpre) and slow displacement by TBB (smallVs in Eq. [6]). At the same time, the breakthrough results fora dried carbon bed but wet air (RH = 80%) are relatively closeto those obtained for dry air (Tables 3–6). Thus, there is a sig-nificant difference between the breakthrough results obtainedfor dry and wet (prehumided) carbon beds, but the humidity ofair/TBB results in a smaller effect because of a stronger inter-action of TBB with hydrophobic graphite sheets with water, as
the heat of water adsorption on carbons is markedly lower (15–30 kJ/mol) than the water liquefaction heat (44–45 kJ/mol) (4).bed depth (Lc) and the weight (Wc), maximal adsorption ca-pacity (Awb), and minimal bulk density ρb. These lead to the
TABLE 5Dynamic Adsorption of TBB on Dry and Prehumidified Carbon Beds of PS2 (0.5–0.7 and 0.71–1.0 mm)
Sample tb (min) Awb (mg g−1) β∗e (min−1) Lc (cm) Wc (g) We (mg g−1) Aw (g g−1) Fitting equation
aPS2 102 198 14,800 0.78 1.34 422 — Bx = 0.0455t − 9.6368aPS2∗∗ 12 21 8,300 1.39 2.38 277 0.547c Bx = 0.0353t − 5.4325bPS2 67 130 11,100 1.04 1.80 425 — Bx = 0.0335t − 7.2357bPS2∗∗ ≈0 7,500 1.54 2.67 327 0.547d Bx = 0.0312t − 4.8592aPS2 101 180 14,900 0.77 1.33 376 — Bx = 0.0468t − 9.7298bPS2 64 113 11,300 1.02 1.77 356 — Bx = 0.037t − 7.3747
Note. tb is the breakthrough time; Awb is the maximal adsorption capacity; Aw isH2O per 2.578 g activated carbon; d 1.426 g H2O per 2.607 g activated carbon; ∗∗T
One can assume that not only a reduction of the pore volume ac-cessible for organics due to water adsorption (or preadsorption)but also relations between lateral and longitudinal diffusions ofTBB molecules impact the breakthrough results differently forvarious flow rates.
The calculated overall adsorption rate coefficient β∗e values
(linked to effective mass transfer in pores) (Tables 3–7) dependon the structural properties of carbons, as an increase in theporosity enhances β∗
e , but at the larger granule sizes of carbons,it decreases (since the accessibility of a portion of pores in largergranules decreases), and the greater the β∗
e values, the longer thetb times. From Eq. [2], β∞ = 31,031 min−1 at d = 0.6 mm (ave-rage for the first studied fraction) and β∞ = 18,403 min−1 atd = 0.85 mm (second fraction); i.e., these values are markedlylarger than β∗
e (Table 3, see, e.g., PS3) calculated on the basis ofthe experimental breakthrough plots. The β∗
e values are maximalfor PS3 (Tables 3–6) possessing large Vp, SBET, and xDS valuesand a marked contribution of mesopores (Table 1, SK, maxi-mal hysteresis loop (Fig. 1) and maximal f (x) at x > 1.5 nm(Fig. 2)), which are more appropriate for the fast adsorptionof TBB (molecular size ≈0.8 nm) than narrow micropores be-cause of a diffusive damping factor. Besides, PS3 character-ized by the maximal tb value has minimal critical values of the
the total amount of adsorbed water; d = a0.5–0.7 and b0.71–1.0 mm; c1.410 g= 293 K, prehumided carbon beds in air at RH = 80%.

TERT-BUTYLBENZENE BREAKTHROUGH 15
TABLE 6Dynamic Adsorption of TBB on Carbon Beds of PS3 (0.5–0.7 mm) under Different Conditions
Sample tb (min) Awb (mg g−1) β∗e (min−1) Lc (cm) Wc (g) We (mg g−1) Fitting equation
PS3 152 350 21,200 0.54 0.82 559 Bx = 0.0579t − 13.803PS3∗∗ 148 331 19,600 0.59 0.88 553 Bx = 0.0525t − 12.791PS3de-ash 203 445 24,100 0.48 0.72 665 Bx = 0.0526t − 15.681PS3de-ash
∗∗ 177 400 21,600 0.53 0.80 635 Bx = 0.0509t − 14.032
∗∗
Note. Air at RH = 80%.displacement of the TBB breakthrough curves for PS3 towardlonger breakthrough times in comparison with CS2 having maxi-mal Vp and SBET but characterized by a smaller contribution ofpores at x > 1.5 nm, corresponding to two (or more) moleculardiameters of TBB (Fig. 2). The removal of ash gives small posi-tive changes in tb for both dry and wet PS1 (Table 4); however,in the case of PS3, the ash removal affects the breakthroughdynamics stronger (Table 6). Thus, PS3 is the most effectiveadsorbent among those studied with respect to TBB absorptionfrom dry or wet air.
The solution of Eq. [16] or [17] by using the regularization-SVD method applied to the initial portions of the breakthroughplots at c(t)/c0 < 0.2 (for better fitting) gives the f (βe) distribu-tion functions dependent on the structural parameters of carbonsand the presence of water (Fig. 6), which are in agreement withβ∗
e computed with no the regularization (see Tables 3–7) andsmaller than β∞. Broader PSDs (Fig. 2) correspond to broaderf (βe) distributions (Fig. 6) due to alterations of the mass transferin pores of different sizes. It should be noted that the presenceof water causes the displacement of f (βe) toward smaller βe in-dependent of the used model (Fig. 6) (as the breakthrough timedecreases) and the narrowing of the f (βe) peaks. The last corres-ponds to better fitting of the experimental curves of the overallamounts of outlet TBB by the theoretical graphs. This effect canbe connected to the preferable adsorption of water and TBB ondifferent surface sites, which results in an apparent diminution ofthe nonuniformity of carbon surfaces with adsorbed water withrespect to the TBB adsorption. Note that the DAJ values for CS1and CS2 carbons with frozen water (Table 2) is lower than that
TABLE 7Impact of the Flow Rate on TBB Breakthrough Results
for PS1 (0.71–1.0 mm)
νL β∗e β∗
e /νL tb Awb
(cm min−1) (min−1) (cm−1) (min) (mg g−1)
390 6,480 16.62 230 141500 6,850 13.73 120 82750 8,900 11.84 74 76
1000 9,900 9.88 35 501500 12,400 8.28 7 14
2000 15,400 7.72 0.1 0.3for these carbons without water (Table 1). Consequently, in thecase of the wet air and dry carbons, water molecules can adsorbin narrow pores inaccessible to larger TBB molecules, as TBBadsorption energy is higher than that for water; therefore organicmolecules displace water molecules and its dimers (which do nothave time to form large clusters blocking pores as in the case ofthe preadsorption of water) from graphite sheets. Therefore, thebreakthrough graphs and the corresponding parameters change
FIG. 6. Distribution f (βe) functions of the mass transfer coefficient for TBB
breakthrough results obtained for different carbons dry or wet using Eq. [16](symbols and lines) or Eq. [17] (lines, LV model).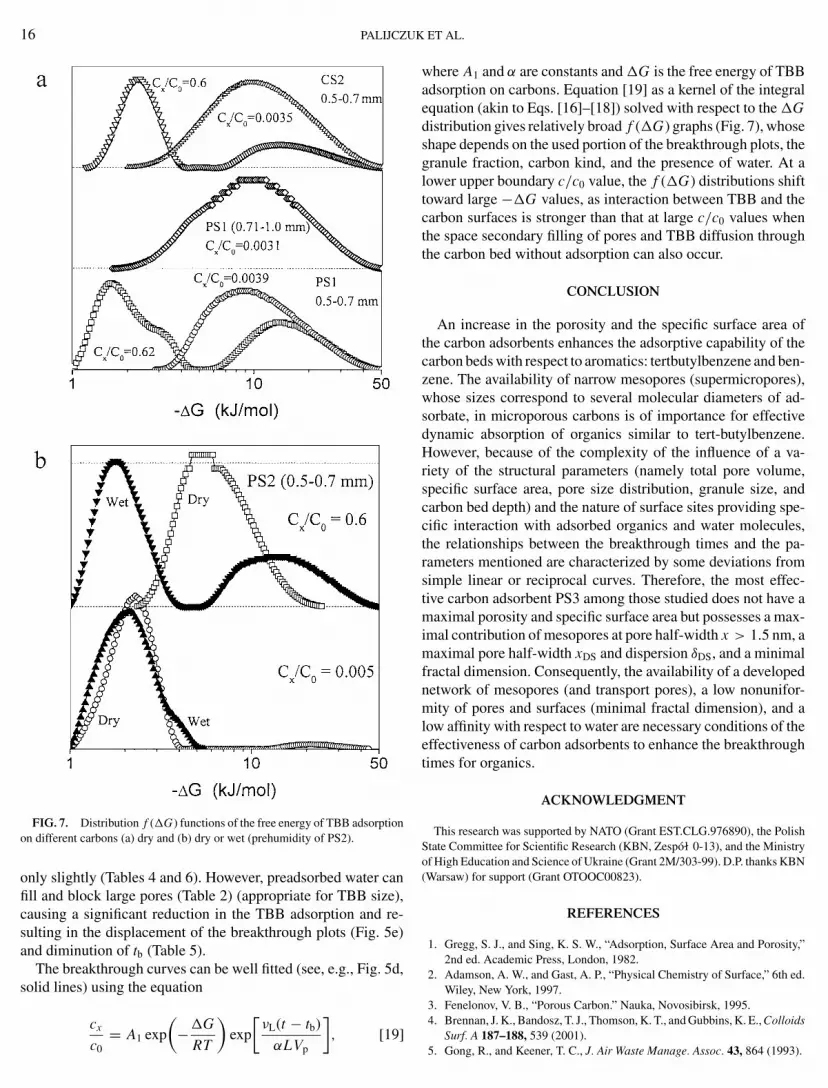
16 PALIJCZU
FIG. 7. Distribution f (G) functions of the free energy of TBB adsorptionon different carbons (a) dry and (b) dry or wet (prehumidity of PS2).
only slightly (Tables 4 and 6). However, preadsorbed water canfill and block large pores (Table 2) (appropriate for TBB size),causing a significant reduction in the TBB adsorption and re-sulting in the displacement of the breakthrough plots (Fig. 5e)and diminution of tb (Table 5).
The breakthrough curves can be well fitted (see, e.g., Fig. 5d,solid lines) using the equation
cx(
G) [
νL(t − tb)]
c0= A1 exp −
RTexp
αLVp, [19]
K ET AL.
where A1 and α are constants and G is the free energy of TBBadsorption on carbons. Equation [19] as a kernel of the integralequation (akin to Eqs. [16]–[18]) solved with respect to the Gdistribution gives relatively broad f (G) graphs (Fig. 7), whoseshape depends on the used portion of the breakthrough plots, thegranule fraction, carbon kind, and the presence of water. At alower upper boundary c/c0 value, the f (G) distributions shifttoward large −G values, as interaction between TBB and thecarbon surfaces is stronger than that at large c/c0 values whenthe space secondary filling of pores and TBB diffusion throughthe carbon bed without adsorption can also occur.
CONCLUSION
An increase in the porosity and the specific surface area ofthe carbon adsorbents enhances the adsorptive capability of thecarbon beds with respect to aromatics: tertbutylbenzene and ben-zene. The availability of narrow mesopores (supermicropores),whose sizes correspond to several molecular diameters of ad-sorbate, in microporous carbons is of importance for effectivedynamic absorption of organics similar to tert-butylbenzene.However, because of the complexity of the influence of a va-riety of the structural parameters (namely total pore volume,specific surface area, pore size distribution, granule size, andcarbon bed depth) and the nature of surface sites providing spe-cific interaction with adsorbed organics and water molecules,the relationships between the breakthrough times and the pa-rameters mentioned are characterized by some deviations fromsimple linear or reciprocal curves. Therefore, the most effec-tive carbon adsorbent PS3 among those studied does not have amaximal porosity and specific surface area but possesses a max-imal contribution of mesopores at pore half-width x > 1.5 nm, amaximal pore half-width xDS and dispersion δDS, and a minimalfractal dimension. Consequently, the availability of a developednetwork of mesopores (and transport pores), a low nonunifor-mity of pores and surfaces (minimal fractal dimension), and alow affinity with respect to water are necessary conditions of theeffectiveness of carbon adsorbents to enhance the breakthroughtimes for organics.
ACKNOWLEDGMENT
This research was supported by NATO (Grant EST.CLG.976890), the PolishState Committee for Scientific Research (KBN, Zespol� 0-13), and the Ministryof High Education and Science of Ukraine (Grant 2M/303-99). D.P. thanks KBN(Warsaw) for support (Grant OTOOC00823).
REFERENCES
1. Gregg, S. J., and Sing, K. S. W., “Adsorption, Surface Area and Porosity,”2nd ed. Academic Press, London, 1982.
2. Adamson, A. W., and Gast, A. P., “Physical Chemistry of Surface,” 6th ed.Wiley, New York, 1997.
3. Fenelonov, V. B., “Porous Carbon.” Nauka, Novosibirsk, 1995.4. Brennan, J. K., Bandosz, T. J., Thomson, K. T., and Gubbins, K. E., Colloids
Surf. A 187–188, 539 (2001).5. Gong, R., and Keener, T. C., J. Air Waste Manage. Assoc. 43, 864 (1993).

TERT-BUTYLBENZEN
6. “Proceedings of the Sixth Conference on Fundamentals of Adsorption,”presqu’ile de Giens, France, 24–26 May 1998, Elsevier, Paris, 1998.
7. Lodewyckx, P., and Vansant, E. F., Am. Ind. Hyg. Assoc. J. 60, 612 (1999);61, 461 (2000); 61, 501 (2000).
8. Nikolaev, K. M. (Ed.), “Facilities of Individual and Collective Protection.”Military Academy of Chemical Protection, Moscow, 1976.
9. (a) Jonas, L. A., Carbon 16, 115 (1978); (b) Jonas, L. A., and Rehrmann,J. A., Carbon 12, 95 (1974); 10, 657 (1972); 11, 59 (1973); (c) Wheeler, A.,and Robell, A. J., J. Catal. 13, 299 (1969); (d) Jonas, L. A., and Svirbely,W. J., J. Catal. 24, 446 (1972); (e) Rehrmann, J. A., and Jonas, L. A.,Carbon 16, 47 (1978).
10. (a) Wood, G. O., and Stampfer, J. F., Carbon 31, 195 (1993); (b) Wood,G. O., Carbon 30, 593 (1992); (c) Busmundrun, O., Carbon 31, 279(1993); (d) Yoon, Y. H., and Nelson, J. H., Am. Ind. Hyg. Assoc. J. 45, 509(1984).
11. (a) Leboda, R., Gun’ko, V. M., Tomaszewski, W., and Trznadel, B. J.,J. Colloid Interface Sci. 238, 489 (2001); (b) Leboda, R., Turov, V. V.,Tomaszewski, W., Skubiszewska-Zi ba, J., and Gun’ko, V. M., Carbon, inpress; (c) Leboda, R., Turov, V. V., Tomaszewski, W., Gun’ko, V. M., andSkubiszewska-Zi ba, J., J. Colloid Interface Sci. Carbon 40, 389 (2002).
12. Gun’ko, V. M., and Do, D. D., Colloid. Surf. A 193, 71 (2001).
13. Leboda, R., and L� odyga, A., Patent 153846 (Poland).14. Leboda, R., and L� odyga, A., Chem. Anal. (Warsaw) 36, 113 (1991).E BREAKTHROUGH 17
15. Zhu, Z. H., Radovic, L. R., and Lu, G., Carbon 38, 451 (2000).16. Dubinin, M. M., in “Progress in Surface and Membrane Science” (D. A.
Cadenhead, Ed.), Vol. 9, p. 1. Academic Press, New York, 1975.17. (a) Dubinin, M. M., and Stoeckli, F., J. Colloid Interface Sci. 75, 34 (1980);
(b) Dubinin, M. M., Adv. Colloid Interface Sci. 2, 217 (1968).18. Kiselev, A. V., Dreving, V. P., and Runov, A. D., Dokl. AN USSR 46, 310
(1945).19. Kruk, M., Jaroniec, M., and Gadkaree, K. P., J. Colloid Interface Sci. 192,
250 (1997).20. (a) Nguyen, C., and Do, D. D., Langmuir 15, 3608 (1999); (b) Nguyen, C.,
and Do, D. D., Langmuir 16, 7218 (2000); (c) Do, D. D., Nguyen, C., andDo, H. D., Colloids Surf. A 187–188, 51 (2001).
21. Provencher, S. W., Comp. Phys. Comm. 27, 213, 229 (1982).22. Avnir, D., and Jaroniec, M., Langmuir 5, 1431 (1989).23. Jaroniec, M., and Madey, R., “Physical Adsorption on Heterogeneous
Solids.” Elsevier, Amsterdam, 1988.24. (a) Choma, J., and Jaroniec, M., Langmuir 13, 1026 (1997); (b) Jaroniec,
C. P., Jaroniec, M., and Kruk, M., J. Chromatogr. A 797, 93 (1998).25. Szombathely, M. V., Brauer, P., and Jaroniec, M., J. Comput. Chem. 13, 17
(1992).26. Kruk, M., Jaroniec, M., and Gadkaree, K. P., Langmuir 15, 1442 (1999).
27. Rozenbaum, V. M., Mebel, A. M., and Lin, S. H., Mol. Phys. 99, 1883(2001).
![(3,5-Di- tert -butyl-2-ethoxybenzylidene)[2-(3,5-di- tert -butyl-1 H -pyrazol-1-yl)ethyl]amine](https://img.pdfslide.net/doc/110x75/634f8d5aeb0b18f1440ae541/35-di-tert-butyl-2-ethoxybenzylidene2-35-di-tert-butyl-1-h-pyrazol-1-ylethylamine.jpg)


